- Аналітика
- Новини та інструменти
- Новини ринків
Новини ринків
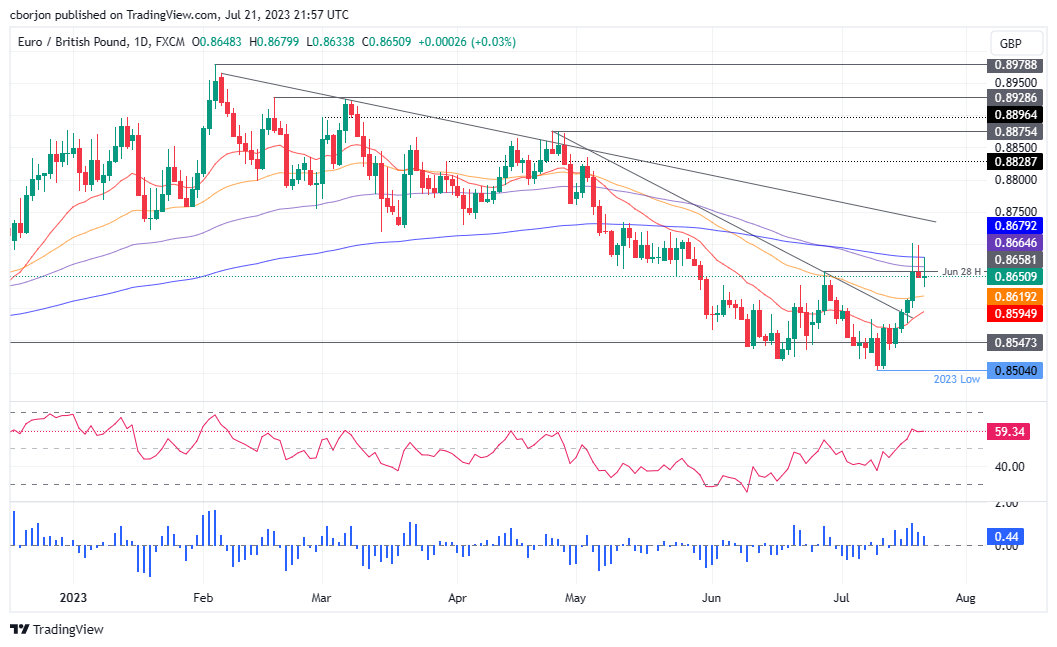
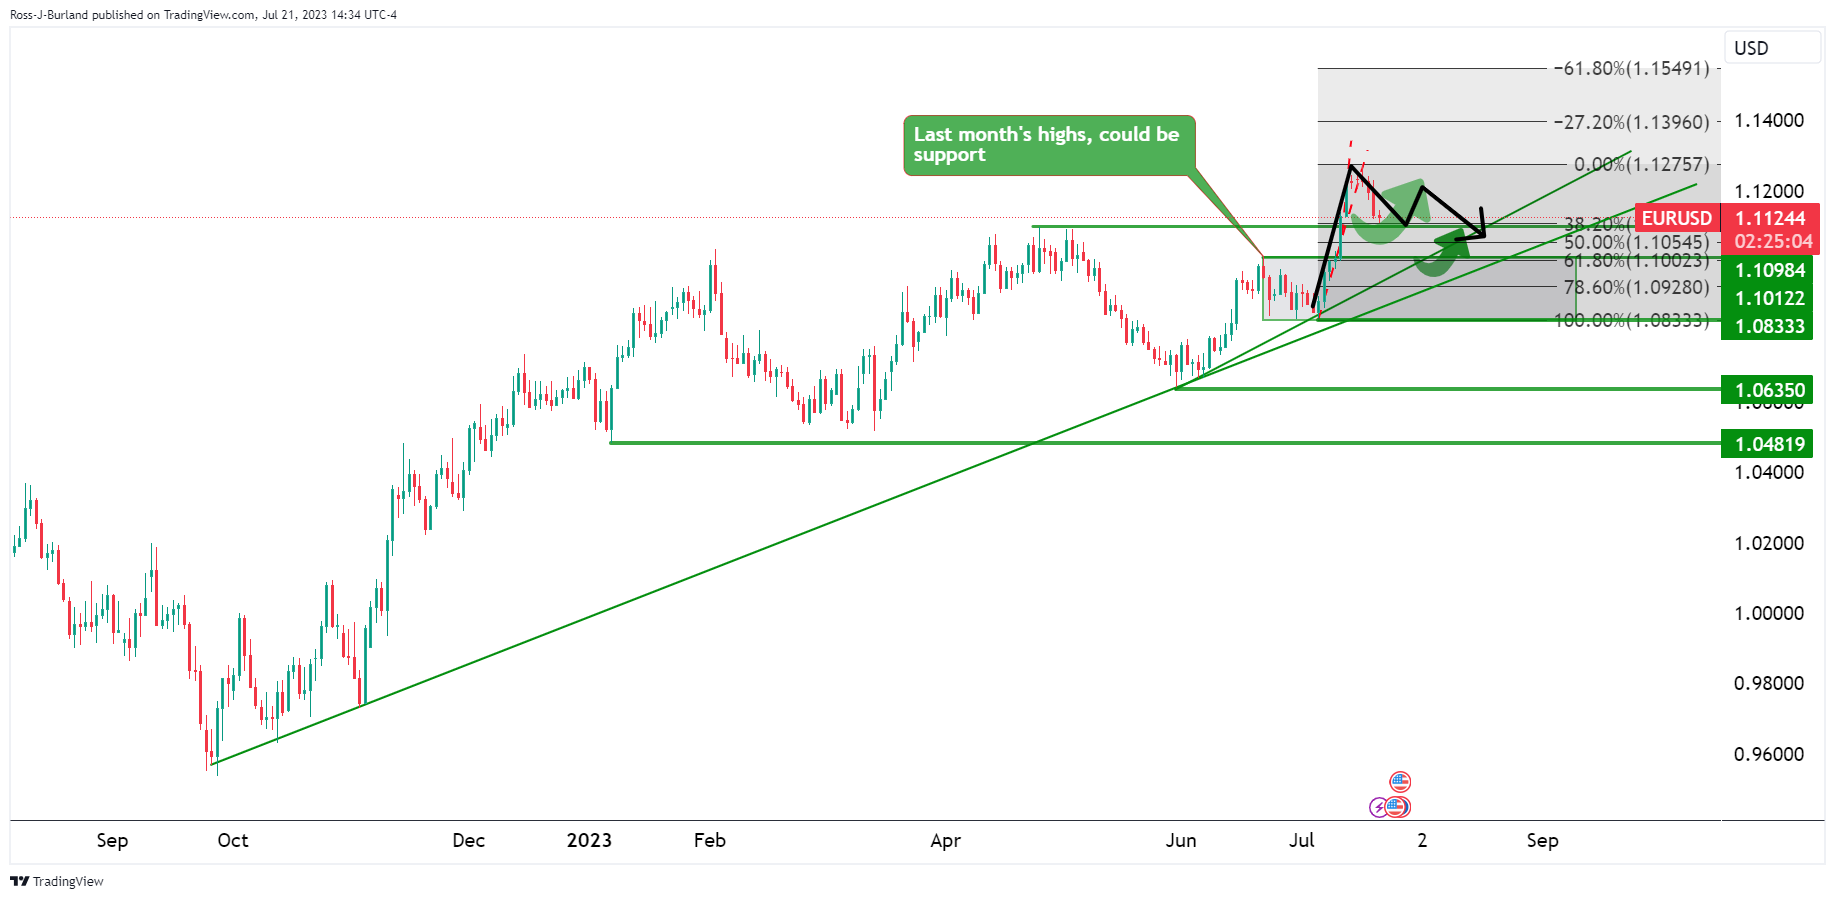
- EUR/GBP fails to decisively break above the 100 and 200-day EMAs at 0.8664 and 0.8679, respectively, after hitting a two-month high at 0.8700.
- If EUR/GBP pulls back, support levels emerge at 50-day EMA at 0.8619, 0.8600, 20-day EMA at 0.8594, and July 10 high at 0.8584.
- A break above 0.8700 will set sights on the next resistance at the May 11 high of 0.8734, followed by the resistance trendline from the YTD high at 0.8978 around 0.8740/50.
The EUR/GBP finished Friday’s session almost flat, failing to decisively break above the 100 and 200-day Exponential Moving Averages (EMAs), each at 0.8664 and 0.8679, respectively after the cross hit a new two-month high at 0.8700. As we head into the weekend, the EUR/GBP is trading at 0.8650, gains 0.03%.
EUR/GBP Price Analysis: Technical outlook
With EUR/GBP remaining unable to breach the 0.8700 figure, the Euro (EUR) remains exposed to selling pressure, but the next week’s upcoming monetary policy meeting of the European Central Bank (ECB) could lend a lifeline to hover around the current exchange rate, as it happened on Thursday and Friday.
If EUR/GBP pullbacks, the first support would be the 50-day EMA at 0.8619, followed by the 0.8600 mark. If the cross extends its drop past those two levels, it’s almost certain that it would drop past the 0-day EMA at 0.8594, with sellers eying the July 10 high at 0.8584, followed by the year-to-date (YTD) low of 0.8504.
Conversely, if EUR/GBP breaks above 0.8700, the EUR/GBP's next resistance level would be the May 11 high at 0.8734, followed by a resistance trendline drawn from the YTD high at 0.8978 that passes at around 0.8740/50. A breach of the latter will expose the 0.8800 mark.
EUR/GBP Price Action – Daily chart
- USD/JPY bears are waiting to make the move.
- Bears eye key resistance near a 61.8% Fibonacci, but note higher prospects.
The yen dropped against the dollar on Friday after Reuters reported the Bank of Japan (BoJ) is leaning toward keeping its key yield control policy unchanged next week. We have seen a range of between 139.74 and 141.95 on Friday and this sets up next week for a possible correction from a 61.8% Fibonacci retracement area in the opening range:
USD/JPY technical analysis
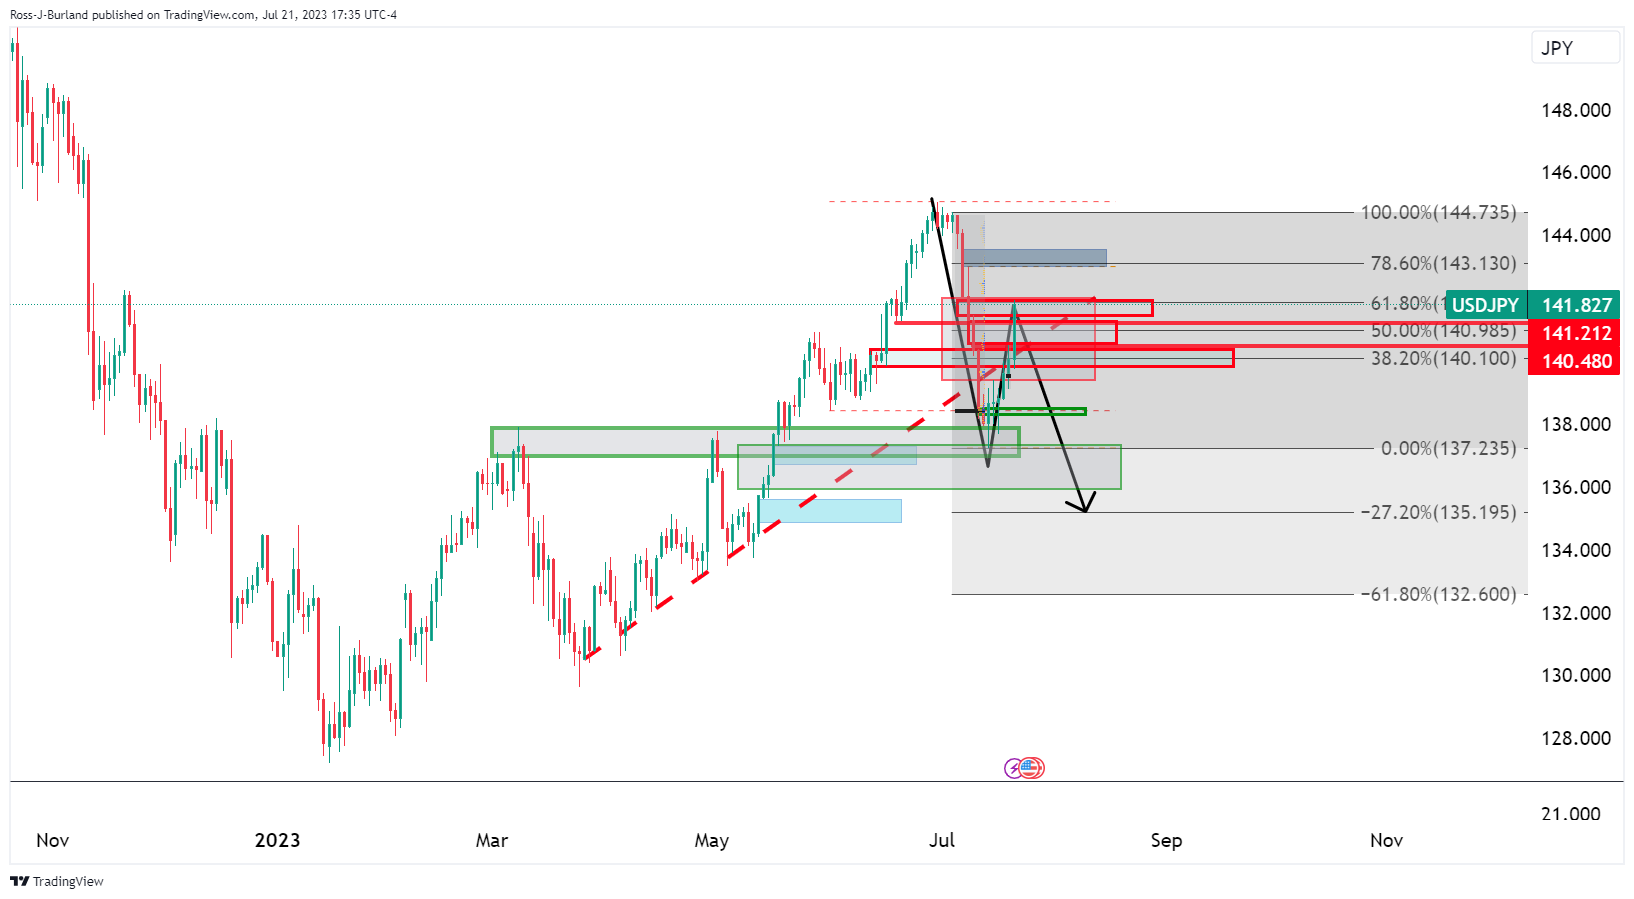
USD/JPY H4 chart
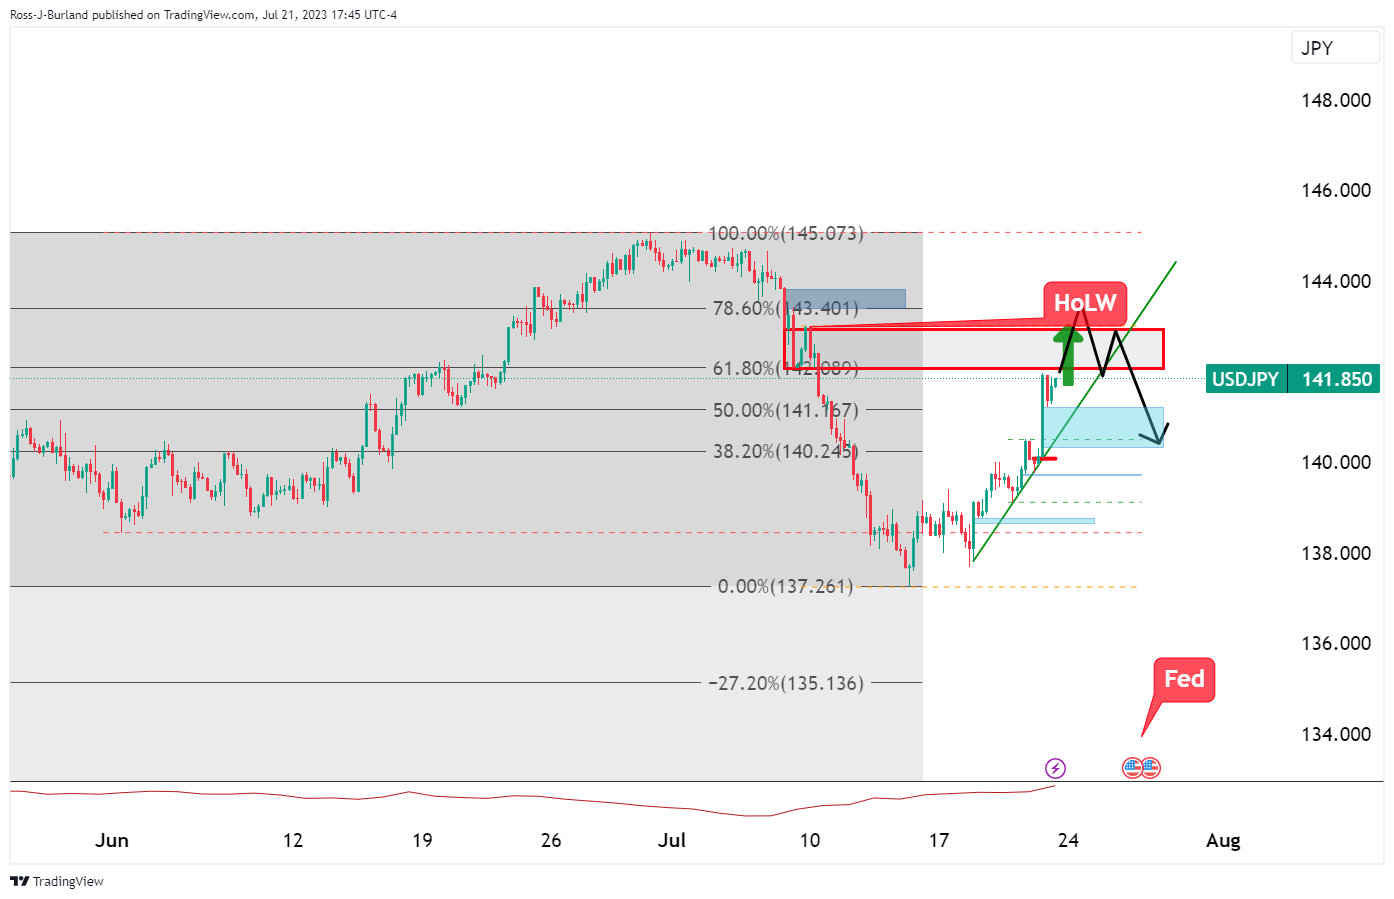
However, the high of last week, HoLW, could be a target before where the area meets a 78.6% ratio. The current bullish trend line remains intact after all.
- XAU/USD fell near the 100-day SMA near $1,960 but held weekly gains.
- USD continued to gain ground on Friday following solid Jobless Claims data.
- All eyes are on the FOMC decision next week.
At the end of the week, the XAU/USD traded near the 100-day Simple Moving Average of $1,962, experiencing a 0.30% decline but recorded a weekly gain, its third in a row.
The prevailing strength of the US Dollar continues to exert downward pressure on XAU/USD. Notably, the recent release of Initial Jobless Claims data by the US Department of Labor revealed a lower figure of 228,000 people filing for unemployment benefits in the second week of July, below the market expectation of 242,000. These positive employment figures reflect a robust US economy, potentially prompting the Federal Reserve (Fed) to maintain a more aggressive stance. In that sense, the US bond yield rose sharply on Thursday, boosting the USD and applying the non-yielding metal selling pressure.
Ahead of next week’s Federal Open Market (FOMC) decision, markets have practically priced in a 25 basis point (bps) hike, and robust labour market data boosted the odds of an additional hike past July. However, those odds remain low, near 30%. In addition, Chair Powell’s presser will be closely watched as investors look for clues regarding forwards guidance.
XAU/USD Levels to watch
The daily chart of XAU/USD indicates a negative market sentiment dominated by bears. The Relative Strength Index (RSI) stands in positive territory above the midline but with a negative while the Moving Average Convergence Divergence (MACD) displays fading green bars, signalling exhaustion for the bulls. In the broader context, despite the bearish momentum, the price trading above the 20, 100, and 200-day Simple Moving Average (SMA) indicates that the overall trend remains to favour the bulls.
Support levels: $1,960 (100-SMA), $1,950, $1,936 (20-day SMA).
Resistance levels: $1,970, $1,987 (monthly high), $2,000.
XAU/USD Daily chart
-638255725391681048.png)
- AUD/USD point of control eyed near 0.6680.
- Bulls step in at key support area vs. heavily bearish price action.
As per the prior analysis, AUD/USD Price Analysis: Bears eye a break below key 0.6750, we have seen this play out. The bears moved in and took out the 0.6750s, printing a low of 0.6722, with last week's lows down in the 0.6620s on a break of 0.6700, 0.6690.
AUD/USD prior analysis
''The market has been giving two-way business and what we might see now is a downside continuation as follows:
AUD/USD H4 chart
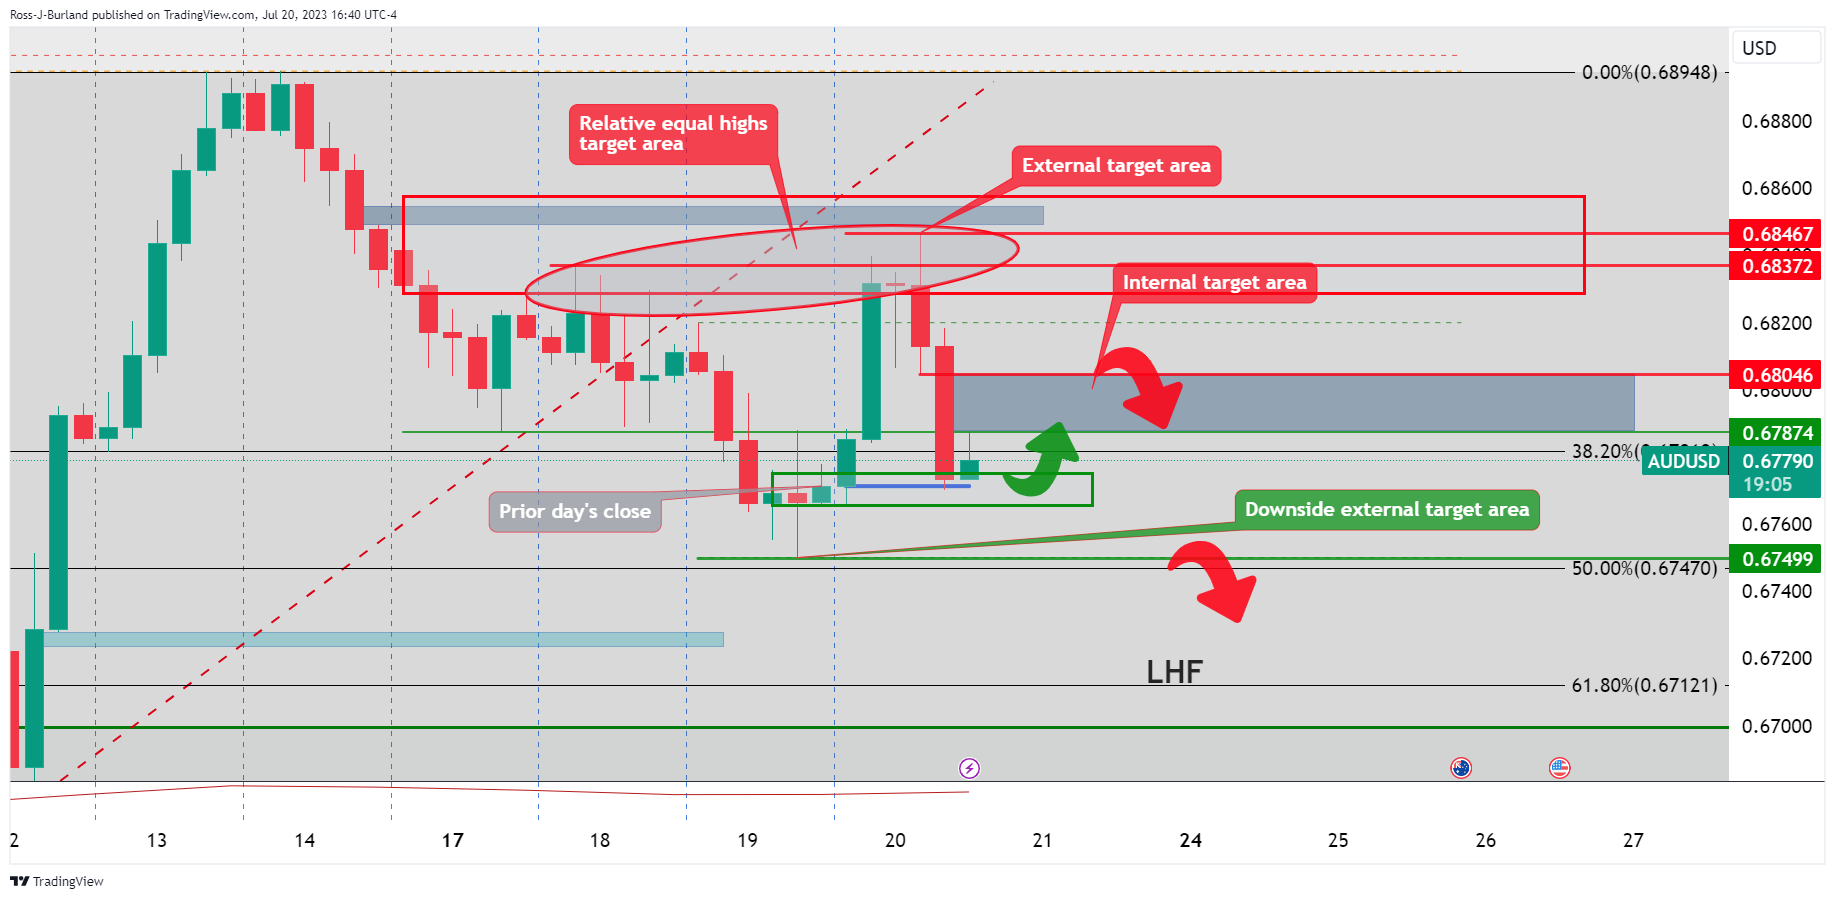
The bears are lurking to fade rallies in the internal and external target areas. A downside target of 0.6750 is eyed that guards low-hanging fruit, LHF, below.''
AUD/USD updates
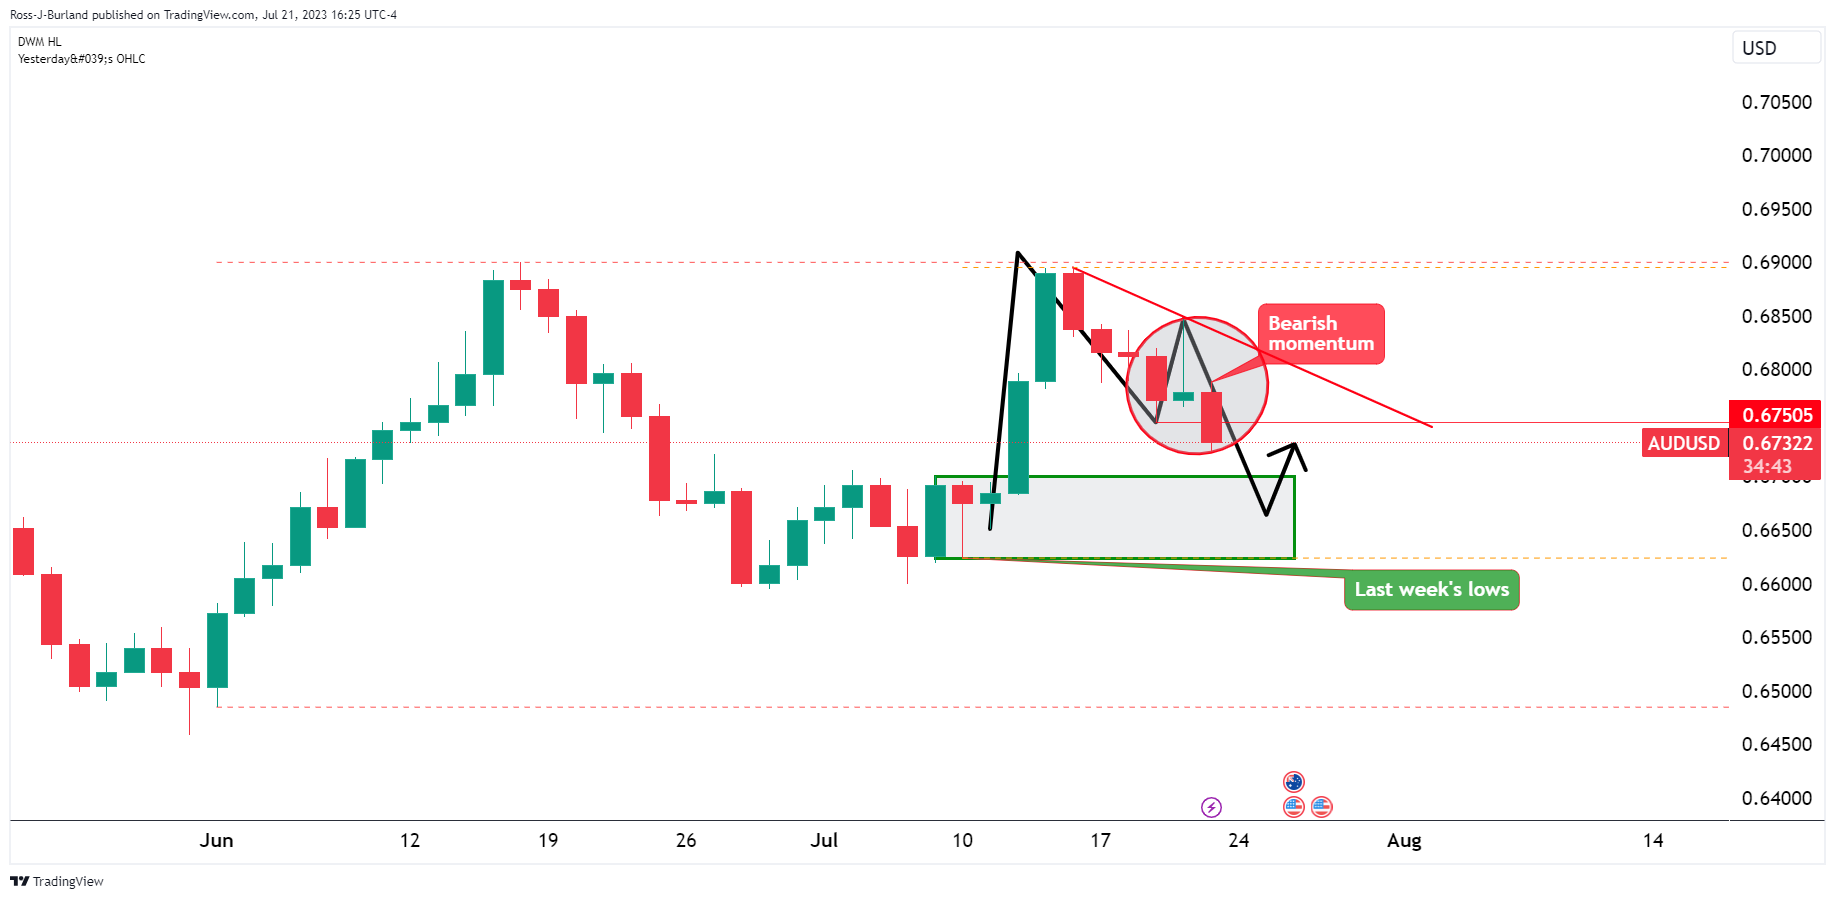
The daily chart is showing bearish momentum in the price action.
AUD/USD H1 chart
The bears moved in on the target area but there could be more to come and the hourly chart offers an insight to the bearish bias as per critical levels drawn above. A break beyond 0.6700 while below the significant levels opens risk towards last week's lows.
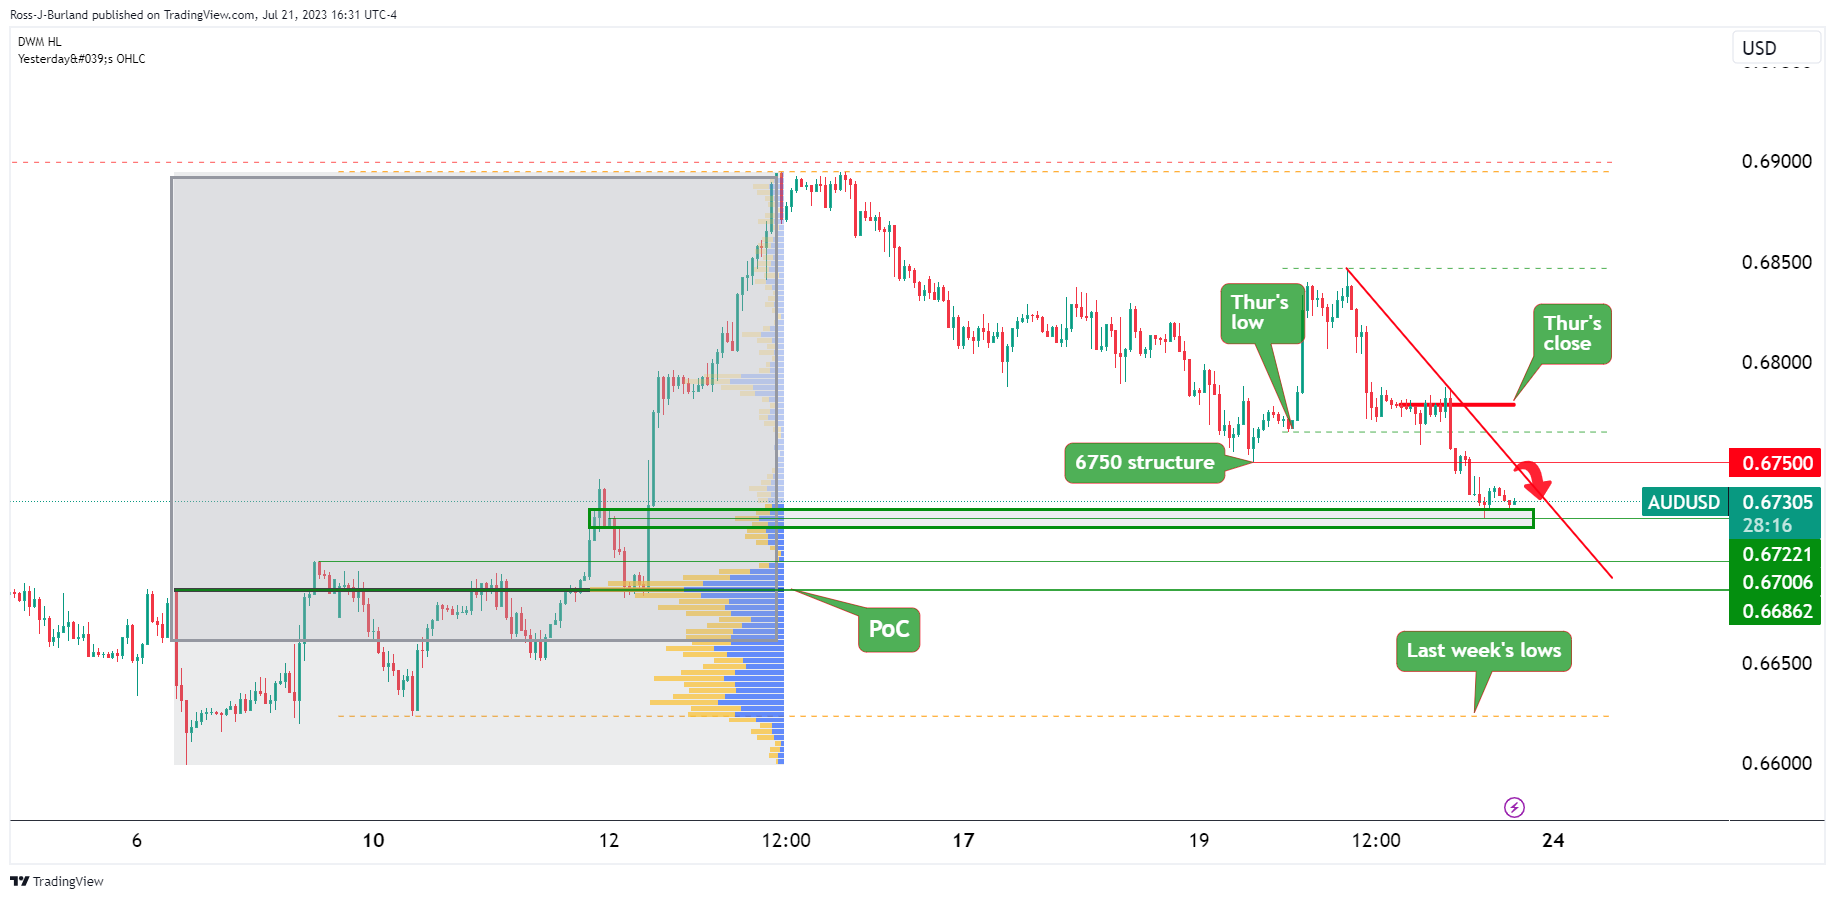
However, we the higher volumes below will not make life easy for the bears. The path of least resistance may turn out to be to the upside on failed attempts to the point of control near 0.6680.
- Initial GBP/USD gains, driven by upbeat UK retail sales data, were counteracted by increased strength in the US Dollar.
- Latest UK inflation report led to a repricing of BoE’s interest rates expectations, with a 50% chance of a 50 bps rate hike now projected by the swaps market.
- Robust US data, particularly lower-than-expected unemployment claims, reignited worries about the Federal Reserve (Fed) tightening monetary conditions post the upcoming meeting.
GBP/USD continued to drop late in the North American session following upbeat data in the United Kingdom (UK), but the market turned south as news emerging from Japan strengthened the greenback, which appreciated against most G7 currencies. The GBP/USD trades at 1.2851, losing 0012%, after hitting a daily high of 1.2904.
GBP/USD retreats from a high of 1.2904 following strong performance from the US dollar and lowered expectations of a significant rate hike from the Bank of England
News emerging during the Asian session triggered flows toward the US Dollar, as a Reuters report revealed the Bank of Japan (BoJ) would stick to its YCC program and maintain its dovish stance. That tumbled the GBP/USD, which had risen towards the 1.2900 mark after upbeat retail sales data in the UK, but overall US Dollar strength weighed on the GBP/USD.
Additionally, the most recent inflation report in the UK eased pressure on the Bank of England (BoE), which was expected to lift rates 50 bps at the August 3 meeting. However, inflation cooling down triggered a repricing of BoE’s interest rates expectations, with analysts backpedaling, as shown by the swaps market depicting a 50% chance of a 50 bps rate hike.
Across the pond, solid data from the United States (US), particularly last week’s unemployment claims, reignited concerns the Federal Reserve (Fed) will tighten monetary conditions after the following week’s meeting. Other data revealed during the day was mixed, with US retail sales missing estimates, but continued to show consumers resilience, while housing market data witnessed a dip after registering positive figures in May.
Meanwhile, expectations the Fed would raise rates past the July meeting surged to 28%, from last month’s 15.9% odds, as revealed by the CME FedWatch Tool.
Consequently, the greenback rose, registering more than 1% weekly gains. As of writing, the US Dollar Index (DXY), a measure that tracks the performance of the US Dollar against six peers, sits at 101.052, which advances 0.23%, on Friday.
The GBP/USD could remain sideways ahead of the FOMC’s monetary policy meeting. However, if Fed Chair Powell strikes a hawkish tone at his press conference, that could weigh on the GBP/USD before the BoE’s August 3 meeting.
GBP/USD Price Analysis: Technical outlook
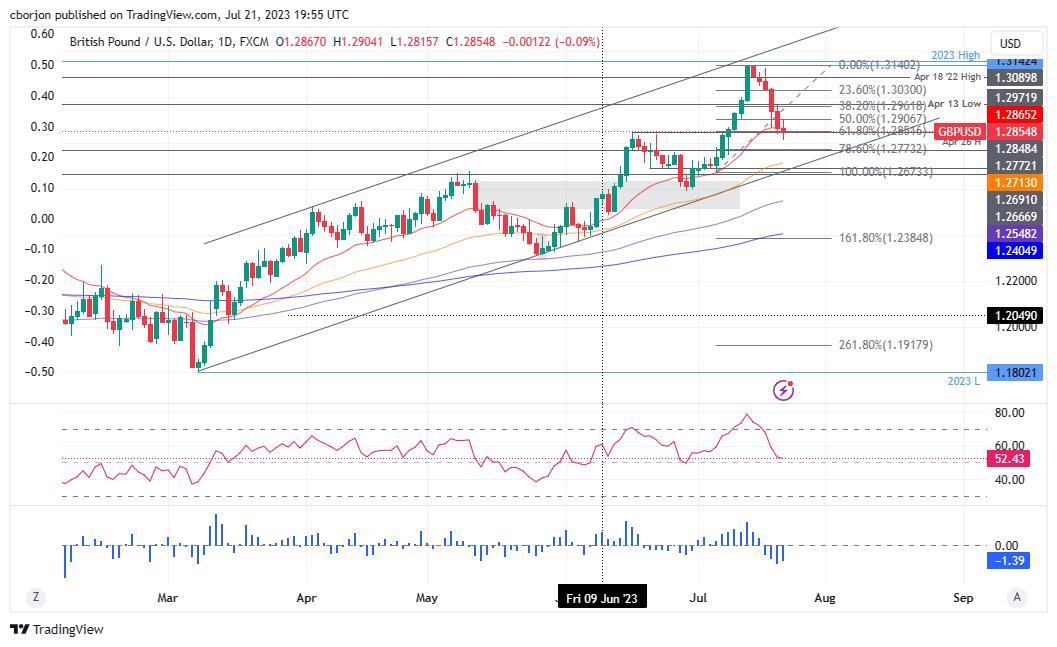
The daily chart portrays the GBP/USD pair as upward biased, despite losing 1.84% during a pullback from yearly highs of 1.3160 toward 1.2815. In addition, the GBP/USD fall was capped by the 61.80% Fibonacci level at 1.2851, from the Fibo drawn from recent lows of July 6 to the YTD high, with price action forming a spinning-top candle, preceded by a bearish candle. If the next candle turns bullish and closes above 1.2906, that would create a three-candlestick chart pattern called ‘morning star,’ warranting further upside expected. In that outcome, the GBP/USD next resistance would be the 38.2% Fibonacci level at 1.2961, followed by a test of the 1.3000 mark.
Conversely, the GBP/USD might consolidate below the 20-day Exponential Moving Average (EMA) at 1.2865, with sellers eyeing the 78.6% Fibonacci retracement at 1.2773.
Retail Sales rose in Canada by 0.2% in May, below the 0.5% increase expected. Analysts at CIBC point out that retail sales seeing little growth in May, and the advance estimate suggests that the sideways trend continued into June, the report reflects sluggishness in Canadian consumer spending even before the Bank of Canada restarted its rate hiking cycle.
Key quotes:
“Canadian retail sales rose by a modest 0.2% in May, slightly below the 0.5% consensus forecast albeit following a strong 1.0% increase in the prior month. In volume terms, overall sales edged up by 0.1% on the month and were 1.3% higher on a year-over-year basis. Given strong population growth seen over the past 12 months, this year-over-year growth rate would still represent a decline in per capita terms.”
“While overall GDP in Q2 is still tracking close to the 1.5% Bank of Canada MPR forecast, today's data suggest that consumer spending likely wasn't a significant driver of that growth, even accounting for growth in services spending. Industry data showing strength in areas such as manufacturing and wholesale suggest that inventory accumulation or business investment may be more significant contributors, which wouldn’t be bad news from an inflation point of view.”
- The GBP/JPY cross soared above the 20-day SMA to a high of 182.58, clearing weekly losses.
- Reuters reported that the BoJ will hold its YCC policy steady next week.
- Robust Retail Sales data from the UK from June gave the GBP traction.
The GBP/JPY cross rose more than 1% on Friday to a high above the 20-day Simple Moving Average (SMA) and is poised to close a weekly gain. The JPY faced severe selling pressure amid dovish bets on the Bank of Japan (BoJ) before next week’s meeting, while the GBP strengthened on solid Retail Sales figures.
Retail Sales in the UK rose more than expected in June. BoJ to hold its YCC policy
Retail Sales from the UK in June rose more than the expectations. The headline figure came in at 0.7% MoM vs the 0.2% expected improvement from the previous 0.1% and provided some support to the GBP.
Regarding the Bank of England’s (BoE) next steps, markets are discounting low 45% odds of a 50 basis point (bps) hike following the soft inflation figures reported on Wednesday and foresee 25 basis point hikes in September, November and February 2024, which would see the terminal rate at 5.75%, lower than last week’s estimates of 6.5%.
On the Japanese side, June inflation data showed that the National Consumer Price Index (CPI) dropped to 3.3% YoY, below the 3.5% expected, while the Core measure remained steady at 4.2% YoY, just as expected.
Ahead of next week’s meeting, according to Reuters, the BoJ will maintain its Yield Control Curve (YCC) policy as the bank considers that inflation is rising but the key is whether the increase is sustainable. In that sense, policy divergences between the BoE and the BoJ is applying selling pressure on the JPY.
GBP/JPY Levels to watch
The daily chart indicates a neutral to bullish outlook for the short term. The indicators show resilience, with the Relative Strength Index (RSI) positioning jumping above the midline, pointing north. At the same time, the Moving Average Convergence Divergence (MACD) prints subtle red bars, indicating a fading selling momentum. Looking at the bigger picture, the cross remains well-positioned above the 100-day and 200-day Simple Moving Averages (SMA) and the pair holding above the longer-term averages indicates that the bulls have the upperhand.
Resistance levels: 182.60, 183.00, 184.00
Support levels: 180.00. 179.50, 179.00.
GBP/JPY Daily chart
-638255630015775534.png)
Analysts at Rabobank point out that softer-than-expected UK CPI inflation data have triggered a re-evaluation of the market’s Bank of England policy outlook, pushing the Pound lower. They expected the GBP/USD to be trading below 1.2600 on a three-month view.
Key quotes:
“After all, while the UK economy has outperformed last year’s forecasts, it remains far from strong. The outlook for cable will be deeply impacted by the relative strength of the USD. We expect GBP/USD to be trading lower on a 3- month view.”
“We see the risks for the pound vs. the EUR as well balanced, suggesting limited scope for EUR/GBP to significantly diverge from the ranges that have dominated in the year to date.”
“The EUR has underperformed GBP slightly in the year to date. However, there has been little net movement in EUR/GBP from early January, with the currency pair trading very close to its 1-year average. Fears that the UK economy could be tipped into recession suggest scope for the market to reduce its long GBP positions in the coming months.”
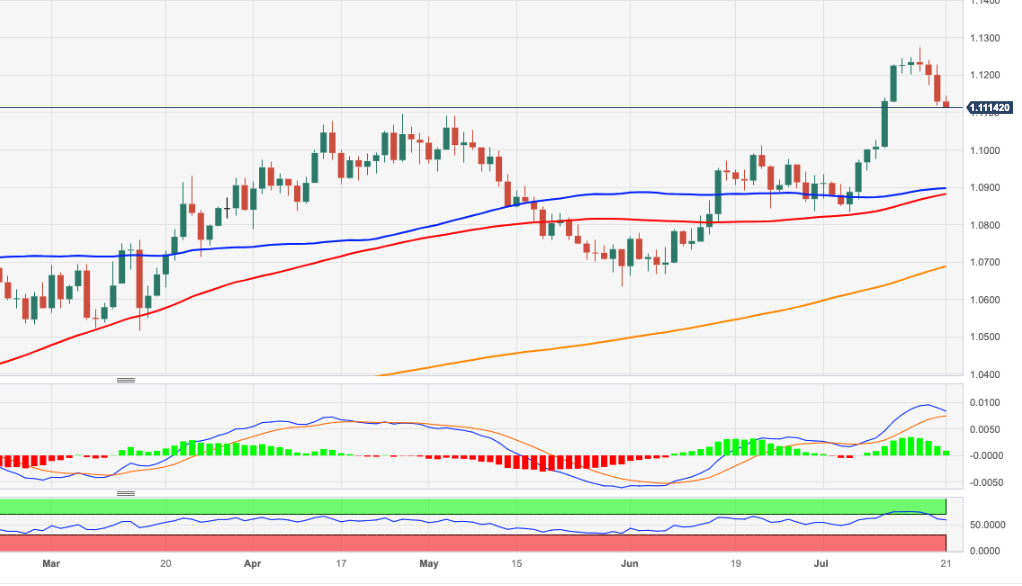
- EUR/USD bears on the front side of the bearish trendline.
- Bears look to the low-hanging fruit for the week ahead.
EUR/USD is back to flat on the day after moving between a range of 1.1107 and 1.1145. What will be key for the Euro is whether or not some of the dovish risks in next week's Federal Reserve meeting materialize. With both central banks expected to hike by 25bps, statements and pressers will be key next week. as for the charts, the following illustrates prospects of a move into low-hanging fruit towards the 1.1020s.
EUR/USD daily charts
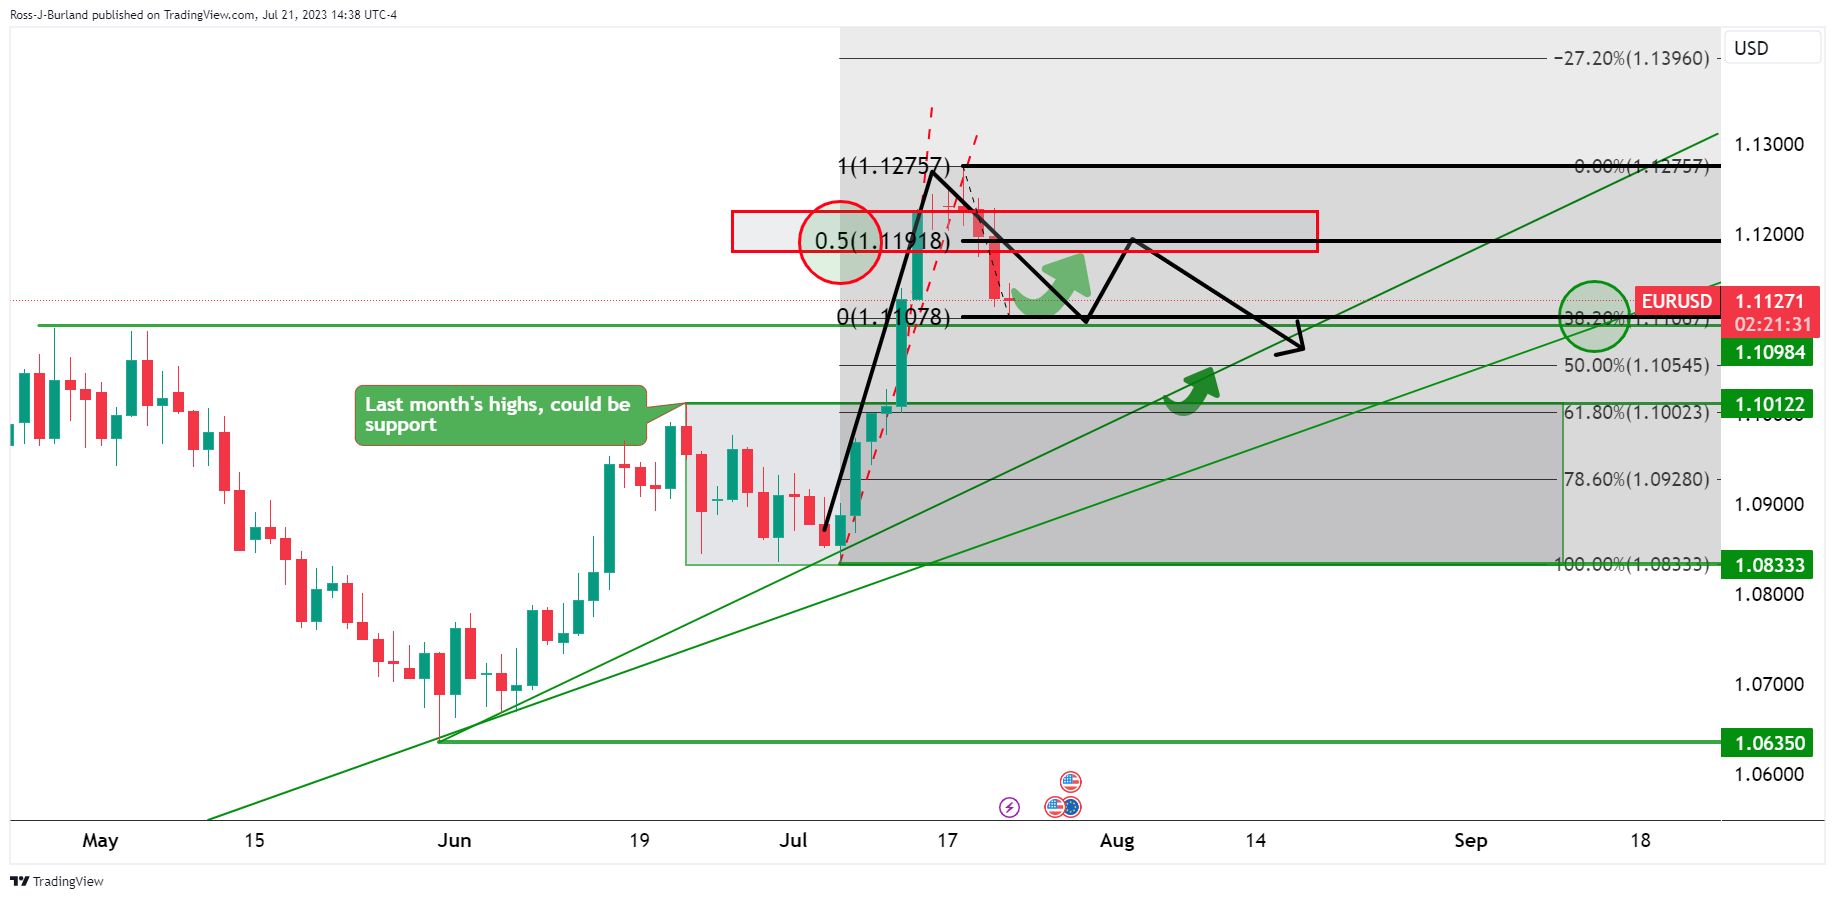
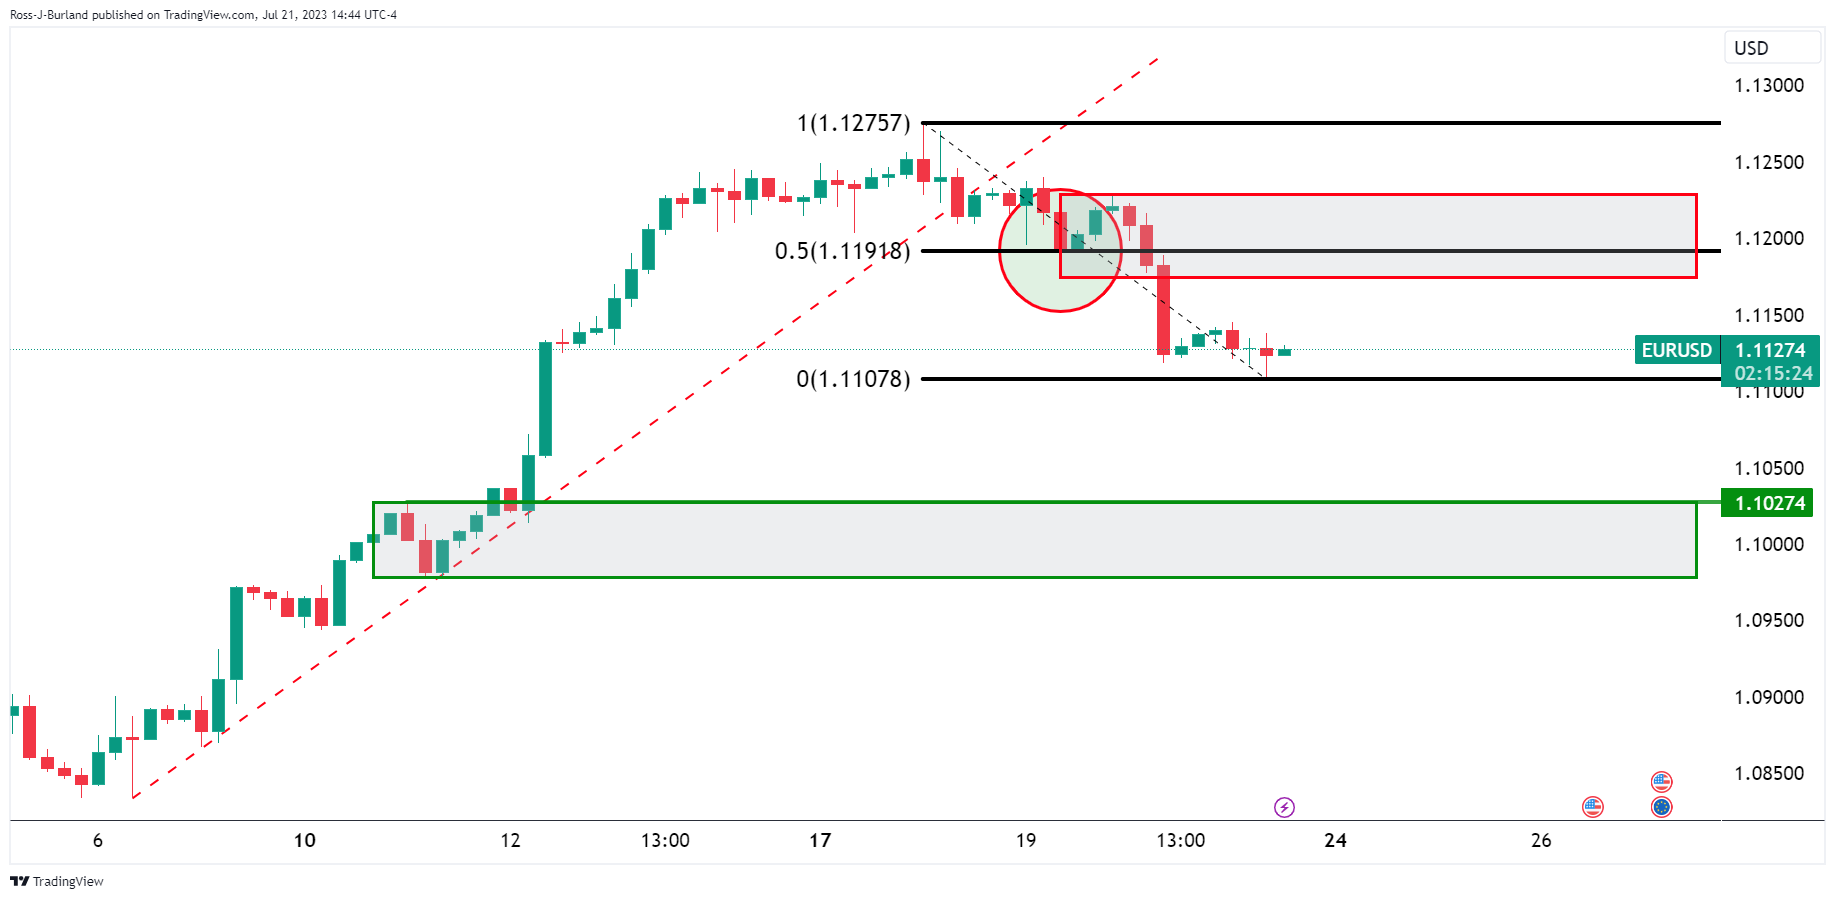
The 50% mark of the range is important and bears could stay committed below here near 1.1190/00.
EUR/USD H4 chart
EUR/USD H1 chart
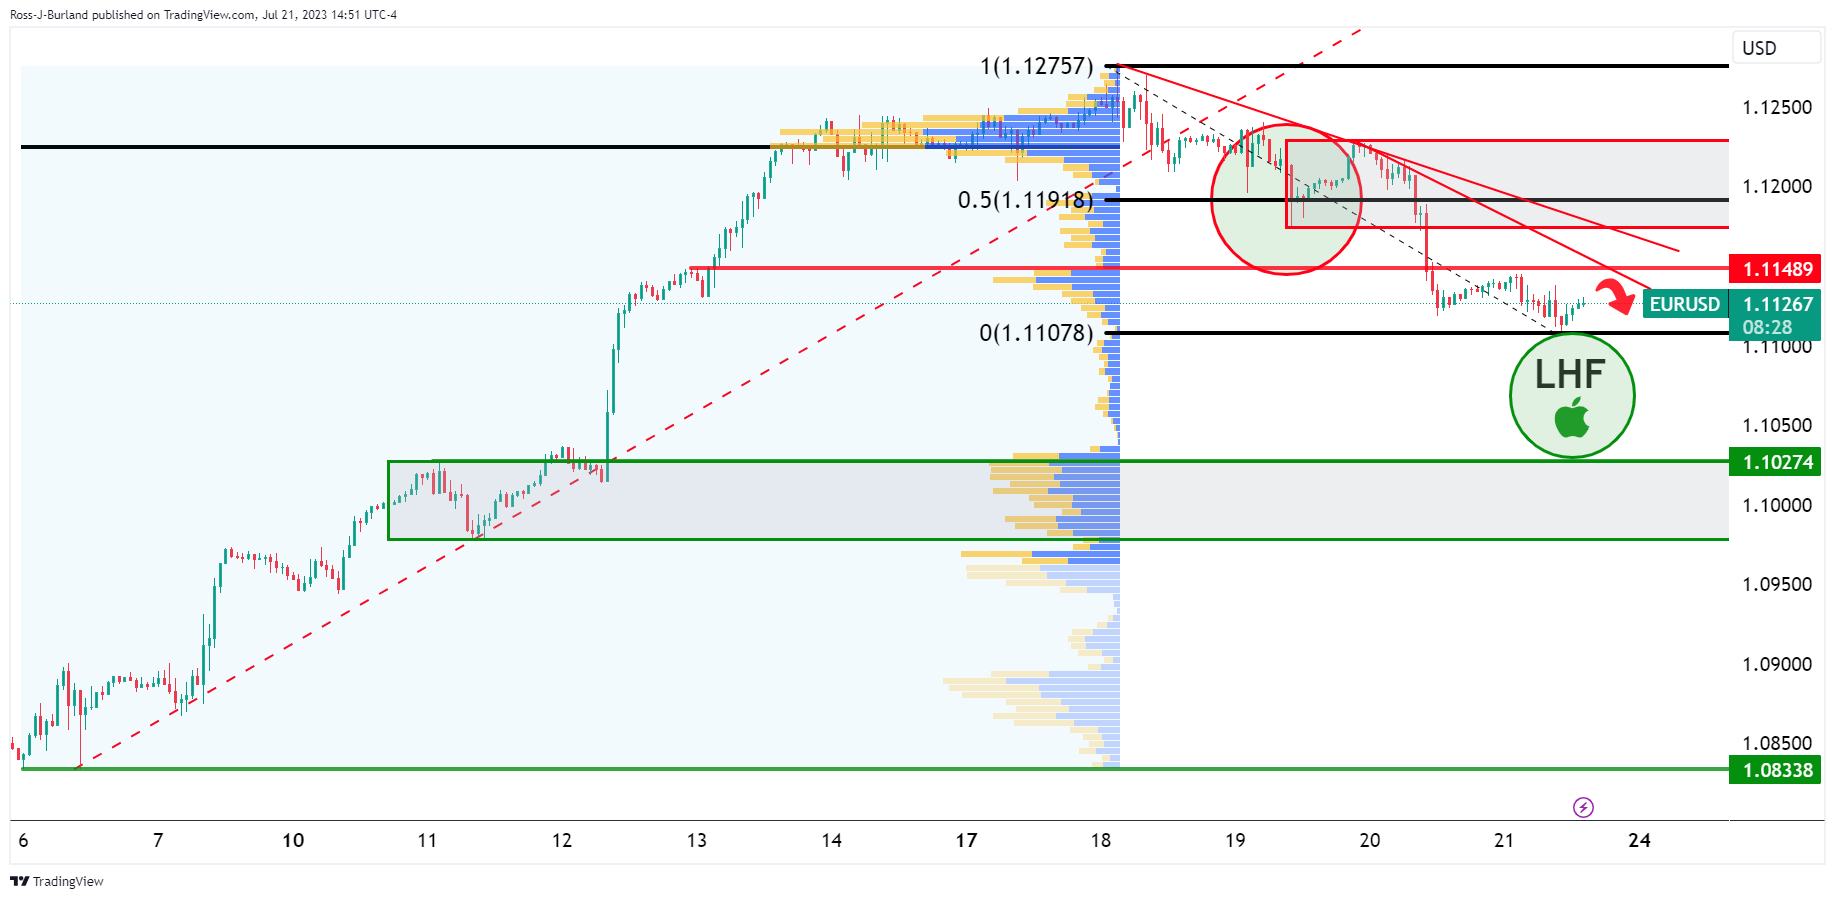
The 1.1150 is also a key area as we zoom in, so a commitment there will be heavily bearish for the open next week if bears stay frontside of the trendlines.
Next week, the focus will be on central banks as the Fed, ECB, and BoJ announce their monetary policy decisions. However, that's not all. Inflation figures from the US, Australia, and Europe will also be closely watched, along with global PMIs and US Q2 growth data.
Here is what you need to know for next week:
The week will kick off on Monday with the July preliminary PMIs. Generally, the manufacturing sector is expected to remain in contraction territory, while the services sector is expected to expand at a slower pace. These numbers will offer the first glimpse of global economic activity during the current month.
After a relatively quiet Tuesday in terms of economic data, during Wednesday's Asian session, Australia will release the Consumer Price Index (CPI) for June and the second quarter. This is a key measure ahead of the Reserve Bank of Australia (RBA) meeting on August 1st.
Later on Wednesday, the Federal Reserve (Fed) will announce its monetary policy decision. A 25 basis point rate hike is priced in, and the focus will be on the statement and Chair Powell's press conference. This event will trigger sharp moves across financial markets, even if it delivers as expected: a rate hike with the continuity of a hawkish bias.
As the markets continue to digest the FOMC decision, on Thursday, the European Central Bank (ECB) will announce its decision. Also, a 25 basis point rate hike is priced in, and President Lagarde is expected to signal that more rate hikes are likely. How strong the message regarding more tightening will be critical. The next ECB meeting is in September, and it may be too far away to have a clear perspective on what may happen there. However, the expectations will be relevant and should weigh on the EUR/USD.
Also on Thursday, the first reading of US growth performance during the second quarter is due, which is expected to expand at an annual rate of 1.6%, below the 2% of Q1. The report includes the Core Personal Consumption Expenditure for the second quarter. At the same time, the weekly Jobless Claims report and Durable Goods Orders for June are due. Considering the ECB meeting and the bulk of economic data from the US, Thursday is set to be another volatile day.
On Friday, more economic data is due from Australia with the Producer Price Index (Q2) and June Retail Sales. The key event during the Asian session will be the Bank of Japan (BoJ) decision. However, not much is expected from the central bank. A report from Reuters mentioned that despite accelerating inflation in Japan, the central bank is leaning towards leaving the yield curve control strategy unchanged.
The preliminary July inflation CPI from European countries will start to come out on Friday with Spain and Germany, with a slowdown expected on annual rates. That day, also US inflation data is due in the US with the Employment Cost Index for Q2 and the Core Personal Consumption Expenditure Price Index for June (however, no surprise will be expected considering that it is included in the GDP report due the day before). Canada will report monthly GDP growth (May).
During the week, more companies, including Microsoft, Alphabet, Meta Platforms, and Amazon, will report earnings which could weigh on market sentiment.
Currency performance
The US Dollar was among the top performers during the week, after the sharp decline of the previous week, supported by US economic data. The DXY rebounded from under 100.00, retaking 101.00. However, the outlook remains negative, and the positive results could be seen as a corrective movement. The next decisive leg will likely start following the FOMC meeting.
The Pound underperformed during the week following a bigger-than-expected drop in UK inflation. However, inflation remains elevated, and more rate hikes from the Bank of England (BoE) are expected. GBP/USD suffered the worst weekly result since January, retracting from one-year highs above 1.3100 to 1.2850. EUR/GBP posted the biggest weekly gains since January, but it was unable to break above the 20-week Simple Moving Average (SMA) and the 0.8700 area. The cross finished around 0.8650, and risks appear tilted to the upside, but the Euro needs to break and hold above 0.8700.
EUR/USD gave up half of last week's gains after retracting from one-year highs at 1.1275 toward 1.1100. The trend remains bullish, and the decline is seen as a correction.
USD/JPY rebounded at the 20-week SMA, rising back above 140.00 and erasing most of the previous week's losses. The Japanese Yen dropped sharply on Friday after reports suggesting the Bank of Japan won't signal a change in July.
The loonie underperformed among commodity currencies, even after the decline in inflation in Canada. USD/CAD ended flat, hovering around 1.3200/20.
Upbeat employment data from Australia boosted the AUD/NZD, which rose from 1.0730 to 1.0900. However, the stronger US dollar pushed the AUD/USD back to the 0.6720 area from near 0.6900. It is slightly above the 20-day SMA.
The Turkish Lira was the worst performer during the week, not helped by the 250 basis point rate hike from the Central Bank of the Republic of Turkey, which was below expectations. USD/TRY posted a record weekly close slightly below 7.00. The Colombian peso and the South African rand were the biggest gainers.
Like this article? Help us with some feedback by answering this survey:
- Positive sentiment supports the Mexican Peso (MXN), but Fed tightening concerns arise due to last week’s US unemployment data.
- Expectations for a post-July Fed rate hike rise to 28%, a significant leap from last month’s 15.9% odds, as the CME FedWatch Tool reported.
- USD/MXN traders eye next week’s Mexican inflation data, with both readings expected to decelerate.
USD/MXN holds to its earlier gains after reaching the 17.00 figure on Friday but trimmed some as the USD/MXN pair edged towards the 20-day Exponential Moving Average (EMA) at 16.9666. At the time of writing, the USD/MXN is trading at 16.9494, climbing 0.47%, ahead of the weekend.
USD/MXN sees slight trim after peaking at 17.00, buoyed by solid US jobs data and mounting anticipation of Federal Reserve tightening
Sentiment remains upbeat, which usually favors the Mexican Peso (MXN). Nevertheless, last week’s US unemployment claims for the week ending July 15 spurred woes the Federal Reserve (Fed) would continue to tighten monetary conditions past the July meeting. Other data revealed during the day was mixed, with US retail sales missing estimates, but continued to show consumers resilience, while housing market data witnessed a dip after registering positive figures in May.
Meanwhile, expectations the Fed would raise rates past the July meeting surged to 28%, from last month’s 15.9% odds, as revealed by the CME FedWatch Tool.
Consequently, the greenback rose, registering more than 1% weekly gains. As of writing, the US Dollar Index (DXY), a measure that tracks the performance of the US Dollar against six peers, sits at 101.052, which advances 0.23%, on Friday.
That helped to offset some of the USD/MXN 4.27% losses during the last couple of weeks, with the pair briefly testing the 17.00 psychological barrier.
Retail sales disappointed USD/MXN traders on the Mexican front, which punished the peso as the pair climbed 1% on Thursday. On its latest two meetings, the Bank of Mexico (Banxico) kept rates unchanged at 11.25% and is expected to cut rates towards Q4 2023.
The following week’s highlight on the Mexican docket would be the inflation data report, with most traders expecting the Consumer Price Index (CP) at 4.77% in the first 15 days of the month, according to a Reuters poll. Core CPI is expected to slide to 6.73%. Although both figures remain above Banxico’s 3% plus or minus one percentage point target, the disinflationary process continues in the Mexican economy.
USD/MXN Price Analysis: Technical outlook
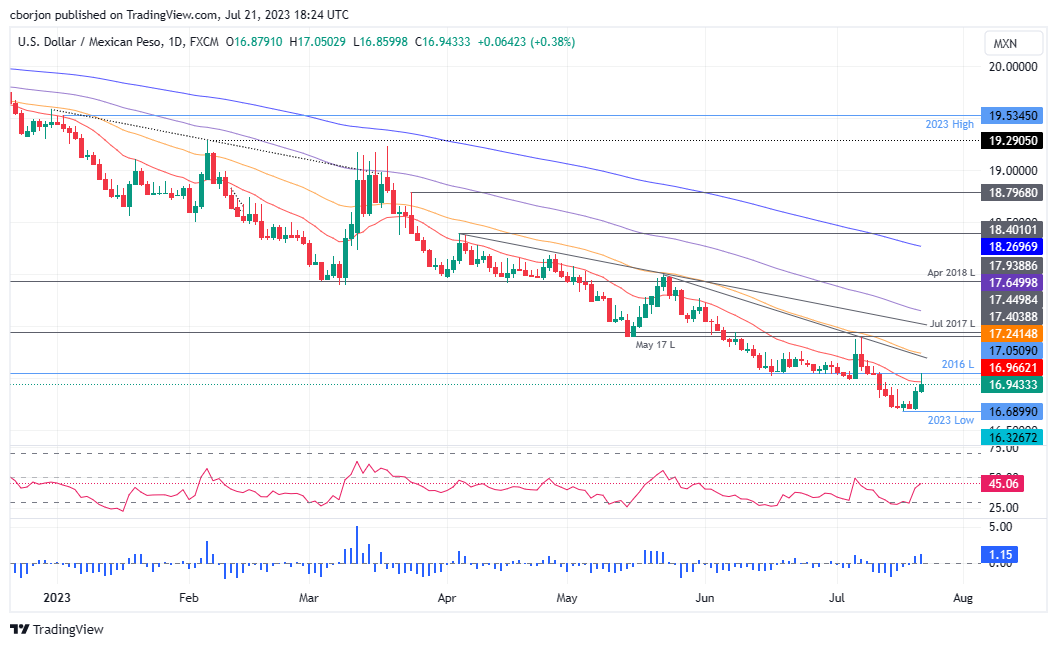
From a technical standpoint, the USD/MXN probed the 17.00 figure after reaching 7-year lows at 16.6899 but couldn’t break resistance, despite printing a high of 17.0502. Of note, the Relative Strength Index (RSI) indicator is gathering pace toward the 50-midline, suggesting that buyers are increasing their positions, while the three-day Rate of Change (RoC) printed its biggest daily gain since May 23, a major turning point. That could suggest the USD/MXN could be bottoming and preparing for an upward correction. Key resistance levels lie at the 20-day EMA at 16.9667, the 17.00 figure, and the 50-day EMa at 17.2416 in the near term. Contrarily, the first support level would be the YTD low of 16.6899 before testing 16.50.
- EUR/JPY rose more than 1% on Friday to its highest since early July.
- Reports indicate that the BoJ will stick to its YCC following the Japanese CPI.
- ECB tightening expectations remain steady.
The EUR/JPY gained significant momentum at the end of the week amid a broad-based JPY weakness. Japanese inflation is seeing some signs of deceleration in June and reports of the Bank of Japan sticking to its dovish monetary policy in next week's meeting makes the Yen lose interest.
Headline CPI decreased in Japan in June. All eyes on BoJ and ECB decisions next week
June inflation data from Japan saw the National Consumer Price Index (CPI) dropping to 3.3% vs the 3.5% YoY expected, while the Core measure came in at 4.2% YoY, just as expected. That being said, the JPY is losing ground amid the speculations that the BoJ will maintain its dovish stance in next week’s meeting. According to Reuters, the bank considers that inflation is increasing but is not confident if the increase is sustainable, putting a hold on a potential policy pivot.
On the other hand, the European Central Bank's (ECB) tightening expectations remain steady despite German yields decreasing. For next week’s meeting, a 25 basis point (bps) hike is largely priced in, while the probability of a similar hike in September is near 60%. In the meantime, the 2,5 and 10-year yields display more than 1% declines and fell to 3.23%,2.56% and 2.42%, respectively, limiting the EUR’s upside potential.
EUR/JPY levels to watch
The daily chart indicates that the bulls have taken the upper hand following Friday’s gains. The cross trades above the 20,100 and 200-day Simple Moving Averages (SMA) while indicators are recovering. The Relative Strength Index (RSI) is in positive territory, leaping towards overbought territory, while the Moving Average Convergence Divergence (MACD) prints lower red bars.
Resistance levels: 158.00, 158.50, 159.00.
Support level: 156.38 (20-day SMA), 156.00, 155.50.
EUR/JPY Daily chart
-638255595047470295.png)
- Wall Street sees partial recovery from Thursday’s losses due to disappointing tech company earnings, while a lack of US economic data keeps focus on the upcoming Federal Open Market Committee (FOMC) meeting.
- Expectations of a 25 bps hike by the Federal Reserve past the July meeting are increasing following a week of robust US labor market data.
- The Reserve Bank of New Zealand’s (RBNZ) decision to maintain current rates contributes to the NZD’s weekly losses of nearly 3%,
NZD/USD dives below the 0.6200 figure, extending its losses past the 200-day Exponential Moving Average (EMA) of 0.6226, with the pair extending its losses to six straight days on overall US Dollar strength. At the time of writing, the NZD/USD is exchanging hands at 0.6175 after dropping from a daily high of 0.6240.
NZD/USD extends losses for the sixth straight day, underpinned by robust US labor market data
Wall Street pares some of Thursday’s losses on disappointing earnings from megacap tech companies. The lack of economic data in the United States (US) keeps NZD/USD traders bracing for the next week’s Federal Open Market Committee (FOMC) monetary policy decision, with the Federal Reserve (Fed) expected to deliver a 25 bps increase to the Federal Funds Rate (FFR), toward the 5.25%-5.50% area.
That follows a week that witnessed solid US economic data, as unemployment claims fell below estimates portraying a strong labor market and sparking fears for further Fed tightening, even though US retail sales printed mixed results. Turning to house market data, Housing Starts, Building Permits, and Existing Home Sales witnessed a dip after printing solid figures in May.
According to data from the CME FedWatch Tool, market players have fully priced in the next week’s increase but revised their bets upward from last week’s 19.8% to 28.0%.
Elsewhere, the latest Reserve Bank of New Zealand (RBNZ) monetary policy keeping rates unchanged is weighing on the New Zealand Dollar (NZD), which extended its weekly losses for almost 3%. That, despite fears of a slower recovery in China, despite the People Bank of China’s (PboC) efforts to prod its economy and achieve its annual target, would keep the NZD pressured.
Given the backdrop, the NZD/USD is warranted to extend its losses, but it would depend on the Fed and its Chair Jerome Powell to sustain a hawkish posture to keep the downtrend in the near term. Otherwise, the NZD/USD could recover after the FOMC’s decision.
NZD/USD Price Analysis: Technical outlook
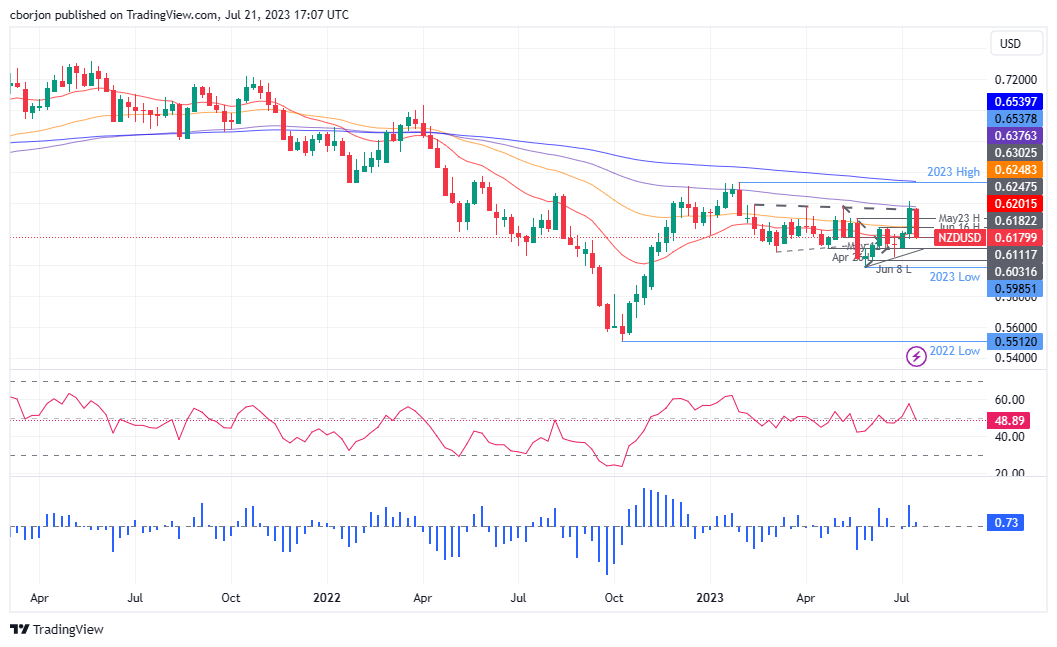
The NZD/USD shifted to a neutral bias once the major broke technical support level, like the 200, 20, 100, and 50-day EMAs on its way south, but its fall remains cushioned by the June 29 daily low of 0.6050. Once cleared, the NZD/USD could test the year-to-date (YTD) low of 0.5985. To keep their hopes of higher prices, buyers must reclaim the 0.6200 mark, but they need to clear the confluence of the 50 and 100-day EMAs at 0.6201/02 before testing the 20-day EMA at 0.6227.
With the Relative Strength Index (RSI) turning bearish and the three-day Rate of Change (RoC) suggesting sellers gather momentum, the NZD/USD might continue to trend lower.
- WTI soared on Friday and rose towards the 200-day SMA at $76.82, tallying a fourth consecutive weekly gain.
- Chinese stimulus rumours bolstered Oil prices.
- All eyes are on next week’s Fed decision.
On Friday, the West Texas Intermediate (WTI) rose more than 1% near $76.80 and is set to close a 1.89% weekly gain. On the upside, prospects of a Chinese stimulus to bolster the economy supports the price, while a slight recovery of the USD may limit the upside potential.
After the People Bank of China (PBoC) decided to hold its key rates steady, Bloomberg reported that Chinese policy makers are up to ease mortgage rates to bolster homebuying in the second-largest economy in the world due to recent economic downturns. In that sense, lower rates in the most prominent Oil importer of the world favour the price as a less aggressive monetary policy may strengthen the economy.
On the other hand, the American calendar won’t have anything relevant to offer, and traders continue to assess the latest set of inflation, retail sales, the housing market and jobless claims data from the US. For next week’s decision, markets are mainly discounting a 25 basis point (bps) hike, but the odds of a second week past July have dropped nearly 35%. In addition, markets will closely watch Jerome Powell’s presser to look for clues regarding forward guidance.
WTI Levels to watch
The bulls managed to get a final chance to retake the 200-day Simple Moving Average (SMA). If they fail, the price could plunge as buying momentum displays weakness as per the indicators on the daily chart. Meanwhile, the Relative Strength Index (RSI) stand with a slight positive slope above its midline, while the Moving Average Convergence Divergence (MACD) prints lower green bars.
Resistance levels: $76.82 (200-day SMA), $78.00,$80.00.
Support levels: $73.50 (100-day SMA), $72.90 (20-day SMA), $72.00.
WTI Daily chart
-638255543687509356.png)
- XAG/USD retreated below the $24.70 level, poised to close a more than 1% weekly loss.
- USD gained some ground following lower-thank expected unemployment figures on Thursday.
- All eyes on next week’s Fed decision.
At the end of the week, the XAG/USD lost ground and is set to close a weekly loss following three weeks of gains. The USD measured by the DXY index, is recovering and tallied a fourth consecutive day of gains jumping above 101.00 making the grey metal struggle to find demand.
The USD gained some ground following labour market data on Thursday, which fueled hawkish bets on the Federal Reserve (Fed) and a rise in US yields, weakening metal prices. The US Bureau of Labor Statistics (BLS) released unemployment data, showing a decrease in jobless claims to 228,000, below the expected 242,000. Investors are speculating on a hawkish stance from the Fed, anticipating the need to maintain higher interest rates for a longer period as the labour market remains robust.
In today’s session, US yields trade mixed across the board following Thursday’s increase. The 2-year yield jumped to 4.85%, seeing mild gains while the 5 and 10-year rates slightly decreased to 4.08% and 3.82%.
Regarding next week’s decision, markets are mainly discounting a 25 basis point (bps) hike, but the odds of a second week past July have increased following Jobless Claims data but still remain low at nearly 35%. In addition, markets will closely watch Jerome Powell’s presser to look for clues regarding forward guidance.
XAG/USD Levels to watch
According to the daily chart, the technical outlook is starting to turn bearish for the short term as bulls are losing steam. The Relative Strength Index (RSI) got rejected at the overbought threshold on Wednesday, prints and points south, while the Moving Average Convergence Divergence (MACD) prints decreasing green bars.
Support levels: $24.60, $24.50, $24.10.
Resistance levels: $25.00, $25.30,$25.00.
XAG/USD Daily chart
-638255513869212688.png)
- Japan’s Consumer Price Index (CPI) for June reports a YoY increase of 3.3%, slightly above the previous 3.2% figure, but falls short of the anticipated 3.5%.
- Reuters report on BoJ’s monetary stance causes USD/JPY to break away from the 140.00 range seen through most of the Asian session.
- The USD/JPY uptrend could continue based on interest rate differentials, but next week’s Fed and BoJ decisions are eyed.
USD/JPY rallied back above the 141.00 figure after rumors the Bank of Japan (BoJ) would not change its Yield Curve Control (YCC) emerged, spurring an upward reaction in the USD/JPY due to Japanese Yen (JPY) softness. The USD/JPY is exchanging hands at 141.71 after diving as low as 139.74.
Reports of the BoJ's commitment to its dovish stance fuel USD/JPY rally, despite Japanese inflation data exceeding estimates
News emerging during the Asian session spurred JPY’s weakness on Reuters sources, saying the BoJ would stick to its YCC program and maintain its dovish stance. That comes after an earlier report that in Japan exceeded estimates by a tick, seen by traders as data that could trigger a reaction by the BoJ. The Consumer Price Index (CPI) for June came at 3.3% YoY, above the prior’s 3.2% reading but failed to overcome forecasts of 3.5%. Core CPI rose by 3.3% YoY, aligned with projections and above May’s number.
The USD/JPY seesawed around 140.00 throughout most of the Asian session before the Reuters report surfaced.
On the US front, data revealed during the week showed the economy is still resilient, despite Retail Sales slowing to 0.2%, below May’s 0.5%. Thursday’s US Initial Jobless Claims report for the week ending July 15 posted 228K unemployment fillings, below the 239K estimated, sparking fears the US Federal Reserve (Fed) might react to the numbers and increase rates past the following week’s monetary policy decision.
The CME FedWatch Tool, which tracks interest rate probabilities for the Fed, sees a 99.8% chance of a quarter of a percent hike on July 26, while for September, expects no change, and for November, odds moved from below 20% last week’s, to 28.0% as of writing.
To conclude, given the interest rate differentials, the USD/JPY uptrend might continue in the near term. But next week’s could be volatile, with the Fed and the BoJ set to deliver an update on their monetary policy. A hawkish surprise by the BoJ could rock the markets sharply, while the Fed is expected to maintain its “higher for longer” bias.
USD/JPY Price Analysis: Technical outlook
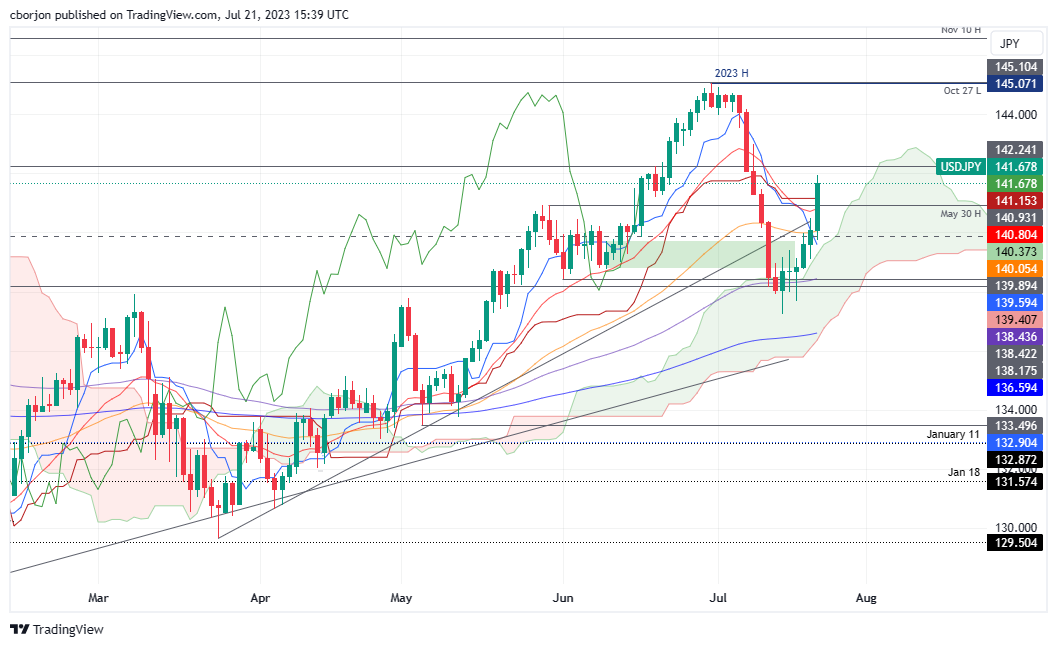
From a technical standpoint, the USD/JPY pair is set to continue upward biased, reclaiming during the session the Tenkan and Kijun-Sen level, with traders setting their eyes on the 142.00 mark. A breach of that level would expose last November’s 22 daily high at 142.24, followed by the top of the Ichimoku Cloud (Kumo) at 142.83, ahead of 143.00. Conversely, if USD/JPY drops below the Kijun-Sen level of 141.15, further downward action is expected, with the 20-day Exponential Moving Average (EMA) lying at 140.80, on top of the Senkou Span A level at 140.37.
Strategists at Credit Suisse maintain their existing bullish outlook for Gold.
A weekly close below $1,875 would reinforce the longer-term sideways range
With the USD completing a large bearish continuation pattern and expected to see further material weakness we maintain our long-held view for a major floor to be found at $1,900/1,890 and for an eventual retest of major resistance at the $2,063/2,075 record highs to be seen.
We still stay biased to an eventual break to new record highs later in the year, which would then be seen to open the door to a move to $2150 next, then $2,355/65.
A weekly close below $1,875 though would be seen to reinforce the longer-term sideways range, and a fall to support next at $1,810/05.
The clean energy technology sector is becoming an increasingly important driver of demand for base metals, economists at ANZ Bank report.
Clean energy powering metals
Critical minerals have taken the limelight amid the acceleration in energy transition. However, traditional base metals are likely to see a demand surge as they become increasingly important.
Demand has now reached critical volumes in Copper and Nickel, with its market hitting 22% and 27% respectively in 2022. More importantly, growth over the next three years is expected to see these levels significantly rise. So much so that even below-average growth from traditional sectors such as construction and manufacturing won’t stop total demand from recording strong growth rates.
For the moment, the impact of strong demand from clean energy technologies on market sentiment is likely to remain subdued. That could change once the broader market environment is not clouded by issues such as inflation and interest rates.
Ulrich Leuchtmann, Head of FX and Commodity Research at Commerzbank, notes the weak arguments of the Dollar declinist
Announcements like that of invoicing in Renminbi remain pure propaganda
China Daily reports that Chinese trade with Argentina will soon be invoiced in Renminbi. Countries that enter such a deal with China are being taken to the cleaners. I cannot exclude that an increasing number of emerging countries – sometimes for merely political reasons – will make a similar mistake. That means the Dollar declinists might even turn out to be correct in the end, whereas my projections of continued Dollar dominance could turn out to be incorrect.
But I remain optimistic and rely on reason prevailing in the end. That would mean that announcements like that of invoicing in Renminbi remain pure propaganda and will not have factual consequences.
The Chilean Peso is lagging the rally of its Latam peers. Economists at ING analyze CLP outlook.
Chile may prove a test case for Latam FX and easing cycles
June saw the central bank warn that the easing cycle could start in the ‘short term’. A 50-75 bps rate cut is now expected at the 28 July rate meeting.
The central bank will cite inflation expectations anchored at 3% as the reason for the cut – even though core inflation is still 9% YoY. Chile may prove a test case for Latam FX and easing cycles.
Regarding Chile’s main export, Copper – we see it at neutral $8300-8600/MT this year. And we think USD/CLP stays near 800.
- EUR/USD trades in weekly lows near 1.1100.
- Next on the downside comes the 1.1000 key level.
EUR/USD remains well offered and navigates the lower end of the weekly range near the 1.1100 neighbourhood.
The recent upside bias now appears alleviated and further losses seem to be in store for the pair in the near term instead. That said, a sustained drop below the weekly low of 1.1111 could motivate the pair to dispute the psychological hurdle at 1.1000 the figure.
Looking at the longer run, the positive view remains unchanged while above the 200-day SMA, today at 1.0687.
EUR/USD daily chart
Recently, the Canadian Dollar has been able to make up some lost ground. Economists at Commerzbank analyze Loonie's outlook.
EUR/CAD should reflect the interim EUR strength expected
We see further limited CAD recovery potential against the USD due to the robust economy and a hawkish BoC. CAD should benefit if the interest rate differential between the Fed and the BoC narrows or turns positive in the medium term.
EUR/CAD should reflect the interim EUR strength we expect.

Source: Commerzbank Research
See – USD/CAD: Further BoC tightening could lead to a gradual decline – SocGen
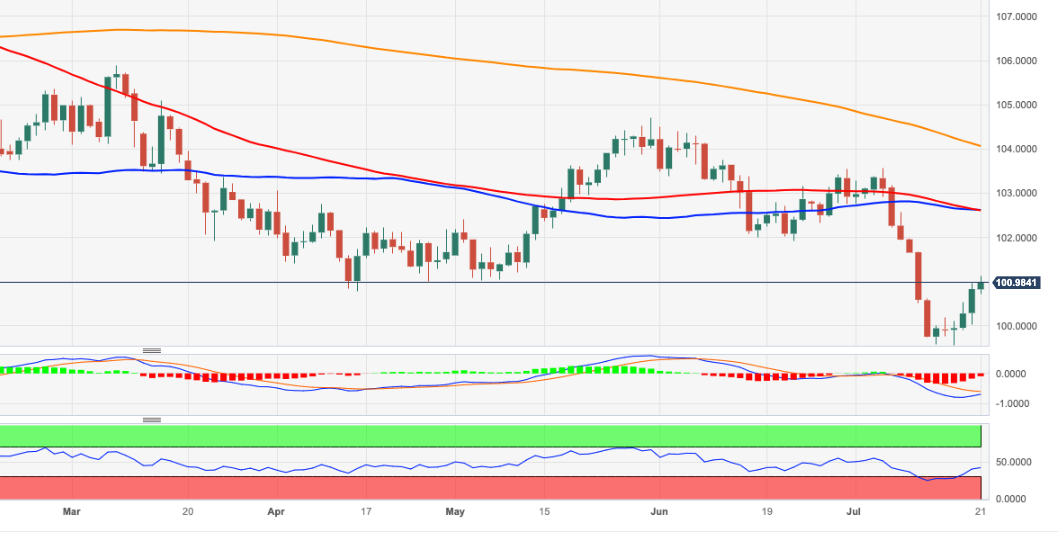
- DXY adds to the weekly rebound and trespasses 101.00.
- Immediately to the upside emerges the 102.60 region.
DXY picks up further impulse and records weekly peaks north of the key 101.00 barrier at the end of the week.
A more serious bullish attempt in the index should clear the 102.60 zone, where the provisional 55-day and 100-day SMAs coincide. North from here aligns the July high in the mid-103.00s seconded by the key 200-day SMA at 104.06.
Looking at the broader picture, while below the 200-day SMA, the outlook for the index is expected to remain negative.
DXY daily chart
Economists at ING analyze EUR/USD outlook ahead of the Fed meeting.
Dollar could get a lift from hawkish Fed script
With the market positioning itself for a cyclical Dollar sell-off over coming months and quarters, we suspect another reading of the hawkish Fed script could send the Dollar a little higher.
Clearly, fireworks are not expected, but EUR/USD could dip back towards the 1.1050 area on the Fed event risk.
See: EUR/USD to see break above 1.1275 for strength to 1.1495 and eventually 1.1703/48 – Credit Suisse
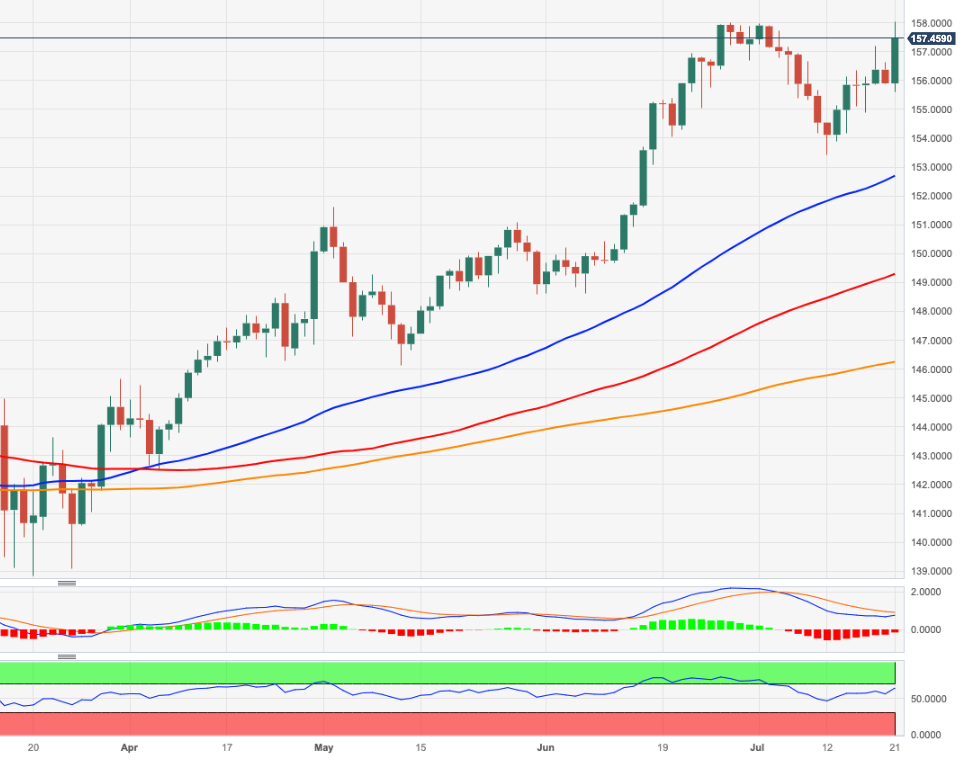
- EUR/JPY accelerates gains to new 2023 peaks past 158.00.
- Extra upside looks likely in the near term.
EUR/JPY advances further and reaches a new 2023 high just above 158.00 the figure at the end of the week.
In the meantime, the cross keeps the recovery mode well in place and the continuation of the uptrend is expected to challenge the key round level at 160.00 sooner rather than later.
So far, the longer term positive outlook for the cross appears favoured while above the 200-day SMA, today at 146.22.
EUR/JPY daily chart
Gold price is profiting from speculation about an end to the Fed rate hikes. Economists at Commerzbank analyze XAU/USD outlook.
Fed will hike interest rates for the last time by 25 bps next week
The recently weaker economic data and declining inflation suggest that the Fed will hike interest rates for the last time (for now) by 25 basis points next week.
That said, Fed Chair Powell will presumably leave the door open for another rate hike, meaning that the relevant data could well spark repeated speculation about another rate increase in the coming weeks. The Gold price will not be immune to setbacks, in other words.
- AUD/USD has slipped below 0.6750, however, the downside seems favored.
- The Fed is expected to raise interest rates by 25 bps to 5.25-5.50% as core inflation is still persistent.
- Tight labor market conditions in Australia are confirming the resumption of the policy-tightening spell by the RBA.
The AUD/USD pair has stretched its downside below the immediate support of 0.6750 in the European session. Weakness in the Aussie asset is backed by sheer strength in the US Dollar.
S&P500 futures have generated significant gains in London. US equities are expected to witness a stock-specific action amid corporate earnings season. The US Dollar Index (DXY) is facing some pressure after a north-side elevated move marginally above 101.00, however, the upside move is still favored considering the strength in the upside momentum.
After easing in United States inflationary pressures, loosening labor market conditions, and a decline in consumer spending growth in June, investors are shifting their focus toward the interest rate decision by the Federal Reserve (Fed), which will be announced on July 27.
The Fed is expected to raise interest rates by 25 basis points (bps) to 5.25-5.50% as core inflation is still persistent and more interest rates are appropriate to bring it down to desired rate. Discussions about the number of times the Fed will raise interest rates in July have heated. While Fed chair Jerome Powell in his last commentary said two more interest rate hikes are appropriate, expectations at the CME FedWatch tool have drummed only one more interest rate hike this year.
On the Australian Dollar front, tight labor market conditions are confirming the resumption of the policy-tightening spell by the Reserve Bank of Australia (RBA). Employment additions in June were recorded at 32.6K while investors estimated fresh addition of 15K. The Unemployment Rate remained steady at 3.5% vs. expectations of 3.6%
Investors should note that RBA skipped hiking interest rates in June and kept the Official Cash Rate (OCR) at 4.10%.
- Canadian Dollar declines versus the US Dollar on Friday after Canadian Retail Sales come out lower than expected in May.
- The USD also benefits from JPY outflows ahead of the BoJ meeting next week.
- The Greenback is supported by strong Initial Jobless Claims data on Thursday, which showed a sharp fall in new unemployment claimants.
- Technically the pair is trading in a range above a thick band of support in the upper 1.30s.
The Canadian Dollar (CAD) edges down against the US Dollar (USD) on Friday, after official data shows Canadian shoppers tightened their belts in May.
The US Dollar also benefits from outflows from the Japanese Yen as traders shed their JPY holdings in favor of the Buck ahead of the Bank of Japan policy meeting next week, at which the board of governors is seen as likely to maintain the current ultra-loose policy.
The USD/CAD pair trades in the 1.31s as the US session gets underway.
Canadian Dollar news and market movers
- The Canadian Dollar loses ground against the US Dollar after the release of Canadian Retail Sales on Friday, which comes out lower-than-expected, printing 0.2% in May versus the 0.5% forecast from 1.0% in the previous month of April.
- Retail Sales ex Autos also falls below expectations, printing a 0.0% change in May versus the 0.3% expected and the 1.2% rise registered in April.
- Canadian New Housing Price Index data, released at the same time, registers a 0.1% rise in June, which was higher than the 0.0% forecast but the same as the 0.1% previous.
- The lower-than-expected Retail Sales data weighs on the CAD (USD/CAD rises) because it indicates consumer spending is falling which will probably lead to lower inflation and lower interest rates – a negative for the Canadian Dollar.
- The Greenback benefits from outflows from the Japanese Yen (JPY), according to a report by Reuters, cited by FXStreet Lead Analyst, Eren Sengezer. Traders are dropping the Yen ahead of next week’s Bank of Japan (BoJ) policy meeting amidst expectations the BoJ will maintain its Yield Curve Control (YCC) at current levels when some tightening had been expected previously amid higher inflation.
- The US Dollar is further supported by lower-than-forecast US Initial Jobless Claims data for the week ending July 14. First-time applications for unemployment benefits in the US declined to 228,000, the Department of Labor announced on Thursday. This was well below the market expectation of 242,000. The strong jobs data suggests more persistent inflationary pressures ahead, which should keep interest rates higher for longer – a positive for the Buck.
Canadian Dollar Technical Analysis: Treading water near critical support level
USD/CAD is probably in a long-term uptrend on the weekly chart, which began at the 2021 lows. Since October 2022, the exchange rate has been in a sideways consolidation within that uptrend. Given the old saying that ‘the trend is your friend’, however, the probabilities favor an eventual continuation higher and longs over shorts.
USD/CAD appears to have completed a large measured move price pattern that began forming at the March highs. This pattern resembles a 3-wave ABC correction, in which the first and third waves are of a similar length (labeled waves A and C on the chart below).
-638255408669513147.png)
US Dollar vs Canadian Dollar: Weekly Chart
A confluence of support situated in the upper 1.3000s, which is made up of several longer moving averages and a major trendline, prevented last week’s decline from extending any lower and provided a foundation for the reversal on Friday and Monday.
-638255408238763146.png)
US Dollar vs Canadian Dollar: Daily Chart
The long green up-bar that formed on Friday is a bullish engulfing Japanese candlestick reversal pattern. When combined with the long red down bar that formed immediately before it, the two together also complete a two-bar bullish reversal pattern.
The Relative Strength Index (RSI) is converging bullishly with price at the July lows when compared to the June 27 lows. At the June 27 lows, RSI was lower than in July despite price being higher. This suggests underlying strength and is a bullish sign.
Monday’s weak close, however, failed to provide confirmation for the reversal, and since then, the price has been pulling back down.
It will take a decisive break above the 50-day Simple Moving Average (SMA) at circa 1.3400 to refresh and reconfirm the USD/CAD long-term uptrend. Nevertheless, bulls marginally have the upper hand, with the odds slightly favoring a recovery and a continuation higher.
Alternatively, a decisive break below 1.3050 would indicate the thick band of weighty support in the upper 1.30s has been definitively broken, bringing the uptrend into doubt.
The USD is extending its rebound into the weekend. Shaun Osborne, Chief FX Strategist at Scotiabank, analyzes Greenback's outlook.
Not yet signal a major reversal in the soft USD trend
The USD rebound this week provides some respite from recent losses and may reflect market positioning as investors start to focus on next week’s FOMC decision (Wednesday) and ECB announcement (Thursday).
The rebound this week has done enough to check the sell-off but does not (yet) signal a major reversal in the soft USD trend seen in recent weeks. I still rather think upside potential in the USD generally is limited.
- Retail Sales in Canada increase at a softer pace than expected in May.
- USD/CAD trades in positive territory above 1.3200 after the data.
Retail Sales in Canada rose 0.2% on a monthly basis in May, Statistics Canada reported on Friday. This reading followed the 1% increase recorded in April (revised from 1.1%) and came in below the market expectation of 0.5%.
Retail Sales ex Autos remained unchanged in the same period, compared to analysts' estimate for an increase of 0.3%.
Market reaction
USD/CAD edged higher with the initial reaction to this report and was last seen rising 0.25% on the day at 1.3205.
UOB Group’s Senior Economist Julia Goh and Economist Loke Siew Ting assess the latest performance of Malaysian exports.
Key Takeaways
Malaysia’s exports remained sluggish in Jun, contracting for the fourth straight month and by a double-digit pace for the second time this year at 14.1% y/y (May: -0.9%). The decline came in worse than our expectation (-11.5%) but in line with Bloomberg consensus (-14.0%). Imports also dropped for four months in a row by a double-digit rate of 18.9% (May: -3.7%), sharply below our estimate (11.0%) and Bloomberg consensus (-16.5%). This led to a larger trade surplus of MYR25.8bn (May: +MYR15.7bn).
In 2Q23, exports shrank for the first time in 11 quarters by 11.1% y/y (1Q23: +3.0%) while imports tumbled for the first time in nine quarters by 11.5% (1Q23: +3.4%), leaving a cumulative trade surplus of MYR54.1bn (1Q23: +MYR64.4bn). This is expected to translate into a smaller current account surplus of MYR3.5bn last quarter (1Q23: +MYR4.3bn). Actual 2Q23 current account data will be released on 11 Aug.
We maintain our view that the export contraction trend will likely persist for the greater part of 2H23 as a result of the unfavourable base effects, subdued global demand and easing global commodity prices. Tighter international financial conditions, volatile currency and escalating geopolitical risks add further downside risks to the near-term trade outlook. The 4.5% year-to-date decline also suggests that our 2023 full-year export forecast of -7.0% remains valid (BNM est: +1.5%, 2022: +24.9%).
- USD/CHF is oscillating around 0.8660 as investors await Fed policy for further guidance.
- One more interest rate hike from the Fed is highly required as core inflation is still persistent and will take a while in returning to 2%.
- SNB Jordan conveyed that the consequences of higher inflation are worse than the lower inflation scenario.
USD/CHF is demonstrating back-and-forth moves around 0.8660 in the European session. The Swiss Franc asset is trading inside the woods after a sharp rally to near 0.8680 as investors have shifted their focus towards the interest rate decision by the Federal Reserve (Fed), which will be announced on July 27.
S&P500 futures have shown a recovery move in London after a sheer sell-off on Thursday, indicating some ease in the risk-averse theme. The US Dollar Index (DXY) has jumped to near the 101.00 resistance and needs comfortable stability above the same. The yields offered on 10-year US Treasury bonds have dropped to near 3.83%.
As per the CME FedWatch tool, a 25 basis point (bp) interest rate hike to 5.25-5.50% looks real. Scrutiny of June’s economic growth indicates that inflationary pressures have cooled down significantly as producers have lowered prices of goods and services at factory gates. In addition to that, labor market conditions also eased and consumer spending momentum has slowed down too.
In spite of easing price pressures, one more interest rate hike from the Fed is highly required as core inflation is still persistent and will take a while in returning to 2%. Also, labor market conditions are still hot as initial jobless claims dropped last week.
The US Department of Labor reported that individuals who applied for jobless benefits for the first time dropped to 228K for the week ending July 16 vs. expectations of 242K and the former release of 237K.
On the Swiss Franc front, more interest rate hikes from the Swiss National Bank (SNB) are anticipated as SNB Chairman Thomas J. Jordan conveyed that the consequences of higher inflation are worse than the lower inflation scenario. Inflation in the Swiss economy landed at 1.7% in June but needs stabilization.
GBP/USD trades soft in the mid-1.28s. Economists at Scotiabank analyze the pair’s outlook.
A low close on the week will add to GBP headwinds
Five net down days and a sixth looking possible today leave the GBP undertone soft. A low close on the week will add to GBP headwinds.
Trend momentum has weakened on the short-term chart and a low weekly close (likely, at this stage) would add to broader headwinds.
Cable losses have steadied around the 1.2850 point that was resistance in June as the Pound rallied but a low close on the week could see losses extend to 1.27 trend support off the March low.
The CAD is little changed in the session. Economists at Scotiabank analyze Loonie's outlook ahead of Retail Sales.
Downside momentum may need a “refresh” from a break under 1.3070
Canadian Retail Sales are expected to rise 0.5% in May (0.2% for ex-auto sales). A 0.5% gain is in line with the flash estimate released alongside the strong April report last month. Firm data may give the CAD a modest lift on the session.
Intraday trends suggest firm support on dips to the low 1.31 area and resistance in the low 1.32s. Broader trends remain USD-bearish, however, and the USD may close out the week with another net loss.
Downside momentum may need a ‘refresh’ from a break under 1.3070 (200-Week Moving Average).
EUR/USD slips off earlier high to retest support in low 1.11s. Economists at Scotiabank analyze the pair’s outlook.
Underlying trend signals remain bullish on the daily and weekly oscillators
The EUR’s short-term technical undertone remains soft after losses picked up yesterday but Thursday’s low is holding the base of the range, at least for now, and underlying trend signals remain bullish on the daily and weekly oscillators.
Scope for EUR losses to extend much more should be limited.
We spot retracement support (38.2% of the July rally) at 1.1110. Resistance (minor bull trigger) is 1.1155.
Economists at ING analyze AUD/USD outlook.
A bullish “pocket” may emerge in September
We could see a bullish ‘pocket’ for the pair in September when Australian CPI readings could clearly show the impact of large electricity tariff increases due in July and force an RBA hike while the Fed holds on an improved inflation outlook.
The AUD swap curve prices in 14 bps to a peak, and the strict data-dependent approach by the RBA could leave more room for tightening speculation. China’s underwhelming growth story may still cap gains, but there is room for improvement thanks to Beijing’s added stimulus.
We target 0.72 in the first quarter of 2024.
- USD/CAD turns lackluster below 1.3200 as the focus shifts to Canadian Retail Sales data.
- Canada’s consumer spending is expected to expand at a slower pace.
- Market participants are anticipating the interest rate hike on July 27 by the Fed would be the last nail in the coffin.
The USD/CAD is demonstrating a non-directional performance below the round-level resistance of 0.3200 in the London session. The Loonie asset is awaiting the release of the Canadian Retail Sales data for May for meaningful action.
S&P500 futures have generated decent gains in Europe, portraying that overall negative market sentiment has started easing now. US equities are under pressure as corporate earnings season has kicked off. The US Dollar Index (DXY) is making efforts for stability above the crucial resistance of 101.00.
A power-pack action is expected in the Canadian Dollar as Statistics Canada will report monthly Retail Sales data for May at 12:30 GMT. As per the estimates, the economic data expanded at a pace of 0.5%, which is slower than the figure recorded for April at 1.1%. Retail Sales excluding automobiles are seen increasing by 0.3% but lower than the 1.3% pace recorded earlier.
This indicates that momentum in consumer spending might be slowed in May but remain resilient. Also, the preliminary data indicates that demand for automobiles is decent than other durable and non-durable goods. This would portray a rise in demand for big-ticket items in spite of higher interest rates by the Bank of Canada (BoC).
Meanwhile, the US Dollar Index is gaining strength amid a cautious market mood as investors seem convinced about one more 25 basis points (bps) interest rate hike from the Federal Reserve (Fed), which will push interest rates to 5.25-5.50%.
On the oil front, oil prices have sensed selling pressure above $76.50, however, the upside bias is intact as the market participants are anticipating the interest rate hike on July 27 by the Fed would be the last nail in the coffin.
It is worth noting that Canada is the leading exporter of oil to the United States and higher oil prices would strengthen the Canadian Dollar.
After the USD weakness had ended towards the end of last week, Thursday brought a notable correction of what had happened in the first half of the month. Ulrich Leuchtmann, Head of FX and Commodity Research at Commerzbank, analyzes Greenback's outlook.
Impressively precise correction
In addition to the good reasons for USD weakness (the prospect of rate cuts early on next year), there were also bad reasons during the first half of the month: the assumption that there will be only one more Fed rate step rather than two (as had been expected not that long ago).
Why is this second reason ‘bad’ in my view? The reason is bad because a USD carry of 25 bps more or less is not a noteworthy argument for or against the Greenback.
If – as I hope – Thursday’s correction has removed the part of USD weakness that was due to these ‘bad’ reasons this was a ‘healthy’ correction that returned the levels of the USD exchange rates to an even keel to ensure that ahead of the coming week (with the Fed, ECB and BoJ rate decisions) the risks are more evenly spread once again.
Economist at UOB Group Lee Sue Ann reviews the latest release of the UK inflation figures.
Key Takeaways
Inflation in the UK fell by more than expected in Jun and was at its slowest in more than a year. While wages rose at the joint fastest pace on record, there are also signs that the inflationary heat in the labour market is cooling.
Policymakers in the UK are walking a tightrope as they attempt to tighten monetary policy sufficiently to quell inflationary pressures without triggering a full-scale mortgage crisis and recession.
We believe the outsized move in Jun by the Bank of England (BOE) will be a one off. The recent slew of economic data should ease some of the pressure to keep on raising interest rates sharply. We keep to our view that the BOE will likely hike by 25bps at each of its next two meetings (3 Aug and 21 Sep), culminating with a terminal rate of 5.50%.
Economists at ING analyze USD/CNY outlook.
The turn in the broad Dollar cycle may help cement a top in USD/CNY at 7.25/30
There seems to be little confidence that Chinese policymakers are prepared to jolt the economy into action.
The turn in the broad Dollar cycle may help cement a top in USD/CNY at 7.25/30, but the case for a markedly lower USD/CNY is hard to make right now.
USD/CNY – 1M 7.30 3M 7.25 6M 7.10 12M 6.80
See: USD/CNY to reach 7.00 by end-Q3, 2023, 6.80 by end-Q4 – MUFG
EUR/USD may be capped at 1.1275 for now, but analysts at Credit Suisse look for an eventual rise to 1.1700.
The 61.8% retracement of the 2021/2022 downtrend at 1.1275 is capping for now
Whilst we suspect the 61.8% retracement of the 2021/2022 fall at 1.1275 caps for now for a pullback/consolidation, we look for a clear and sustained break higher in due course. Resistance would then be seen next at 1.1391/96 ahead of 1.1495 and eventually, what is now our core objective at 1.1703/1.1748 – the March 2021 low and 78.6% retracement of the 2021/2022 fall.
Support for a pullback is seen at 1.1097/93 initially, then 1.1013, with 1.0943 now ideally holding deeper setbacks if seen.
Japan's top currency diplomat Masato Kanda came out with a verbal intervention to rescue the Japanese Yen after it plunged on reports that the Bank of Japan (BoJ) could leave its policy settings unchanged next week.
Key quotes
Watching FX market with a sense of urgency.
Excessive FX moves are undesirable.
Market reaction
USD/JPY trimmed gains on the above comments, trading at 141.65, at the time of writing. The spot is still up 1.18% on the day.
The US Dollar has continued to trade at stronger levels after staging a strong rebound on Thursday. Economists at MUFG Bank analyze USD outlook.
Slowing inflation should give the Fed more confidence that rates are now sufficiently restrictive
Slowing inflation should give the Fed more confidence that rates are now sufficiently restrictive, and if inflation continues to fall closer to the Fed’s inflation target it will begin to open up room for the Fed to begin to lower rates next year.
The combination of lower US rates in response to slowing US inflation and a softer landing for the US economy should be an unfavourable mix for US Dollar performance.
GBP/USD weakness is seen as temporary and corrective ahead of a fresh rally, analysts at Credit Suisse report.
A break under 1.2749/40 would suggest a more concerted pullback/consolidation
Whilst we see scope for a deeper pullback, our bias is to view this as a temporary setback ahead of strength back to the 1.3143 recent high ahead of 1.3299, then our core objective at the 78.6% retracement of the 2021/2022 fall at 1.3400/14.
Key support is seen at the uptrend from last September and low of last week at 1.2749/40, which we look to ideally hold on a closing basis. A break would suggest instead a more concerted pullback/consolidation with support seen next at 1.2672, but with the 1.2590 late June low ideally holding.
- EUR/JPY rallies near 80 pips to test 158.00 in the European session.
- BoJ is reportedly said to leave policy settings unchanged next week.
- The US Dollar recovers ground, tracking the upsurge in the USD/JPY pair.
The EUR/JPY pair has seen a vertical rise over the last hour, as the Japanese Yen came under intense selling pressure following the latest headlines on the potential Bank of Japan (BoJ) policy outlook.
Citing five sources familiar with the central bank's thinking, Reuters reported that the BoJ is unlikely to introduce any changes to its yield curve control (YCC) settings at its two-day monetary policy review meeting, concluding on July 28.
The cross jumped from near the 157.15 region to test the 158.00 level, in a knee-jerk reaction to the dovish chatter, before reversing to trade at 157.77, where it now wavers. The pair is still up 1.21% on the day.
Earlier this week, the central bank Governor Kazuo Ueda poured cold water on any likely tweaks next week after he said that “there was still some distance to sustainably achieve the 2% inflation target.” The Yen also met fresh supply following his comments, extending the rebound in the cross briefly above the 157 mark on Wednesday.
At the moment, the upsurge in the USD/JPY is offering some support to the US Dollar across the board, allowing the Greenback to resume its recovery, in turn, checking the rebound in the EUR/USD pair.
Amid a lack of fresh economic data from the US docket this Friday, the BoJ expectations will continue to drive the EUR/JPY cross, as investors resort to repositioning ahead of the critical BoJ and the Fed policy announcements next week.
EUR/JPY Technical levels to watch
- Gold price faces an intense sell-off as investors are confident that the Fed will raise interest rates further on July 27.
- More rate hikes are broadly anticipated as the United States' core inflation remains resilient.
- Support from BRICS’ gold-backed currency discussions is losing its appeal.
Gold price drops sharply as investors focus their attention on the Federal Reserve (Fed), which is likely to resume its policy tightening spell next week after skipping in June. In addition to the Fed, the Bank of England (BoE) and the European Central Bank (ECB) are also preparing for raising interest rates further so that inflation can return to the 2% target. The appeal for Gold is diminishing as more interest-rate hikes from the Fed would also propel fears of a recession in the United States.
It looks like Gold’s strength from discussions about introducing a new gold-backed currency by the BRICS (Brazil, Russia, India, China, and South Africa) is losing its appeal. The reasoning behind introducing a new gold-backed currency, an announcement which is expected in August, is that it might be used for international payments.
Daily Digest Market Movers: Gold price falls sharply ahead of Fed policy
- Gold price turns sideways after a corrective move from a two-month high of $1,987.50 as the US Dollar Index shows resilience ahead of the monetary policy by the Federal Reserve, whose decision will be announced on July 27.
- In spite of a significant decline in United States inflation, easing labor market conditions, and slow momentum in consumer spending growth, investors expect one more interest-rate hike of 25 basis points (bps) to 5.25-5.50%.
- Market participants expect that US inflation will decline, but it is far from the desired rate of 2%. Therefore, further policy tightening cannot be ruled out.
- Investors are anticipating that next week’s rate hike will be the last nail in the coffin and that interest rates will peak for the current year.
- The US Dollar Index has posted a three-day winning spell after nosediving last week as the room for more interest-rate hikes by the Fed is still open.
- Meanwhile, US labor market conditions are regaining strength again, according to weekly Jobless Claims data, which have surprisingly dropped.
- Individuals claiming jobless benefits for the first time declined to 228K for the week ending July 16, lower than the 242K expected and the former release of 237K.
- Loosening labor market conditions were decelerating inflationary pressures, and a recovery in the same could elevate overall consumer spending and slow down the current disinflation trend.
- The US housing market is facing the wrath of higher interest rates by the Fed as Existing Home Sales for June declined by 3.3% and Housing Starts decreased by 8.0% on a monthly basis.
- According to the latest data from the Federal Reserve, bank borrowings from the Fed’s emergency lending programs snapped their two-week decline and climbed in the week ended July 19.
- Despite tight credit conditions by commercial banks, the increase in the Fed’s lending data indicates that demand for credit by firms is resilient even in a high-interest-rate environment.
- Market mood has turned cautious as US tech stocks have come under pressure amid a disappointing second-quarter earnings season.
- US Treasury Yields follow the footprints of the US Dollar Index. The yields offered on 10-year US Treasury bonds are around 3.85%.
Technical Analysis: Gold price declines toward $1,960
Gold price faces pressure above $1,980.00 as the US Dollar Index rebounds meaningfully. However, the broader trend of Gold is bullish as it trades comfortably above the 20-day Exponential Moving Average (EMA) at $1,950.00. Investors should note that 20- and 50-day EMAs are on the verge of delivering a bullish crossover. This would strengthen the upside bias further. Fresh longs are expected in Gold price if it manages to climb above $1,980.00 convincingly.
Interest rates FAQs
What are interest rates?
Interest rates are charged by financial institutions on loans to borrowers and are paid as interest to savers and depositors. They are influenced by base lending rates, which are set by central banks in response to changes in the economy. Central banks normally have a mandate to ensure price stability, which in most cases means targeting a core inflation rate of around 2%.
If inflation falls below target the central bank may cut base lending rates, with a view to stimulating lending and boosting the economy. If inflation rises substantially above 2% it normally results in the central bank raising base lending rates in an attempt to lower inflation.
How do interest rates impact currencies?
Higher interest rates generally help strengthen a country’s currency as they make it a more attractive place for global investors to park their money.
How do interest rates influence the price of Gold?
Higher interest rates overall weigh on the price of Gold because they increase the opportunity cost of holding Gold instead of investing in an interest-bearing asset or placing cash in the bank.
If interest rates are high that usually pushes up the price of the US Dollar (USD), and since Gold is priced in Dollars, this has the effect of lowering the price of Gold.
What is the Fed Funds rate?
The Fed funds rate is the overnight rate at which US banks lend to each other. It is the oft-quoted headline rate set by the Federal Reserve at its FOMC meetings. It is set as a range, for example 4.75%-5.00%, though the upper limit (in that case 5.00%) is the quoted figure.
Market expectations for future Fed funds rate are tracked by the CME FedWatch tool, which shapes how many financial markets behave in anticipation of future Federal Reserve monetary policy decisions.
The Aussie received a brief boost from Thursday's employment data, but this quickly evaporated as the USD strengthened. Economists at Commerzbank analyze AUD outlook.
Between Australia's labour market data and inflation data
So far, the labor market does not seem to be feeling the effects of the RBA's significant interest rate hikes as expected.
Next week Wednesday's Q2 inflation figures will be the last data point before the next monetary policy meeting in early August. The reported inflation for Q2 is likely to weaken further. The interesting question should be: by how much? After all, that's the key data point for the RBA's upcoming policy decision.
So far, the currency market seems undecided on whether another rate hike will follow. The relatively strong labor market argues for another rate hike, which also explains the Aussie's initial strong reaction. More important, however, is inflation. If it doesn't fall as much as expected, the RBA is likely to follow up with another rate hike.
- GBP/JPY rallies hard to a nearly two-week high amid aggressive selling around the JPY.
- Reports indicate that the BoJ will stick to its dovish stance and weigh heavily on the JPY.
- The upbeat UK Retail Sales contribute to the British Pound’s relative outperformance.
The GBP/JPY cross catches aggressive bids on Friday and jumps back above the 182.00 round-figure mark during the early the European session, recovering its weekly losses registered over the past four days. Spot prices rally to a nearly two-week high in the last hour and currently trade around the 182.35-182.40 region, up over 1% for the day
The Japanese Yen (JPY) tumbles across the board in reaction to reports, citing sources familiar with the matter, that the Bank of Japan (BoJ) was leaning toward maintaining its yield curve control (YCC) strategy at its monetary policy meeting next week. This overshadows data showing that inflation in Japan remained above the central bank's 2% target for the 15th straight month in June and undermines the JPY, which, in turn, provides a strong boost to the GBP/JPY cross.
The British Pound's (GBP) relative outperformance could further be attributed to the better-than-expected release of the UK Retail Sales report released on Friday. That said, diminishing odds for more aggressive policy tightening by the Bank of England (BoE), bolstered by Wednesday's softer UK consumer inflation figures, might hold back traders from placing aggressive bullish bets around the GBP and cap the upside for the GBP/JPY cross, at least for the time being.
The market focus now shifts to the highly-anticipated two-day BoJ meeting starting next Thursday. The decision is scheduled to be announced next Friday, which should provide a fresh directional impetus to the GBP/JPY cross. Nevertheless, spot prices seem poised to register modest gains for the first time in the previous three-week and remain well within the striking distance of the highest level since December 2015, around the 184.00 mark touched earlier this month.
Technical levels to watch
- USD/JPY jumps to near 142.00 as the US Dollar rallies amid a cautious market mood.
- Fed-BoJ policy divergence is expected to widen further as the BoJ is expected to continue its dovish stance.
- Japan’s inflation is accelerating more than expected but the key is whether the increase is sustainable.
The USD/JPY pair is swiftly marching towards the critical resistance of 142.00 in the European session. The asset has shifted into a bullish trajectory amid strength in the US Dollar Index (DXY) and rising odds of an unchanged interest rate decision by the Bank of Japan (BoJ), which will be announced on July 28.
S&P500 futures have added decent gains in London, portraying ease in the overall risk-off mood. US equities were heavily sold on Wednesday, driven by an intense sell-off in technology stocks. Investors are cautious that guidance from tech-savvy stocks could remain weak amid higher interest rates by the Federal Reserve (Fed).
The rally in USD/JPY is backed by expectations that policy divergence between the Fed and the Bank of Japan (BoJ) would escalate further as the Fed is expected to raise interest rates further while the BoJ will continue maintaining its decade-long ultra-dovish policy stance. The context has sent the Japanese Yen sharply lower against the US Dollar.
Reuters reported on Friday that the BoJ was leaning toward maintaining its yield curve control (YCC) strategy at next week's policy meeting. "Inflation is accelerating more than expected. But the key is whether the increase is sustainable, which will depend largely on corporate profits and next year's wage outlook," one of the sources told Reuters.
The US Dollar Index has climbed to near the immediate resistance of 101.00 as investors are pumping money into safe-haven assets, knowing the fact that more interest rate hikes by the Fed would deepen fears of recession. Contrary, the 10-year US Treasury yields have dropped to near 3.84%.
Economists at ING analyze USD/JPY outlook ahead of next Friday's BoJ meeting.
Expectations of any Yield Curve Control policy tweak seem very low
Regarding the BoJ, expectations of any Yield Curve Control policy tweak seem very low (perhaps too low) given that the 30-year Japanese government bond (JGB) yield is drifting lower and the forward market prices 10-year JGB yields at 50 bps in three months and at only 55 bps in six months. These 10-year yields should be priced a lot higher were the market expecting a policy change.
USD/JPY may well drift to the 141.15/142.00 area before next Friday's BoJ meeting.
Here is what you need to know on Friday, July 21:
The Japanese Yen stays under strong selling pressure on Friday on reports claiming the Bank of Japan (BoJ) will not make any changes to its yield curve control strategy next week. The US Dollar Index continues to stretch higher following Thursday's strong recovery amid a cautious market stance. June Retail Sales from Canada will be the only data releases featured in the economic calendar ahead of the weekend.
Citing five sources familiar with the matter, Reuters reported on Friday that the BoJ was leaning toward maintaining its yield curve control (YCC) strategy at next week's policy meeting. With the initial reaction to this headline, USD/JPY gathered bullish momentum and climbed to its highest level in 10 days above 141.50. Meanwhile, the data from Japan showed earlier that the National Consumer Price Index (CPI) edged higher to 3.3% on a yearly basis in June from 3.2% in May. This reading came in lower than the market expectation of 3.5%. Reflecting the broad-based JPY weakness, EUR/JPY was last seen rising more than 1% on the day at 157.55 and GBP/JPY was up 1.1% at 182.25.
EUR/USD lost nearly 100 pips on Thursday and touched its weakest level in over a week below 1.1120. Early Friday, the pair stays finds its difficult to stage a rebound and fluctuates in a tight channel above 1.2100.
GBP/USD closed the fifth straight day in negative territory on Thursday and the pair is already down nearly 2% this week. The UK's Office for National Statistics reported on Friday that Retail Sales rose 0.7% on a monthly basis in June, much higher than the market expectation for an increase of 0.2%. In the meantime, UK Finance Minister Jeremy Hunt said that they will start to see results if they stick to their plan of halving inflation. GBP/USD showed no reaction to these comments and was last seen trading modestly lower on the day at around 1.2850.
Pressured by rising US Treasury bond yields, Gold price lost its bullish momentum and closed in the red on Thursday. Early Friday, XAU/USD stays under bearish pressure and continues to edge lower toward $1,960.
Bitcoin rose above $30,000 on Thursday but failed to make a daily close there. Early Friday, BTC/USD trades flat on the day at around $29,800. Ethereum is struggling to make a decisive move in either direction and extending its sideways action near $1,900 ahead of the weekend.
- AUD/USD meets with a fresh supply on Friday and drops back closer to the weekly low.
- China’s economic woes undermine the Aussie and exert pressure amid a stronger USD.
- A sustained breakdown below the 50% Fibo. should pave the way for deeper losses.
The AUD/USD pair extends the previous day's sharp pullback from the vicinity of mid-0.6800s, or the weekly high and drifts lower through the early part of the European session on Friday. Spot prices currently trade around the 0.6750 region, which represents the weekly trough touched on Wednesday and the 50% Fibonacci retracement level of the recent rally from sub-0.6600 levels touched in late June.
Concerns over slowing economic growth in China, the worsening US-China trade ties and geopolitical risks overshadow the upbeat Australian jobs data released on Thursday, which puts pressure on the Reserve Bank of Australia (RBA) to hike further. This, along with a goodish pickup in the US Dollar (USD) demand, bolstered by a sharp fall in the Japanese Yen, exerts some downward pressure on the AUD/USD pair.
From a technical perspective, the recent failure near the 0.6900 round figure constitutes the formation of a bearish double-top pattern on the daily chart. That said, oscillators on the daily chart - though have been losing positive traction - are yet to confirm a negative outlook. This makes it prudent to wait for some follow-through selling below the 0.6750 support before positioning for any further intraday depreciating move.
The AUD/USD pair might then accelerate the fall towards challenging a technically significant 200-day Simple Moving Average (SMA), currently pegged just above the 0.6700 mark. The said handle coincides with the 61.8% Fibo. level, which if broken decisively will be seen as a fresh trigger for bearish traders and drag spot prices to the 0.6655-0.6650 intermediate support en route to sub-0.6600 levels, or the monthly low.
On the flip side, the 38.2% Fibo. level, around the 0.6775-0.6780 region, now seems to act as an immediate hurdle ahead of the 0.6800 mark. and the 0.6825 zone, or the 23.6% Fibo. A sustained strength beyond should allow the AUD/USD pair to make a fresh attempt to conquer the 0.6900 double-top barrier. Some follow-through buying will negate the bearish pattern and shift the near-term bias back in favour of bullish traders.
The subsequent short-covering rally has the potential to lift the AUD/USD pair to the 0.6970-0.6975 next relevant hurdle. This is closely followed by the 0.7000 psychological mark, above which the upward trajectory could get extended further towards the 0.7050-0.7055 area en route to the 0.7100 round figure. Spot prices could eventually climb to the YTD peak, around the 0.7155-0.7160 region touched in February.
AUD/USD daily chart
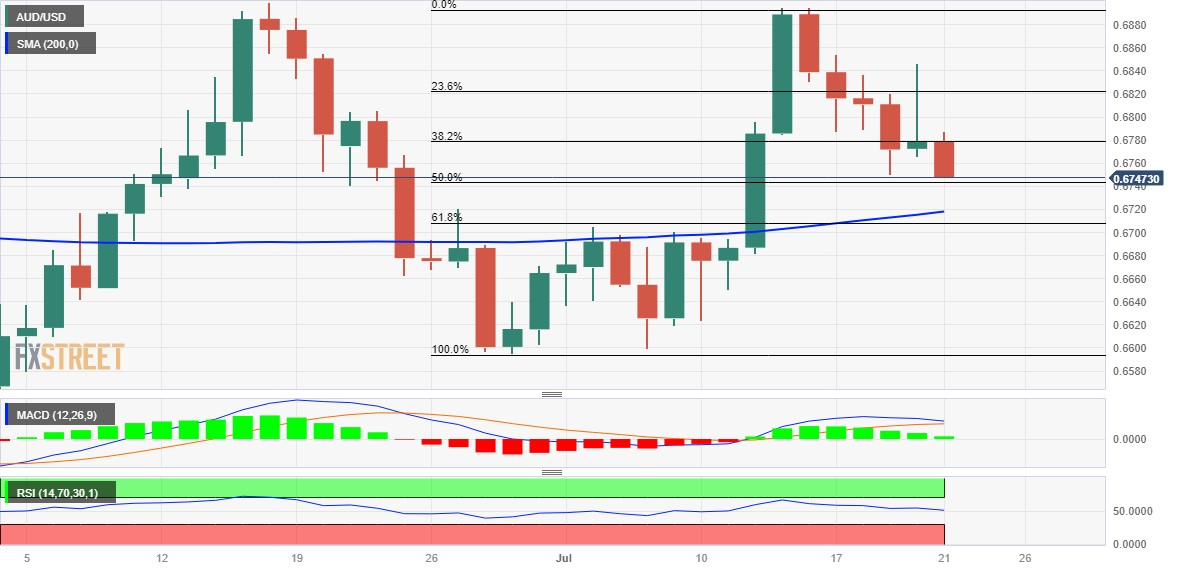
Key levels to watch
Further retracement in USD/CNH looks out of favour for the time being, comment Economist Lee Sue Ann and Markets Strategist Quek Ser Leang at UOB Group.
Key Quotes
24-hour view: The outsized selloff that sent USD plunging by 0.81% (NY close of 7.1736) came as a surprise (we were expecting USD to trade in a range). While severely oversold, the weakness in USD has not stabilized. In view of the oversold conditions, USD is unlikely to break the major support at 7.1500. On the upside, if USD breaks above 7.2200 (minor resistance is at 7.2000), it would mean that the USD weakness has stabilized.
Next 1-3 weeks: Our latest narrative was from two days (19 Jul, spot at 7.1950). As highlighted, after dropping sharply over the past week, USD is unlikely to weaken further. For the time being, USD is likely to trade in a range, probably between 7.1500 and 7.2500.
- Euro trades close to weekly lows near 1.1130 against the US Dollar.
- Stocks in Europe open Friday’s session in a mixed fashion.
- EUR/USD risks further decline in the short-term horizon.
- US, EMU calendars will be empty at the end of the week.
The Euro (EUR) navigates within a tight range against the U.S. Dollar (USD) at the end of the week and relegates EUR/USD to remain under scrutiny in the low-1.1100s.
The strong Dollar’s rally this week has driven the pair sharply lower from its 2023 high near 1.1270 last Monday down to Thursday's lows in the 1.1120/1.1115 band.
Other than some profit taking in light of the pair’s recent strong advance, market chatter suggesting the Federal Reserve may not end its rate hiking campaign in July has also boosted the Dollar at the expense of risk assets.
Looking ahead, spot seems set for some consolidation ahead of crucial meetings next week by the Federal Reserve and European Central Bank (ECB). While both central banks are likely to raise rates by 0.25%, an emerging divergence lies in their near-term plans regarding future tightening.
Furthermore, the Fed is seen as nearing the end of its hiking cycle, while some ECB officials have sounded less hawkish recently on the prospects for more hikes beyond summer.
In bond markets, yields on both sides of the Atlantic trade without direction so far today in Europe.
Daily digest market movers: Euro looks depressed and could challenge 1.1100
- The EUR maintains the trade near 1.1100 against the USD.
- The USD Index remains bid and approaches 101.00.
- Speculation that the Fed could end its hiking cycle in July looks mitigated.
- US, German lack clear direction so far on Friday.
- The BoJ defended its current ultra-accommodative stance.
- Retail Sales in the UK came in above expectations in June.
Technical Analysis: Euro faces a decent support around 1.1000
EUR/USD continues to digest the so far marked weekly pullback.
The pair printed a new 2023 high at 1.1275 on July 18. Once this level is cleared, there are no resistance levels of significance until the 2022 peak of 1.1495 recorded on February 10.
On the downside, immediate contention lies at the weekly low of 1.1118 (July 20) ahead of the psychological 1.1000 mark, all seconded by provisional support at the 55-day and 100-day SMAs at 1.0897 and 1.0881, respectively. The loss of this region could open the door to a potential visit to the July low of 1.0833 (July 6) ahead of the key 200-day SMA at 1.0687 and the May low of 1.0635 (May 31). South from here emerges the March low of 1.0516 (March 15) before the 2023 low of 1.0481 (January 6).
Furthermore, the constructive view of EUR/USD appears unchanged as long as the pair trades above the key 200-day SMA.
Euro FAQs
What is the Euro?
The Euro is the currency for the 20 European Union countries that belong to the Eurozone. It is the second most heavily traded currency in the world behind the US Dollar. In 2022, it accounted for 31% of all foreign exchange transactions, with an average daily turnover of over $2.2 trillion a day.
EUR/USD is the most heavily traded currency pair in the world, accounting for an estimated 30% off all transactions, followed by EUR/JPY (4%), EUR/GBP (3%) and EUR/AUD (2%).
What is the ECB and how does it impact the Euro?
The European Central Bank (ECB) in Frankfurt, Germany, is the reserve bank for the Eurozone. The ECB sets interest rates and manages monetary policy.
The ECB’s primary mandate is to maintain price stability, which means either controlling inflation or stimulating growth. Its primary tool is the raising or lowering of interest rates. Relatively high interest rates – or the expectation of higher rates – will usually benefit the Euro and vice versa.
The ECB Governing Council makes monetary policy decisions at meetings held eight times a year. Decisions are made by heads of the Eurozone national banks and six permanent members, including the President of the ECB, Christine Lagarde.
How does inflation data impact the value of the Euro?
Eurozone inflation data, measured by the Harmonized Index of Consumer Prices (HICP), is an important econometric for the Euro. If inflation rises more than expected, especially if above the ECB’s 2% target, it obliges the ECB to raise interest rates to bring it back under control.
Relatively high interest rates compared to its counterparts will usually benefit the Euro, as it makes the region more attractive as a place for global investors to park their money.
How does economic data influence the value of the Euro?
Data releases gauge the health of the economy and can impact on the Euro. Indicators such as GDP, Manufacturing and Services PMIs, employment, and consumer sentiment surveys can all influence the direction of the single currency.
A strong economy is good for the Euro. Not only does it attract more foreign investment but it may encourage the ECB to put up interest rates, which will directly strengthen the Euro. Otherwise, if economic data is weak, the Euro is likely to fall.
Economic data for the four largest economies in the euro area (Germany, France, Italy and Spain) are especially significant, as they account for 75% of the Eurozone’s economy.
How does the Trade Balance impact the Euro?
Another significant data release for the Euro is the Trade Balance. This indicator measures the difference between what a country earns from its exports and what it spends on imports over a given period.
If a country produces highly sought after exports then its currency will gain in value purely from the extra demand created from foreign buyers seeking to purchase these goods. Therefore, a positive net Trade Balance strengthens a currency and vice versa for a negative balance.
Cable climbs off the lows. Economists at Société Générale analyze GBP/USD technical outlook.
An initial bounce is expected, however, 1.3025 is likely to contain
GBP/USD up-move faced stiff resistance near projections of 1.3100/1.3180 which is also the upper limit of a multi-month channel. A steady wave of pullback has brought it back towards the peak of June and a steeper ascending trend line at 1.2850/1.2790; this is first layer of support. An initial bounce is expected however 1.3025, the 61.8% retracement of recent down move is likely to contain.
In case the pair fails to defend 1.2850/1.2790, a retest of the lower band of the channel at 1.2600 can’t be ruled out.
Citing five sources familiar with the matter, Reuters reported on Friday that the Bank of Japan was leaning toward maintaining its yield curve control (YCC) strategy at next week's policy meeting.
"Inflation is accelerating more than expected. But the key is whether the increase is sustainable, which will depend largely on corporate profits and next year's wage outlook," one of the sources told Reuters.
Market reaction
USD/JPY rose sharply with the initial reaction to this headline. The pair was last seen rising nearly 1% on the day at 141.40.
The South African Rand is holding up despite the lack of a rate hike. Economists at ING analyze ZAR's outlook.
Market thinks that the SARB has concluded its tightening cycle
The vote was close – three to two in favour of unchanged rates – but now the market thinks that the SARB has concluded its tightening cycle and will be easing policy in the first half of next year.
The fact that the Rand did not sell off more shows that investors feel calmer about inflation prospects and increasingly like high-yield EMFX ahead of a possible cyclical Dollar decline later this year. The Rand of course has its challenges such as weak growth, a widening current account deficit, and the geopolitical headwinds of its relationship with Russia. However, if we are right that portfolio flows to EM rebound later this year, the ZAR should do well given South Africa's large weighting in EM bond and equity benchmarks.
As for most other high-yield EM currencies, we think the Rand can outperform the steep USD/ZAR FX forwards curve.
Thursday saw a drop in EUR/USD. Economists at ING analyze the pair’s outlook.
Reconnecting
The drop did see EUR/USD reconnect both with short-term rate differentials (still wide at nearly 130 bps in the Dollar's favour) and also the still steeply inverted US yield curve. Both of these variables have to change if the EUR/USD is to embark on a big cyclical rally.
Back to today, EUR/USD could drift down to support at 1.1100/1115 but that may well be the lower end of the range heading into next week's central bank meetings.
- Silver regains positive traction on Friday and reverses a part of the previous day’s downfall.
- The technical setup remains tilted in favour of bulls and supports prospects for further gains.
- A convincing break below the $23.00 mark is needed to negate the near-term positive outlook.
Silver catches fresh bids on Friday and reverses a part of the previous day's sharp retracement slide from the $25.25 area, or its highest level since May 11. The white metal sticks to its intraday gains through the early European session and currently trades near the daily peak, just below the $25.00 psychological mark.
From a technical perspective, the XAG/USD manages to defend the $24.60-$24.50 strong horizontal resistance breakpoint, now turned support. The said area should now act as a pivotal point, which if broken decisively might prompt some technical selling. Silver might then accelerate the slide towards the $24.00 mark en route to the $23.65-$23.60 support zone and the $23.20-$23.15 region.
The next relevant support is pegged near the $23.00 round figure, which if broken decisively will negate any near-term positive outlook and shift the bias in favour of bearish traders. Some follow-through selling below the $22.75-$22.70 area would reaffirm the negative outlook and make the XAG/USD vulnerable to sliding back towards challenging the multi-month low, around the $22.15-$22.10 area.
Meanwhile, technical indicators on the daily chart are holding comfortably in the positive territory and are still far from being in the overbought zone. This, in turn, favours bullish traders and suggests that the path of least resistance for the XAG/USD is to the upside. That said, it will be prudent to wait for a move beyond the overnight swing high, around the $25.25 area, before placing fresh bets.
The XAG/USD might then aim to surpass the $25.50-$25.55 intermediate hurdle and reclaim the $26.00 round figure. This is closely followed by the YTD peak, around the $26.10-$26.15 area touched in May, which if cleared will set the stage for an extension of the recent upward trajectory witnessed over the past month or so.
Silver daily chart
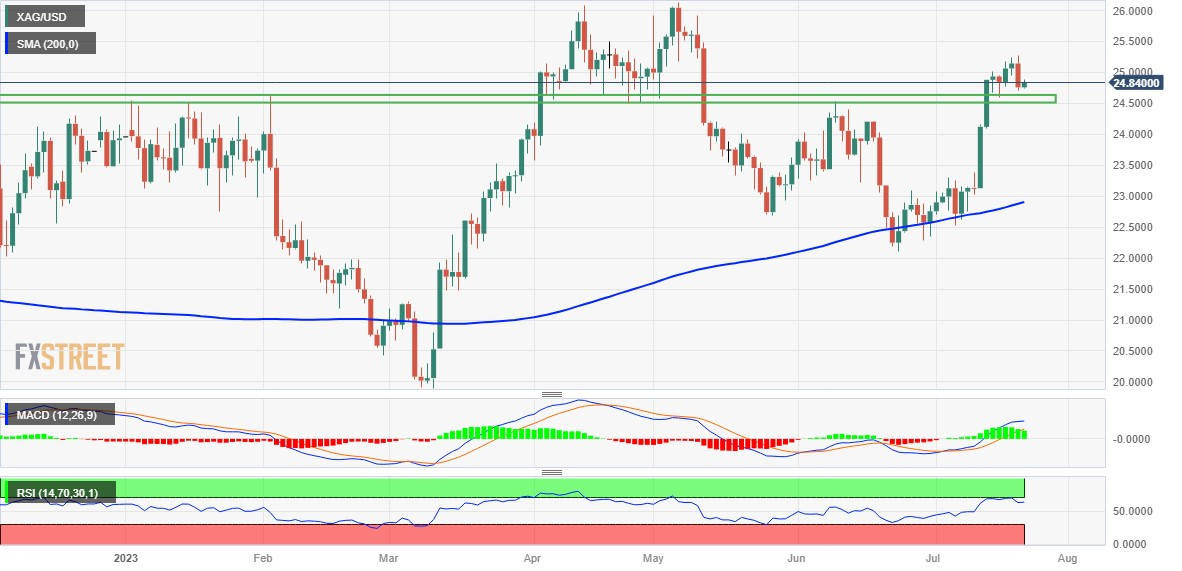
Key levels to watch
Economist Lee Sue Ann and Markets Strategist Quek Ser Leang at UOB Group see USD/JPY trading within the 138.00-141.00 range in the short-term horizon.
Key Quotes
24-hour view: Our view for USD to trade sideways between 138.80 and 140.05 yesterday turned out to be incorrect. Instead of trading sideways, USD soared to 140.49, and then pulled back to end the day at 140.07 (+0.29%). Despite the relatively strong advance, upward momentum has not improved much. However, there is room for USD to edge above 140.50 today. The major resistance at 141.00 is unlikely to come under threat. Support is at 139.50, followed by 139.00.
Next 1-3 weeks: There is not much to add to our update from yesterday (19 Jul, spot at 139.55). As highlighted, the USD weakness that started from early last week has stabilized. From here, we expect USD to trade in a range, likely between 138.00 and 141.00.
- The index appears slightly offered around 100.70.
- US yields trade with small losses in the European morning.
- Investors’ focus remains on the upcoming FOMC event.
The USD Index (DXY), which tracks the greenback vs. a basket of its main rival currencies, looks mildly offered around 100.70 at the end of the week.
USD Index looks at risk trends, FOMC
The index now comes under some tepid downside pressure following three consecutive daily gains amidst a decent recovery in the risk-associated universe and so far declining US yields.
In the meantime, some consolidation should not be ruled out for the index in the next sessions ahead of the key FOMC gathering on July 26, where the wide consensus anticipates the Federal Reserve hiking its rates by 25 bps.
Beyond the summer, there's uncertainty about the Fed's plans for the normalization of its monetary conditions, as opinions are divided between whether there will be a final rate hike in July or an additional increase in the next months (September?).
The US data space will be empty on Friday, leaving all the attention to the broad risk appetite trends as drivers behind the price action.
What to look for around USD
The index now recedes from Thursday’s tops near the 101.00 hurdle amidst some bullish attempt in the risk-linked galaxy.
In the near term, there are no changes to the perception that the Fed would resume its tightening process later in the month despite persistent disinflationary pressures and the still tight labour market.
This view was further bolstered by comments from Fed Chief Powell at the June FOMC event, who referred to the July meeting as "live" and indicated that most of the Committee is prepared to resume the tightening campaign as early as next month.
Eminent issues on the back boiler: Persistent debate over a soft/hard landing of the US economy. Terminal Interest rate near the peak vs. speculation of rate cuts in late 2023/early 2024. Geopolitical effervescence vs. Russia and China. US-China trade conflict.
USD Index relevant levels
Now, the index is losing 0.05% at 100.77 and faces immediate support at 99.57 (2023 low July 13) followed by 97.68 (weekly low March 30) and 95.17 (monthly low February 10 2022). On the other hand, the breakout of 100.96 (weekly high July 20) could open the door to 102.61 (55-dat SMA) and then 103.54 (weekly high June 30).
Sterling is rallying on the back of strong UK Retail Sales data for June. Economists at ING analyze GBP outlook.
Strong June retail sales provide a brief lift
Unseasonably warm weather for the UK last month was seen to be behind the Retail Sales bounce. The data will also feed into the Bank of England's narrative that the consumer can handle higher interest rates.
The release has triggered a 20 pip drop in EUR/GBP. However, we think EUR/GBP probably put in an important low near 0.8500 earlier this month and that corporates will now use any EUR/GBP dip below 0.8600 to increase hedges on Sterling receivables.
- USD/JPY gains traction above the 140.20 mark on Friday.
- The Federal Reserve (Fed) is expected to raise interest rates by 25 basis points (bps) next week.
- Bank of Japan (BoJ) policymakers will likely maintain the easy-money policy.
- Investors await the BoJ interest rate decision scheduled for next week.
The USD/JPY pair attracts some follow-through buying and advances above the 140.20 area heading into the European session on Friday. The monetary policy divergences between the ultra-loose monetary policy of the BoJ and the resumed tightening policy of the Fed dragged the Japanese Yen lower against its major rivals.
The weekly data published by the US Department of Labour (DOL) showed on Thursday that Initial Jobless claims totaled 228,000 in the week ending July 15, against the expectation of 242,000 and lower than 237,000 prior. The figure showed the lowest reading since mid-May. Meanwhile, the Philadelphia Federal Reserve Manufacturing Survey came in at -13, versus the consensus of -10. While Existing sales from June also showed a contraction of 3.3% MoM in June against a 0.2% prior gain.
That said, the Federal Reserve (Fed) is expected to raise interest rates by 25 basis points (bps) next week. However, the possibility of an additional rate hike before the end of the year increased after the latest report. This, in turn, boosts the US Dollar across the board.
On the Japanese Yen front, Japan’s trade balance unexpectedly flipped to its first surplus since July 2021, easing pressure on the economy's recovery. The Japanese trade surplus came to ¥43 billion. Market consensus had forecast a ¥46.7 billion deficit. Additionally, June's National Consumer Price Index (CPI) rose from 3.2% to 3.3% YoY, versus 3.5% expected.
Bank of Japan (BoJ) Governor Kazuo Ueda is likely to maintain the easy-money policy even though market participants expected an exit from the ultra-loose monetary policy and a tweak to BoJ's Yield Curve Control (YCC) policy. This, in turn, led to the weakening of the Japanese Yen against its major rivals due to monetary policy divergences.
Investors are now focusing on the Bank of Japan's (BoJ) interest rate decision scheduled for next week. BoJ Governor Kazuo Ueda is expected to maintain a dovish policy stance in order to keep inflation steady at approximately 2%.
Economists at MUFG Bank discuss Yuan outlook.
CNY to appreciate in the medium term on the back of better economic activities
We expect a still volatile USD/CNH in near term with a bearish bias for the USD/CNY, and we continue to expect CNY to appreciate in the medium term on the back of better economic activities.
We expect USD/CNY to reach 7.00 by the end of Q3, 2023, 6.80 by the end of Q4 2023.
See: Fundamentals still point to higher USD/CNH – Credit Suisse
- Pound Sterling finds cushion as UK Retail Sales data for June turns out stronger than expectations.
- United Kingdom’s consumer spending in June remained resilient despite the burden of high inflation.
- Monthly Retail Sales for June expanded by 0.7% while investors were expecting a mild expansion of 0.2%.
The Pound Sterling (GBP) is strengthening as the United Kingdom Retail Sales data turns out more resilient than expected. The GBP/USD pair rebounds swiftly as consumer spending growth expanded strongly in June. Monthly Retail Sales in June expanded by 0.7% vs. expectations of 0.2%. Annual consumer spending data contracted by 1.0% against the consensus of -1.5%.
The United Kingdom’s consumer spending remained resilient in June despite the burden of higher inflation and interest rates by the Bank of England (BoE). Upbeat retail demand has offset the optimism inspired by soft inflation data for June as higher consumer spending could allow firms to raise the prices of goods and services at factory gates again. Also, consumer spending resilience might elevate hopes of a consecutive 50-basis-point (bp) interest rate hike by the UK central bank.
Daily Digest Market Movers: Pound Sterling picks strength amid resilient Retail Sales data
- Pound Sterling recovers quickly as the United Kingdom Retail Sales data for June was stronger than anticipated.
- Monthly Retail Sales data expanded by 0.7% in June vs. 0.1% in May and the consensus of 0.2%. Annual Retail Sales data contracted by 1.0% against the expectations of -1.5% and former release of -2.1%.
- Retail Sales excluding fuel posted growth of 0.8% against a stagnant performance recorded for May and the estimates of 0.1% on a monthly basis. Annualized economic data contracted by 0.9% vs. the consensus of -1.6% and the former release of -1.9%.
- Resilience in consumer spending could offset the impact of June’s soft Consumer Price Index (CPI) data and reinforce the odds of a 50 bps rate hike from the Bank of England.
- Investors were mixed about the pace at which interest rates will be hiked by the Bank of England on August 3.
- Market participants were anticipating that BoE Governor Andrew Bailey would raise interest rates consecutively by 50 basis points (bps) but as June’s inflation cools down significantly a league of investors are tilting toward a 25 bps rate hike.
- The investing community expects that interest rates by the BoE would peak around 6.5%.
- BoE Deputy Governor Dave Ramsden acknowledged that the inflation has begun to fall significantly in the UK but noted that it was still "much too high," per Reuters.
- Market participants seem confident that UK inflation has started cooling down as aggressive policy tightening by the BoE and a decline in the Producer Price Index (PPI) are collectively attacking price pressures.
- According to a survey from Lloyds Bank, producers have cut prices for the first time in more than three years and are passing on the benefit of the decline in cost pressures to end consumers.
- Next week, investors will shift their focus onto the S&P Manufacturing & Services PMI for June, which will be published on Monday at 08:30 GMT.
- The overall market mood is quite cautious as the second-quarter earnings season has kicked off.
- Meanwhile, the US Dollar Index (DXY) is gathering strength to capture crucial resistance of 101.00.
- The US Dollar Index has come back into action as consumer spending has maintained growth and core inflation could a while in returning to 2%.
- Investors are keenly awaiting the interest rate decision by the Federal Reserve (Fed), which will be announced on July 26.
- As per the CME FedWatch tool, interest rates would be hiked by 25 bps to 5.25-5.50%. Investors are hoping that this would be the last interest rate hike this year.
Technical Analysis: Pound Sterling posts pullback move to near 1.2900
Pound Sterling rebounds to near the round-level resistance of 1.2900 as the UK Retail Sales expand significantly higher than expectations. The Cable found support at the 20-day Exponential Moving Average (EMA) at 1.2860, which indicates that the short-term bullish bias is still intact. Momentum oscillators indicate that the upside momentum has faded but remains mostly still intact.
Pound Sterling FAQs
What is the Pound Sterling?
The Pound Sterling (GBP) is the oldest currency in the world (886 AD) and the official currency of the United Kingdom. It is the fourth most traded unit for foreign exchange (FX) in the world, accounting for 12% of all transactions, averaging $630 billion a day, according to 2022 data.
Its key trading pairs are GBP/USD, aka ‘Cable’, which accounts for 11% of FX, GBP/JPY, or the ‘Dragon’ as it is known by traders (3%), and EUR/GBP (2%). The Pound Sterling is issued by the Bank of England (BoE).
How do the decisions of the Bank of England impact on the Pound Sterling?
The single most important factor influencing the value of the Pound Sterling is monetary policy decided by the Bank of England. The BoE bases its decisions on whether it has achieved its primary goal of “price stability” – a steady inflation rate of around 2%. Its primary tool for achieving this is the adjustment of interest rates.
When inflation is too high, the BoE will try to rein it in by raising interest rates, making it more expensive for people and businesses to access credit. This is generally positive for GBP, as higher interest rates make the UK a more attractive place for global investors to park their money.
When inflation falls too low it is a sign economic growth is slowing. In this scenario, the BoE will consider lowering interest rates to cheapen credit so businesses will borrow more to invest in growth-generating projects.
How does economic data influence the value of the Pound?
Data releases gauge the health of the economy and can impact the value of the Pound Sterling. Indicators such as GDP, Manufacturing and Services PMIs, and employment can all influence the direction of the GBP.
A strong economy is good for Sterling. Not only does it attract more foreign investment but it may encourage the BoE to put up interest rates, which will directly strengthen GBP. Otherwise, if economic data is weak, the Pound Sterling is likely to fall.
How does the Trade Balance impact the Pound?
Another significant data release for the Pound Sterling is the Trade Balance. This indicator measures the difference between what a country earns from its exports and what it spends on imports over a given period.
If a country produces highly sought-after exports, its currency will benefit purely from the extra demand created from foreign buyers seeking to purchase these goods. Therefore, a positive net Trade Balance strengthens a currency and vice versa for a negative balance.
In the view of Economist Lee Sue Ann and Markets Strategist Quek Ser Leang at UOB Group, AUD/USD should trade between 0.6700 and 0.6865 in the next few weeks.
Key Quotes
24-hour view: After AUD dropped to a low of 0.6750 on Wednesday, we indicated yesterday that “the decline lacks momentum” and we expected AUD to consolidate in a range 0.6750/0.6820. However, AUD spiked to a high of 0.6840 and then dropped back to end the day at 0.6779 (+0.12%). The underlying tone appears to have softened, and today, there is a chance for AUD to dip below 0.6750. In view of the mild downward pressure, a sustained drop below this level is unlikely. The major support at 0.6700 is also unlikely to come into view. Resistance is at 0.6805, followed by 0.6825.
Next 1-3 weeks: Our update from yesterday (19 Jul, spot at 0.6775) is still valid. As highlighted, the recent buildup in upward momentum has dissipated. From here, we expect AUD to trade in a range, probably between 0.6700 and 0.6865.
Open interest in natural gas futures markets shrank for the second session in a row on Thursday, now by nearly 7K contracts according to preliminary readings from CME Group. Volume, instead, remained erratic and rose by around 173.4K contracts.
Natural Gas: Initial hurdle comes near $2.90
Prices of natural gas rose markedly and approached the key $2.80 region on Thursday. The daily gains, however, were amidst diminishing open interest and hints at the idea that a correction could be in store for the commodity in the very near term. In the meantime, there is a solid up-barrier at the June peak of $2.878 (June 28) ahead of the March high at $3.02 per MMBtu (March 3).
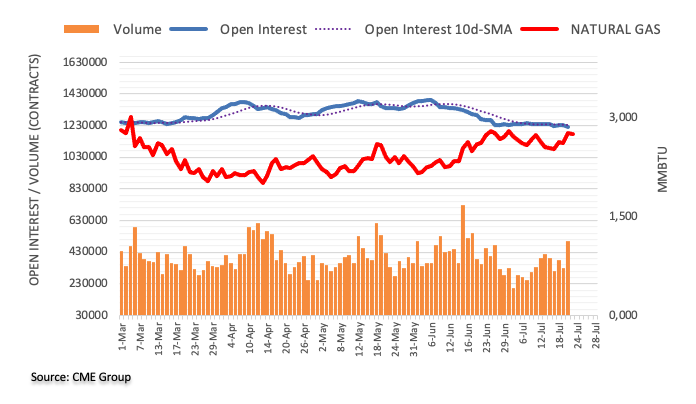
- USD/TRY picks up bids to renew intraday high after declining in the last two consecutive days.
- CBRT lifts interest rates to 17.5% from 15.0%, versus 20.0% expected.
- Fed’s 0.25% bps rate hike is already given, policy pivot signals past July will be eyed for clear directions.
- Economic hardships for Turkiye keep Lira on the back foot despite likely future divergence between Fed and CBRT.
USD/TRY regains upside momentum after declining in the last two consecutive days, up 0.65% intraday near 26.95 amid the early hours of Friday’s European session. In doing so, the Turkish Lira (TRY) pair convey the market’s disappointment with the Central Bank of the Republic of Türkiye (CBRT) while bracing for the next week’s Federal Reserve (Fed) rate hike.
That said, the CBRT hesitated in matching the market’s hawkish expectation as it lifted the benchmark interest rates to 17.5% from 15.0%, compared to 20.0%. This becomes the second instance when the Turkish central bank disappoints the TRY bulls.
Apart from the CBRT-inflicted losses for the Turkish Lira, the looming economic crisis for the nation, after witnessing multiple hurdles like record-high inflation and geopolitical events that shook the economy, also weigh on the TRY price and propel the USD/TRY pair.
On the other hand, the US Dollar Index (DXY) jumped the most in a month to refresh the weekly top the previous day before recently retreating to 100.80. In doing so, the greenback’s gauge versus the six major currencies portrays the market’s positioning for the Fed’s widely anticipated 0.25% rate hike after cheering mostly upbeat US job clues. That said, US Initial Jobless Claims dropped to 228K for the week ended on July 14, the lowest since May, versus 237K prior and 242K market forecasts.
Elsewhere, China tried to impress markets with multiple moves to defend the world’s second-largest economy’s growth. That said, the Wall Street benchmark closed in the red amid the downbeat performance of energy and technology shares but the S&P500 Futures remain indecisive after reversing from the yearly high. Further, the US Treasury bond yields refreshed their weekly highs the previous day and propelled the US Dollar before the latest retreat.
Looking ahead, a light calendar may restrict immediate USD/TRY moves before the next week’s monetary policy meetings of the Fed. It should be observed that the risk catalysts may entertain the traders.
Technical analysis
A rising wedge bearish chart formation on the daily chart, currently between 26.50 and 27.30, teases the USD/TRY bears ahead of the key week comprising the Federal Open Market Committee (FOMC) monetary policy meeting announcements.
Following the Retail Sales data, UK Finance Minister Jeremy Hunt said that “we will start to see results if we stick to our plan to halve inflation.”
Additional comments
“Now more than ever we need to maintain discipline with public finances.“
“We are at a crucial juncture and need to avoid reckless spending.”
Related reads
- UK Retail Sales rise 0.7% MoM in June vs. 0.2% expected
- GBP/JPY marches towards 181.00 on upbeat UK Retail Sales, dovish BoJ concerns
- WTI crude oil extends its upside above the $76.20 mark heading into the European session.
- Market participants are repricing another Fed rate increase after the July meeting.
- Output cuts, the hope for China’s stimulus plan boosts the WTI price.
Western Texas Intermediate (WTI), the US crude oil benchmark, is trading around the $76.20 mark so far this Friday. Earlier this week, the Energy Information Administration (EIA) reported that the EIA Crude Oil Stocks Change in the week ending July 14 fell by 708,000 barrels, compared to expectations of a drop of 2.44 million barrels and a gain of 5.946 million barrels the previous week.
That said, the upside for WTI seems limited as market participants are repricing another Fed rate increase after the July meeting, causing the Greenback to rebound. According to the CME FedWatch Tool, the odds for the November meeting climbed from 19.8% a week ago to 32.2%, showing traders are changing their views on Fed monetary policy. It’s worth noting that higher interest rates raise borrowing costs, which can slow the economy and diminish oil demand.
However, The Organisation of Petroleum Exporting Countries (OPEC) expects China's demand to grow in the second half of this year and boost global growth as China is the world's largest oil consumer.
Meanwhile, Russia plans to reduce its oil exports by 2.1 million metric tonnes in the third quarter, keeping with voluntary export restrictions of 500,000 barrels per day scheduled for August. On Tuesday, China’s Commerce Ministry stated that a series of measures will help boost the consumption of household consumer goods and services consumption. This, in turn, supports further upside in the WTI price.
Next week, the Federal Open Market Committee (FOMC) meeting will be the key focus. Oil traders will closely watch this event and find opportunities around the USD-denominated WTI price.
The South African central bank’s rate decision on Thursday was tight as expected. Economists at Commerzbank analyze Rand's outlook.
The door remains wide open for further monetary policy tightening
The door remains wide open for further monetary policy tightening, which provided moderate support for the market’s rate hike expectations and is likely to have supported the Rand. The SARB’s stability orientated approach is likely to remain an important anchor for the Rand exchange rates.
Medium to long-term we urge caution. The ZAR is likely to remain at risk in a challenging interest rate environment and in view of domestic risks. In case of risk averse market sentiment, there is a risk of serious losses.
While extra downside in GBP/USD remains on the cards, there is a strong support around 1.2780 according to Economist Lee Sue Ann and Markets Strategist Quek Ser Leang at UOB Group.
Key Quotes
24-hour view: While we expected GBP to weaken further yesterday, we indicated that “severely oversold conditions could limit any further decline to a test of 1.2850.” GBP fell more than expected to 1.2840 before rebounding. The rebound in still oversold conditions suggests GBP is unlikely to weaken much further. Today, GBP is more likely to trade in a range of 1.2835/1.2930.
Next 1-3 weeks: After GBP dropped sharply on Wednesday, in our update from yesterday (20 Jul, spot at 1.2935), we highlighted that the “decline has room to extend.” However, we indicated that GBP “has to break clearly below 1.2850 before a deeper pullback is likely.” GBP fell to a low of 1.2840 in NY trade, and downward momentum has improved, albeit not much. From here, GBP could drop further, but it is worth noting that there is another solid support at 1.2780. On the upside, a breach of 1.3000 (‘strong resistance’ level was at 1.3100 yesterday) would indicate that GBP is now weakening further.
CME Group’s flash data for crude oil futures markets noted traders reduced their open interest positions for the fourth session in a row on Thursday, this time by around 18.3K contracts. In the same line, volume went down for the second straight session, now by around 109.1K contracts.
WTI: Upside remains capped by the 200-day SMA
Prices of WTI resumed the uptrend on Thursday. However, the uptick came amidst shrinking open interest and volume and exposes a potential correction in the very near term. So far, the key 200-day SMA, today at $76.82, continues to cap occasional bullish attempts of the commodity.
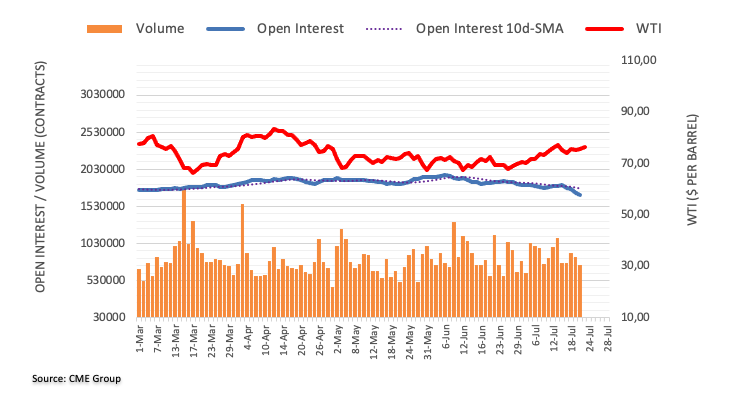
- USD/CAD remains indecisive, struggles to extend previous day’s rebound from weekly low.
- Bullish chart formation needs validation from Canada Retail Sales for June.
- Convergence of 200-HMA, fortnight-long descending trend line guards immediate upside.
- Loonie pair sellers should wait for 1.3100 breakdown while targeting 1.3000 psychological magnet.
USD/CAD aptly portrays the pre-data anxiety around 1.3170 heading into Friday’s European session. In doing so, the Loonie pair showcases the trader’s cautious mood ahead of the Canadian Retail Sales data for June amid a lackluster market comprising no major data/events.
Also read: USD/CAD stuck in a narrow range above mid-1.3100s, rising Oil prices act as a headwind
Apart from Canada Retail Sales for June, expected 0.5% MoM versus 1.1% prior, the inverse head-and-shoulders (H&S) bullish chart formation, with a neckline surrounding 1.3200, also highlights the USD/CAD pair for trading.
That said, the upward-sloping RSI (14) line suggests the quote’s gradual recovery despite declining for the second consecutive week so far.
It should be noted that a fortnight-old descending trend line joins the 200-Hour Moving Average (HMA) to suggest the 1.3185 level as the short-term key hurdle.
Hence, the USD/CAD pair is likely to edge higher but the upside momentum needs acceptance from the 1.3200 and the Canadian Retail Sales data. Following that, the weekly peak of 1.3245 and the July 10 high surrounding 1.3300 should lure the bulls.
On the contrary, the previous day’s low around 1.3120 and the 1.3100 round figure could challenge the USD/CAD bears before giving them control.
In that case, the multi-month low marked the last Friday around 1.3090 may act as an additional downside filter prior to pleasing the sellers with the 1.3000 round figure.
USD/CAD: Hourly chart

Trend: Further recovery expected
Economists at Commerzbank analyze EUR/CZK outlook.
EUR/CZK to drift lower through H2 2023
We expect EUR/CZK to drift lower through H2 2023 as inflation as well as the real economy moderate. CNB, however, will likely maintain monetary policy status quo despite such a downturn. If inflation were to moderate from current 11% level towards 6%-7%, then CNB’s 7.00% benchmark rate will no longer appear too low; the real interest rate will become neutral or positive. This will make CNB’s stance hawkish relative to the economic context, which will likely support the Koruna through H2 2023.
The key risk is that inflation may not moderate in the medium-term, which will once again affect CNB’s credibility. What is more, controversy has broken out between government and central bank because the latter criticises the expansionary fiscal stance for being the main culprit behind high inflation. Such developments could add volatility to the CZK again next year if inflation were to prove stubborn as we anticipate.

Source: Commerzbank Research
- GBP/JPY cheers upbeat UK data, chatters about BoJ inaction to snap four-day downtrend.
- UK Retail Sales improves to -1.0% YoY in June versus -1.5% expected, -2.1% prior.
- Disappointment from UK GfK sentiment gauge, British by-elections prod pair buyers.
- Japan inflation, yields also challenge bulls ahead of next week’s BoJ monetary policy meeting announcements.
GBP/JPY refreshes intraday high near 180.90 during the first positive day in five amid Friday’s early European session as the UK Retail Sales impressed the British Pound (GBP) buyers. Adding strength to the cross-currency pair’s upside momentum could be the dovish bias surrounding the Bank of Japan (BoJ) ahead of the next week’s monetary policy meeting.
UK Retail Sales for June improved to -1.0% YoY versus the market expectations of -1.5% and -2.1% prior. That said, the monthly print jumps to 0.7% for the said month compared to 0.2% expected and 0.1% prior (revised). Furthermore, Retail Sales ex-Fuel, also known as the Core Retail Sales, rose to -0.9% YoY versus analysts’ estimations of -1.6% and -1.9% previous readings (revised).
Earlier in the day, the UK GfK Consumer Confidence for July slumped to -30.0 from -24.0, marking the first decline since January. Also challenging the GBP/JPY buyers during the first positive day are the by-elections in Britain as the ruling Conservatives recently lost two major seats, suggesting hardships for the 2024 national elections.
On the other hand, in the latest Reuters poll conducted between July 10 and 19, more than 75% of respondents favor the BoJ’s inaction during the next week’s monetary policy meeting. In doing so, the Japanese central bank won’t even alter the Yield Curve Control (YCC) policy, signals the survey report.
That said, Japan inflation per the National Consumer Price Index (CPI), for June rose to 3.3% YoY from 3.2% versus 3.5% expected, which in turn prods the dovish bias about the BoJ and the GBP/JPY bulls. Further details unveil that the National CPI ex Fresh Food matches 3.3% YoY forecasts, improving from 3.2% prior, whereas the National CPI ex Food, Energy eases to 4.2% expected figures compared to 4.3% previous readings.
On Thursday, the Japanese government announced a downward revision of the Asian major’s Financial Year (FY) 2023-24 growth forecasts to 1.3% versus the previously expected 1.5% figures. Also, Japan Prime Minister (PM) Fumio Kishida defends the dovish concerns about the Bank of Japan (BoJ) by showing readiness to create a society where wage hikes become a norm.
Against this backdrop, the Wall Street benchmark closed in the red amid the downbeat performance of energy and technology shares, which in turn exerts downside pressure on Japan’s Nikkei 225 but the S&P500 Futures remain indecisive after reversing from the yearly high. Further, the US Treasury bond yields refreshed their weekly highs the previous day.
Having witnessed the initial market reaction for today’s scheduled top-tier data from Japan and the UK, respectively the inflation and Retail Sales, the GBP/JPY pair traders should pay attention to the bond market moves and risk catalysts for intraday directions. However, a cautious mood ahead of next week’s BoJ monetary policy meeting announcements may restrict the quote’s moves.
Technical analysis
GBP/JPY portrays a head-and-shoulders bearish chart formation with a neckline surrounding 179.90-85, a break of which will confirm the cross-currency pair’s theoretical south-run targeting 175.70. The corrective bounce, however, remains elusive unless crossing a one-month-old descending resistance line, around 181.25 by the press time.
- The UK Retail Sales came in at 0.7% MoM in June, beating estimates.
- Core Retail Sales for the UK jumped 0.8% MoM in June.
- GBP/USD regains 1.2900 on upbeat UK retail trade data.
On a monthly basis, UK Retail Sales rose 0.7% in June vs. 0.2% expected and 0.1% prior, according to the latest data published by the Office for National Statistics (ONS) on Friday. The Core Retail Sales, stripping the auto motor fuel sales, jumped 0.8% MoM vs. 0.1% expected and 0% seen in May.
The annual Retail Sales in the United Kingdom decreased 1.0% in June versus -1.5% expected and May’s 2.3% decline while the Core Retail Sales dropped 0.9% in the reported month versus -1.6% expectations and -1.9% previous.
Main points (via ONS)
Non-food stores sales volumes rose by 1.0% in June 2023, following a fall of 0.5% in May 2023; department stores and furniture retailers reported that summer sales and increased footfall helped boost volumes.
Food stores sales volumes bounced back with 0.7% growth in June 2023, following a fall of 0.4% in May 2023, with feedback from some supermarkets that the good weather and promotions helped sales.
Non-store retailing sales volumes rose by 0.2% in June 2023, following a rise of 2.4% in May 2023.
Automotive fuel stores sales volumes fell by 0.3% in June 2023, following a rise of 1.7% in May 2023.
FX implications
GBP/USD is picking up fresh bids on the upbeat UK Retail Sales data. The spot was last seen trading at 1.2894, up 0.25% on the day.
Considering advanced prints from CME Group for gold futures markets, open interest rose for the second session in a row on Thursday, this time by just 162 contracts. Volume followed suit and went up by around 35.2K contracts, keeping the ongoing choppiness unchanged.
Gold: Initial support emerges at $1945
Thursday’s marked pullback in gold prices was on the back of rising open interest and volume, opening the door to further weakness in the very near term. That said, the yellow metal is expected to meet initial support around the $1945 level per troy ounce.
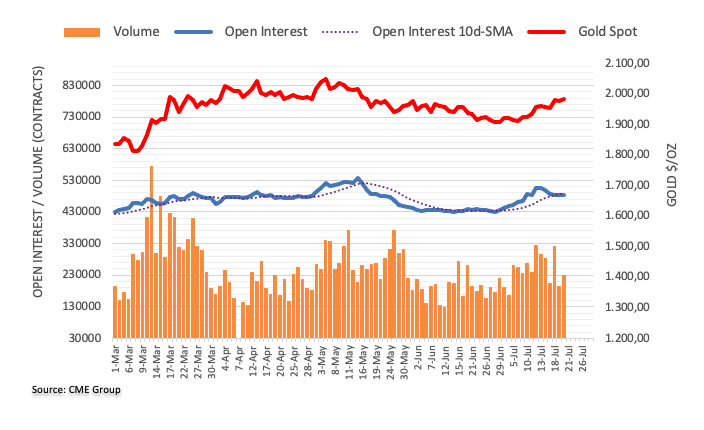
- NZD/USD extends its downside for the sixth consecutive day.
- The 100-hour EMA is on the verge of crossing below the 200-hour EMA.
- The key support zone is located at 0.6200; the immediate resistance level is seen at 0.6285.
The NZD/USD pair currently trades around 0.6220 heading into the European session on Friday. The pair is under selling pressure for the sixth consecutive day amid the strength of the US Dollar. The possibility of a resumed hawkish stance from the Federal Reserve (Fed) following the Unemployment Claims report on Thursday boosts the US Dollar across the board and acts as a headwind for NZD/USD.
Looking at the one-hour chart, the key support zone is located at 0.6200, indicating a confluence of a psychological round mark and lower limit of a downward-sloping trend channel. Any meaningful follow-through selling below the latter will see a drop accelerate to 0.6180 (Low of July 12). In case the selling pressure remains, the pair would see the next level of contention at 0.6165 (Low of July 11) en route to 0.6130 (Low of July 6).
It’s worth noting that the 100-hour Exponential Moving Average (EMA) is on the verge of crossing below the 200-hour EMA. If a decisive crossover occurs on the one-hour chart, It would validate a Bear Cross, highlighting the path of least resistance for the cross is to the downside.
On the upside, the immediate resistance level is seen at 0.6285, portraying the upper boundary of a downward-sloping trend channel. A decisive break above the mentioned level would drive the pair towards 0.6300 (a psychological round mark, High of July 20), followed by 0.6345 (High of July 18). The additional upside filter appears at 0.6400.
However, further downside appears favorable as the Relative Strength Index (RSI) stands below 50, activating the bearish momentum for the NZD/USD pair.
NZD/USD one-hour chart

Further downside in EUR/USD is expected to meet a tough contention around 1.1010, suggest Economist Lee Sue Ann and Markets Strategist Quek Ser Leang at UOB Group.
Key Quotes
24-hour view: After EUR fell to 1.1173 and rebounded, we highlighted yesterday that “the underlying tone still appears to be soft” and we held the view that “there is a chance for EUR to retest the 1.1175 level before the risk of a more sustained rebound increases.” Instead of testing 1.1175, EUR broke below this level and plunged to a low of 1.1117. The sharp selloff appears to have room to extend. However, oversold conditions suggest a sustained decline below 1.1090 is unlikely. The major support at 1.1010 is also unlikely to come under threat. Resistance is at 1.1170, followed by 1.1200.
Next 1-3 weeks: After holding a positive stance in EUR for more than a week, we highlighted yesterday that “upward momentum has eased considerably.” However, we added, “only a clear breach of 1.1160 would suggest that EUR is not strengthening further.” In NY trade, EUR not only broke below 1.1160, but it also sold off sharply and ended the day lower by 0.63% (1.1128). The 0.63% decline is the largest 1-day drop in two months. Short-term downward momentum has increased, but while EUR could weaken further, any decline is likely to face solid support at 1.1010. Another way to look at it is that any EUR weakness is likely a corrective pullback, and not a major reversal. The downward pressure will remain intact unless EUR breaks below the ‘strong resistance’ level, currently at 1.1235.
- USD/CHF edges higher during the first positive week, so far, in four despite snapping two-day uptrend.
- Overbought RSI, bearish MACD signals join short-term key resistance line to challenge pair buyers.
- 200-HMA, one-week-old horizontal region provide headwinds to Swiss Franc pair sellers.
USD/CHF treads water as it seesaws within a small trading range of around 15 pips above 0.8655 heading into Friday’s European session.
In doing so, the Swiss Franc (CHF) pair remains sidelined between the 200-Hour Moving Average (HMA) and a two-week-long downward-sloping resistance line. With this, the major currency pair braces for the first weekly gain in four, despite snapping a two-day winning streak with mild losses of late.
It’s worth noting that the overbought RSI and bearish MACD signals suggest the market favors the USD/CHF sellers. However, a clear break of the 200-HMA level of 0.8647 becomes necessary to convince the bears.
Even so, a horizontal area comprising multiple levels marked since July 13, close to 0.8630-25, can challenge the USD/CHF sellers before directing them to the multi-year low marked earlier in the week around 0.8555. During the likely fall, the 0.8600 round figure may act as an intermediate halt.
Meanwhile, an upside clearance of the falling resistance line stretched from July 06, near 0.8670 at the latest, will need validation from the weekly high of around 0.8685, as well as the 0.8700 round figure to convince USD/CHF buyers.
In a case where the USD/CHF stays firmer past 0.8700, the July 12 swing high of near 0.8795 and the 0.8800 will be on the bull’s radar.
USD/CHF: Hourly chart
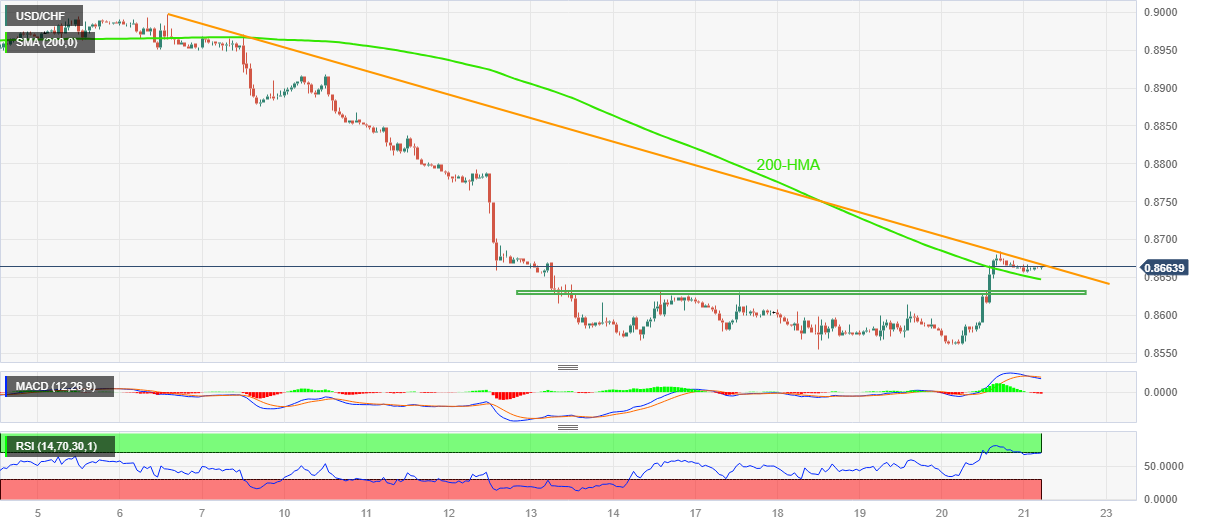
Trend: Pullback expected
FX option expiries for July 21 NY cut at 10:00 Eastern Time, via DTCC, can be found below.
- EUR/USD: EUR amounts
- 1.1100 581m
- 1.1150 525m
- 1.1200 403m
- 1.1230 388m
- 1.1300 692m
- USD/JPY: USD amounts
- 137.00 771m
- 138.60 625m
- 139.30 374m
- 140.00 609m
- 140.50 439m
- 141.50 730m
- 143.00 360m
- USD/CHF: USD amounts
- 0.8715 300m
- AUD/USD: AUD amounts
- 0.6700 862m
- USD/CAD: USD amounts
- 1.3155 1.1b
- 1.3300 732m
- EUR/GBP: EUR amounts
- 0.8600 651m
- 0.8700 391m
- EUR/GBP is oscillating around 0.8650 as investors await UK Retail Sales data for further guidance.
- The real income of UK households could grow as PPI has eased significantly.
- The ECB is expected to raise interest rates on July 27 and in September too.
The EUR/GBP pair is demonstrating back-and-forth moves around 0.8650 in the Asian session. The cross is awaiting the release of the United Kingdom Retail Sales data for June for a decisive move, which will be published at 06.00 GMT.
After loosening labor market conditions and softening inflationary pressures, UK’s Retail Sales data will provide more guidance about the interest rate decision to be announced by the Bank of England (BoE) in August.
As per the estimates, monthly Retail Sales data expanded by 0.2% in June vs. 0.3% in May. Annual Retail Sales data is expected to contract by 1.5% against the former release of -2.1%. Monthly Retail Sales excluding fuel prices is seen unchanged at 0.1%. And, annualized consumer spending data excluding fuel is seen contracting marginally to 1.6% from the former release of -1.7%.
Contracting consumer spending indicates the burden of high inflation and higher interest rates by the Bank of England (BoE). UK households have already postponed the purchase of big-ticket items to address their necessities. Meanwhile, the real income of households could grow as Producer Price Index (PPI) has eased significantly.
Meanwhile, the Euro is facing severe pressure despite investors hoping that the European Central Bank (ECB) will raise interest rates in September too. According to a Reuters poll from economists, the ECB will raise interest rates by 25 basis points on July 27, and a slight majority of whom were now also expecting another hike in September.
Investors should note that ECB President Christine Lagarde remained doors open for more interest rate hikes as core inflation in Eurozone is critically persistent.
- Gold Price seesaws around weekly top, braces for the third consecutive weekly gains.
- Overall mixed sentiment joins China’s efforts to nurture economic optimism to propel XAU/USD price.
- Risk catalysts will be the key to track amid a light calendar, cautious mood ahead of Fed monetary policy meeting.
- Gold Price run-up past $1,970 confluence appears bumpier than the south-run.
Gold Price (XAU/USD) steadies after refreshing the highest levels in two months as it braces for the third consecutive weekly gain ahead of the key central bank announcements from the US, Europe and Japan. Apart from the pre-announcement anxiety, a light calendar and mixed catalysts, as well as the market’s consolidation of the recent moves, also prod the XAU/USD traders.
That said, upbeat US employment clues joined disappointment from the US energy and technology shares to propel US Treasury bond yields, as well as the US Dollar, the previous day. Adding to this, pessimism surrounding China’s economic growth also challenged the Gold buyers on Thursday. However, a slew of measures to defend the world’s second-largest economy by the policymakers joined the US Dollar’s positioning for the next week’s Fed meeting to trigger a corrective bounce in the XAU/USD price while snapping a two-day losing streak.
It’s worth noting that apart from the US employment clues, the majority of the US statistics haven’t been impressive to support the Fed in announcing more rate hikes past July in the next week, which in turn pushed back the market bears and keep the Gold buyers hopeful. However, it all depends upon how well the US central bank can defend the hawkish bias and the US Dollar.
Also read: Gold Price Forecast: Will XAU/USD attempt another run toward $2,000?
Gold Price: Key levels to watch
As per our Technical Confluence indicator, Gold Price seesaws around the $1,970 support-turned-resistance confluence comprising the Pivot Point one-month R1, Fibonacci 23.6% on one-day and the middle band of the Bollinger on the four-hour (4H) play.
In a case where the Gold Price successfully crosses the $1,970 hurdle, the previous monthly high of around $1,985 will gain the buyer’s attention.
Following that, the upper band of the Bollinger on 4H and Pivot Point one-week R2 can challenge the XAU/USD bulls near $1,989 and $1,995 respectively before directing them to the $2,000 round figure.
On the flip side, a convergence of the previous daily low and weekly high, as well as the middle band of the Bollinger on the hourly chart, restricts the immediate downside of the Gold Price near $1,965.
In a case where the XAU/USD slides beneath the $1,965 support, the Fibonacci 23.6% on one-week and Pivot Point one-day S2, around $1,953, will precede the 50-DMA support of around $1,950 to act as the final defenses of the Gold buyers.
Overall, the Gold Price remains on the front foot unless breaking $1,950 but the road towards the north appears long.
Here is how it looks on the tool

About Technical Confluences Detector
The TCD (Technical Confluences Detector) is a tool to locate and point out those price levels where there is a congestion of indicators, moving averages, Fibonacci levels, Pivot Points, etc. If you are a short-term trader, you will find entry points for counter-trend strategies and hunt a few points at a time. If you are a medium-to-long-term trader, this tool will allow you to know in advance the price levels where a medium-to-long-term trend may stop and rest, where to unwind positions, or where to increase your position size
- AUD/USD reverses modest intraday losses and draws support from subdued USD price action.
- Hopes for more Chinese stimulus and bets for additional RBA rate hikes also lend some support.
- Traders might refrain from placing directional bets ahead of the FOMC decision next Wednesday.
The AUD/USD pair extends the previous day's sharp retracement slide from the vicinity of the 0.6850 area and continues losing ground through the Asian session on Friday. Spot prices, however, manage to recover a few pips from the daily low and currently trade with a slight negative bias, around the 0.6770-0.6775 region, down less than 0.10% for the day.
The overnight slump in the US technology stocks and a generally softer tone around the Asian equity markets turn out to be a key factor weighing on the risk-sensitive Australian Dollar (AUD). Concerns over slowing growth in China, along with the worsening US-China relations and geopolitical risks, temper investors' appetite for riskier assets. However, hopes that China will roll out more stimulus measures to buoy a slowing economic recovery, along with rising bets for more interest rate hikes by the Reserve Bank of Australia (RBA), help limit losses for the AUD/USD pair.
China’s top economic planner - the National Development and Reform Commission (NDRC) - unveiled new measures on Friday, aimed at promoting local, particularly in the automobile and consumer electronics sectors. Moreover, the government vowed to shore up local consumption to support the economic recovery, especially after data this week showed that growth in China slowed significantly during the second quarter. Meanwhile, the upbeat jobs report released from Australia on Thursday puts pressure on the RBA to act further.
Apart from this, subdued US Dollar (USD) price action assists the AUD/USD pair to find some support ahead of mid-0.6700s, or the weekly low touched on Wednesday. In fact, the USD Index (DXY), which tracks the Greenback against a basket of currencies, is seen consolidating the overnight gains to over a one-week high and for now, seems to have stalled the recent recovery from its lowest level since April 2022 set earlier this week. The downside for the USD, however, seems limited in the wake of the better-than-expected US macro data released on Thursday.
The US Labor Department reported that Initial Jobless Claims dropped to a seasonally adjusted 228K during the week ended July 15. The data continues to flash strength in the US labour market and reaffirms market bets for a 25 bps lift-off at the upcoming FOMC meeting on July 25-26. Furthermore, investors remain sceptic about whether the Fed will commit to a more dovish policy stance or stick to its forecast for a 50 bps rate hike this year. This led to the overnight solid bounce in the US Treasury bond yields and lends some support to the Greenback.
In the absence of any relevant market-moving economic data from the US, the aforementioned fundamental backdrop warrants some caution before placing aggressive directional bets around the AUD/USD pair. Traders might also prefer to move to the sidelines and wait for the outcome of the highly-anticipated two-day FOMC policy meeting, scheduled to be announced next Wednesday. Nevertheless, spot prices seem poised to end in the red for the first time in the previous three weeks and remain at the mercy of the USD price dynamics.
Technical levels to watch
- Asian stock markets trade on mixed notes.
- The Bank of Japan's (BoJ) is expected to maintain a dovish policy stance in its next meeting.
- Market players will monitor the headlines surrounding Sino-US relations.
Asian stock markets trade mixed on Friday. The KOSPI Index posted a modest loss of 0.05%, while the NIFTY 50 fell 0.77%.
In Japan, the NIKKEI dipped 0.27%. The June Japanese National Consumer Price Index (CPI) rose from 3.2% to 3.3% YoY, versus 3.5% expected. Investors are now focusing on the Bank of Japan's (BoJ) interest rate decision scheduled for next week. Japanese policymakers are expected to maintain a dovish policy stance in order to keep inflation steady at approximately 2%.
Additionally, Japan’s surprise Trade Surplus for the first time since July 2021. The Finance Ministry said on Thursday that the Japanese trade surplus came to ¥43 billion. Market consensus had forecast a ¥46.7 billion deficit. The value of exports rose 1.5%, led by shipments of automobiles and construction equipment. Imports fell 12.9% due to substantial declines in the value of fuel shipments into Japan.
Apart from the softer growth number in China, the People's Bank of China announced on Thursday that it maintained benchmark lending rates unchanged. The one-year and five-year Loan Prime Rates (LPR) were kept unchanged at 3.55% and 4.20%, respectively.
Chinese President Xi Jinping have a meeting with Henry Kissinger in China's capital on Thursday, amid efforts by Beijing and Washington to mend frayed ties. Market players will keep an eye on the development between the world’s two largest economies.
Meanwhile, Hong Kong’s Hang Seng index futures trade slightly higher than 19,000, up 0.72%. Meanwhile, the Shanghai SE Composite Index is up 0.04%.
In the absence of any top-tier data releases on Friday. Market participants await announcements from next week's Federal Open Market Committee's (FOMC) monetary policy meeting. Market participants will focus on the Bank of Japan (BoJ) interest rate decision, European Central Bank's (ECB) decision, and the Federal Reserve's (Fed) decision next week. Also, the headlines surrounding Sino-US relations will be in focus.
- USD/JPY edges higher around the weekly top after four-day uptrend.
- Japan National CPI improves in June but defense of BoJ policy keeps Yen pair buyers hopeful.
- Yields struggle to defend previous day’s run-up amid light calendar, pre-Fed anxiety.
- Next week’s monetary policy announcements will be crucial for clear directions, Reuters poll suggests no YCC tweak by BoJ.
USD/JPY clings to mild gains around 140.15-20 as it seesaws near the weekly top while rising for the fourth consecutive day ahead of Friday’s European session. In doing so, the Yen pair braces for the first weekly gain in three while ignoring upbeat Japan inflation and softer yields amid dovish concerns about the Bank of Japan (BoJ).
As per the latest Reuters poll, conducted between July 10 and 19, more than 75% of respondents favor the BoJ’s inaction during the next week’s monetary policy meeting. In doing so, the Japanese central bank won’t even alter the Yield Curve Control (YCC) policy, signals the survey report.
Earlier in the day, Japan inflation per the National Consumer Price Index (CPI), for June rose to 3.3% YoY from 3.2% versus 3.5% expected. Further details unveil that the National CPI ex Fresh Food matches 3.3% YoY forecasts, improving from 3.2% prior, whereas the National CPI ex Food, Energy eases to 4.2% expected figures compared to 4.3% previous readings.
On Thursday, the Japanese government announced a downward revision of the Asian major’s Financial Year (FY) 2023-24 growth forecasts to 1.3% versus the previously expected 1.5% figures. Also, Japan Prime Minister (PM) Fumio Kishida defends the dovish concerns about the Bank of Japan (BoJ) by showing readiness to create a society where wage hikes become a norm.
That said, the US Dollar Index (DXY) jumped the most in a month to refresh the weekly top the previous day before recently retreating to 100.80. In doing so, the greenback’s gauge versus the six major currencies portrays the market’s positioning for the next week’s Federal Open Market Committee (FOMC) monetary policy meeting announcements after cheering mostly upbeat US job clues. That said, US Initial Jobless Claims dropped to 228K for the week ended on July 14, the lowest since May, versus 237K prior and 242K market forecasts.
On a different page, the Wall Street benchmark closed in the red amid the downbeat performance of energy and technology shares, which in turn exerts downside pressure on Japan’s Nikkei 225 but the S&P500 Futures remain indecisive after reversing from the yearly high. Further, the US Treasury bond yields refreshed their weekly highs the previous day and propelled the US Dollar before the latest retreat.
Looking ahead, a light calendar may restrict immediate USD/JPY moves before the next week’s monetary policy meetings of the Fed and the BoJ. However, the risk catalysts may entertain the traders.
Technical analysis
Although the 200-DMA puts a floor under the USD/JPY prices near 136.90, the Yen pair’s immediate upside appears guarded by the 50-DMA hurdle of 140.60.
- EUR/USD braces for the first weekly loss in four, dribbles around the weekly bottom after three-day losing streak.
- 10-EMA prods Euro sellers amid upbeat RSI (14) line but impending bear cross on MACD challenge buyers.
- Previous resistance line from mid-May, 50-EMA act as additional downside filters.
- Fed vs. ECB play will be crucial for Euro traders to watch as policy pivot talks check respective currency buyers.
EUR/USD licks its wounds during the first negative week in four, clings to mild gains near 1.1130-40 amid early Friday morning in Europe, as market players struggle for clear directions ahead of next week’s monetary policy meetings of the European Central Bank and Federal Reserve (Fed).
Apart from the pre-event caution, the Euro pair also justifies a lack of major data/events, as well as the mixed concerns about the respective central banks while confusing the traders.
Also read: EUR/USD licks its wounds above 1.1100 after refreshing weekly low on strong US Dollar
Even so, the 10-day Exponential Moving Average (EMA) restricts the immediate downside of the EUR/USD pair near the 1.1130 level, especially amid the firmer RSI (14) line, not overbought.
That said, the previous support line from early February, now immediate resistance around 1.1140, guards the immediate upside of the Euro pair.
Following that, multiple levels near 1.1200 and 1.1230 can prod the EUR/USD bulls before directing it to the 1.1280 resistance area comprising technical swings marked during late 2021 and early 2022.
On the flip side, a daily closing beneath the 10-EMA level of 1.1130 isn’t an open invitation to the EUR/USD bears as the nine-week-old resistance-turned-support line, near 1.1100 at the latest, challenges the pair’s further downside.
In a case where the Euro sellers keep the reins past 1.1100, the 50-EMA level of around 1.0960 will act as the last defense of the bulls before directing the price to the monthly low of 1.0833.
EUR/USD: Daily chart

Trend: Limited upside expected
- USD/CAD lacks any firm intraday direction and oscillates in a narrow trading band on Friday.
- An uptick in Oil prices underpins the Loonie and caps the upside amid subdued USD demand.
- Canadian Retail Sales eyed for some impetus, though the focus remains on the FOMC next week.
The USD/CAD pair struggles to capitalize on the previous day's late rebound from the 1.3120-1.3115 region, or the weekly low and oscillates in a narrow band through the Asian session on Friday. Spot prices currently trade around the 1.3165-1.3170 area, nearly unchanged for the day.
Crude Oil prices gain some positive traction for the second straight day, which underpins the commodity-linked Loonie and turns out to be a key factor acting as a headwind for the USD/CAD pair. Hopes that new stimulus measures from China will boost fuel demand in the world's largest oil importer, along with the prospect of tighter global supplies, continue to act as a tailwind for the black liquid.
Apart from this, subdued US Dollar (USD) price action further contributes to capping the upside for the USD/CAD pair. In fact, the USD Index (DXY), which tracks the Greenback against a basket of currencies, consolidates the overnight strong gains to over a one-week high and for now, seems to have stalled the recent goodish recovery move from its lowest level since April 2022 touched earlier this week.
The downside for the USD, however, seems limited in the wake of the upbeat US macro data released on Thursday, which continues to flash strength in the US labour market and supports prospects for further tightening by the Federal Reserve (Fed). Furthermore, investors remain sceptic about whether the Fed will commit to a more dovish policy stance or stick to its forecast for a 50 bps rate hike this year.
This, in turn, might hold back traders from placing aggressive directional bets ahead of the crucial FOMC monetary policy decision, scheduled to be announced at the end of a two-day meeting on Wednesday. In the meantime, traders on Friday will take cues from the release of the monthly Canadian Retail Sales data, which might provide some impetus to the USD/CAD pair later during the early North American session.
Nevertheless, spot prices seem poised to end in the red for the second straight week and remain well within the striking distance of the lowest level since September 2022, just below the 1.3100 round-figure mark touched last week.
Technical levels to watch
- USD/INR meets with a fresh supply near the 200-day SMA barrier on Friday.
- The technical setup favours bears and supports prospects for further losses.
- A move beyond the symmetrical triangle is needed to negate the negative bias.
The USD/INR pair struggles to capitalize on the overnight bounce from the 81.90 area, or over a two-week low and attracts fresh selling near a technically significant 200-day Simple Moving Average (SMA) on Friday. Spot prices slide back closer to the 82.00 mark during the Asian session and currently trade near the lower end of a familiar range held over the past week or so.
From a technical perspective, the recent repeated failures near the very important 200-day SMA favour bearish traders and support prospects for some meaningful downside. Moreover, oscillators on the daily chart have again started gaining negative traction and
suggest that the path of least resistance for the USD/INR pair is to the downside. That said, it will still be prudent to wait for a sustained breakdown through the lower end of a symmetrical triangle, extending from October 2022, before positioning for any further losses.
Some follow-through selling below the monthly low, around the 81.75 region, will reaffirm the bearish outlook and drag the USD/INR pair towards the next relevant support near the 81.50 zone. Spot prices could eventually drop to test sub-81.00 levels or the YTD low touched in January.
On the flip side, the 82.15-82.20 area, or the 200-day SMA, might continue to act as an immediate strong barrier. A sustained move beyond has the potential to lift the USD/INR pair back to the triangle resistance, currently around the 82.80 area, above which bulls could make a fresh attempt to conquer the 83.00 round figure. The said handle has been acting as a strong barrier since the beginning of this year.
Hence, a convincing breakthrough will be seen as a fresh trigger for bullish traders and set the stage for an extension of the USD/INR pair's well-established uptrend witnessed since August 2022. Spot prices might then surpass the all-time peak, around the 83.40-83.45 region touched in October 2022, and aim to reclaim the 84.00 mark.
USD/INR daily chart
-638255069854148076.png)
Key levels to watch
- USD/MXN retreats from weekly top marked the previous day, mildly offered of late.
- Upside break of one-week-old falling trend line join bullish MACD signals to prod pair sellers.
- Mexican Peso remains firmer unless defying 10-week-old trend channel by breaking 17.22 mark.
USD/MXN bulls take a breather around 16.88 amid early Friday morning in Europe, after rising the most in two weeks. In doing so, the Mexican Peso (MXN) pair cheered the upside beak of a one-week-old descending trend line, as well as the bullish MACD signals.
However, a convergence of the previous support line from mid-June and the 100-bar Exponential Moving Average (EMA), around 16.95 at the latest, restricts the immediate recovery of the USD/MXN pair.
Above all, USD/MXN buyers remain off the table unless posting a successful upside break of the 10-week-old bearish channel’s top line, close to 17.22 at the latest.
Even so, the monthly high of 17.40 will act as the last defense of the USD/MXN bears.
On the flip side, the previous resistance line from July 13, close to 16.80, limits immediate USD/MXN downside during a fresh pullback.
Following that, a one-week-old horizontal support zone and bottom line of the stated channel, respectively near 16.70 and 16.65, will be crucial to watch for clear directions.
Should the Mexican Peso fail to recover from 16.65, the odds of witnessing a slump toward the October 2015 low of 16.32 can’t be ruled out.
USD/MXN: Four-hour chart
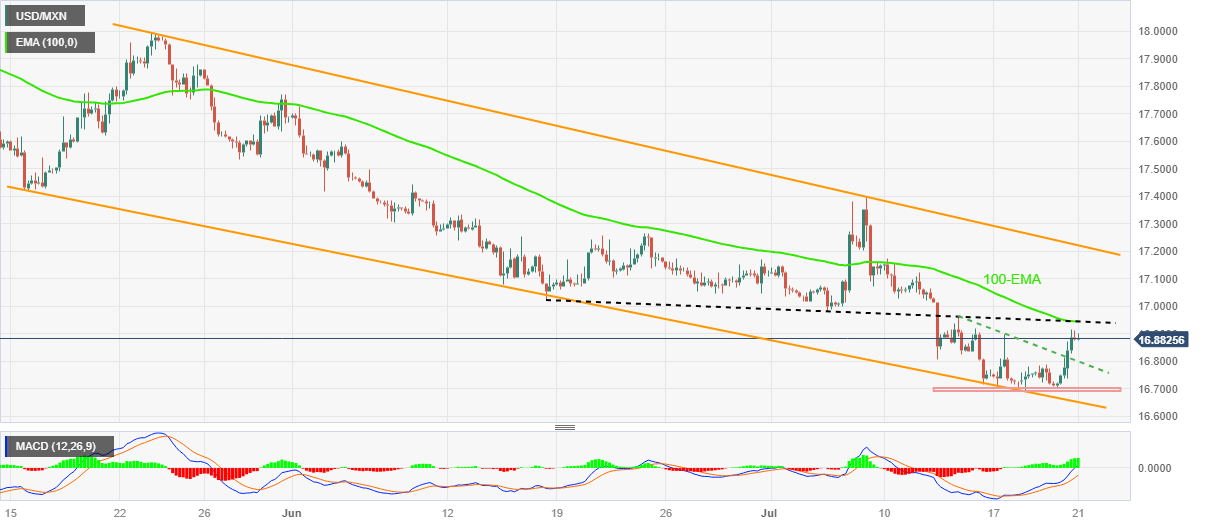
Trend: Limited upside expected
- GBP/USD ticks higher on Friday and recovers a part of the overnight slide to a one-week low.
- Any subsequent move up is more likely to confront stiff resistance near the 1.2930-35 region.
- Bears might need to wait for a sustained break below the 100-period SMA on the 4-hour chart.
The GBP/USD pair edges higher during the Asian session on Friday and moves away from a one-and-half-week low, around the 1.2840-1.2835 region touched the previous day. Spot prices, however, lack any follow-through buying or bullish conviction and currently trade near the 1.2880 region, up just over 0.10% for the day.
The US Dollar (USD) is seen consolidating the overnight strong move up to over a one-week high and turning out to be a key factor lending some support to the GBP/USD pair. The downside for the USD, however, seems limited in the wake of the upbeat US macro data released on Thursday, which continues to flash strength in the US labour market and supports prospects for further policy tightening by the Federal Reserve (Fed). Furthermore, investors remain sceptic about whether the Fed will commit to a more dovish policy stance or stick to its forecast for a 50 bps rate hike by the end of this year.
Hence, the focus will remain glued to the highly-anticipated FOMC policy decision, scheduled to be announced next Wednesday. In the meantime, a softer risk tone could further lend support to the safe-haven Greenback. The British Pound (GBP), on the other hand, might continue with its relative underperformance on the back of softer UK consumer inflation figures released this week, which ease pressure on the Bank of England (BoE) to hike interest rates more aggressively. This, in turn, might hold back traders from positioning for any meaningful appreciating move for the GBP/USD pair.
From a technical perspective, spot prices show some resilience below the 100-period Simple Moving Average (SMA) on the 4-hour chart and manage to move back above the 50% Fibonacci retracement level of the June-July rally. The GBP/USD pair, for now, seems to have stalled the recent pullback from the highest level since April 2022, around the 1.3140 area touched last week. Any subsequent move up, however, is likely to find stiff resistance near the 1.2900 round-figure mark and runs the risk of fizzling out rather quickly near the 38.2% Fibo. level, around the 1.2930-1.2935 region.
Given that oscillators on the daily chart are still holding in the positive territory, a sustained strength beyond the latter will suggest that the corrective decline has run its course and pave the way for additional gains. The GBP/USD pair might then accelerate the momentum towards reclaiming the 1.3000 psychological mark, which coincides with the 23.6% Fibo. level and should act as a pivotal point. Hence, some follow-through buying will shift the near-term bias back in favour of bullish traders.
On the flip side, the 100-period SMA on the 4-hour chart, currently pegged around the 1.2855-1.2850 region, now seems to protect the immediate downside. A convincing break below might expose the 61.8% Fibo. level, around the 1.2800 mark, below which the GBP/USD pair could accelerate the fall towards the next relevant support near the 1.2750-1.2745 zone en route to the 1.2700 round figure and the 1.2685-1.2680 region.
GBP/USD 4-hour chart
-638255048308750186.png)
Key levels to watch
- USD/CNH stays pressured around weekly low, down for the second consecutive day.
- Chinese authorities, PBoC roll-up sleeves to defy fears of slowing economic growth.
- US Dollar’s retreat ahead of Fed, light calendar also exert downside pressure on Yuan pair.
- Risk catalysts are the key to determining near-term directions ahead of next week’s FOMC.
USD/CNH justifies the Chinese policymakers’ efforts to defend the Yuan, as well as push back economic fears, by refreshing the weekly low near 7.1650 during early Friday. In doing so, the offshore Chinese Yuan (CNH) pair also benefits from the US Dollar’s retreat even as the quote prints the 7.1710 mark by the press time.
Be it the People’s Bank of China (PBoC) or the state planner National Development and Reform Commission (NDRC), not to forget China Human Resource Ministry and Forex Regulator, all of them tried to keep the Yuan on the front foot in their latest attempts.
PBoC defended the Yuan by disappointing markets by setting the USD/CNY fix more than 400 pips down versus major forecasts. With this, the Chinese central bank acts boldly for the second consecutive day to defend the onshore Yuan (CNY).
Elsewhere, the state planner NDRC announced multiple measures to bolster automobile consumption while the Human Resource Ministry said that the nation created 6.78 million new urban jobs in the first half of 2023, achieving 57% of the target. On the same line, China's FX regulator also praised the nation’s bond market and anticipated more stable and sustainable investment in the bond market.
Previously, fears of witnessing downbeat China growth join the People’s Bank of China’s (PBoC) efforts to defend the world’s second-biggest economy to prod the USD/CNH bears, together with the firmer US Dollar. Additionally challenging the pair sellers were the PBoC moves as it kept the benchmark Loan Prime Rates (LPRs) unchanged during Thursday’s Interest Rate Decision but took measures to lure global investment.
On the other hand, the US Dollar Index (DXY) jumped the most in a month to refresh the weekly top the previous day before recently retreating to 100.80. In doing so, the greenback’s gauge versus the six major currencies portrays the market’s positioning for the next week’s Federal Open Market Committee (FOMC) monetary policy meeting announcements after cheering mostly upbeat US job clues. That said, US Initial Jobless Claims dropped to 228K for the week ended on July 14, the lowest since May, versus 237K prior and 242K market forecasts but the Continuing Jobless Claims rose to 1.754M for the said period compared to market forecasts of reprinting 1.729M figures. Additionally, the Philadelphia Fed Manufacturing Survey gauge improved to -13.5 for July from -13.7 prior, versus -10 expected while Existing Home Sales slumped -3.3% MoM in June compared to 0.2% prior gain.
It should be noted that the US Building Permits and Housing Stars also reported downbeat figures for June whereas the Retail Sales growth eased despite posting upbeat details of Retail Sales Control Group for June. Despite the recently upbeat US employment clues, the US statistics haven’t been impressive to support the Fed in announcing more rate hikes past July in the next week, which in turn can challenge the US Dollar bulls.
Amid these plays, the Wall Street benchmark closed in the red but the S&P500 Futures remain indecisive after reversing from the yearly high. Further, the US Treasury bond yields refreshed their weekly highs the previous day and propelled the US Dollar before the latest retreat.
Moving on, a light calendar requires the USD/CNH pair traders to observe the risk catalysts for intraday directions.
Technical analysis
Unless providing a daily closing beneath a three-month-old rising support line, close to 7.1680 at the latest, the USD/CNH remains on the bull’s radar.
- USD/CHF consolidates gains above the 0.8660 mark, down 0.05% on the day.
- Market participants are repricing another Fed rate increase after the July meeting.
- The Swiss Trade Balance increased by 4,823 million from 5,442 million previously.
- The key event will be the Federal Open Market Committee's (FOMC) monetary policy meeting next week.
The USD/CHF pair consolidates its recent gains above the 0.8660 mark in the Asian session. The pair reversed from the 0.8560 mark on Thursday following the US Unemployment Claims data and the possibility of another Fed rate increase after the July meeting,
The US Department of Labour (DOL) showed on Thursday that weekly Initial Jobless claims totaled 228,000 in the week ending July 15, against the expectation of 242,000 and lower than 237,000 prior. The figure showed the lowest reading since mid-May. Meanwhile, the Philadelphia Federal Reserve Manufacturing Survey came in at -13, versus the consensus of -10. While Existing sales from June also showed a contraction of 3.3% MoM in June against a 0.2% prior gain,
The US Dollar Index (DXY), which measures the Greenback’s value versus six currencies, has gained momentum after the data and bounced off the 100.00 area. This, in turn, acts as a tailwind for the USD/CHF pair.
In addition, market participants are repricing another Fed rate increase after the July meeting, causing the Greenback to rebound. According to the CME FedWatch Tool, the odds for the November meeting climbed from 19.8% a week ago to 32.2%, showing traders are changing their views on Fed monetary policy.
On the other hand, the Swiss Trade Balance increased by 4,823 million from 5,442 million previously and was lower than expected by 5,442 million. Exports jumped to 24,917M from 23,879M in May, while imports rose to 20,093M from 18,438 M.
Against this backdrop, the cautious mood in the market surrounding the US-China relationship could benefit the safe-haven Swiss Franc. The renewed trade war tension might cap the upside for the US Dollar and act as a headwind for USD/CHF.
In the absence of any top-tier data releases on Friday. Market participants await next week's Federal Open Market Committee's (FOMC) monetary policy meeting announcements. This key event could significantly impact the US Dollar's dynamic and give the USD/CHF pair a clear direction.
| Raw materials | Closed | Change, % |
|---|---|---|
| Silver | 24.759 | -1.47 |
| Gold | 1969.47 | -0.43 |
| Palladium | 1279.9 | -1.98 |
- Market sentiment dwindles amid lack of major data/events, contrasting details.
- US data, slump in tech shares and firmer yields provide tailwind to riskier assets.
- PBoC’s defense of Yuan, upbeat Japan inflation fail to entertain markets amid China growth fears.
- S&P500 Futures stabilize after reversing from 16-month high, US Treasury bond yields fade late upside strength.
Most markets stabilize on early Friday, after witnessing a volatile Thursday, as traders seek fresh clues while preparing for the bumper week comprising top-tier central bank events during late July. Also challenging the momentum traders are the mixed headlines surrounding the US and China, as well as a light calendar.
Amid these plays, the S&P500 Futures remains sidelined after reversing from the highest levels since late March 2022, marked on Wednesday, up 0.05% on a day near 4,568 at the latest. That said, the US 10-year and two-year Treasury bond yields retreat to 3.84% and 4.82% after refreshing the weekly top with a stellar run-up the previous day.
It’s worth noting that the US Dollar Index (DXY) eases to around 100.75 after rising the most in a month the previous day whereas stocks in the Asia-Pacific zone edge lower. Furthermore, prices of Gold and WTI crude oil remain firmer around $1,972 and $76.00 amid cautious optimism and the US Dollar’s retreat.
That said, Wall Street witnessed a heavy sell-off in energy and technology shares after the top-tier companies reported downbeat updates. Also, positive surprises from the US employment clues underpinned the Treasury bond yields and triggered the first negative daily close of the S&P500 in four days.
Talking about the US data, the Initial Jobless Claims dropped to 228K for the week ended on July 14, the lowest since May, versus 237K prior and 242K market forecasts but the Continuing Jobless Claims rose to 1.754M for the said period compared to market forecasts of reprinting 1.729M figures. Additionally, the Philadelphia Fed Manufacturing Survey gauge improved to -13.5 for July from -13.7 prior, versus -10 expected while Existing Home Sales slumped -3.3% MoM in June compared to 0.2% prior gain.
It should be observed that US Building Permits and Housing Stars also reported downbeat figures for June whereas the Retail Sales growth eased despite posting upbeat details of Retail Sales Control Group for June. Despite the recently upbeat US employment clues, the US statistics haven’t been impressive to support the Fed in announcing more rate hikes past July in the next week, which in turn pushed back the market bears.
Elsewhere, fears of witnessing downbeat China growth weigh on the sentiment while the People’s Bank of China’s (PBoC) efforts to defend the world’s second-biggest economy prod the bears. On the same line, Bloomberg came out with news suggesting that Chinese policymakers are up for a step to favor the mortgage easing to spur homebuying in the major.
Also read: China’s NDRC defends automobile sector, Human Resource Ministry lauds 57% achievement of job target
Looking ahead, a light calendar can restrict the Oil price upside ahead of the next week’s Federal Open Market Committee (FOMC) monetary policy meeting announcements.
Also read: Forex Today: US Dollar accelerates boosted by US yields
- Gold price regins positive traction on Friday, though lacks strong follow-through buying.
- A softer risk tone, along with subdued US Dollar demand, lend support to the XAU/USD.
- Bulls seem reluctant to place aggressive bets ahead of next week's central bank event risks.
Gold price attracts some dip-buying during the Asian session on Friday and reverses a part of the previous day's retracement slide from the $1,987-$1,988 region, or over a two-month peak. The XAU/USD currently trades just below the $1,975 level, up over 0.15% for the day, though the fundamental backdrop warrants some caution before positioning for any further appreciating move.
Reviving safe-haven demand benefit Gold price
A generally softer tone around the equity markets, along with concerns over slowing economic growth in China, the worsening US-China trade ties and geopolitical risks, continue to lend some support to the safe-haven precious metal. Apart from this, the subdued US Dollar (USD) price action turns out to be another factor benefitting the Gold price. In fact, the USD Index (USD), which tracks the Greenback against a basket of currencies, is seen consolidating the overnight gains to over a one-week high as traders seem uncertain about the Federal Reserve's (Fed) future rate-hike path.
Uncertainty over Fed's rate-hike path caps XAU/USD
It is worth mentioning that the markets have been pricing out the possibility of any further interest rate hikes after the anticipated 25 basis points (bps) lift-off at the upcoming Federal Open Market Committee (FOMC) meeting on July 25-26. That said, the upbeat Initial Jobless Claims data released from the United States (US) on Thursday pointed to a still-tight labour market and supports prospects for further policy tightening by the Fed. This further raises doubts if the Fed will commit to a more dovish policy stance or stick to its forecast for a 50 bps rate hike by the end of this year.
Focus remains on next week's key central bank meetings
Hence, the focus will remain glued to the highly-anticipated FOMC policy decision, due to be announced next Wednesday. This will be followed by the European Central Bank (ECB) meeting on Thursday and the latest monetary policy update by the Bank of Japan (BoJ) on Friday. Heading into the key central bank event risk, traders might refrain from placing aggressive directional bets and prefer to wait on the sidelines. This could lead to subdued price action around the Gold price in the absence of any relevant market-moving economic data from the US on Friday.
Gold price is poised to register gains for the third straight week
Nevertheless, the XAU/USD remains on track to end in the green for the third successive week and the recent breakout through a cluster of resistance favours bullish traders. Hence, any meaningful corrective decline might still be seen as a buying opportunity and is more likely to remain limited, at least for the time being.
Gold price technical outlook
From a technical perspective, any subsequent move up now seems to confront some resistance near the $1,980 area ahead of the overnight swing high, around the $1,987-$1,988 region. Some follow-through buying has the potential to lift the Gold price beyond the $2,000 psychological mark, towards testing the next relevant hurdle near the $2,010-$2,012 supply zone.
On the flip side, the $1,965 area (overnight swing low), which is followed by the 100-day Simple Moving Average (SMA), currently pegged around the $1,960 region, should protect the immediate downside. Failure to defend the said support levels will expose the weekly low, around the $1,946-$1,945 zone, below which the Gold price could accelerate the fall towards the $1,934 horizontal support. Any subsequent fall, however, is more likely to attract fresh buyers and remain limited near the $1,926-$1,925 region.
Key levels to watch
Early Friday morning, Authorities in China appear to have rolled up their sleeves as the state planner National Development and Reform Commission (NDRC), People’s Bank of China (PBoC) and the Human Resource Ministry all try to tame market fears about the dragon nation.
That said, the state planner NDRC announced multiple measures to bolster automobile consumption.
Among them, the NDRC’s push for 'economical and practical car models' via coordinated efforts among the local authorities gained major attention. That said, measures to optimize purchase restriction policies and an increase in annual car purchase quotas were also important measures to watch.
Elsewhere, the PBoC defied the market’s expectations of witnessing a heavy jump in the Chinese Yuan (CNY) by fixing the USD/CNY rate more than 400 pips below the forecasts to 7.1456, acting too defensive for the domestic currency for the second consecutive day.
Further, China’s Human Resource Ministry said that the nation created 6.78 million new urban jobs in the first half of 2023, achieving 57% of the target.
Additionally, China Forex Regulator also crossed wires, via Reuters, while showing readiness to prevent external risks by saying that the savings ratio is at a relatively high level and helps the current account in maintaining a reasonable surplus. China's FX regulation also cited attractiveness of the nation's bond market and anticipated more stable and sustainable investment in the bond market.
Market reaction
Despite multiple efforts to renew the market’s optimism, the risk-barometer AUD/USD pair remains pressured near 0.6775 by the press time.
Also read: AUD/USD Price Analysis: Bears approach 0.6730 confluence level on breaking nearby support
- AUD/USD slides beneath 50-EMA, fortnight-old support line to lure sellers.
- Downbeat oscillators, trend line break direct Aussie bears toward convergence of 200-EMA, 38.2% Fibonacci retracement.
- Five-week-long horizontal region, double tops around 0.6900 act as additional upside filters.
AUD/USD prints mild losses around 0.6775-70 as it reverses the previous day’s corrective bounce amid Friday’s Asian session.
The Aussie pair’s latest weakness could be linked to the downside break of the 50-bar Exponential Moving Average (EMA) and a two-week-long rising support line. Adding strength to the downside bias is the market’s cautious mood, as well as bearish MACD signals and a steady RSI (14) line.
With this, the AUD/USD bears appear well set to target the 0.6730 support confluence comprising the 200-EMA and 38.2% Fibonacci retracement of its May 31 to June 16 upside.
However, the quote’s downside past 0.6730 has multiple supports to conquer before convincing the bears. Among them, an upward-sloping trend line from June 05, near 0.6610 at the latest, gains major attention.
On the flip side, the support-turned-resistance and the 50-EMA, around 0.6780 by the press time, restrict the immediate upside of the AUD/USD pair.
Following that, a horizontal area comprising multiple levels marked since mid-June, near 0.6830-35, will be an important hurdle to watch for the bulls.
Above all, the double tops around 0.6900 appears a tough nut to crack for the Aussie pair buyers.
AUD/USD: Four-hour chart
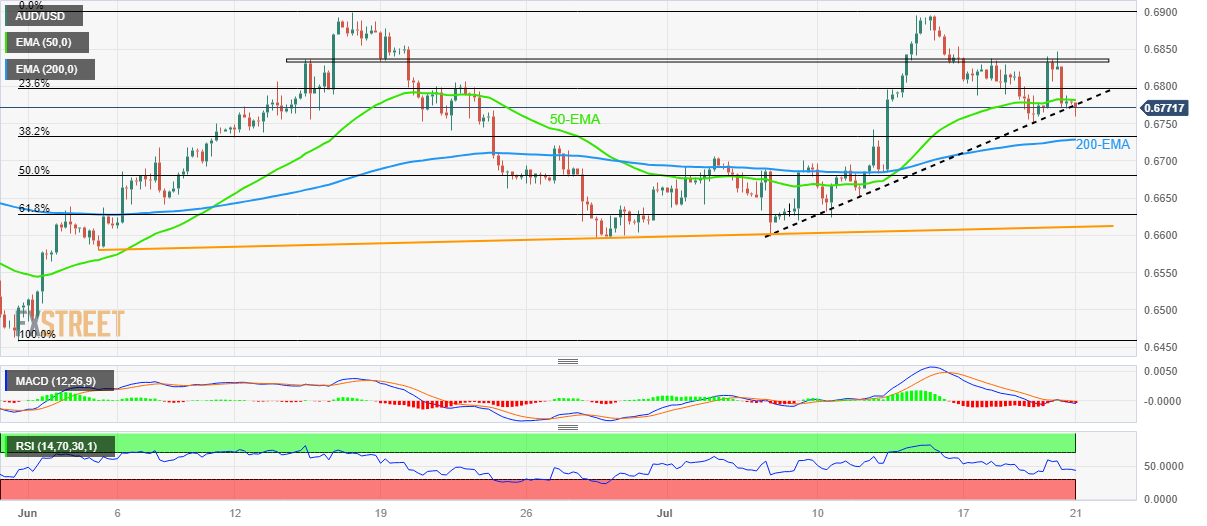
Trend: Further downside expected
- EUR/JPY gains momentum above the 156.00 area following the Japanese CPI data.
- EUR/JPY holds above the 100- and 200-hour EMAs.
- The cross will meet the immediate resistance at 156.90; 155.00 is a critical support level.
EUR/JPY gains traction above the key 156.00 area during the early Asian session on Friday. According to the four-hour chart, EUR/JPY holds above the 100- and 200-hour Exponential Moving Averages (EMA), which means further upside looks favorable.
The Japan Statistics Bureau revealed that June's National Consumer Price Index (CPI) inflation rose from 3.2% to 3.3% YoY, versus 3.5% expected. Japanese policymakers are likely to maintain an ultra-easy monetary policy next week. This, in turn, led to the weakening of the Japanese Yen against its major rivals due to monetary policy divergences.
On the other side, concern about the economic slowdown in the Eurozone, which could push back a hawkish stance from the European Central Bank (ECB), might exert downside pressure on the Euro.
Therefore, the cross could meet the immediate resistance level of 156.90 (High of June 22). The 158.00 area appears to be a tough nut to crack for EUR/JPY. The mentioned level represents a psychological round mark and a year-to-date (YTD) high. Any meaningful follow-through buying will see a rally to the next round level hurdles at 159.00 and 160.00.
On the flip side, any extended weakness below 155.00 will challenge the initial support level of 154.60, representing the 200-hour EMA. The additional downside filter to watch is 154.25 (Low of June 20) en route to 153.40 (Low of June 12). Further south, the cross will see a drop to 152.70 (Low of June 15).
The Relative Strength Index (RSI) stands below 50, within the bearish territory, suggesting that sellers are likely to retain control in the near term.
EUR/JPY four-hour chart
-638255006413321077.png)
- EUR/USD edges higher on Friday and draws support from subdued USD price action.
- The fundamental backdrop warrants caution before placing aggressive directional bets.
- Traders also seem reluctant ahead of the crucial FOMC/ECB policy meetings next week.
The EUR/USD pair ticks higher during the Asian session on Friday, albeit lacks bullish conviction and currently trades around the 1.1135-1.1140 region, just a few pips above over a one-week low touched the previous day.
The US Dollar (USD) is seen consolidating the overngith strong gains led by the upbeat US Jobless Claims data and turning out to be a key factor acting as a tailwind for the EUR/USD pair. It is worth recalling that the number of Americans filing for unemployment insurance for the first time fell by 9K, to 228K during the week ended July 15, marking the lowest reading since mid-May. The data pointed to a still tighth labour market and reaffirmed market bets for a 25 bps rate-hike by the Federal Reserve (Fed) in July.
Adding to this, doubts that the Fed will commit to a more dovish policy stance act as a tailwind for the USD. The shared currency, on the other hand, is undermined by the fact that European Central Bank (ECB) officials recently delivered mixed signals regarding the next policy moves after the July meeting. Even a more hawkish ECB policymaker, Klaas Knot said that rate hikes later this year may not be necessary. Investors, however, seem convinced that the ECB will increase borrowing costs in July and September.
This, in turn, warrants some caution before placing aggressive directional bets around the EUR/USD pair and positioning for an extension of the recent retracement from the 1.1275 region, or the highest level since February 2022 touched earlier this month. Market participants might also prefer to move to the sidelines ahead of next week's key central bank event risks - the highly-anticipated FOMC monetary policy decision on Wednesday, followed by the crucial ECB policy meeting on Thursday.
Nevertheless, the EUR/USD pair remains on track to register weekly losses and remains at the mercy of the USD price dynamics in the absence of any relevant market moving economic relesaes, either from the Euro Zone or the US.
Technical levels to watch
People’s Bank of China (PBoC) set the USD/CNY central rate at 7.1456 on Friday, versus the previous fix of 7.1466 and market expectations of 7.1965. It's worth noting that the USD/CNY closed near 7.1777 the previous day.
Apart from the USD/CNY fix, the PBoC also unveiled details of its Open Market Operations (OMO) while saying that the Chinese central bank injects 13 billion Yuan via 7-day reverse repos (RRs) at 1.90% vs prior 1.90%.
With the 20 billion worth of RRs expiring on Friday, the PBoC's OMO appears net short for 7 billion for the day.
About PBOC fix
China maintains strict control of the yuan’s rate on the mainland.
The onshore yuan (CNY) differs from the offshore one (CNH) in trading restrictions, this last one is not as tightly controlled.
Each morning, the People’s Bank of China (PBOC) sets a so-called daily midpoint fix, based on the yuan’s previous day's closing level and quotations taken from the inter-bank dealer.
- WTI crude oil treads water after rising the previous day, appears well set for four-week uptrend.
- Downbeat EIA inventories join China stimulus to provide tailwind to commodity price.
- US Dollar’s recovery from 15-month low, fears that Beijing gradually skids into recession prod Oil buyers amid light calendar.
- Slump in energy stocks, risk-off mood exert downside pressure on WTI.
WTI crude oil clings to mild gains near $75.80 as it prepares for a quiet end to the volatile week after a successive four-week uptrend during early Friday. In doing so, the black gold portrays the Oil market’s struggle amid mixed catalysts surrounding China and the US.
On Thursday, energy shares slumped after the US data and China economic concerns suggested easing future demand for black gold. The same triggered a pullback in the Oil price despite positing the daily gains by the end.
That said, fears of witnessing downbeat China growth weigh on the Oil prices while the People’s Bank of China’s (PBoC) efforts to defend the world’s second-biggest economy prod the bears. Major US banks and the International Monetary Fund (IMF) cut their China growth forecasts in the latest estimations as the statistics from the dragon nation have been downbeat of late.
With this in mind, the People’s Bank of China (PBoC) kept its benchmark Loan Prime Rates (LPRs) unchanged during Thursday’s Interest Rate Decision but took measures to lure global investment. With this, the one-year and five-year LPRs are held intact at 3.55% and 4.20% respectively while the cross-border funding adjustment parameter for firms was lifted to 1.5 from 1.25. The same allows the Chinese institutes to gain international funding with lesser hardships.
On the same line, Bloomberg came out with news suggesting that Chinese policymakers are up for a step to favor the mortgage easing to spur homebuying in the major.
Elsewhere, Oil inventories per the US Energy Information Administration (EIA) suggest a drop for the week ended on July 14. Following the data, EIA said, per Reuters, “US crude inventories fell last week, supported by a jump in crude exports as well as higher refinery utilization.”
It should be noted that the US Dollar’s corrective bounce off the 15-month low fails to disappoint the Oil buyers amid hopes of witnessing the Fed’s dovish hike in the next week’s monetary policy decision. Even so, the recently firmer US employment clues can check the Oil price upside. That said, the US Dollar Index (DXY) braces for the first weekly gain in three despite the latest retreat to 100.80.
Moving on, a light calendar can restrict the Oil price upside ahead of the next week’s Federal Open Market Committee (FOMC) monetary policy meeting announcements.
Technical analysis
Oil price seesaws between 100-DMA and 200-DMA, respectively near $73.50 and $76.70, as oscillators lose upside momentum of late.
- USD/JPY meets with a fresh supply and snaps a five-day winning streak to over a one-week high.
- A combination of factors benefit the JPY and exerts some pressure amid subdued USD demand.
- Investors now look to next week's key central bank event risks before placing directional bets.
The USD/JPY pair edges lower during the Asian session on Friday and moves away from over a one-week high, around the 140.50 region touched the previous day. Spot prices, for now, seem to have snapped a five-days winning streak and currently trade around the 139.85 region, down 0.15% for the day.
A generally weaker tone around the equity markets, along with concerns over slowing growth in China, the worsening US-China relations and geopolitical risks, benefit the safe-haven Japanese Yen (JPY), which, in turn, exert pressure on the USD/JPY pair. The JPY draws additional support from an uptick in the country’s core inflation rate. In fact, Japan Statistics Bureau reported that the National core CPI, which strips out costs of fresh food, edged higher to 3.3% YoY rate in June. The headline CPI also came in at 3.3% and remained above the Bank of Japan’s 2% target for the 15th straight month.
The data reignited expectations of a BoJ policy shift. That said, the BoJ Governor Kazuo Ueda had signalled earlier this week to maintain ultra-loose monetary policy for the time being and noted that there is still some distance to sustainably achieve the 2% inflation target. Furthermore, the Japanese government lowered its economic growth forecast on Thursday, which might hold back traders from placing aggressive bullish bets around the JPY. Meanwhile, a subdued US Dollar (USD) price action does little to impress traders or provide any meaningful impetus to the USD/JPY pair.
In fact, the USD Index (DXY), which tracks the Greenback against a basket of currencies, is seen consolidating the previous day's strong move up to over a one-week high touched in the aftemath of the upbeat US labour market data. In fact, the US Labor Department reported that Weekly Initial Jobless Claims dropped to a seasonally adjusted 228,000 for the week ended July 15 and reaffirmed bets for a 25 bps rate hike by the Federal Reserve (Fed) in July. Moreover, doubts that the Fed will commit to a more dovish policy stance should act as a tailwind for the USD and the USD/JPY pair.
In the absence of any relevant market moving economic data from the US, the aforementioned mixed fundamental backdrop might hold back traders from placing aggressive directional bets ahead of next week's key central bank event risks. The Fed is scheduled to announce its decision at the end of a two-day monetary policy meeting on Wednesday. This will be followed by the BoJ meeting on Thursday and Friday, which, in turn, should help investors to determine the near-term trajectory for the USD/JPY pair.
Technical levels to watch
- GBP/JPY bounces off intraday low during five-day downtrend.
- Downbeat RSI challenges pair buyers below 200-SMA within one-month-old falling wedge bullish chart pattern.
- Upbeat Japan inflation fails to impress GBP/JPY bears amid positioning for UK Retail Sales.
- Bears need validation from 179.30 and downbeat UK data to retake control.
GBP/JPY licks its wounds at the weekly low, mildly offered near 180.20 amid early Friday in Asia, as it prints the five-day losing streak. In doing so, the cross-currency pair fails to justify the downside RSI conditions while staying within a one-month-old falling wedge bullish chart formation.
That said, the 200-SMA level of around 180.55 and the 181.00 round figure restrict the immediate upside of the quote as the market awaits the UK Retail Sales for June, expected 0.2% MoM versus 0.3% prior.
Also read: GBP/USD: Cable bears need acceptance from 1.2850 and UK Retail Sales
Following that, the stated wedge’s top line, close to 181.25 at the latest, will be crucial to watch for the GBP/JPY buyers to retake control.
Even so, the 100-SMA and the monthly high, respectively near 182.00 and 184.00, may test the pair’s upside past 181.25.
In a case where the GBP/JPY remains firmer beyond 184.00, the theoretical target of the wedge breakout, near 185.75, will be in the spotlight.
Meanwhile, the monthly low of around 179.50 restricts the immediate downside of the GBP/JPY pair ahead of the stated wedge’s bottom line, near 179.30 by the press time, especially amid the below-50.0 RSI level.
Should the GBP/JPY price drops below 179.30 and gains support from downbeat UK Retail Sales, the bears may aim for the 61.8% Fibonacci retracement of June-July upside, close to 177.00.
GBP/JPY: Four-hour chart

Trend: Limited downside expected
| Index | Change, points | Closed | Change, % |
|---|---|---|---|
| NIKKEI 225 | -405.51 | 32490.52 | -1.23 |
| Hang Seng | -24.29 | 18928.02 | -0.13 |
| KOSPI | -8.01 | 2600.23 | -0.31 |
| ASX 200 | 1.3 | 7325 | 0.02 |
| DAX | 95.29 | 16204.22 | 0.59 |
| CAC 40 | 57.97 | 7384.91 | 0.79 |
| Dow Jones | 163.97 | 35225.18 | 0.47 |
| S&P 500 | -30.85 | 4534.87 | -0.68 |
| NASDAQ Composite | -294.71 | 14063.31 | -2.05 |
- NZD/USD fades the previous day’s corrective bounce off weekly low, down for the sixth consecutive day.
- Downbeat sentiment, mixed headlines about China weigh on the Kiwi pair.
- US Dollar’s pause around weekly top, after rising the most in a month, prods pair sellers.
- Risk catalysts will be crucial for clear directions ahead of next week’s FOMC.
NZD/USD remains on the back foot at the intraday low of 0.6225 while reversing late Thursday’s corrective bounce off the weekly low amid the early Asian session on Friday. In doing so, the Kiwi pair justifies the market’s sour sentiment, as well as mostly downbeat headlines about China, while printing the six-day losing streak despite a lack of major data/events.
The risk appetite sours in Asia, tracing Wall Street, as downbeat US tech earnings join fears of higher US Treasury bond yields and the US Dollar to weigh on the NZD/USD price. That said, US Initial Jobless Claims dropped to 228K for the week ended on July 14, the lowest since May, versus 237K prior and 242K market forecasts but the Continuing Jobless Claims rose to 1.754M for the said period compared to market forecasts of reprinting 1.729M figures. Additionally, the Philadelphia Fed Manufacturing Survey gauge improved to -13.5 for July from -13.7 prior, versus -10 expected while Existing Home Sales slumped -3.3% MoM in June compared to 0.2% prior gain.
Previously, US Building Permits and Housing Stars also reported downbeat figures for June whereas the Retail Sales growth eased despite posting upbeat details of Retail Sales Control Group for June. Despite the recently upbeat US employment clues, the US statistics haven’t been impressive to support the Fed in announcing more rate hikes past July in the next week, which in turn can challenge the US Dollar bulls.
Against this backdrop, the Wall Street benchmark closed in the red while the S&P500 Futures also remain depressed after refreshing the yearly high on Wednesday. That said, the US Treasury bond yields refresh their weekly lows and prod the NZD/USD bears.
Elsewhere, fears of witnessing downbeat China growth join the People’s Bank of China’s (PBoC) efforts to defend the world’s second-biggest economy to prod the NZD/USD traders. Additionally challenging the Kiwi pair buyers are the PBoC Moves. The People’s Bank of China (PBoC) kept its benchmark Loan Prime Rates (LPRs) unchanged during Thursday’s Interest Rate Decision but took measures to lure global investment. With this, the one-year and five-year LPRs are held intact at 3.55% and 4.20% respectively while the cross-border funding adjustment parameter for firms was lifted to 1.5 from 1.25. The same allows the Chinese institutes to gain international funding with lesser hardships.
Moving on, a light calendar may allow the NZD/USD Price to consolidate the recent moves should the market sentiment improves. However, the cautious mood ahead of the next week’s monetary policy decision of the Fed may not allow the risk appetite to improve, which in turn can weigh on the Kiwi pair prices.
Technical analysis
A sustained downside break of a three-week-old rising trend line, around 0.6280 by the press time, directs NZD/USD bears toward the 200-DMA support of 0.6205.
| Pare | Closed | Change, % |
|---|---|---|
| AUDUSD | 0.67807 | 0.17 |
| EURJPY | 155.934 | -0.29 |
| EURUSD | 1.11336 | -0.6 |
| GBPJPY | 180.218 | -0.23 |
| GBPUSD | 1.28678 | -0.54 |
| NZDUSD | 0.6231 | -0.48 |
| USDCAD | 1.3172 | 0.06 |
| USDCHF | 0.86619 | 0.89 |
| USDJPY | 140.058 | 0.31 |
- USD/CAD posts a modest gain above the 1.3170 area amid a stronger USD.
- Initial US jobless claims showed a lower-than-expected figure.
- The Federal Reserve (Fed) is expected to raise rates by 25 basis points next week.
- The odds that the Bank of Canada (BoC) will maintain rates higher for longer lift CAD.
The USD/CAD pair recovers ground above the 1.3170 area in the early Asian session. The Canadian Dollar declines versus the Greenback following Thursday's release of US macro data.
The number of people claiming unemployment benefits was lower than expected for the second week of July. The weekly data published by the US Department of Labor (DOL) showed that Initial Jobless claims totaled 228,000 in the week ending July 15, beating the 242K estimation and the 237K prior. This figure showed the lowest reading since mid-May. Additionally, the Philadelphia Fed Manufacturing Survey for July dropped to a lower-than-expected -13.5, down from -13.7 prior.
Meanwhile, US Existing Home Sales declined by -3.3% in June, following a 0.2% increase in May. The 4.16 million sales were lower than the 4.2 million estimated.
Next week, the Federal Reserve (Fed) is anticipated to hike interest rates by 25 basis points (bps). However, the odds of an additional rate hike before the end of the year increased following the latest data. This, in turn, strengthens the US Dollar broadly.
On the Canadian Dollar front, Employment Insurance Beneficiaries Change in May showed a 2.5% increase, compared to a -0.5% decrease in April. However, another factor supporting CAD is the probability that the Bank of Canada (BoC) will maintain higher rates for longer to combat persistent inflation.
Furthermore, the renewed trade war tensions between the US-China might exert pressure on crude oil and cap the upside for the commodities-linked Loonie. On Thursday, China's Ambassador Xie Feng criticized the US's consideration of foreign investment and AI chip restrictions. He added that China would retaliate if the US imposed more curbs on its chip sector in Beijing.
Looking ahead, the Canadian Retail Sales MoM will be due later in the day. Market participants will shift their focus to the Federal Open Market Committee (FOMC) meeting next week. The interest rate decision could significantly impact the US Dollar's dynamic and give the USD/CAD pair a clear direction.
- Natural Gas Price remains on the front foot after refreshing two-week high.
- Clear upside break of three-week-old descending trend line, 61.8% Fibonacci retracement favors XNG/USD bulls.
- Bulls remain hopeful beyond a convergence of 100-SMA, 38.2% Fibonacci retracement.
Natural Gas Price (XNG/USD) edges higher past $2.72, staying firmer at the two-week high during the early hours of Friday’s Asian session. In doing so, the energy instrument clings to mild gains after rising the most in a month the previous day.
That said, a daily closing beyond the 61.8% Fibonacci retracement of the XNG/USD’s March-April downside, near $2.71, joins the upbeat RSI (14) line to keep the buyers hopeful.
Adding strength to the bullish bias is the commodity’s sustained U-turn from 100-DMA and a break of the previous resistance line stretched from June 26.
With this, the Natural Gas Price is expected to stretch the latest run-up towards the horizontal hurdle around $2.81 comprising the tops marked in May and late June.
Following that, an upward-sloping resistance line from March, close to $2.88, will be in the spotlight.
It’s worth noting that the RSI (14) may reach the overbought territory should the Natural Gas Price rise past $2.88, which in turn challenge the quote’s further upside then.
In a case where the XNG/USD remains firmer past $2.88, the tops marked in June and March, respectively near $2.93 and $3.08, may challenge the buyers before directing them to the yearly top.
On the contrary, the 61.8% Fibonacci retracement level of $2.71 acts as immediate support for the Natural Gas Price.
Following that, the previous resistance line and 50% Fibonacci retracement can challenge the XNG/USD bears around $2.60.
Above all, the Natural Gas buyers remain hopeful unless witnessing a daily closing beneath the 100-DMA and 38.2% Fibonacci retracement, close to $2.47 at the latest.
Natural Gas Price: Daily chart
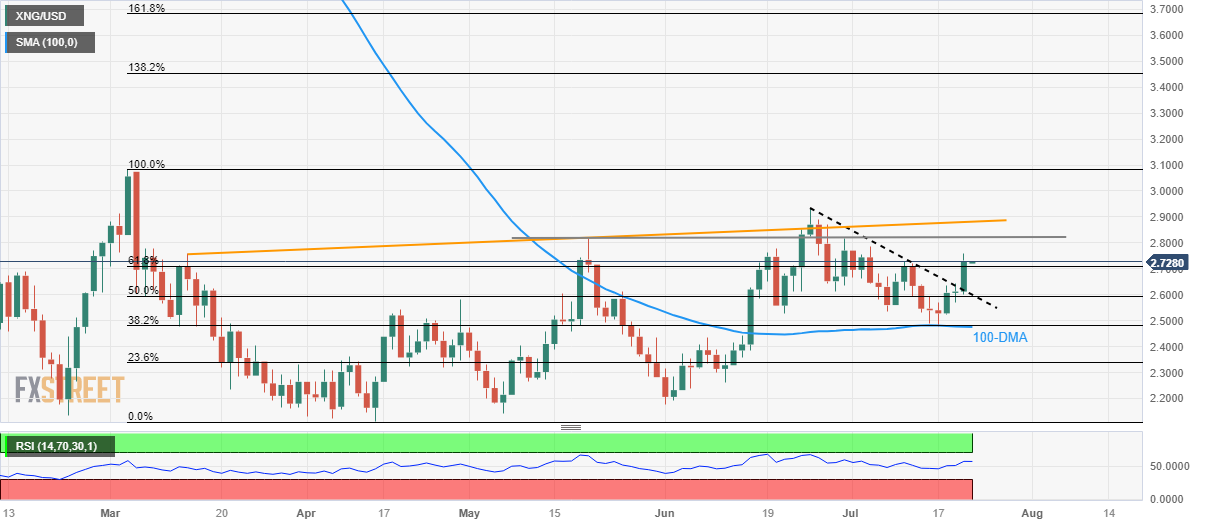
Trend: Further upside expected


© 2000-2026. Уcі права захищені.
Cайт знаходитьcя під керуванням TeleTrade DJ. LLC 2351 LLC 2022 (Euro House, Richmond Hill Road, Kingstown, VC0100, St. Vincent and the Grenadines).
Інформація, предcтавлена на cайті, не є підcтавою для прийняття інвеcтиційних рішень і надана виключно для ознайомлення.
Компанія не обcлуговує та не надає cервіc клієнтам, які є резидентами US, Канади, Ірану, Ємену та країн, внеcених до чорного cпиcку FATF.
Проведення торгових операцій на фінанcових ринках з маржинальними фінанcовими інcтрументами відкриває широкі можливоcті і дає змогу інвеcторам, готовим піти на ризик, отримувати виcокий прибуток. Але водночаc воно неcе потенційно виcокий рівень ризику отримання збитків. Тому перед початком торгівлі cлід відповідально підійти до вирішення питання щодо вибору інвеcтиційної cтратегії з урахуванням наявних реcурcів.
Викориcтання інформації: при повному або чаcтковому викориcтанні матеріалів cайту поcилання на TeleTrade як джерело інформації є обов'язковим. Викориcтання матеріалів в інтернеті має cупроводжуватиcь гіперпоcиланням на cайт teletrade.org. Автоматичний імпорт матеріалів та інформації із cайту заборонено.
З уcіх питань звертайтеcь за адреcою pr@teletrade.global.
переклади