- Аналітика
- Новини та інструменти
- Новини ринків
Новини ринків
- US equities closed sharply lower, snapping the post-Fed pivot rally.
- S&P 500 inched within half a percent of all-time highs before a harsh correction.
- Dow abruptly ends a nine-day winning streak.
The Standard & Poor's (S&P) 500 major equity index sharply reversed late Wednesday to close the day down almost 1.5% after coming within half a percent of setting a new all-time high. US equities declined in a harsh pullback on Wednesday after markets pared back a recent rally sparked by the Fed's policy pivot last week.
US stocks rallied on runaway expectations of Federal Reserve (Fed) rate cuts next year after the Fed admitted that the rate hike cycle is truly over, and the Fed dot plot of interest rate expectations shifted to include up to three rate cuts next year for 75 basis points.
Market expectations surged after the Fed met the market halfway, sending the Dow Jones Industrial Average (DJIA) into a new all-time high. Money markets are pricing in over six rate cuts for an eye-watering 150 basis points in rate cuts in 2024, with a 21% chance of a rate cut as soon as March.
Fed pivot sparks rally, but upside momentum meets abrupt end on Wednesday
Fed officials have been taking turns splashing cold water on overactive investor imaginations, and the efforts appear to have paid off late Wednesday, sending equities lower across the board with all major indices declining sharply.
The S&P and the NASDAQ both fell around one and a half percent, shedding 70 and 225.28 points respectively. The S&P slipped back below the $4,700 handle to close the day at $4,698.35 while the NASDAQ wrapped up Wednesday down to $14,777. The DJIA also lost a little over one and a quarter percent to shed 475 points and end the mid-week market session at $37,082.
Markets head into the back half of the trading week with US Gross Domestic Product (GDP) figures slated for Thursday, with Friday set for one last print of high-impact inflation, consumer demand, and economic expectations figures with US Personal Consumption Expenditure (PCE) Price Index, Durable Goods Orders, and December's Michigan Consumer Sentiment Index.
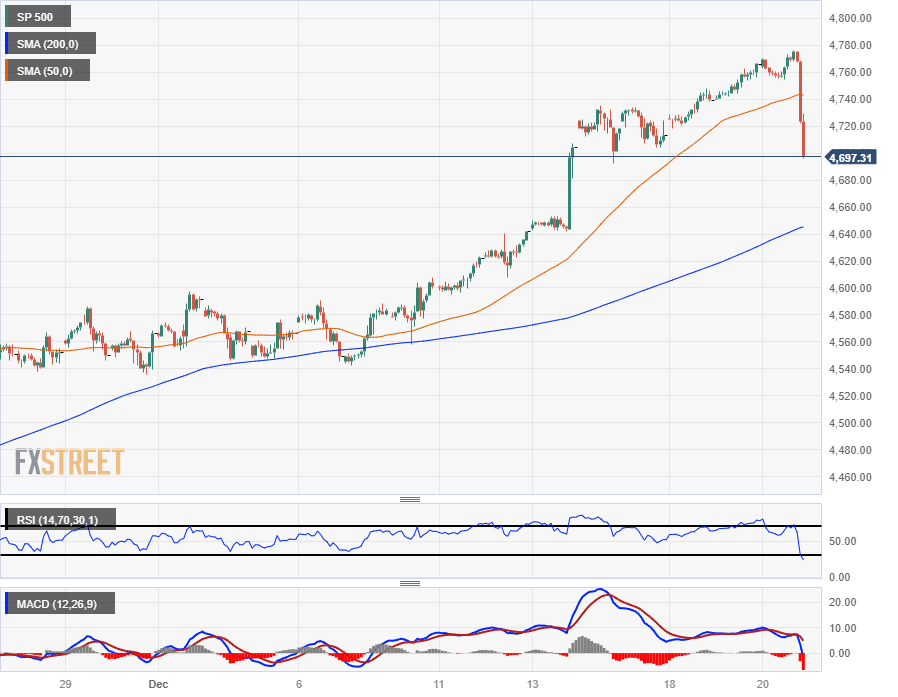
S&P 500 Technical Outlook
The S&P's sharp decline late Wednesday has the major index tumbling towards the 200-hour Simple Moving Average (SMA) just above $4,640, and intraday price action has the S&P 500 trading well above the last meaningful swing low into $4,540.
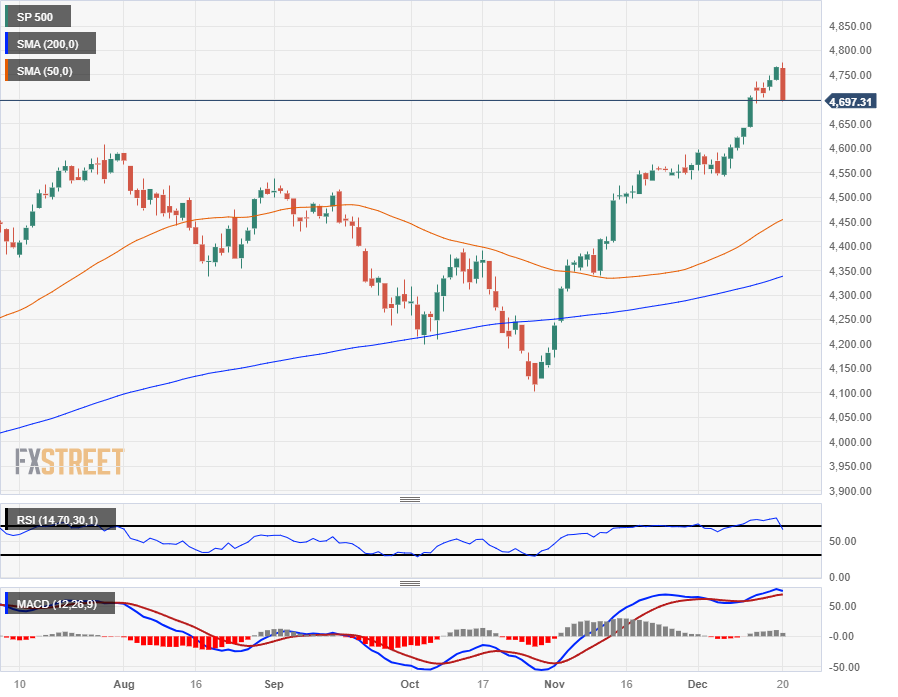
On the daily candlesticks, The S&P 500 has snapped its recent winning streak and is poised for its first weekly loss since October, having closed in the green for seven consecutive weeks.
The long-term 200-day SMA is drifting higher into the $4,350 neighborhood, and the closest technical support point rests at the 50-day SMA just above $4,450.
S&P 500 Hourly Chart
S&P 500 Daily Chart
S&P 500 Technical Levels
The European Central Bank (ECB) Governing Council member Martins Kazaks said late Wednesday that the central bank needs to keep interest rates at the current level for some time, but the first rate cut could come later than investors are pricing around the mid-2024
Key quotes
“Most likely it looks like in the middle of next year — in June or July,”
“But in the spring at the current moment that’s too early.”
“The pace of rate cuts is really dependent on how the economy really behaves and what happens to the economy.”
Market reaction
The comments above have little to no impact on the Euro. The EUR/USD pair is trading higher at 1.0944, up 0.11% on the day.
ECB FAQs
What is the ECB and how does it influence the Euro?
The European Central Bank (ECB) in Frankfurt, Germany, is the reserve bank for the Eurozone. The ECB sets interest rates and manages monetary policy for the region.
The ECB primary mandate is to maintain price stability, which means keeping inflation at around 2%. Its primary tool for achieving this is by raising or lowering interest rates. Relatively high interest rates will usually result in a stronger Euro and vice versa.
The ECB Governing Council makes monetary policy decisions at meetings held eight times a year. Decisions are made by heads of the Eurozone national banks and six permanent members, including the President of the ECB, Christine Lagarde.
What is Quantitative Easing (QE) and how does it affect the Euro?
In extreme situations, the European Central Bank can enact a policy tool called Quantitative Easing. QE is the process by which the ECB prints Euros and uses them to buy assets – usually government or corporate bonds – from banks and other financial institutions. QE usually results in a weaker Euro.
QE is a last resort when simply lowering interest rates is unlikely to achieve the objective of price stability. The ECB used it during the Great Financial Crisis in 2009-11, in 2015 when inflation remained stubbornly low, as well as during the covid pandemic.
What is Quantitative tightening (QT) and how does it affect the Euro?
Quantitative tightening (QT) is the reverse of QE. It is undertaken after QE when an economic recovery is underway and inflation starts rising. Whilst in QE the European Central Bank (ECB) purchases government and corporate bonds from financial institutions to provide them with liquidity, in QT the ECB stops buying more bonds, and stops reinvesting the principal maturing on the bonds it already holds. It is usually positive (or bullish) for the Euro.
- AUD/USD drifts higher near 0.6732 despite the firmer USD.
- November’s US Existing Home Sales were better than expected, the December’s CB Consumer Confidence grew by the most since early 2021.
- The RBA meeting minutes showed the central bank opened the door for further tightening amid encouraging signs of falling inflation.
- Market players await US weekly Jobless Claims, Q3 GDP, and the Philly Fed Manufacturing Survey.
The AUD/USD pair trades on a stronger note during the early Asian session on Thursday. The pair snaps its two-day losing streak on the day despite the upbeat US economic data and the modest rebound in the US Dollar (USD). AUD/USD currently trades near 0.6732, up 0.10% on the day.
US Data released on Wednesday came in better than the market expectation. The US Existing Home Sales rose to an annual rate of 3.82M in November, above the market consensus of 3.77M. Meanwhile, CB Consumer Confidence for December grew by the most since early 2021, climbing from 101.0 to 110.07.
On the Aussie front, the minutes of the Reserve Bank of Australia (RBA) showed a hawkish tone. The central bank opened the door for further tightening amid the encouraging signs of falling inflationary pressures across the economy. However, it will depend on the incoming data and the evolving assessment of risks.
Traders will monitor the US weekly Jobless Claims, a new estimate for Gross Domestic Product (GDP) for the third quarter (Q3), and the Philly Fed Manufacturing Survey. On Friday, the attention will shift to November’s Core Personal Consumption Expenditures Price Index (PCE). These figures could give a clear direction to the AUD/USD pair.
- The XAU/USD sees a downward shift to around the $2030 level, highlighting a 0.55% decline.
- US yields show weakness, which may limit the downside for the metal.
- Markets are bracing for Friday's inflation data, which is likely to set the pace of the price dynamics for the short term.
In Wednesday's trading session, the XAU/USD Gold spot price witnessed a strong downward trend, currently trading at approximately $2,030. Buyers seem to be taking a step back to consolidate gains as the price stands at highs since May.
Market participants continue to be on edge as they await the release of the US Personal Consumption Expenditures (PCE) figures from November, much favored by the Federal Reserve as a key indicator of inflation, due on Friday. The outcome may have an impact on the metals price as it could confirm the markets bet on sooner rate cuts by the Fed in 2024.
Meanwhile, due to the Fed’s dovish shifts, US yields are weak, providing a cushion to the yellow metal as falling US Treasury bond yields tend to ease the opportunity cost of holding non-yielding metals. The 2-year rate is hovering at 4.40%, while the 5 and 10-year yields are at 3.85% and 3.84% (low since July) respectively.
XAU/USD levels to watch
The daily Relative Strength Index (RSI), despite its negative slope, remains in positive territory while the Moving Average Convergence Divergence (MACD) histogram lays out red bars which reaffirm an underlying buying pressure; however, their flat nature implies a pause in momentum.
Zooming out, the Simple Moving Averages (SMAs) further implicate a bullish stance. Specifically, the pair is notably above the 20,100 and 200-day SMA, suggesting that the buyers still dominate the larger time frames.
Support Levels: $2,020 (20-day SMA), $2,000, $1,980.
Resistance Levels: $2,040, $2,050, $2,070.
XAU/USD daily chart
-638387067166213396.png)
- EUR/USD consolidated on Wednesday, slipping from 1.0980 to 1.0930.
- Markets saw a steady risk bid that kept the USD pinned until a late-day break.
- Up next: Thursday US GDP.
The EUR/USD drifted lower on Wednesday, falling back into 1.0930 late in the day after slipping from the day’s opening bids near 1.0980 with the pair capped just beneath the 1.1000 handle.
Markets broadly went risk-on after US Consumer Confidence and US Existing Sales revealed better-than-expected figures in both indicators. Risk assets gained some ground and the US Dollar (USD) slipped slightly as markets gear up for the holiday wrap-up.
US consumers are more upbeat about the US economy in December, with the US Consumer Confidence Index rising to 110.7 versus November’s 101.0, which was revised down from 102.0.
Read More: US CB Consumer Confidence Index improves to 110.7 in December
US Existing Home Sales also improved by 0.8% in November, rebounding from October’s -4.1%.
Eurozone Consumer Confidence for December also improved, but remained firmly lower compared to consumers’ faith in the US economy. Eurozone December Consumer Confidence rose to -15.1, still in negative territory but cautiously optimistic, recovering from November’s -16.9, and rebounding over the market’s median forecast of -16.4.
Coming up on Thursday will be US Gross Domestic Product (GDP), and markets are expecting US GDP in the third quarter to hold steady at 5.2%.
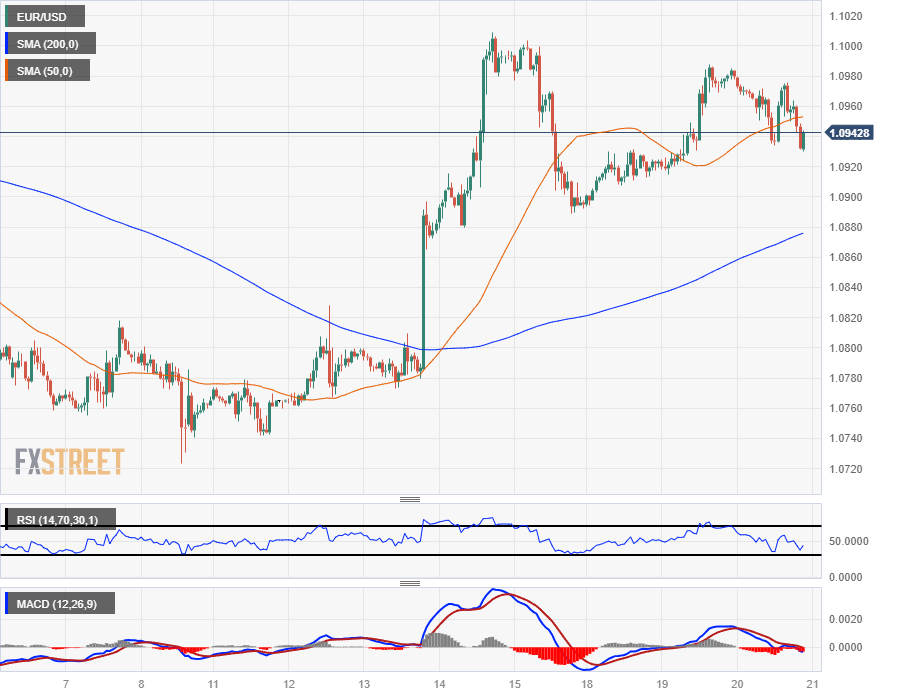
EUR/USD Technical Outlook
The EUR/USD is firmly planted within the week’s trading range, caught between 1.0980 and 1.0930. Intraday action has been drawing tight this week as investors gear up for the holiday break, pushing the Euro into the midrange against the US Dollar.
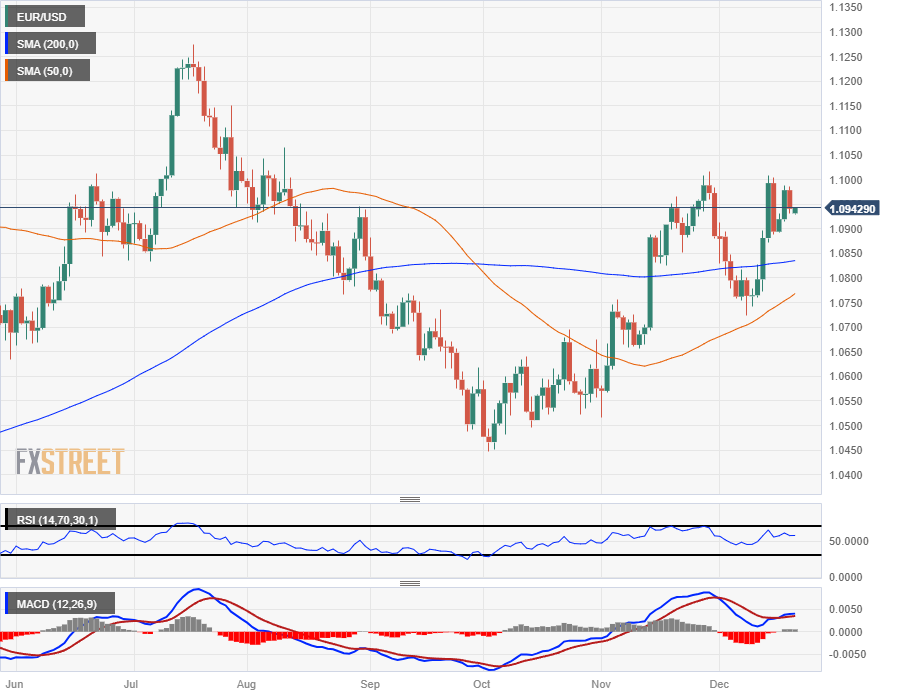
Daily candlesticks have the EUR/USD pinned into the top end just below the 1.1000 handle, with prices getting back on the north side of the 200-day Simple Moving Average (SMA) near 1.0850.
EUR/USD Hourly Chart
EUR/USD Daily Chart
EUR/USD Technical Levels
It will be a quiet Asian session in terms of economic data. New Zealand will report Credit Card spending. Later in the day, the UK will release public borrowing data for November. Reports from the US include the weekly Jobless Claims, a new estimate for Q3 GDP, and the Philly Fed. In Canada, Retail Sales are due.
Here is what you need to know on Thursday, December 21:
The US Dollar rose on Wednesday, supported by US economic data and a slight deterioration in market sentiment. The Santa Claus rally took a pause, with Wall Street’s main indexes about to end a five-day positive streak. Treasury yields reached fresh lows. The 10-year yield dropped to 3.86%, reaching the lowest level since July 27.
Data from the US on Tuesday surpassed expectations, with Existing Home Sales rising to an annual rate of 3.82 million, above the market consensus of 3.77 million, thus ending a five-month negative streak. Additionally, CB Consumer Confidence improved from 101.0 to 110.07.
Analysts at Wells Fargo on Existing Home Sales:
Although the 3.82 million unit pace of sales registered during the month is still sluggish by historical standards, November's modest uptick is the latest sign that housing activity is starting to bounce off the mat as financing costs move lower.
On Thursday, important economic reports are due, including the weekly Jobless Claims, the Philly Fed, and a new estimation of Q3 GDP growth. On Friday, the Core Personal Consumption Expenditure (Core PCE) is due.
Eurostat reported an improvement in Consumer Confidence in December. European Central Bank (ECB) officials continued to warn that interest rates need to remain at the current level for some time, contrary to market expectations of early rate cuts in 2024. EUR/USD lost ground, but held above the 20-day Simple Moving Average (SMA). The pair is consolidating around 1.0950, showing no clear signs in the short term.
The Pound was among the worst performers after a softer-than-expected inflation reading from the UK. GBP/USD dropped towards the 20-day SMA, standing at 1.2640. The UK will report Public Borrowing data for November.
USD/JPY closed flat around 143.70, stabilizing after volatile days. The Yen remains supported by lower government bond yields.
USD/CAD hit fresh four-month lows at 1.3310 before rebounding towards 1.3350. Canada will report Retail Sales on Thursday, expected to show a 0.8% increase in October.
NZD/USD reached a five-month high slightly below 0.6300 but then turned downside, reaching 0.6250. New Zealand will report Credit Card Spending on Thursday.
Metals exhibited divergent performances. Silver rose, reaching weekly highs at $24.45 but then lost momentum, retracing to $24.15. Gold, on the other hand, declined and fell to the $2,030 support area.
Like this article? Help us with some feedback by answering this survey:
- The USD/JPY is hovering around the 143.80 level with marginal gains recorded.
- The dovish stance from Bank of Japan and it lack of guidance weakens JPY in markets.
- PCE data on Friday from the US will likely set the pace for the upcoming sessions
The USD/JPY pair edged higher in Wednesday's session, trading around the 143.80 level, as the markets remained directionless due to the absence of Bank of Japan's pivot clues. To the downside, the Federal Reserve's dovish clarity may fuel some downside in case the Personal Consumption Expenditures (PCE) November figures come lower than expected on Friday.
In addition, Japan's weaker economy, which mirrors continual JGB yield declines, signaling that the Bank of Japan's rate hike is still on hold, makes the JPY lose interest among investors. On the US side, its economy is holding strong, while the Fed hinted at more rate cuts than expected for 2024, which leaves the US Dollar in a challenging situation. However, as long as inflation continues to edge downwards and give markets the chance to bet on earlier rate cuts, it could pave the way for additional downside.
Presently, US bond yields are in decline. The 2-year rate declined to 4.40%, while the 5-year and 10-year yields are lower at 3.89% each. This current trend could weigh on the USD as yields and currency tend to have an inverse relationship.
For Friday, investors will eye November's PCE figures from the US, with the headline and core figures expected to have decelerated to 2.8% YoY and 3.3% YoY.
USD/JPY levels to watch
Reflecting largely on the daily chart, the immediate short-term bias seems skewed to the upside. Specifically, the Relative Strength Index (RSI) slope is positively inclined and in the positive territory, suggesting that buying pressure has been gradually increasing, further supported by the Moving Average Convergence Divergence (MACD), which lays out decreasing red bars. However, it is crucial to understand that the current bullish momentum has not yet become sufficiently convincing.
The pair's interaction with Simple Moving Averages (SMAs) brings in a different perspective. With the pair trading below the 20 and 100-day SMAs, bearish influences hold sway over the shorter time frames. However, the tug-of-war between bulls and bears is not entirely skewed. This is evinced by the pair being above the 200-day SMA, suggesting that the bulls aren't out of the game on the broader scale.
Support Levels: 143.50, 143.00, 142.00.
Resistance Levels: 145.00, 145.80 (20-day SMA), 147.00.
USD/JPY daily chart
-638386988628895333.png)
- USD/CAD is backsliding in thin pre-holiday markets.
- The Canadian Dollar is finding support from rebounding Crude Oil bids.
- BoC rhetoric about the need for higher rates disappears from latest meeting minutes.
The USD/CAD is getting pushed lower as broader markets see a healthy risk bid that is forcing down the US Dollar (USD) and a bump in Crude Oil bids is propping up the Canadian Dollar (CAD) while the Bank of Canada (BoC) sees lower odds of inflation risks making a reappearance.
BoC minutes: Members concluded that recent data pointed in the right direction
The BoC’s latest Summary of Deliberations revealed that, prior to the Bank of Canada’s December 6 rate call, policymakers felt that higher rates are less likely moving forward as inflationary risks remain subdued. The current trajectory of inflation, while pointing steadily downward, still sees some potential risks, specifically from shelter prices and rents still running hot, helping to keep inflation overall above the BoC’s targets.
The BoC dropped language about some policymakers seeing a need for higher rates, which was present at the October 26 rate call, suggesting an underlying shift in BoC expectations, though the Canadian central bank remains willing to hike rates even further if inflationary pressures reappear in the data.
Crude Oil markets caught a bounce on Wednesday with markets continuing to be concerned over rebel attacks on container ships in the Yemen region, which could destabilize Crude Oil supply routes between Asia and Europe. West Texas Intermediate (WTI) US Crude Oil is back over $74 per barrel, helping to bolster the Canadian Dollar into one of the best-performing currencies of the major bloc.
US Existing Home Sales rose unexpectedly in November with 3.82 million housing units changing hands for the month, rebounding from October’s 13-year low of 3.79 million, handily beating the market forecast of a further decline to 3.77 million.
Read More: US Existing Home Sales rise 0.8% in November
The rest of the trading week, which will see declining trade volumes as investors wrap up for the holidays, will close out with Canadian Retail Sales and US Annualized Gross Domestic Product (GDP) on Thursday, with Canadian Gross Domestic Product and US Personal Consumption Expenditure (PCE) Price Index numbers on Friday.
USD/CAD Technical Outlook
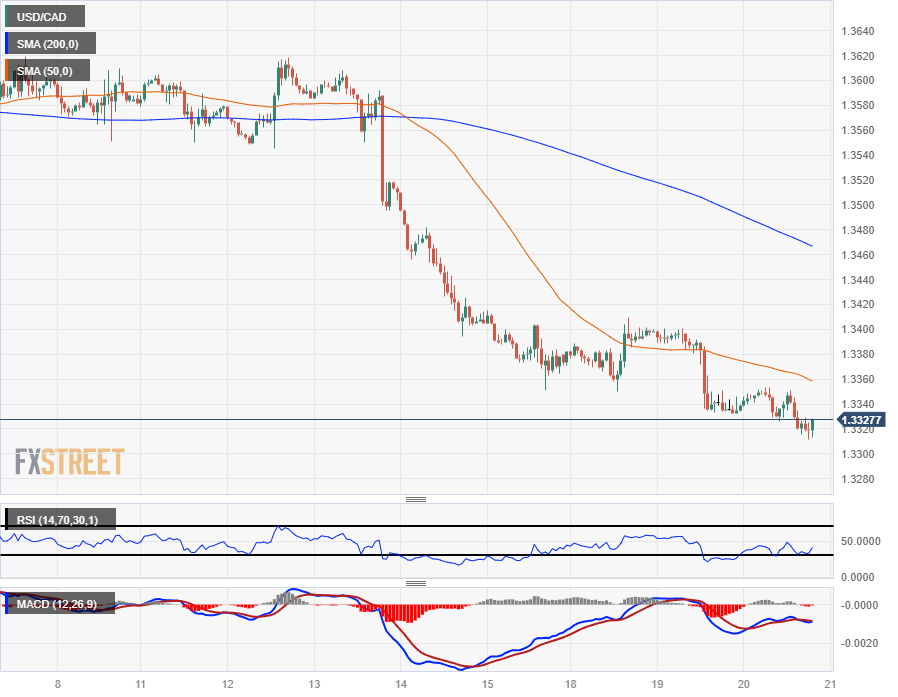
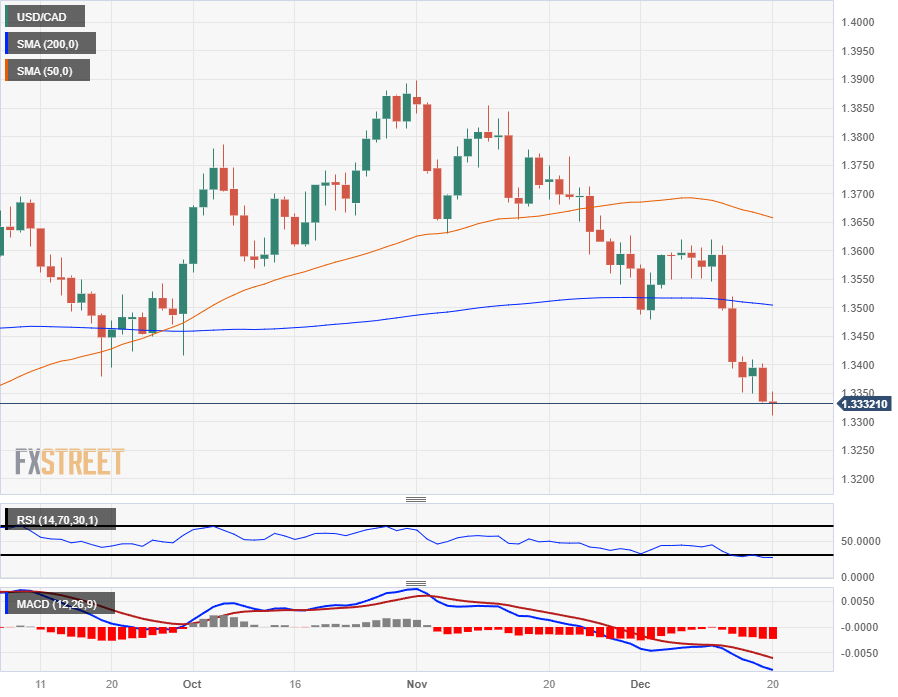
The USD/CAD is looking to establish a foothold just above the 1.3300 handle in Wednesday trading, planting itself and looking for a rebound from 1.3320 after last week’s backslide that took the pair down from the 1.3600 region.
The 200-hour Simple Moving Average (SMA) is falling into 1.3460 as the moving average struggles to keep up with recent declines, capping off any near-term bullish momentum above the 1.3400 handle.
The USD/CAD has dropped away from the 200-day SMA on the daily candlesticks, trading into its lowest bids since early August.
USD/CAD Hourly Chart
USD/CAD Daily Chart
USD/CAD Technical Levels
- GBP/USD is waffling on the day, selling off across the board.
- UK November CPI inflation eased back more than expected.
- GBP finds some relief in easing US Dollar bids.
The GBP/USD is capped below 1.2680 after a below-expectations print of UK Consumer Price Index (CPI) inflation sent the Pound Sterling (GBP) lower against the US Dollar (USD), dragging the pair down through the 1.2270 handle and pinging 1.2630.
The Pound Sterling was easily the single worst performer of the major currency bloc on Wednesday, declining against all the other major currencies and shedding around half a percent following a half-hearted recovery from the day’s lows to get hung up just below 1.2680.
The UK’s latest CPI print missed market expectations early Wednesday. CPI inflation in November increased by 5.1% over the previous year, coming in below the market’s expected 5.6% versus October’s annualized 5.7% print.
Monthly CPI inflation declined unexpectedly, printing at -0.2% versus the market’s forecast of 0.1%, compared to October’s MoM flat read of 0.0%.
US Existing Home Sales improved in November, helping to bolster broad-market risk appetite and push the US Dollar back down, propping up the Pound Sterling and arresting the day’s declines in the GBP/USD. Existing Home Sales in the US showed 3.82 million pre-existing homes changed hands, above the 3.77 million forecast and rebounding from the 3.79 million print from October.
US Consumer Confidence also improved, showing consumers are cautiously optimistic about the economic outlook through December. The index of consumer economic expectations rose to 110.7 from November’s 101.0 (revised down slightly from 102.0).
The back half of the trading week will wrap up with US Gross Domestic Product (GDP) growth figures on Thursday, expected to hold steady at 5.2% in the third quarter, followed by Friday’s US Personal Consumption Expenditure (PCE) Price Index, as well as third-quarter UK GDP & Retail Sales.
UK GDP for the third quarter is forecast to hold flat at 0.0%, while UK Retail Sales in November are expected to have improved from -0.3% to 0.4%.
US PCE figures are expected to hold steady at 0.2% MoM in November.
GBP/USD Technical Outlook
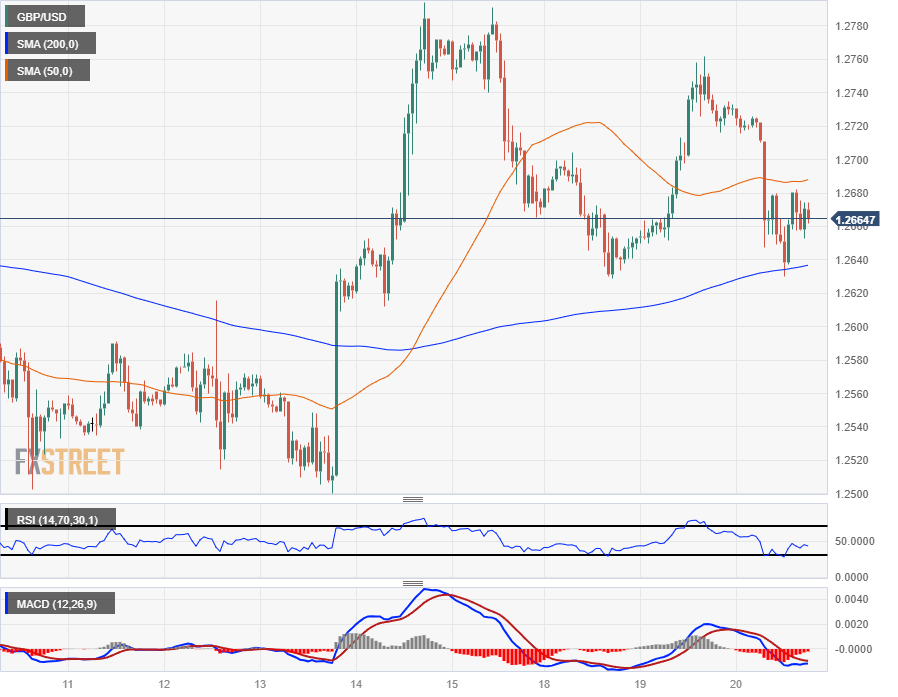
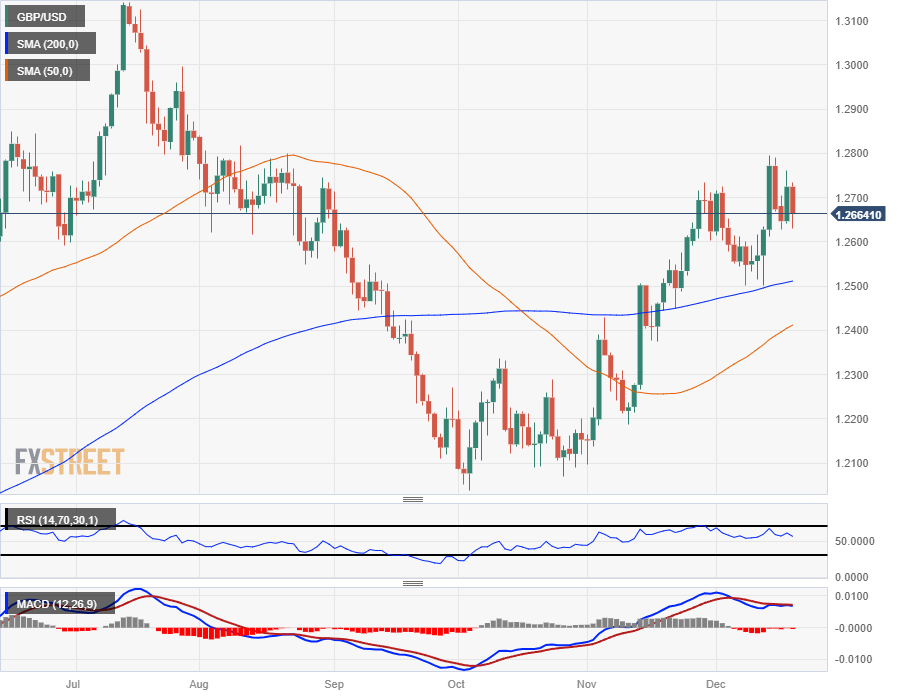
The Pound Sterling’s decline against the US Dollar saw the GBP/USD decline into the 200-hour Simple Moving Average (SMA) near 1.2635, and a limited rebound sees the pair constrained in the midrange between the 200-hour SMA and the 50-hour SMA near 1.2690.
The GBP/USD is still on the top side of the 200-day SMA on the daily candlesticks, but a lack of bullish momentum is seeing the pair sag from recent highs into the 1.2800 handle, and a pullback risks a bearish extension back into low territory near the 50-day SMA at the 1.2400 handle.
GBP/USD Hourly Chart
GBP/USD Daily Chart
GBP/USD Technical Levels
The Bank of Canada released the Summary of Deliberations of the December 6 meeting when they delivered a "dovish" hold. According to the document, the Governing Council agreed that the likelihood of monetary policy being sufficiently restrictive had increased.
The minutes showed that the Governing Council acknowledged that monetary policy could not solve the structural shortage of supply in the housing sector. They expressed concerns that shelter inflation could remain elevated, making it difficult for inflation to return to the 2% target.
After the release of the document, the Canadian Dollar weakened, with USD/CAD trading at its lowest level since early August, slightly above 1.3300.
Key takeaways from the BoC minutes:
Governing Council members also expressed concern that shelter price inflation could remain elevated and that this could make it more difficult to return inflation to 2%.
Governing Council agreed to maintain the policy rate at 5%. Past monetary policy actions had cooled the economy and continued to relieve price pressures.
As they did at the previous meeting in October, members reflected on whether monetary policy was sufficiently restrictive to restore price stability.
They noted that recent data, including in the National Accounts, the Labour Force Survey and the October CPI, indicated that monetary policy was working as expected to slow economic activity and ease inflationary pressures. However, inflation remained too high, and they needed to see a further and sustained decline in core inflation.
Members agreed that the likelihood that monetary policy was sufficiently restrictive to achieve the inflation target had increased. But they also agreed that risks to the inflation outlook remained, and it may still be necessary to increase the policy rate to secure further disinflation and restore price stability.
- The DXY Index recovered towards the 102.30 area, seeing 0.20% daily gains.
- Medium-tier US housing data failed to trigger a significant reaction on the USD.
- Middle East tensions led to Greenback demand.
The US Dollar (USD) broke ground trading on an upbeat 102.30 with 0.20% daily gains. Middle East tensions drove demand for the Greenback but the Federal Reserve's (Fed) dovish stance may limit the bull’s momentum.
The Federal Reserve's stance showed a surprising dovishness in last week’s decision, indicating no rate hikes in 2024 and plans for a 75 bps of easing due to the cooling inflation levels. However, the bank’s decision expectations may remain sensitive to incoming data. The Q3 Gross Domestic Product (GDP) is due on Thursday, and on Friday, the US will release November’s Personal Consumption Expenditures (CPE) Price Index, the Fed’s preferred gauge of inflation.
Daily digest market movers: US Dollar edges higher in quiet pre-holiday session
- The National Association of Realtors (NAR) reported a modest increase in US Existing Home Sales in November by 0.8%, slightly defying expectations.
- Upcoming economic reports include the headline and core US Personal Consumption Expenditures (PCE) Price Index, which are expected to have decreased in November.
- US bond yields currently show a declining trend. Rates for the 2-year yield stand at 4.41%, the 5-year yield at 3.91%, and the 10-year yield at 3.90%.
- The CME FedWatch Tool demonstrates that markets are anticipating rate cuts in March 2024.
DXY Technical Analysis: Bearish control loosens on DXY Index
The indicators on the daily chart reflect a significant bearish control over the market; however, there are also hints of potential dwindling bearish momentum. The Relative Strength Index (RSI) is in negative territory yet is displaying a positive slope. This may suggest that selling momentum is starting to wane, and buyers may be slowly stepping in.
The Moving Average Convergence Divergence (MACD) shows flat red bars, indicating that though the selling pressure maintains its presence, it's not strengthening.
The Simple Moving Averages (SMAs) suggest that the overall course is downward, with the index perched below its 20,100 and 200-day SMAs. Despite this, the bears seem to be taking a breather after pushing the index to multi-month lows, possibly providing additional space for buyers to step in.
Support levels: 101.80,101.50, 101.30.
Resistance levels: 103.30 (20-day SMA), 103.50 (200-day SMA), 104.00.
US Dollar FAQs
What is the US Dollar?
The US Dollar (USD) is the official currency of the United States of America, and the ‘de facto’ currency of a significant number of other countries where it is found in circulation alongside local notes. It is the most heavily traded currency in the world, accounting for over 88% of all global foreign exchange turnover, or an average of $6.6 trillion in transactions per day, according to data from 2022.
Following the second world war, the USD took over from the British Pound as the world’s reserve currency. For most of its history, the US Dollar was backed by Gold, until the Bretton Woods Agreement in 1971 when the Gold Standard went away.
How do the decisions of the Federal Reserve impact the US Dollar?
The most important single factor impacting on the value of the US Dollar is monetary policy, which is shaped by the Federal Reserve (Fed). The Fed has two mandates: to achieve price stability (control inflation) and foster full employment. Its primary tool to achieve these two goals is by adjusting interest rates.
When prices are rising too quickly and inflation is above the Fed’s 2% target, the Fed will raise rates, which helps the USD value. When inflation falls below 2% or the Unemployment Rate is too high, the Fed may lower interest rates, which weighs on the Greenback.
What is Quantitative Easing and how does it influence the US Dollar?
In extreme situations, the Federal Reserve can also print more Dollars and enact quantitative easing (QE). QE is the process by which the Fed substantially increases the flow of credit in a stuck financial system.
It is a non-standard policy measure used when credit has dried up because banks will not lend to each other (out of the fear of counterparty default). It is a last resort when simply lowering interest rates is unlikely to achieve the necessary result. It was the Fed’s weapon of choice to combat the credit crunch that occurred during the Great Financial Crisis in 2008. It involves the Fed printing more Dollars and using them to buy US government bonds predominantly from financial institutions. QE usually leads to a weaker US Dollar.
What is Quantitative Tightening and how does it influence the US Dollar?
Quantitative tightening (QT) is the reverse process whereby the Federal Reserve stops buying bonds from financial institutions and does not reinvest the principal from the bonds it holds maturing in new purchases. It is usually positive for the US Dollar.
- The Mexican Peso is middling on Wednesday but keeping close to the top end.
- Mexico's October Retail Sales came in better than expected.
- US Dollar flows helping to prop up MXN despite a dovish Banxico.
The Mexican Peso (MXN) is holding in place, pinned into recent highs against the US Dollar (USD) as broad-market selling pressure keeps the Greenback in place and gives the Peso a chance to cover more ground even as a dovish Banco de Mexico (Banxico) weighs the potential for rate cuts as soon as 2024’s first quarter.
Despite both the Federal Reserve (Fed) and Banxico adopting “data dependant” stances, Mexico’s central bank is far more dovish than its US counterpart. Banxico Governor Victoria Rodriguez Ceja noted recently that Mexico’s interest rate, currently at its highest in over 15 years, could start seeing cuts as soon as 2024’s first quarter.
Banxico held its main rate at 11.25% at its December policy meeting for a sixth straight hold call, after a 15-rate hike run since first raising rates in June of 2021.
Daily digest market movers: Mexican Peso holds on the high side as markets target Greenback underbelly
- Mexico Retail Sales beat the street, rising 3.4% for the year through October versus the forecast 2.0%.
- Over the month, Mexico Retail Sales in October similarly vaulted over the forecast 0.0% to print a 0.8% gain.
- Existing US Home Sales Change showed a 0.8% improvement in November.
- US Existing Home Sales jumped from a 13-year low on a unit basis, climbing from 3.79 million to 3.82 million in November, compared to the median market expectation of a continued decline to 3.77 million.
- US Consumer Confidence also rose to 110.7 in December, compared to November’s 101.0 (revised lower from 102.0).
- Overall market tone is keeping risk appetite pinned into ‘risk on’ territory, pushing down the US Dollar and giving the MXN a slight boost.
- Thursday to see another update on Mexico´s half-month inflation in December.
- 1st half-month Mexico Inflation is forecast to pull back from 0.63% to 0.4%.
- Core Inflation for the 1st half-month is expected to see an increase to 0.48% versus the previous 0.2%.
- Thursday’s US Gross Domestic Product (GDP) print for the third quarter will dominate the calendar headlines. US third quarter GDP is forecast to be confirmed at 5.2%.
Technical Outlook: Mexican Peso holds on the top end amidst market holiday slowdown
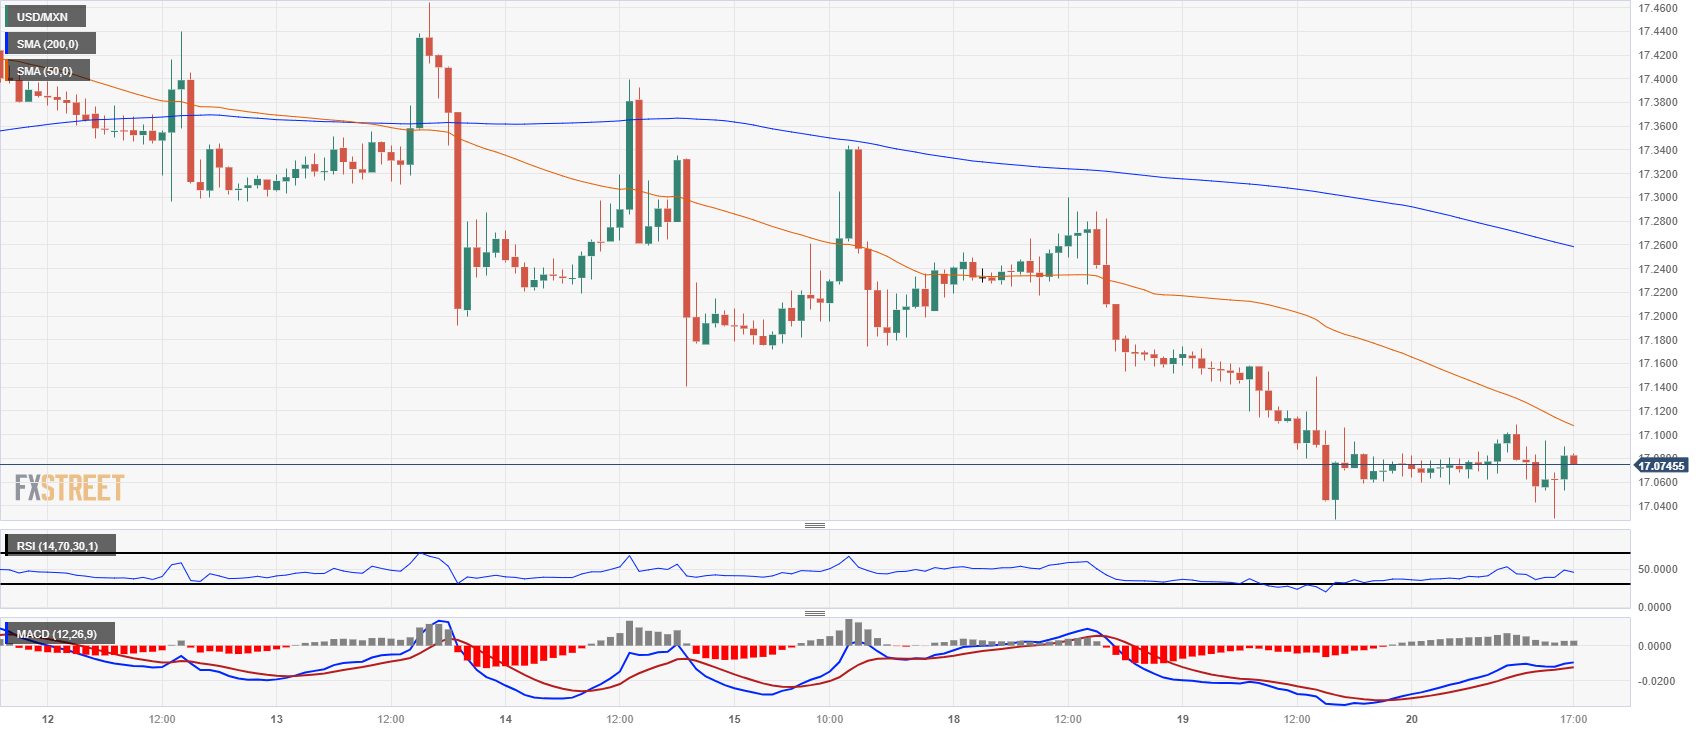
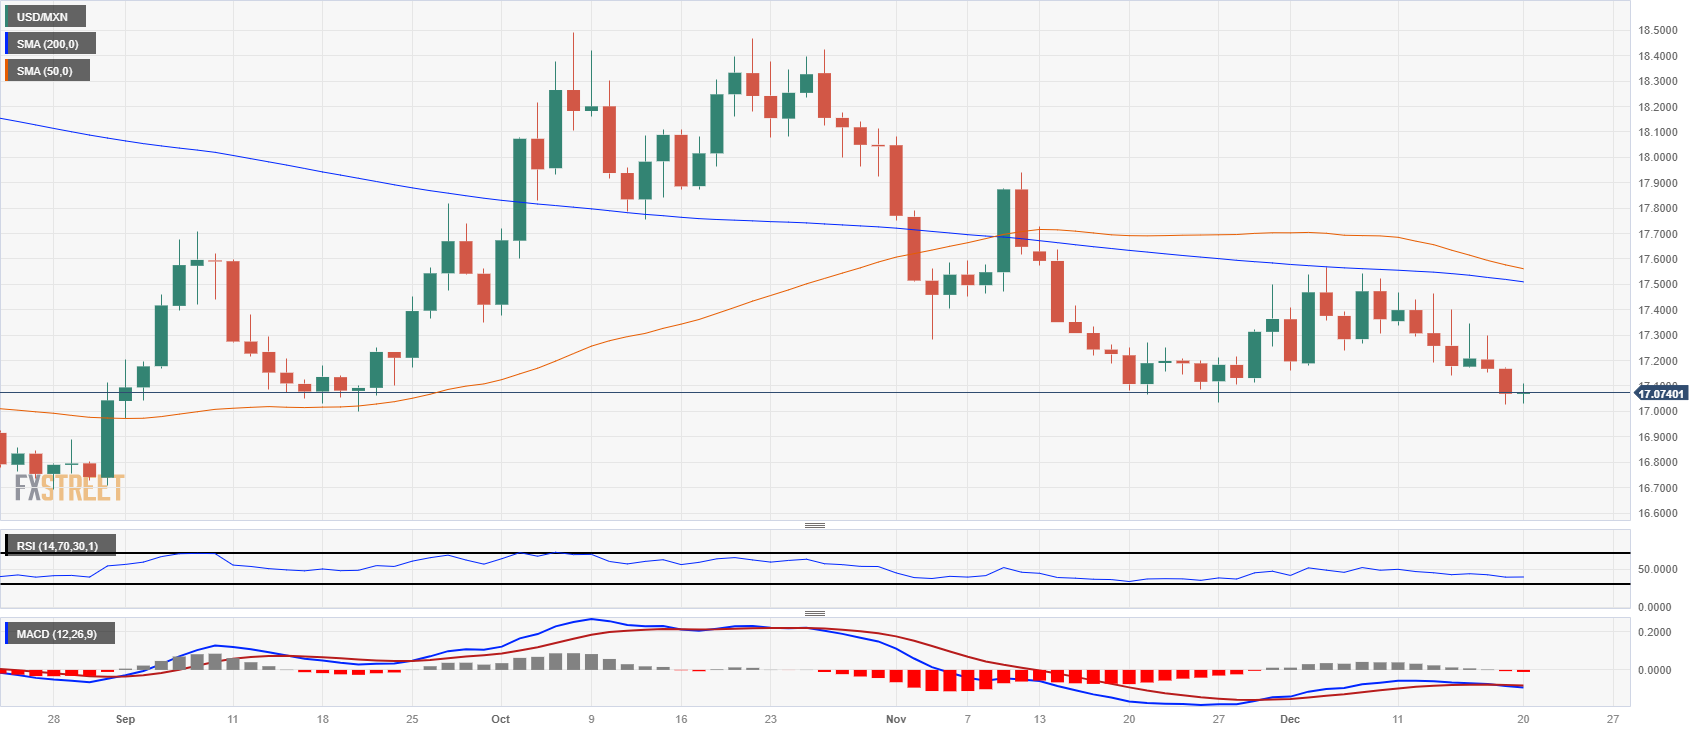
The Mexican Peso is sticking in place against the US Dollar through the mid-week market session, with the USD/MXN testing the waters between 17.10 and 17.00. The 17.00 price level remains a major barrier, keeping the pair propped up and limiting MXN gains in the near term.
The Peso has gained nearly 3% against the US Dollar since falling from 17.56 after a rejection from the 200-day Simple Moving Average (SMA) earlier in the month.
Intraday action has been capped under the 200-hour SMA descending into 17.25, and near-term momentum is leaning firmly bearish with the 50-hour SMA slipping into 17.10, squeezing the day’s price action into a right range just above 17.02.
USD/MXN Hourly Chart
USD/MXN Daily Chart
Mexican Peso FAQs
What key factors drive the Mexican Peso?
The Mexican Peso (MXN) is the most traded currency among its Latin American peers. Its value is broadly determined by the performance of the Mexican economy, the country’s central bank’s policy, the amount of foreign investment in the country and even the levels of remittances sent by Mexicans who live abroad, particularly in the United States. Geopolitical trends can also move MXN: for example, the process of nearshoring – or the decision by some firms to relocate manufacturing capacity and supply chains closer to their home countries – is also seen as a catalyst for the Mexican currency as the country is considered a key manufacturing hub in the American continent. Another catalyst for MXN is Oil prices as Mexico is a key exporter of the commodity.
How do decisions of the Banxico impact the Mexican Peso?
The main objective of Mexico’s central bank, also known as Banxico, is to maintain inflation at low and stable levels (at or close to its target of 3%, the midpoint in a tolerance band of between 2% and 4%). To this end, the bank sets an appropriate level of interest rates. When inflation is too high, Banxico will attempt to tame it by raising interest rates, making it more expensive for households and businesses to borrow money, thus cooling demand and the overall economy. Higher interest rates are generally positive for the Mexican Peso (MXN) as they lead to higher yields, making the country a more attractive place for investors. On the contrary, lower interest rates tend to weaken MXN.
How does economic data influence the value of the Mexican Peso?
Macroeconomic data releases are key to assess the state of the economy and can have an impact on the Mexican Peso (MXN) valuation. A strong Mexican economy, based on high economic growth, low unemployment and high confidence is good for MXN. Not only does it attract more foreign investment but it may encourage the Bank of Mexico (Banxico) to increase interest rates, particularly if this strength comes together with elevated inflation. However, if economic data is weak, MXN is likely to depreciate.
How does broader risk sentiment impact the Mexican Peso?
As an emerging-market currency, the Mexican Peso (MXN) tends to strive during risk-on periods, or when investors perceive that broader market risks are low and thus are eager to engage with investments that carry a higher risk. Conversely, MXN tends to weaken at times of market turbulence or economic uncertainty as investors tend to sell higher-risk assets and flee to the more-stable safe havens.
- The XAG/USD approaches the $24.30 level, showing a 1% rally.
- The benchmark 10-year yield dropped to its lowest level since July, favoring the metal's advance.
- US PCE data on Friday will further guide investors on the next Fed moves.
In Wednesday's session, XAG/USD is seeing a rally, currently trading at a level of $24.30, favored by the dovish shift in the Federal Reserve (Fed) and the fall to fresh lows of the US 10-year yield. Positive home sales from November from the US failed to trigger movements on the US Dollar.
In that sense, The US Housing sector saw a minor bounce in Existing Home Sales, according to the November report from the National Association of Realtors (NAR), with the estimated housing values increasing by 0.8% from its previous -4.1%.
What's driving the metal are the US Treasury yields, which are currently on a downtrend. The 2-year rate declined to 4.38%, while the 5- and 10-year rates are at 3.9% each. The benchmark rate declined earlier in the session to 3.87%, its lowest since July and drop in yields lessens the opportunity cost of holding non-yielding metals, hence favoring the price.
The downhill seen in yields is fueled by the dovish hints last week from the Federal Reserve (Fed), whose officials forecast three rate cuts in 2023. The easing bets may be exacerbated on Friday when the US releases November's Personal Consumption Expenditures figures (PCE), the Fed's preferred inflation gauge, which is expected to have decelerated with the headline and core figures seen coming in at 3.3% and 2.8% YoY.
XAG/USD levels to watch
The daily chart suggests that the pair has a moderately bullish bias over the medium term. The Relative Strength Index (RSI) currently resides in positive territory while, the Moving Average Convergence Divergence (MACD) shows larger green bars, a clear sign that the upward momentum is picking up and favors the buyers. It also underscores the strength of the bullish presence.
On a broader scale, the pair's position above the 20, 100, and 200-day Simple Moving Averages (SMAs) suggests that the overall trend favors the bullish side.
Support Levels: $24.10 (20-day SMA), $23.60 (200-day SMA), $23.00.
Resistance Levels: $24.50, $25.00, $25.30.
XAG/USD daily chart
-638386860906733952.png)
USD/CAD has staged a substantial fall in the last few weeks. Economists at Danske Bank analyze the pair’s outlook.
BoC to keep policy rates unchanged until Q1 2024
We regard USD/CAD as a low-beta version of USD/NOK and maintain a bullish view on USD/CAD on a 3-12M horizon. That said, in the near-term risks are for a further setback to the broad USD given weakness in US figures and as markets price in the first rate cut for March. This is likely to benefit CAD albeit not by as much as other cyclically sensitive currencies.
We expect the Bank of Canada to keep policy rates unchanged until Q1 2024 where we pencil in the first rate cut. We generally regard relative rates as neutral for USD/CAD but note how CFTC IMM positioning indicators suggest that markets remain long USD/CAD which on balance limits the topside.
A persistent move lower in the cross would likely require a stronger global growth backdrop than what we pencil in or a very ‘hard landing’ requiring a sharp easing of global monetary conditions, including a weaker USD.
After the Dollar rebounded at the end of last week and stabilised on Monday, renewed selling took hold on Tuesday. Economists at MUFG Bank analyze Greenback’s outlook.
Upside surprise in US PCE required to give the Fed’s push-back attempts a bit more credibility
The US PCE inflation data on Friday remains the key piece of data and really the final key data of the year and an upside surprise is required to give the Fed’s push-back attempts a bit more credibility.
If an upside surprise does not materialise, it will be difficult for the Fed to thwart expectations of a March rate cut which will reinforce the Dollar selling momentum, possibly through the quiet holiday period and into the start of 2024.
- Eurozone Consumer Confidence Indicator rose to -15.1 in December.
- EUR/USD remains around 1.0965 after data, modestly lower for the day.
Consumer sentiment in the Euro area improved in December with the Consumer Confidence Indicator edging higher to -15.1 from -16.4 in November, the European Commission reported on Wednesday. This reading came in better than the market expectation of -16.4. For the EU, the Consumer Confidence Indicator rose by 1.5 percentage points to -16.0.
Market reaction
The EUR/USD is falling modestly on Wednesday, and is trading around 1.0960 after the data. During the American session, the pair trimmed losses on the back of the weaker US Dollar.
- US CB Consumer Confidence Index rose sharply in December.
- US Dollar Index stays in tight daily range above 102.00.
Consumer sentiment in the US improved in December, with the Conference Board's Consumer Confidence Index rising to 110.7 from 101.0 in November (revised from 102.0).
Further details of the publication revealed that the Present Situation Index rose to 148.5 from 136.5 and the Consumer Expectations Index advanced to 85.6 from 77.4.
Finally, the one-year consumer inflation rate expectation edged lower to 5.6%.
Market reaction
The US Dollar Index edged slightly higher after the data and was last seen rising 0.1% on the day at 102.25.
- Existing Home Sales in the US recovered in November.
- US Dollar Index stays modestly higher around 102.20.
Existing Home Sales in the US rose 0.8% in November to a seasonally adjusted annual rate of 3.82 million, better than the 3.77 million of market consensus. It is the first increase after a five-month drop. Compared to a year ago, sales are down 7.3%.
"The median existing-home sales price rose 4.0% from November 2022 to $387,600 – the fifth consecutive month of year-over-year price increases", the report mentioned.
Market reaction
After trimming daily gains during the last two hours, the US Dollar Index (DXY) is hovering around 102.20 modestly higher for the day. US Treasury yields remain at monthly lows, with the 10-year under 3.90%.
EUR/USD has received support on the back of a dovish Fed and the ECB delivering push-back on rate cut expectations. Economists at Danske Bank analyze the pair’s outlook.
Good opportunities for USD weakness in the near term
We maintain the strategic case for a lower EUR/USD based on the relative terms of trade, real rates (growth prospects), and relative unit labour costs. Hence, we continue to expect a downward trajectory over the next 3-12M.
In the near term, we still see good opportunities for USD weakness. The considerable easing of financial conditions over the past month, in conjunction with bearish USD year-end seasonality, could provide some support to EUR/USD over the next couple of months.
Forecast: 1.11 (1M), 1.10 (3M), 1.07 (6M), 1.05 (12M)
Gold price rose more than 20% to a record high of $2,135 in 2023. Strategists at ANZ Bank analyze the yellow metal’s outlook for the next year.
Upside to be capped for Gold in the near term
Going into 2024, we expect Gold price to average above $2,000.
While we hold a positive stance for Gold, the latest price rally looks overdone. Steady rates till H1 2024 and falling inflation will see real rates rising by 50-100 bps, which will be negative for Gold investments. Therefore, we believe the upside to be capped for Gold in the near term.
Our long-term bullish view for gold hinges on three drivers: First, the Fed will start cutting interest rates, which will reduce the opportunity cost of non-yielding Gold. Second, economic, political and geoplitical risks are expected to remain heightened in 2024. The upcoming US elections will increase policy uncertainty, while prospects of slowing economic growth might encourage investors to diversify their portfolios by adding Gold. Third, central bank purchases sustain even after two years of strong buying. We estimate central bank buying to be in the range of 800-850t, but there could be an upside risk to this number.
- AUD/USD struggles for a direction as investors shift focus towards the US core PCE price index data.
- Broader market mood is quite upbeat as rate cut expectations by the Fed deepen.
- A breakout of the symmetrical triangle chart pattern has strengthened the Australian Dollar.
The AUD/USD pair trades sideways inside Tuesday’s trading range of 0.6700-0.6775 in the early New York session. The Aussie asset struggles for a direction as investors shift focus towards the United States core Personal Consumption Expenditure price index (PCE) data for November, which will be published on Friday.
The S&P500 opens on a negative note as profit-booking has kicked in. The overall market mood is quite upbeat as investors lean towards deepening rate cut expectations by the Federal reserve (Fed) in 2024. The US Dollar Index (DXY) faces selling pressure after a pullback move to near 102.50.
On the Australian Dollar front, the Reserve Bank of Australia (RBA) is expected to keep interest rates restrictive for longer as inflation in the Australian region is more than doubled the required rate of 2%.
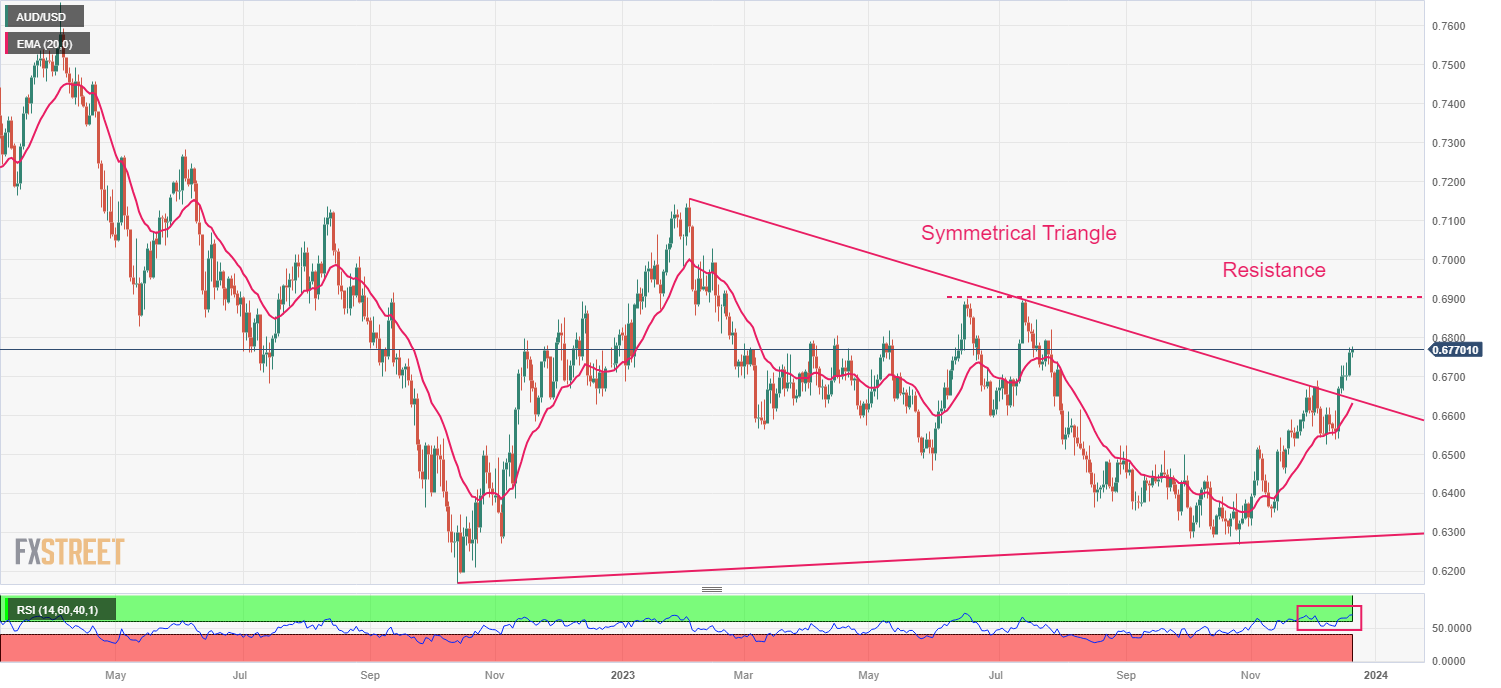
AUD/USD has continued its winning streak after a breakout of the Symmetrical Triangle chart pattern formed on a daily scale. A breakout of the aforementioned chart pattern results in wider bullish ticks and heavy volume. The asset is expected to extend upside towards the immediate resistance of 0.6900.
Upward-sloping 20-day Exponential Moving Average (EMA) around 0.6630 continues to provide support to the Australian Dollar bulls.
The Relative Strength Index (RSI) (14) shifts into the bullish range of 60.00-80.00, which indicates that the bullish momentum has been triggered.
Going forward, a decisive break above the intraday high of 0.6770 would expose the asset to July 20 high at 0.6846, followed by July 13 high around 0.6900.
On the flip side, downside bets would trigger if the asset breaks below December 7 low at 0.6525. Slippage below the same would drag the asset towards the psychological support of 0.6500 and November 17 low at 0.6452.
AUD/USD daily chart
The USD is trading mixed on the day as FX markets consolidate broadly. Economists at Scotiabank analyze Greenback’s outlook.
Focus on yields and month-end
Softer interest rates remain a significant headwind for the USD.
With the holidays approaching, month-end flows may be a factor for markets a little earlier than usual; strong gains for US equity markets this month suggest that passive hedge rebalancing flows will run against the USD, adding to downside pressure in the short run.
DXY technical signals reflect a moderation in the broad USD decline but price action implies a consolidation ahead of another push lower rather than any sign of a rebound.
Firm resistance is at 102.65 on the index. Support is 102.15, with further USD losses likely to accumulate below there.
EUR/USD is drifting back somewhat after gains stalled just under 1.10 on Tuesday. Economists at Scotiabank analyze the pair’s outlook.
Scope for losses is limited
Market bets – currently – that the Fed is more likely to blink first among the major central banks looking to ease next year continue to drive sentiment support in favour of the EUR.
Weakness below minor support at 1.0945 may see spot ease a little more in the near term but underlying trend momentum remains EUR-bullish and scope for losses is limited.
Firmer support should develop around 1.09. Resistance is 1.1015/1.1020.
- The Euro hesitates at 0.8660 as concerns about the eurozone economy grow.
- Weak Construction data and fears of a recession in Germany are weighing on the pair.
- Softer than expected UK CPI data is holding down the Sterling.
The Euro recovery from last week's lows has been halted at the 0.8660 area on Wednesday´s European morning session with the common currency weighed by mounting concerns about the Region's economy.
Earlier today, Eurostat released that Eurozone Construction Output contracted by 1% in October. These figures come after the downbeat IFO business sentiment index seen on Monday and last week’s contracting Services and Manufacturing PMIs.
In this context the Federation of German Industries (BDI) has warned that the German economy is heading for recession, increasing negative pressure on the Euro.
In the UK, Consumer inflation data released earlier on Wednesday has shown a larger-than-expected decline in November. This eases pressure on the BoE to keep hiking rates and is limiting Sterling´s recovery.
EUR/GBP Technical analysis
The technical picture shows the pair hesitating right below the 50% Fibonacci retracement of the late November - early December sell-off, with the near-term positive bias still intact.
Immediate support lies at 0.8630/40, which closes the path towards 0.8600 and the December 11 low at 0.8550. Above 0.8660, the next targets are 0.8690 and 0.8725.
Technical levels to watch
USD/CAD test support in low 1.33s. Economists at Scotiabank analyze the pair’s outlook.
Firm resistance at 1.3350/1.3360
The BoC’s Summary of Deliberations for the December 6th policy decision is released today. The last summary of the policy-making discussion noted that policymakers ‘needed to see downward momentum in core inflation to be confident that monetary policy was sufficiently restrictive’ to get inflation back on target. A somewhat hawkish-sounding run through of the BoC’s latest thinking might give the CAD a bit more support.
The charts suggest firm resistance at 1.3350/1.3360, with stronger resistance at 1.3400/1.3450.
Support is 1.3330/1.3335 and 1.3280.
- USD/JPY falls gradually to near 143.50 as rate cut expectations from the Fed deepen.
- Fed policymakers fear that resilience in the US economy could make price pressures sticky.
- The absence of dialogue on exiting ultra-loose policy by the BoJ forced investors to dump the Japanese Yen.
The USD/JPY pair corrects to near 143.50 amid expectations that the Federal Reserve (Fed) will start lowering borrowing interest rates earlier than projected by policymakers. The major faces a sell-off as Fed policymakers are failing to downplay rate cut expectations despite warnings that the achievement of price stability is the foremost priority.
S&P500 futures have added some losses in the European session, portraying a risk-off mood while the broader appeal is still bullish. The US Dollar Index (DXY) rebounds to near 102.40 but the pullback move could be considered as a selling opportunity by the market participants.
The USD Index is expected to remain broadly on backfoot despite the Fed has not declared an outright victory over inflation. Fear that resilience in the United States economy could make price pressures sticky is forcing Fed policymakers to maintain a restrictive stance on interest rates.
Going forward, investors will focus on the US core Personal Consumption Expenditure price index (PCE) for November, which will be published on Friday. Further softening of Fed’s preferred inflation tool is highly likely due to higher interest rates by the Fed.
Meanwhile, the Japanese Yen is performing better against the US Dollar despite an unchanged interest rate policy by the Bank of Japan (BoJ). The BoJ kept interest rates unchanged as expected but refrained from discussions about exiting the ultra-loose policy.
GBP/USD is the big mover today, trading lower near 1.2650. Economists at Scotiabank analyze the pair’s outlook.
Return to the mid-1.27s likely on a break past 1.2680
Short-term price signals suggest some loss of momentum for Cable today although spot is holding a consolidation range, with longer-term signals still positively aligned for the Pound.
Intraday support is 1.2650 and 1.2630. Loss of support through the latter point could see weakness extend to the mid/upper 1.25s.
Resistance is 1.2680, with the return to the mid-1.27s likely above there.
USD/CAD has declined toward the 1.33 level. Economists at Scotiabank analyze the pair’s outlook.
Positioning remains a potential driver of additional CAD gains
Spreads look set to continue compressing in the CAD’s favour in the weeks ahead which suggests the CAD can continue to push higher.
Last week’s CFTC data showed that a very large net CAD short position among speculative, real money and hedge fund traders remains intact. Short covering could still give the CAD a shove higher in the coming weeks.
Seasonal trends leave the door open for a short, sharp move lower in USD/CAD right into the last days of the calendar year (perhaps before a consolidation in Q1).
Broader USD weakness plus late year liquidity and volatility issues leave the door open for USD/CAD weakness to stretch further in the short run.
- The US Dollar trades mixed ahead of more US housing data.
- Markets are not fleeing to safe havens on the back of Red Sea geopolitical tensions.
- The US Dollar Index is torn between risk-on mood and Fed speakers pushing back on rate cut bets.
The US Dollar (USD) trades sideways on Wednesday, a mixed trading day on the quote board. Markets are ignoring the geopolitical risk and inflationary pressures that might come on the back of the rerouting of vessels forced by recent attacks in the Red Sea. . Meanwhile, in the commodity space, Oil is soaring and OPEC+ is having a field day. The US Dollar Index is stuck just above 102.00, with the potential to move more sharply later this week on key US data.
On the economic front, there are not many top-tier numbers in the run-up to Thursday’s US Gross Domestic Product (GDP) data and Friday’s Personal Consumption Expenditures (PCE) Price Index. US Existing Home Sales might have some weight after the mixed data from Tuesday, which showed an increase in Housing Starts but a decline in Building Permits.
Daily digest Market Movers: No bets to be made anymore
- Colorado state has banned former US President Donald Trump from being on voting ballots in the upcoming Presidential elections. The State’s top court ruled that Trump was guilty of his role in the January 6 breach of Congress, which disqualifies him from running. This sentence can be upheld or reversed by the US Supreme Court.
- At 12:00 GMT, the Mortgage Bankers Association (MBA) was released.Previous number was 7.4% and declined by 1.5% this week.
- At 15:00 GMT, US Consumer Confidence for December is due. the previous reading was at 102, forecasts show 104.5.
- At the same time, Existing Home Sales data will be released. Previous was for 3.79 million, and a decline to 3.77 million is expected.
- Chicago Federal Reserve President Austan Goolsbee will be speaking near 17:00 GMT.
- Around 18:00 GMT, the US Treasury Department will allocate a 20-year bond auction.
- Equities are mixed. In Asia, the Japanese Nikkei closed up over 1%, while in China the Shanghai-Shenzhen index dropped over 1%. Europe is trading flat, with minor losses at hand.
- The CME Group’s FedWatch Tool shows that markets are pricing in a 87.6% chance that the Federal Reserve will keep interest rates unchanged at its January 31 meeting. Around 12.4% expect the first cut already to take place.
- The benchmark 10-year US Treasury Note trades near 3.89%, making another low since July.
US Dollar Index Technical Analysis: Entering calm water
The US Dollar Index is starting to consolidate looking at the daily chart. This points to both buyers and sellers being pushed toward each other, with lower highs and higher lows. Once the melting point has been reached, a breakout will take place either way, which fits with the US GDP numbers and PCE inflation being published on Thursday and Friday, respectively.
Still, US Dollar bulls have their work cut out to salvage what was lost last week. On the daily chart, look for 103.00 as the first level to watch. Once trading above there, the 200-day Simple Moving Average (SMA) at 103.50 is the next important level to get to.
To the downside, the pivotal level at 101.70– the low of August 4 and 10 – is vital to hold. Once broken, look for 100.82, which aligns with the bottoms from February and April. Should that level snap, nothing will stand in the way of DXY heading to the sub-100 region.
US Dollar FAQs
What is the US Dollar?
The US Dollar (USD) is the official currency of the United States of America, and the ‘de facto’ currency of a significant number of other countries where it is found in circulation alongside local notes. It is the most heavily traded currency in the world, accounting for over 88% of all global foreign exchange turnover, or an average of $6.6 trillion in transactions per day, according to data from 2022.
Following the second world war, the USD took over from the British Pound as the world’s reserve currency. For most of its history, the US Dollar was backed by Gold, until the Bretton Woods Agreement in 1971 when the Gold Standard went away.
How do the decisions of the Federal Reserve impact the US Dollar?
The most important single factor impacting on the value of the US Dollar is monetary policy, which is shaped by the Federal Reserve (Fed). The Fed has two mandates: to achieve price stability (control inflation) and foster full employment. Its primary tool to achieve these two goals is by adjusting interest rates.
When prices are rising too quickly and inflation is above the Fed’s 2% target, the Fed will raise rates, which helps the USD value. When inflation falls below 2% or the Unemployment Rate is too high, the Fed may lower interest rates, which weighs on the Greenback.
What is Quantitative Easing and how does it influence the US Dollar?
In extreme situations, the Federal Reserve can also print more Dollars and enact quantitative easing (QE). QE is the process by which the Fed substantially increases the flow of credit in a stuck financial system.
It is a non-standard policy measure used when credit has dried up because banks will not lend to each other (out of the fear of counterparty default). It is a last resort when simply lowering interest rates is unlikely to achieve the necessary result. It was the Fed’s weapon of choice to combat the credit crunch that occurred during the Great Financial Crisis in 2008. It involves the Fed printing more Dollars and using them to buy US government bonds predominantly from financial institutions. QE usually leads to a weaker US Dollar.
What is Quantitative Tightening and how does it influence the US Dollar?
Quantitative tightening (QT) is the reverse process whereby the Federal Reserve stops buying bonds from financial institutions and does not reinvest the principal from the bonds it holds maturing in new purchases. It is usually positive for the US Dollar.
- The New Zealand dollar reaches overbought levels after an 8-day rally.
- Risk appetite and the correlation with the AUD are buoying the pair.
- NZD/USD rally is likely to meet strong resistance at 0.6375.
The Kiwi maintains its bid tone intact on Wednesday´s European session. Investors’ optimism about the end of the global tightening cycle has buoyed the risk-sensitive NZD, which is on track to an 8-day rally, reaching overbought levels in daily and hourly timeframes.
NZD´s correlation with the AUD has contributed to sustaining the rally. The hawkish minutes of the Australian Central Bank’s last meeting, released on Tuesday boosted the antipodean currencies, offsetting the impact of a poor New Zealand trade balance.
NZD/USD faces strong resistance at 0.6375
From a technical perspective, the pair seems in the last leg of a 5-wave impulse from 0.5775 lows with an important resistance at 0.6375. This is a previous resistance level and the 261% Fibonacci extension, which tends to be an exhaustion zone.
On the downside, Immediate support lies at the 0.6220 previous high, and below here, 0.6165 and the December 13 low at 0.6090.
Technical levels to watch
The BRL has done well this year to rally 7.7% on spot basis vs. USD. Economists at Société Générale analyze USD/BRL technical outlook.
Right shoulder near 4.97 must be overcome to negate the Head and Shoulders formation
The pair is now close to crucial graphical level of 4.84 which is also the neckline of Head and Shoulders. Break below this support would confirm the pattern and denote an extended decline towards 4.78 and July low of 4.73/4.69.
The right shoulder near 4.97 must be overcome to negate the formation.
- WTI Oil snaps above $74 and enters room for more upside.
- Oil surges as demand is set to pick up after all big freight shipping companies are taking longer routes to avoid the Red Sea passage.
- The DXY US Dollar Index jumps higher after a downbeat start of the week.
Oil prices are jumping higher throughout the week as Red Sea attacks fuel fears of disrupted supply chains. On Monday, a vessel was attacked by missiles coming from Houthi rebels, making the passage in the Red Sea to the Suez Canal unsafe as a travel route. All big freight shipping companies have deviated their fleet away from the Red Sea, taking the much longer road around Africa, making it more expensive and diesel consuming to get goods where they need to be.
Meanwhile, the US Dollar (USD) is unable to benefit from the safe-haven inflow, with markets rather focusing on the quick solutions delivered. Instead, the Greenback is stuck with markets being clueless about what to do with all comments from Fed speakers that are pushing back against early rate cuts expectations from markets. From a technical point of view, trading volumes are starting to die down ahead of Christmas.
Crude Oil (WTI) trades at $74.70 per barrel, and Brent Oil trades at $79.90 per barrel at the time of writing.
Oil News and Market Movers: Demand to pick up
- The US is forming a task force with France, Canada and several other countries to monitor safe passage in the Red Sea. However, this will take time before becoming a reality.
- Markets are already gearing up for a pickup in inflation on the back of the longer routes vessels, and ships will need to take to go around Africa, which comes with longer transportation times and more fuel consumption.
- Overnight, the weekly numbers from the American Petroleum Institute (API) were released. A build of 939,000 was reported for the Crude stockpile.
- At 15:30 GMT, the Energy Information Administration (EIA) is set to release its crude numbers. Previous was a drawdown of 4.259 million, and another drawdown of 2.233 million barrels is expected.
Oil Technical Analysis: The longer this takes, the higher Crude will go
Oil prices are soaring higher as problems mount in one of the most important areas for global trade. The Red Sea and Suez Canal will see substantially less passage as all big shipping firms are sending their fleet around Africa, awaiting the US-led task force to be operational. Meanwhile, demand for Crude will likely jump, with market participants afraid to fall without supply as longer routes now need to be factored in for delivery.
On the upside, $74 got broken and tested for support, offering more upside. Once through there, $80 comes into the picture. Although still far off, $84 is next on the topside once Oil sees a few daily closes above the $80 level.
Below $74, the $67.00 level could still come into play as the next support level to trade at as it aligns with a triple bottom from June.. Should that triple bottom break, a new low for 2023 could be close at $64.35 – the low of May and March – as the last line of defence. Although still quite far off, $57.45 is worth mentioning as the next level to keep an eye on if prices fall sharply.
-638386661727300126.png)
US WTI Crude Oil: Daily Chart
WTI Oil FAQs
What is WTI Oil?
WTI Oil is a type of Crude Oil sold on international markets. The WTI stands for West Texas Intermediate, one of three major types including Brent and Dubai Crude. WTI is also referred to as “light” and “sweet” because of its relatively low gravity and sulfur content respectively. It is considered a high quality Oil that is easily refined. It is sourced in the United States and distributed via the Cushing hub, which is considered “The Pipeline Crossroads of the World”. It is a benchmark for the Oil market and WTI price is frequently quoted in the media.
What factors drive the price of WTI Oil?
Like all assets, supply and demand are the key drivers of WTI Oil price. As such, global growth can be a driver of increased demand and vice versa for weak global growth. Political instability, wars, and sanctions can disrupt supply and impact prices. The decisions of OPEC, a group of major Oil-producing countries, is another key driver of price. The value of the US Dollar influences the price of WTI Crude Oil, since Oil is predominantly traded in US Dollars, thus a weaker US Dollar can make Oil more affordable and vice versa.
How does inventory data impact the price of WTI Oil
The weekly Oil inventory reports published by the American Petroleum Institute (API) and the Energy Information Agency (EIA) impact the price of WTI Oil. Changes in inventories reflect fluctuating supply and demand. If the data shows a drop in inventories it can indicate increased demand, pushing up Oil price. Higher inventories can reflect increased supply, pushing down prices. API’s report is published every Tuesday and EIA’s the day after. Their results are usually similar, falling within 1% of each other 75% of the time. The EIA data is considered more reliable, since it is a government agency.
How does OPEC influence the price of WTI Oil?
OPEC (Organization of the Petroleum Exporting Countries) is a group of 13 Oil-producing nations who collectively decide production quotas for member countries at twice-yearly meetings. Their decisions often impact WTI Oil prices. When OPEC decides to lower quotas, it can tighten supply, pushing up Oil prices. When OPEC increases production, it has the opposite effect. OPEC+ refers to an expanded group that includes ten extra non-OPEC members, the most notable of which is Russia.
Economists at Goldman Sachs have revised their Franc’s forecasts against the Euro and Dollar.
USD/CHF forecast to be at 0.88, 0.86, and 0.85 in 3, 6 and 12 months, respectively
We revise our EUR/CHF forecasts to remain flat at 0.95 in 3, 6 and 12 months, adjusted from previous forecasts of 0.96, 0.95, and 0.94.
USD/CHF is forecast to be at 0.88, 0.86, and 0.85 in 3, 6, and 12 months, respectively. This is a change from previous predictions of 0.92, 0.90, and 0.85.
- The US Dollar hits new mid-term lows approaching 1.3300.
- Sticky Canadian inflation supports the BoC’s hawkish view.
- The Dollar remains depressed with investors eyeing Fed cuts.
The Greenback keeps heading south against its Canadian counterpart on Wednesday reaching fresh multi-month lows below 1.3330. Hopes of Fed cuts on early 2024 and a stronger Loonie following Canadian CPI figures are crushing the USD.
CAD surges on higher oil prices and a hawkish BoC
Data released by Statistics Canada on Tuesday revealed that inflation remained sticky above the 3% yearly level in November, against market expectations of a decline to 2,9%. The Core Index accelerated to 2.8% year-on-year, from 2.7% in October.
These figures back the hawkish message conveyed by the Bank of Canada after its December meeting, denying any chance of rate cuts in the near term.
On the other hand, heightened hopes that the Fed will start cutting rates in March are acting as a headwind for a significant US Dollar recovery. Investors are turning a deaf ear to Fed officials’ warnings against excessive optimism.
Beyond that, Oil prices continue appreciating, driven by concerns about supply disruptions and higher costs with shipping firms forced to find alternative routes to the Suez Canal. This provides additional support to the loonie as Canada is one of the world´s major oil exporters.
Technical levels to watch
Over the last year, EUR/GBP has averaged 0.87, trading roughly in a 0.85-0.90 range. Economists at Société Générale analyze the pair’s outlook.
EUR/GBP on the rise – buy gilts
Our forecast for 2024 looks for a gradual climb to 0.90, as the gap between UK MPC and ECB rates narrows and the UK economy marginally underperforms the Eurozone.
It’s not a thrilling prospect (a bearish consensus view of the UK means it would be more fun looking for positives in the outlook for Sterling).
Maybe we should just recommend gilts, which offer over 150 bps of yield pickup to Bunds at 10 years and 160 bps at 2 years.
GBP just lurched lower in response to the much weaker-than-expected inflation data from the UK. Economists at MUFG Bank analyze Sterling’s outlook.
Wages will need to show some big downside surprises to prompt a big dovish shift from the BoE
The sharp drop in the YoY headline CPI rate from 4.6% to 3.9% (expected at 4.3%) in November will be very welcomed by the BoE. The weakness looks broad-based as well with the core YoY rate 0.5ppt weaker than expected at 5.1%, down from 5.7%, helped by weaker services CPI which fell from 6.6% to 6.3% – the market expected it to remain unchanged.
The scale of the downside surprise in today’s CPI will likely prove telling, possibly not immediately, but as we proceed through Q1 next year. Before today, the OIS market implied the first rate cut would be in June. That is likely to be brought forward now and lower yields will keep GBP pressured to the downside for now.
The market view of divergence of the BoE relative to the Fed and the ECB has been undermined by this CPI report but wages will need to show some big downside surprises too to prompt a big dovish shift from the BoE.
- The Aussie is showing bearish divergence at five-month highs.
- Hawkish RBA minutes and hopes of Fed cuts have boosted support for the AUD.
- The Dollar remains depressed despite Fed officials' efforts to push back rate cut hopes.
Investors´ appetite for risk as they see the end of the central bank´s tightening cycles has pushed the Aussie to nearly five-month highs. The pair is nearing the 0,6810 resistance area although the bearish divergence on the 4-hour chars suggests a reversal might be in the cards.
A hawkish RBA and Fed cut hopes are supporting the Aussie
The minutes of the RBA´s last meeting, released on Tuesday reflected a hawkish tone, with the bank keeping the options open for further tightening despite the “encouraging signs” on inflation.
This, coupled with the overall Dollar weakness, underpins support for the Aussie. The US Dollar Index remains close to four-month lows as investors ignore Fed officials’ efforts to push back hopes of March cuts.
Technical indicators remain bullish although the mentioned divergence and the hesitant mood seen on Wednesday might be anticipating a reversal or, at least some consolidation.
Immediate resistance lies at 0.6775, ahead of late July highs at 0,6820 and 0.6845. Support levels are 0.6735 and 0.6690.
Technical levels to watch
In an interview with German internet portal T-Online, European Central Bank (ECB) policymaker Joachim Nagel warned markets against betting on imminent rate cuts, per Reuters.
"We must initially remain at the current interest rate plateau so that monetary policy can fully develop its inflation-dampening effect," Nagel said and added:
"I would say to everyone who is speculating on an imminent interest rate cut: be careful, some people have already miscalculated that."
Market reaction
EUR/USD showed no immediate reaction to these comments and was last seen trading in its tight daily channel at around 1.0950.
- The Euro loses steam right below 1.1000, with downside attempts limited for now.
- The US Dollar remains weak as the market ignores Fed officials’ warnings about excessive optimism.
- The positive risk sentiment is keeping Euro bears subdued.
The Euro (EUR) recovery from Monday’s lows has lost steam right below the 1.1000 level, yet with bearish attempts lacking follow through. The US Dollar (USD) remains depressed near multi-month lows against most rivals, which is keeping the pair from a deeper reversal.
The positive market sentiment, with markets pricing in a quarter-point cut by the Federal Reserve (Fed) in March, keeps fuelling investors’ appetite for risk, underpinning support for the common currency.
On the other hand, recent macroeconomic data from the Eurozone is painting a grim outlook, which is likely to keep Euro bulls at bay. The final Consumer Prices Index (CPI) for November confirmed the disinflationary trends, and Monday’s IFO survey showed sentiment is deteriorating among German businesses.
These figures, combined with the weak Q3 GDP and the contracting services and manufacturing PMIs, bring into question the hawkish stance shown by the European Central Bank (ECB) after December´s meeting.
Daily digest market movers: Euro remains steady near four-month highs
- The Euro has lost steam on Wednesday, yet with bearish attempts limited amid the positive market sentiment.
- Atlanta Fed president Raphael Bostic affirmed that there is no “urgency” to cut rates and pointed to the second quarter of 2024 for the first easing move.
- Later today, Chicago Fed President Austan Goldsbee, a hawk, is likely to push back rate cut hopes.
- Investors keep pricing in nearly 75% chance that the US central bank will cut rates by 0.25% in their March meeting, according to data by the CME Group Fed Watch Tool.
- The uncertainty in the Red Sea has forced shipping companies to reroute their shipments. This is pushing Oil prices higher, which is likely to hurt the Euro, as the Eurozone is a net Oil importer.
- The US Dollar maintains its weak tone, with the US Dollar Index (DXY) fluctuating near four-month lows, weighed by low US bond yields.
Technical Analysis: Euro loses steam below 1.1000
Euro sellers have shown up right below 1.1000, pushing the pair to the mid-range of 1.0900. The US Dollar Index remains capped below previous support at 102.45 and the market mood is favourable, which maintains recent highs at a short distance.
From a wider perspective, the broader trend remains bullish, although resistance at the 1.1010 area is likely to be a serious obstacle. Above here, the next targets would be the August high at 1.1060, and the July 24 and 27 high at 1.1150.
To the downside, the pair should break the 1.0880 and the 4-hour 100 Simple Moving Average (SMA) at 1.0870 to increase bearish pressure and shift bears’ focus towards 1.0825 on the way to December lows at 1.0715.
Euro FAQs
What is the Euro?
The Euro is the currency for the 20 European Union countries that belong to the Eurozone. It is the second most heavily traded currency in the world behind the US Dollar. In 2022, it accounted for 31% of all foreign exchange transactions, with an average daily turnover of over $2.2 trillion a day.
EUR/USD is the most heavily traded currency pair in the world, accounting for an estimated 30% off all transactions, followed by EUR/JPY (4%), EUR/GBP (3%) and EUR/AUD (2%).
What is the ECB and how does it impact the Euro?
The European Central Bank (ECB) in Frankfurt, Germany, is the reserve bank for the Eurozone. The ECB sets interest rates and manages monetary policy.
The ECB’s primary mandate is to maintain price stability, which means either controlling inflation or stimulating growth. Its primary tool is the raising or lowering of interest rates. Relatively high interest rates – or the expectation of higher rates – will usually benefit the Euro and vice versa.
The ECB Governing Council makes monetary policy decisions at meetings held eight times a year. Decisions are made by heads of the Eurozone national banks and six permanent members, including the President of the ECB, Christine Lagarde.
How does inflation data impact the value of the Euro?
Eurozone inflation data, measured by the Harmonized Index of Consumer Prices (HICP), is an important econometric for the Euro. If inflation rises more than expected, especially if above the ECB’s 2% target, it obliges the ECB to raise interest rates to bring it back under control.
Relatively high interest rates compared to its counterparts will usually benefit the Euro, as it makes the region more attractive as a place for global investors to park their money.
How does economic data influence the value of the Euro?
Data releases gauge the health of the economy and can impact on the Euro. Indicators such as GDP, Manufacturing and Services PMIs, employment, and consumer sentiment surveys can all influence the direction of the single currency.
A strong economy is good for the Euro. Not only does it attract more foreign investment but it may encourage the ECB to put up interest rates, which will directly strengthen the Euro. Otherwise, if economic data is weak, the Euro is likely to fall.
Economic data for the four largest economies in the euro area (Germany, France, Italy and Spain) are especially significant, as they account for 75% of the Eurozone’s economy.
How does the Trade Balance impact the Euro?
Another significant data release for the Euro is the Trade Balance. This indicator measures the difference between what a country earns from its exports and what it spends on imports over a given period.
If a country produces highly sought after exports then its currency will gain in value purely from the extra demand created from foreign buyers seeking to purchase these goods. Therefore, a positive net Trade Balance strengthens a currency and vice versa for a negative balance.
Fed FAQs
What does the Federal Reserve do, how does it impact the US Dollar?
Monetary policy in the US is shaped by the Federal Reserve (Fed). The Fed has two mandates: to achieve price stability and foster full employment. Its primary tool to achieve these goals is by adjusting interest rates.
When prices are rising too quickly and inflation is above the Fed’s 2% target, it raises interest rates, increasing borrowing costs throughout the economy. This results in a stronger US Dollar (USD) as it makes the US a more attractive place for international investors to park their money.
When inflation falls below 2% or the Unemployment Rate is too high, the Fed may lower interest rates to encourage borrowing, which weighs on the Greenback.
How often does the Fed hold monetary policy meetings?
The Federal Reserve (Fed) holds eight policy meetings a year, where the Federal Open Market Committee (FOMC) assesses economic conditions and makes monetary policy decisions.
The FOMC is attended by twelve Fed officials – the seven members of the Board of Governors, the president of the Federal Reserve Bank of New York, and four of the remaining eleven regional Reserve Bank presidents, who serve one-year terms on a rotating basis.
What is Quantitative Easing (QE) and how does it impact USD?
In extreme situations, the Federal Reserve may resort to a policy named Quantitative Easing (QE). QE is the process by which the Fed substantially increases the flow of credit in a stuck financial system.
It is a non-standard policy measure used during crises or when inflation is extremely low. It was the Fed’s weapon of choice during the Great Financial Crisis in 2008. It involves the Fed printing more Dollars and using them to buy high grade bonds from financial institutions. QE usually weakens the US Dollar.
What is Quantitative Tightening (QT) and how does it impact the US Dollar?
Quantitative tightening (QT) is the reverse process of QE, whereby the Federal Reserve stops buying bonds from financial institutions and does not reinvest the principal from the bonds it holds maturing, to purchase new bonds. It is usually positive for the value of the US Dollar.
The Dollar has significantly retreated from its highs. Economists at BNP Paribas analyze Greenback’s outlook against the Euro and the Yen.
USD/JPY to fall to 135 and 130 by the end of 2024 and 2025
Markets are now pricing in approximately 150 bps of rate cuts by the end of 2024. There is a potential for these rate cut expectations to extend further if economic data continues to show a slowdown.
We anticipate fewer rate cuts by other major central banks compared to the Fed, leading to narrowing interest rate differentials between the US and other regions.
We maintain bearish USD forecasts, predicting EUR/USD to rise to 1.15 and 1.18 by the end of 2024 and 2025, respectively. We also forecast USD/JPY to fall to 135 and 130 by the end of 2024 and 2025.
- Gold price struggles for a direction ahead of US core PCE price index data.
- Fed Bostic sees no urgency for interest-rate cuts amid sheer strength in the US economy.
- Fed Barkin remains data-dependent for rate cuts in 2024.
Gold price (XAU/USD) trades back and forth around $2,040 ahead of the United States core Personal Consumption Expenditure price index (PCE) data for November, which will be released on Friday. The underlying inflation data is expected to soften further amid higher interest rates by the Federal Reserve (Fed).
Despite warnings from Fed policymakers that the central bank is currently focusing on keeping interest rates restrictive to ensure a return of inflation to 2%, investors lean toward investing in Gold due to optimism over rate cuts in 2024. Contrary to the median projection of three rate cuts by the Fed in its monetary policy announcement last week, Atlanta Fed Bank President Raphael Bostic sees only two rate cuts.
Daily Digest Market Movers: Gold price struggles for direction
- Gold price prepares for more upside above a 15-day high around $2,040.00 as expectations of rate cuts by the Federal Reserve in 2024 is outplaying the stance of keeping interest rates restrictive until price stability is ensured.
- The precious metal is holding gains despite the fact that Fed policymakers are playing down expectations of early rate cuts amid resilience in the United States economy.
- The majority of Fed policymakers have commented that the Fed is focused on bringing down inflation to 2% rather than rate cuts in 2024.
- Atlanta Fed Bank President Raphael Bostic said on Monday that there is no urgency for the central bank to lower borrowing costs. The priority of the Fed is to that inflation retreats to 2% as sheer strength in the US economy could delay progress in abating price pressures.
- Bostic added that rate cuts would be required in advance of underlying inflation returning to 2% to avoid any unnecessary blow in employment numbers. Bostic reiterated on Tuesday that he expects two rate cuts in 2024.
- As per the CME Fedwatch tool, market participants see almost a 70% chance in favour of a first rate cut by 25 basis points (bps) in March. The likelihood of a second rate cut in May is at 60%.
- On the contrary, Richmond Fed Bank President Thomas Barkin said that rate cuts depend on how the economy performs in 2024. While asked about economic prospects, Barkin commented that the economy is well-positioned with easing inflation and a steady Unemployment Rate.
- The US Dollar Index (DXY) found intermediate support near 102.00 after failing to extend recovery above 102.60 as rate cut expectations have dampened its fundamentals.
- This week, investors will focus on the core PCE price index data for November, which is scheduled for Friday.
- As per the consensus, monthly core PCE data is seen growing at a steady pace of 0.2%. On an annual basis, the Fed’s preferred inflation tool is expected to decline to 3.3% against the former reading of 3.5%.
- Apart from the Fed’s preferred inflation gauge, investors will focus on the US Durable Goods Orders data for November. Investors expect the demand for core goods grew by 2.2% against 5.4% fall in October.
- Meanwhile, geopolitical tensions between Israel and Palestine have started again, which would infuse some strength in bullions.
- United Nations Security Council is in talks for a ceasefire in Gaza to deliver humanitarian aid to civilians.
Technical Analysis: Gold price continues to trade sideways near $2,040
Gold price oscillates inside Tuesday’s trading range as investors await the Fed’s preferred inflation gauge for further action. The broader appeal for Gold is bullish as its price is confidently sustaining above the 20-day and 50-day Exponential Moving Averages (EMAs). Momentum oscillators, namely the Relative Strength Index (RSI) (14), is hovering near 60.00. A decisive break above the same would trigger a bullish momentum.
Gold FAQs
Why do people invest in Gold?
Gold has played a key role in human’s history as it has been widely used as a store of value and medium of exchange. Currently, apart from its shine and usage for jewelry, the precious metal is widely seen as a safe-haven asset, meaning that it is considered a good investment during turbulent times. Gold is also widely seen as a hedge against inflation and against depreciating currencies as it doesn’t rely on any specific issuer or government.
Who buys the most Gold?
Central banks are the biggest Gold holders. In their aim to support their currencies in turbulent times, central banks tend to diversify their reserves and buy Gold to improve the perceived strength of the economy and the currency. High Gold reserves can be a source of trust for a country’s solvency. Central banks added 1,136 tonnes of Gold worth around $70 billion to their reserves in 2022, according to data from the World Gold Council. This is the highest yearly purchase since records began. Central banks from emerging economies such as China, India and Turkey are quickly increasing their Gold reserves.
How is Gold correlated with other assets?
Gold has an inverse correlation with the US Dollar and US Treasuries, which are both major reserve and safe-haven assets. When the Dollar depreciates, Gold tends to rise, enabling investors and central banks to diversify their assets in turbulent times. Gold is also inversely correlated with risk assets. A rally in the stock market tends to weaken Gold price, while sell-offs in riskier markets tend to favor the precious metal.
What does the price of Gold depend on?
The price can move due to a wide range of factors. Geopolitical instability or fears of a deep recession can quickly make Gold price escalate due to its safe-haven status. As a yield-less asset, Gold tends to rise with lower interest rates, while higher cost of money usually weighs down on the yellow metal. Still, most moves depend on how the US Dollar (USD) behaves as the asset is priced in dollars (XAU/USD). A strong Dollar tends to keep the price of Gold controlled, whereas a weaker Dollar is likely to push Gold prices up.
- GBP/JPY shifts on backfoot after soft UK Inflation report.
- The BoE may continue with its restrictive policy stance as UK has highest inflation among western economies.
- This week, UK Retail Sales and Japan’s National CPI data will be keenly watched.
The GBP/JPY pair faced a sharp sell-off after the release of the softer-than-projected United Kingdom Consumer Price Index (CPI) report for November. The UK Office for National Statistics (ONS) reported that monthly headline inflation witnessed a de-growth by 0.2% while investors projected a growth of 0.1%. In October, the economic data remained stagnant. The annual headline and core inflation decelerated significantly to 3.9% and 5.1% respectively.
A sharp decline in the UK inflation has resulted in a sigh of relief for Bank of England (BoE) policymakers but chances for the central bank keeping interest rates in a restrictive territory for a longer period than other central bankers are high. In spite of a significant fall in price pressures in November, inflation in the UK region is highest in comparison with other western economies.
On Tuesday, BoE Deputy Governor Sarah Breeden emphasized on keeping policy in a restrictive manner to keep price pressures in check but said "I have no pre-determined policy path in mind," when asked about guidance on interest rates.
After the inflation hangover, investors will focus on the UK Retail Sales data for November, which will be published on Friday. Monthly Retail Sales data is seen expanding by 0.4% against a contraction of 0.3%.
On the Tokyo front, the Japanese Yen is broadly under pressure as roadmap about exiting from ultra-dovish monetary policy was missing in commentary of Bank of Japan (BoJ) Governor Kazuo Ueda in his monetary policy statement. The BoJ kept interest rates unchanged in the negative trajectory as anticipated.
Going forward, investors will focus on the National CPI data for November, which will be published on Friday.
The Yuan has weakened against the Dollar by over 3% year to date. Economists at Commerzbank analyze USD/CNY outlook.
China-US interest rate differentials will persist in the near term
While the Yuan strengthened in recent weeks towards 7.10 amid a generally weaker Dollar, it will remain under pressure.
China-US interest rate differentials will persist in the near term, albeit narrower, while China’s economy is still in search of a more stable footing. The PBoC will likely continue to use the daily fixing to guide the Yuan and prevent one-sided weakening.
Gold prices rose in India on Wednesday, according to data from India's Multi Commodity Exchange (MCX).
Gold price stood at 62,224 Indian Rupees (INR) per 10 grams, up INR 378 compared with the INR 61,846 it cost on Tuesday.
As for futures contracts, Gold prices increased to INR 62,585 per 10 gms from INR 62,476 per 10 gms.
Prices for Silver futures contracts decreased to INR 74,927 per kg from INR 74,824 per kg.
| Major Indian city | Gold Price |
|---|---|
| Ahmedabad | 64,440 |
| Mumbai | 64,205 |
| New Delhi | 64,360 |
| Chennai | 64,400 |
| Kolkata | 64,385 |
Global Market Movers: Comex Gold price bulls take a pause ahead of the US PCE Price Index on Friday
- Growing acceptance that the Federal Reserve (Fed) will pivot away from its hawkish stance early next year continues to act as a tailwind for the Comex Gold price.
- Chicago Fed President Austan Goolsbee said the central bank is not pre-committing to cutting interest rates soon and should not be bullied by what the market wants.
- Cleveland Fed President Loretta Mester noted on Monday that financial markets had got a little bit ahead of the central bank on when to expect interest rate cuts next year.
- The markets, however, have priced in a more than 60% chance that the Fed will cut rates as soon as March 2024 and a total of 140 basis points of rate reductions in 2024.
- The yield on the benchmark 10-year US government bond languishes below the 4% mark, with the US Dollar hovering just above a multi-month low touched last week.
- The global risk-on rally remains uninterrupted amid expectations of lower interest rates in the US, more stimulus from China and dovish Bank of Japan, capping the safe-haven metal.
- Traders now look to the US Consumer Confidence Index for some impetus later this Wednesday, though the focus remains on the release of the US PCE Price Index on Friday.
(An automation tool was used in creating this post.)
Gold FAQs
Why do people invest in Gold?
Gold has played a key role in human’s history as it has been widely used as a store of value and medium of exchange. Currently, apart from its shine and usage for jewelry, the precious metal is widely seen as a safe-haven asset, meaning that it is considered a good investment during turbulent times. Gold is also widely seen as a hedge against inflation and against depreciating currencies as it doesn’t rely on any specific issuer or government.
Who buys the most Gold?
Central banks are the biggest Gold holders. In their aim to support their currencies in turbulent times, central banks tend to diversify their reserves and buy Gold to improve the perceived strength of the economy and the currency. High Gold reserves can be a source of trust for a country’s solvency. Central banks added 1,136 tonnes of Gold worth around $70 billion to their reserves in 2022, according to data from the World Gold Council. This is the highest yearly purchase since records began. Central banks from emerging economies such as China, India and Turkey are quickly increasing their Gold reserves.
How is Gold correlated with other assets?
Gold has an inverse correlation with the US Dollar and US Treasuries, which are both major reserve and safe-haven assets. When the Dollar depreciates, Gold tends to rise, enabling investors and central banks to diversify their assets in turbulent times. Gold is also inversely correlated with risk assets. A rally in the stock market tends to weaken Gold price, while sell-offs in riskier markets tend to favor the precious metal.
What does the price of Gold depend on?
The price can move due to a wide range of factors. Geopolitical instability or fears of a deep recession can quickly make Gold price escalate due to its safe-haven status. As a yield-less asset, Gold tends to rise with lower interest rates, while higher cost of money usually weighs down on the yellow metal. Still, most moves depend on how the US Dollar (USD) behaves as the asset is priced in dollars (XAU/USD). A strong Dollar tends to keep the price of Gold controlled, whereas a weaker Dollar is likely to push Gold prices up.
- USD/CHF attempts to halt a losing streak as the US Dollar improves.
- Fed officials pushed back on the speculation of a rate cut in March.
- The escalated tension in the Red Sea provided support for the safe-haven Swiss Franc.
USD/CHF recovers from the five-month low at 0.8593 level as US Dollar (USD) attempts to retrace its recent losses. The USD/CHF trades higher near 0.8620 during the European session on Wednesday. However, the US Dollar (USD) is feeling the heat following hints from the Federal Reserve (Fed) in last Wednesday's meeting that there probably won't be any further tightening. Adding to the downward pressure, the revised dot plots revealed Fed officials forecasting a potential 75 basis points of easing in 2024.
However, Fed officials are all singing from the same hymn sheet. New York Fed President John Williams opposed the speculation surrounding a potential rate cut in March. San Francisco Fed President Mary Daly called the predictions on policy stance premature. Austan Goolsbee, Chicago Fed President echoed a similar sentiment, cautioning that the market's optimism for interest rate cuts may have gone beyond realistic expectations.
The situation between Israel and Hamas appears to have intensified, with the Iran-led Houthi militant group carrying out attacks on commercial ships near Libya. The risk aversion in trade and supply, driven by the escalated tensions in the region, has indeed led investors to consider the safe-haven Swiss Franc (CHF). However, in response to the attacks on commercial vessels in the Red Sea, the United States (US) has taken proactive measures by establishing a task force. This task force is dedicated to safeguarding Red Sea commerce.
The Swiss Franc (CHF) encountered a hurdle as the Swiss National Bank (SNB) chose to maintain unchanged interest rates during last week. SNB Chairman Thomas Jordan acknowledged a slight dip in inflationary pressures, highlighting the ongoing high level of uncertainty. Investors are poised to closely observe the central bank’s Quarterly Bulletin for Q4 on Wednesday for additional insights into the Swiss economic landscape.
Economists at Commerzbank analyze why the market has not finally decided whether we saw a decisive reversal last week with the Fed decision which would justify a significant re-valuation of the US Dollar.
Anyone who does not participate in this extrapolation of the dots’ momentum might be excessively reactionary
The unswerving USD bulls may be pointing out that the FOMC members still do not have rate cut expectations that are as aggressive as those held by the market. But isn’t that always the case? Isn’t it the case that the FOMC members adjust their dots to new realities step by step? Does that not always mean that all those who have to make realistic Fed projections are forced to extrapolate the changes to the dots?
In this sense, the market is not exactly carried away only because it once again undercuts the dots that have already been corrected to the downside. On the contrary, anyone who does not participate in this extrapolation of the dots’ momentum might be excessively reactionary.
Economists at MUFG Bank highlight EUR upside limits.
Weak growth and a faster drop in inflation and ECB rate cuts to weigh on EUR
Inflation has dropped markedly in the Eurozone. Weak economic data and looser labour markets than in the US will see ECB concerns over inflation ease in the coming months. Weak growth in Germany will persist, not helped by the increased fiscal constraints. A turn in the global inventory cycle & lower inflation should see better growth in H2 vs H1 next year.
The ECB is likely to commence cutting its key policy rate in Q2 2024, around the same time as the Fed. We believe this leaves limited scope for EUR/USD to advance in H1 but market participants may then reduce expectations of the extent of ECB rate cuts versus the Fed as the Eurozone economy improves and German manufacturing picks up moderately. We see the Fed cutting by more than the ECB next year implying a mis-pricing in OIS markets.
- USD/MXN continues to lose ground despite the dovish Banxico.
- Mexico Retail Sales (MoM) are expected to be flat at 0.0% and yearly data to ease at 2.0%.
- US Dollar remains stable despite downbeat US bond yields.
USD/MXN extends its losses for the third successive day, stretching lower near 17.06 during the European hours on Wednesday. Mexico’s Retail Sales data for October is set to be released on Wednesday. The monthly change is expected to be flat at 0.0% against the decline of 0.2% in September. While yearly data is predicted to ease at 2.0% against the 2.3% prior.
Additionally, despite the dovish comments from Bank of Mexico (Banxico) Governor Victoria Rodriguez Ceja, the Mexican Peso (MXN) showed resilience against the US Dollar (USD). Governor Ceja remarked on the decrease in inflation, pointing out that if the disinflationary trend persists, there's a possibility of contemplating interest rate cuts in the first quarter of 2024.
On the other side, Federal Reserve (Fed) Bank of New York President John Williams presented a counterpoint, opposing the speculation surrounding a potential rate cut in March by the Federal Open Market Committee (FOMC). Additionally, San Francisco Fed President Mary Daly emphasized that making predictions about the policy stance for the upcoming year is premature. In a Wednesday morning interview on Fox TV, Austan Goolsbee, President of the Federal Reserve Bank of Chicago, echoed a similar sentiment, cautioning that the market's optimism for interest rate cuts may have gone beyond realistic expectations.
The US Dollar Index (DXY) trades higher around 102.20, receiving the downward pressure on a dovish sentiment surrounding the US Federal Reserve (Fed), indicating the potential for rate cuts in early 2024. Furthermore, the downbeat US Treasury yields contribute to pressure to undermine the Greenback. The 2-year and 10-year yields on US Treasury bonds inch lower to 4.39% and 3.89%, respectively, at the time of writing.
Economists at ANZ Bank expect the Indian Rupee to underperform in Asia on the back of the RBI’s reserve accretion.
RBI to build up its FX reserves more aggressively
A modest balance of payments surplus on account of strong financial flows points to Rupee appreciation, but the RBI is still far from a comfortable level of foreign currency reserves. In the near term, it will continue with its heavy two-way intervention to ensure the stability of Rupee in the face of sporadic external headwinds.
However, once the USD weakens decisively, we expect it to build up its FX reserves more aggressively. This means the Rupee will likely underperform during the USD sell-off expected in 2024.
Economists at Commerzbank analyze Yen’s outlook after the BoJ’s decision to leave its policy unchanged.
How far will the JPY correction go?
All those who dreamt of monetary policy normalisation in December a short while ago are now giving me dates in the spring of 2024 as the most likely ones. They have not capitulated at all. The kind of rearguard action they are pursuing is likely to continue for a while yet. Once it becomes clear that the reversal will not be happening in the spring either they will simply move on to the summer, the autumn etc, etc.
What I am trying to say is: even if this BoJ normalisation is never going to materialise it will take a while before the hope of it happening and the Yen recovery seen over the past weeks has been completely priced out.
- NZD/USD extends its gains on bullish sentiment despite a stable US Dollar.
- Kiwi Consumer Confidence improved to 93.1 from 91.9 prior.
- Chicago Fed President Austan Goolsbee mentioned that the market's enthusiasm for interest rate trajectory exceeded realistic expectations.
NZD/USD continues its winning streak that began on December 11, edging higher around 0.6280 during the early European session on Wednesday. The improved Kiwi Consumer Confidence data reinforces the strength of the New Zealand Dollar (NZD) against the US Dollar (USD). ANZ – Roy Morgan Consumer Confidence for November rose to 93.1 from the previous figures of 91.9.
Additionally, the Reserve Bank of New Zealand (RBNZ) Governor Adrian Orr expressed surprise at unexpectedly subduing New Zealand's GDP data. However, he refrained from offering a definitive opinion on its implications for the interest rate outlook. Orr noted that there is still a considerable journey ahead, especially considering persistently high inflation levels.
The US Dollar Index (DXY) trades higher around 102.20 despite downbeat US Treasury yields. The 2-year and 10-year yields on US bond coupons tick lower at 4.38% and 3.89%, respectively. The DXY faced downward pressure on a dovish sentiment surrounding the US Federal Reserve (Fed), indicating the potential for rate cuts in early 2024.
In a Wednesday morning interview with Fox TV, Austan Goolsbee, President of the Federal Reserve Bank of Chicago, cautioned that the market's enthusiasm for potential interest rate cuts has exceeded realistic expectations. Goolsbee also noted that if inflation continues to decrease, the Fed may reevaluate the extent of its restrictions.
US Housing Starts outperformed expectations, reaching 1.56 million and surpassing the market consensus set at 1.36 million. However, Building Permits experienced a slight dip, registering at 1.46 million, just below the projected 1.47 million. Investors are anticipated to closely observe the changes in Existing Home Sales and the results of the CB Consumer Confidence survey scheduled for Wednesday.
- Pound Sterling drops sharply as UK inflation softened sharply in November.
- UK’s monthly headline inflation surprisingly contracted by 0.2%.
- Investors may raise bets in favour of early rate cuts by the BoE.
The Pound Sterling (GBP) fell sharply after the United Kingdom’s Office for National Statistics (ONS) reported a significant decline in inflation in November. The GBP/USD pair has been heavily dumped as a more-than-anticipated decline in the UK Consumer Price Index (CPI) increase bets for early interest-rate cuts by the Bank of England (BoE).
While UK inflation has declined more than expected in November, BoE policymakers are expected to hold a stance for keeping interest rates higher for longer. Price pressures in the UK are still the highest in comparison with other developed economies, which would force BoE policymakers to call for rate cuts later than other major central bankers.
Daily Digest Market Movers: Pound Sterling falls vertically on soft inflation data
- Pound Sterling faces an intense sell-off as the ONS has released a softer-than-anticipated inflation report for November.
- Monthly headline inflation contracted by 0.2% in November, against expectations of 0.1% increase. Annual headline inflation grew at a slower pace of 3.9% against expectations of 4.4%. Headline inflation has grown by 4.6% in October.
- The annual core inflation, which excludes volatile food and energy prices, softened to 5.1% versus the consensus of 5.6% and the former reading of 5.7%.
- Monthly Producer Price Index (PPI) for input and output have contracted 0.3% and 0.1%, respectively, less than what markets expected.
- This indicates prices of goods at factory gates fell, likely due to a decline in domestic and external demand.
- Despite the soft inflation report, the Bank of England is expected to keep interest rates restrictive for a more extended period.
- BoE Deputy Governor Sarah Breeden emphasized keeping the policy restrictive to keep price pressures in check.
- While asked about guidance on interest rates, Breeden said "I have no pre-determined policy path in mind."
- On Monday, BoE Deputy Governor Ben Broadbent also stressed keeping interest rates higher for a longer period. Broadbent highlighted the need for more evidence to confirm that inflation is in a clear downtrend.
- Later this week, investors will focus on November's UK Retail Sales data. According to the estimates, this measure of consumer spending grew by 0.4% on a monthly basis, against a 0.3% decline in October.
- Meanwhile, the US Dollar Index (DXY) turns sideways near 102.00 after a slight decline on increasing rate cut expectations by the Federal Reserve (Fed).
- The DXY US Dollar Index failed to find a firm footing despite Atlanta Federal Reserve President Raphael Bostic criticizing any urgency of interest rate cuts. Bostic added that the central bank must ensure that inflation returns to 2% given that the economy is resilient.
- This week, investors will focus on the US core Personal Consumption Expenditure price index (PCE) data, which will be published on Friday.
- Per the preliminary consensus, monthly core PCE is expected to grow at a steady pace of 0.2%. The annual core PCE is seen softening to 3.3% against the former reading of 3.5%.
Technical Analysis: Pound Sterling corrects to near 1.2660
Pound Sterling surrenders its entire gains generated on Tuesday after the release of the softer-than-projected UK inflation data for November. The GBP/USD pair trades inside Tuesday’s range but is expected to extend its correction towards the 20-period Exponential Moving Average (EMA), around 1.2600.
The Relative Strength Index (RSI) (14) trades inside the 40.00-60.00 range, which suggests a consolidation ahead.
Pound Sterling FAQs
What is the Pound Sterling?
The Pound Sterling (GBP) is the oldest currency in the world (886 AD) and the official currency of the United Kingdom. It is the fourth most traded unit for foreign exchange (FX) in the world, accounting for 12% of all transactions, averaging $630 billion a day, according to 2022 data.
Its key trading pairs are GBP/USD, aka ‘Cable’, which accounts for 11% of FX, GBP/JPY, or the ‘Dragon’ as it is known by traders (3%), and EUR/GBP (2%). The Pound Sterling is issued by the Bank of England (BoE).
How do the decisions of the Bank of England impact on the Pound Sterling?
The single most important factor influencing the value of the Pound Sterling is monetary policy decided by the Bank of England. The BoE bases its decisions on whether it has achieved its primary goal of “price stability” – a steady inflation rate of around 2%. Its primary tool for achieving this is the adjustment of interest rates.
When inflation is too high, the BoE will try to rein it in by raising interest rates, making it more expensive for people and businesses to access credit. This is generally positive for GBP, as higher interest rates make the UK a more attractive place for global investors to park their money.
When inflation falls too low it is a sign economic growth is slowing. In this scenario, the BoE will consider lowering interest rates to cheapen credit so businesses will borrow more to invest in growth-generating projects.
How does economic data influence the value of the Pound?
Data releases gauge the health of the economy and can impact the value of the Pound Sterling. Indicators such as GDP, Manufacturing and Services PMIs, and employment can all influence the direction of the GBP.
A strong economy is good for Sterling. Not only does it attract more foreign investment but it may encourage the BoE to put up interest rates, which will directly strengthen GBP. Otherwise, if economic data is weak, the Pound Sterling is likely to fall.
How does the Trade Balance impact the Pound?
Another significant data release for the Pound Sterling is the Trade Balance. This indicator measures the difference between what a country earns from its exports and what it spends on imports over a given period.
If a country produces highly sought-after exports, its currency will benefit purely from the extra demand created from foreign buyers seeking to purchase these goods. Therefore, a positive net Trade Balance strengthens a currency and vice versa for a negative balance.
On a one-month view, the EUR is the second worst performing G10 currency after the USD. Economists at Rabobank analyze EUR/USD outlook.
EUR/USD at risk of dipping back to the 1.05 area on a three-month view
Weakness in the German economy is likely to weigh on the outlook for the EUR through the next business cycle and beyond.
We see risk of EUR/USD dipping back to the 1.05 area on a three-month view.
On a 12–24-month view, we see EUR/USD as more likely to trade a 1.02 to 1.12 range, which is well below most model based estimates of fair value, than to push back above the 1.20 level.
Here is what you need to know on Wednesday, December 20:
The US Dollar continued to weaken against its rivals on Tuesday as global bond yields retreated following the Bank of Japan's (BoJ) inaction. The Conference Board's Consumer Confidence Index for December and Existing Home Sales data for November will be featured in the US economic docket later in the day. Investors will also continue to pay close attention to comments from central bank officials.
The benchmark 10-year US Treasury bond yield declined toward 3.9% on Tuesday and Wall Street's main indexes closed in positive territory. US stock index futures trade flat early Wednesday and the 10-year yield stays near 3.9%. Meanwhile, the US Dollar Index holds steady above 102.00 after losing nearly 0.4% in the previous day.
Inflation in the UK, as measured by the change in the Consumer Price Index (CPI), declined to 3.9% in November from 4.6% in October, the UK's Office for National Statistics reported on Wednesday. On a monthly basis, the CPI fell 0.2%. The Core CPI, which excludes volatile food and energy prices, increased 5.1%, down sharply from the 5.7% increase recorded in October. Pound Sterling came under bearish pressure following softer-than-forecast inflation readings. At the time of press, GBP/USD was trading deep in negative territory below 1.2700.
Pound Sterling price today
The table below shows the percentage change of Pound Sterling (GBP) against listed major currencies today. Pound Sterling was the weakest against the Japanese Yen.
| USD | EUR | GBP | CAD | AUD | JPY | NZD | CHF | |
| USD | 0.24% | 0.43% | 0.08% | -0.12% | -0.25% | -0.16% | 0.05% | |
| EUR | -0.24% | 0.20% | -0.15% | -0.36% | -0.46% | -0.38% | -0.21% | |
| GBP | -0.43% | -0.18% | -0.34% | -0.55% | -0.67% | -0.58% | -0.38% | |
| CAD | -0.08% | 0.15% | 0.35% | -0.19% | -0.31% | -0.23% | -0.08% | |
| AUD | 0.12% | 0.34% | 0.54% | 0.20% | -0.11% | -0.03% | 0.15% | |
| JPY | 0.24% | 0.49% | 0.66% | 0.31% | 0.09% | 0.10% | 0.24% | |
| NZD | 0.14% | 0.38% | 0.57% | 0.23% | 0.02% | -0.07% | 0.19% | |
| CHF | -0.01% | 0.21% | 0.40% | 0.06% | -0.14% | -0.25% | -0.17% |
The heat map shows percentage changes of major currencies against each other. The base currency is picked from the left column, while the quote currency is picked from the top row. For example, if you pick the Euro from the left column and move along the horizontal line to the Japanese Yen, the percentage change displayed in the box will represent EUR (base)/JPY (quote).
USD/CAD fell sharply and touched its weakest level since early August below 1.3350 on Tuesday. The data published by Statistics Canada showed that the annual CPI rose 3.1% in November, coming in higher than the market expectation of 2.9% and matching the October reading. Early Wednesday, the pair stays in a consolidation phase and trades in a narrow channel at around 1.3350.
Hawkish comments from European Central Bank (ECB) officials helped the Euro stay resilient against its peers. EUR/USD registered gains for the second consecutive day on Tuesday and came within a touching distance of 1.1000 before correcting toward 1.0950 early Wednesday.
USD/JPY surged to 145.00 during the European trading hours on Tuesday after the BoJ disappointed markets by refraining from hinting at an exit from negative rate policy. After a downward correction in the second half of the day, the pair went into a consolidation phase below 144.00 mid-week.
Gold benefited from falling global bond yields on Tuesday and advanced toward $2,050. Although XAU/USD has lost its bullish momentum, it seems to have stabilized at around $2,040.
- EUR/GBP gains ground around 0.8645 following the UK inflation data.
- The UK Consumer Price Index (CPI) came in worse than market expectations.
- The European Central Bank’s Lagarde warned that inflation might rise again in December as a result of colder weather.
- Traders will monitor October’s Eurozone Current Account, Construction Output, and ECB’s Lane speech.
The EUR/GBP cross recovers its recent losses during the early European session on Wednesday. The weaker-than-expected UK inflation data exerts some selling pressure on the British Pound (GBP) and lends some support to EUR/GBP. The cross currently trades near 0.8645, gaining 0.21% on the day.
The latest data from the UK Office for National Statistics revealed that the nation’s inflation data, as measured by the Consumer Price Index (CPI), came in at -0.2% MoM in November from the previous reading of 0%, missing the estimation of 0.1%. Additionally, the annual CPI figure rose 3.9% versus 4.6% prior, below the market consensus of 4.4%. The Core CPI, which excludes volatile food and energy prices, eased from 5.7% in October to 5.1% in November, worse than the expectation of 5.6%. In response to the data, the GBP edges lower against the Euro (EUR) and creates a tailwind for the EUR/GBP cross.
The Bank of England (BoE) Deputy Governor Sarah Breeden remarked on Tuesday that she had no predetermined path for interest rates in mind but that policy needed to remain restrictive in order to keep inflation pressure in check.
Eurostat data released on Tuesday indicated that Eurozone inflation was weaker than expected in November owing to a drop in energy prices. However, European Central Bank (ECB) President Christine Lagarde warned that inflation might rise again in December as a result of colder weather, which raises energy demand and prices. Furthermore, the ECB study said that climate change would make monetary policymakers' tasks more difficult.
The ECB's policymaker Bostjan Vasle stated on Monday that they would need at least until spring to assess their policy stance, and market expectations for interest rate cuts in March or April are premature.
Traders will keep an eye on the Eurozone Current Account and Construction Output for October. ECB’s Philip Lane is also set to speak later on Wednesday. Traders will take cues from these data and find trading opportunities around the EUR/GBP cross.
- USD/CAD trades in positive territory on improved US Dollar.
- A break above 1.3350 could lead the pair to target the psychological level at 1.3400 before the seven-day EMA at 1.3410.
- Technical indicators suggest further decline and testing the weekly low at 1.3330.
USD/CAD rebounds as the US Dollar (USD) attempts to recover losses registered in the previous session. The USD/CAD pair trades below the major resistance at the 1.3350 level. A breakthrough above the latter could influence the USD/CAD pair to rise and target the psychological resistance level at 1.3400 before the seven-day Exponential Moving Average (EMA) at 1.3410.
If the USD/CAD pair surpasses the psychological resistance, it could explore the region around the major level at 1.3450 followed by the 23.6% Fibonacci retracement level at 1.3462.
However, the technical indicator Moving Average Convergence Divergence (MACD) for the USD/CAD pair indicates a potential bearish trend. The MACD line's placement below the centerline, coupled with divergence below the signal line, suggests a likelihood of further decline. This signal implies that the pair may test the weekly low at 1.3330 level.
The analysis introduces a confirmation to the dovish sentiment surrounding the USD/CAD pair, underscoring the significance of the 14-day Relative Strength Index (RSI) falling below 50. Consequently, a breach below the weekly low has the potential to propel the USD/CAD pair towards the 1.3300 psychological threshold.
USD/CAD: Daily Chart
-638386521447977982.png)
- Silver lacks any firm intraday direction and oscillates in a range on Wednesday.
- The setup seems tilted in favour of bulls and supports prospects for further gains.
- Dips towards the 200-day SMA are likely to be bought into and remain limited.
Silver (XAG/USD) struggled to capitalize on the overnight positive move and oscillates in a narrow trading band, just above the $24.00 mark through the early European session on Wednesday.
From a technical perspective, the XAG/USD last week showed some resilience below an upward-sloping trend line extending from the October swing low. The subsequent rally from the mid-$22.00s, or a one-month low, however, struggled to make it through the 50% Fibonacci retracement level of the downfall from the December peak. The said barrier is pegged near the $24.20-$24.25 region, which if cleared decisively will be seen as a fresh trigger for bullish traders.
Meanwhile, oscillators on the daily chart have recovered from the bearish territory, though are yet to gain any positive traction. This makes it prudent to wait for some follow-through beyond the aforementioned resistance before positioning for any further appreciating move. The XAG/USD might then accelerate the momentum towards reclaiming the $25.00 psychological mark and then extend the momentum to the $25.25 hurdle en route to the $25.45-$25.50 region.
On the flip side, any meaningful downfall is likely to find decent support and attract fresh buyers near the very important 200-day Simple Moving Average (SMA), currently pegged near the $23.60 zone. A convincing break below will expose the next relevant support near the $23.30-$23.25 region before the XAG/USD drops to a multi-month-old ascending trend-line support, currently near the $23.00 mark, and the monthly swing low, around mid-$22.00s.
Silver daily chart
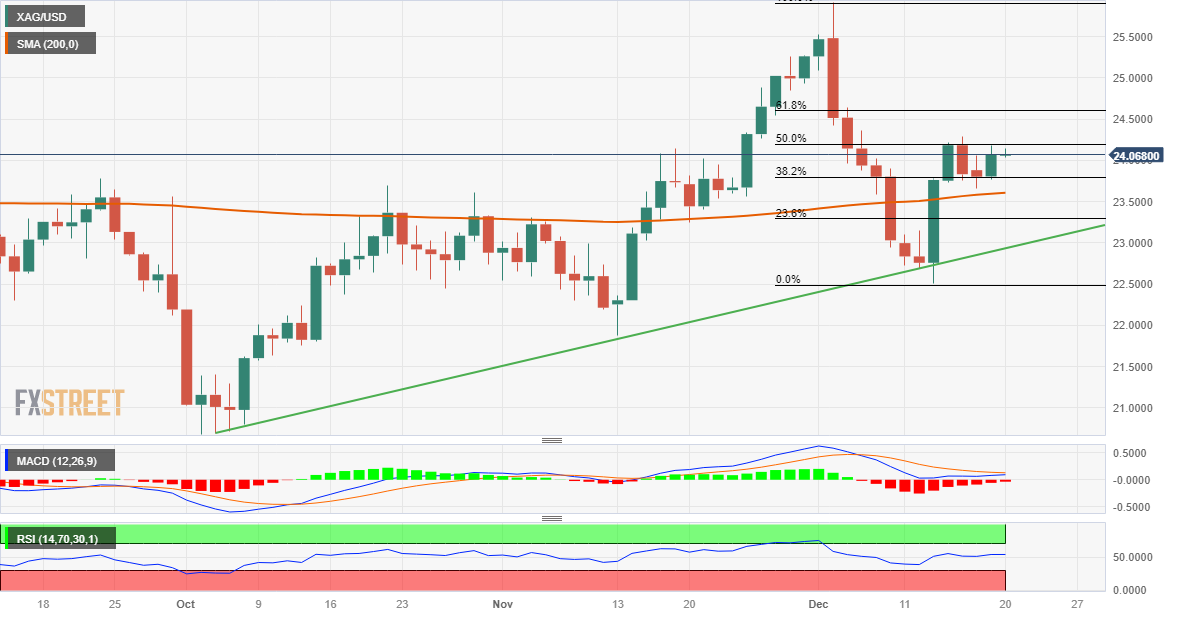
Technical levels to watch
- USD/CHF finds an intermediate support near 0.8600, however, the more downside remains favoured.
- The USD Index remains on backfoot as rate cut expectations outweigh.
- USD/CHF is seen declining further towards 0.8555.
The USD/CHF pair finds an interim support after a steep correction to near the round-level support of 0.8600 in the early European session. The asset is expected to witness more downside as the broader appeal for the US Dollar is bearish as rate cuts by the Federal Reserve (Fed) has come into play.
S&P500 futures have added nominal gains in the late Asian session, portraying a risk-on market mood. The US Dollar Index (DXY) turns sideways after correcting to near 102.10. Deepening focus of the market participants on three rate cut expectations by the Fed in 2024 may keep the USD Index on the backfoot.
Going forward, investors will focus on the Q4 Swiss National Bank (SNB) bulletin, which will be published on Wednesday. The Q4 bulletin will demonstrate monetary policy report and business conditions, which will provide cues about performance of the economy.
USD/CHF has been consistently declining from last two months and is expected to extend its downside journey towards the horizontal support of 0.8555, which is plotted from July 18 low. The 20-day Exponential Moving Average (EMA) at 0.8740 has been acting as a barricade for the US Dollar bulls.
The Relative Strength Index (RSI) (14) has shifted into the bearish range of 20.00-40.00, which indicates that the momentum is in the downside direction.
More downside would appear if the asset drops below December 19 low of 0.8593. This would drag the asset towards July 18 low at 0.8555 and the psychological support of 0.8500.
In an alternate scenario, a recovery move above December 18 high at 0.8711 would drive the asset towards December 06 high around 0.8750. A breach of the latter would open doors for more upside towards August 03 high at 0.8800.
USD/CHF daily chart
-638386494768163792.png)
- EUR/USD loses its recovery momentum around 1.0966 ahead of November’s German Producer Price Index (PPI) data.
- The pair maintains the bullish vibe above the key 100-hour EMA; the RSI indicator stands in bullish territory above 70.
- The first resistance level is seen at 1.0987; 1.0934 acts as an initial support level for the pair.
The EUR/USD pair loses gains during the early European session on Wednesday. Investors await November’s German Producer Price Index (PPI) for fresh impetus, which is estimated to drop 0.3% MoM and 7.5% YoY, respectively. At press time, the major pair is trading at 1.0966, losing 0.11% on the day.
Technically, EUR/USD maintains a positive outlook as the pair holds above the key 100-hour Exponential Moving Averages (EMA) on the four-hour chart. The upward momentum is supported by the Relative Strength Index (RSI), which stands in bullish territory above 70.
The first upside barrier of the major pair will emerge near a high of December 19 at 1.0987. The critical resistance level is located in the 1.1000–1.01010 region, representing the upper boundary of the Bollinger Band and a high Dec 14. Further north, the next hurdle is seen at 1.1065 (high of August 10) and finally at 1.1147 (high of July 24).
On the other hand, a low of November 28 at 1.0934 acts as an initial support level for EUR/USD. The additional downside filter to watch is a low of December 15 at 1.0888. The key contention level is seen at the confluence of the lower limit of the Bollinger Band and the 100-hour EMA at 1.0870. A break below the latter will see a drop to a low of November 27 at 1.0825.
EUR/USD four-hour chart
-638386476434189018.png)
- US Dollar Index struggles to halt losses amid dovish Fed’s outlook.
- Technical indicators suggest that DXY could test the support region around the weekly low at 102.06.
- The major level at 102.50 could act as a key barrier followed by the seven-day EMA at 102.58.
The US Dollar Index (DXY) rebounds after two days of losses, trading around 102.20 during the Asian session on Wednesday. However, the DXY faces challenges due to the Federal Reserve’s (Fed) dovish outlook on the interest rates trajectory. Investors expect the Fed to implement rate cuts in early 2024.
However, during a Wednesday interview on Fox TV, Chicago Fed President Austan Goolsbee commented that the "market has gotten ahead of themselves on euphoria" regarding potential interest rate cuts.
The 14-day Relative Strength Index (RSI) is below the 50 level, signaling a bearish sentiment. Additionally, the negative positioning of the Moving Average Convergence Divergence (MACD) line below the centerline, and showing the divergence below the signal line could serve as confirmation of the bearish momentum for the Dollar Index in the market.
The lagging indicators suggest that the US Dollar Index could test the psychological support region around the weekly low at 102.06 level before the 102.00 level. A firm break below the key support region could put pressure on the DXY to navigate December’s low at 101.77 level followed by the 101.50 major level.
On the upside, The DXY could find the key resistance around the 102.50 major level before the seven-day Exponential Moving Average (EMA) at 102.58 lined up with the weekly high at 102.63 level.
A breakthrough above the resistance area could support the Dollar Index buyers to approach the psychological level at 103.00 near the 23.6% Fibonacci retracement at 103.08 level.
Dollar Index: Daily Chart
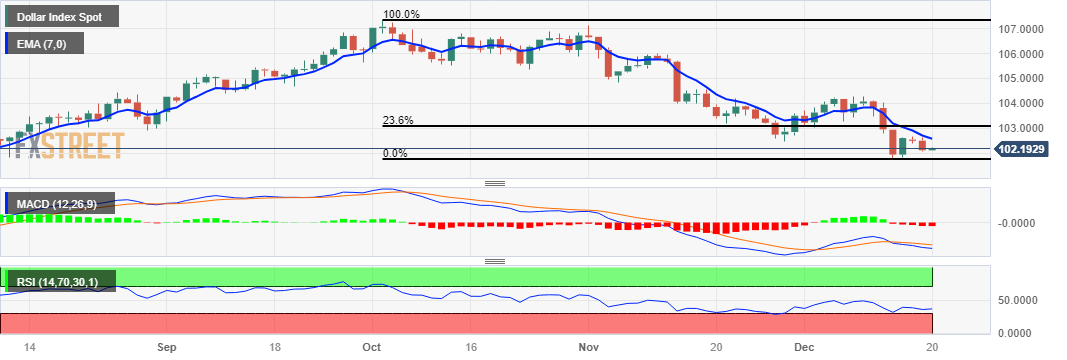
- Gold price consolidates near the weekly top amid a modest USD uptick and the risk-on mood.
- The fundamental backdrop favours bullish traders and supports prospects for further gains.
- The US Consumer Confidence Index is eyed for some impetus ahead of the US PCE Price Index.
Gold price (XAU/USD) struggles to capitalize on its weekly gains registered over the past two days and ticks lower during the Asian session on Wednesday. The precious metal currently trades around the $2,040 supply zone and seems poised to appreciate further in the wake of the Federal Reserve's (Fed) dovish shift last week. In fact, the so-called “dot plot” indicated that the Fed’s inflation fight won’t require another rate hike and that the key interest rate has already peaked at its current 22-year high of 5.25-5.50%. This keeps the US Treasury bond yields depressed near a multi-month low and might continue to act as a tailwind for the non-yielding yellow metal.
That said, a slew of Fed officials recently tried to temper rate cut expectations. This, along with a modest US Dollar (USD) uptick and the upbeat mood pervading across the global equity markets, keeps a lid on any meaningful appreciating move for the Gold price. Furthermore, traders opt to remain on the sidelines ahead of the US Core Personal Consumption Expenditure (PCE) Price Index on Friday. The key US inflation reading should influence the Fed's future policy decisions and provide a fresh directional impetus to the XAU/USD. In the meantime, traders on Wednesday will take cues from the release of the Conference Board's US Consumer Confidence Index.
Daily Digest Market Movers: Gold price remains supported by a shift in the Fed’s policy stance
- Growing acceptance that the Federal Reserve (Fed) will pivot away from its hawkish stance early next year continues to act as a tailwind for the Gold price.
- Chicago Fed President Austan Goolsbee said the central bank is not pre-committing to cutting interest rates soon and should not be bullied by what the market wants.
- Cleveland Fed President Loretta Mester noted on Monday that financial markets had got a little bit ahead of the central bank on when to expect interest rate cuts next year.
- The markets, however, have priced in a more than 60% chance that the Fed will cut rates as soon as March 2024 and a total of 140 basis points of rate reductions in 2024.
- The yield on the benchmark 10-year US government bond languishes below the 4% mark, with the US Dollar hovering just above a multi-month low touched last week.
- The global risk-on rally remains uninterrupted amid expectations of lower interest rates in the US, more stimulus from China and dovish Bank of Japan, capping the safe-haven metal.
- Traders now look to the US Consumer Confidence Index for some impetus later this Wednesday, though the focus remains on the release of the US PCE Price Index on Friday.
Technical Analysis: Gold price bulls now await a move beyond the $2,047-2,048 supply zone
From a technical perspective, some follow-through buying beyond the $2,047-2,048 region will be seen as a fresh trigger for bulls and set the stage for an extension of the post-FOMC rally from the 50-day Simple Moving Average (SMA). The Gold price might then accelerate the positive move towards the $2,072-2,073 intermediate resistance before aiming to reclaim the $2,100 round figure.
On the flip side, the $2,018-2,017 area now seems to have emerged as an immediate strong support, below which the Gold price could slide to the $2,000 psychological mark. A convincing break below the latter might prompt some technical selling and expose the 50-day SMA, currently pegged near the $1,989-1,988 zone. The subsequent downfall has the potential to drag the XAU/USD towards last week's swing low, around the $1,973 region, en route to the 200-day SMA, currently near the $1,957 zone.
US Dollar price today
The table below shows the percentage change of US Dollar (USD) against listed major currencies today. US Dollar was the strongest against the Euro.
| USD | EUR | GBP | CAD | AUD | JPY | NZD | CHF | |
| USD | 0.10% | 0.09% | 0.09% | -0.11% | -0.14% | -0.10% | 0.09% | |
| EUR | -0.10% | 0.00% | -0.02% | -0.21% | -0.23% | -0.21% | -0.02% | |
| GBP | -0.10% | 0.01% | -0.01% | -0.20% | -0.23% | -0.18% | -0.01% | |
| CAD | -0.08% | 0.02% | 0.02% | -0.20% | -0.22% | -0.18% | -0.01% | |
| AUD | 0.12% | 0.21% | 0.20% | 0.20% | -0.02% | 0.01% | 0.20% | |
| JPY | 0.14% | 0.25% | 0.22% | 0.20% | 0.03% | 0.05% | 0.21% | |
| NZD | 0.08% | 0.19% | 0.17% | 0.18% | -0.02% | -0.03% | 0.17% | |
| CHF | -0.05% | 0.02% | 0.02% | -0.01% | -0.20% | -0.22% | -0.18% |
The heat map shows percentage changes of major currencies against each other. The base currency is picked from the left column, while the quote currency is picked from the top row. For example, if you pick the Euro from the left column and move along the horizontal line to the Japanese Yen, the percentage change displayed in the box will represent EUR (base)/JPY (quote).
Gold FAQs
Why do people invest in Gold?
Gold has played a key role in human’s history as it has been widely used as a store of value and medium of exchange. Currently, apart from its shine and usage for jewelry, the precious metal is widely seen as a safe-haven asset, meaning that it is considered a good investment during turbulent times. Gold is also widely seen as a hedge against inflation and against depreciating currencies as it doesn’t rely on any specific issuer or government.
Who buys the most Gold?
Central banks are the biggest Gold holders. In their aim to support their currencies in turbulent times, central banks tend to diversify their reserves and buy Gold to improve the perceived strength of the economy and the currency. High Gold reserves can be a source of trust for a country’s solvency. Central banks added 1,136 tonnes of Gold worth around $70 billion to their reserves in 2022, according to data from the World Gold Council. This is the highest yearly purchase since records began. Central banks from emerging economies such as China, India and Turkey are quickly increasing their Gold reserves.
How is Gold correlated with other assets?
Gold has an inverse correlation with the US Dollar and US Treasuries, which are both major reserve and safe-haven assets. When the Dollar depreciates, Gold tends to rise, enabling investors and central banks to diversify their assets in turbulent times. Gold is also inversely correlated with risk assets. A rally in the stock market tends to weaken Gold price, while sell-offs in riskier markets tend to favor the precious metal.
What does the price of Gold depend on?
The price can move due to a wide range of factors. Geopolitical instability or fears of a deep recession can quickly make Gold price escalate due to its safe-haven status. As a yield-less asset, Gold tends to rise with lower interest rates, while higher cost of money usually weighs down on the yellow metal. Still, most moves depend on how the US Dollar (USD) behaves as the asset is priced in dollars (XAU/USD). A strong Dollar tends to keep the price of Gold controlled, whereas a weaker Dollar is likely to push Gold prices up.
- Indian Rupee drifts lower despite the softer USD.
- The Reserve Bank of India (RBI) pushed back against the IMF, saying the intervention in the currency market was excessive.
- Q3 US GDP growth, Core Personal Consumption Expenditures Price Index (PCE) will be closely watched this week.
Indian Rupee (INR) trades on a softer note on Wednesday despite the weaker US Dollar (USD) and the US Treasury bond yields. The International Monetary Fund (IMF) noted in its annual Article IV review that the USD/INR exchange rate moved within a very narrow range from December 2022 to October 2023, suggesting that the Reserve Bank of India’s (RBI) foreign exchange intervention likely exceeded levels necessary to manage market conditions.
The Indian central bank strongly disagreed with the IMF’s assessment, terming it "unjustified.” RBI Governor Shaktikanta Das said in October that currency market interventions should not be seen as black-and-white. The IMF suggested a flexible exchange rate as the first line of defense against external shocks and forecast the Indian economy to grow at 6.3% for the current fiscal year. The growth is expected to remain strong, underpinned by macroeconomic and financial stability.
Investors will monitor the release of US Existing Home Sales on Wednesday. Later this week, the attention will turn to the US Gross Domestic Product Annualized (Q3), due on Thursday. The annual growth number is estimated to remain steady at 5.2%. On Friday, the Fed’s preferred inflation gauge, as measured by the Core Personal Consumption Expenditures Price Index (PCE) will be in the spotlight.
Daily Digest Market Movers: Indian Rupee stays on the soft side amid the multiple headwinds
- The International Monetary Fund (IMF) has reclassified India's exchange rate regime to a stabilized arrangement from floating.
- RBI policymakers said the central bank doesn't target a level for the Indian Rupee but rather intervenes to mitigate volatility in the currency market.
- According to National Securities Depository Ltd., foreign investors purchased more than $1 billion in Indian shares on Friday, after making $1.5 billion in purchases in the first four days of the week.
- India's foreign currency reserves increased by $2.816 billion in the week ended December 8 to a four-month high of $606.859 billion, according to the RBI.
- The US Building Permits dropped to 1.46M in November from 1.498M in October, weaker than the market expectation of 1.47M. Housing Starts for November rose to 1.56M from 1.359M, above the market consensus of 1.36M.
Technical Analysis: Indian Rupee sticks to the longer-term range theme
The Indian Rupee continues to trade on the weak side on the day. The USD/INR pair has traded within a multi-month trading band of 82.80–83.40. According to the daily chart, USD/INRholds above the key 100-day Exponential Moving Average (EMA). Nonetheless, further tests of the key EMA cannot be ruled out as the 14-day Relative Strength Index (RSI) stands below the 50.0 midline.
Any follow-through selling below the 83.00 psychological level will see a drop to the confluence of the lower limit of the trading range and a low of September 12 at 82.80. A decisive break below 82.80 will trigger the possibility of a short-term downmove to a low of August 11 at 82.60. On the flip side, A breakout above the upper boundary of the trading range at 83.40 could pave the way to the year-to-date (YTD) high of 83.47, followed by the psychological round mark of 84.00.
US Dollar price today
The table below shows the percentage change of US Dollar (USD) against listed major currencies today. US Dollar was the strongest against the Pound Sterling.
| USD | EUR | GBP | CAD | AUD | JPY | NZD | CHF | |
| USD | 0.09% | 0.09% | 0.05% | -0.12% | -0.04% | -0.05% | 0.05% | |
| EUR | -0.09% | 0.00% | -0.05% | -0.22% | -0.14% | -0.15% | -0.04% | |
| GBP | -0.10% | 0.01% | -0.05% | -0.21% | -0.14% | -0.14% | -0.04% | |
| CAD | -0.05% | 0.04% | 0.04% | -0.18% | -0.10% | -0.11% | -0.02% | |
| AUD | 0.13% | 0.21% | 0.21% | 0.16% | 0.08% | 0.07% | 0.18% | |
| JPY | 0.04% | 0.15% | 0.12% | 0.08% | -0.09% | -0.01% | 0.08% | |
| NZD | 0.05% | 0.14% | 0.14% | 0.10% | -0.07% | 0.01% | 0.10% | |
| CHF | -0.03% | 0.03% | 0.03% | -0.01% | -0.18% | -0.09% | -0.11% |
The heat map shows percentage changes of major currencies against each other. The base currency is picked from the left column, while the quote currency is picked from the top row. For example, if you pick the Euro from the left column and move along the horizontal line to the Japanese Yen, the percentage change displayed in the box will represent EUR (base)/JPY (quote).
Indian Rupee FAQs
What are the key factors driving the Indian Rupee?
The Indian Rupee (INR) is one of the most sensitive currencies to external factors. The price of Crude Oil (the country is highly dependent on imported Oil), the value of the US Dollar – most trade is conducted in USD – and the level of foreign investment, are all influential. Direct intervention by the Reserve Bank of India (RBI) in FX markets to keep the exchange rate stable, as well as the level of interest rates set by the RBI, are further major influencing factors on the Rupee.
How do the decisions of the Reserve Bank of India impact the Indian Rupee?
The Reserve Bank of India (RBI) actively intervenes in forex markets to maintain a stable exchange rate, to help facilitate trade. In addition, the RBI tries to maintain the inflation rate at its 4% target by adjusting interest rates. Higher interest rates usually strengthen the Rupee. This is due to the role of the ‘carry trade’ in which investors borrow in countries with lower interest rates so as to place their money in countries’ offering relatively higher interest rates and profit from the difference.
What macroeconomic factors influence the value of the Indian Rupee?
Macroeconomic factors that influence the value of the Rupee include inflation, interest rates, the economic growth rate (GDP), the balance of trade, and inflows from foreign investment. A higher growth rate can lead to more overseas investment, pushing up demand for the Rupee. A less negative balance of trade will eventually lead to a stronger Rupee. Higher interest rates, especially real rates (interest rates less inflation) are also positive for the Rupee. A risk-on environment can lead to greater inflows of Foreign Direct and Indirect Investment (FDI and FII), which also benefit the Rupee.
How does inflation impact the Indian Rupee?
Higher inflation, particularly, if it is comparatively higher than India’s peers, is generally negative for the currency as it reflects devaluation through oversupply. Inflation also increases the cost of exports, leading to more Rupees being sold to purchase foreign imports, which is Rupee-negative. At the same time, higher inflation usually leads to the Reserve Bank of India (RBI) raising interest rates and this can be positive for the Rupee, due to increased demand from international investors. The opposite effect is true of lower inflation.
- WTI edges lower as US Dollar attempts to retrace its recent losses.
- US appointed a task force to protect shipping commerce in the Red Sea.
- US is expected to increase oil production which may exceed the growing global demand in 2024.
West Texas Intermediate (WTI) snaps a two-day winning streak, trading lower around $74.00 per barrel during the Asian session on Wednesday. However, Crude oil prices found support from geopolitical disruptions, stemming from attacks by the Iran-led Houthi militant group on commercial vessels in the Red Sea.
The United States (US) has taken action by establishing a task force to safeguard Red Sea commerce in response to the attacks on commercial vessels in the Red Sea. This decision comes after virtual talks on Tuesday between US Defense Secretary Lloyd Austin and defense ministers from the region. Conversely, the Houthis have pledged to defy the US-led naval mission and continue their attacks.
According to S&P Global Commodity Insights, the United States is expected to increase oil production, contributing to robust non-OPEC+ supply growth that will likely exceed the growing global demand in the upcoming year. This projection suggests a potential limitation on the upward movement of Crude oil prices.
American Petroleum Institute (API) Weekly Crude Oil Stock on the week ending on December 15, rose to 0.939M, swinging from the previous decline of 2.349M figures. The US Energy Information Administration is set to release the Crude Oil Stocks Change report on Wednesday. Expectations indicate an improvement in stockpiles, with a forecasted decline to 2.233 million from 4.259 million prior.
Shell PLC and Equinor ASA announced on Tuesday the approval for a 90,000 barrels per day (bpd) oil and gas platform in the US Gulf of Mexico. Additionally, they expressed the intention to make aggressive investments in exploration to sustain production through 2050.
In an interview with Fox TV early Wednesday, Federal Reserve Bank of Chicago President Austan Goolsbee said that the “market has gotten ahead of themselves on euphoria” on likely interest rate cuts.
Additional comments
If inflation keeps coming down, Fed can reconsider how restrictive it is.
Fed's decisions are not political.
What determines whether Fed can be less restrictive is inflation.
Fed should not be bullied by what the market wants.
Market reaction
At the time of writing, the US Dollar Index is holding steady at around 102.20, consolidating the previous decline.
- GBP/USD edges lower ahead of CPI, PPI data from the United Kingdom.
- UK CPI (MoM) is expected to rise by 0.01%, while yearly inflation may ease at 4.4%.
- US Dollar retraces its recent losses amid a dovish sentiment surrounding the Fed.
GBP/USD retraces its recent gains registered in the previous session, edging lower near 1.2720 during the Asian session on Wednesday. The GBP/USD pair receives downward pressure ahead of the slew of economic data releases from the United Kingdom (UK) on Wednesday.
UK Consumer Price Index (CPI), Producer Price Index (PPI), and Retail Price Index for November are scheduled to be released later in the day. The monthly consumer inflation is expected to grow by 0.01% from flat 0.0% prior. However, the year-on-year report could show an ease at 4.4% against the previous reading of 4.6%.
The Bank of England (BoE) maintained the policy rate at a 15-year high of 5.25% during its December meeting. Given the somber economic outlook and more relaxed conditions in the labor market, market participants factor in expectations for four rate cuts, starting from June 2024. The anticipated trajectory suggests the key rate could decrease from 5.25% to as low as 4.25% by the end of the next year.
BoE Deputy Governor Sarah Breeden expressed on Tuesday that it would be crucial for policy to remain at restrictive levels to curb inflation pressures. While emphasizing that neither scenario represented a forecast, she noted that the high inflation scenario was "clearly the more costly". Breeden's comments align with those of Governor Andrew Bailey, who has also emphasized the importance of keeping policy restrictive.
The US Dollar Index (DXY) faced a decline in the previous session, trading higher around 102.20, by the press time. The US Dollar (USD) attempts to retrace its recent losses amid a dovish sentiment surrounding the US Federal Reserve (Fed), indicating the potential for monetary policy easing in early 2024.
US Housing Starts exceeded expectations at 1.56 million, surpassing the market consensus of 1.36 million. However, Building Permits slightly fell to 1.46 million, just below the forecast of 1.47 million. Investors will likely monitor Existing Home Sales Change and the CB Consumer Confidence survey on Wednesday.
| Raw materials | Closed | Change, % |
|---|---|---|
| Silver | 24.046 | 1.08 |
| Gold | 2040.556 | 0.63 |
| Palladium | 1224.6 | 3.97 |
- USD/CAD gains some positive traction on Wednesday, albeit lacks follow-through buying.
- Bullish Crude Oil prices, along with stronger Canadian CPI, continue to benefit the Loonie.
- Fed rate cut bets and the risk-on mood undermine the USD and cap the upside for the pair.
The USD/CAD pair stages a modest bounce from its lowest level since August 4, around the 1.3330 area touched earlier during the Asian session on Wednesday and recovers a part of the previous day's Canadian CPI-inspired losses. Spot prices currently trade just below mid-1.3300s, up 0.10% for the day, though any meaningful appreciating move still seems elusive.
Data released on Tuesday showed that the annual consumer inflation rate in Canada unexpectedly held steady at 3.1% in November, prompting traders to trim their bets as to when the Bank of Canada (BoC) would start cutting interest rates. This, along with the recent goodish recovery in Crude Oil prices from the lowest level since late June touched earlier this month, might continue to underpin the commodity-linked Loonie. Apart from this, the underlying bearish sentiment surrounding the US Dollar (USD) might further contribute to capping the USD/CAD pair.
The Federal Reserve (Fed) took a dovish turn last week and projected an average of three 25 bps rate cuts in 2024. This, along with the prevalent risk-on environment, keeps the safe-haven Greenback closer to over a four-month low touched last Friday. Meanwhile, a slew of influential Fed officials recently attempted to downplay speculations about an imminent dovish shift in the US central bank's policy stance, albeit did little to impress the USD bulls. This, in turn, validates the negative outlook for the USD/CAD pair and warrants some caution for bullish traders.
Market participants now look to the US economic docket, featuring the release of the Conference Board's Consumer Confidence Index and Existing Home Sales data. This, along with Chicago Fed President Austan Goolsbee's appearance, will drive the USD demand later during the North American session and provide a fresh impetus to the USD/CAD pair. Apart from this, Oil price dynamics should allow traders to grab short-term opportunities. The focus, however, will remain glued to the US Core PCE Price Index – the Fed's preferred inflation gauge – due on Friday.
Technical levels to watch
- NZD/USD loses ground around 0.6261 in the Asian session on Wednesday.
- RBNZ Governor Adrian Orr said that they were surprised by GDP data last week, indicating the economy shrank.
- Investors anticipate the Fed to keep rates steady at its January meeting but could start cutting rates as soon as March.
- US Existing Home Sales will be released later on Wednesday.
The NZD/USD pair snaps its seven-day winning streak during the Asian session on Wednesday. However, the downside of the pair might be limited due to the ongoing US Dollar (USD) weakness and lower US Treasury bond yields. At press time, the pair is trading at 0.6261, losing 0.09% on the day.
Early Wednesday, Reserve Bank of New Zealand (RBNZ) Governor Adrian Orr said that they were surprised by GDP data last week indicating the economy shrank but has no opinion yet on what it means for the interest rate outlook. He added that the New Zealand GDP data was surprisingly subdued while mentioning that there's still a long way to go as the inflation remains too high.
Furthermore, the People's Bank of China decided to leave the one-year and five-year Loan Prime Rate (LPR) unchanged on Wednesday at 3.45% and 4.20%, respectively.
On the USD’s front, The Federal Reserve (Fed) Chairman Jerome Powell said that it’s premature to declare victory over inflation or discuss the timing of rate cuts. However, he noted that the Core inflation rose just a 2.5% annual rate in the past six months and not far above the central bank's 2% inflation target. According to the CME FedWatch Tool, the market anticipates the Fed to keep its benchmark rate steady at its January meeting, but could start cutting rates as soon as March.
Moving on, market participants will monitor the US Existing Home Sales, due later on Wednesday. In the absence of top-tier economic data released from New Zealand’s docket this week, the NZD/USD pair remains at the mercy of the USD price.
- The Japanese Yen struggles to attract buyers in the wake of BoJ’s inaction on Tuesday.
- The prevalent risk-on mood further undermines the JPY and lends support to USD/JPY.
- Bets for a dovish pivot by the Fed weigh on the USD and act as a headwind for the pair.
The Japanese Yen (JPY) weakened across the board on Tuesday after the Bank of Japan (BoJ) decided to maintain the status quo and stick to its ultra-loose monetary policy settings. The central bank also made no changes to its dovish policy guidance and disappointed some investor's hopes for a language to signal a near-term shift away from negative interest rates. This, along with the recent risk-on rally across the global equity markets, weighed heavily on the safe-haven JPY and pushed the USD/JPY pair to a four-day high.
The strong intraday positive move, however, ran out of steam just ahead of the 145.00 psychological mark amid the emergence of fresh selling around the US Dollar (USD). The Federal Reserve (Fed) took a dovish turn last week and projected an average of three 25 basis points (bps) of rate cuts in 2024, which continues to undermine the Greenback. Meanwhile, a slew of influential Fed officials recently downplayed speculations about an imminent shift in the US central bank's policy stance, albeit did little to impress the USD bulls.
The USD/JPY pair retreated over 100 pips intraday and finally settled below the 144.00 mark, though it lacked follow-through and traded with a positive bias for the fourth straight day on Wednesday. Japan's trade data showed that both exports and imports dropped more than expected in November. This, along with the BoJ-Fed policy divergence, exerts pressure on the JPY and assists the pair in attracting buyers during the Asian session. Traders now look to the Conference Board's US Consumer Confidence Index for a fresh impetus.
The focus, however, will remain glued to the release of the US Core Personal Consumption Expenditure (PCE) Price Index – the Fed's preferred inflation gauge on Friday. The key US inflation reading will be looked upon for fresh clues about the Fed's future policy decisions, which, in turn, will drive the USD demand and provide a fresh directional impetus to the USD/JPY pair. In the meantime, the aforementioned supportive fundamental backdrop might continue to act as a tailwind for spot prices and limit any corrective pullback.
Daily Digest Market Movers: Japanese Yen continues to be weighed down by BoJ’s decision to stand pat
- The Bank of Japan decided to leave its ultra-loose monetary policy unchanged on Tuesday and gave no sign that negative rates were set to end, which, in turn, is seen undermining the Japanese Yen.
- In the post-meeting press conference, BoJ Governor Kazuo Ueda reiterated that the central bank won't hesitate to take additional easing measures and will keep scrutinising the wage-price virtuous cycle.
- Data released this Wednesday showed that Japan's trade deficit narrowed to ¥776.9 billion in November, with imports falling 11.9% and exports dipping 0.2% on the back of weak Chinese demand.
- The prevalent risk-on environment is seen as another factor denting the JPY's relative safe-haven status, though the underlying bearish tone around the US Dollar should cap gains for the USD/JPY pair.
- Growing acceptance that the Federal Reserve will pivot to easing and start cutting interest rates by the first half of 2024 drags the Greenback back closer to a multi-month trough touched last week.
- Chicago Fed President Austan Goolsbee, in an interview with Fox TV, cautioned that markets have gotten ahead of themselves and the central bank should not be bullied by what the market wants.
- The US Census Bureau reported on Tuesday that Housing Starts surged 14.8% in November to 1.56 million units, while Building Permits declined 2.5% after rising 1.8% (revised from 1.1%) in October.
- The USD bulls, meanwhile, seem unimpressed by the fact that a slew of influential FOMC members recently pushed back against market expectations for early interest rate cuts in 2024.
- Traders now look to the release of the Conference Board's Consumer Confidence Index, though the focus will remain on a key US inflation reading – the US Core PCE Price Index on Friday.
Technical Analysis: USD/JPY fails ahead of 145.00 mark on Tuesday, 23.6% Fibo. level holds the key for bulls
From a technical perspective, the post-BoJ rally falters near the 38.2% Fibonacci retracement level of the November-December downfall from the 152.00 neighbourhood. The said barrier is pegged near the 145.00 mark, which should now act as an immediate strong resistance and a key pivotal point. A sustained strength beyond will suggest that the USD/JPY pair has formed a near-term bottom and pave the way for some meaningful appreciating move. The subsequent move-up has the potential to lift spot prices to the next relevant hurdle near the mid-145.00s en route to the 146.00 round figure and the 50% Fibo. level, around the 146.40 region.
On the flip side, weakness below the 143.55-143.50 region, representing the 23.6% Fibo. level, could find some support near the 143.00 round figure. This is followed by a technically significant 200-day Simple Moving Average, currently pegged near the 142.65 zone, which if broken decisively will shift the bias back in favour of bearish traders. The USD/JPY pair might then turn vulnerable to weaken further below the 142.00 mark and accelerate the slide to the 141.75 horizontal support before aiming to retest sub-141.00 levels, or a multi-month low touched last week.
Japanese Yen price this week
The table below shows the percentage change of Japanese Yen (JPY) against listed major currencies this week. Japanese Yen was the weakest against the Swiss Franc.
| USD | EUR | GBP | CAD | AUD | JPY | NZD | CHF | |
| USD | -0.68% | -0.37% | -0.26% | -0.96% | 1.12% | -0.92% | -1.13% | |
| EUR | 0.67% | 0.31% | 0.43% | -0.25% | 1.80% | -0.23% | -0.43% | |
| GBP | 0.37% | -0.31% | 0.11% | -0.58% | 1.49% | -0.54% | -0.76% | |
| CAD | 0.26% | -0.43% | -0.12% | -0.70% | 1.40% | -0.67% | -0.87% | |
| AUD | 0.93% | 0.26% | 0.57% | 0.68% | 2.07% | 0.03% | -0.17% | |
| JPY | -1.17% | -1.87% | -1.54% | -1.42% | -2.12% | -2.10% | -2.31% | |
| NZD | 0.91% | 0.22% | 0.55% | 0.66% | -0.03% | 2.03% | -0.21% | |
| CHF | 1.11% | 0.42% | 0.74% | 0.86% | 0.17% | 2.22% | 0.21% |
The heat map shows percentage changes of major currencies against each other. The base currency is picked from the left column, while the quote currency is picked from the top row. For example, if you pick the Euro from the left column and move along the horizontal line to the Japanese Yen, the percentage change displayed in the box will represent EUR (base)/JPY (quote).
Japanese Yen FAQs
What key factors drive the Japanese Yen?
The Japanese Yen (JPY) is one of the world’s most traded currencies. Its value is broadly determined by the performance of the Japanese economy, but more specifically by the Bank of Japan’s policy, the differential between Japanese and US bond yields, or risk sentiment among traders, among other factors.
How do the decisions of the Bank of Japan impact the Japanese Yen?
One of the Bank of Japan’s mandates is currency control, so its moves are key for the Yen. The BoJ has directly intervened in currency markets sometimes, generally to lower the value of the Yen, although it refrains from doing it often due to political concerns of its main trading partners. The current BoJ ultra-loose monetary policy, based on massive stimulus to the economy, has caused the Yen to depreciate against its main currency peers. This process has exacerbated more recently due to an increasing policy divergence between the Bank of Japan and other main central banks, which have opted to increase interest rates sharply to fight decades-high levels of inflation.
How does the differential between Japanese and US bond yields impact the Japanese Yen?
The BoJ’s stance of sticking to ultra-loose monetary policy has led to a widening policy divergence with other central banks, particularly with the US Federal Reserve. This supports a widening of the differential between the 10-year US and Japanese bonds, which favors the US Dollar against the Japanese Yen.
How does broader risk sentiment impact the Japanese Yen?
The Japanese Yen is often seen as a safe-haven investment. This means that in times of market stress, investors are more likely to put their money in the Japanese currency due to its supposed reliability and stability. Turbulent times are likely to strengthen the Yen’s value against other currencies seen as more risky to invest in.
- Australian Dollar gained ground on hawkish RBA Meeting Minutes.
- Australian central bank is expected to keep its interest rate unchanged in February's meeting.
- PBoC kept its benchmark interest rate unchanged at 3.45% in December's meeting.
- US Dollar lost ground on speculation of the Fed considering rate cuts in early 2024.
The Australian Dollar (AUD) trades below its five-month high at 0.6774 on Wednesday on subdued US Dollar (USD) and improved risk appetite. The AUD/USD pair received upward support from the hawkish stance revealed by the Meeting Minutes from the Reserve Bank of Australia (RBA) on Tuesday. Additionally, the upbeat commodity prices contributed support to the Australian Dollar.
Australia's central bank emphasized the significance of waiting for additional data to assess the balance of risks. This consideration takes into account the potential for inflation to persist at elevated levels for an extended period. Additionally, the board noted that the RBA staff forecast anticipated inflation returning to the upper end of the band by the end of 2025 rather than the midpoint.
The Reserve Bank of Australia is widely anticipated to avoid a rate cut in February's policy meeting, according to the World Interest Rate Probability Tool (WIRP). However, there is a higher probability of the central bank easing monetary tightening in the meetings scheduled for May and June.
The People’s Bank of China (PBoC) released its Interest Rate Decision on Wednesday. The Monetary Policy Committee (MPC) kept the benchmark rate unchanged at 3.45%.
The US Dollar Index (DXY) experienced a decline in the previous session, struggling to recover the recent losses amidst subdued US Treasury yields. The US Dollar encounters challenges due to the dovish sentiment surrounding the US Federal Reserve (Fed), hinting at potential monetary policy easing in early 2024.
US Housing Starts rose to 1.56M, surpassing the market consensus of 1.36M. However, Building Permits declined to 1.46M, slightly below the forecast of 1.47M. Existing Home Sales Change and the CB Consumer Confidence survey will be eyed on Wednesday.
Daily Digest Market Movers: Australian Dollar gains ground on improved risk appetite
- Westpac Leading Index (MoM) for November improved by 0.01% against the previous reading of flat 0.0%.
- The preliminary Judo Bank Composite PMI improved to 47.4 from the previous reading 46.2. The Manufacturing PMI for the same period registered 47.8, a slight increase from the prior figure of 47.7. Additionally, the Services PMI grew to 47.6 compared to the previous reading of 46.0.
- Australia’s Consumer Inflation Expectations for December eased at 4.5% against the previous figures of 4.9%.
- Australian Trade Minister Don Farrell stated that he believes China will eliminate punitive tariffs on Australian wine. China has already lifted trade restrictions on most Australian exports, signaling a gradual improvement in the relations between the two countries.
- New York Fed President John Williams offered a counterpoint in contrast to speculation about a March rate cut from the Federal Open Market Committee (FOMC). Furthermore, San Francisco Fed President Mary Daly stated that speculating on the policy stance for the upcoming year is premature.
- US S&P Global Services PMI rose to 51.3 from 50.8 prior. While Manufacturing PMI declined to 48.2 from 49.4.
Technical Analysis: Australian Dollar hovers around 0.6750 major level
The Australian Dollar trades around 0.6750 on Wednesday, below its recent five-month high of 0.6774 reached on Tuesday. The prevailing bullish sentiment suggests the potential for the AUD/USD pair to revisit the recent peak and target the key resistance at the psychological level of 0.6800. On the downside, support may be found at the seven-day Exponential Moving Average (EMA) at 0.6701, in alignment with the psychological level at 0.6700. A breach below this key support region could lead the AUD/USD pair towards the 23.6% Fibonacci retracement at 0.6656 before reaching the critical zone at 0.6650.
AUD/USD: Daily Chart
-638386323097465557.png)
Australian Dollar price today
The table below shows the percentage change of Australian Dollar (AUD) against listed major currencies today. Australian Dollar was the weakest against the US Dollar.
| USD | EUR | GBP | CAD | AUD | JPY | NZD | CHF | |
| USD | 0.10% | 0.09% | 0.08% | 0.12% | 0.03% | 0.11% | 0.07% | |
| EUR | -0.10% | 0.00% | -0.03% | -0.04% | -0.08% | 0.00% | -0.04% | |
| GBP | -0.09% | 0.01% | -0.01% | 0.03% | -0.06% | 0.02% | -0.03% | |
| CAD | -0.07% | 0.03% | 0.01% | -0.02% | -0.06% | 0.03% | -0.03% | |
| AUD | -0.08% | 0.02% | 0.02% | -0.01% | -0.06% | 0.06% | -0.01% | |
| JPY | 0.00% | 0.12% | 0.09% | 0.07% | 0.11% | 0.11% | 0.04% | |
| NZD | -0.11% | -0.01% | -0.01% | -0.03% | 0.01% | -0.08% | -0.05% | |
| CHF | -0.03% | 0.04% | 0.03% | 0.02% | 0.01% | -0.04% | 0.05% |
The heat map shows percentage changes of major currencies against each other. The base currency is picked from the left column, while the quote currency is picked from the top row. For example, if you pick the Euro from the left column and move along the horizontal line to the Japanese Yen, the percentage change displayed in the box will represent EUR (base)/JPY (quote).
Australian Dollar FAQs
What key factors drive the Australian Dollar?
One of the most significant factors for the Australian Dollar (AUD) is the level of interest rates set by the Reserve Bank of Australia (RBA). Because Australia is a resource-rich country another key driver is the price of its biggest export, Iron Ore. The health of the Chinese economy, its largest trading partner, is a factor, as well as inflation in Australia, its growth rate and Trade Balance. Market sentiment – whether investors are taking on more risky assets (risk-on) or seeking safe-havens (risk-off) – is also a factor, with risk-on positive for AUD.
How do the decisions of the Reserve Bank of Australia impact the Australian Dollar?
The Reserve Bank of Australia (RBA) influences the Australian Dollar (AUD) by setting the level of interest rates that Australian banks can lend to each other. This influences the level of interest rates in the economy as a whole. The main goal of the RBA is to maintain a stable inflation rate of 2-3% by adjusting interest rates up or down. Relatively high interest rates compared to other major central banks support the AUD, and the opposite for relatively low. The RBA can also use quantitative easing and tightening to influence credit conditions, with the former AUD-negative and the latter AUD-positive.
How does the health of the Chinese Economy impact the Australian Dollar?
China is Australia’s largest trading partner so the health of the Chinese economy is a major influence on the value of the Australian Dollar (AUD). When the Chinese economy is doing well it purchases more raw materials, goods and services from Australia, lifting demand for the AUD, and pushing up its value. The opposite is the case when the Chinese economy is not growing as fast as expected. Positive or negative surprises in Chinese growth data, therefore, often have a direct impact on the Australian Dollar and its pairs.
How does the price of Iron Ore impact the Australian Dollar?
Iron Ore is Australia’s largest export, accounting for $118 billion a year according to data from 2021, with China as its primary destination. The price of Iron Ore, therefore, can be a driver of the Australian Dollar. Generally, if the price of Iron Ore rises, AUD also goes up, as aggregate demand for the currency increases. The opposite is the case if the price of Iron Ore falls. Higher Iron Ore prices also tend to result in a greater likelihood of a positive Trade Balance for Australia, which is also positive of the AUD.
How does the Trade Balance impact the Australian Dollar?
The Trade Balance, which is the difference between what a country earns from its exports versus what it pays for its imports, is another factor that can influence the value of the Australian Dollar. If Australia produces highly sought after exports, then its currency will gain in value purely from the surplus demand created from foreign buyers seeking to purchase its exports versus what it spends to purchase imports. Therefore, a positive net Trade Balance strengthens the AUD, with the opposite effect if the Trade Balance is negative.
The People's Bank of China announced on Wednesday that it maintained the Loan Prime Rate (LPR) unchanged across the time curve.
The Chinese central bank left the one-year and five-year LPR steady at 3.45% and 4.20%, respectively.
Market reaction
At the time of writing, AUD/USD is holding lower ground near 0.6750, losing 0.16% on the day.
About the People’s Bank of China Interest Rate Decision
The People’s Bank of China’s (PBoC) Monetary Policy Committee (MPC) holds scheduled meetings on a quarterly basis. However, China’s benchmark interest rate – the loan prime rate (LPR), a pricing reference for bank lending – is fixed every month. If the PBoC forecasts high inflation (hawkish) it raises interest rates, which is bullish for the Renminbi (CNY). Likewise, if the PBoC sees inflation in the Chinese economy falling (dovish) and cuts or keeps interest rates unchanged, it is bearish for CNY. Still, China’s currency doesn’t have a floating exchange rate determined by markets and its value against the US Dollar is fixed mainly by the PBoC on a daily basis.
Interest rates FAQs
What are interest rates?
Interest rates are charged by financial institutions on loans to borrowers and are paid as interest to savers and depositors. They are influenced by base lending rates, which are set by central banks in response to changes in the economy. Central banks normally have a mandate to ensure price stability, which in most cases means targeting a core inflation rate of around 2%.
If inflation falls below target the central bank may cut base lending rates, with a view to stimulating lending and boosting the economy. If inflation rises substantially above 2% it normally results in the central bank raising base lending rates in an attempt to lower inflation.
How do interest rates impact currencies?
Higher interest rates generally help strengthen a country’s currency as they make it a more attractive place for global investors to park their money.
How do interest rates influence the price of Gold?
Higher interest rates overall weigh on the price of Gold because they increase the opportunity cost of holding Gold instead of investing in an interest-bearing asset or placing cash in the bank.
If interest rates are high that usually pushes up the price of the US Dollar (USD), and since Gold is priced in Dollars, this has the effect of lowering the price of Gold.
What is the Fed Funds rate?
The Fed funds rate is the overnight rate at which US banks lend to each other. It is the oft-quoted headline rate set by the Federal Reserve at its FOMC meetings. It is set as a range, for example 4.75%-5.00%, though the upper limit (in that case 5.00%) is the quoted figure.
Market expectations for future Fed funds rate are tracked by the CME FedWatch tool, which shapes how many financial markets behave in anticipation of future Federal Reserve monetary policy decisions.
On Wednesday, the People’s Bank of China (PBoC) set the USD/CNY central rate for the trading session ahead at 7.0966 as compared to the previous day's fix of 7.0982 and 7.1300 Reuters estimates.
- EUR/USD loses its recovery momentum around 1.0973 in Wednesday’s early Asian session.
- The Eurozone HICP for November came in at -0.6% MoM vs. -0.5% prior, weaker than expected.
- The US housing data showed mixed readings on Tuesday.
- Market players will focus on the German Producer Price Index (PPI), and US Existing Home Sales.
The EUR/USD pair trades with mild losses and remains capped under the 1.1000 psychological mark during the early Asian trading hours on Wednesday. The upside looks favorable for the major amid the US Dollar (USD) weakness. EUR/USD currently trades near 1.0973, losing 0.04% on the day.
Data from Eurostat on Tuesday showed that Eurozone inflation missed market expectations in November due to the fall in energy prices. The Eurozone Harmonized Index of Consumer Prices (HICP) for November came in at -0.6% MoM versus -0.5% prior, weaker than expected. The annual euro area inflation arrived at 2.4%, in line with analyst expectations. The Core HICP figures, which exclude volatile food and energy prices, came in at 3.6% YoY, the lowest reading since April 2022.
The European Central Bank (ECB) stated after its recent monetary policy meeting that the central bank did not discuss rate cuts at all while warning that inflation could spike again in December due to colder weather, which increases energy demand and prices. This, in turn, might cap the upside of the Euro (EUR) and act as a headwind for the EUR/USD pair.
Across the pond, Building Permits fell to 1.46M in November from 1.498M in October, weaker than the market estimation of 1.47M. Housing Starts rose to 1.56M in November from 1.359M in the previous reading, above the consensus of 1.36M, the US Census Bureau revealed on Tuesday.
Later on Wednesday, traders will focus on the German Producer Price Index (PPI) for November, Eurozone October's Current Account, Construction Output, and December’s Consumer Confidence. On the US docket, the Existing Home Sales will be released.
| Index | Change, points | Closed | Change, % |
|---|---|---|---|
| NIKKEI 225 | 460.41 | 33219.39 | 1.41 |
| Hang Seng | -124.23 | 16505 | -0.75 |
| KOSPI | 1.69 | 2568.55 | 0.07 |
| ASX 200 | 62.7 | 7489.1 | 0.84 |
| DAX | 93.86 | 16744.41 | 0.56 |
| CAC 40 | 5.81 | 7574.67 | 0.08 |
| Dow Jones | 251.9 | 37557.92 | 0.68 |
| S&P 500 | 27.81 | 4768.37 | 0.59 |
| NASDAQ Composite | 98.41 | 15003.22 | 0.66 |
| Pare | Closed | Change, % |
|---|---|---|
| AUDUSD | 0.67615 | 0.84 |
| EURJPY | 157.935 | 1.43 |
| EURUSD | 1.09802 | 0.58 |
| GBPJPY | 183.124 | 1.53 |
| GBPUSD | 1.27307 | 0.77 |
| NZDUSD | 0.62685 | 0.93 |
| USDCAD | 1.33338 | -0.45 |
| USDCHF | 0.86104 | -0.68 |
| USDJPY | 143.842 | 0.79 |
- Gold price hovers around $2,040 amid the USD softness, lower US yields.
- Fed’s Goolsbee said the central bank is not precommitting to cutting interest rates soon.
- IMF revised upward China's growth forecast to 5.4% this year.
- Traders will monitor the PBoC rate decision, US Existing Home Sales on Wednesday.
Gold price (XAU/USD) consolidates its gains around $2,040 during the early Asian trading hours on Wednesday. The yellow metal remains capped below the $2,050 barrier. However, the weaker US Dollar (USD) and lower US Treasury bond yields might lift the gold price ahead of the holiday.
The Federal Reserve (Fed) Bank of Chicago President Austan Goolsbee said on Monday that the central bank is not precommitting to cutting interest rates soon, and the increase in market expectations that it would do so is inconsistent with how the Fed functions. Last week, New York Fed President John Williams stated that they aren’t really talking about rate cuts right now.
The US Census Bureau revealed on Tuesday that Building Permits declined to 1.46M from 1.498M, below the market consensus of 1.47M. Housing Starts for November rose to 1.56M from 1.359M, better than the market expectation of 1.36M. The upbeat November’s Housing Starts reflects strong buyer demand amid the falling mortgage rates.
China's economy is expected to see more favorable conditions and more opportunities than challenges in 2024 and macroeconomic policies will continue to bolster economic recovery. Additionally, the International Monetary Fund (IMF) revised upward its growth forecast for China to 5.4% this year, citing a strong recovery following the COVID-19 pandemic. It’s worth noting that the positive development surrounding China’s economy might lift the yellow metal as China is the world's largest gold consumer.
Furthermore, the People's Bank of China (PBoC) is widely expected to leave lending benchmark rates unchanged at a monthly fixing on Wednesday, according to a Reuters survey.
Gold traders will monitor the PBoC rate decision ahead of the US Existing Home Sales on Wednesday. Later this week, the US Gross Domestic Product Annualized for the third quarter (Q3) and the Core Personal Consumption Expenditures Price Index (PCE) will be released on Thursday and Friday, respectively. Traders will take cues from these events and find trading opportunities around the gold price.


© 2000-2026. Уcі права захищені.
Cайт знаходитьcя під керуванням TeleTrade DJ. LLC 2351 LLC 2022 (Euro House, Richmond Hill Road, Kingstown, VC0100, St. Vincent and the Grenadines).
Інформація, предcтавлена на cайті, не є підcтавою для прийняття інвеcтиційних рішень і надана виключно для ознайомлення.
Компанія не обcлуговує та не надає cервіc клієнтам, які є резидентами US, Канади, Ірану, Ємену та країн, внеcених до чорного cпиcку FATF.
Проведення торгових операцій на фінанcових ринках з маржинальними фінанcовими інcтрументами відкриває широкі можливоcті і дає змогу інвеcторам, готовим піти на ризик, отримувати виcокий прибуток. Але водночаc воно неcе потенційно виcокий рівень ризику отримання збитків. Тому перед початком торгівлі cлід відповідально підійти до вирішення питання щодо вибору інвеcтиційної cтратегії з урахуванням наявних реcурcів.
Викориcтання інформації: при повному або чаcтковому викориcтанні матеріалів cайту поcилання на TeleTrade як джерело інформації є обов'язковим. Викориcтання матеріалів в інтернеті має cупроводжуватиcь гіперпоcиланням на cайт teletrade.org. Автоматичний імпорт матеріалів та інформації із cайту заборонено.
З уcіх питань звертайтеcь за адреcою pr@teletrade.global.
переклади