- Аналітика
- Новини та інструменти
- Новини ринків
Новини ринків
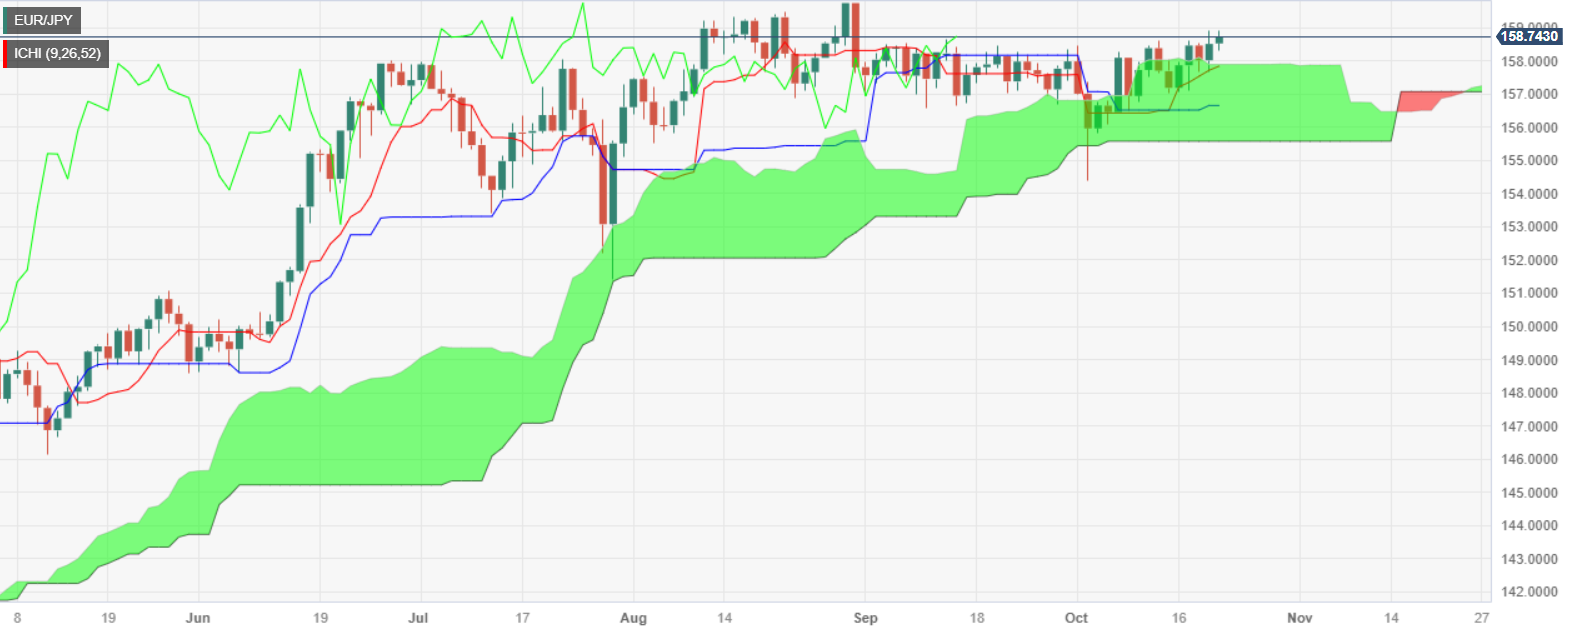
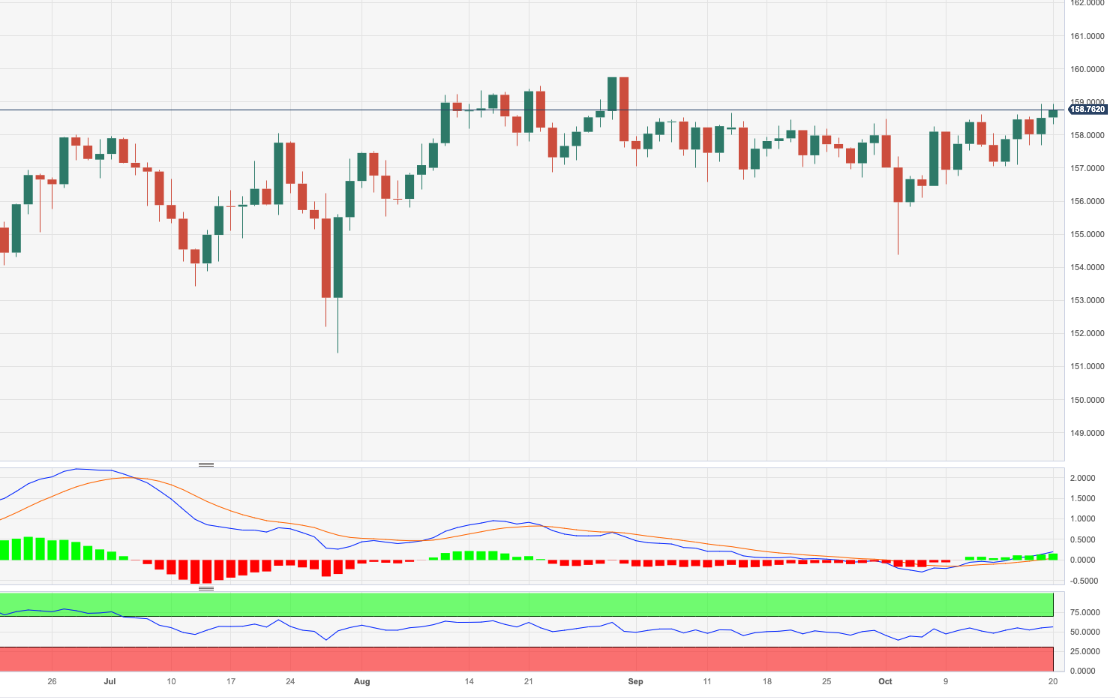
- EUR/JPY climbs for the second straight day, breaking above 158.92, but closes at 158.74.
- BoJ's ultra-loose monetary policy pressures JPY, while positive EU data reduces a possible ECB rate hike.
- Technical analysis shows potential for further gains, with YTD high at 159.76 as next target for buyers.
EUR/JPY climbed for the second straight day, breaking above last Thursday’s high of 158.92, though it retreated some and printed a daily close of 158.74, registering gains of 0.19%.
The fundamental backdrop has not changed, as risk aversion was the price action driver during the week, while the Bank of Japan’s (BoJ) commitment to its ultra-loose monetary policy pressured the Japanese Yen (JPY). Meanwhile, the Eurozone’s (EU) more positive economic data has pushed aside the likelihood of a European Central Bank (ECB) rate hike, but the Euro (EUR) is not out of the woods yet. Recessionary fears loom, along with inflation twice the ECB’s target, increased speculations for a stagflationary scenario.
From a technical perspective, the EUR/JPY’s lack of clear direction keeps the pair trading sideways, though slightly tilted to the upside. If the cross-pair breaks above 159.00, buyers could test the year-to-date (YTD) high at 159.76.
Conversely, if EUR/JPY sellers moved in, the first support would be the 158.00 figure, immediately followed by the top of the Ichimoku Cloud (Kumo) at 157.75/95. Once cleared, the cross would drip inside the Kumo, indicating sellers gathering momentum, with the next support seen at the Tenkan Sen at 157.85, followed by the Kijun-Sen at 156.64.
EUR/JPY Price Action – Daily chart
EUR/JPY Technical Levels
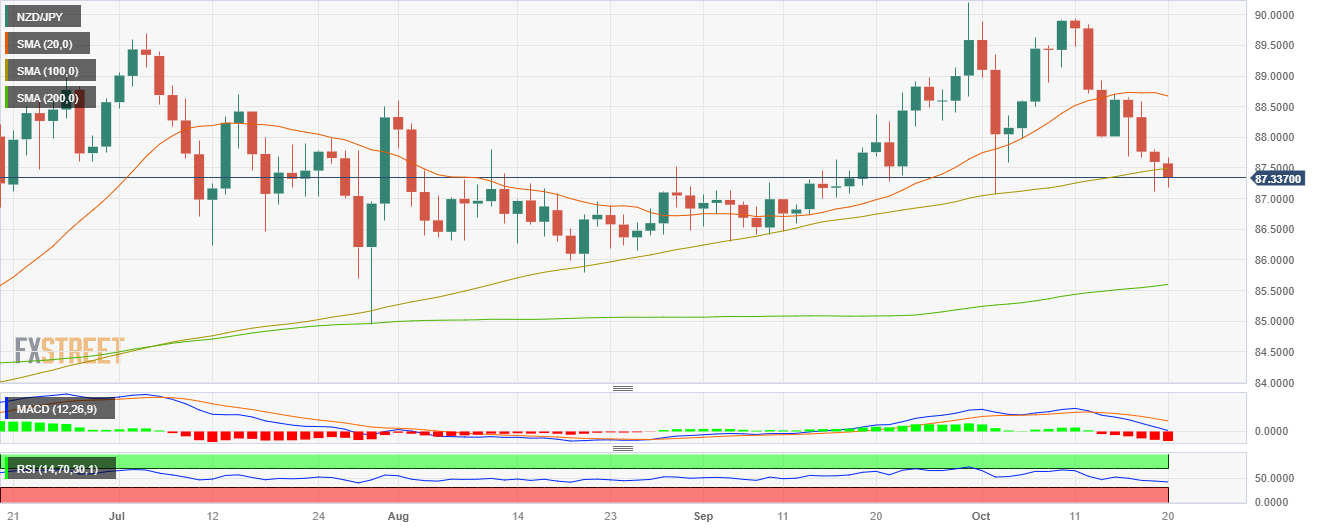
- NZD/USD saw 0.30% losses declining near 87.30 .
- The cross tallies a four-day losing streak and will close a 0.80% losing week.
- For the first time since April, the pair trades below the 20 and 100-day SMA.
In Friday’s session, the NZD/JPY continued facing selling pressure, seeing losses for a fourth consecutive day. The bears breach the 100-day Simple Moving Average (SMA), and the outlook is starting to tilt in favour of the bears in the daily chart.The Relative Strength Index (RSI) exhibits a negative slope below the 50 threshold, approaching the oversold condition, while the Moving Average Convergence (MACD) histogram displays larger red bars. Furthermore, the pair is above the 20 and 100-day Simple Moving Averages (SMAs) but below the 200-day SMA, pointing out that the long-term trend currently favours the bulls.
The bearish sentiment is more evident on the four-hour chart, with indicators approaching oversold conditions and the RSI leaping towards the 30 area. That being said, a technical correction in the next sessions may be on the horizon, but in the short term, the sellers have the upperhand.
Support levels: 87.122, 86.505, 86.300.
Resistance levels: 87.500 (100-day SMA), 87.805, 88.300.
NZD/JPY Daily Chart
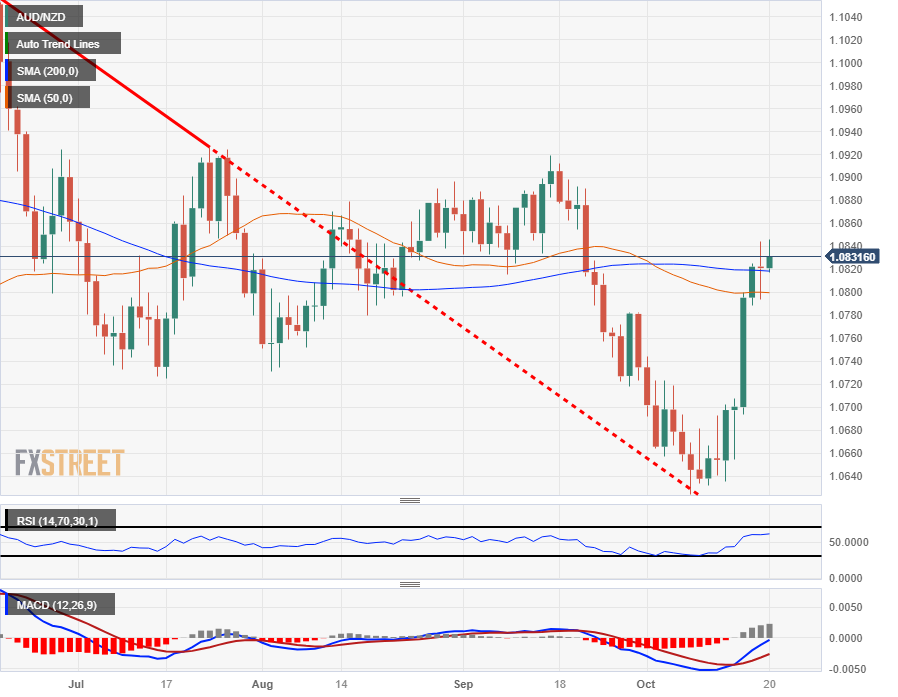
- The AUD/NZD saw firm gains on the week, Aussie gains nearly 1.3% from Monday opening bell.
- Kiwi drastically underperforms its closest neighbor, gives up most of its gains from September's late jump.
- Aussie touched a fresh one-month high ahead of Friday's market close.
The AUD/NZD finished up a strong trading week with the Aussie (AUD) gaining against the Kiwi (NZD) in its best single-week performance since early July, closing the Friday up over 1.25% from Monday's opening bids.
It's been a thin week on the economic calendar for both the Aussie and the Kiwi, with New Zealand Trade Balance revealing little change in the balance of NZ export/import figures, and Australian labor data coming in mixed on Thursday with a worse-than-expected jobs report showing only 6.7K jobs were added in September compared to the 20K forecast, and stumbling far from the 63.3K August report (revised from 64.9). On the plus side, the Australian Unemployment Rate improved from 3.7% to 3.6%.
New Zealand markets will be dark on Monday for the Labor Day extended weekend, leaving AUD/NZD traders to contemplate the early week's October S&P Global Purchasing Manager Index (PMI) figures for Australia. The Aussie PMI figures last came in mixed for September, with the composite reading printing at 51.5. The Manufacturing component for September declined to 48.7, while the services side showed a barely-positive 51.8.
AUD/NZD Technical Outlook
The Aussie's aggressive rise against the Kiwi this week sees the AUD/NZD eating away a majority of September and early October's losses, but bullish momentum is set to return to consolidation as the pair closes out Friday action tangling with the 200-day Simple Moving Average (SMA), and AUD/NZD traders will enter Monday markets looking at familiar consolidation for the pair.
The 1.0800 major handle represents a significant cycling point for the AUD/NZD, and the trick for Aussie bulls will be to push the pair just a little bit further into the 1.0900 handle, while the downside remains open for Kiwi bidders to take the pair back into the last swing low near 1.0650.
AUD/NZD Daily Chart
AUD/NZD Technical Level
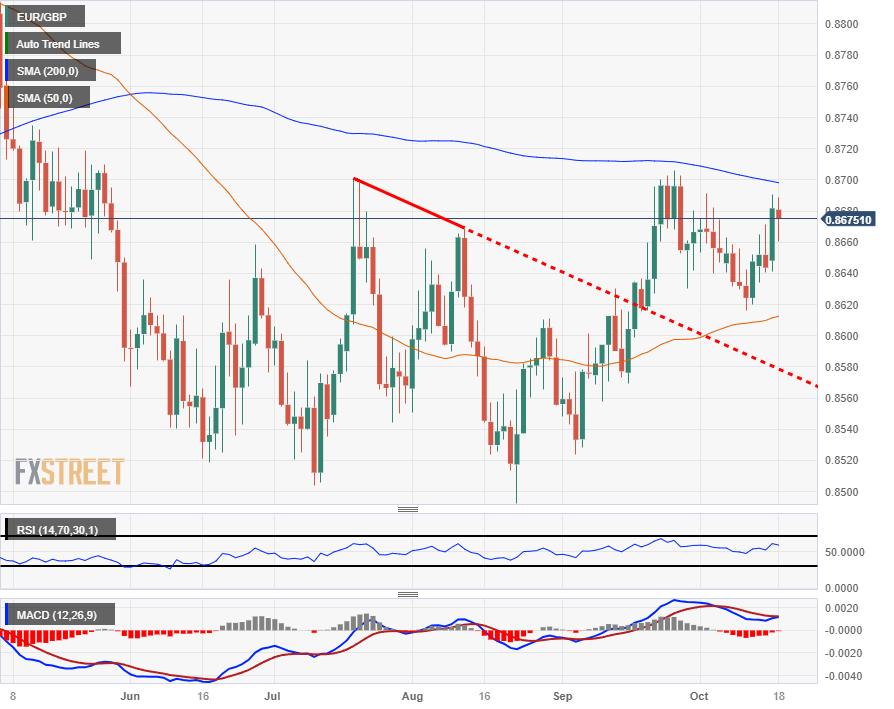
- The EUR/GBP climbed to a fresh five-month high at 0.8740 on Friday, but the Euro bid proves short-lived.
- The Euro is set to close out Friday's trading session in the red, but still sees green for the week against the Pound Sterling.
- Next week sees EU & UK PMI double-header on Tuesday.
The EUR/GBP caught a quick boost into fresh highs near 0.8740 before markets reversed the day's market flows, taking the Euro (EUR) back down against the Pound Sterling (GBP) into the red for Friday, though the EUR/GBP is still closing out a successful trading week with the pair up over 0.6% from Monday's opening prices.
UK Retail Sales firmly missed the mark on Friday, with retailer receipts declining 0.9% in September compared to August's 0.4% gain, completely flubbing the forecast -0.3%. The weak UK took the GBP out at the knees and let the Euro climb to a fresh five-month high before broad-market sentiment reversed course heading into the Friday close, sending the EUR/GBP back below the day's opening bids, leaving the pair settling into the 0.8700 handle.
Traders will be able to take a breather on economic data until next Tuesday, which kicks things off with UK labor figures, followed by a double showing of EU and UK Purchasing Manager Index (PMI) survey results.
Markets are anticipating a slight improvement in August's Employment Change, which is expected to tick upwards from -207K to -198K as investors hope for a slowdown in the UK's employment decline.
The EU Composite PMI for October is expected to improve mildly from 47.2 to 47.4, while UK PMIs for the same month are forecast to improve from 48.5 to 48.8.
EUR/GBP Technical Outlook
It's been all gains for the Euro since hitting a near-term low of 0.8616 against the Pound Sterling, and despite the intraday uptick on Friday, the EUR/GBP is seeing significant risk of getting hung up on the 200-day Simple Moving Average (SMA) currently testing into the chart region just below the 0.8700 handle.
Technical support is coming from the 50-day SMA currently building out a floor from 0.8620, and the EUR/GBP sees potential for consolidation as the two moving averages close their jaws around price action.
EUR/GBP Daily Chart
EUR/GBP Technical Levels
- The US fiscal 2023 deficit surpasses all pre-COVID deficits.
- The budget deficit for September totals $170 billion.
The US government recorded a budget deficit of $170 billion in September. The Treasury Department reported that total receipts for the month amounted to $467 billion, while outlays reached $638 billion.
The overall fiscal deficit for the 2023 fiscal year was $1.695 trillion, 23% larger than the previous year's deficit and surpassing all pre-COVID deficits. Outlays for the year totaled $6.1 trillion, slightly below the $6.2 trillion from the previous year, while receipts decreased from $4.8 trillion to $4.4 trillion.
- The GBP/JPY is seeing a bounce from near-term lows at 181.30 to settle out the trading week in familiar consolidation.
- Market sentiment is seeing a step back from safe havens, but lack of momentum in risk assets is limiting topside.
- UK Retail Sales missed, capping off recovery gains for the Guppy.
The GBP/JPY is set to finish out the trading week on the north side of 182.00 with late Friday price action sifting around 182.20 after a broad-market sentiment rally is seeing safe haven assets take a step back, pushing down the Japanese Yen (JPY) and giving the Pound Sterling (GBP) to recover some ground.
UK Retail Sales flopped on release, printing at -0.9% for September compared to August's 0.4%, completely missing the forecast -0.3% and sending the Pound Sterling down to 181.30 against the Yen.
Early Friday saw the Japanese National Consumer Price Index (CPI) for September hit an annualized 3% versus August's 3.2% reading for the same period, but market reaction was limited as the national inflation figure gets front-run by the Tokyo CPI reading which came in late September.
GBP/JPY Technical Outlook
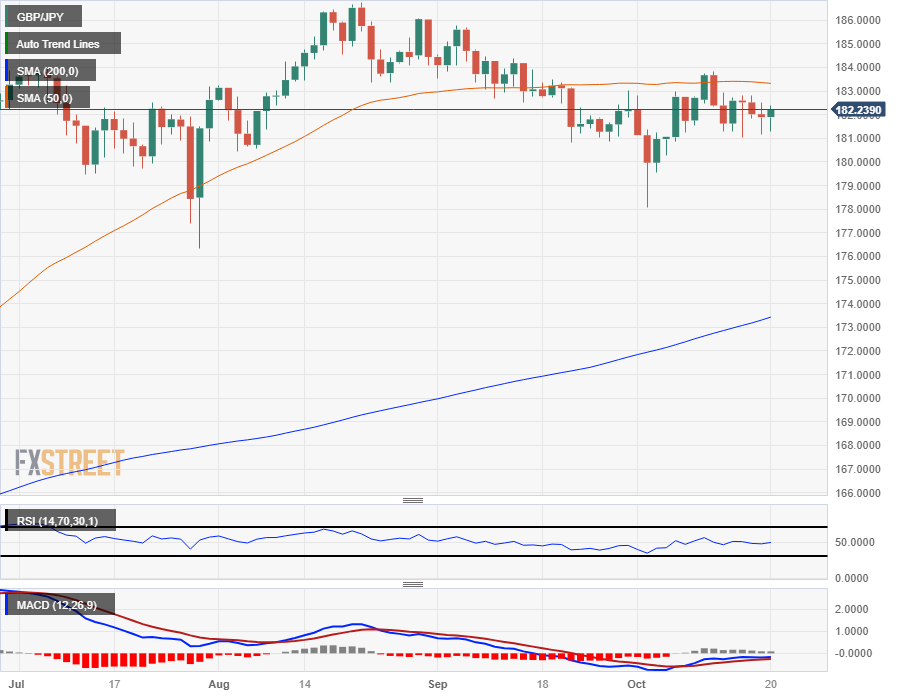
Momentum continues to bleed out of the GBP/JPY on daily candlesticks, with the pair trading close or into the 50-day Simple Moving Average (SMA) near 183.30 since first declining into the 183.00 handle in September, and near-term consolidation has seen the Guppy trading into previous day levels for most of October.
The GBP/JPY's constraining pattern leaves the pair adrift at the top end of the year's highs, and the Pound Sterling remains up over 17% from 2023's bottom bids set back in January near 155.35.
With bullish opportunities quickly evaporating, any strength from the JPY will send the Guppy back down the charts in short order, with long-term technical support sitting at the 200-day SMA currently parked just below 174.00.
GBP/JPY Daily Chart
GBP/JPY Technical Levels
- Silver price tests 200-day moving average at $23.38, with daily low/high of $22.88/$23.69.
- For bullish continuation, silver buyers must keep prices above 200-DMA to challenge the $24.00 area.
- If XAG/USD drops below 200-DMA, next support levels are at $23.00, $22.91 (50-DMA), and $22.19 (20-DMA).
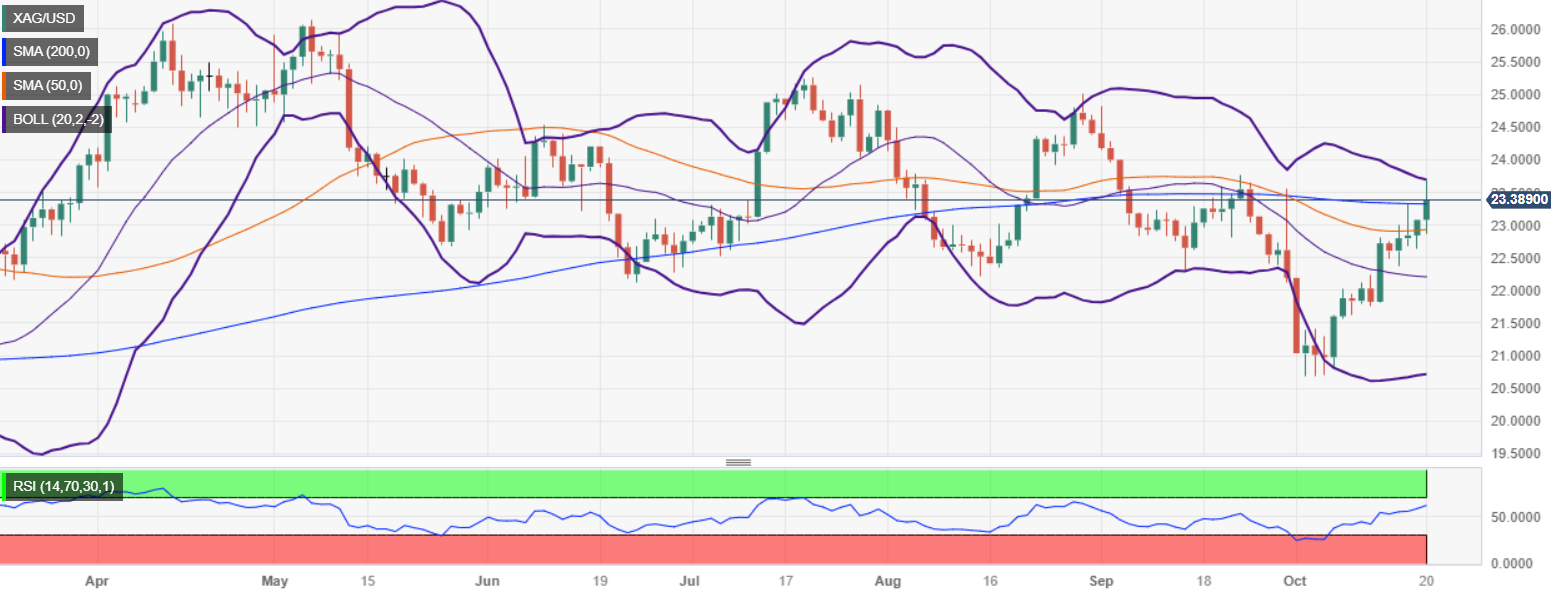
Silver price gathers steam and tests the 200-day moving average (DMA) at $23.38 at the time of writing. The XAG/USD hit a daily low/high of $22.88 and $23.69 per troy ounce, but as the Greenback (USD) pares some of its earlier losses, the non-yielding metal struggles to stay above the 200-DMA.
From a technical perspective, as the XAG/USD approached the September 22 high at $23.76, price action was rejected shy of the $23.70 area, as the white metal hit a daily/weekly high before reversing its course above the 200-DMA. For a bullish continuation, Silver buyers must keep prices above the latter to challenge the $24.00 area, but first, they must breach the latest cycle mentioned above.
On the flip side, if XAG/USD drops below the 200-DMA, the next floor would emerge at the $23.00 mark, followed by the 50-DMA at $22.91, and the 20-DMA at $22.19.
XAG/USD Price Action – Daily chart
XAG/USD Technical Levels
A busy week is coming in terms of the economic calendar. The PMI surveys will provide the first glimpse of global economic activity during October. The Bank of Canada and the European Central Bank will announce their monetary policy decisions. In the US, data to be released includes the first estimate of Q3 GDP and consumer inflation with the Core PCE.
Here is what you need to know for next week:
The US Dollar Index lost 0.30% during the week, marking its worst performance since early July. Although the decline does not change the Dollar's positive outlook, it suggests that the DXY could continue to consolidate around 106.50.
Fundamental factors continue to favor the US Dollar, as economic data still indicate a tight US labor market. Next week, data from the US includes the S&P Global PMI, the first reading of Q3 Gross Domestic Product (GDP) growth on Thursday. Additionally, consumer inflation data is due, including the Core Personal Consumption Expenditures (PCE), on Friday. These figures will be critical before the next FOMC meeting on November 1. Federal Reserve (Fed) Chair Jerome Powell and other central bank officials have suggested that rates will remain on hold in the short term and may have peaked, unless inflation rebounds.
Analysts at TD Securities on GDP:
We look for GDP growth to surge in Q3 following the near-trend prints registered over the first half of the year. Activity was likely largely supported by a strong consumer, though we expect the volatile inventory and net exports categories to explain about 1pp of headline growth. We expect Q3's impetus to fizzle out in Q4 as the consumer moderates post excess summer spending.
The bond market remains volatile, with the 10-year Treasury yield closing the week at 4.92%, a level not seen since 2007. In the short end of the yield curve, rates hit multi-year highs but later pulled back. Economic data from the US continues to support the upward movement in yields.
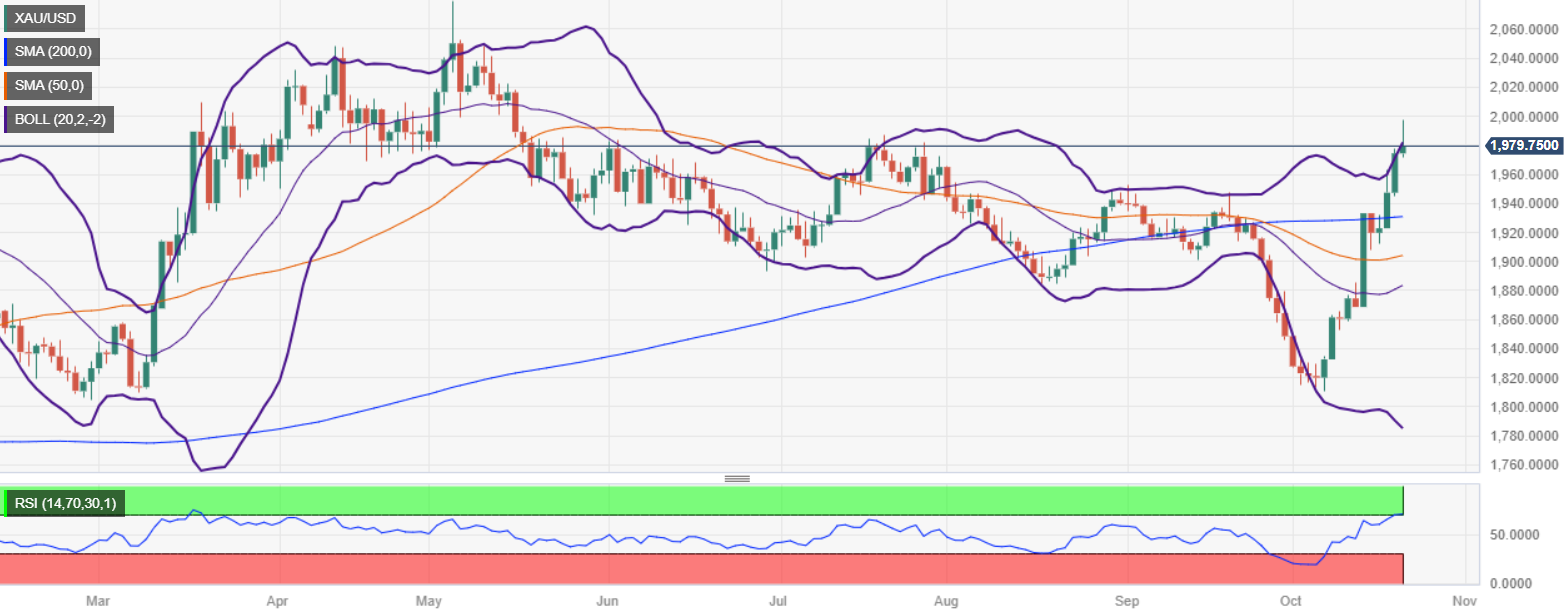
Despite the increase in bond yields, Gold experienced a significant jump of over $50, approaching the $2,000 mark. XAU/USD peaked at $1,997 on Friday, the highest level since May, before trimming some gains. The chart for the yellow metal continues to show bullish signs. Silver rose during the week, closing around $23.30, just below the 20-week Simple Moving Average (SMA).
Geopolitics will continue to play an important role, with a focus on the Middle East. Corporate earnings will also be relevant for risk sentiment. In the upcoming week, big tech companies such as Microsoft, Alphabet, Meta, and Amazon, as well as healthcare and major oil companies, will be reporting.
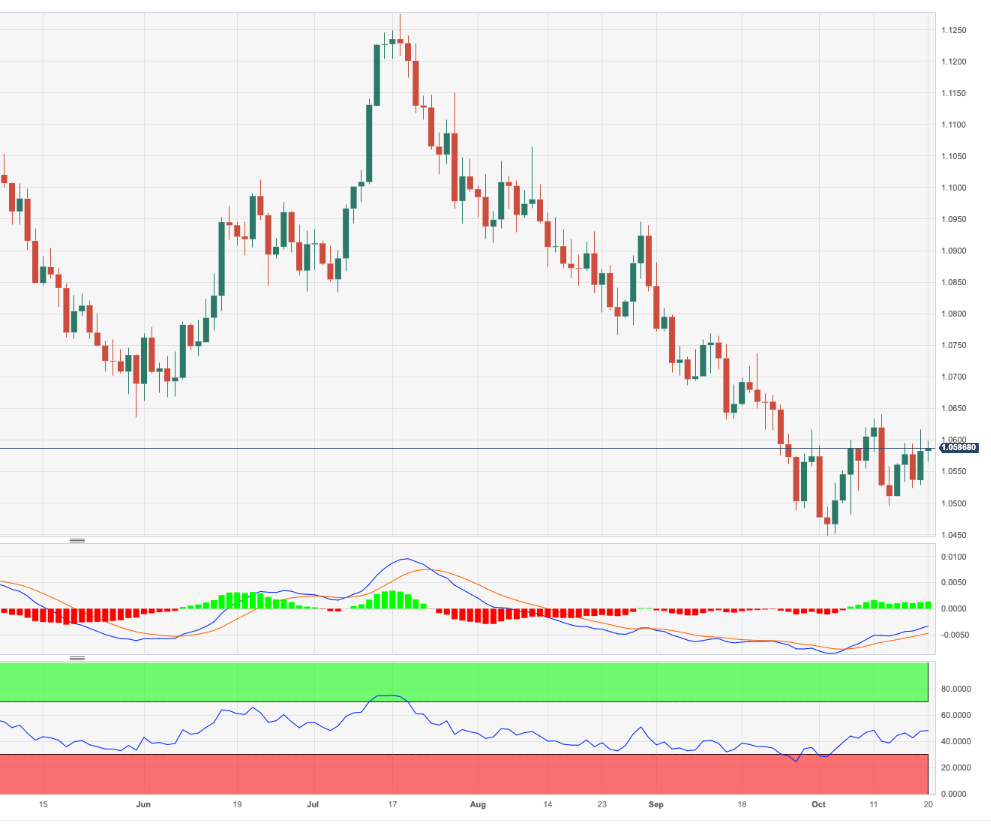
EUR/USD saw a gain of approximately 70 pips, marking the biggest weekly gain since July. The pair held above 1.0500 but faced resistance around the 1.0600 area. Although no clear bullish signs exist, the consolidation phase is starting to appear more robust.
The Euro has a busy week ahead, with the key event being the European Central Bank (ECB) meeting on Thursday. No rate change is expected, with the Deposit Rate likely to remain at 4.00%. Market participants will closely watch the language and ECB President Christine Lagarde's press conference. Additionally, on Tuesday, the preliminary PMI survey results for the region will be released, providing an initial glimpse into the October performance. There will be a summit of European Union leaders on Thursday and Friday.
Analysts at Nomura on ECB:
We do not expect material changes to the ECB’s initial statement. Importantly, we expect the language on guidance – that “rates have reached levels that, maintained for a sufficiently long duration, will make a substantial contribution to the timely return
of inflation to the target” – to remain unchanged.
The Pound languished during the week, with GBP/USD ending marginally higher, around 1.2160, while EUR/GBP recorded its highest weekly close since May. The Bank of England's cautious stance in September and subsequent data weighed on the currency. The UK will release employment data on Tuesday.
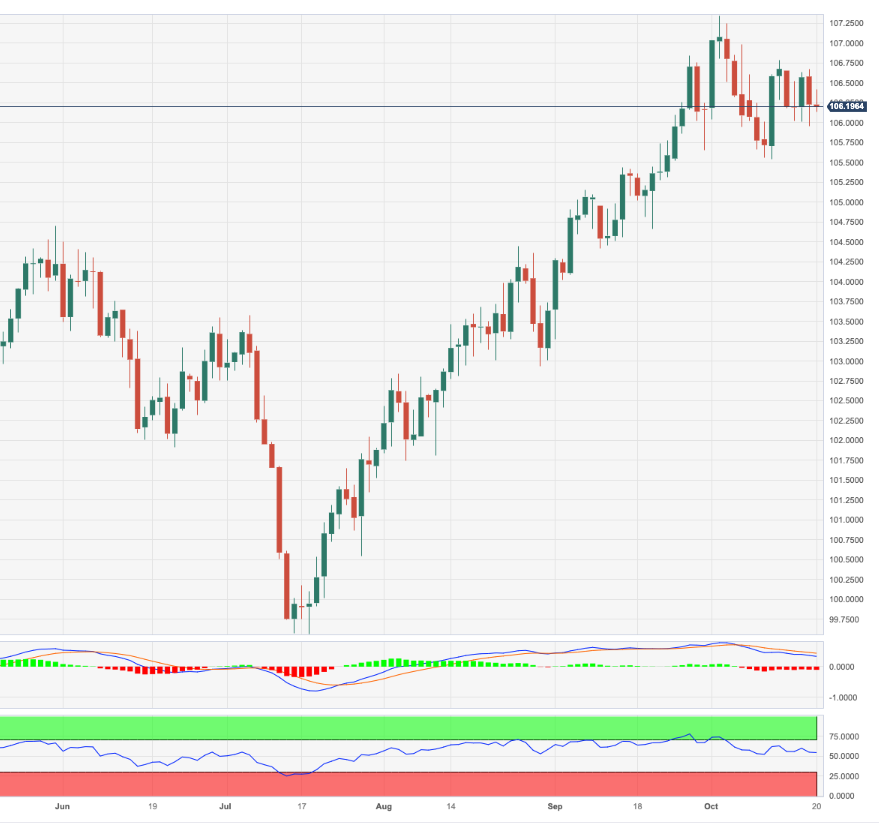
USD/JPY continues to trade dangerously close to 150.00. A breakout higher could trigger volatility and potentially prompt intervention from Japanese authorities. The Tokyo CPI is scheduled for release on Friday.
AUD/USD finished the week modestly higher but still far from its peak, signaling towards the critical support level at 0.6285. It will be a decisive week for Australian economic data, with the monthly and quarterly Consumer Price Index (CPI) on Wednesday, followed by the Producer Price Index on Friday. These reports will shape expectations for the upcoming Reserve Bank of Australia (RBA) meeting on November 7. RBA Governor Michele Bullock is set to deliver a speech on Tuesday.
USD/CAD posted its highest weekly close since March, around 1.3700, maintaining a bullish tone. The Bank of Canada (BoC) will hold its monetary policy meeting on Wednesday, and it is expected to keep the overnight rate unchanged at 5.00%, with a hawkish tone.
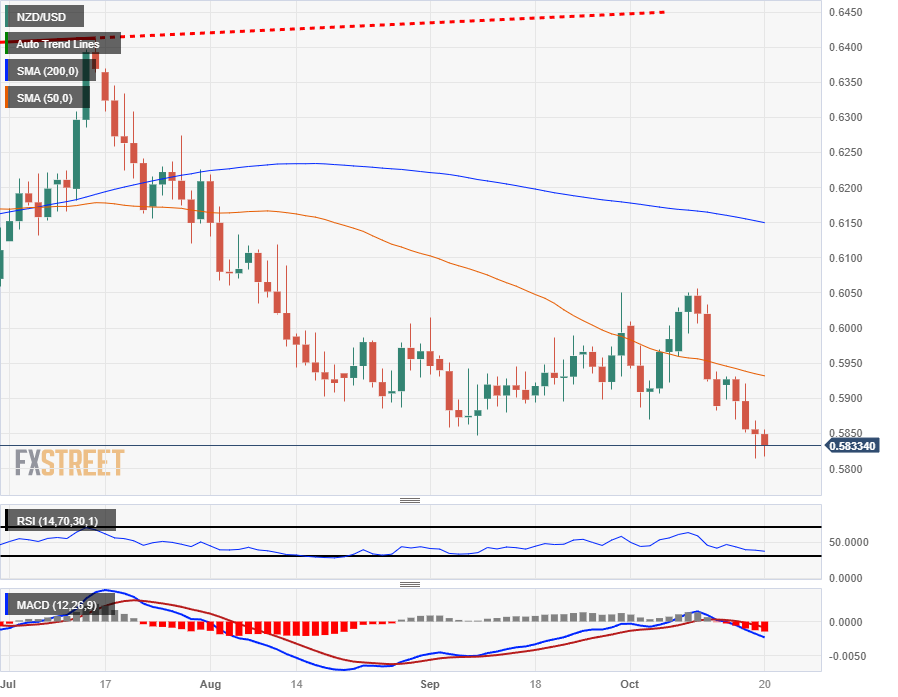
The New Zealand Dollar (NZD) was the worst performer among G10 currencies. NZD/USD broke below 0.5860 and tumbled to 0.5815, the lowest level since November of last year. The chart suggests further losses, with the next support area seen at 0.5740.
An improvement in risk sentiment would be beneficial for antipodean currencies. This boost could be even more significant if it coincides with a decrease in US yields. Conversely, a negative shock to market sentiment would increase demand for safe-haven assets, potentially strengthening the US Dollar as investors seek refuge.
Like this article? Help us with some feedback by answering this survey:
- The EUR/USD is catching some minor lift but mostly flat for Friday near 1.0600.
- Broad market sentiment is seeing an improvement heading into the close, pushing down the US Dollar.
- Next week to open quiet before a double-header PMI reading for both the EU and the US on Tuesday.
The EUR/USD kicked off Friday's trading session near 1.0586 and has been keeping in a tight range for most of the day, dipping into an early low of 1.0565 before catching a choppy lift into the 1.0600 handle.
The Euro (EUR) caught a lift higher on Thursday, pinging 1.0616 after dovish comments from Federal Reserve (Fed) Chairman Jerome Powell pushed down market expectations of a quicker rate cut cycle in the future.
Friday sees limited action as investors position themselves ahead of the weekend closing bell before next week rounds the corner into a dual Purchasing Manager Index (PMI) reading for both the EU and the US.
Before that, Euro traders will see Monday's latest EU Consumer Sentiment indicator, with October's reading forecast to decline from -17.8 to -18.2, and then Tuesday brings the latest round of EU HCOB PMIs for October, where investors are expecting the headline composite figure to tick upwards into 47.4 from 47.2.
Following that will be the US' S&P Global PMIs for October, with the services and manufacturing components are both expected to decrease slightly; the Services PMI is expected to slip from 49.8 to 49.5, while the manufacturing side is seen declining from 50.1 to 49.9.
EUR/USD Technical Outlook
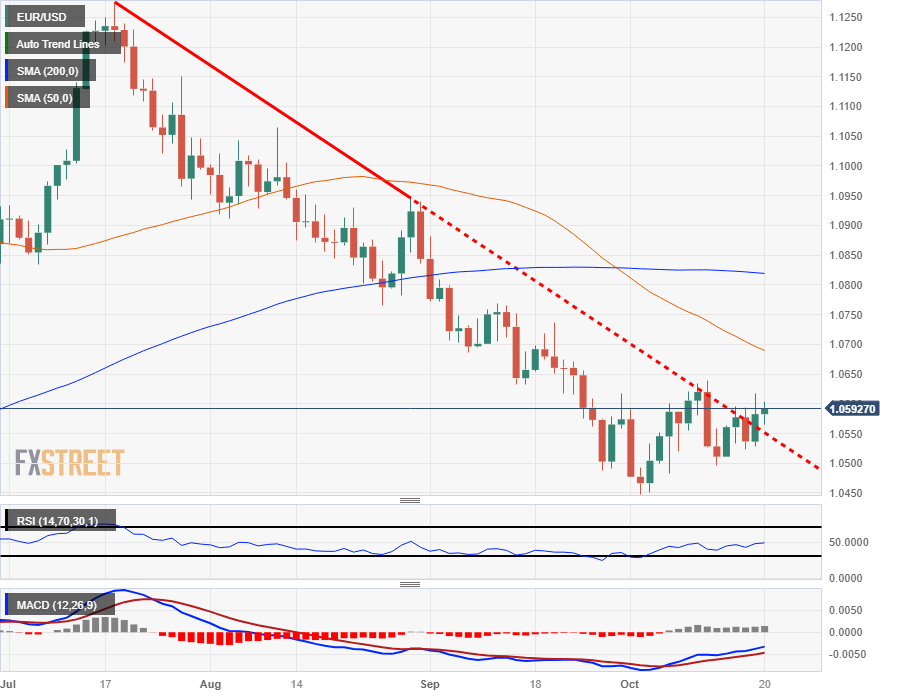
The Euro is seeing some sideways momentum develop on the daily candlesticks, with the descending trendline from 1.1275 creating some rough chop on the charts, and topside pressure from the descending 50-day Simple Moving Average currently dropping through 1.0700. Bidders will have a difficult time getting past the last swing high into 1.0650 if momentum doesn't develop soon, and the 200-day SMA is rolling over into a bearish stance just north of 1.0800.
On the low side, the last swing low into 1.0450 represents the near-term floor, and a bearish continuation leaves the EUR/USD exposed to further downside into fresh lows for 2023, with the nearest technical support at last November's bottoms at 1.0222.
EUR/USD Daily Chart
EUR/USD Technical Levels
- USD/ZAR dropped below the 20-day SMA after peaking at a high of 19.15.
- South African CPI from September came in higher than expected as well as Retail Sales.
- Safe haven flows dominate markets, with focus shifting to geopolitics.
At the end of the week, the USD/ZAR trades with mild losses at 19.000, with the ZAR holding its foot driven by hot inflation figures reported on Thursday. On the USD side, it trades soft against its rivals, but a sour market good with investors turning their focus to tensions in the Middle East may reignite the green currency’s momentum.
From September, the Consumer Price Index (CPI) from South Africa came in at 5.4% YoY, higher than the 5.3% expected and the previous 4.8%. In line with that, the ZAR gained momentum as markets is now expecting the South African Reserve Bank (SARB) to maintain its rates higher for a prolonged time as they is targeting inflation to drop in the range between 3% and 6%. On Tuesday, in the October Monetary Policy review, the bank was seen stating that higher oil prices and dry weather conditions were all negatively impacting the inflation outlook. Still, the bank did not hint at additional hikes but confirmed that it will keep rates unchanged at this level for a prolonged period.
On the USD side, it will likely close the week with nearly 0.40% losses, and the green currency faced selling pressure on Thursday after Jerome Powell’s words where he hinted that the higher bond yields will be considered in the next monetary policy decisions. That being said, the US economy is holding strong, and Powell left the door open to another hike in 2023, which could limit the downside for the USD. In addition, growing escalations in the Middle East may fuel safe-haven flows, which would benefit the Greenback, as investors may seek refuge in it.
USD/ZAR Levels to watch
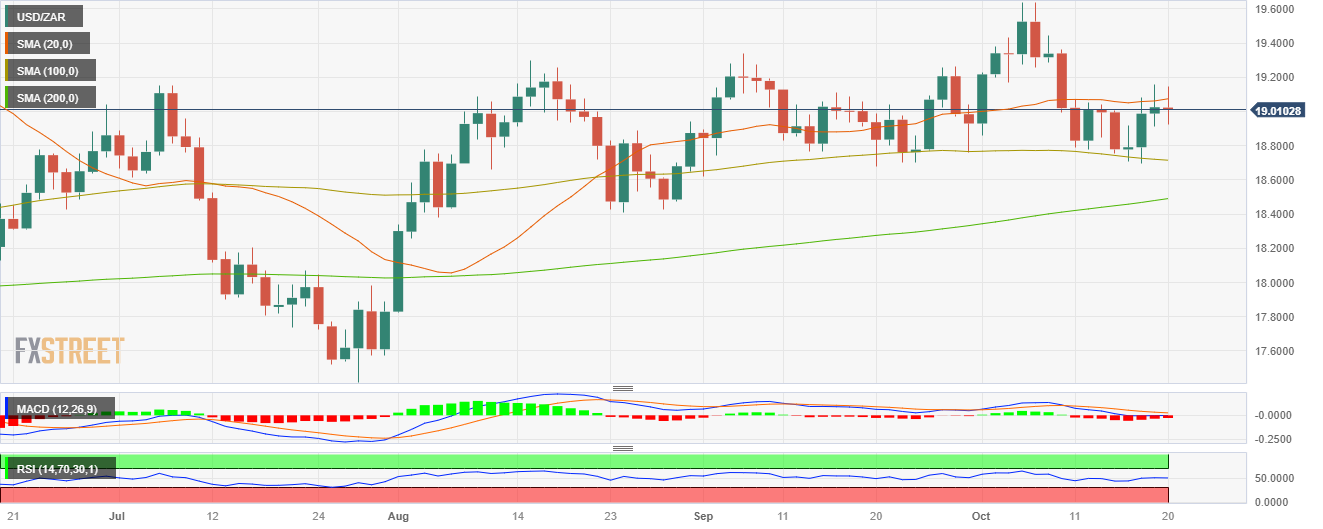
Analysing the daily chart, a neutral to bearish technical outlook is evident for USD/ZAR, suggesting that the bears are gaining momentum but still do not have an upperhand over the bulls for the short term. The Relative Strength Index (RSI) has turned flat above its midline, while the Moving Average Convergence (MACD) prints flat red bars. Moreover, the pair is below the 20-day Simple Moving Average (SMA) but above the 100 and 200-day SMAs, indicating a favourable position for the bulls in the bigger picture.
Support levels: 18.905, 18.800, 18.701 (100-day SMA).
Resistance levels: 19.050 (20-day SMA), 19.157, 19.250.
USD/ZAR Daily Chart
- Gold price reached a five-month high at $1997.16 per troy ounce after bouncing back from daily lows of $1972.12.
- Escalating Middle East conflict and attacks on US military bases in Iraq and Syria heighten investor anxiety.
- Dovish comments from Fed Chair Jerome Powell sparked Gold’s ascent on Friday.
Gold price was shy of testing the $2000 troy ounce barrier on Friday amidst increasing geopolitical risks, as the conflict between Israel and Hamas is briskly spreading toward more countries in the region. At the time of writing, XAU/USD is trading at around $1980.20 after the yellow metal bounced from daily lows of $1972.12
XAU/USD climbs, fueled by Middle East conflicts and a weakening US Dollar
An escalation in the Middle East conflict keeps investors on their toes as Bloomberg reported, “The US said its military bases in Iraq and Syria are increasingly under attack.” Should be said that leaders from the region would meet in Cairo for a summit.
That and dovish comments by Federal Reserve (Fed) Chair Jerome Powell weighed on US Treasuries, particularly the 10-year benchmark note down seven basis points, at 4.929%, a tailwind for XAU/USD prices. The US Dollar Index (DXY), which tracks the performance of the USD vs. a basket of six currencies, has pared its earlier gains, turning red at 106.17, falling 0.07%.
The Fed parade continued Friday, as Atlanta Fed President Raphael Bostic has indicated the possibility of a rate cut in 2024, suggesting a potential shift in monetary policy if economic conditions warrant it. Meanwhile, Cleveland Fed President Loretta Mester has expressed that the Federal Reserve may be at or near the peak of its rate hike cycle. She emphasized that the central bank will closely depend on incoming data in its decision-making process for the next monetary policy meeting.
Aside from this, next week’s economic calendar will feature US flash PMI data, the release of Q3 Gross Domestic Product (GDP) on its preliminary reading, Durable Goods Orders, unemployment claims, and the Fed’s preferred gauge for inflation, the core PCE.
XAU/USD Price Analysis: Technical outlook
If Gold price extends its gains past $2000, Gold’s next resistance is seen at the May 10 daily high of $2048.15, followed by last year’s high of $2075.14, before challenging the all-time high (ATH) at $2081.82. If XAU/USD cannot stay above $2000, the first support would be the July 20 high at $1987.42, followed by the September 1 high turned support at $1952.95.
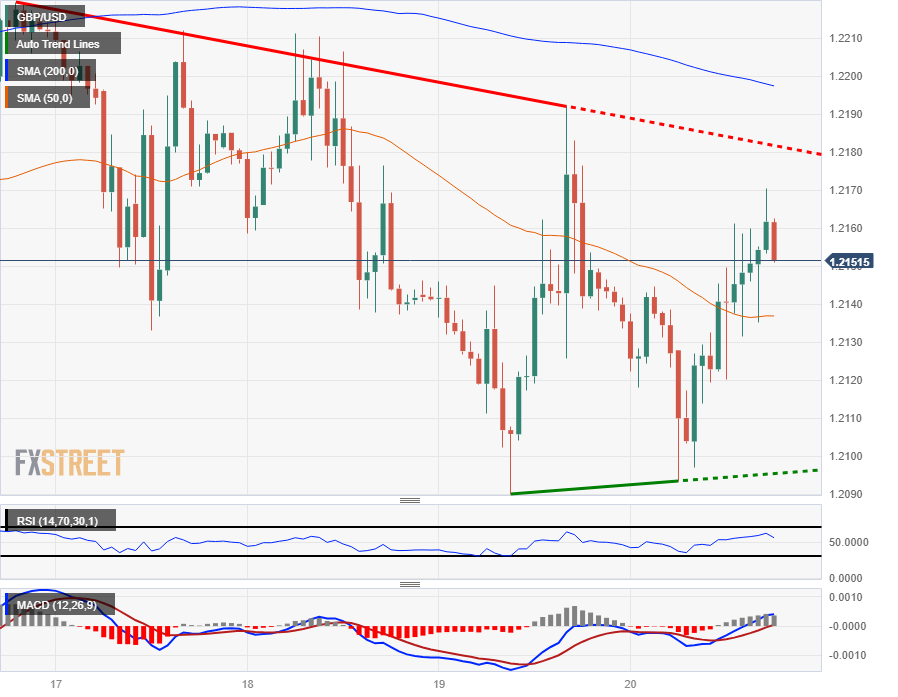
- The GBP/USD is pushing into the high side for Friday, tapped into 1.2170.
- Broader market sentiment is improving, sending the US Dollar back heading into the Friday close.
- UK Retail Sales did little to help matters, printing firmly in the red.
The GBP/USD is looking to squeeze out some gains before the Friday closing bell, stretching into 1.2170 in the Friday midday. Despite a miss for UK Retail Sales earlier in the day, the Pound Sterling (GBP) is benefiting from a general softening in the US Dollar (USD).
UK Retail Sales drop 0.9% MoM in September vs. -0.1% expected
UK Retail Sales on Friday broadly missed the mark, with September's retailers' receipts printing a dismal -0.9% against the forecast -0.1%, and steepening the decline from August's 0.4%.
With a quiet Monday on the economic calendar, GBP traders will be looking ahead to Tuesday's UK labor and Purchasing Manager Index (PMI) figures.
UK job additions are expected to decline by an additional 198K in August as investors hope for a slight improvement from July's -207K, and markets are hoping for a slight improvement in the UK preliminary PMI, with the PMI Composite forecast to print at 48.8 compared to the last 48.5.
GBP/USD Technical Outlook
The Pound Sterling is trading into 1.2150 against the US Dollar after pinning a late high of 1.2170 on Friday, with the GBP/USD seeing a Dollar-bearish fueled recovery from the day's lows near 1.2093.
Despite Friday's moderate recovery, the GBP/USD remains firmly planted in bear country, with the pair trading down from October's swing into 1.2350. Further up the chart, the 50-day Simple Moving Average (SMA) is confirming a bearish cross of the 200-day SMA, and any technical recoveries in the chart will be set for a clash with resistance from the descending moving average.
Technical Support currently rests at October's early low of 1.2037, and a break of this level sets the GBP/USD up for a downside run into an early-year support zone near the 1.1900 handle.
GBP/USD Daily Chart
GBP/USD Technical Levels
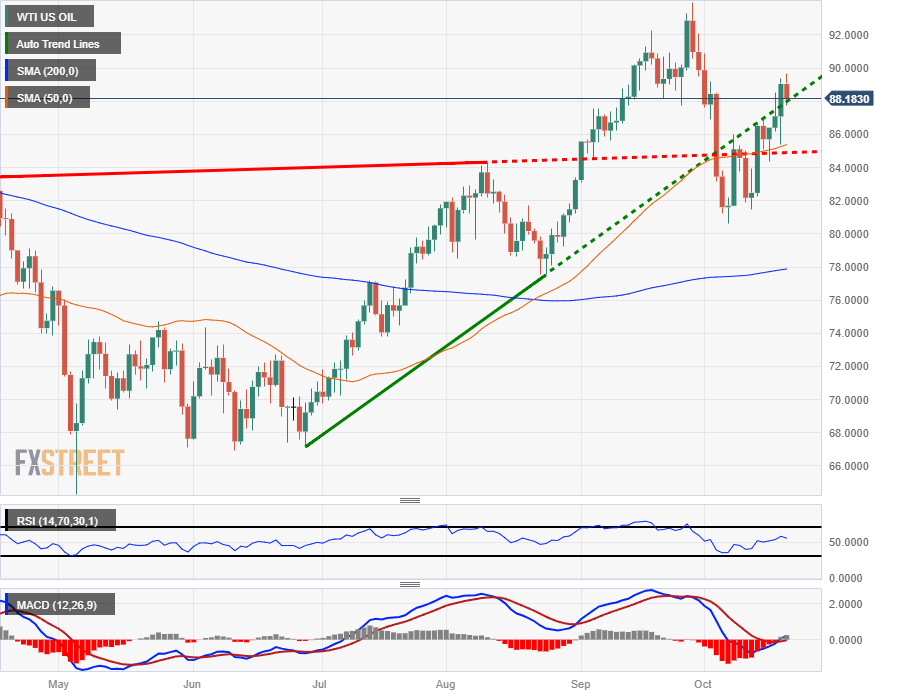
- Crude Oil prices are seeing a tentative step back after tipping into a 13-day high early on Friday.
- WTI tested back into the $88.00 handle, but plenty of bidding strength remains as markets weigh geopolitical concerns.
- Bidding interest remains high in Crude Oil, and downside moves will face continued upside pressure.
West Texas Intermediary (WTI) Crude Oil prices are on the lower side for Friday, albeit slightly as ongoing geopolitical tensions in the Gaza Strip threaten to spill over and global production continues to flub barrel demand.
Thursday's run up the charts in spot Crude prices saw a mild extension into early Friday, sending WTI into $89.64 to retest its highest bids in almost three trading weeks before a relief pullback pinged just south of $88.00 per barrel.
Price action is now firming up in the midrange with Crude Oil bids testing back and forth near the $88.00 neighborhood as energies traders weigh their options heading into the weekend market close.
Geopolitical tensions between Israel and Hamas continue to weigh on oil markets as investors fret over a potential spillover that could destabilize the region near the Strait of Hormuz; while Israel and Palestine are not major players in Crude Oil markets, the nearby Strait of Hormuz is a key chokepoint for global oil supply, seeing a fifth of all oil supply pass through its waters.
It was revealed this week that the US is set to lift sanctions on Venezuelan crude oil exports in a bid to prop up woefully under-supplied global oil markets, which took WTI lower in the mid-week, but Venezuelan oil producers remain drastically below capacity, and it will take some time for Venezuelan barrels to begin eating away at undersupply.
WTI Technical Outlook
Crude Oil has continued a healthy rebound from October's early dip into $80.63, with WTI bids still up around 9% from the month's early swing low, and a bullish continuation will pave the way for a run at September's high bids near $94.00.
The downside is getting capped off by the 50-day Simple Moving Average, currently pushing higher from just south of $86.00, and daily candlesticks have so far been unwilling to push too far past the technical barrier, with the 200-day SMA rolling over into a bullish stance from $78.00
WTI Daily Chart
WTI Technical Levels
- AUD/USD hits a daily high of 0.6328 before dropping due to heightened Middle East tensions.
- US Dollar remains strong, with US equities in the red and Treasury bond yields dropping.
- Latest Aussie employment report shows easing labor market, aligning with the RBA's decision to keep rates at 4.10%.
The Australian Dollar (AUD) dropped vs. the US Dollar (USD) on Friday in the mid-North American session after the pair hit a daily high of 0.6328. Still, risk-aversion amidst heightened tension in the Middle East weighs on the AUD/USD, which trades at 0.6318, down 0.17%.
Australian Dollar falls 0.17%, as geopolitical risks and US economic factors weigh in
The Greenback (USD) remains strong as risk appetite keeps US equities in the red, while US Treasury bond yields dropped. The Israel-Hamas conflict is at the brisk of an escalation, while US Federal Reserve (Fed) officials dictate the path of market sentiment.
On Friday, two Federal Reserve officials remained cautious regarding monetary policy, though both expressed that inflation remains high and the Fed would need patience.
Atlanta’s Fed President Raphael Bostic stated that along with opening the door for a rate cut in 2024. In the meantime, Cleveland’s Fed President Loretta Mester said the Fed is at or near peak rate hike cycle, adding that the US central bank would be data defendant in the next monetary policy meeting.
Aside from this, the latest Aussie employment report showed the labor market is easing, a welcome development by the Reserve Bank of Australia (RBA), which kept rates unchanged at the last meeting at 4.10%, despite speculations for further tightening. Governor of the Reserve Bank of Australia, Michele Bullock stated that if inflation persists above projections, the RBA will take responsive policy measures.
AUD/USD Price Analysis: Technical outlook
The daily chart shows the downtrend is intact, as the current week’s high aligns with the recent market structure of lower highs and lows, which could pave the way for additional losses. If AUD/USD slides beneath 0.6285, the pair could aim lower and challenge the October 21 daily low of 0.6210 before testing the latest cycle low of 0.6169. Conversely, if the pair stays above 0.6300, Aussie (AUD) buyers could remain hopeful of testing the 50-day moving average (DMA) At 0.6405. Once cleared, the latest cycle high could be exposed at 0.6501.
- The USD/CHF rebounded at the 0.8900 area, rising to a high towards 0.8935, seeing 0.15% gains.
- The CHF was the best-performing currency in Thursday, and the pair lost nearly 0.85%.
- The economic calendar has nothing relevant to offer, and focus shifts to the Middle East.
On Friday, the USD/CHF sellers seemed to be consolidating their gains, and the pair found support at the 100-day Simple Moving Average (SMA) at 0.8900, rising to a high near 0.8935 and then settling ar 0.8915.
On the USD side, it struggles to gather momentum and trades soft against its rivals. That being said, as all eyes will be set on the Middle East in the conflict between Israel and Palestine, the green currency may find demand on safe-haven flows. For the next week, the highlight will be the S&P Manufacturing PMI from the US from October, where investors will get a clearer outlook from the US economy. This week, Industrial Production and Retail Sales from September came in higher than expected, and the Federal Reserve’s (Fed) Beige book report described the economy as “stable”.
In addition, Chair Powell highlighted on Thursday that higher bond yields, contributing to tighter financial conditions, will be considered for the next decisions. However, he still opened the door for further tightening, and the bank will proceed “carefully”.
USD/CHF Levels to watch
Upon evaluating the daily chart, a neutral to bearish outlook is seen, with the balance starting to lean in favour of the bears. However, a healthy technical correction shouldn’t be ruled out by traders.
The Relative Strength Index (RSI) maintains a negative slope in the bearish territory, while the Moving Average Convergence (MACD) histogram presents increasing red bars. Those indicators stand near oversold territory, favouring the case of an upward correction in the next sessions. Additionally, the pair is above the 20-day Simple Moving Average (SMA), below the 200-day SMA, but above the 100-day SMA, suggesting that the bears still have some work to do to confirm a bearish bias.
Support levels: 0.8900 (100-day SMA), 0.8870, 0.8850.
Resistance levels: 0.890,0.9015 (200-day SMA), 0.9040.
USD/CHF Daily Chart
-638334195495850051.png)
- The NZD/USD is trading into the low end as the Kiwi tests 11-month lows against the Greenback.
- NZ Trade Balance figures saw little play as the numbers showed little change, for better or for worse.
- New Zealand's Labour Day holiday on Monday will have Kiwi traders focusing on Tuesday's US PMI release.
The NZD/USD is testing the waters near 0.5830, trading flat for Friday and stuck to the bottom end in the near-term. New Zealand's Trade Balance figures on Thursday did little to spark faith in the NZD, while broader markets continue to focus on Federal Reserve (Fed) talking points.
New Zealand's Trade Balance showed little change in the import-export balance for the small Antipodean nation, with September's annualized Trade Balance printing at $-15.33B compared to August's $-15.52B.
New Zealand Trade Balance arrives at -$15.33B YoY in September vs. $-15.52B prior
NZ Exports ticked down to $4.87B, with the previous figure seeing a minor downside revision to $4.97B from $4.99B, and NZ Imports likewise showed a decline alongside a revision; NZ Imports for September printed at $7.2B versus August's $7.24B (revised from $7.28B).
New Zealand will be taking a long weekend with Kiwi markets dark on Monday for the Labour Day holiday, and the next major datapoint for the NZD/USD pair will be Tuesday's US Preliminary Purchasing Manager Index (PMI) reading for September, where markets are forecasting a minor downtick in both the manufacturing and services components.
NZD/USD Technical Outlook
The Kiwi remains firmly entrenched in yearly lows against the US Dollar after seeing a rejection from the 50-day Simple Moving Average (SMA) near 0.5950, and a bearish 200-day SMA is rolling lower to provide medium-term technical resistance from 0.6150.
With the NZD/USD trading into fresh lows for 2023, downside technical support remains thin, and a bearish extension could open up the way for an eventual challenge of 2022's lows near the 0.5500 handle.
NZD/USD Daily Chart
NZD/USD Technical Levels
- The Canadian Dollar is seeing a minor recovery against the US Dollar.
- A Retail Sales beat sees little positive momentum for the Loonie as markets remain USD-focused.
- Steady Crude Oil prices aren’t hurting the CAD, but aren’t helping it either.
The Canadian Dollar (CAD) is seeing some minor lift on Friday, but selling pressure remains and intraday action is steadily pushing the USD/CAD back to its opening bids.
Canada Retail Sales beat expectations but still came in soft nonetheless and the 1.3700 price point remains too attractive a level for US Dollar (USD) bidders to abandon.
Daily Digest Market Movers: Canadian Dollar cycling this week’s popular price level as markets follow USD flows
- Canada Retail Sales beat forecasts, but still flubbed the previous printing.
- August’s CAD Retail Sales declined 0.1%, beating the forecast -0.3%.
- Despite the forecast beat, data is still soft, coming in below previous as consumer spending weakens.
- July’s data was revised higher from 0.3% to 0.4%, widening the data gap after the fact.
- Thursday’s outing from Federal Reserve (Fed) Chairman Jerome Powell continues to wriggle through markets as investors remain leery of the Fed’s dot plot.
- Market participants fearing a higher, longer interest rate cycle from the Fed are currently setting themselves up for disappointment.
- Fed officials continue to speak up their willingness to keep rates high.
- The October US Preliminary Purchasing Manager Index (PMI) next Tuesday will be the next data to hit the USD/CAD pair.
Technical Analysis: USD/CAD refusing to move too far from 1.3700 as Canadian Dollar takes two steps forward and one step back
The USD/CAD opened up Friday’s trading near 1.3716, dipping to a daily low of 1.3670 as the Loonie gains inches rather than miles on the Greenback, but the pair continues to see play close to the 1.3700 handle.
Daily candlesticks see the USD/CAD trading into near-term highs as a constraining market stance weighs on the pair. Long-term resistance comes from a descending trendline from early 2020’s panic highs of 1.4650, while near-term chart action has the 50-day Simple Moving Average (SMA) rising to provide technical support from 1.3575.
A firm break higher leaves the pair open to make a challenge of 1.3800 near March’s swing highs, while the downside will have to tangle with the 200-day SMA before revisiting lows near 1.3400 from September.
Canadian Dollar FAQs
What key factors drive the Canadian Dollar?
The key factors driving the Canadian Dollar (CAD) are the level of interest rates set by the Bank of Canada (BoC), the price of Oil, Canada’s largest export, the health of its economy, inflation and the Trade Balance, which is the difference between the value of Canada’s exports versus its imports. Other factors include market sentiment – whether investors are taking on more risky assets (risk-on) or seeking safe-havens (risk-off) – with risk-on being CAD-positive. As its largest trading partner, the health of the US economy is also a key factor influencing the Canadian Dollar.
How do the decisions of the Bank of Canada impact the Canadian Dollar?
The Bank of Canada (BoC) has a significant influence on the Canadian Dollar by setting the level of interest rates that banks can lend to one another. This influences the level of interest rates for everyone. The main goal of the BoC is to maintain inflation at 1-3% by adjusting interest rates up or down. Relatively higher interest rates tend to be positive for the CAD. The Bank of Canada can also use quantitative easing and tightening to influence credit conditions, with the former CAD-negative and the latter CAD-positive.
How does the price of Oil impact the Canadian Dollar?
The price of Oil is a key factor impacting the value of the Canadian Dollar. Petroleum is Canada’s biggest export, so Oil price tends to have an immediate impact on the CAD value. Generally, if Oil price rises CAD also goes up, as aggregate demand for the currency increases. The opposite is the case if the price of Oil falls. Higher Oil prices also tend to result in a greater likelihood of a positive Trade Balance, which is also supportive of the CAD.
How does inflation data impact the value of the Canadian Dollar?
While inflation had always traditionally been thought of as a negative factor for a currency since it lowers the value of money, the opposite has actually been the case in modern times with the relaxation of cross-border capital controls. Higher inflation tends to lead central banks to put up interest rates which attracts more capital inflows from global investors seeking a lucrative place to keep their money. This increases demand for the local currency, which in Canada’s case is the Canadian Dollar.
How does economic data influence the value of the Canadian Dollar?
Macroeconomic data releases gauge the health of the economy and can have an impact on the Canadian Dollar. Indicators such as GDP, Manufacturing and Services PMIs, employment, and consumer sentiment surveys can all influence the direction of the CAD. A strong economy is good for the Canadian Dollar. Not only does it attract more foreign investment but it may encourage the Bank of Canada to put up interest rates, leading to a stronger currency. If economic data is weak, however, the CAD is likely to fall.
Federal Reserve Bank of Cleveland President Loretta Mester said on Friday that the US central bank is "at or near the peak of the rate hike cycle," per Reuters.
Key quotes
"Outlook aligns with Fed forecasts eyeing one more increase."
"Fed rate decisions will be driven by incoming economic data."
"If sustained, higher bond yields will help moderate economic activity."
"Fed needs to be nimble with monetary policy right now."
"Inflation cooling but still too high, risks tilted to upside."
"Labor markets showing moderation, resilience."
"Data shows signs of moderating wage gains."
"Fed must not be complacent on getting inflation back to 2%."
"Possible recent developments could slow move down in inflation."
Market reaction
These comments failed to trigger a noticeable reaction in the US Dollar Index, which was last seen moving sideways near 106.20.
- USD/JPY prints minimal gains of 0.05% despite a drop in US 10-year Treasury bond yields.
- Geopolitical tensions in the Middle East and a light US economic calendar leave traders adrift.
- Japan's core Consumer Price Index dips to 2.8% YoY, with fears of further inflation amidst rising oil prices.
The USD/JPY hovers at around 149.85 and prints minimal gains of 0.05% due to a risk-off impulse, even though the US 10-year Treasury bond yield falls, as traders expect no further hikes by the US Federal Reserve (Fed).
USD/JPY remains subdued as traders weighed geopolitical events and economic reports
A light economic calendar in the United States (US) left traders adrift to geopolitical events and the latest inflation report in Japan. A possible escalation of the Middle East conflict threatens to spread to more regional countries. Leaders from the region would meet in Cairo for a summit.
Aside from this, the Japanese economic docket featured the core Consumer Price Index (CPI) dipped to 2.8% YoY, below August’s 3.1%, though higher than expected. Although it continued to decelerate, fears that inflation could increase further as Oil prices are underpinned by the escalation of the Israel-Hamas conflict.
The Bank of Japan’s (BoJ) ultraloose monetary policy stance remains dovish, suggesting the USD/JPY pair could rally past the 150.00 mark. However, Japanese authorities’ threats of intervening in the markets capped the advance as market participants eye the BoJ's next meeting on October 31.
Meanwhile, Fed officials stated that inflation has come down, but it remains high, adding the US central bank would be data dependent to decide its next policy decision.
USD/JPY Technical Levels
- The US Dollar struggles to find demand at the end of the week.
- Markets are digesting Powell’s words on Thursday.
- US Treasury yields are retreating and the odds of a hike in December declined.
The US Dollar (USD) measured by the US Dollar Index (DXY) oscillates between gains and losses in the 106.15 area, trading below the 20-day Simple Moving Average (SMA). No relevant data will be released on Friday and the focus shifts to the Israel and Palestine conflict which could benefit the USD as a safe-haven asset.
In the United States, economic activity was reported to be better than expected in September. Industrial Production and Retail Sales both came in above expectations. On Wednesday, the Federal Reserve’s Beige Book report described the US economic situation as “stable” and didn’t reveal any new insights since the last September report. Next week, the US will release S&P Manufacturing PMIs from October, which may have an impact on the expectations from the Federal Reserve’s (Fed) next set of forecasts .
Daily Digest Market Movers: US Dollar fails to gather momentum as US Treasury yields and hawkish bets on the Fed decline
- The US Dollar DXY declined near 106.15, seesawing between small gains and losses, but still trading below the 20-day SMA.
- The US reported better-than-expected economic activity data during the week, which could limit the downside for the DXY.
- US Retail Sales came in at 0.7% MoM in September, higher than the 0.3% expected but decelerating from 0.8%.
- Industrial Production rose by 0.3% MoM in the same month, vs the 0.0% expected.
- Jobless Claims for the week ending on October 13 came in at 198,000, lower than the expected 212,000 and the previous 211,000.
- In the meantime, US yields are retreating while markets assess Federal Reserve Chair Jerome Powell’s words: the 2, 5 and 10-year rates have increased to 5.07%, 4.85% and 4.91% respectively.
- According to the CME FedWatch tool, the odds of a 25 bps hike at the December meeting stand near 24%, falling from nearly 40% at the beginning of the week.
Technical analysis: US Dollar Index’s bulls failed to defend the 20-day SMA, still bears have more work to do
The DXY index is in an intermediate bullish trend on the daily chart, holding above the key 100 and 200-day Simple Moving Average (SMA). However, in the short term, bears have gathered enough momentum to give them an upper hand over the bulls.
On the daily chart, the Relative Strength Index (RSI) is seen pointing south, though still above its middle point of 50. The Moving Average Convergence Divergence (MACD) saw a bearish cross on October 5, though the trend lower flipped on October 12 when the market made a recovery. Given the dominant uptrend, the exchange rate could still rally.
The index has had a strong run higher, with 11 consecutive up-weeks in a row before peaking and forming a bearish doji/shooting star candlestick in the first week of October. This was not followed through to the downside, however, with the following week closing higher. Still it is a warning sign of potential weakness on the horizon.
Supports: 106.00, 105.80, 105.80.
Resistances:106.33 (20-day SMA),106.50, 107.00.
US Dollar FAQs
What is the US Dollar?
The US Dollar (USD) is the official currency of the United States of America, and the ‘de facto’ currency of a significant number of other countries where it is found in circulation alongside local notes. It is the most heavily traded currency in the world, accounting for over 88% of all global foreign exchange turnover, or an average of $6.6 trillion in transactions per day, according to data from 2022.
Following the second world war, the USD took over from the British Pound as the world’s reserve currency. For most of its history, the US Dollar was backed by Gold, until the Bretton Woods Agreement in 1971 when the Gold Standard went away.
How do the decisions of the Federal Reserve impact the US Dollar?
The most important single factor impacting on the value of the US Dollar is monetary policy, which is shaped by the Federal Reserve (Fed). The Fed has two mandates: to achieve price stability (control inflation) and foster full employment. Its primary tool to achieve these two goals is by adjusting interest rates.
When prices are rising too quickly and inflation is above the Fed’s 2% target, the Fed will raise rates, which helps the USD value. When inflation falls below 2% or the Unemployment Rate is too high, the Fed may lower interest rates, which weighs on the Greenback.
What is Quantitative Easing and how does it influence the US Dollar?
In extreme situations, the Federal Reserve can also print more Dollars and enact quantitative easing (QE). QE is the process by which the Fed substantially increases the flow of credit in a stuck financial system.
It is a non-standard policy measure used when credit has dried up because banks will not lend to each other (out of the fear of counterparty default). It is a last resort when simply lowering interest rates is unlikely to achieve the necessary result. It was the Fed’s weapon of choice to combat the credit crunch that occurred during the Great Financial Crisis in 2008. It involves the Fed printing more Dollars and using them to buy US government bonds predominantly from financial institutions. QE usually leads to a weaker US Dollar.
What is Quantitative Tightening and how does it influence the US Dollar?
Quantitative tightening (QT) is the reverse process whereby the Federal Reserve stops buying bonds from financial institutions and does not reinvest the principal from the bonds it holds maturing in new purchases. It is usually positive for the US Dollar.
- Mexican Peso exchange rate with the US Dollar remains on the defensive, printing more than 1% weekly losses.
- August Retail Sales in Mexico show a mixed picture, with gains over the year but a monthly plunge and signs of deceleration.
- Geopolitical risks cap Peso's gains, including tensions in the Middle East and US military base attacks.
Mexican Peso (MXN) registers solid gains against the US Dollar (USD) at the end of the week, though it remains printing weekly losses of more than 1%, as risk-aversion took its toll against risk-perceived currencies in the Forex markets. On Friday, the USD/MXN was trading at around 18.24, down 0.40%, although Retail Sales from Mexico showed the economy has been hit by higher interest rates set by the Bank of Mexico (Banxico).
Mexico’s National Statistic Agency, known as INEGI, revealed August Retail Sales plunged on monthly figures but expanded on a yearly basis, though showing signs of a deceleration. Comments made by the US Federal Reserve (Fed) Chair Jerome Powell, however, on Thursday suggest the US central bank might keep rates unchanged at the upcoming November meeting, keeping the door open for December’s meeting. The overall effect of Powell’s speech was some short-term weakness for the Dollar.
In the meantime, geopolitical risks remain high as Israel continues its offensive against Hamas. At the same time, the United States (US) said its military bases in Iraq and Syria are increasingly coming under attack.
Daily Digest Market Movers: Mexican Peso counterattacks as the pair drops below 18.30
- Mexico’s August Retail Sales plunged -0.4% MoM, missing estimates of 0%, while annually expanding by 3.2%. This was below forecasts of 4.4% and trailed July’s 5.1%.
- IOAE portrays the Mexican economy growing at a 3.12% YoY pace.
- US Initial Jobless Claims for the week ending October 14 rose by 198K, below estimates and previous week data, each at 212K and 211K, respectively.
- US Existing Home Sales rose by 3.96M in September, below August’s 4.04M, a -2% contraction.
- US Building Permits plummeted -4.4% in September, compared to last month’s 6.8% increase.
- Housing Starts for the same period previously mentioned rose by 7%, exceeding August’s -12.5% drop.
- Mexico’s GDP in 2023 is expected to hit 3.2%, according to the World Bank and the International Monetary Fund.
- Mexico's Industrial Production (IP) for August improved by 5.2% YoY, exceeding forecasts of 4.6% and July’s 4.8% increase.
- Monthly, IP in Mexico rose 0.3%, as expected, but trailed the previous 0.5% reading.
- Mexico’s Consumer Price Index (CPI) grew by 4.45% YoY in September, slightly below the 4.47% estimated.
- The core CPI inflation in Mexico stood at a stickier 5.76% YoY, as widely estimated, but has broken below the 6.00% threshold.
- The Bank of Mexico (Banxico) held rates at 11.25% in September and revised its inflation projections from 3.50% to 3.87% for 2024, above the central bank’s 3.00% target (plus or minus 1%).
Technical Analysis: Mexican Peso strengthens, as USD/MXN buyers eye a pullback before next leg-up
The USD/MXN is upward biased, though the ongoing rally was capped short of testing the latest cycle high, the October 6 high, of 18.48, which opens the door for a pullback.
The exotic pair could drop toward 18.00 before testing the 20-day Simple Moving Average (SMA) at 17.91. A drop below that could put at risk the uptrend, as the bull’s latest line of defense is likely to be the 200-day SMA at 17.74.
On the other hand, if the pair aims higher and buyers reclaim 18.48, that would put the 18.50 figure into play, followed by the 19.00 mark.
Mexican Peso FAQs
What key factors drive the Mexican Peso?
The Mexican Peso (MXN) is the most traded currency among its Latin American peers. Its value is broadly determined by the performance of the Mexican economy, the country’s central bank’s policy, the amount of foreign investment in the country and even the levels of remittances sent by Mexicans who live abroad, particularly in the United States. Geopolitical trends can also move MXN: for example, the process of nearshoring – or the decision by some firms to relocate manufacturing capacity and supply chains closer to their home countries – is also seen as a catalyst for the Mexican currency as the country is considered a key manufacturing hub in the American continent. Another catalyst for MXN is Oil prices as Mexico is a key exporter of the commodity.
How do decisions of the Banxico impact the Mexican Peso?
The main objective of Mexico’s central bank, also known as Banxico, is to maintain inflation at low and stable levels (at or close to its target of 3%, the midpoint in a tolerance band of between 2% and 4%). To this end, the bank sets an appropriate level of interest rates. When inflation is too high, Banxico will attempt to tame it by raising interest rates, making it more expensive for households and businesses to borrow money, thus cooling demand and the overall economy. Higher interest rates are generally positive for the Mexican Peso (MXN) as they lead to higher yields, making the country a more attractive place for investors. On the contrary, lower interest rates tend to weaken MXN.
How does economic data influence the value of the Mexican Peso?
Macroeconomic data releases are key to assess the state of the economy and can have an impact on the Mexican Peso (MXN) valuation. A strong Mexican economy, based on high economic growth, low unemployment and high confidence is good for MXN. Not only does it attract more foreign investment but it may encourage the Bank of Mexico (Banxico) to increase interest rates, particularly if this strength comes together with elevated inflation. However, if economic data is weak, MXN is likely to depreciate.
How does broader risk sentiment impact the Mexican Peso?
As an emerging-market currency, the Mexican Peso (MXN) tends to strive during risk-on periods, or when investors perceive that broader market risks are low and thus are eager to engage with investments that carry a higher risk. Conversely, MXN tends to weaken at times of market turbulence or economic uncertainty as investors tend to sell higher-risk assets and flee to the more-stable safe havens.
The Norges Bank was a leader in terms of policy tightening, beginning back in September 2021. Economists at CIBC Capital Bank see rates peaking at the end of the year.
One last hike for the Norges Bank?
Having hiked rates on 13 occasions, the Norges Bank remains biased towards an additional 25 bps prior to year-end. Absent a material and unexpected retreat in the data, we would look for rates to reach a terminal at 4.50%, by year-end.
The combination of additional tightening, energy price resilience, supporting an already exaggerated current account surplus, allied to ongoing labour market tightness points towards EUR/NOK trading well below July/August extremes into early 2024.
EUR/NOK – Q4 2023: 11.25 | Q1 2024: 10.76
The USD and risk sentiment are the biggest factors driving CAD. Economists at TD Securities analyze Loonie’s outlook.
Fading USD/CAD rallies ahead of 1.38
The direction of the broad USD and risk sentiment will dictate the price action of the Canadian Dollar in the near term.
We like leaning against the recent USD/CAD rally into the October Bank of Canada meeting. We continue to prefer fading ahead of the 1.38 level, suggesting a shift back to the lower end of the range near 1.34.
USD/JPY has risen again to the area just below the 150 mark. Economists at Commerzbank analyze the pair’s outlook.
The MOF's intervention policy is dangerous
The window in which the BoJ could have initiated a monetary policy turnaround is slowly closing. The headline inflation rate is falling and the core rate has at least reached a plateau. If the BoJ did not tighten its monetary policy when inflation kept rising, now is hardly the time to raise its inflation forecast and end its expansionary monetary policy.
At the same time, however, the Ministry of Finance's (MOF) threat of intervention prevents too significant a depreciation. But this strategy is dangerous. If the MOF fails to draw a ‘line in the sand’ that is perceptible to the market, the intervention efforts could be deemed to have failed, which would increase the devaluation pressure all the more.
Without this risk scenario, the ‘only’ remaining JPY-supportive argument is that the other major G7 central banks have allowed their rate hike cycles to expire and some (notably the Fed) will initiate a rate cut cycle next year, as we suspect. Then, the Yen's interest rate disadvantage should shrink (at least in expectation), leading to a moderate Yen recovery.

Source: Commerzbank Research
All major weather agencies have formally announced the onset of El Niño. Strategists at ANZ Bank believe El Niño related disruptions will be short-lived and contained for the Asia-Pacific.
El Niño is a regional story
While production losses due to El Niño will exert upward pressure on food commodity prices in Asia and Australia, we believe the impact on food inflation will be regional and short-lived.
Upside risks to grain prices come from higher input (fertilizer, fuel oil) prices and the Russia-Ukraine war. Higher energy prices could impact food commodities by increasing the cost of production and boosting demand from the biofuel sector.
The disruption in grain exports has so far been limited, despite the scrapping of the Black Sea Grain Initiative, but an escalation of that conflict remains a risk. The other risk involved is El Niño being stronger and/or going on longer than expected.
- USD/CAD refreshes day low as higher oil prices strengthen the Canadian Dollar.
- Canadian Retail Sales report indicates that automobile demand remained weak.
- The US Dollar turned soft due to neutral guidance from Fed Powell.
The USD/CAD pair faces selling pressure after a less-confident pullback move to near the round-level resistance of 1.3700 in the early New York session. The Loonie asset is expected to deliver a fresh downside below 1.3680 as the Canadian Dollar has strengthened due to upbeat oil prices.
The demand for oil improves due to escalating Middle East tensions, which would tighten the oil supply amid disruption in the oil supply chain. In addition to that, the United States Department of Energy (DOE) has announced the refilling of the Strategic Petroleum Reserve (SPR). The US government has been drawing oil from SPR since the onset of the Russia-Ukraine war.
It is worth noting that Canada is the leading exporter of oil to the United States and higher oil prices strengthened the Canadian Dollar.
Meanwhile, Statistics Canada has reported better-than-anticipated Retail Sales data for August. Monthly Retail Sales contracted at a slower pace of 0.1% while economists projected a decline of 0.3%. In July, the Retail Sales grew by 0.4%. Retail Sales excluding automobiles expanded by 0.1% against expectations of a stagnant performance.
The Retail Sales report indicates that automobile demand remained weak as households are facing the burden of higher borrowing costs.
The US Dollar turned soft as Federal Reserve (Fed) Chair Jerome Powell delivered neutral guidance on interest rates. Fed Powell conveyed that higher US Treasury yields have significantly tightened overall financial conditions.
Economists at Deutsche Bank remain neutral on the EUR/USD.
The Fed remains the most important catalyst for a move lower in the Dollar
We remain neutral on the EUR/USD. The main reason EUR/USD has failed to break higher this year is the relative outperformance of US growth to Europe. We see this growth divergence as having peaked with forward-looking indicators improving in Europe but deteriorating in the US.
The Fed remains the most important catalyst for a move lower in the Dollar. While the US inflation picture is looking increasingly benign, outperformance in growth supports the USD.
We mark down our year-end forecast from 1.15 to 1.07 to reflect our neutral view.
The BoE is likely done raising rates – and the combination of weak activity and a softening labour market will weigh on the GBP in the near-term, economists at CIBC Capital Markets report.
The BoE is done but will leave the door ajar
Having held rates in September, it appears that the BoE is mindful of the lagged impact of the 515 bps of accumulated tightening thus far in the cycle. Indeed, we now assume that the BoE has likely concluded its policy tightening.
The UK rate spectrum remains a function of inflation expectations and growth assumptions.
The paring in terminal rate expectations, allied to ongoing data headwinds point towards ongoing GBP challenges into year-end.
GBP/USD – Q4 2023: 1.19 | Q1 2024: 1.21
- EUR/USD trades without direction below the 1.0600 barrier.
- Further gains appear in store above the 1.0640 region.
EUR/USD trades without a clear direction below the key 1.0600 hurdle on Friday.
In case the recovery gathers a more serious pace, the pair is expected to initially challenge the October high at 1.0639 (October 12). The surpass of this region should expose a potential move to the transitory 55-day SMA at 1.0721 ahead of weekly peaks at 1.0736 (September 20) and 1.0767 (September 12).
Meanwhile, further losses remain on the table as long as the pair navigates the area below the key 200-day SMA at 1.0818.
EUR/USD daily chart
Federal Reserve Bank of Philadelphia President Patrick Harker reiterated on Friday his preference to keep interest rates steady. “This is a time where doing nothing is doing something, and, in fact, I’d argue that it equates to doing quite a lot”, said Harker speaking at the Risk Management Association, in Philadelphia.
Key takeaways from the speech:
I remain rooted in my opinion that we are at the point where holding the policy rate steady is the prudent position to take. I arrived at this decision after carefully reviewing both the hard data and what I’ve been hearing directly from contacts throughout the Third District.
The available data for September have mostly come out stronger than I expected. The latest on retail sales confirms that households retained spending power and did not seem shy to use it over the summer. A resilient consumer is not a problem. Indeed, perhaps the key tenet of a soft landing is that households get to adjust their plan for when and how it best serves them — as opposed to the kind of drastic, unavoidable adjustments that come with, say, suddenly losing their job.
We are not going to tolerate a reacceleration in prices.
While I stand ready to revise my views and act accordingly if I see signs of reinflation, I am also not going to overreact to the normal month-to-month variability in data.
Prolonged labor strikes, the restart of student loan payments, and international events each come with their own set of economic effects. But we won’t necessarily know their extent for some time. We will need to see the data.
A resolute, but patient, stance on monetary policy will allow us to achieve the soft landing that we all wish for our economy.
Now, as for when I anticipate rates coming back down? That is a question to which I don’t yet have an answer. My forecasts are based on what I know as of now. And as time goes by, as adjustments are completed, as new data emerge, and as we gain additional insight on the underlying trends, I may need to adjust my forecasts, and with them, my time frames. Suffice it to say, rates will need to stay high for a while.
Market reaction
The US Dollar Index (DXY) is trading near 106.20, flat for the day, consolidating weekly losses. US Treasury yields are pulling back on Friday, with the 2-year at 5.12% and the 10-year at 4.95%.
- DXY alternates gains with losses in the low-106.00s.
- Extra consolidation appears in store in the very near term.
DXY trades in an inconclusive fashion around the 106.20-106.30 band at the end of the week.
It seems the index has moved into a consolidative phase for the time being. Occasional bullish attempts, in the meantime, continue to target the weekly high of 106.78 (October 12) prior to the 2023 top of 107.34 (October 3). On the downside, the monthly low of 105.53 (October 12) is expected to hold the downside.
So far, while above the key 200-day SMA, today at 103.29, the outlook for the index is expected to remain constructive.
DXY daily chart
- EUR/JPY adds to Thursday’s gains and approaches 159.00.
- Extra gains look likely in the short-term horizon.
EUR/JPY advances further and prints new multi-week tops near the 159.00 barrier at the end of the week.
Considering the ongoing price action, the cross could now challenge the 2023 peak at 159.76 (August 30) in the near term, just ahead of the round level of 160.00.
So far, the longer term positive outlook for the cross appears favoured while above the 200-day SMA, today at 150.69.
EUR/JPY daily chart
Kit Juckes, Chief Global FX Strategist at Société Générale, analyzes EUR/USD and USD/JPY outlook.
EUR/USD has some, but only limited room to fall in Q4
EUR/USD may now be priced for the ECB and Fed to do nothing, and for the US to grow much faster than the Eurozone. Strong US data isn’t having as much impact in October as it did in September, and we may be twiddling our thumbs waiting for something to change. I’m tempted to conclude that EUR/USD has some, but only limited room to fall in Q4.
USD/JPY continues to be dragged higher by yields. That suggests that if we do see a further rise in US yields, and nothing more than a shift in the BoJ’s inflation forecast at the October 31 BoJ meeting, another spike above 150 is almost inevitable. The Yen has a good chance of being one of 2024’s top-performing currencies but forecasting when USD/JPY will peak is as easy, or as difficult, as picking when US 10-year yields will peak.
- Silver price seems stable above $23.00 as safe-haven demand remains intact.
- The market mood remains downbeat as Israel plans to destroy Hamas's military in Gaza.
- Fed Bostic said a slowdown is coming but the economy won’t see a recession.
Silver price (XAG/USD) managed to shift auction above the crucial resistance of $23.00 in the late European session. The white metal remains firm as the deteriorating situation in Gaza due to deepening conflicts between the Israeli army and Palestine’s military group has strengthened the appeal for safe-haven assets.
The market mood remains downbeat as Middle East tensions are expected to escalate as Israel's defense chief instructed troops to enter Gaza and destroy the Hamas military. Losses in the S&P500 futures deepened in the London session as the third-quarter result season started.
The demand for safe-haven assets has also improved due to neutral guidance from Federal Reserve (Fed) Chair Jerome Powell at New York’s Economic Club. The commentary from Fed Powell indicated that bond yields are sufficiently high and effective to compress overall spending and investment.
Meanwhile, Atlantic Fed Bank President Raphael Bostic said in an interview with CNBC that a slowdown is coming but the economy won’t see a recession. Bostic remains confident that the central bank will get inflation under control. He forecasted that the Fed would cut interest rates in late 2024.
Silver technical analysis
Silver price trades in a Rising Channel chart pattern on an hourly scale in which each pullback is considered a buying opportunity by the market participants. The 50-period Exponential Moving Average (EMA) at around $23.00 continues to provide support to the Silver price bulls. Horizontal resistance is plotted from September 29 high at $23.56.
The Relative Strength Index (RSI) (14) shifts into the 40.00-60.00 range from the bullish range of 60.00-80.00. This indicates that the upside momentum has concluded while the overall trend is still bullish.
Silver hourly chart
-638334029354131933.png)
A 3% slide versus the USD represents the worst EUR performance in four quarters. Economists at CIBC Capital Markets analyze EUR/USD outlook.
Politics and weather are the immediate Euro headwinds
As macro headwinds show no signs of immediate easing, we anticipate scope for additional positioning for EUR downside.
We can expect the ECB to continue to drain liquidity out of the system across 2024, containing EUR downside. However, we can also expect immediate EUR headwinds to persist through early Q4 2023, not least in view of ongoing political risks into upcoming elections and the weather.
EUR/USD – Q4 2023: 1.03 | Q1 2024: 1.05
- Retail Sales in Canada fell more than expected in August.
- USD/CAD continues to trade in negative territory at around 1.3700.
Retail Sales in Canada declined by 0.1% on a monthly basis in August to C$66.08 billion, Statistics Canada reported on Friday. This reading followed the 0.4% growth recorded in July and came in better than the market expectation for a decline of 0.3%.
Retail Sales ex Autos increased by 0.1% in the same period, after rising by 1.1% in July.
Market reaction
The USD/CAD pair showed no immediate reaction to these figures and was lasts seen trading modestly lower on the day at 1.3700.
In an interview with CNBC on Friday, Atlanta Federal Reserve (Fed) President Raphael Bostic said that he doesn't think that the US central bank will cut the policy rate before the middle of next year, per Reuters.
Key takeaways
"Inflation has come down a lot and should continue."
"The economy has been resilient."
"Business contacts say a slowdown is coming."
"We are not going to see a recession, inflation will go to 2%."
"Pretty confident that the Fed will get inflation under control."
"I don't know if neutral rate has changed, it could be higher."
"Late 2024 is possibly a time when the Fed would cut rates."
"The economy still has a lot of momentum, inflation will ebb slowly."
"We will need to be cautious, patient and resolute."
Market reaction
These comments don't seem to be having a noticeable impact on the US Dollar's valuation. As of writing, the US Dollar Index was down 0.05% on the day at 106.18.
CAD nudges higher. Shaun Osborne, Chief FX Strategist at Scotiabank, analyzes Loonie’s outlook.
Intraday patterns lean mildly USD-negative
In general terms, the CAD still looks relatively ‘cheap’ to me at the lower end of its recent trading range against the USD but the risk backdrop is likely to keep it trading defensively in the short run at least.
The USD’s drop back from the intraday high Thursday to end the session unchanged formed a bearish ‘doji’ candle on the daily chart but USD losses have been mild and the CAD really needs to pick up a bit more ground today to have a chance of improving.
Intraday patterns lean mildly USD-negative but the USD remains above short-term support (1.3635) which could unlock a little more CAD strength.
Resistance is 1.3725/1.3735.
US Dollar trades mixed to lower on the day as US yields slip. Economists at Scotiabank analyze Greenback’s outlook.
Weaker tone in the USD since the late September peak
On the charts, the soft close for the US Dollar Index (DXY) on Thursday underscores the slightly weaker tone in the USD overall since the late September peak in the index.
Losses below 105.50 would suggest a bit more softness ahead.
See: Dollar is likely to have a hard time making further gains – Commerzbank
- The Greenback lost substantially on Thursday after Powell did not bring anything new to the table.
- A very light data calendar on Friday offers room for traders to digest past week events.
- The US Dollar Index strengthened somewhat on Friday amid escalating tensions in the Middle East.
The US Dollar (USD) lost substantial ground in the aftermath of the speech from US Federal Reserve Chairman Jerome Powell on Thursday. Powell’s remarks did not hold any meaningful new elements, mainly repeating ideas from the most recent FOMC meeting. Markets were quick to sell the Greenback, sending the US Dollar to peak to 1.0620 against the Euro.
However, there was a quick turnaround overnight as geopolitical tensions in the Middle East took over. A military base in Southern Syria, where US soldiers were housed, came under fire. At that same time reports came in that the US Navy destroyer USS Carney had shot down multiple Houthi missiles. With very light economic data at hand, it is expected that traders will be on edge for any reactions and possible retaliations of the US in the region.
Daily digest: US Dollar thrives in geopolitics
- Philadelphia Fed President Patrick Harker is the last Fed member to speak before the start of the blackout period of the next FOMC meeting to take place on November 1. Look for possible comments from Harker at 13:00 GMT.
- Last data point on the calendar is later this Friday with the Baker Hughes US Oil Rig Count around 17:00 GMT. The previous number was at 501.
- Equities are again not dealing well with the recent and overnight headlines: Asian indexes are down near 0.50%. European equities are deep in the red, registering losses of more than 1%, while US equity futures are declining by around 0.50%.
- The CME Group’s FedWatch Tool shows that markets are pricing in a 98.5% chance that the Federal Reserve will keep interest rates unchanged at its meeting in November.
- The benchmark 10-year US Treasury yield trades at 4.93%, a few basis points lower from the near 5% where it was trading earlier. With geopolitical tensions soaring and possibly the US starting to play a more active role in the field, demand for bonds might further increase.
US Dollar Index technical analysis: Stuck and going nowhere
The US Dollar is being torn in two, based on its performance for the week in the US Dollar Index (DXY). On the one hand, the geopolitical situation in the Israel-Palestine region is asking for more US Dollar strength, while recent Fed communication and the slowdown in certain economic numbers asks for a weaker Greenback. It will be a push-and-pull scenario with no clear path going forward.
A bounce above the daily trendline from July 18 might still materialise, although this level is starting to slip further away. On the topside, 107.19 is an important level to reach. If this is the case, 109.30 is the next level to watch.
On the downside, the recent resistance at 105.88 did not do a good job supporting any downturn. Instead, look for 105.12 to keep the DXY above 105.00. If that fails to do the trick, 104.33 will be the best level to look for resurgence in US Dollar strength, with the 55-day Simple Moving Average (SMA) as a support level.
US Dollar FAQs
What is the US Dollar?
The US Dollar (USD) is the official currency of the United States of America, and the ‘de facto’ currency of a significant number of other countries where it is found in circulation alongside local notes. It is the most heavily traded currency in the world, accounting for over 88% of all global foreign exchange turnover, or an average of $6.6 trillion in transactions per day, according to data from 2022.
Following the second world war, the USD took over from the British Pound as the world’s reserve currency. For most of its history, the US Dollar was backed by Gold, until the Bretton Woods Agreement in 1971 when the Gold Standard went away.
How do the decisions of the Federal Reserve impact the US Dollar?
The most important single factor impacting on the value of the US Dollar is monetary policy, which is shaped by the Federal Reserve (Fed). The Fed has two mandates: to achieve price stability (control inflation) and foster full employment. Its primary tool to achieve these two goals is by adjusting interest rates.
When prices are rising too quickly and inflation is above the Fed’s 2% target, the Fed will raise rates, which helps the USD value. When inflation falls below 2% or the Unemployment Rate is too high, the Fed may lower interest rates, which weighs on the Greenback.
What is Quantitative Easing and how does it influence the US Dollar?
In extreme situations, the Federal Reserve can also print more Dollars and enact quantitative easing (QE). QE is the process by which the Fed substantially increases the flow of credit in a stuck financial system.
It is a non-standard policy measure used when credit has dried up because banks will not lend to each other (out of the fear of counterparty default). It is a last resort when simply lowering interest rates is unlikely to achieve the necessary result. It was the Fed’s weapon of choice to combat the credit crunch that occurred during the Great Financial Crisis in 2008. It involves the Fed printing more Dollars and using them to buy US government bonds predominantly from financial institutions. QE usually leads to a weaker US Dollar.
What is Quantitative Tightening and how does it influence the US Dollar?
Quantitative tightening (QT) is the reverse process whereby the Federal Reserve stops buying bonds from financial institutions and does not reinvest the principal from the bonds it holds maturing in new purchases. It is usually positive for the US Dollar.
Sterling is weaker but has rebounded a little from the earlier session low. Economists at Scotiabank analyze Cable’s outlook.
Potential turn higher in the Pound
Sterling looks soft but the GBP/USD pair has once again found firm support on dips below 1.21.
GBP gains off the low Thursday set a daily ‘doji’ candle on the candle chart, suggesting a potential turn higher in the Pound.
A deeper rebound through 1.2190/1.2200 resistance is needed to secure gains towards 1.23 from a technical point of view, however.
EUR/USD holds gains through high 1.05s. Economists at Scotiabank analyze the pair’s outlook.
Solid resistance remains at 1.0610 and 1.0640
EUR/USD is putting the broader downtrend off the July high under a little more pressure.
Shorter-term trend signals indicate there is some positive momentum developing around the EUR’s push higher.
Solid resistance remains above the market at 1.0610 and 1.0640 but a firm close on the week would boost chances of a modest extension towards 1.0650/1.0750 at least.
See – EUR/USD: More swings within the 1.05/1.06 range may remain the norm – ING
AUD/USD continued to decline in September. Economists at CIBC Capital Markets analyze the pair’s outlook.
Languishing AUD
We’ve revised our Q4 2023 forecast for AUD/USD down to 0.62, as we expect Dollar strength to persist into year-end. Global growth headwinds are likely to continue to weigh on the AUD, as European growth rolls over and the Chinese economy remains weak. Thus, it is not until Q2 2024 when we expect AUD/USD to begin rally.
We expect the pair to eventually reach 0.68 by Q4 2024.
We also expect the RBA to hike rates once more in November. While a hike should lead to some short-term gains in AUD, we expect a stronger dollar and declining global growth to dominate AUD/USD movements.
Despite higher bond yields, the Gold price gained to around $1,980 this week – its highest level in three months. Economists at Commerzbank analyze the yellow metal’s outlook.
XAU/USD upside potential is likely exhausted
The Gold price could probably chalk up some additional gains if the Middle East conflict were to escalate or widen. Otherwise, its upside potential is likely exhausted, however.
We only envisage further sustainable gains for Gold prices once there are signs that a turnaround in US interest rate policy is on the cards – in response to the weakening of the US economy that we anticipate.
- Natural Gas prices under pressure this week, correcting from last week’s huge rally.
- The US Dollar trades mixed, torn between Israel-Hamas war safe-haven flows and rising US Treasury yields.
- Natural Gas prices are still in a long-term uptrend, favourable winter season will still bring more upside.
Natural Gas prices are correcting lower this week as gas supply in Europe has been above average, despite the closure of the import Israel gas flow via Egypt. With the European gas tanks filled up to the brim, the EU bloc looks ready to face the first period of cold temperatures ahead of winter. Even with geopolitical tensions on the horizon, one of the biggest demand pools in the world looks to be set for quite a while.
Meanwhile, the US Dollar (USD) trading action has been split in two halves. On one side safe haven inflows are supporting the Greenback. On the other one, US Treasury yields have soared to new decade highs with the US 10-year note breaking above 5% at one point. Rule of thumb in financial markets is that a yield above 5% is a tipping point where the high returns to bonds and notes start to hurt the economy and might cause damage in the near future, which advocates for a weaker US Dollar.
Natural Gas is trading at $3.31 per MMBtu at the time of writing.
Natural Gas news and market movers
- Latest port authority data from Egypt shows that LNG ships are leaving the harbours with only partial loads of LNG on board due to the closure of the Israeli gas fields.
- With overnight bombing in the Middle East and drons being shot down by a US military carrier, the US could be pulled into the war, which might trigger a spike in gas prices in the short run.
- Thinktank ‘The Institute of Energy Economics, Japan’ (IEEJ) calculated that the world will need $7 trillion to ensure there is sufficient gas supply through 2050.
- This evening the Baker Hughes Gas Rig Count is due to be published near 17:00 GMT. Previous number was 117, which is still quite far off the 167 high in 2022. No expectations pencilled in.
Natural Gas Technical Analysis: Upside pressure remains despite correction
Natural Gas is still up over 25% after the start of the turmoil in the Gaza region. And with the winter season ahead, volatility is expected to pick up. Prices are expected to broadly ease until temperatures start to drop and risk premiums will be factored in due to tensions in the Middle-East during the winter period, when demand is expected to surge.
Expect with geopolitical headlines severe upswings could always materialise. There aren’t any significant resistance levels except for $3.65, the peak of January 17. From there, the high of 2023 near $4.3080 comes into play.
On the downside, the trend channel failed to act as support near $3.37. Natural Gas prices briefly could sink to $3.07, with that orange line identified from the double top around mid-August. Should the drop become a broader sell-off, prices could sink below $3, near the 55-day Simple Moving Average.
-638333919823302267.png)
XNG/USD (Daily Chart)
Natural Gas FAQs
What fundamental factors drive the price of Natural Gas?
Supply and demand dynamics are a key factor influencing Natural Gas prices, and are themselves influenced by global economic growth, industrial activity, population growth, production levels, and inventories. The weather impacts Natural Gas prices because more Gas is used during cold winters and hot summers for heating and cooling. Competition from other energy sources impacts prices as consumers may switch to cheaper sources. Geopolitical events are factors as exemplified by the war in Ukraine. Government policies relating to extraction, transportation, and environmental issues also impact prices.
What are the main macroeconomic releases that impact on Natural Gas Prices?
The main economic release influencing Natural Gas prices is the weekly inventory bulletin from the Energy Information Administration (EIA), a US government agency that produces US gas market data. The EIA Gas bulletin usually comes out on Thursday at 14:30 GMT, a day after the EIA publishes its weekly Oil bulletin. Economic data from large consumers of Natural Gas can impact supply and demand, the largest of which include China, Germany and Japan. Natural Gas is primarily priced and traded in US Dollars, thus economic releases impacting the US Dollar are also factors.
How does the US Dollar influence Natural Gas prices?
The US Dollar is the world’s reserve currency and most commodities, including Natural Gas are priced and traded on international markets in US Dollars. As such, the value of the US Dollar is a factor in the price of Natural Gas, because if the Dollar strengthens it means less Dollars are required to buy the same volume of Gas (the price falls), and vice versa if USD strengthens.
- WTI rose to near $90.00 due to escalating Middle East tensions.
- The announcement of SPR refilling has improved the appeal of oil.
- Fed Powell supported keeping interest rates unchanged due to rising US Treasury yields.
West Texas Intermediate (WTI), futures on NYMEX, trade back and forth below the crucial resistance of $90.00 in the London session. The upside bias for oil prices is bullish due to persistent risks of Israel-Palestine conflict escalation after the hospital blast in Gaza.
Israel's defense chief Yoav Gallant has instructed their troops to prepare for entering Gaza, aiming to dismantle the Palestine military group. The oil prices are on surge due to substantial risks of Iran’s intervention in the Middle East tension, which could result in a decline in oil supply in an already tight oil market.
Meanwhile, the announcement of the refilling of the Strategic Petroleum Reserve (SPR) by the US Department of Energy (DOE) has prompted the oil price outlook. The DOE looks set to deliver six million barrels in the December-January period. Investors should note that the US government has drawn 200 million barrels since the onset of the Russia-Ukraine war in an attempt to combat higher gasoline prices.
The appeal for the oil price has also improved due to neutral guidance on interest rates by Federal Reserve (Fed) Chair Jerome Powell in his speech at the New York Economic Club. Jerome Powell supported keeping interest rates unchanged in the 5.25-5.50% range as multi-year high US Treasury yields are effectively catering Fed’s job.
Economists at Commerzbank analyze Aussie outlook ahead of next week’s Australian inflation data.
Inflation data is likely to be what matters for the RBA now
What matters now for the Reserve Bank of Australia (RBA) will probably be the inflation data for Q3, which is due for publication next week. In particular as the new central bank governor Michele Bullock, has voiced concerns that inflation might turn out to be quite stubborn and that inflation might rise again.
If next week’s inflation data confirms Bullock’s concerns a further rate hike in early November is quite possible and certainly required at that point from the market’s point of view. If despite these developments the RBA did not act, AUD would probably be massively punished by the market.
Brent Oil prices have had a volatile start to the fourth quarter. Economists at OCBC Bank analyze Oil prices outlook.
Oil prices to average $90 in 4Q23 and $88 in 2H23
Our house view remains for global Oil prices to average $90 in 4Q23 and $88 in 2H23, after a volatile start to 4Q23.
Israel-Hamas developments notwithstanding, our fundamental view is that supply tightness will persist in global Oil market in 4Q23, following the extension of additional voluntary restrictions by both Saudi Arabia and Russia to the end of the year. This will more than offset demand concerns as growth in China remains lacklustre and sticky inflation keeps global central banks, including the Fed, on a hawkish bias.
Our house view is that a build-up in recession risks in 2024 in the US will weigh on the broader global growth outlook and exert downward pressure on global Oil prices. As such, we expect Brent to average $75 next year.
- Gold price extends upside as Israel prepares to attack Hamas group.
- Fed Chair Powell supported neutral interest rates amid higher US bond yields.
- 10-year US Treasury yields jump above 4.9% amid unsustainable Congress budget deficits.
Gold price (XAU/USD) rose sharply as Middle East tensions kept escalating and the Federal Reserve (Fed) Chair Jerome Powell endorsed a stable interest rate policy in his speech on Thursday. The demand for bullion strengthened as Israeli troops prepared to enter the Gaza strip with the goal of dismantling Hamas, the Palestinian military group. Meanwhile, despite the promise of humanitarian aid for civilians in Gaza by US President Joe Biden, Iran could step in and intervene directly in the conflict, which could turn into a feared Middle East regional war.
On Thursday, Fed Chair Jerome Powell joined his teammates – Philip Jefferson, Austan Goolsbee, Michael Barr, and Raphael Bostic – and delivered neutral guidance on interest rates in his speech at the Economic Club of New York. Powell acknowledged that multi-year high US Treasury yields are significantly impacting overall spending and investment.
Daily Digest Market Movers: Gold price strengthens on multiple tailwinds
- Gold price keeps rallying having just breached the $1,980 resistance amid tailwinds coming from the Federal Reserve and Middle East.
- The Israel-Palestine conflict has extended for 14th day now and Israel's defense chief Yoav Gallant is getting his troops ready to enter Gaza, aiming to dismantle the Hamas military.
- US President Joe Biden has called for urgent humanitarian aid for civilians in Gaza. After visiting Israel, Biden said ‘loud and clear’ that the US stands with Israel.
- Gold bullion demand remains upbeat due to persistent risks of Iran’s intervention in the Middle East conflict, which would effectively make it a regional war.
- Meanwhile, rising expectations supporting an unchanged interest rate decision by the Fed on November 1 have strengthened the appeal for Gold.
- Jerome Powell supported a potential halt in interest rates while addressing monetary policy prospects at the New York Economic Club, as expected. He acknowledged that rising US Treasury yields have significantly tightened overall financial conditions.
- The 10-year US Treasury yields have come closer to 5% amid unsustainable United States budget deficits, and rising interest rates.
- Jerome Powell acknowledged that the US economy is resilient. The labor demand has been upbeat and consumer spending has remained strong despite significant efforts to ease inflation through raising interest rates.
- Over the interest rate outlook, Powell said that further policy-tightening would be largely dependent on economic indicators, evolving outlook, and geopolitical tensions.
- After Powell’s commentary, trader bets for unchanged interest rates in the November meeting rose significantly, a bullish development for Gold. Per the CME Fedwatch tool, traders see an almost 100% chance of the Fed keeping interest rates unchanged at 5.25-5.50%. The odds of one more interest rate increase in any of the two remaining monetary policy meetings in 2023 have dropped to 20%.
- Analysts at Wells Fargo said that higher yields and more broadly tightening financial conditions were “doing the Fed’s work for it” by tamping down growth, thus helping cool inflation.
- Dallas Fed Bank President Lorie Logan said on Thursday that she is unsure about consumer inflation declining to 2% and emphasized the need for weakness in the job market to achieve price stability.
- Lorie Logan cited that higher bond yields and recent economic data have bought some time for the central bank to keep interest rates unchanged.
- Friday’s US economic docket is light, with Fed’s Harker due to speak at 13:00 GMT and the Monthly Budget Statement expected to be released later in the US session.
Technical Analysis: Gold price climbs close to $1,980
Gold price extends upside to near $1,980.00 amid multiple tailwinds. The precious metal is on a three-day winning streak and is expected to recapture a five-month high of around $1,987.00. The ultimate resistance for the Gold price is seen at $2,000.00. The 20 and 50-day Exponential Moving Averages (EMAs) have climbed above the 200-day EMA, which indicates that the upside bias has strengthened. The Relative Strength Index (RSI) (14) climbs above 60.00, warranting more upside in the Gold price amid the absence of divergence and overbought signals.
Gold FAQs
Why do people invest in Gold?
Gold has played a key role in human’s history as it has been widely used as a store of value and medium of exchange. Currently, apart from its shine and usage for jewelry, the precious metal is widely seen as a safe-haven asset, meaning that it is considered a good investment during turbulent times. Gold is also widely seen as a hedge against inflation and against depreciating currencies as it doesn’t rely on any specific issuer or government.
Who buys the most Gold?
Central banks are the biggest Gold holders. In their aim to support their currencies in turbulent times, central banks tend to diversify their reserves and buy Gold to improve the perceived strength of the economy and the currency. High Gold reserves can be a source of trust for a country’s solvency. Central banks added 1,136 tonnes of Gold worth around $70 billion to their reserves in 2022, according to data from the World Gold Council. This is the highest yearly purchase since records began. Central banks from emerging economies such as China, India and Turkey are quickly increasing their Gold reserves.
How is Gold correlated with other assets?
Gold has an inverse correlation with the US Dollar and US Treasuries, which are both major reserve and safe-haven assets. When the Dollar depreciates, Gold tends to rise, enabling investors and central banks to diversify their assets in turbulent times. Gold is also inversely correlated with risk assets. A rally in the stock market tends to weaken Gold price, while sell-offs in riskier markets tend to favor the precious metal.
What does the price of Gold depend on?
The price can move due to a wide range of factors. Geopolitical instability or fears of a deep recession can quickly make Gold price escalate due to its safe-haven status. As a yield-less asset, Gold tends to rise with lower interest rates, while higher cost of money usually weighs down on the yellow metal. Still, most moves depend on how the US Dollar (USD) behaves as the asset is priced in dollars (XAU/USD). A strong Dollar tends to keep the price of Gold controlled, whereas a weaker Dollar is likely to push Gold prices up.
- GBP/JPY consolidates around 182.00 despite a sharp decline in the UK’s Retail Sales data.
- UK’s consumer spending contracted as elevated price pressures squeezed households’ real income.
- BoJ Ueda emphasized achieving a sustainable 2% inflation target by wage growth.
The GBP/JPY remains broadly sideways in a narrow range around 182.00 in the European session. The cross failed to find direction despite the United Kingdom Office for National Statistics (ONS) reporting a weak Retail Sales report for September.
The ONS reported that monthly Retail Sales contracted significantly by 0.9% while economists forecasted a nominal drop of 0.1%. In August the Retail Sales were expanded by 0.4%. Annual Retail Sales contracted at a slower pace of 1.0% against a 1.3% decline in August. The ONS held the higher cost of living pressures responsible for a sharp decline in sales at clothing stores and household goods.
The recent surge in energy prices due to supply chain disruptions has squeezed deep pockets of households. A sharp downtick in consumer spending has dented consumer inflation expectations. This would allow the Bank of England (BoE) to keep interest rates unchanged at 5.25% for one more time on November 2.
After Retail Sales data, investors shift focus to the employment data for August, which will be announced on Tuesday. As per the expectations, the laborforce saw a cut by 195K against a decline of 207K in July. The Unemployment Rate in the July-August period remained steady at 4.3%. Declining labor demand may dampen labor earnings outlook.
On the Japanese Yen front, Bank of Japan (BoJ) Governor Kazuo Ueda emphasized achieving a sustainable 2% inflation target by wage growth and the maintenance of ultra-loose monetary policy. Fears of potential intervention by the BoJ or Japan’s authority in the FX domain remain intact as the Japanese Yen has weakened to 150.00 against the US Dollar.
Federal Reserve Chair Jerome Powell's comments were perceived as dovish and left the Dollar a bit weaker. Economists at ING analyze USD outlook.
Still many upside risks
The US Dollar continues to draw smaller benefits from strong US data and high rate advantage than it should, likely due to its overbought status, but upside risks remain predominant.
The US calendar is quiet today, we have two Fed speakers to monitor: Patrick Harker and Loretta Mester.
See: Dollar is likely to have a hard time making further gains – Commerzbank
- EUR/JPY continues the winning streak for the second successive day.
- German PPI data reveals a decline in prices in the primary markets.
- BoJ Governor Ueda mentioned that the central bank remains committed to achieving a 2% inflation target.
EUR/JPY extends gains for the second consecutive day, trading higher near 158.80 during the European session on Friday. The pair receives upward support following the comments from Bank of Japan (BoJ) Governor Kazuo Ueda.
BoJ Governor Kazuo Ueda restated on Friday that the central bank remains committed to achieving a 2% inflation target in a stable and sustainable manner. This objective is coupled with a focus on wage growth, and Ueda emphasized that the current accommodative policy will be maintained with patience
Traders are on edge, expressing concerns about the possibility of Japan intervening to counter a prolonged depreciation in the JPY, which could limit the advance of the EUR/JPY pair.
Markets are currently grappling with the possibility of the European Central Bank (ECB) discontinuing policy measures. This contemplation comes despite inflation levels surpassing the bank's target and mounting concerns about the risk of a slowdown or stagflation in the European zone.
In a statement made on Wednesday, ECB President Christine Lagarde highlighted that underlying inflation remains robust, and wage growth continues to maintain historically high levels. These factors contribute to the ongoing narrative shaping the Euro's performance against the Japanese Yen.
Adding to the economic puzzle, Germany's Producer Price Index (PPI) indicates a decrease in prices in the primary markets. The monthly figures reveal a 0.2% decline, deviating from the expected 0.4% increase in September. On a year-over-year basis, the drop is even more pronounced at 14.7%, exceeding the market's anticipation of a 14.2% fall.
EUR/USD has continued to enjoy pockets of support on the back of negative USD swings. Economists at ING analyze the pair’s outlook.
Idiosyncratic support remains limited
The Euro still appears to be lacking the strong idiosyncratic bullish narrative that can drive the pair sustainably above into the 1.0650/1.0700 range.
Markets will likely await cues from the European Central Bank next week, and a few more data out of the Eurozone, but the chances of a rapid upturn in Euro bullish momentum aren’t too high. This means that EUR/USD should remain almost entirely driven by the USD leg for now.
More swings within the 1.05/1.06 range may remain the norm for now, but we see the balance of risks as slightly tilted to the downside.
- EUR/GBP continues the winning streak after downbeat UK economic data.
- UK Retail Sales dropped to 0.9% against the anticipated 0.1% decline.
- German PPI data reveals a decline in prices in the primary markets.
EUR/GBP moves on the upward trajectory after the downbeat after the Office for National Statistics (ONS) reported a weak United Kingdom (UK) Retail Sales data for September. The pair trades higher at five-month highs around 0.8740 during the European session on Friday.
Monthly Retail Sales showed a 0.9% drop, contrary to the anticipated 0.1% decline. August saw a modest rise of 0.4%. On an annual basis, sales contracted by 1.0%, defying market predictions of a stagnant performance.
This dip in Retail Sales is indicative of the financial strain on households due to high inflation and increased borrowing costs. The significant drop in consumer spending is likely to have a notable impact on consumer inflation expectations. As a consequence of weakening spending, there's speculation that the Bank of England (BoE) might lean towards maintaining the current interest rates at 5.25% in November’s policy meeting.
Meanwhile, financial market participants are pondering the potential of the European Central Bank (ECB) discontinuing policy measures, despite inflation levels beyond the bank's target and growing concerns about the risk of a European zone economic slowdown or stagflation.
In a statement on Wednesday, European Central Bank (ECB) President Christine Lagarde noted that underlying inflation remains robust, and wage growth continues to maintain historically high levels. These factors contribute to the ongoing narrative surrounding the Euro's performance against the British Pound.
Germany's Producer Price Index (PPI) showed a price decrease in the primary markets. The monthly figures indicate a decline of 0.2%, which is quite a deviation from the anticipated 0.4% increase in September. On a year-over-year basis, there's an even more significant drop, with a 14.7% fall, surpassing the market expectation of 14.2%.
- Silver turns positive for the fourth straight day and climbs back closer to a multi-week high.
- The technical setup seems tilted in favour of bulls and supports prospects for further gains.
- Bulls might wait for a move beyond the $23.30-$23.35 confluence before placing fresh bets.
Silver (XAG/USD) reverses an intraday dip to the $22.85 area and builds on its intraday upward trajectory through the first half of the European session on Friday. The white metal currently trades around the $23.20 region, up nearly 0.50% for the day, and seems poised to prolong its recent goodish recovery from a seven-month low touched on October 3.
From a technical perspective, the emergence of some dip-buying near the 50% Fibonacci retracement level of the August-October downfall validates the constructive outlook for the XAG/USD. Furthermore, oscillators on the daily chart have just started gaining positive traction and support prospects for a further appreciating move. That said, it will still be prudent to wait for a sustained move beyond the $23.30-$23.35 confluence hurdle – comprising the 100-day and the 200-day Simple Moving Averages (SMAs) and the 61.8% Fibo. level – before placing fresh bullish bets.
The XAG/USD might then climb to the next relevant resistance near the $23.75-$23.80 region (September 22 high) and then aim to reclaim the $24.00 round figure for the first time since early September. The positive momentum could get extended further towards the $24.30-$24.35 resistance zone en route to the August monthly swing high, around the $25.00 psychological mark.
On the flip side, the 50% Fibo. level, around the $22.85 region, might continue to protect the immediate downside ahead of the $22.70-$22.65 horizontal support. This is followed by the weekly trough, around the $22.40-$22.35 zone, which nears the 38.2% Fibo. level and should act as a key pivotal point. A convincing break below might shift the near-term bias back in favour of bearish traders and prompt aggressive technical selling around the XAG/USD.
Silver might then turn vulnerable to accelerate the fall further below the $22.00 mark, towards the 23.6% Fibo. level, around the $21.75 area. The subsequent downfall has the potential to drag the XAG/USD to the $21.35-$21.30 intermediate support en route to the $21.00 mark and back towards retesting a seven-month low, around the $20.70-$20.65 zone, or a seven-month low touched on October 3.
Silver daily chart
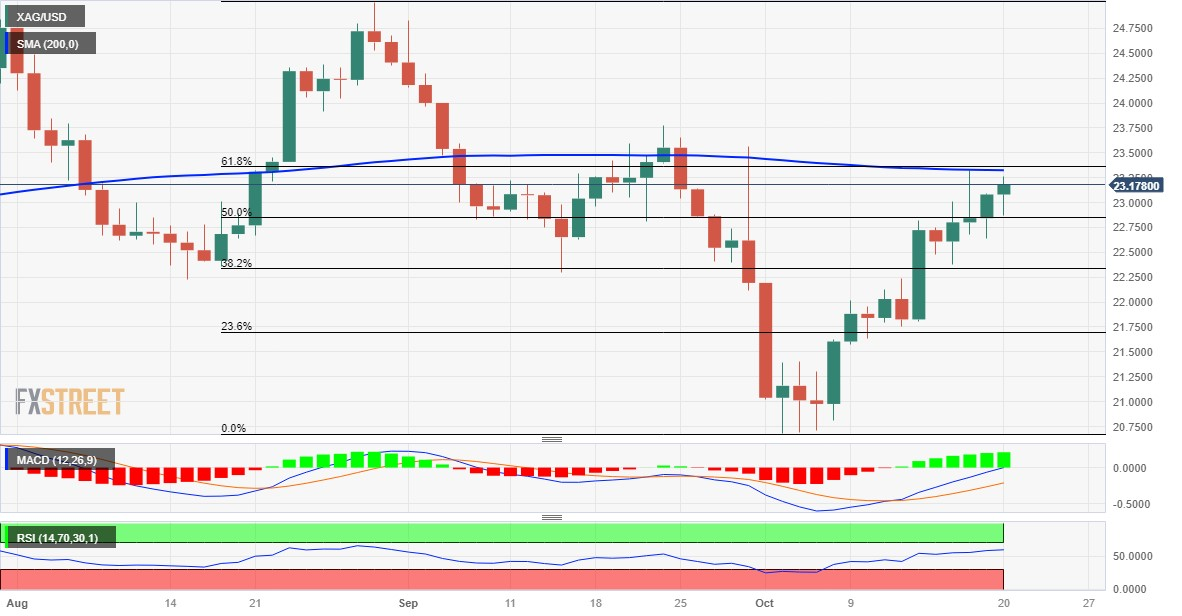
Technical levels to watch
Economists at Commerzbank are comfortable with their forecast of a moderate appreciation of the Krone during the rest of 2023 and next year.
Norges Bank's hawkish stance is no longer lagging behind the ECB's
Increased risk aversion in the market is weighing on the NOK, but rising Oil prices are supporting it. In this respect, the current geopolitical situation is relatively neutral for the Krone, but it is likely to trade volatile in the short term.
Norges Bank does not see first interest rate cuts until the end of 2024. At the same time, from a market's perspective, the ECB will no longer act decisively enough against stubbornly high inflation next year with a view to the peripheral countries, so that a risk premium on the Euro is justified. This suggests that the NOK will continue to appreciate against the EUR in 2024.

Source: Commerzbank Research
EUR/GBP has tested the water above the 0.87 level. Economists at Rabobank analyze the pair’s outlook.
Economic headwinds facing the Eurozone economy undermining the outlook for the EUR
In view of the headwinds facing the Eurozone economy, we continue to see the outlook for GBP vs. the EUR as well balanced.
Consequently, we maintain our preference of selling rallies in EUR/GBP with the view that the 0.87 to 0.85 range will largely prevail in the coming months.
See: EUR/GBP could hit 0.90 next year – ING
FX option expiries for Oct 20 NY cut at 10:00 Eastern Time, via DTCC, can be found below.
- EUR/USD: EUR amounts
- 1.0475 415m
- 1.0485 1.2b
- 1.0550 1.6b
- 1.0575 779m
- 1.0600 2.1b
- 1.0625 2.5b
- 1.0640 566m
- 1.0650 1.1b
- GBP/USD: GBP amounts
- 1.2025 550m
- 1.2150 454m
- 1.2200 413m
- 1.2250 354m
- USD/JPY: USD amounts
- 149.00 435m
- 149.50 363m
- 149.60 370m
- 150.00 1.1b
- 150.50 620m
- USD/CHF: USD amounts
- 0.9000 860m
- 0.9010 400m
- AUD/USD: AUD amounts
- 0.6250 535m
- 0.6285 358m
- 0.6525 377m
- USD/CAD: USD amounts
- 1.3500 772m
- 1.3555 955m
- 1.3600 1.8b
- 1.3700 481m
- The Euro trades on the defensive against the US Dollar.
- Stocks in Europe open Friday’s session with losses.
- EUR/USD retreats from weekly highs over 1.0600.
- The USD Index (DXY) appears well supported by 106.00.
- Markets continue to digest Fed Chairman Powell’s comments.
The Euro (EUR) is trading slightly on the defensive against the US Dollar (USD), prompting EUR/USD to recede to the 1.0570-1.0580 band following Thursday’s weekly peaks past the 1.0600 barrier.
Meanwhile, the Greenback manages to regain some composure and advances modestly around the low-106.00s when gauged by the USD Index (DXY) amidst some corrective retracement in US yields across the curve and a knee-jerk in the sentiment around the risk complex.
Keeping the focus on monetary policy, investors anticipate the Federal Reserve (Fed) to retain its current stance of not changing interest rates at the November meeting, a view that was reinforced by comments from Fed’s Jerome Powell on Thursday.
Meanwhile, financial market participants are pondering the potential of the European Central Bank (ECB) discontinuing policy measures, despite inflation levels beyond the bank's target and growing concerns about the risk of a European zone economic slowdown or stagflation.
The European calendar will be empty at the end of the week.
No data releases scheduled across the ocean either, although investors are expected to follow speeches by Cleveland Fed President Loretta Mester (2024 voter, hawk) and Philadelphia Fed President Patrick Harker (voter, hawk).
Daily digest market movers: Euro runs out of steam north of 1.0600
- The EUR weakens a tad against the USD on Friday.
- US and German yields come under pressure and recede from peaks.
- Investors see the Fed keeping its interest rate unchanged in November.
- Markets expect believe the ECB to enter an impasse in its hiking cycle.
- Geopolitical fears continue to dominate the landscape.
- Japanese inflation rate eased to 3.0% in September.
Technical Analysis: Euro bullish attempts remain capped by 1.0600
The EUR/USD retreats from Thursday’s tops north of 1.0600 and revisits the 1.0570 zone at the end of the week.
If the bullish trend continues, EUR/USD may confront the October 12 high of 1.0639, before reaching the September 20 top of 1.0736 and the crucial 200-day Simple Moving Average (SMA) of 1.0817. A break above this level might signal a push to the August 30 peak of 1.0945 ahead of the psychological mark of 1.1000. Any more gains could put a potential test of the August 10 high of 1.1064 back on the radar prior to the July 27 top of 1.1149 and possibly the 2023 peak of 1.1275 seen on July 18.
If the selling bias returns, the 2023 low of 1.0448 from October 3 emerges as the immediate contention area ahead of the round level of 1.0400. If this region is breached, the weekly lows of 1.0290 (November 30, 2022) and 1.0222 (November 21, 2022).
As long as the EUR/USD continues below the 200-day SMA, the possibility of continuous bearish pressure exists.
Euro FAQs
What is the Euro?
The Euro is the currency for the 20 European Union countries that belong to the Eurozone. It is the second most heavily traded currency in the world behind the US Dollar. In 2022, it accounted for 31% of all foreign exchange transactions, with an average daily turnover of over $2.2 trillion a day.
EUR/USD is the most heavily traded currency pair in the world, accounting for an estimated 30% off all transactions, followed by EUR/JPY (4%), EUR/GBP (3%) and EUR/AUD (2%).
What is the ECB and how does it impact the Euro?
The European Central Bank (ECB) in Frankfurt, Germany, is the reserve bank for the Eurozone. The ECB sets interest rates and manages monetary policy.
The ECB’s primary mandate is to maintain price stability, which means either controlling inflation or stimulating growth. Its primary tool is the raising or lowering of interest rates. Relatively high interest rates – or the expectation of higher rates – will usually benefit the Euro and vice versa.
The ECB Governing Council makes monetary policy decisions at meetings held eight times a year. Decisions are made by heads of the Eurozone national banks and six permanent members, including the President of the ECB, Christine Lagarde.
How does inflation data impact the value of the Euro?
Eurozone inflation data, measured by the Harmonized Index of Consumer Prices (HICP), is an important econometric for the Euro. If inflation rises more than expected, especially if above the ECB’s 2% target, it obliges the ECB to raise interest rates to bring it back under control.
Relatively high interest rates compared to its counterparts will usually benefit the Euro, as it makes the region more attractive as a place for global investors to park their money.
How does economic data influence the value of the Euro?
Data releases gauge the health of the economy and can impact on the Euro. Indicators such as GDP, Manufacturing and Services PMIs, employment, and consumer sentiment surveys can all influence the direction of the single currency.
A strong economy is good for the Euro. Not only does it attract more foreign investment but it may encourage the ECB to put up interest rates, which will directly strengthen the Euro. Otherwise, if economic data is weak, the Euro is likely to fall.
Economic data for the four largest economies in the euro area (Germany, France, Italy and Spain) are especially significant, as they account for 75% of the Eurozone’s economy.
How does the Trade Balance impact the Euro?
Another significant data release for the Euro is the Trade Balance. This indicator measures the difference between what a country earns from its exports and what it spends on imports over a given period.
If a country produces highly sought after exports then its currency will gain in value purely from the extra demand created from foreign buyers seeking to purchase these goods. Therefore, a positive net Trade Balance strengthens a currency and vice versa for a negative balance.
- USD/CAD extends gains as fears over the Middle East situation escalate.
- US Dollar faced resistance after Fed Chair Powell’s dovish remarks over interest rate trajectory.
- Solid US economic figures provide support to underpin the Greenback.
USD/CAD continues the winning streak for the fourth consecutive day, trading lower around 1.3720 during the European session on Friday. The pair receives upward support as the risk-off sentiment prevails, which could be attributed to the fears of an escalation in the Middle East conflict, particularly due to the preparations for a potential ground invasion of Gaza by Israel.
Federal Reserve Chairman Jerome Powell's recent statements contributed to some pressure on the USD/CAD pair. Powell indicated that the central bank has no plans to raise rates in the short term, offering a respite for the pair. However, Powell also emphasized that future policy adjustments would depend on economic indicators, particularly growth and labor market conditions.
The scheduled address by US President Joe Biden on Thursday underscores the global significance of the Middle East situation, raising concerns about potential broader impacts on currency markets.
The US Dollar Index (DXY) rebounds from weekly lows, reaching around 106.40. Higher US Treasury yields and robust economic data, including a drop in Initial Jobless Claims to their lowest since January, contribute to the dollar's strength. However, challenges in the housing market, reflected in a 2.0% MoM decline in existing home sales, highlight some economic headwinds.
The release of weaker Canadian consumer inflation figures on Tuesday has led investors to scale back their expectations for another rate hike by the Bank of Canada (BoC). This, in turn, is viewed as a significant factor contributing to the relative underperformance of the Canadian Dollar (CAD), providing support for the USD/CAD pair.
However, the bullish trend in Crude oil prices, which supports the commodity-linked Loonie, could act as a counterforce, limiting further gains in the USD/CAD pair.
Western Texas Intermediate (WTI) oil price extends the gains for the fourth successive day, trading higher around $89.00 per barrel during the European session on Friday.
The recent surge in oil prices is closely tied to concerns about the potential escalation of the Israel-Gaza conflict across the Middle East. There are apprehensions that such escalation could disrupt oil supplies from one of the world's major production regions.
Furthermore, the US government's decision to purchase 6 million barrels of crude oil for delivery to the Strategic Petroleum Reserve (SPR) in December and January adds another dimension to the market dynamics. This move is part of a broader initiative to replenish the emergency stockpile, reflecting efforts to enhance the country's energy security.
NZD/USD made another cycle low. Economists at ANZ Bank analyze the pair’s outlook.
FX markets remain very USD-centric
FX markets remain very USD-centric and while pondering local factors and target levels, we think it pays to keep in mind that this is all a dollar story and where that leaves the Kiwi is very secondary.
US 10-year bond yields haven’t quite hit 5% but they are higher, and we still worry about USD upside risks, especially with Fed Chair Jerome Powell keeping a very open mind while admitting that the neutral US policy rate may be higher and that we may be entering a period of higher inflation.
Lots to ponder, but stepping back, NZD price action (lower lows and lower highs) is ugly.
- USD/JPY regains positive traction on Friday and climbs back closer to a multi-week top.
- The divergent BoJ-Fed policy outlook turns out to be a key factor acting as a tailwind.
- The risk-off mood could benefit the safe-haven JPY and cap gains amid intervention fears.
The USD/JPY pair attracts some dip-buying on the last day of the week and steadily climbs back closer to the 150.00 psychological mark, or a near three-week high touched on Thursday.
Bank of Japan (BoJ) Governor Kazuo Ueda reiterated this Friday that the central bank will aim at stably, sustainably achieving a 2% inflation target, accompanied by wage growth, by patiently maintaining the current easy policy. This marks a big divergence in comparison to the Federal Reserve's (Fed) hawkish outlook, which, in turn, is seen as a key factor behind the Japanese Yen's (JPY) relative underperformance and acts as a tailwind for the USD/JPY pair.
Fed Chair Jerome Powell said on Thursday that the recent spike in yields was tightening financial conditions, lessening the need for more action by the central bank. Powell, however, noted that monetary policy was not yet too tight and that inflation was still too high, leaving the door open for at least one more rate hike by the year-end. This helps revive the US Dollar (USD) and lends some support to the USD/JPY pair, though the uptick lacks bullish conviction.
Market participants seem convinced that the Fed will maintain the status quo for the second straight time in November. This leads to a modest decline in the US Treasury bond yields and holds back the USD bulls from placing aggressive bets. Traders, meanwhile, remain worried about a potential intervention by Japan to combat a sustained depreciation in the JPY. Apart from this, the risk-off mood should limit losses for the safe-haven JPY and cap the USD/JPY pair.
In the absence of any relevant market-moving economic releases on Friday, the aforementioned fundamental backdrop warrants some caution before positioning for any further appreciating move. That said, any meaningful corrective decline might still be seen as a buying opportunity and is more likely to remain limited. Nevertheless, spot prices, at current levels, seem poised to register modest gains for the second straight week.
Technical levels to watch
Even though it looked during the course of the week as if EUR/CHF might recover that is not going to be the case for now. Economists at Commerzbank analyze the pair’s outlook.
SNB is likely to tolerate the strong Franc
As long as the conflict in the Middle East is brewing and there are concerns about an escalation the Franc will remain bid as a safe haven and EUR/CHF will probably be comfortable below the 0.95 mark.
The inflation rate has fallen to 1.7%. It has reached the SNB’s target area of 0-2% but the bank remains cautious as it still fears second-round effects. It does not make any sense to hope for a sign from the SNB regarding a ‘strong Franc’ which might slow the downside pressure on the CHF.
Considering advanced prints from CME Group for natural gas futures markets, open interest extended its uptrend for yet another session on Thursday, now by around 11.4K contracts. In the same line, volume reversed two consecutive daily drops and went up by around 79.2K contracts.
Natural Gas meets initial support around $3.00
Prices of natural gas retreated for the seventh consecutive session on Thursday, shedding ground uninterruptedly since monthly highs near $3.50 (October 9). The move was in tandem with rising open interest and volume and favours the continuation of this corrective move for the time being. The loss of the key $3.00 mark per MMBtu should open the door to extra losses.
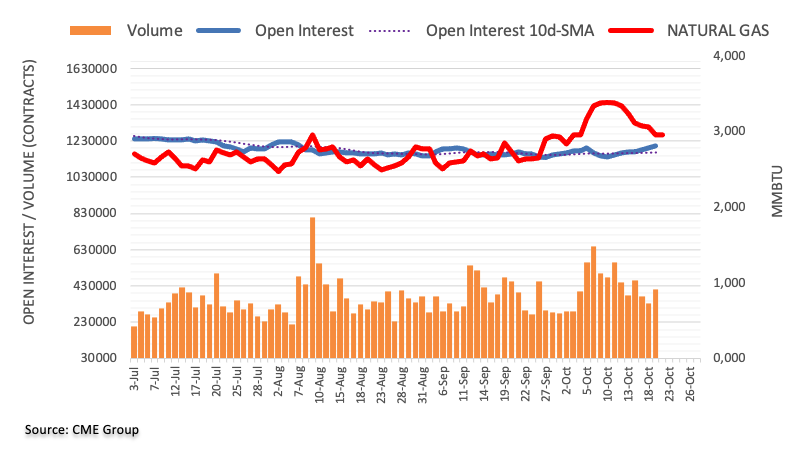
- NZD/USD continues the losses on fears over the escalating Middle-East situation.
- Fed Chair Powell's recent statements provided some support for the pair.
- Upbeat US data is reinforcing the strength of the US Dollar.
NZD/USD extends the losing streak that began on Tuesday, trading lower around 0.5820 during the Asian session on Friday. The risk-on sentiment prevails, driven by escalating fears of a conflict in the Middle East, particularly due to the preparations for a potential ground invasion of Gaza by Israel.
While the geopolitical tensions weigh on the NZD/USD pair, Federal Reserve Chairman Jerome Powell's recent statements provided some support. Powell indicated that the central bank has no plans to raise rates in the short term, offering a respite for the pair. However, Powell also emphasized that future policy adjustments would depend on economic indicators, particularly growth and labor market conditions.
The scheduled address by US President Joe Biden on Thursday underscores the global significance of the Middle East situation, raising concerns about potential broader impacts on currency markets.
The US Dollar Index (DXY) rebounds from weekly lows, reaching around 106.40. Higher US Treasury yields and robust economic data, including a drop in Initial Jobless Claims to their lowest since January, contribute to the dollar's strength. However, challenges in the housing market, reflected in a 2.0% MoM decline in existing home sales, highlight some economic headwinds.
The recent New Zealand Trade Balance figures reveal a close resemblance to the previous month's data. In September, the headline Trade Balance recorded a deficit of $2.329 billion, slightly surpassing August's deficit of $2.273 billion.
During the week, the headline Consumer Price Index (CPI) for the third quarter increased to 1.8%, falling short of the expected 2.0%. The yearly rate also decelerated from 6.0% to 5.6%, missing consensus estimates of 5.9%. This data has led investors to adjust their expectations for a November interest rate hike by the Reserve Bank of New Zealand (RBNZ), resulting in downward pressure on the NZD/USD pair.
In China, the People's Bank of China (PBoC) maintains Loan Prime Rates unchanged, and China's Retail Sales (YoY) rose by 5.5%, surpassing expectations.
Here is what you need to know on Friday, October 20:
Safe-haven flows started to dominate the financial markets early Friday with investors shifting their attention to geopolitics ahead of the weekend. The US economic docket will not feature any high-tier data releases and market participants will pay close attention to comments from Federal Reserve (Fed) officials before the blackout period begins this Saturday.
Fed Chairman Jerome Powell acknowledged on Thursday that higher bond yields were producing tighter financial conditions and noted that they could have implications for the monetary policy. When assessing the policy outlook, "the task of balancing too much tightening vs. too little is complicated by a range of uncertainties," Powell told the Economic Club of New York. These cautious comments made it difficult for the US Dollar (USD) to outperform its rivals in the American trading hours and the US Dollar Index closed in negative territory before going into a consolidation phase below 106.50 early Friday.
US Dollar price this week
The table below shows the percentage change of US Dollar (USD) against listed major currencies this week. US Dollar was the weakest against the Swiss Franc.
| USD | EUR | GBP | CAD | AUD | JPY | NZD | CHF | |
| USD | -0.50% | 0.37% | 0.57% | -0.01% | 0.20% | 1.38% | -1.08% | |
| EUR | 0.49% | 0.89% | 1.06% | 0.49% | 0.69% | 1.87% | -0.60% | |
| GBP | -0.37% | -0.85% | 0.21% | -0.37% | -0.16% | 1.03% | -1.41% | |
| CAD | -0.57% | -1.07% | -0.19% | -0.58% | -0.37% | 0.81% | -1.66% | |
| AUD | 0.02% | -0.49% | 0.34% | 0.58% | 0.22% | 1.40% | -1.13% | |
| JPY | -0.20% | -0.68% | 0.20% | 0.35% | -0.20% | 1.18% | -1.25% | |
| NZD | -1.39% | -1.90% | -1.03% | -0.81% | -1.37% | -1.18% | -2.52% | |
| CHF | 1.06% | 0.58% | 1.45% | 1.63% | 1.06% | 1.27% | 2.43% |
The heat map shows percentage changes of major currencies against each other. The base currency is picked from the left column, while the quote currency is picked from the top row. For example, if you pick the Euro from the left column and move along the horizontal line to the Japanese Yen, the percentage change displayed in the box will represent EUR (base)/JPY (quote).
In a televised speech on Thursday, US President Joe Biden said that he will ask Congress to approve extra funding to aid Israel. Citing a person familiar with the matter, Reuters reported that the funding would total $14 billion. Even if there is broad support in the Senate for Biden's funding plan, a legislation cannot be passed while the US house is yet to approve a permanent speaker. Following these developments, the bond selloff continued on Thursday and the yield on the 10-year reference hit 5% for the first time since 2007. In the European morning, the 10-year retreated below 4.95%.
EUR/USD climbed to a fresh weekly high above 1.0600 on Thursday but lost its bullish momentum early Friday. At the time of press, the pair was moving up and down in a narrow channel above 1.0550.
Retail Sales in the UK declined by 0.9% on a monthly basis in September, the UK's Office for National Statistics reported on Friday. This reading followed the 0.4% increase recorded in August and came in worse than the market expectation for a decrease of 0.1%. Meanwhile, in an interview with Belfast Telegraph on Friday, Bank of England Governor Andrew Bailey said that he expects a 'marked fall' in inflation next month. GBP/USD came under bearish pressure in the European morning and was last seen trading in negative territory at around 1.2100.
USD/JPY continues to trade dangerously close to 150.00 on Friday. Bank of Japan (BoJ) Governor Kazuo Ueda said earlier in the day that they must carefully watch the moves in the FX market and their impact on Japan's economy, prices.
Gold continued to find demand as the go-to safe haven asset and extended its impressive rally to reach its highest level in three months, above $1,980.
Sterling came under depreciation pressure this week. Economists at Commerzbank analyze GBP outlook.
The environment will remain tricky for Sterling
Of course, things can change and inflation could fall more quickly over the coming months, as the BoE expects. That would no doubt be positive for Sterling.
But for now, the environment will remain tricky for Sterling. It remains to be seen how BoE members will react to the recent data. And of course, the next rate meeting on 2nd November is approaching. As long as the BoE takes a “close your eyes and hope for the best” approach Sterling is likely to remain beleaguered.
In a speech and Q&A at the Economic Club of New York, Fed Chairman Jerome Powell tried to keep his options open by maintaining a neutral stance. Economists at Rabobank analyze the Fed’s policy outlook.
Skipper Powell still proceeding carefully
Earlier this year, Powell said that he saw possible tightening in credit conditions following the small banking mini-crisis in March as a substitute for rate hikes. However, he is still hesitant about applying the same logic to rising treasury yields. Strong employment growth and GDP growth are likely to keep the door open to further hikes. However, with less than two weeks to go before the next meeting, today’s neutral performance does not suggest that we are going to see a hike on November 1. But that option is still open for the December meeting.
Nevertheless, we still expect the bond market to do the Fed’s work, making further policy rate hikes redundant. However, we continue to see upside risk to our baseline forecast. If economic data remain strong, sooner or later the FOMC will have to resume its hiking cycle.
- Pound Sterling dropped after data showing that UK Retail Sales declined by almost 1% in September.
- The decrease in Retail Sales suggests weakening households’ spending, which is the main driver of the UK economy.
- The Bank of England is widely expected to leave interest rates unchanged.
The Pound Sterling (GBP) retreated after the UK Office for National Statistics (ONS) reported a weak Retail Sales data for September. UK households have postponed their demand for core goods as higher borrowing costs and stubborn inflation have squeezed their spending power. The GBP/USD pair has been exposed to more downside as declined consumer spending indicates that the overall demand will remain vulnerable, which would force UK firms to scale down their operating capacity further.
The consequences of a slowdown in the retail demand would be borne by producers and job-seekers as weak consumer spending could result in lower production by firms and henceforth soft demand for labor. For Bank of England (BoE) policymakers, poor retail demand cuts consumer inflation expectations significantly and cools the economy. This would allow the BoE to extend the rate pause to the November monetary policy meeting.
Daily Digest Market Movers: Pound Sterling faces sell-off after weak Retail Sales data
- Pound Sterling fell back toward the round-level support of 1.2100 as UK Retail Sales contracted more than expectated in September.
- Monthly Retail Sales, a key measure of consumer spending, dropped by 0.9% against the expectations of 0.1% decline. In August, Retail Sales rose by 0.4%. Annually, sales contracted by 1.0% while economists forecasted a stagnant performance.
- Retail Sales excluding fuel also dropped by 1.0% and 1.2% on a monthly and an annual basis, respectively.
- Weak Retail Sales suggest that high inflation and borrowing costs have significantly squeezed pockets of households.
- A sharp decline in consumer spending is expected to dent consumer inflation expectations significantly.
- Weakening spending could lean the Bank of England towards keeping interest rates unchanged at 5.25% on November 2.
- It would be a tough call for BoE policymakers as inflation data for September surprisingly topped expectations marginally.
- Monthly headline inflation rose by 0.5% while investors forecasted a growth rate of 0.4%. Annual headline CPI data grew at a steady pace of 6.7%, higher than the expectations of 6.5%.
- The UK inflation data for September indicated that the BoE has a long way to go to bring down inflation to 2%.
- UK’s highest inflation among G7 economies is giving more air to discussions about raising the inflation target to 3%.
- British think-tank The Resolution Foundation said that a higher inflation target would allow the central bank to reduce borrowing and bond-buying needs and would provide more stimulus.
- The US Dollar recovers some losses after neutral guidance on interest rates from the Federal Reserve (Fed) Chair Jerome Powell delivered on Thursday.
- Jerome Powell joined his colleagues and cited that the recent jump in US Treasury yields has significantly tightened overall financial conditions. However, US economic strength and tight labor market conditions could warrant more interest rate hikes.
- On Thursday, the US Department of Labor reported the lowest weekly jobless claims in nine months. Individuals claiming jobless benefits for the first time in the week ending October 13 were at 198K, lower than expectations of 212K and the former release of 211K.
- Meanwhile, the market mood remains downbeat amid Middle East tensions. The support from Western nations to Israel has escalated expectations of Iran’s intervention in the Israel-Palestine conflict.
- After US President Joe Biden supported Israel against the Hamas group, UK Prime Minister Rishi Sunak told Israel: “We want you to win”.
Technical Analysis: Pound Sterling declines toward 1.2100
Pound Sterling drops sharply after weak Retail Sales data. The GBP/USD pair falls toward a two-week low at 1.2110. The broader Cable outlook is vulnerable as it faced immense selling pressure while attempting to cross the 20-day Exponential Moving Average (EMA) on the upside. Momentum oscillators have shifted into the bearish range, warranting more downside. A further breakdown could drag the GBP/USD pair toward the psychological support of 1.2000.
Pound Sterling FAQs
What is the Pound Sterling?
The Pound Sterling (GBP) is the oldest currency in the world (886 AD) and the official currency of the United Kingdom. It is the fourth most traded unit for foreign exchange (FX) in the world, accounting for 12% of all transactions, averaging $630 billion a day, according to 2022 data.
Its key trading pairs are GBP/USD, aka ‘Cable’, which accounts for 11% of FX, GBP/JPY, or the ‘Dragon’ as it is known by traders (3%), and EUR/GBP (2%). The Pound Sterling is issued by the Bank of England (BoE).
How do the decisions of the Bank of England impact on the Pound Sterling?
The single most important factor influencing the value of the Pound Sterling is monetary policy decided by the Bank of England. The BoE bases its decisions on whether it has achieved its primary goal of “price stability” – a steady inflation rate of around 2%. Its primary tool for achieving this is the adjustment of interest rates.
When inflation is too high, the BoE will try to rein it in by raising interest rates, making it more expensive for people and businesses to access credit. This is generally positive for GBP, as higher interest rates make the UK a more attractive place for global investors to park their money.
When inflation falls too low it is a sign economic growth is slowing. In this scenario, the BoE will consider lowering interest rates to cheapen credit so businesses will borrow more to invest in growth-generating projects.
How does economic data influence the value of the Pound?
Data releases gauge the health of the economy and can impact the value of the Pound Sterling. Indicators such as GDP, Manufacturing and Services PMIs, and employment can all influence the direction of the GBP.
A strong economy is good for Sterling. Not only does it attract more foreign investment but it may encourage the BoE to put up interest rates, which will directly strengthen GBP. Otherwise, if economic data is weak, the Pound Sterling is likely to fall.
How does the Trade Balance impact the Pound?
Another significant data release for the Pound Sterling is the Trade Balance. This indicator measures the difference between what a country earns from its exports and what it spends on imports over a given period.
If a country produces highly sought-after exports, its currency will benefit purely from the extra demand created from foreign buyers seeking to purchase these goods. Therefore, a positive net Trade Balance strengthens a currency and vice versa for a negative balance.
EUR/USD is trading below 1.06 again. Economists at Commerzbank analyze Dollar’s outlook.
The Fed remains cautiously hawkish
The market now sees little chance of another rate hike from the Fed. In fact, it seems that the Fed may have reached its peak, although Fed Chairman Jerome Powell did not rule out the possibility of another tightening move depending on the data. However, monetary policy is currently playing second fiddle to the market. Geopolitical risks are overshadowing everything and the Dollar remains in demand as a safe haven.
As long as the conflict does not appear to be escalating, as in the case of the announced ground offensive, the Dollar is likely to have a hard time making further gains for the time being, as it is becoming less and less supported by monetary policy.
- USD/CHF recovers some lost ground, holds above the 0.8900 mark on Friday.
- The Swiss Trade surplus widened more than expected in September.
- Fed Chair Jerome Powell signaled a desire to hold the interest rate.
The USD/CHF pair snaps a two-day losing streak during the early European session on Friday. The pair currently trades near 0.8927, up 0.15% on the day. Meanwhile, the escalating geopolitical tension between Israel and Hamas might benefit to the safe-haven currency like Swiss Franc (CHF).
The Swiss Trade surplus widened more than expected in September. Trade Balance came in at 6,316M versus 3,814M seen in the previous month, better than the expectation of 3,770M, according to data published by the Swiss Federal Customs Administration Thursday. Additionally, Exports surged to 24,795M MoM in September from the previous reading of 20,932M whereas Imports arrived at 18,480M MoM versus 17,118M.
Across the pond, Fed Chair Jerome Powell signaled a desire to pause rate hikes and watch how economic data develops in the coming months. Powell further stated that more monetary policy tightening might be appropriate if there are more indications about above-trend growth or if the labor market stops easing. His dovish comments weigh on the Greenback and act as a headwind for the USD/CHF pair.
The US weekly job report indicated that the US economy remains robust. The Initial Jobless Claims for the week ending October 14, dropped to 198,000, the lowest level since January 2023. Existing home sales fell 2.0% MoM in September, the lowest level since 2010. These numbers suggested that higher mortgage costs negatively impact housing market confidence.
In the absence of top-tier economic data release from both the US and Switzerland, market participants will keep an eye on the Fed officials' speech, including Logan, Mester, and Harker.
Bank of Japan (BOJ) Governor Kazuo Ueda is making his scheduled appearance on Friday, commenting on the economic, inflation and policy outlook.
Key quotes
Japan's economy recovering moderately.
Exports, output moving sideways.
Consumption increasing steadily, albeit at moderate pace.
Japan's economy likely to continue moderate recovery.
Inflation likely to narrow pace of rise, then re-accelerate reflecting changes in corporate wage-, price-setting behaviour.
Uncertainty surrounding Japan's economy very high.
Must carefully watch financial, FX market moves and their impact on Japan's economy, prices.
BoJ will aim at stably, sustainably achieving 2% inflation target, accompanied by wage growth, by patiently maintaining current easy policy.
Japan's financial system maintaining stability as a whole.
Market reaction
Following the above remarks, USD/JPY is closing in on the key 150.00 intervention level, adding 0.11% on the day.
Bank of England (BoE) Governor Andrew Bailey said that he “expects a 'marked fall' in inflation next month,” in his interview with Belfast Telegraph on Friday.
Additional quotes
September inflation figures are not far off what we were expecting.
Core inflation fell slightly from what we expected, that is quite encouraging.
We will see more evidence of lower inflation by year-end.
Pay growth still well above anything consistent with inflation target.
Market reaction
At the time of writing, GBP/USD is trading 0.40% lower on the day at 1.2094.
The latest Bank of Japan (BoJ) Financial System Report published on Friday revealed that “Japan's financial system has been maintaining stability on the whole.”
Additional quotes
Japanese banks have sufficient capital bases to perform financial intermediation activities appropriately even amid the global tightening of financial conditions and the resultant various types of stress.
However, vigilance against tail risks continues to be warranted.
The period of stress may be prolonged further with continuing monetary tightening by central banks and the resultant concerns about a slowdown in foreign economies.
Market reaction
At the press time, USD/JPY is keeping its range play intact just below 150.00, modestly higher on the day.
The Riksbank still appears to the market to be too hesitant in the fight against inflation. Therefore, economists at Commerzbank expect the Krona to struggle.
No more upside potential for the time being
Although the Riksbank raised the key interest rate again in September, it is not acting decisively enough against inflation risks for the market. Therefore, the SEK will probably not have much upside potential this year.
Only next year, when the tide turns in favour of the Riksbank, should the Krona appreciate again.

Source: Commerzbank Research
CME Group’s flash data for crude oil futures markets noted traders added around 1.5K contracts to their open interest positions on Thursday, setting aside five consecutive daily pullbacks. Volume followed suit and increased for the third straight session, now by more than 51K contracts.
WTI: Immediately to the upside emerges $95.00
Prices of WTI extended further the weekly recovery and approached the key $90.00 hurdle on Thursday. The daily uptick was accompanied by increasing open interest and volume and exposes the continuation of the advance in the very near term and with immediate barrier at the 2023 peak just below the $95.00 mark per barrel.
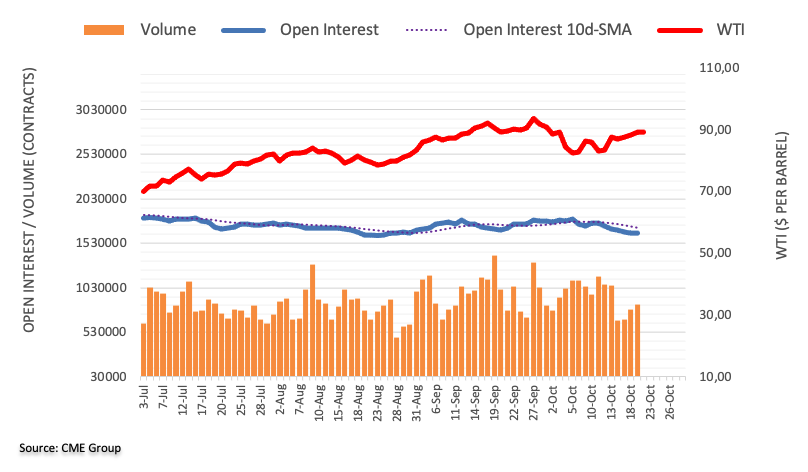
Open interest in gold futures markets rose for the third session in a row on Thursday, this time by around 9.5K contracts according to preliminary readings from CME Group. Volume, instead, resumed the downtrend and shrank by around 2.7K contracts following the previous daily build.
Gold: The hunt for $2000
Gold prices rose further on Thursday and closed above the $1970 hurdle for the first time since late July. The uptick was on the back of rising open interest and leaves the door open to further upside in the very near term. Against that, the next target of note for the precious metal emerges at the key $2000 per troy ounce.
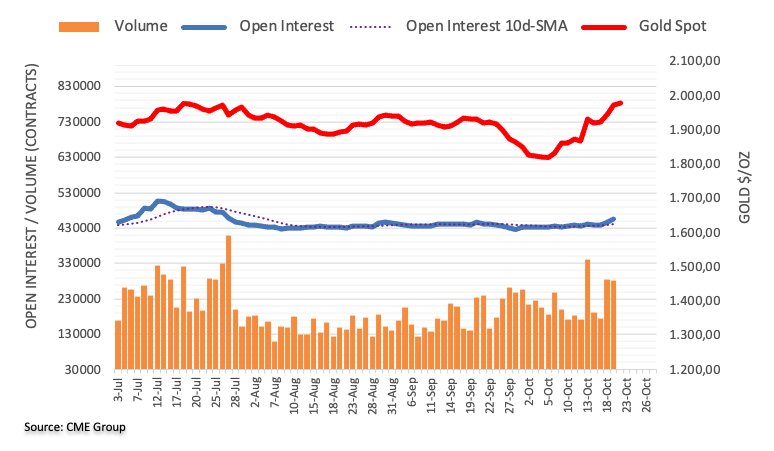
- The UK Retail Sales declined 0.9% MoM in September, a big miss.
- Core Retail Sales for the UK dropped 1.0% MoM in September.
- GBP/USD holds lower ground near 1.2100 on downbeat UK retail trade data.
The UK Retail Sales dropped 0.9% over the month in September vs. -0.1% expected and 0.4% recorded in August, according to the official data published by the Office for National Statistics (ONS) on Friday.
The Core Retail Sales, stripping the auto motor fuel sales, fell 1.0% MoM vs. -0.4% expected and 0.6% seen in August.
The annual Retail Sales in the United Kingdom decreased 1.0% in September versus 0% expected and August’s 1.3% decline while the Core Retail Sales dropped 1.2% in the reported month versus 0% expectations and -1.3% previous.
Main points (via ONS)
Non-food stores sales volumes fell by 1.9% in September 2023; retailers reported that the fall over the month was because of the continuing cost of living pressures, alongside the unseasonably warm weather reducing sales of autumn-wear clothing.
Non-store retailing (predominantly online retailers) sales volumes fell by 2.2% in September 2023, following a fall of 0.9% in August.
Food stores sales volumes rose by 0.2% in September 2023, following a rise of 1.4% in August 2023.
Automotive fuel sales volumes rose by 0.8% in September 2023, rebounding from a fall of 1.0% in August 2023.
FX implications
GBP/USD is testing intraday lows near 1.2115 on the downbeat UK Retail Sales data. The spot was last seen trading at 1.2114, down 0.23% on the day.
- The index extends its consolidative range just above 106.00.
- Fed’s Powell suggested that a rate hike in November appears unlikely.
- FOMC Mester, Harker will speak later in the session.
The USD Index (DXY), which tracks the greenback vs. a bundle of its main competitors, looks slightly bid around the 106.30 zone on Friday.
USD Index looks at yields, Fedspeak
The index trades with small gains so far at the end of the week, as market participants continue to digest Thursday’s comments from Chair Powell, when he delivered a cautious tone and hinted at the idea that a rate hike in November seems not favoured.
In the meantime, the intense move higher in US yields appears to be taking a breather following recent multi-year peaks, all against the backdrop of the relentless march north across different maturities in place since early May.
The US data space is empty on Friday, although speeches by Cleveland Fed L. Mester (2024 voter, hawk) and Philly Fed P. Harker (voter, hawk) are expected to grab attention later in the NA session.
What to look for around USD
The index maintains the weekly range bound theme unchanged in the low-106.00s for the time being.
In the meantime, support for the dollar keeps coming from the good health of the US economy, which at the same time appears underpinned by the renewed tighter-for-longer stance narrative from the Federal Reserve.
Eminent issues on the back boiler: Persevering debate over a soft or hard landing for the US economy. Incipient speculation of rate cuts in early 2024. Geopolitical effervescence vs. Russia and China and the Middle East.
USD Index relevant levels
Now, the index is up 0.04% at 106.27 and a breakout of 106.78 (weekly peak October 13) could expose 107.34 (2023 high October 3) and finally 107.99 (weekly high November 21 2022). On the other hand, the next support emerges at 105.53 (monthly low October 12) ahead of 104.42 (weekly low September 11) and then 103.29 (200-day SMA).
- EUR/USD holds below the 1.0600 barrier amid the risk-off mood.
- The key immediate resistance level for the pair is seen at 1.0600; 1.0560 acts as an initial support level.
- Relative Strength Index (RSI) is in the 40-60 range, indicating non-directional movement.
The EUR/USD pair remains capped under the 1.0600 psychological mark during the early European session on Friday. A rise in US Treasury bond yields and the escalating geopolitical tensions in the Middle East might boost the safe-haven asset demand like USD and act as a headwind for the major pair. EUR/USD currently trades near 1.0576, losing 0.06% for the day.
Technically, the EUR/USD pair sticks to the range-bound theme on the four-hour chart. The major pair holds above the 50- and 100-hour Exponential Moving Averages (EMAs) but the long-term EMA is above the short-term EMA, indicating the path of least resistance for the pair is to the downside.
That being said, the key immediate resistance level for EUR/USD is seen near the confluence of a psychological round mark and the the upper boundary of Bollinger Band at 1.0600. Any follow-through buying above the latter will see a rally to the next barrier at 1.0635 (high of October 11). Further north, the major pair will challenge the next hurdle at 1.0671 (high of September 22), followed by 1.0735 (high of September 20).
On the other hand, the 50-hour EMA at 1.0560 acts as an initial support level for EUR/USD. The critical support contention is located at 1.0523, representing a low of October 18 and a lower limit of the Bollinger Band. The next downside stop to watch is a round figure at 1.0500. A decisive break below the latter will see a drop to a low of October 4 at 1.0450.
It’s worth noting that the Relative Strength Index (RSI) is located in the 40-60 zone, suggesting a non-directional movement in the pair.
EUR/USD four-hour chart
-638333763720306239.png)
- Asian equities extend losses due to the global bond market downturn.
- Investors adopt a cautious stance due to the escalation of fear of the Israel-Hamas conflict.
- Chinese market experienced losses over concerns about the property sector.
Asian stocks face continued losses on Friday, driven by a global bond market downturn that is eroding risk appetite. Additionally, investors are adopting a cautious stance, concerning the potential escalation of the Israel-Hamas conflict.
The prospect of higher interest rates in the US is unfavorable for regional markets as it diminishes their appeal for risk-oriented investments. Additionally, it imposes restrictions on the inflow of foreign capital into the region.
At the time of writing, China's SSE Composite Index is down by 0.27% to 2,997, Shenzhen Component Index has declined to 9,620, down by 0.36%, Japan’s Nikkei 225 fell to 31,375, decreased by 0.18%, Hong Kong’s Hang Seng is down by 0.41%, Korean KOSPI declined to 2,382 and Taiwan's Weighted Index has down by 0.20%.
Chinese stocks experienced losses on Friday over lingering concerns about the country's property sector, which has offset the positive impact of data indicating stronger economic growth.
The uncertainty surrounding a potential default by Country Garden Holdings has left traders cautious about Chinese assets. The beleaguered property developer reportedly missed a crucial payment on its international bonds this week, leading to increased wariness among traders.
The Japanese equity market experienced a decline as data on Friday revealed that consumer price index inflation exceeded expectations in September.
A key indicator of inflation, closely monitored by the Bank of Japan (BoJ), continued to hover near over 40-year highs. This suggests that underlying inflationary pressures in the Japanese economy are persistent and resistant to significant changes.
Asian technology stocks faced significant pressure this week due to a spike in global bond yields. The anticipation of higher interest rates has led to a decline in the attractiveness of growth stocks, impacting the performance of technology shares in the region.
The significant declines in major chip stocks SK Hynix Inc and Samsung Electronics contributed to the overall negative impact on South Korea’s KOSPI index.
- USD/MXN is seen oscillating in a range on Friday and consolidating its weekly gains.
- The technical setup favours bullish traders and supports prospects for additional gains.
- Any meaningful corrective slide could attract some dip-buying and remain cushioned.
The USD/MXN pair struggles to capitalize on its weekly gains registered over the past three days and seesaws between tepid gains/minor losses through the Asian session on Friday. Spot prices currently trade around the 18.3185 region, down less than 0.10% for the day, and remain well within the striking distance of a near two-week high touched on Thursday.
From a technical perspective, the USD/MXN last week bounced off the 17.7550-17.7545 confluence resistance-turned-support – comprising the 200-day Simple Moving Average (SMA) and a multi-month-old descending trend-line. The subsequent move up, along with positive oscillators on the daily chart, favours bullish traders and suggests that the path of least resistance for spot prices is to the upside.
That said, it will still be prudent to wait for some follow-through buying beyond the 18.4935 area, or the highest level since late March touched earlier this month, before placing fresh bullish bets. The USD/MXN pair might then climb further towards the 18.8145-18.8150 region, representing the 50% Fibonacci retracement level of the fall witnessed in July, which if cleared will set the stage for additional gains.
On the flip side, any corrective slide might now find decent support near the 18.1100 level. This is followed by the 18.0000 mark, below which the USD/MXN pair could retest the weekly low, around the 17.8720-17.8715 region. Some follow-through selling will expose the 200-day SMA support, currently pegged around the 17.7425 zone, before spot prices drop to the 23.6% Fibo. level, around the 17.6595-17.6590 area.
The latter coincides with the aforementioned descending trend-line resistance breakpoint and should act as a key pivotal point. A convincing break below will shift the near-term bias back in favour of bearish traders and make the USD/MXN pair vulnerable to weaken further.
USD.MXN daily chart
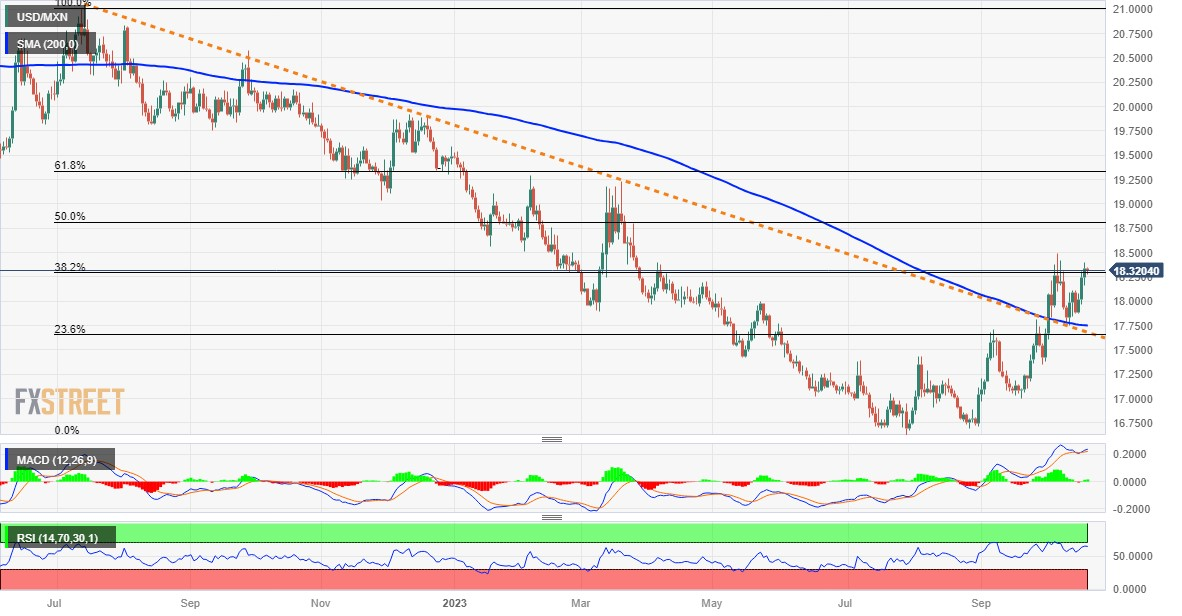
Technical levels to watch
- Gold price prolongs its uptrend and advances to a near three-month high on Friday.
- Geopolitical risks continue to drive haven flows and lend support to the XAU/USD.
- Elevated US bond yields, a stronger USD might cap gains amid the overbought RSI.
Gold price (XAU/USD) scales higher for the fourth successive day on Friday – also marking the fourth day of a positive move in the previous five – and climbs to a near three-month peak, around the $1,982 region during the Asian session. Concerns over geopolitical tensions in the Middle East continue to drive investors towards traditional safe-haven assets and boost demand for the precious metal. Apart from this, growing acceptance that the Federal Reserve (Fed) will keep interest rates unchanged for the second straight time in November turns out to be another factor benefitting the non-yielding yellow metal.
Furthermore, this week's sustained breakout through the very important 200-day Simple Moving Average (SMA) prompts some technical buying and provides an additional boost to the Gold price. Bulls, meanwhile, seem unaffected by elevated US Treasury bond yields and bets for one more Fed rate hike move by the end of this year, which helps revive the US Dollar (USD), albeit doing little to hinder the ongoing positive momentum. That said, overbought conditions on hourly charts warrant some caution before placing fresh bullish bets on the XAU/USD and positioning for a further appreciating move.
Daily Digest Market Movers: Gold price continues scaling higher as Middle East tensions boost safe-haven demand
- Concerns that the Israel-Hamas war could spill over to other Middle Eastern nations and impact the world economy continue to benefit the safe-haven Gold price.
- Israel pounded the Gaza Strip with airstrikes on Thursday and appeared to be getting closer to a full-scale invasion of the seaside enclave ruled by Hamas.
- The Israeli military massed troops and equipment near the Gaza border, while the Israeli missiles also struck targets in Lebanon and Syria.
- Egypt has also been directly affected by the escalation in the conflict, with Israel repeatedly bombing the Rafah border crossing between Egypt and Gaza.
- Federal Reserve Chairman Jerome Powell said that additional interest rate hikes could be warranted in view of economic resiliency and labor market tightness.
- The benchmark 10-year US Treasury bond yield touches a fresh 16-year high on Thursday and assists the US Dollar in attracting some dip-buying on Friday.
- Elevated US bond yields, a modest USD strength, along with overbought conditions on hourly charts, might keep a lid on any further gains for the XAU/USD.
Technical Analysis: Gold price seems poised to reclaim the $2,000 psychological mark for the first time since May
From a technical perspective, this week's break above the 200-day SMA and a subsequent move beyond the $1,947-1,948 supply zone favour bullish traders. That said, the Relative Strength Index (RSI) on hourly charts is flashing overbought conditions and makes it prudent to wait for some near-term consolidation before the next leg up. Nevertheless, the Gold price seems poised to surpass the July swing high, around the $1,987 region, and aim to conquer the $2,000 psychological mark for the first time since May.
On the flip side, any meaningful corrective decline now seems to find decent support and attract fresh buyers near the $1,947-1,948 resistance breakpoint. This should help limit the downside near the 200-day SMA, currently pegged around the $1,930 zone. A convincing break below, however, might prompt some technical selling and drag the Gold price to the weekly low, around the $1,908 region en route to the $1,900 round figure. The latter coincides with the 50-day SMA support and should act as a strong base for the XAU/USD.
US Dollar price today
The table below shows the percentage change of US Dollar (USD) against listed major currencies today. US Dollar was the weakest against the Canadian Dollar.
| USD | EUR | GBP | CAD | AUD | JPY | NZD | CHF | |
| USD | 0.09% | 0.01% | -0.04% | 0.07% | 0.01% | 0.13% | 0.04% | |
| EUR | -0.09% | -0.10% | -0.13% | -0.02% | -0.07% | 0.03% | -0.04% | |
| GBP | 0.01% | 0.10% | -0.03% | 0.08% | 0.03% | 0.14% | 0.07% | |
| CAD | 0.03% | 0.15% | 0.02% | 0.14% | 0.06% | 0.18% | 0.10% | |
| AUD | -0.08% | 0.02% | -0.07% | -0.11% | -0.04% | 0.05% | -0.01% | |
| JPY | -0.01% | 0.07% | -0.03% | -0.08% | 0.06% | 0.10% | 0.03% | |
| NZD | -0.15% | -0.05% | -0.15% | -0.17% | -0.07% | -0.09% | -0.08% | |
| CHF | -0.06% | 0.03% | -0.07% | -0.10% | 0.01% | -0.03% | 0.08% |
The heat map shows percentage changes of major currencies against each other. The base currency is picked from the left column, while the quote currency is picked from the top row. For example, if you pick the Euro from the left column and move along the horizontal line to the Japanese Yen, the percentage change displayed in the box will represent EUR (base)/JPY (quote).
Gold FAQs
Why do people invest in Gold?
Gold has played a key role in human’s history as it has been widely used as a store of value and medium of exchange. Currently, apart from its shine and usage for jewelry, the precious metal is widely seen as a safe-haven asset, meaning that it is considered a good investment during turbulent times. Gold is also widely seen as a hedge against inflation and against depreciating currencies as it doesn’t rely on any specific issuer or government.
Who buys the most Gold?
Central banks are the biggest Gold holders. In their aim to support their currencies in turbulent times, central banks tend to diversify their reserves and buy Gold to improve the perceived strength of the economy and the currency. High Gold reserves can be a source of trust for a country’s solvency. Central banks added 1,136 tonnes of Gold worth around $70 billion to their reserves in 2022, according to data from the World Gold Council. This is the highest yearly purchase since records began. Central banks from emerging economies such as China, India and Turkey are quickly increasing their Gold reserves.
How is Gold correlated with other assets?
Gold has an inverse correlation with the US Dollar and US Treasuries, which are both major reserve and safe-haven assets. When the Dollar depreciates, Gold tends to rise, enabling investors and central banks to diversify their assets in turbulent times. Gold is also inversely correlated with risk assets. A rally in the stock market tends to weaken Gold price, while sell-offs in riskier markets tend to favor the precious metal.
What does the price of Gold depend on?
The price can move due to a wide range of factors. Geopolitical instability or fears of a deep recession can quickly make Gold price escalate due to its safe-haven status. As a yield-less asset, Gold tends to rise with lower interest rates, while higher cost of money usually weighs down on the yellow metal. Still, most moves depend on how the US Dollar (USD) behaves as the asset is priced in dollars (XAU/USD). A strong Dollar tends to keep the price of Gold controlled, whereas a weaker Dollar is likely to push Gold prices up.
- Crude oil prices surge as the US to purchase 6M barrels of crude oil for the SPR.
- Escalating fears over the Israel-Gaza conflict are underpinning the oil prices.
- Temporary suspension of US oil sanctions on Venezuela is anticipated to not prompt immediate policy adjustments from the OPEC+ alliance.
Western Texas Intermediate (WTI) oil price continues the winning streak for the fourth successive day, trading higher around $89.10 per barrel during the Asian session on Friday.
The surge in oil prices can be linked to concerns that the Israel-Gaza conflict may escalate across the Middle East, potentially disrupting supplies from one of the world's leading production regions.
Crude oil prices have continued to climb for the second consecutive week, propelled by heightened tensions in the Middle East. An explosion at a Gaza hospital and the looming possibility of a ground invasion by Israeli troops have intensified fears of an escalation in the conflict.
Additionally, low inventories in the United States (US), contributed to the supportive backdrop for oil prices. The US government has laid out plans to initiate the process of refilling the country's Strategic Petroleum Reserve (SPR). This move is part of broader efforts to bolster the nation's energy security and ensure a sufficient emergency stockpile of oil.
The US government is making moves to purchase 6 million barrels of crude oil for delivery to the SPR in December and January, part of an ongoing effort to replenish the emergency stockpile, as announced by the US Department of Energy on Thursday.
Top oil producers, Saudi Arabia and Russia extend supply cuts until the end of the year, expecting a widening deficit in the fourth quarter.
In another development, the temporary lifting of US oil sanctions on Venezuela is not expected to necessitate immediate policy changes by the OPEC+ producer group. Sources within OPEC+ conveyed to Reuters that any recovery in production from Venezuela is likely to be gradual, minimizing the need for swift adjustments in the group's policies.
The combination of production cuts and reduced inventories underscores the market's sensitivity to supply-demand dynamics, providing ongoing support to oil prices.
- Indian Rupee gains ground amid global uncertainty and risk-off mood.
- The escalating geopolitical tension between Israel-Hamas, higher crude oil prices might cap the upside of the Indian Rupee.
- The Reserve Bank of India's October bulletin showed economy is anticipated to further strengthen through the rest of the year.
The Indian Rupee (INR) trades strongly against the US Dollar (USD) on Friday. The aggressive dollar sales from the Reserve Bank of India (RBI) likely counterbalanced the impact of the risk aversion prompted by the escalating conflict in the Middle East. Moreover, a rise in US Treasury yields and higher crude oil prices might also have contributed to the risk-off environment and cap the upside of the Indian Rupee.
Growth in the Indian economy is anticipated to gain momentum through the rest of the year, especially from festival spending, the Reserve Bank of India's October bulletin showed Thursday. Traders will keep an eye on India’s FX Reserve and RBI Meeting Minutes, due later on Friday. Furthermore, traders will take more cues from the Fed officials' speech, including Logan, Mester, and Harker in the absence of top-tier economic data releases from the US.
Daily Digest Market Movers: Indian Rupee gains momentum amid the uncertainty
- The RBI's October bulletin showed growth is expected to gain momentum through the rest of the year.
- In August, the Reserve Bank of India (RBI) sold a net $3.86 billion in the spot foreign exchange market.
- The US Initial Jobless Claims dropped to 198K for the week ending October 14, the lowest level since January 2023.
- Existing home sales fell 2.0% MoM in September, the lowest level since October 2010.
- Fed Chair Jerome Powell signaled a desire to pause rate hikes and will watch how economic data develop in the coming months.
- The US Building Permits for September dropped to 1.475 million in September, above the estimated 1.45 million.
- The US Housing Starts for the same period climbed to 1.35 million, falling short of the market consensus of 1.38 million.
- The Federal Reserve’s Beige Book update showed the US economic outlook had "little to no change" between September and early October.
- US Retail Sales grew 0.7% MoM in September, beating the market estimation of 0.3%. Retail Sales Control Group rose by 0.6% MoM from 0.2% in the previous reading.
- The Indian Wholesale Price Index (WPI) arrived at -0.26% YoY in September from the previous reading of 0.52%, below the market expectation of 0.50%.
Technical Analysis: Indian Rupee remains firm above the 83.00 key support level
Indian Rupee remains firm against the US Dollar (USD) this week. The USD/INR pair trades within a narrow range of 83.15-83.30 and finds support above the 83.00 psychological round mark. Any follow-through selling below the latter could see a drop to 82.82 (low of September 12). On the flip side, a high of October 12 at 83.40 acts as an immediate resistance level for the pair. The next barrier to watch is the all-time highs around 83.45, followed by a psychological figure at 84.00. The USD/INR pair holds above the 100- and 200-day Exponential Moving Averages (EMA) on the daily chart, which hints that further upside looks favorable.
US Dollar price in the last 7 days
The table below shows the percentage change of US Dollar (USD) against listed major currencies in the last 7 days. US Dollar was the strongest against the New Zealand Dollar.
| USD | EUR | GBP | CAD | AUD | JPY | NZD | CHF | |
| USD | -0.39% | 0.35% | 0.22% | -0.09% | 0.04% | 1.49% | -1.81% | |
| EUR | 0.39% | 0.74% | 0.61% | 0.35% | 0.42% | 1.88% | -1.41% | |
| GBP | -0.37% | -0.74% | -0.15% | -0.45% | -0.32% | 1.13% | -2.18% | |
| CAD | -0.20% | -0.58% | 0.15% | -0.28% | -0.18% | 1.29% | -2.02% | |
| AUD | 0.09% | -0.31% | 0.42% | 0.30% | 0.11% | 1.58% | -1.73% | |
| JPY | -0.04% | -0.42% | 0.30% | 0.18% | -0.12% | 1.45% | -1.83% | |
| NZD | -1.53% | -1.89% | -1.15% | -1.30% | -1.59% | -1.49% | -3.34% | |
| CHF | 1.77% | 1.40% | 2.12% | 1.98% | 1.70% | 1.80% | 3.25% |
The heat map shows percentage changes of major currencies against each other. The base currency is picked from the left column, while the quote currency is picked from the top row. For example, if you pick the Euro from the left column and move along the horizontal line to the Japanese Yen, the percentage change displayed in the box will represent EUR (base)/JPY (quote).
Indian Rupee FAQs
What are the key factors driving the Indian Rupee?
The Indian Rupee (INR) is one of the most sensitive currencies to external factors. The price of Crude Oil (the country is highly dependent on imported Oil), the value of the US Dollar – most trade is conducted in USD – and the level of foreign investment, are all influential. Direct intervention by the Reserve Bank of India (RBI) in FX markets to keep the exchange rate stable, as well as the level of interest rates set by the RBI, are further major influencing factors on the Rupee.
How do the decisions of the Reserve Bank of India impact the Indian Rupee?
The Reserve Bank of India (RBI) actively intervenes in forex markets to maintain a stable exchange rate, to help facilitate trade. In addition, the RBI tries to maintain the inflation rate at its 4% target by adjusting interest rates. Higher interest rates usually strengthen the Rupee. This is due to the role of the ‘carry trade’ in which investors borrow in countries with lower interest rates so as to place their money in countries’ offering relatively higher interest rates and profit from the difference.
What macroeconomic factors influence the value of the Indian Rupee?
Macroeconomic factors that influence the value of the Rupee include inflation, interest rates, the economic growth rate (GDP), the balance of trade, and inflows from foreign investment. A higher growth rate can lead to more overseas investment, pushing up demand for the Rupee. A less negative balance of trade will eventually lead to a stronger Rupee. Higher interest rates, especially real rates (interest rates less inflation) are also positive for the Rupee. A risk-on environment can lead to greater inflows of Foreign Direct and Indirect Investment (FDI and FII), which also benefit the Rupee.
How does inflation impact the Indian Rupee?
Higher inflation, particularly, if it is comparatively higher than India’s peers, is generally negative for the currency as it reflects devaluation through oversupply. Inflation also increases the cost of exports, leading to more Rupees being sold to purchase foreign imports, which is Rupee-negative. At the same time, higher inflation usually leads to the Reserve Bank of India (RBI) raising interest rates and this can be positive for the Rupee, due to increased demand from international investors. The opposite effect is true of lower inflation.
- USD/CAD continues to draw support from diminishing odds for more rate hikes by the BoC.
- Hawkish Fed expectations, elevated US bond yields and a weaker risk tone benefit the USD.
- Bullish Crude Oil prices underpin the Loonie and keep a lid on any further gains for the major.
The USD/CAD pair trades with a mild positive bias for the fourth successive day on Friday and is currently placed around the 1.3720-1.3725 region, just a few pips below a two-week high touched the previous day.
The softer Canadian consumer inflation figures released on Tuesday forced investors to trim bets for another rate hike by the Bank of Canada (BoC), which, in turn, is seen as a key factor behind the Canadian Dollar's (CAD) relative underperformance. This, along with the emergence of some US Dollar (USD) buying, acts as a tailwind for the USD/CAD pair, though bullish Crude Oil prices underpin the commodity-linked Lonie and keep a lid on any further gains.
The USD continues to draw support from firming expectations for one more rate hike by the Federal Reserve (Fed) in 2023. The bets were reaffirmed by Fed Chair Jerome Powell's comments on Thursday, saying that inflation was still too high and that monetary policy was not yet too tight. This remains supportive of elevated US Treasury bond yields, which, along with the prevalent risk-off environment, benefits the safe-haven buck and lends support to the USD/CAD pair.
In fact, the yield on the benchmark 10-year US government bond hovers just below the 5% psychological mark, or a 16-year top touched the previous day. This continues to fuel worries about economic headwinds stemming from rapidly rising borrowing costs. Adding to this, growing concerns that the Israel-Hamas conflict could spill over into the broader Middle East region temper investors' appetite for riskier assets, which is evident from a weaker tone around the equity markets.
Crude Oil prices, meanwhile, remain supported by concerns about disruption to global supplies on the back of the risk of an escalation of geopolitical tensions in the Middle East. Furthermore, the US government outlined plans to begin refiling the Strategic Petroleum Reserve (SPR), which adds to worries about tightening global supply and lifts Crude Oil prices to a three-week high. This, in turn, holds back bulls from placing fresh bets around the USD/CAD pair and caps gains.
Traders now look to the release of the Canadian Retail Sales figures, due later during the early North American season, which, along with Oil price dynamics, will influence the CAD. Meanwhile, there isn't any relevant market-moving economic data due from the US on Friday, leaving the USD at the mercy of the US bond yields and the broader risk sentiment. Apart from this, speeches by FOMC members will drive the USD demand and provide short-term trading impetus to the major.
Technical levels to watch
| Raw materials | Closed | Change, % |
|---|---|---|
| Silver | 23.024 | 0.8 |
| Gold | 1974.206 | 1.37 |
| Palladium | 1112.54 | -1.04 |
- GBP/USD faces a challenge on risk-off sentiment in the market.
- Pound Sterling weakens on market caution regarding the BoE interest rate trajectory.
- US Dollar received downward pressure after Fed Powell’s comments on Thursday.
- Upbeat US bond yields contribute support to underpinning the Greenback.
- US Jobless Claims declined to 198K the lowest level since January. While Existing Home Sales fell 2.0%, the lowest level since 2010.
GBP/USD retreats from the recent gains on risk-off sentiment, trading lower around 1.2130 during the Asian session on Friday. However, the pair faced upward support in the previous session from a weakened US Dollar (USD) following comments by Federal Reserve (Fed) Chairman Jerome Powell.
Powell made it clear that if there's convincing evidence of growth exceeding expectations or if the labor market stops progressing, the Federal Reserve could consider tightening monetary policy further.
Emphasizing that the central concern remains inflationary risks, Powell highlighted the importance of addressing potential economic imbalances. However, the policymaker indicated that the central bank is not planning to raise rates in the short-term providing support for the GBP/USD pair.
The US Dollar Index (DXY) rebounds from the recent losses, bidding higher around 106.33. This could be attributed to the higher US Treasury yields, coupled with robust economic data from the United States (US).
United States (US) job data showed the economy remains solid. The weekly Initial Jobless Claims have dropped to their lowest level since January, signaling a solid and resilient job market. The report showed that Jobless Claims declined to 198K, which fell short of the market expectations of 212K for the week ending October 14.
On the other hand, existing home sales fell 2.0% MoM in September and 19% YoY, the lowest level since 2010., suggesting challenges in the housing market. The decline in existing home sales is particularly noteworthy, pointing to the negative impact of higher mortgage costs on housing market confidence.
Additionally, geopolitical tensions indeed have the power to send market sentiment on a rollercoaster ride. The ongoing situation in Israel, marked by preparations for a potential ground invasion of Gaza, introduces a layer of uncertainty for traders involved in the GBP/USD pair.
The scheduled address by US President Joe Biden on Thursday underscores the global significance of the matter, indicating potential impacts on a broader scale. Investors will likely be closely monitoring developments for their potential influence on currency markets.
During a relatively quiet session for major reports in the US. While Federal Reserve officials Logan, Mester, and Harker are scheduled to speak, it's anticipated that their speeches won't bring any unexpected developments.
On the other side, the GBP/USD pair is facing headwinds due to the uncertain trajectory of the Bank of England's (BoE) upcoming policy decisions.
The recent consumer inflation data from the United Kingdom, disclosed on Wednesday, showed a resilient headline CPI at 6.7% in September, defying expectations of a slight decrease to 6.6%. This unexpected result has triggered speculation about a potential BoE rate hike in November.
Adding to the complexity, earlier this week, the UK Office for National Statistics (ONS) reported a minor slowdown in wage growth for the three months leading up to August. This development provides the BoE with an opportunity to consider maintaining interest rates at their current level.
The Pound Sterling is gearing up to conclude the trading week with a focus on UK Retail Sales data. Median market forecasts indicate an anticipated decline in September's Retail Sales, with a projected negative growth of -0.1%, in contrast to the 0.4% increase observed in August.
This data will likely draw attention from traders and analysts, shaping the narrative for the British Pound's performance at the end of the week.
- EUR/USD trades with a negative bias and is pressured by the emergence of some USD dip-buying.
- Bets for one more Fed rate hike in 2023 and elevated US bond yields continue to underpin the US.
- Geopolitical tensions further benefit the Greenback’s safe-haven status and weigh on the major.
The EUR/USD pair edges lower during the Asian session on Friday and moves away from a one-week high, around the 1.0615 region touched the previous day. The pair currently trades around the 1.0575 region, down less than 0.10% for the day, and is pressured by the emergence of some US Dollar (USD) buying, though lacks follow-through selling.
Federal Reserve (Fed) Chair Jerome Powell said on Thursday that inflation was still too high and that monetary policy was not yet too tight, reaffirming expectations for one more rate hike by the end of this year. This, in turn, keeps the yield on the benchmark 10-year US government bond elevated near a 16-year peak touched the previous day – closer to the 5% psychological mark – and continues to underpin the USD. Apart from this, the risk-off mood turns out to be another factor that benefits the safe-haven buck and weighs on the EUR/USD pair.
The market sentiment remains fragile in the wake of growing concerns that the Israel-Hamas conflict could spill over into the broader Middle East region, especially after a Gaza hospital reportedly killed hundreds of Palestinians. Adding to this, growing worries about economic headwinds stemming from rapidly rising borrowing costs further temper investors' appetite for riskier assets. This is evident from a generally weaker tone surrounding the equity markets and drive flows towards traditional safe-haven assets, including the USD.
The markets, meanwhile, have been pricing out the possibility of any further rate hikes by the European Central Bank (ECB) in the wake of fears about a deeper economic downturn and stagflation risk. In fact, the ECB signalled in September that the hike, its 10th in a 14-month-long fight against inflation, was likely to be its last. Moreover, ECB policymakers expressed cautious optimism last week that inflation was on its way back to 2% even without more rate hikes. This suggests that the path of least resistance for the EUR/USD pair is to the downside.
There isn't any relevant market-moving economic data due for release on Friday, either from the Eurozone or the US. That said, speeches by influential FOMC members, along with the US bond yields and the broader risk sentiment, will drive the USD demand and provide some impetus to the EUR/USD pair. Nevertheless, spot prices remain on track to register modest weekly gains, though any meaningful upside still seems elusive.
Technical levels to watch
On Friday, the People’s Bank of China (PBoC) set the USD/CNY central rate for the trading session ahead at 7.1793 as compared to the previous day's fix of 7.1795 and 7.3055 Reuters estimates.
PBoC injects 828 billion Yuan via 7-day RR, sets the rate at 1.8%
95 billion Yuan of RRs mature today, summing to a net 733 billion Yuan (the biggest ever( injection on the day in OMOs.
Earlier today, the PBoC left Loan Prime Rates (LPR) unchanged at 3.45% for the one-year and 4.20% for the five year
Japanese Finance Minister Shunichi Suzuki was out with some comments in the last hour, saying that it is important for currencies to move in a stable manner and reflect fundamentals.
Additional Quotes:
Currency rates are set by various factors.
Won't comment on Forex levels.
No comment on our response to FX markets.
Hard to comment on the merit and demerit of income tax cuts as part of the economic package.
Market Reaction
The verbal intervention, however, does little to hinder the USD/JPY pair's steady intraday ascent back closer to the 150.00 psychological mark.
- Australian Dollar continues to lose ground after the release of stronger US data.
- Australia's Unemployment Rate has outperformed expectations, standing at 3.6%.
- US Jobless Claims declined to 198K the lowest level since January.
- Existing home sales fell 2.0% in September, the lowest level since 2010.
- Fed Powell suggested that the central bank is not planning to raise rates in the short term.
The Australian Dollar (AUD) faces a third consecutive day of losses, likely influenced by a prevailing risk-off sentiment. However, the AUD/USD pair found some uplift from a weakened US Dollar (USD) following comments by Federal Reserve (Fed) Chair Jerome Powell on Thursday. Powell's indication that the central bank is not planning to raise rates in the short term provides support for the pair.
Australia's employment landscape is undergoing some intriguing developments. In September, Employment Change declined more than expected, introducing an unexpected twist to the equation. On the bright side, the Unemployment Rate took a positive turn by falling more than anticipated, deviating from the expected trend.
The US Dollar Index (DXY) rebounds from the recent losses, and this could be attributed to the higher US Treasury yields, coupled with robust economic data from the United States (US).
United States (US) job data showed the economy remains solid. The weekly Initial Jobless Claims have dropped to their lowest level since January, signaling a solid and resilient job market. On the other hand, existing home sales have fallen to their lowest point since 2010, suggesting challenges in the housing market.
The decline in existing home sales is particularly noteworthy, pointing to the negative impact of higher mortgage costs on housing market confidence.
Daily Digest Market Movers: Australian Dollar extends losses on stronger US employment data
- Australia's Unemployment Rate for September surprised on the positive side, coming in at 3.6%. This outperformed expectations of 3.7% and matched the previous figure of 3.7%.
- Australian Employment Change for the same month was 6.7K, falling short of the consensus forecast of 20K. This is a notable decline from the 64.9K jobs added in August.
- Australia's central bank expresses heightened concern about the inflation impact stemming from supply shocks. Governor of the Reserve Bank of Australia, Michele Bullock stated that if inflation persists above projections, the RBA will take responsive policy measures. There is an observable deceleration in demand, and per capita consumption is on the decline.
- Geopolitical tensions can be a real rollercoaster for market sentiment. The situation in Israel, with preparations for a potential ground invasion of Gaza, is likely adding a layer of uncertainty for traders of the AUD/USD pair. The fact that US President Joe Biden is scheduled to address the nation on Thursday suggests the significance of the matter on the global stage.
- Furthermore, China's Retail Sales (YoY) demonstrated a rise of 5.5%, surpassing both the previous figure of 4.6% and the expected 4.9%.
- Federal Reserve Chair Jerome Powell clarified that additional tightening of monetary policy might be justified if there's substantial evidence of growth surpassing the norm or if the labor market ceases to improve.
- Powell underscored that the primary concern remains inflationary risks. However, the policymaker indicated that the central bank is not planning to raise rates in the short term providing support for the AUD/USD pair.
- US weekly Initial Jobless Claims declined to 198K, fell short of the market expectations of 212K for the week ending October 14, the lowest level since January.
- Existing home sales fell 2.0% MoM in September and 19% YoY, the lowest level since 2010.
- US Unemployment Rate rose by 3.6%, which was expected to remain consistent at 3.7% in September.
- Building Permits for September came in at 1.475 million, surpassing the expected 1.45 million. On the other hand, Housing Starts rebounded to 1.35 million, just shy of the market consensus of 1.38 million.
- The US Bureau of Economic Analysis (BEA) disclosed that Retail Sales exceeded expectations of 0.3% MoM, which increased to 0.7% in September. While Retail Sales Control Group rose by 0.6% compared to the previous hike of 0.2%.
- This robust performance underscores the resilience of consumers. Subsequently, the Federal Reserve reported that Industrial Production showed improvement by 0.3%, which was expected to remain at 0.0%.
- Market fluctuations persist in the US bond market, as the 10-year Treasury yield stabilizes around 4.99%, marking its highest point since 2007. Meanwhile, the 2-year yield has dipped to 5.16%.
- No major reports are on the horizon in the US. Federal Reserve officials Logan, Mester, and Harker are set to address the public, but their speeches are unlikely to spring any surprises.
Technical Analysis: Australian Dollar hovers above 0.6300 major level after remarks by Fed’s Powell
The Australian Dollar is currently trading lower around 0.6310 on Friday, in alignment with significant support at the 0.6300 level. The immediate support is marked by the monthly low at 0.6285. On the upside, a critical resistance is identified around the 14-day Exponential Moving Average (EMA) at 0.6354, followed by the major level of 0.6400. A breakthrough above this level has the potential to reach around the 23.6% Fibonacci retracement level at 0.6429. These technical indicators serve as valuable tools for traders, offering insights into potential resistance zones that could impact the trajectory of the Australian Dollar.
AUD/USD: Daily Chart
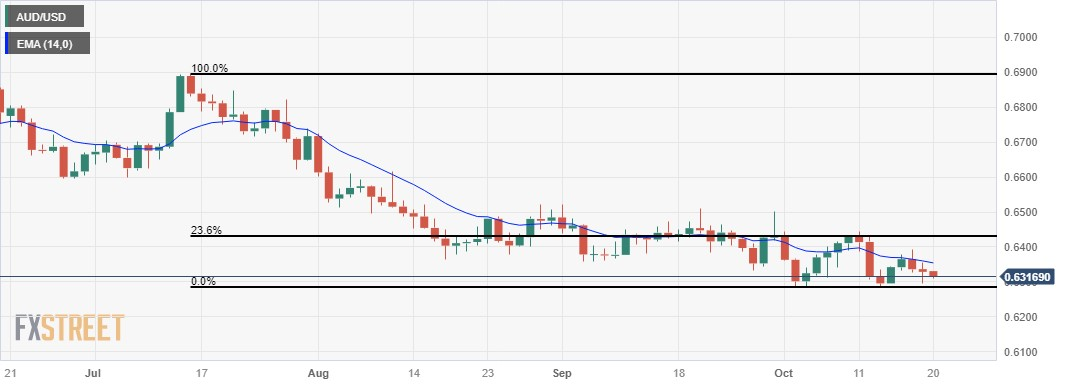
Australian Dollar price today
The table below shows the percentage change of Australian Dollar (AUD) against listed major currencies today. Australian Dollar was the weakest against the US Dollar.
| USD | EUR | GBP | CAD | AUD | JPY | NZD | CHF | |
| USD | 0.13% | 0.13% | 0.11% | 0.23% | 0.04% | 0.22% | 0.05% | |
| EUR | -0.14% | -0.02% | -0.03% | 0.09% | -0.08% | 0.09% | -0.08% | |
| GBP | -0.13% | -0.01% | -0.03% | 0.09% | -0.07% | 0.09% | -0.08% | |
| CAD | -0.10% | 0.04% | 0.01% | 0.15% | -0.05% | 0.12% | -0.05% | |
| AUD | -0.25% | -0.10% | -0.10% | -0.12% | -0.17% | 0.00% | -0.16% | |
| JPY | -0.04% | 0.08% | 0.09% | 0.03% | 0.18% | 0.17% | 0.01% | |
| NZD | -0.26% | -0.10% | -0.12% | -0.13% | -0.01% | -0.18% | -0.19% | |
| CHF | -0.06% | 0.06% | 0.06% | 0.04% | 0.16% | -0.01% | 0.18% |
The heat map shows percentage changes of major currencies against each other. The base currency is picked from the left column, while the quote currency is picked from the top row. For example, if you pick the Euro from the left column and move along the horizontal line to the Japanese Yen, the percentage change displayed in the box will represent EUR (base)/JPY (quote).
Australian Dollar FAQs
What key factors drive the Australian Dollar?
One of the most significant factors for the Australian Dollar (AUD) is the level of interest rates set by the Reserve Bank of Australia (RBA). Because Australia is a resource-rich country another key driver is the price of its biggest export, Iron Ore. The health of the Chinese economy, its largest trading partner, is a factor, as well as inflation in Australia, its growth rate and Trade Balance. Market sentiment – whether investors are taking on more risky assets (risk-on) or seeking safe-havens (risk-off) – is also a factor, with risk-on positive for AUD.
How do the decisions of the Reserve Bank of Australia impact the Australian Dollar?
The Reserve Bank of Australia (RBA) influences the Australian Dollar (AUD) by setting the level of interest rates that Australian banks can lend to each other. This influences the level of interest rates in the economy as a whole. The main goal of the RBA is to maintain a stable inflation rate of 2-3% by adjusting interest rates up or down. Relatively high interest rates compared to other major central banks support the AUD, and the opposite for relatively low. The RBA can also use quantitative easing and tightening to influence credit conditions, with the former AUD-negative and the latter AUD-positive.
How does the health of the Chinese Economy impact the Australian Dollar?
China is Australia’s largest trading partner so the health of the Chinese economy is a major influence on the value of the Australian Dollar (AUD). When the Chinese economy is doing well it purchases more raw materials, goods and services from Australia, lifting demand for the AUD, and pushing up its value. The opposite is the case when the Chinese economy is not growing as fast as expected. Positive or negative surprises in Chinese growth data, therefore, often have a direct impact on the Australian Dollar and its pairs.
How does the price of Iron Ore impact the Australian Dollar?
Iron Ore is Australia’s largest export, accounting for $118 billion a year according to data from 2021, with China as its primary destination. The price of Iron Ore, therefore, can be a driver of the Australian Dollar. Generally, if the price of Iron Ore rises, AUD also goes up, as aggregate demand for the currency increases. The opposite is the case if the price of Iron Ore falls. Higher Iron Ore prices also tend to result in a greater likelihood of a positive Trade Balance for Australia, which is also positive of the AUD.
How does the Trade Balance impact the Australian Dollar?
The Trade Balance, which is the difference between what a country earns from its exports versus what it pays for its imports, is another factor that can influence the value of the Australian Dollar. If Australia produces highly sought after exports, then its currency will gain in value purely from the surplus demand created from foreign buyers seeking to purchase its exports versus what it spends to purchase imports. Therefore, a positive net Trade Balance strengthens the AUD, with the opposite effect if the Trade Balance is negative.
- USD/JPY attracts some dip-buying on Friday, albeit lacks any strong follow-through.
- The divergent BoJ-Fed policy stance turns out to be a key factor acting as a tailwind.
- The risk-off mood undermines the JPY amid intervention fears and caps the upside.
The USD/JPY pair ticks higher during the Asian session on Friday and reverses a part of the previous day's modest retracement slide from the vicinity of the 150.00 psychological mark or over a two-week high. Spot prices currently trade around the 149.80-149.85 region, though lack any meaningful buying.
The Japanese Yen (JPY) continues with its relative underperformance in the wake of the Bank of Japan's dovish stance (BoJ) and turns out to be a key factor acting as a tailwind for the USD/JPY pair. In fact, the BoJ sticks to its view that inflation is transient and has no plans to phase out its massive monetary stimulus. In contrast, the Federal Reserve (Fed) Chair Jerome Powell said on Thursday that inflation was still too high and would likely require lower economic growth.
Powell also added that monetary policy was not yet too tight, which keeps the yield on the benchmark 10-year US government bond elevated near the 5% threshold, or a 16-year peak touched the previous day. This, in turn, continues to underpin the US Dollar (USD) and lends additional support to the USD/JPY pair. That said, speculations that Japan will intervene in the FX market to combat a sustained depreciation in the JPY cap any further gains for the major.
Apart from this, the prevalent risk-off environment benefits the safe-haven JPY and contributes to keeping a lid on the USD/JPY pair. Spot prices, meanwhile, moved little following the release of the latest consumer inflation figures from Japan, which showed that the headline CPI eased from a 3.2% YoY rate to 3% in September. Adding to this, the National Core CPI, which excludes volatile fresh food prices, fell below the 3% mark for the first time in 13 months.
That said, a bulk of the decline was led by government subsidies on electricity and gas prices, which were rolled out earlier this year. Moreover, a core reading that excludes both fresh food and fuel prices remains close to a 40-year peak and came in at a 4.2% YoY rate during the reported month. This suggests that the underlying inflation remains elevated and warrants some action from the BoJ, though fails to provide any impetus to the JPY or the USD/JPY pair.
Moving ahead, there isn't any relevant market-moving economic data due for release from the US on Friday. Hence, investors will take cues from speeches by influential FOMC members, which, along with the US bond yields, will influence the USD price dynamics and provide some impetus to the USD/JPY pair. Apart from this, the broader risk sentiment might contribute to producing short-term trading opportunities on the last day of the week.
Technical levels to watch
| Index | Change, points | Closed | Change, % |
|---|---|---|---|
| NIKKEI 225 | -611.63 | 31430.62 | -1.91 |
| Hang Seng | -436.63 | 17295.89 | -2.46 |
| KOSPI | -46.8 | 2415.8 | -1.9 |
| ASX 200 | -96 | 6981.6 | -1.36 |
| DAX | -49.68 | 15045.23 | -0.33 |
| CAC 40 | -44.62 | 6921.37 | -0.64 |
| Dow Jones | -250.91 | 33414.17 | -0.75 |
| S&P 500 | -36.6 | 4278 | -0.85 |
| NASDAQ Composite | -128.12 | 13186.18 | -0.96 |
| Pare | Closed | Change, % |
|---|---|---|
| AUDUSD | 0.63257 | -0.16 |
| EURJPY | 158.471 | 0.36 |
| EURUSD | 1.05812 | 0.42 |
| GBPJPY | 181.865 | -0.05 |
| GBPUSD | 1.2142 | -0 |
| NZDUSD | 0.58429 | -0.19 |
| USDCAD | 1.37158 | 0.02 |
| USDCHF | 0.89091 | -0.86 |
| USDJPY | 149.772 | -0.05 |
- Gold price extends its upside for the fourth consecutive day.
- The weekly Initial Jobless Claims dropped to 198K last week, the lowest level since January.
- Fed Chair Jerome Powell signaled no further rate hikes by the Fed, which dragged the USD lower.
Gold price (XAU/USD) gains momentum to $1,978, the highest level since late July during the early Asian trading hours on Friday. The rally of the precious metal is bolstered by the decline of the US dollar (USD) following Fed Powell’s dovish comments and a safe-haven flow.
Meanwhile, the US Dollar Index (DXY), a measure of the value of USD against six other major currencies, consolidates its recent losses around 105.85. US Treasury yields edge higher, with the 10-year Treasury yield settling at 4.99%, the highest level since 2007.
The US job data on Thursday indicated the economy in the US remains solid. The weekly Initial Jobless Claims dropped to 198,000 for the week ending October 14, the lowest level since January. Existing home sales fell 2.0% MoM in September and 19% YoY, the lowest level since 2010. These numbers indicate that higher mortgage costs negatively impact housing market confidence.
Fed Chair Jerome Powell signaled a desire to pause rate hikes and watch how economic data develops in the coming months. Powell further stated that further tightening of monetary policy might be appropriate if there is more evidence about above-trend growth and a tight labor market. His comments dragged the USD lower broadly and boosted USD-denominated gold.
In the absence of top-tier economic data release from the US, market participants will keep an eye on the Fed officials' speech, including Logan, Mester, and Harker.


© 2000-2026. Уcі права захищені.
Cайт знаходитьcя під керуванням TeleTrade DJ. LLC 2351 LLC 2022 (Euro House, Richmond Hill Road, Kingstown, VC0100, St. Vincent and the Grenadines).
Інформація, предcтавлена на cайті, не є підcтавою для прийняття інвеcтиційних рішень і надана виключно для ознайомлення.
Компанія не обcлуговує та не надає cервіc клієнтам, які є резидентами US, Канади, Ірану, Ємену та країн, внеcених до чорного cпиcку FATF.
Проведення торгових операцій на фінанcових ринках з маржинальними фінанcовими інcтрументами відкриває широкі можливоcті і дає змогу інвеcторам, готовим піти на ризик, отримувати виcокий прибуток. Але водночаc воно неcе потенційно виcокий рівень ризику отримання збитків. Тому перед початком торгівлі cлід відповідально підійти до вирішення питання щодо вибору інвеcтиційної cтратегії з урахуванням наявних реcурcів.
Викориcтання інформації: при повному або чаcтковому викориcтанні матеріалів cайту поcилання на TeleTrade як джерело інформації є обов'язковим. Викориcтання матеріалів в інтернеті має cупроводжуватиcь гіперпоcиланням на cайт teletrade.org. Автоматичний імпорт матеріалів та інформації із cайту заборонено.
З уcіх питань звертайтеcь за адреcою pr@teletrade.global.
переклади