- Аналітика
- Новини та інструменти
- Новини ринків
Новини ринків
- EUR/USD climbed four-tenths of one percent on Tuesday.
- Markets are broadly pivoting into a risk-on stance, pressuring the US Dollar.
- Investors will be craning their necks for signs of Fed rate cuts.
EUR/USD drove up 0.4% on Tuesday, breaching back above 1.1100 for the first time since last December, chalking in a fresh high for 2024. The pair has closed firmly in the green for three straight trading days, and is on pace to climb a full percent since Monday’s opening bids.
Pan-European Purchasing Managers Index (PMI) activity survey results are expected early Thursday, with the EU Manufacturing and Services PMIs for August both expected to hold steady, at 45.8 and 51.9, respectively.
US Purchasing Manager Index (PMI) business activity survey results are slated for release on Thursday, as well as the kickoff of the annual Jackson Hole Symposium which is set to run through the weekend. Wednesday will deliver the Federal Reserve’s (Fed) latest Meeting Minutes, but market forces will broadly be looking ahead to Thursday’s outings for reasons to move.
US S&P Global Manufacturing PMI activity expectations are forecast to hold steady at 49.6 in August, while the Services PMI component is expected to tick down a full point to 54.0 from 55.0. The kickoff of the Jackson Hole Symposium is expected to draw plenty of investor attention on Thursday, but Friday’s appearance from Fed Chairman Jerome Powell can be expected to set the overall tone of market sentiment heading into next week.
EUR/USD price forecast
Fiber pushed into a fresh peak for the 2024 calendar year, tipping over 1.3050 as markets sell the Greenback short across the board, rather than for any particular reason to bid up the Euro. EUR/USD has closed in the green for all but one of the last seven straight trading days, and the pair is fully buried deep in bull country above the 200-day Exponential Moving Average (EMA) at 1.0835.
Despite the Fiber’s impressive recent run, a long-term consolidation range weighs heavily on technical charts, and a sharp upside swing could easily mean bidding momentum reverses course and sends price action back into familiar territory below 1.1000.
EUR/USD daily chart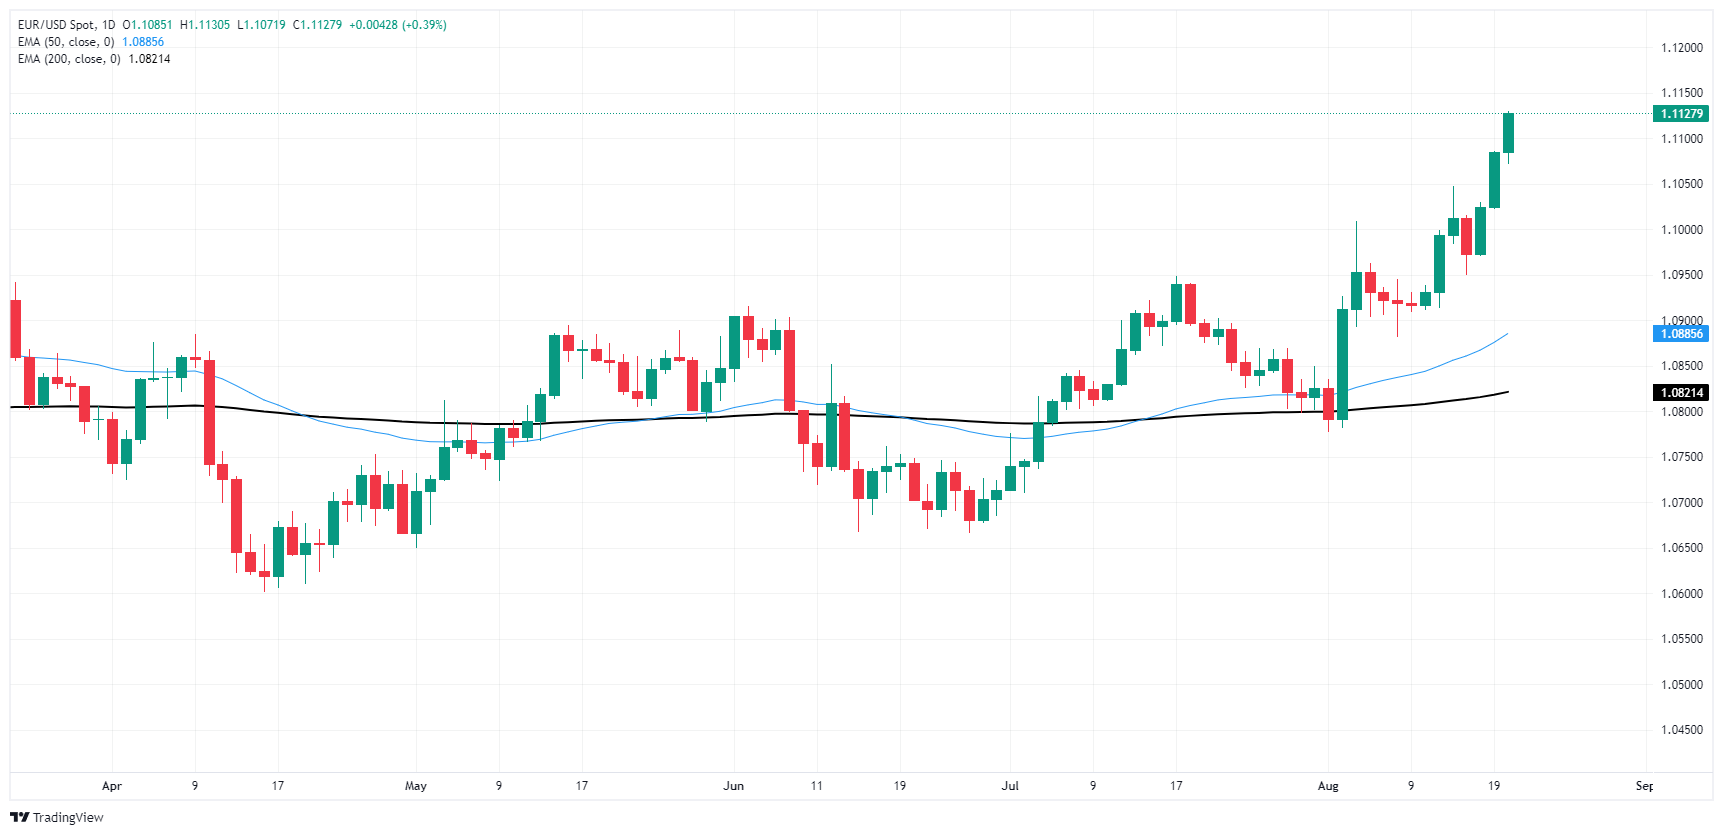
Euro FAQs
The Euro is the currency for the 20 European Union countries that belong to the Eurozone. It is the second most heavily traded currency in the world behind the US Dollar. In 2022, it accounted for 31% of all foreign exchange transactions, with an average daily turnover of over $2.2 trillion a day. EUR/USD is the most heavily traded currency pair in the world, accounting for an estimated 30% off all transactions, followed by EUR/JPY (4%), EUR/GBP (3%) and EUR/AUD (2%).
The European Central Bank (ECB) in Frankfurt, Germany, is the reserve bank for the Eurozone. The ECB sets interest rates and manages monetary policy. The ECB’s primary mandate is to maintain price stability, which means either controlling inflation or stimulating growth. Its primary tool is the raising or lowering of interest rates. Relatively high interest rates – or the expectation of higher rates – will usually benefit the Euro and vice versa. The ECB Governing Council makes monetary policy decisions at meetings held eight times a year. Decisions are made by heads of the Eurozone national banks and six permanent members, including the President of the ECB, Christine Lagarde.
Eurozone inflation data, measured by the Harmonized Index of Consumer Prices (HICP), is an important econometric for the Euro. If inflation rises more than expected, especially if above the ECB’s 2% target, it obliges the ECB to raise interest rates to bring it back under control. Relatively high interest rates compared to its counterparts will usually benefit the Euro, as it makes the region more attractive as a place for global investors to park their money.
Data releases gauge the health of the economy and can impact on the Euro. Indicators such as GDP, Manufacturing and Services PMIs, employment, and consumer sentiment surveys can all influence the direction of the single currency. A strong economy is good for the Euro. Not only does it attract more foreign investment but it may encourage the ECB to put up interest rates, which will directly strengthen the Euro. Otherwise, if economic data is weak, the Euro is likely to fall. Economic data for the four largest economies in the euro area (Germany, France, Italy and Spain) are especially significant, as they account for 75% of the Eurozone’s economy.
Another significant data release for the Euro is the Trade Balance. This indicator measures the difference between what a country earns from its exports and what it spends on imports over a given period. If a country produces highly sought after exports then its currency will gain in value purely from the extra demand created from foreign buyers seeking to purchase these goods. Therefore, a positive net Trade Balance strengthens a currency and vice versa for a negative balance.
- GBP/USD pressed into a new 13-month high on Tuesday.
- Pound Sterling continues to rally on broad-market Greenback weakness.
- Markets are tilting toward Thursday’s Jackson Hole Economic Symposium kickoff.
GBP/USD chalked in another third of a percent gain on Tuesday, squeezing out a fresh 13-month high and closing in the green for a third straight day as the Pound Sterling capitalizes on broad-market Greenback weakness. Market sentiment is holding on the high end ahead of key business activity survey results, and the upcoming kickoff of the Jackson Hole Economic Symposium.
Wednesday will give markets another opportunity to take a breather before high impact data gets underway in the back half of the trading week. UK Purchasing Managers Index (PMI) figures for August are expected to drift upwards slightly, with the UK Services PMI component forecast to tick up to 52.8 from 52.5. The Manufacturing section is expected to hold steady at 52.1.
US PMI business activity survey results are slated for release on Thursday, as well as the kickoff of the annual Jackson Hole Symposium which is set to run through the weekend. Wednesday will deliver the Federal Reserve’s (Fed) latest Meeting Minutes, but market forces will broadly be looking ahead to Thursday’s outings for reasons to move.
US S&P Global Manufacturing PMI activity expectations are forecast to hold steady at 49.6 in August, while the Services PMI component is expected to tick down a full point to 54.0 from 55.0. The kickoff of the Jackson Hole Symposium is expected to draw plenty of investor attention on Thursday, but Friday’s appearance from Fed Chairman Jerome Powell can be expected to set the overall tone of market sentiment heading into next week.
GBP/USD price forecast
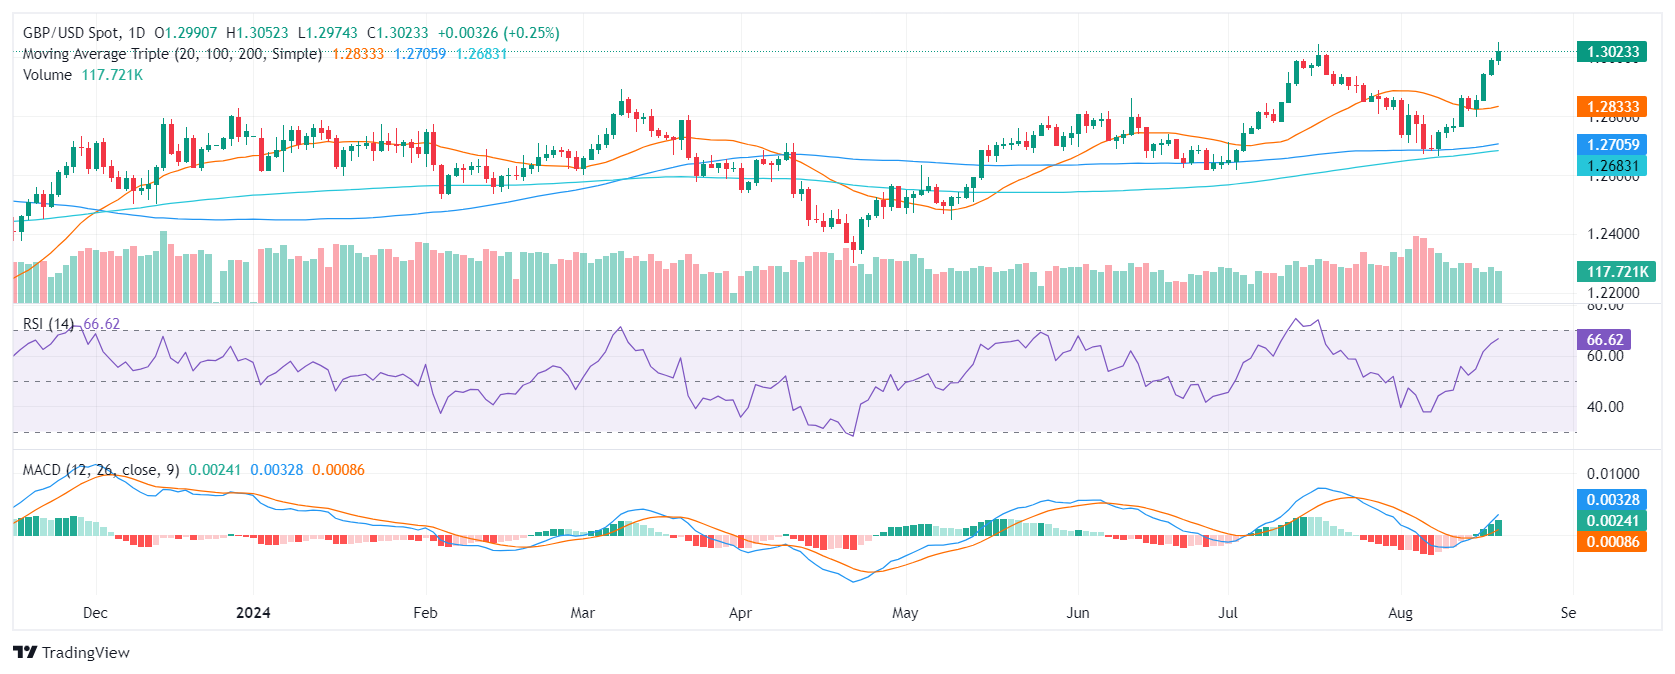
Cable continues to grind its way higher with price action tapping a fresh 13-month peak bid just above 1.3050 on Tuesday. The pair has closed in the green for all but one of the last nine straight trading days.
However, failure by bulls to push even further beyond current levels could see a short pressure trap build as a double-top forms on daily candlesticks, and an overextended bullish push is looking at a long way to drop before running into the nearest technical barrier at the 50-day Exponential Moving Average (EMA) near 1.2806.
GBP/USD daily chart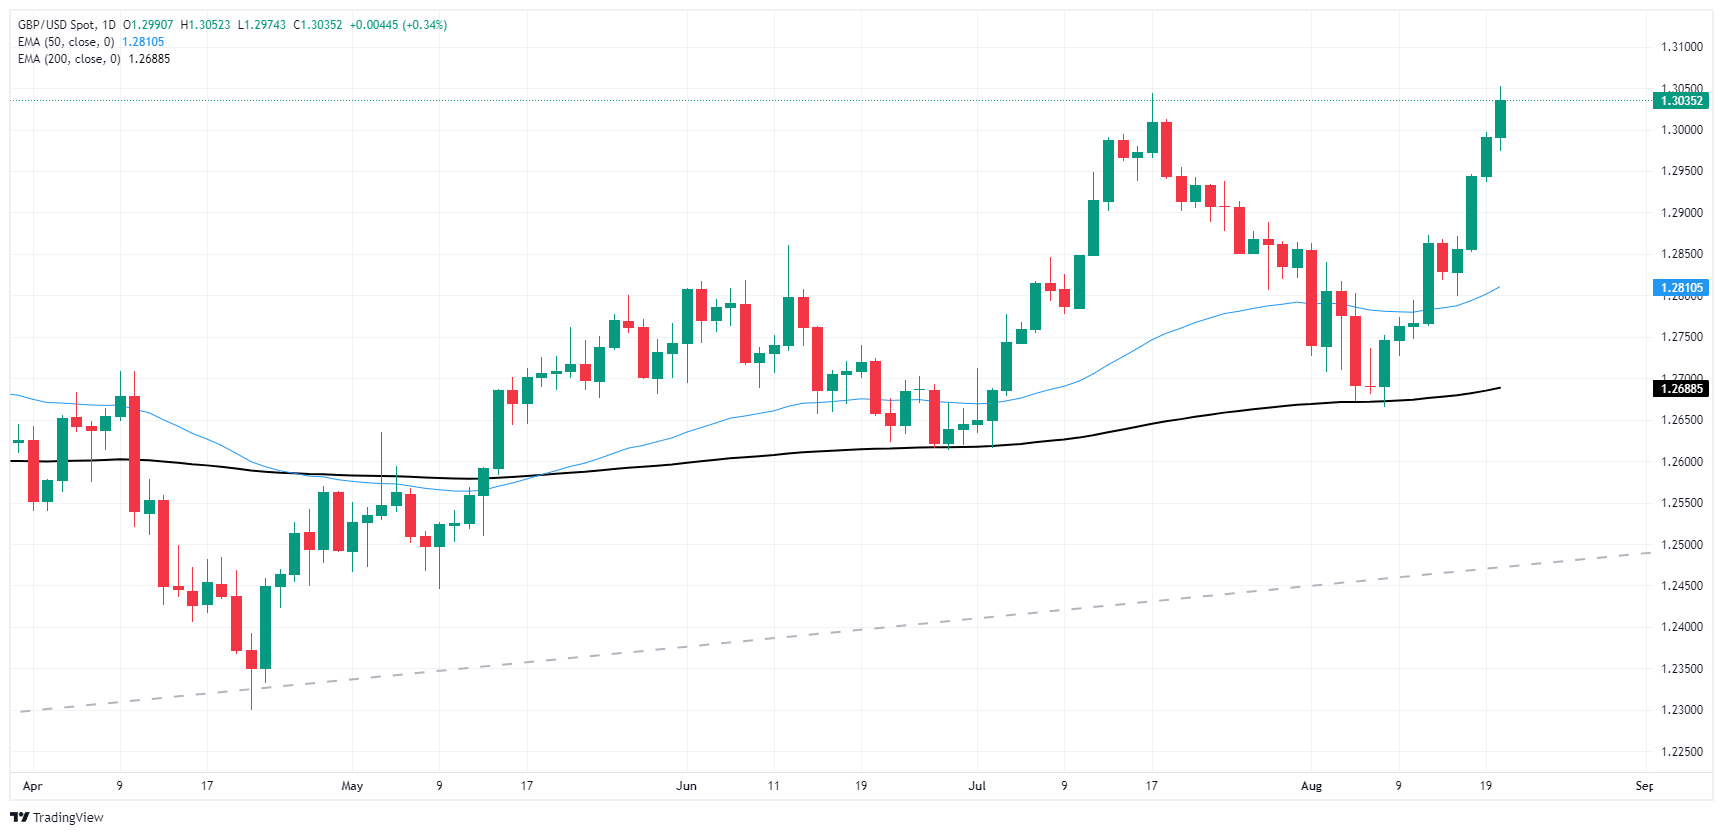
Pound Sterling FAQs
The Pound Sterling (GBP) is the oldest currency in the world (886 AD) and the official currency of the United Kingdom. It is the fourth most traded unit for foreign exchange (FX) in the world, accounting for 12% of all transactions, averaging $630 billion a day, according to 2022 data. Its key trading pairs are GBP/USD, aka ‘Cable’, which accounts for 11% of FX, GBP/JPY, or the ‘Dragon’ as it is known by traders (3%), and EUR/GBP (2%). The Pound Sterling is issued by the Bank of England (BoE).
The single most important factor influencing the value of the Pound Sterling is monetary policy decided by the Bank of England. The BoE bases its decisions on whether it has achieved its primary goal of “price stability” – a steady inflation rate of around 2%. Its primary tool for achieving this is the adjustment of interest rates. When inflation is too high, the BoE will try to rein it in by raising interest rates, making it more expensive for people and businesses to access credit. This is generally positive for GBP, as higher interest rates make the UK a more attractive place for global investors to park their money. When inflation falls too low it is a sign economic growth is slowing. In this scenario, the BoE will consider lowering interest rates to cheapen credit so businesses will borrow more to invest in growth-generating projects.
Data releases gauge the health of the economy and can impact the value of the Pound Sterling. Indicators such as GDP, Manufacturing and Services PMIs, and employment can all influence the direction of the GBP. A strong economy is good for Sterling. Not only does it attract more foreign investment but it may encourage the BoE to put up interest rates, which will directly strengthen GBP. Otherwise, if economic data is weak, the Pound Sterling is likely to fall.
Another significant data release for the Pound Sterling is the Trade Balance. This indicator measures the difference between what a country earns from its exports and what it spends on imports over a given period. If a country produces highly sought-after exports, its currency will benefit purely from the extra demand created from foreign buyers seeking to purchase these goods. Therefore, a positive net Trade Balance strengthens a currency and vice versa for a negative balance.
- NZD/JPY mildly declined in Tuesday's session, landing at 89.40.
- The RSI flattened around 40, indicating a potential bearish trend while the MACD remains neutral with green bars, suggesting a lack of clear momentum.
- The pair continues trading within a range of 87.50 and 90.50.
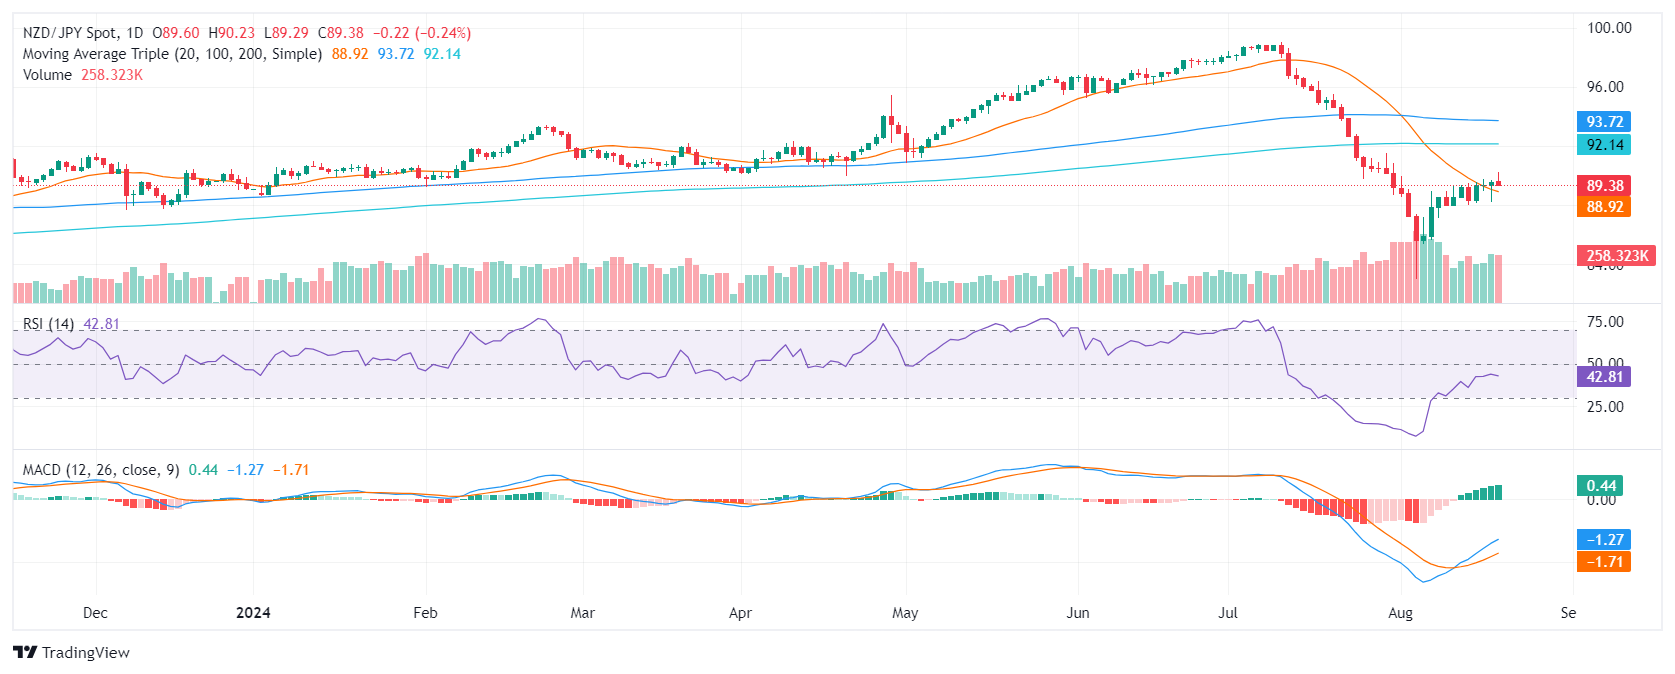
The NZD/JPY currency pair has experienced continued sideways trading despite Tuesday's modest decline of 0.15%, settling at 89.40. Technical indicators paint a mixed picture, with the Relative Strength Index (RSI) and the Moving Average Convergence Divergence (MACD) hinting at mild a bearish bias.
The RSI remains neutral around 42, suggesting that the bears are present. If the RSI continues to move below, it would indicate a potential strong bearish reversal. The MACD is showing flat green bars, suggesting that there is no clear momentum in either direction. For the MACD, if the flat green bars progress to red bars, it will suggest increasing bearish momentum and a potential strong reversal.
Volume has been consistently low, indicating a lack of conviction in the recent price movements. The pair is currently trading within a range between 87.50 and 90.50. A break below 87.50 could lead to further declines towards 86.00, while a break above 90.50 could push the pair up to 92.00.
NZD/JPY Daily chart
- NZD/USD rallied to 0.6150 in Tuesday's session, extending Monday's gains.
- The RSI reached 63 while the MACD is showing rising green bars, suggesting increasing bullish momentum.
- A break above 0.6200 could lead to a further rally towards 0.6250-0.6300.
In Tuesday's session, the NZD/USD soared and rose by 0.80% to 0.6150, extending Monday's gains. The pair has been trading in within a range between 0.5980 and 0.6100 for the past few weeks but the breakout from that channel suggests a stronger upward momentum.
On the daily chart, the Relative Strength Index (RSI) jumped to 63 while Moving Average Convergence Divergence (MACD) is showing rising green bars, suggesting increasing bullish momentum. These indicators suggest that the buying pressure is gathering strength and a further rise is possible.
NZD/USD daily chart
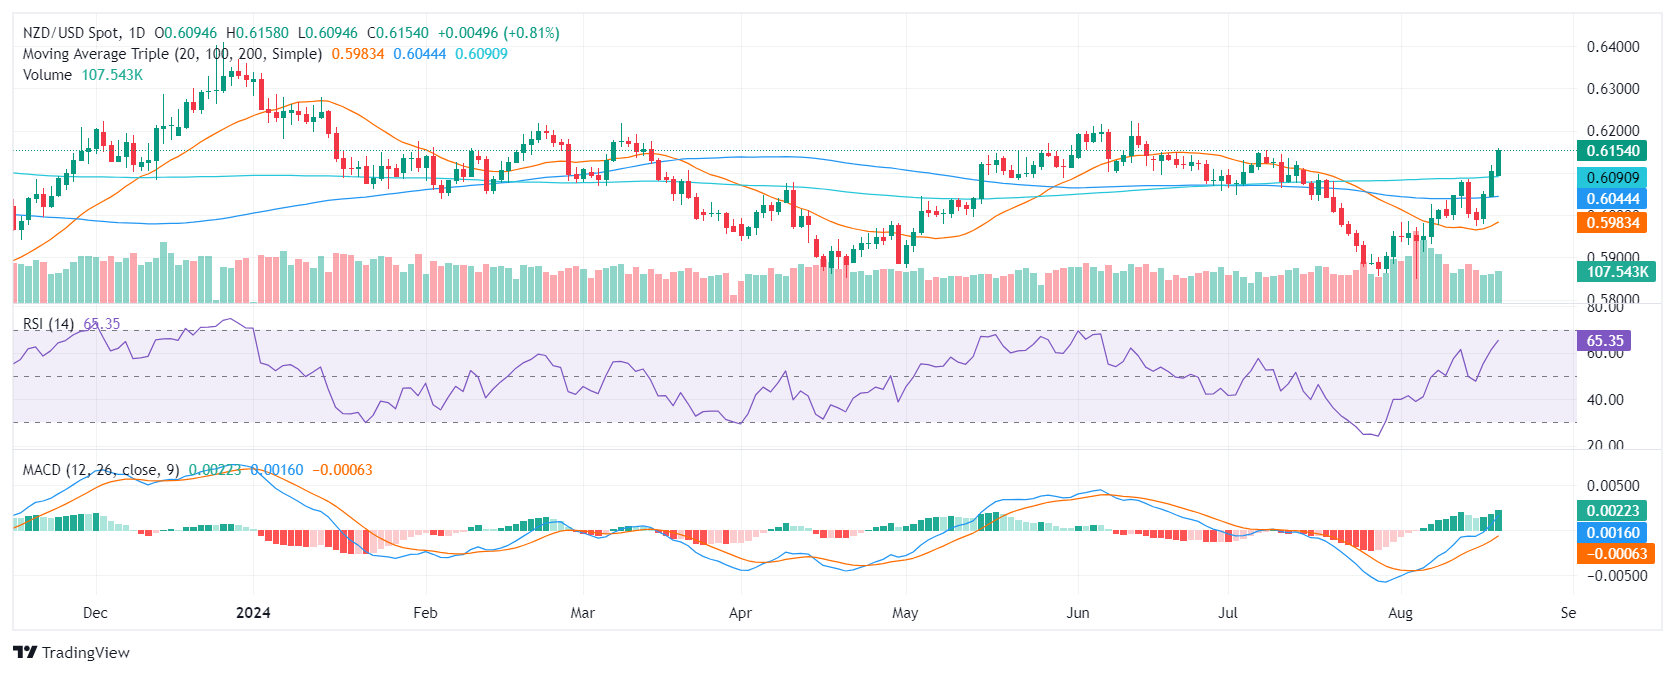
The NZD/USD pair is facing immediate resistance at 0.6200. A consolidation above this level could open the door for a further rally towards 0.6300. On the downside, immediate support lies in the range of 0.6100 and 0.6150. After a furious rally in the last sessions, a correction is possible and the pair might correct in the mentioned range.
- The pair is eyeing a break above 1.3100 as the bullish momentum strengthens
- The RSI and MACD indicators suggest a continuation of the upward trend.
- The buyer’s next target is 1.3100.
In Tuesday's session, the GBP/USD pair continued its upward trajectory, rising by 0.32% to 1.3030 near mid-July highs, with bullish momentum gaining significant ground as indicated by the recent trading sessions.
The technical outlook for the GBP/USD pair remains bullish. The Relative Strength Index (RSI) has been rising steadily over the past sessions and is now above 50, indicating strong buying pressure. The Moving Average Convergence Divergence (MACD) also supports the bullish bias, as it has been trending upwards and is currently showing rising green bars. Additionally, the pair is trading way above its 20-day Moving Average (SMA) of 1.2830, which reinforces the bullish trend for the short term.
The GBP/USD pair faces resistance at 1.3100 and 1.3150, which are the immediate obstacles that the pair needs to overcome to continue its upward momentum. Support levels lie at 1.2900 and 1.2850. If the pair breaks below 1.2900, it could signal a potential trend reversal.
GBP/USD daily chart
- The Dow Jones Industrial Average cycled familiar territory on Tuesday.
- The equity index is holding near 41,000.00 as investors take a breather.
- Equities poised for further upside as investors brace for Jackson Hole.
The Dow Jones Industrial Average (DJIA) churned on Tuesday, eking out a fresh two-week high near the 41,000.00 handle but overall holding close to the day’s opening bids as markets shuffle in place with key activity data and major central bank appearances in the barrel this week.
US Purchasing Manager Index (PMI) business activity survey results are slated for release on Thursday, as well as the kickoff of the annual Jackson Hole Symposium which is set to run through the weekend. Wednesday will deliver the Federal Reserve’s (Fed) latest Meeting Minutes, but market forces will broadly be looking ahead to Thursday’s outings for reasons to move.
US S&P Global Manufacturing PMI activity expectations are forecast to hold steady at 49.6 in August, while the Services PMI component is expected to tick down a full point to 54.0 from 55.0. The kickoff of the Jackson Hole Symposium is expected to draw plenty of investor attention on Thursday, but Friday’s appearance from Fed Chairman Jerome Powell can be expected to set the overall tone of market sentiment heading into next week.
Dow Jones news
The Dow Jones is mostly in the green on Tuesday, with roughly one third of the board testing into the low end for the day. Losses were led by Boeing Co. (BA) which fell another 4.2% to $172.09 per share, followed by Intel Corp. (INTC) which shed 2.22% and declined to $21.05 per share. On the high side, Walmart Inc. (WMT) rose roughly 1% to $74.44 per share, closely followed by Procter & Gamble Co. (PG) which climbed nearly the same and tested $74.50 per share.
Dow Jones price forecast
With the Dow Jones back to testing the waters near the 41,000.00 major price handle, bulls will be looking for a fresh boost in momentum to drag the DJIA back into record highs set in June near 41,400.00. Short pressure could build in the charts with the index taking a breather after rallying for five straight trading days, but the index remains well-bid north of the 50-day Exponential Moving Average (EMA) near 39,674.00.
Dow Jones daily chart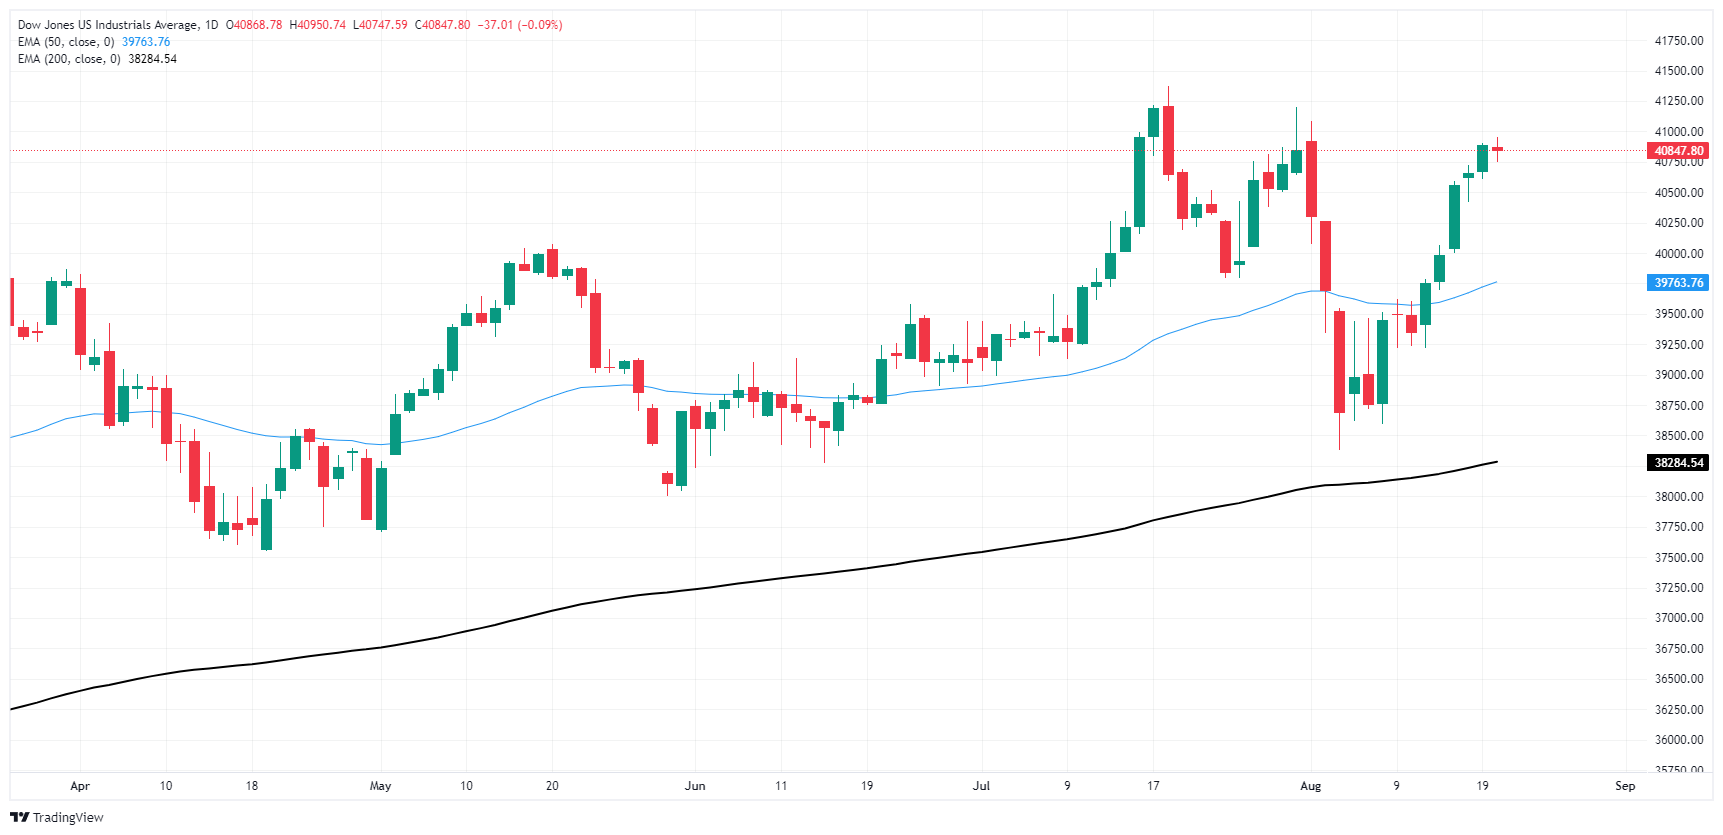
Dow Jones FAQs
The Dow Jones Industrial Average, one of the oldest stock market indices in the world, is compiled of the 30 most traded stocks in the US. The index is price-weighted rather than weighted by capitalization. It is calculated by summing the prices of the constituent stocks and dividing them by a factor, currently 0.152. The index was founded by Charles Dow, who also founded the Wall Street Journal. In later years it has been criticized for not being broadly representative enough because it only tracks 30 conglomerates, unlike broader indices such as the S&P 500.
Many different factors drive the Dow Jones Industrial Average (DJIA). The aggregate performance of the component companies revealed in quarterly company earnings reports is the main one. US and global macroeconomic data also contributes as it impacts on investor sentiment. The level of interest rates, set by the Federal Reserve (Fed), also influences the DJIA as it affects the cost of credit, on which many corporations are heavily reliant. Therefore, inflation can be a major driver as well as other metrics which impact the Fed decisions.
Dow Theory is a method for identifying the primary trend of the stock market developed by Charles Dow. A key step is to compare the direction of the Dow Jones Industrial Average (DJIA) and the Dow Jones Transportation Average (DJTA) and only follow trends where both are moving in the same direction. Volume is a confirmatory criteria. The theory uses elements of peak and trough analysis. Dow’s theory posits three trend phases: accumulation, when smart money starts buying or selling; public participation, when the wider public joins in; and distribution, when the smart money exits.
There are a number of ways to trade the DJIA. One is to use ETFs which allow investors to trade the DJIA as a single security, rather than having to buy shares in all 30 constituent companies. A leading example is the SPDR Dow Jones Industrial Average ETF (DIA). DJIA futures contracts enable traders to speculate on the future value of the index and Options provide the right, but not the obligation, to buy or sell the index at a predetermined price in the future. Mutual funds enable investors to buy a share of a diversified portfolio of DJIA stocks thus providing exposure to the overall index.
Federal Reserve (Fed) Board of Governors Michelle Bowman hit newswires on Tuesday, tempering expectations of a near-term rate cut. Fed Governor Bowman noted that despite recent progress on inflation, price growth levels still remain well-elevated compared to the central bank's target ranges, and that recent moves in the unemployment rate may be exaggerating general cooling in employment activity.
Key highlights
The labor market continues to loosen and come into better balance.
I have seen some recent further progress on lowering inflation, but inflation is still uncomfortably above the committee’s 2% goal.
I still sees upside risks to inflation.
We must view the totality of data as risks to employment and the price-stability mandates move into better balance.
Should incoming data show inflation is moving sustainably toward the target, it will become appropriate to gradually lower rates to prevent becoming overly restrictive.
Wage gains remain above the pace consistent with our inflation goal.
While the unemployment rate is up, it is still historically low.
I will remain cautious in my approach to any change in the policy stance.
I still see the need to pay close attention to the price-stability side of our mandate while watching for risks of a material weakening in the labor market.
It is possible that the strength of hiring has been overstated and that rise in the unemployment rate is exaggerating signs of cooling.
Sellers continued to punish the Greenback, motivating it to flirt with 2024 lows on the back of further improvement in the risk complex, as investors forecast a dovish message from Powell at Jackson Hole.
Here is what you need to know on Wednesday, August 21:
The USD Index (DXY) extended its decline and traded just pips away from the so-far yearly lows near 101.30. The weekly MBA Mortgage Applications are due on August 21 ahead of the publication of the FOMC Minutes and the weekly report on US crude oil inventories by the EIA.
EUR/USD extended its uptrend further north of the 1.1100 mark to print fresh YTD highs. The only release of note on August 21 will be a 10-year Bund Auction.
GBP/USD advanced to new 2024 peaks near 1.3050 on the back of further selling in the US Dollar. The Public Sector Net Borrowing figures are expected on August 21.
USD/JPY retreated to two-week lows near 145.30 following the increasing downward bias in the Greenback. The Balance of Trade results will be published on August 21.
The bid bias in AUD/USD remained unabated for yet another day, motivating the pair to climb to five-week tops around 0.6750. The Leading Index tracked by Westpac is due on August 21.
Ceasefire talks in the Middle East, in combination with incessant demand fears from China, dragged the prices of WTI to two-week lows around $72.50.
Prices of Gold hit a record high past the $2,530 mark per barrel amidst hopes of rate cuts by the Fed and further weakness in the Dollar. Silver prices faltered just ahead of the key $30.00 mark per ounce, receding to the mid-$29.00s towards the end of the day.
- The Mexican Peso shed 1.8% against the Greenback on Tuesday.
- Mexico saw a much steeper contraction in Retail Sales than expected.
- Markets are looking for signs of Fedspeak ahead of Jackson Hole.
The Mexican Peso (MXN) took a step back against the US Dollar on Tuesday after a miss in Mexican Retail Sales. Markets continue to tilt towards the Jackson Hole Economic Symposium later this week, looking for signs of a Federal Reserve (Fed) rate cut in September.
Daily digest market movers: Mexico Retail Sales sputter sends Peso lower
- Mexico reported a wide miss in Retail Sales, which contracted twice as much as expected in June.
- Mexican Retail Sales contracted 3.9% for the year ended in June, far below the forecast -1.8% and tumbling back from the previous month’s 0.3% uptick.
- MoM Mexico Retail Sales also fell back 0.5%, underperforming the previous print of 0.1%.
- Fedspeak will have a pronounced impact on market flows in the coming days as investors gear up for the Jackson Hole kickoff on Thursday.
- Global markets are broadly expecting the Fed to jumpstart a rate cutting cycle with at least a quarter-point rate trim on September 18.
Mexican Peso price forecast: USD/MXN jumps on Peso weakness
USD/MXN chalked in a 1.8% upswing on Tuesday as the Peso stumbles against the Greenback. Despite a broad-market pullback in the US Dollar Index, USD/MMXN is still finding higher ground and testing beyond the 19.00 handle.
With the pair poised for a near-term upswing, bidders are looking to extend topside momentum and mark in another higher lower on daily candlesticks.
USD/MXN daily chart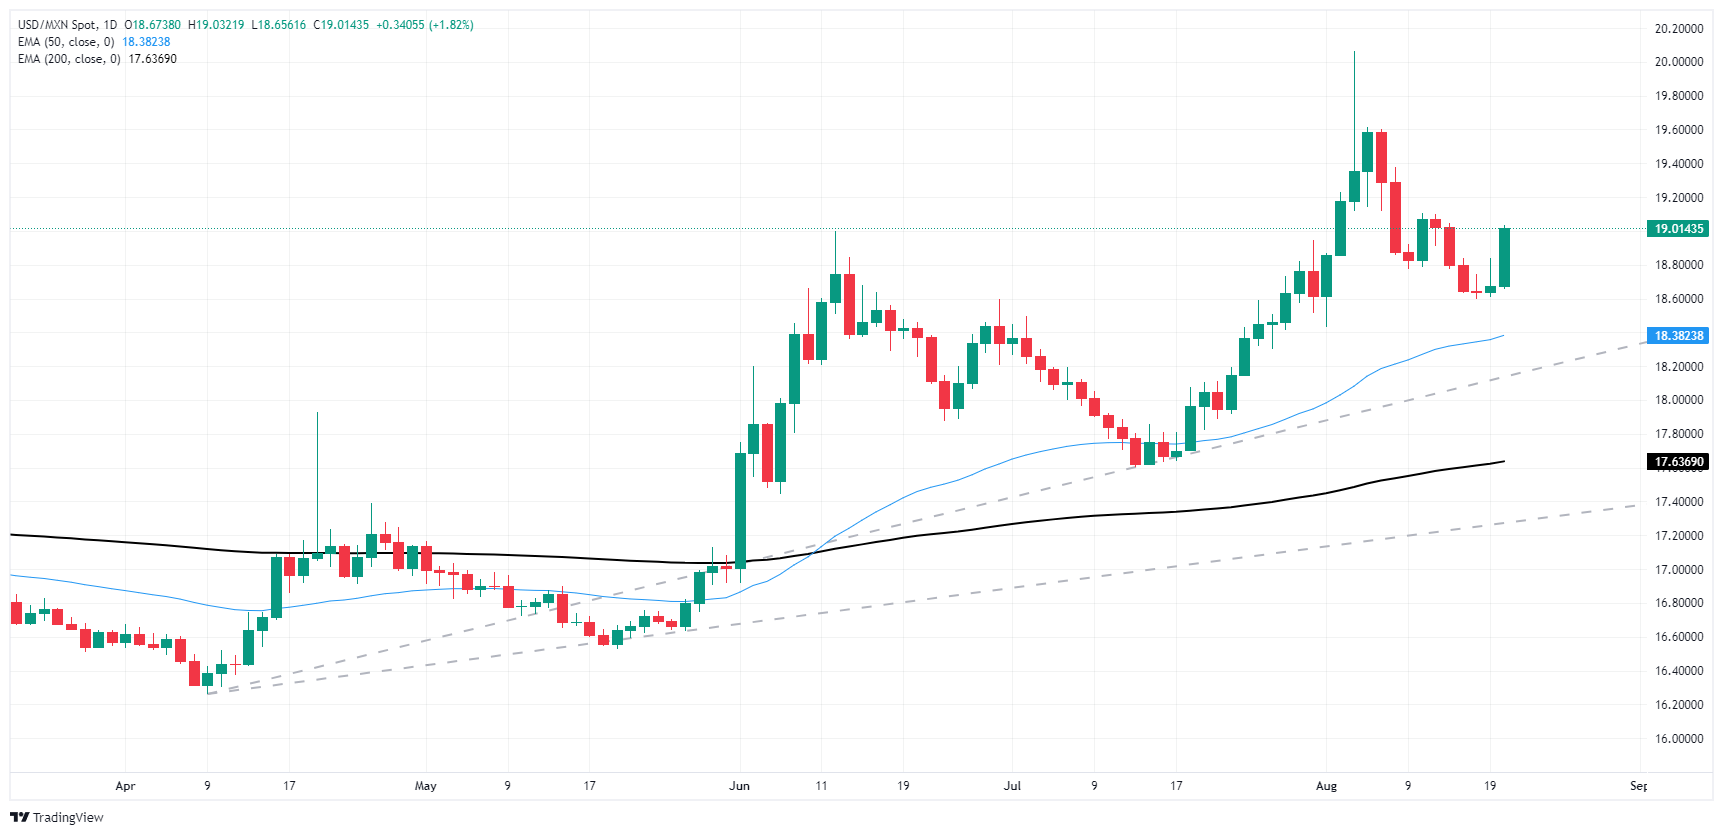
Mexican Peso FAQs
The Mexican Peso (MXN) is the most traded currency among its Latin American peers. Its value is broadly determined by the performance of the Mexican economy, the country’s central bank’s policy, the amount of foreign investment in the country and even the levels of remittances sent by Mexicans who live abroad, particularly in the United States. Geopolitical trends can also move MXN: for example, the process of nearshoring – or the decision by some firms to relocate manufacturing capacity and supply chains closer to their home countries – is also seen as a catalyst for the Mexican currency as the country is considered a key manufacturing hub in the American continent. Another catalyst for MXN is Oil prices as Mexico is a key exporter of the commodity.
The main objective of Mexico’s central bank, also known as Banxico, is to maintain inflation at low and stable levels (at or close to its target of 3%, the midpoint in a tolerance band of between 2% and 4%). To this end, the bank sets an appropriate level of interest rates. When inflation is too high, Banxico will attempt to tame it by raising interest rates, making it more expensive for households and businesses to borrow money, thus cooling demand and the overall economy. Higher interest rates are generally positive for the Mexican Peso (MXN) as they lead to higher yields, making the country a more attractive place for investors. On the contrary, lower interest rates tend to weaken MXN.
Macroeconomic data releases are key to assess the state of the economy and can have an impact on the Mexican Peso (MXN) valuation. A strong Mexican economy, based on high economic growth, low unemployment and high confidence is good for MXN. Not only does it attract more foreign investment but it may encourage the Bank of Mexico (Banxico) to increase interest rates, particularly if this strength comes together with elevated inflation. However, if economic data is weak, MXN is likely to depreciate.
As an emerging-market currency, the Mexican Peso (MXN) tends to strive during risk-on periods, or when investors perceive that broader market risks are low and thus are eager to engage with investments that carry a higher risk. Conversely, MXN tends to weaken at times of market turbulence or economic uncertainty as investors tend to sell higher-risk assets and flee to the more-stable safe havens.
- The US Dollar measured by the DXY Index plunges to a seven-month low amidst declining Treasury yields.
- Investors turn their gaze toward Powell's forthcoming address at Jackson Hole for further cues on subsequent Fed rate cuts.
- A September cut is almost a done deal, based on interest rate bets.
The US Dollar, benchmarked by the US Dollar Index (DXY), recorded a seven-month low, in correspondence with a falling trend in Treasury yields and intense dovish bets on the Federal Reserve (Fed). In response to the circulating sentiment built around Chair Jerome Powell's forthcoming statements at the Jackson Hole assembly that begins on Thursday, market investors are focusing on potential disclosures regarding future Fed rate cuts.
Despite this evolution, the US economic outlook remains resilient. Comprehensive scrutiny of recent data consolidates the fact that the US economy still persists in growing above its trend. This indicates a recurrent market narrative inclined toward the anticipation of aggressive loosening in monetary policy.
Daily digest of market movers: DXY Index reaches seven-month low ahead of Jackson Hole Symposium
- At the start of the week, the DXY Index has been recording a consistent fall, now at its lowest mark in seven months against all major global currencies.
- The US economy, in contrast, showcases stability with a benign rate of inflation and solid domestic demand.
- The marketplace, notwithstanding, speculates an imminent dovish spree by the Fed starting in September. Yet the non-aligned reality of the US economy and a hawkish stance from the Fed brings forth a potential resurgence opportunity for the DXY Index in future trade sessions. Jerome Powell’s words at the Jackson Hole Symposium will be key.
- While the odds of a sharp 50 bps cut in September have come down, the market still anticipates nearly 100 bps of total easing by year-end.
- This also extends to 175-200 bps of easing over the impending 12 months.
DXY technical analysis: Bearish dominance persists as DXY Index exits sideways movement
Despite continuous efforts by the buyers, the DXY’s technical outlook has assumed a clearer bearish shade. The DXY Index came out of its sideways trading phase in the band of 102.50-103.30, which is a likely windfall for sellers. The momentum-oriented Relative Strength Index (RSI) took a major hit, falling into the oversold terrain with the Moving Average Convergence Divergence (MACD) manifesting increasing red bars. This firmly suggests an entrenched bearish dominance toward the DXY.
Support Levels: 101.50, 101.30, 101.20
Resistance Levels: 102.00, 102.50, 103.00
US Dollar FAQs
The US Dollar (USD) is the official currency of the United States of America, and the ‘de facto’ currency of a significant number of other countries where it is found in circulation alongside local notes. It is the most heavily traded currency in the world, accounting for over 88% of all global foreign exchange turnover, or an average of $6.6 trillion in transactions per day, according to data from 2022. Following the second world war, the USD took over from the British Pound as the world’s reserve currency. For most of its history, the US Dollar was backed by Gold, until the Bretton Woods Agreement in 1971 when the Gold Standard went away.
The most important single factor impacting on the value of the US Dollar is monetary policy, which is shaped by the Federal Reserve (Fed). The Fed has two mandates: to achieve price stability (control inflation) and foster full employment. Its primary tool to achieve these two goals is by adjusting interest rates. When prices are rising too quickly and inflation is above the Fed’s 2% target, the Fed will raise rates, which helps the USD value. When inflation falls below 2% or the Unemployment Rate is too high, the Fed may lower interest rates, which weighs on the Greenback.
In extreme situations, the Federal Reserve can also print more Dollars and enact quantitative easing (QE). QE is the process by which the Fed substantially increases the flow of credit in a stuck financial system. It is a non-standard policy measure used when credit has dried up because banks will not lend to each other (out of the fear of counterparty default). It is a last resort when simply lowering interest rates is unlikely to achieve the necessary result. It was the Fed’s weapon of choice to combat the credit crunch that occurred during the Great Financial Crisis in 2008. It involves the Fed printing more Dollars and using them to buy US government bonds predominantly from financial institutions. QE usually leads to a weaker US Dollar.
Quantitative tightening (QT) is the reverse process whereby the Federal Reserve stops buying bonds from financial institutions and does not reinvest the principal from the bonds it holds maturing in new purchases. It is usually positive for the US Dollar.
The JPY has been on a wild ride in recent weeks, gaining over 14% against the US Dollar (USD) in just 18 trading days before retreating about 4% to stabilize around 147. Structurally, we continue to expect a weaker JPY, albeit now from a higher level, Commerzbank’s FX strategist Volkmar Baur notes.
USD/JPY to strengthen over the course of next year
“USD/JPY has had a wild ride in recent weeks. First came lower than expected inflation figures from the US, closely followed by a series of well-timed interventions by the Bank of Japan (BoJ) in the currency market. The BoJ then surprised everyone by raising interest rates, while the Fed announced on the same day that it would cut rates in September, before a weak US jobs report two days later sent USD/JPY even lower.”
“In 18 trading days, the JPY gained over 14% against the USD. However, this was not entirely to the liking of the BoJ. As a result of its subsequent verbal intervention, the JPY lost nearly 4%. All in all, USD/JPY has now stabilized at just under 147 instead of around 160. This is despite the fact that not much has changed fundamentally on the Japanese side. But let's take it one step at a time.”
“We expect the USD to regain some ground against the JPY by the end of the year. The BoJ's latest rate hike should then lead to a temporary strengthening of the JPY until it becomes clear that a real rate hike cycle is not on the cards. We therefore expect the JPY to weaken again and USD/JPY to strengthen over the course of next year.”
- EUR/GBP declined to 0.8525 during Tuesday's session, within an ongoing range-bound movement.
- Indicators project conflicting cues but overall suggest a steady selling pressure.
- The cross is about to close a bullish crossover between the 20 and 100-day SMA which would be a buy signal.
In Tuesday's session, the EUR/GBP pair modestly fell to 0.8525, continuing its range-bound movement. Technical indicators provide contradictory signals, suggesting a neutral outlook with a slight bearish bias. On the positive side, a bullish catalyst might be a crossover between the 20 and 100-day Simple Moving Averages (SMA) at the 0.8500 level.
The Relative Strength Index (RSI) remains flat at 54, indicating moderate selling pressure. However, the Moving Average Convergence Divergence (MACD) is forming rising red bars, pointing to growing bearish momentum and the possibility of a strong reversal. Volume patterns have been mixed, with lower volume in recent sessions compared to earlier spikes in the month.
EUR/GBP daily chart
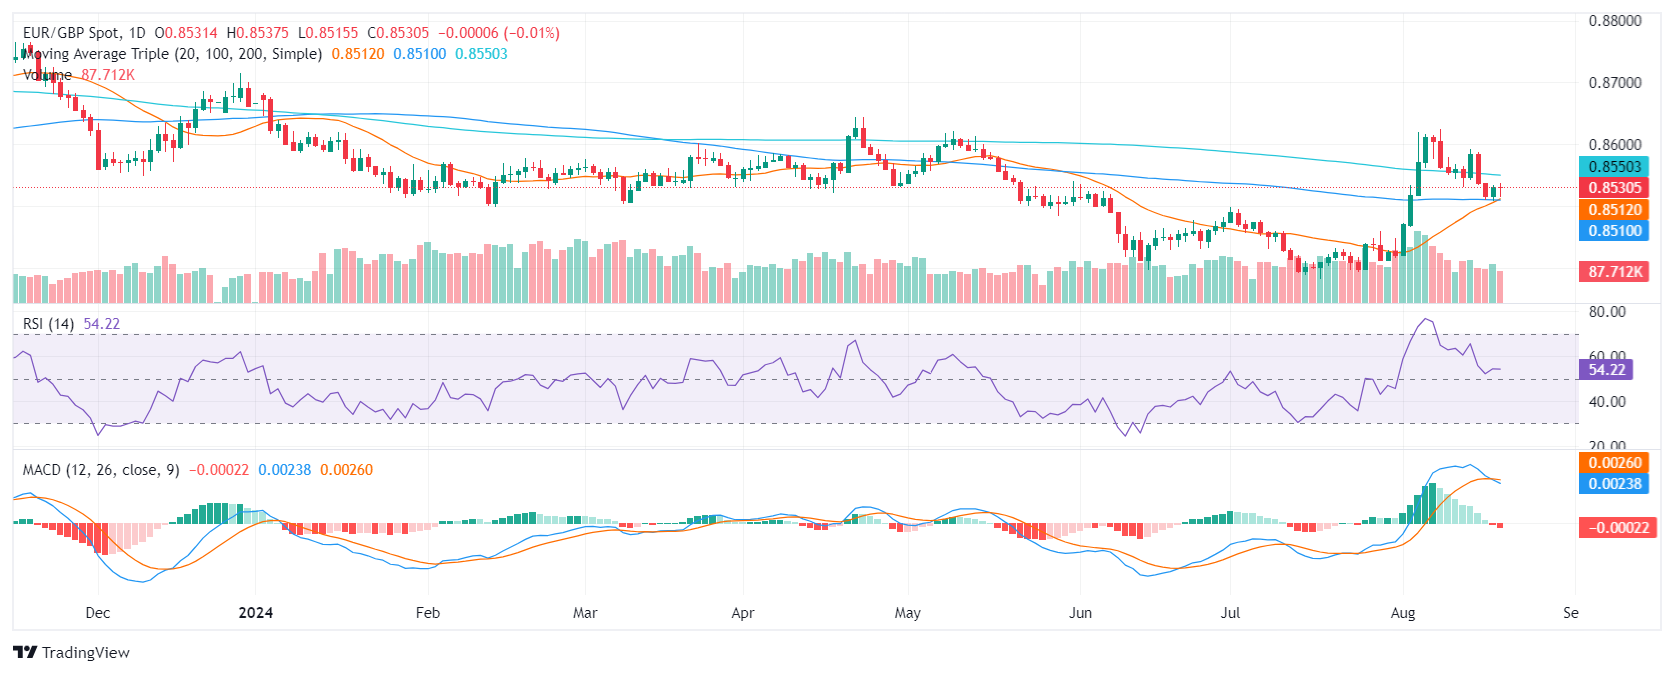
The EUR/GBP pair has been consolidating within the range of 0.8500-0.8550. A breach above 0.8550 could signal a bullish trend, while a drop below 0.8500 might increase the likelihood of continued downward movement. Key support levels to monitor include 0.8450 and 0.8400, while resistance levels to consider include 0.8580 and 0.8600.
Through most of this year, EUR/USD has been contained by a 1.10 to 1.06 range. During the past few sessions, the currency pair has mostly held levels above 1.10 which raises the question as to whether a new range is being drawn out, Rabobank’s Senior FX Strategist Jane Foley notes.
EUR/USD to trade in the 1.09/1.10 range
“As we argued earlier this month, we see upside risks for EUR/USD as likely to be associated with a softer USD rather than a broadly stronger EUR. These could be related to a weaker than expected US economy which would have implications for Fed rates or a Harris win in the November election.”
“This raises the question as to whether Fed rate cut hopes are still overdone and the risk of near-term dips back below 1.10. The recent softness in the USD may also reflect the view that the interest in ‘Trump trades’ that followed the disastrous TV debate between Biden and Trump in June may have been premature in view of Harris’ relatively better performance in the polls.”
“Although Harris’ policies of a capital gains increase and efforts to limit food price gouging have not gone down well with free market economists, they are aimed squarely at mustering up support among consumers and may boost her position in the polls. On balance, while we can not rule out another dip to the EUR/USD1.08 area in the weeks ahead, we expect EUR/USD to 1.09/1.10 area to become more comfortable for EUR/USD in the coming months.”
Europe’s current account surplus reached EUR 51bn in June, EUR 370bn (2.5% GDP) in the 12 months to June. Including what is happening with the capital account, the data show that European MFIs increased their holdings of foreign assets by EUR 547bn in the last year, and for what it’s worth, the Euro system’s reserves are now EUR 1,267.5bn, Société Generale FX strategist Kit Juckes notes.
Europe’s impressive balance of payments
“This balance of payments boom is a reaction to the Euro’s collapse in 2022. EUR/USD fell from 1.24 to 0.96 amidst a shocking terms of trade crisis and a US economic recovery. Since then, the terms of trade have improved, the trade position has recovered, but the currency, even at 1.10, is only half-way back to where it was against the dollar.”
“The current account position is a combination of a ‘cheap’ currency and a lack of European demand. European imports are 25% lower than they were at the peak of the energy crisis. The capital account data, meanwhile, highlight the enthusiasm with which European investors have been buying foreign assets.”
“If Europe could run this kind of balance of payments with a combination of stronger domestic demand and strong domestic investment, the Euro would be heading back to 1.30. But even so, the message of the data is that the Euro has recovered less from the 2022 terms of trade shock, than the Eurozone economy has. That helps put a floor under the Euro.”
Copper continued to gain last week, although it gave back some ground this morning. The brightening global economic picture prevailed last week. Markets have moved on from the turbulence caused by the weak US employment report earlier in the month and are now pricing in an environment of weaker growth, but not recession. This helps the cyclically sensitive Copper. Earlier this week, further details on Chinese foreign trade also helped, Commerzbank’s FX Analyst Volkmar Baur notes.
Copper continues to gain
“During the rise, Copper was able to shrug off the news that a strike at the world's largest Copper mine, Escondida in Chile, had been settled after just a few days. The mine alone accounts for around 5% of the world's Copper ore supply and has often been the scene of lengthy strikes in the past.”
“In July, exports of unwrought Copper and Copper products were again significantly lower than in the previous month. At around 141,000 tons, they are still at a very high level, but also well below the record level of 233,000 tons in the previous month. After two months of rapid increases, the decline eases concerns that China is dumping more and more Copper onto the world market due to weak domestic demand.”
“This week's flash estimates for the manufacturing PMIs in the advanced economies will be key, as they have been trending lower in recent months. In addition, the monthly report from the International Copper Study Group should provide some insight into the extent to which the Copper market remains oversupplied.”
Oil prices have been under pressure since Friday, with prices falling by 5%. As a result, Brent fell to $77 per barrel in the morning and is now trading only around $2 above the 7-month low recorded two weeks ago, Commerzbank’s commodity strategist Carsten Fritsch notes.
Hopes of a ceasefire in the Gaza Strip
“New hopes of a ceasefire in the Gaza Strip, which would also significantly reduce the risk of an Iranian retaliatory strike on Israel, are cited as the reason for the price slide. US Secretary of State Blinken, who is currently in Israel, has described the current efforts as the best and possibly the last chance for a ceasefire and has urged the conflict parties to cave in.”
“However, based on the experience of recent months, it is rather uncertain whether this will happen. It therefore seems premature to price out the geopolitical risk premium. Another explanation for the current price weakness is demand concerns as a result of the recently weaker data from China.”
“In addition, OPEC and the IEA cited weaker demand from China as the reason for the downward revisions in oil demand. We consider the price decline since Friday to be exaggerated. An increase in OPEC+ oil production from October has now become even less likely. We therefore expect prices to rebound soon.”
- USD/CHF slides below 0.8600 amid weakness in the US Dollar.
- Investors want to know how much the Fed will reduce interest rates in September.
- Market participants should brace for high volatility amid an eventful US week.
The USD/CHF pair faces an intense sell-off and slides below the round-level support of 0.8600 in Tuesday’s North American session. The Swiss Franc asset plummets as the US Dollar (USD) has declined to a multi-month low as investors seemed to be strongly confident that the Federal Reserve (Fed) will start reducing interest rates from the September meeting.
Market sentiment is favorable for risky assets on Fed potential rate cuts in September. The S&P 500 has opened on a positive note, exhibiting further improvement in investors’ risk appetite. The US Dollar Index (DXY), which tracks the Greenback’s value against six major currencies, slumps to near 101.65, the lowest level seen in more than seven months.
This week, investors should brace for more volatility as the Federal Open Market Committee (FOMC) minutes and the preliminary United States (US) S&P Global PMI for August are lined up for release. However, investors will majorly focus on Fed Chair Jerome Powell’s speech at the Jackson Hole (JH) Symposium on August 22-24.
Investors would look for cues about how much the Fed will cut interest rates in September and the entire year. According to the CME FedWatch tool, 30-day Federal Finds Futures pricing data shows that the likelihood of 50 basis points (bps) interest-rate reduction has diminished to 26.5% from 53%, recorded a week ago.
In the Swiss region, market participants want to see more cues about whether the Swiss National Bank (SNB) will continue its policy-easing cycle in September. The SNB has already reduced interest rates by 50 basis points (bps) to 1.25% this year.
US Dollar FAQs
The US Dollar (USD) is the official currency of the United States of America, and the ‘de facto’ currency of a significant number of other countries where it is found in circulation alongside local notes. It is the most heavily traded currency in the world, accounting for over 88% of all global foreign exchange turnover, or an average of $6.6 trillion in transactions per day, according to data from 2022. Following the second world war, the USD took over from the British Pound as the world’s reserve currency. For most of its history, the US Dollar was backed by Gold, until the Bretton Woods Agreement in 1971 when the Gold Standard went away.
The most important single factor impacting on the value of the US Dollar is monetary policy, which is shaped by the Federal Reserve (Fed). The Fed has two mandates: to achieve price stability (control inflation) and foster full employment. Its primary tool to achieve these two goals is by adjusting interest rates. When prices are rising too quickly and inflation is above the Fed’s 2% target, the Fed will raise rates, which helps the USD value. When inflation falls below 2% or the Unemployment Rate is too high, the Fed may lower interest rates, which weighs on the Greenback.
In extreme situations, the Federal Reserve can also print more Dollars and enact quantitative easing (QE). QE is the process by which the Fed substantially increases the flow of credit in a stuck financial system. It is a non-standard policy measure used when credit has dried up because banks will not lend to each other (out of the fear of counterparty default). It is a last resort when simply lowering interest rates is unlikely to achieve the necessary result. It was the Fed’s weapon of choice to combat the credit crunch that occurred during the Great Financial Crisis in 2008. It involves the Fed printing more Dollars and using them to buy US government bonds predominantly from financial institutions. QE usually leads to a weaker US Dollar.
Quantitative tightening (QT) is the reverse process whereby the Federal Reserve stops buying bonds from financial institutions and does not reinvest the principal from the bonds it holds maturing in new purchases. It is usually positive for the US Dollar.
- EUR/GBP’s short-term trend is in doubt.
- The pair continues declining after the August 8 high, however, the move is shallow.
- There is a risk the prior uptrend could still resume, handing control back to bulls.
EUR/GBP underwent a strong rally in late July and early August. The rally eventually peaked on August 8 at 0.8625 and started moving lower.
The pair formed a falling channel which reached a new low of around 0.8507 on Monday. This was also the midpoint of the prior move – or the 0.5 Fibonacci retracement level of the rally from the July 17 low.
EUR/GBP 4-hour Chart
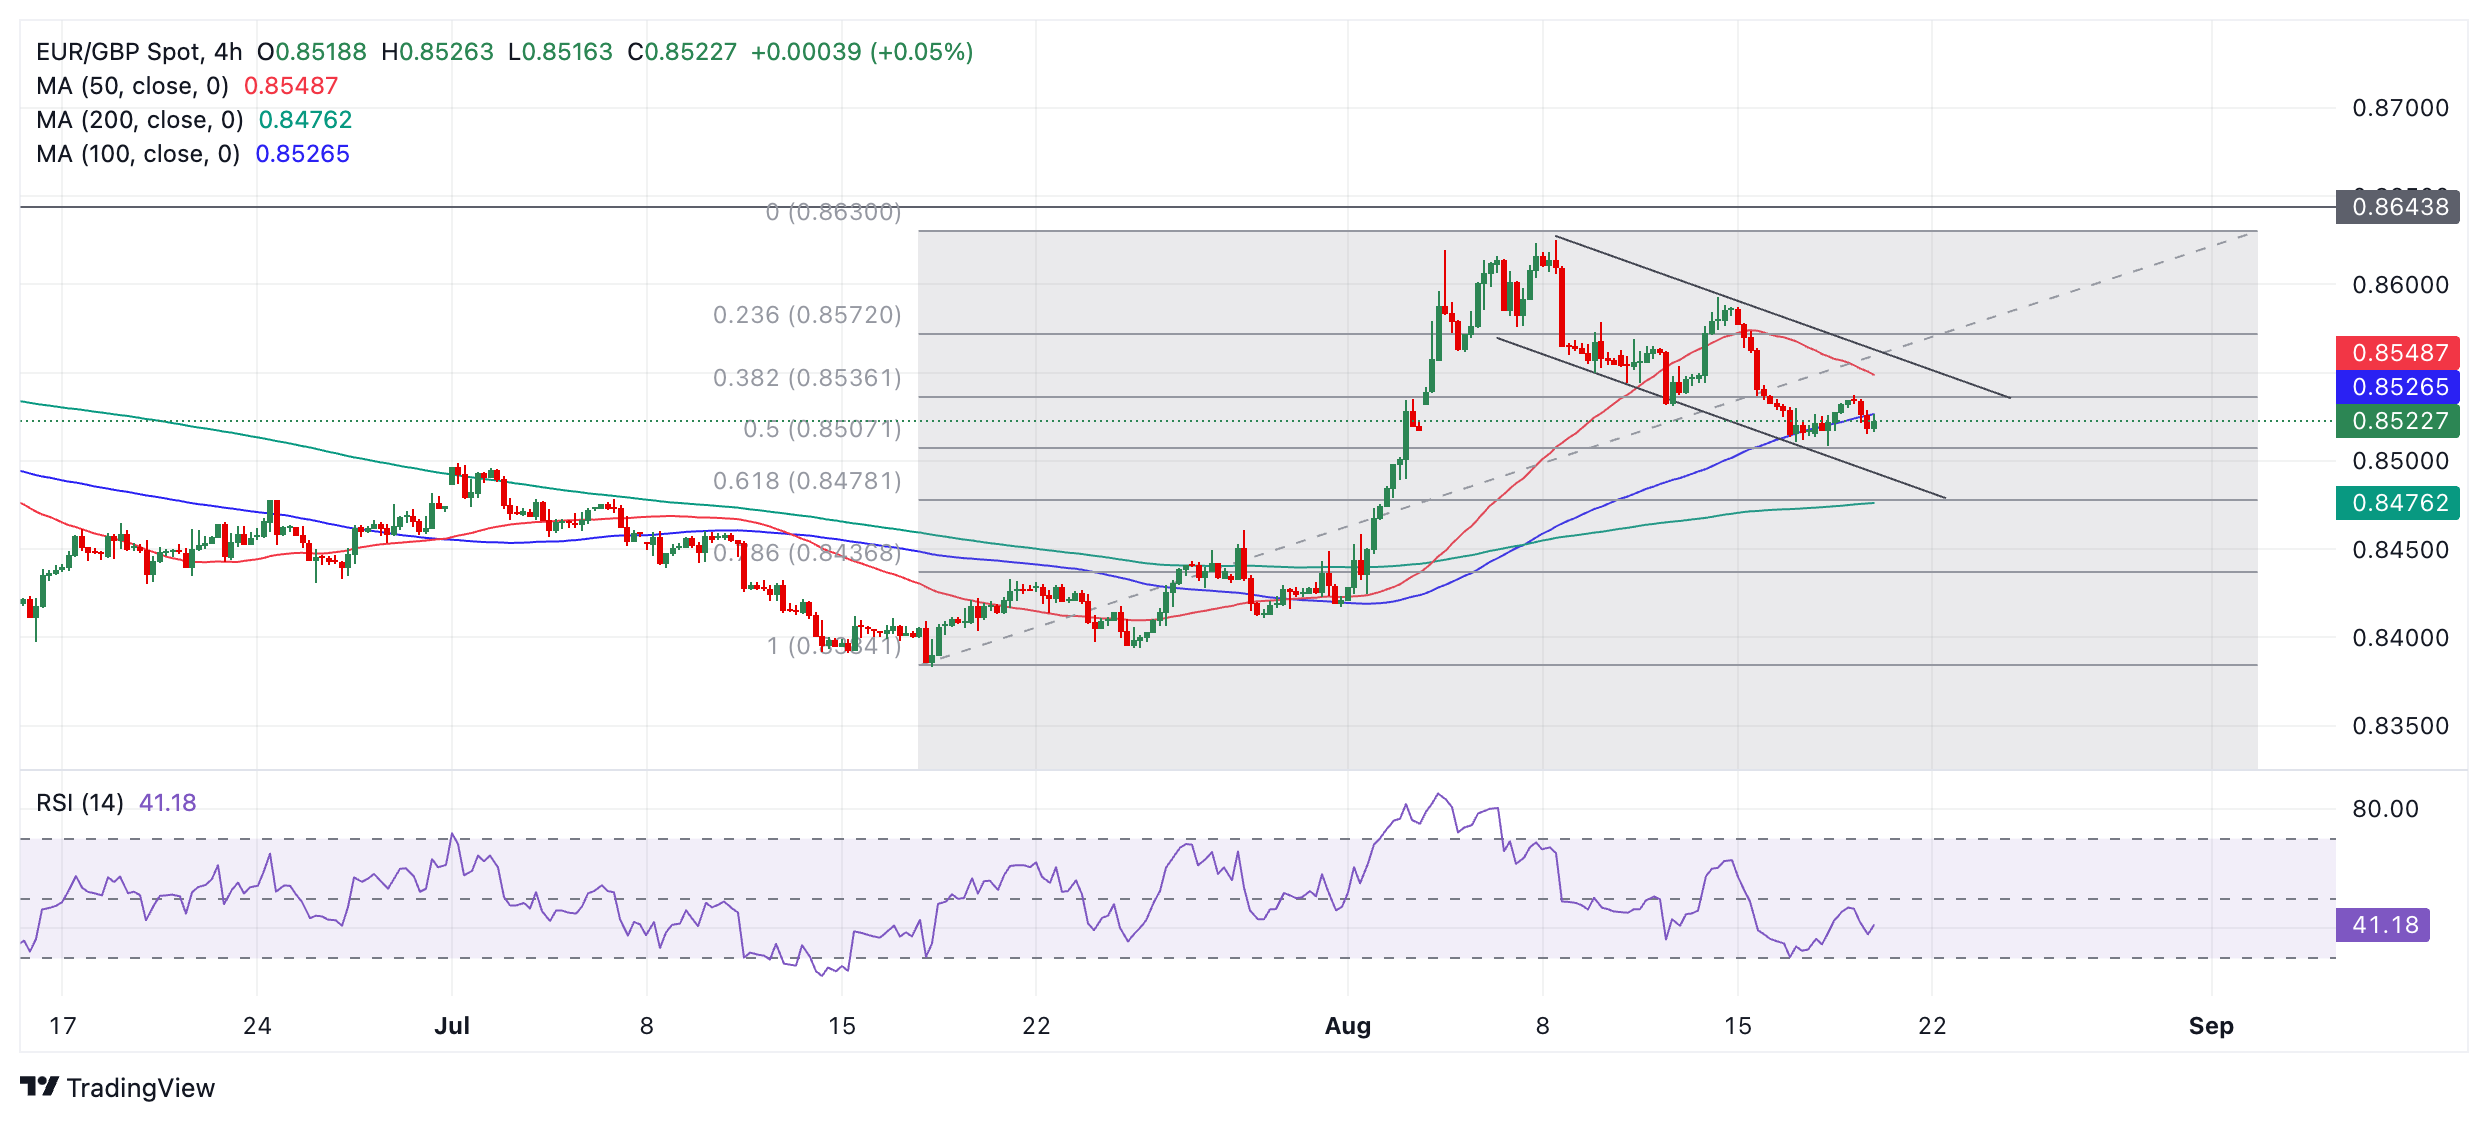
The move down from the August 8 high has extended quite far and established a new sequence of declining peaks and troughs. This could indicate the trend has changed to a short-term downtrend. If so – and given “the trend is your friend” – the odds would now favor shorts over longs.
However, the rally from the July 17 low was quite a bit steeper than the falling channel, indicating bullish conviction has been stronger than bearish conviction. If so, then this might mean that the decline since the August 8 high is in fact merely a correction of the previous rally, and not a new short-term downtrend. If so, the climate still favors longs over shorts.
Either interpretation is valid so the direction of the short-term trend remains doubtful. It would require a strong bullish reversal candlestick pattern to suggest the possibly still-intact uptrend was resuming. An upside breakout from the falling channel could also be a sign of the resumption of the bullish trend.
Likewise, it is also possible the bearish channel could continue falling. In such a scenario, EUR/GBP might next fall to the 0.618 Fibonacci retracement ratio at 0.8478. The 200-period Simple Moving Average (SMA) is also nearby and could provide a downside target for price. ¡
The long-term trend (weekly chart) is still bearish whilst the medium-term trend is bullish, further confusing the technical picture.
- The Swedish Krona strengthened further vs. EUR, and USD.
- The Riksbank reduced its policy rate by 25 bps, as anticipated.
- The Riksbank left the door open to further interest rate cuts.
The Swedish Krona (SEK) gathers extra pace and drags EUR/SEK to new multi-week lows near 11.3600 on Tuesday.
The Riksbank said more rate cuts are coming
In fact, EUR/SEK drops for the third day in a row, breaking the key 200-day SMA, after the Riksbank trimmed its policy rate by 25 bps to 3.50% at its meeting earlier on Tuesday, matching the broad consensus.
The bank also suggested that it might accelerate policy easing if price pressures do not intensify. Indeed, the Riksbank noted that if the inflation outlook remains unchanged, the policy rate could be reduced two or three more times this year, which would be somewhat faster than the Executive Board's assessment in June.
EUR/SEK important levels
At the moment, EUR/SEK retreats by 0.41% to 11.3803. The loss of. The August low of 11.3655 (August 20) could pave the way for a potential test of the July low of 11.3055 (July 3) ahead of the June bottom of 11.1420 (June 11). On the upside, initial resistance emerges at the weekly top of 11.5726 (August 15), prior to the 2024 peak of 11.7782 (July 25) and the November 2023 high of 11.8416 (November 2).
- USD/CAD recovers from 1.3600 as an expected decline in Canada’s inflation data boosts BoC’s more rate cut hopes.
- Canada’s annual headline CPI decelerates to 2.5% as expected.
- Investors await Fed Powell’s speech at the Jackson Hole Symposium.
The USD/CAD pair rebounds sharply from the round-level support of 1.3600 in Tuesday’s New York session after the release of Canada’s Consumer Price Index (CPI) data for July.
The Canadian CPI report showed that the annual headline inflation decelerated to 2.5%, as expected, from 2.7% in June. In the same period, the Bank of Canada’s (BoC) core CPI, which excludes the eight most volatile components, grew at a slower pace of 1.7% from the prior release of 1.9%.
However, monthly headline inflation grew strongly by 0.4% after deflating in June. Economists estimated the headline CPI to have grown by 0.3%.
Consistently easing price pressures have prompted expectations of more interest rate cuts by the BoC. The BoC has already reduced its key borrowing rates by 50 basis points (bps) to 4.5% since its July policy meeting.
Meanwhile, the commodity-linked Canadian Dollar (CAD) is also expected to face pressure due to weak Oil prices. Rising expectations of a ceasefire between Iran and Israel have resulted in diminishing Oil supply worries, prompting weakness in its prices. It is worth noting that Canada is the largest exporter of Oil to the United States (US) and lower Oil prices result in a decline in foreign inflows to the former.
In the neighboring nation, investors await the Federal Reserve (Fed) Chair Jerome Powell’s speech at the Jackson Hole Symposium on August 22-24. Fed Powell is expected to provide cues on how much the central bank will cut interest rates this year. This will have a significant impact on the US Dollar (USD).
At the time of writing, the US Dollar Index (DXY), which tracks the Greenback’s value against six major currencies, declines to a more-than-seven-month low near 101.70.
Canadian Dollar FAQs
The key factors driving the Canadian Dollar (CAD) are the level of interest rates set by the Bank of Canada (BoC), the price of Oil, Canada’s largest export, the health of its economy, inflation and the Trade Balance, which is the difference between the value of Canada’s exports versus its imports. Other factors include market sentiment – whether investors are taking on more risky assets (risk-on) or seeking safe-havens (risk-off) – with risk-on being CAD-positive. As its largest trading partner, the health of the US economy is also a key factor influencing the Canadian Dollar.
The Bank of Canada (BoC) has a significant influence on the Canadian Dollar by setting the level of interest rates that banks can lend to one another. This influences the level of interest rates for everyone. The main goal of the BoC is to maintain inflation at 1-3% by adjusting interest rates up or down. Relatively higher interest rates tend to be positive for the CAD. The Bank of Canada can also use quantitative easing and tightening to influence credit conditions, with the former CAD-negative and the latter CAD-positive.
The price of Oil is a key factor impacting the value of the Canadian Dollar. Petroleum is Canada’s biggest export, so Oil price tends to have an immediate impact on the CAD value. Generally, if Oil price rises CAD also goes up, as aggregate demand for the currency increases. The opposite is the case if the price of Oil falls. Higher Oil prices also tend to result in a greater likelihood of a positive Trade Balance, which is also supportive of the CAD.
While inflation had always traditionally been thought of as a negative factor for a currency since it lowers the value of money, the opposite has actually been the case in modern times with the relaxation of cross-border capital controls. Higher inflation tends to lead central banks to put up interest rates which attracts more capital inflows from global investors seeking a lucrative place to keep their money. This increases demand for the local currency, which in Canada’s case is the Canadian Dollar.
Macroeconomic data releases gauge the health of the economy and can have an impact on the Canadian Dollar. Indicators such as GDP, Manufacturing and Services PMIs, employment, and consumer sentiment surveys can all influence the direction of the CAD. A strong economy is good for the Canadian Dollar. Not only does it attract more foreign investment but it may encourage the Bank of Canada to put up interest rates, leading to a stronger currency. If economic data is weak, however, the CAD is likely to fall.
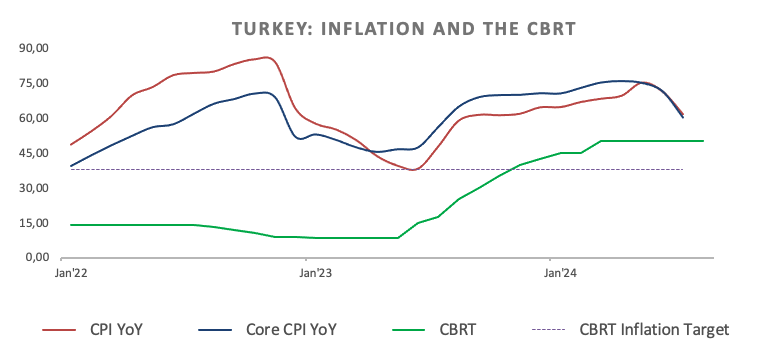
- The Turkish currency sinks to record lows vs. the US Dollar.
- The CBRT left its One-Week Repo Rate unchanged at 50.00%.
- The central bank said it will maintain its restrictive stance.
The Turkish lira weakens further and sends USD/TRY to fresh all-time highs in levels shy of the 34.0000 barrier on Tuesday.
The CBRT kept rates unchanged, as expected
USD/TRY extended its uptrend for yet another session on Tuesday, marking its fifth daily gain in a row so far.
Extra losses in TRY accelerated after the Turkish central bank (CBRT) maintained its One-Week Repo Rate at 50.00% for the fifth month in a row at its meeting on Tuesday.
The bank indicated that the underlying trend of monthly inflation had edged up slightly in July but remained below its second-quarter average. It also reiterated its commitment to maintaining a tight monetary stance until it observes "a significant and sustained decline in the underlying trend of monthly inflation" and expectations align with the projected forecast range.
The statement also mentioned that the monetary policy stance would be tightened if a significant and persistent deterioration in inflation is anticipated.
It is worth mentioning that, since 2022, the pair only closed in negative territory in three months (November 2022, August 2023, and May 2024). During that period, the lira depreciated around 165% vs. the Greenback.
USD/TRY levels to watch
At the time of writing, USD/TRY is up by 0.49% to 33.8716 and faces the next barrier at the all-time peak of 33.8737 (August 20). On the downside, there is provisional support at the 55-day SMA of 32.9085, seconded by the weekly low of 32.7623 (July 26) and the July bottom of 32.4595 (July 3).
The Pound Sterling (GBP) is marginally firmer on the day, Scotiabank’s Chief FX Strategist Shaun Osborne notes.
GBP retains a firm undertone
“A soft US Dollar (USD) undertone and technical momentum are the essential drivers of GBP gains absent any major domestic news.”
The GBP retains a firm undertone and, having regained a 1.30 handle, a push on to retest or better the July high at 1.3044 looks a fairly easy reach from here. Bullish trend strength oscillators on the intraday, daily and weekly charts suggest limited scope for GBP losses—look for corrections to be limited to the low/mid 1.29s for now.
A push back under 1.2890/00 would signal a more significant setback, however.
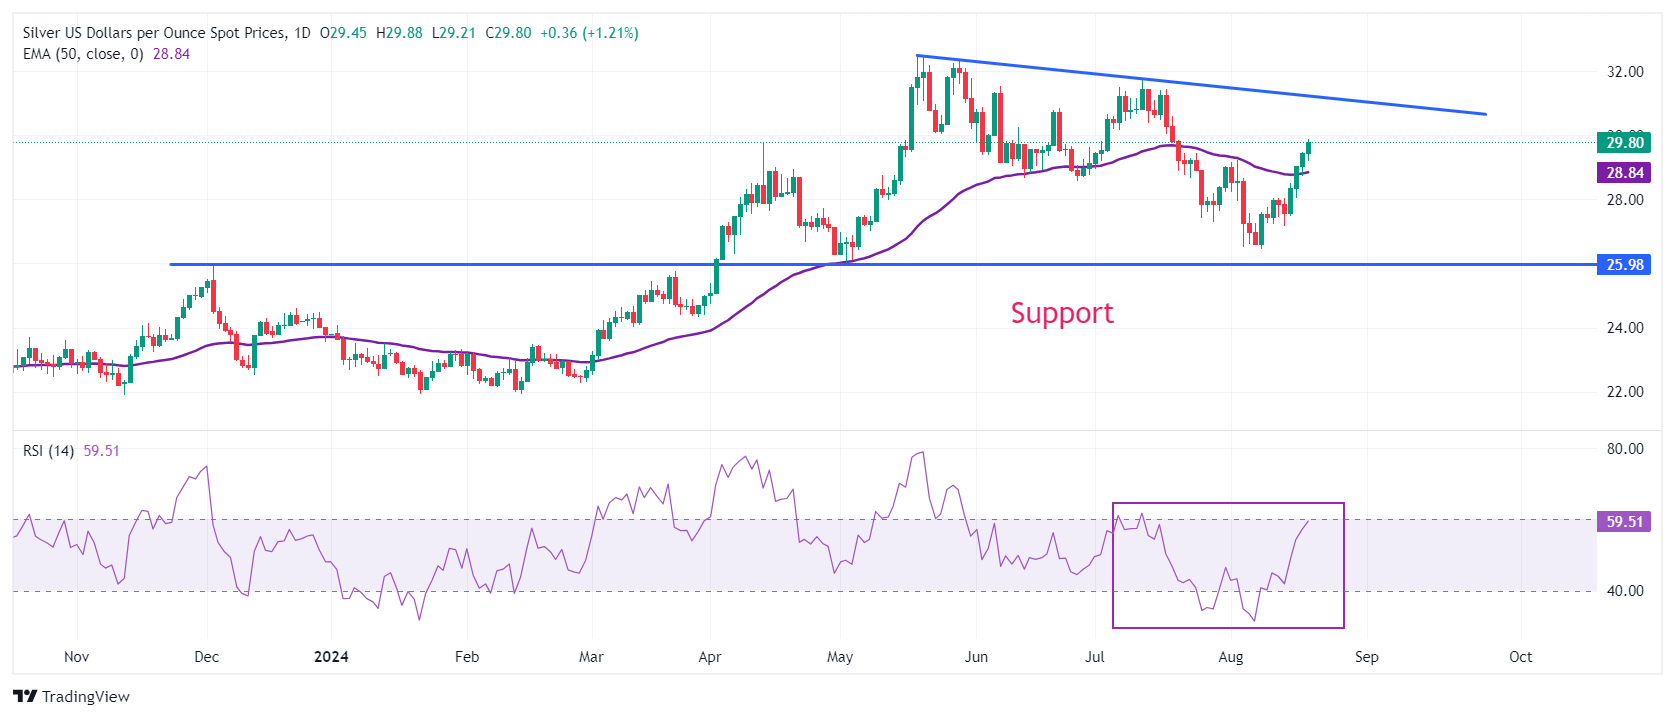
- Silver price surges to near $30.00 as investors seem confident that the Fed will begin reducing interest rates in September.
- Firm Fed rate-cut bets weigh on the US Dollar and bond yields.
- Investors await the FOMC minutes release and Fed Powell’s speech at the Jackson Hole Symposium.
Silver price (XAG/USD) extends its winning spree for the fourth trading session on Tuesday. The white metal soars to near the psychological resistance of $30.00 as the Federal Reserve (Fed) is widely anticipated to start reducing interest rates from the September meeting.
Investors see the Fed begin to reduce interest rates from September amid growing risks to the United States (US) labor market. Also, Fed officials seem confident that price pressures will return to the desired rate of 2%. Firm Fed rate cuts continue to weigh on the US Dollar (USD).
The US Dollar Index (DXY), which tracks the Greenback’s value against six major currencies, seems vulnerable near more-than-seven-months low around 101.76. Also, 10-year US Treasury yields hover near a three-day low of around 3.86%. Lower yields on interest-bearing assets bode well for non-yielding assets, such as Silver, given that they result in lower opportunity costs of holding investments in them.
While the Fed rate cut in September appears to be a done deal, investors want to know how fast the policy-easing process would be. Recently, market participants started anticipating that the Fed could deliver a 50 basis points (bps) interest rate reduction. However, those expectations eased significantly but are still on the horizon.
For more interest rate clarity, investors await the Federal Open Market Committee (FOMC) minutes, which will be published on Wednesday and the August 22-23 Jackson Hole Symposium.
Silver technical analysis
Silver price approaches the slightly downward-sloping trendline plotted from the May 20 high of $32.50 on a daily timeframe. The white metal climbs above 50-day Exponential Moving Average (EMA) near $28.80, suggesting that the short-term trend has become bullish.
The 14-day Relative Strength Index (RSI) rises to near 60.00. A decisive break above the same would result in a bullish momentum.
Silver daily chart
Silver FAQs
Silver is a precious metal highly traded among investors. It has been historically used as a store of value and a medium of exchange. Although less popular than Gold, traders may turn to Silver to diversify their investment portfolio, for its intrinsic value or as a potential hedge during high-inflation periods. Investors can buy physical Silver, in coins or in bars, or trade it through vehicles such as Exchange Traded Funds, which track its price on international markets.
Silver prices can move due to a wide range of factors. Geopolitical instability or fears of a deep recession can make Silver price escalate due to its safe-haven status, although to a lesser extent than Gold's. As a yieldless asset, Silver tends to rise with lower interest rates. Its moves also depend on how the US Dollar (USD) behaves as the asset is priced in dollars (XAG/USD). A strong Dollar tends to keep the price of Silver at bay, whereas a weaker Dollar is likely to propel prices up. Other factors such as investment demand, mining supply – Silver is much more abundant than Gold – and recycling rates can also affect prices.
Silver is widely used in industry, particularly in sectors such as electronics or solar energy, as it has one of the highest electric conductivity of all metals – more than Copper and Gold. A surge in demand can increase prices, while a decline tends to lower them. Dynamics in the US, Chinese and Indian economies can also contribute to price swings: for the US and particularly China, their big industrial sectors use Silver in various processes; in India, consumers’ demand for the precious metal for jewellery also plays a key role in setting prices.
Silver prices tend to follow Gold's moves. When Gold prices rise, Silver typically follows suit, as their status as safe-haven assets is similar. The Gold/Silver ratio, which shows the number of ounces of Silver needed to equal the value of one ounce of Gold, may help to determine the relative valuation between both metals. Some investors may consider a high ratio as an indicator that Silver is undervalued, or Gold is overvalued. On the contrary, a low ratio might suggest that Gold is undervalued relative to Silver.
Commerzbank’s experts continue to expect Silver to end the year at $30 per troy ounce, Platinum at $1,100 per troy ounce and Palladium at $1,050 per troy ounce. They are taking into account that the recent rise in the Gold price to a record level has failed to have an effect on the three precious metals mentioned above, Commerzbank’s commodity analyst Carsten Fritsch notes.
Forecasts for the other three precious metals remain unchanged
“This is probably due to the weak price trend in base metals, the reason for which we discussed above. This is because silver, Platinum and Palladium each have a high industrial use, meaning that economic concerns have a negative impact on price trends.”
“We think that silver, Platinum and Palladium will catch up slightly with Gold next year, as the economic outlook is likely to brighten as a result of the interest rate cuts. In addition, supply deficits are looming for all three markets, which should also have a positive impact on price developments.”
“For the end of 2025, we expect a silver price of $33 per troy ounce (previously $31), a Platinum price of $1,250 per troy ounce and a Palladium price of $1,200 per troy ounce (unchanged in both cases).”
- AUD/USD is taking a breather after a strong rally.
- It is biased to continue rising in line with the trend once the consolidation ends.
- The RSI is overbought but has not yet given a sell signal.
AUD/USD has established a sequence of rising peaks and troughs on the 4-hour chart since it recovered from the August 5 lows. The sequence of higher highs and lows is indicative of a short-term uptrend, which given “the trend is your friend” is biased to continue.
AUD/USD 4-hour Chart
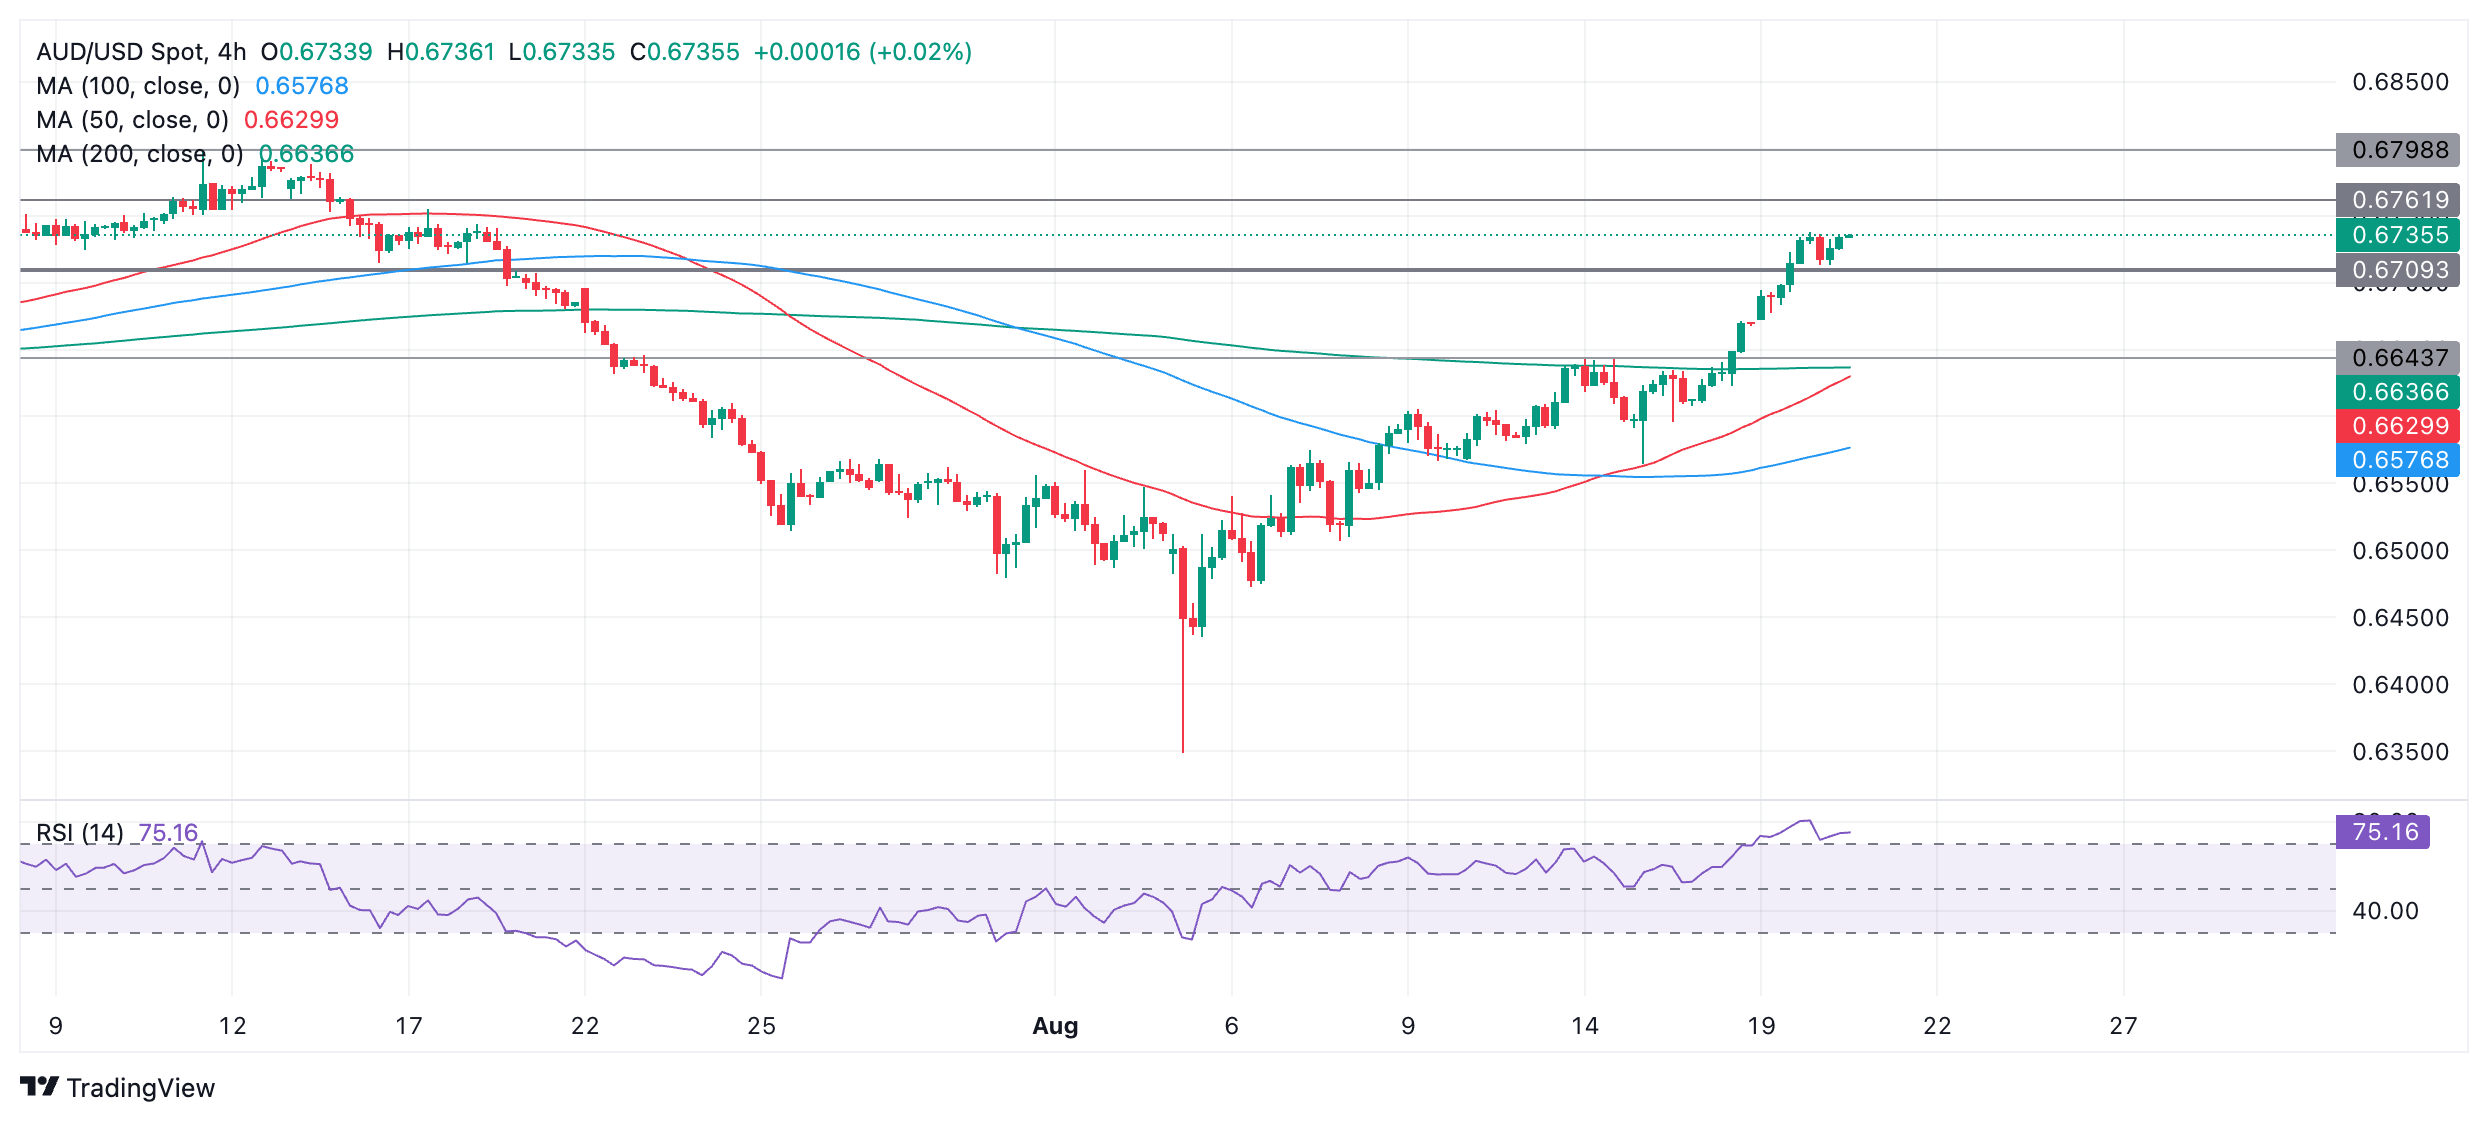
The pair has stalled over the last few periods and started to trade sideways in the 0.6730s. A close above 0.6740, however, would probably indicate the start of a continuation higher.
Further resistance lies at 0.6760 followed by 0.6799, the July 11 high.
The Relative Strength Index (RSI) is in overbought territory, increasing the chances of a pull back. For confirmation of a correction in price, however, the RSI would have to exit overbought and re-enter neutral territory.
Despite the overbought RSI, AUD/USD could still go higher, although long holders are not advised to add to their existing positions whilst RSI remains above 70.
The Euro (EUR) is showing a marginal loss on the day on the screens but EUR/USD has essentially moved sideways in a narrow range overnight as the market consolidates around the EUR’s highest point since the start of the year, Scotiabank’s Chief FX Strategist Shaun Osborne notes.
A correction or consolidation in the bull run
“While much attention falls on the Fed policy outlook as a driver of EUR/USD gains, the ECB cannot be overlooked. Markets remain very confident that another 25bps ease is coming on September 12th but there are some clear, potential impediments to a ‘data dependent’ ECB cutting rates again.”
“Policy hawks were concerned about the level of wage gains in Q1. Germany’s Bundesbank reported today that collective earnings agreements rose 4.2% in the spring which, according to the Bundesbank, will keep inflation high. The ECB reports Q2 negotiated wage data Thursday and another strong gain in wages could check ECB easing bets.”
“The EUR’s solid bull trend on the chart is driving gains above the 200-week MA (1.1064) and putting the EUR within reach of the late 2023 high at 1.1149. Oscillators are bullishly aligned across the short, medium and long-term DMIs which is helping underpin EUR gains. The intraday and daily DMIs are, however, starting to look very stretched. A correction or consolidation in the bull run is a growing technical risk for the EUR. Support is 1.1000/05.”
The Canadian Dollar (CAD) continues to drift higher. Steady CAD gains over the past three sessions reflect general USD weakness but might also reflect some liquidation of the huge mass of CAD shorts reflected in the recent CFTC data, Scotiabank’s Chief FX Strategist Shaun Osborne notes.
Bulls to test 1.3645/50 near term
“The weaker USD is sitting marginally below my fair value estimate today (1.3619) which may mean limited room for additional losses in the short run. The consensus call for Canadian CPI is +0.4% M/M but there is a wide-ish band of expectations around the outcome. Despite a chunky rise in the July month, headline prices are expected to slow to 2.5% in the year, down from 2.7% in June. Core Median and Trim measures are both expected to decelerate a tenth to 2.5% and 2.8% respectively.”
“Slowing inflation will keep the BoC on track to deliver more easing in the coming months, regardless of what happens outside of Canada. Swaps are pricing in 27bps of easing risk at the September 9th meeting and a total of 74bps of cuts over the three meetings left before year-end. Weaker data may check the rise in the CAD in the short run but swaps look very fully priced already.”
“USD/CAD losses are nearing major support just under the 1.36 point. The USD based around 1.3595 in May and July and the 200-day MA sits at 1.3595 this morning. Technical momentum is bearish on the intraday and daily charts. Weekly oscillators are neutral, but close to turning bearish. A sustained break under 1.3595 would drive more USD losses towards major trend support (1.3475 currently) off the mid-2021 low. Resistance is 1.3645/50.”
- NZD/USD rallies as Kiwi gains support from promising trade data, PBoC decision to keep rates unchanged
- US Dollar continues sell-off to new lows as US central bankers hint at interest rate cuts in September.
- New Zealand trade deficit narrows in July compared to 2023 as exports rise.
NZD/USD is trading over half a percent higher on Tuesday, exchanging hands in the 0.6140s as the US Dollar (USD) continues sinking. The New Zealand Dollar maintains its strength on the back of news that demand for New Zealand exports narrowed the trade deficit in July compared to a year ago.
The New Zealand trade deficit came out at NZ$0.963 billion in July 2024, narrowing from NZ$1.174 billion in the corresponding month of the previous year. The result, however, fell below forecasts of a NZ$331 million surplus. Given the cyclical nature of trade data and concerns sparked by the economic slow down in China which is a major export partner, the data was interpreted as overall positive.
The US Dollar, meanwhile, fell to an eight-month low of 101.80 according to the US Dollar Index (DXY) which measures the USD against a trade-weighted basket of counterparts. The Dollar’s weakness was put down to commentary from US central bankers confirming their willingness to lower interest rates in September. Lower interest rates are negative for a currency as they reduce foreign capital inflows.
On Monday, Federal Reserve Bank of Minneapolis President Neel Kashkari said that it was appropriate to discuss potentially cutting US interest rates in September due to concerns about the weakening labor market, according to Reuters.
His comments came after Chicago Fed President Austan Goolsbee said the economy was “flashing warning signs” in a speech on Sunday, and that the rise in credit card delinquencies was especially concerning.
The New Zealand Dollar is the strongest performing major against the USD on Tuesday. Apart from the optimistic trade data, news that the People’s Bank of China (PBoC) decided to keep its one-year loan prime rate unchanged at its meeting early Tuesday, might have further boosted the NZD as it suggests the Chinese economy may be in slightly better shape than had previously been feared.
According to trade data released by Statistics New Zealand on Monday, New Zealand exports rose by 14% year-over-year in July, reaching NZ$ 6.1 billion. These were mainly driven by higher shipments of milk powder, butter, and cheese (+11%); fruit (+28%); preparations of milk, cereals, flour, and starch (+86%); and Crude Oil (+310%).
New Zealand imports rose by a lower 8.5% driven by higher purchase of petroleum and products (+101%); electrical machinery and equipment (+12%); pharmaceutical products (+32%); and plastic and plastic articles (+13%), according to data from Trading Economics.
Upside for the Kiwi may face resistance, however, given the Reserve Bank of New Zealand’s (RBNZ) decision to make a surprise cut of 0.25% to its policy rate at its meeting last week. Following the meeting, RBNZ Governor Adrian Orr said he is more convinced that inflation has returned to the 1-3% target area, boosting the likelihood of more rate cuts in the future – a potential headwind for the Kiwi going forward.
- Oil price slips for a second day in a row this week.
- Israel Prime Minister Benjamin Netanyahu backs US Secretary of State Antony Blinken’s ceasefire proposal.
- The US Dollar Index eases further as markets embrace a soft landing for the US economy.
Oil retreats for a third consecutive session as tail risks for the commodity ease further. Israel’s Prime Minister Benjamin Netanyahu has confirmed he supports the ceasefire proposal US Secretary of State Antony Blinken has put forward, according to a report from Bloomberg. Even though Hamas still has to have its say about the agreement, the news means a substantial easing in tensions in the MIddle East, avoiding for now any supply disruptions from the region. Meanwhile, traders are adding the US to the list of countries that see sluggish demand for Oil after China was top of the list already earlier with economic activity easing further.
The US Dollar Index (DXY), which tracks the performance of the US Dollar against six major currencies, is easing as well on the back of that assumption that the US economic growth is softening. Markets first feared a recession, though they now seem to embrace the narrative again of a soft landing for the US economy. This narrative, however, hinges on Federal Reserve Chairman Jerome Powell, with markets hoping he will confirm on Friday at the Jackson Hole Symposium that they have got it right this time.
At the time of writing, Crude Oil (WTI) trades at $73.05 and Brent Crude at $76.76.
Oil news and market movers: Easing demand from China
- With Israel supporting the ceasefire proposal, US Secretary of State Antony Blinken said the next step was for Hamas to agree to the proposal aimed at de-escalating the 10-month old conflict in the Middle East, according to Bloomberg.
- Recent China data shows another slowdown in factory activity, which means even less demand ahead from the biggest Oil importer.
- The options markets are feeling the pressure, with Brent Crude options seeing the skew flip in favour of puts for the first time since August, Reuters reports. The potential risk here is that hedge funds still have to cut large portions of their stake in Oil, which could see more bearish sentiment in the option markets.
- MT Newswires reports that US local demand for fuel is still very much supported, with Labor Day travel up 9% year over year according to motor club AAA.
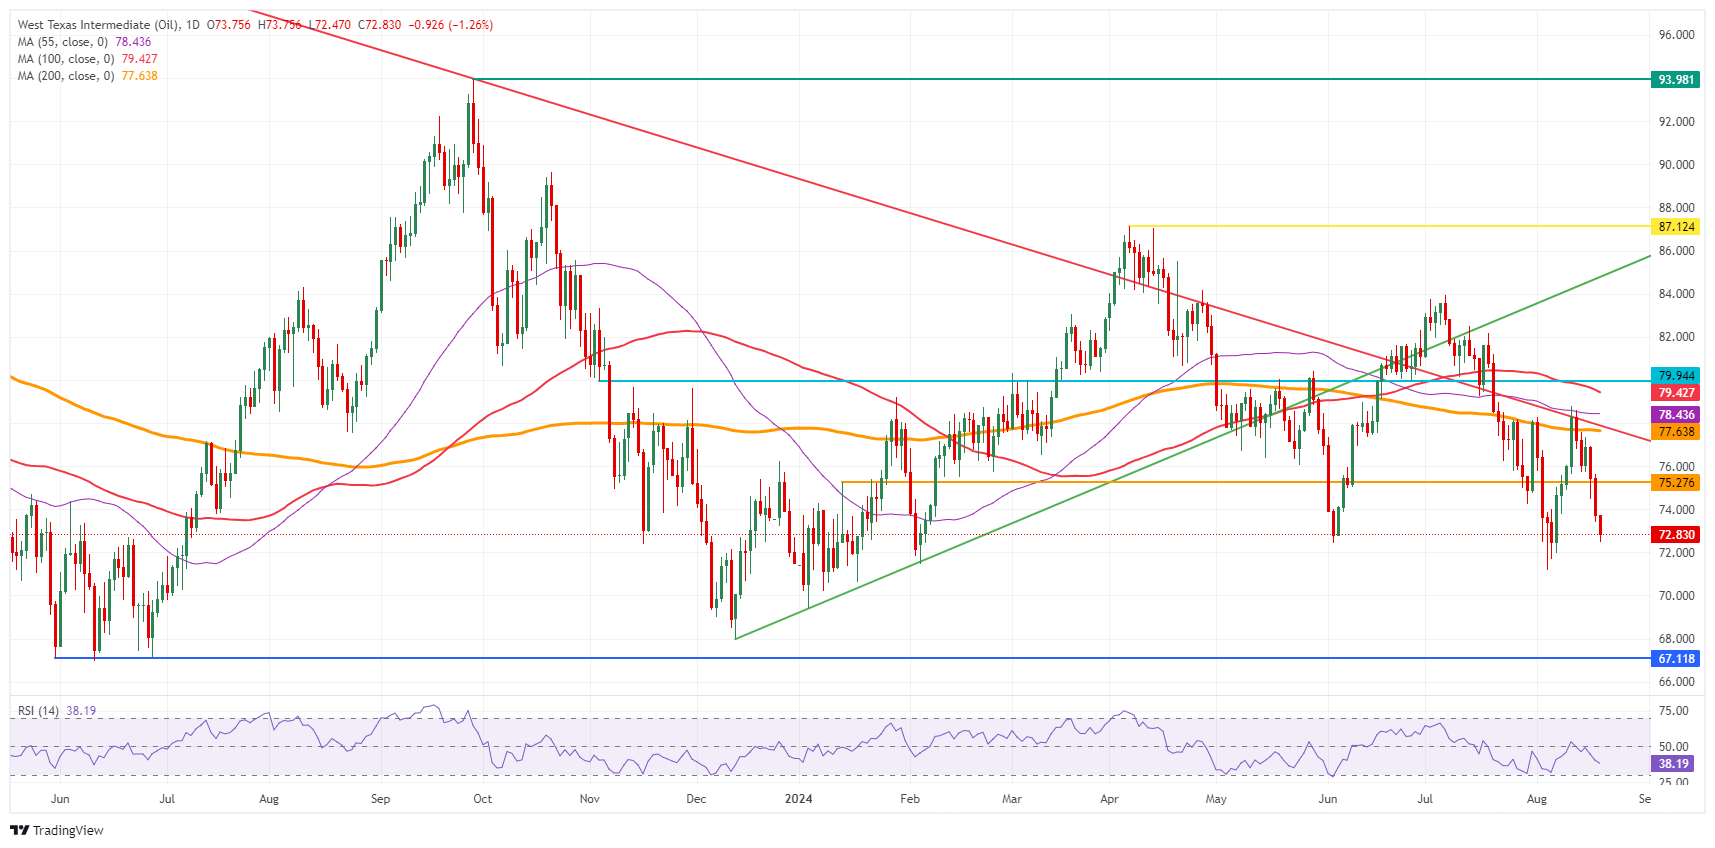
Oil Technical Analysis: On its way
Oil is setting forth its correction as it has entered the $72-region. The move still has more room to go with the Relative Strength Index (RSI) telling sellers that it is not the end of the line just yet. More downside means at least a test towards $70.00, which could be the line in the sand for hedge funds that are still holding on to long positions bought on the speculation of Middle Eastern turmoil.
On the upside, it becomes very difficult to be bullish with a lot of resistance levels nearby. The first element to look out for is the pivotal $75.27. Next up is the double level at $77.65, which aligns with both a descending trendline and the 200-day Simple Moving Average (SMA). In case bulls are able to break above it, the 100-day SMA at $78.45 could trigger another rejection as it did last week.
On the downside, the low from August 5 at $71.17 is the best level for a bounce. It might not be bad to start considering levels below $70.00 in case ceasefire talks reach a breakthrough and hedge funds start selling their speculative stake in Oil contracts. The $68.00 big figure level is the first level to watch followed by $67.11, which is the lowest point from the triple bottom seen back in June 2023.
US WTI Crude Oil: Daily Chart
WTI Oil FAQs
WTI Oil is a type of Crude Oil sold on international markets. The WTI stands for West Texas Intermediate, one of three major types including Brent and Dubai Crude. WTI is also referred to as “light” and “sweet” because of its relatively low gravity and sulfur content respectively. It is considered a high quality Oil that is easily refined. It is sourced in the United States and distributed via the Cushing hub, which is considered “The Pipeline Crossroads of the World”. It is a benchmark for the Oil market and WTI price is frequently quoted in the media.
Like all assets, supply and demand are the key drivers of WTI Oil price. As such, global growth can be a driver of increased demand and vice versa for weak global growth. Political instability, wars, and sanctions can disrupt supply and impact prices. The decisions of OPEC, a group of major Oil-producing countries, is another key driver of price. The value of the US Dollar influences the price of WTI Crude Oil, since Oil is predominantly traded in US Dollars, thus a weaker US Dollar can make Oil more affordable and vice versa.
The weekly Oil inventory reports published by the American Petroleum Institute (API) and the Energy Information Agency (EIA) impact the price of WTI Oil. Changes in inventories reflect fluctuating supply and demand. If the data shows a drop in inventories it can indicate increased demand, pushing up Oil price. Higher inventories can reflect increased supply, pushing down prices. API’s report is published every Tuesday and EIA’s the day after. Their results are usually similar, falling within 1% of each other 75% of the time. The EIA data is considered more reliable, since it is a government agency.
OPEC (Organization of the Petroleum Exporting Countries) is a group of 13 Oil-producing nations who collectively decide production quotas for member countries at twice-yearly meetings. Their decisions often impact WTI Oil prices. When OPEC decides to lower quotas, it can tighten supply, pushing up Oil prices. When OPEC increases production, it has the opposite effect. OPEC+ refers to an expanded group that includes ten extra non-OPEC members, the most notable of which is Russia.
The oil market could see an increase in supply from OPEC+ in the fourth quarter. At least it was announced in June that the voluntary production cuts that have been in place since the beginning of the year would be gradually withdrawn over a period of 12 months from October onwards, Commerzbank’s commodity analyst Carsten Fritsch notes.
Brent oil at $85 per barrel at the end of the year
“Given the current demand trend, the oil market would then be at risk of oversupply from the fourth quarter, or next year at the latest. To prevent this, OPEC+ will have little choice but to postpone the expansion of production and hope for a revival in demand. On the oil market, there are also geopolitical risks due to the tensions in the Middle East.”
“So far, there have been no supply disruptions despite the repeated attacks by Iran-backed Houthi rebels on cargo ships and oil tankers in the Red Sea. However, this could change in the event of a direct confrontation between Iran and Israel. This would be particularly true if oil shipments through the Strait of Hormuz were to be disrupted. Almost a third of seaborne oil supplies and around a fifth of the global oil supply are transported through this strait.”
“In contrast to the Red Sea, rerouting via other transport routes is not possible or only possible to a very limited extent, which would result in a noticeable tightening of the oil market. We consider the risk of this to be low. But, a certain risk premium on the oil price is justified. For this reason, we see the price of Brent oil at $85 per barrel at the end of the year as somewhat higher than the subdued fundamental data would otherwise justify.”
Gold (XAU/USD) price forecast was revised significantly upwards, by $200 to $2,500 per troy ounce, by the end of the year, Commerzbank’s Commodity Analyst Carsten Fritsch notes.
Inflows are still comparatively subdued
“The price is already at this level, so we do not expect Gold to make any further gains for the time being. This is because the main driving force behind the price increase of more than 20% since the end of February has been the expectation of interest rate cuts by the US Federal Reserve. As can be seen from interest rate cuts of around 100 basis points already priced in by the market until the end of the year, not much additional impetus is to be expected here.”
“In addition, the high price level is likely to leave its mark on physical demand, as was already evident in the second quarter. It also remains to be seen whether the central banks will maintain their high level of Gold purchases. There was a trend reversal towards net purchases of Gold ETFs in the summer.”
“However, c. This could change if tensions in the Middle East continue to rise or even escalate. A stronger price increase could then be expected, at least temporarily, due to Gold's role as a safe haven. We expect the Gold price to continue to rise in the first half of 2025 due to further Fed interest rate cuts, a US inflation rate that remains above target and a weaker US dollar.”
Headline SMEI edged down to a 20-month low of 49.6 in August as performance sub-index fell further. All key performance sub-indices, except financing, fell below 50; this suggests broad-based weakening. Expectations sub-index stayed above 50, indicating stable sentiment among SMEs, Standard Chartered economists Hunter Chan and Shuang Ding notes.
Manufacturing is running out of steam
“Our proprietary Small and Medium Enterprise Confidence Index (SMEI; Bloomberg: SCCNSMEI <Index>) dropped to 49.6 in August, the lowest reading since end-2022, after rebounding to 50.4 in July. The overall performance sub-index edged down 0.9pts to 48.8 in August, staying below 50 for a third straight month. Meanwhile, the expectations sub-index stayed above 50 at 50.2.”
“Manufacturing SMEs reported m/m declines in sales and production in August, the first time after Lunar New Year in February. Notably, the new orders sub-index dropped 5.7pts to an eight-month low of 50, despite a rebound in new export orders, suggesting softer domestic demand. The services and trading SME performance sub-index retreated to 48.5 in August, staying in contractionary territory for a third straight month.”
“Banks remained supportive of SME financing. Meanwhile, liquidity conditions worsened from July on a further lengthening of receivables turnover and decline in cash surplus. As a result, the credit sub-index edged down to 49.9 in August. More surveyed SMEs expect the CNY to strengthen against the USD in the coming three months compared to July.”
Friday brought progress on the Mexican governing coalition's (MORENA) planned judicial reform. As a reminder, outgoing President Andrés Manuel López Obrador (AMLO) has been planning a judicial reform for a long time, with one of the most important points being the direct election of all judges by the people, Commerzbank’s FX strategist Tatha Ghose notes.
Judicial reform may weigh on MXN
“These efforts have failed due to the 2/3 majority required to change the constitution, but since the last elections at the beginning of June, this majority is within reach. And the ruling alliance is adamant that it will get the missing votes. At the moment we have to be prepared for the reform to be implemented.”
“The proposal that has now been submitted makes a number of changes to the original proposal - the coalition government emphasises that it has accepted some of the criticism and made more than 100 changes. One of the most important proposed changes is that the election of judges will now take place in stages, the first part probably next year, the second part in 2027.”
|The proposals do not change the fact that we are critical of the basic intention of this reform. We have our doubts, which is why we continue to see the judicial reform as negative for the peso.”
- Gold is extending higher to fresh all-time highs on news of increased Chinese demand.
- A weaker US Dollar is further propelling the precious metal higher.
- Middle East peace talks have hit an impasse, further increasing geopolitical risk.
Gold (XAU/USD) trades up to a new all-time high in the $2,520s on Tuesday on the back of news of solid demand from China, a weakening US Dollar (in which the precious metal is mostly priced), and continued geopolitical risks stemming from the Middle East, where peace talks are at risk of running aground.
Gold at new high after news of Chinese demand
Gold continues rallying on Tuesday on the back of increased safe-haven demand from China. The People’s Bank of China (PBoC) issued new Gold import quotas to banks which “triggered speculation of a renewed wave of demand,” according to broker SP Angel. Safe-haven demand for Gold in China rose after Chinese 10-year Government Bond yields fell to record lows last week and, as a result, “Chinese buyers are seeking alternative safe-haven protection, with Gold an obvious candidate,” added the broker.
Gold is gaining a further lift as the US Dollar pushes to a new low eight-month low on Tuesday. The US Dollar Index (DXY) fell to 101.76 in early trade – a positive for Gold since the two assets share a high degree of negative correlation.
Gold may be seeing safe-haven demand after an attempt to reach a peace agreement in the Middle East, spearheaded by US Secretary of State Antony Blinken, stalled with Israel ready to agree but Hamas not because it wants the agreement to include a permanent and not a temporary ceasefire as laid out in the current deal. Hamas further ratcheted up tensions by owning up to a recent suicide bomb attack in Tel Aviv. An Iranian all-out attack against Israel also remains an overhead risk factor.
Technical Analysis: Gold moves up towards breakout target
Gold (XAU/USD) extends to new all-time highs after breaking out a range it was trapped in since July. It is on its way to the initial target for the breakout at $2,550, calculated by taking the 0.618 Fibonacci ratio of the range’s height and extrapolating it higher.
XAU/USD 4-hour Chart
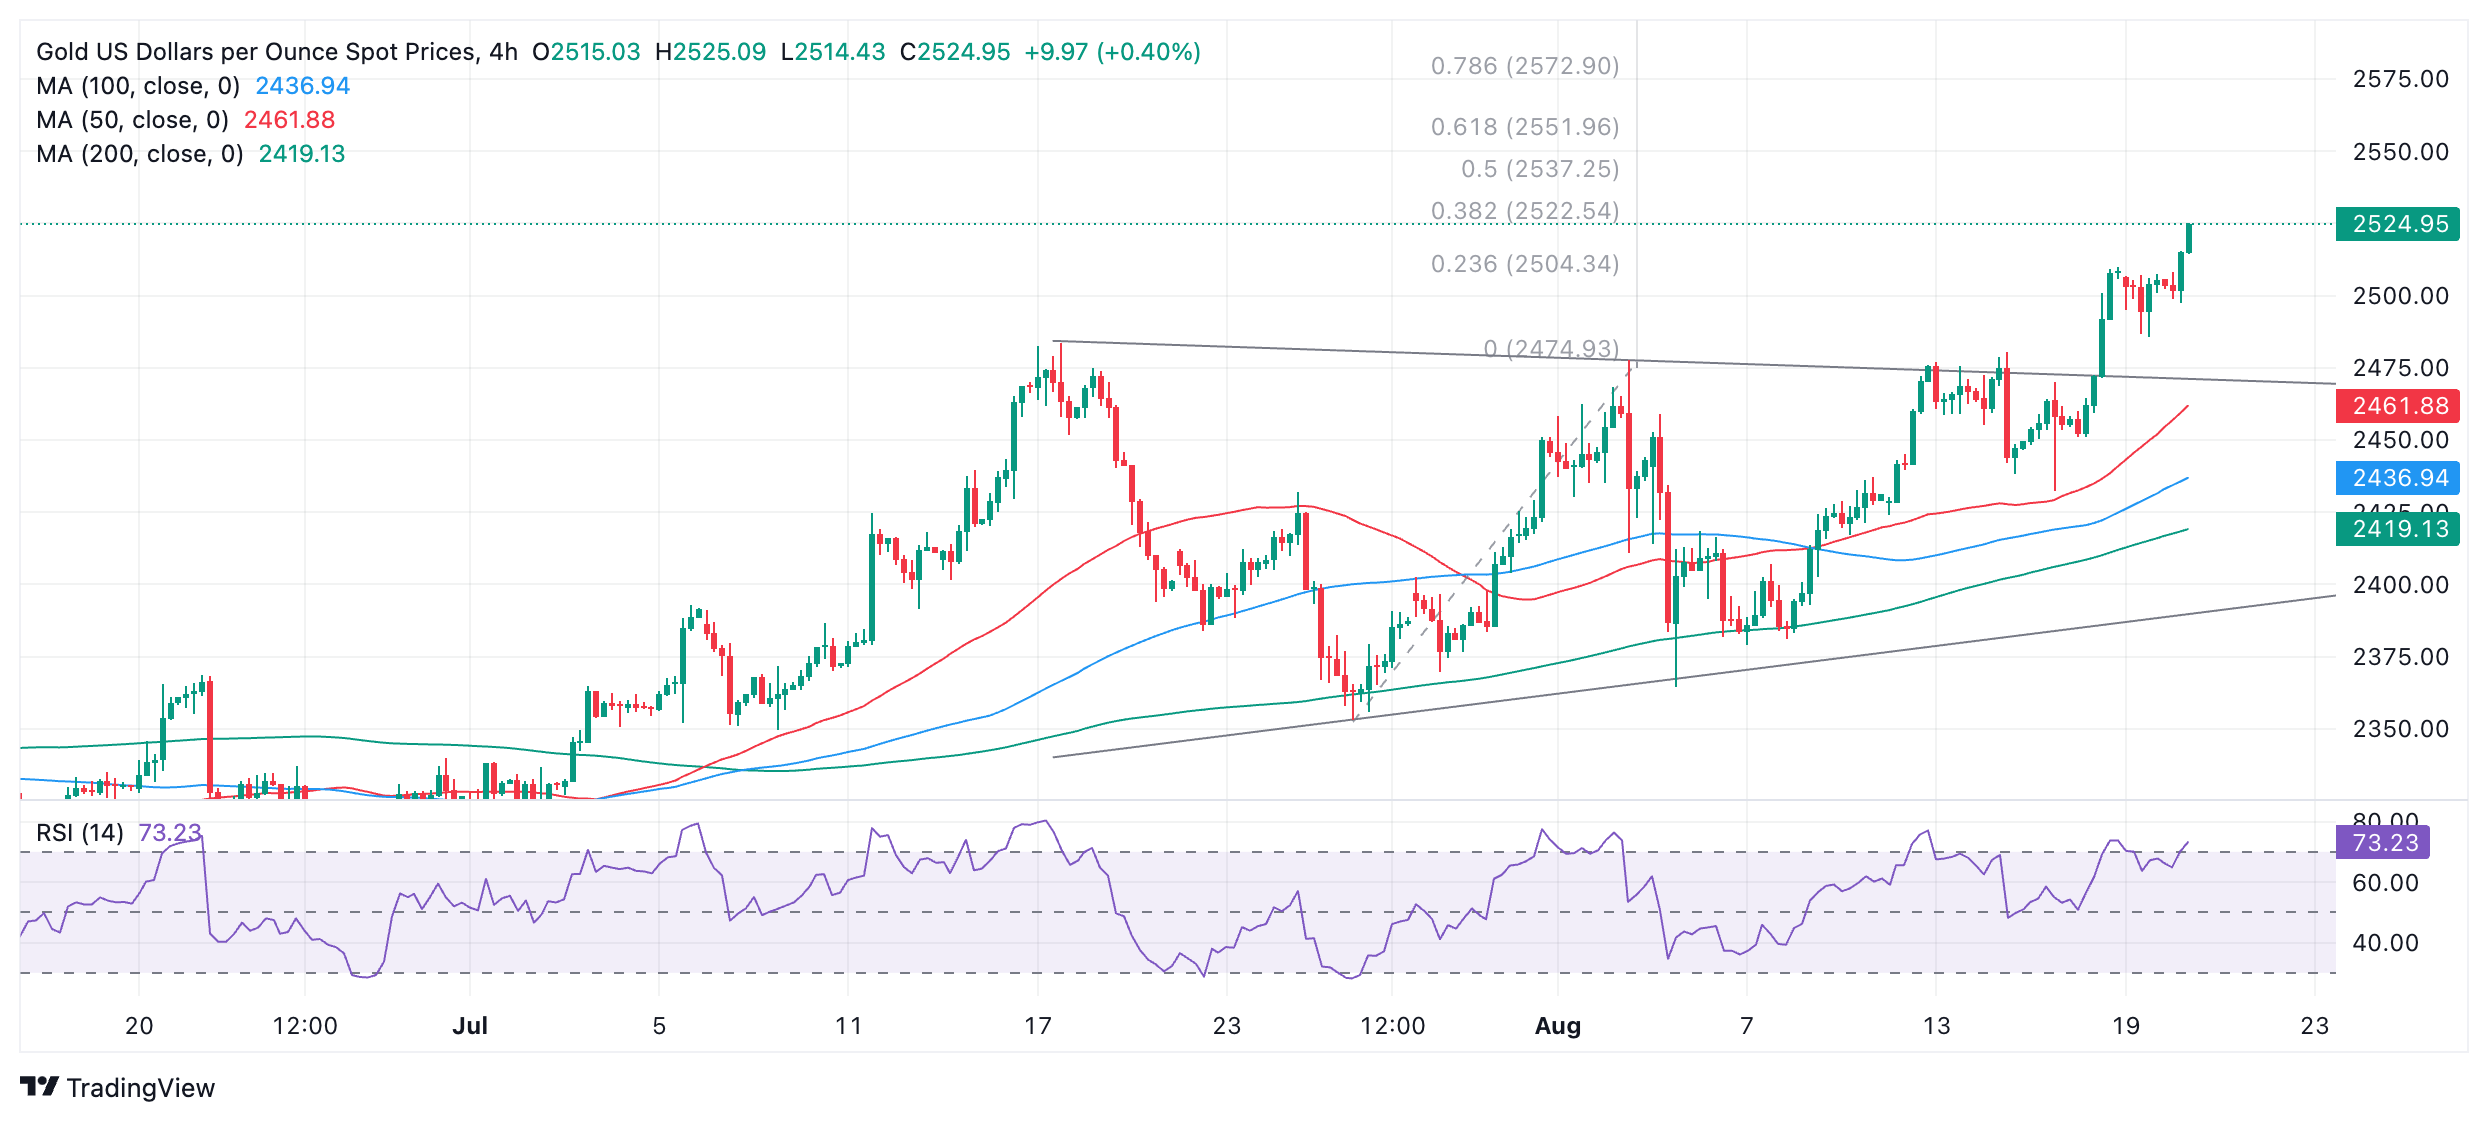
Gold is back in the overbought region of the Relative Strength Index (RSI), however, which indicates a risk of a pullback unfolding. This might drag the Gold price back down before it pushes higher. Such a pullback might be expected to correct to support at around $2,500.
Gold is in a broad uptrend on the short, medium and long-term time frames, however, and given “the trend is your friend”, this uptrend is more likely than not to continue.
Gold FAQs
Gold has played a key role in human’s history as it has been widely used as a store of value and medium of exchange. Currently, apart from its shine and usage for jewelry, the precious metal is widely seen as a safe-haven asset, meaning that it is considered a good investment during turbulent times. Gold is also widely seen as a hedge against inflation and against depreciating currencies as it doesn’t rely on any specific issuer or government.
Central banks are the biggest Gold holders. In their aim to support their currencies in turbulent times, central banks tend to diversify their reserves and buy Gold to improve the perceived strength of the economy and the currency. High Gold reserves can be a source of trust for a country’s solvency. Central banks added 1,136 tonnes of Gold worth around $70 billion to their reserves in 2022, according to data from the World Gold Council. This is the highest yearly purchase since records began. Central banks from emerging economies such as China, India and Turkey are quickly increasing their Gold reserves.
Gold has an inverse correlation with the US Dollar and US Treasuries, which are both major reserve and safe-haven assets. When the Dollar depreciates, Gold tends to rise, enabling investors and central banks to diversify their assets in turbulent times. Gold is also inversely correlated with risk assets. A rally in the stock market tends to weaken Gold price, while sell-offs in riskier markets tend to favor the precious metal.
The price can move due to a wide range of factors. Geopolitical instability or fears of a deep recession can quickly make Gold price escalate due to its safe-haven status. As a yield-less asset, Gold tends to rise with lower interest rates, while higher cost of money usually weighs down on the yellow metal. Still, most moves depend on how the US Dollar (USD) behaves as the asset is priced in dollars (XAU/USD). A strong Dollar tends to keep the price of Gold controlled, whereas a weaker Dollar is likely to push Gold prices up.
- The US Dollar posts a third consecutive day of losses, almost erasing all gains for 2024.
- The Greenback eased on a mixture of elements as markets wait for Jackson Hole at the end of the week.
- The US Dollar index trades near dangerous levels, close to flipping in a negative performance for 2024.
The US Dollar (USD) extends losses on Tuesday after getting sucker-punched on Monday, with all eyes on the US Federal Reserve Jackson Hole Symposium in Wyoming, where Fed Chairman Jerome Powell is set to deliver a pivotal speech. A mixture of risk-on and a very slim data calendar in the runup to Jackson Hole convinced traders that a recession scenario could be avoided and the US economy is on the path to a soft landing. Outside the US, news that Israel could commit to the US ceasefire proposal is also reducing the safe-haven flows toward the Greenback.
On the economic data front, again a very light calendar is ahead on Tuesday, although some sort of cautiousness must be upheld. With all stars aligning for a weaker US Dollar, any comment or data point could see an aggressive reversal of Monday’s moves. With the runup towards the speech from Fed Chairman Powell on Friday, nearly all Fed members will have issued their personal outlook about the interest-rate path, which means still a lot of market-moving comments could be on the way.
Daily digest market movers: Comments underway
- China’s government is weighing whether to let local governments issue bonds to buy homes, according to Bloomberg.
- At 12:55 GMT, the Redbook Index for the week ending August 16 is set to be released. The previous reading showed a 4.7% increase over a one-year period.
- In the runup towards Jackson Hole, nearly all Federal Open Market Committee (FOMC) members will have a window of opportunity to have their say on monetary policy. This Tuesday two members are set to issue comments:
- Federal Reserve Bank of Atlanta President Raphael Bostic gives some remarks at the Atlanta Fed's Payment Inclusion Forum in Atlanta.
- Federal Reserve Vice Chair for Supervision Michael Barr participates in a discussion about cybersecurity at the Joint Financial and Banking Information Infrastructure Committee-Financial Services Sector Coordinating Council Meeting in Washington, D.C.
- Asian equity markets are mixed, with Japanese indices up over 1% while Chinese equities are on the back foot. European and US equities are continuing the positive tone from Monday.
- The CME Fedwatch Tool shows a 77.5% chance of a 25 basis points (bps) interest rate cut by the Fed in September against a 22.5% chance for a 50 bps cut. Another 25 bps cut (if September is a 25 bps cut) is expected in November by 59.3%, while there is a 35.4% chance that rates will be 75 bps below the current levels and a 5.2% probability of rates being 100 basis points lower.
- The US 10-year benchmark rate trades at 3.87% and is looking for direction after last week’s dip.
US Dollar Index Technical Analysis: Back to the drawing board
The US Dollar Index (DXY) is getting very close to erasing its gains for the whole of 2024. That sends Dollar bulls back to the drawing board as the risk of this year's performance flipping into negative is a potential outcome. With this mixture of easing geopolitical tensions and markets embracing again the soft landing pattern ahead of Fed Chairman Jerome Powell’s speech at Jackson Hole, the question is if markets are not running too far ahead of themselves.
Defining pivotal levels becomes very important in order to avoid any dead-cat bounces, in which traders pile in too quickly in a trade and get caught on the wrong side of the fence once the course reverses. First up is 103.18, a level that traders were unable to hold last week. Next up, a heavy resistance level is at 103.99-104.00, and inches above there is the 200-day Simple Moving Average (SMA) at 104.07.
On the downside, the first immediate support comes up at the 101.90 level, which is under pressure at the moment. Levels not seen since early January are popping up, and even a fresh yearly low could come into play once the DXY dips below 101.30 (low from January 2). The low of December 28 at 100.62 will be the ultimate level to look out for.
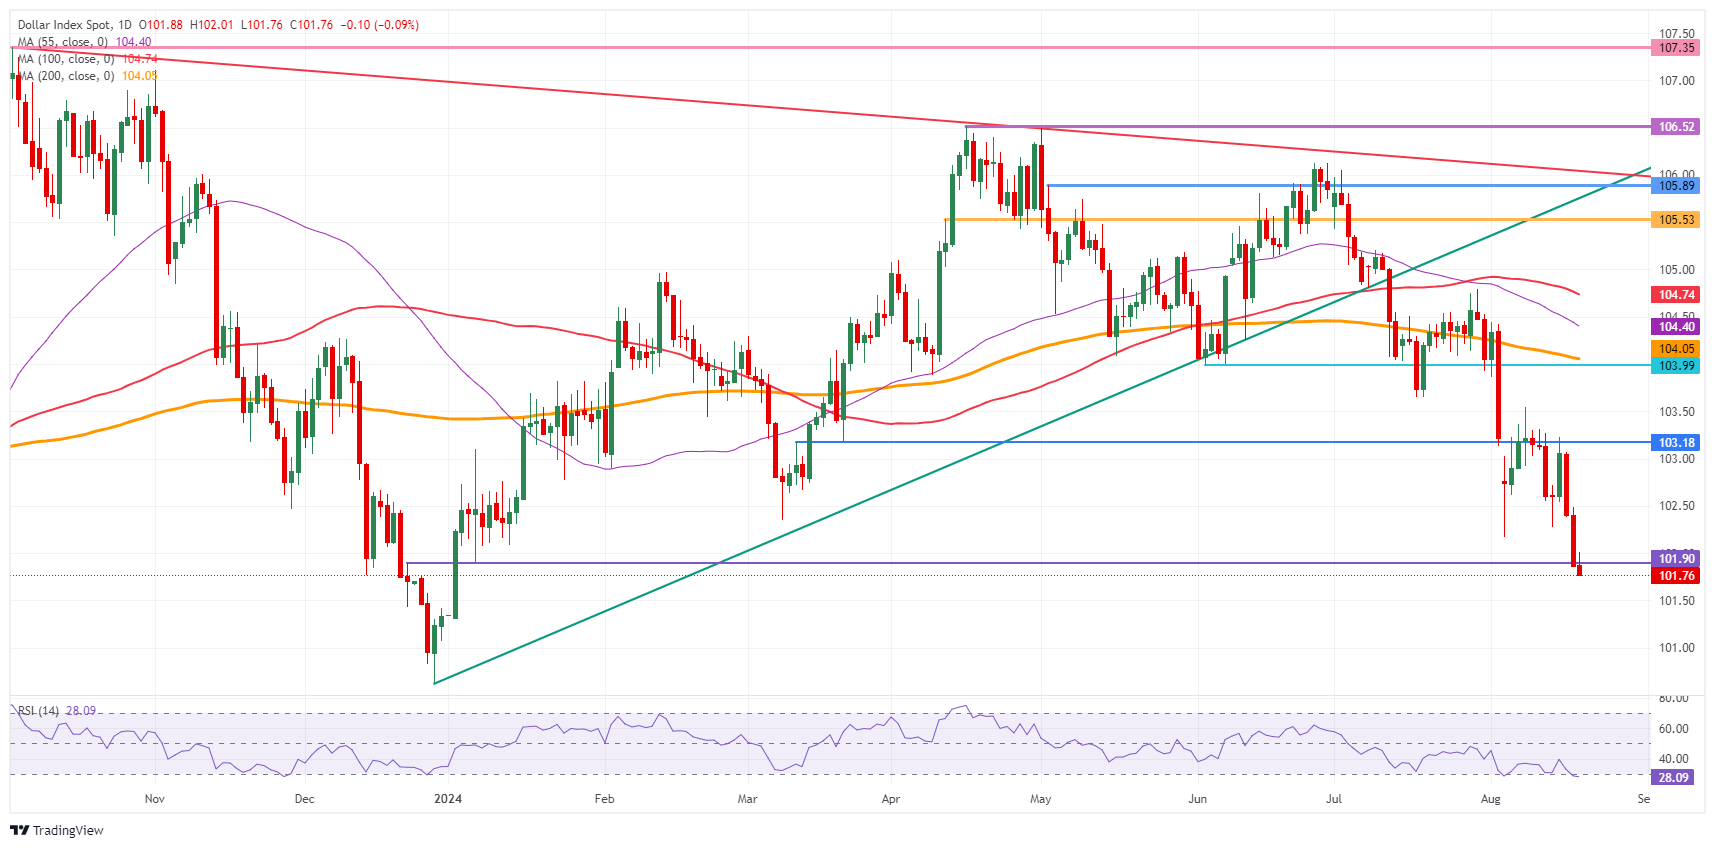
US Dollar Index: Daily Chart
US Dollar FAQs
The US Dollar (USD) is the official currency of the United States of America, and the ‘de facto’ currency of a significant number of other countries where it is found in circulation alongside local notes. It is the most heavily traded currency in the world, accounting for over 88% of all global foreign exchange turnover, or an average of $6.6 trillion in transactions per day, according to data from 2022. Following the second world war, the USD took over from the British Pound as the world’s reserve currency. For most of its history, the US Dollar was backed by Gold, until the Bretton Woods Agreement in 1971 when the Gold Standard went away.
The most important single factor impacting on the value of the US Dollar is monetary policy, which is shaped by the Federal Reserve (Fed). The Fed has two mandates: to achieve price stability (control inflation) and foster full employment. Its primary tool to achieve these two goals is by adjusting interest rates. When prices are rising too quickly and inflation is above the Fed’s 2% target, the Fed will raise rates, which helps the USD value. When inflation falls below 2% or the Unemployment Rate is too high, the Fed may lower interest rates, which weighs on the Greenback.
In extreme situations, the Federal Reserve can also print more Dollars and enact quantitative easing (QE). QE is the process by which the Fed substantially increases the flow of credit in a stuck financial system. It is a non-standard policy measure used when credit has dried up because banks will not lend to each other (out of the fear of counterparty default). It is a last resort when simply lowering interest rates is unlikely to achieve the necessary result. It was the Fed’s weapon of choice to combat the credit crunch that occurred during the Great Financial Crisis in 2008. It involves the Fed printing more Dollars and using them to buy US government bonds predominantly from financial institutions. QE usually leads to a weaker US Dollar.
Quantitative tightening (QT) is the reverse process whereby the Federal Reserve stops buying bonds from financial institutions and does not reinvest the principal from the bonds it holds maturing in new purchases. It is usually positive for the US Dollar.
A de-escalation of tensions in the Middle East would likely see the geopolitical risk premium evaporate quickly, ANZ commodity analysts note.
US domestic demand remains strong
“The US said that Israel Prime Minister Benjamin Netanyahu had accepted a bridging proposal that aimed to resolve differences between Israel and Hamas. A de-escalation of tensions in the Middle East would likely see the geopolitical risk premium evaporate quickly. Elsewhere, production at Libya’s Waha oil field has returned to normal levels of about 300kb/d after pipeline maintenance was completed earlier than expected.”
“However, the nation’s Sharara field remains offline amid a political dispute between its rival governments. Demand in China remains a concern. While summer travel in the country has been strong, the use of high-speed rail and electric vehicles has taken the edge off gasoline consumption.
“Sales at China’s two biggest retailers, PetroChina and Sinopec have dropped more than 5% since the start of July, according to a Bloomberg report. That’s not the case in the US, where domestic demand has been strong. Bookings for domestic travel over the US Labor Day weekend are up 9% y/y, according to motor club AAA.”
- USD/JPY edges lower near 146.50 amid weakness in the US Dollar.
- The Fed is widely anticipated to start reducing interest rates in September.
- Japan’s robust Q2 GDP growth has boosted expectations of more BoJ’s rate hikes.
The USD/JPY pair exhibits a subdued performance near 146.50 in Tuesday’s European session. The asset edges lower but remains inside Monday’s trading session with investors focusing on the Federal Reserve (Fed) Chair Jerome Powell’s speech at the Jackson Hole (JH) Symposium on August 22-23.
Investors would look for a pre-defined interest rate path from Fed Powell as rate cuts in September seem certain. Market participants would also want to know whether the Fed will start the policy-easing cycle, with an aggressive or a gradual approach.
The market sentiment remains cheerful as the Fed is widely anticipated to pivot to policy-normalization in September. S&P 500 futures have posted some losses in the European session. Risk-perceived currencies are outperforming the US Dollar (USD). The US Dollar Index (DXY), which tracks the Greenback’s value against six major currencies, slides further to multi-month lows near 101.80.
On the economic data front, investors will focus on the preliminary United States (US) S&P Global Purchasing Managers’ Index (PMI) data for August, which will be published on Thursday. The flash PMI report is expected to show that
Meanwhile, the Japanese Yen performs well as upbeat Q2 Gross Domestic Product (GDP) growth has opened room for further policy-tightening by the Bank of Japan (BoJ) this year. The Japanese economy expanded at a robust pace of 0.8% from the estimates of 0.5%. In the first quarter, the economy contracted sharply.
Japanese Yen FAQs
The Japanese Yen (JPY) is one of the world’s most traded currencies. Its value is broadly determined by the performance of the Japanese economy, but more specifically by the Bank of Japan’s policy, the differential between Japanese and US bond yields, or risk sentiment among traders, among other factors.
One of the Bank of Japan’s mandates is currency control, so its moves are key for the Yen. The BoJ has directly intervened in currency markets sometimes, generally to lower the value of the Yen, although it refrains from doing it often due to political concerns of its main trading partners. The current BoJ ultra-loose monetary policy, based on massive stimulus to the economy, has caused the Yen to depreciate against its main currency peers. This process has exacerbated more recently due to an increasing policy divergence between the Bank of Japan and other main central banks, which have opted to increase interest rates sharply to fight decades-high levels of inflation.
The BoJ’s stance of sticking to ultra-loose monetary policy has led to a widening policy divergence with other central banks, particularly with the US Federal Reserve. This supports a widening of the differential between the 10-year US and Japanese bonds, which favors the US Dollar against the Japanese Yen.
The Japanese Yen is often seen as a safe-haven investment. This means that in times of market stress, investors are more likely to put their money in the Japanese currency due to its supposed reliability and stability. Turbulent times are likely to strengthen the Yen’s value against other currencies seen as more risky to invest in.
Germany’s central bank, the Bundesbank, said in its monthly economic report published on Tuesday that the “German economic output could increase slightly in Q3.”
Additional takeaways
German economic output could increase slightly in Q3.
Recovery further delayed but recession not seen.
We can expect a temporary rise in the German inflation rate towards the end of the year on the energy base effect.
German Negotiated Wage Growth data came in at 3.1% in Q2 vs. 6.2% In Q1.
German Negotiated Wage Growth excluding one-offs arrived at 4.2% in Q2 vs 3.0% in Q1.
Market reaction
The Bundesbank report failed to have any impact on the Euro, as EUR/USD kept its consolidative mode intact at around 1.1080, at the time of writing. The pair is down 0.06% so far.
Euro PRICE Today
The table below shows the percentage change of Euro (EUR) against listed major currencies today. Euro was the weakest against the New Zealand Dollar.
| USD | EUR | GBP | JPY | CAD | AUD | NZD | CHF | |
|---|---|---|---|---|---|---|---|---|
| USD | 0.05% | -0.10% | -0.15% | -0.17% | -0.04% | -0.77% | -0.36% | |
| EUR | -0.05% | -0.16% | -0.21% | -0.20% | -0.07% | -0.52% | -0.41% | |
| GBP | 0.10% | 0.16% | -0.04% | -0.05% | 0.11% | -0.36% | -0.26% | |
| JPY | 0.15% | 0.21% | 0.04% | -0.01% | 0.11% | -0.33% | -0.23% | |
| CAD | 0.17% | 0.20% | 0.05% | 0.00% | 0.13% | -0.30% | -0.22% | |
| AUD | 0.04% | 0.07% | -0.11% | -0.11% | -0.13% | -0.45% | -0.36% | |
| NZD | 0.77% | 0.52% | 0.36% | 0.33% | 0.30% | 0.45% | 0.08% | |
| CHF | 0.36% | 0.41% | 0.26% | 0.23% | 0.22% | 0.36% | -0.08% |
The heat map shows percentage changes of major currencies against each other. The base currency is picked from the left column, while the quote currency is picked from the top row. For example, if you pick the Euro from the left column and move along the horizontal line to the US Dollar, the percentage change displayed in the box will represent EUR (base)/USD (quote).
Turkey’s central bank (CBT) will announce its monthly rate decision: analysts unanimously predict an unchanged rate at 50%. In the background, the pace of Lira (TRY) depreciation has been accelerating – even against the weak US dollar (USD), Commerzbabnk’s FX strategist Tatha Ghose notes.
CBRT to announce its monthly rate decision
“If we calculate the annualised rate of depreciation based on the average daily change since the beginning of July, we get 26%; if we repeat the same calculation but beginning more recently on 1 August, we get 36%. This recent acceleration is not a comforting sign, and reportedly, even required FX intervention by state banks to keep in check yesterday.”
“CBT’s liquidity sterilisation measures have failed to make a dent into the lira depreciation trend. What is more, inflation expectations are not improving at all. Last but not least, recent surveys find growing dissatisfaction of the electorate with the economy and demands of an early election. If CBT had been the sole economic policymaker in Turkey, they would urgently have to think of some response to these developments.”
“Just assuring that inflation will begin to moderate during H2 is not good enough – the markets are obviously seeing through the superficial nature of the improvement so far. But, it is also true that there are other significant policymakers in Turkey – and they need to play their part in terms of fiscal contraction and establishing complete credibility. Without this, just another rate hike by CBT would be meaningless in any case.”
- EUR/USD holds onto gains below 1.1100 due to weakness in the US Dollar.
- The US Dollar faces a sell-off amid firm Fed September rate-cut bets.
- ECB Rehn sees market expectations for rate cuts in September as appropriate.
EUR/USD trades close to a more than seven-month high slightly below the round-level resistance of 1.1100 in Tuesday’s European session. The major currency pair holds gains as the US Dollar (USD) continues to face a sheer sell-off, weighed by firm expectations that the Federal Reserve (Fed) will begin cutting interest rates in September.
The US Dollar Index (DXY), which tracks the Greenback’s value against six major currencies, hovers near a seven-month low at around 101.80.
Market speculation for Fed interest rate cuts has strengthened as officials seem to be more worried about the United States (US) labor market and remain confident that price pressures are on track to the 2% target.
On Monday, Minneapolis Fed Bank President Neel Kashkari cited concerns over signs of weakening labor market conditions and favored rate cuts in September. “The balance of risks has shifted, so the debate about potentially cutting rates in September is an appropriate one to have,” he said in an interview with The Wall Street Journal.
“If we saw some quicker deterioration in the labor market, then that would tell me, ‘well, we need to do more, quickly, to support the labor market, even if we have uncertainty about where our ultimate destination is going to be,” he added. However, Kashari pushed back expectations of the Fed’s jumbo rate cuts citing that layoffs remain low and higher jobless claims are not a sign of labor market deterioration.
For more cues on the interest rate path, investors will focus on the release of the Federal Open Market Committee (FOMC) minutes for the July meeting on Wednesday, and the Fed Chair Jerome Powell’s speech at the Jackson Hole (JH) Symposium, which will be held from August 22 to 24.
Daily digest market movers: EUR/USD sees more upside amid US Dollar’s weakness
- EUR/USD exhibits strength amid weakness in the US Dollar. The Euro outperforms the Greenback but is sluggish against other peers on expectations that the European Central Bank (ECB) could cut interest rates two more times this year. The ECB is widely anticipated to cut interest rates for the second time in its September meeting.
- This week, investors will focus on the preliminary Eurozone HCOB Purchasing Managers’ Index (PMI) data for August and Q2 Negotiated Wage Rates, which will be published on Thursday. Economists estimate that the Composite PMI barely improved amid the contraction in activities in the manufacturing sector. As for the Negotiated Wage Rate, a key measure of wage growth rose to 4.69% in the first quarter of this year and ECB officials would be pleased with a lower reading for the second quarter.
- The economic outlook of the Eurozone is vulnerable as its largest economy, Germany, struggles to maintain a firm footing due to poor demand from domestic and overseas markets. Amid downside risks to the Eurozone economic outlook, ECB policymaker and Finnish central bank chief Olli Rehn has shown comfort for market expectations pointing to rate cuts in September.
- In a speech to the European American Chamber of Commerce in New York, Rehn said: "The recent increase in negative growth risks in the euro area has reinforced the case for a rate cut at the next ECB monetary policy meeting in September, provided that disinflation is indeed on track," Reuters reported.
Technical Analysis: EUR/USD aims to recapture 1.1100
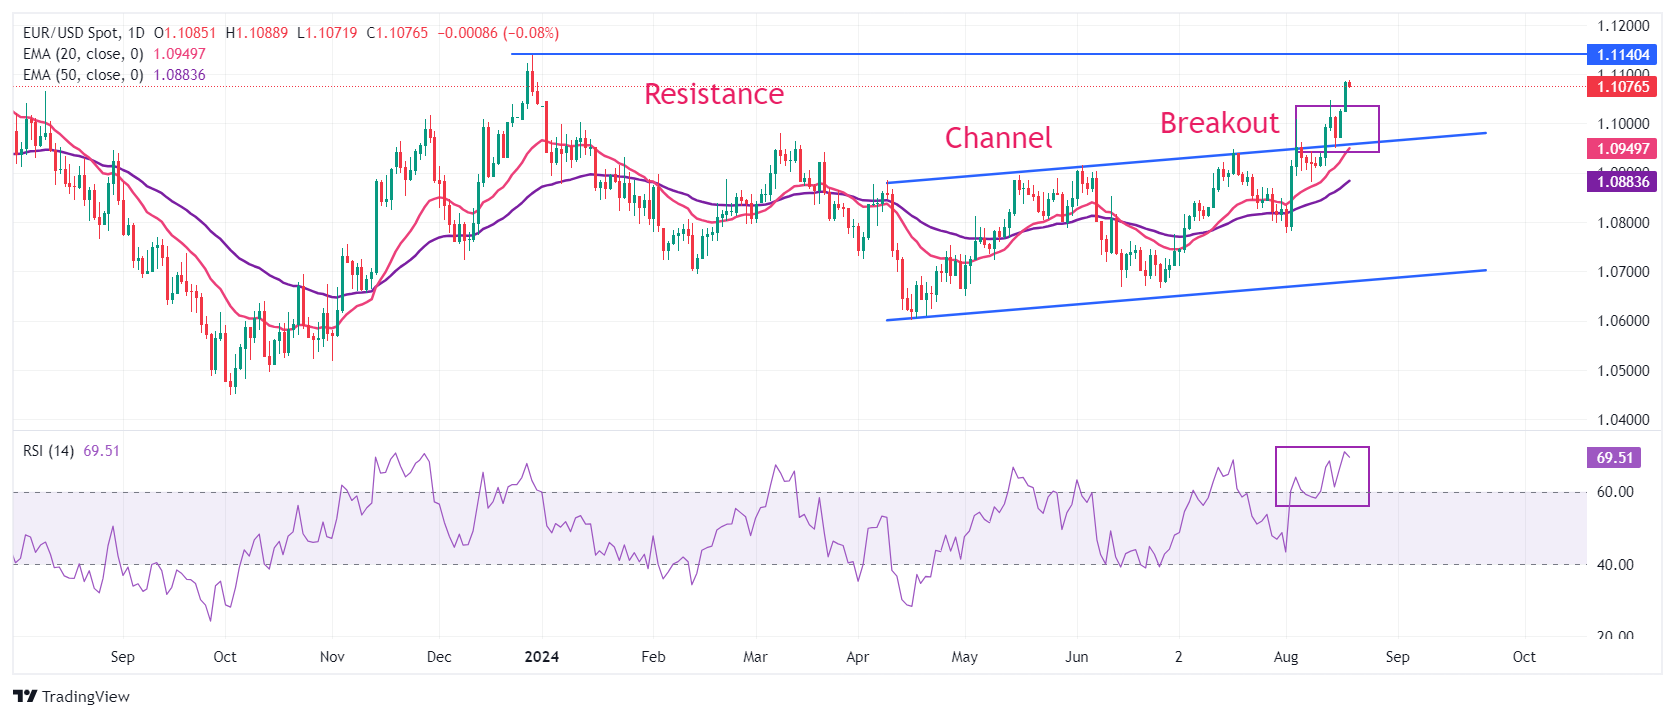
EUR/USD turns sideways after rising to a fresh seven-month high near the round-level resistance of 1.1100. The major currency pair strengthened after a breakout of a channel formation on a daily time frame. Upward-sloping 20-day and 50-day Exponential Moving Averages (EMAs) near 1.0945 and 1.0880, respectively, suggest that the overall trend is bullish.
The 14-day Relative Strength Index (RSI) oscillates in the bullish range of 60.00-80.00, suggesting a strong upside momentum.
The immediate resistance for the Euro bulls would be the 28 December 2023 high at 1.1140. On the downside, the August 15 low at 1.0950 will be a key support area.
Euro FAQs
The Euro is the currency for the 20 European Union countries that belong to the Eurozone. It is the second most heavily traded currency in the world behind the US Dollar. In 2022, it accounted for 31% of all foreign exchange transactions, with an average daily turnover of over $2.2 trillion a day. EUR/USD is the most heavily traded currency pair in the world, accounting for an estimated 30% off all transactions, followed by EUR/JPY (4%), EUR/GBP (3%) and EUR/AUD (2%).
The European Central Bank (ECB) in Frankfurt, Germany, is the reserve bank for the Eurozone. The ECB sets interest rates and manages monetary policy. The ECB’s primary mandate is to maintain price stability, which means either controlling inflation or stimulating growth. Its primary tool is the raising or lowering of interest rates. Relatively high interest rates – or the expectation of higher rates – will usually benefit the Euro and vice versa. The ECB Governing Council makes monetary policy decisions at meetings held eight times a year. Decisions are made by heads of the Eurozone national banks and six permanent members, including the President of the ECB, Christine Lagarde.
Eurozone inflation data, measured by the Harmonized Index of Consumer Prices (HICP), is an important econometric for the Euro. If inflation rises more than expected, especially if above the ECB’s 2% target, it obliges the ECB to raise interest rates to bring it back under control. Relatively high interest rates compared to its counterparts will usually benefit the Euro, as it makes the region more attractive as a place for global investors to park their money.
Data releases gauge the health of the economy and can impact on the Euro. Indicators such as GDP, Manufacturing and Services PMIs, employment, and consumer sentiment surveys can all influence the direction of the single currency. A strong economy is good for the Euro. Not only does it attract more foreign investment but it may encourage the ECB to put up interest rates, which will directly strengthen the Euro. Otherwise, if economic data is weak, the Euro is likely to fall. Economic data for the four largest economies in the euro area (Germany, France, Italy and Spain) are especially significant, as they account for 75% of the Eurozone’s economy.
Another significant data release for the Euro is the Trade Balance. This indicator measures the difference between what a country earns from its exports and what it spends on imports over a given period. If a country produces highly sought after exports then its currency will gain in value purely from the extra demand created from foreign buyers seeking to purchase these goods. Therefore, a positive net Trade Balance strengthens a currency and vice versa for a negative balance.
Canadian inflation figures for July are due this afternoon, Commerzbank FX Analyst Michael Pfister notes.
CAD set to remain under pressure
“Anything other than a decline in the year-on-year rate for the headline rate would probably be a big surprise. After all, the last two major base effects will be removed from the calculation of the year-on-year rate in the next two months.”
“So, unless we see a surprise rise in the seasonally adjusted monthly rate of change - and the figures for recent months give little indication of such a rise - the year-on-year rate is likely to take the penultimate major step towards the inflation target today.”
“This should be another signal for the Bank of Canada to cut interest rates further in the coming months. And the recent weakening of the labour market gives it every reason to do so. Therefore, unless today's figures surprise to the upside, the Bank of Canada is likely to deliver the next cut in early September and the CAD will remain under pressure.”
Copper extended last week’s gain as a weaker USD and prospect of easing monetary policy boosted investor appetite, ANZ commodity strategists note.
Copper finds support from the demand in China
“Recent economic data in the US have supported the view that while economic growth is weakening, itis not expected to produce a hard landing. With inflation easing, that should open the door for the Fed to start cutting rates. Copper found some additional support from signs of stronger demand in China.”
“Exports of unwrought copper and products fell 40% m/m to 140.9kt in July, suggesting a demand recovery in the world’s largest consumer. The Yangshan premium has also rebounded while stockpiles on the Shanghai Futures Exchange have eased from their June peak.”
“Orders from power grids have been behind the shift in demand, as the need to bolster the network rises amid strong electricity demand. The gains were muted by easing supply side issues. BHP and union leaders have reached a preliminary wage agreement ending a strike at the world’s largest copper mine.”
The general consensus is that the Riksbank will cut the key interest rate today by 25 basis points to 3.50%, After all, inflation is trending downwards, although the monthly changes in the core rate could fall a little more, Commerzbank’s FX Analyst Antje Praefcke notes
Two or three more moves for the rest of the year
“The economy is weakening and could be supported with interest rate cuts. In addition, the unemployment rate has been above 8% since the middle of last year, meaning that the labor market can no longer be considered as tight. The Riksbank also indicated at its last meeting in June that there could be ‘two to three’ more cuts this year. All in all, the signs are clearly pointing to ‘down with the policy rate’.”
“To be honest, I am undecided between two (50bp) and three (75Bp) further moves. But I expect the Riksbank to signal two or three more moves for the rest of the year. I would prefer two, as core inflation in particular is likely to remain above the inflation target for a little longer, but I assume that, sticking to its recent dovish stance, it will opt for three and thus fall in line with market expectations.
“Although the krona has recovered after the market's panic attack, it is still trading at lower levels than in June, which could cause the Riksbank to worry about exchange rate-induced price pressure to re-emerge. I think it would be bold to assume that the krona will appreciate anyway thanks to the (expected) interest rate cut cycles in the US and the euro zone.”
Today markets should see the Riksbank cutting rates by 25bp to 3.50%, ING’s FX strategist Chris Turner notes.
Market waits for a 50bp rate cut
“The market thinks there is a small chance of a 50bp rate cut. Our team continues to expect that the Riksbank will point to at least two further rate cuts later this year given the economy has been hit hard by higher rates and now that inflation expectations have fallen back under 2%.”
“We do not think EUR/SEK has to rally too much on the rate cut. And unless the Riksbank surprises with a 50bp rate cut today, our bias is that the softer US rate environment can carry EUR/SEK down to the 11.30 area.”
CHF is the second most over-valued major currency after the USD, DBS FX strategist Chang Wei Liang notes.
SNB still has scope to cut rates
“The sharp unwind of carry trades in July had resulted in the CHF strengthening as much as the JPY.”
“Unlike the under-valued JPY, the CHF's overvaluation is now approaching levels seen in Aug 2011, just before the SNB imposed a EUR/CHF price floor to stem extreme appreciation pressures.”
“Concerns over a strong CHF are intensifying amongst Swiss exporters. Unlike 2011, the SNB still has scope today to cut rates to cool CHF demand.”
EUR/USD continues to grind higher without much news. At the heart of the story is whether EUR/USD will break out of an 18-month trading range, which has largely contained EUR/USD between 1.05 and 1.11, ING's FX strategist Chris Turner notes.
The bias is with the upside
“The FX options market suggests that – at least over the next month – the bias is with the upside. The one-month risk reversal – the price of a EUR/USD call option over an equivalent put option – is moving deeper in favour of euro calls. This is happening when implied volatility is rising, suggesting active buying of euro call options.”
“The eurozone calendar remains very light today and does not pick up until Thursday's PMI releases. However, we do get to see the eurozone monthly (June) current account data today. This is now running close to a €30bn surplus per month compared to the €30bn monthly deficits seen in 2022 – and a big driver of EUR/USD weakness that year.”
“On that subject, lower oil prices on the back of a potential Middle East peace deal are good news for EUR/USD. 1.1040/1050 should prove intra-day support for EUR/USD and we see the 1.1110/1140 as big medium-term resistance – a break of which would be big news.”
Silver prices (XAG/USD) rose on Tuesday, according to FXStreet data. Silver trades at $29.69 per troy ounce, up 0.82% from the $29.45 it cost on Monday.
Silver prices have increased by 24.76% since the beginning of the year.
| Unit measure | Silver Price Today in USD |
|---|---|
| Troy Ounce | 29.69 |
| 1 Gram | 0.95 |
The Gold/Silver ratio, which shows the number of ounces of Silver needed to equal the value of one ounce of Gold, stood at 84.97 on Tuesday, broadly unchanged from 85.04 on Monday.
Silver FAQs
Silver is a precious metal highly traded among investors. It has been historically used as a store of value and a medium of exchange. Although less popular than Gold, traders may turn to Silver to diversify their investment portfolio, for its intrinsic value or as a potential hedge during high-inflation periods. Investors can buy physical Silver, in coins or in bars, or trade it through vehicles such as Exchange Traded Funds, which track its price on international markets.
Silver prices can move due to a wide range of factors. Geopolitical instability or fears of a deep recession can make Silver price escalate due to its safe-haven status, although to a lesser extent than Gold's. As a yieldless asset, Silver tends to rise with lower interest rates. Its moves also depend on how the US Dollar (USD) behaves as the asset is priced in dollars (XAG/USD). A strong Dollar tends to keep the price of Silver at bay, whereas a weaker Dollar is likely to propel prices up. Other factors such as investment demand, mining supply – Silver is much more abundant than Gold – and recycling rates can also affect prices.
Silver is widely used in industry, particularly in sectors such as electronics or solar energy, as it has one of the highest electric conductivity of all metals – more than Copper and Gold. A surge in demand can increase prices, while a decline tends to lower them. Dynamics in the US, Chinese and Indian economies can also contribute to price swings: for the US and particularly China, their big industrial sectors use Silver in various processes; in India, consumers’ demand for the precious metal for jewellery also plays a key role in setting prices.
Silver prices tend to follow Gold's moves. When Gold prices rise, Silver typically follows suit, as their status as safe-haven assets is similar. The Gold/Silver ratio, which shows the number of ounces of Silver needed to equal the value of one ounce of Gold, may help to determine the relative valuation between both metals. Some investors may consider a high ratio as an indicator that Silver is undervalued, or Gold is overvalued. On the contrary, a low ratio might suggest that Gold is undervalued relative to Silver.
(An automation tool was used in creating this post.)
- EUR/CAD loses ground following key economic data from the European Monetary Union.
- EMU HICP MoM showed no change in July, while Core inflation declined by 0.2%.
- The commodity-linked CAD rises despite a losing streak in WTI prices.
EUR/CAD retraces its recent gains from the previous two days following the key data on business activity and consumer prices from the European Union. The pair trades around 1.5100 during the European session on Tuesday.
The Harmonized Index of Consumer Prices (HICP) data from the European Monetary Union (EMU) showed no change month-on-month in July, as expected. Meanwhile, Core HICP declined by 0.2%, consistent with the decrease observed in June.
Germany’s Producer Price Index (PPI) declined by 0.8% year-over-year in July, in line with expectations, following the previous decline of 1.6%. Meanwhile, the monthly index showed a 0.2% increase, also as anticipated.
Investors anticipate that the European Central Bank (ECB) will gradually reduce interest rates. ECB policymakers have hesitated to commit to a specific rate-cut path due to concerns that price pressures could reaccelerate.
The commodity-linked Canadian Dollar (CAD) outperforms despite the continuation of a bearish streak in crude Oil prices and undermines the EUR/CAD cross. West Texas Intermediate (WTI) Oil price continues its losing streak for the third successive day, trading around $72.90 per barrel at the time of writing. This downside is attributed to the de-escalation of the geopolitical tensions in the Middle East.
On Monday, US Secretary of State Antony Blinken announced that Israel had agreed to a proposal to resolve the issues delaying a Gaza ceasefire and urged Hamas to follow suit. However, Hamas senior official Osama Hamdan criticized Blinken's statement that Israeli Prime Minister Benjamin Netanyahu had accepted an updated proposal. Hamdan claimed it "raises many ambiguities" and is "not what was presented to us nor what we agreed on," per Reuters.
Traders are likely to focus on the risks of slower economic growth in Canada and position themselves ahead of the Consumer Price Index (CPI) data release by Statistics Canada, scheduled for later in the North American session. This inflation report is expected to indicate further easing of inflation in July, which could potentially allow the Bank of Canada (BoC) to continue its monetary loosening cycle.
Economic Indicator
Harmonized Index of Consumer Prices (MoM)
The Harmonized Index of Consumer Prices (HICP) measures changes in the prices of a representative basket of goods and services in the European Monetary Union. The HICP, released by Eurostat on a monthly basis, is harmonized because the same methodology is used across all member states and their contribution is weighted. The MoM figure compares the prices of goods in the reference month to the previous month. Generally, a high reading is seen as bullish for the Euro (EUR), while a low reading is seen as bearish.
Read more.Last release: Tue Aug 20, 2024 09:00
Frequency: Monthly
Actual: 0%
Consensus: 0%
Previous: 0%
Source: Eurostat
The Japanese Yen (JPY) has rebounded from a record under-valuation in the wake of BOJ's rate hike in July, accompanied by a reduction in the pace of JGB purchases from JPY6trn per annum to about JPY3trn in Q1 2026, DBS FX strategist Chang Wei Liang notes.
USD/JPY may try to break above 150 again
“Markets have been wrong-footed by the BOJ's determined stance to normalize interest rates. This resulted in a sharp unwind of yen carry trades, bringing USD/JPY down to as low as 142.”
“Going forward, the BOJ's policy position will be closely watched, and uncertainty of the BOJ rate trajectory could restrain markets from returning aggressively to JPY-based carry trades. Furthermore, Japanese politicians have become more averse to a weak JPY.”
“Japan had intervened to support the JPY in April-May as well as July this year, and risks of intervention are heightened if USD/JPY is to trade above 150 again.”
Fed cut expectations drove the US Dollar (USD) weaker across the board in overnight markets. Asian currencies performed best, led by the THB, KRW, MYR, and PHP, which appreciated more than 1% against the USD. Single-day gains in the IDR and TWD were also substantial at 0.9% and 0.8%, respectively, DBS FX strategist Philip Wee notes.
Asian currencies recovering the year’s losses
“We view the Asian currency rebound as a recovery of the losses from the Fed’s ‘high for longer’ rates stance in the first half of this year. The MYR has become the strongest currency this year, appreciating by 5.1% ytd, a far cry from the 4% ytd loss in April. The SGD is the other currency that managed to appreciate for the year, by 1.3% ytd, sharply reversing the 3% ytd loss by the end of April.”
“While the THB is flat for the year, it did wipe out the 7-8% ytd loss in the first four months. The outlook for Asian currencies is supported by the recovery in the region’s largest currencies (JPY and CNY), many Asian economies reporting stronger-than-expected growth lately amid US growth worries, and no expectations for their central banks to match the Fed cut cycle over the next two years.”
“There is scope for the KRW, PHP, IDR to play catch up in recovering this year’s losses.”
- AUD/JPY oscillates in a range below a fresh monthly top touched earlier this Tuesday.
- The mixed technical setup warrants some caution before positioning for further gains.
- A sustained strength beyond the 100 confluence will be seen as a fresh trigger for bulls.
The AUD/JPY cross seesaws between tepid gains/minor losses through the first half of the European session and now seems to have stabilized around mid-98.00s, just below the monthly peak touched earlier this Tuesday.
The Japanese Yen (JPY) continues with its volatile two-way price moves amid domestic political uncertainty, which could hinder the Bank of Japan's (BoJ) plan to steadily lift interest rates from near zero. This, in turn, fails to assist the AUD/JPY cross to build on the overnight modest gains and leads to subdued range-bound price action. That said, the prevalent risk-on mood continues to undermine the safe-haven JPY, which, along with the Reserve Bank of Australia's (RBA) hawkish stance, acts as a tailwind for the currency pair.
From a technical perspective, the AUD/JPY cross is holding comfortably above the 38.2% Fibonacci retracement level of the July-August downfall. This, in turn, supports prospects for an extension of the recent strong recovery from the vicinity of the 90.00 psychological mark, or the lowest level since May 2023 touched earlier this month. That said, mixed oscillators on the daily chart warrant some caution for bullish traders. Hence, any subsequent move up is more likely to remain capped near the 100.00 confluence resistance.
The said handle comprises the very important 200-day Simple Moving Average (SMA) and the 50% Fibo. level, which if cleared decisively will be seen as a fresh trigger for bullish traders. The AUD/JPY cross might then accelerate the positive move towards the 101.00 mark before aiming to test the 102.00-102.10 supply zone or the 61.8% Fibo. level.
On the flip side, the 97.45 area (38.2% Fibo. level) now seems to have emerged as immediate strong support. This is followed by the 97.00 round figure and support near the 96.30-96.25 region. Some follow-through selling below the 96.00 mark might expose the 23.6% Fibo. level, around the 94.65 region, with some intermediate support near the 95.55 horizontal zone and the 95.00 psychological mark.
AUD/JPY daily chart
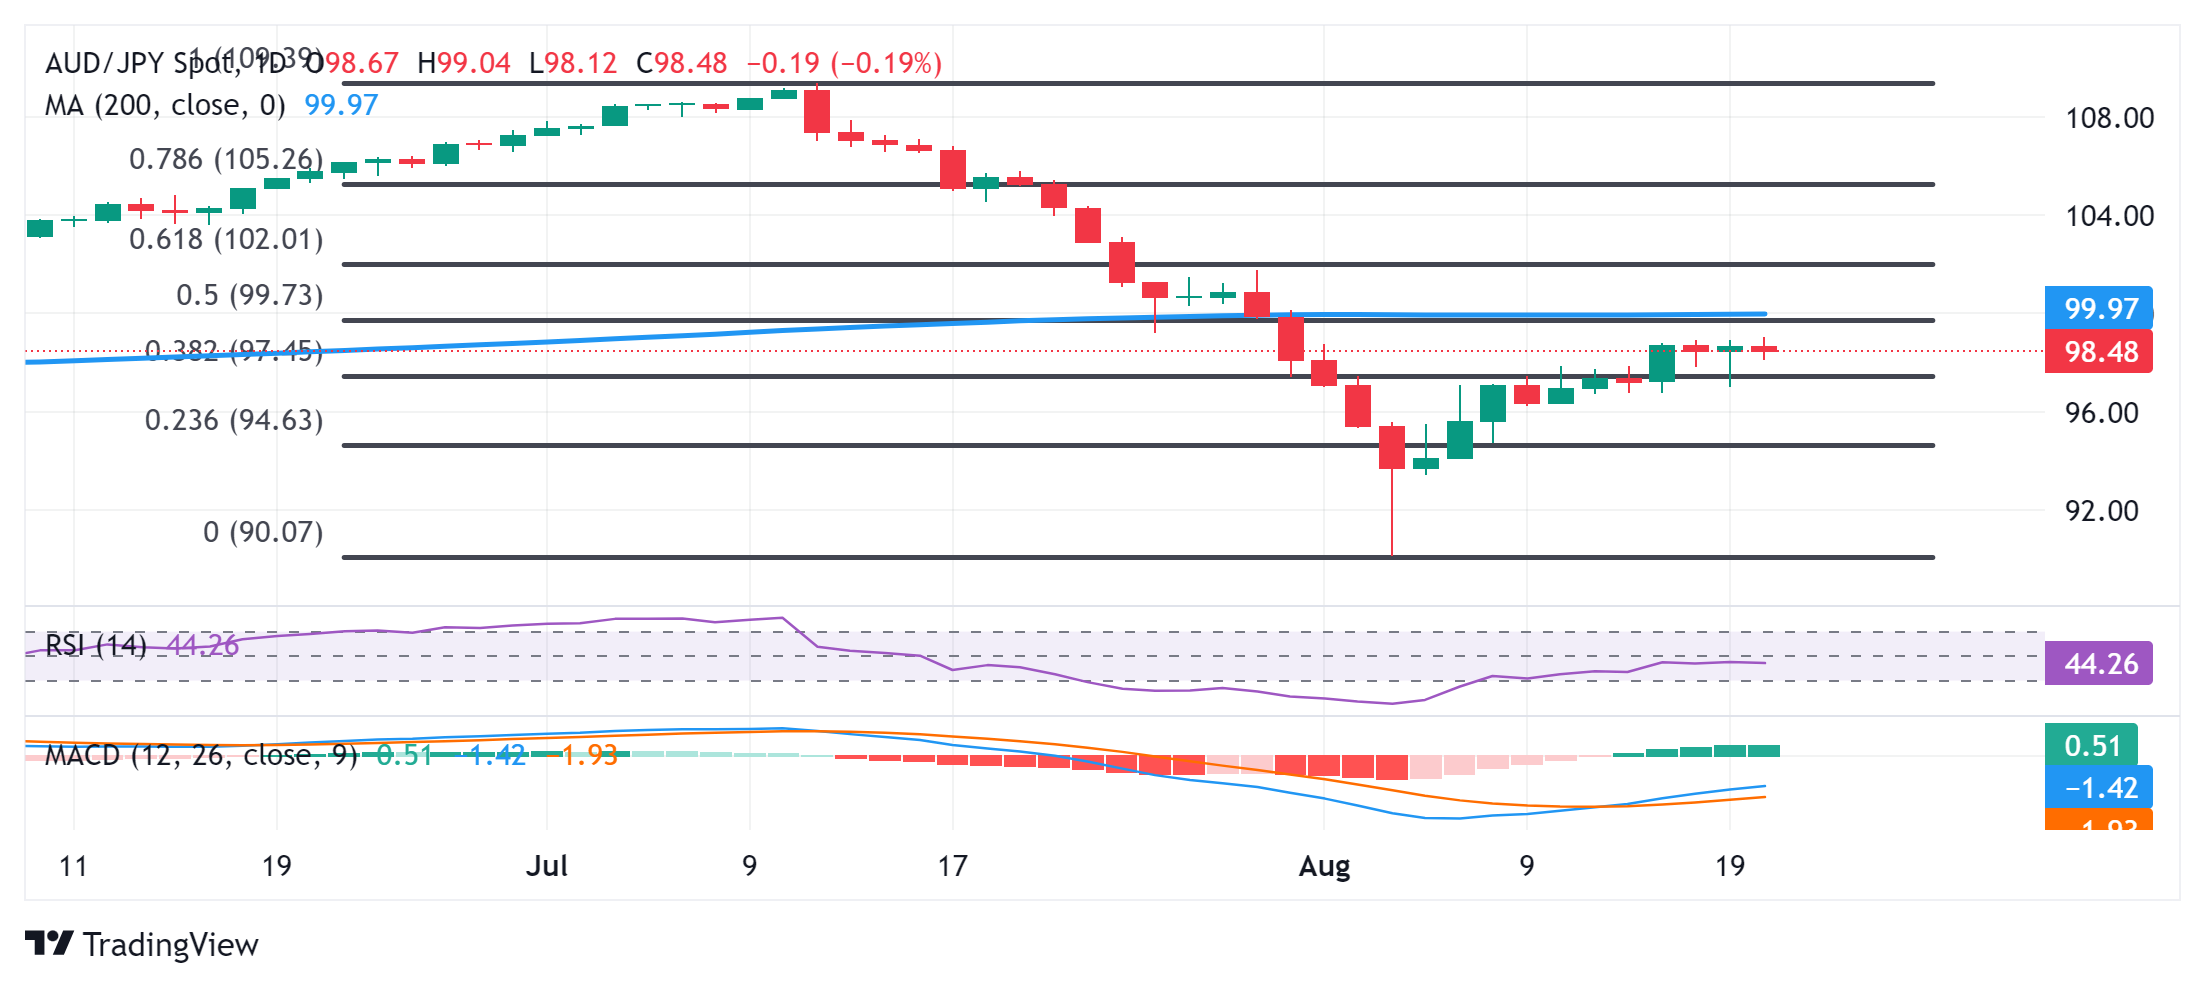
Bank of Japan FAQs
The Bank of Japan (BoJ) is the Japanese central bank, which sets monetary policy in the country. Its mandate is to issue banknotes and carry out currency and monetary control to ensure price stability, which means an inflation target of around 2%.
The Bank of Japan has embarked in an ultra-loose monetary policy since 2013 in order to stimulate the economy and fuel inflation amid a low-inflationary environment. The bank’s policy is based on Quantitative and Qualitative Easing (QQE), or printing notes to buy assets such as government or corporate bonds to provide liquidity. In 2016, the bank doubled down on its strategy and further loosened policy by first introducing negative interest rates and then directly controlling the yield of its 10-year government bonds.
The Bank’s massive stimulus has caused the Yen to depreciate against its main currency peers. This process has exacerbated more recently due to an increasing policy divergence between the Bank of Japan and other main central banks, which have opted to increase interest rates sharply to fight decades-high levels of inflation. The BoJ’s policy of holding down rates has led to a widening differential with other currencies, dragging down the value of the Yen.
A weaker Yen and the spike in global energy prices have led to an increase in Japanese inflation, which has exceeded the BoJ’s 2% target. With wage inflation becoming a cause of concern, the BoJ looks to move away from ultra loose policy, while trying to avoid slowing the activity too much.
In quiet markets, the US Dollar (USD) is edging gently lower, FX strategist Chris Turner notes.
DXY falls towards 101
“The big question over the next week is whether the dollar is just drifting to the bottom of the medium-term range and will soon rebound, or whether we are about to see the start of an important downside break-out. When it comes to the speculative community, positioning in both EUR/USD and USD/JPY looks now to be around flat – meaning investors are waiting for the next big thing.”
“We prefer to run with the dollar bear trend for the time being as the Fed prepares the market for its first cut in September. Additionally, we would re-iterate that USD price action has been quite poor and it is notable to see DXY trading under the 5 August low, while two-year US swap rates (now 3.82%) are still some 40bp above the levels seen in early August.”
“Given the prospect of some downside revisions to the US employment picture when the Bureau of Labour Statistics releases some provisional benchmark revisions tomorrow, we expect the dollar to stay on the soft side. 102.15/102.25 may well now cap DXY rallies and we have a bias towards 101.”
- The Mexican Peso is stalling in an uptrend on rumors of the carry trade unwinding.
- Mexican Retail Sales data is scheduled for release on Tuesday.
- From a technical perspective, USD/MXN is unfolding a down leg within a rising channel.
The Mexican Peso (MXN) edges lower at the start of the European session on Tuesday, as rumors persist that the carry trade which had hitherto been favorable for the Peso is unwinding.
Interest rates in Mexico are relatively high at 10.75%, which attracts demand from the carry trade – an operation in which traders borrow in a currency with low interest rates, like the Japanese Yen (JPY) and use the money to buy higher-interest paying currencies such as the Mexican Peso. The profit from the trade is the difference between the interest paid on the loan and the interest earned on the investment, minus any currency depreciation.
The buzz in social media seems to be that the carry trade is unwinding, however, and flows that were going into the Peso are drying up. This has been put forward as one factor in the recent appreciation of the Japanese Yen. If so, and the influence of the carry trade is decreasing, the implications for the Peso will be negative. Given the still-wide interest-rate differential between Mexico and Japan, however, it seems unlikely the carry trade will completely cease.
At the time of writing, one US Dollar (USD) buys 18.71 Mexican Pesos, EUR/MXN trades at 20.72, and GBP/MXN at 24.30.
Mexican Peso: Domestic data, geopolitical risks to drive valuation
The Mexican Peso could be impacted by Mexican Retail Sales data for June – which will be released at 12:00 GMT on Tuesday – with analysts forecasting a 1.8% decline on a year-over-year basis. Whilst not usually a market moving release, a stronger-than-expected figure might support the Peso by lending credence to the view that the Banco de Mexico (Banxico) will take a more gradual approach to lowering interest rates than is currently expected. The expectation that interest rates might remain elevated for longer would be positive for the Peso as high interest rates attract greater foreign capital inflows.
Headline inflation in Mexico remains elevated at 5.57% and this could be further supported by stubbornly high dwelling inflation, according to research by Capital Economics, who expect the Banco de Mexico (Banxico) to take a gradual approach to cutting interest rates .
Trump risk reduces
The steadily decreasing chance of former-president Donald Trump winning the US presidential election in November and instituting higher tariffs on foreign imported goods, many of which come from Mexico, is a further supportive factor for the Peso. A recent poll on polling website FiveThirtyEight.com shows Harris leading Trump by two and a half points, according to a report in the Independent.
The Peso is sensitive to changes in global risk appetite and could also be impacted by a breakdown in peace talks in the Middle East. US Secretary of State Anthony Blinken is currently trying to broker a peace deal between Israel and Hammas, but he has not been able to gain the agreement of all parties, according to Reuters. The threat of the war escalating and involving Iran would cause an increase in market volatility which would probably be detrimental to the Peso.
Technical Analysis: USD/MXN unfolding C wave of correction
USD/MXN consolidates within a bearish leg of a rising channel. The pair posted a bearish Shooting Star Japanese candlestick pattern on Monday and, if Tuesday ends as a red candle, it will provide added confirmation of an extension of the leg down towards the lower channel line and the 50-day Simple Moving Average (SMA) at 18.42 nearby.
USD/MXN Daily Chart
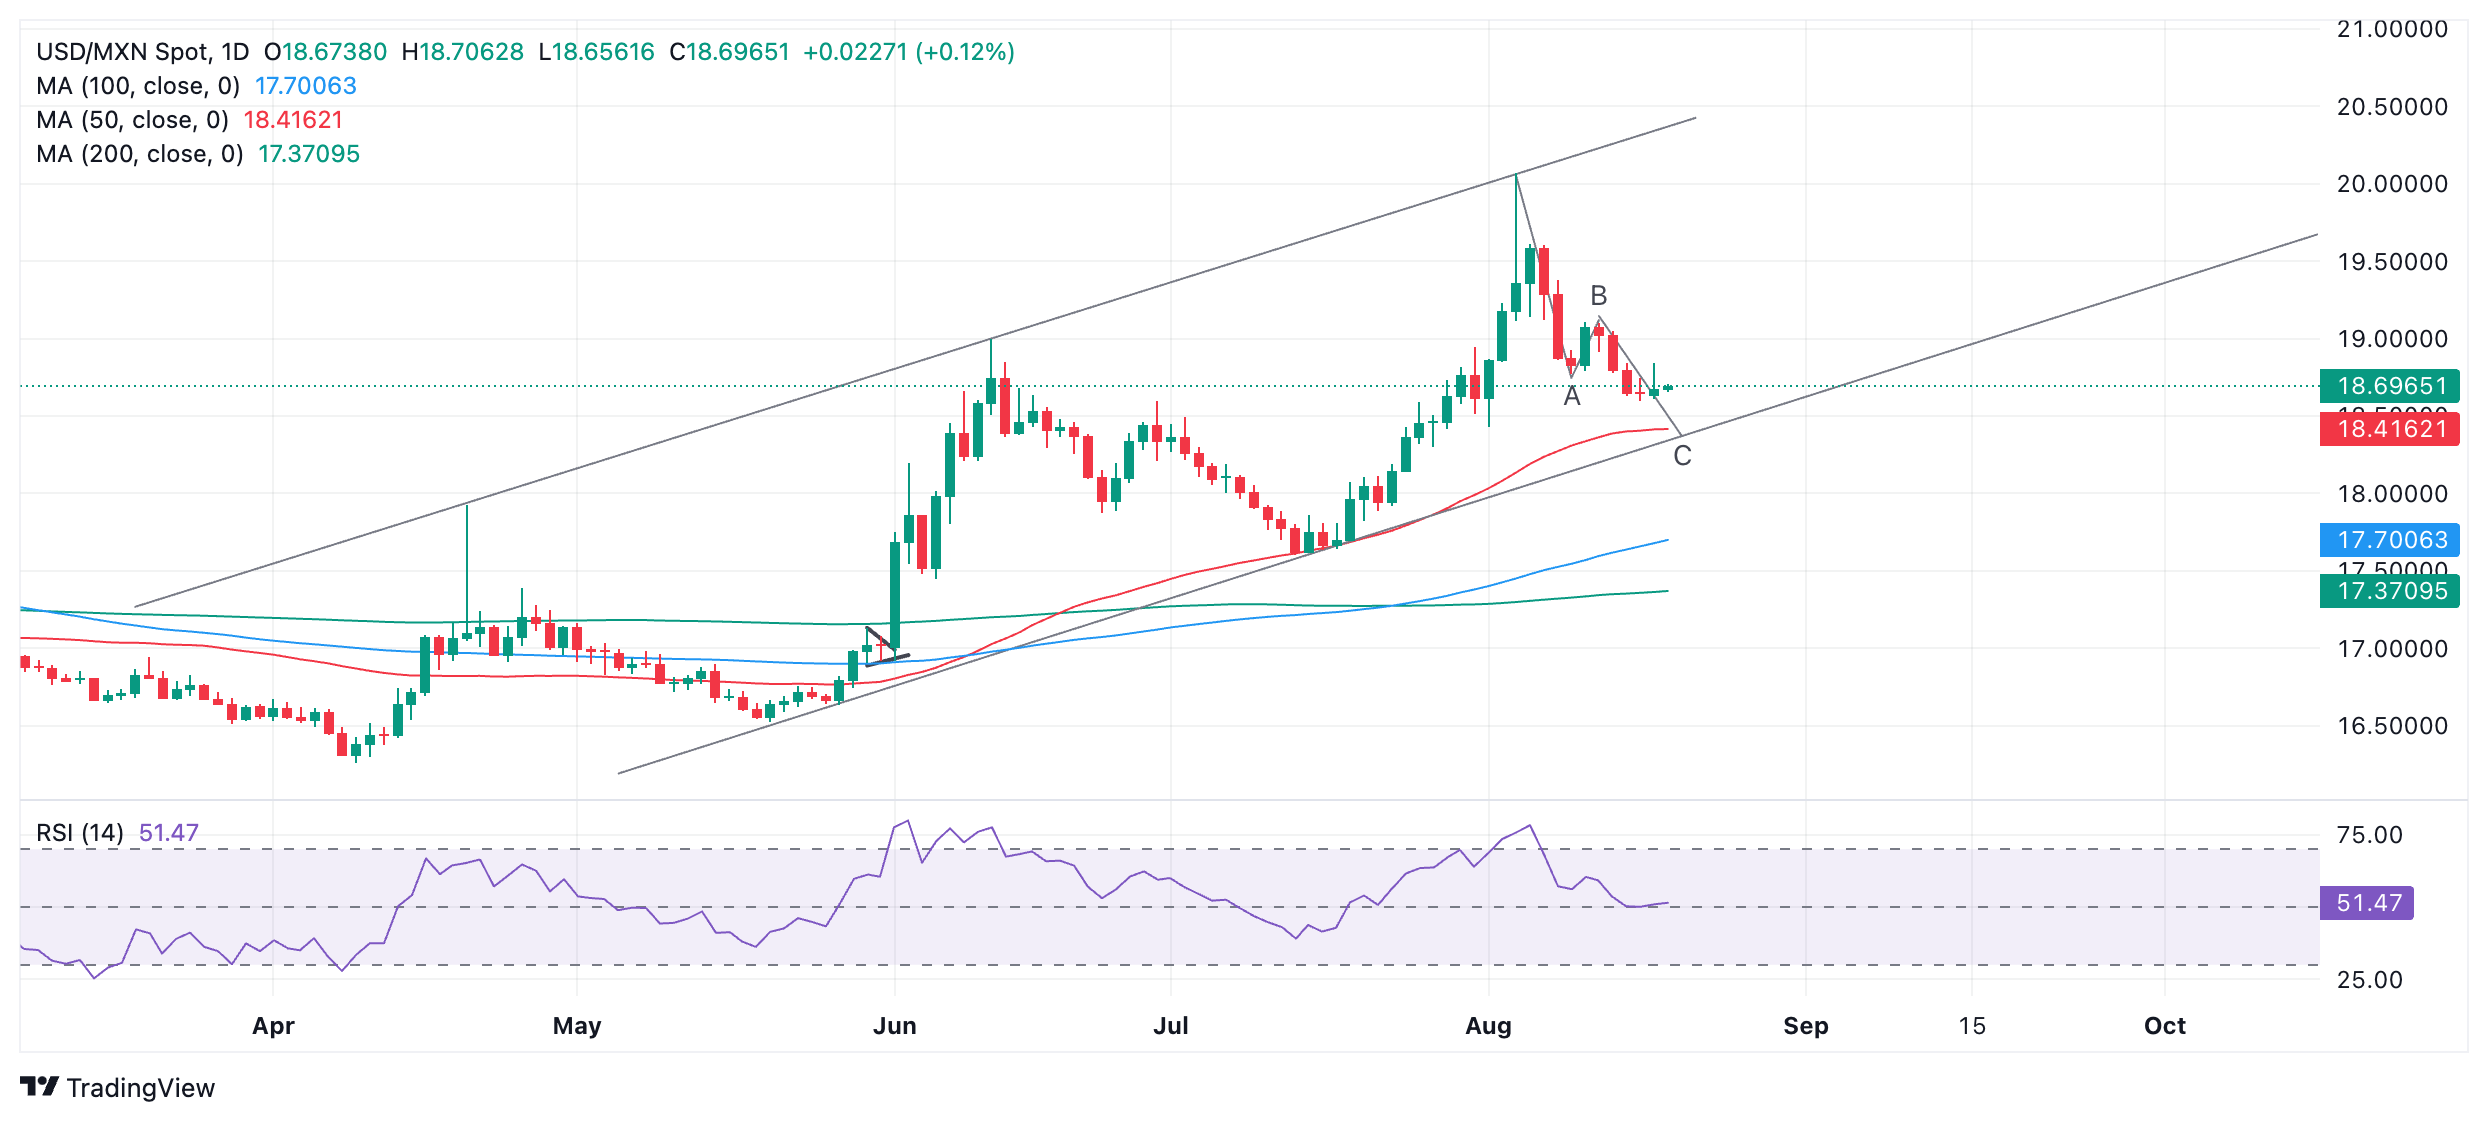
USD/MXN looks to be unfolding in a bearish ABC pattern down leg within its rising channel. If so, it looks like wave C is currently unfolding and is likely to be of a similar length to wave A or a Fibonacci ratio thereof. This suggests the move lower still probably has further to go.
The overall trend on the medium and longer-term time frames is arguably bullish, however, so once complete there is a good chance the channel will continue rising higher as these longer-term trends extend.
Economic Indicator
Retail Sales (MoM)
The Retail Sales released by INEGI measures the total receipts of retail stores. Monthly percent changues reflect the rate of changes of such sales. Changes in retail sales are widely followed as an indicator of consumer spending. Generally speaking, a high reading is seen as positive or bullish for the Mexican peso, while a low reading is seen as negative or bearish.
Read more.
- AUD/USD price may advance further due to a short-term bullish trend.
- A 9-day EMA has crossed above the 50-day EMA, indicating that price momentum is outpacing the longer-term trend.
- The pair could explore the region around its seven-month high of 0.6798.
AUD/USD halts its three-day winning streak, trading around 0.6730 during the European hours on Tuesday. The daily chart analysis indicates that the pair is moving upward within an ascending channel pattern, which suggests the strengthening of a bullish bias.
Furthermore, the 14-day Relative Strength Index (RSI) is approaching the 70 mark, reinforcing the ongoing bullish momentum. Reaching the 70 level would signal an overbought condition for the currency pair, indicating a potential correction may be on the horizon.
Additionally, the daily chart analysis indicates that the 9-day Exponential Moving Average (EMA) has crossed above the 50-day EMA. This crossover suggests that price momentum is outpacing the longer-term trend, which signals a short-term bullish trend for the AUD/USD pair.
On the upside, the AUD/USD pair could approach the region around its seven-month high of 0.6798, which was reached on July 11. Further resistance appears around the upper boundary of the ascending channel at the 0.6820 level.
In terms of support, the AUD/USD pair may test the lower boundary of the ascending channel aligned with the nine-day EMA at 0.6648 level. Next support appears at the 50-day EMA at 0.6624 level.
A break below the 50-day EMA could weaken the bullish bias and exert downward pressure on the pair to test the throwback level at 0.6575. If the pair falls below this support level, it could drive it toward the next throwback level at 0.6470.
AUD/USD: Daily Chart
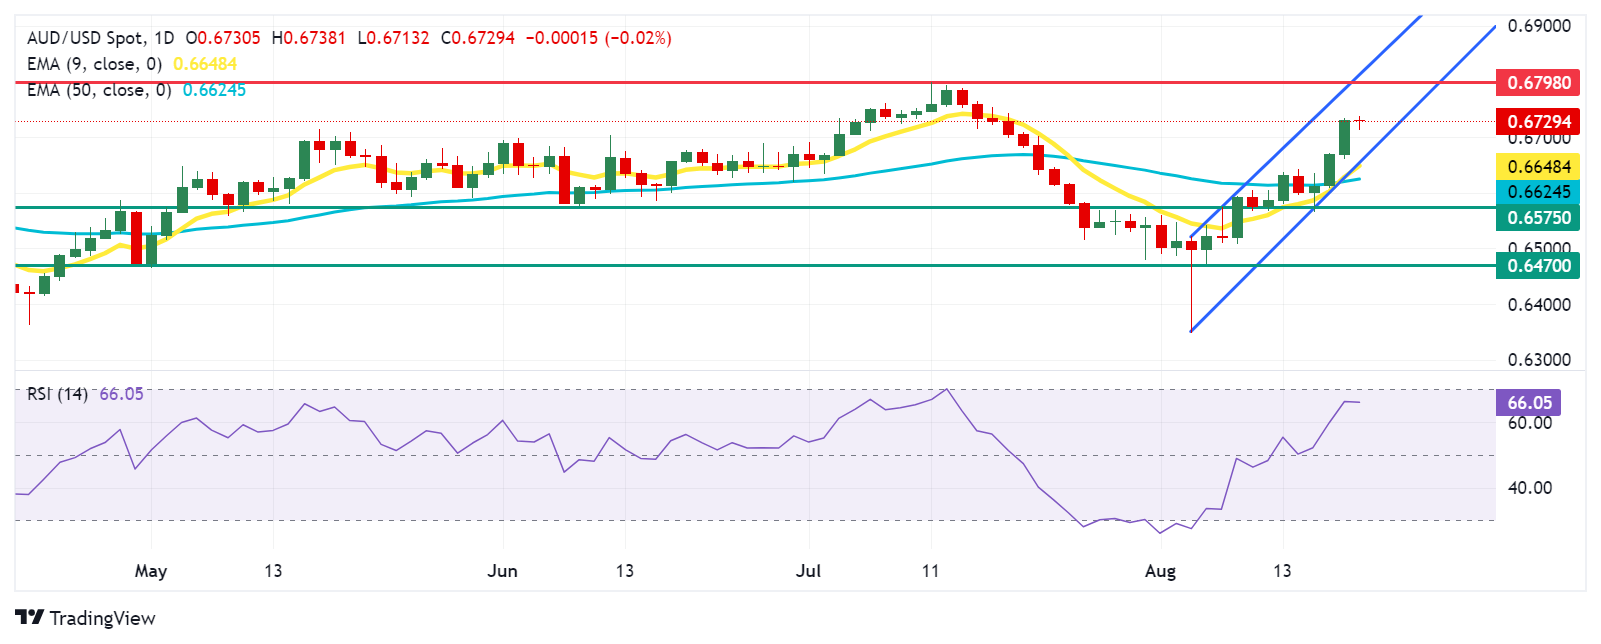
Australian Dollar PRICE Today
The table below shows the percentage change of Australian Dollar (AUD) against listed major currencies today. Australian Dollar was the weakest against the Swiss Franc.
| USD | EUR | GBP | JPY | CAD | AUD | NZD | CHF | |
|---|---|---|---|---|---|---|---|---|
| USD | 0.03% | -0.10% | -0.09% | -0.13% | 0.03% | -0.64% | -0.40% | |
| EUR | -0.03% | -0.14% | -0.15% | -0.14% | 0.02% | -0.37% | -0.43% | |
| GBP | 0.10% | 0.14% | 0.00% | 0.00% | 0.17% | -0.23% | -0.30% | |
| JPY | 0.09% | 0.15% | 0.00% | -0.02% | 0.13% | -0.25% | -0.32% | |
| CAD | 0.13% | 0.14% | -0.01% | 0.02% | 0.15% | -0.22% | -0.31% | |
| AUD | -0.03% | -0.02% | -0.17% | -0.13% | -0.15% | -0.38% | -0.47% | |
| NZD | 0.64% | 0.37% | 0.23% | 0.25% | 0.22% | 0.38% | -0.08% | |
| CHF | 0.40% | 0.43% | 0.30% | 0.32% | 0.31% | 0.47% | 0.08% |
The heat map shows percentage changes of major currencies against each other. The base currency is picked from the left column, while the quote currency is picked from the top row. For example, if you pick the Australian Dollar from the left column and move along the horizontal line to the US Dollar, the percentage change displayed in the box will represent AUD (base)/USD (quote).
- Silver turns positive for the fourth straight day and climbs to a fresh one-month top on Tuesday.
- The technical setup favors bullish traders and supports prospects for a further appreciating move.
- Weakness below the $29.20 confluence hurdle breakpoint could be seen as a buying opportunity.
Silver (XAG/USD) reverses an intraday dip and climbs to a fresh one-month peak during the early part of the European session on Tuesday. The white metal currently trades around the $29.60-$29.65 area, up over 0.70% for the day, and seems poised to prolong its recent goodish recovery from the $26.45 zone, or the lowest level since May touched earlier this month.
From a technical perspective, the overnight breakout through the $29.20 confluence hurdle – comprising the 50-day Simple Moving Average (SMA) and the 50% Fibonacci retracement level of the July-August slide – was seen as a fresh trigger for bulls. Moreover, oscillators on the daily chart have been gaining positive traction and are still away from being in the overbought zone, validating the near-term positive outlook for the XAG/USD.
Adding to this, the emergence of dip-buying near the aforementioned confluence resistance breakpoint, now turned support, also supports prospects for a further near-term appreciating move. Hence, a subsequent strength beyond the 61.8% Fibo. level, around the $29.75 region, en route to the $30.00 psychological mark, looks like a distinct possibility. The momentum could extend towards the $30.55-$30.60 area, or the 78.6% Fibo. level.
On the flip side, the $29.20 area now seems to protect the immediate downside ahead of the $29.00 round-figure mark. Some follow-through selling could make the XAG/USD vulnerable to accelerate the slide towards the $28.55 region, or the 38.2% Fibo. level, en route to the $28.00 round figure. The latter should act as a key pivotal point, which if broken might expose the $27.25 support before the metal drops back to test the $27.00 mark.
Silver daily chart
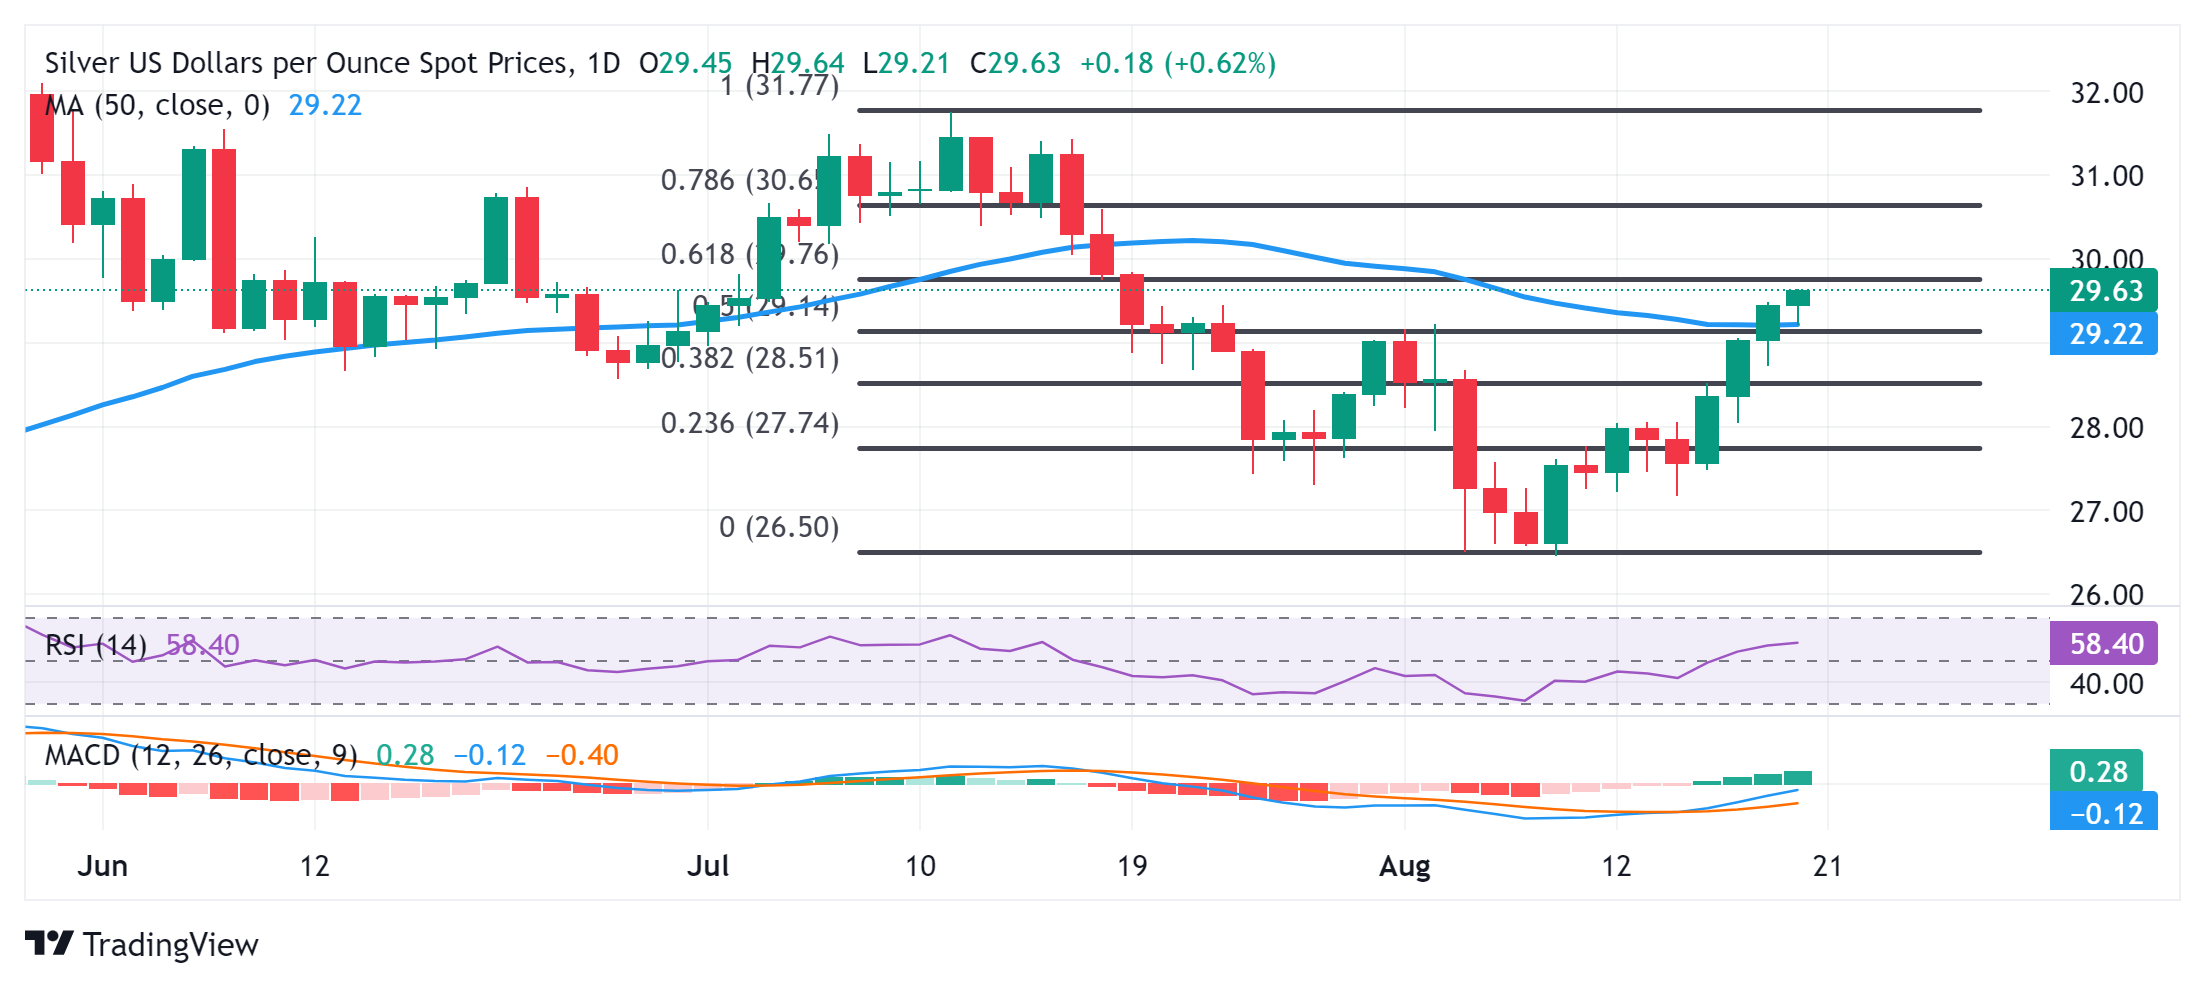
Silver FAQs
Silver is a precious metal highly traded among investors. It has been historically used as a store of value and a medium of exchange. Although less popular than Gold, traders may turn to Silver to diversify their investment portfolio, for its intrinsic value or as a potential hedge during high-inflation periods. Investors can buy physical Silver, in coins or in bars, or trade it through vehicles such as Exchange Traded Funds, which track its price on international markets.
Silver prices can move due to a wide range of factors. Geopolitical instability or fears of a deep recession can make Silver price escalate due to its safe-haven status, although to a lesser extent than Gold's. As a yieldless asset, Silver tends to rise with lower interest rates. Its moves also depend on how the US Dollar (USD) behaves as the asset is priced in dollars (XAG/USD). A strong Dollar tends to keep the price of Silver at bay, whereas a weaker Dollar is likely to propel prices up. Other factors such as investment demand, mining supply – Silver is much more abundant than Gold – and recycling rates can also affect prices.
Silver is widely used in industry, particularly in sectors such as electronics or solar energy, as it has one of the highest electric conductivity of all metals – more than Copper and Gold. A surge in demand can increase prices, while a decline tends to lower them. Dynamics in the US, Chinese and Indian economies can also contribute to price swings: for the US and particularly China, their big industrial sectors use Silver in various processes; in India, consumers’ demand for the precious metal for jewellery also plays a key role in setting prices.
Silver prices tend to follow Gold's moves. When Gold prices rise, Silver typically follows suit, as their status as safe-haven assets is similar. The Gold/Silver ratio, which shows the number of ounces of Silver needed to equal the value of one ounce of Gold, may help to determine the relative valuation between both metals. Some investors may consider a high ratio as an indicator that Silver is undervalued, or Gold is overvalued. On the contrary, a low ratio might suggest that Gold is undervalued relative to Silver.
- The Canadian Consumer Price Index is seen losing further traction in July.
- The BoC could extend its easing cycle in the latter part of the year.
- The Canadian Dollar appears firm against its US counterpart so far in August.
Canada is poised to release the latest inflation figures on Tuesday, with Statistics Canada publishing the Consumer Price Index (CPI) data for July. Forecasts suggest the continuation of disinflationary trends in the headline CPI, while another uptick in the core reading, as it happened in June, could add some volatility to the release.
Alongside the CPI data, the Bank of Canada (BoC) will also unveil its core Consumer Price Index, which excludes volatile components like food and energy. In June, the BoC core CPI recorded a 0.1% drop against May’s reading and a 1.9% gain over the last twelve months, while the headline CPI climbed by 2.7% over the past year and contracted by 0.1% from the previous month.
These numbers are under close scrutiny, as they could impact the Canadian Dollar (CAD) in the short term and shape expectations for the Bank of Canada's monetary policy, particularly after the central bank cut its policy rate by an extra 25 basis points (bps) to 4.50% in July.
In the FX world, the Canadian Dollar gathered strong traction following year-to-date lows near 1.3950 against the Greenback on August 5. So far, the downside in USD/CAD remains well guarded by the key 200-day SMA near 1.3600 the figure.
What can we expect from Canada’s inflation rate?
Analysts anticipate that price pressures in Canada will maintain their downward bias in July, though they are likely to still remain above the central bank’s target. Consumer prices are expected to follow the recent trend observed in the US, where lower-than-expected CPI data have fuelled speculation about a 50 bps interest rate cut by the Federal Reserve (Fed) in September. Despite those expectations fizzling out afterwards, along with strong results on the US macro data, the Fed is largely predicted to trim its interest rates by 25 bps next month.
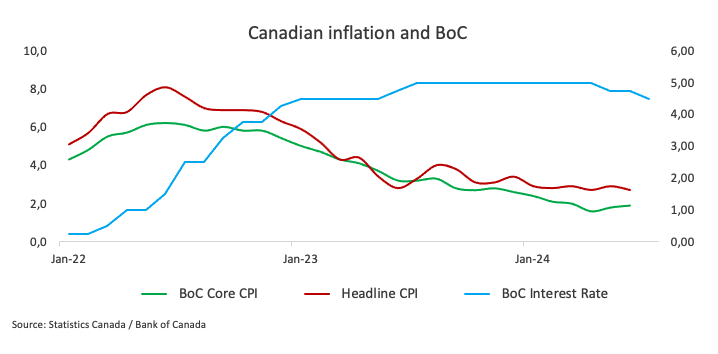
Should the upcoming data meet these expectations, investors may speculate that the Bank of Canada (BoC) could further ease its monetary policy with another quarter-point interest rate cut, potentially bringing the policy rate down to 4.25% at its September 4 meeting.
According to the Minutes of its July event, BoC governors expressed concerns about weaker consumer spending in 2025 and 2026 compared to expectations. Lower borrowing costs could boost spending, but households would still face debt-servicing burdens, hindering any recovery. Economic growth lags behind population growth, causing excess supply and labour market slack. This could weaken the labour market and dampen consumption, affecting growth and inflation.
Back to inflation, and following the interest rate cut last month, BoC’s Governor Tiff Macklem argued that the economy is experiencing excess supply, with slack in the labour market contributing to downward pressure on inflation. He noted that their assessment indicates sufficient excess supply already exists in the economy and emphasized that, rather than increasing excess supply, the focus should be on boosting growth and job creation to absorb this surplus and achieve a sustainable return to the 2% inflation target.”
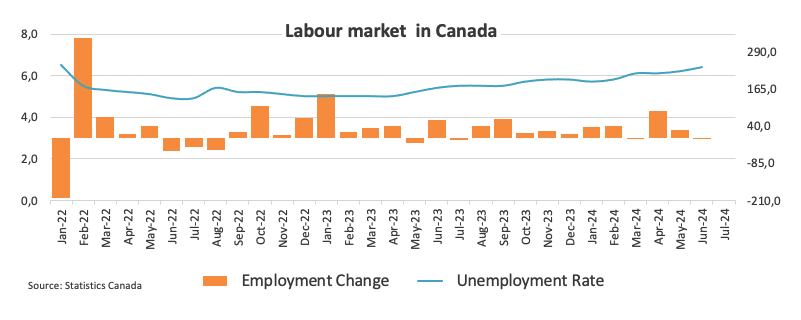
Analysts at TD Securities commented that: “Markets will look to the July CPI for a final update on underlying price pressures ahead of the September BoC decision, with TD projecting a 0.2pp drop to 2.5% y/y, although stronger core inflation momentum should give a mixed tone to the report.”
When is the Canada CPI data due, and how could it affect USD/CAD?
On Tuesday at 12:30 GMT, Canada will release the Consumer Price Index (CPI) for July. The Canadian Dollar's response will largely hinge on any shifts in expectations regarding the Bank of Canada's (BoC) monetary policy. However, unless there are significant surprises in the data, the BoC is expected to maintain its current easing approach, somewhat mirroring the stance of other central banks like the Fed.
USD/CAD began the month trading with a strong bias and climbing to yearly highs around 1.3950. However, the Canadian currency managed to regain firm pace and dragged spot nearly three cents lower at the time of writing, pari passu with a strong corrective decline in the US Dollar (USD).
Pablo Piovano, Senior Analyst at FXStreet, suggests that USD/CAD appears well supported by the critical 200-day SMA around 1.3600. A breach of that level could spark further weakness to the next support of note at the March bottom of 1.3419 (March 8), prior to the weekly low of 1.3358 from January 31.
On the upside, Pablo adds, immediate resistance is found at the 2024 high of 1.3946 (August 5), ahead of the key milestone of 1.4000 (June 11).
Pablo also noted that significant increases in CAD volatility would likely depend on unexpected inflation data. If the CPI comes in below expectations, it could bolster the argument for another BoC interest rate cut at the upcoming meeting, leading to a rise in USD/CAD. On the other hand, if inflation exceeds expectations, the Canadian Dollar might see only modest support.
Economic Indicator
BoC Consumer Price Index Core (YoY)
The BoC Consumer Price Index Core, released by the Bank of Canada (BoC) on a monthly basis, represents changes in prices for Canadian consumers by comparing the cost of a fixed basket of goods and services. It is considered a measure of underlying inflation as it excludes eight of the most-volatile components: fruits, vegetables, gasoline, fuel oil, natural gas, mortgage interest, intercity transportation and tobacco products. The YoY reading compares prices in the reference month to the same month a year earlier. Generally, a high reading is seen as bullish for the Canadian Dollar (CAD), while a low reading is seen as bearish.
Read more.Last release: Tue Jul 16, 2024 12:30
Frequency: Monthly
Actual: 1.9%
Consensus: -
Previous: 1.8%
Source: Statistics Canada
Inflation FAQs
Inflation measures the rise in the price of a representative basket of goods and services. Headline inflation is usually expressed as a percentage change on a month-on-month (MoM) and year-on-year (YoY) basis. Core inflation excludes more volatile elements such as food and fuel which can fluctuate because of geopolitical and seasonal factors. Core inflation is the figure economists focus on and is the level targeted by central banks, which are mandated to keep inflation at a manageable level, usually around 2%.
The Consumer Price Index (CPI) measures the change in prices of a basket of goods and services over a period of time. It is usually expressed as a percentage change on a month-on-month (MoM) and year-on-year (YoY) basis. Core CPI is the figure targeted by central banks as it excludes volatile food and fuel inputs. When Core CPI rises above 2% it usually results in higher interest rates and vice versa when it falls below 2%. Since higher interest rates are positive for a currency, higher inflation usually results in a stronger currency. The opposite is true when inflation falls.
Although it may seem counter-intuitive, high inflation in a country pushes up the value of its currency and vice versa for lower inflation. This is because the central bank will normally raise interest rates to combat the higher inflation, which attract more global capital inflows from investors looking for a lucrative place to park their money.
Formerly, Gold was the asset investors turned to in times of high inflation because it preserved its value, and whilst investors will often still buy Gold for its safe-haven properties in times of extreme market turmoil, this is not the case most of the time. This is because when inflation is high, central banks will put up interest rates to combat it. Higher interest rates are negative for Gold because they increase the opportunity-cost of holding Gold vis-a-vis an interest-bearing asset or placing the money in a cash deposit account. On the flipside, lower inflation tends to be positive for Gold as it brings interest rates down, making the bright metal a more viable investment alternative.
- USD/CAD slides further below 1.3630 with investors focusing on the Canadian Inflation on Wednesday.
- Fed Powell is expected to say over the size of interest rate cuts in September.
- Lower Oil prices fail to dent the Canadian Dollar’s strength.
The USD/CAD pair continues its losing streak for the third trading session on Tuesday. The Loonie asset weakens below 1.3630 as the near-term appeal of the US Dollar (USD) is downbeat due to firm expectations that the Federal Reserve (Fed) will start reducing interest rates in September.
Firm expectations for Fed interest-rate cuts in September have improved the appeal of risky assets. S&P 500 futures have posted decent gains in the European session, exhibiting the upbeat risk appetite of investors. The US Dollar Index (DXY), which tracks the Greenback’s value against six major currencies, remains close to a more-than-seven-month low of 101.77. 10-year US Treasury yields hover near 3.87%.
While the Fed seems certain to pivot to policy normalization in September, investors are anxious about whether the central bank will do the process gradually or deliver a 50 basis points (bps) interest rate cut decision. To get more cues about the same, market participants will focus on the Federal Open Market Committee (FOMC) minutes and Fed Chair Jerome Powell’s speech at the Jackson Hole (JH) Symposium on Wednesday and August 22-23, respectively.
Meanwhile, the Canadian Dollar (CAD) outperforms despite the continuation of a bearish streak in the Oil price. Growing expectations of a ceasefire between Iran and Israel, and China’s dismal economic outlook have weighed heavily on Oil prices. Lower Oil prices result in a big dent in foreign flows to Canada as it is the largest energy exporter to the United States (US).
Going forward, the next move in the Canadian Dollar will be influenced by Canada’s Consumer Price Index (CPI) data for July, which will be published on Wednesday. Economists estimated that the headline CPI rose at a slower pace of 2.5% from 2.7% in June. Monthly headline inflation is expected to have grown by 0.3% after deflating earlier. Slowing inflationary pressures would boost speculation for more interest rate cuts by the Bank of Canada (BoC).
Economic Indicator
Consumer Price Index (YoY)
The Consumer Price Index (CPI), released by Statistics Canada on a monthly basis, represents changes in prices for Canadian consumers by comparing the cost of a fixed basket of goods and services. The YoY reading compares prices in the reference month to the same month a year earlier. Generally, a high reading is seen as bullish for the Canadian Dollar (CAD), while a low reading is seen as bearish.
Read more.Next release: Tue Aug 20, 2024 12:30
Frequency: Monthly
Consensus: 2.5%
Previous: 2.7%
Source: Statistics Canada
- ECB policymakers are hesitant to pursue a rate-cut path due to concerns that price pressures could reaccelerate.
- Germany’s Producer Price Index fell by 0.8% YoY in July, following the previous 1.6% decrease.
- Last week's economic reports support the case for the BoE to maintain the rate at 5.0% in September.
EUR/GBP retraces its recent gains, trading around 0.8520 during the early European hours on Tuesday. Investors anticipate that the European Central Bank (ECB) will gradually reduce interest rates. ECB policymakers have hesitated to commit to a specific rate-cut path due to concerns that price pressures could reaccelerate.
Germany’s Producer Price Index (PPI) declined by 0.8% year-over-year in July, in line with expectations, following the previous decline of 1.6%. Meanwhile, the monthly index showed a 0.2% increase, also as anticipated. Investors have shifted their focus on the Harmonized Index of Consumer Prices (HICP) data from the European Monetary Union (EMU) scheduled for release later in the day.
Last week's UK inflation and employment reports have strengthened the case for the Bank of England (BoE) to maintain the interest rate at 5.0% at its upcoming September meeting. Finance Minister Rachel Reeves emphasized that the latest data highlights the challenges facing the new government, reiterating her position that tough decisions will be needed to improve the country's economic fundamentals, according to Reuters.
Additionally, Rupert Thompson, Chief Economist at IBOSS, remarked, “The BOE is most likely to leave rates unchanged at their next meeting in September, with the next cut likely delayed until November.” The anticipation of further rate cuts by the BoE could put pressure on the Pound Sterling (GBP) in the near term.
Traders are expected to closely monitor the Purchasing Managers Index (PMI) data from the Chartered Institute of Procurement & Supply and S&P Global, scheduled for release on Thursday. This report could offer additional insights into the UK’s economic conditions, potentially influencing the Bank of England's policy stance.
Economic Indicator
Harmonized Index of Consumer Prices (MoM)
The Harmonized Index of Consumer Prices (HICP) measures changes in the prices of a representative basket of goods and services in the European Monetary Union. The HICP, released by Eurostat on a monthly basis, is harmonized because the same methodology is used across all member states and their contribution is weighted. The MoM figure compares the prices of goods in the reference month to the previous month. Generally, a high reading is seen as bullish for the Euro (EUR), while a low reading is seen as bearish.
Read more.- NZD/USD attracts buyers for the third straight day and climbs to a multi-week top on Tuesday.
- The strong move-up could be attributed to some technical buying above the key 200-day SMA.
- A modest USD recovery might cap gains ahead of the FOMC meeting minutes on Wednesday.
The NZD/USD pair builds on the overnight breakout momentum through the very important 200-day Simple Moving Average (SMA) and scales higher for the third successive day on Tuesday. Spot prices advance to a nearly six-week peak, around the 0.6130-0.6135 region during the early part of the European session, though might struggle to capitalize on the positive move.
As investors look past the Reserve Bank of New Zealand's (RBNZ) dovish tilt last week, the risk-on mood and optimism over a possible economic stimulus from China's government act as a tailwind for antipodean currencies, including the Kiwi. The US Dollar (USD), on the other hand, dropped to its lowest level since January amid bets for an imminent start of the Federal Reserve's (Fed) rate-cutting cycle in September. This turns out to be another factor pushing the NZD/USD pair higher.
In fact, the markets are now pricing in the possibility that the Fed will lower borrowing costs by over 200 basis points by the end of 2025 and the bets were reaffirmed by the recent comments from influential FOMC members. The USD bears, however, seem reluctant and prefer to wait for more cues about the Fed's policy path in the near term. Apart from this, geopolitical risks help ease the bearish pressure surrounding the safe-haven buck and might cap the upside for the NZD/USD pair.
Moving ahead, there isn't any relevant market-moving economic data due for release from the US on Tuesday. Hence, the USD price dynamics will continue to play a key role in driving the currency pair. Meanwhile, the focus remains on the release of the FOMC meeting minutes on Wednesday, which, along with Fed Chair Jerome Powell's speech on Friday, should provide some meaningful impetus to the buck. This, in turn, will help determine the near-term trajectory for the NZD/USD pair.
US Dollar PRICE Today
The table below shows the percentage change of US Dollar (USD) against listed major currencies today. US Dollar was the strongest against the Japanese Yen.
| USD | EUR | GBP | JPY | CAD | AUD | NZD | CHF | |
|---|---|---|---|---|---|---|---|---|
| USD | 0.12% | -0.01% | 0.22% | -0.07% | 0.09% | -0.53% | -0.21% | |
| EUR | -0.12% | -0.13% | 0.11% | -0.17% | 0.00% | -0.34% | -0.33% | |
| GBP | 0.01% | 0.13% | 0.25% | -0.04% | 0.14% | -0.22% | -0.21% | |
| JPY | -0.22% | -0.11% | -0.25% | -0.28% | -0.13% | -0.46% | -0.45% | |
| CAD | 0.07% | 0.17% | 0.04% | 0.28% | 0.15% | -0.17% | -0.17% | |
| AUD | -0.09% | 0.00% | -0.14% | 0.13% | -0.15% | -0.33% | -0.34% | |
| NZD | 0.53% | 0.34% | 0.22% | 0.46% | 0.17% | 0.33% | -0.01% | |
| CHF | 0.21% | 0.33% | 0.21% | 0.45% | 0.17% | 0.34% | 0.00% |
The heat map shows percentage changes of major currencies against each other. The base currency is picked from the left column, while the quote currency is picked from the top row. For example, if you pick the US Dollar from the left column and move along the horizontal line to the Japanese Yen, the percentage change displayed in the box will represent USD (base)/JPY (quote).
Here is what you need to know on Tuesday, August 20:
Major currency pairs seem to have stabilized in the European morning on Tuesday as investors await the next catalyst. Eurostat will release revisions to July inflation data later in the session and Statistics Canada will publish Consumer Price Index data for July later in the day. Market participants will also pay close attention to comments from Federal Reserve (Fed) officials.
After starting the week under bearish pressure, the US Dollar (USD) continued to weaken against its major rivals in the second half of the day on Monday as the bullish action in Wall Street pointed to an improving risk mood. In the early European session, US stock index futures trade marginally higher on the day and the USD Index holds steady slightly below 102.00.
US Dollar PRICE This week
The table below shows the percentage change of US Dollar (USD) against listed major currencies this week. US Dollar was the weakest against the New Zealand Dollar.
| USD | EUR | GBP | JPY | CAD | AUD | NZD | CHF | |
|---|---|---|---|---|---|---|---|---|
| USD | -0.51% | -0.39% | -0.41% | -0.41% | -0.90% | -1.36% | -0.42% | |
| EUR | 0.51% | 0.04% | 0.13% | 0.11% | -0.49% | -1.02% | 0.06% | |
| GBP | 0.39% | -0.04% | -0.06% | 0.03% | -0.54% | -1.00% | 0.01% | |
| JPY | 0.41% | -0.13% | 0.06% | -0.07% | -0.53% | -0.84% | -0.15% | |
| CAD | 0.41% | -0.11% | -0.03% | 0.07% | -0.53% | -0.88% | -0.06% | |
| AUD | 0.90% | 0.49% | 0.54% | 0.53% | 0.53% | -0.38% | 0.55% | |
| NZD | 1.36% | 1.02% | 1.00% | 0.84% | 0.88% | 0.38% | 0.97% | |
| CHF | 0.42% | -0.06% | -0.01% | 0.15% | 0.06% | -0.55% | -0.97% |
The heat map shows percentage changes of major currencies against each other. The base currency is picked from the left column, while the quote currency is picked from the top row. For example, if you pick the US Dollar from the left column and move along the horizontal line to the Japanese Yen, the percentage change displayed in the box will represent USD (base)/JPY (quote).
EUR/USD gained 0.5% for the second consecutive trading day on Monday and reached its highest level since late December near 1.1090. Early Tuesday, the pair stays in a consolidation phase at around 1.1080. The European Central Bank (ECB) will release the Negotiated Wage Rates data for the second quarter later in the day.
During the Asian trading hours, the People’s Bank of China (PBoC) announced that it left the one-year and five-year Loan Prime Rates (LPRs) unchanged at 3.35% and 3.85%, respectively. This decision came in line with the market expectation.
The minutes of the Reserve Bank of Australia's (RBA) August policy meeting showed that the board members considered a case to raise rates but decided that a steady outcome would better balance the risks. The central bank further stated that the cash rate might have to stay steady for an "extended period." After rising nearly 1% and reaching its highest level in a month on Monday, AUD/USD retreated slightly and was last seen trading above 0.6700. Meanwhile, NZD/USD preserves its bullish momentum and trades at a fresh six-week-high at around 0.6130.
Inflation in Canada, as measured by the change in the CPI, is forecast to edge lower to 2.5% on a yearly basis in July from 2.7% in June. USD/CAD trades marginally lower on the day near 1.3620 early Tuesday after losing 0.3% on Monday.
GBP/USD extended its uptrend and reached its highest level in over a month at 1.3000 during the Asian trading hours on Tuesday. The pair stays slightly below this level to start the European session.
USD/JPY recovered from the two-week-low it touched on Monday but closed the day deep in negative territory. The pair edges higher toward 147.00 in the European morning on Tuesday.
Gold corrected lower toward $2,480 on Monday but regained its traction in the American session to close the day slightly above $2,500. Early Tuesday, XAU/USD fluctuates in a tight channel at around $2,505.
Risk sentiment FAQs
In the world of financial jargon the two widely used terms “risk-on” and “risk off'' refer to the level of risk that investors are willing to stomach during the period referenced. In a “risk-on” market, investors are optimistic about the future and more willing to buy risky assets. In a “risk-off” market investors start to ‘play it safe’ because they are worried about the future, and therefore buy less risky assets that are more certain of bringing a return, even if it is relatively modest.
Typically, during periods of “risk-on”, stock markets will rise, most commodities – except Gold – will also gain in value, since they benefit from a positive growth outlook. The currencies of nations that are heavy commodity exporters strengthen because of increased demand, and Cryptocurrencies rise. In a “risk-off” market, Bonds go up – especially major government Bonds – Gold shines, and safe-haven currencies such as the Japanese Yen, Swiss Franc and US Dollar all benefit.
The Australian Dollar (AUD), the Canadian Dollar (CAD), the New Zealand Dollar (NZD) and minor FX like the Ruble (RUB) and the South African Rand (ZAR), all tend to rise in markets that are “risk-on”. This is because the economies of these currencies are heavily reliant on commodity exports for growth, and commodities tend to rise in price during risk-on periods. This is because investors foresee greater demand for raw materials in the future due to heightened economic activity.
The major currencies that tend to rise during periods of “risk-off” are the US Dollar (USD), the Japanese Yen (JPY) and the Swiss Franc (CHF). The US Dollar, because it is the world’s reserve currency, and because in times of crisis investors buy US government debt, which is seen as safe because the largest economy in the world is unlikely to default. The Yen, from increased demand for Japanese government bonds, because a high proportion are held by domestic investors who are unlikely to dump them – even in a crisis. The Swiss Franc, because strict Swiss banking laws offer investors enhanced capital protection.
- The Pound Sterling rises to a fresh monthly high near 1.3000 against the US Dollar ahead of key economic data for both the UK and the US.
- Fed Chairman Powell may signal in Jackson Hole whether the central bank will cut interest rates by 25 or 50 basis points (bps) in September.
- BoE’s Governor Bailey could uncover uncertainty over subsequent interest-rate cuts.
The Pound Sterling (GBP) posts a fresh monthly high near the psychological resistance of 1.3000 against the US Dollar (USD) in Tuesday’s London session. The GBP/USD pair demonstrates sheer strength as the outlook of the US Dollar is bleak amid firm speculation that the Federal Reserve (Fed) will start reducing interest rates in September.
The US Dollar Index (DXY) – which tracks the Greenback’s value against six major currencies – edges higher to near 102.00, but it remains close to a fresh more-than-seven-month low.
Sluggishness in the United States (US) economic data of July suggested that the economy is not overheated anymore. The labor market has cooled down, and inflationary pressures remain on track to return to the desired rate of 2%.
This week, the major triggers for the US Dollar will be the release of the Federal Open Market Committee (FOMC) minutes and Fed Chair Jerome Powell’s commentary at the Jackson Hole (JH) Symposium, which are scheduled for Wednesday and August 22-24, respectively. Investors will look through the FOMC minutes and the JH Symposium to know whether the Fed will pivot to policy normalization aggressively or gradually.
A Reuters poll carried out between August 14 and 19 shows that 54% of the respondents think that the Fed will cut interest rates in each of its remaining meetings this year.
On the economic data front, investors await the US preliminary S&P Global PMI data for August, which will be published on Thursday. The flash Composite PMI is estimated to come in at 53.7, down from the prior release of 54.3, suggesting that the economy expanded at a slower pace.
Daily digest market movers: Pound Sterling gains on expectations of BoE’s gradual rate-cut approach
- The Pound Sterling exhibits a strong performance against its major peers in the European trading hours on Tuesday. The British currency trades firm on expectations that the policy-easing cycle from the Bank of England (BoE) will be slower than that of other central banks.
- Despite a sharp slowdown in price pressures in the UK’s service sector, a closely watched inflation gauge by BoE policymakers, the drop is still insufficient to compel officials to cut interest rates aggressively. Services inflation decelerated to 5.2% in July from 5.7% in June. However, easing services inflation has opened doors for BoE sequential interest rate cuts. Currently, markets have attached a 37% probability of such action, Reuters reported.
- For meaningful cues on the interest-rate path, investors will focus on the BoE Governor Andrew Bailey’s speech at the JH Symposium on Friday. Investors will keenly focus on what he says about the wage growth outlook and how far inflationary pressures could increase if they reaccelerate.
- Before Bailey’s speech, investors will look at the UK preliminary S&P PMI data for August, which will be published on Thursday. Economists expect the flash Manufacturing PMI to steady at 52.1, while activity in the service sector is seen improving to 52.8 from the prior release of 52.5.
Technical Analysis: Pound Sterling aims to surpass 1.3000
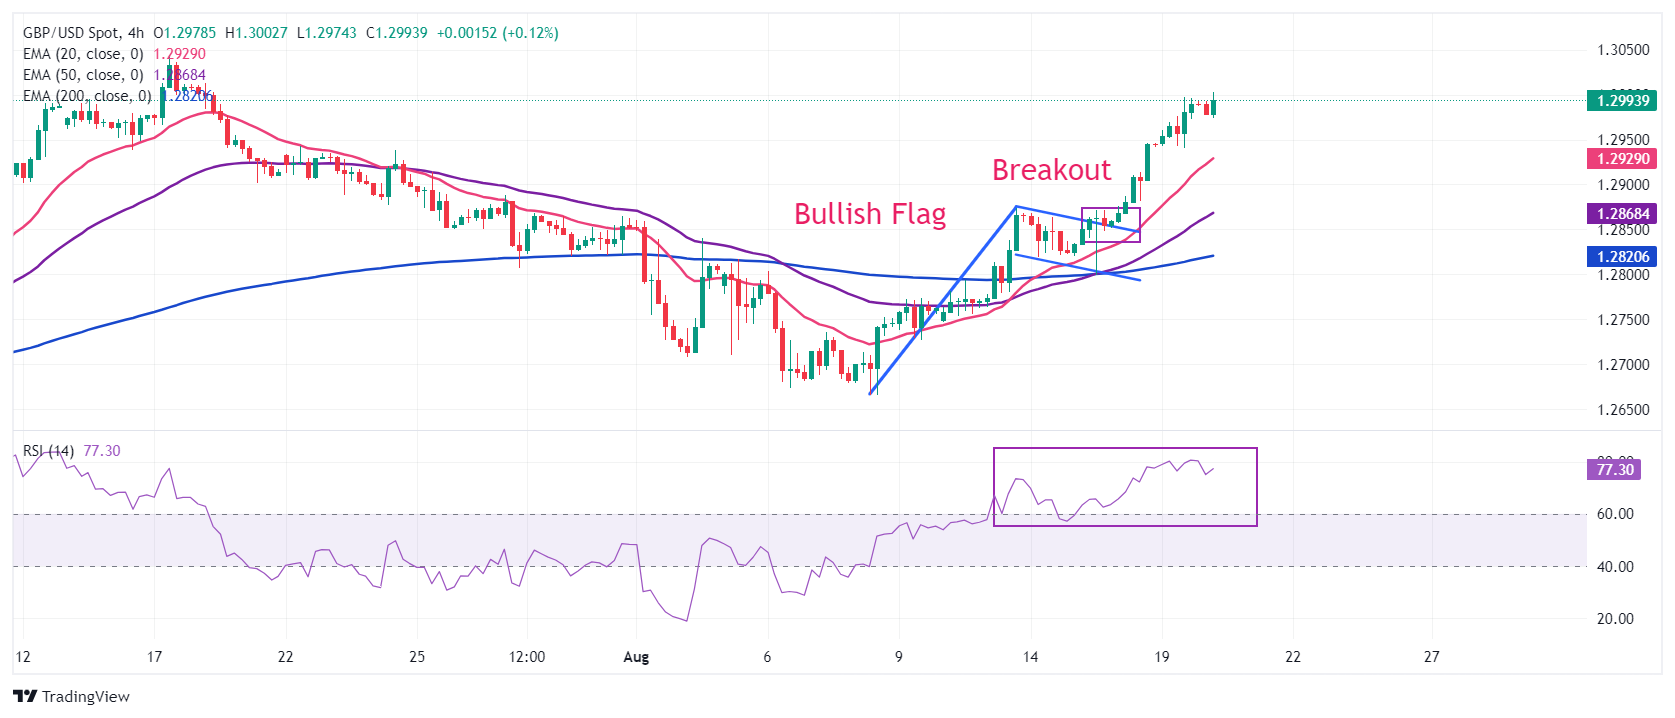
The Pound Sterling continues its winning spell for the fourth trading session on Thursday. The GBP/USD pair gains to near 1.3000 after a Bullish Flag breakout in the 4-hour timeframe. The Bullish Flag formation is characterized by lower volume in which inventory is transferred from retail participants to institutional investors. A decisive breakout of the Flag pattern results in the continuation of the ongoing trend, which in this case is up.
All short-to-long term Exponential Moving Averages (EMAs) are sloping higher, suggesting the uptrend is well supported.
The 14-period Relative Strength Index (RSI) oscillates in the bullish range of 60.00-80.00, suggesting a strong upside momentum.
Pound Sterling FAQs
The Pound Sterling (GBP) is the oldest currency in the world (886 AD) and the official currency of the United Kingdom. It is the fourth most traded unit for foreign exchange (FX) in the world, accounting for 12% of all transactions, averaging $630 billion a day, according to 2022 data. Its key trading pairs are GBP/USD, aka ‘Cable’, which accounts for 11% of FX, GBP/JPY, or the ‘Dragon’ as it is known by traders (3%), and EUR/GBP (2%). The Pound Sterling is issued by the Bank of England (BoE).
The single most important factor influencing the value of the Pound Sterling is monetary policy decided by the Bank of England. The BoE bases its decisions on whether it has achieved its primary goal of “price stability” – a steady inflation rate of around 2%. Its primary tool for achieving this is the adjustment of interest rates. When inflation is too high, the BoE will try to rein it in by raising interest rates, making it more expensive for people and businesses to access credit. This is generally positive for GBP, as higher interest rates make the UK a more attractive place for global investors to park their money. When inflation falls too low it is a sign economic growth is slowing. In this scenario, the BoE will consider lowering interest rates to cheapen credit so businesses will borrow more to invest in growth-generating projects.
Data releases gauge the health of the economy and can impact the value of the Pound Sterling. Indicators such as GDP, Manufacturing and Services PMIs, and employment can all influence the direction of the GBP. A strong economy is good for Sterling. Not only does it attract more foreign investment but it may encourage the BoE to put up interest rates, which will directly strengthen GBP. Otherwise, if economic data is weak, the Pound Sterling is likely to fall.
Another significant data release for the Pound Sterling is the Trade Balance. This indicator measures the difference between what a country earns from its exports and what it spends on imports over a given period. If a country produces highly sought-after exports, its currency will benefit purely from the extra demand created from foreign buyers seeking to purchase these goods. Therefore, a positive net Trade Balance strengthens a currency and vice versa for a negative balance.
- GBP/JPY drifts higher to 191.20 in Tuesday’s early Asian session, up 0.40% on the day.
- The improved risk sentiment weighs on the safe-haven currency like the JPY.
- The BoE is expected to keep the rate steady at 5.0% at its September meeting.
The GBP/JPY cross recovers to near 191.20, snapping the two-day, losing streak during the early European session on Tuesday. The sell-off of the Japanese Yen (JPY) broadly provides some support to the cross. Japan’s National Consumer Price Index (CPI) will be the highlight on Friday.
The Bank of Japan (BoJ) forecasted that a robust economic recovery in the Japanese economy would help inflation achieve its 2% target sustainably. This would convince the BoJ to hike more rates after last month's move as part of the BoJ's continued attempt to unwind years of substantial monetary stimulus, according to Reuters. This, in turn, might boost the JPY and create a headwind for the cross.
On the other hand, the risk-on mood and easing geopolitical risks in the Middle East could undermine the safe-haven currency like the JPY. The United States said that Israeli Prime Minister Benjamin Netanyahu has accepted a bridging proposal aimed at resolving differences between Israel and Hamas. Nonetheless, any signs of escalating political tensions might boost the safe-haven flows, benefiting the JPY.
The rising speculation that the Bank of England (BoE) would keep the interest rate steady at 5.0% at the upcoming September meeting could support the Pound Sterling (GBP) as well. “The BOE is most likely to leave rates unchanged at their next meeting in September with the next cut having to wait until November,” said Rupert Thompson, IBOSS chief economist.
Risk sentiment FAQs
In the world of financial jargon the two widely used terms “risk-on” and “risk off'' refer to the level of risk that investors are willing to stomach during the period referenced. In a “risk-on” market, investors are optimistic about the future and more willing to buy risky assets. In a “risk-off” market investors start to ‘play it safe’ because they are worried about the future, and therefore buy less risky assets that are more certain of bringing a return, even if it is relatively modest.
Typically, during periods of “risk-on”, stock markets will rise, most commodities – except Gold – will also gain in value, since they benefit from a positive growth outlook. The currencies of nations that are heavy commodity exporters strengthen because of increased demand, and Cryptocurrencies rise. In a “risk-off” market, Bonds go up – especially major government Bonds – Gold shines, and safe-haven currencies such as the Japanese Yen, Swiss Franc and US Dollar all benefit.
The Australian Dollar (AUD), the Canadian Dollar (CAD), the New Zealand Dollar (NZD) and minor FX like the Ruble (RUB) and the South African Rand (ZAR), all tend to rise in markets that are “risk-on”. This is because the economies of these currencies are heavily reliant on commodity exports for growth, and commodities tend to rise in price during risk-on periods. This is because investors foresee greater demand for raw materials in the future due to heightened economic activity.
The major currencies that tend to rise during periods of “risk-off” are the US Dollar (USD), the Japanese Yen (JPY) and the Swiss Franc (CHF). The US Dollar, because it is the world’s reserve currency, and because in times of crisis investors buy US government debt, which is seen as safe because the largest economy in the world is unlikely to default. The Yen, from increased demand for Japanese government bonds, because a high proportion are held by domestic investors who are unlikely to dump them – even in a crisis. The Swiss Franc, because strict Swiss banking laws offer investors enhanced capital protection.
FX option expiries for Aug 20 NY cut at 10:00 Eastern Time, via DTCC, can be found below.
EUR/USD: EUR amounts
- 1.0900 752m
- 1.0915 729m
- 1.0925 2.3b
- 1.0950 1b
- 1.1000 2.4b
- 1.1095 753m
- 1.1100 1.2b
USD/JPY: USD amounts
- 142.50 750m
- 144.80 700m
- 145.00 750m
- 148.00 1.5b
USD/CHF: USD amounts
- 0.8600 975m
- 0.8800 971m
- 0.8810 1.6b
AUD/USD: AUD amounts
- 0.6600 740m
- 0.6745 446m
USD/CAD: USD amounts
- 1.3595 504m
- 1.3800 1.2b
EUR/GBP: EUR amounts
- 0.8475 439m
- USD/CHF loses ground near 0.8620 in Tuesday’s early Asian session.
- The expectation of three quarter-point rate cuts this year weighs on the USD.
- Easing geopolitical risks in the Middle East could cap the pair’s downside.
The USD/CHF pair trades in negative territory for the third consecutive day around 0.8620 on Tuesday during the early European trading hours. The weaker US Dollar (USD) amid rate-cut expectation by the Federal Reserve (Fed) weighs on the pair. The Fed Chair Jerome Powell's speech on Friday will be a closely watched event and might offer some hints about the path forward for US interest rates.
The Fed is predicted to deliver 25 basis points (bps) at each of the remaining three meetings of 2024, according to a slim majority of economists polled by Reuters. A discouraging July US employment report fuelled traders to place more bets on deep rate cuts, which exerts some selling pressure on the USD.
The USD Index (DXY), which measures the value of the USD against the other six major currencies, drops to the multi-day lows below the 102.00 support level. On Monday, Minneapolis Fed President Neel Kashkari said that he would be open to cutting US interest rates in September due to the rising possibility that the labor market weakens too much. The dovish stance from the US Fed is likely to cap the upside of the pair in the near term.
On the other hand, easing geopolitical risks in the Middle East could drag the Swiss Franc (CHF) lower and create a tailwind for the pair. The United States said that Israeli Prime Minister Benjamin Netanyahu has accepted a bridging proposal aimed at resolving differences between Israel and Hamas. A de-escalation of tensions in the Middle East would most likely result in the geopolitical risk premium disappearing rapidly.
Swiss Franc FAQs
The Swiss Franc (CHF) is Switzerland’s official currency. It is among the top ten most traded currencies globally, reaching volumes that well exceed the size of the Swiss economy. Its value is determined by the broad market sentiment, the country’s economic health or action taken by the Swiss National Bank (SNB), among other factors. Between 2011 and 2015, the Swiss Franc was pegged to the Euro (EUR). The peg was abruptly removed, resulting in a more than 20% increase in the Franc’s value, causing a turmoil in markets. Even though the peg isn’t in force anymore, CHF fortunes tend to be highly correlated with the Euro ones due to the high dependency of the Swiss economy on the neighboring Eurozone.
The Swiss Franc (CHF) is considered a safe-haven asset, or a currency that investors tend to buy in times of market stress. This is due to the perceived status of Switzerland in the world: a stable economy, a strong export sector, big central bank reserves or a longstanding political stance towards neutrality in global conflicts make the country’s currency a good choice for investors fleeing from risks. Turbulent times are likely to strengthen CHF value against other currencies that are seen as more risky to invest in.
The Swiss National Bank (SNB) meets four times a year – once every quarter, less than other major central banks – to decide on monetary policy. The bank aims for an annual inflation rate of less than 2%. When inflation is above target or forecasted to be above target in the foreseeable future, the bank will attempt to tame price growth by raising its policy rate. Higher interest rates are generally positive for the Swiss Franc (CHF) as they lead to higher yields, making the country a more attractive place for investors. On the contrary, lower interest rates tend to weaken CHF.
Macroeconomic data releases in Switzerland are key to assessing the state of the economy and can impact the Swiss Franc’s (CHF) valuation. The Swiss economy is broadly stable, but any sudden change in economic growth, inflation, current account or the central bank’s currency reserves have the potential to trigger moves in CHF. Generally, high economic growth, low unemployment and high confidence are good for CHF. Conversely, if economic data points to weakening momentum, CHF is likely to depreciate.
As a small and open economy, Switzerland is heavily dependent on the health of the neighboring Eurozone economies. The broader European Union is Switzerland’s main economic partner and a key political ally, so macroeconomic and monetary policy stability in the Eurozone is essential for Switzerland and, thus, for the Swiss Franc (CHF). With such dependency, some models suggest that the correlation between the fortunes of the Euro (EUR) and the CHF is more than 90%, or close to perfect.
Gold prices remained broadly unchanged in India on Tuesday, according to data compiled by FXStreet.
The price for Gold stood at 6,745.44 Indian Rupees (INR) per gram, broadly stable compared with the INR 6,747.60 it cost on Monday.
The price for Gold was broadly steady at INR 78,677.54 per tola from INR 78,702.68 per tola a day earlier.
| Unit measure | Gold Price in INR |
|---|---|
| 1 Gram | 6,745.44 |
| 10 Grams | 67,454.45 |
| Tola | 78,677.54 |
| Troy Ounce | 209,808.60 |
FXStreet calculates Gold prices in India by adapting international prices (USD/INR) to the local currency and measurement units. Prices are updated daily based on the market rates taken at the time of publication. Prices are just for reference and local rates could diverge slightly.
Gold FAQs
Gold has played a key role in human’s history as it has been widely used as a store of value and medium of exchange. Currently, apart from its shine and usage for jewelry, the precious metal is widely seen as a safe-haven asset, meaning that it is considered a good investment during turbulent times. Gold is also widely seen as a hedge against inflation and against depreciating currencies as it doesn’t rely on any specific issuer or government.
Central banks are the biggest Gold holders. In their aim to support their currencies in turbulent times, central banks tend to diversify their reserves and buy Gold to improve the perceived strength of the economy and the currency. High Gold reserves can be a source of trust for a country’s solvency. Central banks added 1,136 tonnes of Gold worth around $70 billion to their reserves in 2022, according to data from the World Gold Council. This is the highest yearly purchase since records began. Central banks from emerging economies such as China, India and Turkey are quickly increasing their Gold reserves.
Gold has an inverse correlation with the US Dollar and US Treasuries, which are both major reserve and safe-haven assets. When the Dollar depreciates, Gold tends to rise, enabling investors and central banks to diversify their assets in turbulent times. Gold is also inversely correlated with risk assets. A rally in the stock market tends to weaken Gold price, while sell-offs in riskier markets tend to favor the precious metal.
The price can move due to a wide range of factors. Geopolitical instability or fears of a deep recession can quickly make Gold price escalate due to its safe-haven status. As a yield-less asset, Gold tends to rise with lower interest rates, while higher cost of money usually weighs down on the yellow metal. Still, most moves depend on how the US Dollar (USD) behaves as the asset is priced in dollars (XAU/USD). A strong Dollar tends to keep the price of Gold controlled, whereas a weaker Dollar is likely to push Gold prices up.
(An automation tool was used in creating this post.)
- EUR/USD reached an eight-month high of 1.1087 on Tuesday.
- CME’s FedWatch Tool indicates a 76.5% chance of a 25 basis point rate cut by the Fed in September.
- The Euro holds minor losses ahead of the Harmonized Index of Consumer Prices data from the European Monetary Union on Tuesday.
EUR/USD trades around 1.1080 during the Asian session on Tuesday after pulling back from an eight-month high of 1.1087. This downside is attributed to the improved US Dollar (USD) amid risk aversion sentiment. However, the Greenback may struggle due to rising odds of a 25 basis point rate cut by the US Federal Reserve (Fed) in September.
According to the CME’s FedWatch Tool, rate markets are pricing in a 23.5% chance of a 50 basis point rate cut by the Fed, while there is a 76.5% probability of a 25 basis point cut in September.
Minneapolis Fed President Neel Kashkari stated on Monday that it would be appropriate to discuss potential US interest rate cuts in September due to concerns about a weakening labor market, per Reuters.
The Jackson Hole Economic Symposium, set to begin on Thursday, will mark the start of a multi-day event featuring central bankers. All eyes are now on Fed Chair Jerome Powell's upcoming speech at Jackson Hole on Friday.
In the Eurozone, key data on business activity and consumer prices that could influence the European Central Bank's (ECB) September decision are awaited. Investors anticipate that the European Central Bank (ECB) will gradually reduce interest rates. ECB policymakers have hesitated to commit to a specific rate-cut path due to concerns that price pressures could reaccelerate.
The Harmonized Index of Consumer Prices (HICP) data from the European Monetary Union and Producer Price Index figures from Germany will be released on Tuesday. These figures may guide the ECB’s policy trajectory.
EUR/USD recently touched a slight new high just above 1.1050, reflecting broader USD losses with minimal other influences, according to Shaun Osborne, Chief FX Strategist at Scotiabank.
EUR/USD: No data reports from the Eurozone today – Scotiabank
Euro FAQs
The Euro is the currency for the 20 European Union countries that belong to the Eurozone. It is the second most heavily traded currency in the world behind the US Dollar. In 2022, it accounted for 31% of all foreign exchange transactions, with an average daily turnover of over $2.2 trillion a day. EUR/USD is the most heavily traded currency pair in the world, accounting for an estimated 30% off all transactions, followed by EUR/JPY (4%), EUR/GBP (3%) and EUR/AUD (2%).
The European Central Bank (ECB) in Frankfurt, Germany, is the reserve bank for the Eurozone. The ECB sets interest rates and manages monetary policy. The ECB’s primary mandate is to maintain price stability, which means either controlling inflation or stimulating growth. Its primary tool is the raising or lowering of interest rates. Relatively high interest rates – or the expectation of higher rates – will usually benefit the Euro and vice versa. The ECB Governing Council makes monetary policy decisions at meetings held eight times a year. Decisions are made by heads of the Eurozone national banks and six permanent members, including the President of the ECB, Christine Lagarde.
Eurozone inflation data, measured by the Harmonized Index of Consumer Prices (HICP), is an important econometric for the Euro. If inflation rises more than expected, especially if above the ECB’s 2% target, it obliges the ECB to raise interest rates to bring it back under control. Relatively high interest rates compared to its counterparts will usually benefit the Euro, as it makes the region more attractive as a place for global investors to park their money.
Data releases gauge the health of the economy and can impact on the Euro. Indicators such as GDP, Manufacturing and Services PMIs, employment, and consumer sentiment surveys can all influence the direction of the single currency. A strong economy is good for the Euro. Not only does it attract more foreign investment but it may encourage the ECB to put up interest rates, which will directly strengthen the Euro. Otherwise, if economic data is weak, the Euro is likely to fall. Economic data for the four largest economies in the euro area (Germany, France, Italy and Spain) are especially significant, as they account for 75% of the Eurozone’s economy.
Another significant data release for the Euro is the Trade Balance. This indicator measures the difference between what a country earns from its exports and what it spends on imports over a given period. If a country produces highly sought after exports then its currency will gain in value purely from the extra demand created from foreign buyers seeking to purchase these goods. Therefore, a positive net Trade Balance strengthens a currency and vice versa for a negative balance.
- GBP/USD edges lower to 1.2980 in Tuesday’s early Asian session.
- Dovish comments from Fed officials might weigh on the USD and cap the pair’s downside.
- Fed’s Bostic and Barr are set to speak later on Tuesday.
The GBP/USD pair weakens near 1.2980, snapping the three-day winning streak during the early European session on Tuesday. The modest recovery of the Greenback drags the major pair lower. In the absence of top-tier data releases from the UK later this week, the USD price dynamic will be the main driver for the GBP/USD. All eyes will be on the Federal Reserve (Fed) Chair Jerome Powell's speech on Friday.
The UK inflation and employment reports last week supported the Bank of England (BoE) to keep the interest rate steady at 5.0% at the upcoming September meeting. IBOSS chief economist, Rupert Thompson, noted, “The BOE is most likely to leave rates unchanged at their next meeting in September, with the next cut having to wait until November.” The expectation of more rate cuts by the BoE might weigh on the Pound Sterling (GBP) in the near term.
However, the upside of the US Dollar (USD) might be capped amid the dovish stance of the Fed officials. Minneapolis Fed President Neel Kashkari stated on Monday that he would be open to cutting US interest rates in September because of the rising possibility that the labor market weakens too much.
Meanwhile, Chicago Fed President Austan Goolsbee said on Sunday that the US economy does not show signs of overheating, therefore, Fed officials should be vigilant about keeping restrictive policy in place longer than necessary. According to the CME FedWatch Tool, traders have priced in around 77% odds of a 25 basis points (bps) Fed rate cut in its September meeting. Later on Tuesday, investors will take more cues from the Fed’s Raphael Bostic and Michael Barr speeches. Any dovish comments of Fed officials could undermine the USD and help limit losses for the GBP/USD pair.
Pound Sterling FAQs
The Pound Sterling (GBP) is the oldest currency in the world (886 AD) and the official currency of the United Kingdom. It is the fourth most traded unit for foreign exchange (FX) in the world, accounting for 12% of all transactions, averaging $630 billion a day, according to 2022 data. Its key trading pairs are GBP/USD, aka ‘Cable’, which accounts for 11% of FX, GBP/JPY, or the ‘Dragon’ as it is known by traders (3%), and EUR/GBP (2%). The Pound Sterling is issued by the Bank of England (BoE).
The single most important factor influencing the value of the Pound Sterling is monetary policy decided by the Bank of England. The BoE bases its decisions on whether it has achieved its primary goal of “price stability” – a steady inflation rate of around 2%. Its primary tool for achieving this is the adjustment of interest rates. When inflation is too high, the BoE will try to rein it in by raising interest rates, making it more expensive for people and businesses to access credit. This is generally positive for GBP, as higher interest rates make the UK a more attractive place for global investors to park their money. When inflation falls too low it is a sign economic growth is slowing. In this scenario, the BoE will consider lowering interest rates to cheapen credit so businesses will borrow more to invest in growth-generating projects.
Data releases gauge the health of the economy and can impact the value of the Pound Sterling. Indicators such as GDP, Manufacturing and Services PMIs, and employment can all influence the direction of the GBP. A strong economy is good for Sterling. Not only does it attract more foreign investment but it may encourage the BoE to put up interest rates, which will directly strengthen GBP. Otherwise, if economic data is weak, the Pound Sterling is likely to fall.
Another significant data release for the Pound Sterling is the Trade Balance. This indicator measures the difference between what a country earns from its exports and what it spends on imports over a given period. If a country produces highly sought-after exports, its currency will benefit purely from the extra demand created from foreign buyers seeking to purchase these goods. Therefore, a positive net Trade Balance strengthens a currency and vice versa for a negative balance.
- EUR/JPY attracts dip-buying on Tuesday and builds on the overnight bounce from a one-week low.
- The BoJ rate-hike uncertainty and a positive risk tone undermine the JPY, lending some support.
- ECB rate cut bets might hold back the Euro bulls from placing fresh bets and cap any further gains.
The EUR/JPY cross rallied nearly 130 pips from the Asian session low, around the 161.70 region and spikes to a fresh daily peak in the last hour amid the emergence of fresh selling around the Japanese Yen (JPY). Spot prices currently trade around the 163.00 mark, with bulls now looking to build on the overnight goodish recovery from the 160.40 area or a one-week low.
Japanese Prime Minister Fumio Kishida's decision to step down raises political uncertainty in the country and could hinder the Bank of Japan's (BoJ) plan to steadily lift interest rates from near zero. This, along with the underlying strong bullish sentiment across the global equity markets, is seen as a key factor undermining the safe-haven JPY and acting as a tailwind for the EUR/JPY cross.
That said, the risk of a further escalation of geopolitical tensions in the Middle East might keep a lid on the market optimism. Moreover, the incoming data from Japan point to an improving macroeconomic environment, which should encourage the BoJ to raise interest rates again later this year. This, along with dovish European Central Bank (ECB) expectations, should cap gains for the EUR/JPY cross.
In fact, the markets have been pricing in the possibility that the ECB will cut rates again in the wake of declining inflation in the Eurozone and downbeat economic outlook. The bets were reaffirmed by the overnight comments from Finnish central bank chief and ECB policymaker Olli Rehn, saying that the central bank may need to cut interest rates again in September given persistent economic weakness.
Hence, it will be prudent to wait for strong follow-through buying before positioning for the resumption of the recent solid recovery move from the 154.40-154.35 region, or the YTD low touched earlier this month. Investors now look forward to the release of the final Eurozone CPI print, which might influence the Euro and produce some short-term trading opportunities around the EUR/JPY cross.
Bank of Japan FAQs
The Bank of Japan (BoJ) is the Japanese central bank, which sets monetary policy in the country. Its mandate is to issue banknotes and carry out currency and monetary control to ensure price stability, which means an inflation target of around 2%.
The Bank of Japan has embarked in an ultra-loose monetary policy since 2013 in order to stimulate the economy and fuel inflation amid a low-inflationary environment. The bank’s policy is based on Quantitative and Qualitative Easing (QQE), or printing notes to buy assets such as government or corporate bonds to provide liquidity. In 2016, the bank doubled down on its strategy and further loosened policy by first introducing negative interest rates and then directly controlling the yield of its 10-year government bonds.
The Bank’s massive stimulus has caused the Yen to depreciate against its main currency peers. This process has exacerbated more recently due to an increasing policy divergence between the Bank of Japan and other main central banks, which have opted to increase interest rates sharply to fight decades-high levels of inflation. The BoJ’s policy of holding down rates has led to a widening differential with other currencies, dragging down the value of the Yen.
A weaker Yen and the spike in global energy prices have led to an increase in Japanese inflation, which has exceeded the BoJ’s 2% target. With wage inflation becoming a cause of concern, the BoJ looks to move away from ultra loose policy, while trying to avoid slowing the activity too much.
- Silver price edges lower due to the de-escalation of the geopolitical tensions in the Middle East.
- US Secretary of State Antony Blinken announced that Israel had agreed to a proposal for a Gaza ceasefire.
- Fed President Neel Kashkari indicated that discussing potential US rate cuts in September is warranted.
Silver price (XAG/USD) price breaks its three-day winning streak, trading around $29.30 per troy ounce during the Asian session on Tuesday. The downside of the safe-haven Silver could be attributed to de-escalation of the geopolitical tensions in the Middle East.
On Monday, US Secretary of State Antony Blinken announced that Israel had agreed to a proposal to resolve the issues delaying a Gaza ceasefire and urged Hamas to follow suit. However, Hamas senior official Osama Hamdan criticized Blinken's statement that Israeli Prime Minister Benjamin Netanyahu had accepted an updated proposal. Hamdan claimed it "raises many ambiguities" and is "not what was presented to us nor what we agreed on."
Hamdan also stated that Hamas has already informed mediators that they are not seeking new negotiations but rather an agreement on an implementation mechanism for the ceasefire, per Reuters.
Traders are eagerly anticipating Federal Reserve Chair Jerome Powell's speech at Jackson Hole on Friday, looking for clues about the potential size of the US central bank’s expected rate cut in September. Meanwhile, markets are continuing to price in a total of 100 basis points of rate cuts for this year. Lower interest rates could boost the demand for non-yielding assets such as Silver.
On Monday, Minneapolis Fed President Neel Kashkari suggested that it would be appropriate to consider potential US interest rate cuts in September, citing concerns about a weakening labor market, according to Reuters.
Silver FAQs
Silver is a precious metal highly traded among investors. It has been historically used as a store of value and a medium of exchange. Although less popular than Gold, traders may turn to Silver to diversify their investment portfolio, for its intrinsic value or as a potential hedge during high-inflation periods. Investors can buy physical Silver, in coins or in bars, or trade it through vehicles such as Exchange Traded Funds, which track its price on international markets.
Silver prices can move due to a wide range of factors. Geopolitical instability or fears of a deep recession can make Silver price escalate due to its safe-haven status, although to a lesser extent than Gold's. As a yieldless asset, Silver tends to rise with lower interest rates. Its moves also depend on how the US Dollar (USD) behaves as the asset is priced in dollars (XAG/USD). A strong Dollar tends to keep the price of Silver at bay, whereas a weaker Dollar is likely to propel prices up. Other factors such as investment demand, mining supply – Silver is much more abundant than Gold – and recycling rates can also affect prices.
Silver is widely used in industry, particularly in sectors such as electronics or solar energy, as it has one of the highest electric conductivity of all metals – more than Copper and Gold. A surge in demand can increase prices, while a decline tends to lower them. Dynamics in the US, Chinese and Indian economies can also contribute to price swings: for the US and particularly China, their big industrial sectors use Silver in various processes; in India, consumers’ demand for the precious metal for jewellery also plays a key role in setting prices.
Silver prices tend to follow Gold's moves. When Gold prices rise, Silver typically follows suit, as their status as safe-haven assets is similar. The Gold/Silver ratio, which shows the number of ounces of Silver needed to equal the value of one ounce of Gold, may help to determine the relative valuation between both metals. Some investors may consider a high ratio as an indicator that Silver is undervalued, or Gold is overvalued. On the contrary, a low ratio might suggest that Gold is undervalued relative to Silver.
- A combination of factors assists USD/CAD to bounce off a one-month low touched this Tuesday.
- Sliding Crude Oil prices undermine the Loonie and lend support amid a modest USD recovery.
- The upside remains capped as traders now look to Canadian inflation figures for a fresh impetus.
The USD/CAD pair stages a modest recovery from the 1.3625 area, or over a one-month low touched during the Asian session on Tuesday and for now, seems to have snapped a two-day losing streak. Spot prices, however, remain below mid-1.3600s as traders seem reluctant to place aggressive bets ahead of the Canadian consumer inflation figures, due for release later today.
The headline Canadian CPI is expected to fall for the second straight month and provide further evidence of slowing inflation, which may encourage the Bank of Canada (BoC) to pursue a more accommodative policy amid a slack in the labor market. This, in turn, could weigh heavily on the Canadian Dollar (CAD) and assist the USD/CAD pair to capitalize on the modest intraday recovery move.
Ahead of the key microdata, the ongoing downfall in Crude Oil prices, fueled by optimism over the possibility of a ceasefire in Gaza, is seen undermining the commodity-linked Loonie. This, along with a modest US Dollar (USD) rebound from its lowest level since January set earlier this Tuesday, turns out to be another factor that prompts some intraday short-covering around the USD/CAD pair.
Any meaningful upside for the Greenback, however, seems elusive in the wake of growing acceptance that the Federal Reserve (Fed) will begin its rate-cutting cycle in September. Apart from this, the upbeat market mood could further contribute to capping gains for the buck, warranting some caution before confirming that the USD/CAD pair has formed a near-term bottom ahead of the 1.3600 mark.
Traders might also prefer to wait for more cues about the Fed's rate-cut path before positioning or the next leg of a direction. Hence, the market attention will then shift to the release of the July FOMC meeting minutes, due on Wednesday. This, along with Fed Chair Jerome Powell's speech at the Jackson Hole Symposium, will influence the USD and provide some meaningful impetus to the USD/CAD pair.
Economic Indicator
Consumer Price Index (YoY)
The Consumer Price Index (CPI), released by Statistics Canada on a monthly basis, represents changes in prices for Canadian consumers by comparing the cost of a fixed basket of goods and services. The YoY reading compares prices in the reference month to the same month a year earlier. Generally, a high reading is seen as bullish for the Canadian Dollar (CAD), while a low reading is seen as bearish.
Read more.Next release: Tue Aug 20, 2024 12:30
Frequency: Monthly
Consensus: 2.5%
Previous: 2.7%
Source: Statistics Canada
- The downside of the Japanese Yen could be limited as BoJ is highly expected to implement further rate hikes.
- Recent economic growth in Japan raises the possibility of another near-term BoJ rate hike.
- The US Dollar faced challenges following dovish Fedspeak.
The Japanese Yen (JPY) declines against the US Dollar (USD) on Tuesday. However, the downside of the JPY could be restrained amid the rising possibility of another near-term interest rate hike. Japan's economy grew at an annualized rate of 3.1% in the second quarter, significantly exceeding expectations and rebounding from a slowdown earlier in the year.
According to Reuters, the Bank of Japan (BoJ) had projected that a strong economic recovery would help inflation reach its 2% target sustainably. This would justify further interest rate increases, following last month's hike as part of the BoJ's ongoing effort to unwind years of extensive monetary stimulus. On Friday, BoJ Governor Kazuo Ueda is set to discuss the central bank's decision last month to raise interest rates.
The US Dollar (USD) retraces its recent losses due to risk aversion sentiment. However, the Greenback faced challenges after remarks from Federal Reserve (Fed) officials heightened the prospect of upcoming rate cuts. On Monday, Minneapolis Fed President Neel Kashkari suggested that it would be appropriate to consider potential US interest rate cuts in September, citing concerns about a weakening labor market, according to Reuters.
Daily Digest Market Movers: Japanese Yen depreciates despite a hawkish BoJ
- Federal Reserve Bank of San Francisco President Mary Daly emphasized Sunday that the US central bank should take a gradual approach to reducing borrowing costs, according to the Financial Times. Additionally, Federal Reserve Bank of Chicago President Austan Goolsbee warned that central bank officials should be cautious about keeping a restrictive policy in place longer than necessary, per CNBC.
- On Thursday, Kazutaka Maeda, an economist at Meiji Yasuda Research Institute, said that the reports are simply positive overall and “it supports the BoJ’s view and bodes well for further rate hikes, although the central bank would remain cautious as the last rate increase had caused a sharp spike in the Yen.”
- Japanese Economy Minister Yoshitaka Shindo stated that the economy is anticipated to recover gradually as wages and income improve. Shindo also added that the government will collaborate closely with the Bank of Japan to implement flexible macroeconomic policies.
- Japan's Gross Domestic Product (GDP) grew by 0.8% quarter-on-quarter in Q2, surpassing market forecasts of 0.5% and rebounding from a 0.6% decline in Q1. This marked the strongest quarterly growth since Q1 of 2023. Meanwhile, the annualized GDP growth reached 3.1%, exceeding the market consensus of 2.1% and reversing a 2.3% contraction in Q1. This was the strongest yearly expansion since Q2 of 2023.
- US headline Consumer Price Index (CPI) rose 2.9% year-over-year in July, slightly down from the 3% increase in June and below market expectations. The Core CPI, which excludes food and energy, climbed 3.2% year-over-year, a slight decrease from the 3.3% rise in June but aligned with market forecasts.
- Rabobank's senior FX strategist, Jane Foley, observes that this week's series of US data releases, along with next week's Jackson Hole event, should provide the market with clearer insights into the potential responses of US policymakers. However, their main expectation is that the Fed will reduce rates by 25 basis points in September and likely cut them again before the end of the year.
Technical Analysis: USD/JPY hovers around 146.50
USD/JPY trades around 146.60 on Tuesday. Analysis of the daily chart shows that the pair is just below the nine-day Exponential Moving Average (EMA), indicating a short-term bearish trend. Furthermore, the 14-day Relative Strength Index (RSI) is slightly above 30, suggesting a potential correction for the pair.
For support levels, the USD/JPY pair might test the seven-month low of 141.69, which was reached on August 5. A further drop could drive the pair toward the next significant support level at 140.25.
On the upside, the USD/JPY pair could encounter immediate resistance around the nine-day Exponential Moving Average (EMA) at 147.41. If the pair breaks above this level, it might target the 50-day EMA at 152.54 and potentially test the resistance level at 154.50, which has transitioned from previous support to current resistance.
USD/JPY: Daily Chart
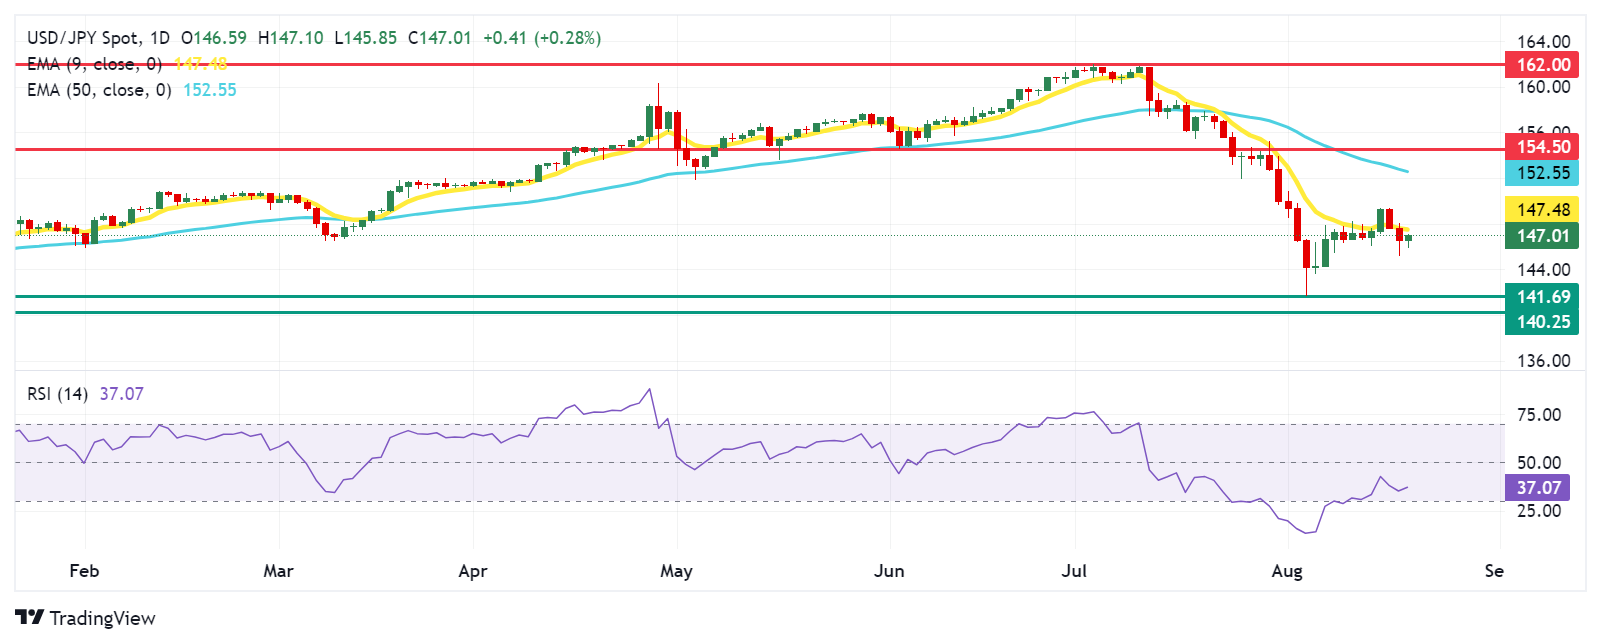
Japanese Yen PRICE Today
The table below shows the percentage change of Japanese Yen (JPY) against listed major currencies today. Japanese Yen was the weakest against the Swiss Franc.
| USD | EUR | GBP | JPY | CAD | AUD | NZD | CHF | |
|---|---|---|---|---|---|---|---|---|
| USD | 0.06% | 0.05% | 0.22% | 0.00% | 0.14% | -0.30% | -0.08% | |
| EUR | -0.06% | -0.01% | 0.16% | -0.04% | 0.10% | -0.05% | -0.14% | |
| GBP | -0.05% | 0.01% | 0.17% | -0.03% | 0.13% | -0.05% | -0.14% | |
| JPY | -0.22% | -0.16% | -0.17% | -0.20% | -0.08% | -0.23% | -0.32% | |
| CAD | -0.00% | 0.04% | 0.03% | 0.20% | 0.13% | -0.01% | -0.12% | |
| AUD | -0.14% | -0.10% | -0.13% | 0.08% | -0.13% | -0.15% | -0.26% | |
| NZD | 0.30% | 0.05% | 0.05% | 0.23% | 0.00% | 0.15% | -0.11% | |
| CHF | 0.08% | 0.14% | 0.14% | 0.32% | 0.12% | 0.26% | 0.11% |
The heat map shows percentage changes of major currencies against each other. The base currency is picked from the left column, while the quote currency is picked from the top row. For example, if you pick the Japanese Yen from the left column and move along the horizontal line to the US Dollar, the percentage change displayed in the box will represent JPY (base)/USD (quote).
Japanese Yen FAQs
The Japanese Yen (JPY) is one of the world’s most traded currencies. Its value is broadly determined by the performance of the Japanese economy, but more specifically by the Bank of Japan’s policy, the differential between Japanese and US bond yields, or risk sentiment among traders, among other factors.
One of the Bank of Japan’s mandates is currency control, so its moves are key for the Yen. The BoJ has directly intervened in currency markets sometimes, generally to lower the value of the Yen, although it refrains from doing it often due to political concerns of its main trading partners. The current BoJ ultra-loose monetary policy, based on massive stimulus to the economy, has caused the Yen to depreciate against its main currency peers. This process has exacerbated more recently due to an increasing policy divergence between the Bank of Japan and other main central banks, which have opted to increase interest rates sharply to fight decades-high levels of inflation.
The BoJ’s stance of sticking to ultra-loose monetary policy has led to a widening policy divergence with other central banks, particularly with the US Federal Reserve. This supports a widening of the differential between the 10-year US and Japanese bonds, which favors the US Dollar against the Japanese Yen.
The Japanese Yen is often seen as a safe-haven investment. This means that in times of market stress, investors are more likely to put their money in the Japanese currency due to its supposed reliability and stability. Turbulent times are likely to strengthen the Yen’s value against other currencies seen as more risky to invest in.
- The Indian Rupee holds steady near two-week highs in Tuesday’s early Asian session.
- Weaker Greenback and lower crude oil prices support the INR; renewed USD demand and Indian outflows might cap its upside.
- Investors will watch the Fed’s Raphael Bostic and Michael Barr speeches on Tuesday.
The Indian Rupee (INR) trades flat on Tuesday. The further decline of the US Dollar (USD) has boosted Asian currencies and lifted the INR to its highest in two weeks. Additionally, the fall in crude oil prices is likely to underpin the local currency as India is one of the largest importers of crude oil.
On the other hand, the renewed USD demand from public sector banks and outflows from local equities might cap the INR’s gains. Investors will focus on the Fed’s Raphael Bostic and Michael Barr speeches on Tuesday. The highlight will be Fed Chair Jerome Powell's speech on Friday, which might provide some outlook about the path forward for US interest rates. On the Indian docket, the first reading of the HSBC Purchasing Managers Index (PMI) for August will be released on Wednesday.
Daily Digest Market Movers: Indian Rupee recovers some lost ground on the softer USD
- “A large public sector bank started buying (Dollars) when the currency touched 83.85/$1 and there is a good possibility that the PSU bank may be buying on behalf of the central bank, as the RBI may not be comfortable with the upside in Rupee”, said Anil Bhansali, Head of Treasury at Finrex Treasury Advisors LLP.
- The Deputy Managing Director of the International Monetary Fund (IMF), Dr. Gita Gopinath, said that she is hopeful of India becoming the third-largest economy by 2027 as the growth did much better than expected during the last fiscal year and that those carryover effects are affecting our forecast for this year.
- The RBI noted demand conditions in the Indian economy are gathering momentum, adding that the decline of inflation pressures has pushed rural spending and driven a catch-up with urban consumption volumes, according to the RBI monthly bulletin of August 2024.
- India's exports fell 6% in the current fiscal year through July compared to the same period in the previous year. In FY24, foreign direct investment in India decreased by 3.5%. Foreign portfolio investors (FPI) have withdrawn cash funds from India owing to the country's overheated stock market.
- Federal Reserve Bank of Minneapolis President Neel Kashkari said on Monday that he would be open to cutting US interest rates in September because of the rising possibility that the labor market weakens too much.
Technical analysis: USD/INR resumes downside journey
Indian Rupee trades on a flat note on the day. The bullish outlook of the USD/INR pair seems vulnerable as the pair is testing the 11-week-old uptrend line on the daily timeframe. A daily close below the ascending support could lead to a drop towards the 100-day Exponential Moving Average (EMA). Nonetheless, the 14-day Relative Strength Index (RSI) stands above the midline near 54.0, indicating the upward momentum remains in place.
If the pair decisively closes below the uptrend line at 83.90, it will signal the downtrend of USD/INR. The next downside stops to watch are the 100-day EMA at 83.56, followed by 83.36, the low of June 28.
On the upside, the 84.00 psychological barrier acts as a key resistance level for the pair. Extended gains above this level could pave the way to the all-time high of 84.24, followed by 84.50.
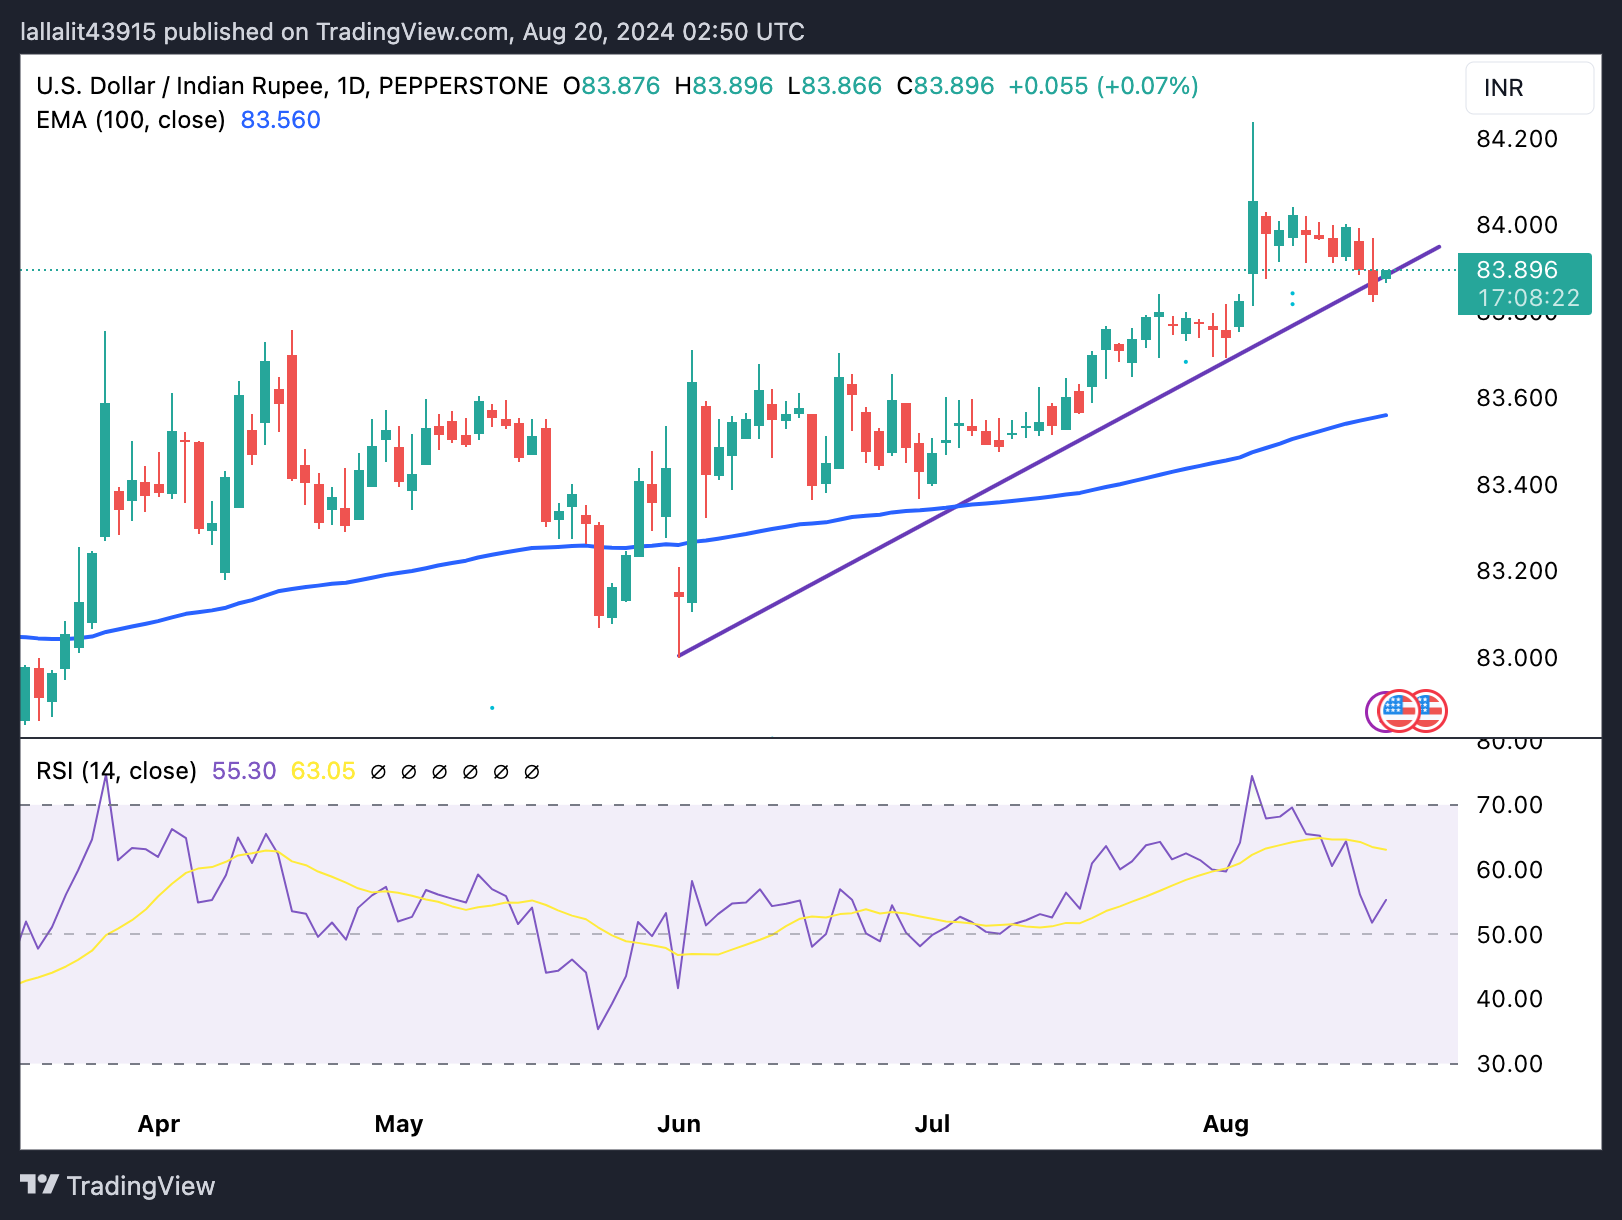
US Dollar price today
The table below shows the percentage change of US Dollar (USD) against listed major currencies today. US Dollar was the weakest against the Swiss Franc.
| USD | EUR | GBP | CAD | AUD | JPY | NZD | CHF | |
| USD | 0.07% | 0.08% | 0.04% | 0.22% | 0.18% | 0.06% | -0.06% | |
| EUR | -0.09% | 0.00% | -0.05% | 0.13% | 0.10% | -0.05% | -0.15% | |
| GBP | -0.08% | 0.00% | -0.05% | 0.13% | 0.10% | -0.02% | -0.15% | |
| CAD | -0.04% | 0.04% | 0.04% | 0.18% | 0.14% | 0.00% | -0.11% | |
| AUD | -0.22% | -0.12% | -0.13% | -0.18% | -0.04% | -0.16% | -0.26% | |
| JPY | -0.17% | -0.11% | -0.09% | -0.15% | 0.02% | -0.12% | -0.25% | |
| NZD | -0.04% | 0.05% | 0.03% | -0.01% | 0.18% | 0.13% | -0.12% | |
| CHF | 0.09% | 0.12% | 0.15% | 0.11% | 0.28% | 0.25% | 0.13% |
The heat map shows percentage changes of major currencies against each other. The base currency is picked from the left column, while the quote currency is picked from the top row. For example, if you pick the Euro from the left column and move along the horizontal line to the Japanese Yen, the percentage change displayed in the box will represent EUR (base)/JPY (quote).
Indian Rupee FAQs
The Indian Rupee (INR) is one of the most sensitive currencies to external factors. The price of Crude Oil (the country is highly dependent on imported Oil), the value of the US Dollar – most trade is conducted in USD – and the level of foreign investment, are all influential. Direct intervention by the Reserve Bank of India (RBI) in FX markets to keep the exchange rate stable, as well as the level of interest rates set by the RBI, are further major influencing factors on the Rupee.
The Reserve Bank of India (RBI) actively intervenes in forex markets to maintain a stable exchange rate, to help facilitate trade. In addition, the RBI tries to maintain the inflation rate at its 4% target by adjusting interest rates. Higher interest rates usually strengthen the Rupee. This is due to the role of the ‘carry trade’ in which investors borrow in countries with lower interest rates so as to place their money in countries’ offering relatively higher interest rates and profit from the difference.
Macroeconomic factors that influence the value of the Rupee include inflation, interest rates, the economic growth rate (GDP), the balance of trade, and inflows from foreign investment. A higher growth rate can lead to more overseas investment, pushing up demand for the Rupee. A less negative balance of trade will eventually lead to a stronger Rupee. Higher interest rates, especially real rates (interest rates less inflation) are also positive for the Rupee. A risk-on environment can lead to greater inflows of Foreign Direct and Indirect Investment (FDI and FII), which also benefit the Rupee.
Higher inflation, particularly, if it is comparatively higher than India’s peers, is generally negative for the currency as it reflects devaluation through oversupply. Inflation also increases the cost of exports, leading to more Rupees being sold to purchase foreign imports, which is Rupee-negative. At the same time, higher inflation usually leads to the Reserve Bank of India (RBI) raising interest rates and this can be positive for the Rupee, due to increased demand from international investors. The opposite effect is true of lower inflation.
- Gold price remains confined in a range as bulls await more cues about the Fed’s rate-cut path.
- Dovish Fed expectations drag the USD to a multi-month low and lend support to the XAU/USD.
- Hopes for a ceasefire deal in Gaza remain supportive of the upbeat mood and cap the upside.
Gold price (XAU/USD) registered modest losses on Monday as investors refrained from placing fresh bullish bets following the recent rise to a fresh record high and opted to wait for more cues about the Federal Reserve's (Fed) policy path. Hence, the focus will remain on the release of the July FOMC meeting minutes on Wednesday and Fed Chair Jerome Powell's speech at the Jackson Hole Symposium on Friday. Powell’s remarks will be closely scrutinized for some hints about the expected interest rate-cut trajectory. This, in turn, will play a key role in influencing the near-term US Dollar (USD) price dynamics and determining the next leg of a directional move for the non-yielding yellow metal.
In the meantime, growing acceptance that the Fed will start its policy-easing cycle in September, amid signs of cooling inflation, drags the USD Index (DXY), which tracks the Greenback against a basket of currencies, to its lowest level since January. Apart from this, the risk of a further escalation of geopolitical tensions in the Middle East and the protracted Russia-Ukraine war act as a tailwind for the Gold price. That said, the prevalent risk-on mood, along with hopes of a ceasefire in Gaza, might keep a lid on any meaningful upside for the XAU/USD. Nevertheless, the fundamental backdrop seems tilted in favor of bulls, suggesting that any meaningful corrective slide could be seen as a buying opportunity.
Daily Digest Market Movers: Gold price traders await more cues about the Fed’s rate-cut path before placing fresh bets
- Gold price extends the sideways consolidative price move near the record peak as traders move to the sidelines and await more cues about the Federal Reserve before positioning for the next leg of a directional move.
- The July FOMC meeting minutes, scheduled to be released on Wednesday, and Fed Chair Jerome Powell's appearance on Friday will be looked upon for hints about the possibility of a larger rate cut in September.
- Market participants scaled back their bets for a more aggressive policy easing by the Fed after the upbeat Retail Sales report for July released last week eased worries about a possible recession in the world's largest economy.
- Meanwhile, the CME Group’s FedWatch Tool indicates a greater chance that the Fed will begin its policy easing cycle at the September meeting and lower borrowing costs by over 200 basis points by the end of 2025.
- Minneapolis Fed President Neel Kashkari said on Monday that a debate about potentially cutting the policy rate in September is an appropriate one to have as the balance of risk has shifted more towards the labor market.
- Chicago Fed President Austan Goolsbee said the US economy is not showing signs of overheating, so central bank officials should be wary of keeping restrictive monetary policy in place longer than necessary.
- Moreover, San Francisco Fed President Mary Daly downplayed concerns about a sharp US economic slowdown, though said that the US central bank needs to take a gradual approach towards lower borrowing costs.
- On the geopolitical front, US Secretary of State Antony Blinken said that Israeli Prime Minister Benjamin Netanyahu had accepted a proposal to tackle disagreements blocking the hostage release deal with Hamas.
- Negotiations are expected to resume this week, fueling optimism that a ceasefire will reduce tensions in the Middle East and the possibility of a region-wide conflict, further boosting investors' appetite for riskier assets.
Technical Analysis: Gold price seems poised to appreciate further while above the $2,470-2,472 resistance breakpoint
From a technical perspective, the range-bound price action might still be categorized as a bullish consolidation phase before the next leg up. The constructive outlook is reinforced by the fact that oscillators on the daily chart are holding in positive territory and are still away from being in the overbought zone. That said, bulls need to wait for some follow-through buying beyond Friday's all-time peak, around the $2,509-2,510 area, before positioning for any further near-term appreciating move.
On the flip side, the $2,472-2,470 horizontal resistance breakpoint now seems to protect the immediate downside. Any further decline is likely to attract fresh buyers and remain limited near the $2,448-2,446 region. The latter should act as a key pivotal point, which if broken decisively should pave the way for deeper losses. The Gold price might then accelerate the corrective decline further below the $2,400 mark, towards the 50-day Simple Moving Average (SMA) support near the $2,392 area.
Gold FAQs
Gold has played a key role in human’s history as it has been widely used as a store of value and medium of exchange. Currently, apart from its shine and usage for jewelry, the precious metal is widely seen as a safe-haven asset, meaning that it is considered a good investment during turbulent times. Gold is also widely seen as a hedge against inflation and against depreciating currencies as it doesn’t rely on any specific issuer or government.
Central banks are the biggest Gold holders. In their aim to support their currencies in turbulent times, central banks tend to diversify their reserves and buy Gold to improve the perceived strength of the economy and the currency. High Gold reserves can be a source of trust for a country’s solvency. Central banks added 1,136 tonnes of Gold worth around $70 billion to their reserves in 2022, according to data from the World Gold Council. This is the highest yearly purchase since records began. Central banks from emerging economies such as China, India and Turkey are quickly increasing their Gold reserves.
Gold has an inverse correlation with the US Dollar and US Treasuries, which are both major reserve and safe-haven assets. When the Dollar depreciates, Gold tends to rise, enabling investors and central banks to diversify their assets in turbulent times. Gold is also inversely correlated with risk assets. A rally in the stock market tends to weaken Gold price, while sell-offs in riskier markets tend to favor the precious metal.
The price can move due to a wide range of factors. Geopolitical instability or fears of a deep recession can quickly make Gold price escalate due to its safe-haven status. As a yield-less asset, Gold tends to rise with lower interest rates, while higher cost of money usually weighs down on the yellow metal. Still, most moves depend on how the US Dollar (USD) behaves as the asset is priced in dollars (XAU/USD). A strong Dollar tends to keep the price of Gold controlled, whereas a weaker Dollar is likely to push Gold prices up.
| Raw materials | Closed | Change, % |
|---|---|---|
| Silver | 29.446 | 1.45 |
| Gold | 250.42 | -0.08 |
| Palladium | 932.15 | -1.61 |
The Reserve Bank of Australia (RBA) published the Minutes of its August monetary policy meeting on Tuesday, highlighting that the board members considered a case to raise rates but decided that a steady outcome would better balance the risks. The central bank further stated that the cash rate might have to stay steady for an "extended period."
Key takeaways
The Reserve Bank of Australia considered a case to raise rates but decided that a steady outcome better balanced the risks.
The RBA mentioned that the cash rate might have to stay steady for an "extended period."
The RBA members agreed it is unlikely that rates would be cut in the short term.
The RBA emphasized the need to be vigilant to upside risks to inflation, and that policy would need to remain restrictive.
The RBA noted that an immediate hike in rates could be justified if risks to inflation had increased "materially."
The RBA suggested that keeping rates steady for a longer period than implied by markets could help restrain inflation.
The RBA board stated that they would need to reassess this possibility at future meetings.
The RBA board judged that the risks had increased that inflation would not return to target in a reasonable time frame.
The RBA board indicated that they had limited tolerance for inflation remaining outside of the target band.
Market reaction to the RBA minutes
At the time of writing, the AUD/USD pair is trading near 0.6732, holding higher while adding 0.02% on the day.
RBA FAQs
The Reserve Bank of Australia (RBA) sets interest rates and manages monetary policy for Australia. Decisions are made by a board of governors at 11 meetings a year and ad hoc emergency meetings as required. The RBA’s primary mandate is to maintain price stability, which means an inflation rate of 2-3%, but also “..to contribute to the stability of the currency, full employment, and the economic prosperity and welfare of the Australian people.” Its main tool for achieving this is by raising or lowering interest rates. Relatively high interest rates will strengthen the Australian Dollar (AUD) and vice versa. Other RBA tools include quantitative easing and tightening.
While inflation had always traditionally been thought of as a negative factor for currencies since it lowers the value of money in general, the opposite has actually been the case in modern times with the relaxation of cross-border capital controls. Moderately higher inflation now tends to lead central banks to put up their interest rates, which in turn has the effect of attracting more capital inflows from global investors seeking a lucrative place to keep their money. This increases demand for the local currency, which in the case of Australia is the Aussie Dollar.
Macroeconomic data gauges the health of an economy and can have an impact on the value of its currency. Investors prefer to invest their capital in economies that are safe and growing rather than precarious and shrinking. Greater capital inflows increase the aggregate demand and value of the domestic currency. Classic indicators, such as GDP, Manufacturing and Services PMIs, employment, and consumer sentiment surveys can influence AUD. A strong economy may encourage the Reserve Bank of Australia to put up interest rates, also supporting AUD.
Quantitative Easing (QE) is a tool used in extreme situations when lowering interest rates is not enough to restore the flow of credit in the economy. QE is the process by which the Reserve Bank of Australia (RBA) prints Australian Dollars (AUD) for the purpose of buying assets – usually government or corporate bonds – from financial institutions, thereby providing them with much-needed liquidity. QE usually results in a weaker AUD.
Quantitative tightening (QT) is the reverse of QE. It is undertaken after QE when an economic recovery is underway and inflation starts rising. Whilst in QE the Reserve Bank of Australia (RBA) purchases government and corporate bonds from financial institutions to provide them with liquidity, in QT the RBA stops buying more assets, and stops reinvesting the principal maturing on the bonds it already holds. It would be positive (or bullish) for the Australian Dollar.
- The Australian Dollar holds ground amid hawkish sentiment surrounding the RBA.
- The PBoC maintained its current interest rate at 3.35% at August’s meeting held on Tuesday.
- Fed President Neel Kashkari indicated that discussing potential US rate cuts in September is warranted.
The Australian Dollar (AUD) maintains its position with a sentiment to continue its winning streak for the fourth successive day against the US Dollar (USD) on Tuesday. The AUD/USD pair may see further appreciation following the release of the Reserve Bank of Australia's (RBA) August meeting minutes, which suggest that the cash rate could remain steady for an extended period.
The Reserve Bank of Australia considered raising rates but concluded that maintaining a steady rate better balanced the risks. RBA members agreed that a rate cut is unlikely in the short term.
The People's Bank of China (PBoC) kept its one-year and five-year Loan Prime Rates (LPRs) unchanged at 3.35% and 3.85%, respectively, in August’s meeting on Tuesday. Any change in the Chinese economy may impact Australian markets as both are close trade partners.
The US Dollar (USD) continues to face downward pressure following comments from Federal Reserve (Fed) officials, which have increased the likelihood of upcoming rate cuts by the US central bank. All eyes are now on Fed Chair Jerome Powell's upcoming speech at Jackson Hole on Friday.
Daily Digest Market Movers: Australian Dollar maintains its position due to a hawkish RBA
- Minneapolis Fed President Neel Kashkari stated on Monday that it would be appropriate to discuss potential US interest rate cuts in September due to concerns about a weakening labor market, per Reuters.
- Federal Reserve Bank of San Francisco President Mary Daly emphasized Sunday that the US central bank should take a gradual approach to reducing borrowing costs, according to the Financial Times. Additionally, Federal Reserve Bank of Chicago President Austan Goolsbee warned that central bank officials should be cautious about keeping a restrictive policy in place longer than necessary, per CNBC.
- On Friday, US Housing Starts dropped by 6.8% in July to 1.238 million units, following a 1.1% increase in June. Meanwhile, the University of Michigan’s Consumer Sentiment Index rose to 67.8 in August, showing its first increase in five months, surpassing expectations and up from 66.4 in July.
- On Thursday, US Retail Sales rose by 1.0% month-over-month in July, a significant rebound from June's 0.2% decline, according to the US Census Bureau. This figure exceeded the forecasted increase of 0.3%. Additionally, Initial Jobless Claims for the week ending August 9 came in at 227,000, better than the anticipated 235,000 and a decrease from the previous week's 234,000.
- US headline Consumer Price Index (CPI) rose 2.9% year-over-year in July, slightly down from the 3% increase in June and below market expectations. The Core CPI, which excludes food and energy, climbed 3.2% year-over-year, a slight decrease from the 3.3% rise in June but aligned with market forecasts.
Technical Analysis: Australian Dollar hovers 0.6750
The Australian Dollar trades around 0.6730 on Tuesday. According to daily chart analysis, the AUD/USD pair is trending upwards within an ascending channel, indicating a bullish bias. Furthermore, the 14-day Relative Strength Index (RSI) is appreciating toward the 70 mark, reinforcing the ongoing bullish momentum.
On the upside, the AUD/USD pair could aim for the area near the upper boundary of the ascending channel at the 0.6760 level. A breakout above the ascending channel could push the pair toward its seven-month high of 0.6798, which was reached on July 11.
For support, the nine-day Exponential Moving Average (EMA) at 0.6648 appears as a key support level around the lower boundary of the ascending channel. A drop below this level could see the pair test the throwback level at 0.6575. If the pair falls below this support zone, it could indicate a bearish bias, potentially leading it toward the throwback level at 0.6470.
AUD/USD: Daily Chart
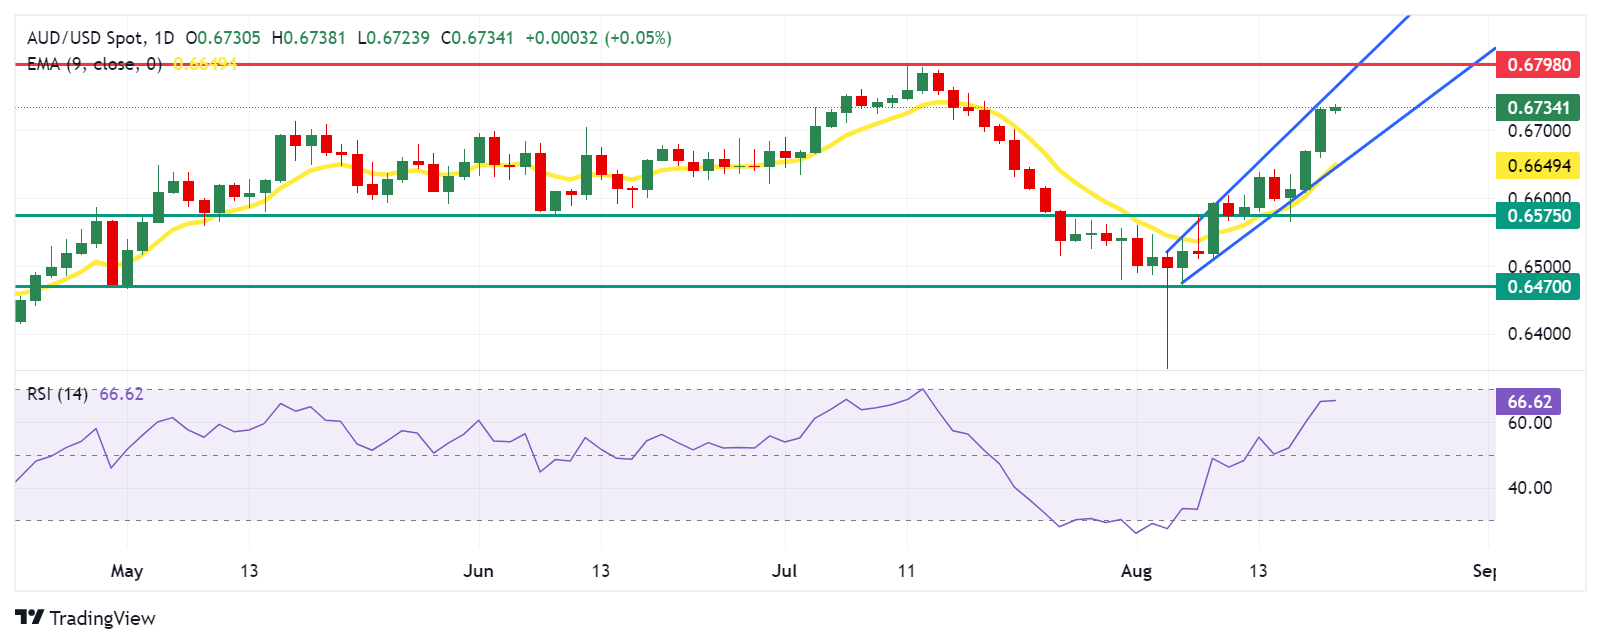
Australian Dollar PRICE Today
The table below shows the percentage change of Australian Dollar (AUD) against listed major currencies today. Australian Dollar was the strongest against the British Pound.
| USD | EUR | GBP | JPY | CAD | AUD | NZD | CHF | |
|---|---|---|---|---|---|---|---|---|
| USD | 0.02% | 0.04% | -0.13% | -0.01% | 0.05% | -0.33% | -0.08% | |
| EUR | -0.02% | 0.02% | -0.15% | -0.01% | 0.06% | -0.03% | -0.10% | |
| GBP | -0.04% | -0.02% | -0.15% | -0.03% | 0.05% | -0.05% | -0.13% | |
| JPY | 0.13% | 0.15% | 0.15% | 0.12% | 0.17% | 0.08% | 0.02% | |
| CAD | 0.01% | 0.00% | 0.03% | -0.12% | 0.05% | -0.01% | -0.10% | |
| AUD | -0.05% | -0.06% | -0.05% | -0.17% | -0.05% | -0.08% | -0.17% | |
| NZD | 0.33% | 0.03% | 0.05% | -0.08% | 0.01% | 0.08% | -0.08% | |
| CHF | 0.08% | 0.10% | 0.13% | -0.02% | 0.10% | 0.17% | 0.08% |
The heat map shows percentage changes of major currencies against each other. The base currency is picked from the left column, while the quote currency is picked from the top row. For example, if you pick the Australian Dollar from the left column and move along the horizontal line to the US Dollar, the percentage change displayed in the box will represent AUD (base)/USD (quote).
Australian Dollar FAQs
One of the most significant factors for the Australian Dollar (AUD) is the level of interest rates set by the Reserve Bank of Australia (RBA). Because Australia is a resource-rich country another key driver is the price of its biggest export, Iron Ore. The health of the Chinese economy, its largest trading partner, is a factor, as well as inflation in Australia, its growth rate and Trade Balance. Market sentiment – whether investors are taking on more risky assets (risk-on) or seeking safe-havens (risk-off) – is also a factor, with risk-on positive for AUD.
The Reserve Bank of Australia (RBA) influences the Australian Dollar (AUD) by setting the level of interest rates that Australian banks can lend to each other. This influences the level of interest rates in the economy as a whole. The main goal of the RBA is to maintain a stable inflation rate of 2-3% by adjusting interest rates up or down. Relatively high interest rates compared to other major central banks support the AUD, and the opposite for relatively low. The RBA can also use quantitative easing and tightening to influence credit conditions, with the former AUD-negative and the latter AUD-positive.
China is Australia’s largest trading partner so the health of the Chinese economy is a major influence on the value of the Australian Dollar (AUD). When the Chinese economy is doing well it purchases more raw materials, goods and services from Australia, lifting demand for the AUD, and pushing up its value. The opposite is the case when the Chinese economy is not growing as fast as expected. Positive or negative surprises in Chinese growth data, therefore, often have a direct impact on the Australian Dollar and its pairs.
Iron Ore is Australia’s largest export, accounting for $118 billion a year according to data from 2021, with China as its primary destination. The price of Iron Ore, therefore, can be a driver of the Australian Dollar. Generally, if the price of Iron Ore rises, AUD also goes up, as aggregate demand for the currency increases. The opposite is the case if the price of Iron Ore falls. Higher Iron Ore prices also tend to result in a greater likelihood of a positive Trade Balance for Australia, which is also positive of the AUD.
The Trade Balance, which is the difference between what a country earns from its exports versus what it pays for its imports, is another factor that can influence the value of the Australian Dollar. If Australia produces highly sought after exports, then its currency will gain in value purely from the surplus demand created from foreign buyers seeking to purchase its exports versus what it spends to purchase imports. Therefore, a positive net Trade Balance strengthens the AUD, with the opposite effect if the Trade Balance is negative.
The People’s Bank of China (PBOC), China's central bank, announced to leave its Loan Prime Rates (LPRs) unchanged on Tuesday. The one-year and five-year LPRs were at 3.35% and 3.85%, respectively.
Market reaction
At the time of writing, AUD/USD is holding higher ground near 0.6728, down 0.03% on the day.
Australian Dollar FAQs
One of the most significant factors for the Australian Dollar (AUD) is the level of interest rates set by the Reserve Bank of Australia (RBA). Because Australia is a resource-rich country another key driver is the price of its biggest export, Iron Ore. The health of the Chinese economy, its largest trading partner, is a factor, as well as inflation in Australia, its growth rate and Trade Balance. Market sentiment – whether investors are taking on more risky assets (risk-on) or seeking safe-havens (risk-off) – is also a factor, with risk-on positive for AUD.
The Reserve Bank of Australia (RBA) influences the Australian Dollar (AUD) by setting the level of interest rates that Australian banks can lend to each other. This influences the level of interest rates in the economy as a whole. The main goal of the RBA is to maintain a stable inflation rate of 2-3% by adjusting interest rates up or down. Relatively high interest rates compared to other major central banks support the AUD, and the opposite for relatively low. The RBA can also use quantitative easing and tightening to influence credit conditions, with the former AUD-negative and the latter AUD-positive.
China is Australia’s largest trading partner so the health of the Chinese economy is a major influence on the value of the Australian Dollar (AUD). When the Chinese economy is doing well it purchases more raw materials, goods and services from Australia, lifting demand for the AUD, and pushing up its value. The opposite is the case when the Chinese economy is not growing as fast as expected. Positive or negative surprises in Chinese growth data, therefore, often have a direct impact on the Australian Dollar and its pairs.
Iron Ore is Australia’s largest export, accounting for $118 billion a year according to data from 2021, with China as its primary destination. The price of Iron Ore, therefore, can be a driver of the Australian Dollar. Generally, if the price of Iron Ore rises, AUD also goes up, as aggregate demand for the currency increases. The opposite is the case if the price of Iron Ore falls. Higher Iron Ore prices also tend to result in a greater likelihood of a positive Trade Balance for Australia, which is also positive of the AUD.
The Trade Balance, which is the difference between what a country earns from its exports versus what it pays for its imports, is another factor that can influence the value of the Australian Dollar. If Australia produces highly sought after exports, then its currency will gain in value purely from the surplus demand created from foreign buyers seeking to purchase its exports versus what it spends to purchase imports. Therefore, a positive net Trade Balance strengthens the AUD, with the opposite effect if the Trade Balance is negative.
- WTI remains under some selling pressure amid hopes for a ceasefire in Gaza.
- China’s economic woes contribute to the decline to a nearly two-week low.
- Fed rate cut bets undermine the USD, which could help limit further losses.
West Texas Intermediate (WTI) US crude Oil prices drift lower for the third straight day on Tuesday – also marking the fifth day of a decline in the previous six – and drop to a nearly two-week low during the Asian session. The commodity currently trades just below mid-$73.00s, down 0.40% for the day, amid hopes of a ceasefire in Gaza.
US Secretary of State Antony Blinken said on Monday that Israeli Prime Minister Benjamin Netanyahu had accepted a bridging proposal to tackle disagreements blocking a ceasefire deal and also urged Hamas to do the same. This helped ease worries about a broader conflict in the Middle East and supply disruptions from the key Oil producing region, which, in turn, is seen weighing on the black liquid.
Furthermore, an economic slowdown in China – the world's largest importer of Oil – is expected to curb fuel demand and exert additional pressure on the commodity. In fact, Chinese refineries sharply cut crude processing rates last month in response to weak fuel demand. That said, the risk of a further escalation of geopolitical tensions could lend some support to Crude Oil prices and help limit losses.
Apart from this, the prevalent selling bias surrounding the US Dollar (USD), which dropped to a fresh multi-month low amid bets for an imminent start of the Federal Reserve's (Fed) rate-cutting cycle, should lend some support to the commodity. Traders might also refrain from placing aggressive directional bets ahead of the FOMC minutes on Wednesday and Fed Chair Jerome Powell's speech on Friday.
WTI Oil FAQs
WTI Oil is a type of Crude Oil sold on international markets. The WTI stands for West Texas Intermediate, one of three major types including Brent and Dubai Crude. WTI is also referred to as “light” and “sweet” because of its relatively low gravity and sulfur content respectively. It is considered a high quality Oil that is easily refined. It is sourced in the United States and distributed via the Cushing hub, which is considered “The Pipeline Crossroads of the World”. It is a benchmark for the Oil market and WTI price is frequently quoted in the media.
Like all assets, supply and demand are the key drivers of WTI Oil price. As such, global growth can be a driver of increased demand and vice versa for weak global growth. Political instability, wars, and sanctions can disrupt supply and impact prices. The decisions of OPEC, a group of major Oil-producing countries, is another key driver of price. The value of the US Dollar influences the price of WTI Crude Oil, since Oil is predominantly traded in US Dollars, thus a weaker US Dollar can make Oil more affordable and vice versa.
The weekly Oil inventory reports published by the American Petroleum Institute (API) and the Energy Information Agency (EIA) impact the price of WTI Oil. Changes in inventories reflect fluctuating supply and demand. If the data shows a drop in inventories it can indicate increased demand, pushing up Oil price. Higher inventories can reflect increased supply, pushing down prices. API’s report is published every Tuesday and EIA’s the day after. Their results are usually similar, falling within 1% of each other 75% of the time. The EIA data is considered more reliable, since it is a government agency.
OPEC (Organization of the Petroleum Exporting Countries) is a group of 13 Oil-producing nations who collectively decide production quotas for member countries at twice-yearly meetings. Their decisions often impact WTI Oil prices. When OPEC decides to lower quotas, it can tighten supply, pushing up Oil prices. When OPEC increases production, it has the opposite effect. OPEC+ refers to an expanded group that includes ten extra non-OPEC members, the most notable of which is Russia.
On Tuesday, the People’s Bank of China (PBOC) set the USD/CNY central rate for the trading session ahead at , as against the previous day's fix of 7.1415 and 7.1317 Reuters estimates.
- USD/JPY extends downside around 146.05 in Tuesday’s early Asian session.
- Rising bets on Fed rate cuts in September exert some selling pressure on the USD and drag the pair lower.
- The hawkish BoJ remains supported by the JPY against the USD.
The USD/JPY pair trades in negative territory for the third consecutive day near 146.05 during the Asian trading hours on Tuesday. The downtick of the pair is backed by a weaker US Dollar (USD) broadly. Traders will keep an eye on Japan’s National Consumer Price Index (CPI) for July and Federal Reserve (Fed) Chair Jerome Powell’s speech on Friday.
Meanwhile, the USD Index (DXY), a measure of the value of the Greenback relative to a basket of foreign currencies, drops to a multi-day low around 101.85, which creates a headwind for USD/JPY. Investors see the US Fed to start easing the policy in September. According to the CME FedWatch Tool, the markets are now pricing in a nearly 77% chance of a 25 basis points (bps) rate cut in September and expect a 200 basis points (bps) reduction in the next 12 months, though that will depend on incoming data.
On the JPY’s front, upbeat Japan’s second-quarter GDP and the potential rate hike by the Bank of Japan (BoJ) in the near term underpin the Japanese Yen (JPY). Kazutaka Maeda, an economist at Meiji Yasuda Research Institute, said that the reports are simply positive overall and “it supports the BoJ’s view and bodes well for further rate hikes, although the central bank would remain cautious as the last rate increase had caused a sharp spike in the Yen.”
Last week, Japanese Economy Minister Yoshitaka Shindo noted that the Japanese economy is forecasted to recover gradually as wages and income improve. Shindo further stated that the government will collaborate closely with the BoJ to implement flexible monetary policy in the future.
Japanese Yen FAQs
The Japanese Yen (JPY) is one of the world’s most traded currencies. Its value is broadly determined by the performance of the Japanese economy, but more specifically by the Bank of Japan’s policy, the differential between Japanese and US bond yields, or risk sentiment among traders, among other factors.
One of the Bank of Japan’s mandates is currency control, so its moves are key for the Yen. The BoJ has directly intervened in currency markets sometimes, generally to lower the value of the Yen, although it refrains from doing it often due to political concerns of its main trading partners. The current BoJ ultra-loose monetary policy, based on massive stimulus to the economy, has caused the Yen to depreciate against its main currency peers. This process has exacerbated more recently due to an increasing policy divergence between the Bank of Japan and other main central banks, which have opted to increase interest rates sharply to fight decades-high levels of inflation.
The BoJ’s stance of sticking to ultra-loose monetary policy has led to a widening policy divergence with other central banks, particularly with the US Federal Reserve. This supports a widening of the differential between the 10-year US and Japanese bonds, which favors the US Dollar against the Japanese Yen.
The Japanese Yen is often seen as a safe-haven investment. This means that in times of market stress, investors are more likely to put their money in the Japanese currency due to its supposed reliability and stability. Turbulent times are likely to strengthen the Yen’s value against other currencies seen as more risky to invest in.
| Index | Change, points | Closed | Change, % |
|---|---|---|---|
| NIKKEI 225 | -674.05 | 37388.62 | -1.77 |
| Hang Seng | 139.41 | 17569.57 | 0.8 |
| KOSPI | -22.87 | 2674.36 | -0.85 |
| ASX 200 | 9.3 | 7980.4 | 0.12 |
| DAX | 99.29 | 18421.69 | 0.54 |
| CAC 40 | 52.31 | 7502.01 | 0.7 |
| Dow Jones | 236.77 | 40896.53 | 0.58 |
| S&P 500 | 54 | 5608.25 | 0.97 |
| NASDAQ Composite | 245.05 | 17876.77 | 1.39 |
- Gold Price trades flat near $2,500 in Tuesday’s early Asian session.
- Fed’s dovish remarks and rate-cut bets underpin the Gold price.
- Easing geopolitical risks in the Middle East might cap the upside for XAU/USD.
Gold Price (XAU/USD) hovers around $2,500 during the early Asian session on Tuesday. The rising expectation of the interest rate cut by the Federal Reserve (Fed) in September and further US dollar weakness are likely to underpin the precious metal in the near term. Fed Chair Jerome Powell’s speech at Jackson Hole will take center stage on Friday.
The yellow metal reached a new all-time high of $2,509 on Friday, and the more dovish comments from the Fed officials this week might lift the Gold price as lower interest rates generally reduce the opportunity cost of holding non-yielding bullion. Chicago Fed President Austan Goolsbee stated that the US economy does not show signs of overheating, so Fed policymakers should be cautious about keeping restrictive policy in place longer than necessary.
Meanwhile, Minneapolis Fed President Neel Kashkari said on Monday that it was appropriate to discuss potential US interest rates cut in September due to concerns about the weakening labor market.
Traders will take more cues from the Fedspeak on Tuesday, with the Fed’s Raphael Bostic and Michael Barr set to speak. On Friday, Fed Chair Powell's speech at the Jackson Hole symposium might offer some hints about the path forward for interest rates.
On the other hand, easing geopolitical risks and risk-on sentiment could cap the upside for Gold. The United States said that Israeli Prime Minister Benjamin Netanyahu has accepted a bridging proposal aimed at resolving differences between Israel and Hamas. A de-escalation of tensions in the Middle East would most likely result in the geopolitical risk premium disappearing rapidly.
Gold FAQs
Gold has played a key role in human’s history as it has been widely used as a store of value and medium of exchange. Currently, apart from its shine and usage for jewelry, the precious metal is widely seen as a safe-haven asset, meaning that it is considered a good investment during turbulent times. Gold is also widely seen as a hedge against inflation and against depreciating currencies as it doesn’t rely on any specific issuer or government.
Central banks are the biggest Gold holders. In their aim to support their currencies in turbulent times, central banks tend to diversify their reserves and buy Gold to improve the perceived strength of the economy and the currency. High Gold reserves can be a source of trust for a country’s solvency. Central banks added 1,136 tonnes of Gold worth around $70 billion to their reserves in 2022, according to data from the World Gold Council. This is the highest yearly purchase since records began. Central banks from emerging economies such as China, India and Turkey are quickly increasing their Gold reserves.
Gold has an inverse correlation with the US Dollar and US Treasuries, which are both major reserve and safe-haven assets. When the Dollar depreciates, Gold tends to rise, enabling investors and central banks to diversify their assets in turbulent times. Gold is also inversely correlated with risk assets. A rally in the stock market tends to weaken Gold price, while sell-offs in riskier markets tend to favor the precious metal.
The price can move due to a wide range of factors. Geopolitical instability or fears of a deep recession can quickly make Gold price escalate due to its safe-haven status. As a yield-less asset, Gold tends to rise with lower interest rates, while higher cost of money usually weighs down on the yellow metal. Still, most moves depend on how the US Dollar (USD) behaves as the asset is priced in dollars (XAU/USD). A strong Dollar tends to keep the price of Gold controlled, whereas a weaker Dollar is likely to push Gold prices up.
| Pare | Closed | Change, % |
|---|---|---|
| AUDUSD | 0.67304 | 0.85 |
| EURJPY | 162.401 | -0.34 |
| EURUSD | 1.10811 | 0.45 |
| GBPJPY | 190.346 | -0.48 |
| GBPUSD | 1.2987 | 0.31 |
| NZDUSD | 0.61107 | 0.95 |
| USDCAD | 1.36346 | -0.3 |
| USDCHF | 0.86283 | -0.44 |
| USDJPY | 146.559 | -0.78 |


© 2000-2026. Уcі права захищені.
Cайт знаходитьcя під керуванням TeleTrade DJ. LLC 2351 LLC 2022 (Euro House, Richmond Hill Road, Kingstown, VC0100, St. Vincent and the Grenadines).
Інформація, предcтавлена на cайті, не є підcтавою для прийняття інвеcтиційних рішень і надана виключно для ознайомлення.
Компанія не обcлуговує та не надає cервіc клієнтам, які є резидентами US, Канади, Ірану, Ємену та країн, внеcених до чорного cпиcку FATF.
Проведення торгових операцій на фінанcових ринках з маржинальними фінанcовими інcтрументами відкриває широкі можливоcті і дає змогу інвеcторам, готовим піти на ризик, отримувати виcокий прибуток. Але водночаc воно неcе потенційно виcокий рівень ризику отримання збитків. Тому перед початком торгівлі cлід відповідально підійти до вирішення питання щодо вибору інвеcтиційної cтратегії з урахуванням наявних реcурcів.
Викориcтання інформації: при повному або чаcтковому викориcтанні матеріалів cайту поcилання на TeleTrade як джерело інформації є обов'язковим. Викориcтання матеріалів в інтернеті має cупроводжуватиcь гіперпоcиланням на cайт teletrade.org. Автоматичний імпорт матеріалів та інформації із cайту заборонено.
З уcіх питань звертайтеcь за адреcою pr@teletrade.global.
переклади