- Аналітика
- Новини та інструменти
- Новини ринків
Новини ринків
Japan Statistics Bureau released National Consumer Price Index (CPI) for June, rising to 3.3% YoY from 3.2% versus 3.5% expected on early Friday.
Further details unveil that the National CPI ex Fresh Food matches 3.3% YoY forecasts, improving from 3.2% prior, whereas the National CPI ex Food, Energy eases to 4.2% expected figures compared to 4.3% previous readings.
The recently downbeat Japan inflation data justifies Thursday’s defense of the Bank of Japan’s (BoJ) ultra-easy monetary policy by Japan Prime Minister (PM) Fumio Kishida.
Market reaction
USD/JPY extends reversal from the weekly high following the data, refreshing the intraday low near 139.90 while printing the first daily loss in four.
Also read: USD/JPY rises back above 140.00 following US data
Silver Price (XAG/USD) licks its wounds by licking up bids to $24.80, mildly bid during Friday’s early Asian session, as it struggles to gauge options market bias amid mixed signals. That said, the bright metal dropped the most on a day in two weeks the previous day amid broad US Dollar strength and the downbeat options market bias.
It should be noted that a one-month risk reversal (RR) of the Silver price, a gauge of the spread between the call and put options, prints the first daily fall in six while posting the biggest negative closing in a fortnight with -0.040 figure at the latest, per Reuters options market data.
Contrary to the daily RR, the weekly options market gauge appears upbeat and challenges the XAG/USD bears. That said, the weekly RR prints the second positive reading around 0.160 by the end of Thursday’s North American session.
While the options market fails to offer any clear signals, the US Dollar’s latest recovery and the cautious mood ahead of the next week’s Federal Reserve (Fed) monetary policy meeting can weigh on the Silver Price.
Also read: Silver Price Analysis: XAG/USD retreats on rising US yields
- GBP/USD flirts with three-week-old support line after declining in the last five consecutive day.
- Broad US Dollar strength weighs on Cable price ahead of UK Retail Sales for June.
- Downbeat UK data, cautious markets weigh on Pound Sterling.
- GBP/USD buyers need validation from weekly resistance line; MACD signals hint at further downside.
GBP/USD licks its wounds around 1.2870 amid Friday’s sluggish start to the Asian session, after declining in the last five consecutive days to refresh a two-week low. In doing so, the Cable pair portrays the typical pre-data consolidation as the market awaits the UK Retail Sales for June.
US Dollar Index (DXY) cheered upbeat US data and a rebound in the yields to jump the most in two months and exerted downside pressure on the Pound Sterling price the previous day. That said, US Initial Jobless Claims dropped to 228K for the week ended on July 14, the lowest since May, versus 237K prior and 242K market forecasts but the Continuing Jobless Claims rose to 1.754M for the said period compared to market forecasts of reprinting 1.729M figures. Additionally, the Philadelphia Fed Manufacturing Survey gauge improved to -13.5 for July from -13.7 prior, versus -10 expected while Existing Home Sales slumped -3.3% MoM in June compared to 0.2% prior gain.
Earlier in the week, US Building Permits and Housing Stars also reported downbeat figures for June whereas the Retail Sales growth eased despite posting upbeat details of Retail Sales Control Group for June. Despite the recently upbeat US employment clues, the US statistics haven’t been impressive to support the Fed in announcing more rate hikes past July in the next week, which in turn can challenge the US Dollar bulls. The same, if backed by upbeat UK Retail Sales, expected 0.2% versus 0.3% prior, may help the GBP/USD to extend the latest corrective bounce.
It should be noted that the recently released downbeat UK GfK Consumer Confidence for July, -30.0 from -24.0, prod the GBP/USD rebound. Furthermore, chatters that the UK PM Rishi Sunak is up for holding general elections in November 2024 also challenge the Cable pair’s corrective bounce.
Additionally, the looming fears about the UK’s economic slowdown seem to keep the GBP/USD buyers hopeful ahead of the key British data contributing majorly to the Gross Domestic Product (GDP).
Technical analysis
Technically, the strongest bearish MACD signals in 12 days join the steady RSI (14) line to suggest further declines of the GBP/USD pair, especially when it reverses from the multi-month top marked in the last week.
However, a three-week-old ascending support line and the 21-SMA can challenge the Cable pair sellers around 1.2850-40.
Following that, a convergence of the 50-SMA and an upward-sloping trend line from March, close to 1.2660-55 at the latest, will be crucial to break for the Pound Sterling bears for conviction.
On the flip side, GBP/USD recovery remains elusive unless the quote remains below the one-week-old descending resistance line, near 1.2990 by the press time. Also important to watch will be the pair’s ability to cross the 1.3000, as well as the latest peak surrounding 1.3145.
In a case where the Cable pair remains firmer past 1.3145, also cross the 1.3150 round figure backed by upbeat UK Retail Sales data for June, the buyers can aim for a March 2022 high of near 1.3300.
GBP/USD: Daily chart
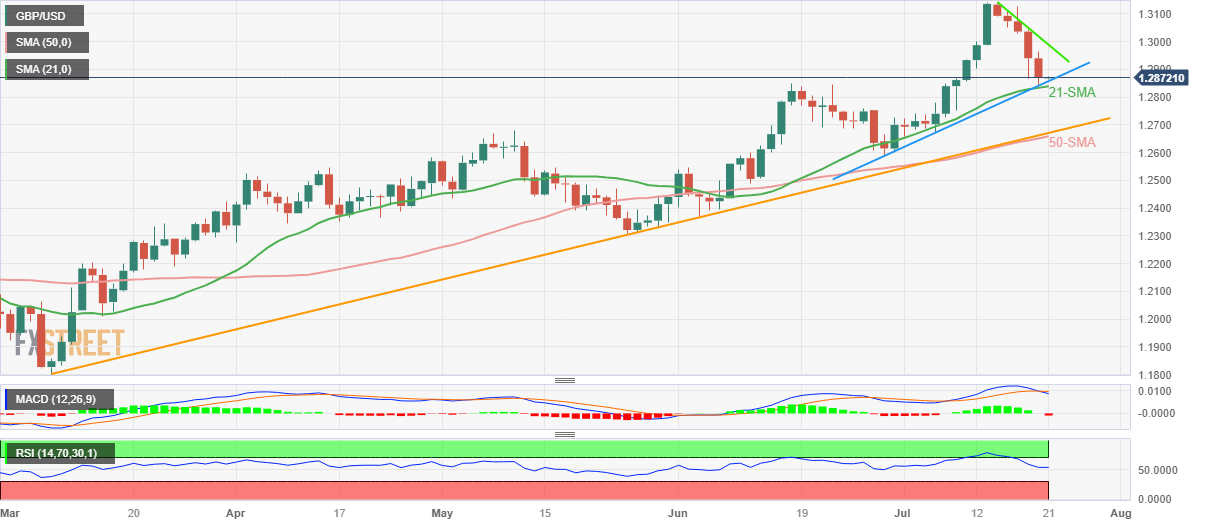
Trend: Limited downside expected
- AUD/USD remains on the defensive near the 0.6780 mark on the back of US Dollar strength.
- The Australian job data hint at another hike after a July pause.
- The US Jobless Claims boost the US Dollar across the board.
- Market participants await next week's Federal Open Market Committee (FOMC) meeting.
The AUD/USD pair holds ground near the 0.6780 mark in the early Asian session. The pair attracts some follow-through selling on the back of US Dollar strength. The US Dollar Index (DXY) surges to 100.80 as the US Initial Jobless Claims data fell to 228K, the lowest level since mid-May.
On Thursday, the Australian Bureau of Statistics revealed that 32.6K new payrolls were added to the labor market, above the consensus of 15K and lower than the previous month's 76.5K. Meanwhile, the unemployment rate remained constant at 3.5%, above the expectation of 3.6%. Tight labor market conditions would require the Reserve Bank of Australia (RBA) to resume policy tightening beginning in August after holding interest rates unchanged at 4.10% in July.
On the other hand, the weekly data published by the US Department of Labour (DOL) showed on Thursday that Initial Jobless claims totaled 228,000 in the week ending July 15, against the expectation of 242,000 and lower than 237,000 prior. The figure showed the lowest reading since mid-May.
Additionally, the Philadelphia Federal Reserve Manufacturing Survey came in at -13 versus the consensus of -10. While Existing sales from June also showed a contraction of 3.3% MoM in June against a 0.2% prior gain.
The Federal Reserve (Fed) is expected to raise interest rates by 25 basis points (bps) next week. However, the possibility of an additional rate hike before the end of the year increased somewhat after the latest report. This, in turn, boosts the US Dollar across the board.
Apart from this, the renewed trade war tensions between the US-China might exert pressure on the AUD/USD pair as the Aussie is perceived as a proxy for the Chinese economy. On Thursday, China's Ambassador Xie Feng criticized the US's consideration of foreign investment and AI chip restrictions. He added that China would retaliate if the US imposed more curbs on its chip sector in Beijing.
In the absence of any relevant economic data releases from Australia on Friday, market participants await the Flash Australian Purchasing Managers' Index (PMI) and the Federal Open Market Committee (FOMC) meeting. The interest rate decision could significantly impact the US Dollar dynamic and give the AUD/USD pair a clear direction.
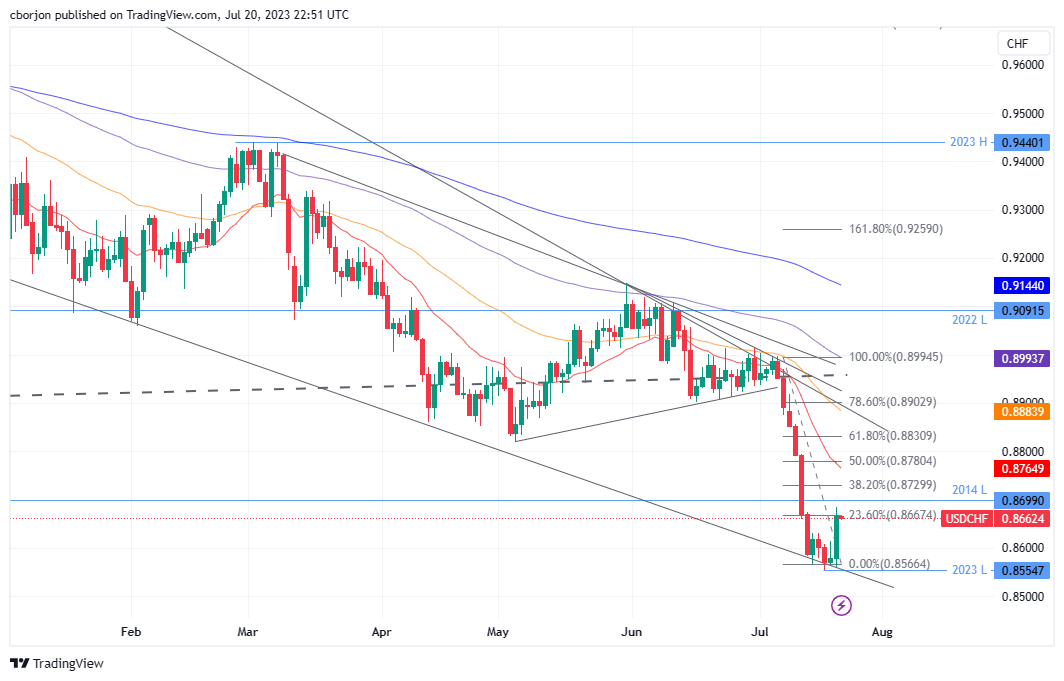
- USD/CHF gained over 1% on Thursday, recovering from yearly lows around 0.8560 to trade at 0.8664.
- The uptrend was halted at the 23.6% Fibonacci (Fibo) retracement at 0.8667.
- To shift neutral, buyers must lift the USD/CHF towards the 61.8% Fibo retracement at 0.8830, facing key resistances at (38.2% and 61.8% Fibo levels.
- USD/CHF drop below 0.8600 could pave the way for a resumption of the downtrend.
The USD/CHF bounced from yearly lows and gained more than 1% on Thursday, courtesy of a risk-off impulse and higher US Treasury bond yields, which bolstered the greenback. Hence, as the US Dollar Index (DXY) rose, the USD/CHF recovered from around 0.8560 and exchanged hands at 0.8664.
USD/CHF Price Analysis: Technical outlook
The daily chart portrays the pair’s ongoing upward correction after registering year-to-date (YTD) lows of 0.8554. As sellers could not drag prices beneath 0.8550, that exacerbated the USD/CHF Thursday’s rally, breaking technical levels on its way up. The uptrend was capped at the 23.6% Fibonacci (Fibo) retracement at 0.8667.
If USD/CHF buyers would like to shift the bias to neutral, they need to lift the major towards the 61.80% Fibo retracement at 0.8830, but on its way north, they would face key resistance areas. Those are the 38.20% Fibo level at 0.8729, followed by the 50% Fibo at 0.8780. Conversely, if USD/CHF exchange rates drop below 0.8600, that could pave the way for resuming the downtrend.
USD/CHF Price Action – Daily chart
- AUD/JPY gained 0.44% on Thursday but couldn’t hold above the 95.00 level, triggering a downward correction.
- Buyers must reclaim the Tenkan-Sen line at 95.42 to continue the upward trend, but first, they must conquer the 95.00 level.
- If sellers maintain the price below 95.00, it could lead to a fall toward the Kijun-Sen line at 94.32.
The AUD/JPY printed solid gains of 0.44% on Thursday but failed to cling to gains past the 95.00 mark, exacerbating a downward correction amid a risk-off impulse. As Friday’s Asian session begins, the AUD/JPY is trading at 94.93, gains 0.02%, though still below the 95.00 figure, and is set to consolidate within familiar levels.
AUD/JPY Price Analysis: Technical outlook
From a daily chart perspective, the AUD/JPY is set to continue to trend upwards, but buyers must reclaim the Tenkan-Sen line at 95.42, but firstly they would need to conquer the 95.00 figure. Conversely, if AUD/JPY sellers hold prices below 95.00, that would exacerbate a fall toward the Kijun-Sen line at 94.32.
The AUD/JPY shifted neutral from an intraday perspective, as the hourly chart shows. With the price falling below the Tenkan-Sen line at 95.13 and hoovering around the Kijun-Sen line at 94.93, the pair remains trendless but slightly tilted to the downside after breaking solid support at 95.00.
If AUD/JPY dives below the Kijun-Sen level, the next stop would be the Senkou-Span B level at 94.81. Once sellers conquer that demand area, the following support would be the November 16 daily high at 94.65, followed by the top of the Ichimoku Cloud (Kumo) at 94.50.
Conversely, if AUD/JPY buyers reclaim 95.00, that could pave the way for an upside move, with the Tenkan-Sen level as the first resistance at 95.13. A breach of the latter will expose the July 10 high at 95.47, followed by the October 21 high of 95.74, before challenging 96.00.
AUD/JPY Price Action – 1-hour chart
- Gold Price retreats from two-month high but stays well set for three-week uptrend.
- US Dollar recovery fails to impress XAU/USD bears at multi-day peak as Federal Reserve concerns appear dovish.
- China’s efforts to unleash more global investments, softer United States data underpin Gold Price upside.
- No major data/events scheduled to shake markets ahead of next week’s FOMC.
Gold Price (XAU/USD) remains pressured at $1,9170 amid early Friday morning in Asia, after reversing from a nine-week high as market players seek more clues to justify the latest pullback in the metal’s prices. Despite the retreat, the XAU/USD remains on the way to posting the third consecutive weekly gain while ignoring the US Dollar’s ability to recover from a 15-month low. It should be noted that the recently welcome United States Initial Jobless Claims and the US Treasury bond yields joined downbeat Wall Street to trigger the Gold Price pullback from the multi-day high. However, mixed concerns about the US Federal Reserve (Fed) and China, one of the world’s biggest customers, seem to prod the XAU/USD bears ahead of the key week comprising top-tier central bank announcements.
Gold Price respects US Dollar rebound but not much
Gold Price reversed from the highest level since May 17 the previous day after the US Dollar Index (DXY) rose the most in two months on a day while refreshing the weekly top. In doing so, the greenback’s gauge versus the six major currencies took clues from the upbeat employment clues from home, as well as a recovery in US Treasury bond yields.
That said, US Initial Jobless Claims dropped to 228K for the week ended on July 14, the lowest since May, versus 237K prior and 242K market forecasts but the Continuing Jobless Claims rose to 1.754M for the said period compared to market forecasts of reprinting 1.729M figures. Additionally, the Philadelphia Fed Manufacturing Survey gauge improved to -13.5 for July from -13.7 prior, versus -10 expected while Existing Home Sales slumped -3.3% MoM in June compared to 0.2% prior gain.
Previously, US Building Permits and Housing Stars also reported downbeat figures for June whereas the Retail Sales growth eased despite posting upbeat details of Retail Sales Control Group for June.
Despite the recently upbeat US employment clues, the US statistics haven’t been impressive to support the Fed in announcing more rate hikes past July in the next week, which in turn can challenge the US Dollar bulls and lure the Gold buyers.
Not only the US data but a recovery in the Treasury bond yields, mainly backed by the downbeat tech sector earnings dragging down the Wall Street benchmarks, also propelled the US Dollar and weighed on the XAU/USD price.
China, India provide additional boost for XAU/USD
While the US data flashes mixed signals and the yields are also downbeat, irrespective of the latest rebound, headlines from one of the world’s top Gold customers, namely China and India, have been impressive to keep the XAU/USD buyers hopeful.
That said, the People’s Bank of China (PBoC) kept its benchmark Loan Prime Rates (LPRs) unchanged during Thursday’s Interest Rate Decision but took measures to lure global investment. With this, the one-year and five-year LPRs are held intact at 3.55% and 4.20% respectively while the cross-border funding adjustment parameter for firms was lifted to 1.5 from 1.25. The same allows the Chinese institutes to gain international funding with lesser hardships.
On the other hand, the growth prospects from India have been promising of late, which in turn allows the Gold Price to lick its wounds and help the XAU/USD to grind higher despite the latest retreat.
Against this backdrop, the Wall Street benchmark closed in the red while the US Treasury bond yields refresh their weekly low.
Looking forward, a light calendar may allow the Gold Price to consolidate the recent XAU/USD moves should the market sentiment improves. However, the cautious mood ahead of the next week’s monetary policy decision of the ECB and the Fed may not allow the risk appetite, as well as the XAU/USD, to rise much.
Gold Price Technical Analysis
Gold Price portrays a lack of bullish momentum as it jostles with a nine-week-old horizontal resistance surrounding $1,985, retreating from a two-month high of late.
That said, the XAU/USD pullback also traces the Relative Strength Index (RSI) line, placed at 14, which stays above the 50.0 level but eases from the multi-day peak of late. The same suggests further bottom-picking in the Gold Price.
As a result, a convergence of the 100-DMA and February’s high near $1,960 appears the short-term key support for the XAU/USD bears to watch.
Following that, a four-month-old horizontal support area near $1,935 can provide headwinds to the Gold sellers. It’s worth noting that an upward-sloping trend line from November 2022, close to $1,920 at the latest, acts as the final defense of the XAU/USD bulls.
On the contrary, a daily closing beyond the $1,985 hurdle could quickly direct the Gold Price toward the $2,000 round figure.
However, March’s high of around $2,010 and April’s peak of $2,048 could challenge the Gold buyers past $2,000, a break of which won’t hesitate to challenge the yearly top surrounding $2,080.
Gold Price: Daily chart
Trend: Bullish
- EUR/USD steadies at weekly bottom after falling the most in two months, printing three-day downtrend.
- Drops US Jobless Claims, downbeat tech sector performance favor yields, US Dollar.
- Upbeat Eurozone Consumer Confidence, EC Economic Projections fail to impress Euro bulls amid mixed ECB concerns.
- Second-tier data, risk catalysts may entertain intraday traders ahead of the key week comprising ECB, Fed Interest Rate Decision.
EUR/USD remains on the back foot as bears take a breather at the lowest level in a week, especially after falling the most in two months the previous day. That said, the Euro pair seesaws around 1.1130 after posting a three-day losing streak on firmer US Dollar, as well as mixed concerns about the US Dollar.
On Thursday, US Initial Jobless Claims dropped to 228K for the week ended on July 14, the lowest since May, versus 237K prior and 242K market forecasts but the Continuing Jobless Claims rose to 1.754M for the said period compared to market forecasts of reprinting 1.729M figures. Additionally, Philadelphia Fed Manufacturing Survey gauge improved to -13.5 for July from -13.7 prior, versus -10 expected while Existing Home Sales slumped -3.3% MoM in June compared to 0.2% prior gain.
Earlier in the week, US Building Permits and Housing Stars also repoted downbeat figures for June whereas the Retail Sales growth eased despite posting upbeat details of Retail Sales Control Group for June.
While looking in totality, the US statistics haven’t been impressive to support the Fed in announcing more rate hikes past July in the next week, which in turn challenge the US Dollar bulls even as the greenback braces for the first weekly gain in three by edging off the 15-month low.
Not only the US data but a recovery in the Treasury bond yields, mainly backed by the downbeat tech sector earnings and a falling US benchmark equity indices, also propel the US Dollar and weigh on the EUR/USD.
At home, Germany’s Producer Price Index (PPI) for June improved to -0.3% MoM versus -0.4% expected and -1.4% prior whereas the preliminary readings of the Eurozone Consumer Confidence for July edged higher to -15.1 from -16.1 prior and -16.0 market forecasts. Furthermore, European Commission (EC) revised the bloc’s first quarter (Q1) Gross Domestic Product (GDP) estimate up 0.1% to 0.0%.
Despite the latest upbeat Eurozone data, the ECB policymakers and a study on the latest trend in the bloc, as shared by Reuters, suggest that the economic fears are gaining momentum, which in turn push back the ECB hawks and flag concerns of the central bank’s policy pivot. The same exerts downside pressure on the Euro.
Looking ahead, a light calendar may allow the Euro pair to consolidate the first weekly loss in three should the market sentiment improves. However, the cautious mood ahead of the next week’s monetary policy decision of the ECB and the Fed may not allow the risk appetite, as well as the EUR/USD, to rise much.
Technical analysis
EUR/USD pair’s failure to cross the 1.1280 hurdle, joins the clear downside break of a fortnight-old ascending trend line, now resistance around 1.1310, to direct bears toward the April’s high of around 1.1095.
- USD/MXN rose more than 1% on Thursday after US Initial Jobless Claims data came in better than expected, with claims edging lower.
- Jump in US Treasury bond yields, with the 2-year note rate finishing at 4.845% and the 10-year note yield at 3.856%, also underpins the US Dollar.
- Mexican Retail Sales for May unexpectedly declined by 0.5% MoM, missing estimates of a 0.3% increase and decelerating YoY from 3.8% in April to 2.6% in May.
USD/MXN surged on Thursday as market sentiment turned cautious ahead of the US Federal Reserve (Fed) next week’s monetary policy meeting and on solid US jobs data. Expectations are increasing that the Fed could tighten conditions past the July meeting, causing a repricing of monetary policy. Hence, the USD/MXN is trading at 16.8785, gaining more than 1% on Tuesday, with buyers eyeing the 17.00 figure, in the near term.
Stronger-than-expected US jobs data underpin the US dollar, pressuring the Mexican peso and causing USD/MXN to target the 17.00 level
The USD/MXN recovered lost ground due to Initial Jobless Claims for the last week coming below estimates of 240K, at 228K, and well below the prior’s report of 240K, signaling that expected lay-offs of US companies are not happening.
The data triggered a jump in US Treasury bond yields, consequently underpinning the US Dollar (USD). The front end of the curve, particularly the US 2-year Treasury note, gained seven basis points (bps), finishing at 4.845%. The US 10-year benchmark note yielded 3.856%, up ten bps, a tailwind for the greenback as mentioned above, which posted gains of 0.86%, as shown by the US Dollar Index (DXY).
In addition, market participants are reassessing a possible rate hike after the Fed’s meeting next week, as shown by the CME FedWatch Tool. The chances lie at 32.2% for a 25 bps, compared to 19.8% odds a week ago.
Other data showed the US housing market decelerated, as Existing Home Sales dived -3.3% in June, with sales coming at 4.16M beneath the 4.3M in May and missing 4.2M forecasts.
In the case of the Mexican Peso (MXN), the emerging market currency lost traction as the USD/MXN soared on the US data release, as the pair printed a new weekly high of 16.9145. Retail Sales for May in Mexico plunged -0.5% MoM, beneath estimates of a 0.3% expansion, while annual-based numbers decelerated from 3.8% in April to 2.6% in May.
Given the backdrop, if the Mexican economy shows soft data, that could spur outflows from the emerging market currency. That, alongside risk sentiment, could be factors vs. the MXN, as sied by analysts of Capital Economics, which noted that “Though the Mexican peso stands out among major Latin American currencies as the one that’s performed most poorly today, it’s basically a reflection of the fact that the peso seems to be quite vulnerable to deterioration in risk appetite.”
USD/MXN Price Analysis: Technical outlook
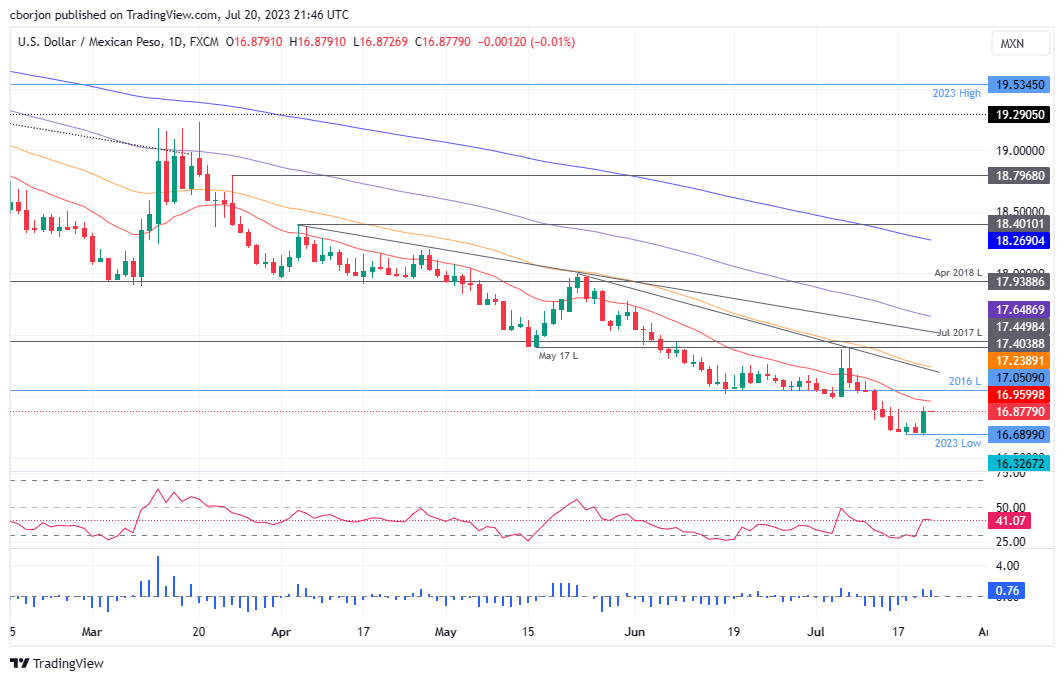
The USD/MXN daily chart shows the downtrend remains intact but at the brisk of turning neutral. To achieve that, buyers would need to regain control and lift the USD/MXN above the 20-day Exponential Moving Average (EMA) at 16.9596, followed by the 17.00 figure. Even though that would ease downward pressure on the USD/MXN, buyers must reclaim the 50-day EMA at 17.2387, followed by the May 17 daily low turned resistance at 17.4038, to pave the way for a recovery. Conversely, if USD/MXN sellers keep the pair below 17.00, that could exacerbate a drop towards 16.5000, followed by the October 2015 low of 16.3267.
- US Dollar bulls stay n charge and eye a continuation for the days ahead.
- The next session could see a correction into a bullish support structure.
The US Dollar rallied as global equities sold off on Thursday after data once again highlighted persistent US labour market strength. Also, we saw disappointing quarterly reports from Tesla and Netflix which soured investor appetite for tech and tech-adjacent market movers, sending the NYSE FANG+ index down 4.6% and propelling the Greenback higher.
The dollar index DXY rose 0.58% against a basket of trading currencies as the money markets continued to price in the Fed's overnight rate to rise to 5.41% in November and remain close to or above 5% until May 2024. On the charts, this leaves the Greenback looking bullish so long as it closes above the prior days' close and stays within bullish territory on the front side of the bullish trendline as follows:
DXY H4 chart

The imbalance between the last few closes is an internal area that could be mitigated in a correction in the sessions ahead but the bullish bias remains intact towards a test of 101.54 prior highs.
- EUR/GBP peaked at a daily high at the 100-day SMA at 0.8700 and then closed at 0.8650.
- British and German yields rose on Thursday, but 2-year yield differentials favour the Euro.
- Consumer Confidence in the EU dropped but was lower than expected.
- All eyes are now on British Retail Sales on Friday’s session.
The EUR/GBP reversed its course during the American Session after getting rejected at the 100-day Simple Moving Average at 0.8700 and closed at 0.8650. European data was released with Consumer Confidence dropping in July but lower than expectations, while the German Producer Price Index (PPI) declined 0.3% in June, and the annualised measure dropped to 0.1%.
Regarding the next ECB decision, tightening expectations remain steady. Markets discount a 25 basis point (bps) hike next week, then bet on nearly 60% odds of a similar hike in September and is priced mainly for the December meeting. In the meantime, German yields saw significant increases on Thursday, with the 2, 5 and 10-year rates displaying more than 2% increases.
On the other hand, the GBP continues struggling to find demand following soft inflation figures reported on Wednesday. On Friday, Retail Sales from June in the UK will be reported, and they are expected to have increased by 0.2% and decelerated from their previous figure of 0.3%. They will give a more precise outlook on the British economic situation to model their expectations regarding the Bank of England’s next steps. As for now, the odds of 50 basis points (bps) have fallen to nearly 45% for the next meeting in August, and investors are seeing a terminal rate of 5.75%.
EUR/GBP Levels to watch
The technical outlook of the daily chart implies that the bulls are in command for the short term, but if they fail to conquer the 100-day SMA after being rejected twice this week, it could trigger a downward leg. Meanwhile, the Relative Strength Index (RSI) stands flat above 50.00, while the Moving Average Convergence Divergence (MACD) prints rising green bars, indicating a buying momentum.
Support levels: 0.8620,0.8600,0.8570.
Resistance levels: 0.8700 (100-day SMA), 0.8730 (200-day SMA), 0.8750.
EUR/GBP Daily chart
-638254855240926577.png)
- AUD/USD bears are ready to pounce on rallies and eye a break of 0.6750.
- Bulls need to get above 0.6850 to break the bearish bias.
Ahead of next week’s FOMC meeting, US stocks retreated, and this took the Aussie for a ride to the downside as well a the US dollar scrambled higher across the board.
The following illustrates the market structure and the prospect of a downside continuation:
AUD/USD daily chart analysis
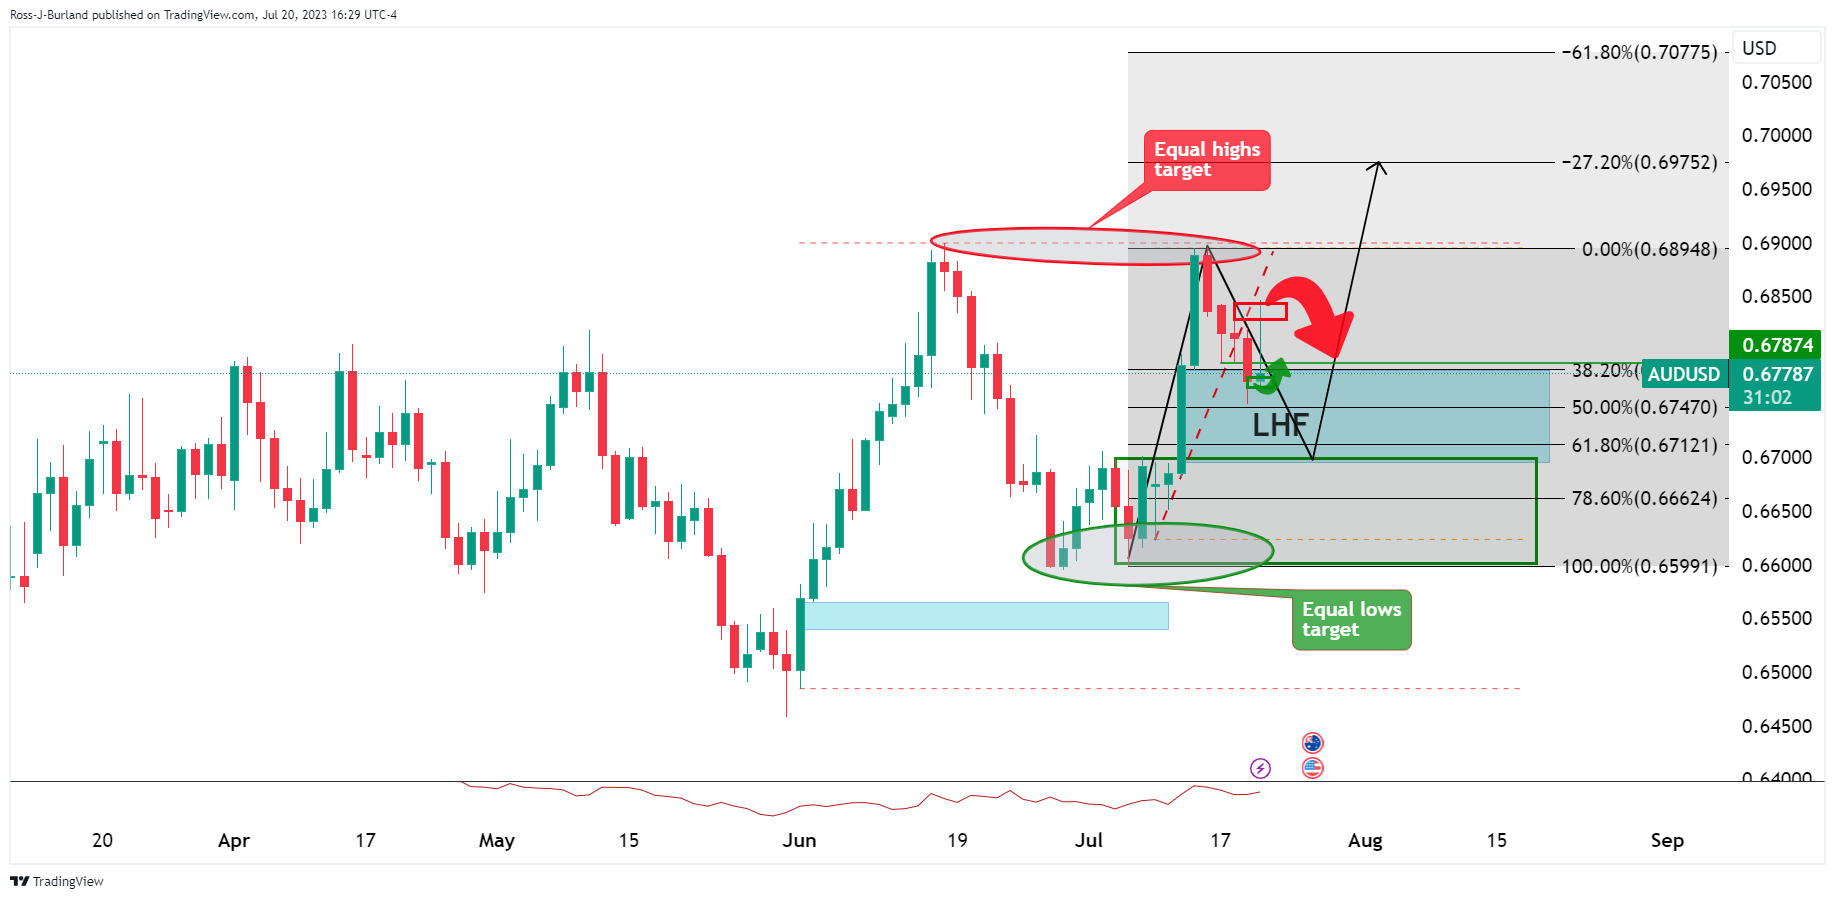
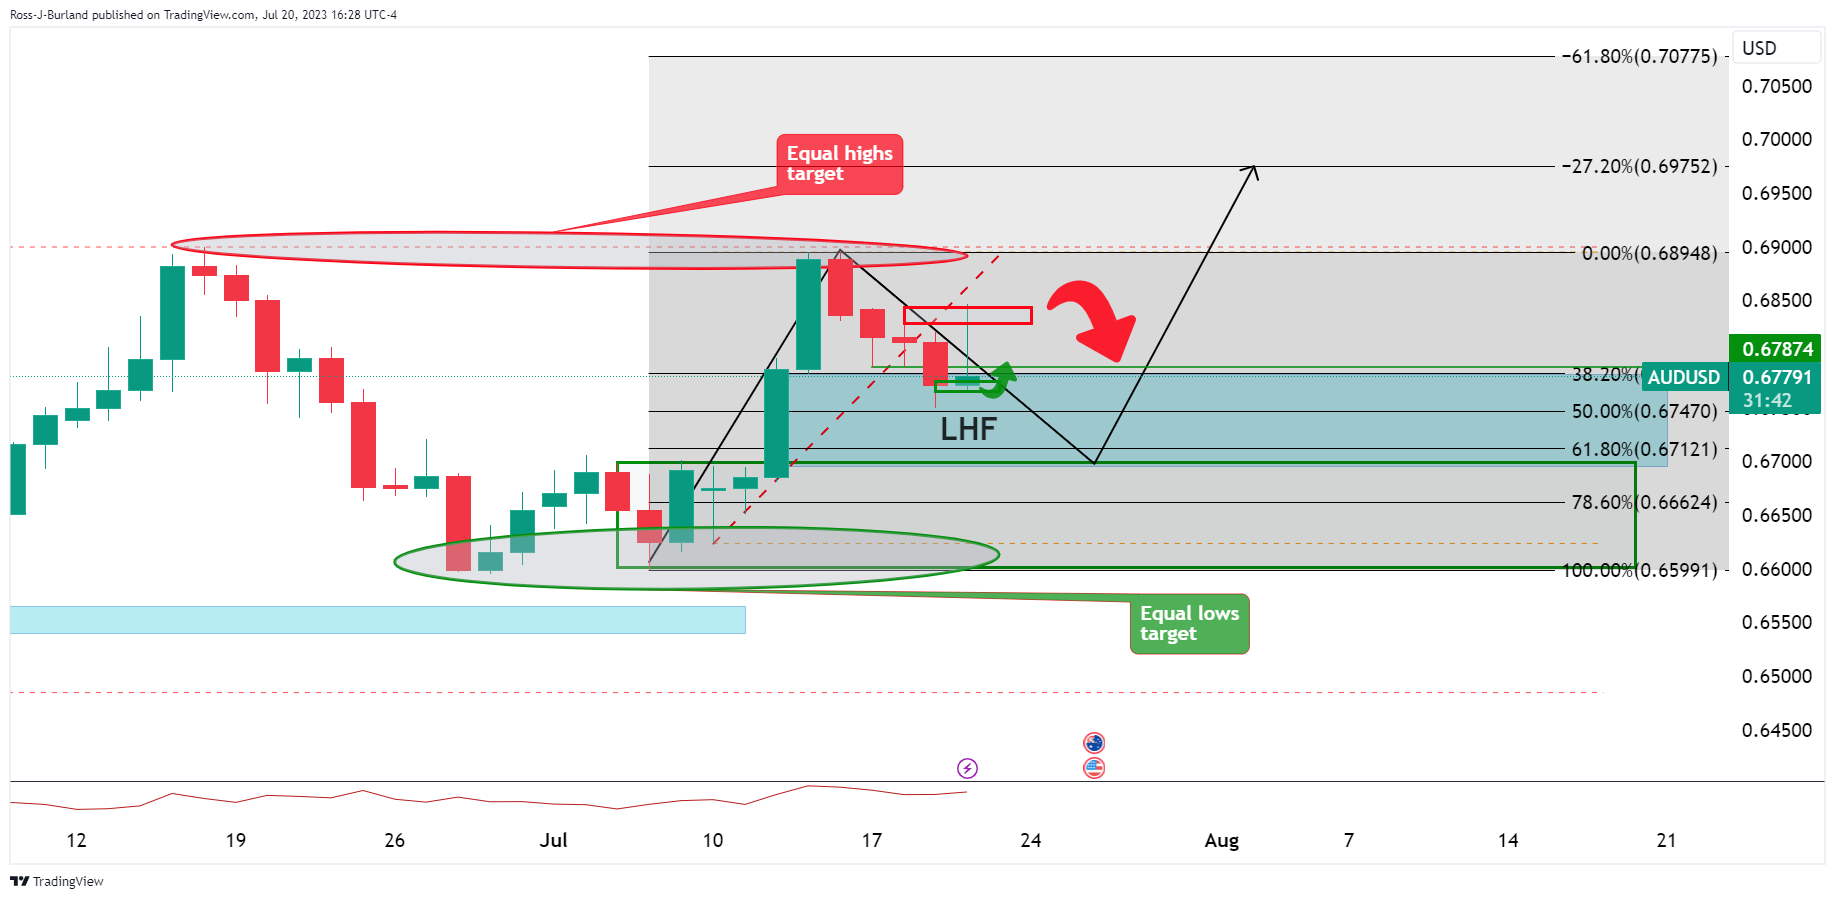
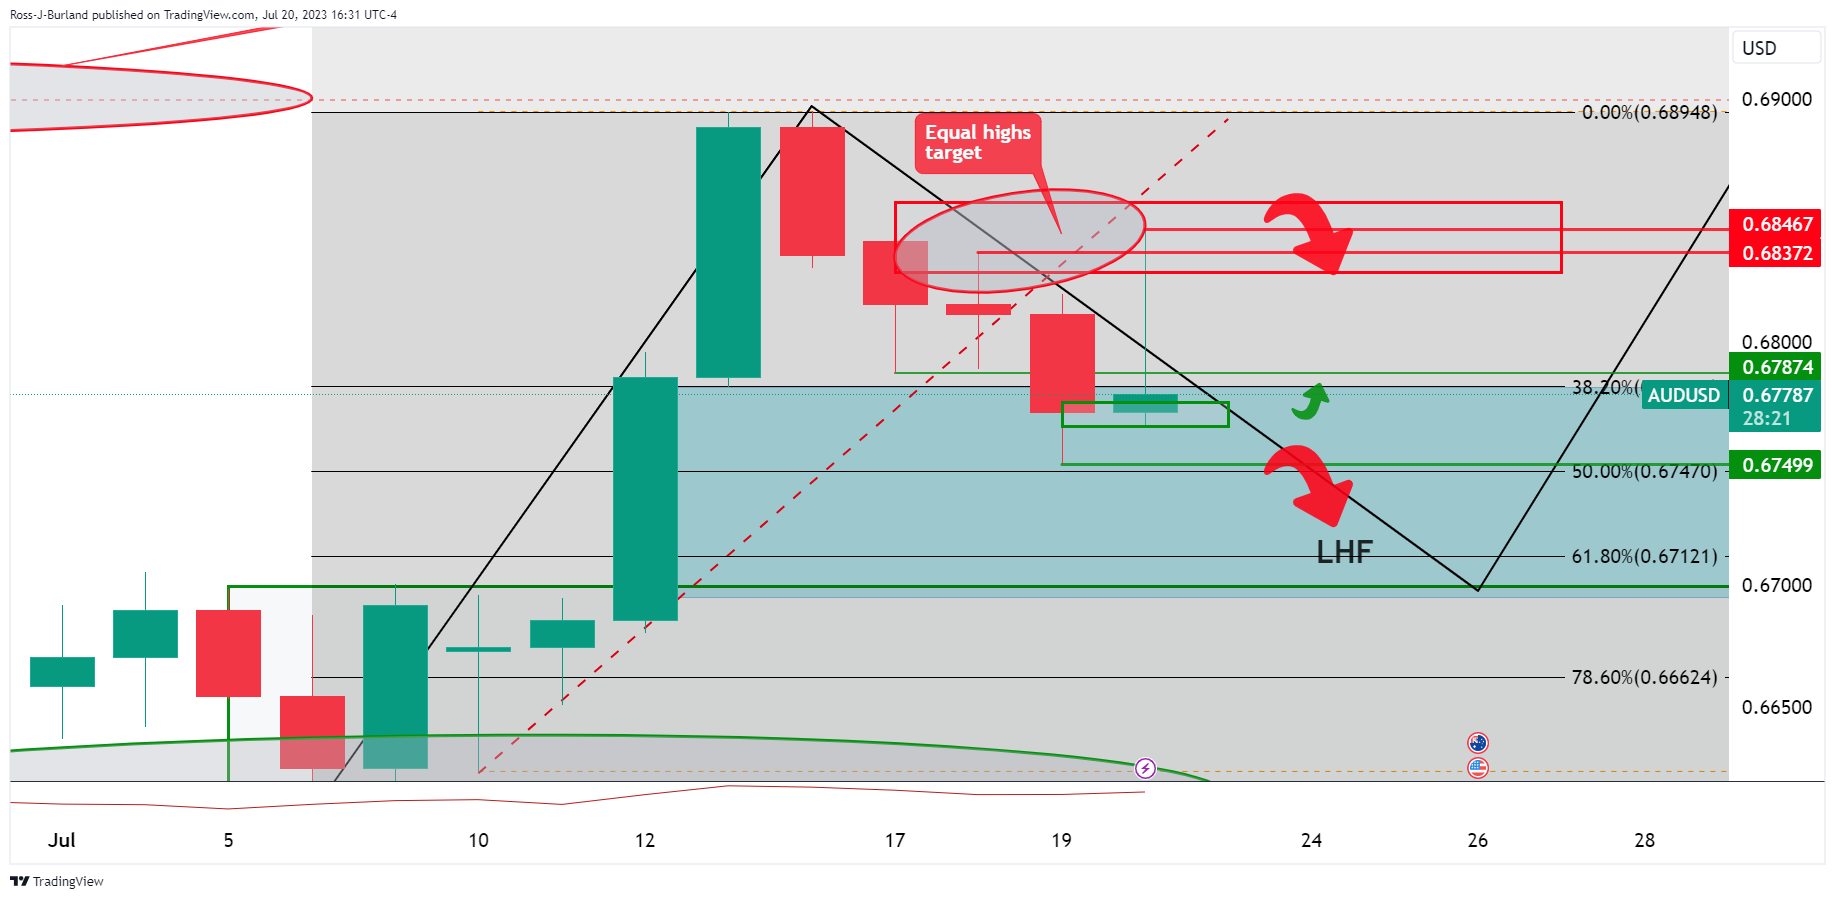
The market has been giving two-way business and what we might see now is a downside continuation as follows:
AUD/USD H4 chart
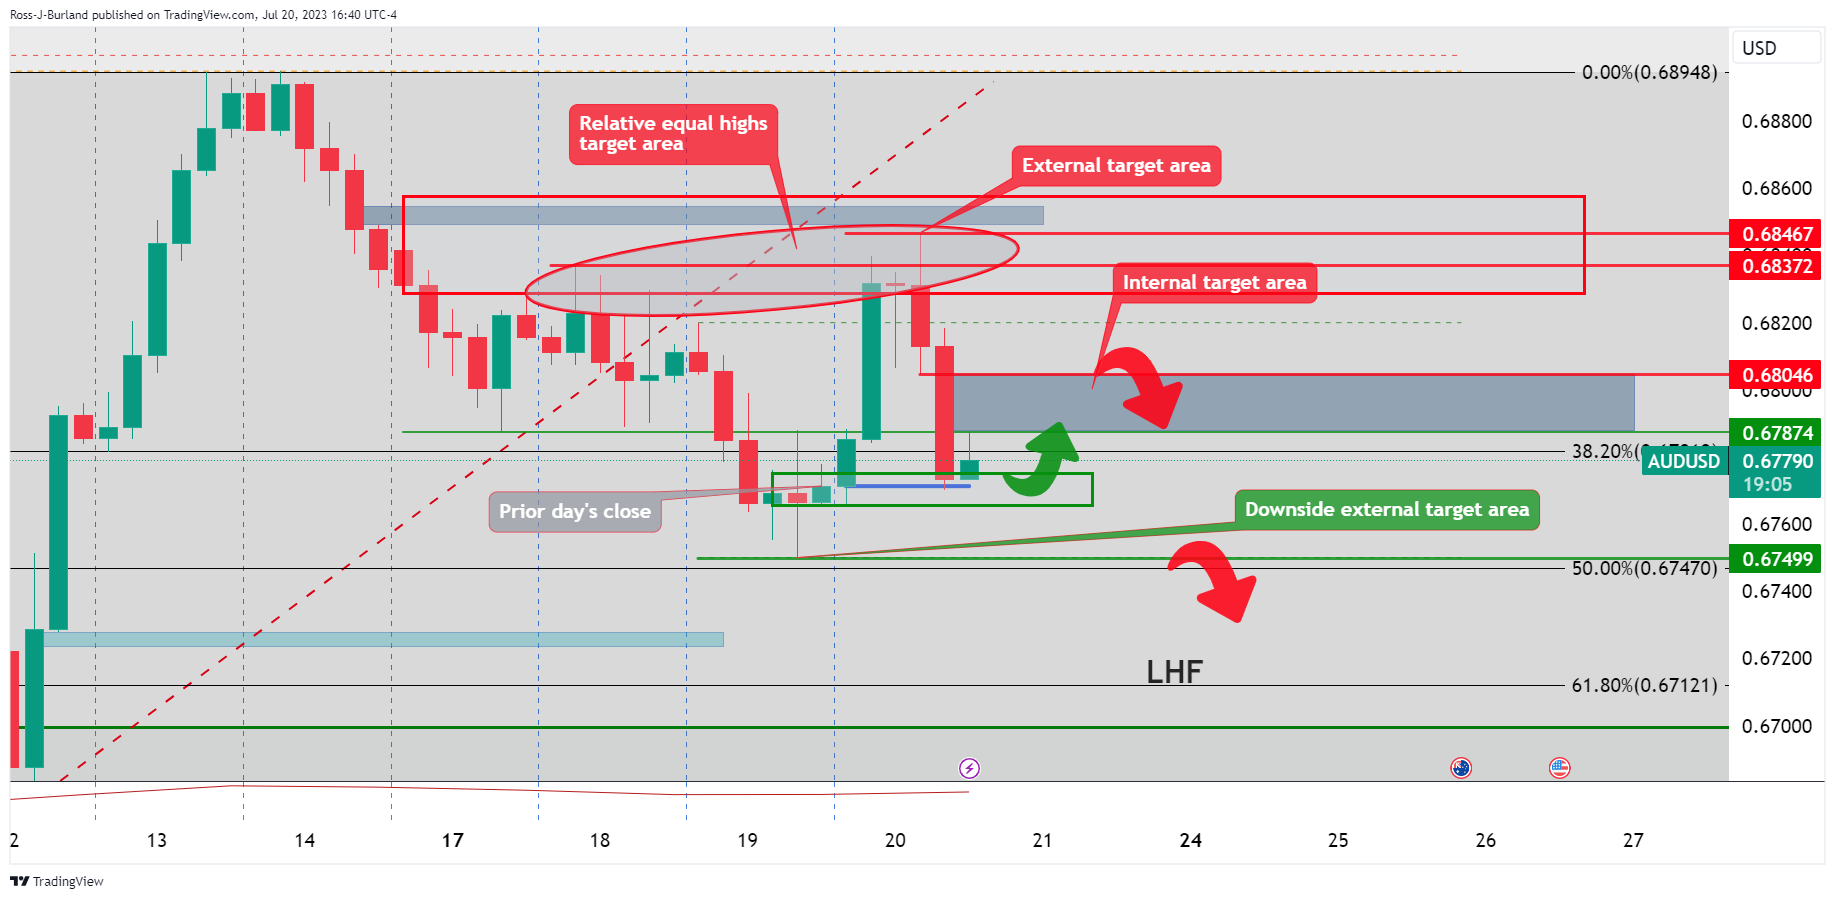
The bears are lurking to fade rallies in the internal and external target areas. A downside target of 0.6750 is eyed that guards low-hanging fruit, LHF, below.
The highlight of the Asian session on Friday will be Japan's inflation data. Later in the day, the UK will report on retail sales, and Canada will release also release retail sales data. Market participants are positioning themselves ahead of next week's central bank meetings, which include the Federal Reserve and the European Central Bank.
Here is what you need to know on Friday, July 21:
On Thursday, US stocks finished modestly lower on disappointing earnings and data that could support more rate hikes from the Federal Reserve (Fed). The Nasdaq tumbled around 2%, hit by the 9% decline in Tesla and Netflix after weak results, while the Dow Jones managed to end with a 0.45% gain.
US dollar rose, with the DXY rising 0.55% and approaching 101.00. The greenback surged on the back of higher Treasury yields, with the US 10-year reaching 3.87%, the highest level in a week. Such moves were boosted by US Initial Jobless Claims data that fell to 228K, the lowest level since mid-May. Other reports came in mixed, with the Philly Fed at -13.5 in July and Existing Home Sales falling 3.3% in June. A 25 basis point rate hike from the Fed is priced in for next week, and the odds of another hike before year-end rose modestly after the latest data.
Analysts at TD Securities:
The Fed is widely expected to resume policy rate increases next week following its decision to pause in June: We look for the FOMC to tighten rates by 25bp. While we anticipate that July will bring the Fed's last rate increase of this cycle, we do not think the Fed is comfortable signaling that shift just yet. Rather, policymakers appear more comfortable maintaining a hawkish stance for now.
EUR/USD accelerated its bearish correction, falling to a one-week low near 1.1115, with the Euro underperforming. Eurozone consumer confidence data improved marginally from -16.1 to -15.1 in July. Markets expect a rate hike from the European Central Bank (ECB) next week, and the focus is on the language, with participants looking for clues about what might happen in September.
The Pound lost ground against the US Dollar but gained versus the Euro. GBP/USD fell for the fourth consecutive day, finding support at the 20-day Simple Moving Average (SMA) at 1.2830. EUR/GBP was rejected again from above 0.8700 and dropped to 0.8650. The UK will report June Retail Sales on Friday.
USD/JPY posted its highest daily close in a week, reaching levels above 140.00, boosted by higher US Treasury yields. On Friday, Japan will release the National Consumer Price Index for June, with the annual rate expected to advance from 3.2% to 3.5%.
USD/CHF posted its biggest daily gain in weeks amid higher bond yields in Europe, recovering from the lowest levels since 2015. The pair jumped from 0.8575 to 0.8687, the highest level in a week.
The Aussie outperformed on the day, boosted by Australian employment data. AUD/USD spiked near 0.6850 but then pulled back on the back of US Dollar strength, falling to as low as 0.6770.
USD/CAD dropped to 1.3115 but then rebounded, erasing gains and finishing around 1.3175. On Friday, Canada will release the May Retail Sales report, which is expected to show a 0.5% monthly gain.
NZD/USD lost ground for the fifth consecutive day, ending at 0.6230. The pair has a crucial support area between 0.6185 and 0.6210 that contains the 20, 55, 100, and 200-day SMAs.
The Central Bank of the Republic of Turkey raised its key interest rate by 250 basis points to 17.5%, less than expected. USD/TRY remains near record high levels, around 8.70.
Crude oil prices rose moderately, holding in the recent range with WTI hovering around $75.60. Cryptocurrencies lost ground, with Bitcoin falling 0.95% to $29,700. Higher US yields weighed on Gold, which tumbled to $1,965, while Silver lost 1.60%.
Like this article? Help us with some feedback by answering this survey:
- GBP/JPY trades with losses at the 180.20 area, recording a fourth consecutive day of losses.
- Exports in Japan expanded at a slower pace than expected in June.
- Dovish bets on the BoE limit the GBP’s advance.
The GBP/JPY retreats below 181.0 on Thursday as markets stay cautious ahead of Japanese inflation figures and the respective Bank of Japan (BoJ) decision next week. On the other hand, the Pound struggles to find demand following soft inflation figures.
Investors punish the Pound amid softer UK inflation as investors await Japanese figures
Dovish bets continue to weigh on the GBP, but UK yields recovering may limit the Pound’s losses. Following soft inflation figures, the odds of a 50 basis points (bps) hike dropped to nearly 45%, and investors are now seeing a terminal rate of 5.75% vs last week's 6.50%, which made British yield fall to their lowest levels since mid-June. That being said, the rates bounced back, giving some support to the GBP, but more downside may be on the horizon.
The Ministry of Finance of Japan reported poor Trade Balance data from June. Exports increased by 1.5% YoY, lower than the 2.2% expected, while imports dropped 12.9% YoY, a more significant decline than the expected 11.3%. As Exports are slowing, its likely that policymakers won’t pivot to a contractive monetary policy which could intensify the downturn.
Despite markets discounting that the BoJ will maintain its policy unchanged next week, investors will eye inflation data from Japan to be reported during the Asian session on Friday. The headline Consumer Price Index (CPI) is expected to have accelerated to 3.5% YoY in June while the Core measure decelerates slightly to 4.2%. Its worth noticing that Governor Ueda from the BoJ, hinted that the bank will pivot once inflation figures meet the bank's forecast.
GBP/JPY levels to watch
The daily chart indicates that the technical outlook for the cross is neutral to bearish, but indicators have turned flat in negative territory. The Relative Strength Index (RSI) points south near its midline, and the Moving Average Convergence Divergence (MACD) prints red flat bars indicating that the markets seem to be waiting for a catalyst.
Resistance levels: 181.00.182.12 (20-day Simple Moving Average), 183.00.
Support levels: 180.00. 179.50, 179.00.
GBP/JPY Daily chart
-638254776350744219.png)
- GBP/USD bulls are waiting in the flanks for a discount.
- The daily trendline support is eyed for a restest.
Sterling continued its slide against the US Dollar on Thursday as the UK's declining inflation pulled back market expectations of further aggressive rate hikes from the Bank of England (BoE). The Greenback was also in a rally of its own accord, weighing heavily on the inflated British currency.
GBP/USD sank to a low of 1.2839 as the money markets lowered their expectations for BoE rate hikes. The prospects of UK rates rising above 6% are now likely off the table.
The following technical analysis illustrates the market structure and leans with a bullish bias longer term:
GBP/USD technical analysis, daily chart
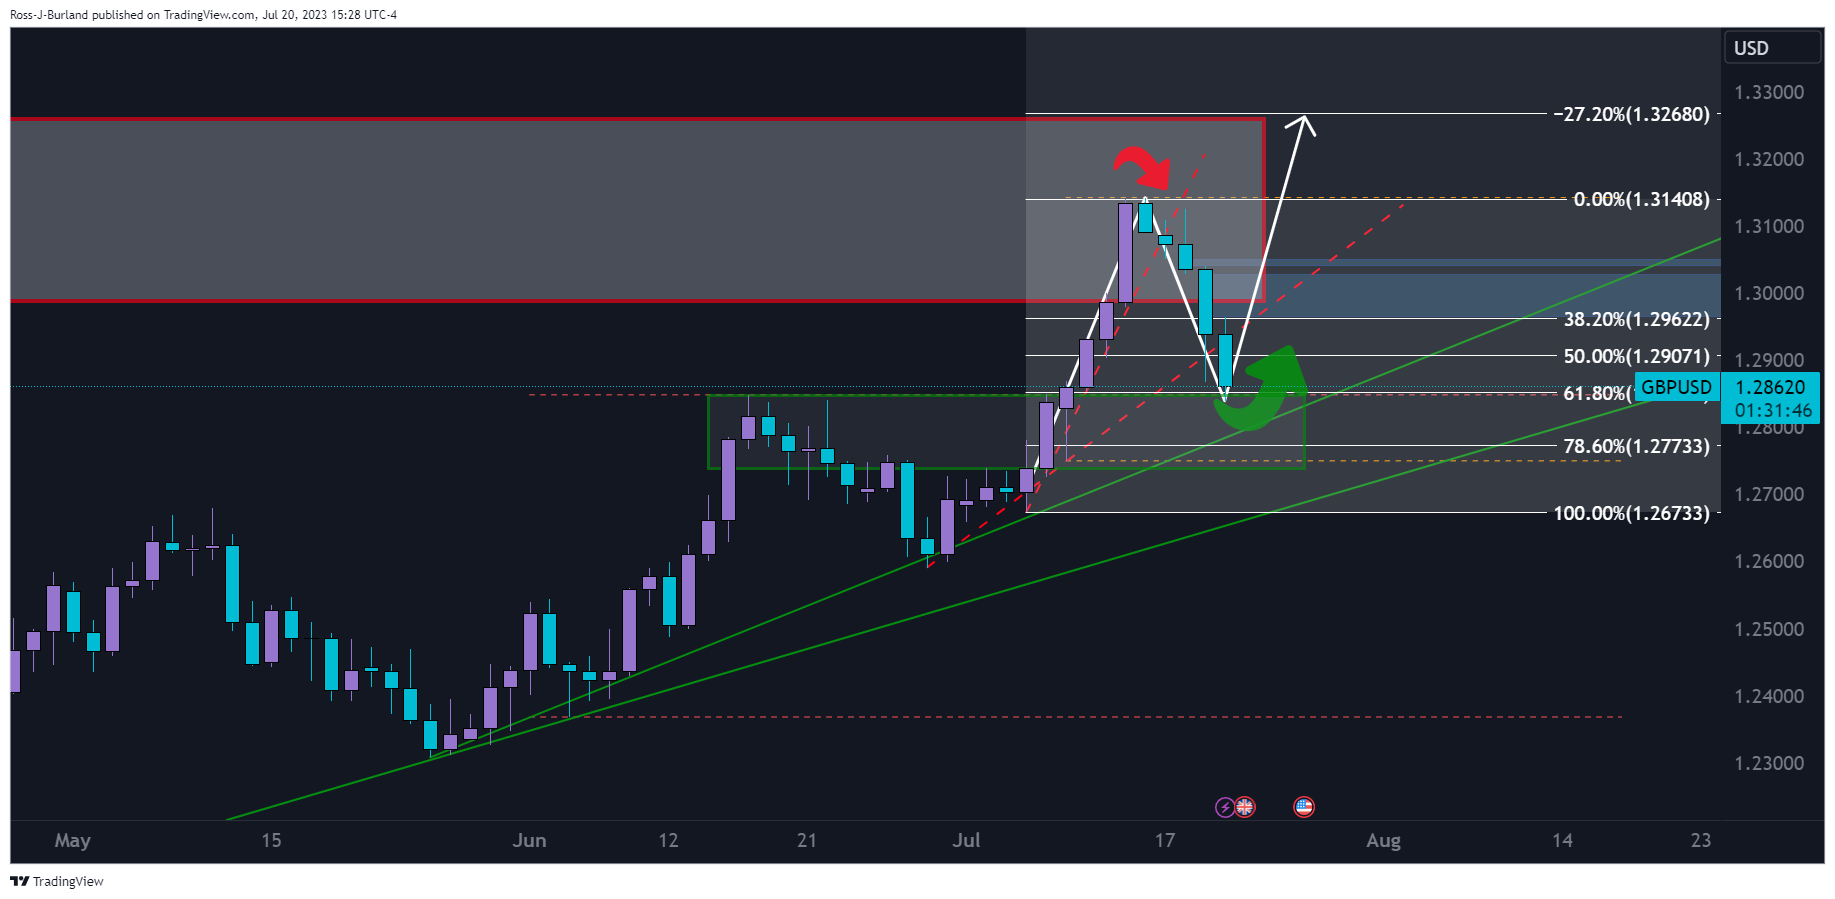
GBP/USD H4 chart
We can see that the price fell into a demand zone where we could see the beginnings of a base and a subsequent move higher. The trendline support is in sight, however, and a 78.6% ratio is in eyeshot as well.
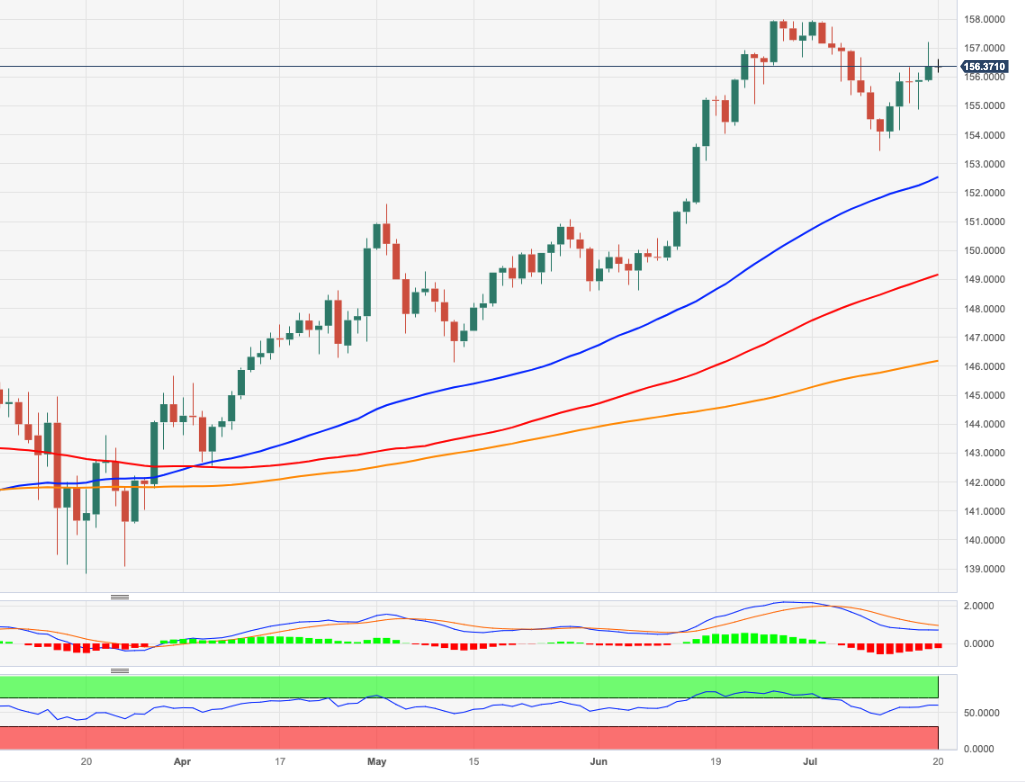
- EUR/JPY registers losses below the 156.00 area due to mixed market sentiment, but the overall uptrend remains.
- The bearish-harami candlestick pattern suggests a potential pullback while maintaining the upward bias.
- EUR/JPY’s key support levels are the Tenkan-Sen line at 155.26, the Senkou Span A at 155.01, and the Kijun-Sen levels at 154.76.
- For buyers to regain control, EUR/JPY must not achieve a daily close below 156.00. Resistance levels lie at the July 19 high of 157.20, and (YTD) high at 157.99.
Late in the North American session, the EUR/JPY registered losses below the 156.00 area amid a mixed market sentiment triggered by upbeat US economic data, underpinning safe-haven currencies in the FX space. At the time of writing, the EUR/JPY exchanges hand at 155.99, after hitting a daily high of 156.62.
EUR/JPY Price Analysis: Technical outlook
The EUR/JPY uptrend remains in play, but today’s price action, coupled with Wednesday, is forming a two-candlestick chart pattern called ‘bearish-harami,’ which suggests the EUR/JPY could be ready for a pullback while maintaining its upward bias.
It should be said that on the EUR/JPY way down, the Tenkan-Sen would be the first support at 155.26. A breach of the latter will expose the Senkou Span A at 155.01, followed by the Kijun-Sen levels emerging at 154.76.
On the flip side, for EUR/JPY buyers to regain control, they must keep prices from achieving a daily close below 156.00. Once done, buyers could remain hopeful for higher prices, with the first resistance being the July 19 high at 157.20, followed by the year-to-date (YTD) high at 157.99.
EUR/JPY Price Action – Daily chart
- US Initial Unemployment Claims data came in at 228K, better than forecasts and previous figures of 240K and 237K, respectively.
- US Existing Home Sales for June declined by 3.3%, with sales at 4.16M, below both the May figures of 4.3M and analyst forecasts of 4.2M.
- Market odds for a Fed rate hike beyond the July meeting increase to 32.2%, up from last week’s 19.8%, as per the CME FedWatch Tool.
Gold price slides from 7-week highs at $1,987.42, as economic data from the United States (US) reignited fears the US Federal Reserve (Fed) would remain tightening conditions past the July meeting. Hence, US Treasury bond yields soared, a headwind for the yellow metal. The XAU/USD is exchanging hands at $1,969.30, down 0.35%.
Gold prices face headwinds as stronger-than-expected US labor market data reinvigorates US rate hike expectations
XAU/USD turned downwards after the US Bureau of Labor Statistics (BLS) revealed that unemployment claims came at 228K, below estimates, and prior’s week, 240K, and 237K, respectively. Although Continuing Claims rose by 33K to 1.754M from 1.721M, the data portray a robust labor market, meaning the Fed would need to act and maintain rates “higher for longer.”
Other data showed the US housing market decelerated, as Existing Home Sales dived -3.3% in June, with sales coming at 4.16M beneath the 4.3M in May and missing 4.2M forecasts.
Given the backdrop, traders are reassessing whether the Fed would raise rates after next week’s Federal Open Market Committee (FOMC) meeting as market participants have priced in a 25 bps hike to 5.25%-5.50%.
According to CME FedWatch Tool, there is a 32.2% chance of the Fed increasing rates to 5.50%-5.75%, from one week 19.8% odds.
Consequently, as shown by the US Dollar Index (DXY), the greenback rose, climbing 0.56% at 100.850, underpinned by high US Treasury bond yields. The US 10-year Treasury note is gaining ten basis points (bps) and yields 3.852%, while US Real Yields, as portrayed by 10-year TIPS, advance five bps to 1.580%.
Therefore, Gold is doomed for the rest of the session as traders await another round of incoming US data. Fears of a worldwide economic slowdown could trigger flows toward safe-haven assets, which could bolster the yellow metal’s appeal. Nevertheless, traders should note that higher US Real yields could dent XAU’s flows in favor of the US Dollar.
XAU/USD Price Analysis: Technical outlook

From a technical standpoint, XAU/USD is trading neutral to upward biased, as strong resistance around $1985 was difficult to overcome. Prices began trending toward a downslope resistance trendline drawn from May highs, which turned support at around $1,960/70, halting Gold’s drop. If prices extend beyond the latter, key support levels would emerge at the confluence of the 50 and 20-day EMAs a $1,948/47, followed by the 100-day EMA at $1,938.35. Conversely, if XAU/USD surpasses $1,985, that could pave the way to test $2,000.
- The XAG/USD dropped more than 1% on Thursday below the $25.00 mark.
- US Jobless Claims in the second week of July came in lower than expected.
- Rising US Treasury yields weight on the precious metals.
The XAG/USD Silver spot price dropped towards the $24.80 area, recording 1.28% losses on Thursday amid a recovery of the USD. Despite weak Manufacturing and Housing data, lower-than-expected Jobless Claims fueled a rise in hawkish bets on the Federal Reserve (Fed) and US Treasury yields, making the grey metal lose interest.
Investors assess US data ahead of next week's Fed’s decision
The US reported mid-tier data. On the negative side, the Philadelphia Federal Reserve Manufacturing survey showed worrying results as its index declined more than expected, coming in at -13 vs the consensus of -10. In addition, following Wednesday’s soft Housing data, Existing sales from the US from June also showed weakness. The figure showed a contraction of 3.3% MoM in June with a 4.16M decrease.
However, investors seem to be weighing more Jobless Claims data. For the week ending on July 14, the number of people filing for unemployment benefits came in lower than the market consensus at 228,000 vs 242,000 expected and below the previous figure of 237,000. It fueled a rise in US Treasury yields on Federal Reserve hawkish bets. The 2-year yield rose to 4.88% while the 5 and 10-year rates jumped to 4.10% and 3.84%, with all three displaying strong increases of more than 1.50%. As bond yields could be seen as the opportunity cost of holding non-yielding metals, Silver prices are retreating.
XAG/USD Levels to watch
According to the daily chart, the technical outlook for the XAG/USD is neutral to bearish for the short term as bulls run out of steam. The Relative Strength Index (RSI) got rejected at the overbought threshold, while the Moving Average Convergence Divergence (MACD) prints lower green bars, indicating a lower buying pressure. However, on the bigger picture, the outlook is bullish as the price trades above the 20, 100 and 200-day Simple Moving Averages (SMA).
Support levels: $24.70, $24.50, $24.10.
Resistance levels: $25.00, $25.30,$25.00.
XAG/USD Daily chart
-638254741768515232.png)
- The WTI peaked at $76.11 and then settled below $76.00.
- Jobless Claims came in lower than expected and strengthened the USD.
- Markets turned cautious amid escalating American and Chinese tensions.
On Thursday, the West Texas Intermediate (WTI) barrel failed to maintain its upwards momentum, which took the price to a high of $76.11. A cautious market environment and a strong Dollar are the main ones responsible for limiting the WTI’s upwards potential, while the reports of Oil American stocks may limit the downside.
The American Petroleum Institute (API) stated that Crude Oil stocks fell in the week ending July 14. In addition, the US Energy Information Administration (EIA) reported that Crude Oil Stocks fell by 708,000 barrels which lifted the black gold’s price.
However, the USD recovered amid lower-than-expected Jobless Claims in the week ending on July 14, meaning fewer people filed for unemployment benefits. The figure came in at 228K, lower than the 242K expected and the previous figure of 237K.
As a reaction, US Treasury yields advanced across the board, meaning that markets are betting on a more aggressive Federal Reserve (Fed). The 2-year yield displays nearly 2% gains and stands at 4.88%, while the 5 and 10-year yields rose to 4.10% and 3.84% showing more than 2% increase. As for now, according to the CME FedWatch tool, markets largely discounted a 25 basis point (bps) hike for next week's meeting, but the odds of a hike past July still remain low. Its worth noticing that higher rates are negatively correlated with Oil prices as they cool down economic activity and lower energy demand.
WTI Levels to watch
According to the daily chart, the technical outlook is neutral to bearish for the short term. Bulls are struggling to gain momentum, and the price is capped by the 200-day Simple Moving Average (SMA) so further downside may be on the horizon. In addition, indicators are losing strength, with the Relative Strength Index (RSI) displaying a negative slope near its midline in positive territory while the Moving Average Convergence Divergence (MACD) prints lower green bars.
Support levels: $73.50 (100-day SMA), $72.53 (20-day SMA), $72.00.
Resistance levels: $76.00, $76.90 (200-day SMA), $78.00.
WTI Daily chart
-638254707506298374.png)
- Initial Jobless Claims for the last week came in at 228K, significantly lower than the 240K forecast, indicating a tight labor market.
- Continuing Claims report showed an increase of 33K to 1.754 million from 1.721 million, underlining persistent demand for labor.
- Existing Home Sales in June slipped by 3.3% to 4.16 million, a decrease from the 4.3 million reported in May.
USD/CHF rallies sharply on Thursday after a solid US jobs report put into the table, another interest rate increase by the US Federal Reserve, past the July meeting. The USD/CHD trades at 0.8669 after hitting a daily low of 0.8560, printing gains of 1.06%.
A robust labor market report triggers a USD rally against the CHF as the prospect of another Fed rate hike resurfaces
Two reports emerged from the US economic docket, with the first being the Initial Jobless Claims for the last week, pushing back against the US Federal Reserve’s (Fed) intentions to pause its hiking cycle as the labor market remains tight. Figures came at 228K beneath the 240K forecast, while Continuing Claims, which lagged the current claims week reported, jumped 33K, to 1.754 million, from 1721K.
Recently, Existing Home Sales in June slipped by 3.3%, as shown by the National Association of Realtors. Sales came at 4.16 million, below the 4.3 million in May and beneath the 4.2 million forecasts by analysts.
The USD/CHF soared after the data, as US Treasury bond yields surged, with 2s and 10s soaring ten basis points (bps), each at 4.866%, and 3.860%, respectively. Meanwhile, the US Dollar Index (DXY), which measures the buck’s value vs. six currencies, advances 0.62%, at 100.903, a tailwind for the USD/CHF.
The jump in US bond yields is also a consequence of traders repricing another rate increase by the Fed after the July meeting. Odds for the November meeting increased from 19.8% a week ago to 32.2%, as shown by the CME FedWatch Tool, suggesting traders are switching their point of view regarding Fed’s monetary policy.
On the Switzerland front, the Trade Balance expanded by 4,823 million vs. estimates of 4,031 million but trailed the 5,442 million in May. Exports grew to 24,917 million from 23,879 million in previous readings, whereas the Imports also rose to 20,093M compared to 18,438M marked in May.
That said, the USD/CHF could continue to rally if the US Fed raises rates and keep the door open for another increase, probably in November. That would catch traders off guard, which are already beginning to price in Federal Funds Rate (FFR) cuts by March 2024. Otherwise, the USD/CHF could hover around current exchange rates, awaiting a fresh catalyst.
USD/CHF Key Technical Levels
- USD/JPY tallied a fifth consecutive day of gains rising to a high near 140.40.
- Jobless Claims decelerated in the second week of July and fueled a rise in US yields.
- Philly’s Fed Survey and Existing Home Sales showed poor results.
The USD strengthened on Thursday and trades with gains agains most of its rivals, including the EUR, GBP, CHF and JPY. Lower Jobless Claims fueled a rise in US bond yields and allowed the USD measured by the DXY index, to rise to its highest level in seven days at 100.80.
Investors assess mid-tier US data. All eyes on Japan’s Inflation data
The US reported mid-tier data. On the negative side, the Philadelphia Federal Reserve Manufacturing survey showed worrying results as it index declined more than expected, coming in at -13 vs the consensus of -10. In addition, following Wednesday’s soft Housing data, Existing sales from the US from June also showed weakness. The figure showed a contraction of 3.3% MoM in June with a 4.16M decrease.
That being said, investors are weighing more the lower-than-expected Jobless Claims figures for the second week of July. The number of people filing for unemployment benefits came in at 228,000 vs the 242,000 expected and also below the previous figure of 237,000.
US Treasury yields advanced across the board. The 2-year yield displays nearly 2% gains and stands at 4.88%, while the 5 and 10-year yields rose to 4.10% and 3.84% showing more than 2% increase. Ahead of next week's Federal Reserve (Fed) meeting, markets have discounted mainly a 25 basis point increase while the odds of another hike past July continue to be low according to World Interest Rate Probabilities (WIRP)
On the Japanese side, investors will eye Japanese inflation figures from June. The headline Consumer Price Index (CPI) is expected to have accelerated to 3.5% YoY in June, while the Core measure to decelerate slightly to 4.2%.
USD/JPY Levels to watch
The daily chart indicates that the bulls are gaining ground, marching towards positive territory. As for now, the Relative Strength Index (RSI) points noth but remains in negative territory while the Moving Average Convergence Divergence (MACD) prints lower red bars, indicating at a fading selling momentum.
Resistance levels: 140.70, 141.00, 141.95 (20-day Simple Moving Average)
Support levels: 140.00, 139.60,139.00.
USD/JPY Daily chart
-638254660367288681.png)
- US Bureau of Labor Statistics (BLS) report reveals lower-than-expected initial jobless claims, spurring a rally in US Treasury bond yields.
- The 2-year and 10-year US Treasury note yields increased by ten basis points each, reaching 4.873% and 3.852%, respectively.
- Diverging monetary policies of the Fed and RBNZ might influence the NZD/USD to continue its downward trend.
NZD/USD slides for the fifth consecutive day as the US Dollar (USD) strengthens on jobs data that still portrays the tightness of the labor market, triggering a reaction in US Treasury bond yields, edging higher. Therefore, the NZD/USD Is trading at 0.6229, losing 0.4%, after reaching a daily high above the 0.6300 figure.
Kiwi faces headwinds as US labor market tightness bolsters the USD, triggering a rise in Treasury bond yields
A report by the US Bureau of Labor Statistics (BLS) showed that unemployment claims for the week ending July 15 cane lower than estimates, spurring a rally in US Treasury bond yields. Initial Jobless Claims rose by 228K, below forecasts of 240K, while Continuing Claims, which lagged the current claims week reported, jumped 33K, to 1.754 million, from 1721K.
After the data, as mentioned, the US 2 and 10-year Treasury note yields skyrocketed, 2s jumping ten basis points (bps) at 4.873, while the 10-year Treasury note followed suit, gaining ten bps at 3.852%.
Per the US bond yields reaction, the greenback rose, as shown by the US Dollar Index (DXY). The DXY, which tracks the buck’s performance against a basket of six currencies, advances 0.51%, up at 100.796, a headwind for the NZD/USD pair resulting from traders reassessing a possible Federal Reserve rate hike past the July meeting.
The CME FedWatch Tool depicts investors fully priced in a 25 bps hike in July. Nevertheless, odds for a November rate increase are lingering back on investors’ minds, with odds standing at 32.2%, higher than one week ago 19.8% chance.
On the New Zealand (NZ) front, the recent monetary policy of the Reserve Bank of New Zealand (RBNZ) witnessed the RBNZ holding rates unchanged at 5.5%, as the central bank noted that consumer spending has eased, helping to cool down inflation. The latest inflation report witnessed the Consumer Price Index (CPI) for Q2 YoY slowing from 6.7% to 6%, aligned with RBNZ’s projections.
Given the fundamental backdrop, with the Fed and RBNZ monetary policy divergences, the NZD/USD could continue to trend lower unless next month’s inflation figures in NZ shift the RBNZ’s board to take action to tame inflation.
NZD/USD Price Analysis: Technical outlook
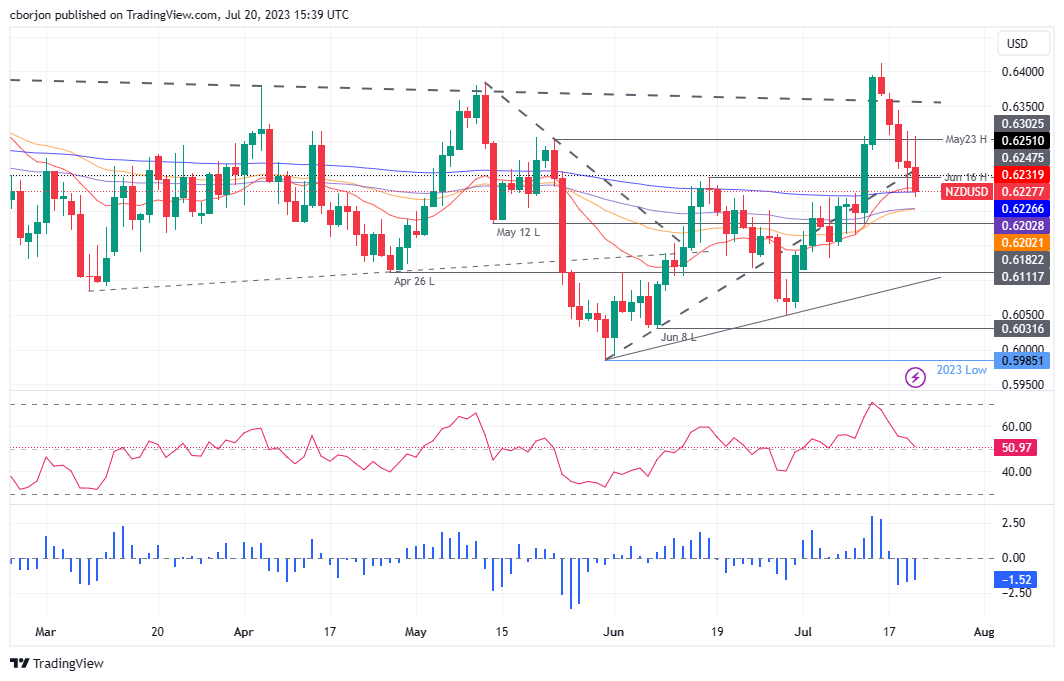
NZD/USD buyers’ failure to conquer the 0.6300 mark exposed the pair to selling pressure, with the major prolonging its losses toward the 200-day Exponential Moving Average (EMA) at 0.6226. Of note, the pair has fallen to the latter twice in the last couple of days, but a daily close has not been achieved to shift the trend to neutral. In addition, the 20-day EMA at 0.6232 cushioned the NZD/USD’s fall, which if breaks the 0.6232/26 area, a challenge to 0.6200 is on the cards. On the other hand, if NZD/USD advances toward 0.6300, that would keep the trend intact.
- The US dollar gains momentum following the release of US data ahead of the FOMC meeting.
- The US Dollar Index is up for the third consecutive day, breaking above 100.50.
- The EUR/USD is accelerating its bearish correction from one-year highs.
The EUR/USD is falling on Thursday, experiencing its worst day in almost a month. The pair dropped to 1.1140, reaching the lowest level in a week. It remains intraday biased towards the downside, hovering around 1.1150 as the US dollar maintains a positive tone.
US data favors US Dollar
The US weekly jobless claims report showed a decline in initial claims to 228K, the lowest level since mid-May and better than the market estimate of 242K. However, in a different report, Existing Home Sales dropped from 4.3 million to 4.16 million (annual rate), below the expected 4.2 million. Data from the Eurozone showed that Consumer Confidence, as measured by the flash estimate for July, improved from -16.0 to -15.1, which was better than expected.
The US job market figures continue to reflect a tight labor market, which contributes to the performance of the US dollar ahead of next week's FOMC meeting. Market participants expect the Federal Reserve to raise rates by 25 basis points on Wednesday. The US 10-year bond yield stands at 3.85%, the highest since July 13, while the 2-year yield is at 4.87%, the highest since July 12. The US Dollar Index climbed from 100.30 to 100.75, reaching the highest level in a week. Stocks on Wall Street are mixed, with the Nasdaq down by 1.15% and the Dow Jones up by 0.71%.
EUR/USD turns negative in the very short-term
The dominant uptrend in EUR/USD remains firm, however, in the short-term, bearish signals are reasserting themselves. Prices turned decisively lower on Thursday after being unable to break above 1.1230. It easily broke under 1.1200 and is now testing 1.1150.
In the short-term, technical indicators are biased to the downside. The next support level is seen around 1.1120/25 followed by 1.1070. On the upside, 1.1190 could be seen as the immediate resistance, followed by 1.1230. A recovery above 1.1240 would negate the current negative bias.
Technical levels
Gold shines again with an end to the Fed’s tightening cycle in sight, economists at ING report.
XAU/USD to average $1,900 in the third quarter and $1,950 in the fourth quarter
We believe that for Gold, the Fed policy is still key over the medium term. We believe the downside remains limited for Gold as the Fed is close to the end of its monetary tightening cycle, with the expected hike at the Fed's meeting next week already priced in for bullion.
We see prices moving higher over the second half of next year, given that the Fed should start to pause its rate hiking cycle, while geopolitical instability will also provide headwinds for Gold prices looking forward.
We forecast prices to average $1,900 in the third quarter and $1,950 in the fourth quarter.
We expect prices to move higher again in the first quarter of 2024 to average $2,000 with the assumption around this that the Fed starts cutting rates in the first quarter of next year.
Interest rate differentials have played a huge part in driving the EUR/USD exchange rate this year. Economists at Rabobank analyze the pair’s outlook.
ECB is close to reaching its peak in policy rates
The release of weaker-than-expected US CPI inflation data last week cemented market expectations that the Fed will reach its peak policy rates after an anticipated 25 bps hike in rates next week. As a result, the USD lurched lower across the board. In the coming months, it is very likely that the ECB will also reach its peak policy rate, and this is likely to undermine the attraction of the EUR.
On anticipation that the ECB is close to reaching its peak in policy rates, we expect EUR/USD to end the year at lower levels and see risk of a move back to the 1.08 region on a three-month view.
Over the past six weeks, the S&P 500 is up nearly 8%, the best performance leading up to an earnings season since the first quarter of 2021. Economists at UBS share their S&P 500 forecast.
Earnings will beat
With economic activity more resilient than expected, Q2 should mark the trough in earnings growth. We look for S&P 500 profits to beat expectations and decline 3-5% year-over-year. Excluding the energy sector, profits could be up slightly. Guidance for Q3 should also be good.
We keep our full-year 2023 and 2024 S&P 500 EPS estimates of $215 (-2% YoY) and $235 (+9% YoY) unchanged but believe there is more upside versus downside risks to these numbers.
Our S&P 500 price targets for December 2023 and June 2024 are 4,100 and 4,400, respectively.
Economists at Commerzbank discuss the Dollar’s status as a reserve and trade currency.
No threat to the Dollar’s special status
The fact that China has extended its economic and political power within the Community of Latin American and Caribbean States (CELAC) at the expense of the EU illustrates that the Renminbi will remain part of the debate about the de-Dollarisation despite it being so far behind when it comes to its use for international payment transactions. Paradoxically that could also stabilise the outstanding status of the Dollar as the dominant reserve and trade currency for years to come.
A relatively rapid change to a system that is less Dollar-centric would probably only be possible with the help of the Euro gaining significance. That seems unlikely for now. However, the Renminbi still faces a lot of catching up to even reach the Euro’s position, which would probably require far-reaching changes to the Chinese financial and economic system. Until that seems imminent the Dollar’s special status is unlikely to be seriously at risk.
- Eurozone Consumer Confidence Indicator rose to -15.1 in July.
- EUR/USD continues to trade in negative territory below 1.1200.
Consumer sentiment in the Euro area improved modestly in July with the Consumer Confidence Indicator edging higher to -15.1 from -16.1 in June, the European Commission reported on Thursday. This reading came in better than the market expectation of -16.
For the EU, the Consumer Confidence Indicator rose by 1.1 percentage point to -16.1.
Market reaction
EUR/USD stays under modest bearish pressure after this data and was last seen losing 0.25% on a daily basis at 1.1170.
- Existing Home Sales in the US declined in June following May's modest increase.
- US Dollar Index clings to daily recovery gains near 100.50.
Existing Home Sales in the US declined 3.3% in June to an adjusted annual rate of 4.16 million, the National Association of Realtors (NAR) reported on Thursday. This reading followed the 0.2% increase recorded in May.
"At $410,200, the median existing-home sales price for June was the second-highest price ever recorded – since January 1999 when NAR began tracking the data – and 0.9% less than the all-time high from one year ago of $413,800," the NAR further noted in its press release.
Market reaction
The US Dollar Index preserves its recovery momentum after this report and was last seen rising 0.23% on the day at 100.51.
Japan releases CPI report this Friday and BoJ MPC take place the following Friday. Economists at OCBC Bank analyze JPY ahead of these events.
There is an economic case for making a policy shift
We believe the meeting is ‘live’ as there is an economic case for making a policy shift.
Core-core inflation (strips away fuel and food) is now running at over 40-year high of 4.3% and both nationwide and Tokyo CPIs show that price pressures are broadening.
Another firmer CPI print should support JPY strength ahead.
- EUR/USD keeps correcting lower and revisits the 1.1170 zone.
- Further south emerges the next contention area at 1.1000.
EUR/USD leaves behind earlier gains and returns to the area of weekly lows near 1.1170 on Thursday.
While the continuation of the upside momentum appears favoured in the very near term, the ongoing corrective decline carries the potential to drag the pair to the 1.1000 neighbourhood, where a more solid contention is expected to emerge.
Looking at the longer run, the positive view remains unchanged while above the 200-day SMA, today at 1.0680.
EUR/USD daily chart
- DXY reverses the initial pessimism and challenges weekly highs.
- If bulls push higher the index could revisit the 102.60 region.
DXY extends the weekly recovery to the area of recent peaks around 100.50 on Thursday.
A more serious bullish attempt in the index should clear the 102.60 zone, where the provisional 55-day and 100-day SMAs coincide.
Looking at the broader picture, while below the 200-day SMA at 104.12, the outlook for the index is expected to remain negative.
DXY daily chart
Nasdaq 100 is losing momentum ahead of resistance at 16,017, and analysts at Credit Suisse continue to look for this to cap for now for a correction lower.
Support seen at 15,608 initially
The uptrend in the Nasdaq 100 is starting to show signs of fading just ahead of next resistance at the 16,017 reaction high from January 2022, and we continue to look for this to cap and for a correction lower to emerge.
Support is seen at 15,608 initially, beneath which can add weight to our view for a test of the rising 13-day exponential average, now at 15,421. Whilst we would look for an attempt to hold here, a closing break lower followed by removal of price/gap support at 15,210 would raise the prospect of a more concerted downturn, with support seen next at 14,925.
Above 16,017 though, we would see no reason not to look for a test of the 16,607/765 record highs.
- EUR/JPY comes under pressure following recent tops.
- Further gains target the 2023 high around 158.00.
EUR/JPY fades part of Wednesday’s advance and returns to the 156.50 region on Thursday.
In the meantime, the cross keeps the recovery mode in place and the continuation of the uptrend carries the potential to challenge the so far 2023 peak in the boundaries of 158.00 the figure (June 29).
So far, the longer term positive outlook for the cross appears favoured while above the 200-day SMA, today at 146.16.
EUR/JPY daily chart
MXN continues to strengthen and extend gains through its recent range highs against the CAD. Economists at Scotiabank analyze CAD/MXN outlook.
Significant rally unlikely to develop
The cross has put some pressure on bear trend resistance in the past couple of weeks but there is little else from price action to suggest that a significant rally in the CAD is poised to develop.
Daily and weekly DMI signals do highlight the stretched nature of the CAD sell-off here but the degree of ‘stretch’ is not that extreme (relative to recent cycles).
Losses could, potentially, extend to the 12 area (range lows from 2010/15) now.
- AUD/USD has slipped sharply to near 0.6800 as the USD Index has extended its recovery.
- US weekly jobless claims for the very first time surprisingly dropped to 228K from the prior release of 237K.
- Australia’s tight labor market conditions would force the RBA to resume its policy-tightening spell from August.
The AUD/USD pair has dropped sharply to near the round-level support of 0.6800 after facing stiff barriers around 0.6850 in the early New York session. The Aussie asset has sensed a sell-off as the US Dollar Index (DXY) has extended its recovery. The USD Index has recaptured the previous day’s high around 100.50 as the United States weekly Jobless Claims for the week ending July 16 have surprisingly declined.
US Department of Labor has reported that last week individuals who applied for jobless claims for the very first time surprisingly dropped to 228K from the prior release of 237K while investors were anticipating a jump to 242K. This indicates that labor market conditions are still tight and might keep inflationary pressures elevated.
S&P500 is expected to open on a bearish note following negative cues from overnight futures. Investors should brace a stock-specific action as the US corporate has started posting quarterly results. Considering the strength in the US Dollar’s rally, more upside in the USD Index seems favored. Also, the 10-year US Treasury yields have jumped to near 3.82%.
Meanwhile, the Australian Dollar could rebound sooner as Australia’s employment conditions remained resilient in June. Australian Bureau of Statistics reported that the labor market was added with fresh 32.6K payrolls, higher than the estimates of 15K but remained lower than the former release of 76.5K. The Unemployment Rate remained unchanged at 3.5% while investors were anticipating an increase to 3.6%.
Tight labor market conditions would force the Reserve Bank of Australia (RBA) to resume its policy-tightening spell from August. RBA Governor Philip Lowe kept interest rates unchanged in July at 4.10%. An upbeat labor market could propel inflationary pressures as labor shortage would be offset by higher employment bills.
Economists at Société Générale see three reasons the BoE may still opt for 50 bps.
Key support levels for GBP/USD are situated at 1.2850/1.2810
Firstly, services and wage inflation may have peaked in June, but both remain uncomfortably high relative to the 2% target. The MPC will not have confirmation that services prices are coming off the boil until two weeks after the August MPC.
Secondly, investors are steering clear of Gilts because of lingering UK inflation. Higher and more persistent inflation means investors ask for higher compensation to hold Gilts vs Treasuries and Bunds. Only when inflation expectations fall sustainably will the premium and cost of borrowing/interest burden for the government decrease. Reassuring investors means not taking your foot off the monetary brakes too soon.
Thirdly, the BoE and Governor Bailey in particular faced a torrent of criticism in recent weeks for fanning the inflation flames by keeping policy too loose for too long. This could tempt the bank into overdoing it to prove its critics wrong.
Tactically, key support levels for GBP/USD are situated at 1.2850/1.2810. EUR/GBP resistance runs at 0.8720/0.8750.
- Canadian Dollar rises versus the Buck on the back of a bullish outlook for Crude Oil.
- The expectation that the BoC will have to keep interest rates higher for longer compared to the Fed may be a factor supporting CAD.
- Technically USD/CAD is coming back down to retest a major support confluence in the upper 1.30s where it has previously bounced.
The Canadian Dollar (CAD) edges higher for the fourth consecutive day against the US Dollar (USD) on Thursday, on the back of bullish expectations for Crude Oil, Canada’s primary export. The possibility that the Bank of Canada (BoC) may keep rates higher for longer to combat persistent inflation is supporting CAD as market expectations that the US Federal Reserve (Fed) will cut rates relatively earlier, in H1 of 2024 persist.
The USD/CAD pair trades in the 1.31s as the US session gets underway.
Canadian Dollar news and market movers
- The Canadian Dollar is rising versus the US Dollar (USD/CAD falling), continuing its trend for the fourth consecutive day.
- A more positive outlook for global Oil prices, Canada’s premier export, may be a factor driving CAD higher.
- China is importing record amounts of – especially Russian – Crude Oil, according to analysis by the Financial Times, cited by Oilprice.com.
- Chinese imports of Russian Oil totalled 2.13M barrels per day in H1 2023, helping Russia oust Saudi Arabia from the top spot as the world’s largest Oil exporter.
- Imports to China surged 45.3% YoY in June alone, to the “second highest monthly figure on record”, according to Oilprice.com, “as refiners continued building up inventories despite weak domestic demand.”
- China’s accumulation may be a sign Chinese Oil traders are building inventory because they foresee a rally ahead for the commodity.
- Crude Oil prices may be basing and preparing for a rally, according to analysis by DailyFX.com.
- WTI Crude Oil has broken and consolidated above a key downtrend line suggesting it could be pausing before another leg higher.
- The US Federal Reserve is still almost certain to raise interest rates by 0.25% at its July 26 meeting, according to the CME FedWatch Tool. The highest chance of another rate hike after that is in November, when the tool assigns a 29% probability to the event.
- The Bank of Canada is 20% liable to raise interest rates at its next meeting in September, however, sticky inflation, according to the BoC’s recent forecasts, may keep rates higher for longer going forward.
- The Fed, on the other hand, is foreseen potentially cutting interest rates in early 2024, and it is possible this expectation of future divergence between the two central banks is another factor helping propel CAD higher (USD/CAD lower).
Canadian Dollar Technical Analysis: Returning to critical support level
USD/CAD is probably in a long-term uptrend on the weekly chart, which began at the 2021 lows. Since October 2022, the exchange rate has been in a sideways consolidation within that uptrend. Given the old saying that ‘the trend is your friend’, however, the probabilities favor an eventual continuation higher and longs over shorts.
USD/CAD appears to have completed a large measured move price pattern that began forming at the March highs. This pattern resembles a 3-wave ABC correction, in which the first and third waves are of a similar length (labeled waves A and C on the chart below).
-638254542667736007.png)
US Dollar vs Canadian Dollar: Weekly Chart
A confluence of support situated in the upper 1.3000s, which is made up of several longer moving averages and a major trendline, prevented last week’s decline from extending any lower and provided a foundation for the reversal on Friday and Monday.
-638254543063925676.png)
US Dollar vs Canadian Dollar: Daily Chart
The long green up-bar that formed on Friday is a bullish engulfing Japanese candlestick reversal pattern. When combined with the long red down bar that formed immediately before it, the two together also complete a two-bar bullish reversal pattern.
The Relative Strength Index (RSI) is converging bullishly with price at the July lows when compared to the June 27 lows. At the June 27 lows, RSI was lower than in July despite price being higher. This suggests underlying strength and is a bullish sign.
Monday’s weak close, however, failed to provide confirmation for the reversal, and since then, the price has been pulling back down.
It will take a decisive break above the 50-day Simple Moving Average (SMA) at circa 1.3400 to refresh and reconfirm the USD/CAD long-term uptrend. Nevertheless, bulls marginally have the upper hand, with the odds slightly favoring a recovery and a continuation higher.
Alternatively, a decisive break below 1.3050 would indicate the thick band of weighty support in the upper 1.30s has been definitively broken, bringing the uptrend into doubt.
Canadian Dollar FAQs
What key factors drive the Canadian Dollar?
The key factors driving the Canadian Dollar (CAD) are the level of interest rates set by the Bank of Canada (BoC), the price of Oil, Canada’s largest export, the health of its economy, inflation and the Trade Balance, which is the difference between the value of Canada’s exports versus its imports. Other factors include market sentiment – whether investors are taking on more risky assets (risk-on) or seeking safe-havens (risk-off) – with risk-on being CAD-positive. As its largest trading partner, the health of the US economy is also a key factor influencing the Canadian Dollar.
How do the decisions of the Bank of Canada impact the Canadian Dollar?
The Bank of Canada (BoC) has a significant influence on the Canadian Dollar by setting the level of interest rates that banks can lend to one another. This influences the level of interest rates for everyone. The main goal of the BoC is to maintain inflation at 1-3% by adjusting interest rates up or down. Relatively higher interest rates tend to be positive for the CAD. The Bank of Canada can also use quantitative easing and tightening to influence credit conditions, with the former CAD-negative and the latter CAD-positive.
How does the price of Oil impact the Canadian Dollar?
The price of Oil is a key factor impacting the value of the Canadian Dollar. Petroleum is Canada’s biggest export, so Oil price tends to have an immediate impact on the CAD value. Generally, if Oil price rises CAD also goes up, as aggregate demand for the currency increases. The opposite is the case if the price of Oil falls. Higher Oil prices also tend to result in a greater likelihood of a positive Trade Balance, which is also supportive of the CAD.
How does inflation data impact the value of the Canadian Dollar?
While inflation had always traditionally been thought of as a negative factor for a currency since it lowers the value of money, the opposite has actually been the case in modern times with the relaxation of cross-border capital controls. Higher inflation tends to lead central banks to put up interest rates which attracts more capital inflows from global investors seeking a lucrative place to keep their money. This increases demand for the local currency, which in Canada’s case is the Canadian Dollar.
How does economic data influence the value of the Canadian Dollar?
Macroeconomic data releases gauge the health of the economy and can have an impact on the Canadian Dollar. Indicators such as GDP, Manufacturing and Services PMIs, employment, and consumer sentiment surveys can all influence the direction of the CAD. A strong economy is good for the Canadian Dollar. Not only does it attract more foreign investment but it may encourage the Bank of Canada to put up interest rates, leading to a stronger currency. If economic data is weak, however, the CAD is likely to fall.
EUR/JPY is correcting off of a high at 158. Economists at ING analyze the pair’s outlook.
Fiscal consolidation could rein in ECB tightening expectations and limit EUR upside in 2024
The case for much lower levels is not strong unless we see some strong independent gains in the Yen on the back of a Bank of Japan policy shift. Otherwise, the narrative of a soft landing is a mildly positive one for the pro-cyclical EUR/JPY cross.
One left-field risk for the Euro is the focus on 2024 fiscal consolidation. Here eurozone finance ministers have faced criticism from the ECB that fiscal policy has been too loose for too long and fuelling inflation. Fiscal consolidation could rein in ECB tightening expectations and limit EUR upside in 2024.
The biggest risk for EUR/JPY is probably some emerging financial crisis from the shadow banking sector – in response to high rates.
EUR/JPY – 1M 153 3M 151 6M 150 12M 142
The diffusion index for current general activity of the Federal Reserve Bank of Philadelphia's Manufacturing Survey rose modestly to -13.5 in July from -13.7 in June. This mark was below the market expectation of -10. It was the 11th consecutive negative reading.
According to the report, data “suggest continued overall declines in the region’s manufacturing sector this month. The indicators for current activity and new orders remained negative, while the index for shipments turned negative. The firms reported overall increases in prices received and prices paid. The survey’s future indexes improved and suggest that respondents expect growth over the next six months.”
Key takeaways from the report:
“On balance, the firms reported mostly steady levels of employment. The employment index ticked down from a reading of -0.4 last month to -1.0 this month.”
“The prices paid diffusion index declined 1 point to 9.5 in July. One-fifth of the firms reported increases in input prices, and 11 percent reported decreases; 68 percent reported no change.”
“The diffusion index for future general activity jumped from a reading of 12.7 in June to 29.1 in July, the index’s highest reading since August 2021.”
Market reaction:
The US Dollar rose across the board after the weekly Jobless Claims report and the Philly Fed. The DXY printed a fresh daily high above 100.40 and US yields spike to fresh weekly highs.
- USD/JPY is consolidating below 140.00 as investors await Japan’s CPI for further guidance.
- S&P500 futures have generated some losses ahead of New York's opening, portraying a cautious market mood.
- USD/JPY has rebounded after testing the breakout of the Ascending Triangle chart pattern.
The USD/JPY pair is demonstrating topsy-turvy moves below the round-level resistance of 140.00 in the London session. The asset is struggling to find a decisive move as investors need guidance about the interest rate decision from the Federal Reserve (Fed) and the Bank of Japan (BoJ), which will be announced next week.
S&P500 futures have generated some losses ahead of New York's opening, portraying a cautious market mood. The US Dollar Index (DXY) has rebounded firmly and is aiming to recapture the previous day’s high of 100.53.
Going forward, Japan’s inflation report for June will be in focus, which will be published on Friday. As per the consensus, the headline Consumer Price Index (CPI) increased to 3.5% vs. the former release of 3.2%. Core inflation that excludes volatile oil and food prices softened marginally to 4.2% against the prior release of 4.3%.
USD/JPY has rebounded after testing the breakout of the Ascending Triangle chart pattern formed on a two-hour scale. A breakout of the aforementioned chart pattern results in wider ticks and heavy volume. The 20-period Exponential Moving Average (EMA) at 139.42 is providing a cushion to the US Dollar bulls.
Meanwhile, the Relative Strength Index (RSI) (14) is attempting a break into the bullish range of 60.00-80.00. An occurrence of the same will activate the bullish momentum.
For an upside move, a decisive break above July 19 high around 140.00 would drive the asset towards June 15 high at 141.50 followed by July 10 high at 143.00.
On the flip side, a downside move below July 18 low of 137.68 would expose the asset to May 17 low at 136.30 and May 12 low at 134.40.
USD/JPY two-hour chart
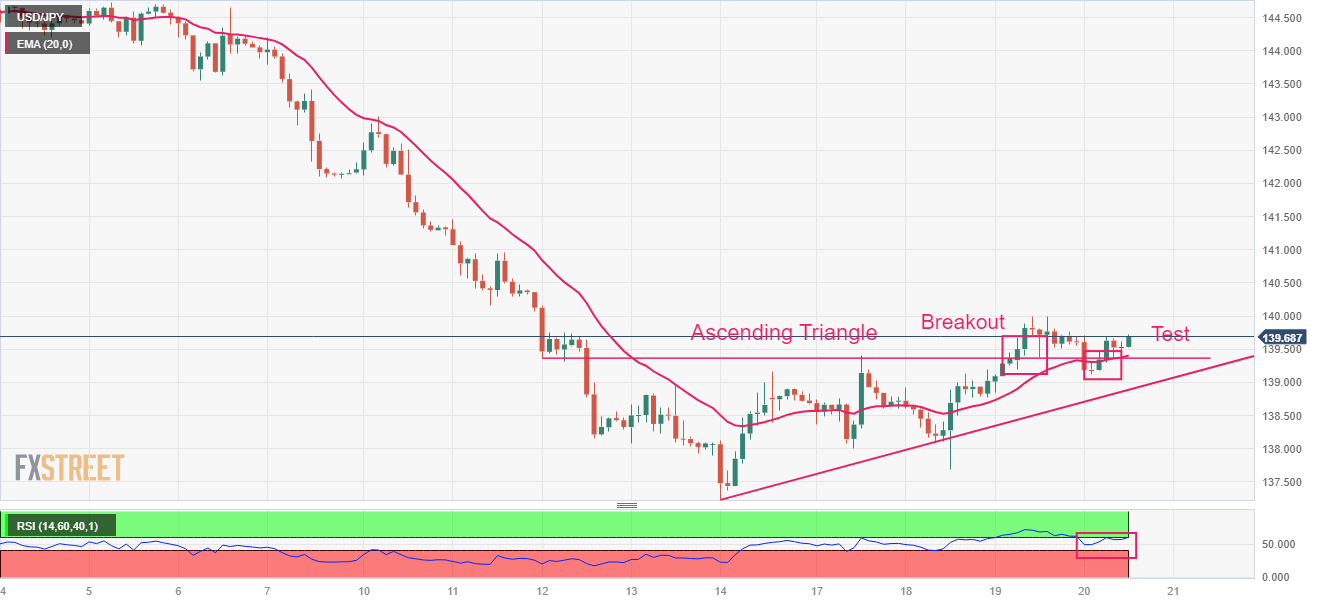
- Initial Jobless Claims decreased by 9,000 in the week ending July 15.
- Continuing Jobless Claims rise by 33,000 in the week ending July 8.
- US Dollar Index prints fresh highs above 100.40 after data.
Initial Jobless claims totaled 228,000 in the week ending July 15, the weekly data published by the US Department of Labor (DOL) showed on Thursday. It is the lowest reading since mid-May. The print follows the previous week's 237,000 (unrevised) and came in below/above market expectations of 242,000. Further details showed that “the 4-week moving average was 237,500, a decrease of 9,250 from the previous week's unrevised average of 246,750.”
Continuing Claims rose by 33,000 in the week ended July 8 to 1.754 million, a reading worse than market estimates of 1.728 million. It is the highest level in four weeks. The four-week moving average “was 1,731,500, a decrease of 1,750 from the previous week's revised average.”
Market reaction:
The US Dollar Index rose above 100.40, reaching fresh daily highs following the release of US Jobless Claims and the Philly Fed. US yields spiked to fresh weekly highs.
S&P 500 has completed a small “doji” reversal at the top of its uptrend channel from March. Analysts at Credit Suisse look for a correction lower.
Break above 4,578 can see a test of 4,593/4,600
S&P 500 has cleared resistance at 4,513/4,535 or a move to test the top of the uptrend channel from March, today seen a tough higher at 4,599. The subsequent rejection from here though has left a small ‘doji’ candle reversal pattern, and we look for a cap here for now and for a retracement lower to emerge.
Support is seen initially at 4,555/54 initially, beneath which can see a slide back price support at 4,515. A break below here can see a test of the 13-day exponential average, currently placed at 4,479, but with a close below here needed to suggest a more concerted correction lower is underway, for support next at 4,448/39.
Above 4,578 can see a test of 4,593/4,600. Above here though is needed to suggest we can see a further acceleration higher for resistance next at the 4,637 high of March 2022.
- USD/TRY sets aside Wednesday’s pullback and resumes the upside.
- The CBRT came in short of expectations… once again.
- The central bank leaves the door open to further tightening.
There is no respite for the selling pressure around the Turkish lira, and this time is lifting USD/TRY to the boundaries of the key round level (another one) at 27.0000.
USD/TRY picks up pace on CBRT hike
USD/TRY seems to have broken above the multi-session consolidative phase that started in late June and now retargets the 27.0000 region on the back of the resumption of the downward bias in the lira.
On a weekly basis, the pair has so far closed with gains in every week since March, while the only month that saw a negative performance was November 2022, since January of that same year. YTD, the Turkish currency has depreciated nearly 45%.
The extra decline in the lira comes after the Turkish central bank (CBRT) hiked the One-Week Repo Rate by 250 bps to 17.50% vs. expectations for a 500 bps rate raise (to 20.00%).

From the statement, the inflation rate target remains unchanged at 5%, while the bank sees the continuation of the ongoing tightening stance as necessary to achieve an improvement in the inflation outlook.
In the meantime, the unabated sell-off in the domestic currency remains so far in place amidst rising scepticism among investors at home and abroad regarding the potential further steps towards a more orthodox monetary policy by the newly appointed economic team.
What to look for around TRY
USD/TRY maintains its upside bias well in place, always underpinned by the relentless meltdown of the Turkish currency.
In the meantime, investors are expected to closely monitor upcoming decisions on monetary policy amidst the ongoing downtrend in domestic inflation.
In a more macro scenario, price action around the Turkish lira is supposed to continue to spin around the performance of energy and commodity prices, which are directly correlated to developments from the war in Ukraine, broad risk appetite trends, and dollar dynamics.
Eminent issues on the back boiler: Persistent skepticism over the CBRT credibility/independence. Absence of structural reforms. Bouts of geopolitical concerns.
USD/TRY key levels
So far, the pair is gaining 0.69% at 26.9199 and faces the next hurdle at 27.0147 (all-time high July 18) followed by 28.00 (round level). On the downside, a break below 22.9997 (55-day SMA) would expose 21.2799 (100-day SMA) and finally 19.9788 (200-day SMA).
USD/CAD turns neutral within 1.31/1.33 range, economists at Scotiabank report.
USD/CAD’s technical tone has turned neutral
The broader range for USD/CAD is well-defined by technical resistance at 1.3350/75 and support at 1.3105/15.
Shorter-term trend momentum has weakened – to neutral on the daily DMI – and an extension of the recent 1.31/1.33 chop in spot may develop from here.
USD/CAD trends remain bearish from a longer run point of view following the USD’s break under long run trend support (1.3350 on the weekly chart).
USD/CAD will have to gain through 1.3385/90 to show more obvious technical strength at this point.
The New Zealand Dollar is the worst performing G10 currency over the last five trading days. Economists at MUFG Bank analyze Kiwi's outlook.
Inflation data underlines RBNZ hold stance
The broad Dollar rebound was reinforced by the drop in New Zealand inflation, released on Wednesday, which is consistent with the RBNZ remaining on hold and indeed being finished with its tightening cycle.
In recent days, the New Zealand Dollar has underperformed the Australian Dollar as well with global growth optimism helping provide AUD with greater support. That reversed somewhat briefly on Wednesday but we continue to see scope for AUD/NZD to advance further and today’s employment data will help.
We see risks skewed to inflation coming down more quickly and the market gradually starting to price for rate cuts in 2024. Coupled with a poor external position we continue to see risks of underperformance relative to other G10 currencies.
- US Dollar struggles to build on Wednesday's gains.
- US Dollar Index consolidates in a narrow range above 100.00.
- US weekly Initial Jobless Claims and June Existing Home Sales data will be released on Thursday.
The US Dollar (USD) finds it difficult to preserve its strength early Thursday after having outperformed its major rivals on Wednesday. The US Dollar Index (DXY), which tracks the USD's valuation against a basket of six major currencies, went into a consolidation phase above 100.00 ahead of US data releases.
The US Department of Labor will publish the weekly Initial Jobless Claims data, and the National Association of Realtors (NAR) will release the Existing Home Sales data for June later in the day.
Daily digest market movers: US Dollar waits for the next catalyst
- The Wall Street Journal reported early Thursday that the United States banned 14 Iraqi banks from using the USD in transactions on suspicion of these banks funnelling USDs to Iran.
- China's ambassador to Washington, Xie Feng, said late Wednesday that China will respond if the US were to impose more curbs on the country's chip sector.
- Nasdaq Futures are down nearly 1% on Thursday following uninspiring earnings from big US tech firms after the closing bell on Wednesday.
- The Federal Reserve Bank of Atlanta's GDPNow model forecasts a 2.4% US GDP growth in the second quarter.
- The monthly data published by the US Census Bureau showed Wednesday that Housing Starts declined 8% on a monthly basis in June, following the 15.7% increase (revised from +21.7%) recorded in May. In the same period, Building Permits fell 3.7%, swinging from May's 5.6% increase.
- The USD managed to capture capital outflows out of Pound Sterling early Wednesday after data from the UK showed that inflation softened at a faster pace than expected in June. Moreover, the sharp upsurge seen in the USD/JPY pair following Bank of Japan (BoJ) Governor Kazuo Ueda's dovish comments reaffirmed strengthening demand for the USD.
- Retail Sales in the US rose 0.2% in June to $689.5 billion, the US Census Bureau reported on Tuesday. The 0.3% increase recorded in May had been forecast to reach 0.5% in June, but the data came in far below. Retail Sales Ex-Autos increased 0.2% in the same period, coming in also slightly below the market expectation of 0.3%.
- Industrial Production in the US contracted 0.5% for the second straight month in June, data from the US Federal Reserve's showed Tuesday.
- The benchmark 10-year US Treasury bond yield clings to modest recovery gains near 3.8% on Thursday.
- US Treasury Secretary Janet Yellen told Bloomberg on Monday that there is a good chance that the Biden administration will go ahead with outbound investment controls on China.
- The US Dollar weakened significantly last week as soft inflation data revived expectations about the Federal Reserve reaching the terminal rate with a 25-basis-point (bps) rate hike in July.
- The Consumer Price Index (CPI) in the US rose 3% on a yearly basis in June, following the 4% increase recorded in May. The annual Producer Price Index (PPI) edged 0.1% higher in the same period.
- Commenting on the USD's outlook: "In case of an increasingly rapid fall in inflation and weakening economic data, the market might increasingly rely on key rates not remaining at high levels for a long time, whereas rate cuts before the end of the year are becoming increasingly likely," said Antje Praefcke, FX Analyst at Commerzbank. "That would cause the USD to ease further."
Technical analysis: US Dollar Index is yet to gather bullish momentum
The Relative Strength Index (RSI) indicator on the daily chart rose above 30 on Wednesday but turned sideways on Thursday, suggesting that the US Dollar Index (DXY) remains technically bearish following a short-lasting correction.
On the downside, critical support is located at 100.00 (psychological level). If the DXY index makes a daily close below that level, sellers could take action. In that case, 99.20 (static level from March 2022) aligns as next support before 99.00 (psychological level) and 98.30 (200-week Simple Moving Average).
Looking north, 100.50 (Wednesday high) forms interim resistance before 101.00 (former support, static level), 101.50 (static level) and 101.80 (20-day Simple Moving Average).
US Dollar FAQs
What is the US Dollar?
The US Dollar (USD) is the official currency of the United States of America, and the ‘de facto’ currency of a significant number of other countries where it is found in circulation alongside local notes. It is the most heavily traded currency in the world, accounting for over 88% of all global foreign exchange turnover, or an average of $6.6 trillion in transactions per day, according to data from 2022.
Following the second world war, the USD took over from the British Pound as the world’s reserve currency. For most of its history, the US Dollar was backed by Gold, until the Bretton Woods Agreement in 1971 when the Gold Standard went away.
How do the decisions of the Federal Reserve impact the US Dollar?
The most important single factor impacting on the value of the US Dollar is monetary policy, which is shaped by the Federal Reserve (Fed). The Fed has two mandates: to achieve price stability (control inflation) and foster full employment. Its primary tool to achieve these two goals is by adjusting interest rates.
When prices are rising too quickly and inflation is above the Fed’s 2% target, the Fed will raise rates, which helps the USD value. When inflation falls below 2% or the Unemployment Rate is too high, the Fed may lower interest rates, which weighs on the Greenback.
What is Quantitative Easing and how does it influence the US Dollar?
In extreme situations, the Federal Reserve can also print more Dollars and enact quantitative easing (QE). QE is the process by which the Fed substantially increases the flow of credit in a stuck financial system.
It is a non-standard policy measure used when credit has dried up because banks will not lend to each other (out of the fear of counterparty default). It is a last resort when simply lowering interest rates is unlikely to achieve the necessary result. It was the Fed’s weapon of choice to combat the credit crunch that occurred during the Great Financial Crisis in 2008. It involves the Fed printing more Dollars and using them to buy US government bonds predominantly from financial institutions. QE usually leads to a weaker US Dollar.
What is Quantitative Tightening and how does it influence the US Dollar?
Quantitative tightening (QT) is the reverse process whereby the Federal Reserve stops buying bonds from financial institutions and does not reinvest the principal from the bonds it holds maturing in new purchases. It is usually positive for the US Dollar.
Economist at UOB Group Lee Sue Ann assesses the latest inflation figures in New Zealand during the April-June period.
Key Takeaways
New Zealand’s CPI climbed 1.1% q/q in 2Q23, a tad lower from the 1.2% q/q in 1Q23, but above expectations for a gain of 0.9% q/q. Compared to the same period a year ago, CPI advanced 6.0% y/y, much lower than the 6.7% y/y reading in 1Q23, a tad above expectations for a gain of 5.9% y/y.
Non-tradeable inflation, a closely-watched indicator of domestic price pressures, eased to 6.6% from 6.8% but was still higher than the Reserve Bank of New Zealand’s (RBNZ) projection of 6.3%.
For now, we are keeping our OCR forecast at 5.50% for the rest of this year. We bear in mind, though, that the RBNZ has paused in previous tightening cycles before hiking again.
EUR/CHF has come steadily lower. Economists at ING analyze the pair’s outlook.
Let’s not get carried away
While our preference has been for a lower EUR/CHF for a while, we would not necessarily chase this move because of developments in USD/CHF. The Dollar has around a 20% weight in the CHF trade-weighted basket and the big drop in USD/CHF will be doing the heavy lifting for the CHF TWI appreciation.
We could see EUR/CHF trading here for a while and only return to 1.00 when global inflation converges back to Swiss levels.
The latest UK CPI print saw its biggest downside surprise in almost two years. Economists at Commerzbank analyze GBP following inflation data.
UK inflation surprise is putting pressure on Sterling
British consumer prices rose much less quickly in June than expected. The resulting strong market reaction confirms our expectation that the rate expectations priced in by the market do not justify sustainable GBP strength.
Instead, we assume that the Bank of England will only tighten its monetary policy as far as necessary to control inflation expectations. The downside correction of the rate expectations following Wednesday’s inflation data is therefore not far reaching enough for us, and we see further correction potential towards a weaker GBP.
- NZD/USD is approaching the 0.6300 resistance as the PBoC has maintained the status quo.
- Investors are expecting that an interest rate hike in July monetary policy meeting by the Fed would be the last nail in the coffin.
- BofA has cut China’s growth forecast to 5.1% after disappointing GDP numbers for the second quarter.
The NZD/USD pair is looking to recapture the round-level resistance of 0.6300 in the European session. The Kiwi asset has attracted bids after a corrective move and has resumed its upside journey. Strength in the Kiwi asset is backed by marginal weakness in the US Dollar Index (DXY). The USD Index is demonstrating signs of volatility contraction as investors are shifting their focus towards the interest rate decision by the Federal Reserve (Fed), which will be announced next week.
S&P500 futures have posted decent losses in London, portraying a cautious market mood. Investors are turning anxious amid uncertainty about further action in the FX domain due to a light economic calendar of the United States. In addition to that, the second-quarter result season has started and a stock-specific action is expected in equity markets.
The USD Index is struggling to stabilize above the psychological support of 100.00 as investors are expecting that interest rates by the Fed will peak around 5.25-5.50%. This conveys that an interest rate hike in July monetary policy meeting by the Fed would be the last nail in the coffin. Convictions in investors about interest rate peak after July’s policy have faded fears of a recession in the United States.
On the New Zealand Dollar front, the People’s Bank of China (PBoC) announced an unchanged interest rate policy. The PBoC has kept its dovish interest rate stance steady as the Chinese economy is going through tough times due to bleak demand by households. Bank of America (BofA) has cut China’s growth forecast to 5.1% after disappointing Gross Domestic Product (GDP) numbers for the second quarter. A downward revision of the economic growth forecast has turned the global market cautious.
It is worth noting that New Zealand is one of the leading trading partners of China and PBoC’s supportive monetary policy provides cushion to the New Zealand Dollar.
Extra decline in USD/CNH looks unlikely in the near term, argue UOB Group’s Economist Lee Sue Ann and Markets Strategist Quek Ser Leang.
Key Quotes
24-hour view: Yesterday, we highlighted that USD could rise above 7.2180. We added, “the major resistance at 7.2500 is unlikely to come into view.” USD then rose to a high of 7.2368 and pulled back. The pullback in overbought conditions and slowing momentum suggests USD is not rising further. Today, we expect USD to trade in a range, likely between 7.2000 and 7.2350.
Next 1-3 weeks: There is not much to add to our update from yesterday (19 Jul, spot at 7.1950). As highlighted, after dropping sharply over the past week, USD is unlikely to weaken further. For the time being, USD is likely to trade in a range, probably between 7.1500 and 7.2500.
- Gold price moves sideways as investors await for Federal Reserve’s monetary policy decision.
- United States inflation cools beyond expectations but needs a continuation of the policy-tightening spell to return to the 2% target.
- Investors seek more guidance about BRICS’ gold-backed currency, which would be used to settle international payments.
Gold price (XAU/USD) drops back inside the woods after printing a fresh two-month high of $1,987.53 on Thursday. The precious metal struggles to find any direction as investors have shifted their focus towards the interest-rate decision by the Federal Reserve (Fed), which will be announced on July 26. The Fed has signaled that two more interest-rate hikes this year are appropriate, but investors are still in favor of only one more interest rate increase.
United States inflation cooled significantly in June, continuing its softening spell as gasoline prices have dropped broadly and demand for second-hand automobiles remained soft. This week, the US economic calendar is light, so investors will likely keep an eye on guidance about interest rates. In addition to that, investors seek more guidance about the BRICS’ gold-backed currency, which would be used to settle international payments.
Daily Digest Market Movers: Gold price moves sideways ahead of Fed’s policy
- Gold price finds support near $1,978.00 after a corrective move from $1,987.50 as the upside in the US Dollar Index (DXY) seems limited.
- The US Dollar Index rebounded after correcting to near 100.00. The upside in the USD index seems restricted amid an absence of supportive fundamentals.
- Some strength is observed in the US Dollar Index after a sharp declining move as investors are awaiting the interest-rate decision by the Federal Reserve (Fed).
- Consumer spending momentum has slowed but the broader picture shows it is still expanding.
- Fed Chair Jerome Powell and other members of the FOMC have been reiterating that two more interest-rate hikes are appropriate to tighten the grip on inflation.
- Even as inflation decelerated sharply in June, the Fed has not announced victory over inflation yet.
- Inflation softened significantly in June as prices of second-hand automobiles dropped.
- While Fed policymakers are favoring two more interest-rate hikes, investors anticipate only one more increase by year-end.
- No matter if Fed policymakers would raise interest rates once or twice, the central bank would not discuss rate cuts this year.
- Higher interest rates by the Fed have hit the housing sector. Monthly Housing Starts data reported by the United States Census Bureau on Wednesday showed that demand for new property has fallen to an annualized rate of 1.434 million in June, less than the estimates of 1.48 million and the prior release of 1.559 million.
- The market mood is expected to turn cautious as the US corporate earnings season has kicked off. In addition to that, the Chinese economy has attracted steep cuts in economic growth prospects after weaker-than-expected second-quarter Gross Domestic Product (GDP) numbers.
- Meanwhile, investors are focusing on a new gold-backed currency announced by BRICS (Brazil, Russia, India, China, and South Africa). Investors are anticipating a formal announcement at the group’s next summit in August.
- The introduction of a new gold-backed currency is expected to give a tough fight to the US Dollar Index as it could be used for making international payments.
Technical Analysis: Gold price touches 50% Fibonacci retracement above $1,980
Gold price settles comfortably above the 20-daily Exponential Moving Average (EMA), confirming that the short-term trend is bullish. The precious metal has reached 50% Fibonacci retracement or the halfway point of the latest swing (plotted from May 4 high at $2,067.00 to June 29 low at $1,893.70) at $1,983.00.
Momentum oscillators have shifted into bullish territory, showing no signs of divergence or any oversold signals.
Fed FAQs
What does the Federal Reserve do, how does it impact the US Dollar?
Monetary policy in the US is shaped by the Federal Reserve (Fed). The Fed has two mandates: to achieve price stability and foster full employment. Its primary tool to achieve these goals is by adjusting interest rates.
When prices are rising too quickly and inflation is above the Fed’s 2% target, it raises interest rates, increasing borrowing costs throughout the economy. This results in a stronger US Dollar (USD) as it makes the US a more attractive place for international investors to park their money.
When inflation falls below 2% or the Unemployment Rate is too high, the Fed may lower interest rates to encourage borrowing, which weighs on the Greenback.
How often does the Fed hold monetary policy meetings?
The Federal Reserve (Fed) holds eight policy meetings a year, where the Federal Open Market Committee (FOMC) assesses economic conditions and makes monetary policy decisions.
The FOMC is attended by twelve Fed officials – the seven members of the Board of Governors, the president of the Federal Reserve Bank of New York, and four of the remaining eleven regional Reserve Bank presidents, who serve one-year terms on a rotating basis.
What is Quantitative Easing (QE) and how does it impact USD?
In extreme situations, the Federal Reserve may resort to a policy named Quantitative Easing (QE). QE is the process by which the Fed substantially increases the flow of credit in a stuck financial system.
It is a non-standard policy measure used during crises or when inflation is extremely low. It was the Fed’s weapon of choice during the Great Financial Crisis in 2008. It involves the Fed printing more Dollars and using them to buy high grade bonds from financial institutions. QE usually weakens the US Dollar.
What is Quantitative Tightening (QT) and how does it impact the US Dollar?
Quantitative tightening (QT) is the reverse process of QE, whereby the Federal Reserve stops buying bonds from financial institutions and does not reinvest the principal from the bonds it holds maturing, to purchase new bonds. It is usually positive for the value of the US Dollar.
The Australian Dollar is the top performer on Thursday. Economists at MUFG Bank analyze Aussie's outlook.
A rate hike is not a done deal
The data revealed a 32.6K increase in employment in June, more than double the market consensus, which followed a large 76.5K increase in May. The decision of the RBA to hold steady with rates on 4th July was deemed to be a ‘hawkish hold’ with the guidance indicating that further tightening ‘may be required’. This would be dependent on the incoming economic data and based on that guidance it certainly increases the prospect of a 25 bps rate hike on 1st August.
We do still have the Q2 inflation data next week before that meeting so a rate hike is not a done deal and a much softer CPI print could persuade the RBA to remain on hold.
Given the jobs data, and given we already assumed another hike after a July pause, we see it as more likely that the RBA hikes which should help provide support for AUD over the coming weeks.
Economists at ING analyze GBP outlook.
GBP volatility should remain elevated
The question of whether the Bank of England will hike by 25 bps or 50 bps remains open. We are in the 25 bps camp while markets are pricing in 35 bps, close to a 50/50 split.
Volatility in the Pound should remain elevated.
We continue to favour a weaker GBP/USD into the 1.2800/1.2850 area in the coming days but are less convinced of EUR/GBP upside potential into the FOMC and ECB risk events next week.
- Euro keeps the trade above 1.1200 against the US Dollar.
- Stocks in Europe trade with decent gains on Thursday.
- EUR/USD clings to small gains just above the 1.1200 mark.
- Producer Prices in Germany surprised to the upside in June.
- US weekly Initial Jobless Claims, Philly Fed Index take centre stage.
The Euro (EUR) manages to regain some balance and advance modestly against the U.S. Dollar (USD) on Thursday, encouraging EUR/USD to regain the area just above 1.1200 the figure against the backdrop of vacillating risk appetite trends.
The recent recovery in the greenback now appears somewhat dented and leaves the USD Index (DXY) hovering around the low-100.00s amidst the so far mild rebound in US yields.
Moving forward, spot is expected to engage in some sort of consolidative range ahead of key meetings by the Federal Reserve and the European Central Bank (ECB) next week. Having said that, both central banks are widely anticipated to hike rates by a quarter point, although an incipient divergence between them lies in their plans for the near-term future.
On this, the Fed is perceived as nearing the end of its tightening cycle, while ECB officials have sounded less hawkish recently on the prospects of additional hikes beyond summer.
In the euro docket, Producer Prices in Germany contracted 0.3% MoM in June and rose 0.1% over the last twelve months. In addition, the Current Account surplus in the euro area widened to €9.1B in May. Later in the session, the European Commission will publish its flash gauge of Consumer Confidence in the region for the current month.
In the US, usual weekly Initial Jobless Claims are due in the first turn, followed by the Philly Fed Manufacturing Index, the CB Leading Index, and Existing Home Sales.
Daily digest market movers: Euro looks to regain upside traction
- The EUR extends the rebound from the 1.1170 area against the USD.
- Germany’s Producer Prices came in on the strong side in June.
- The USD Index clings to gains beyond the 100.00 barrier.
- Speculation that the Fed’s July hike could be the last one runs high.
- US, German yields attempt a tepid bounce so far.
- The PBoC kept lending rates unchanged.
- Australian jobs report surprised to the upside in June.
Technical Analysis: Euro faces a minor support around 1.1170
EUR/USD seems to have now settled in a consolidative fashion around 1.1200 following recent overbought levels.
The pair printed a new 2023 high at 1.1275 on July 18. Once this level is cleared, there are no resistance levels of significance until the 2022 peak of 1.1495 recorded on February 10.
On the downside, there is a minor support at the weekly low at 1.1174 (July 19) prior to the psychological 1.1000 mark, all seconded by provisional support at the 55-day and 100-day SMAs at 1.0896 and 1.0877, respectively, ahead of the July low of 1.0833 (July 6). The breakdown of this region should meet the next contention area at the key 200-day SMA at 1.0681 prior to the May low of 1.0635 (May 31). South from here emerges the March low of 1.0516 (March 15) before the 2023 low of 1.0481 (January 6).
Furthermore, the constructive view of EUR/USD appears unchanged as long as the pair trades above the key 200-day SMA.
Euro FAQs
What is the Euro?
The Euro is the currency for the 20 European Union countries that belong to the Eurozone. It is the second most heavily traded currency in the world behind the US Dollar. In 2022, it accounted for 31% of all foreign exchange transactions, with an average daily turnover of over $2.2 trillion a day.
EUR/USD is the most heavily traded currency pair in the world, accounting for an estimated 30% off all transactions, followed by EUR/JPY (4%), EUR/GBP (3%) and EUR/AUD (2%).
What is the ECB and how does it impact the Euro?
The European Central Bank (ECB) in Frankfurt, Germany, is the reserve bank for the Eurozone. The ECB sets interest rates and manages monetary policy.
The ECB’s primary mandate is to maintain price stability, which means either controlling inflation or stimulating growth. Its primary tool is the raising or lowering of interest rates. Relatively high interest rates – or the expectation of higher rates – will usually benefit the Euro and vice versa.
The ECB Governing Council makes monetary policy decisions at meetings held eight times a year. Decisions are made by heads of the Eurozone national banks and six permanent members, including the President of the ECB, Christine Lagarde.
How does inflation data impact the value of the Euro?
Eurozone inflation data, measured by the Harmonized Index of Consumer Prices (HICP), is an important econometric for the Euro. If inflation rises more than expected, especially if above the ECB’s 2% target, it obliges the ECB to raise interest rates to bring it back under control.
Relatively high interest rates compared to its counterparts will usually benefit the Euro, as it makes the region more attractive as a place for global investors to park their money.
How does economic data influence the value of the Euro?
Data releases gauge the health of the economy and can impact on the Euro. Indicators such as GDP, Manufacturing and Services PMIs, employment, and consumer sentiment surveys can all influence the direction of the single currency.
A strong economy is good for the Euro. Not only does it attract more foreign investment but it may encourage the ECB to put up interest rates, which will directly strengthen the Euro. Otherwise, if economic data is weak, the Euro is likely to fall.
Economic data for the four largest economies in the euro area (Germany, France, Italy and Spain) are especially significant, as they account for 75% of the Eurozone’s economy.
How does the Trade Balance impact the Euro?
Another significant data release for the Euro is the Trade Balance. This indicator measures the difference between what a country earns from its exports and what it spends on imports over a given period.
If a country produces highly sought after exports then its currency will gain in value purely from the extra demand created from foreign buyers seeking to purchase these goods. Therefore, a positive net Trade Balance strengthens a currency and vice versa for a negative balance.
Economists at Société Générale analyze USD/TRY technical outlook.
Signals of a meaningful decline are not yet visible
USD/TRY uptrend has accelerated since March as highlighted by the steep slope of 20-DMA. It has recently broken out from a brief consolidation denoting extension in uptrend. The move is overstretched however signals of a meaningful decline are not yet visible.
Next projections are located at 27.50 and 28.55/28.70.
Defence of the MA near 26.20/25.80 would be crucial for persistence in up-move.
See – Türkiye: A 350 bps rate hike will immediately trigger pressure on the Lira – Commerzbank
FX option expiries for July 20 NY cut at 10:00 Eastern Time, via DTCC, can be found below.
- EUR/USD: EUR amounts
- 1.1120 1.5b
- 1.1200 1.3b
- 1.1270 479m
- 1.1300 592m
- 1.1350 324m
- GBP/USD: GBP amounts
- 1.2945 366m
- 1.3030 406m
- 1.3095 592m
- USD/JPY: USD amounts
- 138.25 570m
- 138.75 396m
- 140.00 2.1b
- 140.10 1.6b
- USD/CHF: USD amounts
- 0.8835 702m
AUD/USD: AUD amounts
- 0.6675 1.3b
- 0.6800 813m
- 0.6815 1.2b
- USD/CAD: USD amounts
- 1.3105 384m
- 1.3420 565m
- 1.3450 377m
- NZD/USD: NZD amounts
- 0.6225 429m
- 0.6310 1.2b
- EUR/GBP: EUR amounts
- 0.8575 301m
- 0.8600 665m
- 0.8645 510m
- 0.8675 903m
- 0.8750 365m
USD/JPY is predicted to keep the 138.00-141.00 trading range in place for the time being, comment UOB Group’s Economist Lee Sue Ann and Markets Strategist Quek Ser Leang.
Key Quotes
24-hour view: We expected USD to edge higher yesterday, but we were of the view that it “is unlikely to break clearly above 139.50.” However, USD broke above 139.50 and rose to a high of 139.99 in NY trade before trading sideways for the rest of the session. There is no clear increase in momentum and USD is unlikely to advance much further. Today, USD is more likely to trade sideways in a range between 138.80 and 140.05.
Next 1-3 weeks: We turned negative USD early last week. After USD fell to 137.23 and rebounded, we indicated on Monday (17 Jul, spot at 138.55) that “while downward momentum has slowed somewhat, only a break of 139.50 would indicate that the USD weakness has stabilized.” Yesterday (19 Jul, spot at 138.90), we indicated that “downward momentum has waned further, and the chance of USD dropping further is slim.” USD then broke above 139.50, and USD weakness has stabilized. From here, we expect USD to trade in a range for now, likely between 138.00 and 141.00.
- AUD/USD gains strong positive traction on Thursday and snaps a four-day losing streak.
- The upbeat Australian jobs data provides a goodish lift amid a modest USD downtick.
- China’s economic woes, US-China tensions and geopolitical risks could cap the upside.
The AUD/USD pair catches aggressive bids on Thursday and sticks to its strong intraday gains through the early part of the European session. Spot prices currently trade around the 0.6825-0.6830 region, just a few pips below the daily peak, and for now, seem to have snapped a four-day losing streak to a one-week low touched on Wednesday.
The Australian Dollar (AUD) gets a lift following the release of the upbeat domestic employment figures, which pointed to a tight labour market and should put pressure on the the Reserve Bank of Australia (RBA) to hike interest rates again in August. Apart from this, the emergence of some US Dollae (USD) selling provides an additional boost to the AUD/USD pair and remains supportive of the intraday positive move.
The prospects for a less aggressive Federal Reserve (Fed) fail to assist the USD Index (DXY), which tracks the Greenback against a basket of currencies, to capitalize on its recent recovery from the lowest level since April 2022 touched on Tuesday. Investors seem convinced that the US central bank is nearing the end of its policy tightening and will hold rates steady for the rest of the year after the expected 25 bps lift-off in July.
Apart from this, the recent bullish run in the global equity markets turns out to be another factor undermining the safe-haven buck and benefitting the risk-sensitive Aussie. That said, concerns over slowing growth in China, the worsening US-China ties and geopolitical risks keep a lid on the optimism. Furthermore, skepticism that the Fed will commit to a more dovish policy stance helps limit losses for the Greenback.
This, in turn, is holding back traders from placing aggressive bullish bets around the AUD/USD pair, at least for the time being. Moreover, the recent repeated failures near the 0.6900 mark consitutes the formation of a bearish double-top on the daily chart and further warrants caution before positioning for any further appreciating move. Nevertheless, spot prices, for now, seem to have stalled the recent pullback from a one-month peak.
Market participants now look to the US economic docket - featuring the release of the usual Weekly Initial Jobless Claims, the Philly Fed Manufacturing Index and Existing Home Sales data. This, along with the broader risk sentiment, might influence the USD price dynamics and provide some imeptus to the AUD/USD pair.
Technical levels to watch
USD/ZAR continues to trade below 18. Economists at Commerzbank analyze Rand's outlook ahead of the South African central bank (SARB) rate decision
South African central bank’s rate decision likely to be narrow
We expect a narrow rate decision today.
The Rand is likely to ease if the SARB keeps its rate unchanged at 8.25%. The losses are likely to be limited though. Conversely, it is likely to appreciate if the SARB hikes its key rate to 8.5%, but in our view upside scope for the Rand is limited.
- Pound Sterling attracts offers above 1.2950 and has resumed its downside journey.
- A decline in United Kingdom’s inflation has offered some relief to Bank of England policymakers.
- UK finance minister is confident of winning the battle against elevated inflation.
The Pound Sterling (GBP) has resumed its downside journey after meeting critical resistance above 1.2950. The GBP/USD pair has shifted into a bearish trajectory as investors hope that the Bank of England (BoE) won’t hike interest rates by a wide margin now since inflation has responded well to easing food prices offered by producers at factory gates.
However, the policy-tightening spell will continue as the United Kingdom’s current inflation is significantly higher than the desired rate. The UK central bank will announce the interest rate decision in August, and an interest rate hike of 25 basis points (bps) would push policy rates to 5.25%.
Daily Digest Market Movers: Pound Sterling meets tough resistance as hawkish BoE bets trim
- Pound Sterling faces stiff resistance above 1.2950 as a journey towards 2% inflation is far from over.
- United Kingdom’s inflation softened in June beyond expectations but further quantitative tightening by the Bank of England cannot be ruled out.
- The monthly headline Consumer Price Index expanded at a nominal pace of 0.1% against the consensus of 0.4% and the former release of 0.9%.
- Annual headline inflation has decelerated significantly to 7.9% vs. the estimates of 8.2% and the prior release of 8.7%. Core CPI that excludes volatile food and oil prices has softened marginally to 6.9% from its fresh highs of 7.1%.
- Headline inflation at 7.9% is the lowest inflation figure in the past 15 months and the first downward surprise in the past five months.
- UK households get a sigh of relief as prices of goods at factory gates have softened dramatically. Producers are passing on the benefit of a decline in raw materials to end-consumers.
- The BoE has used policy tightening aggressively to ease inflationary pressures but has harmed the economic outlook.
- Easing inflationary pressures might motivate the BoE to raise interest rates by 25 bps only.
- Commenting on the inflation data, UK Finance Minister Jeremy Hunt is confident that he can win the battle against inflation. Hunt said, “We are seeing the first fruits of the difficult decision but a long way to go.”
- BoE Deputy Governor Dave Ramsden said on Monday the central bank should speed up the pace at which it is unwinding its 800-billion-Pound ($1 trillion) stockpile of government bonds bought as part of its quantitative easing operations, as reported by Reuters.
- About inflation, BoE Ramsden conveyed that the latest UK inflation data shows indicators of inflation persistence still a bit higher than BoE expected in May.
- The overall market mood is cautious as United States equities remained uncertain on Wednesday.
- The US Dollar Index (DXY) has rebounded after a corrective move as investors await the interest rate decision by the Federal Reserve (Fed) for its July meeting, which is scheduled for next week.
- A small interest rate hike of 25 bps is expected from the Fed, which will push interest rates to 5.25-5.50%.
- On Wednesday, US Census Bureau reported that construction of new single-family homes missed expectations. The economic data dropped to 1.44M vs. the expectations of 1.49M and the former release of 1.559M.
- In Thursday’s session, investors will focus on weekly Initial Jobless Claims data for the week ending July 14.
Technical Analysis: Pound Sterling continues four-day losing streak
Pound Sterling has continued its four-day losing streak. The Cable has witnessed immense selling pressure after failing to sustain the breakout of the Rising Channel chart pattern formed on a daily scale. The asset rebounded after sensing buying interest near the 20-day Exponential Moving Average (EMA) at around 1.2860 but has now resumed its downside journey. Upside momentum has faded but remains mostly still intact.
Pound Sterling FAQs
What is the Pound Sterling?
The Pound Sterling (GBP) is the oldest currency in the world (886 AD) and the official currency of the United Kingdom. It is the fourth most traded unit for foreign exchange (FX) in the world, accounting for 12% of all transactions, averaging $630 billion a day, according to 2022 data.
Its key trading pairs are GBP/USD, aka ‘Cable’, which accounts for 11% of FX, GBP/JPY, or the ‘Dragon’ as it is known by traders (3%), and EUR/GBP (2%). The Pound Sterling is issued by the Bank of England (BoE).
How do the decisions of the Bank of England impact on the Pound Sterling?
The single most important factor influencing the value of the Pound Sterling is monetary policy decided by the Bank of England. The BoE bases its decisions on whether it has achieved its primary goal of “price stability” – a steady inflation rate of around 2%. Its primary tool for achieving this is the adjustment of interest rates.
When inflation is too high, the BoE will try to rein it in by raising interest rates, making it more expensive for people and businesses to access credit. This is generally positive for GBP, as higher interest rates make the UK a more attractive place for global investors to park their money.
When inflation falls too low it is a sign economic growth is slowing. In this scenario, the BoE will consider lowering interest rates to cheapen credit so businesses will borrow more to invest in growth-generating projects.
How does economic data influence the value of the Pound?
Data releases gauge the health of the economy and can impact the value of the Pound Sterling. Indicators such as GDP, Manufacturing and Services PMIs, and employment can all influence the direction of the GBP.
A strong economy is good for Sterling. Not only does it attract more foreign investment but it may encourage the BoE to put up interest rates, which will directly strengthen GBP. Otherwise, if economic data is weak, the Pound Sterling is likely to fall.
How does the Trade Balance impact the Pound?
Another significant data release for the Pound Sterling is the Trade Balance. This indicator measures the difference between what a country earns from its exports and what it spends on imports over a given period.
If a country produces highly sought-after exports, its currency will benefit purely from the extra demand created from foreign buyers seeking to purchase these goods. Therefore, a positive net Trade Balance strengthens a currency and vice versa for a negative balance.
Here is what you need to know on Thursday, July 20:
There is a negative shift in risk mood on Thursday with US stock index futures trading in negative territory. Escalating China-US tensions and the poor performance of technology stocks following uninspiring earnings weigh on market sentiment. In the second half of the day, weekly Initial Jobless Claims, June Existing Home Sales and the Federal Reserve Bank of Philadelphia's Manufacturing Survey for July will be featured in the US economic docket. The European Commission will release the July Consumer Confidence Index.
China's ambassador to Washington, Xie Feng, noted late Wednesday China will respond if the US were to impose more curbs on the country's chip sector. "The Chinese government cannot simply sit idly by. There's a Chinese saying that we will not make provocations, but we will not flinch from provocations," Feng said, as reported by Reuters. The Shanghai Composite Index fell nearly 1% on Thursday and the Nasdaq Futures were last seen losing nearly 1% on the day.
Ahead of the US data releases, the US Dollar Index consolidates Wednesday gains above 100.00 and the benchmark 10-year US Treasury bond yield stays in positive territory at around 3.8%.
In the Asian session on Thursday, the People's Bank of China announced that it left the one-year and five-year Loan Prime Rates unchanged at 3.55% and 4.20%, respectively. Meanwhile, the data from Australia revealed that the Unemployment Rate held steady at 3.5% while Employment Change arrived at +32,600, higher than the market expectation of 15,000. In response, AUD/USD gathered bullish momentum and climbed above 0.6800.
EUR/USD closed in negative territory on Wednesday but managed to rise above 1.1200 early Thursday.
Following Wednesday's sharp decline that was triggered by soft inflation data from the UK, GBP/USD finds it difficult to stage a rebound and stays in the red slightly above 1.2900 early Thursday.
USD/JPY extended its weekly uptrend but lost its momentum after testing 140.00 on Wednesday. The pair stays relatively quiet at around 139.50 in the European session.
Gold price touched its highest level in three months at $1,987 early Thursday. With the 10-year US yield turning north, XAU/USD retreated to the $1,980 area.
Bitcoin failed to make a decisive move in either direction on Monday but advanced beyond $30,000 early Thursday. Ethereum gained traction and climbed above $1,900 after having closed the sixth straight day in negative territory on Wednesday.
- The index alternates gains with losses around 100.30.
- US yields attempt a modest recovery so far on Thursday.
- Weekly Claims, Philly Fed Index take centre stage later in the docket.
The greenback bounces off earlier lows near the 100.00 region when gauged by the USD Index (DXY) on Thursday.
USD Index now looks at data
The index so far manages well to keep the trade above the psychological 100.00 mark in a context of alternating risk appetite trends.
The still inconclusive price action around the index comes on the back of a humble rebound in US yields across the curve, as market participants enter a wait-and-see mode ahead of the key FOMC event on July 26.
In the meantime, investors largely expect the Federal Reserve to hike rates by 25 bps next week, although a similar move beyond the summer seems to have lost traction as of late, particularly in the wake of lower-than-estimated US inflation figures in June.
In the US data space, usual Initial Jobless Claims are due seconded by the Philly Fed Manufacturing Index, Existing Home Sales and the CB Leading Index.
What to look for around USD
The index now finds some obstacles to its current recovery beyond the 100.00 mark on Thursday.
In the near term, there are no changes to the perception that the Fed would resume its tightening process later in the month despite persistent disinflationary pressures and the still tight labour market.
This view was further bolstered by comments from Fed Chief Powell at the June FOMC event, who referred to the July meeting as "live" and indicated that most of the Committee is prepared to resume the tightening campaign as early as next month.
Key events in the US this week: Initial Jobless Claims, Philly Fed Manufacturing Index, CB Leading Index, Existing Home Sales (Thursday).
Eminent issues on the back boiler: Persistent debate over a soft/hard landing of the US economy. Terminal Interest rate near the peak vs. speculation of rate cuts in late 2023/early 2024. Geopolitical effervescence vs. Russia and China. US-China trade conflict.
USD Index relevant levels
Now, the index is losing 0.05% at 100.23 and faces immediate support at 99.57 (2023 low July 13) followed by 97.68 (weekly low March 30) and 95.17 (monthly low February 10 2022). On the other hand, the breakout of 100.53 (weekly high July 19) could open the door to 102.60 (55-dat SMA) and then 103.54 (weekly high June 30).
Economists at ING analyze the USD outlook.
Dollar can consolidate or even tick higher again today
The Philadelphia Fed index and existing home sales data will be watched along with jobless claims today.
We are inclined to think the US Dollar can consolidate or even tick higher again today as markets start to eye next week’s FOMC as a potential hawkish risk.
DXY may test 101.00 by the end of the week.
See: USD to weaken further this year and into 2024 – HSBC
Sterling is licking its wounds after suffering a 1% blow against the Dollar and 0.8% against the Euro on Wednesday. Economists at Société Généraleanalyze GBP outlook.
The question of whether to buy the dip is not straightforward
The pullback was exacerbated by overbought conditions, and the decline in inflation provided the catalyst for investors to take profits.
Disappointing UK Retail Sales on Friday could inflict more damage on GBP/USD, pushing it towards trend support at 1.2650.
The 200-DMA for EUR/GBP runs at 0.8730. The question of whether to buy the dip is not straightforward.
- USD/CAD drifts lower for the fourth straight day and drops to a fresh weekly low on Thursday.
- A modest intraday USD downtick turns out to be a key factor exerting pressure on the major.
- Subdued Crude Oil prices do little to influence the Loonie or provide any impetus to the pair.
The USD/CAD pair continues losing ground for the fourth successive day on Thursday and drops to a fresh weekly low during the early part of the European session. Spot prices currently trade just below mid-1.3100s, down less than 0.20% for the day, and remain well within the striking distance of the YTD trough touched last week.
The US Dollar (USD) fails to capitalize on its recovery from the lowest level since April 2022 touched on Tuesday and comes under some renewed selling pressure, which, in turn, is seen as a key factor dragging the USD/CAD pair lower. Market participants continue to price out the possibility of any further interest rate hikes by the Federal Reserve (Fed) after the widely anticipated 25 bps lift-off in July. This, along with the underlying bullish sentiment around the global equity markets, acts as a headwind for the safe-haven Greenback.
That said, concerns over slowing growth in China, the worsening US-China ties and geopolitical risks keep a lid on any further optimism. Furthermore, investors remain sceptic if the US central bank will commit to a more dovish policy stance or stick to its forecast for a 50 bps lift-off by the end of this year. This leads to a modest recovery in the US Treasury bond yields, which assists the USD to trim a part of its intraday losses and should limit losses for the USD/CAD pair, warranting caution before positioning for any further losses.
Meanwhile, Crude Oil prices struggle to gain any meaningful traction and remain below a technically significant 200-day Simple Moving Average (SMA) amid worries that a global economic downturn will dent fuel demand. Apart from this, the lower-than-expected drop in US crude inventories caps the upside for the black liquid. This could undermine the commodity-linked Loonie and lend some support to the USD/CAD pair, making it prudent to wait for acceptance below the 1.3100 mark before placing fresh bearish bets.
Market participants now look to the US economic docket, featuring the release of the usual Weekly Initial Jobless Claims, the Philly Fed Manufacturing Index and Existing Home Sales data. This, along with the US bond yields and the broader risk sentiment, will drive the USD demand and provide some impetus to the USD/CAD pair. Traders will further take cues from Oil price dynamics to grab short-term opportunities in the absence of any relevant macro data from Canada.
Technical levels to watch
NZD/USD is now seen trading within the 0.6210-0.6370 range in the next few weeks, suggest UOB Group’s Economist Lee Sue Ann and Markets Strategist Quek Ser Leang.
Key Quotes
24-hour view: Yesterday, we held the view that NZD “could retest the 0.6260 level before the risk of a more sustained rebound increases.” Instead of “testing 0.6260”, NZD plunged to a 0.6225 before rebounding. The rebound in severely oversold conditions suggests that NZD is unlikely to weaken further. Today, NZD is more likely to consolidate and trade between 0.6235 and 0.6305.
Next 1-3 weeks: Our update from yesterday (19 Jul, spot at 0.6295) still stands. As highlighted, NZD appears to have moved into a consolidation phase and it is likely to trade in a range of 0.6210/0.6370 for the time being.
EUR/USD has slipped back to the 1.1200 level. Economists at ING analyze the pair’s outlook.
A bit more room for a correction
EUR/USD remains around 2.5% overvalued according to our short-term financial fair value model. A key input to the model, the two-year EUR-USD swap rate gap, has rewidened (in favour of the Dollar) to pre-US CPI levels, now hovering around -115/-120 bps.
We think EUR/USD is more likely to ease back from these levels than jump back higher.
A test of 1.1100 in the coming days would be in line with a re-connection with its short-term fair value.
CME Group flash data for natural gas futures markets noted traders reduced their open interest positions by around 3.2K contracts on Wednesday, leaving behind the previous daily build. In the same line, volume resumed the downtrend and dropped by around 50.7K contracts.
Natural Gas appears supported around $2.50
Prices of natural gas retreated modestly on Wednesday. This daily pullback was amidst shrinking open interest and volume and leaves the door open to the continuation of the rebound in the very near term. In the meantime, prices of the commodity appear so far supported by the July low around the $2.50 zone per MMBtu.
GBP/CAD price action is weakening, economists at Scotiabank report.
A deeper retracement towards the 1.67/1.68 zone now looks quite likely
The Pound tested 1.7330/35 three times since late last week but met solid resistance on each occasion. Hefty losses on the week so far point to a major, bearish reversal developing. Currently, weekly price action is shaping up to form a bearish ‘Engulfing Line’ signal. A low close on the week (at or near current levels) will confirm.
Sterling has already given back more than half of the late June/early July gains and a deeper retracement towards the 1.67/1.68 zone now looks quite likely (daily trend support at 1.6789 currently). Note the daily DMI signal is poised to turn negative for the GBP.
- Silver struggles to preserve its intraday gains to over a two-month high touched this Thursday.
- The technical setup remains tilted in favour of bulls and supports prospects for further upside.
- A convincing break below the $23.00 mark is needed to negate the near-term positive outlook.
Silver retreats from its highest level since May 11, around the $25.25 region touched this Thursday and drops to a fresh daily low during the early European session. The white metal, however, manages to hold above the $25.00 psychological mark and seems poised to prolong its recent upward trajectory witnessed over the past month or so.
Last week's sustained breakout through the $24.50-$24.60 static barrier, which coincided with the 61.8% Fibonacci retracement level of the May-June downfall validates the positive outlook for the XAG/USD. Moreover, oscillators on the daily chart are holding in the positive territory and are still far from being in the overbought zone. This, in turn, suggests that the path of least resistance for Silver is to the upside and supports prospects for a further near-term appreciating move.
From current levels, any subsequent slide below the $25.00 mark is more likely to attract fresh buyers near the $24.75 region, which is followed by the weekly low, around the $24.60 area. The latter coincides with a key resistance breakpoint, now turned support, and should act as a strong base for the XAG/USD. That said, some follow-through selling could drag Silver further towards the $24.00 round figure en route to the $23.65-$23.60 support zone and the $23.20-$23.15 region.
A convincing break below the $23.00 round figure is needed to negate the positive outlook and shift the bias in favour of bearish traders.
On the flip side, the daily swing high, around the $25.25 area, might now act as an immediate hurdle ahead of the $25.50-$25.55 region, above which the XAG/USD might aim to reclaim the $26.00 round figure. Bulls might then aim to challenge the YTD peak, around the $26.10-$26.15 area touched in May. Some follow-through buying will set the stage for an extension of the recent goodish rebound from the vicinity of the $22.00 mark, or a three-month low touched in June.
Silver daily chart
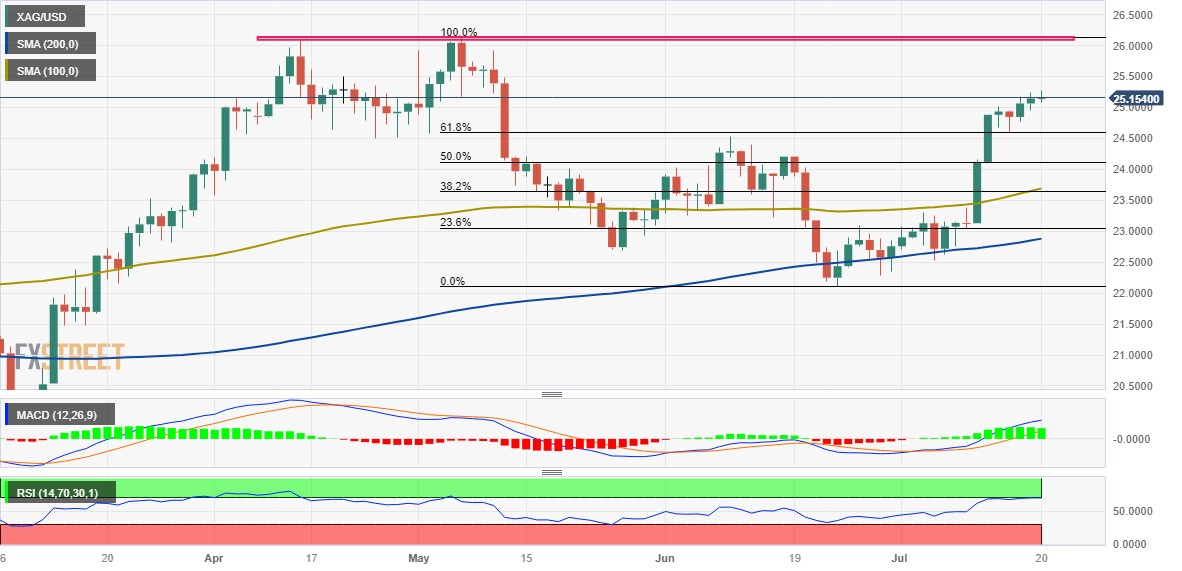
Key levels to watch
EUR/CHF is trading below the 0.97 mark. Economists at Danske Bank discuss the Swiss National Bank (SNB) policy outlook and its implications for the Franc.
Near-term upside potential if the SNB decides to stop intervening
The SNB Governor Jordan's hawkish comments and the current inflation levels suggest that the SNB will not conclude its hiking cycle or allow a significant depreciation of CHF.
The SNB will raise its policy rate by an additional 25 bps at the September meeting, resulting in a policy rate of 2.00%. This move is expected to contribute to the downward trend of the EUR/CHF pair. However, if the SNB decides to completely stop intervening, there is potential for a near-term appreciation of the EUR/CHF pair.
- USD/JPY bounces off intraday low to reverse the first daily loss in three.
- Japan government cuts economic forecasts, PM Kishida advocates sustained exit from deflation.
- Mixed concerns about Fed, unimpressive yields prod Yen pair buyers.
- Japan Trade Balance improves in June, mid-tier US data eyed for fresh impulse.
USD/JPY picks up bids to reverse the early-day losses around 139.50 during the initial hour of Thursday’s European session.
The Yen pair justifies recently downbeat macros, as well as news, surrounding Japan while failing to cheer the US Dollar weakness amid a sluggish trading day so far. That said, the Japanese government recently announced a downward revision of the Asian major’s Financial Year (FY) 2023-24 growth forecasts. In doing so, the policymakers in Tokyo anticipate the FY 2023-24 growth to be at 1.3% versus the previously expected 1.5%.
On the contrary, Japan’s trade figures for June showed an upbeat Merchandise Trade Balance Total amid downbeat Imports and welcome prints of Exports.
Elsewhere, Japan Prime Minister (PM) Fumio Kishida defends the dovish concerns about the Bank of Japan (BoJ) by showing readiness to create a society where wage hikes become a norm.
It’s worth noting that the US Treasury bond yields trace mixed concerns about the Federal Reserve (Fed) despite a widely expected July rate hike. Also likely to exert downside pressure on the bond coupons is the market’s rush towards the US government bonds amid indecision.
With this in mind, US Dollar Index (DXY) remains mildly offered around 100.25 while challenging a two-day rebound from the lowest level since April 2022. In doing so, the greenback justifies the previous day’s downbeat US housing data and mixed concerns about the Fed, as well as ignores the optimism at the US banks.
Against this backdrop, the S&P500 Futures print mild losses whereas the US Treasury bond yields trade mixed at the weekly low.
Looking ahead, Friday’s Japan inflation numbers will be crucial for the USD/JPY pair traders to watch before the next week’s Federal Open Market Committee (FOMC) monetary policy meeting announcements. Ahead of that, the mid-tier US employment and housing data will join the risk catalysts to entertain the Yen pair traders.
Technical analysis
Convergence of the previous support line from late March joins the 50-Exponential Moving Average (EMA) on the daily chart to highlight 140.00-10 as the short-term key upside hurdle for the USD/JPY to cross to convince buyers.
The development of note, leading up to the Central Bank of the Republic of Türkiye (CBRT) rate decision, was a sharp devaluation of the Lira earlier this week. Economists at Commerzbank analyze TRY's outlook.
A 500 bps rate hike will fall within expectations
A 500 bps rate hike will fall within expectations, but it will be large enough to let the debate progress to factors such as the consequence of rate hikes, whether or not conventional monetary policy will be successful, and until when President Recep Tayyip Erdogan will hold patience with this process.
Whereas a smaller 350 bps hike will immediately trigger usual short-term concerns and pressure on the Lira: CBRT has only limited degrees of freedom, rate hikes are already finished, and so on.
- GBP/USD loses ground around 1.2920, declining for the fifth consecutive day.
- UK’s June CPI, renewed USD demand exert pressure on the pair.
- Investors will watch the US Unemployment Claims and the UK Retail Sales for fresh impetus.
The GBP/USD pair remains under pressure around 1.2920 heading into the European session. The Pound Sterling extends its downside following the softer-than-expected inflation readings for June.
The UK headline Consumer Price Index (CPI) MoM rose 0.1% in June, below the 0.4% expected and the 0.9% increase in May. On an annual basis, headline CPI dipped to 7.9%, falling short of the 8.2% expected and the 8.7% growth seen in May. The core CPI, excluding volatile food and oil prices, decreased to 6.9% versus the market consensus of 7.1%. This softer inflation data could help the Bank of England (BoE) hike rates by 25 basis points (bps) rather than 50 bps in the next policy meeting on August 3.
Across the pond, the US Dollar Index (DXY), a measure of the Greenback against a basket of currencies used by US trade partners, has surged to the 100.20 area after reaching the round mark around 100.00 in the early Asian session.
Talking about the US data, US Housing Starts fell 8% MoM in June, following a 15.7% gain (revised from +21.7%) in May and below the market consensus of a 7.2% gain. Meanwhile, Building permits declined 3.7% in June from 5.6% prior (revised). Market participants anticipate that the Federal Reserve (Fed) is nearing the end of its policy tightening cycle and may commit to a more dovish policy stance.
Moving on, investors will watch the US Unemployment Claims and the UK Retail Sales for fresh impetus. Next week, the focus will shift to the Flash Manufacturing Purchasing Managers Index (PMI) and Flash Services PMI from the US and UK. These figures would significantly impact the pair and help determine the next direction for the GBP/USD pair.
Considering advanced prints from CME Group for crude oil futures markets, open interest dropped for the second session in a row on Wednesday, now by around 59.3K contracts. Volume followed suit and went down by around 52.3K contracts after two daily builds in a row.
WTI: Immediate hurdle comes just above $77.00
Wednesday’s downtick in prices of WTI was in tandem with decreasing open interest and volume, exposing further recovery in the very near term. Against that, the immediate hurdle for the commodity remains at the July high past the $77.00 mark per barrel, an area that appears reinforced by the 200-day SMA.
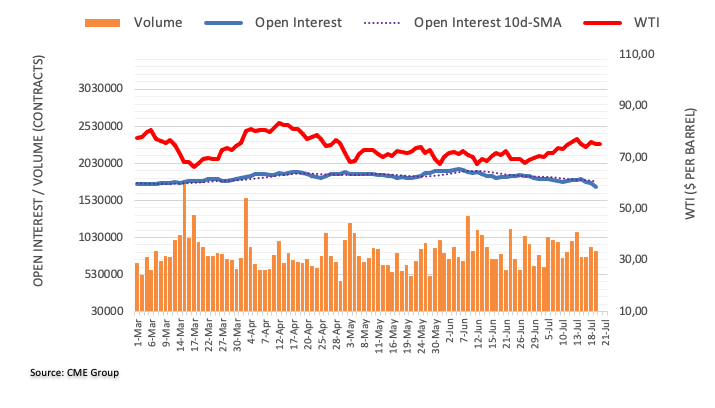
In the view of UOB Group’s Economist Lee Sue Ann and Markets Strategist Quek Ser Leang, GBP/USD faces sustained losses below 1.2850.
Key Quotes
24-hour view: While we expected GBP to weaken yesterday, we held the view that “a sustained break below 1.3000 appears unlikely” and “1.2935 is highly unlikely to come under threat.” We clearly did not expect the sharp selloff that sent GBP plunging to a low of 1.2868. The GBP weakness has not stabilized and it could weaken further today. However, severely oversold conditions could ‘limit’ any further decline to a test of 1.2850. The next support at 1.2800 is unlikely to come into view. On the upside, if GBP breaks above 1.2990 (minor resistance is at 1.2960), it would mean that the weakness in GBP has stabilized.
Next 1-3 weeks: We turned positive in GBP last Monday (10 Jul), when it was trading at 1.2830. After GBP surged to 1.3144 and eased off, we highlighted yesterday (19 Jul, spot at 1.3035) that “upward momentum is fading quickly, and the likelihood of GBP rising further is diminishing.” While our view of the rapidly fading momentum was not wrong, we did not expect GBP to plunge to a low of 1.2868 in NY trade. The breach of our ‘strong support’ at 1.3000 indicates that GBP strength has ended. The sharp pullback yesterday has room to extend, but it is worth noting that 1.2850 is a solid support. To put it another way, GBP has to break clearly below 1.2850 before a deeper pullback is likely. Meanwhile, GBP is likely to stay under pressure unless it can break above 1.3050.
The SEK has been one of the better performing G10 currencies this month. Economists at Rabobank analyze Krona's outlook.
Many technical indicators suggest that the SEK is oversold
EUR/SEK is trading at levels well above long-term averages and many technical indicators suggest that the SEK is oversold.
On the assumption that news regarding the stresses faced by commercial property companies remains contained, we expected EUR/SEK to pull back to the 11.25 region on a three-month view.
See – EUR/SEK: Krona set to lose further ground in the coming days – Commerzbank
- USD/CHF remains on the back foot at the lowest levels since January 2015 marked on Tuesday.
- Swiss trade surplus widens more than expected in June, Exports, Imports
- US Dollar drops on market’s reassessment of Fed bets amid mostly downbeat data.
- Risk catalysts eyed ahead of next week’s all-important FOMC.
USD/CHF bears keep the reins at the lowest levels since January 2015, down for the second consecutive day while reversing the previous day’s corrective bounce. In doing so, the Swiss Franc (CHF) pair justifies the downbeat US dollar and firmer Swiss trade numbers around 0.8560 amid the initial hour of Thursday’s European session.
Swiss Trade Balance rose to 4,823M versus 4,031M expected despite being lower than 5,442M prior. Details suggest that the Exports grew to 24,917M from 23,879M previous readings whereas the Imports also rose to 20,093M compare to 18,438M marked in May.
Apart from the broadly upbeat Swiss foreign trade numbers for June, broad US Dollar weakness also allows the USD/CHF bears to keep the reins. That said, US Dollar Index (DXY) drops 0.25% intraday to retest the 100.00 round figure while snapping a two-day rebound from the lowest level since April 2022. With this, the greenback justifies the previous day’s downbeat US housing data and mixed concerns about the Fed, as well as ignores the optimism at the US banks.
It’s worth noting that the CHF’s haven appeal and the market’s cautious mood amid mixed headlines about China and global central banks keep the USD/CHF bears in the driver’s seat.
Additionally, the hawkish bias of the Swiss National Bank (SNB) contrasts with the market’s doubt about the Federal Reserve’s (Fed) future performances past July to weigh on the USD/CHF prices.
Against this backdrop, the S&P500 Futures print mild losses whereas the US Treasury bond yields trade mixed at the weekly low.
Looking ahead, the risk catalysts may entertain the USD/CHF pair traders ahead of the US Initial Jobless Claims and Existing Home Sales. Above all, the next week’s Federal Open Market Committee (FOMC) monetary policy meeting announcements will be crucial to watch for clear directions.
Technical analysis
Failure to cross even the 5-DMA hurdle of around 0.8590 despite the oversold RSI (14) keeps the USD/CHF sellers hopeful of witnessing further downside toward the year 2015 low of 0.8365.
- EUR/JPY oscillates in a narrow band above the 156.00 area.
- Markets have priced in a 25 basis point (bps) hike for the next ECB meeting,
- Japan's trade balance surprised with its first surplus since July 2021.
The EUR/JPY pair consolidates in a narrow range between 156.60 and 156.20 heading into the European session. The Bank of Japan (BoJ) has maintained its ultra-dovish policy stance, and the European Central Bank (ECB) is expected to raise interest rates by 25 basis points (bps) to 4% in the next meeting.
The final reading of the Eurozone Core Harmonized Index of Consumer Prices (HICP) rose 0.4% MoM for June versus 0.3% prior and above the market consensus. Markets have priced in a 25 basis point (bps) hike for the next ECB meeting, with the odds of a hike in September hovering around 65%.
On the other hand, Japan's trade balance surprised with its first surplus since July 2021, easing pressure on the economy's recovery. That said, the nation’s trade surplus came to ¥43 billion. Market consensus had forecast a ¥46.7 billion deficit. The value of exports rose 1.5%, while Imports fell 12.9%.
The Bank of Japan (BOJ) Governor Kazuo Ueda stated on Tuesday that there was still some way to go before reaching the 2% inflation target, per Reuters.
It’s worth noting that the renewed trade war tensions between the US-China might cap the upside in the Euro and support the safe-haven Japanese Yen (JPY). Market participants will keep an eye on Sino-US relations for fresh impetus.
Looking ahead, market participants will keep an eye on the Bank of Japan's (BoJ) interest rate decision scheduled for next week. BoJ Governor Kazuo Ueda is expected to maintain a dovish policy stance in order to keep inflation steady at approximately 2%. Meanwhile, the French and German Purchasing Managers' Index (PMI) and the Monetary Policy Statement will be due later next week.
Open interest in gold futures markets rose by nearly 2.5K contracts after three consecutive daily pullbacks according to preliminary readings from CME Group. Volume, instead, remained choppy and shrank by around 126.5K contracts.
Gold keeps targeting the $2000 mark
Wednesday’s rebound in prices of gold from the $1970 region was insufficient to lift the metal back to the positive territory. The move, however, was on the back of increasing open interest, which could be supportive of the continuation of the bounce in the very near term. That said, the next hurdle of note remains at the $2000 mark per troy ounce.
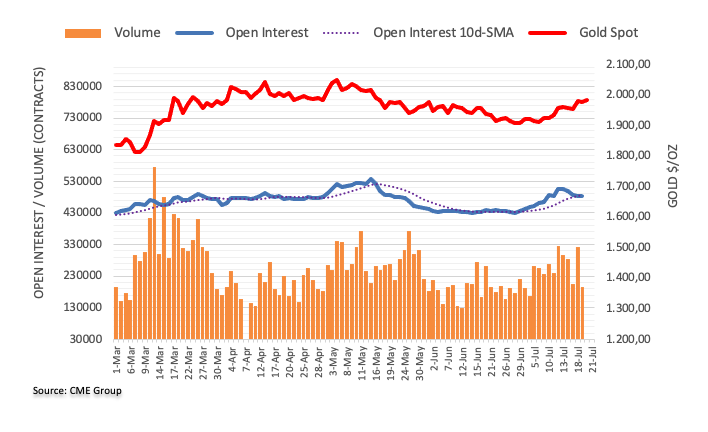
In a mid-year review of its forecasts published on Thursday, the Japanese government cut economic growth forecast for the current fiscal year to 1.3% expansion from 1.5% projected in January.
Additional takeaways
“Expect the economy to grow 1.2% in fiscal 2024.”
“Expect overall consumer inflation to hit 2.6% in the current fiscal year, up from 1.7% seen in January and exceeding BoJ’s 2% target.”
“Expect overall consumer inflation to hit 1.9% in fiscal 2024.”
"While slowing exports will likely drag on growth, consumption is seen recovering mainly for services. Capital expenditure is also expected to increase.”
Market reaction
At the time of writing, USD/JPY is trading at 139.37, down 0.21% on the day.
- EUR/GBP prints five-day winning streak despite retreat from two-month high the previous day.
- Clear break of multi-day-old resistance line, bullish MACD signals favor pair buyers.
- Nearly overbought RSI highlights 200-EMA, six-month-old horizontal area the key hurdles toward the north.
EUR/GBP bulls occupy the driver’s seat around 0.8670, up for the fifth consecutive day heading into Thursday’s London open. In doing so, the cross-currency pair justifies the previous day’s upside break of an eight-week-old descending trend line by reversing the retreat from its highest level since late May, marked on Wednesday.
Apart from the trend line breakout, bullish MACD signals also enable the EUR/GBP buyers to keep the reins.
However, the RSI (14) line appears nearly overbought and hence the 200-Exponential Moving Average (EMA) hurdle surrounding 0.8685 may again prod the pair buyers.
If the EUR/GBP manages to remain firmer past 0.8685, a horizontal area comprising multiple levels marked since January and a five-month-old descending resistance line, respectively near 0.8720 and 0.8765, will be in the spotlight.
Alternatively, the EUR/GBP pullback remains elusive unless the quote provides a daily closing beneath the resistance-turned-support line, close to 0.8620 at the latest.
It’s worth noting that a one-week-long rising support line surrounding 0.8610 and the 0.8600 round figure could challenge the pair sellers past 0.8620 before giving them control.
EUR/GBP: Daily chart
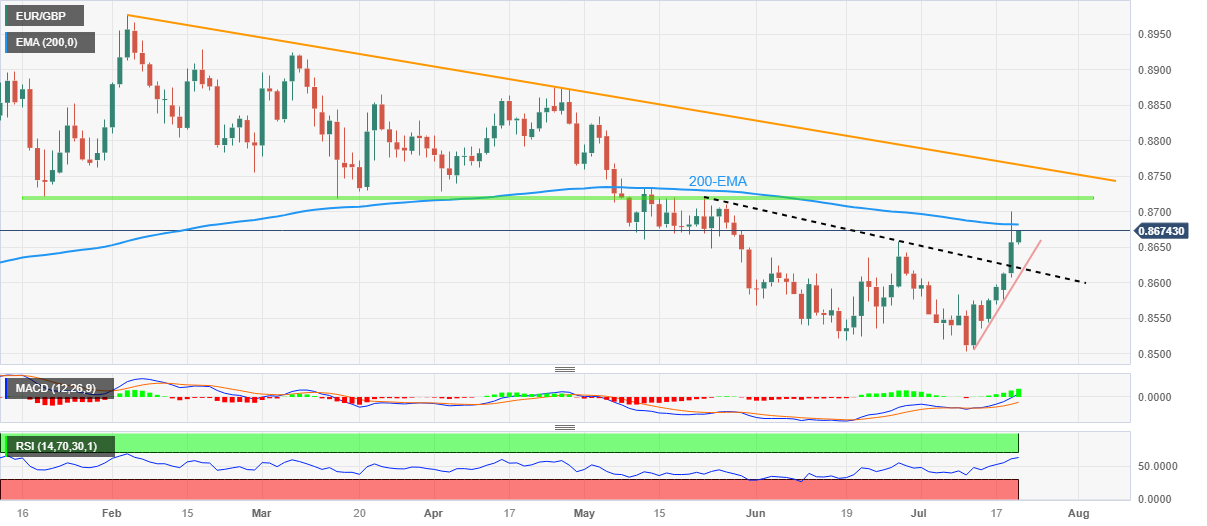
Trend: Limited upside expected
UOB Group’s Economist Lee Sue Ann and Markets Strategist Quek Ser Leang suggest the upside bias in EUR/USD could alleviate once 1.1160 is cleared.
Key Quotes
24-hour view: Our view for EUR to trade sideways in a range of 1.1195/1.1265 was incorrect. EUR fell to a low of 1.1173 and then recovered to end the day at 1.1198 (-0.25%). Despite the recovery, the underlying tone still appears to be soft. There is a chance for EUR to retest the 1.1175 level before the risk of a more sustained rebound increases. Resistance is at 1.1225, followed by 1.1245.
Next 1-3 weeks: We have held a positive EUR view since early last week. After EUR rose to 1.1275, we highlighted yesterday (19 Jul, spot at 1.1235) that “there is a chance of EUR rising to 1.1300 before the risk of a pullback increases.” We did not expect EUR to pull back to a low of 1.1173 in NY trade. Upward momentum has eased considerably with the pullback. However, only a clear breach of 1.1160 (no change in ‘strong support’ level) would suggest that EUR is not strengthening further.
- EUR/USD prints the first daily gains in three, grinds near intraday high of late.
- US Dollar retreats amid mixed markets, braces for next week’s FOMC.
- Talks about easing Eurozone inflation, downbeat employment prod Euro bulls.
- Preliminary readings of EU Consumer Confidence for July, mid-tier US employment, housing clues eyed for intraday directions.
EUR/USD clings to mild gains around 1.1220 as it prints the first daily profits in three heading into Thursday’s European session. In doing so, the Euro pair cheers the broad US Dollar weakness while paying little heed to the mixed concerns about Eurozone.
That said, Reuters’ analysis highlights the multi-year high inflation and Ukrainian war to mark the grim employment conditions in the bloc and prod the optimism surrounding the Eurozone. On the same line, European Central Bank (ECB) Governing Council member Yannis Stournaras told CGTN Europe on Wednesday that he wasn't sure whether the ECB would hike rates again after 25 bps increase next week. The policymaker also argued that the inflation is falling adding that further increases of interest rates might damage the economy.
It’s worth mentioning that the economic transition in the US attracts more doubts than those from the Eurozone, which in turn keeps the EUR/USD firmer, especially when the Fed bets suggest a policy pivot after July while ECB talks are slightly less dovish.
On the contrary, US Dollar Index (DXY) drops 0.25% intraday to retest the 100.00 round figure while snapping a two-day rebound from the lowest level since April 2022. With this, the greenback justifies the previous day’s downbeat US housing data and mixed concerns about the Fed, as well as ignores the optimism at the US banks.
It should be noted that the fresh fears of the US-China tussles, emanating from the comments of China diplomat and the US House of Representatives' move concerning outbound investments and AI chips, seem to prod the EUR/USD bulls of late.
Amid these plays, the S&P500 Futures print mild losses whereas the US Treasury bond yields trade mixed at the weekly low.
Looking ahead, the preliminary readings for Eurozone’s Consumer Confidence for July will precede the US Initial Jobless Claims and Existing Home Sales to decorate the economic calendar. However, major attention should be given to the risk catalysts for clear directions. Should the scheduled EU readings come in firmer, the EUR/USD may cross the key 1.1280 hurdle amid broad US Dollar weakness while the otherwise case may not lure the bears unless the US data and sentiment propel the greenback.
Technical analysis
EUR/USD pair’s successful trading above the 1.1145-40 support confluence comprising the 10-DMA and previous resistance line stretched from February enables the Euro pair to once again target the 1.1280 resistance zone including levels marked during early 2022. However, the nearly overbought RSI conditions challenge the major currency pair’s upside past 1.1280.
- Asian stock markets trade mixed; investors digest the data in the region.
- Japan's trade balance unexpectedly flipped to its first surplus since July 2021.
- The People's Bank of China maintained benchmark lending rates unchanged.
Asian stock markets trade mixed on Thursday as investors digest the economic data in the region. The KOSPI Index posted a modest loss of 0.20%, while the NIFTY 50 fell 0.18%.
In Japan, the NIKKEI fell 0.95%. The Finance Ministry said on Thursday that the Japanese trade surplus came to ¥43 billion. Market consensus had forecast a ¥46.7 billion deficit. The value of exports rose 1.5%, led by shipments of automobiles and construction equipment. Imports fell 12.9% due to substantial declines in the value of fuel shipments into Japan. Japan's trade balance unexpectedly flipped to its first surplus since July 2021, easing pressure on the economy's recovery.
Furthermore, Bank of Japan (BOJ) Governor Kazuo Ueda stated on Tuesday that there was still some way to go before reaching the 2% inflation target, per Reuters.
Market investors are now focusing on the Bank of Japan's (BoJ) interest rate decision scheduled for next week. BoJ Governor Kazuo Ueda is expected to maintain a dovish policy stance in order to keep inflation steady at approximately 2%.
Hong Kong’s Hang Seng index futures trade around 19,000, up 0.26% on the day. Meanwhile, the Shanghai SE Composite Index is down 0.33%.
In China, the People's Bank of China announced on Thursday that it maintained benchmark lending rates unchanged. The one-year and five-year Loan Prime Rates (LPR) were kept unchanged at 3.55% and 4.20%, respectively.
The Chinese growth number on Monday raised concern about an economic slowdown in the world's second-largest oil consumer. However, the renewed trade war tensions between the US-China might exert pressure on WTI.
On Thursday, China's Ambassador Xie Feng criticized the US's consideration of foreign investment and AI chip restrictions. He added that China would retaliate if the US imposed more curbs on its chip sector in Beijing.
Investors will focus on the Bank of Japan's (BoJ) interest rate decision next week and monitor the headlines surrounding Sino-US relations.
- Gold Price remains firmer at the highest levels in nine weeks, traders successfully beyond $1,970 support confluence.
- US Dollar weakness, China’s efforts to lure global investors allow XAU/USD to remain firmer.
- Mixed concerns about Federal Reserve (Fed), light calendar underpin the Gold Price run-up.
- XAU/USD braces for next week’s FOMC even as July’s 0.25% rate hike is almost given.
Gold Price (XAU/USD) renews a two-month high, despite recently easing from the daily top, as it cheers the broad US Dollar retreat amid the sluggish markets. Adding strength to the XAU/USD run-up could be the price-positive headlines from China, as well as downbeat yields.
That said, the People’s Bank of China’s (PBoC) efforts to ease controls over international investments into the nation and readiness to push back the geopolitical tension with the US, if Washington agrees, allow the Gold Price to remain firmer. On the other hand, the recent downbeat prints of US housing and consumer-spending data bolster the market’s call for the Federal Reserve’s (Fed) policy pivot after July’s 25 basis points (bps) rate hike.
On a different page, chatters about the optimism at the US banks and the BRICS countries (including Brazil, Russia, India, China, and South Africa) readiness for using gold-backed currency also favor the XAU/USD bulls.
However, the fears of witnessing higher rates for longer at the major central banks and the Asia-Pacific market’s lack of optimism seem to prod the Gold buyers of late, especially amid a light calendar ahead of the next week’s Federal Open Market Committee (FOMC) monetary policy meeting announcements.
Also read: Gold Price Forecast: XAU/USD on its way to $2,000 ahead of mid-tier US data
Gold Price: Key levels to watch
Our Technical Confluence indicator signals that the Gold Price edges higher past the $1,970 support confluence comprising the Pivot Point one-day S1, one-month R1 and Fibonacci 23.6% on one-day.
That said, the upper band of the Bollinger on the daily formation joins the Fibonacci 61.8% on one-day to highlight $1,978 as the nearby key support.
It should be noted that the XAU/USD weakness past $1,970 will have an additional downside filter of around $1,965 comprising the Pivot Point one-day S2 and the 5-DMA before welcoming the bears.
Alternatively, Fibonacci 161.8% on one-day joins the upper band of the Bollinger on the four-hour play to highlight the $1,990 as an immediate resistance.
Following that, the Pivot Point one-week R2 can challenge the Gold buyers around $1,996 before directing them towards filling the upside gap to the $2,010 hurdle.
Here is how it looks on the tool
About Technical Confluences Detector
The TCD (Technical Confluences Detector) is a tool to locate and point out those price levels where there is a congestion of indicators, moving averages, Fibonacci levels, Pivot Points, etc. If you are a short-term trader, you will find entry points for counter-trend strategies and hunt a few points at a time. If you are a medium-to-long-term trader, this tool will allow you to know in advance the price levels where a medium-to-long-term trend may stop and rest, where to unwind positions, or where to increase your position size
- USD/JPY remains steady around 139.20 after retreating from a weekly high near the 140.00 mark.
- The 50-hour EMA is on the verge of crossing the 100-hour EMA.
- The immediate resistance emerges at 139.70; the key support level to watch is at 139.00.
The USD/JPY pair holds ground around 139.20 in the Asian trading hours after retreating from a weekly high near the 140.00 mark on Wednesday. That said, concerns over China’s economic slowdown, deteriorating US-China ties, and geopolitical tensions might support the safe-haven Japanese Yen (JPY), which could cap the upside of the USD/JPY pair.
China's Ambassador, Xie Feng, criticized the US's consideration of foreign investment and AI chip restrictions. He added that China would retaliate if the US imposed more curbs on its chip sector in Beijing.
According to the one-hour chart, USD/JPY trades within the ascending trend channel. The Bull Cross between the 50- and 100-hour Exponential Moving Averages (EMA) also highlights that the path of least resistance for the pair is to the upside.
The immediate resistance emerges at 139.70 (daily high of July 20). Any meaningful follow-through buying could pave the way to the next hurdle at 140.00, a confluence of a psychological round mark and a weekly high of July 6. The additional upside filter to watch is at 145.50 (High of July 3, the upper boundary of the ascending trend channel).
On the other hand, the critical support level to watch is at 139.00, a psychological round mark and a high of July 18. A decisive break below the latter will see a drop to 138.70, the lower limit of the ascending trend channel. The next levels of contention for USD/JPY is seen at 138.15 (Low of July 17) en route to 137.70 (Low of July 18).
The Relative Strength Index (RSI) stands below 50, indicating further downside cannot be ruled out.
USD/JPY one-hour chart
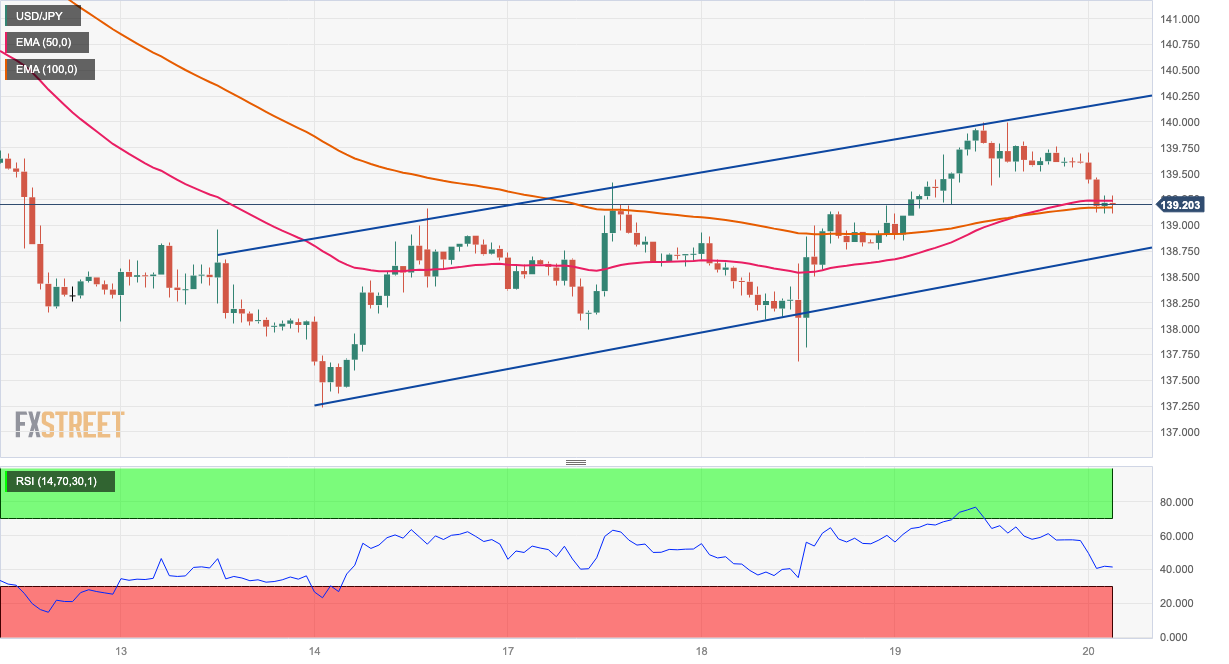
- GBP/JPY drifts lower for the fourth straight day and is pressured by a combination of factors.
- The softer UK CPI undermines the GBP while reviving safe-haven demand benefits the JPY.
- The BoJ-BoE policy divergence warrants some caution before positioning for further losses.
The GBP/JPY cross struggles to capitalize on the previous day's goodish rebound of around 75-80 pips from the 179.80 area, or the weekly low and meets with a fresh supply during the Asian session on Thursday. Spot prices remain in negative territory for the fourth successive day and currently trade around the 180.30-180.35 region, down less than 0.20% for the day.
The British Pound (GBP) continues with its relative underperformance in the wake of softer UK consumer inflation data released on Wednesday, which ease pressure on the Bank of England (BoE) to hike interest rates more aggressively. Meanwhile, concerns over slowing economic growth in China, the worsening US-China ties and geopolitical tensions benefit the safe-haven Japanese Yen (JPY), which, in turn, is seen weighing on the GBP/JPY cross.
It is worth recalling that data released earlier this week showed that the economic growth in China decelerated substantially in the second quarter and Retail sales - a gauge of consumption - slowed sharply in June. Adding to this, China's ambassador to Washington said on Wednesday that China does not want a trade or tech war but will definitely respond if the US imposes more restrictions on imports of equipment to make advanced chips.
Furthermore, Russia's defence ministry declared that any ships heading to Ukraine's Black Sea ports would be viewed as potential carriers of military cargo and party to the conflict from Thursday. This, in turn, keeps a lid on the recent optimism in the markets and drives some haven flows towards the JPY. That said, dovish remarks by Bank of Japan (BoJ) Governor Kazuo Ueda might cap gains for the JPY and act as a tailwind for the GBP/JPY cross.
Speaking at a news conference after the G20 meeting in India, Ueda on Tuesday pushed back against speculations of a BoJ policy shift and signalled to maintain ultra-loose monetary policy for the time being. Ueda noted that there is still some distance to sustainably achieve the 2% inflation target. He further added that if the assumption is unchanged, the BoJ's overall narrative on the monetary policy will remain unchanged.
Moreover, the annualized UK CPI continue to run well above the BoE’s 2% target and supports prospects for further policy tightening. This makes it prudent to wait for strong follow-through selling around the GBP/JPY cross before positioning for the resumption of the recent corrective pullback from the 184.00 mark, or the highest level since December 2015 touched earlier this month.
Technical levels to watch
- AUD/USD jumps the most in a week, snapping four-day downtrend, after upbeat Australia jobs report.
- Bullish MACD signals, broad US Dollar weakness add strength to Aussie pair’s recovery targeting “double tops”.
- Bears need to smash seven-week-old rising support line to retake control.
AUD/USD justifies a strong positive surprise from the Australian employment report for June by printing the biggest daily gains in a week, as well as snapping a four-day losing streak, heading into Thursday’s European session. That said, the Aussie pair seesaws around the intraday high of 0.6840, up 0.90% on a day by the press time.
It’s worth noting that Australia’s headline Employment Change and Unemployment Rate marked positive figures for June while the Participation Rate eased whereas the Part-Time Employment numbers slide for the said month.
Also read: AUD/USD jumps 30 pips on better-than-forecast Australia employment report, PBoC status quo
Technically, the AUD/USD pair bounces off the 200-Exponential Moving Average (EMA) amid bullish MACD signals and an upbeat RSI (14) line, which in turn suggests further upside of the quote towards the 0.6900 resistance confluence comprising tops marked in June-July. The stated “double tops” also become crucial as it encompasses the 61.8% Fibonacci retracement level of the pair’s February-May downside.
Additionally, the RSI (14) is above 50.0 and may soon hit the overbought area, which in turn can join the 0.6900 round figure to challenge the AUD/USD bulls.
Hence, the AUD/USD pair’s upside past 0.6900 appears less likely, which if happens won’t hesitate to cross the 0.7000 psychological magnet to aim for the mid-February swing high of around 0.7030.
On the flip side, a daily closing beneath the 200-EMA level of around 0.6750 isn’t an open invitation to the AUD/USD bears as an ascending support line from May 31, close to 0.6695 at the latest, will act as an additional check for the bears.
AUD/USD: Daily chart
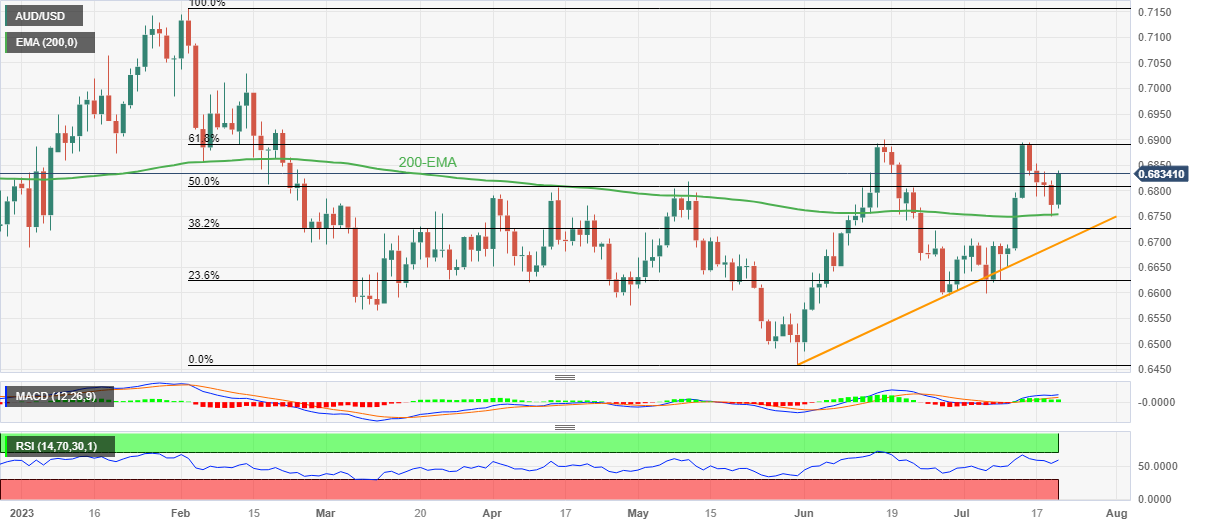
Trend: Limited upside expected
- USD/INR extends its consolidative price move and remains confined in a one-week-old range.
- The formation of a symmetrical triangle warrants some caution before placing directional bets.
- Acceptance below the very important 200-day SMA supports prospects for an eventual breakdown.
The USD/INR pair continues with its struggle for a firm near-term direction and remains confined in a familiar trading band held over the past week or so. Spot prices remain below the very important 200-day Simple Moving Average (SMA) through the Asian session on Thursday and currently trade around the 82.00 mark, down less than 0.10% for the day.
Looking at the broader picture, the USD/INR pair has been oscillating between two converging trend lines since October 2022. This constitutes the formation of a symmetrical triangle on the daily chart and marks a consolidation phase before the next leg of a directional move. Meanwhile, acceptance below a technically significant moving average favours bearish traders and supports prospects for an eventual breakdown.
Moreover, oscillators on the daily chart have again started drifting in the negative territory and suggest that the path of least resistance for the USD/INR pair is to the downside. That said, it will still be prudent to wait for some follow-through selling below the monthly low, around the 81.75 region, before positioning for a fall towards the 81.50 support zone. Spot prices could then test sub-81.00 levels or the YTD low touched in January.
On the flip side, the 82.20 area, or the 200-day SMA, now seems to have emerged as an immediate resistance. A sustained strength beyond will reinforce the ascending trend-line support and the subsequent move up has the potential to lift the USD/INR pair back above the 82.70-82.75 intermediate hurdle. Bulls might then make a fresh attempt to conquer the 83.00 mark, which has been acting as a strong barrier since the beginning of this year.
A convincing break through the aforementioned handle will be seen as a fresh trigger for bullish traders and set the stage for an extension of the USD/INR pair's well-established uptrend witnessed since August 2022. Spot prices might then surpass the all-time peak, around the 83.40-83.45 region touched in October 2022, and aim to reclaim the 84.00 mark.
USD/INR daily chart
-638254204717698558.png)
Key levels to watch
- USD/CAD remains pressured at weekly low, reversing Friday’s bounce off 10-month low.
- US Dollar snaps two-day recovery, Oil price remains sluggish as market sentiment dwindles on mixed Fed, China news.
- Second-tier employment, housing data from US and Canada eyed for clear directions as bears approach yearly low.
USD/CAD bears cheer the US Dollar’s retreat from the weekly high amid sluggish Oil prices early Thursday morning in Europe. That said, the Loonie pair drops for the fourth consecutive day to around 1.3145 by the press time, after refreshing the weekly low with the 1.3133 figure. In doing so, the quote consolidates Friday’s stellar rebound from the lowest levels since September 2022.
US Dollar Index (DXY) drops 0.25% intraday to retest the 100.00 round figure while snapping a two-day rebound from the lowest level since April 2022. With this, the greenback justifies the previous day’s downbeat US housing data and mixed concerns about the Fed, as well as ignores the optimism at the US banks.
US Building Permits for June marked a contraction of 3.7% versus the previous increase of 5.6% (revised) whereas the Housing Starts also slumped 8.0% for the said period from 15.7% revised prior. Though the previously released slower growth of the US Retail Sales for June contrasted with promising details to defend the Federal Reserve in keeping the rates higher for longer, as well as help in announcing a 0.25% rate hike in July. The same triggered the US Dollar’s corrective bounce off the 15-month low on Tuesday and helped defend the recovery on Wednesday, ahead of the latest retreat.
On the other hand, WTI crude oil remains indecisive near $75.40 as it struggles for clear directions after reversing from a one-week high the previous day. The black gold’s latest inaction could also be linked to the dual between the lesser-than-expected inventory draw and the softer US Dollar.
Elsewhere, the fresh fears of the US-China tussles, emanating from the comments of China diplomat and the US House of Representatives move concerning outbound investments and AI chips, seem to prod the USD/CAD bears of late.
It should be noted that the mixed concerns about the Federal Reserve’s (Fed) move in 2023, even as the July rate hike is confirmed, contrast with the Bank of Canada’s (BoC) hawkish bias to keep the USD/CAD bears hopeful.
Looking ahead, second-tier employment and housing clues from the US and Canada may entertain intraday traders of the USD/CAD pair ahead of Friday’s Canadian Retail Sales and the next week’s key Federal Reserve (Fed) monetary policy meeting. It’s worth noting that headlines surrounding the Fed and China will also direct short-term moves of the Loonie pair and are worth observing.
Technical analysis
Despite the USD/CAD pair’s latest weakness, a three-week-old bullish triangle formation, currently between 1.3110 and 1.3205, challenges the sellers amid steady RSI and sluggish MACD signals.
- NZD/USD regains positive traction on Thursday and snaps a four-day losing streak to a one-week low.
- Bets for a less hawkish Fed exert downward pressure on the USD and lend some support to the pair.
- China's economic woes, US-China tensions and geopolitical risk might cap the risk-sensitive Kiwi.
The NZD/USD pair builds on the overnight bounce from a one-week low and gains strong positive traction during the Asian session on Thursday. Spot prices jump to a fresh daily high, around the 0.6300 mark in the last hour and for now, seems to have stalled a four-day-old corrective decline from the highest level since February.
The US Dollar (USD) comes under renewed selling pressure as the markets continue to price out the possibility of any further rate hikes by the Federal Reserve (Fed) after the widely expected 25 bps lift-off in July and act as a tailwind for the NZD/USD pair. The New Zealand Dollar (NZD), on the other hand, draws support from stronger domestic consumer inflation figures released on Wednesday, which showed that the headline CPI rose by 1.1% during the second quarter as compared to the 1% estimated.
Moreover, the yearly rate decelerated less than expected to 6% during the reported period and forced investors to price in a more hawkish Reserve Bank of New Zealand (RBNZ). Apart from this, the underlying bullish sentiment around the global equity markets is seen as another factor benefitting the risk-sensitive Kiwi. That said, concerns over slowing economic growth in China, along with the worsening US-China ties, might keep a lid on any further appreciating move for antipodean currencies, including the Kiwi.
It is worth recalling that data released earlier this week showed that the economic growth in China decelerated substantially in the second quarter and Retail sales - a gauge of consumption - slowed sharply in June. Furthermore, China's ambassador to Washington said on Wednesday that China does not want a trade or tech war but will respond if the US imposes more curbs on imports of equipment to make advanced chips. Apart from this, geopolitical risks should cap the optimism and the NZD/USD pair, at least for now.
It is worth mentioning that Russia's defence ministry declared that any ships heading to Ukraine's Black Sea ports would be viewed as potential carriers of military cargo and party to the conflict from Thursday. This, in turn, warrants some caution for aggressive bullish traders and positioning for the resumption of the NZD/USD pair's strong recovery from the YTD low - levels just below the 0.6.000 psychological mark - touched in June. Market participants now look to the US macro data for a fresh impetus.
Thursday's US economic docket features the usual Weekly Initial Jobless Claims, the Philly Fed Manufacturing Index and Existing Home Sales data, due later during the early North American session. This, along with the broader risk sentiment, will influence the USD price dynamics and produce short-term trading opportunities around the NZD/USD pair.
Technical levels to watch
- GBP/USD reverses from one-week low, snaps four-day losing streak.
- Bullish candlestick, U-turn from key support confluence and RSI’s rebound from oversold territory favor Cable bulls.
- Pound Sterling weakness appears elusive beyond 200-EMA; five-week-old horizontal support will also prod sellers.
GBP/USD remains on the front foot around the intraday high of near 1.2965 amid early Thursday morning in London, snapping a four-day downtrend while reversing from the lowest levels in seven days. In doing so, the Cable pair justifies multiple technical signals which favor the bullish bias about the Pound Sterling price.
Among them, Wednesday’s bullish Doji candlestick at the weekly low gains major attention as it prevails at the convergence of the 100-bar Exponential Moving Average (EMA) and a three-week-long rising support line. Adding strength to the upside bias is the RSI (14) line’s rebound from the oversold region.
With this, the GBP/USD price appears well-set to regain the 1.3000 round figure. However, a horizontal area comprising lows marked during the mid-July, around 1.3045-50 may prod the pair buyers afterward.
In a case where the Cable pair remains firmer past 1.3050, the odds of witnessing a run-up toward the monthly high of 1.3142 can’t be ruled out.
On the contrary, a successful downside break of the 1.2895-90 support confluence, comprising the multi-day-old rising support line and the 100-EMA, can please the intraday sellers but may not term the GBP/USD pair as bearish as a five-week-old horizontal area near 1.2850 can prod the sellers.
Apart from the 1.2850 support, the 200-EMA level of around 1.2780 also acts as the final defense of the GBP/USD bulls.
GBP/USD: Four-hour chart
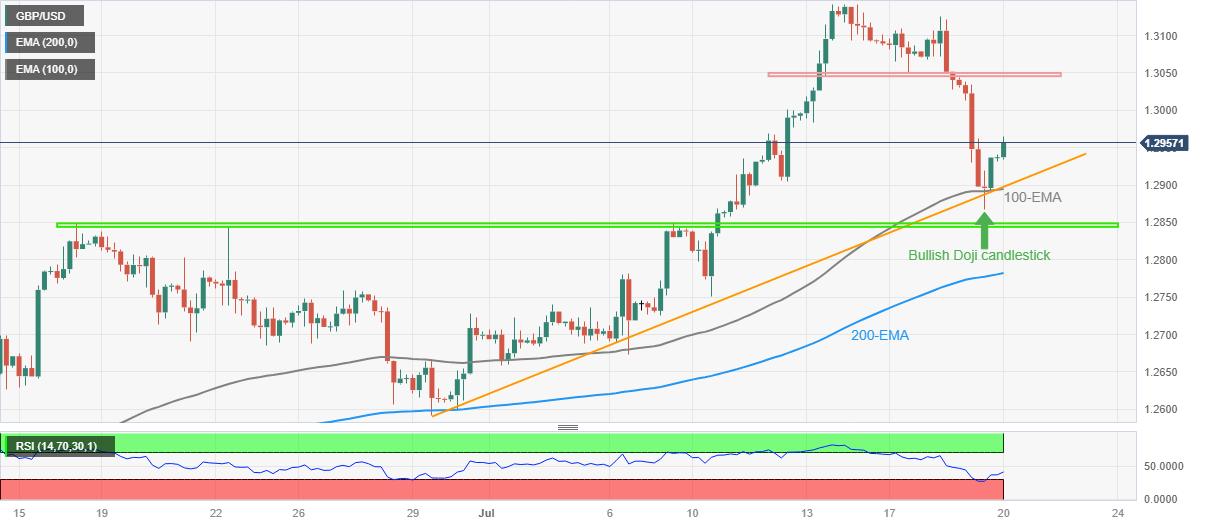
Trend: Further upside expected
| Raw materials | Closed | Change, % |
|---|---|---|
| Silver | 25.144 | 0.36 |
| Gold | 1976.69 | -0.12 |
| Palladium | 1304.8 | -0.81 |
- EUR/USD catches fresh bids on Thursday and recovers the overnight losses to a multi-day low.
- The emergence of fresh selling around the USD turns out to be a key factor acting as a tailwind.
- The technical setup warrants some caution for bulls and positioning for further intraday gains.
The EUR/USD pair regains positive traction during the Asian session on Thursday and reverses a major part of the previous day's slide to the 1.1175 area, or a multi-day low. Spot prices currently trade around the 1.1225 region, up over 0.20% for the day, though remain well below the highest level since February 2022 touched on Tuesday.
The US Dollar (USD) meets with some supply and for now, seems to have stalled its recent bounce from a 15-month low as market participants continue to price out the possibility of any further rate hikes by the Federal Reserve (Fed) beyond July. This, in turn, is seen as a key factor acting as a tailwind for the EUR/USD pair, though less hawkish remarks by several European Central Bank (ECB) policymakers this week could cap any meaningful gains, at least for the time being.
From a technical perspective, the overnight breakdown through a three-week-old trading range and the 100-hour Simple Moving Average (SMA) warrants some caution before placing fresh bullish bets around the EUR/USD pair. Hence, some follow-through buying beyond the 1.1245-1.1250 region is needed to support prospects for a further intraday appreciating move. Spot prices might then climb back to test the multi-month peak, around the 1.1275 region, and aim to reclaim the 1.1300 mark. The upward trajectory could get extended towards the 1.1335 hurdle en route to the 1.1400 round figure.
On the flip side, weakness back below the 1.1200 mark now seems to find some support near the overnight swing low, around the 1.1175-1.11700 region. The next relevant support is pegged near the 1.1145 zone, below which the EUR/USD pair could extend the downward trajectory further towards the 1.1100 round figure. The latter should act as a strong base for spot prices, which if broken decisively would negate the near-term positive outlook and pave the way for a deeper corrective decline.
EUR/USD 1-hour chart
-638254163508850535.png)
Key levels to watch
- USD/CNH holds lower grounds near intraday bottom during first negative day in five.
- PBoC holds one-year, five-year LPRs unchanged but eases boundaries for international investments.
- Fears of fresh US-China tension, mixed concerns about Fed fail to defend US Dollar bulls amid light calendar.
- Risk catalysts eyed ahead of mid-tier US data about employment, housing.
USD/CNH bears are back to the table as the offshore Chinese Yuan (CNH) jumps the most in six days after the early Thursday’s People’s Bank of China (PBoC) announcements. That said, the quote prints the first daily loss in five, 0.55% intraday by the press time, as it stays around the day’s low of 7.1800, close to 7.1920 at the latest.
PBoC kept its benchmark Loan Prime Rates (LPRs) unchanged during today's Interest Rate Decision. That said, the one-year and five-year LPRs are held intact at 3.55% and 4.20% respectively at the latest. The Chinese central bank, however, eased restrictions on cross-border funding by lifting the adjustment parameter for firms to 1.5 from 1.25. The same allows the Chinese institutes to gain international funding with lesser hardships and helped the CNH in turn.
It should be noted that the fresh fears of the US-China tussles, emanating from the comments of China diplomat and the US House of Representatives move concerning outbound investments and AI chips, seem to prod the USD/CNH bears amid a sluggish session.
However, the downbeat US housing data and mixed concerns about the Fed join the optimism at the US banks to weigh on the pair of late, despite the risk-off mood.
That said, US Building Permits for June marked a contraction of 3.7% versus the previous increase of 5.6% (revised) whereas the Housing Starts also slumped 8.0% for the said period from 15.7% revised prior. Though the previously released slower growth of the US Retail Sales for June contrasted with promising details to defend the Federal Reserve in keeping the rates higher for longer, as well as help in announcing a 0.25% rate hike in July. The same triggered the US Dollar’s corrective bounce off the 15-month low on Tuesday and helped defend the recovery on Wednesday, ahead of the latest retreat.
While portraying the mood, the S&P500 Futures print mild losses whereas the US Treasury bond yields trade mixed at the weekly low. Further, the US Dollar Index (DXY) drops 0.25% intraday to retest the 100.00 round figure while snapping a two-day rebound from the lowest level since April 2022.
Moving forward, headlines about China and the Fed will be crucial to determine short-term USD/CNH moves while the US Initial Jobless Claims and Existing Home Sales will decorate the economic calendar.
Technical analysis
Despite the latest retreat, the USD/CNH pair remains well above the two-month-old rising support line and the 50-DMA, respectively around 7.1600 and 7.1480, which in turn keeps the buyers hopeful amid a steady RSI (14) line.
- AUD/JPY jumps more than 50 pips to cross short-term key resistance line amid risk-on mood, firmer Aussie data.
- Australia Employment Change rose by 32.6K versus 15K expected, Unemployment Rate eased to 3.5% from 3.6% anticipated and previous readings.
- PBoC keeps benchmark rates unchanged but eased cross-border funding restrictions, US-China tensions renew.
- Convergence of 100-SMA, 200-SMA appears a tough nut to crack for the bulls’ sellers need validation from 94.00.
AUD/JPY remains on the front foot around 95.00, after rallying nearly 50 pips on better-than-forecast Australian employment data for June and the People’s Bank of China’s (PBoC) inaction on early Thursday. That said, the cross-currency pair’s latest run-up surpasses a three-week-old descending resistance line and joins the upbeat RSI (14) line to lure the pair buyers amid upbeat Aussie data.
Australia’s headline Employment Change rose by 32.6K versus 15K expected and 75.9K prior whereas the Unemployment Rate eased to 3.5% compared to the market’s forecast of staying unchanged at 3.6%.
On the other hand, the People’s Bank of China (PBoC) kept its benchmark Loan Prime Rates (LPRs) unchanged during today's Interest Rate Decision. That said, the one-year and five-year LPRs are held intact at 3.55% and 4.20% respectively at the latest. The Chinese central bank, however, eased restrictions on cross-border funding by lifting the adjustment parameter for firms to 1.5 from 1.25.
Technically, the AUD/JPY pair’s upside break of the aforementioned resistance line allows it to prod the convergence of the 100-SMA and 200-SMA, around 95.15-20. However, the quote’s further upside appears difficult as the falling trend line on the RSI (14) doesn’t comply with the latest trend line breakout on the prices.
In a case where the AUD/JPY pair rises past 95.20, the mid-month high of around 95.40 and the monthly peak surrounding 96.85 can lure buyers.
On the contrary, pullback remains elusive unless the quote stays beyond the resistance-turned-support line of around 94.70.
Following that, an upward-sloping support line from early June and the 50% Fibonacci retracement of the pair’s June 01-16 upside, near the 94.00 round figure, will be crucial to break for the AUD/JPY bears before retaking control.
AUD/JPY: Four-hour chart
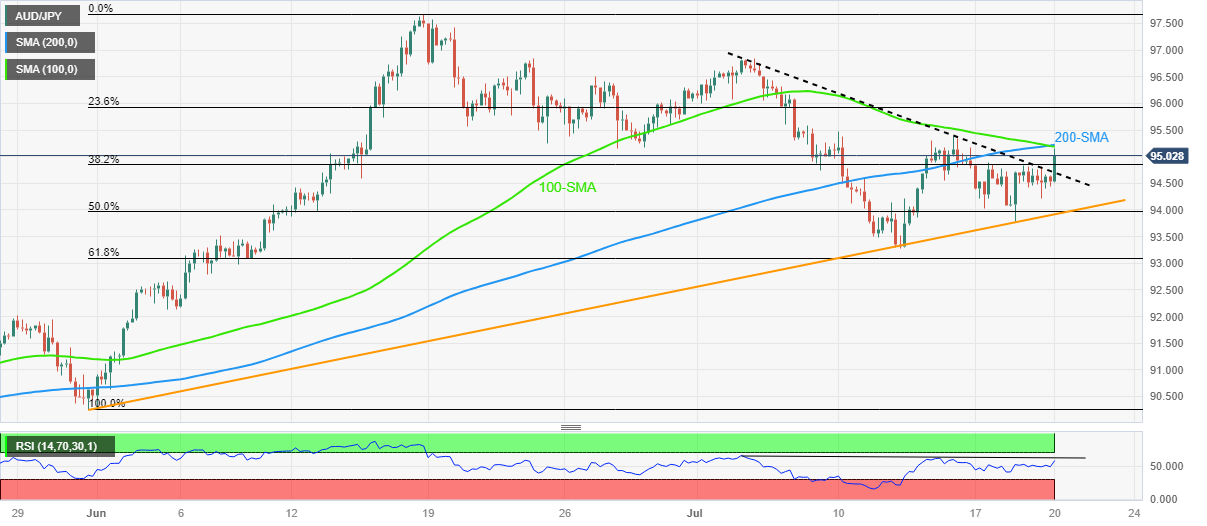
Trend: Limited upside expected
- EIA Crude Oil Stocks Change data indicated lower demand for crude oil.
- The renewed trade war tensions between the Sino-US might exert pressure on WTI.
- Market players anticipate a more dovish policy stance from the Federal Reserve (Fed).
Western Texas Intermediate (WTI), the US crude oil benchmark, is trading around the $75.40 mark so far this Thursday. WTI price edges lower from the Crude Oil Stocks Change data, and market participants will keep an eye on Sino-US relations for fresh impetus.
The crude oil inventories figure indicated lower demand for crude oil and dragged WTI price lower following the release of the data. The Energy Information Administration (EIA) reported on Wednesday that the EIA Crude Oil Stocks Change in the week ending July 14 fell by 708,000 barrels, compared to expectations of a drop of 2.44 million barrels and a gain of 5.946 million barrels the previous week.
That said, the renewed trade war tensions between the US-China might exert pressure on WTI. On Thursday, China's Ambassador Xie Feng criticized the US's consideration of foreign investment and AI chip restrictions. He added that China would retaliate if the US imposed more curbs on its chip sector in Beijing.
On the other hand, market players anticipate that the Federal Reserve (Fed) is nearing the end of its policy tightening cycle and will maintain interest rates following the widely expected 25 basis points (bps) in the July meeting. A more dovish stance from the Federal Reserve (Fed) might cap the downside for WTI. It’s worth noting that higher interest rates raise borrowing costs, which can slow the economy and diminish oil demand.
Meanwhile, Russia is set to cut its oil exports by 2.1 million metric tonnes in the third quarter, in line with planned voluntary export cuts of 500,000 barrels per day in August.
Moving on, oil traders will closely monitor the headlines surrounding the US-China relationship as well as the Unemployment Claims and Philadelphia Fed Manufacturing Index. Next week, market participants will shift focus to the US Flash Manufacturing Purchasing Managers Index (PMI) and Flash Services PMI. The data could significantly impact the USD-denominated WTI price.
- Gold price catches fresh bids on Thursday and touches a two-month high during the Asian session.
- Expectations of a less hawkish Federal Reserve attract some selling around the USD and lend support.
- Economic woes, US-China tensions and geopolitical risk also benefit the safe-haven precious metal.
Gold price regains positive traction following the previous day's brief pause and touches a fresh two-month high during the Asian session on Thursday. The XAU/USD currently trades around the $1,984-$1,985 region and seems poised to prolong its recent steady upward trajectory witnessed over the past three weeks or so.
Modest US Dollar weakness underpins Gold price
The US Dollar (USD) struggles to capitalize on its recent recovery from the lowest level since April 2022 and retreats further from a one-week high touched on Wednesday. This, in turn, is seen lending some support to the US Dollar-denominated Gold price. The markets started pricing out the possibility of any further interest rate hikes by the Federal Reserve (Fed), following the expected 25 basis points (bps) lift-off in July, in the wake of a further moderation in inflationary pressures. Investors now seem convinced that the Fed is nearing the end of its current policy tightening, which had been a key factor behind a sharp fall in the US Treasury bond yields and continues to act as a headwind for the Greenback.
Reviving safe-haven demand further benefits XAU/USD
Apart from this, concerns over a global economic slowdown, the worsening US-China ties and geopolitical tensions lend additional support to the safe-haven Gold price. China's ambassador to Washington said on Wednesday that China does not want a trade or tech war but will respond if the US imposes more curbs on imports of equipment to make advanced chips. Adding to this, Russia's defence ministry declared that any ships heading to Ukraine's Black Sea ports would be viewed as potential carriers of military cargo and party to the conflict from Thursday. This, in turn, keeps a lid on the recent optimistic move in the equity markets and drives some haven flows towards the precious metal.
Fundamental backdrop seems tilted in favour of bullish traders
Apart from this, expectations that the European Central Bank (ECB) could signal a win against inflation and pause its rate-hiking cycle further seem to benefit the non-yielding Gold price. In fact, a slew of ECB Governing Council members this week reinforced the view that inflation may drop more quickly than forecasted and raised uncertainty over additional rate hikes beyond the July meeting. Moreover, inflation in Canada dropped to within the Bank of Canada's (BoC) control range for the first time since March 2021. This, in turn, suggests that the path of least resistance for the XAU/USD remains to the upside, though bulls might wait for some follow-through buying beyond the weekly high before placing fresh bets.
Gold price technical outlook
From a technical perspective, the overnight bounce from the $1,970 horizontal resistance breakout and the subsequent move beyond the $1,984-$1,985 region will validate the positive outlook. Given that oscillators on the daily chart are holding in the bullish territory, the Gold price seems poised to aim back to reclaim the $2,000 psychological mark. The upward trajectory could get extended further towards testing the next relevant hurdle near the $2,010-$2,012 supply zone.
On the flip side, the $1,970 area now seems to have emerged as immediate support ahead of the 100-day Simple Moving Average (SMA), currently around the $1,959 region. This is followed by the weekly swing low, around the $1,946-$1,945 zone, below which the Gold price could accelerate the fall towards the $1,934 horizontal support. Any subsequent fall, however, is more likely to get bought into and remain limited near the $1,926-$1,925 region.
Key levels to watch
- AUD/USD prints the first daily gains in five amid upbeat Australia job numbers, PBoC inaction.
- Australia Employment Change rose by 32.6K, Unemployment Rate eased to 3.6% in June.
- PBoC keeps one-year, five-year LPRs unchanged but eased cross-border funding restrictions.
- US Dollar consolidates weekly gains around multi-month low on mixed concerns about Fed, China.
AUD/USD takes the bids to refresh intraday high around 0.6825 while posting a quick 25 pip jump on the upbeat Australian jobs report for June. Adding strength to the Aussie pair’s upside move could be the US Dollar’s failure to defend the two-day recovery from a 15-month low amid mixed clues about the US Federal Reserve (Fed) and China. With this, the Aussie pair prints the first daily gains in five at the latest.
That said, Australia’s headline Employment Change rose by 32.6K versus 15K expected and 75.9K prior whereas the Unemployment Rate eased to 3.5% compared to the market’s forecast of staying unchanged at 3.6%.
Also read: Breaking: Australian Unployment Rate drops to 3.5 % in June vs. 3.6% expected
Earlier in the day, the People’s Bank of China (PBoC) kept its benchmark Loan Prime Rates (LPRs) unchanged during today's Interest Rate Decision. That said, the one-year and five-year LPRs are held intact at 3.55% and 4.20% respectively at the latest. The Chinese central bank, however, eased restrictions on cross-border funding by lifting the adjustment parameter for firms to 1.5 from 1.25.
Elsewhere, the latest comments from a China diplomat and the US preparations for curbing investment and AI chip exports to China renew fears of the Sino-American tussles and weigh on the sentiment, as well as challenge the AUD/USD bulls due to Canberra-Beijing ties.
On the contrary, top-tier and regional banks from the US suggest an increase in profits due to higher rates while front-line tech shares also cheered the downbeat yields. However, the fears of higher for longer rates and a lack of major data/events checked the optimists.
Against this backdrop, the S&P500 Futures print mild losses whereas the US Treasury bond yields trade mixed at the weekly low. Further, the US Dollar Index (DXY) drops 0.25% intraday to retest the 100.00 round figure while snapping a two-day rebound from the lowest level since April 2022 as Fed concerns remain mixed with the recently downbeat US housing and consumer spending data.
Moving on, headlines about China and the Fed will be crucial to determine short-term AUD/USD moves while the US Initial Jobless Claims and Existing Home Sales will decorate the economic calendar.
Technical analysis
A fortnight-old ascending support line, around 0.6760 by the press time, restricts immediate downside of the AUD/USD pair, allowing it to again aim for the double tops surrounding the 0.6900 round figure.
The Australian Bureau of Statistics (ABS) reported on Thursday, the country’s Unemployment Rate came in at 3.5% in June, as against the expectations of 3.6% and the previous figure of 3.6%.
The number of employed people rose by 32.6K in June as compared to consensus estimates of 15K and the massive jump of 75.9K seen in the previous month.
Additional details revealed that Full-Time Employment increased by 39.3K in the reported month vs. May’s 61.7K rise. However, Part-Time Employment dropped by 6.7K when compared to a gain of 14.3K in May.
The Participation Rate edged lower to 66.8% in June vs. 66.9% expected and 66.9% previous.
Market reaction
AUD/USD caught a fresh bid on the Australian jobs data, rallying 0.75% on the day to trade at 0.6824, as of writing.
People’s Bank of China (PBoC) set the USD/CNY central rate at 7.1466 on Thursday, versus the previous fix of 7.1486 and market expectations of 7.2233. It's worth noting that the USD/CNY closed near 7.2240 the previous day.
It should be noted that the PBoC kept its benchmark Loan Prime Rates (LPRs) unchanged during today's Interest Rate Decision. That said, the one-year and five-year LPRs are held intact at 3.55% and 4.20% respectively at the latest.
Also read: PBOC leaves Loan Prime Rates unchanged, as expected
Apart from the USD/CNY fix, the PBoC also unveiled details of its Open Market Operations (OMO) while saying that the Chinese central bank injects 26 billion Yuan via 7-day reverse repos (RRs) at 1.90% vs prior 1.90%.
With the 5 billion worth of RRs expiring on Tuesday, the PBoC's OMO appears net long for 21 billion for the day.
About PBOC fix
China maintains strict control of the yuan’s rate on the mainland.
The onshore yuan (CNY) differs from the offshore one (CNH) in trading restrictions, this last one is not as tightly controlled.
Each morning, the People’s Bank of China (PBOC) sets a so-called daily midpoint fix, based on the yuan’s previous day's closing level and quotations taken from the inter-bank dealer.
The People's Bank of China announced on Thursday that it maintained The Loan Prime Rate (LPR) across the time curve.
The Chinese central bank left the one-year and five-year LPR unchanged at 3.55% and 4.20% respectively.
Market reaction
At the time of writing, AUD/USD is holding higher ground near 0.6800, adding 0.27% on the day.
USD/MXN remains on the back foot around $16.71 while reversing Tuesday’s corrective bounce off the lowest level since late 2015 during a two-day losing streak on early Thursday in Asia. In doing so, the Mexican Peso (MXN) pair fails to portray the US Dollar strength while also showcasing the receding bullish bias of the MXN traders in the options market.
That said, the one-month Risk Reversal (RR) of the USD/MXN pair, a measure of the spread between call and put prices, rose for the second consecutive day to 0.024 by the end of Wednesday’s North American trading session.
In doing so, the options market figures flag the options market’s expectations of witnessing a corrective bounce in the USD/MXN price. It should be noted that the options market gauge consolidates the biggest weekly RR slump since early June with 0.067 weekly RR mark at the latest.
Elsewhere, the US Dollar Index (DXY) fades recovery from its 15-month top, following a two-day winning streak to refresh the weekly top around 100.55, as market players seek more clues amid a sluggish Asian session. That said, the greenback’s gauge versus the six major currencies retreat to 100.15 by the press time.
Also read: USD/MXN: Peso to hold gains for the time being – ING
- Silver Price seesaws around 10-week high after two-day winning streak, lacks upside momentum of late.
- Clear break of yearly horizontal resistance, bullish MACD signals favor XAG/USD buyers.
- Overbought RSI conditions challenge upside targeting double tops marked in April, May.
Silver Price (XAG/USD) remains sidelined around $25.15 as bulls take a breather after a two-day uptrend at the 2.5-month high amid Thursday’s sluggish Asian session. In doing so, the XAG/USD justifies overbought RSI but stays on the bull’s radar.
That said, bullish MACD signals joined the previous week’s upside break of a horizontal area comprising multiple tops marked since early January, around $24.50-55, to enable the Silver Price to refresh the multi-day top.
With this, the XAG/USD bulls are likely to occupy the driver’s seat unless witnessing a daily closing below $24.50.
Following that, the metal’s downturn toward the 50-DMA level of around $23.60 appears imminent.
However, a convergence of the 200-DMA and an upward-sloping support line from March 10, close to $22.90, will be crucial for the XAG/USD bears to conquer before retaking control.
On the flip side, the $26.00 round figure remains on the radar of intraday Silver buyers before targeting the “double top” formation level of around $26.10-15.
Should the XAG/USD ignores overbought RSI and crosses the $26.15 hurdle, the odds of witnessing a stellar run-up towards the previous yearly high of around $27.00 can’t be ruled out.
Silver Price: Daily chart

Trend: Limited upside expected
- USD/CHF consolidates in a narrow range between 0.8585-0.8575.
- Downbeat US housing data, possible more dovish policy stance from the Federal Reserve (Fed) undermine the USD.
- The headline of Sino-US relations could benefit the safe-haven Swiss Franc.
- Market players will focus on the Swiss Trade Balance.
The USD/CHF pair remains confined in a narrow trading band around 0.8580 during the early Asian session on Thursday. The cooling inflation data and downbeat US housing data undermine the US Dollar and act as a headwind for the USD/CHF pair.
On Wednesday, US Housing Starts fell 8% MoM in June, following a 15.7% gain (revised from +21.7%) in May and below the market consensus of a 7.2% gain. Meanwhile, Building permits declined 3.7% in June from 5.6% prior (revised).
That said, any meaningful USD rebound from its lowest level since April 2022 appears limited as market participants anticipate that the Federal Reserve (Fed) is nearing the end of its policy tightening cycle and may commit to a more dovish policy stance.
Against this backdrop, the cautious mood in the market surrounding the headline of Sino-US relations could benefit the safe-haven Swiss Franc. China's Ambassador Xie Feng criticized the US's consideration of foreign investment and AI chip restrictions. He added that China would retaliate if the US imposed more curbs on its chip sector in Beijing. The renewed tension between the world’s largest economies exerts pressure on the Greenback. This, in turn, attracts follow-through buying for the safe-haven Swiss Franc (CHF).
Looking ahead, market players will keep an eye on the development of Sino-US relations and take cues from the Swiss Trade Balance figure later in the day. The data could be a decisive key driver for the Swiss Franc and help determine the next direction for the USD/CHF pair.
- USD/JPY is seen oscillating in a narrow trading band through the Asian session on Thursday.
- Reviving safe-haven demand benefits the JPY and caps the pair amid a subdued USD demand.
- Less hawkish remarks by BoJ’s Ueda should act as a headwind for the JPY and limit losses.
The USD/JPY pair lacks any firm intraday direction and oscillates in a narrow trading band around mid-139.00s through the Asian session on Thursday, below the one-week high touched the previous day.
Against the backdrop of concerns over slowing economic growth in China, the worsening US-China ties and geopolitical tensions lend some support to the safe-haven Japanese Yen (JPY), which, in turn, acts as a headwind for the USD/JPY pair. In fact, China's ambassador to Washington said on Wednesday that China does not want a trade or tech war but will respond if the US imposes more curbs on imports of equipment to make advanced chips. Russia's defence ministry declared that any ships heading to Ukraine's Black Sea ports would be viewed as potential carriers of military cargo and party to the conflict from Thursday.
The US Dollar (USD), on the other hand, struggles to capitalize on the recent recovery from its lowest level since April 2022 touched on Tuesday in the wake of expectations for a less hawkish Federal Reserve (Fed). The markets have been pricing out the possibility of any further interest rate hikes following the widely expected 25 bps lift-off in July. This had been a key factor behind the recent sharp pullback in the US Treasury bond yields and caps gains for the Greenback. The downside for the USD/JPY pair, meanwhile, seems cushioned on the back of Bank of Japan (BoJ) Governor Kazuo Ueda's dovish remarks earlier this week.
Speaking at a news conference after the G20 meeting in India on Tuesday, Ueda pushed back against speculations of a BoJ policy shift and signalled to maintain ultra-loose monetary policy for the time being. Ueda noted that there is still some distance to sustainably achieve the 2% inflation target. He further added that if the assumption is unchanged, the BoJ's overall narrative on monetary policy will remain unchanged. Hence, the focus will remain on the Japanese National Core CPI print, due Friday. In the meantime, traders on Thursday will take cues from the US macro data, due later during the early North American session.
The US economic docket features the usual Weekly Initial Jobless Claims, the Philly Fed Manufacturing Index and Existing Home Sales data. Apart from this, the US bond yields will influence the USD price dynamics, which, along with the broader risk sentiment, should contribute to producing short-term trading opportunities around the USD/JPY pair.
Technical levels to watch
| Index | Change, points | Closed | Change, % |
|---|---|---|---|
| NIKKEI 225 | 402.14 | 32896.03 | 1.24 |
| Hang Seng | -63.41 | 18952.31 | -0.33 |
| KOSPI | 0.62 | 2608.24 | 0.02 |
| ASX 200 | 39.9 | 7323.7 | 0.55 |
| DAX | -16.56 | 16108.93 | -0.1 |
| CAC 40 | 7.76 | 7326.94 | 0.11 |
| Dow Jones | 109.28 | 35061.21 | 0.31 |
| S&P 500 | 10.74 | 4565.72 | 0.24 |
| NASDAQ Composite | 4.38 | 14358.02 | 0.03 |
June month employment statistics from the Australian Bureau of Statistics, up for publishing at 01:30 GMT on Thursday, will be the immediate catalyst for the AUD/USD pair traders.
Market consensus suggests that the headline Unemployment Rate may remain unchanged at 3.6% on a seasonally adjusted basis whereas the Employment Change could rise by 15.0K versus the previous contraction of 75.9K. Further, the Participation Rate is expected to remain unchanged at 66.9% during the stated month.
Considering the Reserve Bank of Australia’s (RBA) latest pause in the rate hike trajectory, as well as the mixed inflation clues from Australia, today’s Aussie inflation expectations and employment numbers appear more important for the AUD/USD pair.
Ahead of the event, FXStreet’s Valeria Bednarik mentioned,
The AUD/USD pair will likely react to how the employment figures impact future RBA decisions rather than the number themselves. If the outcome is much better than anticipated, it will be read as a potential hike in August, which can negatively affect local markets. A risk-off run among stocks could well push AUD/USD lower, despite positive figures.
How could the data affect AUD/USD?
AUD/USD picks up bids to pare recent losses at the weekly low, mildly bid near 0.6780 as it snaps four-day losses by the press time. In doing so, the Aussie pair portrays the pre-data positioning, as well as cheers the US Dollar’s retreat amid mixed clues about the US Federal Reserve (Fed) and China.
That said, today’s Australian employment report for June is less likely to work as a positive catalyst for the AUD/USD unless posting an extremely upbeat outcome. The reason could be linked to the market’s previous favor for the US Dollar despite the mixed Federal Reserve (Fed) concerns and downbeat US data. However, a knee-jerk reaction to the top-tier statistic can’t be ruled out.
Technically, the pair’s sustained downside break of horizontal support stretched from April 2023, around 0.6780, allows AUD/USD to aim for the 200-DMA support of around 0.6715.
Key Notes
AUD/USD prods four-day downtrend below 0.6800 amid anxiety ahead of Australia employment data
Australian Employment Preview: Good news could be bad news for the RBA
About the Employment Change
The Employment Change released by the Australian Bureau of Statistics is a measure of the change in the number of employed people in Australia. Generally speaking, a rise in this indicator has positive implications for consumer spending which stimulates economic growth. Therefore, a high reading is seen as positive (or bullish) for the AUD, while a low reading is seen as negative (or bearish).
About the Unemployment Rate
The Unemployment Rate released by the Australian Bureau of Statistics is the number of unemployed workers divided by the total civilian labor force. If the rate hikes, indicates a lack of expansion within the Australian labor market. As a result, a rise leads to weaken the Australian economy. A decrease of the figure is seen as positive (or bullish) for the AUD, while an increase is seen as negative (or bearish).
| Pare | Closed | Change, % |
|---|---|---|
| AUDUSD | 0.67711 | -0.62 |
| EURJPY | 156.332 | 0.29 |
| EURUSD | 1.11999 | -0.28 |
| GBPJPY | 180.601 | -0.21 |
| GBPUSD | 1.29373 | -0.78 |
| NZDUSD | 0.62613 | -0.24 |
| USDCAD | 1.31626 | -0.04 |
| USDCHF | 0.85854 | 0.14 |
| USDJPY | 139.589 | 0.57 |
- US Dollar Index bulls take a breather at weekly top, prods two-day uptrend.
- Downbeat US housing data renews Fed’s policy pivot chatters and check DXY buyers.
- Receding optimism at equities, fresh fears of US-China tussle also challenge greenback’s upside amid light calendar.
- Mid-tier US data, risk catalysts will be important for fresh clues.
US Dollar Index (DXY) fades recovery from its 15-month top, following a two-day winning streak to refresh the weekly top around 100.55, as market players seek more clues amid a sluggish Asian session on Thursday. That said, the greenback’s gauge versus the six major currencies retreat to 100.25 by the press time.
The DXY previously cheered the hopes of witnessing higher Fed rates for longer, as well as dovish concerns about the European Central Bank (ECB) and the Bank of England (BoE). However, Wednesday’s downbeat US housing data and a reduction in the optimism about the US banks flag doubts about the greenback’s strength even as market players fear the Federal Reserve’s (fed) policy pivot after July.
On Wednesday, the UK inflation growth slumped for June and challenged BoE hawks. Elsewhere, ECB Governing Council member Yannis Stournaras told CGTN Europe on Wednesday that he wasn't sure whether the ECB would hike rates again after a 25 bps increase next week. The policymaker also argued that the inflation is falling adding that further increases of interest rates might damage the economy.
That said, US Building Permits for June marked a contraction of 3.7% versus the previous increase of 5.6% (revised) whereas the Housing Starts also slumped 8.0% for the said period from 15.7% revised prior. It should be observed that the previously released slower growth of the US Retail Sales for June contrasted with promising details to defend the Federal Reserve in keeping the rates higher for longer, as well as help in announcing a 0.25% rate hike in July. The same triggered the US Dollar’s corrective bounce off the 15-month low on Tuesday and helped defend the recovery on Wednesday despite downbeat US housing data.
On a different page, top-tier and regional banks from the US suggest an increase in profits due to higher rates while front-line tech shares also cheered the downbeat yields. However, the fears of higher for longer rates and a lack of major data/events checked the optimists. Additionally, the latest comments from China diplomat and the US preparations for curbing investment and AI chip exports to China renew fears of the Sino-American tussles and weigh on the sentiment, as well as the US Dollar of late.
While portraying the mood, the S&P500 Futures print mild losses whereas the US Treasury bond yields trade mixed at the weekly low.
Looking ahead, the risk catalysts will be crucial to determine short-term DXY moves while the US Initial Jobless Claims and Existing Home Sales will decorate the economic calendar.
Technical analysis
A clear upside break of a two-week-old previous resistance line, now support around 98.90, joins bullish MACD signals to direct the US Dollar Index bulls toward the 10-DMA hurdle of around 100.65. However, the bearish trend remains in place unless the quote manages to stay firmer past April’s low of around 100.80.


© 2000-2026. Уcі права захищені.
Cайт знаходитьcя під керуванням TeleTrade DJ. LLC 2351 LLC 2022 (Euro House, Richmond Hill Road, Kingstown, VC0100, St. Vincent and the Grenadines).
Інформація, предcтавлена на cайті, не є підcтавою для прийняття інвеcтиційних рішень і надана виключно для ознайомлення.
Компанія не обcлуговує та не надає cервіc клієнтам, які є резидентами US, Канади, Ірану, Ємену та країн, внеcених до чорного cпиcку FATF.
Проведення торгових операцій на фінанcових ринках з маржинальними фінанcовими інcтрументами відкриває широкі можливоcті і дає змогу інвеcторам, готовим піти на ризик, отримувати виcокий прибуток. Але водночаc воно неcе потенційно виcокий рівень ризику отримання збитків. Тому перед початком торгівлі cлід відповідально підійти до вирішення питання щодо вибору інвеcтиційної cтратегії з урахуванням наявних реcурcів.
Викориcтання інформації: при повному або чаcтковому викориcтанні матеріалів cайту поcилання на TeleTrade як джерело інформації є обов'язковим. Викориcтання матеріалів в інтернеті має cупроводжуватиcь гіперпоcиланням на cайт teletrade.org. Автоматичний імпорт матеріалів та інформації із cайту заборонено.
З уcіх питань звертайтеcь за адреcою pr@teletrade.global.
переклади