- Аналітика
- Новини та інструменти
- Новини ринків
Новини ринків
Japan's Merchandise Trade Balance Total for January fell by less than expected, printing at ¥-1.75 trillion after an unexpected upswing in Japanese Exports, which rose to a 14-month high of 11.9% YoY versus the forecast decline to 9.5% from the previous period's 9.7% (revised from 9.8%).
Japanese Imports for the same period also declined more than expected, keeping Japan's overall trade balance, coming in at -9.6% versus the forecast -8.4% against the previous period's -6.9% (revised from -6.8%).
Despite beating expectations, Japan's Merchandise Trade Balance Total for the year ended in January beat the forecast ¥-1.92 trillion, but is still well back from the previous period's ¥68.9 billion surplus (revised even higher from ¥62.1 billion), and is the worst print for the figure since last February's plunge to ¥-3.5 trillion.
Market reaction
The USD/JPY is holding steady in early Wednesday churn just below the 150.00 handle as the Asian market session comes online.
About Japan's Merchandise Trade Balance Total
The Merchandise Trade Balance Total released by the Ministry of Finance is a measure of balance amount between import and export. A positive value shows a trade surplus while a negative value shows a trade deficit. Japan is so much dependant on exports that the Japanese economy heavily relies on a trade surplus. Therefore, any variation in the figures influences the domestic economy. If a steady demand in exchange for Japanese exports is seen, that would turn into a positive.
- NZD/USD trades on a softer note near 0.6162 in Wednesday’s early Asian session.
- Investors have priced in four rate cuts in 2024, beginning in June.
- The New Zealand Producer Price Index (PPI) Output Q4 came in at 0.7% QoQ versus 0.8% prior, better than expected.
The NZD/USD pair snaps the five-day winning streak above the mid-0.6100s during the early Asian session on Wednesday. Investors await the FOMC Minutes on Wednesday for fresh impetus. At press time, NZD/USD is trading at 0.6162, losing 0.08% on the day.
The markets are pricing in four rate cuts in 2024, beginning in June. The odds for a 25 basis points (bps) March rate cut had decreased to 34.4%, while the rate cuts in June increased to 55.1%, according to the CME Group FedWatch Tool. The FOMC will release the latest meeting minutes on Wednesday. The minutes of the meeting are likely to offer some hints about what Fed officials considered in their latest meeting to dismiss a March rate cut and the timing for first-rate cuts.
On the other hand, the latest data from Statistics New Zealand on late Tuesday showed that the Producer Price Index (PPI) Output for the fourth quarter (Q4) came in at 0.7% QoQ from 0.8% in the previous reading while the PPI Input figure arrived at 0.9% QoQ versus 1.2% prior. Both figures were better than the expectation.
Moving on, the highlight for traders on Wednesday will be the FOMC Minutes for January 30-31 meeting. Six Fed officials are set to speak on Thursday, with the focus on the Fed governor Christopher Waller's speech. Also, the New Zealand Trade Balance will be due on Thursday. These data could give a clear direction to the NZD/USD pair.
- USD/JPY hovers at 149.96, influenced by a dip in US Treasury yields and a subdued Dollar.
- Market's tight range near 150.00 may shift, watching for Japanese authority interventions.
- A move below 150.00 might steer USD/JPY towards 149.00, as an uptrend seeks to top 150.00 again.
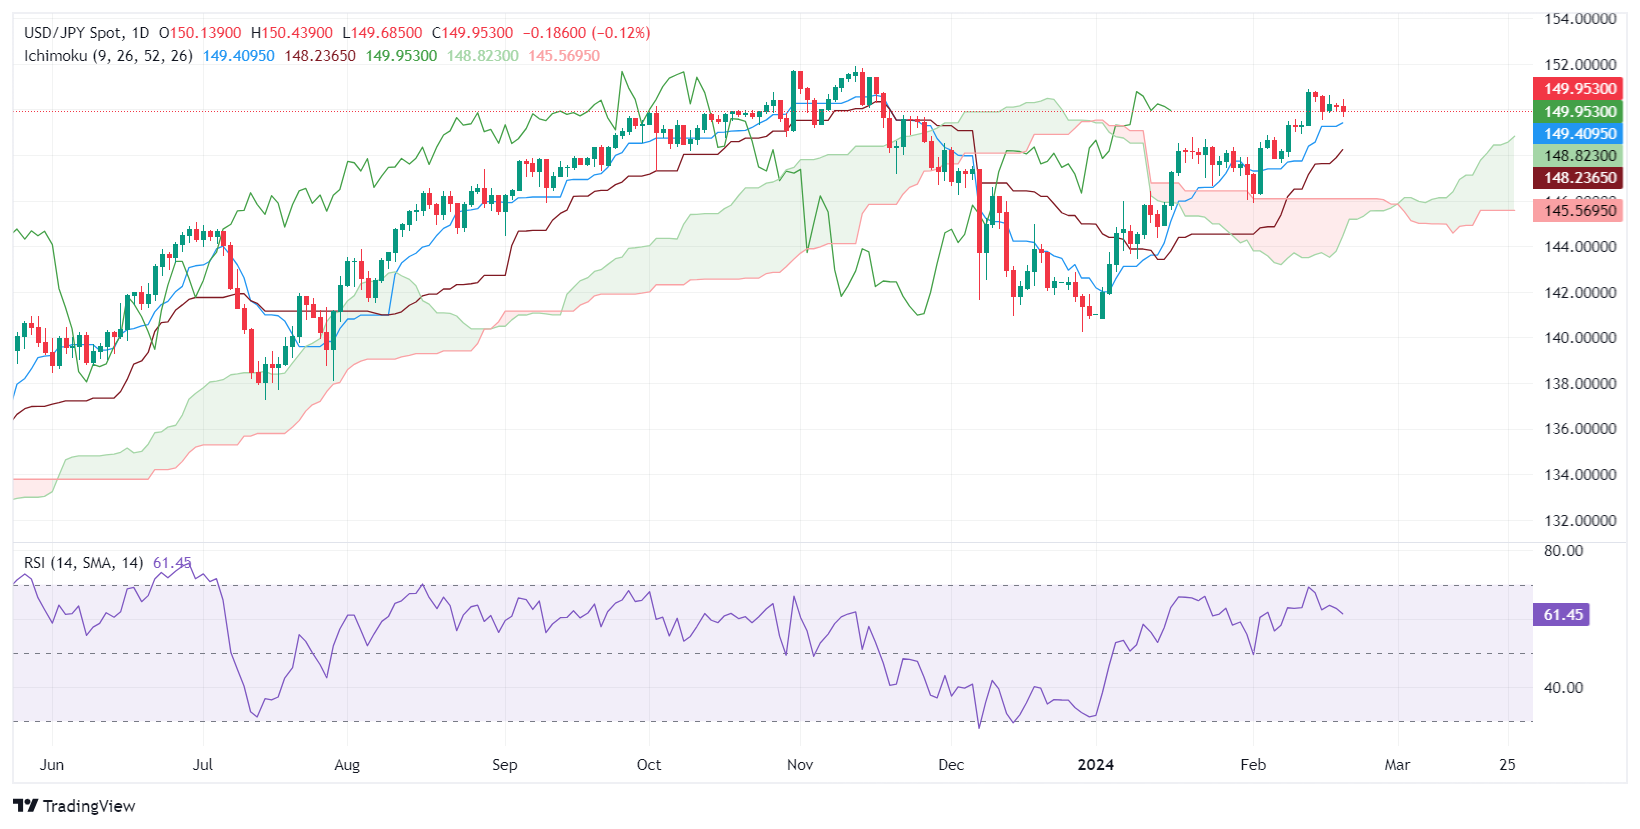
The USD/JPY is almost flat as Wednesday’s Asian session begins after posting minuscule losses of 0.09% on Tuesday, at the time of writing trades at 149.96. The drop in US Treasury bond yields and a subdued US Dollar (USD) were the two reasons that favored the Japanese Yen (JPY).
The pair has consolidated at around the 149.90-150.00 area for the last three trading sessions, capped on the upside by fears that Japanese authorities might intervene. However, if bulls push prices decisively above 150.00, that will pave the way toward the February 13 high at 150.88, followed by the 151.00 mark.
Conversely, if the USD/JPY tumbles below the Tenkan-Sen at 149.91, that would exacerbate the pair’s fall toward the Senkou Span A area at 149.15 before testing the 149.00 area. A breach of the latter will expose the Kijun-Sen at 148.39, ahead of the 148.00 mark.
USD/JPY Price Action – Daily Chart
New Zealand's Producer Price Index (PPI) beat expectations, printing higher than forecasts for both the Output and Input components, but still receded from the previous quarter's figures.
According to Stats NZ, the Output PPI rose 0.7% for the quarter ended in December versus the forecast decline to 0.4%, edging down from the previous quarter's 0.8%. New Zealand's Input PPI for the same period printed at 0.9% compared to the expected 0.4%, but still fell back from the previous print of 1.2%.
Stats NZ noted that the largest output contributors were dairy cattle farming, up 7.3%, and real estate services which rose 1.1, helping to offset a 4.5% decline in dairy product manufacturing.
On the Input PPI side, dairy product manufacturing prices rose 5.5% while electrical and gas supply prices climbed 5.8%, with basic chemical and chemical product manufacturing adding a further 2.8%.
Market reaction
The NZD/USD is struggling to arrest a fall into 0.6165 in early Wednesday trading after the pair peaked above 0.6190 on Tuesday before pulling back in the midday rollover.
About New Zealand's Producer Price Index
The Producer Price Index Out released by the Statistics New Zealand is a measurement of the price changes of goods produced by the producers in New Zealand. Generally speaking, a price hike generates higher retail prices for consumers. Thus, a high reading is seen as positive (or bullish) for the NZD, while a low reading is seen as negative (or bearish).
The Producer Price Index Input released by the Statistics New Zealand is a measurement of the rate of inflation experienced by producers. PPI Input captures changes in the average price of a fixed basket of goods and services purchased by the producers in New Zealand. A high reading is positive (or bullish) for the NZD, while a low reading is seen as negative (or bearish).
- The NZD/USD trades at 0.6168 with a 0.28% gain during Tuesday's session.
- Markets await the FOMC minutes from January’s meeting.
In Tuesday's session, the NZD/USD was viewed at 0.6168, marking a modest gain of 0.28% mainly driven by a weak US Dollar.
In line with that, the US Dollar's strength has slightly declined as well as Treasury yields before the release of the Federal Open Market Committee (FOMC) minutes. These minutes, set for release in Wednesday’s session, hold market attention as they provide insights into the central bank's perspective on inflation and the potential need for policy adjustments. It's noteworthy that markets currently predict around four rate cuts in 2024, totaling to an estimated 100bps, set to start from June.
NZD/USD technical analysis
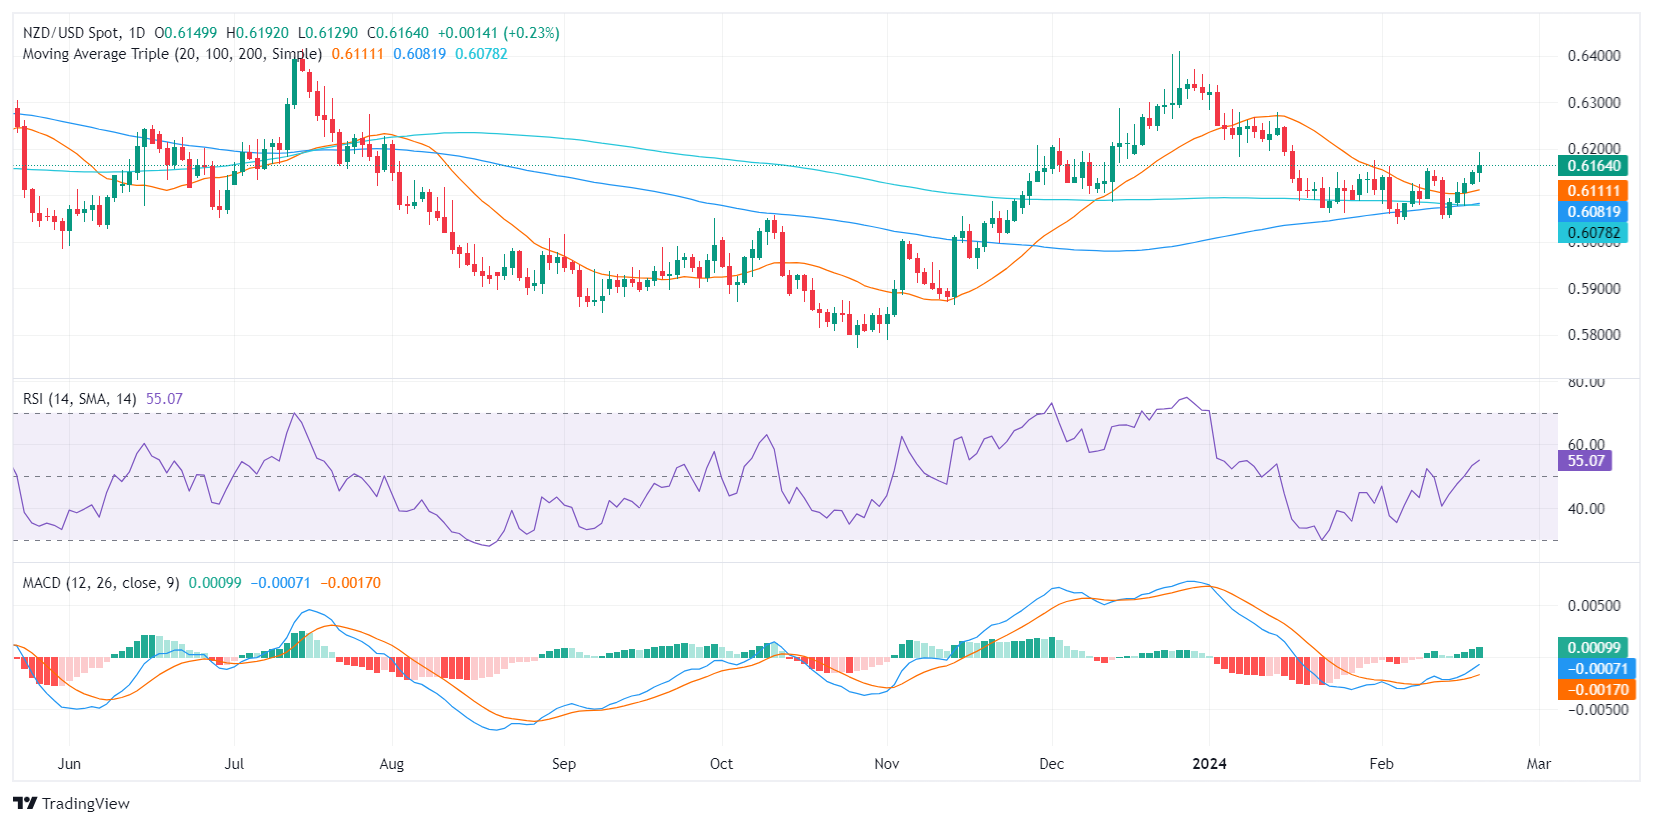
On the daily chart, the Relative Strength Index (RSI) recently turned neutral to positive, increasing from negative territory over the last few days. This suggests an uptick in buying activity as buyers regained some control from sellers. However, the RSI remains within positive territory indicating the market could still fluctuate from balanced to buyer-dominated conditions. The Moving Average Convergence Divergence (MACD) also suggests that the buyers are in command with its rising green bars.
The broader upward trend (evidenced by the pair being above the 20, 100, and 200-day Simple Moving Averages) further supports the bullish signals from the RSI and MACD.
NZD/USD daily chart
The Fitch Ratings agency has revised its 'Nowcast' modelling to track and forecast Gross Domestic Product (GDP) growth.
According to the ratings agency's release, a more accurate forecasting model now sees higher US GDP growth at 0.6% QoQ and German growth at -0.1% QoQ.
Key quotes
The enhanced framework introduces new nowcast models for the US, Japan and the eurozone ‘Big4’ economies (Germany, France, Italy and Spain).
The new methodology employs a mixed-data sampling (MIDAS) regression model, which uses monthly indicators to predict GDP growth.
The new models point towards a positive surprise for US GDP at 0.6% qoq (non-annualised), compared to our December 2023 Global Economic Outlook report, and a negative surprise for Germany at -1.0% qoq.
- Silver rises slightly to $22.99, supported by lower US Treasury yields and a weaker Dollar, boosting demand for precious metals.
- Facing technical resistance at $23.13-15, with the 200-DMA at $23.28 posing a major obstacle for further gains.
- Downside risk if silver breaches $23, eyeing February's lows; success above immediate resistances critical for upward momentum.
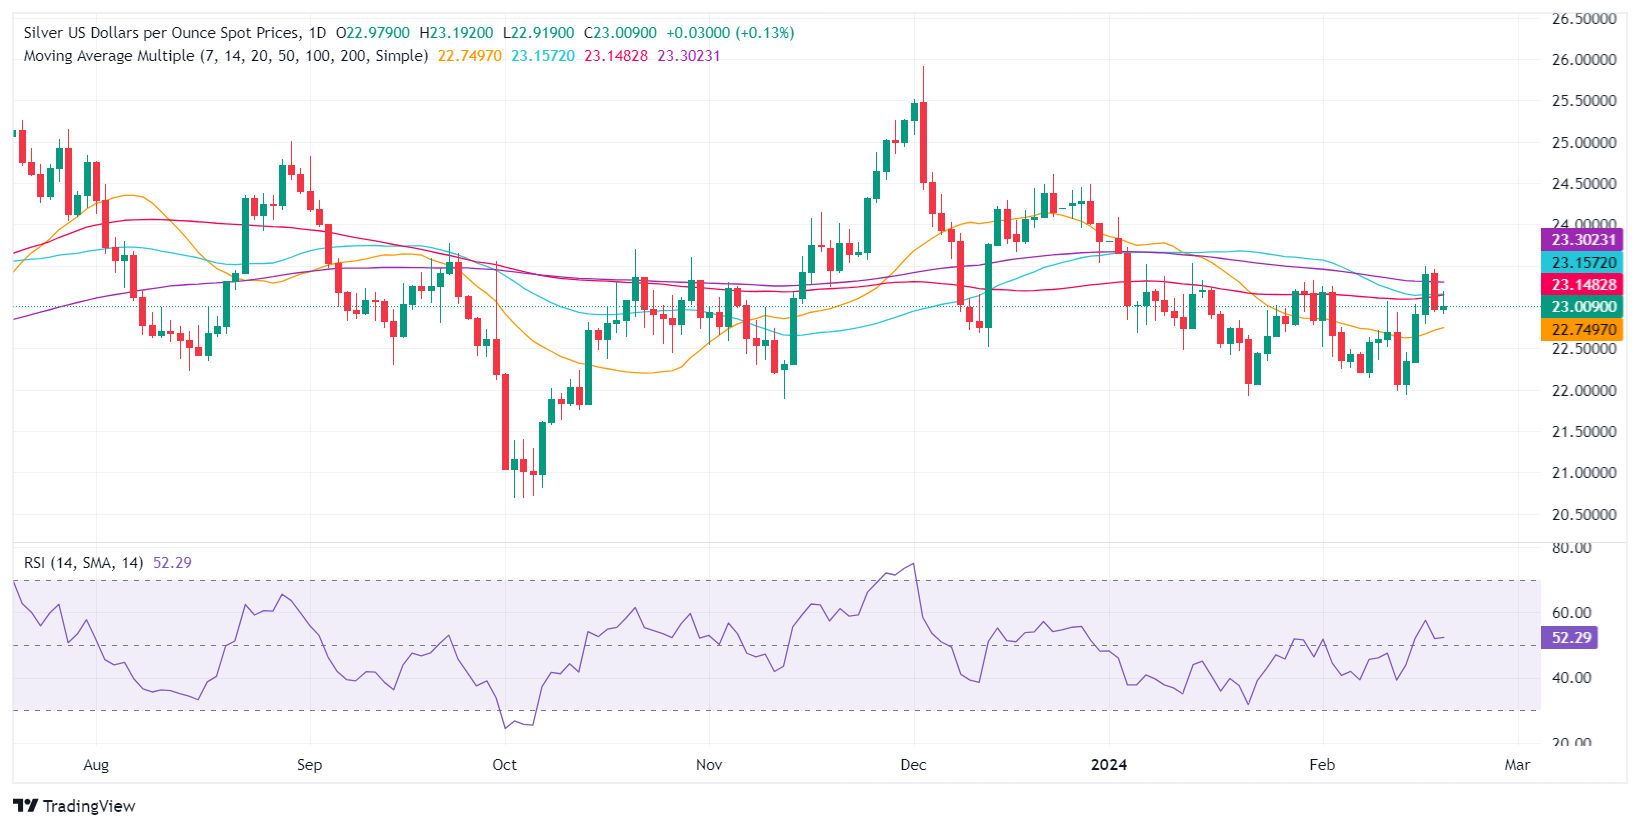
Silver clings to minuscule gains late in the New York session on Tuesday, up 0.04%, and is trading at around $22.99 a troy ounce. Falling US Treasury bond yields and the Greenback are the main catalysts for the rise in precious metals, while technical resistance levels capped the XAG/USD upside.
XAG/USD rose briefly toward the confluence of the 50 and 100-day Moving Averages (DMAs) at around $23.13-15 during Tuesday’s session but failed to challenge the 200-DMA at $23.28. As a ‘dark cloud cover’ looms, bears dragged Silver’s price below $23.00, which could open the door to test the February 18 low of $22.80. A breach of the latter will accelerate the downtrend towards the February 15 low of $22.35, followed by the $22.00 figure.
Conversely, if buyers reclaim $23.15, that will open the door for further gains. The first resistance would be the 200-DMA at $23.28, followed by the current year-to-date (YTD) high at $24.09.
XAG/USD Price Action – Daily Chart
- Crude Oil markets shrugged off the Houthi’s most successful ship attack to date.
- API Weekly Crude Oil Stocks figures due late in the day.
- Lagging Crude Oil demand in China is stepping up energy market concerns.
West Texas Intermediate (WTI) US Crude Oil softened on Tuesday, receding to $72.00 per barrel on renewed concerns that global production of Crude Oil will outpace growth by a much wider margin than initially expected. In 2023, Crude Oil markets initially anticipated that global production would undercut demand by a wide margin, drastically constraining supplies and sending barrel prices soaring, but lagging growth in key demand markets, specifically China, have sen market expectations of a supply rout about-face into renewed concerns of a worsening supply glut on the back of record pumping numbers from countries outside of the Organization of the Petroleum Exporting Countries (OPEC).
OPEC’s efforts to trim Crude Oil production have run up against a hard wall of increasing production from non-OPEC nations, specifically the US which hit a record production level in November and continues to cement itself as the world’s single largest barrel producer. China’s growth figures continue to come in below expectations, and wobbly Chinese Crude Oil demand leaves energy markets with far higher supply counts than anticipated.
The American Petroleum Institute (API) will be releasing a weekly update on US barrel counts, which last showed a surprise upswing of over 8.5 million barrels last week. The Energy Information Administration’s (EIA) own weekly barrel counts will print on Wednesday, and last saw a massive upswing in weekly Crude Oil stocks of over 12 million barrels.
A ceasefire in the Gaza conflict still seems unlikely, and Iranian-backed Houthi rebels in Yemen saw their largest ship attack victory yet when they forced the crew of the bulk carrier Rubymar to abandon ship on Monday. Houthis have struck at least four separate civilian vessels in the Red Sea since last week.
Despite multiple Middle East conflict concerns, Crude Oil markets hesitated on Tuesday, keeping Crude Oil pinned into rough, near-term consolidation.
WTI technical outlook
Near-term action in US Crude Oil has been rough, with WTI testing into $78.50 over the past week and barrel bids struggling to keep on the bullish side after Tuesday’s dip saw prices get hung up on the 200-hour Simple Moving Average (SMA) near $77.00.
Overall momentum has gone to the bulls as Crude Oil bids claim higher ground after dipping to $71.50 in February, but downside shocks remain a technical hazard for bidders.
Despite a halting recovery from recent lows near $68.00 per barrel, WTI remains down nearly 18% from 2023’s October highs near $94.00.
WTI hourly chart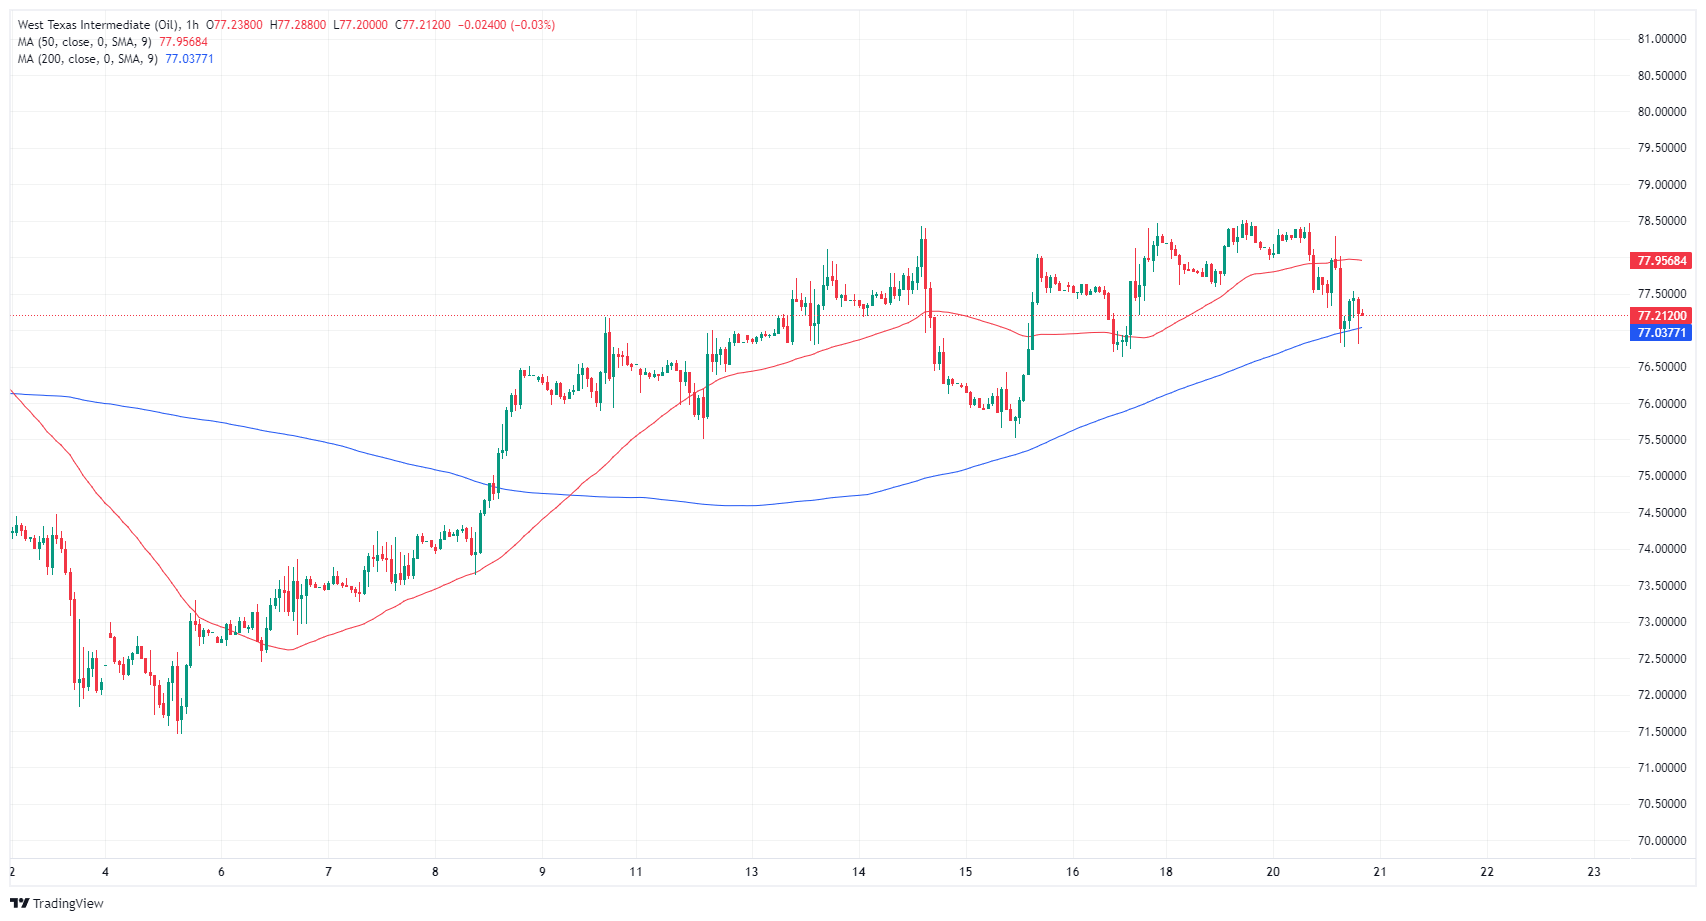
WTI daily chart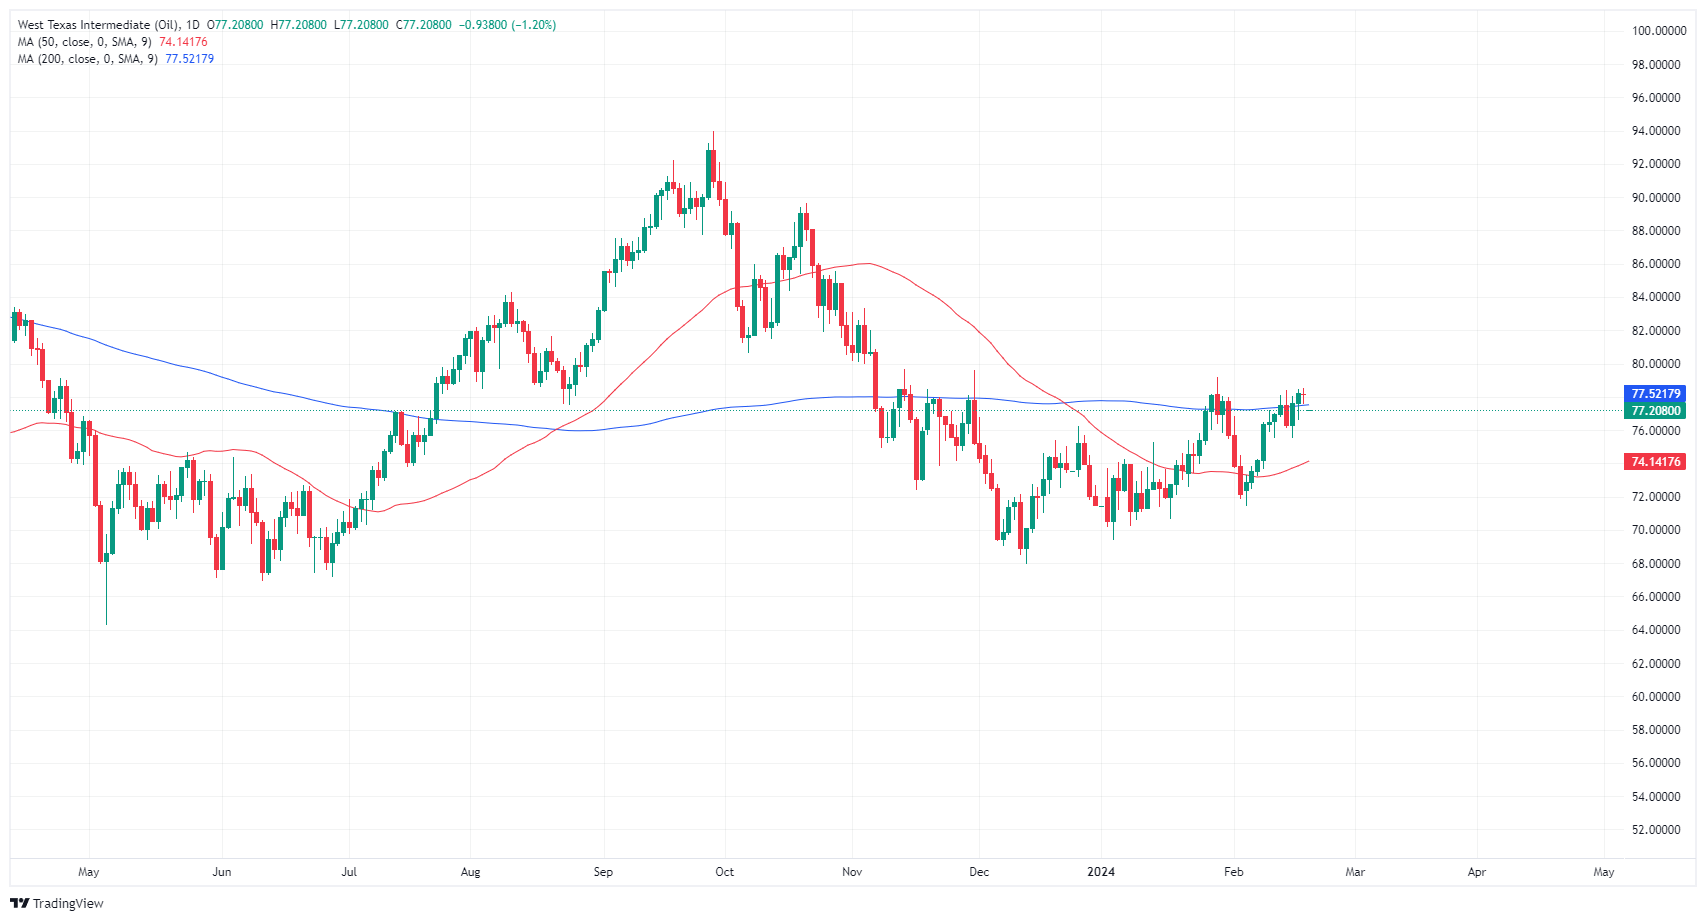
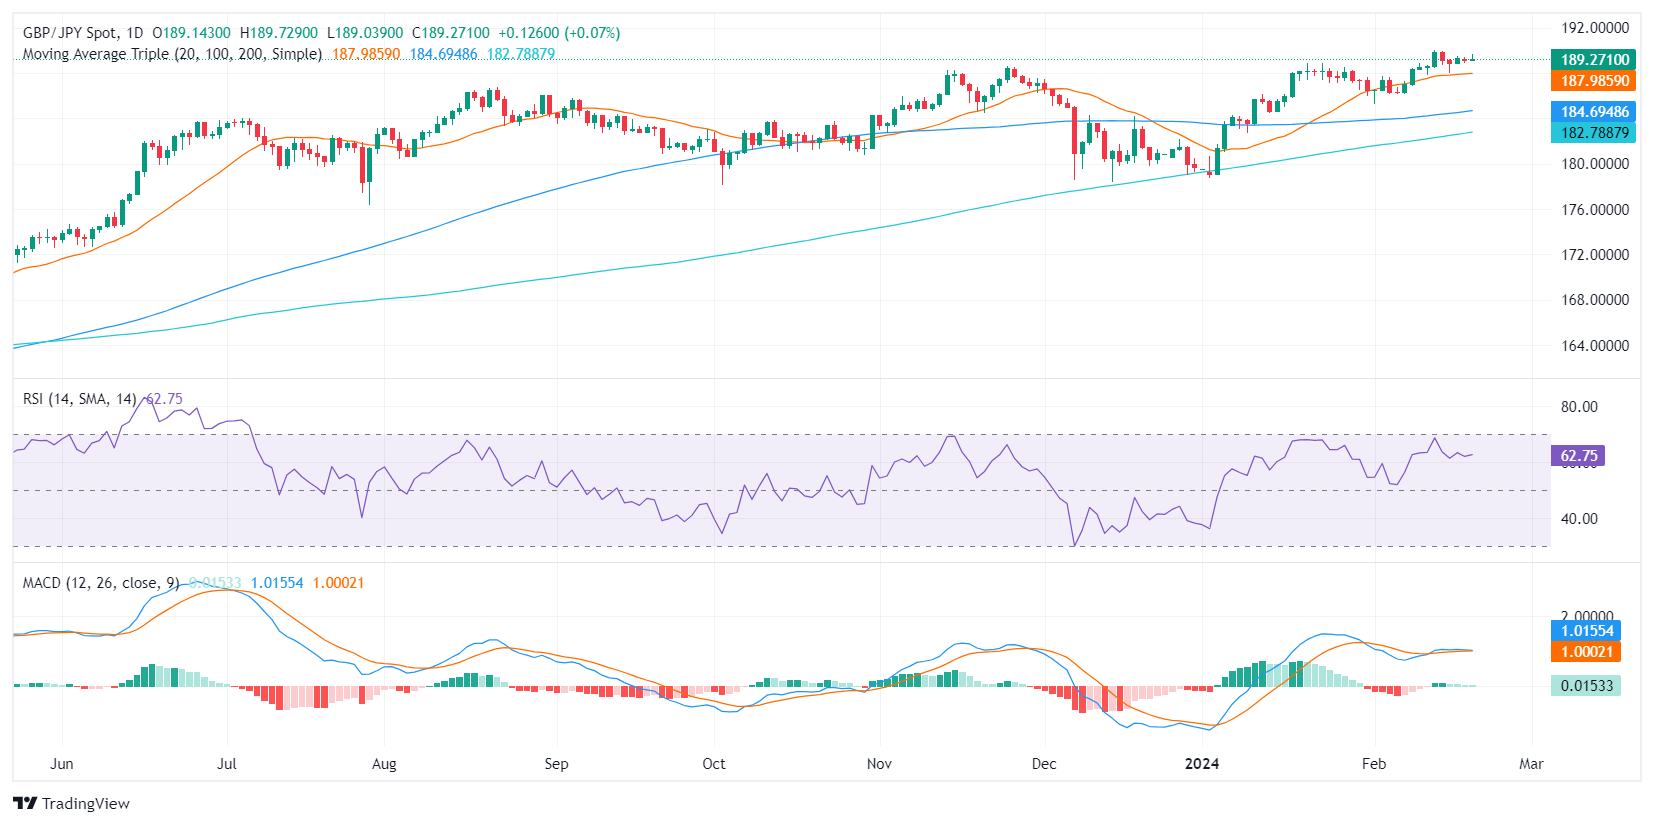
- The GBP/JPY stands at 189.24 reflecting a moderate gain of 0.11% in Tuesday's trading session.
- The Bank of England maintains its neutral stance, with Governor Bailey hinting at potential rate cuts even before inflation reaches the bank’s target.
- Japanese and British preliminary PMIs from February are due on Thursday.
In Tuesday's session, the GBP/JPY pair recorded modest gains, trading at 189.24. Influences on the pair's movement encompass the ongoing shifts in both UK and Japanese financial and economic landscapes which are shaping the Bank of England (BoE) and the Bank of Japan (BoJ) monetary policy decisions. The British bank remains cautious warning about the resilient local economy while the BoJ doesn’t give clear signals on when it will leave its ultra-loose policy.
On the British front, Bank of England (BoE) officials, including Governor Andrew Bailey, gave no fresh policy guidance during their testimony before the UK Treasury Select Committee. Bailey perceived an upturn in the economy and advised that the central bank could consider rate cuts even before inflation hits their target levels. However, as for now, markets are pricing in that the first rate cut will be in the August meeting but incoming data will continue shaping the timing of the easing cycle.
GBP/JPY daily chart
The daily Relative Strength Index (RSI) for GBPJPY is currently situated in positive territory, marking a slight uptrend, with a mild surge further cementing bullish control. Meanwhile, the Moving Average Convergence Divergence (MACD) histogram, complementing the bullish cues from the RSI, has continued to print green bars, reflecting consistently positive momentum in recent days, although the flattening slopes point towards potential slowing of the current bullish momentum.
Finally, it's worth noting that GBPJPY remains above its 20, 100, and 200-day Simple Moving Averages (SMAs), hinting at the bullish command in the overall trend, despite indicators showing some signs of flattening. This technical position largely backs the continued dominance of buyers, with any near-term pullbacks likely serving as technical corrections for further climbs in the medium-to-long term.
GBP/JPY daily chart
What you need to take care of on Wednesday, February 21:
The US Dollar edged lower on Tuesday, extending its slide after the long weekend amid mounting speculation the Fed will further delay the first rate cut. The CME Group FedWatch Tool now shows market players are moving their bets towards June. The odds for a 25 basis points (bps) March rate cut had decreased to 34.4%, while June ones increased to 55.1%.
Stock markets traded with a tepid tone, with Wall Street spending most of the day in the red.
Bank of England (BoE) policymakers testified on inflation and the economic outlook before Parliament's Treasury Committee. Governor Andrew Bailey said that the UK economy is at full employment and added it is already showing distinct signs of an upturn. He added inflation does not need to fall back to 2% before rate cuts materialize, and commented it’s not unreasonable to expect a rate cut this year, although he refrained from providing a specific date.
Canada reported the January Consumer Price Index (CPI), which rose by 2.9% YoY s in January down from 3.4% in December, according to Statistics Canada
The Federal Open Market Committee (FOMC) will release the latest meeting Minutes on Wednesday. The document will likely provide fresh clues on what policymakers considered in their latest meeting to dismiss a March rate cut, while speculative interest will try to assess the odds and dates for upcoming cuts.
The EUR/USD pair neared 1.0840, holding above the 1.0800 level early Wednesday. GBP/USD settled around 1.2620. The Canadian Dollar was the worst performer vs the Greenback, as the pair trades around 1.3520. The AUD/USD, on the other hand, is up for a fifth consecutive day and trades around 0.6550. Finally, CHF and JPY posted modest losses vs the USD, while Gold topped $2,030 a troy ounce.
US Dollar price today
The table below shows the percentage change of US Dollar (USD) against listed major currencies today. US Dollar was the weakest against the .
| USD | EUR | GBP | CAD | AUD | JPY | NZD | CHF | |
| USD | -0.29% | -0.25% | 0.19% | -0.30% | -0.13% | -0.42% | -0.11% | |
| EUR | 0.29% | 0.02% | 0.47% | 0.00% | 0.15% | -0.13% | 0.18% | |
| GBP | 0.25% | -0.04% | 0.43% | -0.05% | 0.10% | -0.18% | 0.14% | |
| CAD | -0.19% | -0.47% | -0.43% | -0.48% | -0.34% | -0.60% | -0.30% | |
| AUD | 0.30% | 0.00% | 0.04% | 0.47% | 0.16% | -0.13% | 0.18% | |
| JPY | 0.14% | -0.13% | -0.12% | 0.31% | -0.13% | -0.28% | 0.01% | |
| NZD | 0.41% | 0.13% | 0.17% | 0.60% | 0.13% | 0.28% | 0.31% | |
| CHF | 0.11% | -0.18% | -0.14% | 0.29% | -0.20% | -0.03% | -0.31% |
The heat map shows percentage changes of major currencies against each other. The base currency is picked from the left column, while the quote currency is picked from the top row. For example, if you pick the Euro from the left column and move along the horizontal line to the Japanese Yen, the percentage change displayed in the box will represent EUR (base)/JPY (quote).
- EUR/USD climbed above 1.0800 early Tuesday, testing the 1.0840 region.
- Broad market US Dollar sell-off props up the Fiber.
- Markets await Fed Meeting Minutes, EU PMIs.
EUR/USD climbed to a two-week high just shy of 1.0840 on Tuesday after the US Dollar (USD) broadly fell before recovering in the US trading session after American markets returned to the fold following an extended weekend. EUR/USD reclaimed the 1.0800 handle for the first time in a week as the pair grapples with jump-starting a bullish recovery.
Markets are gearing up for the latest Meeting Minutes from the Federal Reserve’s (Fed) Federal Open Market Committee (FOMC). European markets are also buckling down for the wait to euro area Purchasing Managers Index (PMI) figures due on Thursday.
Daily digest market movers: EUR/USD recovers ahead of Fed minutes, EU PMI activity data
- Broad market flows dominate EUR/USD as investors await the Fed’s latest Meeting Minutes.
- Investors continue to hope for faster, sooner rate cuts from the FOMC.
- According to the CME’s FedWatch Tool, money markets are pricing in a first rate cut in June of at least 25 basis points.
- Markets still see five rate cuts in 2024 compared to the Fed’s own expectations of three.
- European PMIs on Thursday broadly expected to improve but still remain in contraction territory as the pan-European economy grapples with sluggish growth and a softening landscape.
- Germany’s HCOB Composite PMI in February expected to recover to 47.5 in February compared to January’s 47.0.
- The euro area’s broader HCOB Composite PMI is forecast to bounce to 48.5 from 47.9 in February.
- Europe’s final Harmonized Index of Consumer Prices (HICP) for the year ended in January is expected to reiterate the preliminary print of 3.3% YoY.
- US PMIs will follow on Thursday but are expected to soften with the Services component forecast to decline to 52.0 from 52.5, while the Manufacturing component is expected to tick down to 50.5 from 50.7.
Euro price today
The table below shows the percentage change of Euro (EUR) against listed major currencies today. Euro was the strongest against the Canadian Dollar.
| USD | EUR | GBP | CAD | AUD | JPY | NZD | CHF | |
| USD | -0.32% | -0.29% | 0.12% | -0.34% | -0.19% | -0.44% | -0.13% | |
| EUR | 0.32% | 0.03% | 0.44% | -0.02% | 0.12% | -0.11% | 0.19% | |
| GBP | 0.29% | -0.03% | 0.41% | -0.05% | 0.10% | -0.15% | 0.16% | |
| CAD | -0.12% | -0.44% | -0.39% | -0.45% | -0.31% | -0.56% | -0.25% | |
| AUD | 0.34% | 0.02% | 0.05% | 0.46% | 0.15% | -0.10% | 0.21% | |
| JPY | 0.19% | -0.13% | -0.11% | 0.31% | -0.14% | -0.26% | 0.06% | |
| NZD | 0.42% | 0.12% | 0.15% | 0.54% | 0.11% | 0.18% | 0.30% | |
| CHF | 0.13% | -0.19% | -0.17% | 0.25% | -0.19% | -0.07% | -0.32% |
The heat map shows percentage changes of major currencies against each other. The base currency is picked from the left column, while the quote currency is picked from the top row. For example, if you pick the Euro from the left column and move along the horizontal line to the Japanese Yen, the percentage change displayed in the box will represent EUR (base)/JPY (quote).
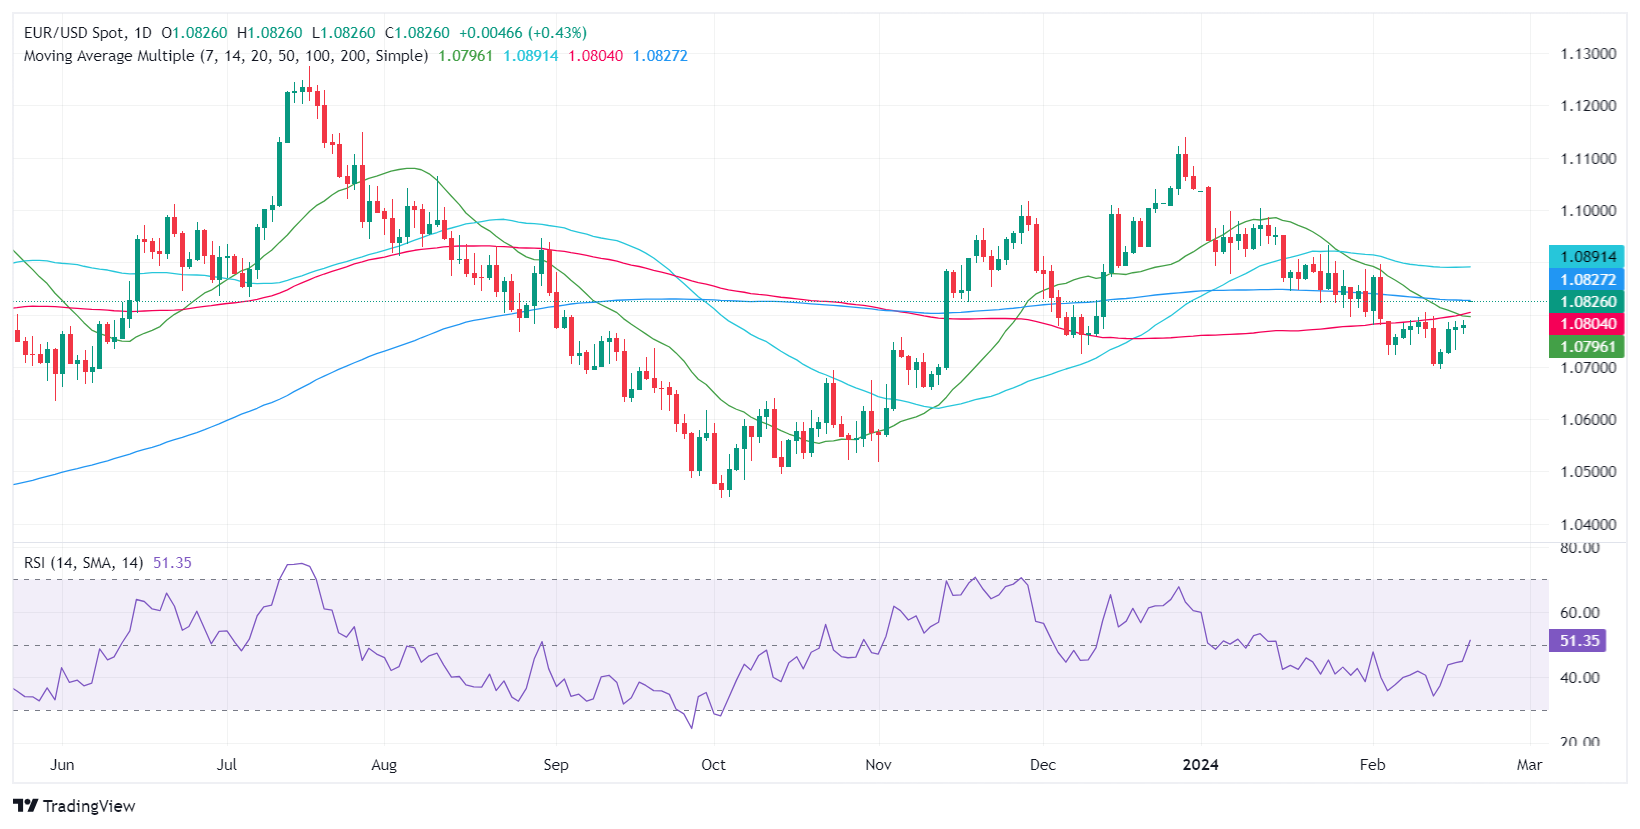
Technical analysis: EUR/USD approaches 1.0840 before buckling under pressure
The EUR/USD came within range of 1.0840 in Tuesday’s early recovery before paring back into the 1.0800 zone. The pair remains bolstered by the 200-hour Simple Moving Average (SMA) near 1.0760. The Fiber continues to grind out a near-term bullish recovery, but technical resistance continues to build as lower highs weigh.
EUR/USD remains trapped on the bearish side of the 200-day SMA at 1.0830, and the pair’s recent descent into 1.0700 represents the EUR/USD’s lowest bids since November. The pair is set for a fifth consecutive bullish close but is still down around 3% from December’s peak at 1.1140.
EUR/USD hourly chart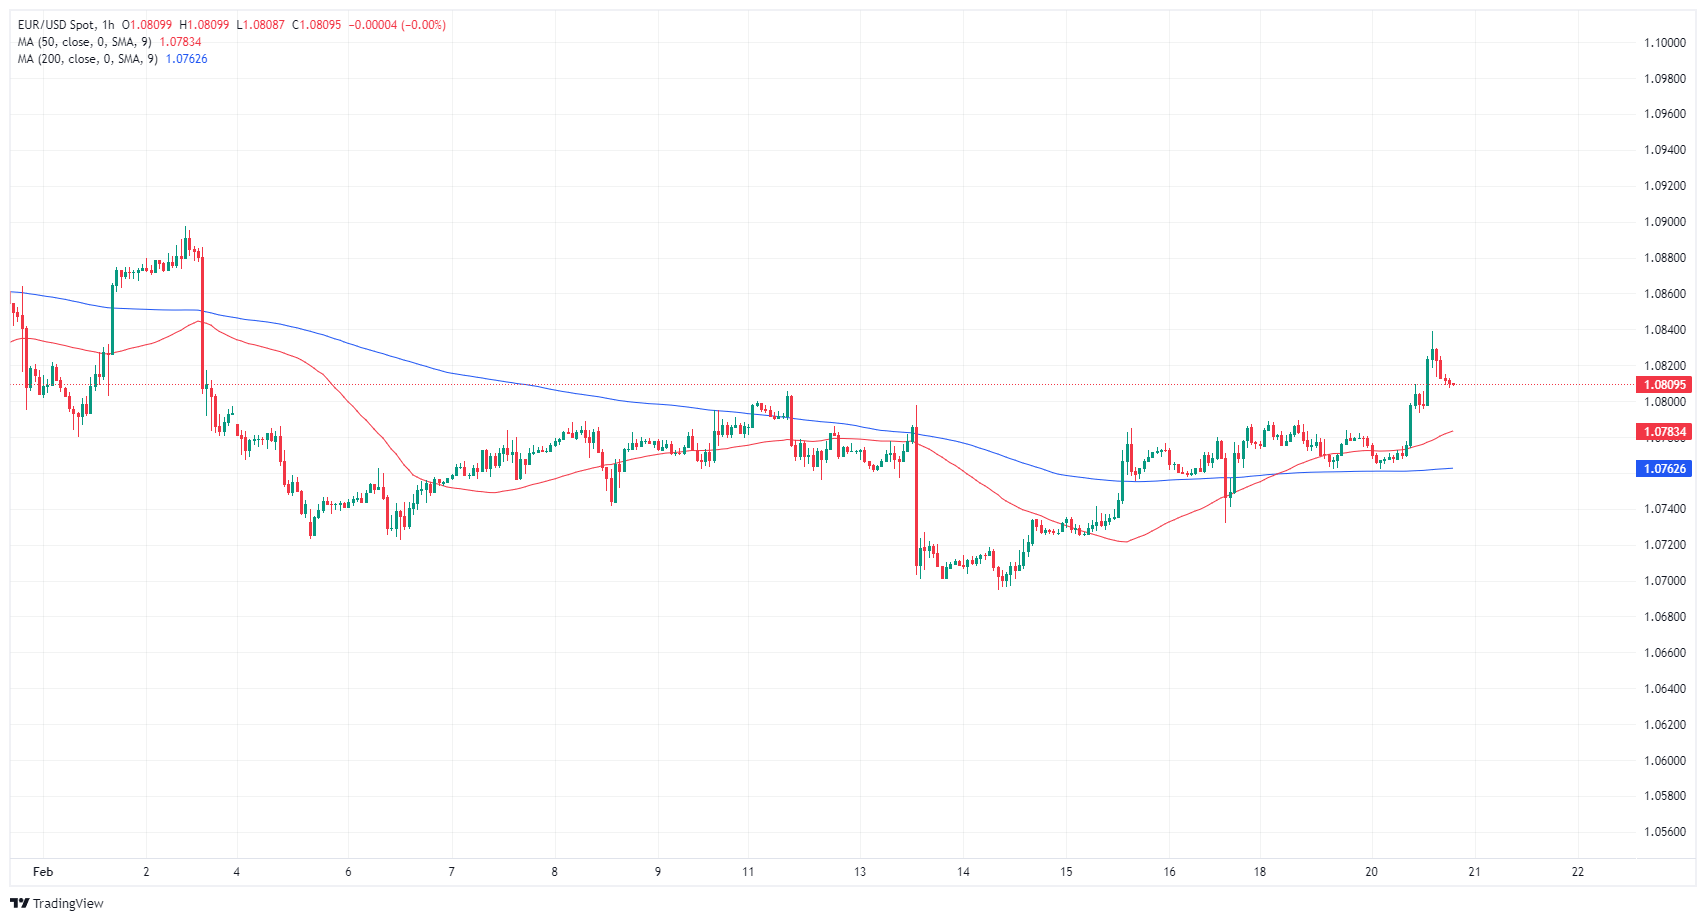
EUR/USD daily chart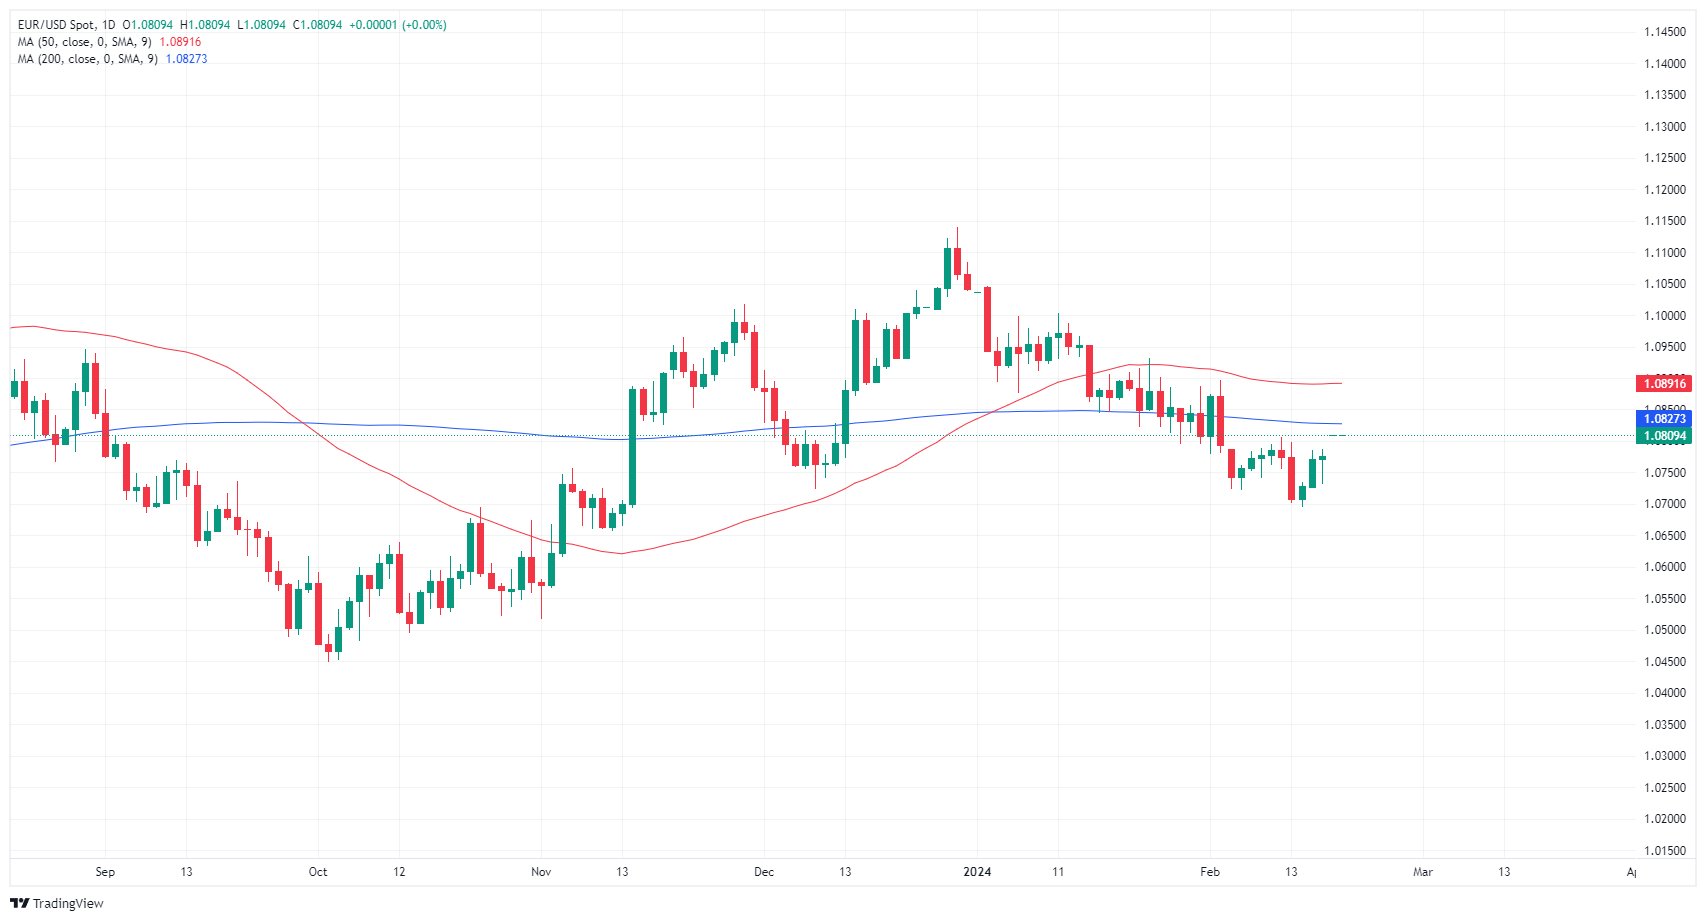
Euro FAQs
What is the Euro?
The Euro is the currency for the 20 European Union countries that belong to the Eurozone. It is the second most heavily traded currency in the world behind the US Dollar. In 2022, it accounted for 31% of all foreign exchange transactions, with an average daily turnover of over $2.2 trillion a day.
EUR/USD is the most heavily traded currency pair in the world, accounting for an estimated 30% off all transactions, followed by EUR/JPY (4%), EUR/GBP (3%) and EUR/AUD (2%).
What is the ECB and how does it impact the Euro?
The European Central Bank (ECB) in Frankfurt, Germany, is the reserve bank for the Eurozone. The ECB sets interest rates and manages monetary policy.
The ECB’s primary mandate is to maintain price stability, which means either controlling inflation or stimulating growth. Its primary tool is the raising or lowering of interest rates. Relatively high interest rates – or the expectation of higher rates – will usually benefit the Euro and vice versa.
The ECB Governing Council makes monetary policy decisions at meetings held eight times a year. Decisions are made by heads of the Eurozone national banks and six permanent members, including the President of the ECB, Christine Lagarde.
How does inflation data impact the value of the Euro?
Eurozone inflation data, measured by the Harmonized Index of Consumer Prices (HICP), is an important econometric for the Euro. If inflation rises more than expected, especially if above the ECB’s 2% target, it obliges the ECB to raise interest rates to bring it back under control.
Relatively high interest rates compared to its counterparts will usually benefit the Euro, as it makes the region more attractive as a place for global investors to park their money.
How does economic data influence the value of the Euro?
Data releases gauge the health of the economy and can impact on the Euro. Indicators such as GDP, Manufacturing and Services PMIs, employment, and consumer sentiment surveys can all influence the direction of the single currency.
A strong economy is good for the Euro. Not only does it attract more foreign investment but it may encourage the ECB to put up interest rates, which will directly strengthen the Euro. Otherwise, if economic data is weak, the Euro is likely to fall.
Economic data for the four largest economies in the euro area (Germany, France, Italy and Spain) are especially significant, as they account for 75% of the Eurozone’s economy.
How does the Trade Balance impact the Euro?
Another significant data release for the Euro is the Trade Balance. This indicator measures the difference between what a country earns from its exports and what it spends on imports over a given period.
If a country produces highly sought after exports then its currency will gain in value purely from the extra demand created from foreign buyers seeking to purchase these goods. Therefore, a positive net Trade Balance strengthens a currency and vice versa for a negative balance.
- The DXY index shows weakness as the US returns from holiday, trading modestly lower.
- No relevant reports were released during the session, while markets await fresh catalysts.
- All eyes are now on FOMC minutes from January’s Federal Reserve meeting on Wednesday.
The US Dollar (USD), as measured by the DXY index, is trading modestly lower at 104.05 with no relevant highlights seen during the European and American sessions.
Despite a post-holiday dip, the US Dollar's stance remains firm amidst a resilient US economy and a seemingly unshakeable Federal Reserve (Fed), whose reluctance to resort to monetary easing may eventually limit the Greenback’s losses.
Daily digest market movers: The US Dollar trades mildly lower ahead of FOMC minutes
- Markets await fresh drivers to continue timing the start of the Fed’s easing cycle. FOMC’s January Meeting Minutes are due on Wednesday.
- Market anticipation is also brewing for upcoming speeches from Federal Reserve members Bowman (Wednesday) and Kashkari (Thursday) to gather additional insights.
- According to the CME FedWatch Tool, the odds of a Fed cut have significantly declined for the March and May meeting as markets push the projected start of easing to June.
Technical analysis: DXY gives up 100-day SMA, more downside may be on the horizon
The daily chart indicators reflect the somewhat conflicted picture of the current technical landscape. Despite the Relative Strength Index (RSI) sitting in positive territory, its negative slope signals a weakening of bullish momentum, hinting at potential downside risks. Simultaneously, the green bars in the Moving Average Convergence Divergence (MACD) histogram are decreasing, indicating a slowdown in buying pressure and a potential shift in sentiment.
Furthermore, although the pair is trading above the 20 and 200-day Simple Moving Averages (SMAs), which suggests a traditionally bullish stance, the struggle of the bulls to effectively consolidate above the 100-day average puts the strength of the uptrend in doubt.
US Dollar FAQs
What is the US Dollar?
The US Dollar (USD) is the official currency of the United States of America, and the ‘de facto’ currency of a significant number of other countries where it is found in circulation alongside local notes. It is the most heavily traded currency in the world, accounting for over 88% of all global foreign exchange turnover, or an average of $6.6 trillion in transactions per day, according to data from 2022.
Following the second world war, the USD took over from the British Pound as the world’s reserve currency. For most of its history, the US Dollar was backed by Gold, until the Bretton Woods Agreement in 1971 when the Gold Standard went away.
How do the decisions of the Federal Reserve impact the US Dollar?
The most important single factor impacting on the value of the US Dollar is monetary policy, which is shaped by the Federal Reserve (Fed). The Fed has two mandates: to achieve price stability (control inflation) and foster full employment. Its primary tool to achieve these two goals is by adjusting interest rates.
When prices are rising too quickly and inflation is above the Fed’s 2% target, the Fed will raise rates, which helps the USD value. When inflation falls below 2% or the Unemployment Rate is too high, the Fed may lower interest rates, which weighs on the Greenback.
What is Quantitative Easing and how does it influence the US Dollar?
In extreme situations, the Federal Reserve can also print more Dollars and enact quantitative easing (QE). QE is the process by which the Fed substantially increases the flow of credit in a stuck financial system.
It is a non-standard policy measure used when credit has dried up because banks will not lend to each other (out of the fear of counterparty default). It is a last resort when simply lowering interest rates is unlikely to achieve the necessary result. It was the Fed’s weapon of choice to combat the credit crunch that occurred during the Great Financial Crisis in 2008. It involves the Fed printing more Dollars and using them to buy US government bonds predominantly from financial institutions. QE usually leads to a weaker US Dollar.
What is Quantitative Tightening and how does it influence the US Dollar?
Quantitative tightening (QT) is the reverse process whereby the Federal Reserve stops buying bonds from financial institutions and does not reinvest the principal from the bonds it holds maturing in new purchases. It is usually positive for the US Dollar.
- Gold reaches $2,028.44, climbing for the fourth day on China's rate moves and US inflation figures.
- US Treasury yields fall, showing market caution and adjusted expectations for Fed rate cuts amid inflation.
- Market anticipates FOMC minutes for clues on Fed's policy stance, bolstering Gold as an uncertainty hedge.
Gold price rallied for the fourth straight day during the mid-North American session as traders from the United States (US) got back to their desks and digested the latest economic news. News that China lowered interest rates sponsored Gold’s leg-up alongside the drop in US Treasury bond yields.
Meanwhile, last week’s data from the US, with the Consumer Price Index (CPI) and the Producer Price Index (PPI) smashing estimates, sounded alarms that inflation remains stickier than expected. The XAU/USD trades at $2,028.44, up 0.52%.
Trading resumed in the US on Tuesday after Monday's Presidents' Day holiday. US Treasury bond yields edged lower as depicted by the 10-year note yield down four basis points to 4.256%. This is despite investors adopting a cautious stance on the US Federal Reserve (Fed) as data from the Chicago Board of Trade (CBOT) expects the Fed to lower rates by 102 basis points in 2024, less than the 180 bps estimated in mid-January.
Nevertheless, the Greenback (USD) is treading water amid the lack of economic data on the US docket. Traders await the release of the last Federal Open Market Committee (FOMC) Meeting Minutes.
Daily digest market movers: Gold advanced despite investors pushing Fed rate cuts to June
- The CME FedWatch Tool sees traders expect the first 25 bps rate cut by the Fed in June 2024.
- Investors are pricing in 102 basis points of easing throughout 2024.
- The US Dollar Index, tracking the performance of the US Dollar against a basket of six major currencies, is currently trading within a narrow range around 104.20.
- The latest inflation reports from the US triggered a change of language from Fed officials, who struck a “cautious” tone. Atlanta Fed President Raphael Bostic suggested the Fed is in no rush to ease policy.
- San Francisco Fed President Mary Daly stated, “We will need to resist the temptation to act quickly when patience is needed and be prepared to respond agilely as the economy evolves.”
- This week the US economic schedule will feature the release of the latest Federal Reserve Open Market Committee (FOMC) Minutes alongside Fed officials' speeches beginning on Wednesday.
- Traders will get further cues from US S&P Global PMIs, Initial Jobless Claims data and the Chicago Fed National Activity Index, usually a prelude to the Institute for Supply Management's (ISM) Manufacturing PMI.
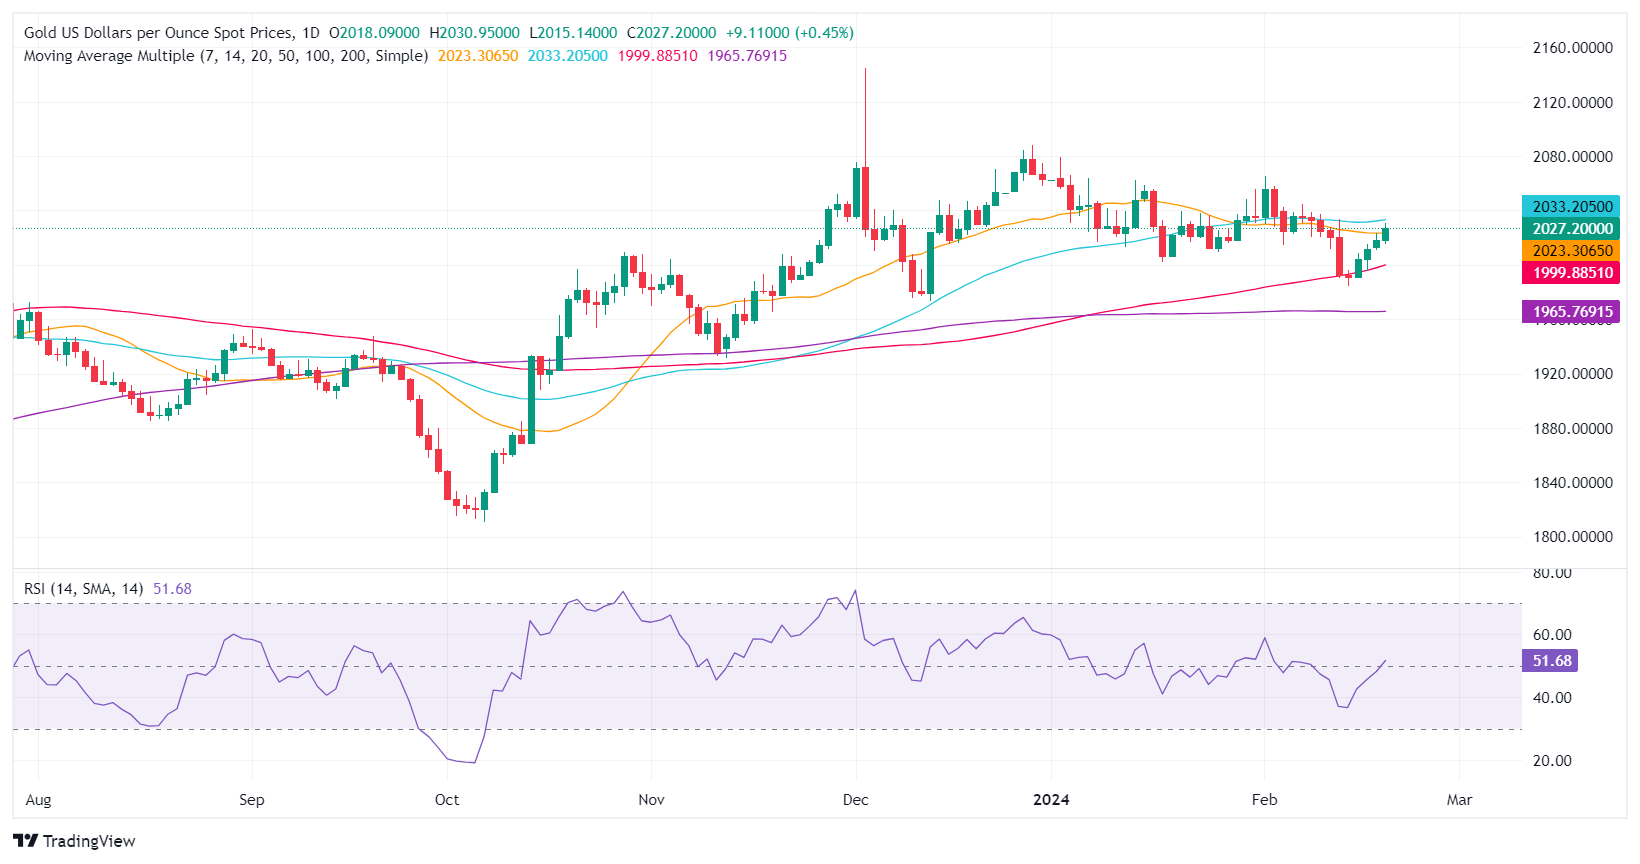
Technical Analysis: Gold stays above 100-day SMA, eyes key resistance near 50-day SMA
Gold´s daily chart portrays the non-yielding metal as neutral to downwardly biased despite staying above the 200-day Simple Moving Average (SMA) at $1,965.46 and extending its gains toward the 50-day SMA at $2,033.69. A breach of the latter will expose $2,050 ahead of the latest cycle high at $2,065.60.
On the flip side, if sellers step in and push prices below the $2,000 figure, that will expose the 100-day SMA at $1,998. The next stop would be the December 13 low at $1,973.13, followed by the 200-day SMA at $1,965.47.
Gold FAQs
Why do people invest in Gold?
Gold has played a key role in human’s history as it has been widely used as a store of value and medium of exchange. Currently, apart from its shine and usage for jewelry, the precious metal is widely seen as a safe-haven asset, meaning that it is considered a good investment during turbulent times. Gold is also widely seen as a hedge against inflation and against depreciating currencies as it doesn’t rely on any specific issuer or government.
Who buys the most Gold?
Central banks are the biggest Gold holders. In their aim to support their currencies in turbulent times, central banks tend to diversify their reserves and buy Gold to improve the perceived strength of the economy and the currency. High Gold reserves can be a source of trust for a country’s solvency. Central banks added 1,136 tonnes of Gold worth around $70 billion to their reserves in 2022, according to data from the World Gold Council. This is the highest yearly purchase since records began. Central banks from emerging economies such as China, India and Turkey are quickly increasing their Gold reserves.
How is Gold correlated with other assets?
Gold has an inverse correlation with the US Dollar and US Treasuries, which are both major reserve and safe-haven assets. When the Dollar depreciates, Gold tends to rise, enabling investors and central banks to diversify their assets in turbulent times. Gold is also inversely correlated with risk assets. A rally in the stock market tends to weaken Gold price, while sell-offs in riskier markets tend to favor the precious metal.
What does the price of Gold depend on?
The price can move due to a wide range of factors. Geopolitical instability or fears of a deep recession can quickly make Gold price escalate due to its safe-haven status. As a yield-less asset, Gold tends to rise with lower interest rates, while higher cost of money usually weighs down on the yellow metal. Still, most moves depend on how the US Dollar (USD) behaves as the asset is priced in dollars (XAU/USD). A strong Dollar tends to keep the price of Gold controlled, whereas a weaker Dollar is likely to push Gold prices up.
- AUD/USD climbed after the RBA pondered rate cuts.
- The Aussie’s extended recovery got hampered after falling just short of 0.6580.
- Fed watchers will be pivoting to Wednesday’s FOMC Meeting Minutes.
The AUD/USD climbed on Tuesday, rebounding from the day’s low near 0.6520 to fall just shy of 0.6580 before pulling back into the day’s range. The Reserve Bank of Australia (RBA) held rates steady early Tuesday as markets broadly expected, but another rate hike is still in the ether and investors will be looking to suss out how close the Federal Reserve (Fed) is to cuttign interest rates when the Federal Open Market Committee’s latest Meeting Minutes drop on Wednesday.
The RBA held rates for the time being, but the Australian central bank’s internal dialogue appears to be leaning towards further rate cuts if faster progress isn’t made on inflation soon. With Australia’s lop-sided economy grappling with a tight labor market and still-high services inflation, the RBA expects it could take until well into 2025 before inflation reaches target levels.
RBA Minutes: Board considered a hike of 25bp or an on hold decision
With the potential for another rate hike on the table, the Aussie (AUD) climbed through Tuesday’s early trading session, before getting pared back during the US market window.
The mid-week trading session will see eyes on the Fed and its FOMC’s latest Meeting Minutes, slated to release at 19:00 GMT on Wednesday. Investors will be looking to see how close the Fed is to delivering interest rate cuts, with the market broadly expecting a first rate trim in June or July, according to the CME’s FedWatch Tool.
AUD/USD technical outlook
The AUD/USD found its highest bids in nearly three weeks on Tuesday, climbing towards 0.6580 but falling just short of the interim level before getting pulled back into 0.6550 on stiffer US Dollar (USD) flows. The pair is grappling with a low-conviction recovery from the last swing low into 0.6450, and bullish momentum is running into a technical ceiling at the 200-day Simple Moving Average near 0.6565.
Beyond near-term price action, a heavy resistance zone from 0.6620 to 0.6600 weighs on bullish momentum into the medium-term.
AUD/USD hourly chart
AUD/USD daily chart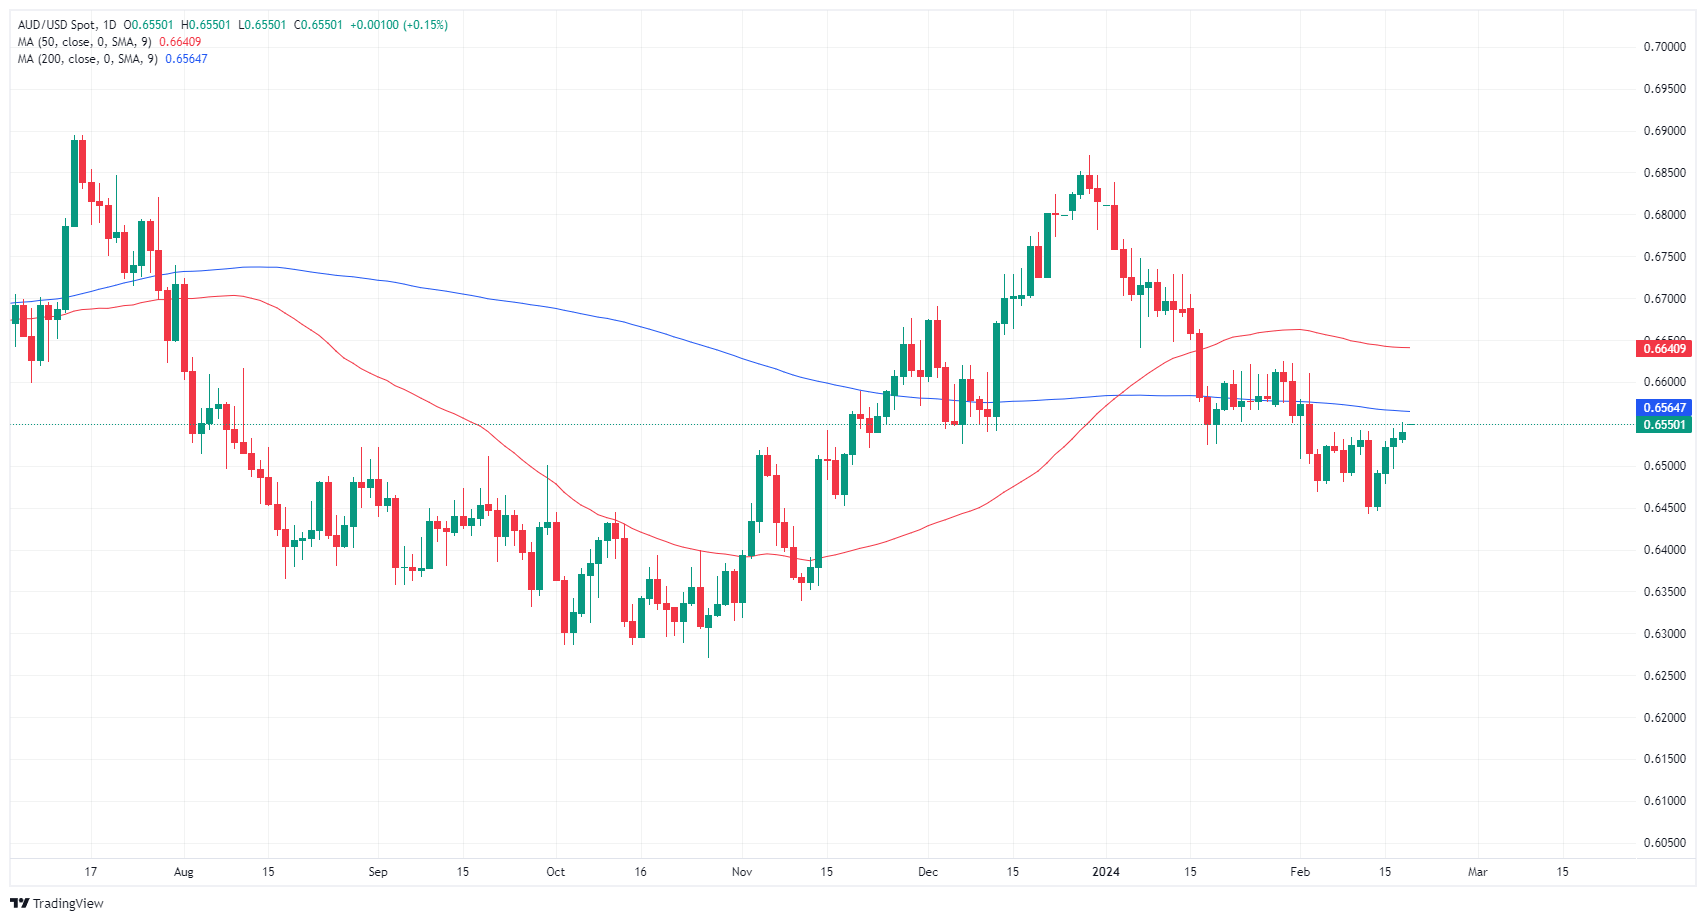
- The EUR/GBP pair stands at 0.8555, suffering mild losses in Tuesday's session.
- Divergences between the ECB and BoE are driving the pair.
- Markets are fully pricing in a cut by the BoE in August.
In Tuesday's session, the EUR/GBP traded mildly lower at 0.8555 with the cross easing from daily highs following Andrew Bailey’s comments.
The Bank of England (BOE) Governor Andrew Bailey warned on Tuesday that the bank need not wait for inflation to reach the target before cutting rates and other than that he didn’t provide any fresh guidance stating that “I can't say when or how much rates will be cut”. Current market expectations perceive virtually no chance of a cut on March 21, rising to nearly 25% by May 9 and rising past 60% by June 20. Rate reductions are fully priced in by August 1.
On the European Central Bank (ECB) side, investors are seeing more easing than the BoE, between 100 and 125 bps, priced in to start in June. However, incoming data will shape the expectations and timing of the easing cycles.
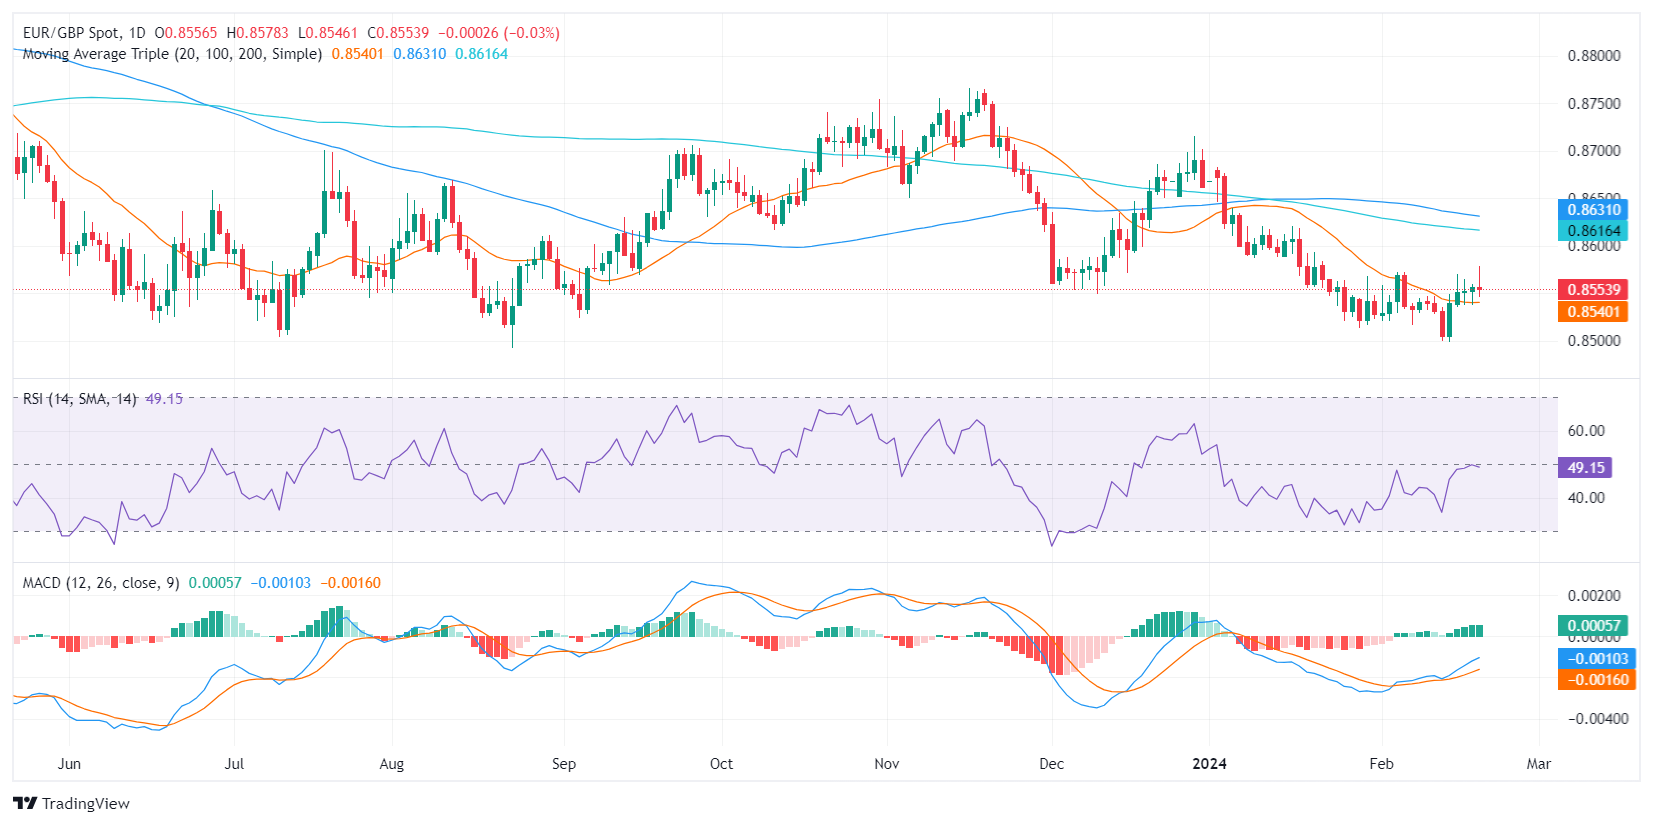
EUR/GBP technical analysis
On the technical front, the Relative Strength Index (RSI) for the EURGBP pair shows a cooling momentum as it hovers within neutral territory. There's been a slight decrease in the daily RSI level suggesting a market slowdown. Meanwhile, as for the Moving Average Convergence Divergence (MACD), the histogram prints flat green bars, aligning with the RSI. Moreover, the overall trend is still negative as the pair trades below the 100 and 200-day Simple Moving Averages (SMA), but if the buyers hold above the 20-day average, the pair could see some additional upside.
EUR/GBP daily chart
- GBP/USD rises to 1.2643, driven by BoE Governor's positive outlook on UK economy and policy shifts.
- BoE's balanced view on inflation and rates boosts optimism, suggesting possible rate reductions amid employment achievements.
- US Leading Index and imminent FOMC minutes expected to offer more insights for GBP/USD in light of worldwide economic adjustments.
The Pound Sterling rose against the US Dollar in the mid-North American session as US traders got back to their offices. Reasons like the Bank of England (BoE) Governor Andrew Bailey stating that Britain’s economy could fare better than expected propelled the GBP/USD pair up. At the time of writing, the major exchanges hands at 1.2643, up 0.40%.
GBP/USD gains on positive economic signals from BoE officials, eyes Fed minutes
UK’s economic calendar featured BoE speakers. BoE’s Michael Broadbent said the question has moved on from the degree of policy restrictiveness to its duration. He added that more persistent components of inflation “may have peaked” while not ruling out policy easing at some time.
The BoE Governor Andrew Baily commented that the economy is recovering, highlighting that it is at full employment. He added, “We don’t need inflation to be back at target before cutting rates,” while noting that he can’t say when the BoE will ease policy.
At the same time, BoE’s member Swati Dhingra, which voted to cut rates, noted that downside risks to the UK economy are substantial due to the restrictiveness of the economy and added that consumption is still very weak.
A Reuters poll revealed the Bank of England would cut the Bank Rate to 4.75% in Q3 2024, while the UK economy is expected to expand by 0.3% in 2024 and 1.1% in 2025.
In the US, the economic docket remains light, though the US Conference Board is expected to reveal the Leading Index for January, which is estimated to plunge by 0.3% MoM. On Wednesday, the schedule will gather pace, with the release of the latest Federal Open Market Committee (FOMC) minutes and Fed speakers crossing the wires.
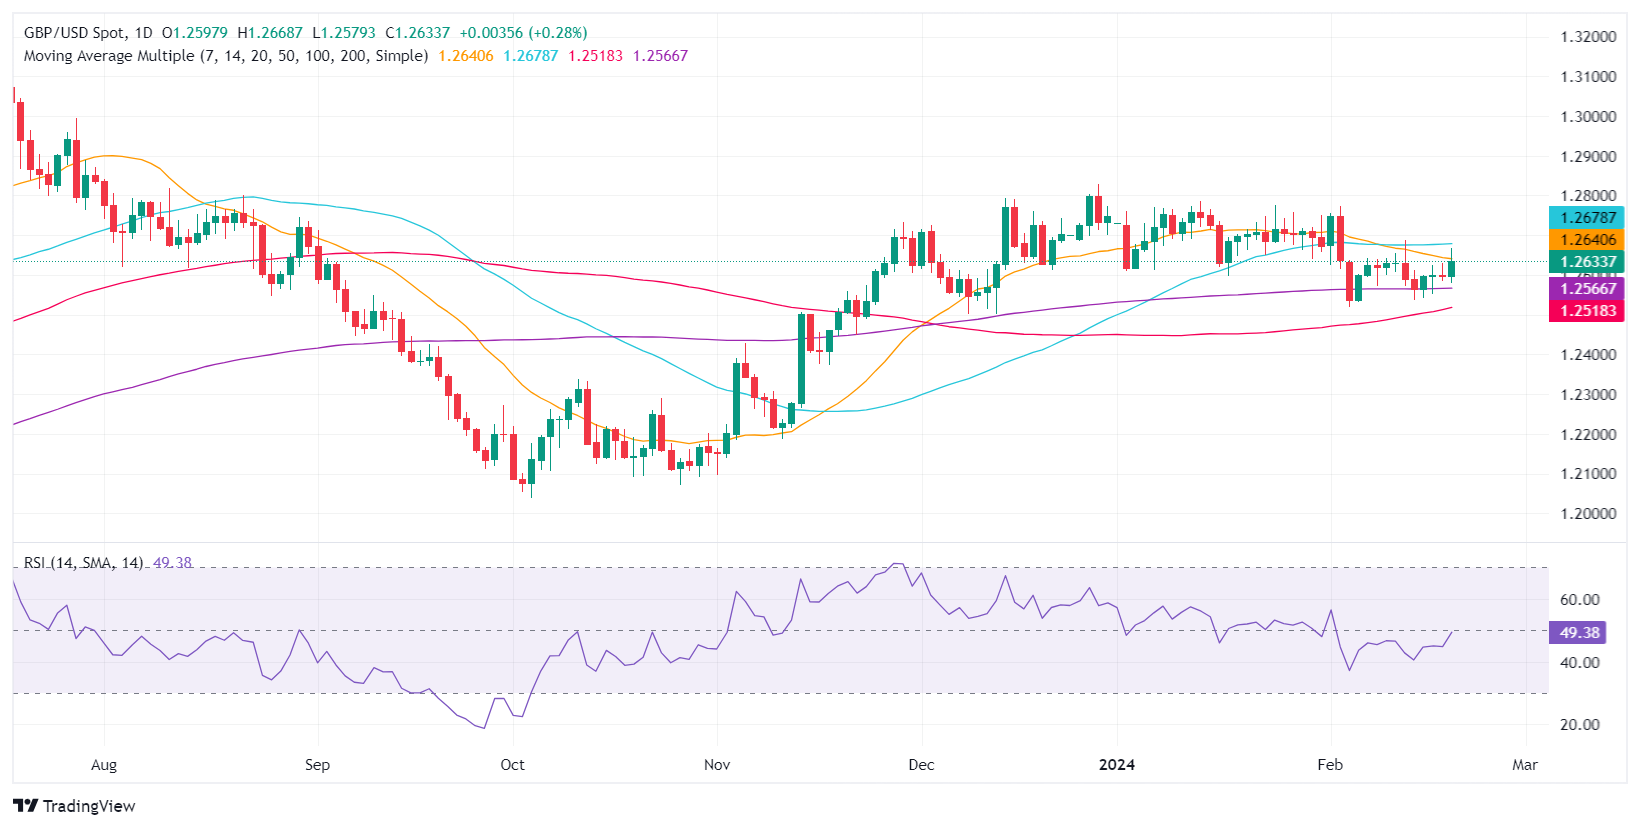
GBP/USD Price Analysis: Technical outlook
The GBP/USD is still range-bound but has edged towards the 50-day moving average (DMA) At 1.2671, the peak of that area, but retraced. However, a daily close above the February 19 high of 1.2629 could open the door for further gains. The next resistance would be the 50-DMA and 1.2700. Conversely, if sellers push the exchange rate below 1.2600, look for a fall to the 200-DMA at 1.2563.
- Mexican Peso faces pressure amid economic contraction concerns; falling US yields limit USD/MXN upside.
- INEGI's report shows Mexico's economy shrinking by 0.7% MoM, with a modest annual growth of 1.3%.
- US Treasury yield decline offers limited support to US Dollar as Conference Board's LEI dispels recession fears.
The Mexican Peso (MXN) lost traction against the US Dollar (USD) on Tuesday as traders from the United States (US) returned from the Presidents’ Day holiday. Monday’s data from Mexico suggests the economy most likely contracted in the first month of 2024, while a fall in US Treasury bond yields caps the USD/MXN upside. The pair exchanges hands at 17.04, up by a minuscule 0.06%.
A report from Mexico’s National Statistics Agency (INEGI) on Monday released the Indicator of Economic Activity (IOAE), which revealed the economy contracted -0.7% MoM, even though yearly figures grew by 1.3%. While data could have triggered weakness in the Mexican Peso, the US holiday capped the emerging market (EM) currency’s fall.
Across the border, US Treasury bond yields dropped, keeping the US Dollar pressured against most currencies, except EMs. In the meantime, the Conference Board (CB) revealed its Leading Economic Index (LEI), which no longer signals an upcoming recession in the US.
Daily digest market movers: Mexican Peso trips down as traders digest Monday’s data
- Mexico´s failure to resolve the steel and aluminum conflict with the US could weigh on the Mexican currency as US trade representative Katherine Tai warned Mexico that the US could reimpose tariffs on imports of the aforementioned commodities if the Mexican government doesn’t stop the increase in exports. US authorities question Mexico’s lack of transparency on imports of steel and aluminum from third countries.
- Mexico’s economic schedule will gather pace on Wednesday with the release of Retail Sales, Gross Domestic Product (GDP) and February’s Mid-Month inflation data.
- Mexico’s Retail Sales are expected to rise 0.2% MoM in December and 2.5% YoY.
- GDP is projected to have grown 0.1% in Q4 2023 and 2.4% YoY.
- Mid-month underlying inflation for February is foreseen cooling from 4.78% to 4.67 YoY, while headline inflation is projected to drop from 4.9% to 4.7%.
- On Wednesday, the US Federal Reserve (Fed) releases the latest Federal Open Market Committee (FOMC) Minutes alongside Fed officials crossing the wires.
- Traders will get further cues from US S&P Global PMIs, Initial Jobless Claims data and the Chicago Fed National Activity Index. The latter is usually a prelude to the Institute for Supply Management’s (ISM) Manufacturing PMI.
- US economic data related to price pressure should greatly influence Federal Reserve officials. Although opening the door to easing policy, Fed officials have expressed numerous times that they will not rush rate cuts.
- Fed’s Bostic said patience is required, and he foresees two rate cuts, which could begin in the summer if the data justifies it. Fed’s Daly said, “We will need to resist the temptation to act quickly when patience is needed and be prepared to respond agilely as the economy evolves.”
- Market players are expecting the first rate cut by the Federal Reserve at the June monetary policy meeting as they have trimmed odds for March and May.
Technical analysis: Mexican Peso prints minimal losses as USD/MXN breaks above 17.05
On Monday, I wrote, “The USD/MXN seesaws near the 17.05 mark, below the 50-day Simple Moving Average (SMA) at 17.09.” At the time of writing, the pair remains within the aforementioned level, though the Relative Strength Index (RSI) has begun to edge higher at the risk of shifting bullish. That and the USD/MXN clearing the 50-day SMA could open the door to test the 200-day SMA at 17.28. Further upside lies at the 100-day SMA at 17.38, before the pair rallies toward 17.50.
Conversely, sellers must drag the exchange rate below the 17.00 figure if they would like to remain hopeful of challenging last year’s low of 16.62.
USD/MXN Price Action – Daily Chart

Mexican Peso FAQs
What key factors drive the Mexican Peso?
The Mexican Peso (MXN) is the most traded currency among its Latin American peers. Its value is broadly determined by the performance of the Mexican economy, the country’s central bank’s policy, the amount of foreign investment in the country and even the levels of remittances sent by Mexicans who live abroad, particularly in the United States. Geopolitical trends can also move MXN: for example, the process of nearshoring – or the decision by some firms to relocate manufacturing capacity and supply chains closer to their home countries – is also seen as a catalyst for the Mexican currency as the country is considered a key manufacturing hub in the American continent. Another catalyst for MXN is Oil prices as Mexico is a key exporter of the commodity.
How do decisions of the Banxico impact the Mexican Peso?
The main objective of Mexico’s central bank, also known as Banxico, is to maintain inflation at low and stable levels (at or close to its target of 3%, the midpoint in a tolerance band of between 2% and 4%). To this end, the bank sets an appropriate level of interest rates. When inflation is too high, Banxico will attempt to tame it by raising interest rates, making it more expensive for households and businesses to borrow money, thus cooling demand and the overall economy. Higher interest rates are generally positive for the Mexican Peso (MXN) as they lead to higher yields, making the country a more attractive place for investors. On the contrary, lower interest rates tend to weaken MXN.
How does economic data influence the value of the Mexican Peso?
Macroeconomic data releases are key to assess the state of the economy and can have an impact on the Mexican Peso (MXN) valuation. A strong Mexican economy, based on high economic growth, low unemployment and high confidence is good for MXN. Not only does it attract more foreign investment but it may encourage the Bank of Mexico (Banxico) to increase interest rates, particularly if this strength comes together with elevated inflation. However, if economic data is weak, MXN is likely to depreciate.
How does broader risk sentiment impact the Mexican Peso?
As an emerging-market currency, the Mexican Peso (MXN) tends to strive during risk-on periods, or when investors perceive that broader market risks are low and thus are eager to engage with investments that carry a higher risk. Conversely, MXN tends to weaken at times of market turbulence or economic uncertainty as investors tend to sell higher-risk assets and flee to the more-stable safe havens.
- USD/CAD saw early declines before getting bolstered by a weak Canadian CPI.
- Canadian CPI inflation fell to 2.9% from the previous 3.4% YoY.
- Wednesday’s FOMC Meeting Minutes in the barrel as investors focus on rates.
USD/CAD fell to a daily low of 1.3472 on Tuesday before rebounding into an intraday high of 1.3530 after Canadian Consumer Price Index (CPI) inflation fell faster than markets expected. A weaker-than-expected Canadian inflation print softened the Canadian Dollar (CAD) across the board.
Canadian Retail Sales figures are due Thursday, and markets will be pivoting to focus on the Federal Reserve (Fed) and the Federal Open Market Committee (FOMC). The FOMC’s latest Meeting Minutes will drop on Wednesday.
Daily digest market movers: USD/CAD grapples with 1.3500 after Canadian inflation recedes
- Canadian CPI inflation declined to 2.9% for the year ended January, well below the forecast tick down to 3.3% from the previous period’s 3.4%.
- January’s MoM Canadian CPI printed unexpectedly at 0.0% versus the forecasted rebound to 0.4% from the previous month’s -0.3%.
- The Bank of Canada’s (BOC) Consumer Price Index Core for the year through January also declined to 2.4% from 2.6%.
- Canada CPI inflation falls to 2.9% vs. 3.3% expected
- Investors will be focusing on the FOMC’s latest Meeting Minutes on Wednesday as traders hope for signs the Fed will move closer to rate cuts.
- According to the CME’s FedWatch Tool, money markets are giving a 60% chance of no rate cut in May and 80% odds of at least a 25 basis point cut in June.
- Markets are expecting Thursday’s Canadian Retail Sales to bounce in December.
- MoM Retail Sales are expected to print at 0.8% versus the previous -0.2%, while Retail Sales Excluding Automobiles is forecast to recover to 0.7% from -0.5%.
Canadian Dollar price today
The table below shows the percentage change of Canadian Dollar (CAD) against listed major currencies today. Canadian Dollar was the strongest against the US Dollar.
| USD | EUR | GBP | CAD | AUD | JPY | NZD | CHF | |
| USD | -0.40% | -0.47% | 0.10% | -0.46% | -0.28% | -0.52% | -0.30% | |
| EUR | 0.39% | -0.07% | 0.51% | -0.06% | 0.12% | -0.11% | 0.10% | |
| GBP | 0.47% | 0.08% | 0.59% | 0.00% | 0.19% | -0.04% | 0.17% | |
| CAD | -0.10% | -0.52% | -0.58% | -0.57% | -0.40% | -0.63% | -0.42% | |
| AUD | 0.47% | 0.07% | 0.00% | 0.57% | 0.18% | -0.05% | 0.17% | |
| JPY | 0.29% | -0.10% | -0.19% | 0.38% | -0.18% | -0.22% | -0.02% | |
| NZD | 0.51% | 0.11% | 0.04% | 0.63% | 0.06% | 0.23% | 0.22% | |
| CHF | 0.31% | -0.10% | -0.17% | 0.41% | -0.16% | 0.02% | -0.21% |
The heat map shows percentage changes of major currencies against each other. The base currency is picked from the left column, while the quote currency is picked from the top row. For example, if you pick the Euro from the left column and move along the horizontal line to the Japanese Yen, the percentage change displayed in the box will represent EUR (base)/JPY (quote).
Technical analysis: USD/CAD bounces on post-CPI CAD weakness
Tuesday’s climb into 1.3530 filled the Fair Value Gap (FVG) from 1.3530 to 1.3470, and the pair hangs in the midrange surrounding the 1.3500 handle. The nearest supply zone rests just below 1.3450 and represents a significant buy zone, while top-side pressure sees heavy selling around the Order Block (OB) near 1.3580.
Daily candlesticks remain caught in a significant congestion zone as bids consolidate near the 200-day Simple Moving Average (SMA). The pair is caught between December’s lows near 1.3177 and last November’s peak just shy of 1.3900.
USD/CAD hourly chart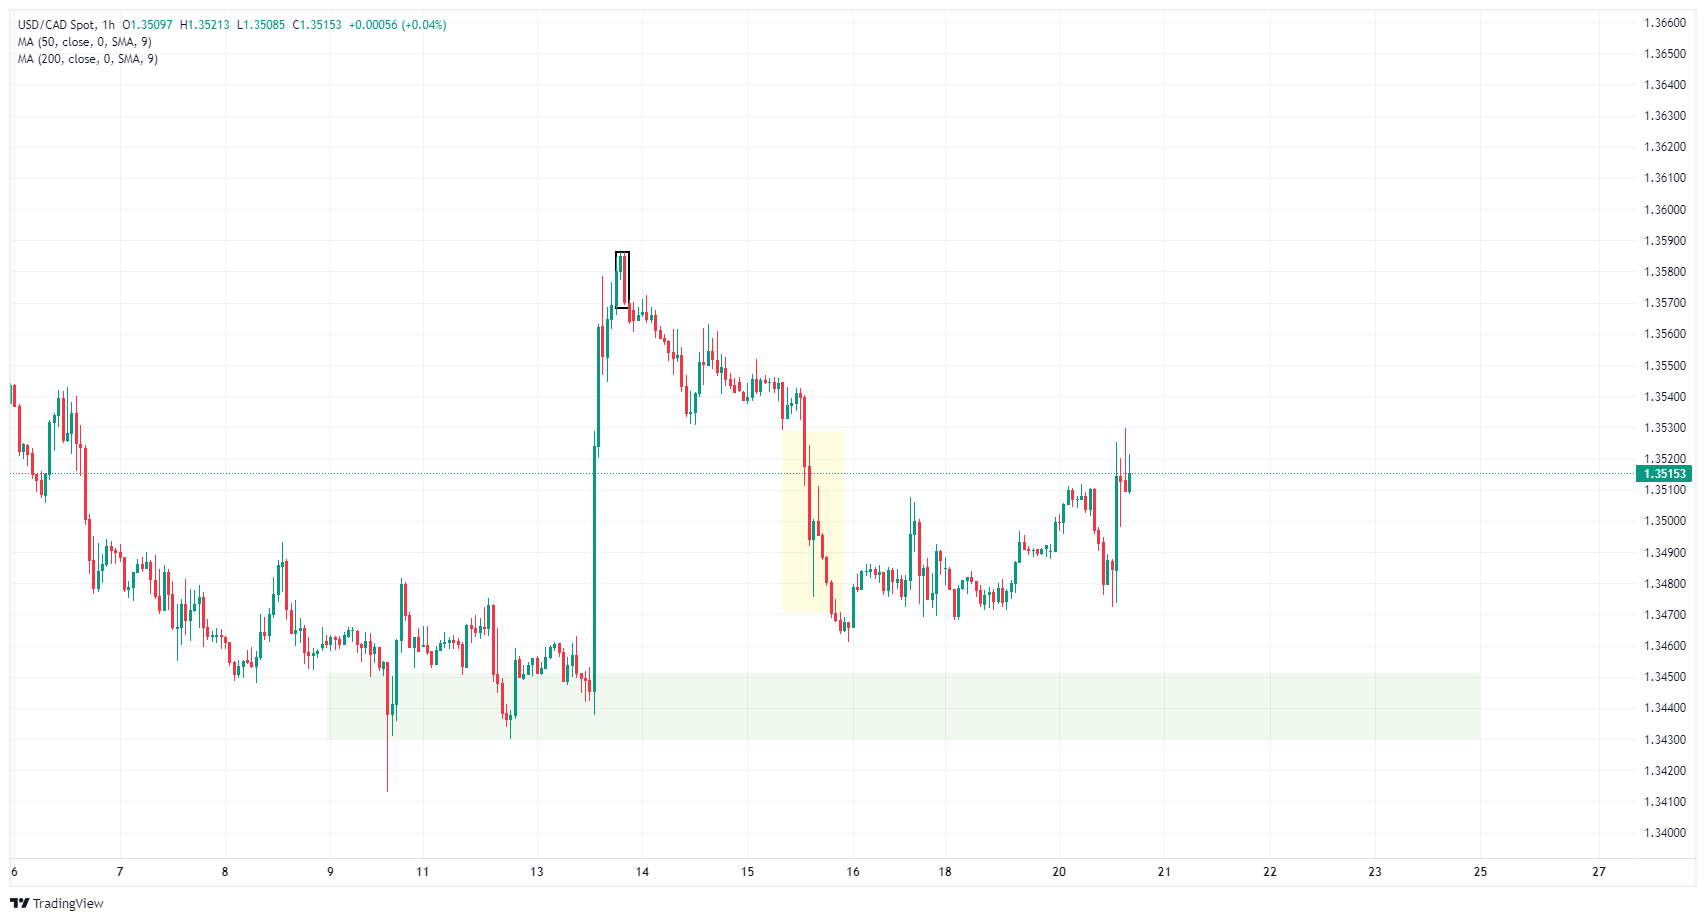
USD/CAD daily chart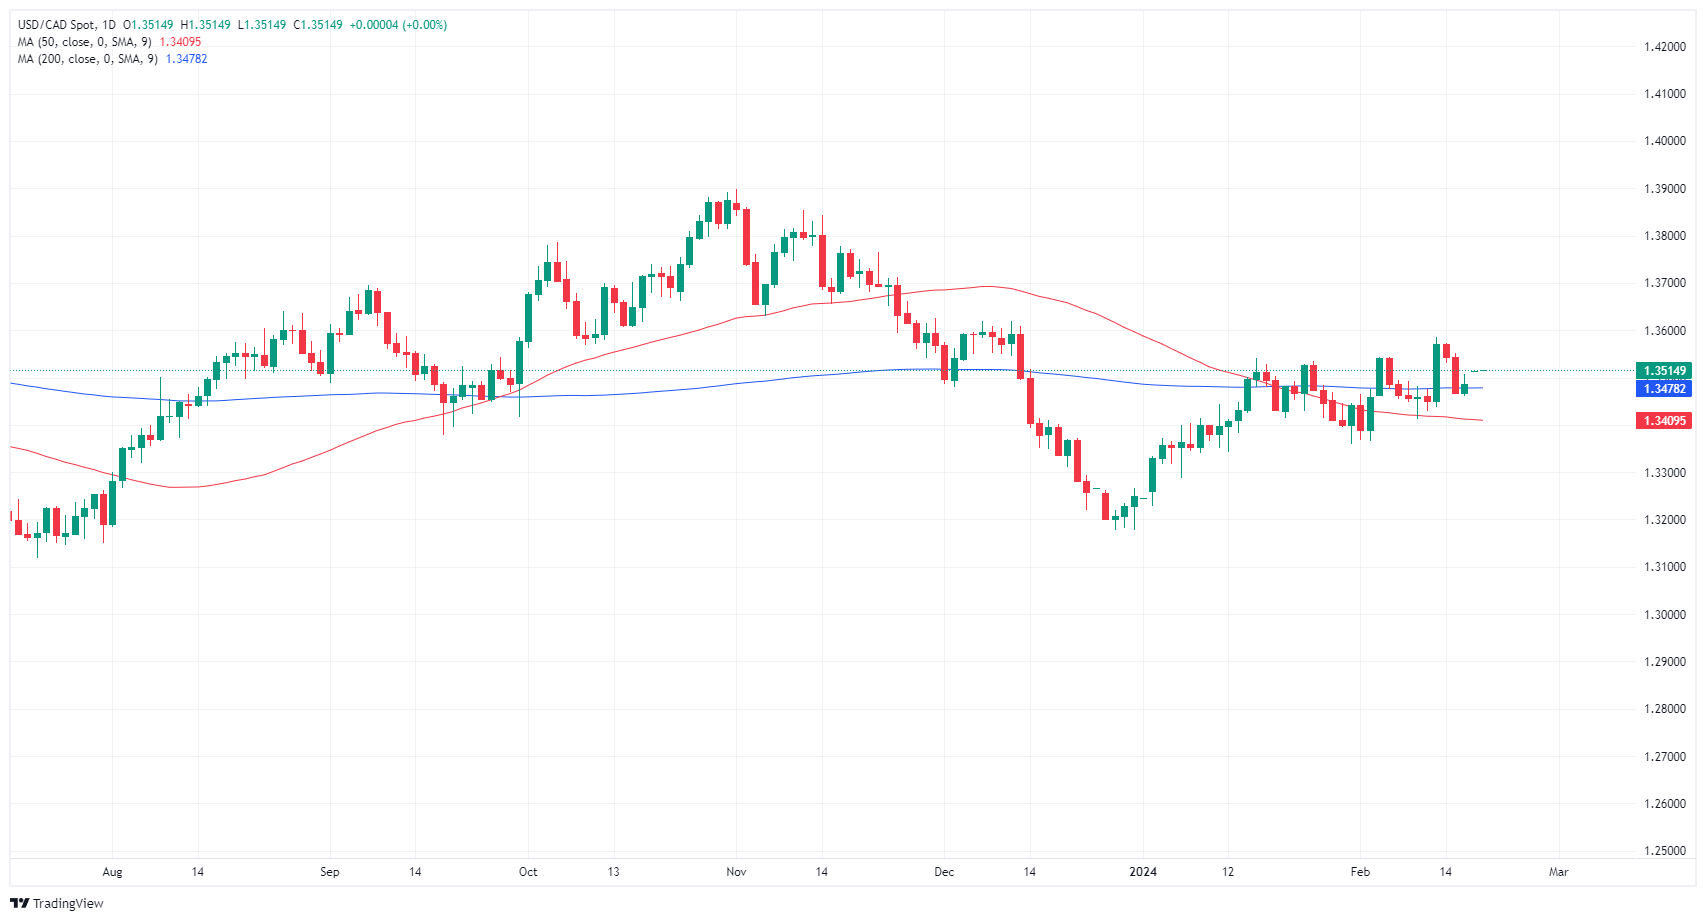
Canadian Dollar FAQs
What key factors drive the Canadian Dollar?
The key factors driving the Canadian Dollar (CAD) are the level of interest rates set by the Bank of Canada (BoC), the price of Oil, Canada’s largest export, the health of its economy, inflation and the Trade Balance, which is the difference between the value of Canada’s exports versus its imports. Other factors include market sentiment – whether investors are taking on more risky assets (risk-on) or seeking safe-havens (risk-off) – with risk-on being CAD-positive. As its largest trading partner, the health of the US economy is also a key factor influencing the Canadian Dollar.
How do the decisions of the Bank of Canada impact the Canadian Dollar?
The Bank of Canada (BoC) has a significant influence on the Canadian Dollar by setting the level of interest rates that banks can lend to one another. This influences the level of interest rates for everyone. The main goal of the BoC is to maintain inflation at 1-3% by adjusting interest rates up or down. Relatively higher interest rates tend to be positive for the CAD. The Bank of Canada can also use quantitative easing and tightening to influence credit conditions, with the former CAD-negative and the latter CAD-positive.
How does the price of Oil impact the Canadian Dollar?
The price of Oil is a key factor impacting the value of the Canadian Dollar. Petroleum is Canada’s biggest export, so Oil price tends to have an immediate impact on the CAD value. Generally, if Oil price rises CAD also goes up, as aggregate demand for the currency increases. The opposite is the case if the price of Oil falls. Higher Oil prices also tend to result in a greater likelihood of a positive Trade Balance, which is also supportive of the CAD.
How does inflation data impact the value of the Canadian Dollar?
While inflation had always traditionally been thought of as a negative factor for a currency since it lowers the value of money, the opposite has actually been the case in modern times with the relaxation of cross-border capital controls. Higher inflation tends to lead central banks to put up interest rates which attracts more capital inflows from global investors seeking a lucrative place to keep their money. This increases demand for the local currency, which in Canada’s case is the Canadian Dollar.
How does economic data influence the value of the Canadian Dollar?
Macroeconomic data releases gauge the health of the economy and can have an impact on the Canadian Dollar. Indicators such as GDP, Manufacturing and Services PMIs, employment, and consumer sentiment surveys can all influence the direction of the CAD. A strong economy is good for the Canadian Dollar. Not only does it attract more foreign investment but it may encourage the Bank of Canada to put up interest rates, leading to a stronger currency. If economic data is weak, however, the CAD is likely to fall.
Gold has almost recovered its losses which it had suffered following the strong US inflation data. Analysts at Commerzbank analyze the yellow metal’s outlook.
Gold investments would continue to be at a significant disadvantage relative to interest-bearing US assets
It appears that interest rate cuts are still likely this year, albeit at a slightly later date. This has been confirmed by statements from FOMC members. They had recently only questioned the market's early timing of a turnaround in interest rates, but not rate cuts per se.
Nevertheless, Gold's further upside potential is likely to remain limited. This is because a persistently robust US economy, coupled with stubbornly high inflation, argues against a pronounced cycle of rate cuts, meaning that Gold investments would continue to be at a significant disadvantage relative to interest-bearing US assets.
In Canada, the first Consumer Price Index (CPI) report in 2024 came in softer than expected. Economists at TD Securities analyze if the Bank of Canada (BoC) could pivot to interest rate cuts.
The BoC will continue to proceed cautiously
The January CPI report surprised to the downside with inflation falling 0.5pp to 2.9% YoY as prices held unchanged on the month. Airfares and core goods helped drive the deceleration while telecoms provided a source of strength. January also brought further progress on CPI-trim/median with 3m rates of core inflation running at 3.2%.
Today's report is a meaningful event for the near-term BoC outlook and should help reinforce rate cuts are coming. Still, we think the Bank will proceed cautiously and require further evidence of moderation before it shifts its stance.
Today's report will not be enough for the Bank to declare mission accomplished in March, but it does move the goalposts a little closer.
The US Dollar (DXY) Index climbed to a three-month high last week. However, economists at UBS do not expect the US Dollar (USD) rally to last.
USD to remain strong in the near term
While we expect the US currency to remain strong in the near term, we think it will weaken as Fed easing approaches-albeit at a slower pace than markets had been expecting in the first weeks of the year.
A renewed period of Dollar depreciation is especially likely given signals from other top central banks.
The Mexican Peso (MXN) continues to perform well and ride out Trump's fears. Economists at ING analyze MXN outlook.
Investors will favour the Mexican Peso
A 25 bps rate cut in March now looks likely. However, Banxico has said it will be very cautious in its rate cutting cycle and the starting point for real rates in the 6%+ area suggests the Peso does not have to sell off as easing starts.
Fourth quarter growth slightly disappointed last year, but consensus 2024 GDP growth is still 2.2% – which should be supported by loose fiscal policy this year. Elections in Mexico are held in June.
Factoring US elections is a tough call into the Peso, but a variety of positive factors suggests MXN outperforms its forward curve.
- EUR/USD climbs to 1.0833, lifted by Eurozone's widened current account surplus and quiet US market.
- ECB wage data and Lagarde's remarks indicate a measured easing stance, awaiting Q1 insights.
- US Leading Index and forthcoming FOMC minutes anticipated to guide EUR/USD amidst varying expectations.
The Euro extended its losses during the North American session, climbing above the 1.0800 figure after current account data in the Eurozone (EU) surpassed estimates. An absent economic calendar in the United States (US) after a holiday weakened the Greenback. The EUR/USD trades at 1.0833, up 0.52%.
EUR/USD gains on EU’s strength, eyes on Fed minutes
The EU’s Current Account surplus widened in December, exceeding estimates, rising to EUR 31.9 billion from EUR 22.5 billion a month earlier in seasonally adjusted figures. This means that, according to the yearly figures, the EU’s surplus increased to 1.8% of the bloc’s GDP from a deficit of 0.6% in the previous year.
Aside from this, the European Central Bank (ECB) revealed its indicator of wage settlements for last year’s Q4. Settlements dipped from 4.7% YoY to 4.5%. ECB’s President Christine Lagarde said that wage data will be vital in deciding when to begin monetary easing. According to BBG analysts, “ECB officials would probably like to see Q1 wage settlements (due out in May) before cutting rates, which points to June as the most likely choice. The market is pricing in less than 10% odds of a cut March 7, rising to 45% April 11 and fully priced on June 6.”
Across the pond, the US economic docket remains light, though the US Conference Board is expected to reveal the Leading Index for January, which is estimated to plunge by 0.3% MoM. On Wednesday, the schedule will gather pace, with the release of the latest Federal Open Market Committee (FOMC) minutes and Fed speakers crossing the wires.
EUR/USD Price Analysis: Technical outlook
The pair has jumped to the upside, in fundamental news from the EU, and is testing stir resistance at the 200-day moving average (DMA) at 1.0826. A daily close above that level could exacerbate a rally toward 1.0900 but, firstly, would need to reclaim the 50-DMA at 1.0891. Further upside is seen at around 1.0950. Conversely, if EUR/USD sellers keep the exchange rate below the 200-DMA, that could open the door to push the price below the 1.0800 mark. Once cleared, the next stop would be the February 20 low of 1.0761.
A host of economic releases and central bank communications have economists and markets pushing back the timing of interest rate cuts. National Bank of Canada’s forecast revisions respond to these same cues.
Patience and prudence pay off
While we never endorsed a March FOMC rate cut, the ongoing resilience of the US economy – combined with the most recent setback on the road to price stability – suggests Chair Powell & Co. could be in even less of a hurry to ease. True, the Fed is at least willing to discuss lower rates and most (all?) FOMC members believe less-restrictive policy will be appropriate before the year is out. But we now see July as a more likely timeframe for the first FOMC cut, the proverbial policy pivot pushed back one meeting vs. our prior forecast.
In starting later, we view it likely that cumulative policy rate relief will be on the order of 100 bps in the second half of this year, surpassing the median amount of easing implied by December’s ‘dot plot’ but less forceful than our prior thinking. Notwithstanding a non-trivial upgrade to our US growth forecast, distinctly sub-potential growth and a rising incidence of joblessness would make an argument for additional easing into 2025.
- USD/JPY falls to near 150.00 amid a sell-off in the USD Index.
- Fed policymakers warned that over-focusing on a one-time inflation increase could be a tremendous mistake.
- The BoJ may postpone plans of exiting the expansionary monetary policy stance.
The USD/JPY pair falls slightly below the psychological support of 150.00 in the early New York session on Tuesday. The asset has faced selling pressure as the US Dollar Index (DXY) has extended its downside to 104.00.
The USD Index has dropped to a weekly low as Federal Reserve (Fed) policymakers are confident that inflation is in the right direction despite a one-time stubborn-than-anticipated consumer price inflation data for January.
Fed policymakers advised that over-focusing on one-time blips in inflation data could be a tremendous mistake. As per the CME FedWatch tool, investors see interest rates remaining unchanged in the range of 5.25%-5.50% till the July policy meeting as the Fed needs more good inflation data for months.
The Japanese Yen performs better against the US Dollar despite easing hopes for the Bank of Japan (BoJ) quitting the decade-long ultra-dovish monetary policy stance. The Japanese Yen entered a recession in the second half of 2023. The situation of a poor domestic economy is an unfavorable situation for exiting the expansionary policy stance.
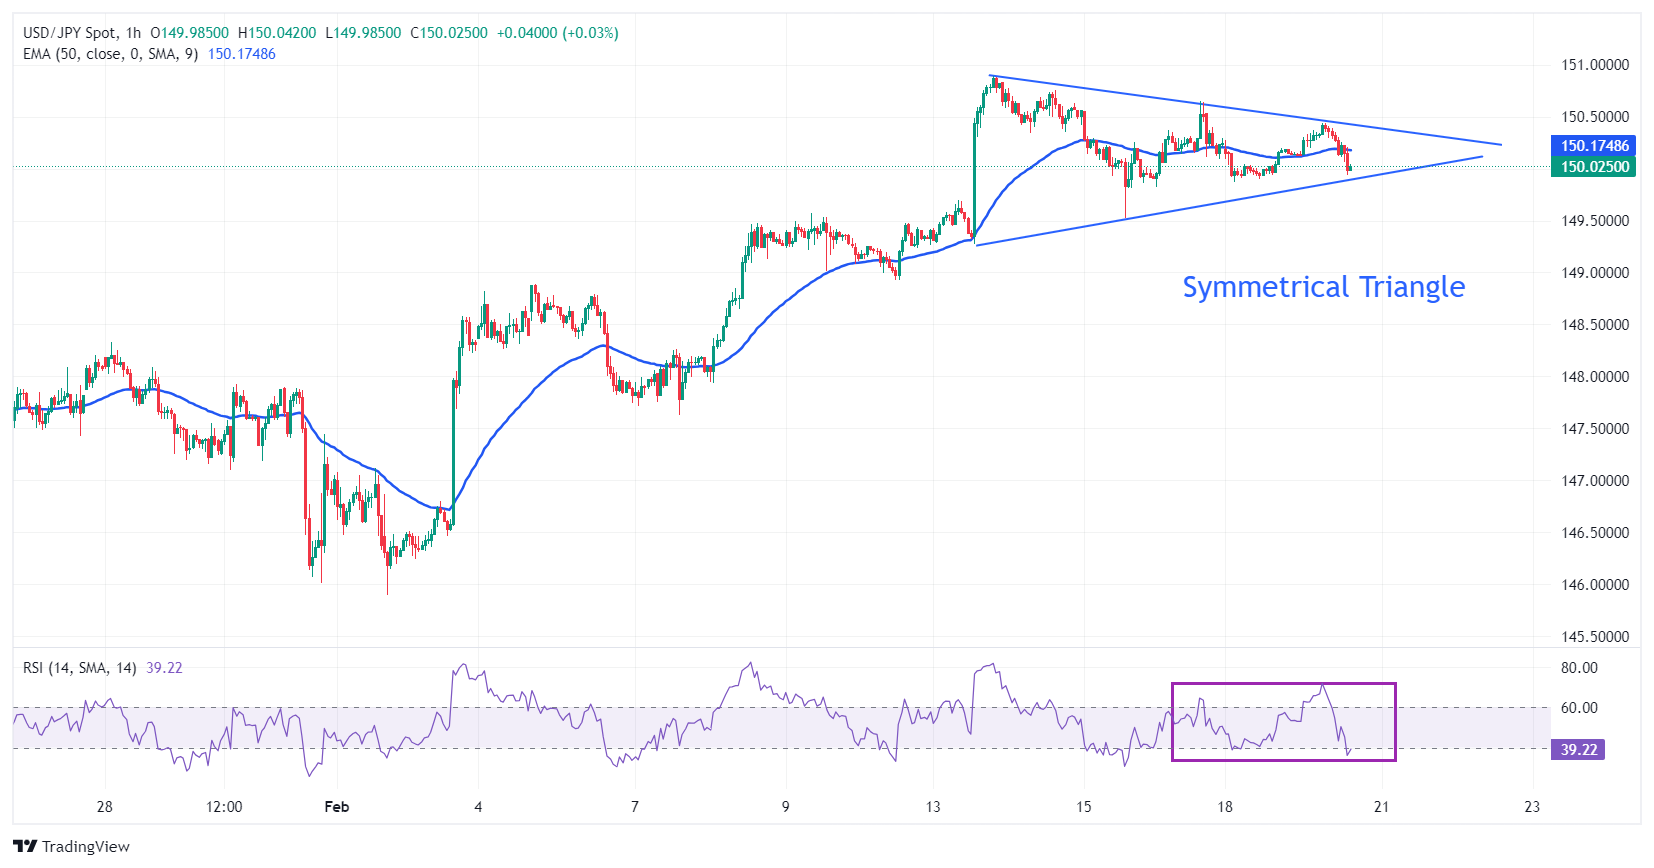
USD/JPY oscillates in a Symmetrical Triangle formation on an hourly time frame. The upward and downward-sloping borders of the aforementioned chart pattern are plotted from February 13 low and high at 149.27 and 150.88, respectively.
The triangle could breakout in either direction, however, the odds marginally favor a move in the direction of the trend before the formation of the triangle – in this case up.
The 50-period Exponential Moving Average (EMA) around 150.20 remains sticky to spot prices, indicates indecisiveness among market participants.
Going forward, a decisive break above February 13 high at 150.88 would drive the asset towards November 16 high at 151.43, followed by November 13 high at 151.90.
On the flip side, a breakdown below February 13 high at 149.27 would drag the asset towards February 5 high at 148.90. Breach of the latter would expose the asset to January 29 high at 148.32.
USD/JPY hourly chart
The 2024 US presidential and congressional elections are scheduled for 5 November. Strategists at HSBC list out some key dates to watch, together with moving parts that could impact the US Dollar.
Likely implications of US elections for the USD appear mixed
The multiple channels of influence mean the election can impact the USD in various ways, ensuring it cannot be ignored, even if the takeaways from each element end up creating a mixed picture for the USD. However, it is also important to remember that the USD’s path is not only determined by the election and that politics is just one part of the equation.
In summary, likely implications of US elections for the USD appear mixed, but, for now, we expect heightened uncertainty to support the USD.

Source: HSBC forecasts
Gold has been trading in a narrow range awaiting clues on the prospects for US interest rates. Economists at ING analyze the yellow metal’s outlook
Gold awaits clues on Fed outlook
Gold has been trading above $2,000 so far this week, with the market awaiting clues on the outlook for US interest rates.
The Federal Reserve is set to release minutes of its recent meeting midweek. We believe Fed policy will remain key to the outlook for Gold prices in the months ahead.
Higher borrowing costs are typically negative for Gold.
- USD/CAD rebounds strongly to 1.3500 as soft Canadian inflation data raise BoC rate-cut hopes.
- The USD Index remains under pressure as the Fed sees inflation moving in the right direction.
- Investors await the FOMC minutes for fresh guidance on interest rates.
The USD/CAD pair rises as Statistics Canada has reported softer-than-forecasted inflation data for January. The monthly headline inflation remained stagnant while investors anticipated a sharp rise of 0.4%. In December, the inflation data was contracted by 0.3%. The annual headline inflation rose at a slower pace of 2.9% from expectations of 3.3% and the former reading of 3.4%.
The core Consumer Price Index (CPI), published by the Bank of Canada (BoC), which excludes volatile food and oil items, decelerated to 2.4% from 2.6% in December. Monthly, the underlying inflation data rose slightly by 0.1% after deflating by 0.5% in December.
A slower-than-projected increase in inflation data is expected to push back expectations for the BoC, maintaining interest rates at 5% for longer.
Meanwhile, the market mood remains upbeat as the Federal Reserve (Fed) is confident that inflation is declining towards 2%, and the one-time increase in the Consumer Price Index (CPI) data for January is insignificant.
Investors see different price actions in risk-perceived assets. S&P500 futures have posted significant losses in the European session while risk-sensitive currencies have been underpinned against the US Dollar. The US Dollar Index (DXY), which measures the value of the US Dollar against six major currencies, has printed a fresh five-day low near 104.00.
The US Dollar (USD) is losing ground as North American markets return from the long weekend. Economists at Scotiabank analyze Greenback’s outlook.
There is little or no faith in the USD’s new year rebound being sustained
USD sentiment had firmed up in the early part of this year; Friday’s CFTC data show large speculative trading accounts have slashed EUR longs and shifted to a small net USD long in aggregate through mid-February, the first bullish bet on the USD since November. However, risk reversals suggest weakening demand for topside USD protection in the past couple of weeks, rather suggesting there is little or no faith in the USD’s new year rebound being sustained. That would be in keeping with the typical seasonal pattern of trade (early year gains in the USD typically give way to weakness in Q2/Q3).
USD losses so far this week warrant attention as some currencies are starting the threaten the weak trend in place since the start of the year.
GBP/USD is little changed after pivoting narrowly around the 1.2600 level. Economists at Scotiabank analyze the pair’s outlook.
GBP pivots around mid-point of its recent trading range
Cable is trading about midway between recent range extremes (1.2525/1.2685).
Broader price trends are tilting somewhat bearish and trend momentum signals are supporting the soft undertone in price action. Recent Sterling losses towards 1.2500 have attracted better demand, however, and scope for significant GBP weakness looks limited in the context of some softening in the broader USD trend.
Look for more range trading for now.
- Major equity indexes in the US look to open modestly lower.
- Walmart and Home Depot reported quarterly earnings ahead of the opening bell.
- Federal Reserve will release the minutes of the January policy meeting on Wednesday.
Following a three-day weekend, US stock index futures opened on a bearish note but managed to erase a portion of the earlier losses.
At the time of press, S&P 500 futures were down 0.27%, Dow Jones futures were losing 0.28%, and Nasdaq futures were falling 0.36%.
What to know before stock market opens
- Dow Jones (DJIA) closed the previous week virtually unchanged at 38,628. S&P 500 lost 0.42% to close at 5,005.56 and Nasdaq fell 0.82% to 15,775.65.
- Retailer giant Walmart Inc. (WMT) reported an adjusted earning per share of $1.8 ahead of the opening bell on Tuesday. The company said that it expects consolidated net sales to rise in the range of 3%-4% and announced that it will buy smart-TV producer Vizio (VZIO) for about $2.3 billion.
- Home Depot Inc. (HD) said net income in Q4 was $2.8 billion and the adjusted earnings per share was $2.82. The company, however, said that if projects sales for the fiscal year 2024 to be below estimates, citing slowing demand for discretionary items such as flooring, furniture and kitchen, per Reuters.
- The Communication Services sector ended Friday in the red by 1.56% as the worst-performing major S&P sector, followed by the Real Estate Sector that shed 0.99% by the closing bell. On the flip side, Friday's largest-gaining sector was the S&P's Materials Sector, climbing 0.51% on the day.
- Applied Materials Inc. (AMAT) was the top S&P 500 gainer on Friday, rising 6.3% to end the day at $199.57. Digital Realty Trust Inc. (DLR) lost 8.3%, wrapping up Friday's trading at $136.22 as the biggest decliner.
- Palo Alto Networks Inc. (PANW), Public Storage (PSA) and Realty Income Corp. (O) will be among the top companies that will release quarterly earnings reports after the closing bell on Tuesday.
- The Federal Reserve will release the minutes of the January policy meeting on Wednesday. On Thursday, preliminary February Manufacturing and Services PMI reports for Germany, the Euro area, the UK and the US will be scrutinized by market participants.
- The Bureau of Labor Statistics reported on Friday that the Producer Price Index (PPI) for final demand in the US rose 0.9% on a yearly basis in January. This reading followed the 1% increase recorded in December but came in above the market expectation of 0.6%. The annual Core PPI rose 2% in the same period, compared to December's increase of 1.8%. On a monthly basis, the Core PPI was up 0.5% following the 0.1% decline recorded in the previous month.
- The University of Michigan's Consumer Sentiment Index improved modestly to 79.6 in February's flash estimate from 79.0 in January. The Current Conditions Index edged lower to 81.5 from 81.9 and the Consumer Expectations Index rose to 78.4 from 77.1.
- Inflation in the US, as measured by the change in the Consumer Price Index (CPI), softened to 3.1% on a yearly basis in January from 3.4% in December, the BLS reported on Tuesday. This reading came in above the market expectation of 2.9%. The Core CPI, which excludes volatile food and energy prices, rose 3.9% in the same period and matched December's increase, surpassing analysts' estimate of 3.7%.
S&P 500 FAQs
What is the S&P 500?
The S&P 500 is a widely followed stock price index which measures the performance of 500 publicly owned companies, and is seen as a broad measure of the US stock market. Each company’s influence on the computation of the index is weighted based on market capitalization. This is calculated by multiplying the number of publicly traded shares of the company by the share price. The S&P 500 index has achieved impressive returns – $1.00 invested in 1970 would have yielded a return of almost $192.00 in 2022. The average annual return since its inception in 1957 has been 11.9%.
How are companies chosen to be included in the S&P 500?
Companies are selected by committee, unlike some other indexes where they are included based on set rules. Still, they must meet certain eligibility criteria, the most important of which is market capitalization, which must be greater than or equal to $12.7 billion. Other criteria include liquidity, domicile, public float, sector, financial viability, length of time publicly traded, and representation of the industries in the economy of the United States. The nine largest companies in the index account for 27.8% of the market capitalization of the index.
How can I trade the S&P 500?
There are a number of ways to trade the S&P 500. Most retail brokers and spread betting platforms allow traders to use Contracts for Difference (CFD) to place bets on the direction of the price. In addition, that can buy into Index, Mutual and Exchange Traded Funds (ETF) that track the price of the S&P 500. The most liquid of the ETFs is State Street Corporation’s SPY. The Chicago Mercantile Exchange (CME) offers futures contracts in the index and the Chicago Board of Options (CMOE) offers options as well as ETFs, inverse ETFs and leveraged ETFs.
What factors drive the S&P 500?
Many different factors drive the S&P 500 but mainly it is the aggregate performance of the component companies revealed in their quarterly and annual company earnings reports. US and global macroeconomic data also contributes as it impacts on investor sentiment, which if positive drives gains. The level of interest rates, set by the Federal Reserve (Fed), also influences the S&P 500 as it affects the cost of credit, on which many corporations are heavily reliant. Therefore, inflation can be a major driver as well as other metrics which impact the Fed decisions.
EUR/USD regains 1.0800. Economists at Scotiabank analyze the pair’s outlook.
Minor new cycle highs are adding to short-term technical strength
EUR/USD is trading higher for a fifth trading session on the trot and bearish pressure that had been accumulating on the chart since the start of January has been blunted by EUR progress to – and just about through – trend resistance (1.0785) off the late December peak.
Minor new cycle highs (above Feb 12th’s 1.0806) are adding to short-term technical strength in the EUR.
A squeeze higher towards 1.0900 may develop if the EUR can hold these gains.
- The US Dollar mildly in the red against most major peers.
- Markets are not moving on Loan Prime Rate cuts by China.
- The US Dollar Index trades away from the 104 marker and moves slightly higher.
The US Dollar (USD) is turning red with markets not applauding the overnight move by the People’s Bank of China (PBoC) to cut its 5-year Loan Prime Rate. China is playing in a whole other ballpark in terms of economic data with deflation, a sluggish job market, a haunted housing market and abating growth. The cuts are bigger than expected, though the market reaction is signalling more needs to be done in order to give China the boost to head back to its pre-pandemic growth and economic levels.
On the economic data front, The US Treasury will have its work cut out this Tuesday with no less than three bond auctions coming up. For more economic data, most data points are pushed forward to Wednesday due to the public holiday on Monday. All eyes are on the retailers in the stock markets this week with Walmart and Home Depot releasing earnings this Tuesday.
Daily digest market movers: Tuesday is the new Monday
- European bond yields are jumping higher against US bond yields this Tuesday after the European Central Bank (ECB) released a report that revealed wages in the Eurozone are still remaining elevated, which could add to sticky inflatoin in the coming months, pushing back on current rate cut expectations. This pushes the Euro up against the US Dollar to 1.08, a level not seen since February 2nd.
- China has lowered its Loan Prime Rate in the following maturities:
- 1-year tenor unchanged at 3.45% where 3.40% was expected.
- the 5-year tenor cut from 4.20% to 3.95%, where 4.10% was expected.
- European car sales jumped 11% in January.
- Near 13:55 GMT the Redbook Index is due to be released. Previous was for 2.5%.
- The US Treasury department is doing a triple auction at 16:30 GMT. A 3-month, a 6-month and a 52-week bill will be auctioned.
- Equities are looking for direction ahead of the retailer earnings in the US before the US opening bell. Chinese equities are not really jumping on the Loan Prime Rate cut in China. European equities are mildly lower in European trading together with US equity futures.
- The CME Group’s FedWatch Tool is now looking at the March 20th meeting. Expectations for a pause are 91.5%, while 8.5% for a rate cut.
- The benchmark 10-year US Treasury Note trades a little bit higher, near 4.29%, after its close on Friday at 4.28% and being closed over Monday due to the US public holiday.
US Dollar Index Technical Analysis: Do not get trapped
The US Dollar Index (DXY) is holding its ground above 104 though pressure is mounting again on the support level. This does not mean anything substantial as this Tuesday is actually Monday after the US was closed due to President’s Day. Expect to see traders catch up, with the first moves taking place on Wednesday in the buildup to the US Federal Reserve Minutes release on Wednesday evening.
Should the US Dollar jump to 105.00 by Friday, 105.12 is a key level to keep an eye on. One step beyond there comes 105.88, the high of November 2023. Ultimately, 107.20 – the high of 2023 – could even come back into scope, but that would be when several inflation measures are coming in higher than expected for several weeks in a row.
The 100-day Simple Moving Average looks to be holding for now, though pressure is building on it to snap, near 104.18, so the 200-day SMA near 103.70 looks more solid. Should that give way, look for support from the 55-day SMA near 103.14.
US Dollar FAQs
What is the US Dollar?
The US Dollar (USD) is the official currency of the United States of America, and the ‘de facto’ currency of a significant number of other countries where it is found in circulation alongside local notes. It is the most heavily traded currency in the world, accounting for over 88% of all global foreign exchange turnover, or an average of $6.6 trillion in transactions per day, according to data from 2022.
Following the second world war, the USD took over from the British Pound as the world’s reserve currency. For most of its history, the US Dollar was backed by Gold, until the Bretton Woods Agreement in 1971 when the Gold Standard went away.
How do the decisions of the Federal Reserve impact the US Dollar?
The most important single factor impacting on the value of the US Dollar is monetary policy, which is shaped by the Federal Reserve (Fed). The Fed has two mandates: to achieve price stability (control inflation) and foster full employment. Its primary tool to achieve these two goals is by adjusting interest rates.
When prices are rising too quickly and inflation is above the Fed’s 2% target, the Fed will raise rates, which helps the USD value. When inflation falls below 2% or the Unemployment Rate is too high, the Fed may lower interest rates, which weighs on the Greenback.
What is Quantitative Easing and how does it influence the US Dollar?
In extreme situations, the Federal Reserve can also print more Dollars and enact quantitative easing (QE). QE is the process by which the Fed substantially increases the flow of credit in a stuck financial system.
It is a non-standard policy measure used when credit has dried up because banks will not lend to each other (out of the fear of counterparty default). It is a last resort when simply lowering interest rates is unlikely to achieve the necessary result. It was the Fed’s weapon of choice to combat the credit crunch that occurred during the Great Financial Crisis in 2008. It involves the Fed printing more Dollars and using them to buy US government bonds predominantly from financial institutions. QE usually leads to a weaker US Dollar.
What is Quantitative Tightening and how does it influence the US Dollar?
Quantitative tightening (QT) is the reverse process whereby the Federal Reserve stops buying bonds from financial institutions and does not reinvest the principal from the bonds it holds maturing in new purchases. It is usually positive for the US Dollar.
Yield differentials need to turn down before we buy the Yen, Kit Juckes, Chief Global FX Strategist at Société Générale, says.
There should only be a few more weeks of pain for Yen ‘dip-buyers’
The Yen remains under pressure. Is the end of yield curve control and negative rates priced-in, or is the market getting too bearish of the JPY? I prefer the latter interpretation.
So far, so simple. Tell me when 10-year Note yields will peak and I’ll tell you when USD/JPY peaks.
The chance of NIRP and YCC policies being ditched at the March 19 BoJ meeting has increased, but how will/would markets react? When rates were cut to -0.1% in 2016, the first reaction saw the yen rally, but the backdrop was very different. It may take some time for the penny to drop, but unless confidence that the Fed’s next move is to ease, is seriously tested (and that’s the big tail risk for all markets) then bringing the curtain down on negative rates and yield curve control ought to signal a long-term turning-point for the Yen. There should only be a few more weeks of pain for Yen ‘dip-buyers’.
- AUD/JPY extends gains on hawkish market sentiment about RBA interest rates trajectory.
- The Australian Dollar faces pressure as the S&P/ASX 200 halted its winning streak on Tuesday.
- Japanese official Atsushi Mimura talked about connecting to other countries regarding FX intervention.
AUD/JPY continues its upward trajectory for the fifth consecutive session on Tuesday, with the pair edging higher around 98.50 during European trading hours. The Australian Dollar (AUD) receives support against the Japanese Yen (JPY) as market sentiment leans towards the expectation of a resilient Australian economy, backed by low unemployment and healthy corporate sector balance sheets. Westpac anticipates that the Reserve Bank of Australia (RBA) will maintain its current monetary policy stance throughout 2024 and adopt a less restrictive approach in 2025.
However, the Australian Dollar (AUD) faced downward pressure from a weaker Aussie money market. The S&P/ASX 200 index halted its winning streak, with declines in mining and energy stocks amid weaker commodity prices, potentially limiting the advance of the AUD/JPY cross.
The Reserve Bank of Australia (RBA) released the minutes from its February monetary policy meeting. During the meeting, the RBA Board deliberated on the possibility of raising rates by 25 basis points (bps) or keeping rates unchanged.
Although recent data provided the board with increased confidence that inflation would return to target within a reasonable timeframe, there was acknowledgment that it would "take some time" before the board could be sufficiently confident about inflation. As a result, the board agreed that it was appropriate not to rule out another rate hike, indicating a cautious approach to future monetary policy decisions.
On Japan’s side, Japanese Finance Ministry official Atsushi Mimura said that the government is in communication with other countries regarding FX intervention." He mentioned that the government can sell assets such as savings and foreign bonds in FX reserves when intervention is required.
Furthermore, Finance Minister Shunichi Suzuki expressed concerns about the negative implications of a weak Yen. In an earlier interview, Suzuki noted, "The Bank of Japan (BoJ) holds jurisdiction over monetary policy. But there will come a time when interest rates rise." Market participants are likely to focus on Japan’s Trade Balance data, including Import and Export figures for January, which are scheduled to be released on Wednesday.
- Natural Gas up over 1% in European trading.
- Traders are sending Gas higher in an inverse correlation with a weaker US Dollar.
- The US Dollar Index is flat to mildly in the red with markets catching up after Monday’s US holiday.
Natural Gas (XNG/USD) is jumping back above $1.65 and is trying another attempt to snap its losing streak. The countermove gets a bit of help from the US Dollar which is retreating a touch just hours before the US opening bell. Selling pressure meanwhile comes from European headlines where Natural Gas is facing even more headwinds.
The US Dollar (USD) is retreating a touch on Tuesday with US markets getting ready to catch up after their public holiday on Monday. Traders are sending European bond yields higher after the European Central Bank Report (ECB) shows European wages are still very elevated. The Euro is up against the US Dollar, which makes the US Dollar Index (DXY) retreat a touch.
Natural Gas is trading at $1.66 per MMBtu at the time of writing.
Natural Gas market movers: EU headlines are remaining an issue
- EU member states and the EU parliament have agreed on a framework to certify carbon removals, which is part of an effort to pull carbon dioxide out of the atmosphere and cut emissions further.
- Several companies have asked the EU to cut energy costs and the regulatory burden for green rules, in order to maintain competitiveness with China.
- Windy weather in Europe is increasing energy production via wind turbines, reducing the need for Natural Gas in an already tepid demand climate.
- Record deliveries from Qatar to Europe in LNG were recorded last week.
Natural Gas Technical Analysis: A drop on a hot plate
Natural Gas faces more and more headaches, on a near daily basis when looking at the headlines that are emerging from one of its biggest consumers: Europe. The green sprint in Europe, together with more and more green energy sources overtaking Natural Gas as a source of energy, threatens the future for Gas in terms of volumes needed. For now India is happy to take over those excess volumes, though the question remains for how long?
On the upside, Natural Gas is facing some pivotal technical levels to get back to. First stop is $1.99, – the level which, when broken, saw an accelerated decline. Next is the blue line at $2.13 with the triple bottoms from 2023. In case Natural Gas sees sudden demand pick up, possibly $2.40 could come into play.
Keep an eye on $1.80, which was a pivotal level back in July 2020 and should act as a cap now. Should more supply emerge in the markets, or more weakening data globally point to even more sluggish global growth – $1.64 and $1.53 (the low of 2020) are targets to look out for.
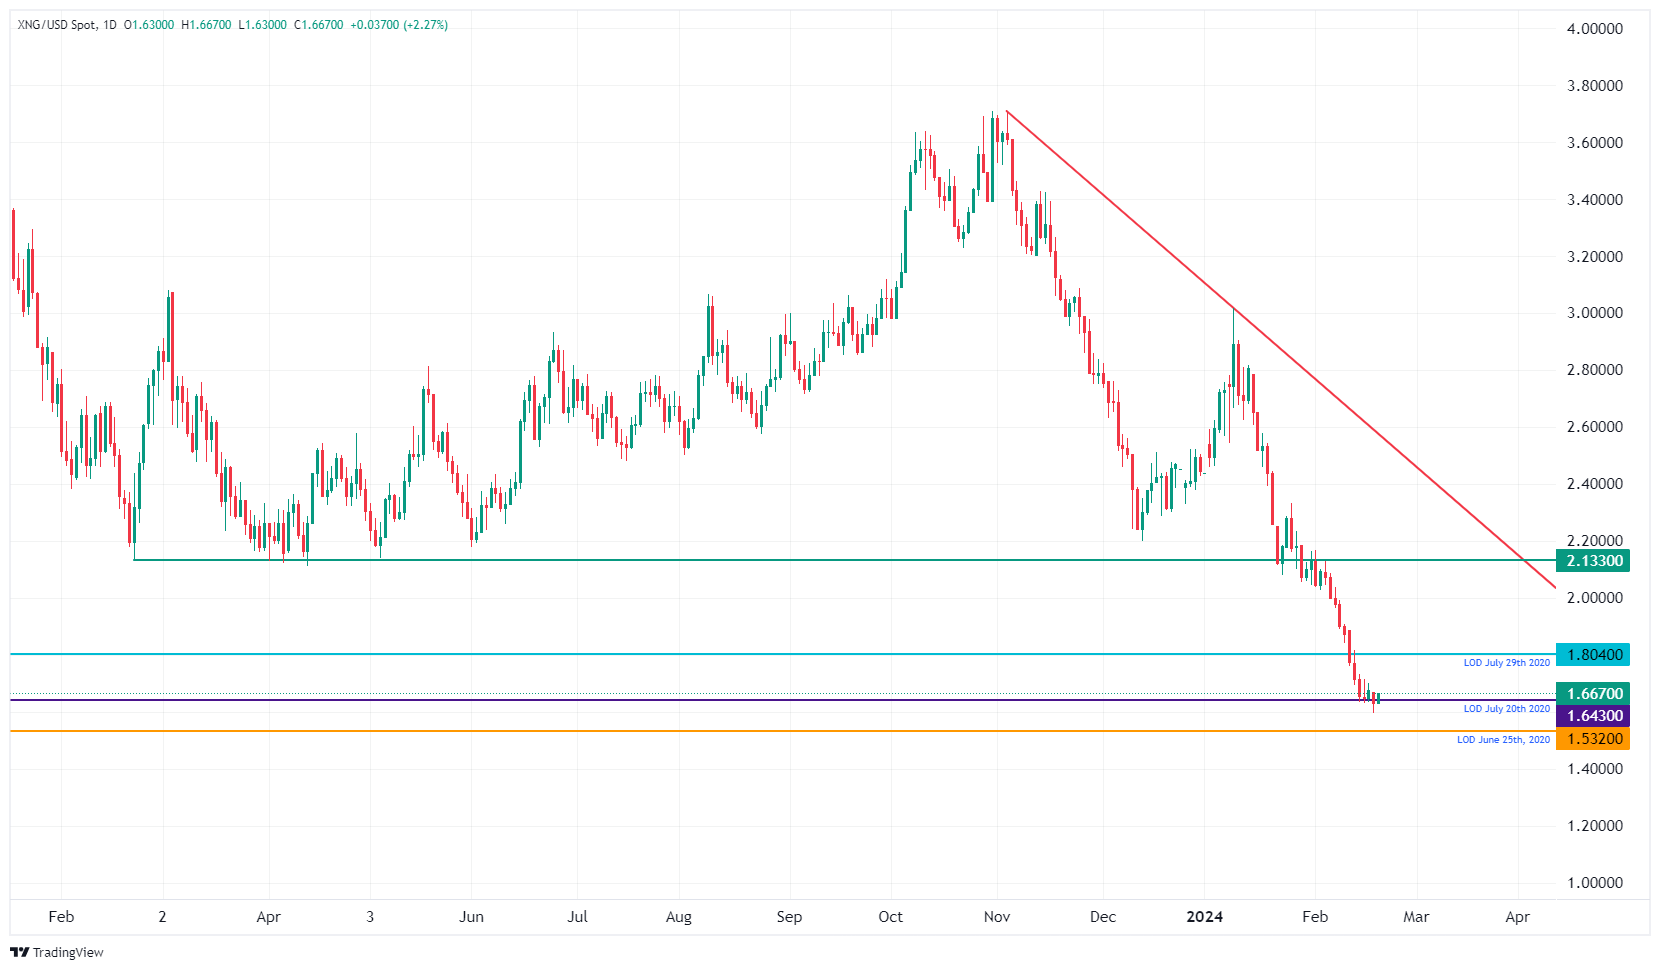
XNG/USD (Daily Chart)
Natural Gas FAQs
What fundamental factors drive the price of Natural Gas?
Supply and demand dynamics are a key factor influencing Natural Gas prices, and are themselves influenced by global economic growth, industrial activity, population growth, production levels, and inventories. The weather impacts Natural Gas prices because more Gas is used during cold winters and hot summers for heating and cooling. Competition from other energy sources impacts prices as consumers may switch to cheaper sources. Geopolitical events are factors as exemplified by the war in Ukraine. Government policies relating to extraction, transportation, and environmental issues also impact prices.
What are the main macroeconomic releases that impact on Natural Gas Prices?
The main economic release influencing Natural Gas prices is the weekly inventory bulletin from the Energy Information Administration (EIA), a US government agency that produces US gas market data. The EIA Gas bulletin usually comes out on Thursday at 14:30 GMT, a day after the EIA publishes its weekly Oil bulletin. Economic data from large consumers of Natural Gas can impact supply and demand, the largest of which include China, Germany and Japan. Natural Gas is primarily priced and traded in US Dollars, thus economic releases impacting the US Dollar are also factors.
How does the US Dollar influence Natural Gas prices?
The US Dollar is the world’s reserve currency and most commodities, including Natural Gas are priced and traded on international markets in US Dollars. As such, the value of the US Dollar is a factor in the price of Natural Gas, because if the Dollar strengthens it means less Dollars are required to buy the same volume of Gas (the price falls), and vice versa if USD strengthens.
Canada releases inflation figures for January today. Economists at ING analyze CAD outlook ahead of the data.
USD/CAD can find a bit more support in the coming weeks
The expected slowdown in the disinflation process is in line with developments in the US and other major countries, and not too concerning for the Bank of Canada which estimates headline inflation at 3.2% in the first quarter of the year. Nevertheless, a tight labour market and the timing of the first Fed rate cut being pushed back means the BoC will likely opt for patience over more dovish guidance in upcoming communication. That is unless today’s CPI numbers surprise markedly on the downside.
USD/CAD can find a bit more support in the coming weeks as we see USD staying strong and risk sentiment fragile. A return to last week’s 1.3585 highs seems appropriate for now. However, we still expect a decline in USD rates to unlock downside potential for the pair in the second half of the year, even with the BoC cutting at the same time as the Fed.
- USD/CHF snaps its recent gains on a weaker US Dollar on Tuesday.
- Swiss Trade Balance came in at 4,738 million in January against December’s figure of 1,271 million.
- The US Fed is expected to avoid rate cuts in March and May on persistent consumer and producer prices.
USD/CHF breaks the two days of advances as the risk sentiment improves after the positive Swiss Trade Balance figures reported on Tuesday. The report showed a trade surplus of 4,738 million in January, which is higher than December’s figure of 1,271 million. The USD/CHF pair edges lower to near 0.8810 during the European session on Tuesday.
Moreover, Swiss Exports (MoM) improved to 22,804 million in January from the previous export figure of 18,788. While Imports (MoM) also rose to 18,067 million from the previous figure of 17,517 million. Furthermore, the Employment Level for the fourth quarter will be released on Friday.
Additionally, the weaker US Dollar (USD) is contributing to the downward pressure for the USD/CHF pair, which could be attributed to the decline in the US Treasury yields. However, the Greenback attempted to halt its losing streak on the risk aversion sentiment due to the fading possibility of interest rate cuts by the Federal Reserve at upcoming meetings in March and May.
The US Dollar Index (DXY) extends its losing streak for the fifth successive session trading lower around 104.10 with 2-year and 10-year yields on US bond coupons standing at 4.61% and 4.27%, respectively, by the press time.
Last week’s data showed that consumer and producer prices remain higher in the United States (US), which could possibly prevent the Federal Reserve from loosening the policy tightening sooner. Moreover, ANZ expects that the Federal Reserve (Fed) will initiate rate cuts starting from July 2024.
According to the CME FedWatch Tool, there is a 53% possibility of a 25 basis points rate cut by the US Fed in the June meeting. Traders will likely observe the Federal Open Market Committee’s (FOMC) minutes for the January meeting scheduled for Wednesday.
While testifying before the UK Treasury Select Committee on Tuesday, Bank of England (BoE) Deputy Governor Ben Broadbent noted that wage growth and services inflation are twice the rate consistent with a sustainable CPI inflation.
"I don't agree that all the evidence points in the direction of rate cuts," Broadbent added and said the timing of any adjustment to policy will depend on the actual evolution of the economic data.
"I cannot be precise about how rapidly domestic inflation rates will fall back – or therefore, when it will be appropriate to reduce the degree of policy restriction," he said but acknowledged that inflation forecasts certainly do not rule out a policy easing at some point this year.
Market reaction
GBP/USD continues to fluctuate at around 1.2600 following these comments.
The US Dollar (USD) continues to emerge as the top performer among G10 currencies this year. Economists at Danske Bank analyze Greenback’s outlook.
Selling EUR/USD on rallies in the coming weeks
Our USD-bullish argument, centred around markets scaling back on rate cut expectations, has essentially been exhausted. However, that does not make us more pessimistic about the USD in the near term.
We maintain our bias toward selling EUR/USD on rallies in the coming weeks.
Until something changes more materially, ongoing US data resilience and more cautious expectations for Fed cuts should continue to support the USD in the near term.
"Markets expect rate cuts this year, we do not endorse the market curve, but it is not unreasonable for the market to think that," Bank of England (BoE) Governor Andrew Bailey said while testifying before the UK Treasury Select Committee on Tuesday.
"We are having to walk a narrow path on monetary policy," Bailey added and noted that there has been a lot of emphasis on UK recession rather than on the strong story on employment.
Market reaction
GBP/USD clings to modest daily gains slightly above 1.2600 following these comments.
Canada’s CPI inflation data is set to impact the timing of a Bank of Canada rate cut. Economists at Commerzbank analyze the BoC’s options as disinflation in Canada seems to have stalled.
No sign of disinflation anywhere in sight
Inflation is not falling any further. Whether today's figures for January will change this seems at least questionable. After all, most of the interest rate hikes should have been passed on to the real economy by now, which would mean that most of the disinflationary effect should have taken place. The economists surveyed by Bloomberg also expect a slight improvement at best.
This is not a particularly good outlook for the BoC. If inflation does not unexpectedly fall further in the coming months, it has only unpleasant options. Either it raises rates again (which is unlikely at this point and would increase the risk of recession), or it has to wait for the economy to slow down further, i.e. it has to go into recession with its eyes wide open to finally break the inflationary pressure. Alternatively, it could cut interest rates despite the developments, risking not only a consolidation of inflation but even a rebound, which would certainly not be helpful for the CAD. Let's hope that doesn't happen.
- NZD/USD could surpass the resistance level of 38.2% Fibonacci retracement at 0.6179.
- A break above the 0.6200 could prompt the pair test 50.0% retracement level of 0.6223.
- The pair could meet the support at the nine-day EMA at 0.6124
- Technical analysis suggests a momentum shift towards an upward direction.
NZD/USD continues to move on an upward trajectory for the fifth successive session on Tuesday as the US Dollar (USD) trims daily gains to extend its losses. The NZD/USD pair surges to near 0.6170 during the European trading hours.
The NZD/USD pair could find immediate resistance around the 38.2% Fibonacci retracement at 0.6179 followed by the psychological resistance level of 0.6200. A firm break above this psychological barrier could exert upward support for the pair to explore the region around the 50.0% retracement level of 0.6223.
The technical analysis of the NZD/USD pair suggests a momentum shift towards upward direction. The Moving Average Convergence Divergence (MACD) line is situated below the centerline but shows divergence above the signal line.
Furthermore, the lagging indicator 14-day Relative Strength Index (RSI) lies above the 50 level, suggesting a bullish sentiment for the NZD/USD pair.
On the downside, the NZD/USD pair could find immediate support at the major level of 0.6150. A break below the latter could put the downward pressure on the NZD/USD pair to test the nine-day Exponential Moving Average (EMA) at 0.6124 to approach the psychological level of 0.6100.
NZD/USD: Daily Chart
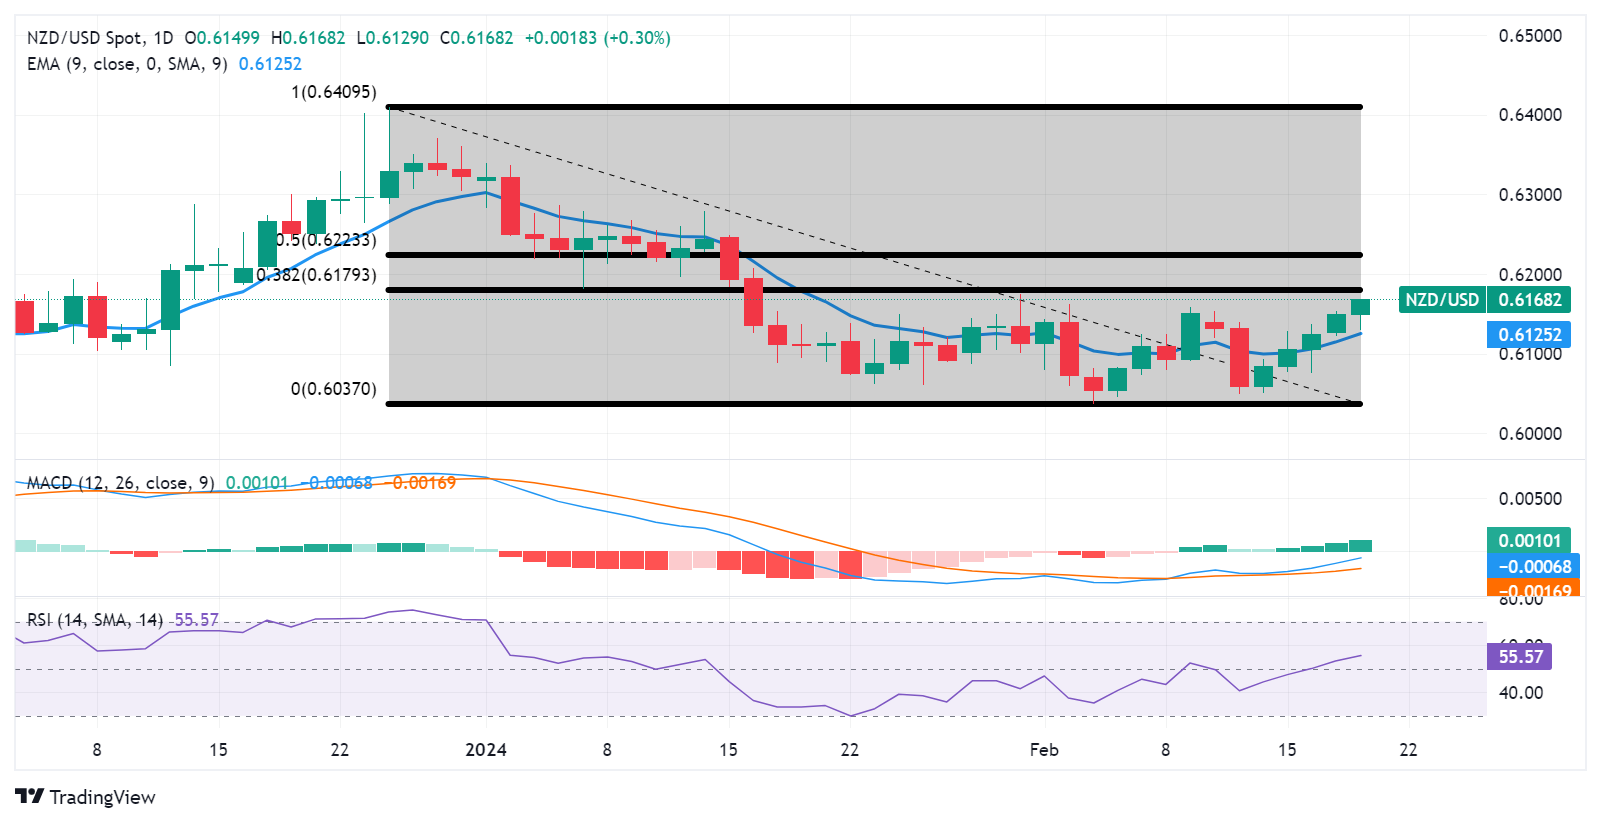
While testifying before the UK Treasury Select Committee on Tuesday, Bank of England (BoE) Governor Andrew Bailey said that the UK economy is at full employment and added it is already showing distinct signs of an upturn.
"We are looking beyond the temporary period when we expect CPI to return to target this year," Bailey said and added that he is looking for a more sustained progress on reduction of more persistent elements of inflation.
Key takeaways
"We are seeing some signs pay growth is adjusting down in line with lower headline inflation."
"We don't need inflation to be back at target before cutting rates."
Market reaction
GBP/USD edged higher with the initial reaction to these comments and was last seen trading at 1.2610, where it was up 0.15% on a daily basis.
- USD/CAD drops from 1.3510 as USD Index declines ahead of FOMC minutes.
- Canadian inflation is expected to have eased in January.
- USD/CAD drops to near the lower border of the Rising Channel pattern.
The USD/CAD pair faces a sharp sell-off while attempting to extend upside above the immediate resistance of 1.3510 in Tuesday’s European session. The Loonie asset falls back due to a sharp decline in the US Dollar Index (DXY).
The USD Index retreats to near a two-day low around 104.10 as the impact of stubborn consumer price inflation data for January has faded. Federal Reserve (Fed) policymakers have said that the one-time surprise in the inflation data should not be given much priority. The focus should be on the longer-term trend, which indicates that inflation is moving in the right direction.
This week, the Federal Open Market Committee (FOMC) minutes for the January monetary policy meeting will be in focus. In the last monetary policy statement, Fed Chair Jerome Powell said that we need more evidence for considering rate cuts, which could convince us that inflation will return to the 2% target.
On the Canadian Dollar front, investors await the inflation data for January, which will be published at 13:30 GMT. Economists expect the annual Canadian CPI to rise by 3.3% in January, slowing from a 3.4% growth recorded in December. The monthly inflation data is seen rebounding to 0.4% in the same period after declining 0.3% in December. Signs of decelerating price pressures would escalate hopes of early rate cuts by the Bank of Canada (BoC).
USD/CAD trades in a Rising Channel chart pattern on a four-hour scale in which market participants consider each pullback a buying opportunity. The aforementioned chart pattern demonstrates an upside trend in a bounded region. The major has dropped near the 50-period Exponential Moving Average (EMA), which trades around 1.3490.
The 14-period Relative Strength Index (RSI) oscillates in the 40.00-60.00 region, which indicates indecisiveness among market participants.
The fresh upside would emerge if the Loonie asset climbed above the January 17 high at 1.3542, which will drive the asset towards the round-level resistance of 1.3600, followed by the November 30 high at 1.3627.
On the flip side, a sell-off could appear if the Loonie asset drops below January 31 low at 1.3359. This will expose the asset to January 4 low at 1.3318 and January 5 low at 1.3288.
USD/CAD four-hour chart

As the market pushed out US rate cut expectations, Gold (XAU/USD) fell 2% YTD, from a high of $2,135 in December 2023. Economists at ANZ Bank analyze the yellow metal’s outlook.
Gold to keep shining
Tactical investors have curtailed their net-long positions by 276t, while strategic global ETF outflows were around 82t YTD. Strong equity market sentiment may have also temporarily weighed on Gold’s relative appeal. However, we believe these developments reflect a consolidation instead of a downtrend. While a strong driver for Gold demand may be temporarily at large, this is unlikely to last.
This year’s elections and rate cuts (whenever they happen) will eventually boost Gold’s appeal among investors, bolstering the tailwind from structurally higher central bank purchases.
We forecast Gold price at $2,200 by the end of 2024.
The European Central Bank (ECB) published its indicator of the Euro area’s negotiated wages data for the final quarter of 2023 on Tuesday.
Data showed that the Euro area negotiated wages grew at an annual rate of 4.50% in Q4 2023, slowing from a 4.70% increase seen in the third quarter.
Market reaction to the EU negotiated wages data
The EUR/USD pair is keeping its upswing intact following the data release, adding 0.19% on the day.
About ECB indicator of negotiated wage growth
The ECB indicator of negotiated wage growth is computed for a subset of countries only. The euro area aggregate is based on nine countries: Germany, France, Italy, Spain, the Netherlands, Belgium, Finland, Austria and Portugal. The indicator relies on data for negotiated monthly earnings. The euro area indicator is based on a mixture of monthly and quarterly time series and is based on non-harmonised country data.
- EUR/USD trims intraday losses to extend gains on Tuesday.
- The Euro received downward pressure from the lower European equity markets.
- PBoC reduced its five-year LPR by 25 bps to support its struggling economy.
- The decline in the US Treasury yields put downward pressure on the US Dollar.
The EUR/USD pair recovers intraday losses and attempts to continue its winning streak that began on February 14. However, the prevailing risk-off sentiment dominates the market ahead of the Federal Open Market Committee’s (FOMC) meeting minutes, scheduled for Wednesday.
The US Dollar (USD) could strengthen against the Euro (EUR) following recent stronger consumer and producer prices from the United States (US). This data has bolstered market sentiment, suggesting that the Federal Reserve (Fed) may avoid implementing any rate cuts in the upcoming meetings in March and May.
The Euro faces downward pressure as European money markets experience a decline, potentially due to market caution amid diminishing prospects for early interest rate cuts globally. However, China's decision to reduce its five-year Loan Prime Rate (LPR) by 25 basis points (bps) to support its struggling economy may provide some support for the Euro. Traders are anticipating potential volatility surrounding the release of the HCOB Purchasing Managers Index (PMI) data from the Eurozone and Germany, scheduled for Thursday.
The US Dollar Index (DXY) continues to hold its ground in positive territory despite a decrease in US Treasury yields. The DXY edges higher to around 104.40, while the yields on US bonds stand at 4.62% for the 2-year and 4.28% for the 10-year, at the time of writing.
Daily digest market movers: EUR/USD remains calm amid a subdued US Dollar
- European Union Passenger Car Registrations rose by 12.1% annually in January, against December’s 3.3% fall, which might have provided some support for the Euro.
- The People’s Bank of China (PBoC) has chosen to keep its one-year Loan Prime Rate (LPR) unchanged at 3.45%. However, it has reduced the five-year LPR by 25 basis points from 4.20% to 3.95%.
- According to the German Bundesbank Monthly Report, economists at Deutsche Bundesbank anticipate a general decline in the inflation rate in the upcoming months. The earlier timing of Easter this year compared to last year is expected to influence the prices of package holidays, consequently impacting the inflation rate.
- German Buba Monthly Report projected that inflation for food and other goods will likely decrease further in the coming months. However, price pressures in the services sector are expected to ease at a slower pace, primarily due to the sustained strength in wage growth.
- ANZ expects that the US Federal Reserve could initiate a rate-cutting cycle from July. According to the CME FedWatch Tool, there is a 53% probability of a 25 basis points rate cut by the US Fed in the June meeting.
- The Federal Reserve's dot plot for this year suggests an anticipation of 75 basis points in rate cuts, while the Fed funds futures market is pricing in approximately 89 basis points in cuts.
- The recent remarks from Fed officials suggest the possibility of rate cuts soon. San Francisco Federal Reserve President Mary C. Daly stated that three rate cuts are a reasonable baseline for 2024. Additionally, St. Louis Federal Reserve President James Bullard recommended that the Federal Reserve should contemplate lowering interest rates at its March meeting.
Technical Analysis: EUR/USD maintains its position around 1.0790
EUR/USD trades near 1.0790 on Tuesday, below the immediate resistance at a psychological level of 1.0800. A breakthrough above this psychological barrier could provide upward support for the pair to retest last week's high at 1.0805.
The technical analysis of the EUR/USD pair displays a 14-4hour Relative Strength Index (RSI) above the 50 mark, indicating bullish sentiment. Additionally, the Moving Average Convergence Divergence (MACD) is positioned above both the centerline and the signal line, signaling a confirmation of the bullish momentum.
On the downside, the EUR/USD pair may find key support at the 21-4hour Exponential Moving Average (EMA) and the 23.6% Fibonacci retracement level at 1.0767. A breach below this level could lead the pair to a test of support around the 38.2% Fibonacci retracement level at 1.0753, aligning with the significant level of 1.0750.
EUR/USD: Four-Hour Chart
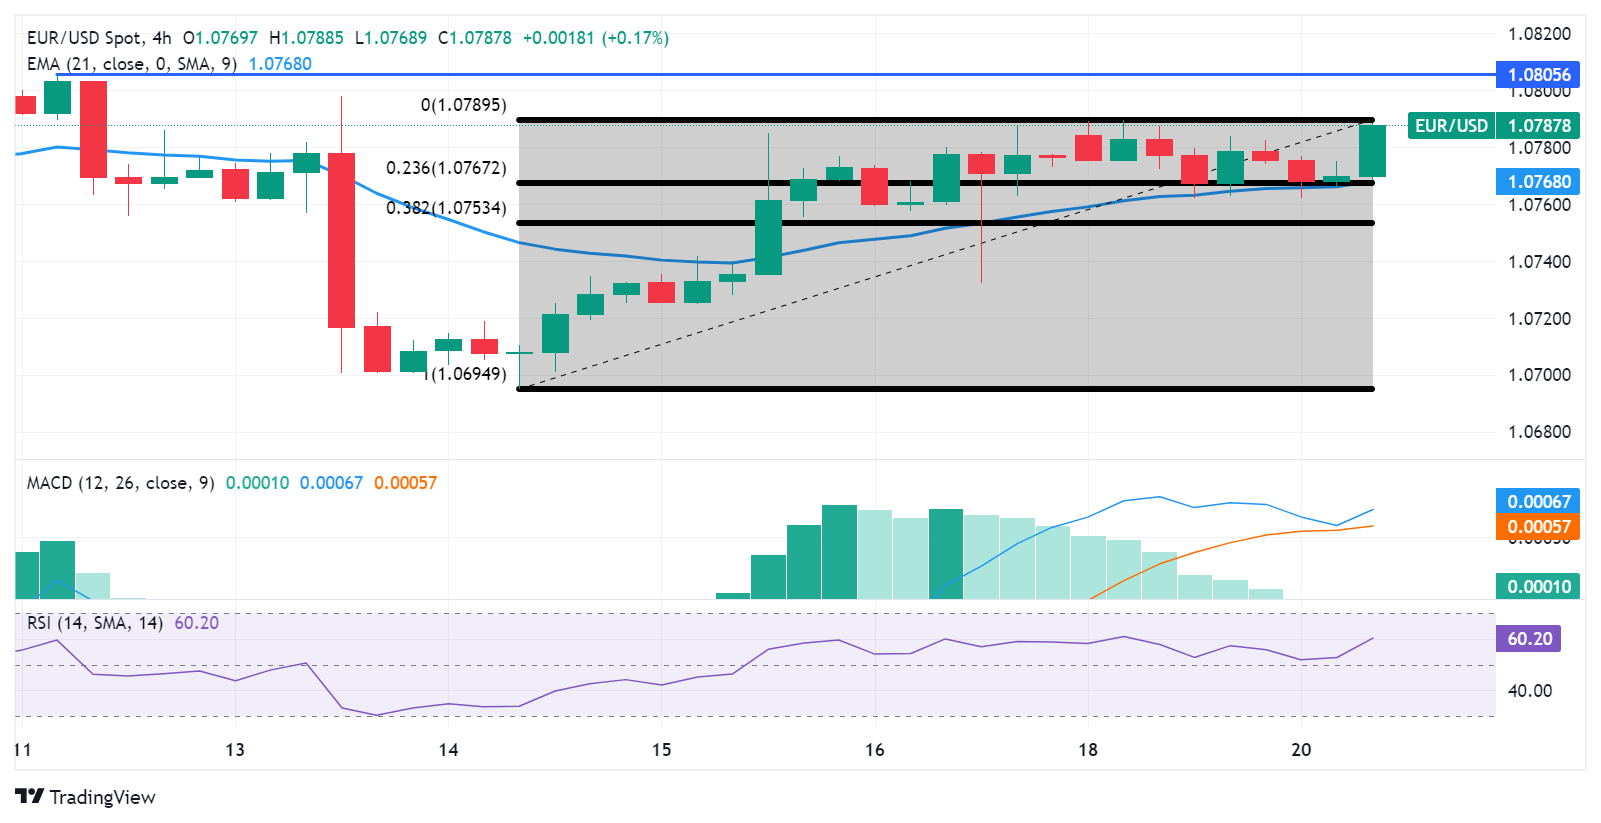
Euro price today
The table below shows the percentage change of Euro (EUR) against listed major currencies today. Euro was the strongest against the US Dollar.
| USD | EUR | GBP | CAD | AUD | JPY | NZD | CHF | |
| USD | -0.22% | -0.15% | -0.06% | -0.33% | 0.01% | -0.35% | -0.13% | |
| EUR | 0.22% | 0.06% | 0.15% | -0.12% | 0.22% | -0.13% | 0.09% | |
| GBP | 0.15% | -0.06% | 0.10% | -0.19% | 0.17% | -0.20% | 0.03% | |
| CAD | 0.06% | -0.15% | -0.07% | -0.27% | 0.08% | -0.29% | -0.06% | |
| AUD | 0.32% | 0.13% | 0.19% | 0.27% | 0.34% | -0.02% | 0.21% | |
| JPY | -0.01% | -0.21% | -0.15% | -0.08% | -0.36% | -0.37% | -0.14% | |
| NZD | 0.34% | 0.14% | 0.21% | 0.29% | 0.01% | 0.36% | 0.23% | |
| CHF | 0.13% | -0.09% | -0.03% | 0.07% | -0.21% | 0.14% | -0.22% |
The heat map shows percentage changes of major currencies against each other. The base currency is picked from the left column, while the quote currency is picked from the top row. For example, if you pick the Euro from the left column and move along the horizontal line to the Japanese Yen, the percentage change displayed in the box will represent EUR (base)/JPY (quote).
Euro FAQs
What is the Euro?
The Euro is the currency for the 20 European Union countries that belong to the Eurozone. It is the second most heavily traded currency in the world behind the US Dollar. In 2022, it accounted for 31% of all foreign exchange transactions, with an average daily turnover of over $2.2 trillion a day.
EUR/USD is the most heavily traded currency pair in the world, accounting for an estimated 30% off all transactions, followed by EUR/JPY (4%), EUR/GBP (3%) and EUR/AUD (2%).
What is the ECB and how does it impact the Euro?
The European Central Bank (ECB) in Frankfurt, Germany, is the reserve bank for the Eurozone. The ECB sets interest rates and manages monetary policy.
The ECB’s primary mandate is to maintain price stability, which means either controlling inflation or stimulating growth. Its primary tool is the raising or lowering of interest rates. Relatively high interest rates – or the expectation of higher rates – will usually benefit the Euro and vice versa.
The ECB Governing Council makes monetary policy decisions at meetings held eight times a year. Decisions are made by heads of the Eurozone national banks and six permanent members, including the President of the ECB, Christine Lagarde.
How does inflation data impact the value of the Euro?
Eurozone inflation data, measured by the Harmonized Index of Consumer Prices (HICP), is an important econometric for the Euro. If inflation rises more than expected, especially if above the ECB’s 2% target, it obliges the ECB to raise interest rates to bring it back under control.
Relatively high interest rates compared to its counterparts will usually benefit the Euro, as it makes the region more attractive as a place for global investors to park their money.
How does economic data influence the value of the Euro?
Data releases gauge the health of the economy and can impact on the Euro. Indicators such as GDP, Manufacturing and Services PMIs, employment, and consumer sentiment surveys can all influence the direction of the single currency.
A strong economy is good for the Euro. Not only does it attract more foreign investment but it may encourage the ECB to put up interest rates, which will directly strengthen the Euro. Otherwise, if economic data is weak, the Euro is likely to fall.
Economic data for the four largest economies in the euro area (Germany, France, Italy and Spain) are especially significant, as they account for 75% of the Eurozone’s economy.
How does the Trade Balance impact the Euro?
Another significant data release for the Euro is the Trade Balance. This indicator measures the difference between what a country earns from its exports and what it spends on imports over a given period.
If a country produces highly sought after exports then its currency will gain in value purely from the extra demand created from foreign buyers seeking to purchase these goods. Therefore, a positive net Trade Balance strengthens a currency and vice versa for a negative balance.
The Riksbank’s dovish turn looks a bit premature, economists at ING say.
EUR/SEK can trade higher from these levels in the short term
We suspect that the easing guidance offered in February can end up being counterproductive. That is because – as admitted by the Riksbank itself – avoiding a weakening of the Krona remains crucial for the inflation battle, but at the same time the early easing guidance (along with the end of FX sales) puts the SEK in a fragile spot if sentiment turns negative for high-beta FX.
We think EUR/SEK can trade higher from these levels in the short term, but the Riksbank may well be ready to redeploy FX sales should SEK weaken too much.
Our medium-term view for the pair is a break below 11.00, but once again we suspect the Riksbank’s monetary policy communication is adding hurdles to the SEK recovery path.
- Gold price generates more gains as Fed policymakers are confident that inflation is broadly declining.
- The FOMC minutes for January policy will be a detailed explanation behind the Fed's steady interest rate decision.
- Investors see the preliminary S&P Global Manufacturing PMI for February at 50.5.
Gold price (XAU/USD) extends its bullish streak for the fourth straight trading session on Tuesday. The outlook for the precious metal has strengthened as commentary from Federal Reserve (Fed) policymakers that inflation is broadly moving in the right direction has faded the impact of stubborn Consumer Price Index (CPI) and Producer Price Index (PPI) data for January.
The confidence of Fed policymakers that inflation is declining over the long term has trimmed the opportunity cost of holding non-yielding assets such as Gold. Meanwhile, investors await the Federal Reserve Open Market Committee (FOMC) minutes for the first monetary policy meeting of 2024. The FOMC minutes will provide cues about the timing of three rate-cuts, as forecasted by the Fed.
On the economic data front, preliminary S&P Global PMI data for February will guide the forward action in the Gold price and the US Dollar, which will be published on Thursday. The US Manufacturing PMI is expected to exceed the 50.0 threshold for the second straight month at 50.5. An upbeat factory data would have a negative impact on the Gold price.
Daily Digest Market Movers: Gold price extends its upside while US Dollar remains sideways
- Gold price continues to generate gains but struggles to extend the upside above four-day high around $2,023.
- The upside in the precious metal seems restricted amid persistent fears of higher for longer interest rates by the Federal Reserve due to stubborn inflation data.
- The United States core inflation data is almost double than the required rate of 2%, easing hopes of rate cuts by the Fed before June.
- The CME FedWatch tool shows that traders are confident about interest rates remaining unchanged in the range of 5.25%-5.50% till the May monetary policy meeting. For the June meeting, chances for a 25 basis points (bps) rate-cut stand at 53%.
- While investors have lowered their bets for rate cuts significantly after stubborn consumer and producer price inflation data for January, Fed policymakers see the one-time high inflation as insignificant.
- Fed policymakers believe that the longer-run inflation trend is declining and overly focusing on a one-time blip could be a tremendous mistake.
- The US Dollar Index, which measures the value of Greenback against six major currencies, is confined in a tight range around 104.20 as investors await the FOMC minutes for January policy meeting, which will be released on Wednesday.
- The FOMC minutes will provide a detailed explanation behind the maintenance of interest rates at their current level for the fourth time in a row.
- In the monetary policy statement, Fed Chair Jerome Powell said a continuation of good data is required to reduce borrowing rates. Good data means easing price pressures.
- Meanwhile, 10-year US Treasury yields which reflect expectations for Fed policy are slightly up to near 4.30%.
Technical Analysis: Gold price aims to stabilize above $2,020
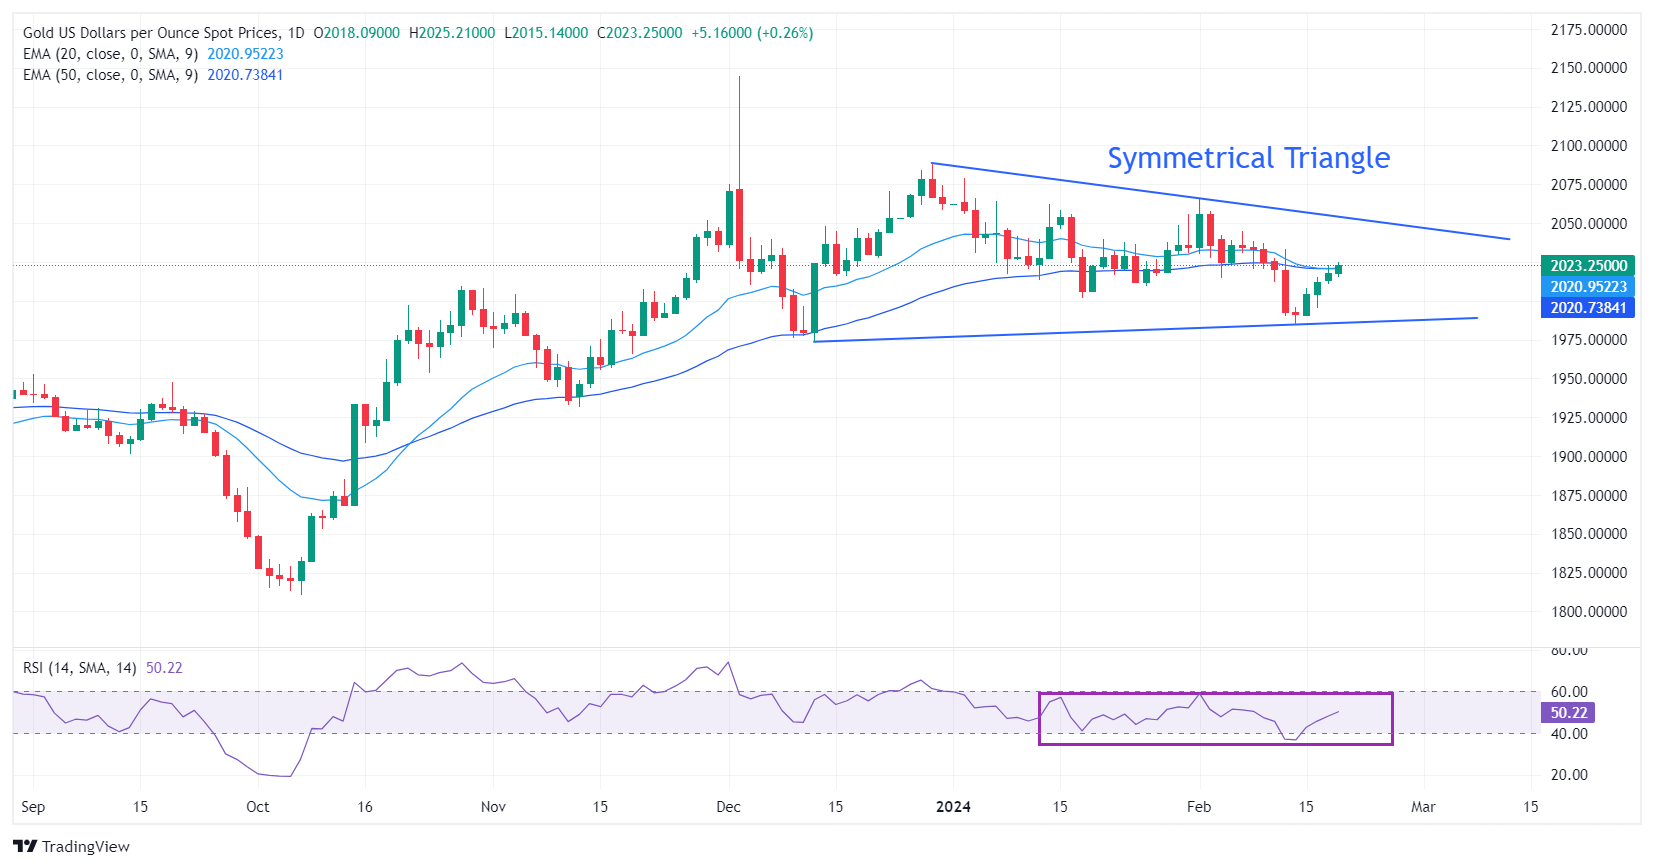
Gold price continues its winning spell for the fourth straight trading session. The precious metal attempts to deliver a decisive break above the 20 and 50-day Exponential Moving Averages (EMAs), which trade around $2,020.
The primary trend in the Gold price indicates indecisiveness among market participants due to a Symmetrical Triangle formation on a daily time frame. The upward and downward-sloping borders of the aforementioned chart pattern are plotted from December 13 low at $1,973 and December 28 high at $2,088, respectively.
The triangle could breakout in either direction, however, the odds marginally favor a move in the direction of the trend prior to the formation of the triangle – in this case up. A decisive break above or below the triangle boundary lines would indicate a breakout was underway.
The 14-period Relative Strength Index (RSI) has returned to the 40.00-60.00 range quickly after testing territory below 40.00, indicating a strong bullish reversal.
Gold FAQs
Why do people invest in Gold?
Gold has played a key role in human’s history as it has been widely used as a store of value and medium of exchange. Currently, apart from its shine and usage for jewelry, the precious metal is widely seen as a safe-haven asset, meaning that it is considered a good investment during turbulent times. Gold is also widely seen as a hedge against inflation and against depreciating currencies as it doesn’t rely on any specific issuer or government.
Who buys the most Gold?
Central banks are the biggest Gold holders. In their aim to support their currencies in turbulent times, central banks tend to diversify their reserves and buy Gold to improve the perceived strength of the economy and the currency. High Gold reserves can be a source of trust for a country’s solvency. Central banks added 1,136 tonnes of Gold worth around $70 billion to their reserves in 2022, according to data from the World Gold Council. This is the highest yearly purchase since records began. Central banks from emerging economies such as China, India and Turkey are quickly increasing their Gold reserves.
How is Gold correlated with other assets?
Gold has an inverse correlation with the US Dollar and US Treasuries, which are both major reserve and safe-haven assets. When the Dollar depreciates, Gold tends to rise, enabling investors and central banks to diversify their assets in turbulent times. Gold is also inversely correlated with risk assets. A rally in the stock market tends to weaken Gold price, while sell-offs in riskier markets tend to favor the precious metal.
What does the price of Gold depend on?
The price can move due to a wide range of factors. Geopolitical instability or fears of a deep recession can quickly make Gold price escalate due to its safe-haven status. As a yield-less asset, Gold tends to rise with lower interest rates, while higher cost of money usually weighs down on the yellow metal. Still, most moves depend on how the US Dollar (USD) behaves as the asset is priced in dollars (XAU/USD). A strong Dollar tends to keep the price of Gold controlled, whereas a weaker Dollar is likely to push Gold prices up.
US markets re-open today after an uneventful Monday for global markets. Economists at ING markets’ outlook.
Markets unimpressed with China's rate cut
The US calendar is unlikely to be a big driver today. China is once again the focus as banks reduced their five-year loan prime rates by a record 25 bps to 3.95% overnight, the first move of this kind since June. This kind of monetary easing has a generally higher impact on the property market, but once again markets have shown little enthusiasm.
We favour a strong Dollar in the near term as US data remains supportive, but this looks increasingly to be the perfect recipe for range-bound trading.
In DXY terms, 104.00/105.00 may hold as a range in the short run.
Canada’s CPI is the highlight of a quiet G10 calendar today. Economists at Société Générale analyze USD/CAD’s technical outlook ahead of inflation figures.
Recent pivot low near 1.3410 is near-term support
USD/CAD has embarked on a series of higher peaks and troughs in daily timeframe chart after carving out a low near 1.3180 in December. The pair has gradually established above flattish 200-DMA denoting possibility of continuation in up move.
Recent pivot low near 1.3410 is near-term support. Defence of this can lead to persistence in rebound towards 1.3620, the 61.8% retracement from last November and projections of 1.3730.
The ECB’s negotiated wage growth indicator is a key test for the Euro. Economists at ING think a decline in salary pressure can help a further unwinding of EUR longs.
Good support at 1.0700 would not be a surprise
We believe our economics team’s call for a 4.4%-4.5% year-on-year read is moderately lower than expectations. This wage indicator has been on a steady rise since mid-2022, and a decline, even if contained, should be welcomed by the ECB. It will be up to the 2024 first quarter GDP print (which includes detailed wage information) in April and the negotiated wage indicator in May to greenlight or redlight a rate cut in June, given the second quarter GDP figures are published after the June meeting.
The Euro is an outlier in the G10 space, being moderately overbought (+7% of open interest) against the Dollar despite its widely negative rate differential. Watch for some positioning adjustment on the downside today in EUR/USD, should the ECB wage growth come in below 4.5%. Still, we would not be surprised to see good support at 1.0700.
After the focus has been on the US side for the past two weeks, the Euro side may cause some action today ahead of Thursday's PMIs: the ECB releases its wage indicator for Q4. Economists at Commerzbank analyze how today’s data could impact the EUR.
Euro could suffer further downside pressure if wage data comes in a little lower
If today's wage data comes in a little lower, the Euro could come under further downside pressure. However, the figures would probably have to be quite low for the Euro to fall more sharply. After all, the large number of wage indicators points to a stabilization of wages rather than a sustained trend reversal.
On the other hand, if we see very strong wage growth today, the Euro could get a boost, as the recent statements by ECB officials would probably be viewed with much more doubt.
- Pound Sterling struggles for direction as investors await BoE’s guidance on inflation and interest rates.
- The stubbornness of the UK inflation outlook has deepened amid robust spending by households.
- The market mood is slightly cautious ahead of the FOMC minutes.
The Pound Sterling (GBP) trades sideways in Tuesday’s European session as the market sentiment is slightly downbeat ahead of the release of the Federal Reserve Open Market Committee (FOMC) minutes, which will provide a fresh outlook on interest rates. In today’s session, Bank of England (BoE) Governor Andrew Bailey and other policymakers will testify before the United Kingdom Parliament to guide the outlook on inflation and interest rates.
Investors expect the maintenance of a hawkish line of rhetoric from Andrew Bailey and his teammates amid less conviction over the achievement of price stability in a sustainable manner. Robust wage growth, sticky service inflation, and solid households spending are indicating a stubborn inflation outlook, allowing the BoE to adopt a wait-and-watch approach before consideration of rate cuts. A hawkish guidance from BoE policymakers may improve the attractiveness of the Pound Sterling.
This week, the GBP/USD pair will be guided by the preliminary S&P Global Manufacturing and Services PMI for February, which will be published on Thursday.
Daily Digest Market Movers: Pound Sterling remains cautious ahead of FOMC minutes
- Pound Sterling remains inside the woods below 1.2600 as the market sentiment remains cautious.
- The Pound Sterling will be guided by the commentaries from Bank of England Governor Andrew Bailey and other Monetary Policy Committee (MPC) members on the inflation and the interest rate outlook before Parliament’s Treasury Committee.
- Andrew Bailey and his teammates are expected to maintain a hawkish narrative on interest rates as momentum in service inflation and wage growth is higher than what is required for bringing inflation down to the 2% target.
- Apart from that, robust Retail Sales data for January have indicated that the impact of hawkish stance on interest rates by the BoE is fading away.
- Also, an indication of higher spending by households would support the United Kingdom economy in coming out from a recession.
- Last week, BoE Chief Economist Huw Pill advised to remain patient for rate cuts as current inflation data is insufficient to convince that inflation will sustainably decline to the 2% target.
- Meanwhile, the near-term outlook for the Pound Sterling has strengthened. The weekly data from the Commodity Futures Trading Commission (CFTC) shows that speculators lifted their bullish sterling position to $3.971 billion in the week to Feb 13, just shy of last July's nine-year high, Reuters reported.
- This week, investors will focus on the preliminary S&P Global/CIPS Manufacturing and Services PMI for January. Expectations are for the Manufacturing PMI to rise to 47.5 from 47.0, while Services PMI to drop to 54.1 from 54.3 in December.
- On the United States front, the US Dollar Index, which gauges the Greenback’s value against six rival currencies, rebounded to 104.40 amid uncertainty ahead of FOMC minutes for the January policy meeting, which will be released on Wednesday.
- The USD Index struggles to deliver a strong recovery as Federal Reserve policymakers are confident that inflation is moving in the right direction despite hotter-than-anticipated consumer price inflation and the Producer Price Index (PPI) data for January.
Technical Analysis: Pound Sterling consolidates below 1.2600
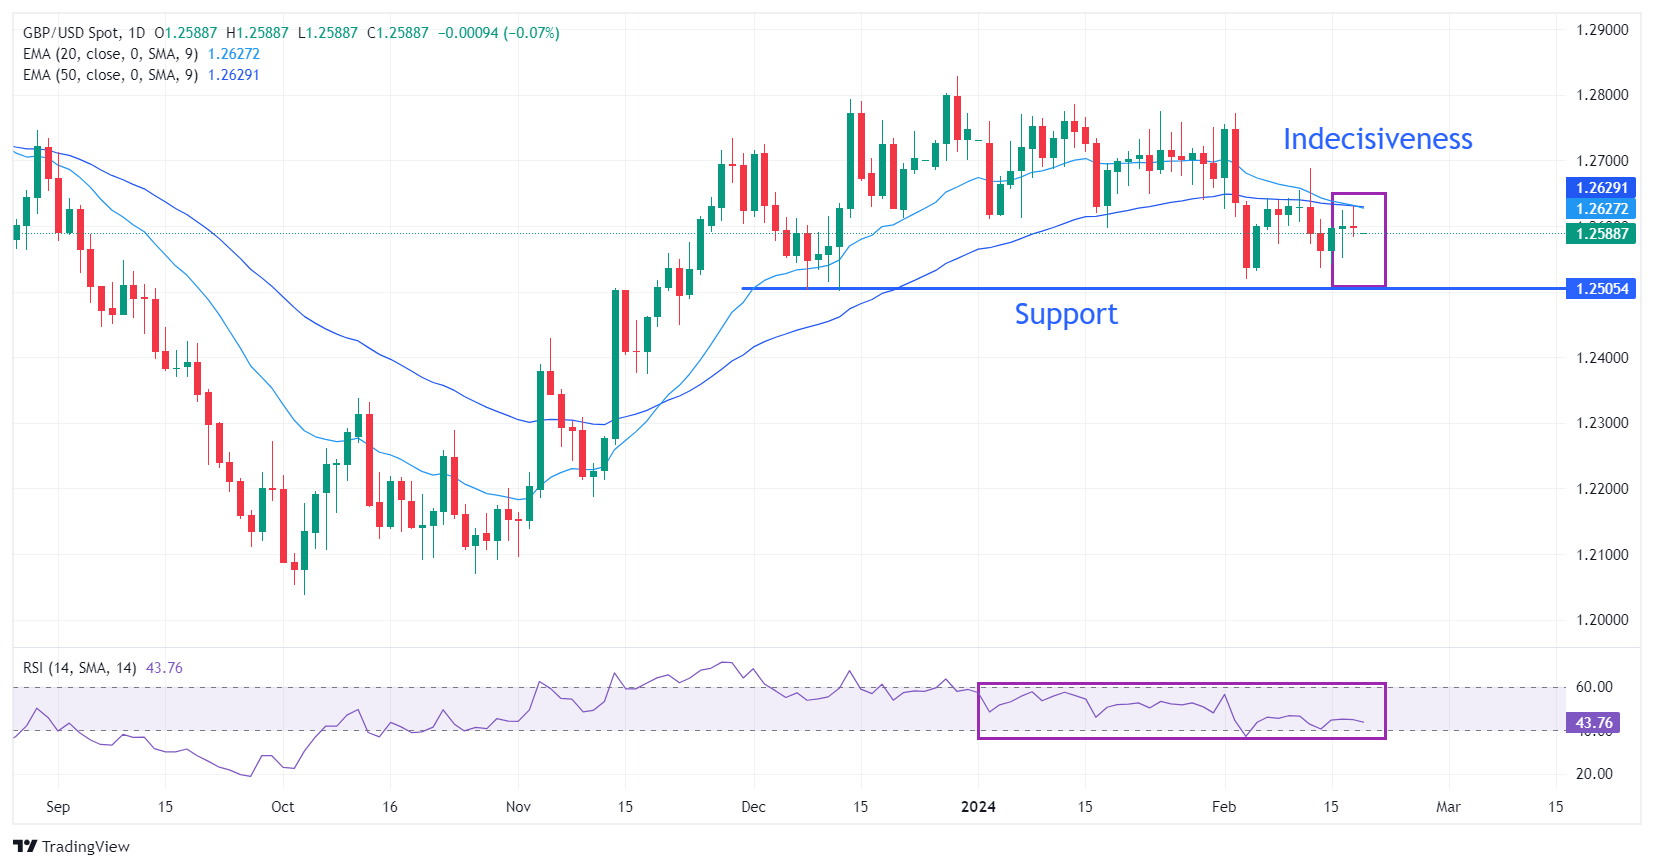
Pound Sterling is stuck in a tight range below 1.2600 on Tuesday after indecisive closing in the last two trading sessions. The broader appeal is expected to remain uncertain as the 20 and 50-day Exponential Moving Averages (EMAs) are on the verge of delivering a bearish crossover. The psychological support at 1.2500 to remain a major support for the Pound Sterling bulls.
The 14-period Relative Strength Index (RSI) oscillates in the 40.00-60.00 range, indicating a sharp volatility contraction.
Pound Sterling FAQs
What is the Pound Sterling?
The Pound Sterling (GBP) is the oldest currency in the world (886 AD) and the official currency of the United Kingdom. It is the fourth most traded unit for foreign exchange (FX) in the world, accounting for 12% of all transactions, averaging $630 billion a day, according to 2022 data.
Its key trading pairs are GBP/USD, aka ‘Cable’, which accounts for 11% of FX, GBP/JPY, or the ‘Dragon’ as it is known by traders (3%), and EUR/GBP (2%). The Pound Sterling is issued by the Bank of England (BoE).
How do the decisions of the Bank of England impact on the Pound Sterling?
The single most important factor influencing the value of the Pound Sterling is monetary policy decided by the Bank of England. The BoE bases its decisions on whether it has achieved its primary goal of “price stability” – a steady inflation rate of around 2%. Its primary tool for achieving this is the adjustment of interest rates.
When inflation is too high, the BoE will try to rein it in by raising interest rates, making it more expensive for people and businesses to access credit. This is generally positive for GBP, as higher interest rates make the UK a more attractive place for global investors to park their money.
When inflation falls too low it is a sign economic growth is slowing. In this scenario, the BoE will consider lowering interest rates to cheapen credit so businesses will borrow more to invest in growth-generating projects.
How does economic data influence the value of the Pound?
Data releases gauge the health of the economy and can impact the value of the Pound Sterling. Indicators such as GDP, Manufacturing and Services PMIs, and employment can all influence the direction of the GBP.
A strong economy is good for Sterling. Not only does it attract more foreign investment but it may encourage the BoE to put up interest rates, which will directly strengthen GBP. Otherwise, if economic data is weak, the Pound Sterling is likely to fall.
How does the Trade Balance impact the Pound?
Another significant data release for the Pound Sterling is the Trade Balance. This indicator measures the difference between what a country earns from its exports and what it spends on imports over a given period.
If a country produces highly sought-after exports, its currency will benefit purely from the extra demand created from foreign buyers seeking to purchase these goods. Therefore, a positive net Trade Balance strengthens a currency and vice versa for a negative balance.
- USD/JPY extends gains on risk-off sentiment ahead of FOMC minutes.
- The US Fed is expected to avoid any rate cut in March and May.
- Japan’s official Atsushi Mimura stated government communicates with other countries regarding FX intervention.
USD/JPY strengthens for the third consecutive trading day, supported by a stronger US Dollar (USD). This uptrend can be attributed to market sentiment, which is biased towards the possibility of the Federal Reserve (Fed) refraining from implementing any rate cuts in the upcoming meetings in March and May. This sentiment has been reinforced by stronger data on consumer and producer prices released last week. The USD/JPY pair trades higher around 150.30 during the early European session on Tuesday.
ANZ has forecasted that the Federal Reserve (Fed) could commence a rate-cutting cycle starting from July in mid-summer. According to the CME FedWatch Tool, there is a 53% probability of a 25 basis points rate cut by the US Fed in the June meeting.
The US Dollar Index (DXY), which gauges the value of the US Dollar against six other major currencies, ends its four-day losing streak. The DXY trades higher around 104.30, with 2-year and 10-year yields on US bond coupons standing at 4.64% and 4.29%, respectively, at the time of writing.
On the other side, Japanese Finance Ministry official Atsushi Mimura stated on Tuesday that the government "is continually communicating and coordinating with other countries regarding FX intervention." He emphasized the importance of maintaining safety and securing liquidity in FX reserves management. Mimura mentioned that the government can sell assets such as savings and foreign bonds in FX reserves when intervention is deemed necessary.
Moreover, Finance Minister Shunichi Suzuki remarked that while a weak Yen has both advantages and disadvantages, he expressed greater concern about the negative implications of a weak currency. In an earlier interview, Suzuki also noted, "The Bank of Japan (BoJ) holds jurisdiction over monetary policy. But there will come a time when interest rates rise."
Market participants will likely observe the Trade Balance data with Import and Export figures for January on Wednesday. Furthermore, the focus will shift to the Federal Open Market Committee’s (FOMC) meeting minutes.
FX option expiries for Feb 20 NY cut at 10:00 Eastern Time, via DTCC, can be found below.
- EUR/USD: EUR amounts
- 1.0675 1.3b
- 1.0740 744m
- 1.0770 784m
- 1.0800 1.1b
- 1.0865 833m
- USD/JPY: USD amounts
- 150.50 1.6b
- AUD/USD: AUD amounts
- 0.6400 1.1b
- 0.6475 1.1b
- USD/CAD: USD amounts
- 1.3625 1.5b
- NZD/USD: NZD amounts
- 0.6150 678m
- EUR/GBP: EUR amounts
- 0.8450 589m
- 0.8530 1.7b
The Chinese Yuan (CNY) weakened over the past month from around 7.1000 at the start of the year to nearly 7.2000 in early February. Economists at ING analyze USD/CNY outlook.
PBoC easing bias could cause near-term weakness
Economic momentum was soft to start the year, and it is possible we could see further monetary easing in the next month, which adds to the short-term depreciation bias.
In subsequent months, an expected recovery of sentiment or fundamentals, as well as the start of global rate cuts would be potential catalysts for CNY appreciation.
Nobody expects a quick turnaround in the Chinese economy, but we expect 7.3000 to continue proving a line in the sand for USD/CNY and the broader Dollar trend to carry it lower in the second half of the year.
Here is what you need to know on Tuesday, February 20:
Financial markets remain relatively quiet following Monday's subdued action. Bank of England (BoE) Governor Andrew Bailey and other policymakers will testify on monetary policy before the UK Treasury Select Committee during the European trading hours. Later in the day, Statistics Canada will release Consumer Price Index (CPI) data for January.
Canada CPI Preview: Forecasts from seven major banks, inflation likely eased in January.
Stock and bond markets in the US return to action following a long weekend. The benchmark 10-year US Treasury bond yield holds steady at around 4.3% and US stock index futures trade in negative territory in the European morning. Meanwhile, the US Dollar (USD) Index clings to modest daily gains above 104.00 after closing the first day of the week virtually unchanged.
US Dollar price this week
The table below shows the percentage change of US Dollar (USD) against listed major currencies this week. US Dollar was the strongest against the Swiss Franc.
| USD | EUR | GBP | CAD | AUD | JPY | NZD | CHF | |
| USD | 0.10% | 0.16% | 0.18% | 0.06% | 0.20% | -0.08% | 0.28% | |
| EUR | -0.10% | 0.06% | 0.07% | -0.04% | 0.10% | -0.19% | 0.18% | |
| GBP | -0.16% | -0.06% | 0.02% | -0.11% | 0.04% | -0.24% | 0.12% | |
| CAD | -0.18% | -0.08% | -0.02% | -0.12% | 0.03% | -0.26% | 0.10% | |
| AUD | -0.05% | 0.05% | 0.11% | 0.12% | 0.14% | -0.14% | 0.22% | |
| JPY | -0.19% | -0.11% | -0.01% | -0.03% | -0.14% | -0.28% | 0.07% | |
| NZD | 0.09% | 0.18% | 0.24% | 0.26% | 0.14% | 0.28% | 0.36% | |
| CHF | -0.31% | -0.21% | -0.12% | -0.10% | -0.25% | -0.08% | -0.36% |
The heat map shows percentage changes of major currencies against each other. The base currency is picked from the left column, while the quote currency is picked from the top row. For example, if you pick the Euro from the left column and move along the horizontal line to the Japanese Yen, the percentage change displayed in the box will represent EUR (base)/JPY (quote).
During the Asian trading hours, the People's Bank of China (PBoC) announced that it maintained the one-year Loan Prime Rate (LPR) unchanged and cut the five-year LPR by 25 basis points (bps) from 4.20% to 3.95%. Shanghai Composite and Hang Seng indexes were last seen trading marginally higher on the day.
USD/CAD continues to fluctuate in a narrow channel at around 1.3500 early Tuesday. The pair reached its highest level since December near 1.3600 in the previous week but erased a large portion of its gains to end the week with small gains slightly below 1.3500.
Canada CPI Preview: Inflation expected to rise at a slower 3.3% rate in January.
Japanese Finance Minister Shunichi Suzuki offered some mild verbal interventions on Tuesday, repeating that they are closely watching the movements in foreign exchange market with a high sense of urgency. Speaking on the same matter, Japanese Finance Ministry official Atsushi Mimura said that the government “is always communicating and coordinating with other countries in case for an FX intervention.” USD/JPY trades in positive territory above 150.00 following these comments.
After closing the first day of the week flat, GBP/USD came under modest bearish pressure and retreated below 1.2600 during the Asian trading hours on Tuesday.
EUR/USD struggled to find direction and moved up and down in a narrow band below 1.0800 on Monday. Early Tuesday, the pair extends its sideways grind above 1.0750.
Following Friday's rebound, Gold continued to push higher and closed in positive territory on Monday. XAU/USD holds its ground early Tuesday and trades at around $2,020.
- Gold price attracts some buyers around $2,020 in Tuesday’s early European session.
- Higher-than-expected US inflation figures fuelled speculation of a delay in the Fed’s move towards monetary policy easing.
- The rising Middle East geopolitical tensions and economic uncertainties lift the yellow metal.
- The FOMC Meeting Minutes will be the highlight of this week.
Gold price gains momentum for the fourth straight day during the early European session on Tuesday. The yellow metal trades in positive territory despite the rebound of the US Dollar (USD) and higher bond yields. Trading activity was low on Monday as markets closed in the US. However, investors will take more cues from the FOMC Minutes on Wednesday about the outlook for US interest rates. At press time, the gold price is trading at $2,020, adding 0.09% on the day.
Meanwhile, the US Dollar Index (DXY), which measures the value of the USD relative to a basket of global currencies, posts modest gains near 104.35. The US Treasury yields edge higher, with the 10-year yield standing at 4.30%.
Given the stronger-than-expected recent US data, investors lower their bets on the rate cut expectations, which provide some support for the US Dollar (USD). According to the CME FedWatch Tool, the markets have priced in the first 25 basis points (bps) rate cut by the Fed in the June 2024 meeting.
On the other hand, the global central banks are likely to diversify foreign reserves and accumulate gold to hedge in their portfolios amid ongoing geopolitical tensions in the Middle East and economic uncertainties. This, in turn, could boost the demand for gold, a traditional safe-haven asset.
The FOMC Meeting Minutes will be released on Wednesday, and it might provide further insights into why Fed officials are not confident enough to begin easing policy in Q1 2024. On Thursday, the preliminary US S&P Global PMI for February will be due. These events could give a clear direction to the gold price.
- The Canadian Consumer Price Index is forecast to rise 3.2% YoY in January.
- Canada’s CPI inflation data is set to impact the timing of a Bank of Canada rate cut.
- Statistics Canada will publish the CPI inflation data on Tuesday.
The high-impact Consumer Price Index (CPI) data from Canada will be published by Statistics Canada on Tuesday at 13:30 GMT. The CPI inflation data is likely to have a significant influence on the market’s pricing of an expected Bank of Canada (BoC) interest rate cut this year, impacting the value of the Canadian Dollar.
What to expect from Canada’s inflation rate?
Economists expect the Canadian CPI to rise at an annual rate of 3.2% in January, slowing from a 3.4% growth recorded in December. On a monthly basis, the CPI inflation is seen rebounding to 0.4% in the same period after December’s 0.3% decline. The Core CPI rose 0.1% MoM in December.
Alongside the CPI data, the Bank of Canada (BoC) will publish its closely watched Core Consumer Price Index data, which excludes volatile items such as food and energy prices. In December, the annual BoC Core CPI rose 2.6% while the monthly BoC Core CPI dropped 0.5%.
The expected slowdown in the headline annual Canadian CPI inflation could be attributed to lower energy and food prices. However, core CPI figures are likely to remain sticky, in the face of the BoC’s higher borrowing costs, which have led to rising mortgage interest costs and rents.
Previewing the Canadian inflation report, analysts at TD Securities (TDS) noted: “We look for headline CPI to fall 0.2pp to 3.2% y/y in Jan as prices rise by 0.4% m/m, but details should reinforce limited progress. Food/energy components will drive most of the deceleration as 3m rates of core CPI accelerate from Dec. That should result in a mixed tone overall and the persistence in underlying inflation sets a high bar for any dovish shift from the BoC in March.”
According to Canada’s overnight index swaps (OIS) curve, a first-rate cut by the BoC is likely seen in July.
Bank of Canada Governor Tiff Macklem, at the Montreal Council on Foreign Relations event last week, said that “the policy discussion is shifting from whether or not the policy is restrictive enough to how long it should remain restrictive.”
“The path back to 2.0% inflation is likely to be slow,” Mackem said, warning that “risks remain, as shelter prices are now the biggest contributor to above-target inflation.”
How could the Canada CPI data affect USD/CAD?
The Canadian Dollar is consolidating its recovery from two-month lows of 1.3586 against the US Dollar heading toward Tuesday’s CPI showdown. Hot inflation data from the United States helped the US Dollar gain some ground last week but growing expectations of delayed US Federal Reserve (Fed) rate cuts capped the Greenback’s upside. Markets now price in a 66% chance of a June Fed rate cut, the CME Group’s FedWatch Tool shows.
The Canadian Dollar could extend its recovery if the headline and core CPI figures come in hotter-than-expected and reinforce the BoC’s narrative of “higher interest rates for longer”. In such a case, USD/CAD could revisit the 1.3400 area. In contrast, soft Canadian inflation data could bring back early BoC rate cuts bets on the table, allowing USD/CAD to resume its uptrend toward 1.3600.
Dhwani Mehta, FXStreet’s Senior Analyst offers key technical levels for trading USD/CAD on Canada’s inflation report: “USD/CAD continues to defend the horizontal 21-day Simple Moving Average (SMA) at 1.3470, as the 14-day Relative Strength Index (RSI) indicator sits above the midline.”
“If the 21-day SMA at 1.3470 holds the fort, USD/CAD could rebound to challenge the 100-day SMA at 1.3550 on its way to the two-month high of 1.3586. Further up, the 1.3600 round level will be on buyers’ radars. On the downside, daily closing below the 21-day SMA will reopen floors for a test of the 50-day SMA at 1.3410. The next relevant downside target is seen at the February low of 1.3365,” Dhwani adds.
Economic Indicator
Canada Consumer Price Index (YoY)
The Consumer Price Index (CPI), released by Statistics Canada on a monthly basis, represents changes in prices for Canadian consumers by comparing the cost of a fixed basket of goods and services. The YoY reading compares prices in the reference month to the same month a year earlier. Generally, a high reading is seen as bullish for the Canadian Dollar (CAD), while a low reading is seen as bearish.
Read more.Next release: 02/20/2024 13:30:00 GMT
Frequency: Monthly
Source: Statistics Canada
Inflation FAQs
What is inflation?
Inflation measures the rise in the price of a representative basket of goods and services. Headline inflation is usually expressed as a percentage change on a month-on-month (MoM) and year-on-year (YoY) basis. Core inflation excludes more volatile elements such as food and fuel which can fluctuate because of geopolitical and seasonal factors. Core inflation is the figure economists focus on and is the level targeted by central banks, which are mandated to keep inflation at a manageable level, usually around 2%.
What is the Consumer Price Index (CPI)?
The Consumer Price Index (CPI) measures the change in prices of a basket of goods and services over a period of time. It is usually expressed as a percentage change on a month-on-month (MoM) and year-on-year (YoY) basis. Core CPI is the figure targeted by central banks as it excludes volatile food and fuel inputs. When Core CPI rises above 2% it usually results in higher interest rates and vice versa when it falls below 2%. Since higher interest rates are positive for a currency, higher inflation usually results in a stronger currency. The opposite is true when inflation falls.
What is the impact of inflation on foreign exchange?
Although it may seem counter-intuitive, high inflation in a country pushes up the value of its currency and vice versa for lower inflation. This is because the central bank will normally raise interest rates to combat the higher inflation, which attract more global capital inflows from investors looking for a lucrative place to park their money.
How does inflation influence the price of Gold?
Formerly, Gold was the asset investors turned to in times of high inflation because it preserved its value, and whilst investors will often still buy Gold for its safe-haven properties in times of extreme market turmoil, this is not the case most of the time. This is because when inflation is high, central banks will put up interest rates to combat it.
Higher interest rates are negative for Gold because they increase the opportunity-cost of holding Gold vis-a-vis an interest-bearing asset or placing the money in a cash deposit account. On the flipside, lower inflation tends to be positive for Gold as it brings interest rates down, making the bright metal a more viable investment alternative.
Japanese Finance Ministry official Atsushi Mimura said on Tuesday, the government “is always communicating and coordinating with other countries in case for FX intervention.”
Additional quotes
Mindful of maintaining safety and securing liquidity in FX reserves management.
Can sell assets such as savings and foreign bonds in FX reserves when it is necessary to intervene.
Market reaction
At the time of writing, USD/JPY is rising 0.18% on the day to 150.37, as the above comments fail to offer any support to the Japanese Yen.
Japanese Yen FAQs
What key factors drive the Japanese Yen?
The Japanese Yen (JPY) is one of the world’s most traded currencies. Its value is broadly determined by the performance of the Japanese economy, but more specifically by the Bank of Japan’s policy, the differential between Japanese and US bond yields, or risk sentiment among traders, among other factors.
How do the decisions of the Bank of Japan impact the Japanese Yen?
One of the Bank of Japan’s mandates is currency control, so its moves are key for the Yen. The BoJ has directly intervened in currency markets sometimes, generally to lower the value of the Yen, although it refrains from doing it often due to political concerns of its main trading partners. The current BoJ ultra-loose monetary policy, based on massive stimulus to the economy, has caused the Yen to depreciate against its main currency peers. This process has exacerbated more recently due to an increasing policy divergence between the Bank of Japan and other main central banks, which have opted to increase interest rates sharply to fight decades-high levels of inflation.
How does the differential between Japanese and US bond yields impact the Japanese Yen?
The BoJ’s stance of sticking to ultra-loose monetary policy has led to a widening policy divergence with other central banks, particularly with the US Federal Reserve. This supports a widening of the differential between the 10-year US and Japanese bonds, which favors the US Dollar against the Japanese Yen.
How does broader risk sentiment impact the Japanese Yen?
The Japanese Yen is often seen as a safe-haven investment. This means that in times of market stress, investors are more likely to put their money in the Japanese currency due to its supposed reliability and stability. Turbulent times are likely to strengthen the Yen’s value against other currencies seen as more risky to invest in.
- USD/CNH loses ground near 7.2090 following the PBoC interest rate decision.
- The pair keeps the bullish vibe above the key EMA; the RSI indicator lies above the 50-midlines.
- The initial support level of USD/CNH will emerge at 7.2018; 7.2336 acts as an immediate resistance level.
The USD/CNH pair trades in negative territory for the fifth consecutive day during the early European session on Tuesday. The People's Bank of China (PBoC) cut the five-year Loan Prime Rate (LPR) by 25 basis points (bps) from 4.20% to 3.95%, which is a key benchmark lending rate used to price mortgages. Meanwhile, the one-year LPR remained unchanged at 3.45%. USD/CNH is trading at 7.2090, down 0.03% on the day.
According to the daily chart, the bullish outlook of USD/CNH remains intact as the pair is above the key 100-day Exponential Moving Averages (EMAs). Additionally, the 14-day Relative Strength Index (RSI) lies above the 50-midlines, suggesting the path of least resistance is to the upside.
The first downside target of USD/CNH will emerge at the 100-day EMA at 7.2018. A breach of this level will see a drop to a low of February 7 at 7.1888. Further south, the next contention level to watch is a low of January 26 at 7.1776. The critical support level is located at the confluence of the psychological level and the lower band of the Bollinger Band.
On the upside, the immediate resistance level is seen at a high of February 14 at 7.2336. The next hurdle is located at the upper band of the Bollinger Band at 7.2388. A break above the latter will pave the way to a low of November 8 at 7.2664, en route to a high of November 13 at 7.3106.
USD/CNH daily chart
-638440060419719590.png)
- EUR/USD could approach the major support at 1.0750 following February’s low at 1.0694.
- The resistance zone could be found around the 21-day EMA at 1.0798 and the 23.6% Fibonacci retracement at 1.0799.
- Traders may await the lagging indicator MACD to confirm a directional trend.
EUR/USD retreats from the weekly high of 1.0789, which was recorded on Monday, snapping a four-day winning streak. The pair trades lower around 1.0770 during the Asian hours on Tuesday with positioning above the immediate support at the psychological level of 1.0750.
A break below the latter could put weight on the EUR/USD pair to navigate the further support region around the psychological level of 1.0700, in conjunction with February’s low at 1.0694, which was observed on February 14.
The EUR/USD pair could find the key resistance zone around the 21-day Exponential Moving Average (EMA) at 1.0798 lined up with the 23.6% Fibonacci retracement at 1.0799 and the psychological level of 1.0800.
A firm breakthrough above the resistance zone could exert upward support on the EUR/USD pair to explore the further major barrier at 1.0850, to revisit February’s high at 1.0897 aligned with the psychological level of 1.0900.
The technical analysis of the EUR/USD pair suggests a mixed outlook in the market. The 14-day Relative Strength Index (RSI) is below the 50 mark, indicating a bearish momentum. However, the lagging indicator Moving Average Convergence Divergence (MACD), although still below the centerline, is above the signal line, suggesting a tepid momentum in the market.
Given these conflicting signals, market participants may choose to await further confirmation from the MACD indicator on the directional trend for the EUR/USD pair.
EUR/USD: Daily Chart
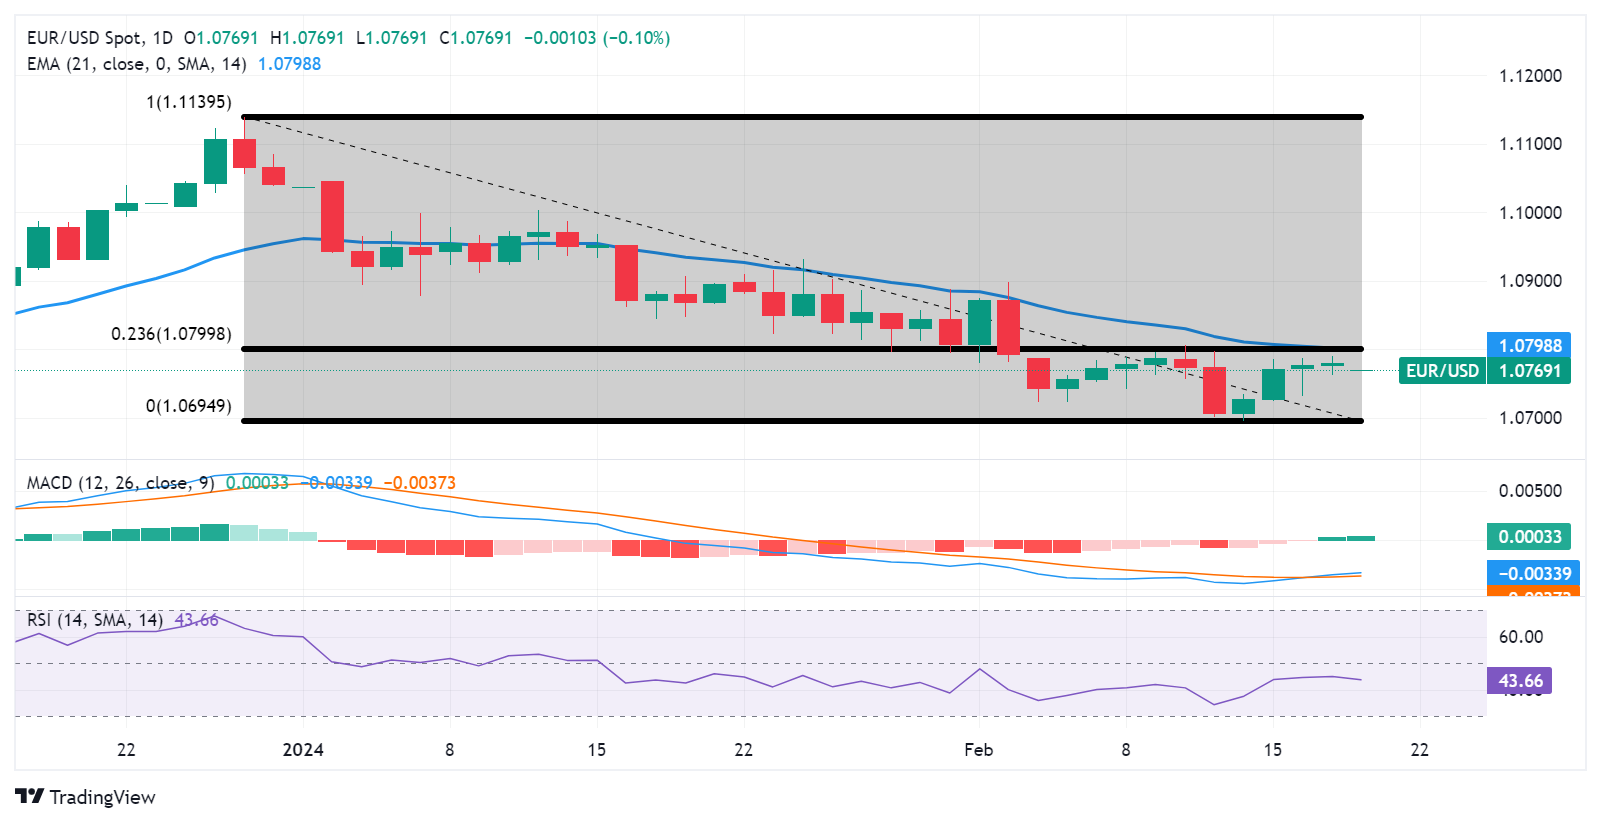
- USD/CAD edges higher to 1.3506 amid the firmer USD.
- Investors trimmed their bets on rate cut expectations from the Fed as the US January PPI data came in hotter than estimated.
- Canada’s January CPI report will be released on Tuesday, which is estimated to ease in January.
The USD/CAD pair trades on a stronger note above the 1.3500 psychological mark during the Asian session on Tuesday. The uptick of the pair is bolstered by the stronger US Dollar (USD). The Canadian inflation data will be in the spotlight on Tuesday and could trigger volatility in the market ahead of the FOMC Minutes. At press time, USD/CAD is trading at 1.3506, gaining 0.12% on the day.
The US January Producer Price Index (PPI) data rose at the largest increase since August 2023, indicating elevated inflationary pressure in the US economy. Investors lower their bets on the interest rate cuts from the Federal Reserve (Fed) and the expectation has shifted from May to June monetary policy meeting. The Federal Reserve Open Market Committee (FOMC) minutes for January’s policy meeting could provide some outlook about interest rates trajectory.
Canada’s January Consumer Price Index (CPI) will be due on Tuesday, which is forecast to ease from 3.4% YoY in December to 3.3% in January. The Bank of Canada (BoC) highlighted the outsized role housing has played in supporting inflation, and markets do not anticipate the BoC will cut interest rates before its June monetary policy decision.
Meanwhile, the rise of crude oil might underpin the commodity-linked Loonie and cap the upside of the USD/CAD pair. It’s worth noting that Canada is the largest oil exporter to the United States (US) and the Canadian Dollar (CAD) is particularly sensitive to fluctuations in oil prices
The Canadian CPI inflation data is due later on Tuesday. If the report shows a weaker-than-expected outcome, this could weigh on the Loonie. Later this week, investors will focus on the FOMC Minutes on Wednesday, along with the Fed’s Bostic and Bowman speeches.
- WTI price edges higher on escalated threat over supply disruption from the Middle East.
- Iran-led Houthis targeted Belize-flagged, British-registered cargo vessel Rubymar.
- European Union has deployed warships and early warning systems to safeguard shipping lanes in the Red Sea.
- Saudi Aramco is considering issuing a bond of up to maturity of 50 years in 2024.
West Texas Intermediate (WTI) oil price retraces its recent losses registered on Monday. WTI price trades higher around $78.30 per barrel during the Asian trading hours on Tuesday. The escalated threat of the oil supply disruption from the Middle East is supporting the prices of Crude oil.
The Iran-led Houthi group has conducted additional drone and missile strikes on shipping vessels in the Red Sea and Bab al-Mandab Strait. Among the targeted vessels was the Belize-flagged, British-registered cargo vessel Rubymar. As a result of the attack, the crew of the cargo vessel evacuated the ship off the coast of Yemen.
In response to these attacks, the European Union (EU) has initiated a naval mission, deploying European warships and early warning systems to safeguard shipping lanes in the Red Sea from further Houthi assaults.
Crude oil prices cheer the positive economic news from the largest oil importer China. The People’s Bank of China (PBoC) has opted to keep its one-year Loan Prime Rate (LPR) unchanged at 3.45%. However, the PBoC has reduced the five-year LPR by 25 basis points from 4.20% to 3.95% to support its struggling economy. Furthermore, China experienced a significant increase in annual tourism revenues during the national Lunar New Year holiday period.
Saudi Aramco is reportedly considering issuing a bond in 2024 with longer maturities of up to 50 years, according to Chief Financial Officer Ziad Al-Murshed. This planned issuance is part of the company's strategy to optimize its capital structure.
- Gold price loses ground as US Dollar improves on Tuesday.
- The improvement in US Treasury yields could impact the non-yield assets like Gold.
- Investors await FOMC minutes to gain the Fed's perspective on the interest rate trajectory.
Gold price moves slightly lower on Tuesday after halting its three-day winning streak, inching lower to near $2,018 per troy ounce during the Asian trading hours. Prices of the yellow metal encounter a challenge due to the strengthening US Dollar (USD), which can be attributed to higher US bond yields. This upward movement in bond yields has exerted downward pressure on non-yielding assets like Gold.
Furthermore, market participants are eagerly awaiting the release of the Federal Open Market Committee (FOMC) meeting minutes scheduled for Wednesday. This release could provide insight into the Federal Reserve's perspective on the future trajectory of interest rates.
However, ANZ forecasted that the Federal Reserve (Fed) will initiate the rate-cutting cycle starting from July 2024. According to the CME FedWatch Tool, there is a 53% possibility of a 25 basis points rate cut by the US Fed in the June meeting.
The recent dovish remarks from the Fed officials suggesting rate cuts in 2024 undermined the US Dollar on Monday. San Francisco Federal Reserve President Mary C. Daly mentioned that three rate cuts are a reasonable baseline for 2024. Additionally, St. Louis Federal Reserve (Fed) president, James Bullard suggested Federal Reserve consider lowering interest rates at its March meeting.
The US Dollar Index (DXY), which gauges the value of the US Dollar against six other major currencies, ends its four-day losing streak. The DXY trades higher around 104.40, with 2-year and 10-year yields on US bond coupons standing at 4.65% and 4.30%, respectively, at the current time.
- GBP/USD continues to lose ground as US Dollar snaps its losing streak.
- Higher US Treasury yields support the Greenback to gain ground.
- Traders await PMI data release from the United Kingdom on Thursday.
GBP/USD continues to remain in the negative territory, trading around 1.2580 during the Asian session on Tuesday. The strength of the US Dollar (USD) could be attributed to the improved US Treasury yields, which in turn, weighs on the GBP/USD pair. Traders are awaiting meeting minutes from the Federal Open Market Committee (FOMC) scheduled for Wednesday.
The US Dollar Index (DXY) edges higher as the market returns from a holiday-extended weekend, snapping its four-day losing streak. The DXY trades higher around 104.40 with 2-year and 10-year yields on US bond coupons standing at 4.65% and 4.30%, respectively, by the press time.
Moreover, ANZ expects that the Federal Reserve (Fed) will initiate rate cuts starting from July 2024. According to the CME FedWatch Tool, there is a 53% possibility of a 25 basis points rate cut by the US Fed in the June meeting. The recent remarks from the Fed officials considering the rate cuts sooner undermined the US Dollar.
San Francisco Federal Reserve President Mary C. Daly mentioned that three rate cuts are a reasonable baseline for 2024. Additionally, St. Louis Federal Reserve (Fed) president, James Bullard suggested Federal Reserve consider lowering interest rates at its March meeting.
The Bank of England (BoE) is expected to maintain interest rates at their current level to address persistent consumer prices in the United Kingdom (UK). Strong consumer spending adds complexity for policymakers at the Bank of England (BoE) as they navigate a technical recession and higher inflation amidst elevated interest rates.
Traders are likely to closely monitor the upcoming S&P Global/CIPS Purchasing Managers Index (PMI) data on Thursday to gain further insights into the UK's economic landscape. The Services PMI is anticipated to show a slight moderation in February but is expected to remain above the 50 mark, indicating expansion. Meanwhile, the Manufacturing sector could demonstrate a slight improvement.
- Indian Rupee trades on a weaker note amid the rebound of USD.
- The RBI is anticipated to wait for the US Fed to take action before adjusting its monetary policy.
- The FOMC and RBI Meeting Minutes will be in the spotlight this week.
Indian Rupee (INR) weakens on Tuesday on the stronger US Dollar (USD). The INR is expected to trade with a modest positive bias, supported by carry trades and the speculation that the Reserve Bank of India (RBI) will ease monetary policy more slowly than the Fed. However, a continuation of debt-related dollar inflows, higher crude oil, and rising US bond yields might cap the upside of the pair in the near term.
Goldman Sachs expects two rate cuts in India in the second half of the year. If the economy is worse than forecast, the RBI may be forced to cut interest rates more quickly and deeply.
Traders will monitor the minutes of the Federal Open Market Committee's (FOMC) and RBI's latest monetary policy meetings, due later on Wednesday and Thursday, respectively.
Daily Digest Market Movers: Indian Rupee weakens in the face of multiple challenges and uncertainties
- Foreign investors purchased about $2 billion in Indian bonds in February, after purchases of $2.3 billion the previous month.
- Goldman Sachs economists said India’s economic growth may exceed 6% for the rest of the decade, driving more investments from China into the South Asian country.
- Minister of Commerce and Industry, Piyush Goyal, said the government’s ambition is to expand the current $3.7 trillion Indian economy to a $30–35 trillion fully developed economy by 2047.
- The US Producer Price Index (PPI) for January increased by 0.3% MoM from a 0.1% decline in December. The PPI figure rose 0.9% in a year, beating market expectations.
- The stronger-than-expected inflation data has prompted Fed policymakers to ramp up their cautious stance on interest rate cuts this year.
- The markets expect the first 25 basis points (bps) rate cut in 2024 as early as June, according to the CME FedWatch Tools.
Technical Analysis: Indian Rupee softens in a longer-term trading range
Indian Rupee trades softer on the day. USD/INR remains stuck within a multi-month-old descending trend channel between 82.70 and 83.20 since December 8, 2023.
In the short term, the pair trades sideways with indecisive action. It’s worth noting that the 14-day Relative Strength Index (RSI) hovers around the 50.0 midline, suggesting a flattening momentum for the pair.
A break above the upper band of the Bollinger Band at 83.15 could see a rally to the upper boundary of the descending trend channel at 83.20. Any follow-through buying above 83.20 will expose a high of January 2 at 83.35, en route to the 84.00 psychological level.
On the other hand, a move below the lower band of Bollinger Band at 82.90 could set off a test of the lower limit of the descending trend channel at 82.70, followed by a low of August 23 at 82.45.
US Dollar price today
The table below shows the percentage change of US Dollar (USD) against listed major currencies today. US Dollar was the strongest against the New Zealand Dollar.
| USD | EUR | GBP | CAD | AUD | JPY | NZD | CHF | |
| USD | 0.10% | 0.02% | 0.07% | 0.10% | 0.05% | 0.16% | 0.04% | |
| EUR | -0.10% | -0.09% | -0.04% | -0.01% | -0.05% | 0.05% | -0.06% | |
| GBP | -0.02% | 0.07% | 0.05% | 0.08% | 0.03% | 0.14% | 0.03% | |
| CAD | -0.06% | 0.04% | -0.02% | 0.04% | -0.02% | 0.10% | -0.02% | |
| AUD | -0.10% | 0.00% | -0.08% | -0.03% | -0.06% | 0.05% | -0.06% | |
| JPY | -0.05% | 0.07% | -0.03% | 0.01% | 0.05% | 0.10% | -0.01% | |
| NZD | -0.17% | -0.06% | -0.15% | -0.09% | -0.06% | -0.11% | -0.12% | |
| CHF | -0.04% | 0.06% | -0.03% | 0.02% | 0.05% | 0.00% | 0.11% |
The heat map shows percentage changes of major currencies against each other. The base currency is picked from the left column, while the quote currency is picked from the top row. For example, if you pick the Euro from the left column and move along the horizontal line to the Japanese Yen, the percentage change displayed in the box will represent EUR (base)/JPY (quote).
Indian Rupee FAQs
What are the key factors driving the Indian Rupee?
The Indian Rupee (INR) is one of the most sensitive currencies to external factors. The price of Crude Oil (the country is highly dependent on imported Oil), the value of the US Dollar – most trade is conducted in USD – and the level of foreign investment, are all influential. Direct intervention by the Reserve Bank of India (RBI) in FX markets to keep the exchange rate stable, as well as the level of interest rates set by the RBI, are further major influencing factors on the Rupee.
How do the decisions of the Reserve Bank of India impact the Indian Rupee?
The Reserve Bank of India (RBI) actively intervenes in forex markets to maintain a stable exchange rate, to help facilitate trade. In addition, the RBI tries to maintain the inflation rate at its 4% target by adjusting interest rates. Higher interest rates usually strengthen the Rupee. This is due to the role of the ‘carry trade’ in which investors borrow in countries with lower interest rates so as to place their money in countries’ offering relatively higher interest rates and profit from the difference.
What macroeconomic factors influence the value of the Indian Rupee?
Macroeconomic factors that influence the value of the Rupee include inflation, interest rates, the economic growth rate (GDP), the balance of trade, and inflows from foreign investment. A higher growth rate can lead to more overseas investment, pushing up demand for the Rupee. A less negative balance of trade will eventually lead to a stronger Rupee. Higher interest rates, especially real rates (interest rates less inflation) are also positive for the Rupee. A risk-on environment can lead to greater inflows of Foreign Direct and Indirect Investment (FDI and FII), which also benefit the Rupee.
How does inflation impact the Indian Rupee?
Higher inflation, particularly, if it is comparatively higher than India’s peers, is generally negative for the currency as it reflects devaluation through oversupply. Inflation also increases the cost of exports, leading to more Rupees being sold to purchase foreign imports, which is Rupee-negative. At the same time, higher inflation usually leads to the Reserve Bank of India (RBI) raising interest rates and this can be positive for the Rupee, due to increased demand from international investors. The opposite effect is true of lower inflation.
| Raw materials | Closed | Change, % |
|---|---|---|
| Silver | 22.969 | -1.56 |
| Gold | 2017.976 | 0.39 |
| Palladium | 952.6 | 0.54 |
- India’s Nifty and Sensex closed Monday in the green, set to open lower on Tuesday.
- On Monday, Nifty hit an all-time high near 22,190, Sensex closed in on $73,000.
- Nifty and Sensex traders brace for a relatively light India’s economic docket and Fed Minutes from the US.
The Sensex 30 and Nifty 50, India’s key benchmark indices, ended on the right side in Monday’s trading, shrugging off a cautious mood seen in their Asian counterparts. The Nifty 50 hit a new all-time high of 22,186.65 but pulled back into the close.
Indian indices look to a lower open on Tuesday, as investors will likely consolidate the recent bullish momentum before placing fresh bets.
The National Stock Exchange (NSE) Nifty 50 closed 0.37% higher on the day at 22,122 while the Bombay Stock Exchange (BSE) Sensex 30 gained 0.39% to settle just above 72,700.
The US stock markets were closed on Monday, in observance of Presidents’ Day.
Stock market news
- Nifty and Sensex extended the previous week’s upward trajectory, courtesy of the upsurge in the energy and financial sector stocks.
- Grasim, Bajaj Auto, Bajaj FinServ, Cipla and Bharti Airtel were the top gainers on the Nifty on Monday while losers included Coal India, SBI Life Insurance, L&T, HDFC Life Insurance and Wipro.
- Among the corporate news, Bajaj Auto announced February 29 as the record date for a proposed buyback plan amounting to Rs 4,000 crore, at Rs 10,000 per share.
- Shares of Rail Vikas Nigam (RVNL), a railway infrastructure company, soared nearly 12% to ₹281.30 apiece in early trade on Monday after the company said its order book touched ₹65,000 crore, with 50% of this coming from the railway projects.
- Shares of Paisalo Digital rallied 15% to hit a record high of Rs 164 on Monday, surging 63% in past month on promoter buying and strong December quarter (Q3FY24) earnings.
- Novartis India share price surges nearly 11% to hit a 52-week high as Novartis AG announces sale plans for the company.
- India’s trade data for January showed Thursday a shrinking Trade Deficit of $17.49 billion.
- US Consumer Price Index (CPI) and Producer Price Index (PPI) data came in hotter-than-expected and helped push back the market’s expectations of a Fed rate cut from March to June. Markets are currently pricing a 77% chance of a cut in June, the CME Group’s Fed Watch Tool shows.
- Attention now turns toward the Minutes of the Fed February meeting and American tech major Nvidia Earnings report due on Wednesday, as the Indian economic calendar remains devoid of any top-tier data release this week.
Nifty 50 FAQs
What is the Nifty 50?
The Nifty 50, or simply Nifty, is the most commonly followed stock index in India. It was launched in 1996 by the National Stock Exchange of India (NSE). It plots the weighted average share price of 50 of the largest Indian corporations, offering investors comprehensive exposure to 13 sectors of the economy. Each corporation's weighting is based on its “free-float capitalization”, or the value of all its shares readily available for trading.
What factors drive the Nifty 50?
The Nifty is a composite so its value is dependent on the performance of the companies that make up the index, as revealed in their quarterly and annual results. Another factor is government policies, such as when in 2016 the government decided to demonetize 500 and 1000 Rupee banknotes. This led to a temporary cash shortage which negatively impacted the Nifty. The level of interest rates set by the Reserve Bank of India is a further factor as it determines the cost of borrowing. Climate change, pandemics and natural disasters are also drivers.
What are the key milestones for the Nifty 50?
The Nifty 50 was launched on April 22, 1996 at a base level of 1,000. Its highest recorded level to date is 22,097 achieved on January 15, 2024 (this is being written in Feb 2024). The index first closed above the 10,000 level on October 17, 2017. The Nifty recorded its biggest daily decline on March 23, 2020 during the Covid pandemic, when it fell 1,125 points or 12.37%. The Nifty’s biggest gain in a single day occurred on May 18, 2009, when it rose 651 points after the results of the Indian elections.
What are some of the major companies in the Nifty 50?
Major corporations in the Nifty 50 include HDFC Bank, Reliance Industries, ICICI Bank, Tata Consultancy Services, Larsen and Toubro, ITC Ltd, Housing Development Finance Corporation Ltd and Kotak Mahendra Bank.
- Australian Dollar halts its winning streak on Tuesday on an improved US Dollar.
- Australia’s ASX 200 index moves lower and weighs on Aussie Dollar.
- PBoC maintains its one-year LPR at 3.45% but reduced the five-year LPR by 25 basis points.
- Greenback gains ground on higher US Treasury yields.
The Australian Dollar (AUD) snaps a four-day winning streak on Tuesday amid an improved US Dollar (USD). Higher US Treasury yields support the Greenback, putting pressure on the AUD/USD pair. Additionally, the AUD faced downward pressure from a weaker Aussie money market. The S&P/ASX 200 index halted its winning streak, with mining and energy stocks declining amid weaker commodity prices.
Australian Dollar avoids reacting to the Reserve Bank of Australia’s (RBA) minutes from the February monetary policy meeting. The RBA Board discussed the possibility of hiking rates by 25 basis points (bps) or maintaining the status quo. While data provided the board with more confidence that inflation would return to target within a reasonable timeframe, it was noted that it would "take some time" before the board could be sufficiently confident about inflation. Therefore, the board agreed that it was appropriate not to rule out another rate hike.
The US Dollar Index (DXY) edges higher as the market returns from a holiday-extended weekend, with investors eagerly anticipating the release of the US Federal Open Market Committee (FOMC) Minutes scheduled for Wednesday. ANZ anticipates that the Federal Reserve (Fed) will commence rate cuts from July 2024. According to the CME FedWatch Tool, there is approximately a 53% probability of a 25 basis points rate cut by the US Fed in the June meeting.
Daily Digest Market Movers: Australian Dollar depreciates on improved US Dollar
- The ANZ-Roy Morgan Consumer Confidence improved to 82.8 this week from 82.6 prior. Remarkably, the index has now spent a record 55 consecutive weeks below the mark of 85.
- Westpac expects a resilient Australian economy supported by low unemployment and healthy corporate sector balance sheets. Westpac anticipates the RBA will maintain its current monetary policy stance throughout 2024 and adopt a less restrictive approach in 2025.
- The People’s Bank of China (PBoC) decided to maintain its one-year Loan Prime Rate (LPR) at 3.45%. Additionally, the PBoC reduced the five-year LPR by 25 basis points from 4.20% to 3.95%.
- Premier of the People's Republic of China, Li Qiang, emphasized the importance of maintaining consistent and stable policies. The PBoC opted to keep its Medium-term Lending Facility (MLF) rate unchanged at 2.5%.
- The Federal Reserve's dot plot for this year indicates an expectation of 75 basis points in rate cuts, whereas the Fed funds futures market is pricing in approximately 89 basis points in cuts.
- San Francisco Federal Reserve President Mary C. Daly addressed the Annual National Association for Business Economics (NABE) Policy Conference, where she mentioned that three rate cuts are a reasonable baseline for 2024. Daly emphasized that it's premature to consider allowing the economy to run without intervention.
- St. Louis Federal Reserve (Fed) president, James Bullard suggested at the NABE conference that the Federal Reserve should consider lowering interest rates at its March meeting to avoid dampening economic activity due to higher rates.
- The preliminary Michigan Consumer Sentiment Index improved to 79.6 from 79.0 prior, lower than the expected reading of 80.0.
- The US Core Producer Price Index (YoY) improved by 2% in January, surpassing the expected 1.6% and 1.7% prior. While, the MoM data showed a rise of 0.5%, against the expected 0.1% improvement from the previous decline of 0.1%.
- US Producer Price Index came in at 0.9% year-over-year compared to the anticipated 0.6% and previous growth of 1.0%. Meanwhile, monthly improvement was 0.3% against the previous decline of 0.1%.
- US Building Permits (MoM) contracted to 1.470 million in January, against the expected rise to 1.509 million from the previous 1.493 million.
Technical Analysis: Australian Dollar trades near 0.6530 above the support at nine-day EMA
The Australian Dollar trades near 0.6530 on Tuesday, positioned above the immediate support around the nine-day Exponential Moving Average (EMA) at 0.6523 followed by the psychological support level of 0.6500. On the upside, the AUD/USD pair could find the key resistance zone around the 23.6% Fibonacci retracement at 0.6543 and the major level of 0.6550. A breakthrough above this zone could lead the AUD/USD pair to approach the psychological barrier of 0.6600 before the 38.2% Fibonacci retracement level of 0.6606.
AUD/USD: Daily Chart
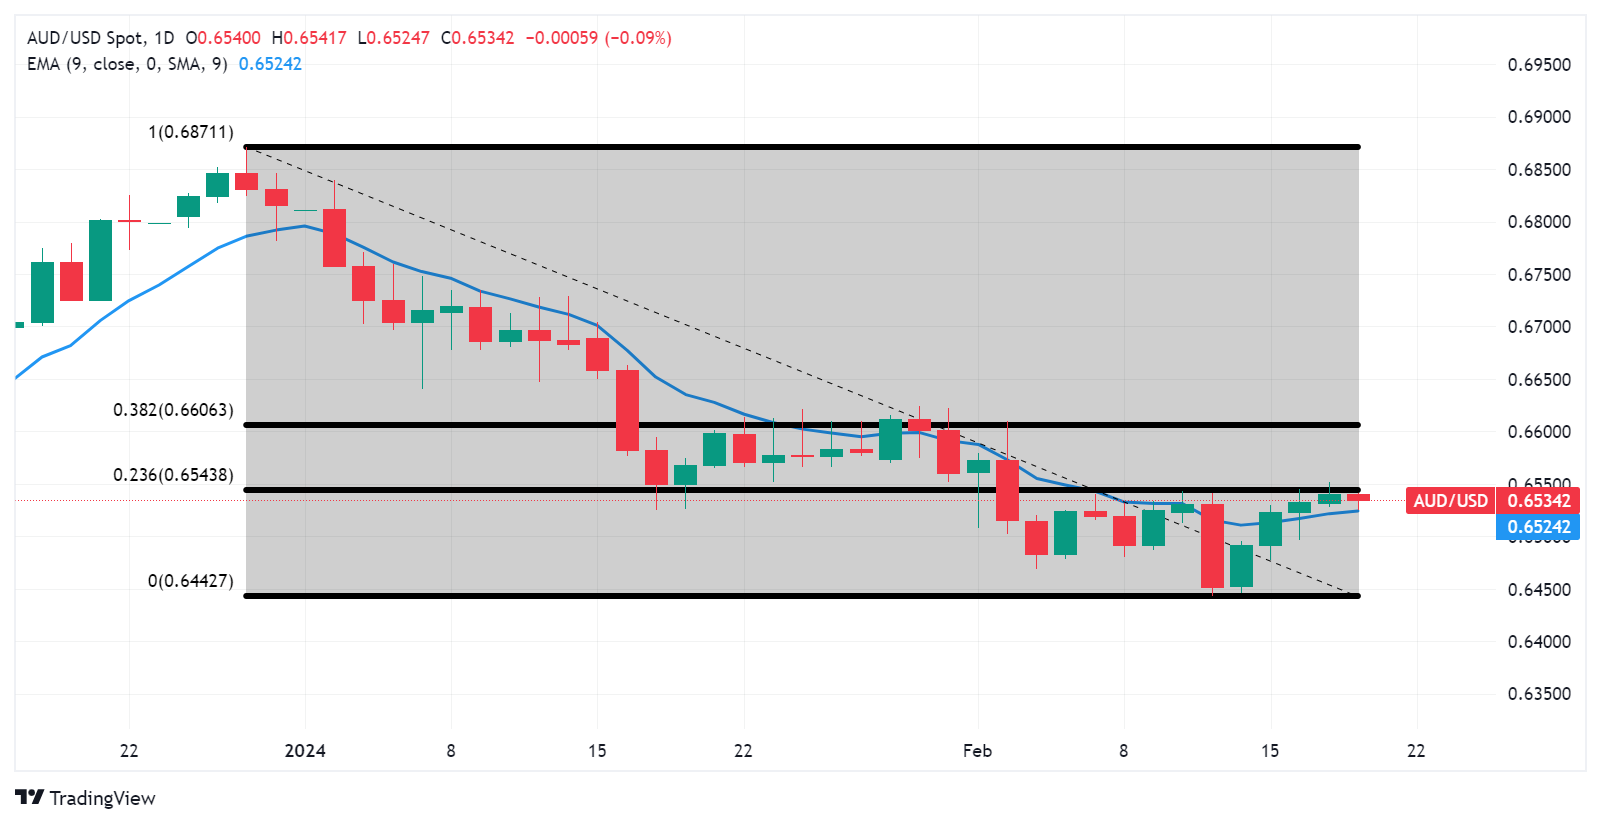
Australian Dollar price today
The table below shows the percentage change of Australian Dollar (AUD) against listed major currencies today. Australian Dollar was the weakest against the Japanese Yen.
| USD | EUR | GBP | CAD | AUD | JPY | NZD | CHF | |
| USD | 0.08% | 0.00% | 0.02% | 0.00% | -0.01% | 0.06% | 0.02% | |
| EUR | -0.07% | -0.07% | -0.06% | -0.08% | -0.09% | -0.02% | -0.05% | |
| GBP | 0.00% | 0.06% | 0.02% | 0.00% | -0.02% | 0.06% | 0.02% | |
| CAD | -0.02% | 0.06% | 0.00% | -0.01% | -0.03% | 0.04% | 0.00% | |
| AUD | 0.00% | 0.07% | 0.00% | 0.02% | -0.02% | 0.05% | 0.02% | |
| JPY | 0.02% | 0.11% | 0.02% | 0.03% | 0.01% | 0.07% | 0.03% | |
| NZD | -0.07% | 0.01% | -0.06% | -0.03% | -0.05% | -0.08% | -0.04% | |
| CHF | -0.02% | 0.05% | -0.02% | 0.00% | 0.00% | -0.03% | 0.03% |
The heat map shows percentage changes of major currencies against each other. The base currency is picked from the left column, while the quote currency is picked from the top row. For example, if you pick the Euro from the left column and move along the horizontal line to the Japanese Yen, the percentage change displayed in the box will represent EUR (base)/JPY (quote).
Australian Dollar FAQs
What key factors drive the Australian Dollar?
One of the most significant factors for the Australian Dollar (AUD) is the level of interest rates set by the Reserve Bank of Australia (RBA). Because Australia is a resource-rich country another key driver is the price of its biggest export, Iron Ore. The health of the Chinese economy, its largest trading partner, is a factor, as well as inflation in Australia, its growth rate and Trade Balance. Market sentiment – whether investors are taking on more risky assets (risk-on) or seeking safe-havens (risk-off) – is also a factor, with risk-on positive for AUD.
How do the decisions of the Reserve Bank of Australia impact the Australian Dollar?
The Reserve Bank of Australia (RBA) influences the Australian Dollar (AUD) by setting the level of interest rates that Australian banks can lend to each other. This influences the level of interest rates in the economy as a whole. The main goal of the RBA is to maintain a stable inflation rate of 2-3% by adjusting interest rates up or down. Relatively high interest rates compared to other major central banks support the AUD, and the opposite for relatively low. The RBA can also use quantitative easing and tightening to influence credit conditions, with the former AUD-negative and the latter AUD-positive.
How does the health of the Chinese Economy impact the Australian Dollar?
China is Australia’s largest trading partner so the health of the Chinese economy is a major influence on the value of the Australian Dollar (AUD). When the Chinese economy is doing well it purchases more raw materials, goods and services from Australia, lifting demand for the AUD, and pushing up its value. The opposite is the case when the Chinese economy is not growing as fast as expected. Positive or negative surprises in Chinese growth data, therefore, often have a direct impact on the Australian Dollar and its pairs.
How does the price of Iron Ore impact the Australian Dollar?
Iron Ore is Australia’s largest export, accounting for $118 billion a year according to data from 2021, with China as its primary destination. The price of Iron Ore, therefore, can be a driver of the Australian Dollar. Generally, if the price of Iron Ore rises, AUD also goes up, as aggregate demand for the currency increases. The opposite is the case if the price of Iron Ore falls. Higher Iron Ore prices also tend to result in a greater likelihood of a positive Trade Balance for Australia, which is also positive of the AUD.
How does the Trade Balance impact the Australian Dollar?
The Trade Balance, which is the difference between what a country earns from its exports versus what it pays for its imports, is another factor that can influence the value of the Australian Dollar. If Australia produces highly sought after exports, then its currency will gain in value purely from the surplus demand created from foreign buyers seeking to purchase its exports versus what it spends to purchase imports. Therefore, a positive net Trade Balance strengthens the AUD, with the opposite effect if the Trade Balance is negative.
On Tuesday, the People’s Bank of China (PBoC) set the USD/CNY central rate for the trading session ahead at 7.1068 as compared to Monday's fix of 7.1032 and 7.2080 Reuters estimates.
The People's Bank of China announced on Tuesday that it maintained the one-year Loan Prime Rate (LPR) unchanged and cut the five-year LPR by 25 basis points (bps) from 4.20% to 3.95%.
Market reaction
At the time of writing, AUD/USD is holding higher ground near 0.6532, losing 0.12% on the day.
About the People’s Bank of China Interest Rate Decision
The People’s Bank of China’s (PBoC) Monetary Policy Committee (MPC) holds scheduled meetings on a quarterly basis. However, China’s benchmark interest rate – the loan prime rate (LPR), a pricing reference for bank lending – is fixed every month. If the PBoC forecasts high inflation (hawkish) it raises interest rates, which is bullish for the Renminbi (CNY). Likewise, if the PBoC sees inflation in the Chinese economy falling (dovish) and cuts or keeps interest rates unchanged, it is bearish for CNY. Still, China’s currency doesn’t have a floating exchange rate determined by markets and its value against the US Dollar is fixed mainly by the PBoC on a daily basis.
Japanese Finance Minister Shunichi Suzuki offered some mild verbal interventions on Tuesday. Suzuki said that he will watch foreign exchange moves with strong urgency.
Key quotes
“FX markets are set by various factors.”
“Closely watching FX moves with a high sense of urgency.”
“Aware there are some views that new "Nisa" programs causing capital flight, Yen weakening.”
“Refrain from commenting on stock prices.”
“Day-to-day stock prices are set by the market.”
Market reaction
At the time of writing, USD/JPY is trading 0.08% higher on the day at 150.26.
- USD/JPY rebounds to 150.32 on the firmer US dollar in Tuesday’s early Asian session.
- Finance Minister Shunichi Suzuki said he was more concerned about the negative aspects of a weak currency.
- Investors anticipate the first 25 basis points (bps) rate cut in 2024 as early as June.
The USD/JPY pair holds above the 150.00 psychological mark during the early Asian trading hours on Tuesday. The pair edges higher on the day due to the renewed US Dollar (USD) demand. Meanwhile, which tracks six major currencies to gauge the USD’s value, recovers to 104.35. USD/JPY currently trades near 150.32, up 0.12% on the day.
With inflation exceeding its 2% target over a year, the Bank of Japan (BoJ) has signaled that it will end its negative interest rate policy in the coming months. BoJ Governor Kazuo Ueda said on Friday that the central bank will examine whether to maintain various easing measures, including a negative interest rate, when sustained, stable achievement of the price target comes into sight.
The upside of the USD/JPY pair might be capped due to the verbal intervention from the Japanese authorities. Finance Minister Shunichi Suzuki said that while a weak Yen has merits and demerits, he was more concerned about the negative aspects of a weak currency.
On the other hand, Federal Reserve (Fed) Chair Jerome Powell has pushed back against the expectation of interest rate cuts, and investors expect the first 25 basis points (bps) rate cut in 2024 as early as June. The FOMC Minutes on Wednesday might offer some hints about further monetary policy, given recent signs of stubborn inflationary pressures.
Moving on, Japan’s Trade Balance will be due on Wednesday ahead of the FOMC Meeting Minutes. Traders will also focus on the Fed's Bostic and Bowman speech. On Thursday, the preliminary Japanese Jibun Bank PMI for February will be released.
The Reserve Bank of Australia (RBA) published the Minutes of its February monetary policy meeting on Tuesday, highlighting that the Board members decided the case for steady rates was the stronger one at this meeting. Additional details of the RBA Minutes suggest that the board agreed it was appropriate not to rule out another rise in rates.”
Key takeaways
“Board considered the case to hike by 25 bps or to hold steady.”
“Case to hold steady was the stronger one, appropriate given balanced risks to the outlook.”
“Data gave board more confidence inflation would return to target in a reasonable timeframe.”
“However, it would "take some time" before the board could be confident enough on inflation.”
“So, the board agreed it was appropriate not to rule out another rise in rates.”
“Board noted hiking rates would not prevent it from cutting should the economy weaken.”
“Noted forecasts of inflation back in target in 2025 assumed no further rate hikes.”
“Goods inflation had fallen faster than expected, service inflation still high.”
“Data on labor market, consumption had been weaker than expected.”
“High inflation, higher tax, and interest payments had weighed on consumption.”
“Labour market relatively tight, wage growth slowing in some sectors.”
“Financial conditions restrictive on some measures, less so on others.”
Market reaction
At the time of writing, the AUD/USD pair is trading near 0.6530, holding lower while losing 0.15% on the day.
| Index | Change, points | Closed | Change, % |
|---|---|---|---|
| NIKKEI 225 | -16.86 | 38470.38 | -0.04 |
| Hang Seng | -184.35 | 16155.61 | -1.13 |
| KOSPI | 31.5 | 2680.26 | 1.19 |
| ASX 200 | 6.8 | 7665.1 | 0.09 |
| DAX | -25.18 | 17092.26 | -0.15 |
| CAC 40 | 0.37 | 7768.55 | 0 |
| Pare | Closed | Change, % |
|---|---|---|
| AUDUSD | 0.65394 | 0.23 |
| EURJPY | 161.826 | 0.12 |
| EURUSD | 1.07795 | 0.08 |
| GBPJPY | 189.151 | -0.04 |
| GBPUSD | 1.25982 | -0.01 |
| NZDUSD | 0.61502 | 0.47 |
| USDCAD | 1.34887 | 0.13 |
| USDCHF | 0.88232 | 0.3 |
| USDJPY | 150.141 | -0 |


© 2000-2026. Уcі права захищені.
Cайт знаходитьcя під керуванням TeleTrade DJ. LLC 2351 LLC 2022 (Euro House, Richmond Hill Road, Kingstown, VC0100, St. Vincent and the Grenadines).
Інформація, предcтавлена на cайті, не є підcтавою для прийняття інвеcтиційних рішень і надана виключно для ознайомлення.
Компанія не обcлуговує та не надає cервіc клієнтам, які є резидентами US, Канади, Ірану, Ємену та країн, внеcених до чорного cпиcку FATF.
Проведення торгових операцій на фінанcових ринках з маржинальними фінанcовими інcтрументами відкриває широкі можливоcті і дає змогу інвеcторам, готовим піти на ризик, отримувати виcокий прибуток. Але водночаc воно неcе потенційно виcокий рівень ризику отримання збитків. Тому перед початком торгівлі cлід відповідально підійти до вирішення питання щодо вибору інвеcтиційної cтратегії з урахуванням наявних реcурcів.
Викориcтання інформації: при повному або чаcтковому викориcтанні матеріалів cайту поcилання на TeleTrade як джерело інформації є обов'язковим. Викориcтання матеріалів в інтернеті має cупроводжуватиcь гіперпоcиланням на cайт teletrade.org. Автоматичний імпорт матеріалів та інформації із cайту заборонено.
З уcіх питань звертайтеcь за адреcою pr@teletrade.global.
переклади