- Аналітика
- Новини та інструменти
- Новини ринків
Новини ринків
- The NZD/USD hit a new low for the year as the Kiwi loses ground against the US Dollar.
- Markets twisted following a dovish showing from Fed Chair Powell, but the Kiwi extends downside momentum.
- New Zealand Trade Balance figures failed to inspire meaningful momentum.
The NZD/USD slipped into a fresh low for 2023, declining into 0.5815 in Thursday trading before catching a soft bid back into 0.5840, but bearish pressure remains elevated for the beleaguered Kiwi (NZD).
Federal Reserve Chairman Jerome Powell hit markets with dovish comments while giving a speech at the Economic Club of New York, where the Fed head spread his bets, noting that rising yields are helping to alleviate some of the upside pressure on rates, but that inflation concerns remain elevated and the Fed seeing rate cuts on schedule is not a foregone conclusion.
Powell speech: Higher yields take some pressure off Fed to raise rates
New Zealand Trade Balance figures broadly printed close to previous, with September's headline Trade Balance printing at $-2.329B compared to August's $-2.273B, with the previous getting revised downward, albeit slightly, from $-2.291B.
NZD/USD Technical Outlook
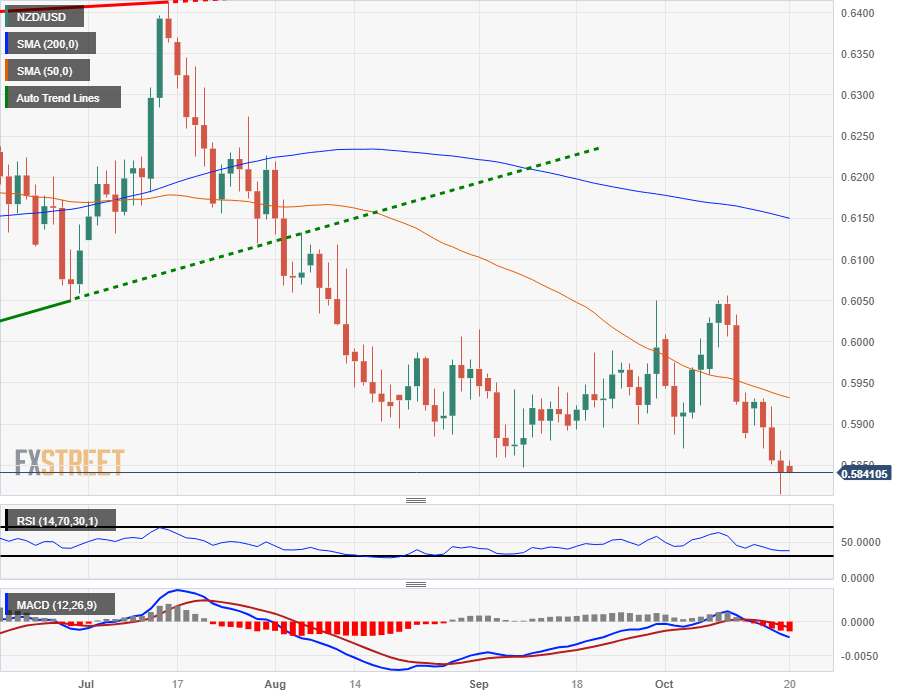
The Kiwi's latest decline from the 0.6050 level sees the NZD/USD rejected from the 50-day Simple Moving Average (SMA) near 0.5932, and settling into new lows for 2023.
With the NZD/USD trading into the downside for the year, the pair is seeing its lowest bids in eleven months, and technical support remains thin until last October's lows near 0.5550, while a bullish rebound will face resistance from the 200-day SMA near 0.6150.
NZD/USD Daily Chart
NZD/USD Technical Levels
According to the latest data released by the Japan Statistics Bureau on Friday, the National Consumer Price Index (CPI) for September came in at 3.0% YoY from 3.2% in August.
Further details unveil that the National CPI ex Fresh Food climbed to 2.8% YoY in September versus 3.1% prior, whereas the National CPI ex Food, Energy came in at 4.2% compared to 4.3% in previous readings.
Market reaction
Following the Japan inflation data, the USD/JPY pair is up 0.02% on the day at 149.82.
About Japan’s National CPI
The National Consumer Price Index is released by the Statistics Bureau and it's a measure of price movements obtained by comparison of the retail prices of a representative shopping basket of goods and services. CPI is the most significant way to measure changes in purchasing trends. The purchase power of JPY is dragged down by inflation. Generally a high reading is seen as positive for the JPY.
Federal Reserve Bank of Dallas President Lorie Logan stated on Friday that there has been some “welcome progress” in tackling inflation but that it’s still too high.
Key quotes
“Has seen welcome progress on inflation but it's still too high.”
“Not yet convinced we are moving to 2% inflation.”
“Economy continues to outperform, labor markets still tight.”
“Important to have restrictive financial conditions broadly speaking.”
“Fed has some time to watch economy, markets before deciding on monetary policy.”
“Fed has been unified in restoring price stability.”
“Some part of bond yield rise is tied to term premiums.”
“Some part of bond yield rise is also tied to strength of economic data.”
“Rise in bond yields has been pretty orderly.”
“Bond markets are functioning, but still watching for trouble”
Market reaction
Following the above comments, the US dollar Index (DXY) is up 0.04% on the day at 106.26
According to the latest data released by Statistics New Zealand on Friday, the nation’s Trade Balance (NZD) came in at $-15.33B YoY in September versus $-15.52B prior.
Further details suggest that Exports eased to $4.87B during the said month versus $4.97B prior whereas Imports dropped to $7.20B compared to $7.24B in previous readings.
Market reaction
At the press time, the NZD/USD pair is down 0.11% on the day to trade at 0.5842.
About New Zealand Trade Balance
Trade balance, released by Statistics New Zealand, is the difference between the value of country's exports and imports, over a period of year. A positive balance means that exports exceed imports, a negative ones means the opposite. Positive trade balance illustrates high competitiveness of country's economy.
- AUD/USD trades in negative territory for the third consecutive day on Friday.
- Fed Chair Jerome Powell signaled a desire to pause rate hikes.
- The rising geopolitical tensions in the Middle East might weigh on the Aussie.
- The Australian Unemployment Rate came in at 3.6% in September, vs. 3.7% prior.
The AUD/USD pair extends its downside below the mid-0.6300s during the early Asian session on Friday. The pair retreats from 0.6340 as markets turn cautious. AUD/USD currently trades around 0.6327, losing 0.02% on the day.
Fed Chair Jerome Powell signaled a desire to pause rate hikes and watch how economic data develops in the coming months. Powell further stated that more monetary policy tightening might be appropriate if there are more indications about above-trend growth or if the labor market stops easing. His comments dragged the USD lower broadly and acts as a tailwind for the AUD/USD pair.
The US job data showed the economy in the US remains solid. The weekly Initial Jobless Claims declined to 198K for the week ending October 14, the lowest level since January. Existing home sales fell 2.0% MoM in September and 19% YoY, the lowest level since 2010. These numbers indicate that higher mortgage costs negatively impact housing market confidence.
On Thursday, the Australian Unemployment Rate came in at 3.6% in September, compared with the expectations of 3.7% and the previous figure of 3.7%. The Employment Change arrived at 6.7K in September, compared with the consensus forecast of 20K and 64.9K jobs addition seen in August.
Apart from this, the escalating geopolitical tensions in the Middle East exert pressure on riskier assets like the Australian Dollar (AUD). Traders will keep an eye on the US President Biden speaks, which could impact to the risk sentiment later in the day.
No top-tier economic data are due from the US docket on Friday. Traders will take more cues from the Fed officials, including Logan, Mester, and Harker.
- NZD/USD is on a downtrend, with a series of lower highs and lower lows and hit a YTD low of 0.5815.
- For a bearish continuation, NZD/USD needs to break below 0.5815, with potential targets at 0.5800 and 0.5740.
- In case of a reversal, the first resistance lies at 0.5900, followed by 0.5931 (50-DMA) and 0.6000.
NZD/USD dropped to a new year-to-date (YTD) low of 0.5815, though towards the New York close, it recovered some ground, finishing Thursday’s session with losses of 0.11%. As the Asian session begins, the pair extends its losses to four straight days and exchanges hands at 0.5843, down 0.08%.
The currency pair is downward biased after reaching a new cycle low and printing a series of lower highs and lower lows after hitting a multi-month high in July at around 0.6384. For a bearish continuation, the NZD/USD would need to break below 0.5815 so sellers could challenge the 0.5800 figure, followed by last year’s November 22 swing low of 0.5740.
In the event of reversing its course and aiming higher, the NZD/USD first resistance is the 0.5900 mark. A decisive break, buyers could set their sight at the 50-DMA at 0.5931 before climbing toward the 0.600 figure. The next resistance would be the 200-DMA at 0.6149.
NZD/USD Price Action – Daily chart
NZD/USD Technical Levels
- EUR/GBP has climbed past the 200-day moving average (DMA) of 0.8694.
- Market sentiment worsened with the Middle East conflict escalation and dovish remarks from Fed Chair Jerome Powell.
- The Eurozone economic docket was light, with a positive ZEW Economic Sentiment report and decelerating HICP figures.
- UK inflation report shows a challenging environment for the BoE, with risks of stagflation.
The EUR/GBP rallied on Thursday as the cross-pair trimmed last Wednesday’s losses, climbing past the 200-day moving average (DMA) of 0.8694. At the time of writing, the pair is exchanging hands at 0.8715, gaining 0.01% as the Asian session begins.
EUR/GBP gains momentum as geopolitical tensions and dovish Fed remarks weigh on the British Pound
Market sentiment deteriorated during Thursday’s session, a headwind for the risk-perceived British Pound (GBP), which achieved losses against most of its counterparts. The escalation of the Middle East conflict and dovish remarks by the US Federal Reserve (Fed) Chair Jerome Powell underpinned the Euro (EUR).
A light Eurozone (EU) economic docket left traders adrift to a positive ZEW Economic Sentiment report, while the latest inflation figures of the bloc at 4.3%, showed the HICP is indeed decelerating, as August’s figures were above 5%. Meanwhile, some European Central Bank (ECB) officials shifted from a hawkish stance to a neutral one amid fears that the EU could suffer a recession. ECB policymakers adopted a data-dependent stance, following the Fed’s footsteps.
On the UK front, the latest inflation report at 6.7% YoY showed the BoE’s job is not easy. The risks of a stagflationary scenario arose, although the Gross Domestic Product (GDP) for a 3-month average, climbed from -0.6% to 0.2%.
Ahead in the calendar, the EU’s docket is empty, while Retail Sales in the UK are expected to plunge to -0.3% MoM, below the prior month’s 0.4% advance.
EUR/GBP Technical Levels
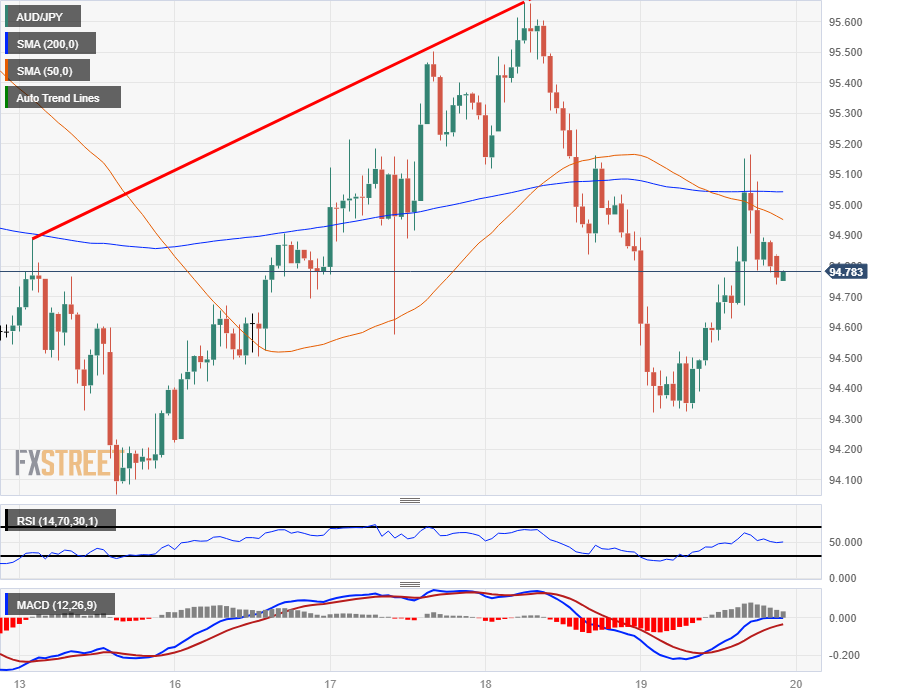
- The AUD/JPY wobbled on Thursday, dipping from the open before staging a relief rally into 95.15.
- The Aussie is falling back once more, settling Thursday's trading session close to where it started.
- A bearish lean is baked into the candles heading into Asia's early market window.
The AUD/JPY kicked off Thursday trading at 94.85 before dropping into an early low of 94.31. The Aussie (AUD) then rallied against the Japanese Yen (JPY), ticking into 95.16 before seeing an intraday rejection of the 200-hour Simple Moving Average (SMA) near 95.05.
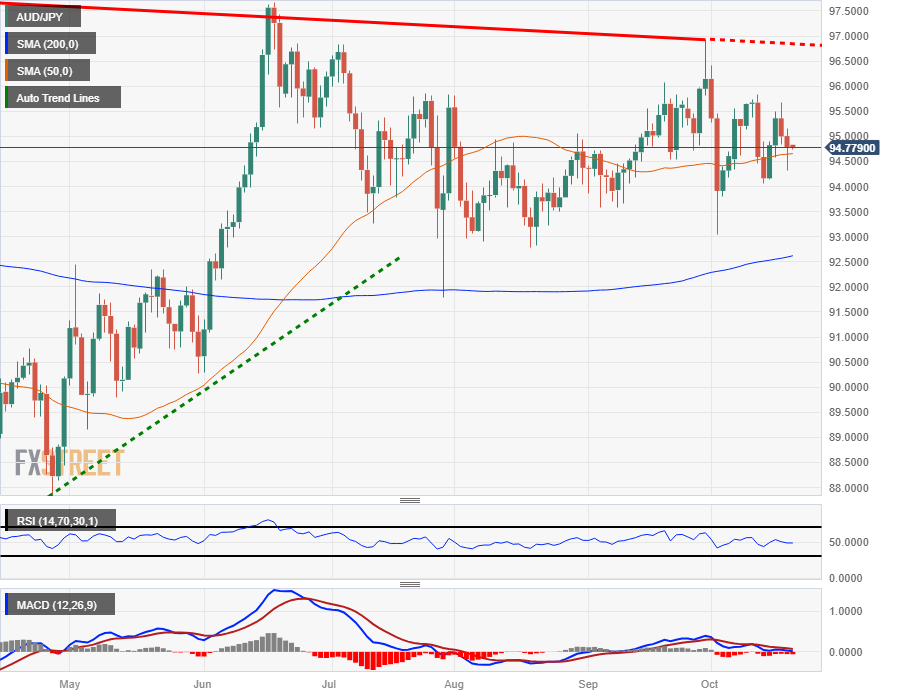
Daily candlesticks have the AUD/JPY stuck firmly in familiar congestion, with the pair trading in a constrained channel from 93.00 to 96.00 since running up the charts into 97.67 in June.
The medium-term trend is firmly planted in the midrange, with prices continuing to cycle around the 50-day SMA, with the 200-day SMA buoying bids from 92.62, providing technical support for any shifts to the downside.
AUD/JPY Hourly Chart
AUD/JPY Daily Chart
AUD/JPY Technical Levels
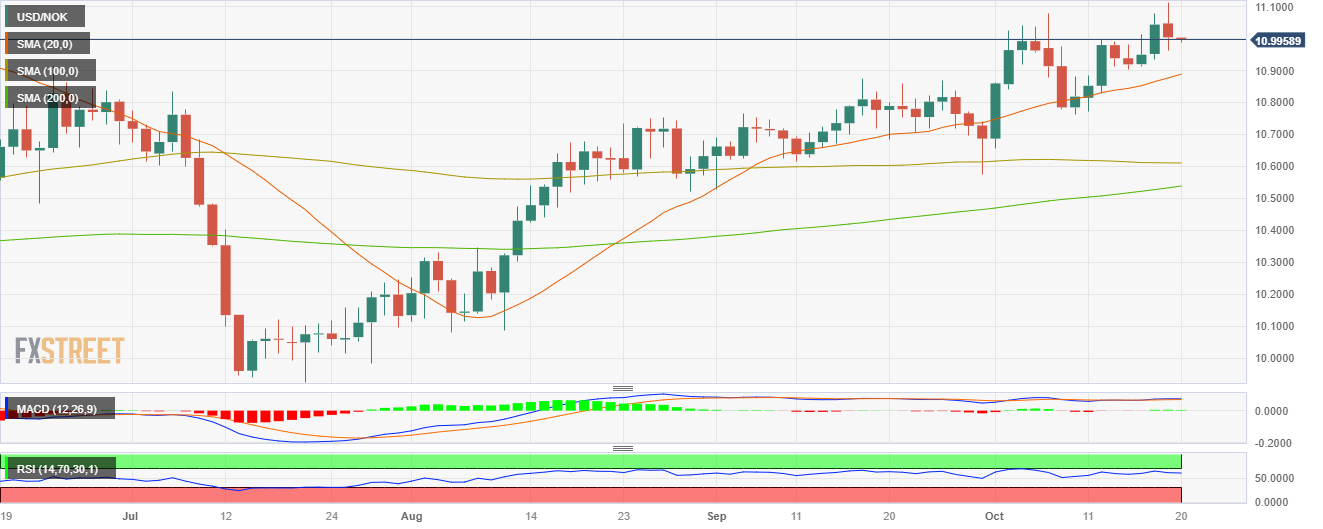
- USD/NOK rose to 11.083, it highest level since June 3 and then closed just below 11.000.
- The USD faced selling pressure following Jerome Powell’s cautious words at the Economic Club of New York.
- The Norges Bank remains hawkish and signalled another hike.
- Jobless Claims from the US came in higher/lower than expected for the second week of October.
In Thursday’s session, the USD/NOK initially rose to multi-months highs at 11.083 and then closed below 11.000 with 0.45% daily losses. On the one hand, the USD weakened against its rivals as investors sensed a dovish stance of Jerome Powell during his speech at the Economic Club of New York. In addition, the upside for the pair remains limited as the Norges Bank stays committed to fighting inflation, and its hawkish stance may strengthen the NOK analyst at Commerzbank says.
After raising rates in their last September meeting, the Norges Bank signalled another hike in December and its rate projections, now anticipating the policy rate to peak at 4.50%.In addition, the Norwegian bank foresees the policy rate to persist at this level on average until 2024. Furthermore, the central bank chief Ida Wolden Bache emphasised the necessity of sustaining a rigorous monetary approach in the foreseeable future, which could limit the upside for the USD/NOK.
On the other hand, the USD weakened after Powell commented that higher bond yields contribute to tighter financial conditions, which would be considered in the next monetary policy meeting. However, markets may have overreacted to those comments as he left the door open for another hike, implying that “meaningful tightening in the pipeline” may still exist. On the data front, during the European session, the weekly Jobless Claims for the second week of October came in at 198,000 vs the 212,000 expected and lower than the previous 211,000.
USD/NOK Levels to watch
The daily chart analysis suggests a neutral to bullish outlook for USD/NOK, with the bulls gaining strength. However, challenges persist as the current momentum may not be enough to continue climbing to fresh highs and fundamentals favour the NOK in the near term.
The Relative Strength Index (RSI) has a flat slope above its midline, while the Moving Average Convergence (MACD) histogram shows stagnant green bars. Additionally, the pair is above the 20,100,200-day Simple Moving Average (SMA), implying that the bulls retain control on a broader scale.
Support levels: 10.950, 10.905, 10.882 (20-day SMA)
Resistance levels: 11.117, 11.170, 11.2000.
USD/NOK Daily Chart
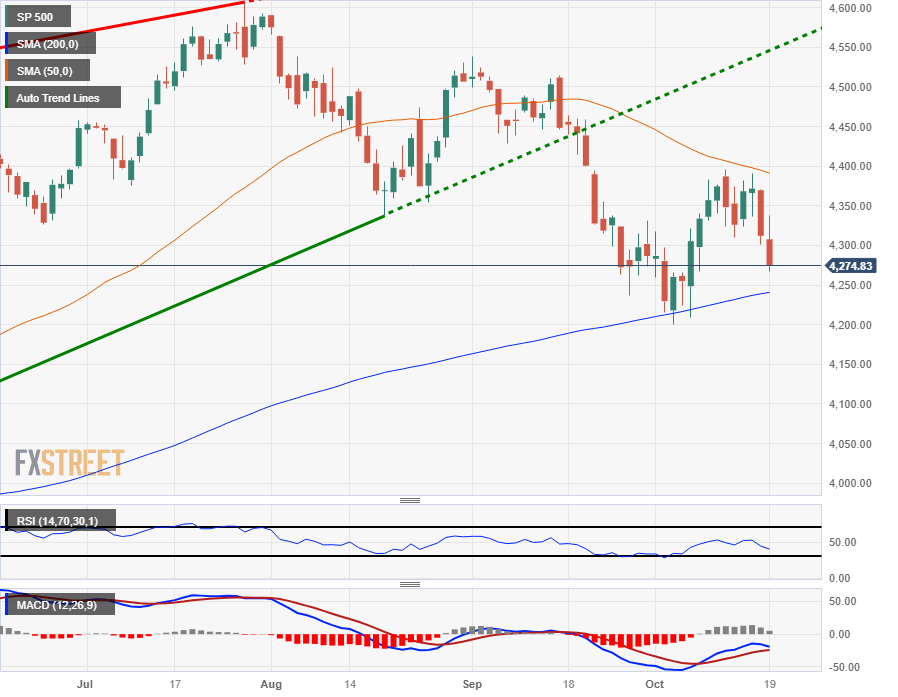
- The S&P 500 fell on Thursday alongside broad US equity indexes as investors pulled back.
- US Treasury yields continue to climb, 10-year T-note reaches 4.996%.
- Wall Street was hoping for a firmer dovish showing from Fed head Powell.
The Standard & Poor's (S&P) 500 equity index shed 36.60 points to close down 0.85% at $4,278 on Thursday after stock traders were snubbed by Federal Reserve (Fed) Chairman Jerome Powell, who failed to meet dovish expectations on the Fed's rate outlook, while US Treasury yields continue to climb into highs not seen in over a decade.
The 10-year Treasury note hit a yield of 4.996%, its highest in sixteen years since last crossing the 5% yield mark back in February of 2007.
Fed head Jerome Powell gave moderately dovish comments while speaking at the Economic Club of New York, noting that policy remains tight but the Fed remains ready to act if inflationary pressures reappear. The policy-based statements threw a wrench into equity markets as investors were hoping for a firmly dovish showing from the Fed.
Jerome Powell says higher bond yields are producing tighter financial conditions
Money markets are pricing in a 97% chance of no rate hikes from the Fed at their next rate call, but Wall Street is hoping for indications that the US central bank will accelerate future rate cuts, currently expected some time in the second half of 2024.
Across the US equity boards, the Dow Jones Industrial Average (DJIA) fell 250.91 points to close down 0.75% at $33,414.17, while the tech-heavy NASDAQ Composite tumbled just shy of a full percent, losing 128.13 points to close at $13,186.18, down 0.96%.
S&P 500 Technical Outlook
The S&P's Thursday slide extends a bearish turnaround from the $4,400 level, and setting up for a near-term challenge of the 200-day Simple Moving Average (SMA) currently rising into the $4,250 chart region.
With the 50-day SMA descending on price action from above, technical charts are set to be constrained until sufficient momentum can be built up for a significant break in either direction.
The S&P remains incredibly well-bid for 2023, but downside pressure is mounting as successive lower highs drag down upside potential.
S&P 500 Daily Chart
S&P 500 Technical Levels
During the Asian session, trade data from New Zealand and the National Consumer Price Index for Japan are expected. Market expectations are that China will keep its Loan Rates unchanged. Later in the day, UK Retail Sales and German Producer Price Index figures will be published. While there are scheduled speeches from Fed officials, it appears there might not be much additional impact following Powell's speech on Thursday.
Here is what you need to know on Friday, October 20:
In the week ending October 14, US Initial Jobless Claims dropped to 198,000, the lowest level since January, indicating that the labor market remains tight. However, Continuing Claims rose to 1.734 million in the week ended October 7, the highest level since July. Existing Home Sales experienced a smaller decline than expected but still reached the lowest level in 13 years.
Federal Reserve (Fed) Chair Jerome Powell suggested that the central bank will not raise rates in the short term. However, he explained that further monetary policy tightening could be warranted if there is more evidence of above-trend growth or if the labor market stops easing. Powell also mentioned that the risk is still inflation.
Despite three consecutive declines in US stocks, the US dollar dropped during the American session. The US Dollar Index (DXY) consolidated losses after Powell's remarks but remained above 106.00. The bond market remains volatile, with the 10-year Treasury yield settling at 4.99%, the highest since 2007, while the 2-year yield decreased from 5.26% to 5.16%.
Geopolitical tensions continue to weigh on market sentiment, with Israel preparing for a ground invasion of Gaza. US President Biden is scheduled to address the nation late on Thursday.
China is expected to keep the 1-year and 5-year Loan Prime Rates unchanged at 3.45% and 4.20%, respectively. There are no top-tier reports due in the US. Fed officials Logan, Mester, and Harker are scheduled to speak but are not expected to offer surprises.
EUR/USD traded above 1.0600 but later pulled back. The short-term bias is towards the upside, but the Euro faces growing resistance between 1.0630 and 1.0650. Germany will release the September Producer Price Index (PPI), with the annual rate expected to deepen into negative territory from -12.6% to -14.2%.
USD/JPY continues to trade near the 150.00 area, raising intervention expectations. Japan will release the National Consumer Price Index (CPI) for September.
Analysts at Commerzbank on JPY:
In our central scenario, the yen appreciates moderately again on the back of our assumed Fed rate cuts. However, the biggest risk for this scenario is not a more pronounced JPY appreciation, but a very significant JPY depreciation if the MOF's intervention strategy fails.
GBP/USD finished the day flat, around 1.2140, after hitting a weekly low at 1.2089 and then rebounding towards 1.2200. On Friday, the UK is set to report September Retail Sales and Public Sector Net Borrowing.
NZD/USD reached a bottom at 0.5814, the lowest level since November of 2022, but managed to trim losses, rising to 0.5850. The overall trend remains downward, although Thursday's rebound provides some hope for the bulls. New Zealand will release September trade data.
USD/CAD saw a marginal rise and ended around 1.3720. Canada is expected to report a 0.3% decline in August Retail Sales on Friday.
AUD/USD trimmed its losses during the American session, supported by a weaker US dollar, and climbed to 0.6340. The pair managed to stay above the key support area at 0.6285.
Gold experienced (another) jump and reached $1,977, its highest level since late July. The precious metal continues to shine despite higher government bond yields. The following relevant resistance area is seen at $1,985; above that, a move beyond $2,000 seems likely. Silver rebounded during the American session, rising to $23.00.
Like this article? Help us with some feedback by answering this survey:
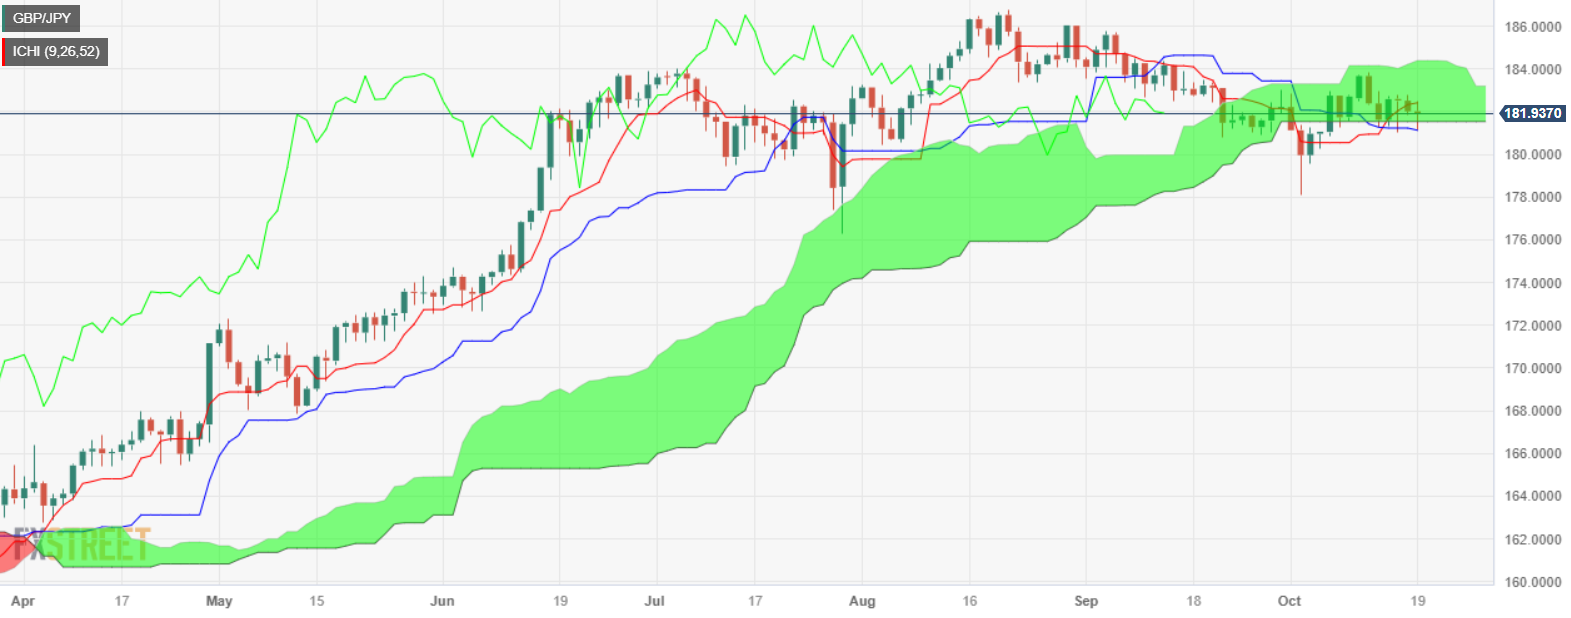
- GBP/JPY daily chart shows the pair trading near the bottom of the Ichimoku Cloud (Kumo).
- Initial support is seen at 181.50/55; clearing this could lead to tests of 18.00 and the October 3 swing low at 178.31.
- First resistance at 182.00, followed by the week's high of 182.81.
The GBP/JPY trends lower late in the New York session after hitting a daily high of 182.51, though a deterioration in sentiment spurred outflows from the Pound Sterling (GBP) toward the safe-haven status of the Japanese Yen (JPY). The cross-pair is trading at 181.98, down 0.01%.
From a technical standpoint, the GBP/JPY daily chart portrays the pair as subdued, exchanging hands inside the Ichimoku Cloud (Kumo) near the bottom of the Kumo. If the pair clears the initial support seen at 181.50/55, that will pave the way to test 18.00, followed by the October 3 swing low of 178.31. Further downside is expected at July 28 daily and the latest cycle low at 176.30.
Conversely, the GBP/JPY first resistance would be the 182.00 figure, followed by the current week’s high of 182.81. Additional upside risks are above the 183.00 mark, like the top of the Kumo at around 184.50/75.
GBP/JPY Price Action – Daily chart
GBP/JPY Technical Levels
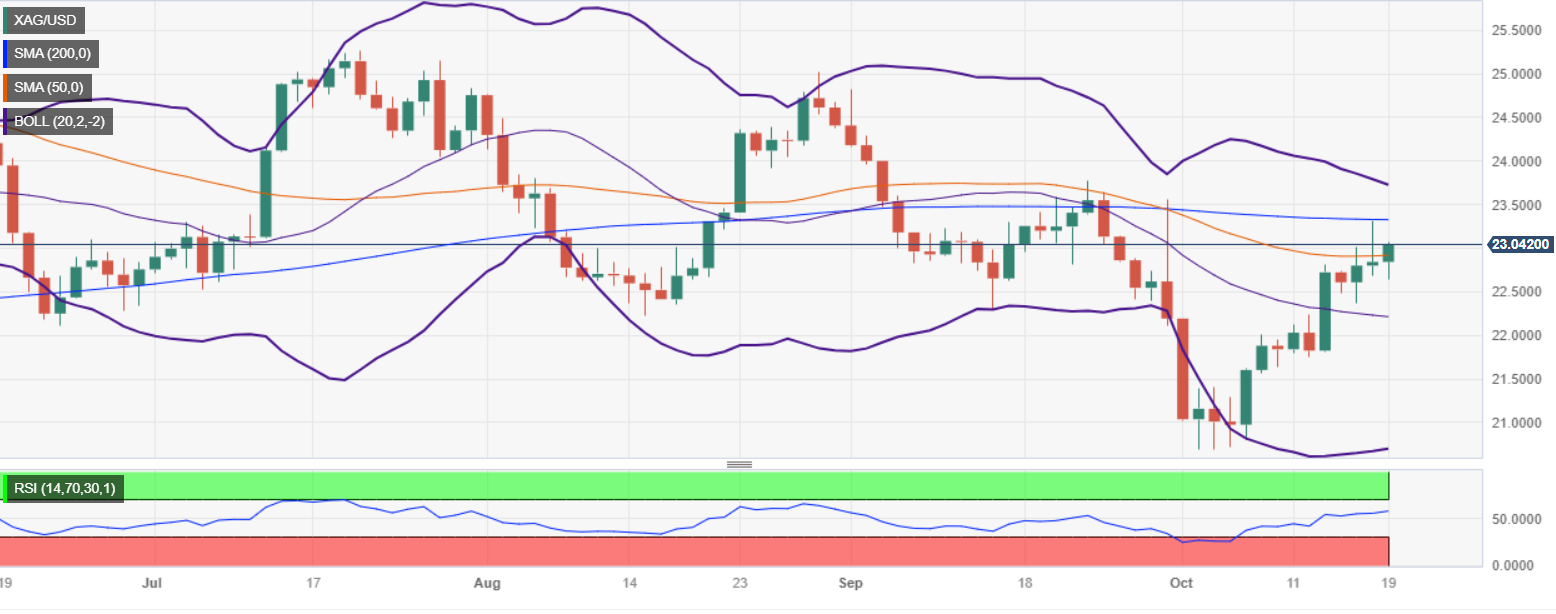
- Daily chart shows Silver as bearish-biased, remaining below the 200-DMA at $23.31.
- A breach of the 200-DMA at $23.31 could open the door for further upside, with potential targets at $23.72 and $24.00.
- If XAG/USD slides below $23.00, it could drop toward the 50-DMA at $22.90, followed by $22.37 and the 20-day EMA at $22.20.
Silver price (XAG/USD) climbed from around two-day lows of $ 22.60 and targeted the 200-day moving average (DMA) on Thursday after comments from the US Federal Reserve (Fed) Chair Jerome Powell impacted the odds for another rate hike in the futures market. Hence, XAG/USD advanced, and trades at around $22.95, gaining 0.50%.
The XAG/USD daily chart portrays the grey metal as bearish-biased, as it remains below the 200-DMA at $23.31, which capped the October 18 rally towards the $24.00 figure. In doing that, Silver registered a daily close below the 50-DMA at $22.90, keeping sellers in charge.
However, dovish remarks from Powell lifted XAG/USD above the $23.00 figure, opening the door for further upside, with the 200-DMA at sight at $23.31. A breach of the latter would open the door to challenge the top of the Bollinger Band at $23.72 before testing $24.00.
Conversely, if Silver Spot slides below $23.00, that would pave the way to test the 50-DMA at $22.90, followed by intermediate support at $22.37. Once cleared, the next stop would be the 20-day EMA at $22.20.
XAG/USD Price Action – Daily chart
XAG/USD Technical Levels
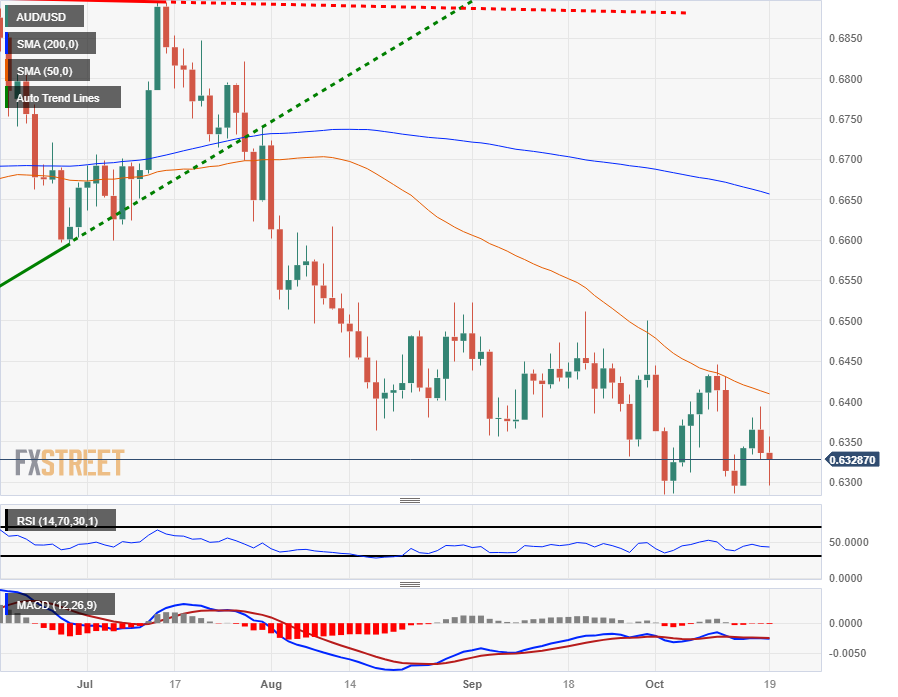
- The AUD/USD is sticking close to Thursday's opening prices near 0.6336.
- Aussie bulls are flubbing the opportunity to see gains as the US Dollar broadly loses ground after a dovish Fed Chair Powell.
- The 0.6300 handle continues to see play on the AUD/USD charts, more downside could be on the cards.
The AUD/USD is pointed downwards for Thursday as bids on the Aussie (AUD) continue to test into the 0.6300 handle against the US Dollar (USD), and a surprisingly balanced-to-dovish appearance by the Federal Reserve (Fed) Chairman Jerome Powell is seeing the Greenback roll over against the broader market.
Jerome Powell says higher bond yields are producing tighter financial conditions
Fed head Jerome Powell didn't give any indication that additional Fed rate hikes were immediately due in course, giving investor sentiment a much-needed boost and driving the US Dollar lower across the board. The Aussie, however, remains unable to capitalize meaningfully on USD weakness, and the AUD/USD pair remains trapped on the low side.
Australian employment figures came in mixed, sapping any upside potential for the Aussie on Thursday; the Australian Unemployment Rate fell to 3.6% in September while the market was expected a steady reading at August's 3.7%, jobs hiring and the Participation Rate both declined.
Australia added a (seasonally-adjusted) meager 6.7K jobs in September, much lower than the 20K expected, and falling even further below the previous month's reading of 63.3K, which was also revised down from 64.9.
The Australian Participation Rate declined to 66.7%, falling below the forecast holding at 67% from August.
AUD/USD Technical Outlook
The Aussie continues to hold on the soft end against the US Dollar, stuck near 0.6330 as a pattern of lower highs continues to weigh on the AUD/USD's technical stance.
A declining 50-day Simple Moving Average (SMA) is adding additional price pressures, capping off upside potential and keeping the AUD/USD pinned into 2023's lows.
The year's low sits nearby at 0.6285, and there is little in the way of technical support until 2022's lows near 0.6170 come into view, and a bullish reversal for the AUD/USD will need to first overcome hefty technical resistance from the 0.6400 handle before a further move higher can even be considered.
AUD/USD Daily Chart
AUD/USD Technical Levels
- EUR/JPY rose to a daily high of 158.92 and then settled at 158.60.
- Indicators suggest that the buyers have the upperhand in the short term, but momentum is weak.
The EUR/JPY’s bulls stepped in on Thursday and advanced to multi-month highs around 158.90. The daily chart suggests that the technical bias is neutral to bullish as the bulls still have more work and the momentum doesn't seem to be enough to trigger the next upwards leg. The neutrality is also given by the pair side-ways trading since September.
The daily Relative Strength Index (RSI) is comfortably positioned in the positive territory above its midline and has a mild northward slope, complemented by a positive signal from the Moving Average Convergence Divergence (MACD), which is showing flat red bars, signalling a growing bullish momentum. Moreover, the pair is above the 20,100,200-day Simple Moving Average (SMA), highlighting the continued dominance of bulls on the broader scale. On the four-hour chart, both indicators support the idea that the upward momentum is somewhat weak, as they turned flat on positive territory.
Support levels: 157.50 (20-day SMA), 157.00, 156.50.
Resistance levels:159.00, 159.50, 160.00.
EUR/JPY Daily Chart
-638333380187933449.png)
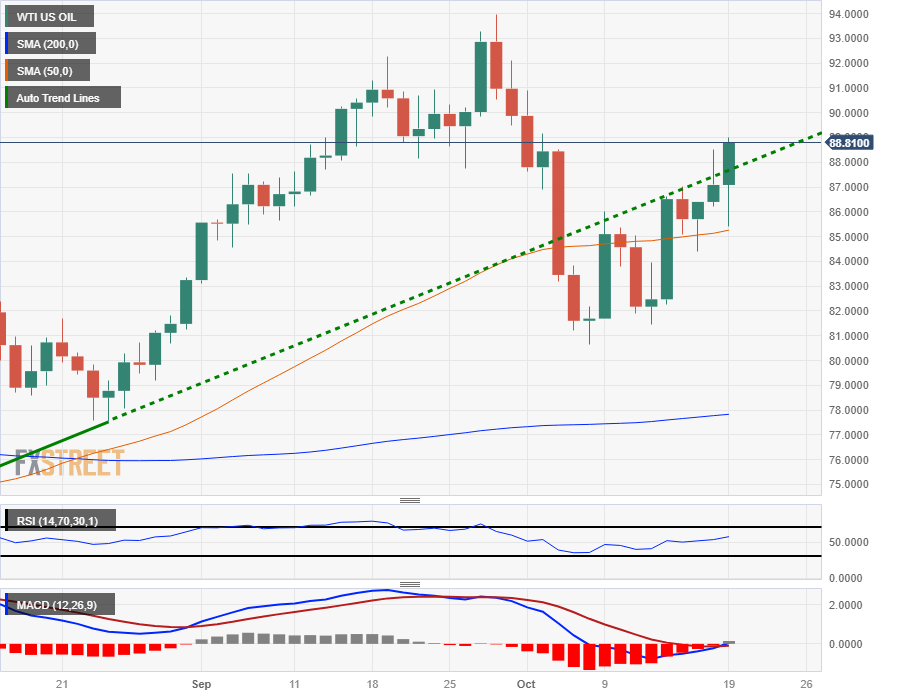
- Crude Oil barrel bids are on the high side for Thursday.
- Global supply constraints remain a key narrative for light sweet crude.
- WTI traders may have overshot their expectations on increasing supply after Wednesday's announced Venezuela sanction easing.
West Texas Intermediary (WTI) barrel prices are getting pushed back into recent highs for Thursday, rising into $88.30 per barrel after kicking the day off with an early decline into $85.50.
Crude Oil markets saw some slight easing on Wednesday after it was announced that US-led sanctions on Venezuela will be lifted, allowing the South American country to return to exporting into the global market, but investors may have overrun their own expectations on how quickly that supply uptick would impact broader markets.
Adding to supply constraint concerns, the Energy Information Administration (EIA) showed on Wednesday that US Crude Oil reserves continue to dwindle down rapidly, with Crude Oil stocks for the week into October 13th declining by 4.491M, far below the 0.3M drawdown traders were expecting and taking a huge chunk out of the previous week's 10.176M barrel buildup.
The Organization of the Petroleum Exporting Countries (OPEC) is reportedly unconcerned about the addition supply provided by Venezuela returning to crude markets, with the oil cartel keeping global production firmly below demand, fueled largely in part by Saudi Arabia and Russia's combined 1.3 million bpd production and export cuts that were extended into the year-end.
Despite waning demand amidst China's steepening economic slump, fossil fuels remain firmly undersupplied, and Middle East geopolitical concerns, fueled by the Gaza Strip escalation in the conflict between Israel and Palestinian Hamas, continue to weigh on energy traders with the critical Strait of Hormuz chokepoint nearby.
WTI Technical Outlook
Crude Oil's Thursday surge into fresh highs is seeing WTI hit its highest bids in almost two weeks with US barrel prices aimed straight at $90.00/bbl.
WTI has seen a clean rejection of the 50-day Simple Moving Average (SMA) as October's recovery from $80.63 turns into a full-on bullish rebound.
A continued push into the top end will see WTI challenging late September's peaks at the $94.00 handle, while the downside remains capped by fundamental market conditions with global oil supply undershooting demand on a consistent basis.
Thursday sees bottom-to-top gains of over 4% for WTI, with more on the way if Crude Oil bidders can get barrel prices pushed over the $90.00 handle.
WTI Daily Chart
WTI Technical Levels
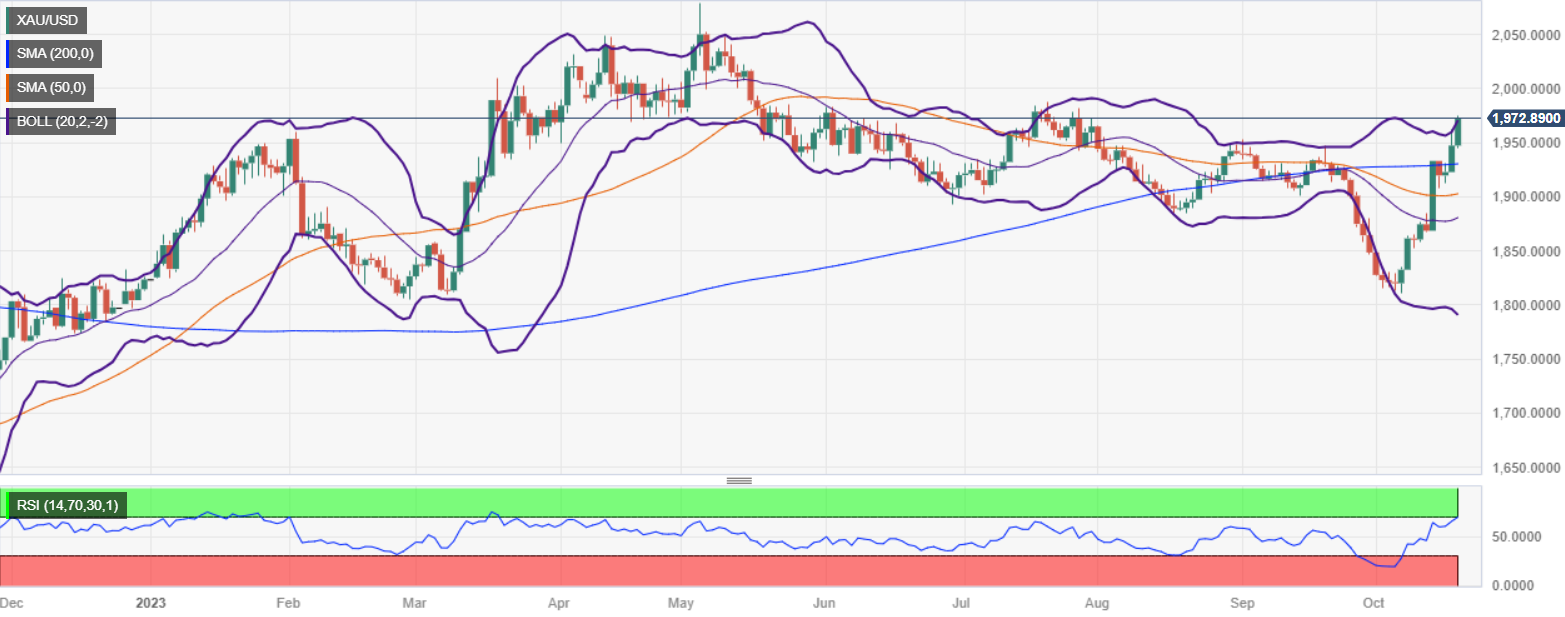
- XAU/USD trades at $1971.15, marking a 1.24% gain.
- Fed Chair Jerome Powell's comments at the Economic Club of New York led to expectations of no further rate hikes by the Fed.
- Powell states that policy is restrictive and emphasizes the need for careful policy setting.
Gold price (XAU/USD) extended its gains to three straight days and approached the next cycle high of $1982.15 a troy ounce after remarks from the US Federal Reserve Chair Jerome Powell weighed on the Greenback, as investors expect no further rate increases by the Fed. The XAU/USD is trading at $1971.15, gaining 1.24%.
Gold price (XAU/USD) extends gains for three consecutive days, approaching the next cycle high of $1982.15 per troy ounce
During Powell’s appearance at the Economic Club of New York, Wall Street seesawed, but at the time of writing, trade with losses. Fed Chair Jerome Powell commented that policy is restrictive and that the Fed would proceed “carefully” in setting its policy. He emphasized that above-trend growth and a tight labor market “could warrant further tightening of monetary policy.”
Consequently, US Treasury bond yields, particularly the 10-year benchmark note rate, wavered at around a ten-basis point spread, though it had settled at around 4.973%, but failed to underpin the Greenback, which prints losses of 0.47%, as shown by the US Dollar Index (DXY), at 106.05.
On the data side, the US calendar featured the Philadelphia Manufacturing Index for September, portraying a gloomy economic outlook for the region. At the same time, the US Bureau of Labor Statistics (BLS) revealed that last week’s Initial Jobless Claims slowed to 198K, below forecasts and previous figures, at 212K and 211K, respectively.
Ahead of the week, the docker would feature Fed speakers before entering their blackout period as they brace for the upcoming monetary policy meeting.
XAU/USD Price Analysis: Technical outlook
After clearing the 200-day moving average (DMA) at $1930.70, Gold could test the latest cycle high of $1987.42, before rallying to $2000. Once those two areas are cleared, up next would be the all-time high (ATH) at $2081.82. On the flip side, if sellers moved in and dragged prices below the psychological $1950, that would open the door to test key support levels like the 200-DMA at 1930.68, the 100-DMA at 1922.13, and the 50-DMA at $1902.54.
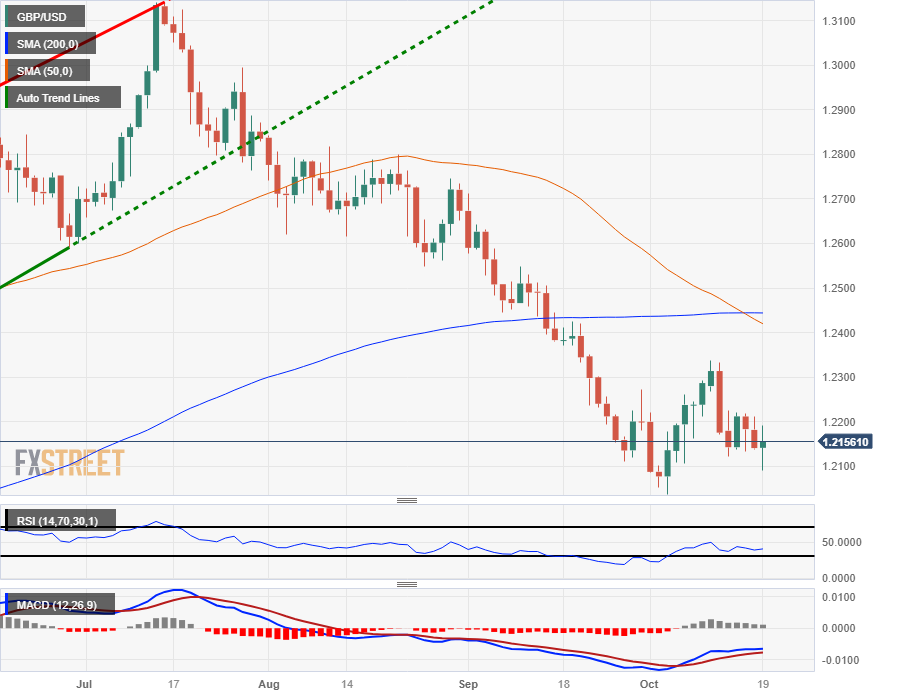
- The GBP/USD is seeing some bullish play on the charts with a firm bounce after comments from Fed Chair Powell.
- US Initial Jobless Claims beat expectations, helping to improve investor mood and sending the US Dollar lower.
- Several Fed officials still scheduled to speak before the trading week closes out.
The GBP/USD climbed to an intraday high of 1.2192 on Thursday after softer comments from Federal Reserve (Fed) Chairman Jerome Powell landed heavy on the US Dollar (USD), taking the broad Dollar Index (DXY) down and giving the Pound Sterling (GBP) a much-needed boost, extending a rebound from the day's early lows near 1.2090.
Powell speech: Higher yields take some pressure off Fed to raise rates
Fed head Jerome Powell struck a notably muted tone in his appearance at the Economic Club of New York. Chair Powell discussed the relative strength of the US economy moving forward, as well as nodding to the fact that pressure on the Fed to raise rates further appears to be easing, sending the US Dollar broadly lower as investors celebrated the potential for easing rate pressures looking forward, with market sentiment spurring firmly into risk-on territory.
Several Federal Reserve officials are slated to give speech notes over the next 24 hours before the US central bank enters the "blackout" period ahead of the next policy meeting and ensuing rate call.
Looking ahead to Friday, the GBP will be closing out the trading week with a UK Retail Sales data read, with median market forecasts calling for a decline in September's Retail Sales, with negative growth of -0.1% expected compared to August's 0.4% increase.
GBP/USD Technical Outlook
Despite Thursday's Fed-fueled bullish spike, the GBP/USD remains firmly entrenched in bear country on the daily candlesticks; the pair has failed to generate a sustained bull move since sinking to 1.2037 at the beginning of the month, with the last move up failing to make a meaningful break of the 1.2300 handle.
The GBP/USD continues to see play on the bearish side of the charts, with the 50- and 200-day Simple Moving Averages (SMA) etching in a bearish cross near 1.2450.
A bearish continuation will quickly see the Pound Sterling challenging 2023';s lows at 1.1800, while a topside recovery will need to first mount and extend from the 1.2300 key level as the 50-day SMA is set to drop into price action and add technical resistance.
GBP/USD Daily Chart
GBP/USD Technical Levels
- USD/CHF declined to 0.8930, seeing nearly 0.64% losses.
- Chair Powell confirmed that the Fed will proceed carefully with eyes on higher bond yields.
- Jobless Claims from the US from the second week of October came in below expectations.
On Thursday, the USD/CHF declined and consolidated below the 200-day Simple Moving Average (SMA), trading around 0.8935. On the US side, the green currency faced selling pressure after Powell’s cautious words and couldn’t capitalise on better than expected Jobless Claims. On the other hand, the Swiss calendar had nothing relevant to offer.
Chair Powell from the Federal Reserve (Fed) revealed that higher Treasury could exacerbate financial tightening, which could have implications in the next decision. That said, he confirmed that the bank would proceed carefully and left the door open for further tightening.
On the data front, the US Jobless Claims for the week ending on October 13 came in at 198,000, lower than the expected 212,000 and the previous reading of 211,000. Regarding expectations, the 2,5 and 10-year stand uncomfortably high for markets, around 5.18%, 4.97% and 4.96%, respectively. In addition, the CME FedWatch tool indicates that the odds of an additional 25 bps hike in December declined to 30% from 40%. It's worth noticing that the markets are underestimating the Fed. Still, recent data, including an accelerating Consumer Price Index (CPI) and better-than-expected economic activity reports, may push the Federal Open Market Committee to consider one more rate increase.
USD/CHF Levels to watch
Analyzing the daily chart, it is apparent that the USD/CHF has a neutral to bearish technical stance, with the bears gradually recovering and asserting themselves. The Relative Strength Index (RSI) has a negative slope in the bearish territory, while the Moving Average Convergence (MACD) histogram lays out increasing red bars. Additionally, the pair is below the 20 and 200-day Simple Moving Averages (SMAs) but above the 100-day SMA, highlighting that despite sellers gaining ground, there is some light for the buyers on the broader scale and that the bears need to increase their efforts to confirm a bearish trend.
Support levels: 0.8930,0.8915, 0.8900 (100-day SMA).
Resistance levels: 0.9015 (200-day SMA), 0.9040, 0.9070.
USD/CHF Daily Chart
-638333346315791761.png)
- USD/JPY hits a new weekly high of 149.96 before retreating 0.13% to trade at 149.75.
- Fed Chair Jerome Powell's dovish remarks led to a decrease in expectations for additional tightening by the Fed.
- Chances for a rate hike in January 2024 trimmed from 50% to 40% following Powell's comments.
USD/JPY turns negative after hitting a new weekly high of 149.96 but retreats 0.13% after dovish remarks of the US Federal Reserve (Fed) Chair Jerome Powell, amid a risk-on impulse, as seen by Wall Street’s posting gains. Therefore, the pair is trading at 149.75 at the time of writing.
USD/JPY shifts negative following dovish remarks from Jerome Powell
Jerome Powell’s words moved the markets, while expectations for additional tightening by the Fed faded, as the chances for a rate hike in January 2024 were trimmed from 50% on Wednesday to 40% on Fed Powell’s remarks.
Fed Chair Jerome Powell commented that the committee would proceed “carefully” in setting monetary policy, as evidence of above-trend growth would warrant further monetary policy tightening. He added that the policy is restrictive and acknowledged that inflation remains too high. He said the labor market is too tight, and markets have been frontrunning the US central bank policy changes.
Data-wise, the US agenda revealed the tight labor market after unemployment claims for the last week hit 198K, below forecasts and previous figures, at 212K and 211K, respectively. Simultaneously, the Philadelphia Fed Manufacturing Index showed business conditions in the region are crumbling, sparking fears of a possible economic downturn.
On the Japanese front, exports rose to a record high in September, rising for the first time in three months, as auto factories increased their shipments to the US and Europe. Exports estimates were at 3.1%, but figures rose by 4.3%. In the meantime, Japan’s top diplomat, Masato Kanda, said there was an “international agreement” that authorities could intervene in the Forex markets if there were excessive moves.
USD/JPY Technical Levels
Jerome Powell, Chairman of the Federal Reserve (Fed), speaks on the economic outlook and policy before the Economic Club of New York.
Key quotes
"Business contacts say economy remains strong."
"Cost of capital could be issue for small companies."
"Fed policy is blunt, but it's what the Fed has to tackle inflation."
"We know Fed actions are having negative impacts on parts of economy."
"Fed must get back to price stability."
"Higher bond yields are producing tighter financial conditions which fed wants."
"At margin, higher yields take some pressure off Fed to raise rates."
"There are many signs labor market getting back into balance."
"Wage increases are moderating, job openings weakening."
"The labor market is gradually cooling."
"Things have settled down on banking front."
"Bank stress has really settled down, Fed is still watching for trouble."
"Banks are strong, well capitalized."
- The Canadian Dollar spent Thursday mostly hung in place on the charts before catching a moderate bid.
- Canada Raw Materials and Industrial Product Price beat expectations, but the market is focused elsewhere.
- Fed Chair Jerome Powell notes that policy is restrictive, but more could be needed, dropping the USD.
The Canadian Dollar (CAD) is catching a late break against the US Dollar (USD) as the Greenback recedes, walking back some of yesterday’s declines that saw the Loonie drop to its lowest prices against the USD since the start of October.
Canada Industrial Product Prices and Raw Materials Price Index numbers for September both beat expectations, but the low-impact data did little to push the CAD into deeper moves with most of the market focused on Federal Reserve (Fed) Chairman Jerome Powell giving a speech to the Economic Club of New York.
Daily Digest Market Movers: Canadian Dollar tunnels sideways, sees some late moves in post-Powell bid
- CAD mostly sticks to the day’s opening prices after testing the water in both directions.
- Canadian economic data is strictly low-impact for the day, leaving traders focused on external drivers.
- Speech from Fed Chair Powell saw an uptick in intraday volatility in USD-based FX pairs, but moves remain limited.
- USD/CAD is having difficulty extending moves beyond 1.3700 as Loonie hangs on firm.
- Crude Oil seeing minor uptick for Thursday, providing limited support for CAD.
- Fed Chair Powell notes that "Inflation is still too high”, and the labor market remains tight, but shows signs of cooling off.
- A softening USD bid is giving the CAD a chance to flip the day into the green.
- CAD traders to look ahead to Canadian Retail Sales on Friday.
Technical Analysis: USD/CAD tests the water beneath 1.3700 post-Fed appearance
The USD/CAD is seeing a late break beneath 1.3700 with intraday action getting pushed into the 50-hour Simple Moving Average (SMA) near 1.3680, with the 50% retracement level of yesterday’s bottom-to-top moves sitting at that price.
Momentum on the daily candlesticks continues to find support from a rising trendline originating from 1.3100, in conjunction with a bullish-leaning 50-day SMA driving into 1.3575 and building a technical support floor to catch any downside extensions in the USD/CAD.
The pair continues to test the boundaries of a descending trendline drawn from 2020’s extreme peaks of 1.4668, and upside momentum could get constrained moving forward as the near-term uptrend runs against long-term resistance.
US Dollar price today
The table below shows the percentage change of US Dollar (USD) against listed major currencies today. US Dollar was the weakest against the .
| USD | EUR | GBP | CAD | AUD | JPY | NZD | CHF | |
| USD | -0.39% | -0.07% | -0.06% | -0.09% | 0.06% | 0.08% | -0.41% | |
| EUR | 0.38% | 0.31% | 0.29% | 0.32% | 0.42% | 0.43% | -0.04% | |
| GBP | 0.07% | -0.32% | 0.01% | 0.00% | 0.13% | 0.13% | -0.36% | |
| CAD | 0.09% | -0.29% | 0.00% | 0.00% | 0.16% | 0.14% | -0.36% | |
| AUD | 0.09% | -0.30% | -0.02% | 0.03% | 0.09% | 0.12% | -0.38% | |
| JPY | -0.03% | -0.46% | -0.15% | -0.12% | -0.09% | 0.00% | -0.49% | |
| NZD | -0.02% | -0.41% | -0.12% | -0.09% | -0.11% | 0.06% | -0.44% | |
| CHF | 0.46% | 0.06% | 0.35% | 0.41% | 0.37% | 0.48% | 0.50% |
The heat map shows percentage changes of major currencies against each other. The base currency is picked from the left column, while the quote currency is picked from the top row. For example, if you pick the Euro from the left column and move along the horizontal line to the Japanese Yen, the percentage change displayed in the box will represent EUR (base)/JPY (quote).
Canadian Dollar FAQs
What key factors drive the Canadian Dollar?
The key factors driving the Canadian Dollar (CAD) are the level of interest rates set by the Bank of Canada (BoC), the price of Oil, Canada’s largest export, the health of its economy, inflation and the Trade Balance, which is the difference between the value of Canada’s exports versus its imports. Other factors include market sentiment – whether investors are taking on more risky assets (risk-on) or seeking safe-havens (risk-off) – with risk-on being CAD-positive. As its largest trading partner, the health of the US economy is also a key factor influencing the Canadian Dollar.
How do the decisions of the Bank of Canada impact the Canadian Dollar?
The Bank of Canada (BoC) has a significant influence on the Canadian Dollar by setting the level of interest rates that banks can lend to one another. This influences the level of interest rates for everyone. The main goal of the BoC is to maintain inflation at 1-3% by adjusting interest rates up or down. Relatively higher interest rates tend to be positive for the CAD. The Bank of Canada can also use quantitative easing and tightening to influence credit conditions, with the former CAD-negative and the latter CAD-positive.
How does the price of Oil impact the Canadian Dollar?
The price of Oil is a key factor impacting the value of the Canadian Dollar. Petroleum is Canada’s biggest export, so Oil price tends to have an immediate impact on the CAD value. Generally, if Oil price rises CAD also goes up, as aggregate demand for the currency increases. The opposite is the case if the price of Oil falls. Higher Oil prices also tend to result in a greater likelihood of a positive Trade Balance, which is also supportive of the CAD.
How does inflation data impact the value of the Canadian Dollar?
While inflation had always traditionally been thought of as a negative factor for a currency since it lowers the value of money, the opposite has actually been the case in modern times with the relaxation of cross-border capital controls. Higher inflation tends to lead central banks to put up interest rates which attracts more capital inflows from global investors seeking a lucrative place to keep their money. This increases demand for the local currency, which in Canada’s case is the Canadian Dollar.
How does economic data influence the value of the Canadian Dollar?
Macroeconomic data releases gauge the health of the economy and can have an impact on the Canadian Dollar. Indicators such as GDP, Manufacturing and Services PMIs, employment, and consumer sentiment surveys can all influence the direction of the CAD. A strong economy is good for the Canadian Dollar. Not only does it attract more foreign investment but it may encourage the Bank of Canada to put up interest rates, leading to a stronger currency. If economic data is weak, however, the CAD is likely to fall.
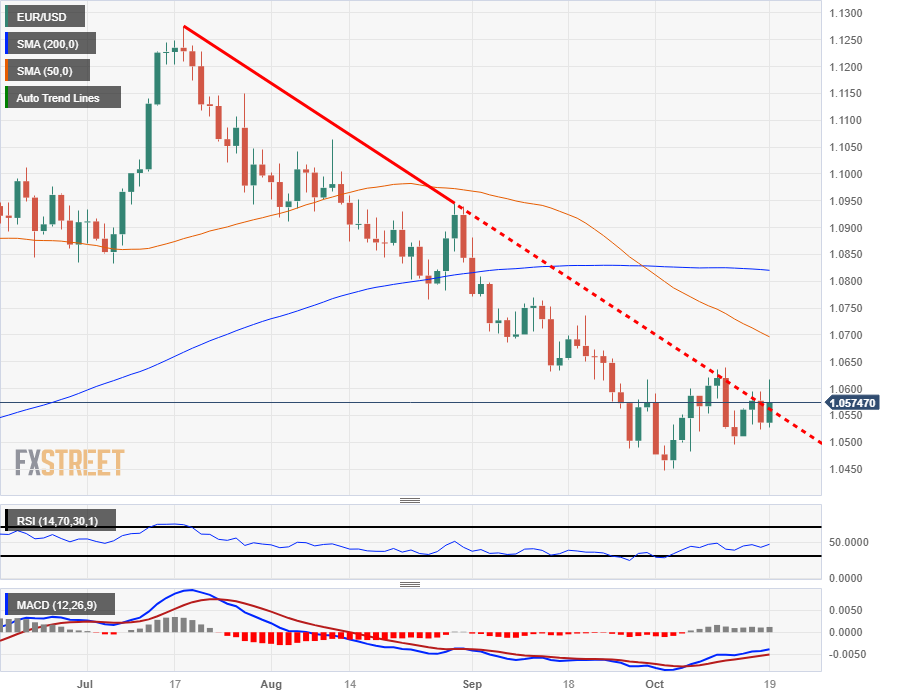
- The EUR/USD tapped into 1.0615 after an appearance from Fed Chair Powell sent the Greenback wobbling.
- The post-reaction markets are eating away at the knee-jerk gains, but the Euro remains firmly well-bid for Thursday.
- US Initial Jobless Claims came in better than expected, helping to improve investor sentiment.
The EUR/USD saw a fast spike into 1.0616 after optimistic talking points from Federal Reserve (Fed) Chairman Jerome Powell. Markets have largely absorbed the Fed-fueled reaction, and the Euro (EUR) remains near pre-Fed intraday highs as the US Dollar (USD) takes a light step back for Thursday.
Market risk appetite is improving on the day, keeping the USD on the low end as investors step back into risk assets.
Breaking: Jerome Powell says higher yields can have implications for policy
US Initial Jobless Claims beat expectations, showing just 198K new jobless benefits seekers for the week into October 13th versus the expected 212K, though the previous week's figure was revised from 209K to 211K.
Fed appearances certainly aren't done this week, with an additional five Fed official appearances over the next 24 hours.
EUR/USD Technical Outlook
Thursday's momentary Fed-fueled pop to the upside sees the EUR/USD toying with chart territory just north of a firmly descending trendline from 1.1275, and a sustained break will see the pair set for additional topside and free to take a run at the 50-day Simple Moving Average (SMA) near 1.0700.
On the low side, the last swing low into 1.0500 sits nearby as technical support, with a break of that level opening up the way for a further bearish run into 2023's lows near 1.0450.
EUR/USD Daily Chart
EUR/USD Technical Levels
Jerome Powell, Chairman of the Federal Reserve (Fed), speaks on the economic outlook and policy before the Economic Club of New York.
Key quotes
"Possible Fed could have done less during pandemic."
"Our economy is doing very well."
"Bond yields analysis needs humility."
"Bond yields not showing higher expected inflation, monetary policy view."
"Bond yields rise driven by term premiums."
"Markets are seeing economic resilience and revising views."
"Markets may be responding to deficits, Fed balance sheet actions."
"Bond yield rise doesn't seem to be about expectations of Fed doing more on rates."
"Not clear if bond yield rise will be persistent, markets are volatile."
"Will let market yield rise play out, Fed will watch it."
"We know fiscal path is ultimately unsustainable."
"Current fiscal situation does not affect Fed near term policy choices."
"Overseas treasury buying has remained robust."
Jerome Powell, Chairman of the Federal Reserve (Fed), speaks on the economic outlook and policy before the Economic Club of New York.
Key quotes
"Long-run potential growth doesn't change much, it's around 2%."
"It's very hard to know how economy can grow with higher rates."
"Don't know where monetary policy will settle."
"Effective lower bound is not an issue for economy, monetary policy."
"By any reckoning, neutral rates ebbed over recent decades, unsure where it is now."
"Neutral rate may have risen in near term, unclear about longer term."
"Evidence is not that policy is too tight."
"It's possible we are going into a more inflationary period, but it's hard to know."
"Fed's issue is trying to get policy right to bring inflation back to 2%."
Jerome Powell, Chairman of the Federal Reserve (Fed), speaks on the economic outlook and policy before the Economic Club of New York.
Key quotes
"Economy is very resilient, growing strongly."
"Growth is running above the longer-run trend, that is a surprise."
"Economy is a story of stronger demand."
"May be ways economy is less affected by interest rates."
"Interest sensitive spending is showing impact of Fed policy."
"We see policy working through usual channels."
"I don't think there's a fundamental shift in how rates affect economy."
"The fact is that we have a strong economy and job market, these are elements we want to see."
"No precision in understanding monetary policy lags."
"Markets have been front running Fed policy changes."
"Household savings are higher, spending has been higher."
"We should be seeing effects of monetary policy arriving."
"Fed has slowed on rates to give policy time to work."
- The New Zealand Dollar recovered some territory, and gained 0.14% on Powell’s remarks.
- Fed Chair Jerome Powell's speech indicates a cautious approach to monetary policy, with inflation remaining a concern.
- The Reserve Bank of New Zealand's neutral stance adds to the downward pressure on the Kiwi Dollar.
The Kiwi Dollar (NZD) cut its agony and registered modest gains against the US Dollar (USD) during the North American session, as risk aversion took its toll on the financial markets. Traders bracing for US Federal Reserve (Fed) Chair Jerome Powell's speech, pereceived his remarks as dovish, while tensions in the Middle East remain high. The NZD/USD is trading at 0.5863 after reaching a new year-to-date (YTD) low of 0.5815, gaining 0.14%.
Kiwi Dollar finds its foot despite geopolitical tensions on Fed Powell’s dovish remarks
Fed Chair Jerome Powell said the committee would proceed “carefully” in setting monetary policy, as evidence of above-trend growth would warrant further monetary policy tightening. He added that the policy is restrictive and acknowledged that inflation remains too high. That spurred a U-turn in the NZD/USD, which turned positive in the day.
Powell’s words echoed some of the latest round of Federal Reserve officials adopting a more neutral stance, even though most expect rates to remain at current levels for a long time. On Wednesday, the New York Fed President said that inflation has come down but remains too high.
Earlier, the US economic docket featured Initial Jobless Claims for the last week rose by 198K below forecasts of 212K, portraying a hot jobs market. At the same time, the Philadelphia Fed Manufacturing Index plunged -9, far below forecasts of -6.4, implying that economic conditions are deteriorating, reigniting fears for an economic slowdown.
Recently, US Existing Home Sales plunged from 4.04M to 396M in September, a -2% MoM drop, reported the National Association of Realtors (NAR). NAR’s Chief Economist Lawrence Yun commented that limited inventory and low housing affordability “hamper home sales.”
On the New Zealand front, an absent economic docket left the Kiwi adrift to Australia’s latest employment data. Aussie’s data, although positive, failed to underpin the NZD/USD, which continued to extend its losses. Even though the latest inflation report in the New Zealand was high, a neutral posture adopted by the Reserve Bank of New Zealand (RBNZ) weighed on the NZD’s outlook.
NZD/USD Price Analysis: Technical outlook
After breaking the previous cycle low, the NZD/USD reinforces its downward bias as sellers observe the November 5, 2022, swing low of 0.5740, but firstly they must reclaim the 0.58 figure. On the other hand, buyers must recover the September 3 last cycle low at 0.5959, ahead of testing the 0.59 handle. Once cleared, the 50-day moving average (DMA) would be up for grabs at around 0.5934.
- The US Dollar consolidates Wednesday gains and trades soft against its main rivals.
- Jobless Claims from the second week of October came in lower than expected.
- The pace of markets will be set by Chair Powel’s words, who will be on the wires starting 16:00 GMT.
The US Dollar (USD) measured by the US Dollar DXY Index declined as the green currency consolidated Wednesday’s gains and failed to gather momentum on better-than-expected Jobless Claims from the second week of October. During the American session, Federal Reserve Chair Jerome Powell will be on the wires, where investors will look for further clues on forward guidance, which could affect the USD price dynamics.
The United States’ economic activity is strong, as revealed by the latest reports, including S&P Global PMIs, Industrial Production and Retail Sales. On Wednesday, the Federal Reserve’s Beige Book report described the US economic situation as “stable”, and as US Treasury yields stand at multi-year highs, investors may be gearing up for one last hike from the Fed in 2023. When he speaks, Chair Powell will likely give markets further insights into the Fed's stance.
Daily Digest Market Movers: US Dollar fails to gather momentum despite higher US yields and positive Jobless Claims
- The US Dollar DXY declined near 106.30, seeing 0.20% daily losses, still above the 20-day Simple Moving Average (SMA).
- Jobless Claims for the week ending on October 13 came in at 198,000, lower than the expected 212,000 and the previous 211,000.
- In the meantime, US yields rose back to multi-year highs, with the 2, 5 and 10-year rates increasing to 5.22%, 4.99% and 4.98% respectively.
- What seems to be weakening the US is investors taking profits from Wednesday’s gains and a slight improvement in the market’s mood.
- Focus shifts to Jerome Powell’s speech at 16:00 GMT for investors to continue placing their bets on the next Fed decisions.
- According to the CME FedWatch tool, the odds of a 25 bps hike in the December meeting stand near 40%.
Technical analysis: US Dollar Index’s bulls step back but hold the 20-day SMA
The DXY index is in an intermediate bullish trend on the daily chart, holding above the key 20,100 and 200-day Simple Moving Average (SMA).
As of late bears gained some momentum and threatened the 20-day Simple Moving Average (SMA) at 106.30. Indicators on the daily chart reveal a rising bearish traction but in case price fails to conquer the mentioned average, further upside may be on the horizon.
The Relative Strength Index (RSI) is looking weak and pointing south, though still above 50. The Moving Average Convergence Divergence (MACD) saw a bearish cross on October 5 though the trend lower flipped on October 12 when the market made a recovery. Given the dominant uptrend the market could still rally.
The pair has had a strong run higher, with 11 consecutive up-weeks in a row before peaking and forming a bearish doji/shooting star candlestick in the first week of October. This was not followed through to the downside, however, with the following week closing higher. Still it is a warning sign of potential weakness on the horizon.
Supports: 106.28 (20-day SMA), 106.00, 105.80.
Resistances:106.55, 107.00, 107.30.
US Dollar FAQs
What is the US Dollar?
The US Dollar (USD) is the official currency of the United States of America, and the ‘de facto’ currency of a significant number of other countries where it is found in circulation alongside local notes. It is the most heavily traded currency in the world, accounting for over 88% of all global foreign exchange turnover, or an average of $6.6 trillion in transactions per day, according to data from 2022.
Following the second world war, the USD took over from the British Pound as the world’s reserve currency. For most of its history, the US Dollar was backed by Gold, until the Bretton Woods Agreement in 1971 when the Gold Standard went away.
How do the decisions of the Federal Reserve impact the US Dollar?
The most important single factor impacting on the value of the US Dollar is monetary policy, which is shaped by the Federal Reserve (Fed). The Fed has two mandates: to achieve price stability (control inflation) and foster full employment. Its primary tool to achieve these two goals is by adjusting interest rates.
When prices are rising too quickly and inflation is above the Fed’s 2% target, the Fed will raise rates, which helps the USD value. When inflation falls below 2% or the Unemployment Rate is too high, the Fed may lower interest rates, which weighs on the Greenback.
What is Quantitative Easing and how does it influence the US Dollar?
In extreme situations, the Federal Reserve can also print more Dollars and enact quantitative easing (QE). QE is the process by which the Fed substantially increases the flow of credit in a stuck financial system.
It is a non-standard policy measure used when credit has dried up because banks will not lend to each other (out of the fear of counterparty default). It is a last resort when simply lowering interest rates is unlikely to achieve the necessary result. It was the Fed’s weapon of choice to combat the credit crunch that occurred during the Great Financial Crisis in 2008. It involves the Fed printing more Dollars and using them to buy US government bonds predominantly from financial institutions. QE usually leads to a weaker US Dollar.
What is Quantitative Tightening and how does it influence the US Dollar?
Quantitative tightening (QT) is the reverse process whereby the Federal Reserve stops buying bonds from financial institutions and does not reinvest the principal from the bonds it holds maturing in new purchases. It is usually positive for the US Dollar.
- Mexican Peso exchange rate with the US Dollar hits a two-week high as the USD/MXN hits 18.39.
- Mexico’s preliminary GDP report showed a 3% YoY growth in September.
- In the US, jobless claims portray a hot labor market, and traders await Fed Chair Jerome Powell's speech at 16:00 GMT.
Mexican Peso (MXN) lost value against the US Dollar (USD) early during the North American session, extending its downtrend to three straight days, weighed by risk aversion amid rising geopolitical worries due to the Middle East conflict. That and high US Treasury bond yields underpin the USD/MXN to print a new two-week high of 18.39 before retreating toward the current spot price at 18.34, gaining 0.50%.
A poll by the National Statistic Agency, known as INEGI, revealed the “Indicator Oportuno de la Actividad Economica (IOAE),” which is a preliminary reading of the Global Indicator of Economic Activity (IGAE), a monthly report of GDP. According to the poll, the Mexican economy grew at a 3% rate in September, while the Mexican Congress approved the 2024 budget proposed by President Andres Manuel Lopez Obrador, which contemplates the most significant deficit since 1988. Apart from that, Mexico’s economic docket remains light.
Across the border, the labor market in the United States (US) remains hot, as jobless claims came below estimates, while the housing market deteriorated further, as Existing Home Sales sank. Aside from this, US Federal Reserve (Fed) officials continue to cross the wires, led by Chair Jerome Powell.
Daily Digest Market Movers: Mexican Peso sways with market sentiment; USD/MXN reaches a two-week high
- IOAE portrays the Mexican economy growing at a 3.12% YoY pace.
- US Initial Jobless Claims for the week ending October 14 rose by 198K, below estimates and previous week data, each at 212K and 211K, respectively.
- US Existing Home Sales rose by 3.96M in September, below August’s 4.04M a -2% contraction.
- US Building Permits plummeted -4.4% in September, compared to last month’s 6.8% increase.
- Housing Starts for the same period previously mentioned rose by 7%, exceeding August’s -12.5% plunge.
- Mexico’s GDP in 2023 is expected to hit 3.2%, according to the World Bank and the International Monetary Fund.
- Mexico's Industrial Production (IP) for August improved by 5.2% YoY, exceeding forecasts of 4.6% and July’s 4.8% increase.
- Monthly, IP in Mexico rose 0.3%, as expected, but trailed the previous 0.5% reading.
- Mexico’s Consumer Price Index (CPI) grew by 4.45% YoY in September, slightly below the 4.47% estimated.
- The core CPI inflation in Mexico stood at a stickier 5.76% YoY, as widely estimated, but has broken below the 6% threshold.
- The Bank of Mexico (Banxico) held rates at 11.25% in September and revised its inflation projections from 3.5% to 3.87% for 2024, above the central bank’s 3% target (plus or minus 1%).
Technical Analysis: Mexican Peso deteriorates, as USD/MXN buyers’ eye 18.50
USD/MXN buyers are preparing to challenge the October 6 cycle high at 18.48. A breach of the latter would expose the psychological 18.50 level, followed by the March 24 high at 18.79 before rallying to 19.00. On the downside, the uptrend would be at risk if the USD/MXN pair falls below the 20-day Simple Moving Average (SMA) at 17.86 and the October 12 low of 17.75.
Mexican Peso FAQs
What key factors drive the Mexican Peso?
The Mexican Peso (MXN) is the most traded currency among its Latin American peers. Its value is broadly determined by the performance of the Mexican economy, the country’s central bank’s policy, the amount of foreign investment in the country and even the levels of remittances sent by Mexicans who live abroad, particularly in the United States. Geopolitical trends can also move MXN: for example, the process of nearshoring – or the decision by some firms to relocate manufacturing capacity and supply chains closer to their home countries – is also seen as a catalyst for the Mexican currency as the country is considered a key manufacturing hub in the American continent. Another catalyst for MXN is Oil prices as Mexico is a key exporter of the commodity.
How do decisions of the Banxico impact the Mexican Peso?
The main objective of Mexico’s central bank, also known as Banxico, is to maintain inflation at low and stable levels (at or close to its target of 3%, the midpoint in a tolerance band of between 2% and 4%). To this end, the bank sets an appropriate level of interest rates. When inflation is too high, Banxico will attempt to tame it by raising interest rates, making it more expensive for households and businesses to borrow money, thus cooling demand and the overall economy. Higher interest rates are generally positive for the Mexican Peso (MXN) as they lead to higher yields, making the country a more attractive place for investors. On the contrary, lower interest rates tend to weaken MXN.
How does economic data influence the value of the Mexican Peso?
Macroeconomic data releases are key to assess the state of the economy and can have an impact on the Mexican Peso (MXN) valuation. A strong Mexican economy, based on high economic growth, low unemployment and high confidence is good for MXN. Not only does it attract more foreign investment but it may encourage the Bank of Mexico (Banxico) to increase interest rates, particularly if this strength comes together with elevated inflation. However, if economic data is weak, MXN is likely to depreciate.
How does broader risk sentiment impact the Mexican Peso?
As an emerging-market currency, the Mexican Peso (MXN) tends to strive during risk-on periods, or when investors perceive that broader market risks are low and thus are eager to engage with investments that carry a higher risk. Conversely, MXN tends to weaken at times of market turbulence or economic uncertainty as investors tend to sell higher-risk assets and flee to the more-stable safe havens.
Gold has risen in October on safe-haven flows as geopolitical tensions rise. Economists at OCBC Bank analyze the yellow metal’s outlook.
Geopolitical situation in Israel-Hamas should pose two-way risks to Gold
The higher for longer (rates) narrative that has pinned down Gold over the last couple of weeks appears to see tentative signs of fading as markets look to refreshed comments from Fed officials. An end to Fed tightening should see Gold trade better bid on dip and an eventual Fed pivot, alongside rates easing lower should lend further support to Gold bulls.
In the interim, geopolitical situation in Israel-Hamas should pose two-way risks to Gold prices. Escalation by way of broadening conflict (to involve more neighbours) and/or protracted conflict could see Gold spike, but the reverse is also true when geopolitical risks ease as safe-haven demand for Gold is expected to wane.
We expect $1,860-$1,960 range to hold amid slightly heightened volatility.
Economists at CIBC Capital Markets still see additional scope for investors to add to US Dollar longs into the end of this year.
Higher for longer means the US Dollar gets stronger
The US economy is less vulnerable to ‘higher for longer’ rates.
We expect investors to add to USD longs as the Fed is likely to be less reactive to weaker data relative to other central banks.
DXY – Q4 2023: 108.04 | Q1 2024: 105.65
See: Some USD appreciation until early 2024 – NBF
Existing Home Sales (MoM) in the United States, released by the National Association of Realtors, dropped 2% in September. In August, United States Existing Home Sales (MoM) had decreased 0.7%.
What is the United States Existing Home Sales Change (MoM)?
The Existing Home Sales, released by the National Association of Realtors, provide an estimated value of housing market conditions. As the housing market is considered as a sensitive factor to the US economy, it generates some volatility for the USD. Generally speaking, a high reading is positive for the Dollar, while a low reading is negative.
When is the next United States Existing Home Sales Change (MoM) report released?
The next United States Existing Home Sales Change (MoM) data will be published on November 17 at 15:00 GMT. For more information, check the United States Existing Home Sales Change (MoM) entry in FXStreet Calendar.
An automation tool was used in creating this post.
US Dollar price today
The table below shows the percentage change of US Dollar (USD) against listed major currencies today. US Dollar was the weakest against the Euro.
| USD | EUR | GBP | CAD | AUD | JPY | NZD | CHF | |
| USD | -0.28% | -0.06% | 0.10% | 0.24% | 0.04% | 0.33% | -0.22% | |
| EUR | 0.30% | 0.24% | 0.40% | 0.54% | 0.34% | 0.63% | 0.07% | |
| GBP | 0.06% | -0.26% | 0.16% | 0.32% | 0.11% | 0.39% | -0.16% | |
| CAD | -0.10% | -0.38% | -0.16% | 0.12% | -0.05% | 0.23% | -0.33% | |
| AUD | -0.25% | -0.52% | -0.30% | -0.15% | -0.19% | 0.08% | -0.46% | |
| JPY | -0.03% | -0.34% | -0.13% | 0.04% | 0.20% | 0.29% | -0.28% | |
| NZD | -0.34% | -0.64% | -0.43% | -0.21% | -0.09% | -0.27% | -0.56% | |
| CHF | 0.24% | -0.04% | 0.17% | 0.34% | 0.47% | 0.28% | 0.56% |
The heat map shows percentage changes of major currencies against each other. The base currency is picked from the left column, while the quote currency is picked from the top row. For example, if you pick the Euro from the left column and move along the horizontal line to the Japanese Yen, the percentage change displayed in the box will represent EUR (base)/JPY (quote).
USD/CAD is trading around the levels of late August and early September. Economists at ING analyze the pair’s outlook.
CAD still struggling to shine
USD/CAD should remain primarily driven by non-Canadian factors: the USD performance on the back of US data releases, geopolitical events and the connected implications for commodity prices and risk sentiment.
While we still expect a turn lower in the pair on the back of a broad-based USD decline from the first quarter of 2024, we maintain a neutral bias (1.37/1.38) into December, with only some potential downside risks on the back of seasonal USD weakness into year-end.
- AUD/USD finds support near 0.6300 amid correction in the US Dollar.
- Investors seem mixed about guidance from Fed Powell on interest rates.
- The Australian Dollar faced selling pressure as labor demand remained weak in September.
The AUD/USD pair discovers the buyer’s interest near the round-level support of 0.6300. The Aussie asst rebounds as the US Dollar faces a sell-off ahead of the speech from Federal Reserve (Fed) Chair Jerome Powell. The US Dollar Index (DXY) drops sharply to near 106.30.
Investors seem mixed about whether Fed Powell will choose a hawkish guidance due to robust labor market conditions, strong consumer spending and reviving factory activities or will support neutral interest rates due to rising US Treasury yields. The 10-year US Treasury yields have risen to near 4.94%.
The S&P500 struggles to hold gains generated at open as the broader market sentiment is cautious due to escalating Israel-Palestine conflicts. On Wednesday, US President Joe Biden said ‘loud and clear’ that the US stands with Israel and is ready to deliver whatever the nation needs to defend itself against the Hamas military.
Meanwhile, the Australian Dollar faced pressure early Thursday after mixed Employment data. Recruitment of a mere 6.7K individuals in September indicates that labor demand was weak. Economists forecasted fresh additions of 20K, which were significantly lower than the August reading of 63.3K. While the Unemployment Rate dropped to 3.6%, against the estimates and the former release of 3.7%.
Going forward, the Australian Dollar will dance to the tunes of the interest rate decision by the People’s Bank of China (PBoC), which will be announced on Friday. Being a proxy to China’s economy, a dovish decision would strengthen the Australian Dollar.
Economists at Deutsche Bank share their forecast for 10-year US Treasury yield.
10Y US Treasury yield at 4.40% by year-end, 10Y bund at 2.85%
The 10-year Treasury yield may rise above 5% in the near term, but we will see it end the year lower at 4.4% and decline to 4.10% by the end of Q2 2024.
We expect 10-year bund yields at 2.85% by year-end and 2.60% by Q4 2024.
See: The USD reaction to rising US yields is disappointingly small – Commerzbank
- Silver price juggles below $23.00 as focus shifts to Fed Powell’s speech.
- Fed Powell is expected to provide guidance on interest rates.
- Silver price struggles to sustain above the 50% Fibo retracement at $22.85.
Silver price (XAG/USD) consolidates in a narrow range below the crucial resistance of $23.00 in the early New York session. The white metal struggles for a direction as investors await the speech from Federal Reserve (Fed) Chair Jerome Powell.
It would be worth watching whether Fed Powell will join his teammates who are supporting keeping interest rates unchanged in the 5.25-5.50% range due to higher US bond yields or will discuss the appropriateness of some further policy-tightening.
The S&P500 opens on a cautiously positive note as investors start digesting the risks of deepening Middle East tensions. The US Dollar Index (DXY) corrects to near 106.00 ahead of Fed Powell’s dialogue on interest rates. While 10-year US Treasury yields rose to 4.94%, indicating investors expect hawkish interest rate guidance from Jerome Powell.
Meanwhile, the US Department of Labor reported a decline in weekly jobless claims for the week ending October 13. The US Department of Labor reported that individuals claimed jobless benefits for the first time in the week ending October 13 were at 198K, lower than expectations of 212K and the former release of 211K.
Silver technical analysis
Silver price struggles to sustain above the 50% Fibonacci retracement (plotted from August 30 high at $25.00 to October 03 low at $20.68) at $22.85 on a two-hour scale. The short-term bias for the white metal is bullish as it is comfortably trading above the 50-period Exponential Moving Average (EMA), which trades at $22.74.
The Relative Strength Index (RSI) (14) drops into the 40.00-60.00 range, indicating a rangebound move ahead.
Silver two-hour chart
-638333199397247877.png)
Economists at Commerzbank explain why the US Dollar should benefit from high Oil prices ceteris paribus.
FX market is the only channel through which relative prices between US and European goods can be balanced
If the Oil price rises, US goods will on average become more valuable on the world market, whereas the goods produced by others, for example by Europe, are becoming less valuable by comparison.
Prices can adjust via a number of mechanisms: Either the Euro prices for European goods fall. That is not the case at present. On the contrary. Inflation in Europe is high. Or the Dollar prices for US goods rise particularly significantly. We do not observe that at present either. The Fed has already reduced US inflation notably.
The only channel through which relative prices between US goods and European goods can therefore be balanced is via the FX market. If the US Dollar appreciates against the Euro, energy-intensive US goods become more expensive compared with low-energy European goods.
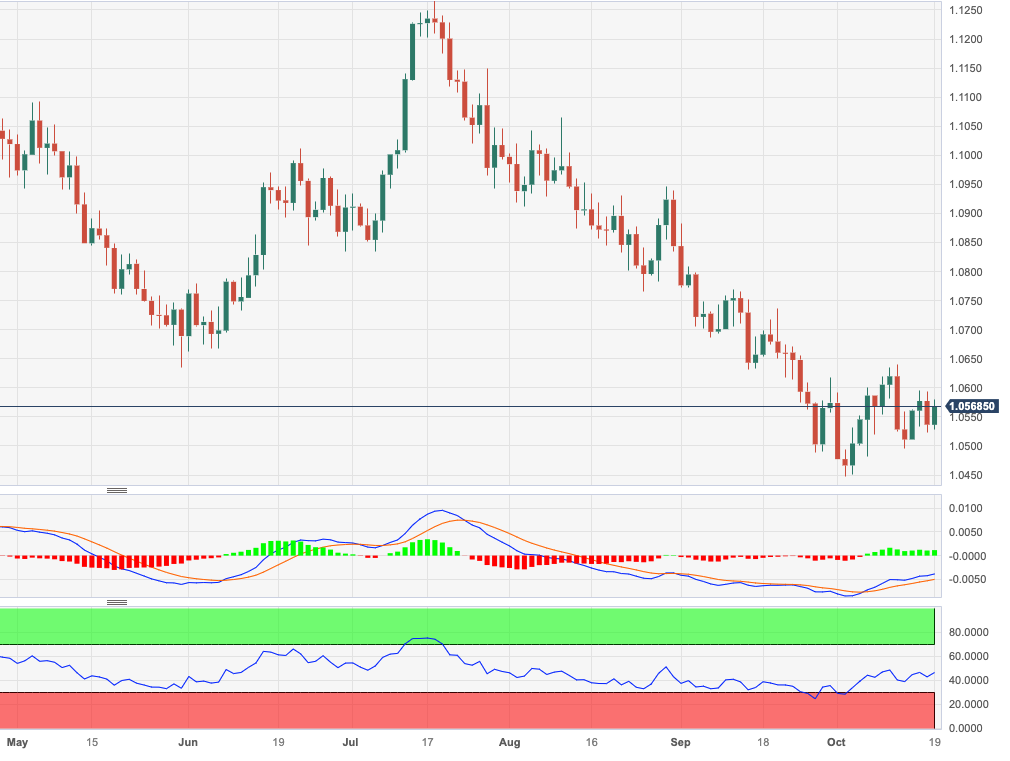
- EUR/USD regains the smile and reverses Wednesday’s decline.
- Extra recovery could see the monthly high around 1.0640 revisited.
EUR/USD keeps the weekly choppiness well in place and now regains the 1.0570 region following Wednesday’s daily decline.
In case the recovery gathers a more serious pace, then the pair is expected to challenge the October high at 1.0639 (October 12) prior to a probable move to the transitory 55-day SMA at 1.0721.
Meanwhile, further losses remain on the table as long as the pair navigates the area below the key 200-day SMA at 1.0819.
EUR/USD daily chart
Bonds are not hurting the Yen and Euro as much as other currencies, Kit Juckes, Chief Global FX Strategist at Société Générale, reports.
EUR/USD may not be the best way to trade the bond market sell-off
The surge in US Treasury yields is having more impact on other currencies, than it is on the Euro or Yen. Is sentiment so bearish and are short positions so big in these two, that they’ve become impervious? Maybe the Euro never really cared as much about long yields as it did about short-term rates (which aren’t moving much), while USD/JPY is simply reacting to ‘big figure-itis’, shying away from a push through 150 for now.
A ‘high for longer’ message on both Fed and ECB rates points to a slow Euro fall. Eurozone data aren’t brilliant but the divergence between US and Eurozone growth forecasts suggests that is largely in the price. A slow grind towards but not through parity seems likely.
EUR/USD may not be the best way to trade the bond market sell-off. GBP/USD is marginally more vulnerable, but one currency that usually tracks relative yields closely is AUD.
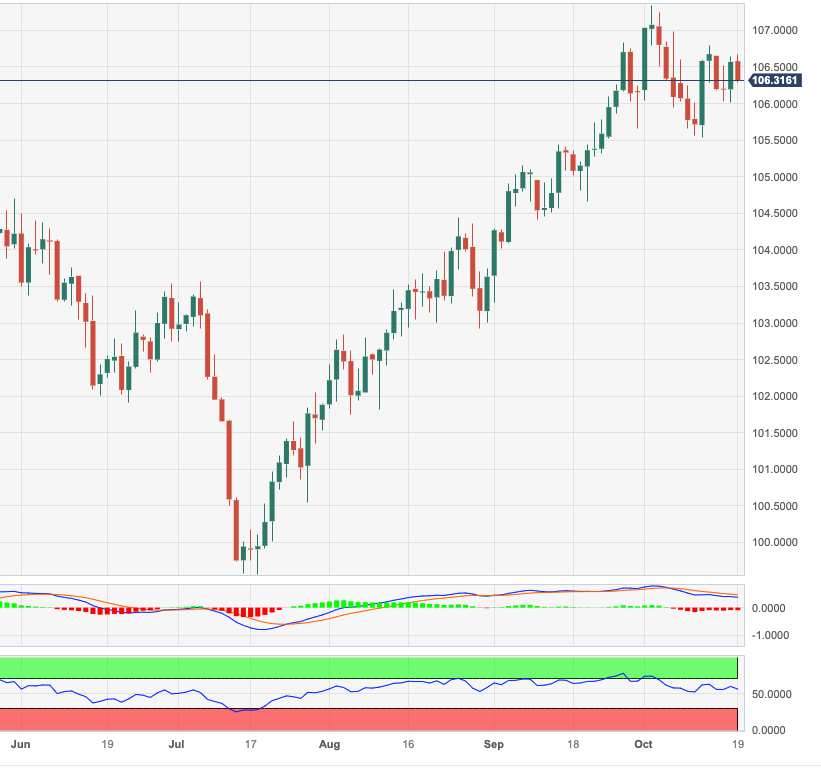
- DXY extends the choppy performance so far this week on Thursday.
- Immediately to the upside emerges the 2023 top near 107.30.
DXY fades Wednesday’s uptick and trades with decent losses in the low-106.00s so far on Thursday.
It seems the index has moved into a consolidative phase for the time being. Occasional bullish attempts, in the meantime, continue to target the weekly high of 106.78 (October 12) prior to the 2023 top of 107.34 (October 3).
So far, while above the key 200-day SMA, today at 103.27, the outlook for the index is expected to remain constructive.
DXY daily chart
Intervention risks notwithstanding, JPY bulls will need additional patience in the months ahead, economists at CIBC Capital Markets report.
The 31 October BoJ meeting remains far too soon for a shift
The 31 October BoJ meeting remains far too soon for a shift. Indeed, we remain mindful of the fact that BoJ Governor Kazuo Ueda stated last month that the ‘distance to ending negative rates’ has not changed much.
Intervention risks notwithstanding, we would reiterate the view that JPY bulls may need to remain patient, likely towards the December BoJ.
USD/JPY – Q4 2023: 145 | Q1 2024: 140
- AUD/JPY drops as the Australian Dollar faces pressure due to weak labor demand.
- Investors await the PBOC policy, which will be announced on Friday.
- The expectations of BoJ’s intervention in the FX domain ease.
The AUD/JPY pair faced a sell-off after the release of the mixed Australian labor market data. The risk-barometer drops to near 94.50 and is expected to remain on the tenterhooks ahead of the interest rate decision by the People’s Bank of China (PBoC), which will be announced on Friday. The PBoC is expected to maintain a dovish policy due to persistent deflation risks in China.
The market mood remains downbeat amid deepening Middle East tensions, which has dampened demand for risk-perceived currencies.
The Australian Bureau of Statistics reported on Thursday that employers added marginally 6.7K employees in September, significantly lower than expectations and the former release of 20K and 63.3K, respectively. While the Unemployment Rate dropped to 3.6% against the estimates and the former release of 3.7%.
A downbeat Australian Employment data dampens expectations of one more interest rate increase by the Reserve Bank of Australia (RBA) in the remainder of 2023.
The hopes of an intervention from the Japanese authority into the FX domain are diminishing. Japanese authorities are worried about further sell-off in the Japanese Yen and are holding volatile moves responsible for them. Historically, volatility spikes remain for days for a few weeks but the appeal for the Japanese Yen is weak from some quarters due to the adaptation of easy monetary policy by the BoJ. Therefore the authorities cannot reverse the tide against weak appeal for the Japanese Yen backed by expansionary monetary policy.
- EUR/JPY maintains the erratic performance above 158.00.
- Further consolidation remains well on the table for the time being.
EUR/JPY regains upside traction and sets aside Wednesday’s pullback, revisiting the 158.00 hurdle and above on Thursday.
Considering the ongoing performance, further range bound trade appears in the pipeline for the cross in the short-term horizon. In the meantime, the breakout of this range could put the September high of 158.65 (September 13) to the test ahead of the 2023 top at 159.76 (August 30).
So far, the longer term positive outlook for the cross appears favoured while above the 200-day SMA, today at 150.59.
EUR/JPY daily chart
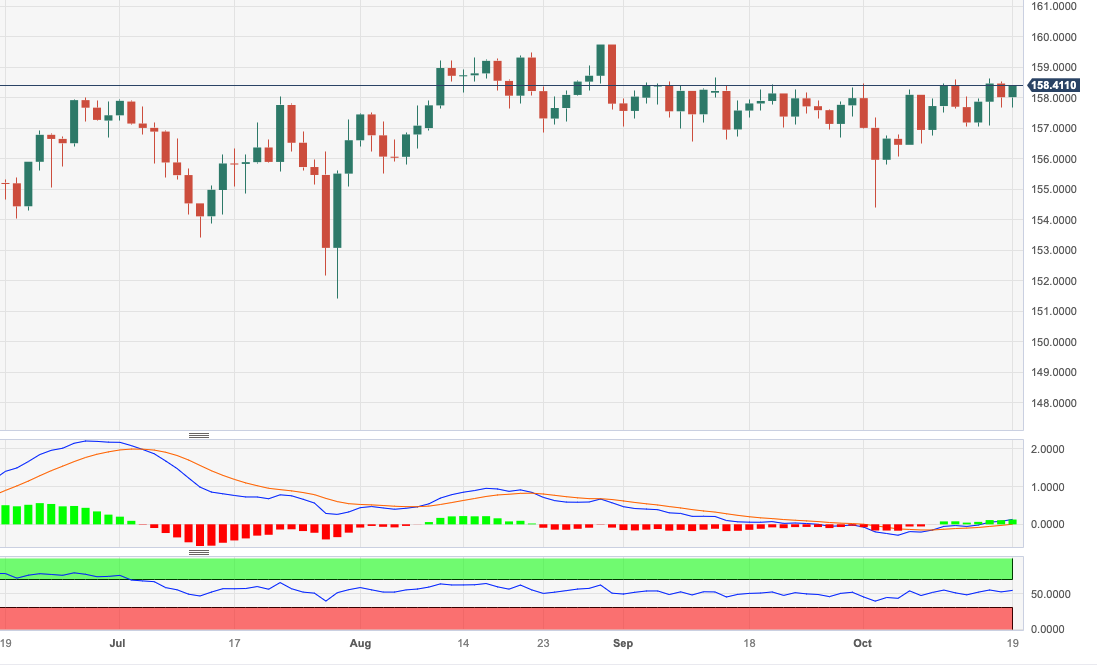
Raw Material Price Index in Canada rose 3.5% in September, exceeding the 2.3% rise expected by markets. In August, Canada Raw Material Price Index had increased 3%.
What is the Canada Raw Material Price Index?
Raw Material Price Index released by the Statistics Canada measures the prices of key raw materials paid by Canadian manufacturers. The RMPI is an early indicator to measure inflation and changes in material prices. A high reading is seen as positive or bullish for the CAD, while a low reading is seen as negative or bearish.
When is the next Canada Raw Material Price Index report released?
The next Canada Raw Material Price Index data will be published on November 17 at 13:30 GMT. For more information, check the Canada Raw Material Price Index entry in FXStreet Calendar.
Canadian Dollar price today
The table below shows the percentage change of Canadian Dollar (CAD) against listed major currencies today. Canadian Dollar was the weakest against the Euro.
| USD | EUR | GBP | CAD | AUD | JPY | NZD | CHF | |
| USD | -0.31% | 0.05% | 0.03% | 0.17% | 0.02% | 0.34% | -0.29% | |
| EUR | 0.31% | 0.37% | 0.35% | 0.47% | 0.33% | 0.66% | 0.01% | |
| GBP | -0.05% | -0.36% | -0.01% | 0.12% | -0.04% | 0.30% | -0.35% | |
| CAD | -0.05% | -0.36% | 0.00% | 0.08% | -0.02% | 0.29% | -0.34% | |
| AUD | -0.15% | -0.46% | -0.10% | -0.11% | -0.15% | 0.19% | -0.46% | |
| JPY | -0.01% | -0.35% | 0.02% | 0.02% | 0.15% | 0.35% | -0.32% | |
| NZD | -0.34% | -0.67% | -0.33% | -0.31% | -0.19% | -0.33% | -0.65% | |
| CHF | 0.30% | -0.01% | 0.34% | 0.35% | 0.45% | 0.31% | 0.65% |
The heat map shows percentage changes of major currencies against each other. The base currency is picked from the left column, while the quote currency is picked from the top row. For example, if you pick the Euro from the left column and move along the horizontal line to the Japanese Yen, the percentage change displayed in the box will represent EUR (base)/JPY (quote).
With regard to the Federal Reserve, economists at Commerzbank still do not expect additional rate hikes.
The Fed has probably reached the rate peak
We continue to believe that the Fed has already reached its interest rate peak.
Despite the fact that the economy is likely to weaken significantly in the medium term, the Fed is unlikely to lower interest rates quickly. After all, it is unlikely to lightly jeopardize the hard-won successes in the fight against inflation but will wait to see whether the decline in inflation is sustainable.
Given that the recession has now been postponed to Q2, we do not expect the first rate cut until the beginning of the third quarter of 2024 and thus somewhat later than before.
Industrial Product Price (MoM) in Canada climbed 0.4% in September, exceeding the 0.3% rise expected by markets. In August, Canada Industrial Product Price (MoM) had increased by a revised 1.9% compared with the 1.3% rise previously estimated.
What is the Canada Industrial Product Price (MoM)?
The Industrial Product Price released by the Statistics Canada measure price changes for major commodities sold by Canadian manufactures. Changes in the IPP are widely followed as an indicator of commodity inflation. A high reading is seen as positive (or bullish) for the CAD, whereas a low reading is seen as negative (or bearish).
When is the next Canada Industrial Product Price (MoM) report released?
The next Canada Industrial Product Price (MoM) data will be published on November 17 at 13:30 GMT. For more information, check the Canada Industrial Product Price (MoM) entry in FXStreet Calendar.
Canadian Dollar price today
The table below shows the percentage change of Canadian Dollar (CAD) against listed major currencies today. Canadian Dollar was the weakest against the Euro.
| USD | EUR | GBP | CAD | AUD | JPY | NZD | CHF | |
| USD | -0.33% | 0.02% | 0.03% | 0.15% | 0.02% | 0.32% | -0.30% | |
| EUR | 0.33% | 0.35% | 0.33% | 0.46% | 0.33% | 0.65% | 0.01% | |
| GBP | -0.03% | -0.34% | -0.01% | 0.13% | -0.01% | 0.30% | -0.34% | |
| CAD | -0.03% | -0.33% | 0.01% | 0.10% | 0.02% | 0.31% | -0.32% | |
| AUD | -0.14% | -0.44% | -0.11% | -0.11% | -0.12% | 0.19% | -0.44% | |
| JPY | -0.01% | -0.38% | -0.02% | 0.00% | 0.13% | 0.27% | -0.34% | |
| NZD | -0.32% | -0.65% | -0.33% | -0.31% | -0.19% | -0.30% | -0.63% | |
| CHF | 0.30% | -0.01% | 0.33% | 0.33% | 0.44% | 0.33% | 0.63% |
The heat map shows percentage changes of major currencies against each other. The base currency is picked from the left column, while the quote currency is picked from the top row. For example, if you pick the Euro from the left column and move along the horizontal line to the Japanese Yen, the percentage change displayed in the box will represent EUR (base)/JPY (quote).
- Initial Jobless Claims in the US increased by 13,000 in the week ending October 14.
- US Dollar Index stays in negative territory below 106.50 after this data.
There were 198,000 initial jobless claims in the week ending October 14, the weekly data published by the US Department of Labor (DOL) showed on Thursday. This print followed the previous week's print of 211,000 (revised from 209,000) and came in better than the market expectation of 212,000.
Further details of the publication revealed that the advance seasonally adjusted insured unemployment rate was 1.2% and the 4-week moving average stood at 205,750, a decrease of 1,000 from the previous week's revised average.
"The advance number for seasonally adjusted insured unemployment during the week ending October 7 was 1,734,000, an increase of 29,000 from the previous week's revised level," the publication read.
Market reaction
The US Dollar Index stays under modest bearish pressure despite this upbeat data and was last seen losing 0.15% on the day at 106.40.
- Philadelphia Fed Manufacturing Index rose to -9 in October.
- US Dollar Index slides to fresh daily lows under 106.40 after US data.
The Diffusion Index for current general activity of the Federal Reserve Bank of Philadelphia's Manufacturing Survey rose to -9 in October from -13.5 in September. This reading came in worse than the market expectation of -6.6.
“This is the index’s 15th negative reading in the past 17 months. Almost 35 percent of the firms reported decreases in general activity this month, while 26 percent reported increases; 38 percent reported no change”, mentioned the publication.
Further detail of the report revealed that the Prices Paid index edged down from 25.7 to 23.1; the employment index rose from ‑5.7 to 4.0, its first positive reading since February; and the diffusion index for future general activity edged down from 11.1 to 9.2.
Market reaction
The US Dollar pulled back after the US Jobless Claims and the Philly Fed reports. The US Dollar Index was down 0.20%, trading at daily lows under 106.40.
The USD is stronger overall. Economists at Scotiabank analyze Greenback’s outlook.
JPY’s stability looks a little curious
The JPY’s stability looks a little curious considering its sensitivity to US yields recently but broader USD (DXY) gains are looking a bit stretched relative to fair value based on short-term spreads alone, suggesting the primary driver of USD appreciation is coming from geo-political/market risk influences.
The USD remains vulnerable to weaker data and greater market conviction around a Fed pivot but weakness is unlikely while risk aversion dominates market thinking.
- Fed Chairman Jerome Powell will speak before the Economic Club of New York.
- Powell’s comments on monetary policy and interest rate path will be scrutinized by markets.
- The US Dollar could show significant reaction to Powell’s speech before the Fed’s blackout period begins on Saturday.
Jerome Powell, Chairman of the Federal Reserve (Fed), will deliver prepared remarks before the Economic Club of New York and respond to questions. Powell’s speech is expected to offer important clues on the Fed’s next policy step and ramp up market volatility before the Fed’s blackout period, during which policymakers are barred from speaking on the economy or policy, starts on Saturday.
The Fed decided to leave the policy rate unchanged at the range of 5.25%-5.5% after the September policy meeting, as expected. The revised Summary of Economic Projections offered a hawkish surprise by showing that the majority of policymakers saw it appropriate to raise the interest rate one more time before the end of the year. Changes in market dynamics and macroeconomic data releases since the Fed’s September policy announcements, however, made it difficult for investors to make up their minds about the Fed’s next policy step.
Growing concerns over a US debt rating downgrade amid a lack of progress in budget negotiations triggered a bond sell-off in late September and early October. In a two-week period, the benchmark 10-year US Treasury bond yield surged from 4.5% to nearly 4.9% to touch its highest level since 2007. Several Fed policymakers saw the increase in yields as a development that could allow the US central bank to keep the policy rate steady for the remainder of the year.
Philadelphia Fed President Patrick Harker said that tighter market conditions were “akin to rate hikes in impact,” while San Francisco Fed President May Daly argued that tight bond yields could be “the equivalent of another rate hike.” On the same note, "financial markets are tightening and that will do some of the work for us,” noted Fed Governor Christopher Waller. These comments attracted dovish Fed bets and the CME Group FedWatch Tool’s probability of a no change in the policy rate this year rose above 70%.
On the other hand, recent macroeconomic data releases from the US highlighted the resilience of the economy and the stubbornness of inflation, causing investors to second guess themselves about the rate outlook.
Inflation in the US, as measured by the change in the Consumer Price Index (CPI), held steady at 3.7% on a yearly basis in September, the US Bureau of Labor Statistics reported. However, the so-called “super core inflation,” which measures the change in the prices of core services excluding the home rent component, rose 0.6% on a monthly basis. Other data showed that Nonfarm Payrolls soared by an impressive 336,000 in September, reaffirming tight labor market conditions. Finally, consumer activity remained strong, with Retail Sales and Personal Spending growing at a healthy pace in September.
When is Powell speech and how could it affect the USD?
Fed Chairman Jerome Powell is scheduled to deliver prepared remarks before the Economic Club of New York at 16:00 GMT.
In case Powell notes that rising bond yields could allow the Fed to refrain from raising the policy rate again this year, the US Dollar (USD) could come under heavy selling pressure, with bond yields making a sharp downward correction. Such a dovish tone is likely to boost risk-sensitive equity markets.
On the other hand, Powell could deliver a hawkish message by reiterating the need to raise the interest rate one more time, citing the lack of progress in inflation and the strength of the US economy. In this scenario, the USD could continue to outperform its major rivals.
The Fed’s chairman could also adopt a neutral tone by saying that they will have more data before the end of the year to decide whether further policy tightening will be necessary. Although the initial reaction in this case could ramp up the USD’s volatility, a decisive move in either direction could be hard to come by with investors opting to wait at least until the October jobs report data to take position.
Economists at Société Générale share a brief preview of Powell’s speech:
“The debate whether higher rates are required appears to have been settled at least for the November meeting (pause) because of the bear steepening of the Treasury curve. Unless Fed chair Powell springs a surprise tomorrow and calls the meeting ‘live’. This may explain why the dollar is struggling to pursue its advance. Whether the greenback will hold its ground may depend on whether pricing for December FOMC surpasses 50%.”
Economic Indicator
United States Fed's Chair Powell speech
Jerome H. Powell took office as a member of the Board of Governors of the Federal Reserve System on May 25, 2012, to fill an unexpired term. On November 2, 2017, President Donald Trump nominated Powell to serve as the next Chairman of the Federal Reserve. Powell assumed office as Chair on February 5, 2018.
Read more.Next release: 10/19/2023 16:00:00 GMT
Frequency: Irregular
Source: Federal Reserve
The EUR is showing some resilience to the general trend higher in the USD. Economists at Scotiabank analyze EUR/USD outlook.
Strong but perhaps “over-owned” USD
Investors may be too pessimistic on Eurozone economic prospects but marginal EUR gains from the intraday low just under 1.0530 perhaps reflect positioning (the long USD trade may be getting a little crowded) more than anything else.
The EUR is trading on a relatively firm basis on the short-term chart but spot remains confined to a narrow trading range and EUR gains need to push on through 1.0555/1.0560 to challenge trend resistance at 1.0580/1.0585. That is a possibility, based on bullish signals from the 1 and 6-hour charts, but the broader strength in the USD may curb EUR gains today.
EUR support is 1.0520/1.0525.
- The Greenback sees yields pushing higher, with T-notes near 5%.
- Investors focus on Fed Chairman Jerome Powell’s speech later on Thursday.
- The US Dollar Index looks broken with no clear sense of direction.
The US Dollar (USD) is becoming a minefield as the clear picture for the Greenback is becoming very tainted. The visit from US President Joe Biden in Israel has not played out as the White House wanted to, with an in person meeting with the Jordan Crown Prince Abdullah II bin Al-Hussein cancelled just hours before the US President touched ground in Tel Aviv. Meanwhile, the rate differential between the US is going rouge, but not for good reasons: China and Japan have sold billions of US holdings in September. Amidst all this, the US macroeconomic data points to an economy that is starting to retreat from the best performance, making traders wonder if a recession is coming.
On the data front, traders will focus on the US Federal Reserve (Fed) Chairman Jerome Powell comments at his speech in the New York Economic Club. Where last week a few Fed members suggested the central bank is done hiking, some hawkish comments on Thursday show no unanimity on the current stance from the board, which means that Powell will likely refrain from making bold statements and will leave traders clueless.
Daily digest: US Dollar gets ugly
- The calendar this Thursday starts at 12:30 GMT with the weekly Jobless Claims: Initial Claims are expected to head from 209,000 to 212,000. Continuing Claims are set to head from 1,702,000 to 1,710,000.
- Also at 12:30 GMT, the monthly Philadelphia Fed Manufacturing Survey is due for the month of October. Expectation is that there will still signal a contraction in the region’s manufacturing activity, but less severe than in September, from -13.5 to -6.6.
- Existing Home Sales data for September are due at 14:00 GMT. Sales are expected to fall from 4.04 million units to 3.89 million.
- All eyes are on US Fed Chairman Jerome Powell, due to speak near 16:00 GMT in the New York Economic Club.
- A big slew of Fed speakers will take the stage as well later this Thursday: Chicago Fed President Austan Goolsbee is due to speak at 17:20 GMT. Near 20:00 GMT, Atlanta Fed President Raphael Bostic is due to speak. Philadelphia Fed President Patrick Harker is speaking at 21:30 GMT. To round off, Dallas Fed President Lorie Logan is due to speak at 23:00 GMT.
- Equities are taking a turn for the worse as Elon Musk mentioned during an earnings call from Tesla that elevated rates are starting to hurt demand. Meanwhile, the big Chinese real-estate company Country Garden missed a payment on an USD bond. All equities in Asia are down over 2%, while European equities are losing around 0.50% and US Futures are overall down by a quarter percentage point.
- The CME Group’s FedWatch Tool shows that markets are pricing in a 93.9% chance that the Federal Reserve will keep interest rates unchanged at its meeting in November.
- The benchmark 10-year US Treasury yield rises to 4.96% as the bond market is shaken up by the surprise massive bond sales from China and Japan, amounting to $118 billion for September alone.
US Dollar Index technical analysis: Overvalued for wrong reasons?
The US Dollar is entering the twilight zone where it might start to hurt. The US Dollar Index (DXY) is starting to float, not really breaking out in any upside or downside sense. The fact that the US 10-year rates are starting to hit 5% is a sign on the wall, as often 5% accounts as a psychological barrier where an economy might start to struggle to meet up with its funding needs.
A bounce above the daily trendline from July 18 might still materialise, although this level is starting to slip further away. On the topside, 107.19 is an important level to reach. If this is the case, 109.30 is the next level to watch.
On the downside, the recent resistance at 105.88 did not do a good job supporting any downturn. Instead, look for 105.12 to keep the DXY above 105.00. If that fails to do the trick, 104.33 will be the best level to look for resurgence in US Dollar strength, with the 55-day Simple Moving Average (SMA) as a support level.
US Dollar FAQs
What is the US Dollar?
The US Dollar (USD) is the official currency of the United States of America, and the ‘de facto’ currency of a significant number of other countries where it is found in circulation alongside local notes. It is the most heavily traded currency in the world, accounting for over 88% of all global foreign exchange turnover, or an average of $6.6 trillion in transactions per day, according to data from 2022.
Following the second world war, the USD took over from the British Pound as the world’s reserve currency. For most of its history, the US Dollar was backed by Gold, until the Bretton Woods Agreement in 1971 when the Gold Standard went away.
How do the decisions of the Federal Reserve impact the US Dollar?
The most important single factor impacting on the value of the US Dollar is monetary policy, which is shaped by the Federal Reserve (Fed). The Fed has two mandates: to achieve price stability (control inflation) and foster full employment. Its primary tool to achieve these two goals is by adjusting interest rates.
When prices are rising too quickly and inflation is above the Fed’s 2% target, the Fed will raise rates, which helps the USD value. When inflation falls below 2% or the Unemployment Rate is too high, the Fed may lower interest rates, which weighs on the Greenback.
What is Quantitative Easing and how does it influence the US Dollar?
In extreme situations, the Federal Reserve can also print more Dollars and enact quantitative easing (QE). QE is the process by which the Fed substantially increases the flow of credit in a stuck financial system.
It is a non-standard policy measure used when credit has dried up because banks will not lend to each other (out of the fear of counterparty default). It is a last resort when simply lowering interest rates is unlikely to achieve the necessary result. It was the Fed’s weapon of choice to combat the credit crunch that occurred during the Great Financial Crisis in 2008. It involves the Fed printing more Dollars and using them to buy US government bonds predominantly from financial institutions. QE usually leads to a weaker US Dollar.
What is Quantitative Tightening and how does it influence the US Dollar?
Quantitative tightening (QT) is the reverse process whereby the Federal Reserve stops buying bonds from financial institutions and does not reinvest the principal from the bonds it holds maturing in new purchases. It is usually positive for the US Dollar.
CAD slipped through 1.37 against the USD. Economists at Scotiabank analyze USD/CAD outlook.
Daily close above 1.3710 will keep near-term focus on a bit more topside movement
Spot gains above resistance at 1.3700/1.3710 are USD-supportive on the face of it but the USD is dropping back from early session highs and the short-term pattern of trade suggests the risk of a bit more USD drift in the short run.
Weakness back though the figure area may extend towards 1.3650/1.3660.
A daily close above 1.3710 will keep near-term focus on a bit more topside movement, potentially towards 1.3775.
GBP/USD slips under 1.21. Economists at Scotiabank analyze the pair’s outlook.
Rebound shows some technical chops
Sterling’s tendency to act more like a high beta (or riskier) currency since Brexit is reflected in today’s performance where it has underperformed relative to the EUR, CHF and JPY.
The Pound is soft but, after weakening through but then recovering from below 1.2100 in late morning European trade, the hourly chart is flashing a potentially bullish reversal signal. This may herald a rebound towards 1.2140/1.2145.
Support is 1.2055.
Economists at Deutsche Bank expect the S&P 500 Index to close the year near current levels.
The typical pullback underway can extend
With widespread expectations that this current cycle was ending, a positioning squeeze was a key driver of the most recent rally. Now, after the squeeze, there is a tug of between factors imparting resilience and recessionary forces.
Near term, with a number of potential negative catalysts, the typical pullback underway can extend.
Further out, the question is whether growth and inflation surprises can continue. We see the bar low for surprises on growth, but not for positive inflation surprises.
Our house view remains that of a quick sell-off and rebound to year-end, leaving the S&P 500 close to current levels, with year-end target of 4,500.
The EUR has been consolidating at lower levels against the USD so far this month. Economists at MUFG Bank analyze the world’s most popular currency pair.
Bearish bias
The main risk of the pair moving closer to parity would be if geopolitical risks in the Middle East continue to intensify.
While we expect the conflict between Hamas and Israel to remain contained, a broader regional conflict could trigger a sharper adjustment higher for energy prices and result in a weaker EUR. To better capture this risk we are shifting our bias for the EUR/USD to bearish from natural.
On the positive side for the EUR, there has been more evidence that economic growth in China is picking up heading into year-end which is helping to ease another downside risk that has been weighing on the EUR over the summer.
- Natural Gas prices are heading lower in search of support.
- The US Dollar trades mixed, struggling to find direction.
- US Natural Gas prices reflect ongoing efforts to defuse Middle-East geopolitical tensions.
Natural Gas prices are heading lower, extending a sell-off that has been underway since last week. The mix that is pushing Natural Gas prices lower in both Europe and the US is one based on the simple economics 101 rule: bigger supply and normal to lower demand means a devaluing price of the good. And that is what is going on at the moment: supply is elevated, above normal, while demand is already lower than usual around this time of year.
Meanwhile, The US Dollar (USD) is under pressure as there isn’t any clearer sense of direction for the Greenback. The visit from US President Joe Biden to Israel has not played out as the White House wanted to. Meanwhile, the rate differential between the US is going rouge for all the wrong reasons: China and Japan have sold billions of US holdings in September.
Natural Gas is trading at $3.43 per MMBtu at the time of writing.
Natural Gas news and market movers
- European gas prices are expected to slide lower as more Western leaders are heading to Israel in an attempt to broker a ceasefire to resolve the conflict in the region.
- European gas inventories are still nearly full, with still very mild weather forecasts at hand for the European region.
- During the visit of Russian President Vladimir Putin in China, Chinese President Xi Jinping reiterated that China wants to deepen ties with Russia for grain and energy. Xi also said Chinais looking to build a gas pipeline between both countries and Mongolia as soon as possible, called Siberia 2.
- The International Gas Union has issued a report together with Rystad Energy which points to a supply deficit in the coming decades if investments in new supply research remains below par. At the current pace, by 2050 less than 1 trillion cubic metres of gas will be available against 4.1 trillion cubic metres currently available.
- Near 14:30 the Energy Information Administration (EIA) is due to release the weekly Gas Storage Changes. Expectations are for a drawdown from 84 to 80 billion cubic feet of gas.
Natural Gas Technical Analysis: upside pressure remains
Natural Gas is still up over 25% after the start of the turmoil in the Gaza region. And with the winter season ahead, volatility is expected to pick up. Prices are expected to broadly ease until temperatures start to drop and risk premiums will be factored in due to tensions in the Middle-East during the winter period, when demand is expected to surge.
With the firm peak and breakthrough out of the trend channel, it will be crucial that the upper band of that same trend channel acts as support. There aren’t any significant resistance levels except for $3.65, the peak of January 17. From there, the high of 2023 near $4.3080 comes into play.
On the downside, the trend channel needs to act as support near $3.37. In case this level breaks down again, Natural Gas prices could sink to $.3.07, with that orange line identified from the double top around mid-August. Should the drop become a broader sell-off, prices could sink below $3 toward $2.98, near the 55-day Simple Moving Average.
-638333057464945014.png)
XNG/USD (Daily Chart)
Natural Gas FAQs
What fundamental factors drive the price of Natural Gas?
Supply and demand dynamics are a key factor influencing Natural Gas prices, and are themselves influenced by global economic growth, industrial activity, population growth, production levels, and inventories. The weather impacts Natural Gas prices because more Gas is used during cold winters and hot summers for heating and cooling. Competition from other energy sources impacts prices as consumers may switch to cheaper sources. Geopolitical events are factors as exemplified by the war in Ukraine. Government policies relating to extraction, transportation, and environmental issues also impact prices.
What are the main macroeconomic releases that impact on Natural Gas Prices?
The main economic release influencing Natural Gas prices is the weekly inventory bulletin from the Energy Information Administration (EIA), a US government agency that produces US gas market data. The EIA Gas bulletin usually comes out on Thursday at 14:30 GMT, a day after the EIA publishes its weekly Oil bulletin. Economic data from large consumers of Natural Gas can impact supply and demand, the largest of which include China, Germany and Japan. Natural Gas is primarily priced and traded in US Dollars, thus economic releases impacting the US Dollar are also factors.
How does the US Dollar influence Natural Gas prices?
The US Dollar is the world’s reserve currency and most commodities, including Natural Gas are priced and traded on international markets in US Dollars. As such, the value of the US Dollar is a factor in the price of Natural Gas, because if the Dollar strengthens it means less Dollars are required to buy the same volume of Gas (the price falls), and vice versa if USD strengthens.
Economists at HSBC expect a stable RMB over the near term.
PBoC to maintain its FX policy stance
China’s economy grew 4.9% in 3Q, beating expectations. USD/CNY and USD/CNH both fell on the data release, but the key is sustainability. It could be a struggle for the RMB unless some market optimism could be rebuilt. This could be indicated by a reversal of Shanghai and Shenzhen Stock Connect net outflows, for example.
Our base case is that the People’s Bank of China (PBoC) will maintain its FX policy stance unless the Chinese economy fails to stabilise and more significant monetary easing is required.
We expect USD/RMB to move largely sideways over the near term.
See: The world does not like the Renminbi – Commerzbank
- USD/JPY holds onto gains near 150.00 ahead of Fed Powell’s speech.
- Investors anticipate support for ‘higher for longer’ interest rates from Fed Powell.
- Market watch for BoJ intervention as the Japanese Yen has dropped to almost 150.00 against the US Dollar.
The USD/JPY pair oscillates near the crucial resistance of 150.00 as investors watch for interest rate guidance from Federal Reserve (Fed) Chair Jerome Powell in his speech at the Economic Club of New York around 16:00 GMT.
Investors anticipate endorsement for keeping interest rates higher for a longer period to ensure progress in inflation declining toward the 2% goal from Jerome Powell. Also, Powell’s colleagues have been supporting for keeping interest rates unchanged in the 5.25-5.50% range as higher US Treasury yields are sufficient to impact spending and investment.
Meanwhile, S&P500 futures added nominal losses in the European session, portraying risk-off market sentiment. US equities were heavily sold on Wednesday amid caution as third quarter result season has kicked off. In addition to that, deepening Middle East conflicts have dented demand for risk-perceived assets. The US Dollar Index (DXY) consolidates around 106.60.
The Fed’s Beige Book released on Wednesday reported that economic activities remained almost unchanged in September. Loan demand declined modestly while credit quality remains healthy. Some heat was released from the tight labor demand as employers were hiring less urgently.
On the Japanese Yen front, investors watch for the Bank of Japan’s (BoJ) intervention in the FX domain as the Japanese Yen has dropped to almost 150.00 against the US Dollar. The intervention from BoJ or the authority may not be able to shift the tide, which is against the Japanese Yen as its weakness is backed by an expansionary monetary policy approach.
Economists at Société Générale revise their EUR/PLN forecast down to 4.35 in the fourth quarter.
Stronger PLN
We are revising our EUR/PLN baseline forecast lower, starting with 4Q23. Our original 4Q23 forecast was 4.60, as many pre-election polls were indicating a strong possibility of a hung parliament. That scenario might have led to more costly fiscal promises, delays to EU fund disbursement, and potentially more NBP rate cuts.
Our new 4Q23 forecast is 4.35, reflecting the higher probability of an earlier disbursement of EU funds, and what is likely to be a more hawkish NBP stance in actual decisions and verbal comments. Also, this should reflect a higher EUR/USD compared to current levels, as expected by our G10 strategists.
The pain trade in Gold markets could still extend further, but the first signs of buying exhaustion are emerging, economists at TD Securities report.
Gold buying exhaustion in sight
The pain trade for Gold shorts could still extend a touch further, but we now estimate that prices will need to break well above the $2,000 range to spark large-scale algorithmic long acquisitions.
Barring a severe escalation, this points to buying exhaustion, opening the door to potential algo selling below the $1,945 mark. Still, more meaningful selling activity from other cohorts will be required before algos reacquire a chunk of their shorts south of $1,875, suggesting prices may not easily recapture recent lows.
- Gold price looks for guidance on interest rates from Fed Chair Jerome Powell.
- The demand for safe-haven assets remains upbeat due to Middle East tensions.
- US Biden shows support for Israel in the war against Hamas.
Gold price (XAU/USD) faced a nominal sell-off after registering a fresh two-month high as investors shifted focus to the speech from Federal Reserve (Fed) Chair Jerome Powell, which is likely to give clues about the interest rate outlook for the remainder of 2023. The broader outlook for Gold is still bullish as Middle East tensions have escalated after the Gaza hospital blast, which resulted in the death of hundreds of civilians and created unrest among the general public.
US President Joe Biden returned to Washington after visiting Israel and announced emergency aid for civilians in Gaza. Joe Biden said “loud and clear” that the US stands with Israel and is ready to provide to the country whatever is needed to defend itself against attacks from Hamas. The cautious market sentiment has improved the safe-haven bid significantly, which is keeping demand for bullions intact.
Daily Digest Market Movers: Gold price eyes Powell's speech for further guidance
- Gold price looks to extend upside above an 11-week high as demand for safe-haven assets remains intact due to Middle East tensions.
- Middle East tensions escalated after a hospital in Gaza was bombed, resulting in hundreds of casualties.
- US President Joe Biden said that the Pentagon has shown evidence that Israel didn’t bomb the hospital in Gaza.
- Risks of Iran’s intervention in the Israel-Palestine conflict escalated after Biden said that the US stands with Israel and promised to deliver whatever it needs to defend itself against Hamas.
- Joe Biden announced $100 million aid for civilians in Gaza citing that, "This money will support over 1 million displaced and conflict-affected Palestinians. And we will have mechanisms in place so this aid reaches those in need – not Hamas or terrorist groups."
- The US Treasury imposed sanctions on Hamas members to squeeze revenues for supporting military activities.
- Robust demand for Gold is expected to remain intact due to the Middle East conflict, but investors should be prepared for a volatile action ahead of the speech from Federal Reserve Chair Jerome Powell at 16:00 GMT.
- Considering the fact that Fed policymakers have recently signaled the need to keep interest rates unchanged at the 5.25%-5.50% range due to multi-year high US Treasury yields, Powell could reiterate the need to keep interest rates higher for longer.
- Jerome Powell may not endorse the requirement of further policy tightening as more interest rate hikes could push the United States economy into a recession.
- Fed policymakers have been suggesting that higher bond yields are sufficient to build pressure on inflation by reducing overall spending and investment.
- The progress in inflation easing toward 2% has slowed as the US economy remains resilient. Strong labor demand and steady wage growth have strengthened the consumer spending momentum, but easing underlying inflation would refrain the need for further policy-tightening.
- On Wednesday, Fed Governor Christopher Waller emphasized the need to analyze the economic data to understand whether higher interest rates are slowing inflation or the strong US economy continues to ramp up consumer prices.
- The US Dollar remains firm ahead of Powell’s speech as investors anticipate the Fed chair to advocate for keeping interest rates higher for longer.
- The Fed’s Beige Book released on Wednesday showed that economic activity remained almost unchanged in September. Loan demand declined modestly while credit quality remains healthy. The data also showed that some heat has been released from the tight labor demand as employers were hiring less urgently.
Technical Analysis: Gold price oscillates inside Wednesday’s range
Gold price trades inside Wednesday’s range as investors shift focus to Jerome Powell’s speech, which will provide guidance on interest rates. The precious metal stabilizes above the 200-day Exponential Moving Average (EMA), which trades around $1,910.00, indicating bullish long-term trend. Momentum oscillators have also shifted into the bullish range, indicating more upside ahead.
Gold FAQs
Why do people invest in Gold?
Gold has played a key role in human’s history as it has been widely used as a store of value and medium of exchange. Currently, apart from its shine and usage for jewelry, the precious metal is widely seen as a safe-haven asset, meaning that it is considered a good investment during turbulent times. Gold is also widely seen as a hedge against inflation and against depreciating currencies as it doesn’t rely on any specific issuer or government.
Who buys the most Gold?
Central banks are the biggest Gold holders. In their aim to support their currencies in turbulent times, central banks tend to diversify their reserves and buy Gold to improve the perceived strength of the economy and the currency. High Gold reserves can be a source of trust for a country’s solvency. Central banks added 1,136 tonnes of Gold worth around $70 billion to their reserves in 2022, according to data from the World Gold Council. This is the highest yearly purchase since records began. Central banks from emerging economies such as China, India and Turkey are quickly increasing their Gold reserves.
How is Gold correlated with other assets?
Gold has an inverse correlation with the US Dollar and US Treasuries, which are both major reserve and safe-haven assets. When the Dollar depreciates, Gold tends to rise, enabling investors and central banks to diversify their assets in turbulent times. Gold is also inversely correlated with risk assets. A rally in the stock market tends to weaken Gold price, while sell-offs in riskier markets tend to favor the precious metal.
What does the price of Gold depend on?
The price can move due to a wide range of factors. Geopolitical instability or fears of a deep recession can quickly make Gold price escalate due to its safe-haven status. As a yield-less asset, Gold tends to rise with lower interest rates, while higher cost of money usually weighs down on the yellow metal. Still, most moves depend on how the US Dollar (USD) behaves as the asset is priced in dollars (XAU/USD). A strong Dollar tends to keep the price of Gold controlled, whereas a weaker Dollar is likely to push Gold prices up.
- NZD/USD continues losing spell for the third day in a row amid Fed jitters.
- Fed Powell is expected to reiterate the need to keep interest rates higher for a longer period.
- NZD/USD trades below the 50-day EMA, indicating that the short-term trend is bearish.
The NZD/USD pair extends its two-day losing spell as investors turn cautious ahead of the speech from Federal Reserve (Fed) Chair Jerome Powell. Jerome Powell is expected to provide guidance on interest rates and a further roadmap of bringing down inflation to 2%.
Investors expect that Jerome Powell would reiterate the need to keep interest rates elevated at 5.25-5.50% for a longer period to ensure decelerating core inflation to 2%. The US Dollar Index (DXY) consolidates near a three-day high at 106.60.
Meanwhile, the New Zealand Dollar failed to find bids despite being a proxy to China’s economic growth. On Wednesday, the National Bureau of Statistics reported upbeat China’s Q3 Gross Domestic Product (GDP) data. China’s GDP grew strongly by 1.3% in the July-September quarter against expectations of 1.0% and the growth rate of 0.5% recorded in the second quarter of 2023.
NZD/USD slips below the crucial support plotted from September 8 low at 0.5847, which has turned into a resistance for the New Zealand Dollar bulls. The Kiwi asset trades below the 50-day Exponential Moving Average (EMA), indicating that the short-term trend is bearish.
The Relative Strength Index (RSI) (14) slips below 40.00, warranting more downside in the Kiwi asset amid an absence of divergence and oversold signals.
Further downside below the round-level support of 0.5800 would expose the asset to a fresh 11-month low at 0.5740, which 03 November 2022 low. A breakdown below the same would expose the asset to the round-level support at 0.5700.
In an alternate scenario, a recovery move above the psychological resistance of 0.6000 would drive the asset toward September 29 high at 0.6050, followed by August 11 high at 0.6088.
NZD/USD daily chart
-638333048998056295.png)
Equities are under pressure. Economists at ING analyze FX correlations with stock performance.
Equity markets are looking increasingly vulnerable
Equity markets are looking increasingly vulnerable as the risk-free rate rises and as businesses are finding their margins under pressure.
A turn lower in core equity markets would like to keep the activity currencies under pressure and the Dollar bid.
A risk-off tone should keep the US Dollar Index (DXY) bid towards the top of its 106-107 range.
See: EUR/USD to pressure support at 1.0500 – ING
- GBP/JPY continues the losing streak on market caution regarding the BoE interest rate trajectory.
- Japan’s Trade Balance increased to ¥62.4B surplus from negative ¥937.8B previously.
- UK revealed a resilient headline CPI at 6.7%, defying expectations of a decrease to 6.6%.
GBP/JPY extends losses in the third trading session, trading lower around 181.40 during the European session on Thursday. The pair receives downward pressure on Japan’s Merchandise Trade Balance Total, showing a positive balance of ¥62.4B for September. The data was expected to report a negative figure of ¥425B, which was negative ¥937.8B in the previous readings.
Additionally, the uncertain direction of the Bank of England's (BoE) upcoming policy decisions is perceived as a significant factor creating headwinds for the GBP/JPY pair.
Recent UK consumer inflation data, disclosed on Wednesday, revealed a resilient headline CPI at 6.7% in September, defying expectations of a slight decrease to 6.6%. This result has sparked speculation about a potential BoE rate hike in November.
Additionally, earlier this week, the UK Office for National Statistics (ONS) reported a minor slowdown in wage growth for the three months leading up to August. This occurrence might offer the BoE an opportunity to maintain interest rates at their current level.
The Bank of Japan (BoJ) has upgraded its assessment for six out of nine economic regions in a recent quarterly report, indicating a moderate recovery for Japan's economy overall. However, the report highlights that exports and output in many regions remain relatively stagnant.
This week, Japan's top financial diplomat, Masato Kanda, noted that the Japanese Yen (JPY) continues to be viewed as a safe-haven asset, benefiting from safe-haven flows due to geopolitical tensions in the Middle East. Kanda asserted that if the currency market experiences excessive fluctuations, authorities are prepared to take measures such as raising interest rates or intervening in the market, potentially supporting the Japanese Yen.
Investors are eagerly awaiting Friday's Japanese inflation data for potential market direction. The National Consumer Price Index (CPI) excluding fresh food is anticipated to show a year-on-year rise of 2.7%, down from the previous reading of 3.1%.
UK Retail Sales will also be eyed by the investors, which is expected to decline in September.
The Indonesian Rupiah is the worst-performing currency in Asia this month. Economists at Société Générale analyze IDR outlook.
BI to stand pat at 5.75%
We expect Bank Indonesia to stand pat at 5.75%. Headline inflation has slowed to 2.3% (BI target 2-4%), but the central bank has abstained from policy easing due to IDR weakness. Our house view is that the next rate move will be a cut in 1Q24 or later.
The Rupiah has weakened to a level last seen during the peak pandemic as USD/IDR breached the December 2022 high of 15,770 and next target for the Rupiah bears will be March 2020 high of 16,625.
Economists at Commerzbank analyze the implications of the rise in US yields.
Yield explosion in the US
The USD reaction to rising US yields is disappointingly small. This rise does not seem to be completely unaffected by a USD-damaging risk premium. Of course, that does not have to remain the case. It is a snapshot of the current situation.
However, it makes sense. It fits into this image that the mortgage applications in the US have fallen further and have now reached a 28-year low. The housing market is one of the most important channels through which rising interest rates can cause a recession. A standstill on the US property market will significantly impede the flexibility of US employees, thus also dampening growth in addition to the direct effect.
Rising yields seem to confirm our US economists, who continue to expect a US recession. The last of the recession Mohicans it sometimes seems to me. But at present, they seem to be the lonely voices that will be confirmed in the end.
- USD/CAD scales higher for the third straight day and advances to a near two-week high.
- Sliding Oil prices undermine the Loonie and remain supportive amid a bullish US Dollar.
- Hawkish Fed expectations, rallying US bond yields and a softer risk tone benefit the buck.
- Traders look to the US macro data for some impetus ahead of Fed Chair Powell’s speech.
The USD/CAD pair gains some positive traction for the third successive day on Thursday and maintains its bid tone, near a two-week high through the early part of the European session. Spot prices currently trade around the 1.3730 region, up 0.10% for the day, and remain well supported by a combination of factors.
Softer consumer inflation figures released from Canada on Tuesday forced market participants to trim bets for another rate hike by the Bank of Canada (BoC). Apart from this, the emergence of some intraday selling around Crude Oil prices undermines the commodity-linked Loonie. This, along with a bullish US Dollar (USD), is seen acting as a tailwind for the USD/CAD pair and supports prospects for a further near-term appreciating move.
OPEC+ is reportedly not planning to take any immediate action on the Iranian call for Islamic countries to impose an oil embargo and other sanctions on Israel over the war with Hamas in Gaza. Furthermore, the Biden administration on Wednesday eased sanctions on Venezuela's oil sector to produce and export oil to its chosen markets for the next six months without limitation. This eases global supply concerns and weighs on the black liquid.
Adding to this, worries about economic headwinds stemming from rapidly rising borrowing costs, which could dent fuel demand, further exert pressure on Oil prices. That said, geopolitical tensions in the Middle East, along with a larger-than-expected inventory draw in the US – the world's biggest oil consumer – could act as a tailwind for the commodity and help limit any meaningful downfall in the near term.
The USD, meanwhile, continues to draw support from growing acceptance that the Federal Reserve (Fed) will keep interest rates higher for longer. The outlook leads to an extended selloff in the US fixed-income market, pushing the yield on the benchmark 10-year government bond to a fresh 16-year peak and closer to the 5% psychological mark. This, along with the prevalent risk-off environment, continues to lend support to the safe-haven Greenback.
The aforementioned fundamental backdrop seems tilted in favour of the USD bulls and suggests that the path of least resistance for the USD/CAD pair is to the upside. Investors, however, might refrain from placing aggressive bets ahead of Fed Chair Jerome Powell's speech later during the US session. In the meantime, the US macro data – Weekly Initial Jobless Clams, the Philly Fed Manufacturing Index and Existing Home Sales data – might provide some impetus.
Technical levels to watch
- USD/CHF receives upward support despite stronger Switzerland’s Trade Balance data.
- Swiss balance of trade increased from 3,814M to 6,316M in September.
- Higher US bond yields contribute support to underpinning the US Dollar.
USD/CHF recovers the intraday losses on surging US Treasury yields, trading higher around 0.9000 during the early European session on Thursday. However, the pair faced a challenge on solid Swiss Trade Balance data released on Thursday.
Federal Customs Administration of Switzerland reported a positive value for the balance amount between import and export, increasing from the previous balance of 3,814M to 6,316M in September. The market expected figure was 3,770M.
Additionally, the escalating geopolitical tension in the Middle East has the potential to increase demand for traditional safe-haven assets like the Swiss Franc (CHF). On Tuesday, conflicting reports emerged about an Israeli air attack that Gaza authorities claimed killed 500 people at a hospital in Palestinian territory. Israel countered, asserting that the damage was caused by a Palestinian attack.
In response to the humanitarian crisis resulting from the Israel-Hamas conflict, US President Joe Biden has reached an agreement with Egypt to provide limited aid to Gaza. This complex situation is undoubtedly influencing financial considerations.
US Dollar Index (DXY) experienced a resurgence, influenced by both economic data from the United States and US Treasury yields. The spot price hovers around 106.60. The 10-year US bond yield climbed to 4.97%, up by 1.18%, by the press time.
However, dovish remarks from multiple Federal Reserve officials suggest a cautious stance, with reluctance to tighten monetary policy in the current economic scenario.
The US housing market is providing mixed signals, with Building Permits in September surpassing expectations at 1.475 million (above the expected 1.45 million). Housing Starts rebounded to 1.35 million, just below the market consensus of 1.38 million, adding complexity to the narrative.
The Beige Book's observation, indicating "little to no change" in economic activity during September and early October, offers a broader perspective.
Thursday could bring the energy of a significant infusion of economic insights into the US economy, featuring Existing Home Sales, the Philly Fed index, and the weekly Jobless Claims report.
- The Euro trades without a clear direction vs. the US Dollar.
- Stocks in Europe open Thursday’s session on the defensive.
- EUR/USD lacks direction around the 1.0540 zone on Thursday.
- The USD Index (DXY) faces some range bound trade near 106.50.
- Investors’ attention is expected to be on Fed’s Jerome Powell.
- Fedspeak, weekly Initial Jobless Claims and the Philly Fed index come next.
The Euro (EUR) is trading in a limited range against the US Dollar (USD), with EUR/USD hovering around 1.0540 following the opening bell in the old continent on Thursday.
On the other hand, the Greenback keeps the trade in the mid-106.00s when gauged by the USD Index (DXY) amidst the unabated march north in US yields across different maturities and rising prudence ahead of the speech by Chair Powell and the geopolitical effervescence.
Keeping the focus on monetary policy, investors presently expect the Federal Reserve (Fed) to maintain its posture of not making any interest rate changes for the rest of the year.
Meanwhile, financial market investors are considering the likelihood of the European Central Bank (ECB) stopping policy changes, despite inflation levels beyond the bank's objective and rising fears about the possibility of an economic slowdown or stagflation in the European zone.
Back to the domestic calendar, Business Confidence in France eased to 98 in October.
In the US docket, Chief Powell will discuss the “Economic Outlook” at the Economic Club of New York, while FOMC Philip Jefferson (permanent voter, centrist), Chicago Fed Austan Goolsbee (voter, centrist), Atlanta Fed Raphael Bostic (2024 voter, centrist), FOMC Michael Barr (permanent voter, centrist), and Philadelphia Fed Patrick Harker (voter, hawk) are all due to speak later in the North American session.
Additionally, the usual weekly Initial Jobless Claims are due seconded by the Philly Fed Manufacturing Index, the CB Leading Index, Existing Home Sales, and the Monthly Budget Statement.
Daily digest market movers: Euro alternates ups and downs around 1.0540
- The EUR trades in an irresolute tone vs. the USD.
- US and German yields extend their move higher.
- Markets are focused on the Fed's tightening-for-a-longer-period approach.
- Investors believe the ECB will hold off on tightening until Q32024.
- Geopolitical concerns in Middle East remain on the rise.
- Australian jobs report came in mixed in September.
- All the attention will be on Powell’s discussion later in the day.
Technical Analysis: Euro risks a deeper pullback once 1.0500 is cleared
The EUR/USD is trading indecisively around 1.0540 against the backdrop of the Greenback's lack of direction.
If the upward trend continues, EUR/USD may test the October high of 1.0639 (October 12), prior to the weekly top of 1.0736 (September 20) and the important 200-day SMA of 1.0819. A break above this level might indicate a push to break over the weekly peak of 1.0945 (August 30) and target the psychological threshold of 1.1000. Any more rises over the August high of 1.1064 (August 10) might push the pair towards the weekly top of 1.1149 (July 27) and perhaps the 2023 peak of 1.1275. (July 18).
If selling pressure returns, the 2023 low of 1.0448 (October 3) and the key support of 1.0400 may be revisited. If this level is breached, the weekly lows of 1.0290 (November 30, 2022) and 1.0222 may be retested (November 21, 2022).
It is crucial to recall that the risk of sustained negative pressure persists as long as the EUR/USD remains below the 200-day SMA.
Euro FAQs
What is the Euro?
The Euro is the currency for the 20 European Union countries that belong to the Eurozone. It is the second most heavily traded currency in the world behind the US Dollar. In 2022, it accounted for 31% of all foreign exchange transactions, with an average daily turnover of over $2.2 trillion a day.
EUR/USD is the most heavily traded currency pair in the world, accounting for an estimated 30% off all transactions, followed by EUR/JPY (4%), EUR/GBP (3%) and EUR/AUD (2%).
What is the ECB and how does it impact the Euro?
The European Central Bank (ECB) in Frankfurt, Germany, is the reserve bank for the Eurozone. The ECB sets interest rates and manages monetary policy.
The ECB’s primary mandate is to maintain price stability, which means either controlling inflation or stimulating growth. Its primary tool is the raising or lowering of interest rates. Relatively high interest rates – or the expectation of higher rates – will usually benefit the Euro and vice versa.
The ECB Governing Council makes monetary policy decisions at meetings held eight times a year. Decisions are made by heads of the Eurozone national banks and six permanent members, including the President of the ECB, Christine Lagarde.
How does inflation data impact the value of the Euro?
Eurozone inflation data, measured by the Harmonized Index of Consumer Prices (HICP), is an important econometric for the Euro. If inflation rises more than expected, especially if above the ECB’s 2% target, it obliges the ECB to raise interest rates to bring it back under control.
Relatively high interest rates compared to its counterparts will usually benefit the Euro, as it makes the region more attractive as a place for global investors to park their money.
How does economic data influence the value of the Euro?
Data releases gauge the health of the economy and can impact on the Euro. Indicators such as GDP, Manufacturing and Services PMIs, employment, and consumer sentiment surveys can all influence the direction of the single currency.
A strong economy is good for the Euro. Not only does it attract more foreign investment but it may encourage the ECB to put up interest rates, which will directly strengthen the Euro. Otherwise, if economic data is weak, the Euro is likely to fall.
Economic data for the four largest economies in the euro area (Germany, France, Italy and Spain) are especially significant, as they account for 75% of the Eurozone’s economy.
How does the Trade Balance impact the Euro?
Another significant data release for the Euro is the Trade Balance. This indicator measures the difference between what a country earns from its exports and what it spends on imports over a given period.
If a country produces highly sought after exports then its currency will gain in value purely from the extra demand created from foreign buyers seeking to purchase these goods. Therefore, a positive net Trade Balance strengthens a currency and vice versa for a negative balance.
NZD/USD has struggled this week. Economists at ANZ Bank analyze Kiwi’s outlook.
Big gap between DXY and bond yields
USD strength has returned amid rising US bond yields, and NZ interest rate spreads to other geographies have narrowed following last week’s MPR and Q3 CPI data this week.
NZD price action looks weak, with lower lows and lower highs seen including a break below the September low.
Looking ahead, the biggest risk seems to be a continuation of the ‘USD exceptionalism’ theme, noting that a noticeable gap (that could close) has opened up between the US Dollar Index (DXY) and bond yields.
- Pound Sterling finds some support after a fresh four-day low as room remains open for further policy-tightening by the BoE.
- A slowdown in progress in achieving 2% inflation has escalated hawkish BoE bets.
- The market mood remains risk-off amid increasing Israel-Hamas tensions.
The Pound Sterling (GBP) strives for a cushion, remaining vulnerable due to persistent inflation fears. The GBP/USD pair struggles for traction as the UK Consumer Price Index (CPI) report for September released on Wednesday showed inflation remains stubborn due to higher Oil prices, services inflation and strong wage growth.
Inflation in the UK is the highest among G7 economies. The decline in inflation towards the 2% target has lost steam, keeping Bank of England(BoE) policymakers on their toes. Meanwhile, market sentiment remains cautious due to persistent fears of Iran’s intervention in the Israel-Palestine conflict. Going forward, the Pound Sterling’s valuation will be guided by the UK Retail Sales data, which will be published on Friday. Economists expect that Retail Sales contracted marginally in September.
Daily Digest Market Movers: Pound Sterling awaits Retail Sales data
- Pound Sterling finds some support after printing a fresh four-day low near 1.2110 as expectations of further policy-tightening by the Bank of England (BoE) increased after inflation data suggested persisting price pressures.
- The UK Office for National Statistics (ONS) reported on Wednesday that monthly headline inflation rose by 0.5% while investors forecasted a growth rate of 0.4%. In August the headline inflation has grown by 0.3%. Annual headline CPI data grew at a steady pace of 6.7%, higher than the expectations of 6.5%.
- The core inflation data, which strips off volatile food and Oil prices, topped expectations marginally. Core inflation came in at 6.1%, higher than the 6% expected but decelerating from the prior reading of 6.2%.
- Stubborn UK inflation has infused fresh life into expectations of further policy-tightening by the BoE. Slowing progress in taming both headline and core inflation has brought discomfort to BoE policymakers.
- Persistent fears of inflation remaining stubborn have deepened discussions about raising the inflation target to 3%. British think-tank The Resolution Foundation said that a higher inflation target would allow the central bank to reduce borrowing and bond-buying needs and would provide more stimulus.
- UK Prime Minister Rishi Sunak pledged to halve inflation by the year-end, a commitment that looks difficult to achieve.
- The Producer Price Index (PPI) for inputs slowed significantly to 0.4% but rose by a sharp 0.4% for outputs, reflecting the consequences of higher wages and fuel prices.
- Going forward, investors will focus on the Retail Sales data for September, which will be published on Friday at 06:00 GMT. As per the estimates, Retail Sales are expected to contract by 0.1% on month. This indicates that high inflation and borrowing costs have squeezed the real income of households.
- After US President Joe Biden, UK PM Rishi Sunak arrived in Israel to meet Prime Minister Benjamin Netanyahu.
- The market sentiment remains downbeat as risks of an Iran intervention in the Israel-Palestine conflicts have escalated. Joe Biden said on Wednesday that the US stands with Israel. Earlier, Iran warned that it would not be a spectator if the US supports Israel.
- The US Dollar remains firm against risk-perceived currencies ahead of the speech from Federal Reserve (Fed) Chair Jerome Powell. It is highly likely that Powell will support the stance of keeping interest rates higher for a longer period to ensure the achievement of bringing back inflation to the 2% target.
- Jerome Powell may refrain from discussing the appropriateness of further policy tightening as higher US Treasury yields seem sufficient to lower overall spending and investment.
Technical Analysis: Pound Sterling eyes support near 1.2100
Pound Sterling seeks support near the round-level cushion of 1.2100. The broader GBP/USD outlook is bearish as the death cross by the 50-day and 200-day Exponential Moving Averages (EMAs) is intact. The 20-day EMA at 1.2230 continues to act as a barricade for Pound Sterling bulls. Momentum oscillators struggle for a firm footing.
Pound Sterling FAQs
What is the Pound Sterling?
The Pound Sterling (GBP) is the oldest currency in the world (886 AD) and the official currency of the United Kingdom. It is the fourth most traded unit for foreign exchange (FX) in the world, accounting for 12% of all transactions, averaging $630 billion a day, according to 2022 data.
Its key trading pairs are GBP/USD, aka ‘Cable’, which accounts for 11% of FX, GBP/JPY, or the ‘Dragon’ as it is known by traders (3%), and EUR/GBP (2%). The Pound Sterling is issued by the Bank of England (BoE).
How do the decisions of the Bank of England impact on the Pound Sterling?
The single most important factor influencing the value of the Pound Sterling is monetary policy decided by the Bank of England. The BoE bases its decisions on whether it has achieved its primary goal of “price stability” – a steady inflation rate of around 2%. Its primary tool for achieving this is the adjustment of interest rates.
When inflation is too high, the BoE will try to rein it in by raising interest rates, making it more expensive for people and businesses to access credit. This is generally positive for GBP, as higher interest rates make the UK a more attractive place for global investors to park their money.
When inflation falls too low it is a sign economic growth is slowing. In this scenario, the BoE will consider lowering interest rates to cheapen credit so businesses will borrow more to invest in growth-generating projects.
How does economic data influence the value of the Pound?
Data releases gauge the health of the economy and can impact the value of the Pound Sterling. Indicators such as GDP, Manufacturing and Services PMIs, and employment can all influence the direction of the GBP.
A strong economy is good for Sterling. Not only does it attract more foreign investment but it may encourage the BoE to put up interest rates, which will directly strengthen GBP. Otherwise, if economic data is weak, the Pound Sterling is likely to fall.
How does the Trade Balance impact the Pound?
Another significant data release for the Pound Sterling is the Trade Balance. This indicator measures the difference between what a country earns from its exports and what it spends on imports over a given period.
If a country produces highly sought-after exports, its currency will benefit purely from the extra demand created from foreign buyers seeking to purchase these goods. Therefore, a positive net Trade Balance strengthens a currency and vice versa for a negative balance.
- European markets receive pressure due to weaker chipmakers' and British drugmaker.
- The strike on a Gaza hospital added tension to President Joe Biden's visit to Israel.
- UK market took a hit following a decline in Wall Street stocks.
European shares took a tumble in the recent session, driven down by a decline in chipmakers' shares and British drugmaker AstraZeneca.
Additionally, growing concerns about an escalation in the Middle East conflict added to the overall negative sentiment, influencing the market downturn. The strike on a Gaza hospital, resulting in the loss of hundreds of Palestinian lives, added tension to President Joe Biden's visit to Israel.
At the time of writing, the UK FTSE 100 is down by 0.54% at 7,546, while the European STOXX 600 drops at 441 points. The German DAX PERFORMANCE-INDEX is down by 0.29% to 15,051.
London shares took a hit following a decline in Wall Street stocks. A British biotech firm announced a £70 million investment from bioMérieux, owned by the French billionaire Merieux family.
Semiconductor equipment maker ASML Holding experienced a 3.4% loss after reporting lower-than-expected orders and warning of flat sales next year. This, in turn, dragged down shares of other chipmakers like ASM International, Aixtron, and BE Semiconductor, impacting Europe's technology sector.
Finnish telecommunications giant Nokia Corporation is set to implement an aggressive cost reduction plan, involving layoffs of 9,000 to 14,000 employees. The move aims to streamline its workforce from 86,000 to between 72,000 and 77,000. The company attributes its financial challenges to macroeconomic factors, reduced customer spending, and slower 5G technology deployment in India and North America.
The Capital Market Authority (CMA) convicted Swiss International Marketing Company and SwissFS for violating securities regulations. The companies were found guilty of unauthorized securities activities, and promoted on LinkedIn, leading to penalties of $560,000 each.
EUR/USD is relatively stable. Economists at ING analyze the pair’s outlook.
Holding up surprisingly well
We would have thought EUR/USD would be trading a little lower given what has been happening to US yields this week. While there may be a tendency to conclude that long Dollars is a very crowded trade and this week's EUR/USD price action is telling, we think the defensive global environment makes it hard to own the pro-cyclical Euro.
The Eurozone data calendar is exceptionally light today and barring some surge in US jobless claims or some surprisingly dovish Fedspeak, we would expect EUR/USD to be pressuring support at 1.0500. We would be careful, however, if we are under-estimating the risk of indiscriminate down-sizing of open (long Dollar) positions and would warn of a sharper correction higher should EUR/USD trade above 1.0600/0610 again.
Here is what you need to know on Thursday, October 19:
Supported by surging US Treasury bond yields and safe-haven flows, the US Dollar outperformed its rivals on Wednesday, with the US Dollar Index closing in positive territory. As the 10-year US yield continues to stretch higher toward 5%, the USD holds its ground early Thursday. Later in the day, Federal Reserve (Fed) Chairman Jerome Powell will speak before the Economic Club of New York and the US economic docket will feature weekly Initial Jobless Claims data alongside Existing Home Sales figures for September.
Wall Street's main indexes suffered large losses on Wednesday as investor reacted to mixed third quarter earnings results and escalating geopolitical tensions. In the European morning, US stock index futures trade modestly lower, reflecting a cautious market stance. "The near-term outlook for the economy was generally described as stable or having slightly weaker growth," the Fed's Beige Book showed late Wednesday.
US Dollar price this week
The table below shows the percentage change of US Dollar (USD) against listed major currencies this week. US Dollar was the strongest against the New Zealand Dollar.
| USD | EUR | GBP | CAD | AUD | JPY | NZD | CHF | |
| USD | -0.26% | 0.10% | 0.53% | 0.01% | 0.13% | 1.31% | -0.47% | |
| EUR | 0.22% | 0.36% | 0.76% | 0.27% | 0.36% | 1.58% | -0.22% | |
| GBP | -0.14% | -0.39% | 0.39% | -0.12% | 0.00% | 1.18% | -0.61% | |
| CAD | -0.56% | -0.82% | -0.43% | -0.54% | -0.42% | 0.76% | -1.03% | |
| AUD | -0.01% | -0.28% | 0.07% | 0.50% | 0.09% | 1.31% | -0.51% | |
| JPY | -0.13% | -0.33% | 0.00% | 0.39% | -0.11% | 1.17% | -0.58% | |
| NZD | -1.38% | -1.63% | -1.27% | -0.84% | -1.36% | -1.24% | -1.89% | |
| CHF | 0.44% | 0.24% | 0.58% | 0.99% | 0.51% | 0.60% | 1.80% |
The heat map shows percentage changes of major currencies against each other. The base currency is picked from the left column, while the quote currency is picked from the top row. For example, if you pick the Euro from the left column and move along the horizontal line to the Japanese Yen, the percentage change displayed in the box will represent EUR (base)/JPY (quote).
According to the latest report, Israeli air raids continued overnight and the Israel Defense Forces noted that there has been a "significant escalation" of conflict with Hezbollah.
After coming within a touching distance of 1.0600 on Wednesday, EUR/USD reversed its direction and closed in negative territory. Early Thursday, the pair consolidates its losses in a narrow channel slightly below 1.0550.
Following the bullish action seen in the European session on stronger-than-forecast UK Consumer Price Index (CPI) data on Wednesday, GBP/USD came under bearish pressure in the American session. The pair stays on the back foot in the European morning on Thursday and trades below 1.2150.
"It's normal not to announce currency intervention immediately after it's done. Basically, we won't make comment when intervening in the FX market," Japan's top currency diplomat Masato Kanda said on Thursday when asked about stealth intervention. USD/JPY showed no immediate reaction to these comments and was last seen moving sideways above 149.50.
Gold capitalized on safe-haven demand and climbed to its highest level since late July above $1,960 on Wednesday. Rising US yields, however, caused XAU/USD to erase a portion of its daily losses in the American session. Early Thursday, the pair holds steady at around $1,950.
In the opinion of Economist Lee Sue Ann at UOB Group, the PBoC is expected to cut both its 1-Year and 5-Year Loan Prime Rate (LPR) at its event on Friday.
Key Quotes
The weak inflation and growth backdrop supports further monetary policy easing. We keep our call for a further 10 bps cut to the 1Y LPR and 20 bps cut to the 5Y LPR in 4Q23 to bring the rates to 3.35% and 4.00% respectively by yearend.
For now, we still expect interest rates to stay on hold in 2024 on the assumption of further economic stabilisation while PBOC wants to avoid encouraging a further build-up in leverage.
- Silver regains positive traction on Thursday and climbs back to the $23.00 round-figure mark.
- The technical setup seems tilted in favour of bulls and supports prospects for additional gain.
- A convincing break below the 38.2% Fibo. level is needed to negate the constructive outlook.
Silver attracts fresh buying on Thursday following the previous day's sharp retracement slide from the $23.30-$23.35 area, or a near three-week high and extends its steady ascent through the early European session. The white metal climbs back closer to the $23.00 mark and seems poised to prolong its recent goodish recovery from a seven-month low touched on October 3.
From a technical perspective, acceptance above the 50% Fibonacci retracement level of the August-October downfall validates the constructive outlook for the XAG/USD. Furthermore, oscillators on the daily chart have just started gaining positive traction and support prospects for a further appreciating move. That said, the overnight failure near the $23.30-$23.35 confluence hurdle – comprising the 100-day and the 200-day Simple Moving Averages (SMAs) and the 61.8% Fibo. level – warrants some caution.
Hence, it will be prudent to wait for a sustained break through the aforementioned barrier before positioning for any further gains. The XAG/USD might then accelerate the positive move towards the next relevant resistance near the $23.75-$23.80 region (September 22 high) and then aim towards reclaiming the $24.00 round figure for the first time since early September. The momentum could get extended further towards the $24.30-$24.35 resistance zone.
On the flip side, the 50% Fibo. level, around the $22.85 region, now seems to protect the immediate downside ahead of the overnight swing low, around the $22.70-$22.65 area. Some follow-through selling might expose the weekly trough, around the $22.40-$22.35 zone. The latter nears the 38.2% Fibo. level and should act as a key pivotal point. A convincing break below might shift the near-term bias back in favour of bearish traders and prompt aggressive technical selling around the XAG/USD.
The subsequent downfall will make the commodity vulnerable to weaken further below the $22.00 mark, towards the 23.6% Fibo. level, around the $21.75 area. Failure to defend the said support levels has the potential to drag the XAG/USD further towards the $21.35-$21.30 intermediate support en route to the $21.00 mark and back towards retesting a seven-month low, around the $20.70-$20.65 zone, or a seven-month low touched on October 3.
Silver daily chart
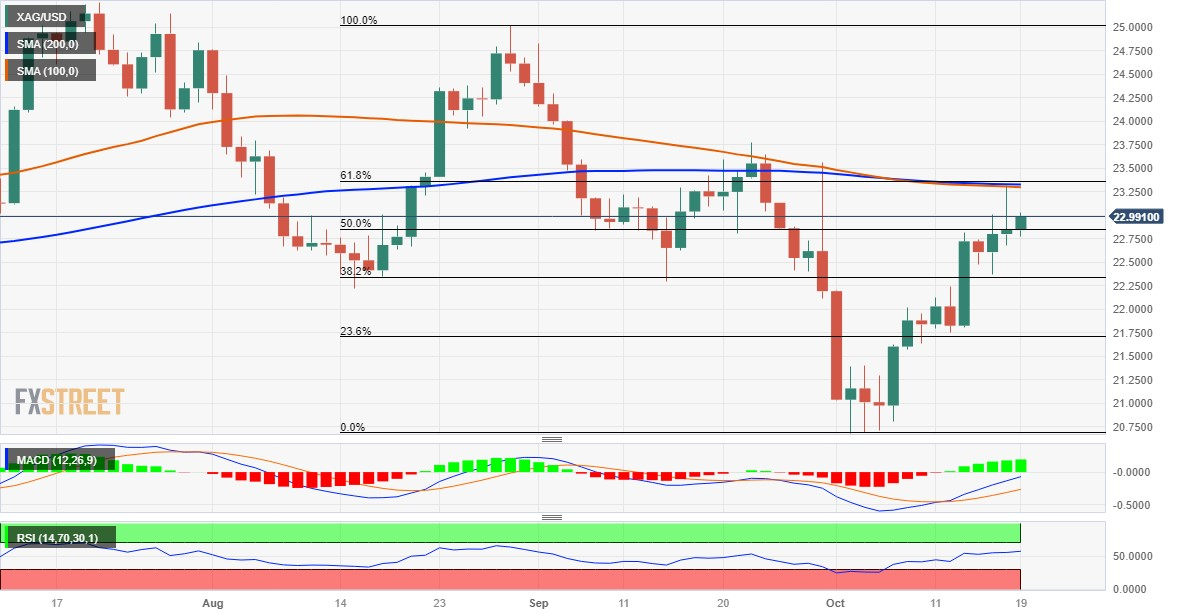
Technical levels to watch
- The index meets resistance around the 106.50 area.
- Chief Powell will discuss the Economic Outlook later in the session.
- Weekly Claims, Philly Fed index, Fedspeak take centre stage as well.
The greenback exchanges gains with losses in the mid-106.00s when tracked by the USD Index (DXY) on Thursday.
USD Index faces initial resistance near 106.70
The index comes under some mild selling pressure following Wednesday’s marked gains to the 106.70 region, all amidst alternating risk appetite trends and some prudence ahead of the speech by Fed’s Powell later in the session.
In the meantime, US yields maintain its march north well in place and appears underpinned by the Fed’s tighter-for-longer narrative, which in turn finds support in the persistent resilience of the US economy.
Later in the session, all the attention will be on Chief Powell and his discussion on the Economic Outlook at the Economic Club of New York. In addition, FOMC P. Jefferson (permanent voter, centrist), Chicago Fed A. Goolsbee (voter, centrist), Atlanta Fed R. Bostic (2024 voter, centrist), FOMC M. Barr (permanent voter, centrist) and Philadelphia Fed P. Harker (voter, hawk) are all due to speak.
In the docket, usual weekly Initial Claims are due in the first turn followed by the Philly Fed Manufacturing Index, the CB Leading Index, Existing Home Sales and the Monthly Budget Statement.
What to look for around USD
The index so far trades without a clear direction near 106.50, as market participants continue to assess geopolitical risks, key US data and get ready to Powell’s speech.
In the meantime, support for the dollar keeps coming from the good health of the US economy, which at the same time appears underpinned by the renewed tighter-for-longer stance narrative from the Federal Reserve.
Key events in the US this week: Initial Jobless Claims, Philly Fed Manufacturing Index, CB Leading Index, Existing Home Sales, Fed Powell (Thursday).
Eminent issues on the back boiler: Persevering debate over a soft or hard landing for the US economy. Incipient speculation of rate cuts in early 2024. Geopolitical effervescence vs. Russia and China and the Middle East.
USD Index relevant levels
Now, the index is down 0.01% at 106.56 and faces the next support at 105.53 (monthly low October 12) ahead of 104.42 (weekly low September 11) and then 103.27 (200-day SMA). On the other hand, a breakout of 106.78 (weekly peak October 13) could expose 107.34 (2023 high October 3) and finally 107.99 (weekly high November 21 2022).
The market maintains the downside pressure on the Yen. Economists at Commerzbank analyze JPY outlook.
The MOF under pressure to act
Pressure is limited by the 150 mark in USD/JPY because it has to be assumed that the Ministry of Finance (MOF) intervenes at this level.
As the market has very clearly taken this view, the MOF is under pressure to act at 150 in USD/JPY. If it does not intervene when the 150 mark is breached, it would be perceived as a toothless tiger and the Yen really could nosedive. On the other hand, it seems questionable whether the MOF can defend a USD/JPY level in perpetuity while the BoJ is so obviously weakening the Yen.
Both factors combined mean: the MOF’s threats of an intervention might cause the opposite of what it intended to achieve in the end: instead of JPY recovery, it might cause JPY depreciation.
Hungary's Minister for EU Funds will meet representatives of the European Commission in Brussels to discuss locked EU funds today. Economists at ING analyze HUF outlook.
Negotiations are moving in a positive direction
According to previous information from the Hungarian side, all the problems should be resolved by the end of November. The timetable has not been set but we will probably see some headlines on this topic.
For now, it seems that the negotiations are moving in a positive direction, which should have been confirmed today.
If the progress in negotiations is confirmed, we could see EUR/HUF test new local lows below 384.
It seems like an eternity has passed since Chinese policy was intent on turning the Renminbi into a global trade currency. Economists at Commerzbank explain why RMB is set to depreciate against the US Dollar.
The remnants of past policies are damaging the Renminbi
With a share of 2.7% in cross-border SWIFT capital transactions the renminbi has no significant international role. And that despite the fact that no other economy undertakes as much foreign trade as China. We have to conclude: the world does not like the Renminbi.
Some remnants of past efforts are still in place. For example, the swap lines China had entered with other countries. If the Renminbi had turned into a world currency and if loans had been denominated in RMB in third countries, these swap lines would have been able to prevent a dramatic collapse of these markets in times of crisis. None of that ever happened.
Now these swap lines are diverted for another use. In Argentina for example to provide the government with a loan that only has to be secured with an internationally largely worthless Argentinian Pesos. However, that is not CNY-positive.
The Argentinian government is not going to be able to do much with the Yuans it received in this deal. It needs a currency with which to pay for urgently required imports: the Dollar. So the whole deal will mainly result in one thing: it will cause the Renminbi to depreciate against the US Dollar.
- EUR/GBP hovers below the psychological level at 0.8700.
- The uncertainty over the BoE's further policy actions put pressure on the Pound Sterling.
- ECB is expected to hold further interest rate hikes could weigh on the Euro.
EUR/GBP trades higher around 0.8680 during the Asian session on Thursday. The uncertainty of the next policy action by the Bank of England (BoE), which, in turn, is seen as a key factor acting as a headwind for the EUR/GBP pair.
The most recent UK consumer inflation figures unveiled on Wednesday revealed that the headline CPI held steady at 6.7% in September, defying expectations for a slight dip to 6.6%. This outcome has fuelled speculations for a potential Bank of England (BoE) rate hike in November.
Earlier this week, the UK Office for National Statistics (ONS) reported a slight moderation in wage growth for the three months leading to August. This development may provide the BoE with room to maintain interest rates at their current level.
The relatively subdued earnings data from the United Kingdom might have exerted downward pressure on the Pound Sterling (GBP), contributing to the overall support on the EUR/GBP pair.
Breaking down the earnings figures, the Average Earnings Excluding Bonus (3Mo/Yr) remained unchanged at 7.8% in August, aligning with expectations. However, the Pay levels Including Bonus for the same quarter decelerated to 8.1%, falling short of the market consensus of 8.3%.
On the Euro docket, the speculations suggesting that additional rate hikes by the European Central Bank (ECB) may not be on the horizon could reinforce the negative outlook for the EUR/GBP pair.
The recent data from Eurostat revealed that the Harmonized Index of Consumer Prices (HICP) in the Eurozone stood at 0.3% in September.
In a statement on Wednesday, European Central Bank (ECB) President Christine Lagarde noted that underlying inflation remains robust, and wage growth continues to maintain historically high levels. These factors contribute to the ongoing narrative surrounding the Euro's performance against the British Pound.
Investors will likely focus on Retail Sales from the United Kingdom and the German Producer Price Index (PPI) on Friday, seeking more cues on economic scenarios in both countries.
- USD/JPY trades in negative territory near 149.80, down 0.10% on the day.
- The US Building Permits came in better than expected; Housing Starts arrived worse than the market consensus.
- The Bank of Japan (BoJ)’s quarterly report suggested a recovery in Japan’s economy for all regions.
- The Fed Chair Jerome Powell’s speech, Japanese inflation data will be closely watched events this week.
The USD/JPY pair loses momentum near 149.80 during the early European session on Thursday. The downside of the pair might be limited due to a rise in US Treasury bond yields. Meanwhile, the US 10-year Treasury yield surges to 4.966%, the highest level since 2007, and the 2-year Treasury yield stays at 5.246%. Investors await the Japanese inflation data on Friday for fresh impetus. Japan’s National Consumer Price Index (CPI) ex-fresh Food is expected to rise 2.7% YoY from 3.1% in the previous reading.
The US housing data on Wednesday showed mixed readings. The Building Permits fell to 1.475M in September, beating the market consensus of 1.45M whereas Housing Starts rose to 1.35M, worse than expected 1.38M, data published by the US Census Bureau. Additionally, the Fed Beige Book update showed the US economic outlook had "little to no change" between September and early October and the data might not convince the Federal Reserve (Fed) to abandon its current guidance.
Furthermore, Fed officials reaffirmed their stance to maintain interest rates at the current level. The Fed Governor Christopher Waller stated that it's too early to tell if more policy rate action is needed while adding that the central bank can make the decision on policy path depending on the data. While Fed Bank of New York John Williams said the central bank needs restrictive monetary policy for a while to cool inflation.
Investors will take more cues from Fed Chair Jerome Powell’s speech in the American session. The hawkish comments from Fed officials on the policy outlook might lift the US Dollar demand and act as a tailwind for the USD/JPY pair.
The Bank of Japan (BoJ) raises its assessment for six of Japan's nine economic regions in a quarterly report. The report indicated that Japan’s economy recovered moderately for all regions. But many regions saw exports and output moving sideways.
Earlier this week, Japanese Finance Minister Shunichi Suzuki denied to comment about currency intervention. Japan’s top financial diplomat Masato Kanda said that the Japanese Yen (JPY) continued to be considered a safe-haven asset and was benefiting from safe-haven flow caused by the geopolitical tension in the Middle East. Kanda additionally affirmed that if excessive moves occurred in the currency market, the authorities would take steps such as raising interest rates or intervening in the market. That said, the potential FX intervention by the Japanese authorities might cap the upside of the USD/JPY pair.
Looking ahead, market players will keep an eye on the US Jobless Claims, the Philly Fed index, and Existing Home Sales due later on Thursday. Also, Fed Chair Jerome Powell’s speech will be due later in the American session. On Friday, the Japanese National Consumer Price Index for September will be a closely watched event.
CME Group’s flash data for natural gas futures markets noted traders added around 7.5K contracts to their open interest positions on Wednesday, extending the ongoing uptrend. On the other hand, volume dropped for the second straight session, now by around 40.3K contracts.
Natural Gas appears supported around $3.00
Prices of natural gas charted an inconclusive session in tandem with rising open interest on Wednesday. That said, further range bound trade appears likely in the very near term, while a solid contention remains at the $3.00 region per MMBtu for the time being.
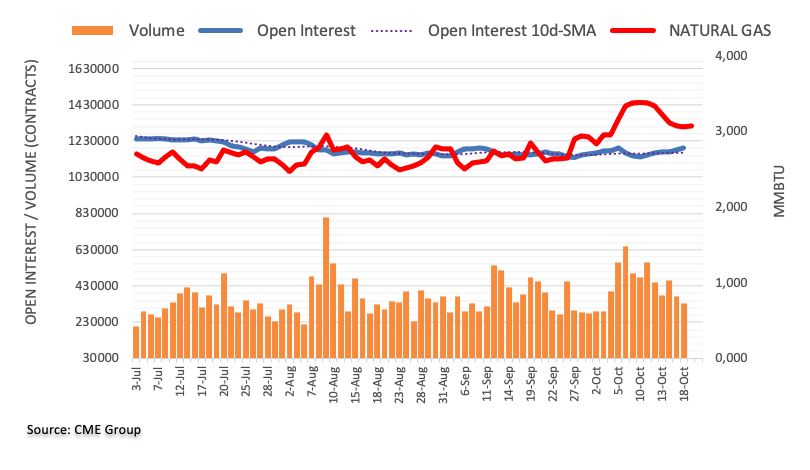
USD/CNY largely hovered around 7.30 since mid-August. Economists at Commerzbank analyze Yuan’s outlook.
Pressure remains
CNY will likely remain under pressure before economic data show that China’s growth momentum turns around and picks up speed, albeit likely just modestly so. In the meantime, the PBoC will continue to defend the Yuan.
We expect USD/CNY to continue to stay at around 7.30 in the near term before easing somewhat towards the end of the year. Longer out, we expect USD/CNY to fall below 7.00 in 2024 due to the expectation of a softer USD as we anticipate the Fed to cut its key interest rate next year.
EUR/CNY will hold up for a few quarters, benefiting from the ECB’s restrictive monetary policy for some time ahead.
Considering advanced prints from CME Group for crude oil futures markets, open interest shrank for the fifth consecutive session on Wednesday, now by around 2.8K contracts. Volume, instead, went up for the second straight session, this time by more than 115K contracts.
WTI: Upside momentum appears limited around $95.00
WTI prices added to Tuesday’s advance and flirted with the key $90.00 mark per barrel on Wednesday. The daily gains were on the back of shrinking open interest, however, and seem to favour some corrective knee-jerk in the very near term. On the upside, the 2023 high around the $95.00 mark per barrel (September 28) remains the next barrier for bulls for the time being.
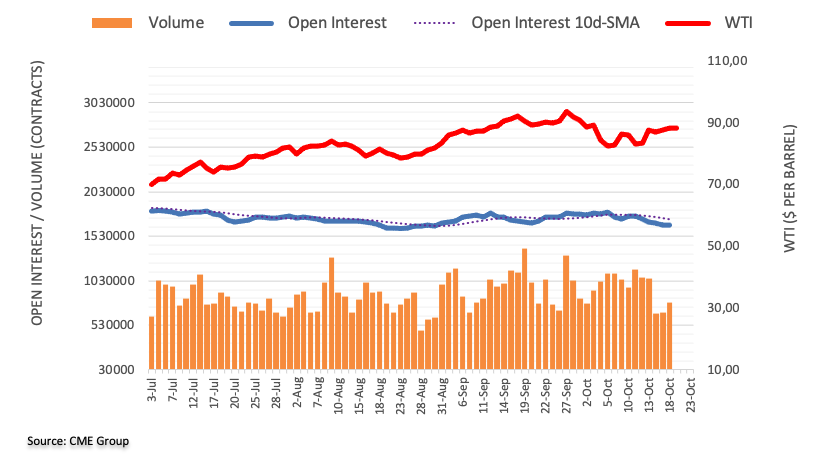
Open interest in gold futures markets increased for the second session in a row on Wednesday, this time by around 7.2K contracts according to preliminary readings from CME Group. Volume followed suit and rose by around 110.6K contracts following two consecutive daily drops.
Gold retargets the $1980 region
Gold prices rose sharply on Wednesday amidst rising open interest and volume, signalling the likelihood that further advances could be in store for the yellow metal in the very near term. That said, the next hurdle of note is now seen at the July tops around the $1980 zone per troy ounce.
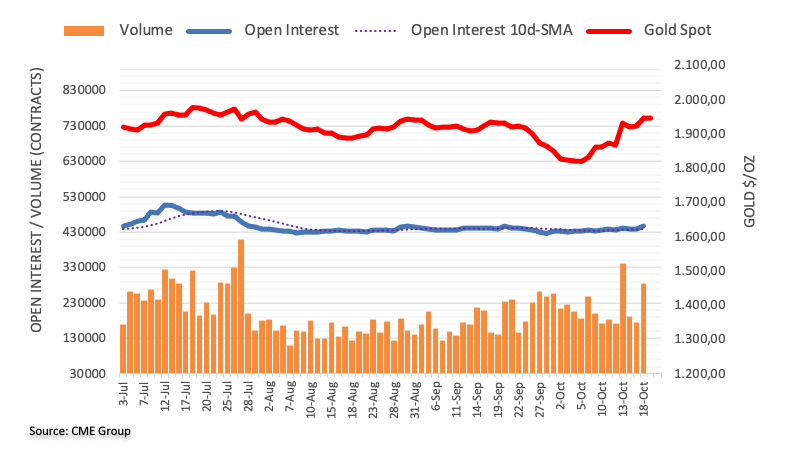
Japan's top currency diplomat Masato Kanda expressed his take on major global economies during his appearance on Thursday.
Key quotes
Chinese economy is slowing down due in part to policy failure.
US economy is stronger than expected, but Beige Book suggests signs of softening.
Risks to global economy skewed to the downside due to China slowdown, Russia-Ukraine conflict and now the situation in the Middle East.
Currency markets are in a deadlock, there is risk aversion in global markets.
Ukraine is striving to tackle reform, breaking free of corruption that has been rampant before war.
One more push is needed to resolve Sri Lanka's debt problems.
Asean+3 should set up emergency lending facility for swift borrowing for those in need in region.
Japan-South Korea FX swap arrangement underscores both countries' commitment to stabilize financial markets in the region.
Various factors determine currency markets, interest rates are only one factor.
Monetary policy has been stable overall.
It's normal not to announce currency intervention immediately after it's done.
Basically we won't make comment when intervening in FX market when asked about stealth intervention.
Currencies must move stably reflecting fundamentals.
If we don't act to excessive moves that could hurt those who are vulnerable.
Market reaction
USD/JPY is keeping its sideways movement intact at around 149.80 on the above comments. The pair is trading marginally lower on the day.
- GBP/USD loses traction around 1.2123 amid a rise in US Treasury yields.
- The pair holds below the 50- and 100-hour EMAs; RSI is located in bearish territory below 50.
- The first support level is seen at 1.2052; 1.2190 acts as an immediate resistance level.
GBP/USD remains under selling pressure below the mid-1.2100s during the early European session on Thursday. A rise in the US Treasury bond yields and the escalating geopolitical tension between Israel and Hamas boost the US Dollar (USD) demand and exert some selling pressure on the GBP/USD pair. The major currently trades near 1.2123, losing 0.14% on the day.
From the technical perspective, GBP/USD holds below the 50- and 100-hour Exponential Moving Averages (EMAs) on the four-hour chart, which means further downside looks favorable. Furthermore, the Relative Strength Index (RSI) holds below 50 in the bearish territory, which supports the sellers for the time being.
Any decisive follow-through selling below the lower limit of the Bollinger Band of 1.2120 will see a drop to 1.2052 (low of October 3), en route to a low of October 4 of 1.2037. The next contention level will emerge at a psychological round mark at 1.2000, and finally at 1.1965 (a low of February 16).
On the upside, 1.2190 acts as an immediate resistance level for GBP/USD. The key barrier is located at 1.2217, portraying the confluence of the 100-hour EMA and a high of October 16. Further north, the upper boundary of the Bollinger Band at 1.2230 will be the next stop. The additional upside filter to watch is near a high of October 10 at 1.2295.
GBP/USD four-hour chart
-638332911663714248.png)
In a quarterly report reviewing the Japanese regional economies, the Bank of Japan (BoJ) raises its assessment for six of the country's nine economic regions.
Additional takeaways
Maintains assessment for three of Japan's nine regions in quarterly report.
Economy picking up, or recovering moderately, for all regions.
Many regions saw exports, output moving sideways.
Many firms said they wanted to look at price developments, what rivals do in deciding by how much they would raise wages next year.
Many firms expect to keep hiking wages given structural labor shortages.
Many regions said companies' price hikes to pass on costs was moderating, though some saw firms setting prices on expectations of future wage hikes.
Some branch managers said companies saw weak yen, rising crude oil prices as heightening cost pressures.
Market reaction
At the time of writing, USD/JPY is keeping its range intact near 149.80, down 0.07% on the day.
- USD/CHF gains momentum around 0.8993 amid a rise of US Treasury bond yields, firmer USD.
- The Fed Beige Book update showed the US economic outlook had "little to no change" between September and early October.
- The escalating tension in the Middle East might lift the Swiss Franc (CHF).
- Investors will monitor the Fed’s Powell speech, Swiss trade data on Thursday.
The USD/CHF pair posts modest gains below the 0.9000 psychological mark during the Asian session on Thursday. The recovery of the pair is supported by a rise in US Treasury yields and a firmer US Dollar (USD). Meanwhile, the US Dollar Index (DXY) surges to 106.63. US Treasury yields edge higher, with the 10-year Treasury yield climbing to 4.965%, the highest level since 2007, and the 2-year Treasury yield staying at 5.251%.
On Wednesday, Federal Reserve (Fed) officials reaffirmed their stance to maintain interest rates at their current level. The Fed Governor Christopher Waller stated that it's too early to tell if more policy rate action is needed while adding that the central bank can make the decision on policy path depending on the data. While Fed Bank of New York John Williams said the central bank needs restrictive monetary policy for a while to cool inflation. These comments lift the US bond yields higher amid robust momentum in US growth.
The US Building Permits fell to 1.475M in September, above the estimated of 1.45M, while Housing Starts rose to 1.35M, below the market consensus of 1.38M, data published by the US Census Bureau showed Wednesday. Additionally, the Fed Beige Book update showed the US economic outlook had "little to no change" between September and early October and the data might not convince the FOMC to abandon its current guidance.
On the Swiss Franc front, the rising geopolitical tension in the Middle East could boost the demand for a traditional safe-haven asset such as Swiss Franc (CHF). On Tuesday, Gaza authorities said an Israeli air attack killed 500 people at a hospital in the Palestinian territory, while Israel stated the damage was caused by a Palestinian attack. US President Joe Biden has reached an agreement with Egypt to provide limited aid to Gaza in order to alleviate a humanitarian catastrophe caused by the Israel-Hamas conflict.
Last week, the Swiss Producer and Import Prices fell 1.0% YoY in September from the previous reading of a 0.8% drop. On a monthly basis, the figures dropped 0.1% versus a 0.8% drop prior.
Traders will monitor the US Jobless Claims, the Philly Fed index, and Existing Home Sales due later on Thursday. All eyes will focus on the Fed Chair Jerome Powell’s speech in the North American session. If Powell delivers hawkish comments on the policy outlook, the US Dollar might attract buyers. Also, the Swiss trade data for September will be released on Thursday. These events could give a clear direction to the USD/CHF pair.
- NZD/USD drifts lower for the third straight day and touched its lowest level since November 2022.
- The Israel-Hamas war, hawkish Fed expectations underpin the Greenback and weigh on the major.
- Traders look to the US macro data for some impetus ahead of Fed Chair Jerome Powell’s speech.
The NZD/USD pair remains under heavy selling pressure for the third successive day – also marking the sixth day of a negative move in the previous seven – and dives to its lowest level since early November 2022 during the Asian session on Thursday. Spot prices currently trade around the 0.5825 region, down over 0.40% for the day, and seem vulnerable to prolonging the recent declining trend from the 0.6055 area, or the monthly peak touched last week.
The market sentiment remains fragile in the wake of growing concerns that the Israel-Hamas conflict could spill over into the Middle East region, especially after a Gaza hospital reportedly killed hundreds of Palestinians. This, in turn, is seen benefitting the safe-haven US Dollar (USD) and driving flows away from the risk-sensitive Kiwi. Apart from this, growing acceptance that the Federal Reserve (Fed) will keep interest rates higher for longer turns out to be another factor underpinning the Greenback and exerting downward pressure on the NZD/USD pair.
The upbeat US Retail Sales figures released on Tuesday suggested that the economy ended the third quarter on a strong note and lifted Q3 GDP estimates. The data also pushed up fears of sticky inflation, which could allow the Federal Reserve to stick to its hawkish stance and keep interest rates higher for longer. This, in turn, leads to an extended selloff in the US fixed-income market and continues to push the US Treasury bond yields higher. In fact, the yield on the benchmark 10-year government bond jumps to a fresh 16-year peak and moves close to the 5% threshold.
The current market pricing, however, points to a greater chance that the US central bank could hold interest rates steady for the second straight time in November. This, in turn, is holding back the USD bulls from placing aggressive bets, though does little to lend any support to the NZD/USD pair. Traders now look to the US macro data – Weekly Initial Jobless Claims, the Philly Fed Manufacturing Index and Existing Home Sales data – for a fresh impetus. The focus, however, will remain glued to Fed Chair Jerome Powell's scheduled speech later during the US session.
Technical levels to watch
- USD/MXN continues the winning streak as negative sentiment sours on the Israel-Hamas war.
- Banxico Deputy Governor Mejia has affirmed that the balance of inflation risks has not worsened.
- US Building Permits surpassed expectations, and Housing Starts rebounded in September.
USD/MXN extends the winning streak for the third consecutive session, trading higher around 18.2990 during the Asian session on Thursday. The pair gains ground due to the risk aversion amid the escalating Israel-Hamas military situation.
United States President Joe Biden’s visit to Israel has, so far, fallen short of easing the conflict. The recent explosion at a Gaza hospital, attributed to Israel, has heightened tensions, with Iran considering the imposition of an oil embargo on Israel and escalating its rhetoric against the country.
Bank of Mexico (Banxico) Deputy Governor Omar Mejia has affirmed that the balance of inflation risks has not worsened and highlighted that the existing restrictive monetary policy is successfully managing inflation. Mejia anticipates it to align with Banxico's target by the second quarter of 2025.
US Dollar Index (DXY) is indeed making a comeback, influenced by both economic data from the United States and the escalating Israel-Hamas conflict. The spot price hovers around 106.60, by the press time. However, dovish remarks from multiple Federal Reserve officials suggest a cautious stance, with reluctance to tighten monetary policy in the current economic scenario.
The US housing market is sending mixed signals, with Building Permits in September surpassing expectations, and Housing Starts rebounding, though slightly below the market consensus, adding complexity to the narrative.
Building Permits for September came in at 1.475 million, surpassing the expected 1.45 million. On the other hand, Housing Starts rebounded to 1.35 million, just shy of the market consensus of 1.38 million.
The Beige Book's observation indicating "little to no change" in economic activity during September and early October provides a broader perspective.
Thursday promises a significant infusion of economic insights in the US, featuring Existing Home Sales, the Philly Fed index, and the weekly Jobless Claims report. Additionally, traders are keeping a close eye on Mexico's Retail Sales for August, set to release on Friday, for potential trading opportunities around the USD/MXN pair.
- Gold price trades with a positive bias for the third successive day on Thursday.
- Geopolitical risks continue to underpin demand for the safe-haven XAU/USD.
- Hawkish Fed expectations, rising US bond yields and stronger USD cap gains.
Gold price (XAU/USD) gained strong positive traction on Wednesday and shot to its highest level since early August, around the $1,962-1,963 area in the wake of the risk of an escalation in the Middle East conflict. That said, a further rise in the US Treasury bond yields, bolstered by expectations that the Federal Reserve (Fed) will keep rates higher for longer, capped gains for the non-yielding yellow metal. Apart from this, a pickup in the US Dollar (USD) demand prompted some profit-taking at higher levels and led to a modest pullback.
The retracement slide, however, lacked follow-through and stalled near the $1,938 region. Geopolitical tensions continue to drive some haven flows, allowing the Gold price to trade in the positive territory for the third successive day on Thursday. That said, bulls seem reluctant to place aggressive bets and prefer to wait on the sidelines ahead of Fed Chair Jerome Powell's speech. Traders will look for fresh cues about the Fed’s future rate-hike path, which, in turn, will drive the USD and provide some meaningful impetus to the XAU/USD.
Daily Digest Market Movers: Gold price remains supported by the Israel-Hamas war
- The safe-haven Gold price continues to draw support from concerns that the Israel-Hamas conflict could spill over to the rest of the Middle East region.
- Egyptian and Palestinian leaders called off a summit with US President Joe Biden after a blast at a Gaza hospital reportedly killed hundreds of Palestinians.
- The UK Times reported that Israeli PM Netanyahu has won private backing from President Biden to press ahead with a ground invasion of Gaza.
- Biden said that the US will make sure Israel has what it needs to defend itself and that Hamas has committed atrocities that make ISIS look more rational.
- The upbeat US Retail Sales figures released on Tuesday suggested that the economy ended the third quarter on a strong note and lifted Q3 GDP estimates.
- The data also pushed up fears of sticky inflation, which could allow the Federal Reserve to stick to its hawkish stance and keep interest rates higher for longer.
- This, in turn, leads to a further rise in the US Treasury bond yields and continues to underpin the US Dollar, which is seen capping gains for the XAU/USD.
- The yield on the benchmark 10-year US government bond climbs to a fresh 16-year peak and moves well within the striking distance of the 5% psychological mark.
- Investors now look to the US Weekly Initial Jobless Claims, the Philly Fed Manufacturing Index and Existing Home Sales data for short-term impetus.
- The focus will remain glued to Fed Chair Jerome Powell's scheduled speech, which will be scrutinized closely for cues about the future rate hike path.
Technical Analysis: Gold price seems poised to build on its recent strong appreciating move
From a technical perspective, the overnight sustained breakout through the 200-day Simple Moving Average (SMA) and a subsequent strength beyond the $1,947-1,948 supply zone was seen as a fresh trigger for bulls. Moreover, oscillators on the daily chart are holding in the positive territory and are still far from being in the overbought zone. This, in turn, suggests that the path of least resistance for the Gold price is to the upside. That said, it will still be prudent to wait for some follow-through buying beyond the overnight swing high, around the $1,962-1,963 region, before positioning for any further gains. The XAU/USD might then accelerate the momentum towards the $1,982 intermediate hurdle and then aim to reclaim the $2,000 psychological mark for the first time since May.
On the flip side, weakness below the $1,948-1,947 area is likely to find decent support near the 200-day SMA, currently around the $1,930 region. This is closely followed by the 100-day SMA, around the $1,922 area ahead of the $1,930 support zone, below which the Gold price could slide back to challenge the $1,900 round figure. The latter coincides with the 50-day SMA and should act as a strong base for the XAU/USD. A convincing break below will negate the positive outlook and shift the near-term bias in favour of bearish traders.
US Dollar price in the last 7 days
The table below shows the percentage change of US Dollar (USD) against listed major currencies in the last 7 days. US Dollar was the strongest against the New Zealand Dollar.
| USD | EUR | GBP | CAD | AUD | JPY | NZD | CHF | |
| USD | 0.83% | 1.53% | 1.02% | 1.84% | 0.51% | 3.18% | -0.21% | |
| EUR | -0.85% | 0.69% | 0.17% | 1.00% | -0.33% | 2.36% | -1.06% | |
| GBP | -1.56% | -0.70% | -0.52% | 0.31% | -1.03% | 1.68% | -1.78% | |
| CAD | -1.03% | -0.20% | 0.51% | 0.80% | -0.52% | 2.18% | -1.26% | |
| AUD | -1.87% | -1.01% | -0.31% | -0.84% | -1.34% | 1.38% | -2.09% | |
| JPY | -0.51% | 0.32% | 1.02% | 0.51% | 1.35% | 2.68% | -0.72% | |
| NZD | -3.29% | -2.42% | -1.71% | -2.24% | -1.40% | -2.75% | -3.50% | |
| CHF | 0.21% | 1.06% | 1.74% | 1.22% | 2.02% | 0.72% | 3.38% |
The heat map shows percentage changes of major currencies against each other. The base currency is picked from the left column, while the quote currency is picked from the top row. For example, if you pick the Euro from the left column and move along the horizontal line to the Japanese Yen, the percentage change displayed in the box will represent EUR (base)/JPY (quote).
Gold FAQs
Why do people invest in Gold?
Gold has played a key role in human’s history as it has been widely used as a store of value and medium of exchange. Currently, apart from its shine and usage for jewelry, the precious metal is widely seen as a safe-haven asset, meaning that it is considered a good investment during turbulent times. Gold is also widely seen as a hedge against inflation and against depreciating currencies as it doesn’t rely on any specific issuer or government.
Who buys the most Gold?
Central banks are the biggest Gold holders. In their aim to support their currencies in turbulent times, central banks tend to diversify their reserves and buy Gold to improve the perceived strength of the economy and the currency. High Gold reserves can be a source of trust for a country’s solvency. Central banks added 1,136 tonnes of Gold worth around $70 billion to their reserves in 2022, according to data from the World Gold Council. This is the highest yearly purchase since records began. Central banks from emerging economies such as China, India and Turkey are quickly increasing their Gold reserves.
How is Gold correlated with other assets?
Gold has an inverse correlation with the US Dollar and US Treasuries, which are both major reserve and safe-haven assets. When the Dollar depreciates, Gold tends to rise, enabling investors and central banks to diversify their assets in turbulent times. Gold is also inversely correlated with risk assets. A rally in the stock market tends to weaken Gold price, while sell-offs in riskier markets tend to favor the precious metal.
What does the price of Gold depend on?
The price can move due to a wide range of factors. Geopolitical instability or fears of a deep recession can quickly make Gold price escalate due to its safe-haven status. As a yield-less asset, Gold tends to rise with lower interest rates, while higher cost of money usually weighs down on the yellow metal. Still, most moves depend on how the US Dollar (USD) behaves as the asset is priced in dollars (XAU/USD). A strong Dollar tends to keep the price of Gold controlled, whereas a weaker Dollar is likely to push Gold prices up.
- Crude oil prices snap the two-day winning streak on US- Venezuela oil deal
- US President’s office could implement relaxation on sanctions of Venezuela's oil and gas sector.
- OPEC stays silent on Iran's proposal for an oil embargo on Israel.
Western Texas Intermediate (WTI) oil price experiences a decline after two days of gains, trading lower around $86.80 per barrel during the Asian session on Thursday. This easing could be attributed to the US-Venezuela deal that would result in an increase in global Crude oil production.
United States (US) is considering exemptions to sanctions on Venezuelan oil exports, which is expected to lead to a significant surge in crude production in the OPEC country. Instead, it could divert barrels from its current primary destination, China.
The US President’s office is reportedly set to implement some substantial relaxation of energy-related sanctions for Venezuela's oil and gas sector in the near term. A senior US State Department official shared this information with Reuters on Wednesday.
American Petroleum Institute released the report of API Weekly Crude Oil Stock for the week ending on October 13, which showed a decline of 4.383M, swinging from the previous stock of 12.94M.
Additionally, OPEC remains unresponsive to Iran's proposal for an oil embargo on Israel, showing no indications of support for such a measure. The conflict in the Gaza Strip is intensifying following a rocket attack on a hospital that resulted in the death of over 500 civilians. Accusations are flying between Israel and Hamas regarding the explosion at the building.
US Dollar Index (DXY) is staging a comeback after recent losses, possibly influenced by economic data from the United States (US) and the escalating situation of the Israel-Hamas military conflict. The spot price beats around 106.50 at the time of writing.
However, dovish remarks from multiple Federal Reserve officials signaled a cautious stance by the central bank. There's a prevailing reluctance to tighten monetary policy amidst the current economic scenario.
The US housing market kept everyone on their toes with mixed signals. Building Permits in September surpassed expectations. Meanwhile, Housing Starts saw a rebound, though slightly below the market consensus, introducing a layer of complexity to the storyline.
Additionally, the Beige Book's observation mentioning "little to no change" in economic activity during September and early October provides a more comprehensive perspective.
Thursday is ready to deliver a significant infusion of economic insights to the US. On the agenda are Existing Home Sales, the Philly Fed index, and the weekly Jobless Claims report, offering a comprehensive examination of various economic aspects.
- Indian Rupee posts modest gains amid the further escalation of geopolitical tensions in the Middle East.
- The rising geopolitical tension between Israel-Hamas might limit the INR’s upward path.
- The Federal Reserve’s Beige Book update showed the US economic outlook had "little to no change" between September and early October.
The Indian Rupee (INR) edges higher against the US Dollar (USD) on Thursday. However, the further escalation of geopolitical tensions in the Middle East and the rise in oil prices might cap the upside of the Indian Rupee and benefit a safe-haven asset like the USD. Furthermore, the Indian Rupee might encounter challenges as a $5 billion RBI swap transaction is set to mature next week. Traders are concerned about the Dollar supply in the Indian banking system as the Reserve Bank of India (RBI) intends to buy USD for its reserves instead of extending the deal.
That being said, elevated oil prices might continue to linger as a risk factor for the Indian Rupee. Market participants will take more cues from the weekly US Jobless Claims and the Philly Fed index on Thursday. The Federal Reserve Chair Powell is also scheduled to speak. On Friday, the attention will shift to India’s FX Reserve and RBI Meeting Minutes.
Daily Digest Market Movers: Indian Rupee upside remains limited ahead of Fed Powell's speech
- The US Building Permits for September fell to 1.475M, above the estimated 1.45M.
- The US Housing Starts for the same period rose to 1.35M, below the market consensus of 1.38M.
- According to the Beige Book, US economic activity showed "little to no change" between September and early October.
- Federal Reserve (Fed) Governor Christopher Waller stated that it's too soon to tell if more policy rate action is needed while adding that the decision will depend on data.
- US Retail Sales for September rose by 0.7% MoM, beating the market consensus of 0.3%. Retail Sales Control Group climbed 0.6% MoM versus 0.2% prior.
Technical Analysis: Remains confined in a narrow trading band of 83.15-83.30
Indian Rupee has hovered in a narrow range between 83.15 and 83.30 this week. The USD/INR pair holds above the 100- and 200-day Exponential Moving Averages (EMA) on the daily chart, indicating that the path of least resistance for the pair is to the upside. Some follow-through buying could pave the way to the all-time highs around 83.45 en route to a psychological round mark at 84.00. On the downside, the 83.00–83.10 region acts as a critical support level for the USD/INR pair. A break below this support zone could lead to a drop in the pair towards 82.82 (low of September 12).
US Dollar price in the last 7 days
The table below shows the percentage change of US Dollar (USD) against listed major currencies in the last 7 days. US Dollar was the strongest against the New Zealand Dollar.
| USD | EUR | GBP | CAD | AUD | JPY | NZD | CHF | |
| USD | 0.82% | 1.48% | 0.98% | 1.82% | 0.53% | 3.07% | -0.22% | |
| EUR | -0.83% | 0.66% | 0.15% | 1.00% | -0.30% | 2.27% | -1.05% | |
| GBP | -1.50% | -0.66% | -0.51% | 0.34% | -0.97% | 1.62% | -1.73% | |
| CAD | -0.98% | -0.16% | 0.51% | 0.85% | -0.45% | 2.12% | -1.22% | |
| AUD | -1.85% | -1.02% | -0.34% | -0.86% | -1.31% | 1.28% | -2.07% | |
| JPY | -0.53% | 0.29% | 0.95% | 0.46% | 1.33% | 2.57% | -0.75% | |
| NZD | -3.17% | -2.32% | -1.65% | -2.18% | -1.30% | -2.64% | -3.40% | |
| CHF | 0.22% | 1.04% | 1.70% | 1.19% | 2.03% | 0.74% | 3.28% |
The heat map shows percentage changes of major currencies against each other. The base currency is picked from the left column, while the quote currency is picked from the top row. For example, if you pick the Euro from the left column and move along the horizontal line to the Japanese Yen, the percentage change displayed in the box will represent EUR (base)/JPY (quote).
RBI FAQs
What is the role of the Reserve Bank of India?
The role of the Reserve Bank of India (RBI), in its own words, is "..to maintain price stability while keeping in mind the objective of growth.” This involves maintaining the inflation rate at a stable 4% level primarily using the tool of interest rates. The RBI also maintains the exchange rate at a level that will not cause excess volatility and problems for exporters and importers, since India’s economy is heavily reliant on foreign trade, especially Oil.
How do the decisions of the Reserve Bank of India affect the Rupee?
The RBI formally meets at six bi-monthly meetings a year to discuss its monetary policy and, if necessary, adjust interest rates. When inflation is too high (above its 4% target), the RBI will normally raise interest rates to deter borrowing and spending, which can support the Rupee (INR). If inflation falls too far below target, the RBI might cut rates to encourage more lending, which can be negative for INR.
Does the Reserve Bank of India directly intervene in FX markets?
Due to the importance of trade to the economy, the Reserve Bank of India (RBI) actively intervenes in FX markets to maintain the exchange rate within a limited range. It does this to ensure Indian importers and exporters are not exposed to unnecessary currency risk during periods of FX volatility. The RBI buys and sells Rupees in the spot market at eys levels, and uses derivatives to hedge its positions.
- EUR/USD consolidates in a narrow trading band through the Asian session on Thursday.
- The fundamental backdrop and the technical setup support prospects for further losses.
- A convincing breakout through the descending channel hurdle will negate the bearish bias.
The EUR/USD pair struggles to gain any meaningful traction on Thursday and oscillates in a narrow band below mid-1.0500s through the Asian session. The fundamental backdrop, meanwhile, seems tilted in favour of bearish traders and suggests that the path of least resistance for spot prices is to the downside.
Growing acceptance that the Federal Reserve (Fed) will hold rates higher for longer in the wake of a resilient US economy and to bring inflation back to its 2% target push the benchmark 10-year Treasury yield to a fresh 16-year peak. This, along with the risk of an escalation in war between Hamas and Israel, continues to underpin the US Dollar (USD). Apart from this, speculations that further rate hikes by the European Central Bank (ECB) may be off the table validate the negative outlook for the EUR/USD pair.
Even from a technical perspective, the recent failures near the top boundary of a downward-sloping channel extending from a 17-month peak touched in June point to a well-established short-term bearish trend. Moreover, oscillators on the daily chart, though have been recovering from lower levels, are still holding in the negative territory. This, in turn, supports prospects for an extension of this week's downfall from the vicinity of the 1.0600 mark and a further depreciating move for the EUR/USD pair.
Hence, a slide back towards retesting the weekly low, around the 1.0500 psychological mark, looks like a distinct possibility. Some follow-through selling will be seen as a fresh trigger for bearish traders and drag the EUR/USD pair back to the YTD trough, around the 1.0450-1.0445 region touched earlier this month.
On the flip side, the 1.0600 mark, which now coincides with the descending trend-channel resistance, should continue to act as an immediate strong barrier. A convincing breakout should allow the EUR/USD pair to surpass the monthly peak, around the 1.0635 region and aim to reclaim the the1.0700 mark, representing the 50-day Simple Moving Average (SMA). The latter should act as a key pivotal point, which if cleared decisively will suggest that spot prices have formed a near-term bottom and pave the way for additional gains.
EUR/USD daily chart
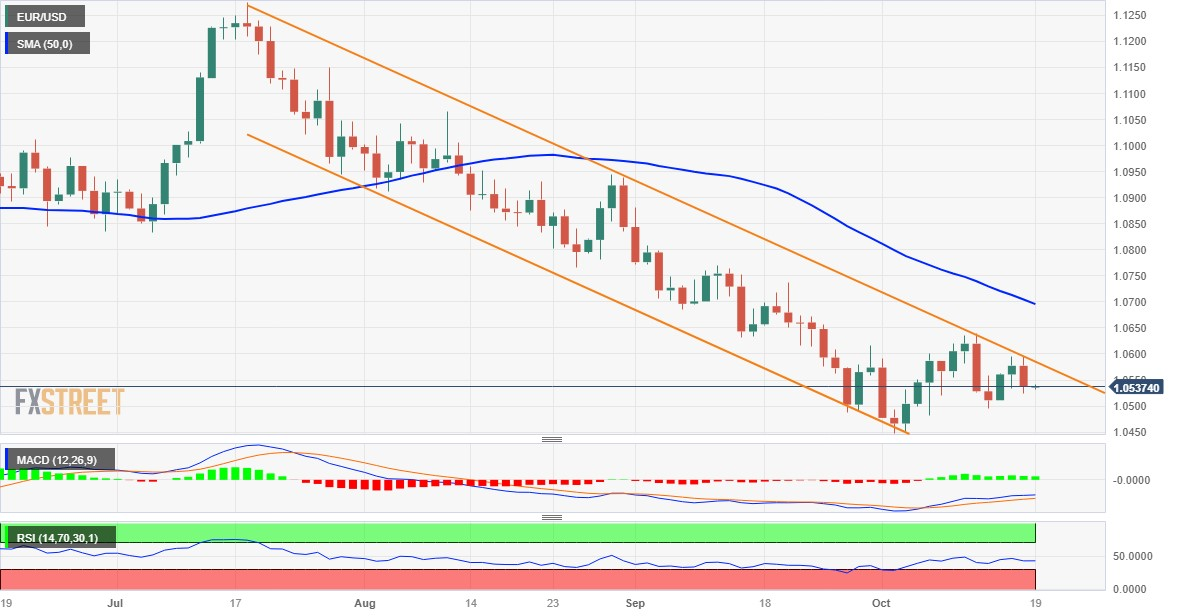
Technical levels to watch
| Raw materials | Closed | Change, % |
|---|---|---|
| Silver | 22.831 | 0.21 |
| Gold | 1947.756 | 1.27 |
| Palladium | 1128.89 | -0.69 |
Japan’s Chief Cabinet Secretary Hirokazu Matsuno said on Thursday, he is “concerned about the possible negative impact to economy, households from higher oil prices.”
Further comments
PM Kishida did not discuss issue of oil market stability in recent call with Saudi Crown Prince
Expect oil producing countries to continue to work towards stability in global market.
Market reaction
USD/JPY is keeping its range below 150.00 on the above comments, marginally lower on the day.
- USD/CAD extends gains on the third successive day due to risk aversion.
- Canada’s Housing Starts increased to 270.5K against the market expectations of 240.0K and the previous 250.4K.
- Higher US Treasury yields provide support to underpinning the US Dollar.
USD/CAD extends the winning streak on the third successive day, trading higher near 1.3720 during the Asian session on Thursday. Despite the better-than-expected Canada housing data, the pair receives upward support due to the risk-on sentiment.
Canada Mortgage and Housing Corporation released Housing Starts s.a (YoY) for September, increasing to 270.5K against the market expectations of 240.0K and the previous 250.4K. Moreover, the Loonie Dollar (CAD) is on a downward slide, dancing hand in hand with declining Crude Oil prices.
The conflict in the Gaza Strip is intensifying following a rocket attack on a hospital that resulted in the death of over 500 civilians. Accusations are flying between Israel and Hamas regarding the explosion at the building.
US Dollar Index (DXY) is staging a comeback after recent losses, possibly influenced by economic data from the United States (US). Adding to the intrigue, there are dovish remarks from multiple Federal Reserve officials, signaling a cautious stance by the central bank. There's a prevailing reluctance to tighten monetary policy amidst the current economic climate.
The US housing market is a bit of a rollercoaster, keeping everyone on their toes with mixed signals. On the positive side, Building Permits in September surpassed expectations, painting a rosy scenario. Meanwhile, Housing Starts saw a rebound, though slightly below the market consensus, introducing a layer of complexity to the storyline.
To broaden the view, the Beige Book's observation noting "little to no change" in economic activity during September and early October provides a more comprehensive perspective.
Thursday is gearing up to deliver a significant infusion of economic insights to the US. On the agenda are Existing Home Sales, the Philly Fed index, and the weekly Jobless Claims report, offering a comprehensive examination of various economic aspects. Canada’s Retail Sales will be eyed on Friday.
- USD/JPY meets with some supply on Thursday and snaps a three-day winning streak.
- Intervention fears and the Israel-Hamas war underpin the JPY and exert some pressure.
- Hawkish Fed expectations continue to benefit the USD and should limit deeper losses.
The USD/JPY pair attracts some sellers during the Asian session on Thursday and for now, seems to have snapped a three-day winning streak back closer to the 150.00 psychological mark. Spot prices currently trade around the 149.75 region, down just over 0.10% for the day, though the downside seems cushioned in the wake of the underlying bullish sentiment surrounding the US Dollar (USD).
Firming expectations that the Federal Reserve (Fed) will hold rates higher for longer in the wake of a still resilient US economy and to bring inflation back to its 2% target continue to push the US Treasury bond yields higher. In fact, the yield on the benchmark 10-year US government bond touches a fresh 16-year peak, which, in turn, is seen underpinning the Greenback and lending some support to the USD/JPY pair.
The upside, however, seems limited on the back of speculations that Japan will intervene in the FX market to combat a sustained depreciation in the Japanese Yen (JPY). Apart from this, the risk of an escalation in the war between Hamas and Israel could further benefit the safe-haven JPY and contribute to capping any meaningful appreciating move for the USD/JPY pair. Traders now look to Fed Chair Jerome Powll's speech for a fresh impetus.
Market participants will look for cues about the Fed's future rate-hike path, which will play a key role in influencing the USD price dynamics and determining the near-term trajectory for the major. Heading into the key event risks, traders might look to the US economic data – the usual Weekly Initial Jobless Claims, the Philly Fed Manufacturing Index and Existing Home Sales data to grab short-term opportunities around the USD/JPY pair.
Nevertheless, the aforementioned fundamental backdrop, along with the Bank of Japan's dovish stance, suggests that the path of least resistance for spot prices remains to the upside. In fact, the Japanese central bank retains its view that inflation is transient and has no plans to phase out its massive monetary stimulus. Hence, any subsequent USD/JPY fall could be seen as a buying opportunity and is more likely to remain limited.
Technical levels to watch
Following its October monetary policy meeting on Thursday, the Bank of Korea (BoK) kept the key base rate unchanged at 3.50%, extending its pause into a sixth meeting in a row.
Summary of the statement
Will maintain restrictive policy stance for considerable time.
To monitor inflation slowdown.
To monitor financial stability risks.
South korea economy to grow as projected earlier.
To monitor economic downside risks.
To monitor monetary policy changes in major countries.
Uncertainties to growth path high.
To monitor household debt growth.
See upside risks to inflation.
Middle east crisis adds to uncertainties for South Korea.
To monitor developments in geopolitical risks.
Might take longer to reach target inflation level.
USD/KRW reaction to the BoK rate decision
USD/KRW caught a fresh bid wave and jumped to hit intraday highs of 1,358.28 on the BoK policy announcement. At the time of writing, the pair is trading 0.09% higher at 1,356.42.
The People’s Bank of China (PBoC) set the USD/CNY central rate for the trading session ahead on Thursday at 7.1795, same as the previous day's fix, and 7.3226 Reuters estimate.
- GBP/USD is seen consolidating in a range near the lower end of a one-week-old trading range.
- The uncertainty over the BoE’s next policy move continues to act as a headwind for the GBP.
- Hawkish Fed expectations, geopolitical risks underpin the USD and also contribute to capping.
- Investors keenly await Fed Chair Jerome Powell’s speech before placing fresh directional bets.
The GBP/USD pair struggles to gain any meaningful traction on Thursday and oscillates in a narrow band, below mid-1.2100s during the Asian session. Spot prices flirt with the lower end of a one-week-old trading range, awaiting a fresh catalyst before the next leg of a directional move.
The British Pound (GBP) continues with its relative underperformance in the wake of the uncertainty over the next policy move by the Bank of England (BoE), which, in turn, is seen as a key factor acting as a headwind for the GBP/USD pair. The latest UK consumer inflation figures released on Wednesday showed that the headline CPI remained steady at 6.7% in September against expectations for a modest dip to 6.6%, riving bets for a potential BoE rate hike in November. The UK Office for National Statistics (ONS), meanwhile, reported earlier this week that wage growth moderated slightly in the three months to August, which might allow the BoE to hold interest rates at their current level.
This comes on top of the BoE's chief economist, Huw Pill's comments last week, saying that the question of further rate rises was finely balanced. Furthermore, BoE policymaker Swati Dhingra cautioned that overtightening could potentially harm the UK's supply potential, while Catherine Mann advocated for an aggressive monetary policy to combat inflation. The split in the BoE's Monetary Policy Committee (MPC) regarding how to respond to the incoming economic indicators is holding back traders from placing fresh directional bets around the GBP/USD pair ahead of the second batch of labour market data due next Tuesday. In the meantime, a bullish US Dollar (USD) might continue to cap the upside.
The Greenback continues to draw support from growing acceptance that the Federal Reserve (Fed) will keep interest rates higher for longer in the wake of a still-resilient US economy. The outlook, meanwhile, lifted the benchmark 10-year US Treasury yield to a fresh 16-year peak on Wednesday, which, along with the risk of an escalation in war between Hamas and Israel, is seen underpinning the safe-haven buck. This further contributes to capping the upside for the GBP/USD pair. That said, the lack of strong follow-through selling warrants some caution for bearish traders as the focus remains glued to Fed Chair Jerome Powell's scheduled speech later during the North American session.
Technical levels to watch
- Australian Dollar continues to lose after the release of jobs figures by the Australian Bureau of Statistics.
- Governor Bullock stated to take responsive policy measures if inflation persists.
- US housing market is currently presenting a puzzle with conflicting signals, keeping observers on alert.
The Australian Dollar (AUD) continues the losses against the US Dollar (USD) on mixed employment data released by the Australian Bureau of Statistics on Thursday. The AUD/USD pair halted its two-day winning streak in the previous session amid a speech by Reserve Bank of Australia (RBA) Governor Michele Bullock.
Australia's employment landscape seems to be experiencing a bit of a twist. In September, the Employment Change dropped more than anticipated, introducing an unexpected element to the equation. On the flip side, the Unemployment Rate took a more positive turn by falling more than expected, deviating from the anticipated consistency.
The US Dollar Index (DXY) rebounds from the recent losses, and this could be attributed to the economic data from the United States (US). The plot thickens with the dovish remarks coming from several Federal Reserve officials, indicating a cautious stance by the central bank. It seems there's a prevailing sentiment of reluctance when it comes to tightening monetary policy in the current economic climate.
The US housing market seems to be keeping everyone on their toes with mixed signals. On one hand, the Building Permits in September came in better than expected, suggesting a positive scenario. Meanwhile, Housing Starts rebounded, albeit slightly below the market consensus, adding a layer of complexity to the narrative.
The Beige Book's observation about economic activity showing "little to no change" during September and early October adds a broader perspective.
Daily Digest Market Movers: Australian Dollar extends losses after the release of employment data
- Australia's central bank expresses heightened concern about the inflation impact stemming from supply shocks. Governor Bullock stated that if inflation persists above projections, the RBA will take responsive policy measures. There is an observable deceleration in demand, and per capita consumption is on the decline.
- Australian Weekly ANZ Roy Morgan Consumer Confidence survey, released on Tuesday, indicates a decline in the nation's Consumer Confidence. The reading fell to 76.4 compared to the previous figure of 80.1. The decline is observed across all sub-indices, reflecting a more cautious or negative sentiment among consumers.
- RBA’s board members acknowledged in October's meeting minutes that there were significant concerns about upside risks to inflation. This suggests that the board is cautious about potential factors that could lead to an increase in inflation.
- The ongoing conflict in the Middle East introduces an additional layer of complexity to the situation. This geopolitical factor could potentially prompt the RBA to implement a 25 basis points (bps) interest rate hike, reaching 4.35% by the end of the year.
- China's Gross Domestic Product surpassed expectations, showing a growth of 1.3% compared to the anticipated 1.0%. The annual report for the same quarter revealed an increase of 4.9%, exceeding the expected 4.4%.
- Furthermore, China's Retail Sales (YoY) demonstrated a rise of 5.5%, surpassing both the previous figure of 4.6% and the expected 4.9%.
- The US Bureau of Economic Analysis (BEA) disclosed that Retail Sales exceeded expectations of 0.3% MoM, which increased to 0.7% in September. While Retail Sales Control Group rose by 0.6% compared to the previous hike of 0.2%.
- This robust performance underscores the resilience of consumers. Subsequently, the Federal Reserve reported that Industrial Production showed improvement by 0.3%, which was expected to remain at 0.0%.
- Richmond Fed President Thomas Barkin noted that current policy is already restrictive. Barkin expressed uncertainty about the upcoming FOMC monetary policy meeting in November. He emphasized that the US central bank cannot depend on longer-term higher bond yields alone to tighten monetary conditions.
- Federal Reserve Bank of Philadelphia President Patrick Harker stated on Monday that the central bank should avoid creating new pressures in the economy by increasing the cost of borrowing. Harker further expressed the view that in the absence of a significant shift in the data, the Fed should maintain interest rates at their current levels.
- The higher US Treasury yields from recent losses could provide support to the US Dollar. The 10-year US Treasury bond yield stands at 4.92%, by the press time.
- Additionally, the USD continues to benefit from safe-haven flows amid rising geopolitical tensions between Israel and Palestine. Safe-haven currencies, including the US Dollar, tend to attract demand during periods of heightened uncertainty and geopolitical risks.
- Thursday seems set to bring a substantial dose of economic insights to the US. Existing Home Sales, the Philly Fed index, and the weekly Jobless Claims report are on the docket, promising a comprehensive look at different facets of the economy. If these indicators continue to signal a robust economy and a labor market that's holding tight, it could very well keep the US Dollar in demand.
Technical Analysis: Australian Dollar moves below the 0.6350 major level on mixed Australian data
The Australian Dollar trades lower around 0.6320 during the Asian session on Thursday. The 0.6300 emerges as the significant support level, which aligns with the monthly low at 0.6285. On the upside, a crucial resistance is observed at the 21-day Exponential Moving Average (EMA) around the 0.6371 level aligned with the major level of 0.6400. A break above the level could reach the region around the 23.6% Fibonacci retracement level at 0.6429. These technical indicators provide traders with insights into potential resistance zones that could influence the direction of the Aussie Dollar.
AUD/USD: Daily Chart
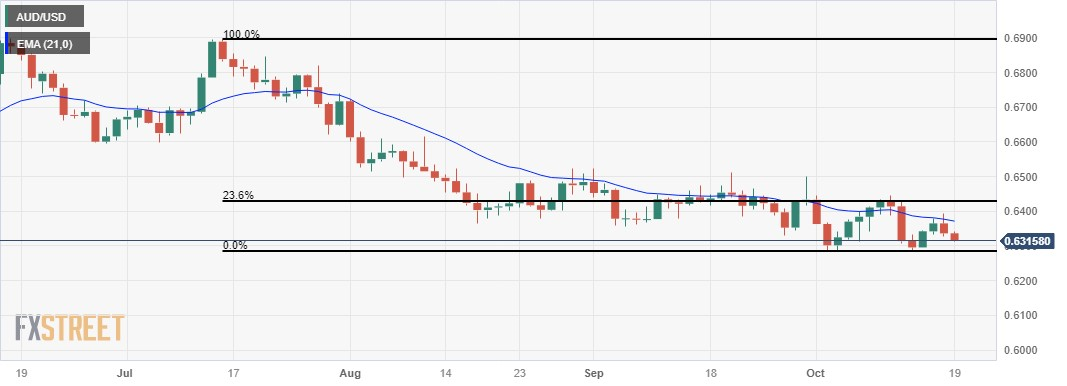
Australian Dollar FAQs
What key factors drive the Australian Dollar?
One of the most significant factors for the Australian Dollar (AUD) is the level of interest rates set by the Reserve Bank of Australia (RBA). Because Australia is a resource-rich country another key driver is the price of its biggest export, Iron Ore. The health of the Chinese economy, its largest trading partner, is a factor, as well as inflation in Australia, its growth rate and Trade Balance. Market sentiment – whether investors are taking on more risky assets (risk-on) or seeking safe-havens (risk-off) – is also a factor, with risk-on positive for AUD.
How do the decisions of the Reserve Bank of Australia impact the Australian Dollar?
The Reserve Bank of Australia (RBA) influences the Australian Dollar (AUD) by setting the level of interest rates that Australian banks can lend to each other. This influences the level of interest rates in the economy as a whole. The main goal of the RBA is to maintain a stable inflation rate of 2-3% by adjusting interest rates up or down. Relatively high interest rates compared to other major central banks support the AUD, and the opposite for relatively low. The RBA can also use quantitative easing and tightening to influence credit conditions, with the former AUD-negative and the latter AUD-positive.
How does the health of the Chinese Economy impact the Australian Dollar?
China is Australia’s largest trading partner so the health of the Chinese economy is a major influence on the value of the Australian Dollar (AUD). When the Chinese economy is doing well it purchases more raw materials, goods and services from Australia, lifting demand for the AUD, and pushing up its value. The opposite is the case when the Chinese economy is not growing as fast as expected. Positive or negative surprises in Chinese growth data, therefore, often have a direct impact on the Australian Dollar and its pairs.
How does the price of Iron Ore impact the Australian Dollar?
Iron Ore is Australia’s largest export, accounting for $118 billion a year according to data from 2021, with China as its primary destination. The price of Iron Ore, therefore, can be a driver of the Australian Dollar. Generally, if the price of Iron Ore rises, AUD also goes up, as aggregate demand for the currency increases. The opposite is the case if the price of Iron Ore falls. Higher Iron Ore prices also tend to result in a greater likelihood of a positive Trade Balance for Australia, which is also positive of the AUD.
How does the Trade Balance impact the Australian Dollar?
The Trade Balance, which is the difference between what a country earns from its exports versus what it pays for its imports, is another factor that can influence the value of the Australian Dollar. If Australia produces highly sought after exports, then its currency will gain in value purely from the surplus demand created from foreign buyers seeking to purchase its exports versus what it spends to purchase imports. Therefore, a positive net Trade Balance strengthens the AUD, with the opposite effect if the Trade Balance is negative.
According to the official data released by the Australian Bureau of Statistics (ABS) on Thursday, Australia’s Unemployment Rate came in at 3.6% in September, compared with the expectations of 3.7% and the previous figure of 3.7%.
The Australian Employment Change arrived at 6.7K in September, compared with the consensus forecast of 20K and 64.9K jobs addition seen in August.
Market reaction
AUD/USD edges lower on the mixed Australian jobs data. At the time of press, the pair was down 0.31% on the day at 0.6317.
| Index | Change, points | Closed | Change, % |
|---|---|---|---|
| NIKKEI 225 | 1.96 | 32042.25 | 0.01 |
| Hang Seng | -40.82 | 17732.52 | -0.23 |
| KOSPI | 2.43 | 2462.6 | 0.1 |
| ASX 200 | 21.5 | 7077.6 | 0.3 |
| DAX | -156.78 | 15094.91 | -1.03 |
| CAC 40 | -63.71 | 6965.99 | -0.91 |
| Dow Jones | -332.57 | 33665.08 | -0.98 |
| S&P 500 | -58.6 | 4314.6 | -1.34 |
| NASDAQ Composite | -219.45 | 13314.3 | -1.62 |
| Pare | Closed | Change, % |
|---|---|---|
| AUDUSD | 0.63353 | -0.47 |
| EURJPY | 157.858 | -0.34 |
| EURUSD | 1.05363 | -0.38 |
| GBPJPY | 181.902 | -0.31 |
| GBPUSD | 1.21406 | -0.34 |
| NZDUSD | 0.58563 | -0.68 |
| USDCAD | 1.37119 | 0.47 |
| USDCHF | 0.89881 | -0.14 |
| USDJPY | 149.838 | 0.04 |
- Gold price holds positive ground near $1,950 amid the escalating tension and cautious mood.
- The Fed officials reiterated their preference to maintain the interest rates.
- The escalating geopolitical tensions in the Middle East could lift safe-haven flows.
Gold price (XAU/USD) hovers around $1,950 after retreating from the two-month highs of 1,962 during the early Asian trading hours on Thursday. The rally in the precious metal is bolstered by the rising geopolitical tension in the Middle East, which boosts the safe-haven flows.
Meanwhile, the US Dollar Index (DXY), a measure of the value of USD against six other major currencies, climbs to 106.55. US Treasury yields edge higher, with the 10-year Treasury yield surging to 4.911%, the highest level since 2007, and the 2-year Treasury yield staying at 5.229%.
On Wednesday, the Fed officials reiterated their preference to keep rates on hold. These comments lift the US bond yields higher amid robust momentum in US growth. Federal Reserve (Fed) Governor Christopher Waller stated that it's too soon to tell if more policy rate action is needed while adding that the central bank can wait, watch, and see before deciding on a policy path. While Fed Bank of New York John Williams said the central bank needs restrictive monetary policy for a while to cool inflation and the path of monetary policy depends on the data.
Furthermore, the geopolitical conflict between Israel and Hamas remains in focus. On Tuesday, Gaza authorities said an Israeli air attack on Tuesday killed 500 people at a hospital in the Palestinian territory, while Israel stated the damage was caused by a Palestinian attack. The escalating geopolitical tensions in the Middle East and the uncertainty in the market could boost the demand for a traditional safe-haven asset such as gold.
Gold traders will monitor the US Jobless Claims and the Philly Fed index and Existing Home Sales due later on Thursday. Also, Fed Chair Powell is scheduled to speak. Market players will take cues from the data and find trading opportunities around gold price.


© 2000-2026. Уcі права захищені.
Cайт знаходитьcя під керуванням TeleTrade DJ. LLC 2351 LLC 2022 (Euro House, Richmond Hill Road, Kingstown, VC0100, St. Vincent and the Grenadines).
Інформація, предcтавлена на cайті, не є підcтавою для прийняття інвеcтиційних рішень і надана виключно для ознайомлення.
Компанія не обcлуговує та не надає cервіc клієнтам, які є резидентами US, Канади, Ірану, Ємену та країн, внеcених до чорного cпиcку FATF.
Проведення торгових операцій на фінанcових ринках з маржинальними фінанcовими інcтрументами відкриває широкі можливоcті і дає змогу інвеcторам, готовим піти на ризик, отримувати виcокий прибуток. Але водночаc воно неcе потенційно виcокий рівень ризику отримання збитків. Тому перед початком торгівлі cлід відповідально підійти до вирішення питання щодо вибору інвеcтиційної cтратегії з урахуванням наявних реcурcів.
Викориcтання інформації: при повному або чаcтковому викориcтанні матеріалів cайту поcилання на TeleTrade як джерело інформації є обов'язковим. Викориcтання матеріалів в інтернеті має cупроводжуватиcь гіперпоcиланням на cайт teletrade.org. Автоматичний імпорт матеріалів та інформації із cайту заборонено.
З уcіх питань звертайтеcь за адреcою pr@teletrade.global.
переклади