- Аналітика
- Новини та інструменти
- Новини ринків
Новини ринків
Japan's top currency diplomat Masato Kanda came out with verbal intervention remarks early Wednesday, according to Reuters.
Key quotes
“Dealing appropriately with FX moves”
“Closely communicating with us, overseas FX authorities”
“Closely watching FX moves with high sense of urgency”
“Japan is closely communicating with US authorities over forex on a regular basis”
“Shared mutual understanding that excessive forex move undesirable”
Market reaction
At the time of writing, USD/JPY is trading at 147.70 down 0.10% on the day.
- Poland is set for a critical parliamentary election, and the NBP's surprise rate cut continues to weaken the PLN.
- Poland's ruling Law & Justice party is facing down headwinds from a Ukrainian grain import ban.
- The Polish government, which campaigned on a platform of being tough on immigration, has been seen selling visas for profit.
The USD/PLN remains pinned to the upside ahead of the Federal Reserve’s (Fed) much–anticipated rate call on Wednesday. The Polish Zloty (PLN) remains a beleaguered currency as central bank blunders, European Union (EU) infighting, and government scandals knock around the currently ruling Law & Justice (PiS) party of Poland heading into next month’s critical parliamentary election.
The National Bank of Poland (NBP) recently slashed interest rates to the confusion of market participants everywhere, given the Polish inflation rate still remains above 10%. The Governor of the NBP, Adam Glapinski, has been accused of using the central bank’s authority to bolster support for the PiS.
Adam Glapinski is an open supporter of the PiS, and the surprise rate cut was seen as a way to temporarily ease borrowing and lending costs to improve the vote for the PiS in the upcoming election.
Poland recently moved to ban additional imports of Ukrainian grain, citing a need to protect their economy and their domestic farmers. Shipments of Ukrainian grains have increased in recent months as the Russian blockade of Ukrainian exports sees market excess sloshing into neighboring countries.
The European Union (EU) recently allowed a ban on Ukrainian grain excess to lapse, and Poland is coming under fire after President Andrzej Duda announced that Warsaw would simply disregard orders from Brussels and introduce their own ban on Ukrainian grain.
Poland, along with several other countries in the Eastern EU, are facing formal charges and lawsuits from Ukraine in both the EU trade courts and the World Trade Organization (WTO) over the grain bans.
President Andrzej Duda and the PiS dealt themselves a political blow this week after allegations of the country selling visas for profit to migrants who then used the credentials to travel to countries they would normally be banned from.
The PiS has undergone damage control, unexpectedly firing the part’s foreign minister for consular affairs, and terminating all contracts for external companies that handle visa processing. The head of the Polish foreign ministry’s legal and compliance department was also terminated.
Everything comes just as Poland is about to face an intense parliamentary election, where the PiS is seen struggling to maintain its vote share.
USD/PLN technical outlook
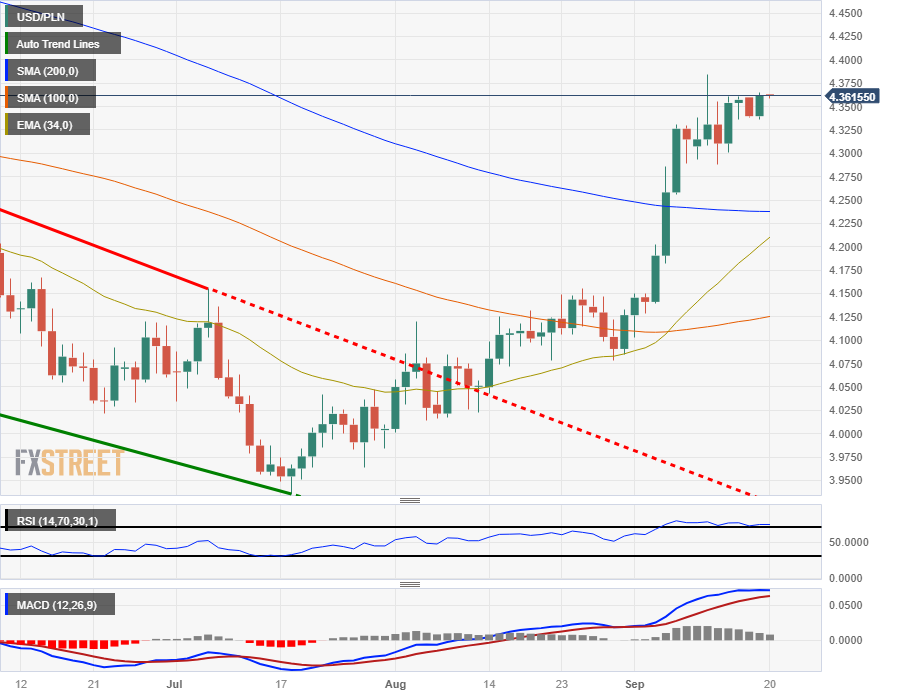
The Polish Zloty has struggled as of late, and continues to fall backwards against the Greenback (USD).
The USD/PLN pair is tapping into recent highs just north of 4.36, and an extended push could see the pair set to challenge fresh six-month highs above last week’s peak of 4.3841.
The pair’s technical stance remains firmly bullish, with both the Relative Strength Index (RSI) and Moving Average Convergence-Divergence (MACD) indicators all but breaking their seals in overbought territory.
The 200-day Simple Moving Average is currently providing support from 4.2377, and the 34-day Exponential Moving Average is racing to cross over into a bullish confirmation, currently pricing in near 4.2100.
USD/PLN daily chart
USD/PLN technical outlook
On Tuesday, US Treasury Secretary Janet Yellen stated that the US would show understanding over another yen-buying intervention by Japan "depends on the details" of the situation, according to Reuters.
Key quotes
"We usually communicate with them about these interventions and generally understand the need to smooth out following undue volatility, but not to attempt to influence the level of exchange rates,"
"So it depends very much on the details in our discussions with the Japanese,”
Market reaction
USD/JPY consolidates near 147.72 following the above the report. The pair is down 0.09% on the day.
- AUD/JPY rallies to 95.64, its highest level in one-and-a-half months, buoyed by RBA’s latest monetary policy minutes.
- Following resistance levels in sight: July 25 swing high at 95.85 and the psychological 96.00 mark.
- Downside risks remain, with key support levels at the Ichimoku Cloud top at 94.74 and the Tenkan-Sen line at 94.60.
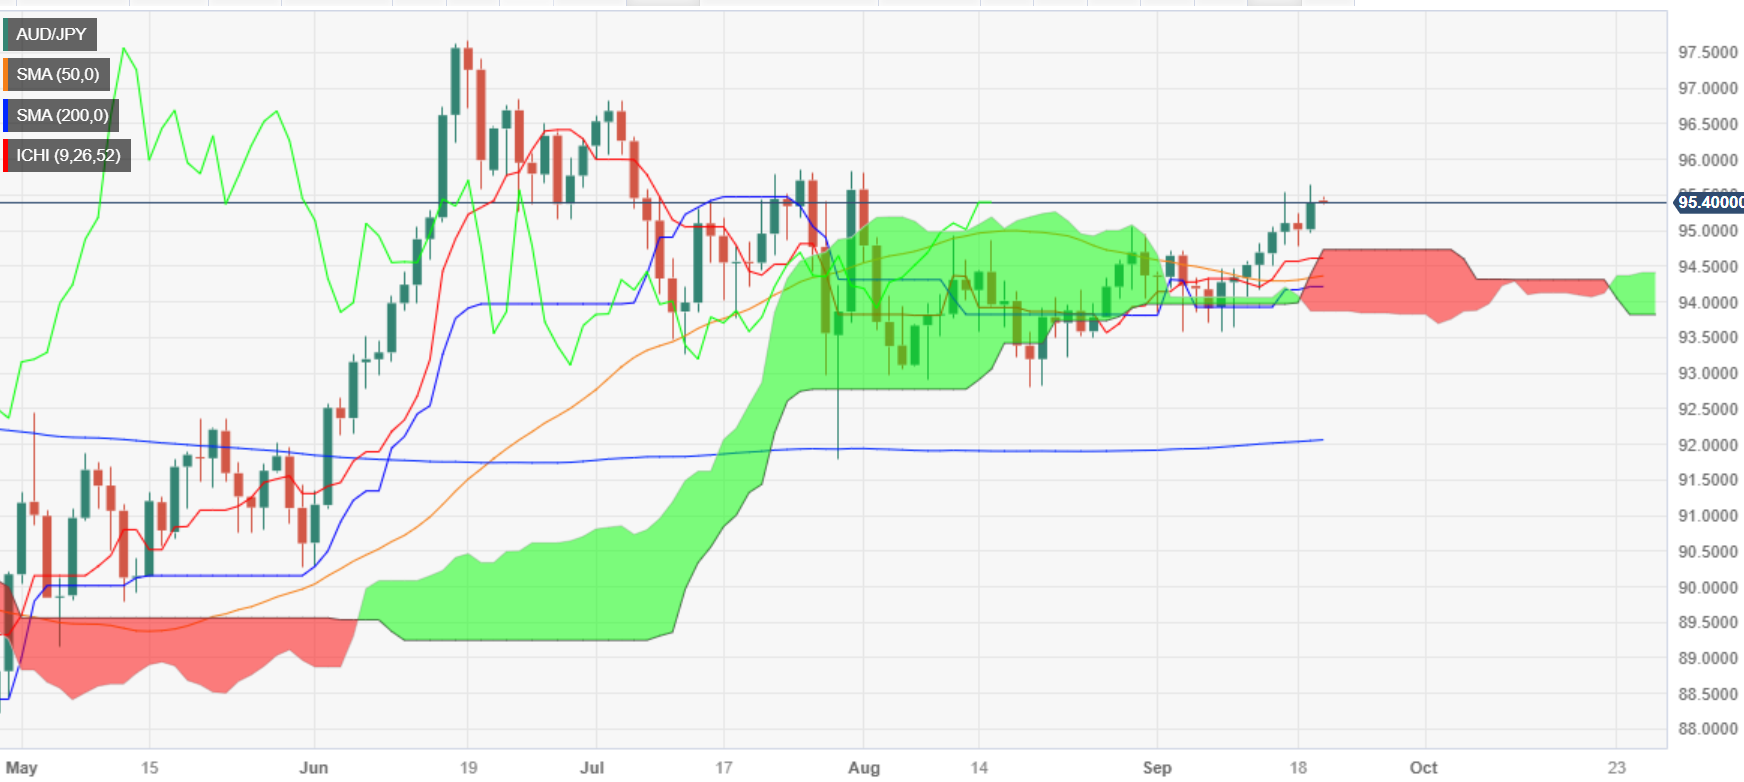
The AUD/JPY printed solid gains on Tuesday, and as Wednesday’s Asian session begins, the cross-currency pair hovers around 95.39 after touching a new one-and-a-half-month high at 95.64.
The AUD/JPY daily chart portrays the pair as neutral to upward biased. Even though it formed a ‘bearish-harami’ until yesterday, the cross-currency pair extended its gains due to fundamental news, such as the latest Reserve Bank of Australia (RBA) monetary policy minutes. Discussions amongst the RBA members kept the door open for additional tightening and sparked Tuesday’s rally.
Hence, the AUD/JPY extended its gains and is set to test the July 25 swing high at 95.85. A breach of the latter would expose the 96.00 mark, followed by last year’s high at 97.67. Conversely, if the cross retreats below 95.00, the next support would emerge at the top of the Ichimoku Cloud (Kumo) at 94.74, followed by the Tenkan-Sen line at 94.60, and followed by the Kijun-Sen at 94.21.
AUD/JPY Price Action – Daily chart
AUD/JPY Technical Levels
- AUD/USD posts modest gain just above the mid-0.6400s ahead of the US key event.
- The Federal Reserve (Fed) is widely expected to hold the interest rates in the 5.25% to 5.5% range.
- Reserve Bank of Australia's (RBA) said additional tightening may be necessary if inflation proves more persistent than anticipated.
- Market players await Australian Westpac Leading Index, the People's Bank of China (PBoC) interest rate decision and Fed decision.
The AUD/USD pair edges higher during the early Asian session on Wednesday. Market players await the highly-anticipated the Federal Reserve (Fed) monetary policy meeting. The pair currently trades around 0.6455, gaining 0.04% on the day.
The Federal Reserve (Fed) is scheduled to announce the two-day monetary policy meeting on Wednesday and is widely expected to hold the interest rates in the 5.25% to 5.5% range.This, in turn, might exert some selling pressure on the Greenback (USD) and acts as a tailwind for the AUD/USD pair. On Tuesday, the US Census Bureau revealed that the US housing industry revealed mixed results in August. Housing Starts fell 11.3%, while building permits surged 6.9%.
On the Aussie front, the release of the Minutes from the Reserve Bank of Australia's (RBA) September monetary policy meeting revealed on Tuesday that additional tightening may be necessary if inflation proves more persistent than anticipated. However, the case for maintaining the status quo was stronger, and recent data have not materially altered the economic outlook.
Furthermore, the People's Bank of China (PBoC) will announce the interest rate decision on Wednesday in Asian session. Chinese central bank is expcted to keep its benchmark lending rate unchanged. Any signs from the Chinese authorities about the additional stimulus plans to deal with the the property crisis might lift the China-proxy Australia Dollar (AUD) against the USD.
Looking ahead, market participants will keep an eye on the Australian Westpac Leading Index for August for fresh impetus ahead of the People's Bank of China (PBoC) interest rate decision later in Asian session. The attention will shift to the Fed interest rate decision on Wednesday at 18:00 GMT. These events could give a clear direction to the AUD/USD pair.
- The EUR/GBP stepped back on Tuesday after a bullish breakout to kick off the week.
- The midweek sees UK inflation figures, and a rate hike from the BoE.
- Friday will cap off the economic calendar with UK Retail Sales, PMI figures for both currencies.
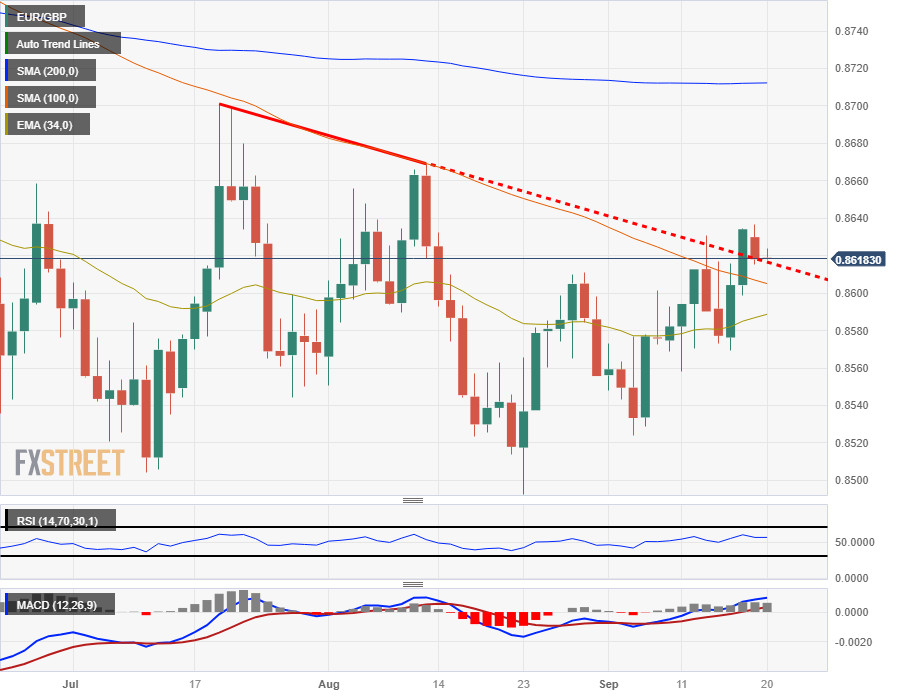
The EUR/GBP took a dip on Tuesday after starting the week strong, and the pair is backing into the 0.8620 neighborhood after the week kicked off with a decisive bullish breakout that couldn’t maintain momentum.
It’s a hectic week for the Pound Sterling (GBP) on the economic calendar. Wednesday will see inflation figures with the Consumer Price Index (CPI) expected to show an uptick to 0.7% from the previous decline of -0.4% for the month of Aug.
The annualized CPI figure for August is also expected to ramp up, forecast to print at 7.1% versus the previous 6.8%.
The UK is broadly expected to suffer from the stickiest, most stubborn inflation of all the advanced economies, and the Bank of England (BoE) will have its work cut out for it as it tries to rope in inflation without cutting the knees out from under the UK’s economy.
BoE benchmark rate to climb once more on Thursday
The BoE is expected to raise its benchmark interest rate by another 25 basis points on Thursday, bringing the headline interest rate to 5.5%.
Friday will close out the week with a bang, with UK Retail Sales expected to show further increases, as well as Purchasing Manager Index (PMI) figures that are slated on the docket for both the EU and the UK.
EUR/GBP technical outlook
The EUR/GBP kicked the week off with a bullish break of the descending trendline from July’s swing high of 0.8700, but momentum is proving a fickle beast ahead of a data-heavy back of the week.
The EUR hasn’t been able to maintain a firm hold of the pairing, despite the recent lift from August’s bottom near 0.8500, and the trendline break could work out to be temporary if GBP bulls find their feet heading into the back half of the week.
EUR/GBP daily chart
EUR/GBP technical levels
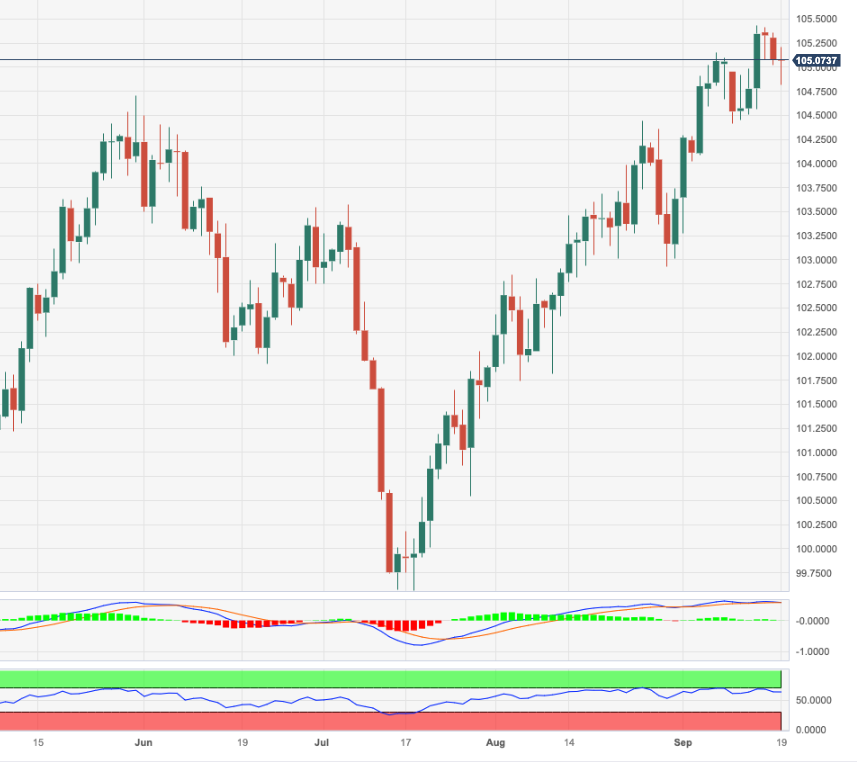
- EUR/JPY soared to a high of 158.23, above the 20-day SMA and then closed at 157.85.
- The bulls seem to have no more gas left in the tank to continue advancing.
In Tuesday’s session, the EUR/JPY cross failed to maintain its momentum, which took the pair to a high of 157.85, above the 20-day Simple Moving Average (SMA) and closed with mild gains at 157.85.
Based on the daily chart, the EUR/JPY continues to show indications of bullish exhaustion, leading to a neutral to bearish technical outlook. The Relative Strength Index (RSI) shows a flat slope over its midline and suggests that the bullish momentum is slowly fading away. This is supported by the Moving Average Convergence (MACD), which lays out flat red bars. It's worth mentioning that the RSI has displayed a downward trend since the beginning of September and lines with the pair being constantly rejected by the 20-day SMA.
That being said, the pair is above the 100 and 200-day SMAs, highlighting the continued dominance of bulls in the broader perspective.
Support levels: 157.00, 155.00, 154.60 (100-day SMA).
Resistance levels: 158.00 (20-day SMA), 158.50, 159.00.
EUR/JPY Daily Chart
-638307575455157908.png)
- EUR/USD trades at 1.0677, extending its losses by 0.01% as US 10-year Treasury yields hit a 16-year high.
- Diverging rate hike expectations between the Fed and ECB could weigh on EUR/USD.
- Market participants await the Federal Reserve’s decision and updated economic projections for directional cues.
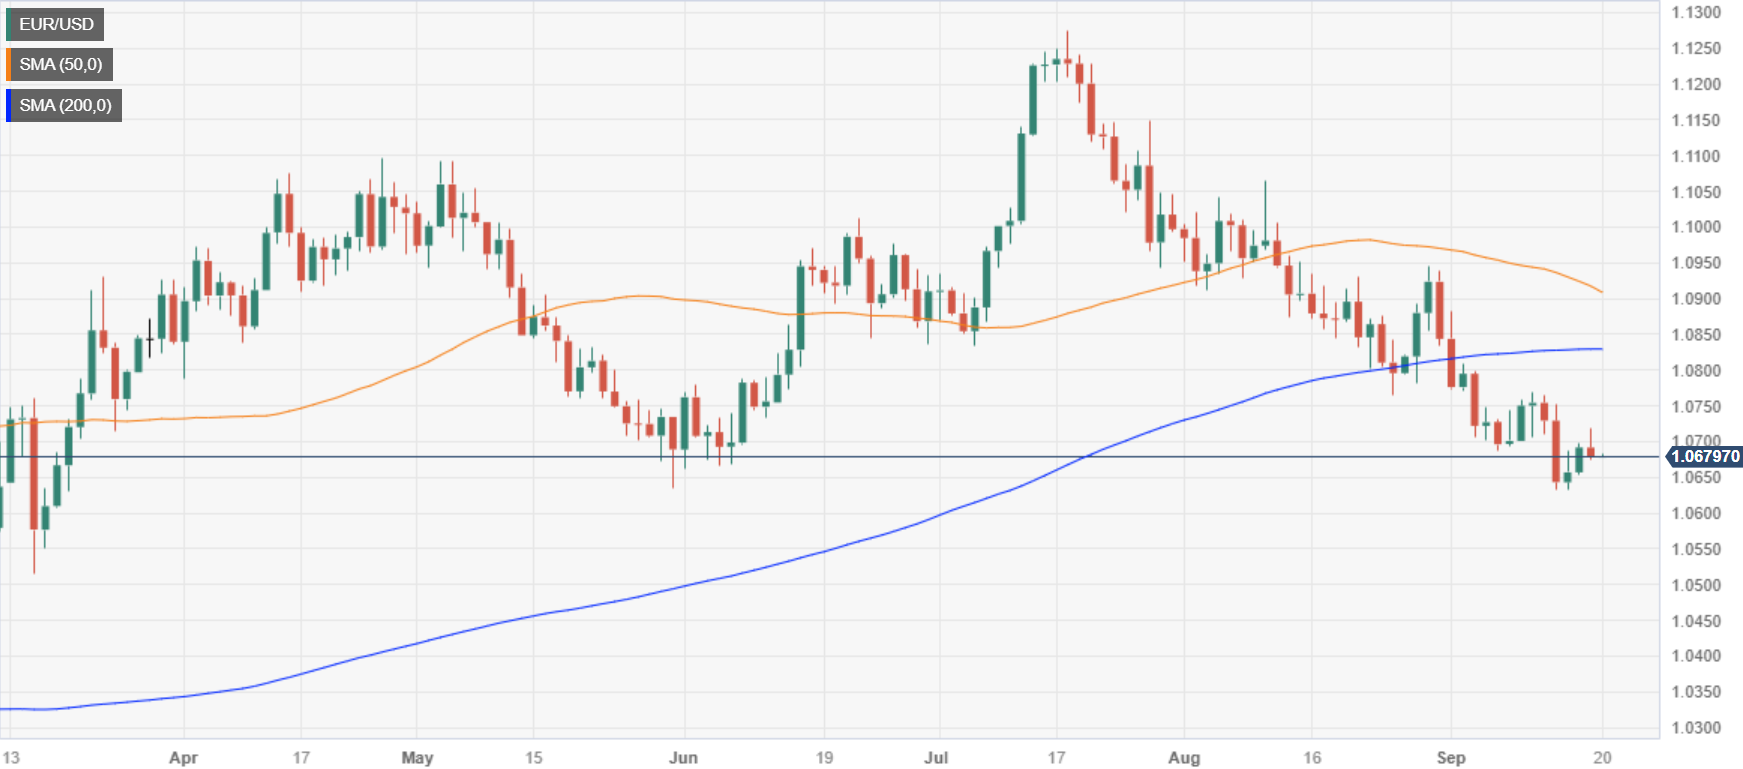
As the Asian session begins, the Euro (EUR) extends its losses by a minuscule 0.01% against the US Dollar (USD) as market participants prepare for the US Federal Reserve’s decision. The Greenback stages a comeback propelled by a jump in US Treasury bond yields. The EUR/USD is trading at 1.0677, following Tuesday’s losses of 0.12%.
Euro faces headwinds as the US Dollar gains strength on soaring Treasury yields, with all eyes on the upcoming Federal Reserve decision
US equities ended the day with losses. The US 10-year Treasury bond yield skyrocketed to a 16-year high at 4.367%, a headwind for the EUR/USD, which remains close to the 1.0700 figure, but it’s set to continue to print losses amidst speculations the Fed would deliver a hawkish hold.
Given that recent data in the United States (US) showed the robustness of the economy, with a hot jobs market, improvement in business activity, and consumer spending expanding – though at a lower rhythm – are reasons for the Fed Chair Powell and Co to keep “at it,” and hold rates higher for longer. Furthermore, last week’s Consumer and Producer Price Index (CPI and PPI) printed higher readings, justifying the need for higher rates.
Besides delivering its monetary policy decision, policymakers would update their economic projections regarding growth, unemployment rate, inflation, and the Federal Funds Rates (FFR). In June, Fed officials expected the FFR to peak at around 5.60%. Despite that, money market futures are pricing the FFR to peak at around 5.46%.
Data-wise, a scarce US economic docket revealed housing data, which came mixed. US Building Permits improved compared to July’s 0.1% expansion grew by 6.9%, while Housing Starts plunged -11.3%, beneath the -2.5% contraction estimated.
Across the pond, the Eurozone (EU) economic docket revealed inflation data. The Harmonised Index of Consumer Prices (HICP) for August came at 5.2% YoY, below 5.3% estimates, while core HICP stood at 5.3% unchanged, aligned with estimates.
Recently, some European Central Bank (ECB) officials signaled the ECB would not continue to tighten monetary conditions. Nevertheless, an ongoing economic deceleration in the bloc and a deposit rate at its highest level since the Euro’s inception at 4.00% could bring inflation towards its target.
A poll by Reuters showed that 70 economists commented the ECB is done hiking rates and that the deposit rate would end the year at its current 4.00% level. Although the ECB’s President Christine Lagarde refrained from saying that rates have peaked, money market futures see a 25% chance for additional hiking towards the end of the year.
Given the backdrop, if the Fed delivers a hawkish hold, expect further EUR/USD’s downside; otherwise, the single currency could rally and reclaim the 1.0700 level, with buyers eyeing 1.0800.
EUR/USD Price Analysis: Technical outlook
The daily chart portrays an ‘evening star’ in the making, as Tuesday’s candle was an ‘inverted hammer’, which could pave the way for further downside. Yet, upside risks remain, with the EUR/USD close to the 1.0700 figure. A hawkish hold by the Fed could open the door to test the September 14 swing low of 1.0632, followed by the 1.0600 figure ahead of plunging toward Mach’s low of 1.0516. Conversely, a dovish surprise and the EUR/USD could rally past the September 19 high at 1.0718 and target the 200-day Moving Average (DMA) at 1.0828.
- US equities trade tightly, fall back into recent ranges as Fed looms large.
- The Federal Reserve is set to keep rates steady for this meeting.
- FOMC to release their latest inflation expectations looking forward.
It’s all eyes on the Federal Reserve (Fed) for this week as the latest interest rate call on Wednesday from the Fed hangs over the markets. US equities were broadly back, albeit softly, and indexes spread towards the middle as investors brace for an updated playbook from the Federal Open Market Committee (FOMC).
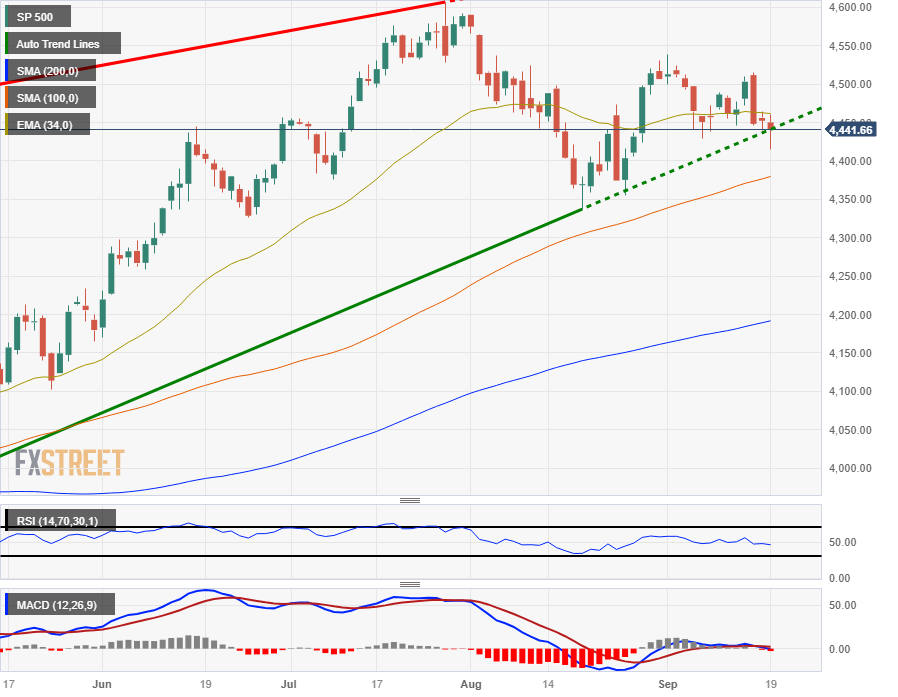
The Standard & Poor’s 500 (S&P) slipped ten points to give up the $4,450.00 handle, settling the day down near $4,430.00 (-0.22%); The NASDAQ tech composite index declined 32 points to end the day near $13,678.00 (-0.23%); and the Dow Jones Industrial Average (DJIA) slid over 105 points to end Tuesday at $34,517.00 (-0.31%).
Stocks down, yields up ahead of Fed
As equity indexes backslid, treasury yields climbed again, with the 2-year note rising to 5.092 and the 10-year lifting to 1.365.
Wednesday will see the latest interest rate call from the Fed, where markets are broadly anticipating the US central bank to hold steady on their benchmark rates.
However, the FOMC will also be dropping its economic projections as well as its updated interest rate outlook. The data docket will be followed by the FOMC’s press conference 30 minutes later where investors will be keeping a close eye out for any changes in the Fed’s rhetoric stance.
S&P 500 technical outlook
Daily candlesticks have the major equity index firmly testing the bounds of a rising trendline, and an extended bearish slide could see the S&P kick into a further leg down to test the last swing low below $4,350.00.
Bullish momentum sees descending resistance from the upside as lower highs price in a ceiling north of the $4,500.00 handle.
The 100-day Simple Moving Average is on the rise, clearing $4,375.00 and could provide support for renewed bullish momentum in the index looking forward.
S&P 500 daily chart
S&P 500 technical levels
- USD/CLP trades neutral at 884.35, with technical indicators flat.
- The Chilean Central Bank kicking off its easing cycle contributes to the upward trajectory.
- The Federal Reserve (Fed) is expected to deliver a hawkish pause on Wednesday.
On Tuesday, the USD/CLP bulls are taking a breather after pushing the pair upwards by more than 3.82% in September and are consolidating gains at the 884.35 area.
Monetary policy divergences with the Federal Reserve (Fed) may explain the increase of the pair as since July, the Chilean Central Bank has already cut rates by 1.75%, and markets are discounting 1.50% more of easing in the remainder of 2023. The week's highlight for the CLP will be the release of the September 5 minutes on Friday, where investors will have a clearer outlook of the bank’s stance for the upcoming October and December meetings.
On the US side, rate swaps markets have practically priced in that the Federal Reserve (Fed) will hold rates steady at 5.25-5.50% on Wednesday. However, Chair Powell will try to convince the markets pausing won’t mean the end of the tightening cycle, leaving the door open for another hike. In addition, the fresh macro forecasts and the revision of the Federal Open Market Committee (FOMC) members' famous dot plots will be closely watched by investors to continue modelling their expectations.
USD/CLP Levels to watch
Considering the daily chart, the USD/CLP presents a bullish outlook. Despite turning flat, the Relative Strength Index (RSI) lies comfortably deep in positive territory, while the Moving Average Convergence (MACD) histogram prints rising green bars. On the other hand, the pair is above the 20,100,200-day Simple Moving Average (SMA), suggesting that bulls are clearly in command of the bigger picture.
Support levels: 884.00, 882.00, 880.00
Resistance levels: 895.00, 898.00, 900.00.
USD/CLP Daily Chart
-638307547470636875.png)
It is FOMC day, and it is a busy one. During the Asian session, New Zealand will release Q2 Current Account data, and Japan will report August trade data. Additionally, the Australian Westpac Leading Index will be released. The focus will be on the People's Bank of China (PBoC) interest rate decision. Later in the day, the UK will report August inflation data, and Germany will release wholesale inflation figures. During the American session, the Federal Reserve will announce its decision on monetary policy.
Here is what you need to know on Wednesday, September 20:
An important event during the Asian session will be the decision of the People's Bank of China regarding interest rates. The 1-year Loan Prime Rate is expected to remain at 3.45% after last month's cut.
The key event on Wednesday will be the Federal Reserve's decisions. Market participants expect the central bank to keep the Fed Fund rate unchanged at 5.25-5.50%. The focus will be on the statement, the economic projections, and Powell's press conference.
Data released on Tuesday showed mixed numbers from the US housing sector. Housing Starts tumbled 11.3% in August, while Building Permits jumped 6.9%.
During the American session, the US Dollar Index rose amid deteriorating market sentiment and higher US Treasury yields. The DXY rebounded to 104.80, rising above 105.00.
EUR/USD failed to hold above 1.0700 and pulled back, remaining within a downward channel. The final reading of the Eurozone Harmonized Index of Consumer Prices came in at an annual rate of 5.2% in August, revised from the preliminary 5.3%. Germany will report the August Producer Price Index on Wednesday, with a decline expected in the annual rate from -6% to -12.8%.
USD/JPY posted its highest daily close since November but remains below 148.00. Japan will release August trade data on Wednesday.
USD/CHF rose again and hit intraday monthly highs but is still unable to break above 0.9000. The Swiss State Secretariat for Economic Affairs (SECO) will release its Autumn 2023 Economic Forecasts report. On Thursday, the Swiss National Bank is expected to announce a 25 basis point rate hike to 2%.
GBP/USD failed to hold above 1.2400 and pulled back, staying near monthly lows. The UK's August inflation report is due on Wednesday. The annual Consumer Price Index rate is expected to rise from 6.8% to 7.1%. Such a number could likely solidify the odds of a rate hike from the Bank of England, which will announce its decision on Thursday.
The Consumer Price Index in Canada rose 0.4% in August, surpassing the market consensus of 0.2%. The annual rate rebounded from 3.3% to 4%. The Canadian Dollar (CAD) peaked after the announcement but then pulled back. USD/CAD lost ground and hit monthly lows at 1.3380 but finished far from the bottom around 1.3440.
TD Securities on Canada inflation:
Today's report leaves Q3 CPI tracking well above projections from the July MPR and will add to the Bank of Canada's concerns around persistent price pressures. We will still get one more inflation report ahead of the October BoC meeting and a softer growth outlook will allow the Bank to look through some of this persistence, but today's report should help reaffirm that the mission is not yet accomplished and upcoming meetings remain live for another hike.
NZD/USD rose above the 20-day Simple Moving Average and posted a daily close above 0.5900. The current indicators are modestly biased to the upside in the short term. New Zealand's Q2 Current Account data is due on Thursday, along with Q2 GDP data.
AUD/USD tested the resistance area around 0.6470 but failed to break higher. It maintains a mostly bullish bias ahead of the Asian session. The Westpac Leading Index is due on Wednesday.
Precious metals erased gains during the American session, driven by a stronger US Dollar. Silver retreated to $23.20, while Gold dropped to $1,930.
Like this article? Help us with some feedback by answering this survey:
- Gold price hit a two-week high at $1937.35 before retreating to $1931.77, down 0.06%.
- US 10-year Treasury bond yield reaches a 16-year high at 4.367%, weighing on gold.
- Investors keenly await the Federal Reserve’s ‘dot plots’ and updated economic projections for rate hike clues.
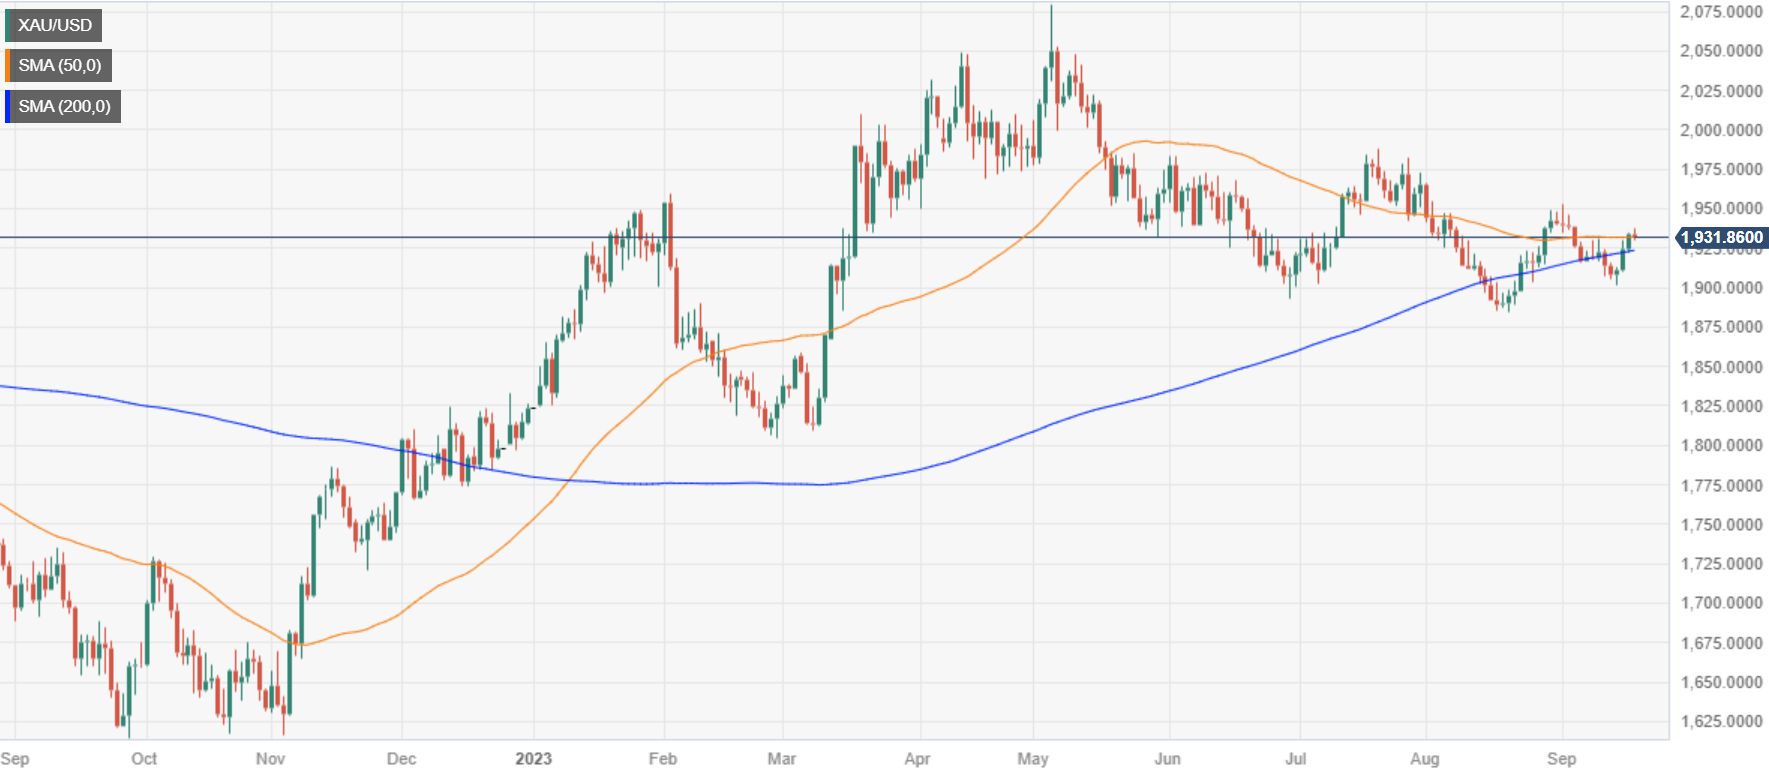
Gold price retreats after hitting a two-week high at $1937.35 as investors remain on the sidelines ahead of the US Federal Reserve monetary policy decision. US Treasury bond yields are climbing ahead of the Fed’s decision, a headwind for the yellow metal, which was shy of clashing with the 100-DMA. At the time of writing, the XAU/USD is trading at $1931.77, down 0.06%.
Gold retreats as investors await the Federal Reserve’s monetary policy announcement, with rising US Treasury yields adding pressure
Wall Street continues to print losses, while the US 10-year Treasury bond yield touches a 16-year high at 4.367%. Tomorrow, Fed Chair Jerome Powell and his colleagues are expected to keep rates at the current 5.25%-5.50% range and to keep them higher for longer, at least until July 2024, as drawn by the Fed money market futures.
Even though the latest round of data showed that inflation has registered back-to-back upticks, the US central bank is set to skip a rate hike in September. According to the CME FedWatch Tool, odds for the November and December meeting had been lowered, suggesting that traders are not expecting additional rate hikes toward the end of 2023.
Although the Fed’s decision is important, market participants would be focused on the ‘dot plots’ to review the US central bank interest rate path. According to the latest Summary of Economic Projections (SEP), the Fed’s median estimates rates to peak at 5.6%. A confirmation could catch off guard interest rate traders, which expect rates to be capped at 5.50%.
In the meantime, the US Dollar Index (DXY) remains firm at around 105.14, gains 0.06%, underpinned by high US Treasury bond yields. The US 10-year Treasury note yields 4.367%, its highest level in 16 years, a headwind for Gold prices.
Meanwhile, Gold traders must also be aware of US Real yields, which could be followed using TIPS (Treasury Inflation Protected Securities) as a proxy. When the US 10-year TIPS coupon rises, XAU/USD’s price falls, as shown by the following chart, depicting the inverse correlation between the assets.
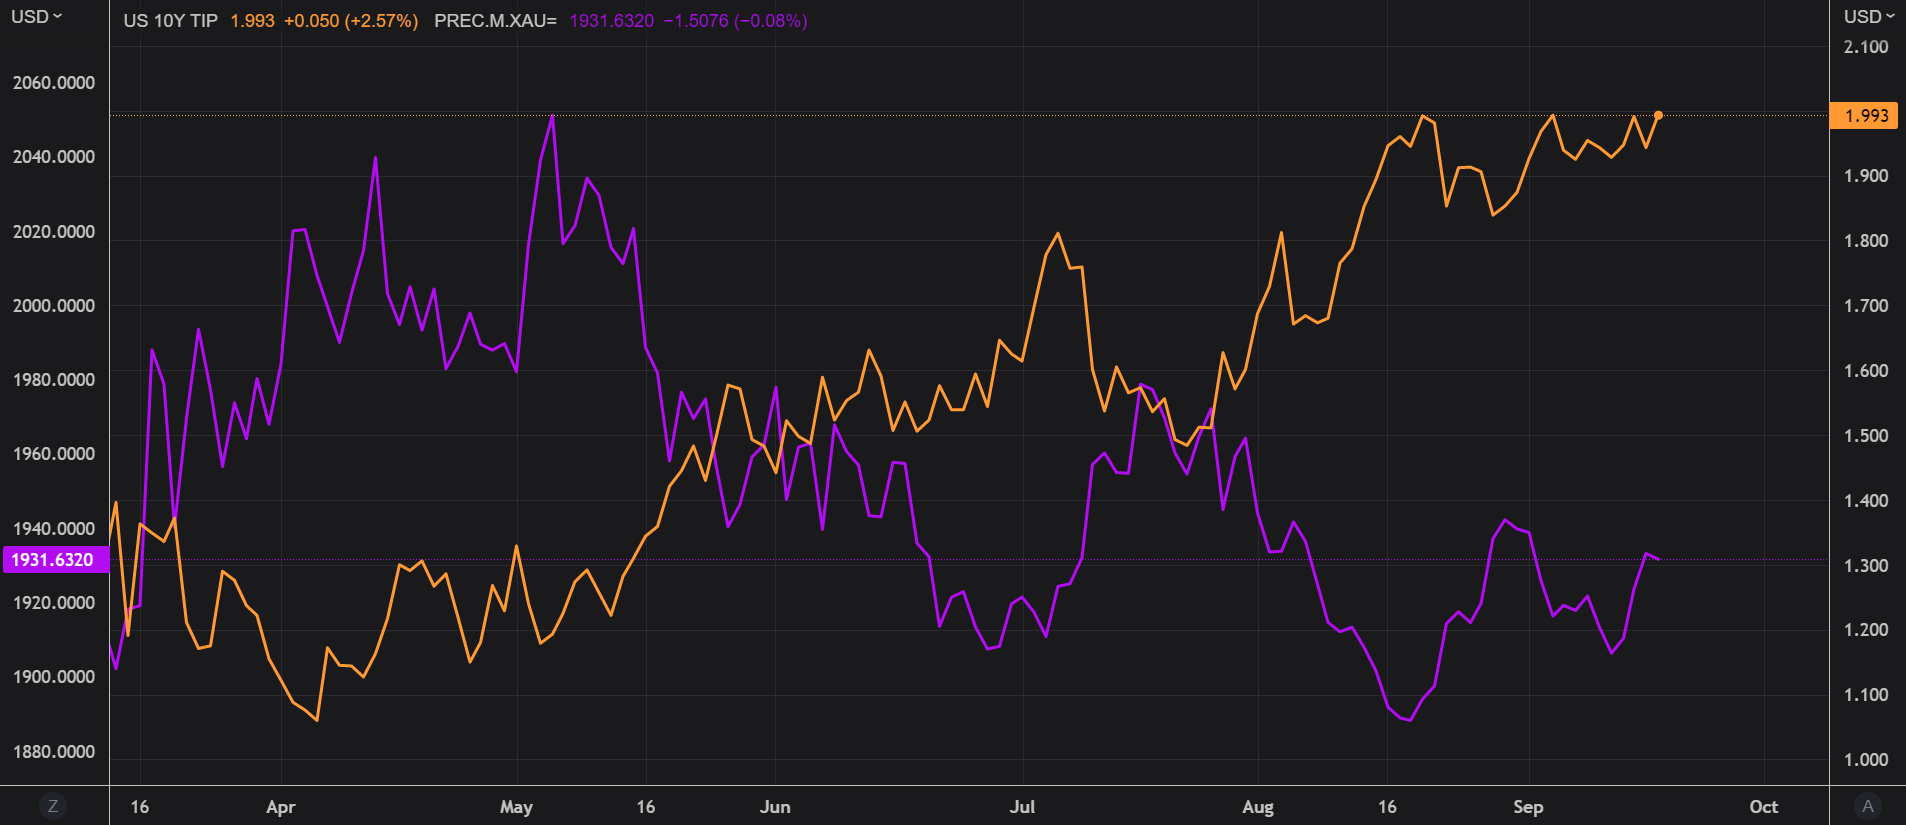
Source: Refinitiv
The US economic docket would feature the Fed’s decision on Wednesday, followed by US housing data, unemployment claims, and S&P Global PMIs.
XAU/USD Price Analysis: Technical outlook
Gold trades sideways inside a descending triangle, cushioned on the downside by a confluence of daily moving averages (DMAs), and the 100-DMA acts as resistance at $1945.20. Although it recorded a higher low on September 14 at $1901.11, it has failed to print a higher peak above the July 20 swing high at $1987.42. If buyers want to shift the bias to neutral, they must reclaim the latter. Otherwise, a break below the confluence of the 20 and 200-DMA around $1924.00 could pave the way to challenge $1900, followed by the August 21 daily low of $1884.89
- The USD/CAD is trying to recover the day’s losses after getting knocked lower.
- The Loonie is catching support from steadily-rising oil costs.
- The USD/CAD is recovering towards the 50% retrace of the day’s declines.
The USD/CAD started Tuesday in freefall, declining from the day’s open near 1.3480 and tapping into 1.3380. Rising oil prices are bolstering the Loonie (CAD), as concerns over global supply constraints knock crude barrel costs into the ceiling.
Despite the Loonie-led dip, the USD/CAD is recovering into the middle ground. Greenback (USD) traders are keeping light on their feet as the next showing from the Federal Reserve (Fed) rounds the corner.
Fed to hold on rates, but investors to watch the rhetoric
The Fed’s latest rate call will be dropping on markets on Wednesday, with the Fed’s rate call and ensuing press conference scheduled for 18:00 GMT tomorrow.
The Fed is broadly expected to stand pat on rates for the time being, holding benchmark rates at 5.5%. The Federal Open Market Committee (FOMC) will also be publishing their economic projections and inflation outlook figures, something that investors will be scrambling to process.
It’s a light economic calendar week for the CAD, and market momentum will be firmly in the hands of crude oil and Greenback traders.
USD/CAD technical outlook
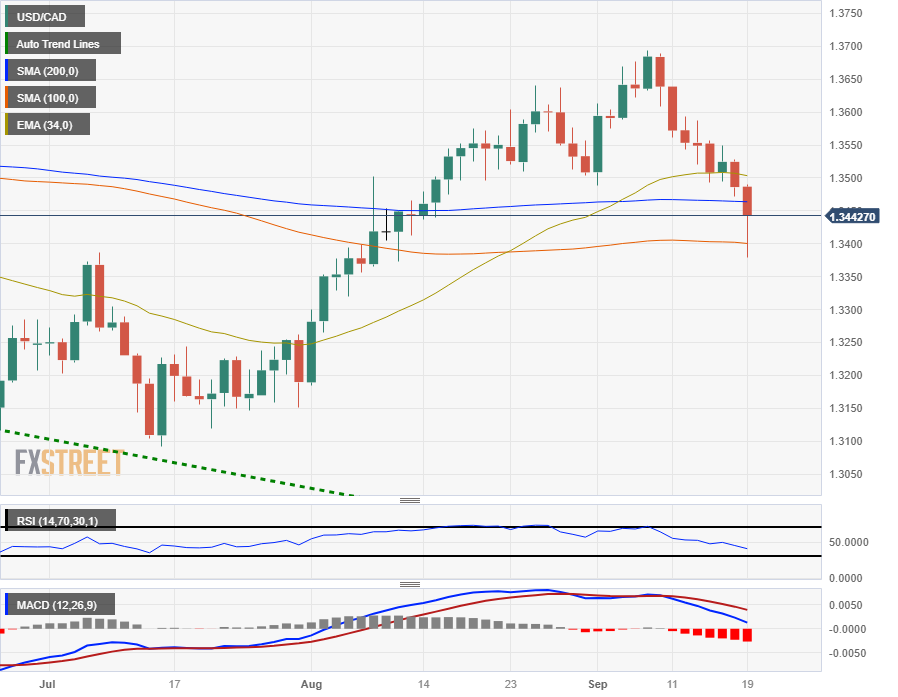
The USD/CAD is drifting into the middle in late Tuesday trading, testing the waters near 1.3450 after the early session’s fast drop.
The pair declined 0.72% from Tuesday’s opening prices near 1.3475, but the mid-day recovery sees the pair nearing the 68% retracement of the day’s drop.
Rapidly increasing crude prices has sent the USD/CAD lower on the daily candlesticks, with the pair set to close in the red for seven of the last eight consecutive trading days.
The Dollar-Loonie pair has slid past the 200-day Simple Moving Average (SMA) in Tuesday’s trading. Continued selling pressure will see the pair challenging the last swing low near 1.3100, while an upside recovery will have to reclaim the 1.3700 handle to establish a determined uptrend.
USD/CAD daily chart
USD/CAD technical levels
Bank of Canada (BoC) Deputy Governor Sharon Kozicki said on Tuesday that interest rates need to remain high. She pointed out that they are concerned about the underlying inflation.
She explained that core measures of inflation have eased, but the latest Consumer Price Index report indicates that inflationary pressures are still broad-based.
Key takeaways from the speech:
Because inflation was very high last year, interest rates had to rise a lot. That’s why we acted forcefully and brought them up quickly. Inflation has come down, but it is still too high. And that tends to mean that real interest rates need to remain high.
When making monetary policy decisions, the Bank of Canada must consider the many ways that shifting economic circumstances affect different households. We don’t set our policy based on what is happening to one subset of households or to the price of any one good or service.
We are seeing signs that monetary policy is working. Both inflation and inflation expectations have come down, and excess demand in the economy is easing. And our past policy actions will continue to have an effect as they work their way through the economy.
However, in our most recent monetary policy decision, we also expressed concern about the persistence of underlying inflation. We will continue to evaluate whether the evolution of excess demand, inflation expectations, wage growth and corporate price-setting behaviour are consistent with achieving the 2% inflation target. We are prepared to raise the policy interest rate further if needed.
Market reaction
The USD/CAD is hovering around 1.3440, unaffected by Kozicki’s comments. The pair bottomed at 1.3378, the lowest in a month and then trimmed losses.
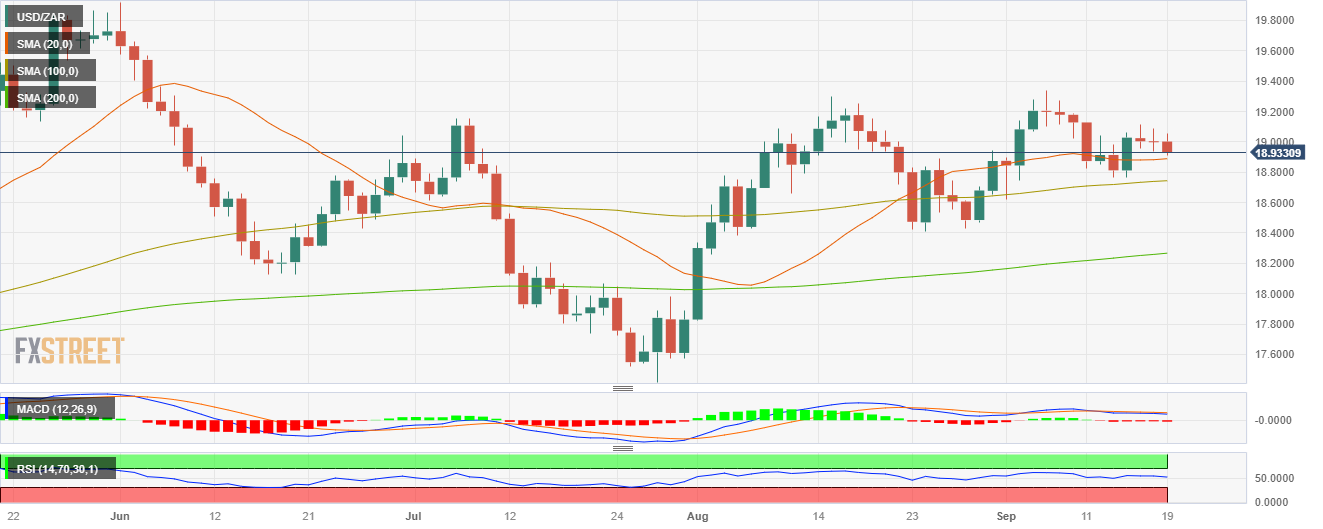
- USD/ZAR declined towards 18.933, near the 20-day SMA.
- South Africa reports August Inflation figures and July Retail Sales on Wednesday.
- Federal Reserve (Fed) is expected to pause but leave the door open for further hikes.
In Tuesday’s session, the USD/ZAR faced some selling pressure and declined to 18.933, down by 0.25%, and seems to be on its way to retest the 20-day Simple Moving Average at 18.880.
All eyes are on Wednesday. South Africa reports the August Consumer Price Index (CPI) with the headline figure expected to increase slightly to 4.8% YoY, while the core inflation rate is anticipated to remain stable at 4.7% YoY. Retail Sales from July are expected to come in at -1.0% YoY, compared to the 0.9% YoY decrease in June. Regarding the South African Reserve Bank meeting on Thursday, the decision will likely be to maintain its interest rates at 8.25% despite some previous expectations of a hike. As for now, for the next twelve years, markets aren’t foreseeing any hikes and discounts that the bank will maintain rates at 8.25%.
On the Fed’s side, Markets expect the bank to keep rates steady at 5.25-5.50%, but Chair Powell will likely show a hawkish tone and signal future rate hikes which could benefit the USD. Strong US economic performance, especially in services, and a mixed labour market suggest the Fed may leave room for one more hike to curb inflation risks.
USD/ZAR Levels to watch
The daily chart shows signs of bullish exhaustion for USD/ZAR. The Relative Strength Index (RSI) indicates a neutral stance above its midline, displaying a flat slope in the positive territory, while the Moving Average Convergence (MACD) presents neutral red bars. On the bigger picture, the pair is above the 20,100,200-day Simple Moving Average (SMA), suggesting that the bears are struggling to challenge the overall bullish trend.
Support levels: 18.880 (20-day SMA), 18.728 (100-day SMA). 18.500.
Resistance levels: 19.000, 19.050, 19.150.
USD/ZAR Daily Chart
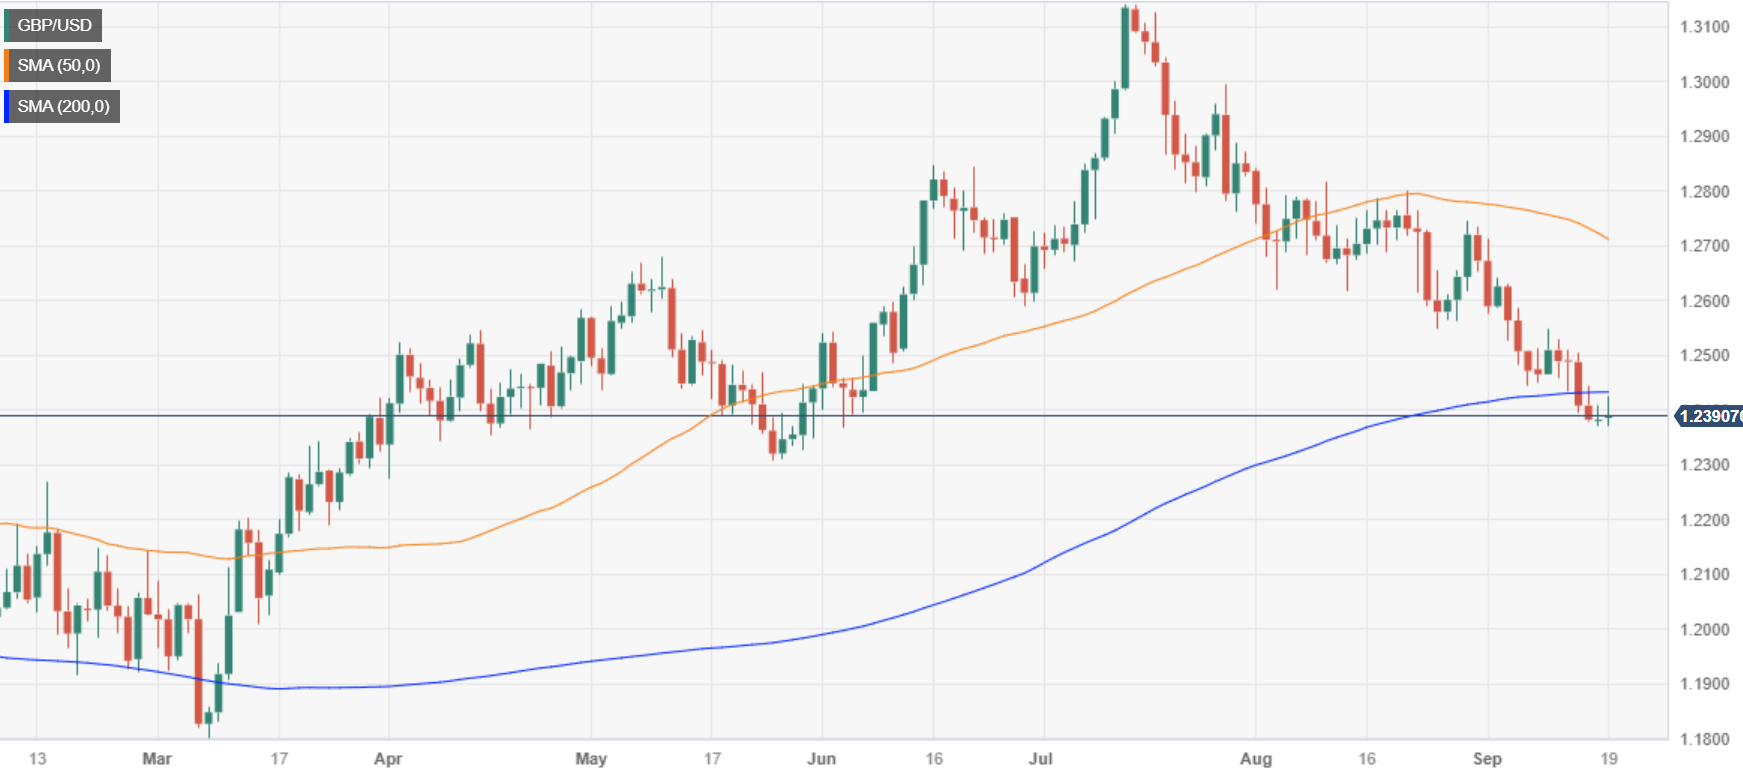
- GBP/USD trades at 1.2395, showing slight gains, but remains below the key 1.2400 level.
- Federal Reserve expected to hold rates steady, while the Bank of England is anticipated to raise rates by 25 basis points.
- UK inflation data and the US Federal Reserve’s monetary policy decision are the key events to watch this week.
The British Pound (GBP) halts last week’s fall against the buck (USD) and prints minuscule gains vs. the latter despite rising US Treasury bond yields, as the UK and US central banks are expected to reaffirm its restrictive stance. Therefore, the GBP/USD is trading at 1.2395 after hitting a daily low of 1.2369, though it is still below the 1.2400 figure.
The British Pound steadies against the US Dollar as the Federal Reserve and the Bank of England are set to announce their monetary policy decisions
US equities extended its losses as sentiment deteriorates ahead of the central bank bonanza. The Federal Reserve is expected to hold rates unchanged amid the latest round of economic data, which revealed inflation in the consumer and producer side rose. In contrast, consumer spending expanded, though at a slower rhythm.
The Federal Funds Rate (FFR) would likely remain at the 5.25%-5.50% range, and in the same meeting, Fed officials would update their economic projections. In the June Summary of Economic Projections (SEP) the Fed anticipated 1% economic growth, a 4.1% unemployment rate, 3.2% PCE inflation, 3.9% core PCE inflation, and a peak FFR of 5.60%.
The swaps market shows the FFR would peak at current pricing, while estimates for the first rate cut are seen in July 2024, as shown by the picture below.
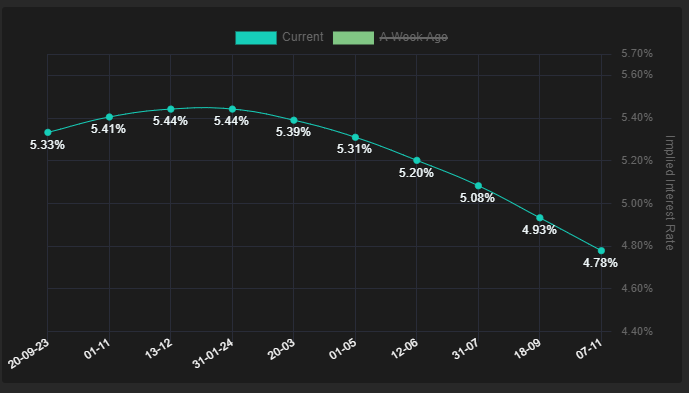
Source: Financialsource
Across the pond, the Bank of England’s (BoE) is foreseen to raise rates 25 bps to 6.50%, which, according to STIRs markets, would be the highest level expected. Even though the UK’s inflation has fallen from 11.1% to 6.8%, it’s the highest among developed countries, and it’s getting lowered at a slower pace than estimated. In addition, the economy in the UK is slowing more than economists forecast, which could deter the BoE from continuing to increase the Bank Rate amid risks of triggering a recession.
The UK economic docket will reveal inflation data ahead of the BoE’s decision on Wednesday. The Consumer Price Index (CPI) is expected to jump, while the core CPI would decelerate a tick. The week’s main event on the US front would be the Federal Reserve’s monetary policy decision, followed by the Fed Chair Jerome Powell press conference.
GBP/USD Price Analysis: Technical outlook
The downward bias remains intact, as shown by the daily chart. With the GBP/USD trading below the 50 and 200-day Moving Averages (DMAs) while drifting lower and printing successive series of lower highs and lows would keep the GBP/USD at around current levels. To shift its bias neutral, buyers must break the August 25 latest swing low at 1.2548; otherwise, further falls are expected, with sellers eyeing the May 25 low of 1.2308. Further downside is expected below that level, with the March 15 swing low at 1.2010.
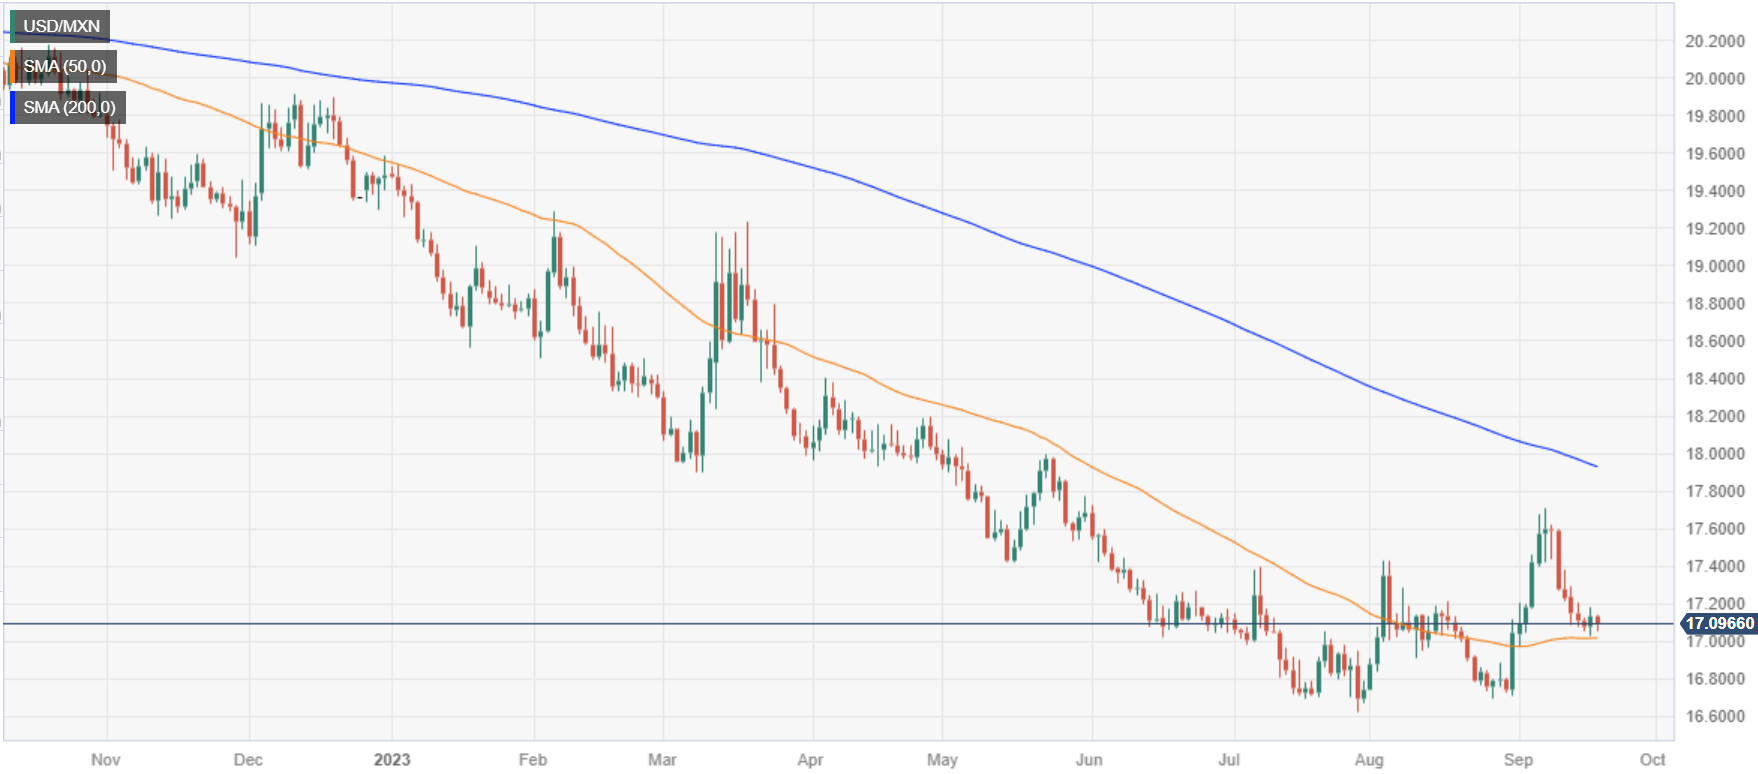
- USD/MXN down 0.37%, trading at 17.0685, as the Mexican Peso recovers some of its losses.
- Investors turn cautious ahead of the Federal Reserve meeting, where updated economic projections are expected.
- Preliminary data from INEGI suggests the Mexican economy likely grew 3.4% YoY in August.
The Mexican Peso (MXN) erases some of its Monday’s losses versus the Greenback (USD) and reclaims the 20-day Moving Average (DMA) despite a firm US Dollar (USD), with traders bracing for tomorrow’s US Federal Reserve’s decision. At the time of writing, the USD/MXN is trading at 17.0685, down 0.37%.
USD/MXN trades lower despite a strong US Dollar, as investors await updated economic projections from the Federal Reserve
Investor sentiment has turned negative ahead of the Fed meeting. During the last economic projections, the Fed anticipated 1% economic growth, a 4.1% unemployment rate, 3.2% PCE inflation, 3.9% core PCE inflation, and the Federal Funds Rate (FFR) peaking at 5.60%. These projections will be updated and play a crucial role in shaping the Fed’s future policy decisions.
In the meantime, housing data was revealed and came worse than expected. Housing starts slumped 11.3% last month, the lowest level since June 2020. Data for July was revised lower to show starts accelerating to a rate of 1.447 million units instead of the previously reported 1.452 million units. Meanwhile, Building Permits jumped 6.9% above the prior month’s 0.1% expansion, the most significant rise in six months.
Meanwhile, US Treasury bond yields are trading in positive territory, with the 10-year note coupon yielding 4.337% amidst a US 20-year bond auction, while the Greenback, as shown by the US Dollar Index (DXY), is firm at around 105.12.
Across the border, the Mexican economic docket revealed a poll by the Instituto Nacional de Estadisitca Geografia e Informatica (INEGI), which shows the economy likely grew 3.4% in August compared with the same month a year earlier, in a preliminary estimate from the statistics agency.
USD/MXN Price Analysis: Technical outlook
At the beginning of the week, the USD/MXN could not crack the 100-DMA at 17.2091, opening the door for a pullback, which witnessed the pair breaching the 20-DMA at 17.1075. With that said, and with price action below most Moving Averages, the exotic pair could again test the psychological 17.00 figure. However, it must challenge the 50-DMA at 17..0101 before sliding towards the figure and beyond. For a bullish resumption, the USD/MXN must reclaim the 100-DMA, followed by the 17.5000 figure.
- XAG/USD met resistance at the 200-day SMA near $23.50 and then declined to $23.15
- The benchmark US 10-year bond yield threatens multi-year highs.
- The two-day FOMC meeting kicked off.
In Tuesday’s session, the Silver Spot price XAG/USD lost momentum and failed to conquer the 200-day Simple Moving Average. The main reason was that the US Treasury yields, often seen as the opportunity cost of holding non-yielding metals, recovered as markets await Wednesday's Federal Reserve (Fed) decision.
The 10-year bond yield reached 4.34% and trades near the crucial 4.36% threshold, which, in case of breaking it, would set a multi-year high since 2007. In addition, The 2-year yield stands at 5.08% with a 0.52% increase, while the 5-year yield is at 4.48%, up by 0.31%.
For Wednesday's Federal Reserve (Fed) decisions, despite markets anticipating a pause, a hawkish tone given by Chair Powell could boost US yields and apply further pressure on the grey metal. The US economy remains strong, mainly driven by the Services sector, while the US labour market is showing a mixed picture, and as the Fed want to see a cool down to mitigate inflation risks, it will likely leave the door open for one last hike.
XAG/USD Levels to watch
The technical analysis of the daily chart suggests a neutral to bearish stance for XAG/USD as the bears work on staging a recovery. With a downward trend below its midline, the Relative Strength Index (RSI) suggests that the bear’s momentum is strengthening, while the Moving Average Convergence (MACD) exhibits stagnant red bars. Moreover, the pair is below the 20,100 and 200-day Simple Moving Averages (SMAs), implying that the bears retain control on a broader scale, leaving the buyers vulnerable.
Support levels: $23.00, $22.80, $22.50
Resistance levels: $23.50 - 70 (200, 20 and 100-day SMA convergence),$24.00, $24.30
XAG/USD Daily Chart
-638307403703313911.png)
- The GBP/JPY couldn't maintain a bullish push, and is falling back to the midrange.
- Investors appear unwilling to dedicate to a direction as the BoE comes in for a landing.
- Japan trade balance figures could kick off JPY momentum for the Wednesday session.
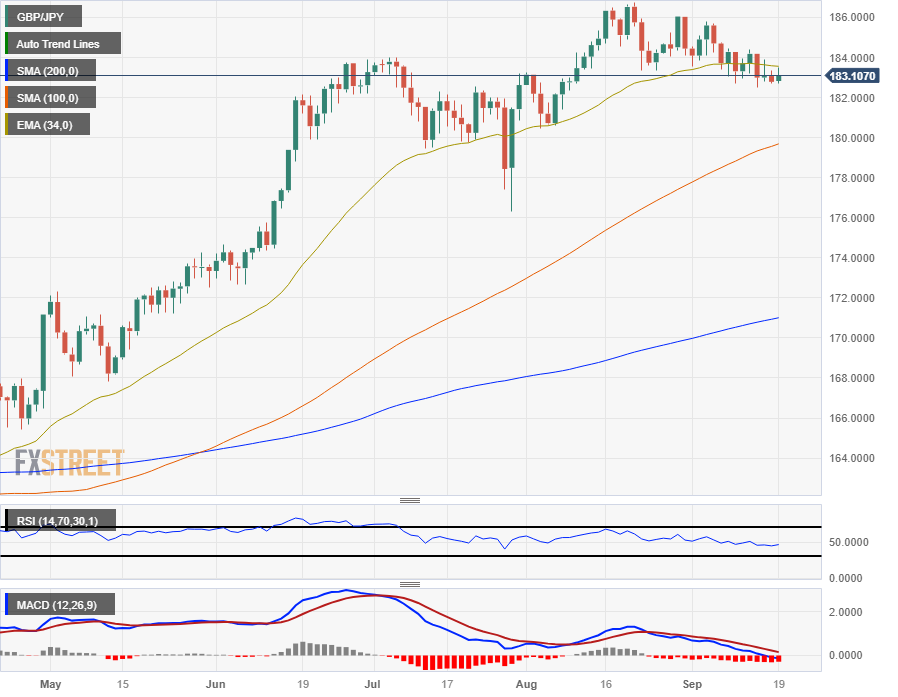
The GBP/JPY is retesting the 183.00 handle after failing to recapture the 183.50 level in Tuesday trading.
The Pound Sterling (GBP) is trading softly in Tuesday markets, lacking momentum as investors largely sit on the sidelines ahead of this week’s central bank showings.
Japan trade balance up first, BoE in the barrel
Late Tuesday will see trade balance figures for Japan, due at 23:50 GMT. Exports and imports are both expected to decline, -1.7% and -19.4% respectively, and the overall Merchandise Trade Balance is forecast to decline ¥-659.1B.
Inflation data is inbound on Wednesday for the United Kingdom (UK), with the Consumer Price Index (CPI) headline for the month of August forecast to tick upwards to 0.7% from the previous month’s 0.4% decline.
The inflation read will serve as a precursor to the Bank of England’s (BoE) showing on Thursday, which is expected to raise rates to 5.5%, a 25-basis-point increase from 5.25%.
Inflation continues to plague the UK even as the British economy continues to wobble, and investors will be keeping a close eye on both inflation figures and the BoE’s Monetary Policy Summary.
The BoE’s rate call and following statement kick off at Thursday at 11:00 GMT.
Friday to close out the week with BoJ, UK retail figures
Friday brings the Bank of Japan’s (BoJ) own interest rate showing, which is broadly expected to maintain their -0.1% negative rate stance. Recent comments from BoJ officials teasing about the possible end of the negative rate regime pushed investors into the bullish camp, but the positioning may have been premature.
Japanese government officials were quick to head off the statements at the pass, noting that BoJ rate hikes would only come if the BoJ were able to hold interest rates above the 2% target mark, a goal that may prove illusory for the BoJ as inflation is expected to slump in Japan.
Friday will also close out the week with Retail Sales figures for the UK. Retail sales figures are forecast to gain 0.5% in August after the previous month’s -1.2% decline.
GBP/JPY technical outlook
The Guppy saw a tidy rejection from the 200-hour Simple Moving Average (SMA) in Tuesday trading, sending the pair back into the 183.50 handle after failing to capture 183.50.
Lower highs continue to plague the hourly candlesticks, and the bearish pattern from late August’s high of 186.77 remains intact.
On daily candlesticks the GBP/JPY is struggling to develop momentum, with the pair struggling to make space for itself away from the 34-day Exponential Moving Average (EMA). The 50-day SMA is currently climbing steadily into the 180.00 major psychological handle, and bidders will be looking to keep the pair afloat.
The Guppy has closed in the green for seven of the past eight months, leaving the pair incredibly overbought and exposed to downside shocks if the rug gets pulled out from beneath GBP bulls.
GBP/JPY daily chart
GBP/JPY technical levels
- USD/CHF continued stepping forward and rose near 0.8988.
- SNB meets on Thursday, and markets expect a 25 bps hike.
- The US reported mixed Housing data from August. US Yields recover.
On Tuesday, the USD/CHF continued gaining ground, increasing to 0.8980, and already tallied a 1.60% monthly gain. On the one hand, the Swiss National Bank is expected to deliver its last rate hike from this tightening cycle to 2%, while the Federal Reserve’s (Fed) cycle isn’t done yet.
In line with that, the Federal Open Market Committee (Fed), two-meeting kicked off on Tuesday and ended on Wednesday with the announcement of the monetary policy decision. It is widely expected that the Fed will hold rates steady at the 5.25-5.50% range but will hint at further rate hikes being necessary. Economic activity in the US was seen holding resilient, and as the Fed is expecting the economy to cool down, one last hike may be appropriate. In that sense, as investors discount that the Swiss National Bank (SNB) will end its last hike on Thursday, monetary policy divergences may continue pushing the pair upwards.
On the data front, the US reported that Building Permits accelerated to 1.543M in August, beating the expected and previous figures, while Housing Starts slightly decelerated to 1.283M.
USD/CHF Levels to watch
The daily chart analysis indicates a bullish outlook for the USD/CHF in the short term. The Relative Strength Index (RSI) is above its midline in positive territory, with a positive slope near 70, aligning with the positive signal from the Moving Average Convergence Divergence (MACD), which displays green bars, reinforcing the strong bullish sentiment. Plus, a bullish crossover between the 20 and 100-day Simple Moving Average (SMA) was recorded at the 0.8885 area, which could further boost the pair.
Support levels: 0.8950, 0.8900, 0.8885.
Resistance levels: 0.8985, 0.9000, 0.9038 (200-day SMA)
USD/CHF Daily Chart
-638307368149957855.png)
- US WTI crude chalks in a new ten-month high on Tuesday.
- US shale production to decline more than expected.
- Oil firmly bullish, aiming for $100.
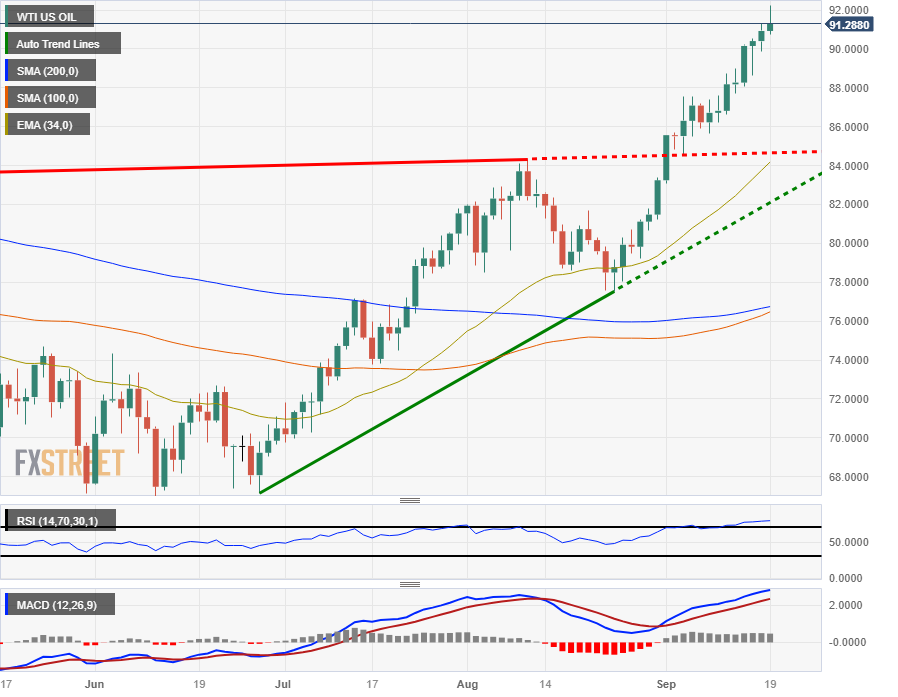
West Texas Intermediary (WTI) crude oil barrels briefly peeked over the $93.00/bbl level in Tuesday trading. Oil is trading steadily higher as supply constraint worries send investors scurrying, sending the price of crude barrels soaring.
US shale production to slow further, oil markets squeezed higher
The Energy Information Agency (EIA) is warning that US shale production is set to decline further in October. The EIA’s Drilling Productivity Report has shale slated to produce 9.393 million bpd, the lowest level since May of this year.
Crude prices have been facing an enormous squeeze ever since Saudi Arabia and Russia announced extensions of their 1.3 million bpd production cuts through the end of the year. WTI crude prices have risen 15% in just four weeks as oil traders fear a global supply snap.
The global oil supply chain is expected to see a 2 million bpd deficit heading into the first quarter of 2024. With such a sharp deficit, global oil reserves are expected to dwindle away to nothing unless additional crude production projects are fired up and capacity is restored.
WTI technical outlook
WTI has closed in the green for ten of the past twelve straight weeks, and is knocking ten-month highs as crude gets pushed higher. US oil briefly saw the north side of $92/bbl, beore settling back to sub-$91.50/bbl.
On the daily candlesticks, there’s plenty of room for crude to run, with prices neatly breaking the 200-day Simple Moving Average (SMA) back in July, which currently rests near $77/bbl.
Further upside will see oil prices testing $92.50, a level that has seen significant rejection in the past.
On the low side, support is coming from the 34-day Exponential Moving Average (EMA) near $84/bbl, with the near-term floor priced in at the last swing low of $78/bbl in mid-August.
WTI daily chart
WTI technical levels
- USD/JPY remains near yearly highs as investors turn cautious ahead of the US Federal Reserve and Bank of Japan (BoJ) policy decisions.
- The Fed is expected to keep rates unchanged, with a focus on economic forecasts and the Federal Funds Rate (FFR) projections.
- The BoJ is not expected to raise rates but may provide insights into potential changes to its Yield Curve Control (YCC) and negative interest rate policies.
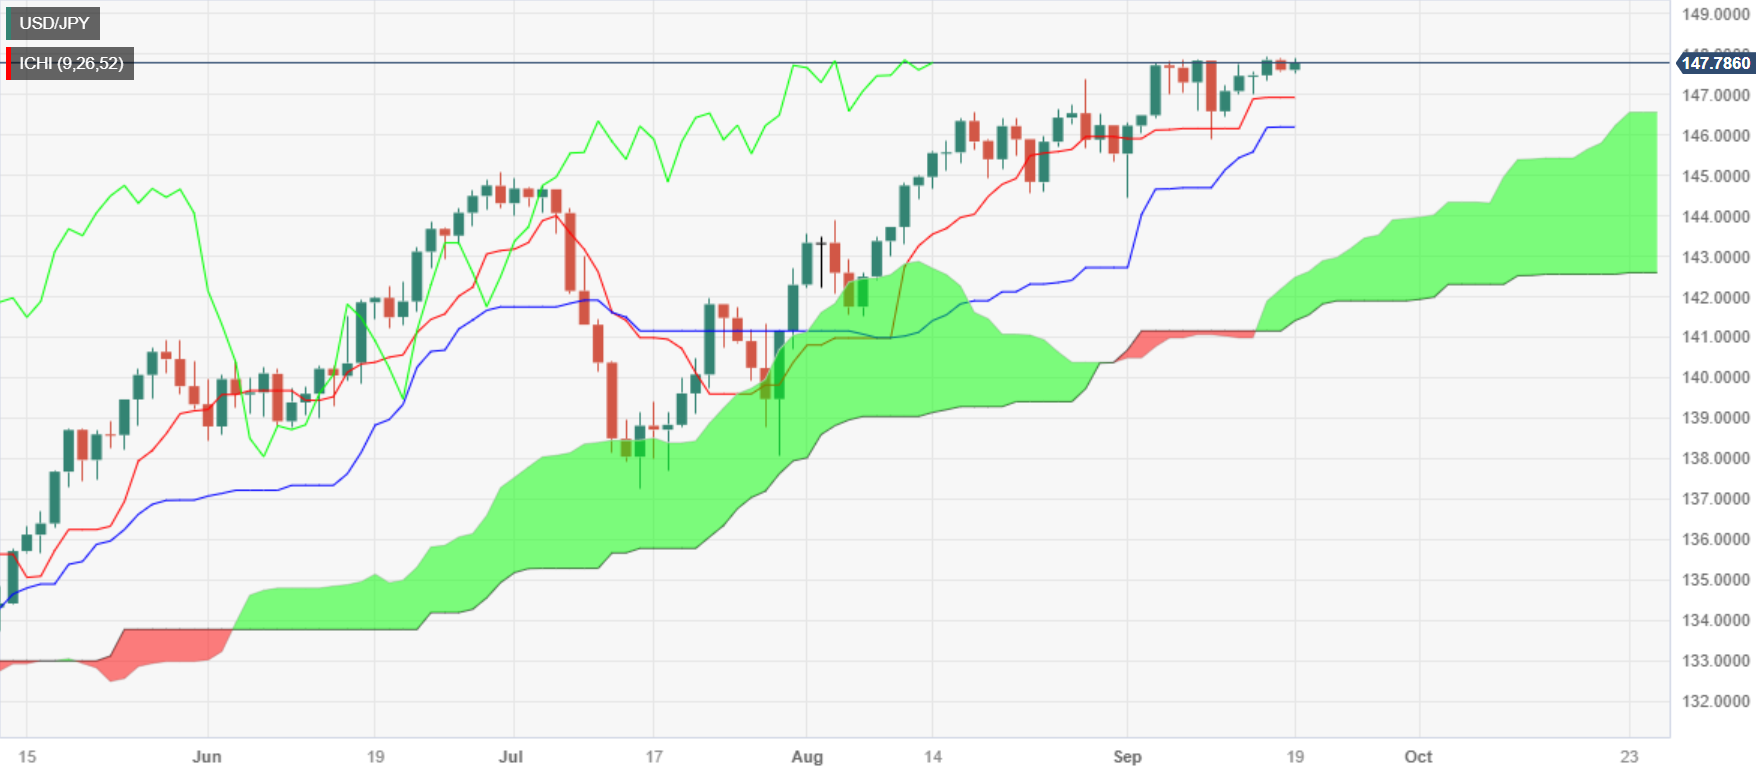
The USD/JPY remains subdued as Tuesday’s session begins, ahead of the US Federal Reserve’s decision on Wednesday, in which the US central bank is expected to keep rates unchanged at the 5.25%-5.50% range. The major is rising on the advancement in US Treasury bond yields and trades at 147.71, at around yearly highs.
USD/JPY trades at 147.71, buoyed by rising US Treasury yields, as markets look forward to key central bank meetings this week
Investors’ sentiment has turned sour ahead of the Fed. Besides the monetary policy decision, Fed Chair Jerome Powell and Co. will update their economic forecasts and Federal Funds Rate (FFR) expectancy. The last Summary of Economic Projections (SEP) witnessed policymakers expecting a 1% economic growth while the unemployment rate would climb to 4.1%. The Fed’s preferred inflation gauge, the PCE, is estimated at 3.2%, and the core PCE at 3.9%. The same report projects the FFR to peak at around 5.60%.
In the meantime, the Bank of Japan (BoJ) will also reveal its decision on September 22, in which the BoJ is not expected to raise rates. Still, it would be interesting to see if there are some expressions about additional tweaking to its Yield Curve Control (YCC) and discussions about ending its negative interest rates program.
Data-wise, August’s US building permits rose above estimates, and housing starts tumbled the most since 2020, down at -11.3%. On the Japanese front, its docket would feature the Balance of Trade for August, estimated at ¥-659.1B, while Exports are foreseen to shrink by -1.7%.
USD/JPY Price Analysis: Technical outlook
Consolidation is the name of the game with the USD/JPY pair. The threat of intervention by Japanese authorities refrains investors from opening fresh long bets in the pair, which could have easily tested the 150.00 threshold if not for the abovementioned. Initial resistance for the USD/JPY is seen at 148.00 before climbing towards the October 31 daily high at 148.84. A downward correction wil face the Tenkan-Sen at 146.92, followed by the Kijun-Sen at 146.19.
The Bank of Japan (BoJ) is getting closer to the end game, in the view of economists at TD Securities who expect USD/JPY to push to 135 in early 2024.
BoJ getting closer to the hiking trigger
The BoJ is getting closer to pulling the trigger to end its negative interest rate policy (NIRP). We believe the BoJ 2% inflation goal is clearly in sight, factoring in the latest inflation data and risks (as well as other events) on the horizon. We expect the BoJ to end its Yield Curve Control (YCC) policy at the Dec'23 meeting and exit NIRP in Jan'24 with a 10 bps hike in the policy balance rate.
Our accelerated timeline for BoJ normalization reinforces our out-of-consensus USD/JPY forecast, which sees a push towards 135 in early 2024.
The cross-fire that had hit the Australian Dollar throughout August (combination of high US rates and plummeting Chinese sentiment) has not ceased since the start of September. Economists at ING analyze AUD/USD outlook.
Still looking for a bottom
Moving ahead, we expect the US growth/Fed easing, and in turn, the global USD story, to be the key driver of AUD/USD. This is not to say that China will be put on the backburner, but a lot of the deterioration in Chinese growth is already priced into AUD, and things may gradually improve from here with monetary and fiscal stimulus being deployed in Beijing.
AUD/USD may still be searching for its bottom, but we still like a strong recovery into the new year, in line with USD decline story.
AUD/USD – 1M 0.63 3M 0.65 6M 0.68 12M 0.72
EUR/USD dropped despite the ECB’s decision to hike. Economists at UBS discuss the pair’s outlook.
Euro likely to rebound after dovish ECB message
The ECB hiked rates to a record high of 4% last week, its 10th consecutive increase. The decision was accompanied by an increase in the central bank’s inflation projections, which are now expected to average 5.6% this year and 3.2% in 2024-still well above the 2% target.
We remain most preferred on the Euro and least preferred on the US Dollar. The ECB’s move narrows the rate premium offered by the US, and we don’t expect rate cuts from the Eurozone’s central bank until at least June next year. An acceleration of quantitative tightening, with the ECB increasing the pace at which it shrinks its balance sheet, is also possible early next year.
We expect EUR/USD to rise to 1.12 by the end of the year.
The Rand strengthened about 0.5% vs. the USD last week. Economists at Société Générale analyze USD/ZAR technical outlook.
Direction lacking
USD/ZAR tested intermittent support near 17.40 representing the 38.2% retracement from 2021 and quickly reclaimed the 200-DMA. The bounce has so far remained stalled near August high of 19.30. A sideways consolidation is underway. Signals of a large decline are not yet visible; the 200-DMA near 18.35/18.10 should be an important support zone near term.
Daily MACD is within positive territory denoting prevalence of upward momentum. Once a break above 19.30 materializes, the uptrend is expected to resume. Next objectives would be at June high of 19.92 and projections of 20.25.
GBP/USD oscillates just below 1.24. Economists at OCBC Bank analyze the pair’s outlook.
25 bps hike likely
Risks skewed to the downside but at the same time, we observed a potential falling wedge, which may point to a bullish reversal at some point. We watch price action for confirmation.
We still expect a 25 bps hike at the upcoming MPC as wage growth remains red hot and core CPI remains elevated. That said, GBP could still trade on the back foot amid the BoE nearing the end of tightening cycle while stagflation concerns returned.
- Silver price stabilizes confidently above $23.00 as the focus shifts to Fed policy.
- The Fed is widely anticipated to keep interest rates unchanged at 5.25-5.50%.
- Silver price stabilizes above the horizontal resistance plotted around $23.12, which has turned into a support.
Silver price (XAG/USD) shifts auction above the crucial resistance of $23.00 as the US Dollar comes under pressure ahead of the interest rate decision by the Federal Reserve (Fed), which will be announced on Wednesday.
The S&P500 opens on a cautious note as investors remain uncertain over the interest rate guidance. The Fed is widely anticipated to keep interest rates unchanged at 5.25-5.50% but will keep doors open for further policy tightening.
Any discussion about rate cuts would improve the appeal for the risk-perceived assets and dampen the US Dollar. Economists at Goldman Sachs expect Fed officials to signal a full percentage point of cuts next year but to keep expectations of one more interest rate increase this year to a range of 5.50%-5.75%.
The US Dollar Index (DXY) finds support near 104.80 but the upside seems restricted as the Fed is expected to skip raising interest rates for the second time in its aggressive policy-tightening since March 2022. Meanwhile, the 10-year US Treasury yields to near 4.34%.
The US economy has remained resilient despite higher interest rates but investors see the economic recovery faltering as the Fed is expected to keep interest rates ‘higher for longer’. Meanwhile, the yields offered on five-year US bonds have increased from 10-year US Treasury yields, indicating that investors see a slowdown in the near term.
Silver technical analysis
Silver price stabilizes above the horizontal resistance plotted from September 7 high around $23.12, which has turned into a support. The 20-period Exponential Moving Average (EMA) at $23.20 is consistently providing support to the Silver bulls. The Relative Strength Index (RSI) (14) struggles to shift into the bullish range of 60.00-40.00.
Silver two-hour chart
-638307296092253924.png)
Economists at Commerzbank analyze EUR outlook after the ECB hiked its key rate last Thursday and ECB President Christine Lagarde signalled that the ECB is now likely to have reached the end of the rate hike cycle.
FX market will largely wait and see what surprises the Fed might have in store
In the coming days and weeks, there should be increasing clarity about the extent to which there may still be a willingness in the ECB's monetary policy council to perhaps raise interest rates again. Or what conditions would have to be met for such a step. Such comments should tend to benefit the EUR, as the market currently seems to be betting on an end to the rate hike cycle, which could clear the way for rate cuts next year. Comments suggesting that rate cuts may still be a long way off would also be positive for the EUR.
However, it may also turn out that the Council members are largely in agreement that the end of the rate hike cycle has been reached. The market is then more likely to interpret this as a dovish stance by the ECB and the EUR could come under depreciation pressure.
In the short term, however, the focus is of course on the US Fed. Ahead of the rate decision on Wednesday the FX market will largely wait and see what surprises the Fed might have in store.
AUD drifted higher following tentative signs of improvement in China data. Economists at OCBC Bank discuss Aussie’s outlook.
Room for gains
Looking out, we still favour AUD to trade higher on of expectations that China growth could stabilise at some point, possibly warmer ties between Australia and China, and a more moderate-to-soft USD profile (as the Fed nears end tightening cycle and embarks on rate cut cycle in 2024).
We have shared that the tourism, education, and property sectors in Australia could benefit if relations between China and Australia further warm up, and this can be a positive for AUD.
Key downside risk factors that may affect AUD outlook are 1/ extent of CNH swings; 2/ if USD strength or Fed tightening cycle unexpectedly extends; 3/ global growth outlook – if DM’s slowdown deteriorates; 4/ any market risk-off event.
Break below 4.84 would lead USD/BRL downtrend to resume, analysts at Société Générale report.
5.01/5.04 is an important resistance zone
USD/BRL defended lower limit of a multi-month channel near 4.69 resulting in a phase of rebound. Interestingly, it has so far struggled to re-enter previous range. Upper band of that channel near 5.01/5.04 which is also the 200-DMA is an important resistance zone.
In case the pair fails to defend recent pivot low at 4.84, one more leg of downtrend can’t be ruled out towards 4.69, and 2022 low at 4.61/4.59.
- EUR/USD’s recovery briefly surpasses the key 1.0700 threshold on Tuesday.
- Next on the upside comes 1.0767 ahead of 1.0828.
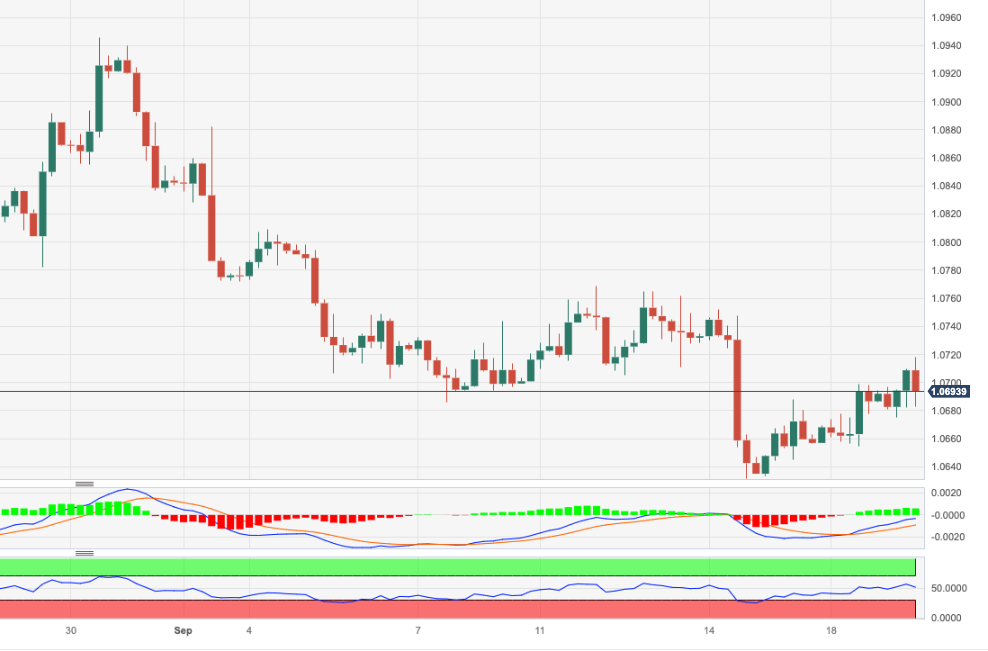
EUR/USD trades in a volatile fashion and looks to consolidate a breakout of the 1.0700 hurdle on Tuesday.
If the rebound gathers extra steam, the pair should face a minor hurdle at the weekly high of 1.0767 (September 12) prior to the critical 200-day SMA at 1.0828.
While below the key 200-day SMA, the pair is likely to face extra weakness.
EUR/USD daily chart
Economists at the Bank of Montreal expect EUR/USD to struggle in the near-term but see the pair recovering toward the 1.10 level by the end of the year.
A deeper correction lower in EUR/USD heading toward year-end is not the base case
A deeper correction lower in EUR/USD heading toward year-end is not the base case, but downside risks have increased, particularly with the global trade backdrop looking poor and transatlantic economic divergence set to remain wide for another quarter or so. Closer ties between Russia and North Korea also portend higher levels of geopolitical risk in relation to the war in Ukraine.
The EUR is likely to struggle to maintain topside momentum over the near-term. However, the base case is for moderate EUR/USD strength to push the exchange rate back to 1.10 around the turn of the year.
- DXY extends the weekly retracement below 105.00.
- Further south comes the weekly low near 104.40.
DXY has been shedding ground for the last three sessions and has opened the door to extra losses in the near term.
In case the corrective decline picks up further pace, the index could extend the drop to, initially, the weekly low of 104.42 (September 11). A sustained pullback below the latter could prompt the index to embark on a potential test of the critical 200-day SMA, today at 103.03.
While above the key 200-day SMA, the outlook for the index is expected to remain constructive.
DXY daily chart
USD/MXN has reversed most of the early September gains. Economists at ING analyze the pair’s outlook.
MXN to find strong buying interest on dips
The Mexican Peso may be under pressure in September and October as Banxico unwinds its intervention forward book, but we expect it to find strong buying interest on dips.
A tough external environment could see the USD/MXN pair trade to 18.00 this month, but a good macro story favours 17 again soon.
See – USD/MXN: Defence of 16.60 can lead to a short-term bounce – SocGen
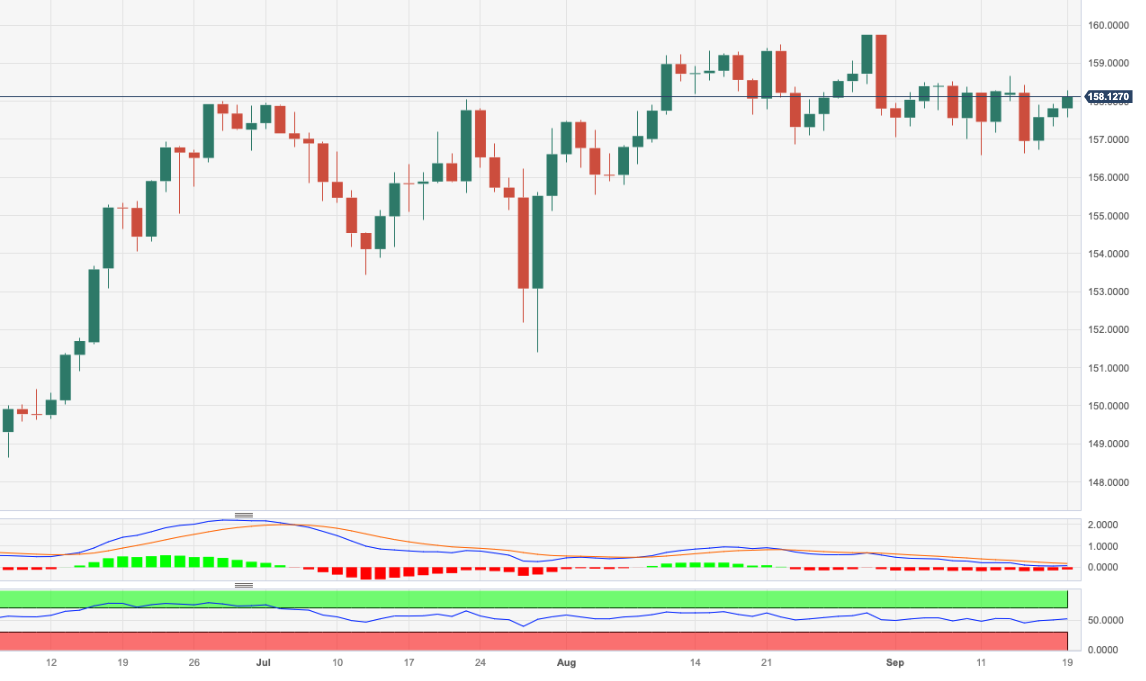
- EUR/JPY extends the weekly uptrend beyond 158.00.
- Next on the upside comes the YTD high.
EUR/JPY clinches its third session in a row of gains and manages to reclaim the 158.00 barrier and beyond on Tuesday.
In the meantime, the cross continues to face some consolidative range. Against that, a minor hurdle emerges at the so far monthly high of 158.65 (September 13) ahead of the 2023 top at 159.76 (August 30), which precedes the key round level at 160.00. The surpass of the latter should not see any resistance level of note until the 2008 high at 169.96 (July 23).
So far, the longer term positive outlook for the cross appears favoured while above the 200-day SMA, today at 148.84.
EUR/JPY daily chart
Markets are treading water ahead of the FOMC decision on Wednesday. Economists at Scotiabank analyze USD outlook.
USD in consolidation mood ahead of FOMC
Overall, markets appear in fairly constructive mood ahead of the Fed.
The Fed may not sound dovish but markets may need quite a lot more supportive evidence to push an expensive looking USD (certainly relative to short-term yield spreads against its major currency peers) even higher at this point.
US yields are bumping up against some key levels (5% or so for 2Y and 4.45% for 5Y) and a lot of good news still looks to be factored into the USD at this point.
Recall that the DXY had advanced for nine consecutive weeks through last Friday and that sort of run usually leaves any market prone to some sort of consolidation or correction – which appears to be playing out, at least ahead of the Fed.
- USD/CAD witnesses selling pressure as the US Dollar corrects sharply ahead of the Fed policy.
- Canada’s headline CPI expanded at a pace of 0.4% while annual CPI accelerated sharply to 4%.
- The BoC may keep interest rate policy stable ahead as the core inflation remains steady.
The USD/CAD pair witnesses an immense sell-off as the US Dollar weakens ahead of the interest rate decision by the Federal Reserve (Fed). The Loonie asset also faces selling pressure as Statistics Canada reported that the headline Consumer Price Index (CPI) expanded at a pace of 0.4% vs. expectations of 0.2%.
The annual headline inflation accelerated sharply to 4% against the estimates of 3.8% and the former release of 3.3%. The core CPI that excludes volatile oil and food prices expanded nominally by 0.1%, indicating subdued demand for non-durable goods and services. On an annualized basis, the core CPI rose to 3.3%.
Canada’s inflation for August is not expected to force the Bank of Canada (BoC) to deliver one more interest rate hike as the core inflation remains steady, which is generally considered for the monetary policy framework.
Meanwhile, the US Dollar Index (DXY) continues a two-day losing spell as the Fed is expected to skip raising interest rates in its September monetary policy on Wednesday. This would be the second time the Fed is expected to skip hiking interest rates in its historically aggressive tightening spell that started in March 2022.
As per the CME Group Fedwatch Tool, traders undoubtedly see interest rates remaining steady at 5.25%-5.50% after the Federal Open Market Committee (FOMC) meeting on Wednesday. For the rest of the year, traders anticipate almost a 58% chance for the Fed to also keep monetary policy unchanged.
Investors would look for the commentary about rate cuts as the US manufacturing sector is going through turbulent times. US firms are operating at lower capacity and working on achieving operational efficiency by controlling costs through lower inventory due to a deteriorating demand environment.
Kit Juckes, Chief Global FX Strategist at Société Générale, is worried about Sterling.
Sterling is only being held up by rate expectations
The more the market worries about the growth outlook in the UK, the more the prospect of further rate hikes beyond this week will a) fade away and b) scare investors.
Sterling, even more perhaps than the Euro, is only being held up by rate expectations. This week’s data calendar might not be too bad for the Pound if Retail Sales and the Services PMI both bounce and core CPI remains at 6.9%. But at best, that will delay what seems an inevitable move by GBP/USD back below 1.20.
- Housing Starts drops sharply while Building Permits rose above expectations in the US in August.
- US Dollar Index stays near daily lows below 105.00 after the data.
The monthly data published by the US Census Bureau revealed on Tuesday that Housing Starts tumbled 11.3% on a monthly basis in August, following a 2% increase (revised from 3.9%) recorded in July, to a seasonally adjusted annual rate of 1,283 million. This reading came in worse than the market expectation for a decline to 1,44 million.
In the same period, Building Permits, which rose 0.1% in July, increased 6.9%., to a seasonally adjusted annual rate of 1,543,000; surpassing the 1,445,000 of market consensus.
Market reaction
The US Dollar Index showed no immediate reaction to these figures and was last seen fluctuating near daily lows under 105.00.
- Annual inflation in Canada rose at a stronger pace than expected in August.
- USD/CAD trades deep in negative territory near 1.3400 after the data.
Inflation in Canada, as measured by the change in the Consumer Price Index (CPI), rose to 4% on a yearly basis in August from 3.3% in July. This reading came in higher than the market expectation of 3.8%. On a monthly basis, the CPI rose 0.4%, compared to analysts' estimate for an increase of 0.2%.
Moreover, the Bank of Canada reported that the monthly Core CPI, which excludes volatile food and energy prices, rose 0.1%, while the annual Core CPI edged higher to 3.3% from 3.2%.
Market reaction
USD/CAD edged lower with the immediate reaction and was last seen losing 0.65% on the day at 1.3400.
- AUD/USD climbs sharply above 0.6430 as the US Dollar faces selling pressure ahead of the Fed policy.
- The Fed is expected to keep interest rates higher long enough to ensure price stability.
- AUD/USD rebounds after discovering buying interest near the horizontal support plotted around 0.6364.
The AUD/USD pair delivers an upside break of the consolidation formed in a range of 0.6430-0.6450 in the European session. The Aussie asset picks strength as the US Dollar Index (DXY) eases ahead of the Federal Reserve (Fed) monetary policy, which will be announced on Wednesday.
Investors see the Fed keeping interest rates steady at 5.25-5.50% as inflation is consistently cooling while economic prospects are strong. The labor growth in the United States economy has remained steady despite higher interest rates from the Fed. The Fed is expected to keep interest rates higher long enough to ensure price stability.
Meanwhile, the Australian Dollar will remain in action amid the interest rate policy by the People’s Bank of China (PBoC), which will be revealed on Wednesday. A dovish interest rate stance is expected from the PBoC due to upside risks to deflation amid bleak household’ demand.
The US Dollar Index drops sharply below the crucial support of 105.00 and is expected to remain vulnerable ahead.
AUD/USD rebounds after discovering buying interest near the horizontal support plotted from August 17 low around 0.6364 on a two-hour scale. The Aussie asset stabilizes above the 50-day Exponential Moving Average (EMA), which trades around 0.6340. Potential resistance is plotted from August 15 high at 0.6522.
The Relative Strength Index (RSI) (14) jumps above 60.0, which indicates that the bullish impulse has been triggered.
A decisive break above August 15 high around 0.6522 will drive the asset to August 9 high at 0.6571. Breach of the latter will drive the asset towards August 10 high at 0.6616.
On the flip side, a fresh downside would appear if the Aussie asset will drop below August 17 low around 0.6360. This would expose the asset to the round-level support of 0.6300 followed by 03 November 2022 low at 0.6272.
AUD/USD two-hour chart
-638307228317349671.png)
The big focus is on the Fed. Any moves in the dot, especially in 2024 will have a significant impact on markets, FX. Economists at OCBC Bank considered three potential scenarios with regard to 2024.
A more dovish dot plot would lead to dovish re-pricing, weighing on USD
A scenario of no-change to dot plot will come as a relief to risk assets. USD may ease as markets have already unwound their prior dovish bets to be aligned with the Fed’s Jun dot plot.
A case of more dovish dot plot (i.e. if the Fed looks for more cuts than what they have pencilled in) would lead to dovish re-pricing and that can weigh on USD.
A more hawkish dot plot (i.e. Fed looks for lesser cuts, dots shift higher) would lead to hawkish re-pricing. Yields can run higher, and USD can continue to trade higher. This would be a risk-off scenario for risk assets. In this scenario, alongside higher Oil prices, there will be upward pressure on inflation and yields. This may result in a deterioration of global growth/inflation mix and can cause headwinds to risk appetite and undermine Asian FX, especially those that are net oil importers, such as THB, PHP.
USD/CAD pushed support in the upper 1.34 area. Economists at Scotiabank analyze the pair’s outlook.
USD/CAD should run lower to test 1.3393
Losses through firm USD support in the upper 1.34 area point to more weakness in the near-term at least.
Short-term trend momentum is picking up more obviously, with the intraday and daily DMIs aligned bearishly for the USD.
USD/CAD should run lower to test 1.3393 (50% retracement of the July/September move up) which coincides with the early July spike high. A break below here puts the low 1.32s on the radar.
USD resistance is 1.3490/1.3495.
GBP/USD is holding a narrow consolidation range between support at 1.2370 and resistance at 1.2410. Economists at Scotiabank analyze Cable’s outlook.
A clear move through the low 1.24s will ease broader, bearish pressure
Short-term trend dynamics are bearish which should limit the scope for gains in the near term.
A clear move through the low 1.24s will ease broader, bearish pressure on the Pound but gains through 1.2550 are needed to suggest more sustainable gains.
The broader trend appears bearish still.
See: The downtrend in Sterling is likely to continue – Commerzbank
EUR/USD edges above 1.07 amid oversold conditions. Economists at Scotiabank analyze the pair’s technical outlook.
The very short-term trend looks constructive
The very short-term trend looks constructive and the EUR does look quite oversold (after nine consecutive weekly losses against the USD). But there is still quite a gap between current levels and points on the chart which would signal scope for more EUR strength.
A clear push through the 1.0765 point would be a bullish, short-term cue for the EUR at least.
- The US Dollar trades marginally in the green on Tuesday after a minor incurred loss on Monday.
- Traders will likely keep powder dry for the Fed interest rate decision on Wednesday.
- The US Dollar Index resides above 105.00, struggling to make new highs.
The US Dollar (USD) took a small step back at the start of this week with traders focusing on the main event on Wednesday with the US Federal Reserve (Fed) rate decision. Expectations are for no hike, though with the recent resurgence in headline inflation via energy prices, US Fed Chair Jerome Powell might be more hawkish than predicted.
Traders, meanwhile, have to split and divide their attention between the Fed and Capitol Hill, with a possible US government shutdown looming again. By Thursday, US House Speaker Kevin McCarthy needs to bring a new stopgap bill to the floor for a vote. If the House fails to pass the bill, the probability of a shutdown in October grows more dire.
Daily digest: US Dollar softens
- A bit more data this Tuesday arrives after the calm start on Monday with US housing data hitting the wires at 12:30 GMT. Building Permits are expected to stay steady near 1.445 million, a touch higher from the 1.443 million in July. Housing Starts are expected to head from 1.443 million to 1.445 million.
- Near 12:55 GMT, the US Redbook will be released. Previous number was 4.6%.
- The US Treasury will be auctioning 20-year Treasuries.
- Equities are in the red this Tuesday ahead of the US Fed meeting. Several trading desks are reporting some profit-taking ahead of a possible failure of the stopgap bill to avoid a US shutdown.
- The CME Group FedWatch Tool shows that markets are pricing in a 99% chance that the Federal Reserve will keep interest rates unchanged at its meeting in September. Traders though will need to watch out for any hawkish rhetoric from Powell as inflation has been ticking up recently.
- The benchmark 10-year US Treasury yield trades at 4.31% and peaked in early Monday trading before starting to sell off. A small flight to safe havens with US bonds being bought triggers a decline in yields.
US Dollar Index technical analysis: Facing selling pressure
THe US Dollar was facing some selling pressure on Monday, which actually is not a bad thing as such. After a ninth consecutive week of gains for the US Dollar Index (DXY), the Relative Strength Index (RSI) is a fair bit into overbought territory. A few days of sideways to lower would help cool down the rally a bit before entering the next leg up, where the US Fed rate decision could act as a catalyst.
The US Dollar Index (DXY) has edged up, reaching 105.41. This is just a sigh away from the 2023 high near 105.88. Should the DXY be able to close above there for the week, expect the US Dollar to go even stronger in the medium-turn.
On the downside, the 104.44 level seen on August 25 kept the Index supported on Monday, halting the DXY from selling off any further. Should the uptick that started on September 12 reverse and 104.44 gives way, a substantial downturn could take place to 103.04, where the 200-day Simple Moving Average (SMA) comes into play for support.
US Dollar FAQs
What is the US Dollar?
The US Dollar (USD) is the official currency of the United States of America, and the ‘de facto’ currency of a significant number of other countries where it is found in circulation alongside local notes. It is the most heavily traded currency in the world, accounting for over 88% of all global foreign exchange turnover, or an average of $6.6 trillion in transactions per day, according to data from 2022.
Following the second world war, the USD took over from the British Pound as the world’s reserve currency. For most of its history, the US Dollar was backed by Gold, until the Bretton Woods Agreement in 1971 when the Gold Standard went away.
How do the decisions of the Federal Reserve impact the US Dollar?
The most important single factor impacting on the value of the US Dollar is monetary policy, which is shaped by the Federal Reserve (Fed). The Fed has two mandates: to achieve price stability (control inflation) and foster full employment. Its primary tool to achieve these two goals is by adjusting interest rates.
When prices are rising too quickly and inflation is above the Fed’s 2% target, the Fed will raise rates, which helps the USD value. When inflation falls below 2% or the Unemployment Rate is too high, the Fed may lower interest rates, which weighs on the Greenback.
What is Quantitative Easing and how does it influence the US Dollar?
In extreme situations, the Federal Reserve can also print more Dollars and enact quantitative easing (QE). QE is the process by which the Fed substantially increases the flow of credit in a stuck financial system.
It is a non-standard policy measure used when credit has dried up because banks will not lend to each other (out of the fear of counterparty default). It is a last resort when simply lowering interest rates is unlikely to achieve the necessary result. It was the Fed’s weapon of choice to combat the credit crunch that occurred during the Great Financial Crisis in 2008. It involves the Fed printing more Dollars and using them to buy US government bonds predominantly from financial institutions. QE usually leads to a weaker US Dollar.
What is Quantitative Tightening and how does it influence the US Dollar?
Quantitative tightening (QT) is the reverse process whereby the Federal Reserve stops buying bonds from financial institutions and does not reinvest the principal from the bonds it holds maturing in new purchases. It is usually positive for the US Dollar.
It is – another – waiting day ahead of Wednesday’s FOMC meeting. Kit Juckes, Chief Global FX Strategist at Société Générale, analyzes the FX market outlook.
The Euro, and even more, the Pound, still look vulnerable
The market doesn’t expect a Fed hike but the dot-plot, which currently suggests there will be one more this year before a steady fall, thereafter, could see cuts pushed further out, while the tone of the statement is certain to be hawkish, as the FOMC reinforces the ‘higher for longer’ message.
Higher Oil prices and decreased pessimism about China can support AUD and CAD for now, but the Euro, and even more, the Pound, still look vulnerable.
Economists at ING analyze how Canadian inflation data could impact USD/CAD and BoC’s rate hike expectations.
Canadian CPI may put a BoC hike back on the table
Any upside surprise in the inflation figures would likely put a BoC rate hike back on the table, even though it is not our base case at the moment to see another BoC move.
Markets are pricing in 15 bps to a peak, and we could see that being pushed to 20 bps or higher after a strong CPI read today.
Given its stretched overvaluation, we had been calling for a correction in USD/CAD for a while: the pair is reconverging (i.e., dropping) with short-term fundamentals now, and a potential post-CPI rally could see it slip further to 1.3400.
See – Canada CPI Preview: Forecasts from five major banks, another jump in inflation
41 of 70 economists polled by Reuters said that they expect the European Central Bank (ECB) to wait until at least the third quarter of 2024 before lowering rates.
All 70 economists said they expect the ECB's key deposit facility rate to remain unchanged at 4% through to year-end.
Market reaction
The Euro showed no immediate reaction to this headline. As of writing, the EUR/USD pair was trading at 1.0695, rising only 0.05% on a daily basis.
Euro price today
The table below shows the percentage change of Euro (EUR) against listed major currencies today. Euro was the strongest against the Japanese Yen.
| USD | EUR | GBP | CAD | AUD | JPY | NZD | CHF | |
| USD | -0.02% | -0.04% | -0.35% | -0.27% | 0.06% | -0.25% | -0.09% | |
| EUR | 0.00% | -0.02% | -0.31% | -0.27% | 0.08% | -0.26% | -0.09% | |
| GBP | 0.05% | 0.02% | -0.26% | -0.24% | 0.09% | -0.25% | -0.04% | |
| CAD | 0.34% | 0.31% | 0.28% | 0.05% | 0.40% | 0.04% | 0.24% | |
| AUD | 0.27% | 0.27% | 0.24% | -0.04% | 0.34% | -0.01% | 0.20% | |
| JPY | -0.05% | -0.09% | -0.11% | -0.39% | -0.33% | -0.32% | -0.14% | |
| NZD | 0.27% | 0.26% | 0.24% | -0.04% | 0.00% | 0.33% | 0.19% | |
| CHF | 0.09% | 0.07% | 0.04% | -0.23% | -0.18% | 0.12% | -0.19% |
The heat map shows percentage changes of major currencies against each other. The base currency is picked from the left column, while the quote currency is picked from the top row. For example, if you pick the Euro from the left column and move along the horizontal line to the Japanese Yen, the percentage change displayed in the box will represent EUR (base)/JPY (quote).
Sterling came under further depreciation pressure over the past few days. Economists at Commerzbank analyze GBP outlook.
When will we finally see a fall in inflation?
Inflation data for August is due for publication on Wednesday. Bloomberg consensus expects a rise in the rate of inflation, possibly even back to 7% or above. And the core rate has been quite stubborn for some time anyway. So when will we finally see a fall in inflation? The recent data on wage growth leaves room for doubt on that front. Just like past inflation publications that frequently surprised to the upside.
So should Wednesday’s inflation data be in line with expectations or even above, with the BoE sounding dovish on Thursday the downtrend in Sterling is likely to continue.
- Natural Gas is up 0.50% on Tuesday after an upbeat Monday.
- The US Dollar is on the backfoot ahead of the Fed.
- US Natural Gas prices might tick up for now, though the outlook looks weaker.
Natural Gas prices are ticking up this Tuesday in a weird counterintuitive move as headlines about easing supply issues would suggest a decline. US Natural Gas futures are rallying, while European futures sink lower. With gas supply from Norway expected to be restored soon and mild temperatures in Europe, the current squeeze higher for Natural Gas could be short-lived.
Meanwhile, the US Dollar waits for the move from the US Federal Reserve on Wednesday. The US central bank is expected to keep rates unchanged, though there is a risk of a very hawkish statement that could strengthen the US Dollar. In Asia, economic data out of China suggests that the world’s second-largest economy is gaining traction, a recovery that could lead to a pickup in gas demand in the medium-term.
Natural Gas is trading at $2.982 per MMBtu at the time of writing.
Natural Gas news and market movers
- In the energy space - Brent Crude oil jumps above $95 per barrel.
- Australian strikes linger on with no real breakthrough.
- In the economic calendar, all eyes will be on Friday, when the European Purchasing Managers Index (PMI) numbers will be published. With all segments in contraction, any uptick could translate into increasing demand for Natural Gas in the European bloc.
- The Norwegian Troll field has is set to reopen, according to a statement. This means higher gas flows toward Europe.
- The Freeport production site is already having its effect in LNG volumes picking up on the markets.
- European gas storage is expected to be enough to cover the upcoming winter. According to current estimates and with storage at 93%, Europe is expected to end the winter season with 44% of its supply left.
- Recent weather models point to still mild temperatures in the old continent, with on average 20 degrees Celsius in the northern half of Europe. The demand for gas in this period compared with last year is already substantially smaller.
Natural Gas Technical Analysis: A move higher on bleak outlook
Natural Gas is in a textbook trade from a technical point of view. Price action has broken back above the 200-day Simple Moving Average (SMA) last week and even confirmed with a test for support on the downside and a bounce higher on Tuesday. This can be perceived as a substantial bullish signal which could push prices up to $3.
As already mentioned, $3 is the target and a hard nut that needs to be cracked. Seeing the current equilibrium, a catalyst is needed to move the needle upwards. That could come with more supply disruptions from Australia or sudden changes in the current gas storage levels in Europe due to a sudden peak in demand. In such events, Gas prices could rally to $3.20, testing the upper band of the ascending trend channel.
On the downside, the 200-day SMA at $2.89 has been turned into support. Should that give way on a downside move, some area will be crossed before the next support kicks in at $2.73. This level aligns with the 55-day SMA, which is likely to step in to avoid any nosedive moves in the commodity.
-638307115206788851.png)
XNG/USD (Daily Chart)
Natural Gas FAQs
What fundamental factors drive the price of Natural Gas?
Supply and demand dynamics are a key factor influencing Natural Gas prices, and are themselves influenced by global economic growth, industrial activity, population growth, production levels, and inventories. The weather impacts Natural Gas prices because more Gas is used during cold winters and hot summers for heating and cooling. Competition from other energy sources impacts prices as consumers may switch to cheaper sources. Geopolitical events are factors as exemplified by the war in Ukraine. Government policies relating to extraction, transportation, and environmental issues also impact prices.
What are the main macroeconomic releases that impact on Natural Gas Prices?
The main economic release influencing Natural Gas prices is the weekly inventory bulletin from the Energy Information Administration (EIA), a US government agency that produces US gas market data. The EIA Gas bulletin usually comes out on Thursday at 14:30 GMT, a day after the EIA publishes its weekly Oil bulletin. Economic data from large consumers of Natural Gas can impact supply and demand, the largest of which include China, Germany and Japan. Natural Gas is primarily priced and traded in US Dollars, thus economic releases impacting the US Dollar are also factors.
How does the US Dollar influence Natural Gas prices?
The US Dollar is the world’s reserve currency and most commodities, including Natural Gas are priced and traded on international markets in US Dollars. As such, the value of the US Dollar is a factor in the price of Natural Gas, because if the Dollar strengthens it means less Dollars are required to buy the same volume of Gas (the price falls), and vice versa if USD strengthens.
- NZD/USD trades in a narrow range as investors await the Fed’s interest rate policy.
- The Fed is expected to keep interest rates unchanged amid falling inflation.
- NZD/USD trades in an Ascending Triangle chart pattern, which indicates a squeeze in volatility.
The NZD/USD pair has oscillated in a narrow range of 0.5900-0.5940 for the past four trading sessions. The Kiwi asset struggles to find as investors await the interest rate decision by the Federal Reserve (Fed), which will be announced on Wednesday.
The US Dollar Index (DXY) faces barricades in extending recovery further as the Fed is expected to deliver a neutral interest rate policy. The US economy is resilient due to easing inflationary pressures and stable labor growth, which would allow Fed policymakers to keep interest rates unchanged at 5.25-5.50%.
Meanwhile, the New Zealand Dollar will dance to the tune of the People’s Bank of China (PBoC) monetary policy, which is also scheduled for Wednesday. The PBoC is expected to continue to favor an expansionary policy framework to diminish deflation risks. Being a proxy for China’s economic recovery, an expansionary policy would support the New Zealand Dollar.
NZD/USD trades in an Ascending Triangle chart pattern on a two-hour scale, which indicates a squeeze in volatility. The upside of the aforementioned chart pattern is restricted near the horizontal resistance plotted from September 6 high at 0.5942 while the upward-sloping trendline is placed from September 7 low at 0.5847.
The 50-period Exponential Moving Average (EMA) at 0.5914 is extremely close to the asset, portraying a sideways trend.
Meanwhile, the Relative Strength Index (RSI) (14) attempts to shift into the bullish range of 60.0080.00. If the RSI (14) manages to do so, a bullish momentum will get triggered.
Going forward, a decisive break above September 14 high at 0.5945 would expose the asset to August 23 high around 0.5980, followed by August 8 low around 0.6035.
On the contrary, a breakdown below September 13 low at 0.5980 would drag the major toward September 7 low at 0.5847. A slippage below the latter would expose the asset to the round-level support at 0.5800.
NZD/USD two-hour chart
-638307150064894514.png)
EUR/USD tumbled to a three-month low on Friday of 1.0632, erasing the previous low of May (1.0635). Economists at Société Générale analyze the pair’s outlook.
Rebound depends on turnaround in 10Y real spread
The likelihood that rates have peaked could make it harder for the Euro to claw back losses if the Fed on Wednesday keeps options open for another rate increase in Q4 and upgrades the growth outlook for the US economy.
A break-out in 10Y UST yields above 4.36% could keep Euro buyers at bay (resistance 10Y UST/Bund 172 bps).
USD/JPY resumed its rise last week. Economists at OCBC Bank analyze the pair’s outlook.
USD/JPY to trade lower beyond the near term
With no imminent BoJ shift, markets could revert back to trading USD/JPY higher. Currency pair is still largely a story of yield differentials and with Treasury yields still higher and UST-JGB yield differentials still wide/ widening, the USD/JPY may continue to trade higher. This puts focus on potential leaning against the wind activities, should the pace of rise become one-sided and excessive.
Beyond the near term, we expect USD/JPY to trade lower on the back of a moderate-to-soft USD profile (as Fed tightening stretches into late cycle and that USD can fall when pause or pivot comes into play) and on expectation for further BoJ shift towards policy normalisation amid higher inflationary and wage pressures in Japan.
UOB Group’s Economist Enrico Tanuwidjaja and Junior Economist Agus Santoso review the latest trade balance figures from Indonesia.
Key Takeaways
Indonesia recorded its 40th consecutive month of surplus amid a larger decline in imports than exports. The latest trade surplus of USD3.1bn in Aug 2023 is a marked increase from USD1.3bn in Jul and higher than consensus expectation of USD1.5bn.
All in all, lower total imports, though bottoming out, continue to suggest a more moderate pace of investment. Together with slower exports, consistent with the outlook of global slowdown, will render Indonesia’s trade balance to register smaller surplus in the immediate term, before potentially turning into slight deficit as delayed import demand might come only closer to the middle of next year.
CAD has done well to recover 1.5% from the low of 1.3695 ten days ago against the USD. Economists at Société Générale analyze USD/CAD technical outlook.
Lack of steady upward momentum
USD/CAD rebound faced stiff resistance at the hurdle of 1.3670/1.3720 representing highs of April/May and the 61.8% retracement from last October.
Daily MACD has dipped below its trigger denoting lack of steady upward momentum.
The pair has started unfolding a pullback after this test and is likely to revisit the 50-DMA near 1.3420/1.3385 which is a potential support zone. In case the pair fails to defend it, there could be risk of a deeper decline.
- Gold price extends winning spell as investors see the Fed keeping interest rates on hold.
- The Fed is expected to announce an unchanged interest rate decision amid falling inflation and upbeat economic prospects.
- Worries about an economic slowdown due to “higher interest rates for longer” linger despite the US economic resilience.
Gold price (XAU/USD) continues to attract bids ahead of the Federal Reserve (Fed) interest rate decision, which will be announced on Wednesday. The yellow metal extended its three-day winning spell on Tuesday as the Fed is expected to maintain the status quo on the grounds of falling inflation and an upbeat economic outlook.
Investors remain curious about the guidance on interest rates as a hawkish outlook would trigger a risk-aversion theme. Markets are pricing in that the Fed is done with hiking rates until year-end, and hopes for the US economy shifting on a “golden path” are high. The only factor that could keep expectations of one more interest rate increase is rising energy prices, which may contribute to inflation and further squeeze households’ real incomes.
Daily Digest Market Movers: Gold price extends recovery
- Gold price extends its upside momentum above $1,930 as investors see the Federal Reserve keeping interest rates unchanged at 5.25%-5.50% after its September monetary policy meeting. The decision will be announced on Wednesday.
- The precious metal kept attracting bids from the past three trading sessions as the upside in the US Dollar is expected to remain restricted on expectations of unchanged rates.
- US inflation is falling and the labor market is resilient despite higher interest rates, allowing policymakers to leave interest rates unchanged.
- The recent rise in Oil prices is exerting pressure on inflation but Fed policymakers generally consider core inflation, which doesn’t include energy prices, while framing monetary policy.
- For the interest rate guidance, the Fed is expected to keep the doors open for further policy tightening to ensure price stability.
- The Fed could keep interest rates elevated long enough to bring down inflation to 2%. This is likely to continue to build pressure on the US economy, particularly for the manufacturing and housing sectors.
- Any discussion about rate cuts would improve the appeal for the risk-perceived assets and dampen the US Dollar. Economists at Goldman Sachs expect Fed officials to signal a full percentage point of cuts next year but to keep expectations of one more interest rate increase this year to a range of 5.50%-5.75%.
- Worries about an economic slowdown due to higher interest rates for longer linger despite the current economic resilience. Shorter-term US Treasury yields have surpassed the yields offered in longer time frames, a situation that has historically indicated risks of a potential recession.
- As per the CME Group Fedwatch Tool, traders undoubtedly see interest rates remaining steady at 5.25%-5.50% after the Federal Open Market Committee (FOMC) meeting on Wednesday. For the rest of the year, traders anticipate almost a 58% chance for the Fed to also keep monetary policy unchanged.
- About the US economic outlook, US Treasury Secretary Janet Yellen on Monday said that she doesn’t see any signs that the economy will enter into a downturn as inflation is coming down and the labor market is quite strong.
- However, Yellen warned that a failure by Congress to pass the legislation to keep the government in control could elevate the risk of an economic slowdown.
- Later this week, investors will watch the preliminary Manufacturing and Services PMI September data to be reported by S&P Global. US factory activity has remained vulnerable due to higher interest rates. Firms are focusing on achieving efficiency by controlling costs in a deteriorating demand environment.
- The US Dollar Index (DXY) seems well-supported above the crucial 105.00 level. Investors keep pumping money into the USD Index due to deepening fears of a global slowdown in a high-interest rate environment.
Technical Analysis: Gold price extends three-day winning streak
Gold price resumes its three-day winning spell as the Fed is expected to keep the monetary policy unchanged on Wednesday. The precious metal is at a two-week high at around $1,935.00 after discovering buying interest near the 200-day Exponential Moving Average (EMA), which trades at around $1,910.00. The yellow metal has climbed above the 20-day and 50-day EMAs, which indicates that the short-term trend has turned bullish.
Fed FAQs
What does the Federal Reserve do, how does it impact the US Dollar?
Monetary policy in the US is shaped by the Federal Reserve (Fed). The Fed has two mandates: to achieve price stability and foster full employment. Its primary tool to achieve these goals is by adjusting interest rates.
When prices are rising too quickly and inflation is above the Fed’s 2% target, it raises interest rates, increasing borrowing costs throughout the economy. This results in a stronger US Dollar (USD) as it makes the US a more attractive place for international investors to park their money.
When inflation falls below 2% or the Unemployment Rate is too high, the Fed may lower interest rates to encourage borrowing, which weighs on the Greenback.
How often does the Fed hold monetary policy meetings?
The Federal Reserve (Fed) holds eight policy meetings a year, where the Federal Open Market Committee (FOMC) assesses economic conditions and makes monetary policy decisions.
The FOMC is attended by twelve Fed officials – the seven members of the Board of Governors, the president of the Federal Reserve Bank of New York, and four of the remaining eleven regional Reserve Bank presidents, who serve one-year terms on a rotating basis.
What is Quantitative Easing (QE) and how does it impact USD?
In extreme situations, the Federal Reserve may resort to a policy named Quantitative Easing (QE). QE is the process by which the Fed substantially increases the flow of credit in a stuck financial system.
It is a non-standard policy measure used during crises or when inflation is extremely low. It was the Fed’s weapon of choice during the Great Financial Crisis in 2008. It involves the Fed printing more Dollars and using them to buy high grade bonds from financial institutions. QE usually weakens the US Dollar.
What is Quantitative Tightening (QT) and how does it impact the US Dollar?
Quantitative tightening (QT) is the reverse process of QE, whereby the Federal Reserve stops buying bonds from financial institutions and does not reinvest the principal from the bonds it holds maturing, to purchase new bonds. It is usually positive for the value of the US Dollar.
EUR/USD traded a “buy on rumor, sell on fact” into the ECB meeting last week. Economists at OCBC Bank analyze the pair’s outlook.
USD to drive direction
Near term, stagflation concerns in EU and ECB at end of tightening cycle may continue to weigh on EUR. That said with ECB behind us, EUR’s outlook would also depend on how USD, USTs trade and FoMC decision may offer some guidance.
We are neutral on EUR’s outlook as growth in Euro area looks to slow while the ECB tightening cycle is likely near its end.
With the Fed potentially closer to a pivot as early as 1Q 2024 vs. ECB in 2H 2024), some degree of convergence in ECB-Fed monetary policies is still likely and that could still marginally be supportive of a mild upward trajectory into 2024.
The key risks to EUR’s outlook are an earlier-than-expected dovish ECB pivot and/or growth momentum in Euro area continues to decelerate sharply.
- USD/MXN reverses the previous day’s gains ahead of the Fed policy decision.
- MACD shows a pattern of divergence below the signal line; indicating a momentum shift.
- The immediate support appears around the weekly low, followed by the 17.0000 psychological level.
USD/MXN retraces the previous day’s gains, trading lower around 17.1040 during the European session on Tuesday. Investors caution ahead of the US Federal Reserve’s (Fed) policy decision contributes the support for undermining the pair.
The immediate support for the USD/MXN pair appears around the weekly low at 17.0308, followed by the 17.0000 psychological level.
If bearish sentiment exerts pressure, the pair could potentially approach the next support level near the 16.9000 psychological level.
The USD/MXN pair could face a challenge around the seven-day Exponential Moving Average (EMA) at 17.1625, following the 23.6% Fibonacci retracement at 17.1904 level.
A firm break above the latter could open the doors for the pair to explore the region around the 17.2000 psychological level.
The Moving Average Convergence Divergence (MACD) line remains above the centerline, but it exhibits a pattern of divergence beneath the signal line. This pattern indicates that the recent uptrend in the USD/MXN pair is losing strength.
However, the 14-day Relative Strength Index (RSI) indicates bearish momentum in the short term as it lies below the 50 level.
USD/MXN: Daily Chart
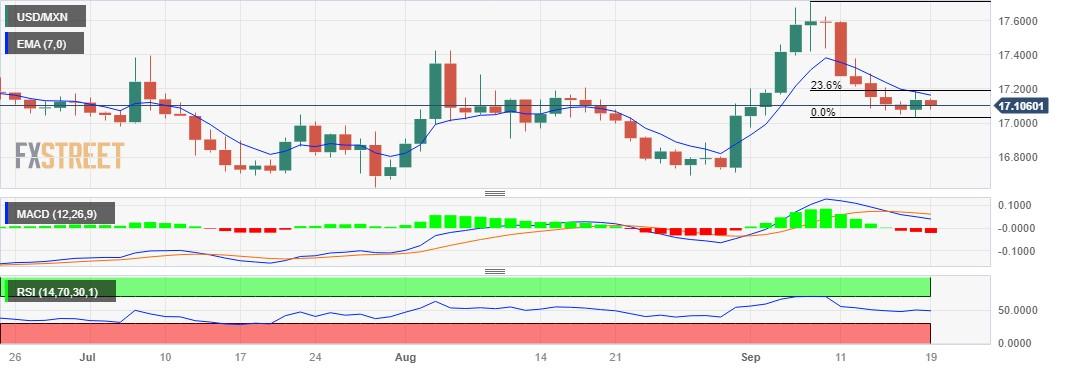
In the latest update of its forecasts for major economies published on Tuesday, the Organisation for Economic Development (OECD) raised the global growth forecast to 3.0% in 2023, compared to the 2.7% expansions projected previously.
The OECD, however, cut the 2024 GDP estimate to 2.7% vs. the previous reading of 2.9%.
Additional takeaways
Raises US growth forecast to 2.2% in 2023 (1.6% previously) and to 1.3% in 2024 (1.0% previously).
Cuts chinese growth forecast to 5.1% in 2023 (5.4% previously) and 4.6% in 2024 (5.1% previously).
Cuts Eurozone growth forecast to 0.6% in 2023 (0.9% previously) and to 1.1% in 2024 (1.5% previously).
Raises Japanese growth forecast to 1.8% in 2023 (1.3% previously), trims 2024 to 1.0% (1.1% previously).
Cuts German GDP forecast to contraction of 0.2% in 2023 (flat growth previously) and 0.9% growth in 2024 (1.3% previously).
Monetary policy should remain restrictive until clear signs underlying inflationary pressures are durably lowered.
Sees UK growth of 0.3% in 2023 (unchanged), cuts 2024 forecast to 0.8% (1.0% previously).
Limited scope for policy rate reductions until well into 2024 in most advanced economies.
Related reads
- Investors are holding on to the Dollar into the Fed – ING
- Markets cautious ahead of central bank decisions
- USD/JPY regains positive traction on Tuesday, though the uptick lacks bullish conviction.
- Traders opt to remain on the sidelines ahead of the key FOMC and the BoJ rate decisions.
- The fundamental backdrop, however, still seems tilted firmly in favour of bullish traders.
The USD/JPY pair attracts some dip-buying on Tuesday, albeit struggles to capitalize on the modest uptick and remains below its highest level since November 2022 touched last week. Spot prices trade around the 147.70 region, up less than 0.10% for the day, as traders keenly await this week's key central bank event risks.
The Federal Reserve (Fed) is scheduled to announce its decision on Wednesday and is widely anticipated to maintain the status quo. Market players, however, seem convinced that the US central bank will stick to its hawkish stance and keep rates higher for longer. The outlook remains supportive of elevated US Treasury bond yields, which assists the US Dollar (USD) to stall its corrective pullback from a six-month peak and lends support to the USD/JPY pair.
That said, speculations of an imminent shift in the Bank of Japan (BoJ) dovish stance hold back traders from placing fresh bullish bets around the major. BoJ Governor Kazuo Ueda, in an interview with Yomiuri newspaper, said that ending negative interest rates is among the options available if the central bank becomes confident that prices and wages will keep going up sustainably. This, in turn, lifted bets that the BoJ could move away from ultra-loose policy.
Hence, the spotlight will also be on the BoJ policy meeting on Friday. Investors will look for any forward guidance on when the Japanese central bank's negative interest rate policy will be reversed. This, in turn, will play a key role in influencing the JPY and provide a fresh directional impetus to the USD/JPY pair. In the meantime, traders on Tuesday might take cues from the US housing market data – Building Permits and Housing Starts – to grab short-term opportunities.
From a technical perspective, the rangebound price moves witnessed over the past two weeks or so might still be categorized as a bullish consolidation phase against the backdrop of the recent runup to a multi-month peak. This, in turn, suggests that the path of least resistance for the USD/JPY pair is to the upside. However, it will still be prudent to wait for a breakout through the trading range resistance, just ahead of the 148.00 mark, before positioning for further gains.
Technical levels to watch
EUR/CHF has continued to shuffle sideways since August near the bottom end of the range between 0.9516 and 0.9650. Economists at Société Générale analyze the pair’s technical outlook.
0.9700 is key hurdle
The EUR/CHF downtrend has stalled after reaching intermittent projections near 0.9515. The pair has evolved within a sideways consolidation since late July and is in vicinity to the 50-DMA. A short-term upside can’t be ruled out however March low near 0.9700 could remain an important hurdle.
In case the pair fails to defend 0.9515, the phase of decline is expected to resume. Next potential supports are located at 0.9455 and 2022 low of 0.9410.
Bank of England Deputy Governor Sam Woods said on Tuesday, “we are seeking a pick-up in impairments across the financial sector from a very low base.”
Additional comments
We are monitoring the commercial real estate, particularly in China.
We are interested in banks' exposure to China’s property sector.
Market reaction
The above comments fail to move the needle around the Pound Sterling, as GBP/USD keeps its range play intact near five-month lows of 1.2370.
The Dollar has remained close to the March highs. Economists at ING analyze Greenback’s outlook.
Positioning consolidates in favour of Dollar
CFTC data show that the net Dollar positioning has increased for eight consecutive weeks and has now moved into net-long territory. Speculators remain net-long EUR/USD at +15% of open interest as of last week, which was however the lowest level since October 2022.
Today, the US calendar includes Housing Starts and Building Permit figures for the month of August, which are unlikely to impact markets.
DXY should keep trading close to 105.00 into the Fed.
- EUR/GBP attracts dip-buying during the early European session, albeit lacks follow-through.
- Bets that the BoE will soon end its rate-hiking cycle undermine the GBP and act as a tailwind.
- The ECB's dovish rate-hike holds back bulls from positioning for any further appreciating move.
The EUR/GBP cross reverses an early European session dip to the 0.8620 region and climbs back closer to its highest level since August 11 touched this Tuesday. Spot prices currently trade around the 0.8630-0.8635 zone and look to build on the recent strong gains registered over the past two days.
Diminishing odds for more aggressive policy tightening by the Bank of England (BoE) continue to undermine the British Pound (GBP), which, in turn, assists the EUR/GBP cross to attract some dip-buying. In fact, BoE Governor Andrew Bailey had told lawmakers recently that the central bank is now "much nearer" to ending its run of interest rate increases. Furthermore, reviving recession fears and signs that the UK labour market is cooling, might put pressure on the BoE to pause its rate-hiking cycle soon.
That said, the current market pricing indicates around a 30% chance for another BoE rate hike in November. Moreover, and the first-rate cut is still not priced in until H2 2024. This, in turn, is holding back traders from placing fresh bearish bets around the GBP, which should keep a lid on any meaningful appreciating move for the EUR/GBP cross. Investors also seem reluctant and might prefer to wait on the sidelines ahead of the highly-anticipated BoE monetary policy meeting, scheduled on Thursday.
In the meantime, the European Central Bank's (ECB) dovish rate decision last Thursday might further contribute to capping the upside for the EUR/GBP cross. The ECB opted to hike rates for the 10th straight time, by 25 bps, taking its main rate to an all-time high level of 4%. The downgrading of CPI and GDP growth forecasts for 2024 and 2025, however, suggested that the 14-month-long policy tightening cycle could have reached its peak already and that further hikes may be off the table for now.
From a technical perspective, meanwhile, the overnight sustained break and acceptance above the 100-day Simple Moving Average (SMA) – for the first time since early May – could be seen as a fresh trigger for bullish traders. Hence, any corrective decline could now be seen as a buying opportunity and is more likely to remain limited. Traders now look to the release of the final Eurozone CPI print for short-term opportunities. The focus will then shift to the latest UK consumer inflation figures on Wednesday.
Technical levels to watch
- The Euro trims earlier losses vs. the US Dollar.
- Stocks in Europe opened Tuesday’s session on a mixed note.
- EUR/USD looks to revisit the key 1.0700 barrier.
- The USD Index (DXY) comes under pressure and confronts 105.00.
- The FOMC meeting (September 20) will be the salient event this week.
- The US housing sector takes centre stage later in the US calendar.
The Euro (EUR) manages to regain some balance against the US Dollar (USD), motivating EUR/USD to rapidly leave behind the initial drop to the vicinity of 1.0670 and refocus its attention to the 1.0700 hurdle on Tuesday.
On the other hand, the Greenback remains under further selling pressure and is likely to challenge the key 105.00 support sooner rather than later when tracked by the USD Index (DXY), in the context of rising US yields and steady prudence prior to the FOMC event on Wednesday.
In terms of monetary policy, investors are still evaluating the dovish rate hike implemented by the European Central Bank (ECB) last week. Furthermore, they maintain their anticipation of potential interest rate cuts by the Federal Reserve (Fed) taking place at some point in the second quarter of 2024.
In the euro’s data space, the Current Account surplus in the euro area shrank to a seasonally adjusted €20.9B in July, while final inflation figures in the region are also due later in the European morning.
In the US, the housing sector will be in the spotlight as Housing Starts and Building Permits for the month of August are due.
Daily digest market movers: Euro looks to extend the rebound beyond 1.0700
- The EUR regains some composure vs. the USD.
- Marginal price action has been seen in US and German yields so far.
- Markets widely anticipate the Fed keeping rates unchanged this week.
- According to RBA Minutes, there was a strong consensus to hold rates.
- Investors continue to price in potential rate cuts by the Fed in H1 2024.
- An impasse in the ECB’s hiking cycle appears to be gathering traction.
- ECB’s Francois Villeroy said the rate could be at 4.0% for as long as needed.
Technical Analysis: Euro faces the next hurdle at the 200-day SMA
EUR/USD appears to be gaining strength and moving towards the 1.0700 level, but it is important for the pair to quickly surpass the 200-day SMA at 1.0828 in order to alleviate some of the recent bearish sentiment.
In the event that the EUR/USD breaks below its September low of 1.0631 (September 14), there is a possibility that it may revisit the March low of 1.0516 (March 15) before reaching the 2023 bottom of 1.0481 (January 6).
Currently, the focus is on the critical 200-day SMA at 1.0828. If the pair manages to break above this level, it could potentially lead to a bullish momentum. This could result in a test of the provisional 55-day SMA at 1.0919, seconded by the weekly high of 1.0945 (August 30). If this scenario unfolds, it may open the way for a rally towards the psychological level of 1.1000 and the August top of 1.1064 (August 10). Further upside movement could see the pair aiming for the weekly peak at 1.1149 (July 27), ahead of the 2023 high at 1.1275 (July 18).
However, it is important to note that as long as the EUR/USD remains below the 200-day SMA, there is a possibility that the pair may continue to experience downward pressure.
Euro FAQs
What is the Euro?
The Euro is the currency for the 20 European Union countries that belong to the Eurozone. It is the second most heavily traded currency in the world behind the US Dollar. In 2022, it accounted for 31% of all foreign exchange transactions, with an average daily turnover of over $2.2 trillion a day.
EUR/USD is the most heavily traded currency pair in the world, accounting for an estimated 30% off all transactions, followed by EUR/JPY (4%), EUR/GBP (3%) and EUR/AUD (2%).
What is the ECB and how does it impact the Euro?
The European Central Bank (ECB) in Frankfurt, Germany, is the reserve bank for the Eurozone. The ECB sets interest rates and manages monetary policy.
The ECB’s primary mandate is to maintain price stability, which means either controlling inflation or stimulating growth. Its primary tool is the raising or lowering of interest rates. Relatively high interest rates – or the expectation of higher rates – will usually benefit the Euro and vice versa.
The ECB Governing Council makes monetary policy decisions at meetings held eight times a year. Decisions are made by heads of the Eurozone national banks and six permanent members, including the President of the ECB, Christine Lagarde.
How does inflation data impact the value of the Euro?
Eurozone inflation data, measured by the Harmonized Index of Consumer Prices (HICP), is an important econometric for the Euro. If inflation rises more than expected, especially if above the ECB’s 2% target, it obliges the ECB to raise interest rates to bring it back under control.
Relatively high interest rates compared to its counterparts will usually benefit the Euro, as it makes the region more attractive as a place for global investors to park their money.
How does economic data influence the value of the Euro?
Data releases gauge the health of the economy and can impact on the Euro. Indicators such as GDP, Manufacturing and Services PMIs, employment, and consumer sentiment surveys can all influence the direction of the single currency.
A strong economy is good for the Euro. Not only does it attract more foreign investment but it may encourage the ECB to put up interest rates, which will directly strengthen the Euro. Otherwise, if economic data is weak, the Euro is likely to fall.
Economic data for the four largest economies in the euro area (Germany, France, Italy and Spain) are especially significant, as they account for 75% of the Eurozone’s economy.
How does the Trade Balance impact the Euro?
Another significant data release for the Euro is the Trade Balance. This indicator measures the difference between what a country earns from its exports and what it spends on imports over a given period.
If a country produces highly sought after exports then its currency will gain in value purely from the extra demand created from foreign buyers seeking to purchase these goods. Therefore, a positive net Trade Balance strengthens a currency and vice versa for a negative balance.
- Crude prices continue the winning streak that began on September 8.
- OPEC+ supply cuts are leading the oil prices higher.
- China’s gloomy economic situation may put a cap on the potential of oil prices.
Western Texas Intermediate (WTI), the US crude oil benchmark, is trading higher around $91.20 during the European session on Tuesday. WTI prices are continuing the winning streak that began on September 8.
The prices of black gold are experiencing upward support due to a tight production outlook by Saudi Arabia and Russia. However, the gloomy economic situation in China may limit the potential of Crude oil prices.
Moreover, the International Energy Agency (IEA) released a report last week, indicating that the reduction in OPEC+ oil production would create a notable supply deficit in the fourth quarter of the year, starting in September. This supply deficit is expected to have a significant impact on the oil market, potentially leading to higher oil prices.
Saudi Arabia and Russia, as two of the world's largest oil exporters, have announced their commitment to extending oil output restrictions until the end of 2023. This decision involves Saudi Arabia reducing its oil production to around 1.3 million barrels per day (bpd) for the rest of 2023. The move aims to support oil prices and stabilize the global oil market by limiting the supply of crude oil.
In its monthly report last week, OPEC expressed optimism about the demand for oil in China throughout the year 2023. OPEC's positive outlook extends to global oil demand, as the organization forecasts strong growth in demand for both 2023 and 2024. This positive outlook comes despite challenges such as rising interest rates and higher inflation, which could potentially impact global economic conditions.
Saudi Arabia's Energy Minister, Prince Abdulaziz bin Salman, emphasized on Monday that the Organization of Petroleum Exporting Countries and its allies (OPEC+) are focused on maintaining stability in the oil markets and enhancing global energy security. He stated that their goal is not to target a particular price level for crude oil.
US Dollar Index (DXY) extends its losing streak for the third successive day, trading lower around 105.00 at the time of writing. Meanwhile, US Treasury yields are rebounding from the losses seen in the previous session, with the yield on the US 10-year bond at 4.31% by the press time.
The upcoming week will see the release of critical data that could influence the USD-denominated WTI oil price. This includes the publication of Crude Oil Stock data by both the American Petroleum Institute (API) and the International Energy Agency (IEA) for the week ending September 15.
Additionally, on Friday, the US will unveil preliminary S&P Global PMI data for September. These events have the potential to substantially affect the WTI oil price, and oil traders will closely analyze the data to identify trading opportunities in the WTI market.
EUR/USD has extended its phase of decline. Economists at Société Générale analyze the pair’s technical outlook.
Signals of reversal are not yet visible
EUR/USD has experienced a steady decline within a steep descending channel and has recently reached the lower band at 1.0630/1.0610 which is also the low of June.
Daily MACD is within deep negative territory denoting an overstretched move. However, signals of reversal are not yet visible.
In case a short-term bounce takes shape, the 200-DMA near 1.0820/1.0870 is likely to be an important resistance zone. Failure to cross this MA is likely to lead to persistence in downtrend. Next potential supports are located at 1.0480 and projections of 1.0430/1.0400.
Further selling pressure could see USD/CNH retreating to the strong support at 7.2390, comment UOB Group’s Economist Lee Sue Ann and Markets Strategist Quek Ser Leang.
Key Quotes
24-hour view: Yesterday, we expected USD to trade between 7.2600 and 7.2900. However, USD rose to a high of 7.2988. Despite the advance, upward momentum has not improved much. Today, we expect USD to trade in a range, likely between 7.2800 and 7.3050.
Next 1-3 weeks: Our update from yesterday (18 Sep, spot at 7.2760) still stands. As highlighted, while USD is likely to weaken further, the major support at 7.2390 might now come into view so soon. Overall, only a breach of 7.3150 (no change in ‘strong resistance’ level from previously) would indicate that the downward pressure that started early last week has faded.
The Pound has been the worst-performing G10 currency in the past 30 days. Economists at ING analyze GBP outlook.
Evidence of lingering price pressures does not guarantee a hike
We are not surprised to see investors staying broadly defensive in FX ahead of Wednesday’s CPI figures and Thursday’s BoE announcement. The data has not pointed clearly in the dovish direction, but BoE communication has (compared to previous expectations), so even evidence of lingering price pressures tomorrow does not guarantee a hike on Thursday.
Our base case remains a rate hike, although the upside for Sterling would entirely depend on whether the BoE will convince markets they can do more (a similar situation to last week’s ECB meeting) since the Sonia curve prices in 38 bps of tightening in total, even if they attach only an 80% implied probability of a hike on Thursday.
- Pound Sterling shows signs of further breakdown ahead of August UK inflation data.
- UK headline inflation is seen accelerating due to rising energy prices.
- Uncertainty grows over PM Sunak fulfilling his promise of halving headline inflation to 5% by year-end.
The Pound Sterling (GBP) demonstrates caution at the start of this week as investors remain uncertain over the UK’s economic outlook. Expectations abound of one more interest rate increase from the Bank of England (BoE), a decision that will be announced on Thursday. The BoE is not in a position to pause the policy-tightening spell as inflationary pressure is stubborn and wage growth momentum is strong.
Before the BoE interest rate decision, investors will keenly watch the inflation data, which is scheduled for Wednesday. The headline Consumer Price Index (CPI) is expected to accelerate due to higher energy prices as global oil prices have rallied in the past four months. Core inflation is almost stable due to a higher labor cost index. Market participants seem uncertain whether UK PM Rishi Sunak will fulfill his promise of halving headline inflation to 5% by year-end. The promise of halving inflation to 5% was made by Sunak when headline inflation was at a double-digit figure in January.
Daily Digest Market Movers: Pound Sterling awaits CPI data
- Pound Sterling seems vulnerable as investors turn cautious ahead of UK inflation data for August, which will be released on Wednesday at 06:00 GMT.
- Headline inflation is expected to persist higher as global oil prices have rallied more than 40% in the last four months.
- As per the estimates, monthly headline CPI expanded at a stronger pace of 0.7% despite contracting by 0.4% in July. Annual headline inflation is seen accelerating to 7.1% against July’s reading of 6.8%.
- The annualized core CPI that excludes volatile oil and food prices is seen softening marginally to 6.8% vs. 6.9% in July. Investors remain worried about high core inflation led by stronger wage growth.
- Generally, Bank of England policymakers take into account core inflation for monetary policy consideration, but higher headline CPI could elevate trouble for them as household income would be squeezed due to more out-of-pocket expenditures on gasoline and energy components.
- The inflation data for August will be followed by the interest rate decision from the BoE, which will be announced on Thursday.
- A Reuters poll showed that the BoE is going to raise interest rates by 25 basis points (bps) to 5.5% in its upcoming monetary decision, which is scheduled for September 21.
- Apart from the interest rate decision for September, investors would like to know whether the BoE will raise interest rates in November or will wait to assess the impact of current policy rates before making a decision.
- Citigroup now predicts the BoE will pause rate hikes in November in contrast to the 25 bps hike expected earlier.
- More interest rate hikes from the central bank would elevate their consequences on the manufacturing sector and labor growth. The British Chamber of Commerce (BCC) reported on Monday that 46% of firms it surveyed said the increase in rates so far was having a negative impact, while 45% said they were not directly impacted.
- The market mood remains cautious in the US as investors await the monetary policy decision from the Federal Reserve (Fed), which will be announced on Wednesday. The Fed is widely expected to keep rates unchanged as inflation is falling and the economy is still resilient.
- It will be exciting to watch whether the Fed manages to secure the economy on a path of easing inflation with only lightly diminished economic prospects. US Treasury Secretary Janet Yellen said on Monday she saw no signs the economy is entering a downturn.
- The US Dollar Index (DXY) oscillates inside Monday’s trading range despite the Fed being expected to maintain the status quo on Wednesday. Meanwhile, 10-year US Treasury yields climb above 4.3% ahead of Fed policy.
Technical Analysis: Pound Sterling juggles near a three-month low around 1.2370
Pound Sterling trades back and forth near a three-month low of around 1.2370 as investors see a vulnerable economic outlook for the UK economy on expectations of one more interest rate increase from the BoE this week. The Cable seems broadly bearish, trading below the 200-day Exponential Moving Average (EMA), which is at 1.2490. Downward-sloping 20 and 50-day EMAs indicate that the short-term trend is bearish. Momentum oscillators also indicate strength in the bearish impulse.
Pound Sterling FAQs
What is the Pound Sterling?
The Pound Sterling (GBP) is the oldest currency in the world (886 AD) and the official currency of the United Kingdom. It is the fourth most traded unit for foreign exchange (FX) in the world, accounting for 12% of all transactions, averaging $630 billion a day, according to 2022 data.
Its key trading pairs are GBP/USD, aka ‘Cable’, which accounts for 11% of FX, GBP/JPY, or the ‘Dragon’ as it is known by traders (3%), and EUR/GBP (2%). The Pound Sterling is issued by the Bank of England (BoE).
How do the decisions of the Bank of England impact on the Pound Sterling?
The single most important factor influencing the value of the Pound Sterling is monetary policy decided by the Bank of England. The BoE bases its decisions on whether it has achieved its primary goal of “price stability” – a steady inflation rate of around 2%. Its primary tool for achieving this is the adjustment of interest rates.
When inflation is too high, the BoE will try to rein it in by raising interest rates, making it more expensive for people and businesses to access credit. This is generally positive for GBP, as higher interest rates make the UK a more attractive place for global investors to park their money.
When inflation falls too low it is a sign economic growth is slowing. In this scenario, the BoE will consider lowering interest rates to cheapen credit so businesses will borrow more to invest in growth-generating projects.
How does economic data influence the value of the Pound?
Data releases gauge the health of the economy and can impact the value of the Pound Sterling. Indicators such as GDP, Manufacturing and Services PMIs, and employment can all influence the direction of the GBP.
A strong economy is good for Sterling. Not only does it attract more foreign investment but it may encourage the BoE to put up interest rates, which will directly strengthen GBP. Otherwise, if economic data is weak, the Pound Sterling is likely to fall.
How does the Trade Balance impact the Pound?
Another significant data release for the Pound Sterling is the Trade Balance. This indicator measures the difference between what a country earns from its exports and what it spends on imports over a given period.
If a country produces highly sought-after exports, its currency will benefit purely from the extra demand created from foreign buyers seeking to purchase these goods. Therefore, a positive net Trade Balance strengthens a currency and vice versa for a negative balance.
In light of advanced prints from CME Group for natural gas futures markets, open interest shrank by around 2.5K contracts after two consecutive daily builds on Monday. On the other hand, volume went up by around 46.3K contracts following three daily drops in a row.
Natural Gas: Longer-term target remains at $3.00
Prices of natural gas started the week on a strong foot, setting aside Friday’s pullback. Monday’s uptick was amidst shrinking open interest and this removes strength from a potential sustained recovery in the very near term. So far, the $3.00 mark per MMBtu remains a key hurdle for the time being.
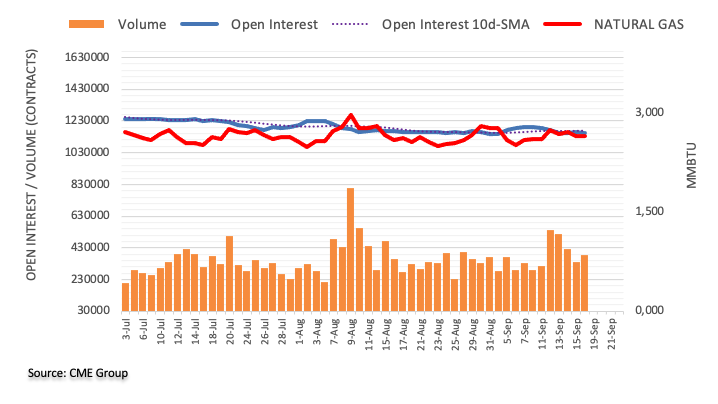
AUD/USD has staged an initial bounce after probing multi-month descending line near 0.6360. 0.6525 is first hurdle, analysts at Société Générale report.
Failure to reclaim 0.6525 can trigger new selling
AUD/USD has recently formed an interim support at 0.6360 as it touched the line connecting lows of March and May. An initial bounce is taking shape however signals of a large upside are not yet visible.
Recent pivot high at 0.6525 is expected to be first layer of resistance near term.
Holding below 0.6525, there would be risk of one more down leg. Next potential support is located at projections and October 2022 low of 0.6200/0.6170.
- Silver attracts some dip-buying on Tuesday and climbs back to a nearly two-week top.
- The mixed technical setup warrants caution before placing aggressive directional bets.
- The 200-day SMA is likely to keep a lid on any further gains and act as a pivotal point.
Silver reverses modest intraday losses to the $23.15 area and climbs back closer to a nearly two-week high touched this Tuesday. The white metal now trades around the $23.25 region during the early European session, nearly unchanged for the day.
From a technical perspective, oscillators on the daily chart – though have been recovering from lower levels – are still holding in the negative territory and favour bearish traders. That said, last week's solid bounce from the $22.30 support area – representing an ascending trend line extending from the June monthly low – and the subsequent strength warrants caution before positioning for deeper losses ahead of the pivotal FOMC monetary policy decision on Wednesday.
In the meantime, any meaningful decline is likely to find some support near the $23.00 round figure ahead of the $22.80 area and the $23.30 region or a nearly one-month low touched last Thursday. A convincing break below the latter will be seen as a fresh trigger for bearish traders and make the XAG/USD vulnerable to accelerate the fall towards the next relevant support near the $21.25 zone. The downward trajectory could get extended further towards the $21.00 mark.
On the flip side, momentum beyond the $23.30 area, or the daily peak, could face stiff resistance and remain capped near a technically significant 200-day Simple Moving Average (SMA), currently pegged around the $23.45 region. A sustained breakout, however, could shift the bias in favour of bullish traders. This, in turn, should allow the XAG/USD to climb further beyond the 100-day SMA barrier near the $23.80 region and aim to reclaim the $24.00 round-figure mark.
The next relevant hurdle is pegged near the $24.30-$24.35 region, above which the XAG/USD is likely to conquer the $25.00 psychological mark. The latter coincides with the August monthly swing high and is closely followed by the July peak, around the $25.25 region.
Silver daily chart
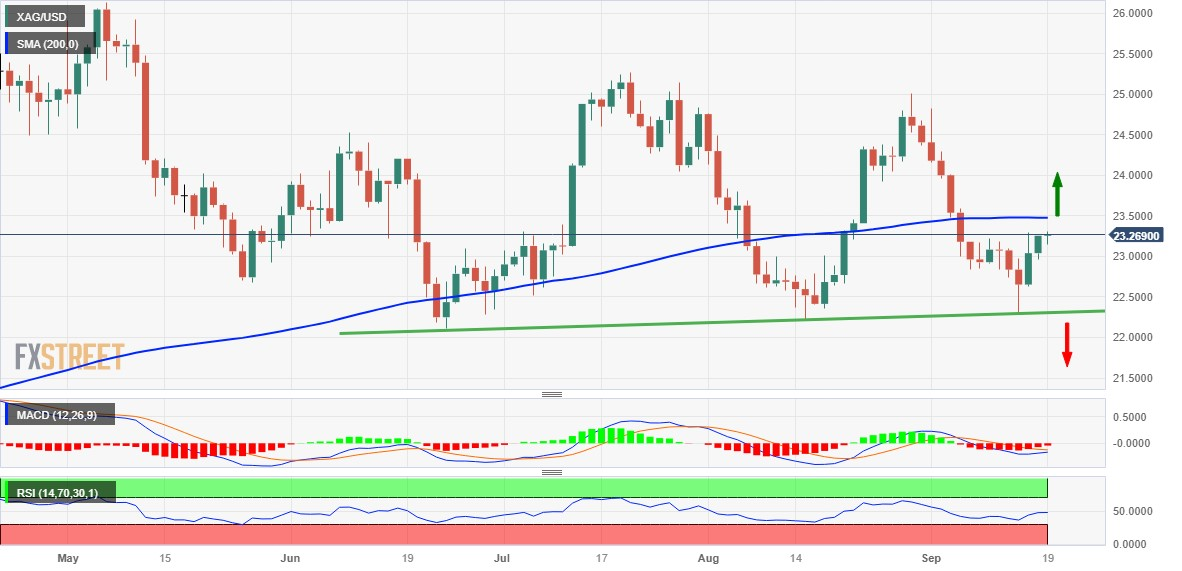
Technical levels to watch
USD/JPY could see its upside bias mitigated on a breach of the 146.85 level, suggest UOB Group’s Economist Lee Sue Ann and Markets Strategist Quek Ser Leang.
Key Quotes
24-hour view: Last Friday, USD rose to a high of 147.96. Yesterday, we indicated that “despite the advance, upward momentum has not improved by much”, and we expected it to grind higher. Instead of grinding higher, USD traded sideways in a relatively narrow range between 147.54 and 147.87. The price action is likely part of a consolidation phase. Today, USD is likely to trade in a range, probably between 147.35 and 147.90.
Next 1-3 weeks: Our update from yesterday (18 Sep, spot at 147.80) is still valid. As highlighted, upward momentum has increased slightly, and USD could edge higher. At this stage, the likelihood of a sustained rise above this level is not high. On the downside, if USD breaks 146.85 (no change in ‘strong support’ level from yesterday) would indicate that the mild upward pressure has eased.
CME Group’s flash data for crude oil futures markets noted traders reduced their open interest positions for yet another session on Monday, now by around 5.6K contracts. Volume followed suit and went down by nearly 23K contracts.
WTI: En route to the November 2022 high
WTI prices extended the rally for yet another session on Monday, closing above the $92.00 mark for the first time since November 2022. The extra uptick was on the back of declining open interest and volume, which hints at the likelihood that a potential corrective move could be in the offing. On the upside, the next hurdle remains at the November 2022 peak at $93.73 (November 7).
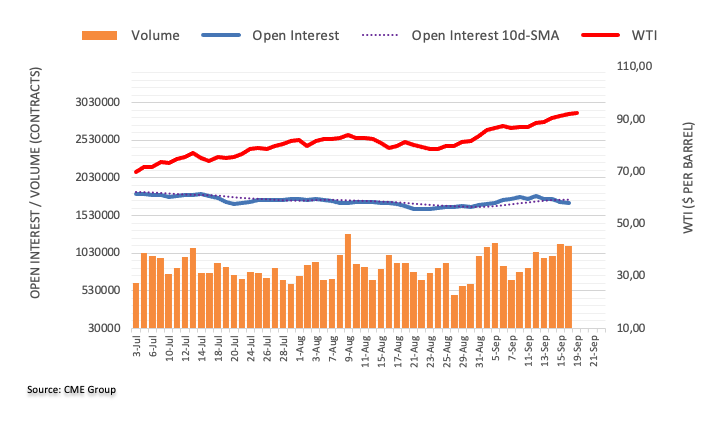
EUR/GBP clears 0.8630. Economists at Société Général analyze the pair’s technical outlook.
0.8560 should cushion downside
EUR/GBP defended the trough of July near 0.8500 on the second attempt resulting in a short-term bounce. It has crossed above a steep descending trend line drawn since September 2022.
The break denotes possibility of continuation in up move towards August peak of 0.8670 and perhaps even towards the 200-DMA near 0.8700/0.8720; this is a key resistance zone.
Low formed last week near 0.8560 should cushion downside.
- USD/CHF recovers from the recent losses amid investors' caution ahead of the interest rate decisions from both countries.
- SNB is anticipated to implement a 25 basis points rate hike.
- Swiss central bank is expected to maintain a restrictive stance to its highest levels since April 2002.
- Investors' caution is likely to be driven by the odds of a Fed attempting an interest rate hike by the end of 2023.
USD/CHF recovers from the previous day’s losses amid investors caution ahead of the interest rate decisions from the US Federal Reserve (Fed) and Swiss National Bank (SNB). The spot price trades around 0.8980 during the early trading hours in the European session on Tuesday.
Switzerland’s Trade Balance data for August showed a surplus of 4,054M, swinging from the previous deficit of 3,132M.
Additionally, the Swiss National Bank (SNB) is expected to raise interest rates by 25 basis points (bps) from 1.75% to 2% on Thursday. The Swiss central bank is expected to maintain a restrictive stance to its highest levels since April 2002 to ensure price stability, especially as the nation's inflation remains below the 2% target with a 1.6% year-over-year increase.
Furthermore, US Secretary of State Antony Blinken met with Chinese Vice President Han Zheng on the sidelines of the United Nations General Assembly on Monday. The US State Department described the discussion as "candid and constructive."
Traders will closely monitor developments in the US-China relationship. However, renewed trade tensions between the US and China could potentially benefit the traditional safe-haven Swiss Franc (CHF) and create headwinds for USD/CHF.
On the other side, the US Federal Reserve (Fed) is widely expected to maintain its current interest rates in the September policy meeting, which is putting pressure on the Greenback.
However, there's a sense of caution among investors, which is likely to be driven by the possibility of a 25 basis points interest rate hike by the end of 2023. This caution could lend support to the US Dollar USD).
Traders are considering the possibility that the Fed may keep interest rates elevated for an extended period due to the robust economic data and persistent inflation. Market participants will closely analyze the central bank's statements for any hints or insights into the potential future path of interest rates.
US Dollar Index (DXY) is attempting to break its two-day losing streak, trading higher around 105.20 below the six-month high reached last week. Meanwhile, US Treasury yields are rebounding from the losses seen in the previous session, with the yield on the US 10-year bond at 4.32% at the time of writing. Improved yields may provide support for the Greenback.
Investors will likely keep an eye on upcoming macroeconomic data from the US, including Building Permits and Housing Starts for August, which are scheduled for release later in the North American session. These datasets could potentially impact US economic activity and influence market sentiment.
The start of the week has seen EUR/USD rebound modestly and attempt to climb back above 1.0700. Economists at ING analyze the pair’s outlook.
Euro finding some modest support from speculation of ECB addressing excess liquidity
It’s not inconceivable we’ll test the 1.050/1.0550 area: a hawkish Fed can hurt the global risk environment, and more resilience in US activity data endorse the higher for longer narrative.
On the ECB side, it was reported that the ECB is planning to discuss how to deal with banks’ excess liquidity and is apparently considering raising reserve requirements. That would be a de-facto additional tightening, so the Euro was slightly stronger on the news, but hardly enough to turn the tide for EUR/USD as the pair remains depressed on a wider Fed/ECB rate differential.
Canadian inflation data for August is due for publication today. Economists at Commerzbank analyze how the CPI report could impact the CAD.
CAD might be able to benefit from a comparatively more hawkish BoC
There are fears that inflation could surprise to the upside. If that is the case, this will re-fuel rate hike speculations, which might support CAD.
In the run-up to the Fed decision on Wednesday, the market is likely to be reluctant to position itself clearly though as it is uncertain what surprises the Fed decision might bring.
If there were going to be any signals that the US central bank’s rate might have peaked, CAD might be able to benefit from a comparatively more hawkish BoC.
See – Canada CPI Preview: Forecasts from five major banks, another jump in inflation
European Central Bank's (ECB) Governing Council member Francois Villeroy de Galhau said on Tuesday, “ECB will maintain its rate at 4 pct for a sufficiently long time, as it is an efficient remedy.”
Additional quotes
Inflation is a sickness, interest rates are the medicine, the medicine is beginning to work.
Current ECB rate is at a good level, better to be patient now.
Once inflation is back around 2 pct, ECB rate can fall again.
Market reaction
EUR/USD is testing lows near 1.0675 on the above comments, down 0.12% on the day.
GBP/USD saw the first daily close below the 200-Day Moving Average (DMA) last week since March. Economists at Société Générale analyze the pair’s outlook ahead of the BoE meeting on Thursday.
Possibility of a final 25 bps increase by the BoE and a pause could keep the GBP out of favour vs. the USD
The possibility of a final 25 bps increase by the BoE and a pause could, in theory, keep the Pound out of favour vs. the USD.
The last breach below the 200-DMA in March proved an inflection point rather than a sell signal but this time the UK labour market is loosening and a sharp drop in employment means the bar for a bounce in GBP/USD is higher than it was six months ago.
- USD/CAD remains on the defensive around 1.3476 ahead of Canadian inflation data.
- The pair holds below the 50- and 100-hour EMAs; Relative Strength Index (RSI) stands in bear territory below 50.
- The key resistance level is seen at the 1.3500-1.3510 region; 1.3470 acts as an initial support level for the pair.
The USD/CAD pair remains under selling pressure below the 1.3500 mark during the early European session on Tuesday. A surge in oil price lift the commodity-linked Loonie against the US Dollar (USD). At the press time, the pair is losing 0.07% on the day to trade at 1.3476. Market players await the Canadian Consumer Price Index for August ahead of the highly-anticipated FOMC monetary policy meeting on Wednesday.
According to the one-hour chart, USD/CAD holds below the 50- and 100-hour Exponential Moving Averages (EMAs) with a downward slope, which supports the sellers for the time being. Additionally, the Relative Strength Index (RSI) stands below 50, activating the bearish momentum for the USD/CAD pair for pair.
The critical resistance level for the pair is seen at the 1.3500-1.3510 region, representing the confluence of the 50-hour EMA, psychological round mark, and the upper boundary of the Bollinger Band. Any follow-through buying above the latter will pave the way to the 100-hour EMA at 1.3520. The additional upside filter to watch is near a high of September 13 at 1.3586, followed by a psychological round figure at 1.3600.
Looking at the downside, the lower limit of Bollonger Band at 1.3470 acts as an initial support level for USD/CAD. A breach below the latter will see a drop to 1.3445 (a low of August 15). Further south, the next downside stop is located near a low of August 11 at 1.3412.
USD/CAD one-hour chart
-638307032651196933.png)
EUR/USD was very volatile during the summer months. At the beginning of June, the pair stood at 1.07. By mid-July, the Euro had risen to 1.12 Dollars. Economists at Erste Group Research analyze EUR/USD outlook.
Dollar determined by US economy
The US economy will be decisive for the further development of the Dollar. The question is how long the solid growth will hold, despite significantly higher interest rates. At present, demand indicators still point to a robust economy. However, we see indications of a looming slowdown in a number of areas. These include the labor market, credit growth and the development of savings.
For us, therefore, a cooling of the US economy is likely during the coming months, which argues for a weaker Dollar.
EUR/USD – Dec.23 1.14 Mar.24 1.16 Jun.24 1.19 Sep.24 1.19
FX option expiries for Sept 19 NY cut at 10:00 Eastern Time, via DTCC, can be found below.
- EUR/USD: EUR amounts
- 1.0625-30 855m
- 1.0645-55 220m
- 1.0700-10 1.34b
- 1.0730-35 496m
- 1.0750-60 765m
- 1.0765-75 3.25b
- 1.0795-05 766m
- GBP/USD: GBP amounts
- 1.2290-00 1.0b
- 1.2400 388m
- 1.2455-65 587m
- 1.2500m 572m
- 1.2700 905m
- USD/JPY: USD amounts
- 145.15-25 1.95b
- 145.30 451m
- 145.50-55 471m
- 147.00-10 1.2b
- 147.95-05 702m
- 148.15 300m
- 148.50 584m
- USD/CHF: USD amounts
- 0.8800 652m
- 0.8935 304m
- AUD/USD: AUD amounts
- 0.6395 450m
- 0.6415-20 416m
- 0.6525 600m
- 0.6550 334m
- 0.6650 562m
- USD/CAD: USD amounts
- 1.3150 569m
- 1.3655-65 332m
- 1.3670-80 370m
- NZD/USD: NZD amounts
- 0.5850 719m
- 0.5910 279m
- EUR/JPY: EUR amounts
- 155.00 400m
- AUD/USD trades sideways amid investors exercise caution before Fed policy decision.
- US Dollar (USD) could strengthen on the odds of another rate hike by the Fed in November or December meetings.
- Meeting minutes showed that the RBA decided to keep the current interest rates on recent economic data.
AUD/USD continues to move sideways amid investors turn cautious ahead of the US Federal Reserve (Fed) policy decision. The spot price trades around 0.6430 during the Asian session on Tuesday.
The Reserve Bank of Australia (RBA) published its September monetary policy meeting minutes. The RBA did contemplate a 25 basis points rate hike, but ultimately decided to maintain the current interest rate. This decision was driven by the fact that recent economic data did not significantly change the economic outlook.
The minutes from the meeting also indicated that the central bank is prepared to tighten monetary policy further if inflation turns out to be more persistent than anticipated. However, since there were no fresh hawkish signals in the minutes, it could act as an undermining factor for the Australian Dollar (AUD) against the US Dollar (USD).
On the other side, the US Federal Reserve (Fed) is expected to keep its current interest rates in September’s policy meeting, which is exerting pressure on the Greenback. However, investor caution ahead of the policy decision could lend support to the buck. This caution may stem from the possibility of a 25 basis points interest rate hike by the end of 2023.
Traders seem considering the possibility that the Fed may maintain higher interest rates for an extended period due to the resilient incoming macro data and sticky inflation. Market participants will carefully scrutinize the central bank's statements for any hints or insights into the potential future path of interest rates.
US Dollar Index (DXY) snaps the two-day losing streak, trading higher around 105.20 below a six-month high touched last week. However, US Treasury yields rebound from the previous day’s losses. The yield on the US 10-year bond stands at 4.31% at the time of writing. Improved yields may provide support in underpinning the Greenback.
Investors will likely watch the upcoming macro data from the US, including Building Permits and Housing Starts for August later in the North American session. These datasets may provide a potential impetus for US economic activities, which could be helpful for traders to place fresh bets on the AUD/USD pair.
NZD/USD is expected to maintain the range bound theme unchanged in the short-term horizon, note UOB Group’s Economist Lee Sue Ann and Markets Strategist Quek Ser Leang.
Key Quotes
24-hour view: Our expectation for NZD to edge lower yesterday did not materialise as it traded in a range of 0.5895/0.5920. Upward momentum is showing signs of building, albeit tentatively. Today, as long as NZD stays above 0.5895 (minor support is at 0.5910), it could strengthen, but it is unlikely to break the major resistance at 0.5960.
Next 1-3 weeks: Our most recent narrative was from last Monday (11 Sep, spot at 0.5900), wherein NZD is likely to trade in a range, probably between 0.5860 and 0.5960. We continue to hold the same view.
Year-to-date, INR is down 0.3% vs. USD. Economists at Commerzbank analyze Rupee’s outlook.
RBI is expected to leave rates unchanged for the rest of the year
We project USD/INR to drift down towards 81.50 by year-end. The main reasons include: Continued strong economic performance; Positive real interest rates. Inflation has moderated steadily since the peak of just under 8% in April 2022 to an average of 5.8% so far this year. RBI has hiked by 250bp to 6.50% since May 2022. This implies positive real interest rates at around 70 bps; A stabilization in CNY volatility and stable to lower oil prices should also aid INR.
RBI is in a wait-and-see mode and there is no incentive for a marked change in policy anytime soon. Nevertheless, RBI would need to stay vigilant on food prices and will continue to keep a close eye on the monsoon season.

Source: Commerzbank Research
- GBP/JPY hovers around 182.86, gaining 0.05% on the day ahead of the key events.
- Traders anticipate that the Bank of England (BoE) to raise the rate to 5.5% from 5.25% at Thursday’s meeting.
- BOJ is anticipated to hold its short-term rate target of -0.1% and its 10-year bond yield target of around 0%.
- Investors will monitor the BoE, BoJ monetary policy meeting this week.
The GBP/JPY cross oscillates in a narrow range below the 183.00 area during the early European session on Tuesday. Markets participants await the Bank of England (BoE) interest rate decision on Thursday ahead of the Bank of Japan (BoJ) meeting on Friday. These key events could trigger the volatility in the market. The cross currently trades around 182.91, up 0.07% on the day.
Traders anticipate that the Bank of England (BoE) will raise the rate to 5.5% from 5.25% at Thursday’s meeting. The UK economic data last week supported Governor Andrew Bailey's statement this month that the BoE is much closer to ending its tightening cycle. Furthermore, the fear of recession from aggressive rate hikes could exert pressure on the BoE to halt its rate-hiking cycle.
On the Japanese Yen front, BoJ would rather wait until there is more clarity on whether Japan's fragile economy can withstand the impact of slowing US and Chinese demand. BoJ Governor Kazuo Ueda stated last week that the central bank could exit its negative interest rate policy when its inflation target of 2% is near and they would have sufficient evidence by the end of the year to evaluate whether interest rates should stay negative.
At Friday's meeting, the BOJ is largely anticipated to maintain its short-term interest rate target of -0.1% and its 10-year bond yield target of around 0%. Markets are waiting to see whether Governor Kazuo Ueda will provide any new signals about the timing of a policy move at his press conference after the meeting.
Later this week, the UK Consumer Price Index for August will be released on Wednesday. Market players will shift their attention to the BoE and BoJ monetary policy meetings on Thursday and Friday, respectively. Traders will take cues from these events and find trading opportunities around the GBP/JPY cross.
- The index rebounds from recent lows near 105.00.
- Markets’ appear side-lined ahead of the FOMC gathering.
- The US housing sector will be in the limelight later in the session.
The greenback, when tracked by the USD Index (DXY), reverses part of the pessimism seen at the beginning of the week on Tuesday.
USD Index looks well supported around 105.00
The index picks up traction and leaves behind two consecutive sessions of losses on turnaround Tuesday.
In the meantime, the dollar appears well underpinned by the 105.00 neighbourhood for the time being, while the cautious trade is expected to prevail until at least the FOMC event on Wednesday.
On the latter, consensus among investors sees the Federal Reserve keeping its interest rate on hold, although the bank’s forward guidance is seen taking centre stage at Powell’s press conference.
In the US docket, Housing Starts and Building Permits will be in the limelight later in the NA session.
What to look for around USD
The index seems to have met some firm contention around the 105.00 region, as market participants get ready for the FOMC event on September 20.
In the meantime, support for the dollar keeps coming from the good health of the US economy, which at the same time appears underpinned by the tighter-for-longer stance narrative from the Federal Reserve.
Key events in the US this week: Building Permits, Housing Starts (Tuesday) – MBA Mortgage Applications, Fed interest rate decision, Fed Press Conference (Wednesday) - Initial Jobless Claims, Philly Fed Index, CB Leading Index, Existing Home Sales (Thursday) – Flash Manufacturing/Services PMIs (Friday).
Eminent issues on the back boiler: Persevering debate over a soft or hard landing for the US economy. Incipient speculation of rate cuts in early 2024. Geopolitical effervescence vs. Russia and China.
USD Index relevant levels
Now, the index is up 0.11% at 105.18 and faces the next up barrier at 105.43 (monthly high September 14) ahead of 105.88 (2023 high March 8) and finally 106.00 (round level). On the other hand, the breach of 104.42 (weekly low September 11) would open the door to 103.03 (200-day SMA) and then 102.93 (weekly low August 30).
In the opinion of UOB Group’s Economist Lee Sue Ann and Markets Strategist Quek Ser Leang, GBP/USD could still slip back to the 1.2300 region in the next few weeks.
Key Quotes
24-hour view: After GBP fell to a low of 1.2380 last Friday, we highlighted yesterday that “conditions remain oversold, but with no signs of stabilisation just yet, GBP could dip to 1.2355 before the risk of a more sustained rebound increases.” Our expectation did not materialise as GBP traded in a relatively quiet manner between 1.2371 and 1.2410 before closing largely unchanged at 1.2385 (+0.02%). While downward momentum has slowed, it is premature to expect a rebound. Today, GBP could edge lower, but any decline is likely part of a lower range of 1.2355/1.2415. In other words, GBP is unlikely to break clearly below 1.2355.
Next 1-3 weeks: We have held a negative view in GBP for more than 2 weeks now. In our most recent narrative from last Friday (15 Sep, spot at 1.2405), we highlighted that the weakness in GBP has not stabilised, and GBP could continue to weaken. We pointed out that “The next level to watch is May’s low near 1.2305.” We continue to hold the same view. However, it is worth noting that downward momentum is beginning to slow. If GBP breaks above 1.2455 (‘strong resistance’ level previously at 1.2485), it would mean that the weakness in GBP has stabilised.
Open interest in gold futures markets rose for the second session in a row on Monday, this time by just 161 contracts according to preliminary readings from CME Group. Volume, instead, shrank for the second straight session, now by around 62.3K contracts.
Gold meets initial resistance around $1930
Gold’s rebound revisited the $1930 region, or multi-day highs, at the beginning of the week. The move was accompanied by a small increase in open interest and quite a marked drop in volume, which opens the door to a potential corrective move in the very near term.
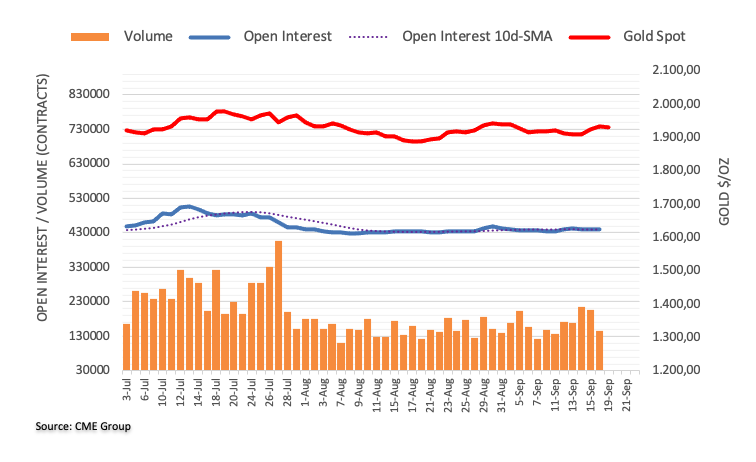
EUR/USD risk extra losses below 1.0630, according to UOB Group’s Economist Lee Sue Ann and Markets Strategist Quek Ser Leang.
Key Quotes
24-hour view: We expected EUR to consolidate in a range of 1.0645/1.0695 yesterday. EUR then traded in a range of 1.0653/1.0698 before closing at 1.0690 (+0.33%). The underlying tone has firmed somewhat, and there is room for EUR to edge higher today. However, any advance is unlikely to break the strong resistance at 1.0730. On the downside, if EUR drops below 1.0655 (minor support is at 1.0675), it would indicate that the current mild upward pressure has faded.
Next 1-3 weeks: After EUR plummeted to a low of 1.0629, in our latest narrative from last Friday (15 Sep, spot at 1.0640), we highlighted that there had been a sharp increase in downward momentum. We held the view that EUR “has likely resumed its weakness, but it remains to be seen if it can reach March’s low near 1.0515 this time around.” Since then, EUR has not been able to make further headway on the downside. Downward momentum is beginning to wane. In order to keep the momentum going, EUR must break and stay below 1.0630, or the odds of further decline will diminish rapidly. Conversely, if EUR breaks above 1.0730 (no change in ‘strong resistance’ in level from yesterday), it would also mean that EUR is not weakening further.
Here is what you need to know on Tuesday, September 19:
Following Monday's indecisive action, markets remain choppy early Tuesday with investors refraining from taking large positions ahead of this week's all important central bank meetings. In the European session, Eurostat will release revisions to the August Harmonized Index of Consumer Prices. In the second half of the day, the US economic docket will feature Building Permits and Housing Starts. Finally, Statistics Canada will publish Consumer Price Index (CPI) for August.
The modest improvement seen in risk mood caused the US Dollar (USD) to lose some interest during the American trading hours on Monday. The USD Index, which tracks the currency's performance against a basket of six major currencies, lost 0.25% but managed to stabilize above 105.00. Meanwhile, the benchmark 10-year US Treasury bond yield fell 0.6% to 4.3% and put additional weight on the USD's shoulders. Early Tuesday, US stock index futures trade flat on the day.
US Dollar price this week
The table below shows the percentage change of US Dollar (USD) against listed major currencies this week. US Dollar was the weakest against the Canadian Dollar.
| USD | EUR | GBP | CAD | AUD | JPY | NZD | CHF | |
| USD | -0.13% | 0.15% | -0.33% | 0.04% | -0.05% | -0.28% | 0.06% | |
| EUR | 0.13% | 0.28% | -0.21% | 0.17% | 0.08% | -0.14% | 0.19% | |
| GBP | -0.15% | -0.28% | -0.48% | -0.11% | -0.22% | -0.42% | -0.10% | |
| CAD | 0.33% | 0.20% | 0.46% | 0.34% | 0.25% | 0.04% | 0.37% | |
| AUD | -0.04% | -0.15% | 0.11% | -0.36% | -0.11% | -0.32% | 0.01% | |
| JPY | 0.05% | -0.08% | 0.20% | -0.25% | 0.09% | -0.23% | 0.12% | |
| NZD | 0.27% | 0.16% | 0.43% | -0.05% | 0.32% | 0.21% | 0.35% | |
| CHF | -0.04% | -0.18% | 0.10% | -0.37% | -0.01% | -0.12% | -0.33% |
The heat map shows percentage changes of major currencies against each other. The base currency is picked from the left column, while the quote currency is picked from the top row. For example, if you pick the Euro from the left column and move along the horizontal line to the Japanese Yen, the percentage change displayed in the box will represent EUR (base)/JPY (quote).
The Minutes of the Reserve Bank of Australia’s (RBA) September monetary policy meeting showed earlier in the day that policymakers agreed that the case to hold the policy rate steady was stronger as recent data did not materially alter the economic outlook. "Members recognize the value of allowing more time to see full effects from past tightening on the economy," the RBA noted in its publication and reiterated that the policy will be guided by incoming data and the assessment of risks. AUD/USD showed no reaction and was last seen moving sideways slightly below 0.6450.
USD/CAD dropped below 1.3500 on Monday as the rising crude oil prices allowed the commodity-sensitive loonie to outperform its rivals. The barrel of West Texas Intermediate gained more than 1% on Monday and reached a fresh 2023-high above $92. On a yearly basis, the CPI in Canada is forecast to rise 3.8%, up from the 3.3% increase recorded in July.
EUR/USD benefited from the USD weakness in the American session and closed the day in positive territory on Monday before going into a consolidation phase slightly below 1.0700 early Tuesday.
USD/JPY continues to fluctuate below 148.00 in the European session. Japanese Industry Minister Yasutoshi Nishimura said on Tuesday that at some point the Bank of Japan will not be able to use monetary policy to buy time. Separately, Japanese Prime Minister (PM) Fumio Kishida said that he plans to explain Japan's financial and economic policies in New York.
GBP/USD briefly climbed above 1.2400 on Monday but erased its recovery gains to end the day flat. The pair was last seen moving up and down in a tight channel at around 1.2380.
Gold took advantage of retreating US Treasury bond yields on Monday and climbed to a fresh two-week high above $1,930. XAU/USD edged lower in the Asian session on Tuesday but managed to hold above that level.
- Most Asian equities trade lower on Tuesday as markets turn cautious ahead of the key events.
- Positive news from major developers in China fails to lift market sentiment.
- The Federal Reserve (Fed), Bank of Japan (BoJ) monetary policy meetings will be in the spotlight this week.
Asian stock markets edge lower on Tuesday amid the cautious mood in the market ahead of the Fed interest rate decision. announcement. Investors are concerned that the Fed's higher-for-longer interest-rate narrative could negatively impact US consumers.
At press time, China’s Shanghai is up 0.02% to 3,126, the Shenzhen Component Index declines 0.73% to 10,126, Hong Kong’s Hang Sang gains 0.02% to 17,933, South Korea’s Kospi drops 0.41% and Japan’s Nikkei falls 0.99%.
Positive news from major developers in China failed to lift market sentiment on Tuesday. Country Garden received bondholder approval for the last of eight local notes on which it sought to extend repayments, while Sunac obtained creditor approval for its debt restructuring plan.
In Japan, the Bank of Japan (BoJ) will announce the interest rate policy on Friday. Market players will take cues from signals that BoJ is exiting its ultra-loose policy sooner than initially assumed, after remarks by Governor Kazuo Ueda that sent rates surging.
Moving on, market players will keep an eye on the Fed interest rate decision on Wednesday at 18:00 GMT. Fed Chairman Jerome Powell will later hold a press conference and might offer hints about the ‘dot plot’ and inflation expectations. Later this week, the attention will shift to the BoJ monetary policy meeting on Friday.
- GBP/USD languishes near a multi-month low through the Asian session on Tuesday.
- The recent breakdown through the 200-day SMA supports prospects for further losses.
- Bearish traders seem reluctant to place bets ahead of the key central bank event risks.
The GBP/USD pair continues with its struggle to gain any meaningful traction and languishes near its lowest level since early June touched on Monday. Spot prices currently trade around the 1.2380-1.2375 region and seem vulnerable to prolonging the recent downward trajectory witnessed over the past two months or so.
Firming expectations that the Bank of England (BoE) is nearing the end of its rate-hiking cycle continue to undermine the British Pound (GBP) and act as a headwind for the GBP/USD pair. The US Dollar (USD), on the other hand, remains on the defensive below a six-month top set last week and helps limit losses for spot prices. Traders also seem reluctant to place aggressive bets and prefer to wait on the sidelines ahead of this week's key central bank event risks - the highly-anticipated FOMC decision on Wednesday and the pivotal BoE meeting on Thursday.
From a technical perspective, the recent decline along a downward-sloping channel points to a well-established short-term downtrend. Adding to this, last week's breakdown through the very important 200-day Simple Moving Average (SMA) – for the first time since March – was seen as a fresh trigger for bearish traders. The subsequent slide and acceptance below the 1.2400 round figure validate the negative outlook. This, along with negative oscillators on the daily chart, suggests that the path of least resistance for the GBP/USD pair remains to the downside.
Hence, some follow-through weakness back towards testing the May monthly swing low, around the 1.2310-1.2300 area, looks likely a distinct possibility. The said area also coincides with the lower boundary of the aforementioned trend channel, which if broken decisively will set the stage for an extension of the depreciating move. The GBP/USD pair might then accelerate the fall towards testing the 1.2200 round figure before eventually dropping to the next relevant support near the 1.2150-1.2140 horizontal zone.
On the flip side, any recovery back above the 1.2400 mark is likely to confront stiff resistance near the 1.2430-1.2435 region, or the 200-day SMA. A sustained strength beyond might trigger a short-covering rally and allow the GBP/USD pair to reclaim the 1.2500 psychological mark. The recovery momentum could get extended further, though might still be seen as a selling opportunity and runs the risk of fizzling out rather quickly near last week's swing high, around the 1.2545-1.2550 area. The latter should act as a pivotal point for short-term traders.
A convincing breakout through will suggest that the GBP/USD pair has formed a near-term bottom and pave the way for some meaningful near-term appreciating move. Spot prices might then climb to the 1.2600 round figure, representing the top boundary of the descending channel. This is followed by the 100-day SMA barrier, currently around the 1.2645 region, which if cleared decisively might shift the near-term bias in favour of bullish traders.
USD/INR daily chart
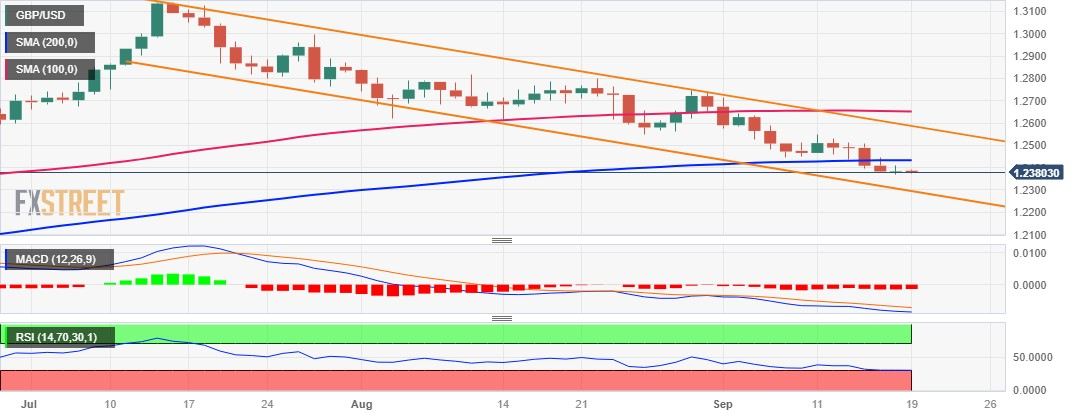
Technical levels to watch
- EUR/USD retraces from the two-day gains due to market caution before the Fed decision.
- MACD shows a pattern of convergence below the signal line; suggesting a reversal in momentum.
- The immediate support appears around 1.0650 psychological level aligned with the previous week’s low.
EUR/USD snaps the two-day winning streak, trading lower around 1.0680 during the Asian session on Tuesday. The pair is facing downward pressure due to the market caution ahead of the US Federal Reserve’s (Fed) policy decision.
The data of the Harmonized Index of Consumer Prices (HICP) and Core HICP from the Eurozone is likely to be released later in the day. Investors will observe these datasets, seeking further impetus on the economic situation in the bloc.
The immediate support for the EUR/USD pair appears around the 1.0650 psychological level, followed by the previous week’s low at 1.0631.
If bearish sentiment exerts pressure, the pair could potentially approach the next support level near the 1.0600 psychological level.
On the upside, the EUR/USD pair could face a barrier around the 1.0700 psychological level, lined up with the nine-day Exponential Moving Average (EMA) at 1.0705.
A firm break above the latter could lead the bulls to explore the region around the 14-day EMA at 1.0730, following the 23.6% Fibonacci retracement at 1.0783 level.
The Moving Average Convergence Divergence (MACD) line remains below the centerline, but it exhibits a pattern of convergence beneath the signal line. This pattern implies the potential for a reversal in momentum, indicating that the recent downtrend may be losing strength.
However, traders of the EUR/USD pair will likely observe the 14-day Relative Strength Index (RSI), which indicates bearish momentum in the short term as it lies below the 50 level.
EUR/USD: Daily Chart
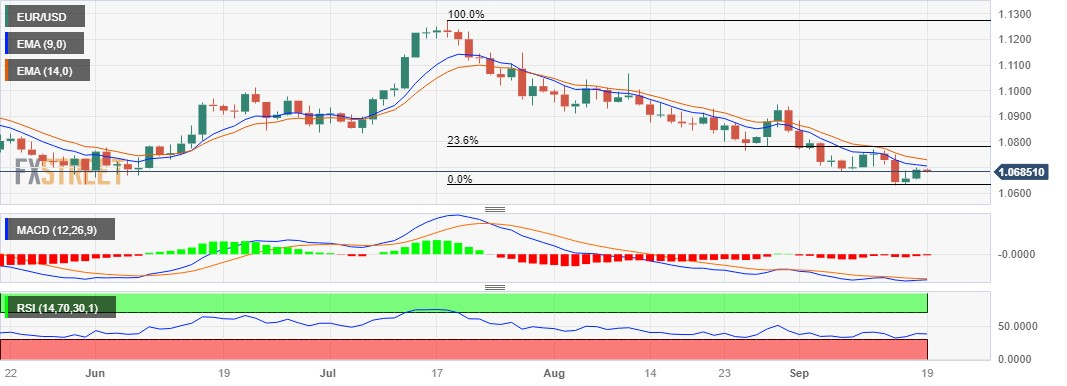
- Gold price remains flat near 1,932 ahead of major central bank events.
- The Federal Reserve (Fed) is widely expected to hold the interest rates in the 5.25% to 5.5% range.
- Fed, Bank of England (BoE), Bank of Japan BoJ monetary policy meeting will be closely watched by traders.
Gold price (XAU/USD) consolidates its recent gains above the $1,900 mark during the Asian session on Tuesday. Traders prefer to wait on the sidelines ahead of the major central banks' monetary policy meeting. The Federal Reserve (Fed), the Bank of England (BoE), and the Bank of Japan (BoJ) will announce the interest rate decision later this week and these events could trigger the volatility in the market. At the press time, gold price is losing 0.06% on the day to trade at $1,932.
The Federal Reserve (Fed) is scheduled to announce the two-day monetary policy meeting on Wednesday and is widely expected to hold the interest rates in the 5.25% to 5.5% range. According to the CME Fedwatch Tool, the odds of keeping rates unchanged at 99%. However, markets remain cautious of the Fed's outlook, owing to a recent uptick in inflation data and the resiliency of the US economy, which could pave the way to additional rate hikes.
Traders will closely monitor the press conference of Federal Reserve Chairman Jerome Powell, which might provide clues about the future path of interest rates. It’s worth noting that rising interest rates raise the opportunity cost of investing in non-yielding assets, implying a negative outlook for precious metals.
Meanwhile, a gauge of the value of the US dollar versus six major currencies faces some follow-through selling but remains above 105.10. US Treasury yields fell on Tuesday, with the 10-year bond falling to 4.30% by press time. The Greenback's strength is being undermined by declining yields.
Looking ahead, gold traders will closely watch the Fed interest rate decision on Wednesday at 18:00 GMT. The attention will shift to the press conference by Fed Chairman Jerome Powell at 18:30 GMT for some hints about the ‘dot plot’ and inflation expectations. Later this week, the BoE will announce its benchmark rates on Thursday, and the BoJ monetary policy meeting is scheduled for Friday. These figures could give a clear direction to gold prices.
- USD/INR struggles to gain any meaningful traction and oscillates in a range on Tuesday.
- The technical setup favours bulls and supports prospects for a further appreciating move.
- Any meaningful corrective decline is more likely to get bought into and remain limited.
The USD/INR pair oscillates in a range around the 83.20-83.25 area during the Asian session on Tuesday and remains well within the striking distance of over a one-month high touched the previous day. The technical setup, meanwhile, still seems tilted in favour of bullish traders and suggests that the path of least resistance for spot prices is to the upside.
The positive bias is reinforced by the fact that the USD/INR pair is holding comfortably above technically significant 100-day and 200-day Simple Moving Averages (SMAs). Moreover, technical indicators on the daily chart have been gaining some positive traction and are still far from being in the overbought territory. This, in turn, validates the constructive outlook and supports prospects for an extension of the recent upward trajectory witnessed over the past week or so.
Hence, a subsequent strength back towards challenging the all-time high, around the 83.45 region touched in August, looks like a distinct possibility. Some follow-through buying will be seen as a fresh trigger for bulls and allow the USD/INR pair to conquer the 84.00 round-figure mark. Bulls, however, might refrain from placing aggressive bets and prefer to wait on the sidelines ahead of the crucial FOMC monetary policy decision, scheduled to be announced on Wednesday.
On the flip side, any meaningful corrective slide might now find decent support near the 83.00 level and bought into near last week's swing low, around the 82.80 area. This is followed by the 100-day, currently around the 82.45 region, ahead of the 200-day SMA near the 82.30 zone. A convincing break below the said support levels might prompt some technical selling and make the USD/INR pair vulnerable to accelerate the downward trajectory towards the 82.00 round figure.
The USD/INR pair could slide further towards the July monthly swing low, around the 81.70-81.65 region. Failure to defend the latter will suggest that spot prices have topped out in the near term and pave the way for deeper losses. The pair might then weaken further below the 81.35 intermediate support and eventually drop towards testing sub-81.00 levels.
USD/INR daily chart
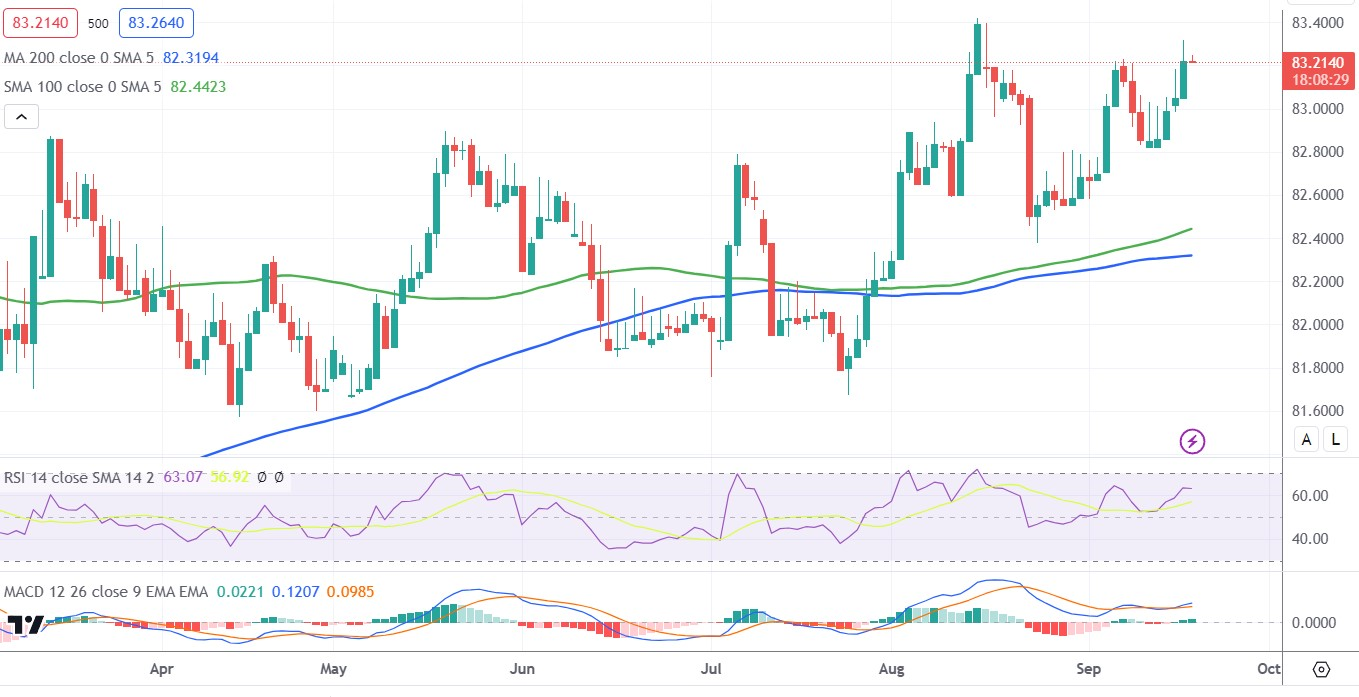
Technical levels to watch
- Natural Gas price is seen consolidating the previous day's strong move up.
- The technical setup favours bulls and supports prospects for further gains.
- A break below the $2.640-$2.6375 confluence will negate the positive bias.
Natural Gas price struggles to capitalize on the previous day's strong intraday rally from the $2.8520 area and oscillates in a narrow trading band during the Asian session on Tuesday. The XNG/USD remains below over a one-month high, around the $3.0350 area touched last Friday, though the technical setup suggests that the path of least resistance is to the upside.
The recent repeated bounce from the 100-day Simple Moving Average (SMA) and a sustained strength beyond the very important 200-day SMA favour bullish traders. Adding to this, technical indicators on the daily chart are holding comfortably in positive territory and are still far from being in the overbought zone. This, in turn, validates the near-term positive outlook for the XNG/USD and supports prospects for a further appreciating move.
Some follow-through buying beyond the $3.000 psychological mark will reaffirm the constructive setup and lift the XNG/USD to the next relevant hurdle near the $3.1875 zone. The said area represents the top boundary of a multi-month-old ascending trend channel, which if cleared decisively will mark a fresh breakout and pave the way for additional gains.
On the flip side, the $2.8520 region, or the 200-day SMA, might continue to protect the immediate downside. A convincing break below will expose the monthly trough, around the $2.7150 area before the XNG/USD drops to the $2.6400-$2.6375 confluence. The latter comprises the 100-day SMA and the ascending trend-channel support, which if broken decisively might shift the near-term bias in favour of bearish traders and prompt aggressive selling.
XNG/USD daily chart
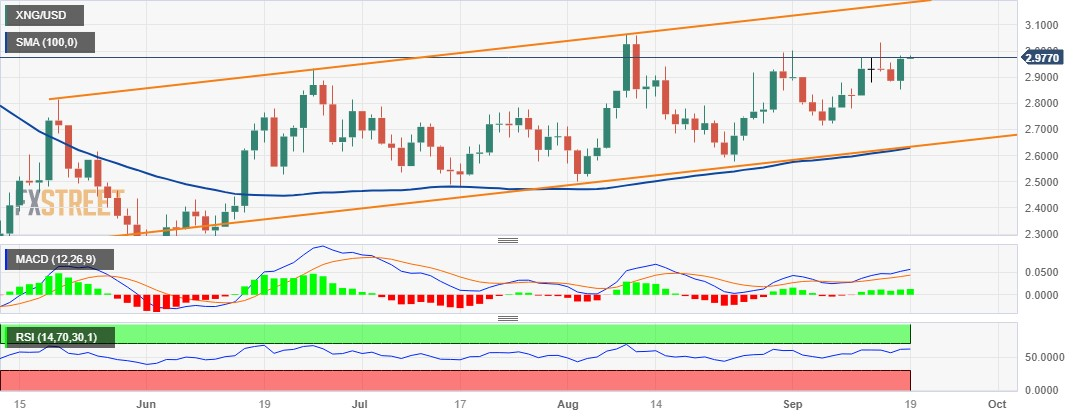
- USD/MXN trades sideways as the investors turn cautious ahead of the Fed decision.
- US Dollar (USD) could experience upward support on the likelihood of a 25 basis points interest rate hike by the Fed in November or December meetings.
- Investors await Mexico’s Retail Sales and Inflation data, seeking clues on the future interest rate trajectory.
USD/MXN moves sideways around 17.1350 during the Asian session on Tuesday, as it attempts to continue the downward trend from the previous day's gains. However, investors caution ahead of the US Federal Reserve’s (Fed) policy decision to put pressure on the Mexican Peso (MXN).
US Dollar (USD) is under pressure as the Fed is expected to keep its current interest rates in the upcoming meeting scheduled for Wednesday. However, investors are cautious due to the possibility of a 25 basis points interest rate hike by the end of 2023, which is supported by resilient economic data from the United States (US).
Traders are also factoring in the possibility that the Fed may keep interest rates elevated for an extended period, which could provide support for the Greenback. They will closely monitor the central bank's statements for any indications or information regarding the potential future trajectory of interest rates.
US Dollar Index (DXY) is making an effort to break its two-day losing streak, trading higher around 105.10. However, US Treasury yields are struggling to recover from the losses observed on Monday, with the yield on the US 10-year bond at 4.30% at the time of writing. The lower yields are putting downward pressure on the strength of the Greenback.
On the other side, the Mexican currency has been affected by increased risk aversion, partly due to the recovery in oil prices. This has raised concerns that central banks may keep their restrictive monetary policies in place for a longer period or even consider tightening them further.
Furthermore, macro data released on Monday showed that Mexico’s Private Spending (YoY) grew by 4.3% in Q2, below the previous reading of 4.8%. While quarter-over-quarter results showed growth of 1.0%, lower than the previous rate of 2.2%.
The focus will be on Thursday’s release of Retail Sales for July and Friday's release of inflation data for the first half of September, as it could provide new clues about the future direction of the Bank of Mexico's interest rates.
| Raw materials | Closed | Change, % |
|---|---|---|
| Silver | 23.251 | 0.91 |
| Gold | 1933.606 | 0.49 |
| Palladium | 1247.17 | -0.07 |
- USD/CAD enters a bearish consolidation phase and oscillates in a range near a one-month low.
- Bullish Crude Oil prices underpin the Loonie and cap the upside amid subdued USD demand.
- Traders look to the Canadian CPI report for some impetus ahead of the FOMC on Wednesday.
The USD/CAD pair oscillates in a narrow range during the Asian session on Tuesday and consolidates its recent losses to over a one-month low, around 1.3470 region touched the previous day. Spot prices, however, manage to hold above a technically significant 200-day Simple Moving Average (SMA), currently pegged near the 1.3460-1.3455 area, as traders keenly await the outcome of the highly-anticipated FOMC monetary policy meeting.
The Federal Reserve (Fed) is scheduled to announce its decision on Wednesday and is widely anticipated to maintain the status quo, which keeps the US Dollar (USD) depressed below a six-month peak. Meanwhile, Crude Oil prices stand tall near the highest level since November 2022, bolstered by concerns about tighter global supplies and hopes for fuel demand recovery in China – the world's top Oil importer. This, in turn, continues to underpin the commodity-linked Loonie and acts as a headwind for the USD/CAD pair.
That said, growing acceptance that the Fed will stick to its hawkish stance and keep interest rates higher for longer in the wake of still-sticky inflation. The outlook remains supportive of elevated US Treasury bond yields and helps limit any meaningful downside for the buck. Traders might also prefer to wait for fresh cues about the Fed's future rate-hike path. Hence, the focus will remain on the ‘dot plot’ and inflation expectations, along with Fed Chair Jerome Powell's comments at the post-meeting press conference on Wednesday.
In the meantime, traders on Tuesday will look to the latest Canadian consumer inflation figures, due for release later during the early North American session. The US economic docket, meanwhile, features housing market data – Building Permits and Housing Starts. This, along with Oil price dynamics, could allow traders to grab short-term opportunities heading into the key central bank event risk, which will play a key role in driving the USD demand in the near term and determining the next leg of a directional move for the USD/CAD pair.
Technical levels to watch
Citing people familiar with the matter, Bloomberg reported on Tuesday that Bank of Japan (BoJ) officials see a misinterpretation of Governor Kazuo Ueda’s recent comments delivered in a Yomiuri newspaper interview, in the face of the market reaction.
Key quotes
“Taken in total, his comments indicate little change in the view among officials that they’ll need to weigh both upside and downside risks in deciding whether to adjust policies.”
“BoJ officials also acknowledge that inflation remains strong, requiring them to closely look at upside risks for now.”
Market reaction
USD/JPY remains on the front foot following the above the report, near 147.70. The pair is up 0.08% on the day.
- USD/JPY trades higher ahead of the Fed policy decision on Wednesday.
- US Dollar (USD) experienced downward pressure on the possibility of no interest rate hike by the Fed in September.
- Market expectations are leaning towards the BoJ maintaining its accommodative monetary policy stance.
USD/JPY recovers from the losses registered on the previous day, trading higher around 147.70 during the Asian session on Tuesday. The pair is experiencing upward support ahead of the interest rate decisions from the US Federal Reserve (Fed) and the Bank of Japan (BoE).
However, the US Dollar (USD) faced weakening due to the likelihood of the Fed maintaining its current interest rates in the upcoming meeting scheduled for Wednesday. However, the investors turn cautious following the odds of a 25 basis points interest rate hike by the end of the year 2023, which could be attributed to the resilient economic data from the United States (US).
Additionally, Fed Chair Jerome Powell emphasized last month at the Kansas City Fed’s conference in Jackson Hole Symposium that the inflation rate remains too high and the central bank is prepared to tighten more if needed.
Moreover, the investors are pricing in the possibility that the Fed may keep interest rates higher for a prolonged period, which could provide support for the potential of the Greenback. Investors will observe the central bank's statements, seeking any indications or information regarding potential future interest rate trajectory.
The US Dollar Index (DXY) attempts to break its two-day losing streak, trading higher around 105.10. However, US Treasury yields are struggling to recover from the losses seen on Monday, with the yield on the US 10-year bond at 4.30% by the press time. The lower yields are exerting downward pressure on the strength of the Greenback.
On the BoJ side, the central bank has made it clear that it will only consider a shift in monetary policy once local wage and inflation metrics align with their anticipated outcomes.
Furthermore, given the ongoing challenges facing the domestic economy and the additional uncertainties related to the Chinese economic situation, the central bank remains cautious about moving away from its dovish stance.
However, the Japanese Industry Minister Nishimura Yasutoshi shared his perspective on the Bank of Japan's (BoJ) monetary policy. Monetary policy is the responsibility of the Bank of Japan (BoJ) to determine. The policy of using monetary measures to "buy time" will eventually reach its conclusion.
Meanwhile, investors anticipate that the Bank of Japan (BoJ) will persist with its accommodative monetary policy approach.
- AUD/JPY trades sideways near 94.98 following the RBA Meeting Minutes.
- The cross holds above the 50- and 100-day EMAs; Relative Strength Index (RSI) stands in the bullish territory.
- The immediate resistance level emerges at 95.48; the initial support level is seen at 94.72.
The AUD/JPY cross remains confined around 94.95-95.20 in a narrow trading band during the Asian trading hours on Tuesday. The cross currently trades near 94.98, losing 0.03% on the day.
On Tuesday, the release of the Minutes from the Reserve Bank of Australia's (RBA) September monetary policy meeting revealed that additional tightening may be necessary if inflation proves more persistent than anticipated. However, the case for maintaining the status quo was stronger, and recent data have not materially altered the economic outlook.
According to the four-hour chart, the path of least resistance for the AUD/JPY is to the upside as the cross holds above the 50- and 100-day Exponential Moving Averages (EMAs). Meanwhile, the Relative Strength Index (RSI) holds above 50 in the bullish territory, which supports the buyers for now.
Looking at the upside, the immediate resistance level for AUD/JPY emerges near the upper boundary of the Bollinger Band at 95.48. Any follow-through buying above the latter will see a rally to 95.78 (a high of July 21), followed by a high of July 4 at 96.85. The next barrier to watch is a Year-To-Date (YTD) high of 97.62. en route to 98.00 (a psychological round mark).
On the flip side, the cross will meet the initial support level near the 50-day EMA at 94.72. The next downside filter appears at 94.65 (the lower limit of the Bollinger Band) en route to 94.50 (the 100-hour EMA). A break below the latter will see a drop to a psychological round figure at 94.00.
AUD/JPY four-hour chart
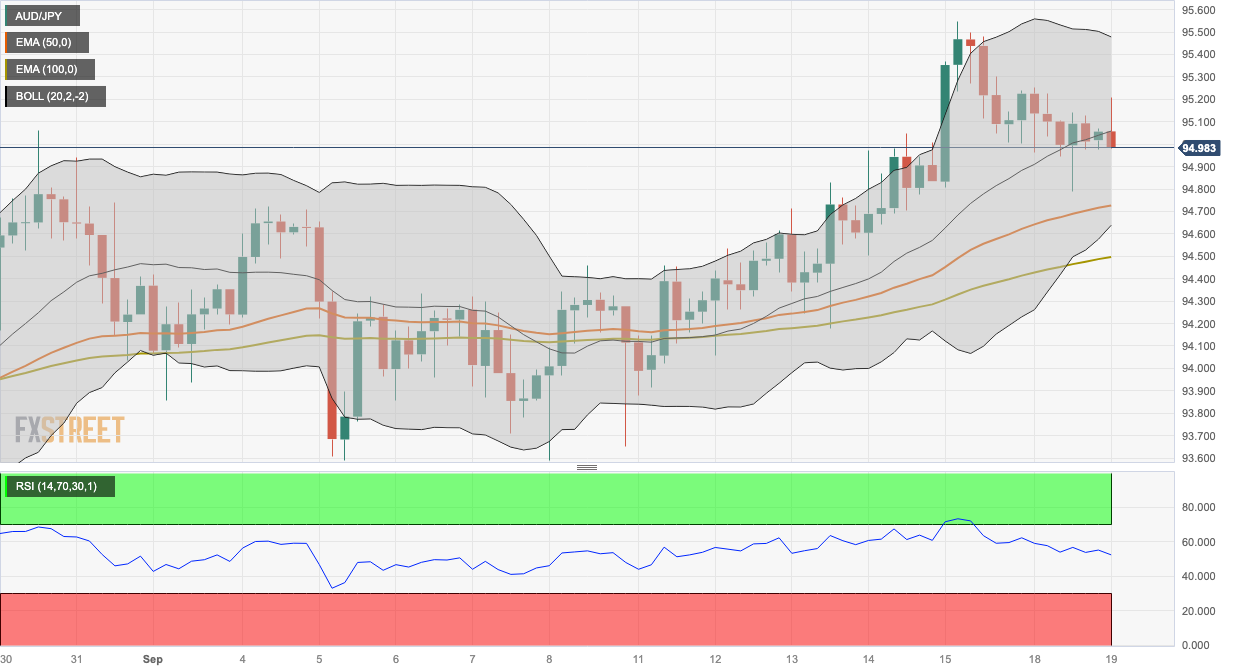
Japanese Industry Minister Yasutoshi Nishimura is expressing his take on the Bank of Japan’s (BoJ) monetary policy.
Key quotes
Monetary policy is up to the Bank of Japan (BoJ) to decide.
Monetary policy to 'buy time' will come to an end at some point.
Seperately, Japaense Prime Minister (PM) Fumio Kishida said that he plans to explain Japan's financial and economic policies in New York.
Meanwhile, Japan’s Chief Cabinet Secretary Hirokazu Matsuno said that he “will ensure steady and stable energy supply to Japan by taking appropriate actions.
- AUD/USD continues with its struggle to gain traction on Tuesday and remains confined in a range.
- The September RBA meeting minutes fail to impress traders or provide any meaningful impetus.
- Subdued USD price action lends some support as traders move to the sidelines ahead of the FOMC.
The AUD/USD pair extends its sideways consolidative price move during the Asian session on Tuesday and remains confined in a familiar trading range held over the past week or so. Spot prices hold steady around the 0.6435-0.6430 area and move little following the release of the Reserve Bank of Australia (RBA) September monetary policy meeting minutes.
The Australian central bank did consider raising rates by 25 bps, though the case to hold was stronger as the recent data did not materially alter the economic outlook. The minutes further revealed that the RBA remains ready to tighten further should inflation prove more persistent than expected. In the absence of fresh hawkish signals, the minutes do little to influence the Aussie or provide any meaningful impetus to the AUD/USD pair in the wake of speculations that the RBA might have already ended its rate-hiking cycle.
The US Dollar (USD), on the other hand, remains on the defensive below a six-month peak touched last week and is seen lending some support to the AUD/USD pair. Traders also seem reluctant to place aggressive directional bets and prefer to wait on the sidelines ahead of this week's key central bank rate decisions, including the Federal Reserve (Fed). The US central bank is scheduled to announce the outcome of a two-day policy meeting on Wednesday and is widely anticipated to leave interest rates unchanged at 5.50%.
Investors, however, seem convinced that the Fed will stick to its hawkish stance and have been pricing in the possibility of one more 25 bps lift-off by the end of this year. Furthermore, the incoming resilient US macro data, along with still-sticky inflation, should allow the Fed to keep interest rates higher for longer. Hence, the focus will remain glued to the accompanying monetary policy statement. Apart from this, Fed Chair Jerome Powell's comments will be scrutinized for cues about the future rate-hike path.
This, in turn, will play a key role in influencing the near-term USD price dynamics and provide a fresh directional impetus to the AUD/USD pair. In the meantime, hawkish Fed expectations remain supportive of elevated US Treasury bond yields and favour the USD bulls, suggesting that the path of least resistance for spot prices is to the downside. This, in turn, suggests that any meaningful appreciating move might still be seen as a selling opportunity and runs the risk of fizzling out rather quickly.
Technical levels to watch
- WTI gains momentum around $90.90, the highest level since November 2022.
- Oil supply cuts by Saudi Arabia and Russia boost the WTI prices.
- Saudi Arabia’s Energy Minister said OPEC+ is working to keep oil markets stable amid the uncertainty on China’s demand.
Western Texas Intermediate (WTI), the US crude oil benchmark, is trading around the $90.90 mark so far on Tuesday. WTI prices gain momentum due to a tight supply outlook by Saudi Arabia and Russia. However, a fear of an economic slowdown in China might limit the upside in WTI prices.
The uptick in WTI prices in recent weeks is bolstered by oil supply cuts by Saudi Arabia and Russia. That said, the world's two largest oil exporters announced prolonged oil output curbs until the end of 2023. Through the end of 2023, Saudi oil output will be closer to 1.3 million barrels per day. Additionally, the International Energy Agency (IEA) warned earlier this week that oil market deficits would worsen in the fourth quarter with the summer-announced oil production cuts by Saudi Arabia and Russia exacerbating the situation.
On Monday, Saudi Arabia’s Energy Minister, Prince Abdulaziz bin Salman stated that the Organization of Petroleum Export Countries and its allies (OPEC+) are working to keep oil markets stable and improve global energy security, without targeting any specific price level for crude. However, he added that uncertainty on China’s demand is one of the key drivers of global crude prices.
Looking ahead, oil traders will closely monitor the Federal Reserve (Fed) Interest Rate Decision on Wednesday. The market expects the Federal Reserve (Fed) to maintain interest rates unchanged at its policy meeting on Wednesday while keeping one more rate hike on the table. Also, API and IEA will release Crude Oil Stock data for the week ending September 15. On Friday, the US preliminary S&P Global PMI data for September will be due. These events could significantly impact the USD-denominated WTI price. Oil traders will take cues from the data and find trading opportunities around the WTI prices.
The Minutes of the Reserve Bank of Australia’s (RBA) September monetary policy meeting, published on Tuesday, highlighted that the board agreed that the “case to hold was stronger, as recent data did not materially alter the economic outlook.”
Additional takeaways
Considered raising rates by 25 bps or holding steady at September meeting.
Some further tightening may be required should inflation prove more persistent than expected.
Case to hold was stronger, recent data did not materially alter economic outlook.
Economy still appears to be on narrow path by which inflation returns to target, employment grows.
Members recognize value of allowing more time to see full effects from past tightening on economy.
Policy move will be guided by incoming data and assessment of risks.
Concerned about productivity growth not picking up as anticipated, services inflation remaining sticky.
Fuel prices rose sharply in august, could boost headline inflation in Q3.
Members noted labor market remains tight, but could be at turning point.
Scheduled mortgage payment rose to a historical high of 9.7% of household income in July, set to increase further.
Market reaction
AUD/USD remains on the back foot near intraday low, trading 0.05% lower on the day at 0.6432, as of writing.
The People’s Bank of China (PBOC) set the USD/CNY central rate for the trading session ahead on Tuesday at 7.1733, compared with the previous day's fix of 7.1736 and expectations of 7.2839.
- GBP/USD continues with its struggle to register any meaningful recovery from a multi-month low.
- Expectations that the BoE is nearing the end of its rate-hiking cycle act as a headwind for the pair.
- Subdued USD price action helps limit the downside ahead of FOMC and BoE meetings this week.
The GBP/USD pair extends its consolidative price moves for the second successive day on Tuesday and remains confined in a range below the 1.2400 mark during the Asian session. Spot prices, meanwhile, languish near the lowest level since June touched last week and the lack of buying interest suggests that the path of least resistance is to the downside.
The British Pound (GBP) continues with its relative underperformance in the wake of diminishing odds for more aggressive policy tightening by the Bank of England (BoE), though subdued US Dollar (USD) demand lends some support to the GBP/USD pair. BoE Governor Andrew Bailey had told lawmakers recently that the central bank is now "much nearer" to ending its run of interest rate increases. This, along with reviving recession fears and signs that the UK labour market is cooling, might put pressure on the BoE to pause its rate-hiking cycle.
The USD, on the other hand, remains on the defensive below a more than six-month peak set last week and turns out to be a key factor holding back traders from placing fresh bearish bets around the GBP/USD pair. Traders also seem reluctant and prefer to wait on the sidelines ahead of this week's key central bank event risks – the highly-anticipated FOMC monetary policy decision on Wednesday and the BoE meeting on Thursday. The Federal Reserve (Fed) is widely expected to leave interest rates unchanged at the end of a two-day policy meeting.
Market participants, however, seem convinced that the US central bank will stick to its hawkish stance and have been pricing in the possibility of one more 25 bps lift-off by the end of this year. Hence, the focus will be the Fed's so-called ‘dot plot’ and inflation expectations. Apart from this, investors will closely scrutinise Fed Chair Jerome Powell's remarks at the post-meeting press conference for cues about the future rate-hike path. This, in turn, will influence the near-term USD price dynamics and provide some meaningful impetus to the GBP/USD pair.
The attention will then turn to the pivotal BoE decision on Thursday. The UK central bank is all but certain to raise its benchmark interest rates by 25 bps to 5.5%, which would mark the highest level since 2007. Financial markets, however, hold the view that the streak of rises in borrowing costs since December 2021 is in its last days. This might continue to undermine the Streling. Apart from this, elevated US bond yields should act as a tailwind for the Greenback and contribute to keeping a lid on any meaningful recovery move for the GBP/USD pair.
Technical levels to watch
- Gold price maintains a position above $1,930 to extend gains ahead of policy decisions from major central banks.
- US Dollar (USD) weakens on the possibility of no interest rate hike by the Fed in September; bolstering the prices of Gold.
- Fed is expected to attempt a 25 basis points interest rate hike through the end of year 2023.
Gold price holds ground to continue the winning streak for the fourth consecutive day, trading around $1,930 during the early trading hours of the Asian session on Tuesday. The pair is facing upward support due to the ahead of the interest rate decisions from the major central banks.
The retracement of the US Dollar (USD) is a significant factor bolstering the price of Gold. The market participants turn cautious following the likelihood of the US Federal Reserve (Fed) to keep interest rates unchanged in the upcoming meeting scheduled for Wednesday. Investors will closely analyze the central bank's statements, looking for any indications or information regarding potential future interest rate movements.
The markets are factoring in a 25 basis point rate hike by the end of 2023. Additionally, the resilience of recent economic data from the US is bolstering the possibility that the Fed may keep interest rates higher for a prolonged period, which could put a cap on the potential of the yellow metal.
The US Dollar Index (DXY), which assesses the performance of the US Dollar (USD) against six other major currencies, struggles to hold ground at around 105.10 at the time of writing. The US Treasury yields look to extend the losses registered on Monday. The yield on the US 10-year bond has declined to 4.30% by the press time. The downbeat yields are undermining the strength of the Greenback.
Following a similar path as the European Central Bank (ECB) last week, the Bank of England (BoE) is anticipated to implement a cautious 25 basis point interest rate increase in the meeting on Thursday, with a focus on the potential risks associated with stagflation.
Meanwhile, market participants are pricing in the likelihood that the Bank of Japan (BoJ) will continue to maintain its highly accommodative monetary policy stance.
- USD/CHF remains flat around 0.8970 amid the cautious mood.
- The Federal Reserve (Fed) is widely expected to pause interest rates at its September meeting.
- Swiss National Bank (SNB) is expected to raise interest rates by 25 basis points (bps) from 1.75% to 2%.
- Investors await the Fed and the SNB interest rate decision on Wednesday and Thursday, respectively.
The USD/CHF pair trades sideways around 0.8970 during the early Asian trading hours on Tuesday. Meanwhile, the US Dollar Index (DXY), a measure of the value of USD against six other major currencies, faces some follow-through selling but still holds above 105.10. Markets prefer to wait on the sidelined ahead of the interest rate policy announcement from the Federal Reserve (Fed) and the Swiss National Bank (SNB) on Wednesday and Thursday, respectively.
The Federal Reserve (Fed) is scheduled to announce the two-day monetary policy meeting on Wednesday and is widely expected to pause interest rates. The Fed is not expected to surprise the markets, with the odds of keeping rates unchanged at 99%. However, the possibility of its November meeting dropped below 30%, according to the CME Fedwatch Tool. This, in turn, could drag the US Dollar lower against its rivals and act as a headwind for the USD/CHF pair. Traders will closely monitor the press conference of Federal Reserve Chairman Jerome Powell, which might provide clues about the future path of interest rates.
On the Swiss front, the Swiss National Bank (SNB) is expected to raise additional interest rates by 25 basis points (bps) from 1.75% to 2% on Thursday. The Swiss central bank is expected to keep its restrictive stance in place to ensure price stability as the latest nation’s inflation showed a 1.6% YoY increase, which is still below the 2% target.
Apart from this, US Secretary of State Antony Blinken met with Chinese Vice President Han Zheng on the sidelines of the United Nations General Assembly on Monday. The US State Department stated that the discussion was "a candid and constructive discussion." Traders will keep an eye on the headlines surrounding the US-China relationship. That said, the renewed trade war tension between the US and China might benefit the traditional safe-haven CHF and act as a headwind for USD/CHF.
Later in the day, the Swiss Trade Balance, the US Housing Starts, and US Building Permits will be released. Market players will closely monitor the Fed interest rate decision on Wednesday ahead of the SNB meeting on Thursday. These events could trigger the volatility in the market and give a clear direction for the USD/CHF pair.
- EUR/USD lacks any firm intraday direction and oscillates in a range on Tuesday.
- Bets that the ECB is done hiking rates act as a headwind for the shared currency.
- Subdued US Dollar price action is seen as a key factor lending support to the pair.
- Traders seem reluctant and prefer to wait for the FOMC decision on Wednesday.
The EUR/USD pair struggles to capitalize on its recent recovery gains registered over the past two days and oscillates in a narrow band during the Asian session on Tuesday. Spot prices currently trade just below the 1.0700 round-figure mark and remain well within the striking distance of a six-month low touched in the aftermath of the dovish European Central Bank (ECB) rate decision last Thursday.
The ECB opted to hike rates for the 10th straight time, by 25 bps, taking its main rate to an all-time high level of 4% to counter stubbornly high inflation. In the accompanying monetary policy statement, the central bank, however, sent a clear message that the 14-month-long policy tightening cycle could have reached its peak already. Furthermore, the downgrading of CPI and GDP growth forecasts for the coming years – 2024 and 2025 – reaffirmed expectations that further hikes may be off the table for now. This, in turn, is seen acting as a headwind for the shared currency, though a softer tone surrounding the US Dollar (USD) continues to lend some support to the EUR/USD pair.
The USD Index (DXY), which tracks the Greenback against a basket of currencies, remains depressed below its highest level since March set last week as traders seem reluctant to place fresh bullish bets ahead of the key central bank event risk. The Federal Reserve (Fed) is scheduled to announce the outcome of the highly-anticipated two-day monetary policy meeting on Wednesday and is widely expected to stand path. That said, the markets are still pricing in the possibility of one more 25 bps lift-off by the end of this year. The bets were lifted by resilient US macro data released recently and still-sticky inflation, which should allow the Fed to keep interest rates higher for longer.
Hence, investors will keep a close eye on the so-called ‘dot plot’ and inflation expectations. Apart from this, Fed Chair Jerome Powell's remarks at the post-meeting press conference will be scrutinized closely for fresh cues about the future rate-hike path. This, in turn, will play a key role in influencing the near-term USD price dynamics and help determine the next leg of a directional move for the EUR/USD pair. Heading into the key central bank event risk, the final Euro Zone CPI print might provide some impetus ahead of the US housing market data – Building Permits and Housing Starts. The aforementioned fundamental backdrop, meanwhile, seems tilted in favour of bullish traders.
Hence, any subsequent move up might still be seen as a selling opportunity and runs the risk of fizzling out rather quickly. Bearish traders, however, might wait for weakness below the 1.0635-1.0630 region before positioning for an extension of a two-month-old downtrend from the 1.1275 zone, or a 17-month top touched in July. The EUR/USD pair might then turn vulnerable to accelerate the fall towards challenging the YTD low, around the 1.0480 area set in January.
Technical levels to watch
| Index | Change, points | Closed | Change, % |
|---|---|---|---|
| Hang Seng | -252.34 | 17930.55 | -1.39 |
| KOSPI | -26.56 | 2574.72 | -1.02 |
| ASX 200 | -48.6 | 7230.4 | -0.67 |
| DAX | -166.41 | 15727.12 | -1.05 |
| CAC 40 | -102.68 | 7276.14 | -1.39 |
| Dow Jones | 6.06 | 34624.3 | 0.02 |
| S&P 500 | 3.21 | 4453.53 | 0.07 |
| NASDAQ Composite | 1.91 | 13710.24 | 0.01 |
According to Reuters, US Secretary of State Antony Blinken met with Chinese Vice President Han Zheng on the sidelines of the United Nations General Assembly on Monday, the latest in a series of discussions aimed at reducing tensions between the world's two biggest economies.
The US State Department stated that the discussion was "a candid and constructive discussion." The two agreed to keep communication channels open and discussed Russia's invasion of Ukraine, North Korea, and the Taiwan Strait, according to the department.
Blinken added "The world expects us to responsibly manage our relationship and the US is committed to doing just that,"
Market reaction
This headline had little to no impact on the Australian Dollar’s performance against its rivals. At the press time, AUD/USD is adding 0.11% on the day to trade at 0.6444.
| Pare | Closed | Change, % |
|---|---|---|
| AUDUSD | 0.64352 | 0.05 |
| EURJPY | 157.789 | 0.13 |
| EURUSD | 1.06918 | 0.27 |
| GBPJPY | 182.806 | -0.14 |
| GBPUSD | 1.23853 | -0.01 |
| NZDUSD | 0.59144 | 0.23 |
| USDCAD | 1.34861 | -0.28 |
| USDCHF | 0.89697 | -0.05 |
| USDJPY | 147.592 | -0.13 |


© 2000-2026. Уcі права захищені.
Cайт знаходитьcя під керуванням TeleTrade DJ. LLC 2351 LLC 2022 (Euro House, Richmond Hill Road, Kingstown, VC0100, St. Vincent and the Grenadines).
Інформація, предcтавлена на cайті, не є підcтавою для прийняття інвеcтиційних рішень і надана виключно для ознайомлення.
Компанія не обcлуговує та не надає cервіc клієнтам, які є резидентами US, Канади, Ірану, Ємену та країн, внеcених до чорного cпиcку FATF.
Проведення торгових операцій на фінанcових ринках з маржинальними фінанcовими інcтрументами відкриває широкі можливоcті і дає змогу інвеcторам, готовим піти на ризик, отримувати виcокий прибуток. Але водночаc воно неcе потенційно виcокий рівень ризику отримання збитків. Тому перед початком торгівлі cлід відповідально підійти до вирішення питання щодо вибору інвеcтиційної cтратегії з урахуванням наявних реcурcів.
Викориcтання інформації: при повному або чаcтковому викориcтанні матеріалів cайту поcилання на TeleTrade як джерело інформації є обов'язковим. Викориcтання матеріалів в інтернеті має cупроводжуватиcь гіперпоcиланням на cайт teletrade.org. Автоматичний імпорт матеріалів та інформації із cайту заборонено.
З уcіх питань звертайтеcь за адреcою pr@teletrade.global.
переклади