- Аналітика
- Новини та інструменти
- Новини ринків
Новини ринків
- GBP/USD remains sidelined around 1.2935 after diving to a weekly low below the 1.2900 area.
- UK’s June CPI revealed an easing in inflationary pressures.
- The US Dollar rebounds to five-day highs despite disappointing US housing data.
The GBP/USD pair licks its wounds around 1.2935 in the early Asian session after diving to a weekly low near the 1.2870 region. The major declines after the publication of the softer UK Consumer Price Index.
The Office for National Statistics in the United Kingdom reported that the headline Consumer Price Index (CPI) MoM increased by 0.1% in June, below the 0.4% expected and the 0.9% increase in May. Annually, headline CPI fell to 7.9%, falling short of the expectation of 8.2% and the 8.7% increase in May. The core CPI figure, excluding volatile food and oil prices, fell to 6.9%, against the market consensus of 7.1%. This softer inflation data could help the Bank of England (BoE) to hike rates towards 25 basis points (bps) rather than 50 bps in the next policy meeting on August 3.
Across the pond, US Housing Starts fell 8% MoM in June, following a 15.7% gain (revised from +21.7%) in May. This number was below the market consensus of a 7.2% increase. Meanwhile, Building permits declined 3.7% in June from 5.6% prior (revised).
Although the US Dollar rebounds to five-day highs and hovered around 100.25 on Thursday despite the disappointing US housing data. Market players anticipate that the Federal Reserve (Fed) is nearing the end of its policy tightening cycle and will maintain interest rates following the widely expected 25 basis points (bps) in the July meeting.
Moving on, investors will watch the US Existing Home Sales and the UK Retail Sales for fresh impetus. Next week, the focus will shift to the Flash Manufacturing Purchasing Managers Index (PMI) and Flash Services PMI from the US and UK. These figures would significantly impact the pair and help determine the next direction for the GBP/USD pair.
- Natural Gas Price eases from weekly high after two-day winning streak.
- Convergence of 100-EMA, three-week-old descending trend line highlights $2.62 as the key resistance.
- Previous support from early June acts as extra filter toward the north.
- Sellers may aim for 61.8% Fibonacci retracement during further downside.
Natural Gas Price (XNG/USD) lacks upside momentum around $2.60 during Thursday’s Asian session, after failing to cross the $2.62 key resistance the previous day. In doing so, the XNG/USD also justifies the RSI (14) line’s retreat, as well as the receding bullish bias of the MACD signals.
With this, the energy instrument is likely to extend the latest pullback toward the 50% Fibonacci retracement of its June 01-26 upside, near $2.55.
However, the golden Fibonacci ratio, comprising the 61.8% mark around $2.46, followed by multiple tops marked since late May around $2.43, could challenge the XNG/USD bears afterward.
In a case where the Natural Gas Price remains weak past $2.43, the odds of witnessing a slump toward the previous monthly low of around $2.17 and then to the yearly low marked in April of around $2.11 can’t be ruled out.
Meanwhile, a successful break of $2.62 isn’t an open invitation to the Natural Gas buyers as the support-turned-resistance line stretched from early June, close to $2.65 at the latest, acts as an extra filter toward the north.
Should the quote XNG/USD remains firmer past $2.65, the monthly high of around $2.88 and June’s peak surrounding $2.93 will be in the spotlight.
Overall, the Natural Gas Price is likely to witness a pullback but the bearish trend is far from the sight.
Natural Gas Price: Four-hour chart
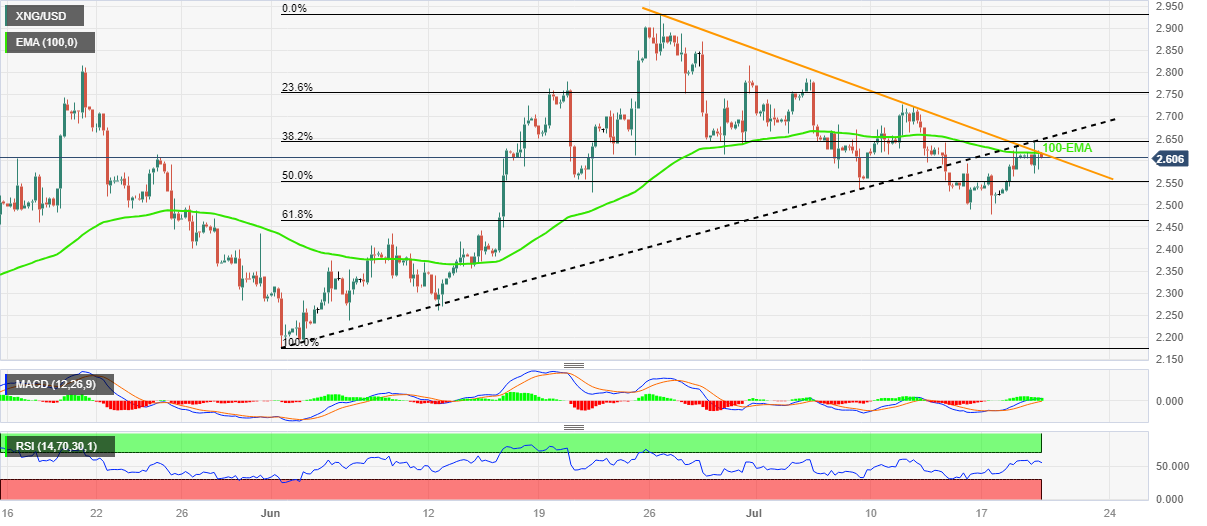
Trend: Further downside expected
China's Ambassador to Washington Xie Feng crossed wires late Wednesday, via Reuters, while speaking at the Aspen Security Forum where he criticized the US consideration for review of the outbound investment about China and further curbs on AI chips to the Asian nation.
Chinese Diplomat Xie initially praised the nation’s ideology of restraining trade or tech war before showing the ability, as well as readiness, to retaliate if the US imposes more curbs on its chip sector.
China’s Xie showed readiness to compete with the US technologies on fairgrounds should Washington go further on its harsh stand against investments and AI chip exports to Beijing.
The news also quotes China’s targeted move on the US company, namely Micron Technology, as well as US Treasury Secretary Janet Yellen’s comments suggesting the investment/chip curbs are for security reasons.
On the same line are the news, shared by Reuters, stating that the US House of Representatives committee has launched an investigation into investments by four US venture capital firms into Chinese artificial intelligence (AI) and semiconductor companies.
Market implications
The news prods S&P500 Futures from tracking Wall Street’s gains as it seesaws at the yearly high surrounding 4,600 marked the previous day, mildly offered by the press time. Additionally, the news adds strength to the US Dollar’s corrective bounce and weighs on the AUD/USD pair.
Also read: AUD/USD prods four-day downtrend below 0.6800 amid anxiety ahead of Australia employment clues
- EUR/USD edges lower around weekly bottom after declining in last two consecutive days.
- Bearish bias gains acceptance amid firmer US Dollar, less accolades for hawkish ECB.
- ECB’s Stournaras highlights easing Eurozone inflation, criticizes more restrictive policy.
- Eurozone Consumer Confidence, US Initial Jobless Claims, housing data will be important for fresh impetus.
EUR/USD remains on the back foot around 1.1200 while fading the previous day’s bounce off the weekly low amid the early hours of Thursday’s Asian session. In doing so, the Euro pair justifies recent doubts about the European Central Bank’s (ECB) hawkish moves amid inflation concerns, as well as justify the US Dollar strength, while keeping the bears on the table after a two-day downtrend from the 17-month high.
Although the final readings of the Eurozone Core inflation, per the Core Harmonized Index of Consumer Prices (HICP), improved for June on a monthly basis, to 0.4% MoM versus 0.3% previous forecasts, Governing Council member Yannis Stournaras told CGTN Europe on Wednesday that he wasn't sure whether the ECB would hike rates again after 25 bps increase next week. The policymaker also argued that the inflation is falling adding that further increases of interest rates might damage the economy.
It’s worth noting that the US Dollar Index (DXY) rose on the last two consecutive days while refreshing the weekly top to around 100.55, close to 100.30 by the press time, despite witnessing downbeat US housing data. The reason could be linked to the market’s concerns that the US Federal Reserve (Fed) may keep the interest rates higher for a longer time after lifting them in July.
On Wednesday, US Building Permits for June marked a contraction of 3.7% versus the previous increase of 5.6% (revised) whereas the Housing Starts also slumped 8.0% for the said period from 15.7% revised prior.
Alternatively, the previously released slower growth of the US Retail Sales for June contrasted with promising details to defend the Federal Reserve in keeping the rates higher for longer, as well as help in announcing a 0.25% rate hike in July. The same triggered the US Dollar’s corrective bounce off the 15-month low on Tuesday and helped defend the recovery on Wednesday despite downbeat US housing data.
Elsewhere, hopes of witnessing firmer earnings by the US banks, both top-tier and regional, due to the higher rates join mixed concerns about the Sino-US ties to allow Wall Street to edge higher while weighing on the US Treasury bond yields at the same time.
Moving on, the preliminary readings for Eurozone’s Consumer Confidence for July will precede the US Initial Jobless Claims and Existing Home Sales to decorate the economic calendar. However, major attention should be given to the risk catalysts for clear directions.
Technical analysis
Overbought RSI joined the failure to cross the 1.1280 horizontal resistance zone, comprising levels marked during early 2022, to trigger the EUR/USD pair’s pullback. That said, the receding bullish bias of the MACD signals adds strength to the downside bias suggesting a fall towards 1.1145-40 support confluence including the 10-DMA and previous resistance line stretched from February.
- USD/CAD oscillates around the 1.3170–1.3160 region in a narrow trading band.
- The US Dollar gains ground despite the disappointing US housing data.
- EIA Crude Oil Stock Changes indicated lower demand for crude oil.
The USD/CAD pair is trading in a narrow range below the 1.32 area. The pair currently trades around 1.3165 in the early Asian session. The Canadian Dollar loses ground against the Greenback despite disappointing US housing data from the US Census Bureau.
The US Census Bureau released monthly data on Wednesday revealing that Housing Starts fell 8% monthly in June, following a 15.7% gain (revised from +21.7%) in May. This number was below the market consensus of a 7.2% increase. Meanwhile, Building permits declined 3.7% in June, following a 5.6% gain in May. The US Dollar Index (DXY), an index of the value of the Greenback relative to a basket of foreign currencies, has climbed to five-day highs despite the disappointing data.
On the Canadian Dollar front, the Canadian Consumer Price Index (CPI) for June decreased to 2.8% YoY from 3.4% in May. This figure was below the market's prediction of 3%. The CPI rose 0.1% MoM against market estimates of a 0.3% gain. Additionally, the monthly Core CPI, excluding volatile food and energy costs, declined 0.1%, while the annual Core CPI fell to 3.2%, down from 3.7% in May.
The Canadian Dollar could get some support from the Bank of Canada's hawkish stance. However, the next meeting is due in September, and the BoC will have received further inflation and labor market data by then before determining the monetary policy.
On Wednesday, the Energy Information Administration (EIA) reported that the EIA Crude Oil Stocks Change in the week ending July 14 was -0.708M, compared to expectations of 2.44M and a gain of 5.946M the previous week. This figure indicated lower demand for crude oil and dragged the oil price lower following the release of the data.
Looking ahead, the Canadian Retail Sales m/m will be keenly watched. Also, the Unemployment Claims and Philadelphia Fed Manufacturing Index will be due later this week.
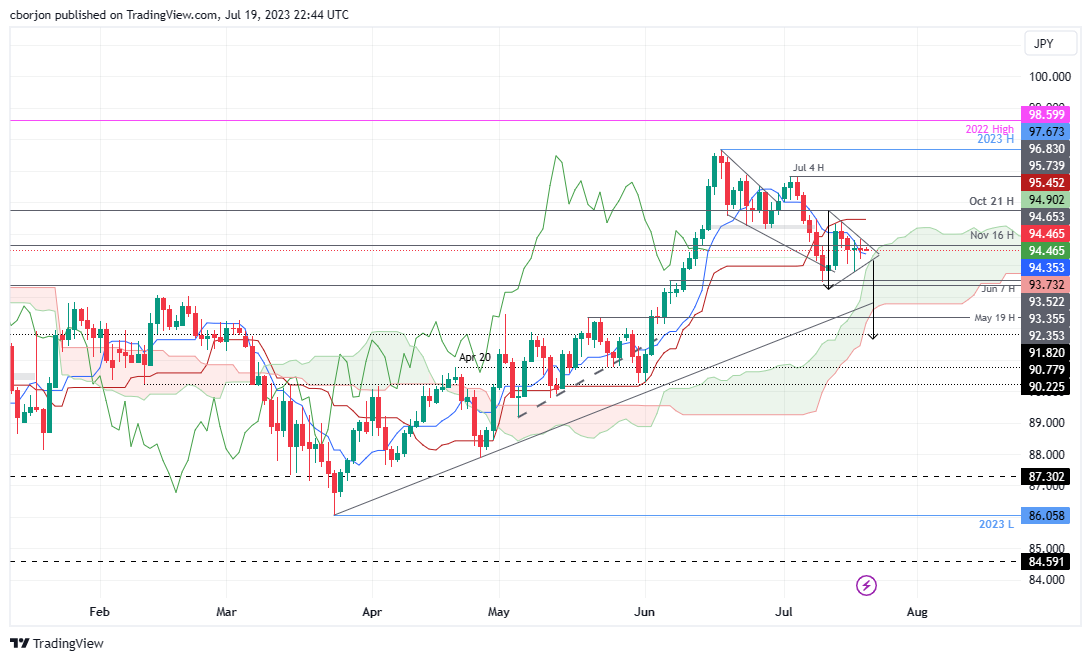
- AUD/JPY fluctuates around the 94.50 area, indicating a lack of a strong catalyst for a breakout.
- A descending symmetrical triangle hints at a potential drop, targeting 92.00.
- On the upside, if a breakout occurs, resistance is at the Kijun-Sen at 95.45, 95.00, and 96.00.
AUD/JPY hovers around the 94.50 area for the fifth straight day, fluctuating above/below the latter amidst the lack of a strong catalyst that would trigger a breakout. As the Asian session begins, the AUD/JPY exchanges hand at 94.51.
AUD/JPY Price Analysis: Technical outlook
The AUD/JPY daily chart portrays the pair as neutral to bullish biased. Still, it could resume downwards as a descending symmetrical triangle has formed nearby the Ichimoku Cloud (Kumo). which could open the door for further downside. If the AUD/JPY breaks downwards, as measured by triangle patterns, the minimum objective would be the 92.00 figure, though, on its way south, the cross-currency pair must reclaim key support levels.
The AUD/JPY first support would be the Tenkan-Sen line at 94.35, followed by the 94.00 figure. A breach of the latter will expose the top of the Kumo at around 93.65/85, followed by the December 13 high at 93.52. With an AUD/JPY further extension downwards, the next demand area would emerge at the May 19 daily high at 92.35 before challenging the 92.00 figure.
Conversely, if the AUD/JPy breaks to the upside, the first supply area will emerge at the Kijun-Sen at 95.45, exposing the 95.00 psychological level once cleared. Following a break of that level, the AUD/JPY would have a clear path to rally towards the 96.00 figure before testing the July 4 daily high at 96.83.
AUD/JPY Price Action – Daily chart
- Gold Price remains dicey at 10-week high on US Dollar recovery, sluggish markets.
- Mixed clues about inflation, employment jostle with the US Dollar rebound from multi-month low to prod XAU/USD price.
- United States economics, Federal Reserve concerns fall short of providing clear directions to the Gold Price.
- Mid-tier US data, risk catalysts eyed for clear XAU/USD guide.
Gold Price (XAU/USD) stays defensive around the highest levels since early June during a three-week uptrend, making rounds to $1,980 amid early Thursday morning in Asia, as market players seek fresh clues to conquer the immediate key upside hurdle. Apart from the lack of major catalysts, mixed data/events from the United States and China, the world’s top-two economies and major players in commodities, as well as concerns about the US Federal Reserve (Fed) also prod the XAU/USD traders at multi-day high.
Gold Price flirts with key resistnace on firmer US Dollar amid uncertainty
Gold Price portrays the bullish consolidation at the two-month-old horizontal resistance backed by downbeat technical signals (read technical analysis for details) as the US Dollar’s sustained recovery contrasts with some XAU/USD positive catalysts.
On Wednesday, US Building Permits for June marked a contraction of 3.7% versus the previous increase of 5.6% (revised) whereas the Housing Starts also slumped 8.0% for the said period from 15.7% revised prior.
It’s worth noting that the previously released slower growth of the US Retail Sales for June contrasted with promising details to defend the Federal Reserve in keeping the rates higher for longer, as well as help in announcing a 0.25% rate hike in July. The same triggered the US Dollar’s corrective bounce off the 15-month low on Tuesday and helped defend the recovery on Wednesday despite downbeat US housing data.
Apart from the US statistics, comments from US Treasury Secretary Janet Yellen suggesting a softening in the recruitment also prod the Fed hawks and US Dollar bulls in turn, which in turn should have put a floor under the XAU/USD price.
Elsewhere, receding inflation pressure at the major economies acts as an additional filter for the US Dollar, even if the greenback prints a corrective bounce, and keeps the market players directed towards the traditional haven, namely the Gold Price. It’s worth noting that the latest inflation clues from the US, Australia, the UK and New Zealand have been disappointing.
Furthermore, the BRICS nations, including Brazil, Russia, India, China, and South Africa, brace for a new gold-backed currency and hence open doors for further upside of the Gold Price.
It should be observed that the downbeat US Treasury bond yields and optimism at the equity markets also add strength to the XAU/USD price. However, the risk-on mood appears to lack strength in the Asia-Pacific zone, one of the major customers of Gold and prod the commodity buyers.
Above all, a lack of major developments and a light calendar limits the Gold Price upside as it jostles with the key technical hurdle surrounding $1,985, especially amid the US Dollar recovery.
Looking ahead, the weekly prints of the US Initial Jobless Claims, Existing Home Sales and the headlines about China, as well as the Fed, will be in the spotlight for getting a clear view of the Gold Price.
Gold Price Technical Analysis
Gold Price remains lackluster after reversing from a two-month-old horizontal resistance area surrounding $1,985.
In doing so, the XAU/USD also justifies the Relative Strength Index (RSI), placed at 14, line’s retreat from overbought territory, as well as the looming bear cross on the Moving Average Convergence and Divergence (MACD) indicator.
With this, the Gold Price is likely to extend the latest pullback towards a fortnight-old rising support line of around $1,965.
However, the 200-SMA and previous resistance line stretched from early June, respectively near $1,940 and $1,933, can prod the XAU/USD bears afterward.
Meanwhile, a successful upside break of the $1,985 hurdle enables the Gold buyers to challenge the $2,000 psychological magnet.
In that case, the tops marked on May 15 and 10, close to $2,022 and $2,048, will check the XAU/USD upside ahead of directing the bulls toward the yearly peak surrounding $2,080.
Gold Price: Four-hour chart
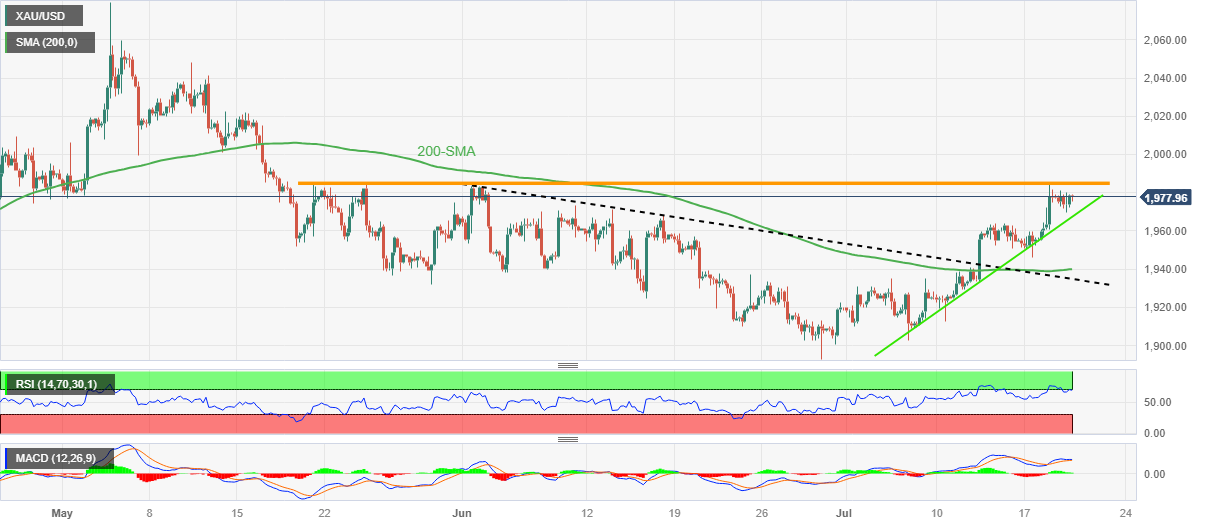
Trend: Pullback expected
- AUD/USD portrays cautious mood by struggling to extend the latest south-run after refreshing weekly low.
- Market sentiment, Australia data jostle with US Dollar rebound to weigh on AUD/USD.
- China news, pre-data anxiety also weigh on Aussie pair due to its risk-barometer status.
- Australia employment for June, PBoC Interest Rate Decision will be crucial for fresh impulse.
AUD/USD remains on the back foot at the lowest levels in a week, making rounds to 0.6770-75 after a four-day losing streak during the early hours of Thursday’s Asian session. In doing so, the risk-barometer pair aptly portrays the market’s cautious mood ahead of Australia’s top-tier employment data, as well as the mixed risk catalysts from China and the US.
Today’s Australian employment data becomes more important as the latest Monetary Policy Meeting Minutes from the Reserve Bank of Australia (RBA) showed the policymakers’ readiness to lift the rates if needed, after pausing the interest rates in the last meeting. Additionally, the downbeat Aussie inflation has had mixed clues and the wage price pressure remains almost static, which in turn suggests the need for restrictive monetary policy and hence can push the RBA toward lifting the rates if today’s Aussie job numbers rally.
Elsewhere, Australia’s CB Leading Index improved to 0.1% increase in June from a downwardly revised -0.3% while the Westpac Leading Index also rose to 0.12 for the said month from -0.27%.
On the other hand, US Building Permits for June marked a contraction of 3.7% versus the previous increase of 5.6% (revised) whereas the Housing Starts also slumped 8.0% for the said period from 15.7% revised prior.
It’s worth noting that the previously released slower growth of the US Retail Sales for June contrasted with promising details to defend the Federal Reserve in keeping the rates higher for longer, as well as help in announcing 0.25% rate hike in July. The same triggered the US Dollar’s corrective bounce off the 15-month low on Tuesday and helped defend the recovery on Wednesday despite downbeat US housing data.
Talking about the risks, China headlines have been mixed as the policymakers’ readiness for more stimulus joins an absence of additional tussles between the Washington and Beijing to raise hopes of placating terms among the world’s top two economies. However, pessimism at Chinese reality markets and recently downbeat statistics from the dragon nation flag fears of witnessing slow economic recovery in the key global player, which in turn weighs on the AUD/USD price due to Australia’s ties with China.
Above all, the US Dollar’s ability to remain firmer for the second consecutive day, despite witnessing downbeat US housing data and concerns about Fed policy pivot keeps the AUD/USD bears hopeful.
Moving on, AUD/USD traders should pay attention to June employment clues and the People’s Bank of China (PBoC) Interest Rate Decision for clear directions. That said, the PBoC is expected to keep the rates unchanged while the anticipated easing in the headline Aussie Employment Change, as well as likely no change in the Unemployment Rate, may keep weighing on the Aussie pair amid a lack of optimism in the Asia-Pacific zone and firmer US Dollar.
Also read: Australian Employment Preview: Good news could be bad news for the RBA
Technical analysis
AUD/USD pair’s sustained downside break of horizontal support stretched from April 2023, around 0.6780, allows AUD/USD to aim for the 200-DMA support of around 0.6715.
- US housing data disappointed investors with June’s Housing Starts falling -8.0% MoM, despite May’s revised increase of 15.7%.
- New Zealand’s Q2 Consumer Price Index (CPI) dropped to 6.0% YoY from 6.7% following the Reserve Bank of New Zealand’s (RBNZ) decision to keep rates unchanged.
- NZD/USD initially increased following the inflation data release but later reversed as the Eurozone and UK also showed decelerating inflation, boosting the USD.
NZD/USD remains depressed as Thursday’s Asian session begins, following Wednesday’s fall of 0.15%, printing a new weekly low of 0.6225. Broad US Dollar (USD) strength, despite a high inflation report in New Zealand (NZ), was the main reason that weakened the NZD/USD pair, which is exchanging hands at 0.6262, down 0.01%.
NZD/USD records weekly low as broad USD strength outweighs New Zealand’s inflation report
A light economic docket in the US witnessed housing data’s release, as Housing Starts for June disappointed investors, falling -8.0% MoM, after a revised 15.7% May numbers. It should be said the housing market continues to recover despite 500 bps of Fed tightening. In the same tone, Building Permits slipped -3.7% MoM, well below May’s 5.6% growth.
In the meantime, the release of inflation data in NZ underpinned the NZD/USD, but later, the move was reversed. The Reserve Bank of New Zealand (RBNZ) keeping rates unchanged at the latest meeting is still lingering in the NZD/USD traders as inflation data revealed the Consumer Price Index (CPI) dropped from 6.7% YoY to 6.0% in the second quarter of 2023.
Given the fundamental backdrop, the NZD/USD initially printed a daily high, but as inflation data releases followed New Zealand’s path, with the Eurozone (EU) and the United Kingdom (UK) decelerating, bolstering the US Dollar (USD), sought by traders amidst uncertainty in the financial markets.
Although the greenback recovered ground, as portrayed by the US Dollar Index (DXY), climbing 0.36% at 100.288, US Treasury bond yields tumbled. After the July meeting, investors seem convinced that the US Federal Reserve would finish tightening monetary conditions, with most economists estimating the Federal Fund Rates (FFR) to peak at around 5.25%-5.50, while expectations for the first Fed rate cut are foreseen in the spring of 2024.
NZD/USD Price Analysis: Technical outlook
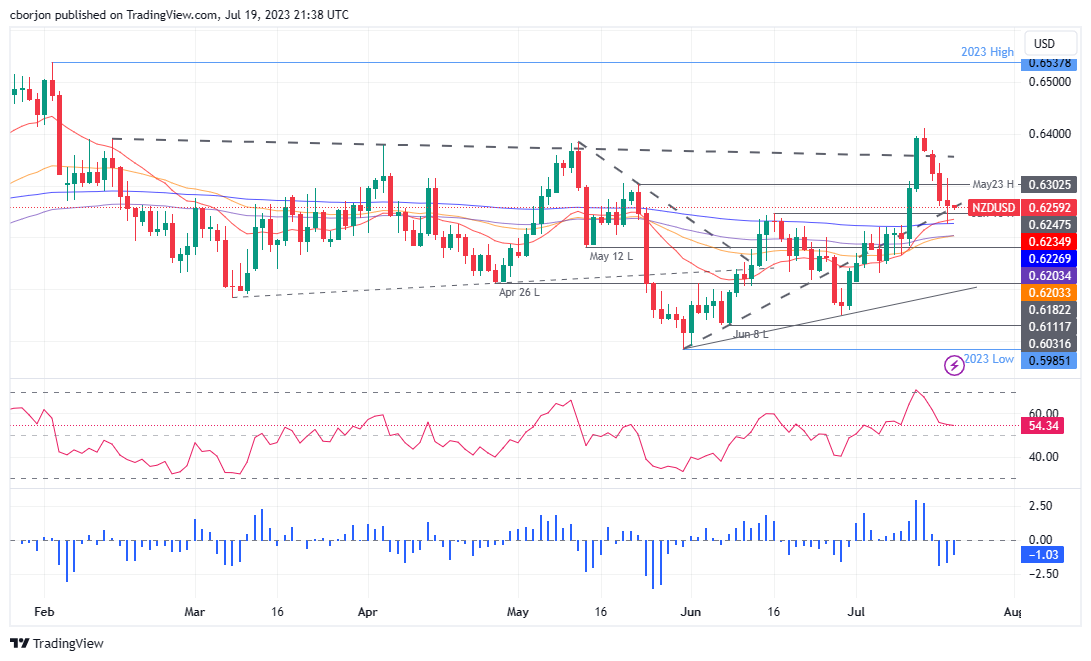
On Wednesday, the NZD/USD tumbled toward the confluence of the 20 and 200-day Exponential Moving Averages (EMAs) at 0.6235 and 0.6226. Still, buyers stepped in as the pair resumed its uptrend but failed to achieve a daily close above its opening price. Nevertheless, a large pin-bar candlestick could suggest the NZD/USD’s uptrend would resume, but buyers must reclaim key resistance levels on their way north. Firstly, the 0.6300 figure, followed by the July 19 daily high at 0.6314, which, once cleared, could open the door for an upside move toward the 00.6350, ahead of the 0.6400 mark. On the downside, the NZD/USD’s first support would be the 0.6250 psychological level before dropping to 0.6200.
Here is what you need to know for July 20:
During the Asian session, we have Australian labour market data and Japan’s trade balance for June are out.
The broader US session was governed by markets that reacted positively to the below consensus Consumer Price Index print in the UK, while awaiting a string of tech earnings due post-session.
UK Core CPI eased for the first time since January from 7.1% YoY to 6.9% YoY and service inflation fell from 7.4% YoY to 7.2% YoY. However, wage growth is accelerating which will make the Bank of England’s (BoE) job of getting inflation down more difficult. Nevertheless, both the core and headline measures came in below expectation and markets pared back expectations the BoE will hike 50bp next month. Consequently, GBP/USD continued its decline and dropped from a high 1.3041 to a low of 1.2867.
This gave the US Dollar a lift. The US Dollar index, DXY, printed a high of 100.535 and from a low of 99.925. Also, the weakness in the yen Wednesday was positive for the US Dollar.
USD/JPY on Wednesday rose by +0.62%. The yen was under pressure Wednesday after Bank of Japan's Governor Ueda suggested that there will be a continuation of the BOJ’s easy monetary policy until there is a shift in its assessment for achieving its inflation target. Stocks were higher which dented the allure of the Yen and its safe-haven demand.
As for the Euro, the DXY rally was a painful ride for stubborn bulls. An additional decline in the 10-year German bund yield to a 3-week low weakened the euro’s interest rate differentials and EUR/USD ended the day considerably lower touching a low of 1.1174.
Lower global government bond yields Wednesday were a bullish factor for precious metals, however, with Gold shining on at times in a volatile US session. However, the Yellow metal ended the day up high in the range and flat near $1,977 from within the balance of the low $1,969.81 and $1,9870.99. Meanwhile, there has been data that shows a fund liquidation of gold weighing on prices as holdings in gold ETFs fell to a 4-month low on Tuesday. Bitcoin is up $181.47 today or 0.61% to $29976.42 Crude oil and gasoline prices Wednesday settled mixed, giving up earlier gains.
Like this article? Help us with some feedback by answering this survey:
- The EUR/GBP cross peaked at a daily high of 0.8700 and then settled near 0.8660.
- UK’s headline CPI declined to 7.9% YoY, lower than expected.
- Lower British yields and dovish bets on the BoE made the GBP struggle to find demand on Wednesday.
The EUR/GBP set a fourth consecutive day of gains and rose to its highest level since late May but faced resistance at the 100-day Simple Moving Average (SMA) at 0.8700 and then retreated to 0.8657. As UK inflation figures came in lower than expected, the GBP trades with losses against most of its rivals on Wednesday, including the USD, EUR, JPY, CAD, etc.
Investors are confident that the BoE won’t be as aggressive as expected amid soft CPI
According to the Office for National Statistics, the Consumer Price Index (CPI) fell to 7.9% year on year in June, lower than the 8.2% predicted and the preceding 8.7%. The Core CPI fell to 6.9% and also fell short of the estimates of 7.1%.
As a result, UK shorter-term bond yields fell as much as 4% as markets bet on a dovish Bank of England's (BoE) . The probability of a 50 basis point (bps) raise at the next BoE meeting in August has dropped to roughly 45%, according to the World Interest Rates Probabilities (WIRP). Markets are discounting 55% odds of 25 bps increase in September, November, and February 2024, with the terminal rate peaking at 5.75%. In that sense, the expectations of lower rate hikes applied selling pressure on the Pound.
On the Euro’s side, all eyes are on next week’s European Central Bank’s (ECB) decision, where a 25 bps hike is already discounted, and investors will look for clues regarding the next steps. On Wednesday, Core Harmonized Consumer Price Index (HICP) was upwardly revised to 5.5% and continues to be near March’s peak of 5.7%. It may pressure the ECB to continue hiking, so Christine Lagarde’s outlook will be closely monitored.
EUR/GBP Levels to watch
The daily chart suggests that the short-term technical outlook is neutral to bullish. The neutral bias is that the bulls failed to consolidate above the 100-day SMA and trade below the 200-day SMA while the positive tilt is given by indicators gaining ground and standing in positive territory.
Resistance levels: 0.8700 (100-day SMA), 0.8726 (200-day SMA), 0.8750.
Support levels: 0.8640, 0.8600, 0.8580.
EUR/GBP Daily chart
-638253980395784811.png)
- EUR/USD bears are in the market and on the verge of a key lower time frame breakout.
- Daily chart correction could be significant with eyes on 1.1100 initially.
The US Dollar bounced on Wednesday as Fed funds futures traders continue to be pricing in 32 basis points of additional tightening and while inflation in the United Kingdom cooled more than economists expected in June. This has seen EUR/USD continue to correct lower as the following analysis shows:
EUR/USD daily charts
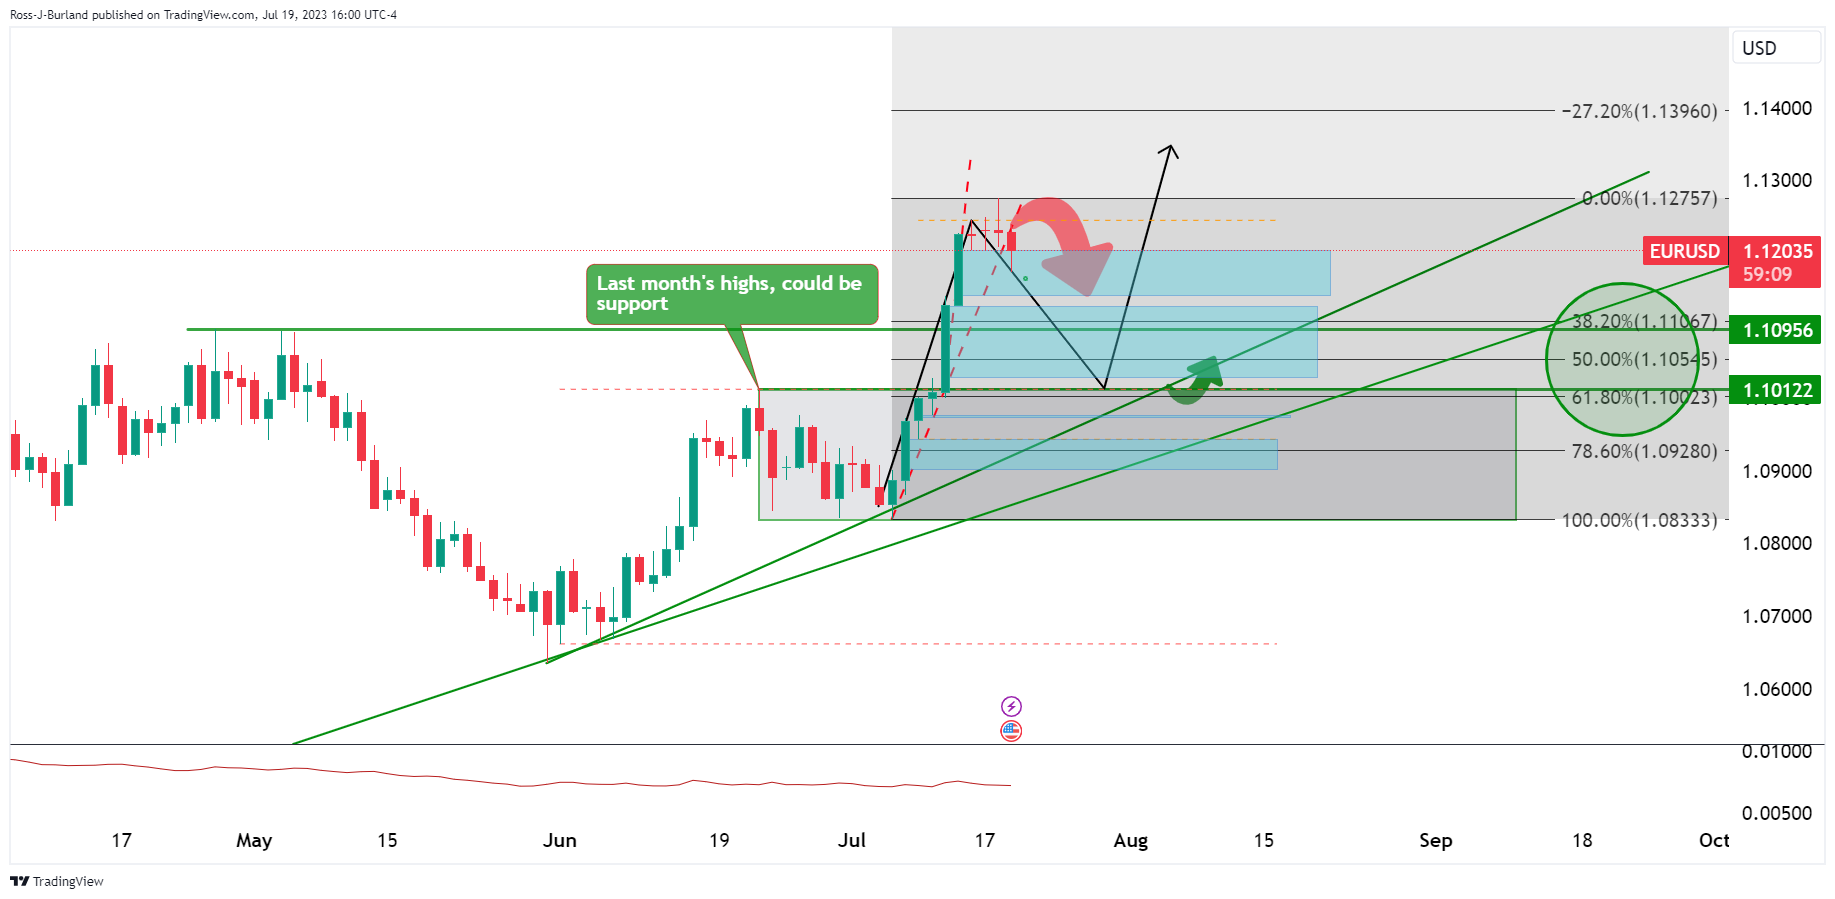
There is plenty of ways to go to the downside if the bears can stay in control. The blue areas are price imbalances in a strongly displaced market.
EUR/USD H4 charts

The price has broken 4-hour support structure so there is a bearish bias here as well.

The M-formation is a reversion pattern that has so far pulled the price back in towards the neckline.

We can see that the price has rallied to a 38.2% Fibonacci level. The question is how far does this correction have before the bears move back in to sell at premium levels?
EUR/USD H1 chart
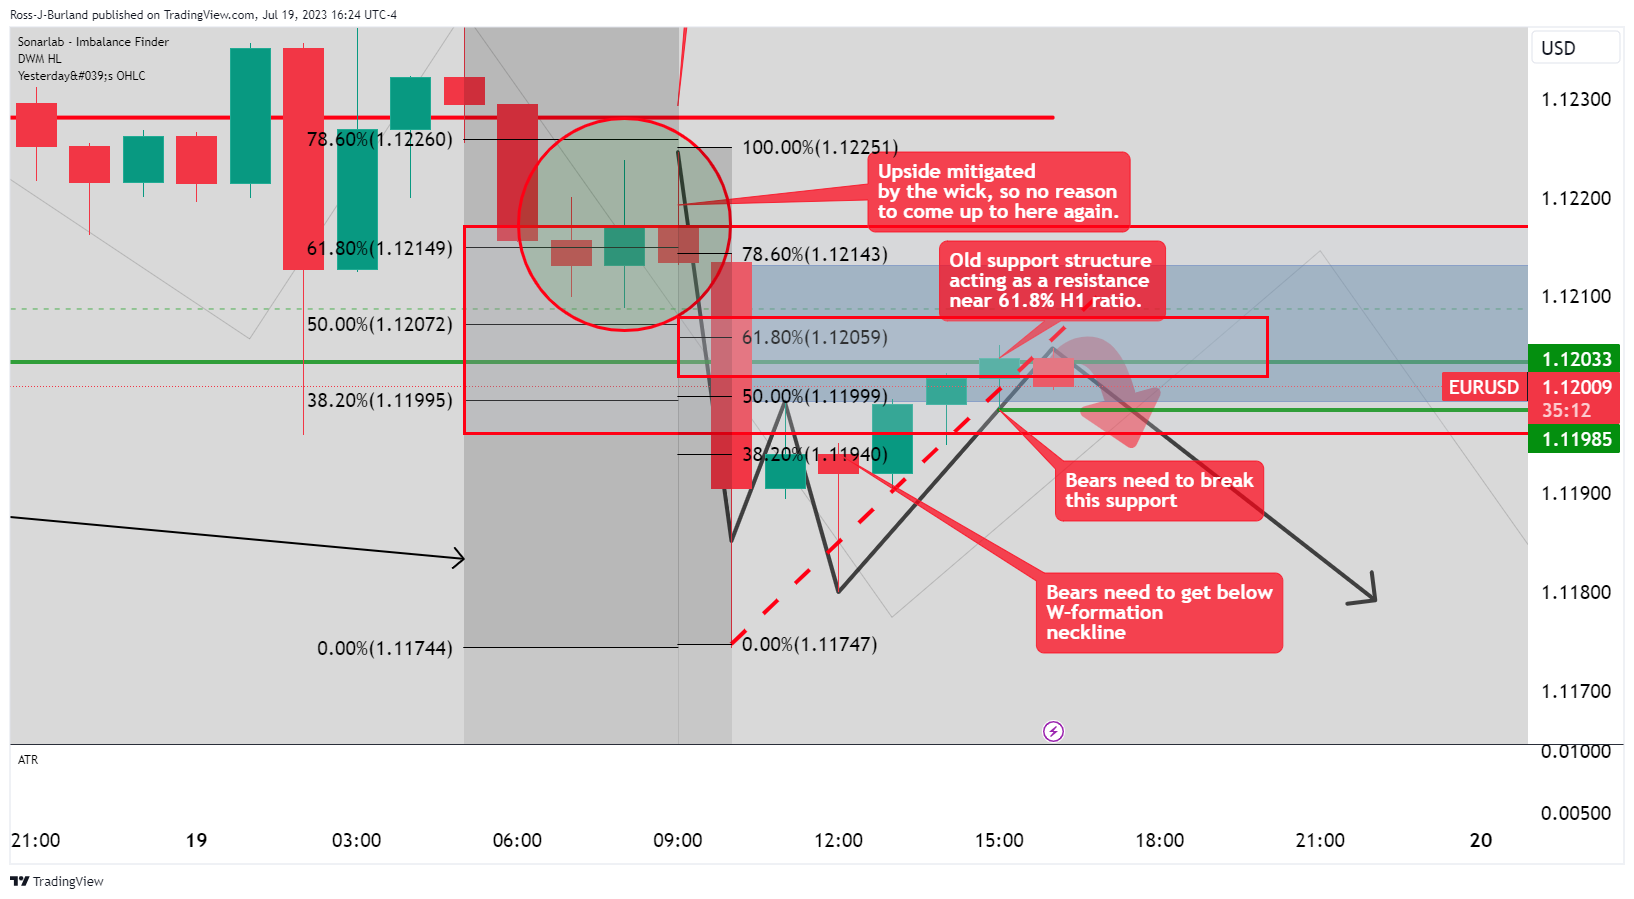
The hourly chart is key. A break of 1.12 could seal the deal for the bears whereby the W-formation's neckline will come under pressure.
- The GBP/JPY tallied its third daily loss in a row and slid to a daily low below 180.50.
- UK’s June CPI came in lower than expected.
- Governor Ueda hinted that the monetary policy will remain unchanged in the next meeting.
The GBP/JPY retreated to the 180.30 area and then settled around 181.60 on Wednesday as the GBP weakened agains most of its rivals following soft inflation figures from June. As markets are betting on a less aggressive Bank of England (BoE) the GBP lost interest.
The Office for National Statistics from the UK reported that the Consumer Price Index (CPI) declined to 7.9% YoY in June, lower than the 8.2% estimated and the previous 8.7%. The Core CPI dropped to 6.9%, failing to live up to the expectations of 7.1%. The Producer Price Index (PPI) also dropped but was above the market consensus at -2.7% vs the -1.6% expected.
As a reaction, UK bond yields plunged as the BoE’s tightening expectations decreased. According to the World Interest Rates Probabilities (WIRP), the odds of 50 basis points (bps) hike in the next BoE meeting in August fell near 45%. For the next meeting, hikes are priced in September, November, and in February 2024. Markets are betting on 55% odds of a final 25 bps, which would see the terminal rate peaking at 5.75% vs. 6.25% at the start of this week and 6.5% at the start of last week.
That being said, the 2-year British yield dropped to its lowest level since mid-June, around 4.85%, while the 5 and 10-year rates to 4.30% and 4.19%, respectively, with all three seeing more than 3.50% declines.
Governor Kazuo Ueda hinted there wouldn’t be a policy tweak of the Yield Control Curve amid recent speculations. He stated that inflation is well below their forecast and noted that unless that premise is “shifted” the whole story would remain unchanged. Following the comments, Japanese bond yields decreased as markets bet on a dovish BoJ making the JPY struggle to find demand.
Moreover, Thursday’s highlight will be Japan’s Trade Balance data which would give markets a better understanding of the Japanese economic situation. Exports are expected to have increased by 2.2% YoY in June, and Imports to have decreased by 11.3% YoY, resulting in a Trade Balance deficit of nearly ¥-46.7B.
GBP/JPY Levels to watch
The daily chart suggests that the technical outlook for the GBP/JPY remains bearish for the short term. Soft inflation figures from the UK made bears regains momentum and indicators took a big hit as the Relative Strength Index (RSI) points south but still positive territory, while the Moving Average Convergence Divergence (MACD) printed a higher red bar.
Support Levels: 181.00, 180.50, 179.00.
Resistance Levels: 182.25 (20-day SMA), 182.50, 183.00.
GBP/JPY Daily chart
-638253923823416924.png)
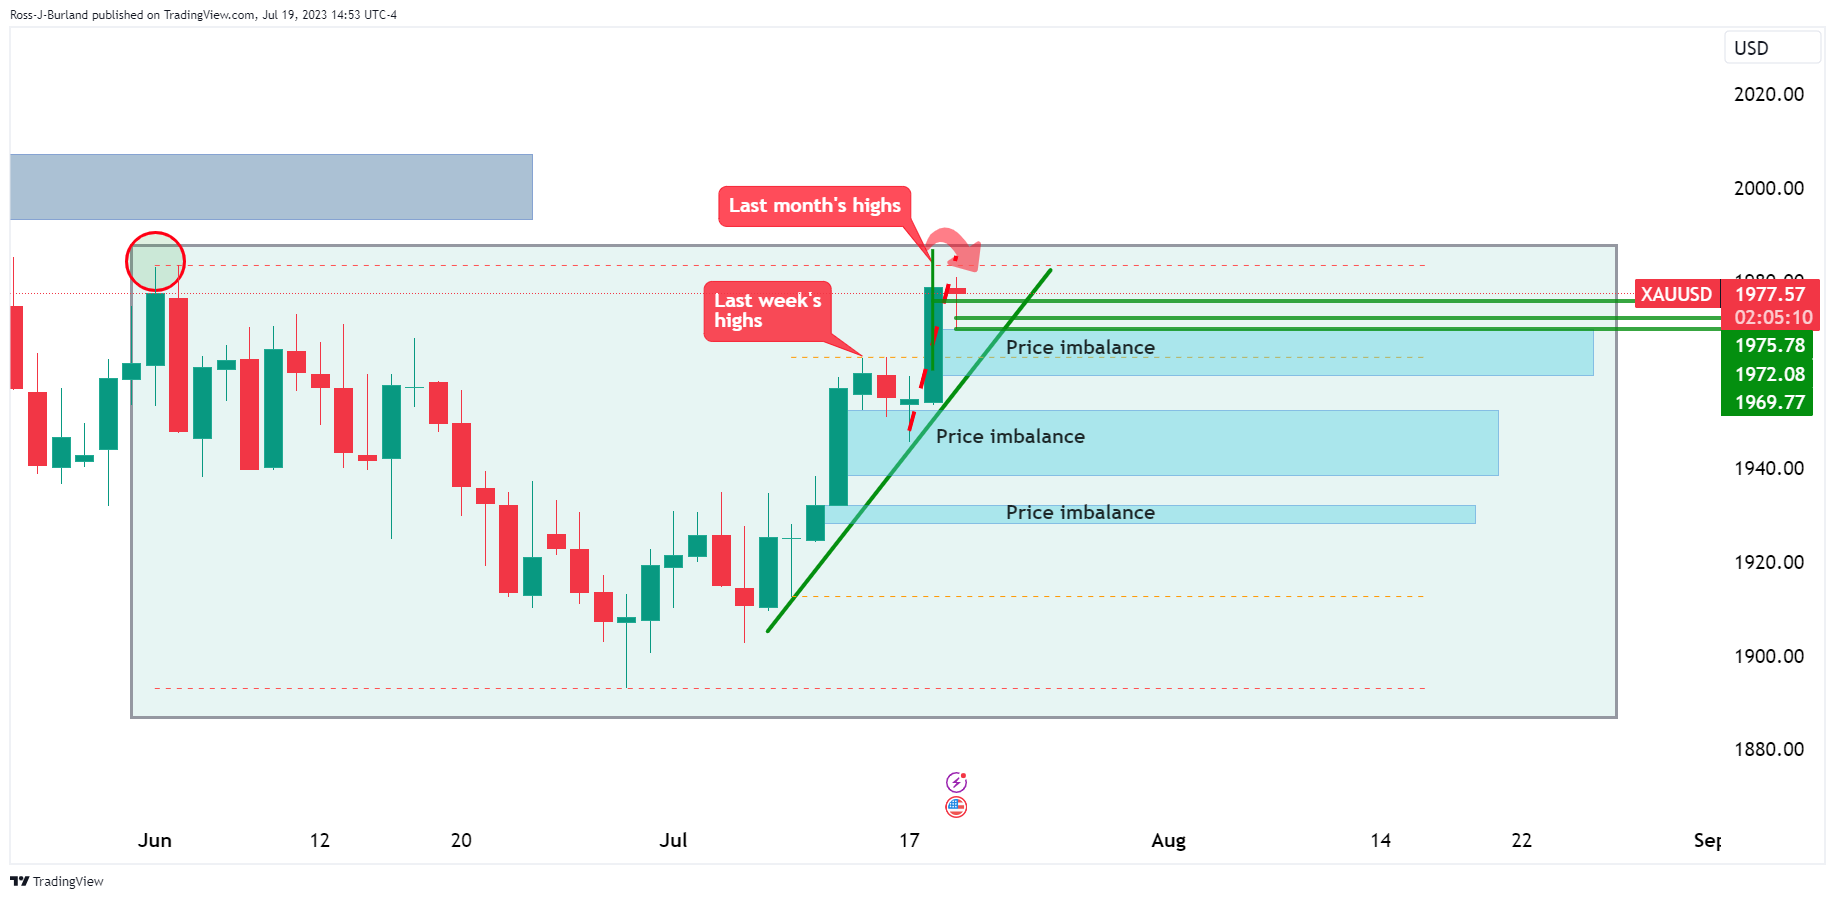
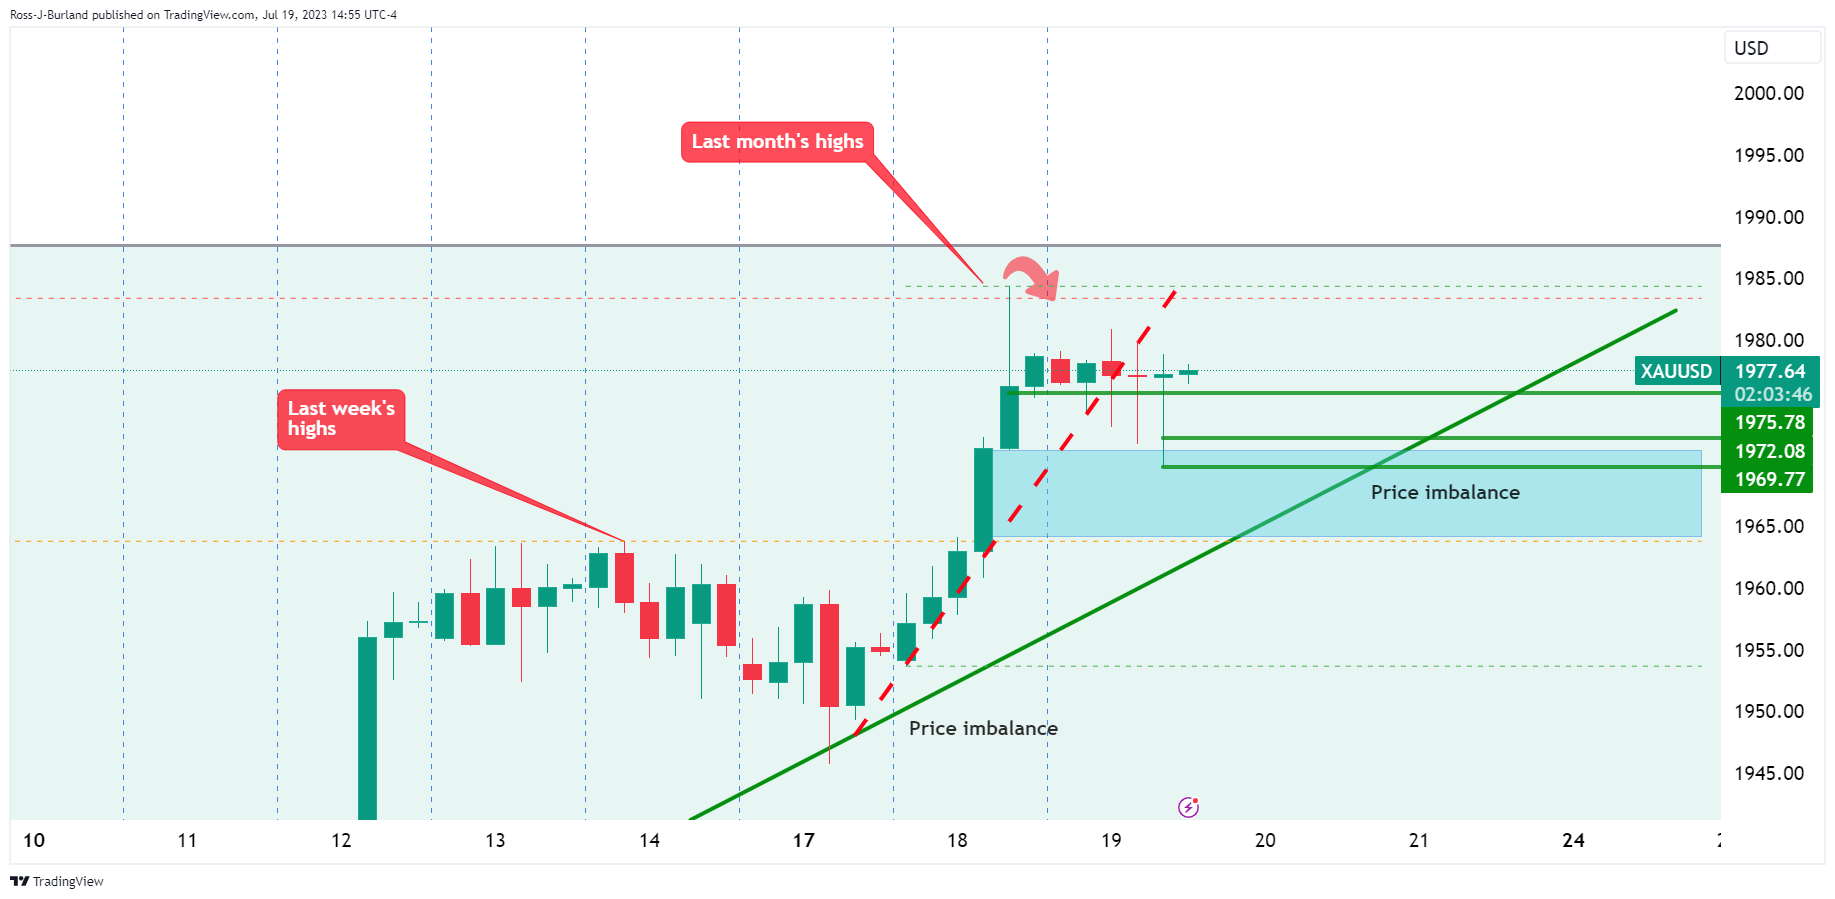
- Gold price is on the back foot as we head into key US events.
- Gold price is below the counter trendline and the prior day's closing price.
The Gold price has started to show signs of deceleration on the bid as we head towards the Federal Reserve meeting next week and ahead of US JOLTS. At the time of writing, Gold price is trading at $1,978.05 and has been stuck between a range of $1,969.77 and $1,980.89 on the day.
Data is crucial at this juncture and on Tuesday, Retail Sales re-ignited hopes that the US Federal Reserve may soon hit pause on its interest rate hiking cycle. As said, traders will also keep a tab on weekly jobless claims data due on Thursday. Employment growth has slowed modestly even as initial claims have increased. ''Overall, the labor market remains fairly strong and JOLTS job openings near 10 mln suggest firms are still having difficulty finding workers,'' analysts at Brown Brothers Harriman argued.
Ahead of the data and the Federal Reserve next week, the US Dollar climbed, making Gold prices more expensive for international buyers, with the DXY index last seen up 0.35 points to 100.27. Treasury yields have also narrowed, bullish for the Gold price since it offers no interest. The US two-year note was last seen paying 4.751%, down 1.3 basis points, while the yield on the 10-year note was down 4.3 basis points to 3.747%.
Investors could modestly add to upside flow north of $1,985 should jobs data continue to show weakness. Technically, the Gold price is lower and headed towards daily trendline support and last week's highs in a long squeeze:
Gold price technical analysis
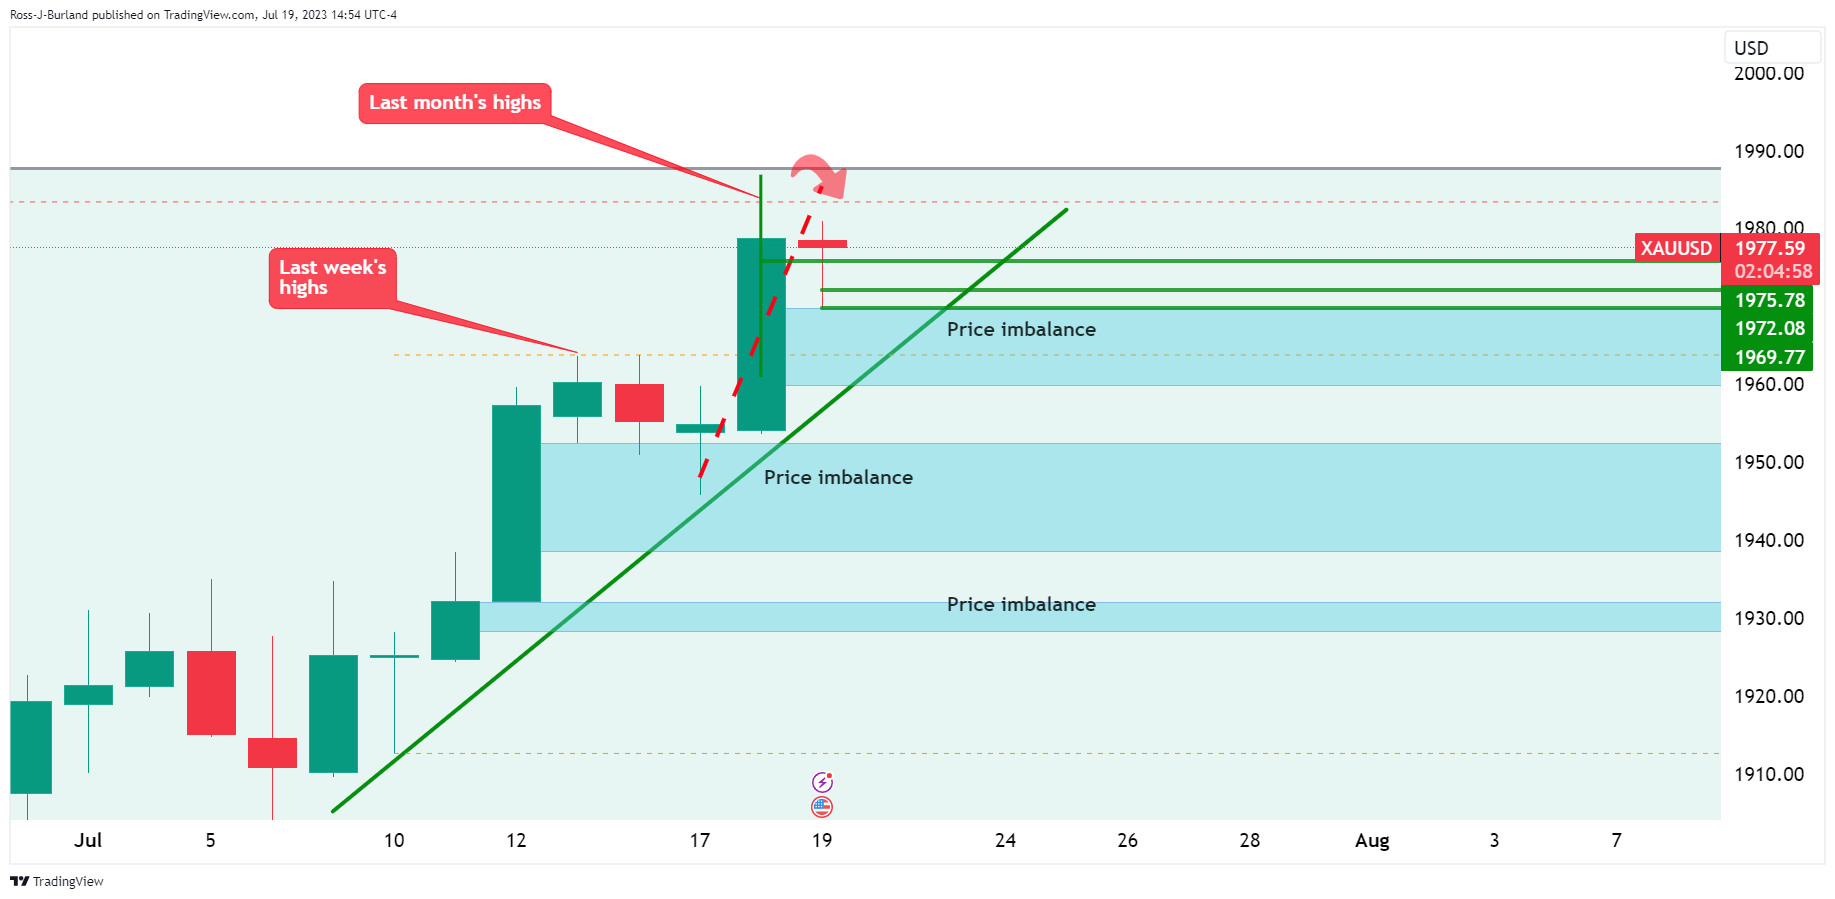
Those daily charts are showing the Gold price in deceleration and we wait to see if we get a bearish close for the day.
The 4-hour chart is showing the bulls putting up a fight.
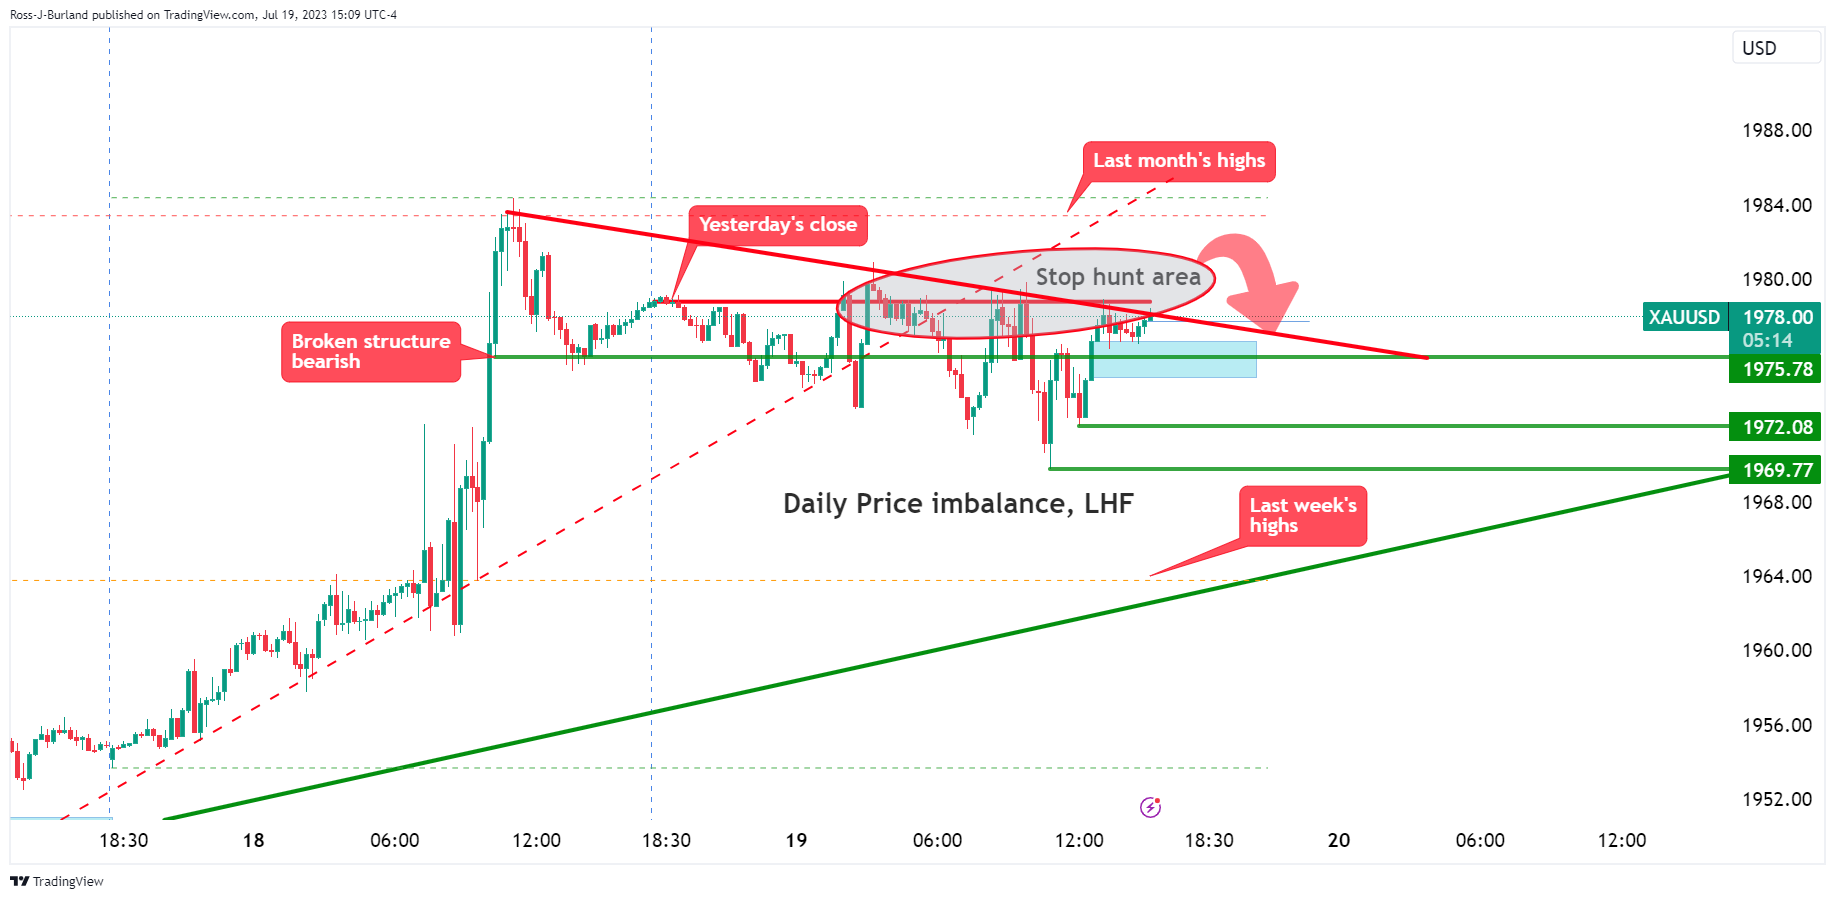
The 15-min chart shows that the bears are in control given the break of structure and staying below the prior day's closing price. However, there will be stops above and this could be food for the next move lower. For the time being, were are still front side of the bearish and counter-trendlines.
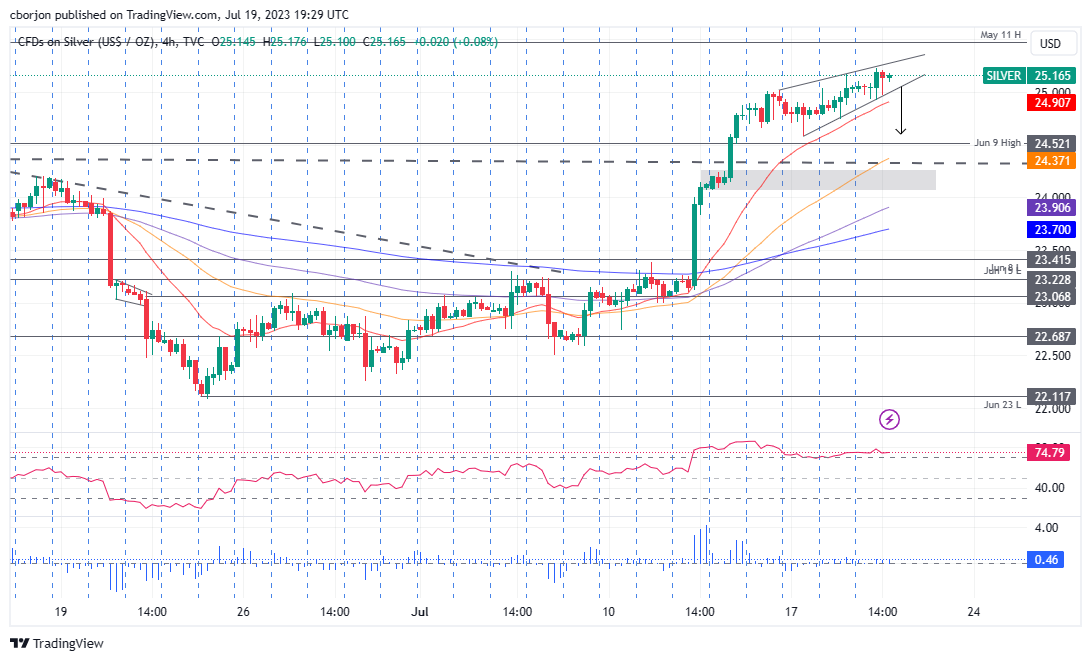
- Four days of steady upward momentum on the daily chart, with XAG/USD consolidating around the $24.50-$25.20 zone.
- The 4-hour chart signals a potential pullback, forming a rising wedge with the 20-EMA offering possible support at around $24.95.
- Resistance lies at the May 11 high of $25.47 and the May 10 high of $25.91. Should XAG/USD fall, support can be found at $25.00, $24.95 (20-EMA), and $24.52 (June 9 high).
Silver price achieves modest gains on Wednesday amid falling US Treasury bond yields despite overall US Dollar (USD) strength across the FX board. Soft US housing data, and yesterday’s mixed Retail Sales figures, boosted the USD. That said, the XAG/USD is trading at $25.14, above its opening price by 0.34%.
XAG/USD Price Analysis: Technical outlook
The XAG/USD daily chart portrays the white metal as upward biased, rising steadily during the last four days after the July 13 rally of almost 3%. Since then, the XAG/USD has remained at around the $24.50-$25.20 area, consolidating ahead of testing strong resistance at the May 11 daily high of $25.47, ahead of the XAG/USD’s reaching the year-to-date (YTD) high of $26.13.
From an intraday perspective, the XAG/USD 4-hour chart portrays the pair as upward biased but forming a rising wedge, which could pave the way for a pullback. Still, the presence of the 20-Exponential Moving Average (EMA) at around $24.95 tracks XAG/USD price action and might cap Silver’s fall, once it breaks out.
The XAG/USD first support would be the $25.00 figure. Once cleared, the next support would be the 20-EMA at $24.95, followed by the June 9 daily high at $24.52. A breakout below that level would expose a strong support area at around $24.00/25.
Conversely, if XAG/USD rallies past the top of the rising wedge, the following supply area would be the May 11 daily high at $25.47, followed by the May 10 high at $25.91.
XAG/USD Price Action – 4-Hour chart
- UK’s June CPI came in at 7.9% YoY, lower than the expected 8.2% and May’s 8.7%, hinting at easing price pressures.
- Expectations for a 50 bps rate hike by the BoE dropped to 45%, leading to a GBP/USD drop of more than 110 pips.
- US Department of Commerce data showed a MoM decrease of -8.0% in Housing Starts and -3.7% in Building Permits.
- Speculations suggest the US Federal Reserve may halt rate hikes after a predicted 25 bps hike in July, with the first cut expected in March 2024.
GBP/USD plunged after the release of inflation figures in the United Kingdom (UK), extending its losses during the North American session, briefly touching the 20-day EMA below the 1.2900 figure. Still, soft US economic data triggered a recovery above the latter. The GBP/USD trades at 1.2914, losses 0.93%.
UK inflation figures trigger a drop in GBP/USD, with losses extending to touch the 20-day EMA before a slight recovery spurred by weak US data
Key economic data revealed in the UK provided some relief for the Bank of England (BoE), which has been under a lot of pressure as it has failed to deliver price stability to British households. June’s inflation figures revealed that price pressures are easing, following the path dictated by the US economy. The Consumer Price Index (CPI) came in at 7.9% YoY, vs. 8.2% expected, well below May’s 8.7%, while core CPI rose by 7.3% YoY, below 7.9% in May.
Following the data, expectations for a 50 bps tightening by the BoE subsided, falling to 45%, after being priced in since Monday. The swaps market estimated 25 bps hikes in September, and November, with Bank Rates expected to peak at 5.75%-6.00%. Consequently, rates repricing in the UK sent the GBP/USD plummeting close to 1% or more than 110 pips.
Across the pond, not so meaning data in the United States (US) showed the housing market, although it’s recovering, slowed its pace, according to the latest data from the US Department of Commerce. Housing Starts experienced a -8.0% MoM decline, after an outstanding increase, in May of 21.7%, which marked the highest growth rate in 11 months. The number of housing starts decreased from 1.631 million to 1.434 million. Furthermore, Building Permits also dropped by -3.7% compared to the previous month, in contrast to May’s growth of 5.6%. The number of permits issued decreased from 1.496 million to 1.440 million.
In the meantime, speculators seem convinced that the US Federal Reserve (Fed) is almost done raising rates, as the CME FedWatch Tool shows odds for July’s 25 bps hike at 99%, but no more increases are expected. The first Fed cut is awaited in March 2024.
The GBP/USD might continue to trade with an upward bias, despite today’s weakness. With interest rates set in the UK to remain higher than in the US, further Pound Sterling (GBP) strength is expected if recessionary woes around the UK economy fade. If the UK falls into a recession, the greenback’s safe-haven status could weigh on the GBP/USD pair.
GBP/USD Price Analysis: Technical outlook
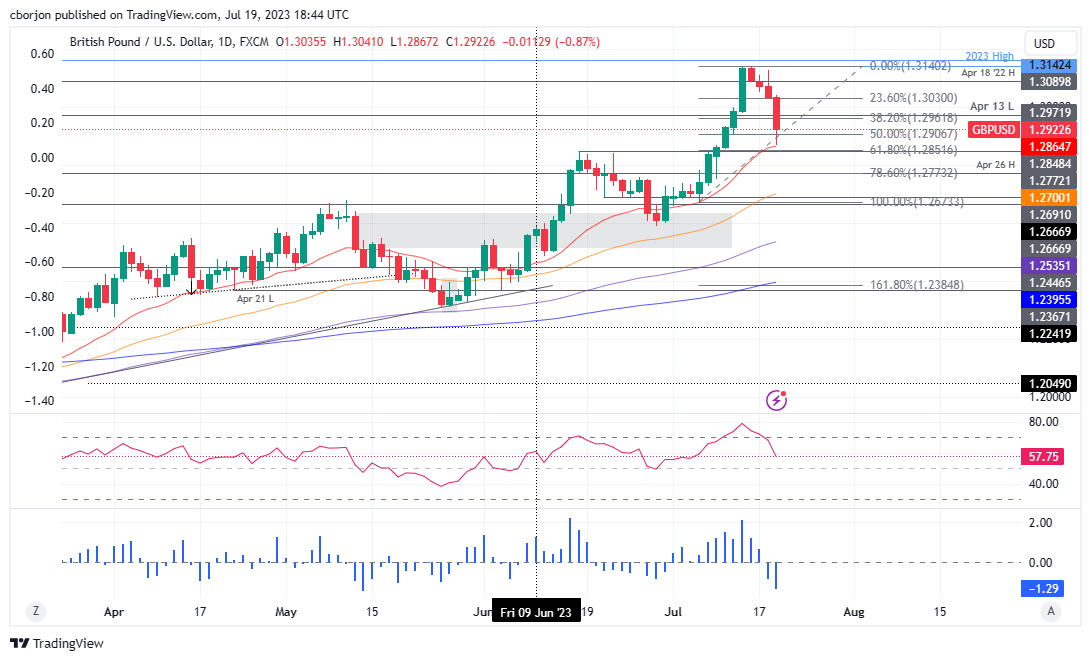
As written in a GBP/USD news article on July 17, I wrote that “The GBP/USD daily chart portrays the pair as upward biased but on an ongoing correction after hitting a year-to-date (YTD) high of 1.3142,” also added that once 1.2962 was breached, it “will expose the 50% Fibo retracement at 1.2906, followed by the confluence of the June 16 high and the 61.8% Fibo at around 1.2848/51.” Even though the scenario did not unfold exactly like that, the GBP/USD dipped to 1.2867 before the pair resumed upwards. Nevertheless, the GBP/USD bias has shifted less bullish in the short term unless buyers reclaim 1.3000. Otherwise, a GBP/USD extension below 1.2850 would expose the confluence of the 50-day EMA and the .2700 figure.
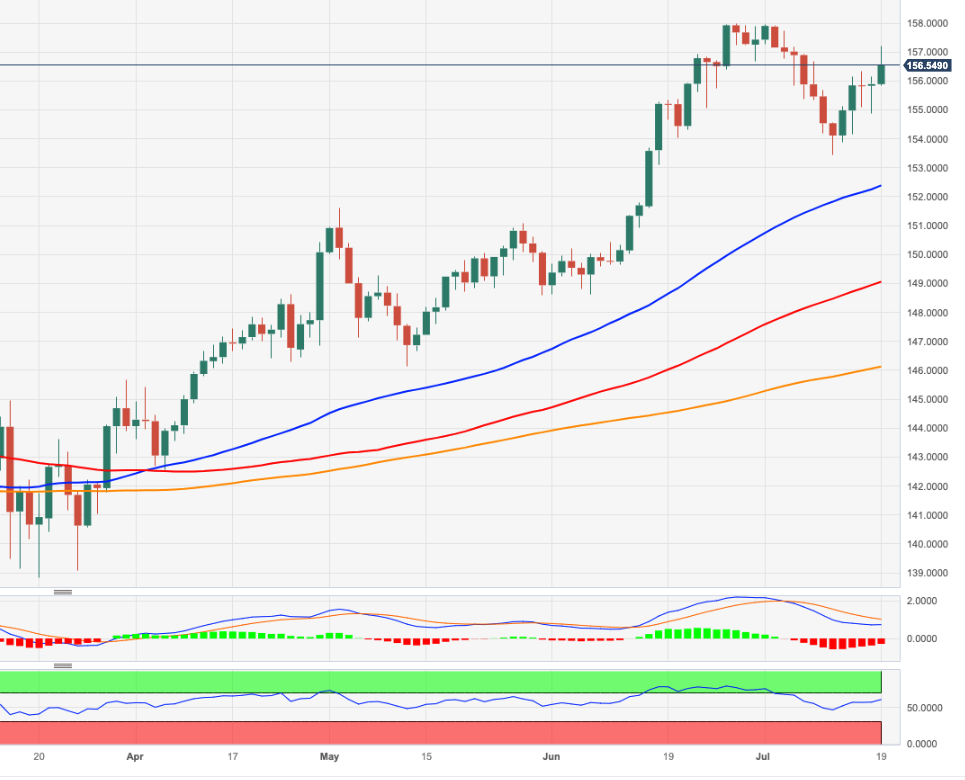
- EUR/JPY rose to a daily high of 157.20, its highest level in July.
- European’s Core inflation was revised higher to 5.5%.
- Governor Ueda put an end to the hopes of a YCC policy tweak.
On Wednesday, the EUR/JPY gained ground and rose above the 20-day Simple Moving Average (SMA) of 156.38 and then settled just below it. Monetary policy divergences between the European Central Bank (ECB) and the Bank of Japan (BoJ) weigh in the JPY, while mixed German yields may limit the EUR’s upside potential.
The Core Harmonized Index for Consumer Prices (HICP) from June was revised higher from 5.4% to 5.5% and shows that the Core inflation has yet to cool down as it still hovers around the 5.7% peak seen in March.
Regarding the European Central Bank (ECB) for next week’s meeting, markets have largely priced in a 25 basis points (bps) hike while the odds of a similar hike in September hover around 65%. That being said, German bond yields trade neutral, with the 2-year yield decreasing to 3.16% while the 5-year rate stands at 2.51% and the 10-year yield rose to 2.37%.
Governor Kazuo Ueda put an end to the speculations of a Yield Control Curve policy tweak, implying that he would maintain its policy steady in the next meeting. As inflation is far beyond the bank’s target, he argued, "Unless the premise is shifted, the whole story will remain unchanged.” Those comments caused Japanese yields to decrease, suggesting that markets continue to bet on a dovish stance by the BoJ.
For Thursday’s session, investors will eye Trade Balance data from Japan from June, where Exports are expected to have increased, Imports to have decreased but still have a Trade Balance deficit of nearly ¥-46.7B.
EUR/JPY Levels to watch
According to the daily chart, buying momentum is rising as the bears seem to have given up. The Relative Strength Index (RSI) points north in positive territory, while the Moving Average Convergence Divergence (MACD) prints lower red bars. In addition, the par now trades above the 20,100 and 200-day Simple Moving Averages (SMA), suggesting that the short-term outlook is bullish.
Resistance Levels: 156.38 (20-day Simple Moving Average), 157.00, 158.00
Support Levels: 156.00, 155.50, 155.00.
EUR/JPY Daily chart
-638253888191385668.png)
- WTI clears daily gains after peaking at a daily high of $76.83 near the 200-day SMA.
- EIA reported that US Crude Oil stocks decreased more than expected.
- Weak Housing data from the US support a less aggressive Fed.
On Wednesday, the West Texas Intermediate (WTI) price saw volatility and retreated to below $76.00 after peaking at $76.83. Oil prices had initially gained traction following weak Housing data from the US which strengthens the case of a less aggressive Federal Reserve (Fed) but the bulls failed to maintain their momentum.
Soft Housing Starts and Permits support a more dovish Fed
The US Census Bureau, part of the Department of Commerce, issued June soft Housing market data. Building Permits increased by 1.44 million, although it fell short of the predicted 1.49 million and was lower than the previous 1.496 million. Similarly, Housing Starts grew by 1.434 million but fell short of the 1.48 million predicted, slowing from the previous month's total of 1.559 million.
As mortgage rates rise when the Fed applies its contractive monetary policy, weak Housing data support the expectations that the Federal Open Market Committee (FOMC) won’t deliver a hike past July. In that sense, as higher rates cool down the economy and hence lowers Oil demand, the WTI gained traction.
Regarding US Oil inventories, the American Petroleum Institute (API) Crude Oil stocks decreased in the week ending on July 14. US Energy Information Administration (EIA) reported that the Crude Oil Stocks also decreased by 708,000 barrels and both figures show bigger declines than expectations.
WTI levels to watch
The daily chart suggests that the technical outlook for the short term of the WTI is neutral to bearish. The Relative Strength Index (RSI) stands flat in positive territory, while the Moving Average Convergence Divergence (MACD) prints decreasing green bars indicating that the bulls are struggling to gain momentum.
Support levels: $75.20, $74.00, $73.53(100-day SMA).
Resistance levels: $76.98 (200-day SMA), $78.00,$80.00.
WTI Daily chart
-638253841942521761.png)
- AUD/USD trades at 0.6762, down 0.70%, marking the fourth straight day of losses.
- US Department of Commerce data showed an MoM decline of -8.0% in Housing Starts, with Building Permits also falling by -3.7%.
- Market speculators expect the US Federal Reserve to halt rate hikes after a predicted 25 bps hike in July, with the first cut expected in March 2024.
AUD/USD extended its losses to four straight days, spurred by the pair’s failure to get traction and surpass 0.6900, exacerbating a correction, with sellers eyeing a test of the 200-day Exponential Moving Average (EMA) at 0.6751. Factors like a dovish tone of the latest Reserve Bank of Australia (RBA) minutes, and looming jobs data on the Aussie’s (AUD) side, keeps the AUD/USD from strengthening further. As of writing, the AUD/USD exchanges hands at 0.6762, down 0.70%.
AUD/USD falls under 0.6900, with sellers eyeing the 200-day EMA at 0.6751 amid a dovish RBA and looming jobs data.
Key US economic data revealed on Wednesday provided a lift on the greenback, which has been under heavy pressure. According to the latest data from the US Department of Commerce, Housing Starts experienced a -8.0% MoM decline. This decrease follows the prior month’s significant increase of 21.7%, which marked the highest growth rate in 11 months. The number of housing starts decreased from 1.631 million to 1.434 million. Furthermore, Building Permits also dropped by -3.7% compared to the previous month, in contrast to May’s growth of 5.6%. The number of permits issued decreased from 1.496 million to 1.440 million.
The AUD/USD reacted downwards on the data, pushing toward 0.6760 after the pair breached support at the S1 daily pivot at around 0.6790, extending its losses toward the daily low of 0.6750.
In the meantime, speculators seem convinced that the US Federal Reserve (Fed) is almost done raising rates, as the CME FedWatch Tool shows odds for July’s 25 bps hike at 99%, but no more increases are expected. The first Fed cut is awaited in March 2024.
Australia is scheduled to release its employment report for June on Thursday. Following a solid performance in May, where the economy added 75,900 jobs, the consensus forecast for June is more modest, at around 15,000 jobs being added. The unemployment rate is expected to remain stable at 3.6%. Resilience in the jobs market would keep the RBA pressured as it scrambles to tame inflation. The RBA stressed that it would be data-dependent, focused on inflation and jobs data, to attain its 2-3% inflation goal.
Given the backdrop, the AUD/USD would remain trading sideways amidst uncertainty around the US and Australian economic path, and it could seesaw around the 200-day EMA.
AUD/USD Price Analysis: Technical outlook
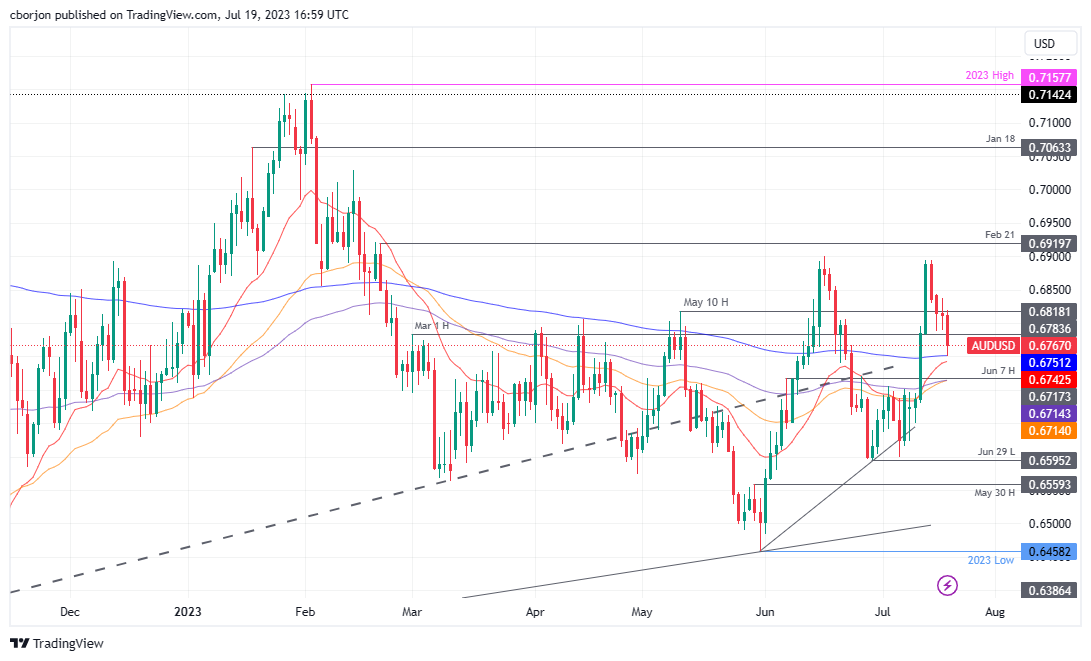
The AUD/USD daily chart portrays the pair as upward biased, but the recent fall towards the 200-day EMA puts the uptrend at risk, as a breach below that level could pave the way for consolidation. It means the AUD/USD would shift range-bound, with well-defined upside risks, at the YTD high of 0.6899. On the flip side, AUD/USD first support would emerge at 0.6717, the June 7 high, followed by the 0.67 figure.
Bank of England (BoE) Deputy Governor Dave Ramsden acknowledged that the Consumer Price Index (CPI) inflation has begun to fall significantly in the UK but noted that it was still "much too high," per Reuters.
Key takeaways
"If there is evidence of more persistent pressures, then further tightening in monetary policy would be required."
"Monetary policy decisions will address the risk of more persistent strength in domestic wage and price setting."
"I support a carefully considered increase in the pace of reduction in the stock of gilts in the twelve months ahead."
"I want QT to set a gradual and predictable pace for unwind and to let it operate in the background."
"QT is having only a limited impact on gilt yields."
Market reaction
These comments failed to help Pound Sterling find demand. As of writing, GBP/USD was down more than 1% on the day at 1.2895.
European Central Bank Governing Council member Yannis Stournaras told CGTN Europe on Wednesday that he wasn't sure whether the ECB would hike rates again after 25 bps increase next week, per Reuters.
"We might have one further move next week of 25 basis points, but I'm not sure that we're going to go further than that," Stournaras said and further explained:
"The argument that inflation is falling and we have found out that we are at the optimal point that further increases of interest rates might damage the economy."
Market reaction
EUR/USD stays under modest bearish pressure following these comments and was last seen losing 0.38% on the day at 1.1183.
- The USD/JPY tallied a fourth consecutive day of gains and trades near 139.80.
- Housing Permits and Starts from the US came in lower than expected in June.
- Governor Ueda hinted that the BoJ’s monetary policy would remain unchanged.
On Wednesday, the USD/JPY gained more than 0.60% and managed to jump near 139.80 amid JPY’s weakness. In that sense, dovish comments from Bank of Japan’s Governor Kazuo Ueda make the Yen lose interest. At the same time, the USD’s upside potential is limited by the release of weak Housing data and dovish bets on the Federal Reserve (Fed).
Investors assess Housing data from the US. Eyes on Japanese Trade Balance figures
The US Census Bureau at the Department of Commerce released soft Housing market data from June. The Building Permits rose 1.44M but failed to live up to the expected 1.49M and came in lower than the previous 1.496M. Similarly, Housing Starts increased by 1.434M but below the 1.48M expected decelerating from the previous monthly figure of 1.559M.
As a reaction, due to the Housing market showing signs of weakness due to higher rates imposed by the Federal Reserve (Fed), investors now have more reasons to bet on a less aggressive monetary policy. For the next July 26 meeting a 25 basis point (bps) hike is almost priced in but investors are confident that the Fed won’t hike in the rest of 2023.
That said, the US Treasury yields are decreasing across the board. The 2-year stands at 4.77%, the 5-year rate at 4.00%, and the 10-year yield retreated to 3.77%, making the USD lose interest.
On the Japanese side, Governor Kazuo Ueda put a stop to rumors about a Yield Control Curve policy change, signalling that he would keep the policy unchanged in the next meeting. Because inflation is beyond the bank's target, he stated, "Unless the premise is shifted, the whole story will remain unchanged." These remarks caused Japanese rates to fall, indicating that markets expect the BoJ to take a dovish position.
USD/JPY Levels to watch
The daily chart indicates a diminishing bearish momentum and a shift in favour of the bulls. The Relative Strength Index (RSI) is currently below its midline but exhibiting a positive slope, and the Moving Average Convergence Divergence (MACD) shows decreasing red bars, which suggests a strengthening bullish momentum.
In the broader context, the currency pair trades below the 20-day Simple Moving Average (SMA) but above the 100 and 200-day SMAs, implying that the overall outlook favours the USD.
Resistance levels: 140.35, 141.00, 142.10 (20-day SMA).
Support levels: 138.40, 137.80, 137.00 (100 and 200-day SMA convergence).
-638253800391731203.png)
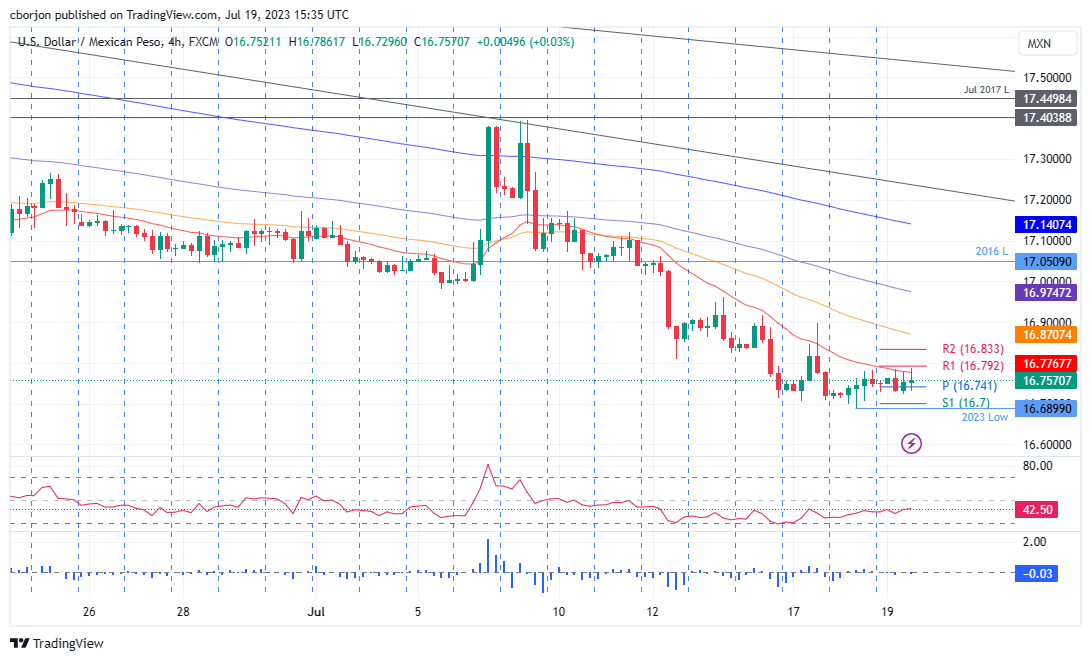
- USD/MXN pair is riding on the uptick from Tuesday after June’s Retail Sales data revealed a moderate rise of 0.2% MoM.
- The US Department of Commerce revealed an -8.0% MoM drop in Housing Starts, a significant decrease from the previous month’s 21.7% increase.
- Building Permits also dropped by -3.7% MoM, compared to a 5.6% increase in May.
USD/MXN bounces from weekly lows but is still under pressure exchanging hands below the 17.00 figure for the fifth consecutive day. Soft housing data in the United States (US) and the absence of economic data releases in Mexico keep the USD/MXN pair trading within familiar levels. The USD/MXN is trading at 16.7770 after hitting a daily low of 16.7232.
USD/MXN trades below 17.00 for five days in a row due to interest rate differentials
Latest data revealed by the US Department of Commerce shows that Housing Starts plummeted -8.0% MoM, below the prior’s month 21.7% increase, which was the highest pace in 11 months. Housing starts decelerated from 1.631M to 1.434M. Building Permits dropped -3.7% MoM, vs. May 5.6%, as permits dropped from 1.496M to 1.440M.
USD/MXN traders did not react to that data, as they continue to ride the uptick of Tuesday after June’s Retail Sales data. Figures revealed yesterday showed sales rose moderately by 0.2% MoM, lower than May upward revised figures at 0.5%. Even though it’s a downtick compared to May’s report, it showed consumer spending resilience despite the 500 basis points (bps) of tightening by the US Federal Reserve (Fed).
Regarding the Fed, expectations for a 25-bps rate hike in July are priced in, as shown by the CME FedWatch Tool. However, speculators seem confident that the Fed would not raise rates past the July meeting, and expectations for the first rate cut eyed by March 2024.
That has underpinned the greenback, as the US Dollar Index (DXY) shows. The DXY, which measures the performance of the US Dollar vs. a basket of six currencies, edges up 0.43%, up at 100.352.
Given the fundamental backdrop, with the US Federal Reserve expected to lift rates and pause while the Bank of Mexico has maintained rates unchanged at 11.25%, the USD/MXN could continue to trade sideways. Nevertheless, USD/MXN traders must be aware that expectations for Banxico’s first rate cut loom towards the end of 2023, which could pave the way for a recovery of the pair.
USD/MXN Price Analysis: Technical outlook
The USD/MXN daily chart portrays the pair as downward biased, with the first resistance level that could trigger a shift to a neutral bias at around the 17.0000 figure, as the 20-day Exponential Moving Average (EMA) sits at 16.9847. Otherwise, the USD/MXN would continue to slide, on its way to the October 2015 low of 16.3267. From an intraday perspective, the 4-hour chart suggests the Mexican Peso (MXN) is weakening toward the R1 daily pivot point at 16.7927, which, once breached, could expose the R2 pivot at 16.8339 past yesterday’s high of 16.7819. Immediate support lies at the YTD low of 16.6899.
Economists at Société Générale note two important things needed to propel EUR/USD into a 1.15-1.20 range.
The Euro needs more growth
US economists have continued to push up their forecasts for 2023 GDP growth, as has happened in the majority of G7 economies. The exception is the eurozone, where 2023 consensus growth has slipped marginally this month. It’s hard to see how the Euro can go on rising at the recent pace of growth expectations fall further.
A push to a 1.15-1.20 EUR/USD range probably requires two things – an improvement in expectations about Eurozone GDP growth and a stronger belief that the ECB will continue hiking rates after the Fed has finished.
The USD has been range bound and choppy for some time. Economists at HSBC now expect this to change.
Downtrend to resume
The end of the Fed’s hiking cycle is near, which will help to soften the USD.
For the USD to have a breakthrough, followed by renewed weakness, we believe a few other things are also needed: risk appetite holding up, less outperformance in US economic data versus the rest of the world, and a continued slowing of global inflation, in particular a decisive decline in US core inflation. Ideally, we have both the US economy moving to ‘soft landing’ and the rest of the world, especially China, seeing some positivity (versus expectations) in their growth outlook.
Should these conditions occur, the range-bound USD is set to end and its downtrend should resume, and this is our central case through the rest of this year and into 2024.
The Mexican Peso remains one of the top FX performers of the year and is only surpassed by the Colombian Peso. Economists at ING analyze MXN outlook.
Political calendar drifts into view
Investors like the high carry in Mexico, the well-run economy and the exposure to surprisingly strong US growth so far this year. Indeed, worker remittances back to Mexico hit a record $5.7bn high in May.
Banxico is promising an extended period of high rates (currently 11.25% policy rate), but will probably cut with the Fed in the first quarter of 2024.
Politics looks the only shadow over the strong peso story, with Mexican elections next June and US elections next November. For the time being, however, expect MXN to hold gains.
USD/MXN – 1M 17 3M 17 6M 17 12M 16.50
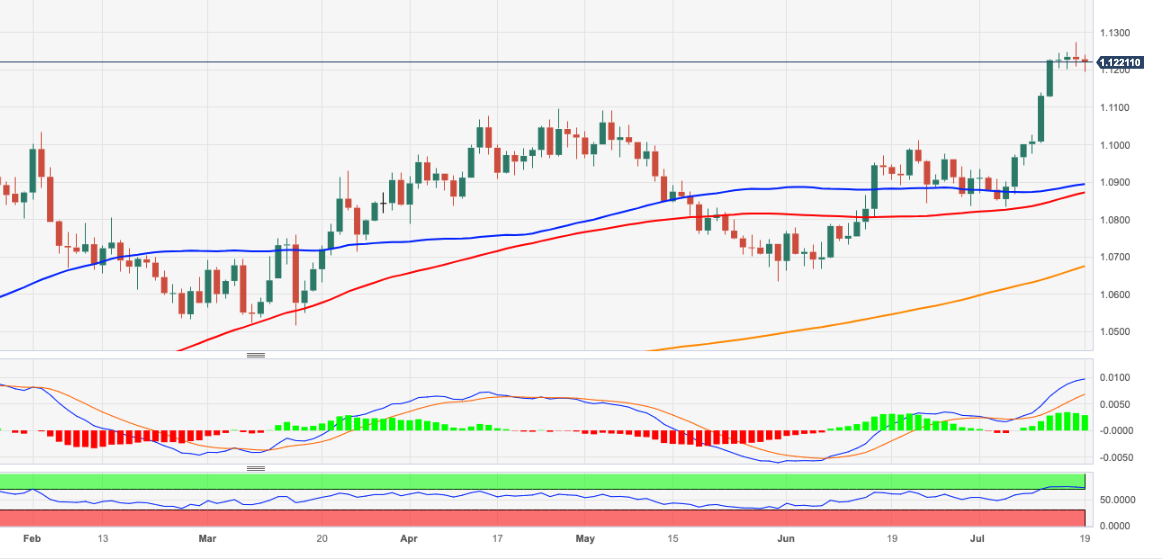
- EUR/USD faces some downside pressure near 1.1200.
- Still overbought condition could bolster further losses.
EUR/USD gives away further ground and confronts the key support at 1.1200 the figure on Wednesday.
While the continuation of the upside momentum appears favoured in the very near term, the pair’s current overbought conditions (as per the everyday RSI near 73) might spark a corrective knee-jerk.
Further north of the 2023 top at 1.1275 (July 18), the pair is expected to meet the next resistance level of note at the 2022 high of 1.1495 recorded on February 10.
Looking at the longer run, the positive view remains unchanged while above the 200-day SMA, today at 1.0673.
EUR/USD daily chart
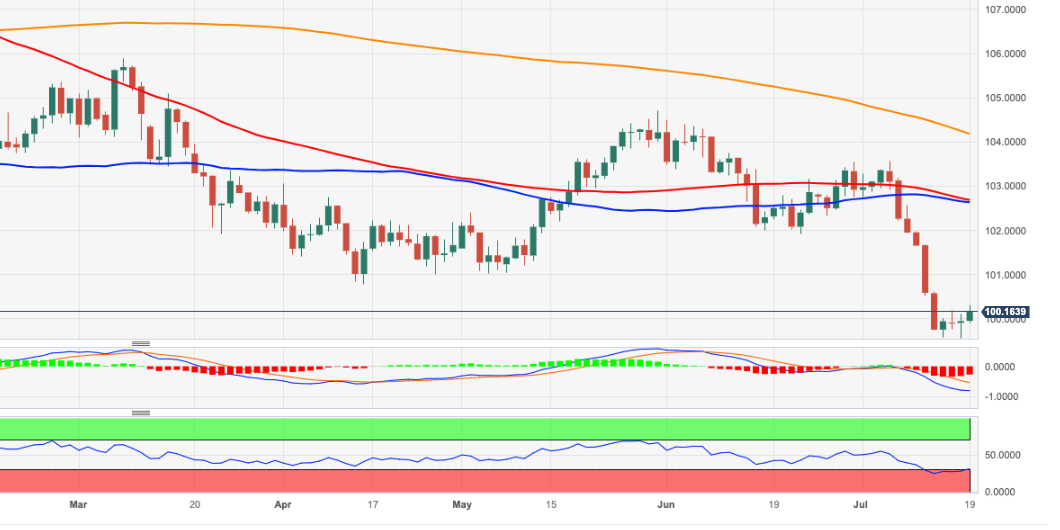
- DXY regains the area above the key 100.00 hurdle on Wednesday.
- Next on the upside comes the resistance band at 102.60/70.
DXY adds to Tuesday’s gains and surpasses the crucial 100.00 barrier on Wednesday.
A more serious bullish attempt in the index should clear the 102.60/70 band, where the provisional 55-day and 100-day SMAs converge.
If sellers regain the upper hand, the breach of the current 2023 low at 99.57 (July 14) could spark a deeper retracement to the weekly low of 97.68 (March 30 2022).
Looking at the broader picture, while below the 200-day SMA at 104.17, the outlook for the index is expected to remain negative.
DXY daily chart
Economists at Société Générale analyze USD/CAD outlook following Canadian June CPI data.
Bank of Canada has yet to cool core inflation
Canadian CPI slowed to 2.8% in June, falling more than the 3% consensus. However, the two metrics of core inflation followed by the Bank of Canada have been slower to fall, currently averaging 3.8%, 1 percentage point above headline inflation, which is pressured by base effects and lower energy prices.
This could prompt further BoC tightening and cause the US/Canada rates differential to head south, leading to a gradual decline in USD/CAD.
- AUD/USD has found temporary support near 0.6750, however, the downside bias is still solid.
- In spite of inflation softening and loosening labor market conditions in the US, further policy tightening from the Fed cannot be ruled out.
- The Australian Dollar is expected to deliver uncertain moves ahead of the Employment data for June.
The AUD/USD pair has gauged an intermediate support around 0.6750 in the late European session. The downside bias in the Aussie asset is still solid as the US Dollar Index (DXY) has posted a decent recovery move after a week of intense sell-off.
S&P500 futures have turned choppy portraying a quiet market mood. The overall market mood is still bullish as the odds of only one more interest rate hike from the Federal Reserve (Fed) are solid. Investors are hoping that the Fed will reach the interest rate peak sooner as inflationary pressures in the United States are on softening spree.
The US Dollar Index is gathering strength for extending upside above the immediate resistance of 100.30. In spite of inflation softening and loosening labor market conditions, further policy tightening from the Fed cannot be ruled out as inflation is still far from the desired rate. Also, core inflation is extremely stubborn as the cost of services has not shown signs of easing yet. Contrary to the US Dollar Index, 10-year US Treasury yields have dropped to near 3.75%.
Meanwhile, the Australian Dollar is expected to deliver uncertain moves ahead of the Employment data for June. As per the estimates, fresh payroll additions were 15K vs. the former release of 75.9K. The Unemployment Rate is seen unchanged at 3.6%. Tight labor market conditions might force the Reserve Bank of Australia (RBA) to raise interest rates in August.
RBA Governor Philip Lowe kept policy rates unchanged in July monetary policy meeting but kept doors open for further policy tightening as inflation is at 5.6% almost thrice the required rate of 2%.
Apart from Australia’s labor market data, THE interest rate decision by the People’s Bank of China (PBoC) will be in focus. The PBoC is expected to remain dovish as the Chinese economy is going through some turbulent times. China’s economic outlook is faltering as households' demand is extremely weak.
It is worth noting that Australia is the leading trading partner of China and dovish PBoC policy would support the Australian Dollar.
- EUR/JPY breaks above the range bound theme seen earlier in the week.
- Extra upside continues to target the YTD peak around 158.00.
EUR/JPY leaves behind the recent inconclusive price action and bounces markedly to the area beyond the 157.00 hurdle on Wednesday.
In the meantime, the cross keeps the recovery mode in place and the continuation of the uptrend carries the potential to challenge the so far 2023 peak in the boundaries of 158.00 the figure (June 29).
So far, the longer term positive outlook for the cross appears favoured while above the 200-day SMA, today at 146.10.
EUR/JPY daily chart
Economists at Commerzbank analyze EUR outlook.
Please don’t forget the Euro
As soon as hawks begin starting to coo like doves we should listen intently. It, therefore, pays to seriously think about the time after next week’s ECB rate decision, for which a 25 bps rate hike has been priced in.
The market still sees the possibility of the deposit rate rising above 3.75% whereas our experts are of the view that the last step will occur in July.
Despite all the shock and licking of wounds following the slide of the Dollar please also keep an eye on the Euro, as it might well stop soaring very soon.
- Housing Starts and Building Permits declined sharply in June.
- US Dollar Index stays in positive territory above 100.00.
The monthly data published by the US Census Bureau revealed on Wednesday that Housing Starts declined 8% on a monthly basis in June, following the 15.7% increase (revised from +21.7%) recorded in May. This reading came in much worse than the market expectation for a growth of 7.2%.
In the same period, Building Permits fell 3.7%, down sharply from May's 5.6% increase.
Market reaction
The US Dollar Index showed no immediate reaction to these figures and was last seen rising 0.3% on the day at 100.22.
USD edged off its lows Tuesday and the US Dollar Index (DXY) is trading above 100. Shaun Osborne, Chief FX Strategist at Scotiabank, analyzes Greenback’s outlook.
USD gains are modest and still look corrective in nature
USD gains are modest and still look corrective in nature after the USD’s sharp slide last week.
DXY gains may extend to retest the 101 area (former support, now resistance) but I still see broader risks for the USD tilted to the downside.
See: Room for some marginal Dollar recovery – ING
USD/CAD is trading in a tight range just under 1.32. Economists at Scotiabank analyze the pair’s outlook.
Technical momentum remains bearishly oriented for the USD
A lower close for the USD on the session on Tuesday may be tilting the short-term technical pointers back in the CAD’s favour – slightly. Stalling USD gains through the low 1.32 zone underscore the limited USD advance after Friday’s sharp rally.
Technical momentum remains bearishly oriented for the USD and is making additional progress hard to come by. It remains to be seen if the CAD can strengthen against the USD though; more likely perhaps is a bit more sideways trading between 1.3125/1.3225 for now.
- US Dollar gathers strength against its major rivals midweek.
- US Dollar Index stays in positive territory above 100.00 heading into the American session.
- US housing data will be watched closely by market participants on Wednesday.
The US Dollar (USD) started to outperform its rivals on Wednesday in the US Dollar Index (DXY), which tracks the USD's valuation against a basket of six major currencies, holding in positive territory above 100.00 ahead of the American session.
The USD managed to capture capital outflows out of Pound Sterling early Wednesday after data from the UK showed that inflation softened at a faster pace than expected in June. Moreover, the sharp upsurge seen in the USD/JPY pair following Bank of Japan (BoJ) Governor Kazuo Ueda's dovish comments highlights strengthening demand for the USD.
The US economic docket will feature Housing Starts and Building Permits data for June. Conditions in the US housing market have been improving consistently on hopes of the US Federal Reserve (Fed) is closing in on the end of its tightening cycle.
Daily digest market movers: US Dollar shows signs of life
- Retail Sales in the US rose 0.2% in June to $689.5 billion, the US Census Bureau reported on Tuesday. The 0.3% increase recorded in May had been forecast to reach 0.5%, but the data came in far below. Retail Sales Ex-Autos increased 0.2% in the same period, coming in slightly below the market expectation of 0.3%.
- Industrial Production in the US contracted 0.5% for the second straight month in June, the US Federal Reserve's monthly publication revealed on Tuesday.
- The annual Consumer Price Index in the UK rose 7.9% in June, down sharply from the 8.7% increase recorded in May. Following the inflation data, markets are leaning toward a 25-basis-point rate hike by the Bank of England (BoE) in August.
- While speaking at the G20 meeting in India on Tuesday, BoJ Governor Ueda said that there was still some distance to sustainably achieve the 2% inflation target. "Unless our assumption on need to sustainably achieve 2% target changes, our narrative on monetary policy won't change," Ueda said, causing the Japanese Yen to lose interest.
- Wall Street's main indexes closed in positive territory on Tuesday. US stock index futures trade modestly higher on the day as investors await earnings figures from big tech firms.
- The benchmark 10-year US Treasury bond yield stays on the back foot below 3.8% on Wednesday.
- China's real Gross Domestic Product (GDP) expanded 6.3% in the second quarter on an annualized basis, according to data released by China's National Bureau of Statistics (NBS) early Monday. This reading followed the 4.5% growth recorded in the first quarter but came in below the market expectation of 7.3%. Citigroup lowered its full-year growth forecast for China to 5% from 5.5%.
- US Treasury Secretary Janet Yellen told Bloomberg on Monday that there is a good chance that the Biden administration will go ahead with outbound investment controls on China.
- The US Dollar weakened significantly last week as soft inflation data from the US revived expectations about the Federal Reserve reaching the terminal rate with a 25-basis-point (bps) rate hike in July.
- The Consumer Price Index (CPI) in the US rose 3% on a yearly basis in June, following the 4% increase recorded in May. The annual Producer Price Index (PPI) edged 0.1% higher in the same period.
- Commenting on the USD's outlook: "In case of an increasingly rapid fall in inflation and weakening economic data, the market might increasingly rely on key rates not remaining at high levels for a long time, whereas rate cuts before the end of the year are becoming increasingly likely," said Antje Praefcke, FX Analyst at Commerzbank. "That would cause the USD to ease further."
- The University of Michigan reported on Friday that the Consumer Sentiment Index improved to 72.6 in July's flash estimate from 64.4 in June.
- Markets are nearly fully pricing in a 25 bps Fed rate increase in July. The probability of one more rate hike in December stands at around 20%, according to the CME Group's FedWatch Tool.
Technical analysis: US Dollar Index looks to extend correction
The Relative Strength Index (RSI) indicator on the daily chart rose above 30 on Wednesday, suggesting that the US Dollar Index (DXY) started to correct the oversold conditions. 101.00 (former support, static level) could be seen as the next recovery target ahead of 101.50 (static level) and 101.90 (20-day Simple Moving Average).
On the downside, critical support is located at 100.00 (psychological level). If DXY fails to make a daily close above that level, buyers could refrain from betting on a steady rebound. In that case, 99.20 (static level from March 2022) aligns as next support before 99.00 (psychological level) and 98.30 (200-week Simple Moving Average).
US Dollar FAQs
What is the US Dollar?
The US Dollar (USD) is the official currency of the United States of America, and the ‘de facto’ currency of a significant number of other countries where it is found in circulation alongside local notes. It is the most heavily traded currency in the world, accounting for over 88% of all global foreign exchange turnover, or an average of $6.6 trillion in transactions per day, according to data from 2022.
Following the second world war, the USD took over from the British Pound as the world’s reserve currency. For most of its history, the US Dollar was backed by Gold, until the Bretton Woods Agreement in 1971 when the Gold Standard went away.
How do the decisions of the Federal Reserve impact the US Dollar?
The most important single factor impacting on the value of the US Dollar is monetary policy, which is shaped by the Federal Reserve (Fed). The Fed has two mandates: to achieve price stability (control inflation) and foster full employment. Its primary tool to achieve these two goals is by adjusting interest rates.
When prices are rising too quickly and inflation is above the Fed’s 2% target, the Fed will raise rates, which helps the USD value. When inflation falls below 2% or the Unemployment Rate is too high, the Fed may lower interest rates, which weighs on the Greenback.
What is Quantitative Easing and how does it influence the US Dollar?
In extreme situations, the Federal Reserve can also print more Dollars and enact quantitative easing (QE). QE is the process by which the Fed substantially increases the flow of credit in a stuck financial system.
It is a non-standard policy measure used when credit has dried up because banks will not lend to each other (out of the fear of counterparty default). It is a last resort when simply lowering interest rates is unlikely to achieve the necessary result. It was the Fed’s weapon of choice to combat the credit crunch that occurred during the Great Financial Crisis in 2008. It involves the Fed printing more Dollars and using them to buy US government bonds predominantly from financial institutions. QE usually leads to a weaker US Dollar.
What is Quantitative Tightening and how does it influence the US Dollar?
Quantitative tightening (QT) is the reverse process whereby the Federal Reserve stops buying bonds from financial institutions and does not reinvest the principal from the bonds it holds maturing in new purchases. It is usually positive for the US Dollar.
EUR/USD losses steadied around the 1.12 level. Economists at Scotiabank analyze the pair’s outlook.
Price action is starting to lean a little more bearish
Flat trading over the past three sessions looks set to extend into Wednesday.
Daily open/close rates have coalesced around the 1.1225 point since Friday.
Spot remains supported on minor dips but can’t hold much of a bid above 1.1250.
Price action is starting to lean a little more bearish, with upward momentum stalling and a break under 1.1200 perhaps opening up the downside for a drop to 1.1125.
The renewed bounce in USD/JPY was in part triggered by comments from Governor Ueda at the G20 summit in India on Tuesday. Economists at MUFG Bank analyze the pair’s outlook.
Reduced speculation over a YCC change next week
Governor Ueda did acknowledge that market functioning has improved but we already know that and really the decision on changing YCC will at this juncture be more based on the fundamentals rather than the functioning of the markets, although future risks of dysfunctional markets could be part of the decision-making process.
The market reaction to the Ueda comments suggests reduce speculation over a YCC change next week although we would argue that the forecast update could still provide the justification and for the BoJ changing YCC when yields are not under upward pressure and threatening the 0.50% band limit is a more ideal time than the opposite.
CPI data on Friday will remain key and the data could prompt renewed speculation once more. But in a backdrop of improved risk appetite and soft-landing optimism, USD/JPY is understandably recovering some lost ground.
The Canadian inflation data for June published on Tuesday surprised in both directions. The Loonie eased a little following the publication. Economists at Commerzbank analyze CAD outlook.
Only the overall rate of inflation eased more significantly than expected
Whereas the overall rate eased more notably than expected to 2.8% thus reaching the BoC’s control area, the fall in the core rates median and trim remained below expectations.
As positive as it is that the overall rate has returned to levels below 3% the BoC is likely to still focus on the core measures. Tuesday’s data is unlikely to ease its concerns that inflation might be more stubborn than originally assumed.
The next meeting is not due until September. It will have received further inflation and labour market data by then. If the core inflation measures above all are not going to trend downwards in a more dynamic manner it is likely to take action.
With a view to a hawkish seeming BoC, we see further support for CAD on this front.
The UK has just released the June inflation data. Economists at MUFG Bank analyze the British Pound (GBP) outlook after the CPI report.
CPI data should help lean the BoE more toward 25 bps rather than 50 bps
We have a UK inflation print that has come in less than expected with the YoY rate falling from 8.7% to 7.9% – the market consensus was for a drop to 8.2%. Core inflation eased to 6.9% but had been expected to remain at 7.1%.
For BoE deliberations into the next policy meeting on 3rd August the CPI data should help lean the BoE more toward 25 bps rather than 50 bps.
We have argued that the UK rates curve was overdone in terms of tightening required and we maintain two further 25 bps rate hikes in August and September are likely before the tightening cycle ends. If our view is correct, that implies about 50-60 bps of excessive pricing which means market rates are likely to adjust lower over the period from now through to around the September meeting. The Pound is set to underperform for a period as this adjustment unfolds.
Economist at UOB Group Enrico Tanuwidjaja and Junior Economist Agus Santoso comment on the latest trade balance release in Indonesia.
Key Takeaways
Indonesia recorded a higher trade surplus due to a larger decline in imports. The latest trade surplus of USD3.5bn in Jun 2023 accelerated from USD0.4bn in May and came in higher than consensus expectation of USD1.4bn.
Oil and gas (OG) exports continued to fall by 18.6% y/y, larger than previous month and non-oil and gas (non-OG) exports fell by 21.4% y/y, reversing from previous month growth of 1.9% y/y.
OG imports contracted by 39.5% y/y, a drop sharply from May's contraction of 6.5%. Non-OG imports also contracted by 13.9% y/y in Jun, a sharp turnaround from May’s growth of 18.9% y/y, underpinned by a large drop in capital goods in the form of (E&E) and machinery product.
US Dollar Index edges higher above 100.00. Economists at ING analyze Greenback’s outlook.
Next week’s FOMC meeting could be the opportunity to recover some lost ground
Next week’s FOMC meeting could be the opportunity to recover some lost ground. We cannot exclude the possibility that markets will position ahead of the meeting by closing some freshly-built speculative Dollar shorts, which could help close the short-term USD undervaluation gap against the Euro.
Today, some housing data and MBA mortgage applications will be in focus and we still see room for some marginal Dollar recovery.
- Euro keeps the trade above 1.1200 against the US Dollar.
- Stocks in Europe opened on a positive foot on Wednesday.
- EUR/USD bounces off earlier lows in the sub-12.00 yardstick.
- Final EMU CPI rose 5.5% YoY in June, Core CPI rose 5.5% YoY.
- US housing data will take centre stage later in the session.
The Euro (EUR) manages to stage a recovery after initially dropping against the U.S. Dollar (USD), allowing EUR/USD to climb back above 1.1200 amid an overall risk-off market environment.
The strengthening dollar, as evidenced by the Dollar Index (DXY) retaking the 100.00 level to hit multi-day highs around 100.30, underpins the pair’s uptick.
This comes alongside falling US yields across the board and new lows for German bund yields, suggesting rising demand for safe havens.
Looking ahead, though the Fed is perceived as nearing the end of its tightening cycle, the broad view of another 25 bps hike in July could keep the dollar supported.
Meanwhile, a rate increase by the European Central Bank (ECB) later this month is widely anticipated, but ECB officials have sounded less hawkish recently on the prospects of additional hikes beyond summer, hinting more consensus may be needed for that.
Data-wise in the region, EMU final inflation data for June showed headline inflation at 5.5% YoY and core inflation at 5.5% YoY.
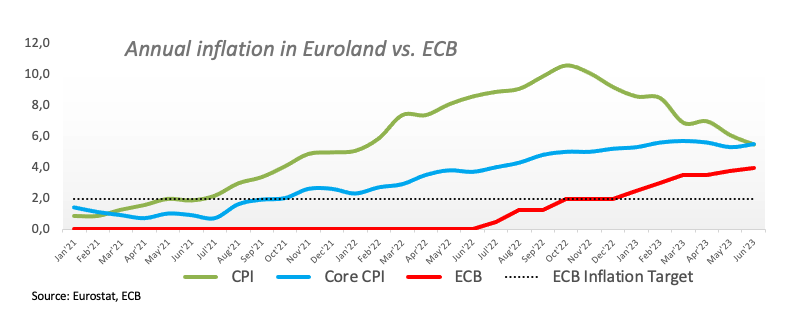
In the US, Mortgage Applications and Housing Starts/Building Permits will be in focus.
Daily digest market movers: Euro bounces off lows below 1.1200
- The EUR rebounds from the sub-1.1200 area against the USD.
- EMU Final CPI, Core CPI rose 5.5% in the year to June.
- The USD Index picks up pace and surpasses the 100.00 hurdle.
- Speculation that the Fed’s July hike could be the last one runs high.
- US, German yields keep the downside well in place for yet another session.
- Traders now see the BoE’s interest rate peaking below 6%.
- UK inflation loses upside traction in June.
Technical Analysis: Euro appears supported around 1.1200
The ongoing price action in EUR/USD hints at the idea that further gains might be in store in the short-term horizon.
The pair printed a new 2023 high at 1.1275 on July 18. Once this level is cleared, there are no resistance levels of significance until the 2022 peak of 1.1495 recorded on February 10.
On the downside, the 1.1000 region emerges as a psychological support seconded by provisional support at the 55-day and 100-day SMAs at 1.0893 and 1.0871, respectively, ahead of the July low of 1.0833 (July 6). The breakdown of this region should meet the next contention area at the key 200-day SMA at 1.0674 prior to the May low of 1.0635 (May 31). South from here emerges the March low of 1.0516 (March 15) before the 2023 low of 1.0481 (January 6).
Furthermore, the constructive view of EUR/USD appears unchanged as long as the pair trades above the key 200-day SMA.
Of note, however, is that the current pair’s overbought condition (as per the daily RSI near 75) carries the potential to spark a technical correction in the short-term horizon.
Euro FAQs
What is the Euro?
The Euro is the currency for the 20 European Union countries that belong to the Eurozone. It is the second most heavily traded currency in the world behind the US Dollar. In 2022, it accounted for 31% of all foreign exchange transactions, with an average daily turnover of over $2.2 trillion a day.
EUR/USD is the most heavily traded currency pair in the world, accounting for an estimated 30% off all transactions, followed by EUR/JPY (4%), EUR/GBP (3%) and EUR/AUD (2%).
What is the ECB and how does it impact the Euro?
The European Central Bank (ECB) in Frankfurt, Germany, is the reserve bank for the Eurozone. The ECB sets interest rates and manages monetary policy.
The ECB’s primary mandate is to maintain price stability, which means either controlling inflation or stimulating growth. Its primary tool is the raising or lowering of interest rates. Relatively high interest rates – or the expectation of higher rates – will usually benefit the Euro and vice versa.
The ECB Governing Council makes monetary policy decisions at meetings held eight times a year. Decisions are made by heads of the Eurozone national banks and six permanent members, including the President of the ECB, Christine Lagarde.
How does inflation data impact the value of the Euro?
Eurozone inflation data, measured by the Harmonized Index of Consumer Prices (HICP), is an important econometric for the Euro. If inflation rises more than expected, especially if above the ECB’s 2% target, it obliges the ECB to raise interest rates to bring it back under control.
Relatively high interest rates compared to its counterparts will usually benefit the Euro, as it makes the region more attractive as a place for global investors to park their money.
How does economic data influence the value of the Euro?
Data releases gauge the health of the economy and can impact on the Euro. Indicators such as GDP, Manufacturing and Services PMIs, employment, and consumer sentiment surveys can all influence the direction of the single currency.
A strong economy is good for the Euro. Not only does it attract more foreign investment but it may encourage the ECB to put up interest rates, which will directly strengthen the Euro. Otherwise, if economic data is weak, the Euro is likely to fall.
Economic data for the four largest economies in the euro area (Germany, France, Italy and Spain) are especially significant, as they account for 75% of the Eurozone’s economy.
How does the Trade Balance impact the Euro?
Another significant data release for the Euro is the Trade Balance. This indicator measures the difference between what a country earns from its exports and what it spends on imports over a given period.
If a country produces highly sought after exports then its currency will gain in value purely from the extra demand created from foreign buyers seeking to purchase these goods. Therefore, a positive net Trade Balance strengthens a currency and vice versa for a negative balance.
- Gold price has turned sideways around $1,980.00 as investors are awaiting a fresh trigger.
- The US Dollar Index sustains confidently above 100.00 despite an absence of supportive fundamentals.
- US Retail Sales for June showed a slowdown in consumer spending momentum.
Gold price (XAU/USD) is demonstrating a non-directional performance on Wednesday after printing a fresh seven-month high above $1,980.00. The precious metal witnessed immense strength on Tuesday after US Retail Sales for June showed that consumer spending momentum has slowed down but is still sufficient to push the Federal Reserve (Fed) to raise interest rates further at its July 26 FOMC meeting.
Inflationary pressures in the United States are slowing down as the recruitment process by firms is increasing at a snail’s pace. US firms are facing the wrath of higher interest rates by the Fed and tight credit conditions by regional banks. New filters have been added to the credit distribution process by commercial banks to maintain asset quality in a turbulent environment.
Daily Digest Market Movers: Gold remains sideways as investors await a key trigger
- Gold price has remained lackluster around $1,980.00 as monthly Retail Sales data for June remained below expectations.
- US Retail Sales expanded nominally by 0.2% vs. the estimates of 0.5% and the former release of 0.3%. Also, the economic indicator excluding automobiles landed at 0.2%, lower than the consensus and prior release of 0.3%.
- Scrutiny of the US Retail Sales report indicates that momentum in consumer spending growth has slowed but is still resilient. Sales at service stations and building home materials remained subdued.
- US economic indicators for June posted so far convey that inflation has slowed down significantly and that labor market conditions have also eased.
- In addition to soft inflation and a loosening employment market, weak momentum in consumer spending indicates that overall inflationary pressures are lessening.
- Apart from soft inflationary pressures in the US economy, price pressures in the Eurozone and the United Kingdom are also losing persistence.
- In spite of softening inflationary pressures, the Federal Reserve is expected to resume its policy-tightening spell next week.
- Investors should note that Fed chair Jerome Powell skipped hiking interest rates in June after a 13-month long rate-hiking spree.
- US Treasury Secretary Janet Yellen said on Tuesday that a fading recruitment process by firms is prompting the disinflationary process.
- Investors anticipate that the Fed would manage to announce victory over sticky inflation without pushing economy into a recession.
- As per the CME Group’s FedWatch tool, only one more interest rate hike will be announced from the Fed by year-end.
- Contrary to market expectations, the Fed is consistently reiterating that two more interest rate hikes are appropriate.
- Meanwhile, the impact of the announcement of a new gold-backed currency by the BRICS (Brazil, Russia, India, China, and South Africa) is fading away.
- The US Dollar Index (DXY) is making efforts for stabilization above the psychological support of 100.00 as momentum oscillators have turned oversold.
- Contrary to the USD index, 10-year US Treasury yields have dropped further to near 3.75% amid an upbeat market mood.
Technical Analysis: Gold price auctions around $1,980.00
Gold price has turned quiet after printing a fresh seven-week high at $1,984.25 on Tuesday. The precious metal has rebounded after testing the 20-day Exponential Moving Average (EMA) at $1.947.28. Momentum oscillators indicate that sheer strength in the upside bias. The yellow metal is approaching the psychological resistance of $2,000.00.
Fed FAQs
What does the Federal Reserve do, how does it impact the US Dollar?
Monetary policy in the US is shaped by the Federal Reserve (Fed). The Fed has two mandates: to achieve price stability and foster full employment. Its primary tool to achieve these goals is by adjusting interest rates.
When prices are rising too quickly and inflation is above the Fed’s 2% target, it raises interest rates, increasing borrowing costs throughout the economy. This results in a stronger US Dollar (USD) as it makes the US a more attractive place for international investors to park their money.
When inflation falls below 2% or the Unemployment Rate is too high, the Fed may lower interest rates to encourage borrowing, which weighs on the Greenback.
How often does the Fed hold monetary policy meetings?
The Federal Reserve (Fed) holds eight policy meetings a year, where the Federal Open Market Committee (FOMC) assesses economic conditions and makes monetary policy decisions.
The FOMC is attended by twelve Fed officials – the seven members of the Board of Governors, the president of the Federal Reserve Bank of New York, and four of the remaining eleven regional Reserve Bank presidents, who serve one-year terms on a rotating basis.
What is Quantitative Easing (QE) and how does it impact USD?
In extreme situations, the Federal Reserve may resort to a policy named Quantitative Easing (QE). QE is the process by which the Fed substantially increases the flow of credit in a stuck financial system.
It is a non-standard policy measure used during crises or when inflation is extremely low. It was the Fed’s weapon of choice during the Great Financial Crisis in 2008. It involves the Fed printing more Dollars and using them to buy high grade bonds from financial institutions. QE usually weakens the US Dollar.
What is Quantitative Tightening (QT) and how does it impact the US Dollar?
Quantitative tightening (QT) is the reverse process of QE, whereby the Federal Reserve stops buying bonds from financial institutions and does not reinvest the principal from the bonds it holds maturing, to purchase new bonds. It is usually positive for the value of the US Dollar.
Economists at Credit Suisse think the squeeze lower in USD/CNH is now finished.
USD/CNH still a buy on dip at levels below 7.20
Monday’s CNH reaction to GDP (USD/CNH rose back to 7.1800, after lows last Friday of 7.1230), despite positive surprises in June industrial production, suggests that the recent squeeze lower in USD/CNH is now over.
We acknowledge that the recent pullback in USD makes our Q3 USD/CNH target of 7.50 more difficult to achieve. PBoC suppression of CNY and CNH volatility ahead of key levels (such as 7.30) also mean that our target may take longer than initially expected.
However, the fundamentals in our view still point to higher USD/CNH. The continued string of weak China data, most notably Q2 GDP, re-affirm the narrative of Fed-PBoC divergence and yuan weakness. As such, even though we did not expect USD/CNH to trade below 7.20 last week, we still view the pair as a buy on dips below this level.
EUR/USD has held above 1.1200. Economists at ING analyze the pair’s outlook.
EUR/USD could move back to the 1.1150/1.1170 region
We have heard a more moderate tone by some of the ECB’s most prominent hawks lately, and the ever-deteriorating Eurozone activity outlook is definitely clashing against stubbornly hawkish rhetoric despite signs of sticky core inflation. Still, markets appear reluctant to move on speculation. For now, they've preferred to keep expectations close to two rate hikes (43 bps) as EUR/USD has held above 1.1200 thanks to the Dollar’s still softish momentum.
We still see room for the overvalued EUR/USD (in the short-term) to correct lower before the end of the week, with a move back to the 1.1150/1.1170 region as a first step.
- AUD/USD drops to a one-week low on Wednesday and is pressured by a combination of factors.
- China’s economic woes weigh on the Aussie and weigh on the pair amid resurgent USD demand.
- Bets for a less hawkish Fed lead to a steep fall in the US bond yields and might cap the Greenback.
The AUD/USD pair extends its recent downfall from the vicinity of the 0.6900 mark, or a nearly one-month high touched last week and drifts lower for the fourth successive day on Wednesday. The downward trajectory remains uninterrupted through the early European session and drags spot prices to a one-week low, around the 0.6770 area in the last hour.
The Australian Dollar (AUD) continues to be undermined by concerns over slowing economic growth in China, which, along with a goodish pickup in the US Dollar (USD) demand, exerts downward pressure on the AUD/USD pair. It is worth recalling that data released on Monday showed that the economic growth in China decelerated substantially in the second quarter and Retail sales - a gauge of consumption - slowed sharply in June. This, in turn, is seen as a key factor weighing on the China-proxy Aussie, though the possibility of more stimulus measures from China could help limit further losses.
The USD, on the other hand, builds on the previous day's rebound from its lowest level since April 2022 and touched a one-week peak amid doubts that the Federal Reserve (Fed) will commit to a more dovish policy stance. The US Core Retail Sales showed more resilience in June and fueled speculations that the Fed might stick to its forecast for a 50 bps rate hike this year. That said, growing acceptance that the US central bank will raise rates one last time in late-July leads to a further steep decline in the US Treasury bond yields, which should cap the USD and act as a tailwind for the AUD/USD pair.
Apart from this, the underlying bullish sentiment around the equity markets might further contribute to keeping a lid on the safe-haven buck and lending support to the risk-sensitive Aussie. Hence, it will be prudent to wait for strong follow-through selling before confirming that the AUD/USD pair has formed a bearish double-top pattern near the 0.6900 mark. Traders now look to the US economic docket, featuring Building Permits and Housing Starts, which, along with the US bond yields, might influence the USD price dynamics and produce short-term trading opportunities around the major.
Technical levels to watch
USD/CNH is now seen navigating within the 7.1500-7.2500 range in the next few weeks, according to Economist Lee Sue Ann and Markets Strategist Quek Ser Leang at UOB Group.
Key Quotes
24-hour view: We highlighted yesterday that “there is a chance of USD breaking above the strong resistance at 7.1930.” We added, “The major resistance at 7.2180 is unlikely to come into view.” In NY trade, USD broke above 7.1930 and reached 7.1968. Despite the advance, upward momentum has increased only slightly. That said, there is a chance for USD to rise above 7.2180 today. This time around, the major resistance at 7.2500 is unlikely to come into view. On the downside, if USD breaks below 7.1710 (minor support is at 7.1820), it would suggest that the current mild upward pressure has eased.
Next 1-3 weeks: We turned negative in USD last Monday (10 Jul, spot at 7.2230). After USD dropped to 7.1240 and rebounded, we indicated two days ago (17 Jul, spot at 7.1500) that while USD “is still weak, the next major support at 7.1000 may not come into view so soon.” Yesterday (18 Jul, spot at 7.1820), we noted that “upward momentum is beginning to fade.” However, we were of the view that only a break above 7.1930 would suggest that 7.1000 is not coming into view this time around. USD rose above 7.1930 in NY trade. In other words, USD is not weakening further For the time being, USD is likely to trade in a range, probably between 7.1500 and 7.2500
Economists at Société Générale analyze USD/IDR technical outlook.
Bounce after defending crucial support at 14,600/14,500
USD/IDR successfully defended the earlier highlighted support zone near 14,600/14,500 representing high of 2021. It has staged a steady bounce after this test however it has so far remained unable to reclaim the 200-DMA near 15,200. Recent test of this MA has resulted in a pullback.
A large downside is not envisaged; only a break below 14,600/14,500 would denote possibility of a larger downtrend.
Once the pair reclaims the MA near 15,200, the phase of rebound is expected to extend. Next potential hurdles would be at March peak of 15,480 and previous down gap near 15,750/15,810.
- NZD/USD turns lower for the fourth straight day and drops to a one-week low on Wednesday.
- The initial reaction to stronger NZ inflation data fades quickly amid China’s economic woes.
- A goodish pickup in the USD demand exerts additional pressure and contributes to the slide.
The NZD/USD pair fades an intraday bullish spike to the 0.6315 region and drops to a one-week low during the early European session on Wednesday. Spot prices, however, manage to recover a few pips in the last hour and currently trade just above mid-0.6200s, down just over 0.15% for the day.
The New Zealand Dollar (NZD) did get a minor lift following the release of stronger domestic consumer inflation figures, which showed that the headline CPI rose by 1.1% during the second quarter as compared to the 1% estimated. Moreover, the yearly rate decelerated less than expected to 6% during the reported period and forced investors to price in a more hawkish Reserve Bank of New Zealand (RBNZ). Apart from this, the prevalent risk-on environment pushed the NZD/USD pair higher, though concerns over slowing economic growth in China.
It is worth recalling that data released earlier this week showed that the economic growth in China decelerated substantially in the second quarter and Retail sales - a gauge of consumption - slowed sharply in June. This, in turn, acts as a headwind for antipodean currencies, including the Kiwi, which, along with a goodish pickup in the US Dollar (USD) demand, drag the NZD/USD pair lower for the fourth straight day. Doubts that the Federal Reserve (Fed) will commit to a more dovish policy stance prompt some short-covering around the USD.
The US Core Retail Sales - excluding automobiles, gasoline, building materials and food services - showed more resilience in June and fueled speculations that the Fed might stick to its forecast for a 50 bps rate hike this year. The markets, however, have been pricing out the possibility of any further rate hikes after the widely expected 25 bps lift-off in July. This is reinforced by a further steep decline in the US Treasury bond yields, which holds back the USD bulls from placing aggressive bets and assists the NZD/USD pair to bounce off the 0.6225 area.
This makes it prudent to wait for some follow-through selling before positioning for an extension of the recent retracement slide from levels just above the 0.6400 mark, or the highest level since early February touched last week. Market participants now look forward to the US housing market data - Building Permits and Housing Starts - for some impetus later during the early North American session. This, along with the US bond yields and the broader risk sentiment, might influence the USD and produce short-term opportunities around the NZD/USD pair.
Technical levels to watch
- The risk-off trade lends support to the US Dollar.
- The index advances past the key 100.00 mark.
- Housing data will be in the limelight later in the NA session.
The greenback, when tracked by the USD Index (DXY), accelerates the recovery beyond the key 100.00 hurdle on Wednesday.
USD Index looks bid on risk-off trade
The index adds to Tuesday’s small uptick and looks to consolidate the breakout of the key 100.00 barrier on the back of the resurgence of the risk aversion and the corrective move in the risk complex.
In the meantime, investors continue to see the Federal Reserve hiking rates by 25 bps next week, although their attention seems to have now shifted to any potential moves on rates beyond the July gathering, particularly amidst lower inflation and some easing in the labour market.
In the US data space, MBA Mortgage Applications are due seconded by Housing Starts and Building Permits for the month of June.
What to look for around USD
Price action around the index now looks constructive above the 100.00 hurdle and bolstered by the risk-off mood.
In the near term, there are no changes to the perception that the Fed would resume its tightening process later in the month despite persistent disinflationary pressures and the still tight labour market.
This view was further bolstered by comments from Fed Chief Powell at the June FOMC event, who referred to the July meeting as "live" and indicated that most of the Committee is prepared to resume the tightening campaign as early as next month.
Key events in the US this week: MBA Mortgage Applications, Building Permits, Housing Starts (Wednesday) – Initial Jobless Claims, Philly Fed Manufacturing Index, CB Leading Index, Existing Home Sales (Thursday).
Eminent issues on the back boiler: Persistent debate over a soft/hard landing of the US economy. Terminal Interest rate near the peak vs. speculation of rate cuts in late 2023/early 2024. Geopolitical effervescence vs. Russia and China. US-China trade conflict.
USD Index relevant levels
Now, the index is gaining 0.20% at 100.12 and the breakout of 100.30 (weekly high July 19) could open the door to 102.62 (55-dat SMA) and then 103.54 (weekly high June 30). On the other hand, initial support emerges at 99.57 (2023 low July 13) followed by 97.68 (weekly low March 30) and 95.17 (monthly low February 10 2022).
The Pound is under pressure after UK inflation slowed more than expected in June. Economists at ING analyze GBP outlook.
Good news on inflation, bad news for the Pound
Headline inflation slid back below 7.9% (below consensus), illustrating a 0.4% MoM increase which has been the slowest seen since early 2022. We know that the BoE is mostly focused on service inflation, and there was good news here too – a decline from 7.4% to 7.2%, contrary to the BoE’s expectations.
The question now is whether this is enough to tilt the balance to a 25 bps hike in August. We are inclined to think so, even though it remains a close call.
We suspect there is more room to fall in GBP/USD, especially if our expectations for some Dollar support into the FOMC prove to be correct. A move to the 1.2800 area in Cable looks possible even before the BoE meeting.
EUR/GBP has spiked, but we suspect markets may like some bullish narrative on the Euro side beyond the 0.8700 level, and that may not come just yet if the ECB turns fully data-dependent and the eurozone outlook remains lacklustre at best.
EUR/GBP rally extends to 0.8670. Economists at Société Générale analyze the pair’s technical outlook.
First support is at 0.8630
EUR/GBP briefly breached June low however the downward momentum is dissipating as highlighted by a quick bounce from the lower limit of a multi-month channel near 0.8500. This is also denoted by daily MACD which has been posting positive divergence.
The pair has crossed above the 50-DMA; ongoing rebound could persist towards the upper limit of the channel near 0.8720/0.8750; this could be an important hurdle.
First support is at 0.8630, the 23.6% retracement of recent bounce.
- USD/CAD is looking vulnerable above the immediate support of 1.3160 amid weakness in the US Dollar.
- The recovery move in the USD Index seems fragile due to an absence of supportive fundamentals.
- USD/CAD is expected to continue its downside journey toward the horizontal support at 1.3077.
The USD/CAD pair is struggling in maintaining an auction above 1.3150 in the early European session. The Loonie asset is failing to pick strength as the upside in the US Dollar Index (DXY) seems restricted due to easing inflationary pressures in the United States economy.
The recovery move in the USD Index seems fragile due to an absence of supportive fundamentals. The fight against United States inflation by the Federal Reserve (Fed) is still on and the central bank is ready to raise interest rates further. Also, US retail demand is not at its best as households have postponed demand for big-ticket items to fulfill basic needs.
Meanwhile, there is some strength in the Canadian Dollar despite inflationary pressure in Canada has eased further. June’s core Consumer Price Index (CPI) reported monthly disinflation by 0.1% against expectations of 0.5%. This would allow the Bank of Canada (BoC) to keep interest rates steady ahead.
USD/CAD has faced selling pressure to near the 20-period daily Exponential Moving Average (EMA) at 1.3230 after attempting a recovery move from around 1.3100. The Loonie asset is expected to continue its downside journey towards the horizontal support plotted from 12 May 2022 high at 1.3077.
The Relative Strength Index (RSI) (14) is on the edge of 40.00. A slippage below the same would trigger the downside momentum.
Should the asset break below June 27 low at 1.3117, Canadian Dollar bulls would drag the asset towards 12 May 2022 high at 1.3077, followed by the psychological support at 1.3000.
In an alternate scenario, a confident recovery above June 28 high at 1.3277 would drive the asset toward June 15 high at 1.3355 and July 7 high at 1.3387.
USD/CAD daily chart
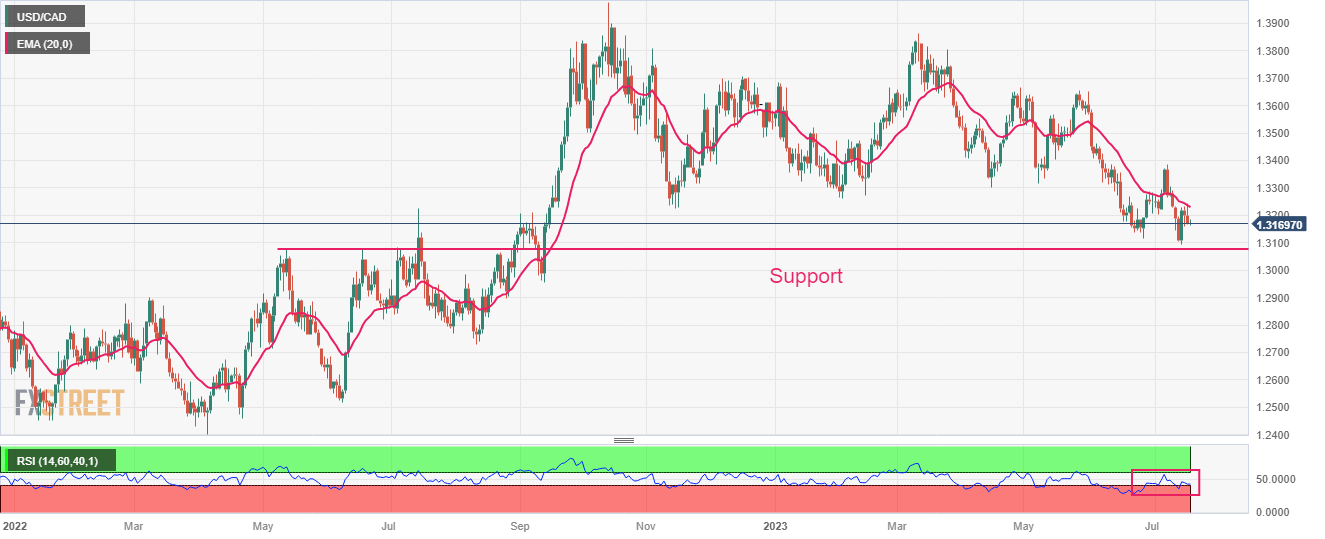
- Natural Gas price oscillates in a narrow trading band through the early European session.
- The descending trend-channel resistance continues to cap the upside for the commodity.
- The technical setup favours bulls and supports prospects for an eventual upside breakout.
Natural Gas price struggles to capitalize on the previous day's strong move up and oscillates in a narrow trading band, around the $2.60 region through the early European session on Wednesday.
The said area represents the top boundary of a downward-sloping channel extending from the June monthly swing high and should act as a pivotal point. This is followed by the 100-period Simple Moving Average (SMA), currently around the $2.65 region, which if cleared will suggest that the descending trend witnessed over the past three weeks or so has run its course and pave the way for further gains.
Given that technical indicators on daily/4-hour charts are holding in the positive territory, the XNG/USD might then accelerate the momentum towards the $2.725-$2.750 en route to the monthly peak, around the $2.785 zone. The upward trajectory could eventually lift the commodity beyond the $2.815 hurdle, towards the $2.850 resistance and the June swing high, just ahead of the $3.00 mark.
On the flip side, the $2.60-$2.595 area could protect the immediate downside, which is closely followed by the $2.570-$2.565 region. Some follow-through selling might expose the monthly low, around the $2.480-$2.475 zone, with some intermediate support near the $2.50 level. The downward trajectory could get extended towards the trend-channel support, currently around the $2.40 zone.
XNG/USD 4-hour chart
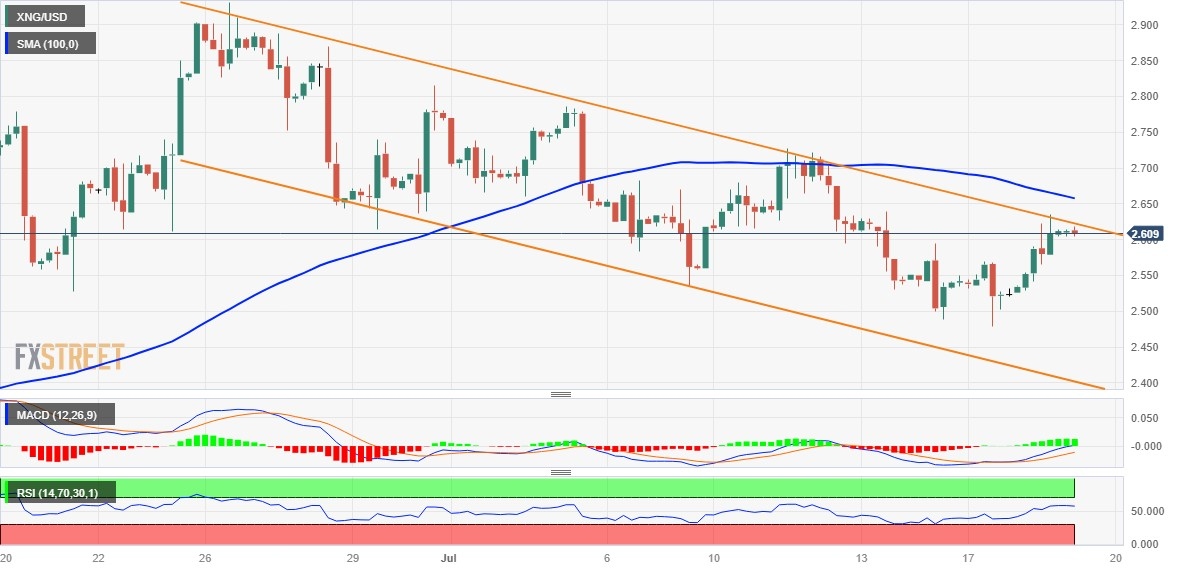
Economists at Société Générale analyze USD/KRW technical outlook.
Downward momentum is prevalent
USD/KRW rebound petered out near 1,343 in May and it recently formed a lower peak near 1,324 after failing to overcome the 200-Day Moving Average (now at 1,310) and a multi-month down sloping trend line.
Daily MACD is anchored within negative territory which denotes downward momentum is prevalent.
In case the pair struggles to cross above the 200-DMA near 1310, the decline is expected to persist towards previous up-gap near 1,250/1,244.
- EUR/JPY extends its upside and holds above the 156.30 mark on Wednesday.
- The cross will meet the immediate resistance level of 156.90 with an eye on the 158.00 area.
- 155.85 acts as an initial support level for EUR/JPY.
The EUR/JPY pair gains traction after bouncing off Monday’s low around 155.00. The pair currently trades around 156.40 heading into Tuesday’s European session. Bank of Japan (BoJ) Governor Kazuo Ueda is expected to maintain the easy-money policy, even though market participants expected and exited ultra-low interest rates and moderated the Yield Curve Control (YCC) policy. This, in turn, leads to the weakening of the Japanese Yen against its major rivals due to monetary policy divergences.
It’s worth noting that the cross stands above the 100- and 200-hour Exponential Moving Averages (EMA), which means further upside looks favorable.
According to the four-hour chart, the cross will meet the immediate resistance level of 156.90 (High of June 22). The 158.00 area appears to be a tough nut to crack for EUR/JPY. The mentioned level represents a psychological round mark, and Year-to-date (YTD) high. Any meaningful follow-through buying will see a rally to the next round figure hurdle at 159.00 and 160.00.
On the downside, 155.85 acts as an initial support level, highlighting the High of July 6. The additional downside filter to watch is 155.55 (100-day EMA), followed by 154.40 (200-day EMA).
The Relative Strength Index (RSI) stands above 60, indicating bullish territory and suggesting that the path of least resistance for the EUR/JPY cross is to the upside.
EUR/JPY four-hour chart
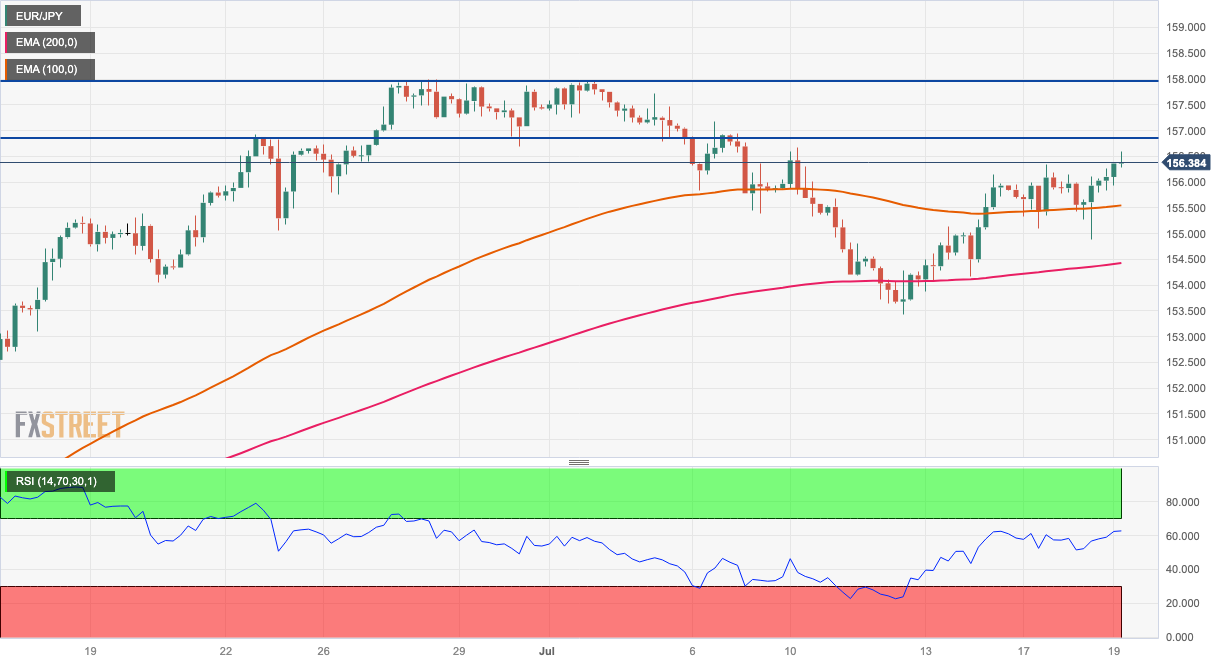
In the view of Economist Lee Sue Ann and Markets Strategist Quek Ser Leang at UOB Group, extra losses in USD/JPY appear unlikely for the time being.
Key Quotes
24-hour view: Yesterday, we expected USD to trade in a range between 138.20 and 139.30. However, USD dropped to 137.69 and then rebounded to a high of 139.13. The underlying tone has improved a tad. Today, USD could edge higher, but it is unlikely to break clearly above 139.50. Support is at 138.40, followed by 138.00.
Next 1-3 weeks: We turned negative USD early last week. After USD fell to 137.23 and rebounded, in our latest narrative from Monday (17 Jul, spot at 138.55), we indicated that “while the recent downward momentum has slowed somewhat, only a break of 139.50 would indicate that the USD weakness has stabilized.” Yesterday, USD dipped to 137.69 and then rebounded strongly. Downward momentum has waned further, and the chance of USD dropping to the major support at 137.15 this time around is slim. Looking ahead, if USD breaks above 139.50, it would suggest that USD could trade in a range for a period of time.
Considering advanced prints from CME Group for natural gas futures markets, open interest resumed the upside and went up by around 5.7K contracts following the previous daily pullback. Volume followed suit and increased by around 68.8K contracts after two daily drops in a row.
Natural Gas faces immediate resistance at the June high
Prices of natural gas rose to 3-day tops past the $2.60 mark on Tuesday. The daily uptick was on the back of increasing open interest and volume and leaves the door open to further upside in the very near term. So far, the June’s peak near the $2.90 per MMBtu is expected to emerge as the next up-barrier of note.
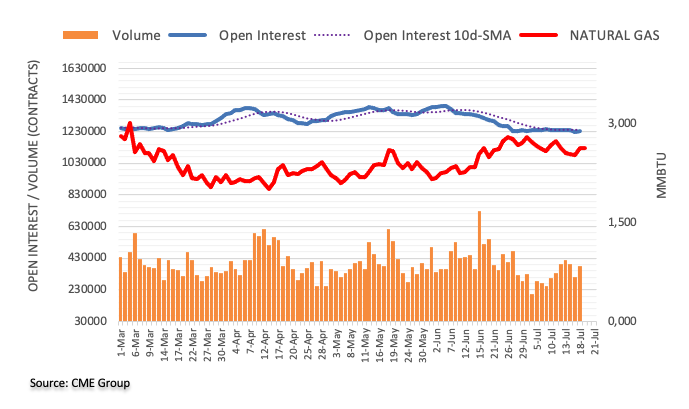
Economists at Credit Suisse do not look to chase AUD/USD lower from current levels.
Fade, don’t chase
Ahead of the Jun jobs data, out on Thursday, and of next week’s Q2 CPI release, and with markets pricing in little risk of an RBA hike on 1 Aug, we do not look to chase AUD/USD lower from current levels, even if our end-Q3 0.6600 target is below current spot.
We prefer to fade data-driven spikes closer to the top end of our Q3 target range at 0.6900, targeting 0.6600.
- Pound Sterling tumbles below 1.3000 as UK inflation decelerated more than expected in June.
- Monthly headline United Kingdom inflation grew at a negligible pace in June.
- The burden of elevated inflation and higher interest rates by the BoE has spread from households to domestic firms.
The Pound Sterling (GBP) attracts significant offers as the United Kingdom’s June inflation report has turned out much softer than expected. The GBP/USD pair slipped swiftly below the psychological support of 1.3000 after the data release, and it is expected to deliver more weakness. The monthly headline Consumer Price Index (CPI) expanded at a negligible pace of 0.1% in June as households and firms face the burden of higher interest rates from the Bank of England (BoE).
Inflationary pressures in the United Kingdom eased more than what markets expected, supported by declining prices of goods and services at factory gates and aggressively restrictive monetary policy from BoE policymakers. However, investors are still cautious over whether UK Prime Minister Rishi Sunak would meet his promise of halving inflation by year-end ahead of a probable election in 2024.
Daily Digest Market Movers: Pound Sterling faces extreme pressure as inflation softens
- Pound Sterling dives as June’s Consumer Price Index has softened more than expected.
- United Kingdom’s Office for National Statistics has reported that monthly headline inflation expanded 0.1% in June, less than the 0.4% expected and the 0.9% advance seen in May.
- On an annual basis, headline CPI decelerated to 7.9% against the consensus of 8.2% and the 8.7% increase registered in May.
- Core inflation, a measure that excludes volatile food and oil prices, softened to 6.9% while investors were anticipating it to rise at a steady pace of 7.1%.
- Labor shortages and high food inflation have been major contributors to stubborn UK inflation.
- Meanwhile, UK’s grocery inflation has eased for a fourth straight month in June to 14.9%, till July 9, posting the steepest decline since its peak in March, Reuters report.
- In addition, a survey from Lloyds Bank showed that food inflation is expected to soften as producers have cut prices for the first time in more than three years as cost pressures have started to relent.
- Synergic effects from soft CPI and PPI are likely to ease the burden on households but are not sufficient to allow the Bank of England to go light on interest rates.
- Markets expect that the BoE will raise interest rates further by 100 basis points (bps) this year, implying an interest rate peak at around 6.5%.
- The burden of high inflation and higher interest rates by the BoE is widening its scope from households to domestic firms. UK’s insolvency services said England and Wales are on track for reporting the highest quarterly number of company insolvencies since early 2009 amid failure in repaying loans.
- The US Dollar Index (DXY) is making efforts to sustain above the psychological resistance of 100.00.
- The USD Index picked strength despite that United States Retail Sales growth failed to match expectations.
- US Retail Sales expanded 0.2% in June, lower than the 0.5% increase expected by markets.
- Softening US inflation, loosening labor market conditions, and moderating retail demand could prompt the Federal Reserve (Fed) to consider raising interest rates further only once this year.
- US Treasury Secretary Janet Yellen said on Tuesday that a cooling labor market is helping to slow inflation. Yellen also said on Monday that the economy is making good progress in returning inflation to 2% and she doesn’t expect the economy to fall into recession.
Technical Analysis: Pound Sterling skids below 1.3000
Pound Sterling cracks sharply below the psychological support of 1.3000 as inflationary pressures have slowed down beyond expectations. The Cable is declining towards the 20-day Exponential Moving Average (EMA), which is trading around 1.2860 as a mean-reversion move has been triggered. The asset has continued its three-day losing streak after printing a fresh annual high of 1.3140.
Pound Sterling FAQs
What is the Pound Sterling?
The Pound Sterling (GBP) is the oldest currency in the world (886 AD) and the official currency of the United Kingdom. It is the fourth most traded unit for foreign exchange (FX) in the world, accounting for 12% of all transactions, averaging $630 billion a day, according to 2022 data.
Its key trading pairs are GBP/USD, aka ‘Cable’, which accounts for 11% of FX, GBP/JPY, or the ‘Dragon’ as it is known by traders (3%), and EUR/GBP (2%). The Pound Sterling is issued by the Bank of England (BoE).
How do the decisions of the Bank of England impact on the Pound Sterling?
The single most important factor influencing the value of the Pound Sterling is monetary policy decided by the Bank of England. The BoE bases its decisions on whether it has achieved its primary goal of “price stability” – a steady inflation rate of around 2%. Its primary tool for achieving this is the adjustment of interest rates.
When inflation is too high, the BoE will try to rein it in by raising interest rates, making it more expensive for people and businesses to access credit. This is generally positive for GBP, as higher interest rates make the UK a more attractive place for global investors to park their money.
When inflation falls too low it is a sign economic growth is slowing. In this scenario, the BoE will consider lowering interest rates to cheapen credit so businesses will borrow more to invest in growth-generating projects.
How does economic data influence the value of the Pound?
Data releases gauge the health of the economy and can impact the value of the Pound Sterling. Indicators such as GDP, Manufacturing and Services PMIs, and employment can all influence the direction of the GBP.
A strong economy is good for Sterling. Not only does it attract more foreign investment but it may encourage the BoE to put up interest rates, which will directly strengthen GBP. Otherwise, if economic data is weak, the Pound Sterling is likely to fall.
How does the Trade Balance impact the Pound?
Another significant data release for the Pound Sterling is the Trade Balance. This indicator measures the difference between what a country earns from its exports and what it spends on imports over a given period.
If a country produces highly sought-after exports, its currency will benefit purely from the extra demand created from foreign buyers seeking to purchase these goods. Therefore, a positive net Trade Balance strengthens a currency and vice versa for a negative balance.
Economist Lee Sue Ann and Markets Strategist Quek Ser Leang at UOB Group see the upside momentum in AUD/USD losing momentum for the time being.
Key Quotes
24-hour view: After AUD dropped to 0.6788 on Monday and rebounded, we indicated yesterday that “despite the decline, there is no clear increase in downward momentum, and AUD is unlikely to weaken much further.” We expected AUD to trade sideways between 0.6785 and 0.6855. Our view of sideways trading was not wrong, as AUD traded between 0.6789 and 0.6837 before ending the day largely unchanged (0.6812, -0.07%). Today, AUD could continue to trade sideways, likely between 0.6785/0.6845.
Next 1-3 weeks: Our update from yesterday (18 Jul, spot at 0.6815) is still valid. As highlighted, the recent buildup in momentum is beginning to wane. A breach of the ‘strong support’ at 0.6760 (no change in level) would indicate that the major resistance at 0.6900 is not coming into view.
The Japanese Yen has weakened for a second consecutive day against the Dollar. It is worth keeping an eye on the JPY, above all Friday when the new inflation data for June will be published, economists at Commerzbank report.
The Bank of Japan might adjust its monetary policy next week
If the overall rate were to fall only slowly, with the core rate remaining stubbornly high, expectations are likely to rise that the BoJ might move away from its ultra-expansionary monetary policy in some shape next week, which would support the Yen.
However, the BoJ would have to be clearer than last time in December 2022 when it ‘only’ widened the yield range and caused a lot of drama short-term, but it then became clear in the end that it hadn’t changed anything about its monetary policy. The new central bank governor Kazuo Ueda did not initiate the hoped for reversal in the spring either. But perhaps the time has now come.
- USD/CHF reverses from the lowest level since January 2015.
- Oversold RSI triggers corrective bounce off multi-day low but convergence of key resistance lines prod Swiss Franc pair buyers.
- May’s low, 21-DMA act as additional upside filters to watch past 0.8630.
- Multiple swings around 0.8580 may prod bears ahead of highlighting 2015 bottom.
USD/CHF consolidates weekly/monthly losses around 0.8580-85 heading into Wednesday’s European session, printing the first daily gain in three.
In doing so, the Swiss Franc (CHF) pair bounces off the lowest level since January 2015 amid an oversold RSI (14) line.
The major currency pair’s recovery, however, appears doubtful amid the bearish MACD signals and the presence of the 0.8630 resistance confluence comprising the previous support line from early February and a fortnight-old descending trend line.
Even if the USD/CHF bulls manage to cross the 0.8630 hurdle May’s bottom of around 0.8820 will be a tough nut to crack for them before retaking control.
That said, 0.8600, 0.8700 and 0.8800 round figures may offer additional challenges to the pair buyers while the 21-DMA level of around 0.8845 acts as the final defense of the bears.
On the contrary, multiple levels around the 0.8580 level marked in January 2015 prod the USD/CHF bears before directing them to the year 2015 bottom of 0.8300.
Overall, the USD/CHF pair’s latest corrective bounce can be considered as bears taking a breather at the multi-day low.
USD/CHF: Daily chart
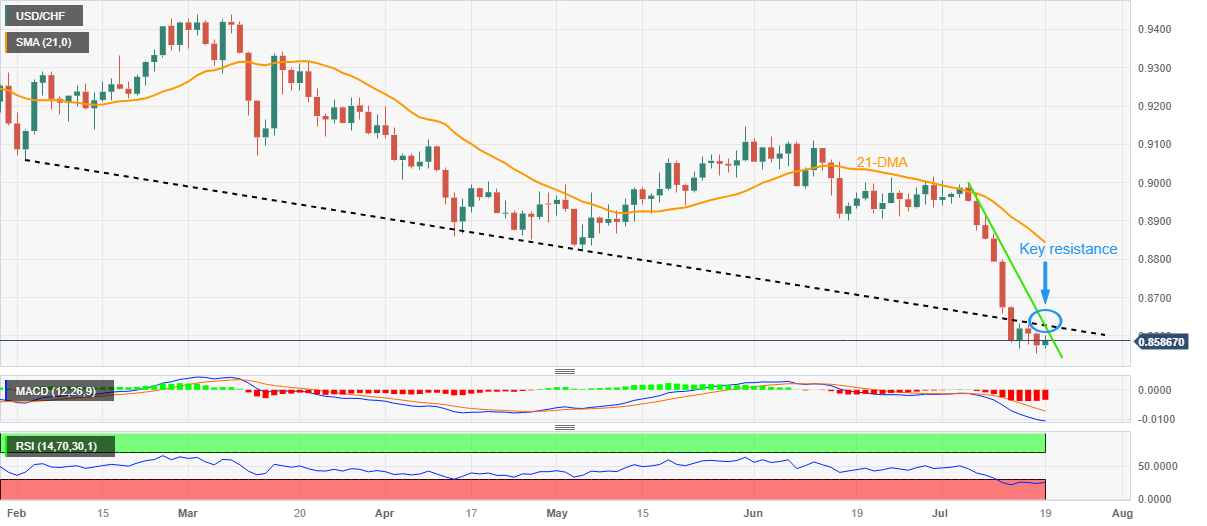
Trend: Limited recovery expected
Commenting on the inflation data, UK Finance Minister, Jeremy Hunt, said, “we can win the battle against inflation.”
Additional quotes
“Bank of England (BoE) has taken difficult decisions.”
“We are seeing the first fruits of the difficult decision but a long way to go.”
Market reaction
GBP/USD is off the lows but remains 0.58% lower on the day at 1.2957, at the time of writing.
Here is what you need to know on Wednesday, July 19:
Pound Sterling weakens against its major rivals early Wednesday following the softer-than-expected inflation readings for June. Eurostat will release revisions to the Harmonized Index of Consumer Prices (HICP) prints for June and the US economic docket will feature Housing Starts and Building Permits.
Inflation in the UK, as measured by the change in the Consumer Price Index (CPI), declined to 7.9% on a yearly basis in June from 8.7% in May. This figure came in lower than the market expectation of 8.2%. Moreover, the Core CPI edged lower to 6.9% from 7.1% in the same period, while the Producer Price Index (Input) declined 2.7%. Finally, the Retail Price Index rose 0.3% on a monthly basis, down from a 0.7% increase recorded in May. Following these reading, GBP/USD came under heavy bearish pressure and dropped to its lowest level in a week below 1.2950.
UK CPI inflation slows sharply to 7.9% in June, disappoints BoE hawks.
Reflecting the broad GBP weakness, EUR/GBP was last seen trading at its highest level since late May above 0.8650 and GBP/JPY was down 0.3% at 180.50.
On Tuesday, the US Dollar Index (DXY) managed to edge higher in the early American session despite mixed macroeconomic data releases but lost its bullish momentum. The risk-positive atmosphere made it difficult for the US Dollar to gather further strength and the DXY posted small gains. Early Wednesday, the DXY stays in positive territory above 100.00.
EUR/USD stays on the back foot and edges lower toward 1.1200 in the early European session. The sharp upsurge seen in EUR/GBP, however, helps the pair limit its losses for the time being. Annual HICP for the Eurozone is expected to be confirmed at 5.5%.
In the Asian session, the data from New Zealand revealed that the annual CPI declined to 6% in the second quarter from 6.7% in the first quarter, compared to the market expectation of 5.9%. NZD/USD edged higher with the initial reaction but reversed its direction heading into the European session. As of writing, the pair was down more than 0.5% on the day at 0.6230.
Following Tuesday's choppy action, USD/JPY gained traction and climbed above 139.50 in the European morning on Wednesday.
Gold benefited from the extended slide seen in US Treasury bond yields on Tuesday and rose to its strongest level in nearly three months above $1,980. XAU/USD stays in a consolidation phase and fluctuates below $1,980 early Wednesday.
Bitcoin closed in the red for the fifth straight day on Tuesday but recovered back above $30,000 early Wednesday. Ethereum holds steady at around $1,900 after having registered small losses on Tuesday.
Dairy commodity prices have continued to decline in recent months. Economists at ANZ Bank now forecast a farmgate milk price of $7.75/kg milksolid (MS) for the 2023-24 season.
Milk price forecast drops sharply
We have revised down our farmgate milk price forecast for the 2023-24 season by 50c to $7.75/kg milksolid.
Our forecast for 2022-23 remains at $8.20/kg milksolid.
Global demand for dairy products has been impacted by deteriorating economic conditions affecting consumer demand, particularly in China.
The relatively weak NZD remains supportive of the farmgate milk price but is not sufficient to offset the impact of lower returns for dairy commodities.
Open interest in crude oil futures markets shrank for the second straight session on Tuesday, now by around 15.8K contracts according to preliminary readings from CME Group. On the other hand, volume added to the previous daily build and rose by around 128.4K contracts.
WTI: Gains capped by the 200-day SMA
WTI prices rose markedly on Tuesday amidst decreasing open interest. That said, the likelihood of further gains appear diminished while the key 200-day SMA around the $77.00 mark per barrel emerges a quite a solid hurdle for the time being. This area also coincides with the July peaks.
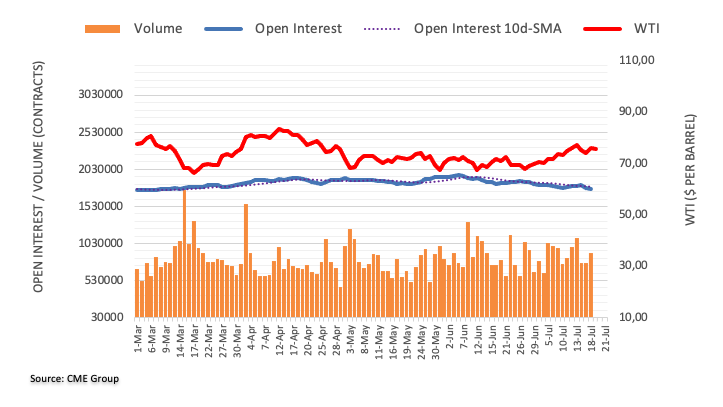
FX option expiries for July 19 NY cut at 10:00 Eastern Time, via DTCC, can be found below.
- EUR/USD: EUR amounts
- 1.1200 565m
- 1.1258 1.6b
- GBP/USD: GBP amounts
- 1.3000 346m
- USD/JPY: USD amounts
- 138.00 687m
- 141.00 1.4b
- USD/CHF: USD amounts
- 0.8550 710m
- AUD/USD: AUD amounts
- 0.6950 893m
- USD/CAD: USD amounts
- 1.3065 384m
- 1.3350 635m
- EUR/GBP gains momentum and extends its upside to 0.8670.
- The cross will meet the next resistance near the 0.8680 area; the 0.8580 region acts as an initial support level.
- The Relative Strength Index (RSI) stands above 60, supporting buyers for now.
The EUR/GBP pair extends its upside and surges above the key resistance level at 0.8600 on Wednesday. The cross currently trades around 0.8670, up to 0.66% on the day.
According to the daily chart, EUR/GBP is set to break above the upper boundary of the Bollinger Band. A decisive break above the latter will see a fresh move higher to 0.8680, representing the 200-day Exponential Moving Average (EMA). Further north, the cross will challenge the next barrier at 0.8720 (Low of March 15, 2023) en route to 0.8830 (High of November 9, 2022).
On the flip side, EUR/GBP will meet an initial support level of 0.8580 (the midline of the Bollinger Band), followed by 0.8550 (Low of December 1, 2022). The additional downside filter to watch is 0.8510, the lower limit of the Bollinger Band and low of July 11.
The Relative Strength Index (RSI) stands above 60, suggesting that the path of least resistance for the EUR/GBP cross is to the upside.
EUR/GBP daily chart
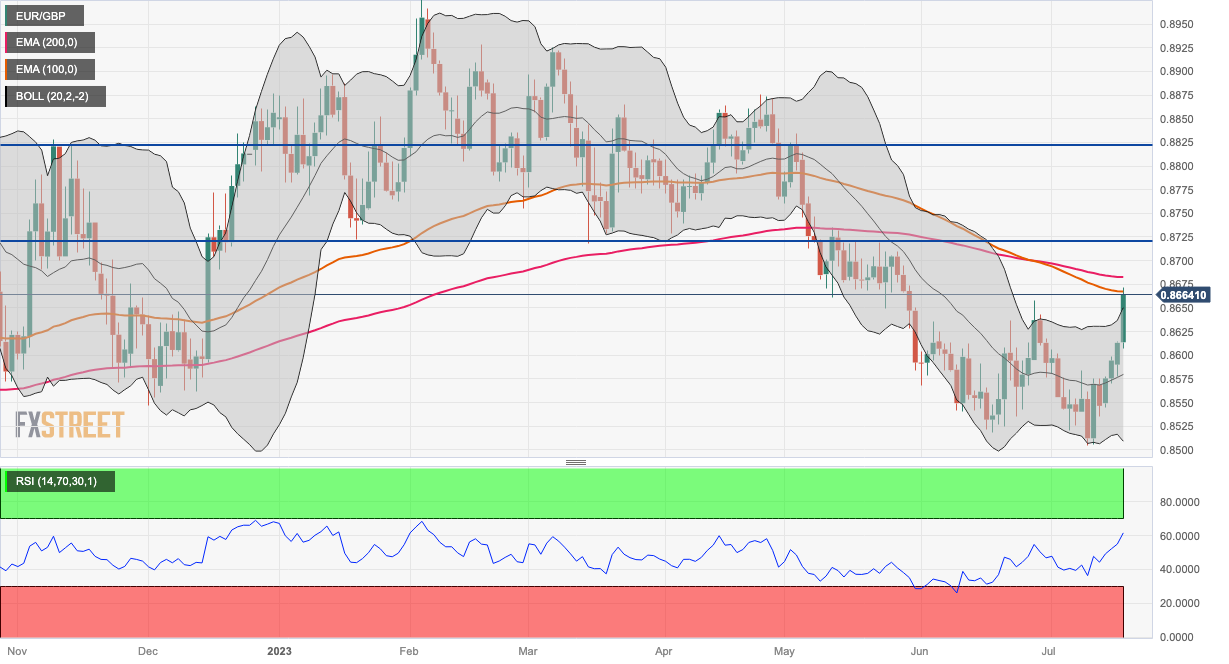
- USD/JPY picks up bids to renew weekly top amid firmer sentiment.
- Dovish concerns about BoJ supersede fears of Fed policy pivot past July.
- Yields drop as market players rush toward bonds amid mixed mood.
- Downbeat economics from Tokyo fuel Yen pair ahead of Japan inflation.
USD/JPY buyers cheer the risk-on mood, as well as the US Dollar’s rebound, as it renews the weekly top around 139.50 amid the early hours of Wednesday’s European session. In doing so, the Yen pair justifies dovish concerns about the Bank of Japan (BoJ) while ignoring downbeat Treasury bond yields and chatters about the US Federal Reserve’s pause in rate hikes after July.
Talking about the risk barometers, Japan’s Nikkei 225 rises more than 1.0% and the S&P500 Futures edges higher at the yearly top amid upbeat sentiment. However, the US 10-year and two-year Treasury bond yields stay pressured at 3.76% and 4.74% by the press time and prod the USD/JPY bulls of late.
While tracing the major catalysts, the mixed headlines surrounding China and optimism in the equity markets gain major attention. That said, China Industry Ministry recently conveyed fears of insufficient demand and declining revenues and justifies the downbeat Gross Domestic Product (GDP) data for the second quarter (Q2) that suggested fears of easing economic recovery in the world’s biggest industrial player. Considering China’s status as one of the biggest oil users, downbeat economic concerns about the dragon nation weigh on the commodity price. On the other hand, the US banks expect more profits from the higher rates and push back recession woes, which in turn allow the sentiment to remain firmer and challenge the US Dollar bulls of late.
Elsewhere, Bank of Japan (BOJ) Governor Kazuo Ueda spoke at a news conference after the G20 meeting in India on Tuesday while stating that there was still some distance to sustainably achieve the 2% inflation target, defending the easy-money policy in turn.
Furthermore, fears surrounding Japan Prime Minister (PM) Fumio Kishida’s cabinet reshuffle and pessimism among the big industrial houses from Tokyo weigh on the Japanese Yen (JPY) and favor the USD/JPY bulls.
Alternatively, the latest Reuters poll of around 109 economists suggests that the Fed’s widely anticipated 25 basis points (bps) rate hike in July will be the last increase of the current tightening cycle. Even so, Tuesday’s upbeat prints of the US Retail Sales Control Group for June underpin the chatters that the Fed will keep the rates higher for longer, if not lifting the rates further toward the north. The same views allow the US Dollar Index (DXY) to edge higher around 100.15, after bouncing off the 15-month low surrounding 99.55 the previous day.
Looking forward, the US housing numbers and risk catalysts may entertain the USD/JPY traders ahead of Friday’s key Japan inflation gauge.
Technical analysis
A daily closing beyond the four-month-old support-turned-resistance, around 139.60 by the press time, becomes necessary for the USD/JPY bulls to retake control.
The upside momentum in GBP/USD is expected to mitigate below the 1.3000 yardsticks, suggest Economist Lee Sue Ann and Markets Strategist Quek Ser Leang at UOB Group.
Key Quotes
24-hour view: We expected GBP to trade in a range between 1.3045 and 1.3105 yesterday. We did not anticipate the increase in volatility as GBP rose to 1.3124, and then fell sharply to 1.3029. Downward momentum has increased, albeit not much. Today, GBP could edge lower, but a sustained break below 1.3000 appears unlikely (the next support at 1.2935 is highly unlikely to come under threat). Resistance is at 1.3075, followed by 1.3110.
Next 1-3 weeks: We have held a positive GBP view since early last week. After GBP surged, in our latest narrative from last Friday (14 Jul, spot at 1.3115), we highlighted that as long as GBP stays above 1.3000, the GBP strength is intact. Yesterday, GBP fell to a low of 1.3029. Upward momentum is fading quickly, and the likelihood of GBP rising further is diminishing. However, only a clear break of 1.3000 would indicate that the GBP strength has come to an end.
Economists at Société Générale analyze USD/CNY technical outlook.
Pullback should remain contained
USD/CNY evolved within a relentless up-move after breakout from a multi-month consolidation. It has recently faced interim resistance near 7.27 as it touched the upper part of a steep ascending channel. An initial pullback is underway; lower limit of the channel at 7.05 should be an important support near term.
If the pair overcomes the hurdle at 7.27, the uptrend is expected to extend. Next potential objectives could be at last year's high of 7.32 and projections of 7.40.
- GBP/JPY takes offers to refresh intraday low down for the third consecutive day.
- UK CPI pushes back hawkish BoE bias by falling to 7.9% YoY in June.
- Dovish comments from BoJ’s Ueda, market’s cautious optimism previously favored GBP/JPY bulls.
- Risk catalysts, Japan inflation will be crucial to watch for clear directions.
GBP/JPY reverses the day-start recovery towards refreshing the intraday trough to around 180.80 amid early Wednesday morning in London, justifying the unwelcome prints of the UK inflation. Adding strength to the downside bias are the weaker Treasury bond yields. However, the market’s cautious optimism and dovish bias surrounding the Bank of Japan (BoJ) prod the cross-currency sellers of late.
UK inflation per the Consumer Price Index (CPI) slides to 7.9% YoY in June versus 8.2% expected and 8.7% prior. More importantly, the Core CPI defies the 7.1% market forecast and previous readings by declining to with 6.9% YoY figures for the said month.
With this, the hawkish bias about the Bank of England (BoE) remains doubtful and drowns the GBP/JPY during the three-day losing streak.
On the other hand, Bank of Japan (BOJ) Governor Kazuo Ueda spoke at a news conference after the G20 meeting in India on Tuesday while stating that there was still some distance to sustainably achieve the 2% inflation target, defending the easy-money policy in turn.
It’s worth noting that fears surrounding Japan Prime Minister (PM) Fumio Kishida’s cabinet reshuffle and pessimism among the big industrial houses from Tokyo weigh on the Japanese Yen (JPY) and challenge the GBP/JPY bears.
Elsewhere, the market sentiment remains cautiously optimistic amid the upbeat performance of the equities backed by the positive mood at the banks, as well as China headlines, which in turn puts a floor under the GBP/JPY prices.
While portraying the mood, Japan’s Nikkei 225 rises more than 1.0% and the S&P500 Futures remain sidelined at the yearly high. However, the US 10-year and two-year Treasury bond yields stay pressured at 3.76% and 4.74% by the press time and prod the GBP/JPY bulls of late.
Having witnessed the initial market reaction to the UK inflation data, the GBP/JPY pair traders should watch the risk catalysts ahead of Friday’s Japan inflation statistics and British Retail Sales.
Technical analysis
A convergence of the 10-DMA and a fortnight-old descending trend line, around 181.65, challenges the GBP/JPY buyers despite the latest run-up.
CME Group’s flash data for gold futures markets noted traders reduced their open interest positions for the third session in a row on Tuesday, this time by nearly 4K contracts. Volume, instead, went up by almost 117K contracts after three consecutive daily pullback.
Gold: Next target emerges at $2000
Tuesday’s strong gains in gold prices were on the back of shrinking open interest and suggests that extra gains are not favoured in the very near term. In the meantime, occasional bullish attempts are expected to meet the next hurdle of note at the key $2000 mark per troy ounce.
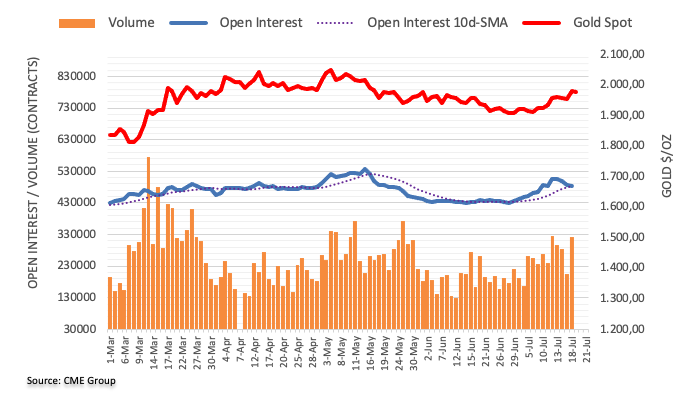
- AUD/USD holds ground above the 0.6790 area on Wednesday.
- Investors anticipate that the Federal Reserve (Fed) is nearing the end of its policy tightening cycle.
- Market players will keep an eye on the development of Sino-US relations.
- The Australian Employment Change and Employment Change reports will be due later this week.
The AUD/USD pair loses traction and holds ground above the 0.6790 mark heading into Wednesday’s European session. The major pair currently trades around 0.6795, down 0.24% for the day. Investors digest the Reserve Bank of Australia (RBA) meeting minutes and monitor Sino-US relations.
Following the softer US inflation data and easing labour market conditions, market players anticipate that the Federal Reserve (Fed) is nearing the end of its policy tightening cycle and will maintain interest rates following the widely expected 25 basis points (bps) in the July meeting. According to the CME Group FedWatch Tool, markets have nearly fully priced in a 25 basis point Fed rate hike in July. The probability of another rate hike in December is approximately 20%.
Additionally, the data released on Tuesday showed that US Industrial Production fell 0.5% in June for the second consecutive month. This figure was lower than the market expected of no change. Meanwhile, Retail Sales increased 0.2% MoM from June to $689.5 billion. This report came in below the market consensus of a 0.5% gain.
On the Australian Dollar front, the Reserve Bank of Australia (RBA) minutes released in Asia suggested that further policy tightening may be necessary. However, the policymakers will reconsider at the August policy meeting.
About the US-China headline, China's defense minister, Li Shangfu, said during a meeting with senior US diplomat Henry Kissinger in Beijing on Tuesday that the US should exercise sound strategic judgment in dealing with China. Market players will keep an eye on the development of Sino-US relations for fresh impetus.
Looking forward, Australia will release the Employment Change and Employment Change on Thursday. Market participants will also take cues from US Housing Starts and Unemployment Claims. These data would have a significant impact on the pair and help determine the next direction for the AUD/USD pair.
Economist Lee Sue Ann and Markets Strategist Quek Ser Leang at UOB Group note EUR/USD could climb to the 1.1300 region in the near term.
Key Quotes
24-hour view: We highlighted yesterday that EUR “is likely to continue to trade sideways.” However, we indicated that “the underlying tone has firmed a tad, and EUR is likely to trade in a higher range of 1.1215/1.1265.” EUR then traded in a range of 1.1207/1.1275 before ending the day little changed at 1.1226 (-0.07%). Momentum indicators are still mostly flat, and we continue to expect EUR to trade sideways. Expected range for today, 1.1195/1.1265.
Next 1-3 weeks: In our most recent narrative from last Friday (14 Jul, spot at 1.1225), we highlighted that while EUR could rise further, “it is premature to expect a move to the 2022 high of 1.1495”. After surging for the most part of last week, EUR has not been able to make much further headway to the upside. Note that yesterday, EUR closed little changed for the third day in a row. The price actions suggest that 1.1495 is unlikely to come into view this time around. That said, there is a chance of EUR rising to 1.1300, before the risk of a pullback increases. On the downside, if EUR breaks below 1.1160 (no change in ‘strong support’ level), it would indicate that the EUR strength that started last Monday has ended.
- Silver Price retreats from 10-week high amid overbought RSI (14), bearish MACD signals.
- Previous resistance line from mid-May, key SMAs challenge XAG/USD sellers.
- Sluggish session allows Silver Price to consolidate weekly/monthly gains but XAG/USD bears are off the table.
Silver Price (XAG/USD) clings to mild losses at the highest levels in 2.5 months, down 0.10% intraday near $25.05 heading into Wednesday’s European session. In doing so, the XAG/USD justifies the overbought RSI (14) line, as well as the bearish MACD signals to pare the bright metal’s week and monthly gains amid a sluggish trading day, so far.
With the downbeat oscillators suggesting further declines in the Silver Price, an ascending resistance line from May 15, now immediate support around $24.80, gains major attention from the XAG/USD sellers.
Following that, a quick decline toward the convergence of the 50% Fibonacci retracement of the May-June downside and the 50-SMA, near $24.10 at the latest, will be crucial to challenge the Silver bears.
In a case where the XAG/USD bears dominate past $24.10, also break the $24.00 round figure, the Silver bears can aim for the 200-SMA level of around $23.50.
On the contrary, the 78.6% Fibonacci retracement level of $25.30 and the $26.00 round figure can lure the Silver buyers during the quote’s run-up past the latest peak of around $25.15.
It’s worth noting that the yearly high marked in May around $26.15 could join the aforementioned price-negative oscillators to challenge the Silver buyers past the $26.00 hurdle.
Silver Price: Four-hour chart
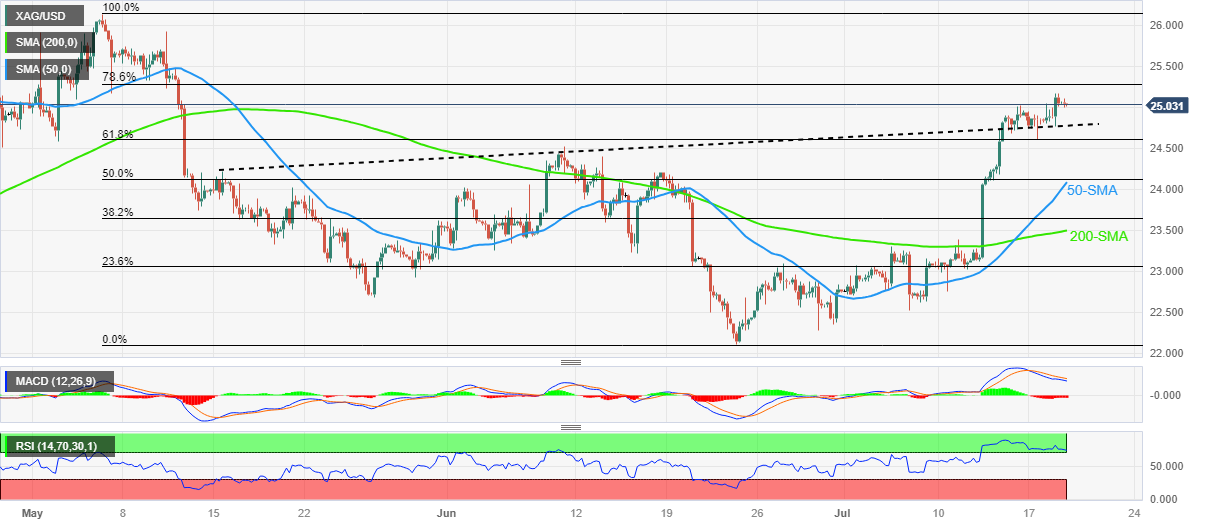
Trend: Limited downside expected
- Oil prices are making efforts for recovery after a corrective move as US inflation is returning to desired levels swiftly.
- Institutional investors have cut their annual GDP forecast for China and have guided for more stimulus requirements.
- The oil price is testing the strength of the breakout and might resume its upside journey.
West Texas Intermediate (WTI), futures on NYMEX, have corrected to near $75.40 in the Asian session after a stellar rally. The oil price is expected to resume its upside journey as inflationary pressures in the United States economy have started easing. After a significant decline in June’s Consumer Price Index (CPI), and easing labor market conditions, retail demand has taken a hit due to higher interest rates by the Federal Reserve (Fed).
Meanwhile, economic recovery in the Chinese economy has faltered considering its second-quarter Gross Domestic Product (GDP) numbers. This has forced institutional investors to cut their annual GDP forecast and have guided for more stimulus requirements. It is worth noting that China is the largest importer of oil in the world and bleak economic growth in China could impact the oil price.
Going forward, oil inventory data for the week ending July 14 will be keenly watched. Oil stockpiles to be reported by US Energy Information Administration (EIA) are expected to report a drawdown of 2.25 million barrels.
Earlier, WTI delivered a breakout of the consolidation formed in a range of $67.20-$74.70 on a four-hour scale. The oil price is testing the strength of the breakout and might resume its upside journey. The 50-period Exponential Moving Average (EMA) at $74.40 is providing support to the oil bulls.
Meanwhile, the Relative Strength Index (RSI) (14) has slipped into the 40.00-60.00 range. This indicates that the bullish momentum has faded, however, the upside bias is still intact.
Going forward, a decisive break above July 17 high at $76.00 would expose the asset to April 26 high at $77.86, followed by the round-level resistance of $80.00.
On the flip side, a breakdown below July 17 low at $73.78 would drag the asset toward July 03 high at $71.83. A slippage below the latter would expose the asset to June 29 low of around $69.00.
WTI four-hour chart
-638253405055636157.png)
- EUR/USD stays defensive, mostly pressured, after reversing from 17-month high.
- US data backs “higher for longer” Fed rate concerns despite talks of policy pivot past July probing USD rebound.
- Chatters about ECB policymakers’ difficulties in conveying future path also weigh on Euro amid mixed sentiment.
- Final readings of Eurozone inflation for June, US housing data will be in the spotlight, risk catalysts eyed as well.
EUR/USD stays on the back foot around 1.1220 heading into Wednesday’s European session, extending the previous day’s retreat from the highest level since February 2022. In doing so, the Euro pair not only justifies the US Dollar’s corrective bounce but also takes clues from the European Central Bank (ECB) concerns amid dicey market hours following a heavily optimistic performance.
Bloomberg came out with news suggesting that the ECB officials are struggling to determine the bloc’s central bank’s future moves. The news cites policymakers from across the spectrum while highlighting the difficulties in conveying the July rate hike. “The task will be to avoid strong signals of either another hike or a pause,” said the Bloomberg News citing anonymous policymakers.
On the other hand, the latest Reuters poll of around 109 economists suggests that the Fed’s widely anticipated 25 basis points (bps) rate hike in July will be the last increase of the current tightening cycle. Even so, Tuesday’s upbeat prints of the US Retail Sales Control Group for June underpin the chatters that the Fed will keep the rates higher for longer, if not lifting the rates further toward the north. The same views allow the US Dollar Index (DXY) to edge higher around 100.05, after bouncing off the 15-month low surrounding 99.55 the previous day.
It’s worth observing that mixed headlines surrounding China and optimism at the equity markets also tease the EUR/USD bears amid a sluggish session. China Industry Ministry recently conveyed fears of insufficient demand and declining revenues and justifies the downbeat Gross Domestic Product (GDP) data for the second quarter (Q2) that suggested fears of easing economic recovery in the world’s biggest industrial player. Considering China’s status as one of the biggest oil users, downbeat economic concerns about the dragon nation weigh on the commodity price.
On the other hand, the US banks expect more profits from the higher rates and push back recession woes, which in turn allow the sentiment to remain firmer and challenge the US Dollar bulls of late.
Against this backdrop, the S&P500 Futures grind near the highest levels since March 2022, dicey near 4,585 by the press time. Not only the US stock futures but the US 10-year and two-year Treasury bond yields also portray the sluggish markets as the benchmark US 10-year bond coupons remain pressured around 3.78% while the two-year counterpart edges lower to 4.75% at the latest.
With this, the EUR/USD is likely to extend the latest pullback amid a light calendar.
However, the final readings of the Eurozone inflation data for June and the US housing market indicators for the said month may entertain the Euro traders, along with the risk catalysts.
Technical analysis
EUR/USD pullback remains elusive unless providing a daily close below the previous resistance line stretched from February 2023, at 1.1140 by the press time. Even so, the overbought RSI and multiple levels marked in early 2022 prod the Euro bulls around 1.1280.
- Asian stock markets trade mixed; the risk appetite improves.
- BoJ Governor Kazuo Ueda is expected to maintain a dovish policy stance.
- Investors are concerned about the economic slowdown in China but have hope for a stimulus plan.
Asian stock markets trade mixed on Wednesday as investors digest better-than-expected results from Wall Street. The risk appetite improves on the outperformance of US banks in the earnings seasons, which boosts Wall Street benchmarks to reclaim the yearly top.
In Japan, the NIKKEI posts gains of 0.73%. Bank of Japan (BOJ) Governor Kazuo Ueda noted on Tuesday that there was still some way to go before reaching the 2% inflation target, per Reuters.
Market participants have now shifted their focus to the Bank of Japan's (BoJ) interest rate decision, which will be announced next week. BoJ Governor Kazuo Ueda is expected to maintain a dovish policy stance in order to keep inflation steady at around 2%.
Hong Kong’s Hang Seng Index declines 1.27% on Wednesday, while the Shanghai SE Composite Index down 0.25%.
The Chinese growth number on Monday raised concern about an economic slowdown in the world's second-largest oil consumer. However, China’s Commerce Ministry stated on Tuesday that a series of measures will help boost the consumption of household consumer goods and services. This, in turn, supports further upside in the oil price.
Looking forward, investors will focus on the People’s Bank of China Interest Rate Decision and the Japanese National Consumer Price Index YoY on Thursday. Also, US Housing Starts and Unemployment Claims might influence the USD dynamic and hint at a sooner end to the rate hike cycle. This, in turn, underpins riskier assets like Gold, equities, the AUDUSD, etc.
- GBP/USD drifts lower for the fourth straight day and is pressured by a modest USD strength.
- Expectations for a less hawkish Fed and the risk-on mood to cap gains for the safe-haven buck.
- Rising bets for more aggressive BoE rate hikes should help limit losses ahead of the UK CPI.
The GBP/USD pair remains under some selling pressure for the fourth successive day on Wednesday and retreats further from its highest level since April 2022, around the 1.3140 region touched last week. The steady descent drags spot prices to a four-day low during the Asian session, though bulls manage to defend the 1.3000 psychological mark, at least for the time being.
The US Dollar (USD) gains some positive traction and looks to build on the overnight bounce from a 15-month low, which, in turn, exerts downward pressure on the GBP/USD pair. Data released on Tuesday showed that the core US Retail Sales - excluding automobiles, gasoline, building materials and food services - remained resilient in June and raised doubts if the Federal Reserve (Fed) will commit to a more dovish policy stance. This, in turn, is seen as a key factor lending some support to the Greenback.
The markets, however, have been pricing out the possibility of any further Fed rate hikes after the widely expected 25 bps lift-off at the upcoming policy meeting on July 25-26. This is reinforced by the ongoing decline in the US Treasury bond yields, which, along with the underlying bullish sentiment around the equity markets, should keep a lid on the safe-haven buck. Apart from this, rising bets for a more aggressive tightening by the Bank of England (BoE) should act as a tailwind for the GBP/USD pair.
In fact, interest-rate swaps indicate that the BoE could raise interest rates from the current 5% to a cycle peak of 6.5% - the highest since 1998 - to dampen demand and force inflation lower. The bets were lifted by stronger UK wage growth data, which, according to BoE Governor Andrew Bailey and UK Finance Minister Jeremy Hunt, is harming the efforts to contain inflation. Furthermore, Bailey, though expects the pace of price growth should fall sharply this year, noted last week that inflation is still far too high.
Hence, the market focus will remain glued to the latest UK CPI report, due later this Wednesday, which will play a key role in influencing the BoE's near-term policy outlook and provide a fresh impetus to the British Pound. Later during the early North American session, traders will take cues from the US housing market data - Building Permits and Housing Starts. Nevertheless, the aforementioned fundamental backdrop supports prospects for the emergence of some dip-buying around the GBP/USD pair.
Technical levels to watch
- Gold Price eases from the highest levels in two months on failure to cross short-term key resistance confluence.
- Mixed sentiment, promising US data allow US Dollar to consolidate recent losses around multi-month low.
- Headlines from China, Fed concerns weigh on Treasury bond yields and XAU/USD price.
- Risk catalysts eyed for clear directions amid light calendar.
Gold Price (XAU/USD) remains on the back foot around the intraday low as it reverses from the highest levels in eight weeks amid the US Dollar’s sustained recovery from a 15-month low. Also exerting downside pressure on the XAU/USD price could be the risk headlines from China. It’s worth noting, however, that the downbeat US Treasury bond yields fail to inspire the Gold Price upside as markets await more clues to defend the previous day’s risk-on mood.
That said, the sentiment improved the previous day as the US banks expect more profits from the higher rates while the growing concerns about the Federal Reserve’s (Fed) policy pivot after July’s 0.25% rate increase also favored the mood and propelled the XAU/USD price. However, the upbeat details of the US Retail Sales and expectations that the Fed will keep the rates higher for longer, if not announce many rate lifts, exert downside pressure on the Gold Price of late.
Elsewhere, China Industry Ministry recently conveyed fears of insufficient demand and declining revenues and justifies the downbeat Gross Domestic Product (GDP) data for the second quarter (Q2) that suggested fears of easing economic recovery in the world’s biggest industrial player. Considering China’s status as one of the biggest oil users, downbeat economic concerns about the dragon nation weigh on the commodity price
Looking ahead, the risk catalysts can entertain the XAU/USD traders amid a light calendar and cautious mood ahead of the next week’s Federal Open Market Committee (FOMC) monetary policy meeting.
Also read: Gold Price Forecast: XAU/USD retreat from two-month highs could test key 100 DMA support
Gold Price: Key levels to watch
As per our Technical Confluence indicator, the Gold Price edges lower past the $1,985 resistance confluence comprising the previous daily and monthly high.
Also challenging the XAU/USD bulls is the Pivot Point one-week R1, around $1,998, quickly followed by the $2,000 psychological manget.
In a case where the Gold Price remains firmer past $2,000, the odds of witnessing a run-up toward April’s peak of around $2,050 can’t be ruled out.
Meanwhile, Pivot Point one-month R1 highlights $1,970 as immediate support for the bears to watch for confirmation.
Following that, the 5-day SMA, Pivot Point one-month S1 and the middle band of the Bollinger on four-hour chart, around $1,961, can lure the Gold sellers.
It’s worth observing that Fibonacci 23.6% on one-week and one-day, around $1,950 is the last defense of the Gold buyers, a break of which will give control to the XAU/USD bears.
Here is how it looks on the tool
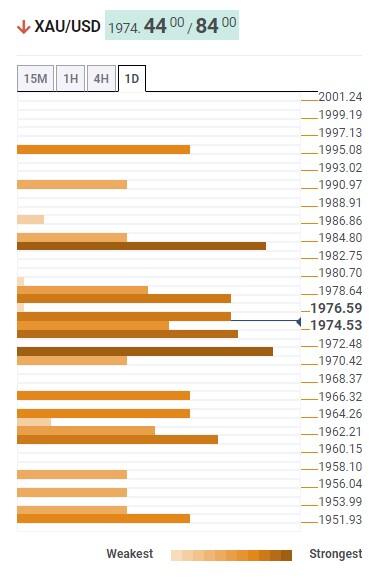
About Technical Confluences Detector
The TCD (Technical Confluences Detector) is a tool to locate and point out those price levels where there is a congestion of indicators, moving averages, Fibonacci levels, Pivot Points, etc. If you are a short-term trader, you will find entry points for counter-trend strategies and hunt a few points at a time. If you are a medium-to-long-term trader, this tool will allow you to know in advance the price levels where a medium-to-long-term trend may stop and rest, where to unwind positions, or where to increase your position size.
- USD/INR lacks firm directional bias; market players await a valid breakout.
- The currency cross gyrates within a symmetrical triangle pattern on the daily chart.
- The key support level is seen at 82.00, while 82.80 area acts as the immediate resistance level.
The USD/INR pair lacks any firm directional bias and oscillates within a large consolidation phase since October 2022. The cross currently trades around 82.10 during the Asian session on Wednesday.
That said, two converging trend-lines constitute the formation of a symmetrical triangle pattern on the daily chart. Market participants await a valid breakout for the next directional move for the cross. Meanwhile, the Relative Strength Index (RSI) holds between 40-60, reinforcing the non-directional movement for USD/INR.
A decisive break below 82.00 (the lower limit of the asymmetrical triangle pattern, a psychological round mark) will see a drop to a crucial support level of 81.70. The mentioned level represents the 200-day Exponential Moving Average (EMA). The additional downside filter to watch is 80.85 (Low of January 23, 2023), followed by 80.35, representing a low of November 11, 2022.
On the upside, any meaningful follow-through buying past 82.80 (the upper boundary of the asymmetrical triangle pattern) will challenge the next contention at 83.00, portraying a psychological round mark and a low of May 24. Further north, the cross will meet the next hurdle near 83.20 (High of December 23, 2022) en route to 83.40 (High of October 19, 2022).
USD/INR daily chart
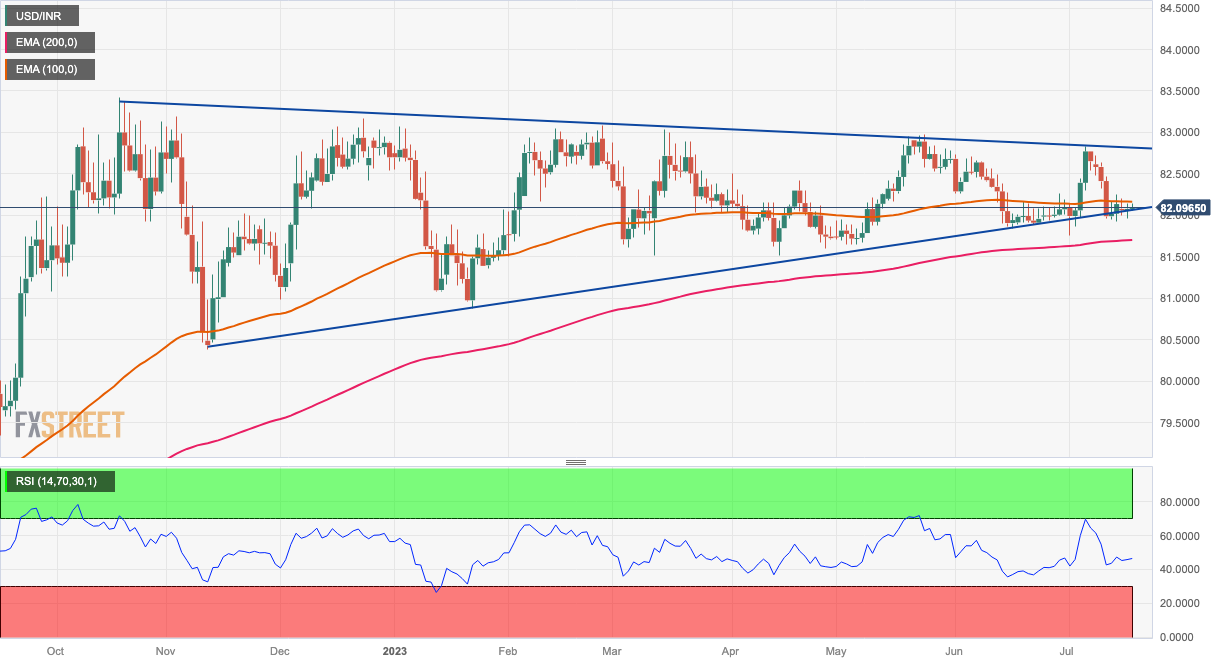
- USD/JPY gains some positive traction on Wednesday and climbs back closer to the weekly high.
- The formation of a bearish flag pattern warrants caution before positioning for any further upside.
- A convincing break below the trend-channel support is needed to reaffirm the negative outlook.
The USD/JPY pair edges higher on Wednesday and climbs back above the 139.00 mark during the Asian session, back closer to the top boundary of its weekly range. Spot prices currently trade around the 139.20 region, up over 0.25% for the day, though the technical setup remains tilted in favour of bearish traders and warrants caution before positioning for any meaningful upside in the near term.
The prevalent risk-on environment, along with less hawkish remarks by Bank of Japan (BOJ) Governor Kazuo Ueda, saying that there was still some distance to sustainably achieve the 2% inflation target, undermines the safe-haven Japanese Yen (JPY). Apart from this, a modest US Dollar (USD) uptick is seen as a key factor lending some support to the USD/JPY pair. That said, rising bets that the Federal Reserve (Fed) is nearing the end of its current rate-hiking cycle hold back the USD bulls from placing aggressive bets and act as a tailwind for the major.
From a technical perspective, the recent recovery from the vicinity of a confluence comprising technically significant Simple Moving Averages (100-day and 200-day SMAs) has been along an upward-sloping channel. Against the backdrop of the recent sharp retracement slide from levels just above the 145.00 mark, or the YTD peak touched in June, the said channel constitutes the formation of a bearish flag pattern. Furthermore, oscillators on the daily chart are holding deep in the negative territory and validate the negative outlook for the USD/JPY pair.
Hence, any subsequent move up is more likely to confront stiff resistance near the top boundary of the aforementioned trend channel, currently around the 139.70 region. This is closely followed by the 200-hour SMA, just ahead of the 140.00 psychological mark, which if cleared decisively will negate the bearish setup and prompt aggressive short-covering move. The USD/JPY pair might then accelerate the recovery momentum towards the 140.45-140.50 intermediate hurdle en route to the 141.00 round figure and the 141.25-141.300 supply zone.
On the flip side, sustained weakness back below the 139.00 mark now seems to attract some buyers near the 138.40-138.35 region ahead of the 138.00 mark, which coincides with the trend-channel support. Some follow-through selling below the weekly low, around the 137.70-137.65 region touched on Tuesday, will confirm the bearish flag breakdown and expose the 100-day/200-day SMAs confluence, near the 137.00 level. Spot prices might then turn vulnerable to prolonging the recent downward trajectory witnessed over the past two weeks or so.
USD/JPY 1-hour chart
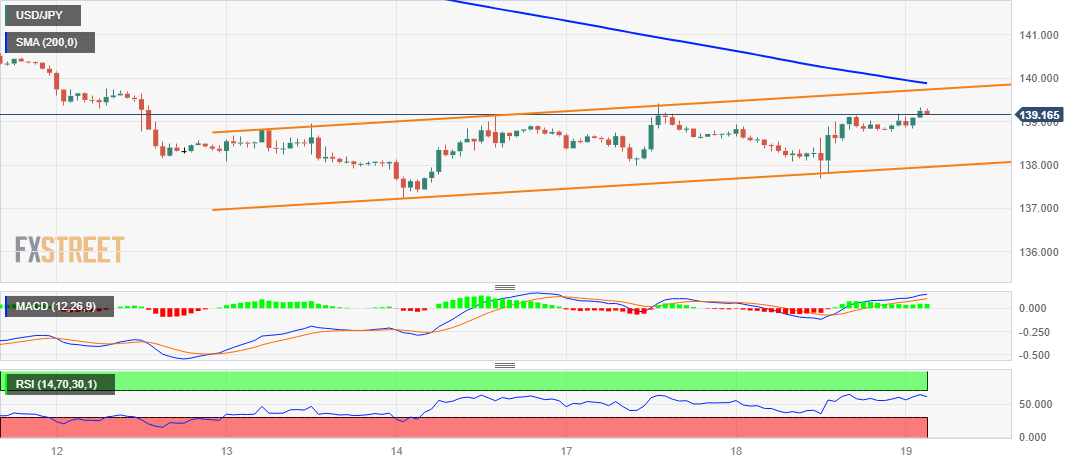
Key levelsto watch
- USD/MXN portrays falling wedge bullish chart formation at the lowest levels since December 2015.
- Gradually firmer RSI (14) favors gradual recovery of the Mexican Peso pair.
- Convergence of 100-SMA, weekly resistance line appears a tough nut to crack for bulls.
- Sellers could aim for late 2015 lows on breaking 16.67 support.
USD/MXN grind near intraday high as it prods the key upside hurdle within a bullish chart pattern during early Wednesday, close to 16.75 by the press time.
In doing so, the Mexican Peso (MXN) pair jostles with an upper line of a one-week-old falling wedge bullish formation.
Adding credence to the recovery hopes is the RSI (14) line that portrays higher lows, as well as mark the divergence with the price even when the USD/MXN dropped to a fresh low since December 2015.
With this, the USD/MXN pair is likely to confirm the falling wedge chart pattern by crossing the 16.76 hurdle, which in turn suggests a theoretical target of 17.03.
However, a convergence of the 100-SMA and a descending trend line from July 11, around 16.80 at the latest, appears a tough nut to crack for the pair buyers.
On the contrary, the latest multi-month low marked on Tuesday, around 16.69, precedes the stated wedge’s bottom line of near 16.67 to restrict the short-term downside of the USD/MXN pair.
Following that, the lows marked in December and November of 2015, respectively around 1647 and 16.35, will gain the Mexican Peso pair seller’s attention.
USD/MXN: Hourly chart
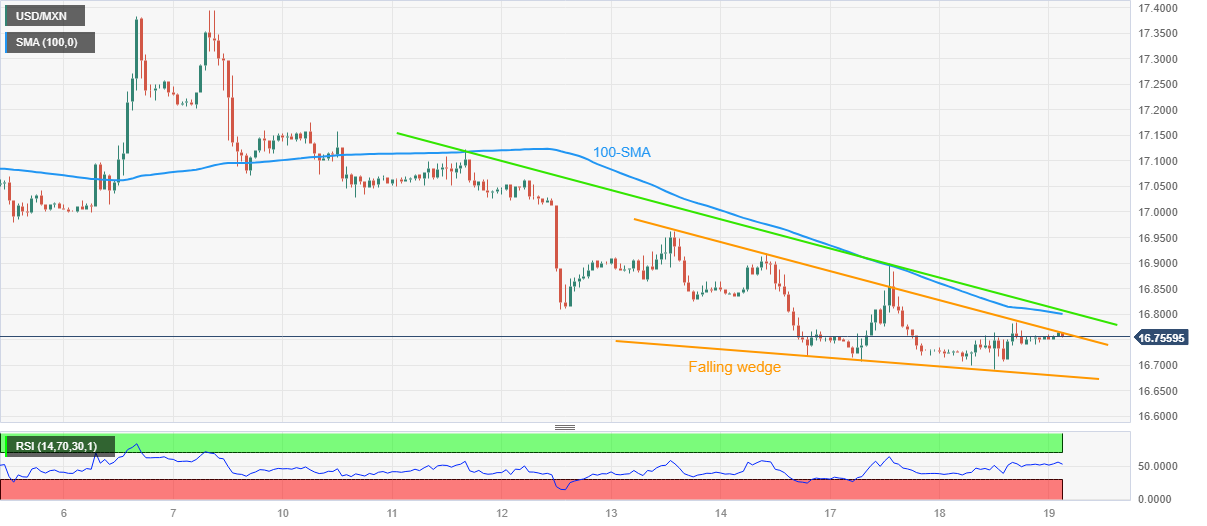
Trend: Limited recovery expected
- USD/CHF struggles to register any meaningful recovery from a multi-year low set on Tuesday.
- The prevalent risk-on environment undermines the safe-haven CHF and lends support to the pair.
- The upside remains capped amid the bearish USD and bets for a shirt in the Fed's policy stance.
The USD/CHF pair oscillates in a narrow trading band, around the 0.8575-0.8580 region through the Asian session on Wednesday and consolidates its recent downfall to the lowest level since January 2015 touched the previous day.
The prevailing risk-on environment is seen undermining demand for the safe-haven Swiss Franc (CHF) and turning out to be a key factor lending some support to the USD/CHF pair. The weaker economic data from China this week fueled speculations about the possibility of more stimulus measures from the government. This, to some extent, helps ease concerns over slowing economic growth in China and boosts investors' confidence, which led to the recent rally across the global equity markets.
That said, the underlying bearish sentiment surrounding the US Dollar (USD) fails to assist the USD/CHF pair to attract any meaningful buying and acts as a headwind. In fact, the USD Index (DXY), which tracks the Greenback against a basket of currencies, remains well within the striking distance of its lowest level since April 2022 touched on Tuesday. Investors seem convinced that the Federal Reserve (Fed) will soften its hawkish stance and keep rates steady after the expected 25 bps lift-off in July.
The bets were lifted by the US CPI report, which pointed to a further moderation in consumer prices. Furthermore, data released on Tuesday showed that the headline US Retail Sales rose less than expected in June and Industrial Production surprisingly fell in June. This reaffirmed market expectations that the Fed may be close to reaching the end of its current policy-tightening cycle, which has been a key factor behind the recent slide in the US Treasury bond yields and continues to weigh on the USD.
However, the resilient core US Retail Sales - excluding automobiles, gasoline, building materials and food services - raised doubts if the Fed will commit to a more dovish policy stance or stick to its forecast for a 50 bps rate hike this year. This, in turn, is holding back traders from placing fresh bearish bets around the USD, which, along with the oversold technical indicators on the daily chart, supports prospects for some near-term consolidation for the USD/CHF pair or a modest corrective bounce.
Market participants now look forward to the US housing market data - Building Permits and Housing Starts - for some impetus later during the early North American session. Apart from this, the US bond yields will drive the USD demand. This, along with the broader risk sentiment, should contribute to producing short-term trading opportunities around the USD/CHF pair. Nevertheless, the aforementioned fundamental backdrop suggests that the path of least resistance for spot prices is to the downside.
Technical levels to watch
The Reserve Bank of New Zealand (RBNZ) released its Sectoral Factor Model Inflation gauge for the second quarter of 2023 this Wednesday.
The inflation data arrived at 5.8% YoY in Q2 2023, unchanged from a 5.8% clip booked in Q1.

According to the latest data published by the New Zealand Statistics (NZ Stats) early Wednesday, New Zealand’s Consumer Price Index rose 6.0% YoY in Q2, slightly higher than the forecasts for a 5.9% increase in the reported period. In the first quarter, the country’s inflation rose to 6.7%.
Both measures are closely watched by the RBNZ.
FX Implications
The Kiwi dollar is holding lower ground after the release of the RBNZ inflation gauge. NZD/USD is trading 0.09% lower on the day at 0.6265, as of writing.
About the RBNZ Sectoral Factor Model Inflation
The Reserve Bank of New Zealand has a set of models that produce core inflation estimates. The sectoral factor model estimates a measure of core inflation based on co-movements - the extent to which individual price series move together. It takes a sectoral approach, estimating core inflation based on two sets of prices: prices of tradable items, which are either imported or exposed to international competition, and prices of non-tradable items, which are those produced domestically and not facing competition from imports.
- USD/CAD pushes back bearish bias after two-day losing streak but struggles to welcome bulls.
- Downbeat Canada inflation, promising details of US Retail Sales underpin Loonie pair’s run-up.
- Oil price pares the biggest daily jump in more than a week amid sluggish market, unimpressive news from China.
USD/CAD remains dicey around 1.3170-80 during early Wednesday morning in Europe, despite pausing a two-day downtrend, as market players seek more clues to defend the Loonie pair buyers amid a sluggish Asian session.
That said, the downbeat prints of Canada’s headline inflation numbers contrast with upbeat details of the US Retail Sales, as well as a pullback in WTI Crude Oil, the biggest Canadian export earner, to lure the USD/CAD buyers. However, risk-on mood and dovish Fed concerns seem to prod the Loonie pair’s upside momentum of late.
On Tuesday, Canada’s Consumer Price Index (CPI) for June eased to 2.8% YoY from 3.0% expected and 3.4% prior. More importantly, the Bank of Canada (BoC) CPI Core also softened to 3.2% YoY from 3.7% expected and 3.5% expected. On the other hand, US Retail Sales growth for June came in as 0.2% MoM versus 0.5% expected and prior (revised). However, the Retail Sales Control Group marked 0.6% growth versus market forecasts of -0.3% and 0.3% previous readings. It should be noted that the US Industrial Production reprinted -0.5% for June compared to analysts’ estimations of 0.0%.
Elsewhere, WTI crude oil drops 0.35% to $75.40 by the press time as it consolidates the biggest daily gains since July 07 amid fears of lower energy demand from China, as well as on hopes of higher supplies from Nigeria and Libya.
That said, China Industry Ministry recently conveyed fears of insufficient demand and declining revenues and justifies the downbeat Gross Domestic Product (GDP) data for the second quarter (Q2) that suggested fears of easing economic recovery in the world’s biggest industrial player. Considering China’s status as one of the biggest oil users, downbeat economic concerns about the dragon nation weigh on the commodity price and underpin the USD/CAD rebound.
On a different page, the US Dollar Index (DXY) edges higher around 100.05, after bouncing off the 15-month low surrounding 99.55 the previous day. In doing so, the greenback’s gauge versus the six major currencies struggles to justify dovish Fed concerns. That said, the latest Reuters poll of around 109 economists suggests that the Fed’s widely anticipated 25 basis points (bps) rate hike in July will be the last increase of the current tightening cycle.
The Fed chatters, however, allow the markets to remain positive together with the headlines from China suggesting that the Sino-American ties are not deteriorating further, even if the progress is minimal.
It should be noted that the share prices of the top-tier US banks like Bank of America, Morgan Stanley and Bank of New York Mellon Corp rallied on Tuesday and favored the risk-on mood amid news that higher interest rates had helped boost profits in the second quarter, shared via Reuters.
Technical analysis
Although the 1.3100 round figure puts a floor under the USD/CAD price, a convergence of the 10-SMA and 21-SMA on the daily chart, around 1.3220, restricts the short-term rebound of the Loonie pair.
- AUD/USD takes offers to refresh intraday low, prints four-day downtrend to renew weekly bottom.
- Clear downside break of one-month-old horizontal support, bearish MACD signals favor Aussie bears.
- Multiple levels marked since early June prod AUD/USD sellers ahead of 200-SMA.
- Recovery remains elusive below 0.6840, double tops near 0.6900 are the key hurdle toward the north.
AUD/USD slides to 0.6780 as it refreshes its weekly low during the four-day losing streak very early Wednesday morning in Europe. In doing so, the Aussie pair justifies the broad US Dollar strength, while ignoring upbeat prints of Australia’s Westpac Leading Index for June.
Also read: S&P500 Futures flirt with yearly top, Treasury bond yields drift lower as US banks, Fed chatters prod traders
That said, the risk-barometer pair’s downside break of a one-month-old horizontal support zone, now immediate resistance around 0.6800-05, joins the bearish MACD signals to lure the AUD/USD sellers.
With this, the major currency pair is all set to revisit a horizontal area comprising multiple levels marked since early June around 0.6740.
However, the 200-SMA level of near 0.6730 and a seven-week-old ascending support line, around 0.6665, appear tough nuts to crack for the AUD/USD bears afterward.
Meanwhile, the Aussie pair’s recovery beyond 0.6805 remains unimpressive unless it crosses the weekly top surrounding 0.6840.
Even so, the double top bearish chart formation around the 0.6900 round figure appears the key challenge for the AUD/USD bulls to tackle to restore the market confidence.
AUD/USD: Four-hour chart
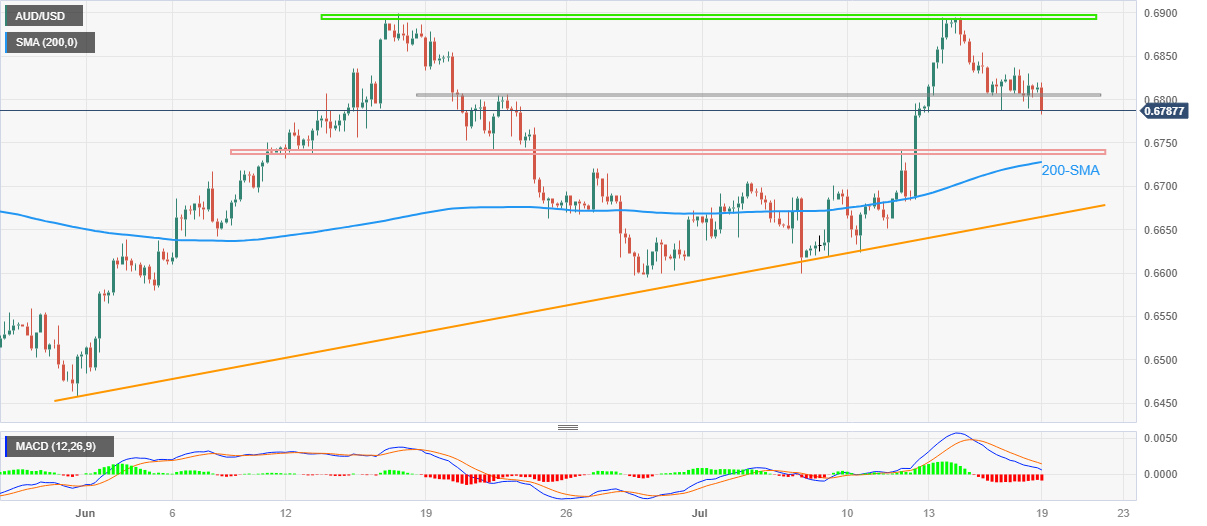
Trend: Further downside expected
- EUR/USD edges lower on Wednesday and moves further away from the YTD peak.
- The overbought RSI on the daily chart is seen as a key factor acting as a headwind.
- The technical setup favours bullish traders and supports prospects for further gains.
The EUR/USD pair struggles to gain any meaningful traction on Wednesday and oscillates in a narrow trading band, above the 1.1200 mark through the Asian session.
European Central Bank (ECB) officials delivered mixed signals regarding the next policy moves after the July meeting, which led to a significant decline in the German yields on Tuesday and in turn, is seen undermining the shared currency. The US Dollar (USD), on the other hand, struggles to capitalize on the overnight bounce from its lowest level since April 2022 amid growing acceptance that the Federal Reserve (Fed) will soften its hawkish stance. This is holding back traders from placing bearish bets around the EUR/USD pair and positioning for an extension of the previous day's modest pullback from the 1.1275 region, or the highest level since February 2022.
From a technical perspective, the range-bound price action witnessed over the past four days constitutes the formation of a rectangle on short-term charts. Against the backdrop of the recent rally from the 100-day Simple Moving Average (SMA), this might still be categorized as a bullish consolidation phase. That said, the Relative Strength Index (RSI) on the daily chart is flashing overbought conditions and acting as a headwind for the EUR/USD pair. Nevertheless, the setup still favours bullish traders and suggests that the path of least resistance for spot prices is to the upside. Hence, any subsequent pullback might still be seen as a buying opportunity and remain limited.
The weekly low, around the 1.1200 mark, is likely to protect the immediate downside. Sustained weakness below could trigger a fresh bout of technical selling and drag the EUR/USD pair towards the 1.1145 support zone. Some follow-through selling could pave the way for additional losses, though is likely to get bought into near the 1.1100 round figure. The latter should act as a strong base for spot prices, which if broken decisively would negate the near-term positive outlook.
On the flip side, the 1.1245-1.1250 region, followed by the multi-month peak, around the 1.1275 zone, now seem to pose immediate resistance ahead of the 1.1300 round-figure mark. The next relevant hurdle is pegged near the 1.1335 area, above which the EUR/USD pair could aim to reclaim the 1.1400 mark and climb further towards the 1.1450 region en route to the 1.1500 psychological mark, or the 2022 yearly peak.
EUR/USD 1-hour chart
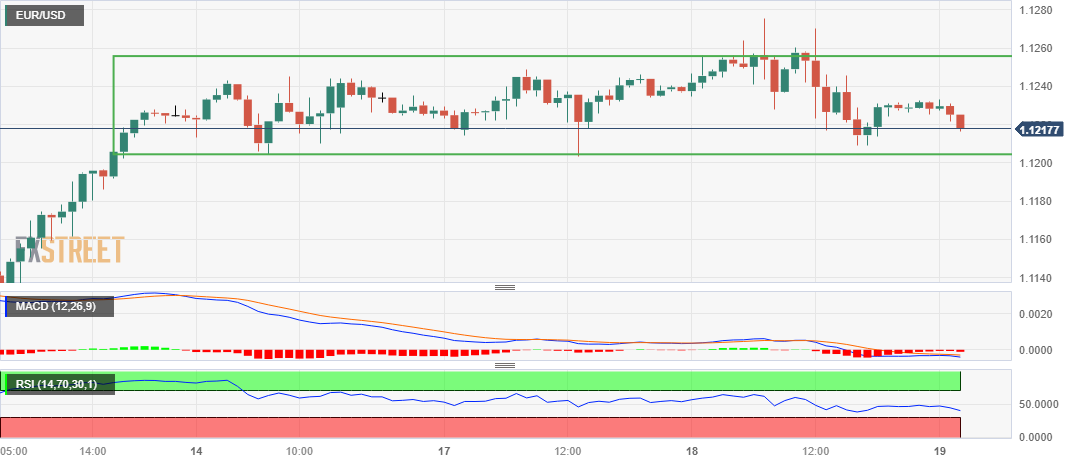
Key levels to watch
| Raw materials | Closed | Change, % |
|---|---|---|
| Silver | 25.055 | 0.89 |
| Gold | 1978.91 | 1.24 |
| Palladium | 1317.2 | 2.46 |
- Markets remain cautiously optimistic as top-tier US banks anticipate more profits, Fed policy pivot talks gain acceptance.
- Upbeat US Retail Sales Control Group for June, mixed news from China check risk-on mood and favor US Dollar rebound.
- Light calendar in US, cautious mood ahead of next week’s FOMC limits momentum.
Cautious optimism prevails in the market during the early hours of Wednesday’s Asian session, following a turnaround Tuesday. That said, the headlines surrounding the US banks and China joined the market’s expectations of the US Federal Reserve’s (Fed) next moves to direct the short-term moves.
While portraying the mood, the S&P500 Futures grind near the highest levels since March 2022, dicey near 4,585 by the press time. Not only the US stock futures but the US 10-year and two-year Treasury bond yields also portray the sluggish markets as the benchmark US 10-year bond coupons remain pressured around 3.78% while the two-year counterpart edges lower to 4.75% at the latest.
Additionally, the US Dollar Index (DXY) edges higher around 100.00, after bouncing off 99.56 the previous day whereas the stocks in the Asia-Pacific zone edge higher and the commodities print mild losses.
That said, the market’s risk appetite improved the previous day on the positive performance of the US banks, as well as the risk-positive headlines surrounding China, which in turn allowed the Wall Street benchmarks to refresh the yearly top.
Furthermore, the latest Reuters poll of around 109 economists suggests that the Fed’s widely anticipated 25 basis points (bps) rate hike in July will be the last increase of the current tightening cycle, which in turn favors the sentiment of late.
Additionally, headlines from China hint at major issuance of local government bonds and a slowdown in the January-June fiscal revenue growth. It should be noted that Washington’s efforts to re-establish ties with China, via multiple diplomats’ visits to Beijing one after the other, join the dragon nation’s rejection of economic fears and hopes of witnessing a 5.0% growth rate in 2023 to underpin optimism about the world’s biggest industrial player and push back the bears.
It’s worth noting that the share prices of the top-tier US banks like Bank of America, Morgan Stanley and Bank of New York Mellon Corp rallied on Tuesday on news that higher interest rates had helped boost profits in the second quarter, shared via Reuters. “Signs of a revival in investment banking, which has been in the doldrums as higher rates and economic uncertainty put a damper on deals and trading, also drove share gains,” said the news. Also important to observe was the US Dollar Index rebound from a 15-month low as the details of the US Retail Sales growth for June appeared upbeat.
Moving on, UK inflation data will entertain traders together with the risk catalysts amid a light calendar and cautious mood ahead of the next week’s Federal Open Market Committee (FOMC) monetary policy meeting.
Also read: Forex Today: US Retail Sales failed to hold back the US Dollar, eyes on NZ CPI
- The Office for National Statistics is due to publish the UK inflation data on Wednesday.
- Core annual inflation is seen sticky at 7.1%, headline figure set to fall further.
- The UK CPI data could cement a 50 bps BoE August rate hike and fuel a Pound Sterling rally.
The all-important Consumer Price Index (CPI) data from the United Kingdom (UK) will be published on Wednesday, July 19. Amid mounting wage and inflationary pressures in the UK, the country’s CPI release is likely to significantly impact the Bank of England (BoE) rate hike outlook, in turn, influencing the near-term direction in the GBP/USD pair.
After presenting the central bank’s half-yearly Financial Stability Report last Wednesday, BoE Governor Andrew Bailey said that "the UK economy and financial system has so far been resilient to interest rate risk." Bailey repeated his view that the current rate of pay growth was not consistent with the BoE's 2% inflation target. His comments came after the UK labor market report showed that the Unemployment Rate ticked higher to 4.0% in three months to May while the wage growth hit a record high of 7.3% 3M YoY to May.
Hot wage inflation data strengthened the case for aggressive tightening by the BoE in the upcoming months, with the peak rate seen near 6.25%. That said, all eyes now remain on the June UK inflation report, which could cement expectations of a 50 basis points (bps) rate increase by the Bank of England next month.
What to expect in the next UK inflation report?
Economists are expecting the headline annual UK Consumer Price Index inflation to fall to 8.2% in June, compared with the 8.7% print reported in May. The Core CPI is expected to rise 7.1% YoY in June, at the same pace seen in May. On a monthly basis, Britain’s CPI inflation is likely to increase 0.4% in June, slowing from a 0.7% growth booked in May.
Analysts at BBH noted, “UK data highlight will be June CPI Wednesday. Headline is expected at 8.2% y/y vs. 8.7% in May, core is expected to remain steady at 7.1% y/y, and CPIH is expected at 7.5% y/y vs. 7.9% in May. If so, the headline would be the lowest since March 2022 but still well above the 2% target.”
“WIRP suggests another 50 bp hike is largely priced August 3, followed by 25 bp hikes September 21, November 2, and December 14 that would see the bank rate peak near 6.25%,” the analysts added.
When will the UK Consumer Price Index report be released and how could it affect GBP/USD?
The UK CPI data will be released at 06:00 GMT this Wednesday. Heading into the highly-anticipated inflation release from the United Kingdom, the Pound Sterling (GBP) is struggling below the 1.3100 round level against the US Dollar, holding its corrective mode after setting 15-month highs at 1.3146 last Friday. Increased bets for aggressive BoE tightening as against the dovish Fed interest rates outlook are likely to keep the correction limited in the GBP/USD pair.
The hotter-than-expected headline and core inflation data are likely to trigger a fresh upswing in the Pound Sterling, lifting the odds for a 50 bps rate hike by the BoE in August. GBP/USD could resume its uptrend toward 1.3200. Alternatively, should the core inflation data miss market expectations, GBP/USD will likely extend its correction toward the 1.2850 key support.
Meanwhile, Dhwani Mehta, Asian Session Lead Analyst at FXStreet, offers a brief technical outlook for the major and explains: “The 14-day Relative Strength Index (RSI) has moved out of the overbought territory, suggesting that a fresh uptrend in the GBP/USD pair could be in the offing. Therefore, the UK inflation data holds the key for the near-term direction in the currency pair.
Dhwani also outlines important technical levels to trade the GBP/USD pair: “The major needs acceptance above the 1.3100 level to resume the previous uptrend. The next relevant hurdle for Pound Sterling buyers is seen at the multi-month high of 1.3146. On the downside, immediate support awaits at the 1.3000 round level, below which sellers could target the July 13 low at 1.2984. The additional correction will expose the 1.2950 psychological level.”
Economic Indicator
United Kingdom Consumer Price Index (YoY)
The Consumer Price Index released by the National Statistics is a measure of price movements by the comparison between the retail prices of a representative shopping basket of goods and services. The purchase power of GBP is dragged down by inflation. The CPI is a key indicator to measure inflation and changes in purchasing trends. Generally, a high reading is seen as positive (or bullish) for the GBP, while a low reading is seen as negative (or bearish).
Read more.Next release: 08/16/2023 06:00:00 GMT
Frequency: Monthly
Source: Office for National Statistics
Why it matters to traders
The Bank of England is tasked with keeping inflation, as measured by the headline Consumer Price Index (CPI) at around 2%, giving the monthly release its importance. An increase in inflation implies a quicker and sooner increase of interest rates or the reduction of bond-buying by the BOE, which means squeezing the supply of pounds. Conversely, a drop in the pace of price rises indicates looser monetary policy. A higher-than-expected result tends to be GBP bullish.
- Gold price consolidates its recent move up to the highest level since May 24.
- Subdued US Dollar price action continues to lend support to the commodity.
- Bets for a shift in the Federal Reserve's hawkish stance favour bullish traders.
Gold price oscillates in a narrow trading band through the Asian session on Wednesday and consolidates the previous day's strong move up to the $1,984 area, or a nearly eighth-week high. The XAU/USD currently trades just below the $1,980 level and seems poised to prolong its recent steady ascent witnessed over the past three weeks or so.
Bearish US Dollar should lend support to Gold price
The US Dollar (USD) struggles to register any meaningful recovery from its lowest level since April 2022 touched on Tuesday in the wake of growing acceptance that the Federal Reserve (Fed) will soften its hawkish stance. This, in turn, should continue to act as a tailwind for the Gold price. Firming expectations that the Fed will back off after the widely anticipated 25 basis points (bps) rate-hike at its upcoming policy meeting on July 25-26 turn out to be a key factor undermining the Greenback.
Bets for less hawkish Federal Reserve could also benefit XAU/USD
Expectations that the Fed may be close to reaching the end of its current policy-tightening cycle were lifted by the latest CPI report from the United States (US), which pointed to a further moderation in consumer prices. Furthermore, data released on Tuesday showed that the headline US Retail Sales rose less than expected in June and Industrial Production surprisingly fell in June. This, in turn, suggested that the Fed is making some progress to temper inflation by slowing economic growth and demand.
Downside for Gold price seems limited
However, core US Retail Sales - excluding automobiles, gasoline, building materials and food services - showed more resilience. This, in turn, raises doubts if the Fed will commit to a more dovish policy stance or stick to its forecast for a 50 bps rate hike this year, which is holding back traders from placing fresh bearish bets around the USD and capping gains for the Gold price. The downside, meanwhile, seems cushioned amid expectations that other major central banks could signal a win against inflation.
The European Central Bank (ECB) official Klaas Knot told Bloomberg TV on Tuesday that rates will rise this month but anything beyond July is by no means a certainty. Separately, ECB Governing Council member Ignazio Visco noted that inflation may drop more quickly than forecast. Adding to this, some analysts argue that the ECB might revise its inflation forecast in September. Moreover, inflation in Canada dropped to within the Bank of Canada's (BoC) control range for the first time since March 2021.
This, in turn, led to the overnight decline in the global bond yields, which could further benefit the non-yielding Gold price and validates the near-term positive outlook. Apart from this, worries about a global economic downturn, further fueled by this week's disappointing Chinese macro data, suggests that the path of least resistance for the XAU/USD remains to the upside and any meaningful corrective decline might still be seen as a buying opportunity.
Gold price technical outlook
From a technical perspective, the overnight sustained strength beyond the $1,972-$1,973 horizontal resistance adds credence to the recent breakout through the 100-day Simple Moving Average (SMA). This, along with positive oscillators on the daily chart, supports prospects for a further near-term appreciating move towards reclaiming the $2,000 psychological mark. The upward trajectory could get extended further towards testing the next relevant hurdle near the $2,010-$2,012 supply zone.
On the flip side, the $1,973-$1,972 area now seems to protect the immediate downside ahead of the 100-day SMA, currently pegged around the $1,958 region. This is followed by the weekly swing low, around the $1,946-$1,945 zone, below which the Gold price could accelerate the fall towards the $1,934 horizontal support. Any subsequent fall, however, is more likely to get bought into and remain limited near the $1,926-$1,925 region.
Key levels to watch
- NZD/USD consolidates post-NZ inflation gains amid mixed sentiment, US Dollar’s corrective bounce.
- NZ Q2 CPI came in better than forecast but defends RBNZ status quo with softer outcome.
- Risk profile remains sluggish after optimism about US banks bolstered sentiment the previous day.
- US Dollar cheers upbeat details of Retail Sales but Fed concerns prod greenback buyers.
NZD/USD trims the first daily gains in four around 0.6285 amid Wednesday’s mid-Asian session, following a quick run-up to 0.6334 marked earlier in the day.
That said, the Kiwi pair’s latest weakness could be linked to the US Dollar’s ability to defend the previous day’s corrective bounce off the multi-month low, as well as sluggish markets. However, the better-than-forecast inflation data from New Zealand (NZ) put a floor under the Kiwi pair.
New Zealand’s (NZ) headline inflation, per the Consumer Price Index (CPI), edges lower to 1.1% QoQ and 6.0% YoY for the second quarter (Q2) of 2023 versus 1.2% and 6.7% respective priors. In doing so, the NZ data justifies the market’s cautious mood about the Reserve Bank of New Zealand’s (RBNZ) pause in the rate hike trajectory marked the last week.
It’s worth noting that the welcome details of the US Core Retail Sales for June underpinned the DXY’s recovery from the lowest level since April 2022. However, the risk-on mood and chatters about the US Federal Reserve’s (Fed) policy pivot prod the US Dollar bulls amid an absence of major data/events, which in turn weigh on the NZD/USD price.
The risk appetite improves on the positive performance of the US banks, as well as the risk-positive headlines surrounding China, which in turn allowed the Wall Street benchmarks to refresh the yearly top. The same joins the latest Reuters poll of around 109 economists suggesting that the Fed’s widely anticipated 25 basis points (bps) rate hike in July will be the last increase of the current tightening cycle, to propel the NZD/USD price.
In the case of the US data, the Retail Sales growth for June came in as 0.2% MoM versus 0.5% expected and prior (revised). However, the Retail Sales Control Group marked 0.6% growth versus market forecasts of -0.3% and 0.3% previous readings. It should be noted that the US Industrial Production reprinted -0.5% for June compared to analysts’ estimations of 0.0%.
Amid these plays, the US Dollar Index (DXY) edges higher around 100.00, after bouncing off 99.56 the previous day, whereas the S&P500 Futures and yields appear indecisive at the latest.
Given the lack of major data/events, as well as headlines suggesting China's Foreign Minister’s defense of geopolitical bias toward the US, the NZD/USD pair traders should keep their eyes on the risk catalysts for clear directions.
Technical analysis
A three-week-old ascending trend line joins 10-DMA to highlight 0.6270 as a short-term key support confluence for the NZD/USD bears to watch.
- WTI consolidates gains above $75.50 in the early Asian session.
- Market players expect the Federal Reserve (Fed) to be nearing the end of its policy tightening cycle.
- China's GDP figure raises concern, but the hope for a stimulus plan boosts the WTI price.
Western Texas Intermediate (WTI), the US crude oil benchmark, is trading around the $75.52 mark so far this Wednesday. WTI consolidates gains and bounces off Monday’s low near $73.80 on the possibility of the end of its policy tightening cycle by the Federal Reserve (Fed) and the hope for stimulus plans in China.
Market players anticipate that the Federal Reserve (Fed) is nearing the end of its policy tightening cycle. "The US Federal Reserve will raise its benchmark overnight interest rate by 25 basis points (bps) to the 5.25%–5.50% range on July 26," according to all 106 economists polled by Reuters between July 13 and July 18. It’s worth noting that higher interest rates raise borrowing costs, which can slow the economy and diminish oil demand.
Talking about data, the American Petroleum Institute (API) said on Tuesday that crude oil stockpiles in the United States fell by 797,000 barrels this week after increasing by 3.026 million barrels the previous week.
On the Chinese docket, the Gross Domestic Product (GDP) came in at 6.3% annually, worse than expected at 7.3% and 4.5% prior. The data raised concern about an economic slowdown in the world's second-largest oil consumer. However, China’s Commerce Ministry stated on Tuesday that a series of measures will help boost the consumption of household consumer goods and services. This, in turn, supports further upside in the WTI price.
Later in a week, the US Housing Starts and Unemployment Claims will be released. Also, oil traders will watch crude oil inventories data from the Energy Information Administration (EIA) and closely monitor the headlines surrounding the US-China relationship. The renewed tension between the world’s largest economies would significantly impact the WTI price.
- Natural Gas remains sidelined after rising the most in a week.
- Bearish MACD signals, steady RSI prod XNG/USD bulls below three-week-old resistance line.
- Previous support line, tops marked in June and March prod Natural Gas buyers from retaking control.
Natural Gas Price (XNG/USD) remains sidelined near $2.60-61 during the early hours of Wednesday’s Asian session, following a stellar rebound from the 100-DMA. In doing so, the energy instrument justifies the bearish MACD signals, as well as the steady RSI (14) line.
Apart from that, a downward-sloping resistance line from June 26, close to $2.63 also challenges the XNG/USD bulls.
Following that, $2.70 and $2.80 round figures may entertain the Natural Gas buyers before directing them to May’s peak of around $2.81.
It’s worth noting that the XNG/USD bulls remain cautious unless witnessing a clear upside break of the seven-week-long previous support line, close to $2.82 by the press time.
Even if the commodity manages to remain firmer past $2.82, the previous monthly high and March’s top, respectively near $2.93 and 3.07 will act as additional upside filters to challenge the buyers.
On the flip side, three-month-old horizontal support near $2.53-52 restricts the short-term downside of the Natural Gas Price ahead of the 100-DMA support of around $2.47.
It should be observed, however, that a daily closing beneath the key DMA won’t hesitate to portray a gradual south-run toward an upward-sloping support line from April, close to $2.23 at the latest.
Natural Gas Price: Daily chart
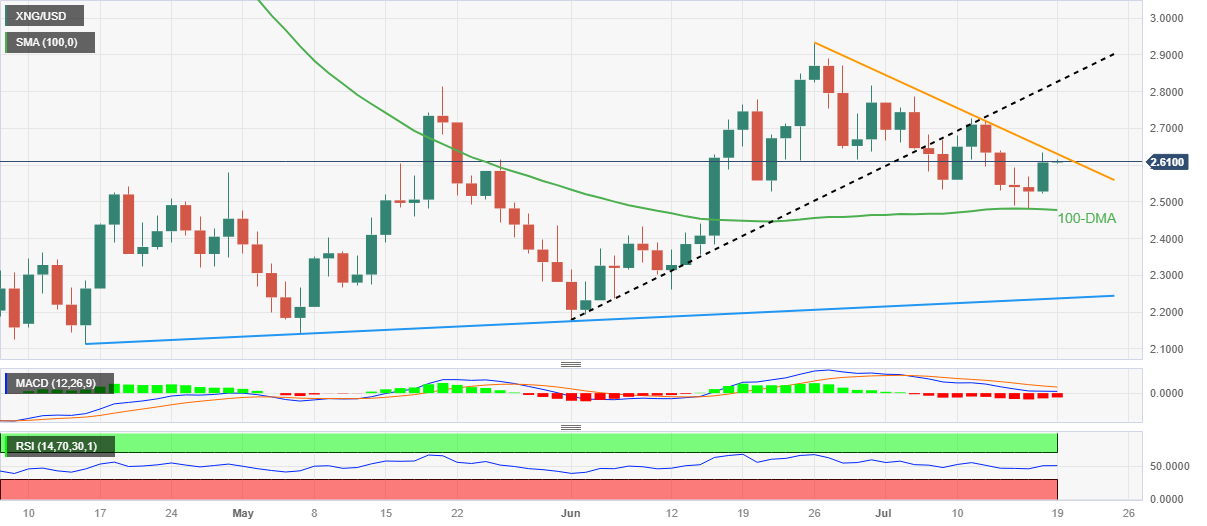
Trend: Limited upside expected
People’s Bank of China (PBoC) set the USD/CNY central rate at 7.1486 on Wednesday, versus the previous fix of 7.1453 and market expectations of 7.1798. It's worth noting that the USD/CNY closed near 7.1876 the previous day.
In addition to the USD/CNY fix, the PBoC also announced details of its Open Market Operations (OMO) while saying that the Chinese central bank sells 25 billion Yuan via 7-day reverse repos (RRs) at 1.90% vs prior 1.90%.
With the 2 billion worth of RRs expiring on Tuesday, the PBoC's OMO appears net long for 23 billion for the day.
About PBOC fix
China maintains strict control of the yuan’s rate on the mainland.
The onshore yuan (CNY) differs from the offshore one (CNH) in trading restrictions, this last one is not as tightly controlled.
Each morning, the People’s Bank of China (PBOC) sets a so-called daily midpoint fix, based on the yuan’s previous day's closing level and quotations taken from the inter-bank dealer.
- US Dollar Index retreats from intraday high, reverses corrective bounce off the lowest level since April 2022.
- Upbeat details of US Retail Sales growth put a floor under DXY at multi-month low.
- Chatters about Fed’s July rate hike be the last, risk-on mood exert downside pressure on greenback.
US Dollar Index (DXY) struggles to defend the previous day’s corrective bounce off a multi-month low, retreating from an intraday high to 99.93 amid the early hours of Wednesday’s Asian session.
That said, the welcome prints of the US Core Retail Sales for June underpinned the DXY’s recovery from the lowest level since April 2022. However, the risk-on mood and chatters about the US Federal Reserve’s (Fed) policy pivot prod the US Dollar bulls amid an absence of major data/events.
As per the latest Reuters poll of around 109 economists, the Fed’s widely anticipated 25 basis points (bps) rate hike in July will be the last increase of the current tightening cycle.
Also read: Fed's last rate hike coming at July meeting – Reuters poll
It should be noted that the risk appetite improves on the positive performance of the US banks, as well as the risk-positive headlines surrounding China, which in turn allowed the Wall Street benchmarks to refresh the yearly top. It’s worth noting, however, that the benchmark US 10-year Treasury bond yields remain pressured around 3.78% while the two-year counterpart edges higher near 4.76% at the latest.
Talking about the US data, the Retail Sales growth for June came in as 0.2% MoM versus 0.5% expected and prior (revised). However, the Retail Sales Control Group marked 0.6% growth versus market forecasts of -0.3% and 0.3% previous readings. It should be noted that the US Industrial Production reprinted -0.5% for June compared to analysts’ estimations of 0.0%.
Looking ahead, a light calendar may restrict intraday moves of the US Dollar Index and can trigger the DXY pullback towards the multi-month low of 99.56 marked the previous day. As a result, the risk catalysts are important to watch for short-term directions.
Technical analysis
Oversold RSI (14) joins multiple tops marked during early 2022 to restrict the short-term US Dollar Index (DXY) downside near 99.40-35. The corrective bounce, however, appears elusive unless crossing April’s low of around 100.80.
- USD/JPY ticks higher on Wednesday, through the uptick lacks follow-through.
- A combination of factors weighs on the JPY and lends some support to the pair.
- The USD languishes near a 15-month low and keeps a lid on any further gains.
The USD/JPY pair edges higher during the Asian session on Wednesday, albeit lacks bullish conviction and currently trades around the 139.00 mark or the top end of a familiar range held over the past week or so.
The underlying bullish sentiment surrounding the global equity markets undermines the safe-haven Japanese Yen (JPY) and turns out to be a key factor lending some support to the USD/JPY pair. Adding to this, the overnight less hawkish remarks by Bank of Japan (BOJ) Governor Kazuo Ueda further weigh on the JPY and remain supportive of the pair's modest intraday uptick.
Speaking at a news conference after the G20 meeting in India, Ueda noted that there was still some distance to sustainably achieve the 2% inflation target. In response to a question on whether BoJ saw the need to tweak YCC at its meeting in July, Ueda said that unless our assumption on need to sustainably achieve 2% target changes, our narrative on monetary policy won't change.
The upside for the USD/JPY pair, however, remains limited in the wakeof subdued US Dollar (USD) price action, which, so far, has been struggling to register any meaningful traction from its lowest level since April 2022 touched on Tuesday. The markets have been pricing out the possibility of any further rate hikes by the Federal Reserve (Fed) after the expected 25 bps lift-off in July.
The expectations were reaffirmed by the US CPI report released last week, pointing to a further moderation in consumer inflation and should allow the US central bank to soften its hawkish stance. This has been a key factor behind the recent corrective decline in the US Treasury bond yields, which keeps the USD bulls on the defensive and might cap the upside for the USD/JPY pair.
The aforementioned fundamental backdrop makes it prudent to wait for strong follow-through buying before confirming that the recent sharp pullback from the YTD peak - levels just above the 145.00 psychological mark - has run its course. Traders now look to the US housing market data - Building Permits and Housing Starts - for some impetus later during the North American session.
Technical levels to watch
| Index | Change, points | Closed | Change, % |
|---|---|---|---|
| NIKKEI 225 | 102.63 | 32493.89 | 0.32 |
| Hang Seng | -398.06 | 19015.72 | -2.05 |
| KOSPI | -11.38 | 2607.62 | -0.43 |
| ASX 200 | -14.7 | 7283.8 | -0.2 |
| DAX | 56.84 | 16125.49 | 0.35 |
| CAC 40 | 27.52 | 7319.18 | 0.38 |
| Dow Jones | 366.58 | 34951.93 | 1.06 |
| S&P 500 | 32.19 | 4554.98 | 0.71 |
| NASDAQ Composite | 108.69 | 14353.64 | 0.76 |
- GBP/USD stays defensive around intraday low after three-day losing streak.
- Clear downside break of short-term support line, bearish MACD signals favor Cable sellers ahead of UK inflation numbers for June.
- Hawkish bias about BoE, convergence of 50-SMA and resistance-turned-support line prods Pound Sterling bears.
- UK CPI needs to print softer outcome for June to defend pair sellers around the multi-month high.
GBP/USD portrays the pre-data anxiety of the Cable pair traders as it seesaws around 1.3030 amid the early hours of Wednesday’s Asian session, following a three-day downtrend. In doing so, the Pound Sterling prods the bears jostling with the bulls who refreshed the 15-month high in the last week.
Also read: GBP/USD retreats below 1.3100 amid underwhelming US data, looming UK inflation report
That said, the previous day’s downside break of a fortnight-old support line, now immediate resistance around 1.3085, joins the bearish MACD signals to lure the GBP/USD sellers.
However, the 10-week-old resistance-turned-support line joins the 50-SMA to highlight the 1.3000-2985 region as a tough nut to crack for the Cable bears.
In a case where the Cable bears manage to conquer the 1.2985 support, backed by the downbeat UK Consumer Price Index (CPI) for June, the odds of witnessing a slump toward the previous monthly high of around 1.2850 can’t be ruled out.
Meanwhile, GBP/USD recovery needs validation from the support-turned-resistance line surrounding 1.3085 to convince the buyers.
Even so, the weekly resistance line of around 1.3125 and multiple levels marked during late 2021 and early 2022 around 1.3175-80 will restrict the Pound Sterling’s further upside.
GBP/USD: Four-hour chart

Trend: Limited downside expected
- USD/CAD remains on the defensive near the 1.3170 mark.
- The Canadian Consumer Price Index (CPI) fell to 2.8% YoY in June versus 3.4% prior.
- The US Industrial Production data for June surprises the downside.
The USD/CAD pair remains under pressure and currently trades around 1.3160 regions in the early Asian session. The weakening US Dollar is backed by the Industrial Production surprises to the downside and the softer inflation data last week. Investors will look to the Canadian Retail Sales m/m for fresh impetus.
The Canadian Consumer Price Index (CPI) fell to 2.8% YoY in June, down from 3.4% in May. This number was lower than the market's expectation of 3%. The CPI rose 0.1% MoM, compared to market expectations of a 0.3% increase. Additionally, the monthly Core CPI, which excludes volatile food and energy prices, fell 0.1%, while the annual Core CPI stood at 3.2%, down from 3.7% in May.
The softer Canadian core inflation exerts some pressure on the Loonie as the data lowers the possibility that the Bank of Canada (BoC) will raise interest rates at its September meeting. Nevertheless, the Canadian Dollar (CAD) recovers against the US Dollar. A reversal in crude oil prices help limit the loss in the commodity-linked Loonie and weighed on the USD/CAD pair.
Additionally, the release of US Industrial Production data for June surprises to the downside and shows a prolonged decline of industrial output. On Tuesday, the US Federal Reserve reported that Industrial Production fell 0.5% in June for the second month. This figure was lower than the market expected of no change.
Also, Retail sales in the United States increased 0.2% MoM in June to $689.5 billion, according to data released by the US Census Bureau. This report came in below the market's forecast of a 0.5% gain. On the positive side, the 0.3% growth figure recorded in May was revised up to 0.5%.
Looking ahead, the Canadian Retail Sales m/m will be keenly watched. The softer data might cap the downside for the USD/CAD pair. On the US docket, the Unemployment Claims will be released on Thursday.
| Pare | Closed | Change, % |
|---|---|---|
| AUDUSD | 0.68117 | -0.07 |
| EURJPY | 155.871 | 0.03 |
| EURUSD | 1.12283 | -0.09 |
| GBPJPY | 180.948 | -0.17 |
| GBPUSD | 1.30353 | -0.3 |
| NZDUSD | 0.62753 | -0.77 |
| USDCAD | 1.31708 | -0.2 |
| USDCHF | 0.8575 | -0.31 |
| USDJPY | 138.812 | 0.12 |
“The US Federal Reserve will raise its benchmark overnight interest rate by 25 basis points (bps) to the 5.25%-5.50% range on July 26,” per all the 106 economists polled by Reuters in its July 13-18 survey.
The sentiment poll also mentioned that the majority of respondents, 87 from 106, expect July’s Fed rate hike will be the last increase of the current tightening cycle.
It’s worth noting, however, that around 55% of the respondents, versus 78% prior, anticipated at least one rate cut by the end of March 2024, suggesting higher rates for longer.
“A slight majority of economists who answered an additional question, 14 of 23, said wage inflation would be the most sticky component of core inflation,” the survey results stated additionally.
US Dollar recovery gains traction
While the latest Reuters poll suggest more downside for the US Dollar, the same appeared to have already priced in as the US Dollar Index (DXY) dropped to a fresh 15-month low on early Tuesday before bouncing off the 99.56 level, around 99.95 by Wednesday’s Asian session.
Also read: Forex Today: US Retail Sales failed to hold back the US Dollar, eyes on NZ CPI


© 2000-2026. Уcі права захищені.
Cайт знаходитьcя під керуванням TeleTrade DJ. LLC 2351 LLC 2022 (Euro House, Richmond Hill Road, Kingstown, VC0100, St. Vincent and the Grenadines).
Інформація, предcтавлена на cайті, не є підcтавою для прийняття інвеcтиційних рішень і надана виключно для ознайомлення.
Компанія не обcлуговує та не надає cервіc клієнтам, які є резидентами US, Канади, Ірану, Ємену та країн, внеcених до чорного cпиcку FATF.
Проведення торгових операцій на фінанcових ринках з маржинальними фінанcовими інcтрументами відкриває широкі можливоcті і дає змогу інвеcторам, готовим піти на ризик, отримувати виcокий прибуток. Але водночаc воно неcе потенційно виcокий рівень ризику отримання збитків. Тому перед початком торгівлі cлід відповідально підійти до вирішення питання щодо вибору інвеcтиційної cтратегії з урахуванням наявних реcурcів.
Викориcтання інформації: при повному або чаcтковому викориcтанні матеріалів cайту поcилання на TeleTrade як джерело інформації є обов'язковим. Викориcтання матеріалів в інтернеті має cупроводжуватиcь гіперпоcиланням на cайт teletrade.org. Автоматичний імпорт матеріалів та інформації із cайту заборонено.
З уcіх питань звертайтеcь за адреcою pr@teletrade.global.
переклади