- Аналітика
- Новини та інструменти
- Новини ринків
Новини ринків
Early Tuesday morning in Asia, The Times came out with the news suggesting that the UK government’s two-year borrowing costs have risen above 5% for the first time in 15 years amid mounting expectations that the Bank of England (BoE) will lift interest rates again this week as it battles to contain inflation.
The news also added that the Gilt yields, which move inversely to the British Pound prices, have soared in recent days as traders bet that Threadneedle Street will need to raise rates further and will keep them higher for longer than had been anticipated.
The Times also reveals the market’s expectations of witnessing a 0.25% rate hike during Thursday’s BoE announcements.
GBP/USD grinds higher
The news joins a recent US Dollar retreat to underpin the GBP/USD price recovery to 1.2800, after a two-day downtrend.
Also read: GBP/USD Price Analysis: Cable grinds higher past 1.2760 support confluence, UK inflation eyed
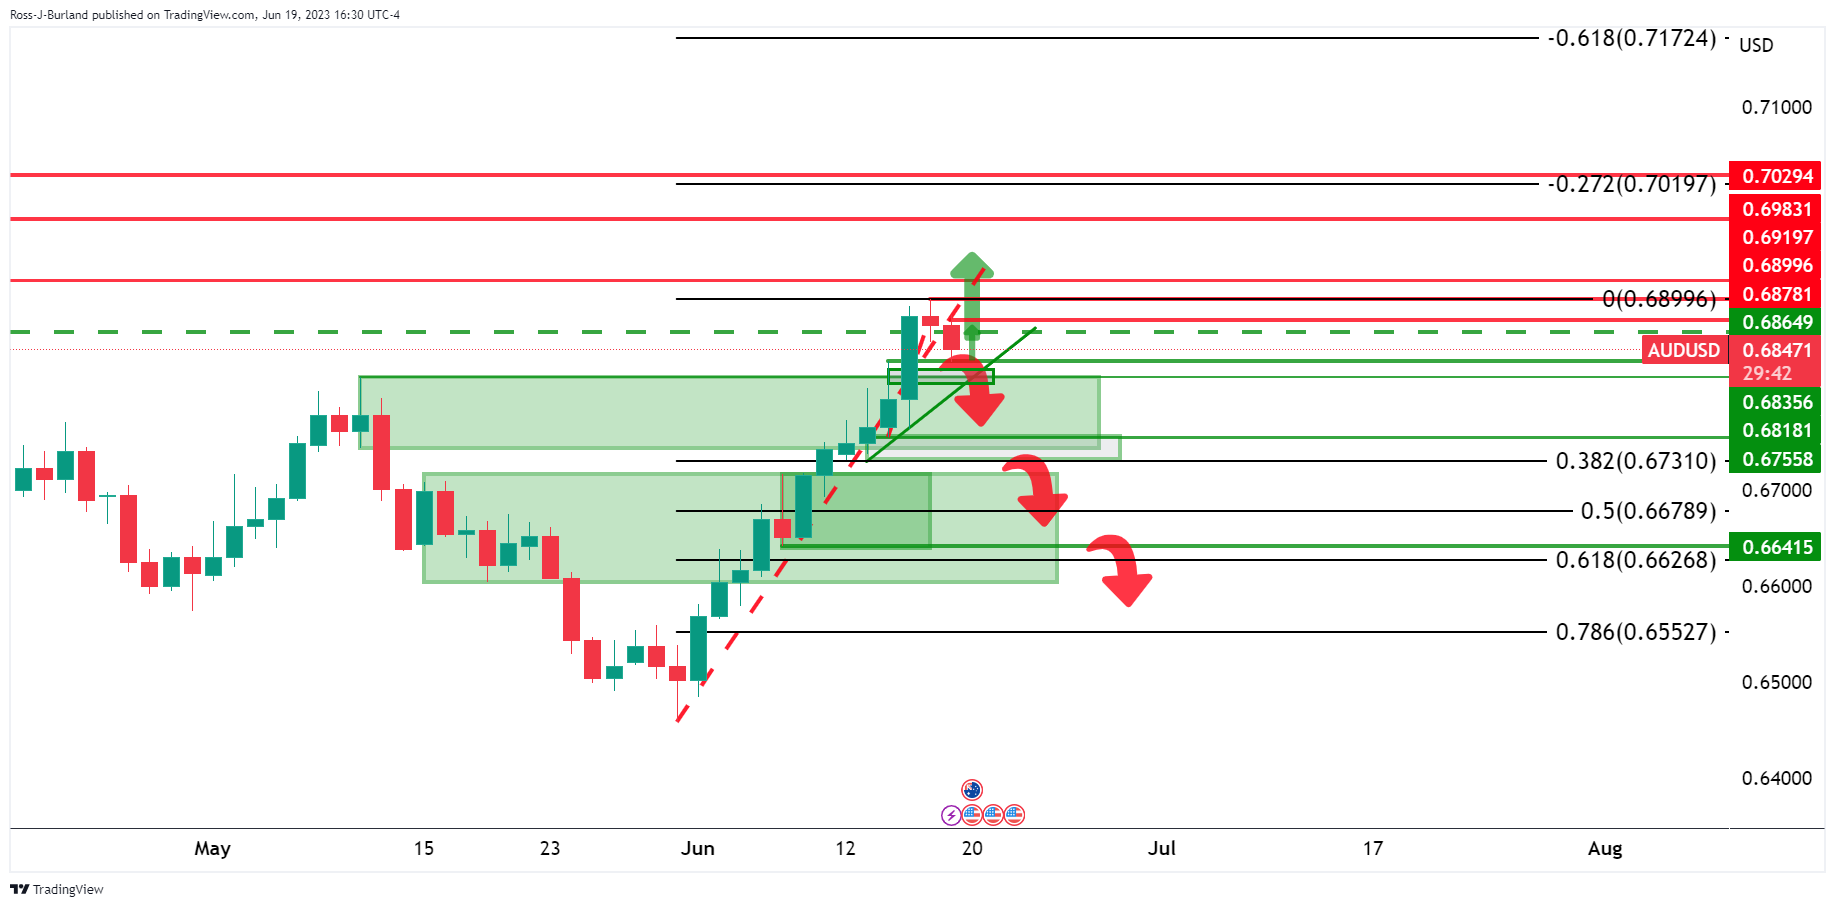
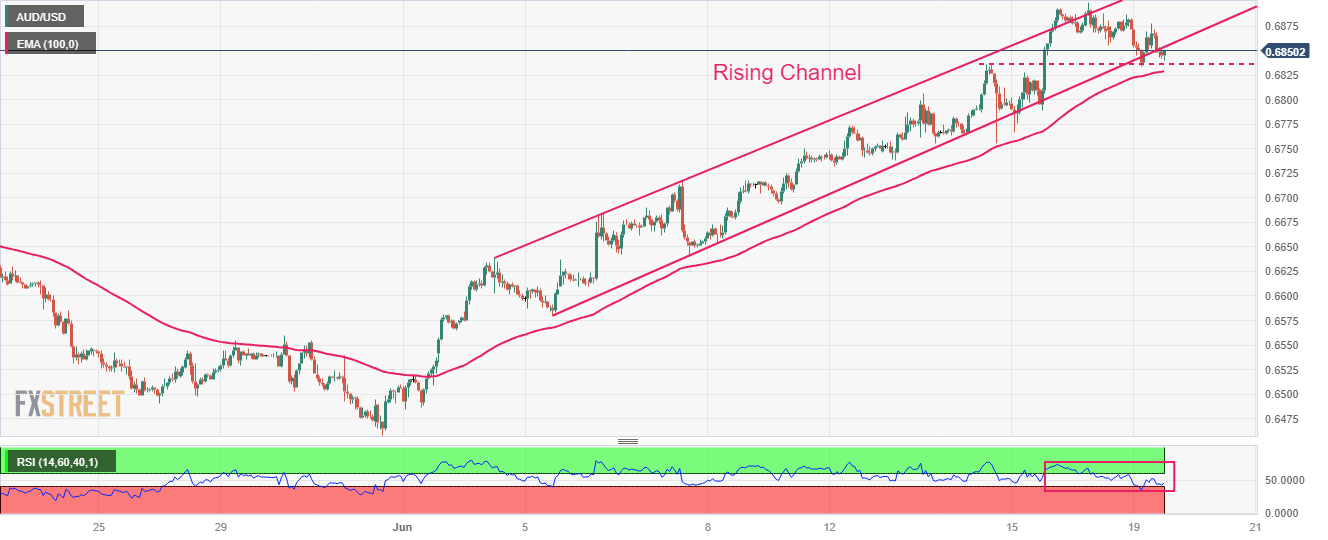
- AUD/USD pauses two-day downtrend near the highest levels in four months, sidelined of late.
- Market sentiment remains sour amid mixed concerns about US-China ties, hawkish Fed bets.
- Hopes of witnessing concrete signals for RBA’s July rate hikes underpin Aussie pair’s recovery.
- Full market’s reaction to the latest risk catalysts, PBoC Interest Rate Decision also eyed for intraday directions.
AUD/USD picks up bids to 0.6855 while licking the wounds at the highest levels in four months, pausing the two-day downtrend, during early Tuesday morning in Asia. In doing so, the Aussie pair portrays the market’s hopes of witnessing hawkish signals from the Reserve Bank of Australia (RBA), as well as upbeat moves of the People’s Bank of China.
While the RBA has already surprised the markets with its second back-to-back rate hike, the Aussie bulls seek more hawkish clues to aim for a July rate lift. It should be noted that the absence of major geopolitical disappointment from the latest round of the US-China talks also underpins the AUD/USD pair’s corrective bounce ahead of the key event. On the same line are the hopes of China’s more stimulus to propel economic recovery.
That said, US Secretary of State Antony Blinken recently met China President Xi Jinping and Beijing’s top diplomat Wang Yi. After the meeting, China President Xi Jinping said that he hopes through the visit, Blinken will make more positive contributions to stabilizing US-Sino relations. The same restricted the AUD/USD price downside as China is one of its biggest customers in Australia. However, China’s top diplomat Wang Yi said on Monday, “China has no room for compromise and concessions on the Taiwan issue,” Ahead of that, the diplomats held what both called candid and constructive talks on their differences from Taiwan to trade but seemed to agree on little beyond keeping the conversation going.
Additionally, the South China Morning Post (SCMP) quoted China State Council while saying, “The Council considered a batch of macroeconomic policies designed to expand ‘effective demand’, strengthen the real economy and defuse risks in key areas.”
However, multiple top-tier investment banks cut China’s growth forecasts and challenge the AUD/USD trader’s optimism. On the same line are the hawkish Fed concerns and recently upbeat yields.
Federal Reserve (Fed) paused the rate hike trajectory in the last week and signals a July rate lift. However, the US central bank’s monetary policy report to the Congress and the latest comments from the officials have been hawkish. That said, the Fed policy report for Congress said, “Inflation in the US is well above target and the labor market remains very tight,” as per Reuters, which in turn put a floor under the US Dollar Index (DXY) and weighs on the AUD/USD Price. Among the Fed talkers, Richmond Fed President Thomas Barkin, Chicago Fed President Austan Goolsbee and Federal Reserve Governor Christopher Waller also appeared a bit hawkish and helped the DXY to reverse from a multi-day low.
Against this backdrop, S&P500 Futures print mild losses and the US Treasury bond yields begin the week on a front foot, taking clues from the UK and Europe.
Moving on, RBA Minutes need to defend the surprise rate hikes to keep the AUD/USD buyers on the table as the PBoC rate cut is already priced-in and may not be able to provide much to cheer. Additionally, comments from RBA and the Fed Officials are also scheduled for the day and may entertain the pair traders.
Technical analysis
Despite the latest pause in the AUD/USD pair’s retreat from the multi-day top, a rejection of the three-week-old bullish channel, by a downside break of the channel’s support line of near 0.6885 at the latest, keeps the Aussie pair bears hopeful.
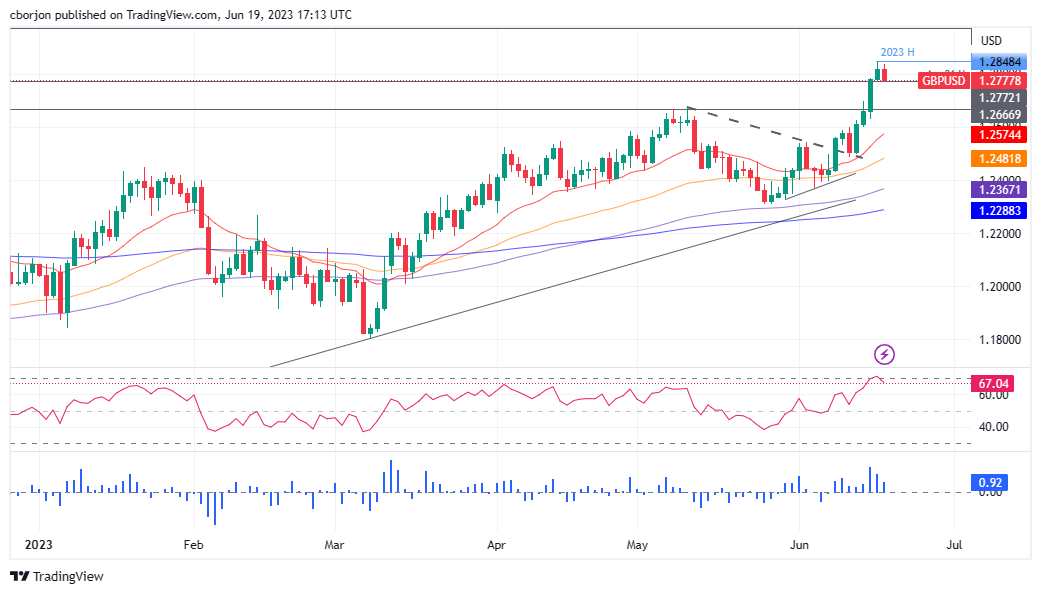
- GBP/USD picks up bids to reverse the week-start pullback from the highest levels since April 2022.
- 21-SMA, one-week-old rising trend channel defends Pound Sterling buyers amid hawkish BoE concerns, UK inflation woes.
- Upside break of previous bullish channel adds strength to hopes of witnessing further Cable price run-up.
- RSI, MACD joins lower-high of prices to challenge intraday buyers.
GBP/USD regains upside momentum, after a downbeat start of the week, as it rises to 1.2800 amid the early hours of Tuesday’s Asian session. In doing so, the Cable pair seesaws around the highest levels in 14 months by staying within a one-week-long bullish trend channel.
Apart from the bullish channel, the 21-SMA level and hawkish hopes from the Bank of England (BoE), amid upbeat inflation pressure in the UK, also underpin the upside bias surrounding the Pound Sterling price.
It should be noted that the latest update from Lloyds Bank stated that the British food manufacturers reported the first drop in their production costs since 2016 in May as lower commodity and energy prices and cheaper shipping outweighed a jump in wage bills. The same highlights Wednesday’s UK inflation data ahead of Thursday’s BoE announcements and becomes crucial for the GBP/USD pair traders to watch.
It’s worth noting that the RSI (14) is still overbought and the MACD flashes bearish signals as the GBP/USD price prints a lower-high formation.
With this, the Cable buyers need to witness a clear break of the recent downward spell by crossing the 1.2820 hurdle to recall the bulls.
Following that, the latest multi-day peak of around 1.2850 and the stated channel’s peak of around 1.2910 can lure the GBP/USD buyers before highlighting the 1.3000 round figure.
On the other hand, a downside break of convergence of the 21-SMA and the bullish channel’s lower line, close to 1.2760 by the press time, could trigger the short-term downside of the GBP/USD pair.
However, the top line of the previous bullish channel stretched from late May, surrounding 1.2650 at the latest, can challenge the GBP/USD sellers before welcoming them, even for a short term.
GBP/USD: Four-hour chart
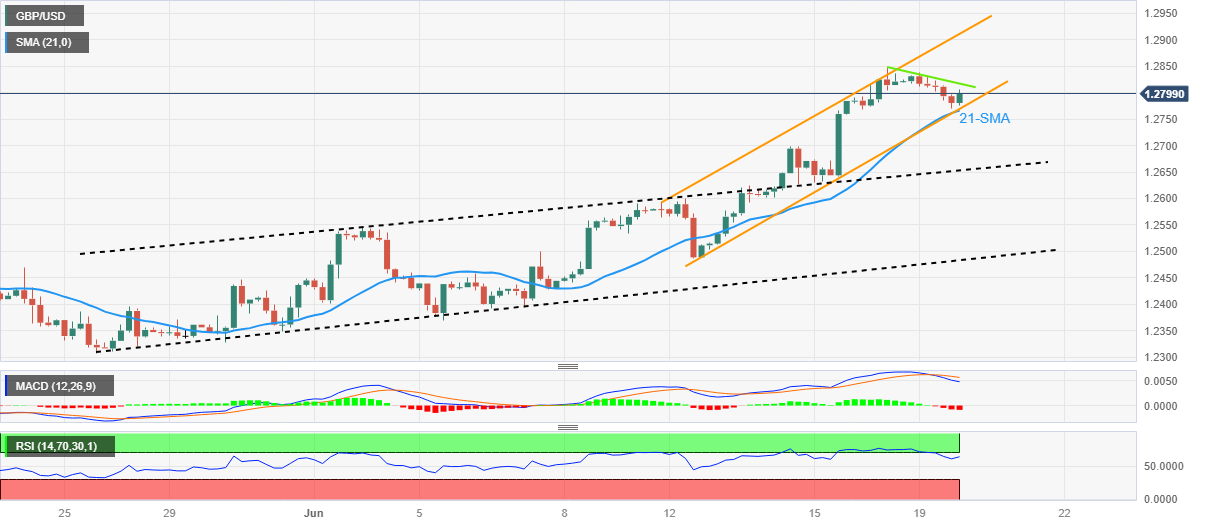
Trend: Further upside expected
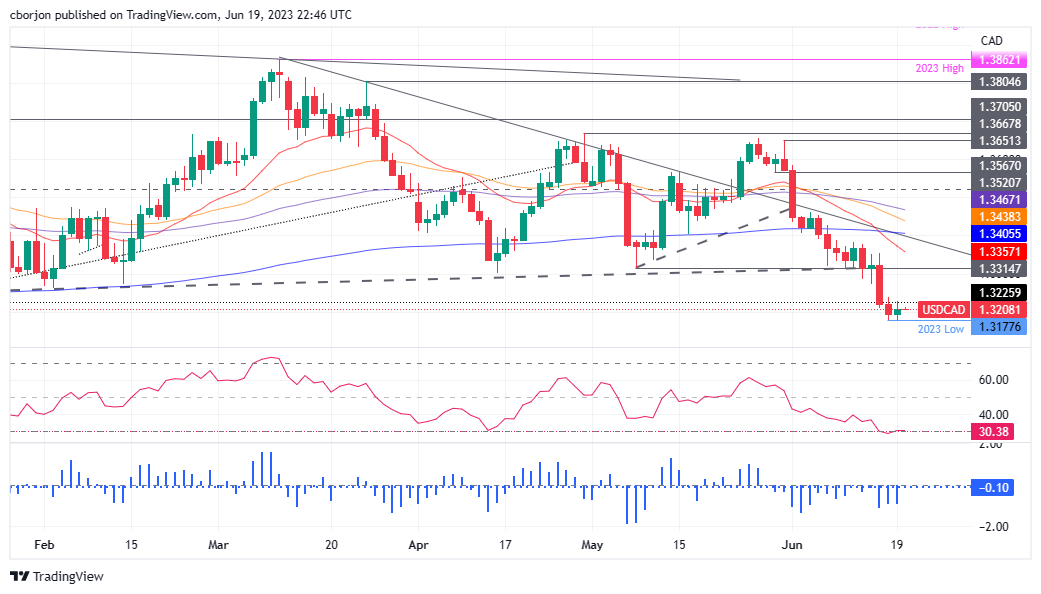
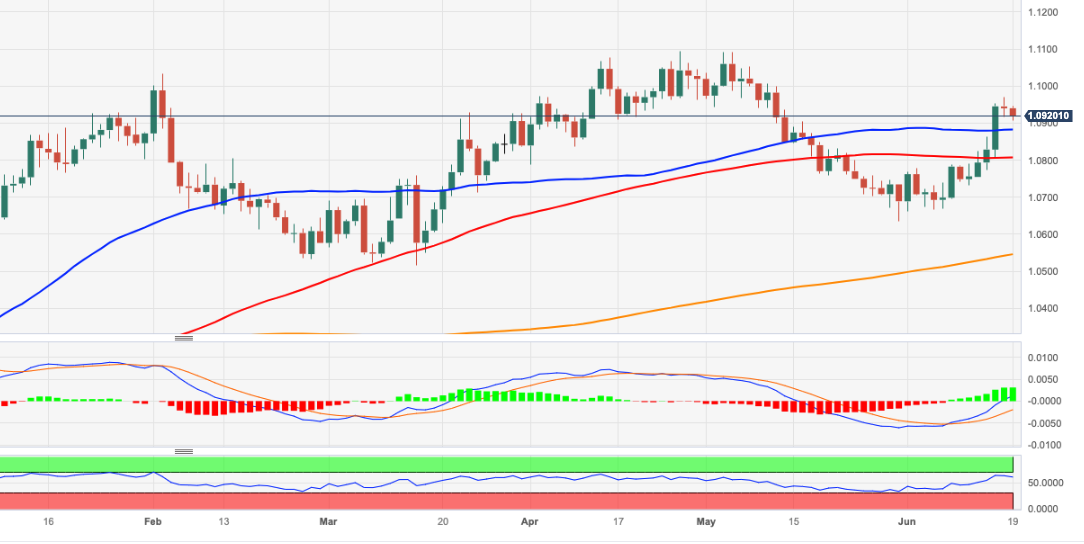
- USD/CAD continues its downward trajectory, trading at 1.3207, showing minor losses of 0.01%.
- A break below 1.3200 may open the way to YTD lows, with RSI indicating oversold conditions.
- If USD/CAD trades above the May 8 daily low of 1.3314, the pair could stabilize, with the 20-day EMA at 1.3357 as the first resistance.
USD/CAD trimmed some of its losses last Friday on Monday, though as the Asian session begins, it is poised to extend its ongoing losses during the previous three weeks. The USD/CAD is trading at 1.3207, down 0.01%, after hitting a weekly high of 1.3229.
USD/CAD Price Analysis: Technical outlook
During the last week, the USD/CAD broke a support trendline drawn from 2022 November lows, surpassing around 1.3314. That exacerbated the USD/CAD fall to new year-to-date (YTD) lows of 1.3177 before rebounding above 1.3200.
It should be said the pair bias is downward, but if the USD/CAD trades above the May 8 daily low of 1.3314, that could pave the way for sideways action. If that outcome continues, the USD/CAD first resistance would be the 20-day Exponential Moving Average (EMA) at 1.3357, followed by the 200-day EMA at 1.3405.
Conversely, if USD/CAD drops below 1.3200, further downside is expected, with the pair challenging the YTD low, followed by the September 13 low of 1.2954.
Notably, the Relative Strength Index (RSI) portrays the pair as oversold, while the three-day Rate of Change (RoC) indicates the pair is heading downwards.
USD/CAD Price Action – Daily chart
- EUR/USD picks up bids to pare recent losses amid market’s consolidation after sluggish calendar and US holiday.
- ECB Officials defend hawkish bias despite unimpressive statistics from the bloc.
- Challenges to sentiment, Fed comments exert downside pressure on Euro price.
- Fed Chair Jerome Powell’s Testimony, PMIs are crucial for immediate directions.
EUR/USD pushes back bears at the highest levels in five weeks, snapping a two-day downturn, as it recovers to 1.0925 amid the early hours of Tuesday’s Asian session. In doing so, the Euro pair justifies hawkish signals from the European Central Bank (ECB) Officials. It’s worth noting that the Federal Reserve (Fed) updates have been suggesting higher rates as well. However, the US central bank’s pause on the rate lift in the last week joined mixed US data to raise doubts about the Fed policymakers’ capacity to lift the rates.
On Monday, European Central Bank (ECB) policymaker Peter Kazimir said, “We need to raise rates again in July.” On the same line, ECB Chief Economist Philip Lane said that another rate hike in July seemed appropriate but noted that the decision in September will depend on incoming data, per Reuters. Furthermore, ECB Governing Council member Isabelle Schnabel also said, “Risks to the inflation outlook are tilted to the upside.” ECB’s Schnabel also cited the need to keep raising interest rates until seeing a convincing evidence that developments in underlying inflation are consistent with a return of headline inflation to 2%.
On the other hand, the Fed monetary policy reports to the US Congress and the latest comments from the Fed officials have been hawkish. That said, the Fed policy report for Congress said, “Inflation in the US is well above target and the labor market remains very tight,” as per Reuters, which in turn put a floor under the US Dollar Index (DXY). Among the Fed talkers, Richmond Fed President Thomas Barkin, Chicago Fed President Austan Goolsbee and Federal Reserve Governor Christopher Waller also appeared a bit hawkish and helped the DXY to reverse from a multi-day low.
Apart from the ECB-Fed play, the market’s fears of easing economic recovery amid higher rates seem to have exerted downside pressure on the EUR/USD price, especially amid upbeat yields in the Eurozone and the UK, as well as downbeat equities. It should be noted that the US Dollar Index (DXY) rose in the last two days after refreshing the lowest level in a month, retreating to 102.45 at the latest.
Furthermore, the US-China tension about Taiwan escalated and the concerns about China’s inability to propel the growth trajectory also roiled the sentiment and the Juneteenth holiday in the US. It’s worth observing that the US National Association of Home Builders (NAHB) survey jumped to 55.0 in June from 50.0 prior, marking the highest level in 11 months and favored the DXY to grind higher, before the latest retreat.
Looking forward, a return of the full markets may entertain the EUR/USD pair traders with the US housing numbers on the calendar to watch. Though, major attention will be given to Fed Chair Jerome Powell’s Testimony and preliminary readings of June’s PMIs for a crystal clear short-term view.
Technical analysis
Overbought RSI (14) joins EUR/USD pair’s failure to cross the 1.0945-50 resistance zone to suggest further downside of the Euro pair towards a two-week-old rising support line, close to 1.0855 by the press time.
- USD/JPY bears are moving in and eye a correction.
- The 38.2% Fibonacci is exposed to the downside.
The US Dollar edged higher forcing the Yen into submission at the start of the week at around 141.96 the highs in USD/JPY. The following is a technical analysis that illustrates the prospects of a continuation longer term to the upside but in the near-term, possibilities of a meanwhile correction.
USD/JPY monthly chart

The W-formation is shaping up on the monthly chart and there is space into the prior highs.
USD/JPY weekly chart
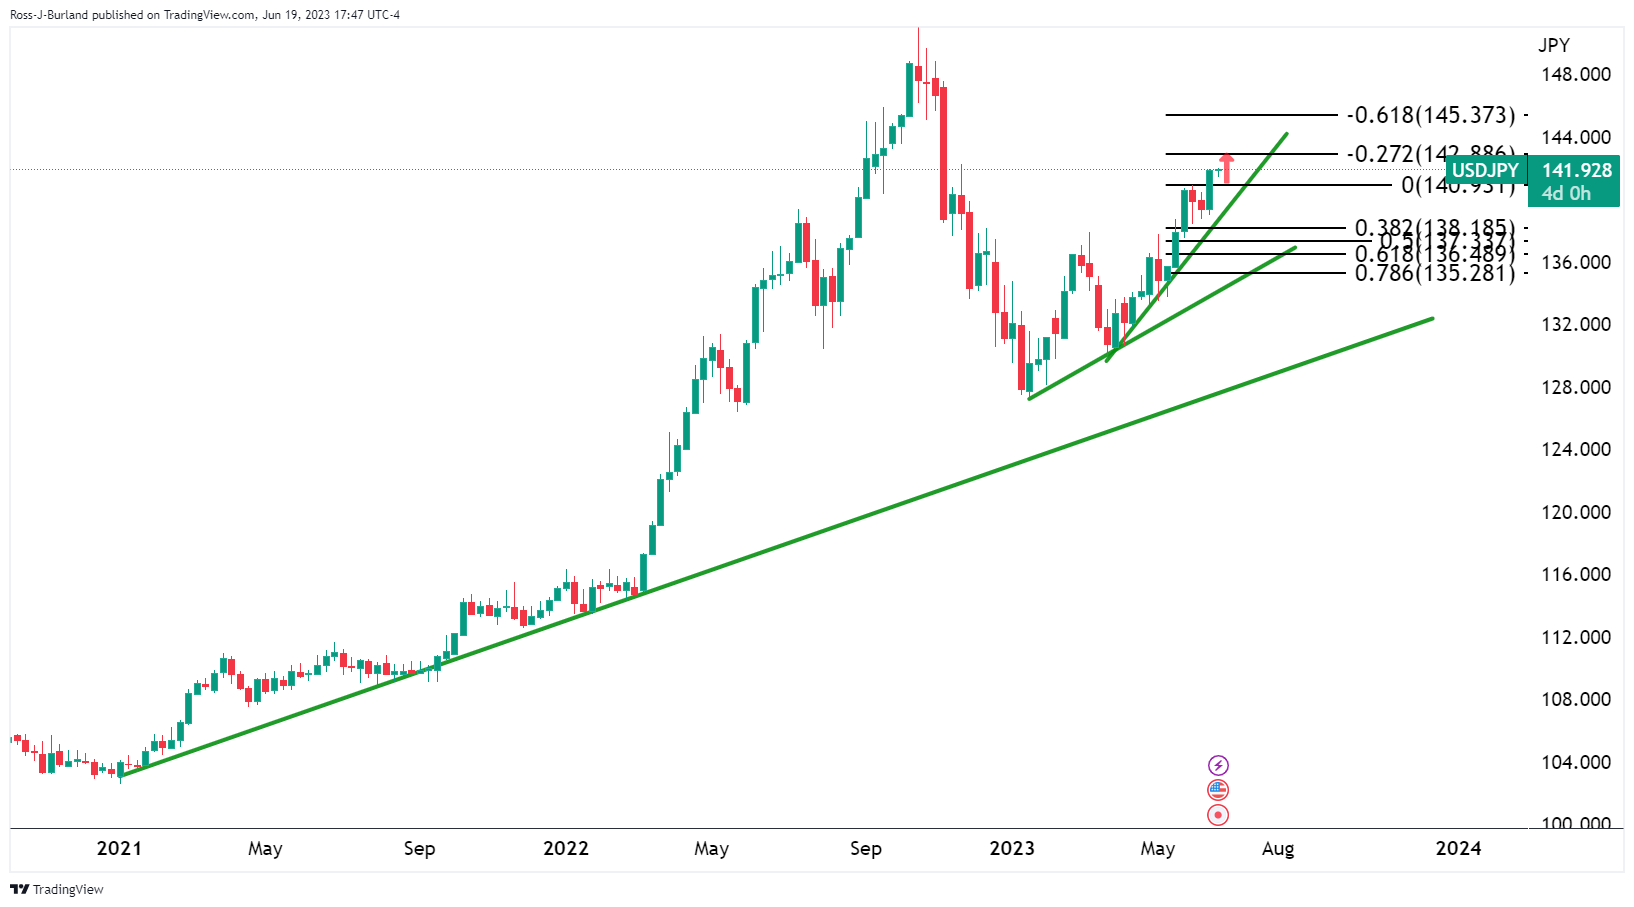
The weekly support line is in tact and this too leaves the bullish bias in play.
USD/JPY daily chart
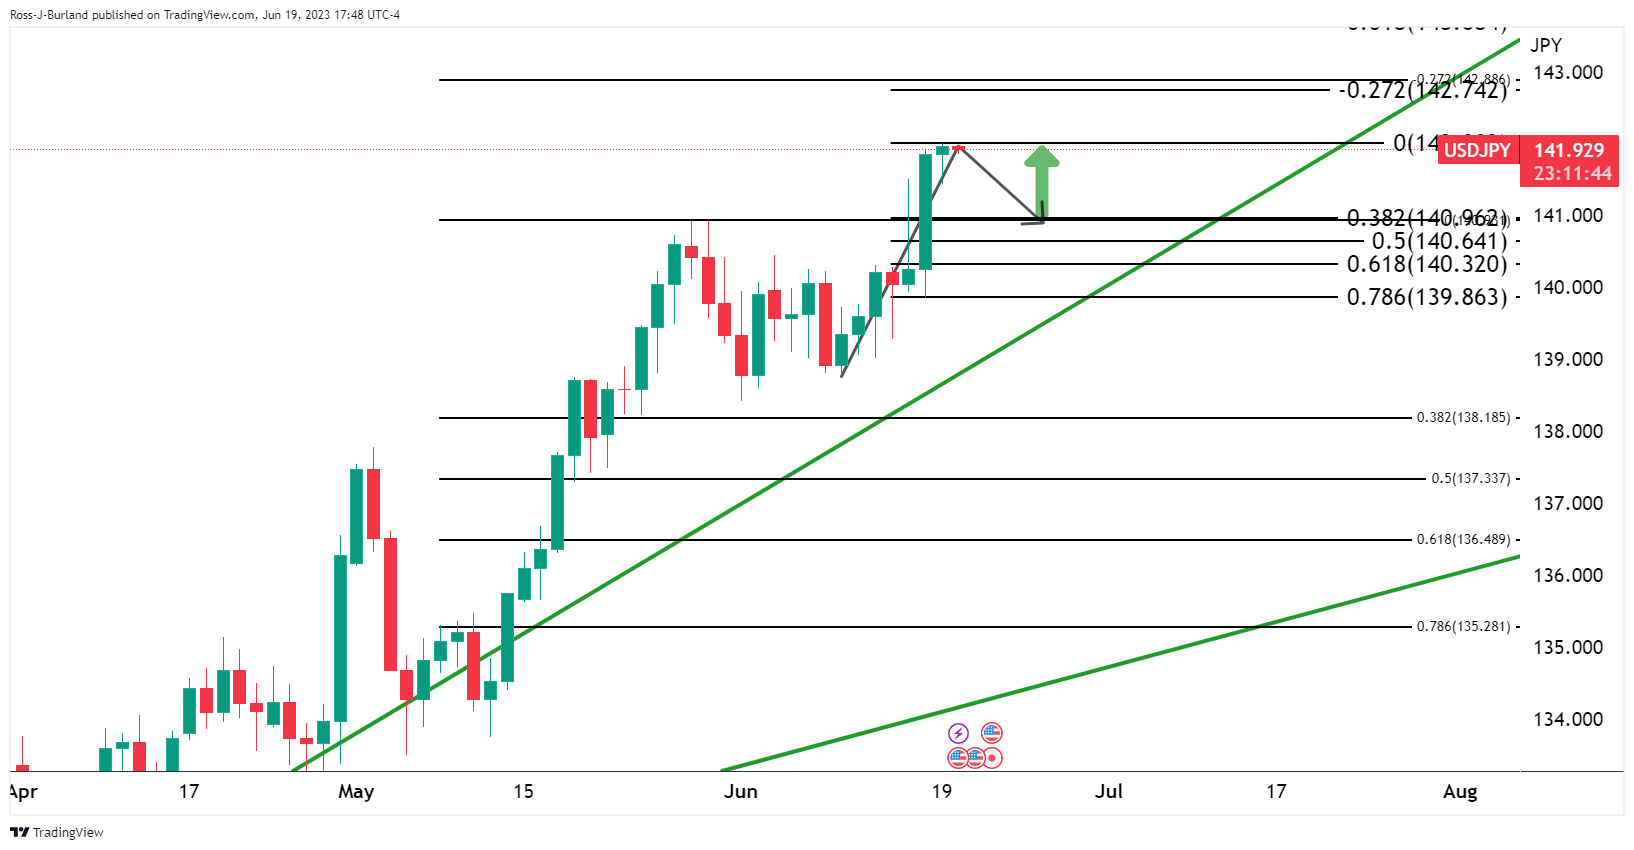
The bears, however, could be about to move in which leaves the Fibonacci scale open for mitigation to the downside and move to test near-term trendline support.
- Gold Price remains pressured below 200-EMA, eyes to revisit three-week-old support.
- US Dollar rebound, mixed clues about the United States–China ties weigh on XAU/USD price.
- DXY edges higher amid hawkish Fed chatters and provides headwind to the Gold Price.
- PBoC Interest Rate Decision, Fed talks eyed as full markets return after Juneteenth holiday.
Gold Price (XAU/USD) edges lower to $1,950 after a softer start to the week, despite a sluggish one due to the United States holiday, as market sentiment appears souring while the Federal Reserve (Fed) signals have been hawkish of late. Furthermore, indecision about the US-China ties and a light calendar also exert downside pressure on the XAU/USD.
Gold Price drops on downbeat sentiment, hawkish Federal Reserve clues
Gold Price began the trading week on a negative foot, after snapping a two-week uptrend in the last, as the risk appetite weakens amid fears of economic slowdown in the global economy, led by hawkish monetary policies at the major central banks and dismal economics. Also challenging the sentiment were mixed concerns about the US-China tussles over Taiwan, despite the recently upbeat talks.
While the Federal Reserve (Fed) paused rate hike trajectory in the last week, the monetary policy report to the US Congress and the latest comments from the officials have been hawkish. That said, the Fed policy report for Congress said, “Inflation in the US is well above target and the labor market remains very tight,” as per Reuters, which in turn put a floor under the US Dollar Index (DXY) and weighs on the Gold Price. Among the Fed talkers, Richmond Fed President Thomas Barkin, Chicago Fed President Austan Goolsbee and Federal Reserve Governor Christopher Waller also appeared a bit hawkish and helped the DXY to reverse from a multi-day low.
On the other hand, US Secretary of State Antony Blinken recently met China President Xi Jinping and Beijing’s top diplomat Wang Yi. After the meeting, China President Xi Jinping said that he hopes through the visit, Blinken will make more positive contributions to stabilizing US-Sino relations. The same restricted the Gold Price downside as China is one of the world’s biggest Gold consumers. However, China’s top diplomat Wang Yi said on Monday, “China has no room for compromise and concessions on the Taiwan issue,” Ahead of that, the diplomats held what both called candid and constructive talks on their differences from Taiwan to trade but seemed to agree on little beyond keeping the conversation going.
It should also be noted that the South China Morning Post (SCMP) quoted China State Council while saying, “The Council considered a batch of macroeconomic policies designed to expand ‘effective demand’, strengthen the real economy and defuse risks in key areas.” The same signals more stimulus from the “Dragon Nation” and more XAU/USD demand. However, multiple top-tier investment banks cut China’s growth forecasts and roiled the optimism afterward.
Amid these plays, markets in the Asia-Pacific region and Europe marked mild losses whereas the yields in the EU and the UK both rose, suggesting an upbeat start for the US bond yields as they begin the key week.
Moving on, the People’s Bank of China’s (PBoC) Interest Rate Decision can entertain Gold traders amid hopes of a rate cut, after the last week’s moves of cutting the lending rates. The same may help the XAU/USD to grind higher. However, the return of the full markets and likely multiple speeches from the Federal Reserve (Fed) and the European Central Bank (ECB) officials may renew hawkish central bank concerns and may weigh on the Gold Price. Above all, this week’s Fed Chair Jerome Powell’s Testimony is the key to watching for clear directions of the XAU/USD.
Gold Price technical analysis
Gold Price fades bounce off a three-week-old falling support line, retreating from the 200-bar Exponential Moving Average (EMA), as the bear cross looms on the Moving Average Convergence and Divergence (MACD) indicator. Adding strength to the hopes of the XAU/USD pullback could be the steady Relative Strength Index (RSI) line, placed at 14.
It’s worth noting that multiple levels marked since May 25 restrict the short-term downside of the Gold Price near $1,940-37 before directing the XAU/USD bears to the aforementioned support line of around $1,922.
Following that, the $1,900 round figure can act as the last defense of the Gold buyers.
Meanwhile, the Gold Price recovery isn’t guaranteed on an upside break of the 200-EMA, around $1,967 at the latest, as a month-long horizontal region around $1,985 appears a tough nut to crack for the XAU/USD buyers.
In a case where the Gold Price remains firmer past $1,985, the $2,000 round figure and $2,020-25 zone will gain the XAU/USD bull’s attention.
Overall, the Gold Price remains vulnerable to further downside as the full markets return.
Gold Price: Four-hour chart
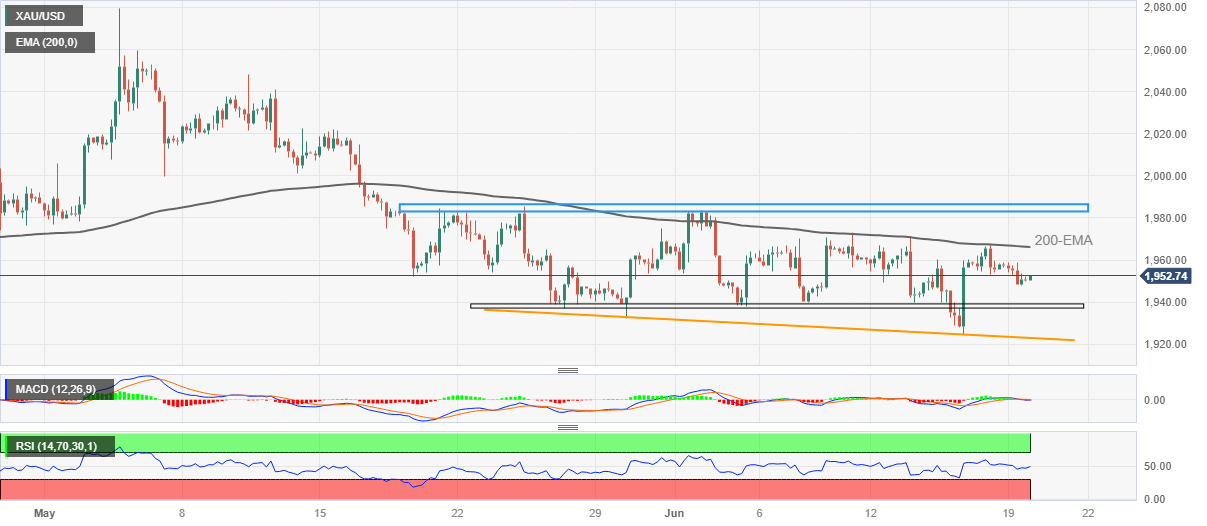
Trend: Limited downside expected
- AUD/JPY is on a downward trajectory as a global risk-off mood sets in, influenced by hawkish central banks.
- Technical indicators suggest a pullback from the early June rally, with immediate support at a June 19 low of 96.73.
- The path of least resistance is downwards, despite YTD high resistance at 97.67.
As the Asian session begins, the AUD/JPY is poised to extend its losses past Monday’s close of 97.26 amidst a risk-off impulse. Expectations of further tightening by global central banks, and hawkish Fed dot plots, weighed on investors’ mood. At the time of writing, the AUD/JPY is trading at 97.20, down by 0.06%.
AUD/JPY Price Analysis: Technical outlook
Following a steep rally in early June that totaled an 8% gain, the AUD/JPY could be set for a pullback as oscillators entered the overbought territory, with the Relative Strength Index (RSI) indicator hitting 80. Since then, the RSI started to trend lower, while the AUD/JPY retreated from year-to-date (YTD) highs of 97.67.
If AUD/JPY slides below the June 19 low of 96.73, the next support would be the June 16 low of 96.24. A breach of the latter will expose the 96.00 figure, followed by the Tenkan-Sen at 95.32. Conversely, AUG/JPY’s first resistance would be the YTD high at 97.67. Break above will expose the 98.00 figure
AUD/JPY Price Action – Daily chart
- EUR/JPY seem to be consolidating last week's 300-pip gains retreating to the 155.00 psychological mark.
- Hawkish ECB speakers limit the EUR downside potential.
- Eyes on BoJ minutes.
On Monday, the EUR/JPY retreated to the 155.00 area as traders seem to be correcting overbought conditions following last week’s impressive gains. However, the European Central Bank (ECB) hawks hint at more rate hikes and limited the Euro’s losses, while investors await Bank of Japan (BoJ) minutes in the early Asian session on Tuesday.
ECB hawks signalled another hike in July
On Monday, Phillip Lane from the ECB was on the wires and stated that another hike in July may be appropriate but opened the door for a pause in the following meeting stating, “then we’ll see on September” and argued that the bank needs to be data-dependent about the inflation outlook. Elsewhere, Isabel Schnabel cited that inflation risks are tilted to the upside and that she prioritizes doing “too much” over doing “too little”.
As a reaction, German bond yields are rising, with the 10-year rate standing at 2.51% and the 2-year yielding 3.22%, with both seeing more of a 1% gain.
On the other hand, the Bank of Japan (BoJ) is scheduled to publish the minutes of its Friday meeting on Tuesday. This release will provide investors with a clearer understanding of the bank's position on its ultra-loose monetary policy, which could influence the value of the Yen.
EUR/JPY Levels to watch
Despite the downward correction, the upside bias is still intact for the pair. Technicals still favour the Euro over the Yen while the pair trades above its main Simple Moving Averages (SMAs) of 20, 100 and 200 days.
Support levels to watch:154.50, 154.00, 153.50
Resistance levels to watch:155.20, 155.50, 156.00
EUR/JPY Daily chart
-638228078120324568.png)
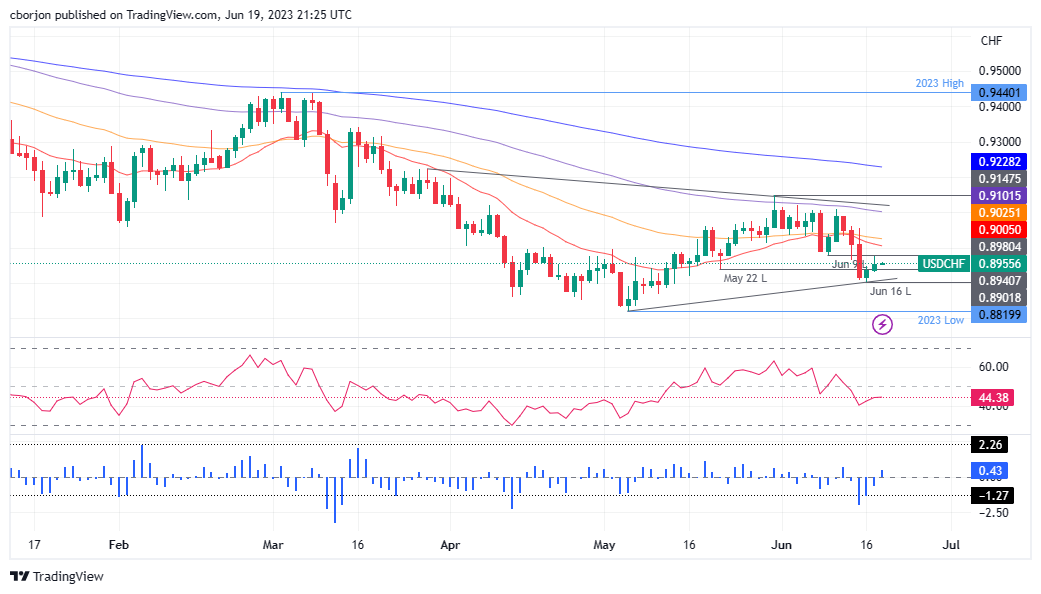
- USD/CHF records minor gains and struggles to rally past 0.8980 due to weak buying momentum.
- Technical indicators point towards a neutral to downward bias, with immediate support at a May 22 low of 0.8940.
- RSI and three-day Rate of Change indicate downward bias; a fall below 0.8940 could lead to further losses.
USD/CHF registers minuscule gains as the Asian session begins after printing back-to-back bullish days, though it failed to cement a rally past the 0.8980 area. On Monday, the USD/CHF printed a weekly high at 0.8975 but closed the session at around 0.8950. At the time of writing, the USD/CHF exchanges hands at 0.8957.
USD/CHF Price Analysis: Technical outlook
From a technical perspective, the USD/CHF is neutral to downward biased, as it stands below the daily Exponential Moving Averages (EMAs). The downtrend shows signs of losing steam, though price action in the last couple of days left two candlesticks with larger wicks above the natural body. This signifies that buyers did not have the strength to hold prices higher, opening the door for further losses.
The USD/CHF first support would be the May 22 low at 0.8940. Break below, and the USD/CHF would dive toward the June 16 daily low at 0.8902 before cracking 0.8900. A breach of the latter will expose the YTD low of 0.8819. Conversely, USD/CHF's immediate resistance lies at 0.8980, June 9 low, before testing 0.9000.
Oscillators-wise, the Relative Strength Index (RSI) indicator portrays the pair as downward biased, though the three-day Rate of Change depicts buyers who stepped in but failed to break the previous peak.
USD/CHF Price Action – Daily chart
- AUD/USD bears are eyeing a trest of key trendline support.
- Bulls have started to throw in the towel.
AUDUSD remains offered following Friday's sell-off and in what could be the start of a significant correction. The bulls have been capped below 0.6900 and the bears are trying to take on dynamic trendline support and the prior highs of June 14 in what has been a 38.2% Fibonacci retracement of the 4-hour bullish impulse as the following charts illustrate:
AUD/USD daily chart
The pair are meeting resistance and bears eye support structures.
AUD/USD H4 chart
Bears are approaching support and will need to overcome the trendline support as shown on the 4-hour chart.
What you need to know on Tuesday, June 20:
The week started in slow motion amid a scarce macroeconomic calendar, and US markets closed due to the celebration of the Juneteenth Holiday. The American Dollar corrected part of the previous week's massive losses but remains on the back foot.
United States Secretary of State Antony Blinken met Chinese President Xi Jinping over the weekend, announcing on Monday they made "good progress" in talks meant to stabilize the relationship between the two countries but failed to produce any major breakthrough.
On Monday, ECB's Member of the Executive Board Philip R. Lane said another hike in July seems appropriate, while September's decision will depend on data. He sounded confident, saying inflation would come down fairly quickly to the central bank's 2% target. Meanwhile, another ECB Member of the Executive Board, Isabel Schnabel, expressed concerns about the central bank underestimating inflation, adding the interest rate path should have been steeper. EUR/USD ended the day around 1.0920.
GBP/USD hovers around 1.2780, not far from the 2023 high posted last week at 1.2848, as investors expect the Bank of England (BoE) to hike its benchmark rate by 25 basis points later this week while leaving the door open for additional hikes. UK interest rate swaps show a greater than 50% chance of BoE rates reaching a terminal rate of 6% by February 2024.
The Reserve Bank of Australia (RBA) will release the Minutes of its latest meeting early on Tuesday. Australian policymakers unexpectedly hiked the cash rate by 25 basis points (bps) for a second consecutive month, as policymakers noted services inflation remains "too high." The Minutes are expected to confirm policymakers' hawkish bias, with investors looking for clues about a potential terminal rate. The People's Bank of China (PBoC) will announce its Interest Decision. AUD/USD heads into the events trading around 0.6850.
XAU/USD remains stable around $1,950 a troy ounce, while USD/JPY pressures the 142.00 region.
Later this week, Federal Reserve Chairman Jerome Powell will testify before Congress. Financial markets hope for additional clues on the future of monetary policy.
Like this article? Help us with some feedback by answering this survey:
- GBP/JPY bears are moving into for the kill sensing tiring bulls.
- The bears eye the trendline support as first port of call.
GBP/JPY bulls are in the market but there are prospects of a significant correction brewing. The following will illustrate the price across a monthly, daily and 4-hour time frame to offer a top-down analysis arriving at a near-term bearish bias.
GBP/JPY monthly chart

The monthly charts show that the price has been rising for six consecutive months and is running into a potential resistance area.
GBP/JPY daily chart
Therefore, a correction could be on the way and the daily chart shows that the price is decelerating. This might lead to the bulls throwing in the towel as we approach key domestic events on the calendar.
GBP/JPY H4 chart

From a 4-hour perspective, the bullish trendline is still intact but the bears are heading in for the kill. A bearish correction to the 38.2% Fibonacci will be testing the trendline support.
- GBP/JPY cut a four-day winning streak and fell to the 181.40 area.
- All eyes on UK inflation data from and its impact on BoE’s decision on Wednesday.
- BoJ to release the June meeting minutes on Tuesday.
The GBP/JPY pair seems to be correcting overbought conditions on Monday ahead of a crucial week for the British economy. In that sense, the Consumer Price Index (CPI) from the UK in May may have an impact on Bank of England’s (BoE) Thursday decision, where a 25 basis point hike is already priced in. On the other hand, investors await Bank of Japan (BoJ) minutes on Tuesday.
Eyes on British CPI ahead of BoE’s decision
On Wednesday, the UK National Statistics Office will release the CPI figures for May, which are expected to have slightly decelerated. The headline figure is expected to come in at 8.5% vs the previous 8.7% and show a 0.4% monthly increase in the month of May. The Core figure is expected to remain unchanged at 6.8% YoY.
Meanwhile, markets already priced in a 25 bps hike on Thursday with small odds of a higher increase of 50 bps. Regarding the next meetings, the updated macro-forecasts will play a big role in their expectations, but as for now, market participants foresee 25 bps hikes priced in for August, September, November, and December that would see the policy rate peak near 5.75%.
On the Japanese side, investors will look for clues on the stance of the BoJ with the minutes of the latest June meeting, where it was decided to maintain its ultra-loose monetary policy.
GBP/JPY Levels to watch
The technical outlook, according to the daily chart, is clearly bullish for the cross. The pair remains above its main Simple Moving Averages of 20,100 and 200 days, while indicators – despite seeing some correction – still stand in overbought conditions. That being said, more corrections may be in the horizon, but the outlook suggests a more favourable outlook for the GBP.
On the downside, support levels line up in the closest round levels of 179.00,178.50 and 178.00. On the upside, the 182.12 cycle high struck on Friday stands as immediate resistance before uncharted territory.
-638227994728785945.png)
- NZD/USD looks to the Aussie for clues ahead of key events.
- The RBA minutes and Fed chair testimony will be in focus.
The New Zealand Dollar fell to a low of 0./6101 on Monday and is currently down by 0.5% to 0.6200 after hitting a three-week top last week.
Markets are looking to a slew of domestic economic data this week, including New Zealand's trade balance for May and Reserve Bank of Australia minutes.
The US Dollar moved higher last week and on Monday following a number of monetary policy decisions by central banks. In this regard, Federal Reserve Chair Powell will present the Semiannual Policy Report to Congress. He is expected to reiterate that the Committee is likely leaning toward higher policy rates this year.
''Note that despite that message the FOMC decided to pause rate hikes in June, and we are of the view that it will be unlikely they lift them again under a context of easing inflation in Jun-Aug,'' analysts at TD Securities said.
The dollar index, DXY, which measures the U.S. currency against six major counterparts, ticked up 0.3% to 102.55, sitting just shy of a one-month low of 102.00 it touched on Friday.
AUD leading Kiwi higher
AUD has been a top performer, helping to support the Kiwi. The Reserve Bank of Australia’s recent surprise rate hikes have helped to bolster the Antipodeans. Additionally, the release of a stellar Australian jobs report is also suggestive of further policy moves that can help lead the Bird higher.
In regards to the RBA, the minutes will be released this week and analysts at TD Securities explained that, ''in the June statement, the Bank dropped “medium-term inflation expectations remains well anchored” which read hawkish to us, and we can expect a lively discussion. Mentions of the impact of the 5+% minimum wage hike on the wage outlook will be closely watched as the recent strong job gains nudges the odds higher of another hike in Jul due to the risk of elevated wage pressures.''
As for the Reserve Bank of New Zealand, the central bank ''has been a strong advocate of front loading rate hikes and was the very first G10 central bank to begin its rate hiking cycle,'' analysts at Rabobank added. ''Bad weather and teachers strikes have recently added to the impact of tighter credit conditions.''
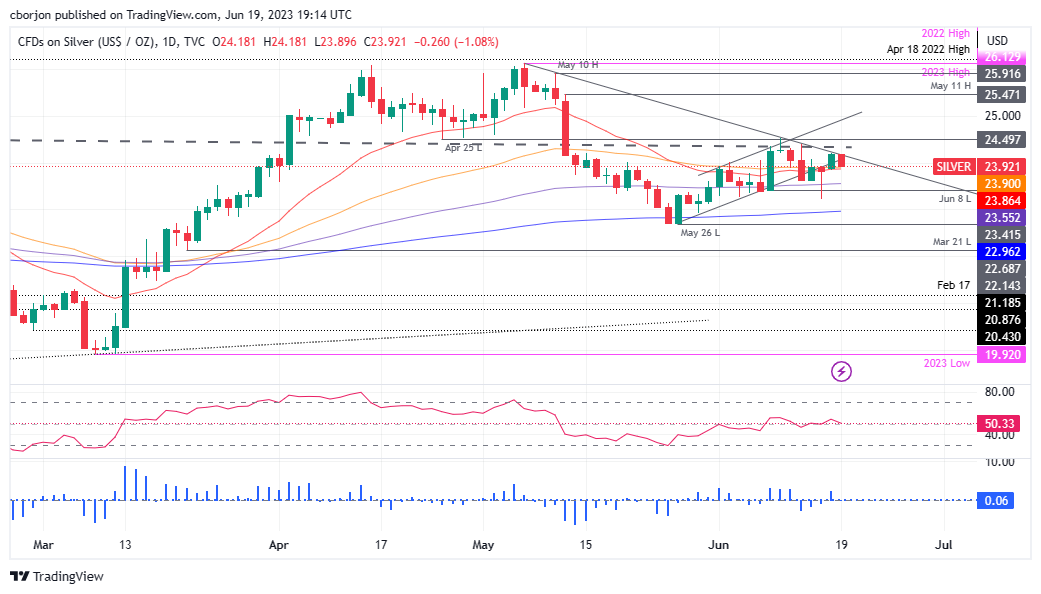
- Silver is down by more than 1%, struggling to stay above the confluence of 50 and 20-day EMAs at $23.86/92.
- Failure to breach the April 29 swing low leads to increased selling pressure; YTD resistance at $24.20/30 adds to downward pressure.
- Bearish RSI signal and weakening buying pressure suggest XAG/USD’s path of least resistance is downwards.
Silver price retraces from last Friday’s highs of $24.20, down more than 1%, as sellers look to get XAG/USD price below the confluence of the 50 and 20-day ExponentialMoving Averages (EMAs) at around $23.86/92. At the time of writing, the XAG/USD is trading at $23.92.
XAG/USD Price Analysis: Technical outlook
The XAG/USD remains neutral to downward biased after slipping past support at the April 29 swing low of $24.49, a price level tested four times last month. However, buyers’ failure to crack that level exposed XAG/USD to selling pressure, witnessed by Monday’s price action as Silver collided with resistance at a downslope trendline drawn from year-to-date (YTD) highs of $26.13 that passes at around the $24.20/30 area.
In addition, the Relative Strength Index (RSI) indicator aims lower, about to pierce below the 50-midline, a bearish signal, while the three-day Rate of Change (RoC) sees the latest spike, well below the last three upside days, suggesting that buying pressure is fading.
Therefore, the XAG/USD path of least resistance is downwards. The first support would be the confluence of the 50 and 20-day EMAs at the $23.86/92 range. A breach of the latter will expose the 100-day EMA at $23.55, followed by the $23.00 figure ahead of the 200-day EMA at $22.96. Conversely, the XAG/USD first resistance would be the $24.00 threshold, ahead of April’s 29 low turned resistance at around $24.49.
XAG/USD Price Action – Daily chart
- USD/MXN stays strong despite a slight retreat; lower European equities dampen market sentiment.
- Fed Chair Powell’s upcoming Congress testimony draws focus; chances for a July rate hike by the Fed are estimated at 73.2%.
- Bank of Mexico is likely to keep rates unchanged; inflation trends are set to influence future rate decisions.
USD/MXN clings to its earlier gains after hitting a daily high of 17.1717 and retreats below the 17.1000 figure due to thin liquidity conditions in the observance of the Juneteenth holiday. At the time of writing, the USD/MXN is trading at 17.0784, almost unchanged.
Investors are cautious about Powell’s address to Congress, as Fed hints at possible rate hikes and the Mexican Peso at the mercy of Banxico’s decision
European equities closed on a lower note portraying a risk-off mood. Therefore, the Mexican Peso (MXN), often viewed as a risk-sensitive currency, weakened, but it’s trimming its earlier losses.
During the week, traders would remain focused on the Federal Reserve (Fed) Chair Jerome Powell’s appearance at the US Congress on Wednesday and Thursday. Nevertheless, most market participants estimate he would not change his latest press conference tone after he and his colleagues held rates unchanged at 5.00%-5.25%.
However, Powell and Co. suggested the Fed still has ammunition for at least 50 bps rate hikes toward the year’s end, according to the Summary of Economic Projections (SEP) dot plots. More than half of the Fed members see rates above 5.50%, a hawkish posture that Jerome Powell weighed on the downside at the post-FOMC decision press conference.
Nevertheless, the CME FedWatch Tool suggests odds for a 25 bps increase at the July meeting at 73.2%. After that, futures do not expect an additional hike, as seen in the last week’s US equity markets, which rallied to new yearly highs.
The US Dollar Index, a measure of the buck’s value against a basket of peers, climbs 0.21%, at 102.515.
On the Mexican front, recent commentaries by the Bank of Mexico (Banxico) officials suggested the central bank is set to keep rates unchanged at the June 22 meeting. Banxico’s Governor, Victoria Rodriguez Ceja, said that rates would not be changed for at least a couple of sessions. However, in the last week, Deputy Governor Jonathan Heath suggested that three meetings would be unnecessary.
Ahead of Banxico¿s decision, inflation in Mexico for the first half of June would be revealed, expected to continue its downtrend and not to change the central bank’s decision after the report.
USD/MXN Key Technical Levels
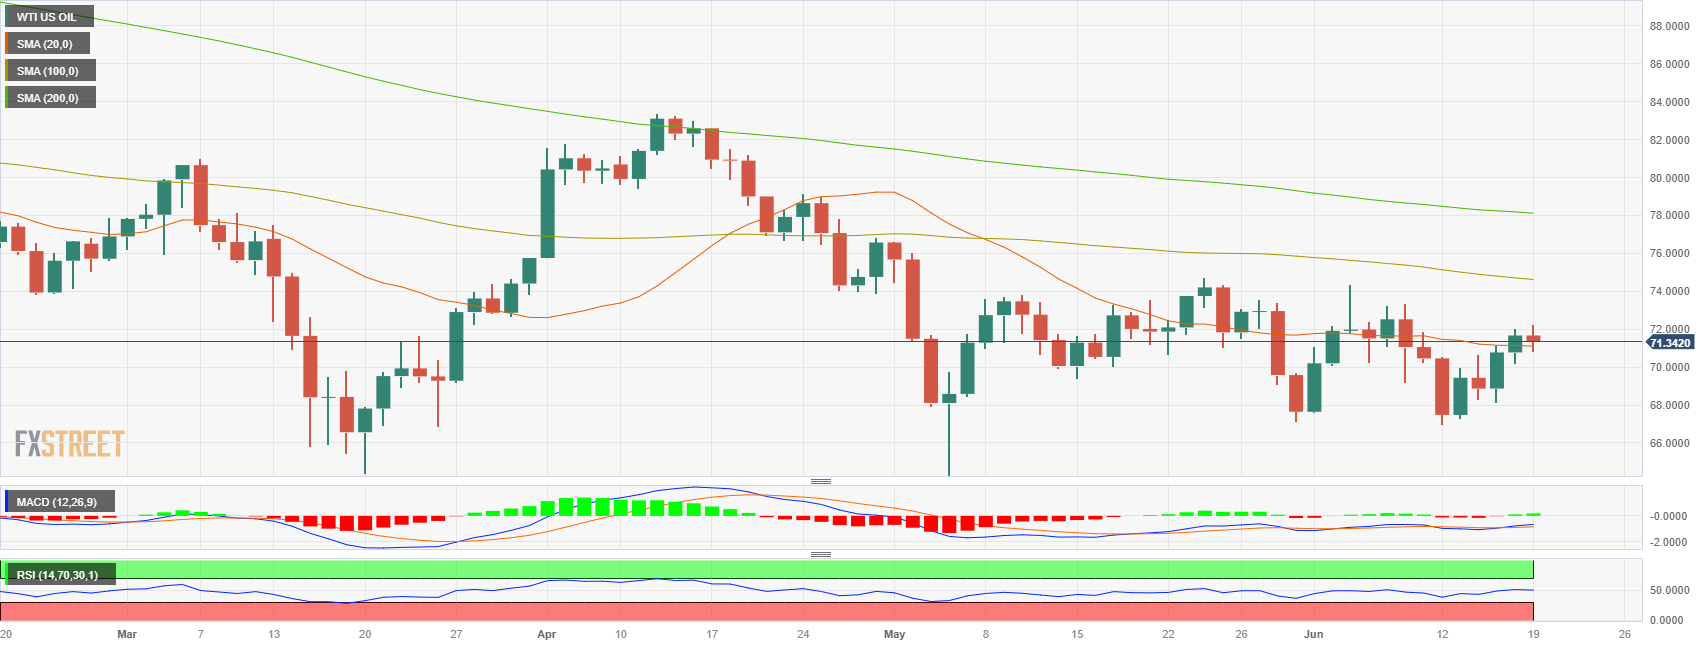
- WTI targets the 20-day SMA at $71.00, trading at the $71.20 area.
- PBoC expected to cut rates to 3.55% in the early Tuesday Asian session.
- Eyes on key economic data from the US.
The West Texas Intermediate (WTI) barrel trades with mild losses on Monday, nearing the 20-day Simple Moving Average (SMA) standing at $71.20. Eyes will be on the People Bank of China (PBoC) decision and, throughout the week, key economic data from the US to start shaping expectations towards the upcoming July meeting of the Fed on July 26.
Eyes will be on key economic data from the US
As Oil prices tend to be positively correlated with strong economic activity and negatively related with higher interest rates, this week’s release of economic data will have an impact on the black gold’s price dynamics. On Tuesday, the focus will be on housing data, which could provide insights into the strength of the real estate market. Subsequently, on Thursday, investors will closely monitor the Jobless Claims report, looking for indications of the labor market's health. Finally, on Friday, attention will shift to the S&P PMIs, which will offer valuable insights into the manufacturing and services sectors.
That being said, it's worth noticing that Jerome Powell opted for a rate hike pause in order to assess additional information and its implications on monetary policy, so the health of the US economy will be crucial for what the Federal Reserve officials decide in the next July meeting.
WTI Levels to watch
The WTI has a neutral outlook for the short term as indicators turned flat on the daily chart with no clear signs of bull or bears dominating. The Relative Strength Index (RSI) stands with a slight negative slope over its midline, while the Moving Average Convergence Divergence (MACD) prints green bars.
If WTI manages to move higher, the next resistances to watch are in the $72.00 area, followed by the $73.20 zone and the 100-day Simple Moving Average (SMA) at $74.50. In addition, the 20-day SMA at the $71.00 level is key for WTI to maintain its upside bias. If breached, the price could see a steeper decline towards the $70.50 area and psychological mark at $69.00.
- The AUD/USD trades with losses below 0.6850 on Monday.
- Investors eye RBA minutes and PBoC monetary policy announcement for cues.
- US Stocks and Bonds markets closed on Juneteenth celebrations.
The AUD/USD tallies a second consecutive day of losses below the 0.6850 area, and investors seem to have turned cautious ahead of the release of the Reserve Bank of Australia (RBA) minutes. In addition, all eyes will be on the People’s Bank of China (PBoC) monetary policy announcement in a quiet session as US traders celebrate Juneteenth. For the rest of the week, key data released by the US is set to start shaping the next Fed policy decision expectations
Investors await RBA minutes and economic data from the US
The Aussie price dynamics may have an impact following the release of RBA’s minutes on the early Tuesday Asian session, where investors will look for clues regarding the latest surprising decision by Governor Philip Lowe to hike rates by 25 basis points to 4.10%. That being said, Lowe and Bullock’s hawkish comments last week may limit a potential surprise in the minutes.
Across the Pacific, the focus will be on the release of housing data, S&P PMI and jobless claims data this week. In that sense, Jerome Powell, Chair of the Federal Reserve, announced last Wednesday a halt in interest rate hikes to allow officials more time to gather crucial information and evaluate its impact on monetary policy. Macroeconomic data points are, therefore, expected to play a significant role in shaping expectations for the upcoming July meeting. Additionally, Chair Powell's testimony before Congress on Wednesday has the potential to trigger notable reactions in USD price dynamics.
AUD/USD Levels to watch
Technically speaking, the AUD/USD maintains a bullish outlook for the short term, as per indicators on the daily chart. Despite the Relative Strength Index (RSI) and Moving Average Convergence Divergence (MACD) both displaying bullish exhaustion, they still remain in positive territory, suggesting that there may be more upside favouring the Aussie in the near term. In addition, the 20-day Simple Moving Average (SMA), is set to display a bullish cross with the longer-term 100-day SMA, which could potentially give an additional boost to the pair.
If AUD/USD manages to move higher, the next resistances to watch are at the 0.6850 area, followed by the psychological mark at 0.6900 and the 0.6920 area. On the other hand, the 0.6800 zone is the immediate support level for the pair. A break below this level could expose the 0.6750 area and then pave the way to the 100-day Simple Moving Average (SMA) at 0.6720.
-638227911198091666.png)
- GBP/USD is slightly down as the Bank of England’s potential rate hike looms amidst easing inflation signals.
- A hawkish BoE stance could push GBP/USD towards 1.3000 if accompanied by increased inflation and rate hike.
- US Dollar Index strengthens; June Housing Market Index outperforms expectations, rising from 50 to 55.
GBP/USD reverses its course late in the European session amidst a low-volume trading day in the FX space, with US markets closed due to a holiday. A risk-off impulse weighs on the Pound Sterling (GBP), which is set to outperform the greenback, as the Bank of England (BoE) is expected to deliver a rate hike on Thursday. The GBP/USD is trading at 1.2793, down a modest 0.19%.
Investors focus on the potential Bank of England’s rate hike amidst easing inflation, while US housing data exceeds forecasts
European equities closed with losses. The GBP/USD is at the mercy of the BoE’s decision to raise rates after being questioned by politicians to deliver price stability amidst inflationary levels last seen 40 years ago. Nevertheless, it should be said that April’s inflation has shown signs of easing from around 10.1% to 8.7% YoY. Still, the core reading depicts inflation is broadening amongst the Consumer Price Index (CPI) basket components, as it ticks from 6.2% to 6.8% YoY.
The BoE will reveal its decision on Thursday at 11:00 GMT. But one day earlier, May’s CPI readings would be delivered. Market participants estimate the headline CPI to stand at 8.4% YoY, while core CPI is estimated at 6.8%, unchanged from last month’s figures. Further inflation data would be released, with Producer Price Index (PPI) and the Retail Price Index (RPI) estimated to edge lower, particularly the former.
If inflation ticks higher, alongside a 25 bps rate increase by the BoE, it would require the delivery of a hawkish message that convinces the market that additional hikes are expected. In reaction, the GBP/USD is expected to appreciate, and it could challenge the 1.3000 figure.
Across the pond, the Federal Reserve (Fed) kept rates unchanged but foresaw peak rates at 5.6%, according to the dot-plot in the Summary of Economic Projections (SEP). A slew of Fed officials have expressed the likelihood of raising rates at the July meeting. Traders will look to Fed Chair Jerome Powell’s testimony at the US Congress.
In the meantime, the greenback is getting stronger amidst light trading. The US Dollar Index (DXY), a measure of the US Dollar value against a basket of peers, climbs 0.22% at 102.536.
Data-wise, the US NAHB Housing Market Index for June improved from 50 to 55, smashing estimates and, according to the report, the highest reading since July 2022. The report highlighted solid demand and the lack of inventory as the main reasons for the surprising jump.
GBP/USD Price Analysis: Technical outlook
From a technical perspective, the GBP/USD is set to continue to edge higher, with the 1.3000 figure on sight. Given the fundamental backdrop suggeting a more aggressive monetary policy, that should help the GBP/USD pair to surpass the 1.3000 mark, which could exacerbate a rally toward the April 21, 2022, high at 1.3089, followed by 1.3100. Conversely, the GBP/USD could witness further downside below the 1.2800 figure, like the May 2022 high of 1.2772, followed by the 1.2700 figure, ahead of diving to the 20-day EMA At 1.2574.
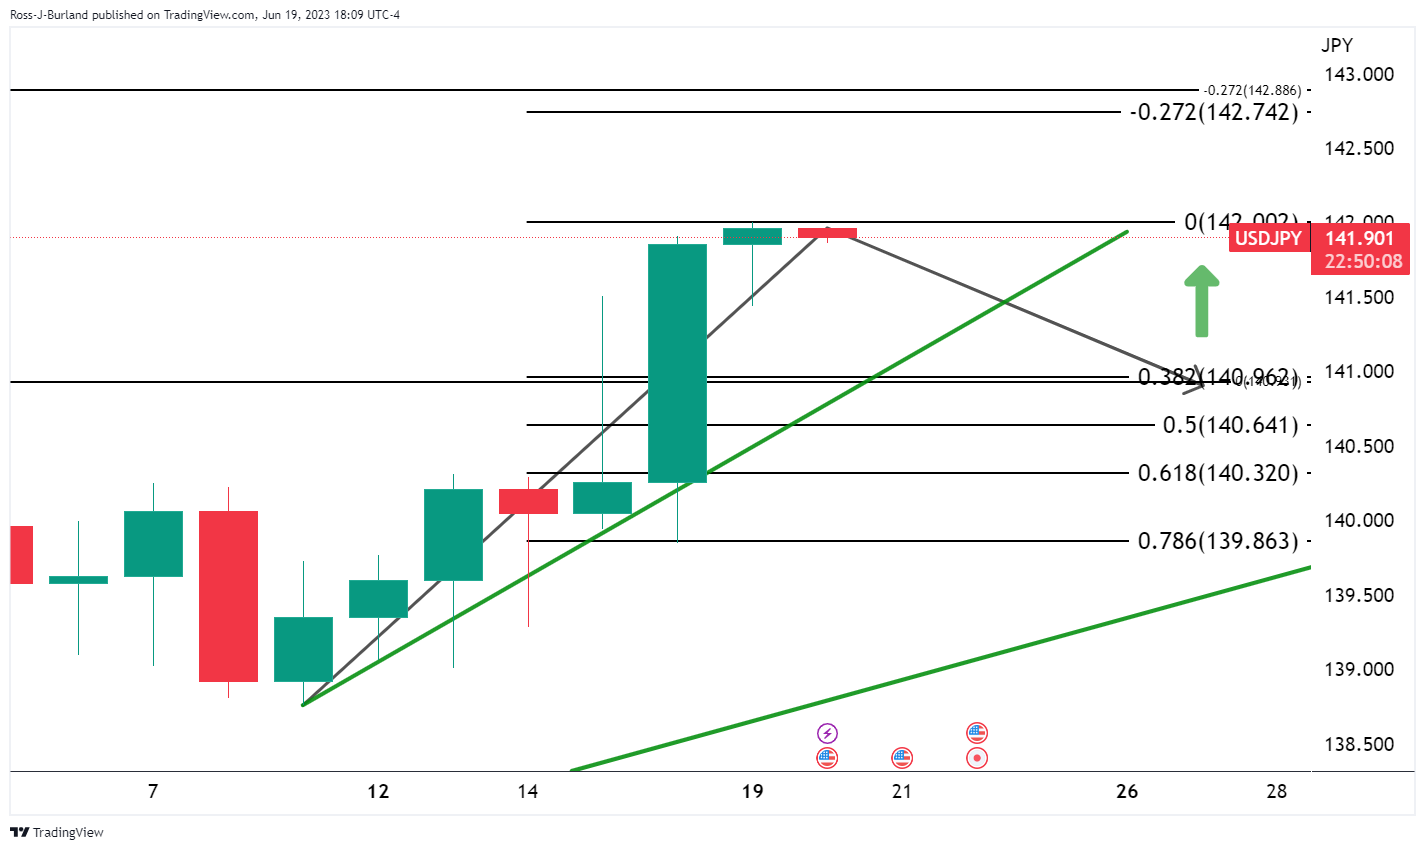
- USD/JPY trades stable in the 141.80 area after hitting its highest point since November 2022.
- US Stock and bond markets are closed on Juneteenth celebrations.
- Eyes on economic data from the US, Chair Powell's testimony on Wednesday.
The USD/JPY slightly retreated on Monday to the 141.80 area after hitting a multi-month high on Friday. US traders are celebrating Juneteenth and markets are relatively quiet. Investors seem to be consolidating gains after the USD/JPY pair increased more than 100 pips on Friday. The week’s focus remains on economic data from the US, released throughout the next sessions, Chair Powell's testimony before the US Congress and the Bank of Japan (BoJ) minutes out on Tuesday.
Economic data to start shaping July’s Fed decision, eyes on BoJ minutes
Last Wednesday, Jerome Powell stated that the Federal Reserve (Fed) opted for a hike pause, and that officials needed additional information to assess its implications on monetary policy. In that sense, US Housing data to be released on Tuesday, followed by Jobless Claims and S&P PMIs on Thursday and Friday, respectively, may impact their expectations regarding the next July meeting. In addition, Chair Powell’s testimony before Congress on Wednesday may trigger some reaction in USD price dynamics.
As for now, according to the CME FedWatch tool, investors are betting on a 75% probability of the Fed hiking by 25 basis points (bps) to the 5.25%-5.50% range on July 26.
On the other hand, the BoJ will release the minutes of its Friday meeting on Tuesday, where investors will get a better outlook of the bank's stance regarding monetary policy that could potentially impact the Yen.
USD/JPY Levels to watch
The USD/JPY has a bullish outlook in the short term, as per the daily chart. The Relative Strength Index (RSI) and Moving Average Convergence Divergence (MACD) are both in positive territory, and the pair trades above its main moving averages, indicating that the buyers are in charge.
If USD/JPY manages to move higher, the next resistances to watch are at the 142.00 zone, followed by the 142.50 area and the 143.00 zone. On the other hand, the 141.50 area is the immediate support level for USD/JPY. A break below this level could pave the way towards the 20-day Simple Moving Average (SMA) at the 139.90 area and then to the 139.20 zone.
-638227873134758323.png)
Gold was little changed after the Fed rate decision. Economists at TD Securities analyze XAU/USD outlook.
Future rate decisions will very much be driven by inflation and economic data
The US central bank signaled a hawkish, hawkish pause, as the FOMC members predicted two more hikes. But since the spread of members’ dots is so wide, ranging from 3.625%-5.875% for next year, the median estimate is not all that relevant as far as we are concerned and future rate decisions will very much be driven by inflation and economic data.
We suspect that data and inflation will weaken in the not too distant future, with the Fed likely lowering rates before hitting its inflation target. As such, we expect Gold to do quite well in the months ahead.
- Gold price slips amid closed US markets and rising bond yields.
- US Dollar gains momentum ahead of potential July Fed rate hike.
- US-China diplomacy progresses; US housing index outperforms expectations.
Gold price trades with minimal losses amidst a quiet US session due to a holiday in the United States (US). Therefore as US markets are closed, thin liquidity conditions drive price action. At the time of writing, XAU/USD is trading at $1952.52 after hitting a daily high of $1958.73.
Investors focus on yield performance and housing data while US-China diplomatic relations warm-up
European equities are trading negatively following a week that witnessed three major central banks delivering monetary policy decisions. The Federal Reserve (Fed) kept rates unchanged but foresaw peak rates at 5.6%, according to the dot-plot in the Summary of Economic Projections (SEP). Since then, officials have expressed the likelihood of raising rates at the July meeting, but the recent rally in US stocks portrays investors are not “buying” a more aggressive Fed.
As US markets remain closed, XAU/USD trading is dictated by yield performance on last Friday’s session. The 10-year benchmark note rate sits at 3.767%, while US real yields, calculated with the nominal yield minus inflation expectations, sit at 1.547%, still below the 2023 high of 1.719%. With US bond yields remaining higher, XAU/USD would likely remain pressured, as high yields, usually mean a stronger US Dollar (USD).
The US Dollar Index (DXY), a measure of the buck’s value against a basket of peers, climbs 0.13% at 102.436.
In the weekend events, US-China talks resumed as the US Secretary of State Anthony Blinken met with its counterpart, the Chinese Foreign Minister Qin, in Beijing. Blinken emphasized the importance of diplomacy and maintaining open channels with China as he invited Qin to Washington. Meanwhile, Qin commented that China is committed to building a stable, predictable, and constructive relationship with the US while maintaining its stance on Taiwan.
Regarding US data, the US NAHB Housing Market Index for June improved from 50 to 55, smashing estimates and, according to the report, the highest reading since July 2022. The report highlighted solid demand and the lack of inventory as the main reasons for the surprising jump.
Upcoming events
The US economic agenda will reveal additional housing data, the US Federal Reserve Chair Jerome Powell’s testimony at the US Congress, and a solid Fed parade, ready to rock the markets.
XAU/USD Price Analysis: Technical outlook
XAU/USD is trading sideways, in an area “vigilant” by the 20 and the 100-day Exponential Moving Averages (EMAs), at $1959.99 and $1939.79, respectively. Even though XAU/USD broke below a symmetrical triangle on a downtrend, it recovered lost territory and negated the pattern. Nevertheless, XAU/USD is trading in a descending channel, while the Relative Strength Index (RSI) and the three-day Rate of Change (RoC) suggest sellers remain in charge. XAU/USD’s first support would be the 100-day EMA at $1939.79. Break below will expose additional support areas, like the June 15 low of $1925.06, ahead of the $1900 figure. On the other hand, XAU/USD’s first resistance would be the 20-day EMA at $1959.95, closely followed by the 50-day EMA at $1964.76, ahead of the top trendline of the descending channel at around $1970-80.
GBP bullish trend remains firmly in place but not without downside risks in week ahead, economists at MUFG Bank report.
A weaker UK CPI and push back from BoE against amount of hikes priced in would be worst outcome for GBP
A weaker UK CPI report and/or a BoE policy update that fails to fully meet lofty expectations for higher UK rates pose the main downside risks to the GBP’s bullish trend.
We still expect Cable to move closer to 1.3000 this year. A full reversal of the GBP sell-off following the outbreak of the Ukraine conflict could even see the pair extend its rebound further back towards the 1.3500 level where it was trading in early 2022.
USD regains a little ground in quiet trade. Shaun Osborne, Chief FX Strategist at Scotiabank, analyzes the greenback outlook.
USD gains may extend a little from here
It’s a light week for US data (although there is plenty of Fedspeak in the next few days) and today is likely to be quiet, given the Juneteenth holiday in the US.
USD gains may extend a little from here as short-term oversold conditions work off but the trend is soft and the USD is likely to remain sensitive to data – especially negative data surprises – in the short run.
I think the greenback remains prone to weakness in the longer run as markets start to consider the top of the US rate cycle.
Economists at Danske Bank remain bearish on the EUR/USD.
EUR/USD to decline towards 1.06/1.03 on a 6M/12M horizon
As we move into H2, we still look for a broadly higher USD, and in general expect near-term USD strength. We think that as long as sticky inflation remains a concern globally, we would expect the EUR/USD to remain soft.
We still find the outlook for the US economy less gloomy relative to the Euro area, which should weigh on the EUR/USD in H2.
We expect the EUR/USD to decline towards 1.06/1.03 on a 6M/12M horizon.
The US Dollar weakened against all other G10 currencies last week with the exception of the Yen. Economists at MUFG Bank discuss USD outlook for the week ahead.
US rate market is still not convinced that the Fed will deliver two more hikes
One of the important risk events for the US Dollar in the week ahead will be the semiannual monetary policy testimony from Fed Chair Powell to Congress delivered on Wednesday and Thursday.
We expect Chair Powell to deliver a similar message to the one at last week’s FOMC meeting. The updated dot plot revealed that the majority of FOMC members now favour delivering two more hikes by the end of this year. Yet the US rate market is still not convinced that the Fed will deliver two more hikes and is currently pricing in only around 21 bps of further hikes by September. However, we do not expect Chair Powell to push back hard against those expectations in his testimony this week.
We continue to believe that building evidence of disinflation pressures will discourage the Fed from following through on current plans to deliver two more hikes and see room for the US Dollar to weaken further as the Fed becomes less hawkish.
Sterling has been the strongest of the G10 currencies over the last 6 months but it will show its less attractive side when rate hikes really bite, Kit Juckes, Chief Global FX Strategist at Société Générale, reports.
Pricing of a further 5 25 bps rate increases in the UK this year is lifting Sterling
At a time when the single biggest driver of foreign exchange rates has been shifts in expectations about short-term interest rates, the pricing of a further 5 25 bps rate increases in the UK this year (to a peak just below 6%), is dragging GBP/USD towards 1.30 and EUR/GBP down towards 0.85.
If UK rates rise as far as is currently priced into the UK curve (which seems both unlikely and dangerous), the Pound will remain strong for just as long as those rates can outweigh the longer-term economic outlook.
Esther Reichelt, FX Analyst at Commerzbank, explains why BRL and MXN are holding up well.
Not only doves cut interest rates
With inflation having come down significantly to 3.9% in Brazil and 5.8% in Mexico, rate cuts are justified to avoid excessive tightening through further increases in real interest rates. Hence, rate cuts are not a dovish signal as both central banks have so far left no doubt that they intend to maintain reasonably positive real interest rates for the time being, given the continuing uncertainties about the future path of inflation.
We expect both central banks to reaffirm their fundamentally hawkish stance in this week's rate decisions, and that the Brazilian Real and the Mexican Peso will remain well supported.
EUR/USD regained upward momentum over the past week. Economists at MUFG Bank analyze the pair’s outlook.
USD remains overvalued
We see room for the rebound to extend further to a new year-to-date highs above the April high at just below the 1.1100 level.
The semi-annual testimony from Chair Powell in the week ahead poses the main downside risks to our trade idea although we doubt he will try strongly push the US rate market to price in a second hike into the curve at the current juncture.
The USD remains overvalued and we expect a further adjustment lower as fundamental drivers of USD strength from last year continue to reverse.
As expected, the FOMC chose to skip a rate hike at the June meeting. Economists at HSBC analyze the implications for equities.
Current bull market should continue
The current bull market, which began last October, should continue. But investors should prepare for some consolidation as valuations have risen, and the potential of further Fed tightening may cut into future earnings estimates and valuations in the short term. However, we feel the Fed is closer to the end of its monetary policy tightening cycle, and this should bode well for US equities.
Historically, when the Fed pauses its monetary policy tightening cycles, US equity markets tend to do very well and usually outperform global indices. In the prior six Fed tightening cycles, the S&P has produced an average return of 19% in the 12 months following a Fed pause.
The CAD is relatively stable over the weekend. Economists at Scotiabank discuss USD/CAD outlook.
IMM data shows CAD shorts still largely intact
Spot remains close to the 1.32 zone and, after a run of solid gains over the past three weeks, can be excused a minor pause for breath.
Neither soft stocks nor a minor drop in crude oil prices are bothering the CAD at the moment, suggesting a firm undertone persists. However, CFTC data Friday showed that the CAD remains the biggest FX short position held by Institutional and Leveraged Accounts while Speculative traders remain bearish on the CAD and reduced net short positioning only marginally last week.
The positioning bias against the CAD could provide the CAD with an additional tailwind if investors cover.
- EUR/USD extends the corrective decline to the 1.0900 area.
- A move to the 1.1000 hurdle remains on the cards.
EUR/USD corrects lower and challenges the 1.0900 region on Monday.
Despite the current downtick, further gains remain well on the table for the time being. Against that, the pair is expected to challenge the psychological barrier at 1.1000 once the June peak at 1.0970 (June 16) is cleared.
Looking at the longer run, the constructive view remains unchanged while above the 200-day SMA, today at 1.0544.
EUR/USD daily chart
- AUD/USD has shown a downside move to near 0.6840 amid a quiet market mood due to an extended weekend in the US.
- The appeal for the Australian Dollar has been trimmed ahead of RBA policy minutes and PBoC policy.
- AUD/USD is climbing higher in a Rising Channel pattern formed in which each pullback is considered as a buying opportunity.
The AUD/USD pair has retreated after facing barricades around 0.6880 in the European session. The Aussie asset has dropped to near 0.6840 as investors are getting precautionary ahead of the release of the Reserve Bank of Australia (RBA) minutes and the monetary policy announcement by the People’s Bank of China (PBoC).
The US Dollar Index (DXY) is demonstrating a lackluster performance as United States markets are closed on Monday on account of Juneteenth.
Meanwhile, US Treasury yields have extended further as the Federal Reserve (Fed) has confirmed expansion in interest rates by 50 basis points (bps) to 5.50-5.75%. The 10-year US Treasury yields have jumped to 3.82%.
AUD/USD is climbing higher in a Rising Channel chart pattern formed on an hourly scale in which each pullback is considered as a buying opportunity. The Aussie has tested territory below the aforementioned pattern but is finding cushion near the horizontal support plotted from June 14 high at 0.6834.
Upward-sloping 100-period Exponential Moving Average (EMA) at 0.6826 indicates that the trend is bullish.
The Relative Strength Index (RSI) (14) is taking support near 40.00. A recovery move above 60.00 would strengthen the upside momentum.
A decisive break above the round-level resistance of 0.6900 will drive the asset toward Feb 16 high at 0.6936 followed by Feb 07 high at 0.6988.
On the flip side, a breakdown below June 14 low at 0.6756 will expose the Aussie asset to May 02 high at 0.6717 and May 19 high at 0.6675.
AUD/USD hourly chart
Economists at Commerzbank discuss ECB and Fed rate expectations and how could impact the EUR/USD pair.
FX market rewards flexibility
The ECB appears to be taking a more open-minded view of the future than the Fed – which the FX market is rewarding in view of the still uncertain inflation outlook. Whatever happens — whether stubbornly high inflation momentum justifies further rate hikes or, as our economists expect, hikes will end in July — there is a likelihood that the Fed will have to correct itself thus admitting an error in judgement, whereas the ECB is well prepared for any scenario.
25 bps more or less do not matter, what matters more than anything is how sensitive to inflation risks a central bank is. And in this respect, the ECB seems to be in the lead at present. As a result, EUR/USD is moving towards our June target of 1.10.
- DXY adds to Friday’s bounce and revisits the 102.50 region.
- Further advance could see the 100-day SMA near 103.00 revisited.
The recovery in DXY gathers extra impulse and reclaims the 102.50 region following Friday’s lows around the 102.00 neighbourhood.
If the index manages to surpass the interim 100-day SMA around 103.00 it could see its selling pressure mitigate somewhat in the short-term horizon.
Looking at the broader picture, while below the 200-day SMA at 105.25 the outlook for the index is expected to remain negative.
DXY daily chart
25 bps rate hikes in the UK, Norway, and Switzerland this week can hold the strong Dollar in check, economists at ING report.
Currencies gear up for another big week of central bank meetings
Having negotiated the hawkish set of Fed and ECB meetings last week, FX markets will this week brace for around 10 central bank policy decisions across the developed and emerging market space.
Further rate hikes in the likes of the UK, Norway and Switzerland can hold the strong Dollar in check, while a rate cut in Hungary should not hurt the Forint too much.
- Natural Gas pauses as traders book profits after the recent rally and the US is off on a national holiday.
- Concerns linger regarding European supply adequately meeting demand after outages in Norway, the continent’s main Gas producer.
- Despite bullish fundamentals, the longer-term technical trend remains down as long as prices stay below $3.079 MMBtu.
Natural Gas price trades flat on Monday, taking a breather after the recent strong rally. Overall volume is light as some traders book profits and those in the US stay away from their desks for the Juneteenth national holiday.
Last week’s surge was one of the biggest of 2023, with Natural gas prices rising over 17%. The main catalyst was supply fears as several European Gas plants suffered longer-than-expected outages, leading to concerns of a repeat of last year’s supply crisis from Russia’s invasion of Ukraine – and unexpectedly hot weather increasing air-conditioning demand.
XNG/USD is trading a whisker down on the day, exchanging hands at $2.685 MMBtu, at the time of writing.
Natural Gas news and market movers
- Natural Gas price stabilizes after the recent surge as traders book profits and the US takes the Juneteenth holiday.
- The main catalyst for recent price gains was the news of longer-than-expected outages at Norwegian Gas plants and rumors of an earlier-than-expected closure of the Groningen Gas field in the Netherlands.
- Norwegian supply is now critical to the European continent after it replaced Russia as the main supplier in 2022, when Norwegian Gas accounted for 23% of imports compared to Russia’s 15%, according to a report by CNN.
- The extended shutdown of plants in Norway could shave one billion cubic meters (bcm) of Gas off supply, and, “It only really takes 5 bcm less… to make the market a lot tighter,” a source told CNN.
- “The European gas market — and by extension the global gas market — [is] certainly not out of the woods in terms of adequately matching supply with demand,” Tom Marzec-Manser, head of Gas analytics at ICIS, told CNN.
- That said the position is not as precarious as in previous years: European storage facilities are now 73% full — a much higher level than the 56% averaged at the same time of the year over the past five years, according to data from Gas Infrastructure Europe (reported by CNN).
- Asian rivalry for Europe’s limited supply is also likely to be less than in previous years, after Japan and South Korea recorded much higher stores and the Chinese economy continues to falter after months of lockdown.
- Demand for air conditioning has risen due to hotter-than-expected weather in the Western hemisphere as the summer season begins.
- The ongoing Atlantic hurricane season in the US could further increase demand in the US.
- Supply showed an unexpected fall in last week’s Energy Information Administration (EIA) data, after dropping to 84 billion cubic feet (Bcf) versus the 95 Bcf forecast and the 104 Bcf of the prior period, further exacerbating supply-demand imbalances.
- The US Dollar could be a factor for XNG/USD, as market expectations of the trajectory of future interest rate changes in the US clash with comments from US Federal Reserve (Fed) officials.
- Fed speakers, Jerome Powell included, are taking a more hawkish line than market-based gauges suggest, with Powell recently mentioning the chance of two more hikes in 2023 when the market only expects one.
- Interest rate hikes are bullish for the US Dollar (bearish for XNG/USD) as higher interest rates attract more inflows from global investors seeking to park their money in the US for maximum return.
Natural Gas Technical Analysis: Long-term trend down; short-term trend up
Natural Gas price is in a long-term downtrend since turning lower at the $9.960 MMBtu peak achieved in August 2022. That said, bearish momentum has tapered off considerably since February 2023. This is evidenced by the bullish convergence of the Relative Strength Index (RSI) momentum indicator with price, beginning in May this year. Bullish convergence occurs when price makes new lows but RSI fails to copy. It can be indicative of a bullish reversal in the offing.
Given the longer-term trend is bearish, Natural Gas would need to break above the last lower high of the long-term downtrend at $3.079 MMBtu to reverse the trend.
As things are a break below the $2.110 MMBtu year-to-date lows would provide a signal for a continuation down to a target at $1.546 MMBtu. This target is the 61.8% Fibonacci extension of the height of the roughly sideways consolidation range that has unfolded during 2023.
-638227754871589427.png)
Natural Gas: Weekly Chart
Scoping into the daily chart, however, it can be seen that price is rising up within its consolidation range. It has now broken above both the 50 and not the 100-day Simple Moving Average (SMA), which is a short-term bullish sign.
-638227755278248229.png)
Natural Gas: Daily Chart
The 4-hour chart shows the pair in a short-term uptrend making successively higher highs and higher lows.
-638227755667268051.png)
Natural Gas: 4-hour Chart
This falls in line with the bullish RSI convergence observed on the weekly chart.
Yet on the 4-hour chart, the RSI is now blinking ‘overbought’ (above 70), which is a signal for bulls not to add any new long positions. It has come down from its peak and in the event that RSI exits the overbought zone and returns to neutral territory, it would be a signal for short-term horizon bulls to close their long positions altogether, and is likely to be indicative of a pullback in price after the recent strong gains.
Natural Gas FAQs
What fundamental factors drive the price of Natural Gas?
Supply and demand dynamics are a key factor influencing Natural Gas prices, and are themselves influenced by global economic growth, industrial activity, population growth, production levels, and inventories. The weather impacts Natural Gas prices because more Gas is used during cold winters and hot summers for heating and cooling. Competition from other energy sources impacts prices as consumers may switch to cheaper sources. Geopolitical events are factors as exemplified by the war in Ukraine. Government policies relating to extraction, transportation, and environmental issues also impact prices.
What are the main macroeconomic releases that impact on Natural Gas Prices?
The main economic release influencing Natural Gas prices is the weekly inventory bulletin from the Energy Information Administration (EIA), a US government agency that produces US gas market data. The EIA Gas bulletin usually comes out on Thursday at 14:30 GMT, a day after the EIA publishes its weekly Oil bulletin. Economic data from large consumers of Natural Gas can impact supply and demand, the largest of which include China, Germany and Japan. Natural Gas is primarily priced and traded in US Dollars, thus economic releases impacting the US Dollar are also factors.
How does the US Dollar influence Natural Gas prices?
The US Dollar is the world’s reserve currency and most commodities, including Natural Gas are priced and traded on international markets in US Dollars. As such, the value of the US Dollar is a factor in the price of Natural Gas, because if the Dollar strengthens it means less Dollars are required to buy the same volume of Gas (the price falls), and vice versa if USD strengthens.
- USD/MXN has shown a recovery move to near 17.10 as the market mood is turning cautious.
- Investors are expecting that interest rates by the Fed will peak sooner than the guidance provided.
- The Mexican Peso is on the seventh sky as interest rates by the Banxico are at 11.25%.
The USD/MXN pair has rebounded to near 17.10 after printing a fresh seven-year low in the European session. The asset is expected to remain less volatile as US markets will be closed on Monday on account of Juneteenth.
S&P500 futures have extended their losses as the risk appetite of the market participants has trimmed due to the extended weekend in the US. The US Dollar Index (DXY) has witnessed some selling pressure after recovering to near 102.56 as investors are expecting that interest rates by the Federal Reserve (Fed) will peak sooner than the guidance provided.
Fed chair Jerome Powell, in his monetary policy statement last week, commented that two interest rate hikes are appropriate as labor market conditions are still tight and the core Consumer Price Index (CPI) is showing persistence.
The journey of bringing down inflation to desired levels is far from over, however, short-term consumer inflation expectations have softened sharply. Also, Consumer Sentiment Index has improved significantly after a sheer deceleration in the consumer and producer price index due to lower gasoline prices.
Meanwhile, the Mexican Peso is on the seventh sky as interest rates by the Bank of Mexico (Banxico) are at 11.25%. Going forward, investors will keep focusing on the Retail Sales data (April). As per the preliminary report, monthly economic data is seen contracting by 0.3% against a stagnant performance reported last month. Annualized data is expected to expand to 2.9% vs. the prior release of 2.5%.
European Central Bank (ECB) Chief Economist Philip Lane said on Monday that another rate hike in July seemed appropriate but noted that the decision in September will depend on incoming data, per Reuters.
Key takeaways
"Inflation will come down fairly quickly in the next couple of years to the ECB's 2% target."
"ECB needs to be data-dependent about inflation outlook."
"ECB is looking at a variety of measures to analyze shocks to prices."
Market reaction
EUR/USD showed no immediate reaction to these comments and extended its sideways action slightly above 1.0900.
Sterling is 2023’s top G10 currency. Kit Juckes, Chief Global FX Strategist at Société Générale, analyzes EUR/GBP outlook.
EUR/GBP might stay below 0.90 for much of the rest of the year
We might get below 0.85 as we wait for the MPC meeting on Thursday, and we might stay below 0.90 for much of the rest of the year, but EUR/GBP will continue to grind lower on the days when we watch rates and jump higher when we assess the economic damage the hikes will cause.
Perversely, the current rate-driven Sterling rally increases the chance of a test of EUR/GBP parity in the next couple of years.
Citing upside risks to inflation outlook, "we need to remain highly data-dependent and err on the side of doing too much rather than too little," European Central Bank (ECB) Governing Council member Isabelle Schnabel said on Monday, as reported by Reuters.
Key takeaways
"The path towards sustained price stability remains uncertain and fraught with risks."
"Profit margins expected to absorb rising labour costs."
"Rules suggest that the optimal interest rate path would have been steeper."
"The fact that we underestimated inflation persistence last year raises the probability that we are also underestimating inflation today."
"Giving more weight to observable data, in particular at times of high uncertainty, can improve the quality of policy decisions."
"Risks of both a de-anchoring of inflation expectations and weaker monetary policy transmission suggest that there is a limit to how long inflation can stay above 2%."
"We thus need to keep raising interest rates until we see convincing evidence that developments in underlying inflation are consistent with a return of headline inflation to our 2%."
Market reaction
These comments failed to provide a boost to the Euro. As of writing, EUR/USD was down 0.2% on the day at 1.0920.
- USD/CHF has failed in extending its recovery as the focus has shifted to SNB policy.
- A sideways auction in the USD Index is widely expected as the street is divided about the interest rate guidance from the Fed.
- The SNB is expected to hike interest rates by 25 bps to 1.75%.
The USD/CHF has shown a mild correction to near 0.8950 in the European session. The Swiss Franc asset has faced barricades around 0.8970 as investors are shifting their focus toward the interest rate decision by the Swiss National Bank (SNB), which will be announced on Thursday.
S&P500 futures have turned bearish again as investors are getting precautionary due to extend weekend in the United States. The market participants will come back on Tuesday as markets are closed on Monday on account of Juneteenth.
The USD Index (DXY) has failed to extend the recovery move made above 102.45. A sideways auction in the USD Index is widely expected as the street is divided about the interest rate guidance from the Federal Reserve (Fed). Although Fed chair Jerome Powell announced that two interest rate hikes are appropriate this year, investors are hoping a single rate hike announcement will be made as US economic prospects are losing resilience.
Meanwhile, headlines from discussions between US Secretary of State Antony Blinken and China’s President XI Jinping are not making any significant impact on the FX domain. US Blinken cited that he is concerned about Chinese businesses providing Russian military technology. US President Joe Biden has clarified that the economy doesn’t want a cold war with China.
On the Swiss franc front, investors are shifting their focus toward the interest rate decision by the Swiss National Bank (SNB). SNB Chairman Thomas J. Jordan is expected to hike interest rates by 25 basis points (bps) as he believes that a high-inflation environment will have more side effects than a low-inflation atmosphere.
USD/CAD holds around 1.32. Economists at Scotiabank analyze the pair’s technical outlook.
Scope for significant gains from the low 1.33 zone looks very limited on the charts
The USD is looking a little oversold from a technical perspective so some back and filling of recent losses would not surprise in the short run.
Gains through 1.3225/30 in the next day or so would give the USD a little more short-term support. There will be firm resistance on gains towards the low 1.33 zone, however, and scope for significant USD gains from here looks very limited on the charts.
The broader technical picture points to a USD decline towards the upper 1.29s after losing major support in the low 1.33s.
- EUR/JPY comes under some pressure following new highs.
- A sustained advance targets the 156.80 region in the near term.
EUR/JPY surrenders some gains and returns to the 155.00 region after advancing to new multi-year higher near 155.30 earlier on Monday’s session.
The current scenario remains open to extra gains in the short-term horizon. Against that, the next up-barrier of certain significance is expected at the weekly top recorded in late September 2008 at 156.83, which precedes the key round level at 157.00.
However, a corrective decline should not be ruled out in the short-term horizon due to the extreme overbought condition of the cross, as per the daily RSI well past the 76 level.
So far, further upside looks favoured while the cross trades above the 200-day SMA, today at 144.51.
EUR/JPY daily chart
Economists at Scotiabank analyze GBP outlook.
EUR/GBP to see a further fall towards support around 0.8450
Sterling gains have steadied versus the USD, with oscillator signals veering towards overbought on the intraday and daily studies.
Price action is neutral, rather than outright bearish at this point, however, and the broader uptrend in Cable remains well-entrenched on the charts after the pound’s break above major trend resistance last week.
Absent stronger signs of a reversal, minor GBP dips should remain well-supported.
EUR/GBP is pressuring the low 0.85 area; trends here point to a further fall towards support around 0.8450.
EUR/USD drifts from mid/upper-1.09s. Economists at Scotiabank analyze the pair’s technical outlook.
Near term risks are tilting towards some retrenchment in EUR gains in the short run.
A minor top/reversal signal on the intraday chart was struck late last week and the EUR’s drift from the mid-1.09 area suggests near term risks are tilting towards some retrenchment in EUR gains in the short run.
The broader trend higher remains constructive, however, and I think scope for EUR losses is limited to the 1.0840/50 area (40-Day Moving Average 1.0855) currently.
Economists at ING discuss Hungarian Forint (HUF) outlook.
Forint to hover within a tight range in the summer
We continue to see a working framework for the coming weeks in the 368-378 EUR/HUF range.
We believe that the market will use weaker levels as a new entry point to build positions in the Forint to benefit from a still very attractive carry. On the other hand, at the lower end of the range, bets will rise on more easing, limiting HUF upside.
We see potential for a positive breakout on an EU deal later this year.
Fed stays hawkish despite no rate move. Economists at HSBC analyze USD outlook.
USD seems to be moving on risk appetite rather than rates
For the first time in over a year, the Fed kept rates steady but signalled more hikes ahead, given elevated inflation.
Policy rates are moving close to their peak and this is likely to remain a headwind for the ‘safe haven’ USD.
It is notable that, so far in June, the USD appears to be taking its signal from risk appetite rather than US rates. So, while the Fed has guided policy rate expectations higher, risk appetite has come back as the key headwind to USD.
Economists at Danske Bank analyze EUR/NOK outlook.
Upward sloping profile for EUR/NOK in the coming months
In the near-term NOK will be very sensitive to news on the global investment environment and the combination of weaker global sequential growth and tighter global liquidity conditions is rarely a good cocktail for NOK.
We expect NB to sharply revise lower their fiscal NOK FX sales in August but before then the fiscal FX transaction mismatch leaves NOK vulnerable. We thus maintain an upward sloping profile for EUR/NOK in the coming months before we pencil in a move lower on both EUR strength fading and the NOK making a 2023-comeback.
We highlight the risk that our bullish NOK view could take longer to play out than in our forecast profile.
Forecast: 11.70 (1M), 11.70 (3M), 11.30 (6M), 10.80 (12M)
- Gold price has dropped to near $1,950.00 citing recovery signs in the USD Index.
- Investors are turning cautious ahead of US State of Secretary Antony Blinken meeting China’s President XI Jinping.
- Gold price has sensed selling pressure from the downward-sloping trendline of the Descending Triangle chart pattern.
Gold price (XAU/USD) has printed a fresh day’s low at $1,952.00 as the US Dollar Index (DXY) has attempted a recovery in the European session. The precious metal is declining towards the crucial support of $1,950.00 as investors are turning cautious ahead of US State of Secretary Antony Blinken's meeting with China’s President XI Jinping.
S&P500 futures are showing nominal gains after recovery losses posted in Asia, which indicates that appeal for US equities is still solid. Investors should note that the overall market mood could turn quiet as US markets will remain closed on Monday on account of Juneteenth.
The US Dollar Index (DXY) has come out of the woods and has climbed to near 103.53. There is a silver line between Federal Reserve’s (Fed) guidance and the expectations of investors for interest rates. Fed Chair Jerome Powell has announced that two small rate hikes are appropriate this year while the street is expecting that the central bank will go with just one hike. United States core inflation is still persistent and labor market conditions are extremely tight, having the potential of denting current expectations.
Elevating caution in the FX domain has also uplifted US Treasury Yields. The yields offered on 10-year US government bonds have jumped above 3.8%.
Gold technical analysis
Gold price has sensed selling pressure from the downward-sloping trendline of the Descending Triangle chart pattern plotted from June 02 high at $1,983.50 on a four-hour scale. The horizontal support is placed from May 30 low at $1,932.12. The broader cushion is placed from March 15 high at $1,937.39.
The 200-period Exponential Moving Average (EMA) at $1,966.70 is acting as a barricade for the Gold bulls, which indicates that the long-term trend is bearish.
Meanwhile, the Relative Strength Index (RSI) (14) is oscillating in the 40.00-60.00 range, portraying a lackluster performance.
Gold four-hour chart
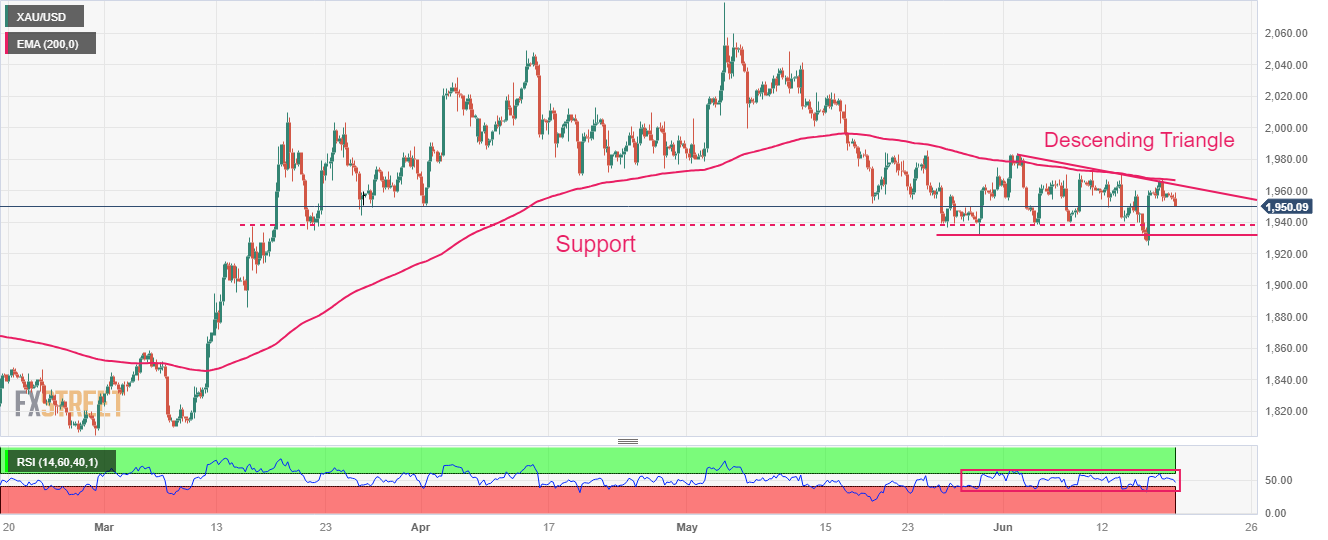
The Rand has recovered well after USD/ZAR nearly hit 20.00 in early June. Economists at ING discuss ZAR outlook.
Geopolitics recommends caution on the Rand
Geopolitics may discourage investors chasing Rand gains. In August, South Africa hosts a summit of BRICS leaders. Expect to hear more on the story of possible South African arms sales to Russia – and US Congress questioning trade ties.
Weak growth (0.5-1.0% over coming years) and a current account deficit in the 2-3% of GDP area will hold ZAR back.
USD/ZAR – 1M 19.50 3M 19.00 6M 18.50 12M 18.00
- The US Dollar opens on a calm note on Monday as both the Asia-Pacific and European sessions are not producing any notable big moves from or against the Greenback.
- Traders will hear from Fed speakers, including Chairman Powell, as he will testify before the Senate later this week.
- The US Dollar Index has moved only a few pips, trading above 102.00.
The US Dollar (USD) is bottoming out at the start of a new week, with no big movers to report from the Asia-Pacific or European sessions. The US has a public holiday on Monday, so no economic data or Fed speakers are on the docket. One element of importance that could move the market is that US Secretary of State Antony Blinken will meet with Chinese President Xi Jinping.
In terms of data, the focus this week will mainly be on housing as several figures such as housing starts, building permits and existing home sales will be reported. Data pointing to a sharp deterioration in the housing sector could be perceived as a negative for the US Dollar and could see it becoming weaker on the back of these numbers. A lot of Fed speakers will be taking the stage as well this week, with the main event for US Fed Chairman Jerome Powell, who is set to deliver his semi-annual speech before US Congress on Wednesday. Closing the week there will be the preliminary prints from S&P Global Manufacturing and Services Purchasing Managers Index (PMI) for June. .
Daily digest: US Dollar keeping its head above water
- The European Central Bank (ECB) has told banks to brace for harsher stress tests and consequent results.
- US Secretary of State Blinken has met Chinese Foreign Minister Wang Yi and President Xi.
- In the wake of the Blinken-Wang Yi meeting, Wang Yi said the US must stop the downward spiral of ties between the two countries. China-US ties need to be back on a stable track, he said.
- Nearly all stock markets in Asia and Europe are on the back foot as traders are disappointed by the less-impactful stimulus package from China. US equity futures are all mildly in the red.
- The CME Group FedWatch Tool shows that markets are pricing in a 74.4% chance of a 25 basis points (bps) hike on July 26th. Overall, the point of view here seems to be just one more hike and done as all other futures for 2023 are pointing to an unchanged rate level. The market is challenging the view of the Fed’s Dot-Plot curve, which showed most Fed members see two more hikes this year.
- The benchmark 10-year US Treasury bond yield trades at 3.76%, unchanged due to the official bank holiday in the US.
US Dollar Index technical analysis: pivotal support not needed yet
The US Dollar is licking its wounds after a very turbulent and downbeat performance last week. With the US holiday this Monday, the Greenback remains afloat and is marginally booking some profits left and right, triggering a small 0.10% gain in the US Dollar index (DXY). Should the DXY refrain from breaking below 102, a bounce higher could be in the cards later this week.
On the upside, the 55-day Simple Moving Average (SMA) at 102.55 has turned from support into resistance. Should the DXY recover further today or this week, look for the 103.00 psychological level as the next big challenge to the upside. The 100-day SMA at 103.05 will be key to reach, should the DXY want to advance further.
On the downside, the psychological level near 102.00 is the only element upholding DXY for now. Once price action should start to reside below it, expect to see another nosedive move for the US Dollar Index toward 100.82. That means a challenge for the low of this year and would imply a substantial devaluation for the Greenback to come.
How does Fed’s policy impact US Dollar?
The US Federal Reserve (Fed) has two mandates: maximum employment and price stability. The Fed uses interest rates as the primary tool to reach its goals but has to find the right balance. If the Fed is concerned about inflation, it tightens its policy by raising the interest rate to increase the cost of borrowing and encourage saving. In that scenario, the US Dollar (USD) is likely to gain value due to decreasing money supply. On the other hand, the Fed could decide to loosen its policy via rate cuts if it’s concerned about a rising unemployment rate due to a slowdown in economic activity. Lower interest rates are likely to lead to a growth in investment and allow companies to hire more people. In that case, the USD is expected to lose value.
The Fed also uses quantitative tightening (QT) or quantitative easing (QE) to adjust the size of its balance sheet and steer the economy in the desired direction. QE refers to the Fed buying assets, such as government bonds, in the open market to spur growth and QT is exactly the opposite. QE is widely seen as a USD-negative central bank policy action and vice versa.
EUR/GBP continues to trade offered. Economists at ING analyze the pair’s outlook.
A hawkish ECB provides some pushback to the BoE pricing
At least a hawkish European Central Bank (ECB) provides some pushback to the Bank of England (BoE) pricing and we continue to forecast a higher EUR/GBP later this year – once the hot UK inflation story cools.
The EUR/GBP pair may find support here at the 0.8500/8550 area.
See: EUR/GBP target lowered to 0.8450 and GBP/USD target raised to 1.2800 – Credit Suisse
In the view of Markets Strategist Quek Ser Leang at UOB Group, USD/IDR could advance to the 15,015 level in the near term.
Key Quotes
Last week, we held the view that USD/IDR “is likely to edge lower but a sustained drop below 14,740 is unlikely”. Our view was incorrect as USD/IDR rose to high of 14,960.
USD/IDR opened on a firm note in Asian trade today and it is likely to rise further to 15,015 this week. The next resistance at 15,045 is unlikely to come under threat. Support is at 14,925, followed by 14,850.
- The oil price has recovered sharply after slipping below $71.00 ahead of PBoC’s interest rate policy.
- Hawkish Fed guidance failed to impact overall oil price recovery.
- Investors will keep an eye on the discussion between US Secretary of State Antony Blinken and China’s President XI Jinping.
West Texas Intermediate (WTI), futures on NYMEX, have reported a quick recovery after correcting below $71.00 in the European session. The oil price is capitalizing on expectations of a dovish stance from the People’s Bank of China (PBoC), which will be announced on Tuesday, as the Chinese economy needs monetary stimulus to support bleak demand from households.
Inflationary pressures in China are critically soft and firms are not getting demand for their output, which indicates weak economic recovery. After a scrutiny of current economic prospects, giant investment banking firm Goldman Sachs has cut its outlook for Q2 Gross Domestic Product (GDP) growth to 1.0% from the prior forecast of 4.9%. The investment banking firm is anticipating an improvement in the second half of the year if monetary policy remains supportive.
Meanwhile, investors are ignoring hawkish interest rate guidance from the Federal Reserve (Fed). Fed chair Jerome Powell, in June’s monetary policy statement, confirmed that two interest rate hikes are appropriate this year. However, investors are hoping that the Fed will hike only once.
Going forward, investors will keep an eye on discussions between US Secretary of State Antony Blinken and China’s President XI Jinping.
The US Dollar Index (DXY) is inside the woods amid an absence of potential economic indicators this week. The upside in the USD Index seems restricted as US short-term consumer inflation expectations have decelerated to 3.3% at an annualized rate over the next year, down from the expectations of 4.2% released in May
Economists at Société Générale analyze USD/CAD technical outlook.
Possibility of a deeper pullback
USD/CAD has breached the lower limit of the broad consolidation within which it evolved since October last year. The break highlights possibility of a deeper pullback.
If the pair struggles to reclaim the multi-month ascending trend line at 1.3350/1.3380, the phase of decline could extend. Next potential objectives are located at projections of 1.3110 and 1.3000/1.2930, the 50% retracement from 2021.
See: USD/CAD can break below 1.30 as early as this summer – ING
USD/MYR could still climb to the 4.6360 region in the near term, notes Markets Strategist Quek Ser Leang at UOB Group.
Key Quotes
Our expectation for USD/MYR to break above last month’s high of 4.6360 last week did not materialize as it traded in a range of 4.5940/4.6330 before ending the week little changed at 4.6110 (-0.02%). While upward momentum has not increased much, we see chance of USD/MYR testing 4.6360 this week before the risk of a more sustained pullback increases.
The next resistance at 4.6500 is unlikely to come into view. Support is at 4.5940, followed by 4.5750.
Economists at ING discuss USD outlook.
Fed Chair Powell to keep the market biased towards a 25 bps hike on 26 July
While much of the focus will be on overseas rate meetings this week, the US calendar still sees important congressional testimony from Fed Chair Jerome Powell on Wednesday and Thursday. It looks too early for him to divert from the Fed's hawkish narrative and will keep the market biased (71% probability now priced) towards a 25 bps Fed hike on 26 July.
DXY will probably continue to trade near 102.00 with a downside bias.
- AUD/USD drifts lower for the second straight day, though the downside remains limited.
- The fundamental backdrop supports prospects for a further near-term appreciating move.
- A slightly overbought RSI is holding back bulls from placing fresh bets and capping gains.
The AUD/USD pair attracts some dip-buying on the first day of a new week and stalls its pullback from the 0.6900 mark, or the highest level since February 2023 touched on Friday. Spot prices, however, remain in the negative territory for the second straight day and trade around the 0.6865 region during the early European session.
The Federal Reserve's (Fed) hawkish outlook, signalling that borrowing costs may still need to rise by as much as 50 bps by the end of this year, assists the US Dollar (USD) to gain some positive traction on Monday. Apart from this, a generally softer risk tone, amid worries about a global economic downturn, particularly in China, further benefits the safe-haven buck and weighs on the risk-sensitive Aussie. That said, the Reserve Bank of Australia's (RBA) surprise 25 bps rate hike and a more hawkish policy statement, act as a tailwind for the Australian Dollar and help limit losses for the AUD/USD pair.
From a technical perspective, last week's breakout through the 100-day Simple Moving Average (SMA) and a subsequent move beyond the 0.6800 round-figure mark was seen as a fresh trigger for bulls. That said, the Relative Strength Index (RSI) on the daily chart is hovering around the 70 mark and holding back traders from placing fresh bullish bets around the AUD/USD pair. Nevertheless, the aforementioned fundamental backdrop suggests that the path of least resistance for spot prices is to the downside and any corrective decline might attract fresh buyers near the 0.6800 resistance breakpoint.
That said, a sustained break below the latter might prompt some technical selling and drag the AUD/USD pair back towards the 100-day SMA, currently pegged around the 0.6725 region. The said area should act as a key pivotal point and a strong near-term base for spot prices, which if broken should pave the way for deeper losses.
On the flip side, the 0.6900 round-figure mark now seems to have emerged as an immediate hurdle. Some follow-through buying has the potential to lift the AUD/USD pair further towards the 0.6955-0.6960 region, above which bulls might aim to conquer the 0.7000 psychological mark for the first time since February 14.
AUD/USD daily chart
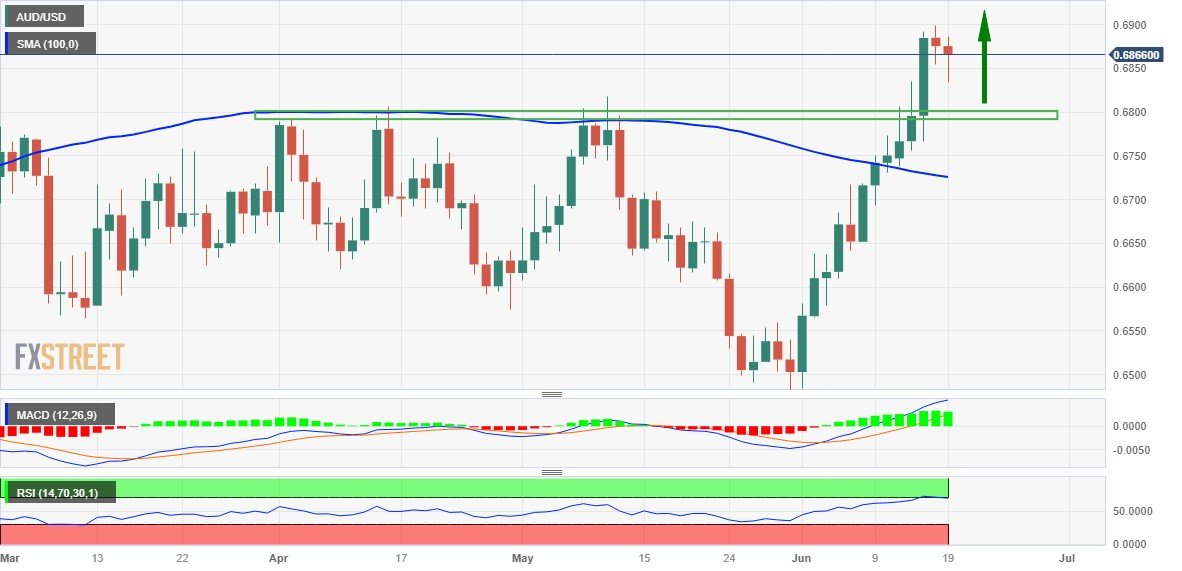
Key levels to watch
On meeting with US Secretary of State Antony Blinken on Monday, China President Xi Jinping said that he hopes through the visit, Blinken will make more positive contributions to stabilizing US-Sino relations.
more to come ...
- GBP/JPY is auctioning around seven-year highs at 182.00 as the focus shifts to UK inflation.
- Last week, BoJ Ueda decided to keep policy unaltered as more stimulus is required to stem inflation from domestic factors.
- UK Hunt showed reluctance while discussions about providing fiscal support to households to offset the impact of high mortgage prices.
The GBP/JPY pair is hovering around a fresh seven-year high around 182.00 in the European session. The cross has remained in the positive trajectory as the Bank of Japan (BoJ) kept its interest rates unchanged at -0.15 and its yields under the 0.5% boundary.
BoJ Governor Kazuo Ueda decided to keep the monetary policy unaltered as more stimulus is required to stem inflationary pressures from domestic factors. Current inflationary pressures in Japan are supported by higher import prices and the BoJ wants to exchange the source by elevating wages and domestic demand.
The need to maintain Japan’s inflation above 2% can be achieved by keeping the monetary policy expansionary.
Meanwhile, sheer strength in the Pound Sterling is coming from expectations that United Kingdom’s inflation will remain stubborn as labor market conditions have tightened further. As per the preliminary report, monthly headline inflation (May) has grown at a pace of 0.4%, slower than the pace of 1.2% registered in April. Annualized headline CPI is seen softening to 8.5% vs. the prior release of 8.7% while core inflation that excludes oil and food prices is seen steady at 6.8%.
UK Finance Minister Jeremy Hunt showed reluctance while discussions about providing fiscal support to households to offset the impact of high mortgage prices, as reported by the Financial Times. Fiscal support to the economy could dampen the impact of tight monetary policy by the Bank of England (BoE) and could fuel inflationary pressures.
The UK inflation release will be followed by the interest rate decision from BoE Governor Andrew Bailey, which is expected to remain severely hawkish.
The USD continues to struggle in the wake of the Fed ‘skip’. That, and a decent performance by risk assets, is keeping the NZD elevated, economists at ANZ Bank report.
Ongoing volatility
Correlations remain high across G10 currencies, with US factors driving most things and local factors playing second fiddle. NZ now sports a recession badge, and it is getting attention globally, and the current account is at a precarious level. But going the other way, markets are clearly keen to call time on the Fed, and that’s weighing on the USD. As this scuffle plays out, we expect ongoing volatility.
At the margin, we suspect the USD adjustment lower (to fair value) will be the more powerful force, and that’s why we are forecasting a mild appreciation over 2023, but it’s a close call.
European Central Bank (ECB) policymaker Peter Kazimir said on Monday, “we need to raise rates again in July.”
Additional quotes
“Upward inflation risks are still substantial, linked to the labor market, food prices, profit margins.”
“Regarding Sept, i'm awaiting analysis of the cumulative impact of past ECB measures.“
“Stopping rate hikes too soon "much more significant" risk than overtightening.”
Market reaction
EUR/USD was last seen trading at 1.0931, down 0.09% on the day, unfazed by the hawkish ECB commentary.
GBP/USD pauses after a 1.95% gain last week. Economists at Société Générale analyze GBP outlook ahead of the UK Consumer Price Index (CPI) data and the Bank of England (BoE) meeting this week.
A hawkish split with some members preferring 50 bps for the first time since January is not impossible
The acceleration in UK core inflation to a new high of 6.8% in May and wages ex-bonuses to 7.2% YoY in April sparked a dramatic repricing of the implied BoE terminal rate in the past two weeks from 5% to 6%. Whether we ultimately get there remains to be seen, but the bank could double down in the statement that tighter policy is required to rein in second-round effects. Compared to the UK, core inflation in the Eurozone and the US is 5.3%.
A hawkish split with some members preferring 50 bps for the first time since January is not impossible if core CPI surprises to the upside on Wednesday, the day before the rate decision.
We are mindful of technically stretched levels in Sterling and profit talking, but won’t rule out further appreciation just yet of GBP/USD towards 1.30 and depreciation of EUR/GBP towards 0.85 and 0.8475 (1.18 GBP/EUR).
- USD/JPY touches a fresh YTD peak on Monday, albeit struggles to capitalize on the move.
- The Fed-BoJ policy divergence continues to act as a tailwind and favours bullish traders.
- A softer risk tone lends some support to the safe-haven JPY and caps any further gains.
The USD/JPY pair reverses an intraday dip to the 141.45 area and steadily climbs back closer to its highest level since November 2022 touched earlier this Monday. Spot prices trade just below the 142.00 mark during the early European session and seem poised to prolong the recent well-established bullish trajectory witnessed over the past three months or so.
The Japanese (JPY) continues to be weighed down by a big divergence in the monetary policy stance adopted by the Bank of Japan (BoJ) and other major central banks, including the US Federal Reserve (Fed). This, along with a modest US Dollar (USD) strength, acts as a tailwind for the USD/JPY pair on the first day of a new week, though slightly overstretched conditions hold back bulls from placing fresh bets and capping the upside.
It is worth recalling that the BoJ on Friday held its short-term interest rate target at -0.1% and made no changes to its yield curve control policy. The BoJ also kept intact its view that inflation will slow later this year, underscoring its focus on supporting a fragile economic recovery on the back of global uncertainty. In contrast, the US central bank, albeit decided to leave its interest rates unchanged, signalled that borrowing costs may still need to rise by as much as 50 bps by the end of this year. This, in turn, is seen lending some support to the Greenback and the USD/JPY pair.
That said, the incoming softer US macro data raised questions over how much headroom the US central bank has to keep raising rates and fueled speculations that the Fed is nearing the end of its policy tightening cycle. This, along with worries about a global economic downturn and a softer risk tone, lends some support to the safe-haven JPY. Apart from this, thin trading volumes on the back of a US bank holiday warrant some caution before placing aggressive bullish bets ahead of Fed Chair Jerome Powell's two-day congressional testimony on Wednesday and Thursday.
Investors will closely scrutinize Powell's remarks for clues about the future rate-hike path, which will play a key role in influencing the near-term USD price dynamics and provide a fresh directional impetus to the USD/JPY pair. Nevertheless, the aforementioned fundamental backdrop suggests that the path of least resistance for spot prices is to the upside. Hence, any corrective decline is more likely to attract fresh buyers and remain limited.
Technical levels to watch
- Silver price has shown a minor decline to near $24.00 as the USD Index is trading sideways.
- The upside in the USD Index seems restricted to around 102.40 due to soft short-term consumer inflation expectations.
- Silver price is approaching the 23.6% Fibonacci retracement at $26.70.
Silver price (XAU/USD) has shown a marginal correction to near $24.00 considering non-directional cues from the US Dollar Index (DXY). The white metal is majorly trading in a range of $24.00-24.20 as investors are assessing soft United States inflation expectations and improved consumer sentiment to freshly discount the impact of economic indicators in the USD Index.
S&P500 futures have recovered their entire losses generated in Asia and have turned positive as investors are confident that the Federal Reserve (Fed) won’t be very harsh on interest rates ahead. The risk appetite theme has been underpinned by the market participants as expectations of only one interest rate hike from the Fed have trimmed fears of recession. The 10-year US Treasury Yields have dropped to 3.76%.
The upside in the USD Index seems restricted to around 102.40 due to soft short-term consumer inflation expectations. United States individuals are expecting that inflation will climb to 3.3% at an annualized rate over the next year, down from the expectations of 4.2% released in May. The figure is the lowest since March 2021 and has infused hope in the street that the Fed will announce only one more interest rate hike this year.
Meanwhile, Chicago Fed Bank President Austan Goolsebee commented that there is conflicting data on whether we are too hot or whether we have done enough. He further added labor market is too hot but working hours are declining.
Silver technical analysis
Silver price is approaching the 23.6% Fibonacci retracement (plotted from March 08 low at $19.92 to May 05 high at $26.14) at $26.70 on a four-hour scale. The 50-period Exponential Moving Average (EMA) at $23.91 is providing a cushion to the Silver price.
The Relative Strength Index (RSI) (14) is oscillating in the bullish range in which the 40.00 level is a cushion for the bullish momentum.
Silver four-hour chart
-638227595095275129.png)
Economists at Commerzbank analyze EUR/NOK outlook ahead of the Norges Bank Interest Rate Decision on Thursday.
It may be difficult for Norges Bank not to disappoint the market
Market expectations are already quite high, and it may be difficult for Norges Bank not to disappoint the market. Given this risk, market participants may prefer to wait and see ahead of the upcoming meeting on Thursday.
As a result, the EUR/NOK pair should continue to trade around the 11.50 level in the coming days.
- Pound Sterling is displaying topsy-turvy moves as investors are sidelined ahead of inflation data.
- United Kingdom’s inflation is expected to soften slowly as labor market conditions are extremely tight.
- The Bank of England is expected to raise interest rates further to sharpen its quantitative tools against stubborn inflation.
The Pound Sterling (GBP) is stabilizing on Monday above 1.2800 after showing a big bullish performance last week, rallying to levels not seen since April 2022, above 1.2800. Investors are keeping an eye on the United Kingdom’s key inflation data, to be released on Wednesday at 6 GMT. The GBP/USD pair is showing a severe contraction in volatility to start the week, ahead of the release of key price indicators, which will provide guidance about the interest rate policy from the Bank of England (BoE).
Tight labor market conditions and higher food prices in the United Kingdom have remained major catalysts that have been keeping inflationary pressures elevated. More interest rate hikes by the UK central bank are widely expected as inflation has not shown yet evidence of coming down.
Daily digest market movers: Pound Sterling continues its four-day winning streak
- Less volatile action is reported by the Pound Sterling as investors are awaiting the release of the UK Consumer Price Index (CPI) data.
- UK’s monthly headline inflation (May) is expected to show a pace of 0.4%, slower than the pace of 1.2% registered in April.
- Annualized headline CPI is seen softening to 8.5% vs. the prior release of 8.7% while core inflation that excludes oil and food prices is seen steady at 6.8%.
- UK’s food price inflation is hovering near a 45-year high at 19% which is keeping inflationary pressures at higher levels.
- The event of Brexit and the execution of early retirement by individuals have resulted in shortages of labor.
- British firms are offsetting labor shortages by offering higher wages, which have increased households’ demand for core goods and services.
- Reuters reported that the BoE looks set to raise interest rates by a quarter point to a 15-year high of 4.75% on June 22.
- For the interest rate guidance, a poll from Reuters indicates that UK’s interest rates will peak around 6% this year.
- BoE Governor Andrew Bailey has already confirmed that inflation is extremely persistent and will take more time to return to the desired rate than expected earlier.
- UK Finance Minister Jeremy Hunt has ruled out giving any direct fiscal support to households struggling with soaring mortgage costs, as reported by Financial Times. Fiscal support to individuals might fuel the price index and force the central banks to elevate interest rates further.
- IMF expects that the UK will avoid recession this year and has upgraded its economic growth forecast to 0.4%. Earlier, it was expecting a contraction of 0.3%.
- The US Dollar Index (DXY) is inside the woods as investors are having mixed responses about Federal Reserve’s (Fed) policy guidance.
- As per the CME Fedwatch tool, investors are expecting that Fed chair Jerome Powell will hike interest rates just once this year.
- Richmond Fed Bank President Thomas Barkin has commented that raising rates further could create the risk of a more significant slowdown in the economy. It will be comfortable doing more on interest rates if coming data doesn't confirm a story that slowing demand is returning inflation to the 2% target."
- Chicago Fed President Austan Goolsebee commented that there is conflicting data on whether we are too hot or whether we have done enough.
- The United States Consumer Sentiment Index has improved to 63.6 as a soft consumer and producer inflationary pressures have infused optimism among the market participants.
Technical Analysis: Pound Sterling prints a fresh 13-month high around 1.2850
The Pound Sterling has stabilized after printing a fresh 13-month high at 1.2848. The Cable is showing a lackluster performance but is expected to continue its four-day winning streak as the USD Index is facing pressure due to a shift in sentiment about Fed’s interest rate guidance. Horizontal support is plotted from 26 May 2022 high at 1.2667, which will act as a cushion for the Pound Sterling.
Sentiment for the GBP/USD pair will get more bullish if it manages to climb above a fresh 13-month high at 1.2848. The Pound Sterling could lose its strength if the Cable drop below June’s low around 1.2370.
Pound Sterling FAQs
What is the Pound Sterling?
The Pound Sterling (GBP) is the oldest currency in the world (886 AD) and the official currency of the United Kingdom. It is the fourth most traded unit for foreign exchange (FX) in the world, accounting for 12% of all transactions, averaging $630 billion a day, according to 2022 data.
Its key trading pairs are GBP/USD, aka ‘Cable’, which accounts for 11% of FX, GBP/JPY, or the ‘Dragon’ as it is known by traders (3%), and EUR/GBP (2%). The Pound Sterling is issued by the Bank of England (BoE).
How do the decisions of the Bank of England impact on the Pound Sterling?
The single most important factor influencing the value of the Pound Sterling is monetary policy decided by the Bank of England. The BoE bases its decisions on whether it has achieved its primary goal of “price stability” – a steady inflation rate of around 2%. Its primary tool for achieving this is the adjustment of interest rates.
When inflation is too high, the BoE will try to rein it in by raising interest rates, making it more expensive for people and businesses to access credit. This is generally positive for GBP, as higher interest rates make the UK a more attractive place for global investors to park their money.
When inflation falls too low it is a sign economic growth is slowing. In this scenario, the BoE will consider lowering interest rates to cheapen credit so businesses will borrow more to invest in growth-generating projects.
How does economic data influence the value of the Pound?
Data releases gauge the health of the economy and can impact the value of the Pound Sterling. Indicators such as GDP, Manufacturing and Services PMIs, and employment can all influence the direction of the GBP.
A strong economy is good for Sterling. Not only does it attract more foreign investment but it may encourage the BoE to put up interest rates, which will directly strengthen GBP. Otherwise, if economic data is weak, the Pound Sterling is likely to fall.
How does the Trade Balance impact the Pound?
Another significant data release for the Pound Sterling is the Trade Balance. This indicator measures the difference between what a country earns from its exports and what it spends on imports over a given period.
If a country produces highly sought-after exports, its currency will benefit purely from the extra demand created from foreign buyers seeking to purchase these goods. Therefore, a positive net Trade Balance strengthens a currency and vice versa for a negative balance.
Markets Strategist Quek Ser Leang at UOB Group suggests USD/THB is seen trading within the 34.50-34.90 range in the next few weeks.
Key Quotes
We expected USD/THB to trade in a range between 34.55 and 34.90 last week. USD/THB then dropped briefly to 34.46, rebounded to 34.87 before ending the day week at 34.66 (+0.12%). The price actions were likely part of a consolidation phase and this week, we expect USD/THB to trade between 34.50 and 34.90.
Sterling is holding onto recent gains. Economists at ING analyze GBP outlook.
Sterling can stay supported for the time being
We doubt the BoE has sufficient ammunition (yet) to push back against the nearly five 25 bps hikes expected before year-end. That suggests Sterling can stay supported for the time being.
Technically, GBP/USD does look as though it can advance to the 1.30 area – though the macro catalyst for further gains appears unclear. Indeed, the UK press is really pushing the 'mortgage timebomb' story at present, but Sterling probably does not correct lower until we see some softer price data – which may take a few months to come through.
- Euro slips back to the 1.0930 region amidst tepid dollar’s recovery.
- Stocks markets in Europe kick in the week with small retracements.
- ECB speak will take centre stage later the session.
- US markets are closed due to the Juneteenth holiday.
- Fed-ECB divergence remains in the centre of the debate.
- US NAHB index will be the sole release across the ocean.
The European currency (EUR) starts the new trading week on a frail note and retest the low-1.0900s on the back of some recovery in the US Dollar.
Indeed, EUR/USD comes under some mild downside pressure on Monday and gives away part of last week’s gains to the 1.0970 region, or multi-week highs, pari passu with investor’ adjustment to the recent hawkish messages from both the European Central Bank (ECB) and the Federal Reserve.
On the latter, it is worth mentioning that the ECB Christine Lagarde, as well as many of her colleagues at the Governing Council, already advocated for an extra quarter-point rate raise in July, while Chief Jerome Powell also left the door open to a similar move at the July 26 gathering. This scenario is favoured with nearly 75% of probability according to CME Group’s FedWatch Tool.
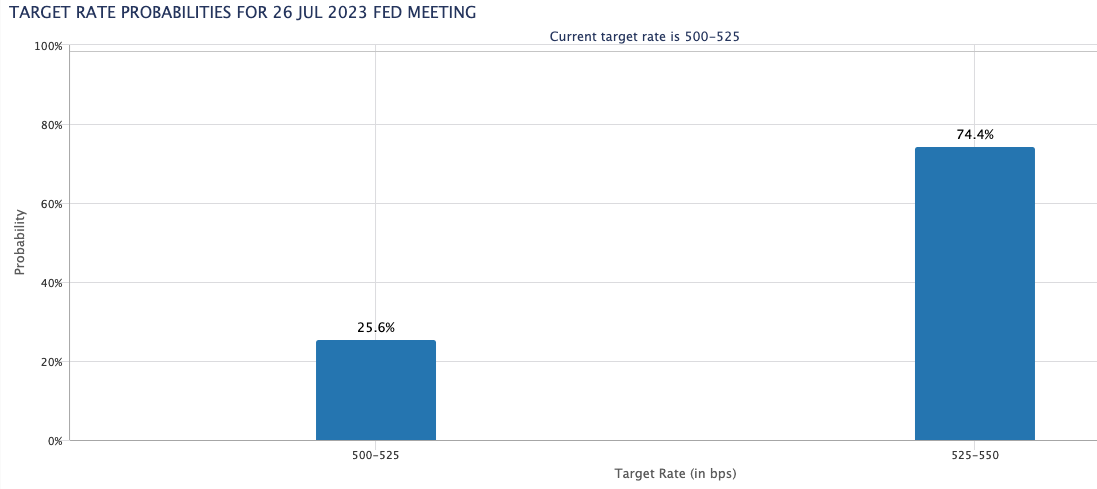
Changing the subject and looking at the latest CFTC positioning report, speculative net longs in the EUR dropped for the fifth consecutive week in the week ended on June 13 to around 151.8K contracts, as investors increased their prudence ahead of the key ECB meeting on June 15.
In the domestic data space, ECB P. Lane, A. Enria and L. De Guindos will be in the centre of the debate later in the session, while the housing market will be in the limelight in the US calendar following the release of the NAHB Housing Market Index for the month of June.
Daily digest market movers: Euro appears offered amidst scarce volatility
- The US Dollar rebounds from last week’s lows in the 102.00 zone.
- Markets’ focus will likely be on the US Secretary of State A. Blinken’s visit to China.
- Fed’s J. Powell’s testimonies will be the salient events later in the week.
- The ECB-Fed policy divergence remains the almost exclusive driver of the pair’s price action for the time being
Technical Analysis: Interim contention emerges around 1.0880
The Euro (EUR) has retreated slightly from its new monthly high of 1.0970 reached on June 16. To make further gains, it needs to overcome this level quickly, which would allow it to potentially reach the psychological barrier of 1.1000. If it continues to climb, the next major resistance levels are the 2023 high of 1.1095 (April 26), followed by the round level of 1.1100, and then the weekly top of 1.1184 (March 31, 2022). The latter is supported by the 200-week SMA, which currently stands at 1.1181.
If the bears take control, there is a temporary support at the 55-day SMA at 1.0881. If this level is breached, there are no significant levels of support until the May low of 1.0635 (May 31) prior to the March low of 1.0516 (March 15) and the 2023 low of 1.0481 (January 6).
Euro FAQs
What is the Euro?
The Euro is the currency for the 20 European Union countries that belong to the Eurozone. It is the second most heavily traded currency in the world behind the US Dollar. In 2022, it accounted for 31% of all foreign exchange transactions, with an average daily turnover of over $2.2 trillion a day.
EUR/USD is the most heavily traded currency pair in the world, accounting for an estimated 30% off all transactions, followed by EUR/JPY (4%), EUR/GBP (3%) and EUR/AUD (2%).
What is the ECB and how does it impact the Euro?
The European Central Bank (ECB) in Frankfurt, Germany, is the reserve bank for the Eurozone. The ECB sets interest rates and manages monetary policy.
The ECB’s primary mandate is to maintain price stability, which means either controlling inflation or stimulating growth. Its primary tool is the raising or lowering of interest rates. Relatively high interest rates – or the expectation of higher rates – will usually benefit the Euro and vice versa.
The ECB Governing Council makes monetary policy decisions at meetings held eight times a year. Decisions are made by heads of the Eurozone national banks and six permanent members, including the President of the ECB, Christine Lagarde.
How does inflation data impact the value of the Euro?
Eurozone inflation data, measured by the Harmonized Index of Consumer Prices (HICP), is an important econometric for the Euro. If inflation rises more than expected, especially if above the ECB’s 2% target, it obliges the ECB to raise interest rates to bring it back under control.
Relatively high interest rates compared to its counterparts will usually benefit the Euro, as it makes the region more attractive as a place for global investors to park their money.
How does economic data influence the value of the Euro?
Data releases gauge the health of the economy and can impact on the Euro. Indicators such as GDP, Manufacturing and Services PMIs, employment, and consumer sentiment surveys can all influence the direction of the single currency.
A strong economy is good for the Euro. Not only does it attract more foreign investment but it may encourage the ECB to put up interest rates, which will directly strengthen the Euro. Otherwise, if economic data is weak, the Euro is likely to fall.
Economic data for the four largest economies in the euro area (Germany, France, Italy and Spain) are especially significant, as they account for 75% of the Eurozone’s economy.
How does the Trade Balance impact the Euro?
Another significant data release for the Euro is the Trade Balance. This indicator measures the difference between what a country earns from its exports and what it spends on imports over a given period.
If a country produces highly sought after exports then its currency will gain in value purely from the extra demand created from foreign buyers seeking to purchase these goods. Therefore, a positive net Trade Balance strengthens a currency and vice versa for a negative balance.
EUR/USD failed to build on gains last Friday. Economists at ING analyze the pair’s outlook.
China misfire sees EUR/USD rally slow
Investors seem a little disappointed that Friday's State Council meeting in China did not result in any fresh stimulus - hence the spike in USD/CNH back to 7.15 today. Chartists will be looking for this USD/CNH rally to stall at 7.15/16 – failure to do so could keep the Dollar a little better bid and weigh on EUR/USD.
If EUR/USD is to maintain last week's bullish momentum, short-term support levels at 1.0910/30 should hold.
We continue to favour a near-term move to 1.1000/30 and probably higher as investors position for the second half Dollar decline.
- EUR/GBP consolidates its recent slide to the lowest level since August 2022 touched this Monday.
- Bets for more aggressive BoE tightening underpin the GBP and exerts some pressure on the cross.
- The downside seems limited as traders keenly await the UK inflation and the BoE meeting this week.
The EUR/GBP cross enters a bearish consolidation phase and oscillates in a narrow trading band around the 0.8525-0.8530 area, just above its lowest level since August 2022 touched this Monday.
The British Pound (GBP) continues with its relative outperformance on the back of expectations that the Bank of England (BoE) will keep raising interest rates, which, in turn, is seen as a key factor weighing on the EUR/GBP cross. In fact, the BoE is widely expected to hike the benchmark rates by 25 bps on Thursday, to 4.75% or the highest since April 2008. Moreover, the markets are pricing in the possibility of a bigger, 50 bps lift-off. The bets were reaffirmed by the upbeat UK jobs data released last week, which came in to show a near-record wage growth and a lower unemployment rate.
The downside for the EUR/GBP cross, however, seems cushioned in the wake of the European Central Bank's (ECB) hawkish outlook, signalling that additional rate hikes will be needed to bring Eurozone inflation to its medium-term target of 2%. It is worth recalling that the ECB hiked interest rates for the eighth straight time last Wednesday, by 25 bps to 3.5% or the highest in 22 years. The inflation projection for this year was raised to 5.1% from 4.6%, suggesting that the central bank is still not done with its policy tightening and is seen lending some support to the shared currency.
Traders might also prefer to wait on the sidelines ahead of Wednesday's release of the latest consumer inflation figures from the UK. This will be followed by the highly-anticipated BoE decision on Thursday, which will play a key role in influencing the Sterling and provide some meaningful impetus to the EUR/GBP cross. Apart from this, traders this week will take cues from the flash PMI prints from the Eurozone and the UK, due on Friday. Nevertheless, the aforementioned fundamental backdrop suggests that the path of least resistance for spot prices is to the downside.
Technical levels to watch
Here is what you need to know on Monday, June 19:
The US Dollar (USD) holds steady early Monday after having suffered large losses against its major rivals last week. Stock and bond markets in the US will be closed in observance of the Juneteenth holiday. The European economic docket will not be featuring any high-impact data releases and market participants will pay close attention to comments from central bank officials.
The US Dollar Index (DXY) fell more than 1% and closed the third straight week in negative territory before going into a consolidation phase above 102.00 in the European session. The benchmark 10-year US Treasury bond yield fluctuated wildly following the Federal Reserve's (Fed) monetary policy announcements but ended the week little changed below 3.8%.
On Sunday, US Secretary of State Antony Blinken and Chinese Foreign Minister Qin Gang reportedly had "candid and constructive talks" on their differences from Taiwan to trade. Sides are said to have agreed on little beyond keeping the conversation going with an eventual meeting in Washington, reported Reuters.
EUR/USD gained nearly 200 pips last week, boosted by the broad-based USD weakness and the European Central Bank's (ECB) hawkish rhetoric. ECB Chief Economist Philip Lane and Governing Council member Isabelle Schnabel will be delivering speeches later in the day. At the time of press, the pair was seen consolidating last week's gains slightly below 1.0950.
GBP/USD surged to its highest level since April 2022 at 1.2850 last week. The pair stays relatively quiet early Monday, moving up and down in a narrow range slightly above 1.2800. On Tuesday, the UK's Office for National Statistics will release inflation data for May ahead of the Bank of England's (BoE) monetary policy announcements on Thursday.
USD/JPY registered its highest weekly close since November as it failed to benefit from the USD's dismal performance. The resilience of the US T-bond yields and the Bank of Japan's (BoJ) dovish tone allowed the pair to gain traction in the second half of the week. USD/JPY was last seen moving sideways above 141.50.
Gold price closed the previous week virtually unchanged, slightly above $1,950. XAU/USD is having a difficult time finding direction early Monday.
AUD/USD edges lower but holds above 0.6850 in the European morning. The People's Bank of China (PBoC) is expected to announce a rate cut early Tuesday.
USD/CAD fell below 1.3180 and touched its lowest level since September on Friday. The pair clings to small recovery gains at around 1.3200 on Monday.
Bitcoin fluctuated in a narrow channel over the weekend and extended its sideways action above $26,000 early Monday. Ethereum recovered from the three-month low it set at $1,620 mid-week last week and stabilized above $1,700.
The SEK’s high beta status and macro challenges have led the EUR/SEK cross higher over the past month. Economists at CIBC Capital Markets discuss the pair’s outlook.
Core prices likely to remain sticky
When it comes to the Riksbank, we’re sticking with our call of another 25 bps hike on June 29th. While real estate remains a residual drag, we don’t expect that to deflect the Riksbank from the primacy of bringing CPI back down to target.
The macro picture in Sweden remains strong, while price pressures are likely to remain sticky. Retail sales have rebounded, while the unemployment rate has retreated for the third time in four months. At the margin, this supports our call for a EUR/SEK reversal into H2.
EUR/SEK – Q3 2023: 11.35 | Q4 2023: 11.20
- NZD/USD remains pressured within bearish chart formation, defends previous day’s pullback from three-week high.
- While 0.6200 holds the key to further downside, 0.6100 appears the last defense of the Kiwi buyers.
- Kiwi pair’s recovery remains elusive below 0.6400, bulls appear running out of steam of late.
NZD/USD bounces off intraday low as it struggles to confirm the fortnight-old rising wedge bearish chart formation amid early Monday morning in Europe. That said, the Kiwi pair licks its wounds near 0.6215 while keeping the previous day’s retreat from the monthly peak.
It’s worth noting that the lower-high formation joins the bearish MACD signals to lure the NZD/USD sellers. However, a clear downside beak of the stated rising wedge’s bottom line, around 0.6200 by the press time becomes necessary for the sellers to keep the reins.
Even so, the 200-SMA support of near 0.6175 can prod the bears.
Above all, a convergence of the 100-SMA and the previous resistance line stretched from early May, near 0.6100. appears crucial support to break for the NZD/USD sellers to retake control.
Meanwhile, a descending resistance line from Thursday, near 0.6240 at the latest, restricts the immediate upside of the NZD/USD pair ahead of the stated wedge’s top line, close to 0.6280 at the latest.
Should the Kiwi price remains firmer past 0.6280, the odds of witnessing a run-up toward the previous monthly high of nearly 0.6385 can’t be ruled out.
NZD/USD: Four-hour chart

Trend: Limited downside expected
USD/CNH is still seen navigating the 7.0900/7.1800 range for the time being, comment UOB Group’s Economist Lee Sue Ann and Markets Strategist Quek Ser Leang.
Key Quotes
24-hour view: We expected USD to trade in a range of 7.1200/7.1600 last Friday. However, USD fell to a low of 7.1050 and then rebounded. We view the price actions as part of a consolidation phase and expect USD to trade between 7.1200 and 7.1630 today.
Next 1-3 weeks: There is not much to add to our update from last Friday (16 Jun, spot at 7.130). As highlighted, the recent USD strength has ended. USD has likely moved into a consolidation phase and is likely to trade between 7.0900 and 7.1800 for the time being.
- USD/CAD kicks off the new week on a positive note, albeit lacks follow-through buying.
- Sliding Oil prices undermines the Loonie and lends support amid a modest USD strength.
- The Fed rate-hike uncertainty acts as a headwind for the USD and caps gains for the pair.
The USD/CAD pair attracts some buyers on the first day of a new week and snaps a two-day losing streak to its lowest level since September 2022, albeit lacks bullish conviction. Spot prices trim a part of the modest intraday gains and trade just above the 1.3200 mark, up less than 0.10% for the day heading into the European session.
Worries that a global economic downturn, particularly in China, will dent fuel demand prompt fresh selling around Crude Oil prices, which, in turn, undermines the commodity-linked Loonie. Apart from this, a modest US Dollar (USD) strength, bolstered by the Federal Reserve's (Fed) hawkish outlook, turns out to be another factor lending support to the USD/CAD pair. It is worth recalling that the US central bank last week decided to leave interest rates unchanged, though signalled that borrowing costs may still need to rise by as much as 50 bps by the end of this year. This, along with a generally softer risk tone, benefits the safe-haven buck.
That said, the incoming US macro data raised questions over how much headroom the US central bank has to keep raising rates and fueled speculations that the Fed's year-long policy tightening cycle might be nearing the end. This, in turn, is holding back the USD bulls from placing aggressive bets. Apart from this, the Bank of Canada's (BoC) surprise 25 rate hike earlier this month continues to lend some support to the Canadian Dollar (CAD) and contributes to capping gains for the USD/CAD pair. Hence, it will be prudent to wait for strong follow-through buying before confirming that spot prices have bottomed out and placing fresh bullish bets.
Moving ahead, there isn't any relevant market-moving economic data due for release on Monday, leaving the USD/CAD pair at the mercy of the USD/Oil price dynamics amid relatively thin trading volumes on the back of a bank holiday in the US. The focus, however, will remain glued to Fed Chair Jerome Powell's two-day congressional testimony on Wednesday and Thursday. Investors will look for fresh clues about the future rate-hike path, which will drive the USD demand and provide a fresh impetus to the major.
Technical levels to watch
- The index adds to Thursday’s gains north of 102.00.
- US markets will be closed on the Monday.
- Investors started to assess the potential Fed’s move in July.
The USD Index (DXY) tracks the greenback, which starts the week on the positive foot and revisits the 102.40 region, marking an increase for the second session in a row so far.
USD Index looks at risk trends, Fed
The index rises for the second session in a row and attempts to put further distance from last week’s multi-week lows around the 102.00 neighbourhood (June 16), as the recent upbeat mood in the risk complex appears to take a breather at the beginning of the week.
In the meantime, investors continue to expect a 25 bps rate hike by the Federal Reserve at the July 26 gathering following June’s hawkish skip, according to CME Group’s FedWatch Tool.
On another front, net longs in the greenback rose to the highest level since early April in the week ended on June 13, just ahead of the crucial FOMC event considering the latest CFTC report.
The only release of note in the US data space will be the NAHB Housing Market Index for the month of June amidst the inactivity in the domestic markets due to the Juneteenth holiday.
What to look for around USD
Despite a three-week negative streak, the index appears to have encountered significant contention around the 102.00 neighbourhood.
Meanwhile, the likelihood of another 25 bps hike at the Fed's upcoming meeting in July remains high, supported by the continued strength of key US fundamentals such as employment and prices.
This view was further bolstered by comments from Fed Chief Powell at the June FOMC event, who referred to the July meeting as "live" and indicated that most of the Committee is prepared to resume the tightening campaign as early as next month.
Key events in the US this week: NAHB Housing Market Index (Monday) – Building Permits, Housing Starts (Tuesday) – MBA Mortgage Applications. Fed’s Powell Testimony (Wednesday) – Chicago Fed National Activity Index, Initial Jobless Claims, Fed’s Powell Testimony, Existing Home Sales (Thursday) – Advanced Manufacturing/Services PMIs (Friday).
Eminent issues on the back boiler: Persistent debate over a soft/hard landing of the US economy. Terminal Interest rate near the peak vs. speculation of rate cuts in late 2023/early 2024. Fed’s pivot. Geopolitical effervescence vs. Russia and China. US-China trade conflict.
USD Index relevant levels
Now, the index is gaining 0.05% at 102.35 and the breakout of 103.04 (100-day SMA) would open the door to 104.69 (monthly high May 31) and then 105.25 (200-day SMA). On the downside, the next support emerges at 102.00 (monthly low June 16) followed by 100.78 (2023 low April 14) and finally 100.00 (round level).
USD/JPY needs to clear 142.25 to open the door to more sustained gains in the near term, note UOB Group’s Economist Lee Sue Ann and Markets Strategist Quek Ser Leang.
Key Quotes
24-hour view: We did not anticipate the volatile trade last Friday as after dropping to a low of 139.83, USD lifted off and blew past the major resistance level at 141.50 (high has been 141.91). While overbought, the strong USD rally is likely to extend even though a sustained rise above the next major resistance at 142.25 is unlikely today (next resistance is at 143.00). In order to keep the strong momentum going, USD must stay above 141.15 (minor support is at 141.45).
Next 1-3 weeks: After USD rose to 141.50 and pulled back sharply, we indicated last Friday that “there is no increase in upward momentum.” We added, “However, as long as 139.30 is not breached, there is a slim chance for USD to break above 141.50.” That said, we did not expect the manner in which USD lifted off and rocketed to a high of 141.91 in NY trade. Upward momentum has increased considerably, but USD must break and stay above another major resistance at 142.25 before further sustained rise is likely. Looking ahead, the next level to watch above 142.25 is 143.00. On the downside, the ‘strong support’ level has moved higher to 140.40 from 139.30.
Considering advanced prints from CME Group for natural gas futures markets, open interest dropped for the third consecutive session on Friday, this time by around 14.6K contracts. In the same direction, volume dropped by around 205.6K contracts, partially reversing the previous daily build.
Natural Gas: Strong resistance remains near $2.70
Natural gas prices rose sharply during last week. Friday’s uptick, however, was in tandem with diminishing open interest and volume and is indicative that a near-term knee-jerk could be in the offing. In the meantime, the May highs around the $2.70 mark per MMBtu emerges as the immediate obstacle in case bulls push harder.
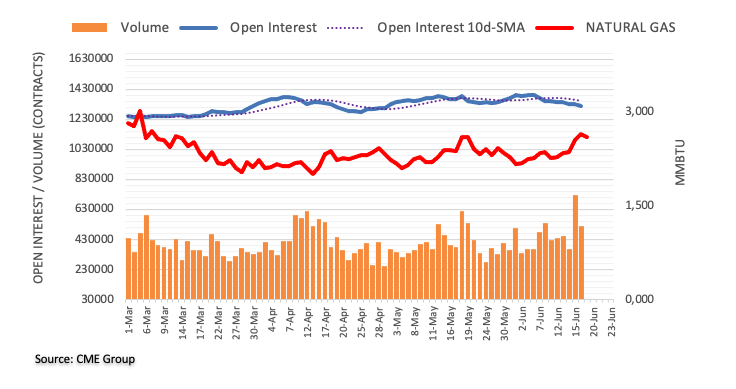
- EUR/JPY prints the first daily loss in six as it retreats from the highest levels since September 2008.
- Bearish candlestick formation, overbought RSI joins looming bear cross on MACD to lure sellers.
- Bullish channel, convergence of 50-SMA, short-term rising trend line favor bulls.
EUR/JPY pares intraday losses within a short-term bullish channel as it prints the first daily fall in six. In doing so, the cross-currency pair retreats from the highest levels since September 2008, marked the previous day, to lure the sellers amid sluggish markets due to the US holiday.
That said, the quote formed a bearish Doji candlestick at the multi-year high while challenging a three-day-old ascending trend channel bullish chart pattern.
It’s worth noting that the placement of the Doji near the highest levels in many months joins the overbought RSI conditions and a looming bear cross on the MACD indicator to suggest a consolidation of the latest gains by the EUR/JPY pair.
However, a clear downside break of the stated bullish channel’s bottom line, close to 154.80 at the latest, becomes necessary for the pair sellers to retake control.
Even so, a convergence of the 50-SMA and a rising trend line from June 07, close to 151.50-45, appears a tough nut to crack for the EUR/JPY bears.
Meanwhile, EUR/JPY rebound may initially aim for the latest peak of around 155.30 ahead of challenging the stated bullish channel’s peak of around 156.10.
Following that, the September 2008 peak of around 156.85 and the 160.00 round figure will be in the spotlight.
Overall, EUR/JPY remains bullish despite the latest signals suggesting a pullback in the prices.
EUR/JPY: Four-hour chart
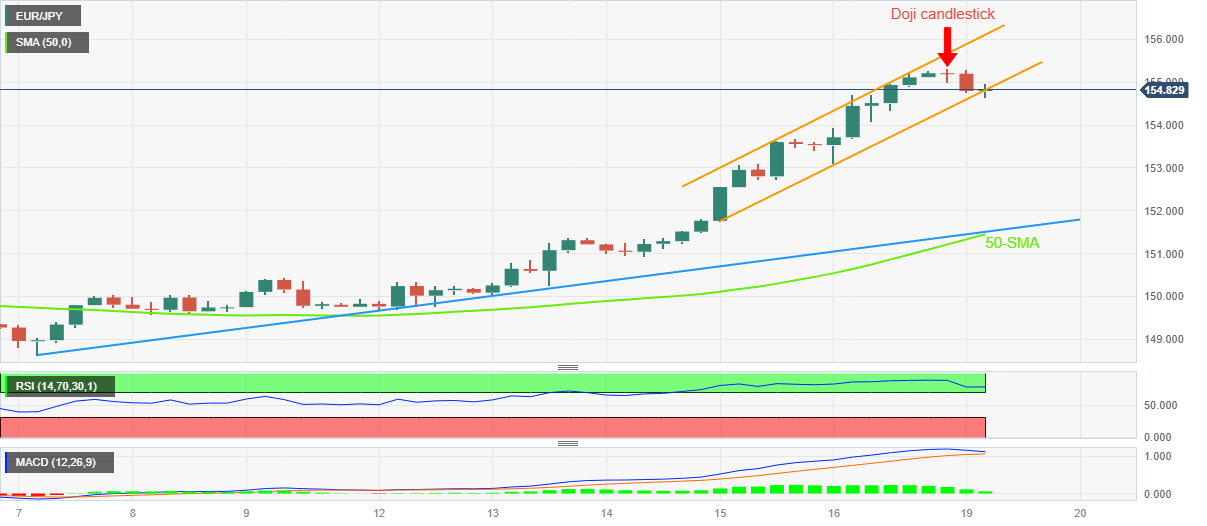
Trend: Limited downside expected
The continuation of the uptrend in AUD/USD is expected to meet solid resistance in the 0.6915/40 band for the time being, suggest UOB Group’s Economist Lee Sue Ann and Markets Strategist Quek Ser Leang.
Key Quotes
24-hour view: Last Friday, we indicated that “there is room for AUD to strengthen further but overbought conditions suggest a break of 0.6915 is unlikely today.” Our view was correct as AUD rose to 0.6900 before easing off to close at 0.6876 (-0.11%). Conditions remain overbought and this combined with tentative signs of slowing momentum suggest AUD is unlikely advance further. Today, AUD could ease further but it is unlikely to threaten the support at 0.6830 (minor support is at 0.6850). Resistance is at 0.6890, followed by the rather strong level at 0.6915.
Next 1-3 weeks: Our update from last Friday (16 Jun, spot at 0.6875) is still valid. As highlighted, the AUD strength that started more than a week ago is still in place. However, after rising sharply and swiftly in the past one week or so, AUD is approaching a solid resistance zone between 0.6915 and 0.6940. This resistance zone might not be ease to break. On the downside, a breach of 0.6790 (no change in ‘strong support’ level) would indicate that AUD is not ready to break above the resistance zone.
CME Group’s flash data for crude oil futures noted traders trimmed their open interest positions for the fourth consecutive session on Friday, this time by more than 22K contracts. Volume followed suit and went down for the fourth straight session, now by around 3.7K contracts.
WTI: Immediate resistance emerges around $72.00
Prices of WTI extended further their weekly recovery on Friday. The move, however, was accompanied by declining open interest and volume and open the door to a potential near-term correction. In the meantime, the $72.00 region per barrel emerges as an initial resistance zone.
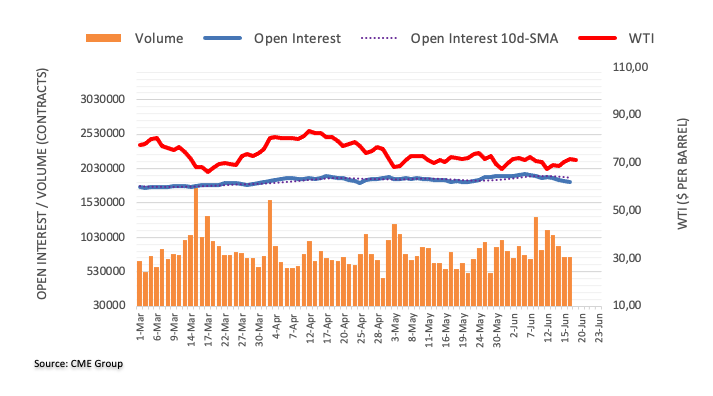
- Gold price struggles to gain any meaningful traction and oscillates in a range on Monday.
- Hawkish central banks and a modest US Dollar strength act as a headwind for the metal.
- A softer risk tone could lend support to the safe-haven XAU/USD and limit the downside.
Gold price ticks lower on the first day of a new week and trades with a mild negative bias, just below the $1,955 level heading into the European session.
The Federal Reserve (Fed) last week signalled that borrowing costs may still need to rise by as much as 50 basis points (bps) by the end of this year, which assists the US Dollar (USD) to gain some positive traction for the second successive day. In fact, the USD Index (DXY), which tracks the Greenback against a basket of currencies, looks to build on Friday's modest bounce from over a one-month low and acts as a headwind for the US Dollar-denominated Gold price.
Apart from this, a more hawkish outlook by major central banks further contributes to capping the upside for the non-yielding Gold price. It is worth recalling that the Reserve Bank of Australia (RBA) and the Bank of Canada (BoC) delivered a surprise 25 bps rate hike earlier this month. Moreover, the European Central Bank (ECB) last week lifted rates by 25 bps, to the highest level in 22 years, and projected indicated further tightening to bring down inflation.
The Bank of England (BoE) and the Swiss National Bank (SNB) are also expected to hike interest rates by 25 bps later this week. That said, a generally weaker tone around the equity markets helps the safe-haven Gold price to hold its neck just above the 100-hour Simple Moving Average (SMA) support. Worries about a global economic downturn, particularly in China, weigh on investors' sentiment and drive some haven flows, warranting caution for bearish traders.
Investors might also prefer to wait on the sidelines ahead of Fed Chair Jerome Powell's two-day congressional testimony on Wednesday and Thursday, which will be looked for fresh clues about the future rate-hike path. This, in turn, will play a key role in influencing the near-term USD price dynamics and provide some meaningful impetus to the Gold price. This makes it prudent to wait for some follow-through selling below the 100-day SMA before positioning for any further losses.
Technical levels to watch
FX option expiries for June 19 NY cut at 10:00 Eastern Time, via DTCC, can be found below.
- EUR/USD: EUR amounts
- 1.0725-35 877m
- 1.0770-75 368m
- 1.0825-30 502m
- 1.0840-50 1.07b
- 1.0900 934m
- USD/JPY: USD amounts
- 140.75 339m
- AUD/USD: AUD amounts
- 0.6700 275m
- 0.6745 371m
- USD/CAD: USD amounts
- 1.3225 200m
- 1.3320-30 437m
- NZD/USD: NZD amounts
- 0.6280 379m
In the opinion of UOB Group’s Economist Lee Sue Ann and Markets Strategist Quek Ser Leang, extra gains could lift GBP/USD to the 1.2900 region in the next few weeks.
Key Quotes
24-hour view: We expected GBP to “rise further” last Friday. However, we indicated, “in view of the severely overbought conditions, it is unlikely to challenge 1.2850.” GBP rose as expected even though it came close to taking out 1.2850 (high has been 1.2849). While conditions remain overbought, GBP could edge above 1.2850 today, but it is unlikely able to maintain a foothold above this level. The next major resistance at 1.2900 is not expected to come into view. Support is at 1.2800, followed by 1.2770.
Next 1-3 weeks: We have held a positive GBP view for more than a week now. In our most recent narrative from last Friday (16 Jun, spot at 1.2780), we indicated that “GBP strength is intact and the next level to aim for is 1.2900.” There is no change in our view. On the downside, a breach of 1.2700 (‘strong support’ level was at 1.2600 last Friday) indicates that the GBP strength has ended.
Open interest in gold futures markets rose for the second session in a row on Friday, this time by just 311 contracts according to preliminary readings from CME Group. On the other hand, volume remained choppy and shrank by around 109.5K contracts.
Gold: Support emerges around $1925
Gold prices charted an inconclusive session at the end of last week amidst a small uptick in open interest and a marked drop in volume. Against that, the precious metal is expected to maintain the ongoing consolidative phase, which appears supported by the $1925 level and gains look limited by the 55-day SMA near $1985 per troy ounce.
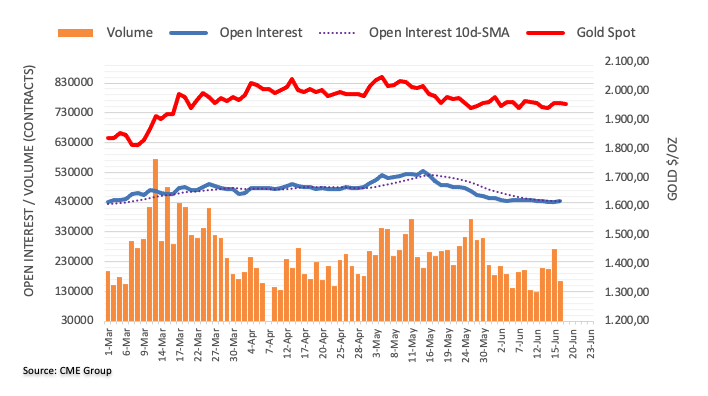
- USD/TRY remains on the front foot at its grinds near all-time high, stays within weekly trading range.
- Higher hopes from CBRT hawks, mixed US data keep Turkish Lira buyers hopeful.
- Turkish President Erdogan may not allow the rates to rise too much, can disappoint markets.
- Fed Chair Jerome Powell’s Testimony, PMIs also become important for clear directions.
USD/TRY bulls keep the reins around 23.61 as they prepare for the key week comprising the all-important Central Bank of the Republic of Türkiye (CBRT) monetary policy meeting. Apart from the pre-CBRT anxiety, holiday in the US and a light calendar elsewhere also restrict the quote’s immediate moves.
The Turkish Lira (TRY) pair previously renewed its record top near 23.70 before marking a sidelined performance in the last week. While tracing the moves, the broad US Dollar weakness and hopes of a solid hawkish action from the CBRT can be traced.
The positioning of the recent appointment of Hafize Gaye Erkan as the new Governor of the CBRT and former economy chief M. Simsek as the new Finance Minister join the previous week’s comments from Turkish President Recep Tayyip Erdogan to prod the USD/TRY bulls.
“Erdoğan said this week that while he had not changed his mind on the unorthodox view that high interest rates caused rather than cured inflation, he would allow Erkan and Şimşek to take steps to bring inflation to single digits from the current level close 40%,” reported the Financial Times (FT).
On the other hand, US Dollar Index (DXY) extends the previous day’s corrective bounce off the monthly low amid slightly downbeat sentiment and the hawkish Fed signals, while also ignoring the mixed US data flashed the previous day. With this, the greenback’s gauge versus the six major currency pair sticks to minor gains of around 102.30.
It should be noted that the chatters of witnessing a CBRT rate hike to 20%, from the current 8.5%, gain major attention and prod the USD/TRY traders. That said, Reuters quotes JP Morgan’s report suggesting the Turkish central bank’s rate lift to 25%.
Hence, the USD/TRY is aptly portraying the market’s cautious mood ahead of the CBRT Interest Rate Decision amid the US holiday. Also important to watch will be Fed Chairman Powell’s bi-annual testimony, as well as PMIs for June.
Technical analysis
USD/TRY remains within a weekly trading range between 23.40 and 23.68 amid overbought RSI (14) and easing bullish bias of the MACD, which in turn suggest correction in the Turkish Lira prices.
- AUD/USD has displayed some recovery from 0.6840 amid a minor correction in the USD Index.
- The overall market mood is extremely cheerful as investors are confident that the Fed won’t hike rates only once this year.
- The release of the RBA minutes will provide a detailed explanation behind the 25 bps interest rate hike.
The AUD/USD pair has shown a recovery move after a correction to near 0.6840 in the early European session. The Aussie asset has got strength as investors are awaiting the release of the Reserve Bank of Australia (RBA) minutes and the interest rate decision by the People’s Bank of China (PBoC).
S&P500 futures have generated some losses in Asia as investors are getting precautionary due to an extended weekend in the United States. The overall market mood is extremely cheerful as investors are confident that the Federal Reserve (Fed) won’t hike rates more than once by the year-end.
The US Dollar Index (DXY) has witnessed some selling pressure and has dropped to near 102.30 as optimism in investors about the United States' economic prospects is improving. On Friday, the University of Michigan reported that the preliminary Consumer Sentiment Index (June) has improved to 63.9 vs. the estimates of 60.0 and the former release of 59.2.
The sheer softening of producer and consumer inflation due to consistent declining gasoline prices has infused optimism among market participants. The street is confident that the Federal Reserve (Fed) won’t hike interest rates more than once this year despite Fed chair Jerome Powell having confirmed two small rate hikes.
On the Australian Dollar front, investors are awaiting the release of the Reserve Bank of Australia (RBA) minutes, which are scheduled for Tuesday. The release of the RBA minutes will provide a detailed explanation behind the 25 basis points (bps) interest rate hike by RBA Governor Philip Lowe. Also, cues about the interest rate guidance will be of key importance.
Apart from that, the interest rate decision by the PBoC will be of significant importance. A dovish guidance is anticipated from the PBoC as the Chinese economy is working on spurting economic activities. It is worth noting that Australia is the leading trading partner of China and an economic recovery in the latter will strengthen the Australian Dollar.
In a scheduled meeting with US Secretary of State Antony Blinken, China’s top diplomat Wang Yi said that “China has no room for compromise and concessions on the Taiwan issue.”
Additional quotes
We need to take a responsible attitude toward the people, history and the world and reverse the downward spiral of US-China relations.”
The US-China relationship is at a low point, with the root cause being the US's incorrect impression of China
Asks the US to stop speculating on the 'China threat theory' and remove illegal unilateral sanctions against China.
Asks US to abandon its suppression of China's scientific and technological development, refrain from arbitrarily interfering in china's internal affairs.
Emphasizes that maintaining national unity will always be the core of China's core interests.
It is necessary for the US to reflect deeply and work with china to manage differences and avoid 'strategic surprises’.
Market reaction
AUD/USD is recovering losses, despite the mixed comments from the Chinese official on the US-Sino relationship. The pair trading 0.15% lower on the day at 0.6867, as of writing.
Further upside prompts EUR/USD to refocus on the 1.1000 hurdle according to UOB Group’s Economist Lee Sue Ann and Markets Strategist Quek Ser Leang.
Key Quotes
24-hour view: We indicated last Friday that EUR “could rise above 1.0965 but is unlikely to threaten the next resistance at 1.1000.” EUR then rose briefly to 1.0970 before pulling back to close at 1.0933 (-0.11%). The current price movements appear to be part of a consolidation phase and EUR is likely to trade in a range of 1.0910/1.0970 today.
Next 1-3 weeks: Last Friday (16 Jun, spot at 1.0940), we highlighted that EUR “is likely to rise further, albeit at a slower pace.” We added, “the next level to watch is 1.1000.” We continue to hold the same view even though overbought short-term conditions could lead to a couple of days of consolidation first. Overall, only a breach of 1.0845 (‘strong support’ level was at 1.0825 last Friday) would indicate the EUR strength that started more than a week ago has come to an end.
In its said in its biannual review of inflation conditions on Monday, the Bank of Korea (BoK), upward risks to core inflation 'a little high'.
Additional takeaways
"While there is high uncertainty regarding global energy prices, domestic and global economic growth and public price hikes over the future inflation path, upward risks are assessed to be a little high when it comes to the outlook on core inflation.”
"If consumption and employment continue their robust trends, spill-over effects from accumulated cost increase pressures on core inflation may last longer than expected.”
“The BoK expects core prices will rise 3.3% this year, it said last month when it raised a February estimate of 3.0%. Overall consumer prices are expected to rise 3.5%.”
Meanwhile, Governor Rhee Chang-yong said that the central bank “will need to respond if inflation deviates signficantly from expected path in H2, but no sign yet.:
“It is too early to discuss rate cut,” Rhee added.
Market reaction
USD/KRW is extending its pullback from daily highs of 1,283.87 to now trade at fresh daily lows of 1,278.94. The pair is still up 0.12% on the day.
- USD/CHF clings to mild gains as bulls lack momentum amid sluggish markets.
- US Dollar grinds higher amid slightly downbeat sentiment, Fed concerns.
- Holiday in the US stock, bond markets restrict immediate moves amid mixed catalysts.
- SNB Interest Rate Decision, Fed Chair Powell’s Testimony and US PMIs are the key for clear directions.
USD/CHF stays defensive around 0.8940-45, fading the previous day’s bounce of a five-week low, heading into Monday’s European session. In doing so, the Swiss Franc (CHF) pair portrays the market’s indecision amid the US Juneteenth holiday and cautious mood ahead of this week’s monetary policy meeting decision from the Swiss National Bank (SNB).
Apart from the holiday in the US shares and bond markets, mixed concerns about the Federal Reserve (Fed) and SNB also prod the USD/CHF traders amid a light calendar. That said, hawkish comments from the Fed policymakers, as well as the latest report from the US central bank to Congress underpin the US Dollar while expectations of witnessing further rate hikes from the SNB prod the Swiss Franc (CHF) bears.
Earlier in June SNB Governor Thomas Jordan said, “It's really important to bring Swiss inflation to a level of price stability." The policymaker also showed readiness to lift the rates before the inflation rise.
On the other hand, Richmond Fed President Thomas Barkin said, “Raising rates further could create the risk of a more significant slowdown in the economy.” The policymaker, however, also added that the Fed can do comfortable more to slow the resilient US economy, which in turn triggered a jump in the 2-year Treasury bond yields to 4.75% and helped the US Dollar to get off the lows. Not only Fed’s Barkin but Chicago Fed President Austan Goolsbee and Federal Reserve Governor Christopher Waller also appeared a bit hawkish and helped the DXY to reverse from a multi-day low the previous day. Furthermore, the Fed’s Monetary Policy Report to the US Congress, published Friday stated, “Inflation in the US is well above target and the labor market remains very tight,” as per Reuters.
It’s worth noting that headlines surrounding multiple banks cutting China’s growth forecasts recently challenged the market’s risk appetite and propel the USD/CHF price.
On a different page, mixed US data and hopes of more stimulus from China, as well as an absence of the US-China tussle during their respective diplomats’ first talks in many months, prod the risk-off mood and check the USD/CHF bulls.
Looking ahead, an off in the US markets will join the pre-SNB anxiety to restrict the USD/CHF moves. While the SNB is likely to announce a 0.25% rate hike, any surprises can’t be ruled out and hence can very well recall the pair sellers. However, Fed Chair Jerome Powell is also up for the bi-annual Testimony and can bolster the hawkish bias to challenge the pair sellers. Additionally, preliminary PMIs for June also become crucial for near-term directions.
Technical analysis
The steady RSI (14) line joins bearish MACD signals and the USD/CHF pair’s sustained break of the 50-DMA, around 0.8980 by the press time, to keep sellers hopeful.
- EUR/USD is showing non-directional performance as the street is divided about further interest rate roadmap by the Fed.
- S&P500 futures are showing some losses as investors are cautious due to an extended weekend in the US.
- ECB hiked interest rates by 25 bps to 4% despite severe challenges to Eurozone’s growth.
The EUR/USD pair is oscillating in a narrow range around 1.0940 in the late Asian session. The major currency pair is demonstrating a non-directional performance as the street is divided about the further roadmap of interest rate policy to be attempted by the Federal Reserve (Fed).
S&P500 futures are showing some losses in the Asian session as investors are cautious due to the extended weekend in the United States. The US markets are closed on Monday on account of Juneteenth.
The US Dollar Index (DXY) is also showing a sideways performance as investors are mixed about further policy rate guidance by the Fed. Last week, Fed chair Jerome Powell allowed interest rates to remain steady but delivered hawkish guidance citing that two small interest rate hikes are appropriate
Considering the US economic outlook and softening US consumer inflation expectations, the street believes that the Fed might announce only one rate hike this year, according to the CME Fedwatch tool. On Friday, preliminary five-year consumer inflation expectations were softened to 3% vs. the estimates and the prior release of 3.0%. While current consumer and producer inflation has softened sharply due to lower gasoline prices.
Apart from that, US labor market conditions have softened sharply as firms are facing pressure from higher interest rates and tight credit conditions by US regional banks.
On the Eurozone front, one more interest rate hike by the European central bank (ECB) has pushed interest rates to 4%. ECB President Christine Lagarde decided not to take the bullet for the bleak economic prospects in Eurozon ad continued its battle against persistent inflation.
- USD/JPY eases from seven-month high but bears appear lacking strength to retake control.
- Multiple supports toward the south, upbeat oscillators keep Yen pair buyers hopeful.
- Late 2022 peak provides headwind to immediate upside.
USD/JPY holds lower ground near the intraday bottom of around 141.50 as it prints the first daily loss in three while easing from the Year-To-Date (YTD) top heading into Monday’s European session.
In doing so, the Yen pair justifies the RSI (14) line’s retreat from the overbought territory.
However, a three-week-old previous resistance line joins bullish MACD signals to challenge the intraday sellers of the USD/JPY pair around 141.40.
Following that, an ascending trend line from the last Wednesday and the 100-Exponential Moving Average (EMA), respectively near 141.20 and 139.70, can restrict the quote’s further downside. It’s worth noting that the 140.00 round figure acts as an extra downside filter for the short term.
Even if the Yen pair drops below 139.70 support, early May’s high of near 137.75 and an ascending trend line from April 26, close to 136.50 at the latest, can act as the last defense of the bulls.
On the contrary, the 142.00 round figure guards the immediate upside of the USD/JPY pair ahead of the November 2022 high of around 142.20-25.
In a case where the Yen pair remains firmer past 142.25, the odds of witnessing a run-up towards a late October 2022 low of 145.10 can’t be ruled out.
USD/JPY: Four-hour chart
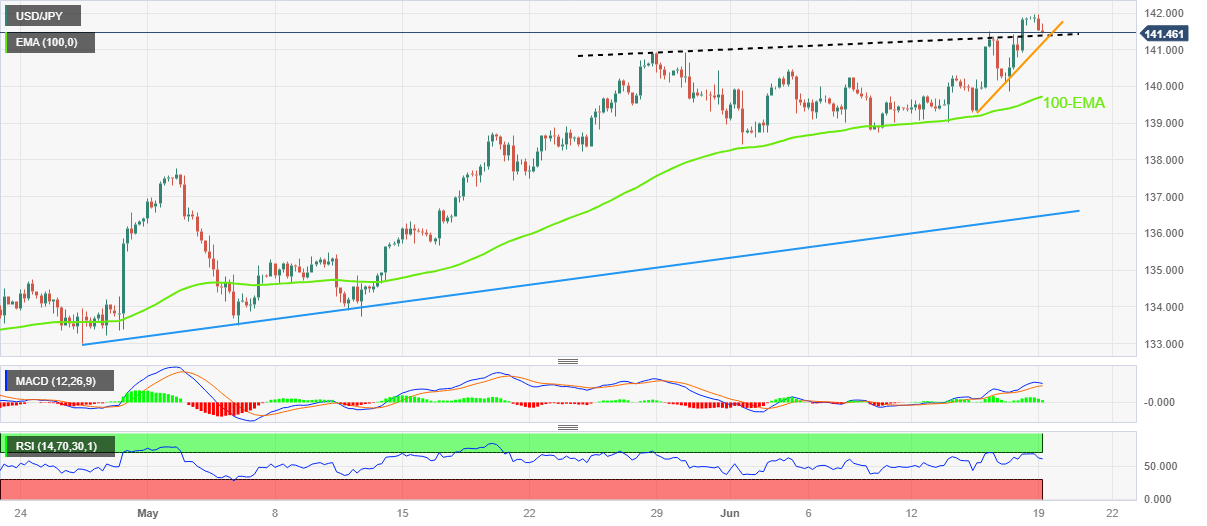
Trend: Bullish
- NZD/USD meets with some supply and stalls a four-day winning streak to the monthly peak.
- The Fed’s hawkish outlook, along with a softer risk tone, benefits the USD and exerts pressure.
- Investors now look to Fed Chair Jerome Powell’s testimony for a fresh impetus later this week.
The NZD/USD pair attracts some sellers near the 0.6235 region on Monday and extends its steady intraday descent through the Asian session, snapping a four-day winning streak. Spot prices retreat further from the monthly peak touched on Friday and drop to the 0.6200 round-figure mark, or a fresh daily low in the last hour.
The US Dollar (USD) gains some positive traction for the second straight day in the wake of the Federal Reserve's (Fed) hawkish outlook and turns out to be a key factor exerting some pressure on the NZD/USD pair. It is worth recalling that the Fed last week decided to leave interest rates unchanged, though signalled that borrowing costs may still need to rise by as much as 50 bps by the end of this year. Apart from this, a generally softer tone around the equity markets further benefits the safe-haven buck and drives flows away from the risk-sensitive Kiwi.
Concerns about a global economic downturn, particularly in China, overshadow hopes for additional rate cuts by the People’s Bank of China (PBoC) and continue to weigh on investors' sentiment. Apart from this, the Reserve Bank of New Zealand's (RBNZ) explicit signal that it was done with its most aggressive hiking cycle since 1999 further undermines the New Zealand Dollar (NZD). That said, expectations that the Fed is nearing the end of its year-long policy tightening might cap gains for the USD and help limit losses for the NZD/USD pair.
Traders might also refrain from placing aggressive bets and prefer to wait on the sidelines ahead of Fed Chair Jerome Powell's two-day congressional testimony on Wednesday and Thursday. Investors will look for fresh cues about the Fed's future rate-hike path, which will play a key role in influencing the near-term USD price dynamics and provide some meaningful impetus to the NZD/USD pair. This, in turn, makes it prudent to wait for strong follow-through selling before confirming that the recent move-up witnessed over the past three weeks or so has run out of steam.
Technical levels to watch
- Natural Gas prints the first daily loss in six amid market’s consolidation on Juneteenth holiday.
- Fears of China’s slowing economic recovery, hawkish Fed signal weigh on XNG/USD.
- Seventh consecutive fall in US Oil and Gas rig count puts a floor under the Natural Gas Price.
Natural Gas Price (XNG/USD) renews intraday low near $2.65 during the first negative daily performance in six. In doing so, the energy instrument reverses from the highest level in a month while taking a U-turn from the key resistance line stretched from March. It’s worth noting that the US Dollar’s rebound and pessimism about China weigh on the market sentiment and the XNG/USD price amid a sluggish start to the key week, mainly to the Juneteenth holiday in the US.
US Dollar Index (DXY) extends the previous day’s corrective bounce off the monthly low amid slightly downbeat sentiment and the hawkish Fed signals, while also ignoring the mixed US data flashed the previous day. With this, the greenback’s gauge versus the six major currency pair sticks to minor gains of around 102.36.
That said, headlines surrounding multiple banks cutting China’s growth forecasts recently challenged the market’s risk appetite and weighed on the XNG/USD price. On the same line could be the hawkish comments from the Fed policymakers, as well as the latest report from the US central bank to Congress.
Alternatively, news from the South China Morning Post (SCMP) quoted China State Council to trigger the week-start optimism by suggesting more stimulus from the Asian major, which in turn puts a floor under the Natural Gas Price. On the same line could be the receding fears of the US-China tussle as the key Diplomats from both nations are said to have held “candid and constructive talks” on their differences from Taiwan to trade, per Reuters.
Elsewhere, a seventh consecutive fall in the US Oil and Gas rig count, by 8 to 687 in the week to June 16, the lowest since April 2022, per Reuters, also puts a floor under the XNG/USD price.
It’s worth noting that the holiday in the US stock and bond markets allows the traders to pare previous moves but the clear directions could be gained from Chairman Powell’s bi-annual testimony, as well as PMIs for June.
Technical analysis
Natural Gas Price reverses from a downward-sloping resistance line from March 03, around $2.71 by the press time, as RSI pokes the overbought region. The pullback moves, however, remain elusive unless breaking the 100-DMA support of around $2.44 at the latest.
- GBP/USD retreats from the highest levels since April 2022, snaps four-day uptrend.
- Confirmation of bearish chart pattern, downbeat MACD signals conditions suggest further declines of the Cable pair.
- Multiple key supports, hawkish hopes from BoE prod Pound Sterling sellers.
- Bulls need sustained break of 1.2850 to register further upside.
GBP/USD sellers prod intraday low of around 1.2810 heading into Monday’s London open, printing the first daily loss in five at the highest levels in 14 months.
In doing so, the Cable pair justifies the downside break of a bearish pennant chart formation amid downbeat signals from the MACD and the RSI (14) technical indicators.
That said, the broad US Dollar rebound amid the Juneteenth holiday, as well as backed by the hawkish Fed talks, join the Pound Sterling pair’s consolidation ahead of the Bank of England (BoE) monetary policy meeting to trigger the quote’s latest pullback from the multi-day high.
Also read: GBP/USD hovers near its highest level since April 2022, remains below mid-1.2800s
With this, the GBP/USD sellers are likely to break the 1.2800 round figure. However, a convergence of the 50-Hour Moving Average (HMA) joins two-day-old horizontal support to restrict the pair’s immediate downside near 1.2770-65.
Following that, a one-week-old rising support line and the 200-HMA, respectively near 1.2730 and 1.2600, will be crucial to watch for clear directions.
On the flip side, the Cable pair’s recovery needs validation from the 1.2850 hurdle, marked the last week.
Following that, lows printed in early April 2022 near 1.2970 may check the upside momentum targeting the 1.3000 psychological magnet.
GBP/USD: Hourly chart
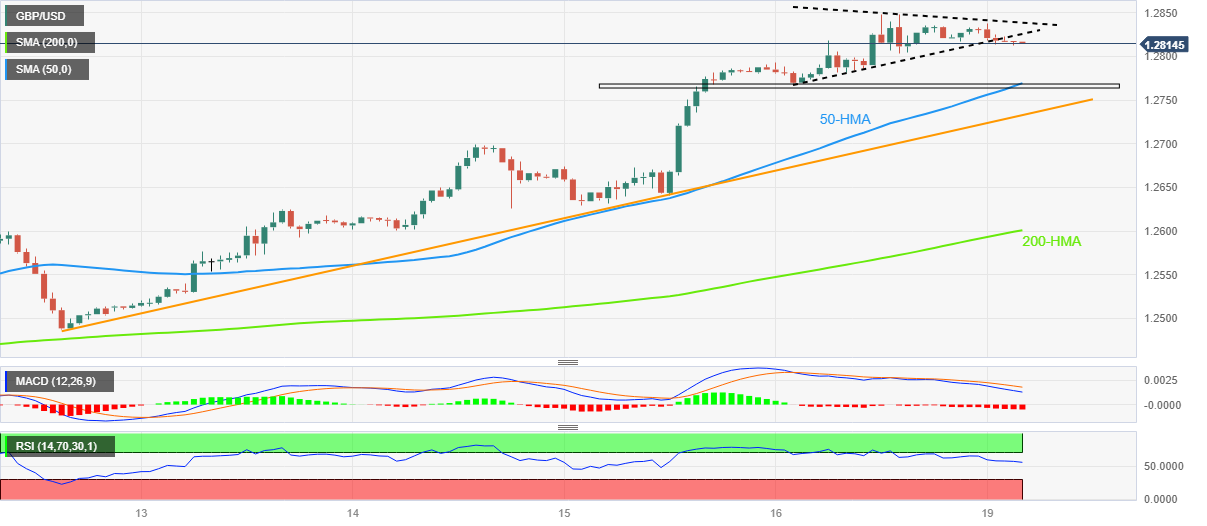
Trend: Pullback expected
- USD/INR oscillates in a narrow trading band through the Asian session on Monday.
- Last week’s sustained breakdown below the 200-day SMA favours bearish traders.
- A sustained strength beyond the 82.30 area is needed to negate the negative bias.
The USD/INR pair struggles to capitalize on Friday's modest bounce from the 81.85 region, or its lowest level since May 9 and kicks off the new week on a subdued note. Spot prices oscillate in a narrow trading band through the Asian session and currently trade just below the 82.00 mark, nearly unchanged for the day.
From a technical perspective, last week's sustained break and acceptance below the very important 200-day Simple Moving Average (SMA) was seen as a fresh trigger for bearish traders. Moreover, oscillators on the daily chart are holding deep in the negative territory and are still far from being in the oversold zone. This, in turn, reaffirms the negative outlook and suggests that the path of least resistance for the USD/INR pair is to the downside.
Hence, a subsequent slide towards testing the next relevant support, near the 81.70-81.65 region, looks like a distinct possibility. Some follow-through selling will make a fresh breakdown and pave the way for an extension of the recent retracement slide from the vicinity of the 83.00 round-figure mark witnessed over the past four weeks or so.
On the flip side, the 200-day SMA, currently pegged around the 82.10 area, now seems to act as an immediate hurdle ahead of the 82.30 horizontal zone. A sustained strength beyond, however, might negate the negative outlook and trigger some near-term short-covering move. The USD/INR pair might then climb back towards the 82.70-82.75 hurdle before making a fresh attempt to conquer the 83.00 mark.
USD/INR daily chart
Key levels to watch
In its latest client note published on Friday, analysts at Goldman Sachs warrant caution on the US inflation outlook.
Key quotes
"Although we expect further declines in inflation going forward, markets appear considerably more optimistic than we are about the pace of cooling."
“Investors are not taking note of the potential for "delayed-onset inflation" in sectors such as healthcare.”
“A sharp deceleration in US economic growth will only have a limited chance of more rapid easing of price pressures.”
- Gold Price extends previous day’s retreat, prods key EMA confluence around $1,955-54.
- Fears about slower economic growth in China, hawkish Fed signals weigh on XAU/USD.
- Juneteenth holiday, mixed US data put a floor under the Gold Price amid a sluggish start to the key week.
- Fed Chair Powell’s bi-annual Testimony, PMIs eyed for clear directions.
Gold Price (XAU/USD) suffers from the market’s pessimism about China, as well as the fresh hawkish concerns for the Federal Reserve (Fed), as it takes offers to renew its intraday low near $1,954 during early Monday in Europe.
That said, headlines surrounding multiple banks cutting China’s growth forecasts recently challenged the market’s risk appetite and weighed on the XAU/USD price. On the same line could be the hawkish comments from the Fed policymakers, as well as the latest report from the US central bank to Congress.
Richmond Fed President Thomas Barkin said, “Raising rates further could create the risk of a more significant slowdown in the economy.” The policymaker, however, also added that the Fed can do comfortable more to slow the resilient US economy, which in turn triggered a jump in the 2-year Treasury bond yields to 4.75% and helped the US Dollar to get off the lows. Not only Fed’s Barkin but Chicago Fed President Austan Goolsbee and Federal Reserve Governor Christopher Waller also appeared a bit hawkish and helped the DXY to reverse from a multi-day low the previous day.
Furthermore, the Fed’s Monetary Policy Report to the US Congress, published Friday stated, “Inflation in the US is well above target and the labor market remains very tight,” as per Reuters.
Alternatively, news from the South China Morning Post (SCMP) quoted China State Council to trigger the week-start optimism by suggesting more stimulus from the Asian major, which in turn puts a floor under the Gold Price. On the same line could be the receding fears of the US-China tussle as the key Diplomats from both nations are said to have held “candid and constructive talks” on their differences from Taiwan to trade, per Reuters.
Moving on, a light calendar and holiday in the US stocks, as well as bond, markets may restrict the Gold Price moves. Though, Fed Chairman Powell’s bi-annual testimony, as well as PMIs for June, will also be important to watch for clear directions.
Technical analysis
Gold Price jostles with a convergence of the 50, 100 and 200 Exponential Moving Averages (EMAs), not to forget the 50% Fibonacci retracement of its June 02-15 downside, near $1,955-54.
In doing so, the XAU/USD extends the previous pullback from a fortnight-old descending resistance line, around $1,965 by the press time, amid bearish MACD signals.
That said, the RSI (14) line is below 50.0 and suggests bottom-picking in the Gold Price.
Hence, the XAU/USD buyers may remain hopeful unless witnessing a clear break of a two-week-long horizontal support zone surrounding $1,940-38, even if the bears conquer the $1,954 support confluence.
Meanwhile, an upside break of the aforementioned resistance line of near $1,965 can quickly direct the buyers toward the monthly high of around $1,983 before flagging the run-up toward the $2,000 psychological magnet.
Gold Price: Hourly chart
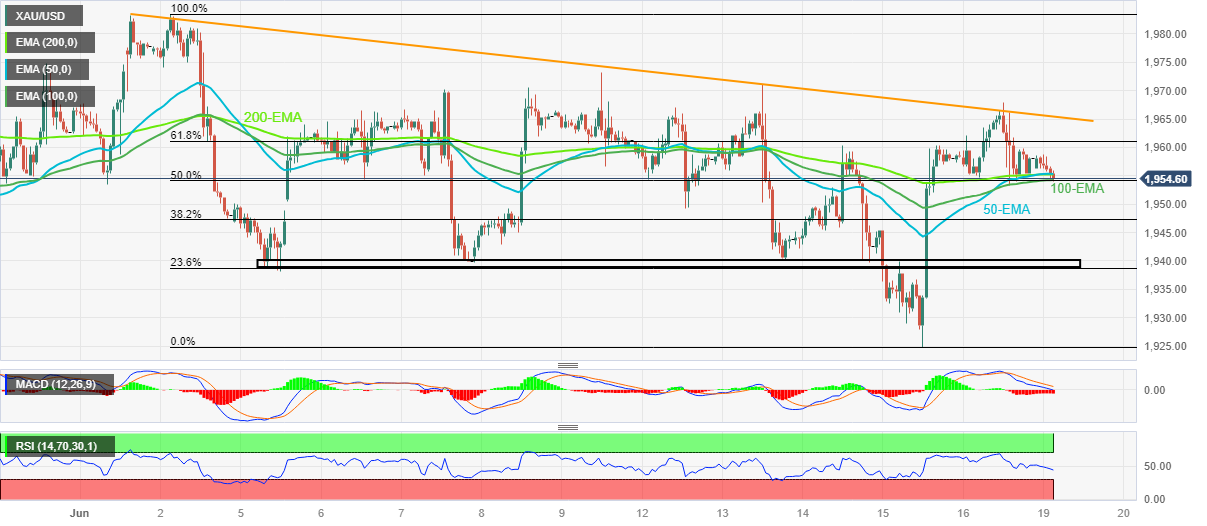
Trend: Limited downside expected
- Market sentiment remains sluggish, fades previous day optimism amid mixed concerns about China, US holiday.
- US-China ties, Beijing’s stimulus favor optimists but major banks cut dragon nation’s growth forecasts and lure bears.
- Hawkish Fed concerns, mixed US data trouble market players during sluggish start of the key week.
- Fed Chair Powell’s Testimony, China measures and PMI eyed for clear directions.
Markets in the Asia-Pacific region edge lower, pausing the previous day’s gains at the multi-day high, as traders struggle to cheer China-inspired optimism amid mixed clues. Adding to the consolidation move could be the US equity and bond markets’ holiday due to the Juneteenth observance.
While portraying the mood, MSCI’s index of the Asia-Pacific shares outside Japan drop 0.90% intraday as it retreats from the highest levels in four months marked the previous day. That said, Japan’s Nikkei 225 also prints mild losses around 33,671 while S&P500 Futures trace Wall Street benchmarks to pause the previous rally that renewed the yearly top.
Headlines surrounding multiple banks cutting China’s growth forecasts recently challenged the market’s risk appetite. However, news from the South China Morning Post (SCMP) quoted China State Council to favor the week-start optimism by suggesting more stimulus from the Asian major. On the same line could be the receding fears of the US-China tussle as the key Diplomats from both nations are said to have held “candid and constructive talks” on their differences from Taiwan to trade, per Reuters.
With this, the Chinese stocks reverse the previous gains and weigh on equities in Hong Kong, Indonesia and New Zealand. It should be noted that the easing hopes of the Reserve Bank of Australia’s (RBA) hawkish moves allow Australia’s ASX 200 to print mild gains.
On a broader front, Fed policymakers’ defense of the July rate hike concerns weighs on the sentiment despite mixed US data. That said, the preliminary readings of the University of Michigan (UoM) Consumer Sentiment Index (CSI) for June improved but the US inflation expectations eased for June the previous day. Even so, Fed policymakers have been hawkish of late and allowed the bears to sneak in amid a sluggish start to another key week. It’s worth noting that the US Dollar Index dropped the most since early January in the last week mainly due to the downbeat US inflation, Retail Sales and Fed’s hawkish pause, not to forget the ECB’s comparatively hawkish move.
It’s worth noting that the Bank of Japan’s (BoJ) inaction joins the likely limited hawkish moves by the RBA and the RBNZ, not to forget PBoC’s rate cut, to keep the Asia-Pacific traders on the front foot despite the latest pullback in the share prices.
Looking ahead, monetary policy meetings of the Bank of England and Swiss National Bank (SNB) will join Fed Chair Jerome Powell’s bi-annual Testimony to entertain market players. Additionally important will be the preliminary PMIs for June.
Also read: A market still desperately seeking clarity on the inflation picture
- GBP/JPY is seen consolidating its recent strong gains to the highest level since December 2015.
- The BoJ-BoE policy divergence is seen as a key factor that continues to lend support to the cross.
- Bulls now await the UK consumer inflation figures and the BoE meeting before placing fresh bets.
The GBP/JPY cross enters a bullish consolidation phase on Monday and oscillates in a narrow range around the 181.80-181.25 area, or just below its highest level since December 2015 touched during the Asian session.
The Japanese Yen (JPY) continues to be undermined by the Bank of Japan's (BoJ) dovish stance, which, in turn, is seen as a key factor acting as a tailwind for the GBP/JPY cross. It is worth recalling that the Japanese central bank decided to leave its ultra-loose policy settings unchanged on Friday and kept intact its view that inflation will slow later this year. As was anticipated, the BoJ held its short-term interest rate target at -0.1% and made no changes to its yield curve control policy to support the fragile domestic economy.
In contrast, the Bank of England (BoE) is expected to hike the benchmark rates by 25 bps on Thursday, to 4.75% or the highest since April 2008. Moreover, the markets are pricing in the possibility of a bigger, 50 bps lift-off, which, continues to lend support to the British Pound and the GBP/JPY cross. Bulls, however, seem reluctant to place fresh bets and prefer to move to the sidelines ahead of this week's key data/central bank event risks - the release of the latest consumer inflation figures from the UK and the BoE policy meeting.
Apart from this, a generally softer tone around the equity markets offers some support to the safe-haven JPY and contributes to capping the upside for the GBP/JPY cross, at least for the time being. That said, the aforementioned fundamental backdrop suggests that the path of least resistance for spot prices is to the upside and any meaningful pullback might still be seen as a buying opportunity. In the absence of any relevant market-moving economic releases on Monday, the cross seems more likely to prolong its sideways consolidative price move.
Technical levels to watch
- USD/MXN kicks off the new week on a positive note and moves away from a multi-year low.
- The RSI on the daily chart flashes oversold conditions on the daily chart and lends support.
- The formation of a descending channel points to a well-established short-term bearish trend.
The USD/MXN pair edges higher during the Asian session on Monday, albeit lacks bullish conviction and remains well within the striking distance of its lowest level since December 2015. The pair currently trades around the 17.0915-17.0920 region, up just over 0.10% for the day, and so far, has managed to defend support marked by the lower boundary of a nearly one-month-old descending channel.
From a technical perspective, the Relative Strength Index (RSI) on the daily chart is flashing oversold conditions and holding back traders from placing fresh bearish bets around the USD/MXN pair. That said, the lack of any meaningful buying suggests that a multi-month-old downtrend is still far from being over. Hence, any attempted recovery move could attract fresh sellers near the 17.2550 area, which coincides with the 50-period Simple Moving Average (SMA) on the 4-hour chart.
This, in turn, should cap the USD/MXN pair near the trend-channel resistance, currently pegged around the 17.2600 round-figure mark, which should now act as a pivotal point for short-term traders. A convincing break through the said barrier will suggest that the USD/MXN pair has formed a near-term bottom and pave the way for a further appreciating move towards last week's swing high, around the 17.3345 area.
On the flip side, the multi-year low, around the 17.0245-17.0240 area touched on Friday, now seems to protect the immediate downside ahead of the trend-channel support, currently around the 17.0000 psychological mark. A convincing break below the latter will mark a fresh bearish breakdown and set the stage for an extension of the recent well-established bearish trend witnessed over the past three months or so.
USD/MXN 4-hour chart
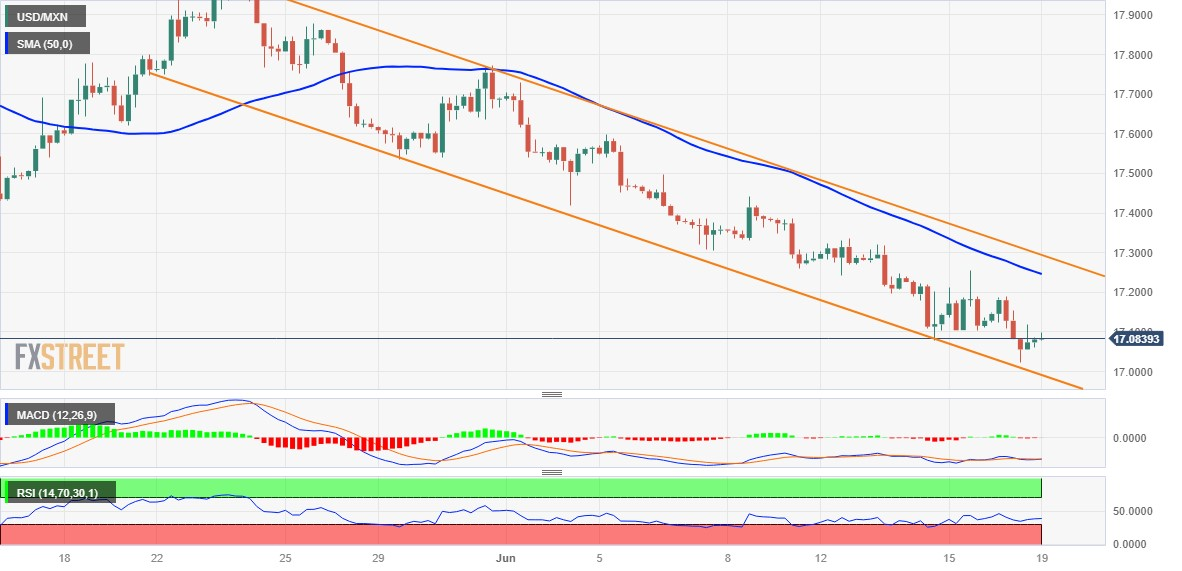
Key levels to watch
| Raw materials | Closed | Change, % |
|---|---|---|
| Silver | 24.189 | 1.3 |
| Gold | 1957.37 | -0 |
| Palladium | 1409.76 | 1.43 |
- USD/CAD renews intraday high as it recovers from yearly low during Juneteenth holiday-inspired sluggish trading.
- Oil Price drops amid fears of less demand from China.
- US Dollar justifies hawkish Fed talks, ignores mixed US data to extend Friday’s corrective bounce.
- Fed Chair Powell’s Testimony, preliminary PMIs for June appear crucial for clear directions during holiday-shortened week.
USD/CAD picks up bids to consolidate the recent losses around the yearly low, refreshing the intraday top near 1.3215 amid early Monday. In doing so, the Loonie pair snaps a two-day downtrend while justifying the broad US Dollar recovery, as well as the downbeat prices of Canada’s main export item WTI crude oil, during a sluggish session due to the Juneteenth holiday in the US.
US Dollar Index (DXY) extends the previous day’s corrective bounce off the monthly low amid slightly downbeat sentiment and the hawkish Fed signals, while also ignoring the mixed US data flashed the previous day. With this, the greenback’s gauge versus the six major currency pair sticks to minor gains around 102.35. On the other hand, WTI crude oil sellers attack the $71.00 round figure while printing the first daily loss in seven.
Headlines surrounding multiple banks cutting China’s growth forecasts and fears of heavy Oil inflow from Iran, due to the likely US-Iran deal, appear to weigh on the WTI crude oil prices. The same joins Fed policymakers’ defense of the July rate hike concerns to weigh on the sentiment and the black gold, as well as favor the DXY.
Preliminary readings of the University of Michigan (UoM) Consumer Sentiment Index (CSI) for June improved but the US inflation expectations eased and tamed the US Dollar bulls. Even so, Fed policymakers have been hawkish of late and allowed the DXY to consolidate recent losses amid a sluggish start to another key week. It’s worth noting that the US Dollar Index dropped the most since early January in the last week. However, downbeat US inflation, Retail Sales and Fed’s hawkish pause join the news about the US-China ties to prod the USD/CAD bulls.
It’s worth noting that the S&P500 Futures print mild losses while tracing Wall Street benchmarks whereas the yields remain lackluster, grinding higher of late.
Moving on, an absence of the US traders will restrict the USD/CAD pair’s moves on Monday. However, Fed Chairman Powell’s bi-annual testimony, as well as PMIs for June, will also be important to watch for clear directions. Also important to watch are the latest outcomes of Canadian Industrial Production and Retail Sales.
Technical analysis
Despite the latest corrective bounce, mainly due to the oversold RSI (14) conditions, the USD/CAD remains on the seller’s radar unless crossing the previous support line stretched from November 2022, around 1.3330 by the press time.
- USD/JPY touches a fresh YTD peak on Monday, albeit lacks follow-through buying.
- The Fed-BoJ policy divergence is seen as a key factor lending support to the major.
- A generally softer risk tone underpins the safe-haven JPY and caps further gains.
The USD/JPY pair enters a bullish consolidation phase on Monday and oscillates in a narrow band below the 142.00 mark, or its highest level since November 2022 touched during the Asian session.
The Japanese Yen (JPY) continues to be undermined by the Bank of Japan's (BoJ) decision on Friday to leave its ultra-loose policy settings to support the fragile domestic economy. In fact, the Japanese central bank held its short-term interest rate target at -0.1% and made no changes to its yield curve control policy. The BoJ also kept intact its view that inflation will slow later this year, suggesting that it will remain a dovish outlier amid global uncertainty. This, in turn, is seen as a key factor acting as a tailwind for the USD/JPY pair on the first day of a new week.
The US Dollar (USD), on the other hand, edges higher for the second straight day and looks to build on Friday's modest bounce from over a one-month low amid the Federal Reserve's (Fed) hawkish outlook. It is worth recalling that the US central bank last week decided to pause its year-long rate-hiking cycle, though signalled that borrowing costs may still need to rise by as much as 50 bps by the end of this year. This, in turn, assists the Greenback to gain some follow-through traction and further lends support to the USD/JPY pair, though the uptick lacks bullish conviction.
The recent softer US macro data raised questions over how much headroom the Fed has to keep raising rates. Moreover, market participants seem confident that the Fed is almost done with its tightening, which is holding back the USD bulls from placing aggressive bets. Apart from this, a generally softer tone around the equity markets helps limit losses for the safe-haven JPY and further contributes to capping the upside for the USD/JPY pair, at least for now. Nevertheless, the fundamental backdrop suggests that the path of least resistance for spot prices is to the upside.
Hence, any meaningful corrective decline might still be seen as a buying opportunity and is more likely to remain cushioned. The market focus now shifts to Fed Chair Jerome Powell's two-day congressional testimony on Wednesday and Thursday, which will be closely scrutinized for fresh clues about the future rate-hike path. This, in turn, will play a key role in influencing the USD price dynamics and provide some meaningful impetus to the USD/JPY pair. Traders this week will also confront the release of the flash US PMI prints on Friday.
Technical levels to watch
- EUR/USD extends previous day’s pullback from five-week high, stays pressured of late.
- Bearish candlestick formation, overbought RSI suggests further downside toward multi-day-old horizontal support.
- Bullish MACD signals, 50-DMA can challenge Euro bears past 1.0900.
- Euro buyers need validation from 1.0960 to retake control.
EUR/USD takes offers to reverse the late Friday’s corrective bounce, as well as the week-start inaction, as it justifies the previous day’s bearish candlestick formation amid overbought RSI conditions on early Monday in Europe. That said, the Euro pair renews its intraday low near 1.0930 while extending earlier pullback from the highest levels in five weeks.
It’s worth noting that the Juneteenth holiday in the US also joins the bearish spinning top candlestick on the daily chart of the EUR/USD pair and the overbought RSI (14) line to please the Euro bears of late.
With this, the quote appears all set to decline towards a nine-week-old horizontal support zone surrounding 1.0910-900.
However, the bullish MACD signals and the 50-DMA support of around 1.0880 can challenge the EUR/USD bears afterward.
In a case where the Euro pair drops below 1.0880, the odds of witnessing a slump towards the 50% and 61.8% Fibonacci retracement of its March-April run-up, respectively near 1.0800 and 1.0735, can’t be ruled out.
On the flip side, a daily closing beyond the 23.6% Fibonacci retracement of near 1.0960 and the previous day’s peak of around 1.0970 restrict the short-term EUR/USD upside.
Following that, multiple tops marked around 1.1000 can challenge the Euro bulls before directing them to the March 2022 high close to 1. 1185.
EUR/USD: Daily chart
Trend: Limited downside expected
AUD/USD takes offers to refresh intraday low near 0.6850 during the mid-Asian session on Monday, reversing the early rebound by extending the previous day’s pullback from the highest levels in four months.
In doing so, the Aussie pair takes clues from the downbeat options market bias and the latest China news.
That said, the one-month risk reversal (RR) of the AUD/USD price, a gauge of the spread between the call and put options, prints the strongest bearish level of -0.025 in three days by the end of Friday’s North American session. With this, the weekly RR also prints the first negative close in three, with the latest figures being -0.040 by the press time.
Apart from the downbeat options market signals, the market’s fears of China’s slower economic recovery also weigh on the AUD/USD prices.
That said, Reuters came out with the news suggesting multiple banks cutting China’s growth forecasts to weigh on the AUD/USD price and reverse the week-start optimism after the US-China ties, as well as on news that Beijing braces for more stimulus.
“Nomura has cut its forecast for China's 2023 GDP growth to 5.1% from 5.5%, the Japanese bank said in a note on Friday, following similar moves by UBS, Standard Chartered, Bank of America and JPMorgan,” said Reuters.
Also read: AUD/USD bulls approach 0.6900 amid China-inspired optimism, focus on RBA Minutes, Fed Powell’s Testimony
- Gold price remains confined in a narrow trading band for the second straight day on Monday.
- A modest US Dollar strength is acting as a key factor acting as a headwind for the XAU/USD.
- Hawkish outlooks by major central banks also contribute to capping the upside for the metal.
Gold price continues with its struggle to gain any meaningful traction on Monday and oscillates in a narrow trading band for the second straight day. The XAU/USD currently trades just below the $1,960 level during the Asian session, albeit, so far, has managed to hold its neck above the 100-hour Simple Moving Average (SMA).
Modest US Dollar strength acts as a headwind for Gold price
The US Dollar (USD) edges higher on the first day of the new week and looks to build on Friday's modest recovery from over a one-month low in the wake of the Federal Reserve's hawkish outlook. It is worth recalling that the Fed last week signalled that borrowing costs may still need to rise by as much as 50 bps by the end of this year. This, in turn, is seen as a key factor acting as a headwind for the US Dollar-denominated Gold price.
Federal Reserve rate-hike uncertainty lends support to XAU/USD
The recent softer macro data from the United States (US), however, raised questions over how much headroom the Fed has to keep raising rates. In fact, market participants seem confident that the Fed is almost done with its tightening, which is holding back the USD bulls from placing aggressive bets and lending support to the Gold price. Apart from this, a softer risk tone is seen as another factor underpinning the safe-haven XAU/USD.
Hawkish central banks should continue to cap the upside
Any meaningful upside, meanwhile, still seems elusive amid a more hawkish stance adopted by other major central banks. It is worth recalling that the Reserve Bank of Australia (RBA) and the Bank of Canada (BoC) delivered a surprise 25 basis point (bps) rate hike earlier this month. Moreover, the European Central Bank (ECB) last week lifted rates by 25 bps, to the highest level in 22 years, and indicated further tightening to bring down inflation.
The Bank of England (BoE) and the Swiss National Bank (SNB) are also expected to hike interest rates by 25 bps later this week, which might further contribute to capping the Gold price. In the absence of any relevant macro data and lighter trading volumes on the back of a bank holiday in the US, the mixed fundamental backdrop warrants caution before positioning for any meaningful recovery from a nearly three-month low touched last Thursday.
Gold price technical outlook
From a technical perspective, the 100-day SMA, currently around the $1,942 area, is likely to protect the immediate downside ahead of the $1,932 region and the monthly swing low, around the $1,925-$1,924 zone. Some follow-through selling will be seen as a fresh trigger for bearish traders and make the Gold price vulnerable to accelerate the fall towards the $1,900 round figure. The downward trajectory could get extended further and drag the XAU/USD towards the $1,876-$1,875 horizontal support en route to the very important 200-day SMA, currently around the $1,839 region.
On the flip side, the immediate hurdle is pegged near the $1,962-$1,964 region ahead of the $1,970-$1,972 supply zone. This is followed by the $1,983-$1,985 resistance, above which a bout of a short-covering has the potential to lift the Gold price beyond the $2,000 psychological mark, towards the next relevant barrier near the $2,010-$2,012 region.
Key levels to watch
People’s Bank of China (PBOC) set the USD/CNY central rate at 7.1201 on Monday, versus previous fix of 7.289 and market expectations of 7.1186. It's worth noting that the USD/CNY closed near 7.1263 the previous day.
"With 25 billion Yuan worth of reverse repos maturing on Monday, China central bank drains 23 billion Yuan on a net basis on the day," said Reuters following the PBOC Fix announcements.
About PBOC fix
China maintains strict control of the yuan’s rate on the mainland.
The onshore yuan (CNY) differs from the offshore one (CNH) in trading restrictions, this last one is not as tightly controlled.
Each morning, the People’s Bank of China (PBOC) sets a so-called daily midpoint fix, based on the yuan’s previous day's closing level and quotations taken from the inter-bank dealer.
- Silver price begins trading week on a back foot, reverses the previous day’s run-up at weekly top.
- RSI’s retreat from above 50.0 levels suggests further pullback in XAG/USD price.
- 100-SMA, fortnight-long horizontal support zone restrict short-term declines of the Silver price.
- Silver bears remain hopeful unless witnessing sustained break of 50% Fibonacci retracement.
Silver Price (XAG/USD) consolidates the previous day’s gains, the biggest in over a week, while easing within a two-week-old descending triangle formation during early Monday. In doing so, the bright metal drops to $24.05 by reversing from the triangle’s top line.
In addition to the pullback from the aforementioned triangle’s upper line, the RSI’s retreat from the above-50.0 region also favors the XAG/USD price pullback.
However, the 100-SMA and the stated triangle’s bottom line, respectively near $23.70 and $23.20, limit the short-term downside of the Silver price. Also challenging the XAG/USD bears are the bullish MACD signals.
Should the Silver Price remains bearish past $23.20, the $23.00 threshold may act as an extra filter towards the south before directing the bears to the previous monthly low of around $22.70.
Alternatively, XAG/USD recovery needs validation from the triangle’s breakout towards the north. In that case, the previously stated resistance line, around $24.20, will be in the spotlight.
Even so, a sustained break of the 50% Fibonacci retracement of the metal’s May 05-25 downturn, near $24.45, quickly followed by the $24.50 round figure, will be necessary to convince the Silver buyers.
Overall, Silver price consolidates recent gains amid a sluggish Asian session on the Juneteenth holiday in the US.
Silver price: Four-hour chart

Trend: Limited downside expected
- US Dollar Index stays defensive near the lowest levels in five weeks, grinds higher of late.
- Juneteenth holiday allows DXY to pare recent losses amid hawkish Fed bias, mixed US data.
- Risk catalysts, Fed chatters will be the key to watch amid a light calendar ahead of Fed Chair Powell’s Testimony, PMIs.
US Dollar Index (DXY) pares recent losses around 102.30-40 amid a sluggish Monday morning in Asia. In doing so, the greenback’s gauge versus six major currencies justifies the market’s lack of interest due to the Juneteenth holiday in the US. Also allowing the DXY to pare the latest losses could be the hawkish Fed concerns. However, the mixed US data and comparatively hawkish European Central Bank (ECB) moves keep US Dollar bears hopeful.
Preliminary readings of the University of Michigan (UoM) Consumer Sentiment Index (CSI) for June improved but the US inflation expectations eased and tamed the US Dollar bulls. Even so, Fed policymakers have been hawkish of late and allowed the DXY to consolidate recent losses amid a sluggish start to another key week. It’s worth noting that the US Dollar Index dropped the most since early January in the last week.
That said, the latest US Federal Reserve (Fed) Monetary Policy Report to the US Congress, published Friday stated, “Inflation in the US is well above target and the labor market remains very tight,” as per Reuters. The report also mentioned, per Reuters, “Outlook for funds rate is subject to considerable uncertainty.”
It should be noted that Richmond Fed President Thomas Barkin said, “Raising rates further could create the risk of a more significant slowdown in the economy.” The policymaker, however, also added that the Fed can do comfortable more to slow the resilient US economy, which in turn triggered a jump in the 2-year Treasury bond yields to 4.75% and helped the US Dollar to get off the lows. Not only Fed’s Barkin but Chicago Fed President Austan Goolsbee and Federal Reserve Governor Christopher Waller also appeared a bit hawkish and helped the DXY to reverse from a multi-day low the previous day.
Alternatively, downbeat US inflation, Retail Sales and Fed’s hawkish pause join the risk-positive news from China to prod the DXY bulls.
During the weekend, US Secretary of State Antony Blinken and Chinese Foreign Minister Qin Gang held “candid and constructive talks” on their differences from Taiwan to trade, per Reuters. Though, the news also mentioned that the diplomats seemed to agree on little beyond keeping the conversation going with an eventual meeting in Washington, reported Reuters. Further, news from the South China Morning Post (SCMP) quoting China State Council also flashes positive signals for the sentiment as it said, “The Council considered a batch of macroeconomic policies designed to expand ‘effective demand’, strengthen the real economy and defuse risks in key areas.”
Against this backdrop, S&P500 Futures tracks Wall Street’s mild losses amid an absence of the US stock and bond market players on Monday, which in turn can prod the DXY moves looking forward. However, Fed Chairman Powell’s bi-annual testimony, as well as PMIs for June, will also be important to watch for clear directions.
Technical analysis
US Dollar Index bounces off a two-month-old ascending support line, near 102.05 at the latest, but the recovery moves remain elusive unless the quote stays below the 50-DMA hurdle of around 102.60.
- GBP/USD gains positive traction for the fourth straight day and trades around a 14-month top.
- Bets for additional rate hikes by the BoE continue to underpin the GBP and act as a tailwind.
- The Fed rate hike uncertainty keeps the USD bulls on the defensive and lends additional support.
The GBP/USD pair gains some positive traction for the fourth successive day on Monday and trades just below mid-1.2800s, near its highest level since April 2022 during the Asian session.
The British Pound (GBP) continues with its relative outperformance in the wake of expectations that the Bank of England (BoE) will continue with its policy tightening to stop inflation expectations from becoming entrenched. In fact, the BoE is universally anticipated to hike the benchmark rates by 25 bps on Thursday, to 4.75% or the highest since April 2008. Moreover, the markets are pricing in the possibility of a bigger, 50 bps lift-off, which, along with subdued US Dollar price action, acts as a tailwind for the GBP/USD pair.
The uncertainty over the Federal Reserve’s (Fed) rate-hike path fails to assist the USD to capitalize on Friday's rebound from over a one-month low and is seen as another factor lending support to the GBP/USD pair. The Fed signalled last week that borrowing costs may still need to rise by as much as 50 bps by the end of this year. That said, the incoming softer US macro data raised questions over how much headroom the Fed has to keep raising rates and fueled speculations that the end of the policy tightening cycle is nearing.
Hence, the market focus will remain glued to Fed Chair Jerome Powell's two-day congressional testimony on Wednesday and Thursday. Investors this week also confront the release of the latest consumer inflation figures on Wednesday. This will be followed by the highly-anticipated BoE monetary policy decision on Thursday. Apart from this, the flash PMI prints from the UK and the US should provide some meaningful impetus to the GBP/USD pair. Heading into the key data/event risks, bulls might refrain from placing fresh bets.
Furthermore, relatively lighter trading volumes on the back of a bank holiday in the US warrant some caution before positioning for an extension of the recent upward trajectory witnessed over the past three weeks or so. Nevertheless, the aforementioned fundamental backdrop suggests that the path of least resistance for the GBP/USD pair is to the upside and any meaningful corrective pullback might still be seen as a buying opportunity.
Technical levels to watch
| Index | Change, points | Closed | Change, % |
|---|---|---|---|
| NIKKEI 225 | 220.59 | 33706.08 | 0.66 |
| Hang Seng | 211.45 | 20040.37 | 1.07 |
| KOSPI | 17.25 | 2625.79 | 0.66 |
| ASX 200 | 75.9 | 7251.2 | 1.06 |
| DAX | 67.51 | 16357.63 | 0.41 |
| CAC 40 | 97.74 | 7388.65 | 1.34 |
| Dow Jones | -108.94 | 34299.12 | -0.32 |
| S&P 500 | -16.25 | 4409.59 | -0.37 |
| NASDAQ Composite | -93.25 | 13689.57 | -0.68 |
- WTI crude oil takes offers to renew intraday low during the first loss-making day in three.
- Oil price pulls back from fortnight-old resistance line amid nearly overbought RSI.
- Bullish MACD signals keep energy buyers hopeful above weekly support line, 1.5-month-old horizontal support.
WTI crude oil pares the previous weekly gains, the first in three, as it renews intraday low near $71.30 to snap a two-day uptrend amid early Monday.
In doing so, the black gold reverses from a two-week-old descending resistance line amid nearly overbought RSI (14). However, the bullish MACD signals and the 200-SMA, around $71.30 by the press time, challenge the Oil bears.
It should be noted, however, that a clear break of the 200-SMA won’t hesitate to prod the $70.00 psychological magnet while the 50% Fibonacci retracement of May 03-24 upside, near $69.50, may test the energy benchmark bears afterward.
In a case where the WTI crude oil remains bearish past $69.50, a one-week-old ascending support line and a horizontal area comprising multiple lows marked since early May, respectively near $69.30 and $67.20-67.00, will be in the spotlight.
On the contrary, Oil’s recovery needs validation from the aforementioned resistance line of around $72.00, a break of which can direct the energy bulls toward the multiple hurdles marked near $73.50.
However, the WTI recovery remains elusive unless the quote stays below the late May swing high of near $74.70.
WTI crude oil: Four-hour chart

Trend: Limited downside expected
| Pare | Closed | Change, % |
|---|---|---|
| AUDUSD | 0.68753 | -0.07 |
| EURJPY | 155.237 | 1.14 |
| EURUSD | 1.09407 | -0.04 |
| GBPJPY | 181.902 | 1.47 |
| GBPUSD | 1.28206 | 0.29 |
| NZDUSD | 0.62348 | 0 |
| USDCAD | 1.31961 | -0.18 |
| USDCHF | 0.89379 | 0.26 |
| USDJPY | 141.888 | 1.19 |
- NZD/USD begins trading week on a positive footing despite inactive markets.
- Business NZ PSI improves for May allowing Kiwi buyers to keep the reins.
- US-China talks, stimulus news from Beijing underpin cautious optimism.
- Juneteenth holiday restricts trading volatility, Fed Chair Powell’s Testimony will be the key.
NZD/USD appears the most active among the G10 currency pairs during early Monday morning in Asia, up 0.35% intraday to 0.6235 at the latest. In doing so, the Kiwi pair benefits from upbeat New Zealand (NZ) data and risk-on mood, mainly backed by China news, even as the Juneteenth holiday restricts the market moves.
New Zealand’s Business NZ PSI for May improves to 53.3 versus 49.4 prior and contrasts with the previous week’s Business NZ PMI for the said month, as well as mixed NZ Gross Domestic Product (GDP) for the first quarter (Q1) 2023 to favor the NZD/USD bulls.
On the same line, the latest headlines surrounding China allowed markets to remain hopeful and propel the Kiwi pair price.
US Secretary of State Antony Blinken and Chinese Foreign Minister Qin Gang on Sunday held what both called candid and constructive talks on their differences from Taiwan to trade but seemed to agree on little beyond keeping the conversation going with an eventual meeting in Washington, reported Reuters. Further, news from the South China Morning Post (SCMP) quoting China State Council also flashes positive signals for the sentiment as it said, “The Council considered a batch of macroeconomic policies designed to expand ‘effective demand’, strengthen the real economy and defuse risks in key areas.”
It’s worth noting that the US Dollar Index (DXY) failed to cheer the US Federal Reserve’s (Fed) hawkish pause to the rate hike trajectory as mostly downbeat data challenged hopes of the US central bank’s rate hike past July.
That said, the preliminary readings of the University of Michigan (UoM) Consumer Sentiment Index (CSI) for June improved but the US inflation expectations eased and tamed the US Dollar bulls. Further, Fed policymakers have been hawkish of late and challenged the NZD/USD bulls.
Alternatively, the latest US Federal Reserve (Fed) Monetary Policy Report to the US Congress, published Friday stated, “Inflation in the US is well above target and the labor market remains very tight,” as per Reuters. The report also mentioned, per Reuters, “Outlook for funds rate is subject to considerable uncertainty.”
Further, Richmond Fed President Thomas Barkin said, “Raising rates further could create the risk of a more significant slowdown in the economy.” The policymaker, however, also added that the Fed can do comfortable more to slow the resilient US economy, which in turn triggered a jump in the 2-year Treasury bond yields to 4.75% and helped the US Dollar to get off the lows.
On the same line, “US economy is still ‘ripping along’,” said Federal Reserve Governor Christopher Waller on Friday while adding that everything seems to be calm in the US banking system, as reported by Reuters.
Looking ahead, a light calendar and Juneteenth holiday can restrict immediate NZD/USD moves but the buyers may remain hopeful amid firmer sentiment and broad US Dollar weakness. That said, Fed Chairman Powell’s testimony, as well as PMIs for June, will also be important to watch for clear directions.
Technical analysis
NZD/USD seesaws around the 200-day Exponential Moving Average (EMA) level of around 0.6230 as bulls seek a sustained break of the key EMA to register further advances.


© 2000-2026. Уcі права захищені.
Cайт знаходитьcя під керуванням TeleTrade DJ. LLC 2351 LLC 2022 (Euro House, Richmond Hill Road, Kingstown, VC0100, St. Vincent and the Grenadines).
Інформація, предcтавлена на cайті, не є підcтавою для прийняття інвеcтиційних рішень і надана виключно для ознайомлення.
Компанія не обcлуговує та не надає cервіc клієнтам, які є резидентами US, Канади, Ірану, Ємену та країн, внеcених до чорного cпиcку FATF.
Проведення торгових операцій на фінанcових ринках з маржинальними фінанcовими інcтрументами відкриває широкі можливоcті і дає змогу інвеcторам, готовим піти на ризик, отримувати виcокий прибуток. Але водночаc воно неcе потенційно виcокий рівень ризику отримання збитків. Тому перед початком торгівлі cлід відповідально підійти до вирішення питання щодо вибору інвеcтиційної cтратегії з урахуванням наявних реcурcів.
Викориcтання інформації: при повному або чаcтковому викориcтанні матеріалів cайту поcилання на TeleTrade як джерело інформації є обов'язковим. Викориcтання матеріалів в інтернеті має cупроводжуватиcь гіперпоcиланням на cайт teletrade.org. Автоматичний імпорт матеріалів та інформації із cайту заборонено.
З уcіх питань звертайтеcь за адреcою pr@teletrade.global.
переклади