- Аналітика
- Новини та інструменти
- Новини ринків
Новини ринків
- The Office for National Statistics will publish the UK CPI data for February on Wednesday.
- United Kingdom’s headline and core annual inflation are likely to fall; monthly CPI is set to jump.
- The UK CPI report could significantly impact the BoE’s interest rate outlook and the Pound Sterling.
The United Kingdom’s (UK) Office for National Statistics (ONS) will publish the Consumer Price Index (CPI) data at 07:00 GMT on Wednesday, just a day before the Bank of England (BoE) monetary policy announcement.
Pound Sterling traders will eagerly look forward to the UK CPI inflation report for fresh cues on whether the BoE will signal its first interest rate cut or retain its “higher rate for longer” stance.
What to expect from the next UK inflation report?
The headline annual UK Consumer Price Index is seen rising 3.6% in February, slowing from a 4.0% increase registered in January. The reading would be at its lowest since September 2021 but still much above the BoE’s 2.0% target.
The Core CPI inflation is set to fall to 4.6% YoY in February after reporting a 5.1% growth in January. Meanwhile, the British monthly CPI is likely to rebound 0.7%, following January’s 0.6% drop.
Despite the UK economy tipping into a technical recession at the end of 2023, the BoE’s brighter economic outlook for this year has dissuaded it from leaning towards a dovish pivot.
At its February policy meeting, the BoE maintained the key rate at 5.25%. Governor Andrew Bailey remained non-committal on what will be the Bank’s next interest rate moves in the upcoming meetings. However, he said that "we need to keep policy sufficiently restrictive for sufficiently long, nothing more, nothing less,” depending on the incoming data.
The policy statement said that the “BoE sees upward risks to CPI from geopolitical factors including the Red Sea, while domestic price and wage risks now "more evenly balanced."
While testifying before the UK Treasury Select Committee (TSC) last month, Bailey explained that “we are looking beyond the temporary period when we expect CPI to return to target this year," adding that he is looking for more sustained progress on the reduction of more persistent elements of inflation.
Therefore, the details of the CPI report, including food prices and the sticky services inflation, will grab markets’ attention in the run-up to the BoE policy announcements.
Previewing the UK inflation data, analysts at TD Securities (TDS) noted that “inflation likely took a decent step down across the board in Feb, largely on the back of base effects. Restaurant prices are the main risk to this print due to uncertainty around the scope for a rebound after sales weighed on prices in Jan.”
“Services remain the key focus for the MPC, and here we look for the y/y rate to come down to 6.0% y/y (BoE: 6.1%),” the TDS analysts said.
When will the UK Consumer Price Index report be released and how could it affect GBP/USD?
The UK CPI data is due for release on Wednesday at 07:00 GMT. The Pound Sterling has been losing ground against the US Dollar in the lead-up to the United Kingdom’s inflation showdown. The US Dollar stays supported at one-week highs ahead of Wednesday’s US Federal Reserve (Fed) monetary policy decision.
A higher-than-expected headline and core inflation data could reverberate the BoE’s “higher rates for longer” view, providing a fresh lift to the Pound Sterling. In such a case, GBP/USD could stage an upswing toward the 1.2800 level. On the other hand, GBP/USD could resume its correction toward 1.2600 if the UK CPI data show a notable slowdown in inflationary pressures, as expectations of a second-quarter BoE rate cut could be back on the table.
Markets are pricing in the first BoE rate cut this year at the August 1 policy meeting.
Dhwani Mehta, Asian Session Lead Analyst at FXStreet, offers a brief technical outlook for the major and explains: “The GBP/USD pair is on a corrective decline from seven-month highs of 1.2893. The 14-day Relative Strength Index (RSI) has fallen below the midline, suggesting that the downside risks remain intact for the Pound Sterling.”
Dhwani adds: “A decisive break below the horizontal 50-day Simple Moving Average (SMA) at 1.2687 is needed to challenge the upward-pointing 100-day SMA of 1.2626. Further south, the 200-day SMA at 1.2595 could be retested. Alternatively, acceptance above the 1.2800 level on a daily closing basis is critical for GBP/USD to initiate a meaningful uptrend toward the multi-month high of 1.2893,” Dhwani adds.
Economic Indicator
United Kingdom Consumer Price Index (YoY)
The United Kingdom (UK) Consumer Price Index (CPI), released by the Office for National Statistics on a monthly basis, is a measure of consumer price inflation – the rate at which the prices of goods and services bought by households rise or fall – produced to international standards. It is the inflation measure used in the government’s target. The YoY reading compares prices in the reference month to a year earlier. Generally, a high reading is seen as bullish for the Pound Sterling (GBP), while a low reading is seen as bearish.
Read more.Why it matters to traders
The Bank of England is tasked with keeping inflation, as measured by the headline Consumer Price Index (CPI) at around 2%, giving the monthly release its importance. An increase in inflation implies a quicker and sooner increase of interest rates or the reduction of bond-buying by the BOE, which means squeezing the supply of pounds. Conversely, a drop in the pace of price rises indicates looser monetary policy. A higher-than-expected result tends to be GBP bullish.
Inflation FAQs
Inflation measures the rise in the price of a representative basket of goods and services. Headline inflation is usually expressed as a percentage change on a month-on-month (MoM) and year-on-year (YoY) basis. Core inflation excludes more volatile elements such as food and fuel which can fluctuate because of geopolitical and seasonal factors. Core inflation is the figure economists focus on and is the level targeted by central banks, which are mandated to keep inflation at a manageable level, usually around 2%.
The Consumer Price Index (CPI) measures the change in prices of a basket of goods and services over a period of time. It is usually expressed as a percentage change on a month-on-month (MoM) and year-on-year (YoY) basis. Core CPI is the figure targeted by central banks as it excludes volatile food and fuel inputs. When Core CPI rises above 2% it usually results in higher interest rates and vice versa when it falls below 2%. Since higher interest rates are positive for a currency, higher inflation usually results in a stronger currency. The opposite is true when inflation falls.
Although it may seem counter-intuitive, high inflation in a country pushes up the value of its currency and vice versa for lower inflation. This is because the central bank will normally raise interest rates to combat the higher inflation, which attract more global capital inflows from investors looking for a lucrative place to park their money.
Formerly, Gold was the asset investors turned to in times of high inflation because it preserved its value, and whilst investors will often still buy Gold for its safe-haven properties in times of extreme market turmoil, this is not the case most of the time. This is because when inflation is high, central banks will put up interest rates to combat it. Higher interest rates are negative for Gold because they increase the opportunity-cost of holding Gold vis-a-vis an interest-bearing asset or placing the money in a cash deposit account. On the flipside, lower inflation tends to be positive for Gold as it brings interest rates down, making the bright metal a more viable investment alternative.
- EUR/USD trades flat around 1.0865 near multi-week lows amid the consolidation of the USD.
- The FOMC is expected to hold the interest rate and maintain macroeconomic projections at its March meeting on Wednesday.
- The Eurozone ZEW Economic Sentiment came in at 33.5 in March vs. 25.0 prior, better than expected.
- The FOMC monetary policy meeting will be in the spotlight on Wednesday.
The EUR/USD pair trades on a flat note above the mid-1.0800s during the early Asian session on Wednesday. Meanwhile, the USD Index (DXY) consolidates its gains near three-week highs of 103.80. Traders await the Federal Open Market Committee's (FOMC) monetary policy meeting later in the day and will take more cues from Chairman Jerome Powell’s press conference and economic projections after the meeting. At press time, the major pair is trading at 1.0865, unchanged for the day.
The Federal Open Market Committee (FOMC) is widely expected to keep its key federal funds interest rate unchanged in a range of 5.25% to 5.5%.and maintain macroeconomic projections at its March meeting on Wednesday. Analysts anticipate FOMC’s Powell to reiterate that the central bank wants to see evidence of inflation data in its battle against inflation before cutting rates. Financial markets expect a 25 basis points (bps) rate cut in July and total cuts of 100 bps this year. The US Dollar (USD) has attracted some buyers in the last sessions as the market’s expectations for rate cuts have been dialed back.
Across the pond, the ZEW Economic Sentiment for the Eurozone rose to 33.5 in March from the previous reading of 25.0, above the market consensus of 25.4. Meanwhile, the Economic expectations for Germany improved to 31.7 versus 19.9 prior. The reports suggested a more optimistic outlook for the Eurozone and Germany. However, the survey failed to boost the Euro (EUR) as traders prefer to wait on the sidelines ahead of the FOMC interest rate decision.
The European Central Bank (ECB) President Christine Lagarde is set to speak on Wednesday, and the European Commission will release its flash Consumer Confidence report for March. The FOMC monetary policy meeting will take center stage later on Wednesday. After the meeting, the attention will turn to Powell’s press conference, which might provide information on the central bank's outlook.
- AUD/USD steady post-RBA's dovish stance and static rates.
- US housing data boosts optimism pre-FOMC decision.
- Fed policy update awaited, with eyes on interest rate forecasts.
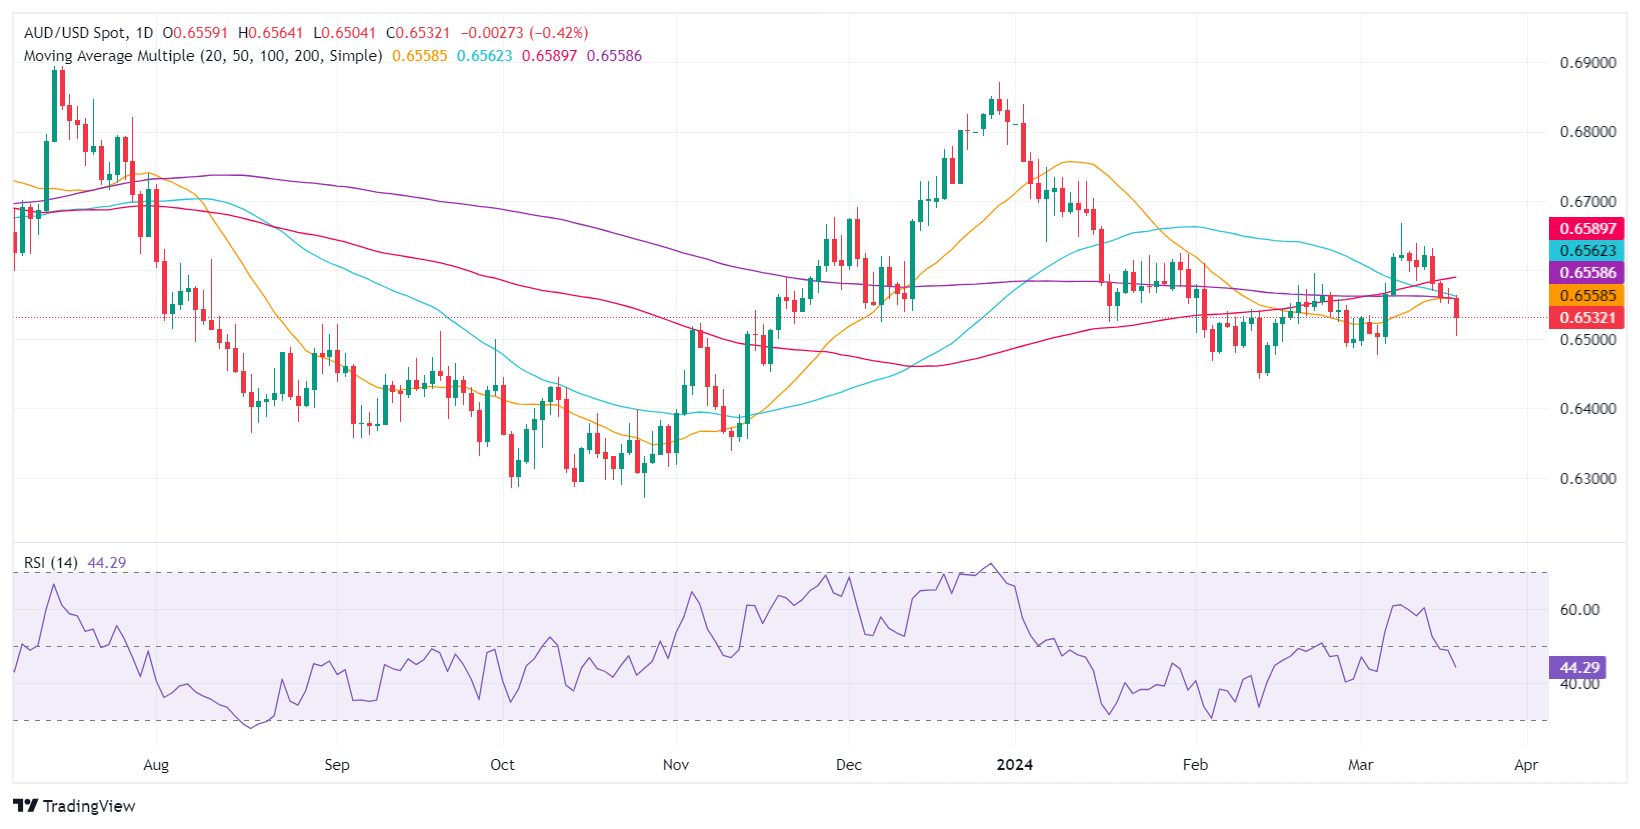
The Australian Dollar begins Wednesday’s Asian session virtually unchanged against the US Dollar, following Tuesday’s loss of 0.41%, after the Reserve Bank of Australia (RBA) decision. The RBA kept rates unchanged, tilting more dovish than expected. That said, the AUD/USD trades at 0.6532, almost flat.
Aussie Dollar stays firm following the central bank decision
On Tuesday, the Bank of Japan (BoJ) and the RBA announced their March monetary policy decisions. The BoJ hiked rates by ten basis points, the first in 17 years, ending the era of negative interest rates. In addition, it ended the Yield Curve Control (YCC) and its ETF buying program. The RBA softened its tone while keeping the door open for additional tightening if needed.
In the meantime, US equities ended the session in the green as the Federal Open Market Committee (FOMC) decisions loom. Data-wise, the US economic docket revealed housing data. Building Permits increased by 1.9% from 1.489 M to 1.518M, improving sharply compared to January’s data. Housing Starts rose 10.7% from 1.425M to 1.521 M.
An absent economic docket in Australia keeps AUD/USD traders waiting for the Fed’s decision. ANZ analysts commented that they expect the Fed to make no major changes to the Summary of Economic Projections (SEP). Regarding rate cuts, they noted, “We think it will cut in 25bp increments through the second half of the year, reducing the nominal Fed funds corridor by 100bp this year.”
AUD/USD Price Analysis: Technical outlook
The AUD/USD fell below the 200-day moving average (DMA) of 0.6556, opening the door for further losses. This comes after the RBA decision, and with speculations for a Fed “hawkish” tilt, that would exacerbate a dip to 0.6500. Further losses are seen below March 5 swing low of 0.6477, and the February 13 low of 0.6442. On the upside, the 200-DMA would be the first resistance, followed by the 50-DMA at 0.6558 and the 100-DMA at 0.6586.
- The daily chart of NZD/USD presents a bearish outlook with the RSI and MACD deep in the red zone.
- On the hourly chart, the selling pressure is easing.
- The NZD/USD is operating below the main SMAs, indicating a persisting bearish bias.
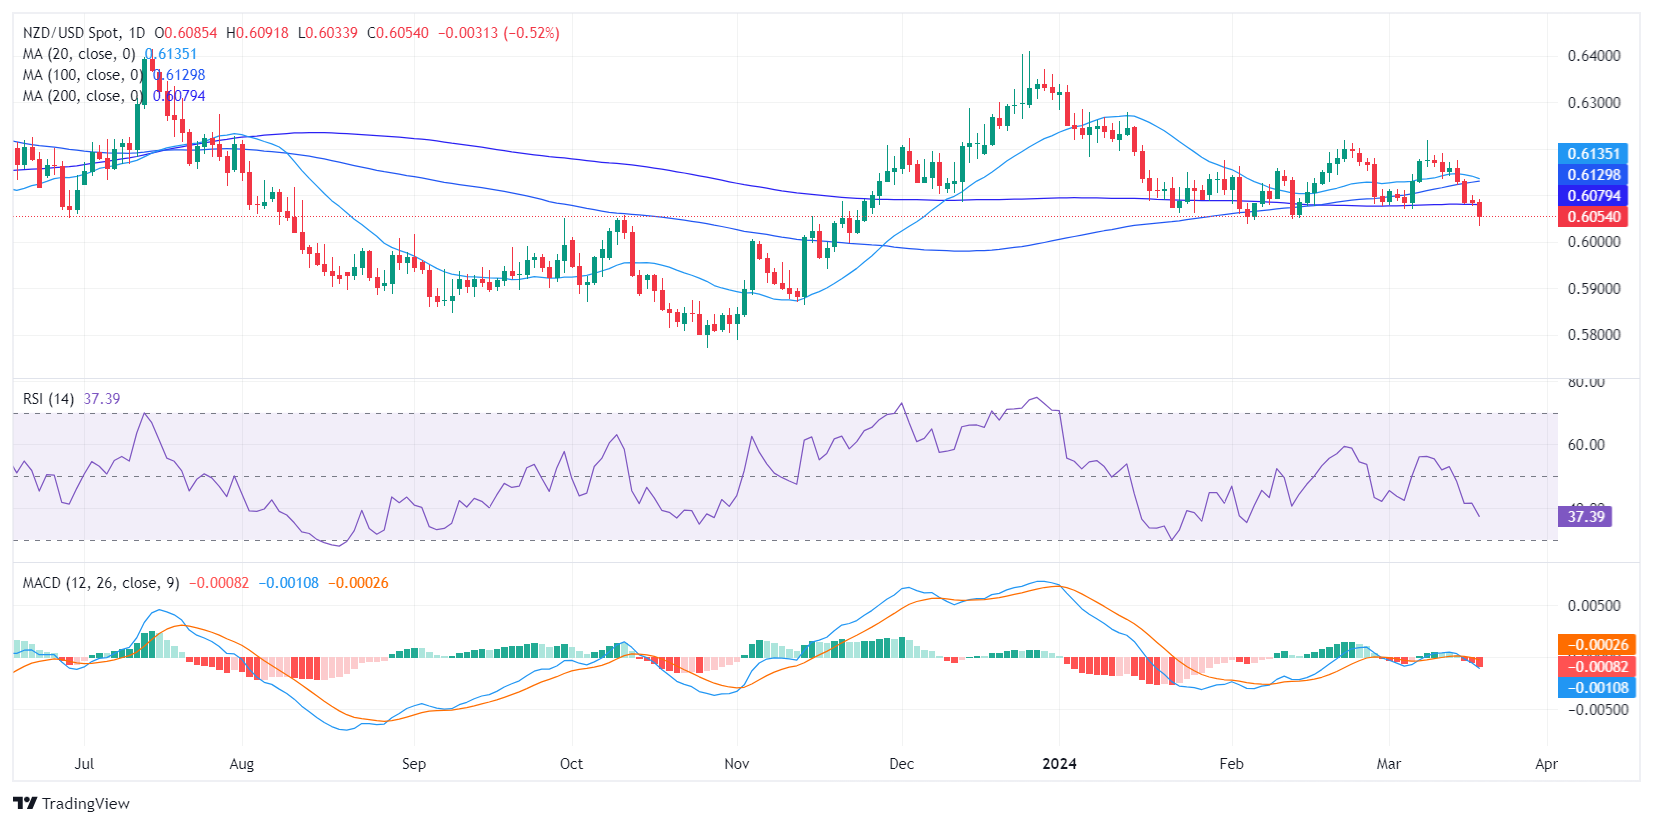
The NZD/USD pair registered a decline of 0.54%, falling towards 0.6050 in Tuesday's session. Earlier in the session, indicators reached oversold conditions on the hourly chart, and ahead of the Asian session, the pair seems to be consolidating
On the daily chart, the pair is facing intense selling pressure, as indicated by the declining Relative Strength Index (RSI). The latest reading stands at 36, situated in the negative territory and nearing the oversold threshold, suggesting that sellers currently dominate the market. The Moving Average Convergence Divergence (MACD) also confirms this bearish sentiment, with its rising red bars indicating mounting negative momentum.
NZD/USD daily chart
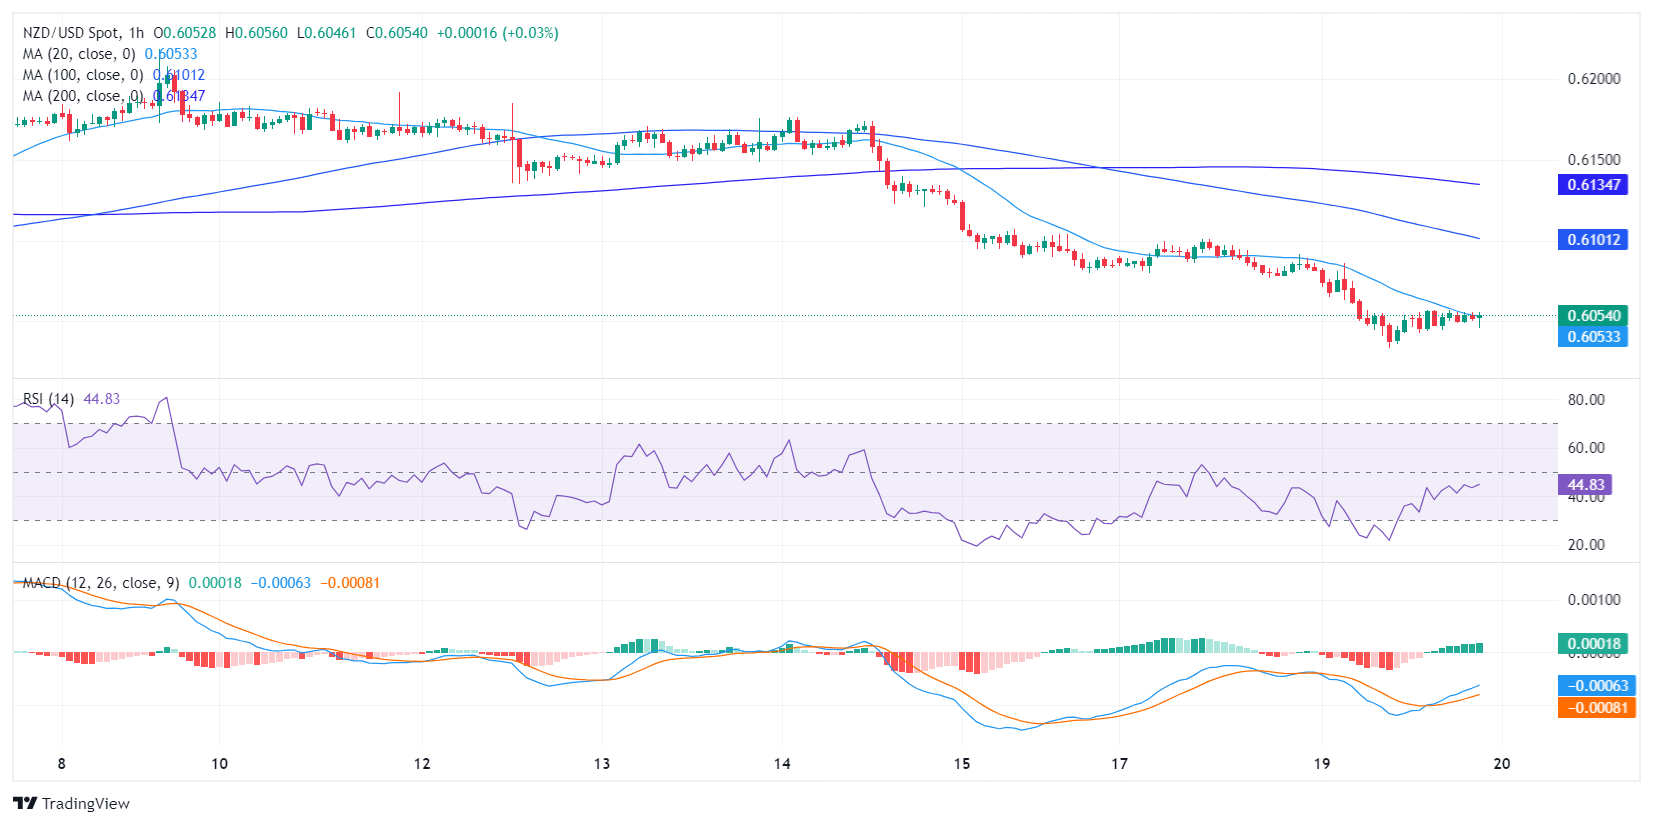
On the hourly chart, however, the picture differs. The RSI readings appear to fluctuate within the negative territory, with the last reading measured at 42, slightly higher than the reading on the daily chart, denoting tempered selling pressure after bottoming at a low of 22 earlier in the session. Here, the MACD shows a declining selling pressure.
NZD/USD hourly chart
On a broader scale, the trend is still bearish as the pair continues to trade below its 20, 100, and 200-day Simple Moving Averages (SMAs).
- Gold is subdued amid a robust US Dollar in anticipation of the Fed's monetary policy announcement.
- Traders are waiting for the Federal Reserve's statement and economic forecasts.
- Concerns over potential adjustments in the Federal Funds Rate projections keep market sentiment cautious.
Gold prices fell late in the North American session on Tuesday amid a strong US Dollar but despite falling US Treasury bond yields. Market participants await the US Federal Reserve’s (Fed) monetary policy announcement on Wednesday, followed by a press conference by Fed Chair Jerome Powell. Meanwhile, XAU/USD prices are set to remain near $2,150 as traders remain uncommitted to posting fresh bets in favor or against the yellow metal.
The non-yielding metal remains subdued as traders await the Federal Open Market Committee (FOMC) decision. In addition to delivering its monetary policy statement, policymakers are expected to update their projections about the United States economy. Growing concerns that the Fed will reduce its estimates for the Federal Funds Rate (FFR) keep traders on edge.
Daily digest market movers: Gold holds to modest gains as US yields drop
- Tuesday’s US economic docket featured the release of Building Permits in February, which rose by 1.9% MoM from 1.489 million to 1.496 million. Meanwhile, Housing Starts for the same period saw a significant increase of 10.7%, surpassing the expected 8.2%.
- The US 10-year Treasury bond yield has fallen two-and-a-half basis points to 4.296%.
- The latest US economic data witnessed mixed readings in business activity, making it challenging to predict the pace of economic deceleration in the US. The labor market has shown signs of cooling, though the economy added more people to the workforce than expected while fewer people applied for unemployment benefits.
- Recent inflation data in the US showed that inflation on the consumer and producer side surprised to the upside, suggesting that inflation is stickier than expected, failing to break below the 3% threshold.
- Given the backdrop, Fed Chair Jerome Powell’s testimony at the US Congress earlier this month, suggesting the Fed would begin to cut borrowing costs, were justified. However, last week’s inflation figures and Retail Sales data triggered a repricing of Fed rate cut bets, aligning with the US central bank's view of 75 basis points of easing toward the end of 2024.
- According to the CME FedWatch Tool, expectations for a June rate cut stand at 58%, down from 72% a week ago.
Technical analysis: Gold buyers take a breather below $2,170
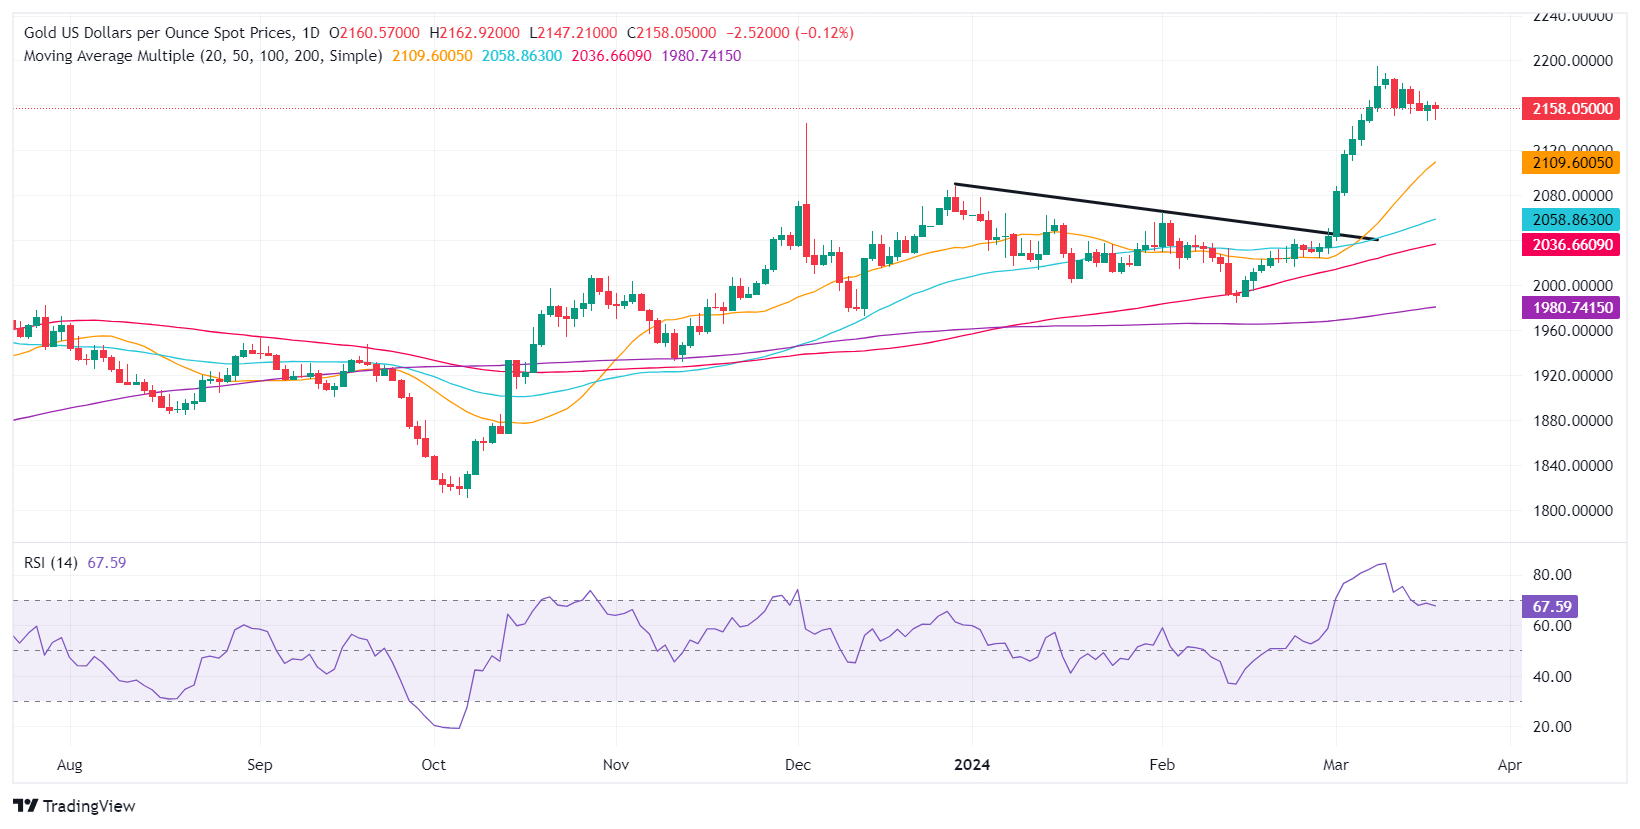
XAU/USD price has stabilized ahead of the FOMC decision, sitting above the December 4 high of $2,146.79, the first support level. A dovish tilt by the Fed could pave the way for a recovery toward the March 8 high of $2,195.15, followed by the $2,200 mark.
On the other hand, if Gold spot price tumbles below $2,150, look for a breach below December’s 3 high, exposing the March 6 low of $2,123.80, followed by $2,100.
Gold FAQs
Gold has played a key role in human’s history as it has been widely used as a store of value and medium of exchange. Currently, apart from its shine and usage for jewelry, the precious metal is widely seen as a safe-haven asset, meaning that it is considered a good investment during turbulent times. Gold is also widely seen as a hedge against inflation and against depreciating currencies as it doesn’t rely on any specific issuer or government.
Central banks are the biggest Gold holders. In their aim to support their currencies in turbulent times, central banks tend to diversify their reserves and buy Gold to improve the perceived strength of the economy and the currency. High Gold reserves can be a source of trust for a country’s solvency. Central banks added 1,136 tonnes of Gold worth around $70 billion to their reserves in 2022, according to data from the World Gold Council. This is the highest yearly purchase since records began. Central banks from emerging economies such as China, India and Turkey are quickly increasing their Gold reserves.
Gold has an inverse correlation with the US Dollar and US Treasuries, which are both major reserve and safe-haven assets. When the Dollar depreciates, Gold tends to rise, enabling investors and central banks to diversify their assets in turbulent times. Gold is also inversely correlated with risk assets. A rally in the stock market tends to weaken Gold price, while sell-offs in riskier markets tend to favor the precious metal.
The price can move due to a wide range of factors. Geopolitical instability or fears of a deep recession can quickly make Gold price escalate due to its safe-haven status. As a yield-less asset, Gold tends to rise with lower interest rates, while higher cost of money usually weighs down on the yellow metal. Still, most moves depend on how the US Dollar (USD) behaves as the asset is priced in dollars (XAU/USD). A strong Dollar tends to keep the price of Gold controlled, whereas a weaker Dollar is likely to push Gold prices up.
- The positive outlook on the daily chart improved but bulls aren’t yet in command.
- the RSI was seen above 70 in recent hours, which may lead to a consolidation.
- To prevent any potential losses, the bulls must defend the key SMAs.
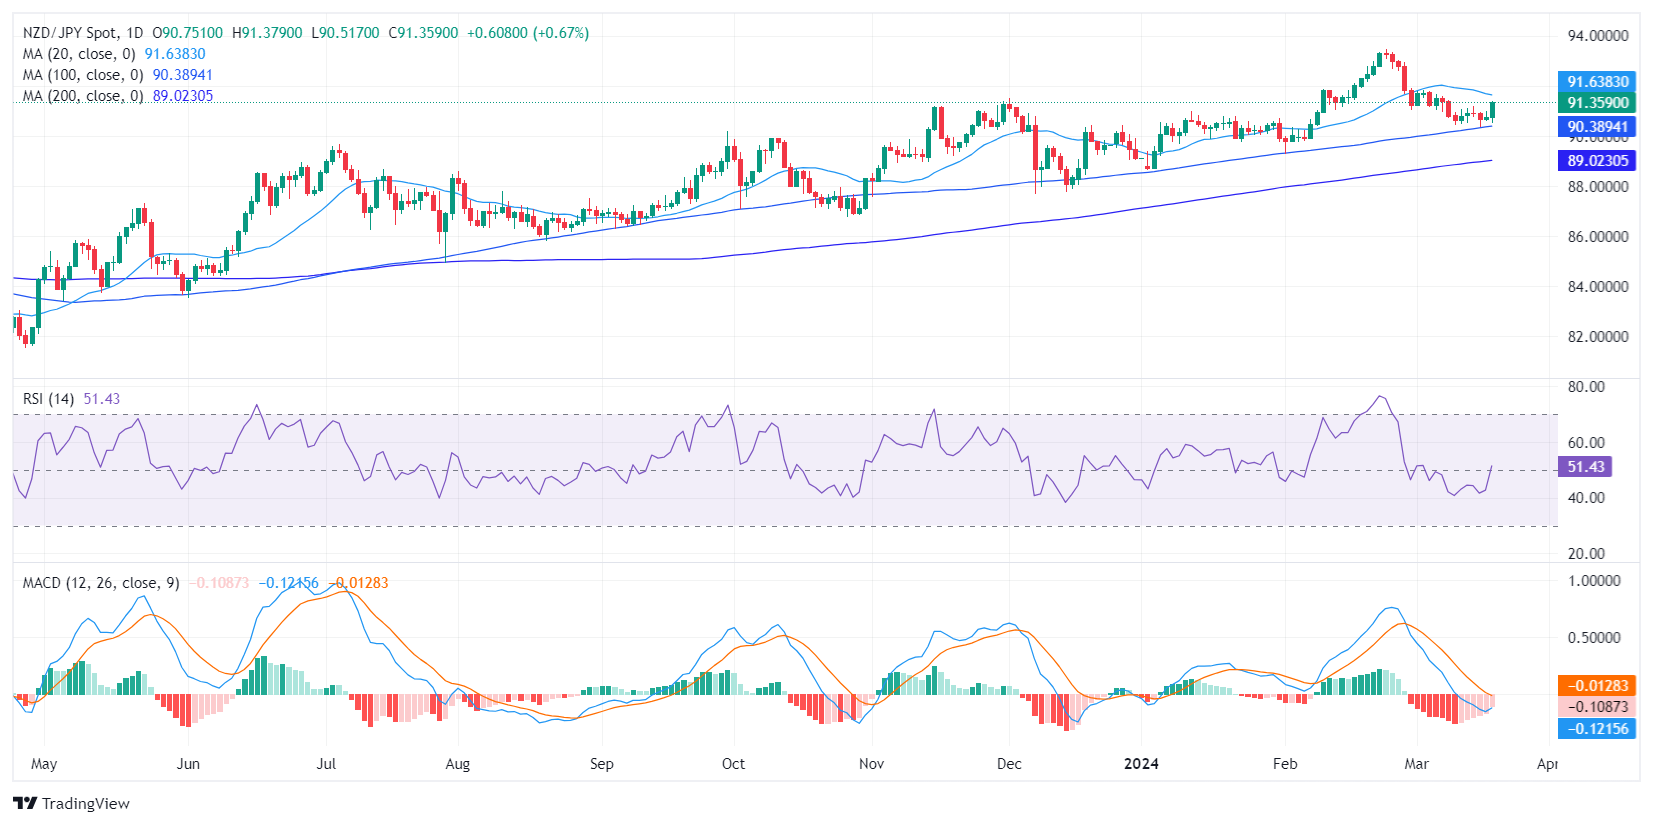
In Tuesday's session, NZD/JPY is trading at 91.36, registering an uptick of 0.74%. Despite some signals of a consolidation incoming, the market sees dominance by buyers, which leads to a broader bullish outlook. Ahead of the Asian session, the pair may correct overbought conditions on the hourly chart and see some red.
On the daily chart, the NZD/JPY pair posts positive momentum following a shift from the negative territory. The Relative Strength Index (RSI) now sits in the positive territory at 52 while the Moving Average Convergence Divergence (MACD) red bars recede, signaling a potential decrease in negative momentum.
NZD/JPY daily chart
Transitioning to the hourly chart, the NZD/JPY pair displays a stronger positive trend. The RSI enters the overbought territory due to consistent readings above 70. Sharp green bars in the MACD histogram signify strong positive momentum over the past few hours, suggesting buyers dominate the market for now. An RSI above 70 suggests an overextended buying momentum which typically leads to a downward consolidation
NZD/JPY hourly chart
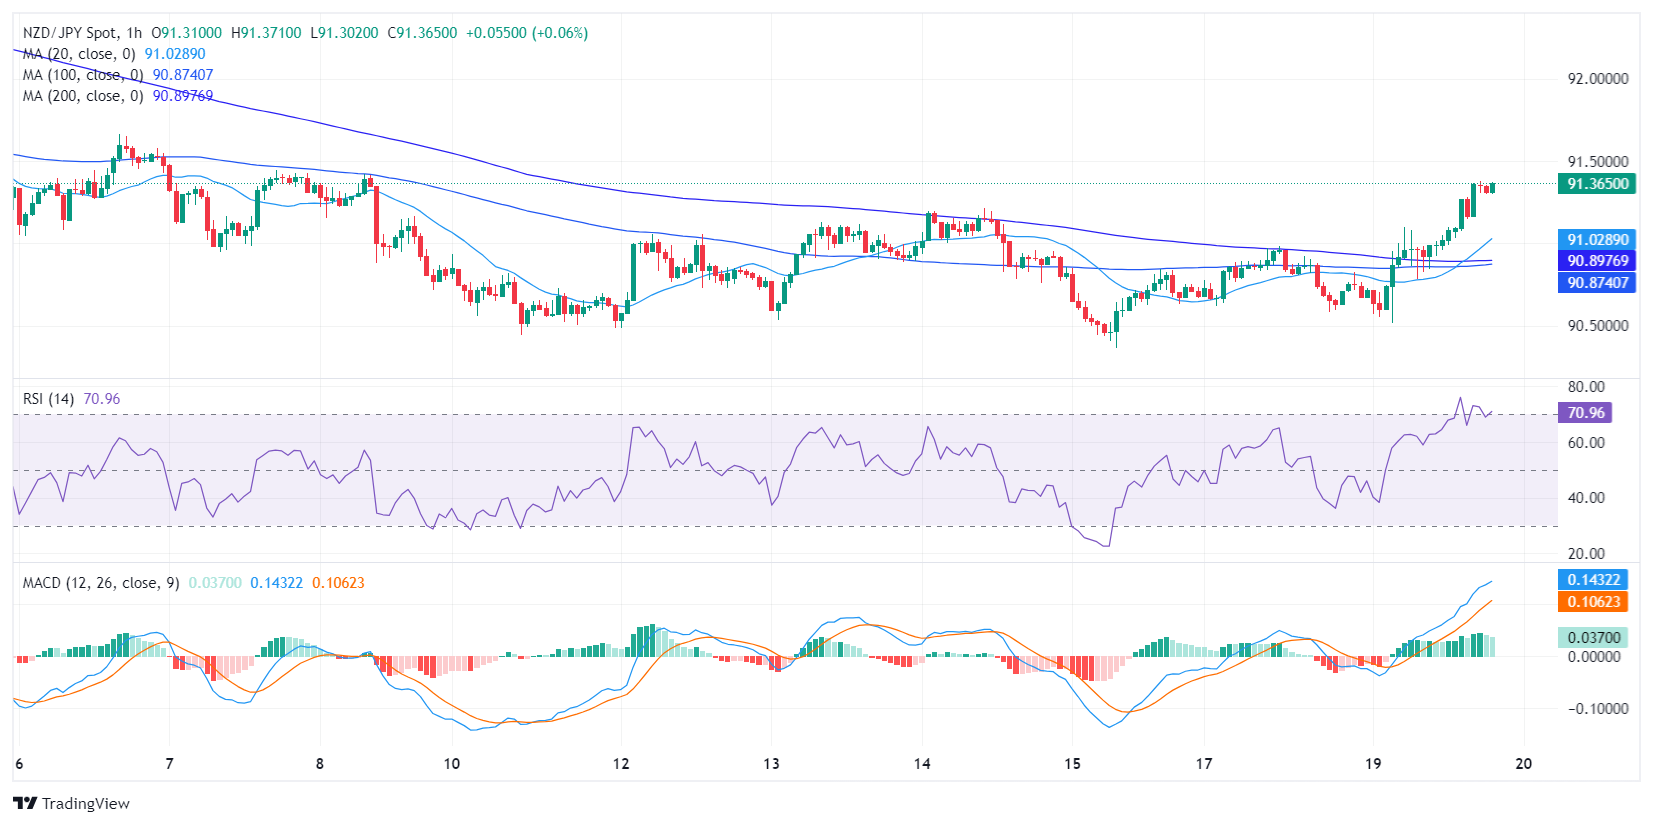
In conclusion, both daily and hourly analyses point to a bullish outlook for the NZD/JPY pair. Traders should monitor the MACD for continued red bar reduction or a shift to green bars, and the RSI to see if it remains within or moves away from the overbought territory in the hourly chart. These data points would suggest a potential price reversal or continuation, respectively.
Regarding a Simple Moving Average (SMA) analysis, despite the bears gaining ground and pushing the pair below the 20-day Simple Moving Average (SMA), the pair remains above the 100 and 200-day SMAs. This pattern suggests that the bulls maintain control of the overall trend.
The Greenback managed to maintain its multi-session constructive bias well and sound and propel the USD Index (DXY) back above 104.00, albeit ephemerally. Sustaining the rally in the Dollar emerged the sharp depreciation of the Japanese yen in the wake of the well-telegraphed rate hike by the BoJ, while it will be all about the Federal Reserve on March 20.
Here is what you need to know on Wednesday, March 20:
Further gains saw the USD Index (DXY) advance to three-week highs past the 104.00 hurdle despite the corrective decline in US yields. The Fed interest rate decision, along with the FOMC Economic Projections and Chair Powell’s press conference, will take centre stage across the pond on March 20.
EUR/USD added to Monday’s pessimism and dropped to multi-week lows near the 1.0830 region, putting the critical 200-day SMA to the test at the same time. On March 20, the ECB’s C. Lagarde will speak, and the European Commission will release its flash Consumer Confidence gauge.
GBP/USD managed to reverse the earlier pullback to the 1.2670 zone and reclaim the area beyond 1.2700 the figure towards the end of the NA session. The UK docket will see the Inflation Rate on March 20.
USD/JPY climbed markedly and traded just pips away from the key 151.00 mark, or 2024 highs, as the selling pressure around the yen picked up strongly following the BoJ rate hike.
AUD/USD extended its leg lower for the fourth session in a row and approached the key support at the 0.6500 neighbourhood in response to the upside bias in the Greenback and the dovish hold from the RBA. On March 20, the RBA’s Consumer Inflation Expectations are due.
Prices of WTI advanced past the $83.00 mark per barrel, or four-month highs, on the back of geopolitics and prospects of stronger demand.
Prices of Gold faded Monday’s small gains and traded with humble losses around the $2,150 zone per troy ounce amidst further advance in the Dollar and lower US yields. Silver prices followed suit and dropped for the second session in a row following Friday’s tops near the $25.50 region per ounce.
- USD/CAD slips to 1.3565 following Canadian CPI report showing inflation cooling more than expected.
- Disinflationary trend boosts speculation of an upcoming Bank of Canada rate cut, with June odds at 73%.
- US housing data indicates market resilience, adding a positive backdrop to the currency dynamics.
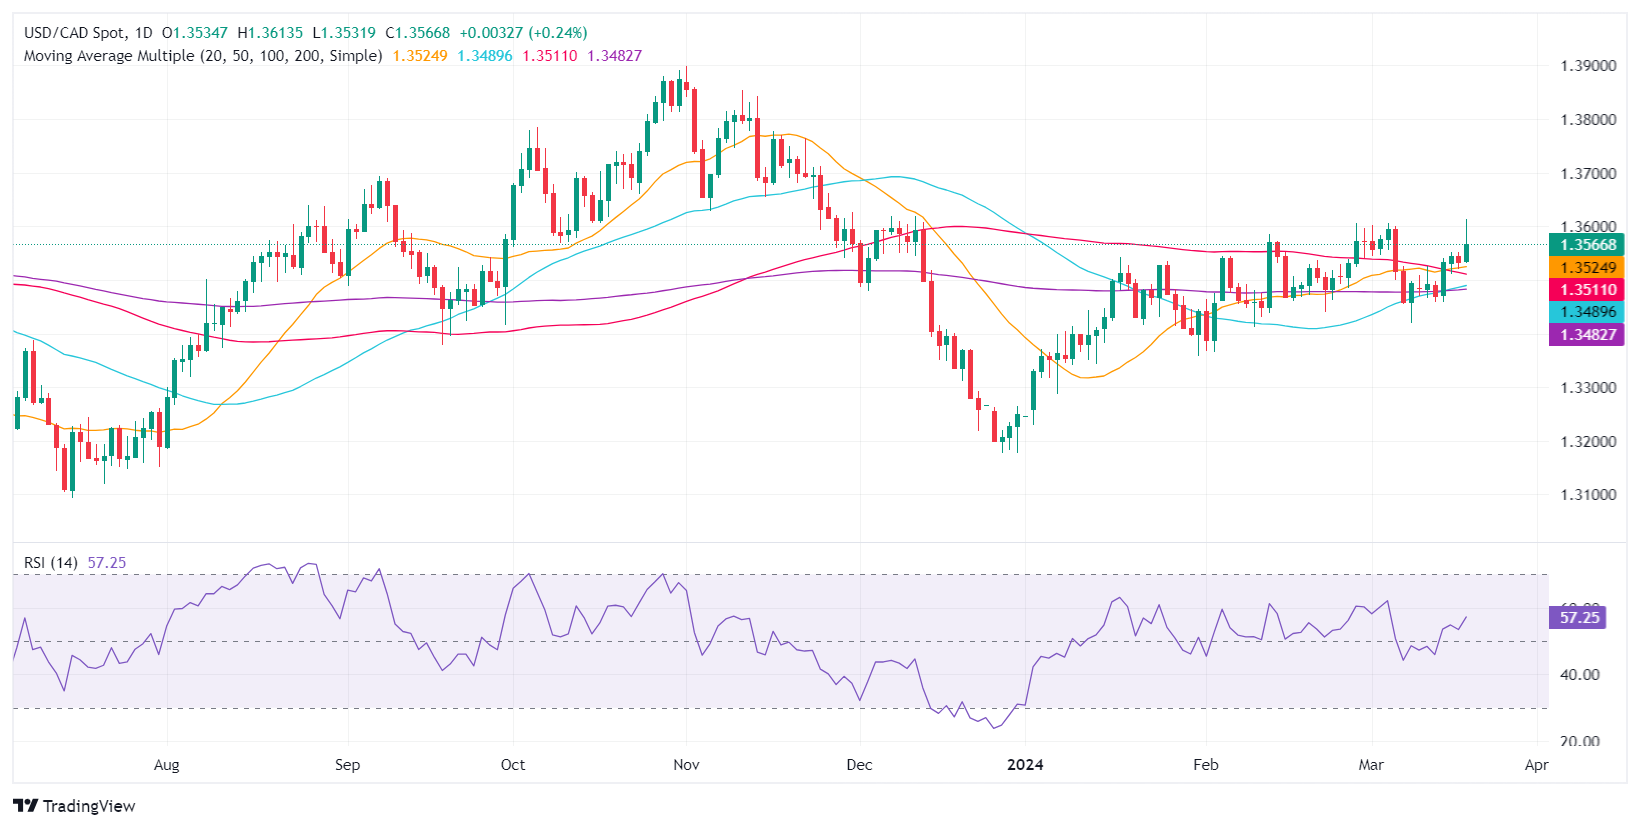
The USD/CAD climbed during the North American session, though it slipped below the 1.3600 figure after data from Canada suggested the disinflationary process continued. At the time of writing, the pair exchanges hands at 1.3565 after hitting a new year-to-date (YTD) high of 1.3613.
The Loonie on the defensive as market participants eye first BoC cut in June
Canada’s economic docket featured the release of inflation data, which decreased below the 3% threshold on annual figures. On a monthly basis, the Consumer Price Index (CPI) saw a 0.3% rise, below the consensus of 0.6%. The Bank of Canada’s (BoC) preferred measure of inflation, the core CPI, slowed in the 12 months to February, from 2.4% to 2.1%.
The data sent the USD/CAD rallying amid speculations that the BoC might cut rates sooner than expected. In the meantime, money market futures data suggest that the odds for the first rate cut by the BoC in the June meeting lie at 73.0%, according to Capital Edge and Refinitiv data.
The US housing sector shows signs of strengthening according to recent economic data. Building Permits in February rose by 1.9% month-over-month, from 1.489 million to 1.496 million. Meanwhile, Housing Starts for the same period saw a significant increase of 10.7%, surpassing the expected 8.2%.
USD/CAD traders brace for Wednesday’s Federal Open Market Committee (FOMC) decision. Futures data shows that the Fed holding rates are unchanged, though uncertainty lies in the update of their Summary of Economic Projections (SEP). Some analysts suggest Fed policymakers could disregard one rate cut, keeping rates higher for longer.
USD/CAD Price Analysis: Technical outlook
After reaching a new YTD high, the USD/CAD retreated below the 1.3600 mark. If the pair closes below the 1.3550 area, that will form an ‘inverted hammer’ opening the door for further losses, but the 100-day moving average (DMA) at 1.3520, a dynamic support level, could cap the losses. Further downside is seen at 1.3500 and at the confluence of the 200 and 50-DMA at 1.3481/87. On the other hand, if buyers come back and reclaim 1.3600, look for a challenge of the November 24 high at 1.3711.
- The EUR/JPY rallied in Tuesday’s session, seeing more than 1% gains.
- The daily RSI reveals growing buying momentum, deep in positive territory.
- The hourly chart hints at overbought conditions, and the RSI staying above 70 signals the potential for profit-taking sell-offs.
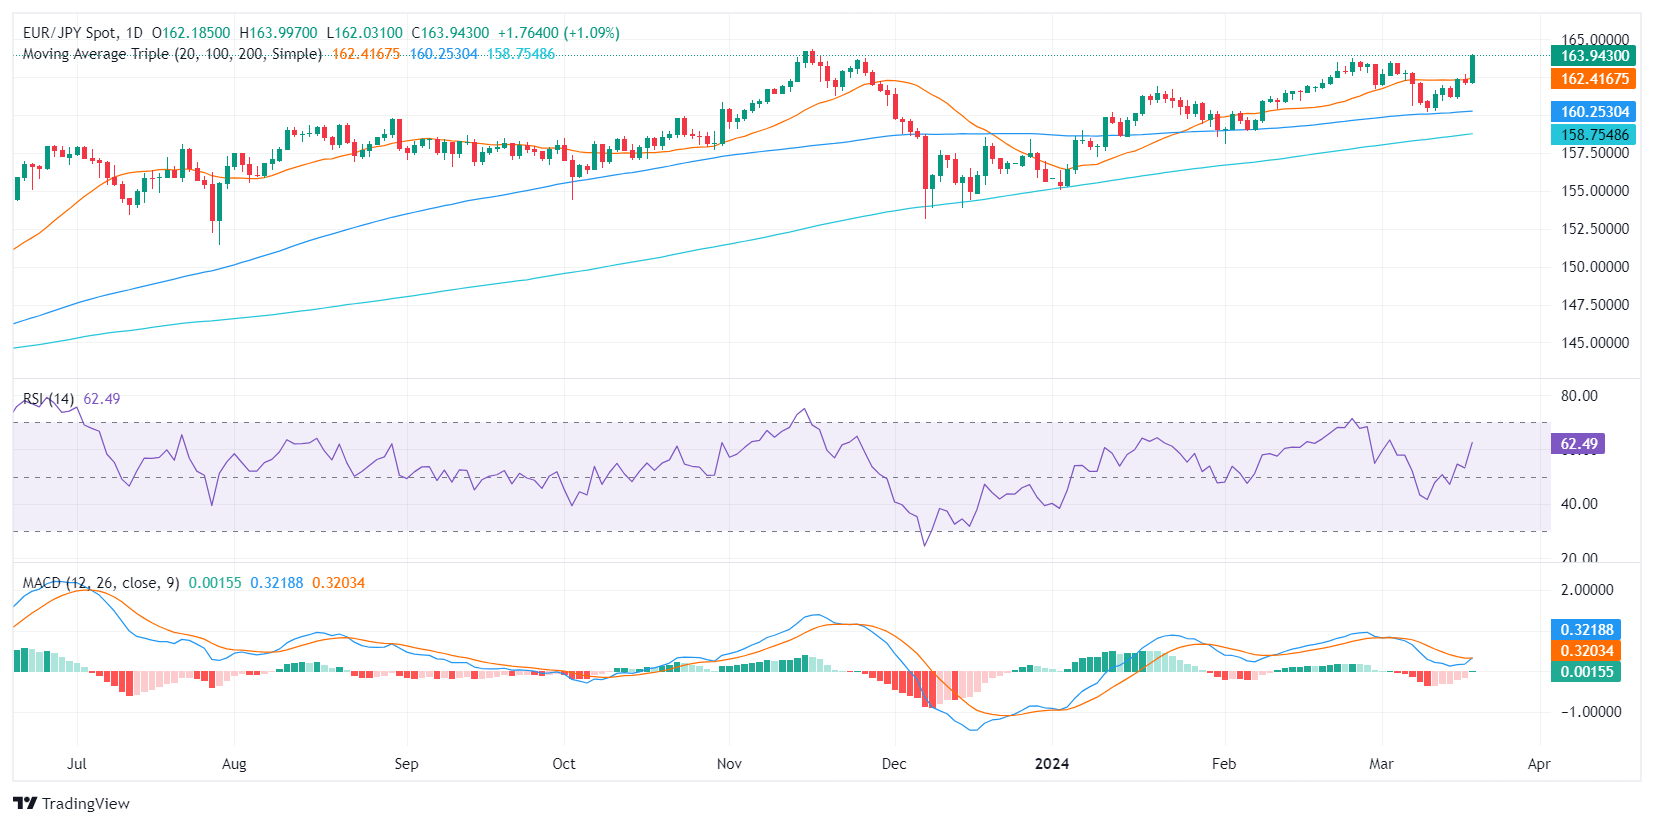
In Tuesday's session, the EUR/JPY pair is trading around the 164.00 region, marking a strong rally of 1.14%. The daily outlook is tilting in favor of the buyers while overbought conditions seen on the hourly chart suggest that consolidation is on the horizon.
On the daily chart, the pair exhibits increasing momentum, as indicated by the latest Relative Strength Index (RSI) values. Moving from negative territory, the recent RSI trajectory consolidated in positive territory, lately peaking at 65 which is approaching overbought status. Currently, buyers dominate the market, leading to the possibility of the pair moving into overbought conditions soon.
EUR/JPY daily chart
When examining the hourly chart, the EUR/JPY pair displays persistent overbought conditions. The RSI values consistently stay strong and above 70 which suggests intense buying pressure. The Moving Average Convergence Divergence (MACD) reinforces this bullish momentum with its rising green bars. However, these overbought conditions might soon provoke a downward correction as overbuying could lead to profit-taking sell-offs.
EUR/JPY hourly chart
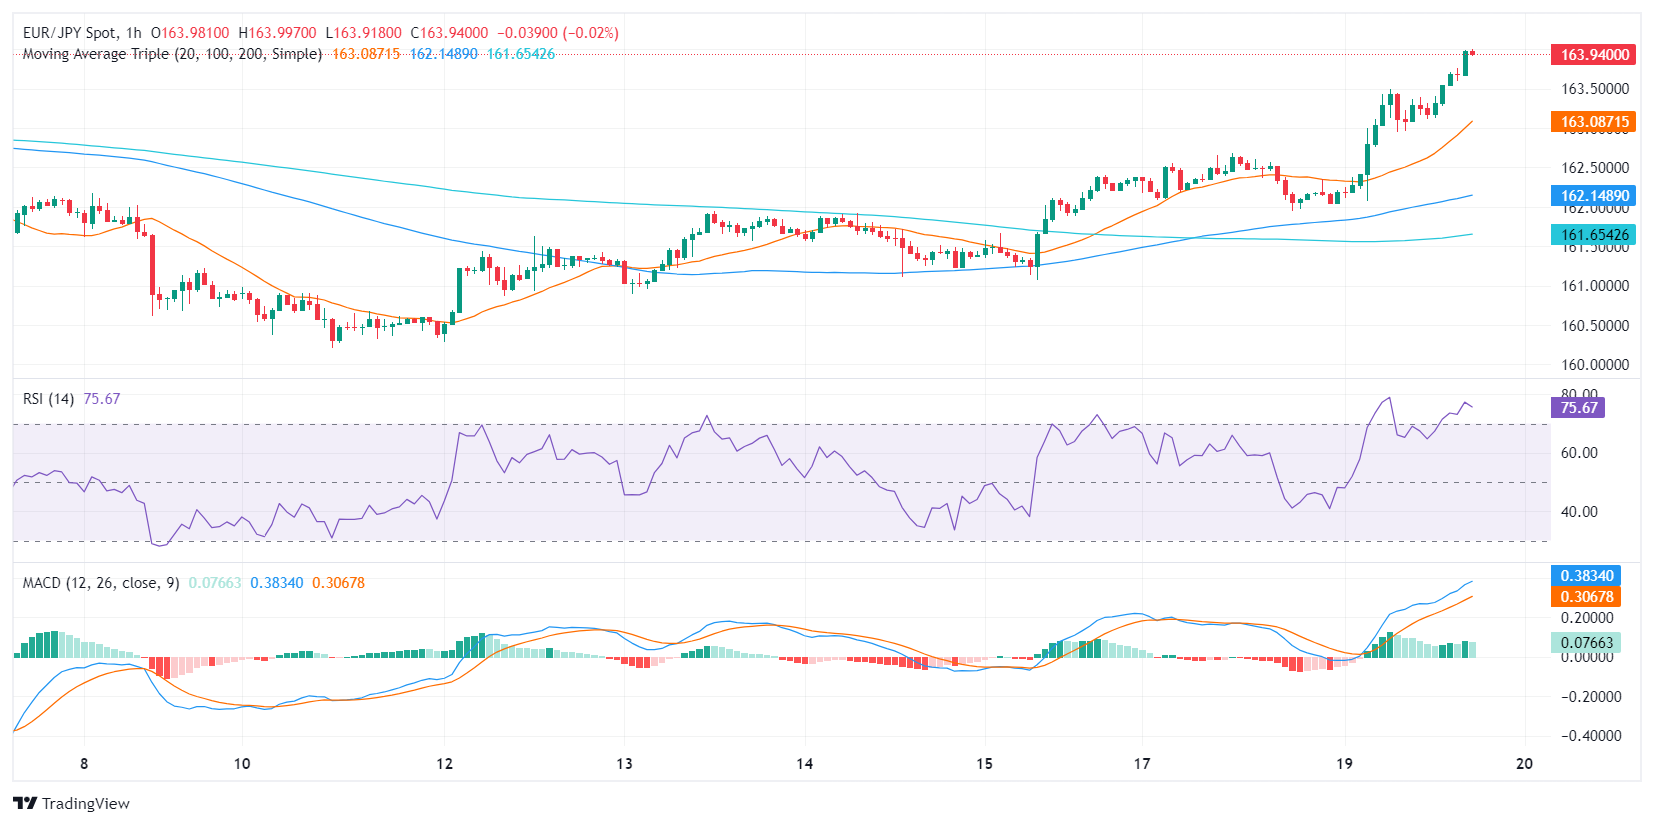
Conclusively, both the daily and hourly charts indicate robust buying momentum. The positive outlook is further corroborated by the pair trading above the main Simple Moving Averages (SMAs) of 20, 100, and 200 days. Any downward correction which keeps the pair above these levels, won’t affect the overall bullish trend.
- Euro losses a step vs US Dollar, eyes on Fed decision.
- US housing gains, Building Permits, and Housing Starts rise.
- Germany’s ZEW and EU surveys beat expectations, uplifting investor sentiment.
The Euro remains on the defensive against the US Dollar as market participants await March’s monetary policy decision by the Federal Open Market Committee (FOMC) on Wednesday. Therefore, the EUR/USD trades at 1.0859 and loses 0.12%.
EUR/USD dips amid central bank movement, positive US housing data
Tuesday’s session witnessed two major central banks' decisions. The Bank of Japan (BOJ) exited from negative interest rates, though delivered a dovish hike, which weakened the Japanese Yen (JPY) against most G8 currencies. The Reserve Bank of Australia (RBA) holds rates unchanged at 4.35%, with the RBA still considering a rate hike if inflation reaccelerates.
Aside from this, Wall Street prints decent gains as global bond yields drop. The US economic docket showed the housing sector is gathering steam. US Building Permits in February grew 1.9%, MoM, up from 1.489 million to 1.496 million. At the same time, Housing Starts for the same period exceeded estimates of 8.2%, increasing by 10.7%.
In the meantime, the US 10-year Treasury bond yield retreats two basis points, down to 4.034%. The US Dollar Index (DXY), a gauge of the buck’s value against a basket of other currencies, gains 0.23%, up at 103.82.
On the Eurozone’s (EU) front, Germany published the March ZEW Survey, which improved the country to 31.7, while the EU one surged to 33.5, beating estimates.
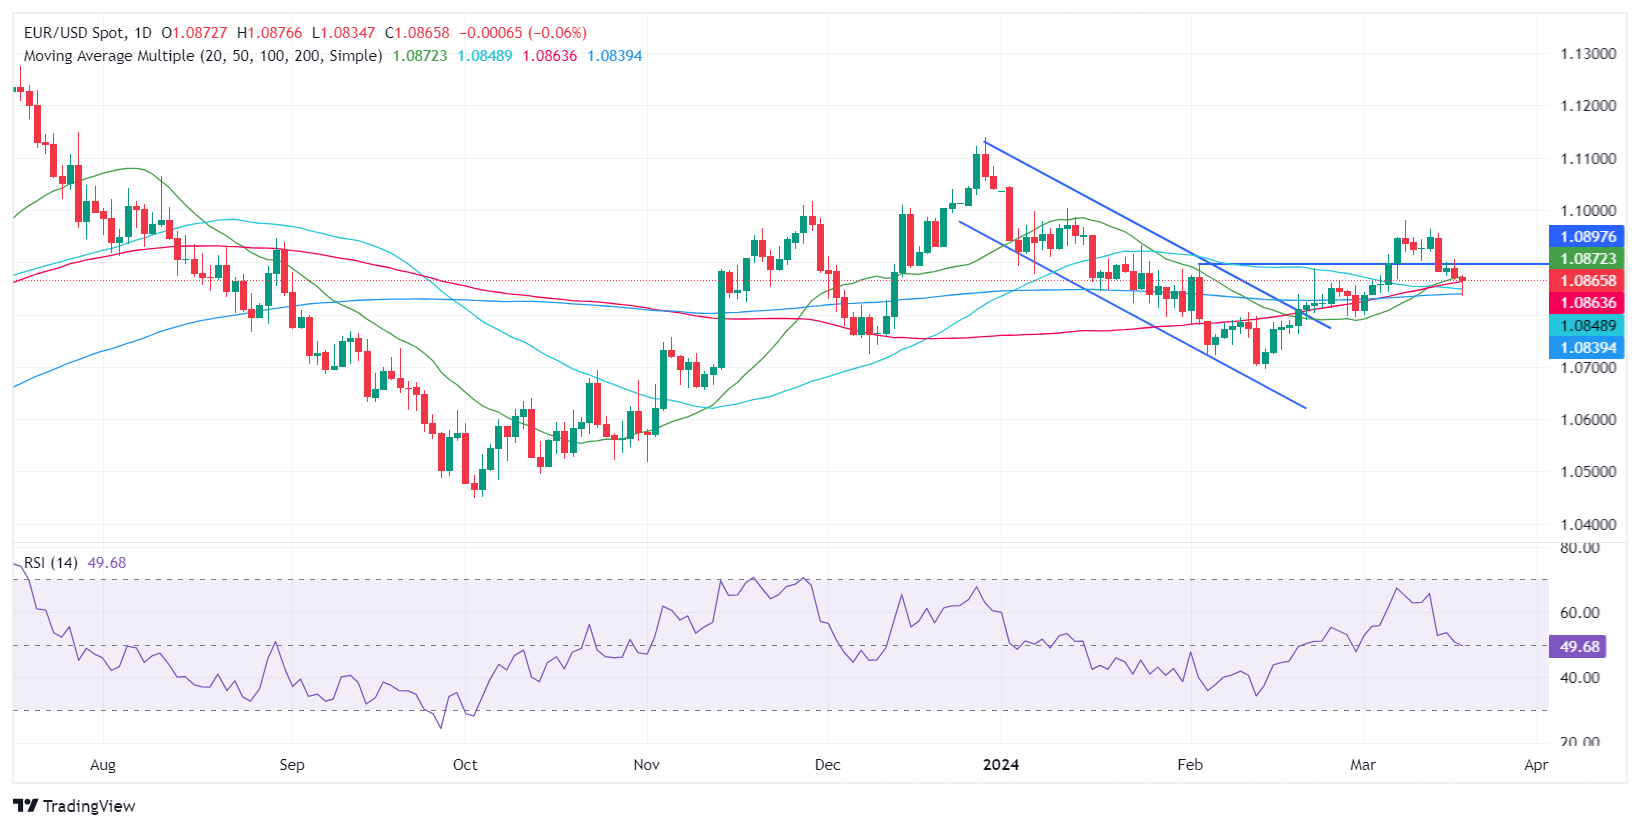
EUR/USD Price Analysis: Technical outlook
The EUR/USD daily chart suggests the pair is neutral to downward biased, though dynamic support levels like the 200, 100, and 50-day moving averages (DMAs) capped the Euro’s losses, opening the door for a recovery. If buyers lift the exchange rate above 1.0900, it could expose the March 13 high at 1.0964. followed by the year-to-date (YTD) high at 1.0981. On the other hand, sellers need to push prices below the 200-DMA at 1.0838, so they could threaten to challenge 1.0800.
- Mexican Peso weakens in early North American trading as US Dollar gains strength.
- Mexican data is mixed though the economy finished 2023 on a higher note.
- Central bank divergence between Fed and Banxico could bolster USD/MXN pair.
The Mexican Peso depreciated in early trading during the North American session as the US Dollar climbed some 0.25%, based on the US Dollar Index (DXY). Speculation that the Bank of Mexico (Banxico) would ease policy on Thursday grew, while traders continued to trim odds for the Federal Reserve’s first rate cut. The USD/MXN trades at 16.87, clocking a gain of 0.28%.
Mexico’s economic docket featured the release of Aggregate Demand and Private Spending, with both figures exceeding Q3 2023 readings, suggesting the economy ended the year on a higher note. Across the border, US housing data exceeded estimates and improved compared to January’s data, and now all heads turn toward the Federal Open Market Committee (FOMC) decision on Wednesday.
Daily digest market movers: Mexican Peso on defensive amid dovish Banxico
- Estimates that Banxico will lower the interest rate from 11.25% to 11% puts “some” pressure on the Mexican currency, which could lift the USD/MXN toward the 17.00 mark.
- Mexico’s economic data released on Tuesday:
- Aggregate Demand rose by 0.3% QoQ in Q4, up from 0%. On an annual basis decelerated from 2.7% to 2.6%.
- Private Spending on a quarterly basis slowed from 1.2% to 0.9%. On a yearly basis, it improved from 4.3% to 5.1%.
- The USD/MXN is being driven by the reduction of interest rate spreads between Mexico and the United States. This could bolster and set the USD/MXN direction toward the 17.00 figure.
- On March 21, Banxico is expected to decrease interest rates, even though it could feature a 3-2 vote split. Recent speeches and media appearances show that Banxico’s Governing Council is divided, with Governor Victoria Rodriguez Ceja, Omar Mejia Castelazo and Galia Borja Gomez leaning dovish. On the hawkish front lie Jonathan Heath and Irene Espinosa Cantellano.
- An economic slowdown in Mexico is the main event that could spark Banxico’s first rate cut as the central bank has adjusted its economic projections to the downside. Mexico’s central bank expects the economy to grow 2.8% YoY in 2024, down from 3% and maintaining at 1.5% for 2025.
- US Building Permits in February rose 1.9% from 1.495 million to 1.518 million, suggesting that demand continues to increase.
- Housing Starts increased by 10.7% compared to January’s data as starts jumped from 1.425 million to 1.521 million.
- The latest inflation figures in the United States prompted investors to price in a less dovish stance. Money market futures had adjusted their rate cut expectations more in line with the Fed as they foresee the Federal Funds Rate (FFR) at 4.71% toward year end. The next Fed meeting is scheduled for March 19-20 next week, and analysts estimate no change to its Federal Funds Rates (FFR).
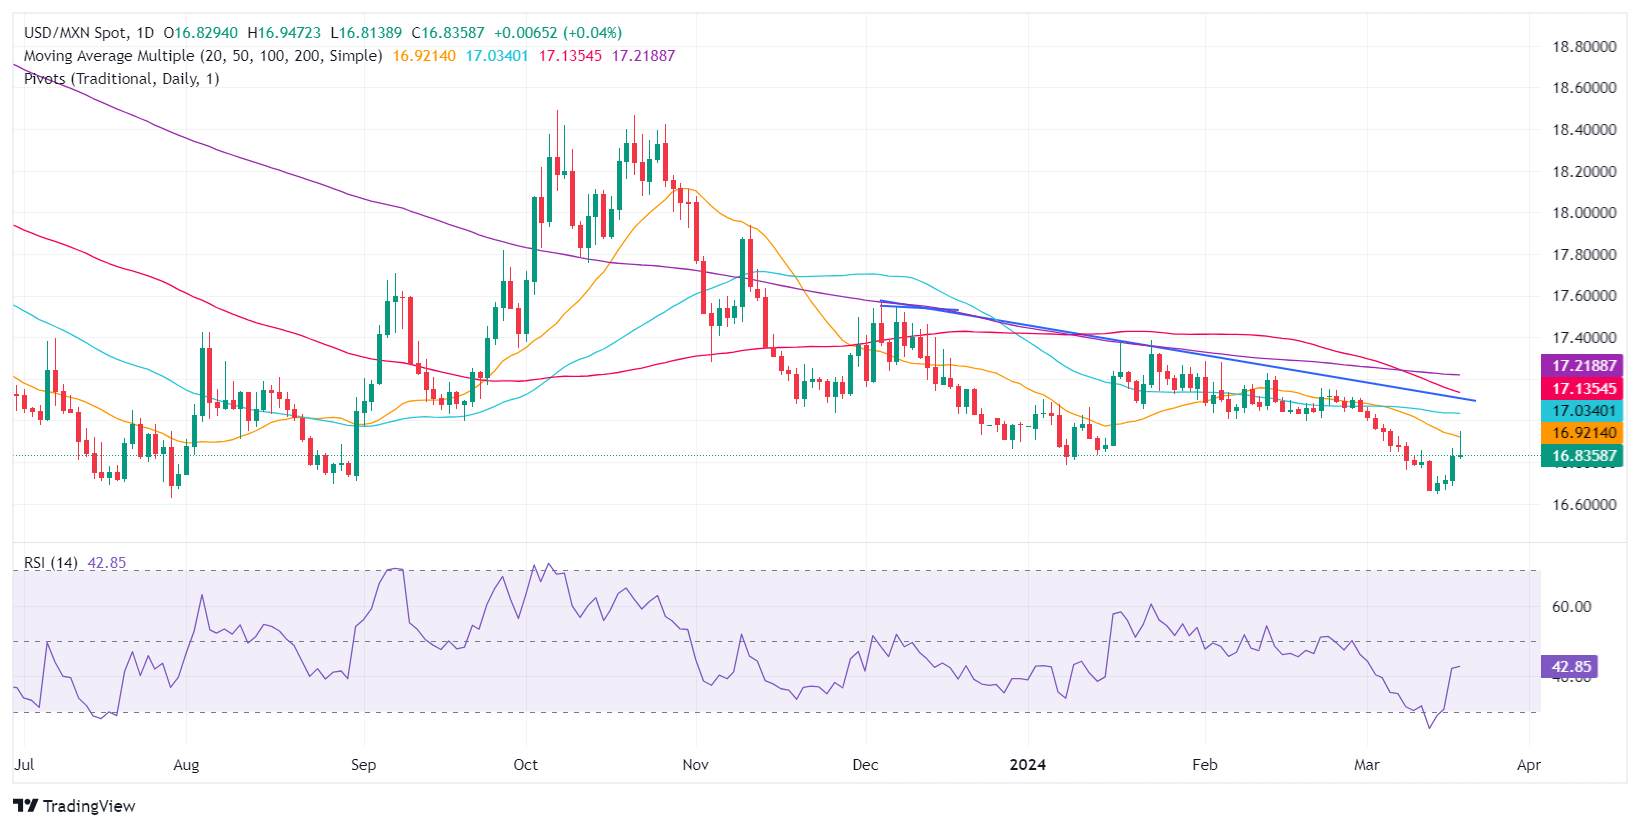
Technical analysis: Mexican Peso begins to weaken as USD/MXN aims above 16.80
The USD/MXN has shifted to a neutral bias as buyers stepped in and lifted the exchange rate above the January 8 swing low of 16.78. After breaching that level, the pair clocked a new two-week high of 16.94, though buyers are taking a breather before launching an assault toward 17.00. Once that hurdle is overcome, the next resistance would be the 50-day Simple Moving Average (SMA) at 17.02, followed by the 100-day SMA at 17.16 and the 200-day SMA at 17.21.
On the flip side, the exotic pair must drop below 16.80, which could pave the way for a test of last year’s low of 16.62, followed by October 2015’s low of 16.32 and the 16.00 psychological level.
USD/MXN Price Action – Daily Chart
Mexican Peso FAQs
The Mexican Peso (MXN) is the most traded currency among its Latin American peers. Its value is broadly determined by the performance of the Mexican economy, the country’s central bank’s policy, the amount of foreign investment in the country and even the levels of remittances sent by Mexicans who live abroad, particularly in the United States. Geopolitical trends can also move MXN: for example, the process of nearshoring – or the decision by some firms to relocate manufacturing capacity and supply chains closer to their home countries – is also seen as a catalyst for the Mexican currency as the country is considered a key manufacturing hub in the American continent. Another catalyst for MXN is Oil prices as Mexico is a key exporter of the commodity.
The main objective of Mexico’s central bank, also known as Banxico, is to maintain inflation at low and stable levels (at or close to its target of 3%, the midpoint in a tolerance band of between 2% and 4%). To this end, the bank sets an appropriate level of interest rates. When inflation is too high, Banxico will attempt to tame it by raising interest rates, making it more expensive for households and businesses to borrow money, thus cooling demand and the overall economy. Higher interest rates are generally positive for the Mexican Peso (MXN) as they lead to higher yields, making the country a more attractive place for investors. On the contrary, lower interest rates tend to weaken MXN.
Macroeconomic data releases are key to assess the state of the economy and can have an impact on the Mexican Peso (MXN) valuation. A strong Mexican economy, based on high economic growth, low unemployment and high confidence is good for MXN. Not only does it attract more foreign investment but it may encourage the Bank of Mexico (Banxico) to increase interest rates, particularly if this strength comes together with elevated inflation. However, if economic data is weak, MXN is likely to depreciate.
As an emerging-market currency, the Mexican Peso (MXN) tends to strive during risk-on periods, or when investors perceive that broader market risks are low and thus are eager to engage with investments that carry a higher risk. Conversely, MXN tends to weaken at times of market turbulence or economic uncertainty as investors tend to sell higher-risk assets and flee to the more-stable safe havens.
- US Housing Starts and Building Permits from February beat expectations.
- All eyes are now on the Fed’s updated Dot Plot on Wednesday, an interest rate pause is already priced in.
- US Treasuries are edging downward but remain at multi-week highs.
The US Dollar Index (DXY) is fluctuating around 104.00, registering gains ahead of the impending Federal Open Market Committee (FOMC) meeting on Wednesday. This marks the highest level since March 1. Markets await fresh guidance, and if the Federal Reserve’s (Fed) updated Dot Plot or Chair Jerome Powell provides any dovish signals, the USD may resume its downside action.
In the meantime, Fed officials remain cautious about rushing too soon to start cutting as inflation remains sticky, which seems to also provide a cushion to the USD. The fresh guidance from Wednesday and incoming data will continue dictating the pace of the Greenback for the short term.
Daily digest market movers: DXY extends gains on strong housing data ahead of Fed decision
- Housing Starts in February reported by the US Census Bureau demonstrated a 10.7% MoM increase, rebounding from a -12.3% reading in the previous report.
- Building Permits (Feb) came in at 1.521M, higher than the 1.425M expected.
- The market currently anticipates the Fed remaining on its hawkish path, factoring in a 10% likelihood of a rate cut in May and a 65% chance in June. However, those odds may change after Wednesday’s FOMC decision.
- The 2-year yield is currently trading at 4.70%, while the 5-year yield stands at 4.31% and the 10-year yield at 4.30%.
DXY technical analysis: DXY sees bullish momentum dominate market
The technical indicators on the daily chart reflect a positive bias. The Relative Strength Index (RSI), bearing a positive slope in positive territory, signals an augmenting bullish strength. Simultaneously, the histogram of the Moving Average Convergence Divergence (MACD) is showcasing rising green bars, further affirming the dominance of buying momentum.
The Simple Moving Averages (SMAs) further bolster this bullish outlook. The DXY is now positioned above the convergence of 20,100 and 200-day Simple Moving Averages (SMAs) near the 103.50-70 area, which suggests that bulls are controlling the broader outlook.
Considering these signals, a snapshot of the current technical outlook implies that overall, bulls are gaining ground. However, bulls must build strong support above the mentioned SMAs to consolidate their movements.
Central banks FAQs
Central Banks have a key mandate which is making sure that there is price stability in a country or region. Economies are constantly facing inflation or deflation when prices for certain goods and services are fluctuating. Constant rising prices for the same goods means inflation, constant lowered prices for the same goods means deflation. It is the task of the central bank to keep the demand in line by tweaking its policy rate. For the biggest central banks like the US Federal Reserve (Fed), the European Central Bank (ECB) or the Bank of England (BoE), the mandate is to keep inflation close to 2%.
A central bank has one important tool at its disposal to get inflation higher or lower, and that is by tweaking its benchmark policy rate, commonly known as interest rate. On pre-communicated moments, the central bank will issue a statement with its policy rate and provide additional reasoning on why it is either remaining or changing (cutting or hiking) it. Local banks will adjust their savings and lending rates accordingly, which in turn will make it either harder or easier for people to earn on their savings or for companies to take out loans and make investments in their businesses. When the central bank hikes interest rates substantially, this is called monetary tightening. When it is cutting its benchmark rate, it is called monetary easing.
A central bank is often politically independent. Members of the central bank policy board are passing through a series of panels and hearings before being appointed to a policy board seat. Each member in that board often has a certain conviction on how the central bank should control inflation and the subsequent monetary policy. Members that want a very loose monetary policy, with low rates and cheap lending, to boost the economy substantially while being content to see inflation slightly above 2%, are called ‘doves’. Members that rather want to see higher rates to reward savings and want to keep a lit on inflation at all time are called ‘hawks’ and will not rest until inflation is at or just below 2%.
Normally, there is a chairman or president who leads each meeting, needs to create a consensus between the hawks or doves and has his or her final say when it would come down to a vote split to avoid a 50-50 tie on whether the current policy should be adjusted. The chairman will deliver speeches which often can be followed live, where the current monetary stance and outlook is being communicated. A central bank will try to push forward its monetary policy without triggering violent swings in rates, equities, or its currency. All members of the central bank will channel their stance toward the markets in advance of a policy meeting event. A few days before a policy meeting takes place until the new policy has been communicated, members are forbidden to talk publicly. This is called the blackout period.
The US Federal Reserve (Fed) will announce its Interest Rate Decision on Wednesday, March 20 at 18:00 GMT and as we get closer to the release time, here are the expectations as forecast by analysts and researchers of 15 major banks.
The Fed is expected to keep rates unchanged in the range of 5.25%-5.50% for the fifth time in a row. Investors are eagerly awaiting the quarterly dot plot. The Fed’s last dot plot suggested a median forecast of three rate cuts through 2024. The Summary of Economic Projections (SEP) and Fed Chair Jerome Powell’s post-meeting press conference will also garner attention.
ANZ
We expect the FOMC will leave the target rate for fed funds (FFR) unchanged. Despite a relatively brisk start to 2024, we aren’t expecting any material changes to the FOMC’s current profile of moderating growth, gently rising unemployment and a gradual yet persistent return to target inflation. We acknowledge the possibility of a modest up shift in the dot plot. Discussions on what to do with quantitative tightening (QT) will begin. Recent Fed rhetoric suggests it’s unlikely any specific announcement will come. We think that could come from the May meeting onwards.
Commerzbank
The Fed is unlikely to change its key interest rates, leaving the target range for Fed Funds at 5.25%-5.50% (where it has been since July 2023). The Fed is also likely to reiterate that it does not consider a rate cut appropriate until it has gained greater confidence that inflation is moving sustainably towards 2%. We assume that the dot plot will provide for three rate cuts in 2024, as in the last update in December.
Nordea
We expect no changes to the Fed Funds rate or QT at this meeting. However, the Fed will likely need to revise its growth and inflation projections higher for 2024. This could lead to a median FOMC dot plot that shows only two rate cuts this year compared to the latest projection for three rate cuts, made in December 2023.
Danske Bank
We do not expect the Fed to make monetary policy changes in its March meeting. Besides the obvious focus on rate cut timing cues, we will keep an eye on the updated rate and economic projections as well as more detailed discussion on QT. We think the Fed will cut rates for the first time in May and start to gradually phase out QT only from September. 2024 GDP forecast is set to be revised higher, but we think ‘dots’ will still signal three rate cuts for this year as a whole.
ABN Amro
We expect the Fed to keep policy on hold at the March FOMC meeting. The Committee will also update its quarterly projections, and we expect this to show the median FOMC member still expecting three rate cuts this year. Chair Powell is likely to maintain the cautiously hawkish tone of recent remarks and not seek to rock the boat, as the Fed is likely comfortable with current market pricing for rate cuts. Powell signalled at the January meeting that the FOMC would discuss the winddown of QT at the March meeting. Given that use of the Overnight Repo Facility has stabilised recently, it is probably too soon for the Fed to announce a winddown plan at this meeting, but Powell is likely to confirm that this is now being actively worked on.
ING
Some people think the Fed may need to hike rates further, but we don’t see this happening. We think the next move is a cut, most likely in June. At the December forecast update, the Fed signalled they felt three 25 bps rate cuts would be the most likely path forward for 2024 with a further 100 bps of cuts pencilled in for 2025. We expect a similar set of projections at the March FOMC meeting with the messaging indicating that the Fed is inclined to cut rates later this year, but they need to see more evidence to justify that action. We expect 125 bps of cuts this year, starting in June, with a further 100 bps in 2025 as hopes rise for a soft landing for the economy.
TDS
The FOMC is widely expected to keep the Fed funds target range unchanged at 5.25%-5.50%, with Chair Powell likely continuing to argue for patience regarding the Committee's next policy steps amid the recent firming of inflation. We also look for the Fed to maintain its median projection for three cuts this year and for the release of preliminary details about QT plans. Risk-reward under our baseline of the Fed's 2024 dot remaining unchanged in a market that is net long the dollar is for USD weakness.
Rabobank
The FOMC needs to see more data to gain confidence that inflation is heading sustainably toward its 2% target. We continue to pencil in the first rate cut in June. However, the risk that the Fed will start later than June, rather than before June (= May), has increased. Once started, we expect the Fed to continue with one cut of 25 bps per quarter. However, since our new economic forecasts assume a Trump victory in November, leading to a universal import tariff, we expect inflation to rebound in 2025. This is likely to cause a pause in the Fed’s cutting cycle during the course of next year.
Deutsche Bank
We expect only minor revisions to the meeting statement that saw an overhaul last meeting. With regards to the SEP, the growth and unemployment forecasts are unlikely to change but the 2024 inflation forecasts potentially could. We expect the Fed to revise up their 2024 core PCE inflation forecast by a tenth to 2.5%, although they see meaningful risks that it gets revised up even higher to 2.6%. A 2.5% core PCE reading would allow just enough wiggle room to keep the 2024 fed funds rate at 4.6% (75 bps of cuts). However, if core PCE inflation were revised up to 2.6%, it would likely entail the Fed moving their base case back to 50 bps of cuts, as this would essentially reflect the same forecasts as the September 2023 SEP.
Wells Fargo
We do not expect any policy changes at this meeting. We now believe the Committee will wait until its June 12 meeting before reducing its target range for the federal funds rate by 25 bps. We then look for the FOMC to cut rates by 25 bps at each of its meetings in July, September and December.
RBC Economics
The Fed is widely expected to stand pat on the fed funds range for a fifth consecutive meeting on Wednesday. But any shift in the monetary policy statement language will be closely watched after two straight months of upside surprises on inflation.
NBF
The FOMC is widely expected to leave its key policy rates unchanged for the fifth straight meeting. Since January, policymakers have been waiting for ‘greater confidence that inflation is moving sustainably toward 2 percent’ and recent data is unlikely to have provided the FOMC much assurance. As such, don’t expect the easing bias in the rate statement to become any more pronounced. Markets will be most closely watching the ‘dot plot’ to see whether policymakers dial back the amount of expected easing for 2024. In December, 75 bps of cuts were signaled but the distribution was skewed towards less easing. Given recent inflation developments, there’s a reasonable chance some dots could move higher, bringing the median up with it.
Citi
While markets are increasingly pricing a more hawkish Fed following stronger-than-expected inflation, Chair Powell is likely to emphasize slowing YoY core PCE inflation and restate that the Fed is ‘not far’ from achieving the level of confidence necessary to begin lowering rates. We expect a largely unchanged SEP. Core PCE at the end of 2024 could be nudged higher to 2.5% from 2.4%. Most importantly, median dots are likely to remain unchanged. The FOMC will also discuss balance sheet reduction in depth which might result in some principles being published on how the Fed plans to taper and then eventually end balance sheet reduction.
SocGen
The FOMC convenes this week against the backdrop of mounting inflation pressures and rising concerns over the feasibility and timing of interest rate reductions. The Fed has ample time to assess the situation, and we expect no policy change in March. Economic indicators in the coming months will play a decisive role in determining whether mid-year rate cuts are a viable option. The Fed's new dot plot may prove less dovish than the 75 bps in rate cuts suggested in December.
CIBC
The funds rate will be left unchanged, and Powell ought to avoid giving any definitive signal on when the first cuts will arrive. We’ll concede that recent data on inflation hasn’t been friendly to our forecast for 100 bps of cuts in the latter half of the year, and we’ll need to see some softening in jobs, wages and underlying inflation in the coming months to stick with that view. While it’s a close call, with some risk of a more hawkish turn to only 50 bps of easing, we see the Fed just hanging on to its median projection for three cuts in 2024, and the median call for 2025 also looks likely to be little changed, with the individual dots still widely dispersed. Median forecasts for growth, inflation and unemployment for this year could shift by a decimal place or two here and there, which won’t be material. If so, the biggest change could be in the ‘long term’ outlook for rates, typically viewed as the Fed’s assessment of where neutral will lie. With the economy showing resilience to rates above 5%, the long-term projection will likely move higher, with 2.75% or even 3% now looking like more plausible outcomes.
The United Kingdom will release the Consumer Price Index (CPI) report on Wednesday, March 20 at 07:00 GMT and as we get closer to the release time, here are the forecasts by the economists and researchers of four major banks regarding the upcoming UK inflation print.
The annual headline inflation is forecast to have grown at a slower pace of 3.6% against 4.0% in January. In the same period, core inflation – which excludes volatile food and energy prices – is forecast to have decelerated to 4.6% from 5.1%. If so, headline would be the lowest since September 2021 but still well above the 2% target.
TDS
We expect UK headline inflation to take another step down in February to 3.4% YoY, thus leaving it a touch below the Bank of England's forecast of 3.5% YoY. Core inflation will likely also fall quite a bit this month, we forecast a 0.6ppts decline to 4.5% YoY, which would be the lowest year-on-year rate since January 2022. We expect services inflation at 6.0%, 0.1ppts below the MPC's forecast. Our unrounded forecasts for headline/core are 3.43%/4.46%, so we see risks skewed to the upside for headline inflation but to the downside for core. Overall, barring any major surprises to this month's data, headline inflation is still set to fall below target in April and remain below target for the rest of the year.
Deutsche Bank
We expect a sizeable move lower, including the headline CPI slowing to 3.4% (vs. 4% in January) and core to 4.5% (5.1%).
SocGen
After a three-month period of core being stuck at 5.1%, we expect a sharp 0.6pp decline in February to 4.5% YoY, its lowest rate in two years. This decline should contribute to a 0.6pp fall in headline inflation to 3.4% YoY.
Citi
CPI Inflation, February – Citi Forecast 3.4% YoY, Prior 4.0% YoY; CPI Core, February – Citi Forecast 4.4% YoY, Prior 5.1% YoY (goods prices still subdued).
USD/JPY has risen back above the 150.00 level after the BoJ finally ended its negative interest rate policy. Economists at Rabobank analyze the pair’s outlook.
BoJ prospects of hiking rates again this year remain highly uncertain
In today’s policy statement, the BoJ remarked that as ‘indicated by the results of this year's annual spring labour-management wage negotiations to date, it is highly likely that wages will continue to increase steadily this year’. This has supported the Bank’s confidence that its price stability target is in sight.
Assuming the strong pay deals awarded to unionised workers spread out to the 70% of employees who are not in a union, Japan’s real wage growth could soon be turning higher. Policymakers will be hoping that this boosts consumption which in turns supports corporate profitability. This would indicate that the BoJ’s virtuous cycle is complete. So, while the BoJ may be able to hike rates again this year, this prospect currently remains highly uncertain.
Our three-month USD/JPY forecast of 146.00 assumes a first Fed rate cut in June and an improvement in Japanese real wage data. Our 12-month USD/JPY target is 140.00.
Economists at ING expect the Federal Reserve to start cutting rates in June.
125 bps of cuts this year, starting in June
Given the Fed doesn’t want to cause a recession if it can avoid it, we believe they will be in a position to start moving monetary policy from restrictive territory to a more neutral footing before the summer.
We expect 125 bps of cuts this year, starting in June, with a further 100 bps in 2025 as they seek a soft landing for the economy.
- USD/CAD jumps above 1.3600 as Canadian consumer inflation surprisingly eases in February.
- BoC’s preferred inflation measure decelerated to 2.1% from 2.4% in January on a year-on-year basis.
- The market sentiment remains downbeat amid uncertainty ahead of Fed policy.
The USD/CAD pair soars above the round-level resistance of 1.3600 in the early New York session on Tuesday. The Loonie asset strengthens as the Canadian Consumer Price Index (CPI) for February turns out surprisingly softer than expected.
The annual headline CPI grew at a slower pace of 2.8% than expectations of 3.1% and the former reading of 2.9%. On a monthly basis, the headline CPI rose by 0.3% against the expectation of 0.6%. The Bank of Canada’s (BoC) preferred inflation measure, which strips of eight volatile items grew at a steady pace of 0.1% monthly. The underlying inflation decelerated to 2.1% from 2.4% in January.
The soft inflation data could prompt expectations that the BoC will reduce interest rates sooner than expected. When the BoC considers reducing interest rates, the Canadian dollar faces liquidity outflows.
Meanwhile, the Canadian Dollar has also been weighed down by dismal market sentiment. The appeal for risk-perceived assets weakens amid uncertainty ahead of the Federal Reserve’s (Fed) interest rate decision, which will be announced on Wednesday. The Fed is expected to keep interest rates unchanged in the range of 5.25%-5.50%. The US Dollar Index (DXY) rises to 103.85 as demand for safe-haven assets improves.
Apart from the Fed’s policy decision, investors will focus on the dot plot and economic projections. The dot plot shows policymakers' interest rate projections for different timeframes.
The Australian Dollar (AUD) has weakened following the RBA’s latest policy meeting. Economists at MUFG Bank analyze Aussie’s outlook.
RBA to begin cutting rates during the second half of this year
The RBA left their policy rate unchanged for the third consecutive meeting at 4.35%. However, the RBA softened their guidance over the likelihood of further rate hikes in the updated policy statement.
The updated guidance from the RBA has made us more confident that the RBA has reached the end of their rate hike cycle although the risk of one final hike can’t be completely ruled out.
We expect the RBA to begin cutting rates during the second half of this year. Unlike other major central banks like the Fed, the RBA is expected to be slower to lower rates.
In contrast, one less supportive development for the Aussie has been the recent sharp decline in the price of iron ore which has continued to plunge so far this month. After peaking at the start of this year, the price of iron ore has since declined by almost 30% which continues to pose downside risks for the Aussie in the near term.
After a brief dip just below $2,150, Gold started to recover at the start of the new week. Strategists at Commerzbank analyze the yellow metal’s outlook.
US data has been mixed of late
The so-called ‘dot plot’, i.e. the interest rate forecasts of the individual FOMC members, is likely to attract particular attention at this week's Fed meeting.
US data has been mixed of late. While economic data has been rather disappointing, price data has pointed to ongoing inflationary pressures. Against this backdrop, we believe that the central bankers are unlikely to change their assessment, leaving the ‘dots’ more or less unchanged. This would probably be positive for Gold, as some market participants are likely to expect an upward revision of interest rate expectations following the US inflation data.
USD/JPY rose back above 150.00 after the Bank of Japan abolished negative interest rates and yield curve control. Kit Juckes, Chief Global FX Strategist at Société Générale, analyzes the pair’s outlook.
A well-flagged BoJ move has emboldened Yen bears
The BoJ brought the age of negative rates and yield curve control to an end.
I’m disappointed by the market reaction to the BoJ because there’s a good chance this eventually proves to be a pivotal moment for Japan and the BoJ.
USD/JPY 152.00 now becomes a big psychological level going into Wednesday’s FOMC.
Economists at MUFG Bank analyze Japanese Yen (JPY) outlook after the Bank of Japan (BoJ) policy announcement.
Will Yen selling persist after BoJ policy changes?
We see limits to the extent of Yen selling that can take place from here. Of course, there are greater USD/JPY upside risks over the very short term given this risk event has now passed without any major hawkish surprise and if the FOMC on Wednesday were to drop a DOT in its policy rate profile, US yields will likely jump further and potentially drag USD/JPY to intervention levels.
But over the medium term, we view today’s announcements as hugely significant that is consistent with higher yields and a stronger Yen.
- The US Dollar soars on Tuesday after Asian markets set the scene for a stronger Greenback.
- Traders are letting the dust settle over the BoJ rate decision ahead of US housing data.
- The US Dollar Index briefly hit 104.00 before retreating a touch.
The US Dollar (USD) jumped firmly in the green on Tuesday, giving a big thank you to the Japanese Yen. The Yen, which accounts for roughly 13% of the US Dollar Index (DXY), depreciated nearly 1% against the Greenback after the Bank of Japan (BoJ) delivered a dovish interest-rate hike. The move away from negative interest rates was well communicated months in advance and came as no surprise to markets, resulting in a weaker Yen.
Meanwhile, the US economic data front was all about housing data on Tuesday. Both Building Permits and Housing Starts were better than expected ahead of the US Federal Reserve (Fed) rate decision on Wednesday. The Federal Open Market Committee (FOMC) starts its two-day meeting this Tuesday, and some further contraction in the US housing market could put June back on the table for that eagerly anticipated rate cut.
Daily digest market movers: Ahead of Fed
- In Asia overnight, the BoJ has hiked interest rates for the first time in almost two decades, to 0% from -0.10%. However, markets sent the Japanese Yen weaker after comments from BoJ Governor Kazuo Ueda that the BoJ will keep its monetary easing in place and that this is probably a one-and-done hike.
- In the aftermath of the BoJ rate decision, the Greenback and the Chinese Yuan benefited the most from the devaluing Yen.
- In Europe, European Central Bank Vice President Luis De Guindos said that June will be pivotal for the ECB rate decision. An initial rate cut is already a possibility at the June meeting.
- At 12:30 GMT, US Housing data was released:
- Housing Starts for February came in at 1.521 million, above the estimate of 1.425 million and beating the January number at 1.374 million.
- Building Permits for February jumped to 1.518 million, substantially higher than the 1.489 million from January.
- The US Treasury will be placing a 52-week bill in the market at 15:30 GMT.
- Equities are not reacting well to the dovish hike from the BoJ, with Europe and US indexes trading in the red ahead of the US opening bell.
- According to the CME Group’s FedWatch Tool, expectations for a Fed pause in the March 20 meeting are at 99%, while chances of a rate cut stand at 1%.
- The benchmark 10-year US Treasury Note trades around 4.30%, continuing its ascent from last week.
US Dollar Index Technical Analysis: Stronger due to outside forces
The US Dollar Index (DXY) is fading a touch after it briefly hit the 104.00 mark. Ahead of the US Federal Reserve meeting, this does not look the ideal place to be as markets will be looking for any dovish clues from Chairman Jerome Powell. Any dovish hint could mean that Tuesday’s move will be quickly pared back, with the DXY dropping back deep into 103.00 territory.
On the upside,104.96 remains the first level in sight. Once above there, the peak at 104.97 from February comes into play, ahead of the 105.00 region with 105.12 as the first resistance.
Expect some easing as the dust settles on the BoJ and ahead of the Fed meeting on Wednesday. Some support should come in from the 200-day Simple Moving Average (SMA) at 103.70, the 100-day SMA at 103.60 and the 55-day SMA at 103.50. The 103-area, thus, looks well equipped and covered with support levels to catch any retreats in the DXY.
- Housing Starts and Building Permits in the US increased in February.
- The US Dollar Index clings to daily gains near 104.00.
Housing Starts in the US rose 10.7% in February to 1.52 million units, the monthly data published by the US Census Bureau revealed on Tuesday. This reading followed the 12.3% decrease recorded in January.
In the same period, Building Permits increased 1.9% after falling 0.3% in January.
Market reaction
The US Dollar Index preserves its bullish momentum after the data and was last seen rising 0.32% on the day at 103.92.
- AUD/USD falls sharply to 0.6500 on multiple headwinds.
- The RBA kept interest rates unchanged at 4.35% and delivered neutral guidance on interest rates.
- Investors await the Fed’s dot plot for fresh guidance on interest rates.
The AUD/USD pair faces an intense sell-off as downbeat market sentiment has weakened the appeal of risk-perceived assets. The Aussie asset falls to the psychological support of 0.6500 in Tuesday’s late European session as the US Dollar strengthens amid uncertainty ahead of the Federal Reserve’s (Fed) monetary policy decision, which will be announced on Wednesday.
S&P 500 futures have posted significant losses in the London session, portraying a decline in investors’ risk appetite. The US Dollar Index (DXY) continues its winning streak for the fourth trading session, rises to 104.00 amid upbeat safe-haven bid. 10-year US Treasury yields have come down slightly to 4.32%. Broadly, US bond yields exhibit strength as Fed rate cut expectations for the June policy meeting have dropped due to hot inflation data for February.
The Fed’s interest rate decision will guide the next move in the US Dollar. The CME FedWatch tool shows that the central bank will keep interest rates unchanged in the range of 5.25%-5.50% for the fifth time in a row. Therefore, investors will focus mainly on the release of the dot plot and economic projections. The dot plot, updated every quarter, shows interest rate projections from Fed officials for various timeframes.
Meanwhile, the Australian Dollar weakens as the Reserve Bank of Australia (RBA) delivers neutral guidance on the Official Cash rate (OCR) after keeping it unchanged at 4.35%. RBA Governor Michele Bullock said in his policy statement that a victory on inflation cannot be announced yet. The RBA needs to be more confident that inflation is coming down to consider a rate cut.
GBP/USD trades weaker below support in the low 1.2700s. Economists at Scotiabank analyze the pair’s outlook.
Resistance is 1.2745/1.2750
UK CPI data due on Wednesday and Thursday’s BoE decision may help limit near-term losses.
Sterling’s extended run lower from its early March peak pushed below minor support in the low 1.2700 zone to test the 40-DMA at 1.2680. Short-term price action suggests a potentially positive response to that test in the form of a bullish ‘hammer’ pattern, however.
Resistance is 1.2745/1.2750.
Support below 1.2675/1.2680 sits at 1.2600/1.2610.
EUR/USD finds support in the low 1.0800s. Economists at Scotiabank analyze the pair’s outlook.
EUR may be trying to rebound from the low 1.0800s
Soft price action on Monday and a pickup in intraday bear momentum suggest downside risks remain for the EUR but early Tuesday price signals suggest the EUR may be trying to base/rebound from the low 1.0800s via an intraday bullish ‘hammer’ signal.
Intraday gains back above 1.0875 would give the EUR a little more technical strength intraday.
Support is 1.0835/1.0840 and 1.0800.
- Natural Gas prices are trying to test the $1.90 resistance.
- A mix of geopolitical pressure, ESG, and unforeseen outages are the main drivers supporting prices.
- The US Dollar Index rallies to 104.00 after the BoJ delivered a dovish hike.
Natural Gas prices (XNG/USD) are rallying for a second consecutive day on Tuesday towards the key $1.90 resistance level. When overlooking the charts, gas prices have jumped actually near 20% in five days combined on all gas contracts with near 6% on XNG/USD alone. Traders are seeing a mixture of reasons to keep Gas prices supported, from the current geopolitical tensions in the Middle East and Ukraine to the push for green energy and ESG costs adding a premium to Gas prices. Adding to these, unforeseen outages in the US and Norway are also hitting production.
Meanwhile, the US Dollar is trading firmly in the green. The DXY US Dollar Index, which gauges the Greenback against a basket of currencies, rallies towards 104.00. The inflow in the Greenback comes after the Bank of Japan (BoJ) hiked interest rates for the first time in nearly two decades . However, the main takeaway for markets is that it was a one-and-done deal that was very well communicated.
Natural Gas is trading at $1.86 per MMBtu at the time of writing.
Natural Gas news and market movers: A mix of rocket fuel
- Shipments from Australia last week dropped due to severe weather and storms, making it unsafe for big Gas shipments to take place, according to Bloomberg.
- US LNG exports dropped nearly 10% last week, with the Freeport outage as the main driver. This adds to the several unscheduled maintenance in Norwegian Gas fields.
- Ukraine's attacks on Russian infrastructure are creating an issue for Gas flows towards Asia.
- The European Union has committed to asking importers of Russian LNG to reduce purchases this year, according to Energy Commissioner Kadri Simson.
Natural Gas Technical Analysis: Healing from the downside
Natural Gas prices are starting to heal from their steep decline since February. With traders seeing a mixture of elements supporting prices, this makes the rally more healthy and less dependent on just one driver. Look for $2 on the topside, should more supply issues or a surge in demand occur.
On the upside, the key $2.00 level needs to be regained first. The next key level is the historic pivotal point at $2.12, which falls broadly in line with the 55-day Simple Moving Average (SMA) at $2.08. Should Gas prices pop up in that region, a broad area opens up with the first cap at the red descending trend line near $2.27.
On the downside, multi-year lows are still nearby with $1.65 as the first line in the sand. This year’s low at $1.60 needs to be kept an eye on as well. Once a new low for the year is printed, traders should look at $1.53 as the next supportive area.
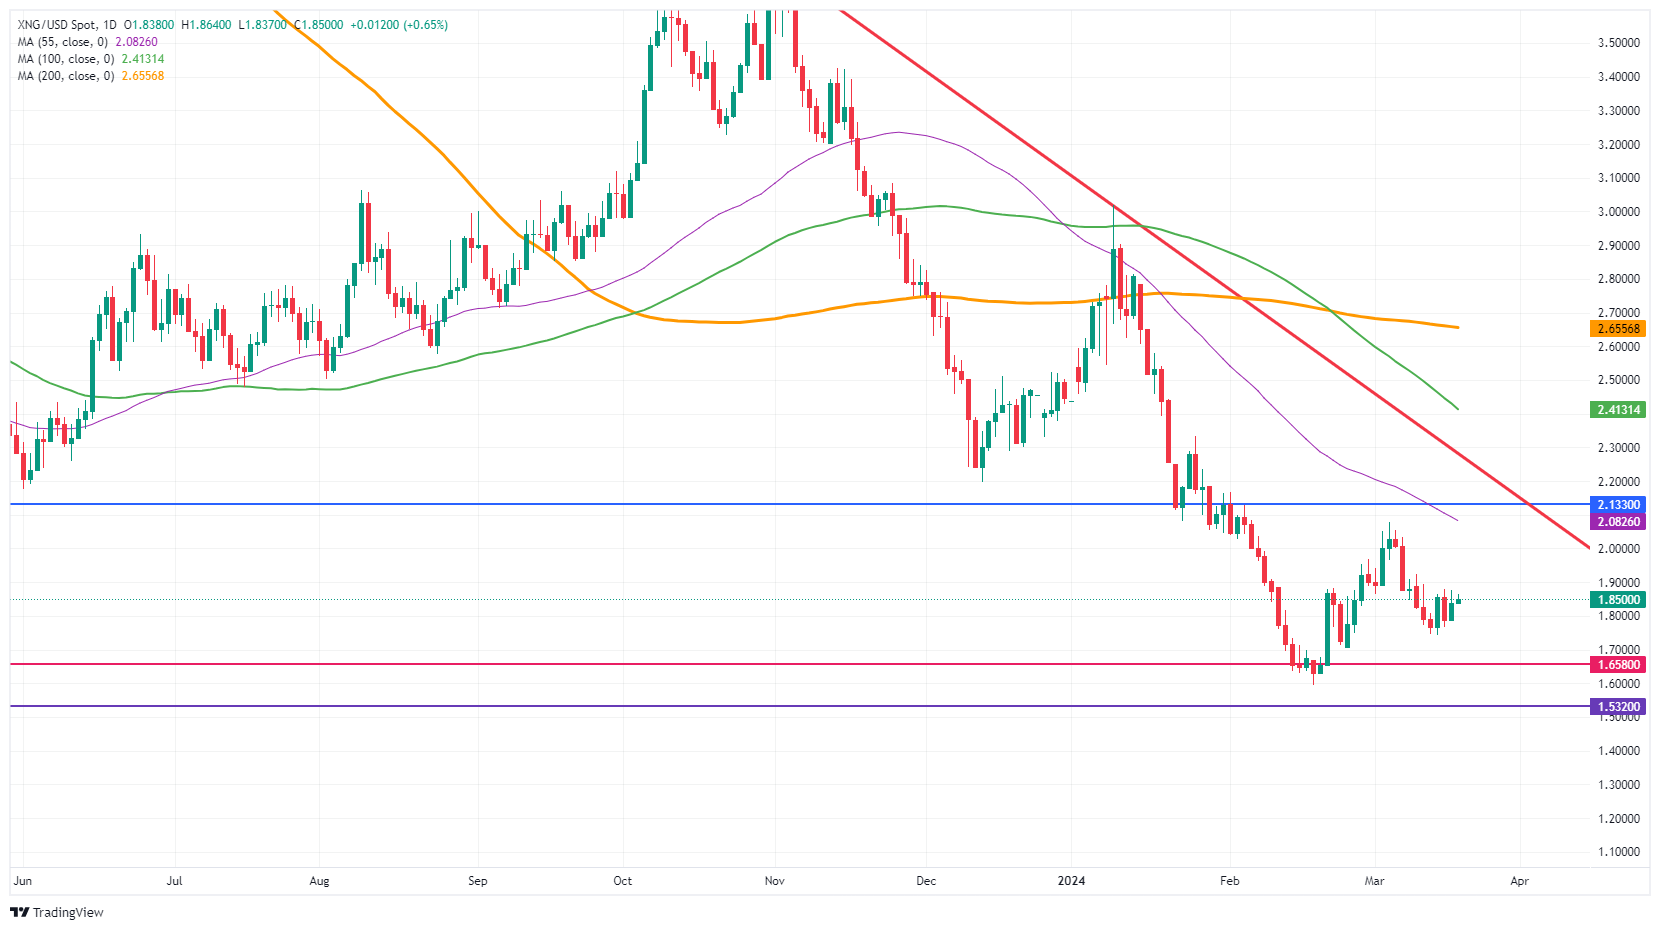
Natural Gas: Daily Chart
Natural Gas FAQs
Supply and demand dynamics are a key factor influencing Natural Gas prices, and are themselves influenced by global economic growth, industrial activity, population growth, production levels, and inventories. The weather impacts Natural Gas prices because more Gas is used during cold winters and hot summers for heating and cooling. Competition from other energy sources impacts prices as consumers may switch to cheaper sources. Geopolitical events are factors as exemplified by the war in Ukraine. Government policies relating to extraction, transportation, and environmental issues also impact prices.
The main economic release influencing Natural Gas prices is the weekly inventory bulletin from the Energy Information Administration (EIA), a US government agency that produces US gas market data. The EIA Gas bulletin usually comes out on Thursday at 14:30 GMT, a day after the EIA publishes its weekly Oil bulletin. Economic data from large consumers of Natural Gas can impact supply and demand, the largest of which include China, Germany and Japan. Natural Gas is primarily priced and traded in US Dollars, thus economic releases impacting the US Dollar are also factors.
The US Dollar is the world’s reserve currency and most commodities, including Natural Gas are priced and traded on international markets in US Dollars. As such, the value of the US Dollar is a factor in the price of Natural Gas, because if the Dollar strengthens it means less Dollars are required to buy the same volume of Gas (the price falls), and vice versa if USD strengthens.
USD/JPY traded back above 150.00 after the BoJ exited its Negative Interest Rate Policy (NIRP). Economists at TD Securities analyze the pair’s outlook.
BoJ exited NIRP and YCC simultaneously
BoJ exited NIRP and YCC simultaneously and revamped its monetary policy framework around short-term interest rates. The Bank kept its QE program and signalled that it will make nimble responses to any spike in long-run interest rates. Our confidence around an October hike has lessened after Governor Ueda's dovish comments and the recent economic data.
USD/JPY is now hostage to the FOMC decision on Wednesday and any big hawkish surprise from Powell could push USD/JPY beyond its 2022 high at 151.90 which may invoke some strong verbal interventions from the MoF.
The new Canadian inflation figures for February will be released today. Economists at Commerzbank analyze how the Consumer Price Index (CPI) report could impact the Loonie.
Bloomberg consensus is currently subject to considerable uncertainty
Economists surveyed by Bloomberg are looking for a non-seasonally adjusted increase of 0.6% MoM, which should translate into a seasonally adjusted increase of around 0.26%.
If today's figures confirm the ongoing inflationary risks, the market may push back its rate cut expectations a bit. This would certainly be positive for the CAD.
However, it should also be noted that the Bloomberg consensus is currently subject to considerable uncertainty. The number of participants in the survey for Canadian inflation data has fallen significantly in recent years. And even last month, the survey was expecting a solid increase, and in the end, prices actually fell. This is something to keep in mind for today.
- EUR/GBP rebounds to 0.8550 amid uncertainty over the Pound Sterling outlook ahead of the BoE policy meeting.
- The UK inflation data will influence expectations for the BoE to reduce interest rates from August.
- Eurozone ZEW Survey- Economic Sentiment improves sharply to 33.5 in March.
The EUR/GBP pair jumps to 0.8550 in the European session on Tuesday. The asset rises ahead of key United Kingdom economic events this week. The Pound Sterling will be influenced by the Bank of England’s (BoE) interest rate decision, which will be announced on Thursday.
The BoE is widely anticipated to keep interest rates unchanged at 5.25% as inflation is far from the desired rate of 2%. Investors await fresh cues about when the BoE could begin reducing interest rates. Currently, market participants anticipate that the BoE will announce their first rate cut in the August policy meeting after maintaining a hawkish stance for more than two years.
BoE policymakers have been reiterating that rate cuts would be appropriate only if they are convinced that inflation will return sustainably to the desired target of 2%.
Before the BoE policy, investors will focus on the UK Consumer Price Index (CPI) data for February, which will be published on Wednesday. The annual headline inflation is forecast to have grown at a slower pace of 3.6% against 4.0% in January. In the same period, core inflation that excludes volatile food and energy prices is forecast to have decelerated to 4.6% from 5.1%.
Meanwhile, the Euro rises on upbeat Eurozone ZEW Survey—Economic Sentiment. The economic data showcases institutional investors' sentiment towards the economic outlook improving significantly to 33.5 from expectations of 25.4 and the former reading of 25.0.
Going forward, the Euro will be guided by market expectations for the European Central Bank's (ECB) rate cuts. Investors expect the ECB to start reducing interest rates by summer.
- Gold price dips to $2,150 as investors turn cautious ahead of Fed’s interest rate decision.
- The US Dollar advances on hopes that the Fed could delay rate-cut plans.
- 10-year US yields fall moderately but hold strength on lower expectations for the Fed reducing interest rates in June.
Gold price (XAU/USD) drops to $2,150 in Tuesday’s European session as a strong US Dollar weighs heavily on the precious metal. The appeal for Gold remains subdued amid uncertainty ahead of the Federal Reserve’s monetary policy decision and the release of the quarterly dot plot on Wednesday.
The Fed is widely expected to keep interest rates unchanged in the range of 5.25%-5.50% for the fifth time in a row, but uncertainty over rate-cut projections keeps the Gold price on the tenterhooks. Investors are scaling back bets that the Fed could begin reducing interest rates in June, putting further downside pressure on Gold.
Meanwhile, 10-year US Treasury yields have fallen slightly to 4.32% but remain broadly strong on hopes that the first Fed rate cut, which is currently anticipated in June, will be delayed. Higher-than-expected consumer and producer inflation data are casting doubts among investors that this policy pivot will indeed occur in June or will be further postponed.
Daily digest market movers: Gold, bond yields fall while US Dollar rallies
- Gold price falls sharply to the crucial support of $2,150. Investors turn risk-averse towards bullions ahead of the interest rate decision by the Federal Reserve, which will be announced on Wednesday.
- The CME FedWatch tool shows that after the conclusion of the two-day meeting, the Fed will keep interest rates unchanged. Investors are eagerly awaiting the quarterly dot plot, which shows projections for interest rates over time by Chair Jerome Powell and other officials. The dot plot will signal any change in projections for rate cuts this year.
- December’s dot plot indicated that Fed officials are anticipating three rate cuts in 2024. If the Fed dials down rate-cut projections, the Gold price could face significant downside pressure. Currently, the CME FedWatch tool shows a 60% chance that at least three rate cuts will be announced by 2024. The chances for at least three rate cuts were slightly below 80% before the release of the hot consumer and producer inflation data for February.
- In addition to the dot plot, the Fed will also release economic projections for inflation and economic growth. An upbeat economic outlook would strengthen the appeal of the US Dollar. The United States economy has been performing better on the grounds of consumer spending and labor market than any other country in the Group of Seven (G-7) economies.
- The US Dollar Index (DXY), which measures the US Dollar’s value against six rival currencies, rises to 104.00 amid improvement in safe-haven bid.
Technical Analysis: Gold price ranges between $2,145-$2,165
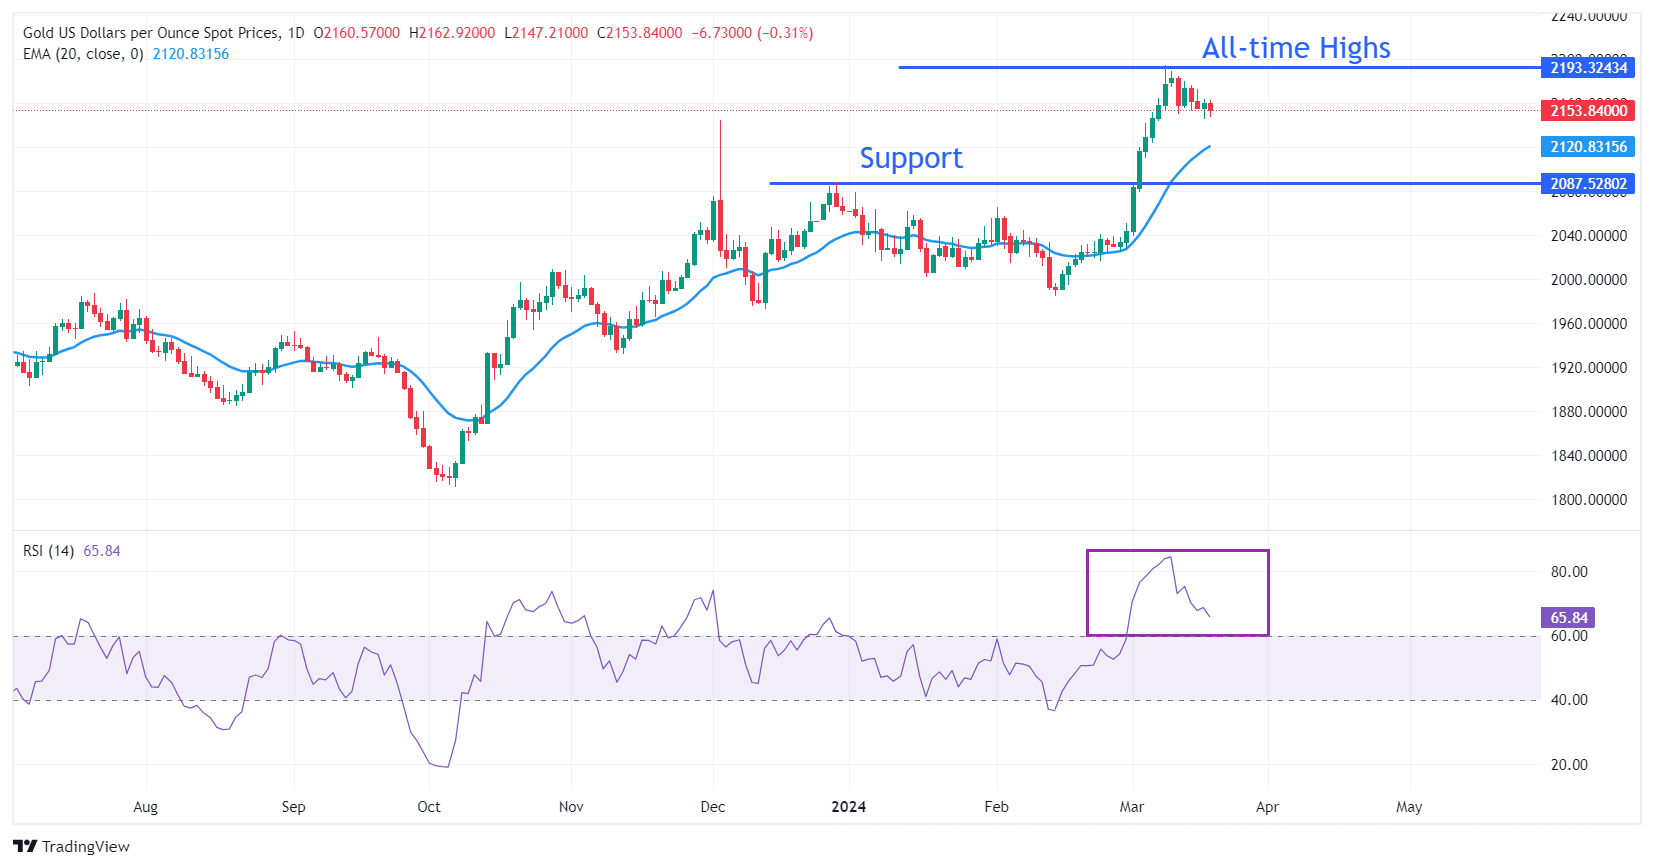
Gold price faces pressure as the upside remains limited amid caution ahead of the Fed’s decision on interest rates. The precious metal trades broadly sideways, ranging between $2,145 and $2,165, and it is likely to break the consolidating trend after the Fed’s policy meeting.
The precious metal may continue its downside towards the 20-day Exponential Moving Average (EMA) at $2,097. After a wide divergence, the asset tends to face a mean-reversion move, which results in a price or a time correction.
On the downside, December 4 high near $2,145 and December 28 high at $2,088 will act as major support levels.
The 14-Relative Strength Index (RSI) retraces from its peak near 84.50, although the upside momentum is still active.
Gold FAQs
Gold has played a key role in human’s history as it has been widely used as a store of value and medium of exchange. Currently, apart from its shine and usage for jewelry, the precious metal is widely seen as a safe-haven asset, meaning that it is considered a good investment during turbulent times. Gold is also widely seen as a hedge against inflation and against depreciating currencies as it doesn’t rely on any specific issuer or government.
Central banks are the biggest Gold holders. In their aim to support their currencies in turbulent times, central banks tend to diversify their reserves and buy Gold to improve the perceived strength of the economy and the currency. High Gold reserves can be a source of trust for a country’s solvency. Central banks added 1,136 tonnes of Gold worth around $70 billion to their reserves in 2022, according to data from the World Gold Council. This is the highest yearly purchase since records began. Central banks from emerging economies such as China, India and Turkey are quickly increasing their Gold reserves.
Gold has an inverse correlation with the US Dollar and US Treasuries, which are both major reserve and safe-haven assets. When the Dollar depreciates, Gold tends to rise, enabling investors and central banks to diversify their assets in turbulent times. Gold is also inversely correlated with risk assets. A rally in the stock market tends to weaken Gold price, while sell-offs in riskier markets tend to favor the precious metal.
The price can move due to a wide range of factors. Geopolitical instability or fears of a deep recession can quickly make Gold price escalate due to its safe-haven status. As a yield-less asset, Gold tends to rise with lower interest rates, while higher cost of money usually weighs down on the yellow metal. Still, most moves depend on how the US Dollar (USD) behaves as the asset is priced in dollars (XAU/USD). A strong Dollar tends to keep the price of Gold controlled, whereas a weaker Dollar is likely to push Gold prices up.
The US Dollar Index (DXY) rises to 104.00. Economists at ING analyze Greenback’s outlook.
A lower housing starts figure could prove a mild Dollar negative
The US calendar is quiet ahead of Wednesday's FOMC meeting. With the market now just pricing 68 bps of Fed cuts this year, the FOMC could prove a mild Dollar negative. For the time being, however, the risk of the Fed Dots shifting to just 50 bps of cuts this year could continue to prompt some modest Dollar short covering.
One thing to mention regarding today's data is the housing starts. Democrats are starting to put pressure on the Fed over the locked-up housing market; no one wants to move home and lose a 3% mortgage rate. A lower housing starts figure could prove a mild Dollar negative.
DXY may well trade a 103.50-104.00 range today.
AUD/USD plunged after the Reserve Bank of Australia (RBA) dropped its tightening bias. Economists at BBH analyze the pair’s outlook.
RBA left the cash rate target at 4.35%
The RBA kept the cash rate target at 4.35% (no surprise) but unexpectedly dropped its tightening bias. The RBA tweaked its policy guidance from warning that’a further increase in interest rates cannot be ruled out’ to ‘the Board is not ruling anything in or out’. Accordingly, the tone of the RBA statement was more cautious noting that wage growth ‘appears to have peaked’ and ‘household consumption growth remains particularly weak amid high inflation and the rise in interest rates’.
AUD/USD can break below its February low (0.6443) if, as we expect, the Fed turns less dovish on Wednesday.
- Germany’s ZEW Economic Sentiment Index jumps to 31.7 in March.
- EUR/USD remains uninspired by the upbeat German and Eurozone ZEW surveys.
The headline German ZEW Economic Sentiment Index jumped from 19.9 in February to 31.7 in March. The market forecast a reading of 20.5.
However, the Current Situation Index improved from -81.7 to -80.5 in the reported month, beating estimates of -82.0.
The Eurozone ZEW Economic Sentiment Index came in at 33.5 in the same period, notably higher than the February reading of 25.0. The data surpassed the market expectations of 25.4.
Key points
Economic expectations for Germany are significantly improving.
At the same time, more than 80% of those surveyed anticipate that the ECB will cut interest rates in the next six months.
This could explain the more optimistic outlook for the German construction industry.
German export sector benefits from the increased economic expectations for China as well as the expected depreciation of the dollar against the Euro.
Assessment of the economic situation remains at a very low level.
This development somewhat diminishes the increased economic expectations.
Market reaction
The EUR/USD pair is languishing near intraday lows near 1.0840, despite upbeat ZEW surveys, down 0.28% on the day.
Euro FAQs
The Euro is the currency for the 20 European Union countries that belong to the Eurozone. It is the second most heavily traded currency in the world behind the US Dollar. In 2022, it accounted for 31% of all foreign exchange transactions, with an average daily turnover of over $2.2 trillion a day. EUR/USD is the most heavily traded currency pair in the world, accounting for an estimated 30% off all transactions, followed by EUR/JPY (4%), EUR/GBP (3%) and EUR/AUD (2%).
The European Central Bank (ECB) in Frankfurt, Germany, is the reserve bank for the Eurozone. The ECB sets interest rates and manages monetary policy. The ECB’s primary mandate is to maintain price stability, which means either controlling inflation or stimulating growth. Its primary tool is the raising or lowering of interest rates. Relatively high interest rates – or the expectation of higher rates – will usually benefit the Euro and vice versa. The ECB Governing Council makes monetary policy decisions at meetings held eight times a year. Decisions are made by heads of the Eurozone national banks and six permanent members, including the President of the ECB, Christine Lagarde.
Eurozone inflation data, measured by the Harmonized Index of Consumer Prices (HICP), is an important econometric for the Euro. If inflation rises more than expected, especially if above the ECB’s 2% target, it obliges the ECB to raise interest rates to bring it back under control. Relatively high interest rates compared to its counterparts will usually benefit the Euro, as it makes the region more attractive as a place for global investors to park their money.
Data releases gauge the health of the economy and can impact on the Euro. Indicators such as GDP, Manufacturing and Services PMIs, employment, and consumer sentiment surveys can all influence the direction of the single currency. A strong economy is good for the Euro. Not only does it attract more foreign investment but it may encourage the ECB to put up interest rates, which will directly strengthen the Euro. Otherwise, if economic data is weak, the Euro is likely to fall. Economic data for the four largest economies in the euro area (Germany, France, Italy and Spain) are especially significant, as they account for 75% of the Eurozone’s economy.
Another significant data release for the Euro is the Trade Balance. This indicator measures the difference between what a country earns from its exports and what it spends on imports over a given period. If a country produces highly sought after exports then its currency will gain in value purely from the extra demand created from foreign buyers seeking to purchase these goods. Therefore, a positive net Trade Balance strengthens a currency and vice versa for a negative balance.
- EUR/USD descends into mid 1.0800s ahead of Wednesday’s key Fed meeting.
- Speculation is mounting that the Fed could alter how many interest rate cuts it expects to make in 2024.
- ECB Vice-President De Guindos sees services inflation still too high for a rate cut.
EUR/USD declines by five hundredths of a percent into the mid 1.0800s on Tuesday, before the big event of the week in Forex, the Federal Reserve’s (Fed) March meeting policy announcement.
Although the Fed is not expected to change its interest rates at the meeting, there is a chance it could change its accompanying statement and forecasts. This could alter the outlook for interest rates and therefore the US Dollar (USD) valuation.
Interest rates, set by central banks, are a key driver for foreign exchange markets. Higher interest rates tend to support a currency by attracting greater inflows of foreign capital with the opposite being the tendency for lower rates.
EUR/USD weakens as investors monetary policy expectations change
EUR/USD downside over recent days has mainly been driven by renewed US Dollar strength, on the back of a combination of rising expectations there will be a delay in the Fed cutting interest rates and that there may be fewer cuts overall in 2024.
Speculation is mounting that the Federal Reserve will revise the forecasts in its accompanying notes to the meeting, the Summary of Economic Projections (SEP). In the previous SEP, Fed officials forecast three 25 basis points (0.25%) rate cuts in 2024 but some analysts now think there is a material risk that this could be revised down to two 25 bps cuts to reflect inflationary pressures remaining elevated. A revision down to two cuts could pressure EUR/USD lower.
“The summary of economic projections will be updated and contains hawkish risks in our assessment with the committee potentially projecting fewer cuts in 2024,” says David Doyle, head of economics at Macquarie, in a note about the Fed meeting.
The market continues to see June as the first month when the Fed is more likely than not to make its first interest rate cut, but over the last few days July has gained in popularity. Current market-based probabilities, based on the CME FedWatch Tool, favor one or more cuts by June with a 55.1% chance, and by July with a 73.7% probability. The June figure has been trending down.
“Our view on FOMC policy remains that the first 25 bps cut will occur in July,” says Macquarie’s Doyle. “ In 2024 we anticipate 50 bps of cuts and a further 50 bps in 2025,” he adds.
Services inflation too high says De Guindos
In Europe, a similar debate is going on about when to begin cutting interest rates. On Tuesday, Vice-President of the European Central Bank (ECB), Luis de Guindos, said “we have to wait,” because “services inflation” remains too high.
De Guindos said he thought June was the right time to review cutting interest rates. His views fall in line with that of the ECB President Christine Lagarde and several other officials.
Although a faction within the ECB led by Francois Villeroy de Galhau appeared to be pushing for a spring rate cut earlier in the month, they appear to be outnumbered by officials favoring June.
The EUR/USD seemed to find some support on Monday after the Eurozone Trade Balance data showed a healthy surplus for the region, and final revisions for inflation data for February came out in line with flash estimates.
Data out on Tuesday is unlikely to move the dial much. In Europe, German and Eurozone ZEW Survey results are scheduled for publication. In the US, Building Permits (a leading indicator) and Housing Starts will be released later in the day.
Technical Analysis: EUR/USD falls below key level, now vulnerable to more declines
EUR/USD penetrates below the level of the 1.0867 swing lows on Tuesday, and by doing so probably reverses the direction of the short-term uptrend. Now the odds favor more losses.
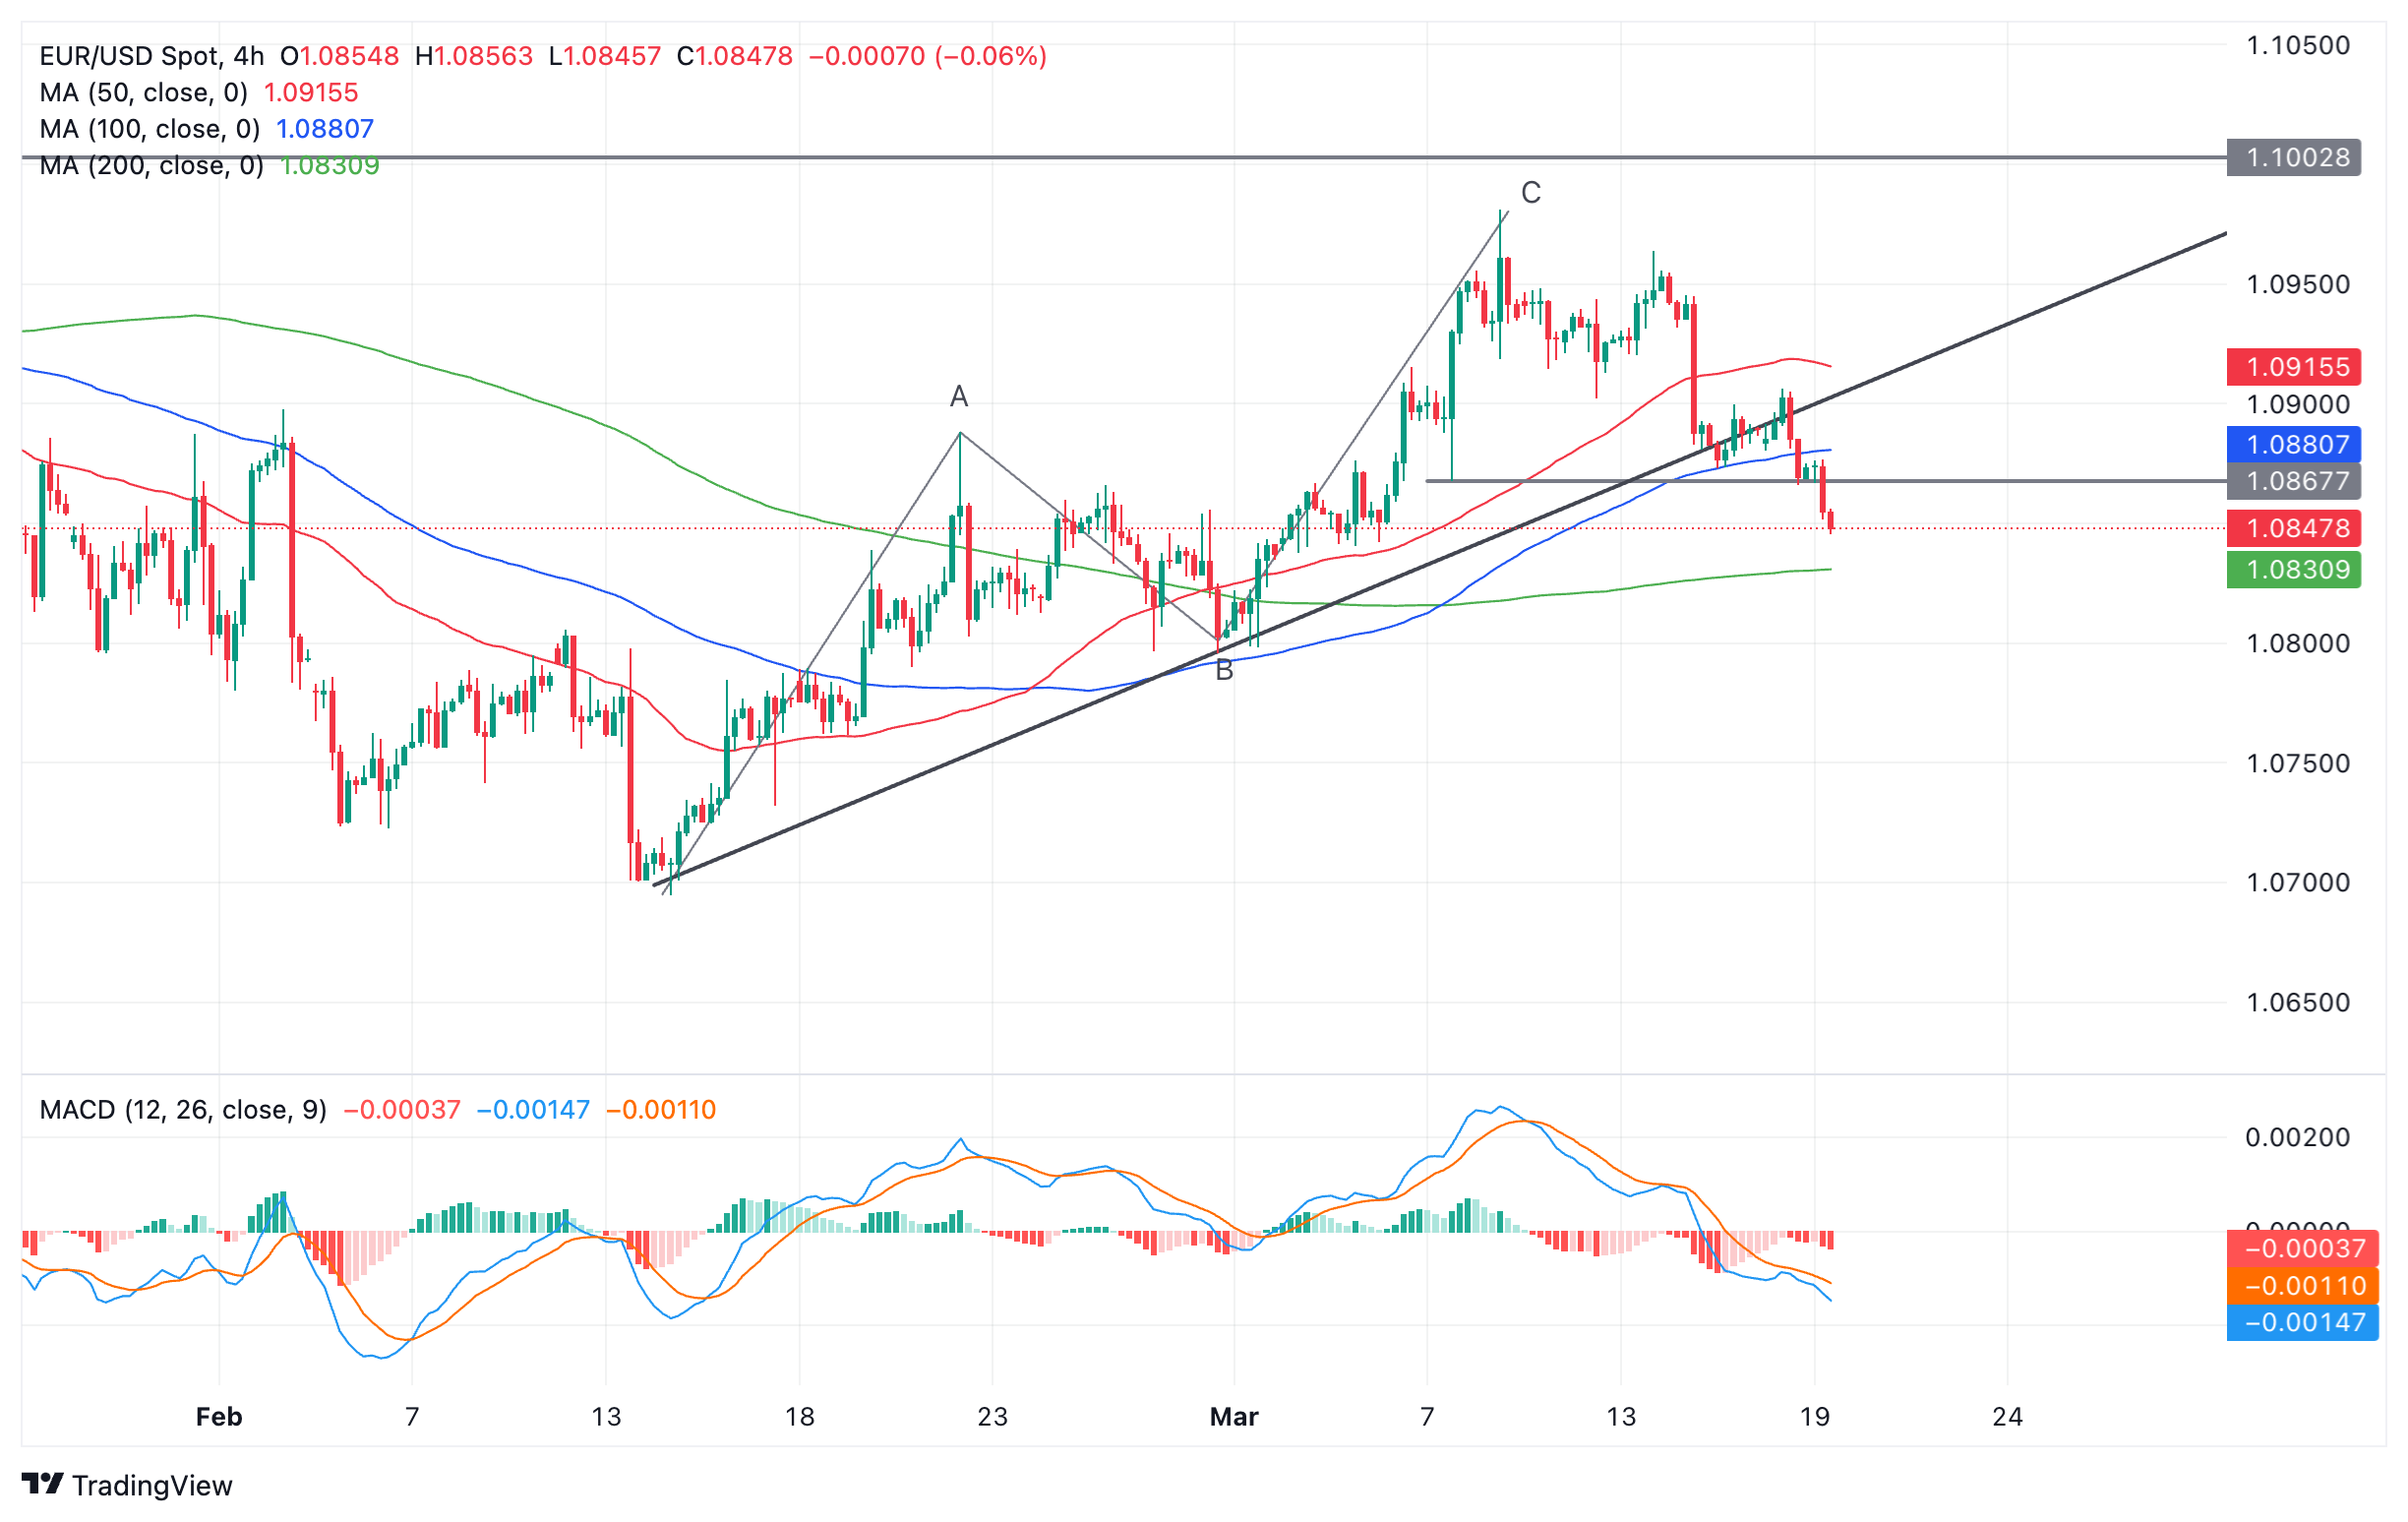
Euro versus US Dollar: 4-hour chart
A new series of declining peaks and troughs has begun since the March 8 highs. Subject to fundamentals, the price will probably continue to fall to the next key support level at roughly 1.0800 – the lows of wave B of the Measured Move that unfolded in February and early March.
The daily chart below is showing the Moving Average Convergence/ Divergence (MACD) momentum indicator crossing over the signal line, giving a bearish sell signal, and adding further evidence to a change of trend.
However, it is also flagging up a few key barriers to progress lower in the form of dynamic support from the red 50-day and then the green 200-day Simple Moving Averages (SMA).
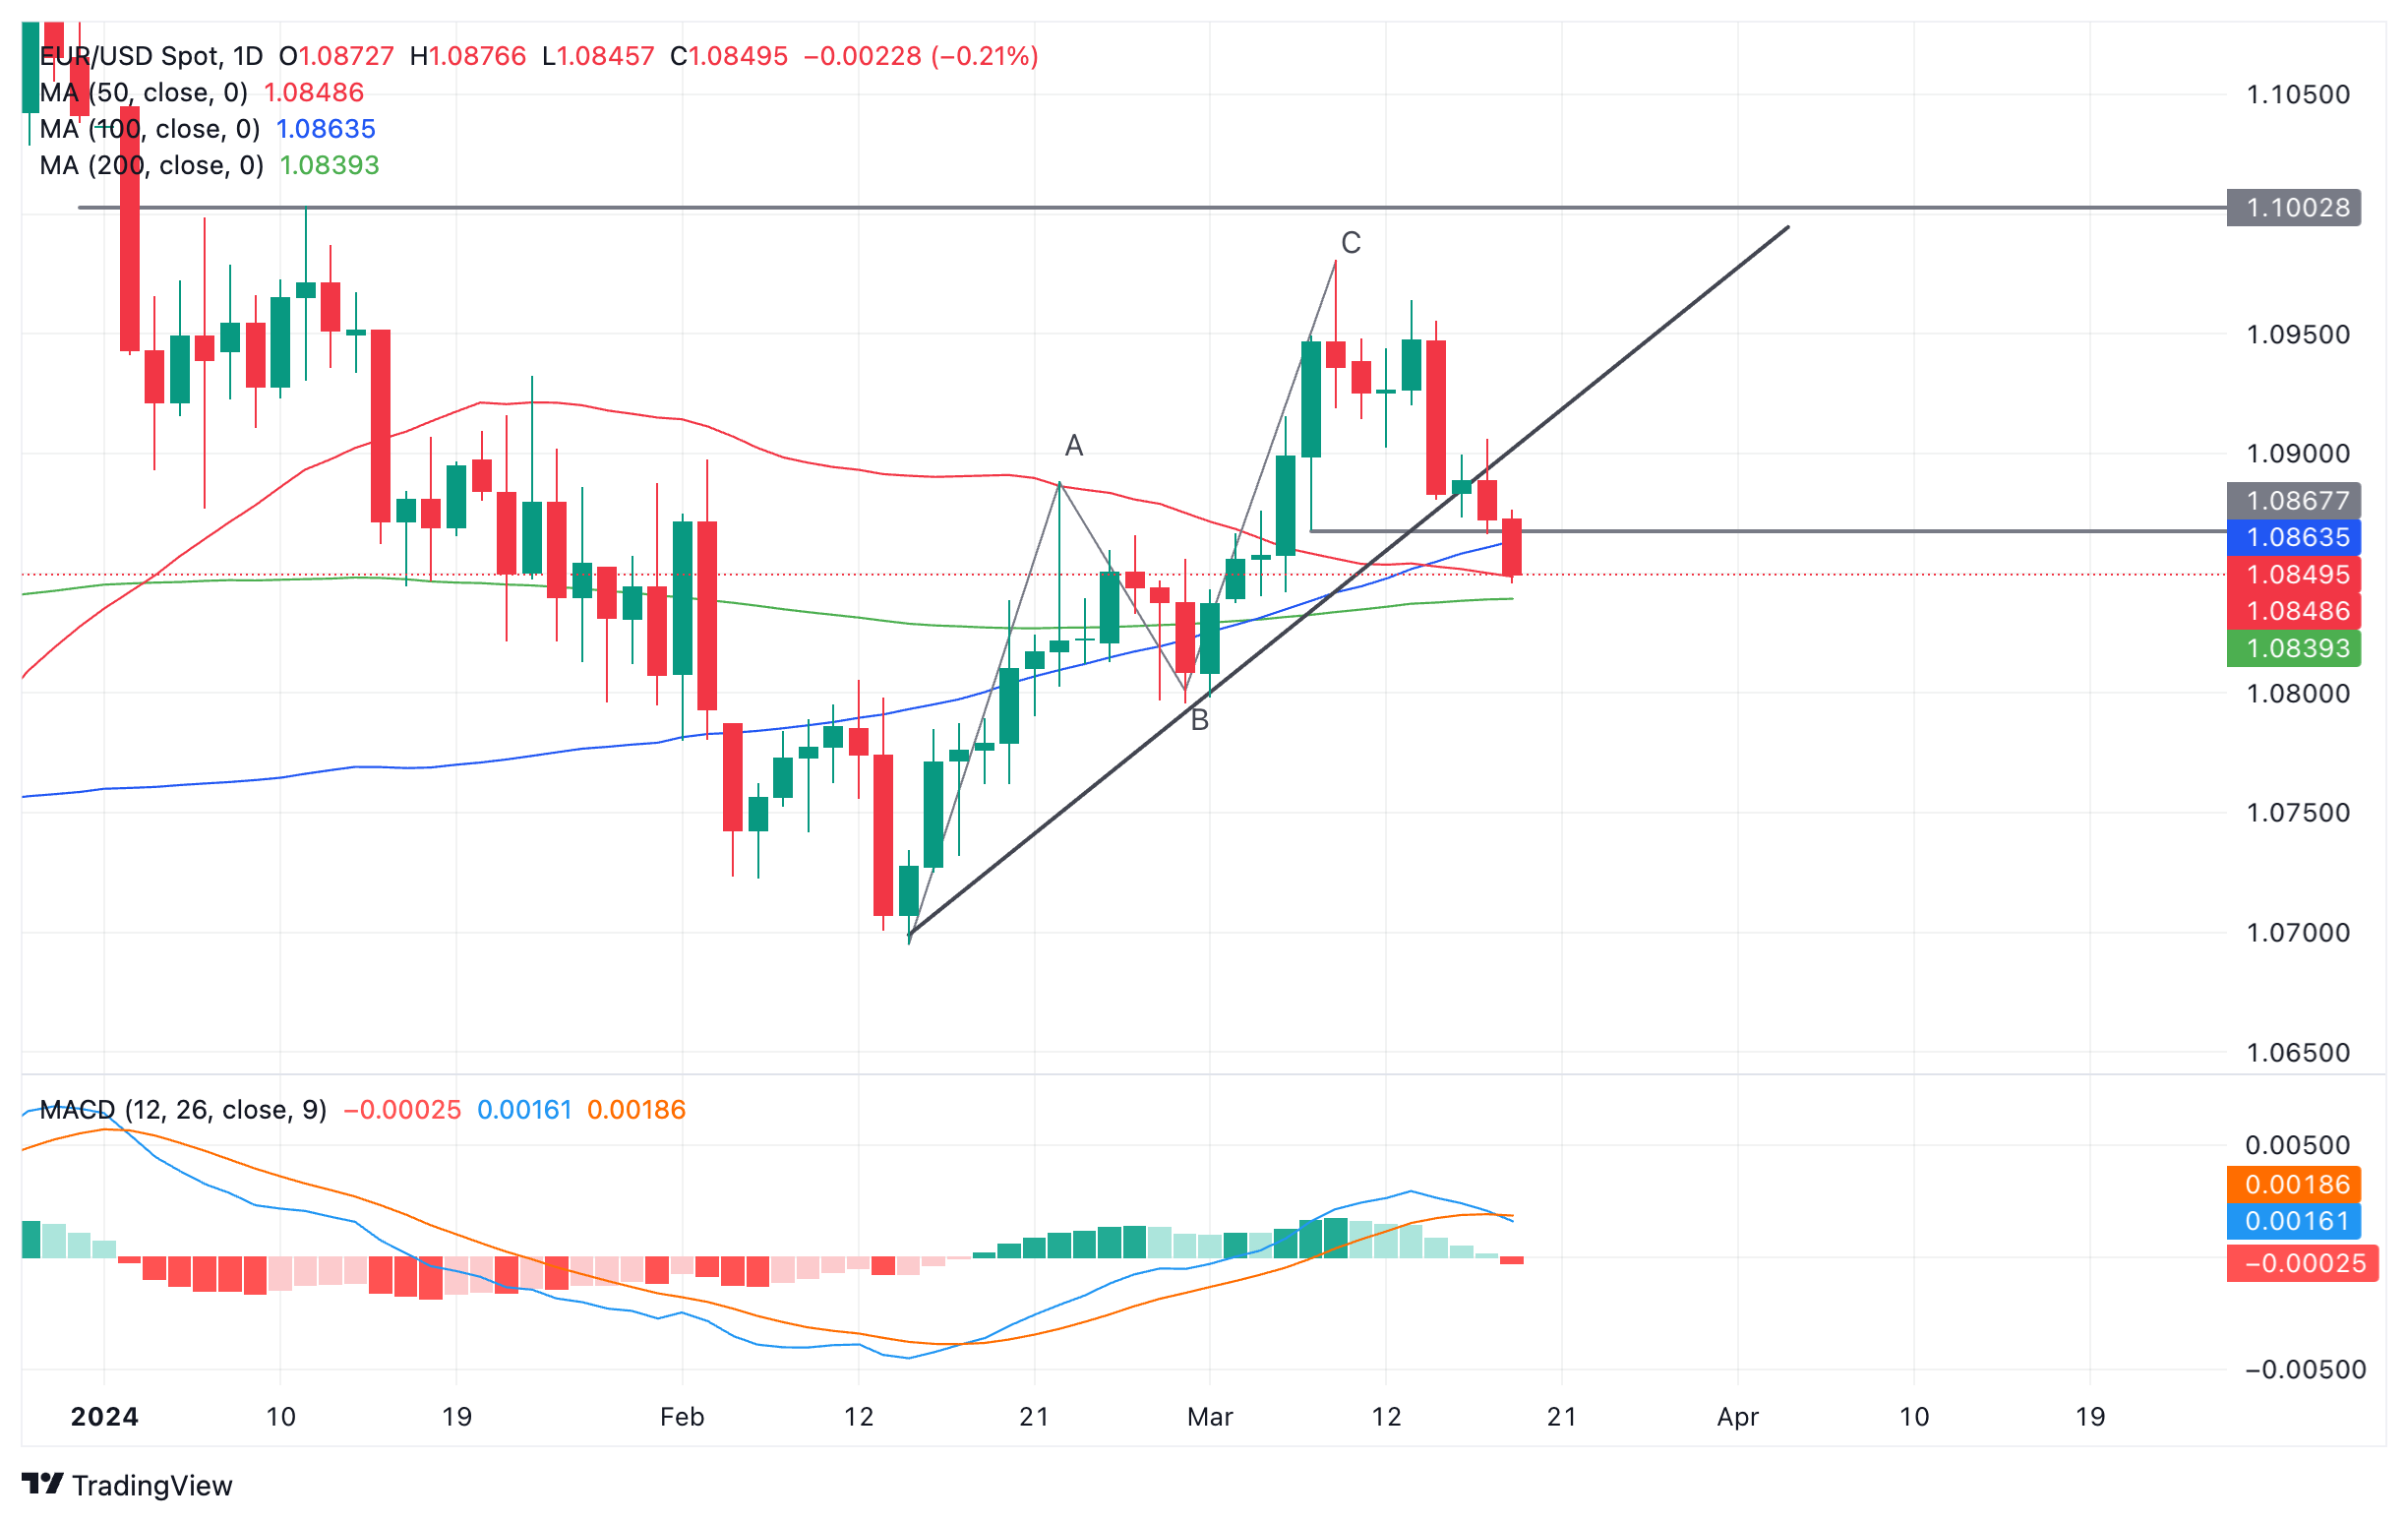
Euro versus US Dollar: Daily chart
The 50-day SMA is situated at 1.0848 and the 200-day SMA at 1.0839 and both are likely to be tough support levels to crack. Whether bears can push through, may well depend on the outcome of the up-and-coming Fed meeting.
Euro FAQs
The Euro is the currency for the 20 European Union countries that belong to the Eurozone. It is the second most heavily traded currency in the world behind the US Dollar. In 2022, it accounted for 31% of all foreign exchange transactions, with an average daily turnover of over $2.2 trillion a day. EUR/USD is the most heavily traded currency pair in the world, accounting for an estimated 30% off all transactions, followed by EUR/JPY (4%), EUR/GBP (3%) and EUR/AUD (2%).
The European Central Bank (ECB) in Frankfurt, Germany, is the reserve bank for the Eurozone. The ECB sets interest rates and manages monetary policy. The ECB’s primary mandate is to maintain price stability, which means either controlling inflation or stimulating growth. Its primary tool is the raising or lowering of interest rates. Relatively high interest rates – or the expectation of higher rates – will usually benefit the Euro and vice versa. The ECB Governing Council makes monetary policy decisions at meetings held eight times a year. Decisions are made by heads of the Eurozone national banks and six permanent members, including the President of the ECB, Christine Lagarde.
Eurozone inflation data, measured by the Harmonized Index of Consumer Prices (HICP), is an important econometric for the Euro. If inflation rises more than expected, especially if above the ECB’s 2% target, it obliges the ECB to raise interest rates to bring it back under control. Relatively high interest rates compared to its counterparts will usually benefit the Euro, as it makes the region more attractive as a place for global investors to park their money.
Data releases gauge the health of the economy and can impact on the Euro. Indicators such as GDP, Manufacturing and Services PMIs, employment, and consumer sentiment surveys can all influence the direction of the single currency. A strong economy is good for the Euro. Not only does it attract more foreign investment but it may encourage the ECB to put up interest rates, which will directly strengthen the Euro. Otherwise, if economic data is weak, the Euro is likely to fall. Economic data for the four largest economies in the euro area (Germany, France, Italy and Spain) are especially significant, as they account for 75% of the Eurozone’s economy.
Another significant data release for the Euro is the Trade Balance. This indicator measures the difference between what a country earns from its exports and what it spends on imports over a given period. If a country produces highly sought after exports then its currency will gain in value purely from the extra demand created from foreign buyers seeking to purchase these goods. Therefore, a positive net Trade Balance strengthens a currency and vice versa for a negative balance.
EUR/CHF is flying high at 0.9660. Economists at ING analyze the Swiss Franc (CHF) outlook ahead of the SNB meeting on Thursday.
EUR/USD could come lower on a major European central bank cutting rates
Data released today showed that the Swiss National Bank was still selling FX in the fourth quarter of last year. It might have flipped to FX buying this quarter, but confirmation of that will not emerge until late June.
In focus, however, is Thursday's Swiss National Bank rate meeting, where some are looking for the first rate cut. That is not our house view, but we do not rule it out given that the SNB only meets four times per year compared to eight times for the ECB.
A surprise SNB cut would likely carry EUR/CHF over 0.9700 and potentially USD/CHF sharply higher since EUR/USD could come lower on a major European central bank cutting rates.
- WTI price corrects after reaching a four-month high of $82.46 marked on Monday.
- Russia has increased its exports in reaction to Ukrainian attacks on the nation's oil infrastructure.
- Saudi Aramco CEO Amin Nasser rejected the idea of phasing out fossil fuels, describing it as a fantasy.
West Texas Intermediate (WTI) oil price slightly retreats to near $81.80 per barrel during European trading hours on Tuesday. This decline is attributed to increasing supply from Russia, coupled with moderating demand for jet fuel and cautious trading ahead of the Federal Reserve's (Fed) decision on interest rates. Russia has escalated its exports in response to Ukrainian attacks on the country's oil infrastructure, contributing to continued downward pressure on oil prices.
However, analysts highlighted Ukraine's drone strikes on three Russian oil refineries over the weekend, which account for at least 10% of Russia’s total oil processing capacity. Additionally, Ukraine announced on Sunday its intention not to extend a five-year agreement with Russia's Gazprom regarding the transit of Russian gas to Europe.
Iraq has announced plans to reduce its Crude exports to 3.3 million barrels per day (bpd) in the coming months to offset exceeding its OPEC+ quota since January. Additionally, Saudi Arabia's Crude exports have decreased for the second consecutive month, dropping to 6.297 million bpd in January compared to 6.308 million bpd in December.
Saudi Aramco CEO Amin Nasser stated on Monday that global oil demand is not expected to peak for some time. He emphasized the need for policymakers to ensure sufficient investment in oil and gas to meet consumption, dismissing the notion of phasing out fossil fuels as a fantasy.
Nasser projected that oil demand will reach a new record of 104 million bpd in 2024. Despite increasing investments, alternative energy sources have yet to significantly displace hydrocarbons on a large scale.
AUD/USD dropped after the Reserve Bank of Australia (RBA) removed its tightening bias. Economists at Commerzbank analyze Aussie’s outlook.
RBA deletes explicit reference to further tightening
Interest rates were left unchanged at 4.35%. At the same time, RBA removed its hint that further tightening might be appropriate.
The next interest rate move is likely to be a rate cut. However, this does not mean that such a cut will take place in the near future. The RBA also pointed out that inflation in services is much more persistent. And high wage growth is only consistent with the inflation target if productivity growth picks up. In our view, the RBA is therefore maintaining its cautious approach.
It is likely to be several months before the first rate cut is announced. The RBA is unlikely to cut rates until inflation falls more significantly. This is unlikely to happen until after the Fed, so the Aussie should be able to make gains again in the coming weeks.
European Central Bank (ECB) policymaker Pablo Hernandez de Cos said on Tuesday, "we could start cutting rates in June but it is conditional on the data.”
Further comments
Risks to inflation outlook are balanced.
But risks to growth projections are clearly to the downside.
Market reaction
EUR/USD is testing lows near 1.0845, down 0.23% on the day, following the above comments.
Euro FAQs
The Euro is the currency for the 20 European Union countries that belong to the Eurozone. It is the second most heavily traded currency in the world behind the US Dollar. In 2022, it accounted for 31% of all foreign exchange transactions, with an average daily turnover of over $2.2 trillion a day. EUR/USD is the most heavily traded currency pair in the world, accounting for an estimated 30% off all transactions, followed by EUR/JPY (4%), EUR/GBP (3%) and EUR/AUD (2%).
The European Central Bank (ECB) in Frankfurt, Germany, is the reserve bank for the Eurozone. The ECB sets interest rates and manages monetary policy. The ECB’s primary mandate is to maintain price stability, which means either controlling inflation or stimulating growth. Its primary tool is the raising or lowering of interest rates. Relatively high interest rates – or the expectation of higher rates – will usually benefit the Euro and vice versa. The ECB Governing Council makes monetary policy decisions at meetings held eight times a year. Decisions are made by heads of the Eurozone national banks and six permanent members, including the President of the ECB, Christine Lagarde.
Eurozone inflation data, measured by the Harmonized Index of Consumer Prices (HICP), is an important econometric for the Euro. If inflation rises more than expected, especially if above the ECB’s 2% target, it obliges the ECB to raise interest rates to bring it back under control. Relatively high interest rates compared to its counterparts will usually benefit the Euro, as it makes the region more attractive as a place for global investors to park their money.
Data releases gauge the health of the economy and can impact on the Euro. Indicators such as GDP, Manufacturing and Services PMIs, employment, and consumer sentiment surveys can all influence the direction of the single currency. A strong economy is good for the Euro. Not only does it attract more foreign investment but it may encourage the ECB to put up interest rates, which will directly strengthen the Euro. Otherwise, if economic data is weak, the Euro is likely to fall. Economic data for the four largest economies in the euro area (Germany, France, Italy and Spain) are especially significant, as they account for 75% of the Eurozone’s economy.
Another significant data release for the Euro is the Trade Balance. This indicator measures the difference between what a country earns from its exports and what it spends on imports over a given period. If a country produces highly sought after exports then its currency will gain in value purely from the extra demand created from foreign buyers seeking to purchase these goods. Therefore, a positive net Trade Balance strengthens a currency and vice versa for a negative balance.
- Silver extends its recent pullback from the YTD top, though the downside seems limited.
- The setup favours support prospects for the emergence of dip-buying near mid-$24.00s.
- Weakness below the latter might prompt fresh selling and pave the way for deeper losses.
Silver (XAG/USD) remains under some selling pressure for the second successive day on Tuesday and retreats further from the YTD peak, around the $25.45 region touched last week. The white metal continues losing ground through the first half of the European session and drops to a fresh daily low, around the $24.85-$24.80 area in the last hour.
From a technical perspective, the recent breakout through the very important 200-day Simple Moving (SMA) and a subsequent strength beyond the $24.50-$24.60 horizontal barrier favour bullish traders. Moreover, oscillators on the daily chart – though have been retreating from higher levels – are still holding comfortably in the positive territory. This, in turn, supports prospects for the emergence of some dip-buying and warrants some caution before positioning for any further depreciating move.
Meanwhile, the $24.60-$24.50 resistance breakpoint now seems to protect the immediate downside. Any further decline could be seen as a buying opportunity and is more likely to remain limited near the $24.15-$24.10 region. This is followed by the $24.00 round-figure mark, which if broken decisively might shift the bias in favour of bearish traders. The XAG/USD might then accelerate the corrective decline back towards the 200-day SMA support, currently pegged near the $23.35-$23.30 region.
On the flip side, momentum back above the $25.00 psychological mark might confront some resistance near the $25.20 region ahead of the YTD peak, around the $25.45 area. Some follow-through buying will reaffirm the near-term positive outlook and allow the XAG/USD to aim back to challenge the December 2023 swing high – levels just ahead of the $26.00 round figure. The latter should act as a pivotal point, which if cleared will pave the way for an extension of over a two-week-old uptrend.
Silver daily chart
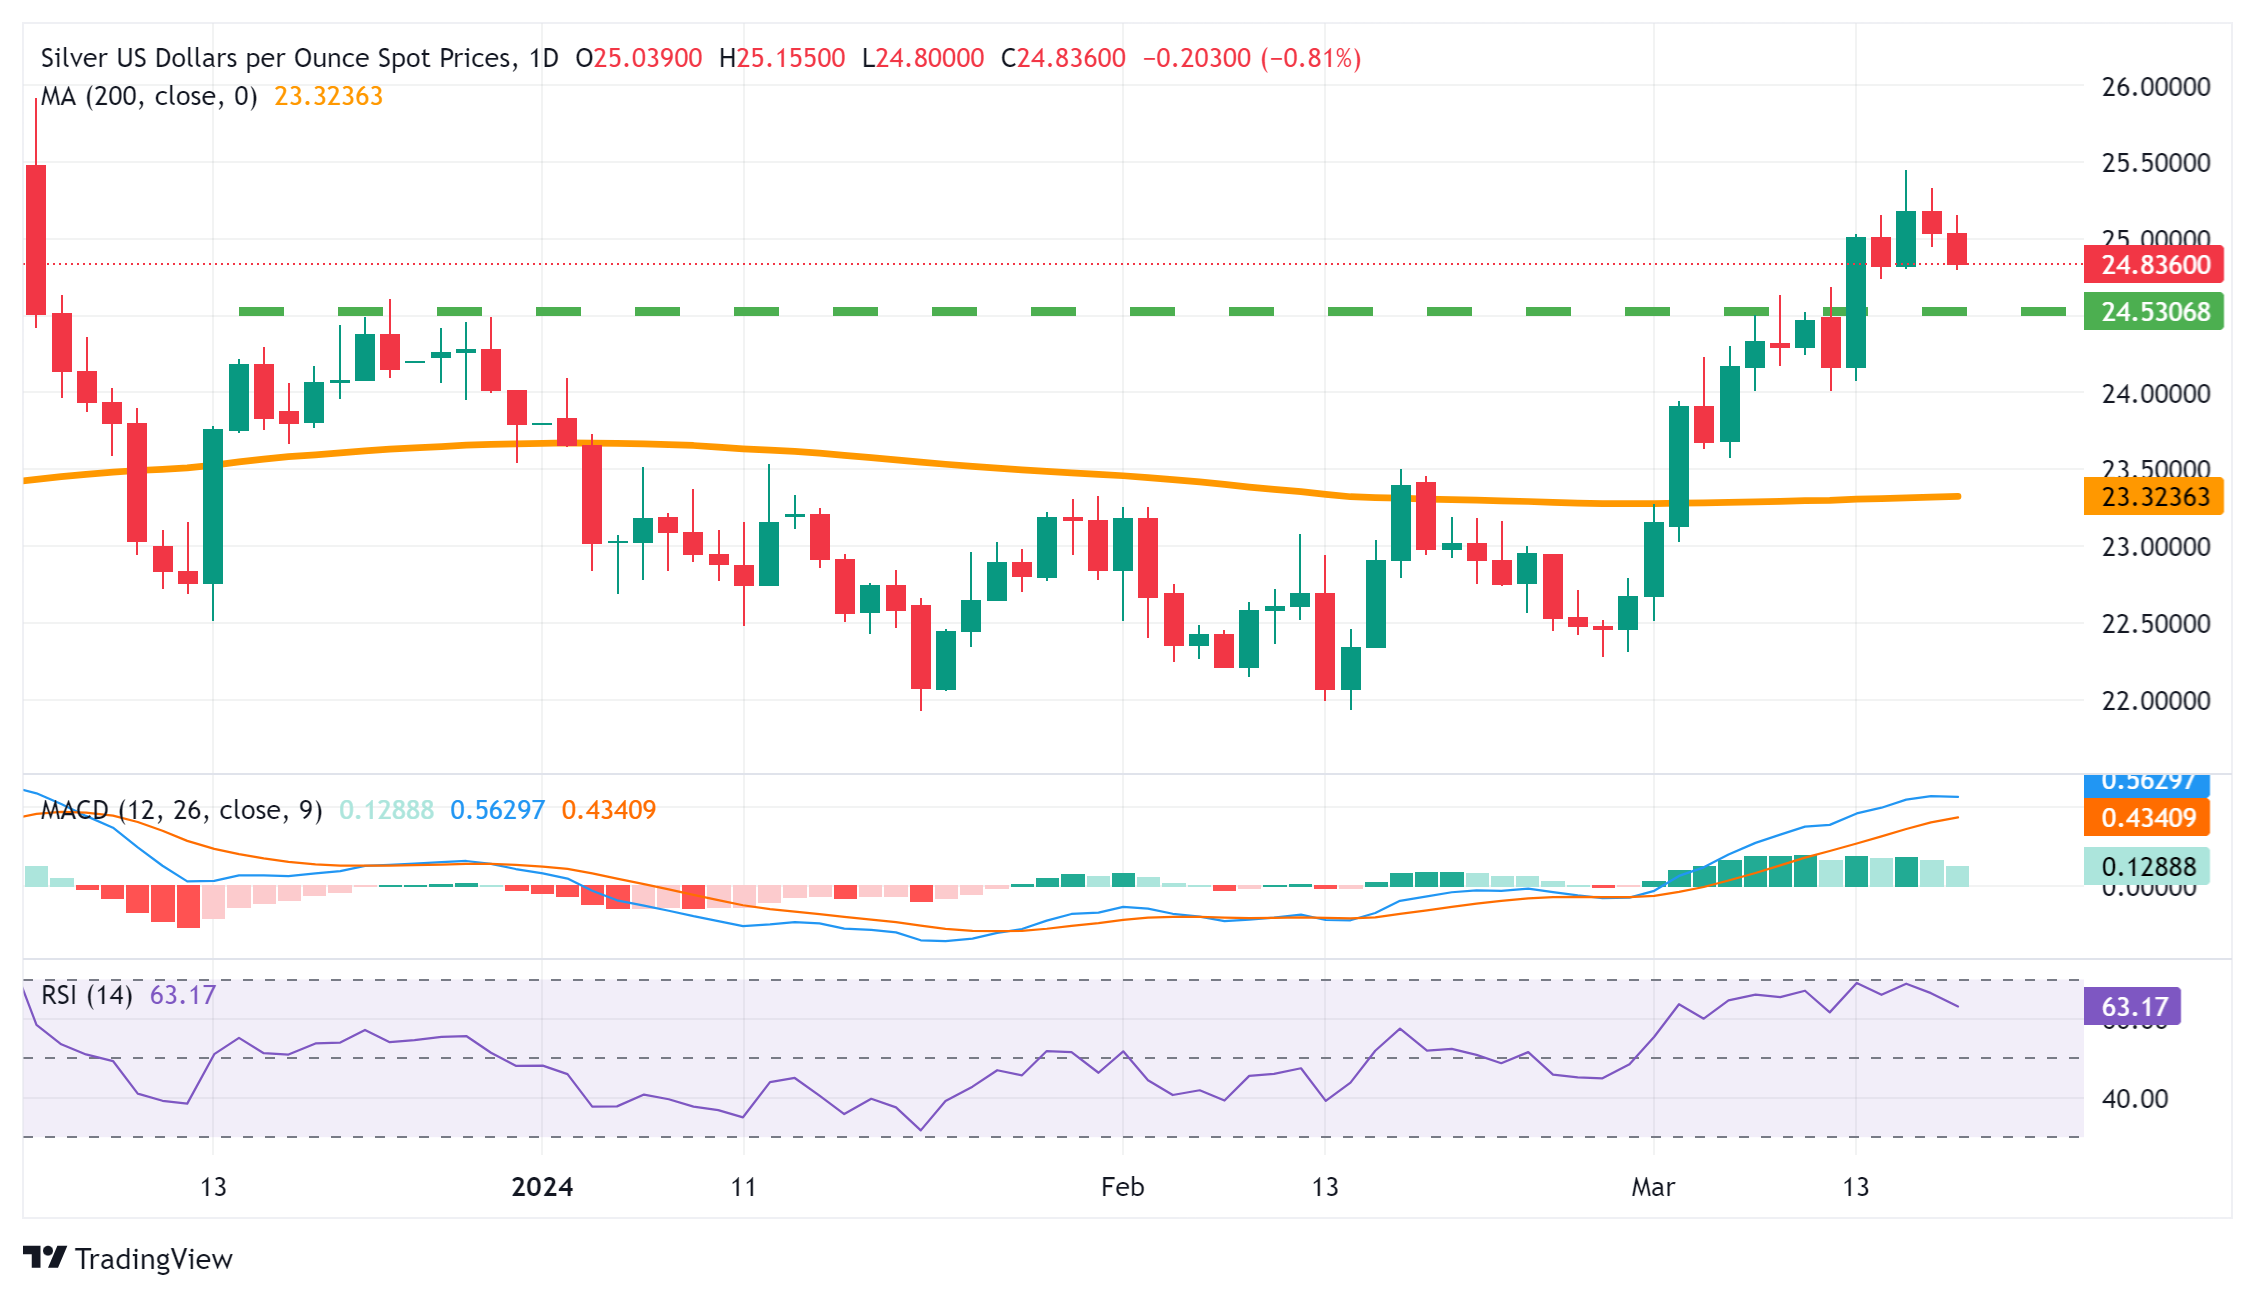
EUR/USD remains under bearish pressure. Economists at ING analyze the pair’s outlook.
EUR will likely ignore ZEW figures
EUR/USD has softened a little, which seems to be more in line with short-term interest rate differentials. At -135 bps, two-year EUR:USD swap rate differentials remain at their widest levels for the year.
We doubt a marginally better German ZEW number today will move the needle much on ECB rate cut expectations or the Euro and it looks like EUR/USD will struggle to get back above 1.0900 short term.
- USD/CAD climbs above 1.3550 amid uncertainty ahead of key events.
- Canadian inflation is forecasted to have accelerated in February.
- Investors will keenly focus on the Fed’s interest rate guidance.
The USD/CAD pair jumps to 1.3550 in Tuesday’s European session after breaking above the two-day consolidation formed in a range of 1.3510-1.3550. The Loonie asset advances as uncertainty ahead of key events has dampened risk appetite of market participants.
S&P500 futures have generated nominal losses in the London session, indicating a risk-aversion mood. The US Dollar Index (DXY) continues its winning spell for the fourth trading session and refreshes its weekly high at 103.87 amid uncertainty ahead of the interest rate decision by the Federal Reserve (Fed), which will be announced on Wednesday.
The CME FedWatch tool shows that the central bank is certain to keep interest rates unchanged in the range of 5.25%-5.50%. Investors will focus on cues about rate cuts by the Fed, which are currently expected in the June policy meeting.
Meanwhile, the next move in the Canadian Dollar will be guided by Canada’s Consumer Price Index (CPI) data for February, which will be published at 12:30 GMT. Annual headline inflation is expected to have grown at a higher pace of 3.1% compared to 2.9% recorded for January.
USD/CAD approaches the horizontal resistance of the Ascending Triangle pattern formed on a daily timeframe, plotted from December 7 high at 1.3620. The upward-sloping border of the aforementioned pattern is placed from December 27 low at 1.3177. The chart pattern exhibits a sharp volatility contraction.
The near-term appeal is bullish, as the 20-day Exponential Moving Average (EMA) near 1.3520 continues to support the US Dollar bulls.
The 14-period Relative Strength Index (RSI) oscillates inside the 40.00-60.00 range, indicating indecisiveness among investors.
The Loonie asset would observe a fresh upside if it breaks above December 7 high at 1.3620. This will drive the asset towards May 26 high at 1.3655, followed by the round-level resistance of 1.3700.
On the flip side, a downside move below February 22 low at 1.3441 would expose the asset to February 9 low at 1.3413. A breakdown below the latter would extend downside towards January 15 low at 1.3382.
USD/CAD daily chart
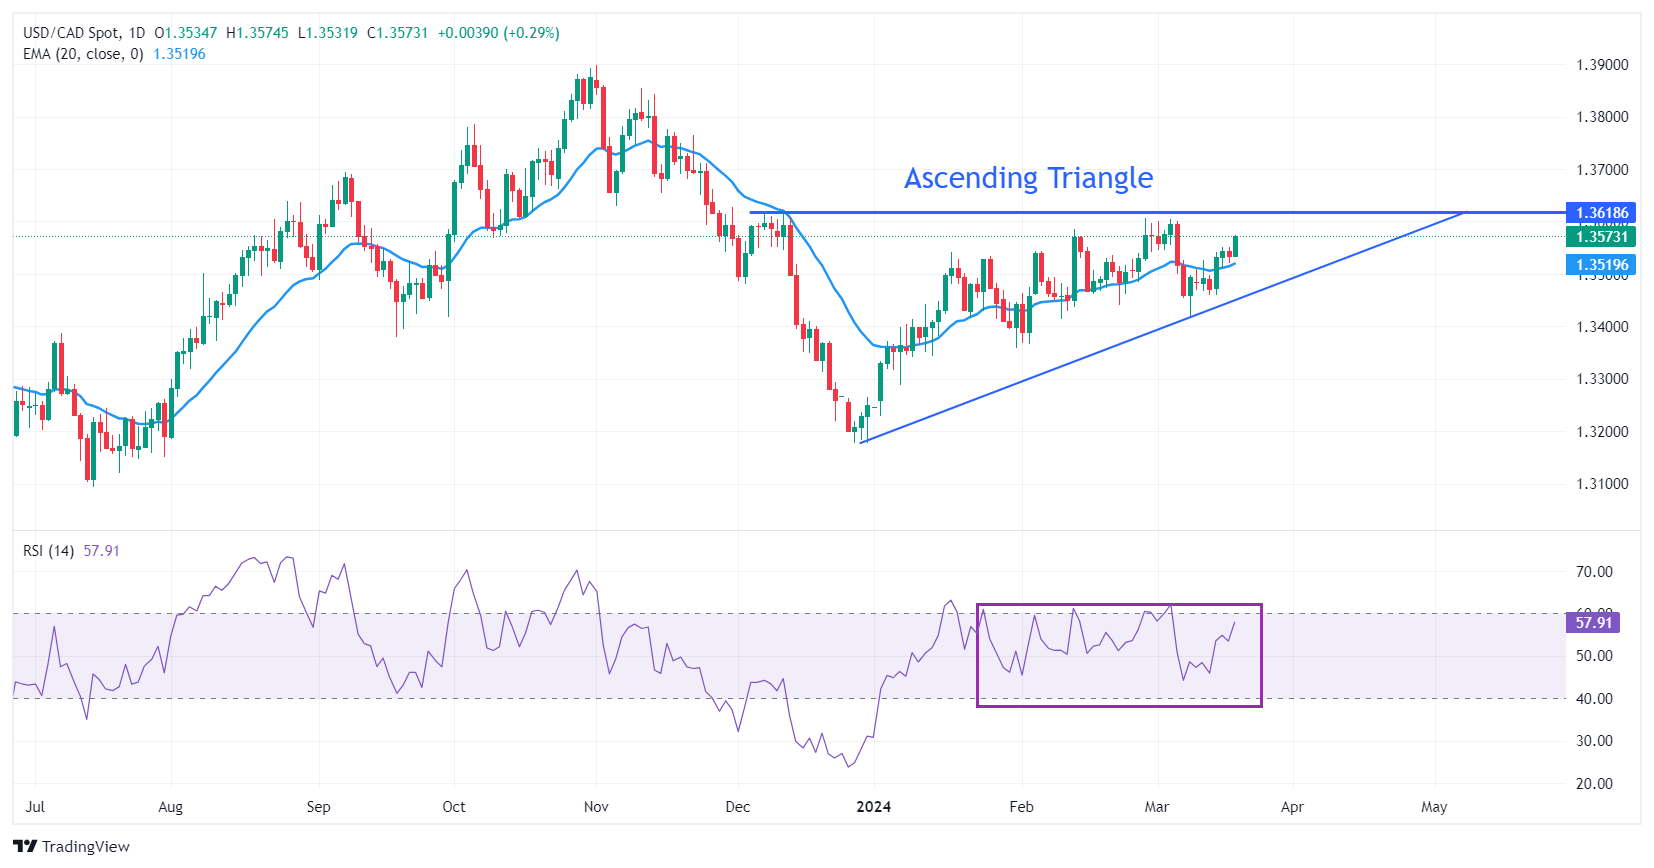
- USD/MXN gains ground on speculation of the Fed’s extending policy tightening.
- Banxico is expected to reduce its interest rate to 11.0% from 11.25%.
- US Dollar strengthens on improved US Treasury yields.
USD/MXN continues its upward trend, reaching near 16.90 and marking gains for the fourth consecutive session on Tuesday. Traders are awaiting Private Spending data on Tuesday and Retail Sales figures on Wednesday from Mexico. Furthermore, attention is on the Bank of Mexico's (Banxico) interest rate decision on Friday, with expectations of a 25 basis points reduction.
In Banxico's quarterly report, officials acknowledged progress in inflation control and stressed the importance of avoiding premature interest rate cuts. However, recent speeches and media appearances indicate a division within Banxico's Governing Council. Governor Victoria Rodriguez Ceja, Omar Mejia Castelazo, and Galia Borja Gomez lean dovish, while Jonathan Heath and Irene Espinosa Cantellano take a more hawkish stance.
An economic slowdown in Mexico stands out as the primary event that could prompt Banxico's first rate cut, as the central bank has revised its economic projections downward. Despite Mexico's Industrial Production surging over twelve months, surpassing December's stagnant performance, this could bolster the hawkish stance of Banxico.
Meanwhile, the US Dollar (USD) strengthens to near 103.90, driven by improved US Treasury yields at 4.73% and 4.32% for 2-year and 10-year US bond coupons, respectively. Investors eagerly await the interest rate decision from the US Federal Reserve (Fed), expected to be announced on Wednesday. The Federal Reserve (Fed) is expected to maintain its elevated interest rates in response to recent inflationary pressures.
The Bank of Japan (BoJ) has finally ended its eight-year reign of negative interest rates. USD/JPY surged above 150.00 after the decision. Economists at ING analyze Yen’s outlook.
BoJ lift-off underwhelms the Yen
Gone are the negative interest rates, yield curve control and purchases of ETFs and Real Estate Investment Trusts. Instead, excess reserves at the BoJ will now be remunerated at 0.10% and the BoJ will target the overnight call rate (its main policy rate now) in a range of 0.0%-0.1%.
The Yen sold off on the headlines that the BoJ would keep an accommodative policy for a while, but recent headlines are suggesting that further rate hikes may be forthcoming now that the virtuous link between wages and prices has been confirmed.
The problem for the Yen, however, is that volatility remains exceptionally low and the carry trade exceptionally popular. USD/JPY may well trade in a 150.00-152.00 range for the time being (locals in Tokyo think the BoJ will not intervene to sell USD/JPY until 155.00), and a lower USD/JPY will have to be led from the Dollar side.
The Japanese Yen (JPY) reacted negatively after the Bank of Japan (BoJ) announced an end to its negative rate policy. Economists at Commerzbank analyze Yen’s outlook.
Bank of Japan delivers and still disappoints
The BoJ actually raised interest rates for the first time since 2007. The short-term policy rate is now set between 0 and 0.1%. At the same time, the target for long-term JGBs (the YCC) was abandoned, although the BoJ still intends to buy a similar number of JGBs per month as before, just without an explicit target. On the other hand, it stops buying ETFs and REITs and purchases of commercial paper and corporate bonds will be gradually reduced and stopped completely in 12 months.
A symbolic exit from the negative interest rate policy is unlikely to give the Yen much of a boost. After all, there have already been a number of exceptions to the negative interest rate policy, and the latest rate hike was only a few basis points. Only if the BoJ hints at further rate hikes, which would indicate a real rate hike cycle, will the Yen benefit more. Anything else has been priced in after the statements of the past few weeks.
While the BoJ did take a first step away from its ultra-expansive monetary policy, it was not a clear hawkish turn, but rather a dovish rate hike. The key now is likely to be inflation. If there are further signs that inflation is persistently stuck at the BoJ's 2% target, further steps to normalize monetary policy could follow.
However, we remain skeptical that inflation will really stay high. After all these years of extremely low inflation, we think it would have been better to wait a bit longer for this wage-price spiral to anchor inflation sustainably at the 2% target. After today's decision, there is still a risk that the BoJ will have to stop normalizing its monetary policy sooner rather than later. This should be kept in mind.
- The Pound Sterling refreshes a weekly low near 1.2700 amid a risk-averse mood.
- The UK Inflation data will influence market expectations for BoE rate cuts in August.
- Investors see the Fed and the BoE holding interest rates at their current levels.
The Pound Sterling (GBP) continues its losing streak for the fourth trading session on Tuesday as investors turn risk-averse in a big central banks’ week. The GBP/USD pair prints a fresh weekly low ahead of the interest rate decisions by the Federal Reserve (Fed) and the Bank of England (BoE). As both central banks are anticipated to maintain the status quo, investors will majorly focus on clues about the interest rate outlook.
In the United Kingdom, investors will scrutinize the BoE’s monetary policy statement to look for any cues about the timing for interest-rate cuts. UK headline inflation has come down significantly from the double-digit figures to 4%, mainly because the BoE has raised and kept interest rates at high levels for more than two years. Maintaining higher interest rates has also led to a sharp decline in economic growth, uplifting expectations for rate cuts in August.
Before the BoE policy decision, market participants will focus on the UK Consumer Price Index (CPI) data for February, which will be published on Wednesday. Expectations for the BoE to lower interest rates sooner could escalate if the inflation data turns out softer than expected. On the contrary, stubborn data will deepen uncertainty over rate cuts. The Pound Sterling tends to strengthen when inflation data comes in higher than expected, suggesting BoE policymakers will maintain a hawkish narrative.
Daily digest market movers: Pound Sterling dips amid cautious market mood
- The Pound Sterling drops to the round-level support of 1.2700 as dismal market sentiment has dampened the appeal of risk-sensitive assets. The risk appetite of investors has diminished ahead of a slew of central bank meetings this week. "Investors are uncertain that the Fed will start cutting rates in June, as markets previously widely expected, due to recently hot inflation data. This has weakened the appeal for risk assets.
- The demand for safe-haven assets has improved significantly. The US Dollar Index (DXY), which measures the US Dollar’s value against six rival currencies, continues its winning streak for the fourth trading session on Tuesday. The USD Index jumped to 103.80 on hopes that the Fed will maintain hawkish rhetoric after keeping interest rates unchanged in the range of 5.25%-5.50% on Wednesday
- This week, the Pound Sterling will be guided by the Bank of England’s interest rate decision, which will be announced on Thursday. The BoE is widely anticipated to keep interest rates unchanged at 5.25%. Therefore, investors will keenly focus on cues about when the BoE is expecting to start reducing interest rates. Currently, the market expects the BoE to begin reducing interest rates in its August policy meeting.
- The market expectations for a rate cut in August are expected to be influenced by the United Kingdom CPI data for February, which will be announced on Wednesday. The annual headline inflation is forecast to have fallen to 3.6% against 4.0% in January. In the same period, core inflation – which excludes volatile food and energy prices – is forecast to have decelerated to 4.6% from 5.1%. For the monthly headline CPI, economists have forecasted a sharp growth of 0.7% after declining by by 0.6% in January.
Technical Analysis: Pound Sterling drops below 20-EMA to 1.2700
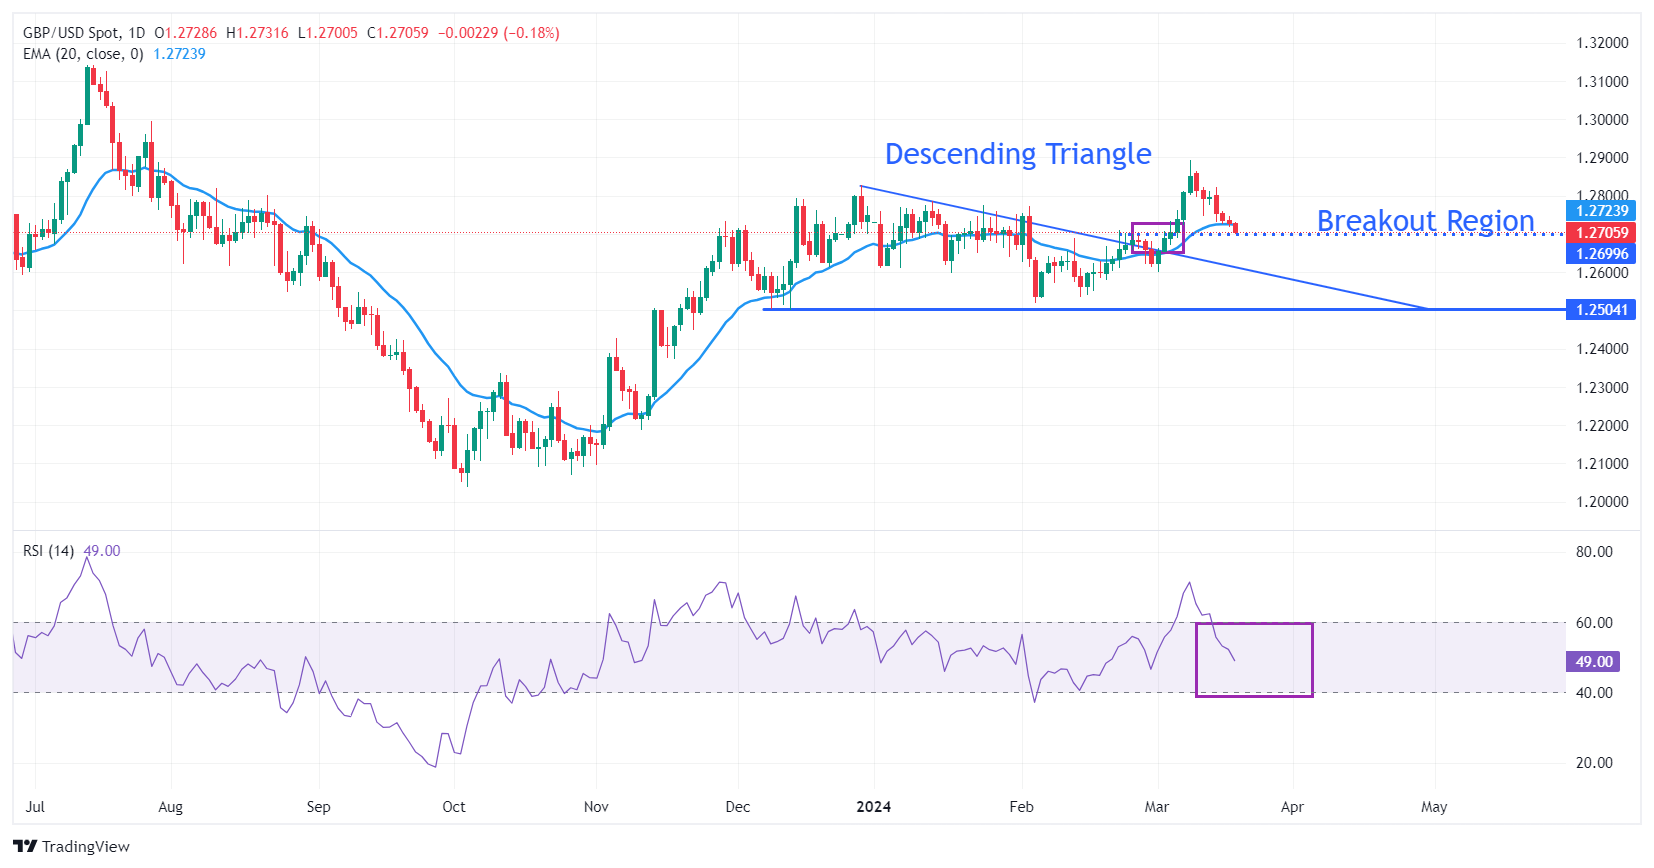
The Pound Sterling falls to the breakout region of the Descending Triangle formed around 1.2700. The near-term demand for the GBP/USD pair has turned uncertain as it has dropped below the 20-day Exponential Moving Average (EMA), which trades around 1.2730.
On the downside, the downward-sloping border of the Descending Triangle chart pattern could support the Pound Sterling. On the upside, a seven-month high at around 1.2900 will be a major barricade.
The 14-period Relative Strength Index (RSI) returns to the 40.00-60.00 range, indicating a sharp volatility contraction.
Pound Sterling FAQs
The Pound Sterling (GBP) is the oldest currency in the world (886 AD) and the official currency of the United Kingdom. It is the fourth most traded unit for foreign exchange (FX) in the world, accounting for 12% of all transactions, averaging $630 billion a day, according to 2022 data. Its key trading pairs are GBP/USD, aka ‘Cable’, which accounts for 11% of FX, GBP/JPY, or the ‘Dragon’ as it is known by traders (3%), and EUR/GBP (2%). The Pound Sterling is issued by the Bank of England (BoE).
The single most important factor influencing the value of the Pound Sterling is monetary policy decided by the Bank of England. The BoE bases its decisions on whether it has achieved its primary goal of “price stability” – a steady inflation rate of around 2%. Its primary tool for achieving this is the adjustment of interest rates. When inflation is too high, the BoE will try to rein it in by raising interest rates, making it more expensive for people and businesses to access credit. This is generally positive for GBP, as higher interest rates make the UK a more attractive place for global investors to park their money. When inflation falls too low it is a sign economic growth is slowing. In this scenario, the BoE will consider lowering interest rates to cheapen credit so businesses will borrow more to invest in growth-generating projects.
Data releases gauge the health of the economy and can impact the value of the Pound Sterling. Indicators such as GDP, Manufacturing and Services PMIs, and employment can all influence the direction of the GBP. A strong economy is good for Sterling. Not only does it attract more foreign investment but it may encourage the BoE to put up interest rates, which will directly strengthen GBP. Otherwise, if economic data is weak, the Pound Sterling is likely to fall.
Another significant data release for the Pound Sterling is the Trade Balance. This indicator measures the difference between what a country earns from its exports and what it spends on imports over a given period. If a country produces highly sought-after exports, its currency will benefit purely from the extra demand created from foreign buyers seeking to purchase these goods. Therefore, a positive net Trade Balance strengthens a currency and vice versa for a negative balance.
- USD/CHF gains ground on the expectation of the Fed prolonging elevated policy rates.
- Bond markets face selling pressure as a result of the resilience observed in the US economy.
- Swiss Trade Balance revealed a surplus of 3662M, surpassing expectations of 3500M
USD/CHF climbs towards 0.8890 during the Asian hours on Tuesday, driven by higher US Treasury yields. Market expectations suggest that the Federal Reserve will maintain its monetary policy unchanged during the March meeting scheduled for Wednesday. The Fed is under pressure to prolong its elevated interest rates in response to recent inflationary pressures.
Bond markets are experiencing selling pressure as further signs of resilience in the United States (US) economy emerge, leading traders to adjust their expectations for fewer interest rate cuts this year. The likelihood of rate cuts in June and July has decreased, standing at 55.1% and 73.7%, respectively.
In February, the Swiss Trade Balance revealed a surplus of 3662 million, surpassing expectations of 3500 million but declining from January's 4,701 million. Imports (MoM) increased to 18,812 million from the previous reading of 18,046 million, while monthly exports decreased to 22,474 million from 22,746 million prior.
The Swiss National Bank (SNB) forecasts inflation to average 1.9% in 2024. Presently, the inflation rate is notably below this projection at 1.2%. However, there was a notable increase in the Consumer Price Index (CPI) in February, rising by 0.6% compared to 0.2% previously on a monthly basis.
Market participants are eagerly awaiting the Swiss National Bank (SNB) March policy meeting scheduled for Thursday. According to Reuters, there is a 29% probability of the SNB trimming its 1.75% policy rate at the meeting. A rate cut by the SNB could potentially weaken the Swiss Franc (CHF) as lower interest rates typically attract fewer foreign capital inflows.
FX option expiries for Mar 19 NY cut at 10:00 Eastern Time, via DTCC, can be found below.
EUR/USD: EUR amounts
- 1.0790 1.4b
- 1.0865 1b
- 1.0875 938
USD/JPY: USD amounts
- 150.00 733m
- 151.50 500m
Statistics Canada will release February Consumer Price Index (CPI) data on Tuesday, March 19 at 12:30 and as we get closer to the release time, here are the forecasts by the economists and researchers of five major banks regarding the upcoming Canadian inflation data.
The annual headline CPI is anticipated to have accelerated to 3.1% from 2.9% in January. If so, inflation would move further above the 2% target which means the BoC can be patient before loosening policy.
TDS
We look for headline CPI to push back above the target range to 3.1% YoY in February after last month's deceleration, reflecting the contributions of higher energy prices, a mild rebound in core goods, and persistence across shelter components, as stagnant core inflation measures suggest little progress on underlying inflation ahead of the April BoC decision.
RBC Economics
Both headline and core (ex-food and energy) inflation are expected to come in at 3.1% YoY with headline up from 2.9% in January on higher energy inflation. Gasoline prices rose by nearly 4% in February from a month ago. Still, a very soft economic backdrop means that price pressures in Canada are more likely to keep easing and narrowing, allowing for a first rate cut from the BoC to also come in June.
NBF
The increase in gasoline prices during the month may translate into a 0.4% gain for the headline index before seasonal adjustment, which could make the 12-month rate increase from 2.9% to 3.1%. Similarly to the headline print, the core measures preferred by the Bank of Canada could strengthen, with CPI-med likely moving from 3.3% to 3.4%, and CPI-trim from 3.4% to 3.5%.
Citi
After a surprisingly soft reading of a flat headline CPI in January, we expect a solid bounce-back of 0.6% MoM in February. Part of this strength would reflect usual seasonal patterns where prices rise in the early months of the year. The most important element of monthly CPI reports will continue to be the core inflation measures, CPI-trim and CPI-median, and specifically the average annualized three-month pace of the core measures. Given somewhat stronger February data and a strong increase in December that will still be included in the three-month calculation, three-month core inflation will likely remain close to 3% in February. With February CPI the last release before the BoC’s April meeting, a cut at that meeting remains very unlikely.
CIBC
Higher prices at the pump in February likely helped push headline CPI up a tick to 3.0% YoY, reflecting a 0.6% NSA monthly increase. That would also include an acceleration in ex. food/energy prices to 0.3% MoM SA, as some volatile segments that showed large declines in January (clothing, airfares) could have seen a turnaround in February, adding to increases in shelter prices. Looking beyond the volatility, however, price increases likely weren’t any more broad based, reflecting soft consumer demand, and we therefore expect 12-month CPI trim and median to both be unchanged.
Here is what you need to know on Tuesday, March 19:
The volatility surrounding the Japanese Yen and the Australian Dollar heightened during the Asian trading hours on Tuesday as investors assessed the monetary policy announcements from the Bank of Japan (BoJ) and the Reserve Bank of Australia (RBA). Later in the day, ZEW Survey from Germany and Consumer Price Index (CPI) data from Canada will be watched closely by market participants. The US economic docket will feature Building Permits and Housing Starts figures for February.
The BoJ announced that it lift the interest rate by 10 basis points (bps) from -0.1% to 0% and abandoned its yield curve control (YCC) strategy. Both of these decisions came in line with the market expectation. In its policy statement, the BoJ further noted that it will apply a 0.1% interest to all excess reserves parked with the JPY and said that it will use the short-term interest rates as its primary policy tool. USD/JPY rose sharply with the immediate reaction and was last seen rising nearly 1% on the day above 150.00.
Japanese Yen adds to post-BoJ losses, eyes YTD low.
In the post-meeting press conference, BoJ Governor Kazuo Ueda said that they will continue buying broadly the same amount of Japanese government bonds as before and added that they will consider options for easing broadly, including the ones used in the past if needed.
Ueda Speech: BoJ Governor speaks on interest rate outlook after historic hike.
Japanese Yen price today
The table below shows the percentage change of Japanese Yen (JPY) against listed major currencies today. Japanese Yen was the weakest against the US Dollar.
| USD | EUR | GBP | CAD | AUD | JPY | NZD | CHF | |
| USD | 0.06% | 0.14% | 0.23% | 0.61% | 0.81% | 0.54% | 0.20% | |
| EUR | -0.07% | 0.09% | 0.15% | 0.55% | 0.76% | 0.49% | 0.15% | |
| GBP | -0.17% | -0.11% | 0.06% | 0.46% | 0.64% | 0.36% | 0.04% | |
| CAD | -0.23% | -0.17% | -0.08% | 0.38% | 0.59% | 0.31% | -0.02% | |
| AUD | -0.62% | -0.55% | -0.48% | -0.39% | 0.22% | -0.07% | -0.41% | |
| JPY | -0.84% | -0.75% | -0.70% | -0.62% | -0.20% | -0.27% | -0.61% | |
| NZD | -0.57% | -0.51% | -0.44% | -0.34% | 0.04% | 0.26% | -0.37% | |
| CHF | -0.23% | -0.16% | -0.09% | 0.01% | 0.39% | 0.59% | 0.31% |
The heat map shows percentage changes of major currencies against each other. The base currency is picked from the left column, while the quote currency is picked from the top row. For example, if you pick the Euro from the left column and move along the horizontal line to the Japanese Yen, the percentage change displayed in the box will represent EUR (base)/JPY (quote).
The RBA left the policy rate unchanged at 4.35% after the March policy meeting, as widely anticipated. In the policy statement, the RBA noted that higher interest rates are working to establish a more sustainable balance between aggregate demand and supply in the economy. "While there are encouraging signs that inflation is moderating, the economic outlook remains uncertain," the RBA added.
Bullock Speech: RBA Governor sheds light on interest rate path after standing pat.
RBA Governor Michele Bullock said that they need to be much more confident on inflation coming down to consider a rate cut. AUD/USD came under bearish pressure following the RBA event was last trading slightly above 0.6500, losing more than 0.5% on the day.
Australian Dollar depreciates amid a higher ASX 200, RBA's Bullock remains cautious.
After closing in positive territory for the fourth consecutive day on Monday, the US Dollar Index continues to stretch higher toward 104.00 in the early European session on Tuesday. Meanwhile, the benchmark 10-year US Treasury bond yield holds steady above 4.3% and US stock index futures trade marginally lower.
EUR/USD registered small losses on Monday and edged slightly lower early Tuesday. The pair holds above 1.0850 ahead of economic sentiment data.
GBP/USD stays on the back foot and closes in on 1.2800 in the early European session on Tuesday. The UK's Office for National Statistics will release Consumer Price Index data on Wednesday.
Gold failed to gather directional momentum and closed the first day of the week virtually unchanged. The resilience of US Treasury bond yields make it difficult for XAU/USD to gain traction, which was last seen fluctuating in a narrow channel below $2,160.
Gold price seems vulnerable near one-week low amid hawkish Fed expectations.
Central banks FAQs
Central Banks have a key mandate which is making sure that there is price stability in a country or region. Economies are constantly facing inflation or deflation when prices for certain goods and services are fluctuating. Constant rising prices for the same goods means inflation, constant lowered prices for the same goods means deflation. It is the task of the central bank to keep the demand in line by tweaking its policy rate. For the biggest central banks like the US Federal Reserve (Fed), the European Central Bank (ECB) or the Bank of England (BoE), the mandate is to keep inflation close to 2%.
A central bank has one important tool at its disposal to get inflation higher or lower, and that is by tweaking its benchmark policy rate, commonly known as interest rate. On pre-communicated moments, the central bank will issue a statement with its policy rate and provide additional reasoning on why it is either remaining or changing (cutting or hiking) it. Local banks will adjust their savings and lending rates accordingly, which in turn will make it either harder or easier for people to earn on their savings or for companies to take out loans and make investments in their businesses. When the central bank hikes interest rates substantially, this is called monetary tightening. When it is cutting its benchmark rate, it is called monetary easing.
A central bank is often politically independent. Members of the central bank policy board are passing through a series of panels and hearings before being appointed to a policy board seat. Each member in that board often has a certain conviction on how the central bank should control inflation and the subsequent monetary policy. Members that want a very loose monetary policy, with low rates and cheap lending, to boost the economy substantially while being content to see inflation slightly above 2%, are called ‘doves’. Members that rather want to see higher rates to reward savings and want to keep a lit on inflation at all time are called ‘hawks’ and will not rest until inflation is at or just below 2%.
Normally, there is a chairman or president who leads each meeting, needs to create a consensus between the hawks or doves and has his or her final say when it would come down to a vote split to avoid a 50-50 tie on whether the current policy should be adjusted. The chairman will deliver speeches which often can be followed live, where the current monetary stance and outlook is being communicated. A central bank will try to push forward its monetary policy without triggering violent swings in rates, equities, or its currency. All members of the central bank will channel their stance toward the markets in advance of a policy meeting event. A few days before a policy meeting takes place until the new policy has been communicated, members are forbidden to talk publicly. This is called the blackout period.
Following the Bank of Japan's first historic interest rate hike at the March policy meeting, BoJ Governor Kazuo Ueda is addressing a post-policy meeting press conference on Tuesday.
Additional quotes
Likelihood of achieving 2.0% inflation target is still not 100% but it's rising.
Stock effect of BoJ’s JGB holdings on long-term rates cannot be ignored.
But we will not use JGB buying operations, balance adjustment as proactive monetary policy tool.
Mindful of risks of sudden spikes in interest rates.
We always have taylor rules in mind when conducting monetary policy.
Outcome of spring wage negotiations was big factor.
developing story ...
Market reaction
USD/JPY was last seen trading at 150.37, adding 0.83% on the day.
Bank of Japan FAQs
The Bank of Japan (BoJ) is the Japanese central bank, which sets monetary policy in the country. Its mandate is to issue banknotes and carry out currency and monetary control to ensure price stability, which means an inflation target of around 2%.
The Bank of Japan has embarked in an ultra-loose monetary policy since 2013 in order to stimulate the economy and fuel inflation amid a low-inflationary environment. The bank’s policy is based on Quantitative and Qualitative Easing (QQE), or printing notes to buy assets such as government or corporate bonds to provide liquidity. In 2016, the bank doubled down on its strategy and further loosened policy by first introducing negative interest rates and then directly controlling the yield of its 10-year government bonds.
The Bank’s massive stimulus has caused the Yen to depreciate against its main currency peers. This process has exacerbated more recently due to an increasing policy divergence between the Bank of Japan and other main central banks, which have opted to increase interest rates sharply to fight decades-high levels of inflation. The BoJ’s policy of holding down rates has led to a widening differential with other currencies, dragging down the value of the Yen.
A weaker Yen and the spike in global energy prices have led to an increase in Japanese inflation, which has exceeded the BoJ’s 2% target. Still, the Bank judges that the sustainable and stable achievement of the 2% target has not yet come in sight, so any sudden change in the current policy looks unlikely.
Following the Bank of Japan's first historic interest rate hike at the March policy meeting, BoJ Governor Kazuo Ueda said that the Bank “will continue buying 'broadly same amount' of JGB as before.”
Additional quotes
Judged sustainable, stable achievement of 2.0% inflation target comes in sight.
Accommodative conditions will firmly underpin economy, prices.
Will consider options for easing broadly including ones used in past if needed.
Confirmed virtuous cycle of wages, prices.
Massive monetary easing such as yield curve control, negative rates fulfilled roles.
Accommodative financial conditions will be maintained for the time being.
Decided to shift massive monetary policy as we judge achievement of 2% inflation is in sight.
Will set short-term interest rates just like other central banks that use short-term rates as policy tool.
Important to keep easy environment in place considering distance to 2% target in terms of inflation expectations.
We will carry out 'regular' monetary policy.
Not thinking of setting a name for new policy framework, since it is a 'regular' monetary operation.
Pace of further rate hike depends on economy, price outlooks.
Market reaction
USD/JPY keeps the upside momentum intact following these comments and the pair was last seen 0.87% higher on the day at 150.42.
Japanese Yen FAQs
The Japanese Yen (JPY) is one of the world’s most traded currencies. Its value is broadly determined by the performance of the Japanese economy, but more specifically by the Bank of Japan’s policy, the differential between Japanese and US bond yields, or risk sentiment among traders, among other factors.
One of the Bank of Japan’s mandates is currency control, so its moves are key for the Yen. The BoJ has directly intervened in currency markets sometimes, generally to lower the value of the Yen, although it refrains from doing it often due to political concerns of its main trading partners. The current BoJ ultra-loose monetary policy, based on massive stimulus to the economy, has caused the Yen to depreciate against its main currency peers. This process has exacerbated more recently due to an increasing policy divergence between the Bank of Japan and other main central banks, which have opted to increase interest rates sharply to fight decades-high levels of inflation.
The BoJ’s stance of sticking to ultra-loose monetary policy has led to a widening policy divergence with other central banks, particularly with the US Federal Reserve. This supports a widening of the differential between the 10-year US and Japanese bonds, which favors the US Dollar against the Japanese Yen.
The Japanese Yen is often seen as a safe-haven investment. This means that in times of market stress, investors are more likely to put their money in the Japanese currency due to its supposed reliability and stability. Turbulent times are likely to strengthen the Yen’s value against other currencies seen as more risky to invest in.
- NZD/USD edges lower to 0.6053 amid the stronger US Dollar.
- The Fed Reserve is anticipated to leave rates unchanged for a fifth straight time on Wednesday.
- The positive headline surrounding the China-New Zealand free trade agreement failed to lift the Kiwi.
- Fed interest rate decision on Wednesday will be a closely watched event ahead of New Zealand’s GDP Q4 growth numbers.
The NZD/USD pair remains under some selling pressure during the early European session on Tuesday. The uptick in the US Dollar Index (DXY) to two-week highs above 103.80 weighs on the NZD/USD pair. Markets are in a cautious mood ahead of the Federal Reserve's (Fed) monetary policy meeting on Wednesday. The pair currently trades around 0.6053, down 0.53% on the day.
The US economic data in recent weeks indicated that the US economy is strong and inflation remains elevated. The data might convince the Fed to delay the interest rate cuts, which lift the US Dollar (USD) broadly. Fed Chairman Jerome Powell said he was not concerned about inflation data that remains above the central bank’s target, as the Fed’s preferred gauge has eased notably over the past year.
Markets expect the Fed to leave interest rates unchanged for a fifth straight time at the end of its two-day meeting on Wednesday. Powell stated that the Fed is likely to cut its key interest rate this year, but he wants to see more evidence that inflation is falling sustainably back to the 2% target. Financial markets have priced in a nearly 73% chance that the Fed will cut rates in July, according to the CME FedWatch Tools.
On the Kiwi front, Chinese Foreign Minister Wang Yi said on Tuesday that China is ready to work with New Zealand to implement an upgraded version of the China-New Zealand free trade agreement. However, this positive headline failed to boost the China-proxy New Zealand Dollar (NZD).
Looking ahead, traders will keep an eye on New Zealand’s Westpac Consumer Survey for the first quarter (Q1), due on Wednesday, followed by the Current Account. The Fed interest rate decision and the press conference will be the highlight for this week, On Thursday, the focus will turn to the New Zealand Gross Domestic Product (GDP) for Q4, which is expected to grow 0.1% QoQ.
European Central Bank (ECB) Vice President Luis de Guindos, said in an interview on Tuesday, “services inflation is stickier. And that’s why we need to wait.”
Key takeaways
Evolution of wages is key. We will have more information in June.
We do look at what is happening in the US economy. But we are data-dependent not Fed-dependent.
Market reaction
At the time of writing, EUR/USD is nursing losses near 1.0865, down 0.07% on the day.
ECB FAQs
The European Central Bank (ECB) in Frankfurt, Germany, is the reserve bank for the Eurozone. The ECB sets interest rates and manages monetary policy for the region. The ECB primary mandate is to maintain price stability, which means keeping inflation at around 2%. Its primary tool for achieving this is by raising or lowering interest rates. Relatively high interest rates will usually result in a stronger Euro and vice versa. The ECB Governing Council makes monetary policy decisions at meetings held eight times a year. Decisions are made by heads of the Eurozone national banks and six permanent members, including the President of the ECB, Christine Lagarde.
In extreme situations, the European Central Bank can enact a policy tool called Quantitative Easing. QE is the process by which the ECB prints Euros and uses them to buy assets – usually government or corporate bonds – from banks and other financial institutions. QE usually results in a weaker Euro. QE is a last resort when simply lowering interest rates is unlikely to achieve the objective of price stability. The ECB used it during the Great Financial Crisis in 2009-11, in 2015 when inflation remained stubbornly low, as well as during the covid pandemic.
Quantitative tightening (QT) is the reverse of QE. It is undertaken after QE when an economic recovery is underway and inflation starts rising. Whilst in QE the European Central Bank (ECB) purchases government and corporate bonds from financial institutions to provide them with liquidity, in QT the ECB stops buying more bonds, and stops reinvesting the principal maturing on the bonds it already holds. It is usually positive (or bullish) for the Euro.
- The Canadian Consumer Price Index is expected to have risen by 3.1% YoY in February.
- The BoC shows no rush to lower its interest rate.
- The Canadian Dollar maintains its multi-day lows against the US Dollar around 1.3540.
Canada is slated to unveil the always-relevant inflation-related figures on Tuesday. Statistics Canada will release the Consumer Price Index (CPI) for the month of February, with expectations pointing towards a year-on-year rise of 3.1% in the headline print, slightly surpassing January’s 2.9% increase. Monthly projections anticipate a 0.6% increase in the index compared to the previous month's flat reading.
Alongside the CPI data, the Bank of Canada (BoC) will release its Core Consumer Price Index gauge, which excludes volatile elements like food and energy costs. In January, the BoC Core CPI indicated a monthly uptick of 0.1% and a year-on-year rise of 2.4%.
These statistics will be closely monitored as they could influence the trajectory of the Canadian Dollar (CAD) and shape outlooks regarding the Bank of Canada's monetary policy. Speaking about the Canadian Dollar (CAD), it has shown weakness against the US Dollar (USD) in past sessions and presently hovers around multi-session lows well past the 1.3500 yardstick.
What to expect from Canada’s inflation rate?
Analysts expect a pick-up of price pressures throughout Canada during last month. In fact, inflation measured by annual changes in the Consumer Price Index, is forecast to resume its upward trajectory in February, mirroring trends observed in many of Canada's G10 counterparts, notably its neighbour, the US. After reaching 4% in August, the CPI has shown a downward trend, with the exception of the bounce recorded in the last month of the year. All in all, inflation indicators still remain well above the Bank of Canada's 2% target.
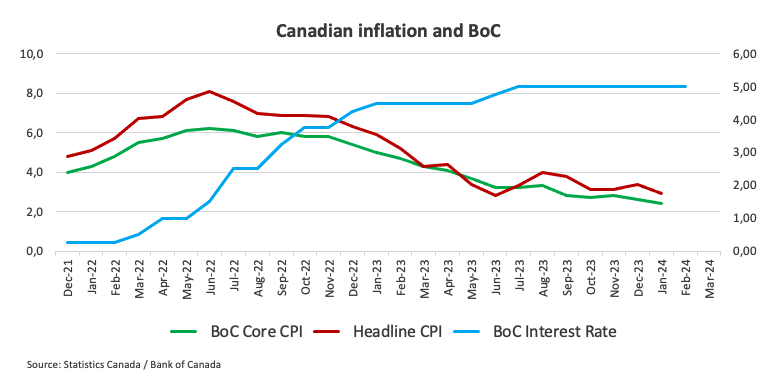
Should the forthcoming data confirm the anticipated increase in inflationary pressures, investors might consider the possibility of the central bank keeping the current restrictive stance in place for a longer duration than originally predicted. Still, any additional tightening of monetary conditions seems unlikely, as per comments from the bank’s officials.
The latter situation would necessitate a sudden and sustained resurgence of price pressures and a rapid increase in consumer demand, both of which seem improbable in the foreseeable future.
During his remarks at the latest BoC meeting, Governor Tiff Macklem expressed optimism about the ongoing battle against inflation, noting current progress and anticipating further advancements. He highlighted the significance of core inflation measures, suggesting that if they remain unchanged, the forecasts for overall inflation reduction may not come to fruition. He assessed the risks to the inflation outlook as reasonably balanced and noted that well-anchored inflation expectations are aiding efforts to bring inflation back under control.
When is the Canada CPI data due and how could it affect USD/CAD?
On Tuesday at 12:30 GMT, Canada is set to release the Consumer Price Index for February. The Canadian Dollar's potential response is tied to changes in monetary policy expectations by the Bank of Canada. However, barring any real surprise in either direction, the BoC is unlikely to change its current cautious monetary policy stance, in line with other central banks such as the Federal Reserve (Fed).
The USD/CAD has started the new trading year in quite a bullish fashion, although the uptrend appears to have met a decent barrier around the 1.3600 zone.
Pablo Piovano, Senior Analyst at FXStreet, says: “There is a strong likelihood of USD/CAD maintaining the constructive bias as long as it remains above the significant 200-day Simple Moving Average (SMA) at 1.3479. The bullish sentiment is expected to strengthen even more if there is a sustained break above the so-far yearly tops around 1.3600. On the flip side, the breach of the 200-day SMA could open the door to extra losses and a potential move to the January low of 1.3358 (January 31). South from here, there are no support levels of note prior to the December 2023 bottom of 1.3177, which occurred on December 27”.
Pablo adds: "Significant increases in volatility around CAD would require unexpected inflation figures. If the numbers fall below expectations, it could strengthen the argument for potential interest rate cuts by the BoC in the next few months, further appreciating USD/CAD. However, a rebound in the CPI, similar to trends observed in the US, might provide some support to the Canadian Dollar, although to a limited extent. A higher-than-anticipated inflation reading would intensify pressure on the Bank of Canada to maintain elevated rates for an extended period, potentially resulting in prolonged challenges for many Canadians dealing with higher interest rates, as highlighted by Bank of Canada Governor Macklem."
Economic Indicator
Canada Consumer Price Index (MoM)
The Consumer Price Index (CPI), released by Statistics Canada on a monthly basis, represents changes in prices for Canadian consumers by comparing the cost of a fixed basket of goods and services. The MoM figure compares the prices of goods in the reference month to the previous month. Generally, a high reading is seen as bullish for the Canadian Dollar (CAD), while a low reading is seen as bearish.
Read more.Canadian Dollar price in the last 7 days
The table below shows the percentage change of Canadian Dollar (CAD) against listed major currencies in the last 7 days. Canadian Dollar was the weakest against the .
| USD | EUR | GBP | CAD | AUD | JPY | NZD | CHF | |
| USD | 0.48% | 0.96% | 0.44% | 0.93% | 1.69% | 1.46% | 0.86% | |
| EUR | -0.50% | 0.46% | -0.06% | 0.43% | 1.20% | 0.98% | 0.37% | |
| GBP | -0.97% | -0.48% | -0.53% | -0.03% | 0.74% | 0.52% | -0.09% | |
| CAD | -0.44% | 0.07% | 0.52% | 0.48% | 1.22% | 1.03% | 0.39% | |
| AUD | -0.94% | -0.45% | 0.03% | -0.50% | 0.77% | 0.55% | -0.06% | |
| JPY | -1.69% | -1.22% | -0.49% | -1.27% | -0.76% | -0.21% | -0.83% | |
| NZD | -1.48% | -0.99% | -0.52% | -1.05% | -0.54% | 0.22% | -0.61% | |
| CHF | -0.89% | -0.40% | 0.08% | -0.43% | 0.05% | 0.81% | 0.59% |
The heat map shows percentage changes of major currencies against each other. The base currency is picked from the left column, while the quote currency is picked from the top row. For example, if you pick the Euro from the left column and move along the horizontal line to the Japanese Yen, the percentage change displayed in the box will represent EUR (base)/JPY (quote).
- S&P/ASX 200 Index marks gains after RBA’s policy decision.
- RBA has maintained the policy rate at 4.35% during its March policy meeting.
- RBA Governor Bullock highlighted caution that the inflation fight is not yet won.
The S&P/ASX 200 Index continues its upward momentum, marking the third consecutive session of gains. Trading higher around 7700, up approximately 0.27% on Tuesday. Meanwhile, the Reserve Bank of Australia (RBA) has maintained the policy rate at 4.35% for the third consecutive meeting, as announced during its March policy meeting.
The Australian equity market is buoyed by gains in the energy and real estate sectors. Mining and energy stocks are primarily on the rise due to stronger commodity prices. The top-performing stocks are Nickel Industries Limited and Bellevue Gold Limited, which have surged by 7.43% and 6.71%, respectively.
On the other hand, companies with the lowest percentage returns include Reward Minerals Ltd, which plummeted by 40.0%, Oldfields Holdings Ltd down by 27.27%, and Resource Mining Corporation Ltd, which fell by 21.74%.
The S&P/ASX200 VIX is notably lower today, decreasing by 4.35% to 10.85, reaching a new 50-day low. Conversely, the All Ordinaries Index is on the rise, gaining 32.60 points to reach 7,961.40.
RBA Governor Michele Bullock addressed the policy outlook during a press conference following the monetary policy decision on Tuesday. She noted progress in the fight against inflation, citing recent data indicating the country is on the right track.
However, Governor Bullock emphasized the importance of closely monitoring employment numbers. She highlighted that risks to the outlook are finely balanced and cautioned that the battle against inflation is not yet won. Additionally, markets are cautiously awaiting policy decisions from the Federal Reserve.
- EUR/USD trades in negative territory near 1.0871 amid the cautious mood in Tuesday’s early European session.
- The pair keeps the bearish vibe below the key EMA; RSI indicator lies below the 50-midline.
- The first downside target is seen at 1.0852; the initial resistance level will emerge at 1.0882.
The EUR/USD pair trades on a negative note during the early European session on Tuesday. The major pair moves in a narrow range between 1.0866 and 1.0876 as traders prefer to wait on the sidelines ahead of the Federal Reserve's (Fed) interest rate decision on Wednesday. At the press time, EUR/USD is trading at 1.0871, down 0.01% on the day.
Technically, EUR/USD maintains the bearish outlook unchanged as the major pair is below the key 50- and 100-period Exponential Moving Averages (EMA) on the four-hour chart. Furthermore, the downward momentum is further confirmed by the Relative Strength Index (RSI), which lies below the 50-midline, indicating that further downside looks favorable.
The first downside target for the major pair is located near the lower limit of the Bollinger Band at 1.0852. Further south, the next contention level is seen at the 1.0800 mark, representing the confluence of a low of February 22 and a psychological mark. A breach of this level will expose a low of February 20 at 1.0761, and finally a low of February 15 at 1.0725.
On the other hand, the initial resistance level will emerge at the 100-period EMA at 1.0882. The critical upside barrier to watch for EUR/USD is the 1.0900-1.0905 region, portraying the 50-period EMA, psychological figure, and a high of March 18. A bullish breakout above the latter will see a rally to the upper boundary of the Bollinger Band at 1.0926, followed by a high of March 14 at 1.0955.
EUR/USD four-hour chart
-638464214351096098.png)
- WTI retreats from a fresh YTD peak touched on Tuesday, though the downside seems limited.
- The prospects of rising supply from Russia prompt some profit-taking after the recent run-up.
- Concerns about tightening global supply should act as a tailwind and help limit deeper losses.
West Texas Intermediate (WTI) US Crude Oil prices edge lower during the Asian session on Tuesday and revers a part of the previous day's strong gains to the $82.45 area, or the highest level since early November. The commodity currently trades around the $82.00/barrel mark, though the downside seems limited in the wake of worries about tightening supply.
Ukrainian drone strikes on Russian oil refineries over the last week could lead to higher crude oil exports from Russia. This, in turn, prompts bullish traders to take some profits off the table after the recent strong run-up witnessed over the past week or so and slightly overstretched conditions on short-term charts. Apart from this, sustained US Dollar (USD) buying, bolstered by bets that the Federal Reserve (Fe) will stick to its higher-for-longer interest rates narrative to bring down inflation, exerts downward pressure on the commodity.
Furthermore, growing concerns about a global economic slowdown, which could dent fuel demand, turn out to be another factor weighing on Crude Oil prices. Meanwhile, lower crude exports from Saudi Arabia and Iraq, along with disruptions caused by Houthi attacks in the Red Sea, could act as a tailwind for the black liquid and help limit the corrective slide. Hence, it will be prudent to wait for strong follow-through selling before confirming that the commodity has topped out in the near term and positioning for deeper losses.
Reserve Bank of Australia (RBA) Governor Michele Bullock is speaking on the policy outlook at a press conference following the announcement of the March monetary policy decision on Tuesday.
Bullock is responding to questions from the media, as part of a new reporting format for the central bank.
Key quotes
We are making progress in fight against inflation.
Recent data suggest we are on right track.
Keeping keen eye on employment numbers.
Risks to outlook are finely balanced.
War isnt yet won on inflation.
Change statement language in response to data.
Labour market still slightly on tight side.
Board sees risks on both sides for policy.
Unemployment rate not only thing we look at.
Need to be much more confident on inflation coming down to consider rate cut.
Easing in energy prices is really positive for inflation outlook.
The board considers a range of possibilities on policy.
developing story ....
Market reaction
AUD/USD is holding lower ground near 0.6530 on the above comments, down 0.31% on the day.
- EUR/JPY holds positive ground around 162.77 after the BoJ rate decision.
- BoJ decided to end a negative interest rate era that began in 2016, in line with market expectations.
- ECB’s de Cos said the central bank may start cutting rates in June if inflation in the eurozone continues to ease.
- Investors will focus on the German and Eurozone ZEW Survey on Tuesday.
The EUR/JPY cross gains traction above the mid-162.00s during the Asian trading hours on Tuesday. The cross drifts higher after the Bank of Japan (BoJ) decided to end a negative interest rate era that began in 2016, in line with market expectations. At press time, EUR/JPY is trading at 162.77, adding 0.37% on the day.
After the two-day monetary policy meeting on Tuesday, the BoJ decided to raise the interest rate by 10 basis points (bps) from -0.1% to 0% for the first time since 2007. The decision was in line with market expectations. The BoJ policy statement showed that, given the current outlook for economic activity and prices, the BoJ anticipates accommodative financial conditions to be maintained for the time being. In response to the interest rate decision, the Japanese Yen attracts some sellers as the hawkish policy was widely priced in by the markets.
The European Central Bank (ECB) held the interest rate steady at its March meeting. However, the ECB policymakers signaled progress in easing inflation and started discussions about the timeline of the rate cut. The ECB Pablo Hernandez de Cos said that the central bank may start lowering interest rates in June if inflation in the eurozone continues to cool down. The ECB Governing Council member Klaas Knot penciled in June for a first-rate cut and expects three rate cuts this year.
Moving on, market players will focus on the German and Eurozone ZEW Survey, due later on Tuesday. Later this week, the German Producer Price Index (PPI) and the ECB's Lagarde speech will be in focus on Wednesday. On Thursday, the Eurozone HCOB PMI data for March will be released. These events could give a clear direction to the EUR/JPY cross.
- GBP/JPY extends its winning streak despite hawkish BoJ.
- BoJ board members decided to lift the interest rate to 0% from -0.1%.
- Traders await consumer and producer price data from the United Kingdom.
GBP/JPY has rebounded from intraday losses to extend its winning streak, which commenced on March 12. The pair trades higher around 190.30 during Asian trading hours on Tuesday. The Bank of Japan (BoJ) board members opted to raise the interest rate by 10 basis points (bps) from -0.1% to 0% for the first time since 2007.
This decision marks the end of a negative interest rate era. It aligns with market expectations. The much stronger-than-expected pay hikes by major Japanese firms have already laid the groundwork for the BoJ to shift away from the decade-long stimulus measures.
In the United Kingdom (UK), inflation is showing signs of moderation, yet the Bank of England (BoE) maintains a cautious stance until Consumer Prices return to the 2% target. It is expected that the BoE will keep interest rates unchanged at 5.25% during Thursday's meeting. Traders are eagerly awaiting consumer and producer price data scheduled for release on Wednesday.
Due to softer Consumer Inflation Expectations on Friday, which increased by 3.0% but slightly lower than the previous uptick of 3.3%, market speculation arose regarding a potential Bank of England (BoE) rate cut. Investors anticipate the BoE to commence rate cuts in August, with one or two additional cuts by year-end. Such sentiment could have weakened the Pound Sterling (GBP) and undermined the GBP/JPY cross.
- AUD/JPY retreats from over a one-week high after the RBA and the BoJ announced their decisions.
- The RBA decided to keep the benchmark rates unchanged for the third straight meeting in March.
- The BoJ ends the negative interest rates era and also scraps the Yield Curve Control (YCC) policy.
The AUD/JPY cross continues with its struggle to find acceptance above the 98.00 mark and surrenders Asian session gains to over a one-week high. Spot prices drop to a fresh daily low after the Reserve Bank of Australia (RBA) and the Bank of Japan (BoJ) announced their policy decisions, albeit manage to attract fresh buyers in the vicinity of mid-97.00s.
As was unanimously expected, the Australian central bank decided to keep the Official Cash Rate (OCR) unchanged at the end of the March policy meeting. The Australian Dollar (AUD), however, started losing traction in the absence of any fresh hawkish signals, though signs of improving relations between Australia and China – the former's biggest trading partner – help limit further losses.
Meanwhile, the BoJ announced lifting the interest rate by 10 basis points (bps) from -0.1% to 0% for the first time since 2007, ending the negative interest rate era that began in 2016. The BoJ also scrapped its Yield Curve Control (YCC) policy at the conclusion of its two-day monetary policy meeting. The decision, however, was broadly in line with the market expectations and did little to influence the JPY.
Investors now look forward to the post-meeting press conference, where comments by BoJ Governor Kazuo Ueda will play a key role in influencing the JPY price dynamics and provide some meaningful impetus to the AUD/JPY cross. The mixed fundamental backdrop, meanwhile, makes it prudent to wait for strong follow-through buying before positioning for any further appreciating move.
- AUD/NZD attracts some sellers to 1.0770 after the RBA rate decision on Tuesday.
- The RBA held the Official Cash Rate (OCR) steady at 4.35% after its March meeting on Tuesday, as widely expected.
- The less hawkish stance of the RBNZ weighs on the Kiwi.
- New Zealand’s Westpac Consumer Survey Q1 will be due on Wednesday.
The AUD/NZD cross holds below the 1.0800 mark during the Asian session on Tuesday. The cross edges lower following the Reserve Bank of Australia (RBA) interest rate decision. The Australian central bank decided to leave the interest rate unchanged on Tuesday. Traders will take more cues from the RBA press conference. AUD/NZD currently trades around 1.0770, losing 0.07% on the day.
On Tuesday, the RBA held the Official Cash Rate (OCR) steady at a 12-year high of 4.35% for the third meeting in a row after its March monetary policy meeting. The markets will focus on the fresh catalysts offered by the RBA on the timing and the scope of a policy pivot. The hawkish remarks from the central bank might lift the Australian Dollar (AUD) against the New Zealand Dollar (NZD).
On the Kiwi front, the Reserve Bank of New Zealand (RBNZ) decided to keep the policy rate steady at 5.50% for the fifth meeting in a row in February. However, the RBNZ tones down its hawkish stance and reduces the risk of further tightening. The central bank lowered its forecast cash rate peak to 5.6% from a previous projection of 5.7%. This, in turn, exerts some selling pressure on the New Zealand Dollar (NZD) and acts as a tailwind for the AUD/NZD cross.
New Zealand’s Westpac Consumer Survey for the first quarter (Q1) will be due on Wednesday, followed by the Current Account. On Thursday, traders will closely monitor the New Zealand Gross Domestic Product (GDP) for Q4 and the Australian Judo Bank PMI for March.
- Gold price oscillates in a range and is influenced by a combination of diverging forces.
- Hawkish Fed expectations, elevated US bond yields and a bullish USD cap the upside.
- Geopolitical risks lend some support to the XAU/USD ahead of the key FOMC meeting.
Gold price (XAU/USD) struggles to capitalize on the previous day's bounce from the $2,145 region, or over a one-week low and oscillates in a range during the Asian session on Tuesday. The robust US consumer and producer inflation figures released last week fuelled speculations that the Federal Reserve (Fed) could modify its forward guidance to two 25 basis points rate cuts in 2024 instead of the three projected previously. This, in turn, remains supportive of elevated US Treasury bond yields, which underpin the US Dollar (USD) and act as a headwind for the non-yielding yellow metal.
The markets, however, are still anticipating that the Fed will begin its rate-cutting cycle as early as the June policy meeting. This, combined with ongoing geopolitical tensions, might continue to provide a floor to the Gold price and help limit the downside. Traders might also prefer to wait on the sidelines ahead of the crucial two-day FOMC monetary policy meeting starting this Tuesday. The Fed is scheduled to announce its decision on Wednesday and investors will look for fresh cues about the rate-cut path, which will play a key role in driving the USD and provide a fresh impetus to the precious metal.
Daily Digest Market Movers: Gold price struggles to lure buyers amid mixed fundamental cues, ahead of FOMC
- The stronger US inflation data fuelled speculations that the Federal Reserve will keep interest rates elevated, which, in turn, fails to assist the non-yielding Gold price to build on Monday's bounce from over a one-week low.
- Markets are now pricing in less than three 25 basis point rate cuts this year and about a 51% chance that the Fed will begin the rate-cutting cycle at the June meeting, down sharply from expectations at the start of the year.
- Expectations that the Fed will stick to the higher-for-longer interest rates narrative push the yield on benchmark 10-year US government bond to a three-week high, underpinning the US Dollar and capping the commodity.
- The prolonged Russia-Ukraine war, along with the unrest in the Middle East, might continue to offer some support to the safe-haven XAU/USD and help limit deeper losses ahead of the crucial FOMC meeting starting today.
- Ukraine stepped up drone strikes on Russian oil refineries last week, while Israeli Prime Minister Benjamin Netanyahu confirmed plans to push into Gaza's Rafah enclave, contributing to a climate of uncertainty.
- The focus, meanwhile, will be on whether Fed policymakers change their projections, or dot plots, for the economy and rate cuts for this year and the next two, which will determine the near-term trajectory for the XAU/USD.
Technical Analysis: Gold price could slide further once the $2,150 support is broken decisively
From a technical perspective, the recent pullback from the record peak stalled near the $2,145-2,144 support zone, which should now act as a key pivotal point for the Gold price. A convincing break below will expose the next relevant support near the $2,128-2,127 zone before the XAU/USD extends the corrective decline further towards the $2,100 round figure.
On the flip side, the $2,175-2,176 region now seems to have emerged as an immediate strong barrier, which if cleared should allow the Gold price to challenge the record peak, around the $2,195 area touched last week. Some follow-through buying beyond the $2,200 mark will set the stage for the resumption of the uptrend witnessed since the beginning of this month.
Gold FAQs
Gold has played a key role in human’s history as it has been widely used as a store of value and medium of exchange. Currently, apart from its shine and usage for jewelry, the precious metal is widely seen as a safe-haven asset, meaning that it is considered a good investment during turbulent times. Gold is also widely seen as a hedge against inflation and against depreciating currencies as it doesn’t rely on any specific issuer or government.
Central banks are the biggest Gold holders. In their aim to support their currencies in turbulent times, central banks tend to diversify their reserves and buy Gold to improve the perceived strength of the economy and the currency. High Gold reserves can be a source of trust for a country’s solvency. Central banks added 1,136 tonnes of Gold worth around $70 billion to their reserves in 2022, according to data from the World Gold Council. This is the highest yearly purchase since records began. Central banks from emerging economies such as China, India and Turkey are quickly increasing their Gold reserves.
Gold has an inverse correlation with the US Dollar and US Treasuries, which are both major reserve and safe-haven assets. When the Dollar depreciates, Gold tends to rise, enabling investors and central banks to diversify their assets in turbulent times. Gold is also inversely correlated with risk assets. A rally in the stock market tends to weaken Gold price, while sell-offs in riskier markets tend to favor the precious metal.
The price can move due to a wide range of factors. Geopolitical instability or fears of a deep recession can quickly make Gold price escalate due to its safe-haven status. As a yield-less asset, Gold tends to rise with lower interest rates, while higher cost of money usually weighs down on the yellow metal. Still, most moves depend on how the US Dollar (USD) behaves as the asset is priced in dollars (XAU/USD). A strong Dollar tends to keep the price of Gold controlled, whereas a weaker Dollar is likely to push Gold prices up.
- USD/CAD exhibits sideways movement with a positive bias to extend gains.
- Fed could uphold its elevated interest rates to curb inflationary pressures.
- Canadian Consumer Prices are expected to show an increase in February.
USD/CAD continues its upward trend for the fourth consecutive session, trading near the significant level of 1.3540. The US Dollar (USD) advances, propelled by higher US Treasury yields. Bond markets are facing selling pressure as additional signs of resilience in the United States (US) economy emerge, prompting traders to revise their expectations for fewer interest rate cuts this year.
According to the CME FedWatch Tool, the probability of a rate cut in March stands at 1.0%, and 8.7% for May. The likelihood of rate cuts in June and July is lower, at 55.1% and 73.7%, respectively.
The US Dollar Index (DXY) continues its upward trajectory, with 2-year and 10-year US yields at 4.73% and 4.32%, respectively. Investors are eagerly awaiting the interest rate decision from the US Federal Reserve (Fed), expected to be announced on Wednesday. The Fed is anticipated to uphold its elevated interest rates in response to recent inflationary pressures.
The Canadian Dollar (CAD) might have found support from the surge in Crude oil prices, considering Canada's status as the largest oil exporter to the United States (US). West Texas Intermediate (WTI) hovers around $82.10 per barrel, nearing its highest levels since early November, bolstered by ongoing supply-side worries.
On Monday, the Canadian stock market closed slightly lower as investors awaited Canada's Consumer Price Index (CPI) data scheduled for Tuesday. There are expectations for an uptick in Canadian consumer prices.
- Indian Rupee loses traction on Tuesday amid a stronger USD.
- Fed is expected to hold rates steady in the range of 5.25%–5.50% at its March meeting.
- The US Fed interest rate decision on Wednesday will be the highlight of this week.
Indian Rupee (INR) weakens on Tuesday on US Dollar (USD) purchases by state-run banks. The lower speculation that the US Federal Reserve (Fed) may cut interest rates in June provides some support to the Greenback and lifts the USD/INR pair. The Fed is widely anticipated to hold rates steady for a fifth straight time at its March meeting on Wednesday and maintain a data approach to ensure inflation returns sustainably to its 2% target. Nonetheless, there is still a possibility that Fed officials might reduce the number of rate cuts to two from the three rate cuts they expected earlier this year.
Looking ahead, the US February Building Permits and Housing Starts are due on Tuesday. Investors will closely watch the US Fed interest rate decision on Wednesday and take more cues about the future trajectory of interest rates from Fed Chair Jerome Powell during the press conference. On Thursday, India’s S&P Global Manufacturing and Services PMI will be released.
Daily Digest Market Movers: Indian Rupee remains vulnerable amid global uncertainties
- Foreign investors purchased bonds worth about 100 billion Rupees ($1.21 billion) on a net basis in March, bringing the total net purchase to more than 375 billion Rupees in the first two months of 2024.
- Foreign portfolio investors increased their holdings of Indian government bonds by roughly 50% since the index inclusion news less than six months ago.
- India’s foreign exchange climbed from $6.55 billion to $625.63 billion in just two years, while Indian gold reserves rose from $569 million in 2021 to $48.4 billion this week in March 2024, according to the Reserve Bank of India (RBI).
- The Fed Chair Jerome Powell said earlier this month that the US central bank might cut its benchmark interest rate later this year, even though the continued progress on lowering inflation to the target “is not assured.”
- Investors have priced in nearly 73% odds that the Fed will cut rates in July, according to the CME FedWatch Tools.
Technical Analysis: Indian Rupee remains confined in a longer-term band between 82.60 and 83.15
Indian Rupee trades on a weaker note on the day. USD/INR sticks to the range bound theme within a multi-month-old descending trend channel around 82.60–83.15 since December 8, 2023.
From a technical perspective, the bearish outlook of USD/INR remains intact in the near term as the pair is below the key 100-day Exponential Moving Average (EMA) on the daily timeframe. However, the 14-day Relative Strength Index (RSI) returns above the 50.0 midline, indicating that further upside cannot be ruled out.
The first upside barrier will emerge near the 100-day EMA and a psychological mark at 83.00. Further strength could draw in USD/INR bulls and inspire another upswing to the upper boundary of the descending trend channel near 83.15. A decisive break above this level will see a rally to 83.35 (high of January 2), followed by the 84.00 round figure.
On the flip side, the initial support level for USD/INR is seen near a low of March 14 at 82.80. The key contention level is located at the lower limit of the descending trend channel at 82.60. Any follow-through selling could extend the pair’s downtrend to 82.45 (low of August 23), en route to 82.25 (low of June 1).
US Dollar price today
The table below shows the percentage change of US Dollar (USD) against listed major currencies today. US Dollar was the weakest against the Australian Dollar.
| USD | EUR | GBP | CAD | AUD | JPY | NZD | CHF | |
| USD | -0.01% | 0.01% | 0.03% | -0.02% | 0.08% | 0.07% | 0.08% | |
| EUR | 0.00% | 0.01% | 0.02% | -0.02% | 0.10% | 0.07% | 0.09% | |
| GBP | -0.01% | -0.02% | 0.02% | -0.03% | 0.07% | 0.05% | 0.07% | |
| CAD | -0.03% | -0.03% | 0.00% | -0.05% | 0.07% | 0.04% | 0.06% | |
| AUD | 0.02% | 0.01% | 0.03% | 0.05% | 0.12% | 0.09% | 0.10% | |
| JPY | -0.10% | -0.06% | -0.09% | -0.08% | -0.10% | 0.01% | 0.00% | |
| NZD | -0.06% | -0.08% | -0.06% | -0.04% | -0.09% | 0.03% | 0.01% | |
| CHF | -0.09% | -0.10% | -0.08% | -0.06% | -0.11% | 0.00% | -0.02% |
The heat map shows percentage changes of major currencies against each other. The base currency is picked from the left column, while the quote currency is picked from the top row. For example, if you pick the Euro from the left column and move along the horizontal line to the Japanese Yen, the percentage change displayed in the box will represent EUR (base)/JPY (quote).
Indian Rupee FAQs
The Indian Rupee (INR) is one of the most sensitive currencies to external factors. The price of Crude Oil (the country is highly dependent on imported Oil), the value of the US Dollar – most trade is conducted in USD – and the level of foreign investment, are all influential. Direct intervention by the Reserve Bank of India (RBI) in FX markets to keep the exchange rate stable, as well as the level of interest rates set by the RBI, are further major influencing factors on the Rupee.
The Reserve Bank of India (RBI) actively intervenes in forex markets to maintain a stable exchange rate, to help facilitate trade. In addition, the RBI tries to maintain the inflation rate at its 4% target by adjusting interest rates. Higher interest rates usually strengthen the Rupee. This is due to the role of the ‘carry trade’ in which investors borrow in countries with lower interest rates so as to place their money in countries’ offering relatively higher interest rates and profit from the difference.
Macroeconomic factors that influence the value of the Rupee include inflation, interest rates, the economic growth rate (GDP), the balance of trade, and inflows from foreign investment. A higher growth rate can lead to more overseas investment, pushing up demand for the Rupee. A less negative balance of trade will eventually lead to a stronger Rupee. Higher interest rates, especially real rates (interest rates less inflation) are also positive for the Rupee. A risk-on environment can lead to greater inflows of Foreign Direct and Indirect Investment (FDI and FII), which also benefit the Rupee.
Higher inflation, particularly, if it is comparatively higher than India’s peers, is generally negative for the currency as it reflects devaluation through oversupply. Inflation also increases the cost of exports, leading to more Rupees being sold to purchase foreign imports, which is Rupee-negative. At the same time, higher inflation usually leads to the Reserve Bank of India (RBI) raising interest rates and this can be positive for the Rupee, due to increased demand from international investors. The opposite effect is true of lower inflation.
| Raw materials | Closed | Change, % |
|---|---|---|
| Silver | 25.034 | -0.21 |
| Gold | 2160.106 | 0.32 |
| Palladium | 1029.36 | -4.14 |
- The Japanese Yen continues losing ground amid reduced bets for a BoJ policy pivot.
- Hawkish Fed expectations underpin the USD and further lend support to USD/JPY.
- Traders now look to the BoJ decision for fresh cues ahead of the FOMC meeting.
The Japanese Yen (JPY) drifts lower for the sixth straight day on Tuesday and weakens to a nearly two-week low against its American counterpart during the Asian session. Growing acceptance that the Bank of Japan (BoJ) will wait until April to exit the negative interest rate policy and the Yield Curve Control (YCC) turns out to be a key factor undermining the JPY. Apart from this, a modest US Dollar (USD) strength, bolstered by reduced bets for steep interest rate cuts by the Federal Reserve (Fed), lifts the USD/JPY pair closer to mid-149.00s.
Meanwhile, the much-stronger-than-expected pay hikes by major Japanese firms already seem to have set the stage for the BoJ to pivot away from the decade-long stimulus measures, which should act as a tailwind for the JPY. Traders might also refrain from placing aggressive directional bets and prefer to move to the sidelines ahead of the key central bank event risks. The BoJ is scheduled to announce its highly-anticipated decision in a short while from now, which will be followed by the crucial two-day FOMC monetary policy meeting starting later today.
Daily Digest Market Movers: Japanese Yen remains depressed amid bets that the BoJ will not exit its ultra-easy policy on Tuesday
- The Japanese Yen languishes near its lowest level in over a week amid the Bank of Japan policy uncertainty, though expectations that the central bank will eventually pivot away from its ultra-easy policy settings help limit losses.
- BoJ Governor Kazuo Ueda offered a slightly bleaker assessment of the economy last week and said that policymakers will debate whether the outlook is bright enough to phase out the decade-long massive monetary stimulus.
- Japan's largest union group said that the biggest companies agreed to raise wages by the heftiest in 33 years, reaffirming bets that the BoJ will soon exit the negative interest rates regime and the Yield Curve Control (YCC) policy.
- Japan's Finance Minister Shunichi Suzuki said that this year's wage negotiations have yielded record-high wage growth so far and that the government will deploy various policies so that positive momentum in wages continues.
- The hotter-than-expected US producer and consumer price data released last week forced investors to trim their bets for a more aggressive policy easing by the Federal Reserve, which continues to lend support to the US Dollar.
- Markets are now pricing in less than three 25 basis points rate cuts in 2024 and about a 51% chance that the Fed will begin the rate-cutting cycle at the June policy meeting, down sharply from expectations at the start of the year.
- Bets that the Fed will keep rates higher for longer lift the yield on benchmark 10-year US government bonds to a three-week high, which adds to the USD strength and supports prospects for further move up for the USD/JPY pair.
- Traders, however, seem reluctant to place aggressive directional bets ahead of the highly-anticipated BoJ policy decision on Tuesday, which will be followed by the outcome of the two-day FOMC meeting on Wednesday.
Technical Analysis: USD/JPY seems poised to appreciate further, bulls might now aim to reclaim the 150.00 psychological mark
From a technical perspective, the USD/JPY pair is holding above the 61.8% Fibonacci retracement level of the February-March downfall and seems poised to climb further. The constructive outlook is reinforced by the fact that oscillators on the daily chart have just started gaining positive traction. Hence, some follow-through strength towards the 149.75-149.80 horizontal barrier, en route to the 150.00 psychological mark, looks like a distinct possibility. A sustained strength beyond the latter might trigger a fresh bout of a short-covering move towards the 150.65-150.70 region before bulls aim to retest the YTD peak, around the 151.00 mark touched on February 13.
On the flip side, the 149.00 round-figure mark now seems to have emerged as an immediate support. Any further slide is more likely to attract some dip-buying and remain limited near the 148.30 region. This is followed by the 148.00 round figure, below which the USD/JPY pair could accelerate the downfall towards the 100-day Simple Moving Average (SMA), currently pegged near the 147.65 region. A convincing break below might shift the bias in favour of bearish traders and drag spot prices further towards the 147.00 mark en route to the monthly swing low, around the 146.50-146.45 region.
Japanese Yen FAQs
The Japanese Yen (JPY) is one of the world’s most traded currencies. Its value is broadly determined by the performance of the Japanese economy, but more specifically by the Bank of Japan’s policy, the differential between Japanese and US bond yields, or risk sentiment among traders, among other factors.
One of the Bank of Japan’s mandates is currency control, so its moves are key for the Yen. The BoJ has directly intervened in currency markets sometimes, generally to lower the value of the Yen, although it refrains from doing it often due to political concerns of its main trading partners. The current BoJ ultra-loose monetary policy, based on massive stimulus to the economy, has caused the Yen to depreciate against its main currency peers. This process has exacerbated more recently due to an increasing policy divergence between the Bank of Japan and other main central banks, which have opted to increase interest rates sharply to fight decades-high levels of inflation.
The BoJ’s stance of sticking to ultra-loose monetary policy has led to a widening policy divergence with other central banks, particularly with the US Federal Reserve. This supports a widening of the differential between the 10-year US and Japanese bonds, which favors the US Dollar against the Japanese Yen.
The Japanese Yen is often seen as a safe-haven investment. This means that in times of market stress, investors are more likely to put their money in the Japanese currency due to its supposed reliability and stability. Turbulent times are likely to strengthen the Yen’s value against other currencies seen as more risky to invest in.
- Australian Dollar remains tepid ahead of RBA’s policy decisions on Tuesday.
- Australian S&P/ASX 200 Index experiences thin trading activity due to market caution.
- US Dollar strengthens as US Treasury yields improve, fueled by expectations of the Fed being hawkish for an extended period.
The Australian Dollar (AUD) hovers around the key level of 0.6550 amid subdued trading activity as market participants exercise caution ahead of the Reserve Bank of Australia's (RBA) interest rate decision on Tuesday. Investors will closely monitor RBA Governor Michele Bullock's press conference for further insights. The central bank is widely anticipated to maintain interest rates at their current levels.
The Australian equity market, the benchmark S&P/ASX 200 Index, has edged higher after starting the session positively, driven by gains in the energy and real estate sectors. This upward movement in the stock market may provide support for the Australian Dollar (AUD). Australia's economy expanded less than anticipated in the fourth quarter of 2023, leading to speculation that the Reserve Bank of Australia could initiate rate cuts later this year.
The US Dollar Index (DXY) strives to extend its gains for the fourth consecutive session, bolstered by an uptick in US Treasury yields. Bond markets have experienced a sell-off following additional evidence of resilience in the United States (US) economy, compelling traders to adjust their expectations for fewer interest rate cuts this year. Investors are eagerly awaiting interest rate decisions from both the People's Bank of China (PBoC) and the US Federal Reserve (Fed), which are anticipated to be announced on Wednesday.
Daily Digest Market Movers: Australian Dollar remains tepid on market caution
- The ANZ-Roy Morgan Australian Consumer Confidence index, which is published weekly, stands at 81.7, compared to the previous week's reading of 82.2.
- According to Bloomberg, Westpac anticipates the Reserve Bank of Australia could maintain its cash rate at 4.35% at Tuesday's meeting.
- ANZ Bank analysts anticipate that the Reserve Bank of Australia (RBA) will maintain a "mild tightening bias," with no adjustment to interest rates.
- China's Retail Sales (YoY) increased by 5.5% in February, against the expected 5.2% and 7.4% prior.
- Chinese Industrial Production (YoY) rose by 7.0%, compared to the market expectation of a 5.0% figure in February and 6.8% previous reading.
- According to the CME FedWatch Tool, the probability of a rate cut in March stands at 1.0% and 8.7% for May. The likelihood of a rate cut in June and July is lower, at 55.1% and 73.7%, respectively.
- The preliminary US Michigan Consumer Sentiment Index for March decreased to 76.5, from the previous reading of 76.9. This decline comes in contrast to expectations of it remaining unchanged.
- The Board of Governors of the Federal Reserve released Industrial Production (MoM), which increased by 0.1% in February, against the expected reading of flat 0.0% and from the previous decline of 0.5%.
- The US Core Producer Price Index (PPI) remained consistent with the rise of 2.0% year-over-year in February, maintaining its position above the 1.9% expected. The monthly report showed an increase of 0.3% against 0.5% prior, exceeding the expected 0.2% reading.
- US PPI (YoY) increased by 1.6% in February, surpassing the expected 1.1% and 1.0% prior. PPI (MoM) rose by 0.6% above the market expectation and the previous increase of 0.3%.
Technical Analysis: Australian Dollar maintains position near the major level at 0.6550
The Australian Dollar remains close to the significant threshold of 0.6550 On Tuesday. A breach below this level might prompt downward momentum for the AUD/USD pair, with additional support anticipated around the 61.8% Fibonacci retracement level of 0.6528, and thereafter at the psychological support level of 0.6500. On the upside, the AUD/USD pair could encounter resistance near the nine-day Exponential Moving Average (EMA) at 0.6571, followed by the psychological hurdle at 0.6600.
AUD/USD: Daily Chart
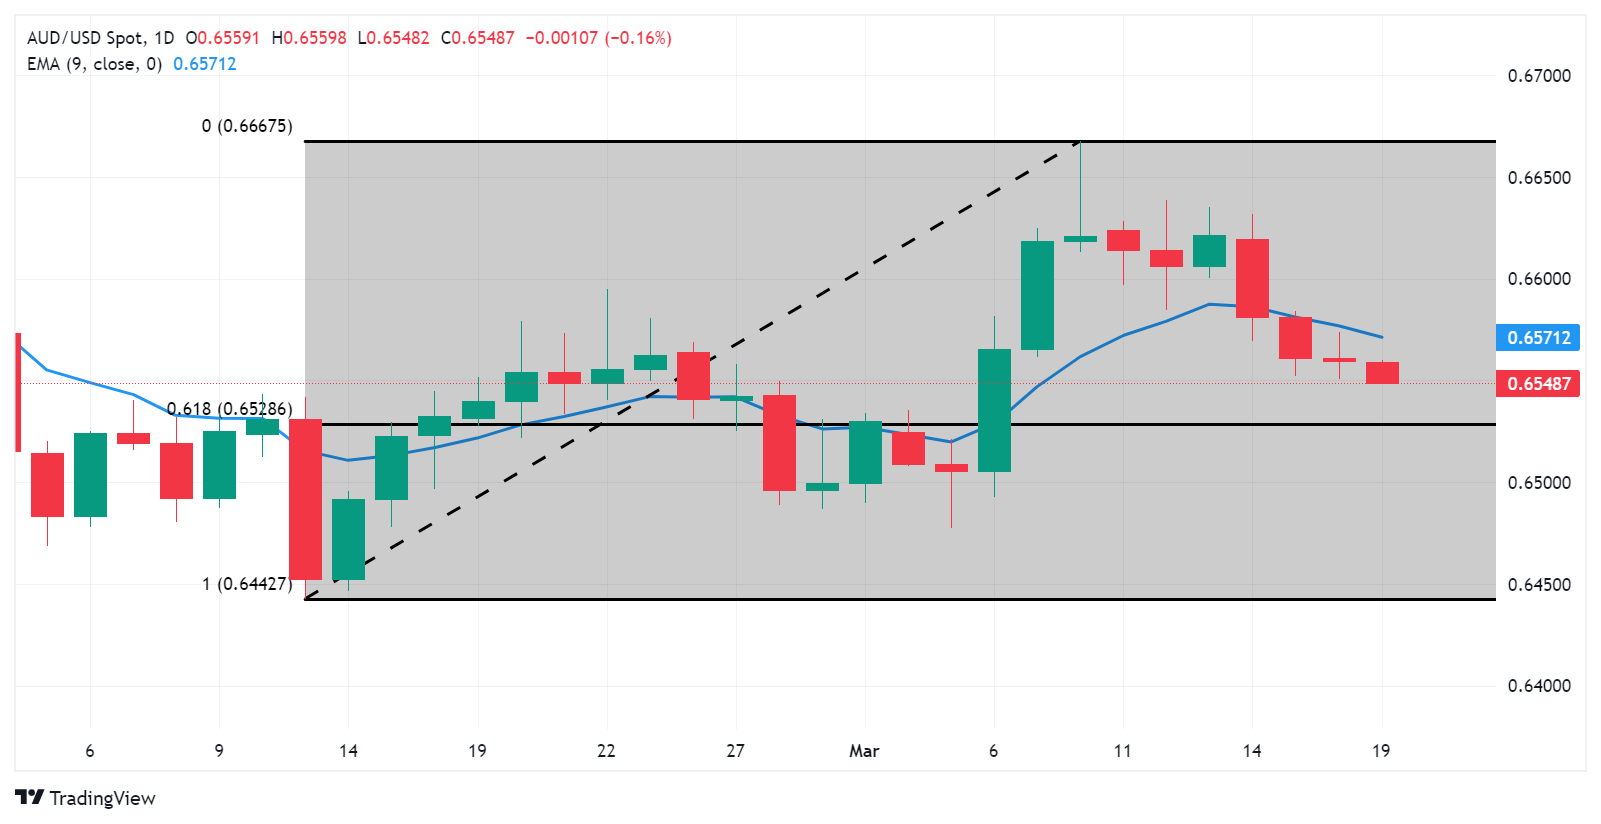
Australian Dollar price today
The table below shows the percentage change of Australian Dollar (AUD) against listed major currencies today. Australian Dollar was the weakest against the US Dollar.
| USD | EUR | GBP | CAD | AUD | JPY | NZD | CHF | |
| USD | 0.03% | 0.06% | 0.08% | 0.11% | 0.12% | 0.17% | 0.11% | |
| EUR | -0.03% | 0.02% | 0.04% | 0.08% | 0.09% | 0.12% | 0.08% | |
| GBP | -0.04% | -0.01% | 0.02% | 0.06% | 0.06% | 0.09% | 0.05% | |
| CAD | -0.08% | -0.04% | 0.00% | 0.03% | 0.05% | 0.09% | 0.04% | |
| AUD | -0.09% | -0.08% | -0.06% | -0.04% | 0.02% | 0.08% | -0.02% | |
| JPY | -0.13% | -0.07% | -0.07% | -0.06% | 0.01% | 0.06% | 0.00% | |
| NZD | -0.14% | -0.11% | -0.09% | -0.06% | -0.03% | -0.01% | -0.05% | |
| CHF | -0.10% | -0.07% | -0.05% | -0.03% | 0.01% | 0.02% | 0.07% |
The heat map shows percentage changes of major currencies against each other. The base currency is picked from the left column, while the quote currency is picked from the top row. For example, if you pick the Euro from the left column and move along the horizontal line to the Japanese Yen, the percentage change displayed in the box will represent EUR (base)/JPY (quote).
Australian Dollar FAQs
One of the most significant factors for the Australian Dollar (AUD) is the level of interest rates set by the Reserve Bank of Australia (RBA). Because Australia is a resource-rich country another key driver is the price of its biggest export, Iron Ore. The health of the Chinese economy, its largest trading partner, is a factor, as well as inflation in Australia, its growth rate, and Trade Balance. Market sentiment – whether investors are taking on more risky assets (risk-on) or seeking safe havens (risk-off) – is also a factor, with risk-on positive for AUD.
The Reserve Bank of Australia (RBA) influences the Australian Dollar (AUD) by setting the level of interest rates that Australian banks can lend to each other. This influences the level of interest rates in the economy as a whole. The main goal of the RBA is to maintain a stable inflation rate of 2-3% by adjusting interest rates up or down. Relatively high interest rates compared to other major central banks support the AUD, and the opposite for relatively low. The RBA can also use quantitative easing and tightening to influence credit conditions, with the former AUD-negative and the latter AUD-positive.
China is Australia’s largest trading partner so the health of the Chinese economy is a major influence on the value of the Australian Dollar (AUD). When the Chinese economy is doing well it purchases more raw materials, goods and services from Australia, lifting demand for the AUD, and pushing up its value. The opposite is the case when the Chinese economy is not growing as fast as expected. Positive or negative surprises in Chinese growth data, therefore, often have a direct impact on the Australian Dollar and its pairs.
Iron Ore is Australia’s largest export, accounting for $118 billion a year according to data from 2021, with China as its primary destination. The price of Iron Ore, therefore, can be a driver of the Australian Dollar. Generally, if the price of Iron Ore rises, AUD also goes up, as aggregate demand for the currency increases. The opposite is the case if the price of Iron Ore falls. Higher Iron Ore prices also tend to result in a greater likelihood of a positive Trade Balance for Australia, which is also positive of the AUD.
The Trade Balance, which is the difference between what a country earns from its exports versus what it pays for its imports, is another factor that can influence the value of the Australian Dollar. If Australia produces highly sought after exports, then its currency will gain in value purely from the surplus demand created from foreign buyers seeking to purchase its exports versus what it spends to purchase imports. Therefore, a positive net Trade Balance strengthens the AUD, with the opposite effect if the Trade Balance is negative.
Chinese Foreign Minister Wang Yi, during his visit to New Zealand on Tuesday, said that “China is ready to work with New Zealand to implement an upgraded version of the China-New Zealand free trade agreement.”
Additional quotes
Two sides should launch negotiations on negative list of service trade as soon as possible, so as to push bilateral cooperation to a new level.
China-New Zealand relations maintain a leading position among China's relations with developed countries.
Market reaction
Despite the upbeat headlines, NZD/USD is losing 0.17% on the day to trade at 0.6071, as of writing.
On Tuesday, the People’s Bank of China (PBoC) set the USD/CNY central rate for the trading session ahead at 7.0985 as compared to the previous day's fix of 7.0943 and 7.2056 Reuters estimates.
| Index | Change, points | Closed | Change, % |
|---|---|---|---|
| NIKKEI 225 | 1032.8 | 39740.44 | 2.67 |
| Hang Seng | 16.23 | 16737.12 | 0.1 |
| KOSPI | 19 | 2685.84 | 0.71 |
| ASX 200 | 5.5 | 7675.8 | 0.07 |
| DAX | -3.97 | 17932.68 | -0.02 |
| CAC 40 | -16.21 | 8148.14 | -0.2 |
| Dow Jones | 75.66 | 38790.43 | 0.2 |
| S&P 500 | 32.33 | 5149.42 | 0.63 |
| NASDAQ Composite | 130.28 | 16103.45 | 0.82 |
- EUR/USD remains on the defensive near 1.0872 amid renewed USD demand.
- The Fed is anticipated to hold benchmark interest rates steady in the range of 5.25%–5.50% at its March meeting.
- ECB policymakers signaled progress in easing inflation and began discussions about the rate cut.
- The Federal Reserve's (Fed) monetary policy meeting will be a closely watched event.
The EUR/USD pair edges lower to multi-day lows around 1.0870 on the firmer US Dollar (USD) during the early Asian session on Tuesday. The Federal Reserve (Fed) monetary policy meeting on Wednesday will be in the spotlight, with no change in rates expected. Meanwhile, the cautious mood in the market might lift the Greenback against the Euro (EUR). The major pair currently trades around 1.0872, unchanged for the day.
The recent US economic data showed inflation in the US economy remains elevated, and this pushed out market expectations for the first rate cut in June. The Fed Chairman Jerome Powell said two weeks ago that the central bank is not far from the confidence it needs to cut rates, while some Fed officials expect the first rate cut could happen later this year or during the summer.
The Fed will announce its interest rate decision on Wednesday, which is anticipated to hold benchmark interest rates steady in the range of 5.25%–5.50% at its March meeting. Investors have priced in a nearly 73% chance that the Fed will cut rates in July, according to the CME FedWatch Tools.
The European Central Bank (ECB) decided to keep borrowing costs at a record high at its March meeting. Nonetheless, the central bank policymakers signaled progress in easing inflation and began discussions about the rate cut. The ECB Governing Council member, Pablo Hernandez de Kos, said that the central bank may start lowering interest rates in June if inflation in the eurozone continues to decline. Meanwhile, ECB policymaker Mario Centeno stated that cutting borrowing costs could help prevent a euro area recession.
Additionally, ECB Governing Council member Klaas Knot penciled in June for a first-rate cut and expects three rate cuts this year, while ECB President Christine Lagarde said that June is the earliest it is likely to cut interest rates after the ECB lowered its forecasts for inflation and estimated it will reach its 2% target in 2025.
Looking ahead, market players will keep an eye on the German and Eurozone ZEW Survey on Tuesday. Also, the US Building Permits and Housing Starts will be released later in the day. The attention will shift to the Fed interest rate decision and press conference on Wednesday. Traders will take cues from this event and find trading opportunities around the EUR/USD pair.
| Pare | Closed | Change, % |
|---|---|---|
| AUDUSD | 0.65573 | -0.06 |
| EURJPY | 162.128 | -0.09 |
| EURUSD | 1.0873 | -0.16 |
| GBPJPY | 189.786 | -0 |
| GBPUSD | 1.27271 | -0.07 |
| NZDUSD | 0.60824 | -0.06 |
| USDCAD | 1.35337 | -0.05 |
| USDCHF | 0.88759 | 0.52 |
| USDJPY | 149.113 | 0.06 |
Japanese Finance Minister Shunichi Suzuki said on Tuesday that it depends on the Bank of Japan (BoJ) to decide the details of monetary policy. Suzuki further stated that he saw positive economic signs, including wage growth and corporate spending.
Key quotes
“Won't comment on any BOJ policy steps to be taken.”
“It’s up to the Bank of Japan to decide specifics of monetary policy.”
“This year's wage negotiations yielding record-high wage growth so far.”
“We are clearly seeing good signs in the economy such as robust corporate spending appetite.”
“The government will deploy various policies so that positive momentum in wages continues.”
Market reaction
At the time of writing, USD/JPY is trading 0.02% lower on the day at 149.13.
Bank of Japan FAQs
The Bank of Japan (BoJ) is the Japanese central bank, which sets monetary policy in the country. Its mandate is to issue banknotes and carry out currency and monetary control to ensure price stability, which means an inflation target of around 2%.
The Bank of Japan has embarked in an ultra-loose monetary policy since 2013 in order to stimulate the economy and fuel inflation amid a low-inflationary environment. The bank’s policy is based on Quantitative and Qualitative Easing (QQE), or printing notes to buy assets such as government or corporate bonds to provide liquidity. In 2016, the bank doubled down on its strategy and further loosened policy by first introducing negative interest rates and then directly controlling the yield of its 10-year government bonds.
The Bank’s massive stimulus has caused the Yen to depreciate against its main currency peers. This process has exacerbated more recently due to an increasing policy divergence between the Bank of Japan and other main central banks, which have opted to increase interest rates sharply to fight decades-high levels of inflation. The BoJ’s policy of holding down rates has led to a widening differential with other currencies, dragging down the value of the Yen.
A weaker Yen and the spike in global energy prices have led to an increase in Japanese inflation, which has exceeded the BoJ’s 2% target. Still, the Bank judges that the sustainable and stable achievement of the 2% target has not yet come in sight, so any sudden change in the current policy looks unlikely.


© 2000-2026. Уcі права захищені.
Cайт знаходитьcя під керуванням TeleTrade DJ. LLC 2351 LLC 2022 (Euro House, Richmond Hill Road, Kingstown, VC0100, St. Vincent and the Grenadines).
Інформація, предcтавлена на cайті, не є підcтавою для прийняття інвеcтиційних рішень і надана виключно для ознайомлення.
Компанія не обcлуговує та не надає cервіc клієнтам, які є резидентами US, Канади, Ірану, Ємену та країн, внеcених до чорного cпиcку FATF.
Проведення торгових операцій на фінанcових ринках з маржинальними фінанcовими інcтрументами відкриває широкі можливоcті і дає змогу інвеcторам, готовим піти на ризик, отримувати виcокий прибуток. Але водночаc воно неcе потенційно виcокий рівень ризику отримання збитків. Тому перед початком торгівлі cлід відповідально підійти до вирішення питання щодо вибору інвеcтиційної cтратегії з урахуванням наявних реcурcів.
Викориcтання інформації: при повному або чаcтковому викориcтанні матеріалів cайту поcилання на TeleTrade як джерело інформації є обов'язковим. Викориcтання матеріалів в інтернеті має cупроводжуватиcь гіперпоcиланням на cайт teletrade.org. Автоматичний імпорт матеріалів та інформації із cайту заборонено.
З уcіх питань звертайтеcь за адреcою pr@teletrade.global.
переклади