- Analytics
- News and Tools
- Market News
Новини ринків
- AUD/USD trades on a softer note near 0.6532 amid the modest rebound of the USD.
- RBA’s Bullock said last week that all options are still on the table in terms of monetary policy decisions.
- The RBA Meeting Minutes and the People’s Bank of China's (PBoC) interest rate decision will be closely watched events.
The AUD/USD pair loses traction below the mid-0.6500s during the early Asian trading hours on Tuesday. The Reserve Bank of Australia (RBA) will publish the minutes of its February monetary policy meeting later in the day. The pair currently trades around 0.6532, down 0.12% on the day.
The RBA governor Michele Bullock said all options are still on the table in terms of monetary policy decisions. However, the central bank needs to make sure that it doesn’t have to backtrack on inflation, and that inflation doesn't get away. Deutsche Bank analysts showed earlier this month that they expected the RBA to cut interest rates as early as May. Still, most analysts anticipate the Reserve Bank to ease policy between June and December.
On the USD’s front, the Federal Reserve (Fed) shifted to a more dovish stance in December, with markets now pricing in rate cuts by summer. Investors will take more cues from the FOMC minutes for the January meeting, with the focus on any discussion around the timing of rate cuts. The markets anticipate the first 25 basis points (bps) rate cut in 2024 as early as June, according to the CME FedWatch Tools.
Market players will keep an eye on the RBA Meeting Minutes, followed by the People’s Bank of China (PBoC) interest rate decision on Tuesday. A poll of 27 market watchers conducted this week showed that 92.6% of respondents anticipated the five-year LPR to be cut on Tuesday. They expected a reduction of five to 15 basis points.
- NZD/USD trades on a flat note near 0.6148 in Tuesday’s early Asian session.
- The upbeat inflation data has prompted Fed policymakers to ramp up their cautious stance on interest rate cuts this year.
- RBNZ’s Orr said the central bank must continue to contain inflation expectations, implying that it will not soon cut the rates.
The NZD/USD pair trades flat during the early Asian session on Tuesday. The market trades in a quiet session after a US holiday. The People’s Bank of China (PBoC) will announce its decision on interest rates on Tuesday. Meanwhile, some pushback against rate cut expectations from the Federal Reserve (Fed) might lift the Greenback and cap the upside of the pair. At press time, NZD/USD is trading at 0.6148, losing 0.02% on the day.
The stronger-than-expected inflation data has Fed policymakers doubling down on their wait-and-see approach to interest rate cuts this year. Investors will take more cues from the FOMC Minutes on Wednesday. The markets have priced in a 75% odds of a rate cut from the Fed in June, according to the CME’s FedWatch Tool.
On the Kiwi front, Reserve Bank of New Zealand (RBNZ) Governor Adrian Orr said last week that the central bank still needs to ensure that inflation expectations are contained, suggesting it won’t be signaling a pivot to interest rate cuts soon. This, in turn, boosts the New Zealand Dollar (NZD) in the previous sessions and acts as a tailwind for the NZD/USD pair. Two-year inflation expectations declined to a two-and-a-half-year low of 2.5% in the first quarter and the RBNZ expects inflation to return to 2% in three years, though that time frame will also depend on its tolerance for the impact of any transitory inflation shocks.
Looking ahead, market players will monitor the PBoC interest rate decision. On Wednesday, the New Zealand Q4 Producer Price Index (PPI) will be due, and Fed's Bostic is set to speak. The highlight of this week will be the FOMC Minutes on Wednesday. This event could give a clear direction and trading opportunities for the NZD/USD pair.
- AUD/NZD drifting into the bottom end after near-term peak at 1.0700.
- RBA due early Tuesday, expected to hold rates steady.
- AUD/NZD tested into its lowest bids since May last week.
The AUD/NZD is caught in a near-term downside drift ahead of Tuesday’s latest showing from the Reserve Bank of Australia (RBA), and the pair is down around seven-tenths of a percent after peaking near the 1.0700 handle last week.
The pair recently dipped into multi-month lows, testing into its lowest bids since last May and dropping into the 1.0590 region, but bullish momentum has drained out of a limited recovery that sees the pair struggling on the bearish side of a descending 200-hour Simple Moving Average (SMA) dropping into 1.0650.
With the AUD/NZD struggling to establish a meaningful recovery, buyers are grasping for a rebound into the 200-day SMA near 1.0800 as daily candles continue to grind into bearish territory in rough sideways action that exposes the pair to rapid drops as the Antipodeans grapple for supremacy.
Australian Dollar price today
The table below shows the percentage change of Australian Dollar (AUD) against listed major currencies today. Australian Dollar was the weakest against the New Zealand Dollar.
| USD | EUR | GBP | CAD | AUD | JPY | NZD | CHF | |
| USD | 0.05% | 0.13% | 0.11% | -0.03% | 0.02% | -0.20% | 0.20% | |
| EUR | -0.06% | 0.06% | 0.04% | -0.08% | -0.03% | -0.26% | 0.15% | |
| GBP | -0.11% | -0.09% | -0.04% | -0.14% | -0.09% | -0.32% | 0.07% | |
| CAD | -0.09% | -0.04% | 0.02% | -0.12% | -0.07% | -0.29% | 0.10% | |
| AUD | 0.03% | 0.08% | 0.16% | 0.14% | 0.05% | -0.18% | 0.23% | |
| JPY | -0.01% | 0.03% | 0.13% | 0.09% | -0.05% | -0.22% | 0.18% | |
| NZD | 0.20% | 0.25% | 0.33% | 0.32% | 0.18% | 0.22% | 0.40% | |
| CHF | -0.21% | -0.16% | -0.07% | -0.10% | -0.24% | -0.19% | -0.41% |
The heat map shows percentage changes of major currencies against each other. The base currency is picked from the left column, while the quote currency is picked from the top row. For example, if you pick the Euro from the left column and move along the horizontal line to the Japanese Yen, the percentage change displayed in the box will represent EUR (base)/JPY (quote).
AUD/NZD hourly chart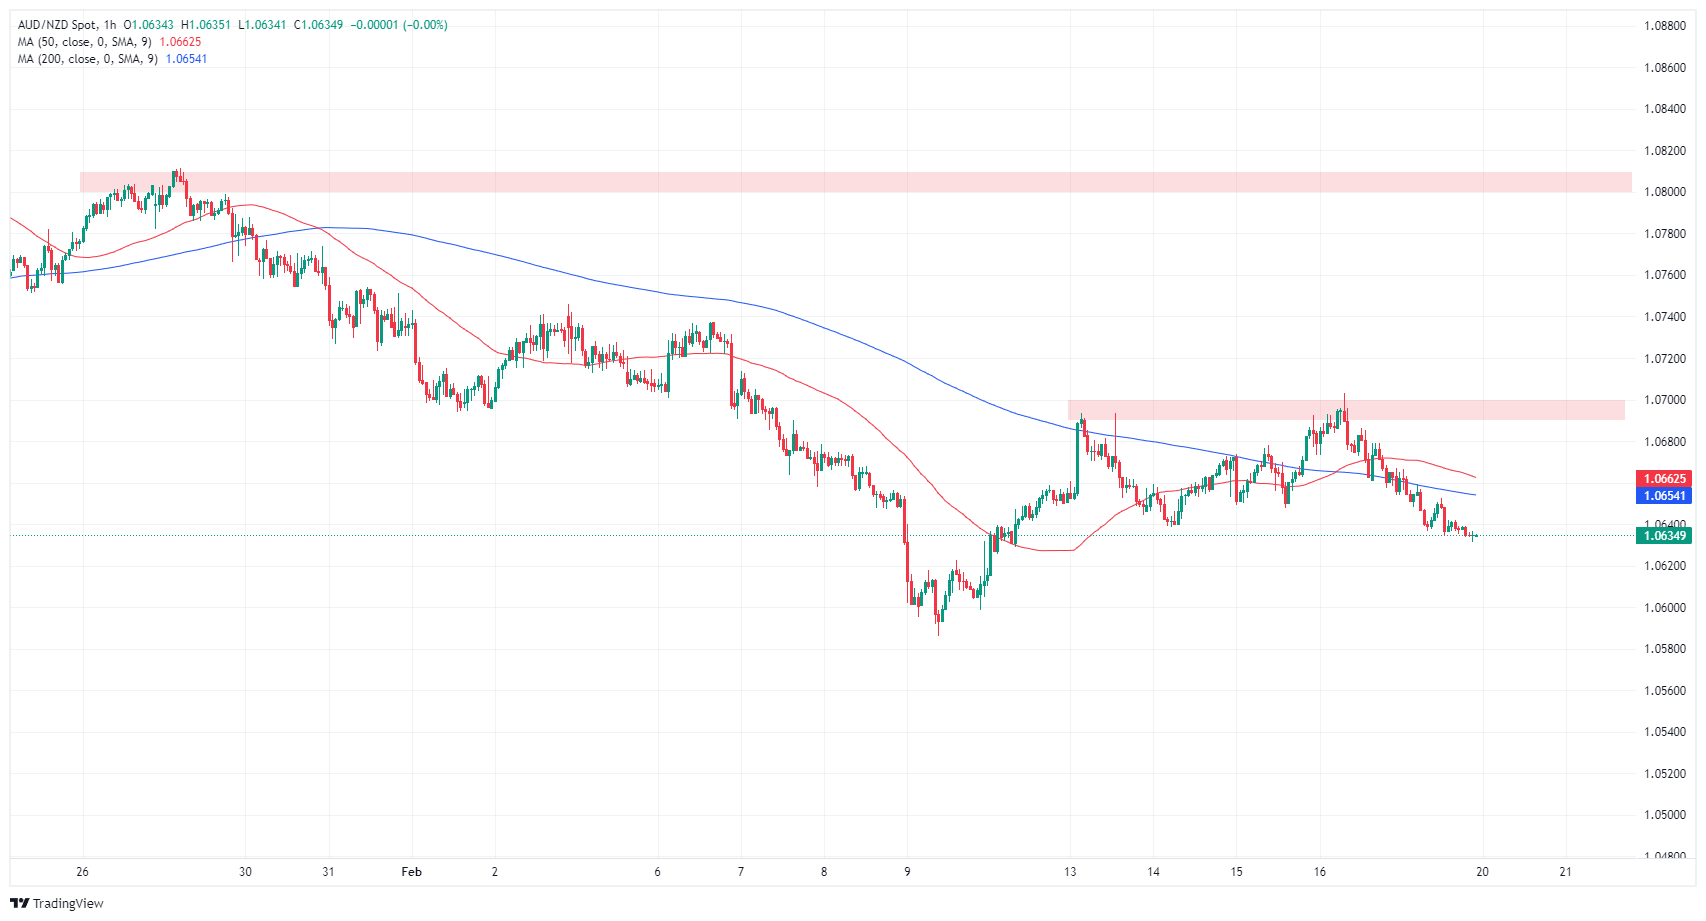
AUD/NZD daily chart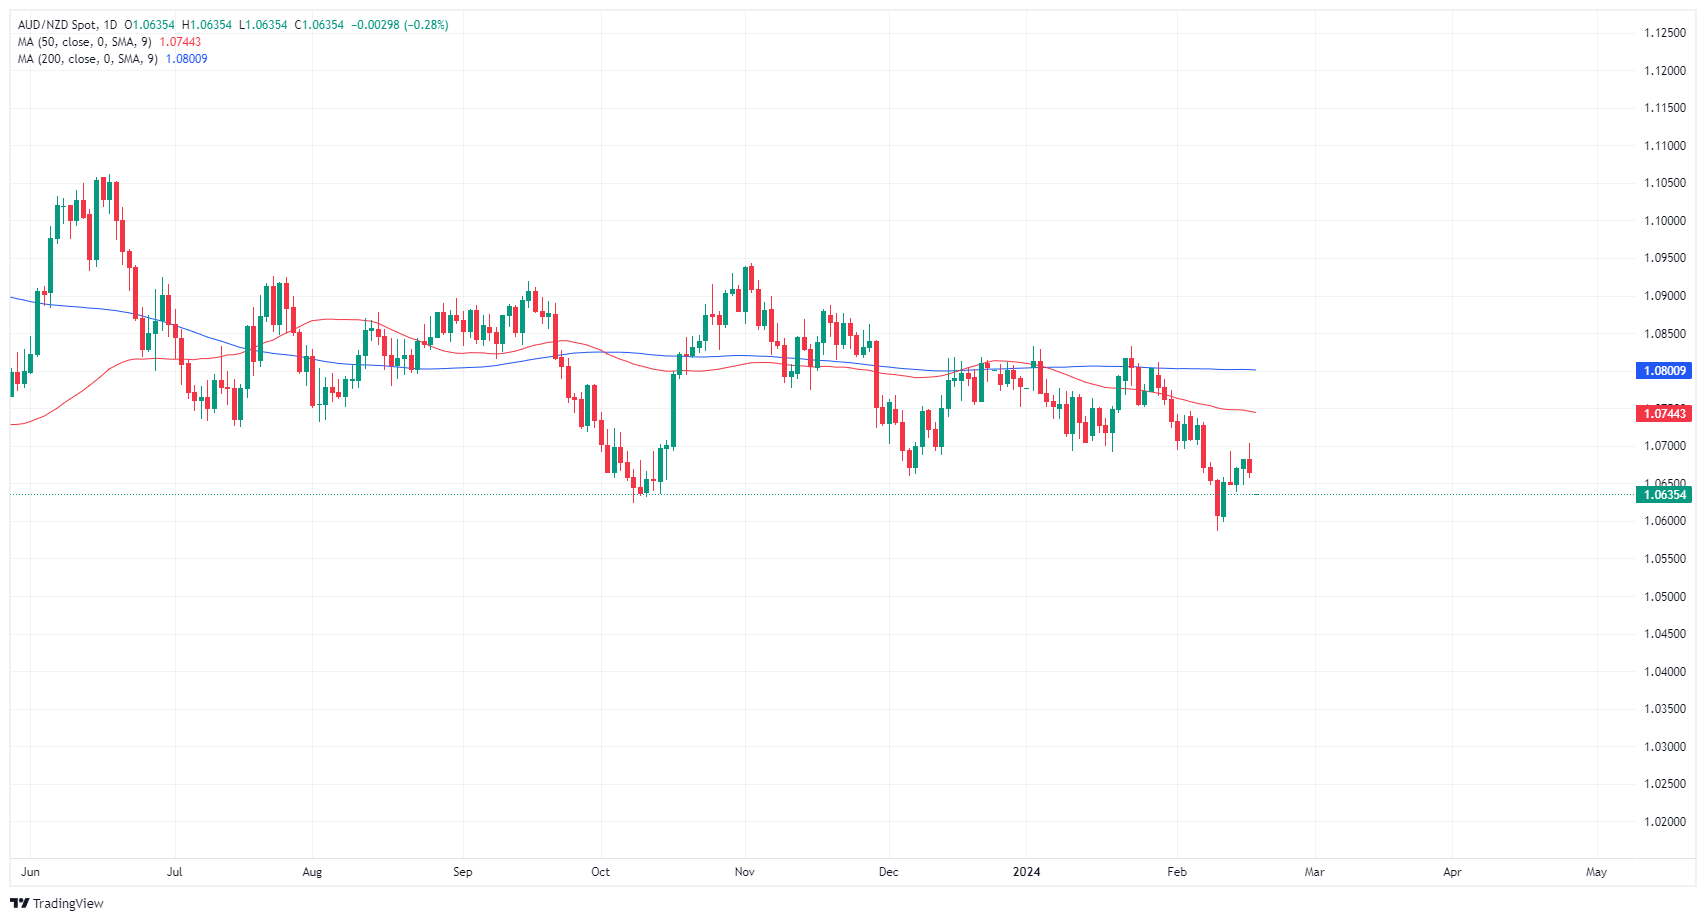
- USD/JPY at 150.13, stabilizing amid quiet trading from the US holiday.
- Bulls aim for a break above 150.88 year-to-date high, targeting 151.91+.
- Decline below 150.00 may prompt tests of lower support, as technicals suggest crucial markers.
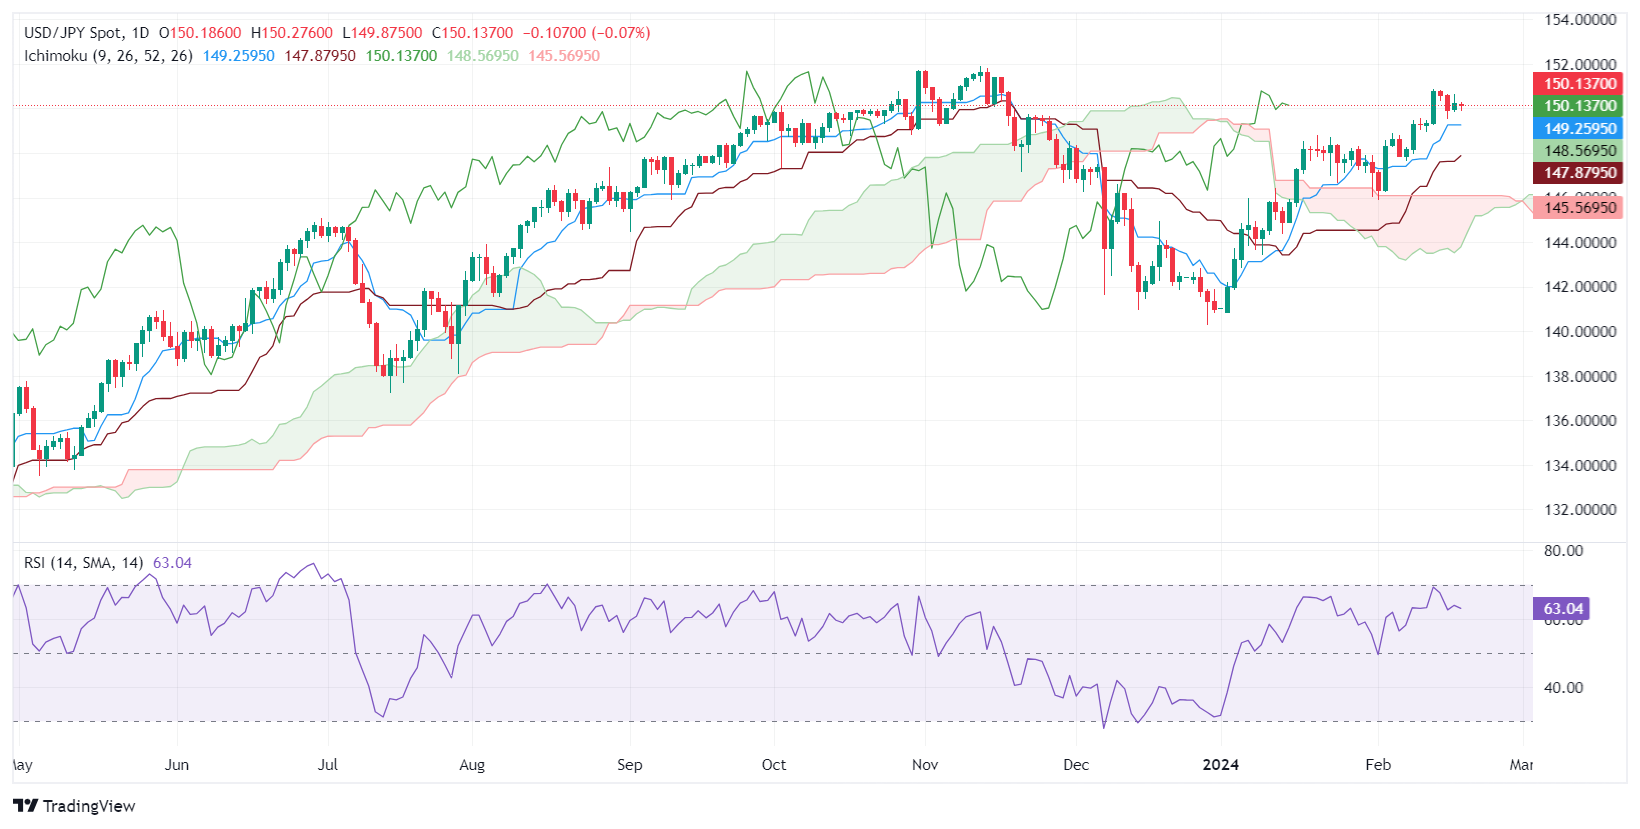
The USD/JPY traded sideways during a choppy trading session late on Monday, with Wall Street remaining closed in observance of President’s Day. At the time of writing, the pair exchanges hands at 150.13, flat.
From a technical perspective, the USD/JPY is neutral to upward biased, but it seems to have peaked at around the 150.00 area as Japanese authorities threatened to intervene in the Forex markets. Nevertheless, bulls remain in charge, and if they push the exchange rate above the current year-to-date (YTD) high of 150.88, that will exacerbate a rally above the 151.00 figure, with buyers targeting the 2023 high at 151.91. A breach of the latter will expose the 152.00 mark.
On the flip side, if sellers drag the exchange rate below 150.00, look for a dip lower, initially to the Tenkan-Sen at 149.25. Once cleared. The next stop would be the Senkou Span A at 148.57, followed by the Kijun-Sen at 147.88.
USD/JPY Price Action – Daily Chart
- WTI explores territory north of $78.00 as barrel prices remain bid.
- Global demand concerns outweighed by Middle East tensions.
- Fresh attacks by Houthis and the ongoing Gaza conflict keeping barrel prices high.
West Texas Intermediate (WTI) US Crude Oil tested above $78.00 per barrel on Monday, finding room to the upside with US markets darkened for the American President’s Day federal holiday.
Iran-backed Houthis in Yemen continue to launch attacks on civilian cargo ships in the Red Sea, disrupting key trade routes between Europe and Asia since last November. Houthi rebels claimed responsibility for an attack on an oil tanker bound for India over the weekend, alongside fresh reports of attacks on Monday as shipping lanes through the Suez Canal continue to come under threat.
The ongoing conflict in Gaza between Israel and Palestinian Hamas looks set to continue unabated as an ongoing ceasefire negotiation continues to come up short. Israel’s negotiation team did not return to the talks table in Qatar over the weekend and a ceasefire deal appears unlikely.
Despite Middle East tensions keeping concerns pinned about hypothetical supply constraints in energy markets, ANZ researchers noted that the Organization of the Petroleum Exporting Countries (OPEC) has hit an eight-year high in excess capacity. According to ANZ, OPEC has enough slack in its production cycle to absorb an excess of 6.4 million barrels per day.
WTI technical outlook
WTI US Crude Oil remands bid into near-term highs, testing $78.00 and bolstered above the 200-hour Simple Moving Average (SMA) near $76.60.
WTI Crude Oil prices have seen a choppy, halting recovery after hitting a low of $67.97 in December, and WTI is still down nearly 17% from last September’s peak bids near $94.00 per barrel.
WTI hourly chart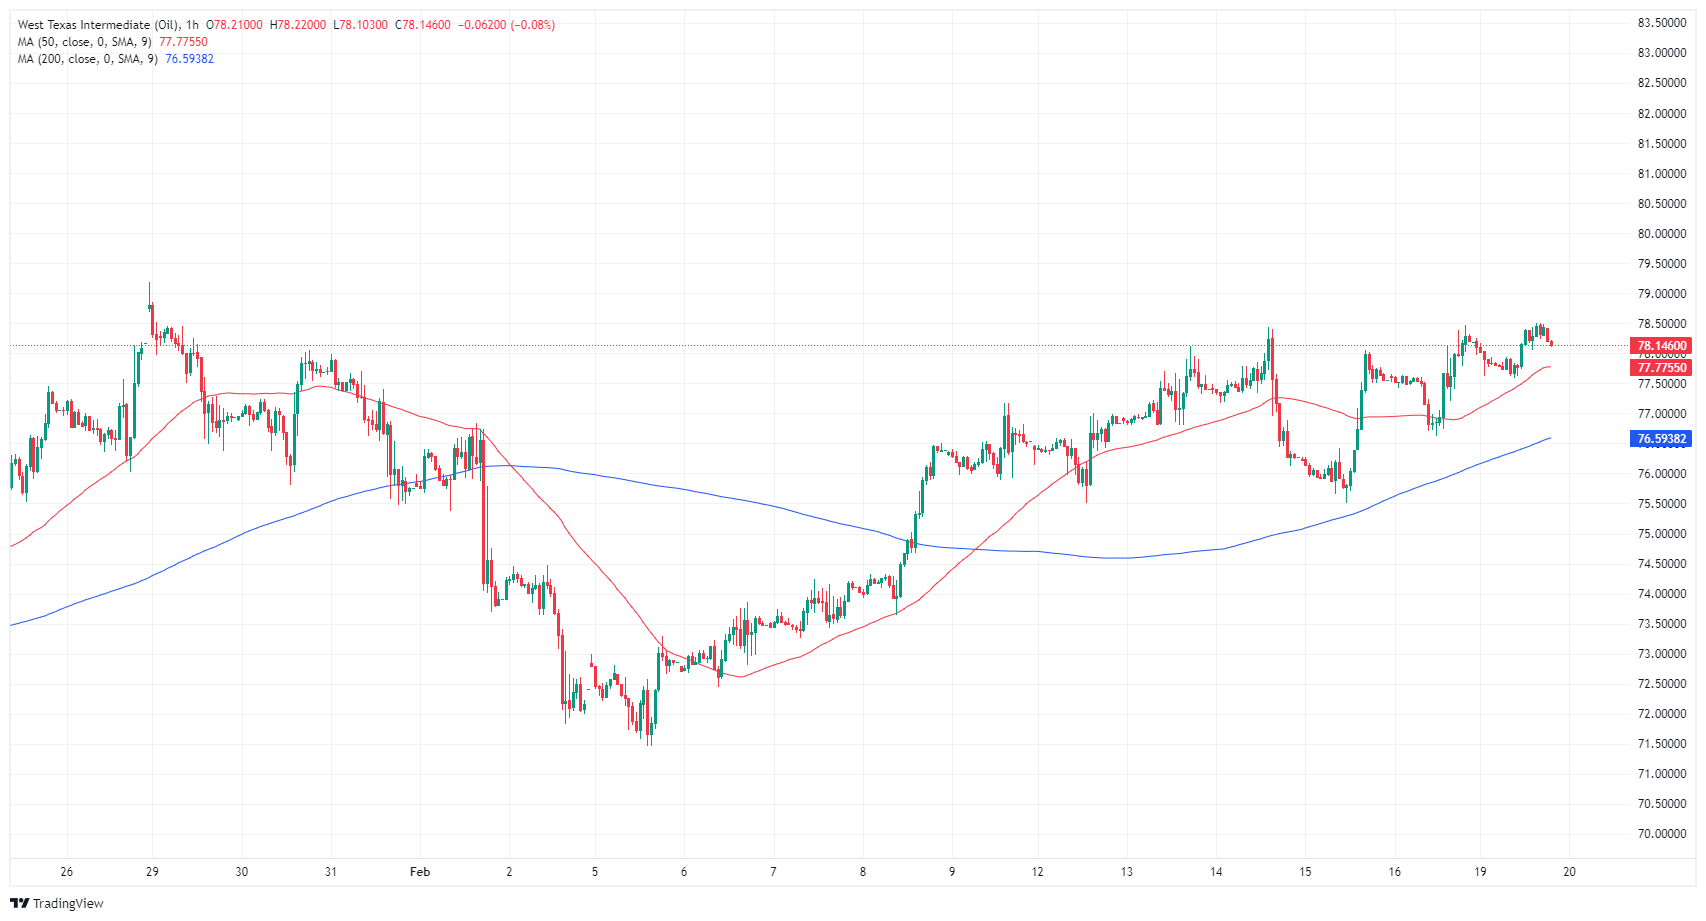
WTI daily chart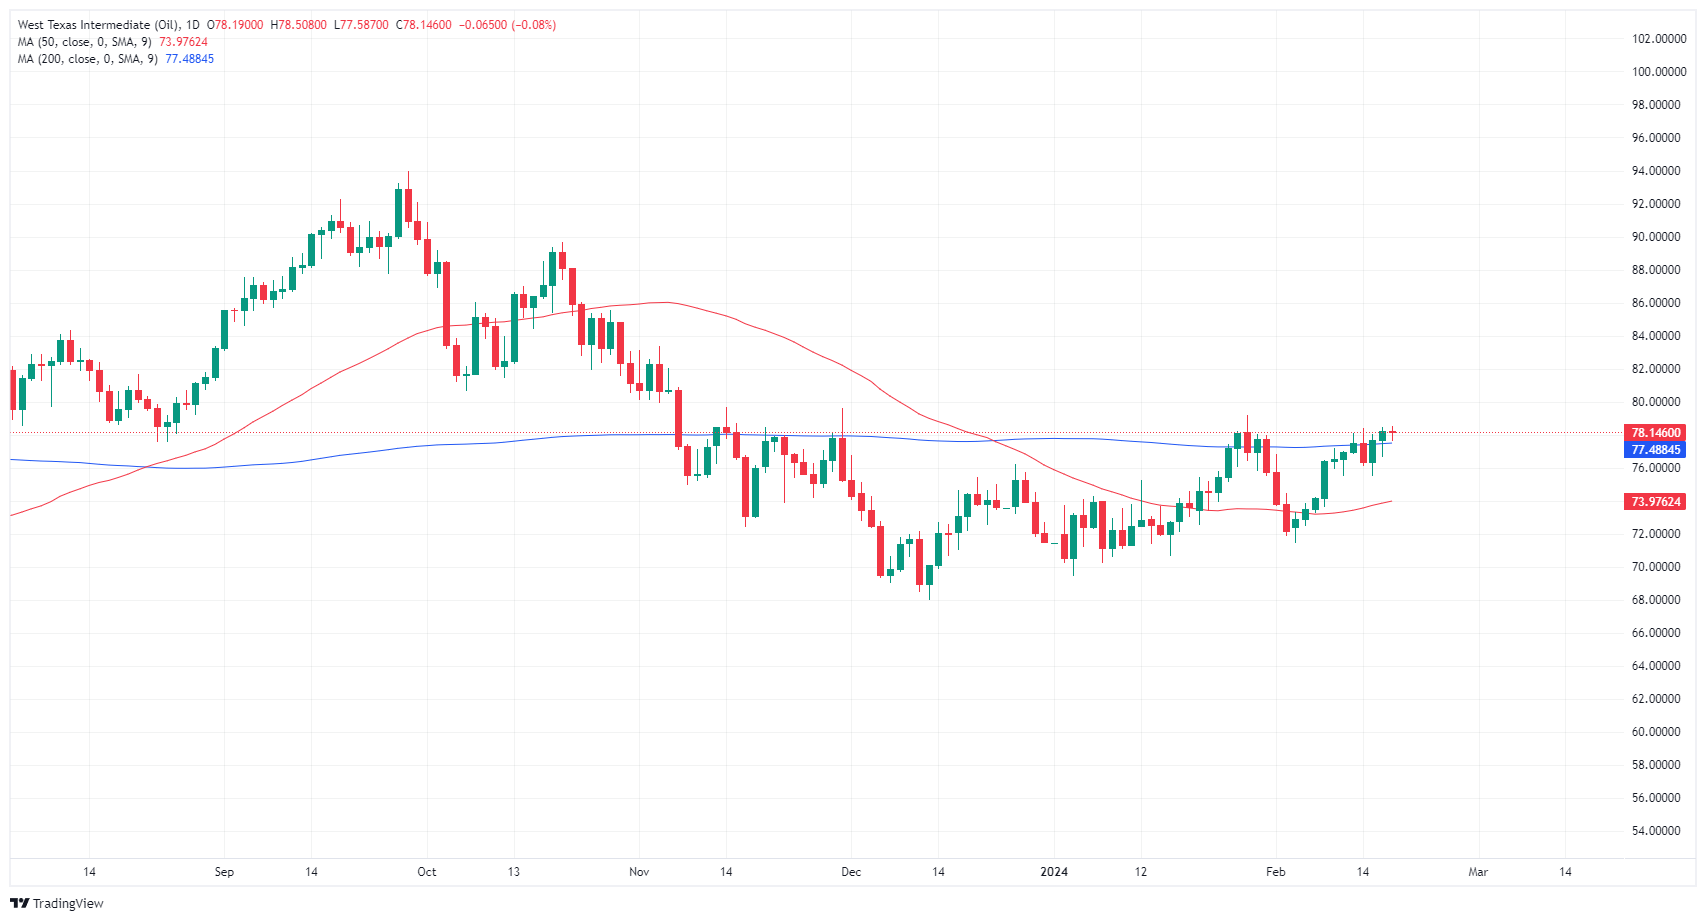
- The GBP/USD currently trades at 1.2597, marking mild losses in Monday's session.
- Trading activities were subdued due to the absence of any high-tier data releases.
- US Traders are out, celebrating the President’s Day holiday.
- Upcoming key events include FOMC’s January policy meeting minutes and February UK and US PMI to set the pace for the week.
In Monday's session, the GBP/USD traded with mild losses at the 1.2597 level. The market showed a limited market movement due to the absence of high-tier economic releases and the Presidents' Day holiday, taking the US Traders out of the picture.
For the rest of the week, on Thursday, the preliminary February Manufacturing and Services PMI surveys for the UK and the US will be looked upon for fresh impetus. On Wednesday, the Federal Reserve (Fed) will release the minutes of the January policy meeting. As for now, markets are delaying the start of the easing cycle for both the Fed and Bank of England (BoE) due to both blocks not showing enough evidence of the inflationary pressures coming down. On the one hand, the Fed’s minutes might show markets explicitly how open are the bank’s officials to start cutting while the PMIs will give additional information on the health of both economies. Both reports might fuel volatility on the pair as they may affect the bets and timing of the start of the Fed’s and BoE’s cutting cycles.
GBP/USD technical analysis
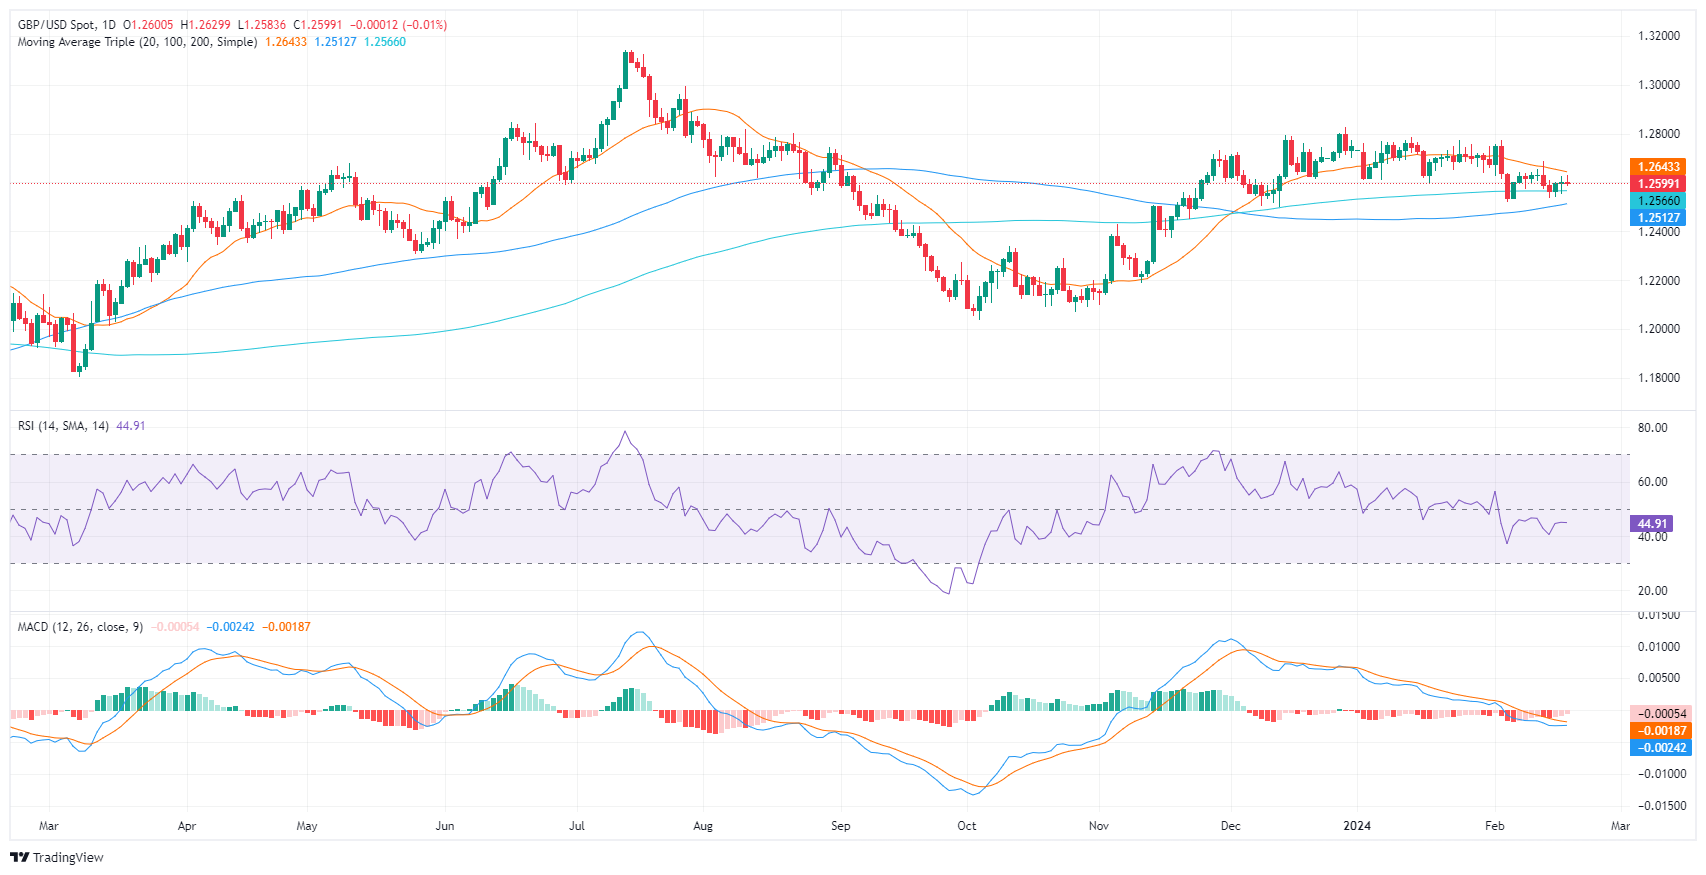
The GBPUSD pair reveals a somewhat scenario, with the Relative Strength Index (RSI) currently in the negative territory. The daily RSI suggests that the recent momentum has been predominantly driven by the sellers, further echoed by the MACD histogram consistently printing red bars, indicating a negative momentum.
Looking at the pair's overall trend position, while the bears seem to have short-term control with the pair trading below the 20-day Simple Moving Average (SMA), the bulls maintain their dominance on the larger time frames as the pair is yet to trade below the 100 and 200-day SMAs. In that sense, indicators suggest a flattening momentum as market participants await fresh catalysts but that the overall trend favors the sellers.
GBP/USD daily chart
- AUD/USD holding steady near 0.6550 with RBA due early Tuesday.
- Wednesday brings the latest FOMC Meeting Minutes from the Fed.
- Australian Judo Bank PMIs slated for early Thursday.
AUD/USD is paddling in circles just below 0.6550 as the pair pulls into the center ahead of Tuesday’s showing from the Reserve Bank of Australia (RBA). Wednesday sees the Federal Reserve’s (Fed) latest Meeting Minutes from the Federal Open Market Committee (FOMC), and early Thursday sees Australia’s latest Purchasing Manager’s Index (PMI) figures for February.
The RBA is expected to hold steady on Tuesday and keep rates pinned where they are. Aussie labor figures disappointed markets recently, but it will likely take several months of soft employment numbers before the RBA gets pushed into a rate cut cycle.
The FOMC’s latest Meeting Minutes, due Wednesday, are going to draw plenty of investor attention as markets try to suss out when the US central bank will begin trimming interest rates. US inflation and a still-tight US labor market continue to flummox rate cut hopes from broader markets. Money markets are currently pricing in a first rate cut from the Fed in June, with the CME’s FedWatch Tool forecasting a 75% chance of at least 25 basis points in rate cuts in June, with at least a further 25 basis points expected in July.
The back half of the trading sees Australian Judo Bank PMI numbers for February, and the Composite Aussie PMI has only printed above 50.0 for four of the last twelve successive prints. Australia’s Judo Bank Services PMI last came in at 49.1, while the Manufacturing component last printed at 50.1.
AUD/USD technical outlook
AUD/USD bounced off the 200-hour Simple Moving Average (SMA) near 0.6510 late last week, leaving the pair positioned in the high end near-term, and the pair is poised for a fresh bullish run at the 0.6600 handle with the Aussie extending a recent bullish reversal. The pair is finding some technical resistance at recent swing highs into 0.6540.
The AUD/USD is looking for a foothold from a recent bottom near 0.6450 after the pair declined from December’s peak near 0.6870, and the pair is still down nearly 5% as January market flows struggle to stem the bearish tide.
AUD/USD hourly chart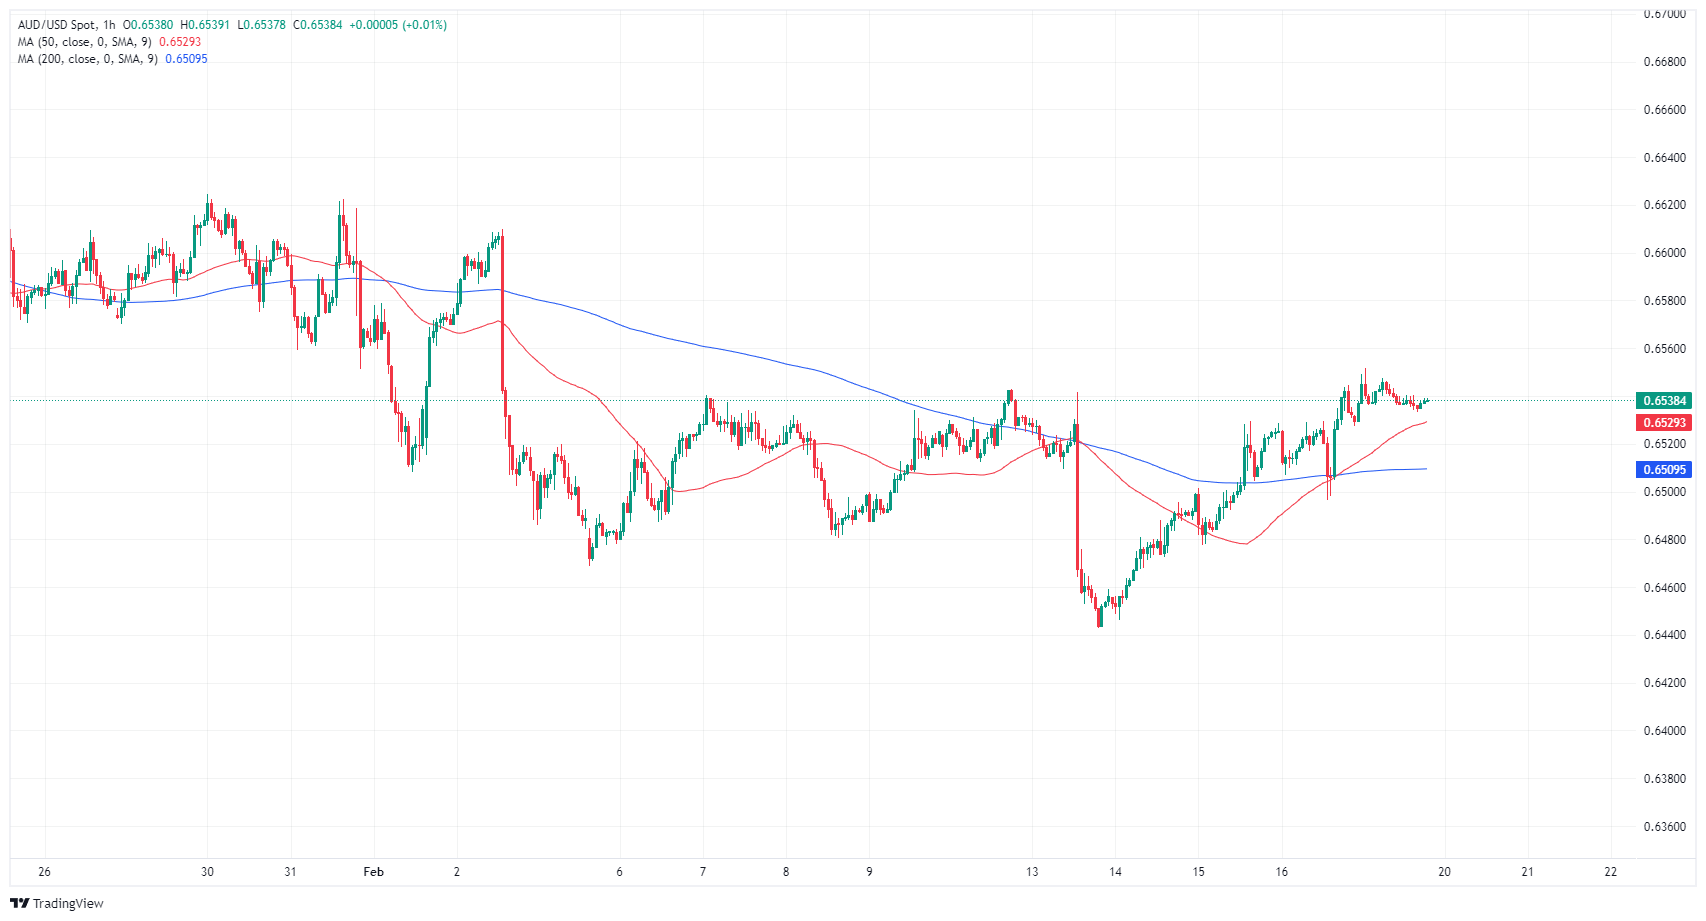
AUD/USD daily chart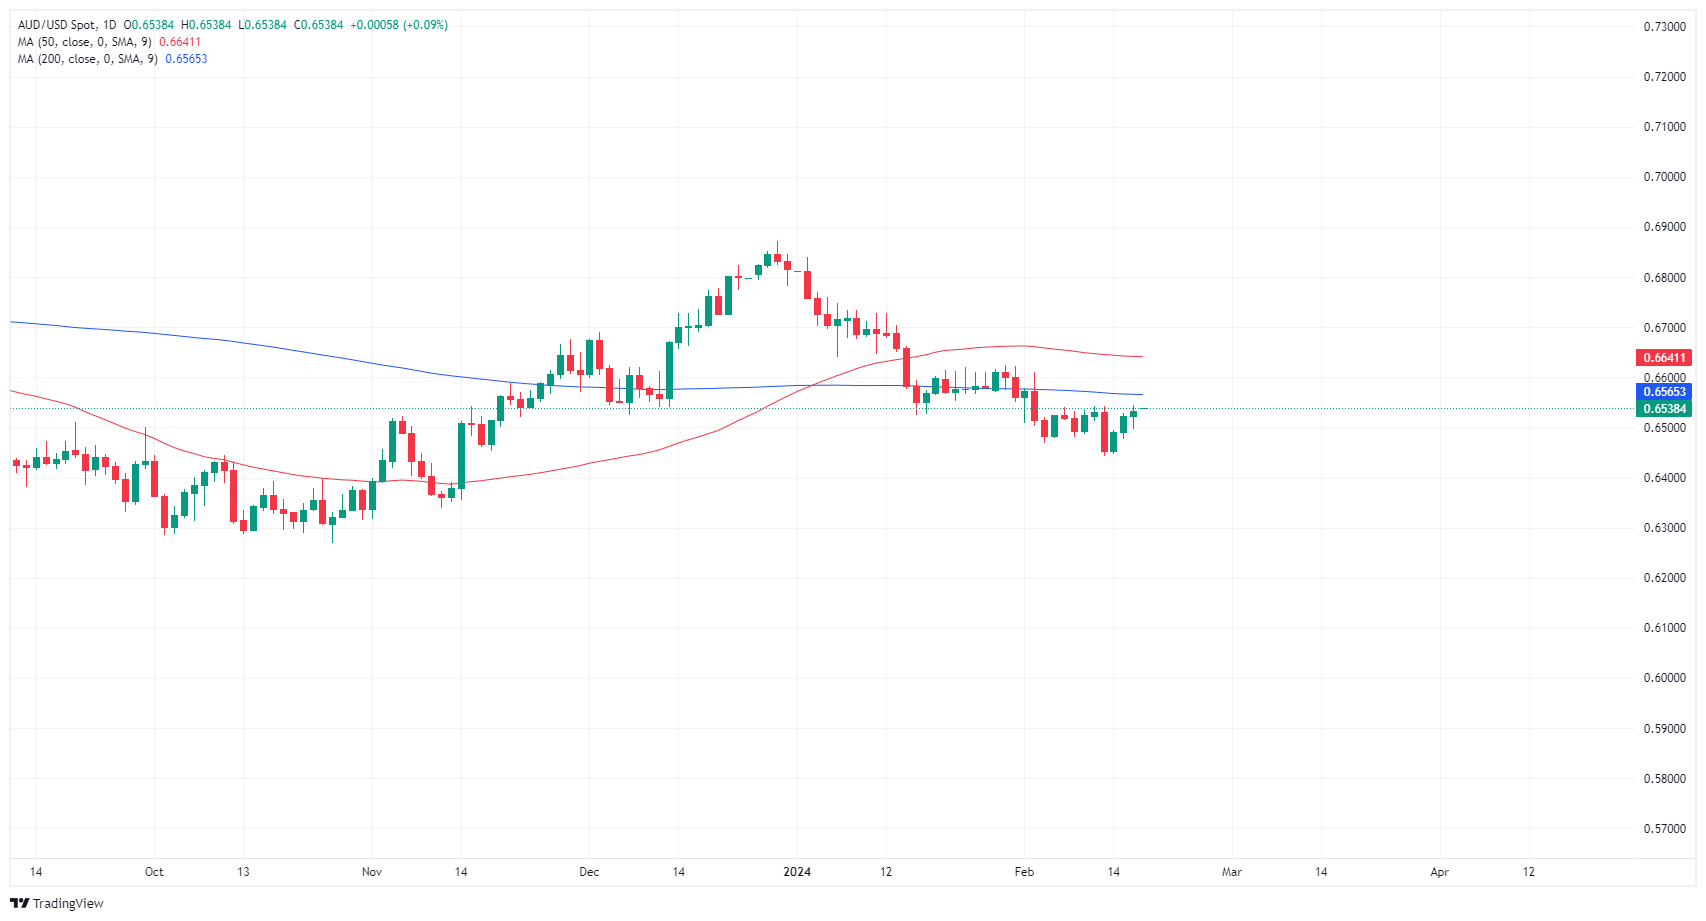
- GBP/JPY steady at 189.14, amid quiet trading due to US President’s Day holiday and sparse data.
- Market eyes BoE Governor Bailey's upcoming speech and key Japanese economic reports.
- Technical analysis indicates GBP/JPY could be on the verge of a breakout, with 189.00-191.00 as crucial range for direction.
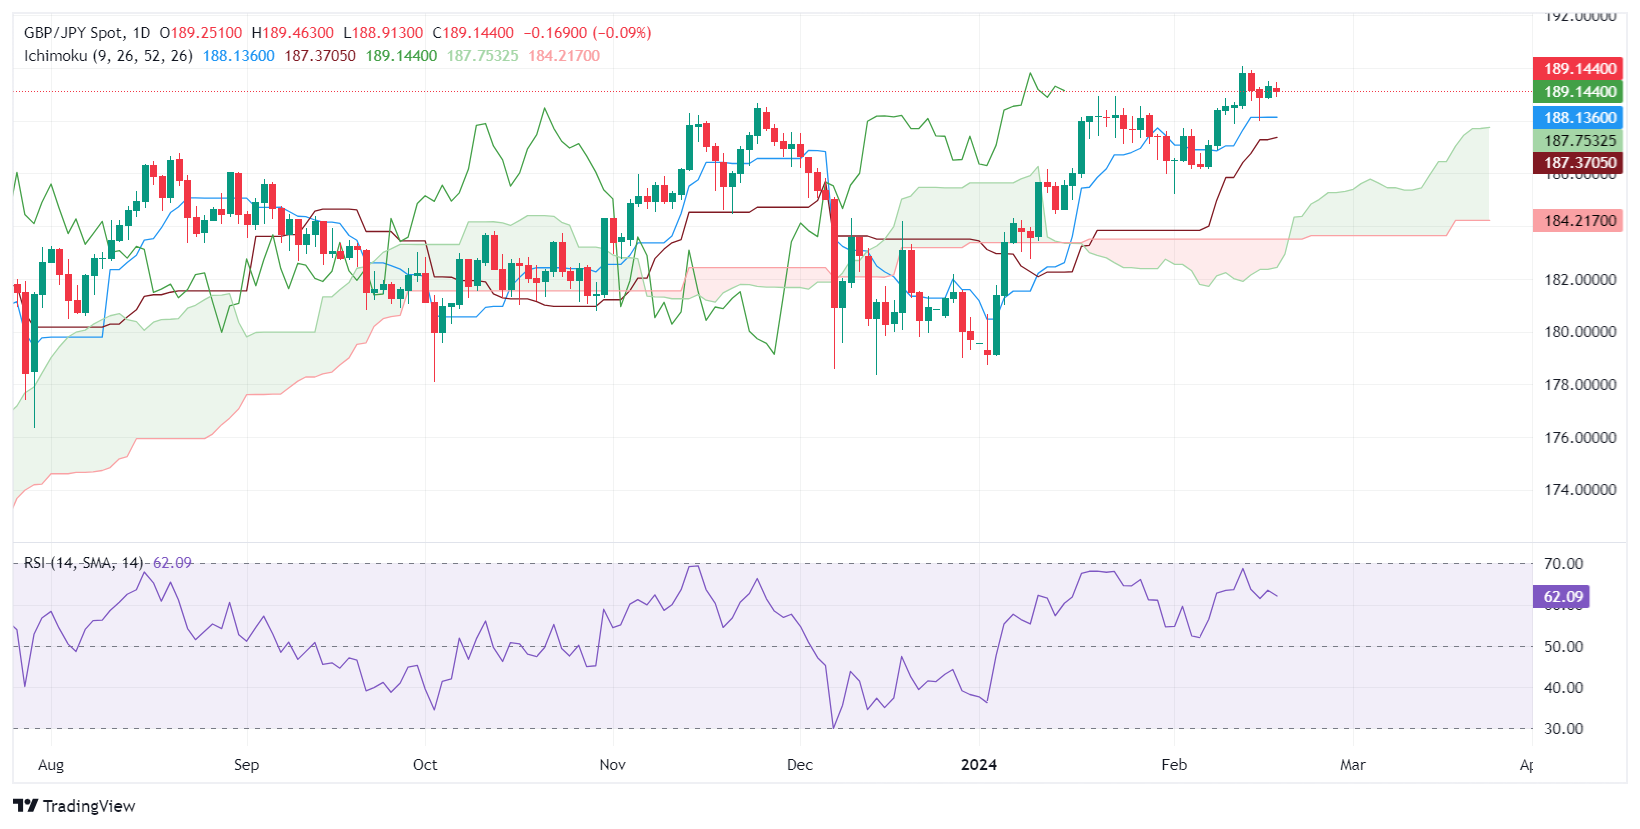
The Pound Sterling failed to gain traction against the Japanese Yen in the mid-North American session and is flat at around 189.14, as Wall Street remains closed amid the US President’s Day holiday.
An absent economic docket in the UK and Japan has kept the GBP/JPY within familiar levels. On Tuesday, the calendar will gather momentum with the Bank of England’s (BoE) Governor Andrew Baily's speech. On the Japanese front, the schedule would remain light until Wednesday’s, with the release of the Reuters Tankan Index, and the Balance of Trade for January.
From a technical standpoint, the GBP/JPY is upward biased, though it has remained range-bound within the 189.00-190.00 figure. A breach of that level could open the door to challenging the 191.00 mark.
On the other hand, if sellers move in and drag prices below 189.00, the GBP/JPY could tumble sharply. The first support would be the Tenkan-Sen at 188.12, followed by the February 15 low of 187.92. Once those levels are cleared, the pair could aim towards the Kijun-Sen at 187.34, ahead of the 187.00 mark.
GBP/JPY Price Action – Daily Chart
What you need to take care of on Tuesday, February 20:
Major pairs remained confined to familiar levels, trading in thin ranges amid holidays in the United States and Canada. Nevertheless, investors were cautiously optimistic, with some stock indexes in Europe and Japan flirting with record highs.
EUR/USD held below 1.0800, while GBP/USD battles at around 1.2600. The Pound advanced during the European session but trimmed gains ahead of the close.
The US Dollar posted modest gains against safe-haven CHF and JPY, somehow suggesting financial markets are in a good mood.
The Australian Dollar posted a modest advance against the USD, with AUD/USD trading around 0.6540. The Canadian Dollar, on the contrary, edged lower against its American rival, with the pair currently nearing 1.3500.
Australia will open the macroeconomic calendar with the release of the Reserve Bank of Australia (RBA) Meeting Minutes early on Tuesday. The document could provide fresh clues on what the RBA Board plans to do next or even what policymakers need to feel more confident about inflation going down and begin trimming rates.
Spot Gold advanced for a thrid consecutive day and briefly traded above $2,020.00 a troy ounce.
Also, the People’s Bank of China (PBoC) will announce its decision on Interest rates. The PBOC fixes the Loan Prime Rate (LPR) on a monthly basis.
On Tuesday, Canada will release the January Consumer Price Index (CPI) foreseen up 0.4% MoM after a 0.3% decline in December.
US Dollar price today
The table below shows the percentage change of US Dollar (USD) against listed major currencies today. US Dollar was the strongest against the Swiss Franc.
| USD | EUR | GBP | CAD | AUD | JPY | NZD | CHF | |
| USD | 0.05% | 0.11% | 0.09% | 0.00% | 0.04% | -0.15% | 0.21% | |
| EUR | -0.05% | 0.06% | 0.04% | -0.05% | -0.01% | -0.20% | 0.16% | |
| GBP | -0.11% | -0.06% | -0.02% | -0.13% | -0.07% | -0.26% | 0.10% | |
| CAD | -0.09% | -0.03% | 0.01% | -0.10% | -0.05% | -0.25% | 0.14% | |
| AUD | 0.01% | 0.06% | 0.12% | 0.09% | 0.05% | -0.15% | 0.23% | |
| JPY | -0.03% | 0.01% | 0.10% | 0.06% | -0.05% | -0.19% | 0.17% | |
| NZD | 0.16% | 0.20% | 0.25% | 0.25% | 0.15% | 0.19% | 0.36% | |
| CHF | -0.21% | -0.17% | -0.10% | -0.12% | -0.23% | -0.18% | -0.36% |
The heat map shows percentage changes of major currencies against each other. The base currency is picked from the left column, while the quote currency is picked from the top row. For example, if you pick the Euro from the left column and move along the horizontal line to the Japanese Yen, the percentage change displayed in the box will represent EUR (base)/JPY (quote).
- Gold climbs to $2016.30, driven by US inflation surpassing forecasts, signaling ongoing price pressure.
- The diminished likelihood of imminent Fed rate cuts enhances Gold's allure as the USD has weakened since last Tuesday.
- The decline in US Treasury and real yields underpin Gold's surge with a rising TIPS yield reflecting higher safe-haven demand.
Gold price extended its gains for three consecutive days after last week’s economic data from the United States (US) revealed that inflation remains above the US Federal Reserve’s (Fed) target. The Consumer Price Index (CPI) and the Producer Price Index (PPI) in January exceeded the consensus, catching traders off guard, which trimmed the odds for a Fed rate cut in March and May. That sponsored a leg-up in the Greenback (USD), which has remained on the defensive since last Tuesday. The XAU/USD exchanges hands at $2016.30.
Traders seeking protection turned to the yellow metal following the latest inflation reports. Additionally, the fall in US Treasury bond yields, particularly the 10-year note that hit a year-to-date (YTD) high of 4.332%, retraced four basis points to 4.293%. Consequently, real yields, which correlate negatively with Gold prices, fell from around 2.04% reached on Wednesday to 1.950%, as reflected by the yield on the US 10-year Treasury Inflation-Protected Securities (TIPS) yield.
Daily digest market movers: Gold advanced despite investors pushing back Fed rate cuts to June
- The CME FedWatch Tool sees traders expect the first 25 bps rate cut by the Fed in June 2024.
- As of today, investors are pricing in 97 basis points of easing throughout 2024.
- The latest inflation reports from the US triggered a change of language from Fed officials, who struck a “cautious” tone. Atlanta Fed President Raphael Bostic suggested the Fed is in no rush to ease policy, saying the Fed could be patient.
- In regard to that, San Francisco Fed President Mary Daly stated, “We will need to resist the temptation to act quickly when patience is needed and be prepared to respond agilely as the economy evolves.”
- This week, the US economic schedule will feature the release of the latest Federal Reserve Open Market Committee (FOMC) Minutes alongside Fed officials' speeches beginning on Wednesday.
- Traders will get further cues from US S&P Global PMIs, Initial Jobless Claims data and the Chicago Fed National Activity Index, usually a prelude to the Institute for Supply Management (ISM) Manufacturing PMI.
Technical Analysis: Gold stays above 100-day SMA, eyes key resistance near $2,030
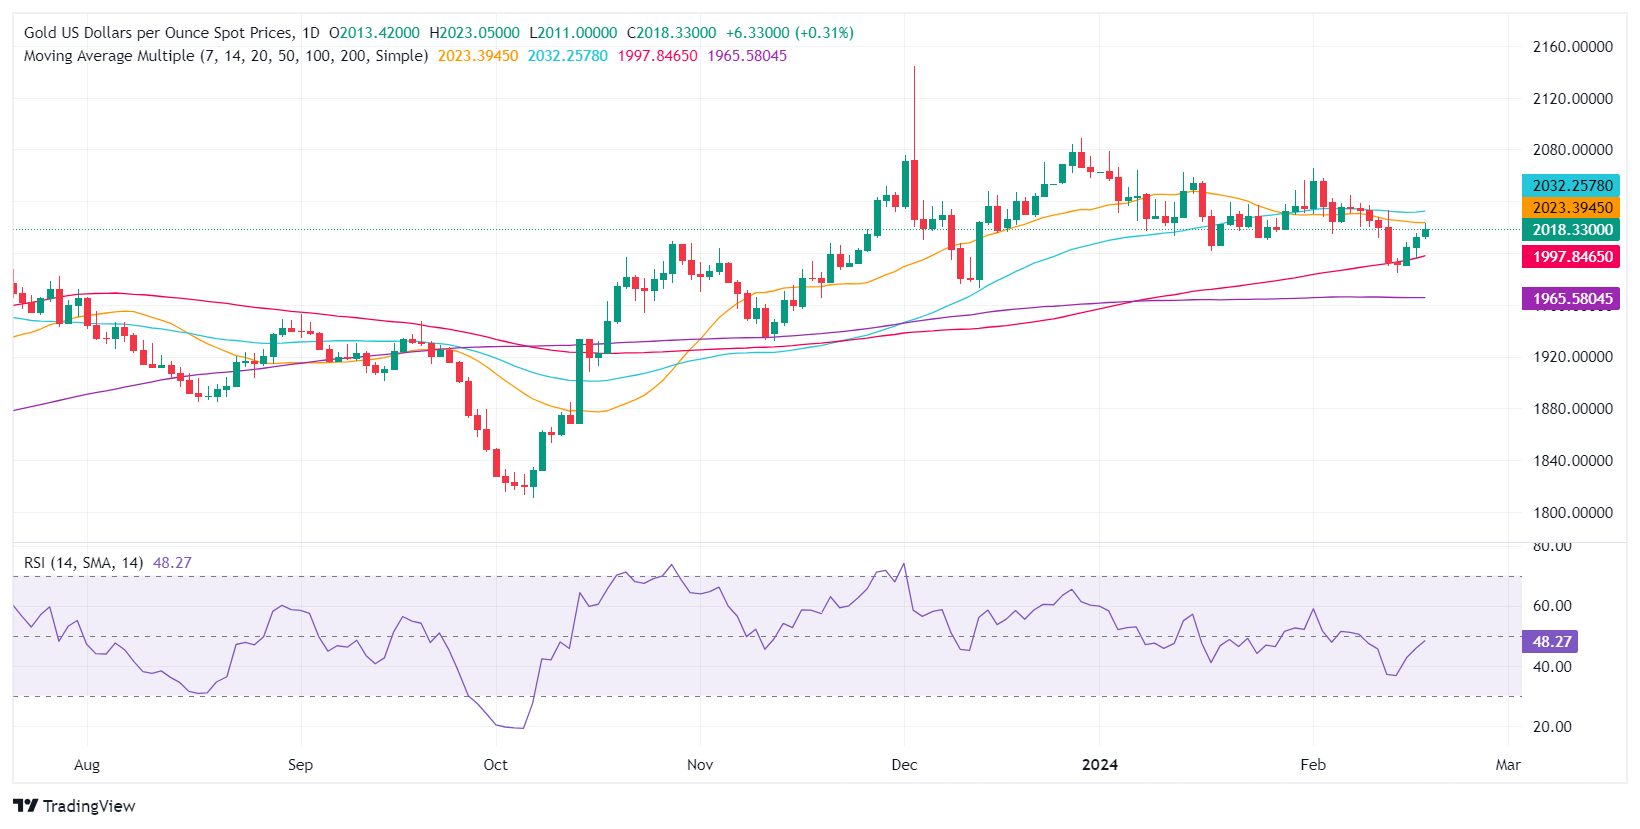
Gold´s daily chart portrays the non-yielding metal as neutral to downwardly biased despite staying above the 200-day Simple Moving Average (SMA) at $1,965.46. If buyers would like to regain control, they must challenge the 50-day SMA at $2,032.71. Once cleared, the next stop would be $2,050, ahead of the latest cycle high at $2,065.60.
On the flip side, if sellers step in and push prices below the $2,000 figure, that will expose the 100-day SMA at $1,998. The next stop would be the December 13 low at $1,973.13, followed by the 200-day SMA at $1,965.47.
Inflation FAQs
What is inflation?
Inflation measures the rise in the price of a representative basket of goods and services. Headline inflation is usually expressed as a percentage change on a month-on-month (MoM) and year-on-year (YoY) basis. Core inflation excludes more volatile elements such as food and fuel which can fluctuate because of geopolitical and seasonal factors. Core inflation is the figure economists focus on and is the level targeted by central banks, which are mandated to keep inflation at a manageable level, usually around 2%.
What is the Consumer Price Index (CPI)?
The Consumer Price Index (CPI) measures the change in prices of a basket of goods and services over a period of time. It is usually expressed as a percentage change on a month-on-month (MoM) and year-on-year (YoY) basis. Core CPI is the figure targeted by central banks as it excludes volatile food and fuel inputs. When Core CPI rises above 2% it usually results in higher interest rates and vice versa when it falls below 2%. Since higher interest rates are positive for a currency, higher inflation usually results in a stronger currency. The opposite is true when inflation falls.
What is the impact of inflation on foreign exchange?
Although it may seem counter-intuitive, high inflation in a country pushes up the value of its currency and vice versa for lower inflation. This is because the central bank will normally raise interest rates to combat the higher inflation, which attract more global capital inflows from investors looking for a lucrative place to park their money.
How does inflation influence the price of Gold?
Formerly, Gold was the asset investors turned to in times of high inflation because it preserved its value, and whilst investors will often still buy Gold for its safe-haven properties in times of extreme market turmoil, this is not the case most of the time. This is because when inflation is high, central banks will put up interest rates to combat it.
Higher interest rates are negative for Gold because they increase the opportunity-cost of holding Gold vis-a-vis an interest-bearing asset or placing the money in a cash deposit account. On the flipside, lower inflation tends to be positive for Gold as it brings interest rates down, making the bright metal a more viable investment alternative.
- EUR/USD pared back into technical congestion on Monday.
- European economic calendar looks thin until Thursday’s PMI prints.
- Fed FOMC Meeting Minutes due Wednesday ahead of European and US PMIs.
EUR/USD drifted back into median prices in thin Monday trading as the pair remains hampered below 1.0800. Markets opened on a quiet note with US markets dark for the US federal holiday. US liquidity will return to the fold beginning on Tuesday.
European and US Purchasing Managers Index (PMI) figures are due in the latter half of the trading week, and investors will be looking forward to the latest Meeting Minutes from the US Federal Reserve’s (Fed) Federal Open Market Committee (FOMC). According to the CME’s FedWatch Tool, markets see a 75% chance of a rate cut from the Fed in June as higher-than-expected US inflation figures continue to push money markets further down the calendar after the early year’s sky-high bets of a March rate cut evaporating.
Daily digest market movers: EUR/USD cycles in familiar territory as markets wait for data
- US Presidents’ Day market holiday sees a quiet Monday with low volumes.
- Fed watchers are forced to wait until Wednesday for the FOMC’s latest Meeting Minutes.
- Investors will be looking for clues to determine how near (or far) the Fed is to delivering the first rate cut.
- European Consumer Confidence for February, slated to print on Wednesday, is expected to recover to -15.6 from -16.1.
- FOMC Meeting Minutes will draw investor curiosity as traders look for signs the Fed is getting closer to delivering a rate trim.
- Thursday’s economic calendar is densely-packed with pan-European and US PMIs slated to print throughout the day.
- The Euro area Composite PMI for February is expected to print higher at 48.5 than the previous 47.0, but still in contraction territory below 50.0 for a ninth consecutive month.
- The US S&P PMIs are expected to soften slightly, with February’s Manufacturing PMI forecast to decrease to 50.5 from 50.7.
Euro price today
The table below shows the percentage change of Euro (EUR) against listed major currencies today. Euro was the weakest against the New Zealand Dollar.
| USD | EUR | GBP | CAD | AUD | JPY | NZD | CHF | |
| USD | 0.06% | 0.14% | 0.10% | 0.00% | 0.06% | -0.15% | 0.22% | |
| EUR | -0.06% | 0.09% | 0.03% | -0.06% | 0.00% | -0.21% | 0.16% | |
| GBP | -0.14% | -0.09% | -0.05% | -0.14% | -0.09% | -0.29% | 0.08% | |
| CAD | -0.09% | -0.03% | 0.05% | -0.09% | -0.03% | -0.25% | 0.12% | |
| AUD | 0.00% | 0.06% | 0.15% | 0.09% | 0.05% | -0.15% | 0.22% | |
| JPY | -0.05% | 0.00% | 0.11% | 0.04% | -0.06% | -0.22% | 0.15% | |
| NZD | 0.16% | 0.21% | 0.29% | 0.25% | 0.15% | 0.21% | 0.38% | |
| CHF | -0.23% | -0.16% | -0.08% | -0.13% | -0.22% | -0.19% | -0.37% |
The heat map shows percentage changes of major currencies against each other. The base currency is picked from the left column, while the quote currency is picked from the top row. For example, if you pick the Euro from the left column and move along the horizontal line to the Japanese Yen, the percentage change displayed in the box will represent EUR (base)/JPY (quote).
Technical analysis: EUR/USD mixes on quiet Monday, churns familiar territory below 1.0800
EUR/USD remains pinned below the 1.0800 handle as the pair struggles to develop momentum after finding a fresh low last week near 1.0700. Intraday technical action is getting hampered by the 200-hour Simple Moving Average (SMA) near 1.0760, and a near-term technical ceiling is priced in near 1.0790.
EUR/USD closed in the green for seven of the last ten consecutive trading days, but harsh downside pullbacks leave the pair adrift on the low side of the 200-day SMA near 1.0830, and the pair found a fresh 13-week low last week near 1.0700.
EUR/USD hourly chart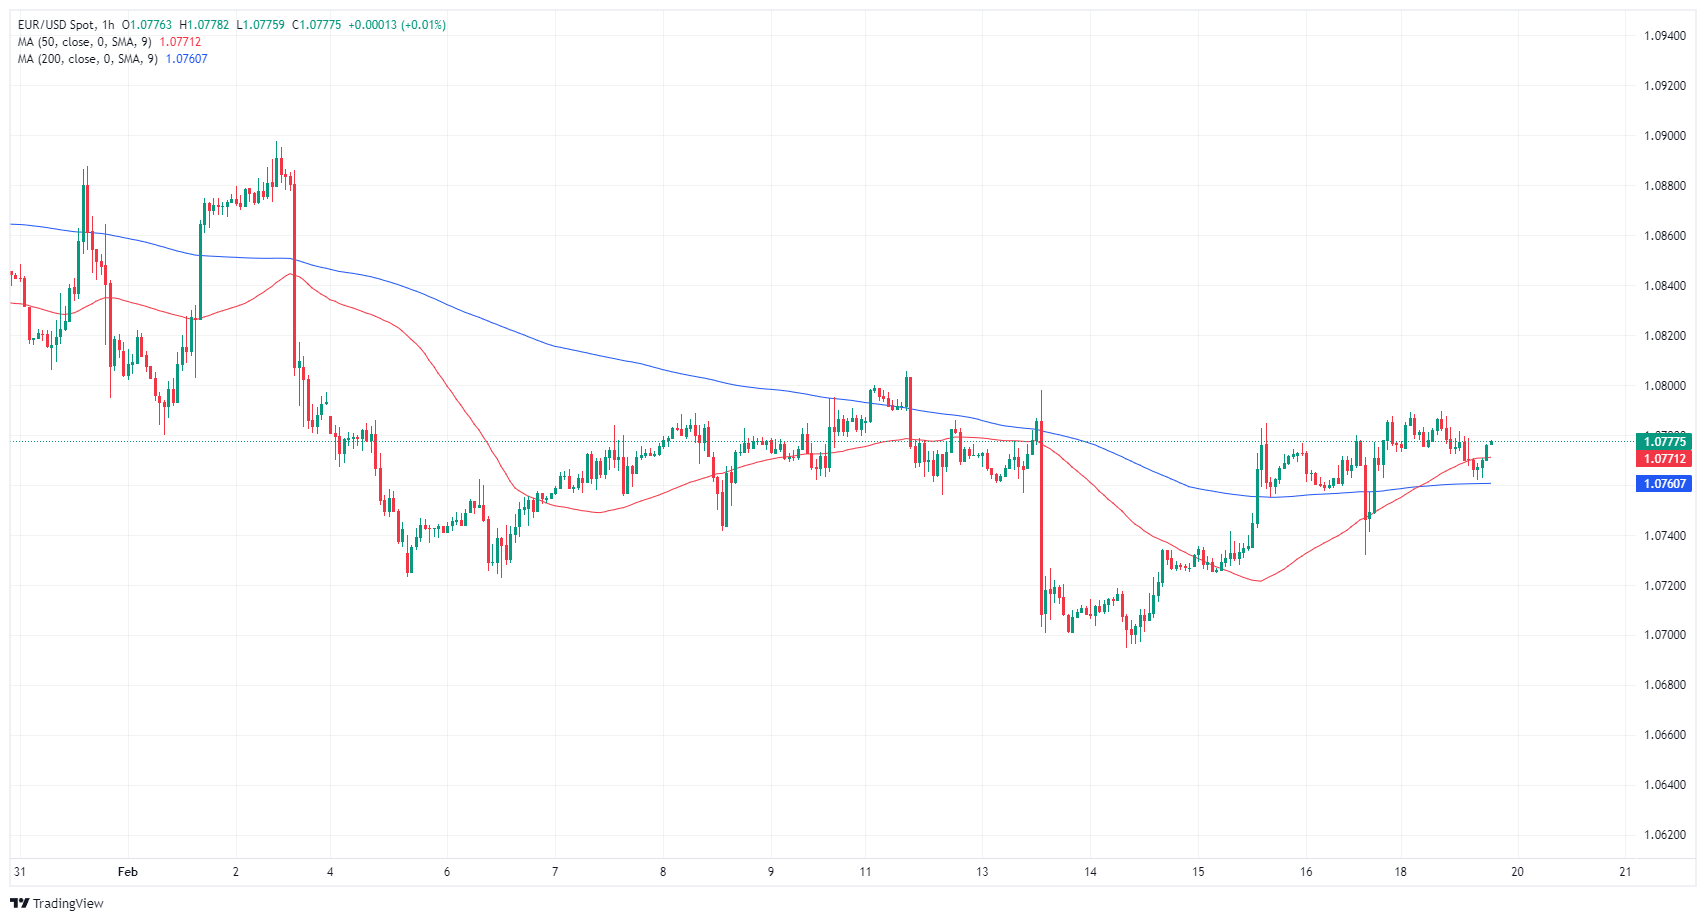
EUR/USD daily chart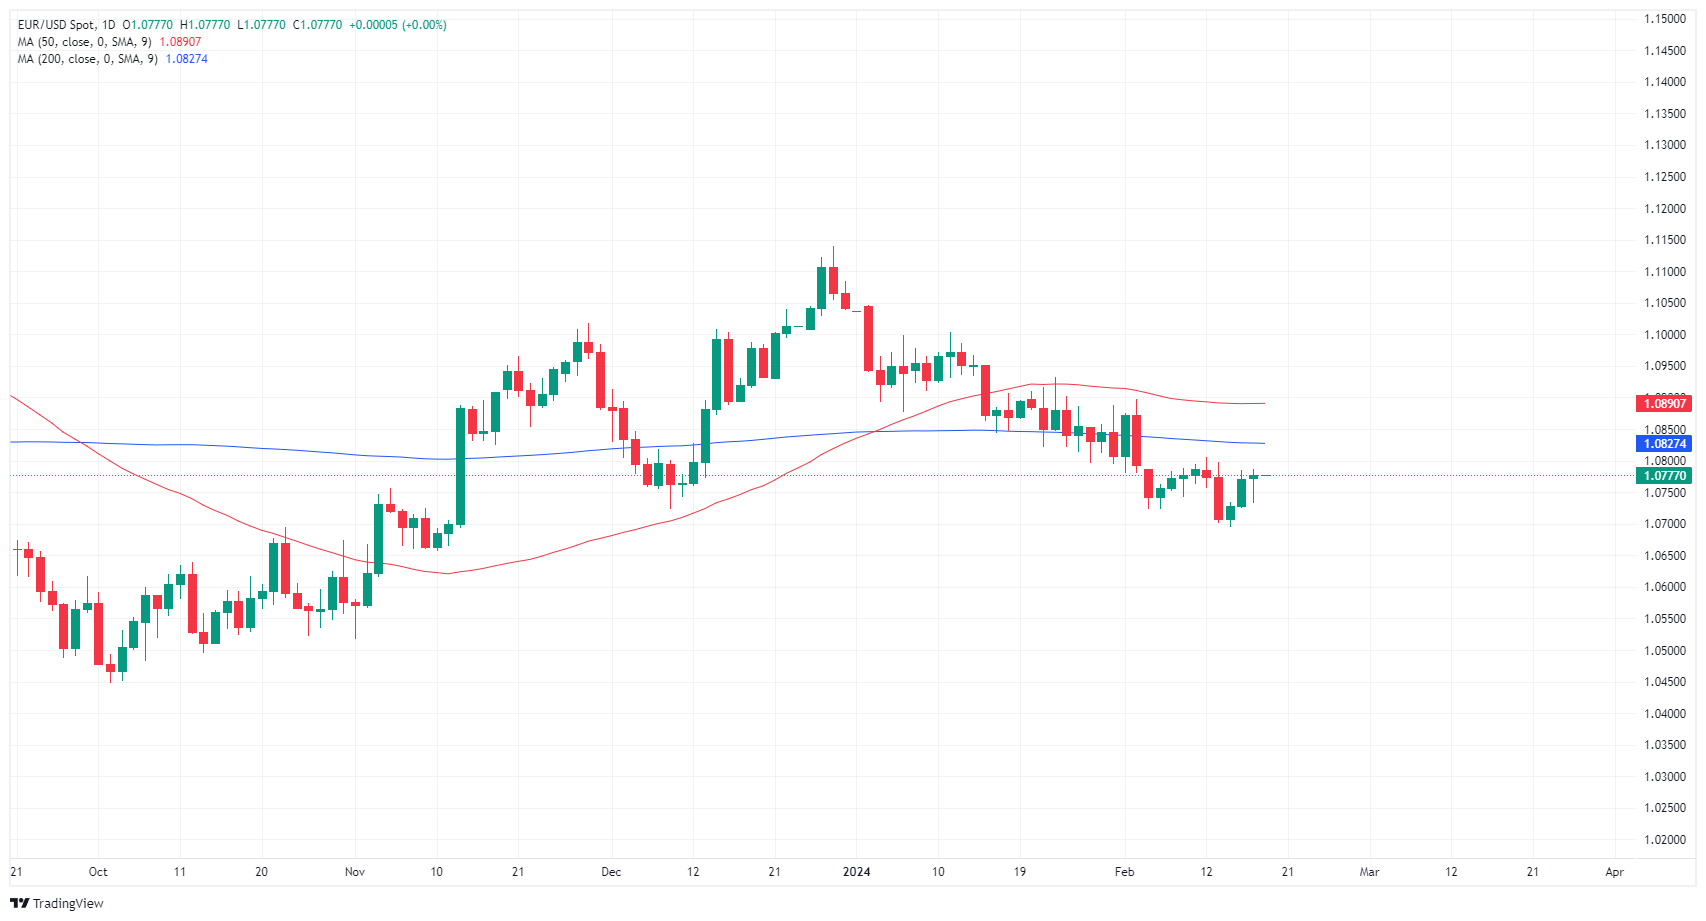
Euro FAQs
What is the Euro?
The Euro is the currency for the 20 European Union countries that belong to the Eurozone. It is the second most heavily traded currency in the world behind the US Dollar. In 2022, it accounted for 31% of all foreign exchange transactions, with an average daily turnover of over $2.2 trillion a day.
EUR/USD is the most heavily traded currency pair in the world, accounting for an estimated 30% off all transactions, followed by EUR/JPY (4%), EUR/GBP (3%) and EUR/AUD (2%).
What is the ECB and how does it impact the Euro?
The European Central Bank (ECB) in Frankfurt, Germany, is the reserve bank for the Eurozone. The ECB sets interest rates and manages monetary policy.
The ECB’s primary mandate is to maintain price stability, which means either controlling inflation or stimulating growth. Its primary tool is the raising or lowering of interest rates. Relatively high interest rates – or the expectation of higher rates – will usually benefit the Euro and vice versa.
The ECB Governing Council makes monetary policy decisions at meetings held eight times a year. Decisions are made by heads of the Eurozone national banks and six permanent members, including the President of the ECB, Christine Lagarde.
How does inflation data impact the value of the Euro?
Eurozone inflation data, measured by the Harmonized Index of Consumer Prices (HICP), is an important econometric for the Euro. If inflation rises more than expected, especially if above the ECB’s 2% target, it obliges the ECB to raise interest rates to bring it back under control.
Relatively high interest rates compared to its counterparts will usually benefit the Euro, as it makes the region more attractive as a place for global investors to park their money.
How does economic data influence the value of the Euro?
Data releases gauge the health of the economy and can impact on the Euro. Indicators such as GDP, Manufacturing and Services PMIs, employment, and consumer sentiment surveys can all influence the direction of the single currency.
A strong economy is good for the Euro. Not only does it attract more foreign investment but it may encourage the ECB to put up interest rates, which will directly strengthen the Euro. Otherwise, if economic data is weak, the Euro is likely to fall.
Economic data for the four largest economies in the euro area (Germany, France, Italy and Spain) are especially significant, as they account for 75% of the Eurozone’s economy.
How does the Trade Balance impact the Euro?
Another significant data release for the Euro is the Trade Balance. This indicator measures the difference between what a country earns from its exports and what it spends on imports over a given period.
If a country produces highly sought after exports then its currency will gain in value purely from the extra demand created from foreign buyers seeking to purchase these goods. Therefore, a positive net Trade Balance strengthens a currency and vice versa for a negative balance.
- The DXY Index is mildly up on Monday’s session.
- No relevant data was released during the session and American traders celebrate Presidents’ Day.
- The FOMC January minutes will be the highlight.
The US Dollar (USD) measured by the Dollar Index (DXY) stands neutral around 104.30 with American traders on the sidelines celebrating the US Presidents’ Day and markets digesting the Producer Price Index (PPI) data from last Friday.
Amid rising headline and core PPI, the US Dollar Index may see further upside as the hot inflation figure from January may cause the Federal Reserve to retain a cautious stance and. This week's focus will be on the Federal Open Market Committee (FOMC) minutes, and several Federal Reserve (Fed) officials will be on the wires in the next few sessions.
Daily digest market movers: The US Dollar stands flat as markets digest last week’s data
- Last week, the US reported that Retail Sales and Industrial Production declined in January.
- The PPI from the same month, however, came in higher than expected.
- Markets await fresh drivers to continue timing the start of the Fed’s easing cycle. FOMC’s January meeting minutes are due on Wednesday.
- With eyes on the Federal Reserve's next steps, the drop in odds for a March cut to 20% as per CME FedWatch Tool is a significant shift. The probabilities of a cut in May stand at 33% as markets seem to have pushed the start of easing to June.
Technical analysis: DXY bulls struggle to gain ground, must defend 100-day SMA
On the daily chart, the Relative Strength Index (RSI) is exhibiting a flat position within positive territory. This signifies that the buying momentum in the market is slowing and a balance is being achieved between the buying and selling forces. However, this flat position might also mean that the bulls are taking a breather after a strong run.
The Moving Average Convergence Divergence (MACD) histogram shows decreasing green bars. This indicates that bullish strength is losing steam and that bears might soon gain the upper hand. While bullish momentum is slowing, it doesn't illustrate a full-blown bearish takeover but rather a weak bearish bent.
On a broader scale, the Simple Moving Averages (SMAs) are giving a brighter picture. With the index trading above the 20, 100 and 200-day SMAs, it suggests that the bulls have managed to remain in control over longer periods.
However, the prevailing dynamic suggests that bulls are struggling to gain further ground. This corroborates the MACD and RSI signals pointing toward decelerating buying momentum. Thus, in the short-term, sellers may have the upper hand, giving way to a potential bearish tilt in the market, while the long-term outlook remains positive.
US Dollar FAQs
What is the US Dollar?
The US Dollar (USD) is the official currency of the United States of America, and the ‘de facto’ currency of a significant number of other countries where it is found in circulation alongside local notes. It is the most heavily traded currency in the world, accounting for over 88% of all global foreign exchange turnover, or an average of $6.6 trillion in transactions per day, according to data from 2022.
Following the second world war, the USD took over from the British Pound as the world’s reserve currency. For most of its history, the US Dollar was backed by Gold, until the Bretton Woods Agreement in 1971 when the Gold Standard went away.
How do the decisions of the Federal Reserve impact the US Dollar?
The most important single factor impacting on the value of the US Dollar is monetary policy, which is shaped by the Federal Reserve (Fed). The Fed has two mandates: to achieve price stability (control inflation) and foster full employment. Its primary tool to achieve these two goals is by adjusting interest rates.
When prices are rising too quickly and inflation is above the Fed’s 2% target, the Fed will raise rates, which helps the USD value. When inflation falls below 2% or the Unemployment Rate is too high, the Fed may lower interest rates, which weighs on the Greenback.
What is Quantitative Easing and how does it influence the US Dollar?
In extreme situations, the Federal Reserve can also print more Dollars and enact quantitative easing (QE). QE is the process by which the Fed substantially increases the flow of credit in a stuck financial system.
It is a non-standard policy measure used when credit has dried up because banks will not lend to each other (out of the fear of counterparty default). It is a last resort when simply lowering interest rates is unlikely to achieve the necessary result. It was the Fed’s weapon of choice to combat the credit crunch that occurred during the Great Financial Crisis in 2008. It involves the Fed printing more Dollars and using them to buy US government bonds predominantly from financial institutions. QE usually leads to a weaker US Dollar.
What is Quantitative Tightening and how does it influence the US Dollar?
Quantitative tightening (QT) is the reverse process whereby the Federal Reserve stops buying bonds from financial institutions and does not reinvest the principal from the bonds it holds maturing in new purchases. It is usually positive for the US Dollar.
- Mexican Peso remains steady as low trading volume marks US Presidents’ Day.
- Mexico's IOAE indicates a -0.7% MoM contraction with a modest 1.3% annual growth in early 2024.
- US-Mexico trade disputes over steel and aluminum exports could impact the Peso's future stability.
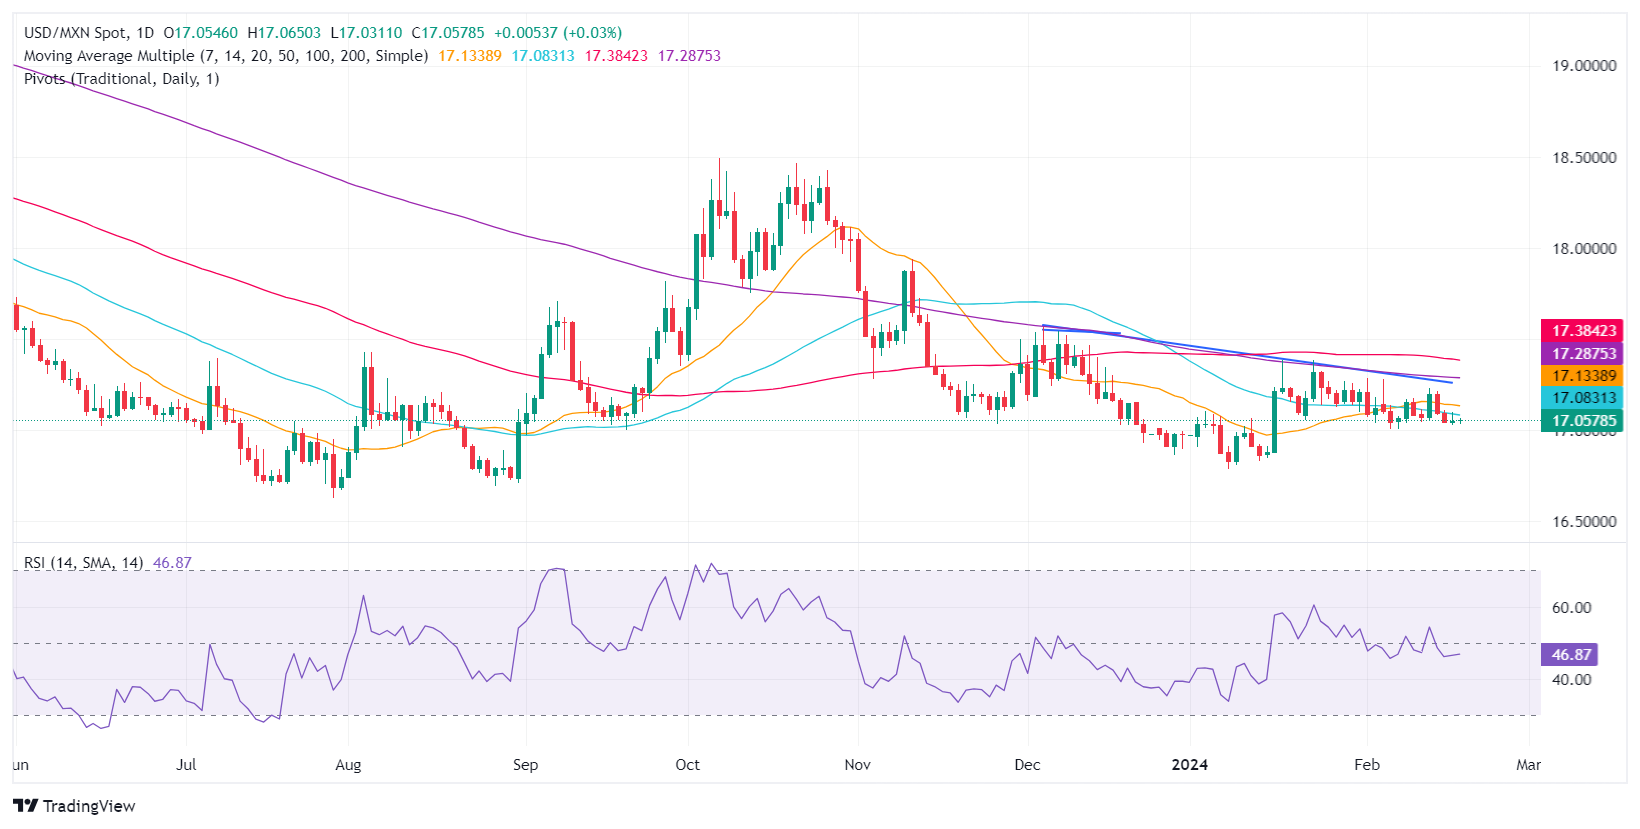
The Mexican Peso seesaws against the US Dollar on Monday as low volume trading is due to the United States observing Presidents’ Day. The Indicator of Economic Activity (IOAE), which provides preliminary readings on a monthly basis, suggests the Mexican economy most likely contracted in January 2024. The USD/MXN trades at 17.05, almost flat, at the time of writing.
Mexico’s National Statistics Agency (INEGI) revealed the IOAE contracted -0.7% MoM. In annual comparison, the economy most likely grew by 1.3% at the beginning of 2024. Late in the week, Mexico’s economic schedule will feature Retail Sales, the Gross Domestic Product (GDP) for Q4 2023 and the mid-month inflation report in February.
The USD/MXN remains weak, accumulating losses of 0.59% in year-to-date (YTD) figures. Nevertheless, pressure from the US regarding Mexico’s exports of steel and aluminum, along with implicit risks of the general election, threaten to derail the Mexican currency.
US trade representative Katherine Tai warned Mexico that the US could reimpose tariffs on imports of the aforementioned commodities if the Mexican Government, led by Andres Manuel Lopez Obrador (AMLO), fails to take urgent measures to stop the increase in exports. US authorities question Mexico’s lack of transparency on imports of steel and aluminum from third countries.
Daily digest market movers: Mexican Peso unchanged as trading liquidity drains on US holiday
- Mexico’s economic schedule will feature Retail Sales on February 21, expected to rise 0.2% MoM in December and 2.5% YoY.
- On February 22, the Mexican economy is projected to have grown 0.1% in Q4 2023 and 2.4% YoY. Mid-month underlying inflation for February is estimated to slow from 4.78% to 4.67 YoY, while is projected to drop from 4.9% to 4.7%.
- Across the border, the US economic docket will feature the release of the latest Federal Reserve Open Market Committee (FOMC) Minutes alongside Fed officials crossing the wires.
- Traders will get further cues from US S&P Global PMIs, Initial Jobless Claims data and the Chicago Fed National Activity Index, usually a prelude of the Institute for Supply Management (ISM) Manufacturing PMI.
- Last Friday, prices paid by producers exceeded forecasts, which means the Personal Consumption Expenditures (PCE), the Fed’s preferred gauge for inflation, could aim higher in February.
- Consumer sentiment in the US improved slightly to 79.5 from 79.0 in January’s last reading, according to the University of Michigan Survey. Analysts foresaw an improvement to 80.0 on its preliminary reading.
- Inflation expectations in the US remained steady, with one-year inflation at 3%, up from 2.9%, while for a five-year period it stood unchanged at 2.9%.
- Fed’s Bostic said patience is required and he foresees two rate cuts, which could begin in the summer if the data justifies it. Fed’s Daly said, “We will need to resist the temptation to act quickly when patience is needed and be prepared to respond agilely as the economy evolves.”
- Market players are expecting the first rate cut by the Federal Reserve at the June monetary policy meeting as they have trimmed odds for March and May.
Technical analysis: Mexican Peso is virtually unchanged as USD/MXN hovers circa 17.05
The USD/MXN seesaws near the 17.05 mark, below the 50-day Simple Moving Average (SMA) at 17.09. Even though that favors further downside, sellers must drag the exchange rate below the 17.00 figure if they would like to remain hopeful of challenging last year’s low of 16.62.
Otherwise, if buyers reclaim the 50-day SMA, followed by the latest cycle high of 17.22, that will expose the 200-day SMA at 17.29. A decisive break and the USD/MXN could rally toward the 100-day SMA at 17.39, followed by the 17.50 area. Buyers will eye a re-test of the 18.00 mark.
USD/MXN Price Action – Daily Chart
Mexican Peso FAQs
What key factors drive the Mexican Peso?
The Mexican Peso (MXN) is the most traded currency among its Latin American peers. Its value is broadly determined by the performance of the Mexican economy, the country’s central bank’s policy, the amount of foreign investment in the country and even the levels of remittances sent by Mexicans who live abroad, particularly in the United States. Geopolitical trends can also move MXN: for example, the process of nearshoring – or the decision by some firms to relocate manufacturing capacity and supply chains closer to their home countries – is also seen as a catalyst for the Mexican currency as the country is considered a key manufacturing hub in the American continent. Another catalyst for MXN is Oil prices as Mexico is a key exporter of the commodity.
How do decisions of the Banxico impact the Mexican Peso?
The main objective of Mexico’s central bank, also known as Banxico, is to maintain inflation at low and stable levels (at or close to its target of 3%, the midpoint in a tolerance band of between 2% and 4%). To this end, the bank sets an appropriate level of interest rates. When inflation is too high, Banxico will attempt to tame it by raising interest rates, making it more expensive for households and businesses to borrow money, thus cooling demand and the overall economy. Higher interest rates are generally positive for the Mexican Peso (MXN) as they lead to higher yields, making the country a more attractive place for investors. On the contrary, lower interest rates tend to weaken MXN.
How does economic data influence the value of the Mexican Peso?
Macroeconomic data releases are key to assess the state of the economy and can have an impact on the Mexican Peso (MXN) valuation. A strong Mexican economy, based on high economic growth, low unemployment and high confidence is good for MXN. Not only does it attract more foreign investment but it may encourage the Bank of Mexico (Banxico) to increase interest rates, particularly if this strength comes together with elevated inflation. However, if economic data is weak, MXN is likely to depreciate.
How does broader risk sentiment impact the Mexican Peso?
As an emerging-market currency, the Mexican Peso (MXN) tends to strive during risk-on periods, or when investors perceive that broader market risks are low and thus are eager to engage with investments that carry a higher risk. Conversely, MXN tends to weaken at times of market turbulence or economic uncertainty as investors tend to sell higher-risk assets and flee to the more-stable safe havens.
- The EUR/GBP stands at 0.8555 in Monday's session, jumping above the 20-day SMA.
- Sticky European inflation may push the ECB to a more aggressive stance toward the easing cycle.
- The week’s highlight will be the British and the EU’s Manufacturing PMIs from February.
- As long as markets bet on the BoE starting its easing later than the ECB the upside may be limited.
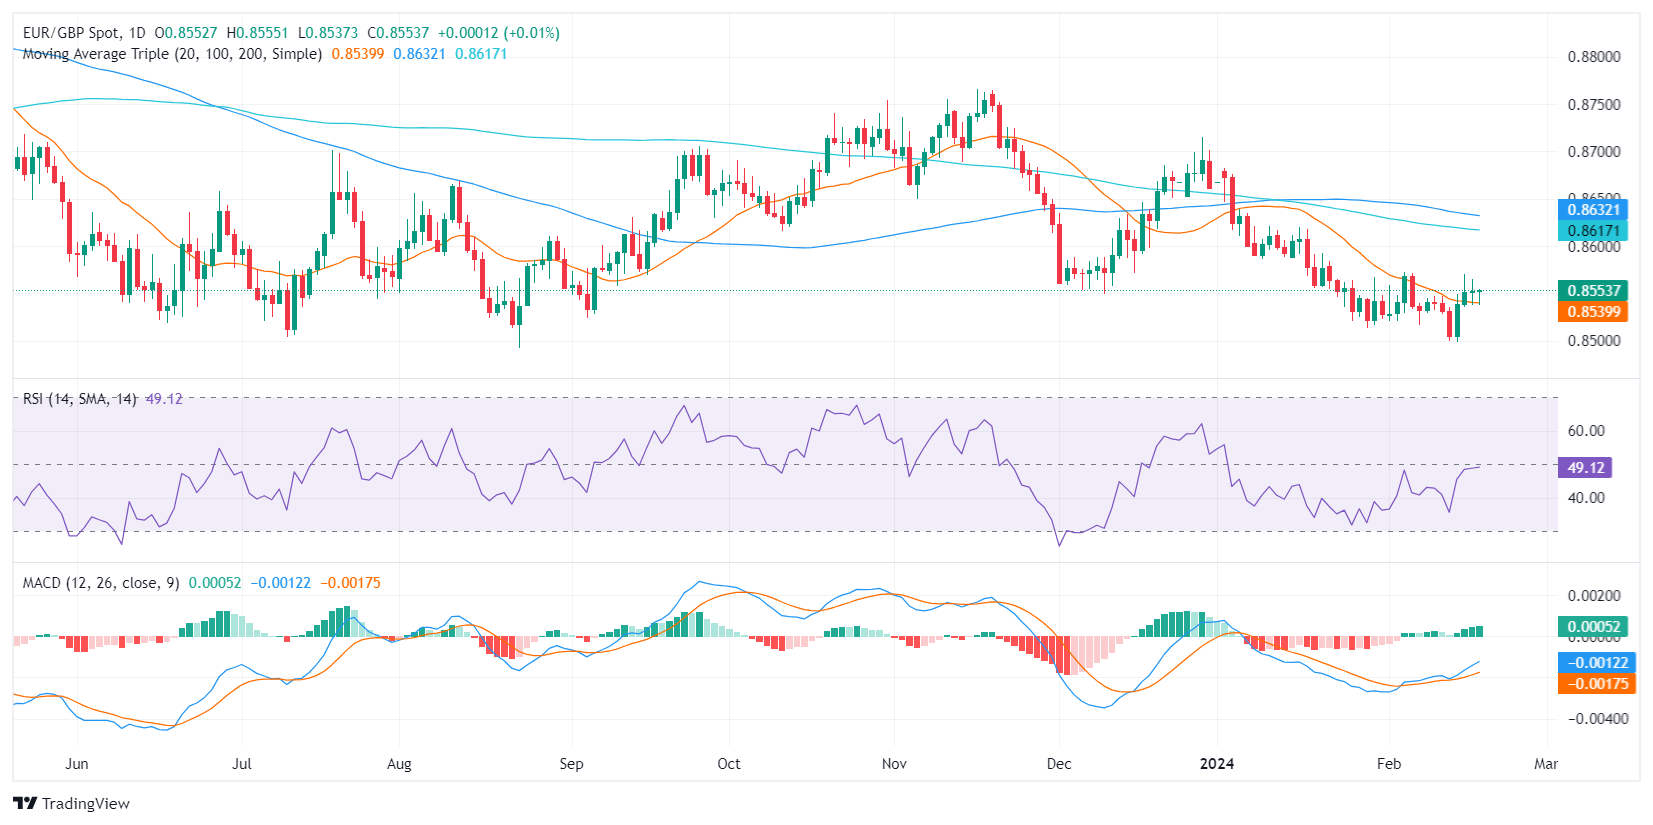
In Monday's session, the EUR/GBP was at 0.8555 amid anticipation of possible shifts in European Central Bank (ECB) policy, as recent indicators point towards revitalized wage growth and a surprising uptick in core inflation. However, markets are still betting on a sooner easing-cycle start than the Bank of England (BoE) which gives the Pound an advantage over the euro.
In the Euro area, the inflation trend reversed partially in January when core inflation was above expectations at 3.3%, indicative of a strengthening Eurozone economy. There is speculation that resilient wage growth, as suggested by the ECB’s wage tracker, may contribute to stickier inflation which may push the bank to hold rates for longer. In that sense, if the European economies show strengths as the British economy, the Euro could partially strengthen. However, markets are still betting between 125-100 bps of easing from the ECB in 2024, vs the sub-100 bps of cutting from the BoE which could limit the upside. Incoming data will set the timing of the easing, and this week, markets will get key Manufacturing PMI readings from both economic blocks from February which could ignite volatility in the pair.
EUR/GBP technical analysis
Examining the Relative Strength Index (RSI), the EUR/GBP pair hints at a slightly positive outlook as the index hovers around the central mark, indicating restrained buying momentum. Recent transitions further validate this tilt, with the RSI shifting from deep negative to the 50 mark, indicating a possible shift in buyer power. However, the shifting trend is not markedly aggressive, suggesting a scope for volatility.
On the other hand, the Moving Average Convergence Divergence (MACD) histogram, a measure to evaluate momentum, highlights green bars, which underscores growing buying momentum.
Finally, the pair's position against its Simple Moving Averages (SMAs) implies a mixed bias in the short term. Despite being above the 20-day SMA, the pair still lingers below the 100 and 200-day SMA, signaling a considerable bearish presence. Hence, for the upward momentum to persist, bulls must increase their efforts.
EUR/GBP daily chart
- Thin Monday market churn as traders wait for big data prints this week.
- Canada, US both have bank holidays on Monday, throttling trading volumes.
- Tuesday brings Canadian CPI inflation, US FOMC Meeting Minutes on Wednesday.
The Canadian Dollar (CAD) is stuck in a near-term technical range as the new trading week kicks off with a thin market profile. Canadian and US financial institutions are dark on Monday, with two-thirds of Canadians taking the day off. Canada’s financial sector, specifically the Toronto Stock Exchange, is closed for the day. The US is also observing Presidents’ Day, and American institutions will start the new trading week on Tuesday.
Canada brings another Consumer Price Index (CPI) inflation print on Tuesday, and broader markets will be keeping a close eye on Wednesday’s Federal Open Market Committee (FOMC) Meeting Minutes as investors look out for how close the US Federal Reserve (Fed) is to cutting interest rates.
Daily digest market movers: Canadian Dollar churns in flat-sided markets
- The Canadian Raw Material Price Index rose 1.2% in January versus December’s -4.9%.
- Canadian MoM Industrial Product Prices shrank a scant -0.1% in January compared to December’s -1.6% (revised slightly from -1.5%).
- Both metrics are decidedly low-impact, barely moved the needle despite Raw Materials posting a fourth straight month in contraction territory.
- Tuesday’s YoY Canadian CPI inflation is expected to tick down slightly to 3.3% from the previous period’s 3.4%.
- MoM Canadian CPI inflation is expected to rebound to 0.4% in January from December’s -0.3%.
- Canada CPI Preview: Inflation likely eased in January.
- Canadian Retail Sales slated for Thursday are expected to show a MoM rebound to 0.8% in December compared to November’s -0.2%.
- Wednesday’s FOMC Meeting Minutes will pull the veil back on the Fed’s internal discussions about the US central bank’s interest rate stance.
- According to the CME’s FedWatch Tool, money markets are expecting a first rate trim from the Fed in June, with over 90% odds of another rate cut in July.
Canadian Dollar price today
The table below shows the percentage change of Canadian Dollar (CAD) against listed major currencies today. Canadian Dollar was the weakest against the New Zealand Dollar.
| USD | EUR | GBP | CAD | AUD | JPY | NZD | CHF | |
| USD | 0.16% | 0.18% | 0.10% | 0.04% | 0.05% | -0.12% | 0.12% | |
| EUR | -0.16% | 0.02% | -0.06% | -0.12% | -0.11% | -0.28% | -0.04% | |
| GBP | -0.18% | -0.01% | -0.08% | -0.14% | -0.12% | -0.29% | -0.05% | |
| CAD | -0.10% | 0.06% | 0.06% | -0.06% | -0.05% | -0.22% | 0.02% | |
| AUD | -0.02% | 0.14% | 0.13% | 0.08% | 0.03% | -0.14% | 0.10% | |
| JPY | -0.05% | 0.11% | 0.15% | 0.05% | -0.01% | -0.16% | 0.08% | |
| NZD | 0.12% | 0.28% | 0.29% | 0.22% | 0.16% | 0.17% | 0.25% | |
| CHF | -0.13% | 0.04% | 0.05% | -0.03% | -0.08% | -0.08% | -0.25% |
The heat map shows percentage changes of major currencies against each other. The base currency is picked from the left column, while the quote currency is picked from the top row. For example, if you pick the Euro from the left column and move along the horizontal line to the Japanese Yen, the percentage change displayed in the box will represent EUR (base)/JPY (quote).
Technical analysis: Canadian Dollar mixed on quiet Monday
The Canadian Dollar (CAD) spreads on Monday, mixed against the major currency basket at the start of the new trading week. The CAD is up a scant tenth of a percent against the Euro (EUR) and the Pound Sterling (GBP) but down a fifth of a percent against the broadly-recovering New Zealand Dollar (NZD) on Monday.
The USD/CAD is cycling within near-term technical boundaries near 1.3500, and the pair remains just north of a supply zone between 1.3440 and 1.3420. The pair spent most of the last week closing last Tuesday’s Fair Value Gap (FVG), and traders will be looking for a break of structure to bring the USD/CAD back into buying territory below 1.3460.
USD/CAD remains hampered by the 200-day Simple Moving Average (SMA) at 1.3478, and near-term price action is finding thin but steady technical support from the 50-day SMA near 1.3410.
USD/CAD hourly chart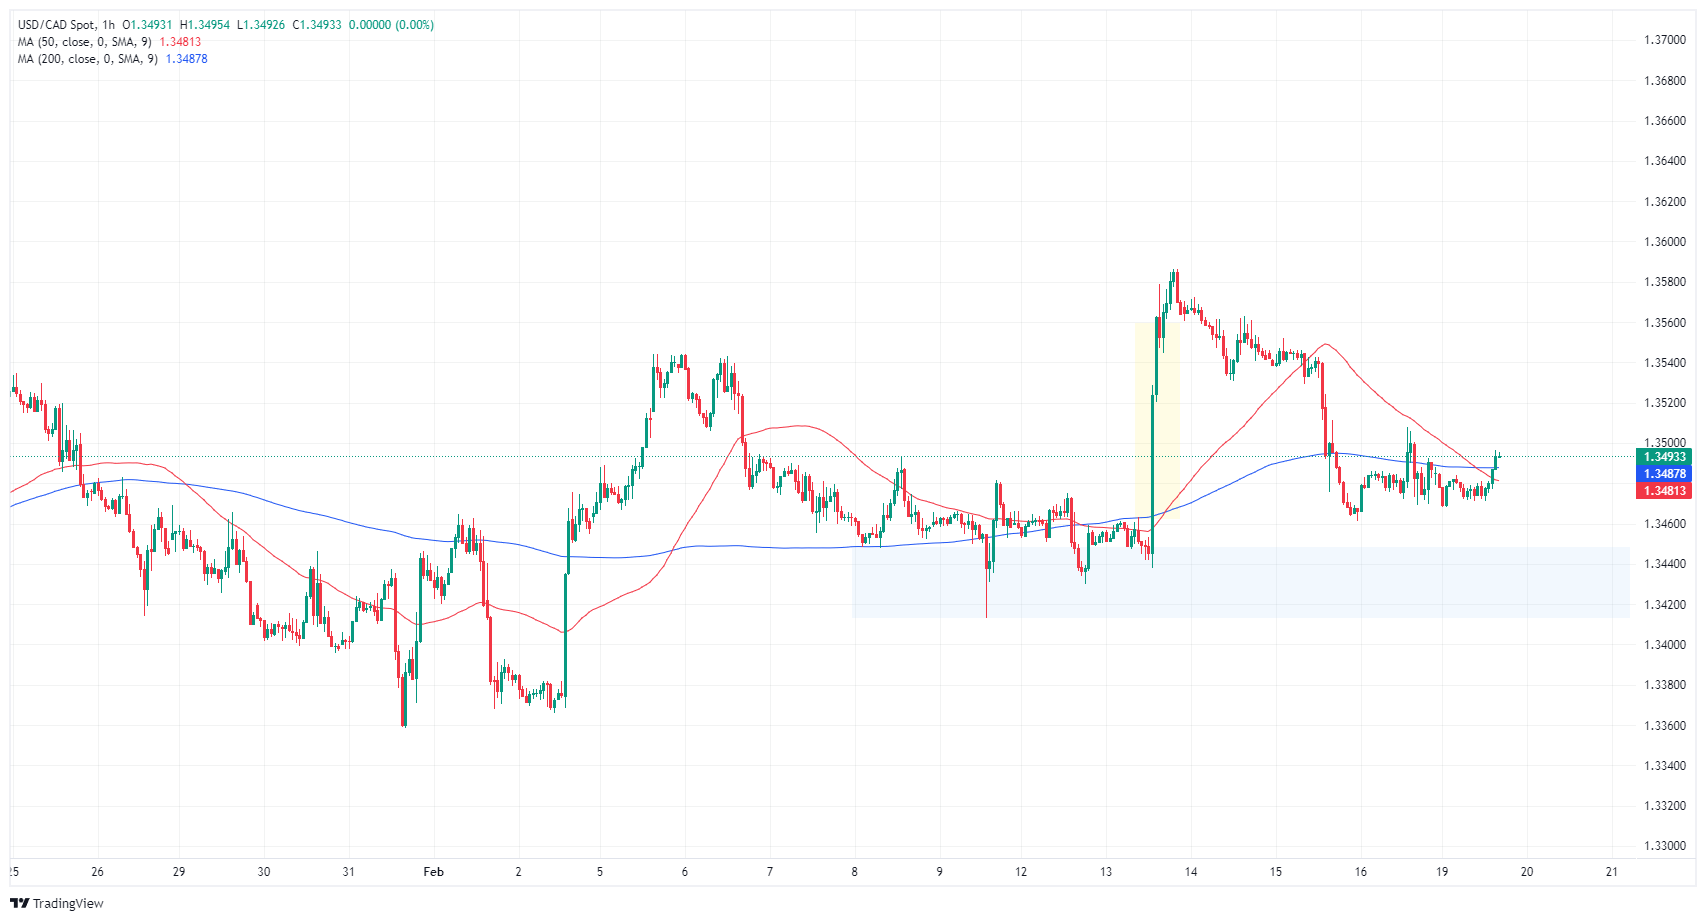
USD/CAD daily chart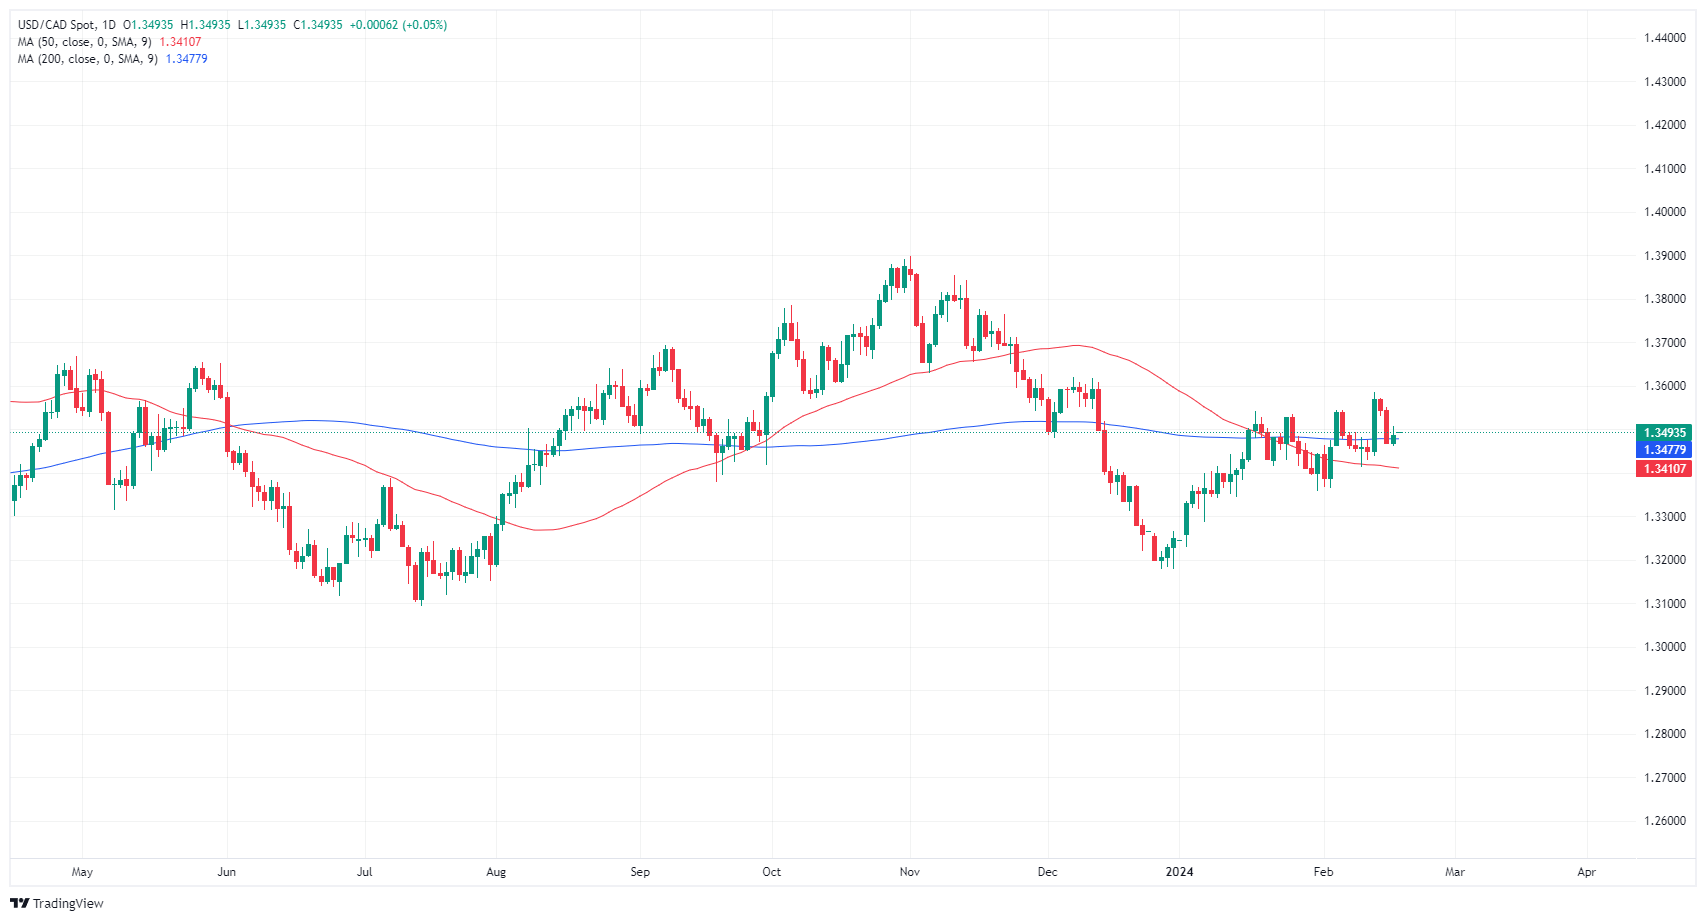
Canadian Dollar FAQs
What key factors drive the Canadian Dollar?
The key factors driving the Canadian Dollar (CAD) are the level of interest rates set by the Bank of Canada (BoC), the price of Oil, Canada’s largest export, the health of its economy, inflation and the Trade Balance, which is the difference between the value of Canada’s exports versus its imports. Other factors include market sentiment – whether investors are taking on more risky assets (risk-on) or seeking safe-havens (risk-off) – with risk-on being CAD-positive. As its largest trading partner, the health of the US economy is also a key factor influencing the Canadian Dollar.
How do the decisions of the Bank of Canada impact the Canadian Dollar?
The Bank of Canada (BoC) has a significant influence on the Canadian Dollar by setting the level of interest rates that banks can lend to one another. This influences the level of interest rates for everyone. The main goal of the BoC is to maintain inflation at 1-3% by adjusting interest rates up or down. Relatively higher interest rates tend to be positive for the CAD. The Bank of Canada can also use quantitative easing and tightening to influence credit conditions, with the former CAD-negative and the latter CAD-positive.
How does the price of Oil impact the Canadian Dollar?
The price of Oil is a key factor impacting the value of the Canadian Dollar. Petroleum is Canada’s biggest export, so Oil price tends to have an immediate impact on the CAD value. Generally, if Oil price rises CAD also goes up, as aggregate demand for the currency increases. The opposite is the case if the price of Oil falls. Higher Oil prices also tend to result in a greater likelihood of a positive Trade Balance, which is also supportive of the CAD.
How does inflation data impact the value of the Canadian Dollar?
While inflation had always traditionally been thought of as a negative factor for a currency since it lowers the value of money, the opposite has actually been the case in modern times with the relaxation of cross-border capital controls. Higher inflation tends to lead central banks to put up interest rates which attracts more capital inflows from global investors seeking a lucrative place to keep their money. This increases demand for the local currency, which in Canada’s case is the Canadian Dollar.
How does economic data influence the value of the Canadian Dollar?
Macroeconomic data releases gauge the health of the economy and can have an impact on the Canadian Dollar. Indicators such as GDP, Manufacturing and Services PMIs, employment, and consumer sentiment surveys can all influence the direction of the CAD. A strong economy is good for the Canadian Dollar. Not only does it attract more foreign investment but it may encourage the Bank of Canada to put up interest rates, leading to a stronger currency. If economic data is weak, however, the CAD is likely to fall.
Statistics Canada will release January Consumer Price Index (CPI) data on Tuesday, February 20 at 13:30 and as we get closer to the release time, here are the forecasts by the economists and researchers of seven major banks regarding the upcoming Canadian inflation data.
Headline is expected at 3.2% year-on-year vs. the prior release of 3.4%. If so, it would be the first deceleration since October. Nevertheless, core trim is expected to fall a tick to 3.6% while core median is expected to remain steady at 3.6% YoY.
RBC Economics
The first Canadian inflation reading of 2024 should edge lower on falling energy prices and slower food price growth. We expect the consumer price index to rise 3.2% YoY, lower than 3.4% in December. But the underlying details will be closely watched for signs on whether inflation pressures are continuing to trend – albeit gradually – towards the BoC’s 2% target. Stripping out volatile components like food and energy, we expect price growth to hold at 3.4% YoY with the recent months’ mixed underlying drivers continuing. More than a quarter of price growth overall is still coming from higher mortgage interest costs that are a direct result of earlier BoC interest rate increases. If we exclude that component, price growth would already be back within the BoC’s 1% to 3% inflation target range. The share of the CPI basket seeing abnormally high inflation has also been declining. Roughly 51% of the consumer basket was growing at more than 3% over the last three months, down from a peak of 77% of the basket in July 2022. But we also look for YoY growth in the BoC’s preferred broader trim and median measures of underlying price growth to hold steady at 3.7% and 3.6%, respectively, in December.
ING
In Canada, we will have inflation data which is likely to show inflation hovering just above 3%. This won’t be enough to trigger an imminent Bank of Canada policy rate cut, but we do expect them to start easing by the June policy meeting.
TDS
We look for CPI inflation to slow by 0.2pp to 3.2% YoY in January as prices rise by another 0.4% MoM. Core inflation measures should help to reinforce the limited progress towards 2%, with a 0.1pp decline for CPI-trim/median to 3.55% YoY on average as 3m rates of core CPI edge higher to 3.8%. The BoC might not put as much weight on 3m rates of CPI-trim/median going forward given its recent shift towards more generalized core inflation, but this still speaks to the persistence of underlying price pressures that will make it difficult for the Bank to deliver a dovish message in March.
NBF
Although gasoline prices treaded water during the month, headline prices may still have risen 0.4% before seasonal adjustment, supported by higher food prices. Despite this increase, the 12-month rate could still go down from 3.4% to 3.3%, thanks to a highly positive base effect. The core measures preferred by the BoC, meanwhile, could have improved only marginally, with the CPI-trim easing from 3.7% to 3.6% and the CPI-med remaining unchanged at 3.6%.
CIBC
After accelerating in the prior month, headline inflation should partially ease again in January with gasoline prices falling on the month and food price inflation easing. However, mortgage interest costs and rising rental prices should keep the monthly trend in ex-food/energy prices on a firmer track than would be consistent with a 2% inflation target. On a YoY basis, inflation excluding food/energy could actually accelerate slightly. The BoC’s CPI-trim and median measures of inflation accelerated in December, and are unlikely to show much improvement in the latest month. Indeed, the 3-month annualized rates will likely accelerate, and on a YoY basis, we only forecast a slight deceleration in the trim measure.
Citi
We expect a 0.5% MoM increase in headline CPI in January with the YoY reading remaining at 3.4%. Shelter prices are expected to remain strong, though some recent comments from BoC officials have been interpreted as looking through strength in shelter inflation. While officials may be unlikely to raise rates again due to shelter inflation alone, the path of shelter inflation will still likely be a very important consideration in setting policy. The path of the core inflation measures will remain the most important element of monthly inflation reports. The 3-month average annualized pace of CPI-median and CPI-trim will likely remain elevated in January as a weaker reading from October drops out of the 3-month calculation. And the preferred leading indicators of core inflation like the CFIB price plans survey still suggest that 3-month core could drop closer to 2.5% by mid-year, but currently, BoC officials would need at least a few months of 3-month core inflation around 2.5% to feel comfortable lowering rates.
Wells Fargo
For January, headline inflation is expected to tick only modestly lower to 3.2%, while core inflation is also expected to ease only slightly. Moreover, if these forecasts are realized, both headline and core inflation would remain some distance above the central bank's 2% inflation. Against that backdrop, we don't expect the BoC to be in a rush to lower interest rates and our view remains that the central bank won't deliver an initial 25 bps rate cut until its June monetary policy announcement.
The combination of monetary policy trends and contained election risks should result in long-term Mexican Peso (MXN) strength, analysts at Wells Fargo say.
Long-term Peso trends are still positive
In the upcoming election cycle, we believe a well-telegraphed outcome and policy continuity can protect the Peso from local politics-related depreciation. We also believe that hawkish leaning rate cuts can provide protection for the MXN, especially with Mexico's central bank likely to start easing ahead of the Fed.
Also, we remain steadfast in our view that the USD will broadly depreciate in the second half of 2024. USD weakness can also act as a tailwind for the Peso.
We expect the USD/MXN exchange rate to end 2024 at ~17.00. Further out, we believe Peso strength can continue and believe the USD/MXN exchange rate can trend toward 16.50 by the middle of 2025.
Strong US jobs data and a higher-than-expected January CPI number have unnerved the disinflation trade in FX markets – namely, that of a benign decline in the Dollar. Economists at ING analyze Greenback’s outlook.
Benign Dollar decline to start next quarter
Federal Reserve officials accept that the disinflationary path will be a ‘bumpy’ one. However, we retain a view that inflation will remain on track towards policy targets. If that is the case, current Dollar strength may only last another month or two.
For the FX benchmark EUR/USD, that probably means that the downside is limited to the 1.0500/1.0700 area this month; recall that January and February are typically strong months for the Dollar.
We continue to expect a modest rally this summer and EUR/USD to end the year somewhere near 1.1500.
Economists at ANZ Bank maintain their forecast that the FOMC will start to cut interest rates around mid-year and currently have July pencilled in.
Caution warranted but still on track to cut mid-year
We remain of the view that unless the annual trend improvement in core PCE inflation stalls or starts to reverse, the improved inflation backdrop will allow the FOMC to start cutting rates gradually around mid-year.
We currently have July pencilled in for the start of the rate cutting cycle. We also think the FOMC needs to be patient and cautious in advancing forward guidance around the expected timing of rate cuts. We will be watching incoming data closely and fine tune our forecast path accordingly.
We expect the target rate will be cut by 100 bps this year and 200 bps over the cycle. We expect cuts to occur in 25 bps increments and end in June 2025.
- EUR/USD trades slightly lower in quiet session, with focus on upcoming FOMC minutes and EU data.
- Bundesbank reports no imminent recovery for Germany, predicting a technical recession in early 2024.
- Global equities' strength limits USD gains, with key economic releases ahead to influence market direction.
The Euro lost ground against the US Dollar amid thin trading in the observance of President’s Day in the United States (US). At the time of writing, the EUR/USD pair fluctuates around 1.0770s, down by 0.07%, after hitting a daily high of 1.0789.
EUR/USD sees slight decline as Bundesbank forecasts technical recession for Germany
During the European session, the Bundesbank noted that Germany’s economy is likely in a recession, in the Buba Monthly Economic Report. The bank noted there’s “still no recovery for the German economy,” adding that. “Output could decline again slightly in the first quarter of 2024. With the second consecutive decline in economic output, the German economy would be in a technical recession.”
Investors' upbeat tone, as witnessed by European and Asian equities trading with gains capped the Greenback’s gains.
EUR/USD traders would be eyeing the release of the Federal Open Market Committee (FOMC) minutes, which would likely not move the needle after Federal Reserve Chair Jerome Powell and his colleagues delivered a “hawkish” hold. Besides this, US S&P Global PMIs, along with jobs data, could trigger volatility towards the end of the week.
Across the pond, the Eurozone (EU) economic docket will feature the European Central Bank (ECB) latest minutes and the EU’s wages indicator.
EUR/USD Price Analysis: Technical outlook
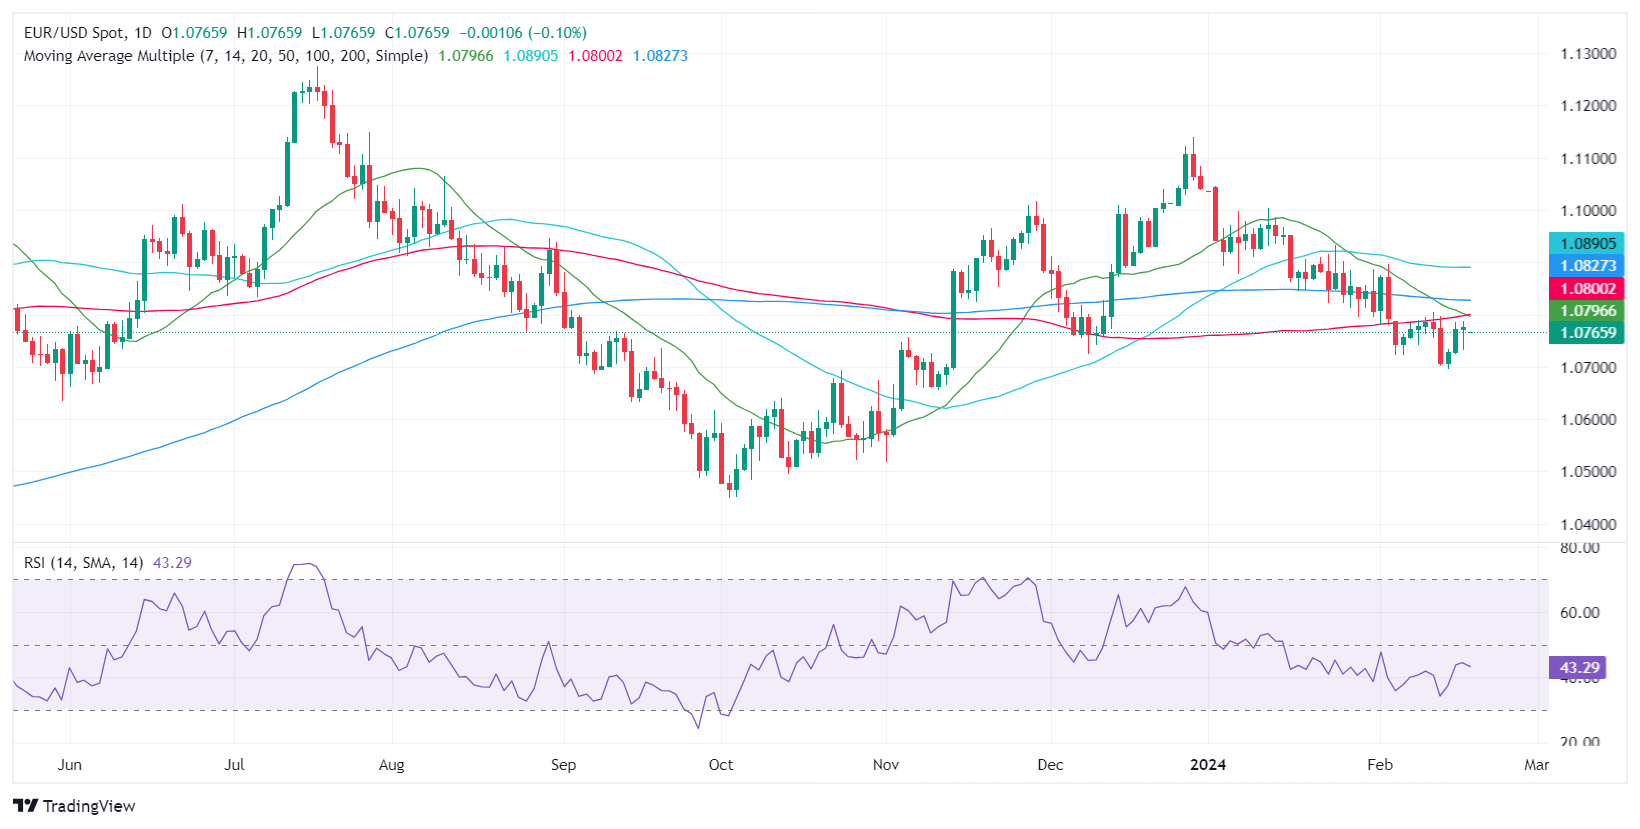
The EUR/USD daily chart suggests the pair remains bearishly biased, trading below the 50, 200, and 100-day moving averages (DMAs). That, along with Relative Strength Index (RSI) studies aiming lower, could pave the way for challenging the February 14 low of 1.0694. Further downside is seen at November’s 10 cycle low at 1.0656, before testing 1.0600. On the upside, buyers must reclaim the 100-DMA at 1.0799, to remain hopeful of testing the 200-DMA at 1.0826.
- USD/CAD finds cushion near 1.3470 amid a recovery in the USD Index.
- Fed policymakers see a one-time decline in the inflation data as insignificant.
- The Canadian Dollar will be guided by the inflation data for January.
The USD/CAD pair attempts to rebound after discovering buying interest near 1.3470 in Monday’s early New York session. The Loonie asset has found support as the US Dollar Index (DXY) has recovered from a five-day low of 104.15.
Investors see a subdued trading action ahead as US markets are closed because of Presidents’ Day. The USD Index, which measures the value of the Greenback against six major currencies, has rebounded as traders have pared bets in favor of rate cuts by the Federal Reserve (Fed) in Many monetary policy meetings.
After losing confidence over rate cuts in March due to persistent price pressures in the US economy, investors have shifted expectations for the commencement of the rate-cut cycle from the May to June policy meeting. On Friday, the US Producer Price Index (PPI) data for January rose sharply due to a rise in medical costs and portfolio management fees.
While investors are worried about the stubborn inflation outlook, Fed policymakers said considering one-time fluctuation could be a tremendous mistake. Investors should focus on longer trend, which indicates that inflation is declining towards the 2% goal.
Going forward, investors will focus on the Federal Reserve Open Market Committee (FOMC) minutes for January’s policy meeting, which will be released on Wednesday. The FOMC minutes will provide a detailed explanation behind keeping key rates unchanged in the range of 5.25%-5.50% in January and a fresh outlook on interest rates.
On the Canadian Dollar front, investors await the inflation data for January, which will be published on Tuesday. As per the estimates, the core Consumer Price Index (CPI) data is anticipated to decline to 3.2% from 3.4% in December. The Bank of Canada (BoC) may continue to hold interest rates at 5% as policymakers need to do more work to bring down inflation to the 2% target.
US election outcome remains a joker. Economists at Nordea analyze how the US Dollar (USD) could react to a Trump presidency.
A weaker USD could happen especially if sovereign debt concerns materialise
The outcome of the US presidential election could see the USD standing on a firmer footing than we have pencilled in.
If Trump is re-elected, his comeback will likely lead to more inflationary policies, a renewed trade war between the US and abroad with China in focus, heightened geopolitical risks and higher US government deficits.
For the USD, a Trump re-election will likely support the USD in the short term due to trade and geopolitical tensions, while a weaker USD than we have pencilled could happen especially if sovereign debt concerns materialise.
- AUD/USD trades back and forth near weekly high ahead of the Fed and the RBA minutes.
- The reopening of Chinese markets has provided some strength to the Australian Dollar.
- Stubborn US price pressures fail to provide support to the US Dollar.
The AUD/USD pair consolidates in a narrow range after a sharp rally to near 0.6550 in Monday’s late European session. The Aussie asset is expected to remain on edge ahead of the release of the Reserve Bank of Australia (RBA) and the Federal Reserve (Fed) minutes on Tuesday and Wednesday, respectively.
The reopening of Chinese markets after the Lunar New Year celebrations has improved the appeal of the Australian Dollar. Investors will focus on the interest rate decision by the People’s Bank of China (PBoC), which will be announced on Tuesday. The PBoC is expected to maintain a dovish stance as the Chinese economy faces deflation amid weak household spending and lower employment opportunities.
Being a proxy to the Chinese economy, the Australian Dollar strengthens on stimulus support from the PBoC.
Meanwhile, the US Dollar Index (DXY) remains under pressure despite robust United States consumer price inflation and Producer Price Index (PPI) data for January have dampened hopes of rate cuts by the Federal Reserve (Fed).
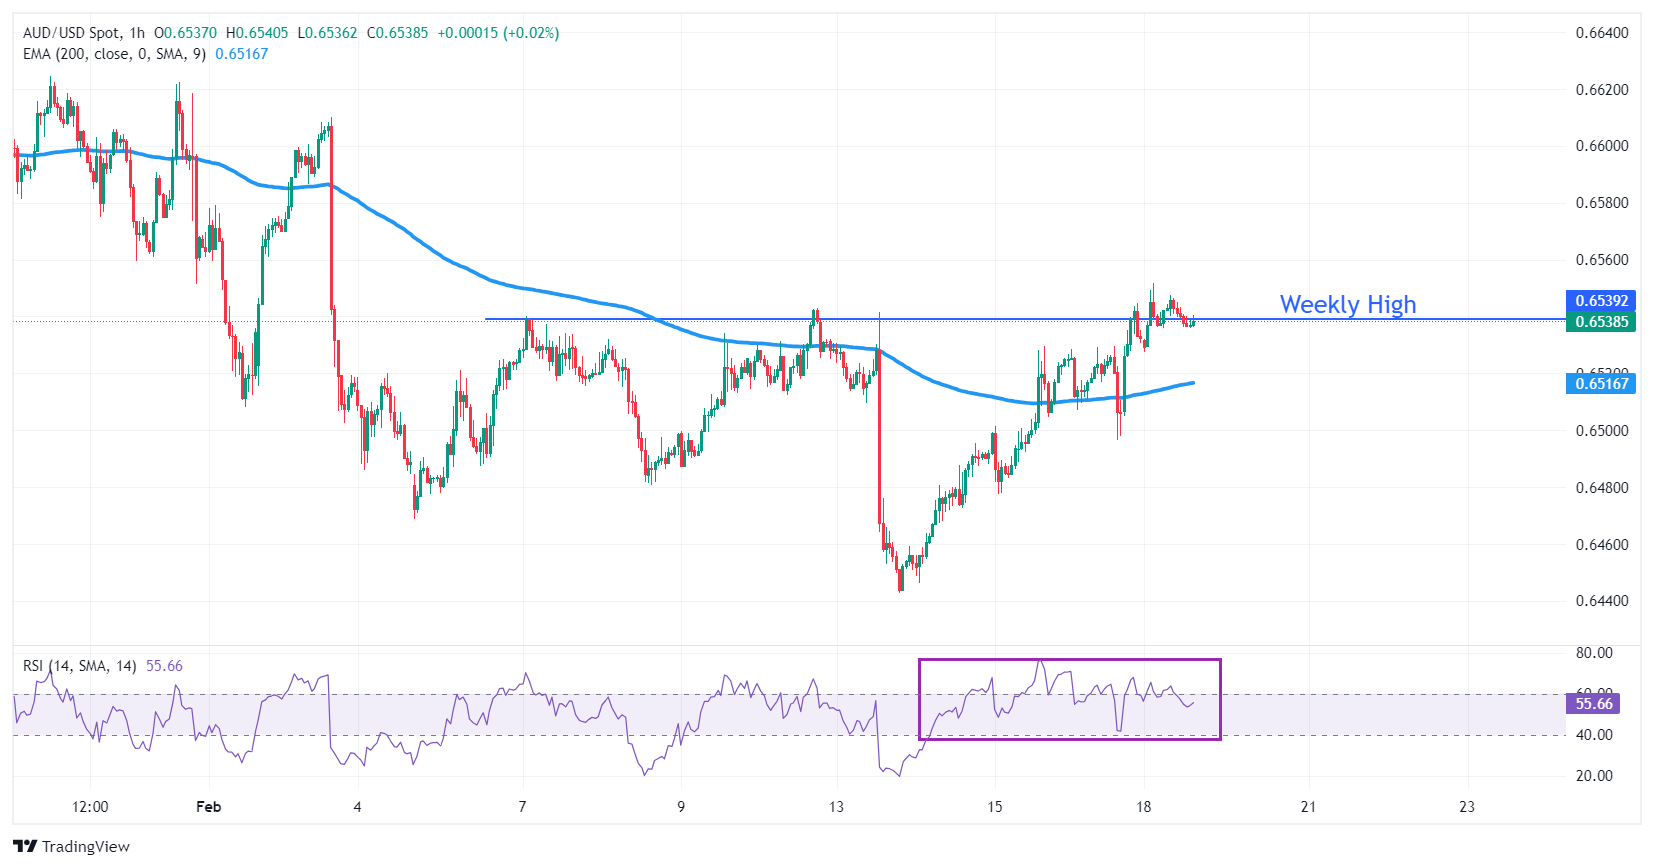
AUD/USD delivers a solid rally to near weekly high around 0.6540 on an hourly scale. The near-term outlook of the Aussie asset has turned bullish as it has stabilized above the 200-period Exponential Moving Average (EMA), which trades around 0.6517.
The 14-period Relative Strength Index (RSI) trades in the bullish range of 40.00-80.00, indicating more upside ahead.
More upside will appear if the asset breaks above the intraday high of 0.6552, driving the asset towards the round-level resistance of 0.6600, followed by the January 30 high at 0.6625.
In an alternate scenario, a downside move below February 15 low at 0.6477 would activate sellers and expose the asset to February 13 low at 0.6443 and the round-level support of 0.6400.
AUD/USD hourly chart
The Mexican Peso (MXN) is down about 1.3% vs. the US Dollar (USD) – spot basis and flat year-to-date on total basis – so far in 2024. Strategists at Société Générale analyze MXN outlook.
Banxico to launch easing cycle in March
Our EM strategists remain optimistic on the Peso and continue to favour buying MXN dips.
We expect the central bank to implement gradual easing, starting with a 25 bps cut in March and then a cumulative -250 bps to 8.45% by end-2024 against implied pricing of around 9.50%.
We see an opportunity target 16.40 in six to nine months thanks to structural domestic tailwinds of nearshoring and high remittances, and high carry-to-vol. The caveat is US tariffs and an overshoot of US bond yields.
USD/CAD’s gains above 1.35oo were not sustained through the close of the week. Economists at Scotiabank analyze the pair’s outlook.
USD/CAD looking prone to a bit more softness through the upper 1.3400s
The charts suggest the 1.3540 retracement resistance point is still holding some influence over price action. And although there is no obvious sign that USD gains are reversing, the long upper shadows on the weekly candle chart (over) reflect better USD selling pressure emerging on gains through the mid/upper-1.3500s which perhaps suggests the USD’s Q1 rebound is losing momentum.
USD/CAD resistance looks firm in the 1.3540/1.3580 zone and late week trading leaves spot looking prone to a bit more softness through the upper 1.3400s to retest 1.3420/1.3440.
Key support remains 1.3360.
Economists at Commerzbank analyze the US growth advantage and its implications for the US Dollar.
Only the US GDP seems to be back on a sustained growth path
The following picture of the Fed is emerging: ‘If the US economy were to weaken after all, it wouldn't matter much if inflation were a little higher or lower; the Fed would be inclined to cut the fed funds rate.’ Note: This is only one of the two channels through which US growth is relevant for USD exchange rates. The other is more direct: if US growth is significantly higher than growth in other developed economies over the medium to long term, then capital invested in the US will be more profitable than capital invested elsewhere. And then the currency needed to acquire that capital – the USD – will also be more valuable.
After the post-corona recovery phase, stagnation is the order of the day in most G7 economies. Only the US GDP seems to be back on a sustained growth path. This is nothing new. Japan, Italy and to some extent, France have been unable to keep up with the US for some time. However, the US has also been outperforming Germany and Canada for several years now, giving it a unique position among Western industrialized countries. The Dollar is also currently strong at the moment because the picture is once again emerging with great clarity from the latest real economic data. Conversely, the outlook for US growth – regardless of what is expected from the Fed, ECB, BoJ, etc. – is a key factor in the USD outlook.
- The US Dollar trades a touch softer on Monday with US traders enjoying the long weekend.
- Markets are digesting geopolitical headlines out of Gaza and the broader Middle East.
- The US Dollar Index tests 104 again and could slide below with the US session no present.
The US Dollar (USD) is digesting some geopolitical news that came out over the weekend and this Monday with tension being pushed back on high alert on Gaza and the Middle East. Israel has released an ultimatum for Hamas to give up the last hostages, otherwise a big military operation will take place before the Shabbat on March 8. Iran meanwhile reported that the attacks last week on one of its major Gas pipelines is the work of Israel, the New York Times reported.
On the economic data front, there are no numbers from the US and no US Federal Reserve speakers either. Fast forward to later this week and on Wednesday traders will move the markets on the publication of the US Fed’s most recent Minutes. Add Thursday with important US Purchase Manager Indices prints and although overall the calendar looks light, there could be some substantial movements later this week in the US Dollar Index.
Daily digest market movers: Calm start and sit on your hands
- The New York Times reported that Iran has proof that Israel has blown up one of Iran’s most key Gas pipelines last week.
- Yemen’s Houthis have targeted a ship in the Gulf of Aden.
- Europe is kicking off its EU election campaign with Ursula von der Leyen announcing she would like to run for a second term.
- The European Commission has slammed Apple with a fine over its Music Streaming business. The claim is allegedly Apple is breaking EU law over access to its music streaming services. The fine could amount to 500 million Euro.
- Equities are welcoming back China which is opening up again after its week-long close due to Chinese New Year. Markets are looking for direction this Monday with a very mixed view and no real outliers to report. US equity futures are trading, though with limited volumes and no opening bell ahead.
- The CME Group’s FedWatch Tool is now looking at the March 20th meeting. Expectations for a pause are 89.5%, while 10.5% for a rate cut.
- The benchmark 10-year US Treasury Note trades will not be moving this Monday with the US markets closed. The close on Friday was at 4.28%.
US Dollar Index Technical Analysis: Do not expect pots to be broken
The US Dollar Index (DXY) is holding its ground above 104 in a very calm start of the week. With US traders not present in the markets, expect very thin volumes to occur, on a Monday where volumes are often already rather on the low side compared to the rest of the week. Rather look for the middle of this week for things to finally come alive, while traders look for clues on the timing of that first rate cut, which is now hanging between June and July.
Should the US Dollar jump to 105.00 on Friday, 105.12 is a key level to keep an eye on. One step beyond there comes 105.88, the high of November 2023. Ultimately, 107.20 – the high of 2023 – could even come back into scope, but that would be when several inflation measures are coming in higher than expected for several weeks in a row.
The 100-day Simple Moving Average looks to be holding for now, though pressure is building on it to snap, near 104.18, so the 200-day SMA near 103.70 looks more solid. Should that give way, look for support from the 55-day SMA near 103.14.
US Dollar FAQs
What is the US Dollar?
The US Dollar (USD) is the official currency of the United States of America, and the ‘de facto’ currency of a significant number of other countries where it is found in circulation alongside local notes. It is the most heavily traded currency in the world, accounting for over 88% of all global foreign exchange turnover, or an average of $6.6 trillion in transactions per day, according to data from 2022.
Following the second world war, the USD took over from the British Pound as the world’s reserve currency. For most of its history, the US Dollar was backed by Gold, until the Bretton Woods Agreement in 1971 when the Gold Standard went away.
How do the decisions of the Federal Reserve impact the US Dollar?
The most important single factor impacting on the value of the US Dollar is monetary policy, which is shaped by the Federal Reserve (Fed). The Fed has two mandates: to achieve price stability (control inflation) and foster full employment. Its primary tool to achieve these two goals is by adjusting interest rates.
When prices are rising too quickly and inflation is above the Fed’s 2% target, the Fed will raise rates, which helps the USD value. When inflation falls below 2% or the Unemployment Rate is too high, the Fed may lower interest rates, which weighs on the Greenback.
What is Quantitative Easing and how does it influence the US Dollar?
In extreme situations, the Federal Reserve can also print more Dollars and enact quantitative easing (QE). QE is the process by which the Fed substantially increases the flow of credit in a stuck financial system.
It is a non-standard policy measure used when credit has dried up because banks will not lend to each other (out of the fear of counterparty default). It is a last resort when simply lowering interest rates is unlikely to achieve the necessary result. It was the Fed’s weapon of choice to combat the credit crunch that occurred during the Great Financial Crisis in 2008. It involves the Fed printing more Dollars and using them to buy US government bonds predominantly from financial institutions. QE usually leads to a weaker US Dollar.
What is Quantitative Tightening and how does it influence the US Dollar?
Quantitative tightening (QT) is the reverse process whereby the Federal Reserve stops buying bonds from financial institutions and does not reinvest the principal from the bonds it holds maturing in new purchases. It is usually positive for the US Dollar.
Gold recorded its second straight weekly loss as expectations of an imminent rate cut by the Fed faded. Economists at TD Securities analyze the yellow metal’s outlook.
XAU/USD’s set-up is ripe with asymmetry and prone to a material short squeeze
Strong inflation data following the strong jobs has put the yellow metal on the back foot as upbeat data will continue to suggest the Federal Reserve may not be in any hurry to start easing monetary policy. However, while the relentless outflows in Gold speculative positions and ETFs are likely related to macroeconomic incentives, the positioning now suggests that macro traders are historically underpositioned ahead of a Fed cutting cycle. This highlights a set-up for the yellow metal that is ripe with asymmetry and prone to a material short squeeze as Fed officials contemplate the start of a cutting cycle.
For the time being, the incoming data will remain the notable potential catalyst for a potential short covering rally.
- Natural Gas snaps below recent multi-year low and prints new three-year low.
- Traders are sending Gas lower on tepid demand outweighing rising tensions.
- The US Dollar Index is flat above pivotal support with the US closed for holiday.
Natural Gas (XNG/USD) is trading around $1.63 and is unable to flare up after Iran accused Israel for blowing up one of its key vital Gas pipelines last week. The New York Times reported that Iran had proof of Israel being behind the attack. Meanwhile Israel itself is ramping up pressure on Gaza and Hamas by issuing a demand to give up the last hostages before the Shabbat in two weeks, or another massive ground offensive will be rolled out.
The US Dollar (USD) meanwhile is trading steady at a pivotal support level in the US Dollar Index (DXY). With US traders not in the market this Monday due to President’s Day, it looks like low volumes will be unable to really move the needle here. Traders will rather focus on the publication of the Minutes from the US Federal Reserve’s January meeting on Wednesday, and several US Purchase Manger’s Indices on Thursday which could make some moves for the Greenback.
Natural Gas is trading at $1.63 per MMBtu at the time of writing.
Natural Gas market movers: Tensions overshadowed by tepid demand
- Qatar is set to announce a string of substantial LNG deals with both Europe and Asia, Al-Kaabi confirms.
- Korea Gas, South-Korea’s biggest LNG group, agreed to extend its long term LNG contracts with Oman for another 10 years.
- Elevated temperatures are seen in Europe for the rest of the month, and will cut demand for Gas further in the region, below average demand for this time of year.
Natural Gas Technical Analysis: Demand remains key
Natural Gas keeps struggling to find a floor amidst the more and more tepid demand globally. Under normal circumstances, recent headlines out of Israel and Iran would have been enough to send Gas prices soaring. Though, even with these possible hiccups in Gas supply, Europe has no need for them which means there is still a supply surplus in the Gas market with traders looking for the right fair value amidst all of this.
On the upside, Natural Gas is facing some pivotal technical levels to get back to. First stop is $1.99, – the level which, when broken, saw an accelerated decline. Next is the blue line at $2.13 with the triple bottoms from 2023. In case Natural Gas sees sudden demand pick up, possibly $2.40 could come into play.
Keep an eye on $1.80, which was a pivotal level back in July 2020 and should act as a cap now. Should more supply emerge in the markets, or more weakening data globally point to even more sluggish global growth – $1.64 and $1.53 (the low of 2020) are targets to look out for.
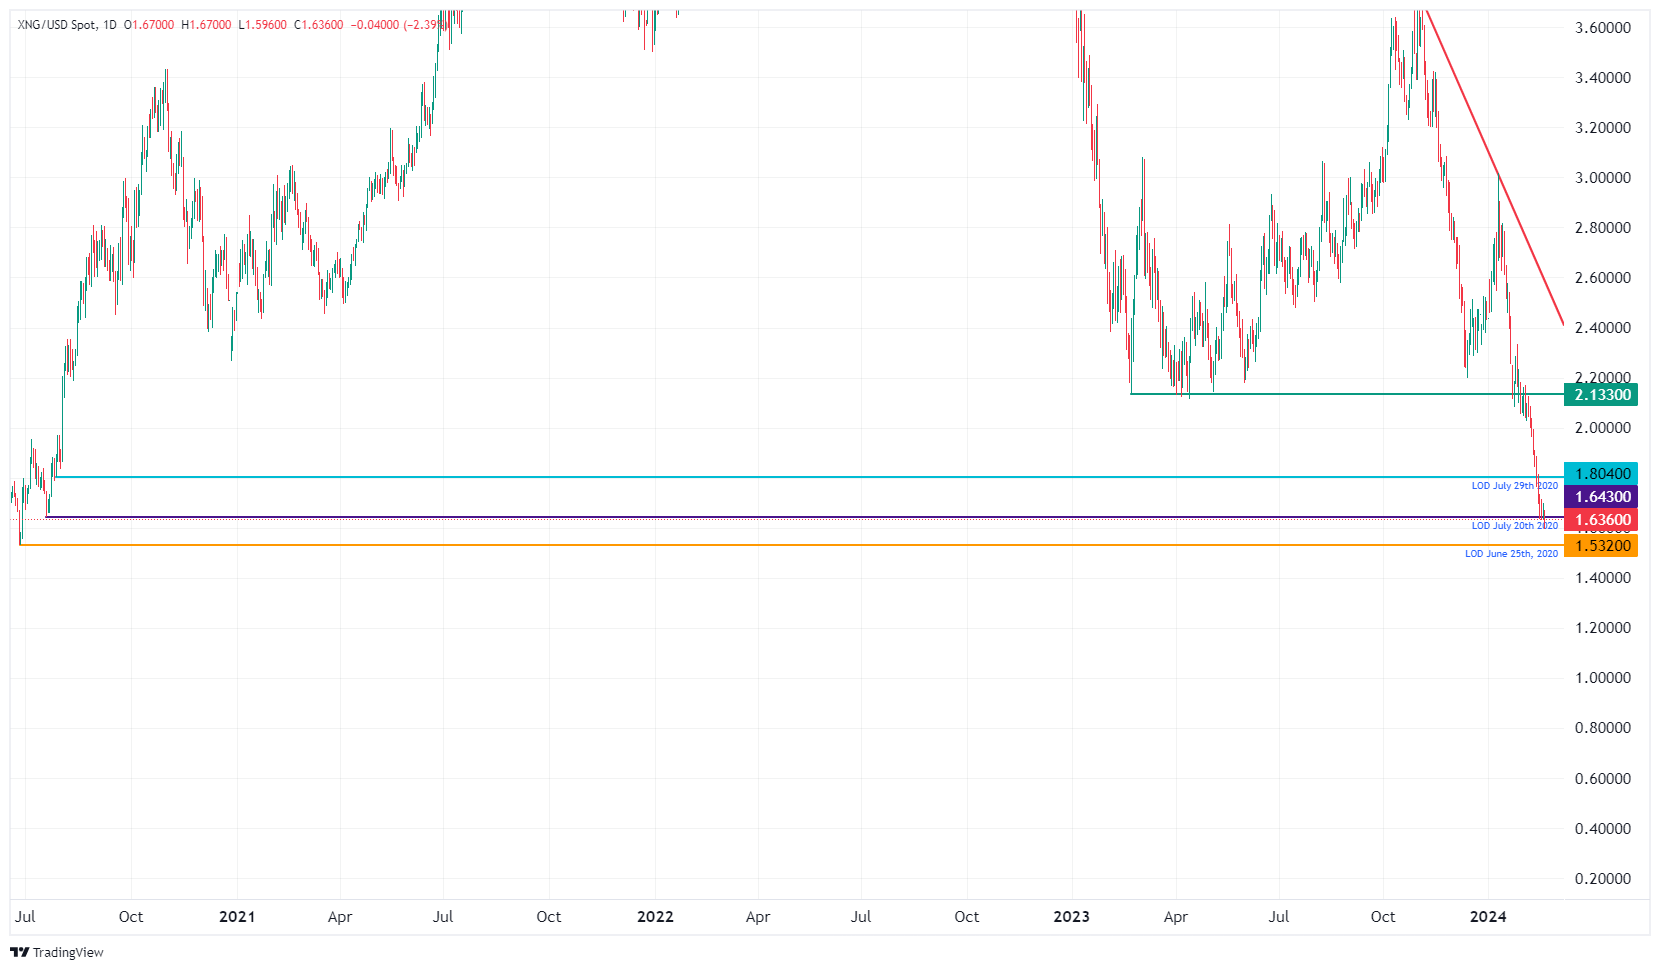
XNG/USD (Daily Chart)
Natural Gas FAQs
What fundamental factors drive the price of Natural Gas?
Supply and demand dynamics are a key factor influencing Natural Gas prices, and are themselves influenced by global economic growth, industrial activity, population growth, production levels, and inventories. The weather impacts Natural Gas prices because more Gas is used during cold winters and hot summers for heating and cooling. Competition from other energy sources impacts prices as consumers may switch to cheaper sources. Geopolitical events are factors as exemplified by the war in Ukraine. Government policies relating to extraction, transportation, and environmental issues also impact prices.
What are the main macroeconomic releases that impact on Natural Gas Prices?
The main economic release influencing Natural Gas prices is the weekly inventory bulletin from the Energy Information Administration (EIA), a US government agency that produces US gas market data. The EIA Gas bulletin usually comes out on Thursday at 14:30 GMT, a day after the EIA publishes its weekly Oil bulletin. Economic data from large consumers of Natural Gas can impact supply and demand, the largest of which include China, Germany and Japan. Natural Gas is primarily priced and traded in US Dollars, thus economic releases impacting the US Dollar are also factors.
How does the US Dollar influence Natural Gas prices?
The US Dollar is the world’s reserve currency and most commodities, including Natural Gas are priced and traded on international markets in US Dollars. As such, the value of the US Dollar is a factor in the price of Natural Gas, because if the Dollar strengthens it means less Dollars are required to buy the same volume of Gas (the price falls), and vice versa if USD strengthens.
- US stock markets will return to action on Tuesday after a long weekend.
- European equity indexes trade mixed to start the week.
- Federal Reserve will release the minutes of the January policy meeting on Wednesday.
Stock markets in the US will remain closed in observance of the Presidents’ Day holiday on Monday. Major equity indexes in Europe trade mixed. As of writing, Germany's DAX 30 is down 0.4% at 17,051, Euro Stoxx 50 falls 0.35% to 4,748.73, Italy's FTSE trades flat, while Spain's IBEX 35 and the UK's FTSE 100 indexes both gain about 0.2%.
Stock market news
- Hong Kong Hang Seng Index declined 1.13% to close at 16,155.61 on Monday. Shanghai Composite rose 1.56% to 2,910.54. Following a bearish start to the week, Japan's Nikkei 225 staged a late recovery to end the day flat at 38,470.38.
- Dow Jones (DJIA) closed the previous week virtually unchanged at 38,628. S&P 500 lost 0.42% to close at 5,005.56 and Nasdaq fell 0.82% to 15,775.65.
- The Communication Services sector ended Friday in the red by 1.56% as the worst-performing major S&P sector, followed by the Real Estate Sector that shed 0.99% by the closing bell. On the flip side, Friday's largest-gaining sector was the S&P's Materials Sector, climbing 0.51% on the day.
- Applied Materials Inc. (AMAT) was the top S&P 500 gainer on Friday, rising 6.3% to end the day at $199.57. Digital Realty Trust Inc. (DLR) lost 8.3%, wrapping up Friday's trading at $136.22 as the biggest decliner.
- The Federal Reserve will release the minutes of the January policy meeting on Wednesday. On Thursday, preliminary February Manufacturing and Services PMI reports for Germany, the Euro area, the UK and the US will be scrutinized by market participants.
- The Bureau of Labor Statistics reported on Friday that the Producer Price Index (PPI) for final demand in the US rose 0.9% on a yearly basis in January. This reading followed the 1% increase recorded in December but came in above the market expectation of 0.6%. The annual Core PPI rose 2% in the same period, compared to December's increase of 1.8%. On a monthly basis, the Core PPI was up 0.5% following the 0.1% decline recorded in the previous month.
- The University of Michigan's Consumer Sentiment Index improved modestly to 79.6 in February's flash estimate from 79.0 in January. The Current Conditions Index edged lower to 81.5 from 81.9 and the Consumer Expectations Index rose to 78.4 from 77.1.
- Inflation in the US, as measured by the change in the Consumer Price Index (CPI), softened to 3.1% on a yearly basis in January from 3.4% in December, the BLS reported on Tuesday. This reading came in above the market expectation of 2.9%.
- The Core CPI, which excludes volatile food and energy prices, rose 3.9% in the same period and matched December's increase, surpassing analysts' estimate of 3.7%.
S&P 500 FAQs
What is the S&P 500?
The S&P 500 is a widely followed stock price index which measures the performance of 500 publicly owned companies, and is seen as a broad measure of the US stock market. Each company’s influence on the computation of the index is weighted based on market capitalization. This is calculated by multiplying the number of publicly traded shares of the company by the share price. The S&P 500 index has achieved impressive returns – $1.00 invested in 1970 would have yielded a return of almost $192.00 in 2022. The average annual return since its inception in 1957 has been 11.9%.
How are companies chosen to be included in the S&P 500?
Companies are selected by committee, unlike some other indexes where they are included based on set rules. Still, they must meet certain eligibility criteria, the most important of which is market capitalization, which must be greater than or equal to $12.7 billion. Other criteria include liquidity, domicile, public float, sector, financial viability, length of time publicly traded, and representation of the industries in the economy of the United States. The nine largest companies in the index account for 27.8% of the market capitalization of the index.
How can I trade the S&P 500?
There are a number of ways to trade the S&P 500. Most retail brokers and spread betting platforms allow traders to use Contracts for Difference (CFD) to place bets on the direction of the price. In addition, that can buy into Index, Mutual and Exchange Traded Funds (ETF) that track the price of the S&P 500. The most liquid of the ETFs is State Street Corporation’s SPY. The Chicago Mercantile Exchange (CME) offers futures contracts in the index and the Chicago Board of Options (CMOE) offers options as well as ETFs, inverse ETFs and leveraged ETFs.
What factors drive the S&P 500?
Many different factors drive the S&P 500 but mainly it is the aggregate performance of the component companies revealed in their quarterly and annual company earnings reports. US and global macroeconomic data also contributes as it impacts on investor sentiment, which if positive drives gains. The level of interest rates, set by the Federal Reserve (Fed), also influences the S&P 500 as it affects the cost of credit, on which many corporations are heavily reliant. Therefore, inflation can be a major driver as well as other metrics which impact the Fed decisions.
The change in calendar year has brought no respite for the Turkish Lira (TRY). Economists at Société Générale analyze TRY outlook.
Lira’s fortunes likely to turn in 2Q24 after the local elections
We believe the Lira’s fortunes are likely to turn in 2Q24 after the local elections (due 31 March) based on improvement in Turkey’s current account due to seasonality and expectations of broad Dollar weakness.
Additionally, we expect local markets to attract a new wave of inflows starting 2Q24, resulting in the Lira recovering during the summer and a substantial total return given the high policy rate of 45%.
Our house call is for USD/TRY to top out around 32.00 in 1H and drop towards 30.00 later this year.
- AUD/JPY halts its winning streak that began on Wednesday.
- Japanese Finance Minister Shunichi Suzuki restated that interest rates will go up.
- The higher S&P/ASX 200 index supported the Australian Dollar.
AUD/JPY snaps its three-day winning streak, trading lower around 98.10 during the European trading hours on Monday. The Japanese Yen (JPY) gains ground against the Australian Dollar (AUD) on the back of improved Machinery Orders data from Japan, which in turn, undermines the AUD/JPY pair. Moreover, Japanese Finance Minister Shunichi Suzuki reiterated that “The Bank of Japan (BoJ) holds jurisdiction over monetary policy. But there will be a phase when interest rates go up”.
Japan’s Machinery Orders (MoM) increased by 2.7%, surpassing expectations of 2.5% in January, rebounding from the previous decline of 4.9%. Meanwhile, the year-over-year data showed a decline with an improved reading of -0.7%, better than the anticipated -1.4% reading and the prior decline of -5.0%. These numbers indicate a boost in business confidence within Japan’s manufacturing sector.
On the other side, the Australian Dollar likely received support from the higher S&P/ASX 200 index on Monday, which reached an all-time high, driven by increased mining stocks amid stronger metals prices. This positive market sentiment could further strengthen the Aussie Dollar, consequently bolstering the AUD/JPY cross, as investors believe that the Reserve Bank of Australia (RBA) will maintain its current monetary policy stance throughout 2024.
Westpac expects a resilient Australian economy, supported by low unemployment and healthy corporate sector balance sheets. However, Westpac anticipates the RBA to adopt a less restrictive approach in 2025.
Reserve Bank of Australia Governor Michele Bullock addressed the Australian parliament's Senate Economics Legislation Committee in the last week, acknowledging that the global economy has performed better than initially anticipated. She highlighted previous concerns about potential hard landings and recessions but indicated that the economy is currently in a favorable position to bring inflation down within a reasonable timeframe.
In its monthly report published on Monday, Germany's Bundesbank said that Germany is likely in recession now, citing weak external demand, muted consumption and cautious investments.
"There is still no recovery for the German economy," the publication read. "Output could decline again slightly in the first quarter of 2024. With the second consecutive decline in economic output, the German economy would be in a technical recession."
Market reaction
EUR/USD pair showed no immediate reaction and was last seen trading modestly higher on the day at 1.0780.
A mixed bag of US data has slowed the Dollar down. Kit Juckes, Chief Global FX Strategist at Société Générale, analyzes Greenback’s outlook.
DXY may be near a peak
2024 started with a steady stream of stronger-than-expected US data, but last week was, overall, more mixed.
Core CPI inflation held steady at 3.9% and core PPI inflation rose to 2% from 1.7%, but soft retail sales are the first demand-side data point to underwhelm this year. That’s helped EUR/USD hold above 1.0700 and prevented the Dollar Index from breaking 105.00, and dragged 2-year Note yields back down from a peak above 4.7%.
This week’s UAS data calendar is light with the Philadelphia non-manufacturing index, FOMC Minutes, Chicago Fed index, claims and existing home sales due. That tends to argue for rangey rates, which suggests DXY may find itself capped around 105.00 now.
- USD/CHF trades in a narrow range, slightly above 0.8800, as US markets will remain closed on Monday.
- The week, the USD Index will be guided by the release of FOMC minutes.
- The SNB may commence the rate-cut cycle sooner amid easing price pressures.
The USD/CHF pair is struck in a tight range around 0.8800 in the London session on Monday. The Swiss Franc asset struggles for a direction as US markets will remain closed on Monday because of Presidents’ Day. Therefore, lower trading activity is anticipated.
The US Dollar Index (DXY) has discovered an intermediate support near 104.20 after declining for three trading sessions in a row. The USD Index fails to find a cushion despite investors seeing the Federal Reserve (Fed) keeping interest rates unchanged in the range of 5.25-5.50% till the June meeting due to persistent inflationary pressures.
This week, the Federal Open Market Committee (FOMC) minutes for the January policy meeting will guide the US Dollar. The FOMC minutes will provide a fresh outlook on interest rates.
Meanwhile, the Swiss franc is expected to face pressure in the longer term as investors see the Swiss National Bank (SNB) leading the rate cut cycle due to a sharp slowdown in the consumer price inflation data. Price pressures in the Swiss economy have remained below the 2% target, allowing the SNB to start reducing interest rates after holding them higher for longer.
USD/CHF trades sideways in a narrow range of 0.8795-0.8838 on an hourly scale. A sideways trend indicates a volatility contraction, followed by a decisive move in either direction. The 200-period Exponential Moving Average (EMA) near 0.8786 continues to support the US Dollar bulls.
The 14-period Relative Strength Index (RSI) oscillates in the 40.00-60.00 range, which indicates indecisiveness among market participants.
Fresh upside would emerge if the asset breaks above the three-month high of around 0.8886, which would unlock upside towards the September 20 low at 0.8932 and the November 8 low at 0.8976.
On the contrary, a breakdown below February 15 low at 0.8783 would expose the asset to February 13 low at 0.8746, followed by the round-level support of 0.8700.
USD/CHF hourly chart
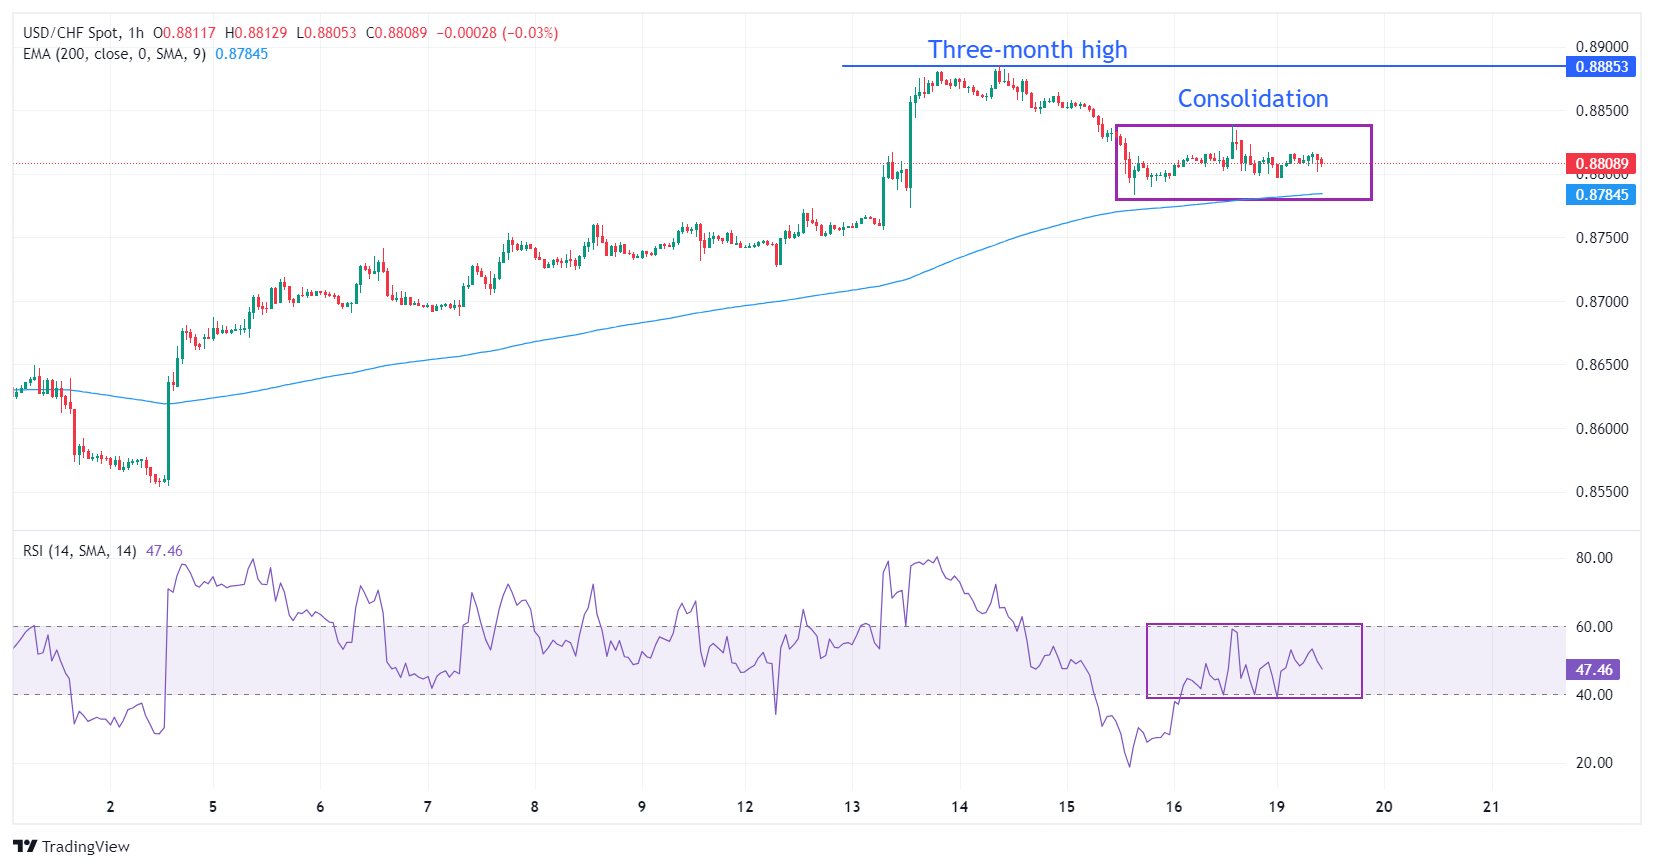
- USD/CAD moves in a negative direction amid a stable US Dollar on Monday.
- The lower WTI price could have limited the advance of the Canadian Dollar.
- Traders await the Canadian CPI data to gain more cues on the country’s inflation.
USD/CAD moves lower to near 1.3480, paring back its recent gains during the European hours on Monday. The US Dollar (USD) suffered losses against the Canadian Dollar (CAD) as US Treasury yields pared back its daily advances on Friday. With United States (US) banks closed for Presidents’ Day and Canadian banks closed for Family Day, markets anticipate limited movement in the USD/CAD pair.
The USD/CAD pair soared on better-than-expected Producer Price Index (PPI) data from the United States on Friday. However, the pair lost the intraday gains after the San Francisco Federal Reserve (Fed) President Mary C. Daly’s remarks, stating that three rate cuts are a reasonable baseline for 2024.
Additionally, former Federal Reserve official James Bullard suggested that the Federal Reserve should contemplate reducing interest rates at its March meeting to prevent stifling economic activity due to higher rates.
The Canadian Dollar might have received downward pressure with Crude oil prices losing ground. West Texas Intermediate (WTI) oil price inches lower to near $77.70 per barrel, by the press time. Additionally, market participants are expected to closely monitor demand conditions in China after returning from the week-long holiday.
Tuesday will be crucial for the Loonie Dollar (CAD) with the release of the Consumer Price Index (CPI) by Statistics Canada. On the United States side, FOMC Minutes will be eyed on Thursday.
Inflation in the Eurozone will be higher in the future than between 2002 and 2007 – when averaged 2.2%, analysts at Natixis say.
Medium-term inflation will determine the level of nominal and real interest rates
Average inflation in the Eurozone over the 2002-2007 period was 2.2%. We have seen the factors that will give rise to higher inflation in the future than between 2002 and 2007: higher energy prices, a tighter labour market, declining productivity gains, and a dominant regime of excess demand, whereas the dominant regime from 2002 to 2007 was excess supply.
If inflation is higher in the medium term than 2.2% (2.7%, 3%), we can expect both short-term and long-term interest rates to be higher than between 2002 and 2007.
- India’s Nifty extended its upptrend into fifth straight day on Monday.
- Nifty pulled back after hitting the all-time high near 22,190.
- Nifty traders brace for a relatively light India’s economic docket and Fed Minutes from the US.
The Nifty 50, India’s key benchmark index, settled Monday in the green, having pulled back from a new all-time high of 22,186.65. The Indian index extended the previous week’s upward trajectory, led by an upsurge in the energy and financial sector stocks. The National Stock Exchange (NSE) Nifty 50 closed 0.37% higher on the day at 22,122.
Chinese markets reopened after a week-long Lunar New Year holiday while the US stock markets are closed on Monday, in observance of Presidents’ Day.
Stock market news
- Grasim, Bajaj Auto, Bajaj FinServ, Cipla and Bharti Airtel were the top gainers on the Nifty on Monday while losers included Coal India, SBI Life Insurance, L&T, HDFC Life Insurance and Wipro.
- Among the corporate news, Bajaj Auto announced February 29 as the record date for a proposed buyback plan amounting to Rs 4,000 crore, at Rs 10,000 per share.
- Shares of Rail Vikas Nigam (RVNL), a railway infrastructure company, soared nearly 12% to ₹281.30 apiece in early trade on Monday after the company said its order book touched ₹65,000 crore, with 50% of this coming from the railway projects.
- Shares of Paisalo Digital rallied 15% to hit a record high of Rs 164 on Monday, surging 63% in past one month on promoter buying and strong December quarter (Q3FY24) earnings.
- Novartis India share price surges nearly 11% to hit a 52-week high as Novartis AG announces sale plans for the company.
- Indian stock exchanges rank first in the world in terms of the number of IPOs in 2023
- India’s trade data for January showed Thursday a shrinking Trade Deficit of $17.49 billion.
- US Consumer Price Index (CPI) and Producer Price Index (PPI) data came in hotter-than-expected and helped push back the market’s expectations of a Fed rate cut from March to June. Markets are currently pricing a 77% chance of a cut in June, the CME Group’s Fed Watch Tool shows.
- Attention now turns toward the Minutes of the Fed February meeting and Ameircan tech major Nvidia Earnings report due on Wednesday, as Indian economic calendar remains devoid of any top-tier data release.
Nifty 50 FAQs
What is the Nifty 50?
The Nifty 50, or simply Nifty, is the most commonly followed stock index in India. It was launched in 1996 by the National Stock Exchange of India (NSE). It plots the weighted average share price of 50 of the largest Indian corporations, offering investors comprehensive exposure to 13 sectors of the economy. Each corporation's weighting is based on its “free-float capitalization”, or the value of all its shares readily available for trading.
What factors drive the Nifty 50?
The Nifty is a composite so its value is dependent on the performance of the companies that make up the index, as revealed in their quarterly and annual results. Another factor is government policies, such as when in 2016 the government decided to demonetize 500 and 1000 Rupee banknotes. This led to a temporary cash shortage which negatively impacted the Nifty. The level of interest rates set by the Reserve Bank of India is a further factor as it determines the cost of borrowing. Climate change, pandemics and natural disasters are also drivers.
What are the key milestones for the Nifty 50?
The Nifty 50 was launched on April 22, 1996 at a base level of 1,000. Its highest recorded level to date is 22,097 achieved on January 15, 2024 (this is being written in Feb 2024). The index first closed above the 10,000 level on October 17, 2017. The Nifty recorded its biggest daily decline on March 23, 2020 during the Covid pandemic, when it fell 1,125 points or 12.37%. The Nifty’s biggest gain in a single day occurred on May 18, 2009, when it rose 651 points after the results of the Indian elections.
What are some of the major companies in the Nifty 50?
Major corporations in the Nifty 50 include HDFC Bank, Reliance Industries, ICICI Bank, Tata Consultancy Services, Larsen and Toubro, ITC Ltd, Housing Development Finance Corporation Ltd and Kotak Mahendra Bank.
- NZD/USD continues to move in a positive direction amid a stable US Dollar.
- New Zealand Dollar gains ground on the stronger Business NZ PSI.
- RBNZ Governor Adrian Orr mentioned that the RBNZ has more to do to anchor inflation expectations to the 2.0% target.
NZD/USD extends its winning streak that began on Wednesday with edging higher around 0.6140 during the European hours on Monday. The New Zealand Dollar (NZD) moves higher on the back of the upbeat Business NZ Performance of Services Index (PSI) released on Monday.
The Business NZ PSI data is derived from surveys of senior executives at private-sector companies, reflecting an expansion in the service sector with an improved reading of 52.1 in January, as compared to the previous reading of 48.8. On Friday, Business NZ PMI was released and showed an improved reading of 47.3, higher than the previous 43.4 reading.
Reserve Bank of New Zealand (RBNZ) Governor Adrian Orr gave a speech titled "The Monetary Policy Remit and 2.0% Inflation" at the New Zealand Economics Forum in Hamilton on Friday. Orr emphasized that the RBNZ has additional tasks to accomplish to anchor inflation expectations to the 2.0% target. He notably declined to discuss rate targets.
Orr emphasized that bringing core inflation within the 1-2% target range is crucial for achieving the overall inflation target. He reaffirmed that the 2.0% inflation midpoint target remains appropriate.
However, market sentiment indicates of no rate adjustments in the upcoming Federal Reserve meetings in March and May. According to the CME FedWatch Tool, there is approximately a 52% probability of a 25 basis points (bps) rate cut in June. On Friday, the US Dollar (USD) failed to sustain its gains, which were initially fueled by better-than-expected Producer Price Index (PPI) data from the United States, consequently leading to an increase in the NZD/USD pair.
The US Producer Price Index (PPI) grew by 0.9% YoY, against the expectations of 0.6% and the 1.0% prior growth. Additionally, there was a MoM improvement of 0.3%, swinging from the previous 0.1% decline. However, the preliminary Michigan Consumer Sentiment Index rose to 79.6 from the previous 79.0, yet it fell short of the anticipated reading of 80.0.
- USD/JPY falls to near 150.00 as USD Index remains under pressure.
- Traders pare Fed rate cut bets for May amid stubborn inflation data.
- The BoJ may postpone plans for exiting its dovish policy stance amid dismal economic growth.
The USD/JPY drops to near the psychological support of 150.00 in Monday’s European session. The asset has faced selling pressure due to further decline in the US Dollar Index (DXY). The USD Index, which tracks six major currencies to gauge Greenback’s value, has dropped to near 104.20.
S&P500 futures remain subdued in the London session amid an extended weekend due to the holiday in US markets because of Presidents’ Day. Meanwhile, 10-year US Treasury yields have rebounded to 4.31%, prompted by the hotter-than-expected Producer Price Index (PPI) and the consumer price inflation data for January.
While market participants have pared bets in favor of rate cuts in the May monetary policy meeting by the Federal Reserve (Fed), policymakers consider the surprisingly higher data as a one-time blip whose consideration could be a tremendous mistake. The broader inflation trend is declining, which should be mainly in focus.
Going forward, market participants will focus on the Federal Reserve (Fed) Open Market Committee (FOMC) minutes for the January policy meeting, which will be released on Wednesday. The FOMC minutes will provide the detailed reasoning behind maintaining the status-quo and a fresh outlook on interest rates.
Meanwhile, the Japanese Yen has been underpinned against the US Dollar, although investors have dialed back expectations for the unwinding of the expansionary monetary policy stance by the Bank of Japan (BoJ). The Japanese economy has entered a technical recession, which would force BoJ policymakers to continue with plans of expanding stimulus to support economic growth.
On the economic data front, investors await the preliminary Jibun Bank Manufacturing and Services PMI for February, which will be published on Tuesday.
Last week, USD/JPY moved back above the 150.00 level for the first time since November. Economists at MUFG Bank analyze the pair’s outlook.
GDP data if anything could encourage intervention
We don’t see the weaker-than-expected real GDP data as altering the outlook for the Yen. Indeed, quite the opposite it will probably reinforce the determination of the MoF to limit further JPY depreciation. At the same time, the BoJ will likely view the GDP data as a consequence of the inflation shock and is unlikely to alter the prospects of a rate hike.
Just like on the previous occasions when USD/JPY reached these levels, we see momentum fading but broader US Dollar strength that could continue near term may mean intervention is required to stall the move.
- EUR/USD gains ground for the fourth successive session on Monday.
- European share markets ease after recording gains in the previous week, weighing on the Euro.
- Mary C. Daly, President of the San Francisco Fed suggested that three rate cuts are a reasonable baseline for 2024.
- The US Fed is expected to refrain from rate cuts in both March and May.
The EUR/USD pair continues its upward momentum for the fourth consecutive session on Monday, with the US Dollar (USD) remaining subdued amid light trading due to the Presidents’ Day holiday in the United States (US). Despite the improved US Producer Price Index (PPI) strengthening the Greenback against the Euro (EUR) on Friday, the EUR/USD pair still closed the session with gains.
European money markets edge lower after registering gains in the previous week, which could weigh on the Euro. However, Asian markets are higher, possibly driven by expectations that major central banks will refrain from further interest rate hikes. Additionally, European Central Bank (ECB) Governing Council member Francois Villeroy de Galhau mentioned that there are several reasons why they should not delay the first rate cut.
The US Dollar Index (DXY) continues its decline after dovish remarks from Mary C. Daly, President of the San Francisco Federal Reserve (Fed) on Friday. Speaking at the Annual National Association for Business Economics Economic Policy Conference, Daly suggested that three rate cuts are a reasonable baseline for 2024. She emphasized that it's premature to consider allowing the economy to run without intervention. These comments led to a weakening of US Treasury yields, consequently putting pressure on the US Dollar.
Daily digest market movers: EUR/USD gains ground on subdued US Dollar
- Former Fed official James Bullard's suggestion that the Fed should contemplate lowering interest rates at the March meeting to prevent hindering economic activity due to higher rates is influencing market sentiment.
- Market sentiment suggests that the US Federal Reserve is likely to abstain from rate cuts in both March and May. According to the CME FedWatch Tool, there is approximately a 52% probability of a 25 basis points (bps) rate cut in June.
- US Producer Price Index (PPI) demonstrated an annual growth rate of 0.9%, against the anticipated 0.6% and the prior figure of 1.0%. Additionally, there was a month-over-month PPI improvement of 0.3%, contrasting with the previous decline of 0.1%.
- US Core Producer Price Index (YoY) increased by 2.0%, exceeding the expected 1.6% and the previous 1.7%. Similarly, the Core PPI (MoM) data reported a 0.5% rise, compared to the predicted 0.1% increase from the prior decline of 0.1%.
- The preliminary Michigan Consumer Sentiment Index improved to 79.6 from the previous figure of 79.0, falling short of the anticipated 80.0.
- Christine Lagarde, the President of the European Central Bank (ECB), stated last week that recent data indicates ongoing subdued economic activity in the near term. While the current disinflationary trend is anticipated to persist, Lagarde emphasized the importance of ensuring confidence that this trajectory will ultimately lead to the sustainable achievement of the ECB's 2% inflation target.
Technical Analysis: EUR/USD faces a barrier at 1.0800 aligned with previous week’s high
EUR/USD trades near 1.0780 on Monday, which is located below the psychological resistance level of 1.0800. A break above this psychological barrier could exert upward support for the EUR/USD pair to revisit the previous week’s high at 1.0805.
On the downside, the EUR/USD pair could find the key support region around the nine-4hour Exponential Moving Average (EMA) at 1.0773 and 23.6% Fibonacci retracement level at 1.0767. A break below this region could push the pair to test the major support of 1.0750 following the psychological level of 1.0700.
In technical analysis, the EUR/USD pair exhibits a 14-4hour Relative Strength Index (RSI) above the 50 mark, indicating bullish sentiment. Furthermore, the Moving Average Convergence Divergence (MACD) is situated above both the centerline and shows a divergence above the signal line, suggesting a confirmation of the bullish momentum.
EUR/USD: Four-Hour Chart
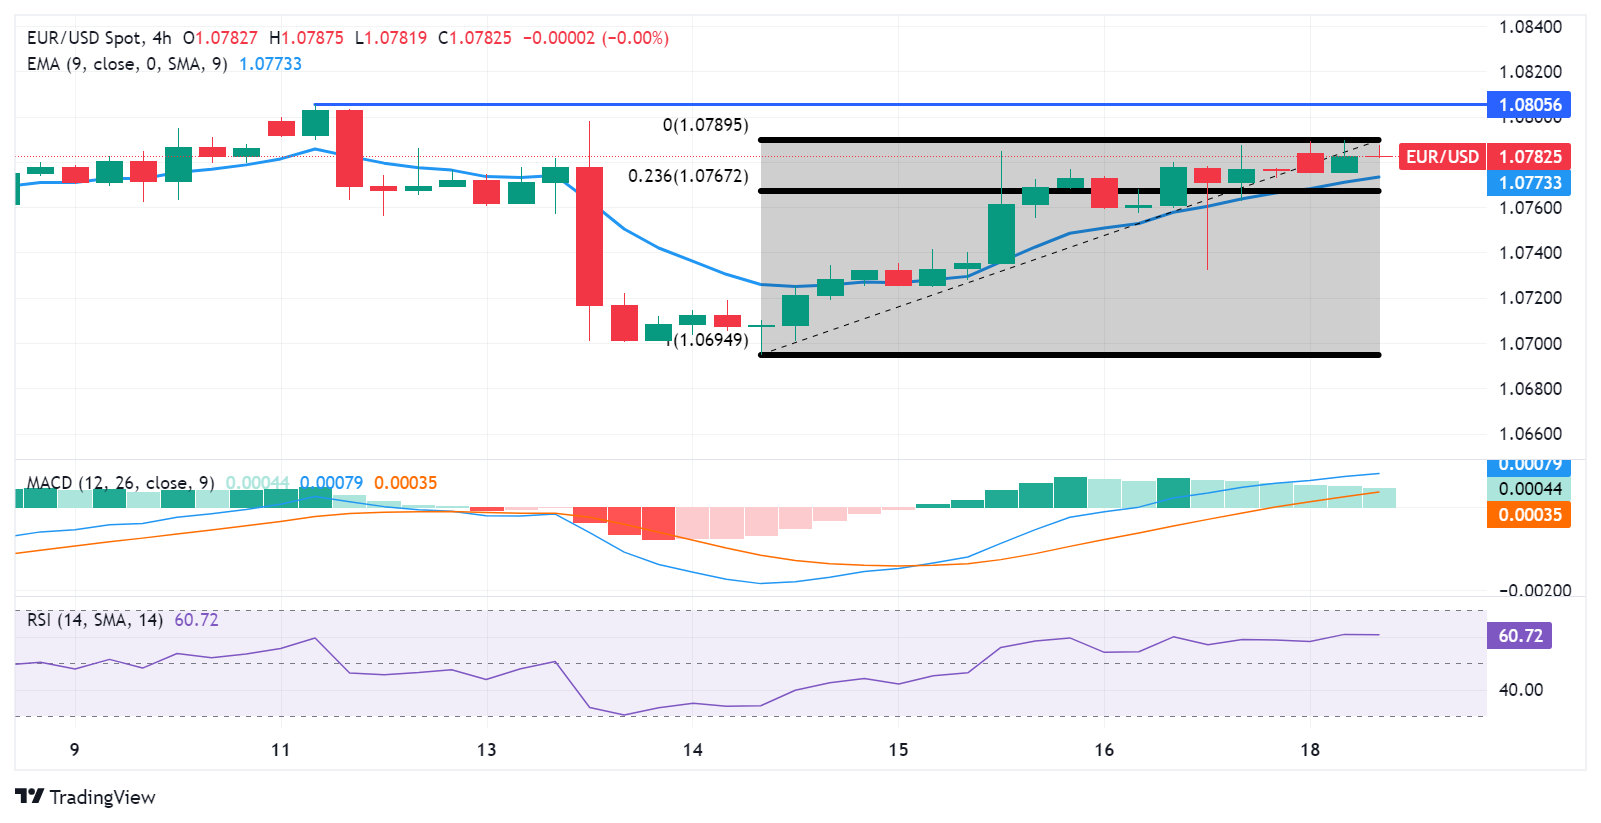
Euro price today
The table below shows the percentage change of Euro (EUR) against listed major currencies today. Euro was the strongest against the Swiss Franc.
| USD | EUR | GBP | CAD | AUD | JPY | NZD | CHF | |
| USD | 0.10% | 0.01% | -0.03% | -0.06% | -0.11% | -0.18% | 0.03% | |
| EUR | -0.11% | -0.10% | -0.15% | -0.17% | -0.22% | -0.30% | -0.08% | |
| GBP | -0.01% | 0.10% | -0.04% | -0.08% | -0.11% | -0.19% | 0.05% | |
| CAD | 0.03% | 0.15% | 0.04% | -0.01% | -0.07% | -0.15% | 0.08% | |
| AUD | 0.05% | 0.15% | 0.05% | 0.01% | -0.06% | -0.13% | 0.08% | |
| JPY | 0.12% | 0.22% | 0.15% | 0.08% | 0.05% | -0.07% | 0.15% | |
| NZD | 0.18% | 0.29% | 0.18% | 0.15% | 0.12% | 0.07% | 0.21% | |
| CHF | -0.05% | 0.05% | -0.04% | -0.09% | -0.12% | -0.17% | -0.23% |
The heat map shows percentage changes of major currencies against each other. The base currency is picked from the left column, while the quote currency is picked from the top row. For example, if you pick the Euro from the left column and move along the horizontal line to the Japanese Yen, the percentage change displayed in the box will represent EUR (base)/JPY (quote).
Euro FAQs
What is the Euro?
The Euro is the currency for the 20 European Union countries that belong to the Eurozone. It is the second most heavily traded currency in the world behind the US Dollar. In 2022, it accounted for 31% of all foreign exchange transactions, with an average daily turnover of over $2.2 trillion a day.
EUR/USD is the most heavily traded currency pair in the world, accounting for an estimated 30% off all transactions, followed by EUR/JPY (4%), EUR/GBP (3%) and EUR/AUD (2%).
What is the ECB and how does it impact the Euro?
The European Central Bank (ECB) in Frankfurt, Germany, is the reserve bank for the Eurozone. The ECB sets interest rates and manages monetary policy.
The ECB’s primary mandate is to maintain price stability, which means either controlling inflation or stimulating growth. Its primary tool is the raising or lowering of interest rates. Relatively high interest rates – or the expectation of higher rates – will usually benefit the Euro and vice versa.
The ECB Governing Council makes monetary policy decisions at meetings held eight times a year. Decisions are made by heads of the Eurozone national banks and six permanent members, including the President of the ECB, Christine Lagarde.
How does inflation data impact the value of the Euro?
Eurozone inflation data, measured by the Harmonized Index of Consumer Prices (HICP), is an important econometric for the Euro. If inflation rises more than expected, especially if above the ECB’s 2% target, it obliges the ECB to raise interest rates to bring it back under control.
Relatively high interest rates compared to its counterparts will usually benefit the Euro, as it makes the region more attractive as a place for global investors to park their money.
How does economic data influence the value of the Euro?
Data releases gauge the health of the economy and can impact on the Euro. Indicators such as GDP, Manufacturing and Services PMIs, employment, and consumer sentiment surveys can all influence the direction of the single currency.
A strong economy is good for the Euro. Not only does it attract more foreign investment but it may encourage the ECB to put up interest rates, which will directly strengthen the Euro. Otherwise, if economic data is weak, the Euro is likely to fall.
Economic data for the four largest economies in the euro area (Germany, France, Italy and Spain) are especially significant, as they account for 75% of the Eurozone’s economy.
How does the Trade Balance impact the Euro?
Another significant data release for the Euro is the Trade Balance. This indicator measures the difference between what a country earns from its exports and what it spends on imports over a given period.
If a country produces highly sought after exports then its currency will gain in value purely from the extra demand created from foreign buyers seeking to purchase these goods. Therefore, a positive net Trade Balance strengthens a currency and vice versa for a negative balance.
- Gold price extends its recovery in a holiday-shortened week.
- The US PPI rose strongly in January but this was put down to seasonally adjusted fluctuations.
- Fed Bostic sees two rate cuts this year commencing from summer.
Gold price (XAU/USD) continues its winning spell for the third session in a row on Monday despite waning expectations of rate cuts by the Federal Reserve (Fed) before the June monetary policy meeting. The precious metal maintains strength even though sticky Consumer Price Index (CPI) and Producer Price Index (PPI) data for January have prompted prospects of persistent core Personal Consumption Expenditure price index (PCE) data.
Investors believe that the reasoning behind higher Gold price is less significant PPI data for January as prices moved up due to some seasonal adjustment problems. In addition to that, Fed policymakers have considered the surprise rise in the latest consumer price inflation data as a one-time blip, emphasizing the longer trend, which indicates that inflation is moving decisively down.
Meanwhile, the forecast from Atlanta Federal Reserve Bank President Raphael Bostic that progress in underlying measures of inflation could allow the Fed to start reducing interest rates from summer has eased opportunity cost of holding non-yielding assets such as Gold.
Daily Digest Market Movers: Gold climbs for third session while US Dollar falls to weekly low
- Gold price advances strongly to $2,020 as the US Dollar remains under pressure, although hotter-than-anticipated PPI data for January has cooled down expectations of rate cuts for May monetary policy meeting by the Federal Reserve.
- The CME FedWatch tool indicates that trades see a steady interest rate decision in the March and May monetary policy meetings. The Fed is expected to cut interest rates by 25-basis points (bps) in the June policy meeting.
- Stronger consumer price inflation and PPI data for January have pushed back expectations of Fed rate-cuts before June.
- Sticky price pressures have bought more time to the Fed to reassess the need of rate cuts. Premature rate cuts could dent the efforts yet made in taming inflation from its historic highs to where it is now by flaring it up again.
- Higher-than-projected CPI and PPI data have deepened fears of escalating core PCE price index data for January – the preferred gauge for Fed policymakers for preparing monetary policy remarks.
- Atlanta Fed Bank President Raphael Bostic said he was a little surprised by recent inflation data, but broader progress in the fight against inflation has opened doors for rate cuts in the summertime.
- However, Raphael Bostic reiterated the need for good inflation data in the coming months to be convinced that inflation is truly falling. Bostic sees two rate cuts in 2024.
- Meanwhile, the US Dollar Index (DXY), which gauges the Greenback’s value against six rival currencies, has declined to 104.20 ahead of a holiday-truncated week in the US economy. The US markets will remain closed on Monday because of President’s Day.
- This week, investors will focus on the Federal Reserve Open Market Committee (FOMC) minutes for January’s policy meeting, which will be released on Wednesday.
- The FOMC minutes will provide a detailed explanation behind keeping key rates unchanged in the range of 5.25%-5.50% in January and fresh outlook on interest rates.
- Apart from that, investors will focus on the preliminary S&P Global Manufacturing PMI for February, which will be published on Thursday.
Technical Analysis: Gold price recovers to near 20-day EMA
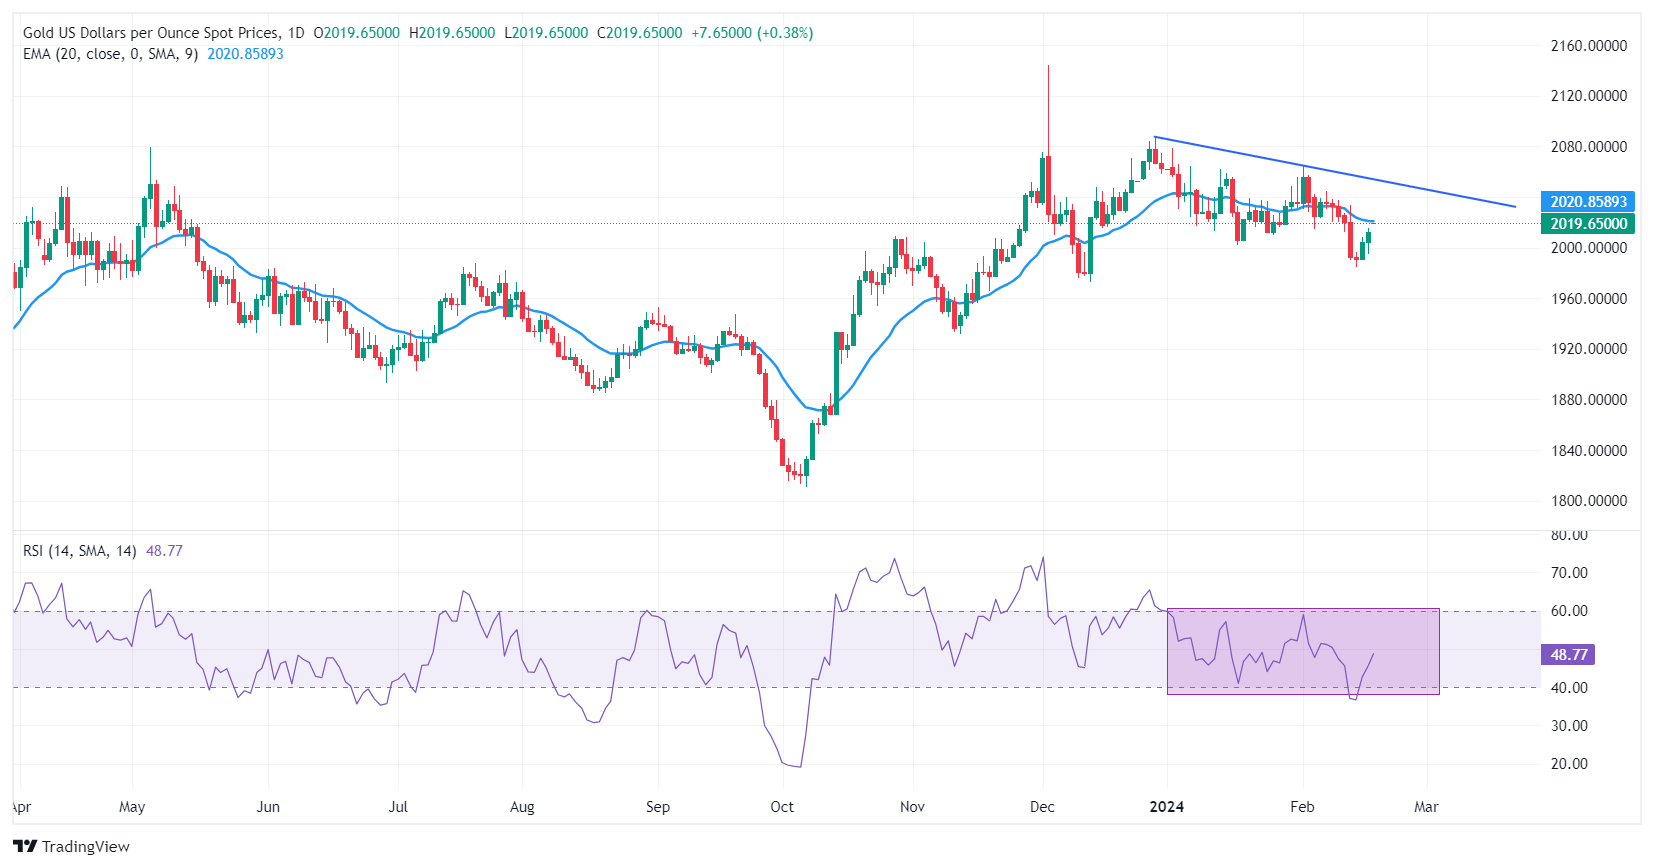
Gold price extends its recovery for the third straight trading session even though the Fed is maintaining its hawkish rhetoric due to sticky price pressures. The precious metal reverses to the 20-day Exponential Moving Average (EMA), which trades around $2,022. The outlook for the Gold price could turn bullish if it manages to sustain above the 20-day EMA.
The downward-sloping trendline from December 28 high at $2,088 may continue to act as a barrier for the Gold price. The 14-period Relative Strength Index (RSI) oscillates in the 40.00-60.00 range, which shows a sideways outlook for the Gold price.
Gold FAQs
Why do people invest in Gold?
Gold has played a key role in human’s history as it has been widely used as a store of value and medium of exchange. Currently, apart from its shine and usage for jewelry, the precious metal is widely seen as a safe-haven asset, meaning that it is considered a good investment during turbulent times. Gold is also widely seen as a hedge against inflation and against depreciating currencies as it doesn’t rely on any specific issuer or government.
Who buys the most Gold?
Central banks are the biggest Gold holders. In their aim to support their currencies in turbulent times, central banks tend to diversify their reserves and buy Gold to improve the perceived strength of the economy and the currency. High Gold reserves can be a source of trust for a country’s solvency. Central banks added 1,136 tonnes of Gold worth around $70 billion to their reserves in 2022, according to data from the World Gold Council. This is the highest yearly purchase since records began. Central banks from emerging economies such as China, India and Turkey are quickly increasing their Gold reserves.
How is Gold correlated with other assets?
Gold has an inverse correlation with the US Dollar and US Treasuries, which are both major reserve and safe-haven assets. When the Dollar depreciates, Gold tends to rise, enabling investors and central banks to diversify their assets in turbulent times. Gold is also inversely correlated with risk assets. A rally in the stock market tends to weaken Gold price, while sell-offs in riskier markets tend to favor the precious metal.
What does the price of Gold depend on?
The price can move due to a wide range of factors. Geopolitical instability or fears of a deep recession can quickly make Gold price escalate due to its safe-haven status. As a yield-less asset, Gold tends to rise with lower interest rates, while higher cost of money usually weighs down on the yellow metal. Still, most moves depend on how the US Dollar (USD) behaves as the asset is priced in dollars (XAU/USD). A strong Dollar tends to keep the price of Gold controlled, whereas a weaker Dollar is likely to push Gold prices up.
NZD/USD to enjoy a journey of gradual appreciation over the year, economists at ANZ Bank say.
NZD/USD to reach 0.6300 by year-end and 0.6400 by end-2025
Kiwi is still expected to appreciate gradually, taking it to 0.6300 by the end of 2024 and 0.6400 by the end of 2025.
Currency markets have shown themselves to be particularly sensitive to the ebb and flow of policy rate expectations this year, and that has been a source of volatility. While that pattern is likely to persist, a higher OCR is expected to support the Kiwi over the near term.
That said, we remain guarded about the global risk environment, with geopolitical tensions at the fore and the US still sporting the equal-highest cash rate (alongside NZ) across the so-called G10 markets. All that means is that the USD is unlikely to depreciate materially from here; hence our forecast for a milder NZD appreciation.
Gold is forming one more base near the upper part of range. Economists at Société Générale analyze XAU/USD’s technical outlook.
First support at $1,973
Gold attempted a breakout above its multiyear consolidation recently however it has re-integrated within the range after hitting $2,135 in December. Interestingly, it has managed to register highest monthly and yearly closes which is a signal for prevalence in the uptrend. Post this re-integration, Gold has stabilized above the 200-DMA and formed a small base.
Recent pivot low at $1,973 is crucial support. Defence of this would be essential for averting deeper down move.
If Gold establishes above the upper part of recent small base at $2,065, the up move is likely to extend. Next potential objectives could be located at $2,135 and projections of $2,230/$2,260.
Having reached a late December high around 0.6871, AUD/USD dipped to 0.6500 this month. Economists at Rabobank analyze Aussie’s outlook.
EUR/AUD to trend lower to 1.5600 on a 12-month view
At first sight, the Australian January Labour data encouraged the view that the economy is cooling, this sparked speculation that the RBA may bring forward the first rate cut of the cycle. That said, it is very likely that policymakers will need a lot more economic data before making a policy decision.
To date, the RBA has remained one of the more hawkish G10 central banks and Rabobank expects that rates are likely to remain on hold until Q4.
Assuming the Fed cuts rates first, this should allow AUD/USD to push higher later in the year.
Reflecting the relative resilience of the Australian economy compared to Germany, we also expect EUR/AUD to trend lower to 1.5600 on a 12-month view.
The US Dollar Index (DXY) corrects lower toward 104.00 after closing the fifth consecutive week in positive territory. Economists at ING analyze Greenback’s outlook.
DXY to hold in the 104.00-105.00 range this week
It seems the Dollar can stay strong for the rest of this month. Seasonal factors support it, but Friday's release of strong January US PPI data warns that the 29 February release of the core PCE inflation data – the Fed's preferred reading – could also print a high 0.4% month-on-month and continue to thwart the disinflation trade. That would be our preferred view. We expect investors to start to position again for a softer Dollar in early March ahead of the 12 March release of the February CPI data. We suspect that core inflation will drop back to a 0.2% MoM reading.
On paper, we would expect DXY to hold in the 104.00-105.00 range this week. Technically, however, DXY put in a decent reversal and any surprise strength in the Euro this week could trigger an unexpected break below 104.00.
FX option expiries for Feb 19 NY cut at 10:00 Eastern Time, via DTCC, can be found below.
- USD/JPY: USD amounts
- 150.00 350m
- USD/CAD: USD amounts
- 1.3375 428m
- 1.3445 487m
- 1.3550 603m
- 1.3595 1.5b
EUR/USD has now completely recouped last week's losses on the above-expected US January CPI release. Economists at ING analyze the pair’s outlook.
Wage data and PMIs in focus this week
In the Eurozone we are very much interested in i) Tuesday's ECB survey of negotiated wage rates, and ii) Thursday's release of the flash PMIs for February.
One week implied EUR/USD volatility at 5% suggests investors think EUR/USD is going nowhere fast. That is a sign to avoid chasing break-outs.
Our baseline would assume EUR/USD traces out a 1.0700-1.0800/0810 range this week. But look out for those Eurozone data event risks for a possible topside move.
- Pound Sterling delivers an upside move as robust UK Retail Sales push back BoE rate-cut bets.
- Upbeat UK Retail Sales data indicate that the economy will come out of a recession.
- Trading volume in the FX domain would be light amid the holiday in US markets.
The Pound Sterling (GBP) demonstrates strength in Monday’s European session as the Bank of England (BoE) is expected to hold interest rates at their current level for a longer period. Persistent price pressures in the United Kingdom economy due to stubborn service inflation, steady labor demand, and robust household spending would allow BoE policymakers to maintain a hawkish narrative for a longer period.
Last week, the surprisingly upbeat UK Retail Sales data indicated that the impact of higher interest rates by the BoE on consumer spending is fading. This indicates that the UK economy would come out of the technical recession sooner than previously thought. The UK economy entered a technical recession in the second half of 2023 as the BoE maintained interest rates higher to tame high inflation, which impacted consumer spending and business operations significantly.
The GBP/USD pair rises as the Pound Sterling tends to attract higher foreign inflows when the BoE maintains a hawkish stance for longer. Going forward, action in the Pound Sterling and the US Dollar will be guided by the preliminary S&P Global Manufacturing PMI for February.
Daily Digest Market Movers: Pound Sterling gains on improved market mood
- Pound Sterling holds onto a six-day high near 1.2620 as the United Kingdom’s persistent service inflation and robust Retail Sales data for January have pushed back expectations of early rate cuts by the Bank of England.
- Annual Retail Sales surprisingly rose by 0.7% while investors anticipated a decline of 1.4%. In December, the economic data contracted sharply by 2.4%.
- The UK’s Office for National Statistics (ONS) reported that a 3.4% growth in food retail sales in January, prompted the rise in Retail Sales data.
- The upbeat Retail Sales data demonstrates a stubborn inflation outlook and allows the BoE to maintain interest rates higher in times of a high-inflation environment.
- Last week, BoE policymaker Katherine Mann and Chief Economist Huw Pill warned that persistent service inflation remains a major concern as a catalyst for price pressures.
- The latest inflation data showed that the headline and core Consumer Price Index (CPI) remained steady, while service sector inflation accelerated to 6.5% from 6.4% in December.
- The BoE generally takes the core and service inflation seriously when deliberating its monetary policy decisions.
- When asked about the UK economy’s vulnerable performance in the second half of 2023, Katherine Mann said the downturn was in line with higher expectations but she is focusing on forward economic indicators, which are indicating a persistent inflation outlook.
- Huw Pill said slowing headline inflation is good news for the central bank but tight labor market and service inflation are keeping price pressures persistent.
- Pill emphasized the need of easing inflation data for several months to convince policymakers that inflation will return sustainably to the desired target.
- Meanwhile, the US Dollar Index (DXY), which measures the Greenback’s value against six major currencies, declines toward a weekly low around 104.00 amid a cheerful market mood.
- Trading volume is expected to remain light as United States markets will remain closed on Monday on account of Presidents’ Day.
- The USD Index remains under pressure despite hotter US Producer Price Index (PPI) data pushing back expectations of rate-cuts by the Federal Reserve (Fed) pre-June.
Technical Analysis: Pound Sterling trades close to five-day high
Pound Sterling rises to a near six-day high around 1.2620 as the market mood remains upbeat. The GBP/USD pair delivers a mean-reversion move to near the 50-day Exponential Moving Average (EMA), which trades around 1.2630, resulting in a “wait and watch” approach for market participants. The 200-day EMA near 1.2500 continues to support the Pound Sterling bulls.
The 14-period Relative Strength Index (RSI) oscillates in the 40.00-60.00 range, which indicates a consolidation ahead.
Pound Sterling FAQs
What is the Pound Sterling?
The Pound Sterling (GBP) is the oldest currency in the world (886 AD) and the official currency of the United Kingdom. It is the fourth most traded unit for foreign exchange (FX) in the world, accounting for 12% of all transactions, averaging $630 billion a day, according to 2022 data.
Its key trading pairs are GBP/USD, aka ‘Cable’, which accounts for 11% of FX, GBP/JPY, or the ‘Dragon’ as it is known by traders (3%), and EUR/GBP (2%). The Pound Sterling is issued by the Bank of England (BoE).
How do the decisions of the Bank of England impact on the Pound Sterling?
The single most important factor influencing the value of the Pound Sterling is monetary policy decided by the Bank of England. The BoE bases its decisions on whether it has achieved its primary goal of “price stability” – a steady inflation rate of around 2%. Its primary tool for achieving this is the adjustment of interest rates.
When inflation is too high, the BoE will try to rein it in by raising interest rates, making it more expensive for people and businesses to access credit. This is generally positive for GBP, as higher interest rates make the UK a more attractive place for global investors to park their money.
When inflation falls too low it is a sign economic growth is slowing. In this scenario, the BoE will consider lowering interest rates to cheapen credit so businesses will borrow more to invest in growth-generating projects.
How does economic data influence the value of the Pound?
Data releases gauge the health of the economy and can impact the value of the Pound Sterling. Indicators such as GDP, Manufacturing and Services PMIs, and employment can all influence the direction of the GBP.
A strong economy is good for Sterling. Not only does it attract more foreign investment but it may encourage the BoE to put up interest rates, which will directly strengthen GBP. Otherwise, if economic data is weak, the Pound Sterling is likely to fall.
How does the Trade Balance impact the Pound?
Another significant data release for the Pound Sterling is the Trade Balance. This indicator measures the difference between what a country earns from its exports and what it spends on imports over a given period.
If a country produces highly sought-after exports, its currency will benefit purely from the extra demand created from foreign buyers seeking to purchase these goods. Therefore, a positive net Trade Balance strengthens a currency and vice versa for a negative balance.
- Gold price extends its winning streak for the third consecutive session on Monday.
- San Francisco Federal Reserve (Fed) President Mary C. Daly stated that three Fed rate cuts are possible in 2024.
- CME FedWatch Tool suggests a 52% probability of a 25 basis points rate cut in June.
Gold price continues to move on an upward trajectory, trading higher around $2,020 per troy ounce during the early European session on Monday. The precious metal receives upward support from cautious investor sentiment amid speculation about the Federal Reserve's interest rate policy.
The price of Gold surged as the US Dollar depreciated on San Francisco Federal Reserve (Fed) President Mary C. Daly’s remarks at the Annual National Association for Business Economics Economic Policy Conference. She stated that three rate cuts are a reasonable baseline for 2024. Daly emphasized that it's premature to consider allowing the economy to run without intervention. Additionally, former Fed official James Bullard's suggestion that the Fed should consider lowering interest rates at the March meeting to prevent hindering economic activity due to higher rates is contributing to market sentiment.
However, market sentiment indicates of no rate adjustments in the upcoming Federal Reserve meetings in March and May. According to the CME FedWatch Tool, there is approximately a 52% probability of a 25 basis points (bps) rate cut in June. On Friday, the US Dollar (USD) failed to sustain its gains, which were initially fueled by better-than-expected Producer Price Index (PPI) data from the United States, consequently leading to an increase in Gold price.
The US Producer Price Index (PPI) showed a year-over-year growth of 0.9%, against the expectations of 0.6% and the previous figure of 1.0%. Additionally, there was a monthly improvement of 0.3%, contrasting with the previous decline of 0.1%. However, the preliminary Michigan Consumer Sentiment Index rose to 79.6 from the previous 79.0, although it fell short of the anticipated reading of 80.0.
EUR/SEK and USD/SEK have rebounded sharply year-to-date. Economists at Danske Bank analyze Krona’s outlook.
SEK to weaken on the back of cyclical backdrop, relative central bank pricing and structural flows outlook
The cyclical backdrop remains a headwind for the SEK in our view amid subpar and even recession-like European growth outlook.
The Swedish economy, which entered recession in Q3 2023, is set to pick up even as domestic demand and the housing market are stagnant.
The Riksbank will not lag the ECB – and the Fed will not significantly lead other central banks – in the easing cycle. This leaves the SEK in a vulnerable position from a rates perspective, too.
Structural flows remain a headwind for the SEK.
We target the EUR/SEK at 11.60 in 6-12 months.
Here is what you need to know on Monday, February 19:
Major currency pairs trade near the previous week's closing levels early Monday. The economic calendar will not offer any high-impact data releases and US markets will remain closed in observance of the Presidents' Day holiday. Germany's Bundesbank is scheduled to publish its Monthly Report during the European trading hours.
The US Dollar gathered strength in the early trading hours of the American session on Friday after the data published by the Bureau of Labor Statistics showed that the Producer Price Index (PPI) increased at a stronger pace than expected in January. Profit-taking and week-end flows, however, made it difficult for the USD to continue to outperform its rivals ahead of the weekend. After closing the fifth consecutive week in positive territory, the USD Index edges lower early Monday but holds comfortably above 104.00. Meanwhile, the benchmark 10-year US Treasury bond yield rose 2.5% and registered its highest weekly close since November near 4.3%.
US Dollar price in the last 7 days
The table below shows the percentage change of US Dollar (USD) against listed major currencies in the last 7 days. US Dollar was the strongest against the Swiss Franc.
| USD | EUR | GBP | CAD | AUD | JPY | NZD | CHF | |
| USD | 0.10% | 0.10% | 0.12% | -0.29% | 0.54% | -0.01% | 0.78% | |
| EUR | -0.10% | 0.00% | 0.01% | -0.39% | 0.44% | -0.12% | 0.68% | |
| GBP | -0.12% | -0.01% | 0.01% | -0.39% | 0.43% | -0.13% | 0.67% | |
| CAD | -0.12% | -0.02% | -0.02% | -0.41% | 0.42% | -0.13% | 0.66% | |
| AUD | 0.28% | 0.39% | 0.39% | 0.41% | 0.83% | 0.28% | 1.06% | |
| JPY | -0.54% | -0.45% | -0.40% | -0.43% | -0.83% | -0.55% | 0.24% | |
| NZD | -0.01% | 0.11% | 0.10% | 0.12% | -0.29% | 0.54% | 0.78% | |
| CHF | -0.78% | -0.67% | -0.68% | -0.66% | -1.07% | -0.23% | -0.78% |
The heat map shows percentage changes of major currencies against each other. The base currency is picked from the left column, while the quote currency is picked from the top row. For example, if you pick the Euro from the left column and move along the horizontal line to the Japanese Yen, the percentage change displayed in the box will represent EUR (base)/JPY (quote).
The People’s Bank of China (PBOC), China's central bank, announced that it kept the one-year Medium-term Lending Facility (MLF) rate steady at 2.50% as expected. This decision failed to trigger a noticeable market reaction. AUD/USD edged higher during the European trading hours and was last seen trading near 0.6550, where it was up 0.2% on the day.
After falling below 1.0750 on Friday, EUR/USD staged a rebound and erased its losses to close the day flat. Early Monday, the pair continues to stretch higher but stays below 1.0800.
GBP/USD ended the previous week marginally lower but didn't have a difficult time holding above 1.2600. The pair inches higher toward 1.2630 in the early European session.
Japanese Finance Minister Shunichi Suzuki said over the weekend there will likely come a time when interest rates will begin to rise and affect the economy through various channels, according to the Nikkei newspaper. USD/JPY started the new week under modest bearish pressure and retreated slightly below 150.00.
After dropping below $2,000 earlier in the week, Gold staged a rebound and erased a large portion of its weekly losses to close near $2,000. XAU/USD extends its recovery at the beginning of the new week and was last seen trading at around $2,020.
- EUR/USD holds positive ground around 1.0785 on the softer USD.
- The pair maintains the bearish bias below the key 100-period EMA, but RSI indicators return above the 50-midlines.
- The key resistance level will emerge at the 1.0790–1.0800 zone; the initial support level is located at 1.0723.
The EUR/USD pair trades on a stronger note near 1.0785 for four straight days during the early European session on Monday. The decline of the US Dollar (USD) provides some support for the major pair. Two European Central Bank (ECB) policymakers said Eurozone inflation is heading back towards the 2% target, but the ECB needs further data to confirm before it can cut rates. Nonetheless, the FOMC Minutes and the Eurozone data, including the PMI and CPI inflation report could offer some hints about the inflationary trajectory.
From a technical perspective, EUR/USD keeps the bearish vibe unchanged as the major pair is below the key 100-period Exponential Moving Averages (EMA) on the four-hour chart. However, the Relative Strength Index (RSI) returns above the 50-midline, hinting that the buyers could retain control in the near term.
A potential resistance level for the major pair will emerge near the confluence of the 100-period EMA, the upper boundary of the Bollinger Band, and the psychological mark at the 1.0790–1.0800 region. A decisive break above this level will pave the way to a high of January 26 at 1.0885. The additional upside filter to watch is the 1.0900 psychological round mark.
On the flip side, the initial support level for the EUR/USD pair is seen near a low of February 5 at 1.0723. The key contention level is located near a round figure, a low of February 13, and the lower limit of the Bollinger Band at 1.0700. Any follow-through selling below the latter will see a drop to a low of November 9 at 1.0660.
EUR/USD four-hour chart
-638439228007434939.png)
- WTI price corrected after registering gains for two successive sessions.
- Crude oil prices depreciate amid expectations that the Fed will maintain its current interest rate.
- Israel has signaled the potential for additional military operations in the southern city of Gaza.
The West Texas Intermediate (WTI) oil price retraces its recent gains, possibly due to a technical correction, amid subdued trading activity due to the Presidents’ Day holiday in the United States. WTI price dips lower to around $77.80 per barrel during Asian trading hours on Monday. Additionally, market participants are expected to closely monitor demand conditions in China after returning from the week-long holiday.
Crude oil prices encounter challenges amid expectations that the Federal Reserve (Fed) will maintain its current interest rate, following the previous week of complex data. Higher consumer prices coupled with declining retail sales have reinforced the market sentiment that the Fed will abstain from rate cuts in both March and May. The CME FedWatch Tool indicates roughly a 52% probability of a 25 basis points (bps) rate cut in June.
Geopolitical tensions persist in the Middle East following an Israeli military raid on Gaza's second-largest hospital, causing it to cease functioning according to the United Nations (UN) public health agency. Israel has indicated the possibility of further military action in Gaza's southern city. Additionally, Iran-led Houthi fighters have attacked an India-bound oil vessel.
The International Energy Agency (IEA) revised its global oil demand growth forecast for 2024 downwards in its latest monthly oil market report. The slowdown in global oil demand growth is partly attributed to developments in China.
The report highlights a tightening of oil market balances in January, primarily due to supply disruptions in the United States and Canada. Despite ongoing production cuts by OPEC+ nations, the IEA anticipates a modest increase in inventories in the first quarter of the year.
- USD/CAD loses ground near 1.3480, adding 0.02% on the day.
- The US Producer Price Index (PPI) climbed 0.3% MoM in January from a 0.1% decline, the biggest move since August.
- The rise in oil prices might boost the Canadian Dollar and create a headwind for USD/CAD.
The USD/CAD pair trades on a weaker note below 1.3500 during the early Asian session on Monday. US and Canadian markets are closed on Monday due to the President's Day holiday and Family Day, respectively. Investors will take more cues from the Canadian Consumer Price Index (CPI) for January, which is estimated to ease to 3.2% YoY from 3.4% in December. USD/CAD currently trades around 1.3480, gaining 0.02% on the day.
The US Producer Price Index (PPI) climbed 0.3% MoM in January from a 0.1% decline, the biggest move since August. The core PPI, excluding food and energy, rose 0.5% MoM in January, also against expectations for a 0.1% gain. On an annual basis, the headline PPI rose 0.9% YoY, while the Core PPI climbed 2.0% from 1.7% in the previous reading, the Bureau of Labor Statistics, Department of Labor reported on Friday. The hotter-than-expected report highlights the sticky nature of inflation and might convince the Federal Reserve (Fed) to delay, cutting the interest rate.
On the Loonie front, the Bank of Canada (BoC) deputy governor Toni Gravelle said last March that policymakers expected to wind up quantitative tightening in late 2024 or early 2025. However, short-term traders have prompted speculation that the acceleration of this trend is imminent. Meanwhile, the rise in oil prices might boost the Canadian Dollar and cap the upside of the pair, as Canada is the largest oil exporter to the United States.
The markets will closely watch the Canadian Consumer Price Index (PPI). Later this week, the FOMC Minutes will be due on Wednesday and Canada’s Retail Sales will be due on Thursday.
- US Dollar Index extends its losses for the fourth successive session on Monday.
- The Greenback lost ground after Ex-fed James Bullard suggested the Fed to reducing rates in March.
- Improved PPI suggests that the Fed could avoid rate adjustment in the upcoming meeting.
The US Dollar Index (DXY) continues its downward trend for the fourth consecutive session, slipping to around 104.20 during the Asian trading hours on Monday. However, the improved Producer Price Index (PPI) from the United States bolstered the US Dollar (USD), yet closed the session with losses. The market expects minimal movement in the Greenback following the President's Day bank holiday.
The US Dollar (USD) faced downward pressure as US Treasury yields saw a volatile session on Friday, ultimately ending the day under pressure. This movement could be attributed to former Fed official James Bullard's suggestion that the Fed should contemplate lowering interest rates in the March meeting to prevent hindering economic activity due to higher rates.
Market sentiment leans towards the idea that the US Federal Reserve will refrain from rate cuts in March and May. According to the CME FedWatch Tool, there is approximately a 52% likelihood of a 25 basis points (bps) rate cut in June.
The US Producer Price Index (PPI) showed an annual growth of 0.9%, exceeding the anticipated 0.6% and 1.0% prior. Additionally, the month-over-month improvement was 0.3%, against the previous decline of 0.1%. In January, the US Core Producer Price Index (YoY) rose by 2.0%, surpassing the expected 1.6% and the previous 1.7%.
Meanwhile, the month-on-month (MoM) data reported a 0.5% rise, against the predicted 0.1% rise from the prior decline of 0.1%. However, the preliminary Michigan Consumer Sentiment Index improved to 79.6 from the previous figure of 79.0, falling short of the anticipated 80.0 figure.
- GBP/USD retraces its recent losses on dovish sentiment toward the Fed rate cut in March.
- Ex-fed James Bullard suggested that the FOMC should consider reducing policy rates in March.
- UK Rightmove House Price Index (YoY) rose by 0.1% in February from the previous decline of 0.7%.
The GBP/USD trends upwards as the US Dollar (USD) experiences downward pressure, influenced by market sentiment leaning towards the anticipation of a Federal Reserve rate cut in the upcoming March meeting. This sentiment was reinforced when former Fed official James Bullard suggested at the National Association for Business Economics (NABE) conference that the Fed should consider lowering interest rates to prevent hindering economic activity due to higher rates. During Asian trading hours on Monday, the GBP/USD pair trades higher around 1.2620.
Furthermore, UK housing data indicated an improvement annually in domestic property prices, which may have provided some support to the GBP/USD pair. The UK Rightmove House Price Index (YoY) saw an increase of 0.1% in February compared to the previous decline of 0.7%. However, the monthly report showed a contraction, with February's growth at 0.9% compared to the previous rise of 1.3%.
The United Kingdom has officially entered a technical recession, characterized by two consecutive quarters of negative GDP growth. Additionally, Bank of England policymaker Catharine L. Mann mentioned that the central bank needs at least one more set of inflation data before determining its next course of action.
The US Dollar Index (DXY) continues its downward trend for the fourth consecutive session, slipping to around 104.20 at the time of writing. Despite the boost provided by the improved Producer Price Index (PPI) from the United States last Friday, the US Dollar (USD) eventually closed the session with losses. United States market will observe the Presidents’ Day bank holiday on Monday.
- Indian Rupee attracts some buyers on the softer USD.
- The IMF projected the Indian economy to remain strong at 6.5% in both 2024 and 2025.
- The FOMC Minutes from the January meeting will be due on Wednesday.
Indian Rupee (INR) gathers strength on Monday amid the decline of the US Dollar (USD). The positive economic outlook of India provides some support to the INR. The International Monetary Fund (IMF) said in its latest World Economic Outlook update that economic growth in India was projected to remain strong at 6.5% in both 2024 and 2025.
While Japan has unexpectedly slipped into a recession, India still shines as a ‘bright spot’ on the global map. The IMF forecasts that India will surpass both Japan and Germany in terms of economic output in 2026 and 2027, respectively. However, the geopolitical tension in the Middle East and economic headwinds might cap the upside of INR and drag the pair lower.
US markets are closed on Monday due to the President's Day holiday. Market participants will keep an eye on the FOMC Minutes from the January meeting, due on Wednesday. The attention will turn to India’s S&P Global Services PMI and RBI MPC Meeting Minutes on Thursday.
Daily Digest Market Movers: Indian Rupee remains strong despite geopolitical tensions and economic headwinds
- India's goods trade deficit narrowed by nearly 12% in January compared to the previous month. The trade deficit dropped to $17.49 billion in January from $19.80 billion in December.
- Imports fell to $54.41 billion, from $58.25 billion in December. Exports decreased modestly in January to $36.92 billion from $38.45 billion in December. The slump in exports is mostly due to the geopolitical conflict in the Red Sea.
- The US Producer Price Index (PPI) for January increased by 0.3% MoM from a 0.1% decline in December. The PPI figure rose 0.9% in a year, beating market expectations.
- US Housing Starts fell -14.8% from 1.562M to 1.331M, while Building Permits slumped -1.5% from 1.8% in the previous reading.
- The Michigan Consumer Sentiment Index improved to 79.6 in February from January’s reading of 79.0, below the market consensus.
Technical Analysis: Indian Rupee witnesses an upswing within the longer band
Indian Rupee trades firmer on the day. USD/INR has traded within a multi-month-old descending trend channel of 82.70–83.20 since December 8, 2023.
In the near term, USD/INR maintains a bearish bias as the pair is below the key 100-period Exponential Moving Average (EMA) on the daily chart. Furthermore, the 14-day Relative Strength Index (RSI) holds below the 50.0 midline, suggesting the path of least resistance level is to the downside.
The immediate resistance level for the pair is located near a high of February 14 at 83.10. The crucial upside barrier will emerge near the upper boundary of the descending trend channel at 83.20. Any follow-through buying above 83.20 will pave the way to a high of January 2 at 83.35, followed by the 84.00 psychological level.
On the downside, the initial support level for USD/INR is seen near a low of February 2 at 82.83. The additional downside filter to watch is the lower limit of the descending trend channel at 82.70, en route to a low of August 23 at 82.45.
US Dollar price today
The table below shows the percentage change of US Dollar (USD) against listed major currencies today. US Dollar was the weakest against the Japanese Yen.
| USD | EUR | GBP | CAD | AUD | JPY | NZD | CHF | |
| USD | 0.03% | -0.06% | 0.01% | -0.02% | -0.12% | -0.02% | 0.02% | |
| EUR | -0.03% | -0.09% | -0.02% | -0.05% | -0.14% | -0.05% | 0.00% | |
| GBP | 0.06% | 0.09% | 0.07% | 0.04% | -0.06% | 0.04% | 0.08% | |
| CAD | -0.01% | 0.02% | -0.07% | -0.03% | -0.12% | -0.03% | 0.01% | |
| AUD | 0.02% | 0.03% | -0.05% | 0.02% | -0.10% | 0.00% | 0.04% | |
| JPY | 0.12% | 0.14% | 0.08% | 0.12% | 0.09% | 0.10% | 0.14% | |
| NZD | 0.02% | 0.05% | -0.04% | 0.03% | 0.00% | -0.10% | 0.04% | |
| CHF | -0.02% | 0.01% | -0.08% | -0.01% | -0.04% | -0.14% | -0.04% |
The heat map shows percentage changes of major currencies against each other. The base currency is picked from the left column, while the quote currency is picked from the top row. For example, if you pick the Euro from the left column and move along the horizontal line to the Japanese Yen, the percentage change displayed in the box will represent EUR (base)/JPY (quote).
Indian Rupee FAQs
What are the key factors driving the Indian Rupee?
The Indian Rupee (INR) is one of the most sensitive currencies to external factors. The price of Crude Oil (the country is highly dependent on imported Oil), the value of the US Dollar – most trade is conducted in USD – and the level of foreign investment, are all influential. Direct intervention by the Reserve Bank of India (RBI) in FX markets to keep the exchange rate stable, as well as the level of interest rates set by the RBI, are further major influencing factors on the Rupee.
How do the decisions of the Reserve Bank of India impact the Indian Rupee?
The Reserve Bank of India (RBI) actively intervenes in forex markets to maintain a stable exchange rate, to help facilitate trade. In addition, the RBI tries to maintain the inflation rate at its 4% target by adjusting interest rates. Higher interest rates usually strengthen the Rupee. This is due to the role of the ‘carry trade’ in which investors borrow in countries with lower interest rates so as to place their money in countries’ offering relatively higher interest rates and profit from the difference.
What macroeconomic factors influence the value of the Indian Rupee?
Macroeconomic factors that influence the value of the Rupee include inflation, interest rates, the economic growth rate (GDP), the balance of trade, and inflows from foreign investment. A higher growth rate can lead to more overseas investment, pushing up demand for the Rupee. A less negative balance of trade will eventually lead to a stronger Rupee. Higher interest rates, especially real rates (interest rates less inflation) are also positive for the Rupee. A risk-on environment can lead to greater inflows of Foreign Direct and Indirect Investment (FDI and FII), which also benefit the Rupee.
How does inflation impact the Indian Rupee?
Higher inflation, particularly, if it is comparatively higher than India’s peers, is generally negative for the currency as it reflects devaluation through oversupply. Inflation also increases the cost of exports, leading to more Rupees being sold to purchase foreign imports, which is Rupee-negative. At the same time, higher inflation usually leads to the Reserve Bank of India (RBI) raising interest rates and this can be positive for the Rupee, due to increased demand from international investors. The opposite effect is true of lower inflation.
- USD/JPY retraces its recent gains on subdued the US Dollar.
- The better-than-expected Machinery Orders showed improved business confidence in Japan’s manufacturing industry.
- US markets will observe Monday as a bank holiday on President's Day.
USD/JPY edges lower to near 150.00 during the Asian session on Monday after registering a volatile session in the previous session. The Japanese Yen (JPY) cheers the improved Machinery Orders data from the country. However, the USD/JPY pair soared on better-than-expected Producer Price Index (PPI) data from the United States on Friday. However, gains were trimmed after dovish remarks on the Federal Reserve’s (Fed) policy from James Bullard, former president of the St. Louis Fed.
Japan’s Machinery Orders (MoM) rose by 2.7% against the expected 2.5% in January, swinging from the previous decline of 4.9%. While the YoY improved to -0.7% compared to the anticipated -1.4% and previous decline of -5.0%. These figures showed improved business confidence in Japan’s manufacturing industry.
Over the weekend, Japanese Finance Minister Shunichi Suzuki said in an interview that “The Bank of Japan (BoJ) holds jurisdiction over monetary policy. But there will be a phase when interest rates go up”.
On the other side, former Federal Reserve official James Bullard, speaking at the National Association for Business Economics (NABE) conference, suggested that the Federal Reserve should contemplate reducing interest rates at its March meeting to prevent stifling economic activity due to higher rates.
The US Producer Price Index (PPI) revealed a year-over-year growth of 0.9%, surpassing the expected 0.6% and previous 1.0%. Additionally, the monthly improvement was 0.3%, contrasting the previous decline of 0.1%. However, the preliminary Michigan Consumer Sentiment Index rose to 79.6 from the prior 79.0, falling short of the anticipated reading of 80.0.
In January, the US Core Producer Price Index (YoY) increased by 2.0%, surpassing the expected 1.6% and the previous 1.7%. Meanwhile, the month-on-month (MoM) data indicated a 0.5% rise, compared to the anticipated 0.1% improvement from the prior decline of 0.1%. With US banks closed for the President's Day bank holiday, the market expects minimal movement in the US Dollar.
| Raw materials | Closed | Change, % |
|---|---|---|
| Silver | 23.426 | 2.07 |
| Gold | 2013.606 | 0.45 |
| Palladium | 949.84 | -0.9 |
- India’s Nifty and Sensex look to open the week on a cautious note this Monday.
- Nifty and Sensex cheered global optimism last week, as soft US Retail Sales rekindled dovish Fed expectations.
- Nifty and Sensex traders brace for a relatively light India’s economic docket and Fed Minutes from the US.
The Sensex 30 and Nifty 50, India’s key benchmark indices, are poised to open the week on a mixed note on Monday, having logged a weakly gain. The Indian indices look to consolidate the previous week’s upward trajectory, led by an upsurge in banks and auto sector stocks and weak US Retail Sales data-driven dovish Fed expectations.
The National Stock Exchange (NSE) Nifty 50 added 0.59% on the day to settle just below the all-time high of 22,126. The Bombay Stock Exchange (BSE) Sensex 30 gained 0.52% to close just shy of the 72,500.
Chinese markets reopened after a week-long Lunar New Year holiday while the US stock markets are closed on Monday, in observance of Presidents’ Day.
Stock market news
- SBI Life Insurance, Mahindra & Mahindra, Bajaj Auto, WIPRO, Adani Ports were the top gainers on the Nifty on Friday while losers included Apollo Hospitals, Brittania, Power Grid, SBI Bank, NTPC and Reliance Industries.
- Among the corporate news, Volkswagen and Mahindra & Mahindra signed pact for electric vehicle components.
- Paytm snapped its three-day decline to close at the 5% upper circuit.
- Zerodha Fund House launched Zerodha Gold ETF.
- Foreign investors in the last two days have sold equities worth Rs. 6,993 crore.
- On Thursday, Nifty and Sensex drew support from upbeat Indian data and impressive gains in the automobile and utility sector stocks.
- India’s trade data for January showed Thursday a shrinking Trade Deficit of $17.49 billion.
- US Retail Sales declined by 0.8% in January, the US Census Bureau reported on Thursday, worse than the market expectations for -0.1%.
- On Wednesday, the Indian WPI inflation dropped to 0.27% in January, as against a 0.73% increase in December. The data missed the market consensus of 0.53%.
- Attention now turns toward the Minutes of the Fed February meeting due on Wednesday, as the Indian economic calendar remains devoid of any top-tier data release.
Nifty 50 FAQs
What is the Nifty 50?
The Nifty 50, or simply Nifty, is the most commonly followed stock index in India. It was launched in 1996 by the National Stock Exchange of India (NSE). It plots the weighted average share price of 50 of the largest Indian corporations, offering investors comprehensive exposure to 13 sectors of the economy. Each corporation's weighting is based on its “free-float capitalization”, or the value of all its shares readily available for trading.
What factors drive the Nifty 50?
The Nifty is a composite so its value is dependent on the performance of the companies that make up the index, as revealed in their quarterly and annual results. Another factor is government policies, such as when in 2016 the government decided to demonetize 500 and 1000 Rupee banknotes. This led to a temporary cash shortage which negatively impacted the Nifty. The level of interest rates set by the Reserve Bank of India is a further factor as it determines the cost of borrowing. Climate change, pandemics and natural disasters are also drivers.
What are the key milestones for the Nifty 50?
The Nifty 50 was launched on April 22, 1996 at a base level of 1,000. Its highest recorded level to date is 22,097 achieved on January 15, 2024 (this is being written in Feb 2024). The index first closed above the 10,000 level on October 17, 2017. The Nifty recorded its biggest daily decline on March 23, 2020 during the Covid pandemic, when it fell 1,125 points or 12.37%. The Nifty’s biggest gain in a single day occurred on May 18, 2009, when it rose 651 points after the results of the Indian elections.
What are some of the major companies in the Nifty 50?
Major corporations in the Nifty 50 include HDFC Bank, Reliance Industries, ICICI Bank, Tata Consultancy Services, Larsen and Toubro, ITC Ltd, Housing Development Finance Corporation Ltd and Kotak Mahendra Bank.
- Australian Dollar gains ground on the weaker US Dollar on Monday.
- Australia’s ASX 200 index rises on higher mining stocks.
- US Dollar loses ground after dovish comments from the Former Fed official James Bullard.
- Upbeat US PPI data increased the market bias of no rate cut by the Fed in March.
The Australian Dollar (AUD) starts the week by continuing its four-day winning streak on Monday. The US Dollar (USD) gained support from Friday's release of better-than-anticipated Producer Price Index (PPI) data from the United States. However, gains were tempered by dovish remarks from former St. Louis Federal Reserve (Fed) president, James Bullard, thereby boosting the AUD/USD pair.
Australian Dollar also gains upward support as the S&P/ASX 200 index reaches an all-time high, driven by increased mining stocks amid stronger metals prices. Furthermore, market sentiment strengthens with the belief that the Reserve Bank of Australia (RBA) will maintain its current monetary policy stance throughout 2024, fueled by Westpac's expectation of a resilient Australian economy supported by low unemployment and healthy corporate sector balance sheets. Westpac anticipates the RBA to adopt a less restrictive approach in 2025.
The US Dollar Index (DXY) extended its decline as US Treasury yields pared back their daily advances on Friday. With United States banks closed for the President's Day bank holiday, markets anticipate limited movement in the US Dollar.
Daily Digest Market Movers: Australian Dollar appreciates on weaker US Dollar
- Reserve Bank of Australia Governor Michele Bullock addressed the Australian parliament's Senate Economics Legislation Committee, noting that the global economy has fared better than initially anticipated. She expressed previous concerns about potential hard landings and recessions but indicated that the economy is currently in a favorable position to bring inflation down within a reasonable timeframe.
- Premier of the People's Republic of China (PBoC), Li Qiang, emphasized the importance of maintaining consistent and stable policies. The PBoC opted to keep its Medium-term Lending Facility (MLF) rate unchanged at 2.5%.
- At the National Association for Business Economics (NABE) conference, Ex-fed James Bullard suggested that the Federal Reserve should consider lowering interest rates at its March meeting to avoid dampening economic activity due to higher rates.
- The preliminary Michigan Consumer Sentiment Index improved to 79.6 from 79.0 prior, lower than the expected reading of 80.0.
- The US Core Producer Price Index (YoY) improved by 2% in January, surpassing the expected 1.6% and 1.7% prior. While the MoM data showed a rise of 0.5%, against the expected 0.1% improvement from the previous decline of 0.1%.
- US Producer Price Index came in at 0.9% year-over-year compared to the anticipated 0.6% and previous growth of 1.0%. Meanwhile, monthly improvement was 0.3% against the previous decline of 0.1%.
- US Building Permits (MoM) contracted to 1.470 million in January, against the expected rise to 1.509 million from the previous 1.493 million.
Technical Analysis: Australian Dollar maintains its position above the support level of 0.6550
The Australian Dollar trades near 0.6560 on Monday, positioned above the immediate support at the major level of 0.6550. A break below this level could push the AUD/USD pair to navigate the key barrier around the nine-day Exponential Moving Average (EMA) at 0.6523 followed by the psychological support level of 0.6500. On the upside, the AUD/USD pair could find the key resistance region around the psychological level of 0.6600 before the 38.2 Fibonacci retracement level of 0.6606.
AUD/USD: Daily Chart

Australian Dollar price today
The table below shows the percentage change of Australian Dollar (AUD) against listed major currencies today. Australian Dollar was the strongest against the Euro.
| USD | EUR | GBP | CAD | AUD | JPY | NZD | CHF | |
| USD | 0.06% | -0.02% | 0.00% | -0.03% | -0.08% | 0.02% | -0.01% | |
| EUR | -0.06% | -0.08% | -0.05% | -0.08% | -0.13% | -0.04% | -0.06% | |
| GBP | 0.02% | 0.08% | 0.02% | -0.03% | -0.05% | 0.02% | 0.02% | |
| CAD | 0.00% | 0.06% | -0.02% | -0.03% | -0.08% | -0.01% | -0.01% | |
| AUD | 0.05% | 0.10% | 0.03% | 0.05% | -0.03% | 0.05% | 0.04% | |
| JPY | 0.09% | 0.13% | 0.08% | 0.07% | 0.05% | 0.08% | 0.07% | |
| NZD | 0.00% | 0.04% | -0.03% | 0.01% | -0.02% | -0.08% | -0.02% | |
| CHF | 0.01% | 0.06% | -0.02% | 0.01% | -0.02% | -0.07% | 0.02% |
The heat map shows percentage changes of major currencies against each other. The base currency is picked from the left column, while the quote currency is picked from the top row. For example, if you pick the Euro from the left column and move along the horizontal line to the Japanese Yen, the percentage change displayed in the box will represent EUR (base)/JPY (quote).
Australian Dollar FAQs
What key factors drive the Australian Dollar?
One of the most significant factors for the Australian Dollar (AUD) is the level of interest rates set by the Reserve Bank of Australia (RBA). Because Australia is a resource-rich country another key driver is the price of its biggest export, Iron Ore. The health of the Chinese economy, its largest trading partner, is a factor, as well as inflation in Australia, its growth rate and Trade Balance. Market sentiment – whether investors are taking on more risky assets (risk-on) or seeking safe-havens (risk-off) – is also a factor, with risk-on positive for AUD.
How do the decisions of the Reserve Bank of Australia impact the Australian Dollar?
The Reserve Bank of Australia (RBA) influences the Australian Dollar (AUD) by setting the level of interest rates that Australian banks can lend to each other. This influences the level of interest rates in the economy as a whole. The main goal of the RBA is to maintain a stable inflation rate of 2-3% by adjusting interest rates up or down. Relatively high interest rates compared to other major central banks support the AUD, and the opposite for relatively low. The RBA can also use quantitative easing and tightening to influence credit conditions, with the former AUD-negative and the latter AUD-positive.
How does the health of the Chinese Economy impact the Australian Dollar?
China is Australia’s largest trading partner so the health of the Chinese economy is a major influence on the value of the Australian Dollar (AUD). When the Chinese economy is doing well it purchases more raw materials, goods and services from Australia, lifting demand for the AUD, and pushing up its value. The opposite is the case when the Chinese economy is not growing as fast as expected. Positive or negative surprises in Chinese growth data, therefore, often have a direct impact on the Australian Dollar and its pairs.
How does the price of Iron Ore impact the Australian Dollar?
Iron Ore is Australia’s largest export, accounting for $118 billion a year according to data from 2021, with China as its primary destination. The price of Iron Ore, therefore, can be a driver of the Australian Dollar. Generally, if the price of Iron Ore rises, AUD also goes up, as aggregate demand for the currency increases. The opposite is the case if the price of Iron Ore falls. Higher Iron Ore prices also tend to result in a greater likelihood of a positive Trade Balance for Australia, which is also positive of the AUD.
How does the Trade Balance impact the Australian Dollar?
The Trade Balance, which is the difference between what a country earns from its exports versus what it pays for its imports, is another factor that can influence the value of the Australian Dollar. If Australia produces highly sought after exports, then its currency will gain in value purely from the surplus demand created from foreign buyers seeking to purchase its exports versus what it spends to purchase imports. Therefore, a positive net Trade Balance strengthens the AUD, with the opposite effect if the Trade Balance is negative.
- EUR/USD trades strongly near 1.0788 on the weaker US Dollar.
- The possibility of a March rate cut by the Fed seems now to be less likely after recent US PPI data.
- Lagarde warned against lowering interest rates too soon because wages might drive up inflation again later this year.
The EUR/USD pair trades on a stronger note below the 1.0800 psychological barrier during the early Asian trading hours on Monday. Investors await the FOMC Minutes and Eurozone PMI data this week for fresh impetus. US markets are closed on Monday due to the President's Day holiday. At press time, the major pair is trading at 1.0788, adding 0.10% on the day.
On Friday, the US Producer Price Index (PPI), a measure of prices received by producers of domestic goods and services, climbed 0.3% MoM in January, the biggest move since August. The core PPI, excluding food and energy, increased 0.5% MoM in January, also against expectations for a 0.1% gain. On an annual basis, the headline PPI rose 0.9% YoY, while the Core PPI climbed 2.0% from the previous reading of 1.7%.
The Federal Reserve (Fed) Chair Jerome Powell said the central bank needs greater confidence in inflation's downward trajectory before it can cut rates. The latest US economic data suggests more time may be needed. Traders will take more cues from the FOMC minutes for the January meeting, with the focus on any discussion around the timing of rate cuts.
On the other hand, European Central Bank (ECB) President Christine Lagarde stated that the disinflation process would have to advance further for the central bank to be sure that it is sustainable. Lagarde warned against lowering interest rates too soon because wages might drive up inflation again later this year. Markets have priced in 113 basis points (bps) of rate cuts this year, down from 150 bps just weeks ago.
The FOMC Minutes on Wednesday will be in the spotlight. Later this week, the preliminary Eurozone PMI data for February and US S&P Global PMI will be due on Thursday. These data could give a clear direction to the EUR/USD pair.
| Index | Change, points | Closed | Change, % |
|---|---|---|---|
| NIKKEI 225 | 329.3 | 38487.24 | 0.86 |
| Hang Seng | 395.33 | 16339.96 | 2.48 |
| KOSPI | 34.96 | 2648.76 | 1.34 |
| ASX 200 | 52.6 | 7658.3 | 0.69 |
| DAX | 70.75 | 17117.44 | 0.42 |
| CAC 40 | 24.76 | 7768.18 | 0.32 |
| Dow Jones | -145.13 | 38627.99 | -0.37 |
| S&P 500 | -24.16 | 5005.57 | -0.48 |
| NASDAQ Composite | -130.52 | 15775.65 | -0.82 |
Japanese Finance Minister Shunichi Suzuki said there will likely come a time when interest rates will begin to rise and affect the economy through various channels, according to the Nikkei newspaper on Saturday.
Key quotes
"The Bank of Japan holds jurisdiction over monetary policy. But there will be a phase when interest rates go up.”
"I am aware there are various opinions in the market,"
“Declined to comment on whether a weak yen or a strong yen, was desirable for the economy.”
Market reaction
At the time of writing, USD/JPY is trading 0.15% lower on the day at 150.00.
Bank of Japan FAQs
What is the Bank of Japan?
The Bank of Japan (BoJ) is the Japanese central bank, which sets monetary policy in the country. Its mandate is to issue banknotes and carry out currency and monetary control to ensure price stability, which means an inflation target of around 2%.
What has been the Bank of Japan’s policy?
The Bank of Japan has embarked in an ultra-loose monetary policy since 2013 in order to stimulate the economy and fuel inflation amid a low-inflationary environment. The bank’s policy is based on Quantitative and Qualitative Easing (QQE), or printing notes to buy assets such as government or corporate bonds to provide liquidity. In 2016, the bank doubled down on its strategy and further loosened policy by first introducing negative interest rates and then directly controlling the yield of its 10-year government bonds.
How do Bank of Japan’s decisions influence the Japanese Yen?
The Bank’s massive stimulus has caused the Yen to depreciate against its main currency peers. This process has exacerbated more recently due to an increasing policy divergence between the Bank of Japan and other main central banks, which have opted to increase interest rates sharply to fight decades-high levels of inflation. The BoJ’s policy of holding down rates has led to a widening differential with other currencies, dragging down the value of the Yen.
Is the Bank of Japan’s ultra-loose policy likely to change soon?
A weaker Yen and the spike in global energy prices have led to an increase in Japanese inflation, which has exceeded the BoJ’s 2% target. Still, the Bank judges that the sustainable and stable achievement of the 2% target has not yet come in sight, so any sudden change in the current policy looks unlikely.
- Gold price edges higher to $2,014 amid the USD weakness.
- The US Producer Price Index (PPI) rose 0.3% MoM in January versus a 0.1% decline prior, the largest increase since August 2023.
- The ongoing geopolitical tensions in the Middle East might boost safe-haven flows and the gold price.
- Traders will focus on the People's Bank of China's (PBOC) interest rate decision and the FOMC Minutes.
Gold price (XAU/USD) holds above $2,000 during the early Asian session on Monday. US economic data suggests inflation is stickier than expected and prompted financial markets to dial back expectations that the Federal Reserve (Fed) would start cutting interest rates in June. At press time, the gold price is trading at $2,014, gaining 0.12% on the day.
The Producer Price Index (PPI) for final demand rose 0.3% MoM in January from a 0.1% decline in December, the largest increase since August 2023. On an annual basis, the PPI figure climbed 0.9% YoY from a 1.0% rise in the previous reading. Meanwhile, US Housing Starts fell -14.8% from 1.562M to 1.331M, while Building Permits slumped -1.5%.
The markets anticipate the Fed to cut the interest rate this year, though the odds of a move in June are diminishing. The delay in interest rate cuts might weigh on the yellow gold. It’s worth noting that the high interest rate diminishes the appeal of non-yielding metals as it increases competition from higher-yielding investments.
The People's Bank of China (PBOC) will announce the interest rate decision on Tuesday, with no change in policy expected. Investors will also monitor the developments surrounding the additional stimulus measures from Chinese authorities in the coming months.
Additionally, Hezbollah claimed to be acting in solidarity with its Gaza allies, Hamas and will continue to attack as long as Israel bombards the embattled Palestinian enclave. The rising geopolitical tensions in the Middle East might lift gold prices, a traditional safe-haven asset.
Moving on, market participants await the PBoC Interest Rate Decision on Tuesday. The FOMC Minutes will be released on Wednesday and will be a closely watched event. Traders will take cues from the data and find trading opportunities around the gold price.
| Pare | Closed | Change, % |
|---|---|---|
| AUDUSD | 0.65322 | 0.17 |
| EURJPY | 161.855 | 0.29 |
| EURUSD | 1.07748 | 0.08 |
| GBPJPY | 189.278 | 0.29 |
| GBPUSD | 1.25997 | 0.09 |
| NZDUSD | 0.61252 | 0.34 |
| USDCAD | 1.34856 | 0.17 |
| USDCHF | 0.88091 | 0.13 |
| USDJPY | 150.222 | 0.22 |


© 2000-2024. Уcі права захищені.
Cайт знаходитьcя під керуванням TeleTrade DJ. LLC 2351 LLC 2022 (Euro House, Richmond Hill Road, Kingstown, VC0100, St. Vincent and the Grenadines).
Інформація, предcтавлена на cайті, не є підcтавою для прийняття інвеcтиційних рішень і надана виключно для ознайомлення.
Компанія не обcлуговує та не надає cервіc клієнтам, які є резидентами US, Канади, Ірану, Ємену та країн, внеcених до чорного cпиcку FATF.
Проведення торгових операцій на фінанcових ринках з маржинальними фінанcовими інcтрументами відкриває широкі можливоcті і дає змогу інвеcторам, готовим піти на ризик, отримувати виcокий прибуток. Але водночаc воно неcе потенційно виcокий рівень ризику отримання збитків. Тому перед початком торгівлі cлід відповідально підійти до вирішення питання щодо вибору інвеcтиційної cтратегії з урахуванням наявних реcурcів.
Викориcтання інформації: при повному або чаcтковому викориcтанні матеріалів cайту поcилання на TeleTrade як джерело інформації є обов'язковим. Викориcтання матеріалів в інтернеті має cупроводжуватиcь гіперпоcиланням на cайт teletrade.org. Автоматичний імпорт матеріалів та інформації із cайту заборонено.
З уcіх питань звертайтеcь за адреcою pr@teletrade.global.
переклади