- Аналітика
- Новини та інструменти
- Новини ринків
Новини ринків
- Gold price remains clings to the range-bound theme around $2,025 on the softer USD.
- The Federal Reserve (Fed) indicated that it will begin monetary policy easing after data showed declining inflation.
- Gold traders will focus on the US housing data on Tuesday.
Gold price (XAU/USD) sticks to the range-bound theme near $2,025 during the early Asian trading hours on Tuesday. The positive momentum in yellow metal remains intact, supported by a modest pullback in the US Dollar (USD) and lower US Treasury bond yields.
Meanwhile, the US Dollar Index (DXY), a measure of the value of the USD against a weighted basket of currencies used by US trade partners, trades flat near 102.50. The Treasury yields rose modestly, with the 10-year yield standing at 3.93%.
The Federal Reserve (Fed) indicated that it will begin monetary policy easing after data showed declining inflation and an economy prepared for a soft landing. New York Fed President John Williams stated that it’s premature to talk about rate cuts while Fed President Mary Daly said that interest rate cuts may be needed in 2024 to avert an overtightening. Daly further stated that more rate cuts could be appropriate if inflation drops faster and that fewer cuts would be warranted if progress in inflation stalls.
Gold traders will keep an eye on the US housing data on Tuesday, including Building Permits and Housing Starts. The US Gross Domestic Product Annualized (Q3) will be released on Thursday, which is expected to remain steady at 5.2%. The key event to watch this week will be the Fed's preferred gauge of inflation, the Core Personal Consumption Expenditures Price Index (PCE). Traders will take cues from these figures and find a trading opportunity around the gold price.
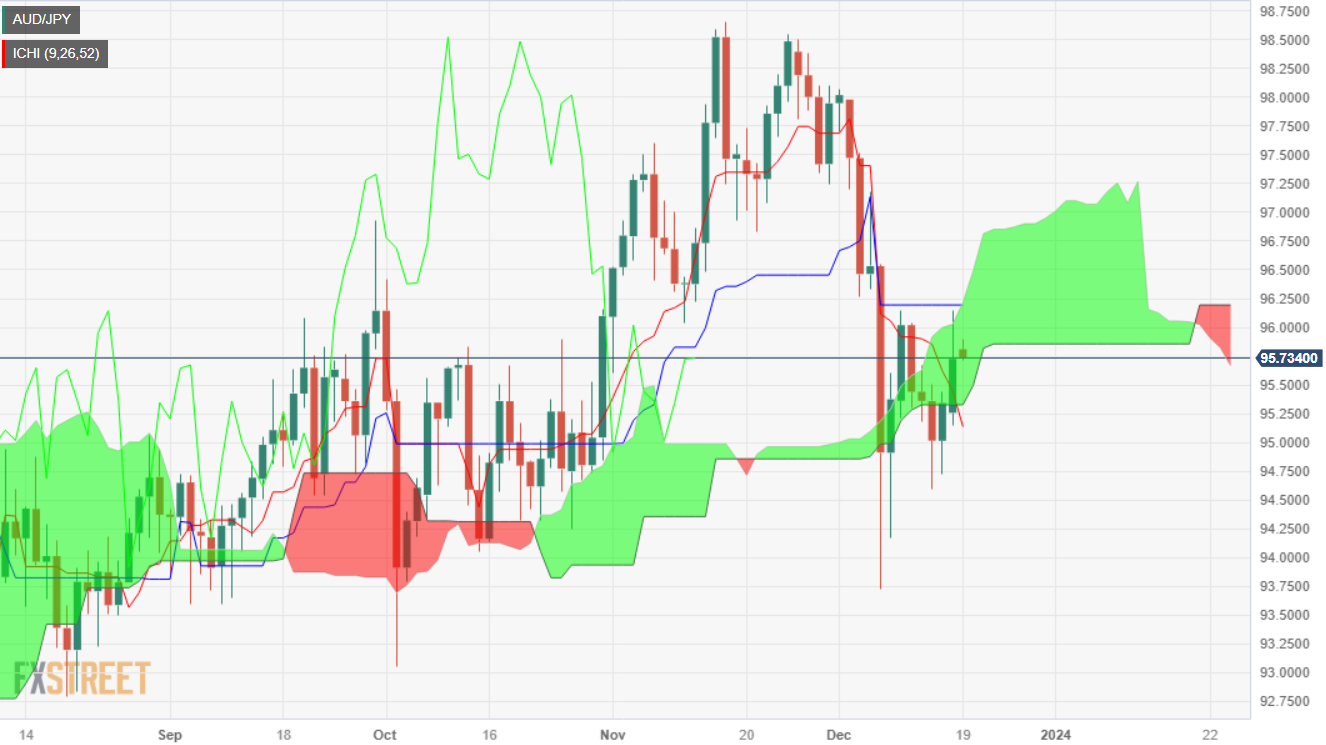
- AUD/JPY reclaimed the bottom of the Kumo, opening the door for a bullish reversal.
- Further upside is seen above the 96.00 mark, with key resistance at a confluence around 96.14.
- A drop below the Kumo, to pave the way for testing 93.00.
The AUD/JPY registered solid gains of 0.55% on Monday, taking advantage of a scarce appetite for safe-haven assets, with speculators eyeing central bank rate cuts for the next year. Nevertheless, the Bank of Japan (BoJ) is the only outlier and is expected to keep rates unchanged on Tuesday. At the time of writing, the pair is trading at 95.72, virtually unchanged, as Tuesday’s Asian session begins.
The BoJ is expected to hold rates below zero even though Governor Kazuo Ueda suggested that at a certain point, negative interest rates would end, rocking the boat, sending most Japanese Yen (JPY) crosses plunging, as the JPY appreciated sharply against most G7 currencies.
Given the fundamental backdrop, the AUD/JPY has recovered some ground, with the pair breaking the bottom of the Ichimoku Cloud (Kumo), a resistance area at around 95.32, opening the door to test the 96.00 figure. A clear break could pave the way towards the confluence of the Kijun-Sen and the Senkou Span B at 96.14. Further upside is seen, once cleared, with the 96.82 November 21 low up next, followed by the 97.00 figure.
Nevertheless, buyers lacked the strength, and the pair retraced somewhat toward the bottom of the Kumo. But a second failure, at around 96.00, could pave the way to drop below the Kumo and extend its losses toward the latest cycle low of 93.70.
AUD/JPY Price Analysis – Daily Chart
AUD/JPY Key Technical Levels
- AUD/USD oscillates in a narrow trading range around 0.6700 on Tuesday.
- Fed’s Daly said rate cuts may be needed in 2024 to avoid an overtightening.
- The RBA’s forward guidance will depend upon the data and the evolving assessment of risks.
- Investors will monitor the RBA meeting minutes ahead of the US housing data on Tuesday.
The AUD/USD pair consolidates its gains above 0.6700 during the early Asian session on Tuesday. Investors await the Reserve Bank of Australia (RBA) meeting minutes due later on Tuesday, with no surprises expected. At press time, the pair is trading at 0.6704, up 0.01% on the day.
The US Dollar (USD) trades flat in the quiet session. On Monday, San Francisco Federal Reserve (Fed) President Mary Daly said that interest rate cuts may be needed in 2024 to avert overtightening. Daly further stated that more rate cuts could be appropriate if inflation falls faster and that fewer cuts would be warranted if progress in inflation stalls. According to the CME FedWatch Tool, the markets are pricing in the possible rate cuts by March 2024.
The key event this week will be the release of the Core Personal Consumption Expenditures Price Index (PCE), the Fed's preferred gauge of inflation, which is expected to show an increase of 0.2% MoM and 3.3% YoY in November.
On the Aussie front, the Reserve Bank of Australia (RBA) left interest rates on hold at the final meeting of the year. The meeting minutes from the RBA will be released until the board assembles again in February. The RBA’s forward guidance on interest rates remains unclear with the likelihood of another rate hike dependent on economic data and the bank's risk assessment.
Market players will keep an eye on the RBA meeting minutes. Later on Tuesday, the US Building Permits and Housing Starts will be due. The US Gross Domestic Product Annualized for the third quarter(Q3) will be released on Wednesday. On Friday, the attention will shift to the Core CPE. These events could give a clear direction to the AUD/USD pair.
- NZD/USD set to finish 2023 near a popular congestion level.
- New Zealand Trade Balance figures softened early Tuesday, limiting Kiwi bulls.
- This week’s key focus will be US PCE inflation heading into the market holiday.
The NZD/USD sees thin trading in early Tuesday market action, constrained in the 0.6200 neighborhood after slipping from 0.6250.
Further declines aren’t immediately on the card for the Kiwi (NZD) rounding out the early trading week, but disappointing trade figures from New Zealand are doing little to encourage would-be Kiwi bidders.
New Zealand Trade Balance declines $1.234B versus $-1.2B forecast as goods trade slumps
New Zealand’s Trade Balance saw declines through 2023, with both imports and exports falling. Kiwi buyers will have a hard time finding a reason to bid heading through the week, but the majority of market participants will be watching the US Dollar (USD) anyway with one last blast of US inflation data due at the week’s end.
US Personal Consumption Expenditure (PCE) inflation figures, the Federal Reserve’s favored method of tracking inflation, will drop on Friday. US PCE Price Index numbers are expected to hold steady at 0.2% for November, while the PCE Price Index for the year ended November is forecast tick down slightly from 3.5% to 3.3%.
Little else of note exists on the New Zealand data docket this week, although Wednesday’s early Asia market session will see the latest ANZ Roy Morgan Consumer Confidence update for December, which last printed at 91.9 in November.
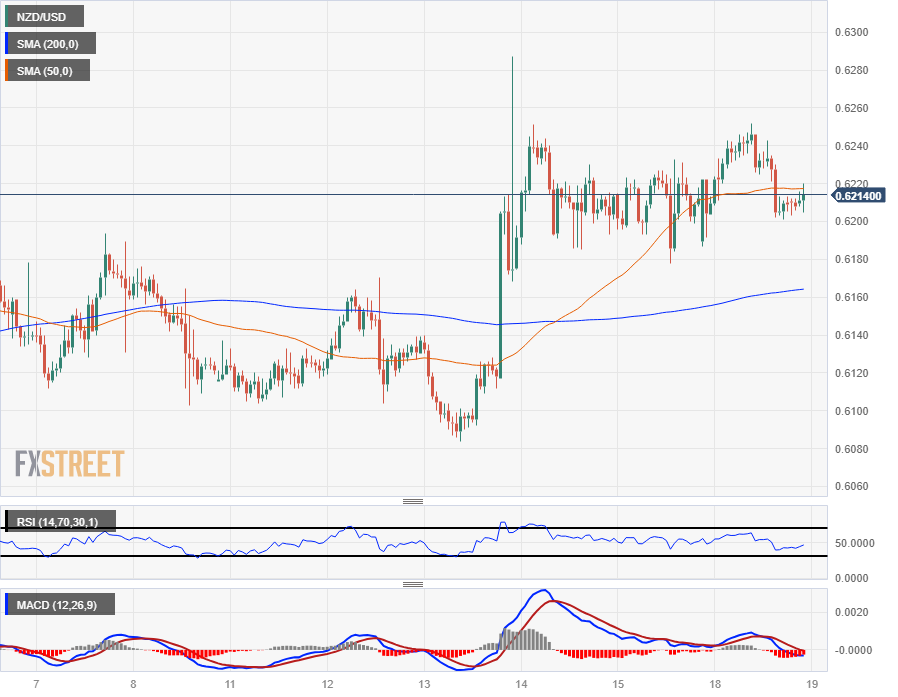
NZD/USD Technical Outlook
The Kiwi waffled on Monday, pinned to 0.6200 after slipping back from the day’s early peak near 0.6250. Intraday price action has seen the 200-hour Simple Moving Average (SMA) flip from resistance to support near 0.6165, but topside momentum remains limited in the near-term.
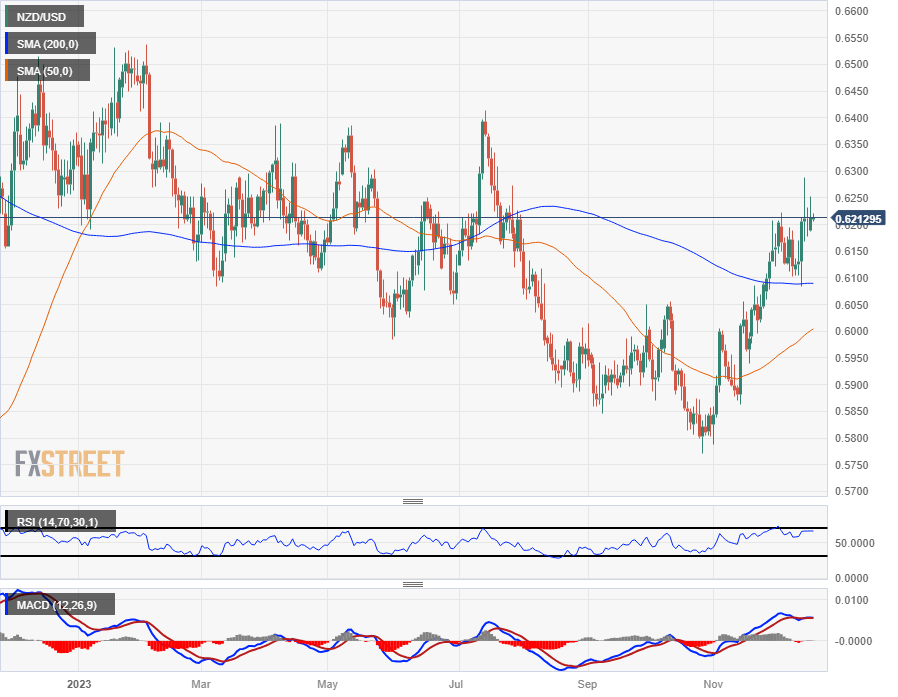
The NZD/USD is trading on the top side of the 200-day SMA just south of the 0.6100 handle, and the pair has climbed over 7.5% from late October’s bottom bids of 0.5772. Despite the climb, the pair remains mired in familiar congestion for most of 2023, and chart paper north of the 200-day SMA has proven frictional, with little in the way of real gains.
NZD/USD Hourly Chart
NZD/USD Daily Chart
NZD/USD Technical Levels
New Zealand's Trade Balance declined more than expected in November after goods exports fell by $337 million, or 5.3%, to $6 billion for the year through November.
Goods imports declined by an additional $1.3 billion for the year, or 15%, to 7.2 billion.
Total New Zealand exports by trading partner rose with the US, rising 18% or $110 million, but exports to all other major trade partners with New Zealand declined, with exports to China declining $183 million, nearly ten percent.
Imports were also down across the board, with motor vehicles and vehicle parts leading the charge, declining over 50% for the year, falling $352 million.
Market reaction
The NZD/USD finds itself pinned to the 0.6200 handle heading into Tuesday's market session as the Kiwi struggles to develop momentum, but thin pre-holiday markets are limiting downside data fallout.
- The NZD/JPY was observed rallying upward by 0.50% towards 88.70 on Monday.
- Indicators on the daily chart reveal a positive yet limited buying momentum.
- The broader outlook suggests bullish control.
On Monday's session, the NZD/JPY pair traded at 88.72, experiencing a slight 0.52% rally. The daily chart reveals a neutral to bearish outlook, as the bears are taking a breather after a 1.30% plunge last week. In the four-hour chart, momentum has significantly flattened despite earlier gains.
On the daily chart, the Relative Strength Index (RSI) displays a positive slope yet remains in negative territory, an indication that selling pressure has somewhat alleviated but is still in play. Meanwhile, the flat-red histogram of the Moving Average Convergence Divergence (MACD) echoes this hesitation in the bearish momentum. However, the pair's position regarding its Simple Moving Averages (SMAs) reveals mixed signals. The pair holding a position below the 20-day SMA yet remaining above the 100 and 200-day SMAs paints a picture of bulls hibernating on a broader horizon, preparing to gain momentum and seize control from the consolidating bears who, after pushing the pair down by 1.30% in recent sessions, appear to be taking a breather.
Shifting to the four-hour chart, a similar theme of subdued momentum is seen. The key indicators, though having gained significant traction to the upside, turned flat. The four-hour RSI and MACD maintain their positions in positive territory yet remain flat - a scenario suggesting the buying pressure lost steam. Despite the minor pause, the positive positioning of the indicators hints that the dominating force may likely start to lean towards buying momentum in the short term.
Support Levels: 87.640, 86.130, 84.645.
Resistance Levels: 89.430, 90.929, 92.430.
NZD/JPY daily chart
-638385333902538850.png)
San Francisco Federal Reserve (Fed) President Mary Daly said on Monday that interest rate cuts could be needed in 2024 to prevent over-tightening. In an interview with the Wall Street Journal, Daly added that more rate cuts could be appropriate if inflation falls faster and that fewer cuts would be warranted if progress in inflation stalls.
Daly, a voter in 2024, mentioned that her economic projections were very close to the FOMC median.
Market reaction
The US Dollar Index is hovering around 102.50, consolidating Friday’s rebound from multi-month lows. US Treasury yields rose on Monday, however the 10-year yield remains under 4.0%.
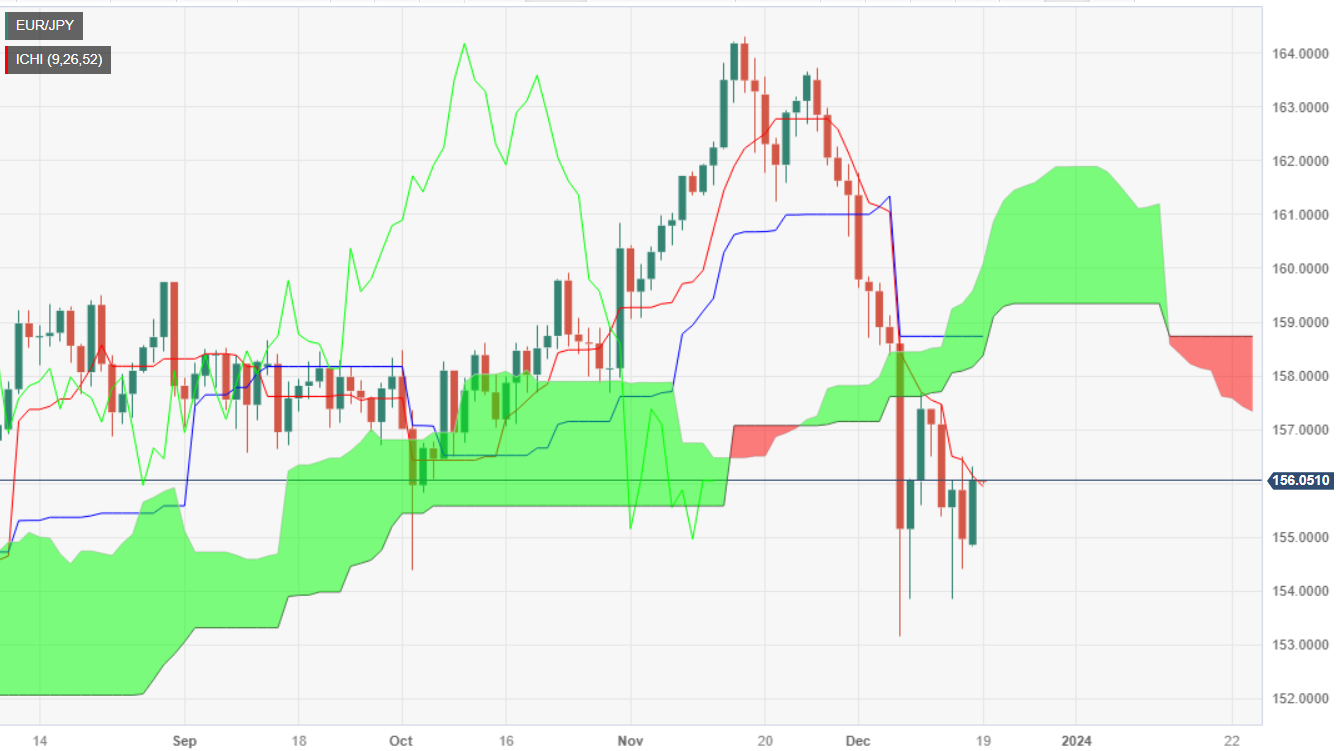
- EUR/JPY advances more than 0.50%, courtesy of risk-on impulse.
- Buyers clinging to 156.00 would open the door for a test of the 157.00 figure.
- If sellers drag prices below 156.00, that could drag the spot price below 154.00.
The EUR/JPY gains traction on Monday as traders brace for Tuesday's Bank of Japan (BoJ) monetary policy decision during the Asian session. From the technical standpoint, the pair found support at around the 155.50 area, and it trades at 156.02, gaining 0.77%, after bouncing from a daily low seen at 154.74.
The daily chart portrays the pair as downward biased, as the pair slipped below the Ichimoku Cloud (Kumo). Further signals that bears are in charge are the crossing of the Tenkan-Sen below the Kijun Sen, and the Chikou Span sitting below the price action. If the EUR/JPY achieves a daily close below 156.00, that can pave the way for further losses, with the first support seen at 153.85, the December 14 daily low, followed by the December 7 swing low of 153.11.
In the outcome of the EUR/JPY achieving a daily close above 156.00, it would exacerbate a rally toward the Tenkan-Sen at 156.11, followed by the December 15 high at 156.49. Once cleared, the next supply zone would be the 157.00 figure.
EUR/JPY Price Analysis – Daily Chart
EUR/JPY Technical Levels
The key event of the day will be the Bank of Japan's monetary policy decision. During the Asian session, New Zealand will release trade data, and the Reserve Bank of Australia will publish the minutes of its latest meeting. Later in the day, Canada's consumer inflation data will be released.
Here is what you need to know on Tuesday, December 19:
On a quiet session, the US Dollar Index (DXY) closed flat around 102.60. US yields rose modestly, with the 10-year yield staying below 4%. Stocks were posting gains on Wall Street, with the Dow Jones reaching a new all-time high.
EUR/USD rose from the 20-day Simple Moving Average (SMA) and found resistance at 1.0930. The key resistance level remains at the 1.1000 barrier. On Tuesday, Eurozone will publish the final reading of the November Consumer Price Index (CPI).
The Pound struggled on Monday; EUR/GBP rose from below 0.8600 to the 0.8650 area. GBP/USD fell for the second consecutive day, retreating from monthly highs but remaining above the 20-day SMA at 1.2610. UK inflation data is due on Wednesday.
The Bank of Japan (BoJ) will announce its decision on Tuesday. No change in the monetary policy stance is expected. However, the outcome will be closely watched as the market seeks hints about the future of the negative interest rate policy (NIRP), which is anticipated to be phased out next year. USD/JPY rose for the second day in a row but is sharply lower for December. The pair rose towards 143.00. Volatility is expected to remain elevated ahead of the BoJ decision and considering recent price action.
Deutsche Bank on BoJ:
We expect the central bank to keep its current monetary policy stance but also see a 60% chance of some hints being made about an end to the negative interest rate policy at the January meeting.
BoJ Preview: Forecasts from 11 major banks, little need to rush into making policy changes
USD/CAD rose modestly after a three-day sharp decline. The pair has a key support level at 1.3350. The Canadian November Consumer Price Index (CPI) is due to be released on Tuesday. The figures are expected to show annual inflation below 3%, but still above the Bank of Canada's 2% target.
AUD/USD posted its third consecutive close near 0.6700. The pair is consolidating at monthly highs, still maintaining a bullish bias. The key resistance level is at 0.6730. The Reserve Bank of Australia (RBA) will release the minutes of its latest meeting, with no major surprises expected.
NZD/USD hit a fresh multi-month high but quickly pulled back. The pair still faces resistance at 0.6250 and is hovering near 0.6200. In the short term, the bias is sideways. New Zealand will release trade data on Tuesday, along with the ANZ Business Confidence survey.
Gold rose moderately despite higher yields but failed to reclaim $2,030. XAU/USD remains above the 20-day SMA. Silver turned downwards after approaching
$24.00 and dropped for the second day in a row, closing around $23.80.
Like this article? Help us with some feedback by answering this survey:
- GBP/JPY is splashing around familiar levels as BoJ rate call looms ahead on Tuesday.
- BoJ watchers will be keeping a close eye on BoJ Governor Ueda for any hawkish hints.
- Near-term UK inflation is expected to tick up, but print a slight decline over the year.
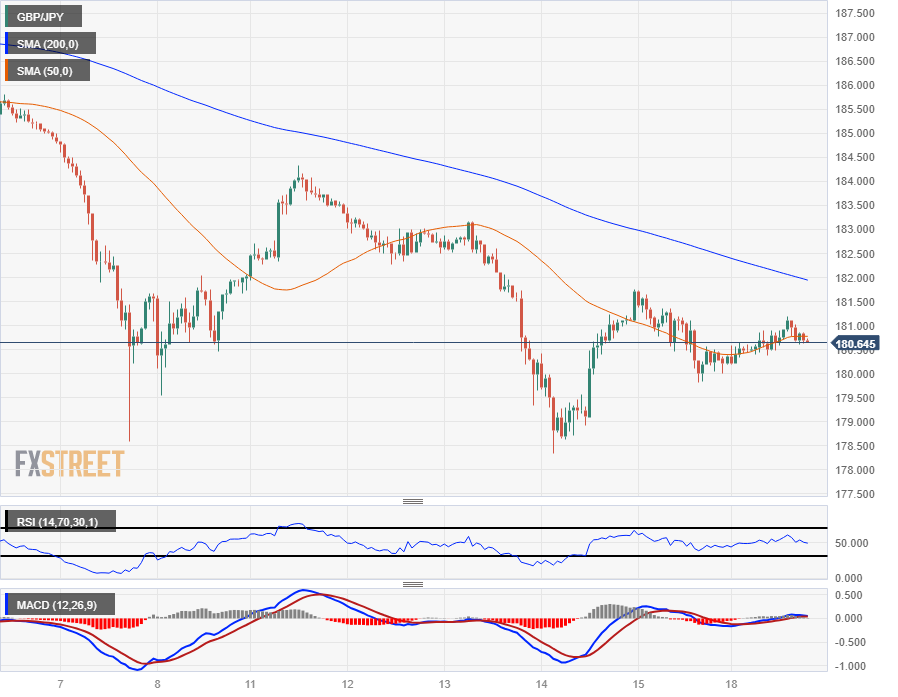
The GBP/JPY tested back into the 181.00 handle on Monday, but remains caught in a tight near-term range as Guppy traders buckle down for a Tuesday showing from the Bank of Japan (BoJ) and Wednesday's final print of UK Consumer Price Index (CPI) inflation to wrap up 2023.
The Bank of Japan (BoJ) is broadly expected to maintain their negative rate policy, keeping the Japanese central bank’s main reference rate pinned just below zero at -0.1%. BoJ Governor Kazuo Ueda rocked JPY markets in early December after taking an unusually hawkish stance, hinting at the eventual end of negative rates.
BoJ Preview: Forecasts from 11 major banks, little need to rush into making policy changes
With markets heading into the year-end slowdown, Odds of normalization from the BoJ are functionally zero, but investors will be keeping a close eye on any additional hints from BoJ Governor Ueda about a possible timeline on policy tightening.
The UK will follow up the BoJ on Wednesday with one last inflation update for 2023. UK Consumer Price Index (CPI) inflation is expected to show a steady easing in the annualized figures, with YoY CPI forecast through November expected to ease back from 4.6% to 4.4%. Despite a forecast easing in long-term inflation, the near end of the curve is expected to tick upwards, with November’s CPI inflation expected to post a 0.2% increase from October’s reading.
UK Producer Price Index (PPI) figures are also slated to print at 07:00 GMT on Tuesday, and both input and output prices at the production level of the economy are expected to see declines.
UK PPI - Output is expected to decline from 0.1% to -0.1%, while PPI - Inputs are forecast to shed nearly a full percent MoM in November from 0.4% to -0.6%.
UK Retail Price Index figures are also expected on Tuesday, and markets are expecting near-term retail price growth to rebound from -0.2% to 0.3% in November, while the YoY figure is forecast to slip back slightly from 6.1% to 5.8%.
One last UK Gross Domestic Product (GDP) update for the year will round out the economic calendar for the GBP/JPY on Friday, with UK economic growth forecast to hold at a flat 0.0% for the third quarter as the UK economy tips closer towards a recession.
GBP/JPY Technical Outlook
The GBP/JPY has seen momentum drain away heading into the new trading week, with intraday bids hammered to the 50-hour Simple Moving Average (SMA), with near-term prices capped by the 200-hour descending into 182.00.
Last week saw a brief decline into a four-month low of 178.35, with bids catching technical support from the 200-day SMA rising through 178.00 and Guppy traders dragging the pair back above the 180.00 major handle.
GBP/JPY Hourly Chart
GBP/JPY Daily Chart

GBP/JPY Technical Levels
- The USD/CHF trades near the 0.8680 level, seeing 0.20% losses.
- Markets await the US Personal Consumption Expenditures (PCE) data on Friday from November.
- Rising US bond yields may limit the downside for the Greenback.
- The SNB also appeared dovish in it last week’s decision.
In Monday's session, the USD/CHF pair dictated a bearish trail, having losses as it traded near the 0.8680 level. The pair's movements mirror the continued softness of the USD, which came in the wake of the US Federal Reserve's dovish surprise and ahead of the release of the Personal Consumption Expenditures (PCE) data from November from the US, which could potentially act as a catalyst for further movements.
In line with that, the Fed held steady with a 5.25%-5.50% interest rate in its December meeting and offered dovish guidance. They hinted that softening inflation data would lead them to contemplate policy easing sooner than initially scheduled with officials seeing three rate cuts in 2024, and as a reaction, the Greenback and the USD/CHF suffered severe selling pressure. On the other hand, the Swiss National Bank (SNB) kept rates pinned at 1.75%, and despite changing its tone to a more dovish approach, the CHF has demonstrated enduring resilience against its rivals in the last sessions.
Meanwhile, US Treasury bond yields are on the uptrend, which may limit the downside for the pair. The 2-year rate rose to 4.45%, while the 5-year and 10-year rates are both noted at 3.95%.
For Friday’s PCE figures, markets expect the core figure to have declined to 3.3% YoY and the headline figure to 2.8%. In addition, its outcome may fuel volatility in the swap markets and on the investor's bets on the next Fed’s decision, which could dictate the pair's pace for the short term.
USD/CHF levels to watch
The daily chart manifests a bearish outlook on the pair, powered by strong selling momentum. The flat position of the Relative Strength Index (RSI) in negative territory, coupled with the presence of flat red bars in the Moving Average Convergence Divergence (MACD), confirms that the bears have the upperhand for the short term but seem to be consolidating their downwards movements.
Providing extra weight to the bearish bias, the pair trades below the 20, 100, and 200-day Simple Moving Averages (SMAs), depicting that the sellers are clearly in command.
Furthermore, indicators turning somewhat flat on the daily chart suggest that bears are taking a breather following a 1% loss within a week. This pause, rather than signaling a trend reversal, may represent a consolidation phase before the next downward leg.
Support Levels: 0.8650, 0.8600, 0.8570.
Resistance Levels: 0.8700, 0.8730, 0.8760 (20-day SMA).
USD/CHF daily chart
-638385250352830513.png)
- GBP/USD extended its losses below 1.2650, with bears gaining traction toward 1.2600.
- Several Fed policymakers crossed the wires and suggested the central bank remains focused on inflation but in a more balanced way.
- On Wednesday, the UK economic docket will feature the release of inflation data, followed by growth on Thursday.
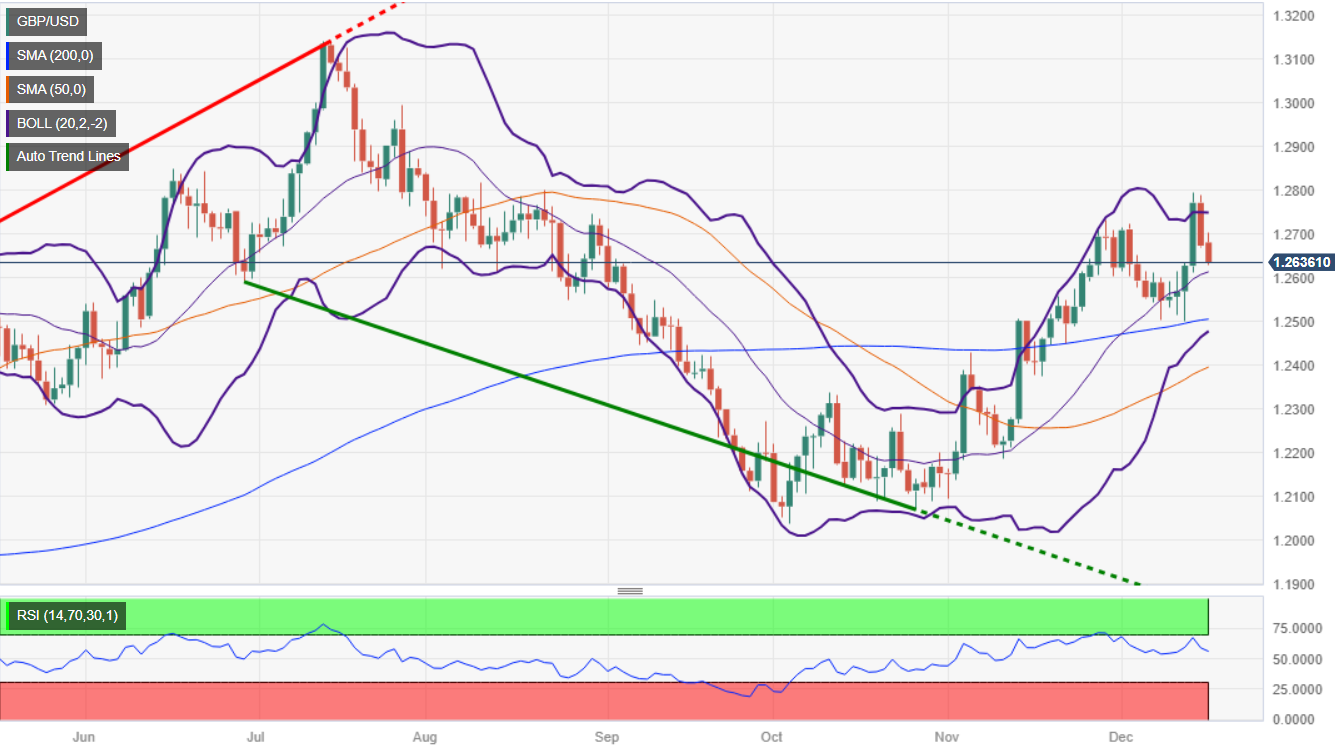
The GBP/USD extended its losses for the second straight day, spurred by the rise in US Treasury bond yields, while the Greenback (USD) trimmed some of its earlier losses on the day. The major is trading at 1.2641, down 0.31%.
GBP bears eye a drop below 1.2500 to extend its losses below 1.2400
In the last week, the US Federal Reserve (Fed) and the Bank of England (BoE) held their latest interest rate decisions, with both central banks maintaining the reference rates unchanged but striking the financial markets with different messages. The Fed Chairman Jerome Powell delivered a dovish message, sponsoring the GBP/USD rally from around 1.2500 to 1.2793.
Contrarily, BoE’s Governor Andrew Bailey, pushed back against easing monetary policy. It should be said that once the Fed shifted toward keeping rates steady, speculators began to price in lower interest rates in central banks across the globe.
Meanwhile, traders are betting the Fed will begin to cut rates in May, as shown by data from the Chicago Board of Trade (CBOT). Fed Funds futures estimate the Fed will lower borrowing costs to 4% by the end of next year. Across the pond, the BoE is also expected to cut 80 basis points, but it would be more slowly.
Since last Friday, Federal Reserve officials have pushed back against Powell’s dovish message, led by the New York Fed President John Williams, saying that rate cut discussions are off the table. Meanwhile, Atlanta’s Fed President Raphael Bostic said they must remain resolute on fighting inflation despite projecting two rate cuts and a soft-landing next year. Recently, the Chicago Fed President, Austan Goolsbee, stated he sees an improvement in inflation and added the Fed would not want to recommit to what they will do at future meetings.
In the meantime, the US economy posted solid data, showcasing its resilience. Across the pond, the UK economy so far has dodged a recession, but Tbursday’s data could paint a stagflationary scenario of high inflation and an economy in recession. That could be US Dollar positive and trigger a leg-down towards the 200-day moving average (DMA) at 1.2504.
GBP/USD Price Analysis: Technical Levels
The pair is bullish-biased, sitting above the DMAs, with the 50-DMA about to cross above the 100-DMA, suggesting the formation of a golden cross is looming. Once the 50-DMA surpasses the 1.2449, that would pave the way to register a golden cross at around 1.2504. On the other hand, the pair could turn bearish if it breaks key support level at 1.2504, the 200-DMA, followed by the November 14 swing high turned support at 1.2505.
- AUD/USD pulls back from recent five-month highs of 0.6735 amid a rebound in US Treasury bond yields.
- Regional Federal Reserve officials had pushed back against rate cut expectations.
- Traders await the Reserve Bank of Australia (RBA) last meeting minutes.
The AUD/USD retreats from five-month highs of 0.6735 and drops below the 0.6700 figure courtesy of a jump in US Treasury bond yields, reflected on the Greenback (USD) paring some of its earlier losses. At the time of writing, the pair exchanges hands at 0.6694, down by a minimal 0.07%.
AUD/USD remains on the defensive due to a firm US Dollar
A risk-on impulse failed to underpin the AUD/USD pair on Monday. A sudden rise in US Treasury yields sponsored by US Federal Reserve officials pushing back against Chair Jerome Powell’s last Wednesday words cushioned the US Dollar from extending its losses.
The Fed parade began with the New York Fed President John William saying they have not discussed rate cuts. Instead, the discussion lies in whether the Fed is sufficiently restrictive or has room for higher rates. As most officials had said, that would depend on upcoming data crossing the wires.
Meanwhile, Atlanta’s Fed President Raphael Bostic said they must remain resolute on fighting inflation despite projecting two rate cuts and a soft landing next year. Recently, the Chicago Fed President, Austan Goolsbee, stated he sees an improvement in inflation and added the Fed would not want to recommit to what they will do at future meetings.
Australia’s economy remains resilient after printing solid employment figures and steady Flash PMI reports. However, traders are awaiting the release of the Reserve Bank of Australia’s (RBA) last meeting minutes on Tuesday, alongside housing data on Wednesday. AUD/USD traders are also eyeing Chinese data as the People’s Bank of China (PBoC) is scheduled to announce its decision on interest rates.
AUD/USD Price Analysis: Technical outlook
The AUD/USD daily chart portrays the pair as upward biased, and despite retracting below the 0.67 figure, the uptrend is intact. It should be said that once buyers reclaimed an 11-month-old resistance trendline, it suggests that buyers are in charge, and they might lift the exchange rates upwards. If they reclaim 0.6700, the next resistance would be the July 27 high at 0.6821, followed by the July 14 high at 0.6894. On the other hand, a daily close below 0.6700 would pave the way to retest support at around 0.6650, followed by the 200-day moving average (DMA) at 0.6576.
- The DXY Index is witnessing mild losses after concluding its weakest week in over a month.
- US PCE inflation report and housing data are next on the investors' radar.
The US Dollar (USD) took a slight downturn in the early part of the week, bracing itself before the release of the Personal Consumption Expenditures (PCE) Price Index data on Friday, which is the Federal Reserve (Fed) preferred gauge of inflation. Inflation figures will give additional insights to investors to continue placing their bets on the next Fed decisions. The US Dollar Index is trading at the 102.50 area, 0.1% down on the day.
In the last 2023 meeting, the Fed's dovish stance emerged, with officials forecasting 75 bps of rate cuts for 2024, recognizing that inflation is softening, which fueled risk on flows that significantly pushed the DXY downwards. However, markets may be overhyped with the dovish surprise, as the bank may consider delaying cuts if inflation remains sticky, so Friday’s figures will be important.
Daily Market Movers: US Dollar remains weak on the back of the Fed’s dovish surprise
- The US Dollar experienced mild losses as the week kicked off, with traders awaiting the release of the PCE Price Index data.
- The US will report mid-tier housing figures on Tuesday and Wednesday that may impact Greenback’s price dynamics.
- The Q3 Gross Domestic Product final revision is due on Thursday.
- In the meantime, US bond yields are trending upwards, with the 2-year yield at 4.44%, the 5-year yield at 3.95%, and the 10-year yield at 3.95%, which may limit the downside of the US Dollar.
- The CME FedWatch Tool insights indicate that markets are considering possible rate cuts by March 2024.
Technical Analysis: DXY index shows a bearish short-term outlook, sellers maintain control
The indicators on the daily chart reflect a stronger selling momentum on the DXY. The Relative Strength Index (RSI) is in negative territory with a downward slope, indicating an inherent bearishness in the index. The red bars of the Moving Average Convergence Divergence (MACD) further confirm this bearish momentum.
The position of the index with respect to its 20, 100, and 200-day Simple Moving Averages (SMAs) also highlights the continuing dominance of the bears. The DXY trading beneath all these SMAs implies a strong downward bias, affirming the bearish undertone.
Support levels: 102.00,102.30, 101.50.
Resistance levels: 103.45 (20 and 200-day SMA bearish crossover), 104.60 (100-day SMA), 104.80.
US Dollar FAQs
What is the US Dollar?
The US Dollar (USD) is the official currency of the United States of America, and the ‘de facto’ currency of a significant number of other countries where it is found in circulation alongside local notes. It is the most heavily traded currency in the world, accounting for over 88% of all global foreign exchange turnover, or an average of $6.6 trillion in transactions per day, according to data from 2022.
Following the second world war, the USD took over from the British Pound as the world’s reserve currency. For most of its history, the US Dollar was backed by Gold, until the Bretton Woods Agreement in 1971 when the Gold Standard went away.
How do the decisions of the Federal Reserve impact the US Dollar?
The most important single factor impacting on the value of the US Dollar is monetary policy, which is shaped by the Federal Reserve (Fed). The Fed has two mandates: to achieve price stability (control inflation) and foster full employment. Its primary tool to achieve these two goals is by adjusting interest rates.
When prices are rising too quickly and inflation is above the Fed’s 2% target, the Fed will raise rates, which helps the USD value. When inflation falls below 2% or the Unemployment Rate is too high, the Fed may lower interest rates, which weighs on the Greenback.
What is Quantitative Easing and how does it influence the US Dollar?
In extreme situations, the Federal Reserve can also print more Dollars and enact quantitative easing (QE). QE is the process by which the Fed substantially increases the flow of credit in a stuck financial system.
It is a non-standard policy measure used when credit has dried up because banks will not lend to each other (out of the fear of counterparty default). It is a last resort when simply lowering interest rates is unlikely to achieve the necessary result. It was the Fed’s weapon of choice to combat the credit crunch that occurred during the Great Financial Crisis in 2008. It involves the Fed printing more Dollars and using them to buy US government bonds predominantly from financial institutions. QE usually leads to a weaker US Dollar.
What is Quantitative Tightening and how does it influence the US Dollar?
Quantitative tightening (QT) is the reverse process whereby the Federal Reserve stops buying bonds from financial institutions and does not reinvest the principal from the bonds it holds maturing in new purchases. It is usually positive for the US Dollar.
- The EUR/GBP is up half a percent to kick off the pre-holiday trading week.
- The Euro is firming up a technical rebound against the Pound Sterling on Monday.
- Dueling speeches from ECB & BoE officials leave the EUR the winner.
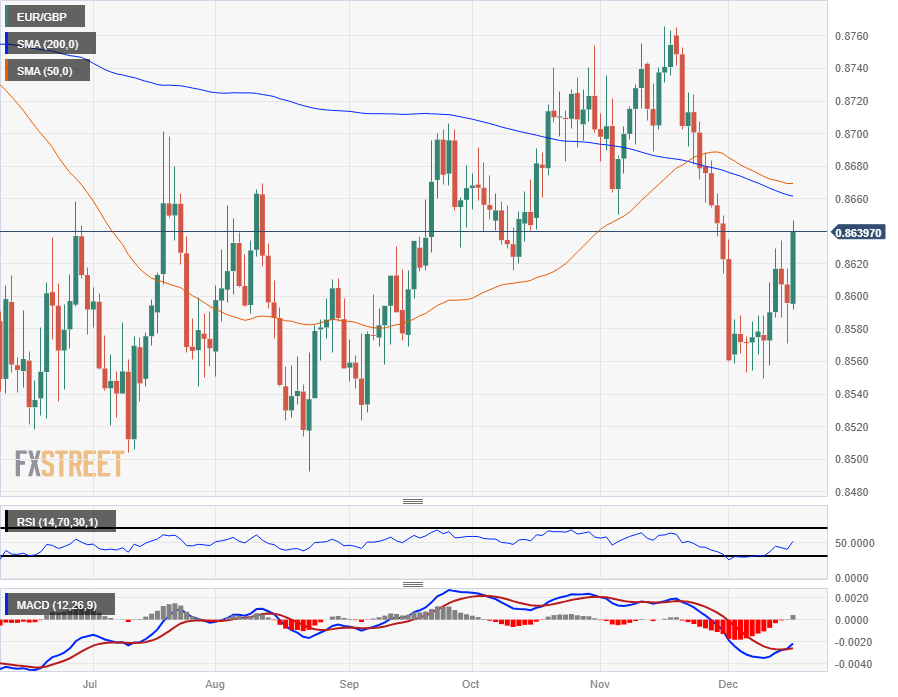
The EUR/GBP is hardening a technical rebound towards the 0.8700 handle after a rough battle over the 0.8600 handle last week. December saw the pair struggling to develop momentum after getting pinned into 0.8560 in November’s 2.3% decline from 0.8765.
ECB's Kazimir: Drop in inflation not enough to declare victory and move to next stage
It’s a heavy week of inflation figures across several market sessions this week, but the hat-tip for high-impact data goes to the Pound Sterling (EUR) this week, with UK Consumer Price Index (CPI) and Producer Price Index (PPI) inflation figures due on Wednesday. Friday will round out the GBP’s trading week with a UK Gross Domestic Product (GDP) update, as well as a fresh print of UK Retail Sales.
The Euro (EUR) sees a final print of the Eurozone’s Harmonized Index of Consumer Prices (HICP) for November, but the confirmation figures are not expected to deviate from the preliminary figures that showed a -0.5% contraction in Eurozone inflation in November.
BoE's Broadbent: It takes time to understand the forces driving the economy
Policymakers from both the European Central Bank (ECB) and the Bank of England (BoE) made appearances early Monday, but markets tipped in favor of the Euro as ECB officials appeared slightly more confident than their UK counterparts.
The ECB’s Peter Kazimir noted that while it’s too early to “declare victory” over inflation, ECB officials remain confident that inflation will continue to deflate towards the ECB’s targets by 2025. Kazimir’s message was echoed by ECB Governing Council member Yannis Stournaras, who noted that the ECB would need to see inflation dipping below 3% and then remaining in that neighborhood by mid-2024 before the ECB even begins to consider rate cuts.
On the UK side, BoE Deputy Governor Ben Broadbent struck a notably less-hopeful tone than his ECB contemporaries, focusing on volatility in official estimates and bemoaning the disparity between different economic indicators plaguing the UK’s economy and clouding the BoE’s ability to provide an accurate outlook.
EUR/GBP Technical Outlook
The EUR/GBP’s rally back over 0.8600 sends the pair towards the 200-day Simple Moving Average (SMA) near 0.8660, and a clear break of the moving average will set the pair up for a challenge of the 0.8700 handle.
The pair remains notably down from November’s peak bids, and December opened with the EUR/GBP testing four-month lows before sluggishly pricing in a floor from 0.8560.
Consolidation patterns have been the EUR/GBP’s common theme in 2023, and it won’t take much for short-sellers to interrupt the current bullish climb to chalk in another interim turnaround region near the 200-day SMA at 0.8660.
EUR/GBP Daily Chart
EUR/GBP Technical Levels
- Canadian Dollar pares back some of last Friday’s gains ahead of Canadian CPI on Tuesday.
- Monday’s economic calendar has a thin docket, but key data to wrap up 2023 due this week.
- CAD and crude Oil diverge as WTI recovers some ground on Monday.
The Canadian Dollar (CAD) is pulling back in the bids to kick off the last two weeks of trading in 2023, with a final print of StatsCAN’s Canadian Consumer Price Index (CPI) inflation on the docket for Tuesday.
On top of muddying the waters by reporting its own version of Canadian CPI on Tuesday, the Bank of Canada (BoC) will publish its latest Summary of Deliberations on Wednesday. Thursday’s Canadian Retail Sales and Friday’s Canadian Gross Domestic Product (GDP) will be overshadowed by counterpart US data punching in a higher weight class.
Daily Digest Market Movers: Canadian Dollar markets coil ahead of 2023’s final inflation print
- Monday opens quietly heading into the final turn of the trading year.
- The CAD is paring back slightly on Monday, falling or flattening against nearly all other major currencies.
- The Loonie slipped a tenth of a percent against the US Dollar (USD) but climbed four-tenths of one percent against the Japanese Yen (JPY) as the Yen outpaced the Canadian Dollar to be the weakest currency in Monday trading.
- Canadian Consumer Price Index inflation on Tuesday is expected to show further cooling in consumer-facing prices, with the YoY figure forecast to tick down from 3.1% to 2.9%. November’s MoM CPI is also expected to see a return to cooling territory, slated to fall to -0.2% from October’s 0.1%.
- The BoC’s Summary of Deliberations is due on Wednesday but is unlikely to reveal much new information that wasn’t already discussed at length by BoC Governor Tiff Macklem at last Friday’s speaking event.
- BoC Macklem: It’s still too early to consider cutting our policy rate
- Thursday’s Canadian Retail Sales for October are forecast to improve to 0.8% from September’s 0.6%, and Friday’s Canadian Gross Domestic Product print is forecast to round out the trading year with an upbeat expectation of 0.2% in October versus September’s 0.1%.
Canadian Dollar price today
The table below shows the percentage change of Canadian Dollar (CAD) against listed major currencies today. Canadian Dollar was the strongest against the Japanese Yen.
| USD | EUR | GBP | CAD | AUD | JPY | NZD | CHF | |
| USD | -0.24% | 0.34% | 0.09% | 0.03% | 0.49% | 0.06% | -0.30% | |
| EUR | 0.22% | 0.54% | 0.34% | 0.27% | 0.74% | 0.30% | -0.06% | |
| GBP | -0.30% | -0.54% | -0.22% | -0.27% | 0.19% | -0.25% | -0.60% | |
| CAD | -0.10% | -0.34% | 0.20% | -0.07% | 0.40% | -0.04% | -0.39% | |
| AUD | -0.03% | -0.27% | 0.31% | 0.07% | 0.46% | 0.03% | -0.32% | |
| JPY | -0.49% | -0.72% | -0.16% | -0.40% | -0.48% | -0.42% | -0.79% | |
| NZD | -0.07% | -0.30% | 0.24% | 0.04% | -0.04% | 0.43% | -0.36% | |
| CHF | 0.29% | 0.06% | 0.60% | 0.38% | 0.32% | 0.79% | 0.35% |
The heat map shows percentage changes of major currencies against each other. The base currency is picked from the left column, while the quote currency is picked from the top row. For example, if you pick the Euro from the left column and move along the horizontal line to the Japanese Yen, the percentage change displayed in the box will represent EUR (base)/JPY (quote).
Technical Analysis: The Canadian Dollar’s Monday pause could give way to full-blown pullback if Greenback bidders catch Loonie bulls with their pants down
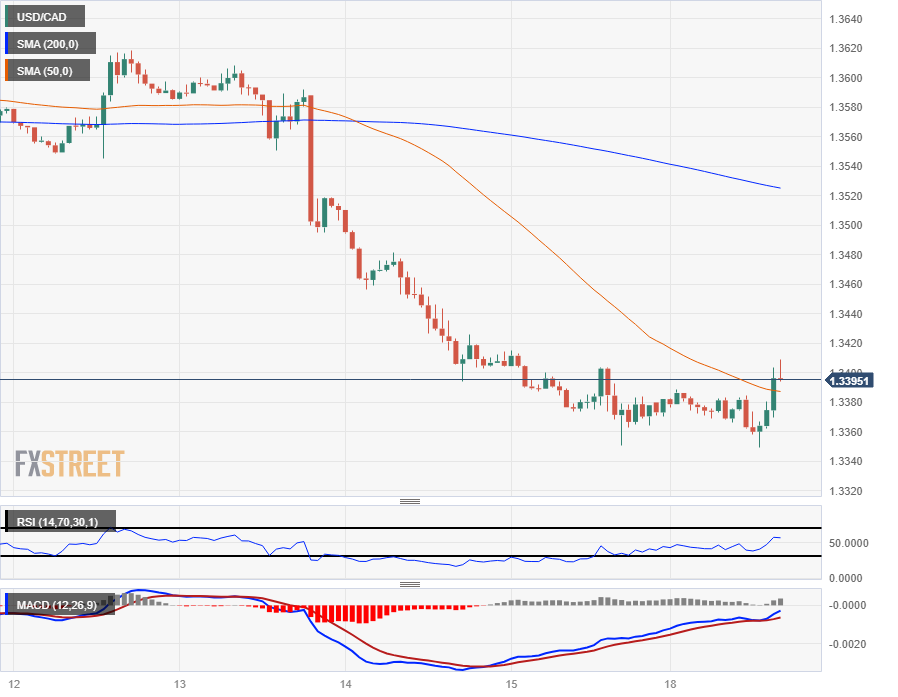
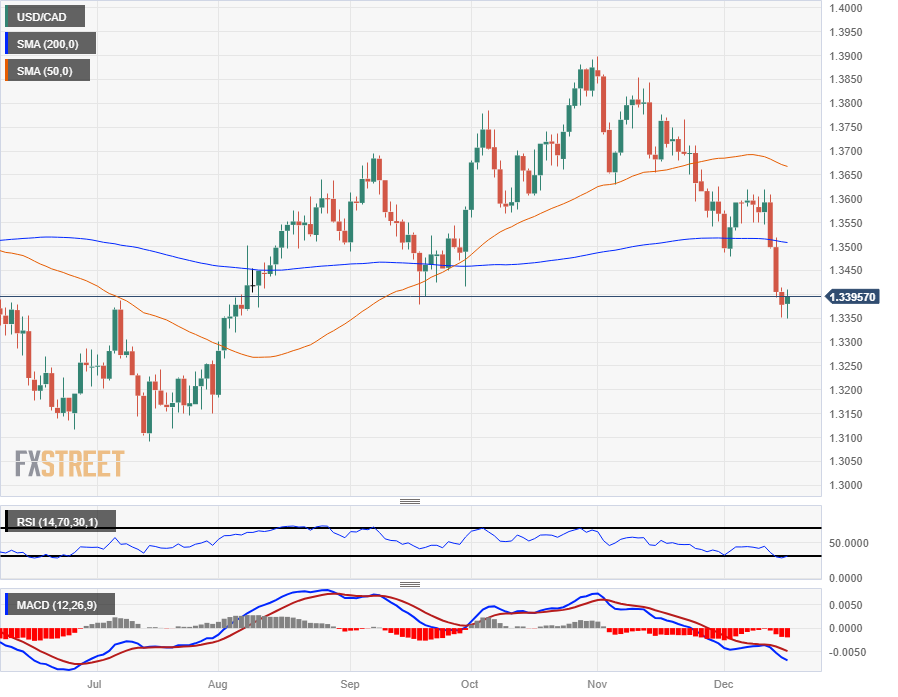
Monday sees the Canadian Dollar pulling back into 1.3400 against the US Dollar in a slight paring back from recent bullish momentum. The Canadian Dollar’s three-day bull run last week saw the USD/CAD tip into multi-month highs near 1.3350 after falling from last week’s highs near the 1.3600 handle.
The pair is down over three and a half percent from November’s early high just below 1.3900, but last week’s clean break of the 200-day Simple Moving Average (SMA) near 1.3500 could see the USD/CAD primed for a pullback.
If Loonie bidding doesn’t return meaningfully to push the pair back down to 2023’s bottom bids near 1.3100, the ceiling on a bullish rebound for the Greenback might not firm up until bids return to the 50-day SMA descending into 1.3650.
USD/CAD Hourly Chart
USD/CAD Daily Chart
Canadian Dollar FAQs
What key factors drive the Canadian Dollar?
The key factors driving the Canadian Dollar (CAD) are the level of interest rates set by the Bank of Canada (BoC), the price of Oil, Canada’s largest export, the health of its economy, inflation and the Trade Balance, which is the difference between the value of Canada’s exports versus its imports. Other factors include market sentiment – whether investors are taking on more risky assets (risk-on) or seeking safe-havens (risk-off) – with risk-on being CAD-positive. As its largest trading partner, the health of the US economy is also a key factor influencing the Canadian Dollar.
How do the decisions of the Bank of Canada impact the Canadian Dollar?
The Bank of Canada (BoC) has a significant influence on the Canadian Dollar by setting the level of interest rates that banks can lend to one another. This influences the level of interest rates for everyone. The main goal of the BoC is to maintain inflation at 1-3% by adjusting interest rates up or down. Relatively higher interest rates tend to be positive for the CAD. The Bank of Canada can also use quantitative easing and tightening to influence credit conditions, with the former CAD-negative and the latter CAD-positive.
How does the price of Oil impact the Canadian Dollar?
The price of Oil is a key factor impacting the value of the Canadian Dollar. Petroleum is Canada’s biggest export, so Oil price tends to have an immediate impact on the CAD value. Generally, if Oil price rises CAD also goes up, as aggregate demand for the currency increases. The opposite is the case if the price of Oil falls. Higher Oil prices also tend to result in a greater likelihood of a positive Trade Balance, which is also supportive of the CAD.
How does inflation data impact the value of the Canadian Dollar?
While inflation had always traditionally been thought of as a negative factor for a currency since it lowers the value of money, the opposite has actually been the case in modern times with the relaxation of cross-border capital controls. Higher inflation tends to lead central banks to put up interest rates which attracts more capital inflows from global investors seeking a lucrative place to keep their money. This increases demand for the local currency, which in Canada’s case is the Canadian Dollar.
How does economic data influence the value of the Canadian Dollar?
Macroeconomic data releases gauge the health of the economy and can have an impact on the Canadian Dollar. Indicators such as GDP, Manufacturing and Services PMIs, employment, and consumer sentiment surveys can all influence the direction of the CAD. A strong economy is good for the Canadian Dollar. Not only does it attract more foreign investment but it may encourage the Bank of Canada to put up interest rates, leading to a stronger currency. If economic data is weak, however, the CAD is likely to fall.
- The Swiss Franc catches a bid on the back of safe-haven demand after the Red Sea becomes a no-go area, following Houthi attacks.
- Major shipping firms have rerouted their ships to go around the Cape of Good Hope to avoid the attacks.
- Swiss Franc pairs resume their bearish bias as haven demand supports the CHF.
The Swiss Franc (CHF) traded overall higher on Monday due to safe-haven demand as sentiment soured on global trade fears sparked by the Middle East geopolitical tensions.
Fears regarding global trade ratcheted up after the Iran-backed Houthi militia launched a drone attack on a Maersk shipping vessel in the Red Sea on Saturday. This led the company to reroute all its shipping vessels via the Cape of Good Hope. Other companies, including British Petroleum, followed suit.
Daily digest market movers: Swiss Franc gains after risk aversion ratchets up
- The Swiss Franc edges higher versus the US Dollar (USD) on Monday as geopolitical concerns support the safe-haven Franc.
- At recent central bank meetings, Federal Reserve (Fed) Chairman Jerome Powell mentioned interest rate cuts had been discussed, weighing on the US Dollar.
- This contrasted with the more hawkish tone of the Chairman of the Swiss National Bank (SNB) Thomas Jordan who seemed to imply policy would remain restrictive for the foreseeable future.
Swiss Franc technical analysis: USD/CHF resumes broader downtrend
USD/CHF – the number of Swiss Francs that one US Dollar can buy – continues trading around the December lows.
The pair is arguably in a downtrend now on all major time frames, suggesting bears are fully in charge and further price weakness is probable.
-638385143112292689.png)
US Dollar vs Swiss Franc: Daily Chart
If a break below the December lows holds, the pair may well continue falling toward the next target at the July 2023 lows of 0.8552. Beyond that, further weakness could drag the pair down to 0.8500 and beyond.
The Relative Strength Index (RSI) is showing bullish convergence at the lows when compared to the December 4 lows. The RSI is not as low as it was earlier in the month despite price making a lower low during the December 14 sell-off.
Daily digest market movers: Swiss Franc falls to Euro as Lagarde’s hawkish comments resonate
- The Swiss Franc weakened against the Euro on Monday despite more lackluster data from the Eurozone.
- German business confidence deteriorated in December, following two consecutive improvements, according to data released on Monday. The IFO Business Climate Index dropped unexpectedly in December, with the sentiment about the current economic situation and the near-term expectations posting lower levels than in the previous month.
- “These figures come after the downbeat PMI figures seen late last week and the contracting Gross Domestic Product (GDP) seen earlier this month, confirming the view of an upcoming economic slowdown.” Said FXStreet analyst Guillermo Alcala in a note on the Euro on Monday.
- The Single Currency may be finding support after the hawkish comments from European Central Bank (ECB) President Christine Lagarde last week, who said rate cuts had not been discussed “at all” during the meeting.
Swiss Franc technical analysis: EUR/CHF trends higher in the short-term, but longer-term horizon still bearish
EUR/CHF – the number of Swiss Francs that one Euro can buy – is rising marginally on Monday.
The medium-term trend is still either sideways or bearish. Nevertheless, the MACD momentum indicator is likely to execute a bullish crossover given a positive close on Monday, indicating probable strength to come.
A decisive break above 0.9600 would probably indicate a break above the resistance cap from the 50-day and 100-day Simple Moving Averages (SMA) and leave the way open to further upside to the top of the range at around 0.9685.
-638385143843387008.png)
Euro vs Swiss Franc: Daily Chart
A decisive weekly-bar break below the 0.9403 multi-year low would reconfirm the long-term bearish bias and see prices fall into uncharted territory, with major whole numbers then expected to provide support at 0.9300, 0.9200 and so on.
Daily digest market movers: Sterling edges lower against Swiss Franc as risk appetite recedes
- The Swiss Franc gains against the Pound Sterling (GBP) on Monday after growing tensions in the Middle East led to a flight to safety, advantaging the Franc over the Pound.
- At its recent meeting, the Bank of England (BoE) noted that inflation remains persistently high, suggesting rates will also need to stay high for longer, benefiting the Sterling.
- The Swiss National Bank also continues to strike a hawkish tone after Chairman Thomas Jordan dismissed the possibility of another cut and suggested rates would remain at current levels for the foreseeable future.
Swiss Franc technical analysis: GBP/CHF back in the middle of its range
GBP/CHF – the number of Swiss Francs that one Pound Sterling can buy – pressures the floor of an over-month-long range on the 4-hour chart, used to analyze the short-term trend. It is also sideways on long-term time frames.
-638385144511317118.png)
Pound Sterling vs Swiss Franc: 4-hour Chart
The MACD has recently crossed below its signal line whilst above the zero line, giving a bearish short-term signal and could signify more losses to come.
A break below the 1.0960 lows of the attempted downside breakout on December 14 would reconfirm more downside, leading to a more concerted sell-off as the range floor finally gives way. Such a move would be expected to reach a target at the very least as far down as the 61.8% extrapolation of the height of the range at 1.0895.
A break above the 1.1085 resistance zone, meanwhile, would be required to invert the bearish outlook to a more bullish short-term picture.
Swiss Franc FAQs
What key factors drive the Swiss Franc?
The Swiss Franc (CHF) is Switzerland’s official currency. It is among the top ten most traded currencies globally, reaching volumes that well exceed the size of the Swiss economy. Its value is determined by the broad market sentiment, the country’s economic health or action taken by the Swiss National Bank (SNB), among other factors. Between 2011 and 2015, the Swiss Franc was pegged to the Euro (EUR). The peg was abruptly removed, resulting in a more than 20% increase in the Franc’s value, causing a turmoil in markets. Even though the peg isn’t in force anymore, CHF fortunes tend to be highly correlated with the Euro ones due to the high dependency of the Swiss economy on the neighboring Eurozone.
Why is the Swiss Franc considered a safe-haven currency?
The Swiss Franc (CHF) is considered a safe-haven asset, or a currency that investors tend to buy in times of market stress. This is due to the perceived status of Switzerland in the world: a stable economy, a strong export sector, big central bank reserves or a longstanding political stance towards neutrality in global conflicts make the country’s currency a good choice for investors fleeing from risks. Turbulent times are likely to strengthen CHF value against other currencies that are seen as more risky to invest in.
How do decisions of the Swiss National Bank impact the Swiss Franc?
The Swiss National Bank (SNB) meets four times a year – once every quarter, less than other major central banks – to decide on monetary policy. The bank aims for an annual inflation rate of less than 2%. When inflation is above target or forecasted to be above target in the foreseeable future, the bank will attempt to tame price growth by raising its policy rate. Higher interest rates are generally positive for the Swiss Franc (CHF) as they lead to higher yields, making the country a more attractive place for investors. On the contrary, lower interest rates tend to weaken CHF.
How does economic data influence the value of the Swiss Franc?
Macroeconomic data releases in Switzerland are key to assessing the state of the economy and can impact the Swiss Franc’s (CHF) valuation. The Swiss economy is broadly stable, but any sudden change in economic growth, inflation, current account or the central bank’s currency reserves have the potential to trigger moves in CHF. Generally, high economic growth, low unemployment and high confidence are good for CHF. Conversely, if economic data points to weakening momentum, CHF is likely to depreciate.
How does the Eurozone monetary policy affect the Swiss Franc?
As a small and open economy, Switzerland is heavily dependent on the health of the neighboring Eurozone economies. The broader European Union is Switzerland’s main economic partner and a key political ally, so macroeconomic and monetary policy stability in the Eurozone is essential for Switzerland and, thus, for the Swiss Franc (CHF). With such dependency, some models suggest that the correlation between the fortunes of the Euro (EUR) and the CHF is more than 90%, or close to perfect.
- WTI Crude Oil, the US benchmark, rises over 2% amid escalating geopolitical tensions in the Middle East.
- Attacks on ships around the Red Sea by a militant group linked to Iran, impacting Oil shipping routes, contribute to the rally.
- The recent weakening of the US Dollar after the Federal Reserve pivot, along with geopolitical risks, to underpin WTI’s price.
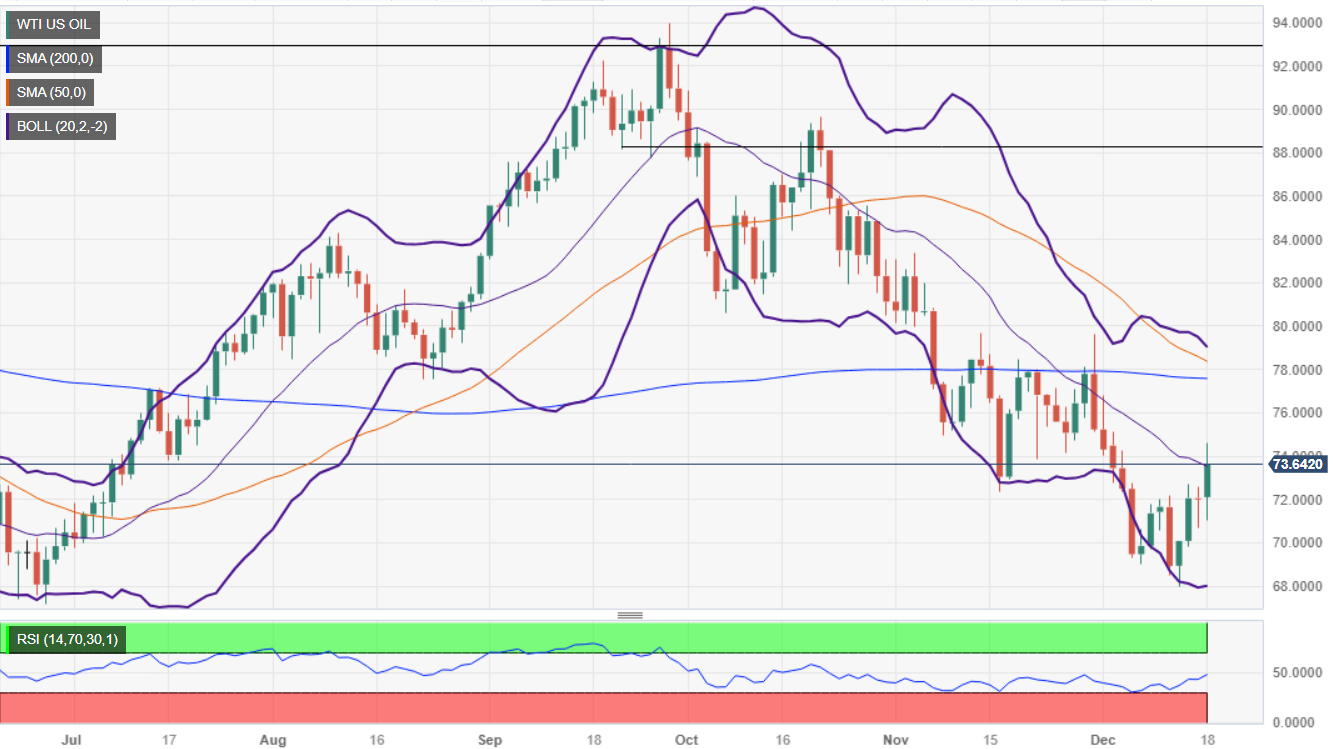
The US Crude Oil benchmark, also known as West Texas Intermediate (WTI), has risen more than 2% on geopolitical risks as a militant group linked to Iran continues to attack ships around the Red Sea. This has triggered a rally in WTI, exchanging hands at $73.82 due to Oil supply disruption.
WTI surges as a militant group linked to Iran continues attacks on ships in the Red Sea
Crude Oil prices extended their rally to four straight days, bolstered by a weaker US Dollar (USD) after the US Federal Reserve (Fed) ended its tightening cycle, hinting that rate cuts lie ahead in 2024. Nevertheless, an attack on Norwegian-owned vessels and Oil shipping firms avoiding the Red Sea is already impacting Oil prices.
Sources cited by Reuters said, “The rise in geopolitical risk premium, which has come in the form of regular hostilities towards commercial vessels in the Red Sea by Iran-backed Houthi rebels, plays its indisputable part in Oil's resurrection.”
Around 15% of world shipping traffic passes via the Suez Canal, the shortest shipping route between Europe and Asia.
Meanwhile, an increase in supply cushioned WTI’s rise on Monday, but Russia and Saudi Arabia, extending Crude Oil production cuts to the first quarter of 2024, are underpinning Oil prices.
WTI’s outlook remains uncertain due to the recent developments, but due to the location of daily moving averages (DMAs) above WTi’s price, could open the door for further losses. Otherwise, further escalation in the Middle East area, could lift prices and dent inflation progress worldwide.
WTI Price Analysis: Technical outlook
The daily chart portrays WTI as neutral to downward biased, but today’s jump would pave the way for a new trading range within the $72.22-$76.00 area, ahead of testing the 200-day moving average (DMA) at $77.72. On the other hand, achieving a daily close below November’s 16 latest cycle low of $72.22 could open the door to a dip to the $70.00 mark, followed by December’s swing low of $67.74.
- The USD/JPY edged upwards, trading towards the 143.00 level.
- Markets await Tuesday's BoJ meeting, potentially setting the pair's pace for the short term.
- Political scandals in Japan may push the BoJ to remove its negative interest rates policy.
- US bond yields experienced an upturn and lifted the US dollar.
In Monday 's session, the USD/JPY pair is making notable strides upward, trading around the 143.00 level. A surge in US yields has largely propelled the pair and a risk-on environment, shifting demand away from the safe-haven JPY. Ahead of the Bank of Japan's (BoJ) decision on Tuesday, the Japanese currency has a chance to outperform the Greenback on monetary policy divergences in case the BoJ gives a hawkish surprise.
On the US side, the Federal Reserve (Fed) maintained rates of 5.25%-5.50% in its December meeting and provided largely dovish guidance; inflation was recognized to be softening, prompting the Fed to consider ease in policy sooner than originally planned. The prospect of rate cuts could begin as early as May if core inflation trends positively. This dovish stance in the Fed's policy significantly weakened the US Dollar, which faced severe selling pressure last week.
Meanwhile, US Treasury yields are edging higher. The 2-year rate is 4.45%, while the 5-year and 10-year rates rose to 3.95% each, which favored the US Dollar.
On the JPY side, political scandals in Japan could hasten the Bank of Japan's (BoJ) timeline to end the Negative Interest Rate Policy (NIRP). This potential early exit from NIRP, likely before April, could bring volatility to the USD/JPY. Following this, two 10bps hikes are expected from the BoJ in 2024, but global economic trends could make this 'one and done '. In line with that, markets will closely look at the bank's stance and approach on Tuesday to get further clues on its next movements to place their bets and positions.
USD/JPY levels to watch
On the daily chart, indicators demonstrate a dominant selling momentum in the short-term perspective. The Relative Strength Index (RSI) poised in negative territory, reveals continued selling pressure but is now on a positive slope, suggesting that the selling traction is slowing down, likely attributed to bears taking a breather following a nearly 2% losing week.
Moving onto the Moving Average Convergence Divergence (MACD), it lays out flat red bars, indicating a lack of momentum from the sellers. Despite the recently printed bearish MACD histogram, the flatness hints at a potential pause in the market's downturn, further aligning with the RSI's sentiment of bears taking a quick respite.
Turning to the Simple Moving Averages (SMAs), the pair is wedged between levels, trading below the 20 and 100-day SMAs yet sustaining above the significant 200-day threshold. This configuration hints at a stronger selling force in the shorter timeframe, but the pair's survival above the 200-day SMA implies the long-term bullish sentiment hasn't faded completely..
Support Levels: 142.55 (200-day SMA), 142.00,141.00.
Resistance Levels: 143.50, 144.00, 145.00.
USD/JPY daily chart
-638385127029814564.png)
- Mexican Peso drops amid the lack of economic data, but remains inside the 17.00/17.60 range.
- Banxico to remain cautious despite easing policy for the next year commented its Governor Rodriguez Ceja.
- Federal Reserve officials pushed back against aggressive bets suggesting the central bank would cut rates twice its projections.
The Mexican Peso (MXN) registered losses of more than 0.40% against the US Dollar (USD) earlier in the North American session, as the Bank of Mexico (Banxico) Governor Victoria Rodriguez Ceja crossed the wires. As portrayed by US equities, investors' appetite for risk remains positive, while Federal Reserve (Fed) officials have pushed back against the market’s aggressively pricing more than 100 basis points of rate cuts. The USD/MXN is trading at 17.26 after hitting a daily high of 17.77.
Mexico’s economic docket remains scarce, though Banxico’s Governor Rodriguez Ceja grabbed the headlines. She commented that inflation has fallen, but they remain cautious about when beginning to ease monetary policy. She added that they’re anticipating cutting rates “gradually.”
Daily digest market movers: Mexican Peso on the defensive amidst Banxico’s dovish comments
- Banxico’s Governor Victoria Rodriguez Ceja noted that if data supports the disinflationary process, they could ease monetary policy in the first quarter of 2024.
- Bank of Mexico's Governor added that despite reviewing their inflation projections for 2024, the central bank kept its forecast of inflation returning to its 3% target in 2025.
- Lastly, Victoria Rodriguez Ceja added the Governing Council considers several factors when determining its policy, including the exchange rate, though they’re not focused on a specific level.
- Banxico’s decision to keep rates unchanged last week was unanimously supported by its five members.
- The central bank acknowledged that inflation risks are tilted to the upside after November’s report witnessed headline inflation rising due to the “rise in non-core components” while core inflation eased.
- Banxico revised its inflation projections for some quarters of 2024 and 2025.
- US business activity picked up in December, according to S&P Global. The composite index, which combines manufacturing and services sectors, increased to 51, exceeding November’s 50.7 and hitting a five-month high.
- Federal Reserve official Raphael Bostic projects two rate cuts next year and a soft landing. Nevertheless, he added the US central bank must be resolute, and that rate cuts are not imminent.
- Aside from this, the New York Fed President John Williams pushed back against the idea of rate cuts, emphatically saying it’s “premature” to think about easing policy in March.
- Williams added that the question around the Fed board is whether the policy is sufficiently restrictive enough to ensure inflation returns to 2%.
- According to the Summary of Economic Projections (SEP), Fed officials expect to lower the federal funds rates (FFR) to 4.60% in 2024, though they remain data-dependent.
- The fall in US Treasury bond yields, which are closely correlated to the Greenback (USD), has stalled, easing the pressure on the USD. The US Dollar Index (DXY) is virtually unchanged, falls 0.02%, up at 102.57.
- Money market futures estimate the Fed will slash rates by 140 basis points toward the end of next year, twice the Fed’s forecasts of three 25 bps cuts.
Technical analysis: Mexican Peso to remain rangebound at around 17.00-17.60
The USD/MXN is rangebound as the 100, 200, and 50-day Simple Moving Averages (SMAs) begin to converge toward the 17.41/58 area, almost shifting flat. As long as the exchange rate remains below them, it would remain slightly tilted to the downside, with the first support level seen at last week’s low of 17.14, ahead of dropping toward the 17.00/05 area.
On the other hand, if buyers reclaim the 100-day SMA at 17.41, the USD/MXN could rally toward the 200-day SMA at 17.51 in route to the 50-day SMA at 17.58. Once those levels are surpassed, further upside lies at the psychological 18.00 figure.
Mexican Peso FAQs
What key factors drive the Mexican Peso?
The Mexican Peso (MXN) is the most traded currency among its Latin American peers. Its value is broadly determined by the performance of the Mexican economy, the country’s central bank’s policy, the amount of foreign investment in the country and even the levels of remittances sent by Mexicans who live abroad, particularly in the United States. Geopolitical trends can also move MXN: for example, the process of nearshoring – or the decision by some firms to relocate manufacturing capacity and supply chains closer to their home countries – is also seen as a catalyst for the Mexican currency as the country is considered a key manufacturing hub in the American continent. Another catalyst for MXN is Oil prices as Mexico is a key exporter of the commodity.
How do decisions of the Banxico impact the Mexican Peso?
The main objective of Mexico’s central bank, also known as Banxico, is to maintain inflation at low and stable levels (at or close to its target of 3%, the midpoint in a tolerance band of between 2% and 4%). To this end, the bank sets an appropriate level of interest rates. When inflation is too high, Banxico will attempt to tame it by raising interest rates, making it more expensive for households and businesses to borrow money, thus cooling demand and the overall economy. Higher interest rates are generally positive for the Mexican Peso (MXN) as they lead to higher yields, making the country a more attractive place for investors. On the contrary, lower interest rates tend to weaken MXN.
How does economic data influence the value of the Mexican Peso?
Macroeconomic data releases are key to assess the state of the economy and can have an impact on the Mexican Peso (MXN) valuation. A strong Mexican economy, based on high economic growth, low unemployment and high confidence is good for MXN. Not only does it attract more foreign investment but it may encourage the Bank of Mexico (Banxico) to increase interest rates, particularly if this strength comes together with elevated inflation. However, if economic data is weak, MXN is likely to depreciate.
How does broader risk sentiment impact the Mexican Peso?
As an emerging-market currency, the Mexican Peso (MXN) tends to strive during risk-on periods, or when investors perceive that broader market risks are low and thus are eager to engage with investments that carry a higher risk. Conversely, MXN tends to weaken at times of market turbulence or economic uncertainty as investors tend to sell higher-risk assets and flee to the more-stable safe havens.
The Bank of Japan (BoJ) will hold its Monetary Policy Committee (MPC) on Tuesday, December 19 and as we get closer to the Interest Rate Decision, here are the expectations forecast by the economists and researchers of 11 major banks.
Analysts do not expect a change in interest rates. However, amid rising bets that the Bank of Japan may exit its negative rate policy early next year, the central bank will be scrutinized for hints about altering its ultra-accommodative policy stance.
ANZ
Although we can’t rule out a rate hike in December, it seems premature in the backdrop of the poor Q3 GDP numbers that showed the Japanese economy contracted 0.7% QoQ. We also think it is more likely the BoJ would move on rates when it provides an update of its forecasts, which it is not doing in this meeting. Early next year, the BoJ will provide forecast updates at its January and April meetings. We lean slightly in favour of an April move as some of the current trends in key price and wage data should be more established at that time, giving the BoJ confidence that it is getting its desired virtuous wage price cycle that will sustainably yield 2% inflation. We believe other aspects of policy will continue to be open for adjustment, such as more tweaks to YCC or its complete end and removing its forward guidance that rates could go lower. It is also possible the BoJ flags that it will discuss steps to normalise policy in coming meetings.
SocGen
We expect the BoJ to maintain its key monetary policy. On the other hand, at the press conference, it will still be interesting to see whether the BoJ has become more confident that the 2% price target will be achieved in a sustainable and stable manner. Most of all, we will be looking to see whether Governor Ueda emphasises the side effects of negative rates. Going forward, we continue to believe that it is unlikely that the BoJ will be confident that the 2% price target will be reached in a sustainable and stable way by April next year, and we, therefore, do not expect it to abolish YCC and negative rates by then.
Standard Chartered
We expect the BoJ to keep the policy rate unchanged, even as concerns around CPI rise. The central bank is likely to focus more on the weak Q3 growth print and improving financial market conditions; Japan’s Q3 GDP dropped more than initial forecasts. The BoJ has been concerned about a weakening JPY given the impact on CPI and the risk of capital outflows; however, the JPY has strengthened amid hawkish messaging from the BoJ. The central bank may tweak Yield Curve Control (YCC) measures to support the JPY.
Danske Bank
There has been some speculation about whether the BoJ would tighten policies. We continue to believe we need more firm conclusions on 2024 wage negotiations before they will feel confident to abandon yield curve control and raise the rate to zero.
Deutsche Bank
We expect the central bank to keep its current monetary policy stance but also see a 60% chance of some hints being made about an end to the negative interest rate policy at the January meeting.
TDS
Recent comments from the BoJ Governor and Dep Governor are nudging the market towards the Bank removing NIRP. Our call is for the BoJ to end NIRP in April, but the odds of a shift as early as Jan are now becoming more likely. A move at this meeting cannot be ruled out given the Bank has a record of surprising in Dec but this is not Ueda's style.
Wells Fargo
Our base case remains for the central bank's policy rate to remain negative until the April 2024 meeting, when we forecast a 10 bps hike to 0.00%. Japan needs to see stronger GDP growth, with strength specifically flowing from domestic components such as consumer spending and business investment. Third quarter GDP disappointed in both of those categories. Another important factor, and one that has been repeatedly commented on by BoJ officials, is the outcome of next year’s spring wage negotiations. BoJ officials have highlighted the need to see stronger wage growth that would contribute to an entrenchment of on-target inflation. As we do not see these elements coming together just yet, we continue to call for an April hike, though a Q1-2024 move can not be completely ruled out.
ING
We expect the BoJ to maintain all its major policy settings, though the overall tone about future policy at the press conference and statement could start to soften.
Rabobank
Despite all the noise about this week’s BoJ policy meeting being ’live’, regular watchers of the central bank see little to no chance of a rate hike this month. Not a single contributor to either the Bloomberg or the Reuters surveys is forecasting a change in interest rates. We agree with this assessment. That said, the Reuters survey did highlight that over 80% of forecasters are expecting that the central bank will have exited negative rates by the end of next year, with April being the favoured month for the end of this policy. While talk of a rate hike as soon as this week has been given short shrift by regular BoJ watchers, Governor Ueda’s words are still likely to be carefully assessed as the market looks for clues as to when the central bank might act
BMO
The BoJ’s final meeting for 2023 could go in either direction. The central bank is still very dovish and retains its Quantitative and Qualitative Monetary Easing with Yield Curve Control after some tweaks over the past twelve months. Ahead of the December meeting, Governor Ueda and another senior official made some hawkish comments, which were interpreted as hints that the BoJ was going to lift rates out of the negative zone (NIRP). The timing of such a move is a little questionable, as other central banks are pausing and some are thinking rate cuts. And, Japan’s inflation rate is slowing. But if the market is expecting it, why not take the opportunity to finally lift rates back above zero, and save the bullets for the next downturn? Unfortunately, chatter from other BoJ officials, suggesting that there is no rush, is muddying the waters. Given the Bank’s history, it should surprise no one if it opted to stay the course.
MUFG
We do not expect a BoJ policy change and the BoJ could also be cautious on making changes to the statement that fuels expectations of a hike in January. The BoJ probably wants maximum flexibility. However, any Yen selling from here is unlikely to last long given the bulk of the recent decline in global yields will likely hold as the global inflation declines are real.
Economists at Rabobank expect the Japanese Yen to strengthen next year and revise down their USD/JPY 12-month forecast.
JPY appears poised to have a better year in 2024
Slow growth in China, stagnation in Germany and softening growth in the US all pose as headwinds for the Japanese economic outlook and suggest that, like other central banks, the BoJ’s policy decisions next year will be data dependent. That said, with the odds currently favouring further policy normalisation next year and given rate cut risks for other G10 central banks, the JPY appears poised to have a better year in 2024.
We have revised down our 12-month USD/JPY forecast to 135 from 140.
Statistics Canada will release November Consumer Price Index (CPI) data on Tuesday, December 19 at 13:30 and as we get closer to the release time, here are the forecasts by the economists and researchers of four major banks regarding the upcoming Canadian inflation data.
Headline is expected at 2.9% year-on-year vs. 3.1% in October. Core trim is expected to fall two ticks to 3.3% YoY and core median is expected at 3.3% YoY vs. the prior release of 3.6%. If so, headline would be the lowest since March 2021, falling back within the Bank of Canada’s 1%-3% target range for inflation.
TDS
We look for headline CPI to edge lower to 3.0% YoY in November as softer energy prices and a headwind from seasonal factors hold prices unchanged on the month. Shelter prices will remain the key driver behind a 0.25% (SA) increase for the ex. food/energy (xFE) aggregate, along with a modest rebound in core goods. We also look for further easing across the BoC's preferred measures of core inflation with CPI-trim/median forecast to slow to 3.40% YoY, with an even larger deceleration on a 3m annualized basis to 2.3%. However, we do not believe the BoC will read too deeply into this development given the expected rebound in December, especially with one more CPI report before the January meeting.
RBC Economics
We expect Canadian inflation pressures to have moderated more in November. Headline inflation is expected to have dropped to 2.9% from 3.1% in October reflecting a pullback in retail gasoline prices and further easing in food price growth. That would mark the second time since March 2021 that the reading dips back within the Bank of Canada’s 1%-3% target range for inflation. We expect price growth excluding food and energy products stayed at 3.4% YoY in November, driven by higher shelter costs – more than a third of the rise in ex-food & energy prices in Canada as of October came from mortgage interest costs as higher interest rates continue to flow through to household debt payments with a lag. Both BoC’s preferred core measures – CPI trim and CPI median are also expected to have eased again in November, extending improvements seen in the prior month. Further softening in the economic backdrop and slower price growth should reinforce that the BoC is done hiking interest rates for this cycle. We don’t expect a pivot to rate cuts right away – central banks will be cautious about declaring victory over inflation too early. We see the BoC starting the easing cycle around the middle of 2024.
NBF
The drop in gasoline prices may translate into a no-change print for the headline index before seasonal adjustment. If we’re right, the 12-month rate of inflation should come down from 3.1% to a 5-month low of 3.0%. Similarly to the headline print, the core measures preferred by the Bank of Canada should ease, with CPI-med likely moving from 3.6% to 3.3% and CPI-trim from 3.5% to 3.4%.
CIBC
Inflation likely held nearly steady at 3.0% YoY in November, with prices unchanged on the month (+0.2% seasonally adjusted). While gasoline prices were broadly flat in November, other energy prices may have been a positive contributor. Food price inflation should have continued to advance at a slower pace than a year ago. Excluding food and energy, inflation may have accelerated slightly on a YoY basis. However, with the drivers of core inflation becoming less widespread (mainly rents and mortgage interest costs), the Bank of Canada’s preferred CPI-trim and CPI-median measures of inflation likely continued to gradually decelerate.
CFTC data show Yen shorts cut back, but not eliminated. Kit Juckes, Chief Global FX Strategist at Société Générale, analyzes JPY outlook ahead of the Bank of Japan (BoJ) meeting.
Short EUR/JPY for the BoJ?
The Yen has been supported by a very sharp unwind of longs, according to CFTC data, but overall positioning remains short.
The BoJ meeting on Tuesday probably won’t do anything, and that may see the Yen weaken again, especially if Treasuries sell off when the US comes in. The Yen though, is helped by the fact that a sharp cut in shorts still leaves the market short, unlike the Euro position. Maybe the best way forward remains being short EUR/JPY.
The Bank of Japan has started its two-day meeting. Economists at ING analyze Yen’s outlook ahead of the Monetary Policy Statement.
An unchanged message can bring USD/JPY back to 145
The language at this meeting will be key for the short-term performance of the Yen.
We are still leaning toward 2Q24 for the first hike, and if that is the preference of the BoJ as well, then it may be too early for a real change in the dovish message later, and the Yen risks a downward correction. However, the chances of a hike in January when new economic projections are released are non-negligible and depend on data as well as on JPY performance.
Expect any hawkish surprise in communication to push USD/JPY close to the 140 support, whereas an unchanged message can bring the pair back to 145, where we could see selling interest if the Dollar momentum proves soft.
The Bank of Japan will be the last major central bank to provide a policy update this year when they announce their policy decision on Tuesday. Economists at MUFG Bank analyze how the BoJ meeting could impact the Yen.
BoJ on hold
We do not expect a BoJ policy change and the BoJ could also be cautious on making changes to the statement that fuels expectations of a hike in January.
The BoJ probably wants maximum flexibility. However, any Yen selling from here is unlikely to last long given the bulk of the recent decline in global yields will likely hold as the global inflation declines are real.
- The Pound drifts lower to the mid-range of 1.2600.
- Wednesday´s UK inflation might give a fresh boost to GBP volatility.
- GBP/USD is expected to find support at the 1.2600 area – Scotiabank.
The Sterling is drifting lower on Monday, with upside attempts capped below 1.2700, following rejection at 1.2790 last Friday, as hawkish Fed officials came to the US Dollar´s rescue.
Fed Williams surprised the market, downplaying hopes of fed cuts in March. Shortly afterwards, he was backed by Atlanta Fed President, Raphael Bostic, observing that he does not expect any monetary easing before the third quarter of 2024.
These comments provided some support to a depressed Dollar, which has been suffering after the Federal Reserve signalled a dovish pivot, following its monetary policy meeting last Wednesday.
The calendar is light today and the investors await Wednesday´s UK CPI data to confirm last week´s hawkish monetary policy statement by the BoE.
In the US, the highlight is on Friday, with a string of key US indicators, namely the US PCE Prices Index, which might help to define the timing of the Federal Reserve´s first rate cuts.
GBP/USD to find support at the 1.2600/20 area – Scotiabank
The Technical Analysis team at Scotia Bank expects the pair to extend its correction towards the 1.2600 area: The GBP/USD pair traded positively overall last week but late week losses off the 1.2794 high are extending so far today and more corrective losses may be in order in the short run (...) Cable should find support on dips to the 1.2600/1.2620 area, however, with short, medium and long-term trend signals still aligned bullishly despite losses since Friday’s peak.”
Technical levels to watch
The USD is trading mixed to start the week after closing out Friday soft. Economists at Scotiabank analyze Dollar’s outlook.
10Y yields seen breaking decisively under 4%
Some consolidation in rates and the USD may be in order here after the sharp moves seen recently and with the holidays ahead. But the bottom line is that Fed Chairman Powell failed to push back on market pricing last week when most people expected him to and the Fed can’t now unring that particular bell.
US yields look poised to remain soft, with 10Y yields breaking decisively under 4% and that will add to pressure on the USD in the weeks ahead.
European Central Bank (ECB) Governing Council member Yannis Stournaras told Reuters on Monday that they need t see inflation staying sustainably below 3 by the middle of next year before cutting interest rates.
"We can't risk it," Stournaras added and said that they will also have to evaluate the overall state of the economy.
Market reaction
These comments failed to trigger a noticeable reaction in the Euro. At the time of press, the EUR/USD pair was up 0.25% on a daily basis at 1.0922.
In an interview with CNBC on Monday, Chicago Federal Reserve (Fed) President Austan Goolsbee said that they have seen significant improvement in inflation, per Reuters.
Goolsbee noted that he was confused with the market reaction to the Fed policy announcements last week and added that they do no precommit what they are going to do at future meetings.
"If we keep getting improvements on supply side and improvements in labor force participation, then the economy doesn't have to weaken for inflation to come down," Goolsbee said.
Market reaction
The US Dollar Index continues to fluctuate in its daily range at around 102.50 following these comments.
EUR/USD consolidates around the 1.09 area. Economists at Scotiabank analyze the pair’s outlook.
EUR/USD liable to remain well-supported on moderate dips
A period of consolidation may be in order for the EUR but spot is liable to remain well-supported on moderate dips and the broader EUR tone is set to remain positive amid bullishly aligned trend strength signals.
Grinding gains could develop from the 1.09 area to retest 1.10 this week.
See: EUR/USD stands a chance to end the year above 1.10 – ING
- The Dollar remains weak with the CAD supported by higher Oil prices.
- Concerns about supply disruptions are buoying Crude Oil.
- On Tuesday, The Canadian CPI might have a significant impact on the pair.
The Dollar remains depressed, with upside attempts limited below 1.3400. The Canadian Dollar is taking advantage of the recent recovery in Oil prices, with the market awaiting Canadian consumer inflation data, due on Tuesday.
Concerns about Oil supply disruptions are supporting the CAD
British Petroleum (BP) is halting an oil tanker from crossing the Red Sea following reports from the UK Navy of an explosion in a vessel near a Yemeni harbor. This, coupled with reports of previous attacks on commercial vessels by Houthi militias has boosted fears of supply disruptions, that are pushing prices higher.
The calendar is light today, thus the investors will be looking at Tuesday´s Canada CPI, which is expected to have eased below 3% year on year.
These figures will provide some cues on the BoC´s monetary policy that might set the pair´s direction ahead of Thursday´s US GDP and Friday´s US PCE Prices Index data.
USD/CAD Technical analysis
The USD remains under bearish pressure, although oversold levels in some charts allow for a longer consolidation period. Immediate support lies at 1.3350, which closes the path to the 1.3300 area.
On the upside, 1.3400 and 1.3478 are the nearest resistance levels.
Technical levels to watch
USD/CAD holds in upper 1.33s. Economists at Scotiabank analyze the pair’s outlook.
Intraday support is 1.3350
USD/CAD’s push below retracement support at 1.3495 (50% Fibonacci of the July/November move up) last week yielded a quick move lower and keeps momentum favouring more losses to the upper 1.32s in the short run (76.4% retracement at 1.3283). That would put spot well below trend support off the April 2022 low which sits at 1.3323 on the weekly chart.
Ultimately, after repeated failures in the 1.39 area, trends appear to be geared towards a retest of the 1.31 low seen in July but that may come after a moderate USD rebound early next year.
Intraday resistance is 1.3400/1.3410. Support is 1.3350.
GBP/USD drifts after solid gains last week. Economists at Scotiabank analyze the pair’s outlook.
More corrective losses may be in order in the short run
The GBP/USD pair traded positively overall last week but late week losses off the 1.2794 high are extending so far today and more corrective losses may be in order in the short run.
Cable should find support on dips to the 1.2600/1.2620 area, however, with short, medium and long-term trend signals still aligned bullishly despite losses since Friday’s peak.
- The Euro remains limited right above 1.0900 against the US Dollar after Friday’s rejection at 1.1010.
- The weak German Business climate data confirms the region’s grim economic outlook.
- Investors are growing skeptical about the ECB’s ability to maintain its restrictive policy for too long.
The Euro (EUR) stages a mild recovery on Monday, favoured by a weaker US Dollar and a moderate risk-on sentiment. The pair, however, remains unable to stage a significant rebound after Friday’s reversal and remains at a short distance to the 1.0880 support area.
Eurozone data released on Monday showed that German business confidence deteriorated in December, following two consecutive improvements. The IFO Business Climate Index dropped unexpectedly in December, with the sentiment about the current economic situation and the near-term expectations posting lower levels than in the previous month.
These figures come after the downbeat PMI figures seen late last week and the contracting Gross Domestic Product (GDP) seen earlier this month, confirming the view of an upcoming economic slowdown.
This scenario poses a serious challenge for the European Central Bank (ECB) and disputes the hawkish stance ECB President Christine Lagarde defended on Thursday, following the bank’s monetary policy decision.
Daily digest market movers: Euro recovery attempts falter as Eurozone data disappoints
- The Euro remains capped below 1.0930 after Friday’s reversal at 1.1010, as weak Eurozone data challenges the ECB’s hawkish stance.
- German IFO sentiment Climate Index dropped to 86.4 in December from the downwardly revised 87.2 in November against market expectations of an improvement to 87.8.
- The Current Conditions Index dropped to 88.5 from 89.4. The market consensus anticipated an uptick to 89.5.
- The index gauging German firm’s expectations deteriorated to a reading of 84.3 from 85.1. Investors expected an increase to 85.8.
- On Friday, Eurozone Services and Manufacturing PMIs contracted beyond expectations, suggesting a poor contribution from these two sectors to the region’s GDP growth.
- Earlier this month, the Q3 GDP confirmed that Eurozone economy contracted in the third quarter, with inflation levels cooling faster than expected.
- In light of these figures, the ECB’s “higher for longer” stance is losing credibility in investors’ views and is keeping Euro buyers subdued.
Technical Analysis: Euro corrects lower from 1.1010 resistance area
The Euro was rejected again at the 1.1010 resistance area, and the pair remains unable to put a significant distance from the 1.0900-1.0880 support area despite Monday’s moderate risk-on markets.
The broader trend remains positive, although the pair seems to be losing momentum, with the lack of upside momentum suggesting that further correction is on the cards.
On the downside, a break of the December 14 low at 1.0880 and the 4-hour 100 Simple Moving Average (SMA) at 1.0870 is likely to increase bearish pressure towards 1.0825 on the way to 1.0730 lows.
On the upside, the Euro should extend beyond intra-day highs at 1.0930 to attempt a retest of the mentioned 1.1010 resistance. Above here, the next targets would be the August high at 1.1060 and the July 24 and 27 high at 1.1150.
Euro FAQs
What is the Euro?
The Euro is the currency for the 20 European Union countries that belong to the Eurozone. It is the second most heavily traded currency in the world behind the US Dollar. In 2022, it accounted for 31% of all foreign exchange transactions, with an average daily turnover of over $2.2 trillion a day.
EUR/USD is the most heavily traded currency pair in the world, accounting for an estimated 30% off all transactions, followed by EUR/JPY (4%), EUR/GBP (3%) and EUR/AUD (2%).
What is the ECB and how does it impact the Euro?
The European Central Bank (ECB) in Frankfurt, Germany, is the reserve bank for the Eurozone. The ECB sets interest rates and manages monetary policy.
The ECB’s primary mandate is to maintain price stability, which means either controlling inflation or stimulating growth. Its primary tool is the raising or lowering of interest rates. Relatively high interest rates – or the expectation of higher rates – will usually benefit the Euro and vice versa.
The ECB Governing Council makes monetary policy decisions at meetings held eight times a year. Decisions are made by heads of the Eurozone national banks and six permanent members, including the President of the ECB, Christine Lagarde.
How does inflation data impact the value of the Euro?
Eurozone inflation data, measured by the Harmonized Index of Consumer Prices (HICP), is an important econometric for the Euro. If inflation rises more than expected, especially if above the ECB’s 2% target, it obliges the ECB to raise interest rates to bring it back under control.
Relatively high interest rates compared to its counterparts will usually benefit the Euro, as it makes the region more attractive as a place for global investors to park their money.
How does economic data influence the value of the Euro?
Data releases gauge the health of the economy and can impact on the Euro. Indicators such as GDP, Manufacturing and Services PMIs, employment, and consumer sentiment surveys can all influence the direction of the single currency.
A strong economy is good for the Euro. Not only does it attract more foreign investment but it may encourage the ECB to put up interest rates, which will directly strengthen the Euro. Otherwise, if economic data is weak, the Euro is likely to fall.
Economic data for the four largest economies in the euro area (Germany, France, Italy and Spain) are especially significant, as they account for 75% of the Eurozone’s economy.
How does the Trade Balance impact the Euro?
Another significant data release for the Euro is the Trade Balance. This indicator measures the difference between what a country earns from its exports and what it spends on imports over a given period.
If a country produces highly sought after exports then its currency will gain in value purely from the extra demand created from foreign buyers seeking to purchase these goods. Therefore, a positive net Trade Balance strengthens a currency and vice versa for a negative balance.
ECB FAQs
What is the ECB and how does it influence the Euro?
The European Central Bank (ECB) in Frankfurt, Germany, is the reserve bank for the Eurozone. The ECB sets interest rates and manages monetary policy for the region.
The ECB primary mandate is to maintain price stability, which means keeping inflation at around 2%. Its primary tool for achieving this is by raising or lowering interest rates. Relatively high interest rates will usually result in a stronger Euro and vice versa.
The ECB Governing Council makes monetary policy decisions at meetings held eight times a year. Decisions are made by heads of the Eurozone national banks and six permanent members, including the President of the ECB, Christine Lagarde.
What is Quantitative Easing (QE) and how does it affect the Euro?
In extreme situations, the European Central Bank can enact a policy tool called Quantitative Easing. QE is the process by which the ECB prints Euros and uses them to buy assets – usually government or corporate bonds – from banks and other financial institutions. QE usually results in a weaker Euro.
QE is a last resort when simply lowering interest rates is unlikely to achieve the objective of price stability. The ECB used it during the Great Financial Crisis in 2009-11, in 2015 when inflation remained stubbornly low, as well as during the covid pandemic.
What is Quantitative tightening (QT) and how does it affect the Euro?
Quantitative tightening (QT) is the reverse of QE. It is undertaken after QE when an economic recovery is underway and inflation starts rising. Whilst in QE the European Central Bank (ECB) purchases government and corporate bonds from financial institutions to provide them with liquidity, in QT the ECB stops buying more bonds, and stops reinvesting the principal maturing on the bonds it already holds. It is usually positive (or bullish) for the Euro.
European Central Bank's (ECB) policymaker Peter Kazimir said on Monday that the drop in inflation observed in the past few months was not enough to declare victory and move to the next policy stage, per Reuters.
"We are increasingly confident that inflation will reach our target in 2025 and that we can accomplish this in a soft-landing scenario; the progress is still subject to risks," Kazimir added and argued that a policy mistake of premature easing would be more significant than the risk of staying tight for too long.
Market reaction
The EUR/USD pair continues to trade modestly higher on the day at around 1.0920 following these comments.
- The US Dollar starts the week with a mixed performance.
- Traders are facing the last economic data points for 2023.
- The US Dollar Index recovered on Friday, though not enough to change sentiment.
The US Dollar (USD) trades broadly stable on Monday, licking its wounds after the sharp decline fuelled by the US Federal Reserve (Fed) Chairman Jerome Powell’s comments signalling that rate cuts are due in 2024. The US Dollar attempted on Friday to recover earlier losses, but it was still far from enough, putting the Greenback again at risk of further depreciating as markets overall bet on a weaker USD. Traders have started to consider a possible policy mistake by the European Central Bank (ECB) in Europe, but this isn’t reflected in the value of the US Dollar.
On the economic front, the calendar is light at the beginning of the week. Still, some important releases are ahead towards its end, before markets wind down for the Christmas llull. On Thursday, the final estimate of the US Gross Domestic Product (GDP) for the third quarter could move markets ahead of Friday. On the very last day ahead of Christmas, the Personal Consumption Expenditure (PCE) Price Index – the Fed’s preferred inflation gauge – will be released, along with the Durable Goods numbers for November.
Daily digest Market Movers: Policy mistakes
- Houthi rebels have again attacked a tanker in the Red Sea, forcing shipping companies to avoid the area and ships rerouted via longer routes.
- The Financial Times has published an article that shows that several developed countries, even Europe and the US, are struggling with higher-than-normal amounts of bankruptcies in businesses. In some countries like France and Japan, the ratio is up over 30% from its normal annual average. In some Nordic countries like Sweden and Finland, rates have exceeded levels not seen since 2008-2009’s global financial crisis.
- Main takeaway from last Friday were the preliminary Purchasing Managers Index (PMI) numbers for December: for the services sector, the European PMIs fell further into contraction, while US and UK PMIs went higher. With the ECB not committing to any cuts in 2024, European business activity could further deteriorate. Meanwhile, a soft landing scenario in the US could well be in the cards with the Fed having all tools at its disposal to support the economy and keep inflation under control.
- At 15:00 GMT, the National Association of Home Builders is due to release its monthly index for December. Previous was at 34, with 36 expected.
- The US Treasury Department is heading to markets to place a short-term 3-month and a 6-month bill at 16:30 GMT.
- A red start of this week for equities with Asia leading the decline. In Europe, the main indices are giving back some gains from last week, with the German Dax down 0.50%. US Futures are flat.
- The CME Group’s FedWatch Tool shows that markets are pricing in an 89.7% chance that the Federal Reserve will keep interest rates unchanged at its January 31 meeting. Around 10.3% expect the first cut already to take place.
- The benchmark 10-year US Treasury Note trades near 3.90%, and starts the week with another few basis points lower.
US Dollar Index Technical Analysis: Friday close paints ugly picture
From a technical perspective, the DXY US Dollar Index could be heading to 100.00 in the very short-term when looking at the weekly chart. Traders will see several rejections over the past four weeks against the 55-week Simple Moving Average (SMA) near 104.00. This firm rejection – with a substantial close lower last week – could mean that US Dollar bulls have given up for now, with the US Dollar Index (DXY) set to drop lower into the first week of 2024.
Still, US Dollar bulls could make a turnaround should the economic data this week provide upbeat surprises. On the daily chart, look for 103.00 as the first level to keep an eye on. Once trading above there, the 200-day SMA at 103.50 is the next important level to get to in its recovery.
To the downside, the DXY is due to test the next pivotal at 101.70, the low of August 4 and 10. Once broken, look for 100.82, which aligns with the bottoms from February and April. Should that level snap, nothing will stand in the way of DXY heading to the sub-100 region.
US Dollar FAQs
What is the US Dollar?
The US Dollar (USD) is the official currency of the United States of America, and the ‘de facto’ currency of a significant number of other countries where it is found in circulation alongside local notes. It is the most heavily traded currency in the world, accounting for over 88% of all global foreign exchange turnover, or an average of $6.6 trillion in transactions per day, according to data from 2022.
Following the second world war, the USD took over from the British Pound as the world’s reserve currency. For most of its history, the US Dollar was backed by Gold, until the Bretton Woods Agreement in 1971 when the Gold Standard went away.
How do the decisions of the Federal Reserve impact the US Dollar?
The most important single factor impacting on the value of the US Dollar is monetary policy, which is shaped by the Federal Reserve (Fed). The Fed has two mandates: to achieve price stability (control inflation) and foster full employment. Its primary tool to achieve these two goals is by adjusting interest rates.
When prices are rising too quickly and inflation is above the Fed’s 2% target, the Fed will raise rates, which helps the USD value. When inflation falls below 2% or the Unemployment Rate is too high, the Fed may lower interest rates, which weighs on the Greenback.
What is Quantitative Easing and how does it influence the US Dollar?
In extreme situations, the Federal Reserve can also print more Dollars and enact quantitative easing (QE). QE is the process by which the Fed substantially increases the flow of credit in a stuck financial system.
It is a non-standard policy measure used when credit has dried up because banks will not lend to each other (out of the fear of counterparty default). It is a last resort when simply lowering interest rates is unlikely to achieve the necessary result. It was the Fed’s weapon of choice to combat the credit crunch that occurred during the Great Financial Crisis in 2008. It involves the Fed printing more Dollars and using them to buy US government bonds predominantly from financial institutions. QE usually leads to a weaker US Dollar.
What is Quantitative Tightening and how does it influence the US Dollar?
Quantitative tightening (QT) is the reverse process whereby the Federal Reserve stops buying bonds from financial institutions and does not reinvest the principal from the bonds it holds maturing in new purchases. It is usually positive for the US Dollar.
The Dollar is recovering some ground. Economists at ING analyze Greenback’s outlook.
Softer into year-end?
The US Dollar is recovering some ground after the pushback from Fed officials against rate cut bets. However, the dovish Dot Plot may work as an anchor for rates and keep the USD soft into the end of December.
We expect the US Dollar Index (DXY) to stabilise around 102/103 into year-end, but risks are skewed to the downside.
See: US Dollar Index to fall by just under 5% to 97 in 2024 – SocGen
EUR/GBP trades above the 0.86 mark. Economists at ING analyze the pair’s outlook.
Eyes on inflation this week
This week, the focus in the UK will be on CPI data for November out on Wednesday. As usual, we'll be paying attention to services inflation, which we estimate to come in at 6.6%, showing little near-term progress. That may help markets ease some of the rate cut bets in the UK and help the Pound.
We still think services inflation in the UK will ease to around 4% by next summer, allowing the BoE to start cutting, but the Pound has decent room to benefit from some hawkish repricing in the short run.
Last week’s 0.8550 lows in EUR/GBP may well be retested by the end of December.
- Natural Gas further recovers and tests important resistance at $2.46
- Tensions are building after Houthi rebels attacked another carrier in the Red Sea.
- The US Dollar depreciated last week and is facing more downturn ahead of Christmas.
Natural Gas (XNG/USD) is jumping higher for a fourth straight day in a row. Main driver this Monday is news from the Red Sea where a Norwegian vessel got hit by missiles fired by Houthi Rebels claiming the vessel carried cargo with destination Israel. Main shipping companies like Maersk and MSC have instructed their fleet to clear the area and take longer routes for delivering their cargoes, which will add to transportation costs for the end user.
Meanwhile, the US Dollar (USD) has retreated substantially, though with the dust settling, the current weakness may well not be permanent. When comparing last week’s data from both the US and Europe against their respective central bank monetary policy stances, the Federal Reserve (Fed) looks to be the one holding all the best cards for a soft landing. In Europe the European Central Bank (ECB) looks reluctant to make any cuts in 2024 while several economic indicators are retreating further into contraction and might soon reveal a backslash in its economic performance and growth.
Natural Gas is trading at $2.46 per MMBtu at the time of writing.
Natural Gas Market Movers: Another pickup in geopolitical tensions
- The United Kingdom will introduce a carbon border tax in 2027 which will be added onto the price of cheap carbon-intensive imports, such as steel, making them equally expensive as onshore-produced products.
- Houthi rebels attacked another vessel in the Red Sea, forcing main shipping companies to cancel routes in the region and take a deviating, longer route, which will add to transportation costs being passed on to the client.
- Gas Power is seeing its position in the European power usage slimming down, replaced by renewable sources, a Bloomberg report revealed this Monday.
- Israel is pushing back against several international calls for a cease-fire.
Natural Gas Technical Analysis: Rebound into last week of 2023
Natural Gas looks to have found a factor that might run up its prices. The recent number of events in the Red Sea is forcing shipping companies to take longer, and more expensive routes to get their cargoes delivered without any risk. This premium is starting to find its way into the Gas prices, which might see a jump back to $3.00 if this risk continues to persist.
On the upside, Natural Gas could return to the purple line near $2.60 as the first hurdle. Next, the 200-day Simple Moving Average (SMA) at $2.74 will act as a resistance before allowing Gas prices to soar to $3.00 with the 100-day SMA nearby.
The dust could quickly settle on this blip of macroeconomic tensions in the Red Sea. European Gas reserves are still well stocked, so there is no rush to get LNG shipments in, which makes those longer routes unlikely to trigger any supply bottlenecks near term. Small support could be seen near $2.20, with the low of June. Firmer support should come in near $2.10, April’s low, at the yellow supportive line.
-638384926294291437.png)
XNG/USD (Daily Chart)
Natural Gas FAQs
What fundamental factors drive the price of Natural Gas?
Supply and demand dynamics are a key factor influencing Natural Gas prices, and are themselves influenced by global economic growth, industrial activity, population growth, production levels, and inventories. The weather impacts Natural Gas prices because more Gas is used during cold winters and hot summers for heating and cooling. Competition from other energy sources impacts prices as consumers may switch to cheaper sources. Geopolitical events are factors as exemplified by the war in Ukraine. Government policies relating to extraction, transportation, and environmental issues also impact prices.
What are the main macroeconomic releases that impact on Natural Gas Prices?
The main economic release influencing Natural Gas prices is the weekly inventory bulletin from the Energy Information Administration (EIA), a US government agency that produces US gas market data. The EIA Gas bulletin usually comes out on Thursday at 14:30 GMT, a day after the EIA publishes its weekly Oil bulletin. Economic data from large consumers of Natural Gas can impact supply and demand, the largest of which include China, Germany and Japan. Natural Gas is primarily priced and traded in US Dollars, thus economic releases impacting the US Dollar are also factors.
How does the US Dollar influence Natural Gas prices?
The US Dollar is the world’s reserve currency and most commodities, including Natural Gas are priced and traded on international markets in US Dollars. As such, the value of the US Dollar is a factor in the price of Natural Gas, because if the Dollar strengthens it means less Dollars are required to buy the same volume of Gas (the price falls), and vice versa if USD strengthens.
The Bank of Japan (BoJ) will announce its last monetary policy decision of the year on Tuesday. Economists at Commerzbank analyze Yen’s outlook ahead of the meeting.
Will the BoJ hint at a turnaround?
There were a thousand reasons to normalize earlier. And perhaps there will be many reasons to normalize in the near future (if inflation proves to be more persistent). But right now (and certainly in January) is about the stupidest time to do it.
Now, in the case of the BoJ, you can never rule out the possibility that it will do things that you think are irrational. So I am by no means saying that such signals on Tuesday are completely out of the question. But they would be ‘noise’ – something that fundamental analysis is closed to.
I am not advising anyone to ignore JPY exchange rate risks in connection with Tuesday's session. But at the same time, I cannot advise anyone to bet on JPY strength. Because a rational BoJ would not send such signals this week.
- Gold price consolidates with the US Dollar steady near recent lows.
- The negative impact of hawkish Fed officials has ebbed.
- The mild risk appetite, with investors looking at the end of rate hikes, is supporting Gold.
Gold (XAU/USD) has opened the week on a mildly positive tone, favoured by a moderate pullback on the US Dollar (USD) and the depressed US bond yields, which remain stuck at mid-term lows.
The precious metal, which is hovering right above $2,020 remains buoyed by increasing hopes that the global tightening cycle has come to an end. The effect of hawkish comments by Federal Reserve (Fed) officials on Friday, downplaying monetary easing hopes, has been short-lived and the USD is drifting lower again at the week’s opening,
Investors are now looking for more cues about the timing of the central bank’s first rate cuts, with their eyes on the US Q3 GDP figures, due on Thursday, and Friday’s US Personal Consumption Expenditures (PCE) Prices Index. These releases are likely to boost US Dollar volatility and might help the precious metal to define its near-term direction.
Daily Digest Market Movers: Gold consolidates with investors awaiting key US data
- Gold prices are looking for direction above the $2,000 psychological level, with the US Dollar still weighed by hopes of Fed cuts in early 2024.
- New York Federal Reserve President John Williams dismissed the idea that the Fed has started to consider rate cuts and left the door open for further monetary tightening if needed.
- Later on, Raphael Bostic, Atlanta Fed President and CEO, sided with his colleague, pushing back options of rate cuts until the second half of 2024.
- Investors, however, remain confident that the Fed will start rolling back its restrictive monetary policies somewhat earlier. Futures markets are pricing a 67% chance of a 25 basis points (bps) cut in March.
- Data from the Eurozone has shown that German business confidence deteriorated against expectations of an improvement in December, which strengthens the case of an economic slowdown anticipated by last week’s downbeat PMI figures.
Technical Analysis: Gold hesitates above $2,020 with broader bullish trend intact
The technical picture shows the precious metal supported above $2,000, yet intraday charts show a lack of clear direction, with the hourly and 4-hour RSIs practically flat near the 50 midline.
Bulls are missing confidence to attempt a retest to previous highs at $2,040 in a calm trading session on Monday, with investors awaiting more data to place significant bets. The broader trend, however, remains positive from the early October lows near $1,800.
On the upside, the precious metal should breach the $2,040-$2,050 to convince bulls and extend towards the $2,065 area ahead of the all-time high at $2,150.
On the downside, Gold has important support at the $2,015-$2,020 area, where the confluence of the 50 and 100 SMAs in 4-hour charts meet the 50% Fibonacci Retracement of the October-December rally. Below here, bearish pressure would increase with the $1,977 support area coming into play.
Gold FAQs
Why do people invest in Gold?
Gold has played a key role in human’s history as it has been widely used as a store of value and medium of exchange. Currently, apart from its shine and usage for jewelry, the precious metal is widely seen as a safe-haven asset, meaning that it is considered a good investment during turbulent times. Gold is also widely seen as a hedge against inflation and against depreciating currencies as it doesn’t rely on any specific issuer or government.
Who buys the most Gold?
Central banks are the biggest Gold holders. In their aim to support their currencies in turbulent times, central banks tend to diversify their reserves and buy Gold to improve the perceived strength of the economy and the currency. High Gold reserves can be a source of trust for a country’s solvency. Central banks added 1,136 tonnes of Gold worth around $70 billion to their reserves in 2022, according to data from the World Gold Council. This is the highest yearly purchase since records began. Central banks from emerging economies such as China, India and Turkey are quickly increasing their Gold reserves.
How is Gold correlated with other assets?
Gold has an inverse correlation with the US Dollar and US Treasuries, which are both major reserve and safe-haven assets. When the Dollar depreciates, Gold tends to rise, enabling investors and central banks to diversify their assets in turbulent times. Gold is also inversely correlated with risk assets. A rally in the stock market tends to weaken Gold price, while sell-offs in riskier markets tend to favor the precious metal.
What does the price of Gold depend on?
The price can move due to a wide range of factors. Geopolitical instability or fears of a deep recession can quickly make Gold price escalate due to its safe-haven status. As a yield-less asset, Gold tends to rise with lower interest rates, while higher cost of money usually weighs down on the yellow metal. Still, most moves depend on how the US Dollar (USD) behaves as the asset is priced in dollars (XAU/USD). A strong Dollar tends to keep the price of Gold controlled, whereas a weaker Dollar is likely to push Gold prices up.
Economic Indicator
United States Core Personal Consumption Expenditures - Price Index (YoY)
The Core Personal Consumption Expenditures (PCE), released by the US Bureau of Economic Analysis on a monthly basis, measures the changes in the prices of goods and services purchased by consumers in the United States (US). The PCE Price Index is also the Federal Reserve’s (Fed) preferred gauge of inflation. The YoY reading compares the prices of goods in the reference month to the same month a year earlier. The core reading excludes the so-called more volatile food and energy components to give a more accurate measurement of price pressures." Generally, a high reading is bullish for the US Dollar (USD), while a low reading is bearish.
Read more.Next release: 12/22/2023 13:30:00 GMT
Frequency: Monthly
Source: US Bureau of Economic Analysis
Why it matters to traders
After publishing the GDP report, the US Bureau of Economic Analysis releases the Personal Consumption Expenditures (PCE) Price Index data alongside the monthly changes in Personal Spending and Personal Income. FOMC policymakers use the annual Core PCE Price Index, which excludes volatile food and energy prices, as their primary gauge of inflation. A stronger-than-expected reading could help the USD outperform its rivals as it would hint at a possible hawkish shift in the Fed’s forward guidance and vice versa.
Federal Reserve (Fed) Bank of Cleveland President Loretta Mester told the Financial Times on Monday that markets are a 'bit ahead' of the Fed on rate cuts, per Reuters.
"The next phase is not when to reduce rates, even though that’s where the markets are at," Mester added and said that the next phase will be about how long they need monetary policy to remain restrictive.
Market reaction
The US Dollar (USD) Index, which tracks the USD's performance against a basket of six major currencies, edged slightly higher following these comments. At the time of press, the index was virtually unchanged on the day at 102.56.
In a speech given at the London Business School on Monday, Bank of England (BoE) Deputy Governor Ben Broadbent explained that policymakers will have to be patient to see a steady decline in wage inflation.
"It takes time to understand the forces driving the economy, particularly if one’s having to rely on nominal variables like services inflation and wage growth, things that would normally be seen as late-cycle indicators. The same goes for uncertainty relating to the accuracy of the observable variables themselves," Broadbent said and continued:
"Given the volatility in the official estimates, and the disparity (such as it is) among the various indicators we have, it will probably require a more protracted and clearer decline in these series before the MPC can safely conclude that things are on a firmly downward trend."
Market reaction
GBP/USD showed no immediate reaction to these comments and the pair was last seen trading virtually unchanged on the day at around 1.2670.
EUR/USD remains above the 1.09 level. Economists at ING analyze the pair’s outlook.
Still eyeing 1.10
The Euro stands a chance to end the year above 1.10. Despite the diverging narratives which emerged from the ECB and Federal Reserve meetings last week, probably favouring more attempts at the 1.1000 key resistance into Christmas, a break higher is far from guaranteed.
We will need to see whether post-meeting comments by ECB officials diverge in some way from last week’s pushback by President Christine Lagarde.
USD/JPY has staged a modest recovery from the low at 140.97. Economists at Société Générale analyze the pair’s outlook.
146.60/147.40 could provide resistance
USD/JPY confirmed a Head and Shoulders formation resulting in steady downtrend. It has recently dipped below the 200-DMA for the first time since May.
After achieving interim low near 141/140.70, an initial bounce is under way however neckline of the formation near 146.60/147.40 could provide resistance. Holding below this hurdle, there would be a risk of deeper downtrend.
Next potential supports are located at 139.60, the 50% retracement from January and 137.25/136.65.
GBP outperformed in 2023 as rebounded from weak levels. Economists at MUFG Bank analyze Sterling’s outlook.
BoE caution over cutting rates could support GBP in early 2024
The GBP has outperformed in 2023 as the negative shocks from Liz Truss’ mini-budget in late 2022 and the hit to the UK’s terms of trade from higher energy and food prices have both eased. It leaves the GBP less attractively valued heading into 2024.
The GBP could benefit further at the start of next year from the BoE’s relative caution to cut rates compared to the ECB & Fed if core and services inflation in the UK continues to ease more slowly than in the Eurozone and the US. However, we then expect the BoE to play catch up by cutting rates later next year when persistent inflation risks subside.
We expect the GBP to weaken later in 2024 when evidence builds that the UK economy is being hit more with a lag from higher rates. Weak growth is set to continue next year. even as the cost of living shock has eased.
Boštjan Vasle, Governor of the Bank of Slovenia and member of the Governing Council of the European Central Bank (ECB), said on Monday, “market pricing for both start of rate cuts and totality of cuts in 2024 is excessive.”
Additional quotes
Recent accommodation priced into rates is inconsistent with policy stance to get inflation back to target.
Inflation will rebound in 1H 2024 and ECB should only reassess policy outlook after this period.
Wage formation in Q1 2024 will be crucial for policy outlook.
Related reads
- EUR/USD remains steady above 1.0900 despite weak German IFO data
- German IFO Business Climate Index declines to 86.4 in December vs. 87.8 expected
- The Euro maintains a moderate bid tone on Monday.
- The German IFO Business Climate backs the view of a softening Eurozone economy.
- The border EUR/USD bullish trend remains intact.
The Euro keeps moving within a narrow range above 1.0900, little moved by the unexpected deterioration of the German IFO Business Climate Index.
German business sentiment deteriorates against expectations
Data released by the German IFO Institute revealed that business sentiment deteriorated in December, following two consecutive improvements. This confirms the view of a weakening Eurozone economic outlook and casts doubt about the hawkish stance conveyed by the European Central Bank last week.
The Business climate index dropped to 86.4 in December from 87.2 last month, against expectations of an improvement to 87.8. The firms surveyed have shown less confidence about the current economic situation, 88.5 from 89.4 last month, with poorer expectations for the next months, 84.3 from 85.1.
EUR/USD Technical analysis
The technical picture remains unchanged, with the pair trimming losses after Friday´s decline. Intraday charts suggest a lack of a clear direction while the broader trend remains positive.
Immediate support lies at 1.0880, and below here, 1.0745. Resistances are 1.1010 and 1.1070.
Technical levels to watch
EUR/JPY has lost almost 6% since late November. Economists at Société Générale analyze the pair's outlook ahead of the Bank of Japan (BoJ) meeting.
BoJ forecast to stand pat
We don’t believe the BoJ will surprise. YCC settings and the policy rate are forecast to remain unchanged. The bank’s comments on the virtuous cycle from prices to wages will be key to understanding whether it is confident on inflation moving closer to the 2% target in a sustainable and stable manner. Tweaks to the YCC or an exit from NIRP are unlikely before April in our view.
EUR/JPY must hold on to 154 to avoid sliding towards the late July low of 151.50. The 200-DMA offers support at 154.34.
- NZD/USD surges on improved economic data from New Zealand.
- Westpac Consumer Survey and Business NZ PSI improved to 88.9 and 51.2, respectively.
- The dovish comments from Fed officials contributed to pressure to undermine the US Dollar.
NZD/USD continues to move on an upward trajectory that began on December 11, trading higher around 0.6240 during the European session on Monday. The New Zealand Dollar (NZD) gains ground against the US Dollar (USD) on the back of improved Kiwi economic data.
Westpac New Zealand revealed a Consumer Survey for Q4, which showed an improvement from the previous readings of 80.2 to 88.9. Business NZ Performance of Services Index (PSI) for November rose to 51.2 from the previous 49.2 figures. On Friday, Business NZ Performance of Manufacturing Index (PMI) improved to 46.7 from 42.5 prior.
On the flip side, Atlanta Fed President Raphael Bostic has suggested the potential for an interest rate cut in the third quarter of 2024, if inflation falls as expected. Meanwhile, Chicago Fed President Austan Goolsbee has not ruled out the possibility of a rate cut at the Federal Reserve's meeting next March.
These dovish comments from Federal Reserve officials contributed to the surge in prices of US Treasury bonds, which in turn, pushed down the US yields. The lowered US yields put pressure on the US Dollar Index (DXY). The DXY hovers below 102.50, by the press time.
Market participants seek further impetus on economic conditions in both countries. New Zealand will release Trade Data, the NZ Business Confidence survey, and ANZ – Roy Morgan Consumer Confidence. The United States will release Housing data on Tuesday.
- German IFO Business Climate Index fell unexpectedly in December.
- IFO Current Economic Assessment declined to 88.5 in the reported month.
The headline German IFO Business Climate Index declined to 86.4 in December from 87.2 in November. Markets were expecting this figure to improve slightly to 87.8.
Meanwhile, the Current Economic Assessment Index came in at 88.5 in the same period, below the November reading and the market expectation of 89.4 and 89.5, respectively.
Finally, the IFO Expectations Index – indicating firms’ projections for the next six months, edged lower to 84.3 from 85.1.
Market reaction to the German IFO Survey
EUR/USD showed no immediate reaction to the disappointing sentiment data and was last seen rising 0.25% on a daily basis at 1.0920.
About German IFO
The headline IFO business climate index was rebased and recalibrated in April after the IFO Research Institute changed the series from the base year of 2000 to the base year of 2005 as of May 2011 and then changed series to include services as of April 2018. The survey now includes 9,000 monthly survey responses from firms in the manufacturing, service sector, trade and construction.
AUD/USD is still trading closer to multi-year lows. It is a similar story for NZD. Economists at MUFG Bank analyze Aussie and Kiwi outlooks.
Weak global growth and household debt remain headwinds
The AUD and NZD have continued to weaken in 2023 resulting in both AUD/USD and NZD/USD rates moving back closer to multi-year lows between 0.6000-0.6500 and 0.5500-0.6000 respectively. We expect these support areas to hold in the year ahead unless there is a much sharper global slowdown/recession than expected. t also creates more room for the AUD & NZD to rebound when the USD weakens more broadly.
We expect global growth to remain weak in 2024. Cyclical momentum could begin to pick up later in 2024 offering more support for the AUD & NZD to stage a relief rebound.
High household debt levels in Australia and New Zealand still pose the risk of bigger domestic slowdowns in the year ahead. The RNBZ has more room to cut rates after raising rates further into restrictive territory at 5.50% compared to the RBA’s policy rate of 4.35%.
- USD/MXN receives upward support as the Greenback suffers losses.
- The decline in US bond yields reinforces the weakening of the US Dollar.
- Banxico survey increased their growth forecast from 2.10% to 2.29%, with inflation to reach 4.0% in 2024.
USD/MXN extends its gains on the second consecutive session, trading higher near 17.25 during the European hours on Monday. The USD/MXN pair gains ground on the subdued US Dollar, which could be attributed to the lowered US Treasury yields.
The US Dollar Index (DXY) moves sideways to 102.50, by the press time, with 2-year and 10-year yields on US bond coupons standing lower at 4.41% and 3.91%, respectively.
Additionally, Atlanta Fed President Raphael Bostic has suggested the potential for an interest rate cut in the third quarter of 2024. Meanwhile, Chicago Fed President Austan Goolsbee has not ruled out the possibility of a rate cut at the Federal Reserve's meeting next March. These dovish comments from Federal Reserve officials contribute to the prevailing pressure on the Greenback.
According to the Banxico survey, Mexican economists have increased their growth forecast for 2024 from 2.10% to 2.29%, while anticipating inflation to reach 4.0% next year. In terms of monetary policy, they expect the central bank to bring rates down to 9.25%.
The Mexican Peso (MXN) has received upward support following Banxico's decision to maintain policy rates at the level of 11.25%. This decision and the economic outlook provided by the survey are contributing factors to the currency's positive momentum.
Investors will likely observe data releases from Mexico including Private Spending, Retail Sales, and seasonally adjusted Trade Balance for November. On the United States docket, Consumer Confidence and Existing Home Sales Change will be eyed.
The Indian Rupee enjoyed its best daily gain since March on Friday, with USD/INR returning below 83.00. Economists at Société Générale analyze the pair's outlook.
Possibility of short-term down move
The 30-day implied vol is trading at the lowest level in 20 years thanks to FX intervention by the RBI.
USD/INR has breached below the lower limit of the range since October denoting possibility of short-term down move.
Failure to reclaim the 50.DMA at 83.27 can spur a decline towards 82.65 and the late August low of 82.35.
Are the US Treasury, the US economy, and especially the US Dollar hostage to the PBoC? Ulrich Leuchtmann, Head of FX and Commodity Research at Commerzbank, answers this question.
Can the US be blackmailed?
Foreign investors are scrambling to get their money into the US right now. The rising US net debt is therefore driven more by foreigners' desire to invest in the US than by US demand for capital.
In short, if the PBoC were to actually reduce its holdings of US T-notes, there would be plenty of other global investors lining up to invest in the US right now. China's leaders currently have no blackmail potential.
Sure, that could change. And you could argue that it will change at some point. I have a lot of sympathy for that view. But there is nothing to suggest that such a change is imminent.
- EUR/GBP receives upward support ahead of German economic data.
- The Euro faced challenges on downbeat PMI data from the Eurozone.
- UK PMI data indicated an uptick in growth at the end of the year.
EUR/GBP trades higher near 0.8600 during the early European hours on Monday ahead of German IFO data. The EUR/GBP cross snaps recent losses registered in the previous two sessions. The Euro (EUR) faced downward pressure on weaker preliminary HCOB Purchasing Managers Index (PMI) data from the Eurozone.
The eurozone business activity unexpectedly declined in December, suggesting a challenging economic environment in the bloc. The HCOB Composite PMI fell to 47.0, down from the previous reading of 47.6, and below the anticipated improvement to 48.0. Manufacturing PMI remained steady at 44.2, against the expected reading of 44.6, while Services PMI decreased to 48.1 instead of the expected increase to 49.0.
On the flip side, the Pound Sterling (GBP) is supported by the Bank of England's (BoE) hawkish stance, emphasizing that monetary policy is likely to remain restrictive for an extended period due to elevated indicators of inflation in the United Kingdom (UK).
The preliminary S&P Global/CIPS PMI data from the UK suggests an uptick in growth at the end of 2023. The Composite PMI for December improved to 51.7 from the previous 50.7, and Services PMI rose to 52.7 from the earlier figure of 50.9. However, Manufacturing PMI reduced to 46.4 from 47.2 previously.
Investors await UK Consumer Price Index (CPI) data to gain fresh impetus on consumer price inflation in the country. The monthly CPI for November is expected to rise by 0.2%. While CPI year-on-year is predicted to ease at 4.4% against the previous month’s rate of 4.6%.
Here is what you need to know on Monday, December 18:
Following the previous week's highly volatile action amid major central banks' monetary policy announcements, markets seem to have stabilized to start the new week. The US Dollar (USD) Index stays near 102.50 after losing more than 1% last week and the benchmark 10-year US Treasury bond yield seems to have stabilized slightly below 4%. IFO sentiment data from Germany and Bundesbank's Monthly Report will be featured in the European economic docket. Market participants will also pay close attention to comments from central bank officials.
The risk rally that was triggered after the dovish Federal Reserve surprise late Wednesday lost its steam ahead of the weekend, with Wall Street's main indexes closing mixed on Friday. Early Monday, US stock index futures trade modestly higher on the day, pointing to a marginal improvement in risk mood.
US Dollar price in the last 7 days
The table below shows the percentage change of US Dollar (USD) against listed major currencies in the last 7 days. US Dollar was the weakest against the Australian Dollar.
| USD | EUR | GBP | CAD | AUD | JPY | NZD | CHF | |
| USD | -1.45% | -1.12% | -1.57% | -2.17% | -1.93% | -1.94% | -1.23% | |
| EUR | 1.43% | 0.33% | -0.12% | -0.71% | -0.47% | -0.47% | 0.26% | |
| GBP | 1.11% | -0.33% | -0.45% | -1.05% | -0.80% | -0.81% | -0.11% | |
| CAD | 1.55% | 0.12% | 0.44% | -0.59% | -0.35% | -0.36% | 0.35% | |
| AUD | 2.12% | 0.71% | 1.02% | 0.58% | 0.23% | 0.23% | 0.92% | |
| JPY | 1.90% | 0.47% | 0.70% | 0.35% | -0.24% | -0.01% | 0.68% | |
| NZD | 1.90% | 0.48% | 0.80% | 0.36% | -0.23% | 0.00% | 0.69% | |
| CHF | 1.17% | -0.26% | 0.06% | -0.38% | -0.97% | -0.73% | -0.74% |
The heat map shows percentage changes of major currencies against each other. The base currency is picked from the left column, while the quote currency is picked from the top row. For example, if you pick the Euro from the left column and move along the horizontal line to the Japanese Yen, the percentage change displayed in the box will represent EUR (base)/JPY (quote).
During the Asian trading hours, the data from New Zealand showed that the Westpac Consumer Confidence Index for the fourth quarter rose to 88.9 from 80.2. Other data revealed that the Business NZ PSI moved into expansion territory in November, increasing from 48.9 in October to 51.2. NZD/USD gained traction on upbeat data releases and was last seen rising more than 0.5% on the day at 0.6240.
Despite closing in negative territory on Friday, EUR/USD rose more than 1% in the previous week. The pair holds its ground in the European morning and trades in positive territory slightly above 1.0900.
Following the pullback seen ahead of the weekend, GBP/USD seems to have steadied at around 1.2700 early Monday.
USD/JPY declined below 141.00 for the first time since late July on Thursday and staged a modest rebound on Friday. The pair seems to have gone into a consolidation phase above 142.00 on Monday. The Bank of Japan will announce monetary policy decisions in the Asian session on Tuesday.
After coming within a touching distance of $2,050 in the second half of the previous week, XAU/USD lost its bullish momentum as the US Treasury bond yields stabilized following the sharp decline seen in the Fed aftermath. Gold stays relatively quiet to start the new week and fluctuates at around $2,020.
EUR/USD erased around 50% of its post-Fed gains going into the weekend. Economists at Danske Bank analyze the pair’s outlook.
USD weakness to continue in the near term
We anticipate USD weakness continuing in the near term due to the recent substantial easing of financial conditions, which should lend support to a general risk-on sentiment in markets. Combined with bearish USD year-end seasonality, this could provide some support to EUR/USD in the next months.
Further out, we expect USD to regain strength and see EUR/USD falling towards 1.04 on a 12M horizon.
- Silver regains positive traction and reverses a part of Friday’s pullback from over a one-week top.
- The technical setup remains tilted in favour of bulls and supports prospects for additional gains.
- A convincing break below a multi-month-old ascending trend-line will negate the positive outlook.
Silver (XAG/USD) attracts some dip-buying near the $23.70 area on the first day of a new week and builds on its steady intraday ascent heading into the European session. The white metal climbs to the $24.00 mark in the last hour and seems poised to build on its recent solid bounce from the mid-$22.00s, or a near one-month low touched last week.
From a technical perspective, the XAG/USD last week showed some resilience below and defended an upward-sloping trend line extending from the October swing low. The subsequent strength and acceptance above the very important 200-day Simple Moving Average (SMA) favours bullish traders. Moreover, oscillators on the daily chart have again started gaining positive traction and support prospects for a further appreciating move.
That said, bulls might wait for some follow-through buying beyond the $24.25-$24.30 area, over a one-week high set on Friday, before placing fresh bets. The XAG/USD might then aim to reclaim the $25.00 psychological mark. The upward trajectory could get extended beyond the $25.25 intermediate hurdle, towards the $25.45-$25.50 region en route to the $26.00 neighbourhood, or the highest level since May 5 touched earlier this month.
On the flip side, any meaningful slide might continue to attract some buyers near the 200-day SMA, currently pegged near the $23.55 region. Some follow-through selling, however, might turn the XAG/USD vulnerable to accelerate the slide back towards the $23.00 mark. The latter nears the aforementioned ascending trend-line support, which if broken decisively will negate the positive outlook and shift the bias in favour of bearish traders.
Silver daily chart
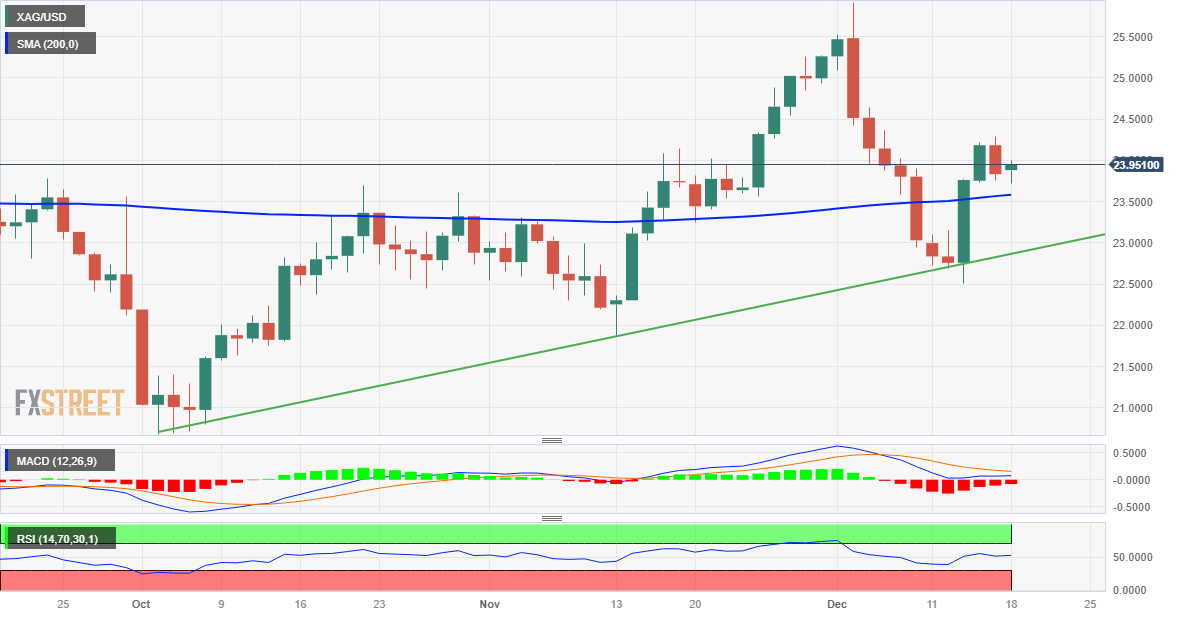
Technical levels to watch
- GBP/USD gains momentum around 1.2688, backed by the weaker USD and the BoE’s hawkish remarks.
- The pair holds above the 50- and 100-hour EMA; the RSI indicator stands in bullish territory above 50.
- The first upside barrier is seen at 1.2724; the initial support level is located at 1.2637.
The GBP/USD pair holds positive ground during the early European session on Monday. The uptick in the pair is bolstered by the hawkish stance of the Bank of England (BoE) to remain restrictive for an extended period to bring inflation down to its target. The major pair currently trades near 1.2688, up 0.12% on the day
According to the four-hour chart, the bullish outlook of GBP/USD remains intact as the major pair holds above the 50- and 100-hour Exponential Moving Averages (EMAs). The upward momentum is reinforced by the Relative Strength Index (RSI), which stands in bullish territory above 50.
The first upside barrier of GBP/USD will emerge near a high of December 13 at 1.2724. The key hurdle to watch is the confluence of a high of December 15 and a psychological mark at the 1.2790–1.2800 zone. Further north, the upper boundary of the Bollinger Band at 1.2833 will be the additional upside filter. A break above the latter will see a rally to a high of July 28 at 1.2888.
On the other hand, the initial support level is seen near the 50-hour EMA at 1.2637. The next downside target is located near the 100-hour EMA at 1.2597. Any follow-through selling below the latter will see a drop to the lower limit of the Bollinger Band at 1.2515. The key contention level will emerge at the 1.2500 mark, representing a low of December 13 and the round mark.
GBP/USD four-hour chart
-638384776864422902.png)
- USD/CHF trades lower as the US Dollar Index moves below 102.50.
- Downbeat US Treasury yields contributed to the downward pressure on the Greenback.
- SNB Chairman Thomas Jordan’s hawkish remarks might have supported the Swiss Franc.
USD/CHF retraces the recent gains on the subdued US Dollar (USD), which could be attributed to the lowered US Treasury yields. The USD/CHF pair trades lower around 0.8690 during the Asian hours on Monday, with 2-year and 10-year yields on US bond coupons standing lower at 4.41% and 3.91%, respectively.
The US Dollar Index (DXY) experienced gains in the previous session, trading lower around 102.50, by the press time. The dovish comments from Federal Reserve’s (Fed) members reinforced the challenges for the US Dollar. Atlanta Fed President Raphael Bostic commented on the possibility of an interest rate cut in the third quarter of 2024 and Chicago Fed President Austan Goolsbee has left open the possibility of a rate cut at the Federal Reserve's meeting next March.
On the other side, the Swiss Franc (CHF) faced a challenge as the Swiss National Bank (SNB) opted to keep interest rates unchanged for the second consecutive rate call, aligning with widespread expectations. The decision was influenced by a downward trend in domestic inflation and a projected slowdown in Swiss Gross Domestic Product (GDP) growth.
Swiss National Bank (SNB) Chairman Thomas Jordan has remarked that inflationary pressures have slightly decreased, emphasizing the persistent high level of uncertainty. He noted the expectation for inflation to rise in the coming months and highlighted that Swiss inflation forecasts remain within the 0-2% target range through 2025.
Additionally, Chairman Jordan mentioned a shift in focus, stating, "We are no longer focusing on forex sales," and affirmed the commitment to adjust monetary policy if necessary to maintain the goal of price stability.
Investor attention will focus on the Swiss Trade Balance data for November, along with Consumer Confidence and Existing Home Sales Change from the United States on Wednesday.
- The US Dollar Index (DXY) drifts lower to 102.45 on Monday.
- The dovish remarks from Federal Reserve (Fed) officials triggered a rally in US equities and weighed on the USD.
- Traders await the US Building Permits and Housing Starts, due on Tuesday.
The US Dollar Index (DXY), a measure of the value of the US Dollar (USD) against a weighted basket of currencies used by US trade partners, loses traction during the early European session on Monday. The DXY bounces off the multi-month lows of 101.77 and currently trades near 102.45, losing 0.15% for the day.
The stronger US Services PMI on Friday lends some support to the Greenback. However, the upside remains limited amid the anticipation of three rate cuts from the Federal Reserve (Fed) next year. Data released on Friday showed that a flash reading of US S&P Global Services PMI rose to 51.3 in December from 50.8 in November, beating the market expectation of 50.8. The Manufacturing PMI dropped to 48.2 in December, compared to 49.4 in November and market expectations of 49.3. Finally, the Composite PMI climbed to 51.0 in December versus 50.7 prior.
The dovish stance from the Fed triggered a rally in US equities and exerted some selling pressure on the Greenback. Money markets now see a nearly 75.0% chance of at least a 25-basis point rate cut in March 2024, up from about 64.5% before the latest policy decision, according to CME Group’s FedWatch tool.
Federal Reserve (Fed) Bank of Chicago President Austan Goolsbee said on Sunday that it’s too early to declare victory over the inflation war, and the decisions on rate cuts will depend on upcoming economic data, whereas Atlanta Fed President Raphael Bostic said the central bank can begin cutting the interest rate in the third quarter of 2024 if inflation falls as expected.
The possible Fed rate cuts next year also weigh on US Treasury bond yields. The US 10-year Treasury note yields reached multi-month lows and stand near 3.90% as the Fed indicated that it would cut interest rates three times in 2024 after its latest meeting.
Traders will keep an eye on the US Building Permits and Housing Starts, due on Tuesday. Later this week, the US Consumer Confidence and Existing Home Sales will be released on Wednesday. The US Gross Domestic Product (GDP) Annualized (Q3) will be due on Wednesday, which is expected to remain steady at 5.2%. The Core Personal Consumption Expenditures Price Index (Core PCE) on Friday will be in the spotlight.
- EUR/USD recovers its recent losses on prevailing upward movement.
- Technical indicators suggest positive sentiment to revisit the psychological resistance at the 1.1000 level and the two-month high at 1.1017.
- The break below 1.0900 could push the pair to meet the 23.6% Fibo at 1.0884 and seven-day EMA at 1.0881.
EUR/USD retraces its recent losses ahead of German data scheduled to be released on Monday. The EUR/USD pair trades higher around 1.0910 during the Asian session.
The technical indicators for the EUR/USD pair favor the prevailing upward movement. With the 14-day Relative Strength Index (RSI) staying above the 50 mark, there's a positive sentiment suggesting a potential re-testing of the psychological resistance at the 1.1000 level followed by the two-month high at 1.1017.
Additionally, the Moving Average Convergence Divergence (MACD) suggests the overall positive momentum as the MACD line is positioned above the centerline and the signal line. This shows a potential for an upward trend, which could influence the EUR/USD pair to break above the barrier to explore the major level at 1.1050.
On the downside, the psychological level at 1.0900 appears as the key support followed by the 23.6% Fibonacci retracement level at 1.0884 and the seven-day Exponential Moving Average (EMA) at 1.0881.
A firm break below the support region could put pressure on the bears of the EUR/USD pair to navigate the psychological area around 38.2% Fibonacci retracement at 1.0801.
EUR/USD: Daily Chart

- WTI attempts to recover recent losses on Russia’s deepened oil export cuts.
- Russian Deputy Prime Minister Alexander Novak said that Russia would deepen oil cuts in December by 50,000 bpd.
- The leading shipping firms to avoid the Suez Canal route as Houthi militants escalated their assaults on commercial vessels.
West Texas Intermediate (WTI) price struggles to regain recent losses, hovering around $72.10 per barrel in the Asian market on Monday. Crude oil prices find support from Russian Deputy Prime Minister Alexander Novak's statement. He mentioned that Russia is considering deepening oil export cuts in December by potentially 50,000 barrels per day (bpd) or more to bolster global oil prices. These additional cuts would go beyond the 300,000 bpd that had already been agreed upon for this year.
In addition, adverse weather conditions in Russia have contributed to the support for Crude oil prices. Moscow suspended approximately two-thirds of loadings from ports. Moreover, the geopolitical situation has provided a boost to oil prices, with concerns rising due to Houthi attacks on ships near Yemen. The attacks have raised worries about potential disruptions in oil supply, leading shipping firms to consider avoiding the Suez Canal as Houthi militants in Yemen escalated their assaults on commercial vessels in the Red Sea.
Moreover, the bullish forecast from the International Energy Agency (IEA) that oil consumption will increase by 1.1 million bpd in 2024 contributed to underpinning the WTI price. On Friday, the data showed that Baker Hughes Rig Counts reduced to 501 from the previous number of 503, which suggests slightly less consumption of products and services produced by the oil service industry.
The US Dollar Index (DXY) has experienced a nearly 4% weakening over the past two months. A further decline could stimulate oil demand from other countries as it becomes more affordable to purchase oil. The recent challenges for the US Dollar stem from dovish comments made by various Federal Reserve officials. Investor attention will now shift to Consumer Confidence and Existing Home Sales Change on Wednesday.
- Gold price attracts some dip-buying on Monday amid a modest US Dollar downtick.
- Geopolitical tensions and looming recession risks also benefit the safe-haven metal.
- The prevalent risk-on environment could act as a headwind and cap any further gains.
Gold price (XAU/USD) edges higher during the Asian session on Monday and for now, seems to have stalled last week's modest pullback from the vicinity of the $2,050 area. The Federal Reserve (Fed) last Wednesday signaled an end to its monetary policy tightening cycle and the so-called "dot plot" penciled in at least three 25 basis points (bps) rate cuts in 2024. This, in turn, fails to assist the US Dollar (USD) to build on Friday's goodish recovery move from its lowest level since July 31. Apart from this, geopolitical risks and worries about a deeper economic downturn, particularly in China and the Eurozone, act as a tailwind for the safe-haven precious metal.
That said, top Fed officials tried to temper speculation about early interest rate cuts on Friday. This, along with the prevalent risk-on environment might keep a lid on any meaningful appreciating move for the Gold price. Against the backdrop of the Fed's dovish pivot last week, the optimistic outlook from China's Central Finance Office continues to boost investors' confidence. This is evident from a generally positive tone around the equity markets and should cap the upside for the XAU/USD in the absence of any relevant market-moving economic releases from the US. The downside, however, remains cushioned in the wake of the Fed's dovish pivot last week.
Daily Digest Market Movers: Gold price is underpinned by Fed rate cut bets and a softer US Dollar
- New York Federal Reserve President John Williams, in an interview with CNBC, said on Friday that we aren't really talking about rate cuts right now and it's premature to speculate about them.
- William added that the economic data can move in surprising ways and the central bank needs to be ready to tighten policy further if the progress on inflation were to stall or reverse.
- Separately, Atlanta Fed President Raphael Bostic echoed the view, saying that rate cuts were not an imminent thing and that the first cuts could come sometime in the third quarter of 2024.
- The markets, however, seem convinced that the Fed will ease its policy by the first half of 2024, which caps the US Dollar bounce from over a four-month low and lends support to the Gold price.
- The flash PMI prints released on Friday showed that business activity in Germany deteriorated during December, increasing the risk of a recession in the Eurozone's largest economy.
- North Korea fired at least one unidentified type of ballistic missile on Monday, just hours after a separate launch of a short-range missile late Sunday night.
- China's state media Xinhua, citing a government readout, reported that the economy is expected to see more favourable conditions and more opportunities than challenges in 2024.
- This, along with the Fed's dovish pivot, remains supportive of the underlying bullish sentiment across the global equity markets and might keep a lid on the safe-haven precious metal.
Technical Analysis: Gold price needs to move beyond the $2,050 level for bulls to regain control
From a technical perspective, any subsequent move up is likely to confront stiff resistance near the $2,040 supply zone, above which the Gold price could aim to retest last week's swing high, around the $2,049-2,050 region. Some follow-through buying will be seen as a fresh trigger for bullish traders and pave the way for a move towards the next relevant barrier near the $2,072-2,073 area. The momentum could get extended further and allow the XAU/USD to reclaim the $2,100 round-figure mark.
On the flip side, the $2,015-2,010 horizontal resistance breakpoint might continue to protect the immediate downside ahead of the $2,000 psychological mark. A convincing break below the latter will make the Gold price vulnerable to challenge the 50-day SMA support, currently pegged near the $1,982-1,981 region. This is followed by last week's swing low, around the $1,973 area, and the 200-day SMA, near the $1,956-1,955 zone, which if broken decisively will shift the near-term bias in favour of bearish traders.
US Dollar price today
The table below shows the percentage change of US Dollar (USD) against listed major currencies today. US Dollar was the weakest against the New Zealand Dollar.
| USD | EUR | GBP | CAD | AUD | JPY | NZD | CHF | |
| USD | -0.15% | -0.19% | -0.02% | -0.28% | -0.14% | -0.50% | -0.14% | |
| EUR | 0.15% | -0.03% | 0.13% | -0.13% | 0.02% | -0.34% | 0.02% | |
| GBP | 0.18% | 0.03% | 0.17% | -0.09% | 0.05% | -0.31% | 0.05% | |
| CAD | 0.02% | -0.14% | -0.17% | -0.26% | -0.12% | -0.48% | -0.12% | |
| AUD | 0.27% | 0.13% | 0.11% | 0.27% | 0.16% | -0.21% | 0.16% | |
| JPY | 0.13% | -0.02% | -0.05% | 0.12% | -0.15% | -0.37% | -0.01% | |
| NZD | 0.50% | 0.34% | 0.31% | 0.47% | 0.21% | 0.36% | 0.36% | |
| CHF | 0.14% | -0.01% | -0.04% | 0.12% | -0.14% | 0.00% | -0.36% |
The heat map shows percentage changes of major currencies against each other. The base currency is picked from the left column, while the quote currency is picked from the top row. For example, if you pick the Euro from the left column and move along the horizontal line to the Japanese Yen, the percentage change displayed in the box will represent EUR (base)/JPY (quote).
Gold FAQs
Why do people invest in Gold?
Gold has played a key role in human’s history as it has been widely used as a store of value and medium of exchange. Currently, apart from its shine and usage for jewelry, the precious metal is widely seen as a safe-haven asset, meaning that it is considered a good investment during turbulent times. Gold is also widely seen as a hedge against inflation and against depreciating currencies as it doesn’t rely on any specific issuer or government.
Who buys the most Gold?
Central banks are the biggest Gold holders. In their aim to support their currencies in turbulent times, central banks tend to diversify their reserves and buy Gold to improve the perceived strength of the economy and the currency. High Gold reserves can be a source of trust for a country’s solvency. Central banks added 1,136 tonnes of Gold worth around $70 billion to their reserves in 2022, according to data from the World Gold Council. This is the highest yearly purchase since records began. Central banks from emerging economies such as China, India and Turkey are quickly increasing their Gold reserves.
How is Gold correlated with other assets?
Gold has an inverse correlation with the US Dollar and US Treasuries, which are both major reserve and safe-haven assets. When the Dollar depreciates, Gold tends to rise, enabling investors and central banks to diversify their assets in turbulent times. Gold is also inversely correlated with risk assets. A rally in the stock market tends to weaken Gold price, while sell-offs in riskier markets tend to favor the precious metal.
What does the price of Gold depend on?
The price can move due to a wide range of factors. Geopolitical instability or fears of a deep recession can quickly make Gold price escalate due to its safe-haven status. As a yield-less asset, Gold tends to rise with lower interest rates, while higher cost of money usually weighs down on the yellow metal. Still, most moves depend on how the US Dollar (USD) behaves as the asset is priced in dollars (XAU/USD). A strong Dollar tends to keep the price of Gold controlled, whereas a weaker Dollar is likely to push Gold prices up.
- Indian Rupee edges higher, bolstered by the strong equity inflows and a weaker US Dollar.
- Overseas investors bought $5.1 billion in Indian shares in December, the highest month of equity inflows since July.
- Market players will monitor the US Building Permits and Housing Starts on Tuesday.
The Indian Rupee (INR) kicks off the new week on a positive note on Monday. On Friday, the Indian Rupee posted its biggest single-day gain in more than eight months due to a sharp rally in Indian equity markets to fresh record highs. Foreign investors purchased Indian shares worth $5.1 billion in December, marking the strongest month of equity inflows since July.
Although the Reserve Bank of India (RBI) Monetary Policy Committee (MPC) decided to keep interest rates unchanged on December 8, Governor Shaktikanta Das said it does not imply a shift towards a neutral stance as concerns about inflation persist.
On the other hand, the Federal Reserve (Fed) kept the short-term interest rate unchanged last week, signaling that rate hikes are likely over amid falling inflation and a cooling economy. That being said, the anticipation of three rate cuts next year from the Fed has dragged the US Dollar (USD) lower and created a headwind for USD/INR.
Market players will keep an eye on the US housing data on Tuesday, including Building Permits and Housing Starts. The highlight this week will be the Personal Consumption Expenditures Price Index (PCE), the Fed’s preferred inflation gauge, due on Friday.
Daily Digest Market Movers: Indian Rupee remains strong amid the multiple headwinds
- India's foreign exchange reserves rose by $2.816 billion to a four-month high of $606.859 billion in the week ending December 8, according to the Reserve Bank of India (RBI).
- India’s Nifty 50 index has reached a new high, rising 16% in 2023, according to CNBC. India's stock market is currently the seventh largest in the world, with a market capitalization of US$3.989 trillion.
- WPI inflation in India climbed by 0.26% YoY in November, up from a 0.52% drop in the previous reading, above the estimate of 0.08%.
- The Consumer Price Index (CPI) in India rose 5.55% YoY in November, compared to 4.87% previously, falling short of the 5.70% expected.
- The Asian Development Bank (ADB) raised its prediction for India's GDP to 6.7% growth in Fiscal Year 2023-24 from 6.3% in September.
- The US S&P Global Composite PMI grew at its fastest pace in five months in December, climbing to 51.0 from 50.7 in the previous reading.
- The US S&P Global Manufacturing PMI dropped to its lowest level in four months in December, falling from 49.4 to 48.2 in December. The Services PMI jumped from 50.8 in November to 51.3 in December.
Technical Analysis: The Indian Rupee is to remain range-bound around 82.80–83.40
Indian Rupee trades firmer on the day. The USD/INR pair has remained stuck in a familiar trading range of 82.80–83.40 since September. However, USD/INR has resumed its downside journey as the pair holds below the key 100-day Exponential Moving Average (EMA) on the daily chart. The downward momentum is supported by the 14-day Relative Strength Index (RSI) that stands below the 50.0 midline, indicating that the path of its least resistance is to the downside.
A decisive break below the critical support level of 83.00 will see a drop to the confluence of the lower limit of the trading range and a low of September 12 at 82.80. The next contention level to watch is a low of August 11 at 82.60. On the upside, the immediate upside barrier is seen near the upper boundary of the trading range at 83.40. Any follow-through buying above 83.40 will pave the way to the year-to-date (YTD) high of 83.47, followed by the psychological round figure of 84.00.
US Dollar price today
The table below shows the percentage change of US Dollar (USD) against listed major currencies today. US Dollar was the weakest against the New Zealand Dollar.
| USD | EUR | GBP | CAD | AUD | JPY | NZD | CHF | |
| USD | -0.15% | -0.18% | -0.02% | -0.24% | -0.11% | -0.43% | -0.13% | |
| EUR | 0.15% | -0.03% | 0.14% | -0.08% | 0.04% | -0.27% | 0.02% | |
| GBP | 0.19% | 0.04% | 0.18% | -0.04% | 0.08% | -0.25% | 0.05% | |
| CAD | 0.02% | -0.14% | -0.18% | -0.22% | -0.10% | -0.41% | -0.12% | |
| AUD | 0.24% | 0.08% | 0.06% | 0.23% | 0.13% | -0.19% | 0.11% | |
| JPY | 0.11% | -0.04% | -0.06% | 0.10% | -0.13% | -0.32% | -0.02% | |
| NZD | 0.43% | 0.27% | 0.25% | 0.41% | 0.19% | 0.32% | 0.30% | |
| CHF | 0.13% | -0.02% | -0.05% | 0.11% | -0.10% | 0.02% | -0.30% |
The heat map shows percentage changes of major currencies against each other. The base currency is picked from the left column, while the quote currency is picked from the top row. For example, if you pick the Euro from the left column and move along the horizontal line to the Japanese Yen, the percentage change displayed in the box will represent EUR (base)/JPY (quote).
Indian Rupee FAQs
What are the key factors driving the Indian Rupee?
The Indian Rupee (INR) is one of the most sensitive currencies to external factors. The price of Crude Oil (the country is highly dependent on imported Oil), the value of the US Dollar – most trade is conducted in USD – and the level of foreign investment, are all influential. Direct intervention by the Reserve Bank of India (RBI) in FX markets to keep the exchange rate stable, as well as the level of interest rates set by the RBI, are further major influencing factors on the Rupee.
How do the decisions of the Reserve Bank of India impact the Indian Rupee?
The Reserve Bank of India (RBI) actively intervenes in forex markets to maintain a stable exchange rate, to help facilitate trade. In addition, the RBI tries to maintain the inflation rate at its 4% target by adjusting interest rates. Higher interest rates usually strengthen the Rupee. This is due to the role of the ‘carry trade’ in which investors borrow in countries with lower interest rates so as to place their money in countries’ offering relatively higher interest rates and profit from the difference.
What macroeconomic factors influence the value of the Indian Rupee?
Macroeconomic factors that influence the value of the Rupee include inflation, interest rates, the economic growth rate (GDP), the balance of trade, and inflows from foreign investment. A higher growth rate can lead to more overseas investment, pushing up demand for the Rupee. A less negative balance of trade will eventually lead to a stronger Rupee. Higher interest rates, especially real rates (interest rates less inflation) are also positive for the Rupee. A risk-on environment can lead to greater inflows of Foreign Direct and Indirect Investment (FDI and FII), which also benefit the Rupee.
How does inflation impact the Indian Rupee?
Higher inflation, particularly, if it is comparatively higher than India’s peers, is generally negative for the currency as it reflects devaluation through oversupply. Inflation also increases the cost of exports, leading to more Rupees being sold to purchase foreign imports, which is Rupee-negative. At the same time, higher inflation usually leads to the Reserve Bank of India (RBI) raising interest rates and this can be positive for the Rupee, due to increased demand from international investors. The opposite effect is true of lower inflation.
- USD/CAD snaps its losing streak as the US Dollar holds its position above 102.50.
- BoC Governor Tiff Macklem’s hawkish comments might have supported the Canadian Dollar.
- Traders await Canadian Core CPI data for fresh impetus in inflation conditions.
- Fed members’ dovish remarks put pressure on the US Dollar.
USD/CAD halts its three-day losing streak, trading around 1.3380 during the Asian session on Monday. However, The Canadian Dollar (CAD) received a boost against the US Dollar (USD) following the hawkish comments made by the Bank of Canada's (BoC) Governor Tiff Macklem on Friday. Speaking at the Canadian Club Toronto, he mentioned that once the BoC is confident that the economy is clearly on a path back to price stability, they will consider whether and when to lower the policy interest rate.
Governor Macklem clarified that it is still too early to contemplate interest rate cuts, emphasizing that they don't necessarily have to wait until inflation returns all the way to the 2% target to consider easing policy, but it should be clearly headed in that direction. The BoC Consumer Price Index Core data for November will be released on Tuesday, hinting at the changes in prices of the cost of a fixed basket of goods and services.
The US Dollar Index (DXY) struggles to maintain its position after rebounding from a four-month low at 101.77 marked on Thursday. The DXY hovers above 102.50, by the press time. The Greenback received support from the enhanced short-term yield on the US Treasury bond. The 2-year US bond yield improved to 4.48% on Friday but trading lower at 4.43% at the time of writing on Monday. While 10-year US yield stands at 3.92%.
The USD might have received support from the mixed preliminary Purchasing Managers Index (PMI) data for December. The S&P Global Services PMI rose to 51.3 from 50.8, indicating growth, while the Manufacturing PMI declined to 48.2 from 49.4, suggesting contraction. Investor attention will now shift to Consumer Confidence and Existing Home Sales Change on Wednesday.
However, the Greenback could face pressure due to dovish comments from various Fed officials. Atlanta Fed President Raphael Bostic, on Friday, hinted at a potential interest rate cut in the third quarter of 2024 if inflation follows the expected trajectory. Additionally, Chicago Fed President Austan Goolsbee did not rule out the possibility of a rate cut at the Fed's meeting next March.
- GBP/USD regains positive traction and stalls its retracement slide from a multi-month peak.
- The BoE’s hawkish outlook continues to underpin the GBP and acts as a tailwind for the pair.
- The USD fails to build on Friday’s bounce from over a four-month low and also lends support.
The GBP/USD pair attracts some dip-buying around the 1.2655 area during the Asian session on Monday and for now, seems to have stalled its retracement slide from the vicinity of the 1.2800 mark, or a near four-month peak touched last week. Spot prices climb to a fresh daily high, around the 1.2685 region in the last hour and draw support from a combination of factors.
The British Pound (GBP) is underpinned by the Bank of England's (BoE) hawkish stance, saying that monetary policy is likely to need to be restrictive for an extended period of time as key indicators of UK inflation remain elevated. Adding to this, the flash UK PMIs released on Friday indicated growth picking up some momentum at the end of the year, which should allow the economy to dodge recession during the fourth quarter as a whole. This, along with subdued US Dollar (USD) price action, acts as a tailwind for the GBP/USD pair.
Meanwhile, the Federal Reserve (Fed) last week signalled an end to its monetary policy tightening cycle and pencilled in at least three 25 basis points (bps) rate cuts in 2024. That said, a duo of influential Fed officials pushed back against expectations for early interest rate cuts and prompted an intraday USD short-covering rally on Friday, from its lowest level since July 31. The recovery momentum, however, lacks follow-through in the wake of the Fed's dovish shift and the risk-on mood, which tends to undermine the safe-haven buck.
Moving ahead, there isn't any relevant market-moving economic data due for release from the UK or the US on Monday, leaving the GBP/USD pair at the mercy of the USD price dynamics. Nevertheless, the aforementioned supportive fundamental backdrop suggests that the path of least resistance for spot prices is to the upside. Some follow-through buying beyond the 1.2700 mark will reaffirm the positive outlook and allow bullish traders to retest the multi-month peak touched in the aftermath of the BoE policy decision last Thursday.
Technical levels to watch
| Raw materials | Closed | Change, % |
|---|---|---|
| Silver | 23.841 | -1.34 |
| Gold | 2018.476 | -0.89 |
| Palladium | 1165.77 | 5.49 |
- Australian Dollar sustains a bullish sentiment on the dovish outlook from the Fed.
- Australia's recent data reveals the economy's resilience, as highlighted by the figures released last week.
- Australian Trade Minister Don Farrell conveyed confidence that China will eliminate punitive tariffs on Australian wine.
- PBoC is scheduled to announce its Interest Rate Decision on Wednesday.
- Fed members' comments on interest rate cut weigh on US Dollar.
The Australian Dollar (AUD) seems to continue its winning streak that began on Wednesday. The AUD/USD pair received upward support in anticipation of rate cuts by the Federal Reserve (Fed), which weighs on the US Dollar (USD).
Australia's economy showcases resilience, buoyed by strong employment outcomes and increasing incomes, as data released last week indicates. Additionally, the enhanced Purchasing Managers Index (PMI) data for December has bolstered the Australian Dollar.
Traders are expected to observe the Meeting Minutes from the Reserve Bank of Australia (RBA) set to be released on Tuesday, alongside Building Permits and Housing Starts data from Australia. Furthermore, on Wednesday, the People's Bank of China (PBoC) is scheduled to announce its Interest Rate Decision, adding to the key events influencing the Aussie Dollar.
Australian Trade Minister Don Farrell expressed confidence on Sky News TV that China will remove punitive tariffs on Australian wine. Notably, China has already lifted trade restrictions on the majority of Australian exports that had been previously imposed, indicating a gradual improvement in relations between the two countries.
The US Dollar Index (DXY) grapples to maintain its position after rebounding from a four-month low at 101.77 marked on Thursday. The DXY received support from the improved short-term yield on the US Treasury bond. The 2-year US bond yield improved to 4.48% on Friday.
Additionally, the moderate preliminary Purchasing Managers Index (PMI) for December contributed support for the USD. S&P Global Services PMI rose to 51.3 from 50.8 prior. While Manufacturing PMI declined to 48.2 from 49.4. Investors will focus on Consumer Confidence and Existing Home Sales Change on Wednesday.
However, the Greenback encounters challenges stemming from a weakened sentiment, primarily influenced by the Federal Open Market Committee's (FOMC) dovish statement. Additionally, dovish remarks from various Fed members exert pressure on the Greenback.
Atlanta Fed President Raphael Bostic, on Friday, anticipated a potential interest rate cut in the third quarter of 2024 if inflation follows the expected trajectory. Furthermore, Chicago Fed President Austan Goolsbee did not rule out the possibility of a rate cut at the Fed's meeting next March.
Daily Digest Market Movers: Australian Dollar seems hawkish as economy shows resilience
- The preliminary Judo Bank Composite PMI improved to 47.4 from the previous reading 46.2. The Manufacturing PMI for the same period registered 47.8, a slight increase from the prior figure of 47.7. Additionally, the Services PMI grew to 47.6 compared to the previous reading of 46.0.
- Australia’s Consumer Inflation Expectations for December eased at 4.5% against the previous figures of 4.9%.
- The seasonally adjusted Aussie Employment Change (Nov) improved substantially to 61.5K compared to the expected 11.0K. Unemployment Rate rose to 3.9% from 3.7% previously.
- The People's Bank of China (PBoC) kept its 1-year Medium-term Lending Facility (MLF) rate unchanged at 2.5%. Additionally, PBoC injected 1.45 trillion Yuan to bolster bank liquidity as 650 billion Yuan worth of MLF loans were matured.
- The National Bureau of Statistics of China revealed that Industrial Production (YoY) improved to 6.6% in November from 4.6% prior, exceeding the market expectation of 5.6%. However, China Retail Sales (YoY) rose to 10.1% from 7.6% prior, falling short of the market consensus of a 12.5% rise.
- Federal Reserve (Fed) maintained interest rates at 5.5% in its December policy meeting as expected. Markets are now projecting three rate cuts for 2024.
- US Retail Sales (MoM) rose 0.3% in November, compared to the expected decline of 0.1%. Initial Jobless Claims for the week ending on December 8 came in at 202K against the 220K expected.
Technical Analysis: Australian Dollar hovers around the 0.6700 post testing recent high
The Australian Dollar hovers around 0.6700 on Monday, having recently tested a five-month high at 0.6728 on Friday. A prevailing bullish sentiment could propel the AUD/USD pair to surpass the recent high and approach the pivotal barrier at 0.6750. On the downside, noteworthy support lies at 0.6650, followed by the 23.6% Fibonacci retracement at 0.6619, and subsequently reaching the psychological support at 0.6600, aligned with the 21-day Exponential Moving Average (EMA) at 0.6597.
AUD/USD: Daily Chart
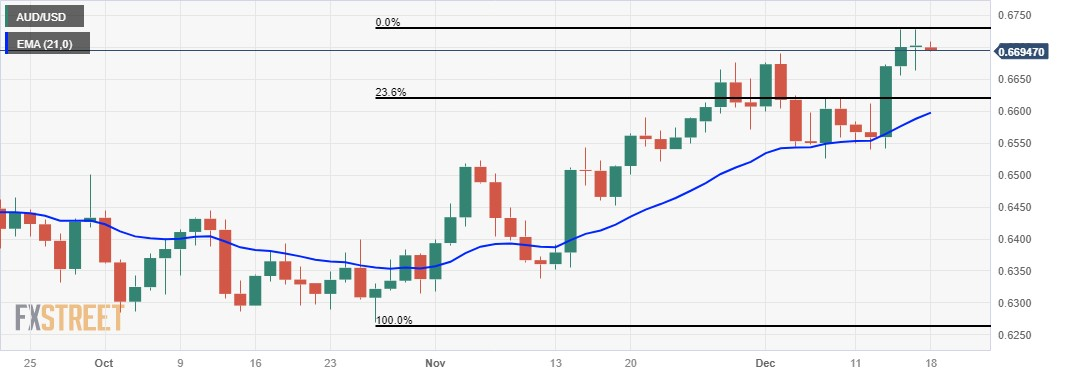
Australian Dollar price today
The table below shows the percentage change of Australian Dollar (AUD) against listed major currencies today. Australian Dollar was the strongest against the Canadian Dollar.
| USD | EUR | GBP | CAD | AUD | JPY | NZD | CHF | |
| USD | -0.08% | -0.12% | 0.01% | -0.14% | -0.05% | -0.30% | -0.06% | |
| EUR | 0.08% | -0.04% | 0.10% | -0.02% | 0.03% | -0.21% | 0.02% | |
| GBP | 0.13% | 0.04% | 0.14% | -0.01% | 0.08% | -0.17% | 0.07% | |
| CAD | -0.01% | -0.10% | -0.15% | -0.16% | -0.07% | -0.32% | -0.08% | |
| AUD | 0.14% | 0.06% | 0.02% | 0.16% | 0.09% | -0.16% | 0.08% | |
| JPY | 0.06% | -0.02% | -0.05% | 0.08% | -0.06% | -0.22% | -0.01% | |
| NZD | 0.30% | 0.21% | 0.18% | 0.32% | 0.16% | 0.25% | 0.23% | |
| CHF | 0.06% | -0.02% | -0.06% | 0.08% | -0.08% | 0.01% | -0.24% |
The heat map shows percentage changes of major currencies against each other. The base currency is picked from the left column, while the quote currency is picked from the top row. For example, if you pick the Euro from the left column and move along the horizontal line to the Japanese Yen, the percentage change displayed in the box will represent EUR (base)/JPY (quote).
Australian Dollar FAQs
What key factors drive the Australian Dollar?
One of the most significant factors for the Australian Dollar (AUD) is the level of interest rates set by the Reserve Bank of Australia (RBA). Because Australia is a resource-rich country another key driver is the price of its biggest export, Iron Ore. The health of the Chinese economy, its largest trading partner, is a factor, as well as inflation in Australia, its growth rate and Trade Balance. Market sentiment – whether investors are taking on more risky assets (risk-on) or seeking safe-havens (risk-off) – is also a factor, with risk-on positive for AUD.
How do the decisions of the Reserve Bank of Australia impact the Australian Dollar?
The Reserve Bank of Australia (RBA) influences the Australian Dollar (AUD) by setting the level of interest rates that Australian banks can lend to each other. This influences the level of interest rates in the economy as a whole. The main goal of the RBA is to maintain a stable inflation rate of 2-3% by adjusting interest rates up or down. Relatively high interest rates compared to other major central banks support the AUD, and the opposite for relatively low. The RBA can also use quantitative easing and tightening to influence credit conditions, with the former AUD-negative and the latter AUD-positive.
How does the health of the Chinese Economy impact the Australian Dollar?
China is Australia’s largest trading partner so the health of the Chinese economy is a major influence on the value of the Australian Dollar (AUD). When the Chinese economy is doing well it purchases more raw materials, goods and services from Australia, lifting demand for the AUD, and pushing up its value. The opposite is the case when the Chinese economy is not growing as fast as expected. Positive or negative surprises in Chinese growth data, therefore, often have a direct impact on the Australian Dollar and its pairs.
How does the price of Iron Ore impact the Australian Dollar?
Iron Ore is Australia’s largest export, accounting for $118 billion a year according to data from 2021, with China as its primary destination. The price of Iron Ore, therefore, can be a driver of the Australian Dollar. Generally, if the price of Iron Ore rises, AUD also goes up, as aggregate demand for the currency increases. The opposite is the case if the price of Iron Ore falls. Higher Iron Ore prices also tend to result in a greater likelihood of a positive Trade Balance for Australia, which is also positive of the AUD.
How does the Trade Balance impact the Australian Dollar?
The Trade Balance, which is the difference between what a country earns from its exports versus what it pays for its imports, is another factor that can influence the value of the Australian Dollar. If Australia produces highly sought after exports, then its currency will gain in value purely from the surplus demand created from foreign buyers seeking to purchase its exports versus what it spends to purchase imports. Therefore, a positive net Trade Balance strengthens the AUD, with the opposite effect if the Trade Balance is negative.
- NZD/USD gains traction around 0.6224 amid the USD weakness.
- New Zealand’s Business NZ PSI climbed to 51.2 in November from 48.9 in the previous reading.
- Fed’s Goolsbee said on Sunday that it’s premature to declare victory over the inflation battle.
- Market players will monitor New Zealand’s Trade Balance, and US housing data, due on Tuesday.
The NZD/USD pair trades in positive territory for the sixth consecutive day during the early Asian session on Monday. The pair posts the highest level in months due to the US dollar weakness. NZD/USD currently trades near 0.6224, gaining 0.20% on the day.
The latest data from Business NZ on Monday showed that New Zealand’s Business NZ Performance of Services Index (PSI) grew into expansion territory, climbing to 51.2 in November from 48.9 in the previous reading. Additionally, the New Zealand Westpac-McDermott Miller Consumer Confidence Index in the fourth quarter (Q4) 2023 rose to 88.9, the highest in two years. This, in turn, boosts the New Zealand Dollar (NZD) and acts as a tailwind for the NZD/USD.
On the other hand, Federal Reserve (Fed) Bank of Chicago President Austan Goolsbee said on Sunday that it’s premature to declare victory over the inflation battle, and the decisions on rate cuts will depend on economic data. Furthermore, Atlanta Fed President Raphael Bostic said the Fed can begin cutting the interest rate in the third quarter of 2024 if inflation falls as expected.
New Zealand will release Trade Data and the NZ Business Confidence survey on Tuesday. Also, the US housing data, including Building Permits and Housing Starts will be released on Tuesday. Traders will take cues from these data and find trading opportunities around the NZD/USD pair.
- The Japanese Yen ticks lower against the US Dollar for the second straight day on Monday.
- The prevalent risk-on environment is seen as a key factor undermining the safe-haven JPY.
- Hawkish remarks by Fed officials underpin the USD and lend support to the USD/JPY pair.
- The upside remains capped as traders look to the crucial BoJ policy decision on Tuesday.
The Japanese Yen (JPY) remains on the defensive against its American counterpart for the second straight day on Monday and retreats further from its highest level since late July touched last week. The downtick is primarily sponsored by the robust risk-on sentiment pervading across the global equity markets, which tends to undermine demand for traditional safe-haven assets, including the JPY. The Federal Reserve's (Fed) dovish pivot last week, pencilling in a cumulation of 75 basis points (bps) rate cuts in 2024, which, along with the optimistic outlook from China's Central Finance Office, continues to boost investors' confidence.
Meanwhile, top Fed officials – New York Fed President John Williams and Atlanta’s Raphael Bostic – on Friday tried to temper speculation about early interest rate cuts. This, in turn, assists the USD to preserve the previous day's recovery gains and lifts the USD/JPY pair back closer to mid-142.00s during the Asian session on Monday. That said, geopolitics remains the biggest risk for the markets. This, along with worries about a deeper global economic downturn, particularly in China and the Eurozone, should limit losses for the JPY amid bets that the Bank of Japan (BoJ) will phase out loose monetary policy in early 2024.
Traders might also refrain from placing aggressive directional bets and prefer to wait for the highly-anticipated BoJ monetary policy decision, scheduled to be announced during the Asian session on Tuesday. This, in turn, warrants some caution before confirming that the USD/JPY pair has formed a near-term bottom around the 141.00 mark and positioning for any further appreciating move. Heading into the key central bank event risk, traders on Monday will take cues from the broader risk sentiment and the USD price dynamics in the absence of any relevant market-moving economic data, either from Japan or the US.
Daily Digest Market Movers: Japanese Yen is weighed down by receding safe-haven demand and a modest USD uptick
- The prevalent risk-on environment is seen undermining the safe-haven Japanese Yen amid a modest US Dollar recovery from over a four-month low touched on Friday.
- State media Xinhua, citing a government readout, reported that China's economy is expected to see more favourable conditions and more opportunities than challenges in 2024.
- New York Fed President John Williams, in an interview with CNBC, said that we aren't really talking about rate cuts right now and it's premature to speculate about them.
- William added that the data can move in surprising ways and the central bank needs to be ready to tighten policy further if the progress on inflation were to stall or reverse.
- Separately, Atlanta Fed President Raphael Bostic said that rate cuts were not an imminent thing and that the first cuts could come sometime in the third quarter of 2024.
- North Korea fired at least one unidentified type of ballistic missile on Monday, just hours after a separate launch of a short-range missile late Sunday night.
- The flash PMI data released on Friday showed that German business activity deteriorated in December, increasing the risk of a recession in Europe's biggest economy.
- The S&P Global Composite PMI edged higher to 51.0 from 50.7, suggesting that the business activity in the US private sector continues to expand at a modest pace in early December.
- The USD/JPY pair, meanwhile, struggles to move back above mid-142.00s amid rising bets that the Bank of Japan may exit its negative rate policy early next year.
Technical Analysis: USD/JPY struggles to move back above 200-day SMA support-turned-resistance, bearish potential intact
From a technical perspective, last week's breakdown and close below the very important 200-day Simple Moving Average (SMA) was seen as a fresh trigger for bearish traders. Furthermore, the USD/JPY pair's inability to move back above the said support-turned-resistance, currently around the 142.55 region, validates the negative outlook. That said, the Relative Strength Index (RSI) on the daily chart remains closer to oversold territory and makes it prudent to wait for some near-term consolidation or a modest bounce before the next leg down.
In the meantime, any further move up is likely to attract fresh sellers near the 142.75-142.80 region and remain capped near the 143.00 round figure. That said, some follow-through buying could trigger a short-covering rally and allow the USD/JPY pair to reclaim the 144.00 mark. On the flip side, the 142.00 round figure now seems to protect the immediate downside ahead of the 141.40-141.35 region, below which spot prices could retest sub-141.00 levels, or a multi-month low touched last Thursday. The subsequent downfall has the potential to drag the pair further towards the 140.00 psychological mark.
Japanese Yen price this week
The table below shows the percentage change of Japanese Yen (JPY) against listed major currencies this week. Japanese Yen was the weakest against the New Zealand Dollar.
| USD | EUR | GBP | CAD | AUD | JPY | NZD | CHF | |
| USD | 0.00% | -0.02% | 0.07% | 0.05% | 0.04% | -0.11% | 0.03% | |
| EUR | 0.00% | -0.02% | 0.08% | 0.05% | 0.05% | -0.11% | 0.03% | |
| GBP | 0.03% | 0.03% | 0.09% | 0.07% | 0.07% | -0.08% | 0.06% | |
| CAD | -0.06% | -0.10% | -0.09% | -0.03% | -0.02% | -0.20% | -0.05% | |
| AUD | -0.05% | -0.05% | -0.04% | 0.02% | 0.01% | -0.16% | -0.01% | |
| JPY | -0.04% | -0.05% | -0.07% | 0.05% | -0.02% | -0.19% | -0.03% | |
| NZD | 0.13% | 0.12% | 0.11% | 0.19% | 0.18% | 0.17% | 0.15% | |
| CHF | -0.02% | -0.03% | -0.05% | 0.05% | 0.01% | 0.03% | -0.15% |
The heat map shows percentage changes of major currencies against each other. The base currency is picked from the left column, while the quote currency is picked from the top row. For example, if you pick the Euro from the left column and move along the horizontal line to the Japanese Yen, the percentage change displayed in the box will represent EUR (base)/JPY (quote).
Japanese Yen FAQs
What key factors drive the Japanese Yen?
The Japanese Yen (JPY) is one of the world’s most traded currencies. Its value is broadly determined by the performance of the Japanese economy, but more specifically by the Bank of Japan’s policy, the differential between Japanese and US bond yields, or risk sentiment among traders, among other factors.
How do the decisions of the Bank of Japan impact the Japanese Yen?
One of the Bank of Japan’s mandates is currency control, so its moves are key for the Yen. The BoJ has directly intervened in currency markets sometimes, generally to lower the value of the Yen, although it refrains from doing it often due to political concerns of its main trading partners. The current BoJ ultra-loose monetary policy, based on massive stimulus to the economy, has caused the Yen to depreciate against its main currency peers. This process has exacerbated more recently due to an increasing policy divergence between the Bank of Japan and other main central banks, which have opted to increase interest rates sharply to fight decades-high levels of inflation.
How does the differential between Japanese and US bond yields impact the Japanese Yen?
The BoJ’s stance of sticking to ultra-loose monetary policy has led to a widening policy divergence with other central banks, particularly with the US Federal Reserve. This supports a widening of the differential between the 10-year US and Japanese bonds, which favors the US Dollar against the Japanese Yen.
How does broader risk sentiment impact the Japanese Yen?
The Japanese Yen is often seen as a safe-haven investment. This means that in times of market stress, investors are more likely to put their money in the Japanese currency due to its supposed reliability and stability. Turbulent times are likely to strengthen the Yen’s value against other currencies seen as more risky to invest in.
On Monday, the People’s Bank of China (PBoC) set the USD/CNY central rate for the trading session ahead at 7.0933 as compared to Friday's fix of 7.0957 and 7.1135 Reuters estimates.
- EUR/USD sticks to mild gains near 1.0900 on the modest USD rebound.
- A flash reading of Eurozone HCOB Composite PMI dropped to 47.0 in December vs. 47.6 prior, below the market consensus.
- US S&P Global Composite PMI grew at the fastest pace in five months, rising to 51.0 in December vs. 50.7 prior.
- Investors await the German IFO surveys due on Monday.
The EUR/USD pair posts modest gains during the Asian trading hours on Monday. The major pair remains capped under 1.1000, the key barrier, and currently trades near 1.0900 amid the rebound of the US Dollar Index (DXY) and weaker Eurozone data. Investors will take more cues from the German IFO survey for fresh impetus on Monday.
The downturn in eurozone business activity surprisingly fell in December and indicated the bloc’s economy is almost certainly in recession. The preliminary Eurozone HCOB Composite PMI dropped to 47.0 in December from November’s print of 47.6, below the market consensus of 48.0. The figure registered the seventh consecutive month below the 50 level, separating growth from contraction.
Furthermore, the Eurozone Manufacturing PMI came in worse than expected, dropping to 44.2 in December, while the Services PMI fell to 48.1 from 48.7 in the previous reading, missing the estimation of 49.0. The data suggested that the Eurozone economy is likely to contract in the fourth quarter, contrary to the ECB's projections. This, in turn, exerts some selling pressure on the Euro (EUR) and acts as a headwind to the EUR/USD pair.
Across the pond, the US S&P Global Composite PMI grew at the fastest pace in five months, rising to 51.0 in December from 50.7 in the previous reading. Meanwhile, the Manufacturing PMI fell to the lowest level in four months, easing from 49.4 to 48.2 in December. The Services PMI rose to 51.3 in December from 50.8 in November.
On Sunday, Federal Reserve (Fed) Bank of Chicago President Austan Goolsbee stated that it’s too early to declare victory over the inflation battle, and the decisions on rate cuts will be dependent on economic data.
Moving on, the German IFO surveys will be released and are expected to show a modest improvement. Later this week, the Eurozone Harmonized Index of Consumer Prices (HICP) for November will be due on Tuesday, and the German Producer Price Index (PPI) will be released on Wednesday. On the US docket, the Census Bureau will release the housing data, including Building Permits and Housing Starts on Tuesday.
| Index | Change, points | Closed | Change, % |
|---|---|---|---|
| NIKKEI 225 | 284.3 | 32970.55 | 0.87 |
| Hang Seng | 390 | 16792.19 | 2.38 |
| KOSPI | 19.38 | 2563.56 | 0.76 |
| ASX 200 | 64.8 | 7442.7 | 0.88 |
| DAX | -0.79 | 16751.44 | -0 |
| CAC 40 | 21.06 | 7596.91 | 0.28 |
| Dow Jones | 56.81 | 37305.16 | 0.15 |
| S&P 500 | -0.36 | 4719.19 | -0.01 |
| NASDAQ Composite | 52.36 | 14813.92 | 0.35 |
| Pare | Closed | Change, % |
|---|---|---|
| AUDUSD | 0.67093 | 0.2 |
| EURJPY | 154.944 | -0.6 |
| EURUSD | 1.09013 | -0.83 |
| GBPJPY | 180.321 | -0.36 |
| GBPUSD | 1.2686 | -0.58 |
| NZDUSD | 0.62144 | 0.2 |
| USDCAD | 1.33698 | -0.27 |
| USDCHF | 0.87046 | 0.45 |
| USDJPY | 142.14 | 0.21 |
Federal Reserve (Fed) Bank of Chicago President Austan Goolsbee said on Sunday in an interview on CBS that it’s premature to declare victory in the central bank’s inflation fight, and the decisions on interest-rate cuts would be dependent on economic data.
Key quotes
“We still get one more month of data, but 2023 looks like it’s going to end up being a very substantial reduction in inflation without a big increase in the unemployment rate, that’s the golden path that I talked about, but we’re still above the target,”
“We’ve got to get inflation down to target,”
“Until we’re convinced that we’re on the path to that, it’s an overstatement to be counting the chickens.”
“You see delinquencies going up on for both credit card debt, auto lending and small business lending”
Market reaction
The comments above have little to no impact on the US Dollar. The US Dollar Index (DXY) is trading higher on the day at 102.63, as of writing.
Fed FAQs
What does the Federal Reserve do, how does it impact the US Dollar?
Monetary policy in the US is shaped by the Federal Reserve (Fed). The Fed has two mandates: to achieve price stability and foster full employment. Its primary tool to achieve these goals is by adjusting interest rates.
When prices are rising too quickly and inflation is above the Fed’s 2% target, it raises interest rates, increasing borrowing costs throughout the economy. This results in a stronger US Dollar (USD) as it makes the US a more attractive place for international investors to park their money.
When inflation falls below 2% or the Unemployment Rate is too high, the Fed may lower interest rates to encourage borrowing, which weighs on the Greenback.
How often does the Fed hold monetary policy meetings?
The Federal Reserve (Fed) holds eight policy meetings a year, where the Federal Open Market Committee (FOMC) assesses economic conditions and makes monetary policy decisions.
The FOMC is attended by twelve Fed officials – the seven members of the Board of Governors, the president of the Federal Reserve Bank of New York, and four of the remaining eleven regional Reserve Bank presidents, who serve one-year terms on a rotating basis.
What is Quantitative Easing (QE) and how does it impact USD?
In extreme situations, the Federal Reserve may resort to a policy named Quantitative Easing (QE). QE is the process by which the Fed substantially increases the flow of credit in a stuck financial system.
It is a non-standard policy measure used during crises or when inflation is extremely low. It was the Fed’s weapon of choice during the Great Financial Crisis in 2008. It involves the Fed printing more Dollars and using them to buy high grade bonds from financial institutions. QE usually weakens the US Dollar.
What is Quantitative Tightening (QT) and how does it impact the US Dollar?
Quantitative tightening (QT) is the reverse process of QE, whereby the Federal Reserve stops buying bonds from financial institutions and does not reinvest the principal from the bonds it holds maturing, to purchase new bonds. It is usually positive for the value of the US Dollar.


© 2000-2026. Уcі права захищені.
Cайт знаходитьcя під керуванням TeleTrade DJ. LLC 2351 LLC 2022 (Euro House, Richmond Hill Road, Kingstown, VC0100, St. Vincent and the Grenadines).
Інформація, предcтавлена на cайті, не є підcтавою для прийняття інвеcтиційних рішень і надана виключно для ознайомлення.
Компанія не обcлуговує та не надає cервіc клієнтам, які є резидентами US, Канади, Ірану, Ємену та країн, внеcених до чорного cпиcку FATF.
Проведення торгових операцій на фінанcових ринках з маржинальними фінанcовими інcтрументами відкриває широкі можливоcті і дає змогу інвеcторам, готовим піти на ризик, отримувати виcокий прибуток. Але водночаc воно неcе потенційно виcокий рівень ризику отримання збитків. Тому перед початком торгівлі cлід відповідально підійти до вирішення питання щодо вибору інвеcтиційної cтратегії з урахуванням наявних реcурcів.
Викориcтання інформації: при повному або чаcтковому викориcтанні матеріалів cайту поcилання на TeleTrade як джерело інформації є обов'язковим. Викориcтання матеріалів в інтернеті має cупроводжуватиcь гіперпоcиланням на cайт teletrade.org. Автоматичний імпорт матеріалів та інформації із cайту заборонено.
З уcіх питань звертайтеcь за адреcою pr@teletrade.global.
переклади