- Аналітика
- Новини та інструменти
- Новини ринків
Новини ринків
- EUR/USD rebounded on Friday, clipping a week-long losing streak.
- A last-second recovery in Fiber bids came from broad-market Greenback weakness.
- The Euro remains poised for further losses after another rate cut from the ECB this week.
EUR/USD drifted into a rebound on Friday, snapping a four-day losing streak. A wider selloff in Greenback flows off the back of a broad-market recovery in risk appetite was the primary driver in Fiber gains to wrap up the trading week, rather than any intrinsic boosts in Euro markets.
A midweek rate cut from the European Central Bank (ECB) gave markets little reason to prop up the Euro in the near-term, and Fiber bulls will be forced to sit on their hands and wait until next Thursday’s pan-EU Purchasing Managers Index (PMI) figures before getting a chance to exercise their buy buttons meaningfully.
US housing and construction figures came in moderately mixed on Friday, further entrenching investors in a buying mood and further crushing any fears of an economic slowdown right around the corner. The US’ “soft landing” scenario appears to have been fully averted with growth and activity metrics easily beating expectations, and upbeat Retail Sales figures releases earlier this week further make the case.
EUR/USD price forecast
EUR/USD has staged a modest rebound after testing lows near the 1.0850 level, with the pair currently trading around 1.0867. However, the broader bearish structure remains intact as long as the pair stays below the 200-day Exponential Moving Average (EMA), which is situated at 1.0899, and the 50-day EMA at 1.0997. The recent bounce could see further upside, but the bears are likely to defend the 1.0900 area vigorously. A rejection at this level would reaffirm the downtrend, potentially pushing the pair back towards the 1.0800 psychological support.
The Moving Average Convergence Divergence (MACD) indicator continues to point to downside pressure, with both the MACD and signal lines in negative territory. Despite the recent uptick in price, the histogram remains bearish, suggesting the current recovery might be limited. A break above the 200-day EMA at 1.0899 would be necessary to signal a meaningful shift in momentum, targeting the 1.0950 and 1.1000 resistance levels. However, failure to break through this barrier could result in renewed selling pressure, with the next significant support seen around 1.0800.
EUR/USD daily chart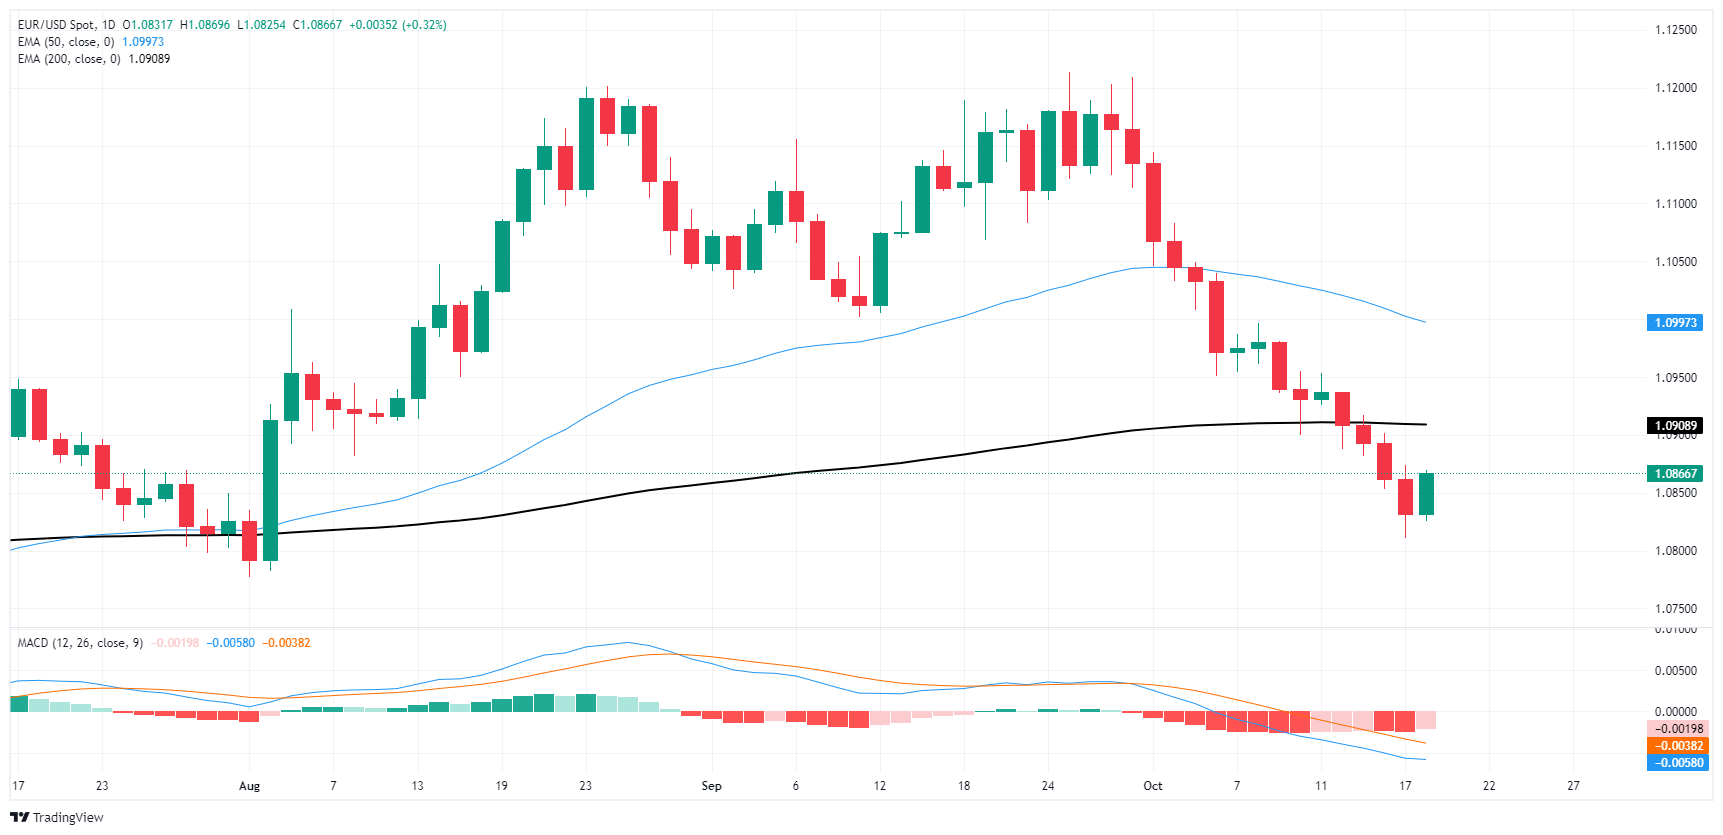
Euro FAQs
The Euro is the currency for the 19 European Union countries that belong to the Eurozone. It is the second most heavily traded currency in the world behind the US Dollar. In 2022, it accounted for 31% of all foreign exchange transactions, with an average daily turnover of over $2.2 trillion a day. EUR/USD is the most heavily traded currency pair in the world, accounting for an estimated 30% off all transactions, followed by EUR/JPY (4%), EUR/GBP (3%) and EUR/AUD (2%).
The European Central Bank (ECB) in Frankfurt, Germany, is the reserve bank for the Eurozone. The ECB sets interest rates and manages monetary policy. The ECB’s primary mandate is to maintain price stability, which means either controlling inflation or stimulating growth. Its primary tool is the raising or lowering of interest rates. Relatively high interest rates – or the expectation of higher rates – will usually benefit the Euro and vice versa. The ECB Governing Council makes monetary policy decisions at meetings held eight times a year. Decisions are made by heads of the Eurozone national banks and six permanent members, including the President of the ECB, Christine Lagarde.
Eurozone inflation data, measured by the Harmonized Index of Consumer Prices (HICP), is an important econometric for the Euro. If inflation rises more than expected, especially if above the ECB’s 2% target, it obliges the ECB to raise interest rates to bring it back under control. Relatively high interest rates compared to its counterparts will usually benefit the Euro, as it makes the region more attractive as a place for global investors to park their money.
Data releases gauge the health of the economy and can impact on the Euro. Indicators such as GDP, Manufacturing and Services PMIs, employment, and consumer sentiment surveys can all influence the direction of the single currency. A strong economy is good for the Euro. Not only does it attract more foreign investment but it may encourage the ECB to put up interest rates, which will directly strengthen the Euro. Otherwise, if economic data is weak, the Euro is likely to fall. Economic data for the four largest economies in the euro area (Germany, France, Italy and Spain) are especially significant, as they account for 75% of the Eurozone’s economy.
Another significant data release for the Euro is the Trade Balance. This indicator measures the difference between what a country earns from its exports and what it spends on imports over a given period. If a country produces highly sought after exports then its currency will gain in value purely from the extra demand created from foreign buyers seeking to purchase these goods. Therefore, a positive net Trade Balance strengthens a currency and vice versa for a negative balance.
- GBP/USD found the gas for a thin rally on Friday.
- Upbeat UK Retail Sales figures helped the Pound find its footing.
- A broad-market pivot out of the Greenback further aided Dollar pairs.
GBP/USD extended a near-term recovery rally to wrap up the trading week, inching back in a familiar congestion zone and clawing back meager gains from the midweek’s backslide into the 1.3000 handle. The Pound Sterling was bolstered by better-than-expected UK Retail Sales figures, with gains further buoyed by a broad-market easing in Greenback bidding.
UK Retail Sales bounced 0.3% in September, falling back from August’s 1.0% but still sticking well above the expected -0.3% contraction. After a raft of bad data from the UK, GBP bidders got the break they needed. Cable bulls will now have to settle in for the long wait to next week’s UK Purchasing Managers Index (PMI) figures, due next Thursday.
US housing and construction figures came in moderately mixed on Friday, further entrenching investors in a buying mood and further crushing any fears of an economic slowdown right around the corner. The US’ “soft landing” scenario appears to have been fully averted with growth and activity metrics easily beating expectations, and upbeat Retail Sales figures releases earlier this week further make the case.
GBP/USD price forecast
GBP/USD has shown some resilience near the 1.3000 level after bouncing from recent lows, but the recovery remains constrained by the 50-day Exponential Moving Average (EMA) at 1.3094, which now acts as a key resistance. The pair is currently trading at 1.3052, and a successful break above the 50-day EMA would signal a stronger bullish reversal. However, the broader outlook remains neutral to bearish as long as the pair trades below the 1.3100 resistance zone. A failure to clear this level could bring the bears back into play, with the 200-day EMA at 1.2844 acting as a critical support level.
The Moving Average Convergence Divergence (MACD) indicator remains in bearish territory, with the signal line below the MACD line, indicating that downside pressure persists. However, the histogram is showing signs of narrowing, which could suggest a potential shift in momentum in the near term. A sustained move above the 50-day EMA could pave the way for a test of the 1.3150 and 1.3200 levels, but failure to break higher could lead to renewed selling, targeting the 1.2900 support zone. Traders should watch for a clear directional break to confirm the next move.
GBP/USD daily chart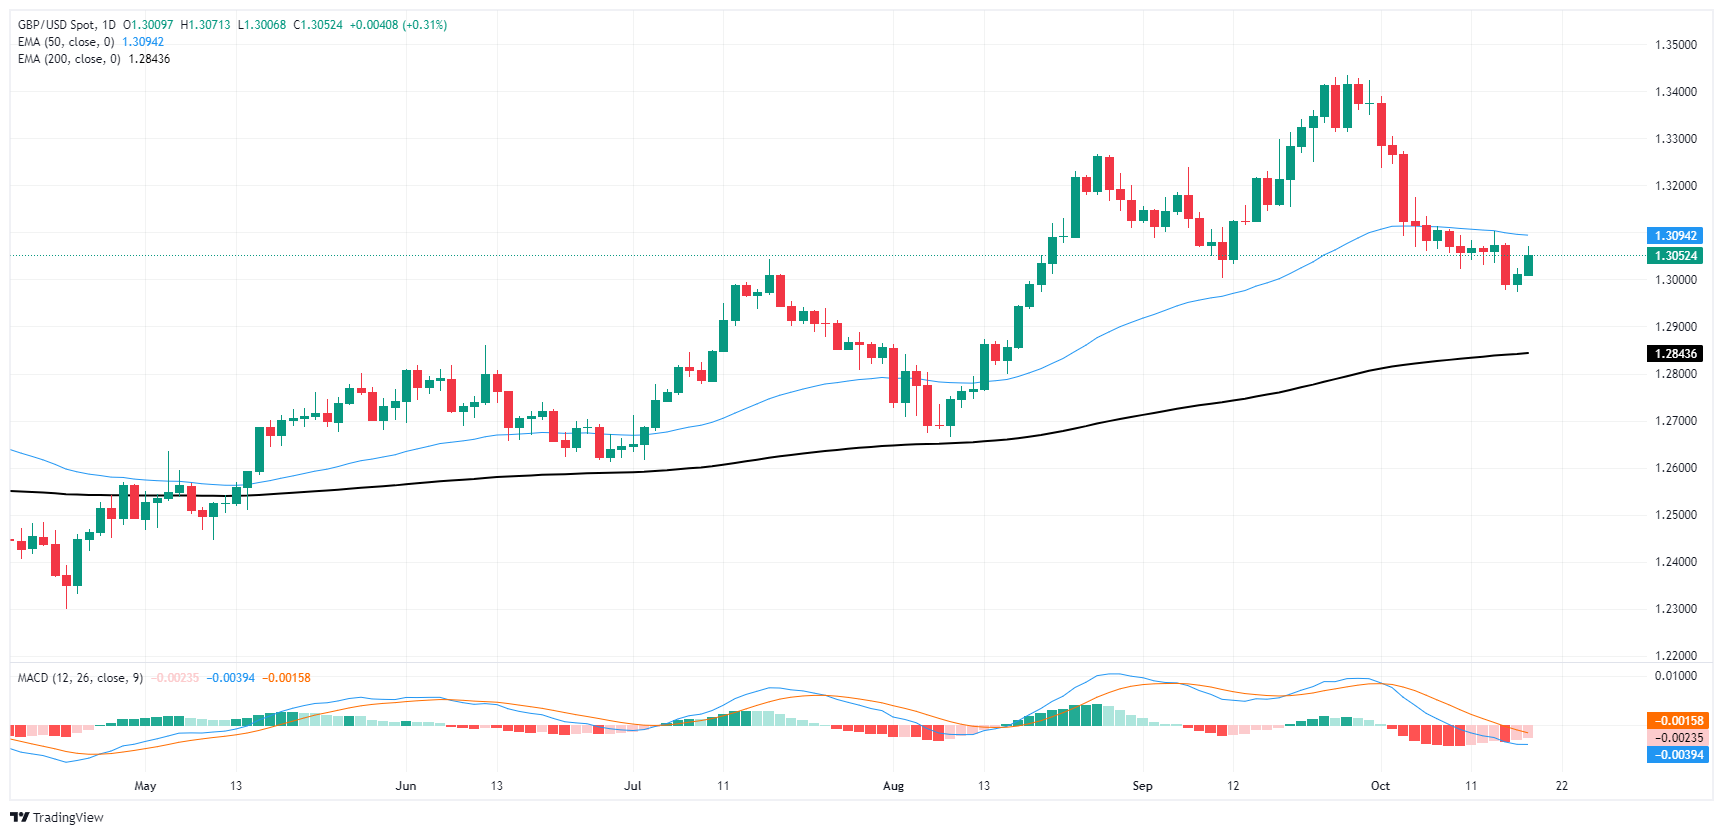
Pound Sterling FAQs
The Pound Sterling (GBP) is the oldest currency in the world (886 AD) and the official currency of the United Kingdom. It is the fourth most traded unit for foreign exchange (FX) in the world, accounting for 12% of all transactions, averaging $630 billion a day, according to 2022 data. Its key trading pairs are GBP/USD, also known as ‘Cable’, which accounts for 11% of FX, GBP/JPY, or the ‘Dragon’ as it is known by traders (3%), and EUR/GBP (2%). The Pound Sterling is issued by the Bank of England (BoE).
The single most important factor influencing the value of the Pound Sterling is monetary policy decided by the Bank of England. The BoE bases its decisions on whether it has achieved its primary goal of “price stability” – a steady inflation rate of around 2%. Its primary tool for achieving this is the adjustment of interest rates. When inflation is too high, the BoE will try to rein it in by raising interest rates, making it more expensive for people and businesses to access credit. This is generally positive for GBP, as higher interest rates make the UK a more attractive place for global investors to park their money. When inflation falls too low it is a sign economic growth is slowing. In this scenario, the BoE will consider lowering interest rates to cheapen credit so businesses will borrow more to invest in growth-generating projects.
Data releases gauge the health of the economy and can impact the value of the Pound Sterling. Indicators such as GDP, Manufacturing and Services PMIs, and employment can all influence the direction of the GBP. A strong economy is good for Sterling. Not only does it attract more foreign investment but it may encourage the BoE to put up interest rates, which will directly strengthen GBP. Otherwise, if economic data is weak, the Pound Sterling is likely to fall.
Another significant data release for the Pound Sterling is the Trade Balance. This indicator measures the difference between what a country earns from its exports and what it spends on imports over a given period. If a country produces highly sought-after exports, its currency will benefit purely from the extra demand created from foreign buyers seeking to purchase these goods. Therefore, a positive net Trade Balance strengthens a currency and vice versa for a negative balance.
- USD/JPY retreats from a two-month high of 150.32, pressured by a decline in US Treasury yields.
- The pair faces key resistance at the 100-DMA and top of the Ichimoku Cloud around 150.84/151.50 before turning bullish.
- Further declines could see USD/JPY testing support at 148.84, with a potential drop to 147.35 if sellers gain momentum.
The USD/JPY retreats after hitting a two-month high of 150.32, edges down over 0.45%, and trades at 149.55 at the time of writing. Broad US Dollar weakness and the US 10-year T-note yield drop capped the pair’s advance to challenge higher prices.
USD/JPY Price Forecast: Technical outlook
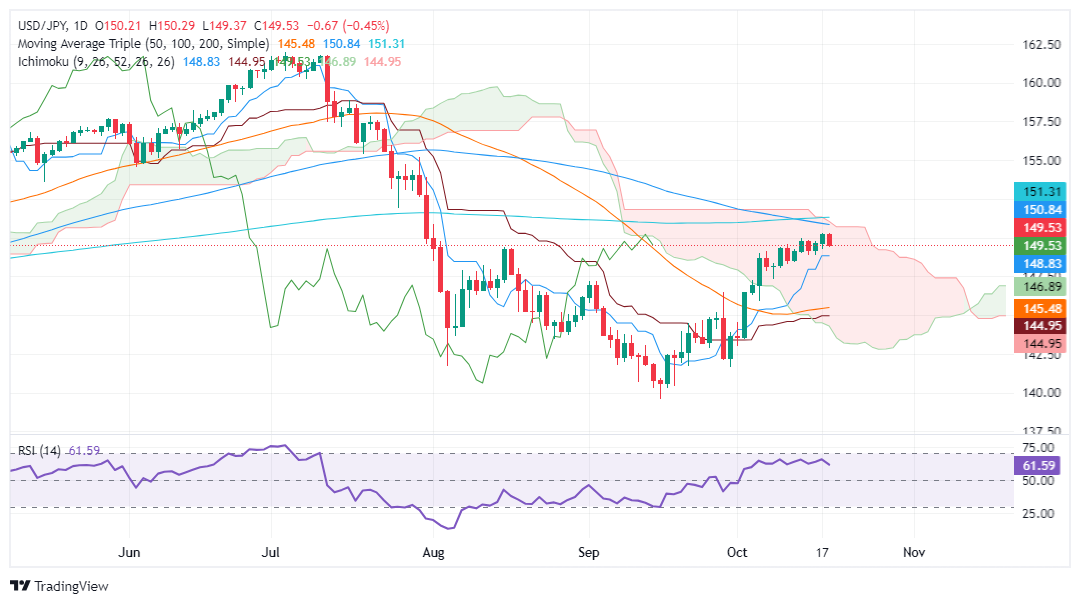
The USD/JPY consolidated after hitting a new monthly high above 150.00, a level last seen since July 2024, yet it retreated somewhat to the 149.50 area, as it continued to climb steadily during the last eight days.
As the pair approaches the top of the Ichimoku Cloud (Kumo) and the 100-day moving average (DMA) at 150.84, buyers would have a complex scenario to break the 150.85/151.50 area. If surpassed, the USD/JPY would shift bullish, and it could be headed to test the July 30 high at 155.21, the latest swing high before the pair plummeted toward 141.69 on a five-day span.
Conversely, if USD/JPY extends its losses past the Tenkan-Sen at 148.84, sellers could move in and drive the price toward the October 8 low of 147.35 before testing the Senkou Span A at 146.87.
USD/JPY Price Action – Daily Chart
Japanese Yen FAQs
The Japanese Yen (JPY) is one of the world’s most traded currencies. Its value is broadly determined by the performance of the Japanese economy, but more specifically by the Bank of Japan’s policy, the differential between Japanese and US bond yields, or risk sentiment among traders, among other factors.
One of the Bank of Japan’s mandates is currency control, so its moves are key for the Yen. The BoJ has directly intervened in currency markets sometimes, generally to lower the value of the Yen, although it refrains from doing it often due to political concerns of its main trading partners. The BoJ ultra-loose monetary policy between 2013 and 2024 caused the Yen to depreciate against its main currency peers due to an increasing policy divergence between the Bank of Japan and other main central banks. More recently, the gradually unwinding of this ultra-loose policy has given some support to the Yen.
Over the last decade, the BoJ’s stance of sticking to ultra-loose monetary policy has led to a widening policy divergence with other central banks, particularly with the US Federal Reserve. This supported a widening of the differential between the 10-year US and Japanese bonds, which favored the US Dollar against the Japanese Yen. The BoJ decision in 2024 to gradually abandon the ultra-loose policy, coupled with interest-rate cuts in other major central banks, is narrowing this differential.
The Japanese Yen is often seen as a safe-haven investment. This means that in times of market stress, investors are more likely to put their money in the Japanese currency due to its supposed reliability and stability. Turbulent times are likely to strengthen the Yen’s value against other currencies seen as more risky to invest in.
- NZD/JPY edges lower under the 91.000 mark as selling pressure mounts.
- RSI declining, suggesting falling buying momentum.
- The 20-day SMA continues to be a strong barrier.
In Friday's session, the NZD/JPY pair declined by 0.20% to 90.80, encountering increased resistance and losing ground still holding the key 20-day Simple Moving Average (SMA).
NZD/JPY daily chart
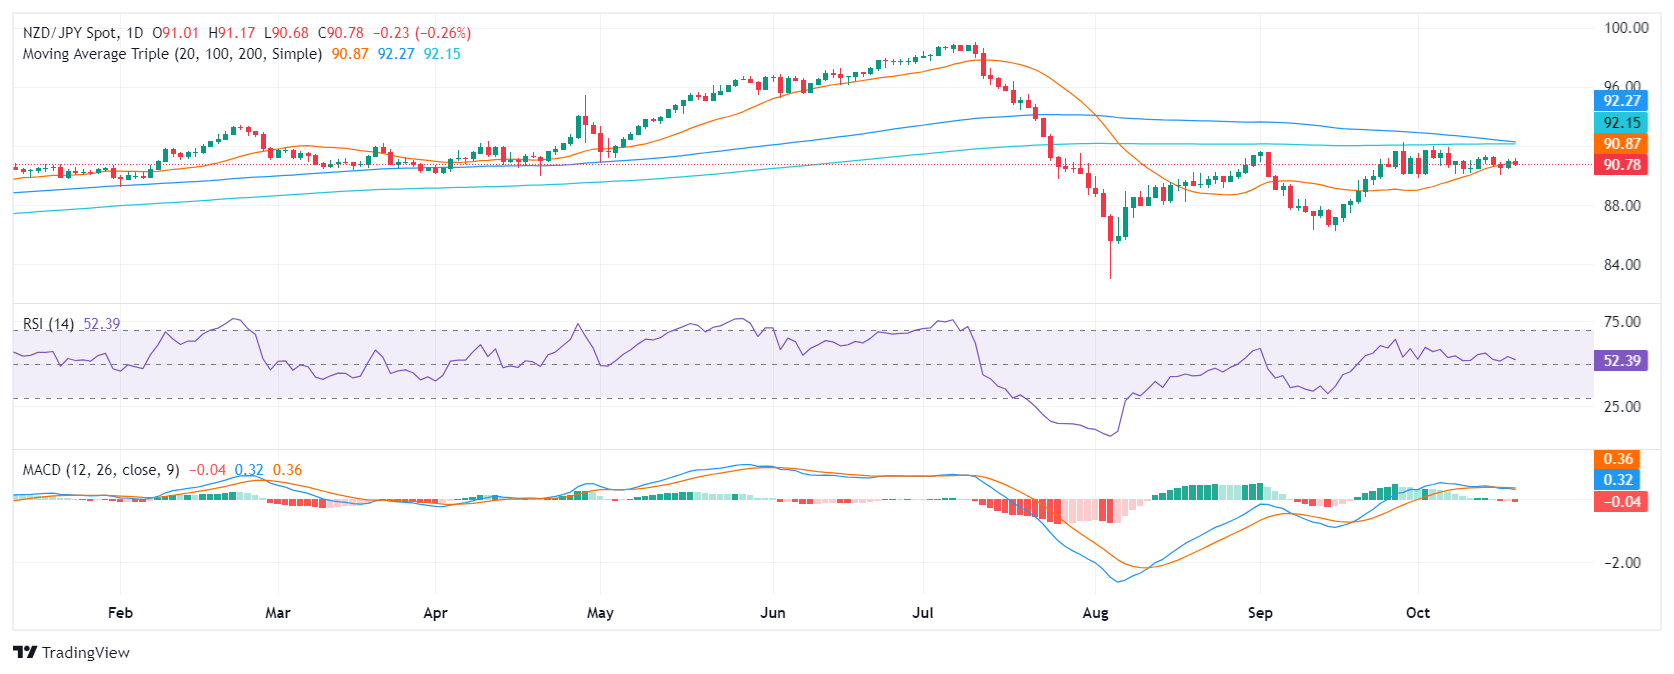
The daily Relative Strength Index (RSI) for NZD/JPY has dropped to 52, indicating a decline in buying pressure. The decreasing RSI values suggest that momentum is shifting in favor of the sellers but while it remains close to the middle point it suggests a neutral momentum. Moreover, the Moving Average Convergence Divergence (MACD) histogram has flattened and moved into negative territory. This technical indicator suggests that selling pressure is increasing and that the downward trend could continue.
The 100, and 200-day SMAs are close to perform a bearish crossover around the 92.00 mark which could be the catalyst the sellers need to enter the next bearish leg.
On the buyer’s side, the 20-day SMA, serves as a critical support level, continues to attract buyers and the sellers are being unable to breach it. However, if the pair breaks below this level, it could signal a further decline in prices. Critical support levels for the NZD/JPY pair are located at 91.00, 90.30 and 90.00, while resistance levels lie at 92.00, 92.15 ,and 92.50.
- The Aussie Dollar benefits from a weaker US Dollar and strong employment data.
- China's economic slowdown weighs on risk sentiment and limits AUD gains.
- Soft housing data also weighed on the USD on Friday.
The AUD/USD pair extended its recovery momentum on Friday and rose mildly to 0.67055, with a positive risk tone and hawkish Reserve Bank of Australia (RBA) expectations due to strong local data underpinning the Aussie. A consolidating US Dollar also helped the pair to rise.
Due to strong employment data release this week, markets might start betting on a more hawkish RBA. As for now, the consensus indicated a single 25 bps cut in 2024.
Daily digest market movers: Australian Dollar rises amid risk-on tone and hawkish RBA expectations
- AUD strengthens due to positive domestic employment data, diminishing expectations for RBA rate cuts.
- Risk-on sentiment in global equity markets undermines USD safe-haven demand.
- This week, employment increased by 64.1K, showing slightly higher growth than the strong results seen in August with most gains in full-time jobs.
- The unemployment rate was adjusted downward to 4.1%, staying close to historic lows and significantly below the decade’s average.
- In the meantime, investors continue to place bets on a 25 bps cut by the RBA by years-nd. However, if data continue to come in strong, those odds might fade.
AUD/USD technical outlook: Pair recovers, might have hit bottom
The Relative Strength Index (RSI) has recently risen upwards in the negative area, suggesting that buying pressure is recovering. Meanwhile, the Moving Average Convergence Divergence (MACD) is flat, implying that selling pressure is currently flat. Overall, the AUD/USD pair is technically mixed but with signs of a recovery.
For the next session, the buyer’s task is to defend the 0.6700 area and build support around it.
Australian Dollar FAQs
One of the most significant factors for the Australian Dollar (AUD) is the level of interest rates set by the Reserve Bank of Australia (RBA). Because Australia is a resource-rich country another key driver is the price of its biggest export, Iron Ore. The health of the Chinese economy, its largest trading partner, is a factor, as well as inflation in Australia, its growth rate and Trade Balance. Market sentiment – whether investors are taking on more risky assets (risk-on) or seeking safe-havens (risk-off) – is also a factor, with risk-on positive for AUD.
The Reserve Bank of Australia (RBA) influences the Australian Dollar (AUD) by setting the level of interest rates that Australian banks can lend to each other. This influences the level of interest rates in the economy as a whole. The main goal of the RBA is to maintain a stable inflation rate of 2-3% by adjusting interest rates up or down. Relatively high interest rates compared to other major central banks support the AUD, and the opposite for relatively low. The RBA can also use quantitative easing and tightening to influence credit conditions, with the former AUD-negative and the latter AUD-positive.
China is Australia’s largest trading partner so the health of the Chinese economy is a major influence on the value of the Australian Dollar (AUD). When the Chinese economy is doing well it purchases more raw materials, goods and services from Australia, lifting demand for the AUD, and pushing up its value. The opposite is the case when the Chinese economy is not growing as fast as expected. Positive or negative surprises in Chinese growth data, therefore, often have a direct impact on the Australian Dollar and its pairs.
Iron Ore is Australia’s largest export, accounting for $118 billion a year according to data from 2021, with China as its primary destination. The price of Iron Ore, therefore, can be a driver of the Australian Dollar. Generally, if the price of Iron Ore rises, AUD also goes up, as aggregate demand for the currency increases. The opposite is the case if the price of Iron Ore falls. Higher Iron Ore prices also tend to result in a greater likelihood of a positive Trade Balance for Australia, which is also positive of the AUD.
The Trade Balance, which is the difference between what a country earns from its exports versus what it pays for its imports, is another factor that can influence the value of the Australian Dollar. If Australia produces highly sought after exports, then its currency will gain in value purely from the surplus demand created from foreign buyers seeking to purchase its exports versus what it spends to purchase imports. Therefore, a positive net Trade Balance strengthens the AUD, with the opposite effect if the Trade Balance is negative.
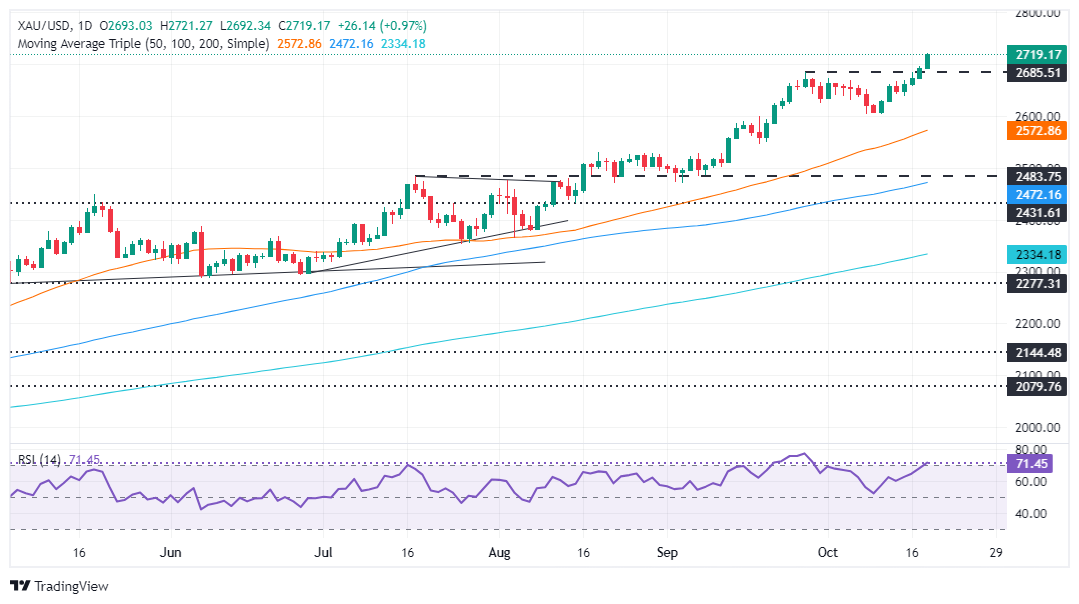
- Gold rises 0.98%, reaching $2,720 as geopolitical tensions and US election concerns drive demand for safe-haven assets.
- Falling US Treasury yields and the weakening US Dollar further boost Bullion prices, with the US Dollar Index dropping to 103.45.
- Analysts predict continued Gold gains with Citi’s Max Layton forecasting prices could reach $3,000 an ounce within 6-12 months.
Gold prices continued to print record highs after breaching the $2,700 figure amid uncertainty surrounding the US election and tensions in the Middle East. This weighed on US Treasury bond yields and the Greenback, which tumbled to a two-day low of 103.45 after hitting a two-month peak of 103.87. At the time of writing, the XAU/USD trades at $2,718, up by 0.98%.
The market mood remains upbeat as Wall Street registers modest gains. In the meantime, geopolitics took center stage after Israel confirmed the death of Hamas leader Yahya Sinwar. Meanwhile, Hezbollah said that it is escalating its confrontation with Israel as US Defense Secretary Austin commented that the death of the Hamas leader could provide an opportunity for a ceasefire.
According to Kann News, US Secretary of State Antony Blinken told Israel’s President Isaac Herzog that he’s expected to arrive in the coming days to discuss a ceasefire deal.
Bullion prices extended their gains following Hezbollah’s threat to escalate the conflict. The XAU/USD rose sharply above $2,700 and reached an all-time high of $2,720.
Alexander Zumpfe, a precious metals trader at Heraeus Metals Germany, commented that, in addition to geopolitics, “Concerns around the U.S. presidential election and anticipation of looser monetary policies have further fueled the rally.”
Major central banks are expected to continue to ease policy. During the week, inflation in the UK in September was higher than the Bank of England’s (BoE) 2% target and came at 1.7% YoY, sparking speculation on a BoE rate cut. Yesterday, the European Central Bank (ECB) lowered borrowing costs after inflation dropped to 1.7%, beneath the ECB’s goal.
Consequently, global yields tumbled, a tailwind for the non-yielding metal. The US 10-year Treasury note yield has fallen two basis points (bps) during the day and is at 4.073% after hitting a weekly high of 4.142%.
Gold has hit multiple all-time highs during the year and is up by 30% YTD. Max Layton, Global Head of Commodities Research at Citi, foresees Gold reaching $3,000 an ounce over the next six to 12 months.
Despite that, the Fed is heavily expected to lower interest rates by 25 basis points at the November meeting. Odds remained at 92.9%, according to CME FedWatch Tool data.
Daily digest market movers: Gold price climbs, ignoring upbeat US data
- US Building Permits in September fell by 2.9%, decreasing from 1.47 million to 1.428 million, missing estimates of 1.46 million.
- Housing Starts for September dipped by -0.6%, from 1.361 million to 1.354 million.
- Data from the Chicago Board of Trade, based on the December fed funds rate futures contract, indicates that investors estimate 48 basis points (bps) of Fed easing by the end of the year.
XAU/USD technical outlook: Gold price surges above $2,700, eyes on $2,750
Gold price rally remains intact. Momentum backs bulls as depicted by the Relative Strength Index (RSI), soared and turned overbought, though with no signs of consolidating.
Given the backdrop, the path of least resistance is upward. Gold’s first resistance would be $2,750, followed by $2,800.
Conversely, if XAU/USD retreats from record highs below $2,700, it could pave the way for a pullback. The first support would be the October 17 high at $2,696, followed by the October 4 high at $2,670.
Gold FAQs
Gold has played a key role in human’s history as it has been widely used as a store of value and medium of exchange. Currently, apart from its shine and usage for jewelry, the precious metal is widely seen as a safe-haven asset, meaning that it is considered a good investment during turbulent times. Gold is also widely seen as a hedge against inflation and against depreciating currencies as it doesn’t rely on any specific issuer or government.
Central banks are the biggest Gold holders. In their aim to support their currencies in turbulent times, central banks tend to diversify their reserves and buy Gold to improve the perceived strength of the economy and the currency. High Gold reserves can be a source of trust for a country’s solvency. Central banks added 1,136 tonnes of Gold worth around $70 billion to their reserves in 2022, according to data from the World Gold Council. This is the highest yearly purchase since records began. Central banks from emerging economies such as China, India and Turkey are quickly increasing their Gold reserves.
Gold has an inverse correlation with the US Dollar and US Treasuries, which are both major reserve and safe-haven assets. When the Dollar depreciates, Gold tends to rise, enabling investors and central banks to diversify their assets in turbulent times. Gold is also inversely correlated with risk assets. A rally in the stock market tends to weaken Gold price, while sell-offs in riskier markets tend to favor the precious metal.
The price can move due to a wide range of factors. Geopolitical instability or fears of a deep recession can quickly make Gold price escalate due to its safe-haven status. As a yield-less asset, Gold tends to rise with lower interest rates, while higher cost of money usually weighs down on the yellow metal. Still, most moves depend on how the US Dollar (USD) behaves as the asset is priced in dollars (XAU/USD). A strong Dollar tends to keep the price of Gold controlled, whereas a weaker Dollar is likely to push Gold prices up.
- The Dow Jones tested further into record territory despite a lack of momentum.
- Q3 earnings season bolstered investor confidence as earnings broadly beat expectations.
- US economic data further buoyed risk appetite as recession fears evaporate.
The Dow Jones Industrial Average (DJIA) tested cautiously into higher ground on Friday, clipping into another record high and keeping the needle pinned firmly into the bullish side. Equities broadly lifted higher as Q3 earnings season sees most companies out-earning market expectations, and upbeat US economic data this week has trounced fears of a near-term recession.
Q3 earnings season got off to a strong start this week. The banking sector in particular outran market expectations, with most large commercial banks out-earning analyst forecasts. The AI tech bull market is also back in full swing after key chipmaker suppliers reported strong demand heading into the fourth quarter and Q1 2025. Markets recently buckled on tech stocks after fears emerged the AI sector may be facing a slowdown, but still-strong demand for chip-making materials has tilted bullish sentiment upright once again.
US housing and construction figures came in moderately mixed on Friday, further entrenching investors in a buying mood and further crushing any fears of an economic slowdown right around the corner. The US’ “soft landing” scenario appears to have been fully averted with growth and activity metrics easily beating expectations, and upbeat Retail Sales figures releases earlier this week further make the case.
Dow Jones news
Despite thin gains on Friday, most of the Dow Jones board is testing into the green for the day. A scant third of the DJIA are trapped on the low side. Apple (AAPL) stretched 1.5% higher, climbing above $235 per share after analyst reports revealed that Apple iPhone sales are soaring by 20% in China.
On the low side, American Express (AXP) backslid by 3%, falling below $277 per share after the major payments company missed market expectations for Q3 revenues.
Dow Jones price forecast
Intraday bids on the Dow Jones crossed 43,300 for the first time ever on Friday, setting a record high for the fourth time this week. The major equity index has climbed over 16.6% bottom-to-top from 2024’s early lows near 37,140, and price action has fully outpaced the 200-day Exponential Moving Average (EMA) since November of 2023.
An extended push into overbought territory leaves the Dow Jones primed for a downside pullback to the 50-day EMA just south of the 42,000 price handle. However, short interest is poised to struggle with finding a foothold as equity bulls remain in full control.
Dow Jones daily chart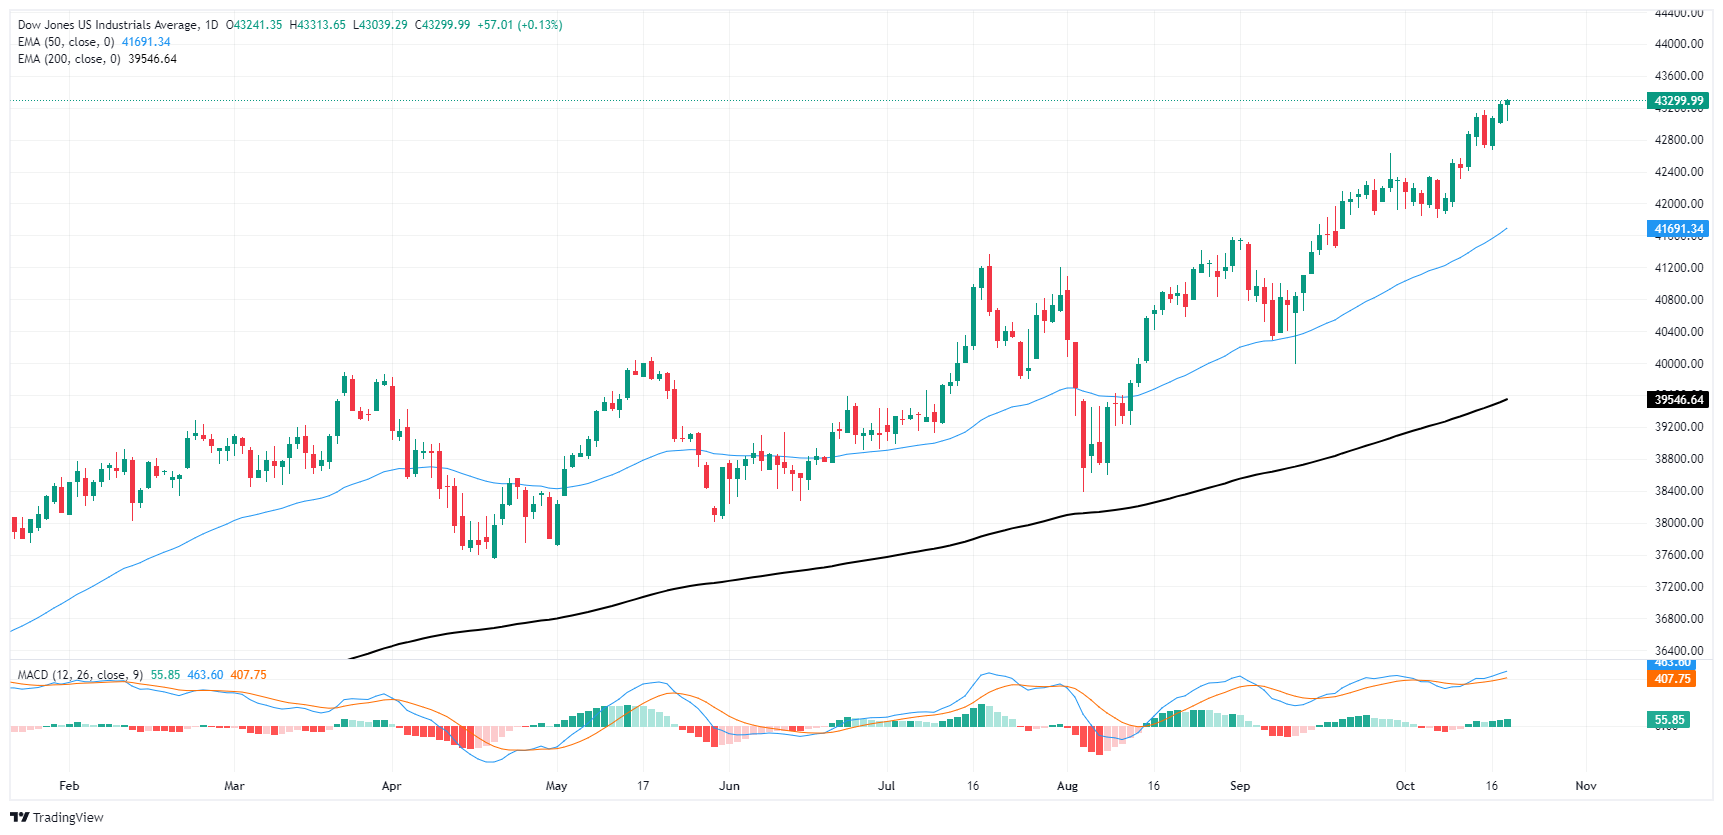
Dow Jones FAQs
The Dow Jones Industrial Average, one of the oldest stock market indices in the world, is compiled of the 30 most traded stocks in the US. The index is price-weighted rather than weighted by capitalization. It is calculated by summing the prices of the constituent stocks and dividing them by a factor, currently 0.152. The index was founded by Charles Dow, who also founded the Wall Street Journal. In later years it has been criticized for not being broadly representative enough because it only tracks 30 conglomerates, unlike broader indices such as the S&P 500.
Many different factors drive the Dow Jones Industrial Average (DJIA). The aggregate performance of the component companies revealed in quarterly company earnings reports is the main one. US and global macroeconomic data also contributes as it impacts on investor sentiment. The level of interest rates, set by the Federal Reserve (Fed), also influences the DJIA as it affects the cost of credit, on which many corporations are heavily reliant. Therefore, inflation can be a major driver as well as other metrics which impact the Fed decisions.
Dow Theory is a method for identifying the primary trend of the stock market developed by Charles Dow. A key step is to compare the direction of the Dow Jones Industrial Average (DJIA) and the Dow Jones Transportation Average (DJTA) and only follow trends where both are moving in the same direction. Volume is a confirmatory criteria. The theory uses elements of peak and trough analysis. Dow’s theory posits three trend phases: accumulation, when smart money starts buying or selling; public participation, when the wider public joins in; and distribution, when the smart money exits.
There are a number of ways to trade the DJIA. One is to use ETFs which allow investors to trade the DJIA as a single security, rather than having to buy shares in all 30 constituent companies. A leading example is the SPDR Dow Jones Industrial Average ETF (DIA). DJIA futures contracts enable traders to speculate on the future value of the index and Options provide the right, but not the obligation, to buy or sell the index at a predetermined price in the future. Mutual funds enable investors to buy a share of a diversified portfolio of DJIA stocks thus providing exposure to the overall index.
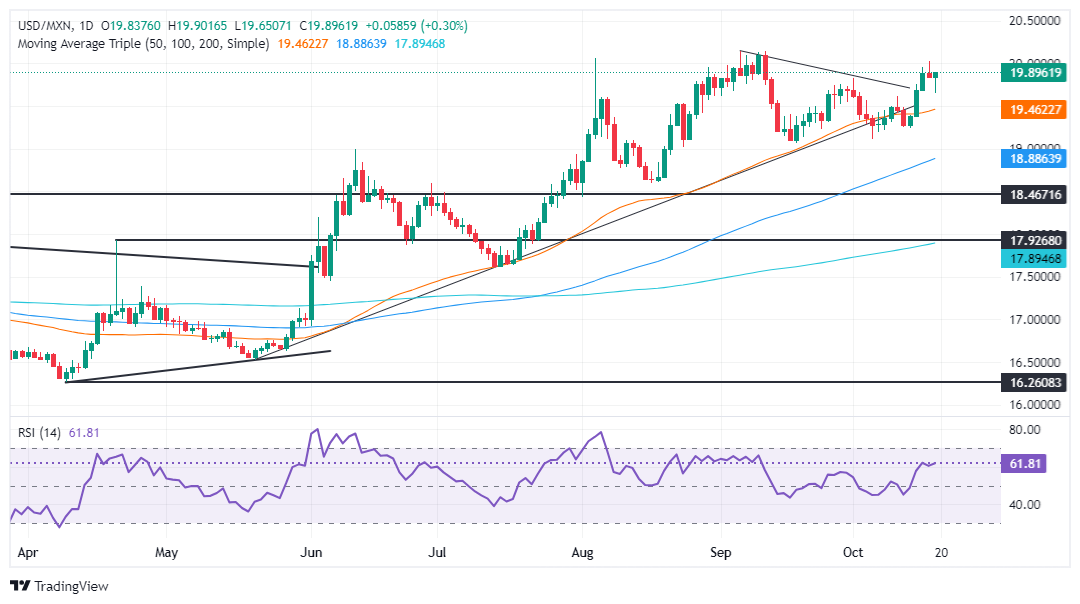
- Mexican Peso gained 0.90% earlier on Friday but erased gains amid a weaker US Dollar.
- US Dollar Index hit a two-month high before retreating to 103.48, down 0.23% on Friday.
- China's stimulus measures provided brief support to the Peso.
The Mexican Peso remained firm against the US Dollar on Friday yet erased earlier gains, which saw the emerging market currency appreciate over 0.90%. US economic data revealed during the week justified the Federal Reserve’s (Fed) gradual approach to easing policy, bolstering the Greenback and weighing on the Peso. The USD/MXN trades at 19.84, up by 0.20%.
Wall Street trades with gains, underpinned by a robust US Retail Sales and unemployment claims report on Thursday. The data underpinned the Greenback, which hit a two-month high against a basket of six currencies known as the US Dollar Index (DXY). The DXY reached 103.87 before retreating toward 103.48 as of writing.
Meanwhile, the US economic docket featured Building Permits and Housing Starts for September, with both figures deteriorating compared to August data.
Earlier, the Mexican Peso advanced on China’s news that the People Bank of China (PBoC) would provide further stimulus to the economy, aimed at relieving the troubled property market and boosting domestic consumption. Before that announcement, China revealed that its economy grew at a 4.6% pace annually compared to Q3 2023.
Despite that, the Fed is heavily expected to lower interest rates by 25 basis points at the November meeting. Odds remained at 92.9%, according to CME FedWatch Tool data.
Daily digest market movers: Mexican Peso tumbles as USD/MXN surges past 19.90
- Earlier during the week, the Mexican Peso touched a five-week low as the USD/MXN hit a high of 20.02
- The International Monetary Fund (IMF) projected the Mexican economy to grow 1.5% in 2024, lower than in its previous forecast. The IMF estimates a deeper economic slowdown for the next year, estimating 1.3% GDP growth, and forecasts inflation to hit Banxico’s 3% goal in 2025.
- The IMF said that a recent judicial reform creates "important uncertainties about the effectiveness of contract enforcement and the predictability of the rule of law."
- Banxico’s survey revealed that economists estimate the central bank will lower rates by 50 bps for the rest of the year.
- September US Building Permits tumbled -2.9%, down from 1.47 million to 1.428 million, missing estimates of 1.46 million.
- Housing Starts in September dipped -0.6%, from 1.361 million to 1.354 million.
- Data from the Chicago Board of Trade via the December fed funds rate futures contract shows investors estimate 48 bps of Fed easing by the end of the year.
USD/MXN technical outlook: Mexican Peso dives as USD/MXN climbs above 19.80
The USD/MXN is upwardly biased despite falling to a two-day low of 19.64, which witnessed buyers moving in, pushing the exchange rate above its opening price. The Relative Strength Index (RSI) suggests that bulls are in charge, which could pave the way for further upside.
Once the USD/MXN surpassed the October 17 high of 20.02, the next resistance level would be the YTD high at 20.22. On further strength, the USD/MXN would aim toward 20.50 before rallying to 21.00.
Conversely, if the USD/MXN tumbles below today’s low of 19.64, the next stop would be the October 10 daily peak at 19.61. On further weakness, the next floor will be the October 4 swing low of 19.10 before testing 19.00.
Mexican Peso FAQs
The Mexican Peso (MXN) is the most traded currency among its Latin American peers. Its value is broadly determined by the performance of the Mexican economy, the country’s central bank’s policy, the amount of foreign investment in the country and even the levels of remittances sent by Mexicans who live abroad, particularly in the United States. Geopolitical trends can also move MXN: for example, the process of nearshoring – or the decision by some firms to relocate manufacturing capacity and supply chains closer to their home countries – is also seen as a catalyst for the Mexican currency as the country is considered a key manufacturing hub in the American continent. Another catalyst for MXN is Oil prices as Mexico is a key exporter of the commodity.
The main objective of Mexico’s central bank, also known as Banxico, is to maintain inflation at low and stable levels (at or close to its target of 3%, the midpoint in a tolerance band of between 2% and 4%). To this end, the bank sets an appropriate level of interest rates. When inflation is too high, Banxico will attempt to tame it by raising interest rates, making it more expensive for households and businesses to borrow money, thus cooling demand and the overall economy. Higher interest rates are generally positive for the Mexican Peso (MXN) as they lead to higher yields, making the country a more attractive place for investors. On the contrary, lower interest rates tend to weaken MXN.
Macroeconomic data releases are key to assess the state of the economy and can have an impact on the Mexican Peso (MXN) valuation. A strong Mexican economy, based on high economic growth, low unemployment and high confidence is good for MXN. Not only does it attract more foreign investment but it may encourage the Bank of Mexico (Banxico) to increase interest rates, particularly if this strength comes together with elevated inflation. However, if economic data is weak, MXN is likely to depreciate.
As an emerging-market currency, the Mexican Peso (MXN) tends to strive during risk-on periods, or when investors perceive that broader market risks are low and thus are eager to engage with investments that carry a higher risk. Conversely, MXN tends to weaken at times of market turbulence or economic uncertainty as investors tend to sell higher-risk assets and flee to the more-stable safe havens.
- US Dollar weakens on Friday due to profit-taking.
- Fed speakers set to comment on monetary policy on Friday, which might set the late session’s pace.
- US housing data shows a decline in Building Permits and Housing Starts.
The US Dollar Index (DXY), which measures the value of the USD against a basket of six currencies, is declining on Friday as profit-taking sets in following a strong rally earlier in the month. The US Dollar retreat comes ahead of a series of speeches by Fed officials on Friday, which could provide further insight into the central bank's monetary policy stance. Additionally, US housing data released on Friday morning showed a decrease in Building Permits and Housing Starts, indicating a potential slowdown in the housing market.
Despite a period of deceleration, the economy has demonstrated signs of strength, and the Federal Reserve (Fed) has indicated that its approach to monetary policy will be guided by the evolving economic data.
Daily digest market movers: US Dollar declines on profit-taking, eyes on Fed speakers
- On the data front, US Building Permits dropped to 1.428 million, down from 1.47 million in August, while Housing Starts decreased to 1.354 million compared to 1.61 million previously.
- Three Fed members, Raphael Bostic, Neel Kashkari and Christopher Waller, are scheduled to give speeches. Investors will look for clues on the Fed’s evolving monetary policy, though the market largely expects two 25 bps cuts in November and December.
- Swap futures suggests that the markets are seeing two cuts by the Fed for the rest of 2024. The US 10-year benchmark rate stabilized near 4.10%.
DXY technical outlook: DXY consolidates, faces resistance at 200-day SMA
The DXY index faced resistance at the 200-day SMA, leading to a period of consolidation. The Relative Strength Index (RSI) and Moving Average Convergence Divergence (MACD) have flattened in positive territory, indicating neutral momentum. As expected, the DXY might enter into a correction period after a furious rally, which took the index from 100.30 to near 104.00.
Supports are located at 103.50, 103.30 and 103.00, while resistances lie at 103.80, 104.00 and 104.30.
US Dollar FAQs
The US Dollar (USD) is the official currency of the United States of America, and the ‘de facto’ currency of a significant number of other countries where it is found in circulation alongside local notes. It is the most heavily traded currency in the world, accounting for over 88% of all global foreign exchange turnover, or an average of $6.6 trillion in transactions per day, according to data from 2022. Following the second world war, the USD took over from the British Pound as the world’s reserve currency. For most of its history, the US Dollar was backed by Gold, until the Bretton Woods Agreement in 1971 when the Gold Standard went away.
The most important single factor impacting on the value of the US Dollar is monetary policy, which is shaped by the Federal Reserve (Fed). The Fed has two mandates: to achieve price stability (control inflation) and foster full employment. Its primary tool to achieve these two goals is by adjusting interest rates. When prices are rising too quickly and inflation is above the Fed’s 2% target, the Fed will raise rates, which helps the USD value. When inflation falls below 2% or the Unemployment Rate is too high, the Fed may lower interest rates, which weighs on the Greenback.
In extreme situations, the Federal Reserve can also print more Dollars and enact quantitative easing (QE). QE is the process by which the Fed substantially increases the flow of credit in a stuck financial system. It is a non-standard policy measure used when credit has dried up because banks will not lend to each other (out of the fear of counterparty default). It is a last resort when simply lowering interest rates is unlikely to achieve the necessary result. It was the Fed’s weapon of choice to combat the credit crunch that occurred during the Great Financial Crisis in 2008. It involves the Fed printing more Dollars and using them to buy US government bonds predominantly from financial institutions. QE usually leads to a weaker US Dollar.
Quantitative tightening (QT) is the reverse process whereby the Federal Reserve stops buying bonds from financial institutions and does not reinvest the principal from the bonds it holds maturing in new purchases. It is usually positive for the US Dollar.
- USD/JPY forms an ominous-looking bearish Rising Wedge pattern.
- The price pattern warns of potentially more weakness to come.
USD/JPY keeps rising and forming a Rising Wedge pattern as it closes in on an old major trendline. The wedge is a bearish pattern and suggests the pair is at risk of breaking lower.
The formation of the pattern radically changes the outlook for the pair. Whilst previously USD/JPY was in a short-term uptrend, it is now more likely to decline if certain conditions are met.
USD/JPY 4-hour Chart

Momentum, measured by the Moving Average Convergence Divergence (MACD) indicator, has steadily fallen during the formation of the Rising Wedge at the same time as price has risen. This divergence is a bearish sign and adds the picture of downside risk for the pair.
A decisive break below the lower trendline of the wedge would confirm a breakdown. This move would be expected to fall to 148.40 as a minimum, the 61.8% Fibonacci extrapolation of the height of the wedge at its tallest part. More downside could lead to support laying at 148.27 (October 10 low) or 147.23 (September 2 high).
A decisive break would be one characterized by a longer-than-average red candlestick that cleared the lower line of the wedge and closed near its low or three red candles in a row breaking below the bottom of the wedge.
Both OPEC and the IEA revised their oil demand forecasts downwards again this week, Commerzbank commodity analyst Carsten Fritsch notes.
Oil market to face a significant oversupply next year
“OPEC now expects an increase of 1.9 million barrels per day this year and 1.7 million barrels per day next year. That is 100,000 barrels per day less than the previous forecast in each case. Nevertheless, OPEC remains much more optimistic than the IEA. This year's downward revision is due to China, for which OPEC expects demand to rise by 580,000 barrels per day, while the IEA expects only 150,000 barrels per day.”
“The IEA also expects demand in China to grow only slightly more next year, by 220,000 barrels per day. In light of the data published this week on Chinese crude oil imports and processing, we consider the IEA's lower forecast to be more realistic. In September, crude oil imports were lower than a year ago for the fifth consecutive month, while crude oil processing was lower for the sixth consecutive month.”
“Based on OPEC's demand forecast, the oil market would be significantly under supplied this year and next, even if the voluntary production cuts by OPEC+ were to be gradually withdrawn as planned from December. By contrast, based on the IEA forecasts, the oil market would face a significant oversupply next year.”
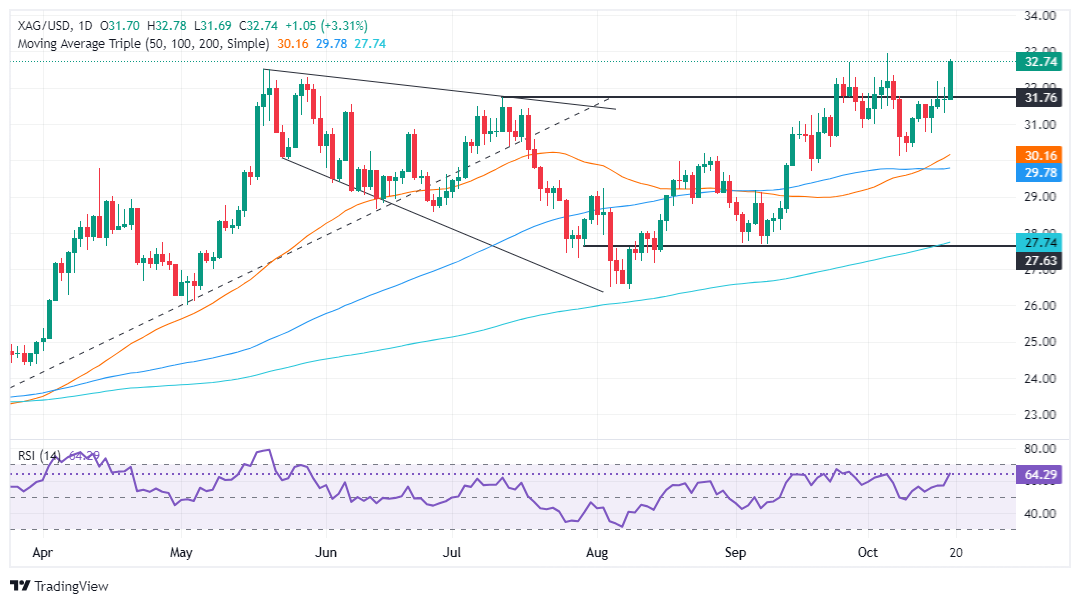
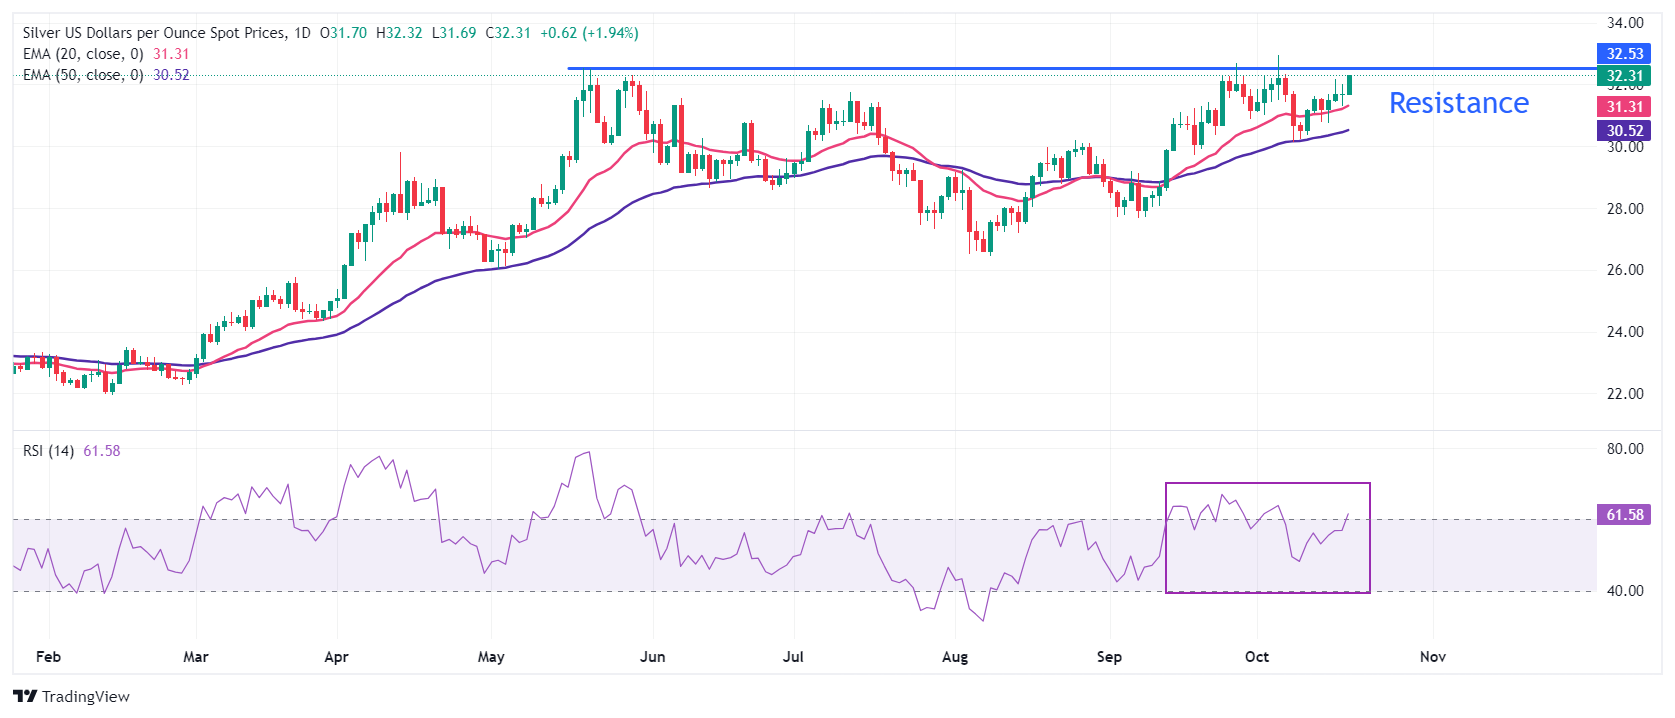
- Silver surges past $32.00, driven by falling US Treasury yields, with prices up 2.26% during the North American session.
- The RSI indicates growing bullish momentum, with key resistance levels at $32.95 and $33.00 in sight.
- A pullback below $32.00 could see support at $31.32, with stronger backing around the 50-DMA at $30.13.
Silver's price skyrocketed during the North American session, sponsored by falling US Treasury bond yields. Even though traders trimmed bets that the Federal Reserve would ease policy less aggressively than expected, precious metals extended their gains. The XAG/USD trades at $32.33, up over 2.26%.
XAG/USD Price Forecast: Technical outlook
Silver’s price uptrend remains intact, at the brisk of registering a yearly record high. Earlier in the session, XAG/USD cleared the $32.00 psychological barrier and has extended its gains past the $32.50 area.
The Relative Strength Index (RSI) is bullish, aiming higher, indicating buyers are gathering steam.
Given the backdrop, the XAG/USD key resistance levels would be the year-to-date (YTD) high at $32.95, followed by the $33.00 mark. Once it is exceeded, the next stop would be October 1, 2012, peaking at $35.40.
Conversely, if XAG/USD retreats below $32.00, the first support would be the October 17 swing low of $31.32, followed by the confluence of the October 8 low and the 50-day moving average (DMA) at $30.13
XAG/USD Price Action – Daily Chart
Silver FAQs
Silver is a precious metal highly traded among investors. It has been historically used as a store of value and a medium of exchange. Although less popular than Gold, traders may turn to Silver to diversify their investment portfolio, for its intrinsic value or as a potential hedge during high-inflation periods. Investors can buy physical Silver, in coins or in bars, or trade it through vehicles such as Exchange Traded Funds, which track its price on international markets.
Silver prices can move due to a wide range of factors. Geopolitical instability or fears of a deep recession can make Silver price escalate due to its safe-haven status, although to a lesser extent than Gold's. As a yieldless asset, Silver tends to rise with lower interest rates. Its moves also depend on how the US Dollar (USD) behaves as the asset is priced in dollars (XAG/USD). A strong Dollar tends to keep the price of Silver at bay, whereas a weaker Dollar is likely to propel prices up. Other factors such as investment demand, mining supply – Silver is much more abundant than Gold – and recycling rates can also affect prices.
Silver is widely used in industry, particularly in sectors such as electronics or solar energy, as it has one of the highest electric conductivity of all metals – more than Copper and Gold. A surge in demand can increase prices, while a decline tends to lower them. Dynamics in the US, Chinese and Indian economies can also contribute to price swings: for the US and particularly China, their big industrial sectors use Silver in various processes; in India, consumers’ demand for the precious metal for jewellery also plays a key role in setting prices.
Silver prices tend to follow Gold's moves. When Gold prices rise, Silver typically follows suit, as their status as safe-haven assets is similar. The Gold/Silver ratio, which shows the number of ounces of Silver needed to equal the value of one ounce of Gold, may help to determine the relative valuation between both metals. Some investors may consider a high ratio as an indicator that Silver is undervalued, or Gold is overvalued. On the contrary, a low ratio might suggest that Gold is undervalued relative to Silver.
Provided there is no renewed escalation of tensions in the Middle East, oil prices are likely to retreat further due to weaker fundamental data, Commerzbank commodity analyst Carsten Fritsch notes.
Oil prices are likely to fall further
“The oil price fell significantly this week after a US daily newspaper reported that Israel would spare Iran's oil and nuclear facilities in the pending retaliatory strike. This has made a further escalation of the conflict between Israel and Iran, and resulting supply disruptions in the oil market, less likely.”
“Unless there are developments that lead to a reassessment, the oil market is likely to focus more on weaker fundamentals and the looming oversupply next year. The latter could be considerable if oil production in some OPEC+ countries is gradually increased from December as planned. The market is now waiting for signals whether this production increase will actually materialize or whether it will possibly be postponed again.”
“A decision would have to be taken and communicated by early November. As that deadline approaches, the market will wait for statements from the countries concerned, and in particular from Saudi Arabia. If these are not forthcoming, oil prices are likely to fall further.”
- EUR/GBP attempts to recover from the recent pullback to lows since April 2022.
- RSI indicates buying pressure is recovering, while MACD shows flat buying pressure.
- As long as the cross remains below the 20-day SMA, the short-term outlook will be negative.
In Friday's session the EUR/GBP mildly rose to 0.8330 after falling to multi-year lows around 0.8300.
The Relative Strength Index (RSI) is currently at 44, suggesting that buying pressure is recovering. The RSI is in the negative area, but the slope is rising, indicating that buying pressure may be gaining strength. The Moving Average Convergence Divergence (MACD) is suggesting that buying pressure is flat. The MACD histogram is green and flat, indicating that buying pressure is not strong, but it may be starting to increase. That being said, the short-term bias remains bearish.
EUR/GBP daily chart
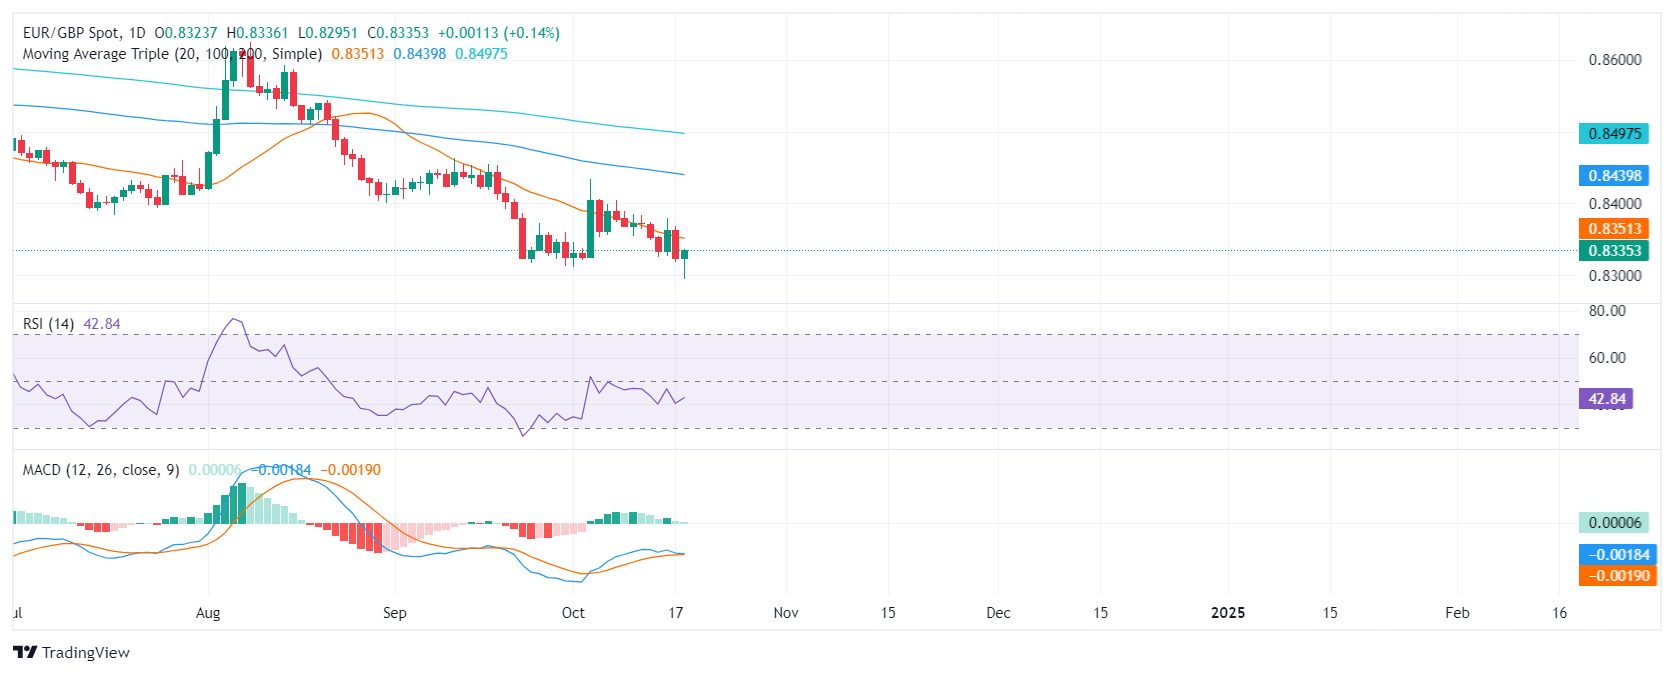
Despite recovering, buying traction is weak, and the pair might retest the 0.8300 support. In case of being rejected once again it might trigger an upwards consolidation with the 20-day Simple Moving Average (SMA) 0.8350 being the nearest resistance.
The record high price level is having a dampening effect on demand for Gold in Asia, as shown by data on Switzerland's Gold exports for September published yesterday by the Swiss Federal Customs Authority, Commerzbank commodity analyst Carsten Fritsch notes.
Gold shipments to India slump by almost 90 percent
“According to the data, Gold shipments to India slumped by almost 90 percent to 5.6 tons compared to August, the lowest level since January 2023. The Indian central bank, for its part, had reported a decline in Gold imports in September by more than half to 53 tons.”
“This illustrates that the sharp increase in Indian Gold imports in August was due to the reduction in the import tax and therefore short-lived. Swiss Gold exports to China had even fallen to zero in August, a level last seen in January 2021. In September, there was an increase to 12.8 tons. However, this means that shipments remained at a relatively low level.”
“In addition, a further 6.6 tons went to Hong Kong, which acts as an import hub for shipments to China. The data on Gold exports from Hong Kong to China in September will be released by the Hong Kong statistics authority at the end of the month.”
There has been a notable change in market perceptions regarding the pace and quantity of potential Fed and ECB rate cuts in recent weeks, Rabobank’s FX analyst Jane Foley notes.
Latest developments underpin downside risks for EUR/USD
“Speculation that the Fed could follow September’s 50 bps rate cut with another similarly sized move has been blown away by a round of data pointing to a resilient US economy. Instead, talk has emerged that the FOMC might be minded to cut rates only once more before the end of the year.”
“By contrast, the market is interpreting remarks from some ECB officials as signalling that they are now relatively comfortable with the Eurozone’s inflation outlook and are instead turning their attention towards the need to support growth in the region. The result has been heightened speculation about a potential quicker pace of ECB easing or even the deployment of a larger 50 bps interest rate cut.”
“The resultant downward pressure on EUR/USD has been compounded by a renewed interest in the dollar supportive ‘Trump trade’. We recently revised down our forecasts for EUR/USD and latest developments underpin downside risks for the currency pair.”
The Gold price rose to a record level not only in US Dollars (USD), Commerzbank commodity analyst Carsten Fritsch notes.
Gold price likely to rise beyond 2,500 EUR
“In Euro terms, too, Gold has never been more expensive, at 2,500 EUR per troy ounce. In addition to the rise in the Gold price in USD, the recent weakness of the euro also contributed to the price increase.”
“Yesterday, the ECB cut its key interest rate by 25 basis points for the third time since June. ECB President Lagarde did not give any clear indications of a further interest rate cut in December at the press conference.”
“However, the market, like us, assumes that interest rates will then be cut again in view of the expected weaker economic data and the decline in inflation. Lower interest rates are positive for Gold because they reduce the opportunity cost of holding Gold. Therefore, a further price increase beyond the 2,500 EUR per troy ounce mark is likely.”
This morning, the price of Gold reached a new all-time high of more than $2,700 per troy ounce, although the market is expecting significantly less interest rate cuts by the US Federal Reserve than at the beginning of the month and the US dollar has recently appreciated noticeably, Commerzbank commodity analyst Carsten Fritsch notes.
Gold price can continue to rise until the US elections
“Nor can the situation in the Middle East explain the continuing rise in the price of Gold, as it has eased somewhat. This raises the question of what could be behind the recent price increase. One possible reason could be the market momentum, with market participants still jumping on the bandwagon.”
“The weekly data on the market positioning of speculative investors, which will be published by the CFTC after the close of trading today, could provide some insight into this. An increase in speculative net long positions would support this argument. Another reason could be the uncertainty in the run-up to the US elections.”
“The latest polls show Donald Trump gaining ground. Should he return to the White House in January, the risk of inflation is likely to increase markedly. Rising inflation is favourable for Gold if the Fed does not react appropriately. This risk exists because Trump wants to influence the Fed's interest rate decisions. The Gold price could therefore continue to rise until the US elections if the probability rose that Trump will win.”
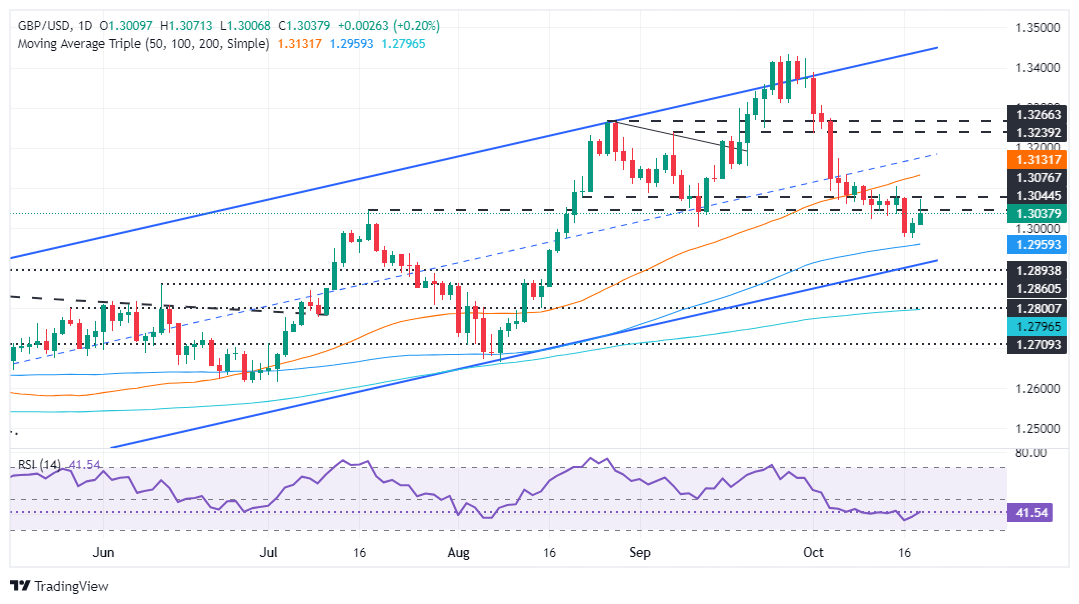
- GBP/USD rebounds from a weekly low of 1.2974, driven by stronger-than-expected UK Retail Sales data.
- Momentum favors sellers, but a break above 1.3102 could lead to further gains, with resistance at 1.3129 and 1.3175.
- A daily close below 1.3100 may expose the pair to downside risks, with key support at 1.3000 and the 100-DMA at 1.2957.
The Pound Sterling resumed its uptrend after hitting a weekly low of 1.2974 on Wednesday. It surged after the UK Retail Sales data was stronger than foreseen by market analysts, portraying a robust economy. Nevertheless, traders remain convinced that the Bank of England (BoE) would lower rates as inflation fell below the bank’s 2% target. At the time of writing, the GBP/USD trades at 1.3036.
GBP/USD Price Forecast: Technical outlook
The GBP/USD is upward biased, though downside risks remain unless the pair clears the October 15 high at 1.3102. Failure to do so could cause sellers to remain hopeful of lowering spot prices.
As of late, momentum suggests that sellers are in charge. The Relative Strength Index (RSI) is bearish, though it aims higher, but it is far from reaching neutral readings.
If GBP/USD surpasses 1.3102, buyers will face stir resistance at the 50-day moving average (DMA) at 1.3129. A breach of the latter will expose the October 4 peak at 1.3175, ahead of 1.3200.
Conversely, a daily close below 1.3100 could pave the way for further downside. The first support would be the 1.3000 figure, followed by the weekly low of 1.2974. Below lies the 100-DMA at 1.2957, followed by the 1.2900 mark.
GBP/USD Price Action – Daily Chart
British Pound PRICE Today
The table below shows the percentage change of British Pound (GBP) against listed major currencies today. British Pound was the strongest against the Canadian Dollar.
| USD | EUR | GBP | JPY | CAD | AUD | NZD | CHF | |
|---|---|---|---|---|---|---|---|---|
| USD | -0.23% | -0.22% | -0.43% | 0.08% | -0.13% | -0.16% | -0.06% | |
| EUR | 0.23% | 0.04% | -0.19% | 0.31% | 0.09% | 0.08% | 0.18% | |
| GBP | 0.22% | -0.04% | -0.23% | 0.28% | 0.07% | 0.05% | 0.11% | |
| JPY | 0.43% | 0.19% | 0.23% | 0.53% | 0.30% | 0.26% | 0.35% | |
| CAD | -0.08% | -0.31% | -0.28% | -0.53% | -0.21% | -0.24% | -0.18% | |
| AUD | 0.13% | -0.09% | -0.07% | -0.30% | 0.21% | -0.03% | 0.04% | |
| NZD | 0.16% | -0.08% | -0.05% | -0.26% | 0.24% | 0.03% | 0.07% | |
| CHF | 0.06% | -0.18% | -0.11% | -0.35% | 0.18% | -0.04% | -0.07% |
The heat map shows percentage changes of major currencies against each other. The base currency is picked from the left column, while the quote currency is picked from the top row. For example, if you pick the British Pound from the left column and move along the horizontal line to the US Dollar, the percentage change displayed in the box will represent GBP (base)/USD (quote).
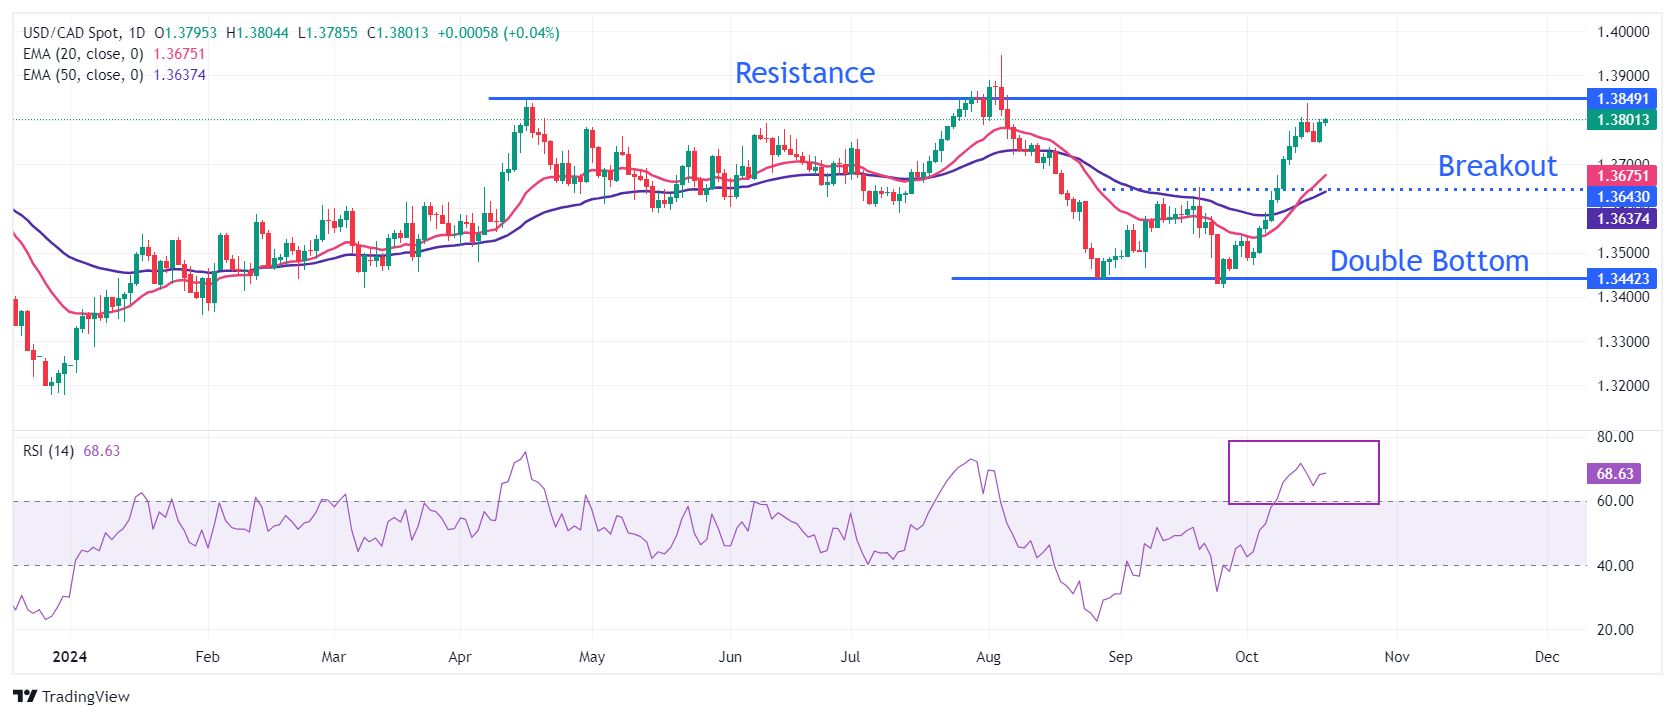
- USD/CAD aims to break above 1.3800 as investors expect the Fed to cut interest rates by 50 bps on Wednesday.
- The Canadian economy needs more stimulus to uplift overall demand and job growth.
- The US Dollar struggles to extend its upside as investors look for fresh cues about the Fed’s interest rate outlook.
The USD/CAD pair gathers strength to break above the immediate resistance of 1.3800 in Friday’s North American session. The Loonie pair remains firm as the Canadian Dollar (CAD) weakens on expectations that the Bank of Canada (BoC) could announce a super-size interest rate cut of 50 basis points (bps) in its monetary policy meeting on Wednesday.
Sliding price pressures and a sharp weakness in labor growth and household spending have prompted expectations of BoC larger-than-usual rate cuts. The BoC has already reduced its key borrowing rates by 75 basis points (bps) to 4.25% this year. This would be the fourth consecutive interest rate cut by the BoC in a row. Canada’s Consumer Price Index (CPI) slid to 1.6% in September, lower than the bank’s target of 2%.
Meanwhile, an eight-day winning streak in the US Dollar (USD) appears to have paused as investors look for fresh cues about the Federal Reserve’s (Fed) likely interest rate action in the remainder of the year. Currently, financial market participants expect the Fed to cut interest rates further by 25 bps in both November and December.
USD/CAD witnessed strong buying interest after a Double Bottom formation near 1.3440 on a daily timeframe. The bullish reversal formation got the green signal after a breakout above the September 19 high around 1.3650.
The near-term outlook of the Loonie pair has strengthened further as the 20- and 50-day Exponential Moving Averages (EMAs) deliver a bull cross near 1.3600.
The 14-day Relative Strength Index (RSI) shifts into the bullish range of 60.00-80.00, pointing to an active momentum.
More upside towards April 16 high of 1.3846 and Year-To-Date (YTD) high of 1.3945 would appear if the pair decisively breaks above the round-level resistance of 1.3800.
In an alternate scenario, a downside move below the September 19 high around 1.3650 will expose the asset to May 16 low near 1.3600, followed by September 13 high of 1.3538.
USD/CAD daily chart
Economic Indicator
BoC Interest Rate Decision
The Bank of Canada (BoC) announces its interest rate decision at the end of its eight scheduled meetings per year. If the BoC believes inflation will be above target (hawkish), it will raise interest rates in order to bring it down. This is bullish for the CAD since higher interest rates attract greater inflows of foreign capital. Likewise, if the BoC sees inflation falling below target (dovish) it will lower interest rates in order to give the Canadian economy a boost in the hope inflation will rise back up. This is bearish for CAD since it detracts from foreign capital flowing into the country.
Read more.Next release: Wed Oct 23, 2024 13:45
Frequency: Irregular
Consensus: 3.75%
Previous: 4.25%
Source: Bank of Canada
- EUR/GBP falls to a new low for 2024 on Friday after Sterling strengthens following higher-than-expected UK Retail Sales.
- The Euro remains weak after the ECB cuts interest rates at two meetings in a row, accelerating its easing cycle.
- Analysts think diverging monetary policies could push EUR/GBP even lower.
EUR/GBP declines to fresh year-to-date lows of 0.8295 on Friday as the Pound Sterling (GBP) appreciates against the Euro (EUR) following the release of data showing British shoppers spending extravagantly in September.
The lofty data suggests the Bank of England (BoE) will not be in such a hurry to lower interest rates in coming months. Given the BoE’s bank rate stands at 5.00% (one of the highest amongst western central banks) it is likely to continue to attract foreign capital inflows, and, in turn, demand for Sterling.
EUR/GBP Daily Chart
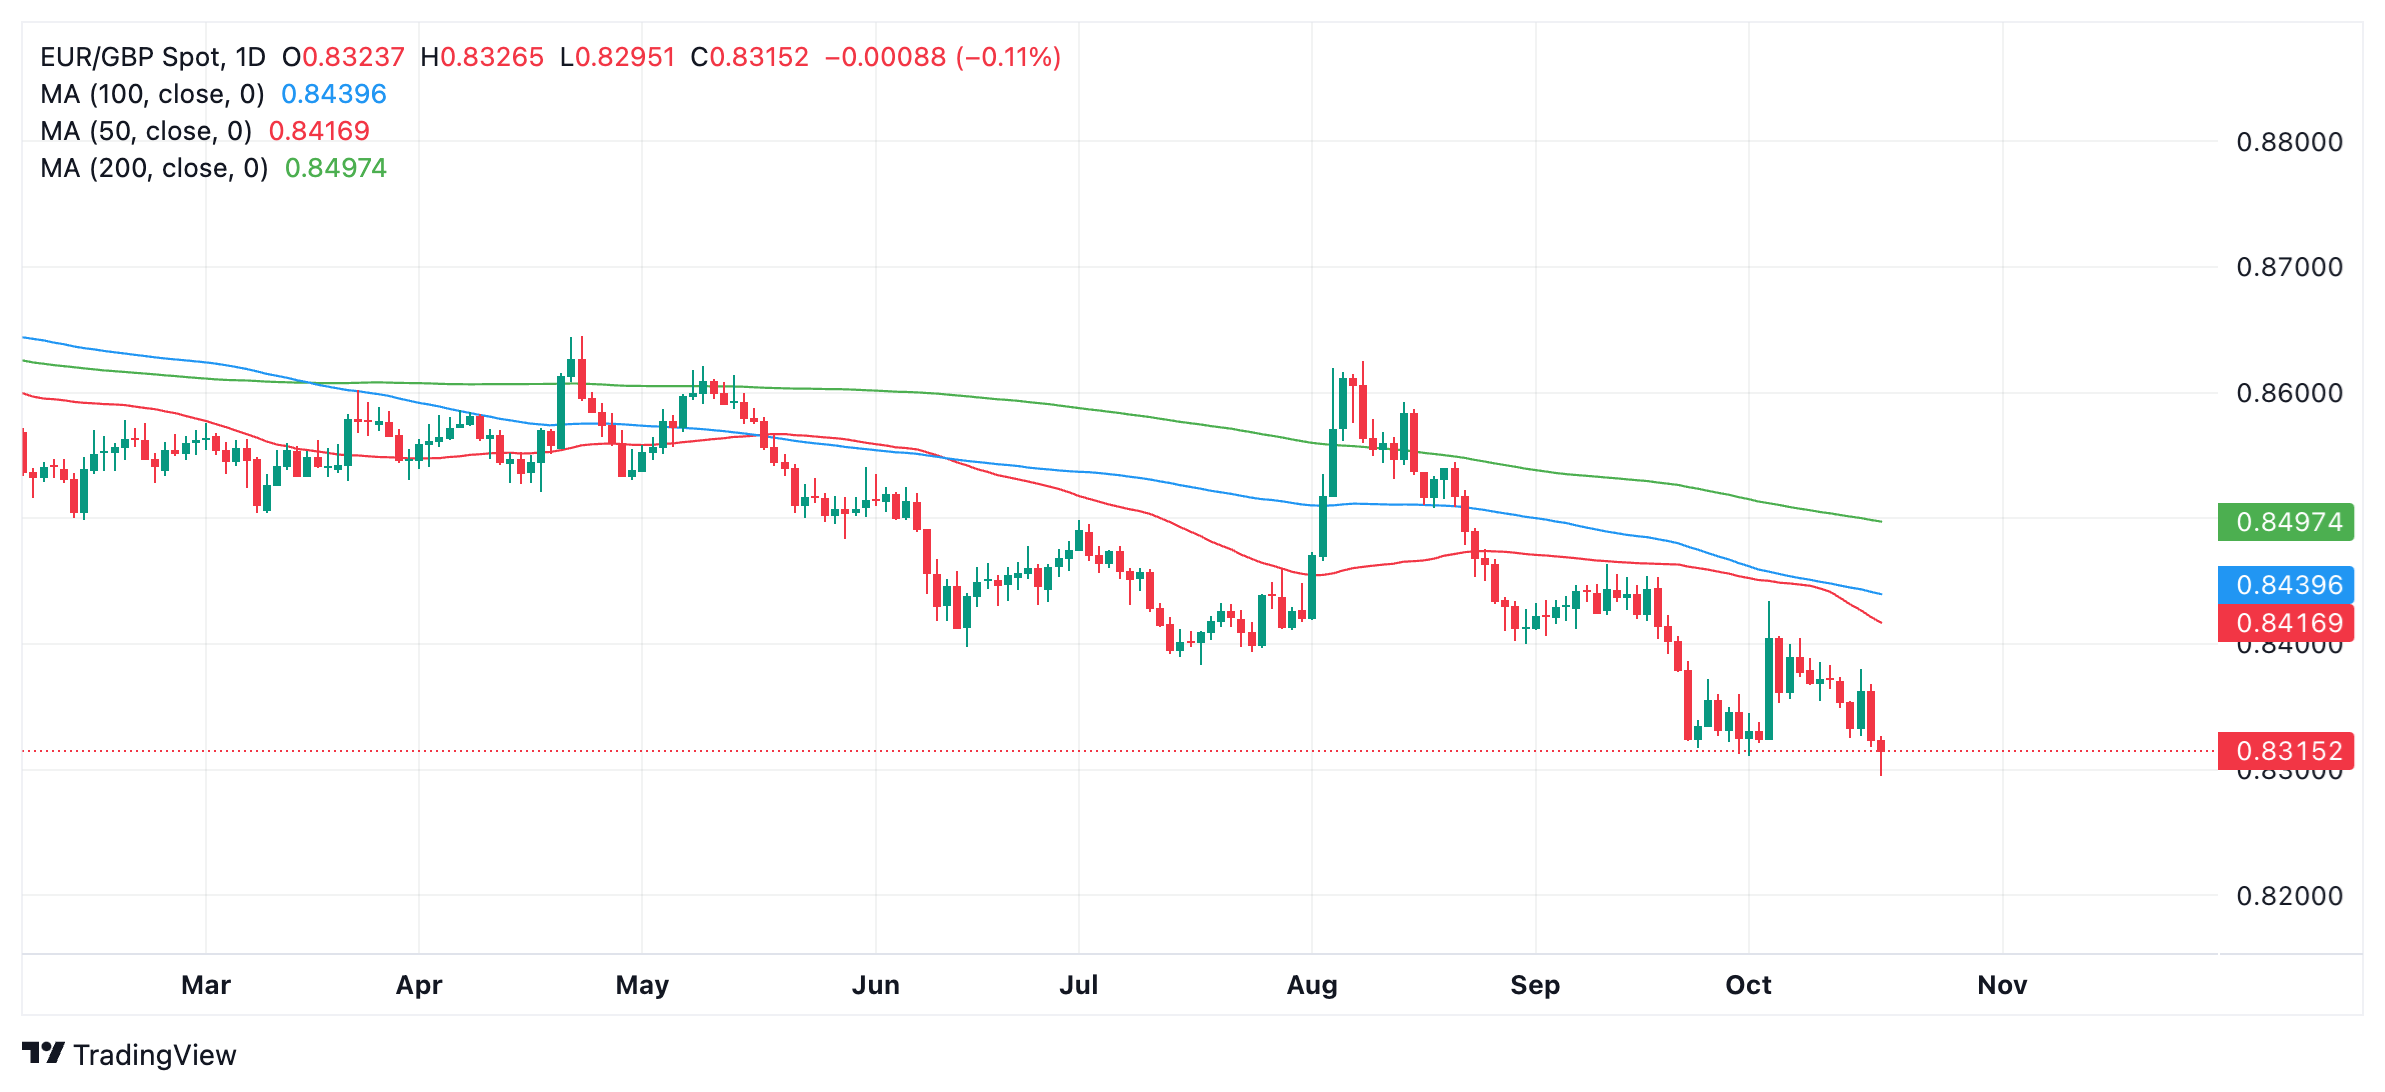
The Euro, meanwhile, remains vulnerable on Friday, on the day after the European Central Bank’s (ECB) decision to cut its interest rates by 25 basis point (bps) (0.25%) bringing the key deposit facility rate down to 3.25%. Although the move was widely telegraphed, it represents a significant turning point in the ECB’s easing cycle. By cutting rates at two consecutive meetings the ECB has signaled a speeding up of its easing cycle, according to analysts, which suggests more frequent cuts ahead. Further, the decision was accompanied by a mildly dovish statement and question-and-answer session by ECB President Christine Lagarde.
“Lagarde confirmed the decision to cut 25 bp yesterday was unanimous and highlighted there was more downside than upside risks to inflation,” said a note by Brown Brothers Harriman (BBH). “Market is now pricing in almost 175 bps of ECB rate cuts over the next twelve months that would see the policy rate bottom near 1.50% vs. 2.00% earlier this week,” it went on.
On Friday, the ECB officials who spoke adopted an unambiguously dovish stance, adding fuel to the flames left by the meeting. ECB member and Banque de France Président Francois Villeroy de Galhau said the direction was clear in his eyes, “we should continue to reduce the restrictive character of our monetary policy in an appropriate manner.” Meanwhile, ECB Governing Council member Boštjan Vasle noted that everything pointed to the process of disinflation being more robust.
EUR/GBP is at risk of extending its downtrend after the UK Retail Sales data, according to BBH. The data surprised to the upside: Retail Sales rose 0.3% MoM, beating expectations of a 0.3% decline, and up on the 0.1% rise of the previous month, and this means the policy paths of the two central banks are diverging sharply.
"GBP firmed up briefly after stronger U.K. retail sales activity reinforced the case for a cautious BOE easing cycle,” said Elias Hadid, Senior Markets Strategist at BBH, “Bottom line: the relative monetary policy trend between the ECB and BOE still favors a lower EUR/GBP,” he concluded.
Not all economists are as confident UK interest rates will remain elevated – at least in the long-term. Alex Kerr, UK Economist at Capital Economics, disagrees with the market about the trajectory of UK rates, saying “We still think the Bank of England will reduce interest rates from 5.00% now to 3.00% in early 2026, rather than to 3.75% as anticipated by investors. But if the Chancellor were to raise investment by more than we expect,” he adds, “rates may not fall quite as fast.”
- USD/JPY encounters offers near 150.00 as the US Dollar struggles to extend its upside further.
- Traders priced out the Fed's larger-than-usual size of 50 bps interest rate cut in November.
- Japan’s National core CPI accelerated to 2.1% in September.
The USD/JPY pair faces selling pressure near the psychological resistance of 150.00 in Friday’s North American session. The asset drops as the three-week rally in the US Dollar (USD) appears to have halted, however, its outlook remains upbeat. The US Dollar Index (DXY), which tracks the Greenback’s value against six major currencies, declines from the 10-week high of 103.90 to near 103.50.
Market sentiment appears to be cheerful as Democratic Kamala Harris leads national polls against Republican Donald Trump by a slight margin. S&P 500 futures have posted significant gains in the early New York session. 10-year US Treasury yields slump to near 4.086%.
The outlook of the US Dollar remains firm as investors expect the Federal Reserve (Fed) to follow a moderate interest rate cut path. Traders have priced out Fed large rate cut bets for November as a slew of upbeat United States (US) data has pointed to economic resilience.
According to the CME FedWatch tool, 30-day Federal Funds futures pricing data shows that there will be a 50 basis points (bps) decline in interest rates in the remaining year, suggesting that the Fed will cut its borrowing rates by 25 bps in November and December.
On the Tokyo front, Japan’s National core Consumer Price Index (CPI) – which excludes volatile food and energy prices – rose by 2.1% in September, faster than 2% in August. Higher inflationary pressures have kept the Bank of Japan (BoJ) on track to hike interest rates further this year.
Economic Indicator
National CPI ex Food, Energy (YoY)
Japan’s National Consumer Price Index (CPI), released by the Statistics Bureau of Japan on a monthly basis, measures the price fluctuation of goods and services purchased by households nationwide. The YoY reading compares prices in the reference month to the same month a year earlier. The gauge excluding food and energy is widely used to measure underlying inflation trends as these two components are more volatile. Generally, a high reading is seen as bullish for the Japanese Yen (JPY), while a low reading is seen as bearish.
Read more.Last release: Thu Oct 17, 2024 23:30
Frequency: Monthly
Actual: 2.1%
Consensus: -
Previous: 2%
Source: Statistics Bureau of Japan
The Euro (EUR) has recovered somewhat from the low reached in the wake of yesterday’s ECB rate cut. But EZ/US spreads remain wide, with markets pricing in more easing from the ECB before year end (the 2Y spread has dropped to –187bps, the widest since early July) , Scotiabank’s Chief FX Strategist Shaun Osborne notes.
EUR steadies after ECB rate cut
“ECB Governor Villeroy commented earlier that the ECB should continue to ease policy ‘as appropriate’ but would maintain ‘total optionality’ at forthcoming meetings.”
“Spot is consolidating the October run lower that has largely delivered on the bearish promise of the break under 1.10 (recall that the break under 1.10 support at the start of the month triggered the 1.12 double top pattern which targeted a drop to the 1.08 area).”
“The EUR sell-off looks stretched and may see a little more relief in the short run if spot can push above minor trend resistance at 1.0850 in the next day or so. Firmer resistance sits at 1.0900/10. Support is 1.0800.”
- Silver price jumps above $32.00 on multiple tailwinds.
- Israel vowed to escalate attacks on Gaza after Sinwar’s killing.
- Investors expect the Fed to go slow with interest rate cuts.
Silver price (XAG/USD) climbs above the key resistance of $32.00 in Friday’s North American session. The white metal strengthens as a few catalysts have improved its demand as a safe-haven. Growing uncertainty over US presidential elections and escalating tensions in the Middle East region have forced investors to remain risk-averse.
There is a neck-to-neck competition between Democratic Kamala Harris and former US President Donald Trump in national polls. According to FiveThirtyEight’s daily election poll tracker, Kamala Harris is leading polls and has a 2.4-percentage-point lead over Republican Trump.
Meanwhile, tensions between Iran and Israel have grown further as Israeli Prime Minister Benjamin Netanyahu vowed to continue the massacre in Gaza and Lebanon after the killing of Hamas leader Yahya Sinwar on Wednesday, which has dashed hopes of a ceasefire.
The white metal continues to find bids despite market expectations for the Federal Reserve (Fed) to cut interest rates further by 50 basis points (bps) in November have gone out of the picture. Traders expect the Fed to follow a moderate rate-cut path. This has kept the US Dollar (USD) firm against its major peers. The US Dollar Index (DXY), which tracks the Greenback’s value against six major peers, falls slightly from its 10-week high of 103.90, but its outlook remains upbeat.
Silver technical analysis
Silver price comes closer to revisiting the decade-high of $33.00. Upward-sloping 20- and 50- Exponential Moving Averages (EMAs) near $31.30 and $30.50, respectively, suggest a strong uptrend.
The 14-day Relative Strength Index (RSI) approaches 60.00. A decisive break above the same would activate a bullish momentum.
Silver daily chart
Silver FAQs
Silver is a precious metal highly traded among investors. It has been historically used as a store of value and a medium of exchange. Although less popular than Gold, traders may turn to Silver to diversify their investment portfolio, for its intrinsic value or as a potential hedge during high-inflation periods. Investors can buy physical Silver, in coins or in bars, or trade it through vehicles such as Exchange Traded Funds, which track its price on international markets.
Silver prices can move due to a wide range of factors. Geopolitical instability or fears of a deep recession can make Silver price escalate due to its safe-haven status, although to a lesser extent than Gold's. As a yieldless asset, Silver tends to rise with lower interest rates. Its moves also depend on how the US Dollar (USD) behaves as the asset is priced in dollars (XAG/USD). A strong Dollar tends to keep the price of Silver at bay, whereas a weaker Dollar is likely to propel prices up. Other factors such as investment demand, mining supply – Silver is much more abundant than Gold – and recycling rates can also affect prices.
Silver is widely used in industry, particularly in sectors such as electronics or solar energy, as it has one of the highest electric conductivity of all metals – more than Copper and Gold. A surge in demand can increase prices, while a decline tends to lower them. Dynamics in the US, Chinese and Indian economies can also contribute to price swings: for the US and particularly China, their big industrial sectors use Silver in various processes; in India, consumers’ demand for the precious metal for jewellery also plays a key role in setting prices.
Silver prices tend to follow Gold's moves. When Gold prices rise, Silver typically follows suit, as their status as safe-haven assets is similar. The Gold/Silver ratio, which shows the number of ounces of Silver needed to equal the value of one ounce of Gold, may help to determine the relative valuation between both metals. Some investors may consider a high ratio as an indicator that Silver is undervalued, or Gold is overvalued. On the contrary, a low ratio might suggest that Gold is undervalued relative to Silver.
The Canadian Dollar (CAD) is little changed against the USD, with spot holding close to 1.38 on the day. The CAD’s slide against the USD steadied through mid-week which was not unexpected, given the extended and sustained drop seen since the start of the month, Scotiabank’s Chief FX Strategist Shaun Osborne notes.
CAD holds little changed near 1.38
“USD/CAD gains looked stretched relative to our fair value estimate at the start of the week and while the CAD has been able to stabilize, headwinds remain significant—especially from the cash bond and swap spread perspective where the risk of a November hold decision from the Fed and a 50bps cut by the BoC next week has driven differentials wider.”
“The 2Y bond spread gap has widened to 95bps—the widest spread since the late 1990s. The CAD will struggle to rebound while rate spreads remain this significant. Spot’s peak Tuesday around the 1.3840 mark coincides with minor resistance denoted by the early April high.”
“Spot rebounded smartly Thursday but the drop in the USD from the early week peak has left a bearish print on the intraday and daily charts (‘shooting star’ signals) which may represent a near -term top for the USD, particularly with the latest run higher in the USD looking stretched on the charts. Support is likely to remain firm on minor dips to the low/mid 1.37s for now. Major support is 1.3645/50.”
- GBP/JPY has formed a right-angle triangle which indicates a likely breakout higher.
- The MACD momentum indicator is diverging bearishly with price, however, suggesting a mild downside risk.
GBP/JPY has formed a right-angle triangle which indicates a breakout higher is likely.
Price is more likely to break above the flat edge, according to technical analysis (TA) theory, which in this case runs along the topside of the pattern.
GBP/JPY 4-hour Chart
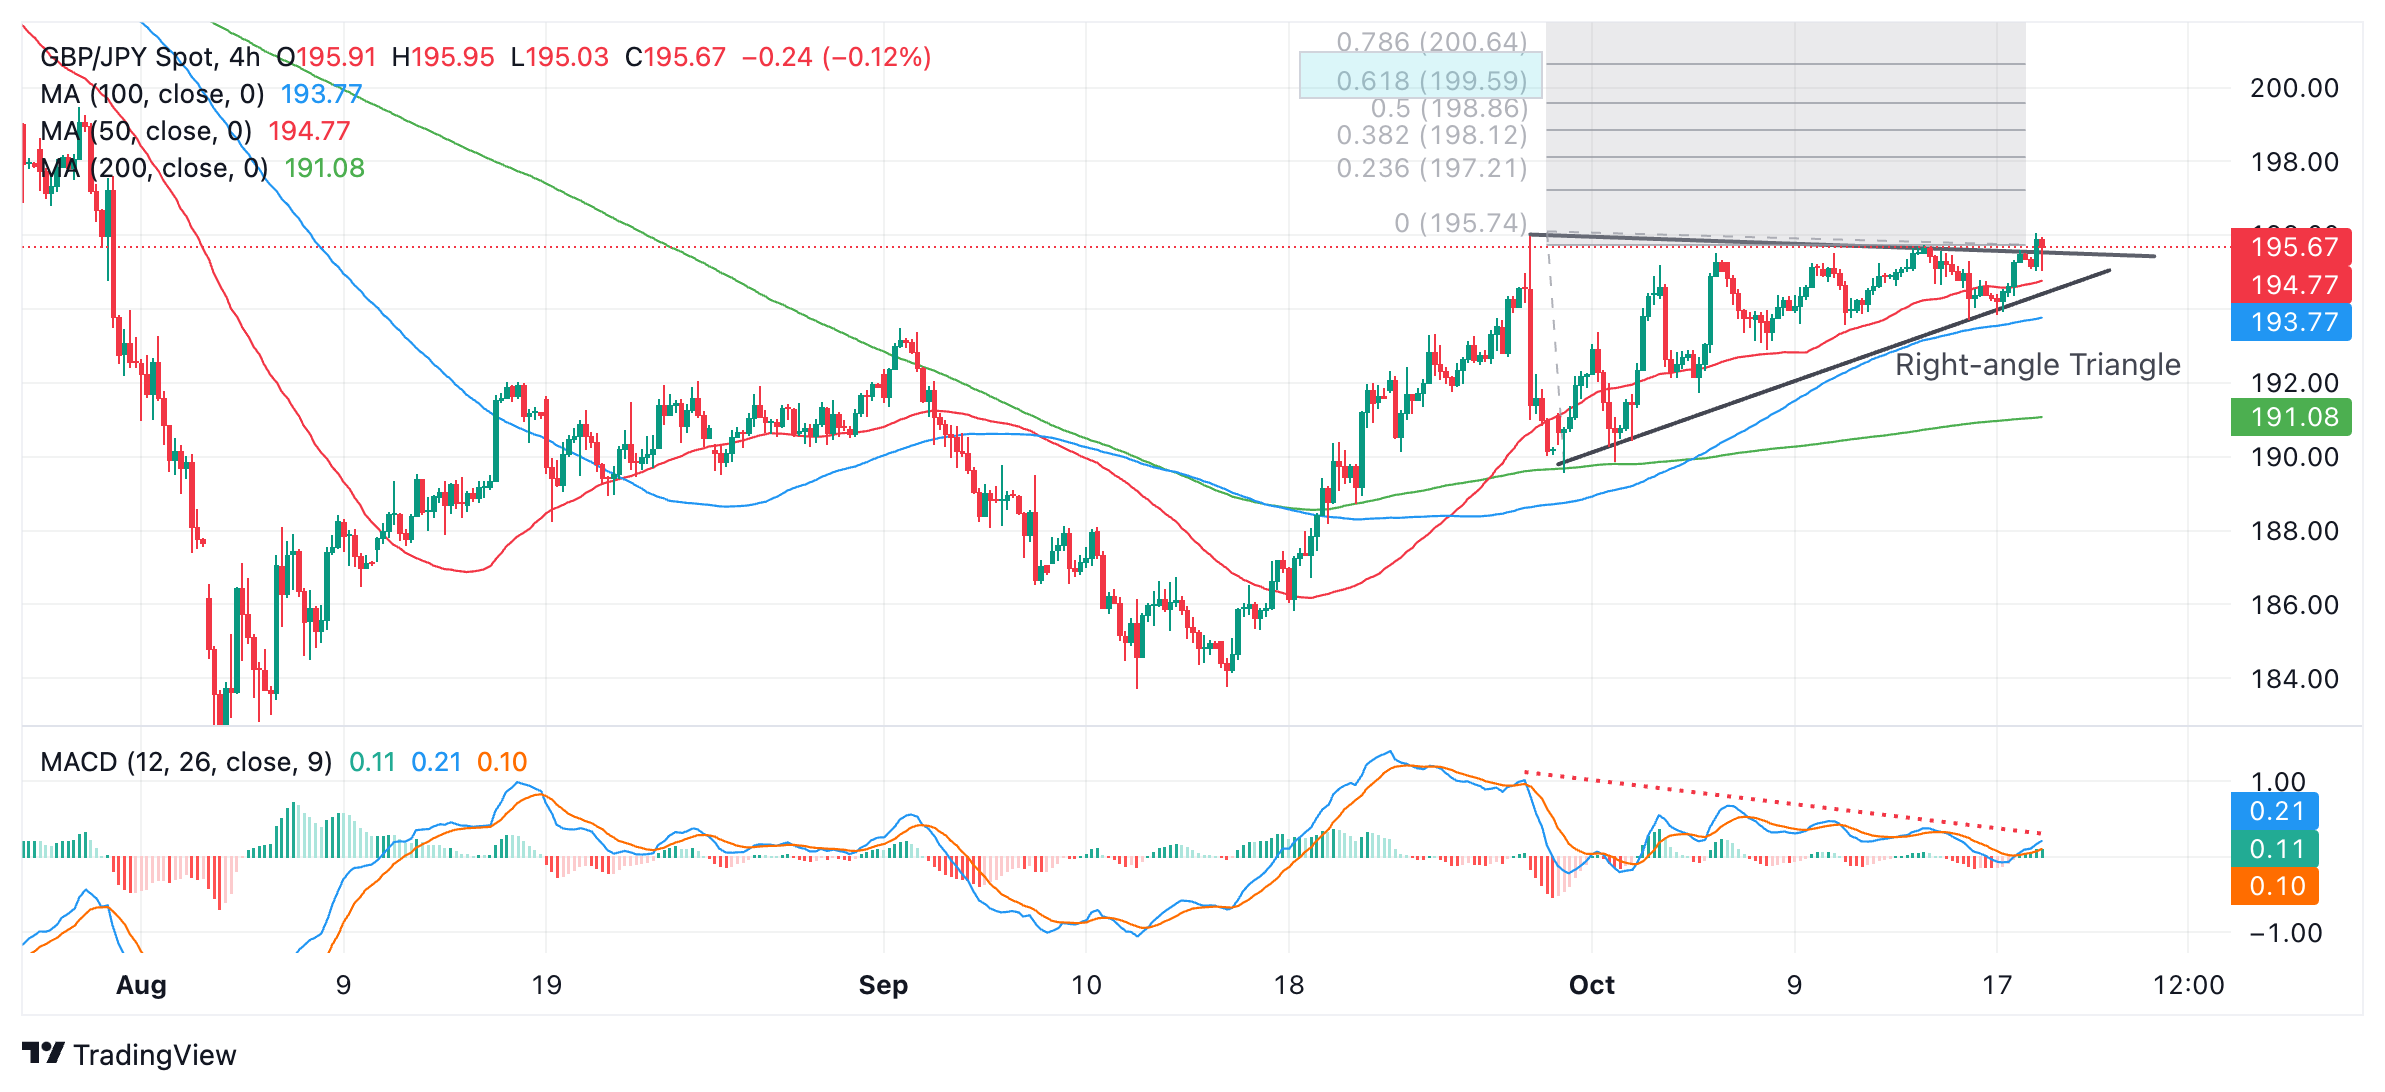
A decisive breakout above the top of the triangle would activate the pattern’s first upside target at 199.59, the 61.8% Fibonacci extrapolation of the height of the triangle (at its widest point) higher. This is the usual TA method for forecasting such moves.
One bearish sign is that the Moving Average Divergence Convergence (MACD) momentum indicator has been diverging bearishly with price during the formation of the triangle. Whilst price has made a higher high, MACD has declined. This is a mildly bearish sign.
A decisive breakout would be one accompanied by a long green candlestick that pierced cleanly through the top of the triangle at 196.00 and closed above near its high. This, or three green candlesticks in a row that broke cleanly above the flat top of the pattern.
The US Dollar (USD) is rounding out the week with broad, if limited, losses against the major currencies, Scotiabank’s Chief FX Strategist Shaun Osborne notes.
Bull run looks stretched
“The USD’s bull run looks very stretched now. The DXY turned into a one-way street higher at the end of last month. The index has traded unchanged or higher for 14 sessions consecutively now. As I noted earlier this week, these sorts of stretches (i.e., double digit in length) are rare.”
“The index is down today (at the moment) after yesterday’s peak coincided with a test of the 61.8% retracement of the July/September decline and 200-day MA around the 103.8 mark.”
“The USD may not weaken too much at this point—certainly ahead of the US presidential election as things stand at the moment—but additional gains should be a bit harder to come by in the short run at least and the risk of a moderate correction at least is increasing.”
Q3 GDP growth eased to 4.6% y/y from 4.7% in Q2; Q3 q/q growth accelerated to 0.9% from 0.5% prior. Industrial production (IP) and retail sales growth jumped in September, beating low market expectations. We expect GDP growth to bounce further in Q4 on China’s recently introduced stimulus package. The better-than-expected Q3 outcome poses upside risk to our annual growth forecast of 4.8%, Standard Chartered’s economists Hunter Chan and Shuang Ding note.
Policy measures likely to boost Q4 momentum
“September activity data surprised the market on the upside. In particular, IP and retail sales growth bounced to 5.4% y/y and 3.2% y/y, exceeding low market consensus estimates of 4.6% and 2.5%, respectively. Manufacturing activity likely normalised from typhoon disruptions. In addition, the consumer goods trade-in campaign lifted car and household appliance sales. Services production index growth rose to a seven-month high of 5.1% y/y in September from 4.6% in August.”
“Seasonally adjusted GDP growth accelerated to 0.9% q/q in Q3 from Q2’s revised growth of 0.5% (0.7% prior). Household demand improved. We estimate that the 3Y CAGR for real consumption expenditure per capita recovered to above 5% y/y in Q3. The drag from real estate investment contraction was offset by still-robust manufacturing investment growth. In addition, the net goods trade surplus widened by about USD 6bn from Q2 levels to USD 258bn in Q3.”
“A sizeable set of monetary, fiscal and housing measures was introduced to stabilise growth and expectations after the end-September Politburo meeting, opening the door to more policy support. We expect further policy rate and reserve requirement ratio (RRR) cuts in Q4. Moreover, we think the fiscal impulse will turn positive for the rest of this year by broadening the use of local special bond proceeds towards unused land and unsold home purchases, and a possible increase in the government debt quota. We expect GDP growth to rebound to 4.8% y/y in Q4 and maintain our annual growth forecast at 4.8%, with risks to the upside on better-than-expected Q3 growth.”
The Pound Sterling (GBP) firmed somewhat and UK yields rose in response to stronger than expected UK Retail Sales data for September, Scotiabank’s Chief FX Strategist Shaun Osborne notes.
GBP firms modestly on USD and EUR
“Sales rose 0.3% in the month, versus expectations of a 0.4% decline. Swaps pricing for the November BoE policy decision is little changed, however, with a quarter point cut still fully reflected in the market. EUR/GBP dipped below 0.83 briefly following the data but gains have been trimmed back somewhat over the course of the European morning session.”
“GBP continues to attract support on dips—although spot losses have extended a little below the potential base that was developing earlier this week.”
“Spot has eased back from its intraday high near 1.3075 made earlier in the session but a second net daily gain today would bolster short-term chances of a more sustained push above 1.31 and perhaps push on to test firmer resistance around 1.3175/00 into next week.”
China economic activity remains sluggish and is undershooting this year's 5% growth target. The economy grew less than expected in Q3 (actual: 0.9% q/q, consensus: 1.1% q/q) and the previous quarter rise was revised down 0.2pts to 0.5% q/q. Year-to-date, real GDP growth slowed at an annual pace of 4.8% (consensus: 4.9%) from 5.0% in Q2, BBH FX analysts note.
China may raise 6 trillion yuan to support economic activity
“The increase in China’s September prints for industrial production, fixed asset investment, and retail sales growth largely matched consensus. However, the property slump worsened and is an ongoing drag on consumer spending. New home prices are down -6.1% y/y vs. -5.7% y/y in August, the biggest decline since May 2015, and used home prices dropped a record -9% y/y vs. -8.6% y/y in August.”
“China’s benchmark CSI 300 Index rose 3.6%. The People’s Bank of China (PBOC) launched its share buyback support program, first announced on September 24. The PBOC governor also said he expects another 25 to 50 bp cuts to banks’ reserve requirement ratio (RRR) before the end of the year.”
“Nevertheless, Chinese policymakers need to deliver a meaningful fiscal stimulus program aimed at boosting consumer spending to sustain the rally in Chinese stocks. Details of China’s recent fiscal stimulus pledge are anticipated to be unveiled later this month. In the meantime, Caixin reported that China may raise 6 trillion yuan (5% of GDP) from ultra-long special government bonds over three years to support economic activity.”
The Dollar Index’s (DXY) recovery looks overstretched after having appreciated 3% so far this month, DBS’ FX analyst Philip Wee notes.
US Treasury bond yields stall near 4%
“Although the Fed has rolled back the market’s expectations for more of last month’s 50 bps rate cut, it plans to follow up with two 25 bps cuts on November 7 and December 18 after the US Presidential Elections on November 5.”
“With this month’s rise in the US Treasury bond yields stalling near 4%, the DXY should be lower, around 102 instead of higher and close to 104.”
- The US Dollar fades a touch on Friday after a steep ride higher.
- Traders see China stepping up measures with deposit rate cuts and more stimulus details.
- The US Dollar Index rally looks to be halting for now, ahead of 104.00.
The US Dollar (USD) turns flat to a touch softer on Friday with some profit-taking after steep rallies against many major G20 currencies this week. The slight retracement comes on the back of Chinese economic data and more details on the stimulus package the Chinese government is rolling out. With Chinese deposit rates being cut this Friday and more details released on the Chinese stimulus package, it looks like China is propping up its economy further.
The US calendar is very light in terms of economic data. No real market-moving data points will be issued on Friday, with only Building Permits and Housing Starts on deck. Instead, look for the Federal Reserve (Fed), where no less than three members are set to speak.
Daily digest market movers: Fed speak could fall on deaf ears
- At 12:30 GMT, the US Census Bureau will release housing data for September. Monthly Building Permits are expected to be at 1.46 million, compared to 1.47 million in August, while Housing Starts are expected to decrease to 1.35 million against 1.356 million prior.
- At 13:30 GMT, Federal Reserve Bank of Atlanta President Raphael Bostic delivers a presentation about economic education to high school students as part of the Mississippi Council on Economic Education Event.
- Around 14:00 GMT, Federal Reserve Bank of Minneapolis President Neel Kashkari moderates a policy panel at the 2024 Macroeconomic Policy Perspectives hosted by the Minneapolis Fed, the University of Chicago, and Stanford University.
- Near 16:10 GMT, Federal Reserve Governor Christopher Waller delivers a speech about decentralized finance at the Nineteenth Annual Vienna Macroeconomics Workshop in Vienna, Austria.
- At 16:30, Fed’s Bostic gives remarks and participates in a moderated conversation at the Mississippi Council on Economic Education's Forum on American Enterprise luncheon, United States.
- Asian equities saw Chinese indices outperform on the extra wave of stimulus measures issued. European equities are trying to grasp European Central Bank President Christine Lagarde’s speech from Thursday on the sluggish European economy. US futures are flat on the day and are yet to choose a direction.
- The CME Fed rate expectation for the meeting on November 7 shows a 90.2% probability of a 25 bps rate cut, while the remaining 9.8% is pricing in no rate cut. Chances for a 50 bps rate cut have been fully priced out.
- The US 10-year benchmark rate is trading at 4.11% after having flirted with a break below 4% on Wednesday.
US Dollar Index Technical Analysis: First stop for now
The US Dollar Index (DXY) sees the rally train come to a halt, with some better-than-expected Chinese data and measures taken by the Chinese government to support domestic demand. Though this rally might face a small fade, a big reversal does not seem to be in the cards. With the interest rate gap between the US, the Euro and other currencies widening again, the Greenback should at least remain supported towards the US elections in November.
A firm resistance ahead is 103.80, which aligns with the 200-day SMA. Above that, there is a small gap before hitting the pivotal level at 103.99 and the 104.00 big figure. Should Trump further lead in the polls, a rapid swing up to 105.00 and 105.53 could be on the cards.
On the downside, the 100-day SMA at 103.19 and the pivotal level at 103.18 are now acting as support and should prevent the DXY from falling lower. With the Relative Strength Index in overbought territory, a test on this level looks granted. Further down, the 55-day SMA at 101.85 and the pivotal level at 101.90 should avoid further downside moves.
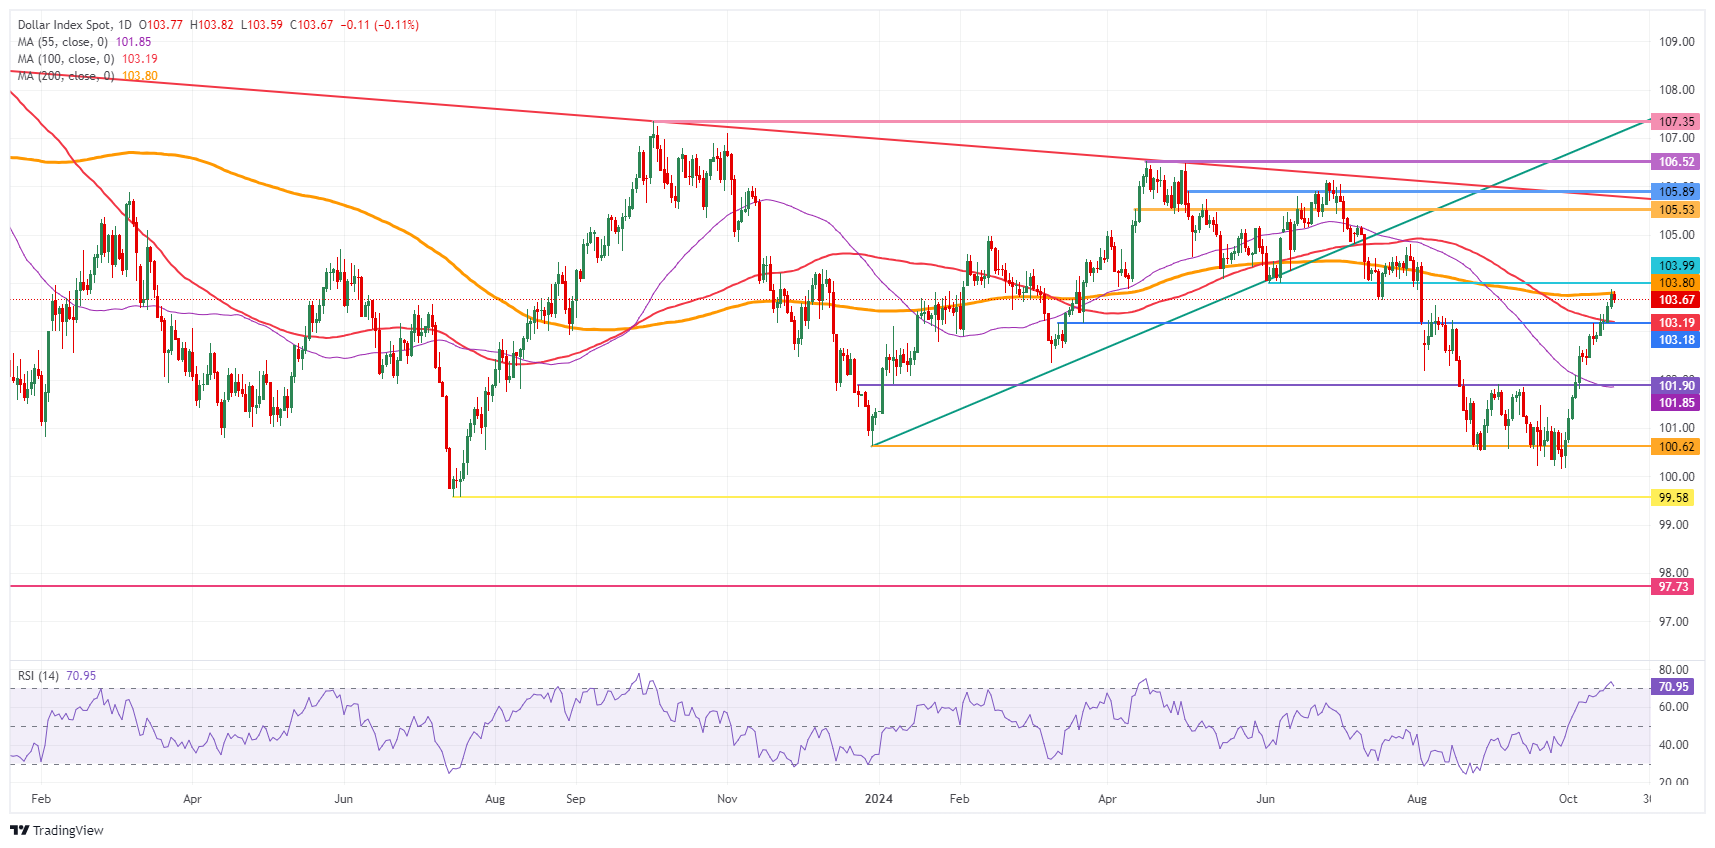
US Dollar Index: Daily Chart
US Dollar FAQs
The US Dollar (USD) is the official currency of the United States of America, and the ‘de facto’ currency of a significant number of other countries where it is found in circulation alongside local notes. It is the most heavily traded currency in the world, accounting for over 88% of all global foreign exchange turnover, or an average of $6.6 trillion in transactions per day, according to data from 2022. Following the second world war, the USD took over from the British Pound as the world’s reserve currency. For most of its history, the US Dollar was backed by Gold, until the Bretton Woods Agreement in 1971 when the Gold Standard went away.
The most important single factor impacting on the value of the US Dollar is monetary policy, which is shaped by the Federal Reserve (Fed). The Fed has two mandates: to achieve price stability (control inflation) and foster full employment. Its primary tool to achieve these two goals is by adjusting interest rates. When prices are rising too quickly and inflation is above the Fed’s 2% target, the Fed will raise rates, which helps the USD value. When inflation falls below 2% or the Unemployment Rate is too high, the Fed may lower interest rates, which weighs on the Greenback.
In extreme situations, the Federal Reserve can also print more Dollars and enact quantitative easing (QE). QE is the process by which the Fed substantially increases the flow of credit in a stuck financial system. It is a non-standard policy measure used when credit has dried up because banks will not lend to each other (out of the fear of counterparty default). It is a last resort when simply lowering interest rates is unlikely to achieve the necessary result. It was the Fed’s weapon of choice to combat the credit crunch that occurred during the Great Financial Crisis in 2008. It involves the Fed printing more Dollars and using them to buy US government bonds predominantly from financial institutions. QE usually leads to a weaker US Dollar.
Quantitative tightening (QT) is the reverse process whereby the Federal Reserve stops buying bonds from financial institutions and does not reinvest the principal from the bonds it holds maturing in new purchases. It is usually positive for the US Dollar.
USD/JPY is struggling to sustain a break above 150.00 as jawboning on the yen resumed, BBH FX analysts note.
USD/JPY tries to sustain a break above 150.00
“Japan’s chief currency official Atsushi Mimura warned at the moment we’re seeing slightly one-sided, sudden moves in the currency market. We’ll keep monitoring the forex market with a high sense of urgency, including any speculative moves.”
“Japan September CPI print was mixed but still argues for a cautious BOJ tightening cycle which can further undermine JPY. Headline CPI inflation matched consensus and slowed to 2.5% y/y vs. 3.0% in August due to subsidies to slash electricity and gas bills. Core (ex-fresh food) fell less than expected to 2.4% y/y (consensus: 2.3%) vs. 2.8% in August but is tracking the BOJ 2024 forecast of 2.5%.”
“Core (ex-fresh food & energy) unexpectedly increased one tick to 2.1% y/y (consensus: 2.0%) and remains slightly above the BOJ 2024 forecast of 1.9%.”
EUR/USD retraced some of yesterday’s post-ECB meeting slump. As was widely anticipated, the ECB cut the key deposit facility rate 25 bp to 3.25%. The ECB also stuck to its data-dependent guidance reiterating it is not pre-committing to a particular rate path, BBH FX analysts note.
Process of disinflation seems more robust
“The bar for additional ECB easing is low and an ongoing drag for EUR. The ECB noted ‘the disinflationary process is well on track’ while ECB President Christine Lagarde reiterated that risks to economic growth are tilted to the downside.”
“Moreover, Lagarde confirmed the decision to cut 25 bp yesterday was unanimous and highlighted there was more downside than upside risks to inflation. Market is now pricing in almost 175 bp of ECB rate cuts over the next twelve months that would see the policy rate bottom near 1.50% vs. 2.00% earlier this week.”
“ECB officials followed through on the bank’s dovish policy outlook this morning. Governing Council member Villeroy said the direction is clear in my eyes — we should continue to reduce the restrictive character of our monetary policy in an appropriate manner. Meanwhile, Governing Council member Vasle noted everything points to the process of disinflation being more robust.”
As expected, the Central Bank of Turkey (CBT) left rates unchanged at 50% and added a bit to its hawkish communication. The statement turned cautious as a result of increasing uncertainty surrounding the pace of inflation improvements. The CBT reiterated that its tight monetary stance would lead to a) a decline in the underlying trend of monthly inflation by moderating domestic demand, b) real appreciation in the Turkish lira, and c) an improvement in inflation expectations, ING’s FX analyst Frantisek Taborsky notes.
Rates remain under pressure
“We believe there could be room for a first rate cut in December, but it will, of course, depend on the October and November inflation numbers. On the positive side, the CBT seems to be aware of the situation and the risk of a mistake is diminishing, which should confirm the bulls in the TRY market.”
“In Hungary, the National Bank of Hungary's deputy governor reiterated that the pause in the rate-cutting cycle may be longer given the headwinds in the EM space. Although the market is pricing in a first rate cut only in January and around 50% for December, the headlines supported the currency and for a while, we got below 400 EUR/HUF.”
“However, yesterday rates and bonds across the region came under pressure again due to higher core rates in the US, which later reduced some gains in FX as well. We'll hear more next week when the NBH is scheduled to meet. It's already almost certain that a rate cut is not on the table, but we could hear more details on how long the pause in the cutting cycle may be.”
Latin American currencies have undergone quite a correction in recent days, with all currencies depreciating, led by the Mexican peso. This was triggered by an interview with Donald Trump, who said on Tuesday that car factories in Mexico were a ‘serious threat’ to the US. This reminded the market that a Trump election would be negative for the peso, both because it would likely lead to a stronger US dollar and because it would likely cause serious trade problems for Mexico. USD/MXN has yesterday briefly reached our forecast for the end of 2024, Commerzbank’s FX analyst Michael Pfister notes.
Main risks for the BRL remain fiscal risks
“The peso is facing political risks due to the 2/3 majority of the ruling coalition and the recent judicial reform, the monetary policy shift by Banxico and the risks posed by Trump. On the other hand, the Brazilian real continues to suffer from the fiscal risks associated with the government's fiscal plans.”
“Despite these arguments, we continue to favour the BRL over the MXN, at least until the end of the year, i.e. we expect BRL/MXN levels to be higher again. Both currencies would likely be similarly affected by a Trump-led US dollar appreciation. On the other hand, the real economies of the two countries have evolved differently recently.”
“The main risks for the BRL therefore remain fiscal risks. These are unlikely to disappear in the coming weeks, at least not unless the government unexpectedly embarks on a more solid fiscal policy. For the time being, however, they are likely to take a back seat to the risks affecting the peso. We therefore think that BRL/MXN has the potential to strengthen further by the end of the year.”
- Crude Oil finds support amidst bearish headlines on China’s output.
- Weekly US Crude production rose to a staggering 13.5 million barrels per day.
- The US Dollar Index breaks above a key level on its way to 104.00.
Crude Oil found a floor earlier this week and stabilizes above the $70.00 level on Friday, although the lifespan could be minimal, seeing the last headlines. Overnight data revealed that China’s steel output and Oil refining continued to slump in October. The Oil refining output fell to a three-month low because domestic demand is simply nonexistent.
The US Dollar Index (DXY), which tracks the performance of the Greenback against six other currencies, also consolidates on Friday after a steep rally this week. The rally was fueled for the most part by former US President Donald Trump, who took the lead in some polls ahead of the November 5 presidential elections. That was enough for market participants to start positioning for a Trump win on November 5, with the Greenback rallying nearly the whole week. However, according to FiveThirtyEight, US Vice President and Democrat nominee Kamala Harris is leading polls by 2.4 percentage points, suggesting a neck-to-neck competition between both candidates.
At the time of writing, Crude Oil (WTI) trades at $70.16 and Brent Crude at $74.16
Oil news and market movers: China and EIA signs on the wall
- Overnight data from China revealed that steel and oil were the worst performing sectors for the country this year, Bloomberg reported.
- The Energy Information Administration (EIA) has reported that a whopping 13.5 million barrels per day are produced by the US. Meanwhile, the US Crude Oil stockpile change came in at a draw of 2.191 million barrels in the week ending on October 11, compared to the prior week’s build of 5.81 million barrels, Reuters reports.
- At 17:00 GMT, the Baker Hughes US Oil Rig Count will be released. Last week, 481 rigs were still operating despite the hurricanes in the Gulf Region.
Oil Technical Analysis: Forget about geopolitics for now
When broken down into several drivers, Crude Oil’s price action clearly sees two defining factors: geopolitics and fundamentals. When stripping away the geopolitical element, the fundamentals clearly point to more downside for Crude Oil for at least the remainder of 2024. With another production record for the US, and once geopolitical pressure eases off, Crude could implode again easily as it did this week.
There is a challenging path to recovery for Crude Oil in the coming days. First, the pivotal level at $71.46, which was strong enough to catch the falling knife on Monday, must be regained again with a daily close above it. Once from there, the hefty technical level at $75.20, with the 100-day Simple Moving Average (SMA) and a few pivotal lines, is possibly the first big hurdle ahead.
On the downside, that previously mentioned $71.46 pivotal level has now turned into resistance and no longer has any value as support. Instead, traders need to look much lower, at $67.11, a level that supported the price in May-June 2023. In case that level breaks, the 2024 year-to-date low emerges at $64.75 followed by $64.38, the low of 2023.
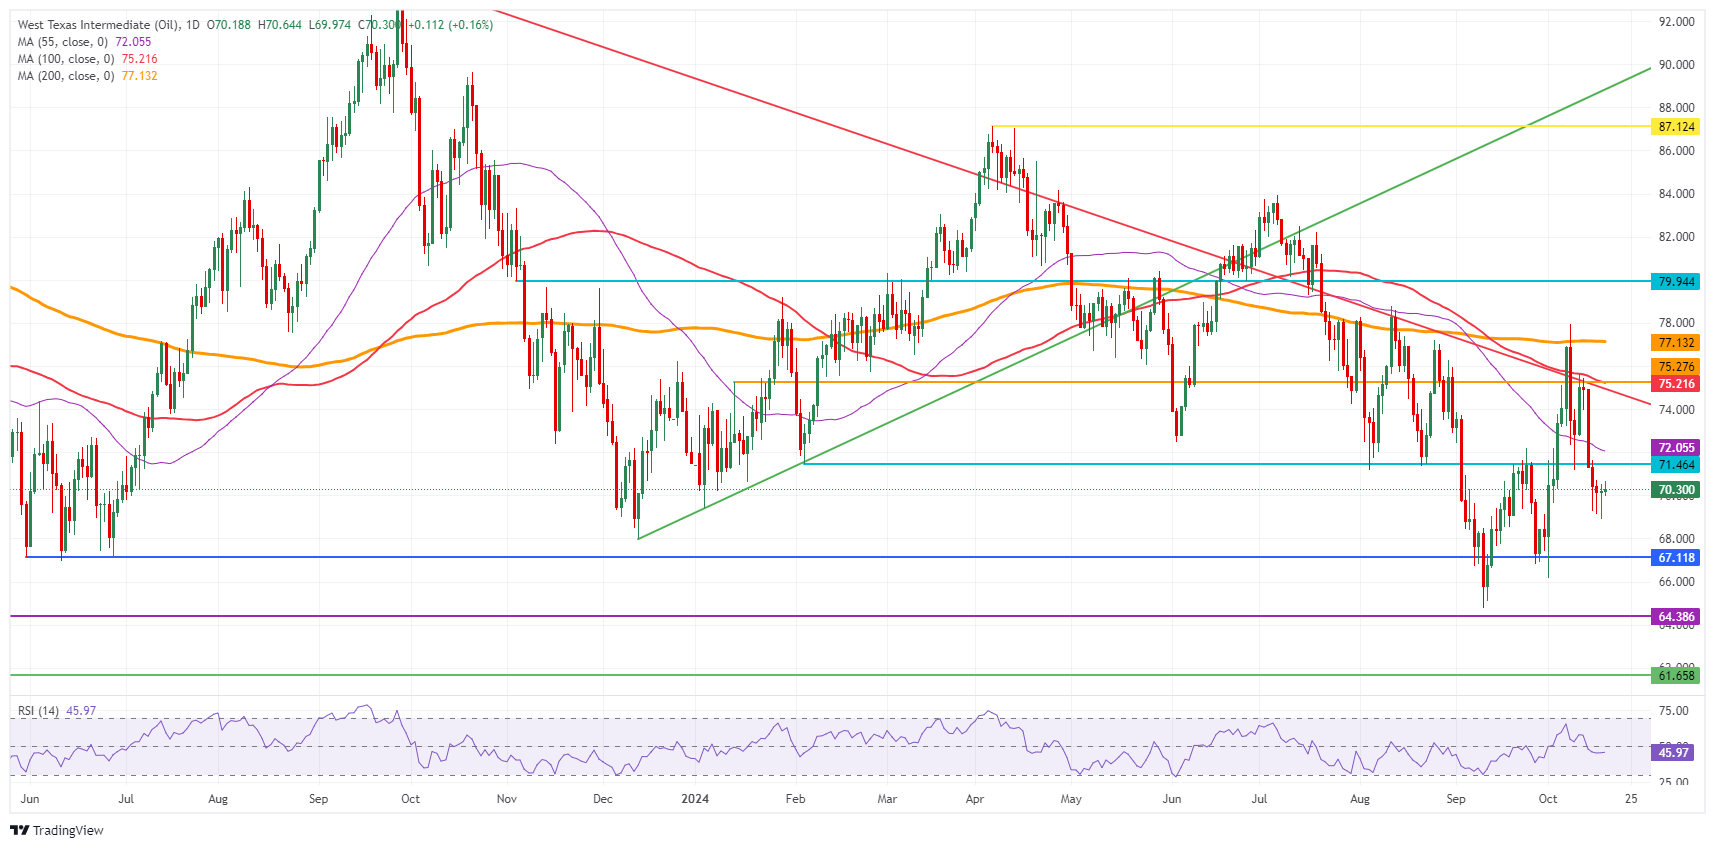
US WTI Crude Oil: Daily Chart
WTI Oil FAQs
WTI Oil is a type of Crude Oil sold on international markets. The WTI stands for West Texas Intermediate, one of three major types including Brent and Dubai Crude. WTI is also referred to as “light” and “sweet” because of its relatively low gravity and sulfur content respectively. It is considered a high quality Oil that is easily refined. It is sourced in the United States and distributed via the Cushing hub, which is considered “The Pipeline Crossroads of the World”. It is a benchmark for the Oil market and WTI price is frequently quoted in the media.
Like all assets, supply and demand are the key drivers of WTI Oil price. As such, global growth can be a driver of increased demand and vice versa for weak global growth. Political instability, wars, and sanctions can disrupt supply and impact prices. The decisions of OPEC, a group of major Oil-producing countries, is another key driver of price. The value of the US Dollar influences the price of WTI Crude Oil, since Oil is predominantly traded in US Dollars, thus a weaker US Dollar can make Oil more affordable and vice versa.
The weekly Oil inventory reports published by the American Petroleum Institute (API) and the Energy Information Agency (EIA) impact the price of WTI Oil. Changes in inventories reflect fluctuating supply and demand. If the data shows a drop in inventories it can indicate increased demand, pushing up Oil price. Higher inventories can reflect increased supply, pushing down prices. API’s report is published every Tuesday and EIA’s the day after. Their results are usually similar, falling within 1% of each other 75% of the time. The EIA data is considered more reliable, since it is a government agency.
OPEC (Organization of the Petroleum Exporting Countries) is a group of 12 Oil-producing nations who collectively decide production quotas for member countries at twice-yearly meetings. Their decisions often impact WTI Oil prices. When OPEC decides to lower quotas, it can tighten supply, pushing up Oil prices. When OPEC increases production, it has the opposite effect. OPEC+ refers to an expanded group that includes ten extra non-OPEC members, the most notable of which is Russia.
USD is likely to trade in a range between 7.1180 and 7.1480. In the longer run, strong and sudden surge suggests further USD strength to 7.1600, potentially 7.1900, UOB Group’s FX analysts Quek Ser Leang and Peter Chia notes.
To trade in a range between 7.1180 and 7.1480
24-HOUR VIEW: “Yesterday, we pointed out that ‘the current price movements are likely part of a range trading phase.’ We expected USD to ‘trade between 7.1100 and 7.1430.’ USD then traded in a 7.1260/7.1468 range, closing largely unchanged at 7.1365 (+0.03%). Further range trading seems likely today, probably between 7.1180 and 7.1480.”
1-3 WEEKS VIEW: “Our update from two days ago (16 Oct, spot at 7.1350) remains valid. As indicated, “the strong and sudden surge suggests further USD strength to 7.1600, potentially 7.1900. To keep the momentum going, USD must not break below the ‘strong support’ level, now at 7.0900.”
At first glance, this morning's national inflation figures from Japan could be seen as positive for further interest rate hikes. The annual rate excluding fresh food and the rate excluding fresh food and energy were slightly higher than expected. However, a look at the underlying data confirms our recent analyses: seasonally adjusted goods prices fell sharply in September, pushing down the annual rate, Commerzbank’s FX analyst Michael Pfister notes.
Japanese intervention game might resume
“This was probably due to the yen's strong appreciation, which is pushing down imported inflation. On the other hand, seasonally adjusted services prices have been rising by around 0.1% per month for several months. This is significantly lower than in other G10 economies, where these more ‘domestic’ price pressures account for most of the rate of price increases. This remained the case in September.”
“In addition, a large base effect from the annual rate of goods prices is likely to be removed from the calculation of the year-on-year rate next month, which should push the inflation rate down further. Readers may point out that the yen has depreciated again in the meantime. That is true, but import prices have continued to fall recently, presumably because the yen is still significantly stronger than it was at the beginning of July. In short, another month has passed without confirmation of the Bank of Japan's story of a sustained stabilisation of Japanese inflation.”
“On a side note, the yen was able to strengthen a bit this morning anyway, as officials said that the recent moves were ‘one-sided’ and ‘sudden’. It was probably only a matter of time before such statements were made, after all USD/JPY broke through the 150 level yesterday. The fear is that unless the USD weakens again in the coming weeks, the intervention game will resume.”
The US Dollar (USD) is likely to trade in a 149.40/150.35 range. In the longer, momentum has improved slightly; it remains to be seen if USD could rise to 151.00, UOB Group’s FX analysts Quek Ser Leang and Peter Chia notes.
Likely to trade in a 149.40/150.35 range
24-HOUR VIEW: “We did not anticipate USD to soar to 150.32 (we were expecting range trading). The advance appears to be running ahead of itself, and USD is unlikely to rise much further. Today, USD is more likely to trade in a 149.40/150.35 range.”
1-3 WEEKS VIEW: “We have held a positive USD view since the start of this month. As we tracked the advance, we indicated two days ago (16 Oct, spot at 149.10) that ‘the price action over the past few days did not result in further increase in momentum.’ We highlighted that ‘a breach of 148.40 (‘strong support’ level) would indicate that USD is not rising further.’ Yesterday, USD broke clearly above 150.00, reaching a high of 150.32. Momentum has improved, albeit not much, and it remains to be seen if USD could rise to 151.00. On the downside, the ‘strong support’ level has moved higher to 149.00 from 148.40.”
September's better-than-expected UK retail sales data, which comes on the heels of decent August growth, is another sign that the economy is still performing relatively solidly, ING’s FX analyst Francesco Pesole notes.
No strong argument against a move to 1.28 in GBP/USD
“The consumer is benefiting from strong real wage growth, though we don't expect the growth rates we saw in the first half of the year to be repeated in the second. Still, growth data is of secondary interest for the BoE right now. This week's surprise dip in services inflation is more important, suggesting back-to-back rate cuts are becoming more likely.”
“GBP has proven to be a bit more resilient than we had thought after that sharp downward surprise in services inflation on Wednesday. Cable has hovered around the 1.30 mark, and so far failed to make another decisive move lower. Still, we think the balance of risks remains skewed to the downside.”
“Even with less than two Bank of England cuts priced in by year-end, the two-year swap rate gap between sterling and the dollar has now tightened to 19bp from 55bp at the start of October. The last time we saw that spread around these levels (early August) GBP/USD was trading at 1.28, and barring major US data downside surprises, we see no strong argument against a move to that level.”
The New Zealand Dollar (NZD) is likely to trade in a range between 0.6040 and 0.6080. In the longer run, NZD is likely to decline further; the level to watch is 0.6005, UOB Group’s FX analysts Quek Ser Leang and Peter Chia notes.
The level to watch is 0.6005
24-HOUR VIEW: “Yesterday, we expected NZD to trade in a range between 0.6035 and 0.6090.NZD then traded in a narrower range than expected (0.6045/0.6075). NZD closed largely unchanged at 0.6060 (-0.06%). Momentum indicators are mostly flat, and we continue to expect NZD to trade in a range, probably between 0.6040 and 0.6080.”
1-3 WEEKS VIEW: “We continue to hold the same view as two days ago (16 Oct, spot at 0.6060). As highlighted, NZD is likely to decline further, and the level to watch is 0.6005. Overall, only a breach of 0.6115 (no change in ‘strong resistance’ level) would mean that the weakness in NZD that started early this month has stabilised.”
After EUR/USD showed almost no imminent reaction to the ECB statement yesterday, the US retail sales figures, which were published shortly afterwards, were more capable to cause a stir, before the ECB press conference took over, Commerzbank’s FX analyst Michael Pfister notes.
USD should remain strong
“The figures were stronger than expected, while at the same time jobless claims surprisingly fell, partially offsetting the previous week's surprisingly strong increase. The US dollar benefited somewhat from this, with EUR/USD now flirting with 1.08 rather than higher levels.”
“This once again confirms the story of recent weeks: US retail sales have been rising at a faster pace for several months now, raising doubts that US growth will slow down any time soon. At the moment, I am a little short of ideas as to what could cause USD weakness in the coming days.”
“There is simply a lack of hard data that could cast doubt on the current moves. As long as this is the case, the USD should remain strong.”
- USD/CHF grips gains near 0.8670 as traders priced out Fed large rate cut bets.
- A slew of upbeat US data has pointed to US economic resilience.
- The SNB is expected to extend its policy-easing cycle further.
The USD/CHF pair holds onto gains near an eight-week high of 0.8670 in Friday’s London session. The Swiss Franc pair remains firm as traders have priced out expectations for the Federal Reserve (Fed) to cut interest rates by a larger-than-usual size of 50 basis points (bps) again in the November meeting.
Traders expect the Fed to go slow on rate cuts as a slew of United States (US) economic data has pointed to economic resilience. After surprisingly upbeat Nonfarm Payrolls (NFP) and the ISM Services PMI for September, monthly Retail Sales data for the same period has come in better than expected. Thursday’s Retail Sales data rose at a faster-than-expected pace of 0.4%.
According to the CME FedWatch tool, there is a strong probability for the Fed to reduce interest rates by 50 bps in the remaining year. Also, the Fed is expected to cut its borrowing rates by 25 bps in each of the two meetings in November and December, which remained this year.
On the political front, market speculation for the US presidential elections that are scheduled on November 5 will influence the US Dollar. According to FiveThirtyEight’s daily election poll tracker, Democratic Kamala Harris is leading polls and has a 2.4-percentage-point lead over former President Donald Trump.
In the Swiss region, easing price pressures has boosted expectations of more interest rate cuts by the Swiss National Bank (SNB). Swiss annual Consumer Price Index (CPI) decelerated to 0.8% in September, the lowest in more than three years, despite the SNB reducing its key borrowing rates in each of the three meetings that took place this year.
Swiss Franc FAQs
The Swiss Franc (CHF) is Switzerland’s official currency. It is among the top ten most traded currencies globally, reaching volumes that well exceed the size of the Swiss economy. Its value is determined by the broad market sentiment, the country’s economic health or action taken by the Swiss National Bank (SNB), among other factors. Between 2011 and 2015, the Swiss Franc was pegged to the Euro (EUR). The peg was abruptly removed, resulting in a more than 20% increase in the Franc’s value, causing a turmoil in markets. Even though the peg isn’t in force anymore, CHF fortunes tend to be highly correlated with the Euro ones due to the high dependency of the Swiss economy on the neighboring Eurozone.
The Swiss Franc (CHF) is considered a safe-haven asset, or a currency that investors tend to buy in times of market stress. This is due to the perceived status of Switzerland in the world: a stable economy, a strong export sector, big central bank reserves or a longstanding political stance towards neutrality in global conflicts make the country’s currency a good choice for investors fleeing from risks. Turbulent times are likely to strengthen CHF value against other currencies that are seen as more risky to invest in.
The Swiss National Bank (SNB) meets four times a year – once every quarter, less than other major central banks – to decide on monetary policy. The bank aims for an annual inflation rate of less than 2%. When inflation is above target or forecasted to be above target in the foreseeable future, the bank will attempt to tame price growth by raising its policy rate. Higher interest rates are generally positive for the Swiss Franc (CHF) as they lead to higher yields, making the country a more attractive place for investors. On the contrary, lower interest rates tend to weaken CHF.
Macroeconomic data releases in Switzerland are key to assessing the state of the economy and can impact the Swiss Franc’s (CHF) valuation. The Swiss economy is broadly stable, but any sudden change in economic growth, inflation, current account or the central bank’s currency reserves have the potential to trigger moves in CHF. Generally, high economic growth, low unemployment and high confidence are good for CHF. Conversely, if economic data points to weakening momentum, CHF is likely to depreciate.
As a small and open economy, Switzerland is heavily dependent on the health of the neighboring Eurozone economies. The broader European Union is Switzerland’s main economic partner and a key political ally, so macroeconomic and monetary policy stability in the Eurozone is essential for Switzerland and, thus, for the Swiss Franc (CHF). With such dependency, some models suggest that the correlation between the fortunes of the Euro (EUR) and the CHF is more than 90%, or close to perfect.
The Australian Dollar (AUD) is likely to trade in a 0.6680/0.6725 range. In the longer run, rapid increase in momentum is likely to lead to further AUD weakness; the levels to monitor are 0.6650 and 0.6620, UOB Group’s FX analysts Quek Ser Leang and Peter Chia notes.
AUD can fall towards 0.6650 short term
24-HOUR VIEW: “AUD traded between 0.6660 and 0.6710 yesterday, narrower than our expected range of 0.6660/0.6720. We continue to expect AUD to trade in a range today, probably between 0.6680 and 0.6725.”
1-3 WEEKS VIEW: “We highlighted two days ago (16 Oct, spot at 0.6680) that ‘the rapid increase in momentum is likely to lead to further AUD weakness.’ We also highlighted that ‘the levels to monitor are 0.6650 and 0.6620.’ While AUD has not been able to make further headway on the downside, we continue to hold the same vie for now. However, should AUD break the ‘strong resistance’ at 0.6740 (no change in level from yesterday), it would mean that the AUD weakness that started early this month has stabilised.”
By and large, the ECB delivered what was expected yesterday. President Christine Lagarde did try to emphasize that the council's decisions remained data-dependent and were not predetermined. She expressed confidence that the neck of inflation would soon be broken and that the disinflation process was well under way. In addition, the data had weakened recently, but the ECB expects the economy to recover over time. She does not see a recession. The ECB will remain restrictive for as long as necessary to bring inflation back to the 2% target in a timely manner, Lagarde said, Commerzbank’s FX analyst Antje Praefcke notes.
More interest rate cuts in the foreseeable future
“Lagarde set the stage for the cutting cycle to continue in December and beyond. The risks to the economy remain tilted to the downside, according to the President. She cited numerous reasons, including the flare-up of tensions in international trade and geopolitical uncertainties. In view of the current election polls in the US and the conflict in the Middle East as well as the war in Ukraine, I think it is unlikely that these risks will diminish in the foreseeable future. When asked whether the current weakness of the German economy might not entail a risk of a recession in the euro zone, Lagarde was convinced that there would be no recession.”
“Despite the risks to growth, she was confident that a soft landing would follow. At this point, I would interject: ‘If you don't fly high, you can't land hard’. Even if there is no doubt that growth in the euro zone saw a decent boost after the pandemic, since 2023 it has not really picked up and is struggling, for a long time the hoped-for revival has been waited for. The winter half-year is likely to be difficult, and the recovery is not expected to be felt until 2025.”
“Although Christine Lagarde tried to paint a cautiously positive picture despite the risks to growth, she obviously did not convince the market. The bottom line for the market is rather the realization that the inflation problem will be solved in the foreseeable future, but that growth remains a problem, paving the way for further interest rate cuts. Accordingly, the euro came under downward pressure during the press conference. I fear that the euro will continue to have a hard time in the coming weeks if the hard data from the euro zone turns out weak, which is to be expected after the leading indicators have recently fallen.”
- Gold holds above the key $2,700 level, reaching fresh all-time highs, as interest rates globally are projected to decline more steeply.
- Many major central banks are expected to enact interest rate cuts as inflation ducks, supporting non-yielding Gold.
- XAU/USD continues trending higher and “the trend is your friend,” as technical traders like to say.
Gold (XAU/USD) establishes a foothold above the $2,700 psychological level on Friday after piercing through above this level on the previous day, setting yet another fresh all-time high. Traders are bullish bullion as they foresee a lower trajectory for interest rates globally. This, in turn, lowers the expected opportunity cost of holding Gold given it is a non-interest-paying asset, and makes it more attractive to portfolio holders.
Gold breaks above $2,700 as central banks accelerate easing cycles
Gold makes higher highs as traders befriend the trend, and central banks appear to accelerate their monetary easing cycles by cutting interest rates. On Thursday, the European Central Bank (ECB) decided to lower its deposit rate by 25 basis points (bps), making it the second rate cut in a row. According to analysts, this marks a significant turning point and acceleration in the ECB’s easing cycle. Previously, the bank had only been expected to cut once per quarter.
“Our European economists see yesterday’s meeting as signaling a pivot to an accelerated easing cycle and they continue to expect back-to-back 25 bps cuts until policy rates reach the midpoint of the 2.00 - 2.50% neutral range,” said Jim Reid, Head of Global Macro Research at Deutsche Bank, adding, “They see the risks tilted towards the ECB cutting faster and further than the baseline, with a 50 bps cut in December a real possibility.”
A fall in Japanese inflation data overnight has further brought into doubt whether the Bank of Japan (BoJ) will go ahead with its planned interest rate hikes. The Consumer Price Index (CPI) ex Fresh Food fell to 2.4% in September, which is below the BoJ’s 2.5% target for fiscal year 2024.
The BoJ Governor Kazuo Ueda has said that if the incoming data meets the BoJ’s forecasts he will raise interest rates, so the inflation miss could be significant. Although inflation only dipped one tenth below the BoJ forecast – and was above the 2.3% estimated by economists – it was still a steep fall from the 2.8% of the previous month. If it remains consistently below 2.5%, the BoJ will likely keep the bank rate at its current super-low 0.25% level, making Gold even more attractive.
In the UK, the Bank of England (BoE) is now expected to cut interest rates at its meeting in November. Previously markets were doubtful about this possibility, but the release of lower-than-expected inflation data in September has somewhat cemented expectations of a cut.
Likewise, in Canada, there is speculation the Bank of Canada (BoC) could take a “bazooka” to its policy rate at its meeting later in October and blow 50 pbs (0.50%) off its 4.25% bank rate.
This, and the fact that several Asian central banks have also made cuts recently, is supporting the rally in Gold.
Upside capped by US data
Gold may face headwinds, however, after strong US data continues favoring a less aggressive approach from the US Federal Reserve (Fed), suggesting the US may be an outlier as interest rates there fall at a more measured pace.
US Retail Sales showed a higher-than-expected 0.4% rise in September, which was above the 0.3% forecast and the 0.1% increase seen a month earlier.
Initial Jobless Claims data also indicated the US labor market remains resilient with 241K out-of-work Americans claiming benefits in the week ending October 11. This was below the 260K expected and 260K (revised up) in the previous week. Given the Federal Reserve’s concerns about the fragility of the US labor market, the data had a disproportionately positive impact on the future path of monetary policy.
Currently, markets are pricing in almost a 92% chance of a 25 bps cut in the fed funds rate in November and an 8% probability of no change at all, according to the CME FedWatch tool. This is down from 94% and 6%, respectively, 24 hours ago.
Technical Analysis: Gold plants flag above $2,700
Gold pierces through the $2,700 psychological level and rallies to a new all-time high. The establishment of a higher high reconfirms the uptrend and suggests the odds favor more upside to come.
XAU/USD 4-hour Chart
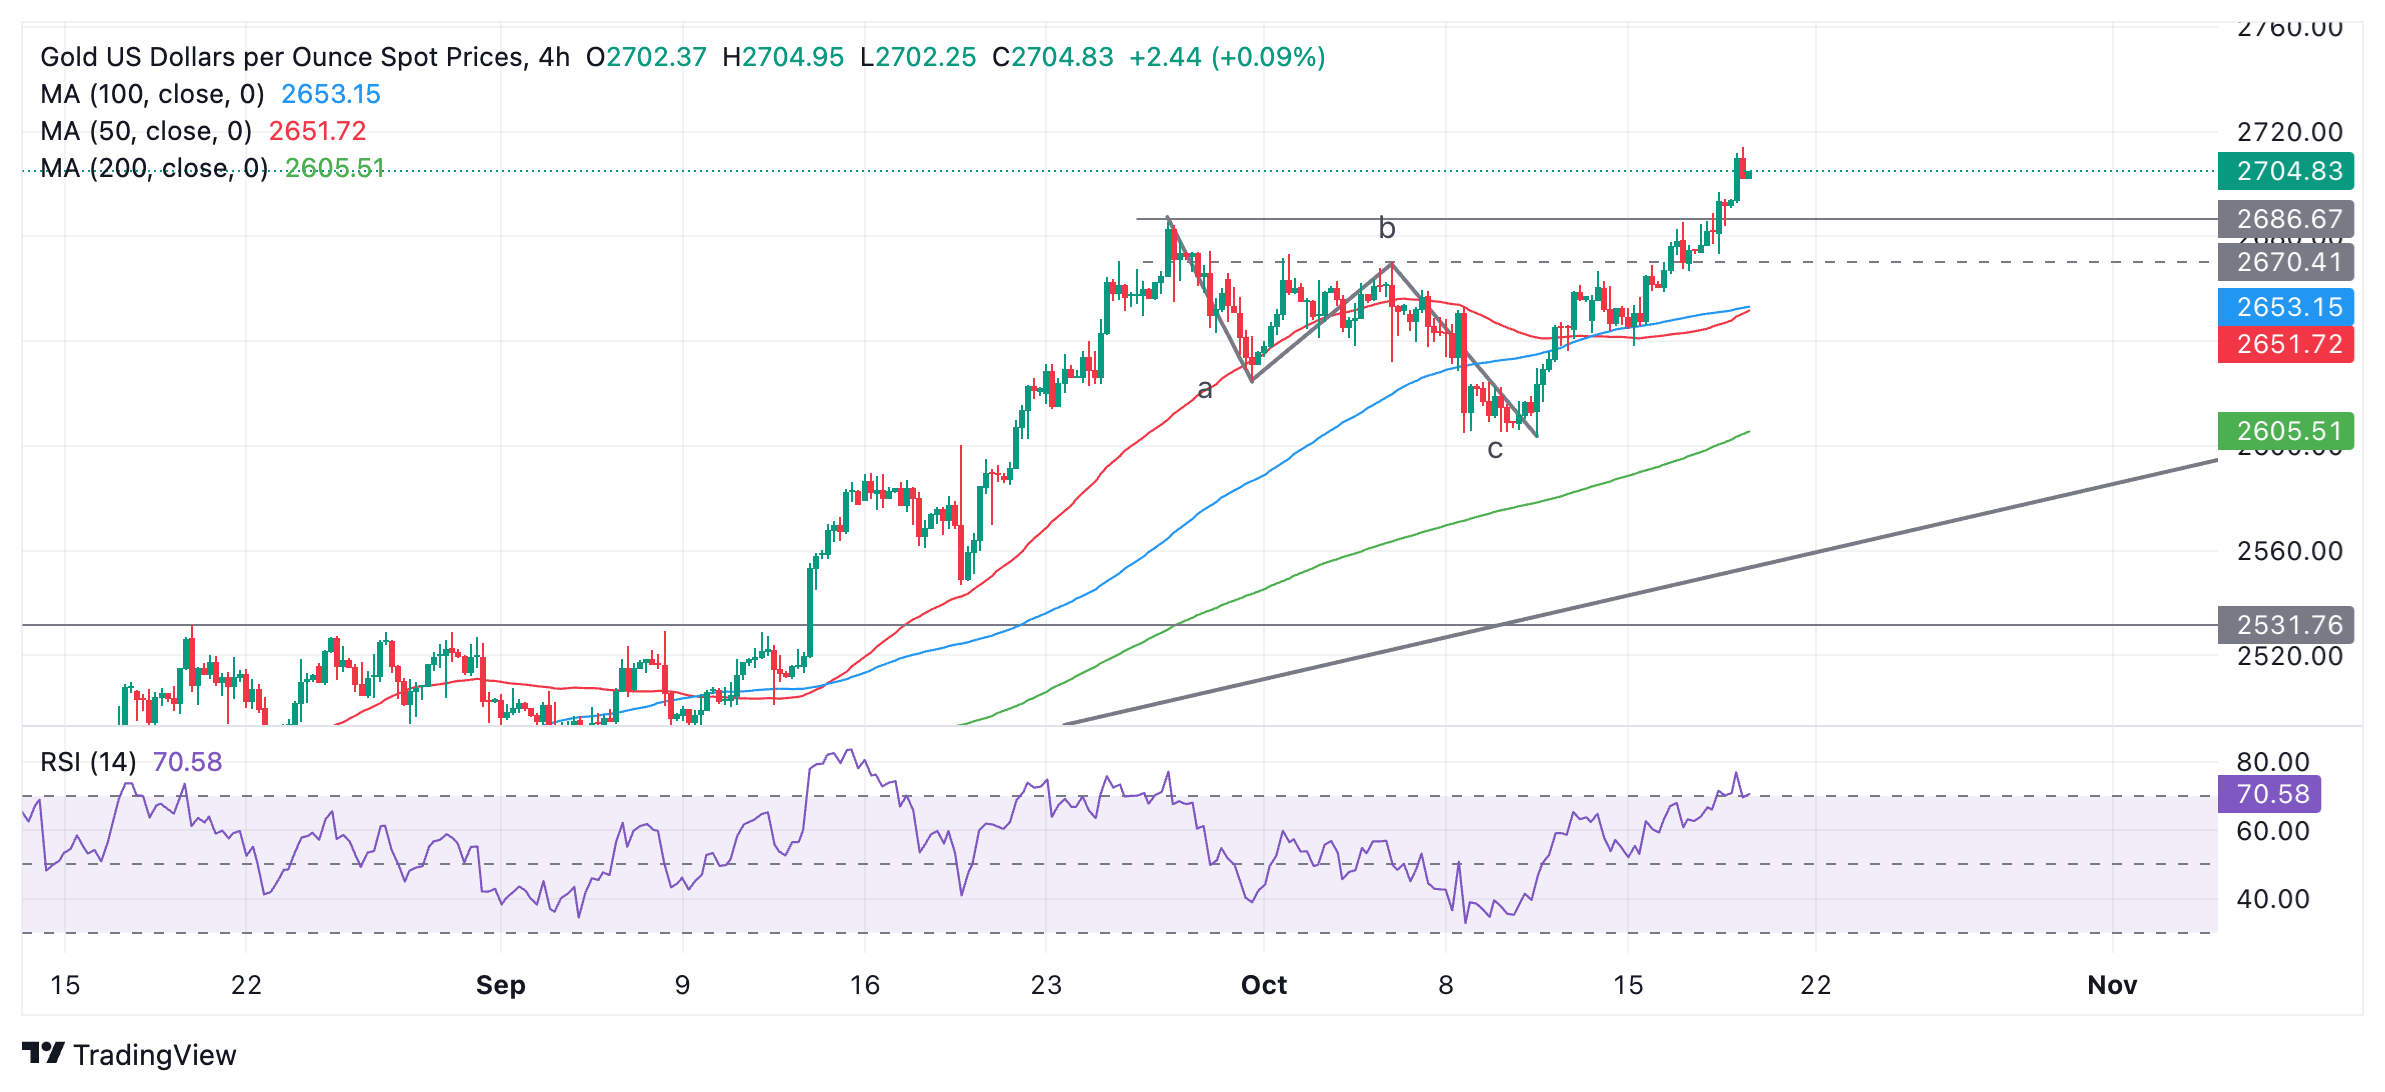
A break above the new high of $2,714 should confirm a continuation to the next somewhat arbitrarily selected target at $2,750 – significant because it is a round number and traders tend to cluster orders around such levels.
The Relative Strength Index (RSI) is overbought, however, advising long-holders not to add to their long positions because of an increased risk of a pullback. Should RSI close back in neutral territory, it will be a sign for long-holders to close their positions and open shorts as a deeper correction is underway. Support lies at $2,700 (key level) and $2,685 (September high).
Gold’s strong overall uptrend, however, suggests that any corrections are likely to peter out and the bull trend to resume.
Gold FAQs
Gold has played a key role in human’s history as it has been widely used as a store of value and medium of exchange. Currently, apart from its shine and usage for jewelry, the precious metal is widely seen as a safe-haven asset, meaning that it is considered a good investment during turbulent times. Gold is also widely seen as a hedge against inflation and against depreciating currencies as it doesn’t rely on any specific issuer or government.
Central banks are the biggest Gold holders. In their aim to support their currencies in turbulent times, central banks tend to diversify their reserves and buy Gold to improve the perceived strength of the economy and the currency. High Gold reserves can be a source of trust for a country’s solvency. Central banks added 1,136 tonnes of Gold worth around $70 billion to their reserves in 2022, according to data from the World Gold Council. This is the highest yearly purchase since records began. Central banks from emerging economies such as China, India and Turkey are quickly increasing their Gold reserves.
Gold has an inverse correlation with the US Dollar and US Treasuries, which are both major reserve and safe-haven assets. When the Dollar depreciates, Gold tends to rise, enabling investors and central banks to diversify their assets in turbulent times. Gold is also inversely correlated with risk assets. A rally in the stock market tends to weaken Gold price, while sell-offs in riskier markets tend to favor the precious metal.
The price can move due to a wide range of factors. Geopolitical instability or fears of a deep recession can quickly make Gold price escalate due to its safe-haven status. As a yield-less asset, Gold tends to rise with lower interest rates, while higher cost of money usually weighs down on the yellow metal. Still, most moves depend on how the US Dollar (USD) behaves as the asset is priced in dollars (XAU/USD). A strong Dollar tends to keep the price of Gold controlled, whereas a weaker Dollar is likely to push Gold prices up.
- EUR/JPY has failed to break out above the top of its range high and has pulled back down to support.
- If the pair continues lower and breaks below a key trendline it will probably signal a new down leg within the range.
EUR/JPY declines after multiple failed attempts to break out of the top of its range high.
The down move has stalled at the level of the trendline for the move up from the mid-September lows. Another break below the trendline and the previous day’s lows would confirm a new move lower within the pair’s multi-month range.
EUR/JPY 4-hour Chart
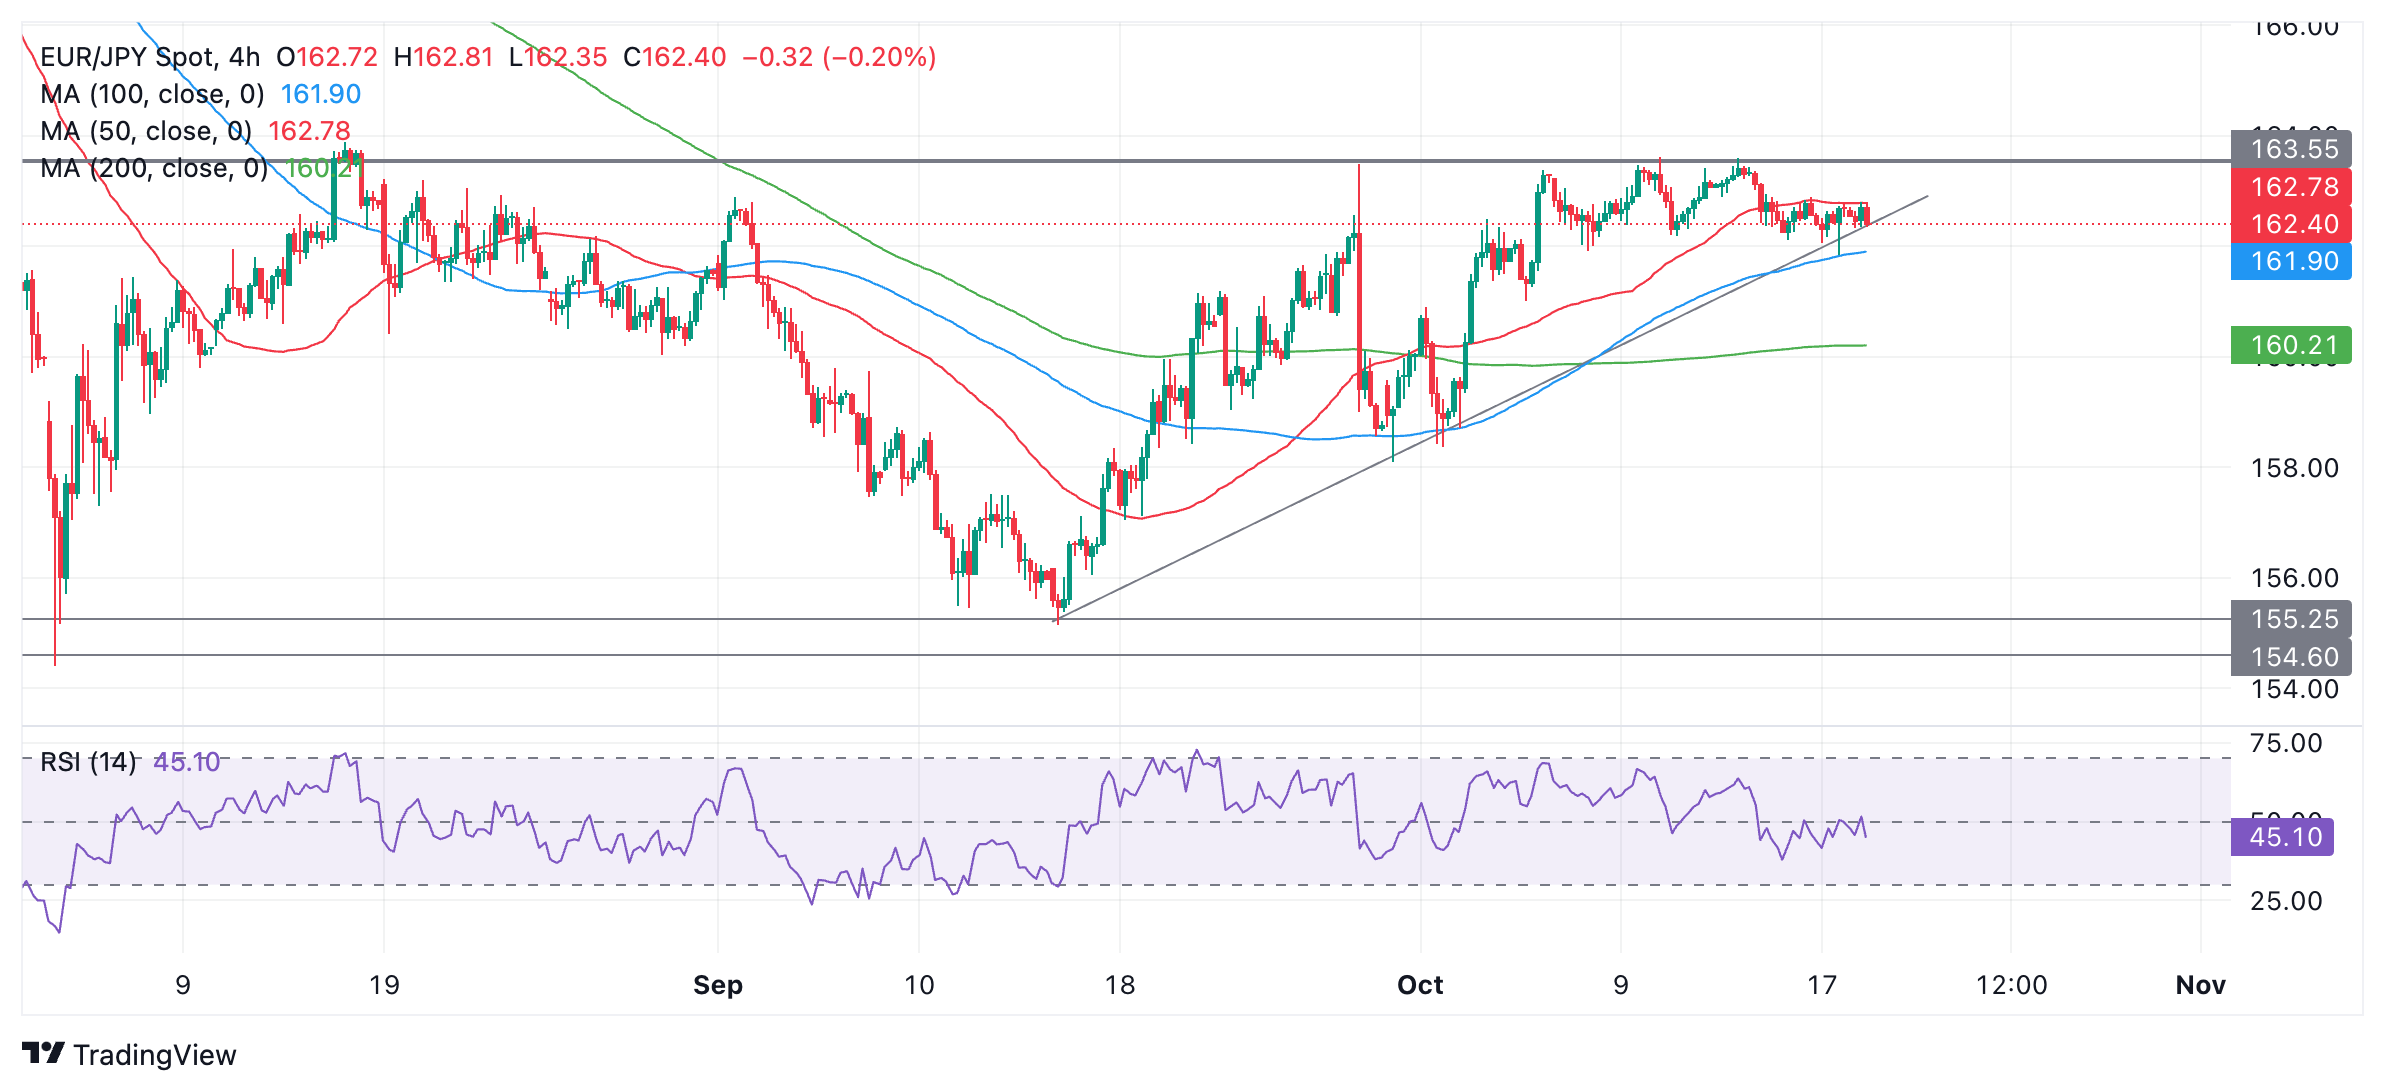
Given the pair’s long-standing adherence to the confines of the range it will probably next start moving lower as it continues to respect its guardrails.
EUR/JPY has broken below 161.91 (October 8 low) helping to confirm the start of a bearish leg. A break below the 161.85 low of Thursday, would provide stronger confirmation. Such a break could eventually reach the next downside target at the range floor of about 158.32 – the October 1 as well as September 30 lows.
The Relative Strength Index (RSI) has fallen below the 50 mid level which suggests fairly strong downside momentum accompanied the most recent sell off. This is a sign of mild underlying weakness in the pair.
Alternatively, it is also still possible that EUR/JPY might break out above its range. Such a break would need to be decisive to inspire confidence. A decisive move would be one characterized by a longer-than-average green candlestick which cleared the range high and closed near its high, or three green candles in a row breaking above the top of the range.
The Pound Sterling (GBP) is expected to trade in a 1.2985/1.3050 range. In the longer run, the breach of the major support at 1.3000 sets the stage for further losses; the levels to monitor are 1.2940 and 1.2900, UOB Group’s FX analysts Quek Ser Leang and Peter Chia notes.
Levels to monitor are 1.2940 and 1.2900
24-HOUR VIEW: “Our expectation for GBP ‘decline further to 1.2940’ did not turn out, as it traded between 1.2971 and 1.3023, closing at 1.3010. The price movements appear to be part of a consolidation phase. Today, we expect GBP to trade in a 1.2985/1.3050 range.”
1-3 WEEKS VIEW: “After GBP breached the major support at 1.3000, we indicated yesterday (17 Oct, spot at 1.2990) that ‘the breach of the major support at 1.3000 sets the stage for further losses.’ We added, ‘the levels to monitor are 1.2940 and 1.2900.’ Our view remains unchanged, even though oversold short-term conditions could lead to a couple of days of consolidation. Overall, only a breach of 1.3080 (no change in ‘strong resistance’ level) would indicate that the weakness from early this month has ended.”
There are times when readers of financial journalism may question whether they have wandered into the twilight zone. Headlines proclaiming that ‘manufacturing output weakens’ and ‘manufacturing output strengthens’ can follow each other with lightning speed. The problem is that the media often misrepresents sentiment as economic reality, UBS’ economist Paul Donovan notes.
Manufacturing output is unchanged over the year
“Over the past two years, sentiment surveys have done a poor job of capturing economic reality. Since January 2023, the US ISM manufacturing survey’s production index has signaled a contraction two-thirds of the time. Actual manufacturing output was been remarkably stable. In 2024. the German manufacturing PMI has consistently signaled a catastrophic collapse in output. Manufacturing output is unchanged over the year.”
“Survey after survey is showing a pessimistic bias, which does not translate into a negative reality. Media portrayals of weaker reported sentiment as being the same thing as economic reality give a very misleading view of the economy.”
“This may be a bigger problem in Europe than the United States. The more limited number of data releases from Europe and the lengthy delays in getting real world data published may give sentiment surveys greater media prominence. Investors need to remember that such surveys err on the pessimistic, and reality is not nearly as bad as people say it is.”
ECB President Christine Lagarde sounded a bit more dovish than usual at yesterday’s post-meeting press conference. She emphasised the ECB’s greater confidence in the disinflation path, and while she said the activity picture only influences policy decisions insofar as it affects inflation, the general perception is that the focus has started to shift from inflation to growth, ING’s FX analyst Francesco Pesole notes.
1.070 is well within reach before month-end
“As our ECB watcher, Carsten Brzeski, points out the drop in September’s headline inflation was in line with the ECB’s own projections, so it must have been the grim PMIs that tilted the balance to the dovish side yesterday. Lagarde repeated at least twice that the ECB is data-dependent and not data-point dependent, but a dovish reaction to an activity survey would instead point to the latter.”
“If indeed the focus is now more on growth, we can probably conclude that the ECB will keep cutting, as the activity outlook will hardly improve much in the near term. Markets agree and are pricing in 100bp of easing in the next four meetings (December, January, March, April). That is probably the maximum the ECB can deliver, and there are risks of some hawkish repricing helping front-end euro rates around the turn of the year.”
“But with regards to the near-term picture, the euro is left weaker, with more limited room for a rebound as the two-year swap rate gap with the dollar is now at -140bp, the widest since May. This is consistent with EUR/USD trading below 1.080, and given the risks are skewed to a firmer USD into a closely contested US election, 1.070 is well within reach before month-end.”
US retail sales came in strong yesterday, and the timing of their release (15 minutes after the European Central Bank cut) worked perfectly to favour another leg higher in the US Dollar (USD), ING’s FX analyst Francesco Pesole notes.
DXY might be due some small and short-lived corrections
“That said, unless markets regain some confidence in Fed cuts, the dollar will hardly face downward corrections in the near term. The risk now is that markets might actually price out one cut in either November or December (currently 42bp priced in total) should core PCE and above all October jobs figures come in a bit hotter.”
“Still, that is not as big an upside risk for USD as the US election. We still think some de-risking into 5 November can lead to some defensive flows into the dollar, and that the likes of the Australian and New Zealand dollars are due another leg lower into the election.”
“Back to the US, the calendar is quite light today and only includes some housing data for September. We’ll be monitoring whether any of today’s Fed speakers (Raphael Bostic, Neel Kashkari and Christopher Waller) take an extra step to the hawkish side on the back of yesterday’s retail sales numbers. DXY might be due some small and short-lived corrections, but we can easily see it climb above 104.0-104.5 in the next couple of weeks.”
The Euro (EUR) could test the 1.0800 level before a recovery can be expected; major support at 1.0770 is not expected to come into view. In the longer run, to reach the significant support at 1.0770, EUR must keep moving lower, or the likelihood of it reaching this level will diminish quickly, UOB Group’s FX analysts Quek Ser Leang and Peter Chia notes.
Below 1.0800 EUR must reach 1.0770
24-HOUR VIEW: “We expected EUR to ‘decline gradually, potentially reaching 1.0825’ yesterday. Instead of declining gradually, EUR fell sharply in London trading, reaching a low of 1.0810. Conditions are severely oversold after the rapid drop, but today, EUR could test the 1.0800 level before a recovery can be expected. The major support at 1.0770 is not expected to come into view. Resistance levels are at 1.0845 and 1.0870.”
1-3 WEEKS VIEW: “We continue to hold the same view as yesterday (17 Oct, spot t 1.0860). As highlighted, the weakness in EUR that started early this month remains intact. However, to reach the significant support at 1.0770, EUR must keep moving lower, or the likelihood of it reaching this level will diminish quickly. The subsequent drop to 1.0810 increases the odds of a decline to 1.0770. On the upside, a breach of 1.0900 (‘strong resistance’ level was at 1.0935 yesterday) would mean that the weakness has stabilised.”
Silver prices (XAG/USD) rose on Friday, according to FXStreet data. Silver trades at $32.09 per troy ounce, up 1.23% from the $31.70 it cost on Thursday.
Silver prices have increased by 34.84% since the beginning of the year.
| Unit measure | Silver Price Today in USD |
|---|---|
| Troy Ounce | 32.09 |
| 1 Gram | 1.03 |
The Gold/Silver ratio, which shows the number of ounces of Silver needed to equal the value of one ounce of Gold, stood at 84.50 on Friday, down from 84.96 on Thursday.
Silver FAQs
Silver is a precious metal highly traded among investors. It has been historically used as a store of value and a medium of exchange. Although less popular than Gold, traders may turn to Silver to diversify their investment portfolio, for its intrinsic value or as a potential hedge during high-inflation periods. Investors can buy physical Silver, in coins or in bars, or trade it through vehicles such as Exchange Traded Funds, which track its price on international markets.
Silver prices can move due to a wide range of factors. Geopolitical instability or fears of a deep recession can make Silver price escalate due to its safe-haven status, although to a lesser extent than Gold's. As a yieldless asset, Silver tends to rise with lower interest rates. Its moves also depend on how the US Dollar (USD) behaves as the asset is priced in dollars (XAG/USD). A strong Dollar tends to keep the price of Silver at bay, whereas a weaker Dollar is likely to propel prices up. Other factors such as investment demand, mining supply – Silver is much more abundant than Gold – and recycling rates can also affect prices.
Silver is widely used in industry, particularly in sectors such as electronics or solar energy, as it has one of the highest electric conductivity of all metals – more than Copper and Gold. A surge in demand can increase prices, while a decline tends to lower them. Dynamics in the US, Chinese and Indian economies can also contribute to price swings: for the US and particularly China, their big industrial sectors use Silver in various processes; in India, consumers’ demand for the precious metal for jewellery also plays a key role in setting prices.
Silver prices tend to follow Gold's moves. When Gold prices rise, Silver typically follows suit, as their status as safe-haven assets is similar. The Gold/Silver ratio, which shows the number of ounces of Silver needed to equal the value of one ounce of Gold, may help to determine the relative valuation between both metals. Some investors may consider a high ratio as an indicator that Silver is undervalued, or Gold is overvalued. On the contrary, a low ratio might suggest that Gold is undervalued relative to Silver.
(An automation tool was used in creating this post.)
China’s 3Q24 GDP growth was largely in line with consensus expectations at 4.6% y/y, 0.9% q/q sa (Bloomberg’s est: 4.5% y/y, 1.1% q/q; UOB est: 4.7% y/y, 1.1% q/q). This marked a further slowdown from 4.7% y/y in 2Q24 but the momentum has picked up from the downwardly revised 0.5% q/q last quarter, UOB Group’s economist Ho Woei Chen notes.
3Q24 GDP growth moderation largely in line with consensus
“China’s 3Q24 GDP growth was largely in line with consensus expectations and clocked a growth of 4.8% YTD. Nominal GDP growth has remained below the real GDP growth rate, indicating that deflationary pressure has yet to abate which was also evident in September CPI and PPI.”
“September data was largely positive with an acceleration in momentum for industrial production, retail sales and urban fixed asset investment while the unemployment rate unexpectedly fell. However, sustained pace of declines in property prices and sales values put a dampener on the recovery outlook.”
“We maintain our growth forecast for China at 4.9% this year and 4.6% in 2025. Anticipation is building around the meeting of the Standing Committee of the National People’s Congress (NPC) later this month to announce the details of the fiscal stimulus following the approval process. This will have an impact on the China’s growth outlook, especially for next year.”
- AUD/USD attracts buyers for the second straight day and draws support from a combination of factors.
- A positive risk tone and hawkish RBA expectations underpin the Aussie amid a modest USD downtick.
- Bets for smaller Fed rate cuts should limit the USD losses and cap any meaningful gains for the major.
The AUD/USD pair builds on the previous day's bounce from the vicinity of mid-0.6600s, or over a one-month low and gains positive traction for the second straight day on Friday. The momentum lifts spot prices back above the 0.6700 mark during the first half of the European session and is sponsored by a combination of factors.
The Australian Dollar (AUD) continues to draw support from Thursday's upbeat domestic employment details, which dashed hopes for an interest rate cut by the Reserve Bank of Australia (RBA) this year. Furthermore, the underlying bullish tone across the global equity markets prompts some profit-taking around the safe-haven US Dollar (USD), especially after the recent rally to the highest level since early August, and further benefits the risk-sensitive Aussie.
Meanwhile, data released earlier today showed that China's economy expanded 4.6% year-on-year in the July-September period, marking the lowest reading in 18 months. The reading was below the government's full-year target of 5%, offsetting the better-than-expected Retail Sales and Industrial Production figures for September. This, in turn, might hold back traders from placing aggressive bullish bets around the China-proxy Aussie and cap the AUD/USD pair.
Furthermore, bets for a regular 25 basis points (bps) interest rate cut by the Federal Reserve (Fed) in November, bolstered by Thursday's upbeat US macro data, should help limit any meaningful downside for the USD. This further makes it prudent to wait for strong follow-through buying beyond the 50-day Simple Moving Average (SMA) support breakpoint, around the 0.6750 area, before confirming that the AUD/USD pair has formed a near-term bottom.
Investors now look forward to the US economic docket, featuring the release of Building Permits and Housing Starts. Apart from this, Fed Governor Christopher Waller's speech, along with the broader risk sentiment, will drive the USD demand and provide some impetus to the AUD/USD pair. Nevertheless, spot prices remain on track to register losses for the third straight week and the fundamental backdrop warrants some caution before positioning for further gains.
Risk sentiment FAQs
In the world of financial jargon the two widely used terms “risk-on” and “risk off'' refer to the level of risk that investors are willing to stomach during the period referenced. In a “risk-on” market, investors are optimistic about the future and more willing to buy risky assets. In a “risk-off” market investors start to ‘play it safe’ because they are worried about the future, and therefore buy less risky assets that are more certain of bringing a return, even if it is relatively modest.
Typically, during periods of “risk-on”, stock markets will rise, most commodities – except Gold – will also gain in value, since they benefit from a positive growth outlook. The currencies of nations that are heavy commodity exporters strengthen because of increased demand, and Cryptocurrencies rise. In a “risk-off” market, Bonds go up – especially major government Bonds – Gold shines, and safe-haven currencies such as the Japanese Yen, Swiss Franc and US Dollar all benefit.
The Australian Dollar (AUD), the Canadian Dollar (CAD), the New Zealand Dollar (NZD) and minor FX like the Ruble (RUB) and the South African Rand (ZAR), all tend to rise in markets that are “risk-on”. This is because the economies of these currencies are heavily reliant on commodity exports for growth, and commodities tend to rise in price during risk-on periods. This is because investors foresee greater demand for raw materials in the future due to heightened economic activity.
The major currencies that tend to rise during periods of “risk-off” are the US Dollar (USD), the Japanese Yen (JPY) and the Swiss Franc (CHF). The US Dollar, because it is the world’s reserve currency, and because in times of crisis investors buy US government debt, which is seen as safe because the largest economy in the world is unlikely to default. The Yen, from increased demand for Japanese government bonds, because a high proportion are held by domestic investors who are unlikely to dump them – even in a crisis. The Swiss Franc, because strict Swiss banking laws offer investors enhanced capital protection.
- EUR/USD recovers mildly while its outlook remains uncertain as the ECB is expected to extend its policy-easing cycle.
- A victory of Donald Trump in the US presidential elections would significantly impact the Eurozone economy.
- Investors expect the Fed to follow the rate-cut path gradually.
EUR/USD recovers mildly on Friday after posting a fresh 10-week low near 1.0800 on Thursday. The outlook of the major currency pair remains bearish as the Euro (EUR) could face selling pressures on expectations that more interest rate cuts from the European Central Bank (ECB) are in the pipeline.
The ECB reduced its Rate on Deposit Facility by 25 basis points (bps) to 3.25% on Thursday. This was the second straight interest rate cut by the ECB and the third of this year. The central bank was widely anticipated to reduce interest rates further as recent commentaries from various ECB officials suggested that they are more concerned about reviving economic growth, with high confidence over inflation remaining under control.
In the press conference after the interest rate decision, ECB President Christine Lagarde did not offer any cues for likely interest rate action in December but was confident that the disinflation process is well on track. However, traders have priced in an additional 25-bps interest rate cut at the last meeting of this year.
When asked about the likely threats to the Eurozone economy from a victory of former US President Donald Trump in the presidential elections, Lagarde said, “Any trade obstacles were a ‘downside’ for Europe,” Reuters reported. She added, "Any restriction, any uncertainty, any obstacles to trade matter for an economy like the European economy, which is very open," adding that the ECB was also "very attentive" to possible oil price moves linked to the Middle East conflict.
Daily digest market movers: EUR/USD strives to end its losing spree
- EUR/USD takes a breather on Friday after a four-day losing streak. The shared currency pair strives to hold its feet as the US Dollar (USD) rally appears to have paused. The US Dollar Index (DXY), which tracks the Greenback’s value against six major currencies, struggles to extend its upside above the immediate resistance of 103.90.
- The Greenback takes a time out, while its outlook remains firm as Thursday’s upbeat United States (US) data pointed to economic resilience. The US Retail Sales data, a key measure of consumer spending, rose at a faster-than-expected pace of 0.4% in September. Also, Initial Jobless Claims for the week ending October 11 came in lower at 241K than estimates of 260K.
- Over the past few weeks, the US Dollar has been outperforming its major peers as traders priced out market speculation of the Federal Reserve (Fed) to deliver another larger-than-usual interest rate cut of 50 basis points (bps) in November. As September US data has diminished fears of a potential slowdown, traders expect the Fed to cut interest rates gradually.
- According to the CME FedWatch tool, traders are pricing in two rate cuts of 25 basis points (bps) in November and December, which will push interest rates lower to 4.25%-4.50% by the year-end.
- Going forward, investors will focus on market expectations over the US presidential elections. Currently, there is a neck-to-neck competition between Donald Trump and Kamala Harris. According to FiveThirtyEight’s daily election poll tracker, Harris is leading polls and has a 2.4-percentage-point lead over Trump.
Technical Analysis: EUR/USD holds above 1.0800
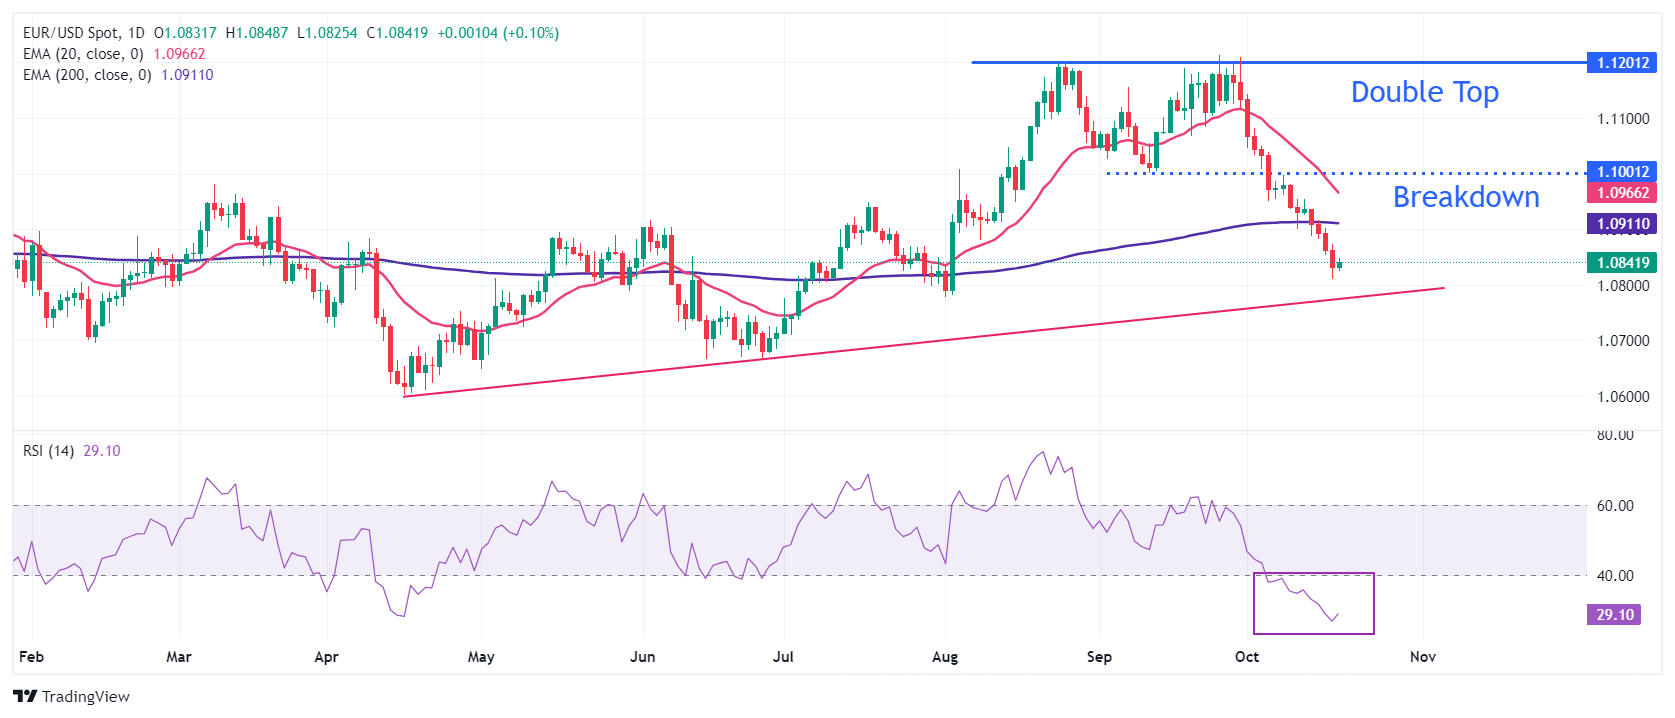
EUR/USD endeavors to hold the immediate support of 1.0800 in European trading hours. The major currency pair extended its downfall after breaking below the 200-day Exponential Moving Average (EMA), which trades around 1.0910, earlier this week.
The downside move in the shared currency pair started after a breakdown of the Double Top formation on a daily timeframe near the September 11 low at around 1.1000, which resulted in a bearish reversal.
The 14-day Relative Strength Index (RSI) dives below 30.00, indicating a strong bearish momentum though entering in oversold conditions.
On the downside, the major could find support near the upward-sloping trendline at 1.0750, which is plotted from the October 3 low around 1.0450. Meanwhile, the 200-day EMA and the psychological figure of 1.1000 will be the key resistances for the pair.
Euro FAQs
The Euro is the currency for the 19 European Union countries that belong to the Eurozone. It is the second most heavily traded currency in the world behind the US Dollar. In 2022, it accounted for 31% of all foreign exchange transactions, with an average daily turnover of over $2.2 trillion a day. EUR/USD is the most heavily traded currency pair in the world, accounting for an estimated 30% off all transactions, followed by EUR/JPY (4%), EUR/GBP (3%) and EUR/AUD (2%).
The European Central Bank (ECB) in Frankfurt, Germany, is the reserve bank for the Eurozone. The ECB sets interest rates and manages monetary policy. The ECB’s primary mandate is to maintain price stability, which means either controlling inflation or stimulating growth. Its primary tool is the raising or lowering of interest rates. Relatively high interest rates – or the expectation of higher rates – will usually benefit the Euro and vice versa. The ECB Governing Council makes monetary policy decisions at meetings held eight times a year. Decisions are made by heads of the Eurozone national banks and six permanent members, including the President of the ECB, Christine Lagarde.
Eurozone inflation data, measured by the Harmonized Index of Consumer Prices (HICP), is an important econometric for the Euro. If inflation rises more than expected, especially if above the ECB’s 2% target, it obliges the ECB to raise interest rates to bring it back under control. Relatively high interest rates compared to its counterparts will usually benefit the Euro, as it makes the region more attractive as a place for global investors to park their money.
Data releases gauge the health of the economy and can impact on the Euro. Indicators such as GDP, Manufacturing and Services PMIs, employment, and consumer sentiment surveys can all influence the direction of the single currency. A strong economy is good for the Euro. Not only does it attract more foreign investment but it may encourage the ECB to put up interest rates, which will directly strengthen the Euro. Otherwise, if economic data is weak, the Euro is likely to fall. Economic data for the four largest economies in the euro area (Germany, France, Italy and Spain) are especially significant, as they account for 75% of the Eurozone’s economy.
Another significant data release for the Euro is the Trade Balance. This indicator measures the difference between what a country earns from its exports and what it spends on imports over a given period. If a country produces highly sought after exports then its currency will gain in value purely from the extra demand created from foreign buyers seeking to purchase these goods. Therefore, a positive net Trade Balance strengthens a currency and vice versa for a negative balance.
- USD/CAD trades sideways near 1.3800 as investors await Fed speakers for more guidance on interest rates.
- The Fed is expected to follow a moderate rate-cut path.
- Investors expect the BoC to cut interest rates again to revive job growth.
The USD/CAD pair trades in a tight range near the round-level resistance of 1.3800 in Friday’s European session. The Loonie pair trades sideways as investors await speeches from a slew of Federal Reserve (Fed) officials, who are scheduled to speak in the North American session.
Fed policymakers such as Atlanta Fed Bank President Raphael Bostic, Minneapolis Fed Bank President Neel Kashkari, and Fed Governor Christopher Waller are expected to provide fresh cues about the likely interest rate action in the remainder of the year.
According to the CME FedWatch tool, 30-day Federal Funds futures pricing data shows that there will a 50 basis points (bps) further decline in interest rates in the remaining year, suggesting that the Fed will cut its borrowing rates by 25 bps in November and December.
The Fed seems to follow a moderate policy-easing cycle as recent United States (US) data for September has diminished economic slowdown risks.
Meanwhile, the Canadian Dollar (CAD) broadly stays on the backfoot as the Bank of Canada (BoC) is expected to cut its interest rates again on Wednesday. The BoC has already reduced its borrowing rates by 75 bps to 4.25% this year.
More rate cuts from the BoC appear to be in the pipeline as price pressures in Canada seem to have come under control, and the economy is not operating at full-employment levels. Canadian Unemployment Rate decelerated at a faster-than-expected pace to 6.6% in September but is well above the bank’s target of 5%.
Canadian Dollar FAQs
The key factors driving the Canadian Dollar (CAD) are the level of interest rates set by the Bank of Canada (BoC), the price of Oil, Canada’s largest export, the health of its economy, inflation and the Trade Balance, which is the difference between the value of Canada’s exports versus its imports. Other factors include market sentiment – whether investors are taking on more risky assets (risk-on) or seeking safe-havens (risk-off) – with risk-on being CAD-positive. As its largest trading partner, the health of the US economy is also a key factor influencing the Canadian Dollar.
The Bank of Canada (BoC) has a significant influence on the Canadian Dollar by setting the level of interest rates that banks can lend to one another. This influences the level of interest rates for everyone. The main goal of the BoC is to maintain inflation at 1-3% by adjusting interest rates up or down. Relatively higher interest rates tend to be positive for the CAD. The Bank of Canada can also use quantitative easing and tightening to influence credit conditions, with the former CAD-negative and the latter CAD-positive.
The price of Oil is a key factor impacting the value of the Canadian Dollar. Petroleum is Canada’s biggest export, so Oil price tends to have an immediate impact on the CAD value. Generally, if Oil price rises CAD also goes up, as aggregate demand for the currency increases. The opposite is the case if the price of Oil falls. Higher Oil prices also tend to result in a greater likelihood of a positive Trade Balance, which is also supportive of the CAD.
While inflation had always traditionally been thought of as a negative factor for a currency since it lowers the value of money, the opposite has actually been the case in modern times with the relaxation of cross-border capital controls. Higher inflation tends to lead central banks to put up interest rates which attracts more capital inflows from global investors seeking a lucrative place to keep their money. This increases demand for the local currency, which in Canada’s case is the Canadian Dollar.
Macroeconomic data releases gauge the health of the economy and can have an impact on the Canadian Dollar. Indicators such as GDP, Manufacturing and Services PMIs, employment, and consumer sentiment surveys can all influence the direction of the CAD. A strong economy is good for the Canadian Dollar. Not only does it attract more foreign investment but it may encourage the Bank of Canada to put up interest rates, leading to a stronger currency. If economic data is weak, however, the CAD is likely to fall.
- The Mexican Peso halts its march lower after strong economic data from the US, its largest trading partner.
- China data tempers slowdown fears and also supports emerging market FX, including the MXN.
- USD/MXN stalls, forms a Shooting Star candlestick pattern and reverses.
The Mexican Peso (MXN) trades marginally higher in its most heavily-traded pairs on Friday after bottoming out of its three-day down slope on Thursday.
A blend of not-as-bad-as-expected China growth data and strong US Retail Sales and Jobless Claims released on Thursday are helping bulls turn the Peso tanker slowly around. The Chinese data lifts market sentiment, providing a gentle backdraught to stern for MXN, whilst the strong US data supports the Peso because of the importance of the US market for Mexican exports.
That said, Peso-negative factors are likely to continue to provide a headwind. These include threats from former president Donald Trump to slam up to 300% tariffs on Mexican car imports, the widespread view that Mexico is facing an economic slowdown – given credence by a recent International Monetary Fund (IMF) report – political risk from constitutional reforms the market doesn’t like, and persistent concerns around the budget deficit.
Mexican Peso recovers after US, China data
The Mexican Peso found support on Thursday and managed to end its string of losing days after strong data out of the US painted an improved economic outlook for its most significant trading partner.
US Retail Sales and Retail Sales ex Autos both showed a higher-than-expected rise in September, and were above the increases seen in August. Retail Sales rose 0.4% and sales ex autos by 0.5%, beating estimates of 0.3% and 0.1%, respectively, and previous readings of 0.1% and 0.2% (revised up).
Initial Jobless Claims also indicated a resilient labor market with 241K out-of-work Americans claiming benefits in the week ending October 11. This was below the 260K expected and 260K (revised up) in the previous week. Given the Federal Reserve’s concerns about the fragility of the US labor market, the data had a disproportionately positive impact on the outlook for the economy as well as the future path of monetary policy, two key elements driving currencies.
“The main catalyst for the day's market moves was another batch of upbeat US data, which dampened any immediate fears about a potential recession,” said Jim Ried, Global Head of Macro Research at Deutsche Bank. “It feels a far cry from the recession fears of the summer, and also from the 260bps of Fed cuts priced in by the end of 2025 shortly before the September FOMC,” added Reid.
China data lessens concerns over slowdown
The Mexican Peso might have gained further support on Friday morning after the release of China Gross Domestic Product (GDP) growth, Retail Sales and Industrial Production data, which came out overall on the positive side, and helped to boost global market sentiment, which, in turn, tends to be positive for the Peso.
Chinese GDP increased by a higher-than-expected 4.6% YoY in Q3, which whilst below Q2’s 4.7% was not as bad as the 4.5% growth forecast by economists.
On a QoQ basis, GDP grew 0.9% in Q3, which though below the 1.0% forecast was, nevertheless, above the 0.7% expansion seen in Q2.
China Retail Sales surged 3.2% YoY in September, from 2.1% in the previous month and trouncing expectations of 2.5%. It was a similar story with Industrial Production, which rose 5.2% YoY in September, beating both previous (4.5%) and expected readings (4.6%).
Technical Analysis: USD/MXN recovery stalls and forms Shooting Star candlestick
USD/MXN stalls mid-takeoff, rolling over after three green up days and threatening to correct back. The pair formed on Thursday a slightly ominous, if small, Japanese Shooting Star candlestick – a bearish formation (shaded rectangle on chart). This could indicate a near-term pullback is about to unfold. The pattern requires the next day to be a red down day for confirmation, however, which will not be clarified until the end of Friday (today).
USD/MXN Daily Chart
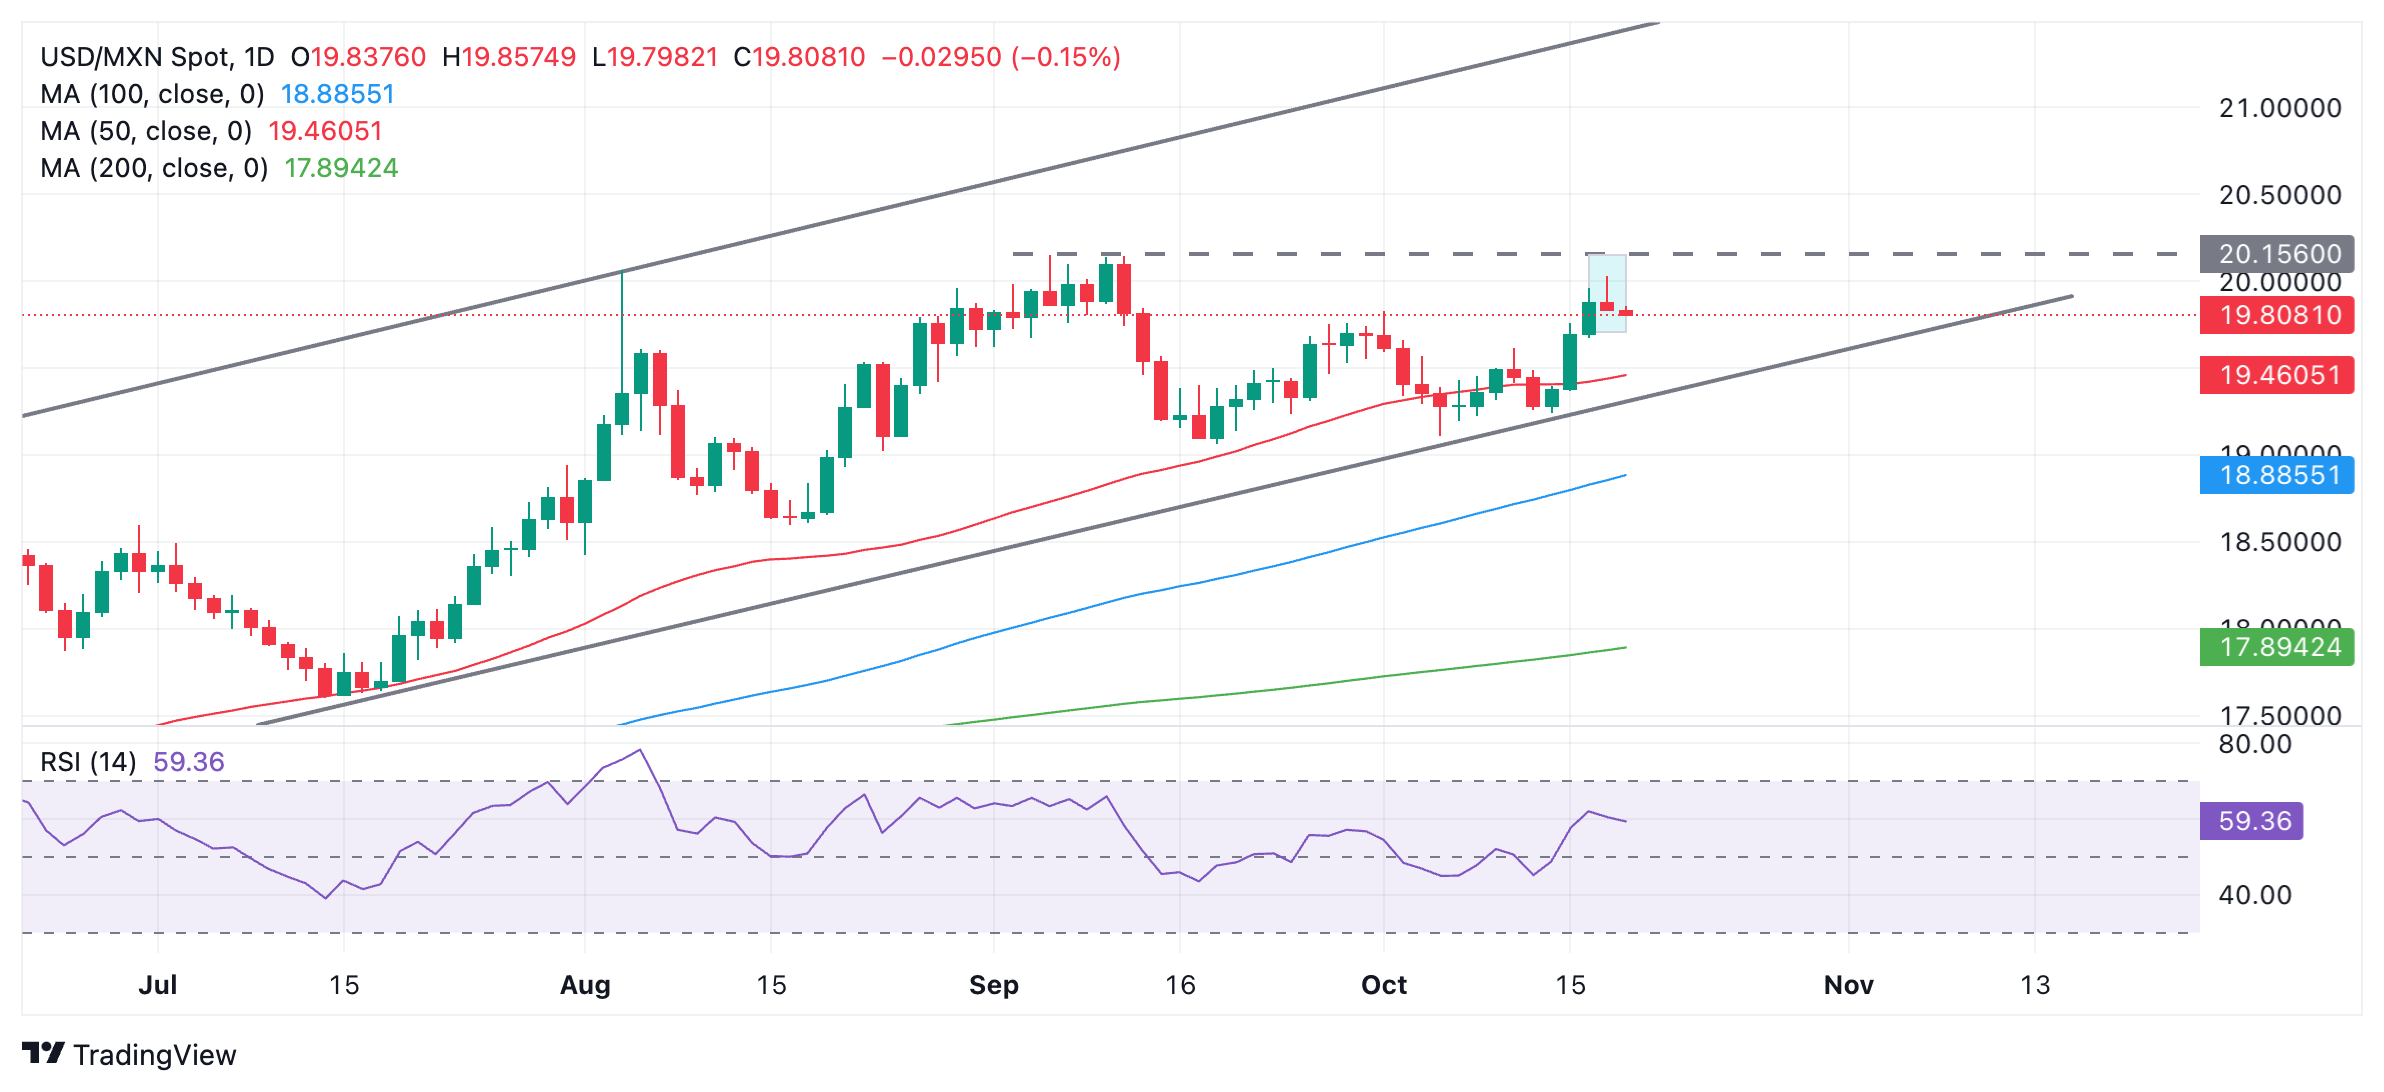
If there is a pullback, it is likely to be short-lived since USD/MXN is probably in a short-term uptrend, which given the technical analysis principle that “the trend is your friend,” is biased to continue.
The break above the key 19.83 (October 1 high) level unlocked an upside target to between 20.10-20.15 and the vicinity of the September 10 high at 20.13, which remains live.
The Relative Strength Index (RSI) momentum indicator shows that the robust momentum that accompanied the last three up days broadly persists, which also supports a mildly bullish outlook overall.
Mexican Peso FAQs
The Mexican Peso (MXN) is the most traded currency among its Latin American peers. Its value is broadly determined by the performance of the Mexican economy, the country’s central bank’s policy, the amount of foreign investment in the country and even the levels of remittances sent by Mexicans who live abroad, particularly in the United States. Geopolitical trends can also move MXN: for example, the process of nearshoring – or the decision by some firms to relocate manufacturing capacity and supply chains closer to their home countries – is also seen as a catalyst for the Mexican currency as the country is considered a key manufacturing hub in the American continent. Another catalyst for MXN is Oil prices as Mexico is a key exporter of the commodity.
The main objective of Mexico’s central bank, also known as Banxico, is to maintain inflation at low and stable levels (at or close to its target of 3%, the midpoint in a tolerance band of between 2% and 4%). To this end, the bank sets an appropriate level of interest rates. When inflation is too high, Banxico will attempt to tame it by raising interest rates, making it more expensive for households and businesses to borrow money, thus cooling demand and the overall economy. Higher interest rates are generally positive for the Mexican Peso (MXN) as they lead to higher yields, making the country a more attractive place for investors. On the contrary, lower interest rates tend to weaken MXN.
Macroeconomic data releases are key to assess the state of the economy and can have an impact on the Mexican Peso (MXN) valuation. A strong Mexican economy, based on high economic growth, low unemployment and high confidence is good for MXN. Not only does it attract more foreign investment but it may encourage the Bank of Mexico (Banxico) to increase interest rates, particularly if this strength comes together with elevated inflation. However, if economic data is weak, MXN is likely to depreciate.
As an emerging-market currency, the Mexican Peso (MXN) tends to strive during risk-on periods, or when investors perceive that broader market risks are low and thus are eager to engage with investments that carry a higher risk. Conversely, MXN tends to weaken at times of market turbulence or economic uncertainty as investors tend to sell higher-risk assets and flee to the more-stable safe havens.
- NZD/USD attracts some buying on Friday amid a modest USD weakness.
- Mixed Chinese macro data fails to impress bulls or provide any impetus.
- Bets for smaller Fed rate cuts and dovish RBNZ expectations cap the pair.
The NZD/USD pair trades with a positive bias for the second straight day on Friday, albeit lacks bullish conviction and remains close to over a one-month low touched earlier this week. Spot prices hover around the 0.6070 region and draw support from a modest US Dollar (USD) downtick.
The USD Index (DXY), which tracks the Greenback against a basket of currencies, pulls back from its highest level since early August as traders opt to take some profits off the table following a strong rally since the beginning of this month. This, along with a generally positive tone around the equity markets, offers some support to the risk-sensitive Kiwi, though concerns about a slowdown in China act as a headwind.
Official data released earlier today showed that China's economy expanded 4.6% year-on-year in the July-September period, slightly slower than the 4.7% growth recorded in the previous quarter. This marked the lowest reading in 18 months and was below the government's full-year target of 5%, offsetting the better-than-expected Retail Sales and Industrial Production figures for the month of September.
Furthermore, the downside for the USD seems cushioned in the wake of growing acceptance that the Federal Reserve (Fed) will proceed with modest rate cuts as the economy remains on solid footing. Apart from this, expectations that the Reserve Bank of New Zealand (RBNZ) will cut rates aggressively amid a fall in domestic inflation to the central bank's target range of 1% to 3% in the third quarter should cap the NZD/USD pair.
Even from a technical perspective, the recent breakdown below the very important 200-day Simple Moving Average (SMA) suggests that the path of least resistance for spot prices remains to the downside. Hence, any subsequent move up might still be seen as a selling opportunity. Traders now look to the US housing market data and Fed Governor Christopher Waller's speech for a short-term impetus heading into the weekend.
US Dollar PRICE Today
The table below shows the percentage change of US Dollar (USD) against listed major currencies today. US Dollar was the strongest against the Swiss Franc.
| USD | EUR | GBP | JPY | CAD | AUD | NZD | CHF | |
|---|---|---|---|---|---|---|---|---|
| USD | -0.08% | -0.23% | -0.18% | -0.01% | -0.25% | -0.17% | 0.05% | |
| EUR | 0.08% | -0.13% | -0.10% | 0.06% | -0.20% | -0.08% | 0.12% | |
| GBP | 0.23% | 0.13% | 0.06% | 0.20% | -0.04% | 0.07% | 0.23% | |
| JPY | 0.18% | 0.10% | -0.06% | 0.18% | -0.08% | -0.00% | 0.19% | |
| CAD | 0.01% | -0.06% | -0.20% | -0.18% | -0.24% | -0.15% | 0.02% | |
| AUD | 0.25% | 0.20% | 0.04% | 0.08% | 0.24% | 0.09% | 0.27% | |
| NZD | 0.17% | 0.08% | -0.07% | 0.00% | 0.15% | -0.09% | 0.18% | |
| CHF | -0.05% | -0.12% | -0.23% | -0.19% | -0.02% | -0.27% | -0.18% |
The heat map shows percentage changes of major currencies against each other. The base currency is picked from the left column, while the quote currency is picked from the top row. For example, if you pick the US Dollar from the left column and move along the horizontal line to the Japanese Yen, the percentage change displayed in the box will represent USD (base)/JPY (quote).
- Silver regains positive traction on Friday and climbs to a nearly two-week top.
- The technical setup favors bulls and supports prospects for additional gains.
- Move beyond $32.20-$32.25 is needed to validate the near-term positive bias.
Silver (XAG/USD) regains positive traction following the previous day's good two-way price moves and climbs to a two-week top during the first half of the European session on Friday. The white metal, however, continues with its struggle to capitalize on the move beyond the $32.00 round figure, warranting some caution for bullish traders.
Looking at the broader picture, the recent bounce from the vicinity of the $30.00 psychological mark and the subsequent move up supports prospects for a further near-term appreciating move. The constructive outlook is reinforced by the fact that oscillators on the daily chart have been gaining positive traction and are still away from being in the overbought zone.
That said, it will still be prudent to wait for some follow-through buying beyond the $32.20-$32.25 hurdle before placing fresh bullish bets. The XAG/USD might then climb to its highest level since December 2012 touched earlier this month and make a fresh attempt to conquer the $33.00 mark. A sustained strength beyond the latter will be seen as a fresh trigger for bulls.
On the flip side, the $31.65 horizontal zone now seems to protect the immediate downside ahead of the overnight swing low, around the $31.30 region. Any further decline could be seen as a buying opportunity and remain limited near the $31.00 mark. A convincing break below the said handle, however, might prompt some technical selling and make the XAG/USD vulnerable.
The downward trajectory might then drag the white metal below the $30.75 support zone, back towards last week's swing low, around the $30.15-$30.10 region. The said area now coincides with the 50-day Simple Moving Average (SMA) and is closely followed by the $30.00 mark, which if broken decisively will shift the near-term bias in favor of bearish traders.
Silver daily chart
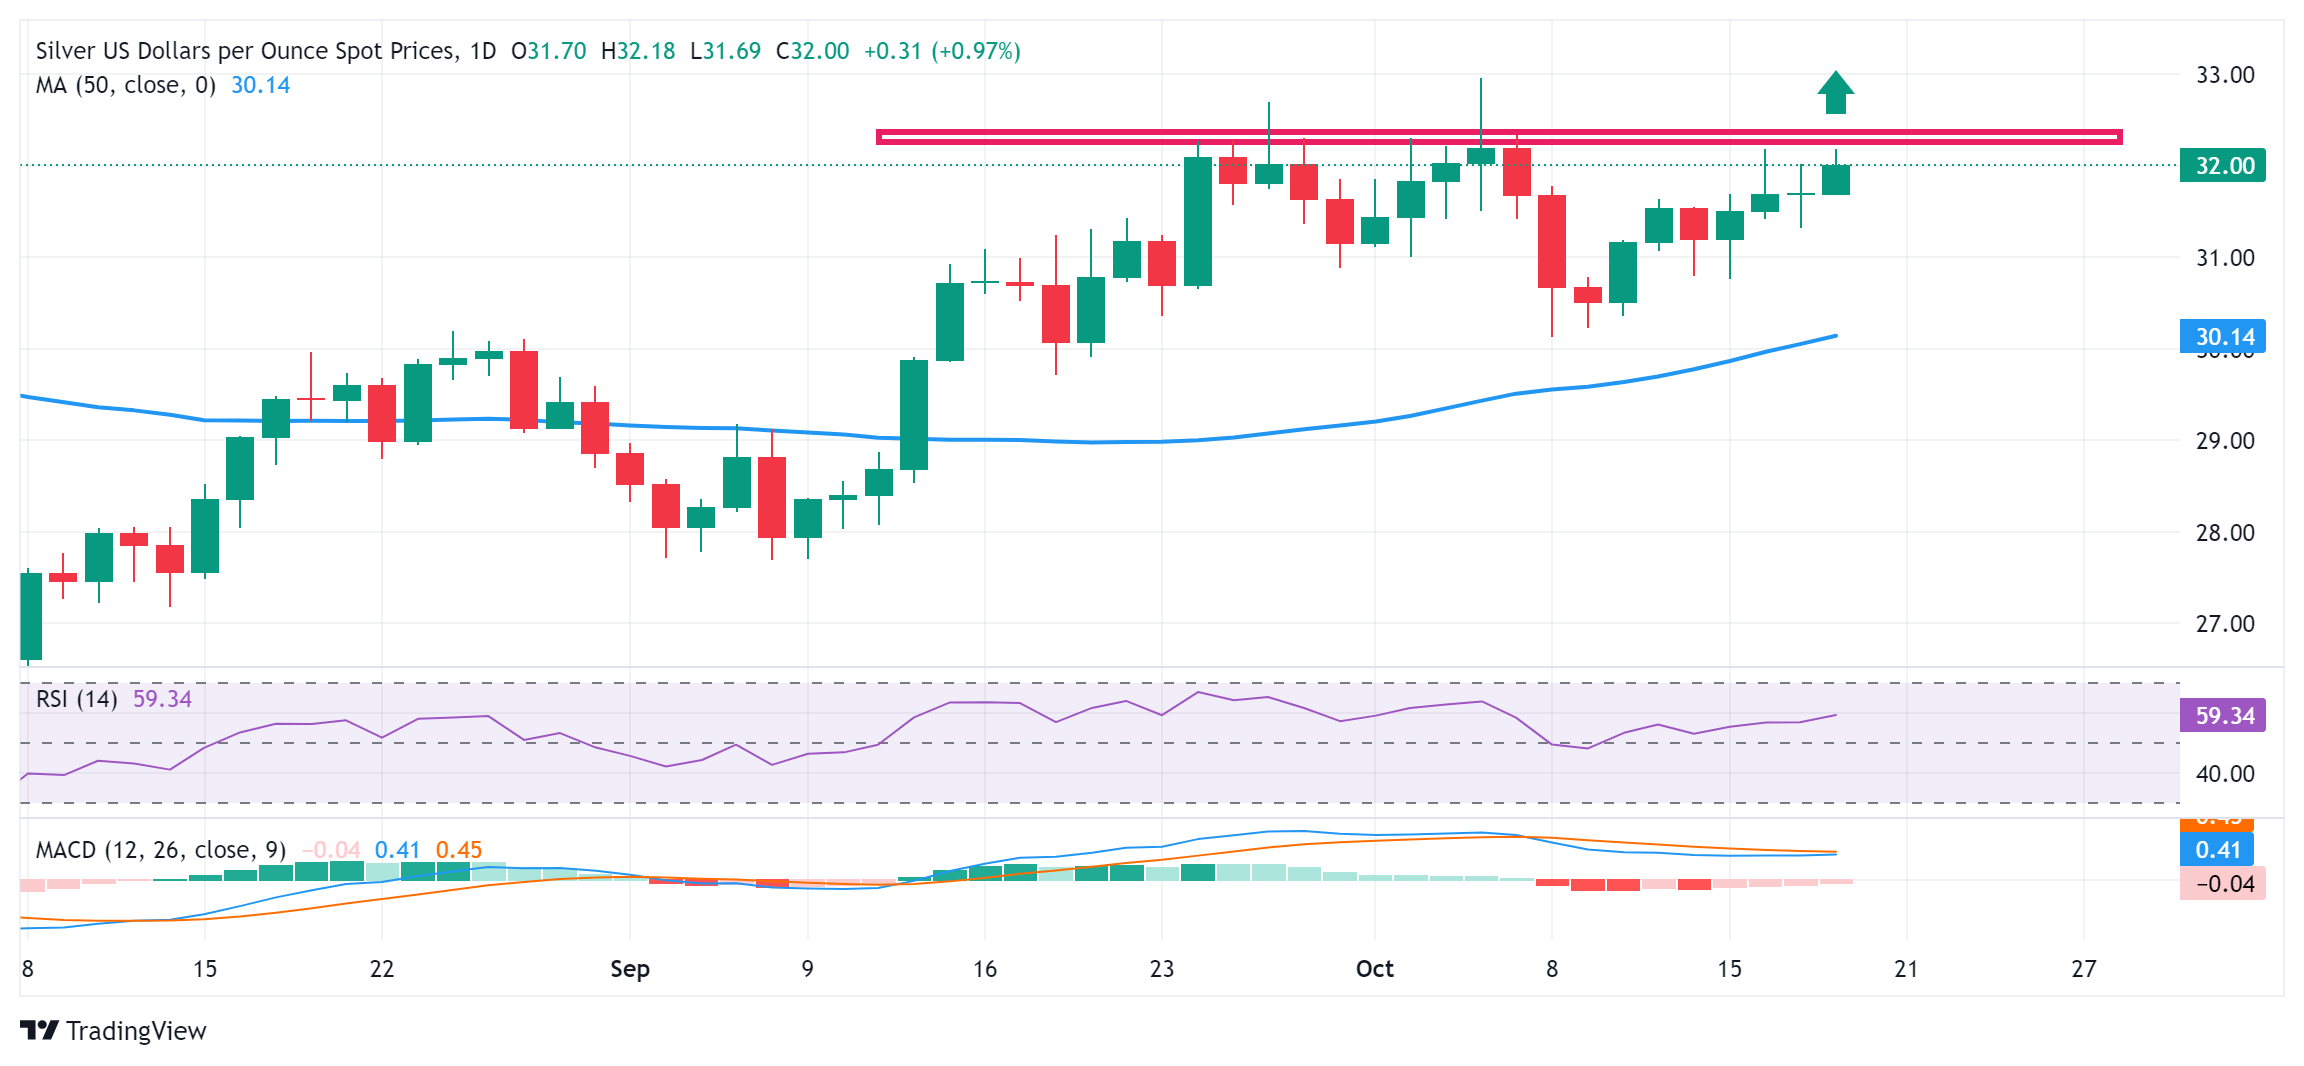
Silver FAQs
Silver is a precious metal highly traded among investors. It has been historically used as a store of value and a medium of exchange. Although less popular than Gold, traders may turn to Silver to diversify their investment portfolio, for its intrinsic value or as a potential hedge during high-inflation periods. Investors can buy physical Silver, in coins or in bars, or trade it through vehicles such as Exchange Traded Funds, which track its price on international markets.
Silver prices can move due to a wide range of factors. Geopolitical instability or fears of a deep recession can make Silver price escalate due to its safe-haven status, although to a lesser extent than Gold's. As a yieldless asset, Silver tends to rise with lower interest rates. Its moves also depend on how the US Dollar (USD) behaves as the asset is priced in dollars (XAG/USD). A strong Dollar tends to keep the price of Silver at bay, whereas a weaker Dollar is likely to propel prices up. Other factors such as investment demand, mining supply – Silver is much more abundant than Gold – and recycling rates can also affect prices.
Silver is widely used in industry, particularly in sectors such as electronics or solar energy, as it has one of the highest electric conductivity of all metals – more than Copper and Gold. A surge in demand can increase prices, while a decline tends to lower them. Dynamics in the US, Chinese and Indian economies can also contribute to price swings: for the US and particularly China, their big industrial sectors use Silver in various processes; in India, consumers’ demand for the precious metal for jewellery also plays a key role in setting prices.
Silver prices tend to follow Gold's moves. When Gold prices rise, Silver typically follows suit, as their status as safe-haven assets is similar. The Gold/Silver ratio, which shows the number of ounces of Silver needed to equal the value of one ounce of Gold, may help to determine the relative valuation between both metals. Some investors may consider a high ratio as an indicator that Silver is undervalued, or Gold is overvalued. On the contrary, a low ratio might suggest that Gold is undervalued relative to Silver.
- EUR/JPY remains steady with downside risks amid verbal intervention from Japanese authorities.
- Japan’s Atsushi Mimura stated that recent Yen movements have been "somewhat rapid and one-sided."
- The Euro faced challenges as the ECB reduced its Rate on Deposit Facility to 3.25%.
The EUR/JPY pair remains stable around 162.60 during early European trading on Friday. The Japanese Yen (JPY) finds support from verbal interventions by Japanese authorities. A government spokesman stressed the importance of stable currency movements that align with economic fundamentals, emphasizing that officials are closely monitoring exchange rate fluctuations, especially any speculative activity, with increased vigilance.
Japan’s Vice Finance Minister for International Affairs, Atsushi Mimura, also commented on Friday that the recent Yen movements have been "somewhat rapid and one-sided." Mimura underscored that excessive volatility in the foreign exchange market is undesirable.
Meanwhile, Japan’s National Consumer Price Index (CPI) slowed to a year-on-year rate of 2.5% in September. The Core CPI, which excludes fresh food prices, dropped to 2.4%, down from a 10-month high of 2.8%.
The Euro came under downward pressure after the European Central Bank's (ECB) policy decision on Thursday. The ECB lowered its Main Refinancing Operations Rate and the Deposit Facility Rate by 25 basis points to 3.40% and 3.25%, respectively, in line with market expectations.
These consecutive rate cuts by the ECB in 13 years, lowered the Deposit Facility Rate to 3.25%. The decision comes in response to a sharp decline in inflation, which had surged to a peak of 10.6% in October 2022 but fell to 1.7% in September, now below the ECB’s 2% target.
During the post-meeting press conference, ECB President Christine Lagarde left the markets uncertain about the timing of future rate cuts, though she reassured that the Eurozone economy is on course for a soft landing.
Interest rates FAQs
Interest rates are charged by financial institutions on loans to borrowers and are paid as interest to savers and depositors. They are influenced by base lending rates, which are set by central banks in response to changes in the economy. Central banks normally have a mandate to ensure price stability, which in most cases means targeting a core inflation rate of around 2%. If inflation falls below target the central bank may cut base lending rates, with a view to stimulating lending and boosting the economy. If inflation rises substantially above 2% it normally results in the central bank raising base lending rates in an attempt to lower inflation.
Higher interest rates generally help strengthen a country’s currency as they make it a more attractive place for global investors to park their money.
Higher interest rates overall weigh on the price of Gold because they increase the opportunity cost of holding Gold instead of investing in an interest-bearing asset or placing cash in the bank. If interest rates are high that usually pushes up the price of the US Dollar (USD), and since Gold is priced in Dollars, this has the effect of lowering the price of Gold.
The Fed funds rate is the overnight rate at which US banks lend to each other. It is the oft-quoted headline rate set by the Federal Reserve at its FOMC meetings. It is set as a range, for example 4.75%-5.00%, though the upper limit (in that case 5.00%) is the quoted figure. Market expectations for future Fed funds rate are tracked by the CME FedWatch tool, which shapes how many financial markets behave in anticipation of future Federal Reserve monetary policy decisions.
Here is what you need to know on Friday, October 18:
The US Dollar (USD) struggles to preserve its strength as risk mood improves on the last trading day of the week. Building Permits and Housing Starts data for September will be featured in the US economic docket on Friday. Several Federal Reserve (Fed) policymakers are scheduled to speak later in the American session.
The USD Index touched a new multi-month-high above 103.80 on Thursday before losing its traction. At the time of press, the index was down 0.15% on the day at around 103.60.
US Dollar PRICE This week
The table below shows the percentage change of US Dollar (USD) against listed major currencies this week. US Dollar was the strongest against the Swiss Franc.
| USD | EUR | GBP | JPY | CAD | AUD | NZD | CHF | |
|---|---|---|---|---|---|---|---|---|
| USD | 0.90% | 0.07% | 0.60% | 0.20% | 0.55% | 0.66% | 1.11% | |
| EUR | -0.90% | -0.90% | -0.41% | -0.62% | -0.32% | -0.33% | 0.13% | |
| GBP | -0.07% | 0.90% | 0.49% | 0.15% | 0.61% | 0.59% | 0.99% | |
| JPY | -0.60% | 0.41% | -0.49% | -0.40% | -0.03% | 0.11% | 0.50% | |
| CAD | -0.20% | 0.62% | -0.15% | 0.40% | 0.30% | 0.47% | 0.73% | |
| AUD | -0.55% | 0.32% | -0.61% | 0.03% | -0.30% | 0.12% | 0.52% | |
| NZD | -0.66% | 0.33% | -0.59% | -0.11% | -0.47% | -0.12% | 0.38% | |
| CHF | -1.11% | -0.13% | -0.99% | -0.50% | -0.73% | -0.52% | -0.38% |
The heat map shows percentage changes of major currencies against each other. The base currency is picked from the left column, while the quote currency is picked from the top row. For example, if you pick the US Dollar from the left column and move along the horizontal line to the Japanese Yen, the percentage change displayed in the box will represent USD (base)/JPY (quote).
Gold extended its weekly rally on Thursday and gained 0.7% on the day. XAU/USD continued to push higher during the Asian trading hours on Friday and reached a new all-time-high above $2,710 before retreating slightly.
The data from China showed earlier in the day that the Gross Domestic Product expanded at an annual rate of 4.6% in the third quarter, at a slightly stronger pace than the market expectation of 4.5%. On a yearly basis, Industrial Production expanded by 5.4% in September and Retail Sales rose by 3.2%. Both of these prints came in above analysts' estimates. Reflecting the risk-on environment, the Shanghai Composite Index is up more than 4% on the day.
Assessing the data releases, China's National Bureau of Statistics (NBS) noted that September economic indicators showed positive changes and added that the confidence is rising on achieving a GDP growth of about 5% in Q4. In the meantime, People's Bank of China (PBOC) Governor Pan Gongsheng said on Friday that they expect, depending on the market liquidity situation, that the reserve requirement ratio (RRR) could be further reduced by the end of the year.
The European Central Bank (ECB) announced on Thursday that it lowered key rates by 25 basis points (bps) following the October policy meeting. With this decision, the interest rate on the main refinancing operations, the interest rates on the marginal lending facility and the deposit facility stood at 3.4%, 3.65% and 3.25%, respectively.
The ECB reiterated in its policy statement it will continue to follow a data-dependent and meeting-by-meeting approach in determining the appropriate level and duration of restriction. In the post meeting press conference, ECB President Christine Lagarde noted that incoming data suggest that the economic activity in the Euro area is weaker than expected. Regarding the growth outlook, Lagarde said that they are still looking at a soft landing, not forecasting a recession. EUR/USD dropped to its lowest level since early August at 1.0811 following the ECB event on Thursday. Supported by the renewed US Dollar (USD) weakness, the pair trades in positive territory near 1.0850 early Friday.
Following a three-day slide, AUD/USD reversed its direction and rose nearly 0.5% on Thursday. The pair continues to edge higher early Friday and trades above 0.6700.
The UK's Office for National Statistics reported early Friday that Retail Sales rose 0.3% on a monthly basis in September. This reading followed the 1.% increase recorded in August and came in better than the market expectation for a decline of 0.3%. After suffering large losses midweek, GBP/USD registered small gains on Thursday and continued to climb higher early Friday. At the time of press, the pair was up 0.4% on the day at 1.3050.
The latest data from Japan showed that the National Consumer Price Index (CPI) rose 2.5% on a yearly basis in September, at a much softer pace than the 3% increase seen in August. After rising above 150.00 for the first time in over 10 weeks on Thursday, USD/JPY retreated below this level during the Asian trading hours on Friday as Japanese officials verbally intervened. Atsushi Mimura, Japan’s Vice Finance Minister For International Affairs and top foreign exchange official, said on Friday, he is “closely watching FX moves with a high sense of urgency.” Meanwhile, Bank of Japan (BoJ) Governor Kazuo Ueda said that they must be vigilant to market and FX moves and their impact on the economy and prices.
Risk sentiment FAQs
In the world of financial jargon the two widely used terms “risk-on” and “risk off'' refer to the level of risk that investors are willing to stomach during the period referenced. In a “risk-on” market, investors are optimistic about the future and more willing to buy risky assets. In a “risk-off” market investors start to ‘play it safe’ because they are worried about the future, and therefore buy less risky assets that are more certain of bringing a return, even if it is relatively modest.
Typically, during periods of “risk-on”, stock markets will rise, most commodities – except Gold – will also gain in value, since they benefit from a positive growth outlook. The currencies of nations that are heavy commodity exporters strengthen because of increased demand, and Cryptocurrencies rise. In a “risk-off” market, Bonds go up – especially major government Bonds – Gold shines, and safe-haven currencies such as the Japanese Yen, Swiss Franc and US Dollar all benefit.
The Australian Dollar (AUD), the Canadian Dollar (CAD), the New Zealand Dollar (NZD) and minor FX like the Ruble (RUB) and the South African Rand (ZAR), all tend to rise in markets that are “risk-on”. This is because the economies of these currencies are heavily reliant on commodity exports for growth, and commodities tend to rise in price during risk-on periods. This is because investors foresee greater demand for raw materials in the future due to heightened economic activity.
The major currencies that tend to rise during periods of “risk-off” are the US Dollar (USD), the Japanese Yen (JPY) and the Swiss Franc (CHF). The US Dollar, because it is the world’s reserve currency, and because in times of crisis investors buy US government debt, which is seen as safe because the largest economy in the world is unlikely to default. The Yen, from increased demand for Japanese government bonds, because a high proportion are held by domestic investors who are unlikely to dump them – even in a crisis. The Swiss Franc, because strict Swiss banking laws offer investors enhanced capital protection.
“Bank of Japan (BoJ) will guide monetary policy appropriately from the standpoint of sustainably, stably achieving price target,” the central bank Governor Kazuo Ueda said in a speech to a trust association meeting, read by Deputy Governor Shinichi Uchida on his behalf.
Additional comments
Japan's economy recovering moderately although some weak moves seen.
Japan's economy likely to continue growing above potential.
Must be vigilant to market, FX moves and their impact on pan's economy, prices.
Outlook regarding US, overseas economies uncertain.
Financial system remains stable as a whole.
Impact of FX volatility on inflation has increased compared with past.
Financial markets remain unstable.
We must scrutinize market moves with high sense of urgency.
BoJ will scrutinize impact of market moves on Japan's economic and price outlook, risks, and likelihood of achieving price target.
Market reaction
USD/JPY is keeping its offered tone intact below 150.00 following these comments, down 0.17% on the day, as of writing.
- The Pound Sterling rebounds from 1.3000 against the US Dollar as UK monthly Retail Sales unexpectedly rose by 0.3%.
- Upbeat Retail Sales data could influence speculation for the BoE rate-cut path.
- Better-than-expected US Retail Sales reinforced markets' confidence in the resilience of the US economy.
The Pound Sterling (GBP) outperforms its major peers on Friday due to stronger-than-expected United Kingdom (UK) Retail Sales data for September. The Retail Sales data, a key measure of consumer spending, grew by 0.3%, while economists anticipated it to decline by 0.3% month-on-month. On year, the consumer spending measure rose at a robust pace of 3.9%, higher than estimates of 3.2% and the August reading of 2.3%, which was downwardly revised from 2.5%.
The report showed that overall sales were boosted by higher receipts at the other non-food stores and department stores, the ONS said.
Upbeat Retail Sales data is expected to partially pare back expectations that the Bank of England (BoE) could cut interest rates in each of the two meetings remaining this year. Markets started to price in this possibility after Wednesday’s Consumer Price Index (CPI) data for September showed that inflation fell more than anticipated below the BoE's 2% target.
Inflation in the services sector – a closely watched indicator by BoE officials – decelerated to 4.9%, the lowest level seen since May 2022. The softening of price pressures in the services sector boosted traders’ confidence that inflation is getting under control.
Daily digest market movers: Pound Sterling bounces back against US Dollar
- The Pound Sterling gains ground near the psychological support of 1.3000 against the US Dollar on Friday. The GBP/USD pair gains ground as the USD struggles to extend its five-day winning streak, with the US Dollar Index (DXY) edging lower to near 103.65 from 103.87 on Thursday, which was the highest level in more than 10 weeks.
- The outlook for the Greenback remains positive as traders appear to be betting that the Federal Reserve (Fed) will cut interest rates gradually rather than aggressively. According to the CME FedWatch tool, 30-day Federal Funds futures pricing data shows that there will be a 50 basis points (bps) decline in interest rates for the remainder of the year, suggesting that the Fed will cut its borrowing rates by 25 bps in November and in December.
- Meanwhile, upbeat United States (US) monthly Retail Sales and lower weekly Jobless Claims have reinforced confidence in the resilience of the economy. Retail Sales rose by 0.4% in September, faster than estimates of 0.3%. The number of individuals claiming jobless benefits for the first time came in at 241K, lower than the 260K expected.
- Apart from upbeat data and growing speculation for the Fed's gradual rate cut path, rising expectations of former US President Donald Trump winning the presidential election have also strengthened the US Dollar. Market participants expect that the Trump 2.0 administration will bring higher import tariffs, tax cuts and loosening financial conditions, which traders assess as US Dollar positive.
Technical Analysis: Pound Sterling rebounds from 100-day EMA
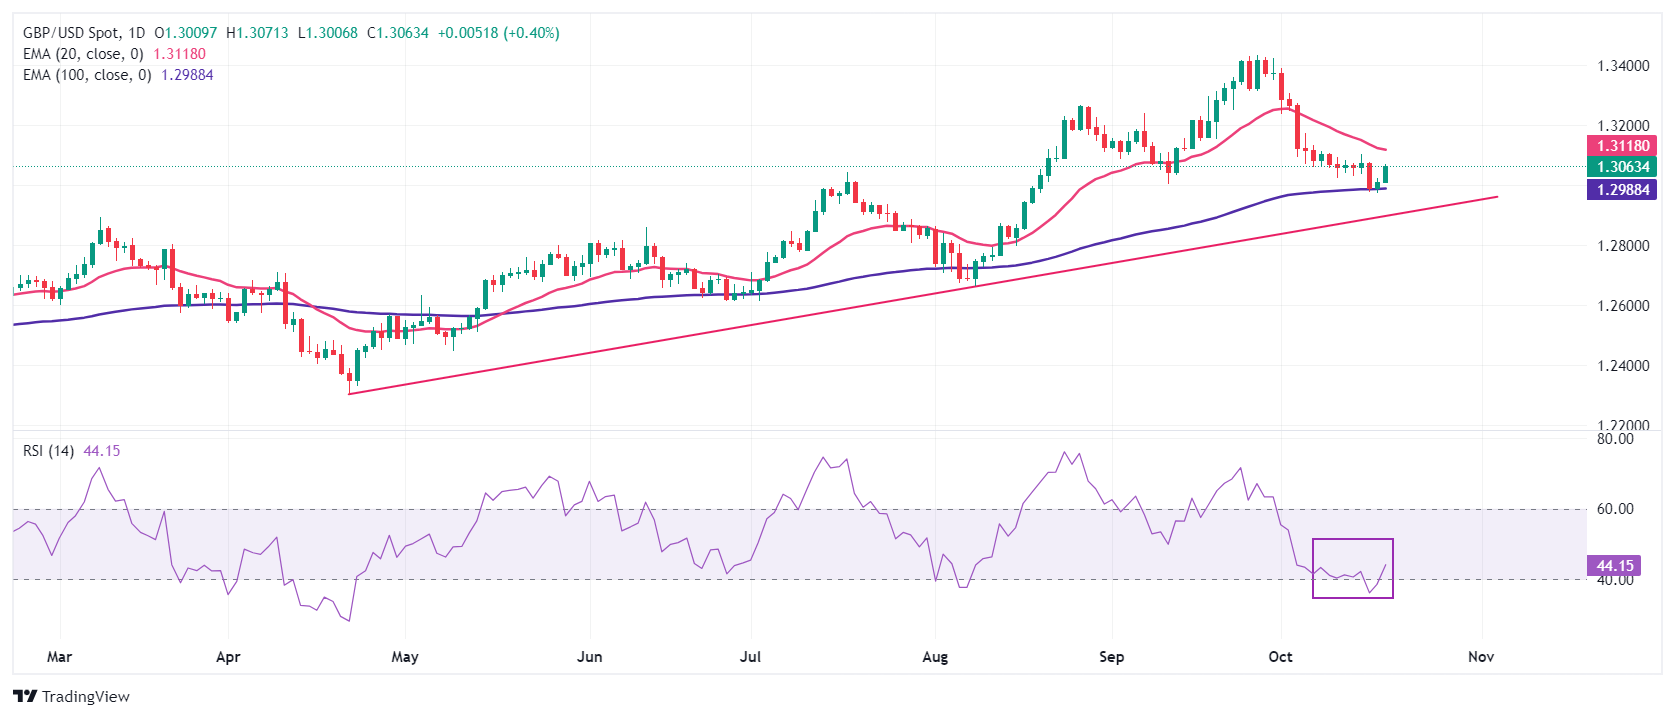
The Pound Sterling discovers strong buying interest near the psychological support of 1.3000 in Friday’s London session. The GBP/USD strengthens after gaining ground near the 100-day Exponential Moving Average (EMA), which trades around 1.2990.
The 14-day Relative Strength Index (RSI) returns swiftly into the 40.00-60.00 range after slipping below it, suggesting that value-buying kicked-in.
Looking down, the upward-sloping trendline drawn from the April 22 low at 1.2300 will be a major support zone for Pound Sterling bulls near 1.2920. On the upside, the Cable will face resistance near the 20-day EMA around 1.3120.
Pound Sterling FAQs
The Pound Sterling (GBP) is the oldest currency in the world (886 AD) and the official currency of the United Kingdom. It is the fourth most traded unit for foreign exchange (FX) in the world, accounting for 12% of all transactions, averaging $630 billion a day, according to 2022 data. Its key trading pairs are GBP/USD, also known as ‘Cable’, which accounts for 11% of FX, GBP/JPY, or the ‘Dragon’ as it is known by traders (3%), and EUR/GBP (2%). The Pound Sterling is issued by the Bank of England (BoE).
The single most important factor influencing the value of the Pound Sterling is monetary policy decided by the Bank of England. The BoE bases its decisions on whether it has achieved its primary goal of “price stability” – a steady inflation rate of around 2%. Its primary tool for achieving this is the adjustment of interest rates. When inflation is too high, the BoE will try to rein it in by raising interest rates, making it more expensive for people and businesses to access credit. This is generally positive for GBP, as higher interest rates make the UK a more attractive place for global investors to park their money. When inflation falls too low it is a sign economic growth is slowing. In this scenario, the BoE will consider lowering interest rates to cheapen credit so businesses will borrow more to invest in growth-generating projects.
Data releases gauge the health of the economy and can impact the value of the Pound Sterling. Indicators such as GDP, Manufacturing and Services PMIs, and employment can all influence the direction of the GBP. A strong economy is good for Sterling. Not only does it attract more foreign investment but it may encourage the BoE to put up interest rates, which will directly strengthen GBP. Otherwise, if economic data is weak, the Pound Sterling is likely to fall.
Another significant data release for the Pound Sterling is the Trade Balance. This indicator measures the difference between what a country earns from its exports and what it spends on imports over a given period. If a country produces highly sought-after exports, its currency will benefit purely from the extra demand created from foreign buyers seeking to purchase these goods. Therefore, a positive net Trade Balance strengthens a currency and vice versa for a negative balance.
- GBP/JPY rises as UK Retail Sales unexpectedly grew by 0.3% MoM in September, defying market expectations of a 0.3% decline.
- The Pound Sterling may struggle as the BoE faces increasing pressure to accelerate rate cuts following lower inflation and jobs data.
- The Japanese Yen strengthened due to verbal intervention from Japanese authorities.
GBP/JPY continues to rise for the second consecutive day, trading around 195.90 during the Asian session. The Pound Sterling (GBP) gained momentum following a solid Retail Sales report from the United Kingdom (UK) released on Friday.
According to data from the Office for National Statistics (ONS), UK Retail Sales increased by 0.3% month-over-month in September, following a 1.0% rise in August. This was unexpected, as markets had anticipated a 0.3% decline for the month. On an annual basis, Retail Sales grew by 3.9%, compared to a 2.3% increase in August. Core Retail Sales, excluding automotive fuel, also rose by 0.3% month-over-month, down from the previous 1.1% growth, but better than the forecasted -0.3%.
Despite the positive Retail Sales report, the British Pound may encounter challenges as the Bank of England (BoE) faces mounting pressure to expedite rate cuts. This pressure stems from recent economic data showing declines in Consumer Price Index (CPI) and Producer Price Index (PPI) inflation figures, along with disappointing labor market statistics.
The Japanese Yen (JPY) gained ground, partly due to verbal intervention from Japanese authorities. Atsushi Mimura, Japan’s Vice Finance Minister for International Affairs and the top foreign exchange official stated on Friday that recent movements in the Yen have been "somewhat rapid and one-sided," emphasizing that excessive volatility in the foreign exchange market is undesirable.
Additionally, a spokesman for the Japanese government highlighted the importance of stable currency movements that reflect economic fundamentals, noting that authorities are closely monitoring foreign exchange fluctuations, particularly any speculative activity, with a heightened sense of urgency.
Japan's National Consumer Price Index (CPI) slowed to a year-on-year rate of 2.5% in September. Meanwhile, the Core CPI, which excludes volatile fresh food items, registered at 2.4%, a decrease from a 10-month high of 2.8%.
Economic Indicator
Retail Sales (MoM)
The Retail Sales data, released by the Office for National Statistics on a monthly basis, measures the volume of sales of goods by retailers in Great Britain directly to end customers. Changes in Retail Sales are widely followed as an indicator of consumer spending. Percent changes reflect the rate of changes in such sales, with the MoM reading comparing sales volumes in the reference month with the previous month. Generally, a high reading is seen as bullish for the Pound Sterling (GBP), while a low reading is seen as bearish.
Read more.Last release: Fri Oct 18, 2024 06:00
Frequency: Monthly
Actual: 0.3%
Consensus: -0.3%
Previous: 1%
Source: Office for National Statistics
- EUR/GBP softens to near 0.8305 in Friday’s early European session, down 0.23% on the day.
- The UK Retail Sales rose 0.3% MoM in September vs. -0.3% expected.
- The dovish remarks of the ECB weigh on the Euro against the GBP.
The EUR/GBP cross loses traction to around 0.8305 on Friday during the early European trading hours. The Pound Sterling (GBP) strengthens after the release of UK Retail Sales data for September. Later on Friday, the Eurozone Current Account for August will be published.
Data released by the Office for National Statistics on Friday showed that UK Retail Sales increased 0.3% MoM in September from a rise of 1.0% in August. This figure came in stronger than the estimations of a decline of 0.3%. On an annual basis, Retail Sales in the UK climbed 3.9% in September versus 2.3% (revised from 2.5%) prior, above the consensus of 3.2%.
The GBP attracts some buyers in an immediate reaction to the encouraging UK Retail Sales and drags the cross lower to the lowest level since April 2022. However, the rising expectation that the Bank of England (BoE) will lower borrowing costs by 25 basis points (bps) at its upcoming meeting in November and December after a surprise fall in the UK Consumer Price Index (CPI) inflation might cap the GBP’s upside.
On the other hand, the Euro (EUR) remains under selling pressure after the European Central Bank (ECB) decided to cut the deposit rate by a further 25 bps at its October meeting as inflation in the Eurozone eased to 1.8% in September, below the ECB’s 2% target.
"We believe that downside risks to growth in a context of easing inflationary pressure will lead to more rate cuts starting in December and continuing in 2025 until interest rates are back around a neutral level, that the ECB itself estimates around 2%," noted Gianluigi Mandruzzato, a senior economist at EFG Asset Management.
Pound Sterling FAQs
The Pound Sterling (GBP) is the oldest currency in the world (886 AD) and the official currency of the United Kingdom. It is the fourth most traded unit for foreign exchange (FX) in the world, accounting for 12% of all transactions, averaging $630 billion a day, according to 2022 data. Its key trading pairs are GBP/USD, also known as ‘Cable’, which accounts for 11% of FX, GBP/JPY, or the ‘Dragon’ as it is known by traders (3%), and EUR/GBP (2%). The Pound Sterling is issued by the Bank of England (BoE).
The single most important factor influencing the value of the Pound Sterling is monetary policy decided by the Bank of England. The BoE bases its decisions on whether it has achieved its primary goal of “price stability” – a steady inflation rate of around 2%. Its primary tool for achieving this is the adjustment of interest rates. When inflation is too high, the BoE will try to rein it in by raising interest rates, making it more expensive for people and businesses to access credit. This is generally positive for GBP, as higher interest rates make the UK a more attractive place for global investors to park their money. When inflation falls too low it is a sign economic growth is slowing. In this scenario, the BoE will consider lowering interest rates to cheapen credit so businesses will borrow more to invest in growth-generating projects.
Data releases gauge the health of the economy and can impact the value of the Pound Sterling. Indicators such as GDP, Manufacturing and Services PMIs, and employment can all influence the direction of the GBP. A strong economy is good for Sterling. Not only does it attract more foreign investment but it may encourage the BoE to put up interest rates, which will directly strengthen GBP. Otherwise, if economic data is weak, the Pound Sterling is likely to fall.
Another significant data release for the Pound Sterling is the Trade Balance. This indicator measures the difference between what a country earns from its exports and what it spends on imports over a given period. If a country produces highly sought-after exports, its currency will benefit purely from the extra demand created from foreign buyers seeking to purchase these goods. Therefore, a positive net Trade Balance strengthens a currency and vice versa for a negative balance.
- The UK Retail Sales rose 0.3% MoM in September, a positive surprise.
- Monthly core Retail Sales for the UK advanced 0.3% in September.
- GBP/USD extends recovery toward 1.3050 after upbeat UK data.
The United Kingdom (UK) Retail Sales rose 0.3% over the month in September after rising 1.0% in August, the latest data published by the Office for National Statistics (ONS) showed Friday. Markets expected a 0.3% decrease in the reported month.
The core Retail Sales, stripping the auto motor fuel sales, increased by 0.3% MoM, against the previous growth of 1.1% and the estimated -0.3% figure.
The annual Retail Sales in the UK grew 3.9% in September versus August’s 2.3% rise while the core Retail Sales climbed 4.0% in the same month versus 2.2% previous. Both readings outpaced market expectations.
Market reaction to UK Retail Sales report
GBP/USD is picking up fresh bids following the encouraging UK data release, 0.24% higher on the day near 1.3040, as of writing.
British Pound PRICE Today
The table below shows the percentage change of British Pound (GBP) against listed major currencies today. British Pound was the strongest against the US Dollar.
| USD | EUR | GBP | JPY | CAD | AUD | NZD | CHF | |
|---|---|---|---|---|---|---|---|---|
| USD | -0.09% | -0.27% | -0.24% | -0.02% | -0.16% | -0.07% | 0.00% | |
| EUR | 0.09% | -0.16% | -0.13% | 0.08% | -0.08% | 0.04% | 0.10% | |
| GBP | 0.27% | 0.16% | 0.04% | 0.23% | 0.09% | 0.19% | 0.23% | |
| JPY | 0.24% | 0.13% | -0.04% | 0.22% | 0.05% | 0.15% | 0.20% | |
| CAD | 0.02% | -0.08% | -0.23% | -0.22% | -0.16% | -0.04% | -0.02% | |
| AUD | 0.16% | 0.08% | -0.09% | -0.05% | 0.16% | 0.10% | 0.14% | |
| NZD | 0.07% | -0.04% | -0.19% | -0.15% | 0.04% | -0.10% | 0.03% | |
| CHF | -0.00% | -0.10% | -0.23% | -0.20% | 0.02% | -0.14% | -0.03% |
The heat map shows percentage changes of major currencies against each other. The base currency is picked from the left column, while the quote currency is picked from the top row. For example, if you pick the British Pound from the left column and move along the horizontal line to the US Dollar, the percentage change displayed in the box will represent GBP (base)/USD (quote).
- The USD/CAD pair grapples to return to the ascending channel as bullish bias is in play.
- The 14-day RSI hovers near the 70 mark, suggesting overbought conditions and a potential downward correction ahead.
- A break below the nine-day EMA at the 1.3741 level could cause the emergence of a bearish trend.
The USD/CAD pair maintains its position on recent gains from the previous session, trading around 1.3800 during the Asian hours on Friday. On the daily chart, the analysis shows that the pair is testing the lower boundary to return to the ascending channel pattern, which, if remains within the channel, supports the bullish trend.
The 14-day Relative Strength Index (RSI) is slightly below 70 level, confirming the ongoing bullish sentiment is in play. However, a move above the 70 mark would suggest overbought conditions and signal a potential downward correction.
On the upside, the USD/CAD pair tests the immediate barrier at the lower boundary of the ascending channel at the 1.3810 level. A return to the ascending channel would reinforce the bullish bias and support the pair to explore the region around the upper boundary of the ascending channel around 1.3920 level. Further resistance appears at the 25-month high of 1.3946 level, which was recorded on August 5.
In terms of support, the USD/CAD pair could find immediate support around the nine-day Exponential Moving Average (EMA) at 1.3741 level. A break below this level could cause the emergence of the bearish trend for a short-term period and put pressure on the pair to navigate the area around the former resistance, now acting as support, around 1.3620, followed by the key psychological level of 1.3600 just below.
USD/CAD: Daily Chart
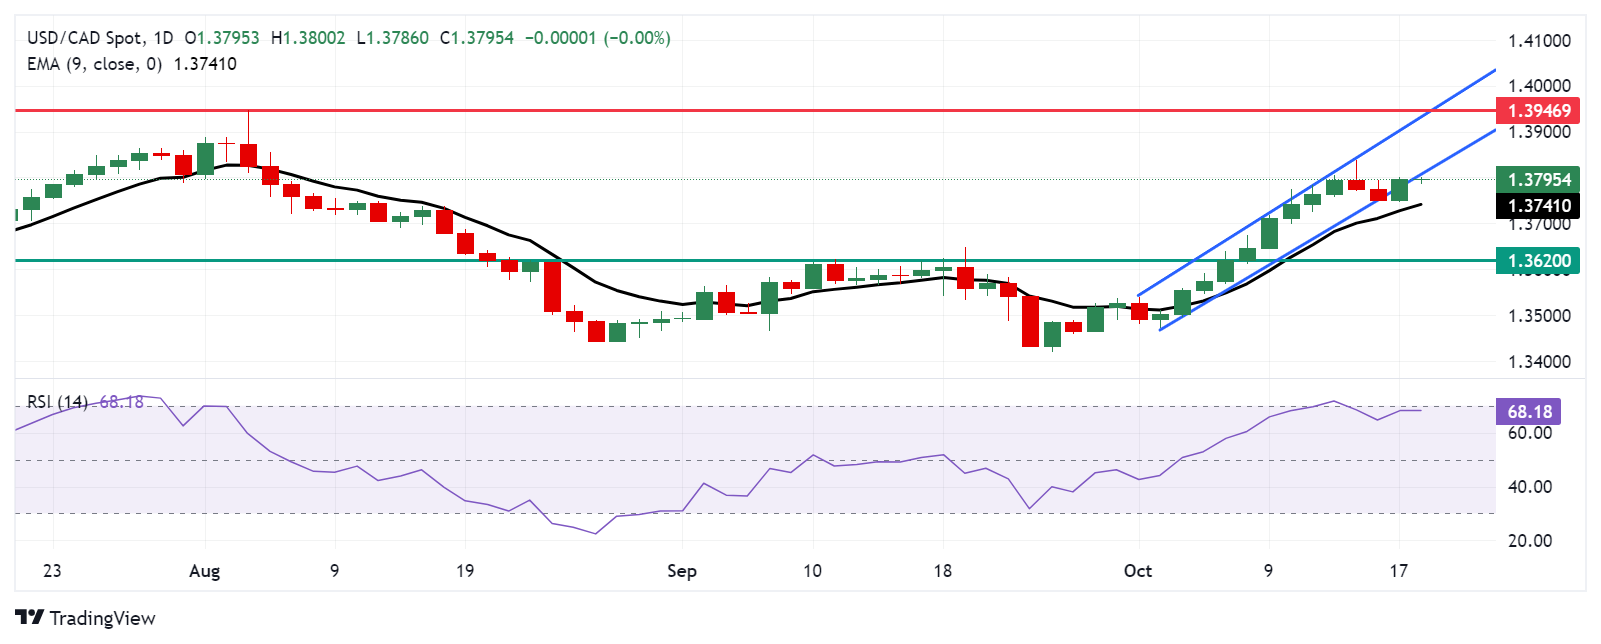
Canadian Dollar PRICE Today
The table below shows the percentage change of Canadian Dollar (CAD) against listed major currencies today. Canadian Dollar was the strongest against the US Dollar.
| USD | EUR | GBP | JPY | CAD | AUD | NZD | CHF | |
|---|---|---|---|---|---|---|---|---|
| USD | -0.11% | -0.13% | -0.25% | -0.02% | -0.16% | -0.06% | -0.02% | |
| EUR | 0.11% | -0.00% | -0.15% | 0.09% | -0.07% | 0.06% | 0.09% | |
| GBP | 0.13% | 0.00% | -0.12% | 0.10% | -0.04% | 0.08% | 0.07% | |
| JPY | 0.25% | 0.15% | 0.12% | 0.25% | 0.10% | 0.18% | 0.21% | |
| CAD | 0.02% | -0.09% | -0.10% | -0.25% | -0.14% | -0.04% | -0.04% | |
| AUD | 0.16% | 0.07% | 0.04% | -0.10% | 0.14% | 0.10% | 0.11% | |
| NZD | 0.06% | -0.06% | -0.08% | -0.18% | 0.04% | -0.10% | 0.00% | |
| CHF | 0.02% | -0.09% | -0.07% | -0.21% | 0.04% | -0.11% | -0.01% |
The heat map shows percentage changes of major currencies against each other. The base currency is picked from the left column, while the quote currency is picked from the top row. For example, if you pick the Canadian Dollar from the left column and move along the horizontal line to the US Dollar, the percentage change displayed in the box will represent CAD (base)/USD (quote).
FX option expiries for Oct 18 NY cut at 10:00 Eastern Time, via DTCC, can be found below.
EUR/USD: EUR amounts
- 1.0750 938m
- 1.0775 723m
- 1.0850 1.4b
- 1.0950 728m
- 1.0975 827m
- 1.1000 1.4b
USD/JPY: USD amounts
- 149.50 816m
- 150.65 1.1b
- 152.00 692m
USD/CHF: USD amounts
- 0.8490 1.5b
- 0.8700 986m
AUD/USD: AUD amounts
- 0.6800 681m
USD/CAD: USD amounts
- 1.3600 850m
- 1.3655 889m
- 1.3680 960m
- 1.3720 858m
- USD/CHF trades with mild negative bias around 0.8655 in Friday’s early European session.
- Stronger US Retail Sales reinforce bets that the Fed will pursue modest rate cuts next year, which might support the USD.
- Any signs of escalating Middle East geopolitical tensions might boost the CHF and cap the pair’s upside.
The USD/CHF pair trades with mild losses near 0.8655 during the early European session on Friday. The increasing bets that the US Federal Reserve (Fed) would cut rates less aggressively might cap the downside for the pair in the near term. Traders will take more cues from the US housing data and Fedspeak later on Friday.
Rising demand for the USD in the backdrop of waning expectations of outsized Fed rate cuts and encouraging US economic data might support the pair. The US Census Bureau revealed on Thursday that US Retail Sales climbed by 0.4% MoM in September versus a 0.1% rise in August, above the market consensus of 0.3%. Additionally, the US Initial Jobless Claims for the week ending October 11 increased to 241,000. The figure came in below the consensus and the previous week's of 260,000 (revised from 258,000).
Meanwhile, the US Dollar Index (DXY), which measures the greenback against six major rivals, currently trades near the highest level since August 2 around 103.65.
Goldman Sachs analysts said on Wednesday that they expect the Fed to cut consecutive 25 basis points (bps) from November 2024 through June 2025 as fears of a potential US recession ease, per the Economic Times. According to the CME Fed Watch Tool, money markets are now pricing a 90.3% probability of a 25bps rate reduction next month.
On the Swiss front, the ongoing geopolitical tensions in the Middle East and the uncertainty surrounding the global economy might boost the safe-haven flows, benefiting the Swiss Franc (CHF). Israel claimed its forces assassinated Hamas commander Yahya Sinwar in the Gaza Strip. Prime Minister Benjamin Netanyahu declared Sinwar's killing as "the beginning of the day after Hamas." He said that Israel would continue fighting Hamas in Gaza until all hostages are returned home, per CNN.
Swiss Franc FAQs
The Swiss Franc (CHF) is Switzerland’s official currency. It is among the top ten most traded currencies globally, reaching volumes that well exceed the size of the Swiss economy. Its value is determined by the broad market sentiment, the country’s economic health or action taken by the Swiss National Bank (SNB), among other factors. Between 2011 and 2015, the Swiss Franc was pegged to the Euro (EUR). The peg was abruptly removed, resulting in a more than 20% increase in the Franc’s value, causing a turmoil in markets. Even though the peg isn’t in force anymore, CHF fortunes tend to be highly correlated with the Euro ones due to the high dependency of the Swiss economy on the neighboring Eurozone.
The Swiss Franc (CHF) is considered a safe-haven asset, or a currency that investors tend to buy in times of market stress. This is due to the perceived status of Switzerland in the world: a stable economy, a strong export sector, big central bank reserves or a longstanding political stance towards neutrality in global conflicts make the country’s currency a good choice for investors fleeing from risks. Turbulent times are likely to strengthen CHF value against other currencies that are seen as more risky to invest in.
The Swiss National Bank (SNB) meets four times a year – once every quarter, less than other major central banks – to decide on monetary policy. The bank aims for an annual inflation rate of less than 2%. When inflation is above target or forecasted to be above target in the foreseeable future, the bank will attempt to tame price growth by raising its policy rate. Higher interest rates are generally positive for the Swiss Franc (CHF) as they lead to higher yields, making the country a more attractive place for investors. On the contrary, lower interest rates tend to weaken CHF.
Macroeconomic data releases in Switzerland are key to assessing the state of the economy and can impact the Swiss Franc’s (CHF) valuation. The Swiss economy is broadly stable, but any sudden change in economic growth, inflation, current account or the central bank’s currency reserves have the potential to trigger moves in CHF. Generally, high economic growth, low unemployment and high confidence are good for CHF. Conversely, if economic data points to weakening momentum, CHF is likely to depreciate.
As a small and open economy, Switzerland is heavily dependent on the health of the neighboring Eurozone economies. The broader European Union is Switzerland’s main economic partner and a key political ally, so macroeconomic and monetary policy stability in the Eurozone is essential for Switzerland and, thus, for the Swiss Franc (CHF). With such dependency, some models suggest that the correlation between the fortunes of the Euro (EUR) and the CHF is more than 90%, or close to perfect.
- Silver price appreciates due to safe-haven flows amid rising geopolitical tensions in the Middle East.
- Risk aversion strengthens due to the killing of Yahya Sinwar, the militant leader of Hamas.
- Demand for the non-yielding Silver increases due to the prevailing likelihood of interest rate reductions by major central banks.
Silver price (XAG/USD) extends its winning streak for the fourth consecutive day, hovering around $32.00 per troy ounce during the Asian trading session on Friday. The price of the grey metal receives support from safe-haven flows amid rising tensions in the Middle East.
Israel's military and the Shin Bet security service confirmed on Thursday that Yahya Sinwar, the Gaza Strip Chief of the Palestinian Islamist group Hamas, was killed by Israeli forces during an operation in southern Gaza on Wednesday. Sinwar's death has raised concerns among the families of Israeli hostages taken to Gaza by Hamas, who fear that the killing of the militant leader might increase the risk to their loved ones, according to Reuters.
The non-yielding assets like Silver gains demand due to the prevailing sentiment of interest rate reductions by major central banks. US Federal Reserve (Fed) is expected to reduce interest rates by 50 basis points by the end of 2024. According to the CME FedWatch Tool, there is a 90.8% probability of a 25 basis point rate cut in November and a 74.0% chance of another cut in December.
On Thursday, the European Central Bank (ECB) lowered its Main Refinancing Operations Rate by 25 basis points to 3.4%. Recent inflation data also indicates that both the Bank of England (BoE) and the Reserve Bank of New Zealand (RBNZ) may consider potential rate cuts next month.
Silver FAQs
Silver is a precious metal highly traded among investors. It has been historically used as a store of value and a medium of exchange. Although less popular than Gold, traders may turn to Silver to diversify their investment portfolio, for its intrinsic value or as a potential hedge during high-inflation periods. Investors can buy physical Silver, in coins or in bars, or trade it through vehicles such as Exchange Traded Funds, which track its price on international markets.
Silver prices can move due to a wide range of factors. Geopolitical instability or fears of a deep recession can make Silver price escalate due to its safe-haven status, although to a lesser extent than Gold's. As a yieldless asset, Silver tends to rise with lower interest rates. Its moves also depend on how the US Dollar (USD) behaves as the asset is priced in dollars (XAG/USD). A strong Dollar tends to keep the price of Silver at bay, whereas a weaker Dollar is likely to propel prices up. Other factors such as investment demand, mining supply – Silver is much more abundant than Gold – and recycling rates can also affect prices.
Silver is widely used in industry, particularly in sectors such as electronics or solar energy, as it has one of the highest electric conductivity of all metals – more than Copper and Gold. A surge in demand can increase prices, while a decline tends to lower them. Dynamics in the US, Chinese and Indian economies can also contribute to price swings: for the US and particularly China, their big industrial sectors use Silver in various processes; in India, consumers’ demand for the precious metal for jewellery also plays a key role in setting prices.
Silver prices tend to follow Gold's moves. When Gold prices rise, Silver typically follows suit, as their status as safe-haven assets is similar. The Gold/Silver ratio, which shows the number of ounces of Silver needed to equal the value of one ounce of Gold, may help to determine the relative valuation between both metals. Some investors may consider a high ratio as an indicator that Silver is undervalued, or Gold is overvalued. On the contrary, a low ratio might suggest that Gold is undervalued relative to Silver.
- GBP/USD recovers further from a two-month low, albeit the upside potential seems limited.
- The USD bulls opt to take some profits off the table, which, in turn, lends support to the pair.
- An unexpected fall in the UK inflation reaffirms bets for more BoE rate cuts and caps the GBP.
The GBP/USD pair attracts some follow-through buying during the Asian session on Friday and looks to build on the overnight bounce from the 1.2975-1.2970 region, or a two-month low. Spot prices currently trade around the 1.3020-1.3025 area, up 0.10% for the day amid a modest US Dollar (USD) downtick, though any meaningful appreciating move still seems elusive.
The USD Index (DXY), which tracks the Greenback against a basket of currencies, pulls back from its highest level since early August as traders opt to take some profits off the table following a strong rally since the beginning of this month. That said, growing acceptance that the Federal Reserve (Fed) will proceed with modest rate cuts over the next year should limit the USD losses and cap the GBP/USD pair.
Furthermore, a surprise fall in the UK Consumer Price Index (CPI) to the lowest level since April 2021 and below the Bank of England's 2% target paves the way for further interest rate cuts. In fact, the money markets are now pricing in over a 90% chance that the UK central bank will lower borrowing costs by 25 basis points (bps) at its upcoming meeting in early November and cut rates again in December.
This might further hold back traders from placing aggressive bullish bets around the British Pound (GBP) and contribute to keeping a lid on the GBP/USD pair. Hence, it will be prudent to wait for strong follow-through buying before confirming that the recent retracement slide from the 1.3435 region, or the highest level since March 2022 touched last month has run its course and positioning for further gains.
Traders now look to the release of UK Retail Sales for some impetus ahead of the US housing market data – Building Permits and Housing Starts later during the early North American session. This, along with Fed Governor Christopher Waller's speech, will influence the USD and produce short-term opportunities around the GBP/USD pair, which seems poised to register losses for the third successive week.
Pound Sterling FAQs
The Pound Sterling (GBP) is the oldest currency in the world (886 AD) and the official currency of the United Kingdom. It is the fourth most traded unit for foreign exchange (FX) in the world, accounting for 12% of all transactions, averaging $630 billion a day, according to 2022 data. Its key trading pairs are GBP/USD, also known as ‘Cable’, which accounts for 11% of FX, GBP/JPY, or the ‘Dragon’ as it is known by traders (3%), and EUR/GBP (2%). The Pound Sterling is issued by the Bank of England (BoE).
The single most important factor influencing the value of the Pound Sterling is monetary policy decided by the Bank of England. The BoE bases its decisions on whether it has achieved its primary goal of “price stability” – a steady inflation rate of around 2%. Its primary tool for achieving this is the adjustment of interest rates. When inflation is too high, the BoE will try to rein it in by raising interest rates, making it more expensive for people and businesses to access credit. This is generally positive for GBP, as higher interest rates make the UK a more attractive place for global investors to park their money. When inflation falls too low it is a sign economic growth is slowing. In this scenario, the BoE will consider lowering interest rates to cheapen credit so businesses will borrow more to invest in growth-generating projects.
Data releases gauge the health of the economy and can impact the value of the Pound Sterling. Indicators such as GDP, Manufacturing and Services PMIs, and employment can all influence the direction of the GBP. A strong economy is good for Sterling. Not only does it attract more foreign investment but it may encourage the BoE to put up interest rates, which will directly strengthen GBP. Otherwise, if economic data is weak, the Pound Sterling is likely to fall.
Another significant data release for the Pound Sterling is the Trade Balance. This indicator measures the difference between what a country earns from its exports and what it spends on imports over a given period. If a country produces highly sought-after exports, its currency will benefit purely from the extra demand created from foreign buyers seeking to purchase these goods. Therefore, a positive net Trade Balance strengthens a currency and vice versa for a negative balance.
Gold prices rose in India on Friday, according to data compiled by FXStreet.
The price for Gold stood at 7,324.40 Indian Rupees (INR) per gram, up compared with the INR 7,278.58 it cost on Thursday.
The price for Gold increased to INR 85,430.94 per tola from INR 84,895.98 per tola a day earlier.
| Unit measure | Gold Price in INR |
|---|---|
| 1 Gram | 7,324.40 |
| 10 Grams | 73,244.50 |
| Tola | 85,430.94 |
| Troy Ounce | 227,819.40 |
FXStreet calculates Gold prices in India by adapting international prices (USD/INR) to the local currency and measurement units. Prices are updated daily based on the market rates taken at the time of publication. Prices are just for reference and local rates could diverge slightly.
Gold FAQs
Gold has played a key role in human’s history as it has been widely used as a store of value and medium of exchange. Currently, apart from its shine and usage for jewelry, the precious metal is widely seen as a safe-haven asset, meaning that it is considered a good investment during turbulent times. Gold is also widely seen as a hedge against inflation and against depreciating currencies as it doesn’t rely on any specific issuer or government.
Central banks are the biggest Gold holders. In their aim to support their currencies in turbulent times, central banks tend to diversify their reserves and buy Gold to improve the perceived strength of the economy and the currency. High Gold reserves can be a source of trust for a country’s solvency. Central banks added 1,136 tonnes of Gold worth around $70 billion to their reserves in 2022, according to data from the World Gold Council. This is the highest yearly purchase since records began. Central banks from emerging economies such as China, India and Turkey are quickly increasing their Gold reserves.
Gold has an inverse correlation with the US Dollar and US Treasuries, which are both major reserve and safe-haven assets. When the Dollar depreciates, Gold tends to rise, enabling investors and central banks to diversify their assets in turbulent times. Gold is also inversely correlated with risk assets. A rally in the stock market tends to weaken Gold price, while sell-offs in riskier markets tend to favor the precious metal.
The price can move due to a wide range of factors. Geopolitical instability or fears of a deep recession can quickly make Gold price escalate due to its safe-haven status. As a yield-less asset, Gold tends to rise with lower interest rates, while higher cost of money usually weighs down on the yellow metal. Still, most moves depend on how the US Dollar (USD) behaves as the asset is priced in dollars (XAU/USD). A strong Dollar tends to keep the price of Gold controlled, whereas a weaker Dollar is likely to push Gold prices up.
(An automation tool was used in creating this post.)
- AUD/JPY weakens to around 100.50 in Friday’s Asian session.
- China's economy expanded in the third quarter at the slowest pace since early last year.
- The Japanese Yen edges higher amid FX intervention fears.
The AUD/JPY cross trades on a softer note near 100.50 during the Asian trading hours on Friday. The verbal intervention from Japanese authorities provides some support to the Japanese Yen (JPY) against the Australian Dollar (AUD).
China's economy expanded at a slower-than-expected rate of 4.6% YoY in the July-September quarter, compared to the previous reading of 4.7%, the National Bureau of Statistics showed Friday. The figure was slightly better than analysts expected. Meanwhile, the country’s Retail Sales increased by 3.2% YoY in September versus the 2.5% expected, and Industrial Production climbed 5.4% YoY in September from 4.5% in August, stronger than the 4.6% expected.
On Friday, the Chinese authorities stated that they will urge financial institutions to act swiftly in implementing expansive financial policies, and the officials will implement incremental policies following a meeting on October 16. Any further plans from China to boost economic growth could boost the Aussie as China is a major trading partner to Australia.
The verbal intervention from Japanese officials lifts the JPY for the time being. Atsushi Mimura, Japan’s Vice Finance Minister for International Affairs and top foreign exchange official, said on Friday that he will closely monitor the foreign exchange move with a high sense of urgency.
The Bank of Japan (BoJ) is widely expected to keep interest rates unchanged at its October meeting, according to a Reuters poll. A slim majority of economists see the Japanese central bank holding the current rate through the end of December, and nearly 90% of economists expect a hike to 0.5% by the end of March.
Japanese Yen FAQs
The Japanese Yen (JPY) is one of the world’s most traded currencies. Its value is broadly determined by the performance of the Japanese economy, but more specifically by the Bank of Japan’s policy, the differential between Japanese and US bond yields, or risk sentiment among traders, among other factors.
One of the Bank of Japan’s mandates is currency control, so its moves are key for the Yen. The BoJ has directly intervened in currency markets sometimes, generally to lower the value of the Yen, although it refrains from doing it often due to political concerns of its main trading partners. The BoJ ultra-loose monetary policy between 2013 and 2024 caused the Yen to depreciate against its main currency peers due to an increasing policy divergence between the Bank of Japan and other main central banks. More recently, the gradually unwinding of this ultra-loose policy has given some support to the Yen.
Over the last decade, the BoJ’s stance of sticking to ultra-loose monetary policy has led to a widening policy divergence with other central banks, particularly with the US Federal Reserve. This supported a widening of the differential between the 10-year US and Japanese bonds, which favored the US Dollar against the Japanese Yen. The BoJ decision in 2024 to gradually abandon the ultra-loose policy, coupled with interest-rate cuts in other major central banks, is narrowing this differential.
The Japanese Yen is often seen as a safe-haven investment. This means that in times of market stress, investors are more likely to put their money in the Japanese currency due to its supposed reliability and stability. Turbulent times are likely to strengthen the Yen’s value against other currencies seen as more risky to invest in.
- EUR/USD may struggle as solid US Retail Sales data reinforces the odds that the Fed may deliver nominal rate cuts.
- CME FedWatch Tool suggests a 90.8% and 74.0% chance of a 25 basis point rate cuts in November and December, respectively.
- The Euro depreciated as the ECB reduced its Rate on Deposit Facility to 3.25%.
The EUR/USD pair breaks its four-day losing streak, trading around 1.0840 during the Asian session on Friday. However, the US Dollar (USD) received support and reached a two-month high of 103.87 on Thursday, supported by a solid US Retail Sales report, which fueled expectations that the Federal Reserve (Fed) may implement nominal rate cuts.
According to the CME FedWatch Tool, there is a 90.8% probability of a 25 basis point rate cut in November and a 74.0% chance of another cut in December.
US Retail Sales rose by 0.4% month-over-month in September, surpassing both the 0.1% gain recorded in August and market expectations of a 0.3% increase.
US Initial Jobless Claims fell by 19,000 during the week ending October 11, the largest decline in three months. The total number of claims dropped to 241,000, significantly below the anticipated 260,000.
However, the Euro faced downward pressure following the European Central Bank's (ECB) policy decision on Thursday.
The ECB reduced its Main Refinancing Operations Rate and the Rate on Deposit Facility by 25 basis points to 3.40% and 3.25%, respectively, as expected by market participants.
This marks the first back-to-back rate cut by the ECB in 13 years, bringing the Deposit Facility rate down to 3.25%. The move follows a significant decline in inflation, which peaked at 10.6% in October 2022 and dropped to 1.7% in September—below the ECB’s 2% target.
During the post-meeting conference, ECB President Christine Lagarde left markets uncertain about the timing of future rate cuts, while stating that the Eurozone economy was on track for a soft landing.
Euro FAQs
The Euro is the currency for the 19 European Union countries that belong to the Eurozone. It is the second most heavily traded currency in the world behind the US Dollar. In 2022, it accounted for 31% of all foreign exchange transactions, with an average daily turnover of over $2.2 trillion a day. EUR/USD is the most heavily traded currency pair in the world, accounting for an estimated 30% off all transactions, followed by EUR/JPY (4%), EUR/GBP (3%) and EUR/AUD (2%).
The European Central Bank (ECB) in Frankfurt, Germany, is the reserve bank for the Eurozone. The ECB sets interest rates and manages monetary policy. The ECB’s primary mandate is to maintain price stability, which means either controlling inflation or stimulating growth. Its primary tool is the raising or lowering of interest rates. Relatively high interest rates – or the expectation of higher rates – will usually benefit the Euro and vice versa. The ECB Governing Council makes monetary policy decisions at meetings held eight times a year. Decisions are made by heads of the Eurozone national banks and six permanent members, including the President of the ECB, Christine Lagarde.
Eurozone inflation data, measured by the Harmonized Index of Consumer Prices (HICP), is an important econometric for the Euro. If inflation rises more than expected, especially if above the ECB’s 2% target, it obliges the ECB to raise interest rates to bring it back under control. Relatively high interest rates compared to its counterparts will usually benefit the Euro, as it makes the region more attractive as a place for global investors to park their money.
Data releases gauge the health of the economy and can impact on the Euro. Indicators such as GDP, Manufacturing and Services PMIs, employment, and consumer sentiment surveys can all influence the direction of the single currency. A strong economy is good for the Euro. Not only does it attract more foreign investment but it may encourage the ECB to put up interest rates, which will directly strengthen the Euro. Otherwise, if economic data is weak, the Euro is likely to fall. Economic data for the four largest economies in the euro area (Germany, France, Italy and Spain) are especially significant, as they account for 75% of the Eurozone’s economy.
Another significant data release for the Euro is the Trade Balance. This indicator measures the difference between what a country earns from its exports and what it spends on imports over a given period. If a country produces highly sought after exports then its currency will gain in value purely from the extra demand created from foreign buyers seeking to purchase these goods. Therefore, a positive net Trade Balance strengthens a currency and vice versa for a negative balance.
- The Japanese Yen attracts some buyers after verbal intervention from government authorities.
- Signs of easing inflation in Japan raise doubts about additional BoJ interest rate hikes this year.
- Bets for smaller rate cuts by the Fed underpin the USD and should lend support to the USD/JPY.
The Japanese Yen (JPY) edges higher against its American counterpart during the Asian session on Friday and for now, seems to have snapped a two-day losing streak to its lowest level since early August touched the previous day. The JPY strengthened a bit in reaction to verbal intervention from Japanese authorities and stronger domestic inflation data, which provides the Bank of Japan (BoJ) room to raise interest rates.
Investors, however, seem convinced that the BoJ will forgo raising interest rates again this year amid uncertainty over the new political leadership's preference for the monetary policy and ahead of the general election on October 27. This, along with a positive risk tone, should keep a lid on any meaningful JPY appreciation on the back of the underlying strong bullish sentiment surrounding the US Dollar (USD).
Daily Digest Market Movers: Japanese Yen strengthens amid intervention fears, BoJ rate hike uncertainty to cap gains
- Japan's vice finance minister for international affairs, or the top currency diplomat, Atsushi Mimura noted this Friday that the recent moves in the Japanese Yen are somewhat rapid and one-sided and that excess volatility in the FX market is undesirable.
- Moreover, a spokesman for the Japanese government said that it is important for currencies to move in a stable manner reflecting fundamentals and that authorities are closely watching FX moves with a high sense of urgency, including speculative moves.
- Government data released earlier today showed that Japan's headline Consumer Price Index (CPI) decelerated to the 2.5% year-on-year (YoY) rate in September and the Core CPI, which excludes volatile fresh food items, eased from a 10-month high.
- Against the backdrop of a surprise opposition to further rate hikes from Japan's Prime Minister Shigeru Ishiba, signs of easing inflationary pressures raise doubts over just how much headroom the Bank of Japan will have to keep raising interest rates.
- The markets, meanwhile, reacted little to the Chinese macro data, which showed that the economy expanded by 0.9% in the third quarter of 2024 and the annual growth rate stood at 4.6%, while Retail Sales and Industrial Production surpassed estimates.
- Thursday upbeat US data suggested that the economy remains on solid footing and reaffirmed bets for a less aggressive easing by the Federal Reserve, which keeps the US Treasury bond yields elevated and acts as a tailwind for the US Dollar.
- The USD Index (DXY), which tracks the Greenback against a basket of currencies, stands tall near its highest level since early August and should act as a tailwind for the USD/JPY pair, warranting some caution before positioning for deeper losses.
- Moving ahead, the US housing market data – Building Permits and Housing Starts – and Fed Governor Christopher Waller's scheduled speech later during the North American session might produce short-term trading opportunities heading into the weekend.
Technical Outlook: USD/JPY downside potential seems limited, setup supports prospects for the emergence of dip-buying
From a technical perspective, the overnight breakout above the 150.00 psychological mark, or the top boundary of a three-day-old range held since the beginning of the week, could be seen as a fresh trigger for bullish traders. Moreover, oscillators on the daily chart are holding comfortably in positive territory and are still away from being in the overbought zone. This, in turn, suggests that the path of least resistance for the USD/JPY pair is to the upside.
Hence, any subsequent slide might still be seen as a buying opportunity and is more likely to find decent support near the 149.20 area. This is closely followed by the 149.00 round figure, below which the USD/JPY pair could accelerate the corrective fall to the 148.60-148.55 region en route to the 148.00 mark and last week's swing low, around the 147.35-147.30 zone. The latter should act as a key pivotal point, which if broken might shift the bias in favor of bearish traders.
On the flip side, momentum above the overnight swing high, around the 150.30 area, could extend further towards the August monthly swing high, around the 150.85-150.90 region. Some follow-through buying beyond the 151.00 mark will reinforce the positive outlook for the USD/JPY pair and pave the way for a further near-term appreciation towards the 152.00 neighborhood.
Japanese Yen FAQs
The Japanese Yen (JPY) is one of the world’s most traded currencies. Its value is broadly determined by the performance of the Japanese economy, but more specifically by the Bank of Japan’s policy, the differential between Japanese and US bond yields, or risk sentiment among traders, among other factors.
One of the Bank of Japan’s mandates is currency control, so its moves are key for the Yen. The BoJ has directly intervened in currency markets sometimes, generally to lower the value of the Yen, although it refrains from doing it often due to political concerns of its main trading partners. The BoJ ultra-loose monetary policy between 2013 and 2024 caused the Yen to depreciate against its main currency peers due to an increasing policy divergence between the Bank of Japan and other main central banks. More recently, the gradually unwinding of this ultra-loose policy has given some support to the Yen.
Over the last decade, the BoJ’s stance of sticking to ultra-loose monetary policy has led to a widening policy divergence with other central banks, particularly with the US Federal Reserve. This supported a widening of the differential between the 10-year US and Japanese bonds, which favored the US Dollar against the Japanese Yen. The BoJ decision in 2024 to gradually abandon the ultra-loose policy, coupled with interest-rate cuts in other major central banks, is narrowing this differential.
The Japanese Yen is often seen as a safe-haven investment. This means that in times of market stress, investors are more likely to put their money in the Japanese currency due to its supposed reliability and stability. Turbulent times are likely to strengthen the Yen’s value against other currencies seen as more risky to invest in.
- WTI gained ground due to an unexpected drop in US Oil inventories.
- US Crude Oil Stock declined by 2.192 million barrels in the previous week, against the expected 2.3-million-barrel increase.
- Israel's military and the Shin Bet security service confirmed the killing of the militant leader Yahya Sinwar on Wednesday.
West Texas Intermediate (WTI) Oil price extends its gains for the second consecutive day, trading around $70.40 per barrel during Asian hours on Friday. The rise in crude Oil prices was supported by an unexpected drop in US Oil inventories.
According to the Energy Information Administration (EIA), US Crude Oil Stock fell by 2.192 million barrels in the week ending October 11, defying market expectations of a 2.3 million barrel increase and contrasting with the previous week's 5.81 million barrel rise.
In addition to the drop in US Oil inventories, rising tensions in the Middle East are providing further support for Oil prices. Israel's military and the Shin Bet security service confirmed on Thursday that Yahya Sinwar, the Gaza Strip Chief of the Palestinian Islamist group Hamas, was killed by Israeli forces during an operation in southern Gaza on Wednesday.
The killing of Sinwar has heightened concerns, especially among the families of Israeli hostages taken to Gaza by Hamas, who fear their loved ones may now be in greater danger following the killing of the militant leader, according to Reuters.
However, the upside potential for WTI Oil prices may be limited as the EIA report showed that US crude Oil production reached a record high of 13.5 million barrels per day last week. Additionally, Libyan Oil output has resumed, and the Organization of the Petroleum Exporting Countries and their allies (OPEC+) have plans to further unwind production cuts in 2025, as reported by Reuters.
On Tuesday, the International Energy Agency (IEA) indicated that the global Oil market is heading for a significant surplus in the coming year. While world Oil demand is expected to rise by 860,000 barrels per day in 2024, this is a downward revision of 40,000 barrels per day from the previous forecast. The IEA attributed this to slower economic growth in China and a shift toward electric vehicles, which have begun to reshape the Oil demand outlook for China, the world's largest Oil importer.
WTI Oil FAQs
WTI Oil is a type of Crude Oil sold on international markets. The WTI stands for West Texas Intermediate, one of three major types including Brent and Dubai Crude. WTI is also referred to as “light” and “sweet” because of its relatively low gravity and sulfur content respectively. It is considered a high quality Oil that is easily refined. It is sourced in the United States and distributed via the Cushing hub, which is considered “The Pipeline Crossroads of the World”. It is a benchmark for the Oil market and WTI price is frequently quoted in the media.
Like all assets, supply and demand are the key drivers of WTI Oil price. As such, global growth can be a driver of increased demand and vice versa for weak global growth. Political instability, wars, and sanctions can disrupt supply and impact prices. The decisions of OPEC, a group of major Oil-producing countries, is another key driver of price. The value of the US Dollar influences the price of WTI Crude Oil, since Oil is predominantly traded in US Dollars, thus a weaker US Dollar can make Oil more affordable and vice versa.
The weekly Oil inventory reports published by the American Petroleum Institute (API) and the Energy Information Agency (EIA) impact the price of WTI Oil. Changes in inventories reflect fluctuating supply and demand. If the data shows a drop in inventories it can indicate increased demand, pushing up Oil price. Higher inventories can reflect increased supply, pushing down prices. API’s report is published every Tuesday and EIA’s the day after. Their results are usually similar, falling within 1% of each other 75% of the time. The EIA data is considered more reliable, since it is a government agency.
OPEC (Organization of the Petroleum Exporting Countries) is a group of 12 Oil-producing nations who collectively decide production quotas for member countries at twice-yearly meetings. Their decisions often impact WTI Oil prices. When OPEC decides to lower quotas, it can tighten supply, pushing up Oil prices. When OPEC increases production, it has the opposite effect. OPEC+ refers to an expanded group that includes ten extra non-OPEC members, the most notable of which is Russia.
People's Bank of China (PBOC) Governor Pan Gongsheng said on Friday that the Chinese central bank “provided specific directions for stock buybacks and reloans to increase holdings, and it is the bottom line that credit funds cannot enter the stock market in violation of regulations.”
Further comments
Central bank's provision of stock buyback and additional purchase re-loans has specific directional aims, and a fundamental bottom line is that loan funds must not unlawfully enter the stock market.
The two tools to support the stable development of the capital market are entirely based on market-oriented principles, and swap facility is not direct financial support from central bank.
Expected that depending on the market liquidity situation by the end of the year, the reserve requirement ratio (RRR) could be further reduced.
To achieve dynamic balance, macroeconomic policy should shift from investment-focused to balancing both investment and consumption.
Monetary policy framework will be further improved, with a focus on achieving a reasonable rise in prices as a key consideration.
Depending on market liquidity, reserve requirement ratio could be further reduced by 0.25 to 0.5 percentage points before the end of the year.
The interest rate of 7-day reverse repo operation in the open market will be lowered by 0.2 percentage points.
Interest rate of medium-term lending facilities could be reduced by 0.3 percentage points, depending on market liquidity.
It is expected that the loan market prime rate (LPR) could also fall by 0.2-0.25 percentage points.
Meanwhile, China’s central bank announced that it launched a swap facility for securities, funds and insurance companies on Friday.
Additional takeaways
Currently, 20 securities and fund companies are approved to participate in the swap facility operation, with the first batch of application quotas exceeding 200 bln yuan.
Officially launched the securities, fund, and insurance company swap facility (SFIFS) operation starting today.
| Raw materials | Closed | Change, % |
|---|---|---|
| Silver | 31.676 | -0.05 |
| Gold | 269.266 | 0.68 |
| Palladium | 1042.03 | 1.53 |
Following the publication of the high-impact China’s growth and activity data for September, the National Bureau of Statistics (NBS) expressed its outlook on the economy during its press conference on Friday.
Key quotes (via Reuters)
September economic indicators showed positive changes.
China's foreign trade situation this year better than expected.
Foundation for economic recovery not solid yet.
Will speed up implementation of a basket of policy measures.
developing story...
Market reaction
AUD/USD is holding mild gains while defending 0.6700, up 0.11% on the day, at the press time.
Australian Dollar FAQs
One of the most significant factors for the Australian Dollar (AUD) is the level of interest rates set by the Reserve Bank of Australia (RBA). Because Australia is a resource-rich country another key driver is the price of its biggest export, Iron Ore. The health of the Chinese economy, its largest trading partner, is a factor, as well as inflation in Australia, its growth rate and Trade Balance. Market sentiment – whether investors are taking on more risky assets (risk-on) or seeking safe-havens (risk-off) – is also a factor, with risk-on positive for AUD.
The Reserve Bank of Australia (RBA) influences the Australian Dollar (AUD) by setting the level of interest rates that Australian banks can lend to each other. This influences the level of interest rates in the economy as a whole. The main goal of the RBA is to maintain a stable inflation rate of 2-3% by adjusting interest rates up or down. Relatively high interest rates compared to other major central banks support the AUD, and the opposite for relatively low. The RBA can also use quantitative easing and tightening to influence credit conditions, with the former AUD-negative and the latter AUD-positive.
China is Australia’s largest trading partner so the health of the Chinese economy is a major influence on the value of the Australian Dollar (AUD). When the Chinese economy is doing well it purchases more raw materials, goods and services from Australia, lifting demand for the AUD, and pushing up its value. The opposite is the case when the Chinese economy is not growing as fast as expected. Positive or negative surprises in Chinese growth data, therefore, often have a direct impact on the Australian Dollar and its pairs.
Iron Ore is Australia’s largest export, accounting for $118 billion a year according to data from 2021, with China as its primary destination. The price of Iron Ore, therefore, can be a driver of the Australian Dollar. Generally, if the price of Iron Ore rises, AUD also goes up, as aggregate demand for the currency increases. The opposite is the case if the price of Iron Ore falls. Higher Iron Ore prices also tend to result in a greater likelihood of a positive Trade Balance for Australia, which is also positive of the AUD.
The Trade Balance, which is the difference between what a country earns from its exports versus what it pays for its imports, is another factor that can influence the value of the Australian Dollar. If Australia produces highly sought after exports, then its currency will gain in value purely from the surplus demand created from foreign buyers seeking to purchase its exports versus what it spends to purchase imports. Therefore, a positive net Trade Balance strengthens the AUD, with the opposite effect if the Trade Balance is negative.
A Japanese government spokesman delivered some verbal warnings after the Japanese Yen fell below 150.00 against the US Dollar.
Key quotes
Won't comment on forex levels.
Important for currencies to move in stable manner reflecting fundamentals.
Closely watching FX moves with a high sense of urgency, including speculative moves.
- NZD/USD struggles to gain any meaningful traction and reacts little to the Chinese macro data.
- Bets for more aggressive rate cuts by the RBNZ continue to undermine demand for the NZD.
- The underlying strong bullish sentiment around the USD also contributes to capping the major.
The NZD/USD pair extends its sideways consolidative price move through the Asian session on Friday and remains within the striking distance of a nearly two-month low touched earlier this week. Spot prices hold steady around the 0.6065 region and move little following the release of mostly upbeat Chinese macro data.
The official data published by the National Bureau of Statistics (NBS) showed that China’s economy expanded 0.9% in the third quarter of 2024, while the annual growth rate stood at 4.6%. A separate report revealed that China’s Retail Sales increased by the 3.2% YoY rate in September vs. 2.5% expected, while Industrial Production rose 5.4% YoY vs. 4.6% anticipated and August’s 4.5%.
This comes on top of the latest optimism over China's stimulus measures, though fail to provide any meaningful impetus to the New Zealand Dollar (NZD). Expectations that the Reserve Bank of New Zealand (RBNZ) will cut rates aggressively in the wake of a fall in domestic inflation to the central bank's target range of 1% to 3% in the third quarter act as a headwind for the domestic currency.
Apart from this, the recent US Dollar (USD) upswing to its highest level since early August, bolstered by bets for a regular 25 basis points interest rate cut by the Federal Reserve (Fed) in November, contributes to capping the NZD/USD pair. Meanwhile, the lack of any meaningful buying favors bearish traders and suggests that the path of least resistance for spot prices remains to the downside.
Economic Indicator
Gross Domestic Product (YoY)
The Gross Domestic Product (GDP), released by the National Bureau of Statistics of China on a monthly basis, is a measure of the total value of all goods and services produced in China during a given period. The GDP is considered as the main measure of China’s economic activity. The YoY reading compares economic activity in the reference quarter compared with the same quarter a year earlier. Generally speaking, a rise in this indicator is bullish for the Renminbi (CNY), while a low reading is seen as bearish.
Read more.
- The Indian Rupee edges higher in Friday’s Asian session.
- Substantial equity outflows, higher crude oil prices might drag the INR down, but possible RBI intervention might cap its downside.
- Investors await the US housing data and FedSpeaks later on Friday.
The Indian Rupee (INR) recovers on Friday on the modest decline of the US Dollar (USD). The upside of the local currency might be limited amid foreign fund outflows, a negative trend in domestic equities and the recent spike in crude oil prices. Additionally, the rising expectations the Federal Reserve (Fed) would cut rates less aggressively might strengthen the Greenback and weigh on the INR.
Nonetheless, the routine foreign exchange interventions by the Reserve Bank of India (RBI) through USD sales could help limit the INR’s losses. Looking ahead, the US Building Permits and Housing Starts are due later on Friday. The Fed’s Raphael Bostic, Neel Kashkari and Christopher Waller are scheduled to speak on the same day.
Daily Digest Market Movers: Indian Rupee rebounds, the potential upside seems limited
- The BSE Sensex dropped 494.75 points, or 0.61%, to end at 81,006.61, while the broader NSE Nifty index closed at 24,749.85, down 221.45 points, or 0.89% from its previous close.
- Foreign investors have sold $8 billion worth of domestic stocks over October so far, the highest monthly outflow in over four years.
- The US Retail Sales climbed by 0.4% MoM in September from a 0.1% rise in August, beating the estimations of 0.3%, the US Census Bureau showed Thursday. Retail sales excluding autos arrived at 0.5% MoM in September versus 0.2% prior (revised from 0.1%), stronger than the 0.1% expected.
- The US Initial Jobless Claims for the week ending October 11 rose to 241K. The figure came in below the market consensus and the previous week's of 260K (revised from 258K).
- According to the CME FedWatch tool, traders have priced in a nearly 90.3% chance of a 25 basis points (bps) Fed rate cut in November.
Technical Analysis: USD/INR keeps the bullish vibe in the longer term
The Indian Rupee trades stronger on the day. According to the daily chart, the USD/INR pair maintains a constructive outlook as the price is well-supported above the ascending trend line and the key 100-day Exponential Moving Average (EMA). The path of least resistance is to the upside, as the 14-day Relative Strength Index (RSI) is located above the midline near 60.60, hinting that the uptrend is more likely to gain traction than the reverse.
The immediate resistance level for the pair emerges near the all-time high of 84.15. Further north, the next upside barrier is seen at 84.50, en route to the 85.00 psychological level.
On the flip side, a decisive break below the rising trend line could pave the way to 83.90, the low of October 10. The key contention level is located at 83.71, the 100-day EMA. The additional downside filter to watch is 83.00, representing the round mark and the low of May 24.
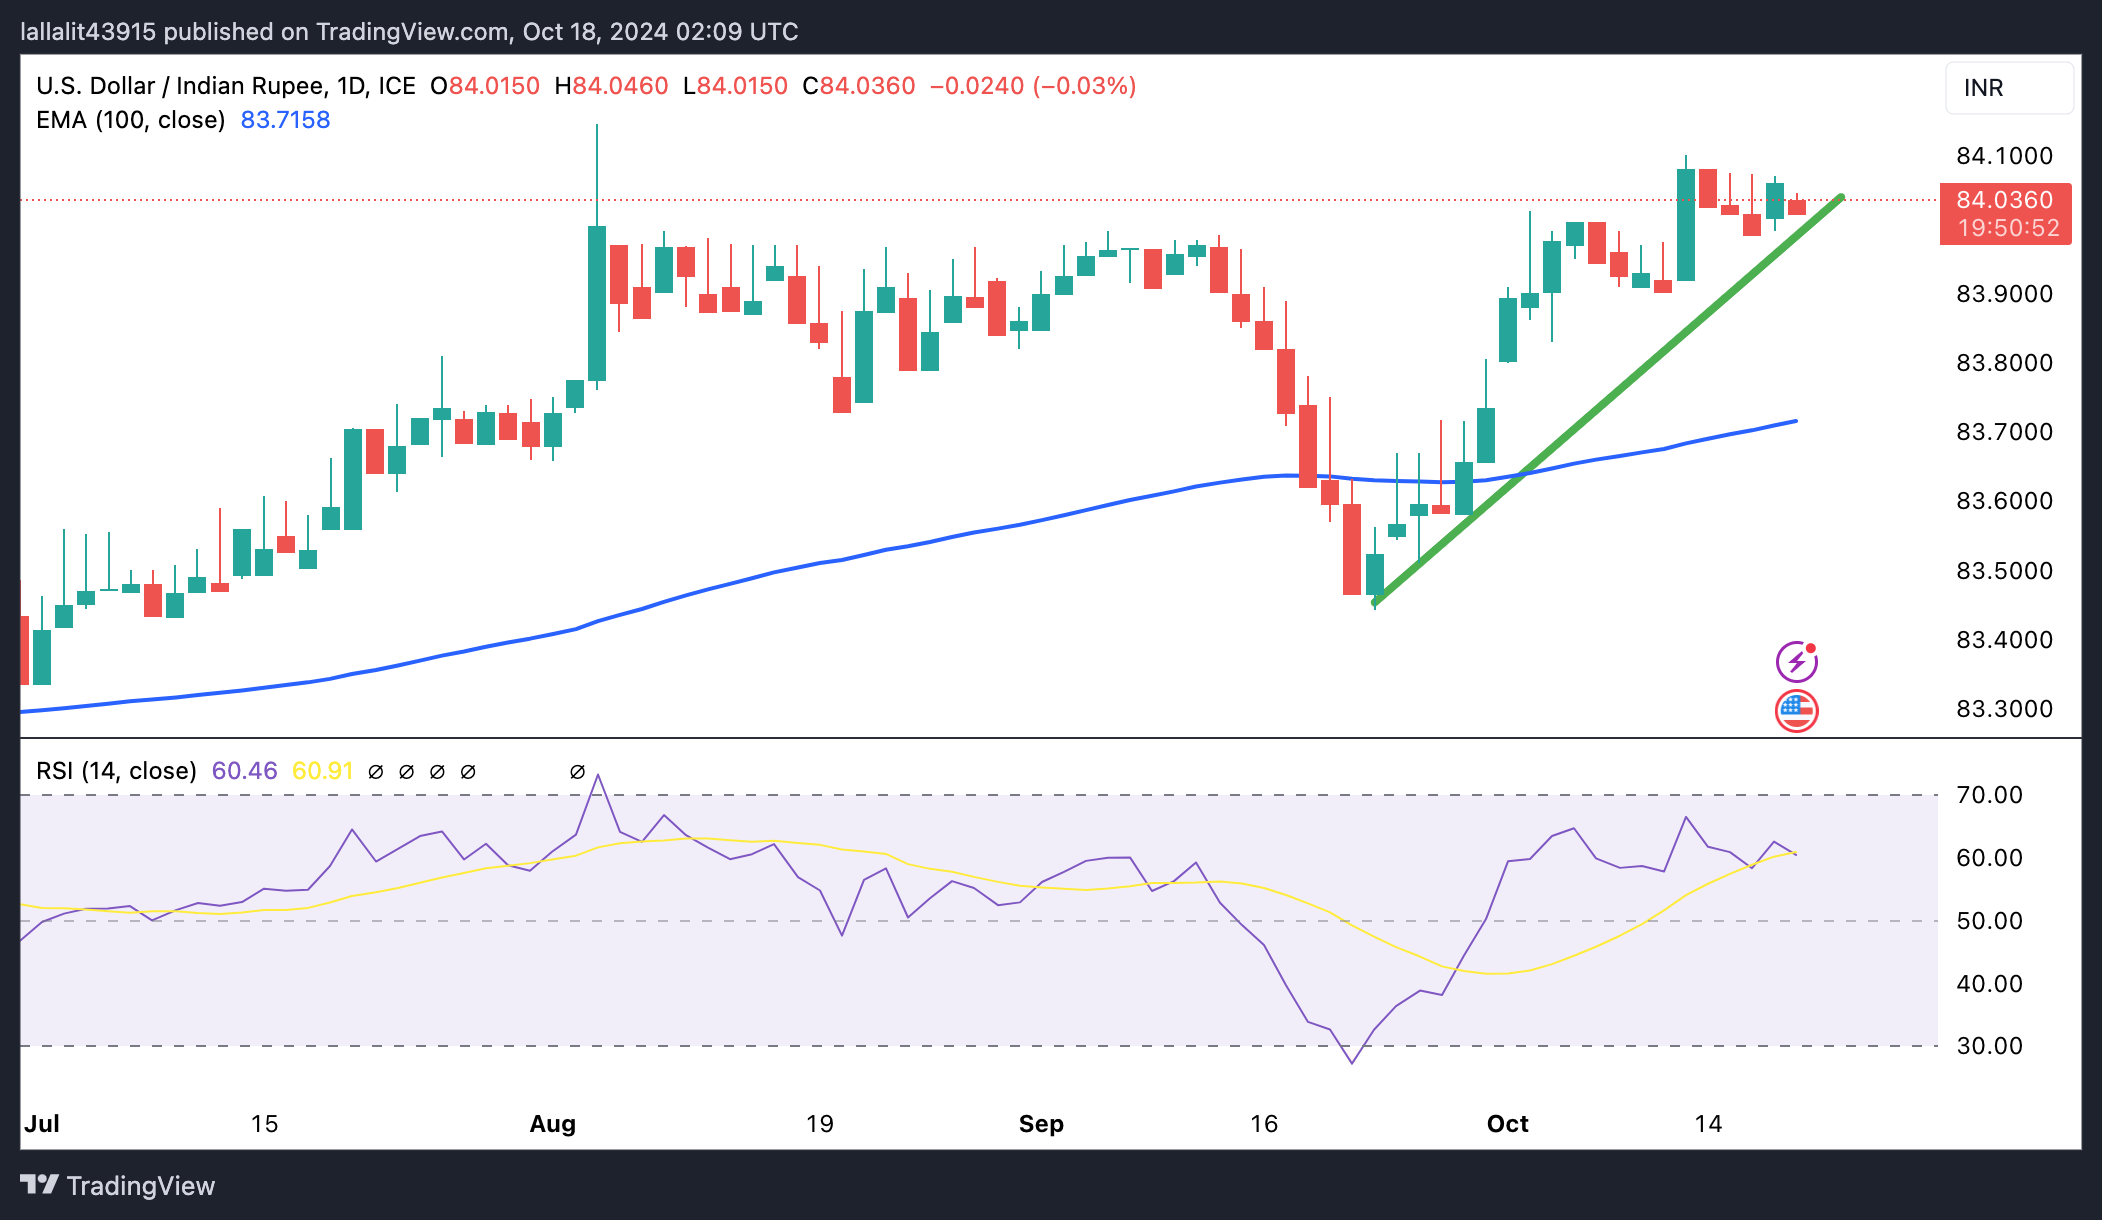
Indian Rupee FAQs
The Indian Rupee (INR) is one of the most sensitive currencies to external factors. The price of Crude Oil (the country is highly dependent on imported Oil), the value of the US Dollar – most trade is conducted in USD – and the level of foreign investment, are all influential. Direct intervention by the Reserve Bank of India (RBI) in FX markets to keep the exchange rate stable, as well as the level of interest rates set by the RBI, are further major influencing factors on the Rupee.
The Reserve Bank of India (RBI) actively intervenes in forex markets to maintain a stable exchange rate, to help facilitate trade. In addition, the RBI tries to maintain the inflation rate at its 4% target by adjusting interest rates. Higher interest rates usually strengthen the Rupee. This is due to the role of the ‘carry trade’ in which investors borrow in countries with lower interest rates so as to place their money in countries’ offering relatively higher interest rates and profit from the difference.
Macroeconomic factors that influence the value of the Rupee include inflation, interest rates, the economic growth rate (GDP), the balance of trade, and inflows from foreign investment. A higher growth rate can lead to more overseas investment, pushing up demand for the Rupee. A less negative balance of trade will eventually lead to a stronger Rupee. Higher interest rates, especially real rates (interest rates less inflation) are also positive for the Rupee. A risk-on environment can lead to greater inflows of Foreign Direct and Indirect Investment (FDI and FII), which also benefit the Rupee.
Higher inflation, particularly, if it is comparatively higher than India’s peers, is generally negative for the currency as it reflects devaluation through oversupply. Inflation also increases the cost of exports, leading to more Rupees being sold to purchase foreign imports, which is Rupee-negative. At the same time, higher inflation usually leads to the Reserve Bank of India (RBI) raising interest rates and this can be positive for the Rupee, due to increased demand from international investors. The opposite effect is true of lower inflation.
China’s economy expanded at an annual rate of 4.6% in the third quarter of 2024 after growing 4.7% in the second quarter, the official data published by the National Bureau of Statistics (NBS) showed on Friday. The market forecast was 4.5% in the reported period.
On a quarterly basis, the Chinese Gross Domestic Product (GDP) rate rose 0.9% in Q3 2024, compared to 0.7% booked in the previous quarter, missing the expectations for a 1.0% reading.
China’s September Retail Sales YoY, increased by 3.2% vs. 2.5% expected and 2.1% prior while the nation’s Industrial Production arrived at 5.4% YoY vs. 4.6% anticipated and August’s 4.5%.
Meanwhile, the Fixed Asset Investment edged higher by 3.4% year-to-date (YTD) YoY in September vs 3.3% expected and 3.9% prior.
AUD/USD reaction to China’s data dump
Mixed China’s GDP and activity data failed to impress the Australian Dollar, as the AUD/USD pair keeps its range just above 0.6700. At the time of writing, AUD/USD is up 0.20% on the day to trade at 0.6708.
Australian Dollar PRICE Today
The table below shows the percentage change of Australian Dollar (AUD) against listed major currencies today. Australian Dollar was the strongest against the US Dollar.
| USD | EUR | GBP | JPY | CAD | AUD | NZD | CHF | |
|---|---|---|---|---|---|---|---|---|
| USD | -0.04% | -0.08% | -0.14% | -0.03% | -0.17% | -0.10% | 0.02% | |
| EUR | 0.04% | -0.02% | -0.07% | 0.00% | -0.15% | -0.04% | 0.06% | |
| GBP | 0.08% | 0.02% | -0.04% | 0.03% | -0.11% | -0.01% | 0.05% | |
| JPY | 0.14% | 0.07% | 0.04% | 0.10% | -0.05% | 0.01% | 0.11% | |
| CAD | 0.03% | -0.01% | -0.03% | -0.10% | -0.15% | -0.05% | 0.01% | |
| AUD | 0.17% | 0.15% | 0.11% | 0.05% | 0.15% | 0.08% | 0.17% | |
| NZD | 0.10% | 0.04% | 0.00% | -0.01% | 0.05% | -0.08% | 0.08% | |
| CHF | -0.02% | -0.06% | -0.05% | -0.11% | -0.01% | -0.17% | -0.08% |
The heat map shows percentage changes of major currencies against each other. The base currency is picked from the left column, while the quote currency is picked from the top row. For example, if you pick the Australian Dollar from the left column and move along the horizontal line to the US Dollar, the percentage change displayed in the box will represent AUD (base)/USD (quote).
- Gold price scales higher for the fourth straight day and touches a fresh all-time peak on Friday.
- Major central banks remain in rate-cut mode and continue to benefit the non-yielding XAU/USD.
- Middle East tensions and the US political uncertainty provide an additional boost to the commodity.
Gold price (XAU/USD) climbs above the $2,700 mark, hitting a fresh record high on Friday amid the expected interest rate cuts by major central banks and easing monetary policy environment. Moreover, persistent geopolitical risks stemming from the ongoing conflicts in the Middle East, along with the uncertainty surrounding the US Presidential election, seem to stimulate demand for the safe-haven precious metal.
The supporting factors, to a larger extent, offset the recent US Dollar (USD) rally to its highest level since August, bolstered by the growing acceptance that the Federal Reserve (Fed) will proceed with modest rate cuts. A stronger buck tends to undermine demand for USD-denominated commodities, including the Gold price, which remains on track to register strong weekly gains and seems poised to appreciate further.
Daily Digest Market Movers: Gold price continues to draw support from a combination of factors
- On Thursday, the European Central Bank decided to lower interest rates for the third time this year – marking the first back-to-back rate cut in 13 years – and eyes more cuts in the wake of the worsening economic outlook.
- The Federal Reserve is also anticipated to lower borrowing costs further after a jumbo rate reduction in September, while weak inflation data from the UK solidified bets for a more aggressive easing by the Bank of England.
- Meanwhile, the tight race between Donald Trump and Kamala Harris adds a layer of uncertainty, which, along with the risk of a further escalation of conflicts in the Middle East, lift the Gold price to a fresh all-time high.
- The Israeli military confirmed that Hamas leader Yahya Sinwar had been killed on Wednesday after a “year-long pursuit”, while the Iran-backed Hezbollah announced a new and escalating phase in its war with Israel.
- Data published by the US Census Bureau on Thursday showed that Retail Sales increased by 0.4% in September, surpassing market expectations for a 0.3% monthly gain and a 0.1% rise recorded in the previous month.
- Separately, the US Labor Department reported that Initial Jobless Claims, after hitting the highest level in more than a year, fell to 241K in the week that ended October 12 against the anticipated reading of 260 K.
- Furthermore, the Philadelphia Federal Reserve's manufacturing sector survey revealed that the business conditions index rose from 1.7 to 10.3 in October, beating consensus estimates by a wide margin.
- The data suggested that the economy remains on solid footing and reaffirmed bets for a less aggressive Fed policy easing, lifting the US bond yields and the US Dollar, albeit doing little to dent demand for the XAU/USD.
- Traders now look to the US housing market data – Building Permits and Housing Starts – and Fed Governor Christopher Waller's scheduled speech to grab short-term opportunities on the last day of the week.
Technical Outlook: Gold price seems poised to appreciate further, breakout above $2,700 in play
From a technical perspective, a sustained move beyond the $2,700 mark could be seen as a fresh trigger for bullish traders. This, along with the fact that oscillators on the daily chart are holding in positive territory and are still away from being in the overbought zone, suggests that the path of least resistance for the Gold price is to the upside.
On the flip side, any meaningful corrective slide now seems to find decent support near the $2,662-2,660 horizontal zone ahead of the $2,647-2,646 area. A convincing break below the latter might prompt some technical selling and drag the Gold price to the $2,630 intermediate support en route to the $2,600 neighborhood.
Gold FAQs
Gold has played a key role in human’s history as it has been widely used as a store of value and medium of exchange. Currently, apart from its shine and usage for jewelry, the precious metal is widely seen as a safe-haven asset, meaning that it is considered a good investment during turbulent times. Gold is also widely seen as a hedge against inflation and against depreciating currencies as it doesn’t rely on any specific issuer or government.
Central banks are the biggest Gold holders. In their aim to support their currencies in turbulent times, central banks tend to diversify their reserves and buy Gold to improve the perceived strength of the economy and the currency. High Gold reserves can be a source of trust for a country’s solvency. Central banks added 1,136 tonnes of Gold worth around $70 billion to their reserves in 2022, according to data from the World Gold Council. This is the highest yearly purchase since records began. Central banks from emerging economies such as China, India and Turkey are quickly increasing their Gold reserves.
Gold has an inverse correlation with the US Dollar and US Treasuries, which are both major reserve and safe-haven assets. When the Dollar depreciates, Gold tends to rise, enabling investors and central banks to diversify their assets in turbulent times. Gold is also inversely correlated with risk assets. A rally in the stock market tends to weaken Gold price, while sell-offs in riskier markets tend to favor the precious metal.
The price can move due to a wide range of factors. Geopolitical instability or fears of a deep recession can quickly make Gold price escalate due to its safe-haven status. As a yield-less asset, Gold tends to rise with lower interest rates, while higher cost of money usually weighs down on the yellow metal. Still, most moves depend on how the US Dollar (USD) behaves as the asset is priced in dollars (XAU/USD). A strong Dollar tends to keep the price of Gold controlled, whereas a weaker Dollar is likely to push Gold prices up.
- The Australian Dollar rises as the solid employment data diminish the odds of RBA’s rate cuts in 2024.
- China’s Gross Domestic Product is expected to report 4.5% growth YoY in Q3, compared to the previous 4.7% reading.
- The US Dollar received support from a solid US Retail Sales report, fueling the likelihood of the Fed delivering nominal rate cuts.
The Australian Dollar (AUD) continued to strengthen against the US Dollar (USD) for the second consecutive day on Friday. This upside of the AUD/USD pair is largely due to stronger-than-expected domestic employment data released on Thursday, which led traders to scale back expectations of a Reserve Bank of Australia (RBA) interest rate cut this year.
The Australian Dollar may have also gained support from confirmation of rate cuts in China, its largest trading partner. China's Industrial Commercial Bank, Bank of Communications, and China Merchants Bank announced a 25 basis point cut. Lower interest rates are expected to stimulate domestic economic activity, which in turn could boost demand for Australian exports to China.
The US Dollar (USD) edges lower as Treasury yields decline. However, the Greenback reached a two-month high of 103.87 on Thursday, supported by a solid US Retail Sales report, which fueled expectations that the Federal Reserve (Fed) may implement nominal rate cuts.
According to the CME FedWatch Tool, there is a 90.8% probability of a 25-basis-point rate cut in November and a 74.0% chance of another cut in December.
Daily Digest Market Movers: Australian Dollar rises as solid labor data diminishes RBA rate cuts
- National Australia Bank revised its projection for the Reserve Bank of Australia (RBA) in a note this week. "We have brought forward our expectations for the timing of rate cuts, now anticipating the first cut in February 2025, instead of May," the bank stated. They continue to foresee a gradual pace of cuts, with rates expected to decrease to 3.10% by early 2026.
- US Retail Sales rose by 0.4% month-over-month in September, surpassing both the 0.1% gain recorded in August and market expectations of a 0.3% increase. Additionally, US Initial Jobless Claims fell by 19,000 during the week ending October 11, the largest decline in three months. The total number of claims dropped to 241,000, significantly below the anticipated 260,000.
- The seasonally adjusted Employment Change in Australia surged by 64.1K in September, bringing the total employment to a record 14.52 million. This far surpassed market expectations of a 25.0K increase, following a revised rise of 42.6K in the previous month. Meanwhile, the Unemployment Rate remained steady at 4.1% in September, matching the revised figure for August and coming in lower than the anticipated 4.2%.
- On Wednesday, Reserve Bank of Australia (RBA) Deputy Governor Sarah Hunter reiterated the central bank's commitment to curbing inflation, emphasizing that although inflation expectations remain well-anchored, ongoing price pressures continue to present significant challenges.
- On Tuesday, Federal Reserve Bank of Atlanta President Raphael Bostic stated that he anticipates just one more interest rate cut of 25 basis points this year, as reflected in his projections during last month's US central bank meeting. "The median forecast was for 50 basis points beyond the 50 basis points already implemented in September. My projection was for an additional 25 basis points," he said, according to Reuters.
- Federal Reserve (Fed) Bank of Minneapolis President Neel Kashkari reassured markets late on Monday by reaffirming the Fed's data-dependent approach. Kashkari reiterated familiar Fed policymaker views on the strength of the US economy, noting continued easing of inflationary pressures and a robust labor market, despite a recent uptick in the overall unemployment rate, per Reuters.
Technical Analysis: Australian Dollar breaks above 0.6700, descending channel
The AUD/USD pair trades around 0.6710 on Friday. A technical analysis of the daily chart shows that the pair has successfully broken above the descending channel pattern, indicating a potential shift from a bearish to a bullish trend. However, the 14-day Relative Strength Index (RSI) remains below 50, suggesting that bearish sentiment is still prevalent.
On the upside, the AUD/USD pair could test the nine-day Exponential Moving Average (EMA) at 0.6724, followed by a key psychological resistance at 0.6800.
Regarding support, the pair may attempt to re-enter the descending channel. A successful return could reinforce the bearish outlook, with the pair potentially targeting its eight-week low of 0.6622, last seen on September 11, and then the lower boundary of the descending channel around 0.6580.
AUD/USD: Daily Chart
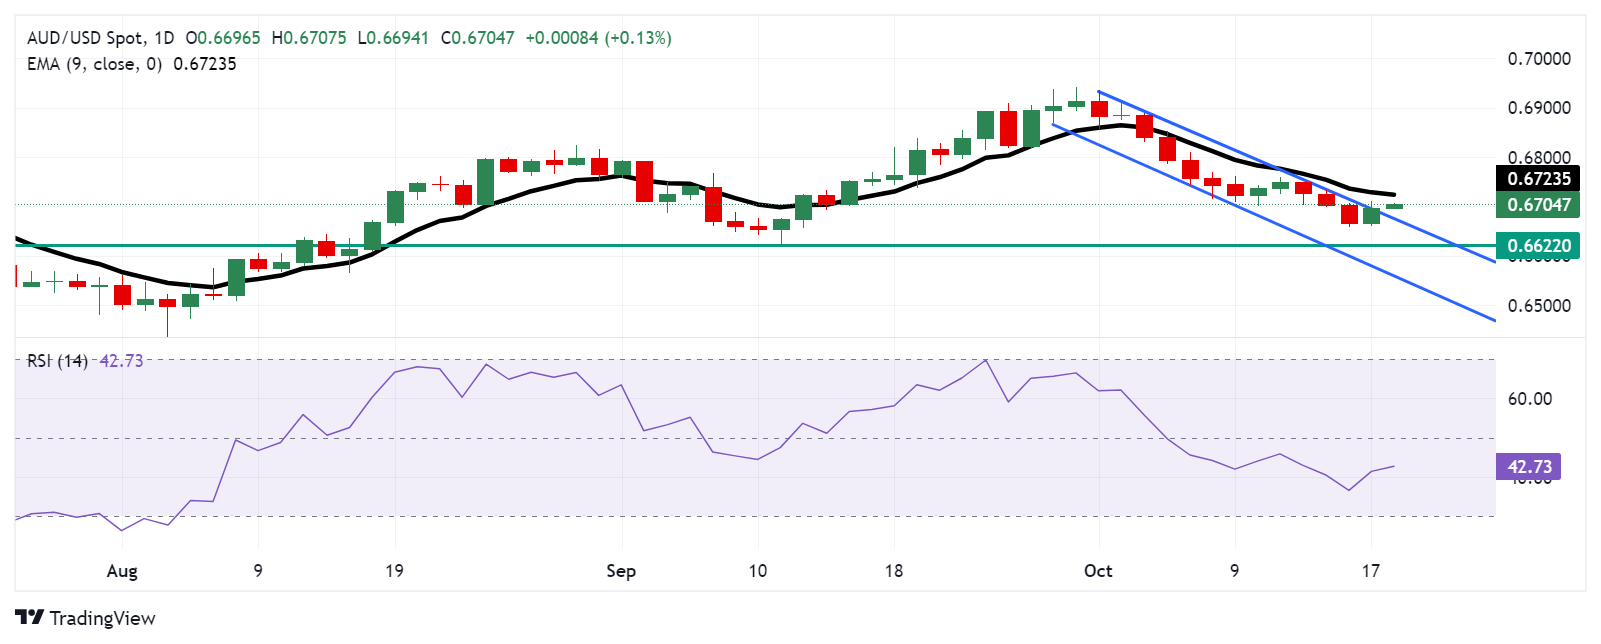
Australian Dollar PRICE Today
The table below shows the percentage change of Australian Dollar (AUD) against listed major currencies today. Australian Dollar was the strongest against the US Dollar.
| USD | EUR | GBP | JPY | CAD | AUD | NZD | CHF | |
|---|---|---|---|---|---|---|---|---|
| USD | -0.03% | -0.09% | -0.12% | -0.03% | -0.13% | -0.07% | 0.01% | |
| EUR | 0.03% | -0.04% | -0.08% | -0.01% | -0.12% | -0.04% | 0.05% | |
| GBP | 0.09% | 0.04% | -0.04% | 0.04% | -0.07% | 0.01% | 0.07% | |
| JPY | 0.12% | 0.08% | 0.04% | 0.10% | -0.01% | 0.03% | 0.11% | |
| CAD | 0.03% | 0.00% | -0.04% | -0.10% | -0.10% | -0.04% | 0.01% | |
| AUD | 0.13% | 0.12% | 0.07% | 0.00% | 0.10% | 0.05% | 0.12% | |
| NZD | 0.07% | 0.04% | -0.01% | -0.03% | 0.04% | -0.05% | 0.07% | |
| CHF | -0.01% | -0.05% | -0.07% | -0.11% | -0.01% | -0.12% | -0.07% |
The heat map shows percentage changes of major currencies against each other. The base currency is picked from the left column, while the quote currency is picked from the top row. For example, if you pick the Australian Dollar from the left column and move along the horizontal line to the US Dollar, the percentage change displayed in the box will represent AUD (base)/USD (quote).
Australian Dollar FAQs
One of the most significant factors for the Australian Dollar (AUD) is the level of interest rates set by the Reserve Bank of Australia (RBA). Because Australia is a resource-rich country another key driver is the price of its biggest export, Iron Ore. The health of the Chinese economy, its largest trading partner, is a factor, as well as inflation in Australia, its growth rate and Trade Balance. Market sentiment – whether investors are taking on more risky assets (risk-on) or seeking safe-havens (risk-off) – is also a factor, with risk-on positive for AUD.
The Reserve Bank of Australia (RBA) influences the Australian Dollar (AUD) by setting the level of interest rates that Australian banks can lend to each other. This influences the level of interest rates in the economy as a whole. The main goal of the RBA is to maintain a stable inflation rate of 2-3% by adjusting interest rates up or down. Relatively high interest rates compared to other major central banks support the AUD, and the opposite for relatively low. The RBA can also use quantitative easing and tightening to influence credit conditions, with the former AUD-negative and the latter AUD-positive.
China is Australia’s largest trading partner so the health of the Chinese economy is a major influence on the value of the Australian Dollar (AUD). When the Chinese economy is doing well it purchases more raw materials, goods and services from Australia, lifting demand for the AUD, and pushing up its value. The opposite is the case when the Chinese economy is not growing as fast as expected. Positive or negative surprises in Chinese growth data, therefore, often have a direct impact on the Australian Dollar and its pairs.
Iron Ore is Australia’s largest export, accounting for $118 billion a year according to data from 2021, with China as its primary destination. The price of Iron Ore, therefore, can be a driver of the Australian Dollar. Generally, if the price of Iron Ore rises, AUD also goes up, as aggregate demand for the currency increases. The opposite is the case if the price of Iron Ore falls. Higher Iron Ore prices also tend to result in a greater likelihood of a positive Trade Balance for Australia, which is also positive of the AUD.
The Trade Balance, which is the difference between what a country earns from its exports versus what it pays for its imports, is another factor that can influence the value of the Australian Dollar. If Australia produces highly sought after exports, then its currency will gain in value purely from the surplus demand created from foreign buyers seeking to purchase its exports versus what it spends to purchase imports. Therefore, a positive net Trade Balance strengthens the AUD, with the opposite effect if the Trade Balance is negative.
Atsushi Mimura, Japan’s Vice Finance Minister For International Affairs and top foreign exchange official, said on Friday, he is “closely watching FX moves with a high sense of urgency.”
Additional comments
Recent Yen moves are somewhat rapid and one-sided.
Excess volatility in FX market is undesirable.
Market reaction
USD/JPY is off the highs, flirting with 150.00 following these verbal warnings. The pair is losing 0.14% on the day, as of writing.
Japanese Yen FAQs
The Japanese Yen (JPY) is one of the world’s most traded currencies. Its value is broadly determined by the performance of the Japanese economy, but more specifically by the Bank of Japan’s policy, the differential between Japanese and US bond yields, or risk sentiment among traders, among other factors.
One of the Bank of Japan’s mandates is currency control, so its moves are key for the Yen. The BoJ has directly intervened in currency markets sometimes, generally to lower the value of the Yen, although it refrains from doing it often due to political concerns of its main trading partners. The BoJ ultra-loose monetary policy between 2013 and 2024 caused the Yen to depreciate against its main currency peers due to an increasing policy divergence between the Bank of Japan and other main central banks. More recently, the gradually unwinding of this ultra-loose policy has given some support to the Yen.
Over the last decade, the BoJ’s stance of sticking to ultra-loose monetary policy has led to a widening policy divergence with other central banks, particularly with the US Federal Reserve. This supported a widening of the differential between the 10-year US and Japanese bonds, which favored the US Dollar against the Japanese Yen. The BoJ decision in 2024 to gradually abandon the ultra-loose policy, coupled with interest-rate cuts in other major central banks, is narrowing this differential.
The Japanese Yen is often seen as a safe-haven investment. This means that in times of market stress, investors are more likely to put their money in the Japanese currency due to its supposed reliability and stability. Turbulent times are likely to strengthen the Yen’s value against other currencies seen as more risky to invest in.
The People's Bank of China (PBoC), National Financial Regulatory Administration (NFRA) and China Securities Regulatory Commission (CSRC) held a meeting on Financial Incremental Policies on Friday. The Chinese officials said they will implement incremental policies following a meeting on October 16.
Key quotes
Urges financial institutions to act swiftly in implementing expansive financial policies.
Necessary to increase credit support for the real economy and maintain reasonable growth in the total amount of money and credit.
Necessary to also strengthen the implementation and transmission of interest rate policies and solidly organize the batch adjustment of interest rates to reduce the stock of housing loans.
Boosting market confidence to be continued.
Emphasizes increasing support for financing small firms.
On Friday, the People’s Bank of China (PBoC) set the USD/CNY central rate for the trading session ahead at 7.1274, as compared to the previous day's fix of 7.1220 and 7.1267 Reuters estimates.
- USD/JPY softens to near 150.05 despite stronger USD in Friday’s Asian session.
- Japan's CPI inflation drops from 3.0% to 2.5% in September.
- The upbeat US economic data strengthens the case for 25 bps Fed rate cuts.
The USD/JPY pair edges lower to around 150.05 despite the firmer US dollar (USD) on Friday during the early Asian session. Investors will keep an eye on the US Building Permits and Housing Starts, which are due later on Friday. The Federal Reserve’s (Fed) Raphael Bostic, Neel Kashkari and Christopher Waller are also set to speak later in the day.
Japan's annual Consumer Price Index (CPI) rose 2.5% in September, compared to 3.0% reported in August, the Statistics Bureau of Japan showed on Friday. Meanwhile, the CPI excluding fresh food and energy grew 2.1% year-over-year in September. The CPI excluding fresh food climbed by 2.4% on an annual basis during the same period. The figure came in slightly stronger than the consensus estimate of 2.3%.
The slowdown in price gains might have a limited impact on the Bank of Japan’s (BoJ) policy path. The BoJ Governor Kazuo Ueda said the Japanese central bank will keep raising rates if inflation remains on track to stably hit the 2% target, adding that the BoJ will spend time gauging how global economic uncertainties affect Japan's fragile recovery. The BoJ is widely expected to hold the benchmark rate steady on October 31.
“The BOJ is waiting to see how the US economy holds up before raising rates further. We think it will be able to confirm a US soft landing by the time it holds its January board meeting,” noted Taro Kimura, economist from Bloomberg Economics.
On the USD’s front, the stronger-than-expected US September Retail sales indicated the US economy maintained a strong growth pace in the third quarter. This, in turn, might cap the downside for the US Dollar (USD).
The US Fed is likely to maintain a very cautious approach to cutting rates. Atlanta Fed President Bostic said that he has one more 25 bps rate cut pencilled in for this year. Minneapolis Fed President Neel Kashkari stated that future interest rate cuts would be “modest” and emphasized that policy decisions would depend on economic data. Money markets are now pricing a 90.3% probability of a 25bps rate cut next month, according to the CME Fed Watch Tool.
Japanese Yen FAQs
The Japanese Yen (JPY) is one of the world’s most traded currencies. Its value is broadly determined by the performance of the Japanese economy, but more specifically by the Bank of Japan’s policy, the differential between Japanese and US bond yields, or risk sentiment among traders, among other factors.
One of the Bank of Japan’s mandates is currency control, so its moves are key for the Yen. The BoJ has directly intervened in currency markets sometimes, generally to lower the value of the Yen, although it refrains from doing it often due to political concerns of its main trading partners. The BoJ ultra-loose monetary policy between 2013 and 2024 caused the Yen to depreciate against its main currency peers due to an increasing policy divergence between the Bank of Japan and other main central banks. More recently, the gradually unwinding of this ultra-loose policy has given some support to the Yen.
Over the last decade, the BoJ’s stance of sticking to ultra-loose monetary policy has led to a widening policy divergence with other central banks, particularly with the US Federal Reserve. This supported a widening of the differential between the 10-year US and Japanese bonds, which favored the US Dollar against the Japanese Yen. The BoJ decision in 2024 to gradually abandon the ultra-loose policy, coupled with interest-rate cuts in other major central banks, is narrowing this differential.
The Japanese Yen is often seen as a safe-haven investment. This means that in times of market stress, investors are more likely to put their money in the Japanese currency due to its supposed reliability and stability. Turbulent times are likely to strengthen the Yen’s value against other currencies seen as more risky to invest in.
| Index | Change, points | Closed | Change, % |
|---|---|---|---|
| NIKKEI 225 | -269.11 | 38911.19 | -0.69 |
| Hang Seng | -207.75 | 20079.1 | -1.02 |
| KOSPI | -1.06 | 2609.3 | -0.04 |
| ASX 200 | 71.2 | 8355.9 | 0.86 |
| DAX | 150.58 | 19583.39 | 0.77 |
| CAC 40 | 91.73 | 7583.73 | 1.22 |
| Dow Jones | 161.35 | 43239.05 | 0.37 |
| S&P 500 | -1 | 5841.47 | -0.02 |
| NASDAQ Composite | 6.53 | 18373.61 | 0.04 |
| Pare | Closed | Change, % |
|---|---|---|
| AUDUSD | 0.66957 | 0.43 |
| EURJPY | 162.656 | 0.11 |
| EURUSD | 1.08313 | -0.27 |
| GBPJPY | 195.366 | 0.55 |
| GBPUSD | 1.30096 | 0.16 |
| NZDUSD | 0.60572 | 0.02 |
| USDCAD | 1.37937 | 0.31 |
| USDCHF | 0.86593 | 0.09 |
| USDJPY | 150.17 | 0.39 |
- EUR/USD lost another one-third of one percent on Thursday.
- The ECB cut rates in-line with expectations, stripping support from underneath the Euro.
- US data blew the doors off market forecasts, further bolstering the Greenback.
EUR/USD continues to backslide following the European Central Bank’s (ECB) quarter-point rate trim early Thursday. A lack of bullish momentum has Fiber extending near-term losses, and the pair is down over 3.5% from late September’s peak bids just above 1.1200.
The ECB trimmed its reference rates exactly in-line with median market forecasts, delivering a 25 bps cut to its Rate on Deposit Facility and Main Refinancing Operations Rate, easing the reference rates to 3.25% and 3.4%, respectively. As if the Euro didn’t have enough support as it is, Europe’s final Harmonized Index of Consumer Prices (HICP) inflation for the year ended September also declined more than expected, with the final print coming in at just 1.7% YoY compared to the expected 1.8%.
All that remains on the EU-centric economic data docket is Friday’s upcoming EU Leadership Summit, but the event is unlikely to spark much confidence in the Euro as policymakers grapple with a lopsided economy tilting toward a steeper slowdown despite insistence from leaders that it isn’t.
US Retail Sales grew by 0.4% MoM in September, recovering from August’s 0.1% and beating median market forecasts of a 0.3% print. Retail Sales excluding Automotive spending also thumped forecasts, growing by 0.5% in September compared to the expected 0.1%, and easily vaulting over August’s 0.2% increase.
US Initial Jobless Claims for the week ended October 11 also beat market expectations, coming in at 241K for the week. Investors expected the week’s new jobless claimant count to hold steady at the previous week’s revised 260K.
EUR/USD price forecast
EUR/USD has experienced significant bearish pressure, breaking below both the 50-day Exponential Moving Average (EMA) at 1.0996 and the 200-day EMA at 1.0904, marking a clear bearish shift in market sentiment. The pair is now trading near 1.0828, testing multi-week lows as the downside momentum intensifies. A sustained break below 1.0800 could lead to further declines, with the next major support area around 1.0750. The sharp decline in recent sessions reflects the growing strength of the bearish trend, with sellers maintaining control as the pair moves away from key moving averages.
The Moving Average Convergence Divergence (MACD) indicator is deeply entrenched in negative territory, with both the MACD and signal lines showing no signs of reversal, suggesting that bearish momentum could continue. The histogram is expanding further into the negative, indicating an acceleration of the downside movement. If the pair fails to hold the 1.0800 support level, we could see additional losses, with 1.0750 and possibly 1.0700 on the horizon. On the flip side, a recovery above 1.0900, where the 200-day EMA lies, is needed to diminish the bearish outlook and bring some relief to the bulls.
EUR/USD daily chart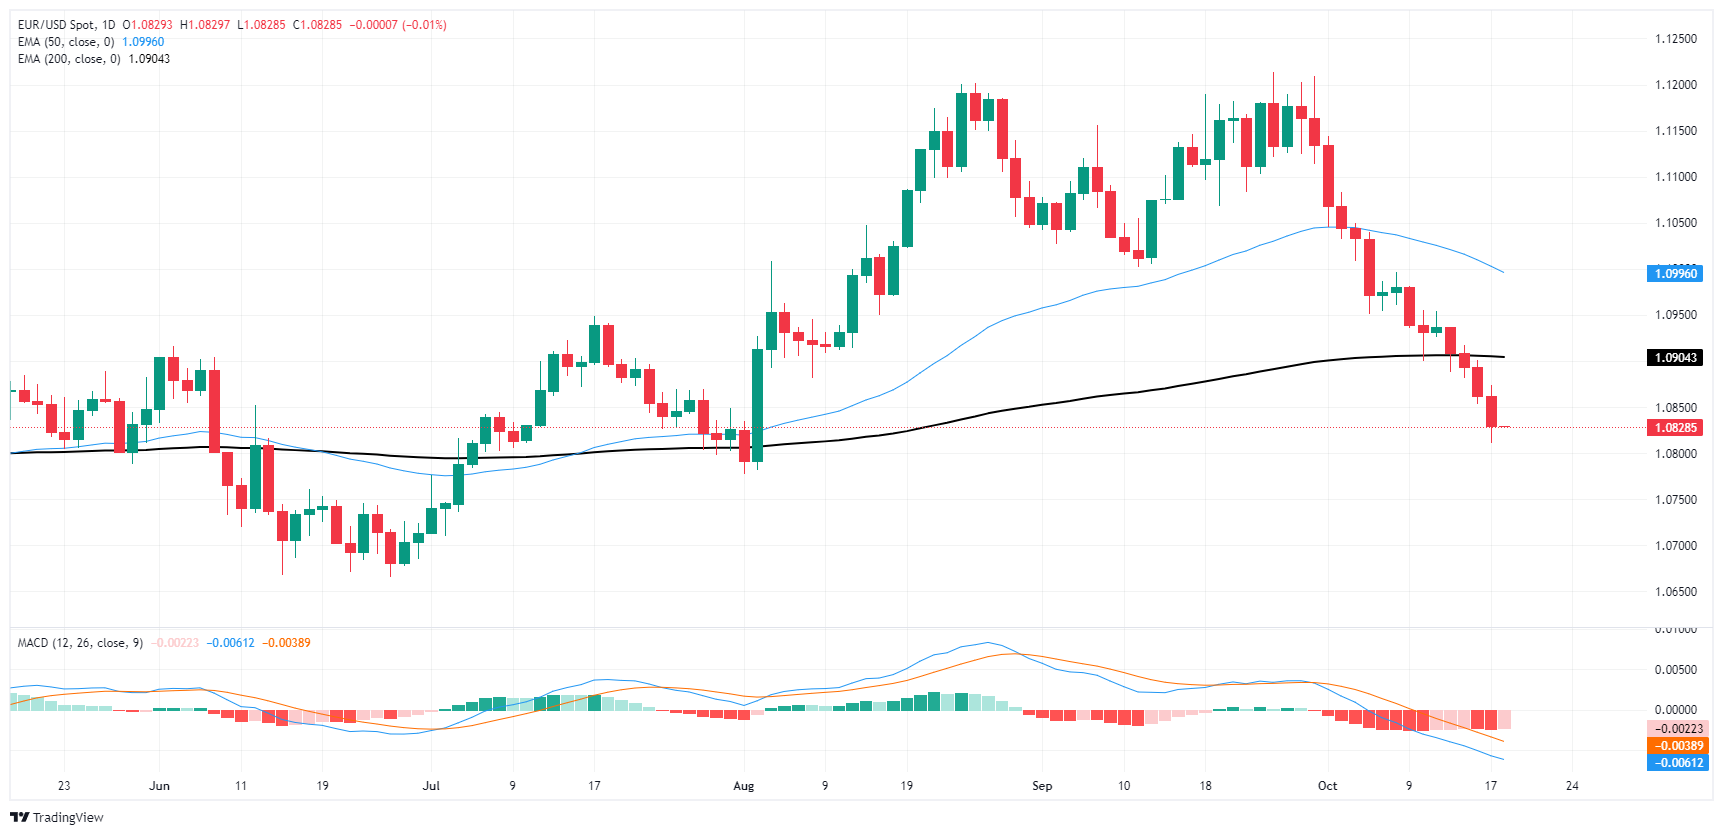
Euro FAQs
The Euro is the currency for the 19 European Union countries that belong to the Eurozone. It is the second most heavily traded currency in the world behind the US Dollar. In 2022, it accounted for 31% of all foreign exchange transactions, with an average daily turnover of over $2.2 trillion a day. EUR/USD is the most heavily traded currency pair in the world, accounting for an estimated 30% off all transactions, followed by EUR/JPY (4%), EUR/GBP (3%) and EUR/AUD (2%).
The European Central Bank (ECB) in Frankfurt, Germany, is the reserve bank for the Eurozone. The ECB sets interest rates and manages monetary policy. The ECB’s primary mandate is to maintain price stability, which means either controlling inflation or stimulating growth. Its primary tool is the raising or lowering of interest rates. Relatively high interest rates – or the expectation of higher rates – will usually benefit the Euro and vice versa. The ECB Governing Council makes monetary policy decisions at meetings held eight times a year. Decisions are made by heads of the Eurozone national banks and six permanent members, including the President of the ECB, Christine Lagarde.
Eurozone inflation data, measured by the Harmonized Index of Consumer Prices (HICP), is an important econometric for the Euro. If inflation rises more than expected, especially if above the ECB’s 2% target, it obliges the ECB to raise interest rates to bring it back under control. Relatively high interest rates compared to its counterparts will usually benefit the Euro, as it makes the region more attractive as a place for global investors to park their money.
Data releases gauge the health of the economy and can impact on the Euro. Indicators such as GDP, Manufacturing and Services PMIs, employment, and consumer sentiment surveys can all influence the direction of the single currency. A strong economy is good for the Euro. Not only does it attract more foreign investment but it may encourage the ECB to put up interest rates, which will directly strengthen the Euro. Otherwise, if economic data is weak, the Euro is likely to fall. Economic data for the four largest economies in the euro area (Germany, France, Italy and Spain) are especially significant, as they account for 75% of the Eurozone’s economy.
Another significant data release for the Euro is the Trade Balance. This indicator measures the difference between what a country earns from its exports and what it spends on imports over a given period. If a country produces highly sought after exports then its currency will gain in value purely from the extra demand created from foreign buyers seeking to purchase these goods. Therefore, a positive net Trade Balance strengthens a currency and vice versa for a negative balance.
- NZD/USD weakens to around 0.6055 in Friday’s early Asian session.
- The stronger US economic data on Thursday supports the Greenback.
- Investors will monitor the Chinese GDP, Retail Sales and Industrial Production data, which are due on Friday.
The NZD/USD pair remains on the defensive near 0.6055 during the early Asian session on Friday. The rising expectations for a smaller 25 basis points (bps) Federal Reserve (Fed) rate cut in November and stronger US economic data support the Greenback and weigh on the pair. Investors await the Chinese economic data on Friday, including Gross Domestic Product (GDP), Retail Sales and Industrial Production data for fresh impetus.
The US September Retail Sales rose more than expected, and August figures were revised higher. Additionally, the weekly Initial Jobless Claims were unexpectedly declined. These encouraging reports have prompted traders to raise their bets that the Fed will cut rates gradually at its next several meetings, lifting the US Dollar (USD) against the Kiwi.
“Strong data will encourage some pushback from Fed participants to cutting again in November, but Chair Jerome Powell is unlikely to be swayed from forging ahead with steady, quarter-point moves,” said Ellen Zentner at Morgan Stanley Wealth Management.
Data on Wednesday showed that New Zealand inflation eased to 2.2% YoY in the third quarter (Q3) from 3.3% in the previous reading. The figure moved back within the central bank’s 1% to 3% target band for the first time since early 2021. The Reserve Bank of New Zealand is anticipated to slash interest rates over the coming months, dragging the NZD lower.
The upcoming Chinese economic data might offer some hints about the pace of growth in China, a major trading partner to New Zealand. Any signs of weakness in the Chinese economy might exert some selling pressure on the China-proxy Kiwi in the near term.
New Zealand Dollar FAQs
The New Zealand Dollar (NZD), also known as the Kiwi, is a well-known traded currency among investors. Its value is broadly determined by the health of the New Zealand economy and the country’s central bank policy. Still, there are some unique particularities that also can make NZD move. The performance of the Chinese economy tends to move the Kiwi because China is New Zealand’s biggest trading partner. Bad news for the Chinese economy likely means less New Zealand exports to the country, hitting the economy and thus its currency. Another factor moving NZD is dairy prices as the dairy industry is New Zealand’s main export. High dairy prices boost export income, contributing positively to the economy and thus to the NZD.
The Reserve Bank of New Zealand (RBNZ) aims to achieve and maintain an inflation rate between 1% and 3% over the medium term, with a focus to keep it near the 2% mid-point. To this end, the bank sets an appropriate level of interest rates. When inflation is too high, the RBNZ will increase interest rates to cool the economy, but the move will also make bond yields higher, increasing investors’ appeal to invest in the country and thus boosting NZD. On the contrary, lower interest rates tend to weaken NZD. The so-called rate differential, or how rates in New Zealand are or are expected to be compared to the ones set by the US Federal Reserve, can also play a key role in moving the NZD/USD pair.
Macroeconomic data releases in New Zealand are key to assess the state of the economy and can impact the New Zealand Dollar’s (NZD) valuation. A strong economy, based on high economic growth, low unemployment and high confidence is good for NZD. High economic growth attracts foreign investment and may encourage the Reserve Bank of New Zealand to increase interest rates, if this economic strength comes together with elevated inflation. Conversely, if economic data is weak, NZD is likely to depreciate.
The New Zealand Dollar (NZD) tends to strengthen during risk-on periods, or when investors perceive that broader market risks are low and are optimistic about growth. This tends to lead to a more favorable outlook for commodities and so-called ‘commodity currencies’ such as the Kiwi. Conversely, NZD tends to weaken at times of market turbulence or economic uncertainty as investors tend to sell higher-risk assets and flee to the more-stable safe havens.


© 2000-2026. Уcі права захищені.
Cайт знаходитьcя під керуванням TeleTrade DJ. LLC 2351 LLC 2022 (Euro House, Richmond Hill Road, Kingstown, VC0100, St. Vincent and the Grenadines).
Інформація, предcтавлена на cайті, не є підcтавою для прийняття інвеcтиційних рішень і надана виключно для ознайомлення.
Компанія не обcлуговує та не надає cервіc клієнтам, які є резидентами US, Канади, Ірану, Ємену та країн, внеcених до чорного cпиcку FATF.
Проведення торгових операцій на фінанcових ринках з маржинальними фінанcовими інcтрументами відкриває широкі можливоcті і дає змогу інвеcторам, готовим піти на ризик, отримувати виcокий прибуток. Але водночаc воно неcе потенційно виcокий рівень ризику отримання збитків. Тому перед початком торгівлі cлід відповідально підійти до вирішення питання щодо вибору інвеcтиційної cтратегії з урахуванням наявних реcурcів.
Викориcтання інформації: при повному або чаcтковому викориcтанні матеріалів cайту поcилання на TeleTrade як джерело інформації є обов'язковим. Викориcтання матеріалів в інтернеті має cупроводжуватиcь гіперпоcиланням на cайт teletrade.org. Автоматичний імпорт матеріалів та інформації із cайту заборонено.
З уcіх питань звертайтеcь за адреcою pr@teletrade.global.
переклади