- Аналітика
- Новини та інструменти
- Новини ринків
Новини ринків
The former Bank of Japan (BoJ) policy board member Makoto Sakurai stated in an interview on Thursday that the central bank may scrap negative interest rates by the end of this year to adjust the currently excessive level of monetary easing.
Key quotes
“They could do it at any time and it won’t be a surprise, given the current economic recovery”
“The BOJ has appeared cautious, but they have steadily taken policy actions at a faster pace than expected”
“Changing the negative rate would lead to slight changes in the shape of the yield curve,”
“But the overall curve has already risen so it’s okay for the furthest part of short-term rates to increase.”
“There is too much extraordinary monetary easing now,”
“The problem with that is it does unnecessary things like continuing to expand the BOJ’s balance sheet.”
Market reaction
USD/JPY remains flat following the above comments from the former BoJ policymaker. At the time of press, the pair was down 0.04% on the day at 149.86.
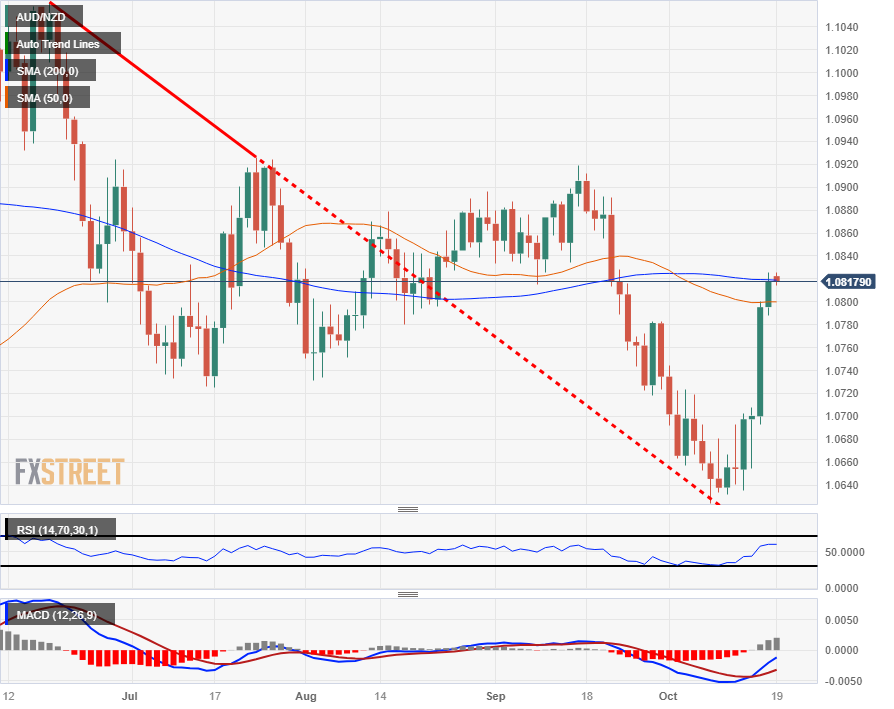
- The Aussie has rebounded firmly against the Kiwi in recent days, climbing nearly 2% from October's low.
- Despite the gains, the AUD's momentum could evaporate quickly with the pair stuck in familiar midrange territory.
- Thursday sees a fresh round of Aussie labor data which could kick off the next leg.
The AUD/NZD heads into a Thursday market session with Australian labor data on the cards, and investors will be looking for the Australian Unemployment Rate to hold steady at 3.7% for September, while the Aussie Employment change is expected to add at least 20K jobs in September compared to August's 64.9K.
Late Thursday will also see New Zealand Trade Balance figures as the Kiwi heads into the early Friday trading window, and Kiwi bidders will be hoping for a bounce in the headline annualized reading for September, which last came in at $-15.54B.
AUD/NZD Technical Outlook
The Aussie has rebounded firmly against the Kiwi as the NZD flubs market value, sending the AUD/NZD into median prices at the 200-day Simple Moving Average (SMA), with September's last swing high at 1.0918.
The Antipodean currency pair remains relatively on-balance for 2023 as the two currencies jockey but struggle to meaningfully develop long-term momentum in either direction. A technical floor has been priced in from the last swing low into 1.0640.
AUD/NZD Daily Chart
AUD/NZD Technical Levels
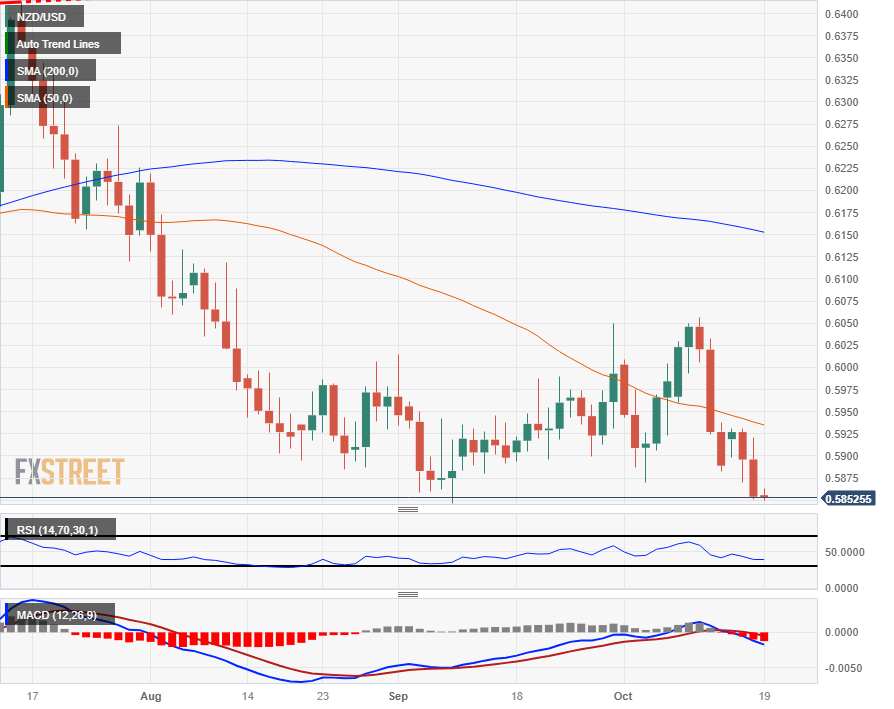
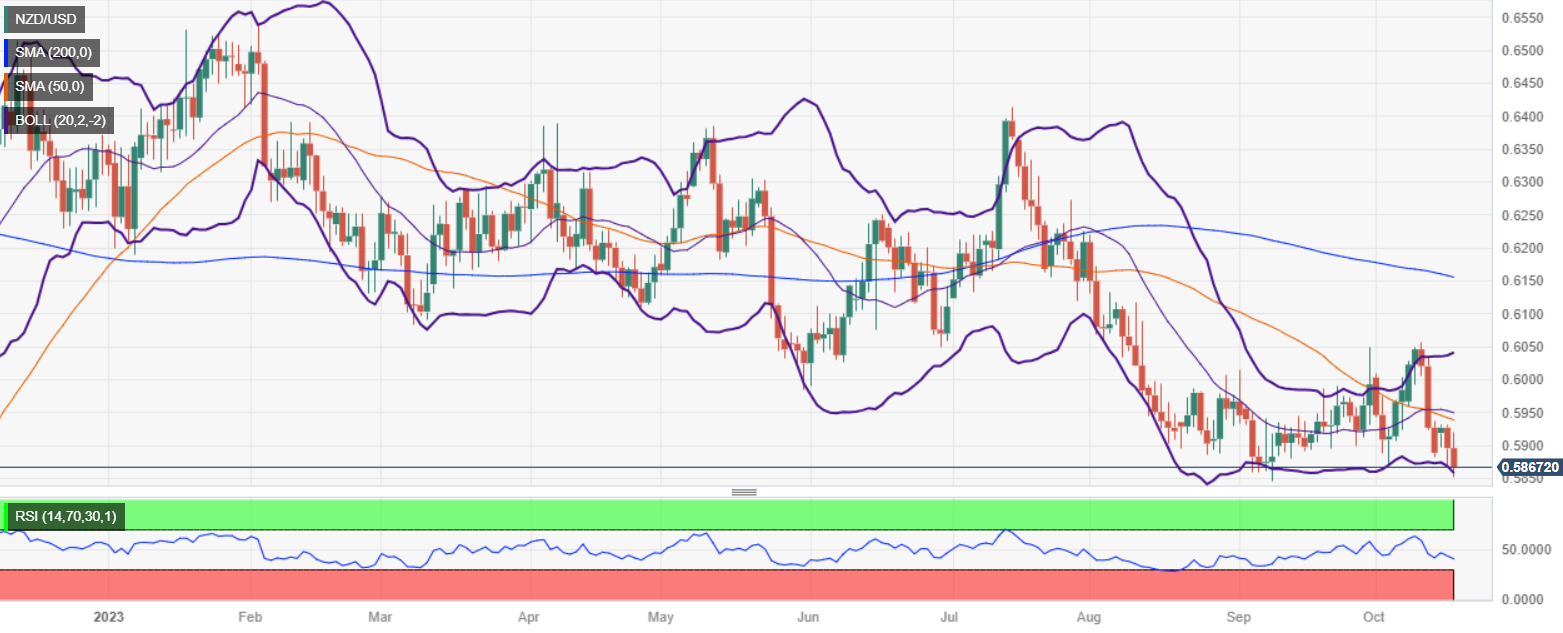
- The NZD/USD is trading into the floor, inches away from setting a new low for 2023 below 0.5846.
- Market sentiment has receded as investors see jitters over geopolitical tensions.
- Markets looking ahead to Fed Powell appearance later on Thursday, followed by NZ Trade Balance figures.
The NZD/USD slipped even further on Wednesday, declining into 2023's lows and set for a new yearly low below 0.5846.
Broad-market sentiment turned firmly risk-off on the trading day, and the Kiwi heads into the Thursday market session pinned to the floorboards.
The Gaza Strip conflict between Israel and Hamas continues to weigh on geopolitical stability concerns for the Middle East, with market tensions rising after a hospital explosion left over 500 civilians dead. Both Israel and Hamas have pointed fingers at the other, with Hamas claiming an Israeli targeted air strike demolished the building while Israel is blaming an errant Hamas missile.
The US Congress remains frozen in place, unable to elect a new Speaker of the House after Congressional Republicans ejected their own Speaker from the position. Congress has faced down to unsuccessful votes in two days trying to find a replacement, log-jamming government procedure and rattling investors with the US set to run into another funding standoff in four weeks.
Thursday brings US Initial Jobless Claims for the week into October 13th, and markets are expecting to see a small uptick in the number of new unemployment applicants, from 209K to 212K.
Later in the day Federal Reserve (Fed) Chair Jerome Powell will be delivering talking points at a luncheon hosted by the Economic Club of New York, and late Thursday will see New Zealand Trade Balance figures as NZ heads into the Friday early market session.
Kiwi investors will be hoping for an improvement in the headline Trade Balance for the annualized period into September, which last showed a $-15.54B undershoot in August.\
NZD/USD Technical Outlook
The Kiwi remains woefully underbid, testing into 2023's lows and set for a break of the year's bottom bids, and Kiwi price action continues to follow a declining 50-day Simple Moving Average (SMA) further down the charts.
A bearish continuation into fresh lows for the year will see the way open up for an extended decline into 2022's lows far below at 0.5511, while a bullish recovery will still face long-term technical resistance from the 200-day SMA currently rolling over into bearish acceleration from 0.6152.
NZD/USD Daily Chart
NZD/USD Technical Levels
Federal Reserve (Fed) Governor Michelle W. Bowman commented at a Fed Listens event on Thursday that inflation in the US has come down but is still too high.
Key quotes
“What has been somewhat surprising, however, is that the relative strength in goods spending has persisted, rather than reverting to its pre-pandemic trends.”
“This pattern we see in the US is also unusual relative to other advanced economies, where the composition of goods versus services spending appears to have returned to historical norms.”
Market reaction
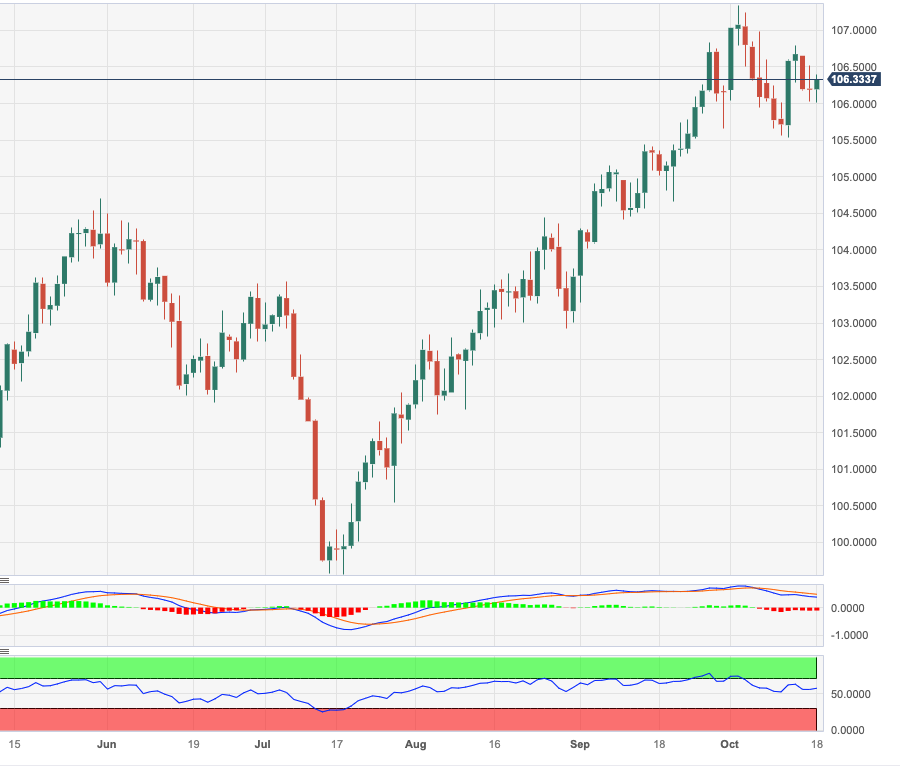
At the time of press, the US Dollar Index was down 0.02% on the day at 106.54.
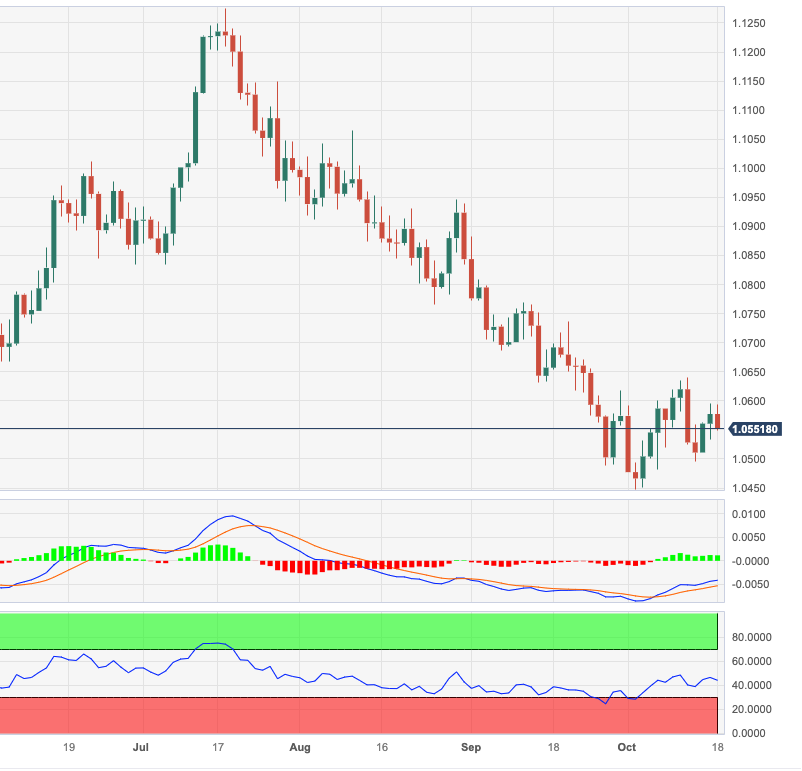
- EUR/USD remains on the defensive around 1.0538 amid the rising US Treasury yields.
- The US housing data showed mixed results on Wednesday.
- The Eurozone Harmonized Index of Consumer Prices (HICP) came in at 0.3% in September, as expected.
- US Jobless Claims, the Philly Fed index, the Federal Reserve Chair Powell’s speech will be closely watched events.
The EUR/USD pair struggles to gain and resumes its downside during the early Asian session on Thursday. The escalating geopolitical tension between Israel-Hamas and higher US Treasury bond yield exert some selling pressure on the pair. EUR/USD currently trades around 1.0538, up 0.01% for the day.
Meanwhile, the US Dollar Index (DXY), a measure of the value of the USD relative to a basket of foreign currencies, resumes its upward path, rising to 105.55. US Treasury yields edge higher, with the 10-year Treasury yield surging to 4.911%, the highest level since 2007.
That being said, a rise in bond yield and the cautious mood in the market boost the US Dollar (USD) broadly. Additionally, the Fed speakers reiterated their preference to keep rates on hold, their comments lift the US bond yields higher amid robust momentum in US growth.
The US housing market revealed mixed results on Wednesday. Building Permits fell to 1.475M in September, above the estimated of 1.45M, while Housing Starts rose to 1.35M, below the market consensus of 1.38M. However, there was nothing in the data to convince the FOMC to abandon its current guidance. According to the Beige Book, economic activity showed "little to no change" between September and early October.
The Harmonized Index of Consumer Prices (HICP) in the Eurozone released by Eurostat came in at 0.3% in September, data published by Eurostat showed Wednesday. The European Central Bank (ECB) President Christine Lagarde remarked that underlying inflation remains strong and wage growth remains historically high.
Market players will focus on the US Jobless Claims and the Philly Fed index. The Federal Reserve Chair Powell is also scheduled to speak. On the Euro docket, the Eurozone Current Account for August will be released. These events could give a clear direction to the EUR/USD pair.
- USD/CHF bounces off the 50-DMA support at 0.8957, currently trading near 0.8987.
- The 200-DMA at 0.9014 is a significant resistance, capping the pair's upside.
- Slowing inflation in Switzerland initially boosted the pair towards 0.9200.
- A recent decline in US bond yields, combined with a double-top pattern, has pressured the pair downwards.
The USD/CHF extended its losses towards the 50-day moving average (DMA) at 0.8957, though bounced off at that level, and finished Wednesday’s session at around 0.8987, capped on the upside by the 200-DMA. As Thursday’s Asian session begins, the major exchanges hands at 0.8987, almost flat.
Revisiting the USD/CHF after a week's absence, the pair trades in between the 50 and 200-DMA, with the latter at around 0.9014, exerting downward pressure on the pair. As inflation in Switzerland continued to slow down, traders bought the pair, lifting prices toward 0.9200. But the recent fall in US bond yields sparked the major’s recent leg down, coupled with a double-top chart pattern.
Given the backdrop, the USD/CHF pair is trading sideways. A break below the 50-DMA would expose the 0.8900 figure, followed by a September 11 swing low test of 0.8893. On the other hand, if USD/CHF reclaims the 200-DMA, the pair could rally and test the latest cycle high of 0.9088 before launching an attack toward the month-to-date (MTD) high of 0.9245.
USD/CHF Price Action – Daily chart

USD/CHF Technical Levels
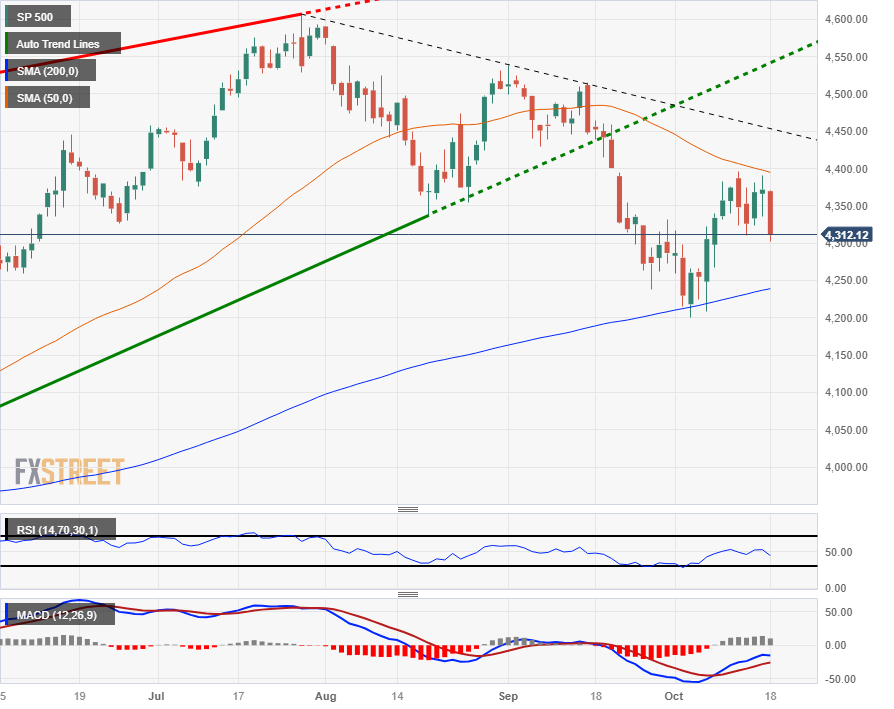
- US equities see red for the mid-week as risk sentiment sours on Wednesday.
- Risk appetite is slumping as US Treasury yields rock into highs not seen in over a decade and a half.
- Middle East geopolitical concerns and a frozen US Congress are souring risk appetite.
The Standard & Poor's (S&P) 500 major equity index tumbled 58.60 points on Wednesday, closing down 1.34% to finish the day at $4,314.60 after broad-market risk appetite soured through the trading day, with investors pushed back into safe havens as the Gaza conflict escalation and a logjammed US Congress weigh on sentiment.
Geopolitical tensions around the Israel-Hamas conflict in the Gaza Strip continue to pin into the high end following a hospital explosion that claimed 500 civilians and left Israel and Hamas pointing the finger at the other over who was responsible for the deadly attack.
Wednesday's risk-off flows saw US equities fall across the board, with the Dow Jones Industrial Average (DJIA) falling 0.98% to close down 332.57 points at $33,665.08. The NASDAQ Composite saw deep red for Wednesday as tech stocks took the hardest hit of the day, with the tech index down 1.62% into $13,314.30, declining 219.44 points.
US Treasury yields rose with the 10-year T-note climbing above 4.9%, tipping into 4.928%, the 10-year's highest yield since early 2007.
Rate cost hikes are seeing spillover into other sectors with the popular US 30-year fixed mortgage median rate hitting 8% for the first time since 2000, a 23-year high.
Earnings season on Wall Street is seeing some grey clouds in an otherwise sunny profit reporting season, with 78% of earnings reports beating expectations.
Wednesday's biggest reporting losers include United Airlines which slid nearly 10% and Morgan Stanely which fell nearly 7% in its single worst trading day since 2020.
Headline earnings reporters for the rest of the day will be Netflix and Tesla, both of which report after the closing bell.
The US is facing political jitters as the US Congress remains frozen as US politicians struggle to elect a new Speaker of the House after previous Speaker Kevin McCarthy was ejected from the position by his own political party. Two failed votes in as many days leaves Congress hamstrung and unable to perform governance duties, and investors have one eye turned to the temporary funding stopgap that was delivered in the eleventh hour of the last funding standoff that froze Congress just a few weeks ago.
The temporary government funding measure is set to expire in only four weeks.
S&P Technical Outlook
The S&P's failed jumpstart into the 50-day Simple Moving Average (SMA) has the equity index set to face the $4,300 major handle just below current price action, and an extended decline will see the S&P taking a run at the 200-day SMA just past the $4,250 key level, which the index last rebounded from in early October.
on the top side, a descending trendline from July's peak of $4,607 is firming up, with lower highs firming up a short-side trend pattern in the medium-term.
S&P Daily Chart
S&P Technical Levels
- EUR/JPY declined to a daily low of 157.70, near the 20-day SMA and then closed at 157.96.
- Despite the correction, indicators suggest that the bulls have a slight upperhand in the short term.
- The 100 and 20-day SMAs seem to be converging to perform a bullish cross.
The EUR/JPY’s buyers seem to be taking profits on Wednesday, and the cross initially declined to a low of 157.70 and then closed at 157.86, holding above the key level of the 20-day Simple Moving Average (SMA). In line with that, indicators point towards a neutral to bullish outlook as the bulls need gather momentum as the cross contains sideways trade since the beginning of September.
The Relative Strength Index (RSI) on the daily chart printed a negative slope, still above its midline, while the Moving Average Convergence (MACD) exhibits decreasing green bars, suggesting that the bulls are struggling to gather momentum. On the four-hour chart, the RSI declined to negative territory. At the same time, the MACD is seen laying out flat red bars, which suggests that there is no evidence of strong bullish momentum in the shorter time frames and that the cross may consolidate Monday and Tuesday’s gains in the next sessions while traders await fresh fundamental catalysts to set their short-term trajectory. Back to the daily chart, the pair is above the 20,100 and 200-day Simple Moving Averages (SMA), which suggests that the bulls are in command on the broader scale.
Support levels: 157.50 (20-day SMA), 157.00, 156.50.
Resistance levels: 158.50, 159.00, 159.50.
EUR/JPY Daily Chart
-638332624476997907.png)
- Rising geopolitical tensions in the Middle East contribute to risk aversion, weighing on the Aussie Dollar.
- The AUD/JPY formed a dark-cloud-cover chart pattern indicating potential bearish momentum.
- Immediate support is identified at the top of the Ichimoku Cloud (Kumo) at 94.30, followed by the psychological level of 94.00.
AUD/JPY extends its losses for two straight days as Thursday’s Asian session begins, with the pair exchanging hands at around 94.94. On Wednesday, risk aversion dented demand for Aussie Dollars (AUD) amid growing tensions in the Middle East conflict, as the cross-pair printed losses of 0.36%.
From a technical standpoint, the AUD/JPY is trading sideways, trapped within the 94.00/95.00 range, unable to crack the top or the bottom. Price action in the last couple of days printed a dark-cloud-cover chart pattern, suggesting that further downside is expected.
In that case, AUD/JPY first support emerges at the Ichimoku Cloud (Kumo) fop at 94.30 before slumping to 94.00. Once those two levels are cleared, the cross-pair next support emerges at the October 3 swing low of 93.01, before dropping towards the July 28 swing low of 91.97.
On the flip side, AUD/JPY buyers must reclaim the 95.00 mark, if they would like to challenge the September 29 swing high of 96.92, before challenging the year-to-date (YTD) high of 97.67.
AUD/JPY Price Action – Daily chart

AUD/JPY Key Technical Levels
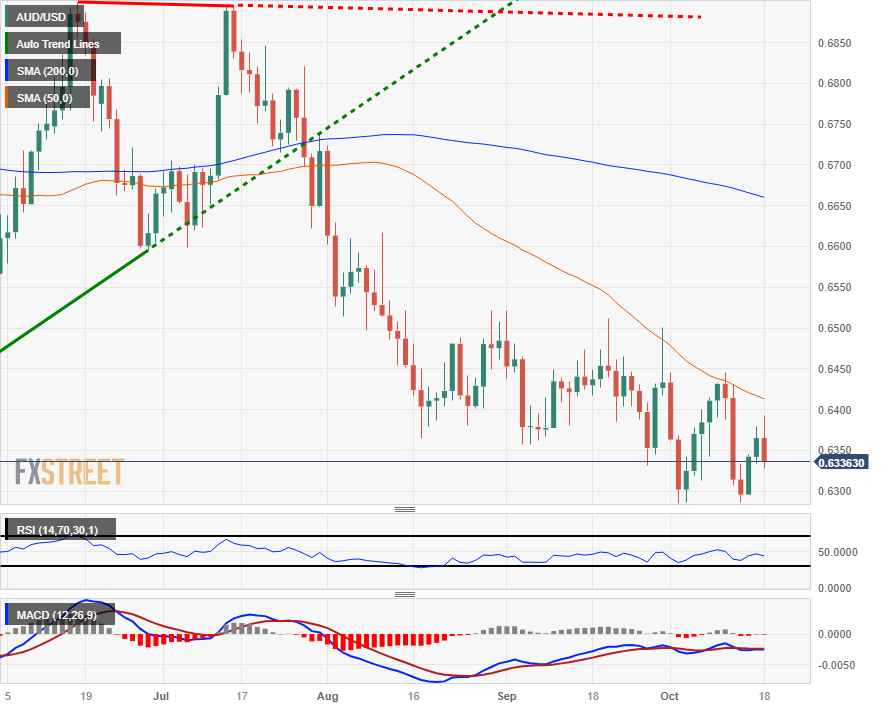
- The AUD/USD is backsliding into 0.6335 after Wednesday markets saw risk appetite evaporate.
- Investor confidence is souring as the Gaza conflict weighs on global sentiment and the US barrels towards yet another debt deadline standoff.
- Aussie traders will be looking ahead to Thursday's Australia labor data with an appearance from Fed Chair Powell on the cards.
The AUD/USD saw an early climb into a daily high of 0.6393 following hawkish, infaltion-fighting comments from Reserve Bank of Australia (RBA) Governor Michelle Bullock early Wednesday, but the bidding momentum would prove to be short-lived as broader market sentiment took a turn for the bearish, sending the AUD/USD back into 0.6330 as investors shake out of risk assets.
RBA’s Bullock: A bit more worried about the inflation impact from supply shocks
The Gaza Strip conflict continues to escalate after a rocket attack on a hospital in Gaza killed over 500 civilians, and both Israel and Hamas have exchanged accusatory barbs for the building explosion.
The US Congress remains hamstrung after two votes in as many days failed to establish a new Speaker of the House after previous Speaker Kevin McCarthy was dumped from the position by his own Republican party. Gridlock on selecting a new Speaker after two weeks of Congressional inactivity on governance duties sees investors concerned that the US could be racing into yet another funding partisan battle after the last one saw only a temporary stopgap funding measure, which is set to expire in four weeks' time.
US Treasuries are climbing into highs over a decade old, with the 10-year T-note hitting 4.928% on Wednesday, its highest since early 2007.
Forex Today: Gold jumps despite Dollar strength, focus turns to Australian jobs and Powell
Thursday will bring a fresh round of Australian Jobs figures, with the Aussie Unemployment Rate expected to hold at 3.7% for September, while investors will be looking for the Employment Change to add at least 20K jobs for the month, compared to August's 64.9K jobs addition.
On the US side, Initial Jobless Claims are forecast to tick slightly higher, with 212K new claimants expected for the week into October 13th compared to the previous week's 209K.
Federal Reserve (Fed) Chairman Jerome Powell is slated to give a speech later on Thursday. Fed Chair Powell will be delivering talking points at the Economic Club of New York's Luncheon.
AUD/USD Technical Outlook
The Aussie's bearish tip-over on Wednesday reaffirms the AUD/USD's downside bias, with the pair routinely facing rejection from a descending 50-day Simple Moving Average (SMA), which is currently painting into the 0.6400 handle on daily candlesticks.
The Aussie remains firmly in bear country for 2023, trading far below the 200-day SMA near 0.6650.
With the AUD/USD's 2023 lows sitting close by at 0.6285, a bearish continuation will see the pair pushed even deeper into red for the year, and the Aussie is trading into incredibly dark waters, down around 11.5% from the year's highs of 0.7157 set back in February.
AUD/USD Daily Chart
AUD/USD Technical Levels
The key event during the Asian session is the Australian employment report. Japan will release trade data, and China will update house prices. Later in the day, market participants will closely monitor the US Jobless Claims and the Philly Fed index. Federal Reserve Chair Powell is due to speak.
Here is what you need to know on Thursday, October 19:
The positive market sentiment that followed bright economic data from China was offset by rising tensions in the Middle East, higher yields and crude oil prices. The Dow Jones lost 0.98%, and the Nasdaq declined by 1.62%. Meanwhile, the price of WTI crude oil rose by 1.70%.
The risk-off sentiment and stronger US yields pushed the US Dollar higher. The US Dollar Index (DXY) rose 0.35%, surpassing the 106.50 level. The 10-year Treasury yield climbed to 4.92%, reaching its highest level since 2007. Federal Reserve Chair Powell is scheduled to speak at the Economic Club of New York on Thursday, and his comments will be closely watched.
On Wednesday, US housing market data showed mixed figures. Building Permits dropped in September to 1.475 million, better than the expected 1.45 million, while Housing Starts rebounded to 1.35 million, slightly below the market consensus of 1.38 million. The Beige Book noted that economic activity had "little to no change" during September and early October.
Upcoming US data on Thursday includes Existing Home Sales, the Philly Fed index, and the weekly Jobless Claims report. Further signs of a robust economy and a tight labor market could keep the US Dollar in demand.
Gold initially jumped and reached $1,963, its highest level in two months, despite the moves in the bond market. The yellow metal later pulled back and settled around $1,950.
EUR/USD failed once again to rise above 1.0600 and turned to the downside, finding support around 1.0530. Risks remain tilted to the downside, but consolidation could persist if the pair remains above 1.0520.
The Pound initially rose following a higher-than-expected UK inflation reading but later gave up all its gains. GBP/USD is trading dangerously close to the key support area around 1.2120.
USD/JPY posted its highest daily close since October of last year, slightly below the 150.00 area. A rally above that area could lead to intervention from Japanese authorities, triggering volatility.
AUD/USD was rejected from above the 20-day Simple Moving Average (SMA) and reversed course near 0.6400, falling towards 0.6330. The key support level stands at 0.6285 (October lows). Australia will release the September employment report early on Thursday.
The New Zealand Dollar (NZD) lagged once again. The technical outlook for NZD/USD points to further losses, as it posted the lowest daily close in almost a year, below 0.5860.
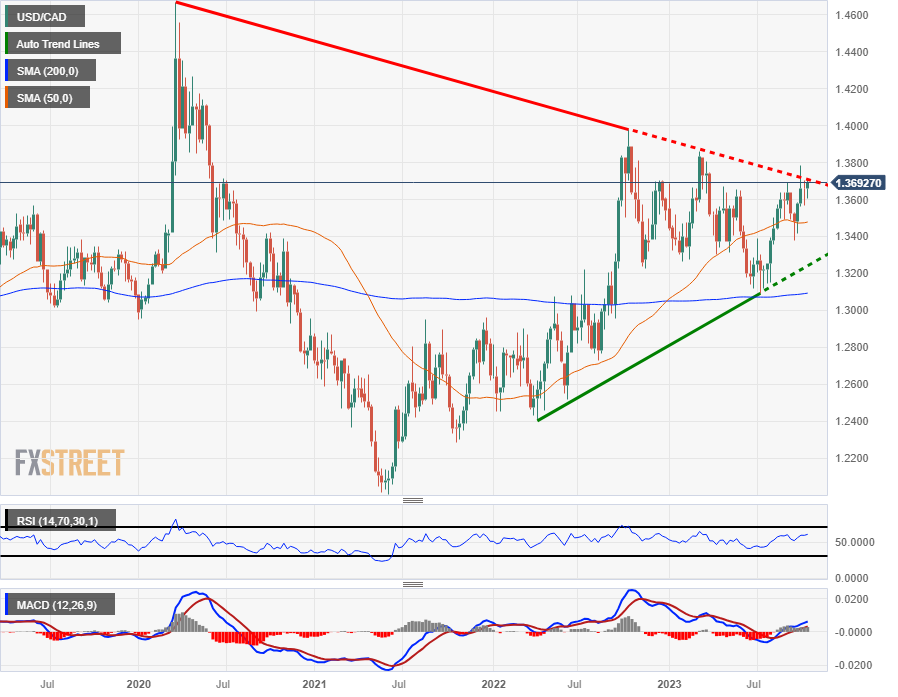
The Canadian Dollar (CAD) did not benefit from the rally in crude oil prices. USD/CAD rose above 1.3700 and closed above it, leaving room for further upside potential.
Like this article? Help us with some feedback by answering this survey:
- Spot Gold climbed further on Wednesday, extending to $1,960 as investors reversed direction.
- Global geopolitical tensions and political instability in the US are seeing market jitters rattle risk assets.
- US Treasury yields continue to climb as investor's nerves shake out, 10-year hits highest yield since 2007.
Gold bids accelerated recent gains, climbing into the $1,960 handle as tensions over the Gaza Strip conflict and a hamstrung US Congress lacking a Speaker of the House give investors cause to pause, sending markets flowing back into safe havens.
XAU/USD is settling near $1,950 heading into the market close and remains up over 1.35% for Wednesday.
Gaza conflict, paralyzed US Congress weigh on risk appetite
An explosion rocked a Gaza hospital this week leaving over 500 civilians dead that were seeking refuge in the building as the Israel-Hamas conflict continues to escalate; Hamas claimed Israel had performed a targeted air strike on the building, while Israel blames a runaway errant Hamas rocket for the building demolition.
Market participants remain uneasy about the Gaza escalation after Iranian Finance Minister Ehsan Khandouzi recently stated that Iran would not remain a passive observer if "crimes in Gaza continue", aiming criticism at Israel and the US by extension.
On the US side, the US Congress remains hamstrung and frozen on federal action as Congress failed to elect a new Speaker of the House, with two votes in two days failing to elect a successor after the former Speaker of the House Kevin McCarthy was ousted from his position by his own Republican party two weeks ago.
The deadline on a temporary funding stopgap is set to unwind in four weeks' time, and investors are growing increasingly agitated as Congress continues to float dead in the water, unable to select a new Congressional speaker. US Treasury yields have climbed, with the 10-year T-note hitting a high of 4.928% on Wednesday.
XAU/USD Technical Outlook
Spot Gold extended over the 200-day Simple Moving Average for Wednesday while also breaking through the descending trendline from May's swing high of $2,079.76.
XAU/USD has climbed rapidly in recent weeks, lifting over 7.5% from early October's swing low into $1,810.
Gold bulls will be looking to turn old resistance into support from the $1,940 level, while the $1,900 major psychological handle will hopefully turn into a major bidding platform now that XAU/USD has decisively climbed over the level.
XAU/USD Daily Chart

XAU/USD Technical Levels
- GBP/JPY struggles to surpass the previous weekly high due to geopolitical tensions and a shift to safe-haven assets.
- Support lies at the intersection of the Kumo's bottom and the Kijun-Sen at 181.20.
- Resistance is found at 183.00, with the next hurdle at the October 12 high of 183.81.
The GBP/JPY consolidates inside the Ichimoku Cloud (Kumo), registering modest losses of 0.25% after failing to crack the previous weekly high of 182.80 amid a deteriorated risk appetite. Geopolitical reasons and flight to safe-haven peers weighed on the Pound Sterling (GBP), extending its losses for two consecutive days against the Japanese Yen (JPY), exchanging hands at around 182.03, slightly below the Tenkan-Sen line.
The daily chart portrays the pair as consolidated after diving towards the October 3 swing low of 178.03, with prices climbing to the 183.80 area before settling at current exchange rates. The cross-pair trades sideways, though slightly bearish tilted, as the GBP/JPY hovers near the bottom of the Kumo, which, once broken, could exacerbate an acceleration of the downtrend.
The first support is seen at the confluence of the bottom of the Kumo and the Kijun-Sen at 181.20. If that level is taken, the GBP/JPY would dive past the next support at 181.00, with sellers eyeing the October 3 daily low of 178.03 before setting their sights on the July 28 swing low of 176.30.
On the other hand, if GBP/JPY climbs above 183.00, that would expose the October 12 high at 183.81 before buyers challenge the top of the Kumo at around 184.20/35.
GBP/JPY Price Action – Daily chart

GBP/JPY Technical Levels
- USD/SEK records more than 1% gains rising above the 20-day SMA around 11.025.
- The USD is getting traction amid risk-off flows.
- The Fed Beige Book report didn’t report any relevant insights on the US economic activity.
- Despite rising inflation, markets discount low odds of further hikes by Riksbank.
On Wednesday, the USD/SEK rose above the 20-day Simple Moving Average (SMA) for the first time since September 25, driven by a broad-based US Dollar strength. Rising hawkish bets on the Federal Reserve (Fed) and negative market sentiment are the main drivers of the green currency’s strength.
Recent economic activity figures revealed that the US economy is holding strong despite the Federal Reserve's (Fed) contractionary monetary policy, and as the bank stated that is stance is data-dependant, the odds of a 25 hike in the December meeting rose to nearly 40% after strong Retail Sales and Industrial Production figures revealed on Tuesday. Those hawkish bets could also explain the increase in US Treasury bond yields, which increased to multi-week highs and also contributed to the upward movements of the USD.
On Wednesday, the Fed’s Beige book report on the US economic activity revealed no significant changes in the outlook since the September report and described the economy as “stable”.
On the SEK’s side, the Swedish Consumer Price Index (CPI) rose to 6.5% YoY, higher than the expected 6.3% but lower than the previous 7.5% reading. As for now, markets are expecting that the Riksbank won’t hike again in 2023 after September’s increase and analysts from Commerzbank Research stated that there is no upside for the SEK for the rest of the year as the Swedish bank is not acting decisively enough to combat inflation.
USD/SEK Levels to watch
Analysing the daily chart, USD/SEK exhibits signs of bulls recovering momentum. The Relative Strength Index (RSI) jumped above 50, while the Moving Average Convergence (MACD) presents decreasing red bars. Plus, the pair is now above the 20,100 and 200-day Simple Moving Averages (SMA), indicating that on the broader scale, the bulls are in command.
Support levels: 10.993 (20-day SMA),10.900,10.808 (100-day SMA).
Resistance levels: 11.055,11.105, 11.158.
USD/SEK Daily Chart
-638332542433182946.png)
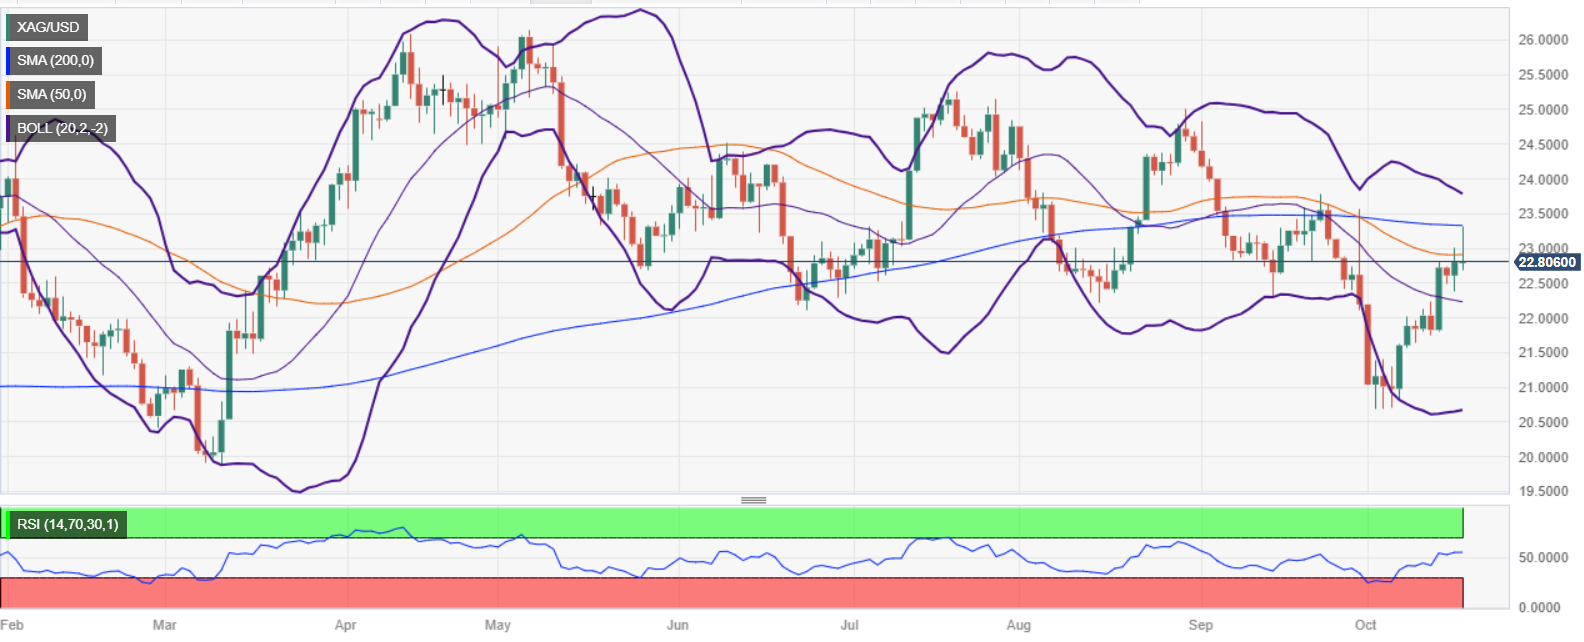
- XAG/USD trades at around $22.85, a modest gain of 0.29%.
- Supports are identified at the psychological level of $22.50, the 50-DMA at $22.85, and the 20-DMA at $22.21.
- Immediate resistance lies at the 200-DMA at $23.31, with a key hurdle at the recent cycle high of $23.76.
Silver price (XAG/USD) clings to gains although US Treasury bond yields continued to rise. However, the white-metal, failed to reclaim the 200-day moving average (DMA), leaving Silver exposed to selling pressure, but at the time of writing, exchanges hands at $22.85, gaining 0.29%.
The daily chart portrays XAG/USD as neutral-downward biased, as the market structure registers lower highs and lower lows. Even though Silver has rallied from around October lows of $20.65, the ongoing rally is an impulse, which needs to clear the latest cycle high of $23.76. to pave the way for a bullish resumption.
Consequently, as XAG/USD’s downtrend remains in place, the current uptrend offers sellers a better entry price. Silver’s first support would be the psychological $22.50 figure after the white metal dropped below the 50=DMA at $22.85. Once those two areas are cleared, the next support would emerge at the 20-DMA at $22.21, followed by the $22.00 mark. Conversely, if XAG/USD climbs past the $23.00 figure, a challenge on the 200-DMA at $23.31 is on the cards.
XAG/USD Price Action – Daily chart
XAG/USD Technical Levels
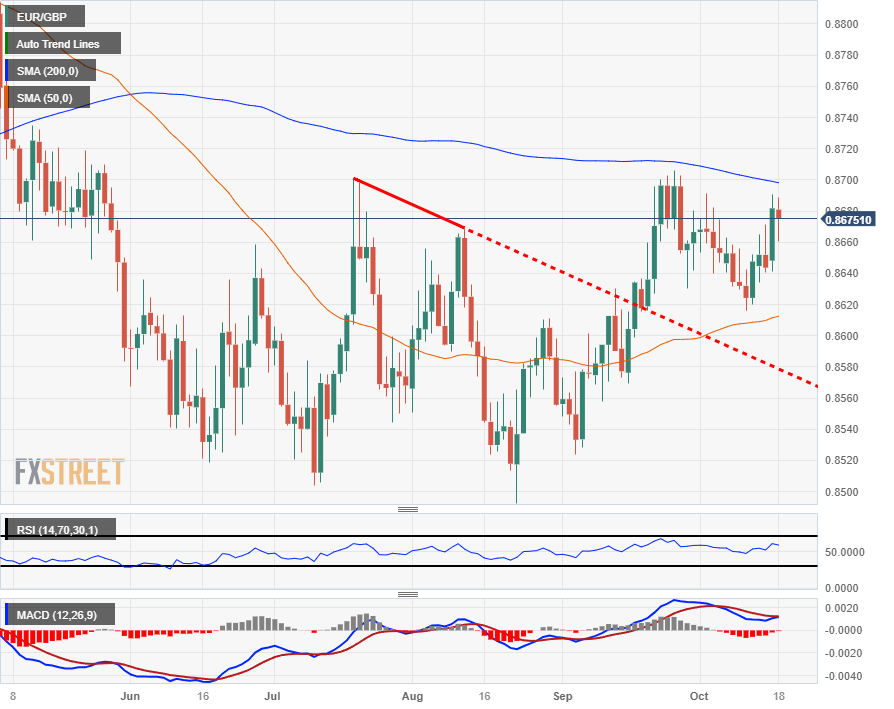
- The EUR/GBP is strung along the midrange after dipping into a low of 0.8660 on Wednesday.
- The Euro's consolidation range against the Pound Sterling remains intact as the 0.8700 handle proves elusive.
- UK inflation held over expectations, ECB's Lagarde notes high wages.
The EUR/GBP declined from the day's opening bids of 0.8680 into an intraday low of 0.8660 before rebounding into 0.8670 as the Euro (EUR) twists into the middle against the Pound Sterling (GBP).
Uk Consumer Price Index (CPI) inflation came in above expectations, holding steady at 6.7% in for the year into September versus the forecast decline to 6.5%. Month-on-month CPI inflation saw a slight uptick into 0.5% from August's 0.4%.
UK Annualized Core CPI inflation (excluding the volatility of food and energies prices) likewise came in above expectancy, with September's figure printing at 6.1% compared to August's 6.2%, against the median forecast of 6.0%.
On the EU side, the Harmonized Index of Consumer Prices (HICP) for September printed as-expected, confirming the previous number and printing at 0.3%.
European Central Bank (ECB) President Christine Lagarde hit newswires on Wednesday, noting that underlying inflation remains quite strong, with wage growth remaining "historically high". Despite the inflationary concerns, ECB President Lagarde noted that worsening demand remains a critical downside risk.
ECB’s Lagarde: Underlying inflation is still strong, wage growth is historically high
EUR/GBP Technical Outlook
The EUR/GBP pair is drifting towards the 200-day Simple Moving Average (SMA) near the top-end of medium-term consolidation at the 0.8700 handle, and the major price level is set to remain a significant cap for the Euro-Pound pairing if bidders aren't able to extend from the last bullish bounce from 0.8620.
The EUR/GBP initially fell into 0.8525 in June, and has struggled to develop a meaningful trend ever since, bouncing between 0.8525 and 0.8700.
A bullish trend correction will see the EUR/GBP set for a challenge of late April's swing high into 0.8850.
EUR/GBP Daily Chart
EUR/GBP Technical Levels
- GBP/USD trades at 1.2166, down modestly after reaching a daily high of 1.2211.
- Escalating tensions between Hamas and Israel, with Iran's intensified rhetoric, drive risk aversion, weighing on the Pound.
- Despite higher UK inflation for September ar 6.7%, odds for a BoE rate hike in early November remain subdued.
The Pound Sterling (GBP) trimmed some of its earlier losses versus the US Dollar (USD) but remained on the defensive, registering modest losses of 0.%, as the GBP/USD exchanges hands at 1.2166 after hitting a daily high of 1.2211.
Pound Sterling on the defensive despite UK inflation surpassing estimates
Risk aversion is taking its toll on risk-perceived currencies like the British Pound. Tensions between Hamas and Israel increased after a blast hit a hospital in Gaza, with Palestinians blaming the latter. Consequently, Iran escalated its rhetoric despite US President Joe Biden clarifying that it was not Israel behind the attack.
Despite solid economic data in the US, including positive Retail Sales and Industrial Production figures, the recent rhetoric from US Federal Reserve (Fed) officials has remained dovish, even with inflation running nearly twice the Fed's target. Today's US data presented a mixed picture, with September's Housing Starts rising by 7%, surpassing expectations, while Building Permits declined by -4.4%.
Given these developments, the money market has not priced a 25-basis-point rate hike for November. Instead, the focus appears to be on the January meeting, with the odds of a rate hike standing at 51.65%.
In the meantime, the UK economic docket revealed that inflation in September was higher than expected, hitting 6.7% YoY, with estimates of 6.6%. Despite that, interest rate probabilities for the Bank of England (BoE) remain lower for a rate hike in early November after the BoE kept rates unchanged in September.
GBP/USD Price Analysis: Technical outlook
From a technical perspective, the GBP/USD is neutral to a downward bias and would accelerate its downtrend if it drops below the latest swing low of 1.2122, with sellers eyeing a test of October’s swing low of 1.2037. The 1.2000 figure would be up for grabs if the pair clears that level. On the upside, buyers must reclaim the October 13 high of 1.2225 to reclaim 1.2300.
According to Federal Reserve’s Beige Book, “most Districts indicated little to no change in economic activity since the September report.” The report noted that “the near-term outlook for the economy was generally described as stable or having slightly weaker growth.”
Key Takeaways from the Beige Book:
Most Districts indicated little to no change in economic activity since the September report.
Consumer spending was mixed, especially among general retailers and auto dealers, due to differences in prices and product offerings.
Banking contacts reported slight to modest declines in loan demand. Consumer credit quality was generally described as stable or healthy, with delinquency rates still historically low but slightly increasing.
Real estate conditions were little changed and the inventory of homes for sale remained low.
Manufacturing activity was mixed, although contacts across multiple Districts noted an improving outlook for the sector.
The near-term outlook for the economy was generally described as stable or having slightly weaker growth.
Expectations of firms for which the holiday shopping season is an important driver of sales were mixed.
Labor market tightness continued to ease across the nation. Most Districts reported slight to moderate increases in overall employment, and firms were hiring less urgently.
Prices continued to increase at a modest pace overall. Districts noted that input cost increases have slowed or stabilized for manufacturers but continue to rise for services sector firms. Increases in fuel costs, wages, and insurance contributed to growth in prices across Districts.
Overall, firms expect prices to increase the next few quarters, but at a slower rate than the previous few quarters
Market reaction
The US Dollar Index remained steady after the Federal Reserve's Beige Book release, hovering around 106.40, up 0.20% for the day. EUR/USD held slightly below 1.0550.
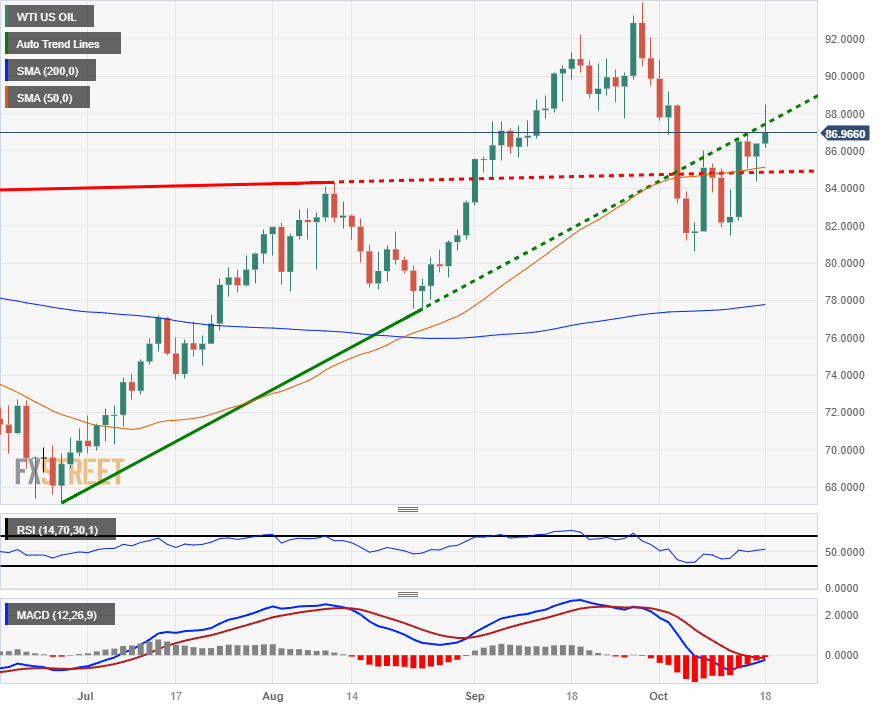
- WTI Crude Oil is seeing green for Wednesday despite broader market sentiment taking a hit.
- US Crude prices initially rose nearly $2/barrel on the day before broad-market risk aversion restrained prices.
- Middle East geopolitical tensions from the Gaza Strip escalation continue to weigh on energies.
West Texas Intermediary (WTI) Crude Oil prices are seeing further gains on Wednesday despite global markets seeing a broad turnaround into safe havens.
Following a rocket strike on a Gaza hospital that left over 500 civilians dead and both Israel and Hamas blaming the other side for devastating attack, investors are getting cold feet once more as geopolitical tensions surrounding the Gaza Strip conflict continue to draw taut.
Middle East tensions, US crude supply drawdown keeping barrel bids pushed into the green
As stability in Gaza continues to deteriorate, markets are increasingly concerned that tensions could rise to the point that the altercation could spill over into knock-on political disputes between the US and neighboring countries to the region. The nearby Strait of Hormuz, a major global energy supply chokepoint that sees a fifth of all global crude shipments, could see negative impact if geopolitical tensions continue to mount.
Adding to Crude Oil price pressures, US Crude Oil inventories reported a steeper-than-expected drawdown on Wednesday, with the Energy Information Administration's (EIA) barrel count seeing a decline of 4.491M barrels for the week into October 13th, much steeper than the forecast -0.3M drawdown and eating significantly into the previous week's 10.176M barrel buildup.
WTI Technical Outlook
WTI Crude Oil barrels touched a fresh daily high of $88.50 before slipping back into the $87.00 neighborhood as risk aversion weighs on markets, but Middle East tensions are keeping Crude prices bid into the green for Wednesday.
Daily candlesticks are struggling to shrug off the 50-day Simple Moving Average (SMA) currently parked near $85.13, and Wednesday's upside action sees WTI knocking on the underside of a rising trendline from late June's swing low into $67.14.
Despite WTI recently slipping from 2023's highs of $93.98 set back in September, Crude Oil remains in a bullish stance, with prices facing a bullish extension from the last turnaround from the $82.00 handle.
WTI Daily Chart
WTI Technical Levels
- USD/CHF declined to it lowest level since September 20, to a daily low of 0.8957.
- The Swiss currency is the best performer in the session.
- The USD holds its foot after mixed Housing market figures, eyes on the Fed’s Beige book.
In Wednesday’s session, the USD/CHF declined to its lowest level in over a month, below 0.8957 and then settled around 0.8970. On the one hand, the CHF is the top performer of the session, trading with gains against the EUR, GBP, JPY and USD. On the other hand, the green currency gained some ground ahead of the anticipated Federal Reserve (Fed) Beige book report and after mixed Housing data. On the Swiss side, nothing relevant was released during the European session.
The US Dollar measured by the DXY Index edged higher, reaching around 106.40, reflecting a modest 0.20% increase for the day. On the data front, Building Permits for September surpassed expectations at 1.475M, while Housing Starts fell short of expectations at 1.358M, showing a mixed housing scenario.
The upcoming release of the Fed's Beige Book is anticipated to offer a clearer perspective on US economic activity and labour market conditions, important for investors to continue placing their bets for the next Fed’s decisions. Meanwhile, US yields are observing a slight uptick, with the 2-year, 5-year, and 10-year rates climbing to 5.20%, 4.87%, and 4.86%, respectively, showing that markets may be gearing up for one last hike by the Fed in 2023. According to the CME FedWatch tool, the probability of a 25 basis points hike during the December meeting has risen to approximately 42%, while a pause in November is near to be priced in.
USD/CHF Levels to watch
The daily chart analysis indicates a neutral to bearish outlook for USD/CHF, as the bears show signs of taking control but still face challenges ahead.The Relative Strength Index (RSI) points south below its middle point, while the Moving Average Convergence (MACD) histogram exhibits larger red bars. Furthermore, the pair is below the 20 and 200-day Simple Moving Averages (SMAs), but above the 100-day SMA, implying that the bears have more work to do to confirm a bearish trend.
Support levels: 0.8950, 0.8930, 0.8900 (100-day SMA).
Resistance levels: 0.9015 (200-day SMA), 0.9040, 0.9070.
USD/CHF Daily Chart
-638332479298321915.png)
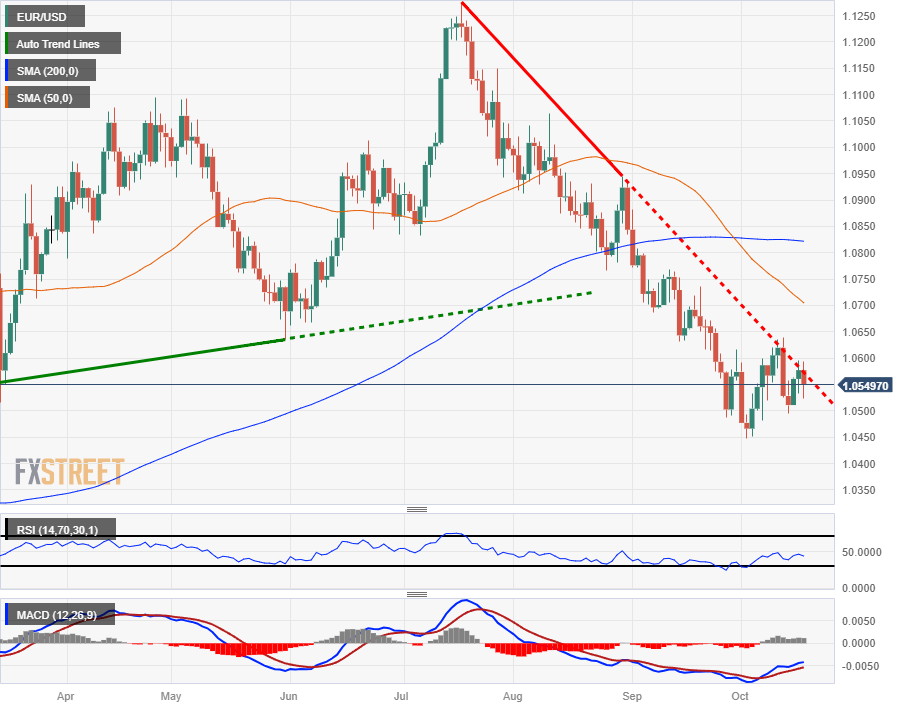
- The EUR/USD is extending its decline for Wednesday, backsliding into 1.0525.
- the EUR failed to complete a drive into the 1.0600 handle as market sentiment turns broadly lower.
- US Treasury yields are back on the rise, with the 10-year T-note yield at its highest price since 2007.
The EUR/USD kicked off Wednesday trading looking to reclaim the 1.0600 handle in the early sessions, but a resurgence of risk-off market flows has sent the Euro (EUR) back down against the US Dollar (USD), knocking the floor out of yesterday's low and testing the waters near 1.0520.
The pair is currently trading back up into 1.0550 in a relief pullback, but overall market sentiment continues to lean bearish and upside momentum is likely to remain limited.
Global tensions are rising as the Gaza Strip conflict between Israel and Hamas continues to escalate; the latest rocket strike on a hospital in Gaza sees one of the largest civilian death tolls in recent history, with over 500 shelter-seekers dead who were looking to take refuge in the hospital before a rocket struck the building. Both Israel and Hamas have blamed the other side for the building strike.
Hamstrung US Congress over failed Speaker vote making investors uneasy as funding crunch looms
In the US, political uncertainty is on the rise as the US Congress fails to select a new Speaker of the House, with two votes in two days failing to secure a nominee. With the US Congress paralyzed after the Republican majority ousted their own Speaker, the US is only 30 days away from the end of a short-term funding stopgap that was secured in the eleventh hour earlier this month.
With the US barreling towards another partisan funding clash in mid-November, uncertainty is on the rise and uneasy investors are pulling back into safe havens, propping up the USD and sending US Treasury yields into multi-year highs, with the 10-year Treasury hitting 4.928% on Wednesday, its highest yield since 2007.
EU Index of Consumer Prices (CPI) inflation figures on Wednesday came in as-expected, with September's CPI inflation coming in at 0.3%, and the European Central Bank (ECB) President Christine Lagarde noting that underlying inflation remains strong, with wage growth still "historically high".
ECB’s Lagarde: Underlying inflation is still strong, wage growth is historically high
Next up on the economic calendar will be US Initial Jobless Claims on Thursday, with investors forecasting 212K new jobless claimants for the week into October 13th, compared to 209K for the previous week.
US Federal Reserve (Fed) Chairman Jerome Powell will also be giving a speech tomorrow. Fed Chair Powell will be speaking at the Economic Club of New York Luncheon around 16:00 GMT Thursday.
EUR/USD Technical Outlook
The EUR/USD is continuing to face rejection from a firm descending trendline drawn from July's swing high at 1.1275. The pair is struggling to maintain a bullish bounce from the last major swing low into 1.0450, and a bearish continuation will see the pair set to make a new 10-month low.
Near-term resistance is coming from a bearish 50-day Simple Moving Average (SMA), currently descending into the 1.0700 chart region, while the 200-day SMA is beginning to rollover into a bearish pattern from just north of the 1.0800 handle.
EUR/USD Daily Chart
EUR/USD Technical Levels
- Geopolitical tensions escalate as Iran intensifies rhetoric against Israel, leading to heightened risk aversion.
- Mixed US data: Housing Starts rose by 7% in September, while Building Permits declined by 4.4%.
- Despite elevated inflation in New Zealand, the RBNZ is expected to maintain its current monetary policy stance..
The New Zealand Dollar (NZD) plunged to a new year-to-date (YTD) low of 0.5851 against the US Dollar (USD) on Wednesday, spurred by risk aversion and the jump in US Treasury bond yields. Geopolitical tensions underpin the Greenback to the detriment of high-beta currencies, like the Kiwi Dollar (NZD). The NZD/USD exchanges hands at around 0.5855, down 0.69%.
Kiwi Dollar faces selling pressure as risk aversion dominates
The market mood remains fragile as Wall Street registers losses. US President Biden's visit to the Middle East has failed to pour cold water into a conflict that could escalate further, as Iran’s intensified its rhetoric against Israel, as reported by Bloomberg. An explosion at a Gaza hospital re-ignited fears amongst traders of a possible escalation as global bond yields soared.
On Tuesday, US Retail Sales and Industrial Production portrayed the economy as solid, though failed to change the latest US Federal Reserve (Fed) officials dovish rhetoric, despite inflation being almost twice the Fed’s target. Today, US data was mixed, with September’s Housing Starts climbing 7%, exceeding forecasts, while Building Permits tanked -4.4%.
Given the backdrop, we could’ve expected a repricing for a hawkish Fed. Still, money market futures have disregarded a 25-bps hike for November, while December and January remain on, with the latter odds at 51.65%.
On the New Zealand front, the last Consumer Price Index (CPI) report revealed that inflation remains elevated, suggesting the Reserve Bank of New Zealand (RBNZ) would stick to its higher for a longer posture. Even though Wednesday’s Chinese data showed the economy is growing faster than foreseen, sentiment deterioration triggered outflows from risk-perceived currencies toward safe-haven peers.
NZD/USD Price Analysis: Technical outlook
The NZD/USD falling to a new YTD low opened the door for further losses, with first support seen last year’s November 22 swing low of 0.5840. A breach of the latter would expose the November 3 daily low of 0.5740, followed by October 21, 2022, a swing low of 0.5599. On the other hand, if NZD/USD stays above 0.5900, that would keep buyers hopeful of reaching the 50-day moving average (DMA) at 0.5937.
- The Canadian Dollar is falling back into familiar lows on Wednesday as investors pull up stakes.
- Canada Housing Starts came in better than expected, but risk-off flows are dominating.
- Thin calendar docket for the CAD until Friday’s Retail Sales.
The Canadian Dollar (CAD) is falling back in the American market session as risk appetite takes a turn south, sending investors back into the US Dollar (USD) and taking the USD/CAD back up the charts.
Canada Housing Starts managed to eke out a better-than-expected print, with US housing data coming in mixed, but overall market sentiment has turned risk-off mid-week, and the US Dollar is rising across the board, sending the Loonie lower in lockstep with Crude Oil prices that are declining back into the day’s opening bids.
Daily Digest Market Movers: Canadian Dollar reverses course at the midway point as risk appetite turns tail
- Canadian Housing Starts beat expectations, showing 270.5 thousand additional homes begin constructed over the year into September.
- The data easily cleared the forecast 240K, and stepped over the last reading of 250.4K (revised downwards from 253K).
- US housing data landed with mixed results, with Building Permits beating expectations but Housing Starts flubbing the forecast.
- The US issued 1.475M new building permits in September, just above the 1.45M forecast but less than August’s 1.541M (revised down from 1.543M).
- US Housing Starts disappointed markets, with 1.358M houses or apartment units beginning construction in September, less than the expected 1.38M, but still an improvement over August’s 1.269M (revised down from 1.283M).
- Thursday still sees US Initial Jobless Claims, as well as a slew of speeches from Federal Reserve (Fed) officials, including Fed Chair Jerome Powell at 16:00 GMT tomorrow.
- Crude Oil saw bidding during the early Wednesday trading session, but the American market window is seeing investors hesitate, and Oil prices are falling back to where they started.
- Global geopolitical tensions over the Israel-Hamas conflict continue to weigh on investor risk appetite.
- The US is also suffering from its own homegrown political uncertainty as the US Government struggles to replace its House Speaker who was ejected by his own party.
- US Treasury yields have hit yet another high, with the US 10-year yield at its highest yield in seventeen years near 4.92%.
Technical Analysis: Canadian Dollar falls back as traders pile back into the Greenback
USD/CAD is breaking past the 1.3700 handle on Wednesday, testing into swing high prices that have become familiar territory in recent weeks. The pair has been in a massive range for a whole year, oscillating between highs just short of 1.4000 and lows in the 1.31s. It is once again approaching the range highs.
In fact the pair is wrestling with a major trendline at around 1.3685, drawn by connecting the October 2022 and March 2023 highs, and this is likely to present tough overhead resistance. Ideally a decisive break is required to definitively put this ceiling in the rear-view mirror.
Such a break would be characterized by a longer-than-average green weekly candle breaking cleanly through the resistance line, or three successive green weekly bars.
Despite the sideways primary trend, the intermediate and short-term trends are more bullish suggesting longs have their backs to the wind. This lends a bias to more upside, and if it were not for the major resistance line there would be a green light signaling ‘go’ – as it is it could prove a spoiler.
USD/CAD Weekly Chart
Canadian Dollar FAQs
What key factors drive the Canadian Dollar?
The key factors driving the Canadian Dollar (CAD) are the level of interest rates set by the Bank of Canada (BoC), the price of Oil, Canada’s largest export, the health of its economy, inflation and the Trade Balance, which is the difference between the value of Canada’s exports versus its imports. Other factors include market sentiment – whether investors are taking on more risky assets (risk-on) or seeking safe-havens (risk-off) – with risk-on being CAD-positive. As its largest trading partner, the health of the US economy is also a key factor influencing the Canadian Dollar.
How do the decisions of the Bank of Canada impact the Canadian Dollar?
The Bank of Canada (BoC) has a significant influence on the Canadian Dollar by setting the level of interest rates that banks can lend to one another. This influences the level of interest rates for everyone. The main goal of the BoC is to maintain inflation at 1-3% by adjusting interest rates up or down. Relatively higher interest rates tend to be positive for the CAD. The Bank of Canada can also use quantitative easing and tightening to influence credit conditions, with the former CAD-negative and the latter CAD-positive.
How does the price of Oil impact the Canadian Dollar?
The price of Oil is a key factor impacting the value of the Canadian Dollar. Petroleum is Canada’s biggest export, so Oil price tends to have an immediate impact on the CAD value. Generally, if Oil price rises CAD also goes up, as aggregate demand for the currency increases. The opposite is the case if the price of Oil falls. Higher Oil prices also tend to result in a greater likelihood of a positive Trade Balance, which is also supportive of the CAD.
How does inflation data impact the value of the Canadian Dollar?
While inflation had always traditionally been thought of as a negative factor for a currency since it lowers the value of money, the opposite has actually been the case in modern times with the relaxation of cross-border capital controls. Higher inflation tends to lead central banks to put up interest rates which attracts more capital inflows from global investors seeking a lucrative place to keep their money. This increases demand for the local currency, which in Canada’s case is the Canadian Dollar.
How does economic data influence the value of the Canadian Dollar?
Macroeconomic data releases gauge the health of the economy and can have an impact on the Canadian Dollar. Indicators such as GDP, Manufacturing and Services PMIs, employment, and consumer sentiment surveys can all influence the direction of the CAD. A strong economy is good for the Canadian Dollar. Not only does it attract more foreign investment but it may encourage the Bank of Canada to put up interest rates, leading to a stronger currency. If economic data is weak, however, the CAD is likely to fall.
- The US Dollar gained traction on Wednesday and trades strong against its main rivals.
- A negative market sentiment made the USD gain interest.
- Building Permits in the US from September came in better than expected. Housing Starts disappointed.
- Investors await Fed’s Beige Book report, to be released later in the session.
The US Dollar (USD) measured by the US Dollar Index (DXY) rose towards 106.60 and seems to be building strong support around the 20-day Simple Moving Average (SMA). Earlier in the session, the US reported mixed housing data and investors await the Federal Reserve’s Beige Book to continue placing their bets on the next monetary policy decisions from the American central bank. Several Fed officials will also be on the wires during the American session.
The United States’ economic activity is holding strong revealed by the latest reports including S&P Global PMIs, Industrial Production and Retail Sales. However, the Beige Book gives a clearer outlook on the current US economic situation through interviews with key business contacts, economists, and market experts gathered by each of the 12 Federal Reserve Districts.
Daily Digest Market Movers: US Dollar gains ground as markets turn cautious ahead of Fed’s Beige Book
- The US Dollar DXY rose near 106.60, seeing 0.40% daily gains.
- Building Permits from the US from September came in at 1.475M, higher than the 1.450M but still lower than the previous 1.541M.
- Housing Starts rose in September but lower than expected, coming in at 1.358M, lower than the 1.380M but above the last reading of 1.269M.
- The Fed’s Beige Book will provide a clearer outlook on the US economic activity and labour market situation.
- In the meantime, US yields are slightly rising, and the 2, 5 and 10-year rates rose to 5.21%, 4.92% and 4.91% respectively.
- According to the CME FedWatch tool, the odds of a 25 bps hike in the December meeting rose to nearly 42%.
Technical analysis: US Dollar Index’s bulls step in and present battle at the 20-day SMA
The DXY index managed to jump back above the 20-day Simple Moving Average (SMA) of 106.25, and technical indicators gained some ground on the daily chart on Wednesday. In the broader context, the index arguably remains in a bullish trend overall, holding above the key 200 and 100-day Simple Moving Averages (SMA).
With the Relative Strength Index (RSI) pointing north above 50 and the Moving Average Convergence Divergence (MACD) printing lower red bars – both are sending mildly supportive signals.
Supports: 106.20 (20-day SMA), 106.00, 105.80.
Resistances:106.70, 107.00, 107.30.
Risk sentiment FAQs
What do the terms"risk-on" and "risk-off" mean when referring to sentiment in financial markets?
In the world of financial jargon the two widely used terms “risk-on” and “risk off'' refer to the level of risk that investors are willing to stomach during the period referenced. In a “risk-on” market, investors are optimistic about the future and more willing to buy risky assets. In a “risk-off” market investors start to ‘play it safe’ because they are worried about the future, and therefore buy less risky assets that are more certain of bringing a return, even if it is relatively modest.
What are the key assets to track to understand risk sentiment dynamics?
Typically, during periods of “risk-on”, stock markets will rise, most commodities – except Gold – will also gain in value, since they benefit from a positive growth outlook. The currencies of nations that are heavy commodity exporters strengthen because of increased demand, and Cryptocurrencies rise. In a “risk-off” market, Bonds go up – especially major government Bonds – Gold shines, and safe-haven currencies such as the Japanese Yen, Swiss Franc and US Dollar all benefit.
Which currencies strengthen when sentiment is "risk-on"?
The Australian Dollar (AUD), the Canadian Dollar (CAD), the New Zealand Dollar (NZD) and minor FX like the Ruble (RUB) and the South African Rand (ZAR), all tend to rise in markets that are “risk-on”. This is because the economies of these currencies are heavily reliant on commodity exports for growth, and commodities tend to rise in price during risk-on periods. This is because investors foresee greater demand for raw materials in the future due to heightened economic activity.
Which currencies strengthen when sentiment is "risk-off"?
The major currencies that tend to rise during periods of “risk-off” are the US Dollar (USD), the Japanese Yen (JPY) and the Swiss Franc (CHF). The US Dollar, because it is the world’s reserve currency, and because in times of crisis investors buy US government debt, which is seen as safe because the largest economy in the world is unlikely to default. The Yen, from increased demand for Japanese government bonds, because a high proportion are held by domestic investors who are unlikely to dump them – even in a crisis. The Swiss Franc, because strict Swiss banking laws offer investors enhanced capital protection.
- USD/JPY trades above 149.80 as US 10-year Treasury bond yield hits its highest since 2007.
- Housing Starts in the US show a 7% increase, while Building Permits see a 4.4% drop.
- Fed officials adopt a neutral stance, reducing the chances of a November rate hike.
- Ex-BoJ Board member Sakurai hints at a potential end to negative rates.
The US Dollar (USD) pares its earlier losses against the Japanese Yen (JPY) and rises above the 149.80 area as the US 10-year Treasury bond yield climbs above 4.913%, its highest level since 2007. Risk aversion dominates the financial markets, though it failed to propel the Yen, as the major gains 0.05%.
US Dollar gains ground vs. Yen as risk-aversion drives the financial markets
US President Joe Biden's visit to Israel aimed to ease tensions within the Middle East spurred an escalation of the rhetoric, with Iran blaming Israel after an explosion at a Gaza hospital, which Biden clarified. Israel's chances of launching a ground attack at Gaza keep traders on edge, as portrayed by US equities posting losses while global bond yields surge.
The latest round of economic data showed that American households remain resilient amid an increase in September’s Retail Sales report. In addition, Industrial Production (IP) expansion portrays the US economy is robust. Wednesday’s economic data in the US revealed that Housing Starts rose 7% in September, while Building Permits plunged 4.4%.
Recent comments from US Federal Reserve officials show they have adopted a more neutral stance, which has diminished the chances for a hike in November, according to the CME FedWatch Tool. Nevertheless, odds for a quarter of a percent increase in January 2024 stand at 51.65%, keeping investors wary of further tightening.
On the Japanese front, an ex-Bank of Japan (BoJ) Board member, Sakurai, said the BoJ could end negative rates before tweaking the Yield Curve Control (YCC). A news article by Bloomberg reported the BoJ would upwardly revise its core inflation forecasts for fiscal years 2023 and 2024.
USD/JPY Technical Levels
It's too soon to tell if more policy rate action is needed, Federal Reserve (Fed) Governor Christopher Waller said on Tuesday and added that they can "wait, watch and see before making definitive moves on policy path," per Reuters.
Key quotes
"More action on policy rate would be needed if demand, economic activity keep up recent pace."
"Past few months' data 'overwhelmingly positive' for fed's employment, inflation goals."
"I will be watching how recently risen longer-term rates evolve and impact financial conditions, economic activity."
"I will be patient in waiting for data to document how spending evolves."
"Time will tell if higher rates dampen business spending, or subsidies and onshoring increase it."
"Anticipating unusually tight labor market to continue loosening, but watching closely."
"Will watch next several inflation reports for clearer indication it's on trajectory to 2%."
Market action
The US Dollar preserves its strength following these comments. At the time of press, the US Dollar Index was up 0.37% on the day at 106.58.
- Mexican Peso exchange rate with the US Dollar registers 0.90% gains, as USD/MXN buyers reclaim 18.00.
- Geopolitical tensions escalate with developments in the Israel-Hamas conflict and the potential involvement of Iran.
- Banxico’s Deputy Governor Mejia: Inflation would hit the central bank’s target in 2025, with the current policy stance.
Mexican Peso (MXN) remains offered early in Wednesday's North American session, particularly against the US Dollar (USD) amid a risk-off impulse spurred by threats of an escalation in the Israel-Hamas conflict. Consequently, Treasury bond yields in the United States (US) rose, lifting yesterday’s battered US Dollar. The USD/MXN trades at 18.18 after bouncing from daily lows of 17.96.
Geopolitics are taking center stage on Wednesday, after US President Joe Biden's visit to Israel. Biden said Israel was not responsible for a blast that hit a Gaza hospital contrary to Palestinian claims. His decision to back Israel’s version of events ignited tensions across the region, with Iran threatening to enter the conflict. The consequent risk aversion boosted the US Dollar, to the detriment of the emerging market currency.
Meanwhile, the lack of data in Mexico’s economic docket put the Bank of Mexico (Banxico) Deputy Governor Omar Mejia in the spotlight. In comments on a podcast, Mejia said the balance of inflation risks has not worsened, reported Reuters. The Banxico official added the current restrictive monetary policy is succeeding at curbing inflation to its target, and that it would reach Banxico’s target by the second quarter of 2025.
The US economic calendar featured Building Permits, which plummeted -4.4% compared to last month’s data, while Housing Starts improved to 7%, from August’s -12.5% plunge.
Daily Digest Market Movers: Mexican Peso sways with market sentiment; USD/MXN reaches 7-day peak
- US Retail Sales in September grew by 0.7% MoM, above forecasts of 0.3%, but trailed upward revised August’s 0.8%.
- Industrial Production rose 0.3% MoM, better than expected, and the previous month's 0.0% reading.
- Mexico’s GDP in 2023 is expected to hit 3.2%, according to the World Bank and the International Monetary Fund.
- New York Fed Empire State Manufacturing Index for October fell to -4.6, higher than forecasts of -7 but worse than September’s 1.9 expansion.
- Philadelphia Fed President Patrick Harker commented the current level of rates kept house buyers on the sideline, highlighting that the Fed is likely done hiking rates.
- According to the Financial Times, Chicago Fed President Austan Goolsbee said the fall in US inflation is not a blip.
- US Inflation expectations for one year rose from 3.2% to 3.8%, while for five years jumped to 3% from 2.8%.
- Mexico's Industrial Production (IP) for August improved by 5.2% YoY, exceeding forecasts of 4.6% and July’s 4.8% increase.
- Monthly, IP in Mexico rose 0.3%, as expected, but trailed the previous 0.5% reading.
- The US Consumer Price Index increased 3.7% YoY in September, unchanged from August but above forecasts of 3.6%.
- US core CPI dipped as expected to 4.1% from 4.3% in August.
- Mexico’s Consumer Price Index (CPI) grew by 4.45% YoY in September, slightly below the 4.47% estimated.
- The core CPI inflation in Mexico stood at a stickier 5.76% YoY, as widely estimated, but has broken below the 6% threshold.
- The Bank of Mexico (Banxico) held rates at 11.25% in September and revised its inflation projections from 3.5% to 3.87% for 2024, above the central bank’s 3% target (plus or minus 1%).
Technical Analysis: Mexican Peso outlook deteriorates, as USD/MXN buyers eye 18.50
The Mexican Peso continues to weaken against the US Dollar after the USD/MXN broke the resistance at 18.10, rallying to a new weekly high of 18.30 before retracing somewhat to current spot prices. Hence, the exotic pair bias remains bullish, and it might test the October 6 high of 18.48 before climbing towards 19.00. On the other hand, if USD/MXN dives below 18.10, traders could expect a test of the psychological 18.00 figure.
Banxico FAQs
What is the Bank of Mexico?
The Bank of Mexico, also known as Banxico, is the country’s central bank. Its mission is to preserve the value of Mexico’s currency, the Mexican Peso (MXN), and to set the monetary policy. To this end, its main objective is to maintain low and stable inflation within target levels – at or close to its target of 3%, the midpoint in a tolerance band of between 2% and 4%.
How does the Bank of Mexico’s monetary policy influence the Mexican Peso?
The main tool of the Banxico to guide monetary policy is by setting interest rates. When inflation is above target, the bank will attempt to tame it by raising rates, making it more expensive for households and businesses to borrow money and thus cooling the economy. Higher interest rates are generally positive for the Mexican Peso (MXN) as they lead to higher yields, making the country a more attractive place for investors. On the contrary, lower interest rates tend to weaken MXN. The rate differential with the USD, or how the Banxico is expected to set interest rates compared with the US Federal Reserve (Fed), is a key factor.
How often does the Bank of Mexico meet during the year?
Banxico meets eight times a year, and its monetary policy is greatly influenced by decisions of the US Federal Reserve (Fed). Therefore, the central bank’s decision-making committee usually gathers a week after the Fed. In doing so, Banxico reacts and sometimes anticipates monetary policy measures set by the Federal Reserve. For example, after the Covid-19 pandemic, before the Fed raised rates, Banxico did it first in an attempt to diminish the chances of a substantial depreciation of the Mexican Peso (MXN) and to prevent capital outflows that could destabilize the country.
The return of volatility to currency markets did not spare the Canadian Dollar from seeing some substantial movement during the month of September into early October. Economists at the National Bank of Canada analyze Loonie’s outlook.
CAD could stabilize and even appreciate in the later part of 2024
Looking at the drivers for the CAD, the short-term yield differential and still high Oil prices should be conducive to a stronger Dollar. That said, the recent risk-off USD appreciation has pushed back most major currencies. The rise of long-term yields hasn’t been accompanied by a significant reduction on the short end of the curve and leaves a lot of questions in regard to where the cycle is headed.
We believe the repricing of hikes for the Bank of Canada is likely overdone and the CAD could see an interval of weakness especially if the economy is to fall in technical recession in the coming quarters.
Our scenario also assumes difficulties for the US economy in the coming months and that should be accompanied by an easing in monetary policy by the Fed. That could set up a stabilization of the Canadian Dollar and even some appreciation in the later part of 2024.
Analysts at Natixis discuss the trends they see for the major currencies.
The Yen exchange rate depends on the BoJ's monetary policy strategy
Persistent inflation in the Eurozone will probably mean that the ECB will keep interest rates fairly high, while the Fed will be able to cut interest rates as disinflation in the US eases. This would favour an appreciation of the Euro against the Dollar, but on the other hand, the US is more attractive than the Eurozone for corporate investment: all things considered, we can expect the Euro to appreciate slightly against the Dollar.
The weak growth in China, due to population ageing, low productivity gains, rising household savings rate and weak investment, is prompting the Chinese authorities to seek a weakening of the Renminbi, hence the ongoing rate cuts in China, which will cause a depreciation of the RMB, albeit with the constraint of not doing too much damage to the financial situation of Chinese banks.
The fact that long-term interest rates remain very low in Japan, due to the yield curve control policy, should lead to a further depreciation of the Yen against the Dollar. This depreciation will end when Dollar interest rates fall and if the BoJ gradually abandons the YCC policy (the cap on 10-year interest rates), a move that is expected to start in 2024.
Economists at ING analyze AUD/USD outlook.
Eyeing new lows
We believe there is still room for another drop in AUD/USD. The new bottom may be 0.61/0.62.
The external environment remains very detrimental for the pair, which should stay under pressure unless the US data narrative flips, and that should not happen in the near term.
Improvements in Chinese sentiment are – if anything at all – very gradual.
AUD/USD – 1M 0.62 3M 0.66 6M 0.69 12M 0.72
See – AUD/USD: Limited upside potential in the coming months – Rabobank
- Silver price seems comfortable above $23.00 as Israel-Palestine conflicts deepen.
- Joe Biden remained ‘loud and clear’ that the US stands with Israel.
- Silver trades in a Rising Channel pattern in which each pullback is considered a buying opportunity.
Silver price (XAG/USD) shifts auction above the crucial resistance of $23.00, which has turned into support for bulls. The white metal strengthens as deepening conflicts between Israel and Palestine have strengthened the appeal for safe-haven assets.
The S&P500 opens on a bearish note amid a cautious market mood. The visit of US President Joe Biden to Israel has escalated fears of an intervention by Iran in the Israel-Palestine tensions. Joe Biden remained ‘loud and clear’ that the US stands with Israel. Also, Biden confirmed that the hospital in Gaza was bombed by Palestine, not by Israel.
Meanwhile, the US Dollar Index (DXY) seems well-supported near 106.00 as the United States economy is resilient despite headwinds of higher interest rates. The US Retail Sales rose by 0.7% in September while investors forecasted a growth by 0.3%. In August, the retail demand rose by 0.9%. US Census Bureau noticed that demand for automobiles and dining out remained upbeat.
For further guidance, investors will focus on the speech from Federal Reserve (Fed) Chair Jerome Powell, which is scheduled for Thursday. The guidance from Jerome Powell on the interest rates will be keenly watched.
Silver technical analysis
Silver trades in a Rising Channel chart pattern in which each pullback is considered as a buying opportunity by the market participants. Upward-sloping 20-period Exponential Moving Average (EMA) at around $23.00 indicates that the short-term trend is bullish. Horizontal resistance is plotted from September 22 high at $23.76.
The Relative Strength Index (RSI) (14) shifts into the bullish range of 60.00-80.00, which warrants more upside ahead.
Silver two-hour chart
-638332353261430669.png)
Economists at Danske Bank stress that labour markets have proven to be surprisingly resilient to the Fed’s tightening mode.
US labour markets defy slowdown expectations
We still think that the Fed is likely to maintain rates at current restrictive levels instead of hiking rates further, especially considering the recent tightening in financial conditions.
But all else equal, while we have called for the first Fed rate cuts already in Q1 2024, the most recent labour market data unequivocally increases the risk of rates staying high for longer than we have anticipated.
- EUR/USD comes under pressure following two daily advances.
- Further weakness could put the 1.0500 region back on the radar.
EUR/USD sets aside part of the positive first half of the week and revisits the 1.0550 region on Wednesday.
In case sellers regain the upper hand, the pair could put the 1.0500 neighbourhood to the test, while the loss of that region should expose a potential decline to the 2023 low at 1.0448 (October 3).
Meanwhile, further losses remain on the table as long as the pair navigates the area below the key 200-day SMA at 1.0820.
EUR/USD daily chart
- AUD/USD looks for further recovery to near 0.6400 on upbeat China data.
- US Biden said that the Pentagon has shown evidence that Israel didn’t bomb the hospital in Gaza.
- The US Dollar consolidates around 106.35 as investors shift focus to the speech from Fed Powell.
The AUD/USD pair remains on track to recapture the round-level resistance of 0.6400 in the early New York session. The Aussie asset discovered interest from buyers as upbeat China’s Gross Domestic Product (GDP) for the July-September quarter eased fears of a slowdown in the Asian economy.
Being a proxy for China’s economic prospects, the Australian Dollar strengthens against the US Dollar. China’s National Bureau of Statistics of China reported that the growth rate was 1.3% in the third quarter of 2023, significantly higher than expectations of 1.0% and the GDP growth of 0.5% in the April-June quarter. Annual GDP at 4.9%, outperformed expectations of 4.4% but remained lower than the former release of 6.3%.
Apart from the GDP data, Industrial Production was up at a steady pace of 4.5%. Annual Retail Sales expanded at a healthy pace of 5.5% in September vs. expectations of 4.9% and the August reading of 4.6%.
Meanwhile, the S&P500 opened on a negative note amid caution over US President Joe Biden’s visit to Israel to discuss over ground assault at the Gaza strip. Biden said that the Pentagon has shown evidence that Israel didn’t bomb the hospital in Gaza.
The US Dollar Index (DXY) consolidates around 106.35 as investors shift focus to the speech from Federal Reserve (Fed) Chair Jerome Powell, which is scheduled for Thursday. Major focus would be on the interest rate guidance as other Fed policymakers have been supporting keeping interest rates unchanged at 5.25-5.50% due to higher long-term US bond yields. The 10-year US Treasury yields rose to 4.85%.
The BoJ may be closer to contemplating as to whether additional flexibility in its yield curve control (YCC) policy is now desirable, economists at Rabobank report.
USD/JPY to move back to 148 in the coming quarter
Given the potential issues involved with maintaining its YCC policy at current settings and the risk that JPY weakness would accentuate any further strength in Oil prices, we see another tweak to policy as likely being on the cards in the months ahead.
While we expect that USD strength will dominate in the coming months, a policy tweak from the BoJ would likely reinforce psychological resistance in the USD/JPY 150.
Our forecast of a move back to USD/JPY 148 on a one-to-three-month view, assumes further policy normalisation by the BoJ.
In the wake of the developments in the Middle East, the Gold price has recently risen significantly and recovered its losses from the end of September/beginning of October. Strategists at Commerzbank analyze the yellow metal’s outlook.
A renewed steep increase in Oil would be likely if the military dispute in the Middle East were to escalate or widen
The Middle East conflict is currently posing a considerable upside risk. If it were to spill over into other countries in the region, the Gold price would presumably gain initially in its role as a safe haven.
If the military dispute in the Middle East were to escalate or widen, a renewed steep increase in the Oil price would be likely, which in turn would raise the risk of persistently high inflation and could then spark further rate hikes. As interest rates have already been increased noticeably, they would probably not rise as steeply as they did last year. All the same, this would certainly postpone any expectations of any interest rate cuts next year, which is what has lent support to the Gold price of late.

Source: Commerzbank Research
- DXY picks up upside traction and reverses two daily pullbacks in a row.
- The continuation of the rebound targets the 106.80 region.
DXY leaves behind the pessimism seen in the first half of the week and revisits the low-106.00s on Wednesday.
In case the bullish impulse accelerates, the surpass of the weekly high of 106.78 (October 12) could encourage the index to embark on a potential test of the 2023 top of 107.34 (October 3) in the short-term horizon.
In the meantime, while above the key 200-day SMA, today at 103.25, the outlook for the index is expected to remain constructive.
DXY daily chart
The Shekel has weakened sharply in response to the conflict between Hamas and Israel. Economists at MUFG Bank analyze ILS outlook.
Move above 4.00 level likely to prove short-lived
Recent history suggests ILS can weaken further during the conflict.
BoI intervention will help to dampen the scale of ILS sell-off.
ILS weakness could make BoI cautious about cutting rates as market expects.
Levels above 4.00 for USD/ILS have proven short-lived since the GFC. We expect ILS to rebound from weaker levels once conflict de-escalates.
The CAD dumped – but only briefly – before returning to the low 1.36s where it was before Tuesday’s data reports. Shaun Osborne, Chief FX Strategist at Scotiabank, analyzes Loonie’s outlook.
The data mix could not have been worse for the CAD
The data mix could not have been worse for the CAD on Tuesday – the Canadian CPI print came in below forecasts and US data generally bettered expectations across the board.
The September CPI results reduce the risk of near-term tightening and set the bar quite high for any additional tightening moves for the moment. But the threat of tighter policy is not entirely extinguished, given elevated wage growth and inflation expectations here.
More choppy range trade in the short run looks likely as weaker risk appetite and firmer crude oil counterbalance each other but if Tuesday’s data mix could not push funds above 1.37, it’s not clear to me what (outside of some significant shock) will.
- Housing Starts rose in September but Building Permits declined.
- US Dollar Index fluctuates in daily range above 106.00 after the data.
The monthly data published by the US Census Bureau revealed on Wednesday that Housing Starts rose 7% on a monthly basis in September, following the 12.5% decline recorded in August.
In the same period, Building Permits fell 4.4% after the 6.8% increase in August.
Market reaction
The US Dollar Index showed no immediate reaction to these figures and was last seen fluctuating in its daily range above 106.00.
Sterling is consolidating. Economists at Scotiabank analyze GBP outlook.
Losses through 1.2145 may drive GBP/USD back to the low 1.2000s
Cable gains through the 1.22 mark are not finding any follow through support and sideways consolidation that has developed in trading over the past few days is shaping up somewhat negatively for the GBP potentially (minor bear flag pattern).
Losses through 1.2145 may drive the GBP/USD pair back to the low 1.2000s.
A clear push above 1.2225 resistance is needed to lift the Pound.
The USD is trading mixed to a little firmer in broad terms. Economists at Scotiabank analyze Greenback’s outlook.
Choppy trading since late September reflects “late cycle” activity
The USD’s failure to advance on the back of stronger-than-expected data and higher yields on Tuesday supports the impression that choppy – but essentially flat – trading in the DXY since late September reflects ‘late cycle’ activity as investors consider the peak of the Fed tightening cycle and the peak in the US economy.
The lid on the DXY rally in the low 107 area is looking a little more solid.
In addition, tensions in Gaza rose further following Tuesday’s hospital blast which has inevitably triggered reactions from regional players as President Biden’s visit starts. The Senate speaker saga meanwhile limps on for another day with little prospect of a resolution and government shutdown risks increasing.
USD/CAD little changed in low 1.36s. Shaun Osborne, Chief FX Strategist at Scotiabank, analyzes the pair’s outlook.
More range trading in the near term
Short-term patterns suggest a firm block on USD/CAD around 1.3690/1.3700 and support sitting just above 1.36, the low from earlier this week.
Trend momentum signals are flat, supporting the outlook for more range trading in the near term. The USD still appears a bit more vulnerable to a downside move to me, however.
The intraday charts are setting up a possible double top pattern (1.37) which a push under 1.3605 will trigger for a move to the low 1.35 area. Major support (trend and 200-DMA) is still well below here at 1.3465, however.
- EUR/JPY comes under selling pressure around the 158.00 zone.
- The continuation of the range bound mood seems likely.
EUR/JPY reverses two consecutive daily gains and faces some downside pressure near 158.00 on Wednesday.
Considering the ongoing performance, further consolidation appears in store for the cross for the time being. In the meantime, the breakout of this range could put the September high of 158.65 (September 13) to the test ahead of the 2023 top at 159.76 (August 30).
So far, the longer term positive outlook for the cross appears favoured while above the 200-day SMA, today at 150.50.
EUR/JPY daily chart
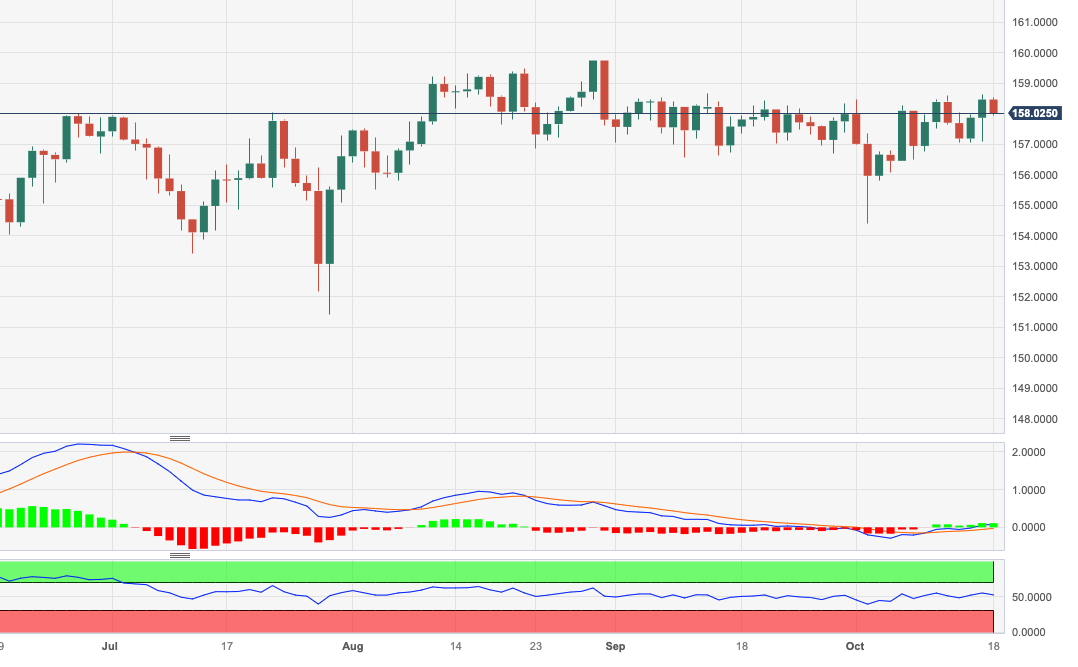
EUR/USD drifts from resistance in the upper 1.05s. Economists at Scotiabank analyze the pair’s outlook.
Bargain hunters likely to remain active on dips
EUR/USD drift from the upper 1.05s on the day suggests the pair still has some work to do in order to rally but bargain hunters are likely to remain active on dips for now.
Trend resistance off the July high for EUR/USD sits at 1.0585 today. Rejection risks tipping spot back to the low 1.05 area in the short run.
- The oil price strengthens as investors hope that US Biden’s blame on Palestine for bombing at Gaza hospital would deepen Middle East conflicts.
- Supply chain disruptions due to Israel-Palestine conflicts would dry the oil supply in an already tight oil market.
- WTI oil rises above the 50% Fibo retracement at $87.36.
West Texas Intermediate (WTI), futures on NYMEX, strengthened after the blast at the Gaza hospital in which around 500 civilians were killed provoked unrest among the general public. The oil price rose sharply to near $88.00 as conflicts between Israel and Palestine are seen worsening further.
Meanwhile, the visit of US President Joe Biden to Israel has pushed the risk-appetite theme on the backfoot. Biden blamed Palestine for hundreds of casualties after the explosion at Gaza hospital, not Israel. The visit of Biden to Jordan has been canceled as the summit has been called off due to civil unrest in Gaza.
Earlier, Iran warned Israel to stop attacks on Gaza otherwise it would not be a spectator in the war situation. The Middle East crisis would deepen if Iran intervenes in the conflicts as it will result in the disruption of the supply chain. This would dry the oil supply in an already tight oil market.
Going forward, investors will focus on the oil inventory data for the week ending October 13, which will be released by the Energy Information Administration (EIA). As per the estimates, oil stockpiles were drawn by 0.3 million barrels last week.
WTI oil rise above the 50% Fibonacci retracement plotted from (September 28 high around $94.00 to October 06 low at $80.36) at $87.36. The 50-period Exponential Moving Average (EMA) at $85.65 continues to provide support to the oil price bulls.
The Relative Strength Index (RSI) (14) shifts into the bullish range of 60.00-80.00, ensuring more upside ahead.
Fresh upside would appear if the oil price will break above 61.8% Fibo retracement around $89.00, which will expose the asset to the psychological resistance at $90.00, followed by October 2 high at $92.10.
In an alternate scenario, a breakdown below October 6 low at $80.63 would expose the asset to August 29 low at $79.21 and August 24 low at $77.53.
WTI two-hour chart
-638332244706226828.png)
- The Greenback heads lower for a third day in a row.
- It’s all about the housing market this Wednesday on the macro front.
- The US Dollar Index is undergoing a squeeze to the downside.
The US Dollar (USD) is being torn in two camps this week. On the one hand, traders appreciate the Greenback as the situation in the Middle-East grows less certain. On the other hand, the local macroeconomic numbers are starting to lose their shine and point to the possible start of a recession for the US. Either way, the US Dollar itself is moving in tight ranges and is heading lower on the US Dollar Index (DXY) for a third day in a row.
On the data front, traders can get their hands dirty on some housing data: the Building Permits and Housing Starts are due on Wednesday. Do not expect market moving triggers but rather confirmation if the recent weakness in the US Dollar is granted. The USD might even see a little continuation of that momentum. Additionally, three US Federal Reserve speakers are set to shed light on the US monetary stance.
Daily digest: US Dollar sees two camps
- Biden has landed in Tel Aviv, Israel, at the start of the European trading session. Markets will be on the lookout for any supportive language from US President Joe Biden in terms of military support or actions. Meanwhile, more and more headlines emerge on who bombed the Palestinian hospital that killed hundreds of civilians.
- At 11:00 GMT, the Mortgage Bankers Association has issued the weekly Mortgage Applications for last week. Previous print was at 0.6% and got revised to 0%.
- At 12:30 GMT, a slew of data gets released: the Building Permits are expected to decline by a touch from 1.543 million to 1.45 million for September. Housing Starts are foreseen to pick up from 1.283 million to 1.38 million.
- Two Fed speakers speak at 16:00 GMT: Fed Board Member Christopher Waller and the New York Fed’s John Williams are taking the stage. Not much later, near 17:00 GMT, Fed Governor Michelle Bowman will speak as well.
- The Fed’s Beige Book will be issued at 18:00 GMT.
- To close off the day, expect to see some comments from Fed Governor Lisa Cook.
- Equities do not seem to care and are flat with minor losses or gains across the board. No real outliers to report as the US earnings season picks up speed.
- The CME Group’s FedWatch Tool shows that markets are pricing in a 90% chance that the Federal Reserve will keep interest rates unchanged at its meeting in November.
- The benchmark 10-year US Treasury yield rises to 4.84% as the bond market sell-off continues again this Wednesday.
US Dollar Index technical analysis: Which camp will win?
The US Dollar is undergoing some moshpit action with both Dollar bulls and bears fighting over which direction the US Dollar Index (DXY) needs to go. On one hand, the US Dollar starts to see both macroeconomic numbers and equity earnings coming in positive, though retreating from previous elevated levels. Meanwhile, the fighting in Gaza might trigger ample US Dollar strength as a safe haven. For now, as long as a proxy war does not emerge, the Greenback is set to retreat little by little.
A bounce above the daily trendline from July 18 might still materialise although that is starting to slip further away. On the topside, 107.19 is important to reach. If this is the case, 109.30 is the next level to watch.
On the downside, the recent resistance at 105.88 did not do a good job supporting any downturn. Instead, look for 105.12 to keep the DXY above 105.00. If that fails to do the trick, 104.33 will be the best level to look for resurgence in US Dollar strength with the 55-day Simple Moving Average (SMA) as a support level.
US Dollar FAQs
What is the US Dollar?
The US Dollar (USD) is the official currency of the United States of America, and the ‘de facto’ currency of a significant number of other countries where it is found in circulation alongside local notes. It is the most heavily traded currency in the world, accounting for over 88% of all global foreign exchange turnover, or an average of $6.6 trillion in transactions per day, according to data from 2022.
Following the second world war, the USD took over from the British Pound as the world’s reserve currency. For most of its history, the US Dollar was backed by Gold, until the Bretton Woods Agreement in 1971 when the Gold Standard went away.
How do the decisions of the Federal Reserve impact the US Dollar?
The most important single factor impacting on the value of the US Dollar is monetary policy, which is shaped by the Federal Reserve (Fed). The Fed has two mandates: to achieve price stability (control inflation) and foster full employment. Its primary tool to achieve these two goals is by adjusting interest rates.
When prices are rising too quickly and inflation is above the Fed’s 2% target, the Fed will raise rates, which helps the USD value. When inflation falls below 2% or the Unemployment Rate is too high, the Fed may lower interest rates, which weighs on the Greenback.
What is Quantitative Easing and how does it influence the US Dollar?
In extreme situations, the Federal Reserve can also print more Dollars and enact quantitative easing (QE). QE is the process by which the Fed substantially increases the flow of credit in a stuck financial system.
It is a non-standard policy measure used when credit has dried up because banks will not lend to each other (out of the fear of counterparty default). It is a last resort when simply lowering interest rates is unlikely to achieve the necessary result. It was the Fed’s weapon of choice to combat the credit crunch that occurred during the Great Financial Crisis in 2008. It involves the Fed printing more Dollars and using them to buy US government bonds predominantly from financial institutions. QE usually leads to a weaker US Dollar.
What is Quantitative Tightening and how does it influence the US Dollar?
Quantitative tightening (QT) is the reverse process whereby the Federal Reserve stops buying bonds from financial institutions and does not reinvest the principal from the bonds it holds maturing in new purchases. It is usually positive for the US Dollar.
Antje Praefcke, FX Analyst at Commerzbank, discusses the discrepancy between analysts, the Fed and the market regarding the possibility of a soft landing.
Analysts against market expectations
I attended a financial symposium last week and interestingly enough all analysts present agreed that a US recession will come – sooner or later. Our experts too are expecting that. The market on the other hand assumes, just like the Fed, that a soft landing will be achieved.
A soft landing cannot be excluded. Each set of positive US data provides further fuel for this view. That is why the USD is in demand regardless of the conflict in the Middle East. However, this view is likely to be largely priced in which is why the Dollar will be able to benefit less and less from positive data and is currently having trouble to gain further ground.
And at some point, the million-dollar question will then be: who is right, the market and the Fed or the majority of analysts? That will also be decisive for the fate of the USD. However, we are only likely to find out in a few months’ time.
Open interest in natural gas futures markets extended their uptrend for yet another session on Tuesday, this time by nearly 12K contracts according to preliminary readings from CME Group. Volume, instead, resumed the downside and dropped by almost 87K contracts.
Natural Gas could revisit $3.00
Prices of natural gas dropped further amidst rising open interest on Tuesday. That said, the commodity remains under pressure and carries the potential to extend the decline to the key $3.00 region per MMBtu in the short-term horizon.
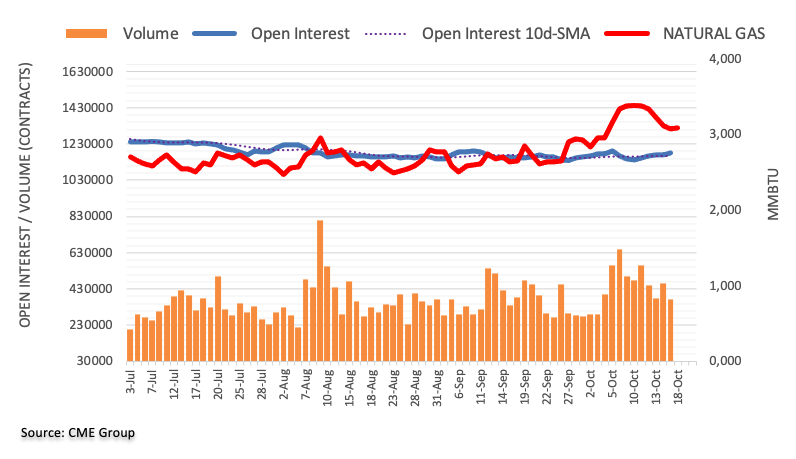
The Swiss Franc has been the best G10 spot performer YTD. Economists at Standard Chartered analyze CHF outlook.
Rates have likely peaked
There is tail risk to CHF strength if risk aversion becomes the main global FX theme. This upside risk would be driven by geopolitical concerns, rather than the SNB policy stance.
Assuming that risk appetite normalises, we expect underperformance in the future on the view that the SNB has finished its hiking cycle. We think the sharp decline in measures of underlying inflation, such as the median inflation rate, will make the SNB cautious about further hikes.
We doubt that the SNB now sees a strong CHF as necessary in the inflation fight, but we also doubt that it will push back hard against safe-haven capital inflows.
- Oil (WTI) trades near $88 and might break above $90 if tensions further build up in the Middle East.
- The US Dollar is in a third consecutive negative trading day.
- Oil could edge further up, although the fading threat of supply cuts limits its upside potential.
Oil prices soar on Wednesday, making good on the losses from Monday and setting forward a positive return for this week. The main driver for Oil prices is the visit from US President Joe Biden to Israel, which could not have been at a worse timing. Biden landed around 08:00 GMT in Tel Aviv, hours after a hospital was bombed in Palestine with hundreds of casualties. Biden is left to take a stance in the conflict while trying to defuse tensions, with any wrong word having the potential to make the current conflict between Israel and Hamas become a feared proxy war.
Meanwhile, The US Dollar (USD) is being torn in two camps. On the one hand, traders want to appreciate the Greenback with these tensions in the Middle East. On the other hand, the US macroeconomic numbers are starting to point to a possible recession for the US. Either way, the US Dollar is moving in tight ranges and is making baby steps lower for a third consecutive day when measured by the US Dollar Index (DXY).
Crude Oil (WTI) trades at $87.31 per barrel, and Brent Oil trades at $90.84 per barrel at the time of writing.
Oil news and market movers
- The Russian Ministry of Finance has set the cut-off price for Russian Rurals Oil at $75 per barrel. This is a substantial discount compared to Brent Oil, which is trading near $90, making it a $15 discount for India, China and other nations daring to buy Russian Oil with EU and US sanctions in place.
- Mexico has conducted its annual Oil-export hedging program. The price target with the hedged would allow the nation to sell their oil at $80 per barrel as floor.
- The American Petroleum Institute (API) released its report on Tuesday. After the build of 12.94 million last week, a drawdown of 4.383 million barrels was reported.
- The US Energy Information Administration (EIA) is due to print its weekly stockpile change at 14:30 GMT. Expectations are for a drawdown of only 0.3 million barrels after the 10.176 million build from last week.
Oil Technical Analysis: Gaza remains key
Oil prices are pushing higher as markets are pricing in a risk premium again. With several neighbouring countries starting to build up tensions on Israel to open up borders and let refugees flee the strip, pressure builds further toward a broader war. With that risk as hangover on the price action and possibly another big drawdown in US stockpiles, a pop in prices looks granted.
On the upside, the resistance level near $88 is the first level on the bulls’ radar. From there, the next level will be this year’s high at $94. Should a substantial squeeze unfold, look for $97.11, the high of August 2022.
On the downside, traders are bracing for the entry of that region near $78. The area should see ample support for buying. Any further drops below this level might see a firm nosedive move, which would cause Oil prices to sink below $70.
-638332186077867823.png)
US Crude (Daily Chart)
WTI Oil FAQs
What is WTI Oil?
WTI Oil is a type of Crude Oil sold on international markets. The WTI stands for West Texas Intermediate, one of three major types including Brent and Dubai Crude. WTI is also referred to as “light” and “sweet” because of its relatively low gravity and sulfur content respectively. It is considered a high quality Oil that is easily refined. It is sourced in the United States and distributed via the Cushing hub, which is considered “The Pipeline Crossroads of the World”. It is a benchmark for the Oil market and WTI price is frequently quoted in the media.
What factors drive the price of WTI Oil?
Like all assets, supply and demand are the key drivers of WTI Oil price. As such, global growth can be a driver of increased demand and vice versa for weak global growth. Political instability, wars, and sanctions can disrupt supply and impact prices. The decisions of OPEC, a group of major Oil-producing countries, is another key driver of price. The value of the US Dollar influences the price of WTI Crude Oil, since Oil is predominantly traded in US Dollars, thus a weaker US Dollar can make Oil more affordable and vice versa.
How does inventory data impact the price of WTI Oil
The weekly Oil inventory reports published by the American Petroleum Institute (API) and the Energy Information Agency (EIA) impact the price of WTI Oil. Changes in inventories reflect fluctuating supply and demand. If the data shows a drop in inventories it can indicate increased demand, pushing up Oil price. Higher inventories can reflect increased supply, pushing down prices. API’s report is published every Tuesday and EIA’s the day after. Their results are usually similar, falling within 1% of each other 75% of the time. The EIA data is considered more reliable, since it is a government agency.
How does OPEC influence the price of WTI Oil?
OPEC (Organization of the Petroleum Exporting Countries) is a group of 13 Oil-producing nations who collectively decide production quotas for member countries at twice-yearly meetings. Their decisions often impact WTI Oil prices. When OPEC decides to lower quotas, it can tighten supply, pushing up Oil prices. When OPEC increases production, it has the opposite effect. OPEC+ refers to an expanded group that includes ten extra non-OPEC members, the most notable of which is Russia.
Gold price rebounded on haven demand following Hamas’s 7 October attack on Israel. Strategists at ANZ Bank analyze the yellow metal’s outlook.
A recent rise in yields reflect tighter monetary condition
Gold is benefitting from haven flows triggered by the geopolitical tension.
Market expectations are shifting to a view that no more rate rises are needed as the recent rise in US Treasury bond yields suggests tighter policy.
While investment demand for Gold is yet to pick up, strong central bank buying and seasonal demand for physical Gold could offset some of the investment sell-off.
- USD/CAD retreats from 1.3650 but stays inside Tuesday’s range.
- A soft Canada inflation report has dented hopes of one more interest rate increase from the BoC.
- USD/CAD trades directionless in a Symmetrical Triangle pattern, which indicates a squeeze in volatility.
The USD/CAD pair demonstrates a compression in volatility, trading inside Tuesday's range of 1.3600-1.3700 ahead of the speech from Federal Reserve (Fed) Chair Jerome Powell, scheduled for Wednesday.
The Loonie asset delivered volatile spikes on Tuesday after Statistics Canada reported soft inflation data and the United States Census Bureau reported strong Retail Sales for September. Consumer spending rose by 0.7% due to robust demand for automobiles and higher gasoline prices.
Canada’s monthly headline and core Consumer Price Index (CPI) contracted by 0.1% while investors forecasted a growth by 0.1%. The annual headline and core CPI softened to 3.8% and 2.8% respectively. A soft Canada inflation report has dented hopes of one more interest rate increase from the Bank of Canada (BoC).
USD/CAD trades directionless in a Symmetrical Triangle chart pattern formed on a two-hour scale, which indicates a squeeze in volatility. The upward-sloping trendline of the aforementioned chart pattern is plotted from October 10 low around 1.3570 while the downward-sloping trendline is placed from October 5 high at 1.3786.
The Loonie asset has dropped to near 100-period Exponential Moving Average (EMA) at 1.3610. A further breakdown could strengthen the Canadian Dollar.
The Relative Strength Index (RSI) (14) oscillates in the 40.00-60.00 range, portraying a consolidation ahead.
A decisive break above March 24 high around 1.3800 would expose the asset to March 10 high at 1.3860, followed by the round-level resistance at 1.3900.
In an alternate scenario, a breakdown below September 25 low around 1.3450 would drag the asset toward September 20 low near 1.3400. A further breakdown could expose the asset to a six-week low near 1.3356.
USD/CAD two-hour chart
-638332187813993532.png)
Economist at UOB Group Lee Sue Ann expects the BoK to maintain its policy rates unchanged at its event later in the week.
Key Quotes
With economic growth taking the precedence, it would take a lot more for the BOK to embark on another rate hike this year. Thus, conditions for the BOK to begin reversing some of its 300bps hike in the current tightening cycle are unlikely to be met this year.
We expect the BOK to remain on hold for the final two meetings this year on 19 Oct and 30 Nov.
- European markets receive pressure on higher Crude oil prices.
- UK market displayed negative sentiment on elevated inflation in the country.
- European STOXX 600 recovers the intraday losses; following the corporate earnings.
European stock markets started the day on a downturn, influenced by surging crude oil prices, increased tensions in the Middle East, and persistently high inflation in the UK.
At the time of writing, the FTSE 100 in the UK is marginally up by 0.06% at 7,680, while the European STOXX 600 remains positive at 449 points. The German DAX index has also seen a slight increase of 0.05% to 15,259.
However, the UK market has displayed a negative sentiment due to the ongoing elevated inflation, standing at 6.7% in September despite multiple interest rate hikes by the Bank of England.
European STOXX 600 recovers the intraday losses as the investors follow the corporate earnings and developments in the Middle East. Eurozone's inflation has remained stable at 4.5%, aligning with expectations. Earlier in the day, European markets experienced a slight dip
The European equities are under pressure, particularly in the mining sector, while insurance stocks are acting as a stabilizing force.
The CETOP experienced a marginal decline in the previous session following higher-than-expected US retail sales, raising concerns about potential further interest rate hikes by the Federal Reserve.
Looks like Nexi is making headlines with a potential takeover bid causing quite a stir in the market. A 15% rally in shares is no small feat, especially in a single day. The involvement of private equity firm CVC Capital Partners adds an interesting dimension to the situation.
The plot thickens with the Italian government holding a significant stake in Nexi through state lender CDP. With a 13.6% ownership and the authority to veto any unwelcome takeover, it introduces an element of suspense to see how this potential acquisition plays out.
The Dollar did not rally very aggressively after the Retail Sales figures which smashed estimates. Economists at ING analyze Greenback’s outlook.
Only a positioning tilt?
US Retail Sales has confirmed that the US strong activity narrative remains untouched. However, the Dollar has corrected lower, which may well be down to positioning adjustment.
We could see some China-related optimism spilling over equity performance today and keep some pressure on the Dollar, even though the big jump in US short-term yields suggests the downside room for the USD probably remains limited for now.
The US calendar today may not move rates and FX as much as on Tuesday, and a lot of focus will be on diplomatic developments in the Middle East.
Economists at Commerzbank analyze Loonie’s outlook as Canadian inflation pressures edged lower in September.
The BoC can breathe a sigh of relief
The Bank of Canada (BoC) is likely to breathe a slight sigh of relief as inflation in September eased further than expected, both the overall rate as well as the different measures of core inflation.
The BoC is likely to feel confirmed in its decision to pause in September. It nonetheless has to signal clearly to the market that it remains vigilant if the fall turns out to be unsustainable. Only in that case will CAD be able to put up some resistance against USD.
On his arrival in Israel on Wednesday, US President Joe Biden said that the "US will make sure Israel has what it needs to defend itself."
Additional comments
Hamas has committed atrocities that make ISIS look more rational.
Gaza hospital explosion caused by "the other side".
Market reaction
Risk sentiment remains in a weaker spot so far this Wednesday but the US Dollar is unable to benefit from it amidst dovish Fed expectations. The US S&P 500 futures are down 0.13% on the day while the US Dollar Index loses 0.12% to trade around 106.15, as of writing.
European Central Bank (ECB) Governing Council member and outgoing Italian central bank Governor Ignazio Visco said on Wednesday, "a (monetary policy) reaction was necessary, exactly because of the second-round effects that have kept and are still keeping inflation at levels that are not consistent with underlying monetary and price stability.”
Visco added that he is “closely monitoring situations of weakness and vulnerability in some less significant Italian banks.”
- USD/CHF aims to defend the crucial support of 0.9000 amid a risk-off market mood.
- The US Dollar remains well supported above 106.00 due to strong Retail Sales data.
- Robust US Retail Sales were prompted by upbeat demand for automobiles, rising dining out, and higher gasoline prices.
The USD/CHF pair attempted recovery below the psychological level of 0.9000 in the European session. The broader outlook of the Swiss Franc asset is still bearish as the US Dollar is struggling to extend recovery despite robust United States Retail Sales data.
S&P500 futures generated some losses in the London session, portraying a cautious market mood due to the deepening Middle East crisis. US equities ended on a flat note on Tuesday as investors turned anxious about the upcoming quarterly result season.
The US Dollar Index (DXY) remains well supported above 106.00 as strong consumer spending in September conveyed that the US economy is resilient despite the headwinds of higher interest rates and the off-season.
The US Census Bureau reported on Tuesday that consumer spending momentum expanded at a higher pace of 0.7% in September against estimates of 0.3%. Robust retail sales were prompted by upbeat demand for automobiles, rising dining out, and higher gasoline prices.
Going forward, investors will keep watch for Federal Reserve (Fed) Chair Jerome Powell’s speech on Thursday. Investors seem baffled whether Jerome Powell would join his colleagues who support neutral interest rate guidance or will remain hawkish on the policy outlook.
On the Swiss Franc front, the appeal for the currency remains upbeat amid rising conflicts between Israel and Palestine. The demand for the Swiss Franc as a safe haven would remain upbeat due to deepening Middle East tensions.
The Dollar is struggling to pursue its advance. Economists at Société Générale analyze FX market outlook.
Stronger growth in China enough to guide EUR/USD above 1.0635?
Whether the USD will hold its ground may depend on whether pricing for December FOMC surpasses 50%.
We are closely watching technicals in the DXY as bullish momentum is showing signs of exhaustion and potentially breaking down.
Stronger growth in China is implicitly positive for EUR/USD (trade balance) but is it enough to guide the pair above 1.0635? We have our doubts and ideally would need to see a significant retracement in UST/Bunds, better Eurozone data (weaker US) and narrowing of the XCCY basis. The 10y spread is closing in on 200 bps, not a signal to add Euro longs.
For the 10y UST yield, a shot at 5% depends on whether 4.88% can be overcome.
- Gold price aims to extend upside as Israel-Palestine conflict deepens.
- The US Dollar consolidates, shrugging off robust US Retail Sales data for September..
- 10-year US Treasury yields rose to 4.85% on rising expectations of one more interest rate increase from the Fed.
Gold price (XAU/USD) extends its upside move as investors’ appeal for precious metals remains upbeat due to the deepening crisis in the Middle East. The precious metal delivered a breakout of the consolidation formed in a range of $1,909-$1,932 despite the fact that robust US Retail Sales data elevated expectations of one more interest rate hike from the Federal Reserve (Fed) for the remainder of 2023.
Demand for bullion rose significantly due to the escalating conflict between Israel and Palestine after the strike at a Gazan hospital. The US Dollar consolidates in a tight range ahead of the speech from Fed Chair Jerome Powell. It will be worth watching whether Jerome Powell reiterates the appropriateness of some further policy-tightening or will join other Fed officials who have supported the need to keep interest rates steady due to rising US bond yields.
Daily Digest Market Movers: Gold price awaits Fed Powell speech
- Gold price aims to capture the immediate resistance of $1,940.00 as the appeal for bullions is upbeat amid escalating geopolitical tensions.
- The Israel-Palestine conflict deepened on Wednesday after an explosion at a Gazan hospital killed almost 500 civilians.
- Risks of intervention by other Middle East nations such as Iran remain persistent, which could disrupt the supply chains further.
- Meanwhile, the visit of US President Joe Biden to Jordan was canceled as civilian unrest increased after the blast in the hospital in Gaza.
- The appeal for Gold price has improved significantly due to deepening Middle East tensions, which supported it to recover quickly despite the release of the upbeat US Retail Sales data on Tuesday.
- The US Census Bureau reported that Retail Sales rose by 0.7% due to robust demand for automobiles, rising dining out, and higher gasoline prices. Investors forecasted a growth rate of 0.3%. In August, Retail Sales grew by 0.8%. August's sales were upwardly revised from an initial estimate of 0.6%.
- Retail Sales excluding automobile sales rose by 0.6% while investors anticipated a growth uptick of 0.2%.
- Strong consumer spending seems backed by robust labor demand and steady wage growth, which could propel consumer inflation expectations and increase the chances of one more interest rate hike from the Federal Reserve (Fed).
- Strong consumer spending in September despite headwinds of off-season and higher borrowing costs has set a positive undertone for the third quarter Gross Domestic Product (GDP) data.
- The US Dollar Index (DXY) seems well-supported above the crucial level of 106.00, but it is failing to extend its upside trend as the majority of traders are still betting in favor of interest rates remaining unchanged.
- As per the CME Group Fedwatch tool, traders see a 90% chance of the Fed keeping interest rates unchanged at 5.25%-5.50%. However, the odds of one more interest rate increase in any of the two remaining monetary policy meetings in 2023 have jumped to 38% from 30% recorded on Tuesday.
- China’s Q3 GDP growth remained upbeat, fading expectations of a global slowdown and weighing on the safe haven USD.
- China’s growth rate in the July-September quarter was recorded at 1.3%, much better than expectations of 1.0% and the 0.5% recorded in the second quarter of 2023. The annual GDP rose by 4.9% against the estimates of 4.4%.
- Meanwhile, investors shift focus to the speech from Fed Chair Jerome Powell, which is scheduled for Thursday. The major focus will be on the interest rate guidance as other Fed policymakers have supported keeping interest rates unchanged at 5.25%-5.50% due to higher long-term US bond yields. The 10-year US Treasury yields rose to 4.85%.
- San Francisco Fed President Mary Daly said this week that the recent surge in long-term bond yields is equivalent to one 25 basis points rate hike. The risk of lifting interest rates further could push the economy into a recession, she said.
Technical Analysis: Gold price aims to capture $1,940
Gold price climbs to near $1,940.00 amid an escalating Israel-Palestine conflict. The precious metal is inches far from the four-week high around $1,947.00 after stabilizing above the 200-day Exponential Moving Average (EMA), which trades around $1,905.00. The yellow metal is expected to extend upside toward the crucial resistance of $1,950.00
Gold FAQs
Why do people invest in Gold?
Gold has played a key role in human’s history as it has been widely used as a store of value and medium of exchange. Currently, apart from its shine and usage for jewelry, the precious metal is widely seen as a safe-haven asset, meaning that it is considered a good investment during turbulent times. Gold is also widely seen as a hedge against inflation and against depreciating currencies as it doesn’t rely on any specific issuer or government.
Who buys the most Gold?
Central banks are the biggest Gold holders. In their aim to support their currencies in turbulent times, central banks tend to diversify their reserves and buy Gold to improve the perceived strength of the economy and the currency. High Gold reserves can be a source of trust for a country’s solvency. Central banks added 1,136 tonnes of Gold worth around $70 billion to their reserves in 2022, according to data from the World Gold Council. This is the highest yearly purchase since records began. Central banks from emerging economies such as China, India and Turkey are quickly increasing their Gold reserves.
How is Gold correlated with other assets?
Gold has an inverse correlation with the US Dollar and US Treasuries, which are both major reserve and safe-haven assets. When the Dollar depreciates, Gold tends to rise, enabling investors and central banks to diversify their assets in turbulent times. Gold is also inversely correlated with risk assets. A rally in the stock market tends to weaken Gold price, while sell-offs in riskier markets tend to favor the precious metal.
What does the price of Gold depend on?
The price can move due to a wide range of factors. Geopolitical instability or fears of a deep recession can quickly make Gold price escalate due to its safe-haven status. As a yield-less asset, Gold tends to rise with lower interest rates, while higher cost of money usually weighs down on the yellow metal. Still, most moves depend on how the US Dollar (USD) behaves as the asset is priced in dollars (XAU/USD). A strong Dollar tends to keep the price of Gold controlled, whereas a weaker Dollar is likely to push Gold prices up.
- The Euro trades without direction against the US Dollar.
- Stocks in Europe open Wednesday’s session in a mixed tone.
- EUR/USD alternates ups and downs around 1.0570.
- The USD Index (DXY) looks sidelined in the low 106.00s.
- Eurozone final inflation figures will be in the spotlight later in the session.
- Housing data, Fedspeak take centre stage in the US docket.
The Euro (EUR) navigates a narrow range against the US Dollar (USD), prompting EUR/USD to hover around the 1.0570 zone on Wednesday.
The Greenback keeps the trade in the low 106.00s when measured by the USD Index (DXY) amidst the equally irresolute price action in the global markets, against the generalized cautious stance in light of increasing geopolitical risks.
Continuing to centre attention on monetary policy, investors anticipate that the Federal Reserve (Fed) will uphold its position of not touching interest rates throughout the remainder of the year. Meanwhile, participants in the financial markets contemplate the possibility of the European Central Bank (ECB) halting policy modifications, despite inflation levels surpassing the bank's target and mounting concerns about the potential for an economic downturn or stagflation in the region.
On the domestic calendar, the final inflation rate for September in the broader Eurozone is due later.
Data-wise, in the US, the usual weekly Mortgage Applications tracked by MBA are due in the first turn, while the housing sector is expected to be at the centre of the debate following the release of Housing Starts and Building Permits. In addition, the Fed’s Beige Book and TIC Flows are also due.
Additionally, markets’ attention will also be on speeches by FOMC Governor Christopher Waller (permanent voter, centrist), NY Fed President John Williams (permanent voter, centrist), FOMC Governor Michelle Bowman (permanent voter, hawk), and Philly Fed President Patrick Harker (voter, hawk).
Daily digest market movers: Euro looks for direction around 1.0570
- The EUR trades in a vacillating fashion against the USD.
- US and German yields look poised to extend their march north.
- Markets remain focused on the Fed’s tighter-for-longer stance.
- Investors see the ECB could pause its tightening cycle until Q3 2024.
- The crisis in the Middle East could get worse before it gets better.
- Chinese data surprised to the upside.
- UK CPI rose 6.7% YoY in September, a tad above estimates.
Technical Analysis: Euro faces next up barrier of note at 1.0640
EUR/USD trades in an inconclusive fashion around 1.0570 against the backdrop of a lack of direction in the Greenback.
If the rising trend continues, EUR/USD may revisit the October 12 high of 1.0639, as well as the September 20 top of 1.0736 and the significant 200-day Simple Moving Average (SMA) of 1.0820. A break above this level might signal an effort to break above the August 30 peak of 1.0945 and target the psychological level of 1.1000. Any more gains over the August 10 high of 1.1064 might take the pair towards the July 27 top of 1.1149 and possibly the 2023 peak of 1.1275 seen on July 18.
In the case that selling pressure persists, the 2023 low at 1.0448 from October 3 might be revisited, as well as the major support of 1.0400. If this level is broken, it may pave the way for a retest of the weekly lows of 1.0290 (November 30, 2022) and 1.0222 (November 21, 2022).
As long as the EUR/USD continues below the 200-day SMA, the possibility of continuous bearish pressure exists.
Euro FAQs
What is the Euro?
The Euro is the currency for the 20 European Union countries that belong to the Eurozone. It is the second most heavily traded currency in the world behind the US Dollar. In 2022, it accounted for 31% of all foreign exchange transactions, with an average daily turnover of over $2.2 trillion a day.
EUR/USD is the most heavily traded currency pair in the world, accounting for an estimated 30% off all transactions, followed by EUR/JPY (4%), EUR/GBP (3%) and EUR/AUD (2%).
What is the ECB and how does it impact the Euro?
The European Central Bank (ECB) in Frankfurt, Germany, is the reserve bank for the Eurozone. The ECB sets interest rates and manages monetary policy.
The ECB’s primary mandate is to maintain price stability, which means either controlling inflation or stimulating growth. Its primary tool is the raising or lowering of interest rates. Relatively high interest rates – or the expectation of higher rates – will usually benefit the Euro and vice versa.
The ECB Governing Council makes monetary policy decisions at meetings held eight times a year. Decisions are made by heads of the Eurozone national banks and six permanent members, including the President of the ECB, Christine Lagarde.
How does inflation data impact the value of the Euro?
Eurozone inflation data, measured by the Harmonized Index of Consumer Prices (HICP), is an important econometric for the Euro. If inflation rises more than expected, especially if above the ECB’s 2% target, it obliges the ECB to raise interest rates to bring it back under control.
Relatively high interest rates compared to its counterparts will usually benefit the Euro, as it makes the region more attractive as a place for global investors to park their money.
How does economic data influence the value of the Euro?
Data releases gauge the health of the economy and can impact on the Euro. Indicators such as GDP, Manufacturing and Services PMIs, employment, and consumer sentiment surveys can all influence the direction of the single currency.
A strong economy is good for the Euro. Not only does it attract more foreign investment but it may encourage the ECB to put up interest rates, which will directly strengthen the Euro. Otherwise, if economic data is weak, the Euro is likely to fall.
Economic data for the four largest economies in the euro area (Germany, France, Italy and Spain) are especially significant, as they account for 75% of the Eurozone’s economy.
How does the Trade Balance impact the Euro?
Another significant data release for the Euro is the Trade Balance. This indicator measures the difference between what a country earns from its exports and what it spends on imports over a given period.
If a country produces highly sought after exports then its currency will gain in value purely from the extra demand created from foreign buyers seeking to purchase these goods. Therefore, a positive net Trade Balance strengthens a currency and vice versa for a negative balance.
Sterling is trading higher after the release of UK inflation figures for September. Economists at ING analyze GBP outlook.
Slight CPI surprise not enough for November hike
UK inflation figures for September came in slightly higher than expected. Headline CPI grew 6.7% YoY like in August, while core slowed marginally from 6.2% to 6.1%. We believe that, despite marginally beating consensus, there is probably nothing in this inflation report that would push the Bank of England into another hike in November.
EUR/GBP may correct a bit lower on the back of some hawkish BoE rate expectation repricing today but is then probably heading higher into the BoE meeting as we expect a hold.
- USD/JPY recovers its intraday losses pre-release of US economic data.
- Chinese GDP exceeded expectations; contributing support for the Japanese Yen.
- Higher US Treasury yields provide support to underpinning the US Dollar.
USD/JPY halts a two-day winning streak possibly on the back of upbeat Chinese economic data. The spot price trades lower near 149.80 during the European session on Wednesday. However, the USD/JPY is benefiting from the upbeat Retail Sales from the United States (US), buoyed by higher US Treasury yields.
Chinese Gross Domestic Product exceeded market consensus in the third quarter, reporting a growth of 1.3% compared to the anticipated 1.0%. The yearly based report for the same quarter revealed a 4.9% increase, surpassing the expected 4.4%.
Moreover, China's Retail Sales (YoY) rose by 5.5%, surpassing both the previous figure of 4.6% and the expected 4.9%.
Japanese Finance Minister Shunichi Suzuki declined to comment on currency intervention following remarks from an International Monetary Fund (IMF) official on Tuesday. Suzuki stated that there was no necessity to delve into the specific factors influencing the currency.
Media reported on Tuesday that the Bank of Japan was contemplating revising its core Consumer Price Index (CPI) forecast for the fiscal years 2023 and 2024 while maintaining its inflation forecast for 2025.
The dovish outlook, combined with generally optimistic risk sentiment, may persist in weakening the safe-haven Japanese Yen (JPY), indicating a higher likelihood of an upward trend for the USD/JPY pair.
Investors might observe interventions by Japanese authorities in the foreign exchange market aimed at strengthening their currency, which could exert downward pressure on the USD/JPY pair.
US Retail Sales in the US exceeded expectations, rising to 0.7% in September instead of the expected 0.3%. The Retail Sales Control Group also saw a significant increase of 0.6%, up from the previous 0.2%. Meanwhile, US Industrial Production improved by 0.3%, defying expectations of stagnation at 0.0%.
The positive Chinese data could exert minor pressure on the US Dollar Index (DXY) struggled to maintain intraday gains, hovering around 106.20. On a positive note, US Treasury yields improved, reaching 4.85% for the 10-year US Treasury bond, potentially giving support to the Greenback.
Market watchers are likely keen on understanding the Federal Reserve's monetary policy trajectory, especially after dovish remarks from officials. Richmond Fed President Thomas Barkin suggested that the current policy is already restrictive, expressing uncertainty about the upcoming FOMC meeting in November. Furthermore, Minneapolis Federal Reserve Bank President Neel Kashkari emphasized that inflation has persisted longer than expected, aligning with the dovish stance of several other Fed officials.
Investor attention is expected to focus on US housing data and Fed officials' speeches on Wednesday. Additionally, Japanese inflation data on Friday, the National Consumer Price Index (CPI) ex-Fresh Food for September, is anticipated to show a year-on-year increase of 2.7%, down from the previous reading of 3.1%.
Strategists at Deutsche Bank see Brent at $92/bbl in Q4.
Brent could reach $100
Looking into the fourth quarter, we expect a supply-demand deficit of -1.1 mmb/d to follow the -1.4 mmb/d in Q3.
Our base case is that Brent Crude Oil prices average $92/bbl in Q4 (up from $85/bbl previously).
However, a median Brent quarterly range of 22% relative to the midpoint is wide enough to encompass the possibility of Brent reaching $100/bbl.
See: Oil prices unlikely to surge materially above $100 – TDS
Economists at ING analyze EUR/USD outlook.
Strong – and growing – USD rate advantage
We still deem a sustainable EUR/USD rally premature, given the strong (and growing) USD rate advantage. Improvements in the Eurozone growth narrative would help, but a weakening in US data remains the key to unlocking major upside room for the pair.
The volatile situation in the Middle East remains a big question mark on the direction of the pair in the short term.
See – EUR/USD: The risks should continue to point downwards – Commerzbank
Economists at ING continue to have a gentle upside bias for EUR/GBP.
The wild card is European politics
Expect EUR/GBP to bump up a little higher this year as the last vestiges of the BoE tightening cycle are priced out. And our call for 100 bps of BoE easing in 24 (not priced now) could see 0.90.
The wild card here is European politics. Elections this year mean that a lack of cohesion could see the Stability and Growth Pact automatically reintroduced next year and EZ peripheral debt hit.
Economist at UOB Group Lee Sue Ann sees the Bank Indonesia (BI) keeping its policy rate unchanged at this week's event.
Key Quotes
BI specifically mentioned that rupiah stabilization is a key focus now and just issued Bank Indonesia Rupiah Securities (SRBI) on 15 Sep. Strong appetite from market participants for SRBI is a good thing that potentially drives rupiah appreciation with additional capital inflows into Indonesia's financial system.
Presently, with more uncertainty and volatility in the global economic conditions and the financial markets, we therefore shift our expectation for BI to start delivering its first rate cut only at the beginning of the second half next year.
- NZD/USD recovers its recent losses on Chinese economic figures.
- Weaker Kiwi’s CPI prompted traders to lower their expectations of a rate hike in November’s meeting by the RBNZ.
- US Dollar receives minor support from upbeat Retail Sales report.
NZD/USD stages a recovery from its recent losses, buoyed by robust Chinese data. As the early European session unfolds on Wednesday, the spot price trades higher, hovering around 0.5910.
Chinese Gross Domestic Product exceeded market consensus in the third quarter, reporting a growth of 1.3% compared to the anticipated 1.0%. The yearly based report for the same quarter revealed a 4.9% increase, surpassing the expected 4.4%.
Moreover, China's Retail Sales (YoY) rose by 5.5%, surpassing both the previous figure of 4.6% and the expected 4.9%.
However, the NZD/USD pair faced resistance post-release of upbeat US Retail Sales, coupled with weaker consumer inflation data from New Zealand.
The headline CPI increased to 1.8% in the third quarter, falling short of the anticipated 2.0%. The yearly rate decelerated from 6.0% to 5.6%, missing consensus estimates of 5.9%. This data is prompting investors to lower their expectations for a November interest rate hike by the Reserve Bank of New Zealand (RBNZ), exerting downward pressure on the NZD/USD pair.
The RBNZ introduced its Sectoral Factor Model Inflation gauge, revealing inflation figures at 5.2% YoY in Q3 2023. This marks a significant decline from the 5.7% recorded in Q2.
On the US front, Retail Sales surpassed expectations, rising to 0.7% in September compared to the projected 0.3%. The Retail Sales Control Group also saw a notable increase of 0.6% from the previous 0.2%. Additionally, Industrial Production in the US improved by 0.3%, contrary to the anticipated stagnation at 0.0%.
US Dollar Index (DXY) struggled to maintain intraday gains after positive Chinese data, hovering around 106.10, US Treasury yields improved, reaching 4.85% for the 10-year US Treasury bond, potentially supporting the Greenback.
Market participants are likely to seek more insights into the monetary policy trajectory of the Federal Reserve (Fed) following dovish remarks from several officials. On Tuesday, Richmond Fed President Thomas Barkin stated that the present policy is already deemed restrictive and expressed uncertainty about the upcoming FOMC monetary policy meeting in November.
Moreover, Neel Kashkari, the President of the Minneapolis Federal Reserve Bank, noted that inflation has endured for a more prolonged duration than initially expected and remains at an excessively elevated level. This viewpoint is in line with the dovish stance upheld by several other Fed officials.
Investor focus is anticipated to center around US housing data and speeches from Fed officials on Wednesday. Furthermore, attention will turn to New Zealand's Trade Balance on Friday.
FX option expiries for Oct 18 NY cut at 10:00 Eastern Time, via DTCC, can be found below.
- EUR/USD: EUR amounts
- 1.0500 2b
- 1.0520 538m
- 1.0550 523m
- 1.0575 513m
- 1.0600 1b
- GBP/USD: GBP amounts
- 1.2100 550m
- USD/JPY: USD amounts
- 149.00 435m
- USD/CHF: USD amounts
- 0.8965 680m
- 0.9020 445m
- AUD/USD: AUD amounts
- 0.6350 420m
- 0.6440 1.5b
- USD/CAD: USD amounts
- 1.3600 923m
- 1.3850 743m
- NZD/USD: NZD amounts
- 0.5915 410m
The views are divided as to whether the Reserve Bank of Australia (RBA) will hike its key rate again or not. Economists at Commerzbank analyze what is needed to see an appreciation of the Aussie.
Will the RBA take further steps?
If the labour market turns out to be reasonably resilient according to the September data, with inflation easing less than expected – data for Q3 will be published next Wednesday – the RBA will probably hike the key rate in early November again. Above all after the economy in China stabilised again according to recent data.
The prospect of another interest rate hike and a stabilization of the Chinese economy should help the AUD, although it also has to fight against USD strength.
- Pound Sterling attempts a recovery move as the UK’s inflation report turned out stickier than anticipated.
- UK’s headline and core inflation landed higher than expectations at 6.7% and 6.1% respectively.
- The market sentiment remains risk-off ahead of US President Joe Biden’s visit to Israel.
The Pound Sterling (GBP) discovered buying interest after the United Kingdom ONS reported that inflation in September remained higher than expectations. The GBP/USD pair could come out of the woods as the stalled inflation report would elevate risks of further policy-tightening by the Bank of England (BoE) in the November monetary policy meeting.
A sticky Consumer Price Index (CPI) would cast doubts on whether UK Prime Minister Rishi Sunak would stick to his promise of halving inflation to 5.5% by the year-end. The consequences of high inflationary pressures are expected to dampen the UK’s housing sector further, which has been struggling for a firm footing due to elevated borrowing costs.
Daily Digest Market Movers: Pound Sterling attracts bids after sticky inflation data
- Pound Sterling finds buyers’ interest as the UK Office for National Statistics (ONS) has reported a sticky inflation report for September month.
- The monthly headline inflation grew at a higher pace of 0.5% against expectations of 0.4% and the former pace of 0.3%. Annual headline CPI data grew steadily by 6.7%, higher than the estimates of 6.5%.
- The core inflation data that excludes volatile food and oil prices expanded by 6.1% from the consensus of 6.0% but slowed from the August reading of 6.2%.
- Producers pushed prices of goods and services at factory gates by 0.4% against the expectations and the former release of 0.9% and 0.8% respectively.
- A stubborn inflation report is expected to bring discomfort for BoE policymakers, who are constantly working on bringing down inflation to 2%.
- On Tuesday, partial labor market data built pressure on the Pound Sterling. The ONS reported soft wage data while Employment numbers were postponed to October 24.
- Three month-to-August Average Earnings excluding bonuses softened to 7.8% as expected from the former release of 7.9%. In the same period, the Average Earnings data including bonuses decelerated to 8.1% from the consensus of 8.3% and the prior release of 8.5%.
- UK’s wage growth slowed for the first time since January as the labor demand is not strong anymore due to declining demand in the domestic and overseas markets.
- Bank of England (BoE) policymaker Swati Dhingra commented after the release of the soft wage report that the labor market is loosening and she doesn't see further wage growth momentum. Last week, Dhingra said that the central bank could look for rate cuts if the growth rate remains below expectations.
- The consequences of higher borrowing costs due to elevated interest rates by the BoE have heavily impacted the property sector. UK’s property website Rightmove said on Tuesday that the ask price for homes rose at the slowest pace since 2008, indicating that higher mortgage rates have slowed the housing demand.
- The market mood remains cautious as investors are worried about the conclusion of US President Joe Biden’s visit to Israel. US Biden will discuss with Israel Prime Minister Benjamin Netanyahu over carrying out ground assault in Gaza. This could result in an intervention of more Middle-East players, which could elevate conflicts.
- The US Dollar Index (DXY) remains sideways near 106.00 despite robust Retail Sales data for September.
- US Retail Sales expanded at a robust pace of 0.7%, boosted by higher automobile demand and spending on dining out. The economic data excluding automobiles rose by 0.6%, almost at a double pace from expectations.
- Meanwhile, investors await the speech from Federal Reserve (Fed) Chair Jerome Powell, scheduled for Thursday. It would be worth watching whether Fed Powell would join his teammates and favor an unchanged interest rate policy or will deliver hawkish guidance.
Technical Analysis: Pound Sterling recovers to near 1.2200
Pound Sterling rebounds to near 1.2200 after the release of the sticky inflation report but remains inside the trading range of 1.2120-1.2270. The broader GBP/USD outlook remains weak as it faced selling pressure while attempting to shift above the 20-day Exponential Moving Average (EMA), which trades around 1.2240. The major trend is bearish as the Cable is trading below the 50 and 200-day Exponential Moving Averages (EMAs).
Pound Sterling FAQs
What is the Pound Sterling?
The Pound Sterling (GBP) is the oldest currency in the world (886 AD) and the official currency of the United Kingdom. It is the fourth most traded unit for foreign exchange (FX) in the world, accounting for 12% of all transactions, averaging $630 billion a day, according to 2022 data.
Its key trading pairs are GBP/USD, aka ‘Cable’, which accounts for 11% of FX, GBP/JPY, or the ‘Dragon’ as it is known by traders (3%), and EUR/GBP (2%). The Pound Sterling is issued by the Bank of England (BoE).
How do the decisions of the Bank of England impact on the Pound Sterling?
The single most important factor influencing the value of the Pound Sterling is monetary policy decided by the Bank of England. The BoE bases its decisions on whether it has achieved its primary goal of “price stability” – a steady inflation rate of around 2%. Its primary tool for achieving this is the adjustment of interest rates.
When inflation is too high, the BoE will try to rein it in by raising interest rates, making it more expensive for people and businesses to access credit. This is generally positive for GBP, as higher interest rates make the UK a more attractive place for global investors to park their money.
When inflation falls too low it is a sign economic growth is slowing. In this scenario, the BoE will consider lowering interest rates to cheapen credit so businesses will borrow more to invest in growth-generating projects.
How does economic data influence the value of the Pound?
Data releases gauge the health of the economy and can impact the value of the Pound Sterling. Indicators such as GDP, Manufacturing and Services PMIs, and employment can all influence the direction of the GBP.
A strong economy is good for Sterling. Not only does it attract more foreign investment but it may encourage the BoE to put up interest rates, which will directly strengthen GBP. Otherwise, if economic data is weak, the Pound Sterling is likely to fall.
How does the Trade Balance impact the Pound?
Another significant data release for the Pound Sterling is the Trade Balance. This indicator measures the difference between what a country earns from its exports and what it spends on imports over a given period.
If a country produces highly sought-after exports, its currency will benefit purely from the extra demand created from foreign buyers seeking to purchase these goods. Therefore, a positive net Trade Balance strengthens a currency and vice versa for a negative balance.
Market in position. Economists at Commerzbank analyze how issues in the Middle East are moving currencies.
Waiting for the ground offensive
Not just the ground forces of the Israeli army seem to be in position, the market is too. Little is happening in the Dollar as the market is waiting for whether and if so when the offensive will start (probably not while US President Joe Biden is in Israel).
Monetary policy considerations for Fed and ECB are likely to be of secondary importance for now.
The risks in EUR/USD should continue to point downwards if the conflict were to increase in strength or escalate.
Here is what you need to know on Wednesday, October 18:
Action in financial markets remain mixed mid-week as investors assess the latest macroeconomic data releases and headlines surrounding the Israel-Hamas conflict. Eurostat will release revisions to the September Harmonized Index of Consumer Prices (HICP) figures on Wednesday. In the second half of the day, Building Permits and Housing Starts data will be featured in the US economic docket. Finally, the Federal Reserve will publish its Beige Book.
During the Asian trading hours, the data from China revealed that the real Gross Domestic Product (GDP) expanded at an annual rate of 4.9% in the third quarter. This reading followed the 6.2% growth recorded in the second quarter and beat the market expectation for an expansion of 4.4%. Other data from China showed that Retail Sales increased by 5.5% on a yearly basis while Industrial Production expanded by 4.5%. Both of these figures came in better than analysts' estimates. AUD/USD and NZD/USD pairs both gained traction in the Asian session and they were last seen rising 0.4% on the day.
US Dollar price this week
The table below shows the percentage change of US Dollar (USD) against listed major currencies this week. US Dollar was the weakest against the Australian Dollar.
| USD | EUR | GBP | CAD | AUD | JPY | NZD | CHF | |
| USD | -0.63% | -0.38% | -0.12% | -1.25% | 0.07% | -0.19% | -0.50% | |
| EUR | 0.63% | 0.25% | 0.50% | -0.62% | 0.69% | 0.44% | 0.12% | |
| GBP | 0.37% | -0.26% | 0.24% | -0.88% | 0.43% | 0.19% | -0.13% | |
| CAD | 0.12% | -0.51% | -0.23% | -1.13% | 0.19% | -0.07% | -0.38% | |
| AUD | 1.24% | 0.61% | 0.87% | 1.11% | 1.30% | 1.05% | 0.73% | |
| JPY | -0.07% | -0.68% | -0.45% | -0.21% | -1.31% | -0.26% | -0.57% | |
| NZD | 0.19% | -0.43% | -0.18% | 0.07% | -1.05% | 0.26% | -0.34% | |
| CHF | 0.49% | -0.12% | 0.12% | 0.38% | -0.73% | 0.58% | 0.31% |
The heat map shows percentage changes of major currencies against each other. The base currency is picked from the left column, while the quote currency is picked from the top row. For example, if you pick the Euro from the left column and move along the horizontal line to the Japanese Yen, the percentage change displayed in the box will represent EUR (base)/JPY (quote).
US President Joe Biden is expected to arrive in Israel for a meeting with Prime Minister Benjamin Netanyahu on Wednesday. Following the news of a strike on al-Ahli Arab Hospital in Gaza, Jordan has cancelled a summit with US President Biden and Egyptian President Abdel Fattah el-Sisi. Palestinian authorities said that at least 500 people were dead after an Israeli air raid on the hospital. Speaking to CNN, Lt. Col. Jonathan Conricus of the Israeli Defense Forces denied the claim: “We did not strike that, and that the intelligence that we have suggests that it was a failed rocket launch by the Islamic Jihad, and I want to add, categorically, that we do not intentionally strike any sensitive facilities, any sensitive facilities, and definitely not hospitals."
US stock index futures trade flat on the day following these developments and the 10-year US Treasury bond yield holds steady above 4.8% after Tuesday's rally. Meanwhile, the US Dollar Index fluctuates in a tight channel slightly above 106.00.
Inflation in the UK, as measured by the change in the Consumer Price Index (CPI), held steady at 6.7% on a yearly basis in September, the Office for National Statistics (ONS) reported on Wednesday. The Core CPI, which strips volatile food and energy prices, rose 6.1% in the same period, compared to the 6.2% increase recorded in August. GBP/USD's reaction to these figures was largely muted and the pair was last seen trading modestly higher on the day at around 1.2200.
EUR/USD registered small gains on Tuesday and continued to edge higher toward 1.0600 early Wednesday.
USD/JPY closed in positive territory slightly above 149.50 on Tuesday but failed to gather momentum in the Asian session on Wednesday.
Gold benefited from upbeat Chinese data and escalating geopolitical tensions mid-week. XAU/SD was last seen trading at its highest level since September 20 at around $1,940.
- Mexican Peso retreats from the recent gains on upbeat US data.
- Upbeat China data could contribute to undermining the US Dollar.
- Mexican Retail Sales (MoM) in August anticipates stagnation at 0.0%.
USD/MXN aims to retreat from the recent gains, trading lower around 18.0000 during the Asian session on Wednesday. The pair faces challenges after the release of upbeat data from the United States (US) on Tuesday.
The US Bureau of Economic Analysis (BEA) revealed that Retail Sales surpassed expectations of 0.3% MoM, rising to 0.7% in September. Additionally, the Retail Sales Control Group recorded a notable increase of 0.6%, compared to the previous hike of 0.2%.
Moreover, the Federal Reserve reported that Industrial Production demonstrated improvement by 0.3%, contrary to the expected stagnation of 0.0%.
The US Dollar Index (DXY) loses intraday gains after the positive Chinese data, struggling to hold ground near 106.10, by the press time. However, US Treasury yields improves, with the 10-year US Treasury bond yield reaching 4.84% could support the Greenback.
Chinese Gross Domestic Product in the third quarter exceeded expectations, showing a growth of 1.3% compared to the anticipated 1.0%. The annual report for the same quarter revealed a 4.9% increase, surpassing the expected 4.4%.
Additionally, China's Retail Sales (YoY) demonstrated a rise of 5.5%, surpassing both the previous figure of 4.6% and the expected 4.9%.
Market participants seek more cues on the Fed’s monetary policy trajectory following the dovish remarks from multiple Fed officials. On Tuesday, Thomas Barkin, the President of the Richmond Fed, stated that the present policy is already viewed as restrictive. Expressing uncertainty about the upcoming FOMC monetary policy meeting in November.
Additionally, Minneapolis Federal Reserve Bank President Neel Kashkari mentioned that inflation has persisted for a more extended period than initially anticipated and remains excessively elevated. This perspective aligns with the dovish stance maintained by several other Fed officials.
The USD/MXN pair is influenced by USD price dynamics and overall risk sentiment as there are no economic data releases from Mexico. Additionally, the escalating geopolitical tensions between Israel and Hamas could limit the downside of the pair and bolster the US Dollar as a safe-haven asset.
The recent publication of Banxico's monetary policy minutes reveals a hawkish outlook, with members expressing reluctance towards considering a near-term rate cut. The prevailing consensus among members reflects a belief in maintaining interest rates at elevated levels for an extended period. This stance is primarily driven by the observed high prices in the services segment, identified as a significant factor impacting inflation data. This hawkish sentiment underscores a cautious approach to monetary policy, prioritizing the management of inflationary pressures.
Investor attention is expected to focus on US housing data and speeches from Fed officials on Wednesday. Additionally, Mexico's Retail Sales for August, scheduled for release on Friday, will be closely monitored by traders for potential trading opportunities around the USD/MXN pair.
Year-to-date, INR is down 0.6% vs. USD. Economists at Commerzbank analyze Rupee’s outlook.
An extended period of elevated Oil prices remains the biggest risk factor
We project USD/INR to drift down towards 81.50 by year-end. The main reasons include: Continued strong economic performance. Positive real interest rates. Inflation has moderated steadily since the peak of just under 8% in April 2022 to an average of 5.8% so far this year. RBI has hiked by 250 bps to 6.50% since May 2022. This implies positive real interest rates at around 70 bps. A stabilization in CNY volatility should also aid INR.
However, an extended period of elevated Oil prices remains the biggest risk factor for INR.

Source: Commerzbank Research
Considering advanced prints from CME Group for crude oil futures markets, open interest dropped for the fourth session in a row on Tuesday, now by around 22.7K contracts. On the other hand, volume went up by around 13.5K contracts after three straight daily declines.
WTI: Next on the upside comes the YTD peak near $95.00
WTI prices resumed the uptrend on Tuesday, leaving behind the daily pullback seen at the beginning of the week. The daily bounce was on the back of shrinking open interest, however, hinting at the idea that the continuation of the move seems not favoured for the time being. In the meantime, the 2023 peak near the $95.00 mark per barrel remains as the next target for bulls.
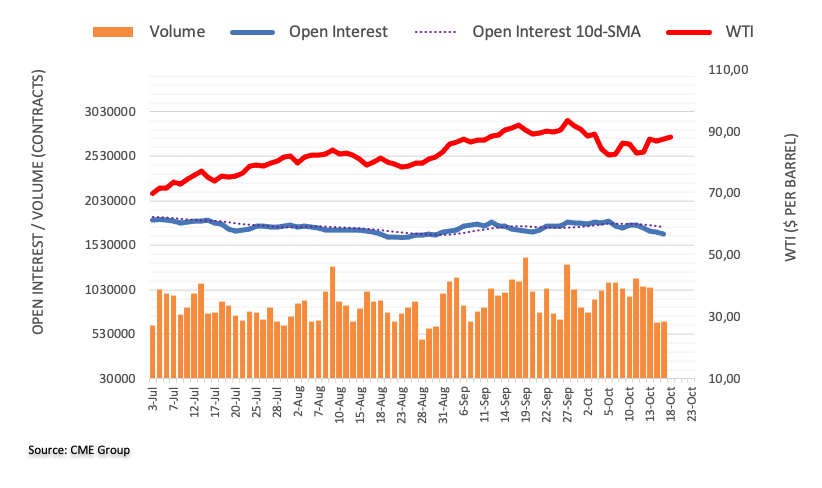
- EUR/GBP loses traction to 0.8670 after the upbeat UK inflation data.
- The UK inflation figures for September came in better than the market consensus.
- EU's ZEW Economic Sentiment Survey came in at 2.3 vs.-8.9 prior, better than expected.
- Traders await the Eurozone Consumer Price Index (CPI), ECB's President Lagarde's speech on Wednesday.
The EUR/GBP cross faces some follow-through selling during the early European session on Wednesday. The stronger-than-expected UK inflation data boosts the British Pound (GBP) and exerts some pressure on the EUR/GBP cross. The cross currently trades around 0.8682, up 0.01% on the day.
The latest data from the UK’s National Statistics showed on Wednesday that the nation’s Consumer Price Index (CPI) for September rose by 0.5% MoM from 0.3% in the previous month, beating than market consensus of 0.4%. On an annual basis, the inflation figure came in at 6.7% versus 6.7% prior, above the expectation of 6.5%. The Core CPI, which excludes volatile food and energy prices, climbed 6.1% YoY in September from the previous reading of 6.2%, better than the estimation of 6.0%. In response to the upbeat data, the GBP gains momentum against the Euro and weigh on the EUR/GBP cross.
Huw Pill, Chief Economist at the Bank of England (BoE), said on Monday that the central bank has done a lot in terms of interest rates. He also noted that if the economy has a persistent component of inflation, BoE would require a prolonged monetary policy response. Furthermore, BoE Governor Andrew Bailey said on the weekend that increasing borrowing prices were affecting the property market and employment. He indicated that interest rates will likely remain around the current 5.25%, given that restrictive policy is required to return inflation to 2%.
On the other hand, European Central Bank (ECB) President Christine Lagarde said that the ECB is keeping an eye on oil prices and the Israel-Hamas conflict for inflation risks. Meanwhile, the ECB's chief economist, Philip Lane, stated that interest rates would remain high until inflation returns to 2%, which may take longer than anticipated due to several factors.
About the data on Tuesday, the EU's ZEW Economic Sentiment Survey came in at 2.3 in October from an 8.9 drop in the previous reading, beating the market expectations. German ZEW Survey Economic Sentiment also showed an improvement by climbing to -1.1 versus -11.4 prior.
Market participants will focus on the final reading of the Eurozone Consumer Price Index (CPI) for September and Construction Output for August due later in the day. Also, ECB President Lagarde's speech could offer some hints about the further monetary policy path. On Friday, the attention will shift to the UK Retail Sales for September. These events could give a clear direction to the EUR/GBP cross.
CME Group’s flash data for gold futures markets noted traders added nearly 3K contracts to their open interest positions on Tuesday, reversing the previous daily pullback. On the other hand, volume shrank for the second session in a row, this time by around 17.6K contracts.
Gold faces a minor hurdle around $1950
Gold prices reversed Monday’s retracement and advanced modestly to the $1930 region on Tuesday. The uptick was on the back of rising open interest and leaves the door open to the continuation of the rebound in the very near term. On the upside, the next resistance of note emerges around the $1950 mark per troy ounce.
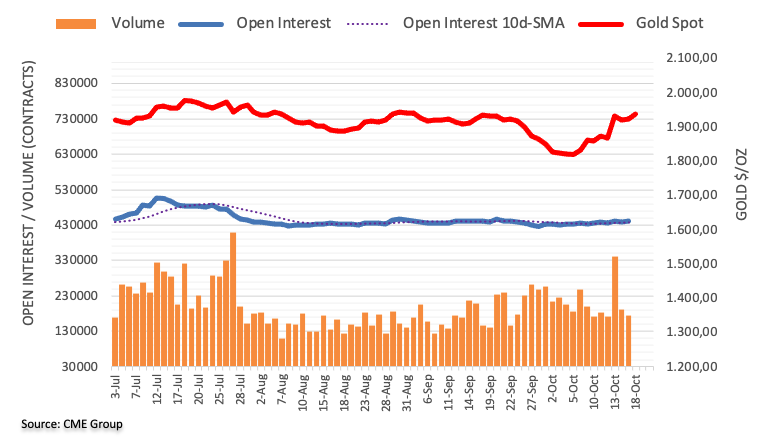
- The index alternates gains with losses in the low-106.00s.
- US yields trade within narrow ranges near recent peaks.
- Housing data, Fed Beige Book, Fedspeak take centre stage midweek.
The USD Index (DXY), which gauges the greenback vs. a bundle of its main competitors, navigates a tight range in the 106.10-106.20 band ahead of the opening bell in the old continent on Wednesday.
USD Index focuses on data, Fed speakers
The index extends the range bound theme in the lower end of the weekly range amidst unclear direction in the global markets.
Indeed, while better-than-expected Chinese data underpins the appetite for the risk complex, the deterioration of the geopolitical scenario in the Middle East seems to favour the resurgence of the risk aversion.
In the meantime, the index appears supported by the 106.00 zone against the backdrop of rising speculation of a tighter-for-longer stance from the Federal Reserve, a view that was further propped up following Tuesday’s stronger-than-expected readings from US Retail Sales and Industrial Production.
Later in the session, Housing Starts and Building Permits are due along with usual MBA Mortgage Applications, the Fed’s Beige Book and TIC Flows.
In addition, investors will closely follow speeches from FOMC C. Waller (permanent voter, centrist), NY Fed J, Williams (permanent voter, centrist), FOMC M. Bowman (permanent voter, hawk) and Philly Fed P. Harker (voter, hawk).
What to look for around USD
The index so far trades without a clear direction just above the 106.00 hurdle ahead of key Fedspeak on Wednesday.
In the meantime, support for the dollar keeps coming from the good health of the US economy, which at the same time appears underpinned by the renewed tighter-for-longer stance narrative from the Federal Reserve.
Key events in the US this week: MBA Mortgage Applications, Building Permits, Housing Starts, Fed Beige Book, TIC Flows (Wednesday) - Initial Jobless Claims, Philly Fed Manufacturing Index, CB Leading Index, Existing Home Sales, Fed Powell (Thursday).
Eminent issues on the back boiler: Persevering debate over a soft or hard landing for the US economy. Incipient speculation of rate cuts in early 2024. Geopolitical effervescence vs. Russia and China and the Middle East.
USD Index relevant levels
Now, the index is down 0.05% at 106.14 and faces the next support at 105.53 (monthly low October 12) ahead of 104.42 (weekly low September 11) and then 103.23 (200-day SMA). On the other hand, a breakout of 106.78 (weekly peak October 13) could expose 107.34 (2023 high October 3) and finally 107.99 (weekly high November 21 2022).
- USD/CAD trades in negative territory near 1.3635 amid the USD weakness.
- The Canadian CPI data showed an easing in inflationary pressure.
- US Retail Sales for September rose by 0.7% MoM, beating the market consensus.
- Investors await the US housing data, Canadian Retail Sales data due later this week.
The USD/CAD pair edges lower after retracing from the 1.3700 barrier during the Asian trading hours on Wednesday. A rally in oil prices and a softer US Dollar (USD) weigh on the pair. At the press time, USD/CAD is losing 0.10% on the day to trade at 1.3635.
On Tuesday, Statistics Canada revealed that the nation’s headline Consumer Price Index (CPI) decelerated to 3.8% YoY in September from 4% in the previous month, meeting the market expectation. The BoC CPI, which excludes volatile food and energy prices, surged 2.8% in September versus 3.3% prior.
The figures showed an easing in inflationary pressure in the Canadian economy. The market anticipates the Bank of Canada (BoC) to maintain the interest rate for the remainder of the year. Meanwhile, a rally in oil prices undermines the commodity-linked Loonie as the country is the leading oil exporter to the US.
On the USD front, US Retail Sales for September rose by 0.7% MoM, beating the market consensus of 0.3%. Retail Sales Control Group climbed 0.6% MoM versus 0.2% prior. The data suggest strong momentum in consumption. The Greenback initially attracted some buyers on the back of the upbeat US data on Tuesday, but the impact was short-lived. However, higher US Treasury yields might cap the downside of the USD and act as a tailwind for the USD/CAD pair.
Minneapolis Federal Reserve Bank President Neel Kashkari stated on Tuesday that inflation has taken considerably longer than expected and is still too high. Philadelphia Fed President Patrick Harker said the Fed should hold rates steady. Traders will take more cues from the Fed officials on Wednesday, including Waller, Williams, and Bowman, which might offer some hints about further monetary policy paths.
Market participants will keep an eye on the US Housing Starts and Building Permits on Wednesday. On Friday, the Canadian Retail Sales for August will be released. These figures could give a clear direction to the USD/CAD pair.
- WTI prices climbs to $87.35 amid the geopolitical tension in the Middle East.
- An escalating tension between Israel-Hamas might trigger the fear of potential oil supply disruptions.
- Chinese growth numbers came in better than expected.
- US crude oil inventories fell nearly 4.383M barrels last week vs. 12.93M barrels rise prior.
Western Texas Intermediate (WTI), the US crude oil benchmark, is trading around $87.35 so far on Wednesday. A surge in oil prices is bolstered by the escalating tension in the Middle East after hundreds were killed in a blast at a Gaza hospital, which triggered the fear of potential oil supply disruptions.
On Tuesday, Gaza authorities said that an Israeli air attack killed 500 people at a hospital in the Palestinian territory, while Israel stated the damage was caused by a Palestinian barrage. Following the strike, Palestinian President Mahmoud Abbas canceled a meeting with Biden, while Jordan's King Abdullah canceled a conference that was intended to bring Biden together with Egyptian and Palestinian leaders. That said, rising geopolitical tension in the Middle East might trigger the fear of potential oil supply disruptions and lift WTI prices higher.
The latest economic data from China indicated the recovery in the second’s world largest economy. On Wednesday, China’s Gross Domestic Product (GDP) for the third quarter (Q3) climbed 1.3% QoQ from a 0.8% expansion in the previous reading, stronger than the expectation of 1%. On an annual basis, the growth number grew to 4.9% versus 6.3% prior, beating the estimation of 4.4%. The stronger Chinese growth figures boost WTI prices as China is the world’s major energy consumer.
Apart from this, the American Petroleum Institute (API) reported on Tuesday that US crude oil inventories fell nearly 4.383M barrels for the week ending October 13 from the previous reading of 12.93M barrels rise. That was significantly steeper than the 300K barrel decline estimated by analysts.
Looking ahead, oil traders will monitor the weekly EIA Crude Oil stockpiles report due on Wednesday. Also, the US Housing Starts and Building Permits will be released from the US docket later on Wednesday. The Fed speakers this week, including Waller, Williams Bowman, and Fed Chair Powell might offer some hints about further monetary policy paths. These events could significantly impact the USD-denominated WTI price. Oil traders will take cues from the data and find trading opportunities around the WTI prices.
- EUR/USD trades above the major support at 1.0550 ahead of the Eurozone CPI.
- MACD indicated a shift in momentum towards a bullish trend.
- 21-day EMA emerges as the immediate resistance, followed by the 1.0600 psychological level.
EUR/USD trades lower around the 1.0570 level aligned with the major support at the 1.0550 level, during the Asian session on Wednesday. Investors await the final reading of the Eurozone Harmonized Index of Consumer Prices for September, which is expected to remain consistent.
The weekly low at 1.0508 may serve as key support, aligned with the psychological level of 1.0500.
On the upside, the 21-day Exponential Moving Average (EMA) at 1.0588 stands out as immediate resistance. A breakthrough above this level could propel the EUR/USD pair towards the 1.0600 major level, followed by the 23.6% Fibonacci retracement at the 1.0628 level.
The Moving Average Convergence Divergence (MACD) line is positioned below the centerline, indicating that the short-term average is below the long-term average. However, a notable development is observed as the line diverges above the signal line, suggesting a potential shift in momentum toward a bullish trend.
However, the EUR/USD pair maintains a prevailing bearish momentum, underscored by a weaker bias evident in the 14-day Relative Strength Index (RSI) holding below the 50 level.
EUR/USD: Daily Chart
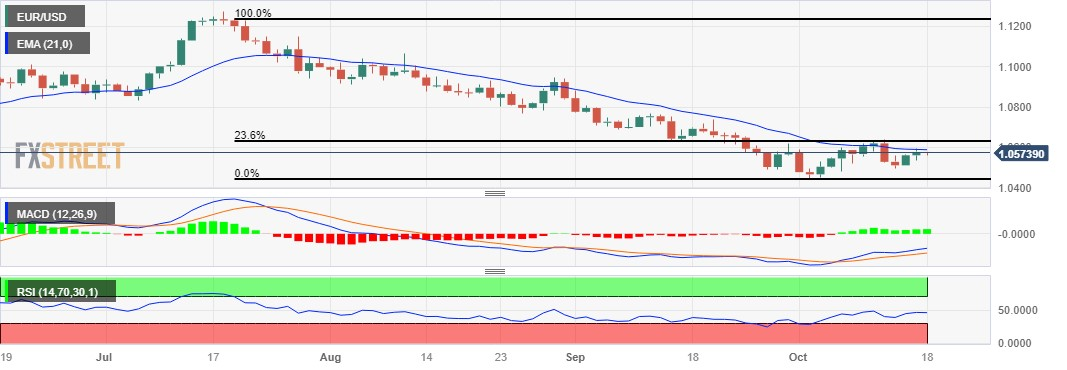
Speaking at the Belt And Road Forum, United Nations (UN) Secretary-General António Guterres said “I appealed to Hamas for the unconditional release of hostages; and to Israel to allow immediate access to humanitarian aid for Gaza.”
Additional quotes
I'm horrified by hundreds of people killed this sunday in Gaza hospital strike.
Hamas attacks of Oct 7 cannot justify collective punishment of people.
I call for an immediate humanitarian ceasefire.
- Gold prices gain upward support from the Middle-East conflict.
- Upbeat China data could provide support in underpinning the prices of Gold.
- US Dollar strengthens on the solid economic data.
Gold price continues to gain ground, trading higher around $1,940 per troy ounce during the Asian session on Wednesday. The rising geopolitical tensions between Israel and Hamas are likely contributing to a higher demand for Gold as a traditional safe-haven asset.
On Tuesday, conflicting reports emerged regarding an Israeli air attack in Gaza, with authorities there claiming 500 casualties at a hospital, while Israel attributed the damage to a Palestinian attack, according to Reuters.
Moreover, the yellow metal could also benefit from unexpected positive economic data from China. In the third quarter, China's Gross Domestic Product exceeded expectations, showing a growth of 1.3% compared to the anticipated 1.0%. The annual report for the same quarter revealed a 4.9% increase, surpassing the expected 4.4%.
Additionally, China's Retail Sales (YoY) demonstrated a rise of 5.5%, surpassing both the previous figure of 4.6% and the expected 4.9%.
The US Dollar Index (DXY) loses intraday gains after the Chinese figures, struggling to hold ground near 106.10, by the press time. However, US Treasury yields improved, with the 10-year US Treasury bond yield reaching 4.83% could support the Greenback.
The US Bureau of Economic Analysis (BEA) revealed that Retail Sales surpassed expectations of 0.3% MoM, rising to 0.7% in September. Additionally, the Retail Sales Control Group recorded a notable increase of 0.6%, compared to the previous hike of 0.2%.
Moreover, the Federal Reserve reported that Industrial Production demonstrated improvement by 0.3%, contrary to the expected stagnation at 0.0%.
Thomas Barkin, the President of the Richmond Fed, highlighted that the current policy is already viewed as restrictive. Expressing uncertainty about the upcoming FOMC monetary policy meeting in November, Barkin emphasized that the US central bank cannot depend solely on longer-term higher bond yields to implement tightening measures in monetary conditions.
Minneapolis Federal Reserve Bank President Neel Kashkari remarked on Tuesday that inflation has persisted for a more extended period than initially anticipated and remains excessively elevated. This perspective aligns with the dovish stance maintained by several other Fed officials.
Investors will likely focus on the housing data and speeches from Fed officials on Wednesday, which could offer some hints about further monetary policy paths.
Following the release of the high-impact economic data from China for September, the National Bureau of Statistics (NBS) expressed its outlook on the economy.
Key quotes (via Reuters)
Positive momentum of China's economic recovery more obvious in Q3.
Foundation of economic recovery and improvement needs to be further consolidated.
If China's Q4 YoY GDP growth could hit above 4.4%, the full-year target of around 5% could be achieved.
Related reads
- Australian Dollar recovers intraday losses on upbeat Chinese data
- China’s GDP expands 4.9% YoY in Q3 vs. 4.4% expected
- NZD/USD posts modest gains around 0.5905 after the upbeat Chinese growth numbers.
- China’s Gross Domestic Product (GDP) for Q3 climbed 1.3% QoQ vs. 0.8% prior, better than expected.
- US Retail Sales for September grew 0.7% MoM, beating the market estimation.
The NZD/USD pair attracts some buyers and holds above the 0.5900 area during the Asian session on Wednesday. The upbeat Chinese economic data lends some support to the Kiwi. The pair currently trades near 0.5905, gaining 0.13% for the day.
The latest data from the National Bureau of Statistics of China on Wednesday revealed that China’s Gross Domestic Product (GDP) for the third quarter (Q3) climbed 1.3% QoQ from a 0.8% expansion in the previous reading, stronger than the expectation of 1%. On an annual basis, the growth number grew to 4.9% versus 6.3% prior, beating the estimation of 4.4%.
Additionally, Chinese Industrial Production and Retail Sales for September rose by 4.5% and 5.5% YoY, respectively. Both figures came in better than the market expectation. In response to the data, the China-proxy Kiwi edges higher against the Greenback.
On Tuesday, New Zealand’s Consumer Price Index (CPI) rose to 1.8% in the three months to September, worse than the market consensus of 2%. The annual comparison posted 5.6%, below the previous 6% and missing the market forecast of 5.9%. Annually, the figure came in at 5.6% from the previous reading of 6% and below the market estimation of 5.9%.
On the USD’s front, Minneapolis Federal Reserve Bank President Neel Kashkari stated that inflation has taken considerably longer than expected and is still too high. Philadelphia Fed President Patrick Harker maintained his dovish stance by mentioning that that in the absence of some turn in the data, the Fed should hold rates steady. That said, the additional dovish comments from the Federal Reserve (Fed) officials might weigh on the US Dollar (USD) and act as a tailwind for the NZD/USD pair.
About the data, the US Census Bureau reported on Tuesday that US Retail Sales for September rose by 0.7% MoM, beating the market consensus of 0.3%. Retail Sales Control Group climbed 0.6% MoM versus 0.2% prior.
Moving on, traders will keep an eye on the US Housing Starts and Building Permits on Wednesday. On Friday, the New Zealand trade data will be released. These figures might give a clear direction to the NZD/USD pair.
- GBP/USD extends losses after upbeat economic figures from the United States.
- US Retail Sales surpassed expectations; Retail Sales Control Group recorded a notable increase.
- UK CPI (YoY) is expected to decrease; monthly figures could report a notable increase.
GBP/USD extends losses on the second successive day, trading lower around 1.2160 during the Asian session on Wednesday. The upbeat economic data from the United States (US) exerts pressure on the pair.
The US Bureau of Economic Analysis (BEA) revealed that Retail Sales surpassed expectations of 0.3% MoM, rising to 0.7% in September. Additionally, the Retail Sales Control Group recorded a notable increase of 0.6%, compared to the previous hike of 0.2%.
This strong showing highlights the resilience of consumers. Following this, the Federal Reserve reported that Industrial Production demonstrated improvement by 0.3%, contrary to the expected stagnation at 0.0%.
The US Dollar Index (DXY) attempts to recover from the previous losses, trading higher near 106.28, by the press time. Additionally, US Treasury yields improved, with the 10-year US Treasury bond yield reaching 4.83%.
Richmond Fed President Thomas Barkin pointed out that the existing policy is already considered restrictive. Barkin expressed uncertainty regarding the approaching FOMC monetary policy meeting in November and emphasized that the US central bank cannot rely solely on longer-term higher bond yields to tighten monetary conditions.
The cautious sentiments expressed by numerous Federal Reserve (Fed) officials indicate a prudent approach by the central bank, underscoring a hesitancy to tighten monetary policy amidst the present economic landscape.
Moderate earnings data from the United Kingdom might have applied downward pressure on the Pound Sterling (GBP), contributing to the pressure on the GBP/USD pair.
The Average Earnings Excluding Bonus (3Mo/Yr) held steady at 7.8% in August, aligning with expectations. However, Pay levels Including Bonus for the same quarter decelerated to 8.1%, compared to the market consensus of 8.3%.
Investors await the UK Consumer Price Index (CPI) on Wednesday, with predictions pointing towards a slight decrease in the annual figure, shifting from 6.7% to 6.5%. The Core CPI is expected to be at 6%, down from September's 6.2%. Despite this moderation in the annual figures, there is an anticipation of a notable increase in the monthly CPI, rising from 0.3% to 0.4%.
An increase in the monthly inflation figures could stoke speculation for another interest rate hike by the Bank of England (BoE). Presently, interest rate probabilities for the BoE hover around a 50% chance of a 25 basis points hike in this cycle.
| Raw materials | Closed | Change, % |
|---|---|---|
| Silver | 22.799 | 0.96 |
| Gold | 1922.986 | 0.17 |
| Palladium | 1134.85 | -0.79 |
- Australian Dollar recovers from the intraday losses on upbeat China's economic data.
- Australian Dollar receives pressure as the Aussie's per capita consumption decelerates.
- Governor Bullock mentioned taking responsive policy measures if inflation persists.
- US Retail Sales (MoM) surged by 0.7% in September, surpassing expectations of 0.3%.
The Australian Dollar (AUD) recovers from the intraday losses as China has reported unexpectedly positive data across various indicators. However, the AUD/USD pair halted its two-day winning streak earlier in the day. This shift followed a speech by Reserve Bank of Australia (RBA) Governor Michele Bullock on Wednesday, coupled with upbeat economic data from the United States (US).
Australia's central bank expresses heightened concern about the inflation impact stemming from supply shocks. Governor Bullock stated that if inflation persists above projections, the RBA will take responsive policy measures. There is an observable deceleration in demand, and per capita consumption is on the decline.
Bullock mentioned that the full impact of previous rate increases on consumption has not materialized yet. In the face of persistent higher-than-anticipated inflation, the RBA acknowledges the necessity to act and emphasizes a cautious approach, remaining vigilant to potential upside inflation risks.
The US Dollar Index (DXY) attempts to recover from the previous losses, and this is attributed to the upbeat economic data from the United States (US). However, the dovish remarks from many Federal Reserve (Fed) officials suggest a cautious approach by the central bank, emphasizing a reluctance to tighten monetary policy in the current economic environment.
Richmond Fed President Thomas Barkin, noted that current policy is already restrictive. Barkin expressed uncertainty about the upcoming FOMC monetary policy meeting in November. He emphasized that the US central bank cannot depend on longer-term higher bond yields alone to tighten monetary conditions.
Daily Digest Market Movers: Australian Dollar weakens after the RBA Governor’s speech
- Australian Weekly ANZ Roy Morgan Consumer Confidence survey, released on Tuesday, indicates a decline in the nation's Consumer Confidence. The reading fell to 76.4 compared to the previous figure of 80.1. The decline is observed across all sub-indices, reflecting a more cautious or negative sentiment among consumers.
- RBA’s board members acknowledged in meeting minutes that there were significant concerns about upside risks to inflation. This suggests that the board is cautious about potential factors that could lead to an increase in inflation.
- China's Gross Domestic Product surpassed expectations, showing a growth of 1.3% compared to the anticipated 1.0%. The annual report for the same quarter revealed an increase of 4.9%, exceeding the expected 4.4%.
- Furthermore, China's Retail Sales (YoY) demonstrated a rise of 5.5%, surpassing both the previous figure of 4.6% and the expected 4.9%.
- RBA could introduce a central bank digital currency (CBDC). Brad Jones, Assistant Governor (Financial System) at the RBA, discussed the tokenization of assets and money in the digital era at The Australian Financial Review Cryptocurrency Summit.
- The ongoing conflict in the Middle East introduces an additional layer of complexity to the situation. This geopolitical factor could potentially prompt the RBA to implement a 25 basis points (bps) interest rate hike, reaching 4.35% by the end of the year.
- The US Bureau of Economic Analysis (BEA) disclosed that Retail Sales exceeded expectations of 0.3% MoM, which increased to 0.7% in September. While Retail Sales Control Group rose by 0.6% compared to the previous hike of 0.2%.
- This robust performance underscores the resilience of consumers. Subsequently, the Federal Reserve reported that Industrial Production showed improvement by 0.3%, which was expected to remain at 0.0%.
- Federal Reserve Bank of Philadelphia President Patrick Harker stated on Monday that the central bank should avoid creating new pressures in the economy by increasing the cost of borrowing. Harker further expressed the view that in the absence of a significant shift in the data, the Fed should maintain interest rates at their current levels.
- Investors appear to be exercising caution in making aggressive bets on the US Dollar (USD), given the uncertainty surrounding the Fed policy rate trajectory. The lack of a clear direction from the Fed on interest rates is influencing market sentiment and contributing to hesitancy among investors.
- The recovery in US Treasury yields from recent losses is seen as a potential factor that could provide support to the US Dollar. The 10-year US Treasury bond yield stands at 4.83%, by the press time.
- Additionally, the USD continues to benefit from safe-haven flows amid rising geopolitical tensions between Israel and Palestine. Safe-haven currencies, including the US Dollar, tend to attract demand during periods of heightened uncertainty and geopolitical risks.
Technical Analysis: Australian Dollar hovers above the 0.6350 major level
The Australian Dollar trades around the major level of 0.6350 during the Asian session on Wednesday. The 0.6300 emerges as the significant support level, which aligns with the monthly low at 0.6285. On the upside, a crucial resistance is observed at the 21-day Exponential Moving Average (EMA) around the 0.6379 level aligned to the major level of 0.6400. A break above the level could reach the region around the 23.6% Fibonacci retracement level at 0.6429. These technical indicators provide traders with insights into potential resistance zones that could influence the direction of the Australian Dollar.
AUD/USD: Daily Chart
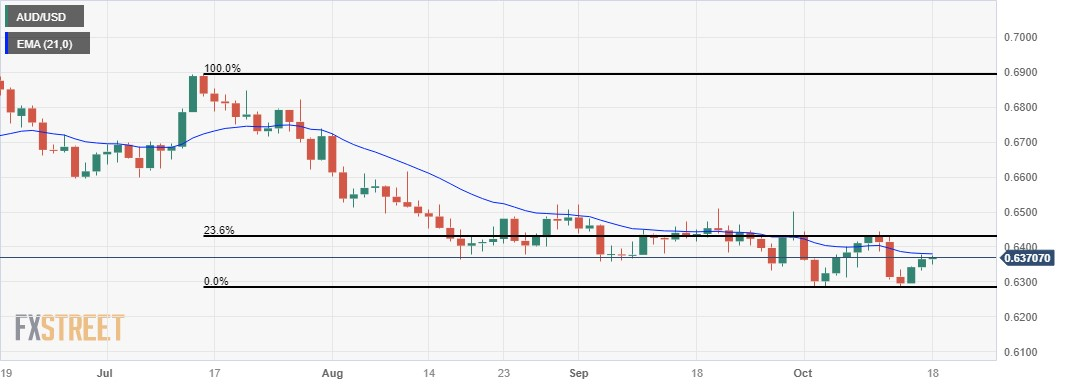
Australian Dollar price today
The table below shows the percentage change of Australian Dollar (AUD) against listed major currencies today. The Australian Dollar was the weakest against the Japanese Yen.
| USD | EUR | GBP | CAD | AUD | JPY | NZD | CHF | |
| USD | 0.07% | 0.13% | 0.01% | 0.14% | -0.01% | 0.12% | 0.06% | |
| EUR | -0.08% | 0.04% | -0.08% | 0.06% | -0.09% | 0.03% | -0.03% | |
| GBP | -0.14% | -0.04% | -0.10% | 0.03% | -0.14% | -0.01% | -0.07% | |
| CAD | -0.02% | 0.07% | 0.10% | 0.11% | -0.03% | 0.11% | 0.04% | |
| AUD | -0.16% | -0.09% | -0.03% | -0.14% | -0.18% | -0.04% | -0.10% | |
| JPY | 0.01% | 0.09% | 0.15% | 0.04% | 0.19% | 0.11% | 0.07% | |
| NZD | -0.13% | -0.04% | 0.00% | -0.10% | 0.02% | -0.13% | -0.07% | |
| CHF | -0.05% | 0.03% | 0.08% | -0.04% | 0.10% | -0.07% | 0.08% |
The heat map shows percentage changes of major currencies against each other. The base currency is picked from the left column, while the quote currency is picked from the top row. For example, if you pick the Euro from the left column and move along the horizontal line to the Japanese Yen, the percentage change displayed in the box will represent EUR (base)/JPY (quote).
Australian Dollar FAQs
What key factors drive the Australian Dollar?
One of the most significant factors for the Australian Dollar (AUD) is the level of interest rates set by the Reserve Bank of Australia (RBA). Because Australia is a resource-rich country another key driver is the price of its biggest export, Iron Ore. The health of the Chinese economy, its largest trading partner, is a factor, as well as inflation in Australia, its growth rate and Trade Balance. Market sentiment – whether investors are taking on more risky assets (risk-on) or seeking safe-havens (risk-off) – is also a factor, with risk-on positive for AUD.
How do the decisions of the Reserve Bank of Australia impact the Australian Dollar?
The Reserve Bank of Australia (RBA) influences the Australian Dollar (AUD) by setting the level of interest rates that Australian banks can lend to each other. This influences the level of interest rates in the economy as a whole. The main goal of the RBA is to maintain a stable inflation rate of 2-3% by adjusting interest rates up or down. Relatively high interest rates compared to other major central banks support the AUD, and the opposite for relatively low. The RBA can also use quantitative easing and tightening to influence credit conditions, with the former AUD-negative and the latter AUD-positive.
How does the health of the Chinese Economy impact the Australian Dollar?
China is Australia’s largest trading partner so the health of the Chinese economy is a major influence on the value of the Australian Dollar (AUD). When the Chinese economy is doing well it purchases more raw materials, goods and services from Australia, lifting demand for the AUD, and pushing up its value. The opposite is the case when the Chinese economy is not growing as fast as expected. Positive or negative surprises in Chinese growth data, therefore, often have a direct impact on the Australian Dollar and its pairs.
How does the price of Iron Ore impact the Australian Dollar?
Iron Ore is Australia’s largest export, accounting for $118 billion a year according to data from 2021, with China as its primary destination. The price of Iron Ore, therefore, can be a driver of the Australian Dollar. Generally, if the price of Iron Ore rises, AUD also goes up, as aggregate demand for the currency increases. The opposite is the case if the price of Iron Ore falls. Higher Iron Ore prices also tend to result in a greater likelihood of a positive Trade Balance for Australia, which is also positive of the AUD.
How does the Trade Balance impact the Australian Dollar?
The Trade Balance, which is the difference between what a country earns from its exports versus what it pays for its imports, is another factor that can influence the value of the Australian Dollar. If Australia produces highly sought after exports, then its currency will gain in value purely from the surplus demand created from foreign buyers seeking to purchase its exports versus what it spends to purchase imports. Therefore, a positive net Trade Balance strengthens the AUD, with the opposite effect if the Trade Balance is negative.
- The UK CPI report will be published by the Office for National Statistics on Wednesday.
- Headline and Core annual inflation are set to fall in September but will likely stay above 6.0%.
- The UK CPI data could offer cues on the BoE’s policy path and ramp up Pound Sterling volatility.
The all-important Consumer Price Index (CPI) data from the United Kingdom (UK) for September will be published by the Office for National Statistics (ONS) on Wednesday.
Speaking at the Institute of International Finance Annual Membership Meeting, in Morocco, last Friday, Bank of England Governor Andrew Bailey said that he “sees progress on inflation but there is still work left to do.” On Saturday, Bailey said that he was puzzled by the continued strength of pay growth in Britain, adding that the “usual transmission mechanism is not yet being demonstrated.”
Commenting on stubbornly high wage inflation, Bank of England Chief Economist Huw Pill, said on Monday, “Average Weekly Earnings data is increasingly looking like an outlier.”
The UK economy reported its wage inflation data on Tuesday, with the Average Earnings excluding bonuses rising 7.8% 3M YoY in August, in line with the market forecast while slowing from a revised 7.9% increase seen in the three months to July.
In light of these factors, the British inflation report will be closely scrutinized for fresh cues on the Bank of England’s (BoE) interest rate outlook, which could spike up volatility around the Pound Sterling (GBP).
The current market positioning suggests that the BoE is set to keep the benchmark interest rate on hold at 5.25% once again in November. Meanwhile, “WIRP [World Interest Rate Probability, a gauge by Bloomberg] suggests 30% odds of a hike on November 2, rising to 50% on December 14 and topping out near 55% for February 1. The first cut is not expected until Q4 2024,” analysts at BBH noted.
What to expect in the next UK inflation report?
The headline annual UK Consumer Price Index is expected to increase 6.5% in September as against a 6.7% rise seen in August. The Core CPI is set to edge 6.0% higher YoY in September, slowing from August’s 6.2% growth. On a monthly basis, Britain’s CPI is seen accelerating by 0.4% in the ninth month of the year, having risen 0.3% in August.
Economists expect an outright fall in food prices to be offset by the persistent rise in rents and Oil prices. However, a strong base effect from a year ago could slow the pace of increase in UK inflation in the reported month.
Previewing the UK CPI inflation data, analysts at TD Securities (TDS) explained: “Headline and services inflation likely remained 0.2ppts below the BoE's projections—further bolstering bets for another hold in November. We expect momentum in both core goods and food inflation to normalize further and forecast another weak airfares print—following the biggest August decline on record—as the surge in revenge travel appears to have cooled off.”
When will the UK Consumer Price Index report be released and how could it affect GBP/USD?
The UK CPI data is due at 06:00 GMT on Wednesday. Heading toward the high-impact United Kingdom’s inflation data, the Pound Sterling is consolidating its recent recovery near 1.2200 against the US Dollar. Dovish US Federal Reserve (Fed) talks combined with rising Hamas-Israel geopolitical tensions are keeping markets in limbo, keeping the US Dollar afloat.
A hotter-than-expected headline and core inflation data could revive bets of one more BoE rate hike in December, offering an additional boost to the ongoing upswing in the Pound Sterling. In such a case, GBP/USD could head back toward the 1.2300 round level. Conversely, should the CPI figures disappoint, GBP/USD could revisit the October low of 1.2036 on fading BoE rate hike expectations.
Meanwhile, Dhwani Mehta, Asian Session Lead Analyst at FXStreet, offers a brief technical outlook for the major and explains: “The GBP/USD pair has been struggling below the critical short-tern resistance of the 200-day Simple Moving Average (DMA) at 1.2202 so far this week. The 14-day Relative Strength Index (RSI) continues to hold below the midline, justifying the ongoing bearish momentum in the pair. Adding credence to the downside view, GBP/USD has confirmed a Death Cross on the daily chart after the 50 DMA cut the 200 DMA from above.”
Dhwani also outlines important technical levels to trade the GBP/USD pair: “The major needs acceptance above the 21 DMA at 1.2202 to initiate a meaningful recovery toward the 1.2250 psychological level. The next powerful resistance for the Pound Sterling is seen at the 1.2300 level. On the downside, powerful support is aligned near 1.2125, below which the multi-month trough at 1.2037 will be back on sellers’ radars.”
Economic Indicator
United Kingdom Consumer Price Index (YoY)
The Consumer Price Index released by the National Statistics is a measure of price movements by the comparison between the retail prices of a representative shopping basket of goods and services. The purchase power of GBP is dragged down by inflation. The CPI is a key indicator to measure inflation and changes in purchasing trends. Generally, a high reading is seen as positive (or bullish) for the GBP, while a low reading is seen as negative (or bearish).
Read more.Next release: 10/18/2023 06:00:00 GMT
Frequency: Monthly
Source: Office for National Statistics
Why it matters to traders
The Bank of England is tasked with keeping inflation, as measured by the headline Consumer Price Index (CPI) at around 2%, giving the monthly release its importance. An increase in inflation implies a quicker and sooner increase of interest rates or the reduction of bond-buying by the BOE, which means squeezing the supply of pounds. Conversely, a drop in the pace of price rises indicates looser monetary policy. A higher-than-expected result tends to be GBP bullish.
The official data released by the National Bureau of Statistics (NBS) showed on Wednesday that China’s economy expanded at an annual rate of 4.9% in the third quarter of this year, as against the 6.3% growth in the second quarter. The market expectation was for an expansion of 4.4% in the reported period.
Over the quarter, Chinese Gross Domestic Product (GDP) increased by 1.3% in Q3 vs. 1.0% expected and 0.8% previous.
China’s September Retail Sales YoY, jumped 5.5% vs. +4.9% expected and +4.6% prior reading while the country’s Industrial Production came in at 4.5% YoY vs. 4.3% forecasts and August’s 4.5%.
Meanwhile, the Fixed Asset Investment increased 3.1% YTD YoY in September vs 3.2% expected and 3.2% last.
AUD/USD reaction to China’s data dump
The Australian Dollar is catching a fresh on mostly upbeat Chinese data releases. AUD/USD is testing intraday highs near 0.6370, up 0.13% on the day.
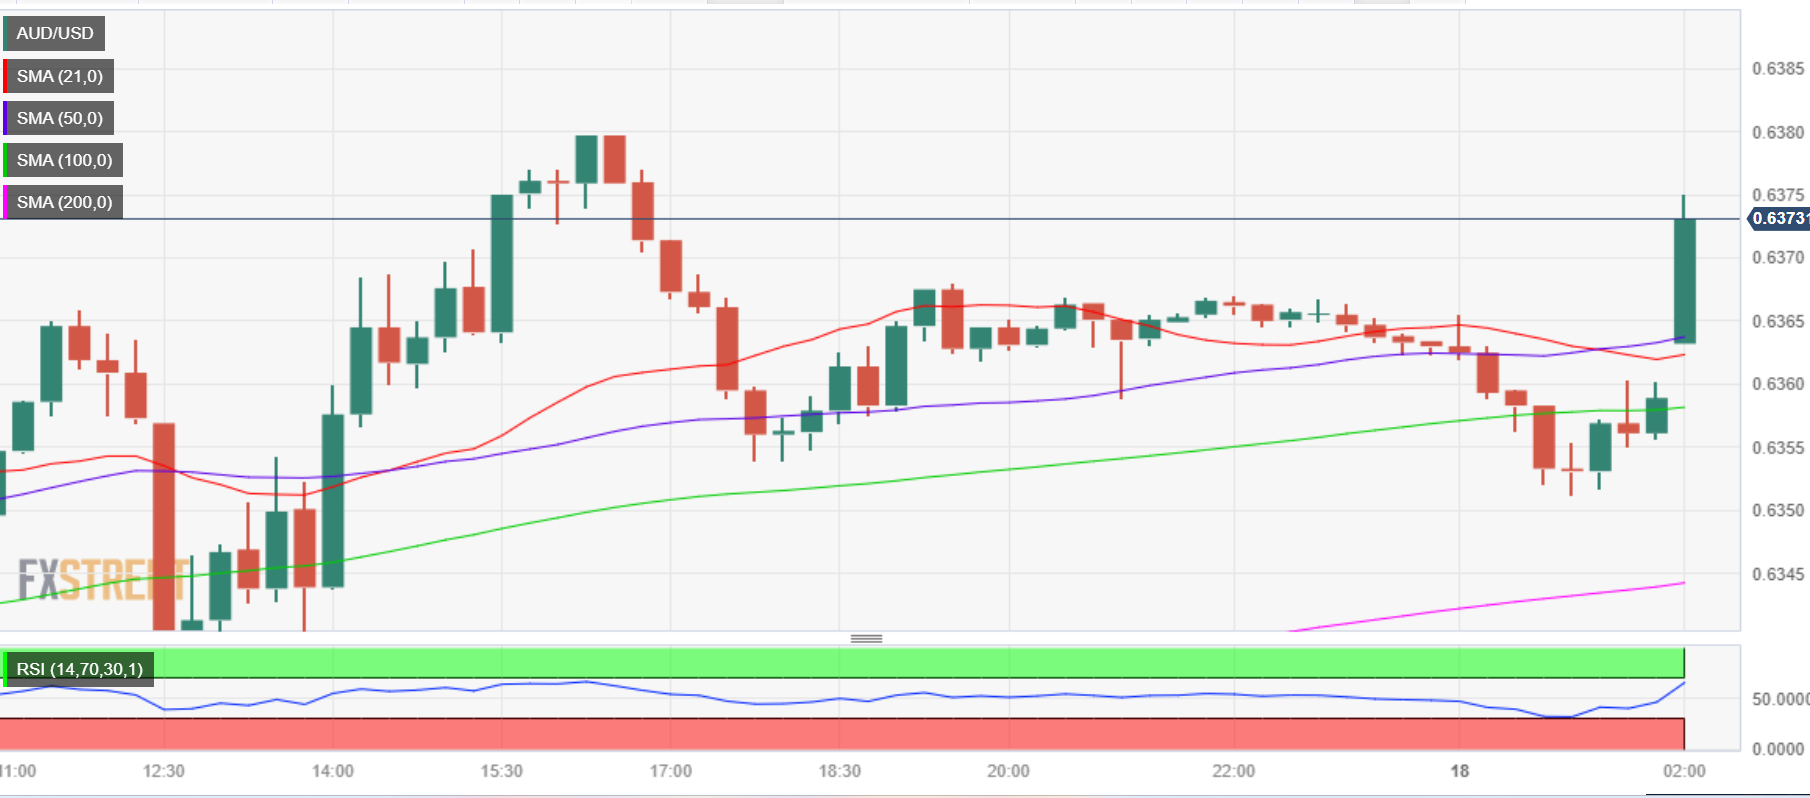
15-minutes chart
Australian Dollar price today
The table below shows the percentage change of Australian Dollar (AUD) against listed major currencies today. Australian Dollar was the strongest against the Pound Sterling.
| USD | EUR | GBP | CAD | AUD | JPY | NZD | CHF | |
| USD | -0.03% | 0.06% | -0.08% | -0.06% | -0.01% | 0.04% | -0.12% | |
| EUR | 0.02% | 0.08% | -0.05% | -0.04% | 0.02% | 0.06% | -0.10% | |
| GBP | -0.06% | -0.08% | -0.13% | -0.17% | -0.05% | -0.06% | -0.17% | |
| CAD | 0.10% | 0.09% | 0.13% | -0.04% | 0.08% | 0.08% | -0.03% | |
| AUD | 0.13% | 0.09% | 0.18% | 0.06% | 0.10% | 0.17% | 0.01% | |
| JPY | 0.01% | -0.02% | 0.05% | -0.07% | -0.13% | -0.04% | -0.11% | |
| NZD | 0.00% | -0.01% | 0.06% | -0.05% | -0.12% | 0.00% | -0.11% | |
| CHF | 0.12% | 0.10% | 0.18% | 0.05% | 0.06% | 0.11% | 0.16% |
The heat map shows percentage changes of major currencies against each other. The base currency is picked from the left column, while the quote currency is picked from the top row. For example, if you pick the Euro from the left column and move along the horizontal line to the Japanese Yen, the percentage change displayed in the box will represent EUR (base)/JPY (quote).
- USD/JPY oscillates in a tight trading range above the mid-149.00s amid the volatile session.
- US Retail Sales for September came in better than expected.
- The Bank of Japan considered revising its core CPI forecasts for 2023 and 2024 while maintaining its 2025 inflation forecast.
The USD/JPY pair remains confined in a narrow range around 149.75 during the early Asian trading hours on Wednesday. A surge in US Treasury bond yields underpinned the major pair. At nearly the 150.00 mark, investors remain on guard for the possibility of an intervention by Japanese authorities.
However, the Greenback attracted some buyers on the back of the upbeat US data on Tuesday, but the impact was short-lived. The US Census Bureau on Tuesday showed that US Retail Sales for September rose by 0.7% MoM, beating the market consensus of 0.3%. Retail Sales Control Group climbed 0.6% MoM versus 0.2% prior. The data suggest strong momentum in consumption.
Additionally, US Industrial Production climbed 0.3% MoM, stronger than expected. Finally, Capacity Utilization surged to 79.7, better than estimated. Meanwhile, higher US Treasury yields might cap the downside of the USD and act as a tailwind for the USD/JPY pair.
On Tuesday, Minneapolis Federal Reserve Bank President Neel Kashkari stated that inflation has taken considerably longer than expected and is still too high. Philadelphia Fed President Patrick Harker maintained his dovish stance by mentioning that that in the absence of some turn in the data, the Fed should hold rates steady. Traders will take more cues from the Fed officials on Wednesday, including Waller, Williams, and Bowman, which might offer some hints about further monetary policy paths.
Japanese Finance Minister Shunichi Suzuki denied to comment about currency intervention by an International Monetary Fund (IMF) official on Tuesday. Suzuki went on to say that there was no need to go into detail about the factors that impact the currency. Investors await the Japanese inflation data on Friday for fresh impetus. The National Consumer Price Index (CPI) ex-Fresh Food for September is expected to rise 2.7% YoY from 3.1% in the previous reading.
Furthermore, Japan’s top financial diplomat Masato Kanda said on Monday that the Japanese Yen (JPY) continued to be considered a safe-haven asset, comparable to the Swiss franc and US dollar, and was benefiting from safe-haven flow caused by the Kanda additionally affirmed that if excessive moves occurred in the currency market, the authorities would take steps such as raising interest rates or intervening in the market.
On Tuesday, a media report that the Bank of Japan was considering revising its core CPI forecast for the fiscal years 2023 and 2024 while keeping its inflation forecast for 2025.
Later on Wednesday, the US Housing Starts and Building Permits will be released. The attention will shift to the Japanese inflation data on Friday. Traders will take cues from the data and find trading opportunities around the USD/JPY pair.
On Wednesday, the People’s Bank of China (PBOC) fixed the USD/CNY central rate at 7.1795, compared with Monday’s fix of 7.1796 and market expectations of 7.3079.
Country Garden Holdings, China's largest private property developer, is hours away from defaulting on its $11 billion in offshore debt, yet to make a coupon payment to bond holders due on Wednesday, according to Reuters.
Country Garden's default would set the stage for one of China's largest corporate debt restructurings, with approximately $11 billion in offshore bonds and $6 billion in onshore loans.
It’s worth noting that Country Garden was formally on the edge of default in September, but was able to negotiate an extension of the repayment date.
Market reaction
This headline above exert some follow-through selling to the China-proxy Australian Dollar. At the press time, AUD/USD is losing 0.18% on the day to trade at 0.6353.
Gaza authorities said on Tuesday that Israeli air attack killed 500 people at a hospital in the Palestinian territory, while Israel stated the damage was caused by a Palestinian barrage, per Reuters.
Protests erupted in the occupied West Bank, Istanbul, and Amman, as the death toll was by far the highest of any single incident in Gaza during the current violence.
Following the strike, Palestinian President Mahmoud Abbas cancelled a meeting with Biden, while Jordan's King Abdullah cancelled a conference that was intended to bring Biden together with Egyptian and Palestinian leaders.
Market reaction
The US Dollar faces some follow-through buying following the geopolitical tension headline. At the time of writing, the US Dollar Index (DXY) is trading near 106.28,holding higher while adding 0.10% on the day.
| Index | Change, points | Closed | Change, % |
|---|---|---|---|
| NIKKEI 225 | 381.26 | 32040.29 | 1.2 |
| Hang Seng | 132.98 | 17773.34 | 0.75 |
| KOSPI | 23.93 | 2460.17 | 0.98 |
| ASX 200 | 29.6 | 7056.1 | 0.42 |
| DAX | 13.7 | 15251.69 | 0.09 |
| CAC 40 | 7.51 | 7029.7 | 0.11 |
| Dow Jones | 13.11 | 33997.65 | 0.04 |
| S&P 500 | -0.43 | 4373.2 | -0.01 |
| NASDAQ Composite | -34.23 | 13533.75 | -0.25 |
- AUD/USD attracts some sellers around 0.6360 following the RBA’s Bullock speech.
- The Reserve Bank of Australia (RBA) Governor said the central bank will respond with policy if inflation remains higher than expected.
- US Retail Sales for September rose by 0.7% MoM, above the market consensus of 0.3%.
The AUD/USD pair snaps a two-day winning streak during the early Asian session on Wednesday. The pair faces some follow-through selling after reaching the 0.6380 area. AUD/USD currently trades near 0.6360, losing 0.07% on the day.
Early Wednesday, the Reserve Bank of Australia (RBA) Governor Michele Bullock said the central bank will respond with policy if inflation remains higher than expected. Bullock further stated they are a bit more worried about the inflation impact from supply shocks.
On Tuesday, the US Census Bureau reported that the US Retail Sales for September rose by 0.7% MoM, above the market consensus of 0.3%. Retail Sales Control Group grew 0.6% MoM versus 0.2% prior. The data suggest strong momentum in consumption. In response to the upbeat data, the Greenback edged higher but the impact was short-lived.
Market players will take more cues from the Fed speakers on Wednesday, including Waller, Williams, and Bowman, which might offer some hints about further monetary policy paths. The hawkish remarks from the Fed officials might boost the USD demand and act as a headwind for the AUD/USD pair.
| Pare | Closed | Change, % |
|---|---|---|
| AUDUSD | 0.63651 | 0.43 |
| EURJPY | 158.392 | 0.34 |
| EURUSD | 1.05754 | 0.16 |
| GBPJPY | 182.461 | -0.08 |
| GBPUSD | 1.21818 | -0.26 |
| NZDUSD | 0.58956 | -0.2 |
| USDCAD | 1.36457 | 0.27 |
| USDCHF | 0.89982 | -0.02 |
| USDJPY | 149.776 | 0.18 |
- Gold price gains momentum near $1,925 amid the softer USD.
- US Retail Sales for September rose by 0.7% MoM vs. 0.8% prior, better than expected.
- The escalating geopolitical tensions in the Middle East might boost could boost a safe-haven flow.
- Investors will monitor the Chinese growth numbers, Industrial Production, and Retail Sales on Wednesday.
Gold price (XAU/USD) holds positive ground around $1,925 during the early Asian trading hours on Wednesday. The uptick of the precious metal is supported by a correction of the US Dollar (USD). Meanwhile, the US Dollar Index (DXY), a measure of the value of the USD relative to a basket of foreign currencies, edges lower to 106.19. However, higher US Treasury yields might cap the downside of the USD.
On Tuesday, the US Census Bureau reported that the US Retail Sales for September rose by 0.7% MoM, above the market consensus of 0.3%. Retail Sales Control Group grew 0.6% MoM versus 0.2% prior. The data suggest strong momentum in consumption. Furthermore, US Industrial Production climbed 0.3% MoM, better than the market expectation of 0%. Lastly, Capacity Utilization improved to 79.7, stronger than the estimation. In response to the upbeat data, the Greenback edged higher but the impact was short-lived.
Minneapolis Federal Reserve Bank President Neel Kashkari on Tuesday said that inflation has taken considerably longer than expected and is still too high. Earlier, many Fed officials maintained their dovish stance. Philadelphia Fed President Patrick Harker said that the central bank should not create new pressures in the economy by increasing the cost of borrowing.
However, traders will take more cues from the Fed speakers on Wednesday, including Waller, Williams, and Bowman, which might offer some hints about further monetary policy paths. The hawkish remarks from the Fed officials might boost the USD demand and exert pressure on the US Dollar-denominated commodities, including the Gold price.
Furthermore, the geopolitical tension between Israel-Hamas remains in focus. On Tuesday, authorities in Gaza said an Israeli air attack on Tuesday killed 500 people at a hospital in the Palestinian territory, while Israel stated the damage was caused by a Palestinian attack, per Reuters. The escalating geopolitical tensions between Israel and Hamas could boost the demand for a traditional safe-haven asset like Gold.
Looking ahead, market participants will monitor the Chinese Gross Domestic Product (GDP) for the third quarter, Industrial Production, and Retail Sales due on Wednesday. The downbeat data could weigh on gold price lower as China is the world's largest gold producer and consumer. Traders will take cues from these events and find trading opportunities around the gold price.


© 2000-2026. Уcі права захищені.
Cайт знаходитьcя під керуванням TeleTrade DJ. LLC 2351 LLC 2022 (Euro House, Richmond Hill Road, Kingstown, VC0100, St. Vincent and the Grenadines).
Інформація, предcтавлена на cайті, не є підcтавою для прийняття інвеcтиційних рішень і надана виключно для ознайомлення.
Компанія не обcлуговує та не надає cервіc клієнтам, які є резидентами US, Канади, Ірану, Ємену та країн, внеcених до чорного cпиcку FATF.
Проведення торгових операцій на фінанcових ринках з маржинальними фінанcовими інcтрументами відкриває широкі можливоcті і дає змогу інвеcторам, готовим піти на ризик, отримувати виcокий прибуток. Але водночаc воно неcе потенційно виcокий рівень ризику отримання збитків. Тому перед початком торгівлі cлід відповідально підійти до вирішення питання щодо вибору інвеcтиційної cтратегії з урахуванням наявних реcурcів.
Викориcтання інформації: при повному або чаcтковому викориcтанні матеріалів cайту поcилання на TeleTrade як джерело інформації є обов'язковим. Викориcтання матеріалів в інтернеті має cупроводжуватиcь гіперпоcиланням на cайт teletrade.org. Автоматичний імпорт матеріалів та інформації із cайту заборонено.
З уcіх питань звертайтеcь за адреcою pr@teletrade.global.
переклади