- Аналітика
- Новини та інструменти
- Новини ринків
Новини ринків
- NZD/USD edges higher to 0.5920, gaining 0.08% on the day.
- A Federal Reserve (Fed) pause is widely expected while keeping one more rate hike on the table.
- Market players will monitor the Fed policy meeting, New Zealand growth data this week.
The NZD/USD pair posts modest gains and trades in positive territory for the second consecutive day during the early Asian session on Tuesday. The modest uptick in the Kiwi (NZD) is supported by a weaker US Dollar (USD) as the markets anticipate that the Federal Reserve (Fed) to maintain the interest rate unchanged at its meeting on Wednesday.
In the quiet day of New Zealand's economic docket, the headline surrounding China’s economic woes remains in focus. Any signs of an economic slowdown in China could drag the China-proxy Kiwi lower against the US Dollar and act as a headwind for the NZD/USD pair. Statistics New Zealand will release the nation’s Gross Domestic Product (GDP) for the second quarter on Thursday. The previous growth number came in at -0.1% and 2.2% on quarter and annual basis, respectively.
On the other hand, a Fed pause is widely expected, while keeping one more rate hike on the table. According to the CME Fedwatch tools, the Fed is not expected to surprise the markets, with the probability of keeping rates unchanged at 99%. The press conference by Fed Chairman Jerome Powell could offer hints about future interest rates path Any dovish stance from officials might trigger a decline in the US Dollar (USD).
Moving on, market participants will closely watch the Fed policy meeting on Wednesday at 18:00 GMT with the Fed widely expected to hold interest rates unchanged at 5.5%. The attention will shift to the press conference by Fed Chairman Jerome Powell at 18:30 GMT for some hints about the ‘dot plot’ and inflation expectations. Later this week, the New Zealand Gross Domestic Product (GDP) for the second quarter (Q2) will be due on Thursday. These figures could give a clear direction to the NZD/USD pair.
- Copper down to $8,375 per ton, or $8.30 per kilogram.
- Copper has come under downside pressure throughout the year as demand remains weak.
- The market is struggling to increase copper demand as the Chinese economy risks stalling out.
Copper price per kilogram fell back to $8.30 on Monday after rising to a weekly high of $8.42 last Friday, and the red metal continues to struggle on the low end after the year’s rapid climb to $9.435 in January.
China’s beleaguered economic recovery has seen copper rangebound for the last quarter as prices struggles to gain traction. Chinese officials have spent significant time, effort, and resources trying to keep the Chinese economy in a successful ‘jumpstart’ state, but buyers have thus far remained largely unconvinced.
Copper down on Chinese weakness
Nearly a quarter of all Chinese copper demand comes from the construction and housing industries, with another fifth coming from consumer goods demand. Both sectors have been hammered recently, with a short-term crisis sprouting in the housing sector and waning consumer demand.
The fourth quarter is expected to bring further declines in Chinese demand growth, keeping copper prices pinned to the low end.
Chinese smelters and metal processors have posted some of their worst profitability in over ten years, driven by both a lack of domestic demand and export figures that have struggled to accelerate growth.
China is expected to resume providing stimulus programs that are targeted at bolstering domestic demand, but copper investors will be waiting for solid evidence that efforts from Chinese central planners have taken hold before stepping up prices meaningfully.
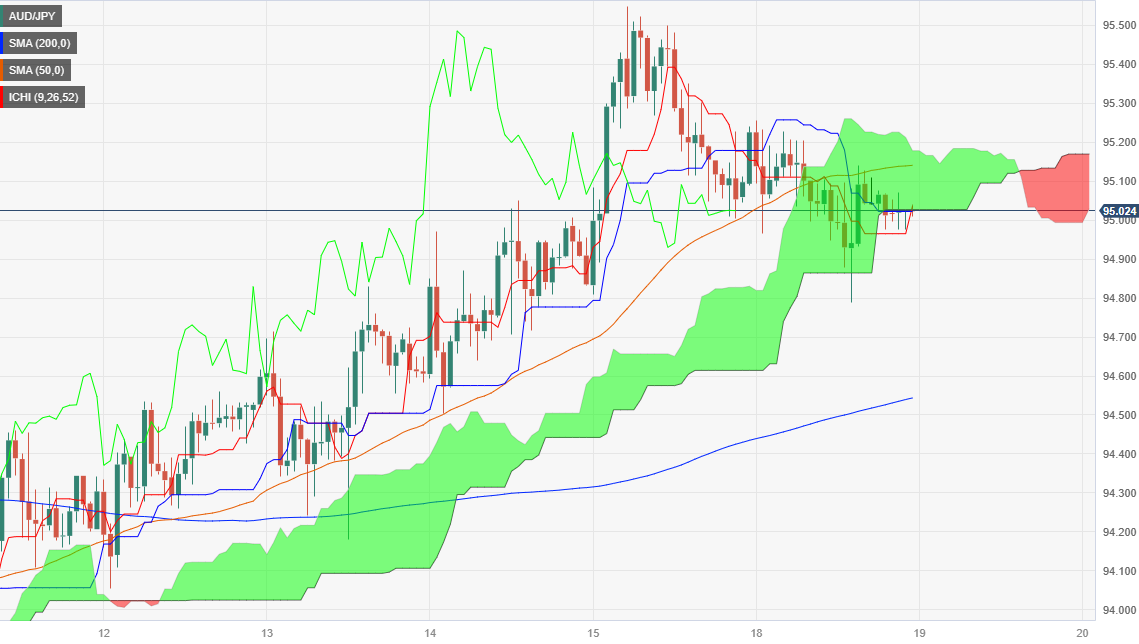
- AUD/JPY remains largely unchanged at 95.01, but recent price action suggests a possible correction could be on the horizon.
- The pair has formed a ‘bearish-harami’ candlestick pattern on the daily chart, indicating potential downside risks.
- Short-term outlook turns bearish as the pair falls below the Kumo.
The Australian Dollar (AUD) trimmed some of its last week’s gains versus the Japanese Yen (JPY), which dropped 0.05% on Monday. However, as the Tuesday Asian session begins, the AUD/JPY hovers at around 95.01, unchanged.
From a daily chart perspective, the AUD/JPY is neutral to upward biased. Still, price action during the last couple of days suggests the cross-currency pair is headed for a correction, as it formed a ‘bearish-harami’ candlestick pattern formed by an inverted hammer and a doji. Hence, the cross-first support would be the 95.00 figure, followed by the top of the Ichimoku Cloud (Kumo) at 94.74, followed by the Tenkan-Sen line at 94.56, and followed by the Kijun-Sen at 94.17.
Short-term, the cross-currency pair has fallen below the Kumo, suggesting the pair turned bearish bias. To resume its downtrend, AUD/JPY sellers must drag prices below the September 18 swing low of 94.78. That would reaffirm the bearish bias and open the door to test the September 14 swing low of 94.50, followed by an upslope support trendline around 94.20/40. A decisive break and the 94.00 threshold would be next.
AUD/JPY Price Action – Hourly chart
AUD/JPY Technical Levels
Foreign holdings of US Treasuries rose in July for a second straight month despite an uncertain interest rate outlook muddied by a mixed set of economic figures, the Treasury Department showed on Monday, according to Reuters.
Key quotes
"Total holdings of U.S. Treasuries climbed to $7.655 trillion in July, up from $7.562 trillion in the previous month. Compared to a year earlier, overseas holdings were up 2.2%."
"China's stash of Treasuries dropped to $821.8 billion, the lowest since May 2009, when it had $776.4 billion."
"Analysts said China has been under pressure to defend its weakening currency, the yuan, and the selling of US debt may have been used for intervention purposes to prop it up."
"There is a huge inflow into US Treasury debt despite a lot of volatility in rates in July,"
"Japan is still the largest non-U.S. holder of Treasuries with $1.112 trillion in July, up from $1.105 trillion in June."
Market reaction
The above statement fails to move the needle around the Australian Dollar. AUD/USD is trading at 0.6437, gaining 0.01% on the day.
- AUD/USD trades sideways around 0.6437 amid the cautious mood.
- Markets expect the Reserve Bank of Australia (RBA) to keep its cash rate at 4.10% for the third consecutive month.
- Federal Reserve (Fed) is not expected to surprise the markets, with the probability of keeping rates unchanged at 99%.
- Market players await the RBA Meeting Minutes ahead of the Fed rate decision.
The AUD/USD pair consolidates in a tight range below the mid-0.6400s during the early Asian session on Tuesday. Markets turn cautious ahead of the Reserve Bank of Australia (RBA) interest rate decision later in the day. The pair currently trades near 0.6437, gaining 0.01% on the day.
Michele Bullock began her seven-year term as RBA governor after taking over from Philip Lowe on Monday. She stated that she will inherit an economy with moderating inflation, robust employment, and continued development. The RBA Minutes are scheduled for Tuesday, and markets expect the Australian central bank to keep its cash rate at 4.10% for the third month in a row. However, the possibility of a rate hike in November cannot be ruled out, if inflation remains sticky. Furthermore, investors will take cues from the board's views on the downside economic risks as well as the spillover effects of China's economic downturn on Australia.
On the other hand, market participants await the US Federal Reserve's (Fed) policy announcement on Wednesday, while the central bank is widely expected to halt interest rates. According to the CME Fedwatch tools, the Fed is not expected to surprise the markets, with the probability of keeping rates unchanged at 99%. Nonetheless, the press conference by Fed Chairman Jerome Powell could offer hints about future interest rates path and this event will be closely watched by traders.
Looking ahead, the RBA Meeting Minutes will be the highlight on Tuesday and might trigger the volatility in the major pair. Later in the day, the US Housing Starts and Building Permits will be due. The attention will shift to the Fed policy meeting on Wednesday. Traders will take cues from the statement and find trading opportunities around the AUD/USD pair.
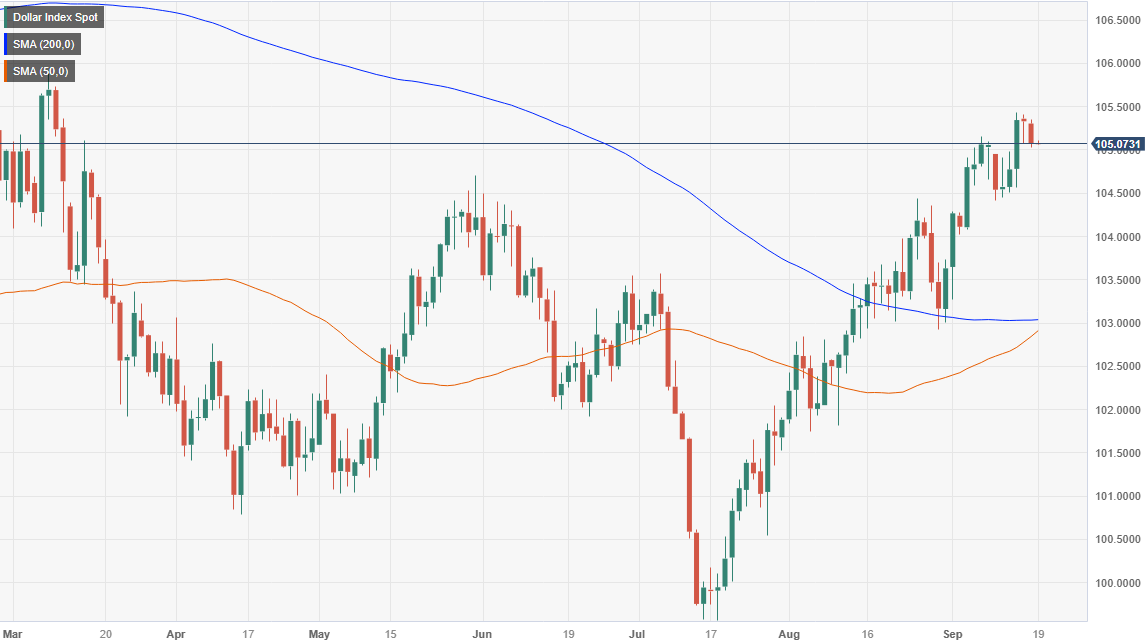
- DXY retreats 0.25% to 105.06, marking consecutive days of losses, as falling US Treasury yields and risk-on sentiment weigh on the greenback.
- Technical indicators point to a golden cross, with the 50-day and 200-day Moving Averages nearing convergence.
- A hawkish hold from the Fed could propel the DXY towards March highs, while a dovish tone may send it tumbling to key support levels.
The US Dollar Index (DXY), a basket of six currencies that trades against the US Dollar, retreats a minuscule 0.25%, sponsored on a risk-on impulse and falling US Treasury bond yields, ahead of the Federal Reserve’s September meeting. Hence, the DXY is trading at 105.06, printing back-to-back days of losses.
From a technical perspective, the DXY is about to achieve a golden cross, with the 50-day Moving Average (DMA) closing into the 200-DMA, each at 102.83 and 103.02, respectively. In addition, the DXY reached a new five-month high at 105.43, breaking the previous resistance, so the trend is up from a market structure perspective.
If the Fed delivers a hawkish hold, the DXY could test the March 8 swing high at 105.88, followed by the 106.00 threshold. A breach of the latter could expose the November 30 daily high at 107.19
Conversely, the DXY first support would be the 105.00 mark. If sellers reclaim that level, the next support would be a three-month-old upslope support trendline at around 104.40/60, followed by the 104.00 figure.
US Dollar Index Price Action – Daily chart
US Dollar Index: Technical levels
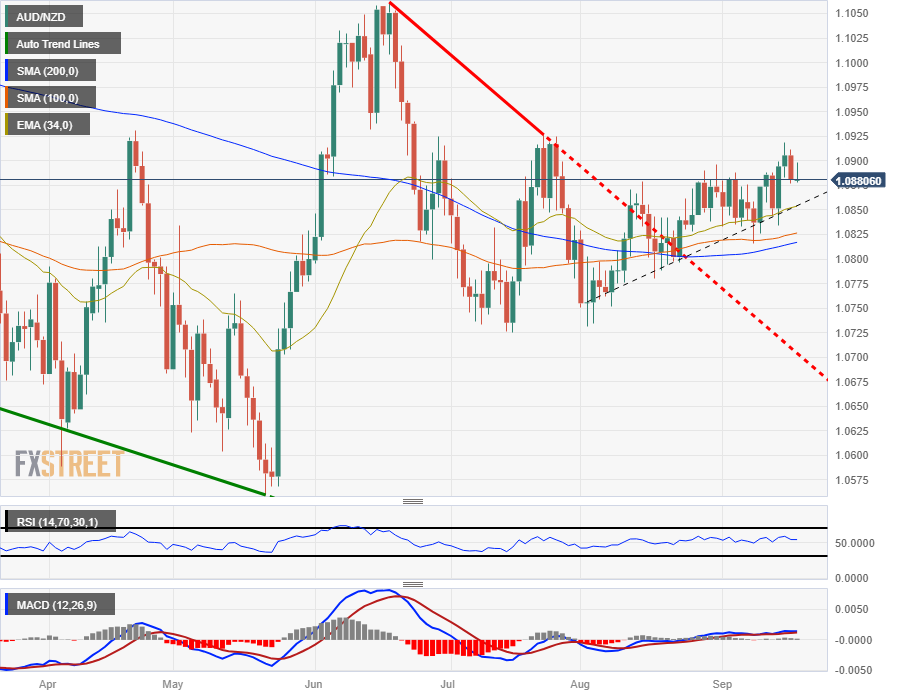
- The AUD/NZD lacks conviction for Monday, ending near where it started.
- The RBA is due early Tuesday with a new face at the helm of the organization.
- NZ GDP, Aussie PMIs to round out the thin data week.
The AUD/NZD pair spread to the middle for Monday, unable to develop momentum as the Reserve Bank of Australia (RBA) comes in for a landing early Tuesday.
The RBA held rates on pause for the third straight month at the Australian central bank’s last meeting, which was also the last appearance of Phillip Lowe as the RBA’s Governor.
Former Deputy Governor Michelle Bullock replaces Lowe at the helm of the RBA today. Markets are broadly not expecting Bullock to rock the boat with any policy changes for her first appearance as the RBA’s Governor.
Lowe's out, Bullock's in at the RBA
Governor Bullock has already stated that the RBA’s stance moving forward will be firmly data-dependent, and Governor Bullock will be preoccupied with significant structural changes underway at the RBA.
At the urging of the Australian government, the RBA will be implementing operational adjustments that are expected to streamline the central bank. Most notably, the RBA will be moving to a twice-quarterly appearance schedule, from the current monthly outing.
Wednesday will bring New Zealand’s Gross Domestic Product (GDP) figures into focus. Quarter-on-quarter figures for the diminutive Antipodean economy last printed a meager 0.1% decline, and Kiwi traders will want to keep an eye on the updated figures for 2023’s second quarter.
NZ trade balance figures and Australia’s Purchasing Manager Index (PMI) data will also be dropping on Thursday to round out the week’s Oceania economic data docket.
AUD/NZD technical outlook
The AUD/NZD pair has twisted to the upside in recent weeks, clipping into a seven-week high last Thursday, but the Aussie-Kiwi pairing remains constrained by unconvinced market sentiment in either direction.
Daily candlesticks have the pair supported by the 200-day Simple Moving Average (SMA) from 1.0817. Higher lows from August’s opening prices near 1.0750 are bolstering upside gains, with price action getting a bump from the 34-day Exponential Moving Average climbing into the 1.0850 neighborhood.
AUD/NZD daily chart
AUD/NZD technical levels
- EUR/JPY advanced near 158.00, setting a consecutive day of gains.
- Bullish momentum is fading, and indicators signal further downside.
- Bulls are struggling to gain the 20-day SMA.
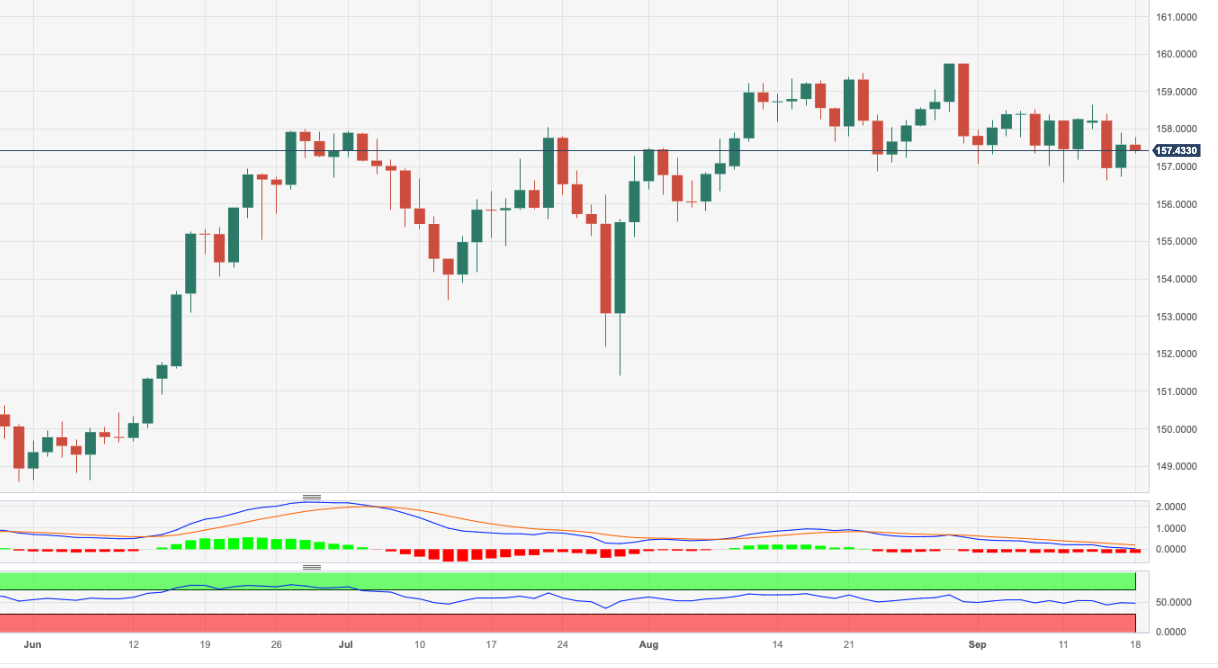
On Monday, the EUR/JPY cross slightly advanced, near the 157.80 zone. Still, the pair could see further consolidation if the bull fails to reclaim the 20-day Simple Moving Average (SMA) at 158.00.
In line with that, indicators on the daily chart exhibit signs of bullish exhaustion, contributing to a neutral to bearish technical perspective. The Relative Strength Index (RSI), despite seeing a positive slope above its midline, displays a clear downward trend since mid-August, while the Moving Average Convergence (MACD) shows neutral red bars. Additionally, the pair is below the 20-day Simple Moving Average (SMA) but above the 100 and 200-day SMAs, indicating that the bulls still have the upper hand when looking at the broader picture. However, the pair got rejected by the 20-day SMA at 158.00 during September, which contributed to the pair losing momentum and left the door open for further downside.
Support levels: 157.00, 155.00, 154.60 (100-day SMA)
Resistance levels: 158.00 (20-day SMA), 158.50, 159.00.
EUR/JPY Daily Chart
-638306707527807935.png)
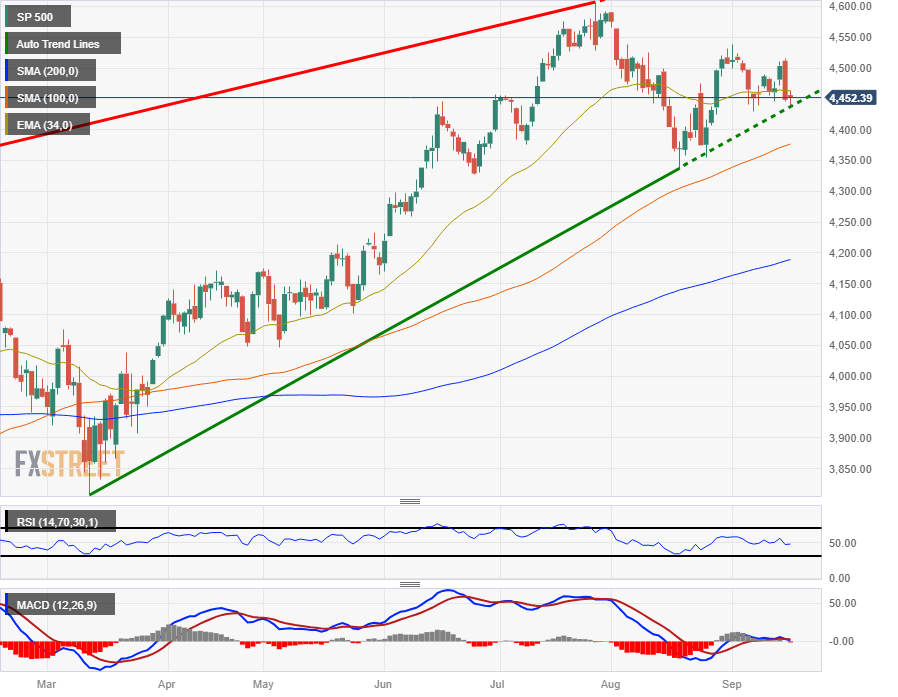
- US equities take a minute to digest, spreading into the middle for Monday.
- S&P 500, DJIA, and NASDAQ all post slim gains for Monday as markets go quiet.
- Fed rate call promises plenty of action for the mid-week.
The Standard & Poor’s (S&P) 500 US equity index wrapped up Monday markets barely changed on the day, near $4,453.00 as US equities take a breather before the Federal Reserve (Fed) drops their latest rate call on Wednesday.
Fed to bring rate call, economic projections in the mid-week
The S&P saw thin trading for Monday as investors gear up for the latest showing from the Fed and its Federal Open Market Committee, which is expected to hold rates steady at the next meeting slated for Wednesday.
The US central bank is set to stand pat on interest rates, and investors will be paying close attention to the FOMC press conference to follow the rate call, looking for any hints about the path forward on the rate hike cycle.
The FOMC will also be releasing their updated inflation expectations for the US economy alongside the Fed’s latest monetary policy statement.
American equities spread their bets on Monday, with the S&P 500, Dow Jones Industrial Average (DJIA), and NASDAQ Composite indexes all wrapping up the day near where they started. The S&P finished the big winner, gaining a scant 0.07% during market hours.
The DJIA and the NASDAQ competed in a slow race, with the indexes closing +0.02% and 0.01% respectively. The DJIA heads into the overnight session trading into $34,625.00 while the NASDAQ sits just above $13,710.00.
S&P 500 technical outlook
The S&P 500 is tipping into support from the rising trendline baked in from March’s lows near $3,800.00, and continued downside will see support from the 100-day Simple Moving Average (SMA) at $4,376.00.
The 200-day SMA sits well below price action near $4,190.00, and market prices are being constrained by a sideways 34-day Exponential Moving Average (EMA), and a lack of meaningful directional momentum is seeing technical indicators drift into their midpoints.
Current chart patterns see a floor from the last swing low eat $4,350.00 and the ceiling marked in from September’s high point near $4,540.00.
S&P 500 daily chart
S&P 500 technical levels
- USD/SEK soared to 11.249, its highest since early November 2022.
- Riskbank is expected to hike 25 bps to 4%.
- The Fed will likely deliver a hawkish pause.
The USD/SEK saw volatility on Monday, rising to a high since November 4, 2022, then settling at 11.122, securing daily losses. The USD trading somewhat soft, and the Krona holding its ground ahead of one last hike by the Riksbank on Thursday contributed to the pair movements.
In line with that, markets are confident that the Riksbank will deliver its last hike of 25 bps of its tightening cycle to 4%. The Swedish bank will also release updated macro forecasts, and Governor Thedeen will be on the wires on Friday. For the rest of the year, investors are discounting that there won’t be any more hikes and that the policy rate will peak at 4.05% in Q2 2024.
On the Fed’s side, markets practically priced in a pause on Wednesday but a hawkish one. The bank will likely try to convince markets that the policy will still depend on incoming data and will leave the door open for further hikes. In the meantime, according to the CME FedWatch tool, investors are placing 35% odds on one last hike of 25 bps in November or December, but those odds will rise and fall according to the outcome of the incoming data.
In addition, the Fed will release an updated macro forecast and revised dot plot, which will likely set the pace of the USD price dynamics and the expectations for the upcoming meetings.
USD/SEK Levels to watch
The daily chart highlights a neutral technical outlook for USD/SEK as signs of bullish exhaustion become evident, but still, the pair remains in multi-month highs. The Relative Strength Index (RSI) indicates a decrease in upward momentum with a negative slope above its midline, while the Moving Average Convergence (MACD) lays out neutral green bars. Furthermore, the pair is above the 20,100,200-day Simple Moving Average (SMA), indicating buyers command the broader perspective.
Support levels: 11.0960, 11.0650, 11.0550.
Resistance levels: 11.175, 11.205, 11.249.
USD/SEK Daily Chart
-638306679294940708.png)
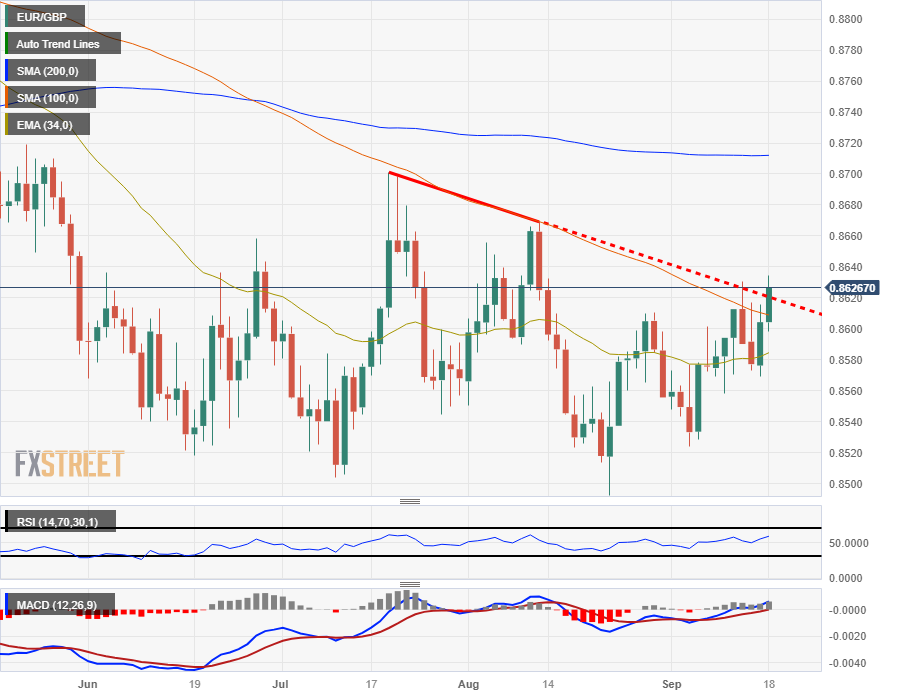
- The EUR/GBP pair is set to confirm a bullish breakout as the Pound Sterling steps lower.
- With the ECB’s latest rate call in the rearview mirror, focus turns to the BoE’s upcoming rate hike.
- The trading week will cap off action with PMI data for both the EU and the UK.
The EUR/GBP is grinding higher to kick off the trading week, decisively climbing over the 0.8600 handle and extending upwards as the Bank of England (BoE) looms over the horizon.
Sterling bulls need to survive Wednesday's inflation figures before BoE rate call
The BoE is broadly expected to lift the benchmark interest rate 25 basis points to 5.5% on Thursday, but market action will be positioning early as inflation figures for the British economy will land on Wednesday beforehand.
The UK’s Consumer Price Index (CPI) will hit markets at 06:00 on Wednesday, with the headline inflation figure for August forecast to show a step up to 0.7%, compared to the previous decline of -0.4%.
Thursday sees the BoE lifting interest rates once more as the UK’s central bank struggles to gain firm control of inflation, with prices continuing to tick higher despite already-high interest rates threatening to tip over the British economy.
The European Central Bank’s (ECB) rate hike last week hit the Euro hard after the ECB’s President Christine Lagarde noted that this is looking like the end of the ECB’s rate hike cycle. Investors will now be turning to the BoE’s upcoming showing to reposition the EUR/GBP exchange rate.
Further into the week, both the EUR and the GBP will see Purchasing Manager Index (PMI) figures. The EU’s pan-continent activity outlook is expected to tick slightly lower to 46.3 versus the previous 46.7. On the UK side, purchasing manager expectations are expected to hold steady at 48.6.
EUR/GBP technical outlook
The Euro-Pound Sterling pair is bounding higher for Monday, clipping into six-week highs as the GBP waffles ahead of the week’s central bank showing.
The EUR/GBP has broken north of a descending trendline from mid-July’s peak of 0.8700, and continued bullish momentum will be capped off by the 200-day Simple Moving Average (SMA) currently floating just above 0.8710.
Despite Monday’s bullish bust-out, prices remain relatively consolidated for the EUR/GBP pair, and market sentiment will be quick to pull the plug and reverse direction if bullish momentum hesitates too strongly from 0.8660, and level that has capped the pair recently.
EUR/GBP daily chart
EUR/GBP technical levels
The Reserve Bank of Australia will release the minutes of its September meeting on Tuesday. Later in the day, Eurostat will release the final CPI (Consumer Price Index). Canada is scheduled to release August inflation data, while the US will report on Housing Starts and Building Permits.
Here is what you need to know on Tuesday, September 19:
The US Dollar Index (DXY) experienced a modest decline but remained above 105.00 on a calm Monday. It marked the first daily loss after nine consecutive days of gains. This correction occurred during a quiet trading session as market participants awaited central bank meetings. On Wall Street, stocks opened the week with marginal gains, while US Treasury yields remained relatively stable.
On Tuesday, housing data including Housing Starts and Building Permits will be released. The FOMC (Federal Open Market Committee) meeting begins. No change in interest rates is expected, but market focus will be on the dot plot, which represents policymakers' projections of future interest rates, as well as the press conference by Fed Chair Powell.
ANZ on FOMC meeting:
We continue to see Fed policy as highly data-dependent, at the same time patient, with most officials open to further rate hikes if appropriate. Our view is the Fed is done with its tightening cycle, but risks remain that further rate hikes may be needed.
EUR/USD rose for the second consecutive day, encountering resistance at the 1.0700 area. However, the overall trend remains bearish. Eurostat will release the final reading of the Eurozone Consumer Price Index (CPI), which is expected to offer no surprises. Also, they will publish the July Current Account figures.
The Pound continued to show weakness; GBP/USD failed to recover beyond the 1.2400 level. It ended the day unchanged after reaching new monthly lows. Meanwhile, EUR/GBP recorded its highest daily close in a month, surpassing the 0.8600 mark. UK consumer inflation data will be released on Wednesday, and the Bank of England will announce its monetary policy decision on Thursday.
USD/JPY traded in a sideways manner and recorded slight losses. The crucial resistance level to watch is around 148.00. The Bank of Japan will announce its monetary policy decision on Friday.
USD/CHF held near September highs and settled around 0.8670; it continues to look at the 0.9000 area. Switzerland will report trade data on Tuesday, and on Wednesday, the Swiss National Bank (SNB) will hold its monetary policy meeting; a 25 basis points rate hike is expected.
The Canadian Dollar continued to outperform, causing USD/CAD to reach its lowest daily close in over a month, falling below 1.3500. The following key support level to monitor on the downside is the 200-day Simple Moving Average (SMA) at 1.3460. On Tuesday, Canada is set to release the August Consumer Price Index (CPI), with expectations of an annual rate rebounding to 3.8% from 3.3%. This would signal a second consecutive acceleration in CPI.
AUD/USD maintained a sideways movement, hovering around the 20-day Simple Moving Average (SMA) at 0.6420. The Reserve Bank of Australia (RBA) is scheduled to release the minutes of its August policy meeting, during which policymakers decided to keep the cash rate unchanged at 4.1%.
NZD/USD climbed back above 0.5900. The pair lacks a clear direction and remains tilted towards the downside as the price remains below the 20-day SMA. The Westpac Q3 Consumer Survey is set to be released on Tuesday.
Like this article? Help us with some feedback by answering this survey:
- USD/CHF trades at 0.8977, a marginal gain of 0.01%, as investors await the Federal Reserve’s policy decision and updated economic projections.
- Market odds for a November rate hike by the Fed dip below 30%, potentially setting the stage for USD weakness.
- Swiss National Bank expected to hike rates by 25 basis points to 2%.
The US Dollar (USD) posts minuscule gains against the Swiss Franc (CHF), ahead of monetary policy decisions by the US Federal Reserve (Fed) and the Swiss National Bank (SNB). At the time of writing, the USD/CHF is trading at 0.8977, gaining 0.01% after hitting a daily low of 0.8949.
US Dollar and Swiss Franc locked in a tight range ahead of pivotal monetary policy updates from the Federal Reserve and Swiss National Bank
Market sentiment improved, as shown by Wall Street’s finishing with solid gains as investors await the Federal Reserve to keep rates unchanged at Wednesday’s meeting. The Fed Chair Powell and Co will also update its Summary of Economic Projections (SEP), which drafts the US central bank economic outlook for the remainder of 2023 and subsequent years.
The outcome of the US central bank is crucial, as investors expect no further hikes, as odds for the November meeting dropped below 30%, as outlined by the CME FedWatch Tool. That could pave the way for US Dollar weakness, hence a headwind for the USD/CHF pair.
On the other hand, the Swiss National Bank (SNB) would likely hike rates by 25 bps, towards 2%, seen as investors as peak rates, according to money market futures. Although the latest inflation report in Switzerland witnessed a 1.6% YoY uptick, it remains below the central bank’s 2% target. Nevertheless, the SNB would likely maintain its restrictive stance to stabilize prices.
USD/CHF Price Analysis: Technical outlook
From a technical standpoint, the major is set to extend its rally, reaching a new multi-month high of around 0.8982. Buyers are still eyeing the 0.9000 figure, followed by the 200-day Moving Average (DMA) at 0.9038. On the flip side, if USD/CHF breaks below 0.8949, that could open the door to test 0.8900.
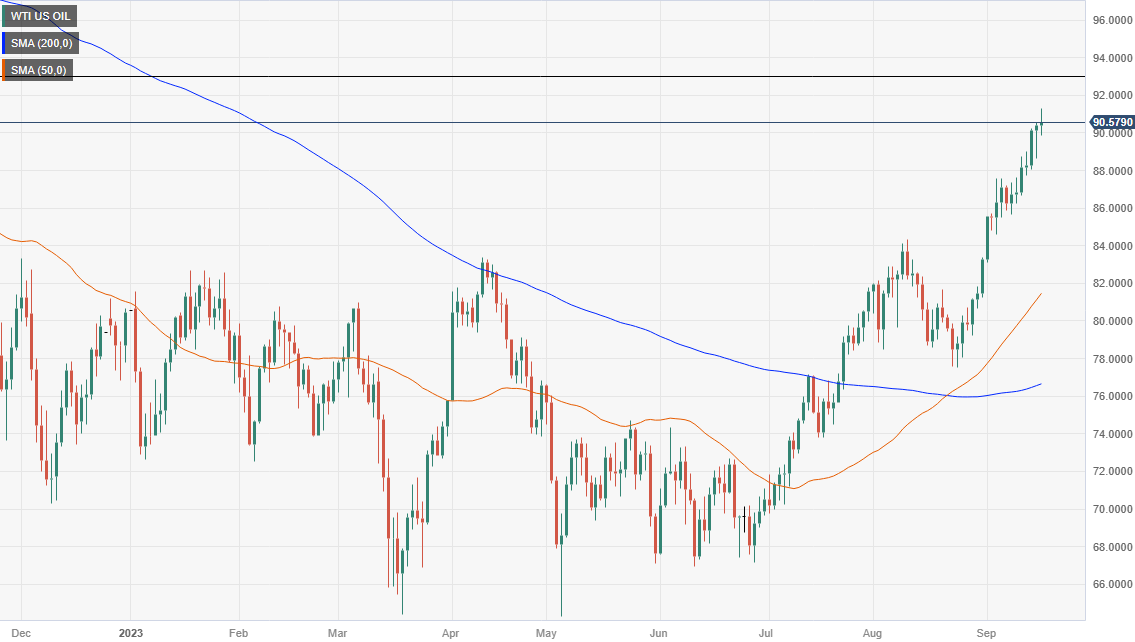
- WTI trades at $90.48 per barrel, up 0.09%, amid Saudi Arabia and Russia’s 1.3 million barrel production cuts aimed at market stabilization.
- Citi Bank and Chevron’s CEO predict Brent crude could surpass the $100 per barrel mark, signaling bullish sentiment in the oil market.
- Upcoming central bank decisions, particularly from the Fed, could impact WTI prices; a hawkish hold may strengthen the USD and pressure oil lower.
Western Texas Intermediate (WTI), the US crude oil benchmark, rises courtesy of supply tightness. At the same time, uncertainty about global demand sparked a jump in WTI, which trades above the $90 per barrel at $90.48, printing modest gains of 0.09%.
Western Texas Intermediate (WTI) hovers near year-to-date highs, bolstered by OPEC+ production cuts and market speculations on future demand
Saudi Arabia’s Energy Minister, Prince Abdulaziz bin Salman, defended the Organization of Petroleum Export Countries and its allies (OPEC+) crude oil cuts needed to stabilize the markets amid uncertainty on China’s demand.
A few months ago, Saudi Arabia and Russia established cuts of 1.3 million barrels of crude production to stabilize oil prices as demand remains fragile. Since then, the Brent and WTI crude oil have climbed for three consecutive weeks.
In the meantime, analysts begin to upwardly revise oil prices for the end of 2023 and 2024. Citi was the last bank that predicts Brent would surpass $100 a barrel this year, echoing comments made by Chevron’s CEO Mike Wirth, who said oil would cross that threshold.
Aside from this, WTI could witness a dip as the global economic agenda would feature central bank decisions, mainly focused on the Fed. If the US Federal Reserve delivers a hawkish hold, that could underpin the Greenback (USD) to the detriment of US dollar-denominated assets.
WTI Price Analysis: Technical outlook
Since August 24, WTI has gained close to 18% and has reached a new year-to-date (YTD) high of $91.29. Oil price is set to extend its gains towards the November 2022 high at $92.92, but price action appears to have peaked, as WTI is forming a doji, meaning that neither buyers nor sellers are in charge. Further upside is seen at $92.00 before the November 2022 high is tested. Conversely, a drop below today’s low of $89.85 could open the door toward a deeper correction, with sellers eyeing $88.00.
- USD/BRL declined towards 4.8475 and has already lost more than 2% in September.
- On Tuesday, markets expect the central bank's primary surplus to come in at BRL 16.8 billion.
- The USD trades soft, consolidating ahead of Wednesday’s Fed meeting.
In Monday’s session, the USD/BRL continued to lose ground and has already tallied a 2.17% decline in September, falling to its lowest point since mid-August at 4.8475.
On the BRL’s side, it is gaining ground as the Brazilian government has taken up fiscal reforms, which are expected to positively impact the government’s account. On Tuesday, budget data will be reported, with the primary surplus expected to have doubled to BRL 16.8 billion in relation to March’s BRL 7.1 billion. In addition, the Real may also gather momentum on the outcome of Gross Domestic Product (GDP) and Trade data on Thursday.
On the USD side, it is trading soft against its rivals, with its DXY index consolidating. However, the US Treasury yields are still high, cushioning its losses. Regarding the Wednesday Federal Reserve (Fed) meeting, markets expect a hawkish pause, with the bank signalling that the tightening cycle isn’t done yet. Investors will also monitor fresh macro forecasts and revised dot plots to continue modelling their expectations towards the upcoming meetings. In that sense, the tone of the Fed will impact the price dynamics of the US Dollar and hence could limit the downside of the pair.
USD/BRL Levels to watch
Technical indicators on the daily chart indicate that the USD/BRL sellers hold the upper hand. The downward slope of the Relative Strength Index (RSI) reinforces this negative sentiment, as does the MACD, which is displaying red bars, indicating a strengthening bearish momentum. Moreover, the pair is below the 20,100 and 200-day Simple Moving Averages (SMAs), suggesting that the bears are firmly in control of the bigger picture.
Support levels: 4.8427, 4.8115, 4.7880.
Resistance levels: 4.8902 (100-day SMA), 4.9143 (20-day SMA), 4.9450.
USD/BRL Daily Chart
-638306600159444624.png)
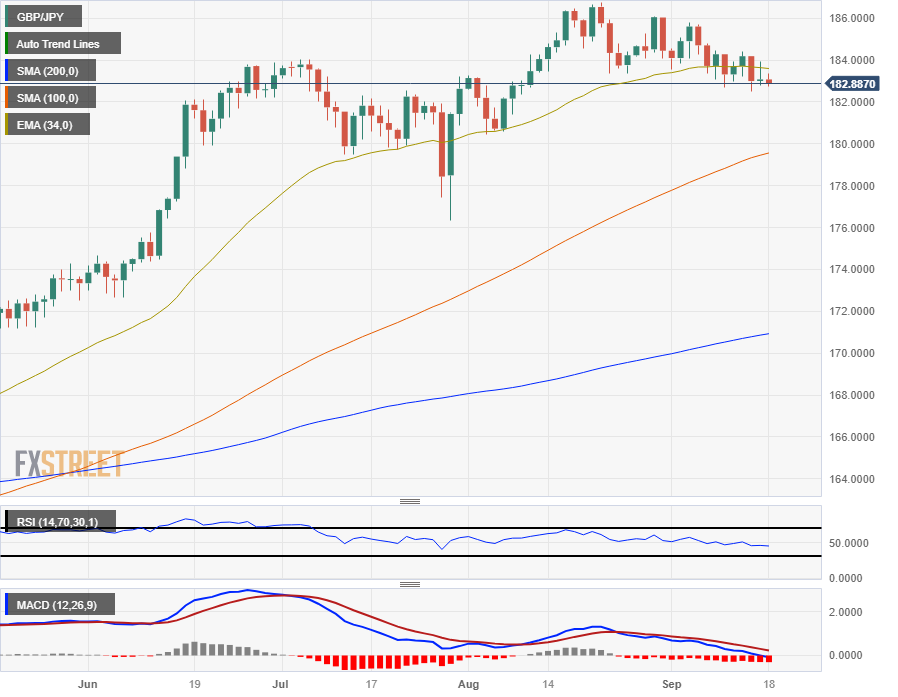
- The GB/JPY is flubbing trading on Monday, down near the day’s lows of 182.80.
- The early week sees inflation figures for the UK ahead of Thursday’s BoE rate call.
- The UK’s rates are expected to climb at least one more time in the current rate cycle.
The GBP/JPY is pinned to the low end through Monday’s trading, failing to establish bullish momentum and sliding into familiar bearish territory below 183.00.
The Consumer Price Index (CPI) figures for the United Kingdom (UK) slated for early Tuesday at 06:00 GMT are expected to show that inflation remains a sticky mess for the UK’s economy. August’s CPI is forecast to bounce to 0.7%, a notable rebound from the previous month’s 0.4% decline.
Inflation remains a problematic area for the Bank of England (BoE) even as data for the UK’s economy flashing warnings that growth is stumbling. The BoE is expected to raise benchmark interest rates by 25 basis points to 5.5% on Thursday.
BoE & BoJ both scheduled for this week, UK inflation figures landing on Friday
The Guppy sees a central bank double-feature this week, with the Bank of Japan (NoJ) scheduled to hold their interest rates steady at -0.1% on Friday.
The BoJ’s negative rate cycle has been a key feature for the Japanese economy as the country struggles to develop long-term fundamental growth. Inflation in Japan briefly soared in recent months, but price increases are expected to slump through the fourth quarter, and the Japanese central bank will be hoping to keep inflation above their minimum target of 2%.
BoJ officials have made comments recently hinting that the Japanese central bank could be set to end its negative rate regime heading into 2024, but that will require firm data suggesting that the Japanese domestic economy has finally solved its problematic lack of inflation.
Friday will also see Retail Sales data for the UK, with retail activity for August expected to jump up 0.5% compared to the previous month’s 1.2% backslide.
Preliminary UK Consumer Price Index (CPI) figures are also slated for Friday, which are forecast to hold steady at 48.6 for the composite component. The Manufacturing PMI is forecast to hold steady at 43, with the Services PMI component expected to tick slightly lower from 49.5 to 49.
Any upside surprises for inflationary data could send the GBP soaring against the JPY as spiraling costs will mean the BoE still has hurdles to overcome using further hikes.
GBP/JPY technical outlook
Despite the near-term flattening for the Guppy, the GBP/JPY pair is firmly at the top end of the charts. The Pound Sterling (GBP) has chalked in gains against the Yen (JPY) for the past eight months, rising firmly from January’s lows near 155.35.
Daily candlesticks have the GBP/JPY slipping the 34-day Exponential Moving Average (EMA), and set to test recent support at the 180.00 major handle.
Long-term bullish momentum for the Guppy has left the pair stranded well above the 200-day Simple Moving Average, currently far below price action near 171.00, and GBP bulls will be looking to mount a recovery rally from here to take a run at reclaiming territory near the 186.00 level.
GBP/JPY daily chart
GBP/JPY technical levels
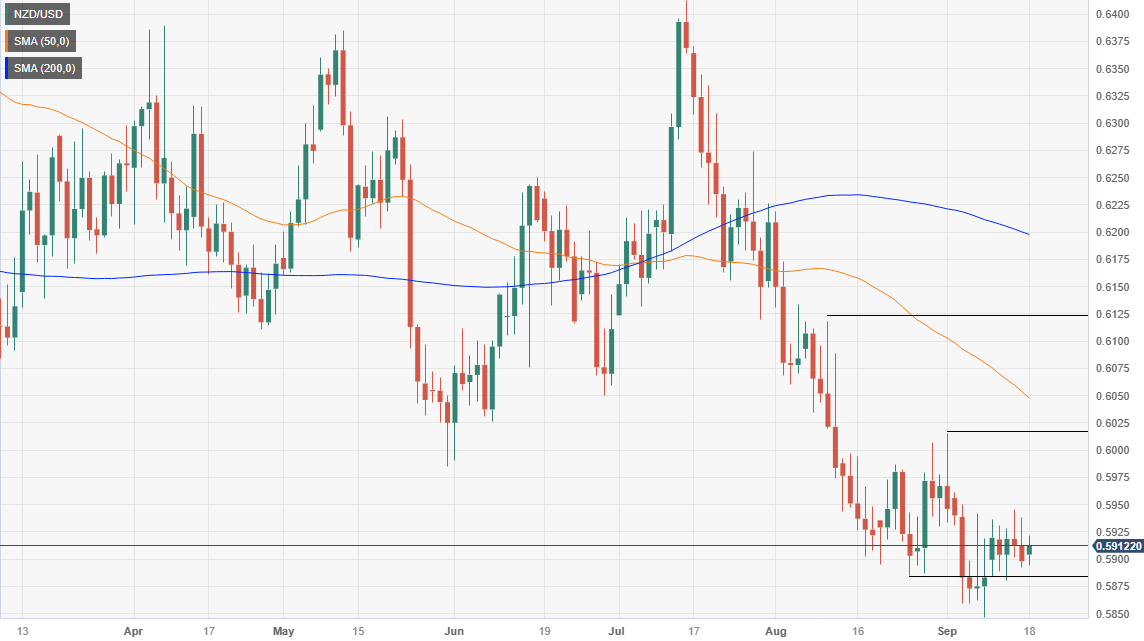
- NZD/USD trades at 0.5917, up 0.37%, as US Treasury bond yields retreat, providing a tailwind for the Kiwi currency.
- Federal Reserve expected to hold rates steady; markets keenly await updates to the 'dot-plot' and Summary of Economic Projections.
- Busy week for New Zealand economic data, including Current Account and GDP, could further influence the NZD/USD direction.
The New Zealand Dollar (NZD) trims some of its losses vs. the American Dollar (USD) and prints solid gains of 0.37% as US Treasury bond yields retrace from last week’s high, ahead of the following US Federal Reserve’s monetary policy decision. Hence, the NZD/USD is trading at 0.5917 after hitting a daily low of 0.5895.
New Zealand Dollar gains against the US Dollar, buoyed by falling US Treasury yields and optimism ahead of the Federal Reserve's policy update
Market sentiment is upbeat ahead of the Fed’s decision, bolstering the Kiwi, though it remains near the day’s lows. Improvement on last week’s Chinese data sponsored a slim recovery on the NZD/USD pair amid an absent US economic docket on Monday.
Jerome Powell and Co. are expected to keep rates unchanged while updating their monetary policy path, as he and his colleagues would actualize the ‘dot-plot.’ Additionally, Fed officials would update their economic forecasts, included in the Summary of Economic Projections (SEP).
Should be said the latest US economic data showed inflation ticked up, retail sales hold the fort, growing at solid levels, while the labor market remains tight. Even though consumer sentiment deteriorated, they remain optimistic that prices would edge lower, as shown by the University of Michigan (UoM) Consumer Sentiment report.
Nevertheless, as US economic activity continues to slow down at a moderate pace, market participants have begun to price in a possible soft landing. In the meantime, the US Dollar Index, which tracks the Greenback’s performance against a basket of six currencies, dropped 0.17%, down at 105.15, a tailwind for the NZD/USD. Falling US Treasury bond yields are to be blamed, as the 10-year note coupon falls 0.39%, at 4.317%.
Aside from this, the New Zealand (NZ) economic docket during the current week could delineate the NZD’s direction. The release of the Current Account, the Westpac Consumer Survey, the Gross Domestic Product (GDP), and the Trade Balance would give us some clues regarding the status of NZ’s economy.
NZD/USD Price Analysis: Technical outlook
Last week, the NZD/USD remained in sideways trading, unable to break to new year-to-date (YTD) lows of 0.589, but unable to reclaim the 0.6000 figure. Nevertheless, the pair is still downward biased as the 50 and 200-day Moving Averages (DMAs) slopes aim downwards. That and price action remaining below the September 1 daily high at 0.6015 could pave the way for further upside and test the 50-DMA at 0.6047. On the downside, the 0.5900 threshold is the first support, followed by the YTD low.
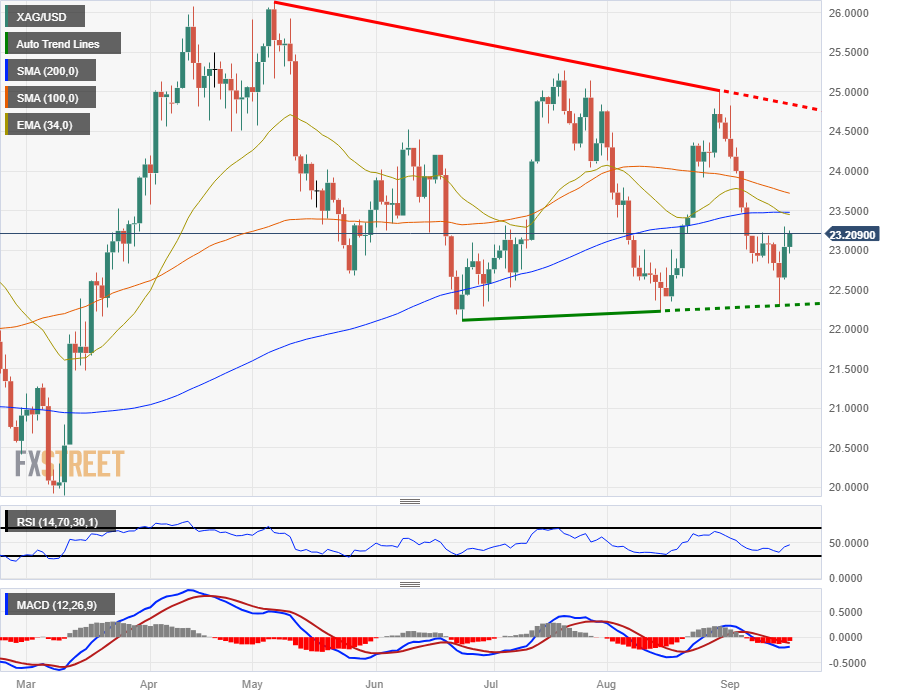
- XAG/USD going higher as the metal turns bullish from the floor near $$22.40.
- Precious metals, commodities recovering ahead of Fed rate call.
- The Federal Reserve is set to stand pat on rate hikes, bolstering risk assets.
The price of Silver has recovered from the recent backslide into the $22.30 region, reclaiming $23.20 in Monday trading. Commodities are broadly turning higher ahead of the Federal Reserve (Fed) rate call on Wednesday, where the Federal Open Market Committee (FOMC) is expected to hold rates at 5.5%.
Silver's bullish turnaround to get support from a Fed holding pattern
The Fed’s recent rate hike cycle has left Silver to tumble to the floor as the United States (US) central bank lifts rates to combat an intense inflationary environment. As interest rates and the US Dollar (USD) have soared, the XAG/USD has struggled, slumping from recent highs of $26.00 set earlier in the year.
Silver has steadily rebounded against the USD from $22.50 in recent months, but lower highs continue to push the precious metal, and XAG bulls will be looking to snap the losing streak by breaking out of the descending trendline marked in by the last swing high at the $25.00 major handle.
XAG/USD technical outlook
Silver has turned bullish and is looking to claim further ground, with the Relative Strength Index (RSI) and Moving Average Convergence-Divergence (MACD) indicators both flashing upside momentum and showing some room for prices to run.
Any nasty surprises from the economic calendar this week could see the XAG/USD stumble, but overall market momentum is leaning firmly bullish with Silver set to make a hard run at the 200-day Simple Moving Average (SMA) currently treading water near $23.50.
Renewed selling pressure from here will see prices set to challenge recent lows near $22.30, while extended bidding will see the XAG/USD set to battle the descending trendline marked in from May’s peak of $26.00.
XAG/USD daily chart
XAG/USD technical levels
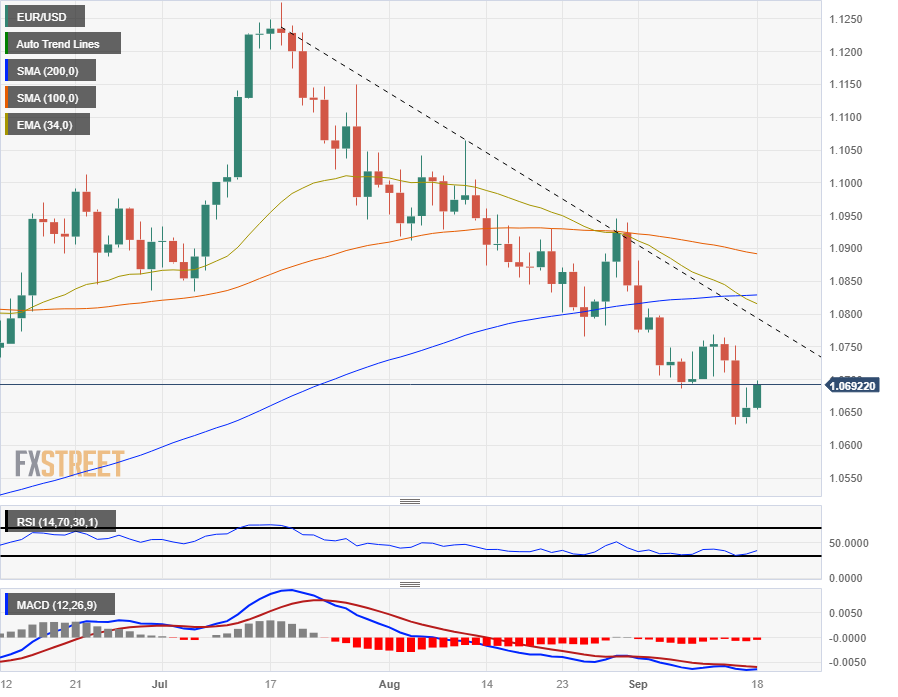
- The EUR/USD is hunting for an upshot to reclaim the 1.0700 handle ahead of a midweek Fed showing.
- The Euro has been belted by the Greenback for nine straight weeks, and bidders will be looking for a foothold.
- EU & US economic data to feature heavily to cap off the trading week.
The EUR/USD is shifting higher to kick off the new trading week, claiming ground that was recently lost in last week’s backslide.
The Euro (EUR) has managed to turn Monday into the green against the Greenback (USD) after opening the day near 1.0668, and the pair is currently tapping into the ceiling near 1.0700.
Fed rate call coming down the chute on Wednesday
It’s going to be a Dollar-dominant week for the EUR/USD with the economic calendar notably thin for the European Union (EU) side of the equation, and the Federal Reserve (Fed) slated for another rate call in the midweek.
The Fed is largely expected to stand pat on interest rates at 5.5%, but investors will be keeping a close eye on the Fed’s ‘dot plot’ and inflation expectations, as well as looking for any forward-looking indications during the Federal Open Market Committee (FOMC) press conference. The Fed’s rate call drops at 18:00 GMT on Wednesday, with the press conference slated for half an hour later at 18:30.
US Initial Jobless Claims for the week into September 15th land on Thursday at 12:30 GMT, followed by preliminary Consumer Confidence figures at 14:00. US jobless claims last printed at 220K, while EU consumer sentiment is expected to decline slightly from -16 to -16.5.
Both releases are expected to be medium impact and market participants will largely be focused on Friday’s Purchasing Manager Indexes (PMI) for both the EU and the US.
The EU’s Composite PMI, scheduled early Friday at 08:00 GMT is expected to decline slightly from 46.7 to 46.3, while the US side sees similar expectations at 13:45 GMT. The US Manufacturing PMI is forecast to slide from 47.9 to 47.8, while the services component is expected to tick down to 50.3 from 50.5.
EUR/USD technical outlook
Euro bulls will be looking to mark in a green week after the EUR/USD pair has closed bearish for the past nine consecutive weeks, and daily candlesticks have the pair firmly on the downside.
The 200-day Simple Moving Average (SMA) sits above current prices, parked near 1.0830, and the 34-day Exponential Moving Average (EMA) has given a bearish cross, gaining downside momentum into 1.0800.
Both the Relative Strength Index (RSI) and the Moving Average Convergence-Divergence (MCAD) indicator are on the low end, implying oversold conditions, and it’s the bulls’ game to lose if the Federal Reserve gives any surprises that could send the USD higher.
EUR/USD daily chart
EUR/USD technical levels
- XAU/USD rose to the $1,930 area, up by 0.40%.
- Markets remain cautious ahead of central bank decisions this week.
- US yields remaining high limit the metal’s upside.
On Monday, the Gold spot price XAU/USD is holding above the 20 and 200-day Simple Moving Average (SMA) convergence at $1,922-1,923, rising to $1,930. Markets remain cautious ahead of the Federal Reserve (Fed), Bank of England (BoE) and Bank of Japan (BoJ), where the British bank is the only one expected to hike rates.
In line with that, similar to the European Central Bank (ECB) last week, the (BoE) is expected to deliver a dovish 25 basis point hike, highlighting stagflation risks. Likewise, investors are discounting that the BoJ will maintain its ultra-dovish stance.
On the Fed’s side, it is widely expected to deliver a hawkish pause and try to convince markets that it isn’t the end of the tightening cycle. For the November and December meetings, investors are placing some bets for one last hike as economic activity remains strong while the labour market sees a mixed outlook. In addition, the Fed will release updated dot plots and fresh macro forecasts.
In the meantime, US Yields, often seen as the opportunity cost of holding Gold, are trading mixed but remain high, limiting the XAU/USD upside. The 10-year bond yield is 4.33%, with mild losses on the day. The 2-year yield stands at 5.06%, up by 0.50%, and the 5-year yield is at 4.45%, down by 0.30%.
XAU/USD Levels to watch
Considering the daily chart, XAU/USD presents a neutral to bullish outlook, with the bulls showing resilience and gaining momentum. The Relative Strength Index (RSI) exhibits a bullish inclination with a positive slope above the 50 threshold, while the Moving Average Convergence (MACD) histogram presents rising green bars. Additionally, the pair is above the 20 and 200-day Simple Moving Average (SMAs), implying that the bulls retain control on a broader scale. Still, the buyers should target the 100-day SMA at $1,946 to confirm the recovery.
Support levels: $1,923 - $1,920 (200 and 20-day SMA), $1,910, $1,900.
Resistance levels: $1,946 (100-day SMA), $1,970, $2,000.
XAU/USD Daily chart
-638306552182673905.png)
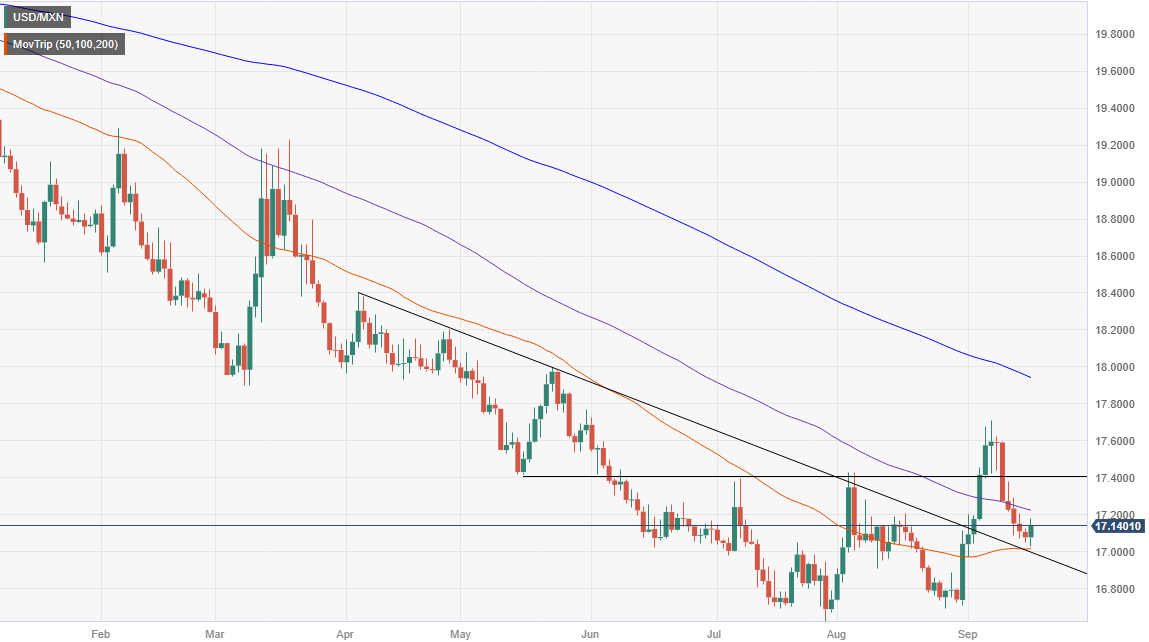
- USD/MXN trades at 17.1182, rebounding from a daily low of 17.0296, as markets anticipate key central bank decisions this week.
- US Federal Reserve expected to hold rates steady, but last week’s uptick in inflation keeps options open; traders await updated ‘dot-plots.’
- Mexican Private Consumption slows to 4.3% YoY in Q2 2023, while upcoming data could show a decline in Retail Sales and a slowdown in inflation.
The Mexican Peso (MXN) loses ground versus the Greenback (USD) on Monday, ahead of a busy week in the central bank space, as three of the most important are set to deliver their decisions. At the time of writing, the USD/MXN is trading at 17.1182 after printing a daily low of 17.0296.
Mexican Peso weakens against the US Dollar ahead of a pivotal week for central banks, with focus on the Fed’s ‘dot-plots’ and inflation data
Investors’ mood depreciated the Mexican currency as the US Federal Reserve (Fed) is expected to deliver its decision on Wednesday, at around 18:00 GMT, followed by Jerome Powell’s press conference. According to data, the swaps market sees the Fed holding rates unchanged, at 5.25%-5.50%, thought would likely keep their options open due to last week’s inflation uptick. USD/MXN traders would look at the update of the so-called ‘dot-plots.’
The US economy witnessed a slight jump in consumer and producer price indices. As fewer Americans filed for unemployment benefits, the jobs market remains hot. That was depicted by Retail Sales, which expanded at a slower rate, while consumer sentiment deteriorated, blamed on high gasoline prices. Notably, inflation expectations were pushed lower, as revealed by the University of Michigan.
On the Mexican front, Private Consumption in Mexico grew by 4.3% YoY in Q2 2023, below the previous reading of 4.8%, according to figures revealed by the Instituto Nacional de Estadistica Geografia e Informatica (INEGI).
Sentiment amongst investors improved as Chinese data witnessed the economy has found its bottom after the Government’s efforts to stimulate the economy, which faltered to recover as expected by most financial market analysts.
In the week ahead, the US economic docket will feature housing data, \the Fed’s decision, jobs data, and S&P Global PMIs. Retail Sales are expected to deteriorate on the Mexican front, while inflation for the first half of September is foreseen to slow down.
USD/MXN Price Analysis: Technical outlook
The pair found its foot at around 17.0297 before testing the 50-day Moving Average (DMA), which has risen above the 20-DMA at 17.0992, exacerbating a test of the 100-DMA at 17.2188. A breach of the latter will expose the 17.50 area, followed by the September 7 swing high at 17.7074. ahead of challenging the 18.0000 psychological level. Conversely, if the pair slides toward the 20-DMA, it could pave the way for a crack under 17.0000. The next support will emerge at August’s 28 daily low of 16.6923.
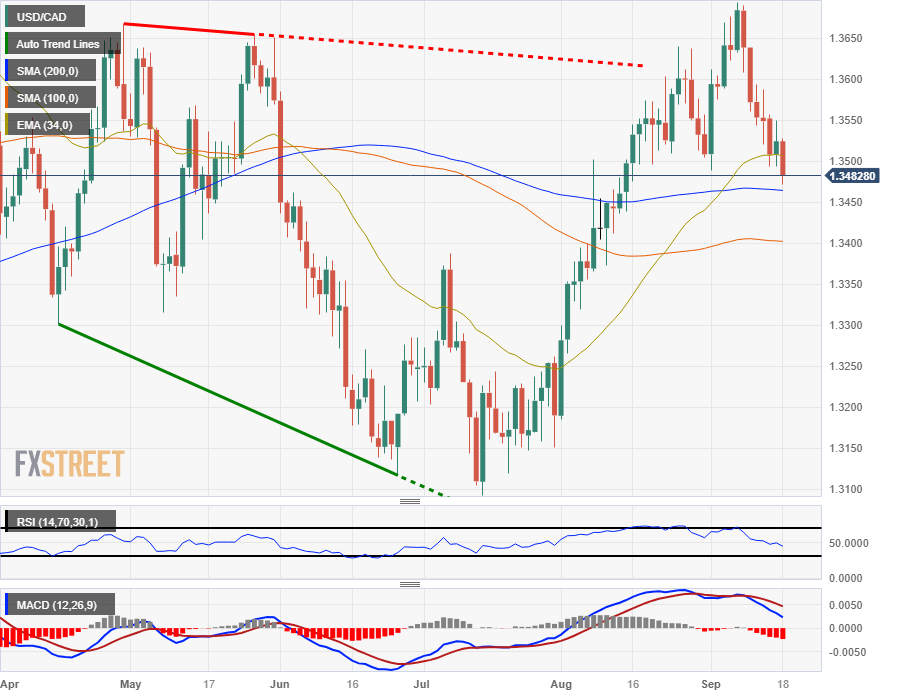
- Oil prices are surging thanks to ongoing supply constraint concerns, sending the CAD soaring against the USD.
- The Federal Reserve's latest rate call is expected to hold steady in the midweek.
- Economic Calendar sees several high-impact figures for both the USD and CAD this week.
The USD/CAD continues to tip to the downside as the Loonie (CAD) gets pushed higher by rising oil prices.
Oil prices continue to chew through chart paper, with West Texas Intermediary (WTI) US crude oil marking a fresh high of $91/bbl in Monday trading.
The USD/CAD is testing into five-week lows as the US Dollar (USD) gives up ground against the commodity-supported CAD, but the midweek sees the Federal Reserve (Fed) landing with another rate call. Markets are broadly expecting the Federal Open Market Committee (FOMC) to hold steady with interest rates at 5%.
Fed's rate call in the pipe for the mid-week, US data to dominate market reactions
Oil prices will be driving the USD/CAD for the early week, but the economic calendar will see plenty of Greenback-based momentum from Wednesday onwards. However, before any of that can happen, the CAD will see Consumer Price Index (CPI) figures for Canada on Tuesday.
The Canadian CPI is scheduled for 12:30 GMT Tuesday, and is expected to climb to 3.8% from the previous 3.3% as the Bank of Canada (BoC) struggles to contain inflation largely bolstered by rising energy prices.
Thursday will bring US Initial Jobless Claims which lasted printed at 220K, while Friday sees Canadian Retail Sales for July, forecast to tick higher from 0.1% to 0.4%.
US Manufacturing and Services Purchasing Manager Index (PMI) data is also slated for Friday. The Manufacturing PMI is expected to decline slightly from 47.9 to 47.8, while the services component is seen declining from 50.5 to 50.3.
USD/CAD technical outlook
The Dollar-Loonie pairing is trading to the midpoint of familiar territory initially reached in late 2022, and the pair is rapidly approaching the 200-day Simple Moving Average (SMA) near 1.3464 as prices slip past the 34-day Exponential Moving Average (EMA), currently turning bearish into 1.3505.
The Relative Strength Index (RSI) and Moving Average Convergence-Divergence (MACD) indicators are firmly bearish on daily candlesticks, and the indicators are warning buyers that there could still be plenty of room to run towards the downside before a successful bullish offensive can be mounted.
USD/CAD daily chart
USD/CAD technical levels
- GBP/USD stuck near major psychological level with dual central bank rate calls in the barrel.
- Heavily-populated economic calendar for this week promises plenty of volatility.
- Lopsided rate calls could see the currency pair twist into the midweek.
It’s a heavy showing for the GBP/USD pair this week with both the Federal Reserve (Fed) and Bank of England (BoE) on-deck with interest rate calls slated for the midweek, and the Pound Sterling (GBP) is jostling for position against the Greenback (USD) as investors gear their positioning.
The Fed is broadly expected to hold rates steady 5.5% at the upcoming Federal Open Market Committee (FOMC) meeting on Wednesday at 18:00 GMT, while the BoE is forecast to give one last 25-basis-point rate hike, bringing the UK’s main rate to 5.5% from 5.25%.
The BoE’s rate call is slated for 11:00 GMT on Thursday.
Plenty of US & UK data on the economic calendar
It’s a bumper week for the GBP/USD on the economic calendar. For the UK, Consumer Price Index (CPI) numbers print on Wednesday, BoE Thursday, and Friday sees Retail Sales and Preliminary Purchasing Manager Index (PMI) figures.
United Kingdom (UK) CPI figures on Wednesday are expected to increase from -0.4% to 0.7%, while Friday’s Retail Sales for August are likewise forecast to bump to 0.5% after the previous month’s 1.2% decline.
On the United States (US) side of the data docket, Wednesday’s Fed showing will be followed by employment figures on Thursday and the Preliminary PMI printing on Friday.
Thursday’s Initial Jobless Claims for the week into September 15th and the Philadelphia Manufacturing Survey for September are scheduled for 12:30 GMT. Initial Jobless Claims last printed at 220K, and the manufacturing survey is expected to decline 0.7% versus the last showing of 12.
Friday’s preliminary PMI numbers, scheduled for 13:45 GMT, are broadly expected to show a minor slip, with the manufacturing PMI forecast to tick down to 47.8 from the previous 47.9, and the services sector PMI is forecast to move slightly lower from 50.5 to 50.3.
GBP/USD technical outlook
On the technical side, the GBP/USD is knocking sideways in early week trading. The pair opened the week near the 1.2400 handle and has so far struggled to find momentum. The intraday action sees a sideways skid between 1.2400 and 1.2380.
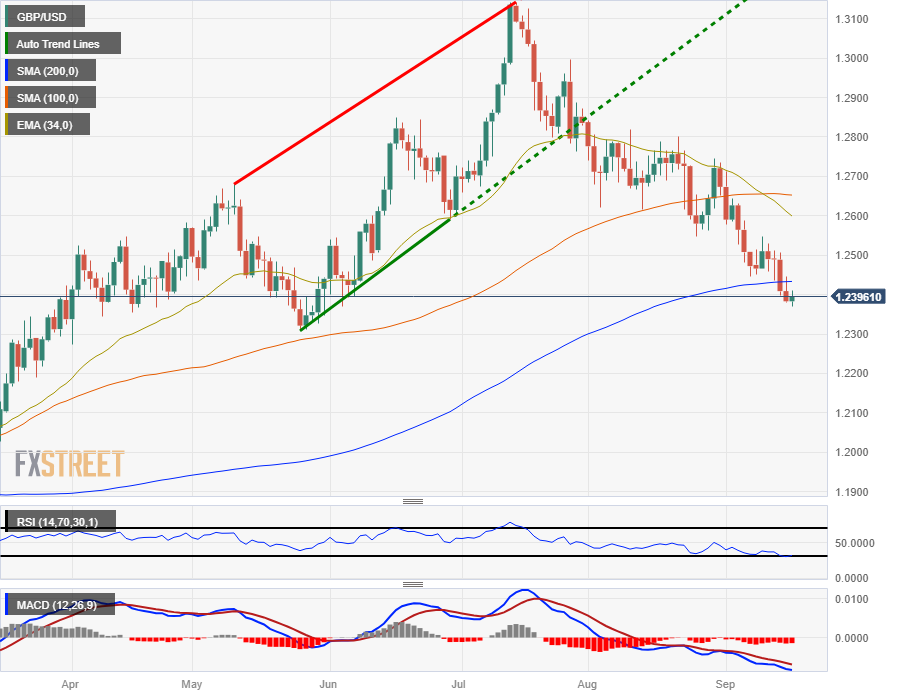
The GBP/USD has closed red or flat for eight of the past nine consecutive weeks from early July’s peak of 1.3142, and Daily candlesticks see the pair decidedly bearish, slipping just below the 200-day Simple Moving Average (SMA) currently parked near 1.2433.
The 34-day Exponential Moving Average (EMA) has turned bearish into the 1.2600 major level, and as long as markets remain on-balance traders will want to keep an eye on the Relative Strength Index (RSI) and Moving Average Convergence-Divergence (MACD) indicators, both of which are flashing oversold conditions on daily candlesticks.
GBP/USD daily chart
GBP/USD technical levels
- USD/JPY slightly declined towards 147.70, and bulls seem to be losing traction.
- US yields are rising as markets await a hawkish pause from the Fed on Wednesday.
- Investors also await fresh macro forecasts and revised dot plots from the Fed.
At the start of the week, the USD/JPY saw some losses and declined to 147.70, mainly driven by the USD trading somewhat weak against its rivals. Both the Federal Reserve (Fed) and Bank of Japan (BoJ) will meet this week on Wednesday and Friday but no hikes are expected from either bank. Powell and Ueda’s stances will be closely watched. No relevant data will be released on Monday.
On the Fed’s side, markets anticipate that the bank will announce a hawkish, similar to the June meeting decision, in which the Fed decided to hold rates steady to asses the lags of monetary policy and their impact on the US economy. In that sense, the bank will try to convince the market that they will remain data-dependent but that the tightening cycle isn’t over.
In line with that, US Yields are seeing gains across the curve and remain high. The 10-year bond yield rose to 4.33% while the 2-year yield stands at 5.06%, up by 0.50%, and the 5-year yielding 4.46%.
On the other hand, the Bank of Japan (BoJ) has clarified that a monetary policy shift will only be considered once local wage and inflation metrics align with their anticipated outcomes. In addition, amid the local economy's ongoing struggles and the added weight of Chinese economic troubles, the central bank remains hesitant to pivot its dovish stance. In that sense, the policy statement will be closely watched for clues on forward guidance.
USD/JPY Levels to watch
The technical analysis of the daily chart suggests a shift towards a neutral to a bearish outlook for USD/JPY, with indications of bullish exhaustion. Having turned flat in positive territory, the Relative Strength Index (RSI) suggests a potential market equilibrium with balanced buying and selling pressure. The Moving Average Convergence (MACD), on the other hand, presents flat red bars. Furthermore, the pair is above the 20,100,200-day Simple Moving Average (SMAs), suggesting that the bulls are firmly in control of the bigger picture.
Support levels: 147.00, 146.60 (20-day SMA), 146.00.
Resistance levels: 148.00, 149.00, 150.00.
USD/JPY Daily Chart
-638306503190990672.png)
- AUD/USD trades at 0.6435, recovering from a daily low of 0.6416, as Chinese economic data boosts market sentiment.
- US Federal Reserve expected to hold rates steady, with a 99% chance of no change, as investors await ‘dot-plots’ for future rate path.
- Michelle Bullock to begin her term as the new RBA Governor with Australian economic data, including PMIs and inflation, on the week’s docket.
The Australian Dollar (AUD) recovers some ground against the US Dollar (USD) as investors brace for a busy week in the central bank space, as the US Federal Reserve is expected to hold rates unchanged. Improvement in Chinese economic data, propelled by its government, cushioned the Aussie’s fall. The AUD/USD is trading at 0.6435 after hitting a daily low of 0.6416.
Australian Dollar gains against the US Dollar ahead of a busy central bank week, buoyed by positive economic data from China
Market sentiment has improved due to Chinese data portraying a more optimistic outlook, which was threatened by deflation and a sudden economic slowdown. That boosted the Aussie Dollar (AUD), which is staging a recovery amid an absent economic docket.
Last week, the US economy witnessed an uptick in inflation on the consumer and producer side while the jobs market remains hot. Retail sales expanded slower than estimated but remained solid above the 2% threshold. Nevertheless, consumer sentiment slipped, blamed on elevated gasoline prices, as revealed by a University of Michigan poll (UoM).
A tranche of US housing data will be revealed ahead in the week, but all eyes are set on Jerome Powell and co. Money markets are not expecting a surprise by the Fed, with the odds of holding rates unchanged at 99%. Aside from the monetary policy statement, traders are looking for the ‘dot-plots’ to see Fed officials’ expectations regarding the Federal Funds Rate (FFR) path.
On the Australian front, the calendar would reveal the Judo Bank Services and Manufacturing PMIs alongside inflation data. However, the main highlight of the week is that Michelle Bullock is beginning her term as the new Reserve Bank of Australia (RBA) Governor.
AUD/USD Price Analysis: Technical outlook
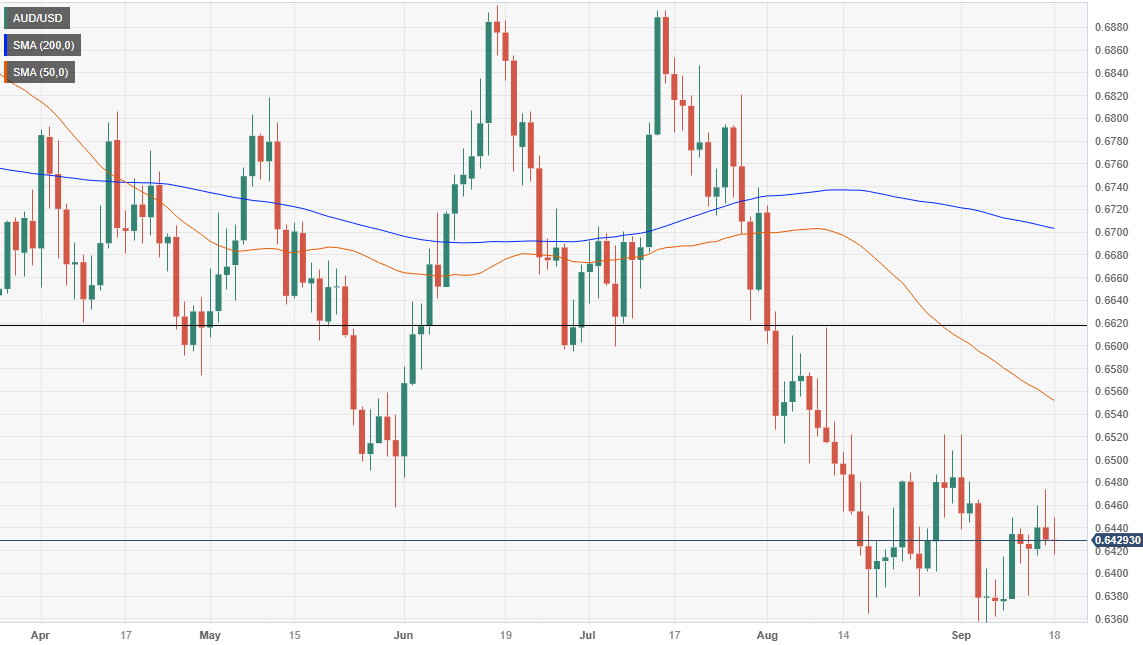
Price action portrays the pair printed a hammer preceded by a slim uptrend, peaking at around last week’s high of 0.6475. However, if buyers clear that area, the pair could test 0.6500 and resume its upward direction to test the 50-day Moving Average (DMA) at 0.6551. Conversely, and in the most likely scenario, the AUD/USD could extend its losses, but first, sellers must drag prices below the 0.6400 mark. A breach of the latter, and the pair could slip towards the yearly lows of 0.6357.
Statistics Canada will release August Consumer Price Index (CPI) data on Tuesday, September 19 at 12:30 and as we get closer to the release time, here are the forecasts by the economists and researchers of five major banks regarding the upcoming Canadian inflation data.
Headline inflation is expected at 3.8% year-on-year vs. 3.3% in July. If so, headline would accelerate for the second straight month to the highest since April and further above the 2% target. On a monthly basis, CPI is seen at 0.2% vs. the prior release of 0.6%.
RBC Economics
Higher energy prices will push headline price growth higher. We expect a 3.7% YoY rate in August, up from 3.3% in July. The BoC’s preferred core measures may tick higher on a YoY basis due to soft year-ago ‘base effects’ (the month-over-month increase in those measures a year ago was relatively small). But it’ll be more focused on the recent three-month average growth rate for the ‘median’, ‘trim’, and trim services ex-shelter (sometimes called ‘super core’) measures. All of these are still ‘sticky’ at rates above the top end of the BoC’s inflation target. But we continue to expect signs of softening in the economy to spill over into softer price growth over the remainder of the year – preventing additional BoC interest rate hikes.
NBF
An increase in gasoline prices could have translated into a 0.2% increase in the CPI in August (before seasonal adjustment). If we’re right, the 12-month rate of inflation should come up from 3.3% to a 4-month high of 3.8%. Similarly to the headline print, the core measures preferred by the Bank of Canada should increase in the month, with CPI-med likely moving from 3.7% to 3.8% and CPI-trim from 3.6% to 3.7%.
Citi
We expect a solid 0.4% MoM increase in headline CPI in August, with base effects implying the YoY reading climbs to 4.1%. Part of the strength in August will be due to further increases in energy prices. A pick-up in mortgage costs with higher interest rates should help support shelter prices. However, the most substantial upside risks to CPI in August are likely to be due to various service prices. The most important elements of August inflation data will be the core inflation measures. The three-month run rate of core inflation has been stably in a 3.5-4% range for a year, implying that annual measures will also remain around this range in August. Higher three-month inflation would understandably increase the chance of further BoC rate hikes, possibly as soon as October.
CIBC
The jump in oil prices that saw consumers paying more at the pump in August will be behind a likely 0.2% MoM NSA advance in the total CPI in that month. That would boost the annual rate of inflation to 3.8%, magnified by a weak year-ago reading falling out of the calculation. Higher gas prices will have left less money for spending elsewhere, and weaker demand could have prevailed in categories outside of food and energy, leaving 12-month ex. food and energy prices at 3.4%, and validating the Bank of Canada’s hold in September.
TDS
We look for headline CPI to rise by 0.2% MoM in August as inflation jumps 0.5pp to 3.8% from a combination of base effects and higher energy prices. Gasoline and other energy products will contribute ~0.2pp on the month or 0.1pp on a year-ago basis, with the latter improving from a 0.6pp drag in July. Setting aside the impact of higher energy prices, we expect the August report to show modest progress on the path to 2%. Seasonal headwinds should hold food prices to a minor increase, and we also look for another muted performance across core goods as households pare back discretionary spending. However, these improvements are unlikely to translate into softer core inflation pressures with CPI-trim/median expected to edge 0.05pp higher to 3.7% YoY (+0.1pp for CPI-trim). This would leave 3m rates of core inflation to persist in their recent (3.5-4.0%) range, although our forecast would see the ex. food/energy measure edge lower by 0.1pp to 3.3% YoY.
While speaking at the World Petroleum Congress in Canada, Saudi Arabia’s Energy Minister Prince Abdulaziz bin Salman said that they are targeting less volatility in energy markets rather than prices, per Reuters.
Key takeaways
"Whole world should focus on energy security.",
"Main pillar for energy security is sustainable markets."
"OPEC conduct is benign, no different from central bank actions."
"International energy markets need light handed regulation."
"We want to be proactive, pre-emptive, precautious."
"Jury still out on Chinese demand, European growth, what central bankers will do."
"IEA has moved from market forecaster to political advocate."
"World could go from one type of energy crisis to another if supply chains for critical minerals aren't well planned."
Market reaction
Crude oil prices continue to edge higher following these comments and the barrel of West Texas Intermediate was last seen rising nearly 1% on the day at $92.00.
Monetary policy argues for further weakness of Yen, analysts at Erste Group Research report.
There is still a lot to be said for the Euro from a fundamental perspective
The Bank of Japan's control of the yield level of 10-year Japanese government bonds (within a target corridor of 50 bps above or below a yield level of 0%) continues to be the determining factor for the development of the JPY. By contrast, German 10-year government bonds are currently comparatively attractively priced with a yield level of around 2.6%. Since core inflation in both currency areas is close to the same level, there is still a lot to be said for the Euro from a fundamental perspective.
The Yen's weakness can therefore continue, provided there are no fundamental changes in the BoJ's monetary policy.
In the event of an escalation of crises, the Yen can also quickly strengthen against the Euro again at any time.
The Dollar is going into the September Fed meeting at the strongest levels since March. Economists at ING analyze USD outlook.
Few reasons for Dollar to hand back gains, yet
The concept of US ‘exceptionalism’ (both in growth and interest rates) looms large over the market and as yet there have been few reasons to bet against the Dollar.
The event risk of the September FOMC meeting does not seem a particularly bearish one for the Dollar. We are not expecting the Fed to call time on its tightening cycle. And by leaving one more hike in the dot plot, the Fed can avoid yields at the long end of the bond market slipping too far and providing premature stimulus. Indeed, the greater risk might be the Fed scaling down its dot plot median forecast of a 100 bps easing cycle in 2024.
A hawkish September FOMC does not mean the USD has to rally a lot. But assuming there are no surprises, it probably means ideas of a prolonged pause in the policy cycle will see interest rate volatility fall even further and demand for the carry trade stay strong.
ECB gave its clearest indication yet that the peak in policy interest rates might have been reached. Economists at Wells Fargo believe the risks for the Euro remain tilted to the downside for the balance of 2023.
Recovery in EUR/USD to around 1.1100 by Q4-2024
Given the likely end to ECB rate hikes and underwhelming Eurozone growth performance, the risks to our Euro forecast, which envisaged a low around 1.0600 during Q4-2023, are clearly – and perhaps significantly – tilted to the downside.
Our forecast also envisages a recovery in the Euro to around 1.1100 by Q4-2024, although that rebound has much more to do with a turn in US economic fortunes than any emphatic recovery in the Eurozone economy.
We expect that a mild US recession and relatively pronounced Federal Reserve rate cuts should see the USD weaken versus the Euro. However, if the US economy continues to display surprising resilience and the Fed adopts a more gradual approach to monetary easing, we also view the risks as tilted towards a more gradual Euro rebound than our current outlook.
In an interview with CNBC on Monday, US Treasury Secretary Janet Yellen said that she doesn't see any signs suggesting that the US economy is in a downturn, as reported by Reuters.
Key takeaways
"US had good, strong labor market and it is important for workers to be able to realize gains."
"Labor market is cooling but without significant layoffs."
"Consumer spending remains robust."
"Would expect to see some impact of Fed tightening, already seen in the housing market."
"I think we're achieving lower inflation."
"Watching oil prices very closely."
"There's absolutely no reason for a government shutdown."
"We want congress to stay focused and avoid anything that could cause the economy to lose momentum."
Market reaction
These comments failed to trigger a noticeable market reaction and the US Dollar Index was last seen losing 0.05% on the day at 105.25.
Strategists at Société Générale continue to like gold in a multi-asset portfolio
Gold is driven by nominal rates and inflation
Real rates are a major driver of the Gold price. The price is driven by two components: nominal rates and inflation.
With nominal rates close to peak levels, gold should continue to see some selling pressure.
While we are structurally bullish on Gold, due to structural buying from central banks, geopolitics, and some renewed trend towards de-dollarisation, we are reducing the allocation to Gold by 1pp, before reverting to a full weighting when US growth materially slows.
- EUR/USD gathers upside traction and advances to 1.0680.
- The resumption of the selling pressure could retest 1.0630.
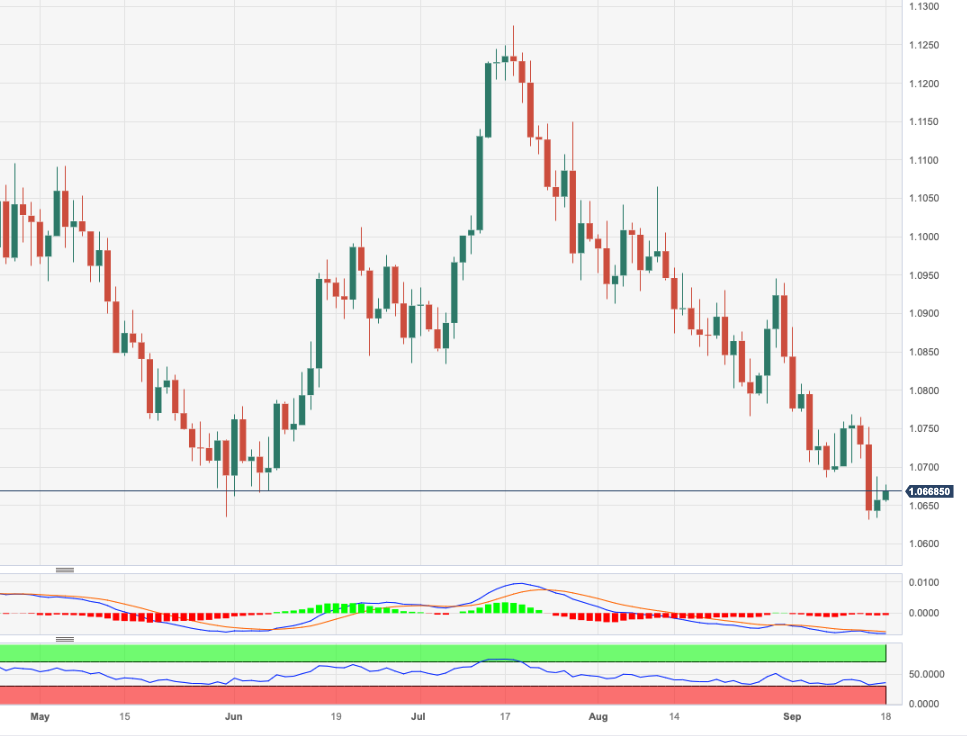
EUR/USD extends Friday’s recovery and hovers around the 1.0680 region on Monday.
Despite the so far two-day bounce, the pair’s underlying bearish sentiment remains unchanged and leaves the door open to extra pullbacks in the short-term horizon. Against that backdrop, further losses could see the September low at 1.0631 (September 14) revisited ahead of the March low of 1.0516 (March 15).
In the meantime, further losses remain in the pipeline while below the key 200-day SMA, today at 1.0827.
EURUSD daily chart
The European Central Bank raised interest rates on Thursday but signalled that the move may be the last one in the current cycle. Economists at ING analyze EUR/USD outlook.
November and December are seasonally weak months for the Dollar
Expect EUR/USD to trade on the soft side now that the ECB has told us that rates have peaked. However, we suspect good demand will emerge near the 1.05 level. Our house call is that US ‘exceptionalism’ does not last and that US growth converges on the weak Eurozone story into 2024.
Typically, November and December are seasonally weak months for the Dollar. Our call is that weaker US activity data will become evident over time and that the current period will come to be viewed as ‘as good as it gets’ both for US growth and the Dollar. We are sticking with our call that EUR/USD will be trading above 1.10 by year-end.
- DXY comes under some mild selling pressure on Monday.
- Immediately to the upside emerges the yearly peak.
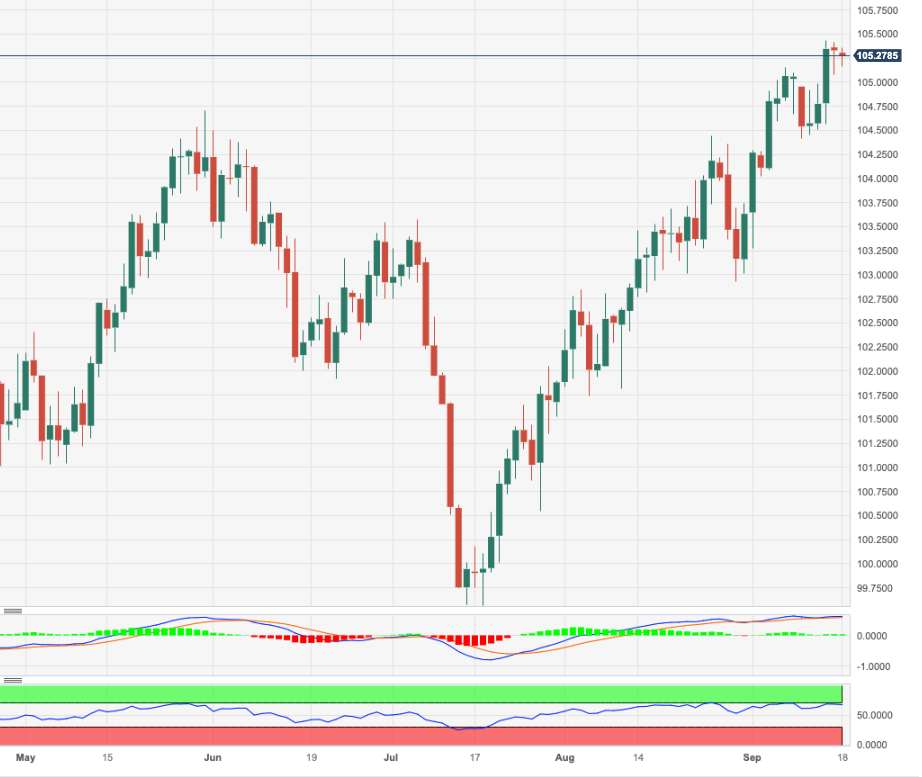
DXY adds to Friday’s small losses and revisits the 105.20/15 band at the beginning of the week.
The continuation of the multi-month rally appears well and sound and a breakout of the monthly high of 105.43 (September 14) should encourages the index to retest the 2023 peak of 105.88 (March 8), just before the round level of 106.00.
While above the key 200-day SMA, today at 103.02, the outlook for the index is expected to remain constructive.
DXY daily chart
Economist at UOB Group Ho Woei Chen, CFA, comments on the latest PBoC’s move on rates.
Key Takeaways
The PBOC has lowered financial institutions’ reserve requirement ratio (RRR) by 25 bps effective today (15 Sep). The move is within expectation as policymakers doubled down their efforts to boost the economy.
It also surprised markets by injecting a larger than expected amount of liquidity via the 1Y Medium-Term Lending Facility (MLF) today despite keeping the rate unchanged as expected. Looking ahead, there will be a further need to boost market liquidity as CNY3.76 tn of 1Y MLF will mature in the next two quarters.
Despite no further reduction in the 1Y MLF, we could still see the benchmark loan prime rates (LPRs) being adjusted lower at the upcoming rate setting on 20 Sep as the earlier MLF cut in Aug has not been fully passed through to the LPRs. Our forecast for the 1Y LPR is at 3.40% end-3Q23 and 3.35% end-4Q23 while our forecast for the 5Y LPR is at 4.05% end-3Q23 and 4.00% end-4Q23.
Plenty of central bank meetings this week, none likely to derail the Dollar rally, in the view of Kit Juckes, Chief Global FX Strategist at Société Générale.
A soft Euro will help keep EUR/CHF down
In G10, I don’t think central banks dominate the currency outlook quite as much now, as they did six months ago. The growth outlook matters more and, in that sense, perhaps the long end of the yield curve matters more than policy rates, too.
The Euro got no help from last week’s ECB rate hike and Sterling may not get much from the MPC meeting. An announcement on gilt sales is likely, but would rising yields from here bring in buyers or trigger a loss of confidence? GBP/USD has 1.20 in its sights. CPI (Wednesday and Retail Sales (Friday) are worth watching, too.
As for the SNB, Riksbank and Norges Bank, if we get 25 bps hikes from all three, SEK may be the currency that benefits least. Domestic concerns are too great. NOK is helped by Oil prices even if global nerves don’t help and a soft Euro will help keep EUR/CHF down.
- EUR/JPY trades within a tight range around 157.50.
- The cross faces further side-lined trading for the time being.
EUR/JPY navigates within a tight range above the 157.00 yardstick at the beginning of the week.
In the meantime, the cross continues to face some consolidative range. Against that, a minor hurdle emerges at the so far monthly high of 158.65 (September 13) ahead of the 2023 top at 159.76 (August 30), which precedes the key round level at 160.00. The surpass of the latter should not see any resistance level of note until the 2008 high at 169.96 (July 23).
So far, the longer term positive outlook for the cross appears favoured while above the 200-day SMA, today at 148.77.
USD/JPY has soared toward 148.00 ahead of the latest policy update from the BoJ in the week ahead. Economists at MUFG Bank analyze the pair’s outlook.
Will BoJ Governor Ueda push back further against JPY weakness by talking up rate hike risks?
Market attention will now turn to comments from Governor Ueda at this week’s policy meeting to see what message he delivers over the future timing of rate hikes and what level of unease he displays over recent Yen weakness.
If BoJ Governor Ueda steps back from providing a strong signal over the possibility of rate hikes by the turn of the year, it will increase the burden on the Japanese government to support the Yen through intervention like late last year if the USD/JPY jumps back above the 150.00 level and moves to retest last year’s high at 151.95.
Economists at Société Générale analyze USD/MXN technical outlook.
16.60 remains important support
USD/MXN rebound petered out near the trend line drawn since September 2022 at 17.73. It has staged a steady pullback and is now challenging 50-DMA near 17.00. It would be interesting to see if the pair can carve out a higher low as compared to the ones in July/August at 16.60. Defence of this level can lead to a short-term bounce towards 17.42 and the trend line near 17.73.
Only if the support at 16.60 gets violated would there be risk of a deeper downtrend.
The CAD booked a gain on the USD last week. Economists at Scotiabank analyze USD/CAD outlook.
CAD shorts building again
The USD’s recent appreciation seems to have run out of gas again in the 1.36/1.37 range, perhaps not unlike the spring. Historically, USD/CAD forays above 1.35 tend to be limited in terms of scope and duration.
CAD gains – so far – are limited and there is enough event risk ahead to keep markets cautious on the prospects for the CAD recovery to extend. But it remains somewhat undervalued and perhaps oversold on the charts.
Friday’s CFTC data reflected a further build-up on net CAD short positioning – just as the CAD is showing tentative signs of steadying – again, similar to the March/April period. A push under 1.35 may put some heat on some of the more freshly minted short CAD positions.
GBP/USD remains relatively soft in the low 1.24 area. Economists at Scotiabank analyze the pair’s outlook.
Markets eye BoE decision
UK markets have a fair bit to contend with this week – CPI on Wednesday and the BoE policy decision on Thursday. A ‘dovish hike’ a la ECB would pressure the GBP and, at the margin, add to price pressures.
The GBP is soft but intraday price action is – right now – showing some signs of relative strength via a bullish outside range session on the six-hour chart.
If the GBP can sustain gains through 1.24, a deeper squeeze may develop towards 1.2450 resistance. A clear move above this point is needed to indicate more GBP strength.
Support is 1.2375.
Loonie holds gains to the 1.35 area. Economists at Scotiabank analyze the USD/CAD outlook.
Short-term technical trends are leaning positive for the CAD
Short-term technical trends are leaning positive for the CAD. The USD has been trading more defensively since peaking and turning lower from the 1.37 zone and the bear trend is developing some decent momentum on the short-term chart. Noted support at 1.3495/1.3500 is, however, hampering additional CAD gains.
A break under the 1.3495 point should see the CAD progress to the low 1.34 area and, possibly, test stronger USD support in the upper 1.33s.
EUR/USD trades little changed in a tight range. Economists at Scotiabank analyze the pair’s outlook.
Technical undertone is weak
EUR/USD is consolidating but there is little positive to say about short-term trends on the face of it.
The pair remains below 1.07 and the market is carving out a bear wedge on the intraday chart which points to more losses ahead.
A break under 1.0650 may see further softness in price action develop.
Resistance is 1.07.
See – EUR/USD: Outside risk to the 1.04/1.05 area on a break below 1.0610/1.0630 support – ING
Economist at UOB Group Lee Sue Ann comments on the latest ECB interest rate decision.
Key Takeaways
The European Central Bank (ECB) decided to raise its three key interest rates by 25bps. After a total of 450 bps rate hikes, the ECB’s main policy rates are now at a record high.
The ECB’s new projections show inflation slowing from a current rate of 5.3% to 3.2% next year and 2.1% in 2025, making only slow progress towards the bank's 2.0% target. The growth outlook continued to sour and the ECB now sees a 2023 expansion of just 0.7% after predicting 0.9% three months ago. For 2024, it sees the economy growing by 1.0%.
While we believe the door to future rate hikes remains open, we prefer keeping to our view of a pause in the current tightening cycle, implying terminal rates of 4.50%, 4.75% and 4.00% for main refinancing operations, the marginal lending facility and the deposit facility, respectively.
- The US Dollar trades mixed at the opening on Monday.
- Traders will likely keep powder dry for the main Fed event on Wednesday.
- The US Dollar Index resides above 105.00, struggling to make new highs.
The US Dollar (USD) was able to close a ninth consecutive week in the green, which makes it almost one of its longest winning streaks. Despite the strength, some signs are starting to mount that the rally might come to an end soon. Although last week got closed in the green for the USD, the University of Michigan inflation expectations components showed that participants believe the US Federal Reserve (Fed) should be nearly done hiking – and this isn’t good news for the Dollar.
The week presents a very light economic calendar that is unlikely to have much impact on current levels. Until Wednesday, some selling pressure is expected, particularly if the US Dollar is unable to break higher. This means that the US Dollar Index (DXY) is at risk of retreating, easing a touch away from a new six-month high.
Daily digest: US Dollar softens
- There is a very light calendar on Monday, in a week in which the focal point will be the US Federal Reserve rate decision.
- The National Association of Home Builders will issue its Housing Market Index for September at 14:00 GMT. Expectations are for an unchanged number at 50.
- The US Treasury Department will auction a 3-month and a 6-month bill.
- Equities are a bit mixed, without a clear direction on Monday. Some disappointing comments from Societe Generale failing to impress investors is putting some selling pressure on European bank shares.
- The CME Group FedWatch Tool shows that markets are pricing in a 97% chance that the Federal Reserve will keep interest rates unchanged at its meeting in September after the recent PPI and Retail Sales numbers.
- The benchmark 10-year US Treasury bond yield trades at 4.35%, and peaked in early Monday trading.
US Dollar Index technical analysis: Afloat until Wednesday
The Greenback had a bit of a rough ride, though the economic conditions compared to Europe and other countries still make it stand out and shine. This makes investors to still flock into the Greenback already for the high rates investors get paid out on the back of it. The question for this week will be if the US Dollar Index can stay above 105.00 even if the Fed delivers a rate pause.
The US Dollar Index (DXY) has edged up, reaching 105.41. This is just a sigh away from the 2023 high near 105.88. Should the DXY be able to close above there for the week, expect the US Dollar to go even stronger in the medium-turn.
On the downside, the 104.44 level seen on August 25 kept the Index supported on Monday, not allowing the DXY to sell off any further. Should the uptick that started on September 12 reverse and 104.44 gives way, a substantial downturn could take place to 103.04, where the 200-day Simple Moving Average (SMA) comes into play for support.
US Dollar FAQs
What is the US Dollar?
The US Dollar (USD) is the official currency of the United States of America, and the ‘de facto’ currency of a significant number of other countries where it is found in circulation alongside local notes. It is the most heavily traded currency in the world, accounting for over 88% of all global foreign exchange turnover, or an average of $6.6 trillion in transactions per day, according to data from 2022.
Following the second world war, the USD took over from the British Pound as the world’s reserve currency. For most of its history, the US Dollar was backed by Gold, until the Bretton Woods Agreement in 1971 when the Gold Standard went away.
How do the decisions of the Federal Reserve impact the US Dollar?
The most important single factor impacting on the value of the US Dollar is monetary policy, which is shaped by the Federal Reserve (Fed). The Fed has two mandates: to achieve price stability (control inflation) and foster full employment. Its primary tool to achieve these two goals is by adjusting interest rates.
When prices are rising too quickly and inflation is above the Fed’s 2% target, the Fed will raise rates, which helps the USD value. When inflation falls below 2% or the Unemployment Rate is too high, the Fed may lower interest rates, which weighs on the Greenback.
What is Quantitative Easing and how does it influence the US Dollar?
In extreme situations, the Federal Reserve can also print more Dollars and enact quantitative easing (QE). QE is the process by which the Fed substantially increases the flow of credit in a stuck financial system.
It is a non-standard policy measure used when credit has dried up because banks will not lend to each other (out of the fear of counterparty default). It is a last resort when simply lowering interest rates is unlikely to achieve the necessary result. It was the Fed’s weapon of choice to combat the credit crunch that occurred during the Great Financial Crisis in 2008. It involves the Fed printing more Dollars and using them to buy US government bonds predominantly from financial institutions. QE usually leads to a weaker US Dollar.
What is Quantitative Tightening and how does it influence the US Dollar?
Quantitative tightening (QT) is the reverse process whereby the Federal Reserve stops buying bonds from financial institutions and does not reinvest the principal from the bonds it holds maturing in new purchases. It is usually positive for the US Dollar.
Rates could be raised as much as 500 bps in Turkey, and cut by 50 bps in Brazil. Economists at ING analyze TRY and BRL outlook.
Strong interest in the carry trade this year
In EMEA, the highlight will be whether the Central Bank of Turkey delivers another large hike on Thursday (+500 bps expected) in a continuing return to policy orthodoxy, while Brazil should cut rates another 50 bps in line with recent guidance.
Given the strong interest in the carry trade this year, both the Turkish Lira and Brazilian Real could stay supported despite these diverging rate stories.
The Dollar is continuing to trade close to recent highs after regaining upward momentum at the end of last week. Economists at MUFG Bank analyze Greenback’s outlook.
The main downside risk for the USD would be if the Fed scraps plans for one more hike
The Fed is expected to leave rates on hold.
Market attention will mainly focus on the Fed’s updated economic projections and forward guidance. We expect the updated projections to include a significant upward revision to the US GDP forecast for this year while the core inflation forecast will be lowered.
The main downside risk for the USD would be if the median projection for one last hike this year is removed, and Chair Powell signals that the rate hike cycle has reached an end. But any correction should again prove short-lived.
We still believe that upward momentum continues to favour further USD upside in the near-term while the US economy is outperforming.
- Oil (WTI) pops higher and flirts with a new yearly high.
- The US Dollar is in wait-and-see mode ahead of the US Fed rate decision.
- Crude prices will be driven by headline risk from the Energy minister of Saudi Arabia.
Oil prices firm up on Monday as traders brace for any comments from the Saudi Arabian minister of energy and oil that could further put pressure on the commodity. Crude prices already saw a big push higher earlier this month on the back of surprise comments from Russia and Saudi Arabia, which outlined plans to extend any production cuts until the end of the year. The question is if Saudi Arabia will do more.
Meanwhile, the US Dollar is facing a tough week with a very calm calendar until Wednesday. That day, the US Federal Reserve (Fed) will take a decision on interest rates and markets expect policymakers to leave interest rates unchanged. . In this context, the Greenback is expected to stay afloat until Fed Chair Jerome Powell delivers his speech after the decision.
Crude Oil (WTI) price trades at $90.72 per barrel and Brent Oil at $94.85 at the time of writing.
Oil news and market movers
- Russian Oil could fall into grace as US diesel producers are falling short of supply.
- Saudi Energy Minister Prince Abdulaziz bin Salman will address an industry conference later Monday.
- Hedge funds boosted their price outlook on Brent and Crude to a 15-month high last week.
- Diesel and gasoline prices at the pumps are rising quickly both in the US and Europe, fueling concerns over renewed energy inflation.
- The supply deficit might grow even larger should demand start to pick up from China, as recent macroeconomic data suggests.
- Kazakhstan raised its daily Oil and Gas condensate production by 10% on Sunday from Saturday to 250,400 tons, according to data from the country’s Energy Ministry.
Oil Technical Analysis: too quick too high?
Oil prices are in a very thin equilibrium in which any hiccup in supply could trigger another price breakout to the upside in Oil futures. Although the Relative Strength Index (RSI) is in deeply overbought territory, the newsflow and possible drawdowns in US stockpiles could eke out that last touch of more gains. Still, a quick jump up to $93.12 isn’t expected as a bigger catalyst would be needed to cause such a big move.
On the upside, the double top from October-November last year at $93.12 is the level to beat. Although this looks very much in reach, do not forget markets have already priced in a lot of possible supply deficits and plenty of bullish outlooks. Should $93.12 be taken out, look for $97.11, the high of August 2022.
On the downside, a pivotal level is at $84.30 from August 10. In case this level does not hold, a substantial nosedive might occur. In such a case, Oil prices might drop to a key floor near $78.00.
-638306231420992940.png)
WTI US OIL daily chart
WTI Oil FAQs
What is WTI Oil?
WTI Oil is a type of Crude Oil sold on international markets. The WTI stands for West Texas Intermediate, one of three major types including Brent and Dubai Crude. WTI is also referred to as “light” and “sweet” because of its relatively low gravity and sulfur content respectively. It is considered a high quality Oil that is easily refined. It is sourced in the United States and distributed via the Cushing hub, which is considered “The Pipeline Crossroads of the World”. It is a benchmark for the Oil market and WTI price is frequently quoted in the media.
What factors drive the price of WTI Oil?
Like all assets, supply and demand are the key drivers of WTI Oil price. As such, global growth can be a driver of increased demand and vice versa for weak global growth. Political instability, wars, and sanctions can disrupt supply and impact prices. The decisions of OPEC, a group of major Oil-producing countries, is another key driver of price. The value of the US Dollar influences the price of WTI Crude Oil, since Oil is predominantly traded in US Dollars, thus a weaker US Dollar can make Oil more affordable and vice versa.
How does inventory data impact the price of WTI Oil
The weekly Oil inventory reports published by the American Petroleum Institute (API) and the Energy Information Agency (EIA) impact the price of WTI Oil. Changes in inventories reflect fluctuating supply and demand. If the data shows a drop in inventories it can indicate increased demand, pushing up Oil price. Higher inventories can reflect increased supply, pushing down prices. API’s report is published every Tuesday and EIA’s the day after. Their results are usually similar, falling within 1% of each other 75% of the time. The EIA data is considered more reliable, since it is a government agency.
How does OPEC influence the price of WTI Oil?
OPEC (Organization of the Petroleum Exporting Countries) is a group of 13 Oil-producing nations who collectively decide production quotas for member countries at twice-yearly meetings. Their decisions often impact WTI Oil prices. When OPEC decides to lower quotas, it can tighten supply, pushing up Oil prices. When OPEC increases production, it has the opposite effect. OPEC+ refers to an expanded group that includes ten extra non-OPEC members, the most notable of which is Russia.
Economists at ING analyze the GBP outlook ahead of Thursday's Bank of England Interest Rate Decision.
Slightly negative on Sterling later this year
Any hints on Thursday that the UK policy rate was something like 'sufficiently restrictive' would most like hit the Pound.
We are slightly negative on Sterling later this year on the view that the 2024 BoE easing cycle will be larger than currently priced. But we will take our cue on the timing of this sell-off from Thursday's BoE statement.
Further upside could see USD/IDR revisit the 15,400 region in the near term, argues Markets Strategist Quek Ser Leang at UOB Group.
Key Quotes
Last Monday (11 Sep, spot at 15,353), we held the view that USD/IDR “is likely to break above last month’s high of 15,359.” We indicated that “The next resistance levels above 15,359 are at 15,375 and 15,400.” Our view for USD/IDR to advance was not wrong, as it rose to a high of 15,385 before pulling back to end the week at 15,350 (+0.17%).
Upward momentum has not improved much, but USD/IDR could test 15,400 before easing. The next resistance at 15,425 is not expected to come into view. On the downside, if USD/IDR breaches 15,320, it would mean that the current upward pressure has faded
Gold tested the $1,900 area last week, but it managed to hold above and rebounded, erasing weekly losses. Strategists at TD Securities analyze the yellow metal’s outlook.
Traders may be positioning for a reversal of the soft-landing narrative
The growing soft-landing and higher-for-longer rates narrative sapped investor appetite for the yellow metal. The upbeat CPI and Retail Sales data only further emboldened this narrative, suggesting the bulls will need to be patient for another upside catalyst.
However, precious metals prices firmed to end the week, suggesting that while the outlook remains glum in the face of higher rates for longer, traders may be positioning for a reversal of the soft-landing narrative in anticipation of a Fed mistake.
European Central Bank (ECB) Vice President, Luis de Guindos, said on Monday, “the worst of underlying inflation has gone.”
Additional comments
Parts of underlying inflation are moderating.
There is uncertainty over hikes' effect on activity.
Rising energy prices add to uncertainty.
Related reads
- ECB’s Kazimir: Can't rule out further rate increases
- Euro wobbles around 1.0680 amidst alternating risk trends
Central banks are in the spotlight. Economists at Commerzbank analyze how their fight against inflation could impact the exchange rates.
End of rate hikes does not mean victory over inflation – yet
The market has accepted that the rate hike cycle will come to an end for now, despite the fact that inflation rates are still well above target levels in some cases. A more notable reaction of the exchange rates should only be expected once the current outlook changes, that means if inflation does not ease as expected or if the economy cools much more quickly than expected.
Only if the central banks have to react to a change in the current status quo will it become foreseeable which central bank is pursuing a properly restrictive course and which one is also keeping an eye on other factors apart from price stability – usually to the detriment of its own currency. The currencies of those central banks that are continuing the fight against inflation in a particularly credible manner are likely to benefit on a long-term basis too.
The European Central Bank's (ECB) Slovakian policymaker Peter Kazimir said on Monday, “I wish is that September rate hike was the last but can't rule out further rate increases.”
Additional quotes
"Only the March forecast can confirm that we are heading unequivocally towards our inflation goal."
"End of rate hikes to open debate on how to adjust PEPP and APP."
"Once clear that no more hikes are needed, debate should start on speeding up QT."
Market reaction
At the press time, EUR/USD is adding 0.14% on the day to trade at 1.0668, maintaining its intraday range.
- GBP/USD is facing downward pressure ahead of the interest rate decisions from both countries.
- Fed is expected to maintain its current interest rates on Wednesday, but a quarter basis points hike is expected through the end of the year 2023.
- Investors expect BoE to increase interest rates by a quarter basis points in the upcoming meeting on Thursday
- BoE Governor Andrew Bailey suggested that the central bank is nearing the end of its current interest rate-hike cycle.
GBP/USD struggles to halt the two-day losing streak, recovering from the intraday losses and trading around 1.2380 during the European session on Monday. The pair is facing downward pressure ahead of the interest rate decisions from the United States (US) and the United Kingdom (UK).
The US Federal Reserve (Fed) is expected to maintain its current interest rates without changes in the upcoming meeting scheduled on Wednesday. Furthermore, market participants will carefully scrutinize the central bank's communications, seeking any clues or insights regarding the possible future direction of interest rates. The market is still factoring in a 25 basis points rate-hike through the end of year 2023.
The US Dollar Index (DXY), assesses the performance of the US Dollar (USD) against six other major currencies, hovering around 105.30 at the time of writing. The improved US Treasury yields could contribute upward support for the Greenback. The yield on the US 10-year bond has declined to 4.34%, up by 0.35% by the press time.
The Greenback faced downward pressure, which could be attributed to the release of downbeat consumer sentiment data from the United States (US) on Friday. The preliminary Michigan Consumer Sentiment Index for September showed a reading of 67.7, down from the previous figure of 69.5 and below the expected reading of 69.1.
The GBP/USD traders anticipate that the Bank of England (BoE) will raise interest rates by 25 basis points in the upcoming meeting on Thursday. This potential rate hike by the BoE is driven by the central bank's aim to tackle rising inflationary pressures and maintain economic stability in the United Kingdom (UK).
However, BoE Governor Andrew Bailey's statement suggests that the central bank is nearing the end of its current interest rate-hike cycle. This, combined with concerns about the possibility of a recession and evidence of a slowing labor market in the UK, could put pressure on the BoE to consider pausing or adjusting its rate-hiking cycle in the future.
Investors will likely watch the notable events scheduled ahead of the monetary policy decisions for the United Kingdom (UK), the Consumer Price Index (CPI), Core CPI, and Producer Price Index (PPI) for August will be published on Wednesday.
On the US docket, Building Permits will be eyed. Traders will closely monitor these data releases, seeking trading opportunities within the GBP/USD pair.
EUR/SEK uptrend has stalled after retesting of July high near 11.95. Economists at Société Générale analyze the pair’s technical outlook.
Signals of a large decline are not yet visible
The pair has witnessed range-bound price action recently however, signals of a large decline are not yet visible.
The 50-DMA near 11.79/11.75 is expected to be first layer of support near term.
Once a breakout above 11.95 materializes, EUR/SEK is likely to resume its up move and head gradually towards projections at 12.10 and 12.19.
Only if support at 11.79/11.75 gets violated, would there be risk of a short-term pullback.
- Gold price retreats from a one-week high touched this Monday, albeit lacks follow-through.
- The cautious market mood underpins the safe-haven XAU/USD amid a modest USD downtick.
- The upside remains capped as traders await this week’s rate decisions by major central banks.
Gold price continues with its struggle to make it through the $1,930 resistance zone and pulls back from a one-week high touched earlier this Monday. The XAU/USD, however, manages to hold in the positive territory for the second successive day and trades around the $1,925 region, up just over 0.10% during the first half of the European session.
The US Dollar (USD) remains on the defensive below its highest level in more than six months touched last week and is seen as a key factor lending some support to the Gold price. Apart from this, concerns about a United States (US) government shutdown, along with the worsening property crisis in China, underpin the safe-haven precious metal. In fact, China Evergrande Group delayed a decision to restructure its debt. Furthermore,
some of the employees of the struggling developer's wealth management unit were detained by police in southern China. This comes on the back of China's conservative approach to introducing more stimulus measures and tempers investors' appetite for riskier assets.
The downside for the USD, meanwhile, remains cushioned as traders seem reluctant to place aggressive bets and prefer to wait for the latest monetary policy update by the Federal Reserve (Fed). This, in turn, keeps a lid on any meaningful appreciating move for the US Dollar-denominated Gold price. The Fed is scheduled to announce the outcome of a two-day monetary policy meeting on Wednesday and is widely anticipated to maintain the status quo. The markets, however, are still pricing in the possibility of one more 25 basis points (bps) lift-off by the end of this year, either in November or December. Hence, the market focus will remain glued to the accompanying monetary policy statement.
Apart from this, investors will closely scrutinize Fed Chair Jerome Powell's comments at the post-meeting press conference for fresh cues about the future rate-hike path. This, in turn, will play a key role in influencing the near-term USD price dynamics and provide a fresh impetus to the Gold price. Market participants this week will also confront a string of rate decisions by other major central banks – the Swiss National Bank (SNB) and the Bank of England (BoE) on Thursday, followed by the Bank of Japan (BoJ) on Friday. Apart from this, the latest consumer inflation figures from Canada and the United Kingdom (UK) on Tuesday and Wednesday, respectively, might contribute to producing trading opportunities around the XAU/USD.
Technical levels to watch
Yen trades at the lowest level against the Dollar since last November. Economists at Commerzbank analyze USD/JPY outlook.
What does the BoJ want?
It seems that the Japanese central bankers want a stronger Yen, but without this being based on the expectation of a less expansionary monetary policy.
Excuse me? Now, not only me, but a number of confused market participants are probably hoping for a clearer signal from the BoJ meeting on Friday as to where the BoJ actually stands now. This puts more focus on the BoJ decision. To be honest I hold out little hope though that I will be any wiser on Friday.
Dollar looks likely to hold gains, in the view of economists at ING.
DXY should continue to find decent demand below 105.00
Despite unchanged rates the Fed, through its statement and dot plots, will hold out the possibility of one further hike to the 5.50-5.75% range later this year.
Even though we should see 25 bps rate hikes across four European central banks through the week we doubt the Dollar has to lose much ground – if any.
DXY remains relatively strong and there does not seem a case for a decisive turn lower this week – unless we are all surprised by the Fed.
There is a strong band of resistance in the 105.40/105.80 area, which may well cap this week. But equally, DXY should continue to find decent demand below 105.00.
Markets Strategist Quek Ser Leang at UOB Group suggests USD/MYR could extend the upside bias further and retest the 4.6880 zone in the near term.
Key Quotes
Our expectations for USD/MYR to “edge above June’s high of 4.6880” last week did not materialise. USD/MYR traded in a relatively quiet manner between 4.6670 and 4.6850.
While there is hardly any increase in momentum, we continue to see room for USD/MYR to edge above 4.6880. The next major resistance at 4.7000 is unlikely to come into view. Support is at 4.6650, followed by 4.6500.
In opinion of Markets Strategist Quek Ser Leang at UOB Group, USD/THB is seen navigating within a range bound theme in the short-term horizon.
Key Quotes
While we expected USD/THB to strengthen last week, we highlighted that “”in view of the overbought short-term conditions, the chance of USD/THB breaking above June’s peak of 35.74 is not high.” USD/THB rose more than expected as it soared to 35.85 before closing slightly higher at 35.69 (+0.11%) on Friday. Conditions remain overbought, and USD/THB is unlikely to strengthen much further.
This week, USD/THB is likely to trade sideways at these higher levels, probably between 35.40 and 35.90.
Russia’s central bank (CBR) hiked its base rate by a further 100 bps last Friday. The USD/RUB ‘fix’ declined visibly after the decision, but this move fully faded before the end of the day. Economists at Commerzbank analyze the pair’s outlook.
Not much new information
There was not much new information from CBR’s statements – markets are broadly familiar with CBR’s tendency to hike rates when faced with rising inflation risk.
Rate hikes cannot really address current Rouble weakness against the Dollar, because this exchange rate does not really exist in the conventional sense, nor can higher interest rates attract capital to Russia (against a backdrop of sanctions) that it might have under normal circumstances.
Lastly, CBR has argued against capital control measures, calling them ineffective. CBR holds that RUB weakness can rather be explained by the deterioration of the trade balance. All this is consistent with our own views too, except we cannot see rate hikes being able to help much with (this current version of) Rouble depreciation either.
- EUR/GBP stays above 0.8600 ahead of the central banks’ decisions.
- The Euro strengthened on the back of hawkish comments made by ECB President Christine Lagarde.
- BoE is expected to increase interest rates by 25 basis points on Thursday.
- BoE Governor Andrew Bailey indicated to approach the ending of interest rate-hike cycle.
EUR/GBP attempts to extend its gains on the second day, trading higher around 0.8610 during the European session on Monday. The pair might gain strength after the statement made by the European Central Bank’s (ECB) President Christine Lagarde on Friday.
Lagarde stated that ECB policymakers had not considered the possibility of implementing further rate cuts. The ECB’s President also suggested that the central bank’s intention was to maintain interest rates at elevated levels for an extended duration and was ready to increase rates if it was deemed necessary.
Economists at Commerzbank have analyzed the outlook for the Euro (EUR) following the ECB’s rate hike last week. According to their analysis, the central bank's decision to signal the end of rate hikes for the time being was largely in line with market expectations. This move by the ECB, however, comes with a certain level of risk, as it indicates a potentially less hawkish stance on monetary policy.
On the other side, the trades of cross-pair anticipate that the Bank of England (BoE) will raise interest rates by 25 basis points in the upcoming meeting scheduled for Thursday. This potential rate hike by the BoE reflects the central bank's efforts to address inflationary pressures and stabilize the British economy.
However, the BoE Governor Andrew Bailey has indicated that the central bank is getting closer to ending its series of interest rate increases. This statement, coupled with concerns about a potential recession and signs of a cooling UK labor market, may increase pressure on the BoE to pause its rate-hiking cycle.
In the upcoming week, there are significant events scheduled for the Eurozone. The Eurozone Harmonized Index of Consumer Prices (HICP) for August will be published on Tuesday and the preliminary HCOB Composite PMI for September is scheduled to be released on Friday. These datasets may provide insights into inflation trends in the Eurozone bloc, which could provide support for the EUR/GBP traders to place their bets.
- Silver gains positive traction for the second straight day, though the setup warrants caution for bulls.
- Any subsequent move up is likely to confront stiff barrier and remain capped near the 200-day SMA.
- A break below a multi-month ascending trend-line support will be seen as a fresh trigger for bears.
Silver attracts fresh buyers near the $23.00 mark on the first day of a new week and sticks to its modest intraday gains through the early part of the European session. The white metal currently trades around the $23.15 area, up 0.45% for the day, though remains below Friday's swing high.
Looking at the broader picture, the XAG/USD last week staged a solid recovery from the $22.30 support area – representing an ascending trend line extending from the June monthly low. The subsequent strength favours bullish traders, though technical indicators on the daily chart are yet to confirm a positive outlook and warrant some caution before positioning for additional gains.
Hence, any further move up is more likely to confront stiff resistance and remain capped near a technically significant 200-day Simple Moving Average (SMA), currently pegged around the $23.45 region. The said area should act as a pivotal point, above which the XAG/USD is more likely to surpass the 100-day SMA barrier near the $23.80 region and aim to reclaim the $24.00 mark.
The next relevant hurdle is pegged near the $24.30-$24.35 region, which if cleared decisively should lift the XAG/USD further towards the $25.00 psychological mark. The latter coincides with the August monthly swing high and some follow-through buying, leading to subsequent gains beyond the July peak, around the $25.25 region, will shift the near-term bias in favour of bullish traders.
On the flip side, the $22.80 area now seems to protect the immediate downside ahead of the $23.30 region, or a nearly one-month low touched last Thursday. A convincing break below will confirm a fresh breakdown and make the XAG/USD vulnerable to accelerate the fall towards the next relevant support near the $21.25 zone before eventually dropping to the $21.00 round-figure mark.
Silver daily chart
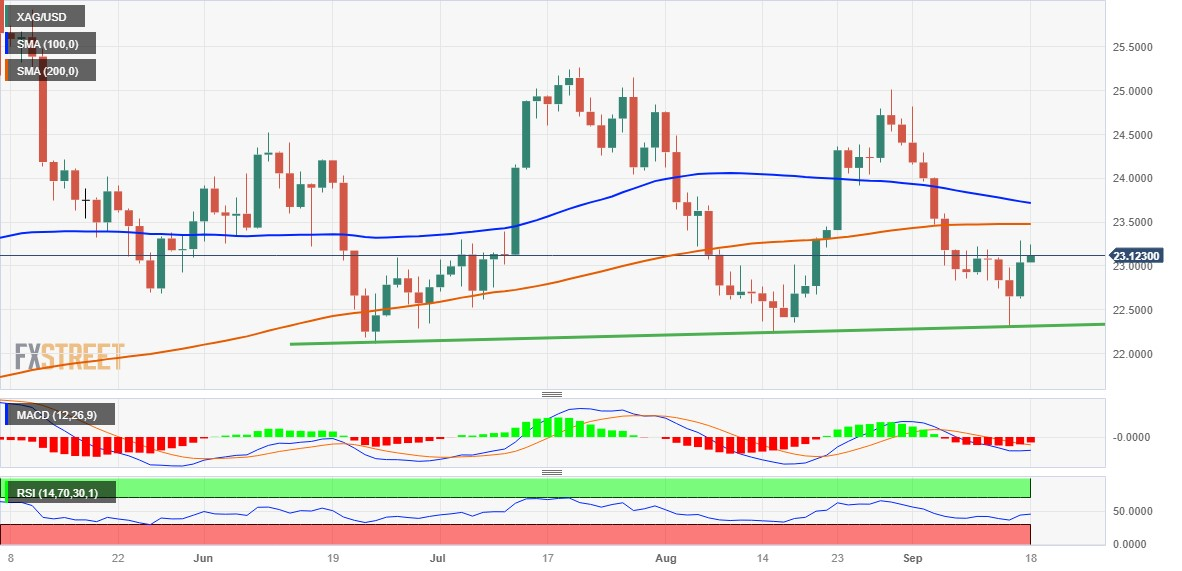
Technical levels to watch
EUR/USD continues to trade in a listless fashion. Economists at ING analyze the pair’s outlook.
Dip to 1.05 seen as an opportunity to reset hedges ahead of seasonal Dollar weakness in November/December
EUR/USD has decent support in the 1.0610/1.0630 region, below which there is an outside risk to the 1.04/1.05 area. However, our strategic view remains that the US economy will converge on the anaemic growth in Europe next year and that the Dollar will weaken.
We would see a dip to the 1.05 area over the coming weeks as an opportunity to reset hedges ahead of seasonal Dollar weakness in November and December this year.
One central bank that seems to have almost emerged victorious from the fight against inflation already is the Swiss National Bank (SNB). Economists at Commerzbank analyze EUR/CHF outlook.
Current CHF exchange rate likely to be distorted towards a stronger Franc
The Swiss Franc should be at an advantage due to the disinflation progress already achieved in Switzerland. We nonetheless project a weaker CHF. That is because another aspect is of relevance when it comes to the Franc. Due to the SNB’s interventions, the current CHF exchange rate is likely to be distorted towards a stronger Franc.
If inflation in Switzerland, as we expect and as the SNB is likely to expect as of Thursday, will fall back into the target area on a sustainable basis, the acceptance of higher EUR/CHF levels amongst SNB members should rise again, with any speculative distortions being reduced again. We assume that this effect is likely to dominate for the time being.
- The Euro now loses some buying pressure vs. the US Dollar.
- Stocks in Europe kicked off the week in the red.
- EUR/USD remains under pressure below 1.0700
- The USD Index (DXY) maintains the trade above the 105.00 hurdle.
- The FOMC gathering will be the salient event this week.
- The NAHB index will take centre stage later in the session.
The Euro (EUR) alternates gains with losses against the US Dollar (USD) at the beginning of the week, prompting EUR/USD to gyrate around the 1.0660 region early in the European morning.
On the flip side, the Greenback appears to be under tepid downside pressure, although it manages well to keep the trade above the key 105.00 barrier amidst the so far persistent upside bias in US yields across different timeframes.
With regards to monetary policy, investors continue to assess last week’s dovish hike by the European Central Bank (ECB) and persist in anticipating the possibility of interest rate reductions by the Federal Reserve (Fed) occurring sometime in the second quarter of 2024.
On another front, EUR net longs extended the downtrend and reached levels last seen in mid-November 2022, according to the latest positioning report by the CFTC for the week ended on September 12. The period under study saw the pair climb to the 1.0750 region and quickly lose ground soon afterwards ahead of the ECB event.
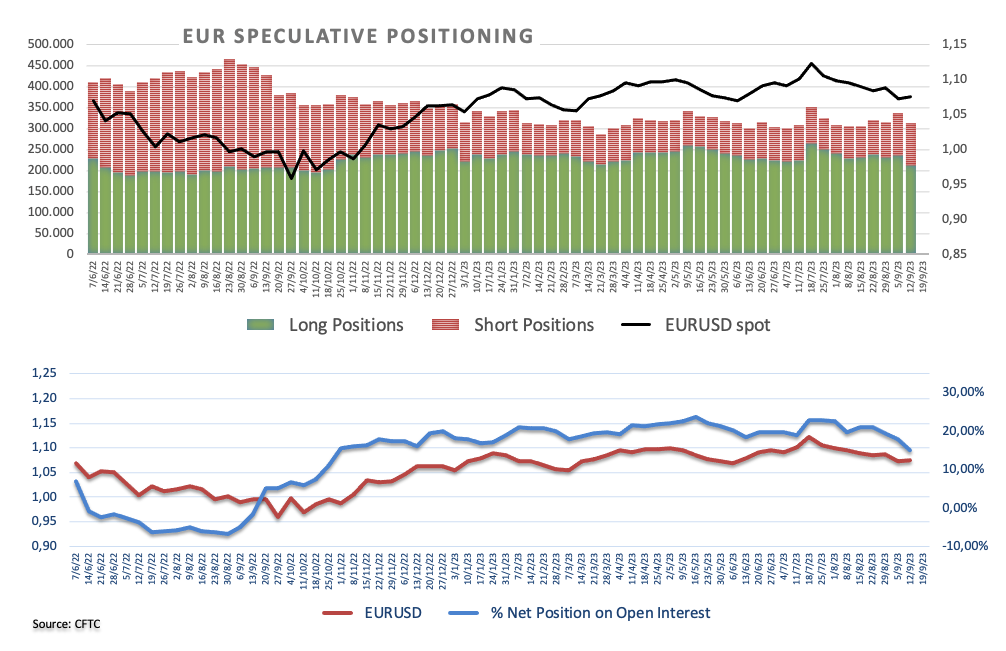
The absence of data releases in the euro docket should shift attention to the US calendar, where the NAHB Housing Price Index and Long-Term TIC Flows are due later in the NA session.
Daily digest market movers: Euro appears under scrutiny ahead the Fed
- The EUR has been unable to gather fresh strength vs. the USD so far.
- US and German yields have started the week in a positive mood.
- Investors see the Fed keeping rates unchanged this week.
- Fitch agency confirms Germany’s AAA rating with a stable outlook.
- Traders see potential rate cuts by the Fed in H1 2024.
- An impasse in the ECB’s hiking cycle appears to be gathering traction.
Technical Analysis: Euro does not rule out extra weakness near term
EUR/USD looks to extend Friday’s rebound from multi-week lows near 1.0630.
If the EUR/USD breaks below its September low of 1.0631 (September 15), it may revisit the March low of 1.0516 (March 15) before reaching the 2023 bottom of 1.0481 (January 6).
The major attention, on the other hand, is presently on the critical 200-day SMA at 1.0827. If the pair breaks through this level, a bullish momentum may develop, leading to a test of the provisional 55-day SMA at 1.0922 ahead of the weekly high of 1.0945 (August 30). As a result, this scenario may open the way for a rally towards the psychological level of 1.1000 and the August top of 1.1064 (August 10). If the pair clears this region, it may relieve some of the bearish pressure and go for the weekly peak at 1.1149 (July 27), followed by the 2023 high at 1.1275 (July 18).
It is critical to remember that as long as the EUR/USD is below the 200-day SMA, the pair might continue to fall.
Euro FAQs
What is the Euro?
The Euro is the currency for the 20 European Union countries that belong to the Eurozone. It is the second most heavily traded currency in the world behind the US Dollar. In 2022, it accounted for 31% of all foreign exchange transactions, with an average daily turnover of over $2.2 trillion a day.
EUR/USD is the most heavily traded currency pair in the world, accounting for an estimated 30% off all transactions, followed by EUR/JPY (4%), EUR/GBP (3%) and EUR/AUD (2%).
What is the ECB and how does it impact the Euro?
The European Central Bank (ECB) in Frankfurt, Germany, is the reserve bank for the Eurozone. The ECB sets interest rates and manages monetary policy.
The ECB’s primary mandate is to maintain price stability, which means either controlling inflation or stimulating growth. Its primary tool is the raising or lowering of interest rates. Relatively high interest rates – or the expectation of higher rates – will usually benefit the Euro and vice versa.
The ECB Governing Council makes monetary policy decisions at meetings held eight times a year. Decisions are made by heads of the Eurozone national banks and six permanent members, including the President of the ECB, Christine Lagarde.
How does inflation data impact the value of the Euro?
Eurozone inflation data, measured by the Harmonized Index of Consumer Prices (HICP), is an important econometric for the Euro. If inflation rises more than expected, especially if above the ECB’s 2% target, it obliges the ECB to raise interest rates to bring it back under control.
Relatively high interest rates compared to its counterparts will usually benefit the Euro, as it makes the region more attractive as a place for global investors to park their money.
How does economic data influence the value of the Euro?
Data releases gauge the health of the economy and can impact on the Euro. Indicators such as GDP, Manufacturing and Services PMIs, employment, and consumer sentiment surveys can all influence the direction of the single currency.
A strong economy is good for the Euro. Not only does it attract more foreign investment but it may encourage the ECB to put up interest rates, which will directly strengthen the Euro. Otherwise, if economic data is weak, the Euro is likely to fall.
Economic data for the four largest economies in the euro area (Germany, France, Italy and Spain) are especially significant, as they account for 75% of the Eurozone’s economy.
How does the Trade Balance impact the Euro?
Another significant data release for the Euro is the Trade Balance. This indicator measures the difference between what a country earns from its exports and what it spends on imports over a given period.
If a country produces highly sought after exports then its currency will gain in value purely from the extra demand created from foreign buyers seeking to purchase these goods. Therefore, a positive net Trade Balance strengthens a currency and vice versa for a negative balance.
Economists at ING analyze USD/JPY outlook ahead of Bank of Japan’s meeting this Friday.
Few expect any substantial move in BoJ policy
The prospect of a prolonged period of unchanged rates is depressing US interest rates and cross-market volatility and leaving carry trade strategies very much en vogue. This – plus Brent trading close to $95/bbl – is keeping the likes of USD/JPY bid and few expect any substantial move in Bank of Japan policy this Friday.
If there is to be a further move from Japan – it will likely come in late October when new economic forecasts are released.
- GBP/USD continues to trade higher but has experienced a reversal below 1.2400.
- Momentum indicators indicate a potential bearish momentum in the Cable pair.
- The immediate support appears around June’s lows, followed by the 1.2350 psychological level.
GBP/USD snaps the two-day losing streak earlier in the day but later reverses, still trading higher around 1.2390 during the early trading hours of the European session on Monday. The pair experienced upward support, likely a result of the downbeat consumer sentiment data from the United States (US) released on Friday.
The preliminary US Michigan Consumer Sentiment Index recorded a reading of 67.7, indicating a decline from the previous figure of 69.5. This reading also fell below the expected figure of 69.1 for the month of September.
Investors are expecting the Bank of England (BoE) to raise interest rates by 25 basis points in the upcoming meeting on Thursday. On the other side, the US Federal Reserve (Fed) is expected to maintain its current interest rate on Wednesday.
The GBP/USD pair could face a challenge around the nine-day Exponential Moving Average (EMA) at 1.2463, followed by the 12-day EMA at 1.2488 level.
A firm break above the 1.2500 psychological level could lead the pair to explore the region around 23.6% Fibonacci retracement at 1.2560.
On the flip side, immediate support for the GBP/USD pair appears around June’s lows at 1.2368, followed by the 1.2350 psychological level.
If bearish sentiment exerts pressure, the currency pair could potentially approach the next support level near the lows seen in May at 1.2308, followed by the 1.2300 psychological level.
The Moving Average Convergence Divergence (MACD) line remains below the centerline and shows divergence below the signal line. This configuration suggests a potential bearish momentum in the market, which can be seen as a signal that the recent downward trend may continue to exist.
Traders of the GBP/USD pair will likely observe the 14-day Relative Strength Index (RSI), which indicates bearish momentum in the short term as it lies below the 50 level.
GBP/USD: Daily Chart
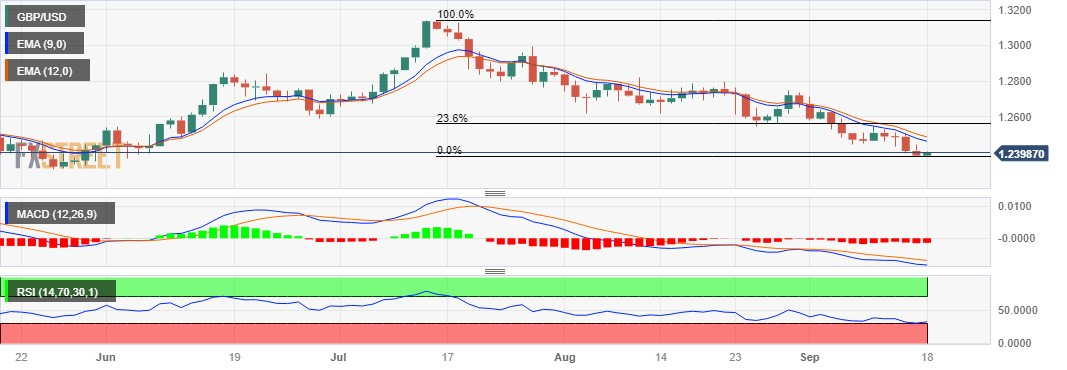
- USD/CHF loses ground near 0.8968, down 0.09% ahead of the key events.
- The market anticipates that the Federal Reserve (Fed) will keep interest rates unchanged at its September policy meeting.
- The Fed interest rate decision, the SNB meeting will be closely watched events this week.
The USD/CHF pair snaps its three-day winning streak during the early European session on Monday. Meanwhile, the US Dollar Index (DXY) hovers around 105.25 after retreating from a nine-month high of 105.40. The pair currently trades near 0.8966, losing 0.11% on the day. Market players await the key interest rate decision from the Federal Reserve (Fed) and the Swiss National Bank (SNB) on Wednesday and Thursday, respectively.
The market anticipates that the Fed will keep interest rates unchanged at its September policy meeting, but remain one more rate rise on the table. Fed Chairman Jerome Powell will hold a press conference later in the day, but no significant changes are anticipated from the Fed. A dovish stance from officials, on the other hand, may cause a decline in the US Dollar (USD), acting as a headwind for the USD/CHF pair. According to the CME Fedwatch tool, the markets have priced in the Fed's decision not to raise rates in September, while the chances of a 25 basis point (bps) increase at the November meeting have dropped to 27%.
The Federal Reserve Bank of New York reported on Friday that the Empire State Manufacturing Index rose to 1.9 in August, up from -19 in the previous reading, above the market consensus of a 10 drop. Furthermore, Industrial Production increased by 0.4% MoM from 1% in July, exceeding market forecasts. According to the University of Michigan, the preliminary Consumer Sentiment Index for September decreased from 69.1 to 67.7. Finally, the five-year Consumer Inflation Expectation fell from 3% to 2.7%.
The Swiss Consumer Price Index (CPI) grew by 0.2% in August 2023 as compared to the previous month. However, yearly inflation increased by 1.6% from the previous reading, falling short of the Swiss National Bank's (SNB) goal maximum rate of 2.0%. The SNB is expected to raise interest rates again on Thursday. Market players anticipate the SNB to hike its interest rate from 1.75% to 2%.
Looking ahead, market participants will keep an eye on the Swiss Trade Balance due on Tuesday ahead of the key event. The key highlight will be the Fed interest rate decision on Wednesday ahead of the SNB meeting on Thursday. These events could trigger the volatility in the market and give a clear direction for the USD/CHF pair.
NZD/USD ended the trading week back at around 0.59. Economists at ANZ Bank analyze Kiwi’s outlook.
USD exceptionalism remains the broad vibe
Encouraging as the various attempts to regain 0.60 (which wasn’t ever actually achieved) last week were, the USD remains the default play amid challenges facing China and Europe, and markets seem eager to fade NZD strength. That’s understandable with no differentiating story to tell here and with markets attuned to USD exceptionalism.
Worse still, it’s hard to see that changing this week with a Fed pause, which has the potential to underscore the US soft landing vibe, even though there are sceptics aplenty. NZ current account and GDP data this week will be watched, but there’s also a good chance markets gloss over, especially with the Fed and the Bank of Japan both scheduled to meet this week.
Here is what you need to know on Monday, September 18:
Financial markets stay relatively calm to begin the new week as investors gear up for big central bank policy meetings this week. The economic docket will not feature any high-tier data releases on Monday. The People's Bank of China and the Federal Reserve will announce interest rate decisions on Wednesday, followed by the Swiss National Bank, the Bank of England and the Bank of Japan.
After posting gains for the ninth straight week, the US Dollar Index edges lower early Monday. Meanwhile, US stock index futures trade modestly higher and the 10-year US Treasury bond yield holds steady above 4.3%.
US Dollar price today
The table below shows the percentage change of US Dollar (USD) against listed major currencies today. US Dollar was the weakest against the Japanese Yen.
| USD | EUR | GBP | CAD | AUD | JPY | NZD | CHF | |
| USD | 0.02% | 0.03% | -0.08% | -0.01% | -0.15% | -0.12% | -0.03% | |
| EUR | -0.04% | 0.00% | -0.13% | -0.04% | -0.19% | -0.15% | -0.05% | |
| GBP | -0.03% | 0.00% | -0.13% | -0.04% | -0.21% | -0.15% | -0.07% | |
| CAD | 0.09% | 0.11% | 0.11% | 0.06% | -0.08% | -0.03% | 0.06% | |
| AUD | 0.01% | 0.05% | 0.05% | -0.07% | -0.16% | -0.11% | -0.02% | |
| JPY | 0.14% | 0.15% | 0.18% | 0.08% | 0.14% | 0.02% | 0.12% | |
| NZD | 0.11% | 0.14% | 0.15% | 0.03% | 0.11% | -0.05% | 0.10% | |
| CHF | 0.01% | 0.03% | 0.05% | -0.06% | 0.01% | -0.15% | -0.10% |
The heat map shows percentage changes of major currencies against each other. The base currency is picked from the left column, while the quote currency is picked from the top row. For example, if you pick the Euro from the left column and move along the horizontal line to the Japanese Yen, the percentage change displayed in the box will represent EUR (base)/JPY (quote).
Following the sharp decline witnessed after the European Central Bank's (ECB) policy decisions last week, EUR/USD stays in a consolidation phase above 1.0650 in the early European session. Germany's Bundesbank is scheduled to release its monthly report later in the day.
GBP/USD registered a daily close below 1.2400 for the first time since late May on Friday. The pair clings to small recover gains near that level early Monday. Ahead of the BoE's policy decisions on Thursday, the UK Office for National Statistics will publish Consumer Price Index (CPI) data on Wednesday.
AUD/USD holds steady at around 0.6450 following the previous week's choppy action. In the early trading hours of the Asian session on Tuesday, the Reserve Bank of Australia (RBA) will release the minutes of the August policy meeting, at which officials decided to leave the cash rate unchanged at 4.1%.
NZD/USD trades in positive territory above 0.5900 early Monday. The inflation outlook for the year ending March 2024 has been revised higher. The New Zealand Institute of Economic Research (NZIER) unveiled revised economic projections early in the day and said that the annual CPI inflation is forecast to ease to 4.3% in the year ending March 2024 before decreasing to 2.4% in 2025.
USD/JPY came under modest bearish pressure early Monday and retreated to the 147.50 area.
Gold price staged a decisive rebound on Friday and erased all of its weekly losses. Early Monday, XAU/USD holds its ground and trades in positive territory near $1,930 amid retreating US yields.
Economists at Commerzbank analyze EUR outlook after the ECB’s rate hike last week.
A significantly weaker Euro entails the risk of increasing the upside pressure on inflation
Fundamentally the ECB delivered exactly what had been largely expected for the September meetings of the central banks: a rather clear signal that rate hikes will end. By doing so the ECB accepted a certain level of risk. After all, it had to lead the way, as the Fed and the other major central banks are only meeting this week. If these central banks send out a less clear signal that the end of rate hikes is imminent for them too, the Euro might get under stronger depreciation pressure again.
That would constitute a problem for the ECB as a significantly weaker Euro also entails the risks of increasing the upside pressure on inflation, which would no doubt rankle the ECB central bankers in view of continued uncertainty about the future development of inflation rates.
It is comforting to know that that is exactly what we – and the market – are not expecting to happen. With the exception of the Bank of Japan of course and the Riksbank, ‘one and done’ is the most that we expect from the central bank decisions this week and that has been priced in. Any deviation from that is therefore likely to lead to more notable exchange rate fluctuations.
FX option expiries for Sept 18 NY cut at 10:00 Eastern Time, via DTCC, can be found below.
- EUR/USD: EUR amounts
- 1.0600 417m
- 1.0625 500m
- 1.0700 381m
- 1.0740 435m
- 1.0800 460m
- USD/JPY: USD amounts
- 147.00 1.2b
- 148.00 958m
- 148.35 1.2b
- 148.50 1.5b
- USD/CHF: USD amounts
- 0.8800 652m
- 0.8935 304m
- AUD/USD: AUD amounts
- 0.6500 428m
- EUR/GBP: EUR amounts
- 0.8800 395m
The continuation of the selling pressure appears on the cards for USD/CNH in the short-term horizon, argue Economist Lee Sue Ann and Markets Strategist Quek Ser Leang at UOB Group.
Key Quotes
24-hour view: We expected USD to consolidate in a range of 7.2750/7.3080 last Friday. However, it dropped briefly to 7.2596 in Asian trade, rebounded, and traded sideways for the rest of the sessions. The price actions still appear to be consolidative. Today, we expect USD to trade between 7.2600 and 7.2900.
Next 1-3 weeks: Our latest narrative was from last Thursday (14 Sep, spot at 7.2740), wherein “downward momentum has increased, and USD could break below 7.2600.” We indicated the next support is at 7.2390. On Friday, USD dropped slightly below 7.2600 (low of 7.2596) before rebounding. We continue to expect USD to weaken, even though the major support at 7.2390 might now come into view so soon. Overall, only a breach of 7.3150 (‘strong resistance’ level previously at 7.3200) would indicate that the downward pressure that started early last week has faded.
- EUR/USD holds ground around 1.0673, gaining 0.16% on the day.
- The major pair holds below the 50- and 100-day EMAs; Relative Strength Index (RSI) remains below 50.
- The immediate resistance level appears at 1.0712; the key support level to watch is 1.0610.
The EUR/USD pair recovers from the recent losses and trades near 1.0675 during the early European trading hours on Monday. The upside of the major seems limited as investors await the Federal Reserve (Fed) interest rate decision on Wednesday.
The key US data indicated healthy economic conditions over the last week, which could support one more rate hike by the end of 2023. However, markets have priced in that the Fed would skip hiking rates in September, while odds for a 25 basis point (bps) hike at the November meeting decline to 27%, according to the CME Fedwatch tool.
According to the four-hour chart, the EUR/USD pair holds below the 50- and 100-day Exponential Moving Averages (EMAs), implying the path of least resistance for the EUR/USD is to the downside. Adding to this, the Relative Strength Index (RSI) remains in the bearish territory below 50, supporting EUR/USD sellers for now.
The immediate resistance level for EUR/USD appears at 1.0712 (the 50-hour EMA). Further north, the pair will challenge the next hurdle at 1.0755 (the 100-hour EMA). Any meaningful follow-through buying beyond the latter could pave the way to the next barrier near the upper boundary of the Bollinger Band at 1.0768 en route to a psychological round mark at 1.0800.
On the downside, the key support level to watch is 1.0610, representing the lower limit of the Bollinger Band. The additional downside stop is seen at 1.0538 (a low of February 27), followed by 1.0515 (a low of March 15).
EUR/USD four-hour chart
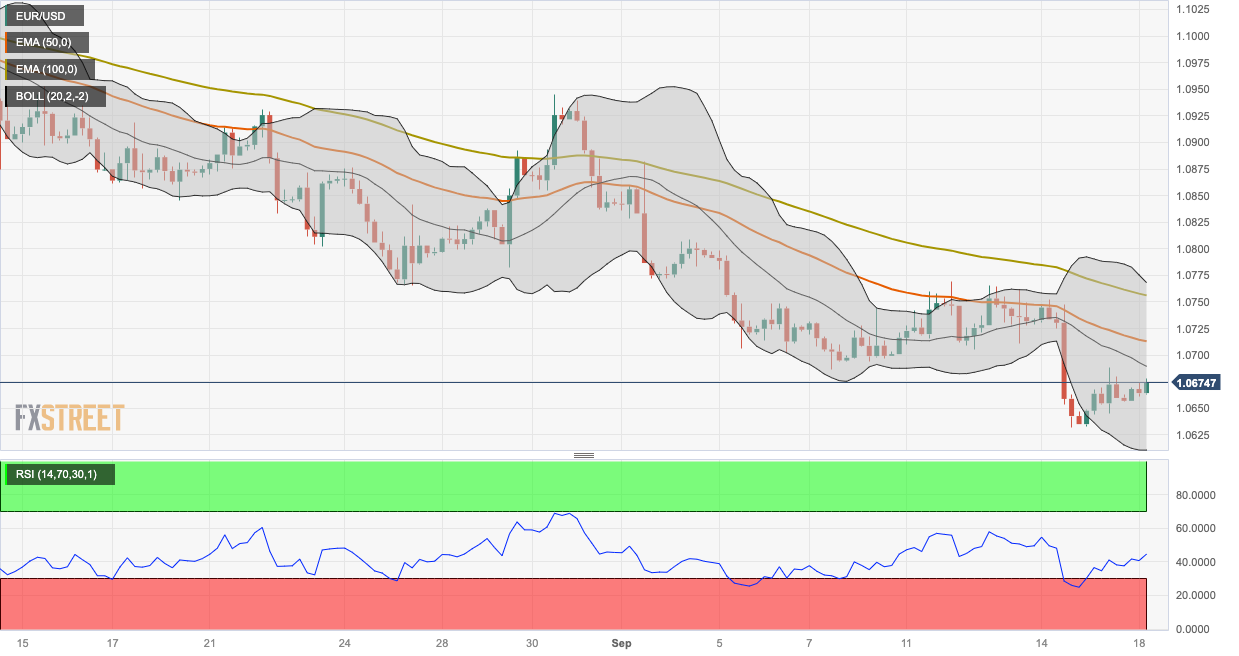
- The index extends the corrective decline to the 105.20 zone.
- The FOMC event will take centre stage later in the week.
- The USD docket includes the NAHB index and TIC Flows.
The greenback, in terms of the USD Index (DXY), adds to Friday’s decline and revisits the low-105.00s ahead of the opening bell in the old continent on Monday.
USD Index: Upside appears capped around 105.40
The index shed ground for the second session in a row following fresh multi-month tops in the 105.40/50 band recorded in the latter part of last week.
The corrective decline in the dollar comes in line with some fresh downside pressure in US yields across different maturities, while investors broadly anticipate interest rates to remain unchanged at the Fed's gathering later in the week.
In the US data space, the NAHB Housing Price Index for the month of September will be in the limelight along with July’s Long-Term TIC Flows.
What to look for around USD
So far, the rally in the greenback seems to have met decent resistance near 105.50, while traders expect the index to enter some sort of consolidative phase pre-FOMC event on September 20.
In the meantime, support for the dollar keeps coming from the good health of the US economy, which at the same time appears underpinned by the tighter-for-longer stance narrative from the Federal Reserve.
Key events in the US this week: NAHB Housing Market Index, Net Long-Term TIC Flows (Monday) – Building Permits, Housing Starts (Tuesday) – MBA Mortgage Applications, Fed interest rate decision, Fed Press Conference (Wednesday) - Initial Jobless Claims, Philly Fed Index, CB Leading Index, Existing Home Sales (Thursday) – Flash Manufacturing/Services PMIs (Friday).
Eminent issues on the back boiler: Persevering debate over a soft or hard landing for the US economy. Incipient speculation of rate cuts in early 2024. Geopolitical effervescence vs. Russia and China.
USD Index relevant levels
Now, the index is down 0.13% at 105.18 and the breach of 104.42 (weekly low September 11) would open the door to 103.02 (200-day SMA) and then 102.93 (weekly low August 30). On the other hand, the next up barrier align at 105.43 (monthly high September 14) ahead of 105.88 (2023 high March 8) and finally 106.00 (round level).
The Forint rallied strongly earlier this month. Economists at Commerzbank analyze HUF outlook.
The Forint is benefitting from the Zloty’s misery
The Forint is rallying as a technical counterpart to a depreciating Polish Zloty. This happens because institutions frequently trade these two as a relative-value pair.
We forecast the Forint to regain more ground by the end of the year because inflation is likely to moderate faster than the pace at which MNB will cut rates, and the real interest rate will therefore become less negative – in this window, we see EUR/HUF in the 375 range. But, we forecast a weaker Forint subsequently in 2024.

Source: Commerzbank Research
- Chinese index rose amid the worse situation around troubled real estate developer Evergrande Group.
- Evergrande Group stock dropped: some employees from the wealth management unit were detained by the Chinese police.
- Hang Seng index declined the most, approaching a 10-month low.
Chinese index trade higher despite the gloomy situation surrounding the Evergrande Group. While other regional stock markets trade lower as investors remain broadly cautious before a slew of major central banks’ rate decisions this week.
At the time of writing, China’s SSE Index is up by 0.06% to 3,119, the Shenzhen Component Index rose to 10,181, up by 0.36%, Hong Kong’s Hang Seng fell to 18,014, South Korea’s Kospi is down 0.88% and Taiwan's Weighted Index fell by 1.26%.
Hong Kong's Hang Seng index experienced the most significant decline among its counterparts, approaching a 10-month low. This decline was driven by renewed selling pressure in property stocks following the worse situation of China’s Evergrande Group.
The real estate developer saw its stock price drop by nearly 20% after delaying a decision on debt restructuring. Additionally, there were reports of some employees from Evergrande's wealth management unit being detained in Shenzhen, raising concerns about increased government oversight of the troubled property developer.
Market participants will likely observe the upcoming US Federal Reserve (Fed) meeting scheduled for Wednesday, where it is widely anticipated that the central bank will maintain its current interest rates.
Moreover, the People's Bank of China (PBOC) is scheduled to decide on its key loan prime rates on Wednesday. However, market expectations are leaning towards the central bank maintaining these rates at their current record-low levels.
The Bank of Japan (BOJ) is scheduled to convene its meeting on Friday, with the possibility of no adjustments to its negative interest rate policy.
In the view of Economist Lee Sue Ann and Markets Strategist Quek Ser Leang at UOB Group, extra gains beyond 148.40 still appear unlikely for USD/JPY.
Key Quotes
24-hour view: Our view for USD to consolidate last Friday was incorrect. Instead of consolidating, USD rose to a high of 147.96. Despite the advance, upward momentum has not improved by much. Today, USD could grind higher, but the major resistance at 148.40 is likely out of reach (there is another resistance at 148.15). Support is at 147.60, followed by 147.40.
Next 1-3 weeks: Last Friday (15 Sep, spot at 147.30), we noted that “downward pressure is easing, and the odds of USD pulling back further have diminished.” In NY trade, USD rose above our ‘strong resistance’ level of 147.80 (high has been 147.96). Not only did downward momentum faded, but upward momentum also increased, albeit not by much. From here, as long as USD stays above 146.85, USD could grind higher towards 148.40. At this stage, the likelihood of a sustained rise above this level is not high.
In light of advanced prints from CME Group for natural gas futures markets, open interest went up for the second straight session on Friday, now by around 2.8K contracts. On the opposite side, volume shrank for the third consecutive day, now by around 82.4K contracts.
Natural Gas looks supported by the 100-day SMA
Prices of natural gas dropped to three-day lows at the end of last week. The move was against the backdrop of increasing open interest and suggest that further decline could be in store for the commodity in the short-term horizon. That said, the 100-day SMA around $2.52 per MMBtu emerges as a temporary contention area for the time being.
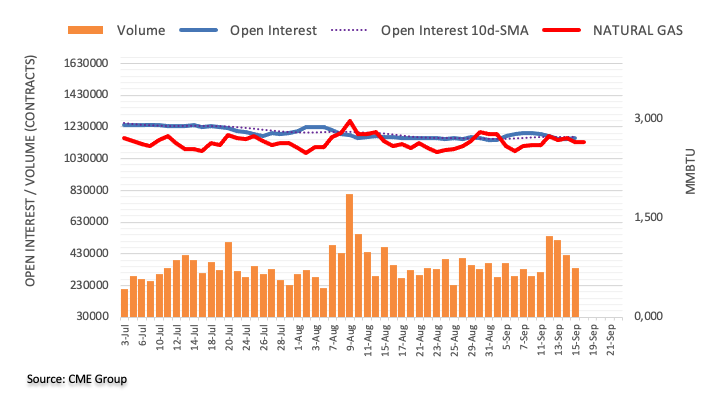
- AUD/USD holds above 0.6445 amid the USD consolidation.
- The market expects the Reserve Bank of Australia (RBA) to keep its rate at 4.10% for a third consecutive month.
- Markets have priced in that the Federal Reserve (Fed) would skip hiking rates in September.
- The RBA and Fed monetary decision will be in the spotlight this week.
The AUD/USD pair recovers its losses after retracing from a two-week high of 0.6473 during the early European session on Monday. The pair is trading at 0.6445, gaining 0.24% on the day. Market players prefer to wait on the sidelines ahead of the monetary poly meeting of the Reserve Bank of Australia (RBA) and the Federal Reserve (Fed).
The Minutes from the RBA are scheduled for Tuesday and the markets anticipate the Australian central bank to maintain its cash rate at 4.10% for a third consecutive month. The latest report from Reuters said that Michele Bullock takes over as the first woman to lead the Reserve Bank of Australia (RBA) on Monday, she will inherit an economy with moderating inflation, robust employment, and continued development. Markets believe Bullock to maintain them in her first meeting as governor next month, and some economists believe her first policy shift would be a rate cut.
On the US Dollar front, the market expects the Fed to hold interest rates steady at its September policy meeting while keeping one more rate hike on the table. Fed Chairman Jerome Powell will later hold a press conference with no major changes expected from the Fed. However, a dovish stance from official might trigger a decline in the US Dollar (USD) and acts as a tailwind for the AUD/USD pair. According to the CME Fedwatch tool, the markets have fully priced in that the Fed would skip hiking rates in September, while odds for a 25 basis point (bps) hike at the November meeting decline to 27%.
On Friday, the Federal Reserve Bank of New York reported that the Empire State Manufacturing Index in August improved to 1.9 from -19 in the previous reading, above the market estimate of a 10 decrease. Additionally, Industrial Production rose by 0.4% MoM from 1% in July, surpassing market expectations. The preliminary Consumer Sentiment Index for September fell from 69.1 to 67.7, per the University of Michigan. Finally, the five-year Consumer Inflation Expectation came in at 2.7% from 3% prior.
Looking ahead, the RBA interest rate decision will take place on Tuesday. The attention will shift to the Fed monetary decision on Wednesday. These events could trigger the volatility in the pair. Traders will take cues from the statement and find trading opportunities around the AUD/USD pair.
The People’s Bank of China (PBOC), in its publication - Financial News, said on Monday that the Yuan exchange rate versus the US Dollar will show 'positive changes' after 'bottoming out'.
No further details are provided about the same.
Related reads
- USD/CNH Price Analysis: Trades with modest intraday gains, 50-day SMA holds the key for bulls
- Chinese police detain some staff of Evergrande’s wealth management
Another test of 0.6485 in AUD/USD seems likely while above 0.6385, comment Economist Lee Sue Ann and Markets Strategist Quek Ser Leang at UOB Group.
Key Quotes
24-hour view: Last Friday, we expected AUD to trade in a range between 0.6415 and 0.6460. However, AUD rose to 0.6474, dropped back to 0.6426, and then settled at 0.6431 (-0.16%). There is no clear directional bias for now, and we continue to expect AUD to trade in a range, probably between 0.6410 and 0.6455.
Next 1-3 weeks: Our latest narrative was from last Tuesday (12 Sep, spot at 0.6395), wherein AUD “could rebound further, but any advance is expected to face solid resistance at 0.6485”. Last Friday, AUD rose to 0.6474 and then pulled back. Despite the advance, there is no increase in upward momentum. However, as long as 0.6385 (no change in ‘strong support’ level) is not breached, there is a chance for AUD to test the resistance at 0.6485. At this stage, the odds for AUD to break clearly above 0.6485 are not high.
Open interest in crude oil futures markets dropped for the third session in a row on Friday, this time by around 31.2K contracts according to preliminary readings from CME Group. On the flip side, volume went up for the second straight session, now by nearly 150K contracts.
WTI continues to target the $94.00 region
WTI prices extended its rally and surpassed the key $90.00 mark per barrel on Friday. The daily advance, however, was on the back of shrinking open interest, indicating that a corrective move could be in the offing in the very near term. In the meantime, the November 2022 peak near $94.00 (November 7) emerges as the next up-barrier for the commodity.
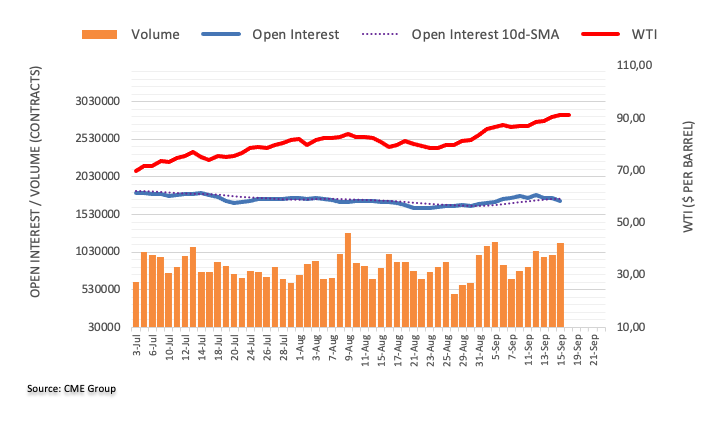
According to Economist Lee Sue Ann and Markets Strategist Quek Ser Leang at UOB Group, GBP/USD could extend the bearish move to the 1.2305 level in the short term.
Key Quotes
24-hour view: We highlighted last Friday that GBP “is likely to continue to weaken.” We also highlighted that “severely oversold conditions suggest a sustained break below 1.2355 is unlikely.” GBP weakened less than expected as it dropped to 1.2380 before settling at 1.2383 (-0.23%). Conditions remain oversold, but with no signs of stabilisation just yet, GBP could dip to 1.2355 before the risk of a more sustained rebound increases. The major support at 1.2305 is highly unlikely to come into view. Resistance is at 1.2420, followed by 1.2445.
Next 1-3 weeks: Our update from last Friday (15 Sep, spot at 1.2405) is still valid. As highlighted, the weakness in GBP that started about two weeks ago (see annotations in the chart below) has not stabilised, and GBP could continue to weaken. The next level to watch is May’s low near 1.2305. On the upside, a breach of the ‘strong resistance’ level at 1.2485 (no change in level from last Friday) would mean that 1.2305 is out of reach this time around.
- A combination of factors lifts the Gold price higher for the third successive day on Monday.
- A softer risk tone benefits the safe-haven XAU/USD amid a modest US Dollar downtick.
- Traders look to this week's key data/central bank event risks for a fresh directional impetus.
Gold price attracts some buying for the third successive day on Monday and steadily climbs back closer to the $1,930 supply zone during the Asian session. The XAU/USD might now be looking to build on its recent goodish rebound from the $1,900 round figure, or over a three-week low touched last Thursday and draws support from a generally weaker tone around the Asian equity markets.
Investors remain concerned about the worsening economic conditions in China and the fears were further fueled by the latest developments surrounding China Evergrande Group. The embattled developer delayed a decision to restructure its debt and some of its employees from the wealth management unit were detained in Shenzhen. This comes on the back of China's conservative approach to introduce more stimulus measures and takes its toll on the global risk sentiment, which, in turn, is seen driving some haven flows towards the Gold price.
Apart from this, a mildly softer tone surrounding the US Dollar (USD) is seen as another factor lending support to the XAU/USD. The downside for the USD, meanwhile, remains cushioned as traders seem reluctant to place aggressive bets ahead of the crucial two-day Federal Open Market Committee (FOMC) policy meeting starting on Tuesday. The Federal Reserve (Fed) is widely anticipated to leave interest rates unchanged, though the markets are still pricing in the possibility of one more 25 basis points (bps) lift-off in November or December.
The outlook remains supportive of elevated US Treasury bond yields, which act as a tailwind for the USD and might keep a lid on any further gains for the non-yielding Gold price. Traders might also refrain from placing aggressive bets and prefer to wait for fresh cues about the Fed's future rate-hike path. Hence, the focus will be on the accompanying monetary policy statement and Fed Chair Jerome Powell's remarks at the post-meeting press conference. This will influence the USD and provide a fresh directional impetus to the US Dollar-denominated commodity.
Investors this week will also confront a string of major central bank rate decisions – including the Swiss National Bank (SNB) and the Bank of England (BoE) on Thursday, followed by the Bank of Japan (BoJ) on Friday. Apart from this, the latest consumer inflation figures from Canada and the United Kingdom (UK) on Tuesday and Wednesday, respectively, will be looked upon for some meaningful trading opportunities around the Gold price.
Technical levels to watch
CME Group’s flash data for gold futures markets noted traders added just 835 contracts to their open interest positions on Friday, partially reversing the previous daily pullback. Volume, instead, kept the erratic performance well in place and shrank by around 8.8K contracts.
Gold: Next on the upside comes $1953
Gold prices rose to multi-day highs past $1920 and reclaimed the key area above the 200-day SMA on Friday. The move was amidst a small uptick in open interest, which suggests that extra gains could be on the cards in the very near term. The next upside target emerges at the so far September high at $1953 per troy ounce (September 1).
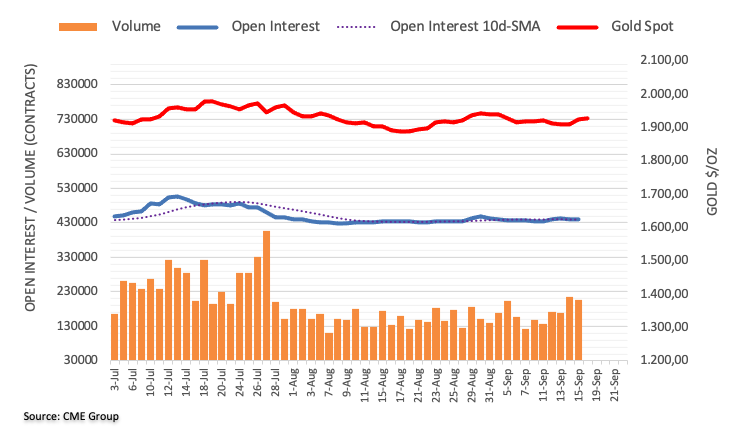
- USD/JPY oscillates around the 147.68-147.88 region in a narrow trading band.
- The Federal Reserve (Fed) is likely to hold rates steady on its September meeting.
- The possibility that the Bank of Japan (BoJ) is notably closer than initially thought to abandon ultra-loose policy rising.
- Fed interest rate decision, BoJ monetary policy meeting will be closely watched events.
The USD/JPY pair consolidates in a narrow range after retracing from the 147.95 area during the early European session on Monday. Markets turn cautious ahead of the key event from both the Federal Reserve (Fed) and Bank of Japan (BoJ) this week. The major currently trades near 147.68, losing 0.11% on the day.
The Empire State Manufacturing Index in August improved to 1.9 from -19 in the previous reading, above the market estimate of a 10 decrease, the Federal Reserve Bank of New York reported on Friday. Also, Industrial Production rose by 0.4% MoM from 1% in July, surpassing market expectations. The preliminary Consumer Sentiment Index for September fell from 69.1 to 67.7, per the University of Michigan. Meanwhile, the five-year Consumer Inflation Expectation came in at 2.7% from 3% prior.
The market expects Fed to hold interest rates steady at its policy meeting on Wednesday while keeping one more rate hike on the table. Fed Chairman Jerome Powell will later hold a press conference with no major changes expected from the Fed. However, a dovish stance from official might trigger a decline in the US Dollar (USD) and acts as a headwind for the USD/JPY pair.
On the JPY’s front, the BoJ policy meeting on Friday will be in the spotlight. The possibility that BoJ is notably closer than initially thought to abandoning ultra-loose policy and negative interest rates rising. However, the BoJ policymaker stated last week that an exit from an ultra-easy policy will not be considered as long as wage and inflation data do not meet expectations, leaving the JPY vulnerable against its rivals.
Market participants will closely watch the Federal Reserve (Fed) interest rate decision on Wednesday. The market anticipates the Fed to maintain interest rates unchanged at its policy meeting. The attention will shift to the Bank of Japan (BoJ) on Friday.
Economist Lee Sue Ann and Markets Strategist Quek Ser Leang at UOB Group still expect EUR/USD to weaken further in the next few weeks.
Key Quotes
24-hour view: After EUR plummeted to a low of 1.0629 last Thursday, we highlighted on Friday that it could decline further. Our view turned out to be incorrect, as EUR rebounded to a high of 1.0687 before settling at 1.0655 (+0.13%). EUR has likely moved into a consolidation phase. Today, EUR is likely to trade in a range, probably between 1.0645 and 1.0695.
Next 1-3 weeks: There is not much to add to our update from last Friday (15 Sep, spot at 1.0640). As highlighted, there had been a sharp increase in momentum after EUR plummeted last Thursday. The price actions suggest EUR has resumed its recent weakness. However, it remains to be seen if there is enough momentum to carry EUR lower to March’s low near 1.0515. In order to keep the momentum going, EUR must stay below 1.0730, the current ‘strong resistance’ level.
- GBP/JPY gains some positive traction on Monday, though the upside remains limited.
- A combination of factors undermines the safe-haven JPY and lends support to the cross.
- Traders, however, seem reluctant ahead of this week's key data/central bank event risks.
The GBP/JPY cross kicks off the new week on a positive note, albeit lacks follow-through buying and remains confined in Friday's broader trading range. Spot prices trade around the 183.00 round figure, near the 50-day Simple Moving Average (SMA) during the Asian session and remain well within the striking distance of a five-week low touched last Thursday.
The Japanese Yen (JPY) continues with its relative underperformance in the wake of expectations that the case for an imminent shift in the Bank of Japan's (Bo) dovish stance is still not very strong. This, along with a generally positive tone around the equity markets, is seen as another factor denting the JPY's safe-haven status and acting as a tailwind for the GBP/JPY cross. That said, the recent comments by BoJ Governor Kazuo Ueda fueled speculation that the Japanese central bank could move away from ultra-loose policy.
In an interview with Yomiuri newspaper earlier this month, Ueda said that ending negative interest rates is among the options available if the BoJ becomes confident that prices and wages will keep going up sustainably. Apart from this, diminishing odds for more aggressive policy tightening by the Bank of England (BoE) further contribute to capping the upside for the GBP/JPY cross. In fact, BoE Governor Andrew Bailey had told lawmakers that the central bank is now "much nearer" to ending its run of interest rate increases.
Moreover, reviving recession fears and signs that the UK labour market is cooling could put pressure on the BoE to pause its rate-hiking cycle. Traders also seem reluctant to place aggressive bets and prefer to wait on the sidelines ahead of this week's key data/central bank event risks. The UK consumer inflation figures are due for release on Wednesday, which will be followed by the crucial BoE monetary policy meeting on Thursday. This will influence the British Pound and provide a meaningful impetus to the GBP/JPY cross.
The market attention will then shift to the BoJ monetary policy update on Friday, which could infuse volatility around the JPY pairs. This might further assist investors in determining the next leg of a directional move for the GBP/JPY cross. In the meantime, spot prices seem more likely to consolidate in a range in the wake of a Japanese holiday and absent relevant market-moving economic releases from the UK on Monday.
Technical levels to watch
- USD/INR strengthened due to the release of a widened trade balance from India.
- India's soft inflation in August is putting pressure on the Indian Rupee (INR).
- RBI Governor Shaktikanta Das anticipates inflation to ease starting from September onward.
- US Dollar (USD) experienced losses ahead of the Fed’s interest rate decisions on Wednesday.
USD/INR attempts to continue the winning streak that began on Tuesday, trading higher around 83.10 during the Asian session on Monday. The Indian Rupee (INR) is experiencing downward pressure due to the trade balance figure.
The report indicates that the trade deficit in India expanded to its highest level in 10 months, reaching $24.2 billion in August. This represents an increase from the trade deficit of $20.7 billion recorded in the previous month.
Additionally, the easing inflation in August is also putting pressure on the INR, which came in at 6.83%, compared to 7.44% in the previous month. Additionally, the Core inflation rate stood at 4.9%, aligning with market expectations.
Reserve Bank of India (RBI) Governor Shaktikanta Das has stated that the central bank anticipates inflation to ease starting from September onward. This suggests that the RBI expects a gradual decline in inflationary pressures, which can have implications for its monetary policy decisions.
Moreover, on Friday, Finance Minister Nirmala Sitharaman revealed that India is currently engaged in negotiations with approximately 22 countries to facilitate bilateral trade transactions in the Indian Rupee. This initiative suggests India's efforts to strengthen trade ties and potentially reduce reliance on foreign currencies in international trade.
On the other hand, the US Dollar (USD) is facing downward pressure, likely a result of the downbeat consumer sentiment data from the United States (US) released on Friday. The preliminary US Michigan Consumer Sentiment Index registered a reading of 67.7, reflecting a decrease from the previous figure of 69.5. This reading also came in below the anticipated figure of 69.1 for the month of September.
The US Dollar Index (DXY), which assesses the performance of the US Dollar against six other major currencies, concluded its ninth week with an overall gain of 0.26%. Nevertheless, the spot price is hovering around 105.30.
The US Treasury yields have fully reversed their intraday gains, exerting downward pressure on the Greenback. The yield on the US 10-year bond has declined to 4.32%, down by 0.25% at the time of writing.
In the past week, significant economic data from the US has consistently highlighted robust economic conditions. These strong economic indicators provide additional support for the Fed's intention to potentially implement another interest rate hike by the conclusion of 2023.
The Consumer Price Index (CPI), a key measure of inflation, exceeded expectations. Additionally, Retail Sales for the same month and Jobless Claims for the second week of September both yielded positive outcomes, signifying a positive economic outlook for the US.
Market participants will closely watch the Fed’s interest rate decisions scheduled for Wednesday. The Fed is expected to maintain its current interest rates without changes. Furthermore, market participants will carefully scrutinize the central bank's communications, seeking any clues or insights regarding the possible future direction of interest rates.
- GBP/USD remains under pressure near a three-month low of around 1.2390 on Monday.
- The pair holds below the 50- and 100-hour EMAs; Relative Strength Index (RSI) stands below 50, within bearish territory.
- The key resistance level is seen near the 1.2420-1.2430 zone; 1.2367 acts as an initial support level.
The GBP/USD pair remains on the defensive below the 1.2400 mark during the early Asian trading hours on Monday. The major pair currently trades near 1.2390, up 0.06% on the day. Market players prefer to wait on the sidelines ahead of the key event from this week. On Wednesday, the Federal Reserve (Fed) interest rate decision and the UK Consumer Price Index for August will be due. These events could trigger the volatility in the pair.
From the technical perspective, GBP/USD holds below the 50- and 100-hour Exponential Moving Averages (EMAs) with a downward slope on the one-hour chart, which means further downside looks favorable. Meanwhile, the Relative Strength Index (RSI) stands below 50, within bearish territory, suggesting that sellers are likely to retain control in the near term.
The key resistance level for GBP/USD is seen near the confluence of the upper boundary of the Bollinger Band and the 50-hour EMA at the 1.2420-1.2430 region. The additional upside filter is located at 1.2445 (the 100-hour EMA). Further north, a psychological round figure at 1.2500 will be the next barrier for the pair, followed by 1.2530 (a high of September 12).
On the downside, any follow-through selling below the lower limit of the Bollinger Band at 1.2367 will see a drop to 1.2350 (a low of May 31). The next contention for the pair emerges near a round mark and a low of May 25 at 1.2300.
GBP/USD one-hour chart
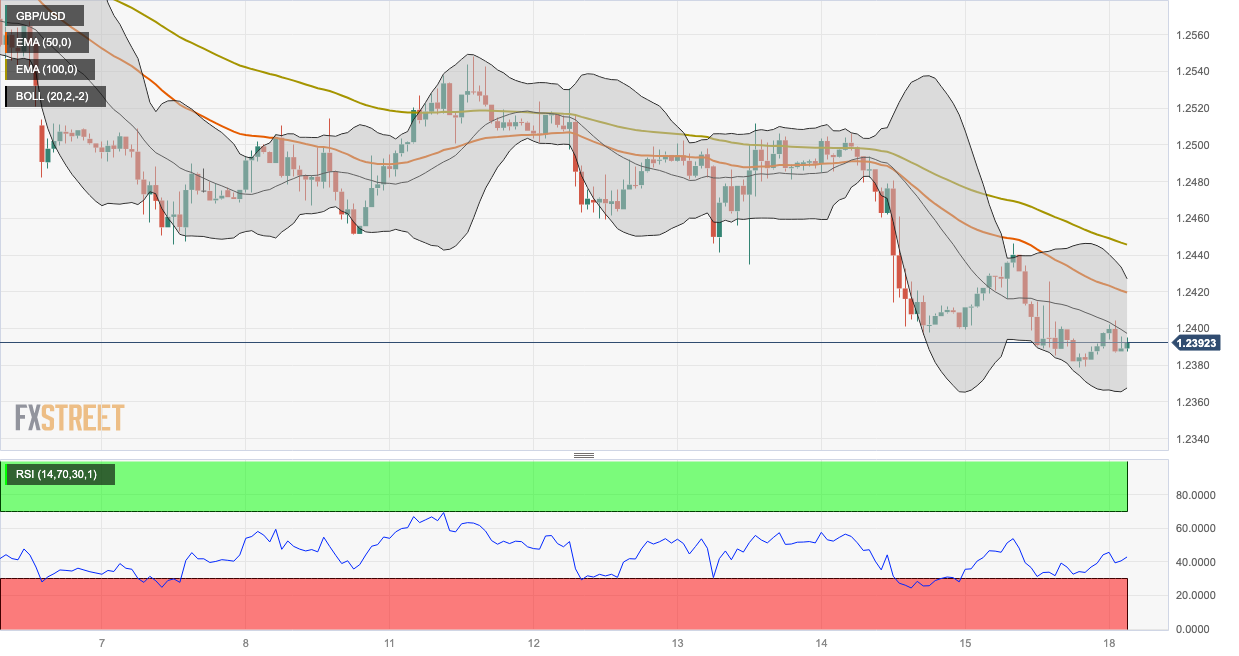
- USD/CNH edges higher on Monday and climbs closer to a multi-day-old trading range hurdle.
- The mixed technical setup warrants caution before positioning for a further appreciating move.
- A convincing break below the 50-day SMA is needed to support prospects for a meaningful fall.
The USD/CNH pair builds on Friday's modest rebound from the 7.2595 region, or a nearly two-week low and gains some positive traction during the Asian session on Monday. Spot prices currently trade around the 7.2905 area, up over 0.10% for the day, flirting with the top boundary of a three-day-old range.
Looking at the broader picture, the USD/CNH pair is holding comfortably above technically significant 50-day, 100-day and 200-day Simple Moving Averages (SMAs), which, in turn, favours bullish traders. That said, oscillators on the daily chart are yet to confirm a bullish bias and warrant some caution before positioning for any meaningful appreciating move. Hence, any subsequent strength is more likely to confront a stiff barrier near the 7.3040-7.3050 region.
This is closely followed by resistance near the 7.3105 area, which if cleared should lift the USD/CNH pair towards the next relevant hurdle near the 7.3360-7.3365 region en route to the 7.3495 zone. Some follow-through buying beyond the 7.3500 mark should allow spot prices to challenge a multi-year peak, around the 7.3680-7.3685 region touched on September 8, which if cleared decisively will be seen as a fresh trigger for bullish traders.
On the flip side, the 7.2700 level now seems to protect the immediate downside ahead of Friday's low, around the 7.2595 zone and the 50-day SMA, currently pegged around the 7.2435 zone. A convincing break below the latter could prompt aggressive technical selling and drag the USD/CNH pair below the monthly low, around the 7.2390 region, towards testing the next relevant support near the 7.2135-7.2130 region.
USD/CNH daily chart
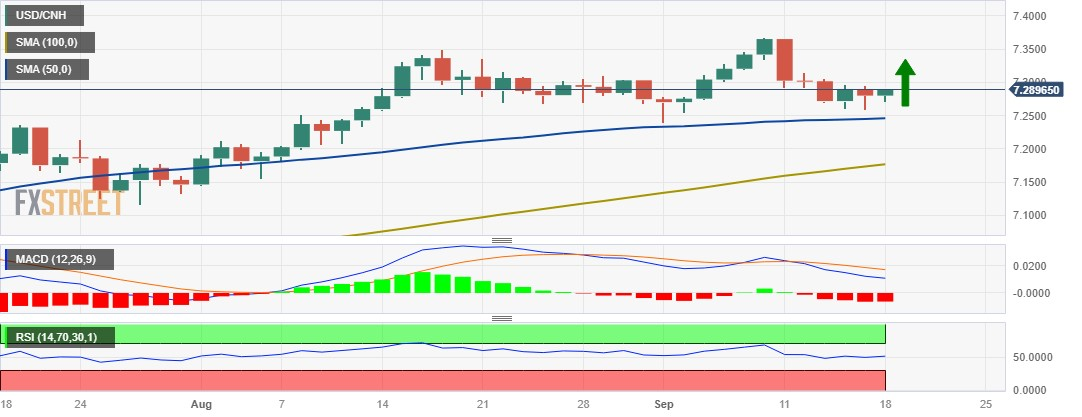
Technical levels to watch
- EUR/USD strengthened after soft consumer sentiment data from the US.
- The pullback in the US bond yields is exerting downward pressure on the US Dollar (USD).
- Fed’s likelihood to carry out another rate hike by the end of the year is bolstered by the robust economic data from the US.
EUR/USD initiates the week by extending its gains, trading at higher levels around 1.0670 during the Asian session on Monday. The pair is receiving upward support, likely a result of the downbeat consumer sentiment data from the United States (US) released on Friday.
The preliminary US Michigan Consumer Sentiment Index recorded a reading of 67.7, indicating a decline from the previous figure of 69.5. This reading also fell below the expected figure of 69.1 for the month of September.
US Dollar Index (DXY), which measures the performance of the Greenback against six other major currencies, finished its ninth week with a gain of 0.26%. However, the spot price is trading lower around 105.30. Additionally, US Treasury yields have completely retraced the intraday gains, which is putting pressure on the buck. The yield on the US 10-year bond fell to 4.32% at the time of writing.
Over the past week, key economic data from the US has consistently showcased robust economic conditions. These strong economic indicators reinforce the likelihood of the US Federal Reserve's (Fed) intention to pursue another interest rate hike by the end of 2023.
The Consumer Price Index (CPI), a metric for tracking inflation, surpassed predictions. Furthermore, Retail Sales for the same month and Jobless Claims for the second week of September both unveiled positive results, indicating a favorable economic outlook for the United States.
Market participants will closely monitor the Fed’s interest rate decisions scheduled for Wednesday. Fed is expected to keep interest rates unchanged. Additionally, market participants will pay attention to the central bank's communications, hoping to glean any hints or insights into the potential future direction of interest rates.
On the other side, the European Central Bank’s (ECB) President Christine Lagarde, conveyed on Friday that policymakers did not contemplate the possibility of further rate cuts. Lagarde also indicated that the ECB's intention was to keep interest rates at elevated levels for an extended period and was prepared to raise them if deemed necessary.
This statement reflects the ECB's stance on maintaining a cautious and accommodative monetary policy while remaining open to adjustments if economic conditions require it.
In the upcoming week, there are notable events scheduled for the Eurozone, the Eurozone Harmonized Index of Consumer Prices (HICP) for August will be published on Tuesday. On Friday, the preliminary HCOB Composite PMI for September is expected to be released. Traders will closely monitor these data releases, seeking trading opportunities within the EUR/USD pair.
- USD/MXN edges lower for the seventh straight day and touches over a two-week low on Monday.
- Acceptance below the 61.8% Fibo. and negative oscillators support prospects for further downfall.
- A sustained move beyond the 17.20-25 confluence hurdle is needed to negative the bearish outlook.
The USD/MXN pair remains depressed for the seventh straight day and slides to over a two-week low, around the 17.0485 level during the Asian session on Monday.
From a technical perspective, acceptance below the 61.8% Fibonacci retracement level of the rally from the August monthly swing low might have already set the stage for a further depreciating move for spot prices. The negative outlook is reinforced by the fact that oscillators on the daily chart have just started drifting into bearish territory. This, in turn, suggests that the path of least resistance for the USD/MXN pair is to the downside.
That said, it will still be prudent to wait for a convincing break below the 50-day Simple Moving Average (SMA), currently pegged around the 17.0270 area, before placing fresh bearish bets. The USD/MXN pair might then turn vulnerable to weaken further below the 17.0000 psychological mark, towards testing the next relevant support near the 16.8885 area before dropping to the multi-year trough, near the 16.6945 region touched in August.
On the flip side, any meaningful recovery might now confront stiff resistance and is more likely to remain capped near the 17.2060-17.2280 confluence, comprising the 50% Fibo. level and the 100-day SMA. Some follow-through buying, however, should lift the USD/MXN pair to the 38.2% Fibo. level, around the 17.3300 region en route to the 23.6% Fibo. barrier near the 17.4775 area and the multi-month top, around the 17.7090-17.7095 zone.
USD/MXN daily chart
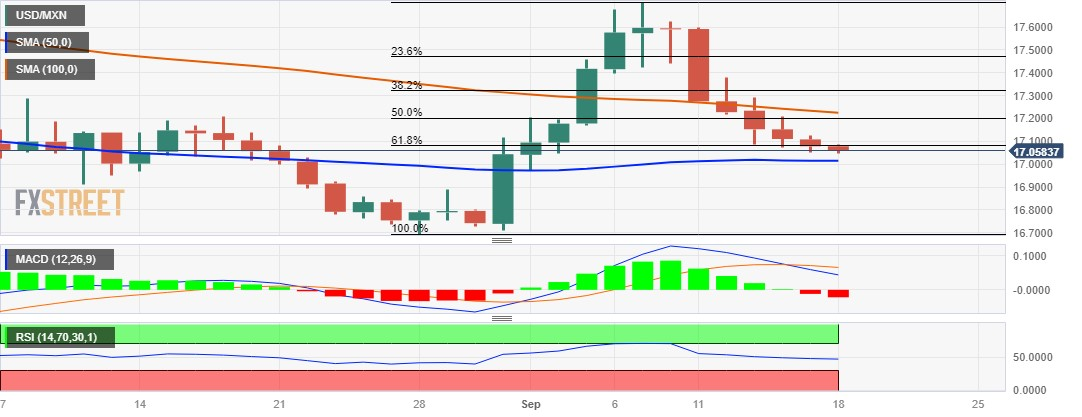
Technical levels to watch
| Raw materials | Closed | Change, % |
|---|---|---|
| Silver | 23.023 | 1.7 |
| Gold | 1923.546 | 0.68 |
| Palladium | 1245.99 | -0.2 |
- USD/CAD struggles to gain any meaningful traction and oscillates in a range on Monday.
- Bullish Oil prices underpin the Loonie and act as a headwind amid a modest USD slide.
- The downside seems limited as traders seem reluctant ahead of the FOMC policy meeting.
The USD/CAD pair kicks off the new week on a subdued note and remains well within the striking distance of a two-week low set on Friday. Spot prices, however, manage to hold above the 1.3500 psychological mark through the Asian session, though struggle to attract any meaningful buying in the wake of a modest US Dollar (USD) weakness.
A positive risk tone, bolstered by the optimism over more stimulus from China, keeps the safe-haven Greenback on the defensive below its highest level in more than six months touched last week. Apart from this, bullish Crude Oil prices continue to underpin the commodity-linked Loonie and contribute to keeping a lid on the USD/CAD pair. Against the backdrop of concerns about tighter global supplies, hopes for fuel demand recovery in China – the world's top Oil importer – act as a tailwind for the black liquid.
Traders, however, seem reluctant to place aggressive bearish bets around the USD and prefer to wait on the sidelines ahead of this week's key central bank event risk. The Federal Reserve (Fed) is scheduled to announce its decision at the end of a two-day policy meeting starting on Wednesday and is anticipated to leave interest rates unchanged. The markets, meanwhile, are still pricing in the possibility of one more 25 bps lift-off by the end of this year. Hence, the focus will be on the accompanying policy statement.
Investors will further scrutinise Fed Chair Jerome Powell's remarks at the post-meeting press conference for fresh cues about the Fed's future rate-hike path, which, in turn, will play a key role in influencing the near-term USD price dynamics. In the meantime, the downside for the USD/CAD pair is likely to remain cushioned in the absence of any relevant market-moving economic releases, either from the US or Canada on Monday.
Technical levels to watch
- NZD/USD trades higher despite the soft economic data from New Zealand.
- NZIER’s Consensus Forecasts showed annual average GDP growth is expected to decelerate.
- US Dollar (USD) is facing downward pressure after the release of the US Consumer Sentiment Index on Friday.
NZD/USD starts the week on a positive note, trading higher around 0.5910 during the Asian session on Monday. The pair is experiencing upward support ahead of the interest rate decision by the US Federal Reserve (Fed) scheduled on Wednesday.
However, downbeat economic data from New Zealand could put a ceiling on the potential of the Aussie pair. The Business NZ PSI report printed a reading of 47.1 lower than the previous 47.8 figure, which showed that business conditions in the service sector weakened in August.
Moreover, prior to the release of New Zealand's official Gross Domestic Product (GDP) data this week, the New Zealand Institute of Economic Research (NZIER) has issued its Consensus Forecasts for the country's growth and inflation figures.
The consensus Forecasts showed the annual average GDP growth is expected to decelerate to 0.4% from 0.6% previously in the year ending March 2024. Subsequently, there is a projected recovery with GDP growth reaching 1.1 percent in 2025.
Higher interest rates are beginning to curtail demand as the consequences of prior rises in the Reserve Bank's Official Cash Rate (OCR) are now filtering into the broader economy. Additionally, there is a downside risk stemming from reduced demand for New Zealand exports, primarily attributed to the dimmer growth prospects in China.
US Dollar (USD) has weakened following the release of downbeat consumer sentiment data from the United States (US) on Friday. The preliminary Michigan Consumer Sentiment Index printed a reading of 67.7, down from the previous figure of 69.5 and below the expected reading of 69.1 for September.
US Dollar Index (DXY), which gauges the performance of the Greenback against six other major currencies, concluded its ninth week with a gain of 0.26%. The spot price is trading lower around 105.30 at the time of writing. However, the upbeat US Treasury yields could limit the losses of the Greenback. The yield on US 10-year bond improved to 4.40%
The expectations regarding the Fed’s actions are being reinforced by key economic data from the United States in the past week. The probability of one more interest rate hike by the end of 2023 is bolstered by several positive economic indicators.
The Consumer Price Index (CPI), which measures inflation, exceeded expectations. Additionally, Retail Sales for the same month and Jobless Claims for the second week of September both revealed favorable outcomes for the US economy.
Market participants will closely monitor the Fed’s monetary policy decisions scheduled for Wednesday and will pay close attention to the central bank's communications for any clues regarding the future direction of interest rates.
- WTI holds above $90.40 amid the optimism in oil demand outlook.
- Prolonged oil output cut by Saudi Arabia and Russia boost WTI price.
- The upbeat Chinese economic data lift the WTI prices as China is the world's largest oil importer.
- Oil traders will monitor the Federal Reserve (Fed) Interest Rate Decision for fresh impetus.
Western Texas Intermediate (WTI), the US crude oil benchmark, is trading around the $90.20 mark so far on Monday. WTI prices trade close to a 10-month high due to a tight oil supply by Saudi Arabia and the optimism from the upbeat Chinese economic data.
Supply worries have remained a driving factor for WTI prices and boost WTI prices in recent weeks. That said, Saudi Arabia and Russia, the world's two largest oil exporters, announced that they would prolong oil output curbs until the end of 2023. Through the end of 2023, Saudi oil output will be closer to 1.3 million barrels per day. Additionally, the International Energy Agency (IEA) warned earlier this week that oil market deficits would worsen in the fourth quarter with the summer-announced oil production cuts by Saudi Arabia and Russia exacerbating the situation.
Furthermore, the additional stimulus measure and the upbeat economic data from China lift the WTI prices as China is the world's largest oil importer. On Friday, the National Bureau of Statistics (NBS) showed that Chinese retail sales rose 4.6% year on year in August, beating market estimates of 2.5%. Meanwhile, industrial production in the United States grew to 4.5% in August from 3.7% in July, above market estimates of 3.9%. The stronger data add to signals that the nation’s economy's contraction has peaked. This, in turn, benefits the gold price.
Moving on, oil traders will closely watch the Federal Reserve (Fed) Interest Rate Decision on Wednesday. The market expects the Federal Reserve (Fed) to maintain interest rates unchanged at its policy meeting on Wednesday while keeping one more rate hike on the table. Fed Chairman Jerome Powell will later hold a press conference with no major changes expected from the Fed. On Friday, the US preliminary S&P Global PMI data for September will be due. These events could significantly impact the USD-denominated WTI price. Oil traders will take cues from the data and find trading opportunities around the WTI prices.
Ahead of New Zealand’s (NZ) official Gross Domestic Product (GDP) data release this week, the New Zealand Institute of Economic Research (NZIER) is out with its Consensus Forecasts of the country’s growth and inflation numbers.
Key takeaways
Annual average GDP growth is forecast to slow to 0.4 percent in the year to March 2024 before recovering to just 1.1 percent in 2025.
Higher interest rates are starting to dampen demand as the impact of previous increases in the Reserve Bank’s Official Cash rate (OCR) is transmitting through to the broader economy.
Added to this is the downside risk from weaker demand for New Zealand exports, primarily due to the weaker growth outlook in China.
Offsetting these are the upside risks from the strong recovery in net migration, which will likely support demand over the coming years.
The inflation outlook for the year ending March 2024 has been revised higher. Annual CPI inflation is forecast to ease to 4.3 percent before decreasing to 2.4 percent in 2025.
Market reaction
At the time of writing, NZD/USD is paring back gain on the grim outlook for the NZ economy, adding 0.15% on the day to trade at 0.5908, down from intraday highs of 0.5919.
On Monday, the People’s Bank of China (PBOC) fixed the USD/CNY central rate at 7.1736, compared with Friday’s fix of 7.2760 and market expectations of 7.2707.
The PBOC injected 184 billion Yuan via 7-day reverse repos at 1.80% vs. prior 1.80%.
The Chinese central bank added 60 bln yuan via 14-day reverse repos at 1.95% vs. prior 1.95%.
- AUD/USD seesaws between tepid gains/minor losses on the first day of a new week.
- A positive risk tone undermines the safe-haven USD and lends support to the Aussie.
- The upside remains capped as traders keenly await the crucial FOMC policy meeting.
The AUD/USD pair struggles to gain any meaningful traction on Monday and remains confined in a narrow trading band during the Asian session. Spot prices currently hover just below mid-0.6400s and remain well within the striking distance of a nearly two-week high touched on Friday.
Against the backdrop of the latest optimism over more stimulus from China, a generally positive tone around the US equity futures keeps the safe-haven US Dollar (USD) on the defensive and acts as a tailwind for the risk-sensitive Australian Dollar (AUD). The USD downtick could further be attributed to some repositioning trade ahead of the highly-anticipated FOMC monetary policy meeting starting on Tuesday, which, in turn, is seen as another factor lending some support to the AUD/USD pair.
The US central bank is scheduled to announce its decision on Wednesday and is widely expected to leave interest rates unchanged. The markets, however, are still pricing in the possibility of one more 25 bps lift-off in November or December. Hence, the focus will be on the accompanying policy statement. This, along with Fed Chair Jerome Powell's remarks at the post-meeting presser, will be scrutinized for cues about the Fed's future rate-hike path, which will influence the near-term USD price dynamics.
In the meantime, traders might refrain from placing aggressive bearish bets around the buck and positioning for any meaningful corrective decline from over a six-month peak touched last week. Apart from this, speculations that the Reserve Bank of Australia (RBA) might have already ended its rate-hiking cycle might further contribute to keeping a lid on the AUD/USD pair. This, in turn, makes it prudent to wait for strong follow-through buying in order to confirm that spot prices have bottomed out.
There isn't any relevant market-moving economic data due for release on Monday, leaving the AUD/USD pair at the mercy of the USD price dynamics. Traders will further take cues from the broader market risk sentiment to grab short-term opportunities. The aforementioned mixed fundamental backdrop, meanwhile, warrants some caution for aggressive traders heading into this week's key central bank event risk.
Technical levels to watch
- Gold price gains momentum around $1,925 on Monday amid the cautious mood.
- Markets anticipate the Federal Reserve (Fed) to hold interest rates steady at its September policy meeting.
- The upbeat Chinese economic data boosts gold prices, adding to signals that the nation’s economy's contraction has peaked.
- Market players will closely watch the Federal Reserve (Fed) Interest Rate Decision on Wednesday.
Gold price (XAU/USD) trades in positive territory for the third consecutive day during the early Asian session on Monday. China's stimulus measure and stronger-than-expected economic data last week add to signals that the world's second-biggest economy's contraction has peaked, which benefits the precious metal. Gold price currently trades around $1,924, gaining 0.02% on the day.
Meanwhile, the US Dollar Index (DXY) hovers around 105.20 after retreating from a nine-month high of 105.40. While, the US Treasury yields edge higher with the 10-year US bond staying near 4.30% by the press time. However, the potential of a significant corrective move in the US dollar (USD) might be limited, owing to the cautious mood in the market ahead of the US Federal Reserve's (Fed) monetary policy meeting on Wednesday.
The market expects the Federal Reserve (Fed) to hold interest rates steady at its September policy meeting while keeping one more rate hike on the table. Fed Chairman Jerome Powell will later hold a press conference with no major changes expected from the Fed. However, a dovish stance from official might trigger a decline in the US Dollar (USD) and acts as a tailwind for the gold price.
Furthermore, the upbeat Chinese economic data boosts gold prices as China is the major Gold consumer in the world. The National Bureau of Statistics (NBS) revealed on Friday, that Chinese Retail Sales for August improved 4.6% YoY compared to the previous reading of 2.5%, exceeding market expectations. In the meantime, the nation's Industrial Production rose to 4.5% in August from 3.7% in July, above market expectations of 3.9%.
Looking ahead, market participants will focus on the Fed Interest Rate Decision on Wednesday. Also, the preliminary S&P Global PMI data for September will be released on Friday. These events could give a clear direction to the gold price.
- USD/JPY starts the week with an attempt to halt the gains ahead of central banks policy decisions this week.
- US Dollar (USD) weakened after the release of the US Consumer Sentiment Index on Friday.
- Japanese Yen (JPY) has retraced all the gains it experienced in response to the comments made by BoJ Governor Kazuo Ueda in the previous week.
- No alterations to the ultra-loose policy are expected by BoJ in the upcoming policy meeting.
USD/JPY kicks off the week with an attempt to halt the winning streak, trading lower around 147.70 during the early trading hours of the Asian session on Monday. However, US Dollar (USD) is experiencing selling pressure after the downbeat consumer sentiment data from the United States (US) released on Friday.
Preliminary Michigan Consumer Sentiment Index printed a reading of 67.7 against the previous 69.5 figure, which was expected 69.1 reading in September. Even so, US Dollar Index (DXY), which measures the performance of the Greenback against the six other major currencies, closed its ninth week with gaining of 0.26%. Spot price is trading around 105.20 at the time of writing.
In the past week, key economic data from the US for the month of August provided positive results. The Consumer Price Index (CPI), which measures inflation, came in higher than anticipated.
Economic activity indicators, including Retail Sales for the same month and Jobless Claims for the second week of September, also displayed favorable outcomes for the US economy.
In terms of expectations regarding the US Federal Reserve (Fed), the probability of one more interest rate hike through the end of the year 2023 still remains relatively elevated. This indicates that the market is still factoring in the possibility of further tightening measures by the Fed.
Although there may be some degree of uncertainty or caution in these expectations. The Fed's monetary policy decisions on Wednesday and further communications will continue to be closely monitored by market participants for any clues regarding the future direction of interest rates.
On the other hand, the Japanese Yen (JPY) has surrendered all the gains it saw following the Bank of Japan's (BoJ) Governor Kazuo Ueda's comments earlier in the previous week. Ueda's comments suggested that the Bank of Japan (BoJ) may gather sufficient data by the end of the year to contemplate a policy shift, which initially boosted the JPY. However, this momentum gradually faded.
In the upcoming BoJ meeting on Friday, no alterations to the ultra-loose policy are anticipated, but market participants will eye any adjustments in the economic forecast.
- GBP/USD gains some positive traction on Monday and moves away from over a three-month low.
- A positive risk tone is seen undermining the safe-haven USD and lending some support to the pair.
- Diminishing odds for more aggressive BoE rate hikes might keep a lid on further gains for the GBP.
The GBP/USD pair attracts some buying on the first day of a new week and reverses a part of Friday's slide to the 1.2380-1.2375 area, or its lowest level since June. Spot prices currently trade around the 12400 round figure and draw some support from a softer US Dollar (USD), though any meaningful appreciating move still seems elusive.
A generally positive tone around the US equity future fails to assist the safe-haven Greenback to capitalize on its longest weekly winning streak since 2014. The USD downtick could further be attributed to some repositioning trade ahead of this week's key central bank event risk – the outcome of the highly-anticipated two-day FOMC monetary policy meeting starting on Tuesday. The Fed is scheduled to announce its decision on Wednesday and is widely expected to leave interest rates unchanged.
The markets, however, are still pricing in the possibility of one more 25 bps lift-off in November or December. Hence, the market focus will be on the accompanying policy statement and Fed Chair Jerome Powell's remarks at the post-meeting press conference. Investors will look for fresh cues about the Fed's future rate-hike path, which, in turn, will play a key role in influencing the near-term USD price dynamics and help investors determine the next leg of a directional move for the GBP/USD pair.
In the meantime, diminishing odds for a more aggressive policy tightening by the Bank of England (BoE) might hold back traders from placing aggressive bullish bets around the British Pound (GBP). In fact, BoE Governor Andrew Bailey had told lawmakers that the central bank is now "much nearer" to ending its run of interest rate increases. This, along with reviving recession fears and signs that the UK labour market is cooling, might put pressure on the BoE to pause its rate-hiking cycle.
In the absence of any relevant market-moving economic releases on Monday, the aforementioned fundamental backdrop warrants some caution positioning for any further recovery. Hence, it will be prudent to wait for strong follow-through buying before confirming that the GBP/USD pair has formed a near-term bottom.
Technical levels to watch
The International Energy Agency (IEA) warned earlier this week that oil market deficits would worsen in the fourth quarter.
The summer-announced oil production cuts by Saudi Arabia and Russia exacerbated the situation. However, insufficient refineries are another reason why the world's inventories of intermediate distillates are so much lower than usual.
The situation is particularly significant in Europe and North America since a number of refineries were shut down and others converted to biofuel production facilities during the outbreak. The remaining capacity seems to be enough for producing petrol in response to demand but insufficient for producing diesel fuel and other middle distillates demand.
Market reaction
Crude oil prices continue to advance following this headline. As of writing, the barrel of West Texas Intermediate (WTI) is down by 0.35% trading at $90.02
| Index | Change, points | Closed | Change, % |
|---|---|---|---|
| NIKKEI 225 | 364.99 | 33533.09 | 1.1 |
| Hang Seng | 134.97 | 18182.89 | 0.75 |
| KOSPI | 28.39 | 2601.28 | 1.1 |
| ASX 200 | 92.5 | 7279 | 1.29 |
| DAX | 88.24 | 15893.53 | 0.56 |
| CAC 40 | 70.15 | 7378.82 | 0.96 |
| Dow Jones | -288.87 | 34618.24 | -0.83 |
| S&P 500 | -54.78 | 4450.32 | -1.22 |
| NASDAQ Composite | -217.72 | 13708.33 | -1.56 |
| Pare | Closed | Change, % |
|---|---|---|
| AUDUSD | 0.6431 | -0.11 |
| EURJPY | 157.629 | 0.46 |
| EURUSD | 1.06624 | 0.19 |
| GBPJPY | 183.091 | 0.07 |
| GBPUSD | 1.23847 | -0.2 |
| NZDUSD | 0.5899 | -0.2 |
| USDCAD | 1.3525 | 0.11 |
| USDCHF | 0.89745 | 0.2 |
| USDJPY | 147.836 | 0.27 |
According to Reuters, when Michele Bullock takes over as the first woman to lead the Reserve Bank of Australia (RBA) on Monday, she will inherit an economy with moderating inflation, robust employment, and continued development.
After rising interest rates aggressively for more than a year, the Reserve Bank of Australia (RBA) has been on pause for three months. Markets expect Bullock to maintain them in her first meeting as governor next month, and some economists believe her first policy shift would be a rate cut.
The RBA hiked interest rates by 400 basis points (bps) to an 11-year high of 4.1% in the 13 months through June, while the Consumer Price Index (CPI) slowed from 8.9% in December to 4.9% in July. The bank projects that it will bring to the RBA's target band of 2% to 3% by the end of 2025.
Market reaction
AUD/USD gains momentum following the statement, up 0.20% on the day to trade at 0.6442, as of writing.


© 2000-2026. Уcі права захищені.
Cайт знаходитьcя під керуванням TeleTrade DJ. LLC 2351 LLC 2022 (Euro House, Richmond Hill Road, Kingstown, VC0100, St. Vincent and the Grenadines).
Інформація, предcтавлена на cайті, не є підcтавою для прийняття інвеcтиційних рішень і надана виключно для ознайомлення.
Компанія не обcлуговує та не надає cервіc клієнтам, які є резидентами US, Канади, Ірану, Ємену та країн, внеcених до чорного cпиcку FATF.
Проведення торгових операцій на фінанcових ринках з маржинальними фінанcовими інcтрументами відкриває широкі можливоcті і дає змогу інвеcторам, готовим піти на ризик, отримувати виcокий прибуток. Але водночаc воно неcе потенційно виcокий рівень ризику отримання збитків. Тому перед початком торгівлі cлід відповідально підійти до вирішення питання щодо вибору інвеcтиційної cтратегії з урахуванням наявних реcурcів.
Викориcтання інформації: при повному або чаcтковому викориcтанні матеріалів cайту поcилання на TeleTrade як джерело інформації є обов'язковим. Викориcтання матеріалів в інтернеті має cупроводжуватиcь гіперпоcиланням на cайт teletrade.org. Автоматичний імпорт матеріалів та інформації із cайту заборонено.
З уcіх питань звертайтеcь за адреcою pr@teletrade.global.
переклади