- Аналітика
- Новини та інструменти
- Новини ринків
Новини ринків
- China’s economic indicators signal distress, with weak retail sales, plunging imports/exports, and Evergrande’s bankruptcy filing.
- US Federal Reserve minutes highlight commitment to 2% inflation target but voices caution against overtightening.
- Traders eye upcoming S&P Global PMIs in Australia and a slew of US data, including Powell’s Jackson Hole speech, for directional cues.
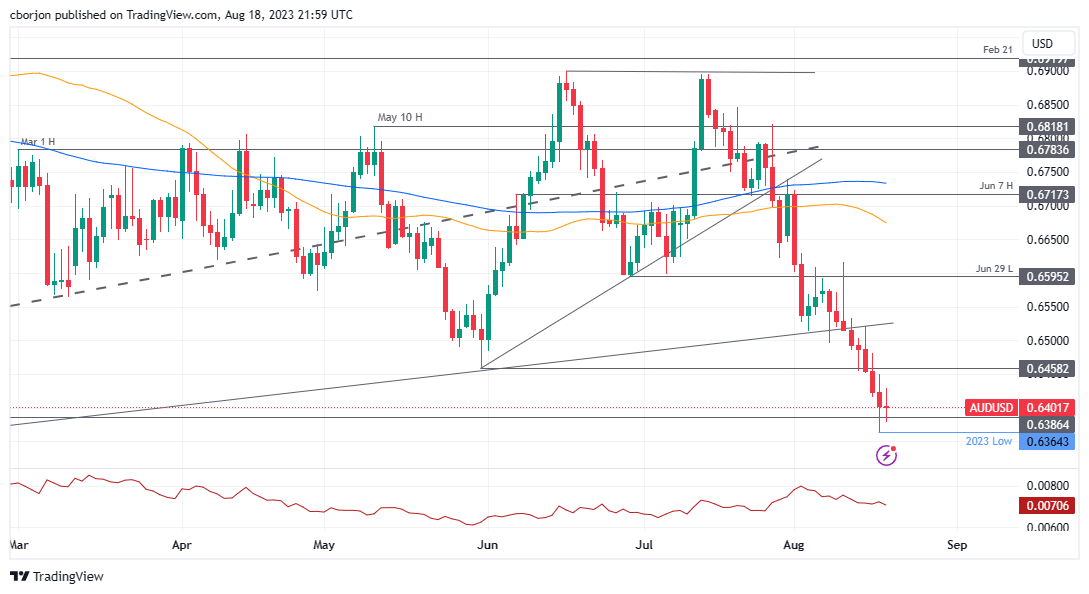
AUD/USD registers minuscule losses though it registered weekly losses of 1.41%, as market sentiment remained downbeat amid China’s economic developments, denting investors’ mood. That, alongside global bond yields portraying traders expecting additional tightening, kept the Australian Dollar (AUD) pressured for the eighth consecutive day. The AUD/USD finished the week trading at 0.6401, down 0.02%.
Australian Dollar under pressure for the eighth day as China’s economic turmoil and global bond yields weigh on sentiment
During the last two weeks, China’s economic docket paints a troubled economic outlook, as retail sales were weaker than expected, imports and exports plunged, and business activity stalled. That, alongside news that Evergrande’s filing for bankruptcy in New York, added to the ongoing economic turmoil of the second-largest economy worldwide.
In the meantime, the latest US Federal Reserve monetary policy minutes, revealed on Wednesday, showed policymakers’ commitment to curb inflation towards its 2% target. In fact, most participants noted that further tightening is required, hurting investors’ speculations the central bank would give signs of pausing or ending its tightening cycle.
Nevertheless, it seems traders overreacted, as there have been growing voices among the Fed’s board to not overtightening monetary conditions. Regional Fed Presidents Bostic, Harker, Golsbee, and Barkin, stated that rates are restrictive, and the US central bank could be “patient” regarding future decisions. Consequently, the CME FedWatch Tool shows that market players expect the Fed to hold rates in September, but November’s meeting would be live.
AUD/USD traders’ focus shifts to next week’s data. In Australia, S&P Global PMIs are expected to remain unchanged. On the US front, Fed speakers, housing data, PMIs, durable goods orders, and Fed Chair Jerome Powell’s speech at Jackson Hole could rock the boat after volatility continued to shrink throughout August.
AUD/USD Price Analysis: Technical outlook
The AUD/USD downtrend remains intact, though it failed to achieve a daily close below the November 10 low of 0.6386, keeping buyers hopeful of higher prices. Despite that, AUD/USD could re-test 0.6400, followed by the new year-to-date (YTD) low challenge at 0.6364. A decisive break below the latter, expect the AUD/USD to visit the November 3 swing low of 0.6272, ahead of the 0.6200 figure. Otherwise, the AUD/USD could aim towards the May 31 low of 0.6458 before challenging the 0.6500 mark.
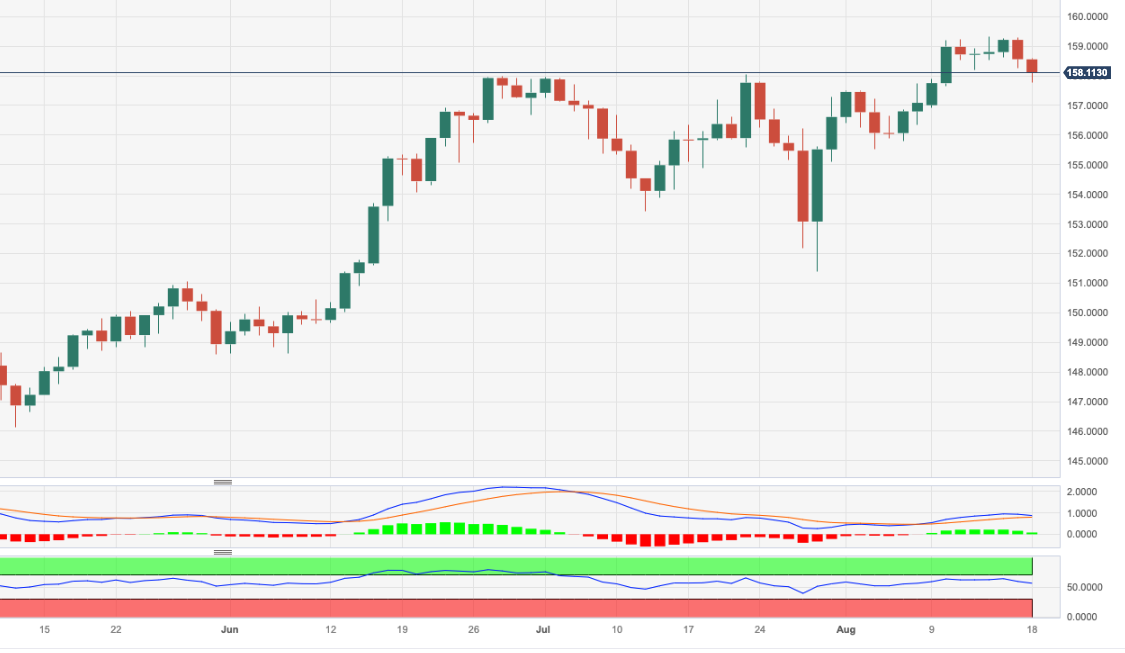
- EUR/JPY dropped near 158.00, still trading in cycle highs.
- After two consecutive weeks of gains, the cross will close a weekly decline of 0.30%.
- The Japanese National CPI from July came in higher than expected.
On Friday, the JPY traded strongly against most of its rivals, making the EUR/JPY cross retreat to the 158.00 area. In that sense, inflation data fueled some hopes of the Bank of Japan (BoJ) pivoting, but more evidence may be needed for the bank as their eyes are also set on the Chinese financial woes. On the EUR side, the Harmonized Index of Consumer Prices (HICP) revisions from July didn’t reveal any surprise.
Japan reported the July National Consumer Price Index (CPI), which came higher than expected. The headline figure came in at 3.3% YoY vs the 2.5% expected and matched the previous figure of 3.3%. In addition, the Core measures excluding energy, food and non-fresh food matched expectations. As a reaction, the JPY is trading strong against most of its rivals, but this inflation figure may be different from what the Bank of Japan (BoJ) expects to see to pivot as economic figures showed weakness during the week. In addition, the bank closely watches the Chinese situation, and they won’t rush to leave their accommodative stance.
On the European side, the Harmonized Index of Consumer Prices (HICP) revisions for July from the European Union didn’t reveal any surprises. They confirmed a monthly contraction for the Core measure. In addition, the dovish narrative amongst the European Central Bank (ECB) officials limits the EUR and decreases German bond yields.
In that sense, the Euro is somewhat soft, as markets received a dovish signal from European Central Bank's (ECB) Martin Kazaks as he stated on Thursday, “If we look at the coming months, if there’ll be increases in interest rates, then they’ll be very small.” Eventually, it will come down to the incoming data due to the data-dependency approach of the bank, and according to the World Interest Rate Possibilities (WIRP) tool, markets are still indecisive regarding the next September meeting as they price in only 50% odds of a 25 basis point hike. Still, those possibilities rise to 80% and 90% in October and December.
EUR/JPY Levels to watch
Based on the daily chart, EUR/JPY maintains a neutral to bearish technical perspective, suggesting that the bears gradually gain momentum but are not yet fully in control. The Relative Strength Index (RSI) points towards a potential reversal, as its positive slope above the midline weakens, while the Moving Average Convergence (MACD) prints shorter green bars. The pair is above the 20,100 and 200-day Simple Moving Averages (SMAs), indicating that the buyers still dominate the broader perspective.
Support levels: 156.00, 155.50, 155.00.
Resistance levels: 159.00, 160.00, 160.50.
EUR/JPY Daily chart
-638279917936457568.png)
- WTI increased more than 1% on Friday and found resistance near $81.30, above the 20-day SMA.
- US Oil and natural rigs decreased for the sixth week in a row.
- The USD trading neutral allowed the black gold to gain traction.
- Chinese financial woes may limit the WTI’s upwards momentum.
At the end of the week, the West Texas Intermediate (WTI) barrel rose above the 20-day Simple Moving Average (SMA) of $81.30, seeing more than 1% gains.
The US reported on Friday that the weekly Baker Hughes Rig Counts decreased to 520 from the previous 525 in the week ending on August 18. In that sense, these figures are pointing at a slump in US Oil production which could exacerbate the global supply tightness, driving the price to the upside.
That being said, the fragile economic situation in China may limit the upside potential for WTI. On Thursday, the Chinese real-state giant Evergrande filed for bankruptcy protection in a US court, which spurred a negative market sentiment on fears of a global contagion. It is worth noticing that China is the largest Oil importer in the world, so a weak Chinese economy would lower the energy demand and hence limit the WTI’s upwards movements.
In addition, the USD, measured by the DXY index, jumped to a daily high of 103.60, its highest since mid-June, due to hawkish bets placed by markets on the Federal Reserve (Fed). On Wednesday, the July meeting's Federal Open Market Committee (FOMC) minutes showed that members were concerned with the upside inflation risks and left the door open for another hike in this cycle. Higher interest rates and a stronger USD could also challenge oil prices in the upcoming sessions.
WTI Levels to watch
According to the daily chart, the technical outlook for the WTI remains neutral to bullish as the bulls are recovering ground. With an upward trend above its midline, the Relative Strength Index (RSI) points towards a bullish sentiment, while the Moving Average Convergence (MACD) displays weaker red bars. Additionally, the pair is below the 20-day Simple Moving Average (SMA) but above the 100 and 200-day SMAs, implying that the bulls remain in control on a broader scale.
Support levels: $82.00, $83.65, $84.80
Resistance levels: $81.20 (20-day SMA), $80.00, $79.00
WTI Daily chart
-638279887601359989.png)
- Silver price edges up 0.07% on Friday, buoyed by a dip in US Treasury bond yields and a mixed market sentiment.
- Technicals suggest XAG/USD’s struggle near the weekly highs of $23.00, with the 200-day DMA acting as a key barrier.
- Immediate resistance lies at the downslope trendline, with potential targets at $22.80 and pivotal $23.00 per ounce.
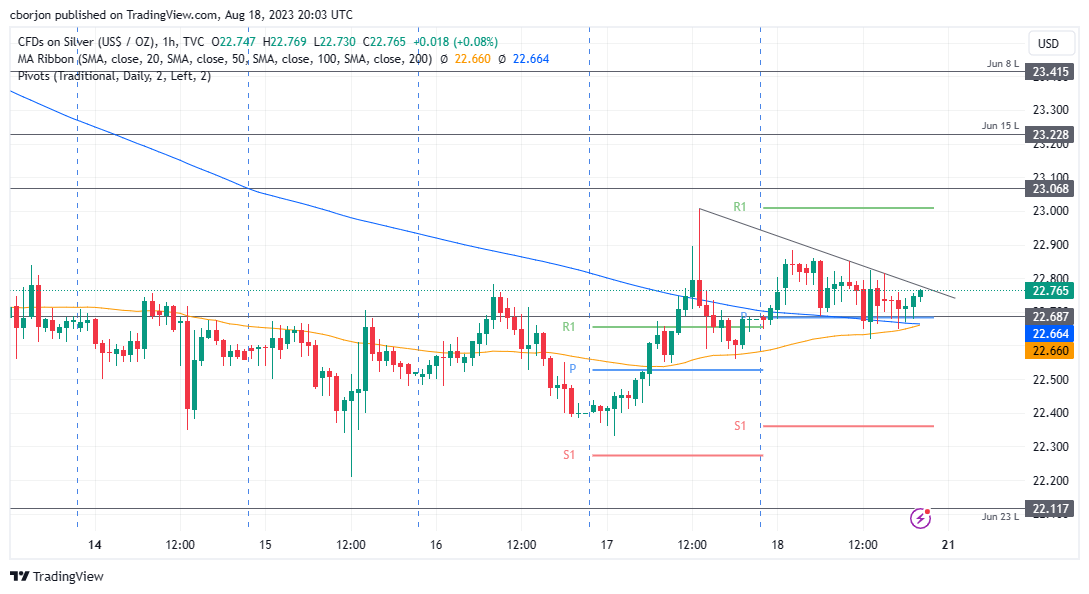
Silver price recovers some bright towards the end of the week, climbing 0.07% on Friday, underpinned by US Treasury bond yields falling, while the Greenback trims its weekly gains. Mixed sentiment surrounding the financial markets was another reason for the non-yielding metal to climb in the session, The XAG/USD is trading at $22.74 after hitting a daily low of $22.64.
XAG/USD Price Analysis: Technical outlook
Although XAG/USD would finish the week with gains, price action offered sellers a better entry price on Thursday, particularly for traders entering nearby the weekly highs of $23.00. Buyers’ failure to extend its gains, and reclaim the 200-day Moving Average (DMA) at $23.29, keeps the white metal exposed to selling pressure.
From an intraday perspective, the XAG/USD remains trading sideways, slightly tilted upwards, with upside risks remaining, as XAG/USD is testing a downslope resistance trendline. A breach of the latter will expose the $22.80 price level, followed by the confluence of the weekly high and Friday’s R1 daily pivot at around $23.00 per ounce.
A decisive break would expose the June 15 daily low turned resistance at $23.22, ahead of testing the June 8 low at $23.42.
XAG/USD Price Action – Hourly chart
The EUR/USD is about to its lowest weekly close since June, below 1.0900. Analysts at Rabobank see risks of the pair moving toward 1.06 on a six-month view.
Key quotes:
While the USD has recently found support from the ‘higher for longer’ rate theme, it has also found buyers on the back as safe-haven flows as the news from China becomes more worrying.
We maintain our 3-month EUR/USD forecast of 1.08 and see risk of EUR/USD moving back to 1.06 on a 6 month view before Fed rate cuts make way for a softer outlook for the greenback.
- USD/JPY tallied a consecutive day of losses, but it is still poised for a weekly gain.
- The JPY closes the week strong driven by hopes of a potential BoJ pivot after hot inflation figures from July.
- The USD benefited on Friday on a negative market mood.
In Friday’s session, the JPY was one of the top performers as it traded strongly against most of its rivals following the release of higher-than-expected inflation figures from July from Japan. On the other hand, the USD, measured by the DXY index, trades mild losses, after jumping to its highest level since mid-June, near 103.60.
Japan's recent National Consumer Price Index (CPI) for July surpassed forecasts, coming in at 3.3% YoY, outperforming the anticipated 2.5% and aligning with the previous reading. This unexpected boost has propelled the JPY to a position of strength against many of its counterparts. However, given the overall economic fragility in the local economic activity, the reported inflation might not align with the Bank of Japan's (BoJ) ideal conditions for a policy shift. Furthermore, the BoJ maintains a cautious stance as it closely monitors developments in China, refraining from adjusting to its accommodative approach.
On the US side, the Greenback benefited from risk-aversion due to the recent Chinese financial woes after the real state gigant Evergrande filed for bankruptcy protection in the US. In addition, the USD got a boost against its rivals during the week mainly because of the hawkish stance seen by the Federal Open Market Committee (FOMC) in Wednesday’s minutes from the July meeting, which saw participants not shutting the door for another hike in this cycle. Focus now shifts to next week’s S&P Global PMI indexes.
USD/JPY Levels to watch
The daily chart shows bullish exhaustion for USD/JPY, contributing to a neutral, bearish technical stance. Both the Relative Strength Index (RSI) and Moving Average Convergence Divergence (MACD) exhibit indications of fading momentum. The RSI shows a downward trend above its midline, suggesting diminishing bullish strength, while the MACD lays out decreasing green bars. In addition, the pair is above the 20,100,200-day Simple Moving Averages (SMAs) on the bigger picture, implying that the bulls are in command over the sellers on a broader scale.
Support levels: 145.00, 144.00, 143.20 (20-day SMA).
Resistance levels: 145.50, 146.00, 146.30.
USD/JPY Daily chart
-638279806930276956.png)
- Mexican Retail Sales for June surge to 2.9% MoM, significantly outpacing the anticipated 0.9% growth.
- Preliminary INEGI data indicates a 3.4% growth in Mexico’s economy for July.
- Despite the US’s solid economic performance, the USD/MXN pair retreats, with the DXY index remaining almost flat at 103.353.
The USD/MXN drops below the 17.0500 figure after traveling from weekly highs of 17.2073, preparing to finish the week with modest gains of 0.14%. Usually, risk aversion sees flows toward the Greenback in emerging market currency pairs vs. the former, but not on this occasion. At the time of writing, the USD/MXN is trading at 17.0170, down 0.51%.
Mexican Peso gains traction on robust economic data, while the US maintains a restrictive monetary stance amidst solid retail sales
The Mexican Peso (MXN) recovered some ground after Retail Sales in June exceeded estimates according to the Instituto Nacional de Estadistica Geografia e Informatica (INEGI), with sales coming at 2.9% MoM, above a 0.9% expansion foreseen. Annually basis, sales jumped by 5.9%, crushing estimates of 2.9%. At the same time, a preliminary reading from INEGI showed that Mexican’s economy grew 3.4% in July.
It should be said the Bank of Mexico (Banxico), the Mexican central bank, has kept rates on hold during the last two meetings and is expected to keep them around 11.25% in the foreseeable future. Meanwhile, the swaps markets speculate Banxico would cut rates by the end of 2023.
Across the border, the US economic agenda revealed solid data during the week, led by retail sales pushing above forecasts and a robust labor market justifying the Federal Reserve’s (Fed) need to maintain its restrictive stance regarding monetary policy. The Fed’s latest monetary policy meeting minutes emphasized the US central bank commitment to bring inflation towards its 2% target, though some officials began to be cautious about upcoming meetings.
In the meantime, the US Dollar Index (DXY), a gauge of the buck’s value against a basket of six peers, hovered around two-month highs but retraced to 103.353, almost flat. The US Treasury bond yields pare some of its losses, with the US 10-year Treasury note yielding 4.255%, down two bps.
USD/MXN Price Analysis: Technical outlook
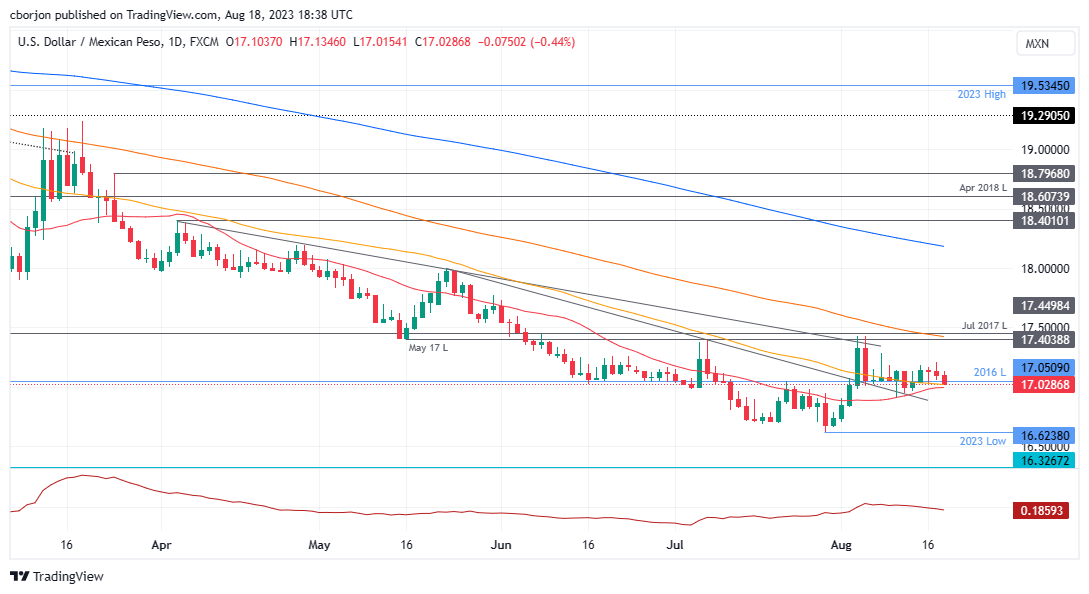
The USD/MXN bias remains downwards but it appears to have bottomed at around 17.0000. A daily close below the latter would expose the year-to-date (YTD) low of 16.6238, followed by the October 2015 swing low of 16.3267. Contrarily, if USD/MXN remains above 17.0000, the 20-day Moving Average (DMA) at 17.0189 would be up for grabs.
Central bankers, primarily Fed Chair Powell, will speak at the Jackson Hole Symposium. The words of central bankers will take center stage, as the market looks for guidance. In terms of data, the global PMIs will be the highlight of the week.
Here is what you need to know for next week:
It's the turn of central bankers. The news flow is likely to be inundated with comments from central bankers. The key speech is scheduled for Friday with Federal Reserve (Fed) Chair Jerome Powell. The impact of these speeches could overshadow economic numbers. The symposium runs from August 24 to 26.
Regarding data, the highlight will be the Global PMI, which will provide a first glimpse of economic activity worldwide. These numbers will be released on Wednesday.
The cautious tone across markets will also remain in focus next week. With growing concerns, mainly from China, the deterioration in market sentiment could trigger some panic. Such a scenario could be positive news for the Japanese Yen and the US Dollar. The Dow Jones had its worst week since March, ending at five-week lows.
The US Dollar Index (DXY) rose for the fifth consecutive week, supported by US economic data, risk aversion, and higher Treasury yields. The last time it achieved such a streak was in May 2022. The DXY closed above 103.00, the highest level since June. Next week, US data includes housing reports, Jobless Claims, and Durable Goods Orders.
US Treasury yields rose during the week, with the 10-year settling above 4.20%, the highest weekly close since 2007, despite market expectations that the Fed will skip a rate hike at the September meeting.
EUR/USD reached six-week lows and ended below the 20-week Simple Moving Average (SMA), suggesting further weakness, with the next support at July lows around 1.0830. The German Producer Price Index (CPI) for July and the Bundesbank monthly report are due on Monday. On Wednesday, the S&P Global preliminary Manufacturing and Services PMI surveys for Germany and Eurozone countries will be released. On Friday, German growth data and the IFO survey.
The Japanese Yen was among the top performers due to risk aversion, and received and extra boost on Friday with the retreat in government bond yields. USD/JPY finished marginally higher above 145.00, after pulling back 146.60, the highest level since November.
USD/CHF rose for the fifth consecutive week and climbed above 0.8800; however, the long-term trend remains downward. If worries intensify in the markets, the Swiss Franc could benefit.
The Pound was the biggest gainer among majors, supported by UK economic data. The negative numbers were Retail Sales on Friday, which somewhat weakened the currency. GBP/USD ended a four-week negative streak and remained above the 20-week SMA and 1.2600.
USD/CAD rose above 1.3500, hitting the highest level since May, and continues to trend higher. Canada will report Retail Sales on Wednesday.
The Antipodean currencies were the worst performers, influenced by the Chinese outlook and the decline in commodity prices. The Reserve Bank of Australia (RBA) and the Reserve Bank of New Zealand (RBA) are currently on pause, and despite some hawkish signs, they are not expected to resume the tightening cycle.
The Australian Dollar was the worst among the major currencies. Employment data from Australia came in below expectations. The only report on the docket for next week is the S&P Global PMI. AUD/USD fell for the fifth consecutive week, breaking below 0.6500 and testing levels below 0.6400. The bias is to the downside; however, a correction seems overdue.
NZD/USD broke the psychological level of 0.6000, falling to the 0.5900 area, the lowest since November of last year. New Zealand will report Trade data on Monday and Retail Sales on Wednesday.
Cryptocurrencies tumbled, affected by global concerns across markets. Bitcoin experienced its worst week in three months, falling to $26,000.
Gold fell below $1,900, reaching one-month lows. It remains under pressure due to a stronger Dollar and higher yields. Silver ended the week flat around $22.70, showing signs of stabilization, but it still faces challenges and uncertainties.
Like this article? Help us with some feedback by answering this survey:
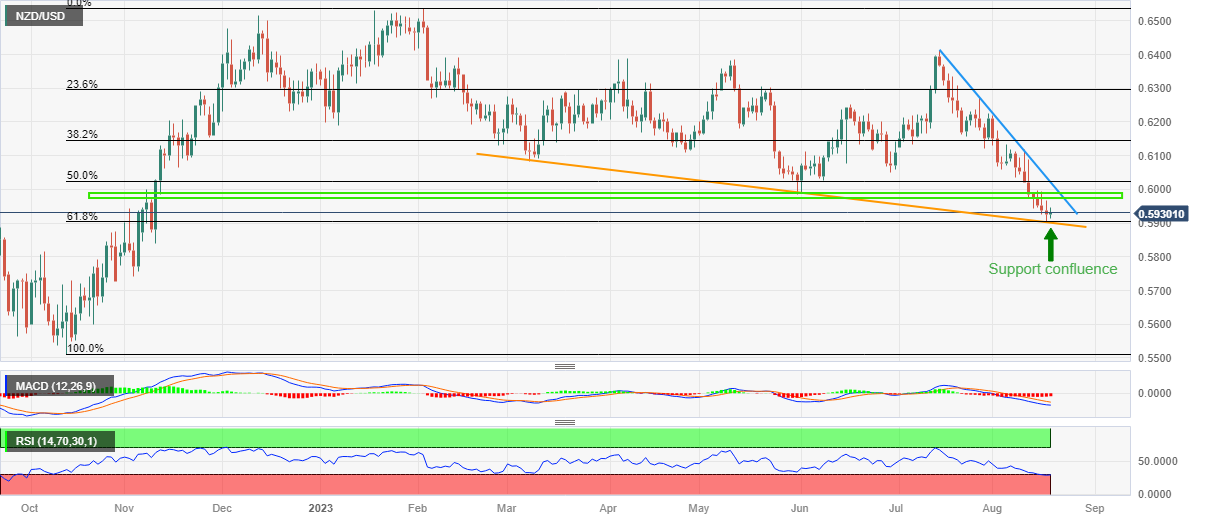
- NZD/USD consolidates its loses and jumps near 0.5940, but it will set its fifth consecutive weekly loss.
- USD closes the week steady, driven upwards by a sour market mood and hawkish bets on the Fed.
- Hawkish signals from the RBNZ limit the Kiwi’s downside.
On Friday, the NZD/USD recovered some ground as the pair corrected oversold conditions on the daily chart. On the one hand, the Kiwi got a boost from the Reserve Bank of New Zealand (RBNZ) Deputy Governor Silk’s messages, while the USD, measured by the DXY index, traded at its highest point since mid June.
The DXY index consolidated itself above its 200-day Simple Moving Average (SMA) and jumped to 103.60, its highest level since June 13 and then settled at 103.30. Factors driving the USD upwards during the week included the hawkish stance seen by the Federal Open Market Committee (FOMC) in Wednesday’s minutes from the July meeting, which boosted US yields and the sour market mood due to the worrying Chinese economic situation. In line with that, markets grew concerned due to Evergrande filing for protection from creditors in a US bankruptcy court.
On the Kiwi’s side, the Reserve Bank of New Zealand (RBNZ) Deputy Governor Karen Silk delivered some hawkish messages and warned that upside risk to inflation may push the bank to retain rates higher for a longer time. As a reaction, the NZD is trading strong against most of its rivals and is one of the session’s top performers alongside the JPY and the USD.
NZD/USD Levels to watch
According to the daily chart, the technical outlook for the NZD/USD remains neutral to bearish as the bulls show signs of recovery. With an ascending slope in oversold territory, the Relative Strength Index (RSI) suggests a potential increase in buying pressure, while the Moving Average Convergence (MACD) displays weaker red bars. On the other hand, the pair is below the 20,100 and 200-day Simple Moving Averages (SMAs), suggesting that the bears are firmly in control of the bigger picture, leaving the buyers vulnerable.
Support levels: 0.5930, 0.5910, 0.5900.
Resistance levels: 0.6000, 0.6020, 0.6050.
NZD/USD Daily chart
-638279755062766657.png)
- USD/CAD advances 0.05% to 1.3551, buoyed by investor concerns over China’s shadow bank and real estate crises.
- US retail sales exceed expectations, supporting the Fed’s stance on maintaining restrictive monetary policy.
- Canadian July Producer Prices rebound with a 0.4% rise, driven by surges in oil and lumber prices.
USD/CAD prepares to finish the week on a higher note, with gains of 0.84%, extending its rally to five straight days but remains unable to claim the 1.3600 figure. Risk aversion continues to take its toll on global equities, sparking flows to safe-haven assets. Hence, the USD/CAD is almost flat, exchanging hands at 1.3545.
Evergrande’s bankruptcy and China’s economic downturn bolster the greenback, while Canadian Producer Prices show recovery
The pair extended its gains on risk aversion, as investors weighed China’s economic woes. Recent data revealed the second-largest economy is deteriorating. At the same time, the shadow bank crisis and real estate turmoil escalated after Thursday’s news that Evergrande filed for Chapter 15 bankruptcy in New York.
The US economic docket was light, but recent data showed that retail sales pushing above estimates and a robust labor market justifies the Federal Reserve’s (Fed) need to keep monetary policy at restrictive levels. The latest monetary policy meeting minutes emphasized the Fed’s commitment to bring inflation towards its 2% target, though some officials began to be cautious about upcoming meetings.
In the meantime, the Canadian economic calendar revealed that July Producer Prices rose by 0.4%, exceeding June’s -0.6% plunge, underpinned by oil and lumber prices. Raw materials prices rose 3.5% in July but remained down 11.1% in the year.
The USD/CAD remained on the front foot, but a late uptick in oil prices shifted the USD/CAD negative. The US Dollar Index (DXY), a gauge of the greenback’s value against a basket of six currencies, hovered around two-month highs but retraced to 103.389, almost flat. The US Treasury bond yields pare some of its losses, with the US 10-year Treasury note yielding 4.239%, down four bps.
What to watch?
USD/CAD Price Analysis: Technical outlook
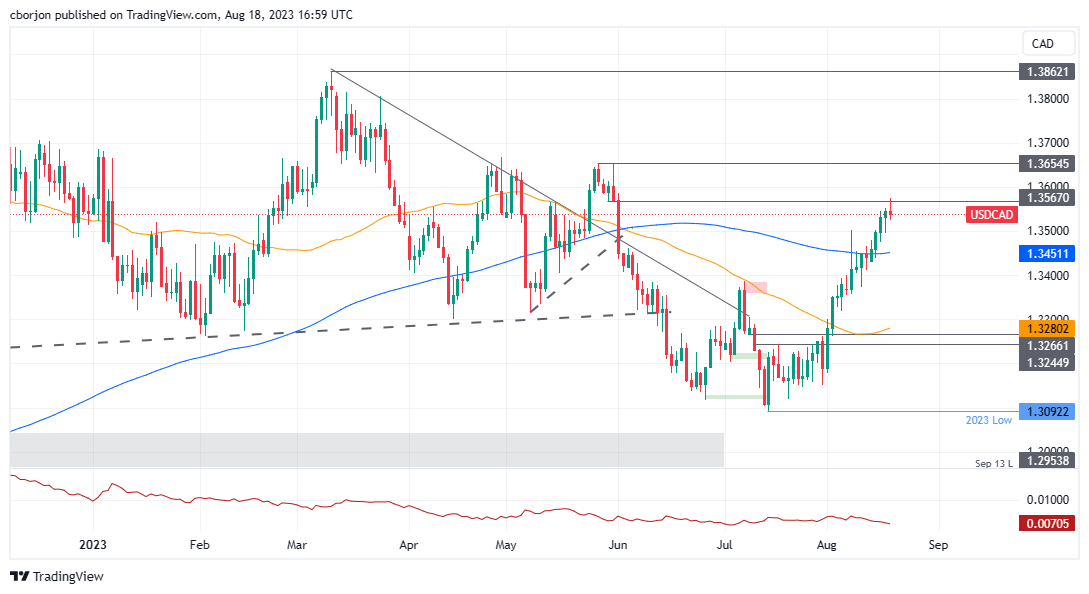
The USD/CAD bias remains upward as price action cleared the 200-day Moving Average (DMA) at 1.3451, though it faltered to clear the May 30 daily low turned resistance at 1.3567, which once reclaimed, as the USD/CAD pair would rally towards the May 26 swing high at 1.3654. If that level is cleared, the year-to-date (YTD) high would be up for grabs at 1.3862.
- XAU/USD recovered towards $1,890, still poised for a weekly decline.
- China’s real state giant Evergrande filed for bankruptcy protection in a US court.
- Lower US yields amid risk aversion benefits Gold prices.
At the end of the week, the XAU/USD Gold spot slightly recovered to $1,890, but it is still poised for a 1% weekly decline, its fourth weekly loss in a row. The metal seems to be consolidating losses after seeing red in the previous four days and also got a boost due to risk aversion fueled by markets worrying about the Chinese economy’s health.
In that sense, a sour market mood was spread due to a Chinese real estate giant, Evergrande, filing for bankruptcy protection in a US court. It's worth noticing that the same giant had defaulted on huge debts back in 2021, which sent shockwaves through financial markets so the yellow metal may benefit in the upcoming sessions as investors may take refuge in it.
On the other hand, what explains the XAU/USD’s decline is that US Treasury yields, often seen as the opportunity cost of holding gold, sharply rose, mainly because of the hawkish stance seen by the Federal Open Market Committee (FOMC) in Wednesday’s minutes from the July meeting which saw participants leaving the door open for another hike. To end the week, US rates are declining, as investors may be taking refuge in bonds allowing the metal to gain traction.
XAU/USD Levels to watch
The technical analysis of the daily chart suggests a neutral to bearish stance for XAU/USD as the bulls are working on staging a recovery but are still deep in negative territory. With an ascending slope below its midline, the Relative Strength Index (RSI) suggests a potential increase in buying pressure, while the Moving Average Convergence (MACD) displays neutral red bars. Furthermore, the pair is below the 20,100 and 200-day Simple Moving Averages (SMAs), implying that the bears retain control on a broader scale while the buyers are urged to make improvements.
Support levels: $1,870, $1,850, $1,830
Resistance levels: $1,900, $1,906 (200-day SMA), $1,930.
XAU/USD Daily chart
-638279715538874121.png)
- UK Retail Sales for July disappoint with a -1.2% MoM drop, surpassing the anticipated -0.5% decline.
- Strong UK GDP readings and high wages keep BoE rate hike expectations alive, with a 6% peak on the Bank Rate anticipated.
- Eyes on upcoming PMIs, housing data, and Fed Chair Jerome Powell’s speech for insights into the future trajectory of monetary policy.
GBP/USD retreats from daily highs and losses for the second day in the week but remains set to finish the week on a higher note. Retail Sales in the United Kingdom (UK) were softer, but most data supports the Bank of England’s (BoE) case for a rate hike at its upcoming meeting. The GBP/USD is trading at 1.2740 after hitting a daily high of 1.2766.
Despite a dip in Retail Sales, robust UK GDP and wage growth fuel expectations of a BoE rate hike, setting the stage for GBP/USD appreciation
Global equities post losses reflect a sour sentiment weighing on the GBP/USD’s pair as flows seeking safety bolstered the US Dollar (USD). The Office for National Statistics (ONS) revealed that Retail Sales for July plunged -1.2% MoM, below estimates for a -0.5% drop, while annually biased plummeted -3.2%, exceeding -2.1% estimates.
Nevertheless, strong readings on UK GDP and steadily high wages maintain expectations for further tightening by the BoE high, as money market players are pricing in a 6% peak on the Bank Rate. Hence, the GBP/USD would appreciate in the near term, as the interest rate differential compared to the Federal Funds Rates (FFR) in the US, currently at 5.25%-5.50%, favors the Sterling (GBP).
On the US front, the latest round of economic data keeps the greenback underpinned, and US Treasury bond yields high. Monetary policy is expected to remain at restrictive levels, as noted by Federal Reserve (Fed) officials, as July’s monetary policy minutes revealed.
The US Dollar Index (DXY), a gauge of the greenback’s value against a basket of six currencies, hovers around two-month highs at 103.680, while US Treasury bond yields pare some of its losses, with the US 10-year Treasury note yielding 4.239%, down four bps.
What to watch?
The UK economic docket will feature PMIs for August on its preliminary reading. On the US front, PMIs, housing data, Fed speakers, and Fed Chair Jerome Powell’s speech at the Jackson Hole Symposium are eyed for clues of the forward path of monetary policy.
GBP/USD Price Analysis: Technical outlook
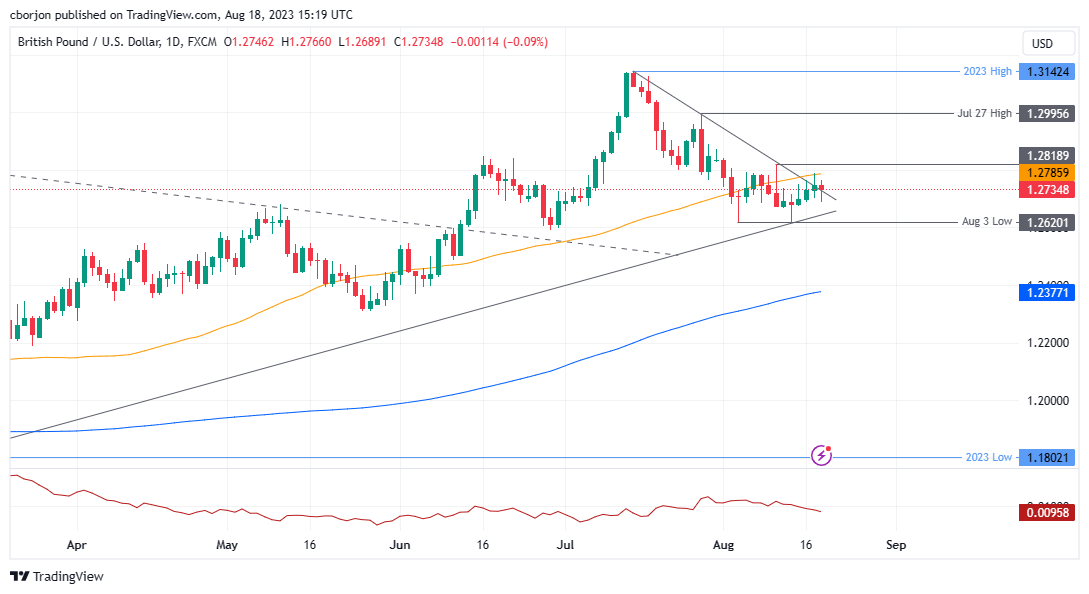
The GBP/USD daily chart portrays the pair as neutral biased, though it appears bottomed at around 1.2620. Since then, the GBP/USD reclaimed 1.2700 and stood four days above the latter. Although the pair edged toward the 1.2800 figure, it was capped by the 50-day Moving Average (DMA) at 1.2786. Nevertheless, once breached, the next stop would be 1.2800, followed by August 10 at 1.2819 and the next intermediate resistance at 1.2850. Contrarily, if GBP/USD tumbles below 1.2700, that would exacerbate a fall to 1.2660.
Gold now finds itself at its lowest level since mid-March. Economists at Commerzbank analyze XAU/USD outlook.
Fed Chair Powell will probably leave all options open
The recent renewed rise in US yields dampens investor interest, among both the more short-term-oriented speculative financial investors and the ETF investors. In this environment, the physical demand in Asia can hardly do anything to help, and China’s Gold imports are unlikely to move prices.
Instead, like on the foreign exchange market, attention is more likely to be focused on the Fed symposium in Jackson Hole. If the market interprets what is said there as making another rate hike more likely in the US, XAU/USD could fall somewhat further still. We are confident that Powell will not indicate any one direction in particular, however.
In general, we are convinced that US interest rates have already peaked. And as soon as there are also clear signs that the market has acknowledged this, the Gold price should profit and recover again.
Gas market is shifting to a more balance position. However, economists at ANZ Bank note supply risks that could lead to further upside in prices.
Striking fear into Gas markets
Supply-side issues are once again back in focus in the global Gas market. Industrial action in Australia could threaten the relative peace the global Gas markets experienced following Russia’s invasion of Ukraine last year.
Workers at several Western Australian LNG facilities operated by Chevron and Woodside are threatening to strike over wages and conditions. Three major facilities there provide around 10% of global supply, and the impact on the market will be dictated by the length of any disruption.
The impact will initially be felt in Asia. Most of the contracted supply finds its way to Japan, but China also receives a sizeable chunk. More significantly, the reduction in supply could ignite a bidding war between Europe and Asia.
This comes as the market shifts to a more balance position. Any disruption lasting more than a month is likely to have a material impact on the supply-demand balance over the northern winter, which would see a re-rating by the market, leading to further upside in prices.
Oil prices still have more upside, in the view of strategists at ING.
Oil market will continue to tighten
We believe that there is still room for the market to move higher. Our balance sheet suggests that the oil market will continue to tighten as we move through the second half of the year with a deficit in the region of 2MMbbls/d.
We have left our forecasts for the remainder of the year unchanged. We still expect ICE Brent to average $86/bbl over 3Q23 and $92/bbl over 4Q23.
Our balance shows that the market will remain in deficit over 2024. However, this deficit is heavily skewed towards the second half of 2024. In fact, we see a small surplus in 1Q24, which suggests that prices could pull back early next year, before moving higher once again.
Silver’s price plunged amid renewed downward pressure on Gold. Economists at ANZ Bank analyze XAG/USD outlook.
A disconnect between price and fundamentals
We believe Silver’s supportive fundamentals should come into play once manufacturing activity recovers in China and other developed markets. Investment demand has been lacklustre since 2022 despite strong fundamentals. This leaves ample scope for investment demand to pick up at current price level.
We believe there are fundamental factors to support an upside to prices: Industrial offtake is at a record high to 580moz in 2023, up 4% YoY. There are encouraging developments on the trade front via India’s Comprehensive Economic Partnership Agreement (CEPA) with the UAE. There are some supply bottlenecks.
The Ministry of Finance (MOF) intervened at levels above 145.90 in USD/JPY last September. Concerns are increasing that the weak Yen might mobilize the MOF. Antje Praefcke, FX Analyst at Commerzbank, analyzes JPY outlook.
Bet on time?
While the US economy remains robust, which has already dampened Fed rate-cut expectations and is supporting the Dollar, I see little chance of the Yen appreciating again. On the contrary, I fear that it might ease further under these conditions unless the MOF tries to end the decline.
Perhaps BoJ and MOF are hoping that things will change once interest rates in the US begin to fall again. We, too, expect the Dollar to weaken at that point. But it will be some time before that happens. The only thing the MOF would achieve with interventions until then would be to gain some time, as in our view ‘leaning against the wind’ cannot lead to success and strengthen the Yen. It is possible that this bet on time will work. But it is uncertain.
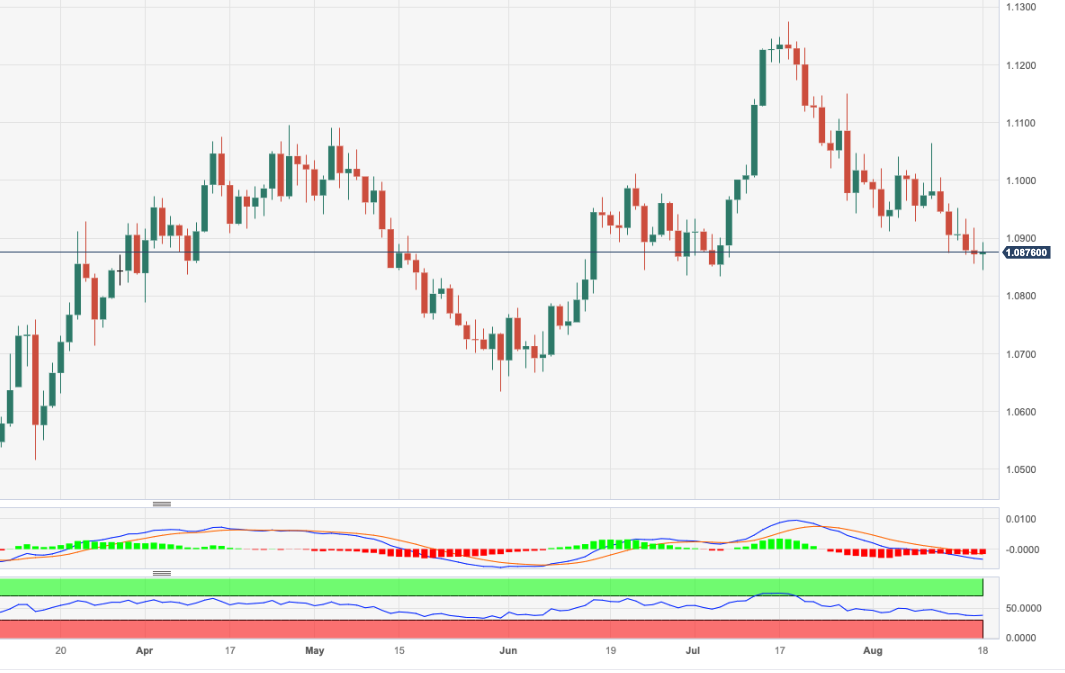
- EUR/USD prints new lows near 1.0840 on Friday.
- Further weakness could revisit the 1.0830 region.
EUR/USD maintains the multi-session bearish move well in place at the end of the week.
A deeper pullback now targets the July low of 1.0833 (July 6). The loss of this region leaves the pair vulnerable to a probable test of the critical 200-day SMA at 1.0790 in the short-term horizon.
In the meantime, the pair’s positive outlook remains unchanged while above the 200-day SMA.
EUR/USD daily chart
Economists at RBC Economics expect the USD/CAD pair to see a range-bound movement in the coming days and weeks.
Year-end target for USD/CAD retained at 1.38
USD/CAD's trajectory seems uncertain in the near term, likely to be influenced by developments around the USD. The pair will see a range-bound movement in the coming days and weeks.
We maintain our year-end target for USD/CAD at 1.38. This forecast hinges on a mild recovery in the USD towards the end of the year.
A slowdown in the US would put downward pressure on USD/CAD, while a global downturn would likely support the pair.
A poll from Reuters showed that out of 110 economists, 99 expected the Federal Reserve (Fed) to keep interest rates unchanged at the September meeting. According to the poll, 80% of respondents do not anticipate any further interest rate hikes by the Fed this year.
A majority of the economists expect the Fed to cut interest rates at least once next year, by the end of the second quarter.
The probability of the US economy falling into a recession has decreased to 40%, after being above 50% since September 2022.
Market reaction:
The US Dollar weakened modestly after the poll, trimming its earlier gains. US stocks moved modestly higher, although they still held significant losses. The price of WTI crude oil rebounded back above $80.00, while the price of Gold edged higher towards $1,895.
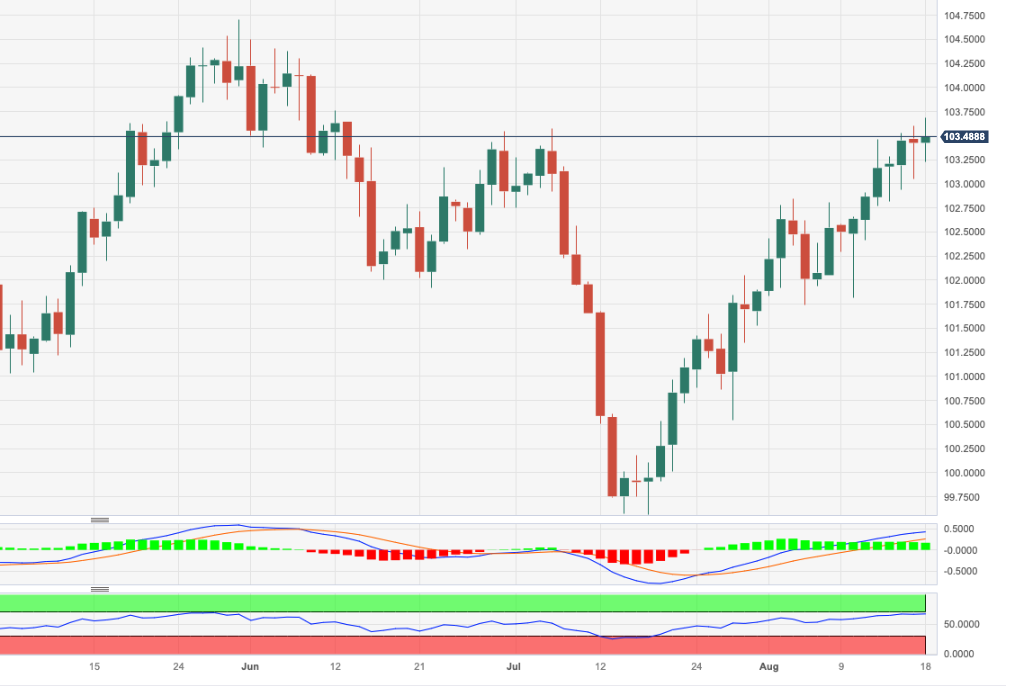
- DXY resumes the upside and advances to new highs near 103.70
- Further gains now appear likely above the 200-day SMA.
DXY leaves behind Thursday’s small downtick and climbs to new multi-week tops near 103.70 at the end of the week.
In the meantime, the index maintains the bullish view well in place with the immediate hurdle now emerging at the May top of 104.69 (May 31) ahead of the 2023 peak of 105.88 (March 8).
It is worth noting that this area of monthly highs appears reinforced by the proximity of the key 200-day SMA, today at 103.20.
Looking at the broader picture, a convincing breakout of the 200-day SMA should shift the outlook for the index to a more constructive one.
DXY daily chart
Recently, Russia’s Rouble exchange rate depreciated in an accelerated manner. Economists at Commerzbank analyze what is behind the Rouble weakness.
Depreciation a consequence of capital flight?
The USD/RUB exchange rate is entirely managed by CBR. Russia’s capital account is largely shut for hard currencies such as Dollar, Yen or Euro by Western sanctions. Neither can rate hikes attract foreign capital nor can domestic capital easily leave because of a negative economic outlook.
Under these circumstances, it is unusual that sudden pressure could arise on the central bank’s managed exchange rate. This raises alerts that channels for sanction-evading capital outflow may have opened up. This will always be difficult to verify or analyse formally, but if this is true, then the regime could easily face a major challenge with financial stability.
The capital looking to exit Russia is probably structurally motivated, and no amount of central bank rate hikes will be sufficient to reverse such incentives.
- EUR/JPY adds to Thursday’s pullback and breaks below 158.00.
- The 160.00 region aligns as the next target on the upside.
EUR/JPY slips back below the 158.00 yardstick to print new weekly lows on Friday.
So far, the emergence of some consolidation seems probable in the very near term ahead of the continuation of the upside. Against that, the immediate target remains at the round level of 160.00.
The surpass of the latter should not see any resistance level of note until the 2008 high at 169.96 (July 23)
So far, the longer term positive outlook for the cross appears favoured while above the 200-day SMA, today at 147.31.
EUR/JPY daily chart
Gold prices have turned downward. Economists at OCBC analyze the yellow metal’s outlook.
Gold prices can outperform at end of Fed tightening cycle
We maintain our constructive outlook on Gold prices.
Near term, rates staying ‘high for longer’ and higher real yields could still weigh on Gold prices until a Fed pivot comes into sight. To put in perspective, the Fed tightening cycle is likely to have ended. Historically, Gold prices can outperform at end of Fed tightening cycle.
While opportunity cost of holding Gold has risen, we should expect real yields to ease lower at some stage. This would then be supportive of Gold prices.
Looking on, we keep a look out on the upcoming Jackson Hole Symposium (24-26 Aug) for any hints from Fed on earlier policy shifts.
USD steady on soft risk mood. Economists at Scotiabank analyze Greenback’s outlook.
Spreads edging in the USD’s favour
The USD retains a firm undertone after six consecutive daily gains and two consecutive closes above the DXY’s 200-DMA. The DXY’s intraday range so far is holding within yesterday’s trading range, hinting at some consolidation in the USD’s overall bull run, however.
The risk backdrop is weak today, amid concerns about China’s growth outlook and investor concerns that high interest rates could weigh on stock market returns. Weak risk appetite is USD-supportive.
All major bond market yields are down but US Treasury yields have fallen less (around 5 bps) than European markets (7-10 bps), edging spreads in the USD’s favour somewhat. This is adding to USD support in effect.
USD/CAD trades little changed in the mid-1.35s. Economists at Scotiabank analyze the pair’s outlook.
Weak risk mood remains a headwind for CAD
Weak risk mood and marginally lower energy prices are enough to keep the CAD tone defensive for the moment while relatively stable short-term spreads may act as something of an anchor for the CAD. External developments will continue to have a major influence on the CAD tone, however.
There is some evidence on the short-term chart to suggest that the USD rally is losing some momentum; price action over the second half of the week has topped out in the mid-1.35s and the broader rally in the USD is becoming confined to a narrowing, upward-sloping range, a bearish wedge pattern. But there is no obvious sign of weakness in the USD at this point.
Resistance is 1.3550/55. Support (bear breakdown trigger) is the wedge base at 1.3525.
Sterling is marginally lower on the day. Economists at Scotiabank analyze GBP/USD outlook.
Thursday’s failure to push through 1.28 is a minor setback
Sterling’s early week rebound from the low 1.26 area still casts a positive technical look over the short-term chart but progress has been limited and Thursday’s failure to push through 1.28 (40-DMA at 1.2805) is a minor setback for the Pound at least.
But short-term trend momentum remains bullish and gains through the low 1.28s (recall that 1.2820 is the bull trigger for a 1.2620 double bottom) should drive further gains.
Intraday support is 1.2700/1.2710.
EUR/USD steadies in the upper 1.08s. Economists at Scotiabank analyze the pair’s outlook.
Support is 1.0835, Resistance is 1.0920
Short-term trend momentum has flattened out completely as EUR/USD steadies in a 1.0850-1.0900 trading range (roughly).
Consolidation appears to be the order of the day for the pair, with the intraday range holding inside Thursday’s range parameters.
Support is 1.0835, the June low. Resistance is 1.0920.
See:
- EUR/USD may keep trading in narrow ranges for now – ING
-
EUR/USD to see a boring sideways trade – Commerzbank
- US Dollar price action was very choppy on Thursday after the US issued tariffs on tin imports.
- Traders have digested the hawkish Fed Minutes and are looking forward to Jackson Hole next week.
- The US Dollar Index consolidates near the monthly high and to close this week again in the green.
The US Dollar (USD) is proving to be resilient although a few market participants are trying to push the Greenback from its pedestal. Not only are the BRICS (Brazil-Russia-India-China-South Africa) countries holding a convention to circumvent their dependency from the US Dollar when exchanging commodities, but the Chinese People’s Bank of China (PBoC) has issued its strongest fixing in its existence for the Yuan against the US Dollar. The PBoC tries to stabilise the Yuan to squeeze out speculators against the Chinese currency.
A very calm Friday on the data front with no real market moving points. This will offer market participants the chance to start preparing for the volatile week ahead, with a lot of data out of Europe and the annual Jackson Hole Symposium as the cherry on the cake. Each year, all the smart minds and souls of biggest central banks over the world meet in Wyoming to debate about monetary policy. This event will bear quite a lot of headline risk as it is often the ideal moment for the US Federal Reserve (Fed) to announce either a change in monetary policy or issue a longer-term commitment on its policy adjustments.
Daily digest: US Dollar moves sideways
- The main focus today will be on headlines from the BRICS convention, where the main topic is de-dollarization.
- Another red day again in equity markets, with Asian equities on their back. The Japanese Topix is about to close this Friday with a 0.70% loss. The stronger Yuan fixing does not help the Hong Kong Exchange, which is down near 2%. Europe is in the red as well, though by less than 0.5%. US futures bear hope for a turnaround, with US futures mildly in the green at 0.1% on average.
- The CME Group FedWatch Tool shows that markets are pricing in an 88.5% chance that the Federal Reserve will keep interest rates unchanged at its meeting in September.
- The benchmark 10-year US Treasury bond yield trades at 4.23%, retreating a touch from its peak earlier this week.
US Dollar Index technical analysis: steady as she goes
The US Dollar is hovering at the monthly high in the US Dollar Index (DXY). The Greenback retreats a touch this Friday, though remains at several three to six-months highs against most major G10 peers. Any sudden headline or squeeze could see fresh highs if the headlines would bear a risk off tone.
On the upside, 104.00 is the level to head to. The high of July at 103.57 is vital and needs to get a daily close above in order for the DXY to eke out more monthly gains. Should this US Dollar strength persist for the last part of this year, May’s peak at 104.70 could become reality again.
On the downside, several floors are likely to prevent a steep decline in the DXY. The first one is the 200-day Simple Moving Average (SMA) at 103.26, which got broken very briefly on Thursday. Passing below the 103.00 big figure, some room opens up for a further drop. However, around 102.34 both the 55-day and the 100-day SMA are awaiting to catch any falling knives.
US Dollar FAQs
What is the US Dollar?
The US Dollar (USD) is the official currency of the United States of America, and the ‘de facto’ currency of a significant number of other countries where it is found in circulation alongside local notes. It is the most heavily traded currency in the world, accounting for over 88% of all global foreign exchange turnover, or an average of $6.6 trillion in transactions per day, according to data from 2022.
Following the second world war, the USD took over from the British Pound as the world’s reserve currency. For most of its history, the US Dollar was backed by Gold, until the Bretton Woods Agreement in 1971 when the Gold Standard went away.
How do the decisions of the Federal Reserve impact the US Dollar?
The most important single factor impacting on the value of the US Dollar is monetary policy, which is shaped by the Federal Reserve (Fed). The Fed has two mandates: to achieve price stability (control inflation) and foster full employment. Its primary tool to achieve these two goals is by adjusting interest rates.
When prices are rising too quickly and inflation is above the Fed’s 2% target, the Fed will raise rates, which helps the USD value. When inflation falls below 2% or the Unemployment Rate is too high, the Fed may lower interest rates, which weighs on the Greenback.
What is Quantitative Easing and how does it influence the US Dollar?
In extreme situations, the Federal Reserve can also print more Dollars and enact quantitative easing (QE). QE is the process by which the Fed substantially increases the flow of credit in a stuck financial system.
It is a non-standard policy measure used when credit has dried up because banks will not lend to each other (out of the fear of counterparty default). It is a last resort when simply lowering interest rates is unlikely to achieve the necessary result. It was the Fed’s weapon of choice to combat the credit crunch that occurred during the Great Financial Crisis in 2008. It involves the Fed printing more Dollars and using them to buy US government bonds predominantly from financial institutions. QE usually leads to a weaker US Dollar.
What is Quantitative Tightening and how does it influence the US Dollar?
Quantitative tightening (QT) is the reverse process whereby the Federal Reserve stops buying bonds from financial institutions and does not reinvest the principal from the bonds it holds maturing in new purchases. It is usually positive for the US Dollar.
Signs of opposition to CNY weakness have helped stall Dollar gains. Still, economists at MUFG Bank expect the USD/CNY pair to advance nicely.
Signs of resistance to a higher USD/CNY unlikely to lead to a turnaround
We doubt very much that the signs of resistance to a higher USD/CNY will lead to a turnaround in USD/CNY. This strategy is very likely more about curtailing sharp moves and fuelling further appetite for Dollars and for capital flight.
The divergence between the PBoC fixing and market estimates of the fix is now at the widest ever, surpassing the previous record from November 2022. Back then falling US inflation and falling US yields alleviated the upward pressure. That seems much less likely at this stage and a break higher through the intra-day high from last November of 7.3274 seems very likely, taking USD/CNY to levels last seen in December 2007.
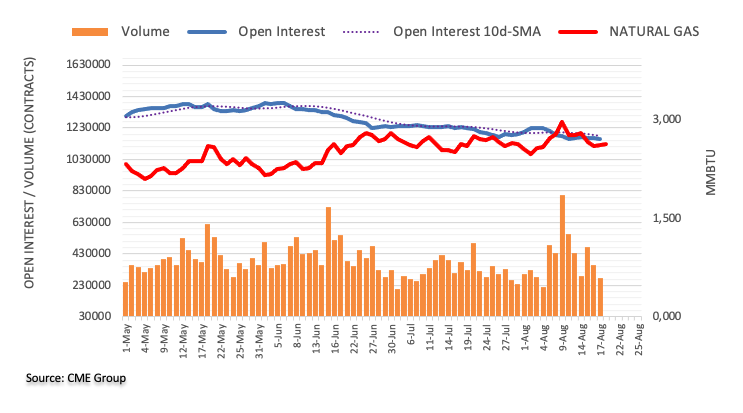
- Natural Gas remains below $3 as stockpile data points to less demand for the winter.
- The US Dollar takes a step back with markets digesting the hawkish tone of the Fed.
- The overall technical picture remains a longer-term ascending trend channel.
Natural Gas price does not look to be eking out any gains for this week as the overall loss remains stuck near an 8% loss. Stockpile numbers are dampening any hopes for a speedy recovery of the Natural Gas price toward $3. With stockpiles in Germany above 90% and US stockpiles ticking up again this week, the demand toward the fall could be less present than in past years.
Although the US Dollar took a step back on Thursday when the US issued surprise tariffs on tin metal imports from China, Germany and Canada. The Greenback remains in the green for this week and consolidates its fresh monthly high. This weighs in the futures market on the contracts as the current price gets capped by a more expensive Greenback.
At the time of writing, Natural Gas is trading at $2.756 per MMBtu.
Natural Gas news and market movers
- The weekly US gas stockpile numbers on Thursday revealed a build from 29B to 35B, while 34B was expected.
- Pipeline gas cuts from Kazakhstan and Uzbekistan could provide some upside push to LNG demand.
- Current weather projections point to an elevated possibility of a cold winter in Europe, which would underpin current gas price levels even as storages are already almost full.
- China’s LNG import growth is set to slow down for the winter, according to Bloomberg gas analyst Daniela Li. China has secured 37 long-term deals in the past two years, which could lead to oversupply by 2024.
- Tropical storm Hilary is on its way to the Baja California peninsula and is set to make landfall by Friday evening.
- All eyes are focused on next week where the annual Jackson Hole Symposium will be the focal point for the week. Each year the US Federal Reserve signals a change in its monetary policy going forward on the event.
Natural Gas Technical Analysis: still in range
Natural Gas has received a beating these past few trading days. With an overall 8% decline, it becomes clear that the equilibrium between supply and demand is very fragile and the current rise in gas stockpiles for the US, EU and China could point to fading demand over the winter. For now more downside pressure looks to be at hand, unless current supply gets reduced should the Australian strikes broaden and fully shut down supply toward their external trade partners.
On the upside, $3 is still the level to watch as the overall ascending trend channel since April is being respected. Should Natural Gas prices recover, look for a close above $2.935, the high of Tuesday, in order to confirm that demand is picking up again. More upside toward $3 and $3.065 (high of August 9) would be targets or levels to watch.
On the downside, the trend channel is doing its work with a 55-day Simple Moving Average (SMA) at $2.639, which is underpinning the price. In case more downside pressure builds, look for $2.579, which is the lower trendline of the trend channel.
-638279457514327042.png)
XNG/USD (Daily Chart)
Natural Gas FAQs
What fundamental factors drive the price of Natural Gas?
Supply and demand dynamics are a key factor influencing Natural Gas prices, and are themselves influenced by global economic growth, industrial activity, population growth, production levels, and inventories. The weather impacts Natural Gas prices because more Gas is used during cold winters and hot summers for heating and cooling. Competition from other energy sources impacts prices as consumers may switch to cheaper sources. Geopolitical events are factors as exemplified by the war in Ukraine. Government policies relating to extraction, transportation, and environmental issues also impact prices.
What are the main macroeconomic releases that impact on Natural Gas Prices?
The main economic release influencing Natural Gas prices is the weekly inventory bulletin from the Energy Information Administration (EIA), a US government agency that produces US gas market data. The EIA Gas bulletin usually comes out on Thursday at 14:30 GMT, a day after the EIA publishes its weekly Oil bulletin. Economic data from large consumers of Natural Gas can impact supply and demand, the largest of which include China, Germany and Japan. Natural Gas is primarily priced and traded in US Dollars, thus economic releases impacting the US Dollar are also factors.
How does the US Dollar influence Natural Gas prices?
The US Dollar is the world’s reserve currency and most commodities, including Natural Gas are priced and traded on international markets in US Dollars. As such, the value of the US Dollar is a factor in the price of Natural Gas, because if the Dollar strengthens it means less Dollars are required to buy the same volume of Gas (the price falls), and vice versa if USD strengthens.
Brent Crude held a continuous rally from $74/bbl to $85/bbl over the month of July. Economists at Rabobank analyze Oil outlook.
Brent will trade between $72 and $88 until Q4
Despite this impressive move driven by reduced Russian crude exports and Saudi production cuts, we expect that Brent will not break out of the yearly range of $72 to $88 just yet.
We witnessed heavy resistance this week at the $88/bbl mark again, and we see the current macro overhang and worsening Chinese economic data to keep this ceiling intact. However, if we are incorrect, we see that crude will continue to consolidate at a higher range with the next resistance levels at $93/bbl and $98/bbl.
We reiterate our call that Brent will trade between $72/bbl and $88/bbl until Q4, when prices are likely to rise and average $90/bbl.
Another leg higher in US Treasury yields and renewed USD strength are weighing on Gold prices. Economists at ANZ Bank analyze the yellow metal’s outlook.
Renewed strength in the USD is another headwind
A rise in US Treasury bond yields and the appreciation of the USD are exerting downward pressure on Gold.
The market is pricing another 25 bps hike by the Fed. If that materialises, real yields will rise further with moderating inflation, because higher yields increase the opportunity cost for holding Gold.
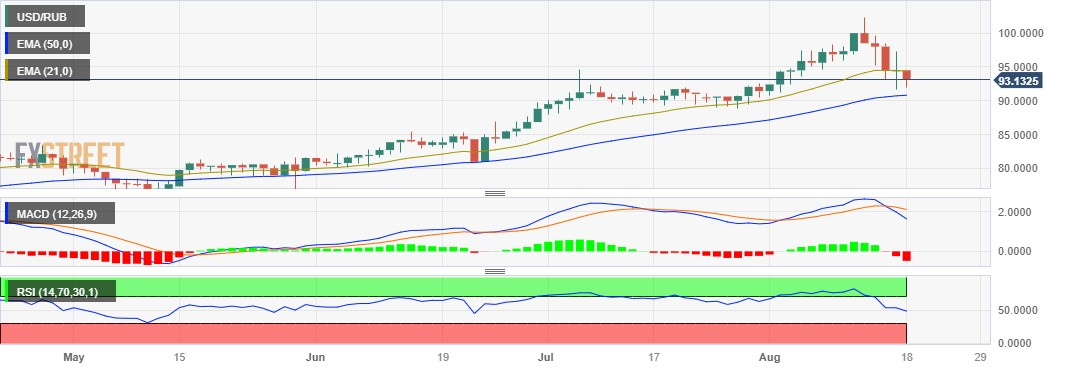
- USD/RUB continues to trade lower after CBR’s rate hikes.
- USD/RUB fall could inculcate a sense of caution in the market.
- MACD and RSI reinforce the confirmation of the bearish bias.
USD/RUB retracts the gains registered on Thursday, presently, trading at a lower level around 93.10 during the early hours of the European session on Friday. The pair is facing downward pressure, which could be attributed to the emergency rate hikes implemented by the Central Bank of the Russian Federation (CBR) on Tuesday.
The USD/RUB pair experiences losses despite improved US economic data, which could inculcate a sense of caution in the market. The optimism of Russian policymakers stands in contrast to the mixed stance among the members of the US Federal Reserve (Fed). However, firmer US Treasury yields and mostly upbeat US data could be enough to support the USD/RUB pair. Additionally, Uncertainties in the market regarding the CBR’s ability to protect the Russian Ruble (RUB) against the US Dollar’s (USD) strength could leave traders indecisive.
The US Dollar Index (DXY) recovers the losses incurred on Thursday, underpinning the USD/RUB pair. Spot trades higher around 103.50. This recovery of the US Dollar (USD) is driven by the improved US economic data, prompting a cautious sentiment within the market as it looks for additional cues regarding the inflation outlook.
Russian Ruble Technical Analysis
USD/RUB continues the downward trend that started on Monday. The pair could find immediate support around a two-week low at 91.5250. A firm break below the latter could push the USD/RUB pair to navigate the region around the 50-day Exponential Moving Average (EMA) at 90.82.
The Moving Average Convergence Divergence (MACD) line stays in the negative territory of the centerline and shows divergence below the signal line, which indicates the bearish sentiment in the USD/RUB pair. The 14-day Relative Strength Index (RSI) continues to remain below 50, reinforcing the confirmation of the bearish bias.
On the upside, the 21-day EMA at 94.36 emerges as the key resistance, followed by the 94.50 psychological level.
USD/RUB: Daily Chart
USD/JPY is lower today and the Yen is the best-performing G10 currency. Economists at MUFG Bank analyze the pair’s outlook.
There is limited upside from here
USD/JPY has reached the intervention zone and it looks like appetite to buy at these levels is receding.
The rhetoric from the MoF this week is not yet at a level consistent with imminent intervention. The Obon vacation period was earlier this week and it may be that next week we will see a pick-up in verbal opposition ahead of the Jackson Hole symposium from 24th-26th August.
We continue to believe that there is limited upside for USD/JPY from here and there are more attractive ways to benefit from US Dollar strength than buying USD/JPY.
- Gold price attracts some buyers on Friday and snaps a four-day losing streak to a multi-month low.
- China’s economic woes and retreating US bond yields turn out to be key factors offering support.
- The Federal Reserve’s hawkish outlook continues to underpin the US Dollar and caps the upside.
Gold price gains some positive traction on Friday and for now, seems to have snapped a four-day losing streak to its lowest level since March 13, around the $1,885 region touched the previous day. The XAU/USD maintains its bid tone through the early part of the European session and currently trades just above the $1,890 level, up around 0.30% for the day. The intraday uptick, however, lacks bullish conviction, warranting some caution before positioning for any meaningful recovery move.
China Evergrande Group – one of the country's biggest real estate developers – has filed for protection from creditors in a US bankruptcy court. This adds to concerns about a deepening crisis in China's property sector and the worsening conditions in the world's second-largest economy, which forces investors to take refuge in traditional safe-haven assets. The global flight to safety, meanwhile, drags the US Treasury bond yields lower and turns out to be another factor that benefits the non-yielding Gold price.
In fact, the yield on the benchmark 10-year US government bond corrects sharply from a 10-month peak touched the previous day, though the prospects for further policy tightening by the Federal Reserve (Fed) should help limit the downside. In fact, the minutes of the last Federal Open Market Committee (FOMC) meeting held on July 25-26 supported prospects for higher-for-longer interest rates in the United States (US) and kept the door open for one more 25 basis point (bps) lift-off later this year.
Moreover, the incoming US macro data continues to point to an extremely resilient economy, which should allow the Fed to stick to its hawkish stance. This, in turn, assists the US Dollar (USD) to stand tall near its highest level in more than two months and further contributes to keeping a lid on the Gold price. this further makes it prudent to wait for strong follow-through buying before confirming that the US Dollar-denominated commodity has formed a near-term bottom and placing aggressive bullish bets.
Traders also seem reluctant and might now prefer to move to the sidelines ahead of the crucial Jackson Hole Symposium next week, where comments by central bankers might infuse significant volatility in the markets. In the meantime, the US bond yields will play a key role in influencing the USD price dynamics in the absence of any relevant economic data from the US. Apart from this, the broader risk sentiment should allow traders to grab short-term opportunities around the Gold price on the last day of the week.
Technical levels to watch
Economists at ING analyze EUR/GBP outlook.
The 0.8500 support is under threat
The Sonia curve is fully pricing in a 6.0% peak rate in the UK, while markets are not convinced the ECB will hike rates at all. Incidentally, the Euro is more exposed to China than the UK. That would suggest the 0.8500 support in EUR/GBP is under threat, and we definitely don’t exclude it will be tested or broken temporarily in the coming days.
However, the short-term swap differential when the pair last traded at 0.8500 (mid-July) was around 20-25 bps wider in favour of GBP, meaning that a further widening of the monetary policy divergence may well be needed to keep EUR/GBP sustainably depressed.
US Dollar Index consolidates weekly gains above 103.00. Economists at ING analyze DXY's outlook.
Balance of risks is moderately tilted to the upside for the Dollar
The US calendar is empty today and the focus will likely be on bond market dynamics after back-end yields touched fresh multi-year highs on Thursday.
The combined effect of high yields and growing risks in China suggests the balance of risks is moderately tilted to the upside for the Dollar.
A return to 104.00 in DXY remains a tangible possibility in the coming days.
- AUD/USD struggles to capitalize on its modest intraday gains to the 0.6425-30 area on Friday.
- China’s economic woes continue to act as a headwind for the Aussie despite stimulus talks.
- The Fed’s hawkish outlook underpins the USD and contributes to keeping a lid on the major.
The AUD/USD pair surrenders its modest intraday gains to the 0.6425-0.6430 region and hovers near the lower end of its daily range during the early European session on Friday. Spot prices currently trade around the 0.6400 round-figure mark and remain well within the striking distance of the lowest level since November 2022 touched the previous day.
Despite talks of additional Chinese stimulus measures, concerns about the worsening economic conditions in the world's second-largest economy continue to act as a headwind for antipodean currencies, including the Australian Dollar (AUD). The fears were fueled by the fact that China Evergrande Group – one of the country's biggest real estate developers – has filed for protection from creditors in a US bankruptcy court. This adds to worries about a deepening crisis in China's property sector and keeps a lid on the AUD/USD pair's modest intraday uptick.
Apart from this, the disappointing domestic jobs data on Thursday pretty much confirms another on-hold rate decision by the Reserve Bank of Australia (RBA) in September and continues to undermine the Aussie. The US Dollar (USD), on the other hand, reverses a modest intraday dip and stands tall near its highest level in more than two months in the wake of firming expectations that the Federal Reserve (Fed) will keep interest rates higher for longer. This further contributes to keeping a lid on any meaningful upside for the AUD/USD pair.
That said, the Relative Strength Index (RSI) on the daily chart is already flashing oversold conditions and holding back traders from positioning for any further losses in the absence of any relevant economic data from the US. Nevertheless, the fundamental backdrop seems tilted firmly in favour of bearish traders and suggests that the path of least resistance for the AUD/USD pair is to the downside.
Technical levels to watch
As expected, Norges Bank raised the policy rate by 25 basis points to 4%. Antje Praefcke, FX Analyst at Commerzbank, expects the Norwegian Krone (NOK) to appreciate in the coming months.
Norges Bank delivered as much as it could
Norges Bank delivered what it could at this moment in time: a 25 bps rate hike to 4% as well as signalling that it will hike the key rate again in September if everything develops as currently projected; while also signalling that the key rate might have to be higher if the Krone was going to weaken and with inflation pressure remaining in place.
If future data turns out as it expects, Norges Bank will hike rates again in September and then probably leave everything on hold. The market is not yet entirely convinced that there will be another rate step in September, but if over the coming weeks, the data is in line with what Norges Bank expected in June the market is likely to increasingly take Norges Bank’s view – which will support NOK. If it surprises on the upside, this increases the likelihood of Norges Bank hiking rates even further than the currently projected terminal rate of 4.25%, which in turn would fuel the NOK.
I remain comfortable with the projection of moderate Krone appreciation over the coming months.
It is quite a success for EUR/USD to be trading around 1.0900. Economists at ING analyze the pair’s outlook.
Surprisingly resilient
It does look like there is a path for the Euro and other pro-cyclical currencies to weather this Chinese turmoil without taking much damage, but that also means a delay in any substantial rally against the Dollar.
EUR/USD may keep trading in narrow ranges for now, with a modestly bearish bias to the 1.0850 level.
See: EUR/USD to see a boring sideways trade – Commerzbank
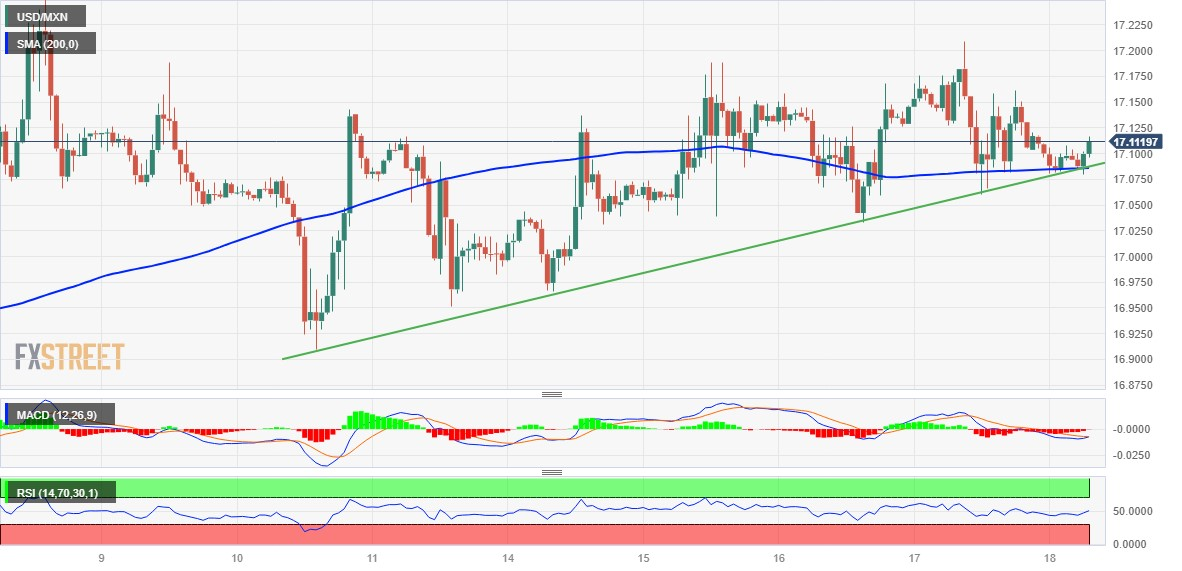
- USD/MXN lacks any firm intraday direction and remains confined in a range on Friday.
- Mixed oscillators on hourly/daily charts warrant some caution for aggressive traders.
- A sustained move beyond 17.20 is needed to support prospects for any further gains.
The USD/MXN pair struggles to gain any meaningful traction on Friday and oscillates in a narrow trading band through the early part of the European session. Spot prices, however, manage to defend the 17.0800-17.0850 confluence support and for now, seem to have stalled the previous day's modest pullback from over a one-week high.
The aforementioned area comprises the 200-hour Simple Moving Average (SMA) and an ascending trend line extending from the August 10 swing low, which, in turn, should now act as a pivotal point for intraday traders. Meanwhile, technical indicators on the 1-hour chart are holding in the negative territory and support prospects for an eventual breakdown. That said, positive oscillators on 4-hour/daily charts warrant some caution before positioning for any further losses.
Hence, bearish traders are likely to wait for a sustained break and acceptance below the 17.0800-17.0850 region before placing fresh bets. The USD/MXN pair might then accelerate the slide towards the 17.0400 horizontal support en route to the 17.00 psychological mark. This is followed by last week's swing low, around the 16.9090 area, below which spot prices could drop to the 16.8200-16.7995 area en route to the next relevant support near the 16.7030-16.7025 region.
On the flip side, the 17.1450-17.1455 region is likely to act as an immediate hurdle ahead of the weekly top, around the 17.2070 area touched on Thursday. A sustained strength beyond has the potential to lift the USD/MXN pair towards the 17.2835 zone en route to the monthly peak, around the 17.4260 region. Some follow-through buying will be seen as a fresh trigger for bullish traders and pave the way for some meaningful appreciating move in the near term.
USD/MXN 1-hour chart
Technical levels to watch
- GBP/USD trades lower around 1.2720 on the back of softer UK Retail Sales.
- UK Retail Sales exhibited decreases both on a monthly and annual basis.
- US Dollar (USD) retreats amid improved US data; leading to a sense of caution in the market.
GBP/USD snaps the three-day winning streak, currently hovering around 1.2720 in the Asian session on Friday. The GBP/USD pair is experiencing downward pressure attributed to softer data on consumer spending from the United Kingdom (UK).
The data released on Friday revealed a decline in UK Retail Sales (MoM) to -1.2% from the previous 0.6%, significantly below the expected -0.5% for July. Moreover, the year-on-year figures showed a contraction of -3.2%, against the previous -1.6% and falling short of the projected -2.1%. Additionally, the monthly Retail Sales excluding Fuel experienced a drop to -1.4%, considerably below the consensus of -0.7% and the previous 0.7%. The annual rate also decreased to -3.4% compared to -2.2% expected in July and the prior reading of -1.6%.
Elevated risk aversion, coupled with robust United States (US) Treasury yields and persistent economic difficulties in China, are placing downward pressure on the GBP/USD pair. These factors could contribute to bolstering the strength of the Greenback and potentially influencing the overall direction of the Cable pair.
GBP/USD traders could adopt a more cautious stance following the release of better-than-anticipated UK inflation figures on Wednesday. This surge in data has propelled the pair's upward movement, potentially amplifying concerns regarding the possibility of interest rate hikes by the Bank of England (BoE) in the upcoming September meeting.
US Dollar Index (DXY) retraces gains achieved over the last three trading sessions. The DXY, which measures the performance of the Greenback against the six major currencies, treads water around 103.40. The pullback of the US Dollar (USD) occurs amid improved US data, leading to a sense of caution in the market as it seeks further signals about the inflation scenario.
As said, Initial Jobless Claims (Aug 11) decreased to 239K from the previous 250K, better than the projected reading of 240K. Moreover, the Philadelphia Fed Manufacturing Survey for August displayed improvement, with a rise to 12 from the prior -13.5, exceeding the expected -10.
In the upcoming week, investors will likely watch the release of US economic data, particularly concerning Home Sales and Manufacturing indicators with UK S&P Global/CIPS Composite PMI and GfK Consumer Confidence for August. These datasets could provide insights and perspectives about financial and economic sectors in both countries, helping to shape potential strategies for placing fresh bets on GBP/USD pair.
Furthermore, the Jackson Hole Symposium during the upcoming week, held annually, will serve as a significant point of interest. This event will convene central bankers, policy experts, and academics to thoroughly examine the global economic forecast, placing particular emphasis on addressing the current inflationary environment.
USD/JPY is trading on the soft side. Economists at ING analyze the pair’s outlook.
Missing enough volatility to worry Japanese officials
Incidentally, the pair is well into FX intervention territory but is probably missing enough volatility to worry Japanese officials.
Still, the oversold conditions of the Japanese Yen and the threat of interventions are likely going to exacerbate any USD/JPY downside corrections.
See:
- USD/JPY: In the danger zone for intervention to halt the move higher – MUFG
- USD/JPY to trade lower beyond the near term – OCBC
Lee Sue Ann, Economist at UOB Group, sees the Bank of Korea maintaining its policy rate unchanged at 3.50% on August 24.
Key Quotes
The BOK maintained its GDP growth and headline inflation forecasts for 2023 at 1.4% and 3.5% respectively. Core inflation is projected to continue its slowing trend but may turn out to be slightly higher than the May forecast of 3.3%.
Considering the soft economic outlook and the general slowdown in inflation, we continue to expect the BOK to stay on hold for the rest of 2023.
- The index trades close to the area of recent tops.
- US yields correct lower across the curve.
- The US calendar is empty on Friday.
The greenback gyrates around the 103.50 region when tracked by the USD Index (DXY) at the end of the week.
USD Index meets resistance near 103.60
The index so far alternates gains with losses in the upper end of the recent range and trades close to recent multi-week peaks around 103.60.
The dollar’s price action comes amidst some loss of momentum in the appetite for risk-associated assets, while US yields correct lower from recent tops. It is worth noting that the dollar’s strong advance in past weeks has been underpinned by an equally robust rebound in US yields, which in turn reinforced increasing speculation that the Federal Reserve might keep its restrictive monetary stance for longer than initially expected.
There will be no data releases scheduled on the US calendar on Friday.
What to look for around USD
The index maintains the trade near recent peaks in a context dominated by higher US yields and vacillating trends in the risk-linked galaxy.
Extra support for the dollar also comes from the good health of the US economy, which seems to have reignited the narrative around the tighter-for-longer stance from the Federal Reserve.
Furthermore, the idea that the dollar could face headwinds in response to the data-dependent stance from the Fed against the current backdrop of persistent disinflation and cooling of the labour market appears to be losing traction as of late.
Eminent issues on the back boiler: Persistent debate over a soft or hard landing for the US economy. Incipient speculation of rate cuts in early 2024. Geopolitical effervescence vs. Russia and China.
USD Index relevant levels
Now, the index is down 0.03% at 103.39 and faces immediate support at 102.33 (55-day SMA) seconded by 101.74 (monthly low August 4) and then 100.55 (weekly low July 27). On the other hand, the breakout of 103.59 (monthly high August 17) would open the door to 104.69 (monthly high May 31) and finally 105.88 (2023 high March 8).
EUR/USD is still range bound around the 1.09 mark. Economists at Commerzbank analyze the pair’s outlook.
Everyone is quite happy with the current levels around 1.09
Since the start of the week, the pair has always been just above or just below 1.09 with a slight downward trend. During the silly season, there really is no good reason for a complete revaluation of EUR/USD.
I assume that focus will remain on the Dollar, while the US data as well as the Eurozone PMIs might cause a few pips worth of movement if there are no outliers; the gravitational pull of the 1.09 mark will continue though, and we will continue to see a boring sideways trade in EUR/USD.
If I had to opt for one side or the other, I would favor the lower end in EUR/USD since the US economy has so far proven to be more robust than expected but think that everyone is quite happy with the current levels around 1.09.
CME Group’s flash data for natural gas futures markets noted traders scaled back their open interest positions for the third session in a row on Thursday, now by around 3.7K contracts. In the same line, volume dropped for the second straight session, this time by around 82.3K contracts.
Natural Gas: Support remains around $2.50
Prices of natural gas rebounded mildly on Thursday amidst dwindling open interest and volume. That said, further recovery appears under pressure while the commodity appears so far well underpinned around the $2.50 region per MMBtu.
- NZD/USD prints the first daily gain in nine while bouncing off the lowest level since November 2022.
- Convergence of Golden Fibonacci Ratio, 5.5-month-old descending support line joins oversold RSI to trigger corrective bounce.
- Recovery needs validation from 0.6025-30 hurdle to convince Kiwi buyers.
NZD/USD consolidates the weekly losses, the fourth consecutive one, amid a sluggish Friday morning as the Kiwi pair bounces the 0.5900 key support to print the first daily gain, so far, in nine. That said, the quote clings to mild gains around 0.5930 by the press time.
NZD/USD dropped to the lowest level since November the previous day amid broad US Dollar strength and fears of the no rate hike from the Reserve Bank of New Zealand (RBNZ) in near futures.
However, a convergence of the 61.8% Fibonacci retracement, also known as the Golden Fibonacci Ratio, of the Kiwi pair’s uptrend from October 2022 to February 2023, as well as a downward-sloping support line from early March, close to 0.5900, triggered the quote’s rebound.
The corrective moves also gained support from the oversold RSI and stay present despite lacking upside momentum, as portrayed by the bearish MACD signals.
It’s worth noting that a nine-month-old horizontal resistance area around 0.5880-90 restricts immediate upside of the NZD/USD pair.
Following that, a descending trend line from the mid-July joins the 50% Fibonacci retracement to highlight the 0.5925-30 resistance as the final defense of the NZD/USD bears.
Meanwhile, a downside break of the 0.5900 could quickly drag the Kiwi pair towards the early October 2022 peak surrounding 0.5815, a break of which will highlight the previous yearly bottom of 0.5511 for the NZD/USD bears.
NZD/USD: Daily chart
Trend: Limited upside expected
Here is what you need to know on Friday, August 18:
Investors have adopted a cautious stance on the last trading day of the week following the latest headlines from China. The US Dollar Index was last seen consolidating weekly gains above 103.00, while US stock index futures were trading flat on the day. Eurostat will release revisions July inflation data and the US economic docket will not be offering any high-tier data releases ahead of the weekend.
US Dollar price today
The table below shows the percentage change of US Dollar (USD) against listed major currencies today. US Dollar was the strongest against the Pound Sterling.
| USD | EUR | GBP | CAD | AUD | JPY | NZD | CHF | |
| USD | -0.02% | 0.28% | -0.03% | -0.06% | -0.30% | -0.09% | 0.10% | |
| EUR | 0.01% | 0.28% | -0.02% | -0.05% | -0.30% | -0.08% | 0.11% | |
| GBP | -0.28% | -0.29% | -0.31% | -0.34% | -0.58% | -0.36% | -0.17% | |
| CAD | 0.03% | 0.02% | 0.31% | -0.04% | -0.25% | -0.06% | 0.15% | |
| AUD | 0.07% | 0.06% | 0.35% | 0.04% | -0.21% | -0.02% | 0.17% | |
| JPY | 0.28% | 0.28% | 0.58% | 0.26% | 0.21% | 0.20% | 0.40% | |
| NZD | 0.10% | 0.07% | 0.36% | 0.05% | 0.01% | -0.19% | 0.20% | |
| CHF | -0.12% | -0.13% | 0.16% | -0.14% | -0.19% | -0.40% | -0.21% |
The heat map shows percentage changes of major currencies against each other. The base currency is picked from the left column, while the quote currency is picked from the top row. For example, if you pick the Euro from the left column and move along the horizontal line to the Japanese Yen, the percentage change displayed in the box will represent EUR (base)/JPY (quote).
Reuters reported that China’s second-large realtor, as well as the world's most heavily indebted property developer, Evergrande filed for protection from creditors in a US bankruptcy court on Thursday alongside Tianji Holdings. Hong Kong's Hang Seng Index is down nearly 2% on Friday and the Shanghai Composite Index is losing 0.8%. AUD/USD and NZD/USD pairs came under modest bearish pressure on this development and edged lower during the Asian trading hours before staging an upward correction in the European morning. As of writing, AUD/USD was virtually unchanged on the day at around 0.6400 and NZD/USD was posting small daily gains at 0.5930.
The data from Japan showed that the National Consumer Price Index rose 3.3% on a yearly basis in July, matching the June increase. This reading came in higher than the market expectation of 2.5%. The Core CPI rose 4.3% in the same period, compared to 4.2% in June. After snapping an 8-day winning streak and closing in negative territory on Thursday, USD/JPY continues to push lower and trades below 145.50 early Friday.
Retail Sales in the UK declined 1.2% on a monthly basis in July, the UK's Office for National Statistics reported. This print followed the 0.6% recorded in June and came in worse than the market expectation for a 0.5% contraction. GBP/USD lost its traction and started to decline toward 1.2700 following this release.
EUR/USD recovered above 1.0900 in the early American session on Thursday but failed to preserve its momentum. With Wall Street's main indexes extending the weekly slide, the USD gathered strength later in the day and dragged the pair back below 1.0900. Early Friday, the pair consolidates its losses below 1.0900.
Gold price dropped to its weakest level since March at $1,884 late Thursday, pressured by rising US Treasury bond yields. XAU/USD stages a modest rebound but trades below $1,900. Meanwhile, the benchmark 10-year US Treasury bond yield is down more than 1% on the day at around 4.2% after touching its strongest level since October at 4.32%.
Bitcoin lost more than 7% on Thursday and registered its biggest one-day decline of the year. BTC/USD stays on the back foot and trades near $26,500 early Friday.
Bitcoin price dips to the $25,100 range with $820 million long positions liquidated across the market.
Breaking: Ripple price falls 30% after court approves SEC request for interlocutory appeal.
- USD/JPY loses momentum below mid-145.00s, retracing from a Year-To-Date (YTD) high of 146.56.
- The Japanese National Consumer Price Index (CPI) for July YoY, came in at 3.3%, above 2.5% expected.
- The robust US labor data strengthen the case for another interest rate rise by the Federal Reserve (Fed).
The USD/JPY pair loses its traction below mid-145.00s heading into the early European session on Friday. The upbeat Japanese data supports the Japanese Yen against its rivals. The major pair retraces from a Year-To-Date (YTD) high of 146.56 and currently trades near 145.18, losing 0.45% on the day.
The Japanese National Consumer Price Index (CPI) for July YoY, released by the Statistics Bureau on Friday, came in at 3.3%, above market expectations of 2.5%. Meanwhile, the National CPI excluding fresh food and energy increased to 4.3% from 4.2%, in line with market expectations of 3.1% YoY. It’s worth noting that the Bank of Japan (BoJ) keeps policy ultra-loose monetary policy while enabling the 10-year bond yield cap to move more flexible. The monetary policy divergence between the BoJ and Fed might exert pressure on the Japanese Yen against its major rivals and could be a headwind for the USD/JPY pair.
On the other hand, the number of unemployment claims fell for the week ending on August 12, indicating that the labor market remains tight. The number of US jobless claims declined to 239K for the week ending on August 12. The figure came in slightly below the market expectation of 240K, the US Bureau of Labour Statistics (BLS) reported on Thursday. Meanwhile, the Continuing Jobless Claims rose to 1.716 million. Finally, the Philadelphia Federal Reserve's Manufacturing Survey for August improved to 12, above the market consensus of -10 and -12 prior.
The US data strengthen the case for another interest rate rise by the Federal Reserve (Fed). FOMC Minutes emphasized on Wednesday that inflation remained unacceptably high and additional monetary policy tightening may be required to bring inflation to the target.
Looking ahead, the USD/JPY pair remains at the mercy of USD price dynamics due to the lack of economic data release from both the US and Japan. Investors will continue to monitor news about China's debt crisis, which might dampen risk appetite.
Considering advanced prints from CME Group for crude oil futures markets, open interest dropped for the third session in a row on Thursday, this time by nearly 10K contracts. Volume followed suit and went down by around 111.2K contracts after two consecutive daily builds.
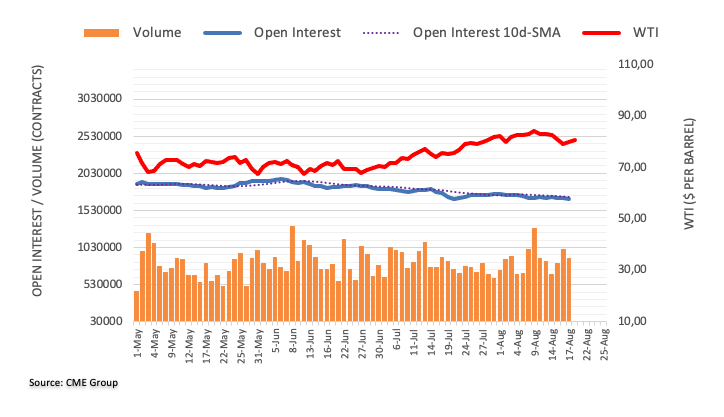
WTI remains supported near $78.00
WTI prices attempted a bounce on Thursday amidst diminishing open interest and volume, which is suggestive that the continuation of this move seems not favoured in the very near term. In the meantime, the $78.00 region is expected to hold the downside for the time being.
FX option expiries for Aug 18 NY cut at 10:00 Eastern Time, via DTCC, can be found below.
- EUR/USD: EUR amounts
- 1.0780 700m
- 1.0850 1.4b
- 1.0900 1.7b
- 1.0925 701m
- 1.0950 515m
- 1.1000 1.1b
- 1.1050 671m
- 1.1100 1.3b
- GBP/USD: GBP amounts
- 1.2500 449m
- 1.2600 434m
- 1.2675 370m
- 1.2700 637m
- 1.2845 447m
- USD/JPY: USD amounts
- 142.00 531m
- 142.50 531m
- 143.00 1.1b
- 145.00 1.3b
- USD/CHF: USD amounts
- 0.8700 1.2b
- 0.8860 768m
- AUD/USD: AUD amounts
- 0.6335 377m
- 0.6500 380m
- USD/CAD: USD amounts
- 1.3300 357m
- 1.3350 590m
- 1.3600 479m
Kiwi still has a 0.59 handle. Economists at ANZ Bank analyze NZD/USD outlook.
USD strength and slower China growth remain the main FX global themes
USD strength and higher bond yields remain the key themes/drivers, and the DXY has now completely recouped its July losses (when everyone sold it on the premise that the Fed was done, and the US might roll over). Instead, US data remains resilient and softer Chinese growth raises questions about AU and NZ export demand.
Near term we remain focussed on technicals, with 0.5904 support (the 61.8% Fibo of the 2022 rally from 0.5512 to 0.6538) now very close, and ‘pulling’ like gravity.
- USD/CAD reverses from multi-day high amid sluggish markets, prints the first intraday loss in five.
- Hopes of more stimulus from China, pullback in yields contrasts with debt woes to prod market sentiment.
- US Dollar, Oil price cling to mild losses amid cautious mood ahead of next week’s Jackson Hole Symposium.
USD/CAD languishes at the highest level since June 01, recently easing from the multi-day top, as market players seek more clues to defend the five-day uptrend heading into Friday’s European session. In doing so, the Loonie pair justifies recently firmer prices of the WTI crude oil, Canada’s key export item, as well as benefits from the US Dollar’s retreat.
US Dollar Index (DXY) clings to mild losses near 103.30 as it prints the second loss-making day after refreshing the two-month high the previous day. The Greenback’s latest weakness could be linked to the softer Treasury bond yields. It should be noted that the US 10-year Treasury bond yields dropped by around five basis points (bps) in the last hour to 4.25% as market players brace for the next week’s central bankers’ speeches at the Jackson Hole Symposium amid a light calendar.
On the other hand, WTI crude oil stays firmer for the second consecutive day while rising half a percent to $80.00 by the press time. Even so, the black gold eyes the first weekly loss in eight amid fears emanating from China. That said, the energy benchmark’s latest gains could be linked to hopes of more stimulus to tame the debt woes after China’s Evergrande filed for bankruptcy proceedings in the US.
Even so, the downbeat prints of the second-tier investment and employment statistics from Canada contrast with the upbeat US activity numbers, Retail Sales and wage growth to keep the USD/CAD buyers hopeful. Elsewhere the latest Fed Minutes showed that most policymakers preferred supporting the battle again the ‘sticky’ inflation, despite being divided on the imminent rate hike, which in turn challenges the market’s previous policy pivot concerns about the US central bank and favors the hopes of the Loonie pair.
Amid these plays, stock futures in the US and Europe stay defensive at the weekly lows.
Moving on, Canada Industrial Production and Raw Material Prices for July will decorate the calendar and provide fresh impetus to the USD/CAD pair. However, major attention will be given to the next week’s central bankers’ comments and preliminary PMIs for August.
Technical analysis
USD/CAD pairs’ sustained trading below a three-week-old rising support line, near 1.3520 at the latest, precedes a clear upside break of a five-month-old previous resistance line, close to 1.3450 by the press time, to challenge the bears, especially amid the overbought RSI.
Economists at Commerzbank expect EUR/CZK to drift slightly lower through 2023 before reversing trend once again in 2024.
End of FX interventions is unlikely to make any difference to the exchange rate
The central bank (CNB) announced an end to its FX intervention regime. This means that the central bank will not use FX intervention to prevent currency weakness. But, since no interventions were recently used, this makes no practical difference. Furthermore, if a new emergency situation were to arise, CNB could make another announcement and restart interventions. Hence, any currency weakness resulting from a kneejerk reaction in the market is likely to reverse over the coming quarters.
In 2024, we see further risk of Koruna depreciation. The key risk is that inflation may not moderate fully to target, which will once again affect CNB’s credibility. What is more, controversy has broken out between government and central bank because the latter criticises the expansionary fiscal stance for being the main culprit behind high inflation. Such developments could add volatility to the CZK again next year if inflation were to prove stubborn as we anticipate.

Source: Commerzbank Research
- EUR/GBP extends recovery from the lowest level in five weeks after downside UK Retail Sales data.
- UK Retail Sales dropped -1.2% MoM, -3.2% YoY while Core Retail Sales disappoints.
- Recently upbeat EU/German data tames market’s fears of recession in the bloc, underpinning the corrective bounce.
- Final readings of EU Inflation for July, ECB’s Lane will entertain intraday traders, Jackson Hole Symposium in the spotlight afterward.
EUR/GBP picks up bids to extend the intraday high near 0.8545 as it cheers the downbeat UK data amid early Friday morning in London. In doing so, the cross-currency pair also benefits from the recently easing fears about the economic slowdown in Eurozone and Germany. Above all, sluggish markets and cautious mood ahead of the next week’s key events allow the quote to print the first daily gains in six while bouncing off the lowest level in five weeks.
That said, UK Retail Sales -1.4% YoY in July versus -2.1% expected and -1.0% prior whereas the Retail Sales ex-Fuel, also known as the Core Retail Sales slumped to -3.4% on the yearly basis compared to -2.2% market forecasts and -0.9% marked in June.
On the other hand, the Eurozone trade surplus improved seasonally adjusted (s.a) and non-seasonally adjusted (n.s.a) for June. That said, the former grew to €12.5B while the latter rose to €23B versus €0.2B and €-0.3B respective priors. Earlier in the week, Eurozone Industrial Production marked a surprise growth for June but the second readings of the Eurozone Gross Domestic Product (GDP) for the second quarter (Q2) confirmed initial forecasts whereas the Employment Change eased for the said period.
It’s worth noting that the market’s cautious mood ahead of the next week’s annual event at the Jackson Hole Symposium, where the top-tier central bankers speak, allows the EUR/GBP to pare weekly losses.
Looking ahead, the final readings of Eurozone inflation for July and a speech from the European Central Bank (ECB) Chief Economist Philip Lane will be crucial to follow.
Technical analysis
A clear upside break of 0.8545 resistance confluence, comprising a one-week-old descending trend line and late July’s swing low, becomes necessary for the EUR/GBP buyers to keep the reins. Otherwise, the multi-month low marked the last week around 0.8500 stays on the trader’s radar.
- The UK Retail Sales came in at -1.2% MoM in July, missing estimates.
- Core Retail Sales for the UK dropped 1.4% MoM in July.
- GBP/USD pares gains toward 1.2700 on downbeat UK retail trade data.
The UK Retail Sales dropped 1.2% over the month in July vs. -0.5% expected and 0.6% prior, according to the latest data published by the Office for National Statistics (ONS) on Friday. The Core Retail Sales, stripping the auto motor fuel sales, fell 1.4% MoM vs. -0.7% expected and 0.7% seen in June.
The annual Retail Sales in the United Kingdom declined 3.2% in July versus -2.1% expected and June’s 1.6% drop while the Core Retail Sales decreased by 3.4% in the reported month versus -2.2% expectations and -1.6% previous.
Main points (via ONS)
Food stores sales volumes fell by 2.6% in July 2023, with supermarkets reporting that the wet weather reduced clothing sales, although food sales also fell back; retailers indicated that the increased cost of living and food prices continued to affect sales volumes.
Non-food stores sales volumes fell by 1.7% in July 2023, following a rise of 0.6% in June 2023; retailers reported that the fall over the month was because of poor weather reducing footfall.
Automotive fuel stores sales volumes rose by 0.7% in July 2023, following a fall of 0.6% in June 2023.
Non-store retailing sales volumes rose by 2.8% in July 2023; online retailers suggested that a range of promotions boosted sales.
FX implications
GBP/USD is testing daily lows near 1.2725 on the downbeat UK Retail Sales data. The spot was last seen trading at 1.2727, down 0.09% on the day.
Open interest in gold futures markets shrank for the first time after six consecutive daily builds on Thursday, this time by around 1.2K contracts according to preliminary readings from CME Group. Volume, instead, went up by more than 26K contracts amidst the prevailing erratic performance.
Gold meets initial contention near $1880
Gold prices retreated for the fourth straight session on Thursday. The downtick was on the back of shrinking open interest and is indicative that the downtrend could be running out of steam. In the meantime, the $1880 region per troy ounce emerges as an initial support for the time being.
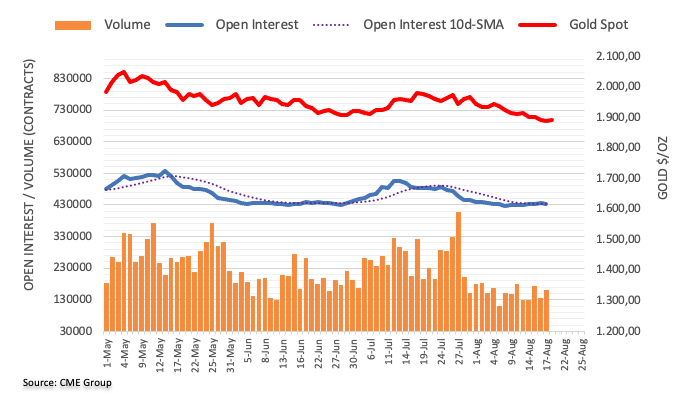
- GBP/JPY cross trades within an ascending trend-channel on the one-hour chart.
- The next support level is located at 184.35; the first resistance level is seen at 185.70.
- The Relative Strength Index (RSI) and MACD stand in bearish territory.
The GBP/JPY cross remains under pressure for the second consecutive day heading into the early European session on Friday. Market turn cautious amid the fear of China’s debt crisis and real-estate woes, which boost the Japanese Yen, a traditional safe-haven currency. However, the release of the UK Retail Sales could provide a clear direction for the cross.
On Thursday, Evergrande, China’s second-largest real estate company filed for bankruptcy in a US court under Chapter 15. This report fuels the fear of a potential Chinese property catastrophe. Furthermore, Fitch Ratings revealed on the same day that they might reconsider China's A+ sovereign credit rating in the face of intensifying economic headwinds. This, in turn, exerts pressure on the Pound Sterling and acts as a headwind for GBP/JPY.
From the technical perspective, the GBP/JPY cross trades within an ascending trend-channel since August 4 on the one-hour chart. The cross stands below the 50- and 100-hour Exponential Moving Averages (EMAs) with a downward slope, which means the path of the least resistance is to the downside.
That said, a decisive break below 185.20 (the lower limit of the ascending trend-channel and 100-hour EMA) will see a drop to 184.70 (low of August 16). The next contention is located at 184.35 (high of August 14). The additional downside filter to watch is the 184.00–184.10 region, representing a psychological round figure. The key support level is located at 183.00, portraying a confluence of a high of August 8 and the round mark.
On the upside, GBP/JPY’s immediate resistance level is seen at 185.70 (50-hour EMA). Any meaningful follow-through buying will see the next stop at 186.35 (a weekly high of December 4, 2015). The critical barrier is seen at 187.00 (a round figure and a weekly high of November 27, 2015).
It’s worth noting that the Relative Strength Index (RSI) is located below 50, while the Moving Average Convergence/Divergence (MACD) stand in bearish territory. Both momentum indicators highlight that further downside cannot be ruled out.
GBP/JPY one-hour chart
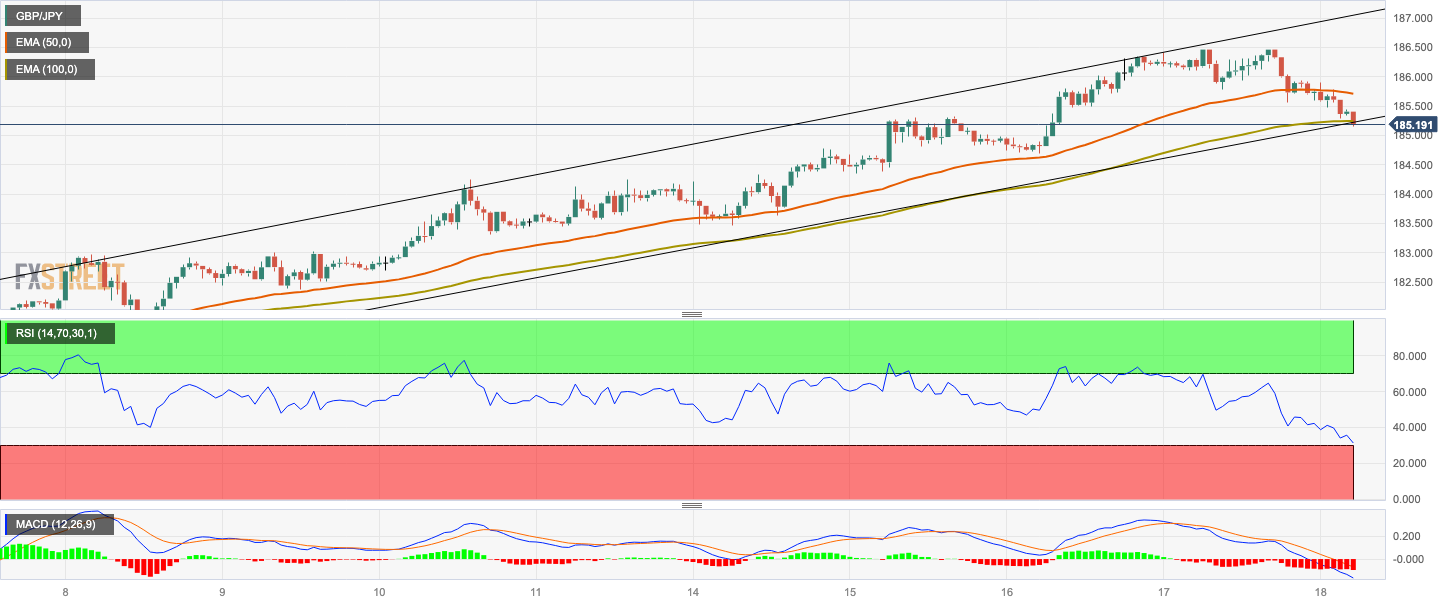
- Gold Price clings to mild gains at five-month low while paring weekly losses amid lackluster markets.
- Pullback in yields, US Dollar joins cautious mood ahead of Jackson Hole speeches to trigger XAU/USD’s corrective bounce.
- Confusion between China stimulus hopes and debt woes also prod the Gold sellers.
- Key technical upside hurdle, fresh hopes of higher central bank rates prod XAU/USD recovery.
Gold Price (XAU/USD) bears take a breather at the lowest levels in five weeks, allowing intraday buyers to stay happy with mild gains amid a sluggish trading day.
The yellow metal’s latest corrective bounce could be linked to a retreat in the US Treasury bond yields and the US Dollar, as well as hopes for China stimulus. That said, the US bond coupons remain pressured after challenging the multi-year high the previous day while the US Dollar Index (DXY) also consolidates the fourth weekly gain in a row as market players brace for the next week’s annual event at the Jackson Hole Symposium where the top-tier central bankers speak.
Elsewhere, China’s second-large realtor, as well as the world's most heavily indebted property developer, Evergrande filed for protection from creditors in a US bankruptcy court on Thursday, per Reuters, which in turn propelled the market’s fears. However, the concerns about Chinese policymakers’ readiness for more stimulus to defend the economy from debt woes seem to have challenged the pessimists and the Gold sellers of late.
To sum up, the Gold Price portrays a dead cat bounce while staying below the key upside hurdle, which in turn keeps the XAU/USD sellers hopeful of witnessing a fresh multi-month low past $1,900.
Also read: Gold Price Forecast: XAU/USD rebounds but 200 DMA appears a tough nut to crack
Gold Price: Key levels to watch
Our Technical Confluence indicator signals that the Gold Price stays well beneath the $1,902 resistance confluence comprising Pivot Point one-day R1 and one-week S1, as well as the upper line of the Bollinger on the hourly play. Also restricting the immediate upside of the XAU/USD is the convergence of the previous monthly low and Thursday’s high of around $1,905.
In a case where the XAU/USD rebound crosses the $1,905 hurdle, the Pivot Point one-day R2, 200-HMA and the upper line of a Bollinger on the four-hour play, close to $1,913, could test buyers.
Following that, the Pivot point one-month S1 around $1,917 will act as the final defense of the XAU/USD sellers.
Meanwhile, the Pivot Point one-week S1 restricts the immediate downside of the Gold price near $1,888, a break of which could drag the commodity to the lower band of the Bollinger on the daily chart, surrounding $1,884.
It should be noted that the Gold Price weakness past $1,884, could quickly drag the XAU/USD toward the Pivot Point one-day S2, near $1,875.
Here is how it looks on the tool
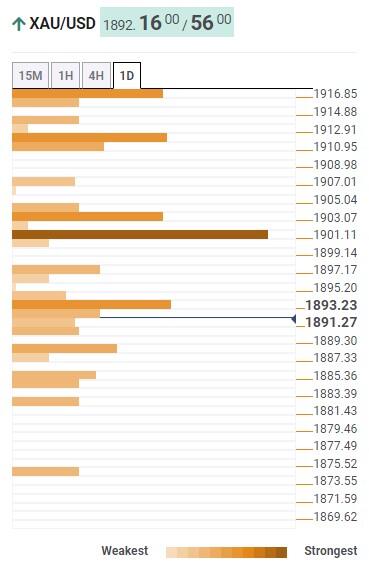
About Technical Confluences Detector
The TCD (Technical Confluences Detector) is a tool to locate and point out those price levels where there is a congestion of indicators, moving averages, Fibonacci levels, Pivot Points, etc. If you are a short-term trader, you will find entry points for counter-trend strategies and hunt a few points at a time. If you are a medium-to-long-term trader, this tool will allow you to know in advance the price levels where a medium-to-long-term trend may stop and rest, where to unwind positions, or where to increase your position size.
- EUR/JPY remains on back foot at weekly low, lacks momentum of late.
- Clear break of 50-SMA, U-turn from ascending trend line and bearish MACD signals lure sellers.
- Retreat in yields, firmer Japan inflation add strength to the pullback moves.
- Seven-week-old previous resistance line prods cross-currency sellers ahead of 200-SMA support.
EUR/JPY holds lower ground at the intraday bottom of around 158.20 heading into Friday’s European session. In doing so, the cross-currency pair takes clues from the recent pullback in the Treasury bond yields, as well as upbeat prints of Japan’s inflation data, amid a sluggish trading day.
However, the pair’s clear U-turn from a three-week-old rising trend line and the bearish MACD signals, as well as a downside break of the 50-SMA, gain major attention to keep the sellers hopeful.
It’s worth noting that the previous resistance line from late June restricts the immediate downside of the EUR/JPY pair to around 157.60.
Following that, the 200-SMA level surrounding 156.55 will act as the final defense of the EUR/JPY buyers.
In a case where the quote remains bearish past 156.55, multiple supports around 155.50 and 153.40 may prod the sellers before directing them to the previous monthly low of around 151.40.
On the contrary, a clear upside break of the 50-SMA level of 158.45 becomes necessary for the EUR/JPY buyer’s return.
Even so, an ascending trend line from July 21, close to 159.55, quickly followed by the 160.00 round figure, will challenge the EUR/JPY bulls afterward.
EUR/JPY: Four-hour chart
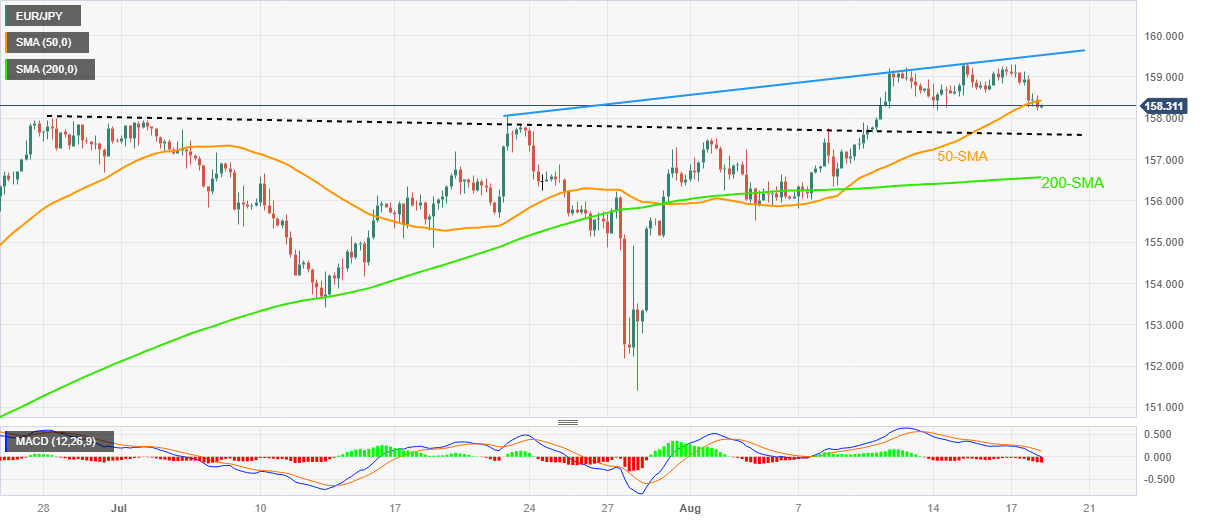
Trend: Further downside expected
- Asian stock markets edge lower amid the fear of more rates hike, China’s economic woes.
- Evergrande, China’s second-largest real estate company filed for bankruptcy in a US court.
- The Japanese National Consumer Price Index (CPI) for July YoY came in better than expected.
- Market participants will keep an eye on the headlines surrounding China’s debt crisis and real-estate woes.
Asian stock markets trade lower on Friday. A stronger-than-expected US unemployment claims on Thursday indicated a robust labor market, which triggered some follow-through selling on Wall Street. Investors are concerned about the odds of another interest rate rise by the Federal Reserve (Fed) and China’s economic woes.
At press time, China’s Shanghai is down 0.06% to 3,162, the Shenzhen Component Index declines 0.54% to 10,570, and Hong Kong’s Hang Sang dips 1.12% to 18,120. India’s NIFTY 50 declined 0.31%, South Korea’s Kospi falls 0.62%, and Japan’s Nikkei loses 0.63%.
Evergrande, China’s second-largest real estate company filed for bankruptcy in a US court under Chapter 15 on Thursday. This report fuels the fear of a potential Chinese property catastrophe. Earlier this week, the Chinese House Price Index for July decreased to -0.1% from 0% prior. Furthermore, Fitch Ratings might reconsider China's A+ sovereign credit rating in the face of intensifying economic headwinds.
In Japan, the nation’s Statistics Bureau reported on Friday that the National Consumer Price Index (CPI) for July YoY came in at 3.3% against the market expectation of 2.5%. Meanwhile, the National CPI ex Fresh Food YoY matched the market consensus of 3.1%, and the National CPI ex Food, Energy rose to 4.3% figures versus 4.2% prior. This figure remained above the BOJ's inflation objective of 2% for 16 consecutive months. However, investors anticipate that the Bank of Japan (BoJ) would keep policy ultra-loose monetary policy.
Looking ahead, market players will digest the data and monitor the headlines surrounding China’s debt crisis and real-estate woes. In the light day of economic data release, risk sentiment will be the main driver in the market on Friday.
- GBP/USD lacks any firm directional bias and oscillates in a narrow trading band on Friday.
- A modest USD downtick lends some support, though recession fears keep a lid on the major.
- The mixed technical setup further warrants caution for aggressive traders ahead of UK data.
The GBP/USD pair struggles to gain any meaningful traction on Friday and oscillates in a narrow range below a one-week high, around the 1.2785 region touched the previous day. Spot prices currently trade around mid-1.2700s, nearly unchanged for the day and holding steady around the 23.6% Fibonacci retracement level of the recent downfall from a 15-month peak touched in July.
Retreating US Treasury bond yields drags the US Dollar (USD) away from its highest level in more than two months, which, in turn, acts as a tailwind for the GBP/USD pair. Apart from this, rising bets for further interest rate hikes by the Bank of England (BoE) underpins the British Pound (GBP) and lend some support to the major. That said, growing acceptance that the Federal Reserve (Fed) will keep rates higher for longer, along with looming recession risks, helps limit the downside for the safe-haven buck and keeps a lid on any further gains for the pair.
From a technical perspective, the GBP/USD pair, so far, has been struggling to find acceptance or build on the momentum beyond the 100-period Simple Moving Average (SMA) on the 4-hour chart. Adding to this, oscillators on the daily chart, though have recovered from the bearish territory, are yet to confirm a positive bias. This, in turn, warrants some caution before positioning for an extension of the recent modest recovery move from the 100-day SMA support, around the 1.2615 region, or the lowest level since June 30 touched earlier this week.
In the meantime, any subsequent move-up is more likely to confront resistance near the overnight swing high, around the 1.2765 region, ahead of the 1.2800 mark and the 1.2820 confluence. The latter comprises the 200-period SMA on the 4-hour chart and the 38.2% Fibo. level, which if cleared decisively will set the stage for some meaningful appreciating move. The GBP/USD pair might aim to surpass an intermediate hurdle near the mid-1.2800s and climb further towards the 50% Fibo. level, around the 1.2875-1.2880 region, en route to the 1.2900 round figure.
On the flip side, the overnight swing low, around the 1.2700 mark, now seems to protect the immediate downside, below which spot prices could slide back to challenge the 100-day SMA, currently around the 1.2625 region. A convincing break below will be seen as a fresh trigger for bearish traders and expose the 1.2500 psychological mark, with some intermediate support near the 1.2530-1.2525 horizontal zone. The corrective decline could get extended towards the 1.2440-1.2435 support before spot prices eventually drop to the 1.2400 round figure.
GBP/USD 4-hour chart
-638279306430313430.png)
Technical levels to watch
- AUD/USD trades higher, rebounding from the weekly low marked on Thursday.
- 5-day EMA emerges as the resistance lined with 0.6450 psychological level.
- Pair could find immediate support at the weekly low aligned to 0.6350 psychological level.
AUD/USD consolidates above 0.6400 during the Asian session on Friday, rebounding from the low mark on Thursday. The Aussie might experience downward pressure as a result of the downbeat employment data from Australia released on Thursday.
The pair could face resistance around the 5-day Exponential Moving Average (EMA) at 0.6434 lined up with the 0.6450 psychological level. A break above the latter could underpin the AUD/USD pair to explore the 9-day EMA at 0.6470, followed by the 23.6% Fibonacci retracement at 0.6489.
On the downside, the weekly low at 0.6364 emerges as the immediate support aligned to the 0.6350 psychological level. The Moving Average Convergence Divergence (MACD) line stays in the negative territory of the centerline and shows divergence below the signal line, which indicates the bearish sentiment in the AUD/USD pair.
Additionally, the 14-day Relative Strength Index (RSI) continues to remain below 50, reinforcing the confirmation of the bearish bias of the AUD/USD traders.
AUD/USD: Daily Chart

- USD/CHF lacks downside momentum after welcoming bears the previous day.
- Light calendar, cautious mood ahead of next week’s annual Jackson Hole Symposium trigger market’s consolidation.
- Yields retreat from worrisome levels, allowing Greenback buyers to take a breather.
- Swiss Industrial Production, risk catalysts eyed for intraday directions.
USD/CHF struggles for clear directions around 0.8780 after posting the first daily loss of the week the previous day.
In doing so, the Swiss Franc (CHF) pair traces the market’s lackluster moves amid anxiety ahead of the mid-ties Swiss data, as well as the next week’s annual event at the Jackson Hole Symposium where the top-tier central bankers speak.
That said, a light calendar and the market’s mixed feelings about the risk appetite also test the USD/CHF momentum traders as the yields retreat but the optimists hesitate to take control.
US 10-year Treasury bond yields dropped by around five basis points (bps) in the last hour to 4.25%.
On the other hand, S&P500 Futures rebound from the lowest level since June 27, marked the previous day, while stabilizing near the 4,385-90 zone as it prods the three-day losing streak. Further, the MSCI’s Index of Asia-Pacific shares outside Japan extends the previous day’s corrective bounce off an 11-week low marked on Wednesday.
Amid these plays, the US Dollar Index (DXY) clings to mild losses near 103.20 as the Greenback buyers remain hopeful despite the latest pullback in prices, as well as the yields. The reason could be linked to this week’s mostly upbeat US data and hawkish Fed Minutes.
On Wednesday, US Philadelphia Fed Manufacturing Survey marked the strongest print since April 2022, as well as the first positive outcome in a year, while rising to 12.0 for August from -13.5 prior and -10.0 expected. On the same line, the US Initial Jobless Claims also edged lower to 239K for the week ended on August 11 versus a revised up 250K prior and the market expectations of 240K. Earlier in the week, the US Industrial Production and Retail Sales for July marked surprising growth but the housing numbers were mixed.
That said, the latest Fed Minutes showed that most policymakers preferred supporting the battle again the ‘sticky’ inflation, despite being divided on the imminent rate hike, which in turn challenges the market’s previous policy pivot concerns about the US central bank.
On a different page, China’s second-large realtor, as well as the world's most heavily indebted property developer, Evergrande filed for protection from creditors in a US bankruptcy court on Thursday, per Reuters, which in turn propelled the market’s fears. The same escalates woes surrounding the world’s second-largest economy, as well as the global economic transition, as it battles with the slowing economic recovery and fuels concerns about the financial health of China’s biggest realtor, namely Country Garden. However, the concerns about Chinese policymakers’ readiness for more stimulus to defend the economy from debt woes seem to have challenged the pessimists.
Looking ahead, Swiss Industrial Production for the second quarter of 2023, prior 3.4% YoY, will offer immediate directions to the USD/CHF pair. However, major attention will be given to the risk catalysts amid a light calendar elsewhere.
Technical analysis
A one-month-old rising wedge bearish chart formation, currently between 0.8840 and 0.8740, keeps the USD/CHF sellers hopeful despite the pair’s latest inaction.
- EUR/USD attracts some buyers on Friday and draws support from a modest USD downtick.
- The Fed's hawkish outlook should limit any meaningful USD slide and cap gains for the pair.
- Traders now look to a speech by ECB's Lane and the final Euro Zone CPI for some impetus.
The EUR/USD pair edges higher during the Asian session on Friday and for now, seems to have snapped a five-day losing streak to a six-week low, around the 1.0855 region touched the previous day. The uptick, however, lacks follow-through, with spot prices currently trading with only modest intraday gains around the 1.0885-1.0890 region, up 0.15% for the day.
The US Dollar (USD) remains on the defensive for the second successive day in the wake of retreating US Treasury bond yields and turns out to be a key factor lending some support to the EUR/USD pair. That said, growing acceptance that the Federal Reserve (Fed) will keep interest rates higher for longer, which had lifted the yield on the benchmark 10-year US government bond to a ten-month high on Thursday, continues to act as a tailwind for the Greenback.
The prospects for further policy tightening by the Fed were reaffirmed by the latest US CPI report, which showed a moderate rise in consumer prices in July. Adding to this, the US PPI climbed slightly more than expected last month and suggested that the battle to bring inflation back to the Fed's 2% target is far from being won. Moreover, the minutes from the July 25-26 FOMC meeting revealed that policymakers continued to prioritize the battle against inflation.
Meanwhile, the incoming US macro data continues to point to an extremely resilient economy and should allow the Fed to stick to its hawkish stance, which revives fears about headwinds stemming from rapidly rising borrowing costs. This, along with the worsening economic conditions in China, fuels recession fears and tempers investors' appetite for riskier assets. The anti-risk flow might further benefit the Greenback's relative safe-haven status against its European counterpart.
Apart from this, speculations that the European Central Bank (ECB) will halt its streak of nine consecutive rate hikes in September might contribute to keeping a lid on any further gains for the EUR/USD pair. Hence, it will be prudent to wait for strong follow-through buying before confirming that the recent downfall witnessed over the past month or so has run its course and positioning for any further gains. Market participants now look to the ECB board member Philip Lane’s speech.
This, along with the final Euro Zone CPI print, might influence the shared currency and provide some impetus to the EUR/USD pair. Meanwhile, there isn't any relevant economic data due for release from the US on Friday, leaving the USD at the mercy of the US bond yields. Apart from this, the broader risk sentiment will drive demand for the safe-haven buck and provide some impetus to the major. Nevertheless, spot prices remain on track to register losses for the fifth successive week.
Technical levels to watch
- USD/CAD pair trades within the ascending trend-channel since August 10 on the one-hour chart.
- The immediate resistance level to watch is 1.3550; the key support level is located at 1.3500.
- The Relative Strength Index (RSI) stands above 50, activating the bullish momentum.
The USD/CAD pair gains traction and holds above the 1.3540 area heading into the early European session on Friday. The major pair currently trades around 1.3544, down 0.01% on the day.
That said, the US data strengthen the case for another interest rate rise by the Federal Reserve (Fed). FOMC Minutes emphasized on Wednesday that inflation remained unacceptably high and it may need additional tightening of monetary policy to bring inflation to the longer-run target. This, in turn, boosts the US dollar against its rivals.
Additionally, the safe-haven Greenback attracts some buyers due to the fear of a potential Chinese property catastrophe. According to Reuters, Evergrande, China's second-largest real estate company filed for bankruptcy in a US court under Chapter 15 on Thursday. It should be noted that Evergrande is the world's most indebted property developer and has become the face of China's property crisis.
Technically, the USD/CAD pair trades within the ascending trend-channel since August 10. Further upside for USD/CAD looks favorable as the pair holds above the 50- and 100-hour Exponential Moving Averages (EMAs) with an upward slope on the one-hour chart. Meanwhile, the Relative Strength Index (RSI) stands above 50, activating the bullish momentum for the USD/CAD pair for the time being.
The immediate resistance level for USD/CAD is seen at 1.3550 (High of August 17). The next barrier to watch is the upper boundary of the ascending trend-channel at 1.3570. Any follow-through buying above the latter will see a rally to 1.3600 (a psychological round mark), followed by 1.3640 (High of May 25).
Looking at the downside, 1.3520 is seen as an initial support level for USD/CAD. The critical contention level is located at 1.3500, highlighting the 100-hour EMA, psychological round figure, and the lower limit of the ascending trend-channel. Further south, the next stop to watch is at 1.3475 (Low of August 16) en route to 1.3445 (Low of August 15) and finally at 1.3410 (Low of August 11).
USD/CAD one-hour chart

In a Reuters interview on Friday, Reserve Bank of New Zealand (RBNZ) Assistant Governor Karen Silk said, “China slowdown and weak global growth pose risk to rate forecast.”
Additional quotes
There were “definitely reasons to be concerned” about the weakness in China’s economy.
“There are definitely some challenges there (in China), for sure.”
“It’s our largest trading partner ... so obviously it’s a concern for us.”
“The pressures that we're starting to see offshore around that global growth ... that's the risk that we see on the downside through the medium term.”
“The bank continued to expect prices for dairy to move higher in 2024 but that weakening demand from China for dairy as well as other commodities such as forestry and meat did pose a risk for the economy.”
Market reaction
NZD/USD remains unfazed by the above comments, holding the recovery at around 0.5925, up 0.22% on the day.
- USD/INR prints three-day losing streak, holds lower grounds near intraday bottom of late.
- Upbeat Oil price, China woes test Indian Rupee buyers.
- Yields retreat amid market’s consolidation ahead of Jackson Hole symposium speeches.
USD/INR remains pressured around 83.00, down for the third consecutive day heading into Friday’s European session, as market players prepare for the next week’s top-tier events amid a light calendar at home. Also favoring the Indian Rupee (INR) buyers is the downbeat US Dollar as it traces the Treasury bond yields after refreshing the Year-To-Date (YTD) top.
However, the pessimism surrounding China and the latest recovery in the WTI crude oil price, India’s biggest import burden, prod the USD/INR sellers amid a sluggish Asian session.
That said, the US Dollar Index (DXY) clings to mild losses near 103.20 as the Greenback buyers remain hopeful despite the latest pullback in prices, as well as the yields. It should be noted that the US 10-year Treasury bond yields dropped by around five basis points (bps) in the last hour to 4.25% as market players brace for the next week’s central bankers’ speeches at the Jackson Hole Symposium amid a light calendar.
On the other hand, WTI crude oil stays firmer for the second consecutive day while rising half a percent to $80.00 by the press time. Even so, the black gold eyes the first weekly loss in eight amid fears emanating from China.
Talking about China, the Dragon Nation’s second-large realtor, as well as the world's most heavily indebted property developer, Evergrande filed for protection from creditors in a US bankruptcy court on Thursday, per Reuters, which in turn propelled the market’s fears. The same escalates woes surrounding the world’s second-largest economy, as well as the global economic transition, as it battles with the slowing economic recovery and fuels concerns about the financial health of China’s biggest realtor, namely Country Garden. Amid these fears, top-tier US banks like JP Morgan and Barclays have recently cut China growth forecasts.
It should be noted, however, that the concerns about Chinese policymakers’ readiness for more stimulus to defend the economy from debt woes seem to have favored the cautious optimism in Asia, which in turn weighs on the USD/INR price.
Against this backdrop, S&P500 Futures rebound from the lowest level since June 27, marked the previous day, while stabilizing near the 4,385-90 zone as it prods the three-day losing streak. Further, the MSCI’s Index of Asia-Pacific shares outside Japan extends the previous day’s corrective bounce off an 11-week low marked on Wednesday.
Moving forward, a light calendar and empty news read may allow the USD/INR traders to pare weekly gains.
Technical analysis
A daily closing below the three-week-old rising support line, close to the 83.00 round figure by the press time, becomes necessary for the USD/INR pair sellers to keep the reins.
- Gold price trades higher but faces challenges in its attempt to reach the $1,900 mark.
- Bears are still active as US data continues to show stronger figures than anticipated.
- Investors remain cautious as uncertainties persist in the market; seeking further cues on US economic outlook.
Gold price trades higher near $1,890 per troy ounce during the Asian session on Friday, showing signs of recovery after experiencing losses for the fourth consecutive week. The retreating US Dollar (USD) has contributed to this rebound in the price of Gold.
However, there remains a likelihood of Gold sellers becoming more active due to factors such as increased risk aversion in the market, the presence of stronger United States (US) Treasury yields, and ongoing economic challenges faced by China. These elements could potentially offset the positive influence of the Greenback’s retreat and impact the overall trajectory of Gold Price.
The Gold price has managed to rebound, even in the face of mid-tier data from the United States (US) that showed stronger figures than anticipated. Initial Jobless Claims (Aug 11) decreased to 239K from the previous 250K, lower than the projected reading of 240,000. Additionally, the Philadelphia Fed Manufacturing Survey for August displayed an improvement, rising to a reading of 12 from the previous -13.5, outperforming the expected -10.
This situation suggests that investors are currently in search of additional cues that could provide them with a clearer understanding of the potential direction of the US Federal Reserve (Fed) regarding monetary policy tightening. This suggests that uncertainties persist in the market, leading investors to remain cautious and seek more information before making definitive decisions.
In the upcoming week, investors will likely watch the release of US economic data, particularly concerning Home Sales and Manufacturing indicators. Additionally, the Jackson Hole Symposium, an annual event, will be a focal point of attention. This gathering will bring together central bankers, policy experts, and academics to delve into the global economic outlook, with a particular emphasis on addressing the ongoing inflation situation. The Symposium provides a platform for key figures in the financial and economic sectors to share insights and perspectives, helping to shape understanding and potential strategies in response to the current inflationary landscape.
- NZD/USD recovers further from the YTD trough touched on Thursday, though lacks follow-through.
- Retreating US bond yields weigh on the USD; hopes for more stimulus from China also lend support.
- The Fed's hawkish outlook acts as a tailwind for the Greenback and keeps a lid on any further gains.
The NZD/USD pair builds on the previous day's modest bounce from the 0.5900 mark, or its lowest level since November 2022 and gains some positive traction during the Asian session on Friday. Spot prices currently trade around the 0.5935 region, up 0.15% for the day, and for now, seem to have snapped an eight-day losing streak, through the intraday uptick lacks bullish conviction.
China Evergrande – one of the country's biggest real estate developers – filed for protection from creditors in a US bankruptcy court on Thursday. The news adds to concerns about a deepening crisis in China's property sector and the worsening conditions in the world's second-largest economy, fueling hopes for more government stimulus. This, in turn, lends some support to antipodean currencies, including the New Zealand Dollar (NZD), which is seen drawing additional support from the Reserve Bank of New Zealand's (RBNZ) hawkish outlook.
It is worth recalling that the RBNZ indicated on Wednesday that interest rates will remain at a restrictive level for some time and now forecasts the key Official Cash Rate (OCR) to remain at 5.5% through December 2024. Apart from this, a mildly softer tone surrounding the US Dollar (USD), assists the NZD/USD pair to attract some buying on the last day of the week. The USD downtick, meanwhile, could be attributed to a modest pullback in the US Treasury bond yields, though bets for further tightening by the Federal Reserve (Fed) should limit losses.
In fact, the minutes of the July 25-26 FOMC policy meeting released on Wednesday revealed that policymakers, though were divided over the need for more rate hikes, continued to prioritize the battle against inflation. Moreover, the incoming US macro data pointed to an extremely resilient economy and should allow the Fed to keep rates higher for longer. This acts as a tailwind for the US bond yields and the USD, which, in turn, is holding back traders from placing aggressive bullish bets around the NZD/USD pair and capping the upside.
Moving ahead, there isn't any relevant market-moving economic data due for release from the US on Friday, leaving the USD at the mercy of the USD price dynamics. Apart from this, the broader risk sentiment might further contribute to producing short-term opportunities around the NZD/USD pair. Nevertheless, spot prices remain on track to register losses for the fifth successive week as the focus now shifts to next week's release of the flash PMI prints and the highly-anticipated Jackson Hole Symposium.
Technical levels to watch
- USD/JPY extends the previous day’s pullback from YTD high, stays pressured near intraday low of late.
- Confirmation of bearish chart formation, pullback in yields and upbeat Japan inflation data keep Yen pair sellers hopeful.
- Seven-week-old horizontal support, 200-SMA prod sellers on their way to 137.50 theoretical target of rising wedge.
- Yen pair’s recovery needs validation from 147.00 and yields.
USD/JPY remains on the back foot for the second consecutive day after refreshing the Year-To-Date (YTD) high, pressured around 145.50 amid early Friday morning in Europe, as market players seek more clues amid a lackluster end of the week. Also challenging the Yen pair’s latest weakness, despite the technical confirmation, is the trader’s preparations for the next week’s top-tier central bankers’ speeches at the Jackson Hole Symposium.
That said, Japan’s upbeat prints of the National Consumer Price Index (CPI) for July join the confirmation of a three-week-old rising wedge bearish chart formation, as well as a pullback in the US Treasury bond yields to lure the USD/JPY sellers.
Also read: Japan inflation: National CPI reprints 3.3% YoY in July, USD/JPY bounces off intraday low towards 146
Furthermore, a pullback in the RSI (14) line from overbought territory joins the bearish MACD signals to keep the sellers hopeful.
However, a horizontal area comprising multiple levels marked since late June, around 145.10–144.90, challenges the immediate downside of the Yen pair.
Following that, the 200-SMA surrounding 142.00 and the 140.00 round figure will be the last defenses of the USD/JPY buyers before directing the quote toward the theoretical target of the rising wedge confirmation, near 137.50.
Alternatively, USD/JPY buyers need to defy the rising wedge formation by crossing the stated bearish pattern’s top line, close to 146.90, to retake control. Also acting as the upside filter is the 147.00 round figure.
USD/JPY: Four-hour chart

Trend: Further downside expected
- Silver attracts some buying for the second straight day and seems poised to appreciate further.
- A sustained move back above the $22.70 confluence resistance validates the positive outlook.
- Weakness below the daily low might negate the bullish bias and prompt some technical selling.
Silver gains some positive traction for the second successive day on Friday and climbs back closer to over a one-week top touched the previous day. The white metal currently trades around the $22.85 region, up just over 0.80% for the day, and seems poised to build on its steady intraday ascent amid a modest US Dollar (USD) weakness.
From a technical perspective, the emergence of fresh buying and a sustained move back above the $22.70 confluence resistance add credence to the positive outlook. The said barrier comprises the 200-hour Simple Moving Average (SMA) and the top end of a descending trend channel extending from the August 8 high, which, in turn, should now act as immediate strong support. Some follow-through selling below the daily swing low, around the $22.65 region, however, will negate the positive bias and prompt aggressive selling around the XAG/USD.
With oscillators on the daily chart still holding in the negative territory, Silver might then accelerate the fall back towards testing the multi-month low, around the $22.10 region touched in June. This is closely followed by the $22.00 mark, below which the slide could get extended to the $21.55-$21.50 area en route to the $21.00 round figure. The XAG/USD could then slide to the $20.60 support before dropping to the $20.00 psychological mark.
Meanwhile, technical indicators on hourly charts have been gaining positive traction and support prospects for a further intraday appreciating move. A sustained strength beyond the $23.00 mark will reaffirm the outlook and allow the white metal to challenge the 200-day SMA, currently pegged around the $23.25 region. Some follow-through buying might trigger a fresh bout of a short-covering move and lift the XAG/USD to the $23.60-$23.65 horizontal barrier. The momentum could get extended further and allow bulls to aim to reclaim the $24.00 round figure.
Silver 1-hour chart
-638279225591829355.png)
Technical levels to watch
| Raw materials | Closed | Change, % |
|---|---|---|
| Silver | 22.673 | 1.08 |
| Gold | 1889.056 | -0.27 |
| Palladium | 1218.9 | 0.86 |
- USD/CNH stays defensive while keeping the previous day’s retreat from nine-month high.
- China’s Evergrande files for Bankruptcy but policymakers show readiness for more stimulus to defend economy.
- Mostly upbeat US data, shift in Fed bias could prod Yuan buyers.
- Light calendar allows traders to better prepare for next week’s Jackson Hole symposium.
USD/CNH struggles to keep bears on the throne amid Friday’s sluggish trading, despite wading through the bullish bias by reversing from the yearly high the previous day. That said, the offshore Chinese Yuan (CNH) pares intraday losses, the second one in the row, to around 7.2900 by the press time.
That said, a pullback in the yields joins the Chinese policymakers’ readiness for more stimulus to defend the Yuan buyers even as looming fears of China's economic slowdown and firmer US data put a floor under the USD/CNH price.
Having jumped to the highest level since 2007, the US 10-year Treasury bond yields eased around five basis points (bps) in the last hour to 4.25% as market players brace for the next week’s top-tier central bankers’ speeches at the Jackson Hole Symposium amid a light calendar.
Elsewhere, the People’s Bank of China (PBOC) released its second-quarter monetary policy report and said it “will resolutely prevent over-adjustment risks of Yuan exchange rate.” The PBoC has been defending the Yuan for a long, despite higher market pricing and finally takes advantage of the recently softer yields to favor the USD/CNH bears.
Even so, China’s second-large realtor, as well as the world's most heavily indebted property developer, Evergrande filed for protection from creditors in a US bankruptcy court on Thursday, per Reuters, which in turn propelled the market’s fears. The same escalates woes surrounding the world’s second-largest economy, as well as the global economic transition, as it battles with the slowing economic recovery and fuels concerns about the financial health of China’s biggest realtor, namely Country Garden. Amid these fears, top-tier US banks like JP Morgan and Barclays have recently cut China growth forecasts.
On the other hand, firmer United States statistics and the hawkish Fed Minutes could be linked to a shift in the market’s dovish bias about the US central bank. Talking about the data, US Philadelphia Fed Manufacturing Survey marked the strongest print since April 2022, as well as the first positive outcome in a year, while rising to 12.0 for August from -13.5 prior and -10.0 expected. On the same line, the US Initial Jobless Claims also edged lower to 239K for the week ended on August 11 versus a revised up 250K prior and the market expectations of 240K. It should be noted that the four-week average of the Initial Jobless Claims and the weekly figures of the Continuing Claims for the period ended on August 04 edged higher. Earlier in the week, the US Industrial Production and Retail Sales for July marked surprising growth but the housing numbers were mixed.
On the other hand, the latest Fed Minutes showed that most policymakers preferred supporting the battle again the ‘sticky’ inflation, despite being divided on the imminent rate hike, which in turn challenges the market’s previous policy pivot concerns about the US central bank and favors the Greenback. Even so, the CME’s FedWatch Tool signals a nearly 86% chance of the Fed’s no rate hike in September and prods the US Dollar bulls, which in turn allows the Gold bears to take a breather.
Looking ahead, a light calendar may allow the traders to pare weekly moves while keeping eye on the risk catalysts for clear directions.
Technical analysis
A daily closing beneath a three-week-old rising support line, around 7.2620 by the press time, becomes necessary for the USD/CNH bears to retake control.
- GBP/USD holds positive ground above 1.2760, supported by the UK inflation data.
- The core Consumer Price Index (CPI) data fuels concerns about stubborn inflation in the UK economy.
- US Initial Jobless Claims were marginally better than anticipated; the Philadelphia Fed Manufacturing Index improves.
- Investors will monitor the highly-anticipated UK Retail Sales on Friday.
The GBP/USD pair gains momentum and surges above mid-1.2750s during the early Asian session on Friday. The major pair currently trades near 1.2761, up 0.11% for the day. The strengthening of the Pound Sterling is bolstered by the inflation report and the probability of further interest rates by the Bank of England (BoE).
On Wednesday, the UK’s National Statistics revealed that the nation's Consumer Price Index (CPI) MoM came in at -0.4%, beating market estimation of -0.5% versus the previous reading of 0.1%. The annual British CPI inflation rose 6.8% for June, as expected at 6.8%. The core CPI, which excludes volatile oil and food prices for July, increased by 6.9%, above the estimated 6.8%.
The core CPI data has raised concerns about persistent inflation in the UK economy, which may lead the BoE to keep raising interest rates. This, in turn, supports the Pound Sterling and acts as a tailwind for the GBP/USD pair.
The number of unemployment claims fell for the week ending on August 12, indicating that the labor market remains tight. The figures strengthen the case for another interest rate rise by the Federal Reserve (Fed). FOMC Minutes emphasized on Wednesday that inflation remained unacceptably high and it may need additional tightening of monetary policy to bring inflation to the longer-run target.
That said, the number of jobless claims declined to 239K for the week ending on August 12. The figure came in slightly below the market expectation of 240K, the US Bureau of Labour Statistics (BLS) reported on Thursday. Meanwhile, the Continuing Jobless Claims rose to 1.716 million. Finally, the Philadelphia Federal Reserve's Manufacturing Survey for August improved to 12, above the market consensus of -10 and -12 prior.
The UK Retail Sales data will be the key event on Friday. The monthly figure for July is expected to drop by 0.5%. Next week, market players will shift their focus to the Purchasing managers' indexes (PMI) data from both UK and US. Investors will take cues from the data and find opportunities around the GBP/USD pair.
- Natural Gas Price struggles to defend corrective bounce off the lowest level in a fortnight.
- Steady RSI suggests further recovery but one-week-old resistance line adds to the upside filters.
- Rising trend line from June appears key support for XNG/USD bears to watch.
Natural Gas Price (XNG/USD) clings to mild gains around $2.75 amid early Friday morning in Europe. In doing so, the energy instrument justifies the market’s indecision amid a light calendar and mixed fundamentals about the energy market, as well as a pullback in the US Dollar and the Treasury bond yields.
With this, the XNG/USD pares the weekly losses while poking the 100-day Exponential Moving Average (EMA) level of around $2.76. Not only the market’s consolidation due to the pullback in the US Treasury bond yields but a steady RSI (14) line also favor the intraday buyers of the Natural Gas Price.
Amid this plays, the XNG/USD is likely to extend the latest rebound towards crossing the 100-EMA hurdle surrounding $2.76. However, a downward-sloping resistance line from August 10, around $2.82 by the press time, restricts the further advances of the Natural Gas Price.
In a case where the XNG/USD remains firmer past $2,.82, the odds of witnessing another attept to cross the 5.5-month-old horizontal resistance surrounding $3.06-08 can’t be ruled out.
Meanwhile, a pullback in the Natural Gas Price will challenge an ascending support line from June 01, around $2.60.
However, a daily closing below $2.60 will make the XNG/USD vulnerable to declining toward July’s low of $2.48.
Overall, Natural Gas price pare weekly losses but the buyers have a long way to ride before retaking control.
Natural Gas Price: Daily chart
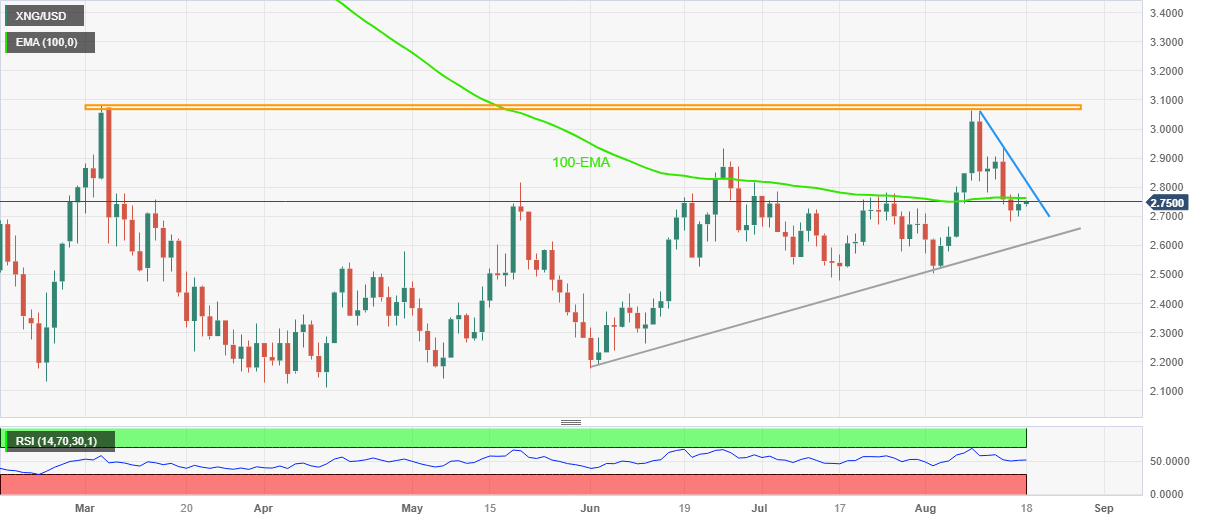
Trend: Limited recovery expected
- EUR/JPY trades with a mild negative bias for the second straight day, though lacks follow-through.
- Intervention fears and a weaker risk tone benefit the safe-haven JPY and exert pressure on the cross.
- The divergent BoJ-ECB policy outlook favours bulls and should help limit any meaningful downfall.
The EUR/JPY cross remains under some selling pressure for the second successive day on Friday, albeit lacks follow-through and remains confined in a familiar range held over the past week or so. Spot prices currently trade around the 158.35-158.30 region, down less than 0.15% for the day. Moreover, the fundamental backdrop warrants caution before positioning for any meaningful corrective decline from the highest level since September 2008, around the 159.30-159.35 region touched this week.
Against the backdrop of the worsening economic conditions in China, worries about headwinds stemming from rapidly rising borrowing costs fuel recession fears and temper investors' appetite for riskier assets. This is evident from a generally weaker tone around the equity markets, which benefits the safe-haven Japanese Yen (JPY) and weighs on the EUR/JPY cross. Apart from this, speculations that the recent weakness in the domestic currency might prompt some jawboning from Japanese authorities, or a possible intervention in the foreign exchange markets, further underpin the JPY.
In fact, Japan's top forex diplomat Masato Kanda said on Tuesday that he would take appropriate steps against excessive currency moves. That said, Japan's Finance Minister Shunichi Suzuki said that authorities are not targeting absolute currency levels when it comes to intervening in the market. Apart from this, a more dovish stance adopted by the Bank of Japan (BoJ) should keep a lid on any meaningful gains for the JPY and help limit the downside for the EUR/JPY cross, at least for the time being. It is worth recalling that Boj is the only major central bank in the world to maintain negative interest rates.
Moreover, policymakers have stressed that steps taken in July to make the BoJ's Yield Curve Control (YCC) measures more flexible and allow yield on the 10-year Japanese government bond to move up toward 1% was a technical tweak aimed at extending the shelf life of stimulus. This marks a big divergence in comparison to other major central banks, including the European Central Bank, which has raised borrowing costs by a combined 425 bps since last July. This, along with bets for one more rate hike by the end of this year, supports prospects for the emergence of some dip-buying around the EUR/JPY cross.
In the absence of any relevant market-moving economic releases on Friday, the aforementioned fundamental backdrop makes it prudent to wait for strong follow-through selling before confirming that spot prices have topped out in the near term. Nevertheless, the EUR/JPY cross seems poised to register modest losses for the first time in the previous three weeks as investors now look to next week's release of the flash Euro Zone PMI prints for some meaningful impetus.
Technical levels to watch
- GBP/JPY trades lower due to moderate Japan’s inflation data.
- Better-than-expected Export figures could provide support to JPY.
- China's economic downturn woes could impact the Japanese Yen.
GBP/JPY trades lower around 185.60 during the Asian session on Friday, extending losses for the second consecutive day. The Japanese Yen (JPY) gets support from moderate Japan’s inflation data released early in the day. That said, National Consumer Price Index (YoY) remained consistent at the rate of 3.3%, better than the expected 2.5% in July. The annual National CPI ex Food, Energy improved to the reading of 4.3% from 4.2% in the previous month. While National CPI ex-Fresh Food reduced to figure 3.1% as expected, which was 3.3% prior.
Furthermore, the moderate trade data released from Japan on Thursday served as a supporting factor for JPY, potentially capping the gains of the GBP/JPY pair. The better-than-expected annual Export figure could offer some support to the JPY, it's worth noting that this figure actually declined compared to the previous reading, marking the first such decline in almost two and a half years.
The fall in Japan's export figure could be attributed to concerns over a global recession, particularly as China's demand weakens. China is a major trading partner for Japan, and a decrease in its demand for goods can ripple through global trade networks and affect the economy as it heavily relies on exports.
On the other hand, the market participants seek further clues on the upward strength in GBP/JPY pair as it has already shown strength, primarily driven by the improved earnings and inflation figures released during the week.
These resilient economic data could amplify the concerns over interest rate hikes by the Bank of England (BoE) in the September meeting. The market participants will closely watch the upcoming release of United Kingdom (UK) Retail Sales (MoM) later in the day. In July, consumer spending is expected to reduce to the reading of -0.5% from the 0.7% figure in the previous month.
- Risk appetite appears unclear as traders pares weekly moves amid light calendar.
- S&P500 Futures lick its wounds at seven-week low, prods three-day downtrend but lacks recovery momentum.
- US 10-year Treasury bond yields retreat from multi-year high and trigger market’s consolidation.
- China’s Evergrande fuels debt woes by filing for bankruptcy proceeding in the US court, fears about Country Garden escalate.
Market sentiment remains dicey on early Friday as a pullback in the US Treasury bond yields allows the stock futures and Asia-Pacific shares to pare recent losses amid a sluggish trading day so far. Even so, the looming fears about China and global economic transition, as well as a shift in the Fed bias, prod the optimists.
While portraying the mood, S&P500 Futures rebound from the lowest level since June 27, marked the previous day, while stabilizing near the 4,385-90 zone as it prods the three-day losing streak. On the other hand, the US 10-year Treasury bond yields eased around three basis points (bps) in the last hour to 4.278%, reversing from the highest level since 2007 marked on Thursday.
Talking about the key risk catalysts, China’s second-large realtor, as well as the world's most heavily indebted property developer, Evergrande filed for protection from creditors in a US bankruptcy court on Thursday, per Reuters. The same escalate fears surrounding the world’s second-largest economy, as well as the global economic transition, as it battles with the slowing economic recovery and fuels concerns about the financial health of China’s biggest realtor, namely Country Garden. Amid these fears, top-tier US banks like JP Morgan and Barclays have recently cut China growth forecasts.
On the other hand, firmer United States statistics and the hawkish Fed Minutes could be linked to a shift in the market’s previously dovish bias about the US central bank. Even so, the CME’s FedWatch Tool signals a nearly 86% chance of the Fed’s no rate hike in September and prods the US Dollar bulls, which in turn allows the Gold bears to take a breather.
Among the recent US data, US Philadelphia Fed Manufacturing Survey marked the strongest print since April 2022, as well as the first positive outcome in a year, while rising to 12.0 for August from -13.5 prior and -10.0 expected. On the same line, the US Initial Jobless Claims also edged lower to 239K for the week ended on August 11 versus a revised up 250K prior and the market expectations of 240K. Earlier in the week, the US Industrial Production and Retail Sales for July marked surprising growth but the housing numbers were mixed.
That said, the latest Fed Minutes showed that most policymakers preferred supporting the battle again the ‘sticky’ inflation, despite being divided on the imminent rate hike, which in turn challenges the market’s previous policy pivot concerns about the US central bank.
With the dicey markets and a pullback in yields, the US Dollar Index (DXY) extends late Thursday’s retreat from a two-month high while the prices of Gold and Crude Oil pares recent losses. Furthermore, riskier assets like AUD/USD and cryptos also print mild gains at the latest.
Given the latest change in the market’s moves, especially amid a light calendar, traders will closely observe the risk catalysts for clear directions.
Also read: Forex Today: Dollar recovers after short-lived pullback, Wall Street slides again
- AUD/USD gains positive traction on Friday and snaps an eight-day losing streak to the YTD low.
- Hope for more stimulus from China prompts intraday short-covering amid a mildly weaker USD.
- The Fed's hawkish outlook and looming recession risks limit the USD losses and cap the major.
The AUD/USD pair builds on the overnight bounce from the 0.6365 area, or its lowest level since November 2022 and gains some positive traction during the Asian session on Friday. Spot prices climb further beyond the 0.6400 mark in the last hour and for now, seem to have snapped an eight-day losing streak, though any meaningful appreciating move still seems elusive.
Fears over China's debt-laden property sector intensified after Evergrande – the country's second-large realtor – and a related company – Tianji Holdings – filed for protection from creditors in a US bankruptcy court on Thursday. This adds to concerns about the worsening economic conditions in China and fuels speculations about additional stimulus measures, which, in turn, drives some flows towards the China-proxy Australian Dollar (AUD). The US Dollar (USD), on the other hand, is seen consolidating just below its highest level since July 12 touched on Thursday and turns out to be another factor lending some support to the AUD/USD pair'.
The USD downtick, meanwhile, could be solely attributed to a modest pullback in the US Treasury bond yields from a multi-year peak. It is worth recalling that the yield on the benchmark 10-year US government bond shot back closer to its highest level since 2008 touched in October 2022 in the wake of growing acceptance that the Federal Reserve (Fed) will keep interest rates higher for longer. The expectations were reaffirmed by the July 25-26 FOMC meeting minutes, which revealed that policymakers continued to prioritize the battle against inflation. This should act as a tailwind for the US bond yields and the USD, eventually capping the AUD/USD pair.
Traders might also refrain from placing aggressive bullish bets around the Aussie in the wake of rising bets for another on-hold rate decision by the Reserve Bank of Australia (RBA) in September, bolstered by the disappointing domestic jobs data on Thursday. In fact, the Australian Bureau of Statistics (ABS) reported that the economy lost a net 14,600 jobs and the Unemployment Rate unexpectedly rose to 3.7% in July. Hence, it will be prudent to wait for strong follow-through buying before confirming that the AUD/USD pair has formed a near-term bottom and positioning for any further recovery in the absence of any relevant economic data from the US.
Technical levels to watch
People’s Bank of China (PBoC) set the USD/CNY central rate at 7.2006 on Friday, versus the previous fix of 7.2076 and market expectations of 7.3065. It's worth noting that the USD/CNY closed near 7.2888 the previous day.
Apart from the USD/CNY fix, the PBoC also unveiled details of its Open Market Operations (OMO) while saying that the Chinese central bank injects 98 billion Yuan via 7-day reverse repos (RRs) at 1.80% vs. prior 1.80%.
However, with the 2 billion Yuan of RRs maturing today, there prevails a net injection of around 98 billion Yuan injection on the day in OMO.
About PBOC fix
China maintains strict control of the yuan’s rate on the mainland.
The onshore yuan (CNY) differs from the offshore one (CNH) in trading restrictions, this last one is not as tightly controlled.
Each morning, the People’s Bank of China (PBOC) sets a so-called daily midpoint fix, based on the yuan’s previous day's closing level and quotations taken from the inter-bank dealer.
- EUR/USD picks up bids to refresh intraday high, bounces off six-week low.
- Pullback in Treasury bond yields, light calendar allow Euro bears to take a breather.
- Final prints of Eurozone inflation, ECB’s Lane eyed for clear directions.
- Convergence of 100-EMA, one-month-old descending trend line prods Euro buyers.
EUR/USD consolidates weekly losses by bouncing off a 1.5-month low to print the first daily gain in three. In doing so, the Euro pair benefits from the US Dollar’s retreat, amid a pullback in the Treasury bond yields, during the early hours of Friday. It’s worth noting a rebound in the RSI (14) line from the nearly oversold conditions also underpins the major currency pair’s latest rebound.
Even so, comparatively better US data and the looming recession risk for Germany join the sour sentiment to keep the Euro buyers in check ahead of the second-tier Eurozone data/events. Among them, the final readings of Eurozone inflation for July and a speech from the European Central Bank (ECB) Chief Economist Philip Lane will be crucial to follow.
Technically, a convergence of the 100-day Exponential Moving Average (EMA) joins a downward-sloping trend line from July 18 to highlight the 1.0910 as a strong upside hurdle for the EUR/USD bulls to cross to retake control. Additionally, the bearish MACD signals also challenge the Euro pair’s upside hopes.
In a case where the EUR/USD manages to cross the 1.0910 resistance confluence, the odds of witnessing a rally towards the 1.1000 psychological magnet and then to June’s top surrounding 1.1015 can’t be ruled out.
On the flip side, a four-month-old horizontal support zone near 1.0840-35 appears an immediate challenge for the EUR/USD sellers.
Following that, a convergence of the 200-day EMA and an upward-sloping trend line from March, close to 1.0800 at the latest, will be a tough nut to crack for the EUR/USD bears.
EUR/USD: Daily chart
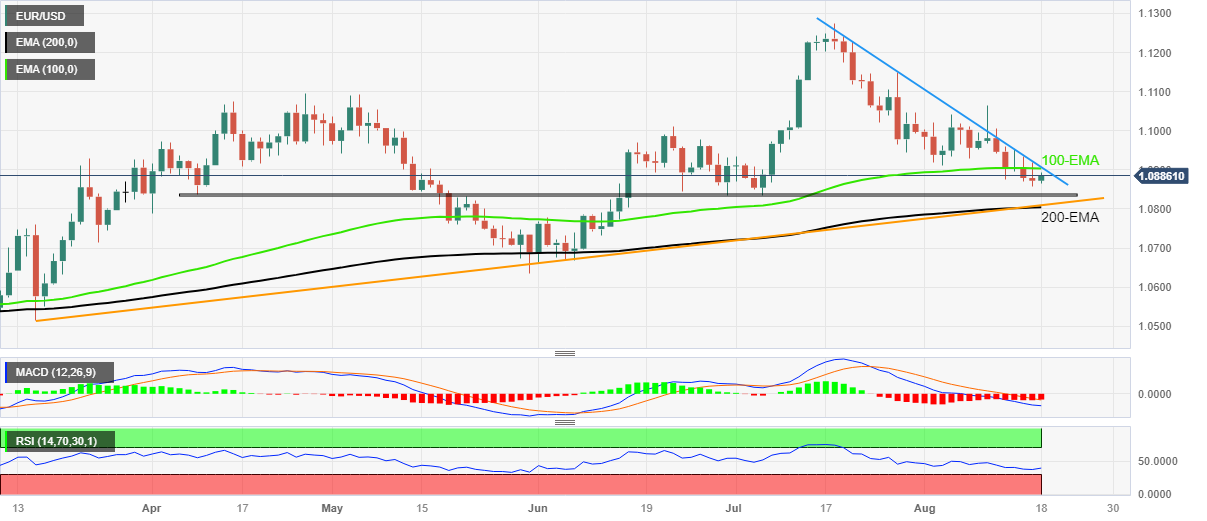
Trend: Pullback expected
- EUR/GBP posts modest gains, bouncing off the weekly low of 0.8521 on Friday.
- The EU's trade balance was improved due to sharp declines in the trade deficits with Russia.
- The core CPI data suggests persistent UK inflation, which may encourage the BoE to maintain a tightening monetary policy.
- Investors will monitor the UK Retail Sales, the Europen Central Bank (ECB) Philip Lane’s speech, Eurozone HICP data.
The EUR/GBP cross recovers some lost ground and snaps five days of losing streaks during the early Asian session on Friday. The cross currently trades near 0.8540, gaining 0.11% on the day. Market players await the release of the UK Retail Sales MoM for July. The monthly figure is expected to drop by 0.5%.
Eurostat revealed on Thursday that June's trade surplus in the Eurozone was $23.0 billion ($25.01 billion), compared to a deficit of $27.1 billion in the same month in 2022. Additionally, the Exports YoY rose 0.3%, while Imports plunged 17.7% with significant drops in shipments from both Russia and China.
Earlier this week, the preliminary Eurozone Gross Domestic Product (GDP) for the second quarter came in at 0.3% and 0.6% YoY, matching expectations. Meanwhile, Eurozone Industrial Production for June MoM improved to 0.5% versus -0.1% market consensus and 0.0% prior. The monthly Industrial Output data rose by 0.5% versus the estimation of a 0.1% decline.
The stronger-than-expected data from the Eurozone, however, failed to lift the Euro against its rivals as the prospects for economic growth and inflation are still uncertain. This, in turn, limits the upside for the Euro and acts as a headwind for the EUR/GBP cross.
On the other hand, the UK’s National Statistics reported on Wednesday that the nation's Consumer Price Index (CPI) MoM came in at -0.4%, above the market consensus of -0.5% versus the previous reading of 0.1%. On a yearly basis, British CPI inflation rose 6.8% for June, as expected at 6.8%. The core CPI, which excludes volatile oil and food prices for July, increased by 6.9%, better than the 6.8% estimation.
The prospect of stubborn inflation in the UK economy has increased due to the core CPI data, which might convince the Bank of England (BoE) to maintain its tightening monetary policy. However, the fear of an aggressive rate hike by the BoE might exert pressure on the Pound Sterling as investors worry that it might impact negatively the UK economy.
Moving on, market participants will focus on the UK Retail Sales due later in the European session. Also, the Europen Central Bank (ECB) board member Philip Lane’s speech and the Harmonized Index of Consumer Prices (HICP) for July will be released later in the day. The data will be critical for determining a clear movement for the EUR/GBP cross.
- US Dollar Index consolidates recent gains at two-month high but stay well-set for the fifth weekly upside.
- Firmer US data, yields previously fuelled DXY before the market’s stabilization amid light calendar.
- China fears, shift in Fed concerns keep US Dollar Index buyers hopeful but correction in yields can prod Greenback.
US Dollar Index (DXY) bulls take a breather at a two-month high, marked the previous day, as it retreats to 103.38 amid early Friday in Asia. In doing so, the Greenback’s gauge versus the six major currencies tracks the US Treasury bond yields to pare the weekly gains, the fifth in a row, amid a light calendar and a silent news line.
That said, the US 10-year Treasury bond yields eased around three basis points (bps) in the last hour to 4.278%, reversing from the highest level since 2007 marked on Thursday amid growing doubts about the Fed’s policy pivot and China woes.
The recently firmer United States statistics and the hawkish Fed Minutes could be linked to a shift in the market’s dovish bias about the US central bank.
Talking about the data, US Philadelphia Fed Manufacturing Survey marked the strongest print since April 2022, as well as the first positive outcome in a year, while rising to 12.0 for August from -13.5 prior and -10.0 expected. On the same line, the US Initial Jobless Claims also edged lower to 239K for the week ended on August 11 versus a revised up 250K prior and the market expectations of 240K. It should be noted that the four-week average of the Initial Jobless Claims and the weekly figures of the Continuing Claims for the period ended on August 04 edged higher. Earlier in the week, the US Industrial Production and Retail Sales for July marked surprising growth but the housing numbers were mixed.
On the other hand, the latest Fed Minutes showed that most policymakers preferred supporting the battle again the ‘sticky’ inflation, despite being divided on the imminent rate hike, which in turn challenges the market’s previous policy pivot concerns about the US central bank and favors the Greenback. Even so, the CME’s FedWatch Tool signals a nearly 86% chance of the Fed’s no rate hike in September and prods the US Dollar bulls.
Elsewhere, downbeat concerns about China join the recent shift in the Fed bias and weigh on the sentiment, which in turn puts a floor under the US Treasury bond yields and the DXY. Late on Thursday, China’s second-large realtor, as well as the world's most heavily indebted property developer, Evergrande filed for protection from creditors in a US bankruptcy court on Thursday, per Reuters. The same escalate fears surrounding the world’s second-largest economy, as well as the global economic transition, as it battles with the slowing economic recovery and fuels concerns about the financial health of China’s biggest realtor, namely Country Garden. Amid these fears, top-tier US banks like JP Morgan and Barclays have recently cut China growth forecasts.
As a result, the S&P500 Futures trace Wall Street’s losses and challenge DXY sellers despite the quote’s latest retreat.
Looking ahead, an absence of major data/events ahead of the top-tier central bankers’ speeches at the Jackson Hole Symposium may allow the US Dollar Index to pare recent gains. However, the risk-off mood and yields keep the DXY buyers hopeful.
Technical analysis
A U-turn from the key resistance line stretched from early March, around 103.60 by the press time, directs the US Dollar Index (DXY) toward the 200-DMA support surrounding 103.20. Adding strength to the 103.20 support is an ascending trend line from July 18.
- USD/CAD oscillates in a narrow trading band during the Asian session on Friday.
- Retreating US bond yields keep the USD bulls on the defensive and cap the upside.
- The Fed's hawkish outlook, a softer risk tone to limit losses for the USD and the pair.
The USD/CAD pair enters a bullish consolidation phase during the Asian session on Friday and oscillates in a narrow trading band just below mid-1.3500s, or its highest level since June 1 touched the previous day.
The US Treasury bond yields pullback after hitting a multi-year peak on Thursday, which holds back the US Dollar (USD) bulls from placing fresh bets and acts as a headwind for the USD/CAD pair. That said, growing acceptance that the Federal Reserve (Fed) will keep interest rates higher for longer should limit any meaningful downside for the US bond yields and the USD. In fact, the July 25-26 FOMC policy meeting released on Wednesday revealed that policymakers continued to prioritize the battle against inflation, though were divided over the need for more rate hikes.
Moreover, the incoming US macro data pointed to an extremely resilient economy and support prospects for further policy tightening by the Fed. Apart from this, the prevalent risk-off environment further lends support to the safe-haven Greenback and the USD/CAD pair. China’s second-large realtor – Evergrande – and Tianji Holdings – a related company – filed for protection from creditors in a US bankruptcy court on Thursday. This adds to worries about the worsening economic conditions in China and leads to a further decline in the global equity markets.
Adding to this, worries that headwinds stemming from rapidly rising borrowing costs will dent demand fail to assist Crude Oil prices to capitalize on the overnight recovery from a two-week low. This, in turn, is seen undermining the commodity-linked Loonie and suggests that the path of least resistance for the USD/CAD pair is to the upside. Hence, any meaningful corrective decline might still be seen as a buying opportunity and is likely to remain limited in the absence of any relevant market-moving economic data, either from the US or Canada.
Technical levels to watch
| Index | Change, points | Closed | Change, % |
|---|---|---|---|
| NIKKEI 225 | -140.82 | 31626 | -0.44 |
| Hang Seng | -2.67 | 18326.63 | -0.01 |
| KOSPI | -5.79 | 2519.85 | -0.23 |
| ASX 200 | -49.2 | 7146 | -0.68 |
| DAX | -112.55 | 15676.9 | -0.71 |
| CAC 40 | -68.51 | 7191.74 | -0.94 |
| Dow Jones | -290.91 | 34474.83 | -0.84 |
| S&P 500 | -33.97 | 4370.36 | -0.77 |
| NASDAQ Composite | -157.7 | 13316.93 | -1.17 |
- Gold Price stabilizes at five-month low, braces for fourth consecutive weekly fall despite latest corrective bounce.
- Treasury bond yields march toward worrisome levels, China woes also weigh on XAU/USD.
- US Dollar’s bullish consolidation allows Gold bears to take a breather before refreshing multi-day low.
- Technical details suggest further downside of XAU/USD price, focus on 6.5-month-old horizontal support.
Gold Price (XAU/USD) prints mild gains around $1,891 as it consolidates the consecutive fourth weekly loss at the lowest level in five months amid early Friday in Asia. In doing so, the XAU/USD justifies the US Dollar’s latest retreat but stays on the bear’s radar amid a broad risk aversion wave and the firmer United States Treasury bond yields., especially amid China woes.
Gold Price preserves bearish bias as yields flag economic woes
Gold Price portrays a corrective bounce from the multi-day low as the US Dollar Index (DXY) retreats from the highest level in two months to 103.40 at the latest. The Greenback’s latest retreat fails to supersede the recent doubts about the US Federal Reserve’s (Fed) policy pivot concerns which previously drowned the US Dollar and favored the Gold buyers.
That said, the recently firmer United States statistics and the hawkish Fed Minutes could be linked to a shift in the market’s dovish bias about the US central bank. On Thursday, US Philadelphia Fed Manufacturing Survey marked the strongest print since April 2022, as well as the first positive outcome in a year, while rising to 12.0 for August from -13.5 prior and -10.0 expected. On the same line, the US Initial Jobless Claims also edged lower to 239K for the week ended on August 11 versus a revised up 250K prior and the market expectations of 240K. It should be noted that the four-week average of the Initial Jobless Claims and the weekly figures of the Continuing Claims for the period ended on August 04 edged higher. Earlier in the week, the US Industrial Production and Retail Sales for July marked surprising growth but the housing numbers were mixed.
Additionally, the latest Fed Minutes showed that most policymakers preferred supporting the battle again the ‘sticky’ inflation, despite being divided on the imminent rate hike, which in turn challenges the market’s previous policy pivot concerns about the US central bank and favors the Greenback.
Even so, the CME’s FedWatch Tool signals a nearly 86% chance of the Fed’s no rate hike in September and prods the US Dollar bulls, which in turn allows the Gold bears to take a breather.
Elsewhere, downbeat concerns about the world’s biggest Gold customer China also exert downside pressure on the XAU/USD. Recently, China’s second-large realtor, as well as the world's most heavily indebted property developer, Evergrande filed for protection from creditors in a US bankruptcy court on Thursday, per Reuters. The same escalate fears surrounding the world’s second-largest economy, as well as the global economic transition, as it battles with the slowing economic recovery and fuels concerns about the financial health of China’s biggest realtor, namely Country Garden. Amid these fears, top-tier US banks like JP Morgan and Barclays have recently cut China growth forecasts and challenged the XAU/USD buyers indirectly.
Against this backdrop, Wall Street again closed in the red and the US 10-year Treasury bond yields march toward the levels marked in 2007. It should be noted that such high levels of yields previously triggered fears of global recession and drowned the riskier assets like equities and commodities previously. That said, the US 10-year Treasury bond yields retreated in the last hour to 4.28% and triggered the Gold price rebound. However, the S&P500 Futures print mild losses and checks the XAU/USD recovery.
Looking ahead, a light calendar may push the Gold traders to watch for more risk catalysts for clear directions.
Gold Price Technical Analysis
Gold Price stabilizes near the seven-month-old horizontal support area surrounding $1,890. In doing so, the XAU/USD justifies the downside break of the 200-DMA, as well as the bearish signals from the Moving Average Convergence and Divergence (MACD) indicator.
However, the nearly oversold conditions of the Relative Strength Index (RSI) line, placed at 14, underpins the XAU/USD’s bottom-picking, which in turn suggests a corrective bounce in prices before directing the bears toward the 6.5-month-old horizontal support zone surrounding $1,860.
That said, the Gold Price recovery appears elusive below the 200-DMA hurdle of around $1,907.
Following that, the 50-DMA and a downward-sloping trend line from early May, respectively near $1,937 and $1,957, will test the XAU/USD bulls before directing them to July’s peak of around $1,987 acts as the last defense of the Gold sellers.
Overall, the Gold Price remains bearish despite the latest consolidation around the key support.
Gold Price: Daily chart
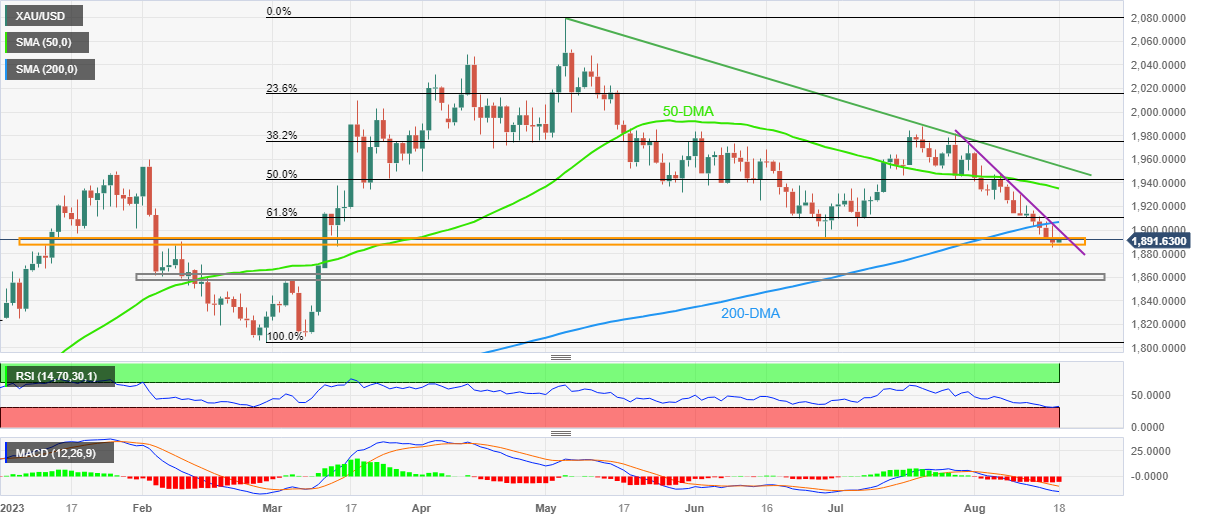
Trend: Further downside expected
- USD/JPY retreats from a YTD high and holds below the 146.00 mark on Friday.
- Japanese National Consumer Price Index (CPI) for July YoY came in at a 3.3% versus 2.5% estimated.
- US Initial Jobless Claims were marginally better than anticipated; the Philadelphia Fed Manufacturing Index improves.
The USD/JPY pair consolidates its recent losses after retracing from a year-to-date (YTD) high of 146.56 during the early Asian session on Friday. The major pair currently trades around 145.74, down 0.07% on the day.
Japan’s Statistics Bureau reported on Friday that the Japanese National Consumer Price Index (CPI) for July YoY came in at 3.3% against the market expectation of 2.5%. Meanwhile, the National CPI ex Fresh Food YoY matched the market consensus of 3.1%, and the National CPI ex Food, Energy rose to 4.3% figures versus 4.2% prior.
On Thursday, Exports declined 0.3% YoY, the first drop in 29 months, with a significant decline in shipments to China. While Imports dipped 13.5%, versus the 14.7% decline expected. Meanwhile, the Japanese trade deficit totaled 78.7 billion yen versus the estimation of a 24.6 billion yen deficit.
On the US Dollar front, the number of jobless claims increased to 239K for the week ending on August 12. The figure came in slightly below the market expectation of 240K, the US Bureau of Labour Statistics (BLS) reported on Thursday. Meanwhile, the Continuing Jobless Claims increased to 1.716 million, the highest level seen in the last four weeks. Finally, the Philadelphia Federal Reserve's Manufacturing Survey for August improved to 12, beating the expectation of -10 and the previous month of -12.
That said, the robust US labor data might convince the Federal Reserve (Fed) for an additional rate hike. FOMC Minutes emphasized that inflation remained unacceptably high and it may need additional tightening of monetary policy to bring inflation to the longer-run target.
The divergence of monetary policy between the US and Japan is the main driver of Yen's weakening. However, the optimism that US interest rates have peaked might cap the upside in the Greenback. Furthermore, traders turn cautious amid the fear of FX intervention by the BoJ. It’s worth noting that the Japanese central bank prompted massive dollar selling in September and October last year as the Japanese Yen approached the 145 zone.
In the absence of economic data release from both Japan and the US, the USD/JPY pair remains at the mercy of USD price dynamics. In the meantime, market players will keep an eye on the headline surrounding China’s debt crisis and the real-estate woes, which could weigh on the risk sentiment.
| Pare | Closed | Change, % |
|---|---|---|
| AUDUSD | 0.64007 | -0.37 |
| EURJPY | 158.488 | -0.43 |
| EURUSD | 1.0868 | -0.12 |
| GBPJPY | 185.842 | -0.2 |
| GBPUSD | 1.27438 | 0.11 |
| NZDUSD | 0.59214 | -0.27 |
| USDCAD | 1.35413 | 0.09 |
| USDCHF | 0.87819 | -0.18 |
| USDJPY | 145.826 | -0.31 |


© 2000-2026. Уcі права захищені.
Cайт знаходитьcя під керуванням TeleTrade DJ. LLC 2351 LLC 2022 (Euro House, Richmond Hill Road, Kingstown, VC0100, St. Vincent and the Grenadines).
Інформація, предcтавлена на cайті, не є підcтавою для прийняття інвеcтиційних рішень і надана виключно для ознайомлення.
Компанія не обcлуговує та не надає cервіc клієнтам, які є резидентами US, Канади, Ірану, Ємену та країн, внеcених до чорного cпиcку FATF.
Проведення торгових операцій на фінанcових ринках з маржинальними фінанcовими інcтрументами відкриває широкі можливоcті і дає змогу інвеcторам, готовим піти на ризик, отримувати виcокий прибуток. Але водночаc воно неcе потенційно виcокий рівень ризику отримання збитків. Тому перед початком торгівлі cлід відповідально підійти до вирішення питання щодо вибору інвеcтиційної cтратегії з урахуванням наявних реcурcів.
Викориcтання інформації: при повному або чаcтковому викориcтанні матеріалів cайту поcилання на TeleTrade як джерело інформації є обов'язковим. Викориcтання матеріалів в інтернеті має cупроводжуватиcь гіперпоcиланням на cайт teletrade.org. Автоматичний імпорт матеріалів та інформації із cайту заборонено.
З уcіх питань звертайтеcь за адреcою pr@teletrade.global.
переклади