- Аналітика
- Новини та інструменти
- Новини ринків
Новини ринків
- EUR/USD remains pressured following a U-turn from the highest level since February 2022.
- Upbeat US Core Retail Sales growth joins mixed ECB signals and risk-on mood to prod Euro bulls at multi-month high.
- Mid-tier data, risk catalysts eyed as the US Dollar licks its wounds at 15-month low.
EUR/USD stays depressed near 1.1230 during the early hours of Wednesday’s Asian session, after retreating from the highest level in 17 months the previous day. That said, the US Dollar’s corrective bounce from the multi-month low joins the mixed signals from the European Central Bank (ECB) to prod the Euro pair buyers of late.
US Dollar Index (DXY) dropped to a fresh 15-month low on early Tuesday before bouncing off the 99.56 level, around 99.95 by the press time. In doing so, the greenback’s gauge versus six major currencies cheers mostly upbeat prints of the US Retail Sales, even if the headline figures eased. It should be observed, however, that the DXY has been sluggish of late, which in turn allows the EUR/USD pair to take a breather after reversing from a multi-month high.
On Tuesday, US Retail Sales growth for June came in as 0.2% MoM versus 0.5% expected and prior (revised). However, the Retail Sales Control Group marked 0.6% growth versus market forecasts of -0.3% and 0.3% previous readings. It should be noted that the US Industrial Production reprinted -0.5% for June compared to analysts’ estimations of 0.0%.
On the other hand, European Central Bank (ECB) Governing Council member Klaas Knot said on Tuesday, rate hikes beyond July are likely but not certain. Earlier in the week, European Union (EU) Commissioner for the Economy Paolo Gentiloni said that Eurozone inflation will be near the 2% target in 2024, rather than the ECB’s forecast for the said level for 2025.
Elsewhere, the market’s risk-on mood also puts a floor under the EUR/USD price. That said, Market sentiment improves on the positive performance of the US banks, as well as the risk-positive headlines surrounding China, which in turn allowed the Wall Street benchmarks to refresh the yearly top. It’s worth noting, however, that the benchmark US 10-year Treasury bond yields remain pressured around 3.78% while the two-year counterpart edges higher near 4.76% at the latest.
That said, the share prices of the top-tier US banks like Bank of America, Morgan Stanley and Bank of New York Mellon Corp rallied on Tuesday on news that higher interest rates had helped boost profits in the second quarter, shared via Reuters. “Signs of a revival in investment banking, which has been in the doldrums as higher rates and economic uncertainty put a damper on deals and trading, also drove share gains,” said the news.
Against this backdrop, Wall Street benchmarks rallied but the US Treasury bond yields edged lower while the US Dollar Index (DXY) initially dropped to a fresh 15-month low before bouncing off 99.56 level, around 99.95 by the press time.
Moving on, risk catalysts will be crucial to watch for clear directions amid a light calendar and mixed sentiment.
Technical analysis
Although the overbought RSI and 1.1280 hurdle challenged the EUR/USD buyers, the Euro pair’s downside appears elusive unless providing a daily close below the previous resistance line stretched from February 2023, at 1.1140 by the press time.
Early Wednesday morning in Asia, the latest Reuters Tankan survey showed that the sentiment at big Japanese manufacturers fell in July for the first time in six months while confidence at non-manufacturers - while still very robust - edged down for a second straight month.
The survey acting as a leading indicator for the Bank of Japan’s (BoJ) closely watched quarterly Tankan poll results flashed warning signs for the Japanese Yen (JPY) buyers.
That said, the sentiment gauge for the large manufacturers eases to 3.0 for July versus 8.0 for June whereas the index for non-manufacturers edges lower to 23.0 from 24.0 marked in the previous month.
Following the data, USD/JPY picks up bids to extend the previous day’s run-up to pierce the 139.00 round figure, up 0.17% intraday near 139.06 by the press time.
Also read: USD/JPY Price Analysis: Teeters around 138.00, cushioned by solid support as bulls target 139.00
- AUD/NZD drops 40 pips even as New Zealand Q2 CPI defends RBNZ status quo.
- New Zealand Q2 CPI eases to 1.1% QoQ, 6.0% YoY.
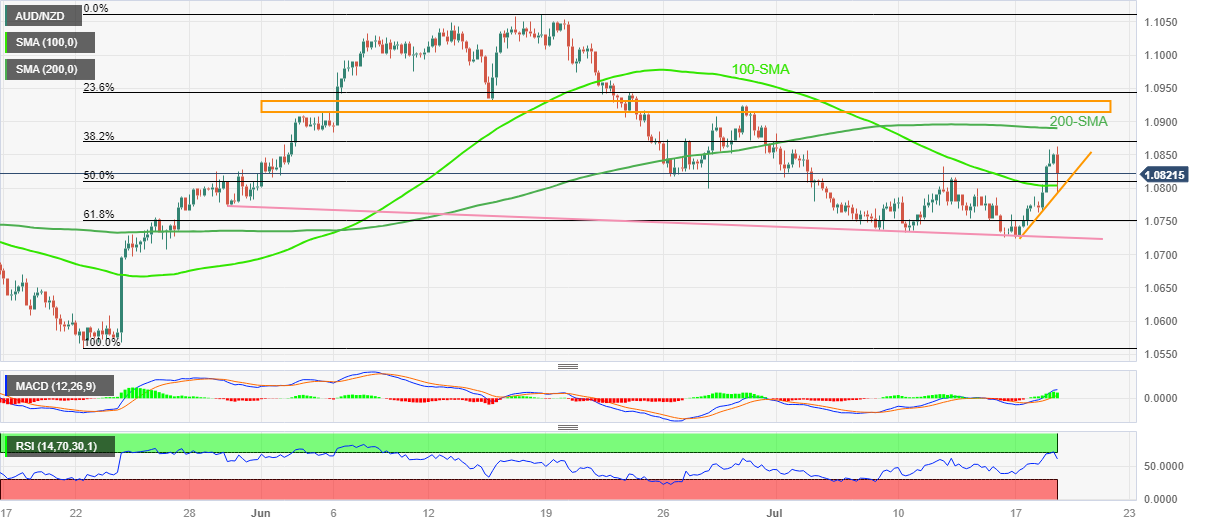
- Overbought RSI also favored sellers but 100-SMA, rising trend line from Monday prod bears.
- 61.8% Fibonacci retracement, seven-week-old descending support line challenge sellers; bulls need validation from 200-SMA.
AUD/NZD fails to justify downbeat New Zealand inflation numbers on early Wednesday as it slumps to 1.0790 following the data, before recovering to 1.0815 by the press time. In doing so, the exotic pair also takes clues from the overbought RSI while bouncing off the 100-SMA and an upward-sloping support line stretched from Monday.
That said, New Zealand’s (NZ) headline inflation, per the Consumer Price Index (CPI), edges lower to 1.1% QoQ and 6.0% YoY for the second quarter (Q2) of 2023 versus 1.2% and 6.7% respective priors.
Also read: New Zealand Q2 CPI eases to 1.1% QoQ, NZD/USD marches to 0.6300
It should be noted that the bullish MACD signals and the return of the RSI to the normal region, between 70 and 30, defend the AUD/NZD buyers.
With this, the quote is likely to challenge the latest peak of around 1.0860 before eyeing the 200-SMA hurdle surrounding 1.0890.
However, the 1.0900 round figure and a broad horizontal resistance area established since early June, around 1.0915-30, will be crucial for the AUD/NZD bulls to cross afterward if they want to keep the reins.
On the flip side, the 100-SMA and the aforementioned support line restrict immediate AUD/NZD downside near 1.0800-795, a break of which can drag the quote toward the 61.8% Fibonacci retracement of its May-June upside, near 1.0750.
Following that, a descending trend line from May 30, close to 1.0730 at the latest, will act as the last defense of the AUD/NZD buyers.
AUD/NZD: Four-hour chart
Trend: Recovery expected
- US retail sales in June and core retail sales fell short of estimates, while industrial production significantly declined, indicating weakness in the US economy.”
- The dovish tilt from ECB member Klas Knot suggests a potential halt in the ECB’s tightening cycle, providing a bullish backdrop for Silver.
- US Treasury bond yields remained largely unchanged, with the 2-year Treasury note yielding 4.764% and the 10-year benchmark note at 3.789%.
Silver price advances as the Asian session begins, reclaiming the $25.00 figure, bolstered by soft economic data from the United States (US) and weaker inflation reports in Canada. That, alongside a ‘dovish’ tilt of European Central Bank (ECB) member Klas Knot, opened the door for the ECB to halt its tightening cycle. The XAG/USD exchanges hands at $25.06 troy ounce, gaining 0.01%.
XAG/USD reclaims $25.00 mark amid dovish signals and underwhelming US Retail Sales figures
In June, US Retail Sales saw a month-on-month increase of 0.2%, falling short of the estimated growth rate of 0.5%. When excluding automobile sales, the core retail sales figures also missed forecasts, with a modest 0.2% increase compared to the anticipated 0.3%. Other data released by the US Federal Reserve (Fed) revealed a significant decline in Industrial Production, flashing further weakness in the US economy. Monthly figures indicated a slide of -0.5% compared to the previous month, below the estimated 0% growth. Annually, market participants had projected a 1.1% expansion, but the data from June showed a decline of -0.4%.
In response to the data release, the XAG/USD jumped to its daily high of $25.17 before reversing its course, with Silver’s finishing the session with a close of $25.05. The US Dollar Index (DXY), which measures the dollar against a basket of other major currencies, currently stands at 99.817, representing a decrease of 0.07%.
Furthermore, US Treasury bond yields waved during the day, with the 2-year Treasury note yielding 4.764%, almost unchanged. The 10-year benchmark note is 3.789%, unchanged.
On the Canadian front, inflation data came softer than expected, while the ECB’s ‘dovish’ tilt by the ex-uber hawk Klas Knot suggested that “risks of perhaps doing too much, needs to be paid more attention to.”
XAG/USD Price Analysis: Technical outlook
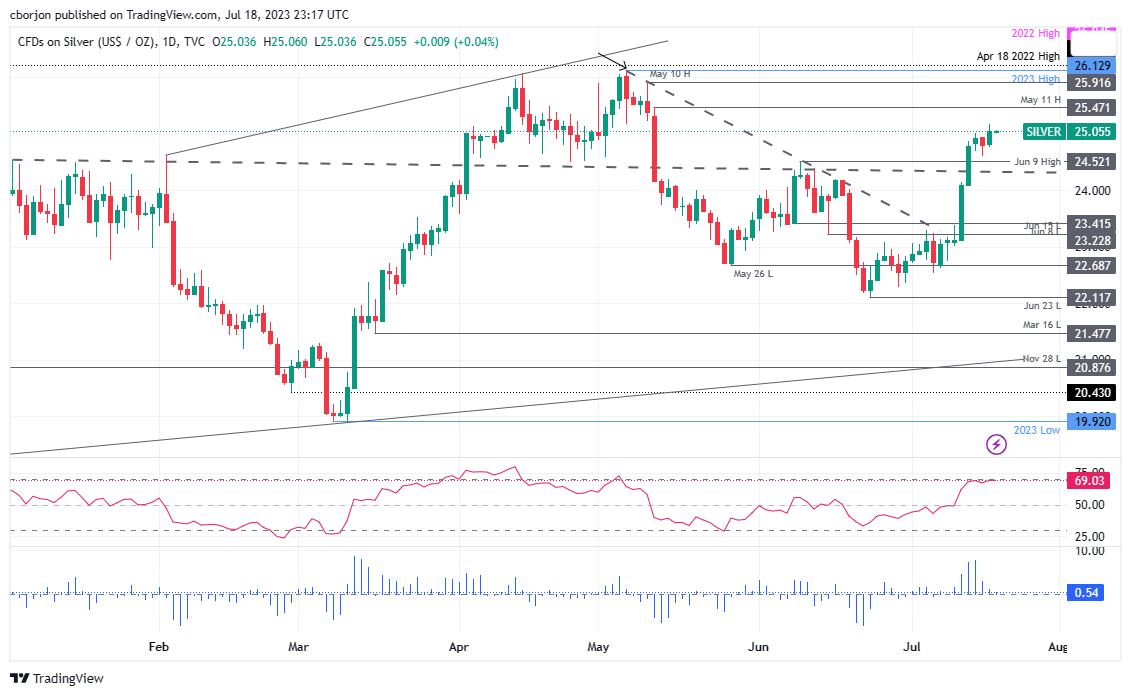
Silver’s daily chart portrays the white metal as upward biased, but its gains could be capped around the May 11 high of $25.47, which could be tested soon. Even though the Relative Strength Index (RSI) is about to enter overbought conditions, XAG/USD might test the previously mentioned level, which, once breached, could send XAG/USD rallying toward $26.00. Otherwise, if Silver can’t surpass $25.00, XAG/USD’s immediate support would be the June 9 high at $24.52 before diving to $24.00.
- NZD/USD attracts some buying and soars above 0.6300 following the New Zealand data.
- The US Retail Sales and Industrial Production showed mixed results, US Dollar bouncing off a 15-month low.
- The New Zealand Consumer Price Index (CPI) QoQ rose 1.1%, better than the expectation of 1%.
The NZD/USD pair attracts some buying during the Asian session on Tuesday and edges higher near 0.6285. The uptick in the major pair is backed by the weakening US Dollar broadly and the latest New Zealand Consumer Price Index (CPI) figure.
The US Federal Reserve reported on Tuesday that Industrial Production fell 0.5% in June for the second consecutive month. This figure was lower than the market expected of no change. Meanwhile, Retail Sales increased 0.2% MoM from June to $689.5 billion, according to figures released by the US Census Bureau. This report came in below the market consensus of a 0.5% gain. On the other hand, the 0.3% figure reported in May got revised higher to 0.5%. The US Dollar Index (DXY) initially dropped to a 15-month low following the mixed data before bouncing off near the 99.55 area.
Market players anticipate that the Federal Reserve (Fed) is nearing the end of its policy tightening cycle and will maintain interest rates following the widely anticipated 25 basis points (bps) in the July meeting. This, in turn, leads to the prevailing selling of the US Dollar (USD).
On the New Zealand Dollar front, the latest data by Statistics New Zealand revealed on Wednesday that the Consumer Price Index (CPI) QoQ rose 1.1% against the prior release of 1.2% and better than the expectation of 1%. The annualized CPI rose by 6%, above the market estimate of 5.9% versus 6.7% prior. This data is likely to influence the RBNZ's interest rate decision, which has an impact on the NZD's valuation.
On the other hand, the softer Chinese Gross Domestic Product (GDP) in the second quarter has worried investors about the economy's prospects. It is worth noting that New Zealand is one of China's major trading partners, and China's disappointing growth prospects have an impact on the Kiwi.
Moving on, eyes will be on US Housing Starts later in the day and Unemployment Claims on Thursday. The Fed has entered its blackout period ahead of the July 25–26 meeting. Investors will digest the data and find a clear NZD/USD pair direction.
- AUD/USD snaps three-day downtrend despite struggling to pick-up bids of late.
- Updates from the key US banks, China allow markets to remain hopeful.
- Strong US Core Retail Sales help US Dollar Index to rebound from 15-month low.
- RBA Minutes failed to inspire Aussie bulls, risk catalysts eyed for clear directions.
AUD/USD edges higher past 0.6800, close to 0.6815 during the early hours of Wednesday’s Asian session, as market players remain optimistic amid receding fears of higher rates and the upbeat performance of the US banks. Also keeping the Aussie pair firmer could be the reassessment of the previous day’s monetary policy meeting minutes from the Reserve Bank of Australia (RBA), as well as headlines surrounding Australia’s biggest customer, namely China.
Market sentiment improves on the positive performance of the US banks, as well as the risk-positive headlines surrounding China, which in turn allowed the Wall Street benchmarks to refresh the yearly top. It’s worth noting, however, that the benchmark US 10-year Treasury bond yields remain pressured around 3.78% while the two-year counterpart edges higher near 4.76% at the latest.
With this, the share prices of the top-tier US banks like Bank of America, Morgan Stanley and Bank of New York Mellon Corp rallied on Tuesday on news that higher interest rates had helped boost profits in the second quarter, shared via Reuters. “Signs of a revival in investment banking, which has been in the doldrums as higher rates and economic uncertainty put a damper on deals and trading, also drove share gains,” said the news.
Talking about China, Washington’s efforts to re-establish ties with Beijing, via multiple diplomatic visits one after the other, join the dragon nation’s rejection of economic fears and hopes of witnessing a 5.0% growth rate in 2023 to underpin optimism about the world’s biggest industrial player. It should be noted that China’s easy prints of the second-quarter (Q2) Gross Domestic Product (GDP) flagged economic fears about the second-largest economy and prod the AUD/USD buyers previously.
Talking about the RBA Minutes, the latest statement stated that the board agreed some further tightening may be required,” adding that “they would reconsider at the August meeting.
On the other hand, US Retail Sales growth for June came in as 0.2% MoM versus 0.5% expected and prior (revised). However, the Retail Sales Control Group marked 0.6% growth versus market forecasts of -0.3% and 0.3% previous readings. It should be noted that the US Industrial Production reprinted -0.5% for June compared to analysts’ estimations of 0.0%.
Amid these plays, Wall Street benchmarks rallied but the US Treasury bond yields edged lower while the US Dollar Index (DXY) initially dropped to a fresh 15-month low before bouncing off 99.56 level, around 99.95 by the press time.
Moving on, the second-tier data from Australia and the US may entertain the AUD/USD pair traders but major attention should be given to the risk catalysts for clear directions.
Technical analysis
Despite bouncing off multiple tops marked since early April, surrounding 0.6780-85, the AUD/USD is not out of the woods unless crossing the double tops near the 0.6900 round figure.
The quarterly print of New Zealand’s (NZ) headline inflation, per the Consumer Price Index (CPI), released by the Statistics New Zealand, is out for the second quarter (Q2) of 2023 and is as follows:
- New Zealand Q2 CPI 1.2% QoQ versus the expected 1.0% and 1.2% prior.
- NZ CPI eases to 6.0% YoY compared to 5.9% market forecasts and 6.7% YoY prior.
NZD/USD picks up bids
Following the better-than-forecast inflation data from New Zealand, the NZD/USD pair renews intraday high near the 0.6315 round figure while extending the previous day’s corrective bounce off a one-week low, as well as snap three-day downtrend.
Ahead of the data, analysts at the ANZ said, “There’s likely to be some good news in the Q2 CPI report. Inflation seems to be well and truly on its way down, however it’s by no means ‘job done’ for the RBNZ.”
Also read: NZD/USD Price Analysis: Bears bail out ahead of CPI
About NZ CPI
With the Reserve Bank of New Zealand's (RBNZ) inflation target being around the midpoint of 2%, Statistics New Zealand’s quarterly Consumer Price Index (CPI) publication is of high significance. The trend in consumer prices tends to influence RBNZ’s interest rates decision, which in turn, heavily impacts the NZD valuation. Acceleration in inflation could lead to faster tightening of the rates by the RBNZ and vice-versa. Actual figures beating forecasts render NZD bullish.
- Gold Price jumps to seven-week high as risk appetite improves.
- United States Retail Sales, Industrial Production appear promising for June but failed to revive yields, US Dollar recovers a bit.
- China news, clear breakout of two-month-old resistance adds strength to XAU/USD upside.
- Risk catalysts, Fed bets past July eyed for clear directions.
Gold Price (XAU/USD) grinds near the highest level since early June after rising the most in a week, making rounds to $1,978 amid early Wednesday morning in Asia. In doing so, the precious metal benefits from the upbeat market sentiment, as well as the United States Treasury bond yields, while ignoring the latest rebound in the US Dollar. Adding strength to the XAU/USD upside could be a technical breakout of the previously key resistance line, now support. However, a lack of major data/events seems to restrict immediate moves of the Gold Price.
Gold Price rallies as United States Treasury bond yields dribble amid risk-on mood
Gold Price edges higher following the previous day’s more than a 1.00% daily jump as market players seek more clues to sustain the latest run-up. That said, the yellow metal recently cheered the US Treasury bond’s inability to remain firmer, despite bouncing off the latest troughs, amid a firmer risk profile. Adding strength to the upside momentum could be the US Dollar’s struggle to pick up bids even if mixed United States data allowed the US Dollar Index (DXY) from the lowest level in 15 months.
That said, market sentiment improves on the positive performance of the US banks, as well as the risk-positive headlines surrounding China, which in turn allowed the Wall Street benchmarks to refresh the yearly top and propel the Gold price. It’s worth noting, however, that the benchmark US 10-year Treasury bond yields remain pressured around 3.78% while the two-year counterpart edges higher near 4.76% at the latest.
Share prices of the top-tier US banks like Bank of America, Morgan Stanley and Bank of New York Mellon Corp rallied on Tuesday on news that higher interest rates had helped boost profits in the second quarter, shared via Reuters. “Signs of a revival in investment banking, which has been in the doldrums as higher rates and economic uncertainty put a damper on deals and trading, also drove share gains,” said the news.
On the other hand, Washington’s efforts to re-establish ties with China, via multiple diplomats’ visits to Beijing one after the other, join the dragon nation’s rejection of economic fears and hopes of witnessing a 5.0% growth rate in 2023 to underpin optimism about one of the world’s biggest Gold customer. It should be noted that China’s easy prints of the second-quarter (Q2) Gross Domestic Product (GDP) flagged economic fears about the second-largest economy and prod the XAU/USD buyers previously.
Elsewhere, US Retail Sales growth for June came in as 0.2% MoM versus 0.5% expected and prior (revised). However, the Retail Sales Control Group marked 0.6% growth versus market forecasts of -0.3% and 0.3% previous readings. It should be noted that the US Industrial Production reprinted -0.5% for June compared to analysts’ estimations of 0.0%.
It’s worth noting, however, that the US Dollar Index (DXY) initially dropped to the fresh 15-month low before bouncing off 99.56 level, around 99.95 by the press time, which in turn prod the Gold buyers at the seven-week high. However, the DXY has been sluggish of late.
Moving on, the risk-on mood and the US Dollar’s inability to defend the latest run-up can prod the Gold buyers amid a light calendar and the market’s wait for the next week’s Federal Reserve (Fed) monetary policy meeting. It should be observed that the latest concerns about the Fed’s rate cut expectations in 2024 may add strength to the Gold Price.
Gold Price Technical Analysis
Gold Price justifies a U-turn from the 50-SMA, as well as an upside break of a two-week-old descending resistance line, now support, while refreshing a multi-day peak.
However, the overbought RSI (14) line highlights the $2,000 as an important upside hurdle for the XAU/USD bulls to watch for further ruling.
In a case where the Gold Price remains firmer past $2,000, a gradual run-up towards April’s peak of around $2,050 and then to the yearly top surrounding $2,067 can’t be ruled out.
On the downside, a daily closing below the resistance-turned-support, close to $1,962, as well as the 50-SMA support of $1,952, becomes necessary for the XAU/USD bear’s return.
Even so, a four-month-old horizontal area of around $1,935 appears a tough nut to crack for the Gold sellers to conquer for conviction.
Overall, the Gold Price remains on the bull’s radar even if the upside room appears limited.
Gold Price: Daily chart
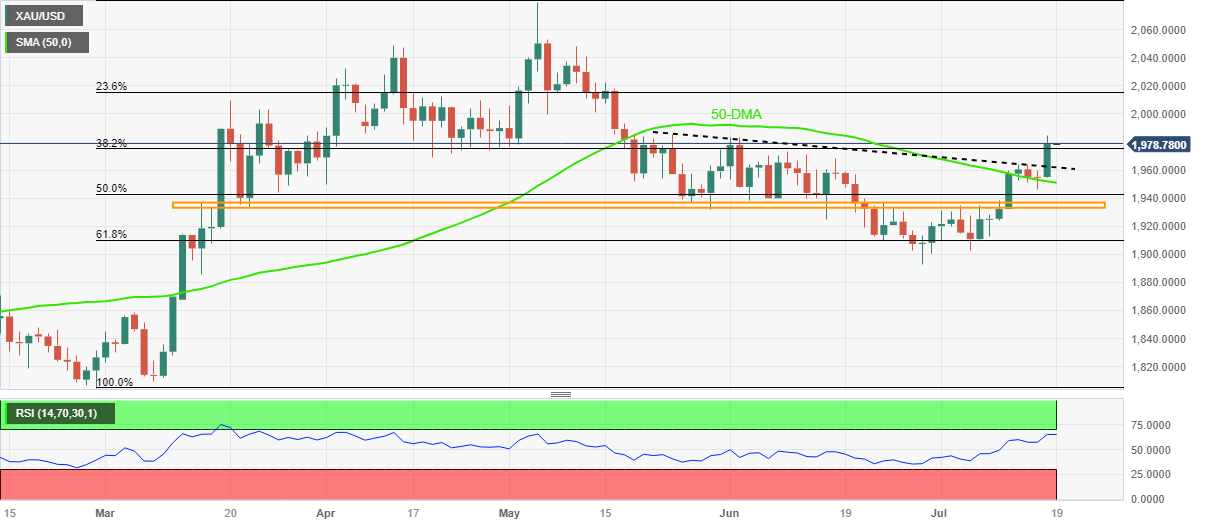
Trend: Further upside expected
- AUD/JPY hovers around 94.54, with upcoming releases of the Westpac Leading Index and Reuters Tankan Index set to impact the pair.
- Tuesday's price movement formed a dragonfly-doji, suggesting a potential upside, especially if AUD/JPY can reclaim 95.00.
- A breach below the 94.00 level could initiate a bearish continuation for AUD/JPY, with further support levels at 93.44, 93.23, and 93.00.
AUD/JPY is almost unchanged as Wednesday’s Asian session commences, which will showcase the release of the Westpac Leading Index on the Australian front and the Reuters Tankan Index for July, a sentiment index for manufacturers in Japan. As of writing, the AUD/JPY is trading at 94.54, below its opening price by 0.01%, with sellers eyeing a break below the Tenkan-Sen line at 94.41.
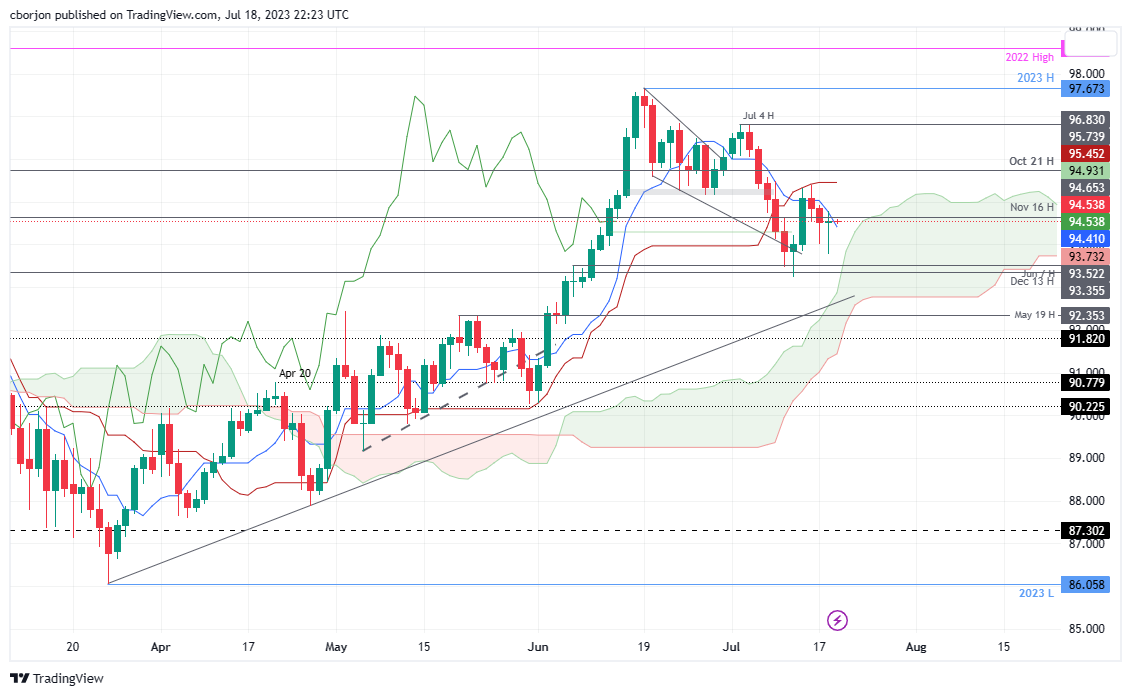
AUD/JPY Price Analysis: Technical outlook
The AUD/JPY daily chat portrays the pair as neutral biased after diving towards its current week low of 93.77 on Tuesday, but words from the Bank of Japan (BoJ) Governor Kazuo Ueda, weighed on the Japanese Yen (JPY), bolstering the AUD/JPY, which closed above its opening price. That formed a dragonfly-doji, opening the door for further upside late in the European session.
An AUD/JPY bullish resumption would occur when the pair claims the 95.00 figure. Break above would expose the July 14 and the Kijun-Sen confluence at around 95.38/95.45, immediately followed by the October 21 daily high at 95.74. Once those levels are surpassed, the AUD/JPY’s next goal would be 96.00.
Conversely, for an AUD/JPY bearish continuation, the pair must get below the 94.00 handle. A breach of the latter will expose the weekly low of 93.44, followed by the July 12 low of 93.23, before getting to the 93.00 mark.
AUD/JPY Price Action – Daily chart
- USD/CHF fell to a low of 0.8555, its lowest level since January 2015.
- US Retail Sales expanded in June but at a slower pace than expected.
- Investors are confident that the Fed won’t hike past the July meeting.
On Tuesday, the USD/CHF slid to its lowest level since January 22, 2015, amid soft Retail Sales figures from the US from June. Following soft inflation and economic data figures from the US, investors are refraining from betting on rate hikes by the Federal Reserve following the upcoming July meeting, weakening the USD.
Dovish bets on the Fed weaken the USD. Eyes on Swiss Trade Balance Data
The US Census Bureau reported that the Retail Sales from June increased by 0.2%, missing the 0.5% expected and below the previous 0.5% monthly increase. Sales excluding the Automobile Sector also expanded but below the expectations at 0.2% vs the 0.3% expected by the Retail Sales Control Group, came in strong at 0.6% vs the 0.3% decline expected. In addition, Industrial production surprisingly decreased by 0.5% MoM while markets expected the figures to remain unchanged regarding the previous month.
As economic activity weakens, the US markets expect the Federal Reserve to be taken off the pressure to continue hiking past July. For the next week’s meeting, 25 basis points (bps) is already priced in, but the odds of a hike in the rest of 2023 dropped to nearly 20% from last week’s 40%.
On the Swiss side, the week's highlight will be Trade Balance data from June, to be reported early in Thursday’s European session.
USD/CHF Levels to watch
According to the daily chart, the short-term USD/CHF outlook is bearish. However, indicators show oversold conditions, with the Relative Strength Index (RSI) standing below conditions and the Moving Average Convergence Divergence (MACD) printed a lower red bar, suggesting that an upwards correction may be on the horizon as bears are losing steam.
Support levels: 0.8555,0.8550, 0.8375.
Resistance levels: 0.8600,0.8670, 0.8700.
USD/CHF Daily chart
-638253120022718070.png)
Here is what you need to know for July 19:
During the Asian session, eyes will be on the early data in New Zealand CPI that will be released just after the rollover in thin market conditions and when spreads will be irregular, making it a tricky event to trade. However, with the Reserve Bank of New Zealand's (RBNZ) inflation target being around the midpoint of 2%, Statistics New Zealand’s quarterly Consumer Price Index (CPI) publication is still of high significance. The trend in consumer prices tends to influence RBNZ’s interest rates decision, which in turn, heavily impacts the NZD valuation. Acceleration in inflation could lead to a faster tightening of the rates by the RBNZ and vice-versa. Actual figures beating forecasts render NZD bullish.
Meanwhile, the US Dollar rose from a 15-month low against a basket of currencies on Tuesday after core Retail Sales saw strong gains in June. Core sales showed resilience and increased 0.6% in June. Data for May was also revised slightly up to show core Retail Sales increasing 0.3% instead of the previously reported 0.2%. Two-year Treasury yields reversed a 9bp fall to a 2bp rise, while 2-year bund yields fell 9.4bp.
EUR/USD was down in late New York trade but overall little changed after failing to breakout of last week's highs again although hitting 1.12750, the highest since Feb. 2022 although failed to hold bullish above the 61.8% Fibo of the 2021-22 collapse at 1.1271.
USD/JPY was higher after Ueda dashed hopes the BoJ would raise its JGB yield cap next Friday. Traders await Japan's CPI on Thursday, although Ueda's stance is more key. the pair is now supported and eyes a bullish correction into the sell-off.
The Pound was pressured in what has been considered a highly overbought market and fell 0.25% vs. the Greenback while UK gilt yields were falling. Traders will be looking to Wednesday's UK core CPI which will be key with respect to the Bank of England, BoE, hiking by either 25bp or 50bp at August's meeting. GBP/USD is testing below 1.3050 and correcting into the daily trend's in-the-money longs.
Elsewhere, Bitcoin, BTC/USD, was down $136.88 or 0.46% to $29794.96 in its worst three-day stretch since the three days ending July 7, 2023 when it fell 1.78%. It is down 1.74% over this three-day period. Gold prices rose to a six-week high after the United States reported Retail Sales rose less than expected last month. Crude oil and gasoline prices rallied sharply and garnered support from Alpha BBL's prediction that Wednesday's weekly EIA report for the week of July 14 will show crude supplies at Cushing, the delivery point of WTI futures, falling -3.3 million bbl. WTI rallied to a high of $75.92.
Like this article? Help us with some feedback by answering this survey:
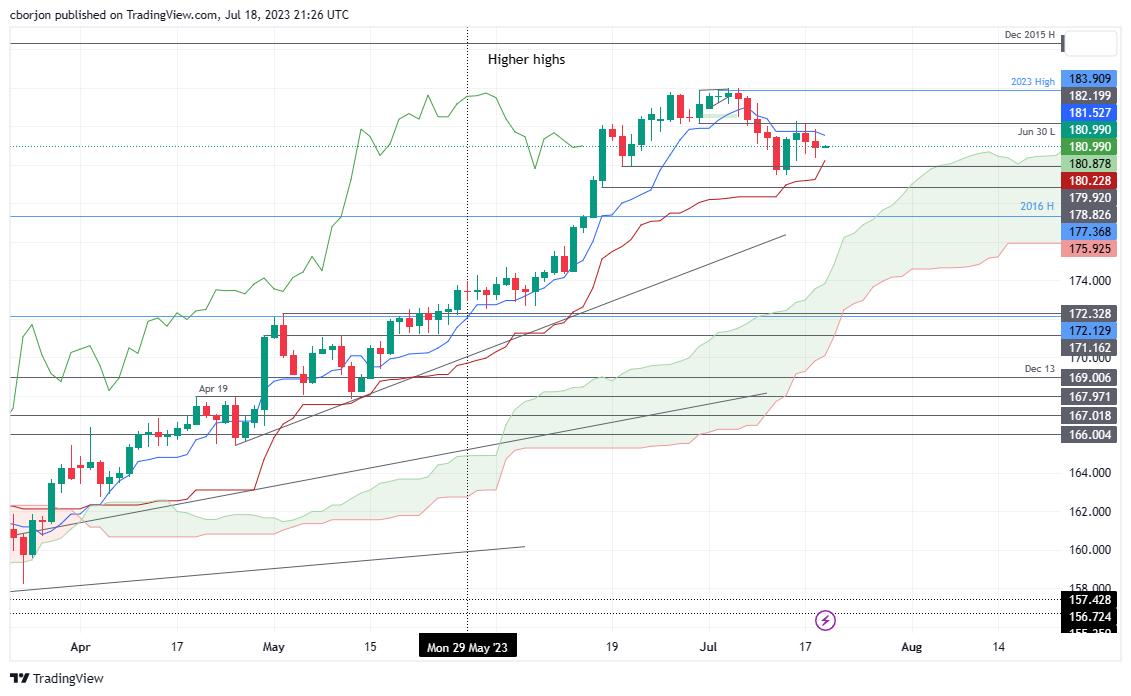
- GBP/JPY halts its slide, hinting at an upward bias with a bullish-harami two-candlestick pattern.
- Pin-bar candles and two negative sessions weigh GBP/JPY, prompting a slump below 181.00.
- GBP/JPY must surpass 180.36 for a bearish continuation; breaching the Tenkan-Sen at 181.52 could signal a bullish resumption.
GBP/JPY registers minimal gains as the Asian session begins, of 0.04% after Tuesday’s session witnessed Pound Sterling (GBP) weakness during most of the day. However, dovish comments from the Bank of Japan (BoJ) Governor Kazuo Ueda weighed on the Japanese Yen (JPY). At the time of writing, the GBP/JPY exchanges hands at 180.99.
GBP/JPY Price Analysis: Technical outlook
The daily chart portrays the cross as upward biased after stopping its slide on July 13 as a bullish-harami two candlestick pattern, suggesting prices would increase. Nevertheless, subsequent pin-bar candles and two negative sessions weighed on the GBP/JPY, slumping from around 182.19, just below the 181.00 figure.
For a bearish continuation, the GBP/JPY must surpass the July 17 low of 180.36, followed by the Kijun-Sen at 180.23. Once cleared, GBP/JPY must test 180.00, aiming toward lower price levels. Contrarily, for the GBP/JPY to resumeits uptrend, the first resistance would be the Tenkan-Sen at 181.52. Once that level hurdled, GBP/JPY would test June 30 daily low turned resistance at 182.20, followed by the year-to-date (YTD) high at 183.90.
GBP/JPY Price Action – Daily chart
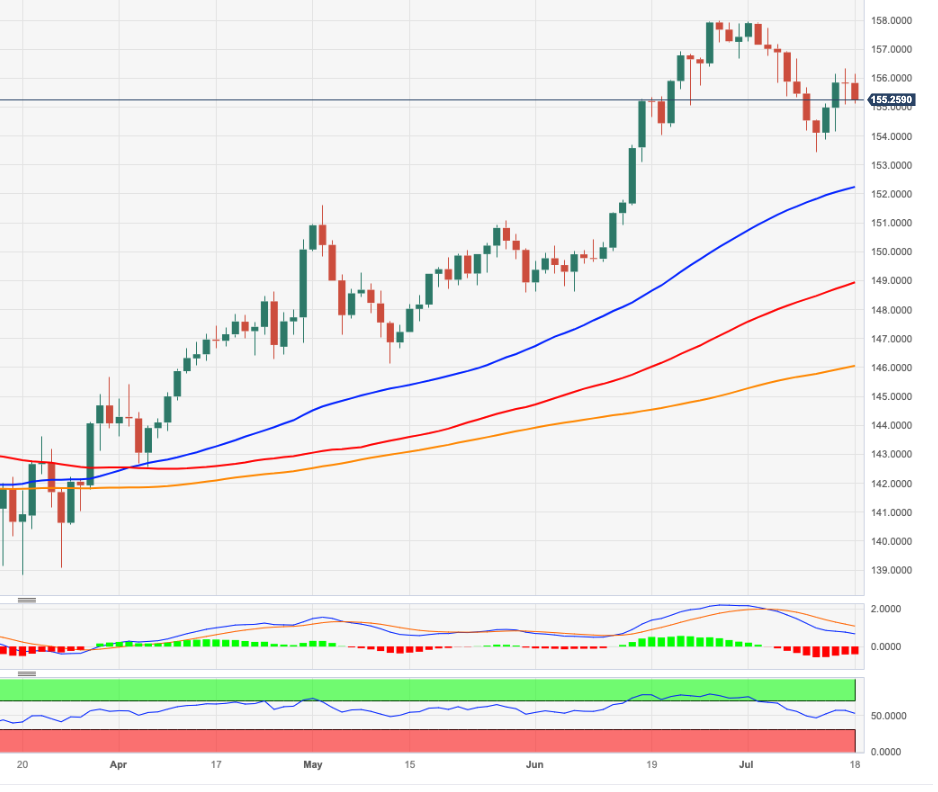
- EUR/JPY found support at a low of 154.84 and then stabilised near 156.90 holding to mild gains.
- German yields are declining following ECB speakers.
- Focus shift to ECB and BoJ decisions next week.
The EUR/JPY regained momentum during the American Session and jumped back towards 155.90 from a low of 154.84. On the downside, lower German yields limit the Euro’s upside potential, while the JPY seems to be struggling to gain momentum due to the Bank of Japan's (BoJ) expectations to maintain its dovish stance next week.
European Central Bank (ECB) officials delivered mixed signals regarding the next monetary policy moves past July. Klaas Knot argued that hikes beyond July are possible but not a “certainty” as he stated that the bank must carefully rely on the upcoming data. In addition, Nagel argued, “We will see, the data will tell us” regarding the September decision. According to the World Interest Rates Probabilities (WIRP), a 25 basis point (bps) hike is already priced in for next week’s meeting and the odds of a hike stand at nearly 60% for the September meeting and at 80% for the December meeting.
That being said, German yields have significantly decreased across the board on Tuesday. The 2-year yield dropped to 3.22% while the 5 and 10-year rates to 2.52% and 2.36%, respectively, seeing more than 3% declines. In that sense, lower yields are not allowing the Euro to gain traction.
On the Japanese front, BoJ’s Governor, Kazuo Ueda, is expected to maintain a dovish stance in the next week’s central bank meeting and maintain steady its inflation forecast. In the meantime, the JPY seems to weaken on monetary policy divergences agains its major rivals.
EUR/JPY Levels to watch
The daily chart suggests that slowly the outlook starts to favour the bulls in the short term, and sellers struggle to gain momentum. However, the 20-day Simple Moving Average (SMA) is a strong barrier for the bulls, which must be regained to regain momentum. Meanwhile, the Relative Strength Index (RSI) stands neutral above its midline, while the Moving Average Convergence Divergence (MACD) prints decreasing red bars.
Resistance levels: 156.35 ( 20-day SMA), 157.00, 158.00.
Support levels: 155.00, 154.50.154.00.
EUR/JPY Daily chart
-638253094360846275.png)
- NZD/USD traders await to see how the land lies after the NZ CPI today.
- Bears have taken profits at key trendline support.
As per the prior analysis, NZD/USD Price Analysis: Bulls seek a break of key trendline resistance, whereby a correction was underway and a continuation would be eyed for in due course, we have seen bears move into a 50% mean reversion area while leaving room on the table for a deeper move should today's data warrant it.
NZD/USD prior analysis
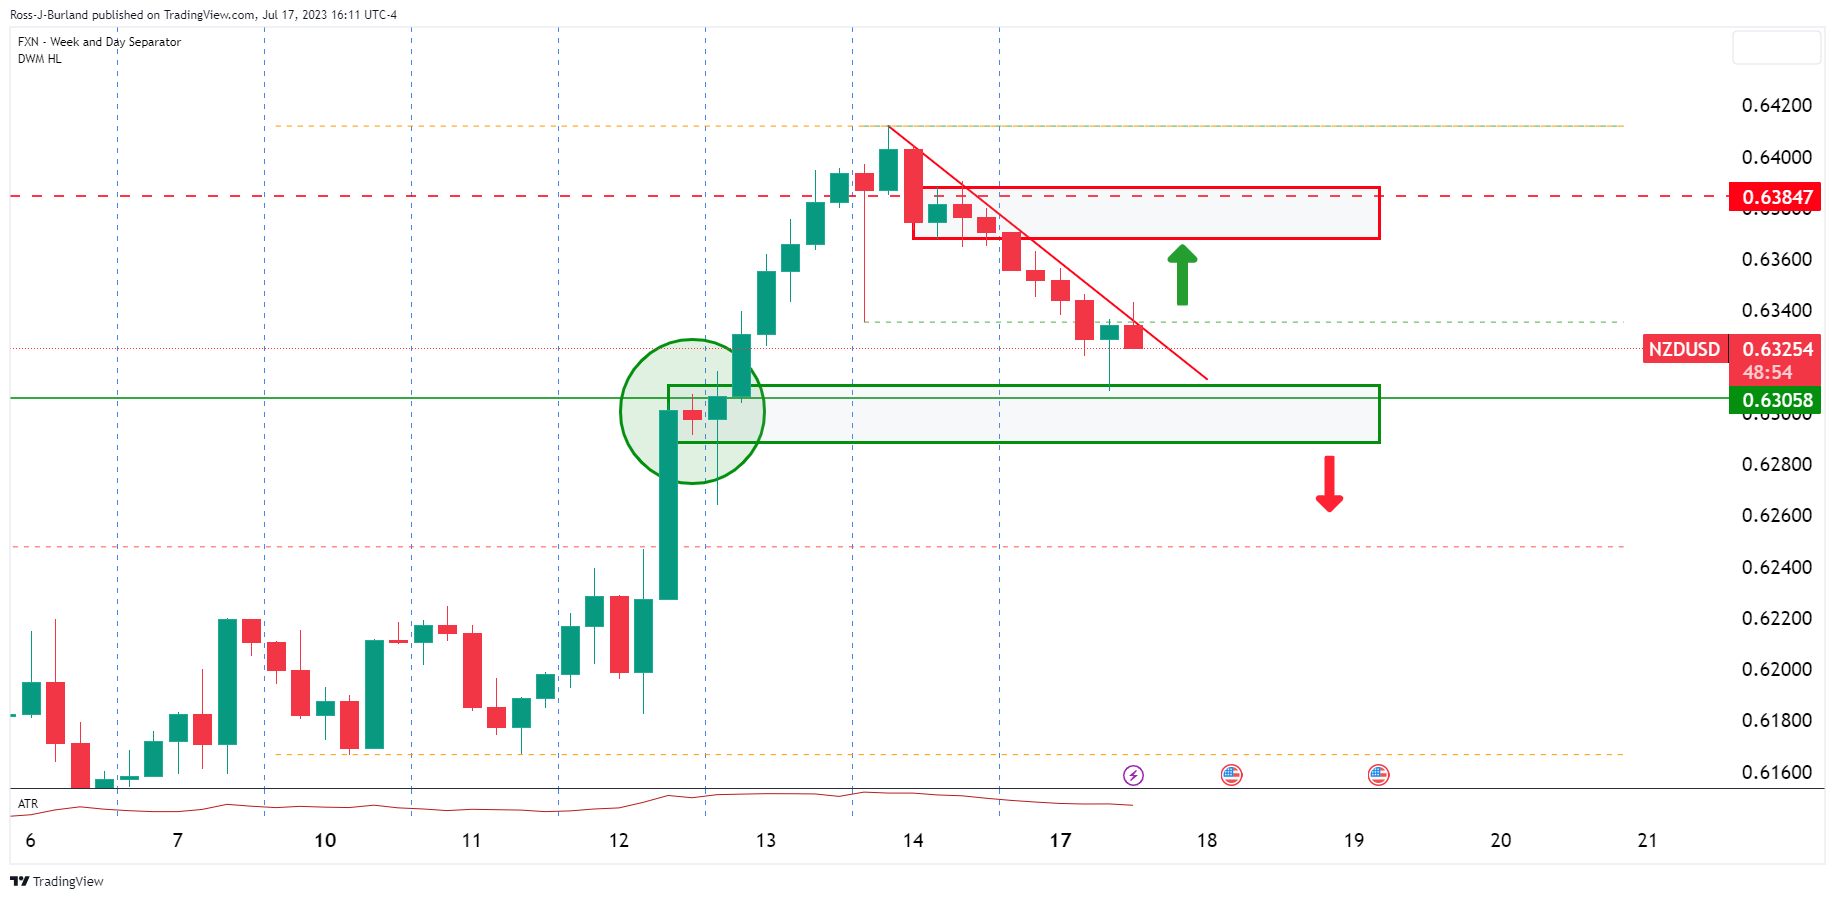
The trendline resistance has kept the bears in play, so far:
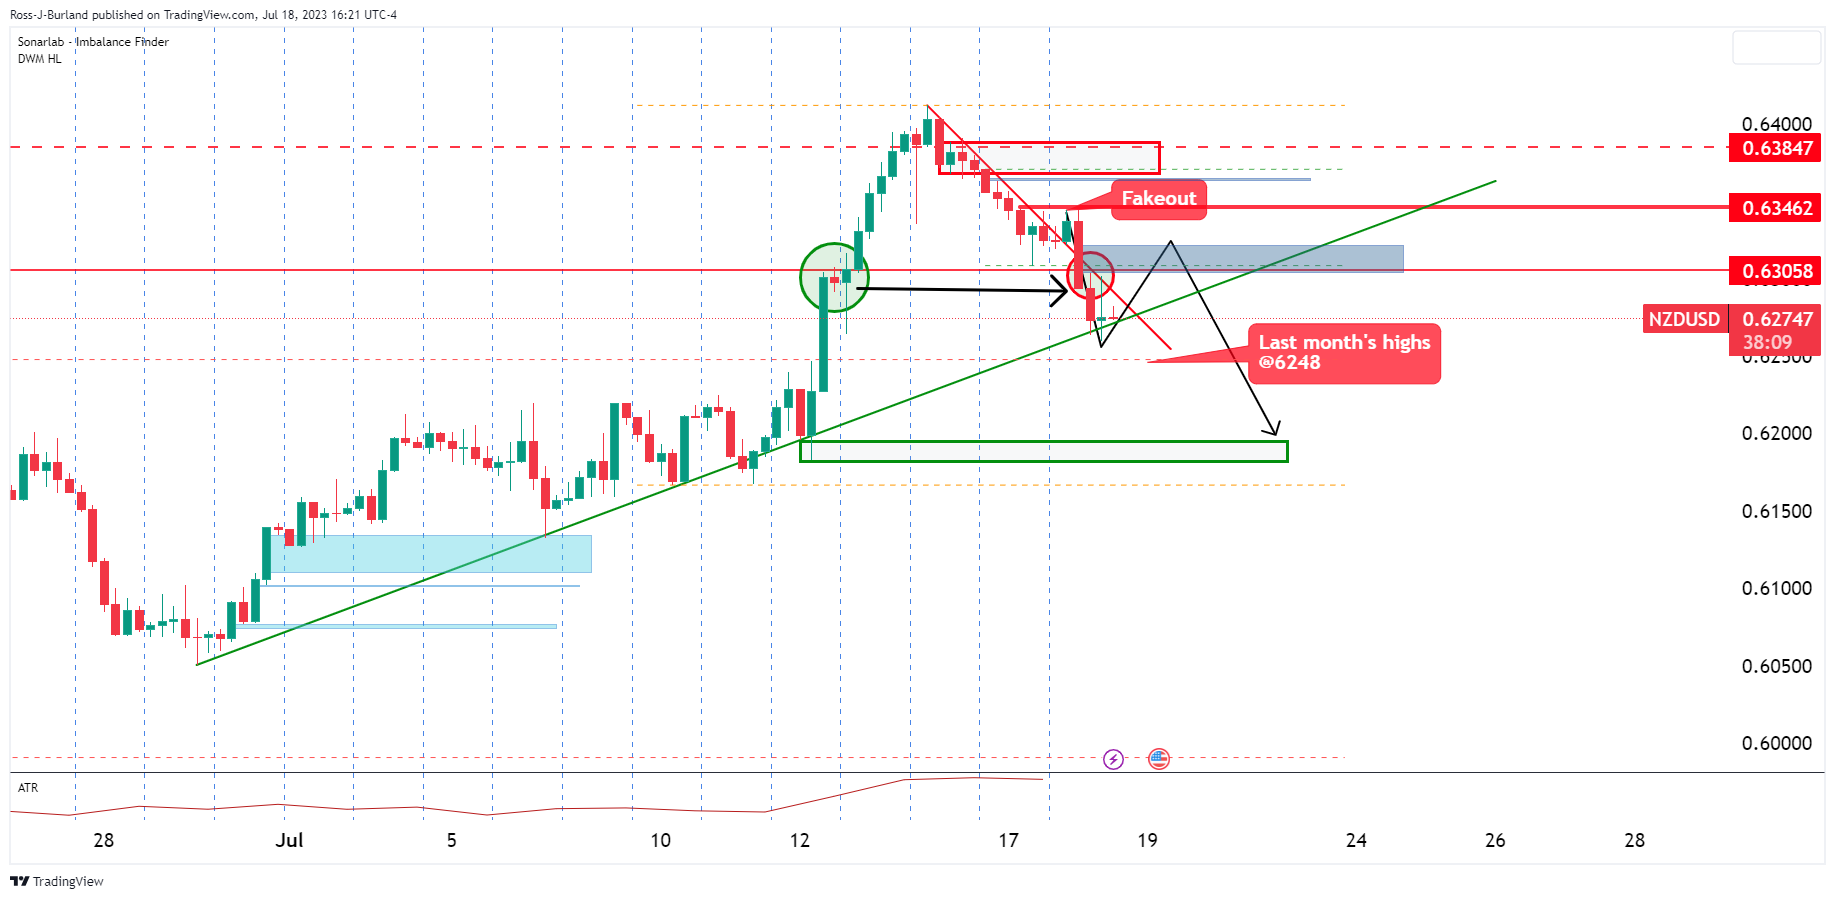
We saw a false break of the trendline and a strong move to the downside to test trendline support on the way to last month's highs. Bears have moved about ahead of the data as the 0.62s come under pressure.
- EUR/USD bears are looking for a free lunch and low-hanging fruit.
- EUR/USD is moving into a key area on the hourly charts.
EUR/USD was down in late New York trade but overall little changed after failing to the breakout of last week's highs again although hitting 1.12750, the highest since Feb. 2022. Meanwhile, the US Dollar rose from a 15-month low against a basket of currencies on Tuesday after core Retail Sales saw strong gains in June. Core sales showed resilience and increased 0.6% in June. Data for May was also revised slightly up to show core retail sales increasing 0.3% instead of the previously reported 0.2%.
EUR/USD daily chart
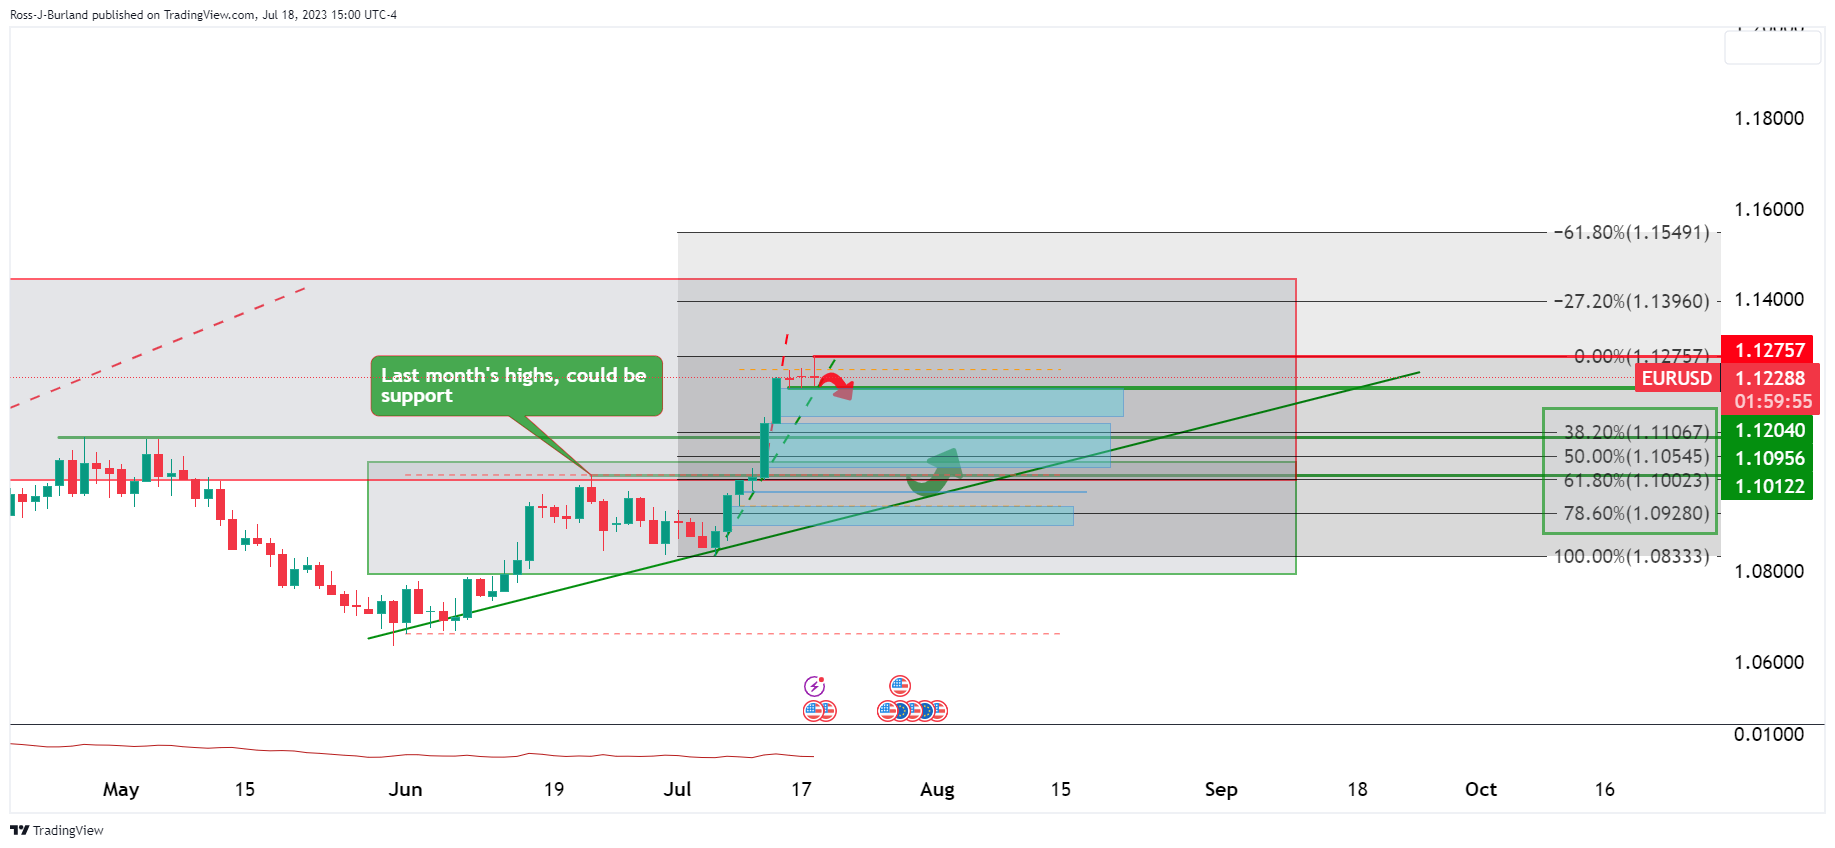
EUR/USD is capped, so far, at the highs of the recent bullish rally as per the daily chart above. The lower timeframes are showing that the price is below last week's lows following a failed breakout:
EUR/USD H1 chart
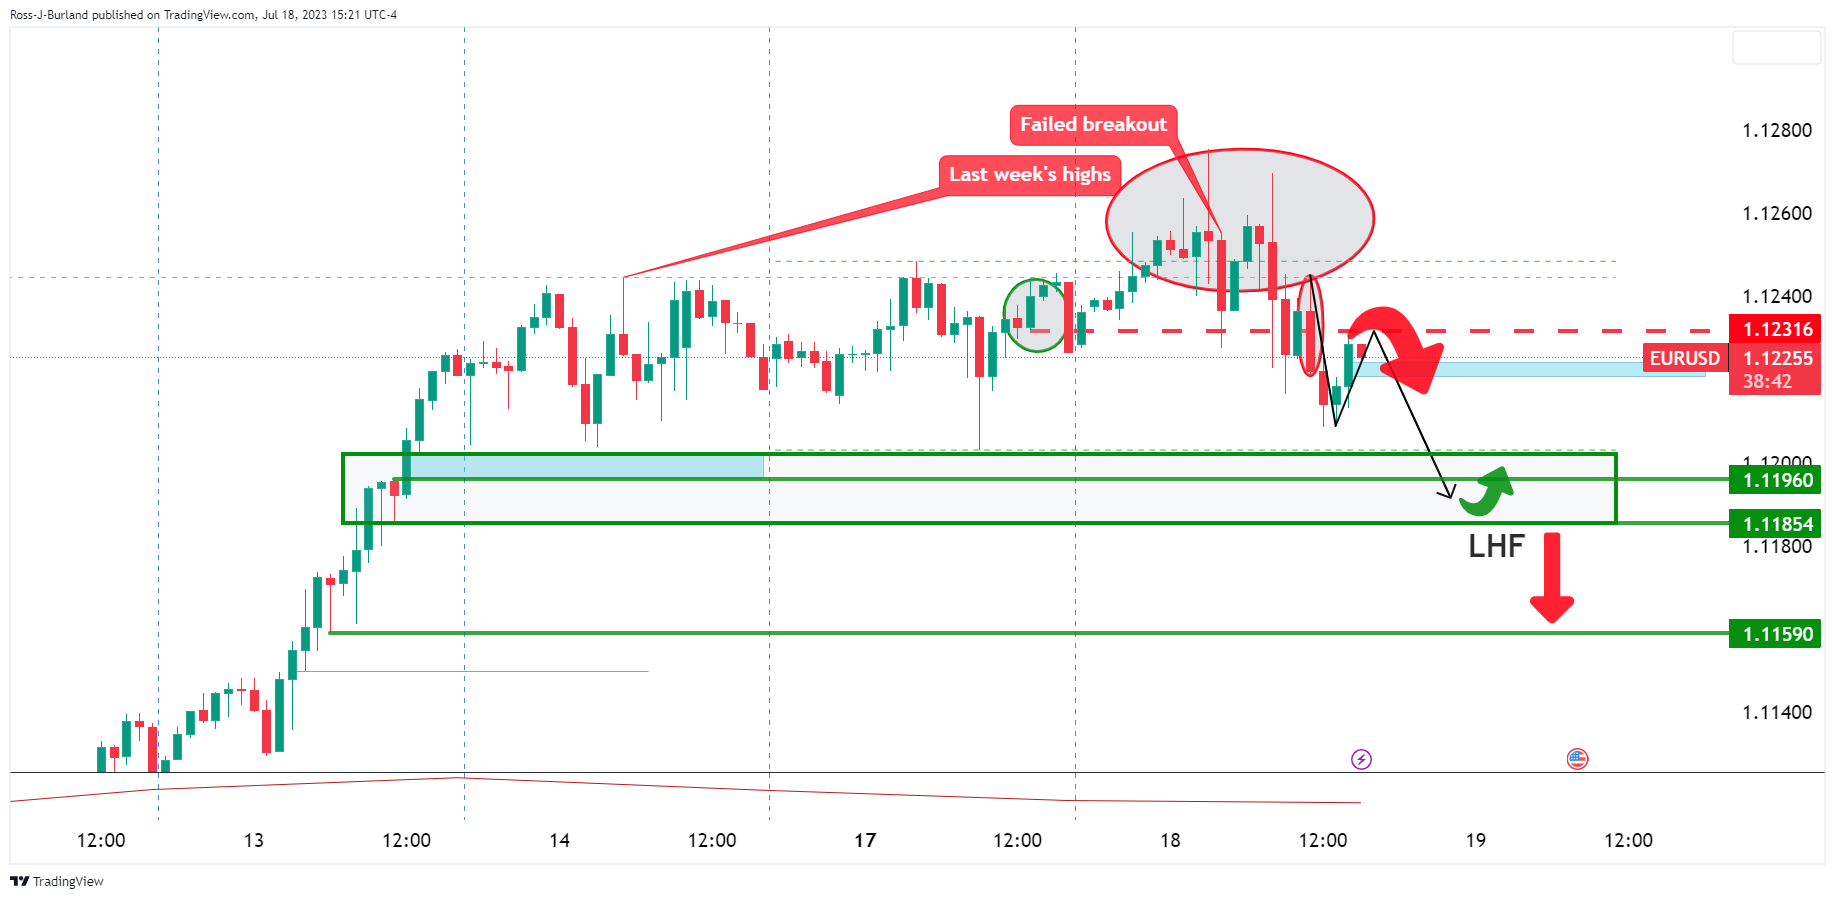
The bears will be looking for the low-hanging fruit, LHF, but there is support to get through first:
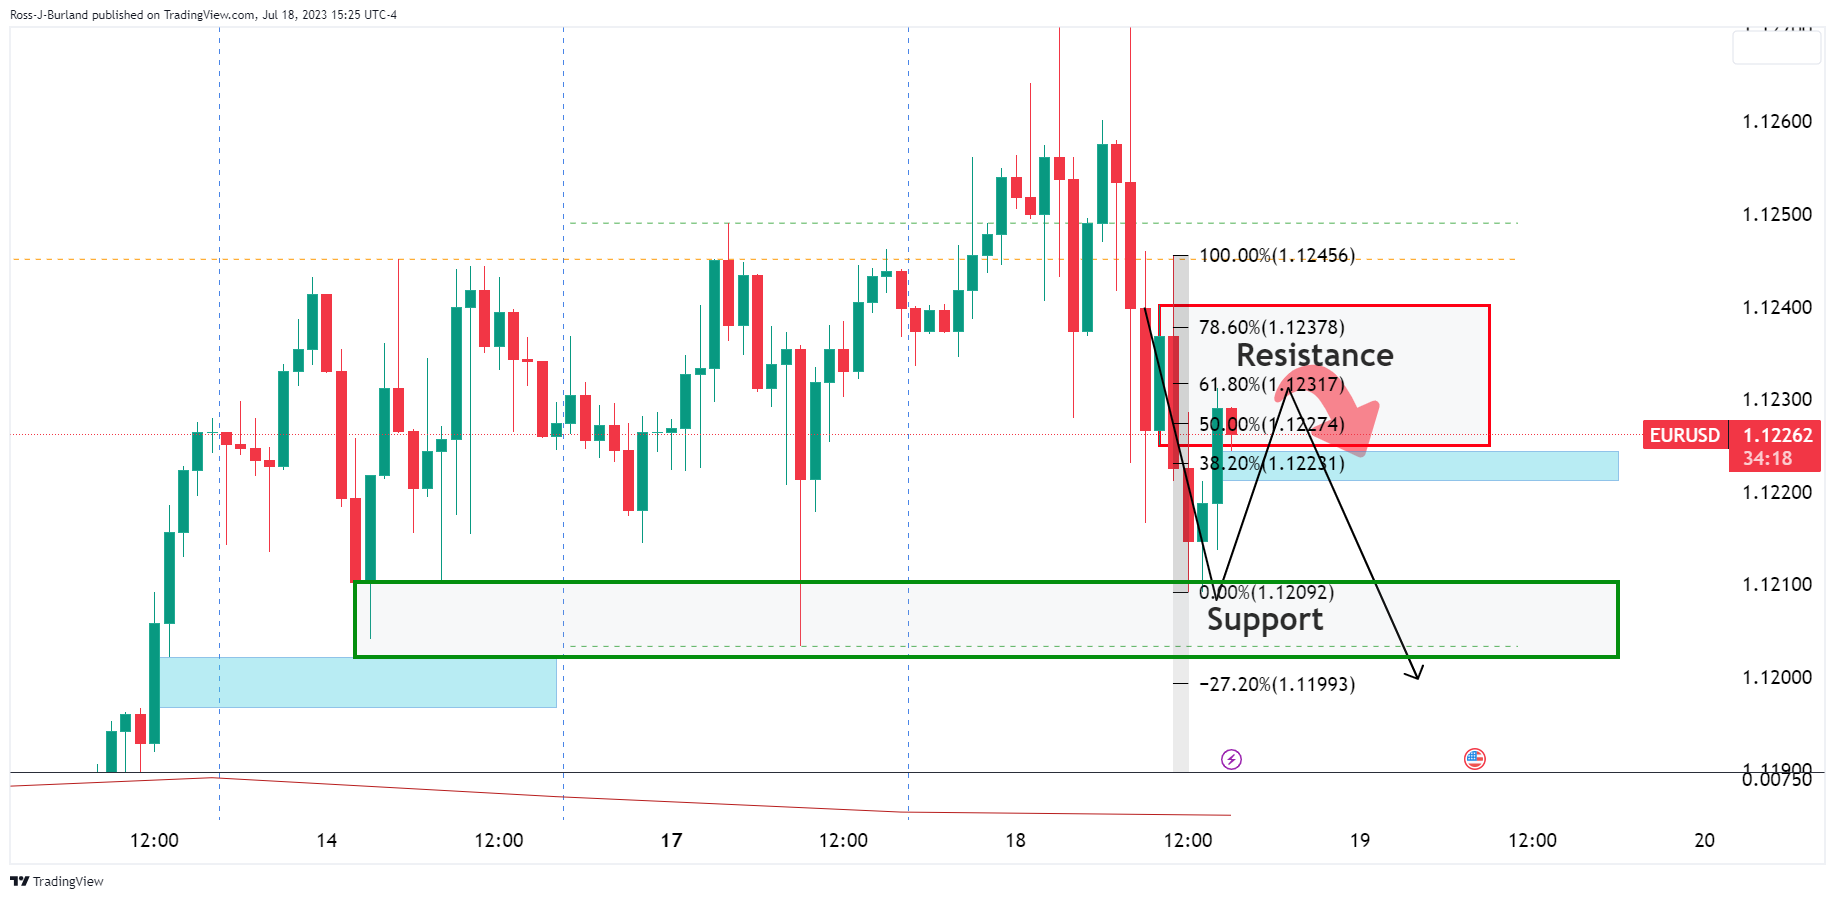
The pair came close to the 61.8% Fibonacci in a deep enough correction that might entice the bears for a move into support.
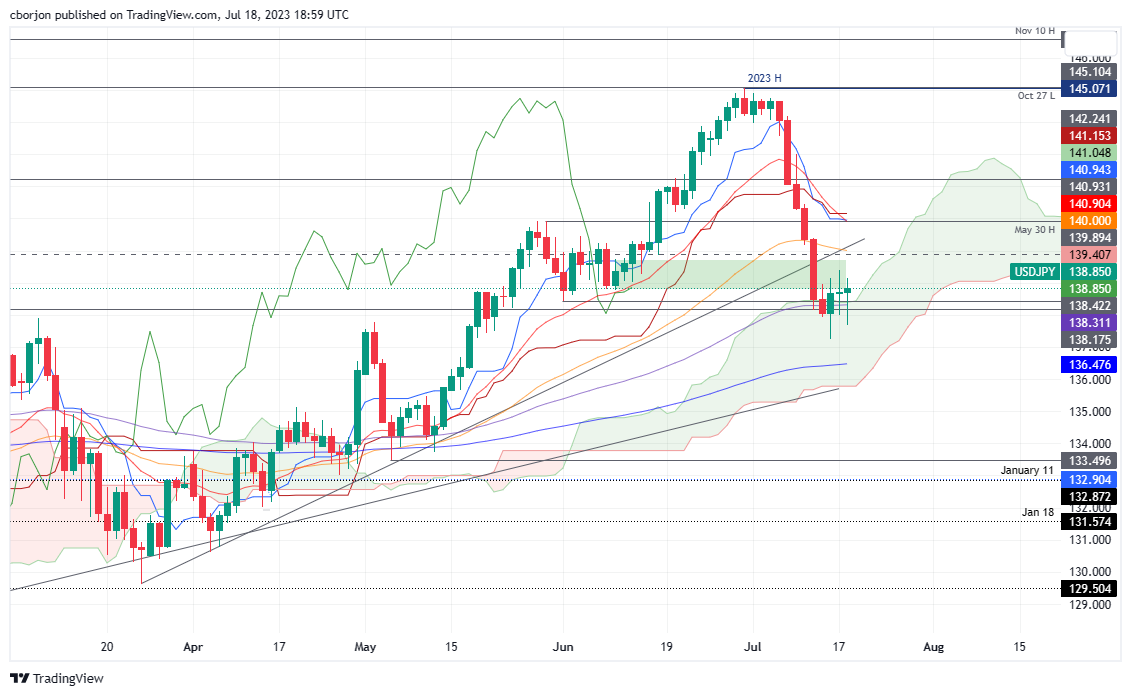
- USD/JPY stabilized, aided by Ichimoku Cloud and 100-day EMA.
- Buyers target 50-day EMA at 139.99; sellers eye a break below 138.00.
- Significant support and resistance lie at 200-day EMA levels.
USD/JPY seesaws around the top/bottom of the 138.00 figure as the Ichimoku Cloud (Kumo) cushions the USD/JPY’s pair fall. That, alongside the 100-day Exponential Moving Average (EMA) at 138.31, maintains the USD/JPY afloat, which trades at around 138.83 after hitting a daily low of 137.67.
USD/JPY Price Analysis: Technical outlook
The USD/JPY daily chart portrays the pair making a base after reaching a month-and-a-half low of 137.23 on July 14. Since then, the USD/JPY has not fallen below 137.50, but price action shows neither buyers nor sellers are in control. Nevertheless, if USD/JPY buyers would like to push prices higher, they will need to reclaim the 50-day Exponential Moving Average (EMA) at 139.99 before challenging the confluence of the 20 and 200-day EMAs at the 140.89/95 range.
For a bearish continuation, USD/JPY sellers would need to crack 138.00, followed by the current month’s low of 137.24, before slumping to the 137.00 psychological figure. Once cleared, the USD/JPY next support emerges at the 200-day EMA 136.47.
USD/JPY Price Action – Daily chart
- XAU/USD advanced near $1,980, its highest since June 2.
- Retail Sales data from the US from June came in below expectations.
- Lower yields allowed metals to advance.
On Tuesday, the XAU/USD advanced towards $1,980 and displayed more than 1% gains. In that sense, as the Retail Sales hint at a decelerating US economy, US Treasury yields declined across the board, favouring the yellow metal’s price.
The US Census Bureau reported that the Retail Sales from June increased by 0.2%, lower than the 0.5% expected and the previous 0.5% monthly increase. Sales excluding the Automobile Sector also expanded but below the expectations at 0.2% vs the 0.3% expected by the Retail Sales Control Group, came in strong at 0.6% vs the 0.3% decline expected.
As a reaction, US yields are retreating, with the 2-year yield standing at 4.72%, while the 5 and 10-year rates fell to 3.97% and 3.77%, respectively, with the latter leading a decline showing more than 1% decreases. As US yields are the opportunity cost of holding non-yielding metals, their decline is tractioning the XAU/USD.
Focus now shifts to next week's Federal Reserve (Fed) decision, where markets have nearly priced in a 25 basis point (bps) hike. Due to soft inflation and weak Retail Sales, investors are now refraining from betting on an additional hike past July. Market participants will closely watch the Fed’s statement and Jerome Powell’s outlook for clues regarding forward guidance.
XAU/USD Levels to watch
After consolidating above the 100-day Simple Moving Average (SMA) at $1,956, the XAU/USD outlook is bullish for the short term. In addition, the Relative Strength Index (RSI) stands with a positive slope above its midline. At the same time, the Moving Average Convergence Divergence (MACD) prints higher green bars suggesting that the bulls are in command.
Resistance levels: $1,985, $2,000, $2,010.
Support levels: $1,956 (100-day SMA), $1,940, $1,930 (20-day SMA).
XAU/USD Daily chart
-638253010229645429.png)
- Canadian inflation drops to a 27-month low, relieving pressure on the Bank of Canada following last week’s rate hike.
- US data releases show weaker-than-expected retail sales and a significant drop in industrial production.
- Lower inflation in Canada may open the path for USD/CAD upside, with a 20% chance of a BoC rate hike in September.
USD/CAD edges lower after data from Canada and the United States (US) put buyers and sellers in a tug-of-war, with the latter getting the upper hand, as the major prints modest losses of 0.05%. The USD/CAD is trading at 1.3192 at the time of writing., after hitting a daily high at 1.3243.
Underwhelming US Retail Sales and Industrial Production pressures the US Dollar
Statistics Canada revealed that inflation fell to a 27-month low, with the Consumer Price Index (CPI) for June jumped to 2.8% YoY, below estimates of 3%, less than May’s 3.4%. Regarding core CPI, figures came at 3.2%, less than estimates and May’s figures, of 3.2% and 3.7%, each, respectively, easing off pressure on the Bank of Canada (BoC), which lifted rates last week to 5% threshold, which stressed that if incoming data suggested further tightening, they could hike rates further.
In data across the border, US Retail Sales in the past month were more modest than expected, with a 0.2% increment rather than the projected 0.5%. The Core Retail Sales, excluding auto sales, also missed estimates, showing the same slight growth of 0.2%, failing to meet the benchmark of 0.3%.
Other data from the US Federal Reserve showed a noteworthy drop in Industrial Production. The monthly figures highlighted a decrease of -0.5% relative to the preceding month, a disappointing result compared to the predicted 0% growth. Year-over-year predictions had forecasted an increase of 1.1%, yet June’s data presented a shrinkage of -0.4%.
Following the data release, the USD/CAD rallied to a daily high at 1.3243 before making a U-turn that benefited the Canadian Dollar (CAD) bulls. They dragged the USD/CAD pair towards a daily low of 1.3167 before settling around current exchange rates.
The greenback has continued to recover some ground, as shown by the US Dollar Index (DXY). The DXY, which tracks the buck’s performance against a basket of six currencies, advances 0.13%, up at 100.017. Meanwhile, bond yields in the US and Canada are dropping, with the 10-year benchmark note rate sitting at 3.781%, down three bps in the US, while the Canadian 10-year bond yield sits at 3.360%, down four bps.
Given the fundamental backdrop, softer inflation data in Canada could pave the way for USD/CAD upside, as odds stand at a 20% chance the Bank of Canada (BoC) would raise rates 25 bps at the September 6 meeting. Contrarily, the Federal Reserve would hike 25 bps at the upcoming July meeting, with officials reiterating that an additional increase would be needed.
USD/CAD Price Analysis: Technical outlook
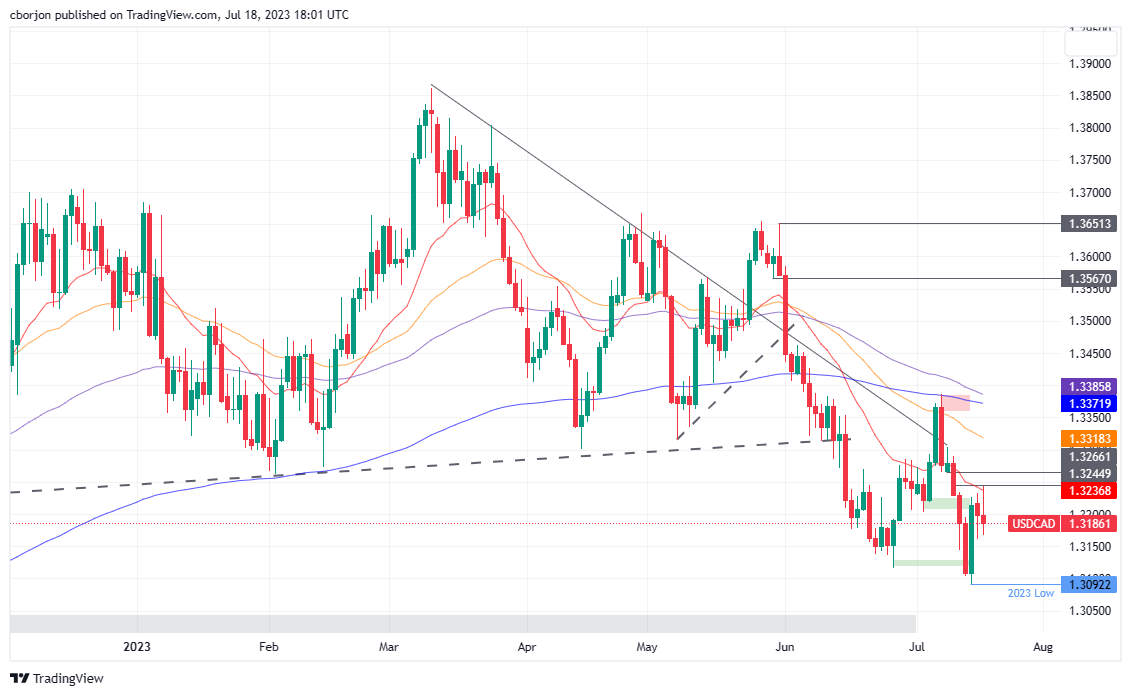
From a technical standpoint, the USD/CAD remains tilted to the downside, set to test initially the June 27 daily low of 1.3116 after USD/CAD sellers claimed the 1.3200 figure. IF USD/CAD drops below 1.3150, the next stop would be the June 27 low, followed by the YTD low of 1.3092. Conversely, if USD/CAD buyers reclaim 1.3200, that will expose the 20-day Exponential Moving Average (EMA) at 1.3237, followed by the 1.3250 psychological level.
- WTI sets more than 2% gains on the day, jumping to a high near $75.70.
- Retail Sales data from June from the US came in lower than expected.
- Weak USD and dovish bets on the Fed favour Oil prices.
The West Texas Intermediate (WTI) price cleared almost all of Monday’s losses and jumped towards $75.70. Following weak Retail Sales data from the US, rising Wall Street indexes and lower US yields signal that markets expect a less aggressive Federal Reserve (Fed) past July.
The US Census Bureau revealed that Retail Sales in the US expanded in June by 0.2%, lower than the 0.5% expected and the previous 0.5%, and the sales excluding the Automobile sector increased 0.2%, failing to live up to the expectations of 0.3%. On the positive hand, the Retail Sales Control Group, which represents the total industry sales used to prepare the Personal Consumer Expenditures (PCE) estimates for most goods, expanded by 0.6% in June, while markets expected a 0.3% decline.
US Treasury yields are declining as a reaction, indicating that markets expect a less aggressive Fed. The 2-year yield fell to 4.70%, while the 5 and 10-year rates to 3.95% and 3.75%, respectively, decreased by more than 0.50%. In that sense, the expectations of lower rates, which tends to be associated with a stronger economy, allowed oil prices to rise. That being said, regarding Federal Reserve bets, according to the CME FedWatch Tool, investors have practically priced in 25 basis points (bps) hike in the upcoming July 26 meeting, while the probability of a hike in 2023 has dropped to around 20% due to the latest set of data which has weakened the USD over the last sessions.
On the downside, the sluggish economic situation of China, the world’s biggest oil importer, may limit WTI’s upside. On Monday, it was reported that the Chinese Gross Domestic Product (GDP) and Retail Sales expanded but below expectations, so weaker Chinese oil demand may apply selling pressure to the black gold.
For the rest of the session, investors will closely watch American Petroleum Institute (API) weekly crude oil stocks.
WTI Levels to watch
According to the daily chart, the technical outlook is neutral to bearish despite daily gains. The Relative Strength Index (RSI) stands with a flat slope above its midline, while the Moving Average Convergence Divergence (MACD) prints lower green bars indicating bullish exhaustion.
Support Levels: $73.55 (100-day SMA), $72.80, $71.90 (20-day SMA).
Resistance Levels:$76.00, $77.00,$77.30 (200-day SMA).
WTI Daily chart
-638252976315962254.png)
- GBP/USD slides 0.13%, pulled down by disappointing US retail sales and industrial production data, alongside the uncertain US economic outlook.
- UK’s upcoming Consumer Price Index release could pressure Bank of England’s monetary policy direction.
- ING analysts predict GBP/USD’s potential rise towards 1.33 in the near term, conditional on inflationary figures and BoE’s response.
GBP/USD struggles at 1.3100 and retreats as the United States (US) economy continued to show signs of weakening, suggested by not-so-good economic data revealed on early Tuesday. In addition, the United Kingdom (UK) inflation report, just around the corner, is set to keep the GBP/USD pair within familiar levels. At the time of writing, the GBP/USD is trading at 1.3055, down 0.13%.
Uneasy equilibrium keeps the GBP/USD pair within familiar ranges as the market awaits UK’s June CPI
The latest data on US retail sales for June showed a modest increase of 0.2% compared to the previous month, falling short of the estimated growth of 0.5%. When excluding automobile sales, often referred to as core retail sales, the figures also missed forecasts, with a modest 0.2% month-on-month increase compared to the anticipated 0.3%. In addition, the US Federal Reserve released data on industrial production, which experienced a significant decline. Monthly figures showed a slide of -0.5% compared to the previous month, below the expected 0% growth. On an annual basis, market participants had projected a 1.1% expansion, but the data revealed a decline of -0.4% for June.
Across the pond, the UK’s economic docket will feature the release of the Consumer Price Index (CPI) for June. Market participants estimate CPI would fall to 8.2% YoY, below May’s 8.7%. Core CPI is projected to stay steady at 7.1% YoY. If inflation exceeds estimates, that could pave the way for further tightening by the Bank of England (BoE). Otherwise, it could ease pressure on the BoE, which remains under stress, as it has failed to provide price stability after the Covid-19 pandemic.
Initially, the US Dollar weakened on the release. As of late, it’s recovering lost ground as depicted by the US Dollar Index, which tracks the performance of six currencies vs. the US Dollar, which stands at 99.952 and gains 0.07%.
Despite that, ING analysts estimate the GBP/USD could aime towards 1.33 in the near term. Nevertheless, they noted that “a soft inflation print could hurt” the Sterling (GBP) prospects and stir a drop in the GBP/USD. Regarding monetary policy, they wrote, “At the moment, we look for two more BoE rate hikes – policy rate to 5.50% – but well below the 6%+ rates priced by the markets.”
GBP/USD Price Analysis: Technical outlook
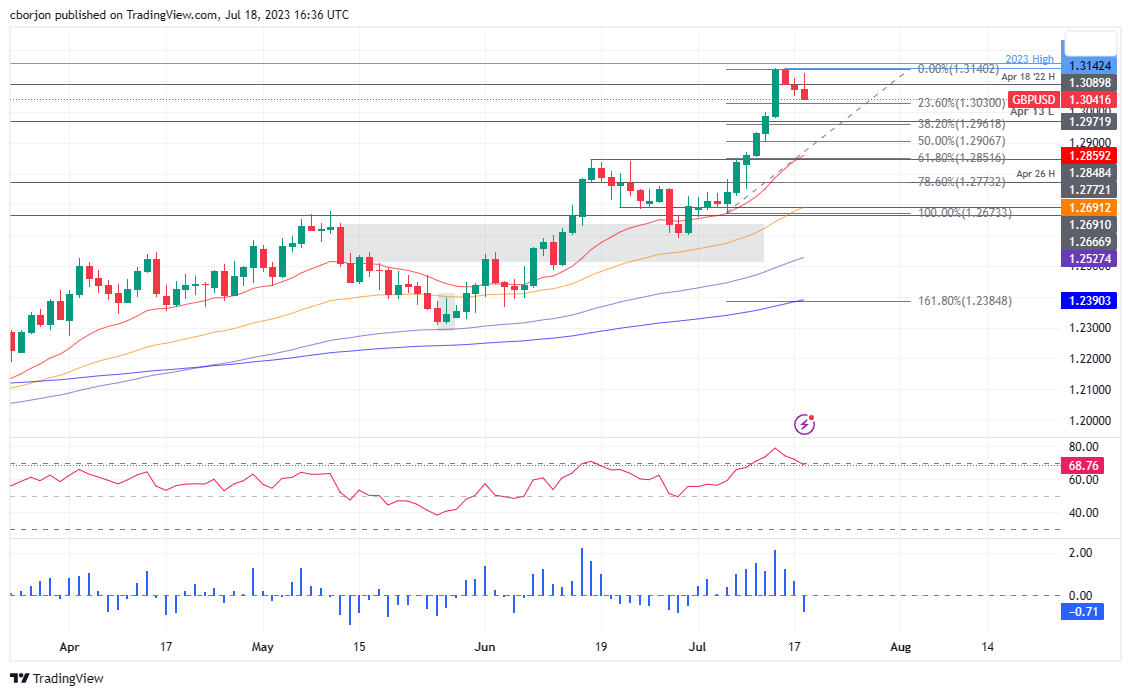
The GBP/USD daily chart portrays the pair as upward biased but on an ongoing correction after hitting a year-to-date (YTD) high of 1.3142, in addition to the Relative Strength Index (RSI) indicator exiting from overbought territory. That, alongside the three-day Rate of Change (RoC) depicting sellers gathering momentum, opens the door for the pullback. The GBP/USD first support would be the 38.2% Fibonacci (Fibo) retracement at 1.2962. A breach of the latter will expose the 50% Fibo retracement at 1.2906, followed by the confluence of the June 16 high and the 61.8% Fibo at around 1.2848/51. Contrarily, the GBPUSD fist resistance would be 1.3100, followed by the YTD high at 1.3142.
- The AUD/USD traded in the 0.6790 - 0.6838 range, holding daily gains.
- Retails Sales in the US increased in June but were below expectations.
- RBA minutes showed board members adopted a cautious stance.
On Tuesday, the USD faced additional selling pressure following soft Retail Sales and Industrial Production data from June, which helped the AUD/USD clear daily losses and jump back above 0.6800. Following the data, US Treasury yields are in decline, applying further pressure on the Greenback.
Investors assess Retail Sales data from June
The US Census Bureau reported that the Retail Sales from June increased by 0.2%, lower than the 0.5% expected and the previous 0.5% monthly increase. Due to the signs of weakness in the US economy following soft inflation readings, US Treasury bond yields decreased. The 2-year yield fell to 4.70%, while the 5 and 10-year rates fell to 3.95% and 3.75%, respectively.
US Industrial Production data from the Board of Governors of the Federal Reserve also undershot expectations, coming out at -0.5% versus the flat 0.0% reading forecast and repeating the 0.5% decline witnessed in May. The data further underscores the cool down that appears to be happening in the world's largest economy.
On the other hand, the Reserve Bank of Australia (RBA) released its July meeting minutes, which showed that members agreed to pause policy due to the uncertainty around the economic outlook and the significant tightening up to the date. Regarding the next movements, the minutes showed that the board would reassess the economic situation in the next meeting in August. According to the World Interest Rates Probabilities (WIRP), markets are discounting a 25 basis point (bps) hike in the next meeting and bet on high probabilities of similar hikes in September and November.
AUD/USD Levels to watch
The daily chart suggests that the technical outlook for the AUD/USD has turned neutral for the short term. The Relative Strength Index (RSI) has a positive slope above its midline, while the Moving Average Convergence Divergence (MACD) prints lower green bars. In the 4-hour chart, there is also no clear dominance, as indicators are somewhat flat. However, on the bigger picture, the pair trades above its main daily Simple Moving Averages (SMAs) of 20,100 and 200-days, suggesting that the bulls are in command on the bigger picture.
Resistance Levels: 0.6840,0.6850,0.6890.
Support Levels: 0.6790,0.6740, 0.6715 (20-day SMA).
AUD/USD Daily chart
-638252911324098364.png)
- USD/MXN sinks to a fresh yearly low of 16.7181 amid weaker-than-expected US Retail Sales and industrial production figures.
- Greenback defensive as US Dollar Index slips 0.07%; US Treasury bond yields also experience a dip.
- Market awaits Mexican Retail Sales data; a risk of ‘hard landing’ in the US may impact emerging market currencies.
USD/MXN tumbled to fresh yearly lows of 17.6899 early in the North American session after the greenback (USD) softened amidst the US Department of Commerce revealed June’s Retail Sales report. The USD/MXN is trading at 16.7181, with losses of 0.03%.
Weak US Industrial Production and Retail Sales boosted the Mexican Peso
Key economic data revealed before Wall Street opened exacerbated the USD/MXN’s fall toward new yearly lows. US Retail Sales for June rose by 0.2% MoM, below estimates of 0.5%, while excluding autos, the so-called core Retail Sales missed the 0.3% forecasts and jumped by a modest 0.2% MoM. In other data revealed by the US Federal Reserve (Fed), industrial Production tanked, with monthly figures sliding -0.5% MoM, below estimates of 0%. At the same time, annually based, market participants projected a 1.1% expansion, though data plunged -0.4 percent in data revealed from June.
Following the data release, the USD/MXN continued to trend lower while the buck remained defensive. The US Dollar Index (DXY), a gauge of the US Dollar against a basket of peers, stands at 99.817, down 0.07%.
US Treasury bond yields dropped as the US 2-year Treasury note yields 4.715%, three basis points below its opening price. The 10-year benchmark note sits at 3.760% and slides five basis points.
The agenda in Mexico remained empty, with Retail Sales expected to be released on Thursday. Annually figures for May are expected to decelerate from 3.8% to 3.5%, while for monthly numbers, analysts foresee a deeper slowdown to 0.3% from April’s 1.5%.
Given the backdrop, the USD/MXN bias remains tilted downwards, though the overextended fall could find some support at around the 16.30/50 area if the current YTD low is broken. The interest rate differential favors the Mexican Peso (MXN) vs. the US Dollar (USD). But any US inflation surprises, or a risk of a ‘hard landing’ increasing in the US, could spur a flight to safety, weighing on the emerging market currency.
USD/MXN Price Analysis: Technical outlook
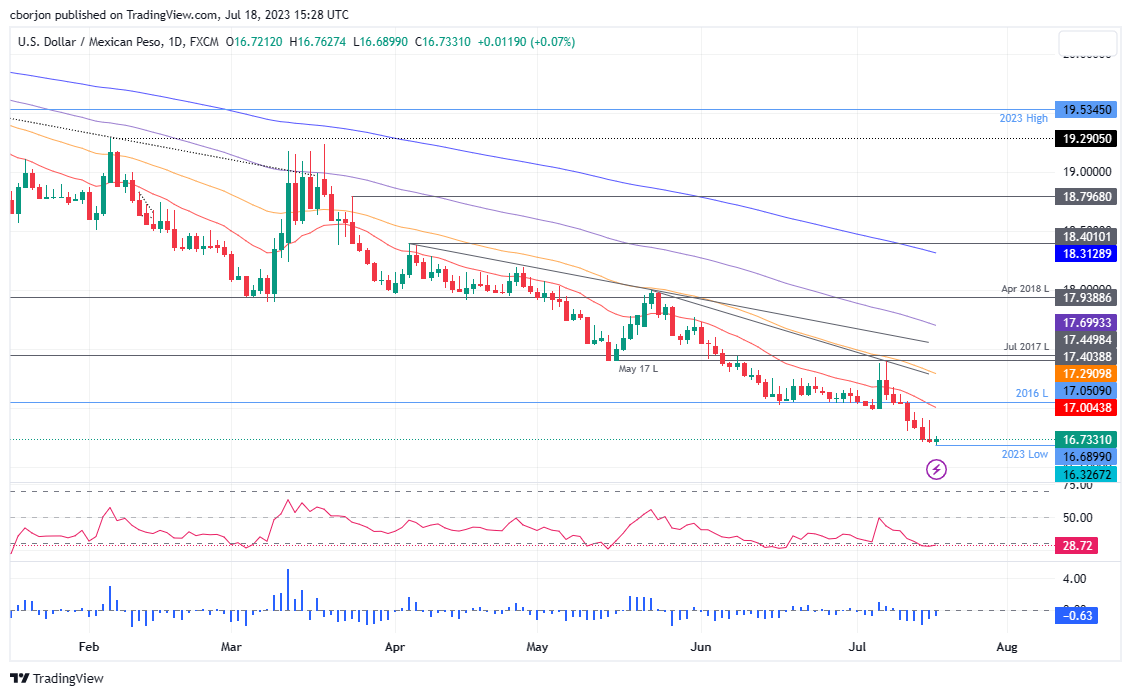
The daily chart shows the USD/MXN as poised to the downside. The Relative Strength Index (RSI) indicator remains at oversold territory, with no intentions to get back above the 30 levels, while the three-day Rate of Change (RoC) portrays sellers jumping in after flashing signs of selling pressure abating. Nevertheless, selling pressure remains weaker than the prior’s day, as revealed by the RoC. That said, the USD/MXN first support emerges at 16.5000, followed by the confluence of the 200-month EMA at 16.3000, nearby the October 2015 swing low of 16.3267. On the flip side, the USD/MXN first resistance would be the 20-day EMA at 17.0032.
Economists at ING analyze GBP/USD outlook.
Two more BoE rate hikes
We can see GBP/USD moving towards the 1.33 area near term. But GBP is subject to the same forces that recently sunk the Dollar – e.g. a soft inflation print could hurt.
At the moment we look for two more BoE rate hikes – policy rate to 5.50% – but well below the 6%+ rates priced by the markets.
GBP/USD – 1M 1.29 3M 1.29 6M 1.31 12M 1.34
See: The Pound is likely to weaken further in the medium term – Commerzbank
Market expectations of a higher Fed terminal rate have been a drag. Nonetheless, economists at ANZ Bank expect Gold (XAU/USD) to reach $2,100 by the end of this year.
Tightening cycle pivoting
Easing fears of a US regional banking crisis, the resolution of US debt-ceiling negotiations, better economic data, rising equity markets and hawkish Fed comments have all weighed on haven demand for Gold. Meanwhile, rising yields increased the opportunity cost of holding Gold, causing a liquidation in exchange traded funds (ETF) and futures.
While these factors are a short-term drag for the Gold price, we believe structural drivers – a pause in interest rates and fears of a US recession – are intact. We expect the Gold price to advance towards $2,100 by the end of this year.
See – Gold Price Forecast: XAU/USD could head to its all-time high in the coming year – Commerzbank
Economists at BNP Paribas believe that the USD is in the early stages of a structural decline and expect EUR/USD to rise to 1.18 and USD/JPY to drop to 123 by end-2024.
USD is in the early stages of a structural decline
The USD is in the early stages of a significant, structural decline. The decline may not be linear.
The recent weakness in the USD is likely a result of diminished recession risks, reflected in resilient activity data and ongoing disinflation. The People's Bank of China (PBoC) is increasingly guiding for a stronger CNY, and the risks of the Bank of Japan (BoJ) widening its Yield Curve Control (YCC) are escalating, both of which weigh on the USD/JPY. We believe there is scope for these moves to continue.
We forecast that EUR/USD will rise to 1.18 and USD/JPY will fall to 123 by the end of 2024.
The Yuan has fallen against all G10FX in the last nine months. Kit Juckes, Chief Global FX Strategist at Société Générale, analyzes CNY outlook.
USD/CNY seen at 7.40 at the end of this year
Our forecasts look for USD/CNY at 7.40 at the end of this year, and DXY at 97, which represents an unusual degree of divergence (and the highest EUR/CNY level since 2014). If nothing else, that’s going to make EUR/CNY a pair to follow much more closely in the coming months than it has been for a while.
The only comforting news on this front so far is that USD/CNY did turn lower at the same time as EUR/USD turned higher again at the start of this month.
While speaking at a news conference after the G20 meeting in India on Tuesday, Bank of Japan (BOJ) Governor Kazuo Ueda noted that there was still some distance to sustainably achieve the 2% inflation target, per Reuters.
Key takeaways
"The BoJ has been patiently maintaining easy policy."
"Unless our assumption on need to sustainably achieve 2% target changes, our narrative on monetary policy won't change."
Market reaction
USD/JPY gained traction in the early American session on Tuesday and was last seen trading modestly higher on the day at 138.85.
Economists at Commerzbank have adjusted their GBP forecast.
Excessive expectations
Market speculation is likely to persist that the BoE will have to do much more to get inflation under control. This should prevent a significant depreciation of the Pound for the time being, which is why we have adjusted our forecast for the short term.
However, given the BoE's hesitant stance, we cannot imagine that it will actually proceed as aggressively as currently priced in. Especially since price pressures are also likely to ease further in the UK in the coming months. From the BoE's perspective, this should then be enough to end the rate hike cycle. The market is therefore likely to be disappointed and the GBP is likely to weaken further in the medium term.
Moreover, we expect the BoE to cut its key rate again next year in view of the weak economic development. In contrast, we expect the ECB to leave its key rate unchanged, contrary to the market's belief. This should make the ECB more hawkish, which will make the EUR more attractive against the Pound.

Source: Commerzbank Research
A high probability for an El Niño event in the second half of 2023 brings concerns of extreme weather, persistent inflation, supply chain disruptions, and market volatility, economists at Charles Schwab report.
Storms on the horizon
Extreme weather heightened by El Niño could bring market volatility, should history repeat.
El Niño may result in disruptions to food production, impact the movement of goods and price of energy, cause hurricane losses for insurance companies, create geopolitical unrest, and keep rates higher for longer in some countries – particularly in emerging markets.
Weather of course is difficult to forecast – as are markets – but the potential impacts are worth considering by investors.
See: The return of El Niño likely to cause issues for commodity markets – ANZ
- Industrial Production in the US continued to decline in June.
- US Dollar Index stays in daily range below 100.00 after the data.
Industrial Production in the US contracted 0.5% for the second straight month in June, the US Federal Reserve reported on Tuesday. This reading came in weaker than the market expectation for a no-change.
"Manufacturing output moved down 0.3% in June but rose 1.5% in the second quarter," the press release further read. "Capacity utilization stepped down to 78.9% in June, a rate that is 0.8 percentage point below its long-run (1972–2022) average."
Market reaction
The US Dollar Index showed no immediate reaction to this report and was last seen trading flat on the day slightly below 100.00.
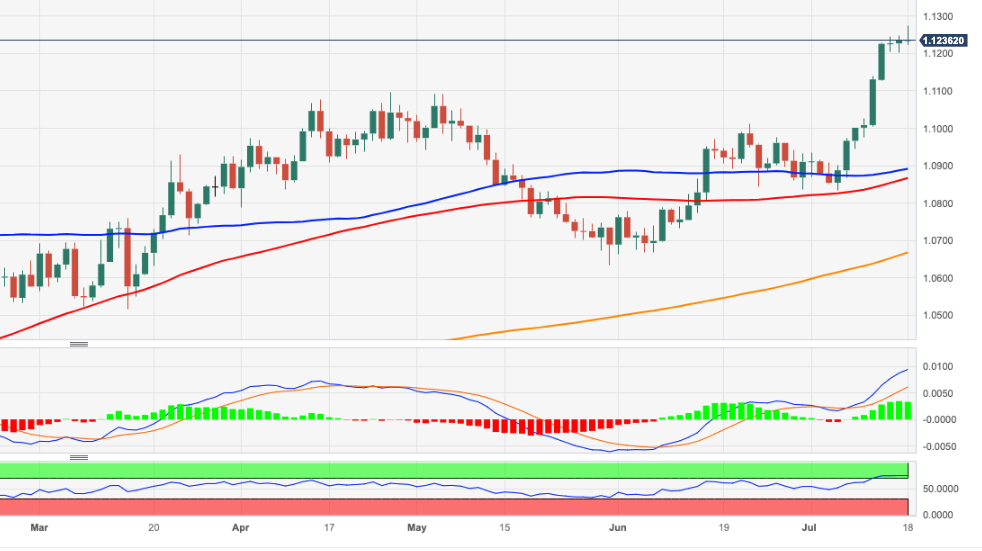
- EUR/USD fades the earlier uptick to the 1.1270 zone.
- Extreme overbought condition might prompt a correction.
EUR/USD retreats from earlier YTD peaks around 1.1275 on Tuesday.
While the continuation of the upside momentum appears favoured in the very near term, the pair’s current overbought conditions (as per the day-to-day RSI near 75) might spark a corrective knee-jerk.
Further north of the 2023 top at 1.1275 (July 18), the pair is expected to meet the next resistance level of note at the 2022 high of 1.1495 recorded on February 10.
Looking at the longer run, the positive view remains unchanged while above the 200-day SMA, today at 1.0666.
EUR/USD daily chart
Bullish momentum remained intact last week and carried GBP/USD over 1.32 for the first time since March 2022. Economists at Société Générale analyze the pair’s outlook.
Seasonality turns negative in August
The pair is technically most overbought since February 2020 and faces downside risk if UK CPI and/or Retail Sales surprise to the downside, or the Dollar rebounds.
Below forecast inflation and Retail Sales would temper the hawkish repricing of the outlook for bank rate and cause front-end Gilt yields to take a step back. The OIS curve is discounting 43 bps next month and another 35 bps in September.
Profit taking in GBP/USD would nudge EUR/GBP back over 0.86.
Seasonality for the Pound turns resolutely negative in August.
- AUD/USD has refreshed its day’s low a little below 0.6800 amid a recovery in the US Dollar.
- The US Dollar picked strength despite US Retail Sales landing below expectations at 0.2%.
- RBA minutes conveyed that further policy tightening could be done in August.
The AUD/USD pair has printed a fresh intraday low marginally below the round-level support of 0.6800 in the early New York session. The Aussie asset has come under pressure as the United States Retail Sales data has failed to match expectations.
US Census Bureau has reported that Retail Sales in June expanded at a pace of 0.2% while the street was anticipating an expansion of 0.5%. In May, US retail demand was expanded by 0.3%. Also, Retail Sales excluding automobiles have posted growth of 0.2% vs. consensus and the former release of 0.2%.
After a sheer slowdown in inflation and easing labor market conditions, soft retail demand by US households might force Federal Reserve (Fed) policymakers to turn neutral on interest rates. One small interest rate hike from the Fed in its July meeting is highly expected but the central bank could hold interest rates at 5.25-5.50% till the end of the year.
The US Dollar Index (DXY) has picked strength near 99.60, however, the downside bias has not faded yet. The yields offered on 10-year US Treasury bonds are hovering around 3.77%. Meanwhile, S&P is expected to open on a flat-to-negative note considering caution in overnight futures.
On the Australian Dollar front, Reserve Bank of Australia (RBA) minutes released in Asia conveyed that further policy-tightening could be done in August. RBA policymakers are worried that higher interest rates dampening Australia’s economic prospects.
Going forward, Thursday’s Employment data will be keenly watched. According to the estimates, the fresh addition of payrolls is seen at 17K, significantly lower than the former release of 75.9K. The Unemployment Rate is expected to remain steady at 3.6%.
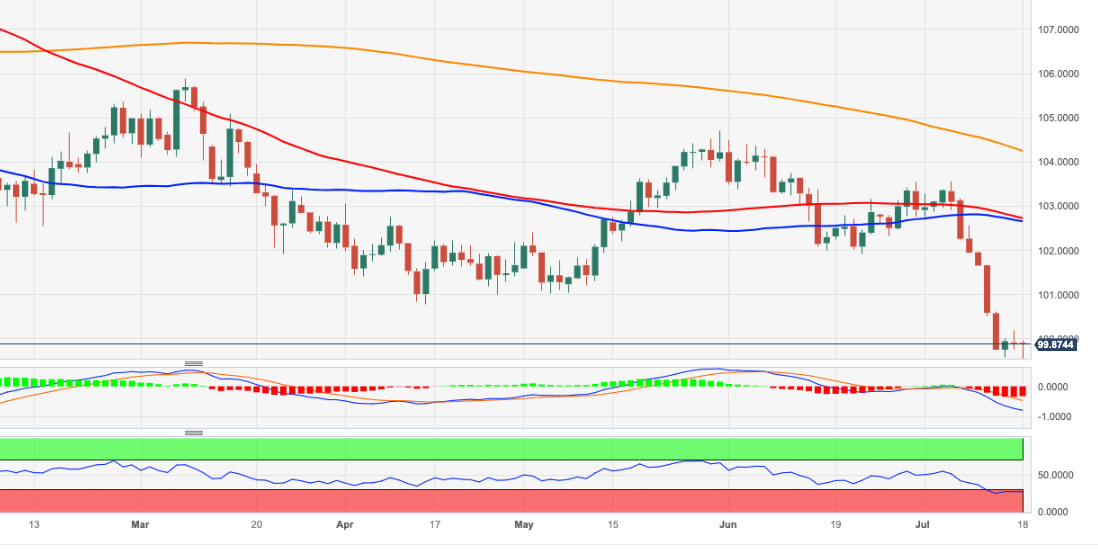
- DXY seems to have embarked on a consolidative phase below 100.00.
- Further weakness is expected to emerge below that region.
DXY remains under pressure below the psychological 100.00 hurdle on Tuesday.
The continuation of the decline of the dollar looks the most likely scenario for the time being. Against that, the breach of the current 2023 low at 99.57 (July 14) could spark a deeper retracement to the weekly low of 97.68 (March 30 2022).
Looking at the broader picture, while below the 200-day SMA at 104.24, the outlook for the index is expected to remain negative.
DXY daily chart
The United Kingdom will release the Consumer Price Index (CPI) data on Wednesday, July 19 at 06:00 GMT and as we get closer to the release time, here are the forecasts by the economists and researchers of four major banks regarding the upcoming UK inflation print.
Headline CPI is expected to fall to 8.2% year-on-year vs. 8.7% in May while Core is expected to remain steady at 7.1% YoY. If so, headline inflation would be the lowest since March 2022 but still well above the 2% target.
Credit Suisse
We expect UK inflation to fall from 8.7% to 8.1% YoY in June on the back of a drop in energy inflation. We expect core inflation to fall from 7.1% to 7.0% YoY. We expect retail sales to fall by 0.3% MoM in June.
TDS
Base effects and another decline in petrol prices will likely pull down headline inflation to 8.1% YoY – just 0.2ppts above the MPC's forecast. That said, we expect core inflation to remain at 7.1% YoY due to continued elevated services momentum. Material surprise on this release will determine the size of August's Bank Rate hike.
SocGen
Favourable base effects should help headline CPI inflation ease from 8.7% to 8.2% in June, meaning, if our forecast comes to fruition, 2Q CPI will overshoot the Bank of England’s forecast in the May MPR by 0.3pp. More worryingly for the Bank, we expect core will remain unchanged at 7.1%. With our expectation that core inflation remains unchanged at 7.1% in June, coupled with the continued acceleration in wage growth in the past week, it should keep the Bank hiking. But whether the Bank downshifts to 25s bp or hikes by another 50 bps is less certain, with any upside or downside surprise to the CPI data possibly swinging the Bank’s decision. Our forecast is for a downshift to 25 bps, in the expectation that more convincing signs that the labour market is cooling will steadily build up.
ING
We should see headline CPI dip noticeably, though this is largely because last June’s near-10% surge in fuel prices won’t be matched – and in fact, petrol/diesel pump prices were down by 2.6% last month. Food inflation should also decline modestly too, not least because producer price inflation has been easing for several months now. Core inflation should inch slightly lower too, though it’s the services component that matters most to the BoE, and we expect this to stay at 7.4% – a post-Covid high. This is also the Bank of England’s expectation, according to the June meeting minutes. Assuming we’re right on services inflation, August’s meeting then becomes an extremely close call. The latest pay data came in hot but was balanced out by some better news on the supply of workers. A further rise in services CPI would probably cement another 50 bps move, and a downside surprise would probably nudge the dial in favour of a 25 bps move.
- EUR/JPY comes under pressure after three straight daily gains.
- The resumption of the upside bias could retarget the 2023 top near 158.00.
EUR/JPY fades the auspicious start of the week and slips back to the 155.00 neighbourhood on Tuesday.
In the meantime, the cross keeps the recovery mode in place and the continuation of the uptrend carries the potential to challenge the so far 2023 peak in the boundaries of 158.00 the figure (June 29).
So far, the longer term positive outlook for the cross appears favoured while above the 200-day SMA, today at 146.02.
EUR/JPY daily chart
- Annual inflation in Canada softened to 2.8% from 3.4% in May.
- USD/CAD trades in positive territory above 1.3200 after the CPI data.
Inflation in Canada, as measured by the change in the Consumer Price Index (CPI), declined to 2.8% on a yearly basis in June from 3.4% in May. This reading came in below the market expectation of 3%. On a monthly basis, the CPI rose 0.1%, compared to analysts' estimate for an increase of 0.3%.
Moreover, the Bank of Canada reported that the monthly Core CPI, which excludes volatile food and energy prices, declined 0.1%, while the annual Core CPI stood at 3.2%, down from 3.7% in May.
Market reaction
The USD/CAD edged higher with the initial reaction to soft inflation data and was last seen rising 0.18% on the day at 1.3220.
Senior Economist at UOB Group Alvin Liew comments on recent trade figures in Singapore.
Key Takeaways
Singapore’s non-oil domestic exports (NODX) deteriorated further on a y/y basis in Jun, affirming the troubled trade outlook. NODX plunged by -15.5% y/y in Jun from -14.8% y/y in May, in line with the Bloomberg median estimate of -15.6% but better than our more bearish forecast of -17.2%. This was the 9th straight month of NODX contraction after 22 months of unabated expansion.
On a seasonally adjusted sequential basis, NODX recovered from May’s steep tumble of -14.6% m/m, and was up 5.4% m/m in Jun, quite in line with our forecast of +5.0% but much better than Bloomberg’s median estimate of -3.6%.
NODX Outlook – The latest Jun trade report still reflects the persistent downturn in NODX, and together with the broad-based weakness in both electronics and non-electronics performance, continued to weigh negatively on manufacturing demand for Singapore. The more negative prints on NODX declines to several major export destinations, also affirmed our cautious outlook and we maintain our call to expect sustained weakness in global demand amidst an on-going electronics downcycle. And with NODX to US turning negative in Jun, that added more gloom to the demand outlook for the developed markets amidst the likelihood of further monetary policy tightening in the near term. The rebound in Hong Kong’s Jun NODX and the second month of positive China’s NODX growth are welcome signs although we again, are uncertain if it can be sustained.
- EUR/GBP is looking for sustainability above 0.8600 as the focus shifts to UK inflation data.
- The heat from red-hot UK inflation could release amid price cuts at factory gates.
- ECB Visco said inflation may come down more quickly as falling energy costs continue to affect a broader range of prices.
The EUR/GBP pair has sensed selling pressure while attempting to break above the round-level resistance of 0.8600 in the London session. The upside bias for the cross is still favored as June’s United Kingdom’s inflation data, which will release on Wednesday at 06:00 GMT, is expected to soften.
As per the preliminary report, the monthly headline Consumer Price Index (CPI) reported a pace of 0.4% lower than the prior pace of 0.7%. While annualized inflation is expected to decelerate to 8.2% against the former release of 8.7%. Core inflation that excludes volatile oil and food prices is expected to remain steady at fresh highs of 7.1%.
According to a survey from Lloyds Bank, UK’s food inflation is expected to soften as producers have cut prices for the first time in more than three years after cost pressures have started to relent. The move by producers will reduce the burden on households as producers are ready to pass on price-cut benefits to end consumers.
In spite of a decline in inflationary pressures, Bank of England (BoE) Governor Andrew Bailey is expected to raise interest rates further as current inflation will take plenty of time to return to the 2% target. Investors are anticipating that interest rates by the BoE will peak around 6.5%.
On the Eurozone front, inflation is consistently slowing but is majorly contributed by a decline in energy prices. European Central Bank (ECB) Governing Council member Ignazio Visco said inflation may come down more quickly than the institution projected last month as falling energy costs continue to affect a broader range of prices, Bloomberg reported. However, core inflation could continue to remain stubborn and keep more interest rates in the pipeline.
Gold remains on the front foot. Economists at TD Securities analyze XAU/USD outlook ahead of US Retail Sales.
Retail Sales data could add some noise to the market
Given an increased focus on the data to determine the future Fed path beyond July, today's Retail Sales data could add some noise to the market.
Our expectation for a beat in the Retail Sales data could see the yellow metal give back a portion of recent gains. However, as fears were rising that the Fed's bark could be as bad as its bite, weaker inflation is likely to tame these concerns and could see the yellow metal hold support.
See – US Retail Sales Preview: Forecasts from eight major banks, modest consumption
-
Canadian Dollar pushes up a few pips as traders await the release of key macro data from both the US and Canada.
-
The data is likely to inject considerable volatility in the pair if it differs from estimates.
-
Monday’s weak close reduces the technical bullishness of the strong reversal that started on Friday for USD/CAD.
The Canadian Dollar (CAD) edges up marginally against the US Dollar (USD) on Tuesday, as traders bide their time before key data releases from Canada and the US. Out of Canada inflation data for June is scheduled for release at 12:30 GMT whilst from the US, at the same time, the US Census Bureau is set to publish Retail Sales data for June.
The USD/CAD pair trades in the 1.32s as the US session gets underway.
Canadian Dollar news and market movers
-
The Canadian Dollar edges higher against the US Dollar as traders await key market moving data from both the US and Canada.
-
The Canadian headline Consumer Price Index (CPI) is forecast to show a 3% rise in June compared to the 3.4% registered in May.
-
Core CPI (excluding volatile Food and Energy) is forecast to come out at 3.5% in June from 3.7% a year earlier. On a monthly basis, the measure is expected to increase by 0.5%, more than the 0.4% seen in May.
-
An unexpected rise in inflation, especially core inflation, would trigger a rally in CAD (bearish for USD/CAD) as it would heighten expectations of the Bank of Canada (BoC) raising interest rates at its September meeting. Higher interest rates are supportive for the local currency since they attract greater inflows of foreign capital. The opposite will be the case if the CPI data comes out lower.
-
US Retail Sales are forecast to rise 0.5% in June from 0.3% in May, and Retail Sales Ex Autos by 0.3% from 0.1%.
-
A higher-than-expected result would support the US Dollar (bullish for USD/CAD) as it would show the US economy is in rude health, making it more likely the US Federal Reserve (Fed) will have to raise interest rates several times before bringing inflation under control. The opposite is true if the data falls below estimates.
-
Friday saw a strong reversal in USD/CAD on the back of a combination of weaker Crude Oil prices, which weighed on CAD, and much better-than-expected Michigan Consumer Sentiment data out of the US, which supported the US Dollar.
Canadian Dollar Technical Analysis: Monday’s weak close disappoints bulls
USD/CAD is in a long-term uptrend on the weekly chart, which began at the 2021 lows. Since October 2022, the exchange rate has been in a sideways consolidation within that uptrend. Given the old saying that ‘the trend is your friend’, however, the probabilities of an eventual continuation higher marginally favor longs over shorts.
USD/CAD appears to have completed a large measured move price pattern that began forming at the March highs. This pattern resembles a 3-wave ABC correction, in which the first and third waves are of a similar length (labeled waves A and C on the chart below).
-638252784021284473.png)
US Dollar vs Canadian Dollar: Weekly Chart
A confluence of support situated in the upper 1.3000s, which is made up of several longer moving averages and a major trendline, prevented last week’s decline from extending any lower and provided a foundation for the reversal on Friday and Monday.
-638252783726547604.png)
US Dollar vs Canadian Dollar: Daily Chart
The long green up-bar that formed on Friday is a bullish engulfing Japanese candlestick reversal pattern. When combined with the long red down bar that formed immediately before it the two together complete a two-bar bullish reversal pattern.
However, Monday’s weak close has brought into doubt the bullish conviction in the reversal and failed to confirm the bullish engulfing.
It will take a decisive break above the 50-day Simple Moving Average (SMA) at circa 1.3400 to refresh and reconfirm the USD/CAD long-term uptrend. Nevertheless, bulls marginally have the upper hand, with the odds slightly favoring a recovery and a continuation higher.
Only a decisive break below 1.3050 would indicate the thick band of weighty support in the upper 1.30s has been definitively broken, bringing the uptrend into doubt.
Canadian Dollar FAQs
What key factors drive the Canadian Dollar?
The key factors driving the Canadian Dollar (CAD) are the level of interest rates set by the Bank of Canada (BoC), the price of Oil, Canada’s largest export, the health of its economy, inflation and the Trade Balance, which is the difference between the value of Canada’s exports versus its imports. Other factors include market sentiment – whether investors are taking on more risky assets (risk-on) or seeking safe-havens (risk-off) – with risk-on being CAD-positive. As its largest trading partner, the health of the US economy is also a key factor influencing the Canadian Dollar.
How do the decisions of the Bank of Canada impact the Canadian Dollar?
The Bank of Canada (BoC) has a significant influence on the Canadian Dollar by setting the level of interest rates that banks can lend to one another. This influences the level of interest rates for everyone. The main goal of the BoC is to maintain inflation at 1-3% by adjusting interest rates up or down. Relatively higher interest rates tend to be positive for the CAD. The Bank of Canada can also use quantitative easing and tightening to influence credit conditions, with the former CAD-negative and the latter CAD-positive.
How does the price of Oil impact the Canadian Dollar?
The price of Oil is a key factor impacting the value of the Canadian Dollar. Petroleum is Canada’s biggest export, so Oil price tends to have an immediate impact on the CAD value. Generally, if Oil price rises CAD also goes up, as aggregate demand for the currency increases. The opposite is the case if the price of Oil falls. Higher Oil prices also tend to result in a greater likelihood of a positive Trade Balance, which is also supportive of the CAD.
How does inflation data impact the value of the Canadian Dollar?
While inflation had always traditionally been thought of as a negative factor for a currency since it lowers the value of money, the opposite has actually been the case in modern times with the relaxation of cross-border capital controls. Higher inflation tends to lead central banks to put up interest rates which attracts more capital inflows from global investors seeking a lucrative place to keep their money. This increases demand for the local currency, which in Canada’s case is the Canadian Dollar.
How does economic data influence the value of the Canadian Dollar?
Macroeconomic data releases gauge the health of the economy and can have an impact on the Canadian Dollar. Indicators such as GDP, Manufacturing and Services PMIs, employment, and consumer sentiment surveys can all influence the direction of the CAD. A strong economy is good for the Canadian Dollar. Not only does it attract more foreign investment but it may encourage the Bank of Canada to put up interest rates, leading to a stronger currency. If economic data is weak, however, the CAD is likely to fall.
The USD spent most of Monday consolidating. Shaun Osborne, Chief FX Strategist at Scotiabank, analyzes Greenback’s outlook.
Moderate USD rebounds remain a sell
There is a little second-guessing on the USD sell-off starting to emerge amid concerns that the drop is overdone. That is quite possible and something I have alluded to, with the USD decline overshooting the shift in spreads to some extent. That may limit the USD decline for the moment and may allow for some short-term gains.
But in the absence of any real change in the inflation/Fed narrative, a significant USD rebound is unlikely and the currency will remain sensitive to weaker data in general.
With technical trends still aligned bearishly as well, moderate USD rebounds remain a sell.
- USD/JPY has retreated to near 138.00 amid uncertainty in the US Dollar Index ahead of retail figures.
- Investors are expecting that the Fed will find a peak in interest rates more quickly than other global central banks.
- BoJ Ueda is expected to maintain a dovish policy stance to maintain inflation steadily around 2%.
The USD/JPY pair has dropped back to near the crucial support of 138.00 in the European session. The asset is struggling to find any direction as the US Dollar Index (DXY) is showing uncertain moves. Sheer volatility in the US Dollar Index would recede and the asset might get a direction after the release of the United States Retail Sales data.
S&P500 futures have generated nominal losses in London, portraying a quiet market mood. US equities could face some heat as firms are reporting quarterly results, therefore, a stock-specific action will be observed.
The US Dollar Index (DXY) is demonstrating signs of a volatility squeeze after finding buying interest post-testing its annual low of around 99.60. Meanwhile, the 10-year US Treasury yields have dropped to near 3.76%.
Investors are keenly awaiting the release of the US Retail Sales data for further guidance. Analysts at RBC Economics expect that US Retail Sales will likely tick up 0.6% in June, thanks to a boost in auto sales during that month. We expect ex-auto sales were little changed at +0.1% on a monthly basis, supported by a price-related increase in gasoline station sales.
Regarding interest rate guidance, investors are expecting that the Federal Reserve (Fed) will find a peak in interest rates more quickly than other global central banks. As per the CME Fedwatch tool, investors are more confident about only one interest rate hike from the Fed by year-end.
On the Japanese Yen front, investors have shifted their focus toward the interest rate decision by the Bank of Japan (BoJ), which will be announced next week. BoJ Governor Kazuo Ueda is expected to maintain a dovish policy stance to maintain inflation steadily around 2%.
GBP/USD is edging higher, regaining the 1.31 area. Economists at Scotiabank analyze the pair’s outlook.
Sterling retains a comfortable yield advantage over the USD along the curve
Sterling retains a comfortable yield advantage over the USD along the curve which will cushion losses and keep the broader GBP tone positive.
After a couple of sessions of downward drift and consolidation, Cable is perking up again and breaking out – bullishly – from its short-term consolidation range (bull flag).
A push to/through 1.3150 is likely in the short run. Broader trends point to gains extending to 1.33.
Intraday support is 1.3075/80.
Economist at UOB Group Ho Woei Chen, CFA, reviews the recent set of data releases in the Chinese docket.
Key Takeaways
The Chinese economy only expanded by 5.5% y/y in 1H23 despite the low comparison base. Taking into consideration of the growth headwinds and potential for policy support to underwhelm, we downgrade our forecast for China’s GDP growth to 5.0% (from 5.6%) for 2023 and 4.5% (from 4.8%) for 2024. Our forecast for 2H23 GDP is now at 4.5%.
The key macroeconomic data for Jun that were released alongside the GDP were mixed as industrial production rebounded while weaker domestic indicators including retail sales and property investment as well as further surge in the youth unemployment rate were concerning.
As expected, the People’s Bank of China (PBOC) kept the benchmark 1Y mediumterm lending facility (MLF) rate unchanged at 2.65% today following a 10-bps cut in Jun. The central bank net increased liquidity by CNY3 bn as it conducted CNY103 bn of 1Y MLF but this was less than consensus expectation of CNY125 bn.
We maintain our expectation of stronger property support measures (in addition to recently announced measure to ensure developers’ access to financing) and our call for another cut to banks’ reserve requirement ratio (RRR) in 2H23. Given the weaker than expected growth and muted price pressure in China, we think the likelihood for a further interest rate cut has also increased. Thus, we now factor in another 10-bps reduction in the 1Y MLF rate in 3Q23. As such, we see the 1Y and 5Y loan prime rates falling to 3.45% and 4.10% (from current 3.55% and 4.20%) respectively.
EUR/USD is trading firm but off the daily high near 1.1275. Economists at Scotiabank analyze the pair’s outlook.
There may be some resistance around the 1.13 figure
Spot reached a new cycle high intraday but slipped off the 1.1275 peak, leaving a bearish ‘shooting star’ candle on the intraday chart. There has been no follow-through selling so far though and the short-term chart also highlights solid support for the EUR on dips to the 1.12 area.
The underlying tone remains bullish – based on solid DMI oscillator readings across the board – which should mean firm support on minor dips.
There may be some resistance around the 1.13 figure zone but there is little major resistance to the EUR advance ahead of the 1.15/1.16 zone now.
Economists at Scotiabank analyze CAD outlook ahead of Canadian CPI data.
Core prices are expected to moderate but only slowly
Canadian CPI data is expected to show some slowing in inflationary pressure, with the headline rate easing to 3.0% in the year. Prices are expected to rise 0.3% in the month. Core prices are expected to moderate but only slowly.
Slowing headline inflation may weigh on the CAD – as it did for the USD last week – but there are limited implications for policy in the short run at least.
The BoC has only just returned to tightening again and left the door open to doing more if required. Governor Macklem indicated last week the Bank expected inflation to fall to around 3% and hold there for some time. This might be about the best headline inflation data we get in a while.
See – Canada CPI Preview: Forecasts from five major banks, better inflation, but not yet good enough
- US Dollar stays on the back foot following Monday's meagre recovery attempt.
- US Dollar Index continues to fluctuate below 100.00.
- US Retail Sales data for June could impact the USD's performance.
The US Dollar finds it difficult to attract investors on Tuesday after having closed the day virtually unchanged on Monday. The US Dollar Index (DXY) stays on the back foot, below 100.00, and remains within a touching distance of the 15-month low it set near 99.50 on Friday.
The US economic calendar will bring Retail Sales data for June later in the day, which could influence the US Dollar's (USD) performance against its major rivals. Markets expect Retail Sales to rise 0.5% on month, more than the 0.3% increase recorded in May.
Daily digest market movers: US Dollar awaits Retail Sales figures
- Previewing the Retail Sales report, "stronger-than-expected US Retail Sales data could revive the US Dollar bulls, triggering a brief correction in the main currency pair ahead of next week’s Fed and European Central Bank (ECB) policy announcements," said FXStreet analyst Dhwani Mehta.
- Following a mixed opening, Wall Street's main indexes closed in positive territory on Monday. Boosted by the upbeat performance of tech shares, the Nasdaq Composite Index gained nearly 1%.
- US stock index futures trade flat heading into the American session on Tuesday.
- The benchmark 10-year US Treasury bond yield retreated to 3.75% early Tuesday after closing broadly unchanged on Monday.
- China's real Gross Domestic Product (GDP) expanded 6.3% in the second quarter on year, according to data released by China's National Bureau of Statistics (NBS) early Monday. This reading followed the 4.5% growth recorded in the first quarter but came in below the market expectation of 7.3%. Citigroup lowered the full-year growth forecast for China to 5% from 5.5%.
- US Treasury Secretary Janet Yellen told Bloomberg on Monday that there is a good chance that the Biden administration will go ahead with outbound investment controls on China.
- The US Dollar weakened significantly last week as soft inflation data from the US revived expectations about the Federal Reserve reaching the terminal rate with a 25-basis-point (bps) rate hike in July.
- The Consumer Price Index (CPI) in the US rose 3% on a yearly basis in June, following the 4% increase recorded in May. The annual Producer Price Index (PPI) edged 0.1% higher in the same period.
- Commenting on the USD's outlook, "In case of an increasingly rapid fall in inflation and weakening economic data, the market might increasingly rely on key rates not remaining at high levels for a long time, whereas rate cuts before the end of the year are becoming increasingly likely," said Antje Praefcke, FX Analyst at Commerzbank. "That would cause the USD to ease further."
- The University of Michigan reported on Friday that the Consumer Sentiment Index improved to 72.6 in July's flash estimate from 64.4 in June.
- The Federal Reserve Bank of New York's Empire State Manufacturing Survey for July, released on Monday, showed that the General Business Conditions Index declined to 1.1 from 6.6 in June.
- Markets are nearly fully pricing in a 25 bps Fed rate increase in July. The probability of one more rate hike in December stands at around 20%, according to the CME Group FedWatch Tool.
Technical analysis: US Dollar Index shows oversold conditions
Following Monday's choppy action, the US Dollar Index (DXY) remains technically oversold on Tuesday, with the Relative Strength Index (RSI) indicator on the daily chart staying well below 30.
The DXY needs to rise above 100.00 (psychological level) and confirm that level as support to attract buyers and stage an extended correction. In that scenario, 101.00 (former support, static level) could be seen as the next recovery target.
On the downside, 99.20 (static level from March 2022) aligns as next support before 99.00 (psychological level) and 98.30 (200-week Simple Moving Average).
US Dollar FAQs
What is the US Dollar?
The US Dollar (USD) is the official currency of the United States of America, and the ‘de facto’ currency of a significant number of other countries where it is found in circulation alongside local notes. It is the most heavily traded currency in the world, accounting for over 88% of all global foreign exchange turnover, or an average of $6.6 trillion in transactions per day, according to data from 2022.
Following the second world war, the USD took over from the British Pound as the world’s reserve currency. For most of its history, the US Dollar was backed by Gold, until the Bretton Woods Agreement in 1971 when the Gold Standard went away.
How do the decisions of the Federal Reserve impact the US Dollar?
The most important single factor impacting on the value of the US Dollar is monetary policy, which is shaped by the Federal Reserve (Fed). The Fed has two mandates: to achieve price stability (control inflation) and foster full employment. Its primary tool to achieve these two goals is by adjusting interest rates.
When prices are rising too quickly and inflation is above the Fed’s 2% target, the Fed will raise rates, which helps the USD value. When inflation falls below 2% or the Unemployment Rate is too high, the Fed may lower interest rates, which weighs on the Greenback.
What is Quantitative Easing and how does it influence the US Dollar?
In extreme situations, the Federal Reserve can also print more Dollars and enact quantitative easing (QE). QE is the process by which the Fed substantially increases the flow of credit in a stuck financial system.
It is a non-standard policy measure used when credit has dried up because banks will not lend to each other (out of the fear of counterparty default). It is a last resort when simply lowering interest rates is unlikely to achieve the necessary result. It was the Fed’s weapon of choice to combat the credit crunch that occurred during the Great Financial Crisis in 2008. It involves the Fed printing more Dollars and using them to buy US government bonds predominantly from financial institutions. QE usually leads to a weaker US Dollar.
What is Quantitative Tightening and how does it influence the US Dollar?
Quantitative tightening (QT) is the reverse process whereby the Federal Reserve stops buying bonds from financial institutions and does not reinvest the principal from the bonds it holds maturing in new purchases. It is usually positive for the US Dollar.
Economists at Rabobank discuss GBP outlook.
GBP will stop reacting positively to rate rises over the medium-term
While economic data releases have the potential to spark volatility in GBP crosses, we expect EUR/GBP to remain mostly within a 0.85 to 0.86 range on a one-to-three month view, edging slowly higher towards the 0.90 area on a 12-month view.
As the BoE raises rates further, economic risks also rise. This suggests an increased risk that GBP will stop reacting positively to rate rises over the medium-term.
In FX, it is all about the relative view, economists at Brown Brothers Harriman & Co. report.
Ongoing Dollar weakness viewed as being at odds with the underlying fundamental story
Relative interest rate differentials and reIative growth rates are the two most important ones for the market. We believe both still favor the Dollar but it has suffered from a massive drop in the two-year yield even as markets embrace the soft landing scenario.
In keeping with the relative view, if one is negative on the Dollar, one must be positive on another currency. The Euro and Sterling are two of the top three performing majors year to date. Yet we are beginning to see larger cracks form in these two currencies as well as in the rest of the world.
This week, comments from two leading ECB hawks suggest the tightening cycle may end sooner than expected. In the UK, stubbornly high inflation is likely to lead to an aggressive BoE tightening cycle that tips the economy into a deep recession. To us, the relative view doesn’t look as good for the Euro and Sterling as it used to.
Statistics New Zealand will release Q2 Consumer Price Index (CPI) inflation data on Tuesday, July 18 at 22:45 GMT and as we get closer to the release time, here are forecasts from economists and researchers of four major banks regarding the upcoming inflation data.
Headline inflation is seen decelerating to 5.9% year-on-year vs. 6.7% in Q1. If so, it would be the lowest YoY rate since Q4 2021 but still well above the 1-3% target range. Meanwhile, the QoQ rate is expected at 1% vs. the former print of 1.2%.
ANZ
We expect annual CPI inflation to decline to 5.9% in Q2 2023, below RBNZ’s May MPS forecast of 6.1%. The bulk of the decline in annual headline inflation reflects an anticipated sharp fall in annual tradeable inflation from 6.4% to 5.3%, as the price increases seen in the wake of the war in Ukraine last year fall out of the annual calculation. We expect annual non-tradeable inflation is also past its peak, falling from 6.8% to 6.4%, still roughly twice the level consistent with the RBNZ’s overall CPI target. We’ll be looking for further moderation across the suite of core measures. All up, a faster deceleration in annual inflation will certainly be welcomed by the RBNZ. We don’t see the figures as deterring the RBNZ from their current strategy to hold the OCR unchanged while they ‘watch, worry and wait.’ However, we suspect non-tradeable inflation will prove persistent later in the year. If we’re right, that will only become evident once some large base effects roll out of the equation.
Citi
We expect NZ Q2 CPI to rise by 0.8% in Q2 (0.84% to two decimal places). The QoQ forecast, if realized, would be the slowest increase in aggregate prices since December 2020 and would moderate the YoY inflation pace from 6.7% to 5.8%. The YoY forecast is also 0.3pp below the RBNZ’s forecast of 6.1% and would show disinflation marginally ahead of the timetable expected by policymakers. We attribute their lower CPI forecast to the outlook for lower GDP growth than the RBNZ and expect CPI to continue underperforming the Bank’s published forecasts, returning within the 1% to 3% target band in Q1’24 rather than the Q3’24 expected by the RBNZ. However, this is unlikely to produce a dovish change of rhetoric from the MPC in the near-term. It will likely take at least one further CPI print showing faster disinflation to move official policy rhetoric forward from the current guidance of late 2024. The RBNZ would also have to consider the labor market, where employment arguably remains above a maximum sustainable level. It is therefore more likely that a change in rhetoric would come towards the end of 2023 if economic conditions evolve. Based on this outlook, we continue to forecast the first OCR cut to occur in Q124.
TDS
We expect Q2 CPI inflation to slow markedly to 0.9% QoQ, down from the 1.2% QoQ last quarter. Our forecast is below the RBNZ's 1.1% QoQ forecast and we expect the annual CPI to print at 5.8% YoY (Q1: 6.7%). The swift sequential QoQ slowdown in inflation momentum should come as a relief to the RBNZ after its pause in July as rate hikes begin to cool demand-side price pressures in the economy. We expect declines in transport/petrol prices to cool inflation in Q2, while non-tradeable goods inflation (i.e., domestic-oriented) is also likely to retrace as economic activity contracts. Overall, we think the bar now is much higher for the RBNZ to restart its hiking cycle, even if CPI surprises to the upside. The July MPS suggests that the RBNZ is confident that its rate hikes are having their intended impact on consumption and inflation, allowing the Bank to monitor developments from the sidelines.
Westpac
We estimate that New Zealand consumer prices rose by 0.9% in the June quarter. That would see annual inflation slipping to 5.9%, down from 6.7% in the year to March. But while headline inflation is dropping back, underlying price pressures remain strong. Measures of core inflation are set to linger at levels of around 5% to 6%. The June quarter saw a further large increase in food prices. Those increases have been partially offset by falls in fuel prices. Our forecast is lower than the RBNZ’s last published projection reflecting a lower forecast for tradable prices.
EUR/USD was able to stabilize on Monday. Economists at Commerzbank analyze the pair’s outlook.
There is potential for disappointments, particularly on the EUR side
Ahead of the Fed and ECB meetings next week, stabilization might continue for the time being.
The market is pricing in 25 bps rate steps for both meetings, and our economists expect the same. The interesting question is: what will happen after that? The market hardly prices in a further rate hike for the US central bank, but not so for the ECB. From the market’s point of view, the likelihood of a further rate hike in September stands at 70%, so there is potential for disappointments, particularly on the EUR side.
A September step can be called into question. If the market increasingly reaches this conclusion too – the ECB might even provide more concrete reasons for that next week – EUR might temporarily come under depreciation pressure.
Economists at MUFG Bank analyze CAD outlook ahead of the Canada CPI data for June.
The BoC is being overly optimistic
While some economic data has shown resilience, we suspect the BoC is being overly optimistic and see risks skewed to the data coming in weaker than expected, which should limit the scope for CAD to outperform other G10 currencies as the US Dollar weakens further.
For now, with the momentum against the US Dollar there seems a greater risk of further near-term declines in USD/CAD.
Perhaps just as important as the CPI print is whether the increased expectations of a soft landing can persist. That expectation is equity market supportive and is a positive backdrop for CAD for now.
See – Canada CPI Preview: Forecasts from five major banks, better inflation, but not yet good enough
CME Group’s flash data for natural gas futures markets noted traders reduced their open interest positions by around 12.2K contracts at the beginning of the week following three consecutive daily builds. In the same line, volume went down for the second straight session, now by more than 83K contracts.
Natural Gas: Extra consolidation seems on the cards
Natural gas prices dropped for the fourth session in a row on Monday. The continuation of the decline was in tandem with diminishing open interest and volume and hints at the idea that a rebound might be in the offing in the very near term. Looking at the broader scenario, the consolidative theme is expected to prevail for the time being.
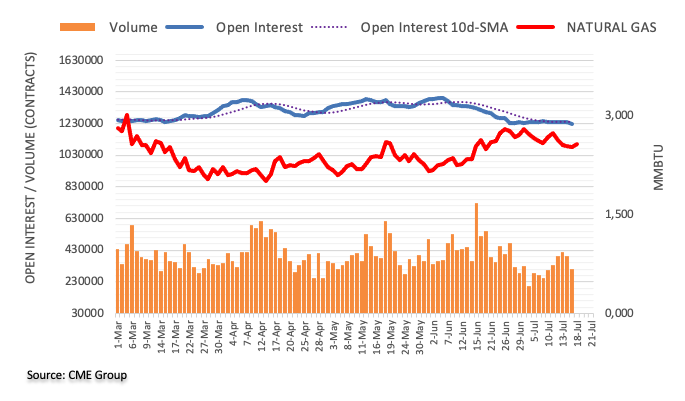
Economists at Commerzbank analyze Gold demand in China and India – the two largest Gold consumer countries.
Weak Gold demand in China and India due to high prices
In view of or despite record-high local Gold prices, China and India – the two largest gold consumer countries – have taken steps to curb Gold imports.
The premium on the global market price reached $19 per troy ounce on Friday, bringing it closer to the six-year high of over $25 per troy ounce that it chalked up in September 2022. This could further slow Gold demand in China, which is weaker in the summer months in any case.
China and India combined account for roughly half of physical Gold demand. The behaviour of Gold buyers there, which tends to be anticyclical with respect to the price, thus has more of a stabilising than amplifying effect on prices.
See – Gold Price Forecast: XAU/USD could head to its all-time high in the coming year – Commerzbank
The US Dollar Index has not been this weak since April 2022, weeks after the invasion of Ukraine started. Kit Juckes, Chief Global FX Strategist at Société Générale, analyzes Greenback’s outlook.
The Dollar’s discounting the peak in rates again
The market is anticipating the peak in US rates and a further narrowing relative rates. If nothing happens to scupper those expectations (another upside surprise in US growth, or further European growth disappointment) I would expect the Dollar Index to closer but not all the way to the lows at the end of 2020.
That won’t happen in a straight line and will require further interest rate convergence between the US and other major economies, however.
- NZD/USD has dropped to near 0.6300 as the USD Index has attempted a decent recovery move.
- Investors dumped the US Dollar Index amid hopes that it has lost its broader appeal as the interest rate peak by the Fed is near.
- NZ’s Quarterly CPI is seen softening to 0.9% vs. the former pace of 1.2%.
The NZD/USD pair has tested territory marginally below the round-level support of 0.6300 in the European session. The Kiwi asset has faced an immense sell-off as the US Dollar Index (DXY) has attempted a solid recovery and investors are worried about Chinese economic prospects.
S&P500 futures have turned choppy ahead of the United States Retail Sales data. Investors are demonstrating marginal caution in an overall upbeat market mood as the second-quarter result season has kicked off. The US Dollar Index has picked strength after testing fresh annual lows of 99.60. For a bullish reversal, the USD Index has to pass through plenty of filters. Currently, the USD Index is broadly bearish.
Investors dumped the US Dollar Index amid hopes that it has lost its broader appeal as the interest rate peak by the Federal Reserve (Fed) is near while other central banks are still raising interest rates. In addition to that, the pace of inflation softening in the United States has remained higher in comparison with other global economies. Eurozone inflation is still near 6% and United Kingdom’s inflation is sticky above 8.5% while headline inflation in the American economy has significantly softened to 3.0% and core inflation has decelerated to 4.8%.
The real action in the USD Index would be driven by US monthly Retail Sales data for June. Analysts at NBF expect auto sales and gasoline station receipts should have increased during the month, which, combined with advances in housing-related categories, should translate into a 0.4% progression for headline sales. Spending on items other than vehicles, meanwhile, might have advanced 0.3%.
On the New Zealand Dollar front, weakness in second-quarter Gross Domestic Product (GDP) figures of China reported on Monday has cautioned investors about the economic outlook. Meanwhile, Morgan Stanley has revised down its China 2023 economic growth forecast by 0.7% to 5% after the country reported a "weak" second quarter GDP reading, reported Reuters.
It is worth noting that New Zealand is one of the leading trading partners of China and China’s weak growth prospects impact the New Zealand Dollar.
Going forward, NZ’s inflation data will be keenly watched, which is scheduled for Wednesday. The quarterly Consumer Price Index (CPI) is seen softening to 0.9% vs. the former pace of 1.2%. Annualized CPI is expected to decelerate to 5.9% against the prior release of 6.7%.
EUR/GBP has crept higher in the past few sessions, back to the 0.8600 gauge. Economists at ING analyze the pair’s outlook.
Softer into the CPI risk event
Volatility in global central bank tightening expectations after the US CPI slowdown seems to have asymmetrically hit those curves that had more room for dovish repricing, like the GBP one.
We are observing some positioning ahead of Wednesday’s key release of the UK inflation numbers. CPI data will make or break a 50 bps August rate hike by the BoE.
We suspect EUR/GBP can remain broadly supported into Wednesday’s CPI.
Further weakness in USD/CNH now appears out of favour for the time being, comment UOB Group’s Economist Lee Sue Ann and Markets Strategist Quek Ser Leang.
Key Quotes
24-hour view: While we highlighted yesterday that the combination of slowing downward momentum and oversold conditions “suggests a low risk of USD weakening”, we held the view that “USD is likely to consolidate between 7.1350 and 7.1800.” Instead of consolidating, USD rose to a high of 7.1890 before closing on a firm note at 7.1793 (+0.30%). Upward momentum has increased a tad, and there is a chance of USD breaking above the strong resistance at 7.1930. The major resistance at 7.2180 is unlikely to come into view. Support is at 7.1720, followed by 7.1560.
Next 1-3 weeks: Last Monday (10 Jul), when USD was trading at 7.2230, we indicated that “short-term momentum is building rapidly and the risk of USD pulling back below 7.1800 has increased.” Our view of a lower USD turned out to be correct. After USD dropped to 7.1240 and rebounded, we indicated yesterday (17 Jul, spot at 7.1500) that while USD “is still weak, the next major support at 7.1000 may not come into view so soon.” In NY trade, USD rose to a high of 7.1890. Upward momentum is beginning to fade. However, only a break above 7.1930 (no change in ‘strong resistance’ level) would suggest that 7.1000 is not coming into view this time around.
The US Dollar is modestly weaker but there is a real sense of lack of direction in the markets, economists at MUFG Bank report.
Retail Sales in focus ahead of next week
The focus today will be on the data from the US with the Retail Sales data for June released along with Industrial Production. Retail Sales are expected to have picked up modestly with autos helping lift consumer spending. But the outlook ahead we believe remains challenging with excess savings held by households close to being depleted while fiscal support measures have been removed and later this year consumers with student debt will restart servicing those debts.
The data today is very unlikely to have much bearing on expectations for next week when the FOMC will likely hike by 25 bps. However, the Fed Funds Futures strip currently has 140 bps of rate cuts priced for 2024 and this will continue to weigh on US Dollar performance.
See – US Retail Sales Preview: Forecasts from eight major banks, modest consumption
- Gold price oscillates in a narrow range of around $1,960.00 ahead of US Retail Sales data.
- Further policy tightening by the Fed is widely anticipated as the United States inflation needs to fall near 2%.
- US Yellen says the US economy will dodge a recession.
Gold price (XAU/USD) is demonstrating auction in an inventory adjustment phase after climbing to near three-weeks high of around $1,960.00 on Tuesday. The precious metal has picked strength as discussions about introducing a novel gold-backed currency by the BRICS (Brazil, Russia, India, China, and South Africa) have improved its appeal. In addition to that, the broader softening of inflationary pressures in the United States economy has ramped up demand for Gold.
The United States Consumer Price Index (CPI) turned out softer -than- expected and labor market conditions eased in June. There is no denying the fact that heated inflationary pressures have cooled down, while further policy -tightening from the Federal Reserve (Fed) is widely anticipated to help return inflation steadily below the 2% target.
Daily Digest Market Movers: Gold price aims further recovery
- Gold price extends recovery above $1,960.00 as the US Dollar Index resumes its downside journey after failing to sustain above the psychological resistance of 100.00.
- Rising odds of only one more interest-rate hike from the Federal Reserve have propelled strength in Gold.
- Meanwhile, a small interest rate hike of 25 basis points (bps) by the Fed in its July monetary policy meeting is expected, according to bets at the CME Group Fedwatch tool.
- The appeal for the US Dollar Index has faded as the BRICS alliance is in discussions about the introduction of a new gold-backed currency. The motive behind launching a new currency seems to be de-dollarization.
- The US Dollar Index has tested its fresh annual support of 99.60. More downside in the safe-haven asset seems hopeful as United States inflation has softened significantly.
- The yields offered on 10-year US Treasury bonds have tested territory below 3.8%.
- Consistently declining gasoline prices and demand for second-hand automobiles have eased red-hot inflationary pressures.
- Despite inflation has softened significantly, risks of a recession are still elevated as current price growth is still far from the desired rate of 2%.
- While investors are anticipating that the US economy will enter into a recession, US Treasury Secretary Janet Yellen has a different viewpoint. Yellen said on Monday that the economy is making good progress in bringing inflation down and she doesn’t expect a recession, Bloomberg report.
- Last week, President of the Federal Reserve Bank of Chicago Austan Goolsbee said “Inflation is progressively declining but is still higher from where the Fed wants it to be.” Goolsbee reiterated that central bank policymakers are on a "golden path" to contain inflation without pushing the economy into a recession.
- On Tuesday, investors will keep an eye on the monthly Retail Sales data from the US, which will be published at 12:30 GMT.
- Credit Suisse expects Retail Sales growth to accelerate in June, driven by strong auto sales. They expect headline retail sales to grow 0.8% MoM. Retail sales ex-autos and gas are set to increase by 0.2% MoM.
- Robust demand from households could allow Fed Chair Jerome Powell to raise interest rates twice by the year-end.
Technical Analysis: Gold price needs decisive break above $1,960
Gold price is forming a bullish Cup and Holder pattern whose breakout results in a reversal move. The chart pattern trades back-and-forth around $1,960.00. The release of the US Retail Sales data might trigger a power-pack action.
Gold price is expected to attract fresh bids after a confident break above the crucial resistance level at $1,960.00. The upside bias could fade if Gold price fails to maintain auction above the $1,940.00 support.
Fed FAQs
What does the Federal Reserve do, how does it impact the US Dollar?
Monetary policy in the US is shaped by the Federal Reserve (Fed). The Fed has two mandates: to achieve price stability and foster full employment. Its primary tool to achieve these goals is by adjusting interest rates.
When prices are rising too quickly and inflation is above the Fed’s 2% target, it raises interest rates, increasing borrowing costs throughout the economy. This results in a stronger US Dollar (USD) as it makes the US a more attractive place for international investors to park their money.
When inflation falls below 2% or the Unemployment Rate is too high, the Fed may lower interest rates to encourage borrowing, which weighs on the Greenback.
How often does the Fed hold monetary policy meetings?
The Federal Reserve (Fed) holds eight policy meetings a year, where the Federal Open Market Committee (FOMC) assesses economic conditions and makes monetary policy decisions.
The FOMC is attended by twelve Fed officials – the seven members of the Board of Governors, the president of the Federal Reserve Bank of New York, and four of the remaining eleven regional Reserve Bank presidents, who serve one-year terms on a rotating basis.
What is Quantitative Easing (QE) and how does it impact USD?
In extreme situations, the Federal Reserve may resort to a policy named Quantitative Easing (QE). QE is the process by which the Fed substantially increases the flow of credit in a stuck financial system.
It is a non-standard policy measure used during crises or when inflation is extremely low. It was the Fed’s weapon of choice during the Great Financial Crisis in 2008. It involves the Fed printing more Dollars and using them to buy high grade bonds from financial institutions. QE usually weakens the US Dollar.
What is Quantitative Tightening (QT) and how does it impact the US Dollar?
Quantitative tightening (QT) is the reverse process of QE, whereby the Federal Reserve stops buying bonds from financial institutions and does not reinvest the principal from the bonds it holds maturing, to purchase new bonds. It is usually positive for the value of the US Dollar.
Considering advanced prints from CME Group for crude oil futures markets, open interest shrank by around 35.7K contracts at the beginning of the week, reversing at the same time four consecutive daily builds. Volume, instead, went up by around 5.4K contracts, partially reversing the previous strong drop.
WTI faces initial resistance around the 200-day SMA
WTI prices dropped markedly at the beginning of the week, extending the move lower from Friday’s pullback. The daily downtick, however, was amidst shrinking open interest, which removes strength from a potential deeper decline and favours a near-term rebound instead. That said, bulls should now meet the next up-barrier a recent July peaks past the $77.00 mark per barrel, an area coincident with the key 200-day SMA.
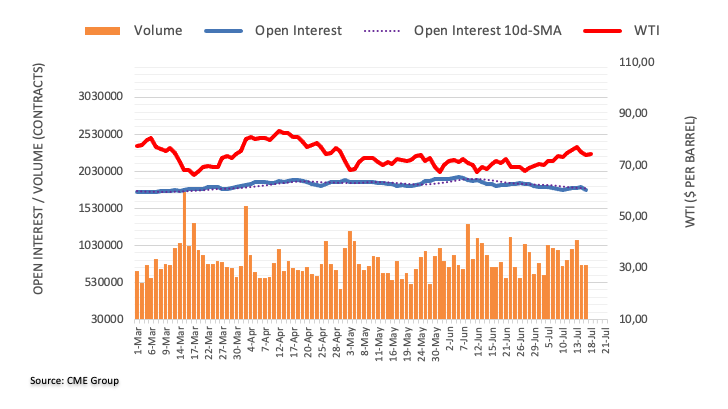
The downside pressure around USD/JPY is expected to lose momentum once the pair surpasses 139.50, suggest UOB Group’s Economist Lee Sue Ann and Markets Strategist Quek Ser Leang.
Key Quotes
24-hour view: After USD fell to 137.23 last Friday and then rebounded strongly, we indicated yesterday that “the rebound in severely oversold conditions suggests USD is unlikely to weaken further” and we held the view that USD “is more likely to trade in a range of 137.80/139.00.” USD dipped to a low of 138.07 in early London trade, rebounded sharply to 139.40 and then eased off to end the day little changed at 138.71 (-0.01%). The price actions appear to be part of a consolidation phase. Today, we expect USD to trade in a range between 138.20 and 139.30.
Next 1-3 weeks: Our update from yesterday (17 Jul, spot at 138.55) still stands. As highlighted, while the recent downward momentum has slowed somewhat, only a break of 139.50 would indicate that the USD weakness that started early last week has stabilized. However, it is worth nothing that USD rose briefly to 139.40 in early NY session, and downward momentum has slowed further.
AUD was very marginally impacted by July’s Reserve Bank of Australia (RBA) minutes. Economists at ING analyze Aussie outlook.
RBA minutes reiterated openness to another hike
The explicit openness to more tightening, if needed, means that another hike remains possible should CPI figures surprise materially on the upside again. We currently expect one last 25 bps hike in September.
AUD/USD may suffer from a USD rebound and lingering negative Chinese effect in the coming days, but we could see it consolidate around 0.6850/0.6900 in the next few weeks.
- AUD/USD turns lower for the third straight day, though the downside seems cushioned.
- China’s economic woes turn out to be a key factor undermining the risk-sensitive Aussie.
- Hope for more stimulus from China and a bearish USD should limit losses for the major.
The AUD/USD pair attracts some sellers following an intraday uptick to the 0.6835 region on Tuesday and drifts into negative territory for the third successive day. Spot prices drop to a fresh daily low during the early European session and currently trade just above the 0.6800 round-figure mark.
Despite the hawkish minutes of the July Reserve Bank of Australia (RBA) policy meeting, the Australian Dollar (AUD) struggles to gain any meaningful traction in the wake of concerns over slowing economic growth in China. It is worth recalling that data released on Monday showed that the economic growth in China decelerated substantially in the second quarter and Retail sales - a gauge of consumption - slowed sharply in June. This, in turn, is seen as a key factor weighing on the China-proxy Aussie, though the possibility of more stimulus measures from China could limit losses for the AUD/USD pair.
The National Development and Reform Commission (NDRC) - China's top economic planner - pledged that it would roll out policies to restore and expand consumption without delay as consumers' purchasing power remained weak. Apart from this, the bearish sentiment surrounding the US Dollar (USD) warrants some caution before placing aggressive bearish bets around the AUD/USD pair. In fact, the USD Index (DXY), which tracks the Greenback against a basket of currencies, languishes near its lowest level since April 2022 in the wake of expectations of a less hawkish Federal Reserve (Fed).
Market participants seem convinced that the US central bank will end its policy-tightening campaign and keep interest rates steady for the rest of the year following the largely priced-in 25 bps lift-off in July. This, in turn, keeps the USD bulls on the defensive and makes it prudent to wait for strong follow-through selling to confirm that the AUD/USD pair has formed a bearish double-top pattern near the 0.6900 mark. Market participants now look forward to the US economic docket - featuring the release of monthly Retail Sales and Industrial Production figures - for short-term trading opportunities.
Technical levels to watch
FX option expiries for July 18 NY cut at 10:00 Eastern Time, via DTCC, can be found below.
- EUR/USD: EUR amounts
- 1.1100 1.5b
- 1.1110 3.5b
- 1.1225 707m
- 1.1450 629m
- GBP/USD: GBP amounts
- 1.2790 314m
- 1.2825 379m
- 1.3010 852m
- USD/JPY: USD amounts
- 139.50 481m
- AUD/USD: AUD amounts
- 0.6730 444m
- 0.6800 981m
- 0.6850 1.1b
- 0.6865 359m
- 0.6890 431m
- 0.7000 824m
- USD/CAD: USD amounts
- 1.3240 526m
- 1.3400 416m
- NZD/USD: NZD amounts
- 0.6400 400m
European Central Bank (ECB) Governing Council member Klaas Knot said on Tuesday, rate hikes beyond July are likely but not certain.
Additional quotes
It looks like core inflation has plateaued.
We need to hike rates in July.
Optimistic to see inflation reaching 2% in 2024.
There is still lots of data due between now and September.
Market reaction
At the time of writing, EUR/USD is losing the upside traction, paring back gains to trade near 1.1240.
Economists at Société Générale analyze USD/CAD technical outlook.
50-DMA near 1.3340/1.3380 is likely to be an important resistance zone
USD/CAD has achieved downside projections near 1.3110 resulting in a bounce. Daily MACD has started posting positive divergence denoting receding downward momentum.
A short-term rebound can’t be ruled out however 50-DMA near 1.3340/1.3380 is likely to be an important resistance zone.
If the pair fails to defend 1.3110, the down move could extend towards 1.3000/1.2930, the 50% retracement from 2021.
See – USD/CAD: Loonie is likely to remain supported for now – Commerzbank
- Euro records a new YTD high near 1.1280 against the US Dollar.
- Stocks in Europe open Tuesday’s session in a mixed note.
- EUR/USD extends the rally to the vicinity of 1.1280 on Tuesday.
- US Retail Sales take centre stage across the pond later in the session.
The Euro (EUR) continues to gain ground against the U.S. dollar (USD), pushing EUR/USD to its highest level since February 2022 near 1.1280 on Tuesday. The greenback is weakening further against the euro as US yields retreat across the yield curve. German 10-year bund yields are also pulling back.
The possibility that the Federal Reserve may be nearing the end of its tightening cycle continues to weigh on the dollar. This view has gained momentum recently with signs of cooling U.S. consumer prices and downward trending producer prices.
Currently, the market has largely priced in the expected 25 basis point rate hikes from both the European Central Bank (ECB) and the Federal Reserve. However, there is still debate about their future policy moves as central banks work to normalize amid concerns of an economic slowdown in both Europe and the U.S.
Around the ECB, board member Klaas Knot suggested core inflation has plateaued while he did not rule out hikes beyond July.
With no major euro area data due, all attention will likely be on the U.S. retail sales report, industrial production, business inventories, NAHB housing index, and TIC flows.
Daily digest market movers: Euro poised to further advances
- The EUR picks up extra impulse against the USD on Tuesday.
- The ECB Knot leaves the door open to extra rate raises beyond July.
- The USD Index revisits the area of 2023 lows near 99.50.
- Investors remain sceptical over further tightening in the next month.
- US, German yields extend the corrective decline.
Technical Analysis: Euro now looks at 1.1300
The ongoing price action in EUR/USD hints at the idea that further gains might be in store in the short-term horizon.
The pair printed a new 2023 high at 1.1275 on July 18. Once this level is cleared, there are no resistance levels of significance until the 2022 peak of 1.1495 recorded on February 10.
On the downside, the 1.1000 region emerges as a psychological support seconded by provisional support at the 55-day and 100-day SMAs at 1.0890 and 1.0865, respectively, ahead of the July low of 1.0833 (July 6). The breakdown of this region should meet the next contention area at the key 200-day SMA at 1.0666 prior to the May low of 1.0635 (May 31). South from here emerges the March low of 1.0516 (March 15) before the 2023 low of 1.0481 (January 6).
Furthermore, the constructive view of EUR/USD appears unchanged as long as the pair trades above the key 200-day SMA.
Of note, however, is that the current pair’s overbought condition (as per the daily RSI above 75) carries the potential to spark a technical correction in the short-term horizon.
Euro FAQs
What is the Euro?
The Euro is the currency for the 20 European Union countries that belong to the Eurozone. It is the second most heavily traded currency in the world behind the US Dollar. In 2022, it accounted for 31% of all foreign exchange transactions, with an average daily turnover of over $2.2 trillion a day.
EUR/USD is the most heavily traded currency pair in the world, accounting for an estimated 30% off all transactions, followed by EUR/JPY (4%), EUR/GBP (3%) and EUR/AUD (2%).
What is the ECB and how does it impact the Euro?
The European Central Bank (ECB) in Frankfurt, Germany, is the reserve bank for the Eurozone. The ECB sets interest rates and manages monetary policy.
The ECB’s primary mandate is to maintain price stability, which means either controlling inflation or stimulating growth. Its primary tool is the raising or lowering of interest rates. Relatively high interest rates – or the expectation of higher rates – will usually benefit the Euro and vice versa.
The ECB Governing Council makes monetary policy decisions at meetings held eight times a year. Decisions are made by heads of the Eurozone national banks and six permanent members, including the President of the ECB, Christine Lagarde.
How does inflation data impact the value of the Euro?
Eurozone inflation data, measured by the Harmonized Index of Consumer Prices (HICP), is an important econometric for the Euro. If inflation rises more than expected, especially if above the ECB’s 2% target, it obliges the ECB to raise interest rates to bring it back under control.
Relatively high interest rates compared to its counterparts will usually benefit the Euro, as it makes the region more attractive as a place for global investors to park their money.
How does economic data influence the value of the Euro?
Data releases gauge the health of the economy and can impact on the Euro. Indicators such as GDP, Manufacturing and Services PMIs, employment, and consumer sentiment surveys can all influence the direction of the single currency.
A strong economy is good for the Euro. Not only does it attract more foreign investment but it may encourage the ECB to put up interest rates, which will directly strengthen the Euro. Otherwise, if economic data is weak, the Euro is likely to fall.
Economic data for the four largest economies in the euro area (Germany, France, Italy and Spain) are especially significant, as they account for 75% of the Eurozone’s economy.
How does the Trade Balance impact the Euro?
Another significant data release for the Euro is the Trade Balance. This indicator measures the difference between what a country earns from its exports and what it spends on imports over a given period.
If a country produces highly sought after exports then its currency will gain in value purely from the extra demand created from foreign buyers seeking to purchase these goods. Therefore, a positive net Trade Balance strengthens a currency and vice versa for a negative balance.
Here is what you need to know on Tuesday, July 18:
Following Monday's choppy action, major currency pair struggle to make a decisive move in either direction early Tuesday. The US economic docket will feature Retail Sales and Industrial Production data for June. Market participants will also keep a close eye on the Consumer Price Index (CPI) figures from Canada in the second half of the day.
During the Asian trading hours, China’s Commerce Ministry announced that they will encourage companies to create online service platforms for household consumer services and that they will step up credit support for household goods consumption. This development failed to help the risk mood improve and the Shanghai Composite Index closed in negative territory after having lost nearly 1% on Monday. Meanwhile, US stock index futures trade modestly lower following the bullish action seen in Wall Street's main indexes on the first trading day of the week.
The US Dollar Index continues to trade below 100.00, pressured by a more-than-1% decline in the benchmark 10-year US Treasury bond yield. Retail Sales in the US are forecast to rise 0.5% in June.
US Retail Sales expected to surge in June, deliver potential US Dollar relief.
The Minutes of the Reserve Bank of Australia's July monetary policy meeting showed that policymakers agreed some further tightening may be required and that they would reconsider a potential rate hike at the August meeting. AUD/USD edged higher in the Asian session but struggled to gather momentum. At the time of press, the pair was virtually unchanged on the day slightly above 0.6800.
EUR/USD climbed to its highest level since February 2022 at 1.1276 early Tuesday but retreated to the 1.1250 area.
GBP/USD registered small losses on Monday but managed to shake off the bearish pressure. As of writing, the pair was moving sideways in a narrow channel below 1.3100.
On a yearly basis, the CPI in Canada is forecast to edge lower to 3.5% in June from 3.7% in May. USD/CAD stays in a consolidation phase at around 1.3200 ahead of key inflation data.
Canada CPI Preview: Forecasts from five major banks, better inflation, but not yet good enough.
Following Monday's recovery attempt, USD/JPY came under renewed bearish pressure and was last seen trading in negative territory near 138.00.
Gold benefits from falling US Treasury yields early Tuesday and trades at its highest level in a month above $1,960.
Bitcoin stays on the back foot and trades below $30,000 early Tuesday. Ethereum closed the fourth straight day in negative territory on Monday and was last seen losing nearly 1% on the day slightly below $1,900.
Chinese data disappointment was not enough to trigger a broad-based rebound in the Dollar. Economists at ING analyze Greenback’s outlook.
No real benefit from China’s data disappointment
The lack of larger-scale Dollar gains on the back of deteriorating Chinese sentiment indicates that markets remain reluctant to build back USD long positions for now. That must be weighed – however – with indications that the Dollar is undervalued in the short-term vs some major currencies (excluding JPY): it may be a matter of time, or a simple lack of catalyst, to see some convergence of the Dollar with its short-term drivers.
Today, the market’s focus will be on June’s Retail Sales figures out of the US (expected to be quite strong), as well as Industrial Production, some housing data and TIC flows. These releases normally do not trigger wide market reactions by themselves, although a combined positive data flow today could at least help keep the Dollar losses capped for now.
See – US Retail Sales Preview: Forecasts from eight major banks, modest consumption
- USD/JPY meets with a fresh supply on Tuesday and is pressured by renewed USD selling bias.
- Bets that the Fed will soon end its rate-hiking cycle continue to undermine the Greenback.
- Speculations that the BoJ will tweak its YCC policy benefit the JPY and contribute to the fall.
The USD/JPY pair attracts some sellers in the vicinity of the 139.00 mark on Tuesday and extends its steady intraday descent through the early part of the European session. The pair drops to a fresh daily low, around the 138.20-138.15 region in the last hour and is pressured by a combination of factors.
The US Dollar (USD) continues with its struggle to register any meaningful recovery and languishes near its lowest level since April 2022 touched last Friday in the wake of expectations that the Federal Reserve (Fed) will soften its hawkish stance. The markets seem convinced that the US central bank will end its policy tightening campaign after the widely anticipated 25 bps lift-off at its upcoming policy meeting on July 25-26. This leads to a further decline in the US Treasury bond yields, which is seen weighing on the Greenback and dragging the USD/JPY pair lower.
The Japanese Yen (JPY), on the other hand, draws some support from speculations that the Bank of Japan (BoJ) could adjust its Yield Curve Control (YCC) policy in July. It is worth recalling, Japanese media reported that the BoJ is likely to raise its FY2023 inflation forecast, which has exceeded the 2% goal for more than a year. This should put pressure on the central bank to start unwinding its ultra-loose monetary policy settings. Apart from this, the prevalent cautious mood further benefits the safe-haven JPY and contributes to the offered tone surrounding the USD/JPY pair.
The market sentiment remains fragile on the back of growing worries about a global economic slowdown. The fears were fueled by weaker Chinese macro data released on Monday, which suggested that the post-COVID recovery is losing steam. In fact, the National Bureau of Statistics of China reported on Monday that the economic growth decelerated substantially in the second quarter and Retail sales - a gauge of consumption - slowed sharply in June. That said, the possibility of more stimulus measures from China helps limit the pessimism in the markets, at least for now.
Furthermore, doubts that the Fed will commit to a more dovish policy stance, instead might stick to its forecast for a 50 bps rate hike this year might hold back traders from placing aggressive bearish bets around the USD. This, in turn, warrants some caution before positioning for an extension of the USD/JPY pair's recent sharp retracement slide from the YTD peak - levels just above the 145.00 psychological mark - touched in June. Investors now look to the release of the US monthly Retail Sales and Industrial Production figures for short-term trading opportunities.
Technical levels to watch
Open interest in gold futures markets dropped for the second session in a row on Monday, this time by around 12.8K contracts according to preliminary readings from CME Group. Volume followed suis and shrank for the third straight session, now by around 79.3K contracts.
Gold remains focused on $1980
Gold started the week in an inconclusive fashion following Friday’s small pullback. The move was amidst shrinking open interest and volume and exposes a potential bounce in the near term. In the meantime, occasional bullish attempts should continue to target the June peaks just above the $1980 mark per troy ounce.
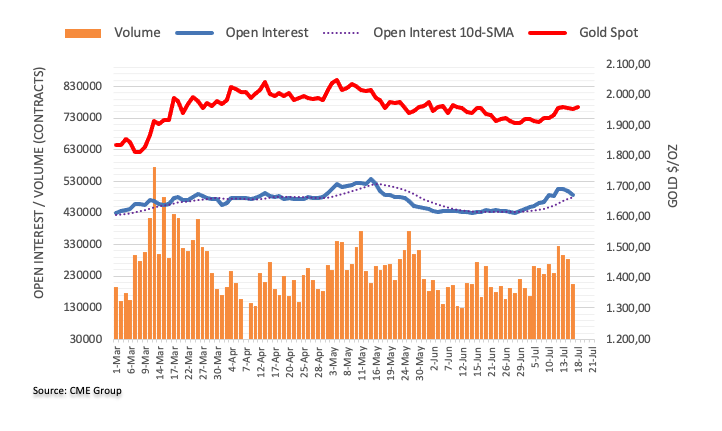
Economists at Commerzbank analyze CAD outlook ahead of the Canada Consumer Price Index (CPI) report.
Will the Canadian inflation data be able to convince?
As the market does not really currently believe in another rate hike in September (the likelihood stands at 30%) the inflation data might fuel expectations, in particular of course if it surprises on the upside. To dissuade the market from its sceptical approach regarding a further rate step the data would have to surprise very significantly though. As price pressure seems to be easing globally in most countries, this might also be the case in Canada.
It is questionable whether that would be sufficient for the BoC though. It is likely to remain hawkish as long as the data does not convince; and (core) inflation data is unlikely to convince today. For that reason, CAD is likely to remain supported for now, and we see further upside potential against USD over the coming weeks.
See – Canada CPI Preview: Forecasts from five major banks, better inflation, but not yet good enough
- Pound Sterling is broadly demonstrating a lackluster performance below 1.3100.
- United Kingdom’s inflation is expected to soften as producers have cut prices at factory gates.
- The Bank of England might continue raising interest rates as the 2% target remains far.
The Pound Sterling (GBP) drops as the upside seems restricted amid caution among market participants ahead of the United Kingdom’s inflation data. The GBP/USD pair struggles in finding a key trigger and has been oscillating near 1.3100. The current volatility squeeze is expected to be followed by an explosion once inflation data is published on Wednesday. UK producer prices have recently eased, as did household demand for big-ticket items, but inflation for consumers has proven to be more persistent than initially expected.
The consequences of the United Kingdom's higher inflation have been widening their scope and the impact of the drop in sales of big-ticket items and the housing sector is expanding to labor market conditions. Wages might fail in maintaining their steady pace and the employment generation process is likely to slow as firms are postponing their expansion plans to avoid higher interest-payment obligations.
Daily Digest Market Movers: Pound Sterling remains in bounded territory
- Pound Sterling has faced stiff resistance around 1.3100 as the upcoming United Kingdom inflation data hogs the limelight.
- Market expectations show that June’s monthly inflation grew at a pace of 0.4%, lower than the 0.7% increase seen in May. Annual headline inflation is expected to decelerate to 8.2% from 8.7% a month earlier.
- The core Consumer Price Index, which strips out the more-volatile categories of food and energy, has been a troublemaker for Bank of England policymakers due to its stubbornness. The measure is expected to remain steady at fresh highs of 7.1%.
- Inflation in the British economy has been fueled by labor shortages and 45-year-high food inflation.
- Food inflation is expected to soften as producers have cut prices for the first time in more than three years after cost pressures have started to relent, according to a survey from Lloyds Bank reported by The Times.
- Apart from consumer prices, investors will focus on Producer Price Index (PPI) figures. Investors should note that UK Finance Minister Jeremy Hunt was in discussions with industry regulators to stop overcharging prices.
- Producer prices are expected to remain extremely soft, according to market expectations, adding to evidence of easing price pressures in the pipeline.
- In spite of the deceleration in factory prices, the Bank of England (BoE) Governor Andrew Bailey said the bank will continue hiking interest rates by a wide margin.
- UK inflation has remained extremely persistent, increasing the chances of further policy tightening by the BoE and heavily weighing on economic prospects.
- A quarterly survey compiled by Deloitte showed that top executives in UK firms expect a slowdown in fresh employment and wage hikes.
- Cooling labor market conditions would be welcomed by BoE policymakers as consumer inflation expectations would likely ease. Still, the economic outlook would also worsen.
- The overall market mood is quite upbeat amid a decent appeal for risk-perceived assets.
- The US Dollar Index (DXY) edged down while attempting to sustain an auction above the psychological resistance of 100.00.
- Investors are anticipating a volatile action in the US Dollar ahead of the release of the United States Retail Sales data for June, which will be published at 12:30 GMT.
- While higher interest rates by the Federal Reserve (Fed) have propelled fears of bleak economic prospects, US Treasury Secretary Janet Yellen said on Monday that the economy is making good progress in bringing inflation down and she doesn’t expect a recession, Bloomberg reports.
Technical Analysis: Pound Sterling demonstrates volatile squeeze around 1.3100
Pound Sterling is still testing its strength in the breakout of the Rising Channel pattern formed on the daily chart by a marginal correction. A breakout of this pattern indicates immense strength in the upside momentum. Upward-sloping short-to-long-term daily Exponential Moving Averages (EMAs) also indicate firmness for Pound Sterling bulls.
Momentum oscillators are in the bullish trajectory, showing no signs of divergence or any evidence of an oversold situation.
BoE FAQs
What does the Bank of England do and how does it impact the Pound?
The Bank of England (BoE) decides monetary policy for the United Kingdom. Its primary goal is to achieve ‘price stability’, or a steady inflation rate of 2%. Its tool for achieving this is via the adjustment of base lending rates. The BoE sets the rate at which it lends to commercial banks and banks lend to each other, determining the level of interest rates in the economy overall. This also impacts the value of the Pound Sterling (GBP).
How does the Bank of England’s monetary policy influence Sterling?
When inflation is above the Bank of England’s target it responds by raising interest rates, making it more expensive for people and businesses to access credit. This is positive for the Pound Sterling because higher interest rates make the UK a more attractive place for global investors to park their money. When inflation falls below target, it is a sign economic growth is slowing, and the BoE will consider lowering interest rates to cheapen credit in the hope businesses will borrow to invest in growth-generating projects – a negative for the Pound Sterling.
What is Quantitative Easing (QE) and how does it affect the Pound?
In extreme situations, the Bank of England can enact a policy called Quantitative Easing (QE). QE is the process by which the BoE substantially increases the flow of credit in a stuck financial system. QE is a last resort policy when lowering interest rates will not achieve the necessary result. The process of QE involves the BoE printing money to buy assets – usually government or AAA-rated corporate bonds – from banks and other financial institutions. QE usually results in a weaker Pound Sterling.
What is Quantitative tightening (QT) and how does it affect the Pound Sterling?
Quantitative tightening (QT) is the reverse of QE, enacted when the economy is strengthening and inflation starts rising. Whilst in QE the Bank of England (BoE) purchases government and corporate bonds from financial institutions to encourage them to lend; in QT, the BoE stops buying more bonds, and stops reinvesting the principal maturing on the bonds it already holds. It is usually positive for the Pound Sterling.
NZD/USD could see its bid bias losing traction on a close below the 0.6285 level, according to UOB Group’s Economist Lee Sue Ann and Markets Strategist Quek Ser Leang.
Key Quotes
24-hour view: We expected NZD to consolidate and trade between 0.6330 and 0.6400 yesterday. However, NZD dipped briefly to 0.6309 before closing on a soft note at 0.6326 (-0.68%). The underlying tone has softened, but while NZD is likely to edge lower today, it is unlikely to threaten the strong support at 0.6285. On the upside, if NZD breaks above 0.6355 (minor resistance is at 0.6340), it would suggest the current mild downward pressure has faded.
Next 1-3 weeks: Last Thursday (13 Jul), when NZD was trading at 0.6300, we highlighted that “the risk for NZD has shifted to the upside towards 0.6385.” After NZD soared, we highlighted on Friday (14 Jul, spot at 0.6385) that “the risk for NZD remains on the upside and the levels to watch are 0.6445 and 0.6495.” NZD has not been able to build on its momentum. as it pulled back from a high of 0.6412. The pullback has diminished the likelihood of NZD rising to 0.6445 and 0.6495. However, only a breach of 0.6285 (no change in ‘strong support’ level) would suggest that the current upward pressure has fizzled out.
EUR/USD kept rising. However, economists at ING expect the world’s most popular currency pair to struggle to enjoy further gains.
Stretched short-term valuation
In our short-term financial fair value model, EUR/USD overvaluation has exceeded 3.0% on the back of the pair’s unusual moves, an indication of how the FX market is pricing in a disinflationary risk premium into the Dollar (i.e. larger than what is factored in by rates and equities).
We suspect gains beyond the 1.1300 mark may prove to be unsustainable for now.
- Silver touches a fresh two-month peak on Tuesday, albeit lacks any follow-through.
- The technical setup favours bullish traders and supports prospects for further gains.
- Any meaningful corrective slide is more likely to get bought into and remain limited.
Silver catches fresh bids on Tuesday and climbs to over a two-month peak, albeit continues with its struggle to find acceptance or build on the momentum beyond the $25.00 psychological mark. The technical setup, meanwhile, suggests that the path of least resistance for the white metal is to the upside.
Last week's sustained breakout through the $24.50-$24.60 static barrier, which coincided with the 61.8% Fibonacci retracement level of the May-June downfall was seen as a fresh trigger for bullish traders. This, along with the fact that oscillators on the daily chart are holding in the positive territory, validates the outlook and supports prospects for a further near-term appreciating move for the XAG/USD.
The subsequent move up could get extended further towards the $25.50-$25.55 region, above which the XAG/USD might aim to reclaim the $26.00 round figure and then challenge the YTD peak, around the $26.10-$26.15 area touched in May. Some follow-through buying will set the stage for an extension of the recent goodish rebound from the vicinity of the $22.00 mark, or a three-month low touched in June.
On the flip side, the $24.50 resistance breakpoint (61.8% Fibo. level) now seems to protect the immediate downside, below which the XAG/USD could slide towards testing the $24.00 mark. This is followed by supports near the $23.65-$23.60 area and the $23.20-$23.15 zone. A convincing break below the $23.00 round figure will negate the positive outlook and shift the bias in favour of bearish traders.
Silver daily chart
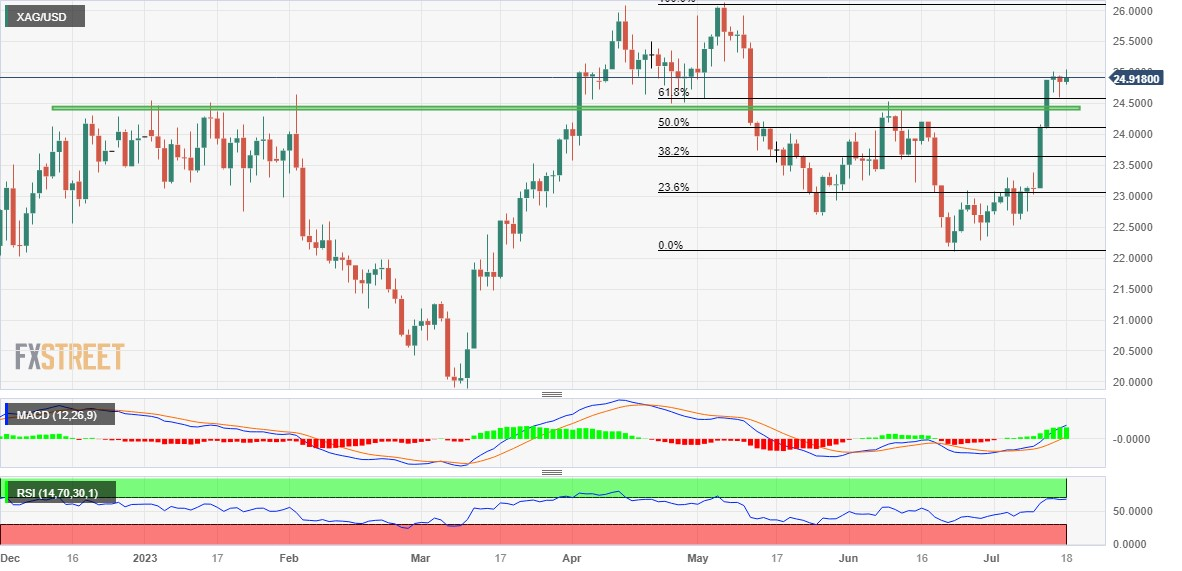
Key levels to watch
Economists at Standard Chartered expect the Central Bank of the Republic of Türkiye (CBRT) to raise policy rate by 400 bps at its 20 July meeting.
CBRT to continue monetary tightening in July
We now expect the CBRT to raise its one-week repo rate by 400 bps to 19.0% on 20 July, having previously put our forecast under review.
Despite some signs of economic slowdown, we expect the central bank to gradually adopt a neutral-to-hawkish monetary policy stance to address renewed Turkish Lira (TRY) weakness, a widening current account deficit and underlying price pressures.
The new central bank leadership has committed to achieving lower trend inflation and a significant improvement in the inflation outlook. Nevertheless, price pressure is likely to remain, with risks tilted to the upside, given elevated inflation expectations, ongoing currency weakness and a wider fiscal deficit.
Economists at ING analyze USD/CAD outlook.
Loonie affected by the US as much as by Canada
CAD remains quite tied to the domestic US story, and therefore to the USD itself. Should we see a fully-fledged risk-on rally on the back of a clear softening in US data, expect CAD underperformance compared to other pro-cyclicals.
A more conservative scenario, where markets have to ‘hold their horses’ on the USD decline/Fed peak story for a bit longer can make CAD stand out.
In all cases, the attractive volatility-adjusted carry means USD/CAD can hit 1.25-1.27 by mid-2024.
- USD/CAD clings to key Fibonacci retracement level within multi-day-old bearish channel.
- Steady RSI suggests further recovery from descending trend channel’s support but 21-DMA guards immediate upside.
- Seven-week-old falling trend line, 1.3350 appear key hurdles to cross for Loonie pair bulls.
- US Retail Sales, Canada inflation data will be crucial for further guidance.
USD/CAD portrays the typical pre-data inaction around 1.3200 heading into Tuesday’s European session. In doing so, the Loonie pair makes rounds to the 61.8% Fibonacci retracement of its August-October upside while holding lower grounds within a four-month-old bearish trend channel.
That said, the quote’s failure to cross the 21-DMA hurdle, around 1.3225 by the press time, joins the steady RSI (14) line to suggest further grinding of the USD/CAD prices toward the south.
However, the bottom line of the aforementioned descending channel, around 1.3100 by the press time, appears a tough nut to crack for the USD/CAD bears.
In a case where the USD/CAD price drops below 1.3100, the 1.3000 psychological magnet and the 78.6% Fibonacci retracement near 1.2990 could attract the sellers.
Meanwhile, an upside break of the 21-DMA resistance of near 1.3225 can propel the USD/CAD toward a downward-sloping resistance line from May 31, close to 1.3285.
Following that, a convergence of the 50-DMA and 50% Fibonacci retracement, around 1.3350, will be crucial to watch for the USD/CAD bulls to retake control.
Fundamentally, Canada’s headline Consumer Price Index (CPI), Bank of Canada CPI and the US Retail Sales for June will be important to watch for clear directions of the Loonie pair.
Also read: USD/CAD Outlook: Traders seem non-committed near 1.3200 ahead of Canadian CPI, US Retail Sales
USD/CAD: Daily chart
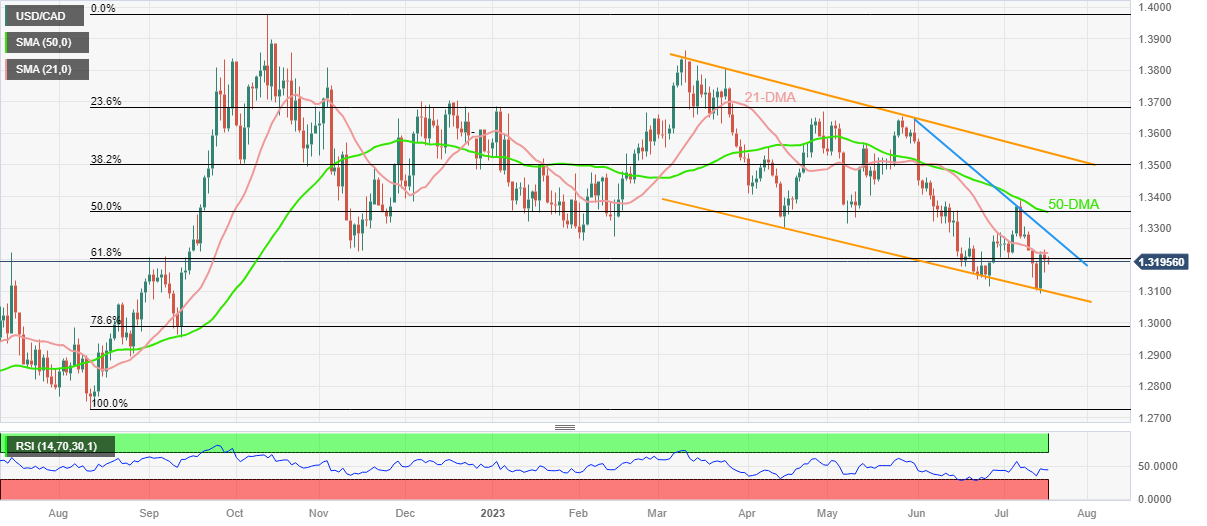
Trend: Limited upside expected
Economists at Commerzbank analyze AUD outlook after the minutes from the Reserve Bank of Australia’s latest meeting.
Monetary policy is unlikely to provide much positive impetus for the AUD
Another rate hike is not off the table, but the RBA is also likely to have reached the end of its hiking cycle soon.
Incidentally, August will be the last meeting under Acting Governor Philip Lowe. He will be replaced by board member Michele Bullock. However, this is unlikely to bring about too much change in monetary policy. As a result, monetary policy is unlikely to provide much positive impetus for the AUD and therefore AUD/USD is likely to remain below the 0.70 level.
- EUR/GBP picks up bids and approaches the 0.8600 round mark.
- EUR/GBP will meet an initial support level of 0.8550, next resistance level is seen at 0.8615.
- The Relative Strength Index (RSI) stands flat above its midline.
The EUR/GBP pair navigates to the north above 0.8590 and challenges the 0.8600 round mark heading into Tuesday’s European session. According to the daily chart, EUR/GBP holds above the 50- and 100-day Exponential Moving Averages (EMA), implying the path of least resistance for the EUR/GBP is to the upside.
That being said, any decisive follow-through buying past 0.8600 will see a rally to 0.8615 (50-day EMA). Further north, the cross will challenge the next hurdle at 0.8635, representing the upper boundary of the Bollinger Band. The additional upside filter to watch is 0.8670 (100-day EMA).
On the downside, EUR/GBP will meet an initial support level of 0.8550 (Low Dec 1, 2022) en route to 0.8515 (the lower limit of the Bollinger Band). The breach of the latter would expose to 0.8500, the intersection of the psychological round mark and a high of Aug 19, 2022. Some follow-through selling below the mentioned level would fuel a drop towards 0.8415 (Low of July 13, 2022).
The Relative Strength Index (RSI) stands flat above its midline, supporting EUR/GBP buyers for now.
EUR/GBP daily chart
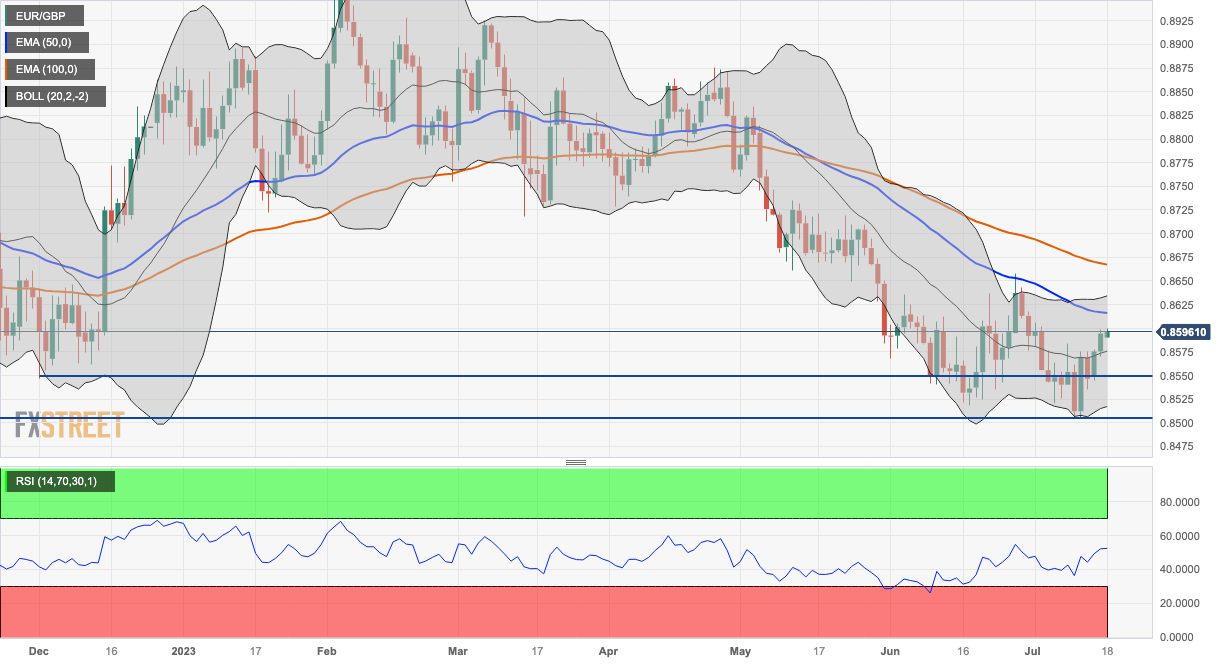
The US Census Bureau will release the June Retail Sales report on Tuesday, July 18 at 12:30 GMT and as we get closer to the release time, here are the forecasts of economists and researchers of eight major banks regarding the upcoming data.
Retail Sales in the US are expected to rise 0.5% month-on-month vs. 0.3% in May. Meanwhile, sales ex-autos are expected at 0.4% MoM and the so-called control group used for GDP calculations is seen at -0.3%
Commerzbank
For Retail Sales in June, we forecast an increase of 0.4% compared with May. However, part of the increase reflects the rise in the price of gasoline, which is inflating nominal sales at gas stations.
Credit Suisse
We expect Retail Sales growth to accelerate in June, driven by strong auto sales. We expect headline retail sales to grow 0.8% MoM. Retail sales ex-autos and gas are set to increase by 0.2% MoM.
TDS
We expect Retail Sales to advance for a third consecutive month in June after registering 0.3%/0.4% MoM gains so far in Q2. Indeed, we forecast a strong 0.6% MoM gain for the headline. Volatile auto sales will likely add to growth while sales in gas stations likely proved to be an obstacle. Importantly, control group sales are expected to stay firm again at 0.5% MoM, though online activity has started to lose some momentum. We also look for sales in bars/restaurants to expand at a brisk pace, which points to a consumer that continues to support spending in the services segment.
NBF
Auto sales and gasoline station receipts should have increased during the month, which, combined with advances in housing-related categories, should translate into a 0.4% progression for headline sales. Spending on items other than vehicles, meanwhile, might have advanced 0.3%.
RBC Economics
US Retail Sales likely ticked up 0.6% in June, thanks to a boost in auto sales during that month. We expect ex-auto sales were little changed at +0.1% on a MoM basis, supported by a price-related increase in gasoline station sales.
CIBC
Consumers showed signs of caution in discretionary Retail Sales categories in May, but stronger income growth in June likely resulted in an acceleration in Retail Sales in that month. The expected 0.6% headline advance in sales will include a boost from higher prices at the pump, but goods prices outside of gasoline and vehicles were generally flat on the month, implying a healthy advance in volume terms in the more important control group. That group excludes gasoline, autos, restaurants, and building materials, and feeds more directly into non-auto goods consumption in GDP, and likely accelerated to 0.5%. We’re slightly more optimistic on the control group than the consensus, which would reinforce the need for further Fed rate hikes and lift bond yields.
Wells Fargo
We forecast a pickup in consumption and forecast Retail Sales to rise 0.5% in June, receiving somewhat of a lift again from sales at auto dealers as the sector continues to normalize. After a few weak months of sales growth, we expect there is some payback to be had in goods spending. But with real income growth showing signs of moderating amid dwindling excess saving and tighter credit conditions, we're somewhat inclined to wave off a few monthly increases in the coming months as low base effects, more so than the start of a sustainable run in retail sales growth.
Citi
We expect a modest 0.3% MoM increase in total Retail Sales in June while control group sales should increase by a softer 0.1% MoM in June which would imply around 1.1% QoQ annualized increase during the second quarter for this category in nominal terms. That increase would also be softer in real terms. Services are likely to remain the main driver of consumption growth.
- USD/TRY prints three-day uptrend around the all-time peak, grinds higher of late.
- Turkish President Erdogan visits Saudi Arabia, signs deals of defense, energy, etc., UK also braces for trade deal with Ankara.
- CBRT braces for another heavy rate hike to tame inflation woes after the previous disappointment.
- US Retail Sales, Industrial Production will guide intraday moves.
USD/TRY bulls flirt with the record peak of around 26.35 heading into Tuesday’s European session, up for the third consecutive day. In doing so, the Turkish Lira (TRY) pair struggles to justify the headline surrounding the trade deal between Saudi Arabia and Turkiye, as well as fail to cheer the US Dollar weakness, amid a sluggish session. That said, the quote’s latest run-up could be linked to the market’s preparations for today’s US Retail Sales and Industrial Production for June, as well as Thursday’s monetary policy decision of the Central Bank of the Republic of Türkiye (CBRT).
Turkish President Tayyip Erdogan is in Saudi Arabia on Tuesday and gets a warm welcome from Saudi Crown Prince Mohammed bin Salman as both leaders have signed multiple deals for energy, defense and direct investments, etc. during the diplomatic gathering.
Saudi Arabia signed two contracts with Turkish defense firm Baykar to buy drones "with the aim of enhancing the readiness of the Kingdom's armed forces and bolstering its defense and manufacturing capabilities," Saudi Defence Minister Prince Khalid bin Salman said in a tweet on Tuesday, reported Reuters.
On the same line, the UK also showed readiness to deepen its trading ties with Ankara. “Negotiations on an updated free trade agreement are expected to begin in 2024 after the two countries announced that there was scope to improve the existing trade deal,” stated the UK Independent.
It should be noted that the markets brace for another bumper rate hike from the CBRT during its Interest Rate Decision on Thursday. As per the latest Reuters poll, Turkey's central bank is expected to raise its policy rate by 500 basis points (bps) to 20% this week, a Reuters poll showed on Monday, making good on its pledge of further tightening with another sharp hike to curb inflation which is set to rise again.
Further, US Dollar Index (DXY) drops to 99.76 while reversing Friday’s corrective bounce off the lowest level since April 2022 as the previous day’s US statistics fail to inspire Fed hawks even as the July rate hike is already given. That said, New York (NY) Empire State Manufacturing Index for July eased to 1.1 from 6.6 prior and 0.0 market forecasts. The data failed to inspire the US Dollar Index (DXY) sellers initially before weighing on the DXY, probing Friday’s recovery backed by the upbeat prints of the University of Michigan’s (UoM) Consumer Sentiment Index and consumer inflation expectations for the said month.
It’s worth noting that the market sentiment appears mildly positive and prods the US Dollar, as well as the USD/TRY bulls.
Moving on, US Retail Sales for June, expected to rise to 0.5% versus 0.3% prior, as well as the Industrial Production for the said month, expected -0.1% versus -0.2% prior, may entertain the USD/TRY traders ahead of Thursday’s CBRT Interest Rate Decision.
Technical analysis
While the 10-DMA level surrounding 26.15 puts a floor under the USD/TRY prices, the monthly low of around 25.20 appears the key to the bear’s entry. Meanwhile, the all-time peak surrounding 26.37 may prod the pair buyers on their way to the 30.00 psychological magnet.
Economists at Société Générale analyze USD/INR technical outlook.
Stuck within a triangle
USD/INR has evolved within a large consolidation since last October forming a triangle. The pair recently approached the upper part of the formation resulting in a pullback.
April low of 81.60 is an important support. In case this gets violated, there would be risk of a deeper down move towards projections of 80.50/80.10.
A triangle denotes clear direction is lacking. The pattern has formed after an elongated up-trend. A move beyond the upper limit near 82.95 is essential to affirm resumption in up-move.
- US Census Bureau will publish the June Retail Sales report on Tuesday, July 18.
- United States Retail Sales are expected to rise by 0.5% after unexpectedly increasing in May.
- The continued uptick in auto sales to boost US Retail Sales, fueling a US Dollar relief rally.
Retail Sales data in the United States (US) will be published by the Census Bureau on Tuesday, July 18. The June headline Retail Sales figure is expected to see another increase after unexpectedly rising in May. Note that the Retail Sales data is adjusted for seasonality but not for inflation.
The United States Dollar (USD) has been struggling near the lowest level in 15 months after last week’s soft United States Consumer Price Index (CPI) and Producer Price Index (PPI) reports, which revived expectations that the US Federal Reserve (Fed) is nearing the end of its tightening cycle.
The US Retail Sales report could have a significant impact on the Fed interest rate expectations and, in turn, on the US Dollar’s valuation, as there is a lack of high-impact US economic data this week and the Fed’s ‘blackout period’ has started ahead of the July 25-26 FOMC meeting.
What to expect in the June US Retail Sales report?
The headline Retail Sales are seen rising 0.5% MoM in June, compared with a 0.3% growth seen in May. Excluding autos, Core Retail Sales are likely to have risen 0.3% in June, compared with a 0.1% increase registered in May. US Retail Sales Control Group is expected to increase 0.4%, courtesy of the growth in online sales.
Economists expect auto sales to contribute to the increase in the retail volume last month. Rapid growth in sales in bars/restaurants is also seen adding to the headline retail sales figure. However, slowing fuel sales could pose a downside risk.
According to analysts at BBH, “June retail sales Tuesday will be the data highlight. Consensus sees headline sales up 0.5% m/m, ex-auto up 0.4%, and the so-called control group used for GDP calculations up 0.4%. We note that markets should not just rely on retail sales data to gauge the strength of the consumer, as it only covers goods. Personal spending covers services as well and will give a much fuller picture, but the June reading won’t be reported until July 28 along with PCE data.”
When will US June Retail Sales data be released and how can it affect EUR/USD?
The US Retail Sales data for June is due to be published at 12:30 GMT on Tuesday. With the US Dollar wallowing in multi-month lows heading into the data release, the EUR/USD pair is holding firmer above the 1.1200 mark. Stronger-than-expected US Retail Sales data could revive the US Dollar bulls, triggering a brief correction in the main currency pair ahead of next week’s Fed and European Central Bank (ECB) policy announcements.
On the other hand, disappointing Retail Sales details are likely to rekindle recession fears while bolstering the market’s expectations of a probable Fed rate hike pause after the expected 25 bps July rate increase. At the moment, markets are pricing in an 83% chance of the Federal Reserve holding rates at the current level in September.
The data-led weakness in the US Dollar, however, could be limited due to increased safe-haven demand on economic growth concerns.
Meanwhile, Dhwani Mehta, Asian Session Lead Analyst at FXStreet, offers a brief technical outlook for the major and explains: “The 14-day Relative Strength Index (RSI) is holding well within the overbought territory, suggesting that a correction is in the offing. However, any pullback in the EUR/USD pair could be seen as a good dip-buying opportunity.”
Dhwani also outlines important technical levels to trade the EUR/USD pair: “On the upside, Euro buyers aim for the 1.1270 static resistance should the 1.1250 level hold. Meanwhile, acceptance above the 1.1300 round figure is critical to unleashing additional upside. Alternatively, immediate support awaits at the previous day’s low of 1.1203, below which a sharp sell-off toward the 1.1150 psychological barrier will be on the cards.”
Economic Indicator
United States Retail Sales (MoM)
The Retail Sales released by the US Census Bureau measure the total receipts of retail stores. Monthly percent changes reflect the rate of changes in such sales. Changes in Retail Sales are widely followed as an indicator of consumer spending. Generally speaking, a high reading is seen as positive (or bullish) for the USD, while a low reading is seen as negative (or bearish).
Read more.Next release: 08/15/2023 12:30:00 GMT
Frequency: Monthly
Source: US Census Bureau
Why it matters to traders
Retail Sales data published by the US Census Bureau is a leading indicator that gives important information about consumer spending, which has a significant impact on the GDP. Although strong sales figures are likely to boost the USD, external factors, such as weather conditions, could distort the data and paint a misleading picture. In addition to the headline data, changes in the Retail Sales Control Group could trigger a market reaction as it is used to prepare the estimates of Personal Consumption Expenditures for most goods.
- WTI crude oil price grinds near intraday high during the first profit-making day in three.
- Bullish MACD signals favor commodity’s bounce off 10-DMA but three-week-old previous support line prods energy buyers.
- 100-DMA acts as additional downside support while 200-DMA appears a tough nut to crack for WTI bulls.
WTI crude oil clings to mild gains around $74.30, up 0.33% intraday heading into Tuesday’s European session, as it rebounds from the 10-DMA support to print the first daily gain in three.
Apart from the 10-DMA support, the bullish MACD signals also underpin the upside bias surrounding the Oil price.
However, the support-turned-resistance line stretched from late June, around $74.40 by the press time, guards the immediate upside of the black gold price.
Following that, the $75.00 and the $76.00 round figures may entertain the buyers of the energy benchmark before highlighting the 200-DMA hurdle of $76.85. Also acting as an upside filter is the monthly high of near $77.20.
It’s worth noting that the late April swing high of near $79.20 and the $80.00 threshold will also challenge the Oil buyers before giving them control.
Alternatively, a daily closing beyond the 10-DMA support of around $74.10 will need validation from the $74.00 psychological mark and the 100-DMA, near $73.50 at the latest.
In a case where the WTI bears keep the reins past $73.50, June’s high of near $72.70 and the $70.00 will be in the spotlight.
To sum up, the WTI crude oil is likely to remain firmer but the road toward the north is bumpier than the south.
WTI: Daily chart

Trend: Limited upside expected
- Asian market trades on a negative note amid the lack of top-tier regional economic data.
- Market participants remain cautious ahead of the US inflation data.
- The downbeat Chinese data fueled the concern about an economic slowdown.
Most Asian stock markets trade in negative territory on Tuesday. Markets turn cautious amid the concern about an economic slowdown in China and market participants await the US Retail Sales and Industrial Production for June.
Japanese traders return from the holiday and NIKKEI posts modest gains of 0.23%. Meanwhile, Hong Kong's Hang Seng is down 1.85%, Shanghai Composite Index loses 0.06% and KOSPI Index down 0.5%.
It's worth noting that the Bank of Japan (BoJ) policymakers continue to maintain the easy-money policy, even though market participants expected and exited from ultra-low interest rates and moderated the Yield Curve Control (YCC) policy.
On the US-China headline, US Climate Envoy John Kerry informed China's top diplomat, Wang Yi, on Tuesday that "our hope is now that this could be the beginning of new cooperation to solve the differences between us." The market will keep an eye on the renewed tensions between the US-China that could weigh on the risk sentiment.
Talking about the Chinese data, the concerns of an economic slowdown in China remain in focus. The National Bureau of Statistics (NBS) revealed that the Chinese Gross Domestic Product (GDP) came in at 6.3% annually, worse than expected at 7.3% and 4.5% prior. At the same time, Industrial Production YoY rose by 4.4% from 3.5% prior, above the consensus of 2.7%.
Looking forward, the Japanese Trade Balance and the National Core CPI YoY will be released later this week. Also, investors will focus on the US Retail Sales for June, which is expected to rise by 0.5% from 0.3% the previous month. This data might influence the USD dynamic and hint at a sooner end to the rate hike cycle. This, in turn, underpins riskier assets like Gold, equities, AUDUSD, etc.
In the opinion of UOB Group’s Economist Lee Sue Ann and Markets Strategist Quek Ser Leang, further gains in GBP/USD are expected to challenge the 1.3335 level.
Key Quotes
24-hour view: GBP traded between 1.3051 and 1.3109 yesterday, lower and narrower than our expected consolidation range of 1.3060/1.3145. The price actions offer no fresh clues, and today, we expect GBP to trade in a range between 1.3045 and 1.3105.
Next 1-3 weeks: We have held a positive GBP view since early last week. After GBP surged, in our latest narrative from last Friday (14 Jul, spot at 1.3115), we highlighted that as long as GBP stays above 1.3000, the GBP strength is intact. We added, “The next significant resistance is at 1.3335.” There is no change in our view. That said, overbought short-term conditions could lead to a couple of days of consolidation.
- The index adds to Monday’s losses near 99.70.
- US yields keep the directionless mood on Tuesday.
- Retail Sales, Industrial Production next on tap.
The USD Index (DXY), which tracks the greenback vs. a bundle of its rival currencies, trades with modest losses in the 99.80/70 band ahead of the opening bell in Euroland on turnaround Tuesday.
USD Index now looks to data
The index sheds ground for the second session in a row and extends the pessimism seen at the beginning of the week below the psychological 100.00 threshold.
Indeed, the greenback remains under heavy pressure and trades close to recent 15-month lows near the 99.50 region, as investors continue to favour the risk-associated universe amidst steady speculation that the Federal Reserve might be nearing the end of its tightening campaign.
On the latter, however, the Federal Reserve is largely anticipated to raise rates by another 25 bps at the July 26 meeting, while further tightening beyond July appears unclear for the time being.
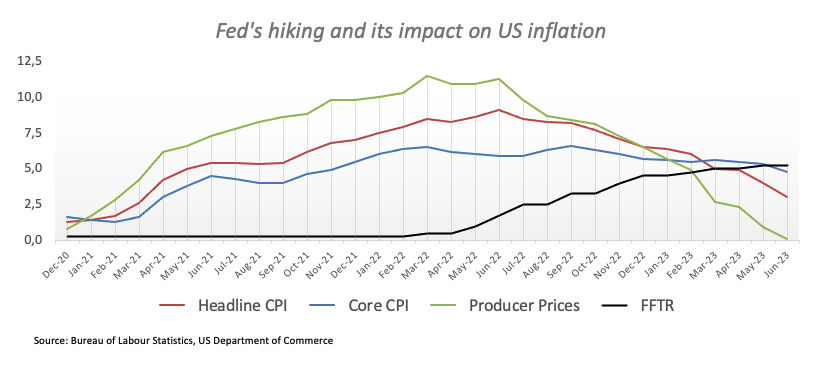
Busy day in the US calendar, as Retail Sales will take centre stage seconded by Industrial Production, Business Inventories, the NAHB Housing Market Index and TIC Flows.
What to look for around USD
Price action around the index remains depressed in the sub-100.00 zone so far on Tuesday.
In the near term, there are no changes to the perception that the Fed would resume its tightening process later in the month despite persistent disinflationary pressures and the still tight labour market.
This view was further bolstered by comments from Fed Chief Powell at the June FOMC event, who referred to the July meeting as "live" and indicated that most of the Committee is prepared to resume the tightening campaign as early as next month.
Key events in the US this week: Retail Sales, Industrial Production, Business Inventories, NAHB Housing Market Index, TIC Flows (Tuesday) – MBA Mortgage Applications, Building Permits, Housing Starts (Wednesday) – Initial Jobless Claims, Philly Fed Manufacturing Index, CB Leading Index, Existing Home Sales (Thursday).
Eminent issues on the back boiler: Persistent debate over a soft/hard landing of the US economy. Terminal Interest rate near the peak vs. speculation of rate cuts in late 2023/early 2024. Geopolitical effervescence vs. Russia and China. US-China trade conflict.
USD Index relevant levels
Now, the index is down 0.18% at 99.70 and faces immediate support at 99.57 (2023 low July 13) followed by 97.68 (weekly low March 30) and 95.17 (monthly low February 10 2022). On the other hand, the breakout of 100.00 (round level) could open the door to 102.64 (55-dat SMA) and then 103.54 (weekly high June 30).
- Gold Price grinds higher past short-term key resistances while snapping three-day downtrend.
- China-linked headlines underpin firmer sentiment, XAU/USD upside.
- US Retail Sales, Industrial Production can guide short-term Gold Price moves ahead of July Fed meeting.
Gold Price (XAU/USD) cheers the return of risk-on mood as traders reassess previous fears emanating from China. Adding strength to sentiment, as well as the XAU/USD price, is the US Dollar’s failure to defend late Friday’s recovery amid unimpressive data. With this, the Gold buyers flex their muscles for another fight to regain the $2,000 round figure.
Apart from the fresh catalysts suggesting the dragon nation’s capacity to defend economic growth, headlines suggesting the restoration of the US-China ties also underpin the market’s cautious optimism. Elsewhere, the US NY Empire State Manufacturing Index failed to impress US Dollar bulls, despite Friday’s upbeat consumer-centric figures.
Elsewhere, hopes of witnessing more stimulus from China and challenges for restrictive monetary policies also allow the Gold Price to remain firmer.
Moving on, US Retail Sales and Industrial Production for June will be crucial to determine the Fed’s rate hike trajectory past July and can help gauge the Gold Price moves.
Also read: Gold Price Forecast: XAU/USD looks to $1,968 and US Retail Sales for fresh Fed cues
Gold Price: Key levels to watch
Our Technical Confluence Indicator shows that the Gold Price recently crossed the key resistances and has softer hurdles toward the north than otherwise.
That said, a convergence of the previous weekly high and upper band of the Bollinger on the four-hour play highlights immediate resistance near $1,965.
Following that, the Pivot Point one-month R1 can prod the XAU/USD bulls around $1,975 before directing them to the $1,985 resistance confluence encompassing the previous monthly high.
On the flip side, the 50-DMA level of around $1,951 limits the immediate downside of the Gold Price.
Adjacent to that is the convergence of the Fibonacci 61.8% on one month and 23.6% on one day, near $1,950.
It’s worth noting that Fibonacci 38.2% on one week, near $1,945, acts as the last defense of the XAU/USD bulls.
Here is how it looks on the tool
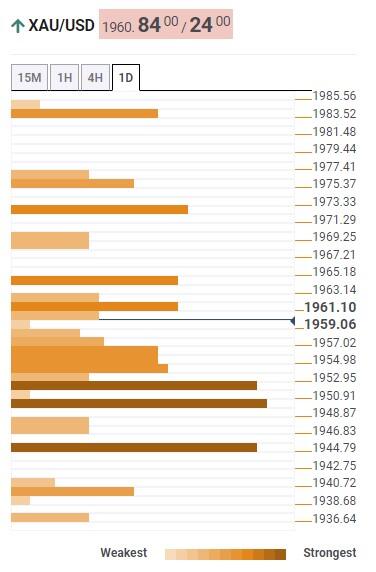
About Technical Confluences Detector
The TCD (Technical Confluences Detector) is a tool to locate and point out those price levels where there is a congestion of indicators, moving averages, Fibonacci levels, Pivot Points, etc. If you are a short-term trader, you will find entry points for counter-trend strategies and hunt a few points at a time. If you are a medium-to-long-term trader, this tool will allow you to know in advance the price levels where a medium-to-long-term trend may stop and rest, where to unwind positions, or where to increase your position size.
- AUD/USD is consistently trading sideways above 0.6800 as investors await US Retail Sales data.
- The Aussie asset has failed to find action despite RBA minutes conveying that further interest rate hikes are required.
- S&P500 futures have posted nominal losses in Asia, portraying caution among market participants.
The AUD/USD pair is consistently demonstrating a sideways auction above the round-level support of 0.6800 in the Tokyo session. The Aussie asset has failed to find action despite Reserve Bank of Australia (RBA) minutes conveying that further interest rate hikes are required.
In July’s monetary policy meeting, favor of RBA policymakers tilted towards the Australian economic outlook and the board decided to keep interest rates steady. In the second quarter, consumer spending seen weak, and the Gross Domestic Product (GDP) growth was seen at around 0.2%, portraying the consequences of aggressive policy tightening.
Investors should note that there is a large deviation in interest rates raised by the RBA and other developed economies, which has allowed much room for further hikes.
This week, investors will focus on Australia’s Employment data, which will be released on Thursday at 01:30 GMT. As per the consensus, the fresh addition of payrolls is seen at 17K, significantly lower than the former release of 75.9K. The Unemployment Rate is expected to remain steady at 3.6%.
Meanwhile, S&P500 futures have posted nominal losses in Asia, portraying caution among market participants. US equities added decent gains on Monday as investors are hoping that only one interest rate hike has left in the inflation-control toolkit of the Federal Reserve (Fed).
The US Dollar Index (DXY) has corrected to near its crucial support of 99.75 after failing to sustain above the psychological resistance of 100.00. Further action in the US Dollar Index would be triggered by the United States Retail Sales (June) data, which will be published at 12:30 GMT.
Further upside in EUR/USD appears likely in the next few weeks, note UOB Group’s Economist Lee Sue Ann and Markets Strategist Quek Ser Leang.
Key Quotes
24-hour view: We noted yesterday that “the current price action is likely part of a consolidation phase” and we expected EUR to trade sideways between 1.1190 and 1.1250. Our view of sideways trading was not wrong, even though EUR traded in a narrower range than expected (1.1202/1.12448). We continue to expect EUR to trade sideways. However, the underlying tone has firmed a tad, and EUR is likely to trade in a higher range of 1.1215/1.1265.
Next 1-3 weeks: There is not much to add to our update from last Friday (14 Jul, spot at 1.1225). As indicated, while EUR could rise further, it is premature to expect a move to the 2022 high of 1.1495. Meanwhile, any further advance could face considerable resistance at 1.1300 and 1.1400. On the downside, a breach of the ‘strong support’ at 1.1160 (level previously at 1.1145) would indicate that the EUR strength that started last Monday has come to an end.
- EUR/JPY fades bounce off intraday low after reversing from one-week high the previous day.
- Bearish candlestick formation, failure to cross 21-DMA keep sellers hopeful.
- Three-week-old horizontal area acts as extra filter towards the north.
- Ascending trend line from early April appears the key support to watch during fresh downside.
EUR/JPY struggles around 155.80 heading into Tuesday’s European session, fading the bounce off the intraday low after reversing from a one-week high the previous day.
The cross-currency pair’s previous rebound from the intraday low appears to have limited acceptance as the 21-DMA and Monday’s bearish Doji candlestick on the daily formation prod the buyers.
Adding strength to the downside bias are the bearish MACD signals and a steady RSI (14) line.
With this, the EUR/JPY prices are likely to remain below the 156.00 round figure and can drop towards the latest trough surrounding 153.40 marked the last week.
However, an upward-sloping support line from early April, close to 152.85 by the press time, appears a tough nut to crack for the pair sellers, a break of which will drag the quote towards May’s peak of around 151.60.
On the contrary, a daily closing beyond the 21-DMA hurdle of around 156.30 isn’t a sure signal for the EUR/JPY rally as a three-week-long horizontal resistance area surrounding 156.70-90, quickly followed by the 157.00 round figure, will challenge the bulls before giving them control.
In that case, the yearly high marked in June around 158.00 and the 160.00 round figure will be in the spotlight.
EUR/JPY: Daily chart
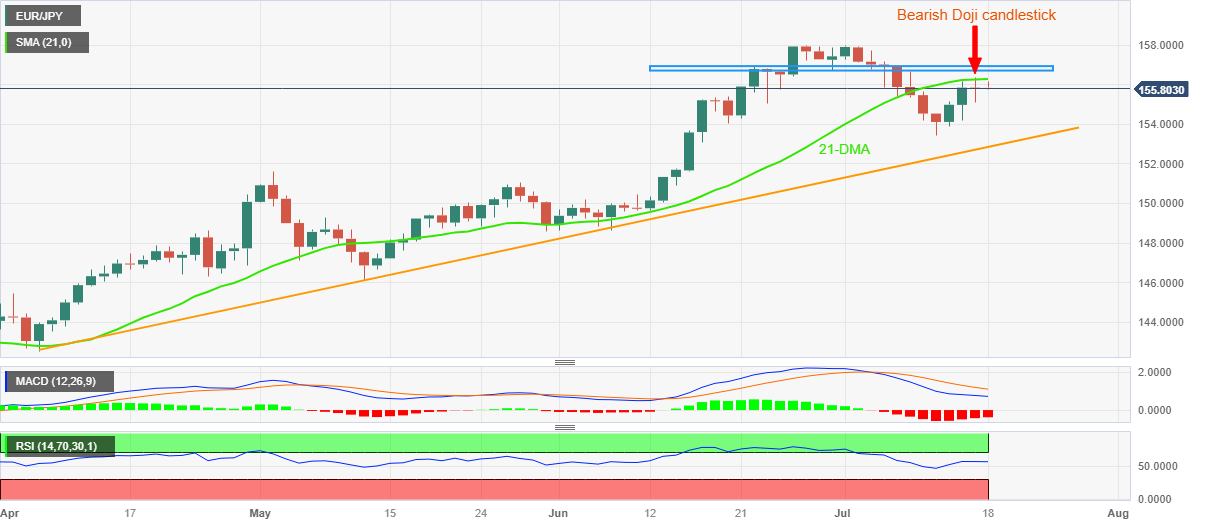
Trend: Downside expected
- USD/CAD loses the momentum near 1.3180 in the Asian session.
- The US Dollar remains under pressure amid a less hawkish stance from the Federal Reserve (Fed).
- Crude oil reverses the pullback on Monday, boosts the commodity-linked Loonie.
The USD/CAD pair struggles to gain traction on Tuesday, backed by the prevailing US Dollar selling bias. The major pair currently trades around 1.3185, down 0.09% on the day.
The Federal Reserve Bank of New York reported Monday that the NY Empire State Manufacturing Index dropped from -5.5 to 1.1, above expectations of -3.5. The US Dollar remains under pressure amid cautious optimism, and markets anticipate the Federal Reserve (Fed) to be less hawkish in tightening monetary policy following an expected interest rate hike in the July 26 meeting. This, in turn, leads to the recent decline in the US Treasury bond yields and keeps the USD bulls on the defensive.
That being said, crude oil reverses its pullback on Monday and boosts the commodity-linked Loonie. Additionally, the broader risk sentiment might influence the USD demand and provide some impetus to the USD/CAD pair in the following sessions.
Looking ahead, market participants will keep an eye on the Canadian Consumer Price Index (CPI) MoM and the US Retail Sales later in the day. The Fed has entered its blackout period ahead of the July 25-26 meeting. Investors will digest the data and find a clear direction for the USD/CAD pair.
European Central Bank (ECB) Governing Council member Ignazio Visco said on Tuesday, “inflation may drop more quickly than forecast.”
Additional quotes
"Manufacturing slowing but services like tourism booming."
"Inflation may drop more quickly than forecast."
"I don’t think we need to have a recession."
Market reaction
EUR/USD was last seen trading at around 1.1255, up 0.18% so far.
In its latest assessment of the Chinese economy, Moody’s Investors Service said on Tuesday, “China's recovery a mixed picture, weighing on growth outlook and raising questions about the strength of rebound.”
Additional findings
“Forecast is for China's GDP to grow by 5% in 2023, followed by 4.5% in 2024.”
“Property sector in China remains subdued, while industrial sectors will post diverging revenue and profit growth trends.”
Related reads
- S&P500 Futures grind at 15-month high, yields remain pressured on mixed clues ahead of US data
- China’s Commerce Ministry issues notice to boost household consumer goods consumption
- EUR/USD climbs to a fresh YTD top and draws support from renewed USD selling bias.
- Bets that the Fed will soon end its rate-hiking cycle continues to weigh on the Greenback.
- Expectations for more rate hikes by the ECB underpin the Euro and also act as a tailwind.
The EUR/USD pair regains positive traction after the range-bound price action witnessed over the past two days and climbs to its highest level since February 2022, around the 1.1255 region during the Asian session on Tuesday.
The US Dollar (USD) comes under some selling pressure and drifts back closer to a 15-month low touched last Friday in the wake of the likelihood that the Federal Reserve (Fed) is nearing the end of its policy tightening campaign. The bets were reaffirmed by a further moderation in the US consumer prices and justifies the recent slide in the US Treasury bond yields. This, along with a positive risk tone, weighs on the safe-haven Greenback, which, in turn, is seen as a key factor acting as a tailwind for the EUR/USD pair.
The shared currency, on the other hand, remains well supported by firming expectations for additional interest rate hikes by the European Central Bank (ECB) beyond July. In fact, the minutes of the June ECB meeting released last Thursday showed that the Governing Council is determined to continue the current hiking cycle to curb stubbornly high inflation, which is anticipated to stay above the 2% target through the end of 2025. This, to a larger extent, helps offset signs of a cooling economy and favours the EUR/USD bulls.
Market participants now look forward to the latest economic forecasts by the European Commission for a fresh impetus. Later during the early North American session, traders will take cues from the release of Retail Sales and Industrial Production figures from the US. This, along with the US bond yields and the broader risk sentiment, might influence the USD and provide some impetus to the EUR/USD pair. The aforementioned fundamental backdrop, meanwhile, suggests that the path of least resistance for spot prices is to the upside.
Technical levels to watch
- USD/JPY grinds near intraday low, remains pressured for the second consecutive day after bouncing off two-month low.
- Traders from Tokyo fail to propel momentum despite returning from long weekend.
- Sluggish markets, mixed concerns about BoJ versus Fed divergence keep Yen prices dicey.
- Cautious mood, US Dollar’s retreats lure sellers ahead of US data.
USD/JPY holds lower grounds near the intraday bottom surrounding 138.50 amid early Tuesday morning in Europe. In doing so, the Yen pair fades the last Friday’s corrective bounce off the two-month low amid sluggish market conditions. That said, Japanese trader’s return from the holiday failed to infuse the market’s volatility as traders await the US Retail Sales and Industrial Production for June amid mixed feelings.
The risk-barometer pair’s latest weakness portray the markets’ cautious optimism as fears of the US-China tussle recede after the recent efforts from Washington to re-establish relations with Beijing via frequent visit. Additionally, mixed concerns about the global central bankers’ next moves, with the looming Fed rate hike in July, also prod the USD/JPY pair traders.
It should be noted that the Bank of Japan (BoJ) policymakers keep singing the tunes to defend the easy-money policy even if the market players anticipated and exit from ultra-low interest rates and moderation to the Yield Curve Control (YCC) policy.
Elsewhere, Friday’s hawkish Fed concerns couldn’t last long as the previous day’s US data fail to defend the optimism surrounding the world’s largest economy, earlier favored by the top-tier consumer-centric numbers. On Monday, New York (NY) Empire State Manufacturing Index for July eased to 1.1 from 6.6 prior and 0.0 market forecasts. The data failed to inspire the US Dollar Index (DXY) sellers initially before reversing Friday’s recovery, backed by the upbeat prints of the University of Michigan’s (UoM) Consumer Sentiment Index and consumer inflation expectations for July.
It’s worth noting that the market sentiment is also sluggish and hence restricts the immediate moves of the USD/JPY pair. While portraying the mood, the S&P500 Futures dribble at the highest level since April 2022, down 0.10% intraday near 4,565 by the press time, whereas the US 10-year and two-year Treasury bond yields cling to mild losses near $3.80% and 4.73% in that order. It’s worth noting that the US Dollar Index (DXY) remains pressured amid cautious optimism, as well as due to Monday’s downbeat data, whereas commodities and Antipodeans print mild gains of late.
Looking ahead, the US Retail Sales for June, expected to rise to 0.5% versus 0.3% prior, will be crucial to watch for clear directions of the USD/JPY pair. Also important will be the US Industrial Production for June, expected -0.1% versus -0.2% prior, as well as the US-China headlines and the bond market moves as Japan returns from a long weekend.
Technical analysis
A failure to cross the previous support line stretched from late March, around 139.50 by the press time, directs USD/JPY bears toward a convergence of the 100 and 200 SMAs near 137.00.
China’s Commerce Ministry announced in a statement on Tuesday, a series of measures that will help boost the consumption of household consumer goods and services.
Key takeaways
“Will encourage companies to create online service platforms for household consumer services.”
“Will kick off household consumer goods promotion.”
“Will step up credit support for household goods consumption.”
Market reaction
AUD/USD was last seen trading 0.19% on the day, at 0.6827.
- USD/INR remains confined in a narrow trading band around the 82.00 mark on Tuesday.
- Acceptance below the 200-day SMA supports prospects for some meaningful decline.
- Some follow-through selling below the monthly low will reaffirm the negative outlook.
The USD/INR pair edges lower for the second successive day on Tuesday, albeit lacks follow-through selling and remains confined in a familiar multi-day-old trading range. Spot prices currently trade around the 82.00 round figure, with bears now awaiting a sustained breakdown through upward-sloping trend-line support extending from November 2022.
Against the backdrop of the recent repeated failures ahead of the 83.00 mark, acceptance back below a technically significant 200-day Simple Moving Average could be seen as a fresh trigger for bearish traders. Moreover, oscillators on the daily chart have again started drifting in the negative territory and suggest that the path of least resistance for the USD/INR pair is to the downside.
That said, it will still be prudent to wait for some follow-through selling below the monthly low, around the 81.75 region, before traders start positioning for any further depreciating move. The USD/INR pair might then accelerate the slide towards the next relevant support near the 81.50 zone before eventually dropping to test sub-81.00 levels or the YTD low touched in January.
On the flip side, the 82.20 area (200-day SMA) now seems to act as an immediate resistance. A sustained strength beyond will reinforce the ascending trend-line support and the subsequent move up has the potential to lift the USD/INR pair beyond the 82.70-82.75 intermediate hurdle. Bullish traders might then make a fresh attempt to conquer the 83.00 round-figure mark.
The said handle has been acting as a strong barrier since October 2022, which if cleared will mark a fresh bullish breakout and set the stage for an extension of the USD/INR pair's well-established uptrend witnessed since August 2022. Spot prices might then surpass the all-time peak, around the 83.40-83.45 region touched in October 2023, and aim to reclaim the 84.00 mark.
USD/INR daily chart
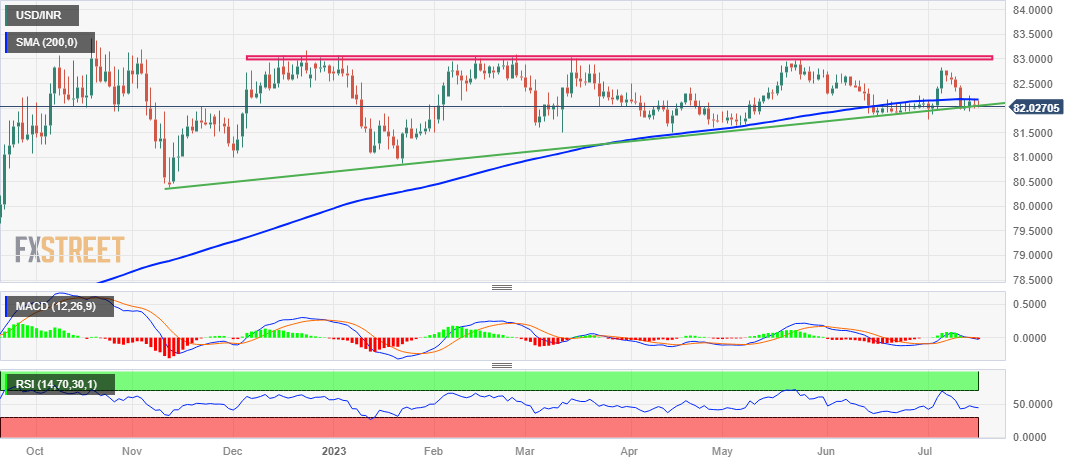
Key levels to watch
Australian Treasurer Jim Chalmers made some comments on the interest rates and inflation outlook, during his speech on Tuesday.
Additional quotes
Remains to be seen if more rate hikes are needed.
Inflation is moderating but is still a major concern.
China's economic slow down a concern for Australia.
Market reaction
At the time of writing, AUD/USD is holding gains near 0.6825, adding 0.18% so far.
- Market sentiment remains dicey as traders await US Retail Sales, Industrial Production.
- Sino-US headlines, concerns about Fed policy pivot keep optimists hopeful.
- Wall Street benchmarks remain on the front foot at the yearly top.
- Treasury bond yields edge lower as traders rush to bonds with mixed feelings.
Risk appetite appears mostly sluggish during early Tuesday even as traders from Tokyo return after a long weekend. The reason could be linked to the cautious mood ahead of the US data, as well as mixed headlines about the key risk areas.
While portraying the mood, the S&P500 Futures dribble at the highest level since April 2022, down 0.10% intraday near 4,565 by the press time, whereas the US 10-year and two-year Treasury bond yields cling to mild losses near $3.80% and 4.73% in that order. It’s worth noting that the US Dollar Index (DXY) remains pressured amid cautious optimism, as well as due to Monday’s downbeat data, whereas commodities and Antipodeans print mild gains of late.
That said, Friday’s hawkish Fed concerns couldn’t last long as the previous day’s US data fail to defend the optimism surrounding the world’s largest economy, earlier favored by the top-tier consumer-centric numbers. On Monday, New York (NY) Empire State Manufacturing Index for July eased to 1.1 from 6.6 prior and 0.0 market forecasts. The data failed to inspire the US Dollar Index (DXY) sellers initially before weighing on the DXY, probing Friday’s recovery backed by the upbeat prints of the University of Michigan’s (UoM) Consumer Sentiment Index and consumer inflation expectations for the said month.
On a different page, US Climate Envoy John Kerry is in China to mark another effort by Washington to improve the Sino-US ties, following the early July visit by US Treasury Secretary Janet Yellen. That said, the US policymaker met China’s top diplomat Wang Yi early Tuesday while saying, per Reuters, “Our hope is now that this could be the beginning of new cooperation to solve the differences between us.”
Elsewhere, the policy hawks at the European Central Bank (ECB), Federal Reserve (Fed), Bank of England (BoE), Bank of Canada (BoC) and Swiss National Bank (SNB) are all likely to run out of steam late amid economic fears and hence underpin the cautious optimism.
Moving on, US Retail Sales for June, expected to rise to 0.5% versus 0.3% prior, will be crucial to watch for clear directions. Also important will be the US Industrial Production for June, expected -0.1% versus -0.2% prior, as well as the US-China headlines and the bond market moves as Japan returns from a long weekend.
Also read: Forex Today: US Dollar posted moderate losses ahead of key data events
- Gold price attracts some buying on Tuesday, albeit lacks bullish conviction.
- A modest US Dollar weakenss is seen lending support to the precious metal.
- The uncertainty over the Fed's rate hike path caps gains for the XAU/USD.
Gold price builds on the overnight bounce from the $1,946-$1,945 area, or a multi-day low and gains some positive traction during the Asian session on Tuesday. The XAU/USD currently trades around the $1,957-$1,958 region, up just over 0.10% for the day, and remains well within the striking distance of a one-month peak touched last Friday.
The US Dollar (USD) remains on the defensive near its lowest level since April 2022 in the wake of firming expectations that the Federal Resreve (Fed) is nearing the end of its policy tightening cycle. In fact, market participants now seem convinced that the Fed will keep interest rates steady for the rest of this year after the highly-anticipated 25 basis points (bps) lift-off in July. This, in turn, continues to weigh on the Greenback, which is seen as a key factor lending some support to the US Dollar-denominated Gold price.
Investors, however, doubt that the Fed will commit to a more dovish policy stance, instead might stick to its forecast for a 50 bps rate hike this year. This helps limit the downside for the US Treasury bond yields and should act as a tailwind for the USD, capping any meaningful upside for the non-yielding Gold price. Apart from this, the overnight rally in the US equity markets might further hold back traders from placing fresh bullish bets and contribute to keeping a lid on the safe-haven precious metal, at least for now.
Even from a technical perspective, the range-bound price action witnessed over the past four days points to indecision among traders over the near-term trajectory for the Gold price. This further makes it prudent to wait for a sustained strength beyond the $1,963-$1,964 region, or the one-month peak before positioning for any further appreciating move. Traders now look to the US monthly Retail Sales and Industrial Production figures for a fresh impetus later during the early North American session.
Technical levels to watch
- GBP/JPY remains indecisive within the key trading range, fades previous week’s recovery.
- Convergence of 100-SMA, one-month-old horizontal region guards immediate upside.
- Nine-week-old rising support line, 200-SMA prods bears; monthly low acts as additional downside filter.
- Oscillators suggest further grinding toward the south but sellers seem cautious of late.
GBP/JPY seesaws around 181.30-40 as it struggles to defend the week-start losses, as well as fade the previous week’s rebound, amid early Tuesday morning in Europe. In doing so, the cross-currency pair portrays the market’s indecision ahead of the top-tier UK data.
That said, the GBP/JPY pair’s recovery from an upward-sloping trend line from May 11 failed to cross the one-month-long horizontal area comprising the 100-SMA.
The quote’s failure to cross the key resistance region surrounding 182.15-40 joins the impending bear cross on the MACD and the steady RSI (14) line to lure the GBP/JPY sellers in marking another attempt to break the multi-day-old support line, close to 180.30 at the latest.
However, the 180.00 psychological magnet and the 200-SMA level of around 179.90 can test the bears before giving them control. Also acting as a downside filter is the monthly low of near 179.45.
Meanwhile, the GBP/JPY pair’s upside clearance of the 182.40 hurdle will target the yearly top of around 184.00 resistance.
Following that, July 2015 low near 185.00 may test the bulls ahead of directing them to the 190.00 threshold.
GBP/JPY: Four-hour chart

Trend: Limited downside expected
| Raw materials | Closed | Change, % |
|---|---|---|
| Silver | 24.84 | -0.21 |
| Gold | 1954.9 | 0 |
| Palladium | 1287.2 | 1.58 |
- WTI crude oil struggles to gain traction around $74.20 during Tuesday’s Asian session.
- The softer Chinese growth figure raises concern about an economic slowdown in the nation.
- Saudi Arabia's supply cuts and easing inflation in the US have boosted crude oil prices in recent weeks.
Western Texas Intermediate (WTI), the US crude oil benchmark, is trading around the $74.20 mark so far this Tuesday. WTI retreats from around $77 after the weaker-than-expected Chinese growth figure raises concern about an economic slowdown in the world's second-largest oil consumer.
The National Bureau of Statistics reported that the Chinese Gross Domestic Product came in at 6.3% annually, worse than expected at 7.3% and 4.5% prior. The annual rate was the fastest pace since the second quarter of 2021. However, it was considerably skewed by last year's COVID-19 lockdowns in Shanghai and other large cities.
On the US-China headline, the US climate envoy John Kerry met China’s climate diplomacy Xie Zhenhua on Tuesday in an effort to rebuild trust between the world's two largest economies. Oil traders will closely watch this headline for a fresh impetus in WTI price. The renewed tensions between the US-China could cap the potential upside in crude oil prices.
On the other hand, Saudi Arabia's supply cuts and easing inflation in the US have boosted crude oil prices in recent weeks. Russian oil exports are expected to fall by 100,000-200,000 barrels per day (bpd) next month, showing that Moscow is following through on a vow to cut output alongside Saudi Arabia.
Looking ahead, the July US Retail Sales will be released. Also, oil traders will take cues from the weekly official oil inventory data released by the Energy Information Administration (EIA) on Wednesday and find opportunities around WTI crude oil.
- GBP/USD edges higher during the Asian session on Tuesday, albeit lacks follow-through.
- The divergent Fed-BoE policy expectations support prospects for further appreciating move.
- Any meaningful corrective slide might be seen as a buying opportunity and remain limited.
The GBP/USD pair attracts some dip-buying during the Asian session on Tuesday and for now, seems to have stalled a two-day-old corrective slide from its highest level since April 2022, around the 1.3140 region touched last week. Spot prices, however, struggle to capitalize on the move and retreat a few pips from the vicinity of the 1.3100 mark, or a fresh daily peak touched in the last hour.
Bets that the Federal Reserve (Fed) will soften its hawkish tone and keep interest rates steady after the widely anticipated 25 bps lift-off in July continues to act as a headwind for the US Dollar (USD). Apart from this, a positive risk tone is seen as another factor undermining the safe-haven Greenback, which, in turn, assists the GBP/USD pair to regain positive traction. That said, speculations that the US central bank could stick to its forecast for a 50 bps rate hike this year hold back traders from placing fresh bearish bets around the USD and keep a lid on any meaningful upside for the major.
The downside for the GBP/USD pair, however, remains cushioned in the wake of firming expectations that the Bank of England (BoE) will be far more aggressive in tightening its monetary policy to curb stubbornly high inflation. Hence, the market focus will remain glued to the latest consumer inflation figures from the UK, due for release on Wednesday. The crucial CPI report should influence the British Pound (GBP) and provide some meaningful impetus to the major. In the meantime, the US monthly Retail Sales data will be looked upon for short-term trading opportunities on Tuesday.
From a technical perspective, last week's sustained breakout through a resistance marked by the top end of a nearly one-month-old ascending channel was seen as a fresh trigger for bullish traders. That said, the Relative Strength Index (RSI) on the daily chart is flashing slightly overbought conditions and capping gains for the GBP/USD pair. Nevertheless, the aforementioned fundamental backdrop seems tilted in favour of bullish traders and suggests that the path of least resistance for spot prices is to the upside. This, in turn, suggests that any meaningful pullback might still be seen as a buying opportunity.
The overnight low, around the 1.3050 area, now seems to act as immediate support. This is followed by the 1.3000 psychological mark, which if broken decisively could prompt some technical selling. The GBP/USD pair might then accelerate the slide towards the next relevant support near the 1.2930 horizontal zone, though any subsequent fall is more likely to get bought into near the 1.2900 round figure. This should help limit any further losses for spot prices near the 1.2850 horizontal resistance breakpoint. The latter should act as a strong base for the major and a key pivotal point for short-term traders.
On the flip side, bulls might now wait for a sustained strength back above the 1.3100 mark before positioning for any meaningful intraday appreciating move. The momentum might then lift the GBP/USD pair back towards the 1.3140 region, or the multi-month peak. Some follow-through buying should pave the way for a move towards reclaiming the 1.3200 mark. The upward trajectory could get extended towards the 1.3250-1.3260 intermediate hurdle, above which spot prices seem poised to climb further towards the 1.3300 mark.
GBP/USD daily chart
-638252430699585509.png)
Key levels to watch
- Natural Gas snaps four-day losing streak, bounces off the lowest level in a month.
- IEA warns of European gas crisis this winter if Russia halts supplies.
- End of maintenance at multiple Norwegian natural gas rigs propel XNG/USD output.
- Downbeat US Dollar, cautious optimism about Sino-US ties also underpin Natural Gas recovery.
Natural Gas Price (XNG/USD) seesaws around the intraday high of $2.53 as it clings to mild gains during the first positive day in five amid early Tuesday. In doing so, the energy asset justifies the market’s fears of the European gas crisis while cheering the broad-based US Dollar weakness. However, headlines suggesting more gas supplies from Norway prod the XNG/USD bulls.
Although Europe has filled ample gas reserves to battle the winter, the International Energy Agency (IEA) cites the odds of witnessing a fierce problem for the old continent if Russia stops its supplies to the bloc. “The IEA said that even if Europe’s gas storage sites are filled close to 100% of capacity before October — the expectation of which has helped lower prices in recent months — that was ‘no guarantee’ against future market tensions,” said the Financial Times (FT).
On the other hand, a slew of gas fields including the giant Troll ended the regular maintenance at the facilities in the last few days, which in turn suggests increased supplies from Norway after witnessing multiple days of downbeat XNG/USD output. It’s worth noting that Norway is the second biggest gas supplier to Europe, after Russia, which in turn makes its XNG/USD updates key for the bloc, as well as for the major traders.
Elsewhere, the downbeat US Dollar and the price-positive headlines surrounding China also underpin the Natural Gas recovery. That said, US Dollar Index (DXY) drops to 99.76 while reversing Friday’s corrective bounce off the lowest level since April 2022 as the US statistics fail to inspire Fed hawks even as the July rate hike is already given. Additionally, US Climate Envoy John Kerry is in China to mark another effort by Washington to improve Sino-US ties. That said, the US policymaker met China’s top diplomat Wang Yi early Tuesday while saying, per Reuters, “Our hope is now that this could be the beginning of new cooperation to solve the differences between us.”
While the current catalysts are mostly in favor of the XNG/USD buyers, traders will pay attention to the US Retail Sales for June, expected to rise to 0.5% versus 0.3% prior, as well as the US Industrial Production for June, expected -0.1% versus -0.2% prior, for clear directions.
Technical analysis
While a clear downside break of the six-week-old support line, now immediate resistance near $2.56, keeps the Natural Gas Price on the bear’s radar, the 100-DMA puts a floor under the XNG/USD near $2.47.
During his meeting with China's top diplomat Wang Yi on Tuesday, US Climate Envoy John Kerry told him that “our hope is now that this could be the beginning of new cooperation to solve the differences between us.”
Additional comments
President Biden is very committed to stability in US-China relationship and also to achieve efforts together that can make significant difference to the world.
Biden values his relationship with President Xi.
Biden looks forward to being able to move forward, change the dynamics.
China's top diplomat Yi calls Kerry 'our old friend' in the meeting in Beijing.
-
AUD/USD retreats towards 0.6800 as RBA Minutes fail to impress Aussie bulls ahead of US Retail Sales
- AUD/USD reverses from intraday high after unimpressive RBA Minutes.
- RBA Minutes for July suggest policymakers’ readiness for August rate hike, if needed.
- Cautious optimism, US-China news joins pre-data positioning to underpin AUD/USD run-up.
- US Retail Sales, risk catalysts eyed for clear directions ahead of Thursday’s Aussie job reports.
AUD/USD reverses from the intraday high to around 0.6815 after the Reserve Bank of Australia’s (RBA) July Monetary Policy Meeting Minutes, published early Tuesday. In doing so, the Aussie pair fails to cheer the downbeat US Dollar, as well as the risk-positive headlines surrounding China.
As per the RBA’s July month Monetary Policy Meeting Minutes, “board agreed some further tightening may be required,” adding that “they would reconsider at August meeting.”
Also read: RBA Minutes: Board agreed some further tightening may be required, would reconsider at August meeting
With this, the Aussie pair pauses on the way to the 0.6900 upside hurdle amid cautious optimism in the market, backed by the hopes of improving the US-China ties and receding hawkish Feds. That said, Monday’s downbeat US NY Empire State Manufacturing Index for July joined the previous week’s disappointing US inflation outcomes to weigh on the US Dollar and underpin cautious optimism in the market.
It should be noted that US Climate Envoy John Kerry is in China to mark another effort by the Washington to improve the Sino-US ties. That said, the US policymaker met China’s top diplomat Wang Yi during early Tuesday while saying, per Reuters, “Our hope is now that this could be the beginning of new cooperation to solve the differences between us.”
Elsewhere, the US Dollar Index (DXY) drops to 99.76 while reversing Friday’s corrective bounce off the lowest level since April 2022 as the US statistics fail to inspire Fed hawks even as July rate hike is already given.
Amid these plays, S&P500 Futures appear indecisive while struggling to trace Wall Street’s gains whereas the US Treasury bond yields remain depressed and weigh on the US Dollar.
Looking ahead, US Retail Sales for June, expected to rise to 0.5% versus 0.3% prior, will be crucial to watch for clear directions of the AUD/USD. Also important will be the US Industrial Production for June, expected -0.1% versus -0.2% prior, as well as the US-China headlines and the bond market moves as Japan returns from a long weekend.
Technical analysis
AUD/USD bounces off the 5-DMA level immediate support, around 0.6820 by the press time, to restore a run-up targeting the 0.6900 hurdle comprising tops marked in June-July.
- NZD/USD edges higher during the Asian session on Tuesday, albeit lacks follow-through.
- Bets that the Fed will soon end its rate-hiking cycle undermine the USD and lend support.
- A positive risk tone further undermines the safe-haven buck ahead of US Retail Sales data.
The NZD/USD pair manages to defend the 0.6300 mark and attracts some buying during the Asian session on Tuesday, stalling its retracement slide from levels just above the 0.6400 round figure or the highest since early February touched last week. Spot prices currently trade just below mid-0.6200s, up nearly 0.30% for the day and draw support from a modest US Dollar (USD) downtick.
In fact, the USD Index (DXY), which tracks the Greenback against a basket of currencies, remains well within the striking distance of a 15-month low set last Friday and continues to be undermined by rising bets for a less hawkish Federal Reserve (Fed). Investors now seem convinced that the US central bank is nearing the end of its policy tightening cycles and have been pricing out the possibility of any further rate hikes this year, following the expected 25 bps lift-off in July. This had led to the recent pullback in the US Treasury bond yields and keeps the USD bulls on the defensive.
Apart from this, a generally positive risk tone is seen as another factor weighing on the safe-haven buck and lending some support to the risk-sensitive Kiwi. Meanwhile, the weaker Chinese GDP print released on Monday adds to worries about a global economic downturn and might cap any optimism in the markets. Furthermore, expectations that the Fed might stick to its forecast for a 50 bps rate hike this year might hold back traders from placing aggressive bearish bets around the USD. This, in turn, should keep a lid on any meaningful appreciating move for the NZD/USD pair.
Market participants now look forward to the US economic docket, featuring the release of monthly Retail Sales and Industrial Production figures later during the early North American session. This, along with the US bond yields and the broader risk sentiment, might influence the USD and provide some impetus to the NZD/USD pair. The aforementioned fundamental backdrop, meanwhile, makes it prudent to wait for some follow-through buying before confirming that the recent pullback from a multi-month high has run its course and placing fresh bullish bets around the pair.
Technical levels to watch
The Reserve Bank of Australia (RBA) published the Minutes of its July monetary policy meeting on Tuesday, highlighting that the “board agreed some further tightening may be required,” adding that “they would reconsider at August meeting.”
Additional takeaways
Board considered holding rates steady or hiking by 25 bps.
Strong case for both, but board judged arguments for holding steady were stronger.
Board agreed some further tightening may be required, would reconsider at august meeting.
Current stance of monetary policy was "clearly restrictive", and would become more so.
Board discussed risks economy, consumption could slow more than expected.
Noted squeeze on household finances, risk unemployment could rise more than needed.
Board noted inverted yield curve pointed to tighter conditions, slowing growth.
Also risks with waiting too long for inflation to return to target.
Inflation proving sticky in other countries, australian rates still lower than many others.
Labour market very tight, weak productivity adding to labour costs.
While domestic inflation had eased, service inflation still high along with rents, energy, food.
Annual wage growth seen rising to 4% in Q3, following fair work award.
Economy had slowed considerably, Q2 gdp growth seen around +0.2% QoQ.
Consumer spending seen weak in Q2, rebound in housing market to support consumption.
Market reaction
On the Minutes release, AUD/USD is holding onto its renewed upside, currently trading at 0.6830, up 0.21% on the day.
People’s Bank of China (PBoC) set the USD/CNY central rate at 7.1453 on Tuesday, versus the previous fix of 7.1326 and market expectations of 7.1704. It's worth noting that the USD/CNY closed near 7.1740 the previous day.
Apart from the USD/CNY fix, the PBoC also unveiled details of its Open Market Operations (OMO) while saying that the Chinese central bank injects 15 billion Yuan via 7-day reverse repos (RRs) at 1.90% vs prior 1.90%.
With the 2 billion worth of RRs expiring on Tuesday, the PBoC's OMO appears net long for 13 billion for the day.
About PBOC fix
China maintains strict control of the yuan’s rate on the mainland.
The onshore yuan (CNY) differs from the offshore one (CNH) in trading restrictions, this last one is not as tightly controlled.
Each morning, the People’s Bank of China (PBOC) sets a so-called daily midpoint fix, based on the yuan’s previous day's closing level and quotations taken from the inter-bank dealer.
- EUR/USD edges higher within immediate trading range surrounding 17-month high.
- Hawkish ECB talks, broad US Dollar weakness underpin Euro upside ahead of key data.
- Upbeat RSI, sustained trading beyond key SMAs favor EUR/USD bulls.
- Euro buyers need validation from 1.1280 and US Retail Sales to approach previous yearly high.
EUR/USD remains on the front foot within a three-day-old 50-pip trading range above 1.1200, poking the upper limit surrounding 1.1250 during the mid-Asian session on Tuesday.
In doing so, the Euro pair cheers broad US Dollar weakness while also justifying hawkish commentary from the European Central Bank (ECB) Officials during a sluggish session ahead of the key US Retail Sales for June.
Also read: EUR/USD prods 1.1250 hurdle on hawkish ECB talks ahead of US Retail Sales
That said, the major currency pair’s successful trading above the 50 and 100 SMAs, as well as beyond a one-week-old rising support line, joins the upbeat RSI (14) line, not overbought, to keep the EUR/USD buyers hopeful of crossing the 1.1250 hurdle.
However, multiple levels marked in late 2021 and early 2022 challenged the Euro bulls near 1.1280 before directing them to the previous yearly high of around 1.1500.
Meanwhile, the 50-SMA and the stated trading range’s lower limit, respectively near 1.1230 and 1.1200, challenge intraday EUR/USD bears.
Following that, a convergence of the 100-SMA and an upward-sloping support line from July 06, close to 1.1175, appears as the key support to break for the EUR/USD sellers before taking control.
EUR/USD: Hourly chart

Trend: Further upside expected
- USD/CHF consolidates around the 0.8600 mark in the early Asian session ahead of the US key data.
- Any meaningful USD rebound appears limited as the Federal Reserve (Fed) will soften its hawkish stance.
- The June Swiss Trade data could be a key driver for the Swiss Franc later this week.
The USD/CHF pair retreats from Monday’s high at 0.8630 and hovers around the 0.8600 area on Tuesday’s Asian session. The pair reverses from a multi-year low following Monday's upbeat US Empire manufacturing survey.
On Monday, the Federal Reserve Bank of New York revealed that the US Empire manufacturing survey of general business conditions index from July fell -5.5 to 1.1, above the market consensus of -3.5. The US Dollar posts a modest gain after the strong-than-expected data. That said, any meaningful USD rebound from its lowest level since April 2022 appears limited as the market participations anticipate that the Federal Reserve (Fed) is nearing the end of its policy tightening cycle.
Against this backdrop, the cautious mood in the market ahead of the US Retail Sales could benefit the safe-haven Swiss Franc. The softer US figure might cap the upside for the US Dollar and act as a headwind for USD/CHF.
Moving on, investors will take cues from the July US Retail Sales later in the day. Also, releasing the June Swiss Trade data could be a decisive key driver for the Swiss Franc and help determine the next direction for the USD/CHF pair.
- USD/CAD remains confined in a narrow trading band through the Asian session on Tuesday.
- An uptick in Oil prices underpins the Loonie and caps the upside amid subdued USD demand.
- Traders look to Canadian consumer inflation figures and US Retail Sales for a fresh impetus.
The USD/CAD pair struggles to gain any meaningful traction and oscillates in a 15-20 pips narrow trading band, around the 1.3200 mark through the Asian session on Tuesday.
Following the recent pullback from a nearly three-month high witnessed over the past two days, Crude Oil prices regain some positive traction and underpin the commodity-linked Loonie. The US Dollar (USD), on the other hand, remains well within the striking distance of its lowest level since April 2022 in the wake of rising bets for a less hawkish Federal Reserve (Fed). This, in turn, is seen as a key factor acting as a headwind for the USD/CAD pair.
It is worth recalling that the markets have been pricing out the possibility of any additional rate hike for the rest of the year by the US central bank after the highly-anticipated 25 bps lift-off in July. The expectations were fueled by the incoming US macro data, which pointed to signs of cooling labor market and a further moderation in consumer prices. This had led to the recent decline in the US Treasury bond yields and keeps the USD bulls on the defensive.
Apart from this, a positive turnaround in the global risk sentiment - as depicted by the overnight rally in the US equity markets - is seen as another factor weighing on the safe-haven Greenback. Market participants, however, argue that the fall in the USD has been too fast and too far. Apart from this, expectations that the Fed might stick to its forecast for a 50 bps rate hike by the end of this year hold back traders from placing fresh bearish bets around the USD.
This, along with worries that a global economic downturn will dent fuel demand, should keep a lid on any meaningful rise in Crude Oil prices and help limit the downside for the USD/CAD pair. Meanwhile, the fundamental backdrop makes it prudent to wait for strong follow-through buying before confirming that spot prices have formed a near-term bottom and positioning for an extension of the recent recovery from sub-1.3100 levels, or the YTD low touched last Friday.
Traders might also refrain from placing aggressive bets and prefer to move to the sidelines ahead of the release of the Canadian consumer inflation figures, due later during the early North American session. Traders will further take cues from the US monthly Retail Sales figures. This, along with the US bond yields and the broader risk sentiment, could drive the USD demand. Apart from this, Oil price dynamics should provide some impetus to the USD/CAD pair.
Technical levels to watch
- US Dollar Index edges lower after bouncing off 15-month low on Friday, sluggish of late.
- Monday’s US data, cautious optimism weigh on DXY amid pre-FOMC blackout.
- China news, US Retail Sales can tease US Dollar Index bulls at multi-month low.
US Dollar Index (DXY) remains on the back foot around 99.85, taking offers to refresh the intraday low to 99.85. In doing so, the greenback’s gauge versus the six major currencies prints mild losses during early Tuesday, following a failed attempt to extend Friday’s corrective bounce off the lowest level since April 2022.
That said, Monday’s unimpressive US data joined fears about China’s economic recovery and hopes of no major hawkish moves from the Federal Reserve (Fed), backed by the previous week’s downbeat US inflation, to weigh on the DXY amid mixed concerns.
Amid these plays, Wall Street closed with minor gains and the US Treasury bond yields edged lower, which in turn weighed on the US Dollar Index (DXY).
That said, New York (NY) Empire State Manufacturing Index for July eased to 1.1 from 6.6 prior and 0.0 market forecasts. The data failed to inspire the US Dollar Index (DXY) sellers initially before weighing on the DXY, probing Friday’s recovery backed by the upbeat prints of the University of Michigan’s (UoM) Consumer Sentiment Index and consumer inflation expectations for the said month.
Elsewhere, China’s second quarter (Q2) 2023 Gross Domestic Product (GDP) confirmed the market’s fears about slowing recovery in the world’s biggest industrial player, as well as the second biggest economy. The same joined mixed updates about the US-China to put a floor under the DXY price.
On Monday, US Treasury Secretary Janet Yellen said during a Bloomberg interview that the US is looking carefully at outbound investment controls on China while adding, “But they would be focused on a few sectors." The policymaker also clarified that these would not be broad controls that would have a fundamental impact on the investment climate in China. During the weekend, US Treasury Secretary Yellen spoke at a meeting of Group of 20 (G20) finance ministers and central bankers in India while saying, “I am eager to build on the groundwork that we laid in Beijing to mobilize further action.” Hence, the US-China tension is back in the spotlight but the pace of pessimism appears slow and mixed.
To sum up, DXY bears the burden of the market’s dovish concerns about the Fed, despite Friday’s upbeat consumer-centric figures. Also exerting downside pressure on the US Dollar is the Fed policymaker’s blackout ahead of late July’s Federal Open Market Committee (FOMC) Monetary Policy Meeting.
Looking ahead, US Retail Sales for June, expected to rise to 0.5% versus 0.3% prior, will be crucial to watch for clear directions of the Gold Price. Also important will be the US Industrial Production for June, expected -0.1% versus -0.2% prior, as well as the US-China headlines and the bond market moves as Japan returns from a long weekend.
Technical analysis
Monday’s Doji candlestick renews bearish bias about the US Dollar even as the oversold RSI (14) prods the DXY sellers above the recent trough surrounding 99.55. That said, the US Dollar Index recovery needs validation from a downward-sloping resistance line from July 06, close to 100.15 at the latest.
- USD/JPY edges higher on Tuesday, albeit lacks any follow-through buying or bullish conviction.
- Bets that the Fed will soon end its rate-hiking cycle continue to weigh on the USD and cap gains.
- Speculations that BoJ will tweak its YCC policy underpin the JPY and further act as a headwind.
The USD/JPY pair attracts some buying during the Asian session on Tuesday and steadily climbs back closer to the 139.00 mark, albeit lacks follow-through and remains confined well within the previous day's broader trading range.
A turnaround in the global risk sentiment - as depicted by the overnight rally in the US equity markets - undermines the safe-haven Japanese Yen (JPY) and acts as a tailwind for the USD/JPY pair. The upside, however, remains capped in the wake of the underlying bearish sentiment surrounding the US Dollar (USD), which continues to be weighed down by firming expectations that the Federal Reserve (Fed) will soften its hawkish stance.
Investors now seem convinced that the US central bank is nearing the end of its policy tightening cycle and will keep interest rates steady for the rest of the year following the anticipated 25 bps lift-off in July. The bets were reaffirmed by the incoming US macro data, which pointed to a further moderation in consumer inflation, which led to the recent decline in the US Treasury bond yields and keeps the USD bulls on the defensive.
The JPY, on the other hand, continues to draw some support from speculations that the Bank of Japan (BoJ) could adjust its Yield Curve Control (YCC) policy as soon as this month. In fact, Japanese media reported that the BoJ is likely to raise its FY2023 inflation forecast, which has exceeded the 2% goal for more than a year and should put pressure on the central bank to start unwinding its ultra-loose monetary policy settings.
Apart from this, worries about a global economic downturn, fueled by weaker Chinese GDP print on Monday - should limit losses for the safe-haven JPY and contribute to capping gains for the USD/JPY pair. This makes it prudent to wait for strong follow-through buying before confirming that spot prices have formed a near-term bottom and positioning for any meaningful recovery from a two-month low touched last Friday.
Market participants now look forward to the US economic docket, featuring the release of monthly Retail Sales and Industrial Production figures later during the early North American session. This, along with the US bond yields, might influence the USD price dynamics and provide some impetus to the USD/JPY pair. Apart from this, the broader risk setniment should contribute to producing short-term opportunities.
Technical levels to watch
| Index | Change, points | Closed | Change, % |
|---|---|---|---|
| KOSPI | -9.3 | 2619 | -0.35 |
| ASX 200 | -4.6 | 7298.5 | -0.06 |
| DAX | -36.42 | 16068.65 | -0.23 |
| CAC 40 | -82.88 | 7291.66 | -1.12 |
| Dow Jones | 76.32 | 34585.35 | 0.22 |
| S&P 500 | 17.37 | 4522.79 | 0.39 |
| NASDAQ Composite | 131.25 | 14244.95 | 0.93 |
Early Tuesday morning in Asia, at 01:30 GMT, the Reserve Bank of Australia (RBA) will release its minutes of the latest monetary policy meeting held in July.
The Australian central bank kept the benchmark interest rate unchanged in July after offering two consecutive hawkish surprises in the last. The Aussie central bank’s economic forecasts and the selection of Michele Bullock for the next RBA Governor’s post also highlight the importance of today’s RBA Minutes for the AUD/USD traders, especially amid the lackluster markets.
Apart from looking at the catalysts that justify the RBA’s status quo in the last monetary policy meeting, the prospects of the policy pivot and fears emanating from China will also be important for the AUD/USD pair traders to watch in today’s RBA Monetary Policy Meeting Minutes.
Ahead of the event, Analysts at ANZ said,
RBA minutes will be released at 1:30pm (NZT), providing additional insight into the Board’s 'finely balanced' decision to pause in July. Discussion on inflation risks is likely to be balanced.
How could the minutes affect AUD/USD?
AUD/USD picks up bids to 0.6820, bouncing off intraday low, while licking the wounds after declining in the last two consecutive days, mostly sluggish during early Tuesday morning in Asia. In doing so, the Aussie pair portrays the market’s hopes of witnessing hawkish signals from the Reserve Bank of Australia (RBA).
That said, the RBA has already put down its weapons after two hawkish surprises. However, the policymakers also cited the monetary policy action as a ‘finely balanced’ one and showed readiness for further rate hikes. Hence, Aussie pair buyers will especially look for the hawkish signals from the statement, suggesting more numbers of policymakers favoring the rate hikes.
Even so, the recent divergence between the RBA and the Fed’s actions highlights today’s RBA Minutes. Should the RBA manages to defend its recent hawkish play, as well as suggest some more in the pipeline, the AUD/USD prices may have further upside to trace.
It’s worth mentioning that the US Retail Sales is also on the calendar for release and hence the market’s reaction to the RBA Minutes will be limited ahead of the US data.
Technically, a clear U-turn from the 0.6900 mark directs AUD/USD bears toward a one-week-old rising support line surrounding 0.6765, a break of which will highlight the 200-DMA level of 0.6710 as the key challenge for the bears before retaking control.
Key Notes
AUD/USD bears stay hopeful of breaking 0.6800, RBA Minutes, US Retail Sales eyed
AUD/USD Forecast: Near term corrective decline may not be over yet
About the RBA minutes
The minutes of the Reserve Bank of Australia meetings are published two weeks after the interest rate decision. The minutes give a full account of the policy discussion, including differences of view. They also record the votes of the individual members of the Committee. Generally speaking, if the RBA is hawkish about the inflationary outlook for the economy, then the markets see a higher possibility of a rate increase, and that is positive for the AUD.
- AUD/JPY remains on the defensive around the 94.50 mark.
- The Relative Strength Index (RSI) reaffirms the non-directional movement of the cross.
- The crucial resistance is near 95.00; 94.00 area acts as a key support level.
The AUD/JPY pair struggles to gain any meaningful traction on Tuesday and remains on the defensive around 94.50 in the early Asian session.
From the technical perspective, AUD/JPY trades below a downward-sloping channel on the four-hour chart. The Relative Strength Index (RSI) holds between 40-60, reinforcing the non-directional movement for the AUD/JPY pair.
The immediate resistance level is seen at 94.80, portraying the 50-hour Exponential Moving Average (EMA). The cross will meet the crucial barrier near 95.00. This level is a confluence of a psychological mark, 100-hour EMA and the upper boundary of the descending channel.
The break above the latter could see the cross test 95.40 (High of July 14), followed by 96.15 (High of July 23). The additional upside filter to watch is 96.50 (High of July 27).
On the downside, the 94.00 area acts as a key support level for the cross, representing a psychological level and a low of July 17. Any meaningful follow-through selling will drop to 93.30 (Low of July 12) en route to 92.60 (the lower limit of the descending channel).
AUD/JPY four-hour chart
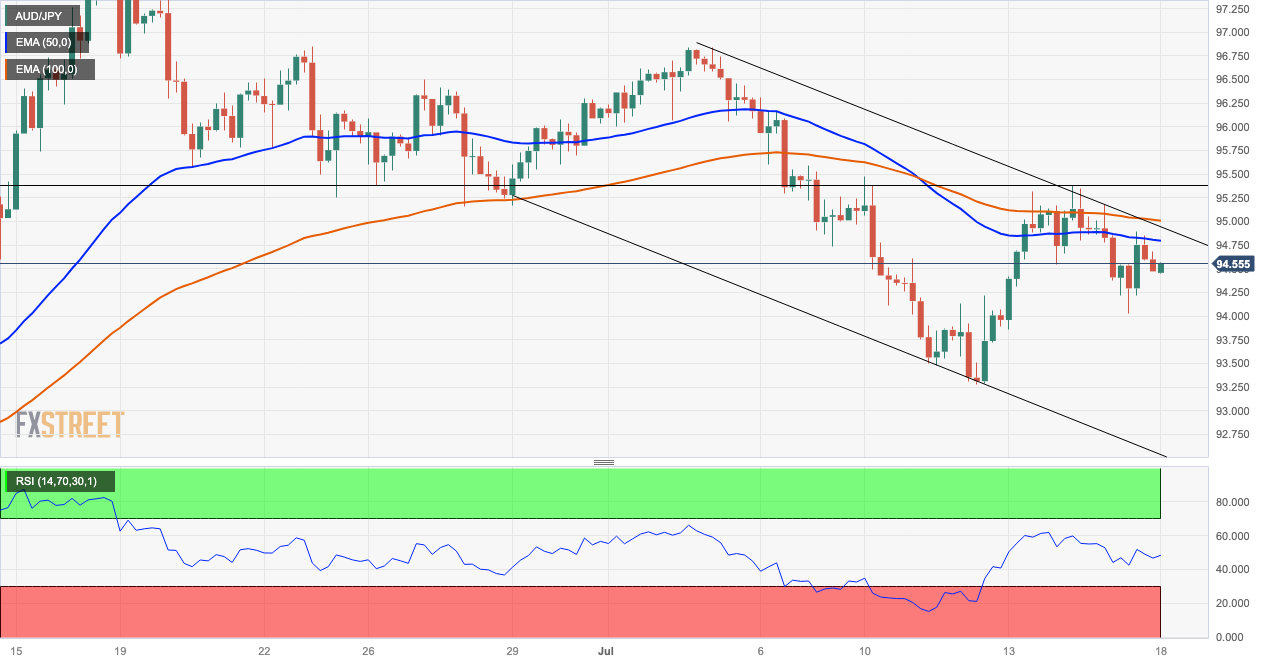
| Pare | Closed | Change, % |
|---|---|---|
| AUDUSD | 0.68168 | -0.28 |
| EURJPY | 155.856 | 0.02 |
| EURUSD | 1.1237 | 0.07 |
| GBPJPY | 181.329 | -0.22 |
| GBPUSD | 1.30734 | -0.18 |
| NZDUSD | 0.6324 | -0.63 |
| USDCAD | 1.3196 | -0.22 |
| USDCHF | 0.86 | -0.21 |
| USDJPY | 138.697 | -0.04 |
- Gold Price stays defensive after pushing back bears, justifies pre-data anxiety.
- Latest United States economics reassess concerns of Federal Reserve policy pivot, putting a floor under the US Dollar.
- Fears of slow economic transition in China, mixed concerns about inflation test XAU/USD bulls.
- US Retail Sales for June, risk catalysts eyed for the Gold Price directions amid pre-Fed blackout.
Gold Price (XAU/USD) stays defensive around $1,955, despite picking up bids during early Tuesday’s Asian session, as market players await the United States Retail Sales data to overcome the indecision at the trading floor. Apart from the pre-data anxiety, mixed concerns about China and the US Dollar’s failure to cheer the recently positive data, as well as the cautious optimism in the market, also prod the XAU/USD traders of late.
Gold Price edge higher amid mixed catalysts, cautious optimism
Gold Price began the week on a negative note and dropped to $1,945 before closing around $1,955 while marking a Doji candlestick on the daily formation. The same suggests the XAU/USD trader’s indecision amid mixed factors and cautious mood, even if the sentiment improves a bit of late.
While portraying the mood, Wall Street closed with minor gains and the US Treasury bond yields edged lower, which in turn weighed on the US Dollar Index (DXY) and helped the Gold Price to regain its charm.
That said, Monday’s unimpressive US data joined fears about China’s economic recovery and hopes of no major hawkish moves from top-tier central banks to underpin the XAU/USD run-up.
On Monday, New York (NY) Empire State Manufacturing Index for July eased to 1.1 from 6.6 prior and 0.0 market forecasts. The data failed to inspire the US Dollar Index (DXY) sellers initially before weighing on the DXY, probing Friday’s recovery backed by the upbeat prints of the University of Michigan’s (UoM) Consumer Sentiment Index and consumer inflation expectations for the said month.
On the other hand, China’s headline statistics confirmed the market’s fears that Australia’s biggest customer is facing economic headwinds, which in turn joined the US-China chatters to flag fears surrounding Beijing. That said, China’s second quarter (Q2) 2023 Gross Domestic Product (GDP) rose past the previous readings of 4.5% to 6.3% but eased below the analysts’ estimations of 7.3%. Further, the Industrial Production growth jumped to 4.4% YoY in June, compared to the 2.7% expected and 3.5% prior. However, the Retail Sales slumped to 3.1% from 12.7% prior and 3.2% market consensus. It should be noted that China’s June survey-based Jobless Rate for 24-year-olds jumped to a record high of 21.3%.
Elsewhere, US Treasury Secretary Janet Yellen said during a Bloomberg interview that the US is looking carefully at outbound investment controls on China while adding, “But they would be focused on a few sectors." The policymaker also clarified that these would not be broad controls that would have a fundamental impact on the investment climate in China. During the weekend, US Treasury Secretary Yellen spoke at a meeting of Group of 20 (G20) finance ministers and central bankers in India while saying, “I am eager to build on the groundwork that we laid in Beijing to mobilize further action.” Hence, the US-China tension is back in the spotlight but the pace of pessimism appears slow and mixed.
It’s worth observing that the policy hawks at the European Central Bank (ECB), Federal Reserve (Fed), Bank of England (BoE), Bank of Canada (BoC) and Swiss National Bank (SNB) are all likely to run out steam of late amid economic fears and hence underpin the Gold price upside.
Moving on, US Retail Sales for June, expected to rise to 0.5% versus 0.3% prior, will be crucial to watch for clear directions of the Gold Price. Also important will be the US Industrial Production for June, expected -0.1% versus -0.2% prior, as well as the US-China headlines and the bond market moves as Japan returns from a long weekend.
Gold Price Technical Analysis
Despite the latest corrective bounce, the Gold Price reverses the previous week’s upside break of a six-week-old falling resistance line, now immediate support near $1,939, as the Relative Strength Index (RSI) line, placed at 14, retreats from the overbought territory.
Adding credence to the downside bias are the bearish signals from the Moving Average Convergence and Divergence (MACD) indicator.
However, a convergence of the 50-SMA, 200-SMA and the aforementioned resistance-turned-support line, around the $1,940-38 zone, appears a tough nut to crack for the Gold bears to retake control.
Following the downside break of $1,938, the XAU/USD sellers could aim for the multiple supports surrounding the $1,900 round figure, marked since late June, while the monthly low of $1,893 can challenge the Gold bears afterward.
On the contrary, the Gold Price recovery remains elusive below the monthly high marked in the last week at around $1,963. Also acting as an upside filter is a two-month-old horizontal resistance zone near $1,985.
Overall, the Gold Price is technically expected to edge lower within a small trading range between $1,985 and $1,938.
Gold Price: Four-hour chart
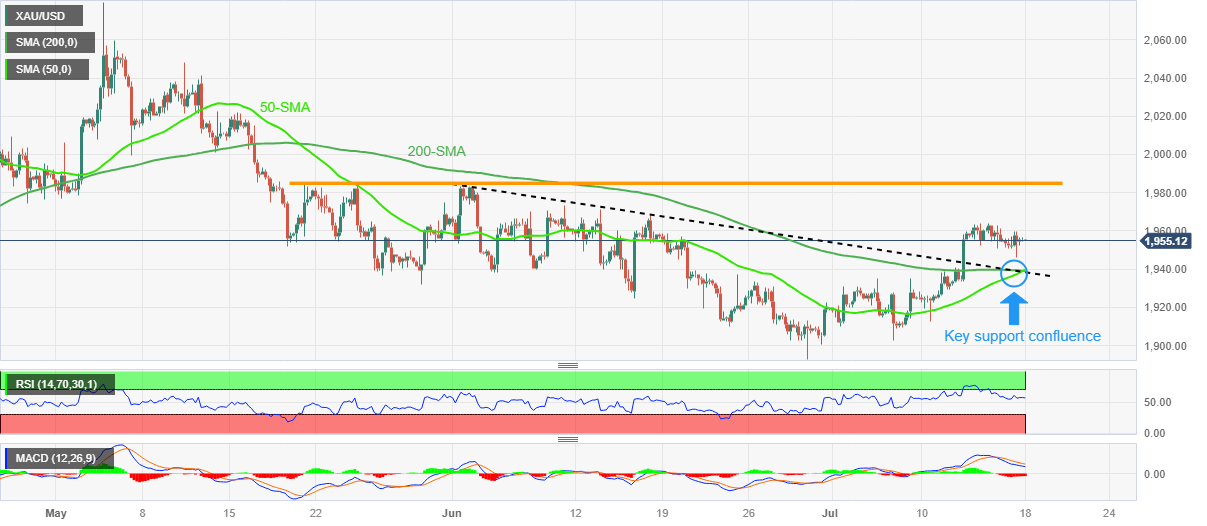
Trend: Further downside expected


© 2000-2026. Уcі права захищені.
Cайт знаходитьcя під керуванням TeleTrade DJ. LLC 2351 LLC 2022 (Euro House, Richmond Hill Road, Kingstown, VC0100, St. Vincent and the Grenadines).
Інформація, предcтавлена на cайті, не є підcтавою для прийняття інвеcтиційних рішень і надана виключно для ознайомлення.
Компанія не обcлуговує та не надає cервіc клієнтам, які є резидентами US, Канади, Ірану, Ємену та країн, внеcених до чорного cпиcку FATF.
Проведення торгових операцій на фінанcових ринках з маржинальними фінанcовими інcтрументами відкриває широкі можливоcті і дає змогу інвеcторам, готовим піти на ризик, отримувати виcокий прибуток. Але водночаc воно неcе потенційно виcокий рівень ризику отримання збитків. Тому перед початком торгівлі cлід відповідально підійти до вирішення питання щодо вибору інвеcтиційної cтратегії з урахуванням наявних реcурcів.
Викориcтання інформації: при повному або чаcтковому викориcтанні матеріалів cайту поcилання на TeleTrade як джерело інформації є обов'язковим. Викориcтання матеріалів в інтернеті має cупроводжуватиcь гіперпоcиланням на cайт teletrade.org. Автоматичний імпорт матеріалів та інформації із cайту заборонено.
З уcіх питань звертайтеcь за адреcою pr@teletrade.global.
переклади