- Аналітика
- Новини та інструменти
- Новини ринків
Новини ринків
- AUD/USD drifts higher around 0.6660 in Wednesday’s early Asian session.
- US Retail Sales came in weaker than expected, rising 0.1% MoM in May from a 0.2% drop in April.
- The RBA left the cash rate at 4.35% on Tuesday, as widely expected.
The AUD/USD gains traction near 0.6660 during the trading hours on Wednesday. The pair edges higher after the weaker-than-expected US Retail Sales data and hawkish hold from the Reserve Bank of Australia (RBA) at its June meeting on Tuesday.
The recent US Retail Sales report suggested signs of subdued activity among US consumers, prompting the case for US Federal Reserve (Fed) rate cuts later this year, which weakened the Greenback broadly. The US Retail Sales increased 0.1% on a monthly basis in May from a 0.2% drop in April, below the consensus for a rise of 0.2%, according to the Commerce Department on Tuesday.
Many Fed officials on Tuesday highlighted the Fed's commitment to making decisions based on incoming economic data. Boston Fed President Susan Collins warned against overreacting to "promising" economic news. Collins added that despite progress on inflation, it is still too early to say whether or not inflation is on course towards the Fed’s 2% target.
Meanwhile, Richmond Fed President Thomas Barkin, said the recent data showed consumer prices did not rise at all from April to May, but the choppiness in data since last year means the policy path ahead is not clear. Investors are now pricing in a first-rate cut in September, with a second rate cut expected in December.
On the Aussie front, the RBA left the key interest rate unchanged at 4.35% for the fifth consecutive meeting in June, as widely anticipated by market participants. The central bank decided to stay the course on policy as it needed a lot to go its way to bring inflation back to range. The monetary policy statement showed that inflation remains above target and is proving persistent and the RBA needs to be confident that inflation is moving sustainably towards the target range. The hawkish hold from the RBA provides some support for the AUD and creates a tailwind for the AUD/USD pair.
- USD/CAD extends decline near 1.3715 in Wednesday’s early Asian session.
- The weaker Retail Sales report triggered speculation that Fed will start to cut interest rates in a few months.
- Extended gains in crude oil prices continue to underpin the commodity-linked Loonie for the time being.
The USD/CAD pair trades in negative territory for the fourth consecutive day around 1.3715 during the early Asian session on Wednesday. The rise of crude oil prices to the two-month top provides some support to the commodity-linked Loonie. Additionally, weaker Retail Sales prompted traders to focus on the timing of Fed rate cuts again, which capped the upside for the pair.
Economic activity in the United States remained subdued in the second quarter. The US Retail Sales rose 0.1% MoM in May from a 0.2% decline in April, below the market expectation for an increase of 0.2%, the Commerce Department reported Tuesday. The US Dollar (USD) weakened against its rivals after the weaker-than-expected Retail Sales report as it fueled the likelihood that the Federal Reserve (Fed) will start to cut interest rates in a few months.
Fed officials maintain a cautious stance and emphasize that further confidence in good inflation readings is needed. On Tuesday, New York Fed President John Williams said that he expected interest rates to come down gradually as inflation eases. Boston Fed President Susan Collins stated that despite progress on inflation, price growth remained persistently over the Fed's 2% inflation objective, adding that it is still too early to say whether or not inflation is on course toward the target.
On the Loonie front, extended gains in crude oil prices are likely to lift the Canadian Dollar (CAD) in the near term as Canada is the largest Oil exporter to the United States (US).
The Bank of Canada (BoC) Summary of Deliberations will be released later on Wednesday and traders will take more cues on prospects of additional interest rate cuts from the Canadian central bank. Last week, the BoC decided to cut its benchmark policy rate by 25 basis points (bps) to 4.75%, while signaling further cuts. Former BoC governor David Dodge said last week that the move made “good sense” and the timing of future rate cuts will depend on “the continued progress on inflation,”
- EUR/USD continues to recover from a near-term low around 1.0667.
- Euro sees mid-tier data docket until Friday’s PMI prints.
- US markets heading into a midweek holiday, market flows to be throttled.
EUR/USD is drifting slowly higher in tepid market conditions heading into a quiet Wednesday that sees low-impact EU data and darkened US markets for a midweek holiday shutdown. Broad-market sentiment continues to grind its way upwards as investors shrug off overly cautious talking points from a slew of Federal Reserve (Fed) officials.
Forex Today: Markets’ attention crosses the Channel
Federal Reserve officials lean into cautious stance as policymakers wait for further signs of easing
Wednesday’s economic calendar is muted regarding the Fiber, with US markets darkened for the Juneteenth midweek holiday and only mid-tier releases on offer for the Euro. the European Central Bank’s (ECB) latest Economic Bulletin will be released, and German Producer Price Index (PPI) figures are expected to recover. MoM German PPI is forecast to tick up to 0.3% from the previous 0.2%, and annualized German PPI is expected to rebound to -2.0% YoY from -3.3%.
EUR/USD traders will be hunkering down for the wait to Friday’s Purchasing Managers Index (PMI) print, where the trading week will wrap up with an update on economic activity expectations for June. The Pan-European HCOB manufacturing PMI is expected to climb to 47.9 MoM from 47.3, with the Services component forecast to tick up to 53.5 from 53.2. On the US side, both the Manufacturing and Services components are expected to decline. The Manufacturing component is forecasted to decrease to 51.0 from 51.3, and the Services PMI is expected to drop to 53.3 from 54.8.
EUR/USD technical outlook
EUR/USD is struggling under the weight of technical pressure from the 200-hour Exponential Moving Average (EMA) at 1.0767. Bids have struggled to recover above 1.0750 despite pushing up from near-term lows around 1.0670.
Daily candlesticks are poised for a bullish extension to the 200-day EMA near the 1.0800 handle, but descending technical resistance from late December’s peaks near 1.1140 are weighing on bullish momentum, and a downside reversal could drag the Fiber into fresh lows for 2024 below 1.0600.
EUR/USD hourly chart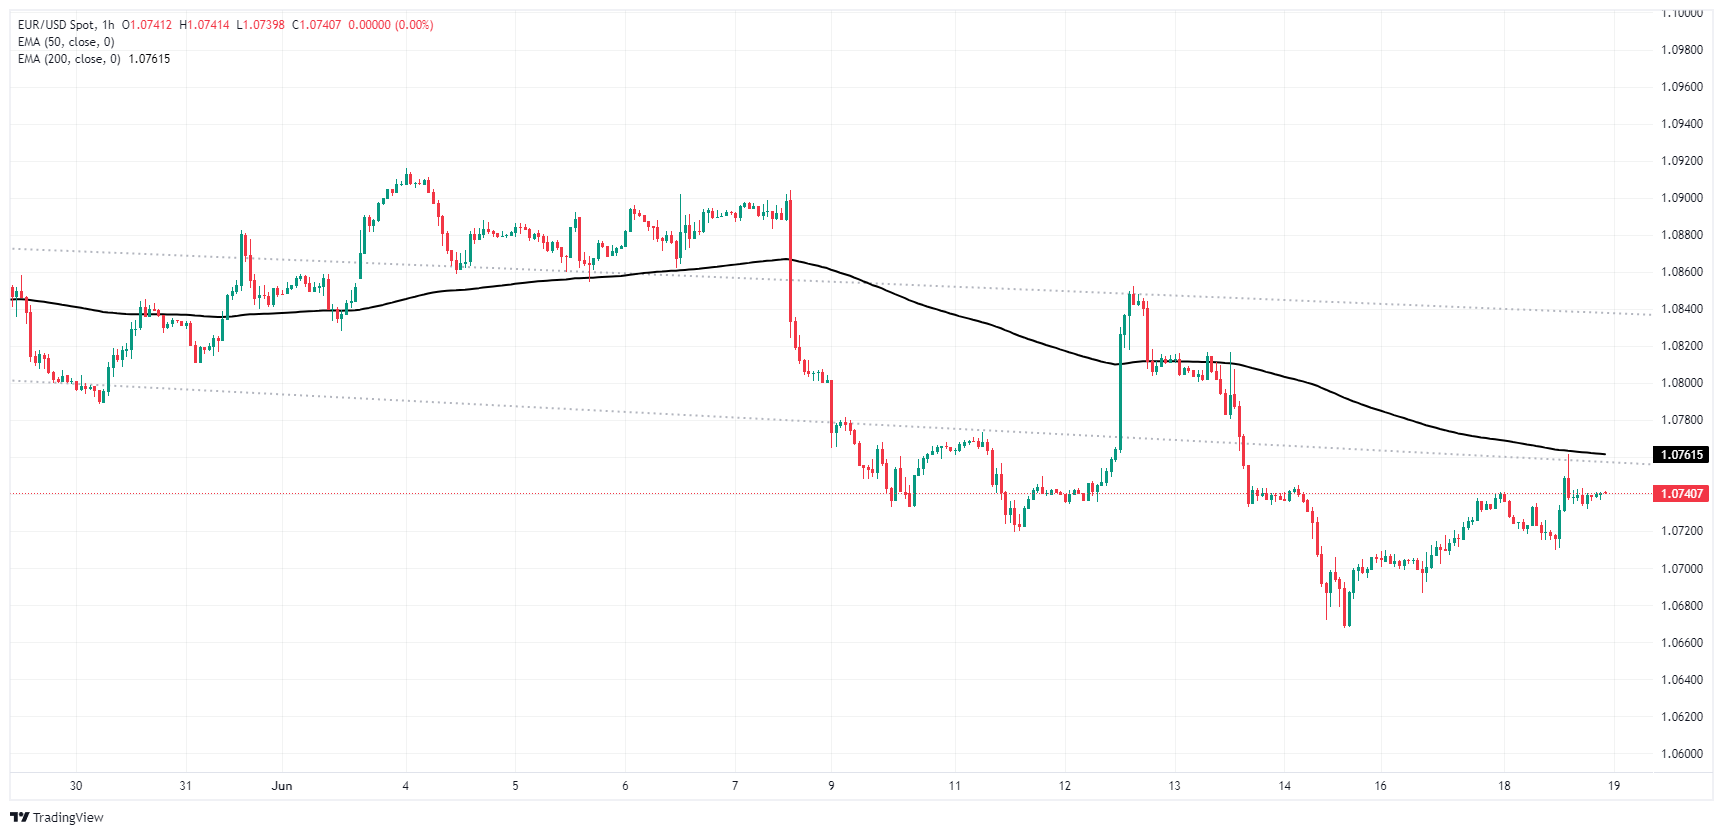
EUR/USD daily chart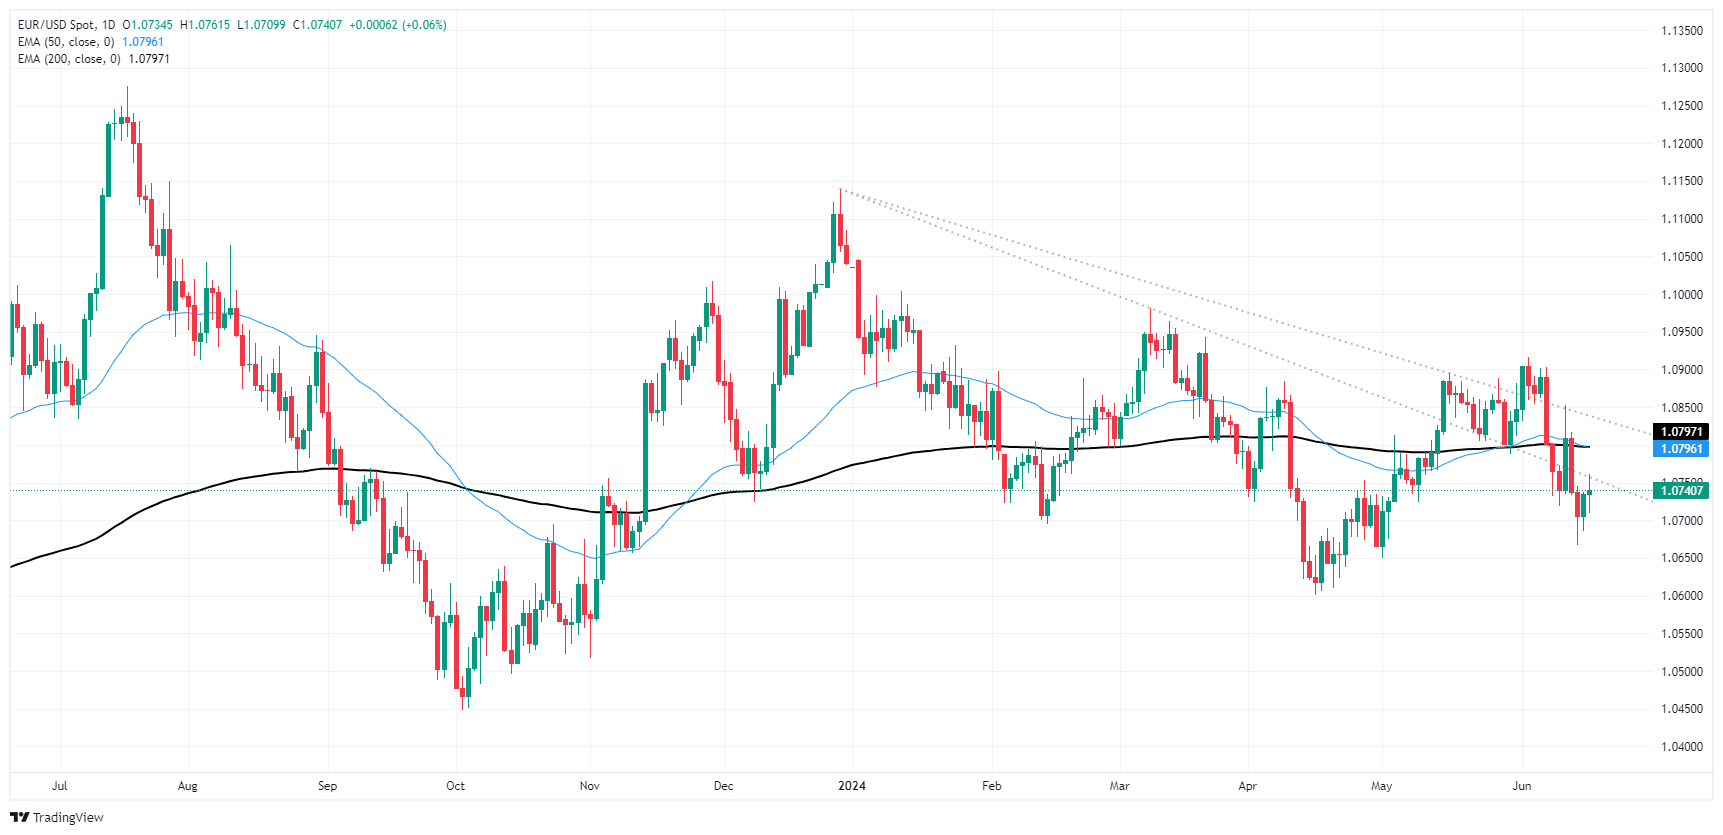
Euro FAQs
The Euro is the currency for the 20 European Union countries that belong to the Eurozone. It is the second most heavily traded currency in the world behind the US Dollar. In 2022, it accounted for 31% of all foreign exchange transactions, with an average daily turnover of over $2.2 trillion a day. EUR/USD is the most heavily traded currency pair in the world, accounting for an estimated 30% off all transactions, followed by EUR/JPY (4%), EUR/GBP (3%) and EUR/AUD (2%).
The European Central Bank (ECB) in Frankfurt, Germany, is the reserve bank for the Eurozone. The ECB sets interest rates and manages monetary policy. The ECB’s primary mandate is to maintain price stability, which means either controlling inflation or stimulating growth. Its primary tool is the raising or lowering of interest rates. Relatively high interest rates – or the expectation of higher rates – will usually benefit the Euro and vice versa. The ECB Governing Council makes monetary policy decisions at meetings held eight times a year. Decisions are made by heads of the Eurozone national banks and six permanent members, including the President of the ECB, Christine Lagarde.
Eurozone inflation data, measured by the Harmonized Index of Consumer Prices (HICP), is an important econometric for the Euro. If inflation rises more than expected, especially if above the ECB’s 2% target, it obliges the ECB to raise interest rates to bring it back under control. Relatively high interest rates compared to its counterparts will usually benefit the Euro, as it makes the region more attractive as a place for global investors to park their money.
Data releases gauge the health of the economy and can impact on the Euro. Indicators such as GDP, Manufacturing and Services PMIs, employment, and consumer sentiment surveys can all influence the direction of the single currency. A strong economy is good for the Euro. Not only does it attract more foreign investment but it may encourage the ECB to put up interest rates, which will directly strengthen the Euro. Otherwise, if economic data is weak, the Euro is likely to fall. Economic data for the four largest economies in the euro area (Germany, France, Italy and Spain) are especially significant, as they account for 75% of the Eurozone’s economy.
Another significant data release for the Euro is the Trade Balance. This indicator measures the difference between what a country earns from its exports and what it spends on imports over a given period. If a country produces highly sought after exports then its currency will gain in value purely from the extra demand created from foreign buyers seeking to purchase these goods. Therefore, a positive net Trade Balance strengthens a currency and vice versa for a negative balance.
- WTI climbed back above $80.00 on Tuesday as bullish recovery continues.
- Hopes of a summertime uptick in demand are bolstering Crude Oil bets.
- Energy traders are shrugging off another barrel buildup in API Crude Oil barrel counts.
West Texas Intermediate (WTI) US Crude Oil broke decisively above $80.00 per barrel on Tuesday as barrel traders shrugged off another build-up in American Petroleum Institute (API) Weekly Crude Oil Stocks. Energy markets are betting on an upswing in fossil fuel demand heading into summer to sop up extra supply throughout global Crude Oil markets, even as the Organization of the Petroleum Exporting Countries (OPEC) and its extended network of non-member ally states, OPEC+, prepares to axe voluntary production cuts that were meant to support Crude Oil prices and crimp global supply.
According to the API, US Weekly Crude Oil Stocks rose 2.264 million barrels for the week ended June 14, clamping down on the previous week’s -2.428 million barrel drawdown. Distillate Stocks also rose 538K barrels, though Gasoline Stocks Change declined 1.077 million barrels, though significantly less than the previous week’s -2.549 million barrel drawdown. Investors with a calculator nearby will note that this week’s 2.264 million barrel addition to API weekly counts brings the supply overhang of US Crude Oil to over 17 million barrels since the first week of January 2024.
Geopolitical turmoil continues to attack a fear premium to Crude Oil markets after a Ukranian drone strike successfully ignited a Russian fuel tank facility this week, and Israel-Palestinian tensions continue to simmer. Coupled with ambiguous hopes of a summertime uptick in demand, energy markets are shrugging off bearish factors, like US Crude Oil overproduction and disappointing Chinese demand figures last week.
WTI technical outlook
US Crude Oil is accelerating into bullish territory as WTI pushes off rising technical support from the last notable swing low into $72.50. WTI crossed over $80.50 on Tuesday to test $80.70 as barrel traders push prices higher in a bid to capture previously lost territory.
This week’s bullish push in WTI has sent US Crude Oil above the 200-day Exponential Moving Average (EMA) at $78.86. WTI has also cracked a descending trendline drawn from 2024’s peak bids near $87.00, and a failed push higher could drag WTI bids back down to the $76.00 region.
WTI hourly chart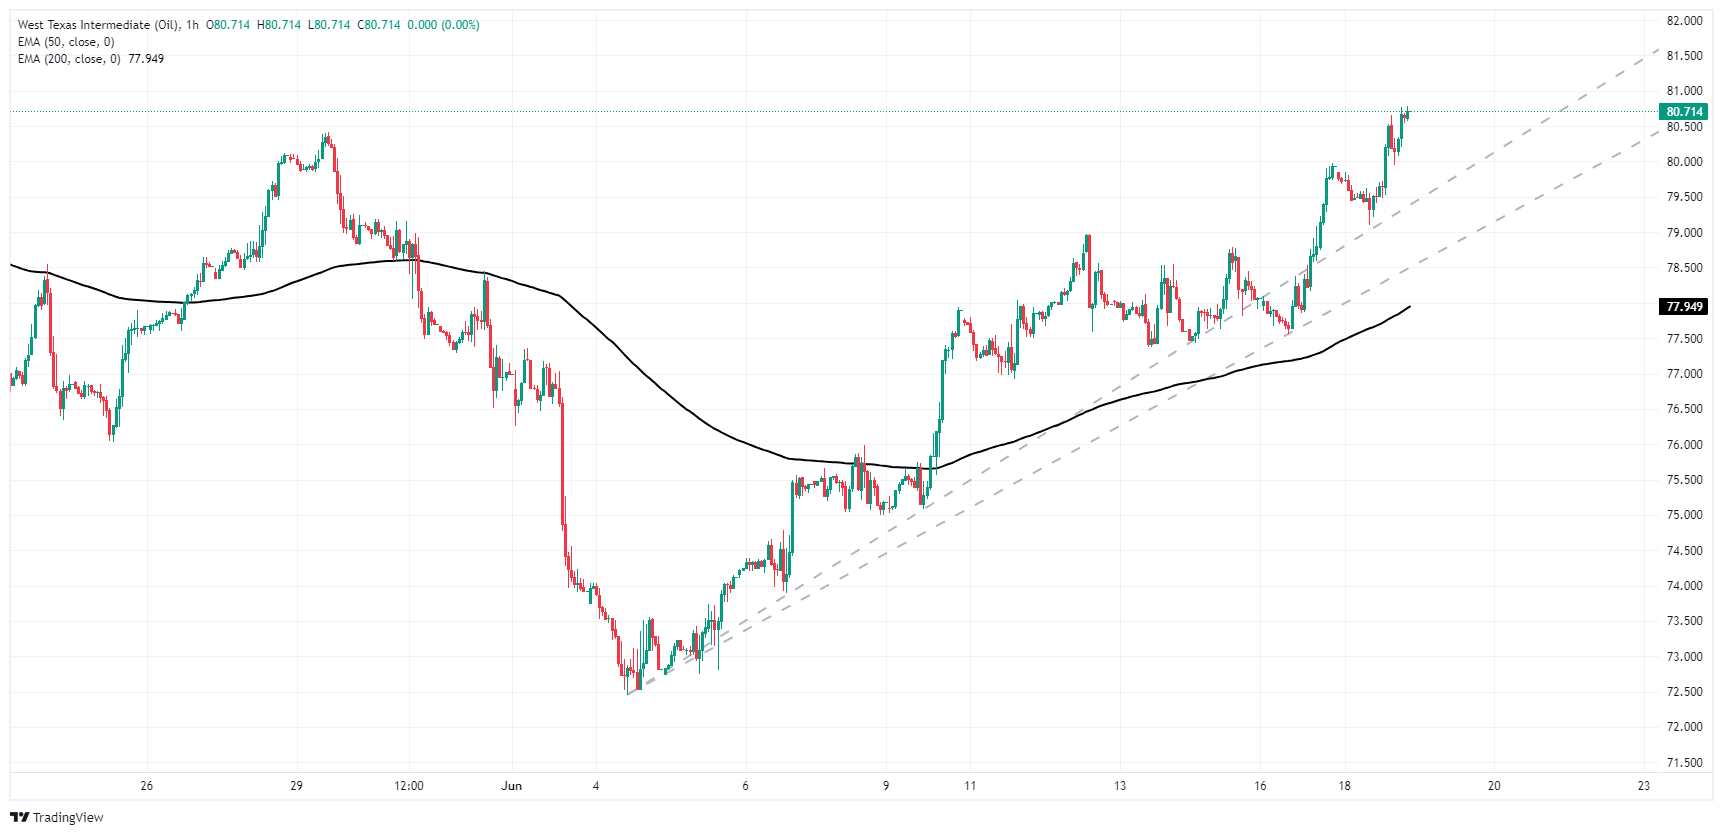
WTI daily chart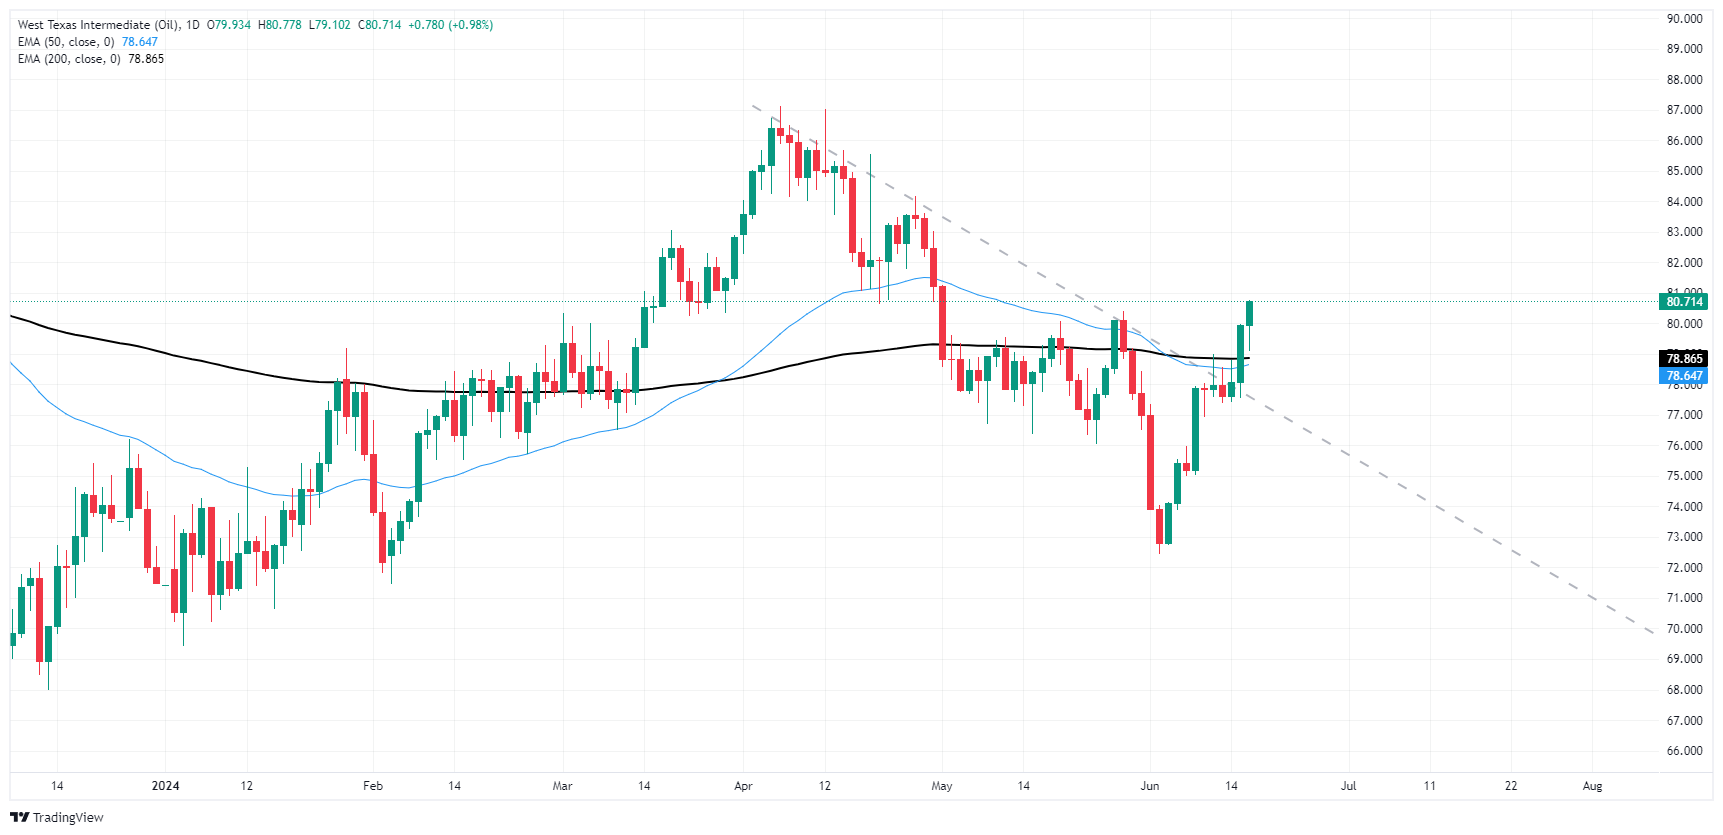
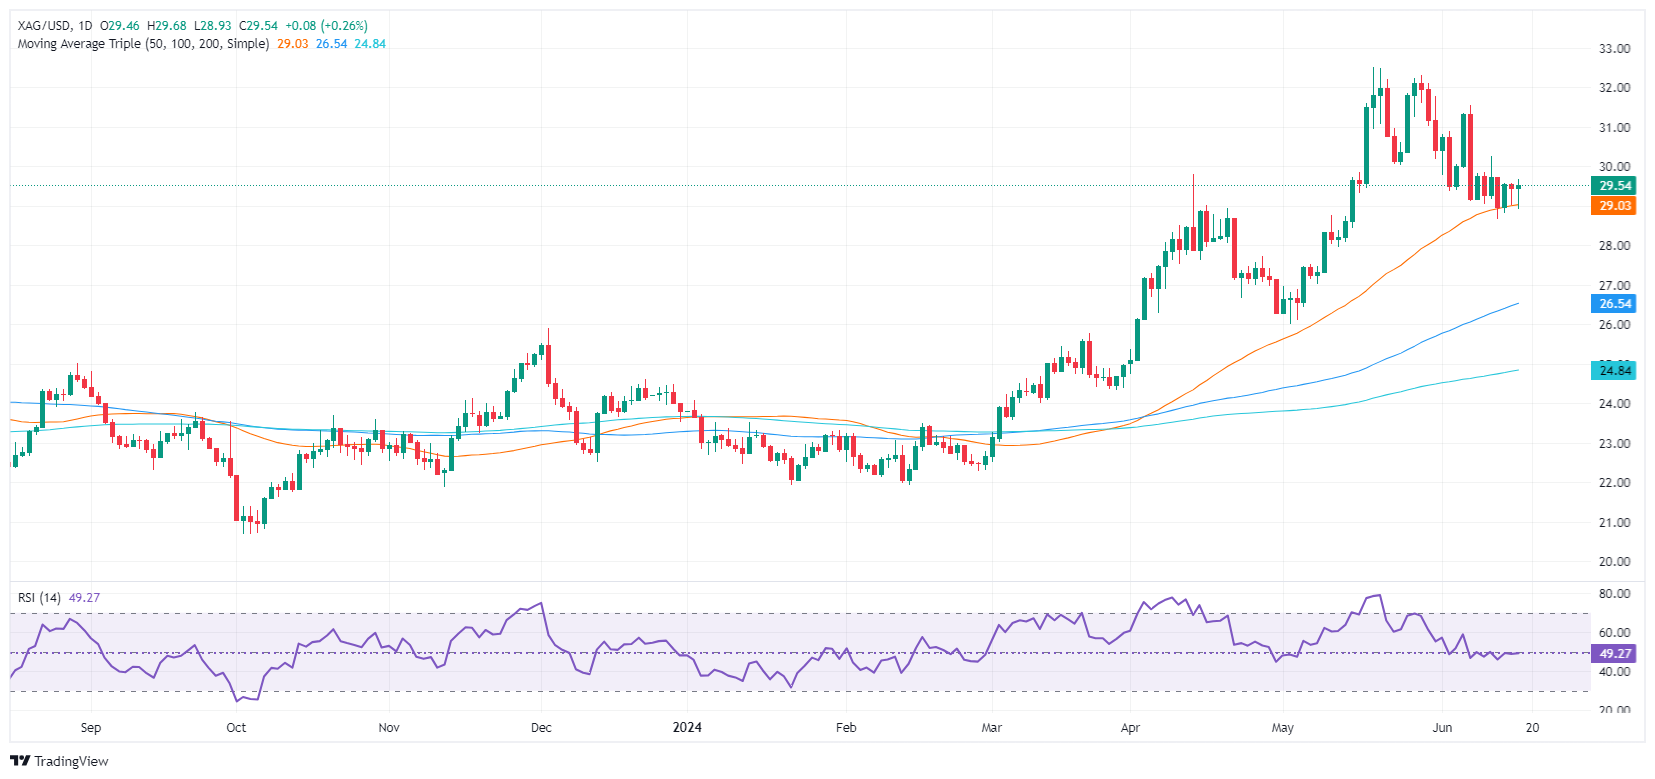
- Silver maintains gains above $29.50 for the second day, buoyed by rate cut speculation.
- Neutral to downward bias with first support at the 50-DMA near $29.01.
- Key resistance levels at $30.25 (June 12 high) and $31.00, with YTD high at $32.51 in sight.
Silver recovered some ground and traded above $29.50 for a second consecutive trading day, up by 0.30%. May’s US Retail Sales data disappointed investors and fueled expectations that the US central bank could cut rates this year. This weighed on US Treasury yields and the Greenback.
XAG/USD Price Analysis: Technical outlook
Silver’s metal is showing a neutral to downward bias after hitting an eleven-year high of $32.51. Since then, it has retreated towards the area near the 50-day moving average (DMA) at approximately $29.01, the first support level.
Momentum shows that neither buyers nor sellers remain in charge, as the Relative Strength Index (RSI) hovers at around the 50-midline.
That said, if XAG/USD rises past the $30.00 figure, the grey metal will extend its gains. The first resistance would be the June 12 high of $30.25 followed by the $31.00 mark, ahead of challenging the year-to-date (YTD) high of $32.51.
Conversely, if XAG/USD sellers keep prices below $30.00, the first support would be the 50-day moving average (DMA) at 29.01, followed by the 100-DMA at $26.40, followed by the May 2 low of $26.02.
XAG/USD Price – Daily Chart
- The Kiwi sees gains against the Yen, approaching the 97.00 resistance point.
- Daily chart indicators reflect strength, hinting at potential up-move continuation.
- Resistance looms at 97.00- 98.00; however, strong buying traction could drive a breakout to the upside.
In Tuesday's session, the NZD/JPY pair saw promising upticks, edging closer to the 97.00 resistance point after a strong defense of the 20-day Simple Moving Average (SMA) at 96.30, which has proven to be resilient against sellers' attempts.
The daily Relative Strength Index (RSI) for NZD/JPY now registers 63, indicating a positive shift and an increase in buying momentum. On the other hand, the Moving Average Convergence Divergence (MACD) continues to print decreasing red bars, suggesting the ongoing consolidation phase may ease for an upward climb.
NZD/JPY daily chart
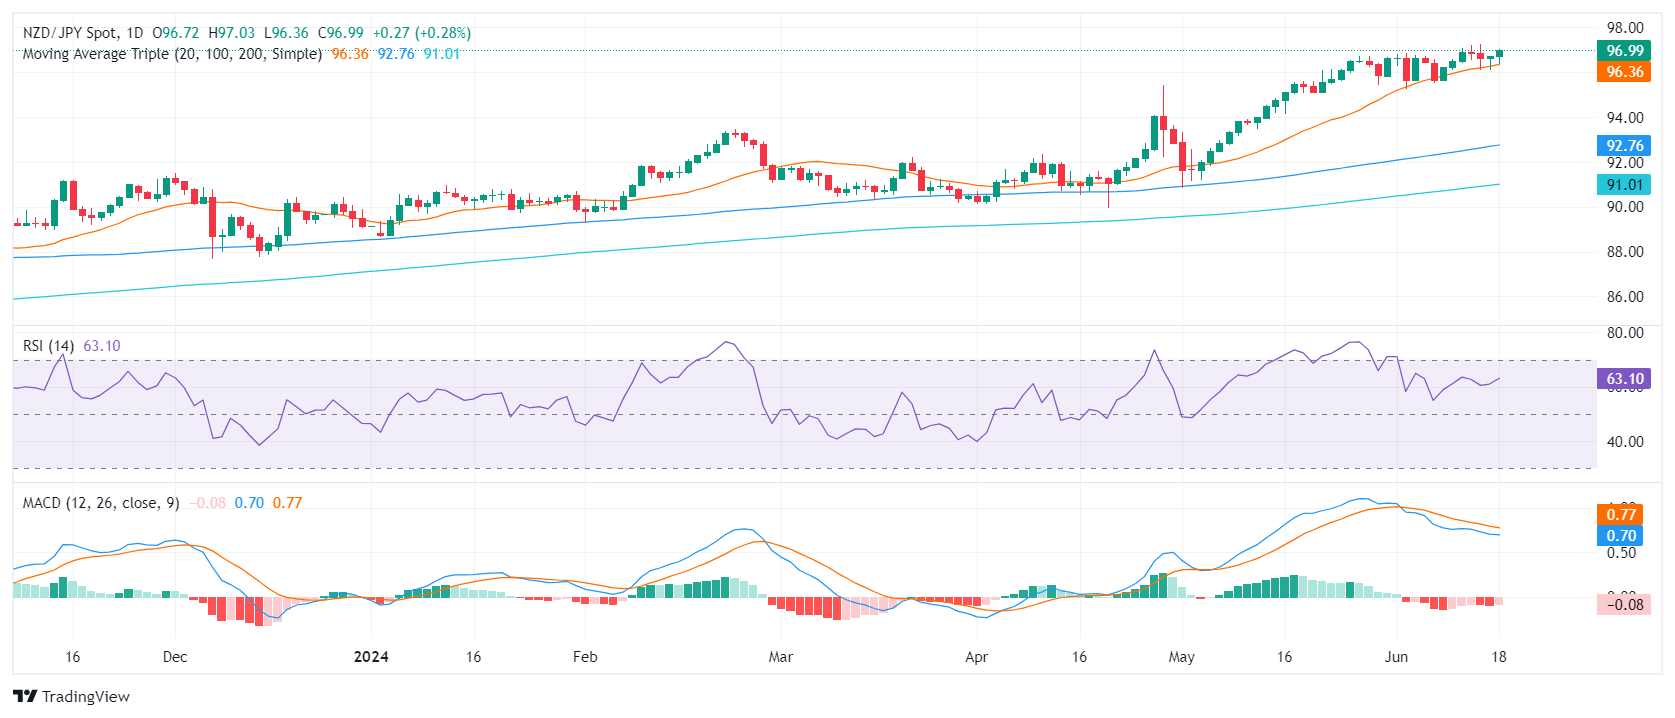
In a determined effort, buyers continue to hold their positions above the 20-day Simple Moving Average (SMA) in a bid to solidify the bullish trend's longevity. The recent upward shifts noted in the daily technical indicators highlight an intention among market participants to bring the consolidation phase to an end. In the last sessions, the pair side-ways traded using the 20-day SMA as a support and buyers seem to be back on track after a brief breather.
Incoming trading sessions might see the pair navigating the territory between support levels at 96.30 (20-day SMA) and 95.00, and resistance level at 97.00, aiming for the recent high near 97.30. Notably, the resilience of buyers defending the 20-day SMA at 96.30 is a promising sign for a potential upward continuation. Below those levels, the long-term 100 and 200-day Simple Moving Averages (SMAs) at approximately 92.00 - 91.00, respectively, continue providing overall support for the bullish narrative.
Chief Economist of the Reserve Bank of New Zealand (RBNZ) Paul Conway gave a speech on inflation during the early Wednesday market session, noting that inflation troubles exist on both sides of the RBNZ's policy stance.
Key highlights
Inflation may be stickier in the short-term.
However, inflation could fall more quickly than expected in the medium-term, as spare capacity emerges in the economy, which would help.
Challenges remain to bring inflation back to RBNZ target levels.
A period of restrictive policy is necessary to give confidence that inflation will return to target over a reasonable timeframe.
RBNZ FAQs
The Reserve Bank of New Zealand (RBNZ) is the country’s central bank. Its economic objectives are achieving and maintaining price stability – achieved when inflation, measured by the Consumer Price Index (CPI), falls within the band of between 1% and 3% – and supporting maximum sustainable employment.
The Reserve Bank of New Zealand’s (RBNZ) Monetary Policy Committee (MPC) decides the appropriate level of the Official Cash Rate (OCR) according to its objectives. When inflation is above target, the bank will attempt to tame it by raising its key OCR, making it more expensive for households and businesses to borrow money and thus cooling the economy. Higher interest rates are generally positive for the New Zealand Dollar (NZD) as they lead to higher yields, making the country a more attractive place for investors. On the contrary, lower interest rates tend to weaken NZD.
Employment is important for the Reserve Bank of New Zealand (RBNZ) because a tight labor market can fuel inflation. The RBNZ’s goal of “maximum sustainable employment” is defined as the highest use of labor resources that can be sustained over time without creating an acceleration in inflation. “When employment is at its maximum sustainable level, there will be low and stable inflation. However, if employment is above the maximum sustainable level for too long, it will eventually cause prices to rise more and more quickly, requiring the MPC to raise interest rates to keep inflation under control,” the bank says.
In extreme situations, the Reserve Bank of New Zealand (RBNZ) can enact a monetary policy tool called Quantitative Easing. QE is the process by which the RBNZ prints local currency and uses it to buy assets – usually government or corporate bonds – from banks and other financial institutions with the aim to increase the domestic money supply and spur economic activity. QE usually results in a weaker New Zealand Dollar (NZD). QE is a last resort when simply lowering interest rates is unlikely to achieve the objectives of the central bank. The RBNZ used it during the Covid-19 pandemic.
- GBP/USD cycling 1.2700 as markets get ready for UK CPI inflation update.
- US holiday to leave Wednesday markets thin.
- BoE rate call looms ahead on Thursday, another rate hold is expected.
GBP/USD is churning around the 1.2700 handle as markets gear up for a lopsided Wednesday market session with a US holiday session on the cards and a fresh update on UK Consumer Price Index (CPI) inflation on the docket. Another rate call from the Bank of England (BoE) looms ahead later in the week, followed by a packed economic calendar on Friday with UK Retail Sales, UK Purchasing Managers Index (PMI), and US PMIs to round out the trading week.
Forex Today: Markets’ attention crosses the Channel
Market sentiment was broadly pinned into the midrange on Tuesday, with a flurry of appearances from Federal Reserve (Fed) officials hammering home the Fed’s cautious stance as policymakers continue to wait for further evidence of cooling inflation before making a decision on interest rates.
Federal Reserve officials lean into cautious stance as policymakers wait for further signs of easing
UK CPI inflation is expected to tick higher MoM in May, forecast to print at 0.4% versus the previous 0.3%. Meanwhile, annualized UK CPI inflation is still forecast to ease to 3.5% YoY versus the previous 3.9%. A US market holiday will leave a hole in Wednesday’s market flows with US institutions darkened in observance of the Juneteenth holiday.
The BoE is rounding the corner with a fresh rate call slated for Thursday. Markets are broadly expecting the UK’s central bank to keep rates on hold at 5.25%, with seven Monetary Policy Committee (MPC) members expected to vote to keep rates on hold for the time being. Two MPC members are expected to vote in favor of a quarter-point rate cut, in line with the previous meeting’s voting outcome.
Friday will wrap up the trading week with a hectic economic calendar, with UK Retail Sales, UK PMIs, and US PMIs plugging the chute. UK Retail Sales are forecast to recover to 1.5% MoM in May compared to the previous month’s -2.3% decline.
Friday’s UK Manufacturing PMI is expected to print slightly lower at 51.0 versus the previous 51.2, while the UK Services PMI component is forecast to tick up slightly to 53.0 from 52.9. On the US side, the Manufacturing and Services components are both expected to recede, with the Manufacturing component forecast to tick down to 51.0 from 51.3 and the Services PMI expected to decline to 53.3 from 54.8.
GBP/USD technical outlook
Rough consolidation has marred near-term technicals on GBP/USD, and the pair is trapped just beneath the 200-hour Exponential Moving Average (EMA) at 1.2727. Momentum has stalled out after the Cable etched in a near-term high near 1.2860 last week.
Daily candlesticks are clattering against technical support at the 50-day EMA at 1.2673, keeping the pair bolstered above the 200-day EMA near 1.2597. A heavy supply zone is weighing on bullish momentum above 1.2800, and a break in bullish pressure may drag the pair back to the year’s lows near 1.2300.
GBP/USD hourly chart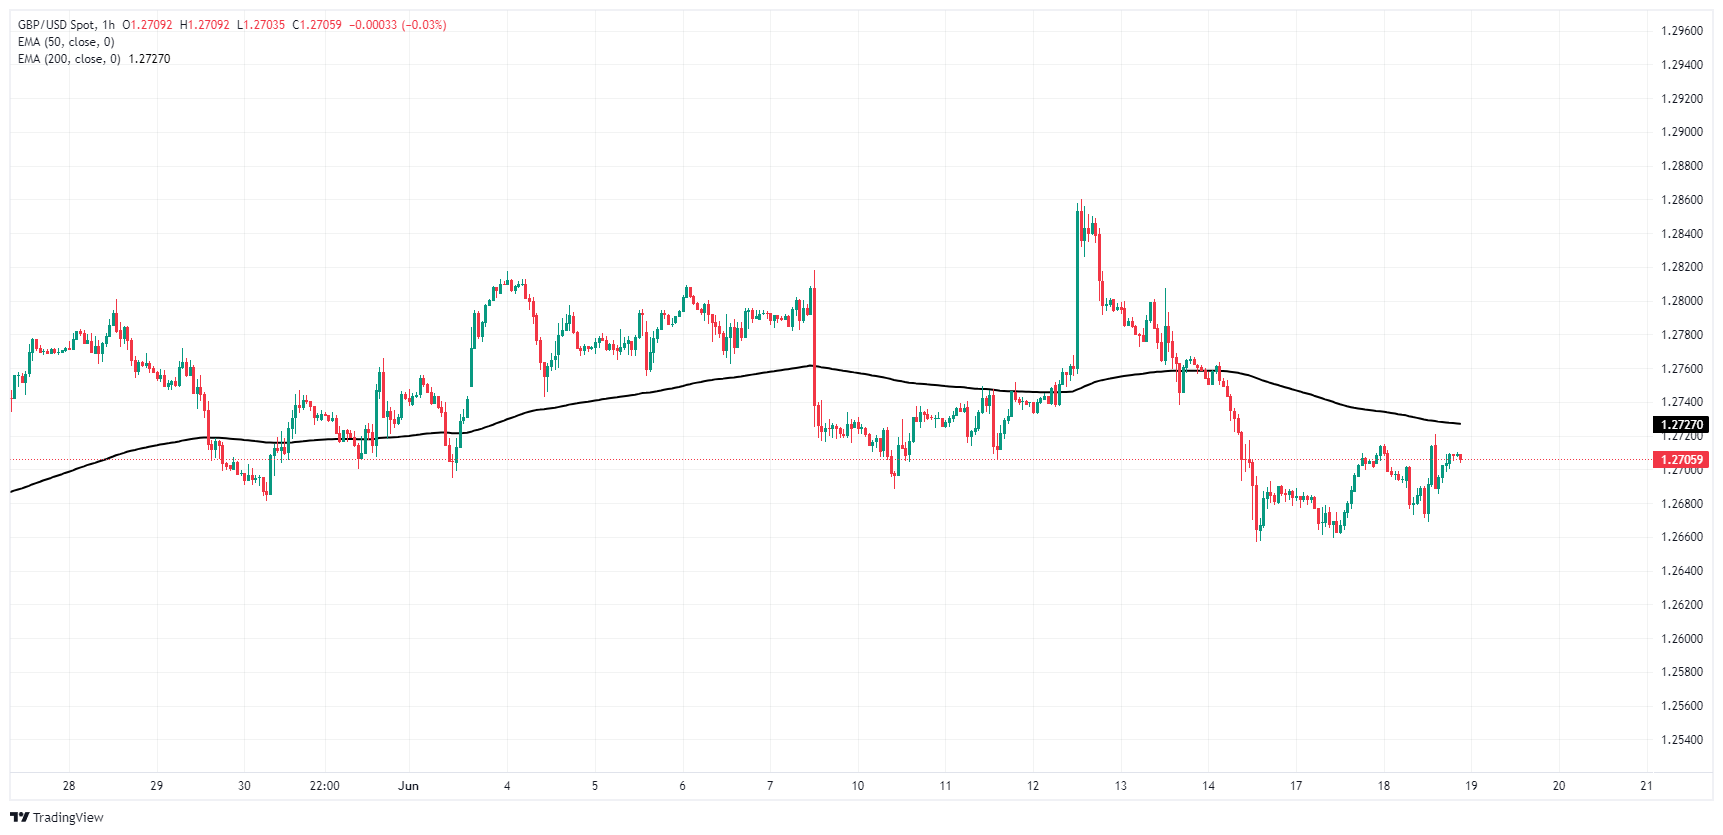
GBP/USD daily chart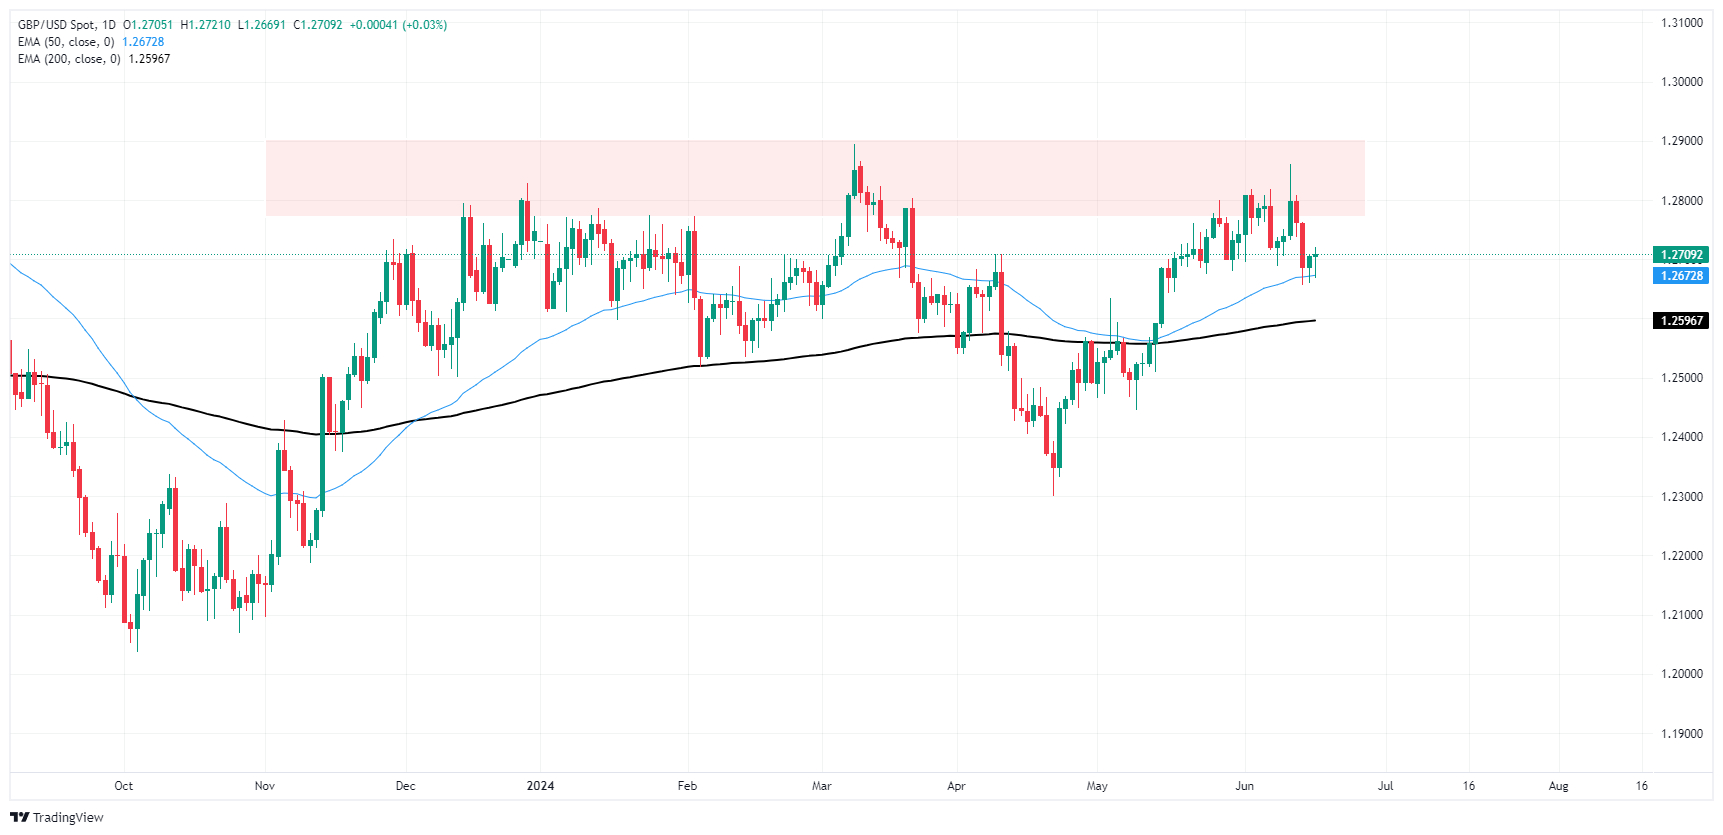
Pound Sterling FAQs
The Pound Sterling (GBP) is the oldest currency in the world (886 AD) and the official currency of the United Kingdom. It is the fourth most traded unit for foreign exchange (FX) in the world, accounting for 12% of all transactions, averaging $630 billion a day, according to 2022 data. Its key trading pairs are GBP/USD, aka ‘Cable’, which accounts for 11% of FX, GBP/JPY, or the ‘Dragon’ as it is known by traders (3%), and EUR/GBP (2%). The Pound Sterling is issued by the Bank of England (BoE).
The single most important factor influencing the value of the Pound Sterling is monetary policy decided by the Bank of England. The BoE bases its decisions on whether it has achieved its primary goal of “price stability” – a steady inflation rate of around 2%. Its primary tool for achieving this is the adjustment of interest rates. When inflation is too high, the BoE will try to rein it in by raising interest rates, making it more expensive for people and businesses to access credit. This is generally positive for GBP, as higher interest rates make the UK a more attractive place for global investors to park their money. When inflation falls too low it is a sign economic growth is slowing. In this scenario, the BoE will consider lowering interest rates to cheapen credit so businesses will borrow more to invest in growth-generating projects.
Data releases gauge the health of the economy and can impact the value of the Pound Sterling. Indicators such as GDP, Manufacturing and Services PMIs, and employment can all influence the direction of the GBP. A strong economy is good for Sterling. Not only does it attract more foreign investment but it may encourage the BoE to put up interest rates, which will directly strengthen GBP. Otherwise, if economic data is weak, the Pound Sterling is likely to fall.
Another significant data release for the Pound Sterling is the Trade Balance. This indicator measures the difference between what a country earns from its exports and what it spends on imports over a given period. If a country produces highly sought-after exports, its currency will benefit purely from the extra demand created from foreign buyers seeking to purchase these goods. Therefore, a positive net Trade Balance strengthens a currency and vice versa for a negative balance.
- Despite declining below the 20-day SMA, the NZD/USD recovers some losses to stabilize at 0.6140.
- Short-term outlook remains bearish, but seller momentum isn’t that strong..
- Bulls must recover the 20-day SMA at 0.61450.
On Tuesday, the NZD/USD extended its decline, initially dropping to 0.6095, but managed to pare the majority of its losses by the end of the trading day. Buyers staged a comeback, pushing the pair back towards 0.6140. However, the short-term outlook still leans towards the downside, but the day's recovery is a positive sign for the pair.
According to the daily chart, the Relative Strength Index (RSI) at 53 suggests a neutral situation. This implies that the market is neither overbought nor oversold, providing some room for upward movement if the buying pressures can keep the momentum. However, the Moving Average Convergence Divergence (MACD) continues to print red bars, which confirms the presence of the sellers.
NZD/USD daily chart
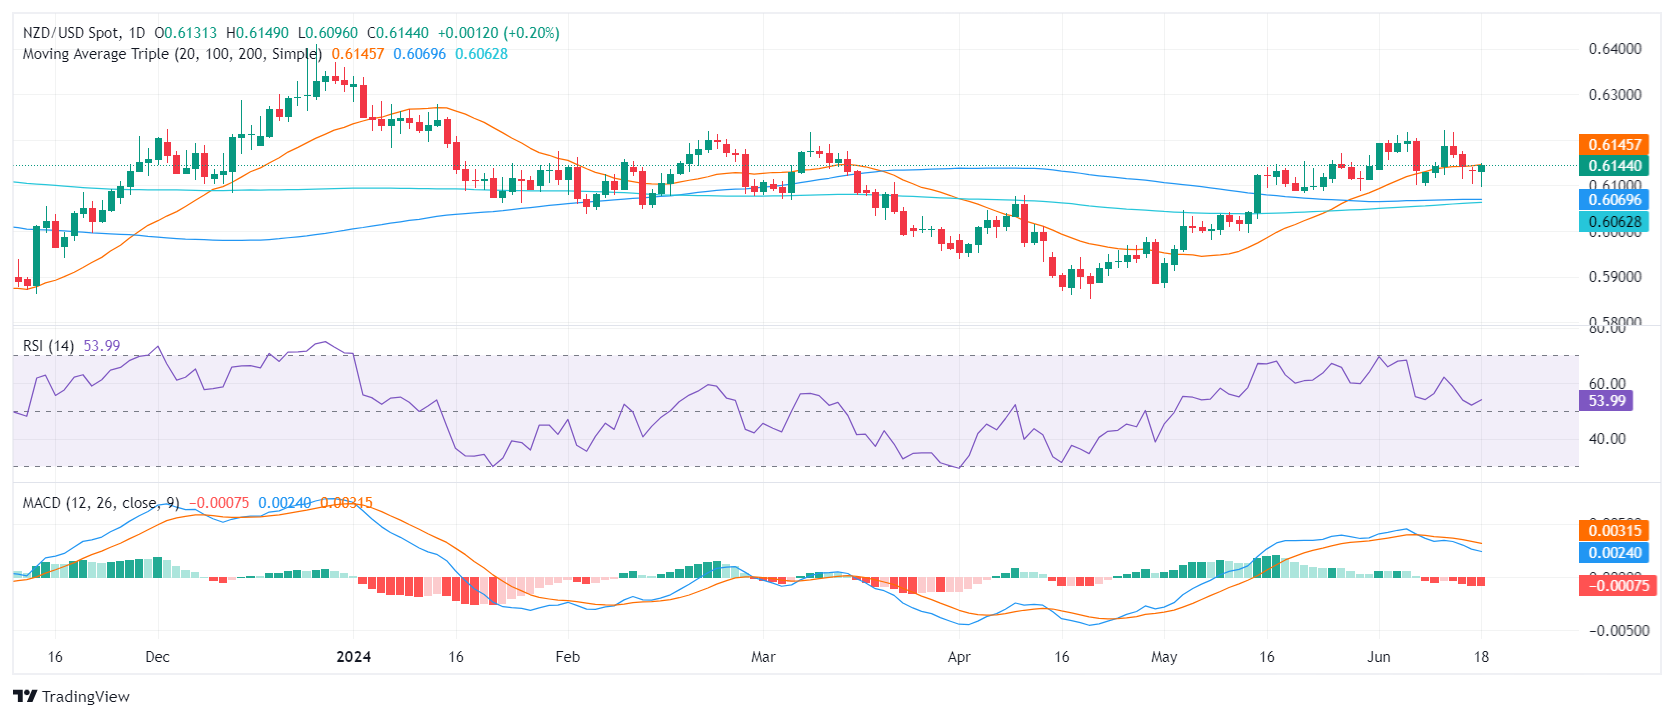
For the NZD/USD, the immediate support resides at 0.6100. Deeper support is available at the convergence of the 100-day and 200-day SMAs at 0.6069 and 0.6062 respectively, which can provide a solid footing for the pair in case of an extended downside move. A break below these SMA convergence points could point towards a huge sell signal.
In contrast, the pair's main resistance remains around the 20-day SMA at 0.6145 and above at the recent high at the 0.6220 level. A breakout above this consolidation range could be interpreted as a buy signal, suggesting the current bearish sentiment could be coming to an end.
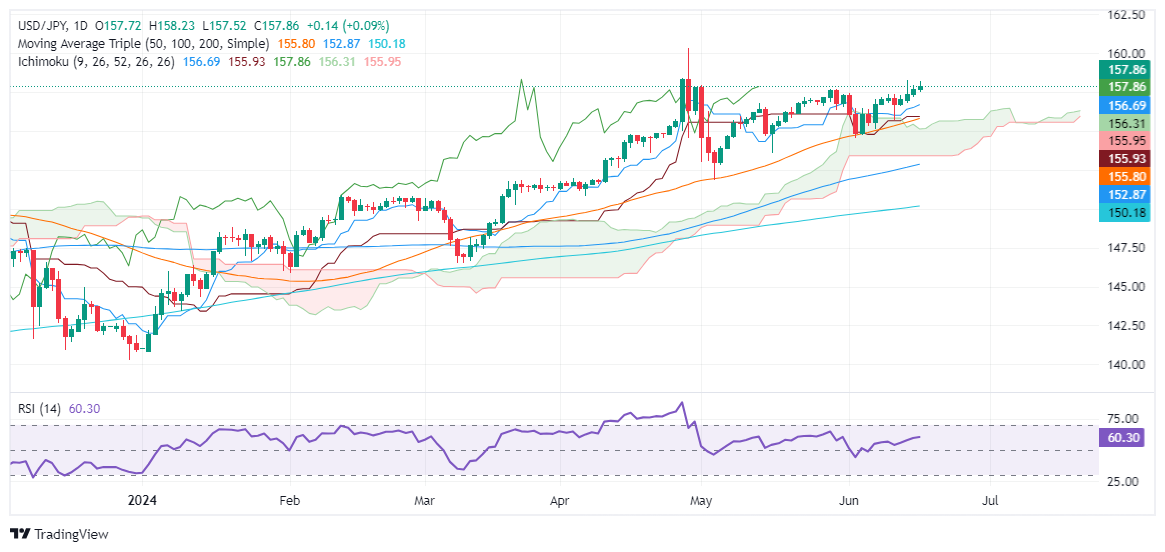
- USD/JPY reaches daily high above 158.00, trading above key moving averages.
- Technical indicators show bullish momentum, with resistance at 158.25 and 158.44.
- Key support levels include 157.00, Senkou Span A at 156.16, and Kijun-Sen at 155.93.
The USD/JPY edges higher for the fourth straight day and registers modest gains of 0.08% after hitting a daily high above 158.00. Fears that Japanese authorities could intervene in the FX space keep the pair within familiar levels, trading at 157.85 at the time of writing.
USD/JPY Price Analysis: Technical outlook
The uptrend in the USD/JPY remains, though price action suggests that buyers remain cautious on Japanese intervention woes. The major is trading above the 50, 100, and 200-day moving averages (DMAs), further confirming the upward bias supported by the Relatives Strength Index (RSI), which shows momentum is bullish.
If USD/JPY climbs above 158.00, the next resistance level would be the 158.25 high hit on June 17, followed by the April 26 peak at 158.44. If those levels are cleared, the year-to-date (YTD) high of 160.32 would be next.
Conversely, sellers can challenge key support levels if USD/JPY drops below 157.00. The first one would be the Senkou Span A at 156.16, followed by the Kijun-Sen at 155.93. The next demand area would be the Senkou Span B at 155.52.
USD/JPY Price Action – Daily Chart
- AUD/JPY got propelled near 105.00 on Tuesday, driven by the Reserve Bank of Australia RBA's hawkish hold.
- Tusaday's move confirms a positive short-term outlook.
- Fundamentals may have driven the pair out of the consolidation phase seen in the last sessions.
In Tuesday's session, the AUD/JPY pair received a boost following the Reserve Bank of Australia (RBA)'s hawkish hold, with the momentum propelling the pair towards the 105.00 level. In the last sessions, price action saw a consolidation above the 104.00 level, which supported the pair now to retest cycle highs.
On the daily scale, the Relative Strength Index (RSI) stands at 62, indicating rising buying pressure and shifting into bullish territory. However, it is important to observe that the Moving Average Convergence Divergence (MACD) line is below the signal line, hinting that there is still bearish activity. Traders will need to keep an eye on a possible crossover in the upcoming sessions to confirm the continuation of Tuesday's bullish movements.
AUD/JPY daily chart
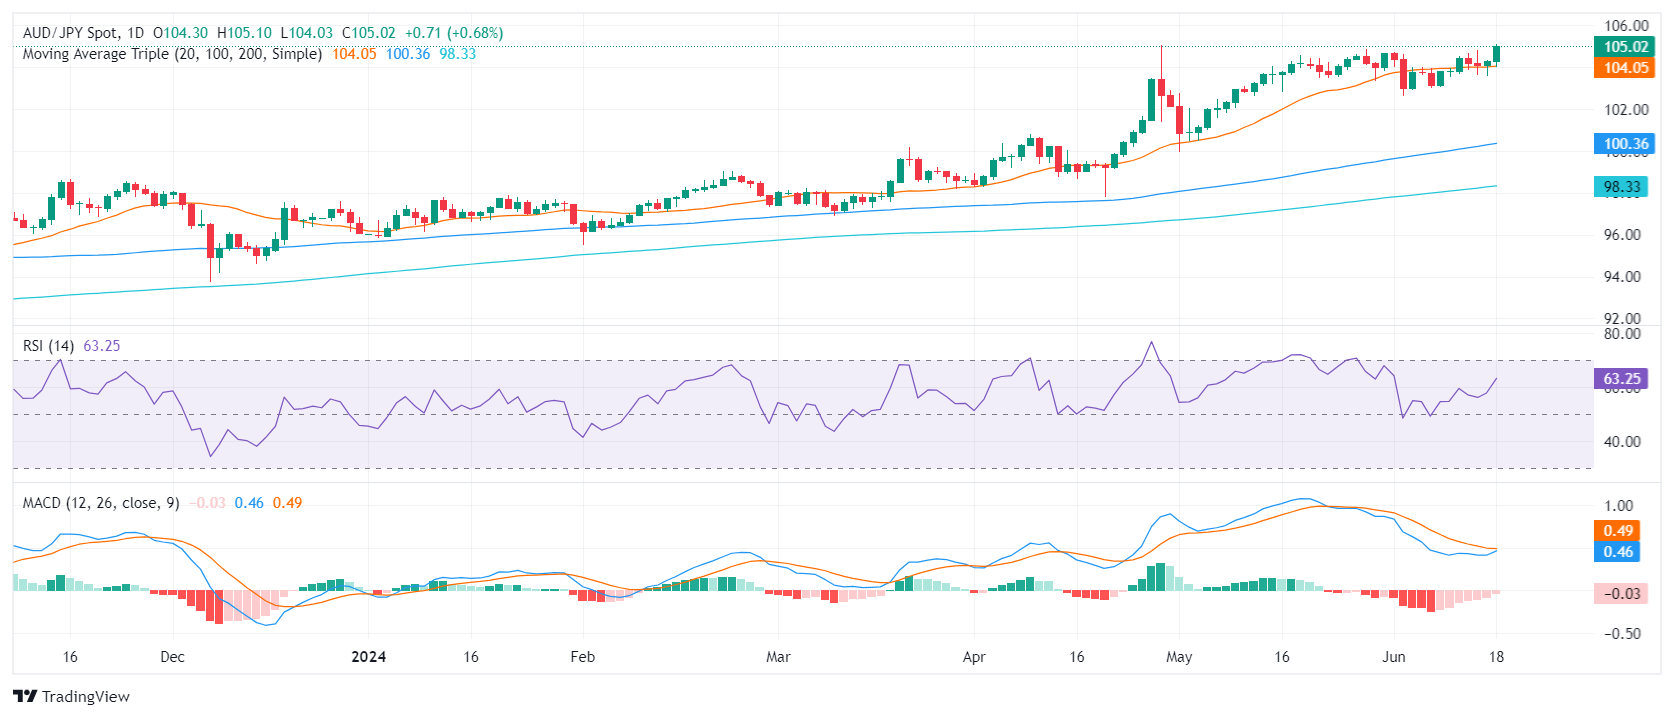
To sum it up, the AUD/JPY pair's solid performance on Tuesday supplements a broader bullish trend, with the trend's strength substantiated by the pair's value above the 20-day, 100-day, and 200-day SMAs. In the next sessions, traders can expect the pair to continue its uptrend movement within the 105.00-106.00 range as bulls have terrain to continue climbing with indicators far from overbought conditions.
On the flip side, if there is a breach below the established support level at 104.00 (20-day SMA), the pair may be prompted to find new support levels. The 102.50 and 100.35 levels are hence seen as the next potential support lines.
- Gold gains as softer-than-expected US Retail Sales boost rate cut expectations.
- Fed officials' comments reveal mixed views on the timing of potential rate cuts.
- 10-year Treasury yield drops six basis points to 4.219%, reflecting market speculation on future rate cuts.
Gold prices rose on Tuesday after economic data from the United States (US) hinted that consumer spending is constraining due to a softer-than-estimated Retail Sales report. This fueled speculation that the Federal Reserve (Fed) could begin its easing cycle this year. The XAU/USD trades at $2,327, up 0.51%.
The US Department of Commerce revealed that May’s Retail Sales improved compared to April’s data, which was downwardly revised but missed the mark. That data reignited investors' rate cut hopes as the Fed signaled in the last meeting that current monetary policy is appropriate.
Other data showed that Industrial Production improved in May, followed by a downward revision in April.
Aside from economic data, Fed officials have crossed the newswires. New York Fed President John Williams said that interest rates would decrease gradually if the disinflation process continued to evolve toward the Fed’s 2% annual core inflation goal. Despite dodging a question about a rate cut in September, he added, “I think that things are moving in the right direction.”
Richmond Fed President Thomas Barkin was cautious, saying he needs to see more data before easing. Later, Boston Fed President Susan Collins said she isn’t carried away about just one good reading on inflation and added that it’s not time to cut rates.
The newly named St. Louis Fed President, Alberto Musalem, stated that he needs to see an evolution in the disinflation process before voting to cut rates. He added that if inflation halts, he favors a rate hike, though it’s not his base case scenario.
Even though most policymakers struck a neutral stance, US Treasury yields reflect investors beginning to price in rate cuts. The 10-year Treasury note yield is down six basis points at 4.219%.
Data from the Chicago Board of Trade (CBOT) shows traders expect 36 bps of easing during the year via December’s 2024 fed funds rate contract.
Daily digest market movers: Gold price jumps as US yields drop
- US Dollar Index (DXY) decreased by 0.05% to 105.27, putting a lid on Gold prices.
- US Retail Sales for May increased by 0.1% MoM, improving from April's 0.2% decline but falling short of the 0.2% estimate. On an annual basis, sales decreased from 2.7% to 2.3%.
- US Industrial Production in May surpassed expectations of a 0.3% increase, rising by 0.9% MoM.
- Last week's CPI report raised the odds of a Fed rate cut in September from 57% to 62%, according to the CME FedWatch Tool.
- Despite the US CPI report showing that the disinflation process continues, Fed Chair Jerome Powell commented that they remain “less confident” about the progress on inflation.
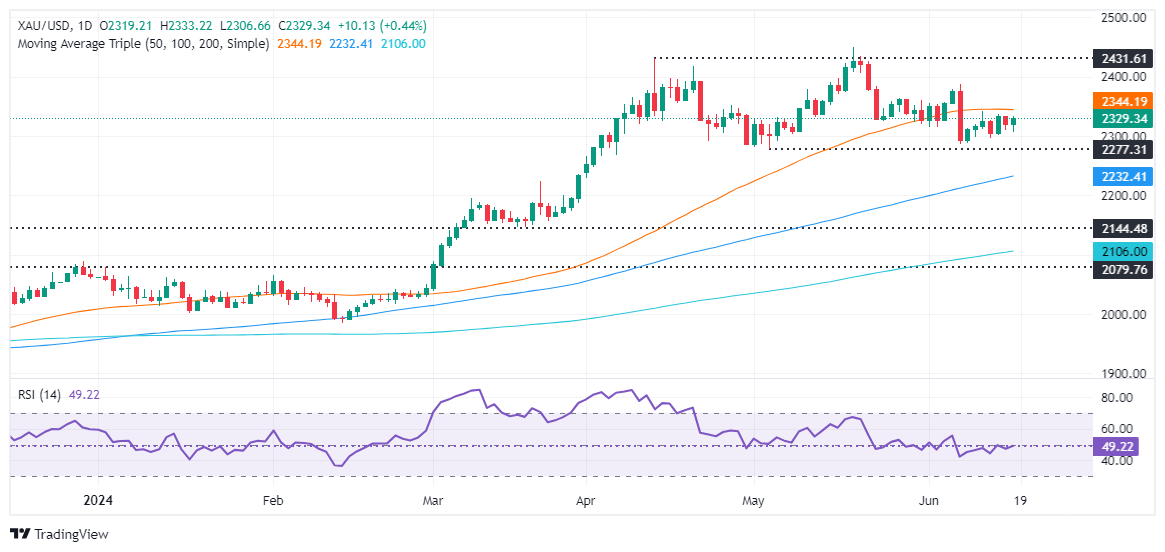
Technical analysis: Gold price remains bearishly biased despite rising
Gold price is neutral to downwardly biased as the bearish Head-and-Shoulders chart pattern remains in play. Although the yellow metal achieved a leg up in the near term, momentum favors sellers, which can be seen by the Relative Strength Index (RSI).
If XAU/USD drops below $2,300, the next support would be the May 3 low of $2,277, followed by the March 21 high of $2,222. Further losses lie beneath as sellers would eye the Head-and-Shoulders chart pattern objective from $2,170 to $2,160.
Conversely, if Gold extends its gains past $2,350, key resistance levels emerge like the June 7 cycle high of $2,387, ahead of challenging the $2,400 figure.
Gold FAQs
Gold has played a key role in human’s history as it has been widely used as a store of value and medium of exchange. Currently, apart from its shine and usage for jewelry, the precious metal is widely seen as a safe-haven asset, meaning that it is considered a good investment during turbulent times. Gold is also widely seen as a hedge against inflation and against depreciating currencies as it doesn’t rely on any specific issuer or government.
Central banks are the biggest Gold holders. In their aim to support their currencies in turbulent times, central banks tend to diversify their reserves and buy Gold to improve the perceived strength of the economy and the currency. High Gold reserves can be a source of trust for a country’s solvency. Central banks added 1,136 tonnes of Gold worth around $70 billion to their reserves in 2022, according to data from the World Gold Council. This is the highest yearly purchase since records began. Central banks from emerging economies such as China, India and Turkey are quickly increasing their Gold reserves.
Gold has an inverse correlation with the US Dollar and US Treasuries, which are both major reserve and safe-haven assets. When the Dollar depreciates, Gold tends to rise, enabling investors and central banks to diversify their assets in turbulent times. Gold is also inversely correlated with risk assets. A rally in the stock market tends to weaken Gold price, while sell-offs in riskier markets tend to favor the precious metal.
The price can move due to a wide range of factors. Geopolitical instability or fears of a deep recession can quickly make Gold price escalate due to its safe-haven status. As a yield-less asset, Gold tends to rise with lower interest rates, while higher cost of money usually weighs down on the yellow metal. Still, most moves depend on how the US Dollar (USD) behaves as the asset is priced in dollars (XAU/USD). A strong Dollar tends to keep the price of Gold controlled, whereas a weaker Dollar is likely to push Gold prices up.
- Dow Jones holding onto familiar levels with US markets set for mid-week break.
- US Retail Sales missed the mark on Tuesday, raising economic activity concerns.
- Investors are putting in double-duty trying to brush off Fed caution.
The Dow Jones Industrial Average (DJIA) is treading water on Tuesday as investors buckle down for the mid-week Juneteenth holiday. US Retail Sales missed the mark in May, and Federal Reserve (Fed) officials have been working double duty on Tuesday to try and tamp down broad-market expectations for an upcoming rate cut that may not materialize as policymakers await further signs of easing inflation.
US Retail Sales grew by a scant 0.1% MoM in May, missing the forecast 0.2%. The previous month’s print was also revised down to -0.2% from 0.0%. Core Retail Sales, or Retail Sales excluding automobiles, declined 0.1% and missing the forecast growth of 0.2%, with the previous release also getting revised to -0.1% from 0.2%.
Federal Reserve officials lean into cautious stance as policymakers wait for further signs of easing
A flurry of Fed official appearances on Tuesday hammered home the Fed’s desire to wait until more inflation data is collected before making any decisions on policy rates. Fed heads from multiple Federal Reserve banks noted that despite a sharp downturn in inflation in recent data, stubborn inflation prints from the first quarter of 2024 continue to spook rate discussions, and policymakers noted the relative strength of the US economy and a still-tight labor market as reasons there is no rush to deliver rate cuts at a pace that markets continue to hope for.
At current cut, the CME’s FedWatch Tool still shows that rate markets are pricing in nearly 70% odds of at least a quarter-point rate trim from the Fed in September.
Dow Jones news
The Dow Jones is roughly balanced on Tuesday, with roughly half of the index’s constituent securities in the green for the day. Losses are being led by Boeing Co. (BA), which declined nearly 2% to $174.94 per share. Goldman Sachs Group Inc. (GS) climbed 1.5% to $456.96 per share, closely followed by Verizon Communications Inc. (VZ), which gained 1.4% to cross above $40.00 per share.
Dow Jones technical outlook
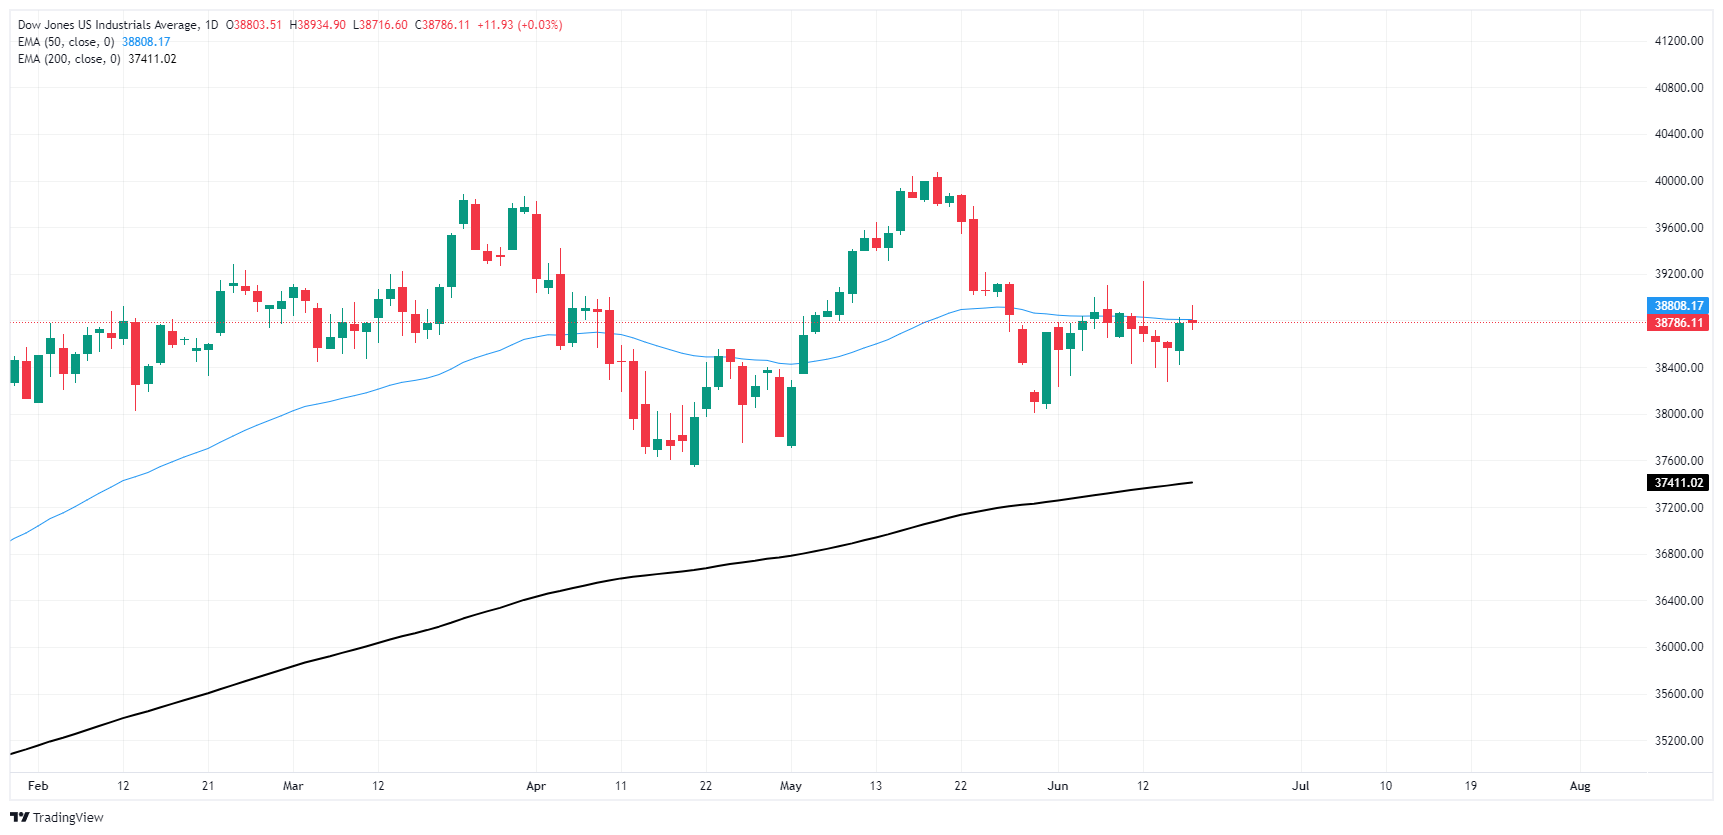
The Dow Jones is hamstrung in the middle on Tuesday, cycling chart territory around 38,800.00 as markets struggle to find a reason to push too far in either direction. The DJIA is trading into technical congestion at the 50-day Exponential Moving Average (EMA) at 38,808.33, and daily candlesticks are swamped out in the middle despite holding tightly to bullish chart levels above the 200-day EMA at 37,411.02.
Dow Jones five minute chart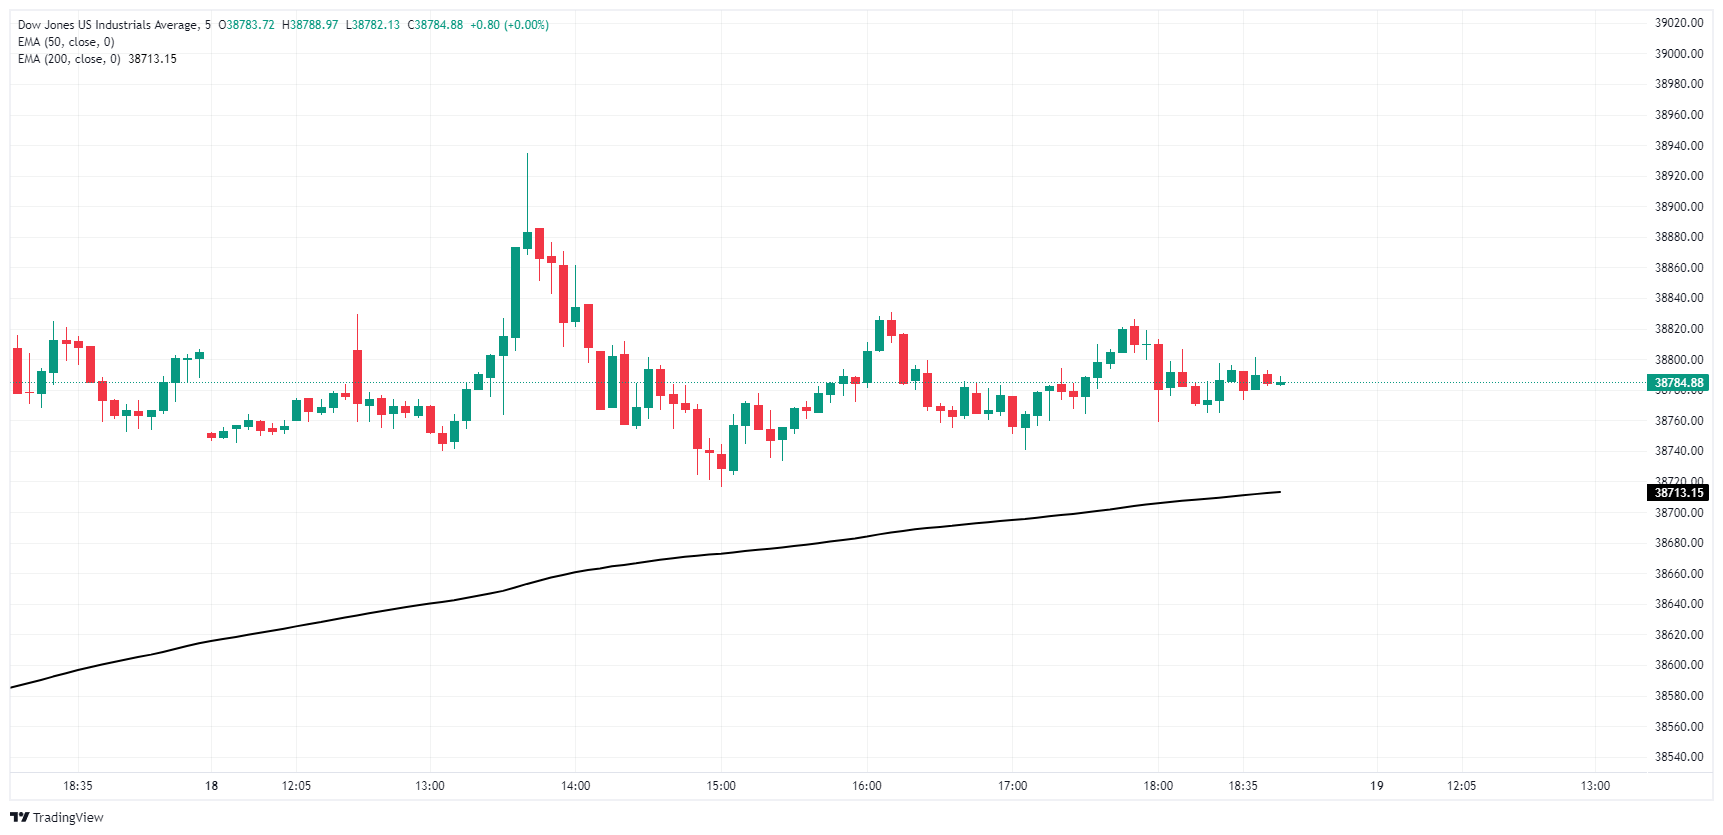
Dow Jones daily chart
Dow Jones FAQs
The Dow Jones Industrial Average, one of the oldest stock market indices in the world, is compiled of the 30 most traded stocks in the US. The index is price-weighted rather than weighted by capitalization. It is calculated by summing the prices of the constituent stocks and dividing them by a factor, currently 0.152. The index was founded by Charles Dow, who also founded the Wall Street Journal. In later years it has been criticized for not being broadly representative enough because it only tracks 30 conglomerates, unlike broader indices such as the S&P 500.
Many different factors drive the Dow Jones Industrial Average (DJIA). The aggregate performance of the component companies revealed in quarterly company earnings reports is the main one. US and global macroeconomic data also contributes as it impacts on investor sentiment. The level of interest rates, set by the Federal Reserve (Fed), also influences the DJIA as it affects the cost of credit, on which many corporations are heavily reliant. Therefore, inflation can be a major driver as well as other metrics which impact the Fed decisions.
Dow Theory is a method for identifying the primary trend of the stock market developed by Charles Dow. A key step is to compare the direction of the Dow Jones Industrial Average (DJIA) and the Dow Jones Transportation Average (DJTA) and only follow trends where both are moving in the same direction. Volume is a confirmatory criteria. The theory uses elements of peak and trough analysis. Dow’s theory posits three trend phases: accumulation, when smart money starts buying or selling; public participation, when the wider public joins in; and distribution, when the smart money exits.
There are a number of ways to trade the DJIA. One is to use ETFs which allow investors to trade the DJIA as a single security, rather than having to buy shares in all 30 constituent companies. A leading example is the SPDR Dow Jones Industrial Average ETF (DIA). DJIA futures contracts enable traders to speculate on the future value of the index and Options provide the right, but not the obligation, to buy or sell the index at a predetermined price in the future. Mutual funds enable investors to buy a share of a diversified portfolio of DJIA stocks thus providing exposure to the overall index.
The FX universe traded in a flattish mood on Tuesday, while investors remained mainly focused on the timing of Fed rate cuts. Next of note will be the release of UK inflation data ahead of the BoE gathering, while flash PMIs will close the week.
Here is what you need to know on Wednesday, June 19:
The USD Index (DXY) alternated gains with losses around 105.30 amidst declining yields across the curve. The NAHB Housing Market Index will be only due on June 19.
EUR/USD could not sustain an early uptick to 1.0760, receding to the 1.0730 region as the US session drew to a close. On June 19, EMU’s Current Account and Construction Output will be published.
GBP/USD traded in a vacillating fashion and ended barely changing just above the 1.2700 barrier. The release of the UK Inflation Rate takes centre stage on June 19.
USD/JPY kept the constructive view unchanged, although a close above 158.00 remained elusive. The Reuters Tankan Index, Balance of Trade results and the BoJ Minutes are all due on June 19.
AUD/USD regained composure and partially faded three consecutive sessions of losses. The Australian calendar is empty on June 19.
WTI prices added to the ongoing uptrend and advanced to seven-week highs near the $81.00 mark per barrel.
Gold prices maintained their consolidative range intact around the $2,330 region per troy ounce on the back of weak yields and the lack of direction in the Dollar. Silver charted humble gains, although it remained below the key $30.00 mark per ounce.
- AUD/USD recovered much of its previous losses in Tuesday’s session, following RBA decision.
- USD started the week softly, and its declines extended following weak Retail Sales figures.
- If the Fed and RBA policies diverge, the Aussie might see further gains.
The Australian Dollar (AUD) witnessed sizable gains against the US Dollar (USD) following Tuesday’s Reserve Bank of Australia (RBA) meeting, which concluded with a hawkish hold.
Despite the underlying weakness in the Australian economy, stubbornly high inflation has prompted the RBA to postpone rate cuts. On the US side, disinflation signals have boosted confidence in a September interest rate cut by the Federal Reserve (Fed).
Daily digest market movers: Australian Dollar buoyant after RBA’s hawkish hold
- Reserve Bank of Australia, as widely expected, left the cash rate static at 4.35% and reiterated that “the Board is not ruling anything in or out.”
- Furthermore, Governor Bullock confirmed that the board discussed rate hike options with a rate cut not being contemplated at this time.
- Resolute tone surrounding Australia's inflation backdrop implies that threshold for policy easement remains high.
- RBA disclosed that "inflation remains above target and proves persistent" and reiterated that "the Board anticipates it will be a while still before inflation is sustainably within the target range."
- On the US front, the US Census Bureau released that Retail Sales, a crucial measure of household spending, grew at a slower-than-anticipated pace in May of 0.1% against the projected 0.2%.
- Slower Retail Sales growth might create significant pressure on the US Dollar, as it is set to bolster investors' belief in the gradual disinflation process.
- CME FedWatch Tool indicates higher probabilities of interest rates starting to decrease from the September meeting, with one or more rate cuts implied in November or December.
Technical analysis: Bullish signals gain traction, pending confirmation
The Relative Strength Index (RSI) has now risen above 50, signifying a shift in momentum. Concurrently, the Moving Average Convergence Divergence (MACD) registers shrinking red bars, hinting at declining selling pressure and a potential reversal.
However, the short-term outlook remains negative unless buyers consolidate above the 20-day Simple Moving Average (SMA) now set at 0.6640. As the AUD/USD struggles with the 20-day SMA, investors should continue to monitor the region of 0.6560-0.6550, where the 100-day and 200-day Simple Moving Averages (SMAs) meet. That support level might be retested in the upcoming sessions if bulls fail to confirm their surge.
Australian Dollar FAQs
One of the most significant factors for the Australian Dollar (AUD) is the level of interest rates set by the Reserve Bank of Australia (RBA). Because Australia is a resource-rich country another key driver is the price of its biggest export, Iron Ore. The health of the Chinese economy, its largest trading partner, is a factor, as well as inflation in Australia, its growth rate and Trade Balance. Market sentiment – whether investors are taking on more risky assets (risk-on) or seeking safe-havens (risk-off) – is also a factor, with risk-on positive for AUD.
The Reserve Bank of Australia (RBA) influences the Australian Dollar (AUD) by setting the level of interest rates that Australian banks can lend to each other. This influences the level of interest rates in the economy as a whole. The main goal of the RBA is to maintain a stable inflation rate of 2-3% by adjusting interest rates up or down. Relatively high interest rates compared to other major central banks support the AUD, and the opposite for relatively low. The RBA can also use quantitative easing and tightening to influence credit conditions, with the former AUD-negative and the latter AUD-positive.
China is Australia’s largest trading partner so the health of the Chinese economy is a major influence on the value of the Australian Dollar (AUD). When the Chinese economy is doing well it purchases more raw materials, goods and services from Australia, lifting demand for the AUD, and pushing up its value. The opposite is the case when the Chinese economy is not growing as fast as expected. Positive or negative surprises in Chinese growth data, therefore, often have a direct impact on the Australian Dollar and its pairs.
Iron Ore is Australia’s largest export, accounting for $118 billion a year according to data from 2021, with China as its primary destination. The price of Iron Ore, therefore, can be a driver of the Australian Dollar. Generally, if the price of Iron Ore rises, AUD also goes up, as aggregate demand for the currency increases. The opposite is the case if the price of Iron Ore falls. Higher Iron Ore prices also tend to result in a greater likelihood of a positive Trade Balance for Australia, which is also positive of the AUD.
The Trade Balance, which is the difference between what a country earns from its exports versus what it pays for its imports, is another factor that can influence the value of the Australian Dollar. If Australia produces highly sought after exports, then its currency will gain in value purely from the surplus demand created from foreign buyers seeking to purchase its exports versus what it spends to purchase imports. Therefore, a positive net Trade Balance strengthens the AUD, with the opposite effect if the Trade Balance is negative.
Federal Reserve (Fed) Bank of Chicago President Austan Goolsbee noted on Tuesday that recent inflation figures have been very positive, and Fed officials hope to see further easing in the future.
Key highlights
Inflation number that came out during last week's meeting was "excellent".
Hopefully we'll see more data like that.
We will get to 2% inflation.
There is still a little bit of "juice" left after last year's rapid inflation decline.
Fed FAQs
Monetary policy in the US is shaped by the Federal Reserve (Fed). The Fed has two mandates: to achieve price stability and foster full employment. Its primary tool to achieve these goals is by adjusting interest rates. When prices are rising too quickly and inflation is above the Fed’s 2% target, it raises interest rates, increasing borrowing costs throughout the economy. This results in a stronger US Dollar (USD) as it makes the US a more attractive place for international investors to park their money. When inflation falls below 2% or the Unemployment Rate is too high, the Fed may lower interest rates to encourage borrowing, which weighs on the Greenback.
The Federal Reserve (Fed) holds eight policy meetings a year, where the Federal Open Market Committee (FOMC) assesses economic conditions and makes monetary policy decisions. The FOMC is attended by twelve Fed officials – the seven members of the Board of Governors, the president of the Federal Reserve Bank of New York, and four of the remaining eleven regional Reserve Bank presidents, who serve one-year terms on a rotating basis.
In extreme situations, the Federal Reserve may resort to a policy named Quantitative Easing (QE). QE is the process by which the Fed substantially increases the flow of credit in a stuck financial system. It is a non-standard policy measure used during crises or when inflation is extremely low. It was the Fed’s weapon of choice during the Great Financial Crisis in 2008. It involves the Fed printing more Dollars and using them to buy high grade bonds from financial institutions. QE usually weakens the US Dollar.
Quantitative tightening (QT) is the reverse process of QE, whereby the Federal Reserve stops buying bonds from financial institutions and does not reinvest the principal from the bonds it holds maturing, to purchase new bonds. It is usually positive for the value of the US Dollar.
Federal Reserve (Fed) Bank of St. Louis President Alberto Musalem noted on Tuesday that inflation progress may be a longer, slower process than many market participants currently hope. St. Lousi Fed President noted specifically that the labor market remains particularly tight, and that it could take entire months or quarters before policies drag inflation back to convicing Fed target levels.
Key highlights
I need to observe a period of favorable inflation, moderating demand and expanding supply before he will have confidence for an interest rate cut.
The retail sales data for May suggests aggregate demand is growing at a moderate pace so far in Q2.
I will remain vigilant until inflation is clearly and convincingly is well on its way back to 2%.
If inflation becomes stuck meaningfully above 2% or moves higher, I would support additional policy tightening.
These conditions could take months and more likely quarters to play out.
I expect some further cooling in labor market in coming months.
The labor market no longer seems overheated, but remains tight.
I expect aggregate consumption to moderate in coming quarters without stalling and then return to or slightly exceed trend by 2026.
Financial conditions feel accommodative in some parts of the economy, and restrictive in others.
It is possible that monetary policy transmission may be slower this cycle.
Personal Consumption Expenditures Price Index should show welcome downshift of inflation in May.
The current monetary policy stance seems restrictive, but there is some uncertainty about to what degree.
Continued high employment and wage growth should moderate impact of easing labor market conditions on aggregate demand.
There are potential early signs of continued progress on inflation.
Fed FAQs
Monetary policy in the US is shaped by the Federal Reserve (Fed). The Fed has two mandates: to achieve price stability and foster full employment. Its primary tool to achieve these goals is by adjusting interest rates. When prices are rising too quickly and inflation is above the Fed’s 2% target, it raises interest rates, increasing borrowing costs throughout the economy. This results in a stronger US Dollar (USD) as it makes the US a more attractive place for international investors to park their money. When inflation falls below 2% or the Unemployment Rate is too high, the Fed may lower interest rates to encourage borrowing, which weighs on the Greenback.
The Federal Reserve (Fed) holds eight policy meetings a year, where the Federal Open Market Committee (FOMC) assesses economic conditions and makes monetary policy decisions. The FOMC is attended by twelve Fed officials – the seven members of the Board of Governors, the president of the Federal Reserve Bank of New York, and four of the remaining eleven regional Reserve Bank presidents, who serve one-year terms on a rotating basis.
In extreme situations, the Federal Reserve may resort to a policy named Quantitative Easing (QE). QE is the process by which the Fed substantially increases the flow of credit in a stuck financial system. It is a non-standard policy measure used during crises or when inflation is extremely low. It was the Fed’s weapon of choice during the Great Financial Crisis in 2008. It involves the Fed printing more Dollars and using them to buy high grade bonds from financial institutions. QE usually weakens the US Dollar.
Quantitative tightening (QT) is the reverse process of QE, whereby the Federal Reserve stops buying bonds from financial institutions and does not reinvest the principal from the bonds it holds maturing, to purchase new bonds. It is usually positive for the value of the US Dollar.
- Mexican Peso rises as Private Spending and Aggregate Demand show solid economic performance.
- Political concerns ease with support for AMLO’s judiciary reform, discussions to start soon.
- US Dollar weakened by lower-than-expected Retail Sales and downward revisions for previous months.
The Mexican Peso registered solid gains on Tuesday against the Greenback due to upbeat Mexican economic data and a softer-than-expected Retail Sales report from the United States (US). Woes surrounding changes to the Mexican Constitution had eased, a tailwind for the emerging market currency. The USD/MXN trades at 18.40, down 0.67%
Mexico’s economic schedule revealed that Private Spending expanded more than 2023 last quarter in Q1 2024. Alongside that, Aggregate Demand shows the economy remains solid, and it might deter the Bank of Mexico (Banxico) from easing monetary policy due to risks of inflation reacceleration.
In the meantime, presumptive President Claudia Sheinbaum revealed that citizens support current President Andres Manuel Lopez Obrador's (AMLO) judiciary reform, according to three surveys commissioned by Mexico’s ruling party, Morena.
“These polls are information, they don't have another objective,” Sheinbaum said in a press conference. “This is just information to be considered in the discussions that will start in the coming days.”
Across the border, Retail Sales in May were slightly shy of estimates, a sign of economic slowdown. However, downward revisions for the previous months hurt the US Dollar, which according to the US Dollar Index (DXY), edges down 0.05% at 105.28
Despite that, the USD/MXN exchange rate would continue to be driven by political uncertainty as some of the reforms pushed by AMLO to change the Mexican Constitution threaten the state of law.
Daily digest market movers: Mexican Peso on defensive amid risk-aversion
- Mexico’s Aggregate Demand for Q1 2024 rose by 1.5% QoQ, exceeding 2023’s Q4 by 0.4%. In the twelve months to Q2, it expanded 2.6% YoY, above the 2.2% in Q4 2023.
- Private Spending grew 1.5% QoQ in the first quarter of 2024, above the previous 0.9% reading. In the yearly comparison, spending rose by 3.6%, lower than the 5.1% in the previous figures.
- USD/MXN stabilizes following last week’s verbal intervention by Banxico Governor Victoria Rodriguez Ceja, who said the central bank is attentive to volatility in the Mexican currency exchange rate and could act to restore “order” in markets.
- Today’s data and the Mexican currency depreciation could deter Banxico from easing policy in the next meeting on June 27. A rate cut could weaken the Mexican Peso and expose the USD/MXN year-to-date high at 18.99.
- US Retail Sales for May came at 0.1% MoM, which improved compared to April’s -0.2% plunge but still missed the estimates of 0.2%. Annually based, sales dipped from 2.7% to 2.3%.
- US Industrial Production in May exceeded projections of 0.3%, increasing by 0.9% MoM.
- Last week’s CPI report increased the odds of a Fed rate cut in September from 57% to 62%, according to the CME FedWatch Tool.
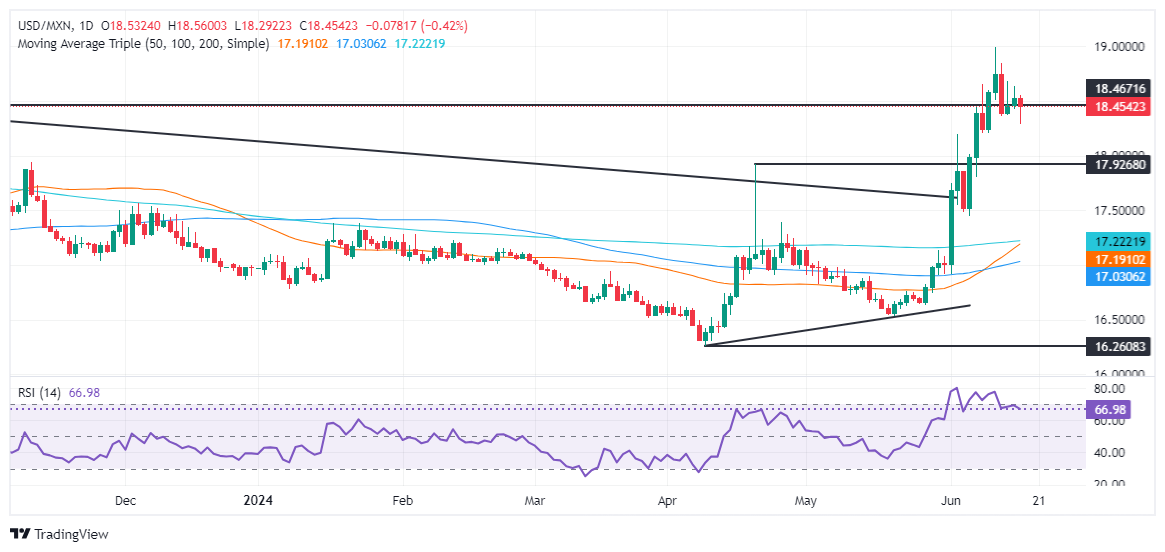
Technical analysis: Mexican Peso remains firm as USD/MXN drops below 18.50
The USD/MXN is bullishly biased despite dipping to a five-day low of 18.29 as momentum shows buyers are in charge. The Relative Strength Index (RSI) is bullish above the 50-midline, indicating that bullish momentum is intact.
Buyers achieving a daily close above 18.50 could pave the way for further upside. Next would be the year-to-date high of 18.99, followed by the March 20, 2023, high of 19.23. A breach of the latter will sponsor an uptick to 19.50, ahead of the psychological 20.00 mark.
Conversely, if sellers push prices below the April 19 high of 18.15, that will keep the exotic pair trading within the 18.00-18.15 range.
Mexican Peso FAQs
The Mexican Peso (MXN) is the most traded currency among its Latin American peers. Its value is broadly determined by the performance of the Mexican economy, the country’s central bank’s policy, the amount of foreign investment in the country and even the levels of remittances sent by Mexicans who live abroad, particularly in the United States. Geopolitical trends can also move MXN: for example, the process of nearshoring – or the decision by some firms to relocate manufacturing capacity and supply chains closer to their home countries – is also seen as a catalyst for the Mexican currency as the country is considered a key manufacturing hub in the American continent. Another catalyst for MXN is Oil prices as Mexico is a key exporter of the commodity.
The main objective of Mexico’s central bank, also known as Banxico, is to maintain inflation at low and stable levels (at or close to its target of 3%, the midpoint in a tolerance band of between 2% and 4%). To this end, the bank sets an appropriate level of interest rates. When inflation is too high, Banxico will attempt to tame it by raising interest rates, making it more expensive for households and businesses to borrow money, thus cooling demand and the overall economy. Higher interest rates are generally positive for the Mexican Peso (MXN) as they lead to higher yields, making the country a more attractive place for investors. On the contrary, lower interest rates tend to weaken MXN.
Macroeconomic data releases are key to assess the state of the economy and can have an impact on the Mexican Peso (MXN) valuation. A strong Mexican economy, based on high economic growth, low unemployment and high confidence is good for MXN. Not only does it attract more foreign investment but it may encourage the Bank of Mexico (Banxico) to increase interest rates, particularly if this strength comes together with elevated inflation. However, if economic data is weak, MXN is likely to depreciate.
As an emerging-market currency, the Mexican Peso (MXN) tends to strive during risk-on periods, or when investors perceive that broader market risks are low and thus are eager to engage with investments that carry a higher risk. Conversely, MXN tends to weaken at times of market turbulence or economic uncertainty as investors tend to sell higher-risk assets and flee to the more-stable safe havens.
Lorie Logan, President of the Reserve Bank of Dallas reiterated that inflation remains too high, although tremendoous progress has been made.
Key Takeaways
I am optimistic about generative ai's effect on productivity.
Understanding how much effect ai will have will take time to know, will have implications for monetary policy.
Inflation is still too high, but have made tremendous progress.
'Great to see' cpi data, will need to see 'several more months' to have confidence heading to 2%.
Will be watching data in coming months quite closely.
In a good position, to be patient, on policy.
Will be watching and seeing what's happening in the economy.
Neutral rate is probably higher now than it was before pandemic.
My guess is we don't go back to the low rates before the pandemic.
We are seeing the economy come into better balance, but still worried about upside risks to inflation.
Still see some lingering supply chain issues.
- Canadian Dollar churns as market focus gets pulled elsewhere.
- Canada remains absent from the economic calendar until Wednesday.
- Mid-week release of the BoC’s Summary of Deliberations on the cards.
The Canadian Dollar (CAD) is broadly mixed on Tuesday as CAD traders find their focus pulled elsewhere. A data-light week has sent the Canadian Dollar adrift, giving a mixed performance against the major currencies board.
Canada has a low-impact week on the cards with strictly mid-tier data releases scheduled. However, CAD traders will still want to keep an eye out for the Bank of Canada’s (BoC) latest Summary of Deliberations slated to be released on Wednesday, as well as Canadian Retail Sales scheduled for Friday.
Daily digest market movers: CAD set adrift as Fedspeak, US data dominate
- A plurality of policymakers from the US Federal Reserve (Fed) are making appearances on Tuesday, working steadily to try and force down rate cut expectations amidst stubbornly-high inflation.
- Fed policymakers remain cautious on inflation, gradual progress expected
- US Retail Sales failed to recover as strongly as forecasts anticipated in May, coming in at 0.1% versus the expected 0.2%. The previous month’s figure was also revised lower to -0.2% from the initial 0.0%.
- US Retail Sales ex Autos declined 0.1% in May, flubbing the 0.2% forecast while the previous print was also revised down to -0.1% from 0.2%.
- BoC’s Summary of Deliberations on Wednesday are unlikely to reveal much new from the Canadian central bank, but there won’t be much else for CAD traders to watch with US markets slated to be shuttered for the Juneteenth holiday.
Canadian Dollar PRICE Today
The table below shows the percentage change of Canadian Dollar (CAD) against listed major currencies today. Canadian Dollar was the strongest against the British Pound.
| USD | EUR | GBP | JPY | CAD | AUD | NZD | CHF | |
|---|---|---|---|---|---|---|---|---|
| USD | -0.05% | 0.03% | 0.02% | -0.03% | -0.63% | -0.22% | -0.63% | |
| EUR | 0.05% | 0.07% | 0.05% | 0.04% | -0.60% | -0.17% | -0.58% | |
| GBP | -0.03% | -0.07% | -0.02% | -0.05% | -0.66% | -0.23% | -0.66% | |
| JPY | -0.02% | -0.05% | 0.02% | -0.03% | -0.65% | -0.22% | -0.65% | |
| CAD | 0.03% | -0.04% | 0.05% | 0.03% | -0.61% | -0.21% | -0.60% | |
| AUD | 0.63% | 0.60% | 0.66% | 0.65% | 0.61% | 0.41% | -0.00% | |
| NZD | 0.22% | 0.17% | 0.23% | 0.22% | 0.21% | -0.41% | -0.42% | |
| CHF | 0.63% | 0.58% | 0.66% | 0.65% | 0.60% | 0.00% | 0.42% |
The heat map shows percentage changes of major currencies against each other. The base currency is picked from the left column, while the quote currency is picked from the top row. For example, if you pick the Canadian Dollar from the left column and move along the horizontal line to the US Dollar, the percentage change displayed in the box will represent CAD (base)/USD (quote).
Technical analysis: Canadian Dollar gives mixed performance on Tuesday
The Canadian Dollar (CAD) is broadly mixed on Tuesday, gaining ground against the US Dollar (USD) and Japanese Yen (JPY) but falling back against the Swiss Franc (CHF) and Australian Dollar (AUD). The CAD climbed around a quarter of one percent against the Yen and a scant tenth of one percent against the Greenback, but fell nearly seven-tenths of one percent against the Swiss Franc and decline half of a percent against the Aussie.
USD/CAD slipped back into all-too-familiar consolidation levels on Tuesday, treading water in a rough consolidation range between 1.3760 and 1.3720. Near-term momentum remains hung up on median bids at the 200-hour Exponential Moving Average (EMA) at 1.3730.
Despite holding in bullish territory above the 50-day EMA at 1.3674, daily candlesticks remain sluggish, trading on the low side of last week’s peak bids near 1.3790. Bullish momentum has drained out of USD/CAD, and bidders may be primed for a fallback to rising technical support below the 1.3700 handle.
USD/CAD hourly chart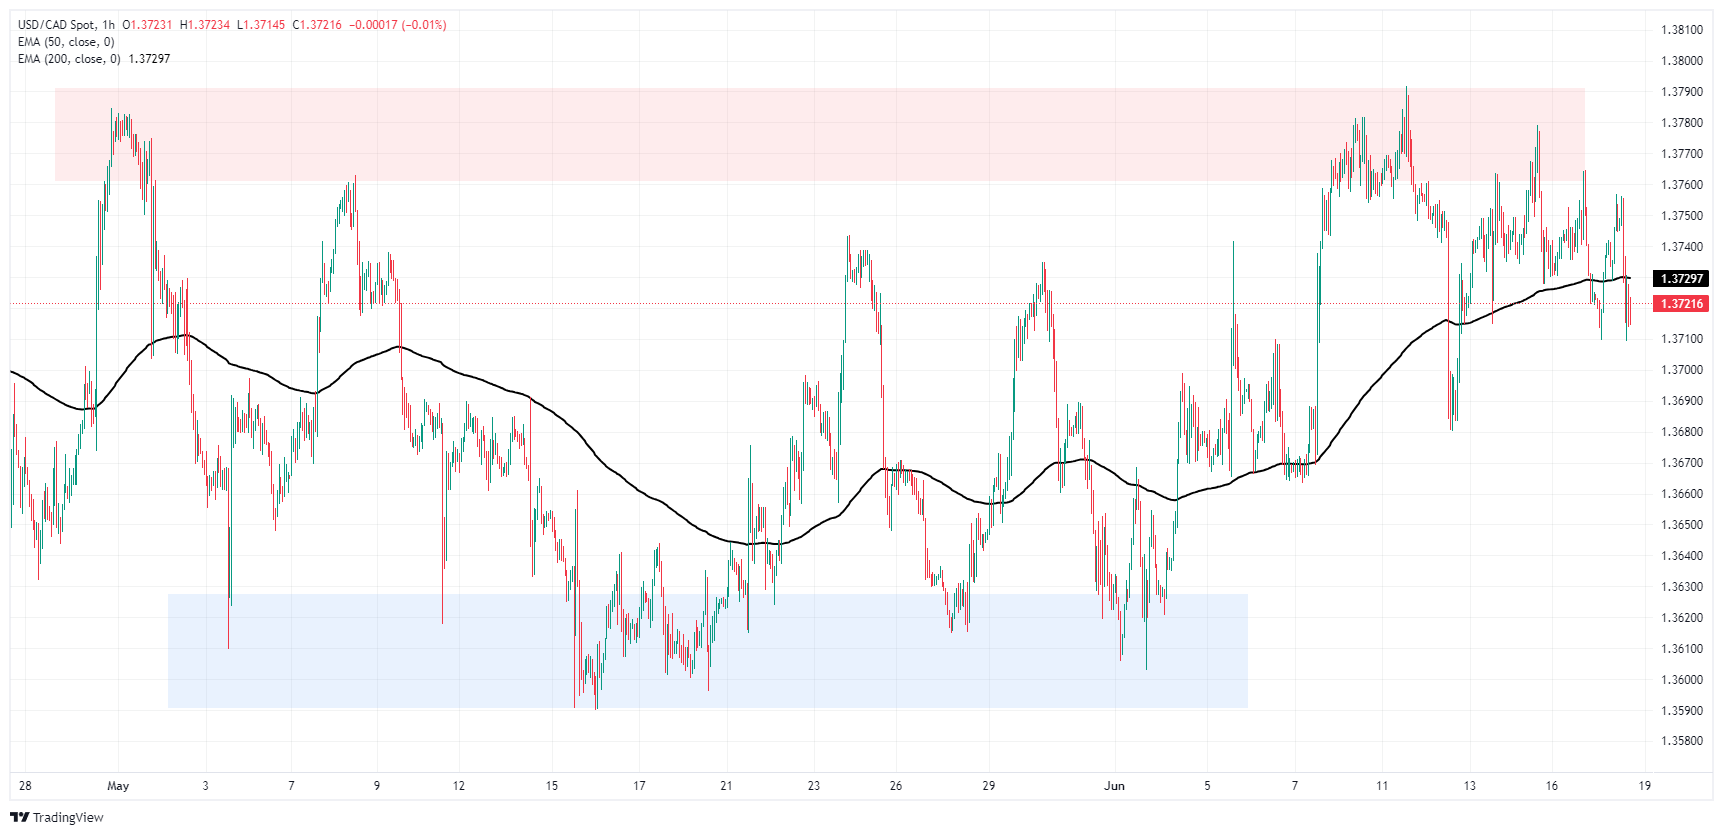
USD/CAD daily chart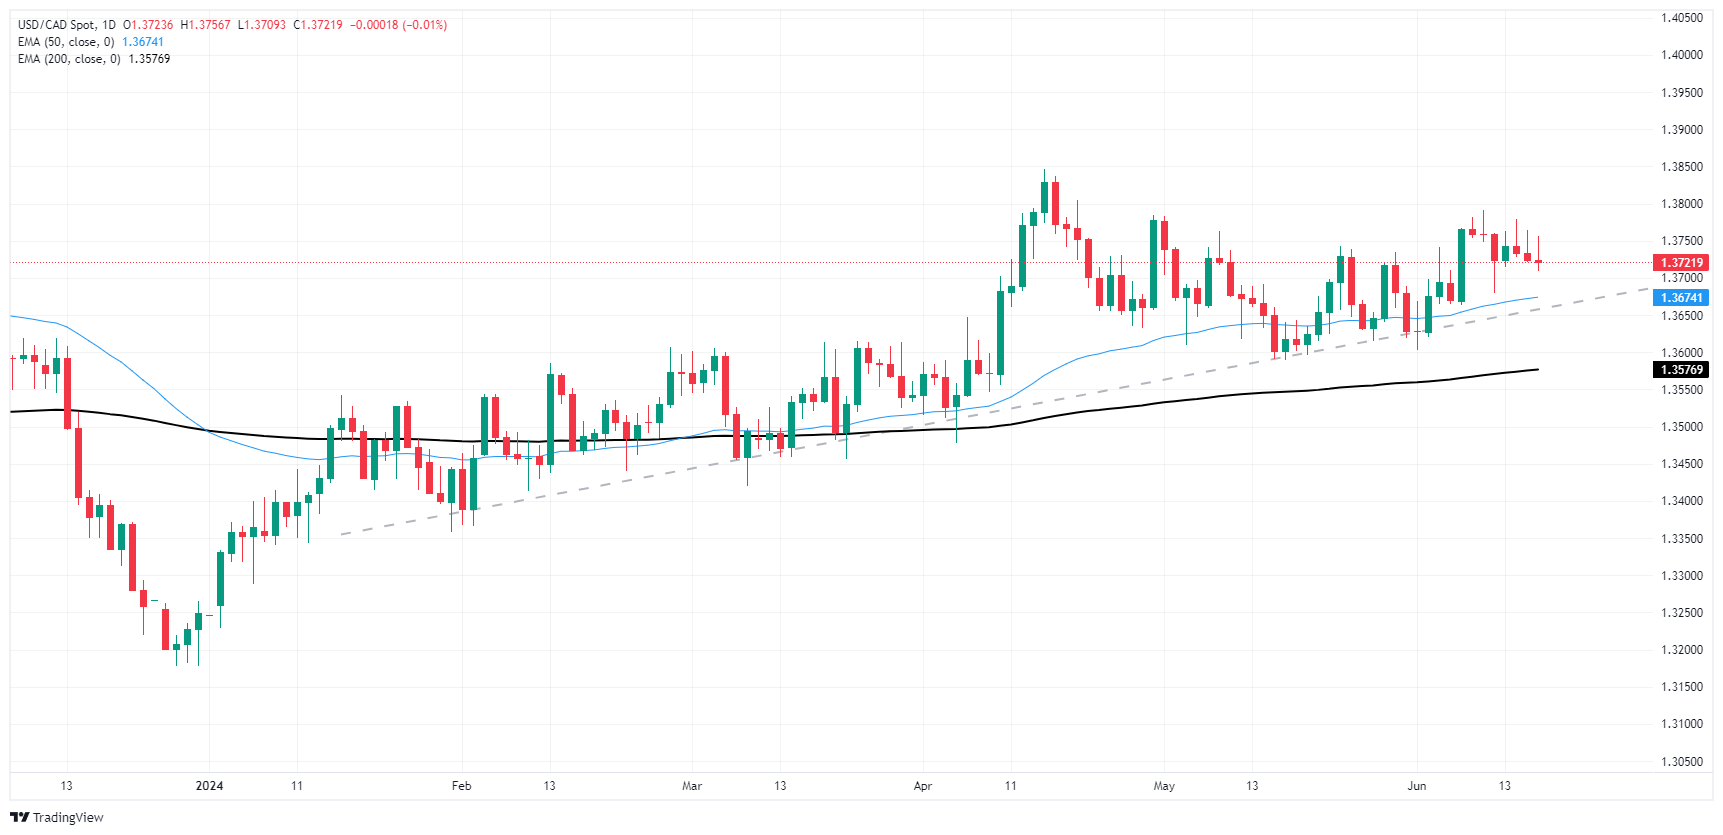
Canadian Dollar FAQs
The key factors driving the Canadian Dollar (CAD) are the level of interest rates set by the Bank of Canada (BoC), the price of Oil, Canada’s largest export, the health of its economy, inflation and the Trade Balance, which is the difference between the value of Canada’s exports versus its imports. Other factors include market sentiment – whether investors are taking on more risky assets (risk-on) or seeking safe-havens (risk-off) – with risk-on being CAD-positive. As its largest trading partner, the health of the US economy is also a key factor influencing the Canadian Dollar.
The Bank of Canada (BoC) has a significant influence on the Canadian Dollar by setting the level of interest rates that banks can lend to one another. This influences the level of interest rates for everyone. The main goal of the BoC is to maintain inflation at 1-3% by adjusting interest rates up or down. Relatively higher interest rates tend to be positive for the CAD. The Bank of Canada can also use quantitative easing and tightening to influence credit conditions, with the former CAD-negative and the latter CAD-positive.
The price of Oil is a key factor impacting the value of the Canadian Dollar. Petroleum is Canada’s biggest export, so Oil price tends to have an immediate impact on the CAD value. Generally, if Oil price rises CAD also goes up, as aggregate demand for the currency increases. The opposite is the case if the price of Oil falls. Higher Oil prices also tend to result in a greater likelihood of a positive Trade Balance, which is also supportive of the CAD.
While inflation had always traditionally been thought of as a negative factor for a currency since it lowers the value of money, the opposite has actually been the case in modern times with the relaxation of cross-border capital controls. Higher inflation tends to lead central banks to put up interest rates which attracts more capital inflows from global investors seeking a lucrative place to keep their money. This increases demand for the local currency, which in Canada’s case is the Canadian Dollar.
Macroeconomic data releases gauge the health of the economy and can have an impact on the Canadian Dollar. Indicators such as GDP, Manufacturing and Services PMIs, employment, and consumer sentiment surveys can all influence the direction of the CAD. A strong economy is good for the Canadian Dollar. Not only does it attract more foreign investment but it may encourage the Bank of Canada to put up interest rates, leading to a stronger currency. If economic data is weak, however, the CAD is likely to fall.
Federal Reserve (Fed) Board of Governors member Adriana Kugler delivered a speech at the Peterson Institute for International Economics on Tuesday, noting that while inflation remains too high, recent inflation data has been encouraging. Fed Governor Kugler also made a point of cautioning that progress to inflation targets may be gradual.
Key highlights
Monetary policy is sufficiently restrictive, economic conditions are moving in the right direction.
It is likely appropriate to begin easing policy sometimes later this year if economy evolves as expected.
I am optimistic on productivity growth, with surge in new businesses, and AI likely to diffuse quickly.
Preponderance of labor market data show supply, demand coming into better balance.
Most indicators point to a slow, steady easing in labor market.
If wage growth continues to moderate, will soon be at levels consistent with price stability.
I am optimistic that improving supply, and cooling demand will support continued disinflation.
Further progress on inflation likely to be gradual.
Policy has more work to do, judgment will be guided by data.
I am watching closely for any signs of labor market deterioration.
Inflation is too high, but I am encouraged by the renewed recent progress & trajectory.
I expect some cooling of economic activity to continue.
Fed FAQs
Monetary policy in the US is shaped by the Federal Reserve (Fed). The Fed has two mandates: to achieve price stability and foster full employment. Its primary tool to achieve these goals is by adjusting interest rates. When prices are rising too quickly and inflation is above the Fed’s 2% target, it raises interest rates, increasing borrowing costs throughout the economy. This results in a stronger US Dollar (USD) as it makes the US a more attractive place for international investors to park their money. When inflation falls below 2% or the Unemployment Rate is too high, the Fed may lower interest rates to encourage borrowing, which weighs on the Greenback.
The Federal Reserve (Fed) holds eight policy meetings a year, where the Federal Open Market Committee (FOMC) assesses economic conditions and makes monetary policy decisions. The FOMC is attended by twelve Fed officials – the seven members of the Board of Governors, the president of the Federal Reserve Bank of New York, and four of the remaining eleven regional Reserve Bank presidents, who serve one-year terms on a rotating basis.
In extreme situations, the Federal Reserve may resort to a policy named Quantitative Easing (QE). QE is the process by which the Fed substantially increases the flow of credit in a stuck financial system. It is a non-standard policy measure used during crises or when inflation is extremely low. It was the Fed’s weapon of choice during the Great Financial Crisis in 2008. It involves the Fed printing more Dollars and using them to buy high grade bonds from financial institutions. QE usually weakens the US Dollar.
Quantitative tightening (QT) is the reverse process of QE, whereby the Federal Reserve stops buying bonds from financial institutions and does not reinvest the principal from the bonds it holds maturing, to purchase new bonds. It is usually positive for the value of the US Dollar.
- US Dollar lost ground on lower-than-anticipated Retail Sales figures, which fuel dovish bets on the Fed.
- Markets are digesting comments from Fed officials for placing their bets on the rate cut cycle.
- Investors continue challenging the Fed and bet on more than one cut in 2024.
On Tuesday, the US Dollar, as measured by the DXY Index (DXY), registered a decline, settling at 105.30. This downturn was mainly invoked by markets reacting to recent comments from Federal Reserve (Fed) officials in combination with the less than anticipated Retail Sales data for May.
The US economic outlook is riddled with mixed signals, but signs of disinflation are starting to arise, which may weaken the USD.
Daily digest market movers: DXY under pressure on disappointing Retail Sales figures
- Markets are now processing words from Fed speakers along with the just-released Retail Sales figures for May.
- On the data front, the US Census Bureau reported May's Retail Sales data growth at a slower pace of 0.1% against the projected 0.2%.
- A softening in Retail Sales growth could potentially affect the US Dollar by affirming investors' belief in the ongoing disinflation process.
- Regarding the Fed speakers, Cleveland Fed President Loretta Mester expressed her preference to observe a "longer run of good-looking inflation data" before any significant decisions are taken.
- Simultaneously, Neel Kashkari, President of the Minneapolis Fed, intimated that the Fed might wait until December for any further rate cuts, favoring the acquisition of more data before any actions are undertaken.
- Several other speakers will be on the wires on Tuesday, and their words might shake the USD.
DXY technical analysis: Momentum flattens, bulls running out of time
Technical indicators suggest a flattening momentum but still retain a positive stance. The Relative Strength Index (RSI) remains above the 50 level, while the Moving Average Convergence Divergence (MACD) continues to print green bars.
With the bullish activity taking a pause, the DXY Index continues to hold above its 20, 100 and 200-day Simple Moving Average (SMA). The slowing down of the momentum from last week might indicate a possible slowdown in the recent rally of the DXY.
Fed FAQs
Monetary policy in the US is shaped by the Federal Reserve (Fed). The Fed has two mandates: to achieve price stability and foster full employment. Its primary tool to achieve these goals is by adjusting interest rates. When prices are rising too quickly and inflation is above the Fed’s 2% target, it raises interest rates, increasing borrowing costs throughout the economy. This results in a stronger US Dollar (USD) as it makes the US a more attractive place for international investors to park their money. When inflation falls below 2% or the Unemployment Rate is too high, the Fed may lower interest rates to encourage borrowing, which weighs on the Greenback.
The Federal Reserve (Fed) holds eight policy meetings a year, where the Federal Open Market Committee (FOMC) assesses economic conditions and makes monetary policy decisions. The FOMC is attended by twelve Fed officials – the seven members of the Board of Governors, the president of the Federal Reserve Bank of New York, and four of the remaining eleven regional Reserve Bank presidents, who serve one-year terms on a rotating basis.
In extreme situations, the Federal Reserve may resort to a policy named Quantitative Easing (QE). QE is the process by which the Fed substantially increases the flow of credit in a stuck financial system. It is a non-standard policy measure used during crises or when inflation is extremely low. It was the Fed’s weapon of choice during the Great Financial Crisis in 2008. It involves the Fed printing more Dollars and using them to buy high grade bonds from financial institutions. QE usually weakens the US Dollar.
Quantitative tightening (QT) is the reverse process of QE, whereby the Federal Reserve stops buying bonds from financial institutions and does not reinvest the principal from the bonds it holds maturing, to purchase new bonds. It is usually positive for the value of the US Dollar.
Federal Reserve (Fed) Bank of Boston President Susan Collins noted on Tuesday that despite significant progress made on inflation by the Fed and its policies, there's still plenty of work to be done. As Boston Fed President Collins noted, inflation remains stubbornly high, and it will likely take more time than many had initially hoped to bring price growth back down to the Fed's 2% target.
Fed policymakers assess inflation data, weigh policy options
Key highlights
Fed Collins: I am cautious against overreacting to recent inflation data.
I remain a realistic optimist on the economy and monetary policy.
It is too soon to say if inflation is retreating again to 2%.
The economy has been remarkably resilient.
Inflation is still stubbornly above 2% target.
Recent inflation data has been encouraging.
The US central bank has made notable progress lowering inflation.
It is appropriate for the US central bank to remain patient on monetary policy.
Inflation FAQs
Inflation measures the rise in the price of a representative basket of goods and services. Headline inflation is usually expressed as a percentage change on a month-on-month (MoM) and year-on-year (YoY) basis. Core inflation excludes more volatile elements such as food and fuel which can fluctuate because of geopolitical and seasonal factors. Core inflation is the figure economists focus on and is the level targeted by central banks, which are mandated to keep inflation at a manageable level, usually around 2%.
The Consumer Price Index (CPI) measures the change in prices of a basket of goods and services over a period of time. It is usually expressed as a percentage change on a month-on-month (MoM) and year-on-year (YoY) basis. Core CPI is the figure targeted by central banks as it excludes volatile food and fuel inputs. When Core CPI rises above 2% it usually results in higher interest rates and vice versa when it falls below 2%. Since higher interest rates are positive for a currency, higher inflation usually results in a stronger currency. The opposite is true when inflation falls.
Although it may seem counter-intuitive, high inflation in a country pushes up the value of its currency and vice versa for lower inflation. This is because the central bank will normally raise interest rates to combat the higher inflation, which attract more global capital inflows from investors looking for a lucrative place to park their money.
Formerly, Gold was the asset investors turned to in times of high inflation because it preserved its value, and whilst investors will often still buy Gold for its safe-haven properties in times of extreme market turmoil, this is not the case most of the time. This is because when inflation is high, central banks will put up interest rates to combat it. Higher interest rates are negative for Gold because they increase the opportunity-cost of holding Gold vis-a-vis an interest-bearing asset or placing the money in a cash deposit account. On the flipside, lower inflation tends to be positive for Gold as it brings interest rates down, making the bright metal a more viable investment alternative.
- GBP/USD trades below 1.2700 after hitting a two-day high of 1.2720.
- Resistance at a broken support trendline could lead to further price drops.
- Key support levels: 1.2656 (June 14 low) and 1.2643/34 (100-DMA confluence and May 3 high).
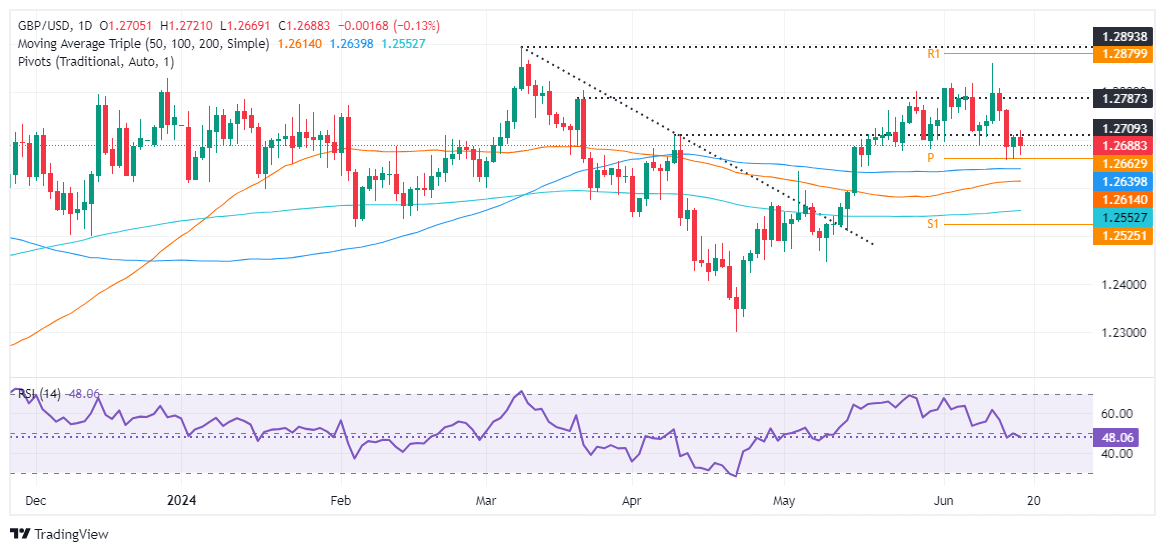
The Pound Sterling creeps lower against the US Dollar on Tuesday, amid a scarce economic docket in the UK following the release of mixed data in the United States. At the time of writing, the GBP/USD trades at 1.2688, down 0.12%.
GBP/USD Price Analysis: Technical outlook
Following a dip to a multi-week low of 1.2656, the GBP/USD has shown signs of resilience, managing to regain some ground. However, it's important to note that it still hovers below a one-month broken support trendline turned resistance, which could potentially lead to further price drops.
Momentum shows that sellers remained unchanged, as revealed by the Relative Strength Index (RSI).
If GBP/USD drops below 1.2700, the exchange rate will continue to fall and face the first support, at 1.2656, the June 14 low. Once cleared, the next stop would be the 100-day moving average (DMA) confluence and the May 3 high at 1.2643/34, ahead of 1.2600.
Conversely, if GBP/USD climbs past 1.2720/30, that could exacerbate a rally toward 1.2800.
GBP/USD Price Action – Daily Chart
Crude Oil continues to prove resilient, with upside momentum firming and Commodity Trading Advisors (CTAs) remaining on the bid, TDS commodity strategists say.
Upside momentum in Oil remains resilient
“We still argue that the rally could start to fade as these CTA flows taper. Indeed, any drop below $80.20/bbl and $84.12/bbl for WTI and Brent crude respectively would see CTAs ease up on their buying and liquidated a portion of the recently acquired length.”
“Aside from the resurgent CTA flows, there is still more relative concern about Q4 balances and beyond, which should serve as a resistance to major upside.”
- USD/CHF refreshes three-month low near 0.8830 as sluggish US Retail Sales growth boosts Fed rate cut hopes.
- Retail Sales, excluding automobiles, contract steadily by 0.1%.
- The Swiss Franc will dance to the tunes of the SNB’s policy outcome.
The USD/CHF pair prints a fresh three-month low near 0.8830 in Tuesday’s American session. The Swiss Franc asset weakens as the US Dollar (USD) falls on the backfoot after the United States (US) Census Bureau reported that Retail Sales returns into positive trajectory in May after contracting 0.2% in April, downwardly revised from a flat performance. However, the pace at which Retail Sales grew was slower at 0.1% than expectations of 0.2%.
The report showed that lower sales at service stations due to fall in gasoline prices and decline in prices of automobiles were responsible for slower growth. Sluggish consumer spendings would dent growth outlook and boosts market speculation for Federal Reserve (Fed) rate cuts in the September meeting.
Retail Sales excluding automobiles, a close measure to consumer spending that accounts for two-thirds of the economy, contracts at a steady pace of 0.1%. This would force economists to revise down expectations for Q2 Gross Domestic Product (GDP) growth.
The CME FedWatch tool shows that the probability for rate cuts in the September meeting has increased to 67% from 61.5%, recorded on Monday. Traders have priced in two rate cuts this year while Fed policymakers continue to argue in favor of reducing interest rates only once as they want to see inflation declining for months.
On the Swiss Franc front, investors await the Swiss National Bank’s (SNB) interest rate decision, which will be announced on Thursday. A close call is expected from the SNB as Swiss exports have become competitive in global markets and imports have become costly due to weak Swiss Franc, which could revamp price pressures again. However, price pressures have remained below the 2% since June 2023 on a year-on-year basis.
Precious metals traders are watching the data like hawks, and this morning's weak US Retail Sales data has given the complex a boost, TDS analysts say.
Markets are on the sidelines in Gold
“Macro investors have remained underpositioned in Gold (XAU/USD) relative to a typical cutting cycle. Macro traders seem to be happy waiting on the sidelines until there is more certainty on the timing of the coming Fed cuts. As a trend of weakening data begins to form, these investors will be more likely to enter the fray, which could ultimately be the next catalyst needed for another leg higher.”
“In this sense, the back-and-forth price action in the Yellow Metal saw some modest selling from Commodity Trading Advisors (CTAs) recently, but these positions could be added back above $2,346/oz.”
The rumblings are starting as we look ahead to China’s third plenum set for July. So far, the latest round of stimulus has failed to solidify markets as data from the property market remains weak, while the latest industrial demand data also came in soft overnight, TD Securities commodity strategists note.
All metals are within range of potential CTA selling triggers
"With households already heavily in debt it is entirely likely the latest property market measures have done little to incentivize new debt to be taken on, particularly as housing prices continue their trend lower, challenging the long-held narrative that prices only go up in the long-run. The market is now hoping that China will announce of new domestic based consumption stimulus measures."
"However, despite this festering optimism, industrial metal prices continue to weaken. Our gauge of commodity demand is weakening amid a precarious global macro landscape, and our return decompositions across the complex confirm the demand side is finally starting to weigh heavy on the metals as the early summer euphoria fades."
"Our return decomposition framework is also showing a major drag in Copper from idiosyncratic factors, such as positioning. This suggests that the red metal could still be prone to additional downside in the near-term as bloated positions are cut. Copper has a margin of safety before the next selling trigger; however, aluminum, zinc, lead and nickel are all within range of potential CTA selling triggers."
- USD/CAD breaks out of a large symmetrical triangle price pattern, activating upside targets.
- Though it has backed and filled since the break, the probabilities favor a continuation higher.
- A break above the June 11 high would provide additional bullish confirmation.
USD/CAD has decisively broken above the upper borderline of a large Symmetrical Triangle price pattern on the daily price chart.
USD/CAD Daily Chart
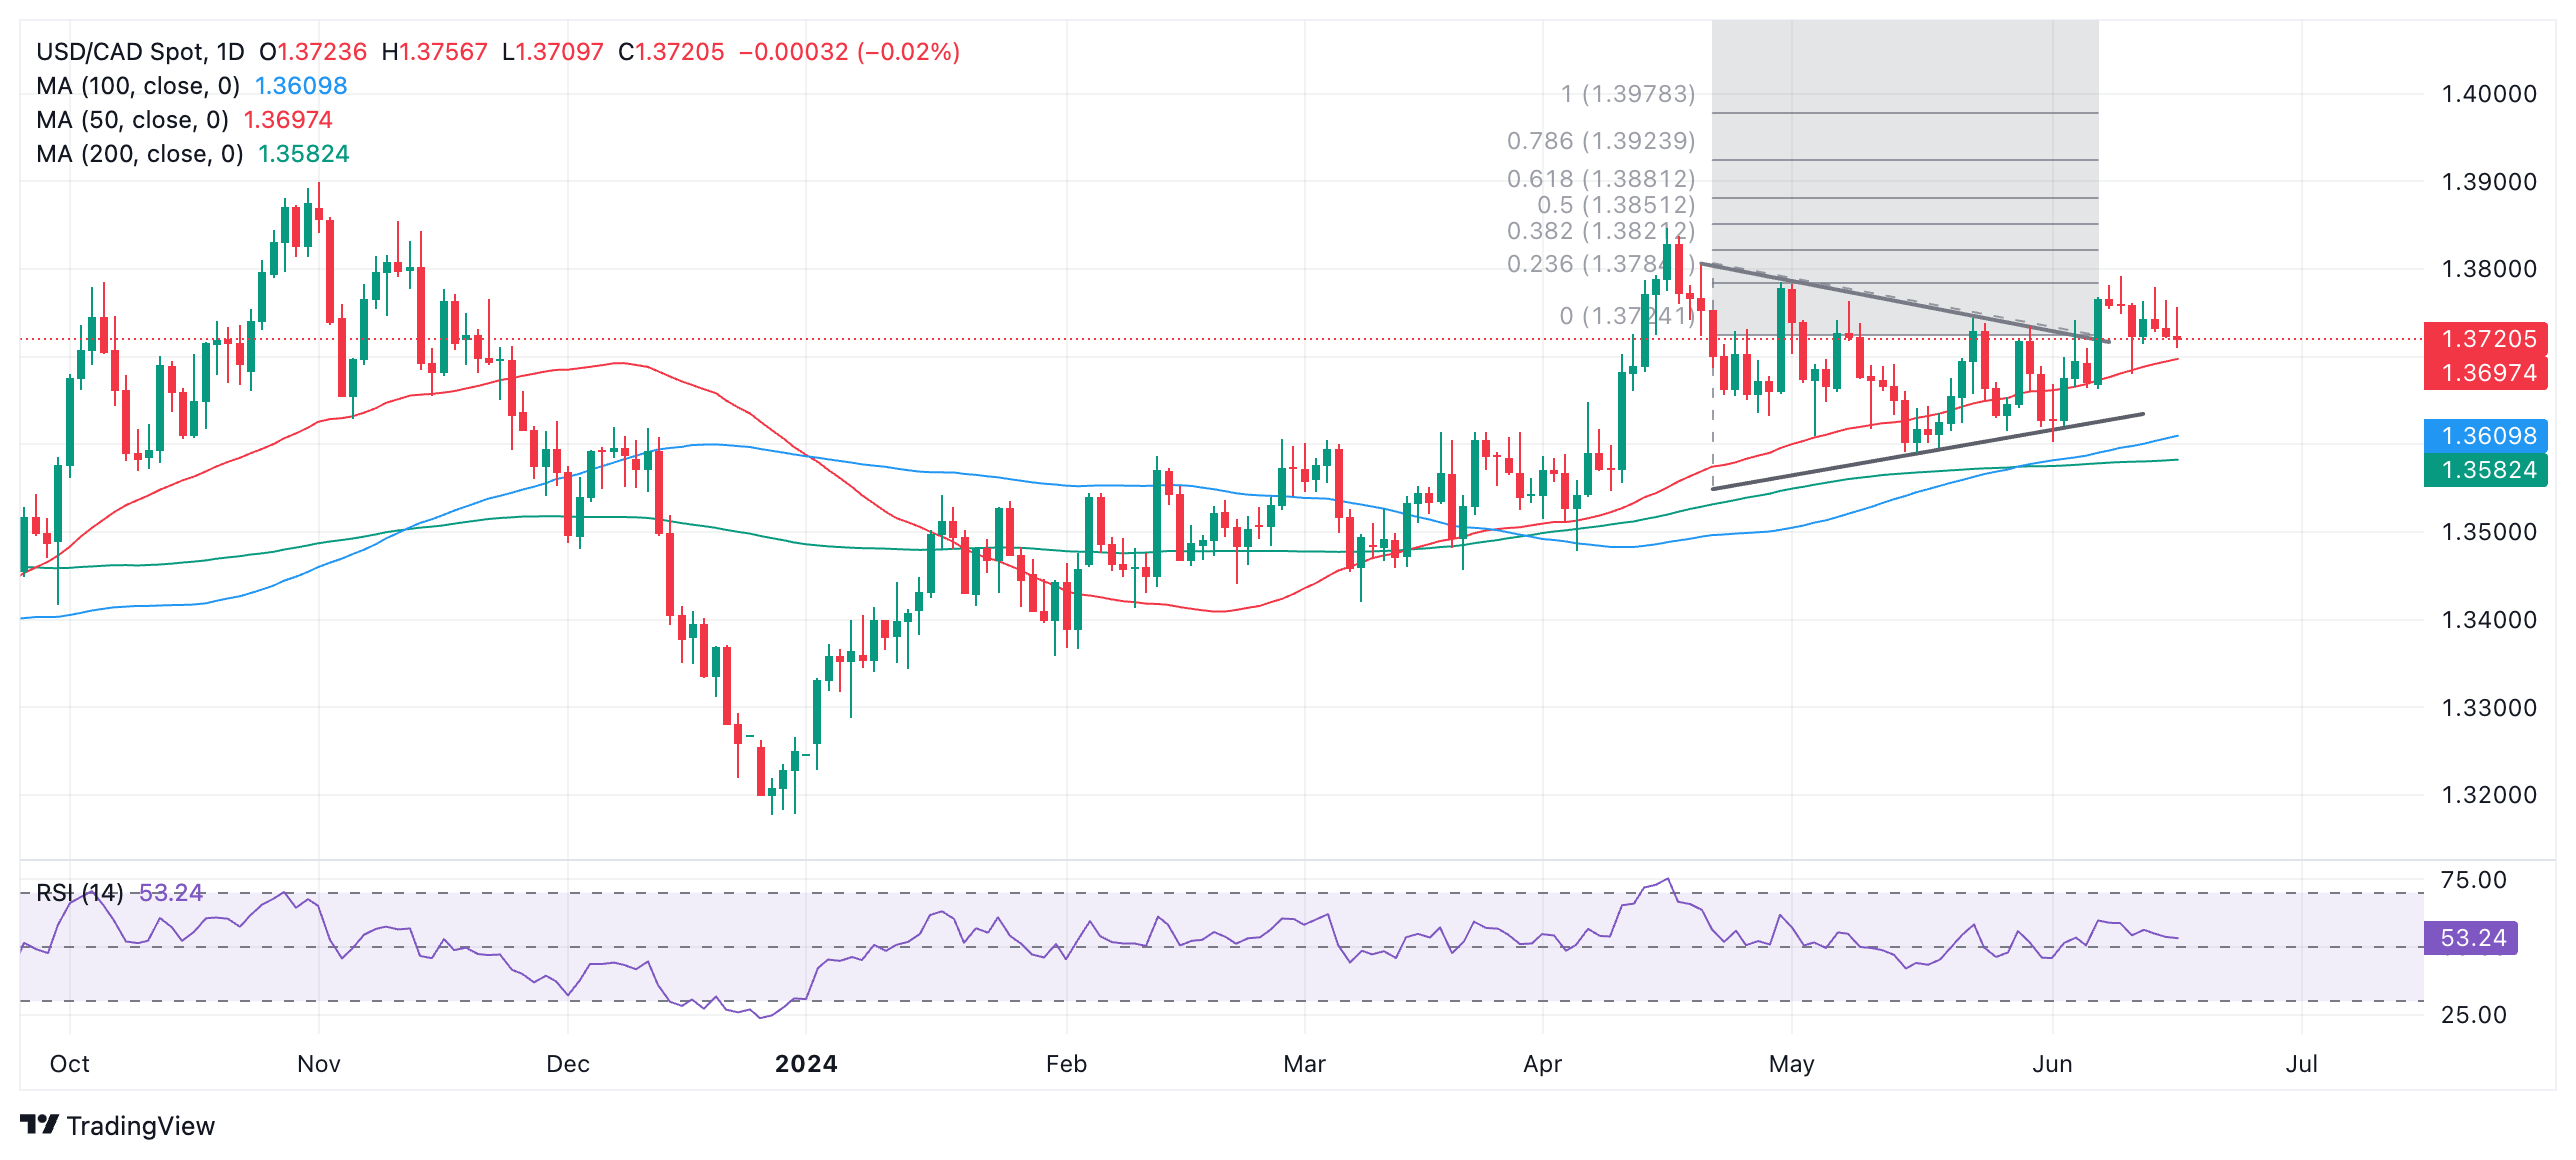
The long green bullish candle that formed on June 7 and accompanied the upside breakout from the Triangle qualifies as the decisive break and activates the bullish targets for the pattern. The conservative target for the pattern lies at 1.3881, the 0.618 Fibonacci extrapolation of the height of the Triangle from the breakout point higher.
A more bullish target lies at 1.3978, the 100% extrapolation of the height of the triangle northwards.
Although price action has been slightly bearish since the June 7 breakout, the odds favor a resumption of the initial move higher. A break above 1.3791 (June 11 high) would provide further bullish confirmation.
A decisive breakdown from the triangle would reverse the trend and suggest a move down to an initial target at roughly 1.3472.
French election poses downside risks for the Euro (EUR). The uncertainty surrounding this election is high given the rapidly-shifting polls and two-step voting process where results between rounds can swing massively. OAT-Bund spreads have widened to levels last seen in 2017 and European stocks have collapsed, TDS strategists note.
European politics imply scope for further Euro downside
“In case of a hung parliament, domestic policies will be hard to pass and this opens the door to another election cycle next year. An outright majority by Le Pen's RN can keep the risk premium in the EUR intact from bigger spending goals and a more constrained relationship with the EU.”
“Growth convergence with US might not be able to save the EUR. The political fabric of EU is becoming strained and making it harder to address bigger issues like energy crises, tech and industrial changes, and management of alliances with US/ China. French gridlock or worse a more Euro-skeptic government could weigh on the economic outlook and the EUR.”
“We remain bearish EUR vs USD, GBP, CHF. We remain USD bulls on three pillars - growth/ inflation exceptionalism and rising geopolitical risks. The USD remains the best global hedge. In RV, we like EUR/GBP downside as a Labour win in the UK with prospects of greater integration with EU can help price out the Brexit premium. Our quant macro framework is also bearish EUR.”
Richmond Federal Reserve Bank President Thomas Barkin said on Tuesday that May inflation data was very encouraging, per Reuters.
Fed policymakers not in a hurry to cut rates, looking for further progress in inflation.
Key takeaways
"We are clearly on the back side of inflation."
"Hard to know how much signal to take from inflation last year, or this quarter, or last couple of weeks."
"On the goods side, I hear pricing power is waning."
"On services side, I still think firms are exploring raising prices as much as possible."
"Shelter and services inflation is not quite there."
"I didn't get more confidence in Q1 this year about inflation, we'll see where we go."
Market reaction
These comments don't seem to be impacting the US Dollar's valuation in a noticeable way. At the time of press, the USD Index was down 0.1% on the day at 105.23.
- Silver price rebounds strongly from $29.00 as slower US Retail Sales growth weighs on the US Dollar and bond yields.
- Sluggish US Retail Sales growth has prompted Fed rate-cut bets for September.
- US households cut spending on discretionary items.
Silver price (XAG/USD) bounces back strongly from the crucial support of $29.00 in Tuesday’s American session. The white metal struggles to gain ground even though the United States (US) Retail Sales grew meagrely by 0.1%, slower than expectations of 0.2% after contracting by 0.2% in April, downwardly revised from a stagnant performance.
The US Census Bureau reports that households cut heavily on discretionary items as banks remain reluctant to increase credit growth due to fears of an increase of delinquency costs. Sales at service stations were lower due to soft gasoline prices.
Slower-than-expected Retail Sales growth suggests deepening household crises due to higher interest rates by the Federal Reserve (Fed). This has weighed on the US Dollar (USD) and bond yields. The US Dollar Index (DXY), which tracks the Greenback’s value against six major currencies, surrenders its entire losses and drops to 105.30.
10-year US Treasury yields slump to 4.25%. Lower yields on interest-bearing assets reduce the opportunity cost of holding an investment in non-yielding assets, such as Silver.
Slower growth in the US Retail Sales has boosted expectations of early rate cuts by the Federal Reserve (Fed). The CME FedWatch tool shows that the probability for rate cuts in the September meeting has increased to 67% from 61.5%, recorded on Monday.
Silver technical analysis
Silver price trades in a Falling Channel chart pattern in which each pullback is considered as a selling opportunity by market participants. The asset aims to shift above the 200-period Exponential Moving Average (EMA), which trades around $29.40.
The 14-period Relative Strength Index (RSI) oscillates in the 40.00-60.00 range, suggesting a consolidating ahead.
Silver four-hour chart
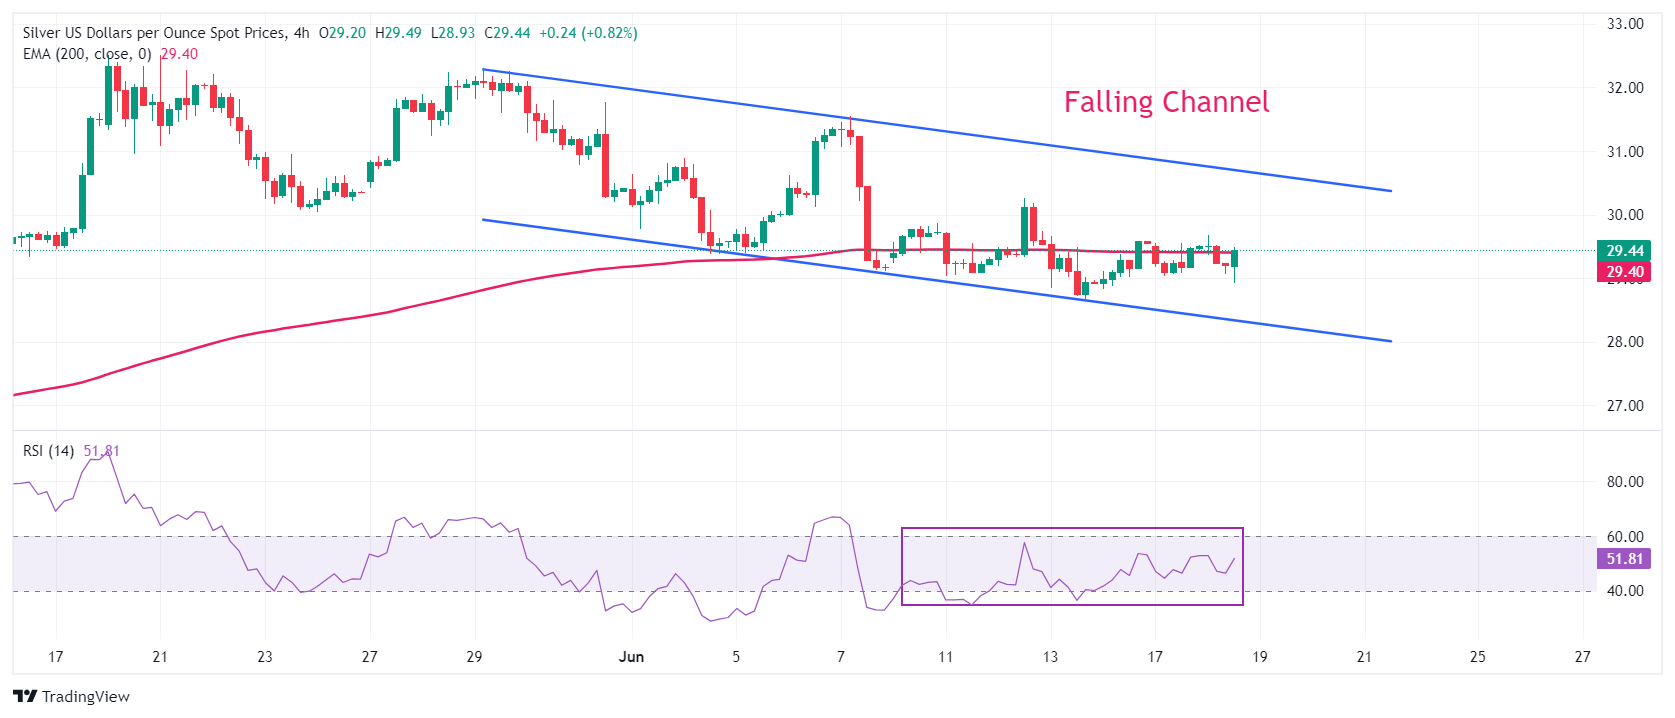
Even though the GBP/USD struggles to hold above 1.27 after last week's bearish close, the pair continues to find support in the upper 1.26s, Shaun Osborne, the Chief FX Strategist at Scotiabank, argues.
GBP to establish a base in the upper 1.26s or in the high 1.25s
“UK CPI data tomorrow is expected to see prices rise 0.4% in the May month but slow to 2.0% in the year. Policymakers are expected to leave the Bank Rate on hold at 5.25% Thursday, however, given still elevated core inflation (forecast to slow to 3.5% in May).”
“The latest opinion poll data show Labour’s substantial lead holding up while PM Sunak’s Conservatives are sagging below 20%, polling at or close to their lowest ever levels of support.”
“Cable continues to find firm support in the upper 1.26s. But there is little staying power in gains which have struggled to hold 1.27+ levels after last week’s bearish close for the GBP. It feels like the pound has more work to do to establish a base—either holding in the upper 1.26s or finding a foothold at a lower level in the high 1.25s perhaps before it can steady and improve.”
- Industrial Production in the US grew at a stronger pace than expected in May.
- The US Dollar Index stays in daily range below 105.50.
Industrial Production in the US grew 0.9% on a monthly basis in May, the US Federal Reserve (Fed) reported on Tuesday. This reading came in better than the market expectation for an increase of 0.3%.
"Manufacturing output posted a similar gain of 0.9% after declining in the previous two months," the Fed noted in its press release. "At 103.3% of its 2017 average, total industrial production in May was 0.4% higher than its year-earlier level. Capacity utilization moved up to 78.7% in May, a rate that is 0.9 percentage point below its long-run (1972–2023) average."
Market reaction
The US Dollar Index showed no immediate reaction to this report and was last seen trading virtually unchanged on the day at 105.34.
- NZD/USD makes a partial recovery in the minutes after the release of US Retail Sales data for May.
- The data shows sales were lower than expected, and that preliminary estimates for April were over optimistic.
- The New Zealand Dollar trades on the back foot amidst weaker services data and GDP.
NZD/USD recovers almost a quarter of a percent to trade in the 0.6110s after the US Dollar (USD) softens, following the release of monthly US Retail Sales data, which shows shoppers tightened their belts in both April and May.
Retail Sales rose 0.1% month-over-month in May but fell below the 0.2% forecast by economists. April’s flat reading, meanwhile, was revised down to a negative 0.2%, according to data from the US Census Bureau, released on Tuesday.
Retail Sales ex Autos, declined 0.2% MoM – falling below the 0.2% consensus estimate and the downwardly revised 0.1% decline in April. The April figure itself was revised down from a positive 0.2% preliminary reading.
Both the lower-than-expected readings for May and the downward revisions for April weighed on the US Dollar (USD), but lifted NZD/USD, which measures the buying power of a New Zealand Dollar (NZD) in terms of USD. The data indicates a slowdown in consumer spending in the US which will probably filter through to lower inflation, and lower interest rates. Lower interest rates negatively impact currencies as they reduce foreign capital inflows.
Market expectations of the future course of US interest rates were revised down following the release. Prior to the release the probability of the Federal Reserve (Fed) making a 0.25% rate cut in September was 55%. After the release this increased to 60%, according to the CME FedWatch Tool, which uses the price of 30-day Fed Funds Futures to calculate its estimates. The probability that interest rates will fall by either 0.25% or 0.50% by September, meanwhile, rose to nearly 68%.
The increased probabilities suggest the Fed could cut interest rates more than once in 2024. This comes despite the bank’s last set of forecasts in June penciling in only one 0.25% rate cut before year end. The hawkish forecast (of the view that interest rates will remain high) has been behind the USD’s appreciation over recent sessions and NZD/USD’s weakness.
Recent commentary from Fed officials has backed the bank’s hawkish stance. Minneapolis Fed President Neel Kashkari said on Sunday that he thought it a “reasonable prediction” that the Fed would reduce interest rates only once this year. On Monday, Philadelphia Fed President Patrick Harker added further support to the view after he said that keeping rates where they were for a bit longer would help get inflation down and mitigate upside risks.
The New Zealand Dollar, meanwhile, trades broadly weaker after data showed the New Zealand’s services sector slumped in May, hitting the lowest level since August 2021. In addition, GDP data for the country has shown two consecutive quarters of negative growth, meeting the definition of a recession. This, in turn, has increased bets the Reserve Bank of New Zealand (RBNZ) will cut interest rates in the near-term, with a 0.25% cut now fully priced in for the November meeting, according to Trading Economics.
The Euro (EUR) is modestly higher on Tuesday's session, reflecting a mild narrowing in 10Y OAT/Bund spreads. The gap remains relatively significant (75bps), however, as tensions in the Eurozone persist, Scotiabank’s Chief FX Strategist Shaun Osborne notes.
Push above 1.0750 to form solid base for EUR/USD
"Germany’s ZEW survey for June reflected a smaller than forecast improvement in investor expectations, rising to 47.5, from May’s 47.1. Germany’s growth momentum is improving slowly."
"Spot gains on Monday left a bullish imprint on the daily chart via a strong, piercing line signal on the daily candle chart. The EUR has drifted back somewhat from earlier gains so far today but the EUR’s rise from the upper 1.06 area suggests a potential low/reversal in place."
"The EUR remains some distance still from technically “safe” ground but gains through 1.0750 would be supportive of a base developing here and give the EUR a bit more lift. Support is 1.0665/75."
The Canadian Dollar (CAD) is a little softer on the day but continues to range trade between the recent US Dollar (USD) peak and trough, Scotiabank’s Chief FX Strategist Shaun Osborne notes.
Markets are waiting for a push in USD/CAD
“The CAD is still holding up somewhat better than our high frequency fair value estimate would suggest is appropriate, however. The estimated equilibrium is little changed around the 1.3820 area today. There are no domestic data releases due, leaving spot trends subject to the broader USD direction and external factors, such as risk appetite, for now.”
“Recall that Friday’s Commodity Futures Trading Commission (CFTC) data showed speculators, real money and hedge fund traders are currently holding a combined record net short position in the CAD. Fresh incentives are needed for markets to add to short CAD positioning.”
“Spot movement remains limited between support at 1.3690 and resistance at 1.3790. The CAD has managed to close a little higher on the session over the past two days, resisting USD gains but the broader technical setup still leans mildly USD-positive. Intraday trend signals are flat but the longer-term DMI signals are bullish-leaning for the USD.”
In an interview with Fox Business, New York Federal Reserve President John Williams noted that recent inflation data have been encouraging and added that he expects inflation to continue to come down, per Reuters.
Fed officials in no rush to cut rates, looking for further progress in inflation.
Key takeaways
"Rate cut path depends on data."
"The US economy is doing well, it's in better balance."
"Fed decisions will depend on the economy."
"Things are moving in the right direction for monetary policy."
"Expecting interest rates to come down gradually as inflation eases."
"Politics will not influence Fed rate decisions."
"We have a very strong economy and incomes are growing."
"Interest rates will come down over next few years."
"3% inflation is not the new norm, Fed will get inflation to 2%."
"We still have a very strong labor market with some hiring slowing."
Market reaction
The US Dollar struggles to gather strength following these comments. At the time of press, the US Dollar Index was unchanged on the day at 105.35.
Fed FAQs
Monetary policy in the US is shaped by the Federal Reserve (Fed). The Fed has two mandates: to achieve price stability and foster full employment. Its primary tool to achieve these goals is by adjusting interest rates. When prices are rising too quickly and inflation is above the Fed’s 2% target, it raises interest rates, increasing borrowing costs throughout the economy. This results in a stronger US Dollar (USD) as it makes the US a more attractive place for international investors to park their money. When inflation falls below 2% or the Unemployment Rate is too high, the Fed may lower interest rates to encourage borrowing, which weighs on the Greenback.
The Federal Reserve (Fed) holds eight policy meetings a year, where the Federal Open Market Committee (FOMC) assesses economic conditions and makes monetary policy decisions. The FOMC is attended by twelve Fed officials – the seven members of the Board of Governors, the president of the Federal Reserve Bank of New York, and four of the remaining eleven regional Reserve Bank presidents, who serve one-year terms on a rotating basis.
In extreme situations, the Federal Reserve may resort to a policy named Quantitative Easing (QE). QE is the process by which the Fed substantially increases the flow of credit in a stuck financial system. It is a non-standard policy measure used during crises or when inflation is extremely low. It was the Fed’s weapon of choice during the Great Financial Crisis in 2008. It involves the Fed printing more Dollars and using them to buy high grade bonds from financial institutions. QE usually weakens the US Dollar.
Quantitative tightening (QT) is the reverse process of QE, whereby the Federal Reserve stops buying bonds from financial institutions and does not reinvest the principal from the bonds it holds maturing, to purchase new bonds. It is usually positive for the value of the US Dollar.
- Retail Sales in the US rose less than expected in May.
- US Dollar Index retreated below 105.50 after the data.
Retail Sales in the United States rose 0.1% on a monthly basis in May to $703.1 billion. This reading followed the 0.2% decline recorded in April and came in slightly below the market expectation for an increase of 0.2%.
"Total sales for the March 2024 through May 2024 period were up 2.9% from the same period a year ago," the publication read. "Retail trade sales were up 0.2% from April 2024, and up 2.0% above last year."
Market reaction to US Retail Sales
The immediate reaction to this report caused the US Dollar to weaken against its rivals. The US Dollar Index retreated from daily highs after the data and was last seen flat on the day at 105.35.
US Dollar PRICE Today
The table below shows the percentage change of US Dollar (USD) against listed major currencies today. US Dollar was the weakest against the Swiss Franc.
| USD | EUR | GBP | JPY | CAD | AUD | NZD | CHF | |
|---|---|---|---|---|---|---|---|---|
| USD | 0.08% | 0.17% | 0.06% | 0.09% | -0.15% | 0.31% | -0.35% | |
| EUR | -0.08% | 0.08% | -0.02% | 0.01% | -0.26% | 0.24% | -0.43% | |
| GBP | -0.17% | -0.08% | -0.12% | -0.07% | -0.33% | 0.17% | -0.52% | |
| JPY | -0.06% | 0.02% | 0.12% | 0.04% | -0.22% | 0.27% | -0.43% | |
| CAD | -0.09% | -0.01% | 0.07% | -0.04% | -0.25% | 0.19% | -0.45% | |
| AUD | 0.15% | 0.26% | 0.33% | 0.22% | 0.25% | 0.48% | -0.22% | |
| NZD | -0.31% | -0.24% | -0.17% | -0.27% | -0.19% | -0.48% | -0.68% | |
| CHF | 0.35% | 0.43% | 0.52% | 0.43% | 0.45% | 0.22% | 0.68% |
The heat map shows percentage changes of major currencies against each other. The base currency is picked from the left column, while the quote currency is picked from the top row. For example, if you pick the US Dollar from the left column and move along the horizontal line to the Japanese Yen, the percentage change displayed in the box will represent USD (base)/JPY (quote).
US Dollar FAQs
The US Dollar (USD) is the official currency of the United States of America, and the ‘de facto’ currency of a significant number of other countries where it is found in circulation alongside local notes. It is the most heavily traded currency in the world, accounting for over 88% of all global foreign exchange turnover, or an average of $6.6 trillion in transactions per day, according to data from 2022. Following the second world war, the USD took over from the British Pound as the world’s reserve currency. For most of its history, the US Dollar was backed by Gold, until the Bretton Woods Agreement in 1971 when the Gold Standard went away.
The most important single factor impacting on the value of the US Dollar is monetary policy, which is shaped by the Federal Reserve (Fed). The Fed has two mandates: to achieve price stability (control inflation) and foster full employment. Its primary tool to achieve these two goals is by adjusting interest rates. When prices are rising too quickly and inflation is above the Fed’s 2% target, the Fed will raise rates, which helps the USD value. When inflation falls below 2% or the Unemployment Rate is too high, the Fed may lower interest rates, which weighs on the Greenback.
In extreme situations, the Federal Reserve can also print more Dollars and enact quantitative easing (QE). QE is the process by which the Fed substantially increases the flow of credit in a stuck financial system. It is a non-standard policy measure used when credit has dried up because banks will not lend to each other (out of the fear of counterparty default). It is a last resort when simply lowering interest rates is unlikely to achieve the necessary result. It was the Fed’s weapon of choice to combat the credit crunch that occurred during the Great Financial Crisis in 2008. It involves the Fed printing more Dollars and using them to buy US government bonds predominantly from financial institutions. QE usually leads to a weaker US Dollar.
Quantitative tightening (QT) is the reverse process whereby the Federal Reserve stops buying bonds from financial institutions and does not reinvest the principal from the bonds it holds maturing in new purchases. It is usually positive for the US Dollar.
- GBP/JPY recovery appears to have slowed near 200.00 as UK Inflation comes under the spotlight.
- The UK annual headline inflation is expected to return to BoE’s 2% target.
- The BoJ postponed plans to reduce bond-buying operations.
The GBP/JPY pair struggles to extend recovery above the psychological resistance of 200.00 in Tuesday’s New York session. The cross is expected to trade sideways as investors shift focus to the United Kingdom (UK) Consumer Price Index (CPI) data for May, which will be published on Wednesday.
Economists expect that the UK Office for National Statistics (ONS) will report a sharp decline in the annual core CPI, which strips off the more volatile items, to 3.5% from 3.9% in April. In the same period, the headline inflation is expected to return to the bank’s target of 2.0% from the prior reading of 2.3%. The monthly headline inflation is estimated to have grown at a faster pace of 0.4% from 0.3% in April.
A more-than-expected decline in UK inflation data will boost expectations of early rate cuts by the Bank of England (BoE). Though headline inflation is expected to return to 2%, investors will keenly focus on service inflation, which has been a major barrier to the BoE’s move towards policy normalization.
Inflation in the UK service sector is majorly driven by strong growth, which has turned out to be persistent in the past few months. Average earnings excluding bonuses, which is a measure of wage inflation, have grown steadily by 6.0% for a straight three-period period. The pace at which wages are growing is significantly higher than what is needed to build confidence among BoE officials to consider rate cuts.
On the Tokyo front, the Japanese Yen is weak across the FX domain as the Bank of Japan (BoJ) pushes plans of tapering bond-buying operations to the July meeting. BoJ Governor Kazuo Ueda left interest rates unchanged but didn’t rule out expectations for further policy tightening in July.
This week, the major trigger for the Japanese Yen will be the National CPI data for May, which will be published on Friday. National CPI excluding Fresh Food is estimated to have accelerated to 2.6% from the prior reading of 2.2% on a year-on-year basis.
- AUD/USD has started an up leg within its range.
- The move is facing tough resistance from a cluster of Moving Averages but will probably eventually extend higher.
- A decisive breakout of the range will change the trend, making it more directional.
AUD/USD bounces off the floor of a range it has formed since the middle of May. The pair is in a sideways trend which, given “the trend is your friend”, is more likely than not to extend. This suggests the up leg which began on Monday will probably continue rising to the range highs at circa 0.6709.
AUD/USD 4-hour Chart
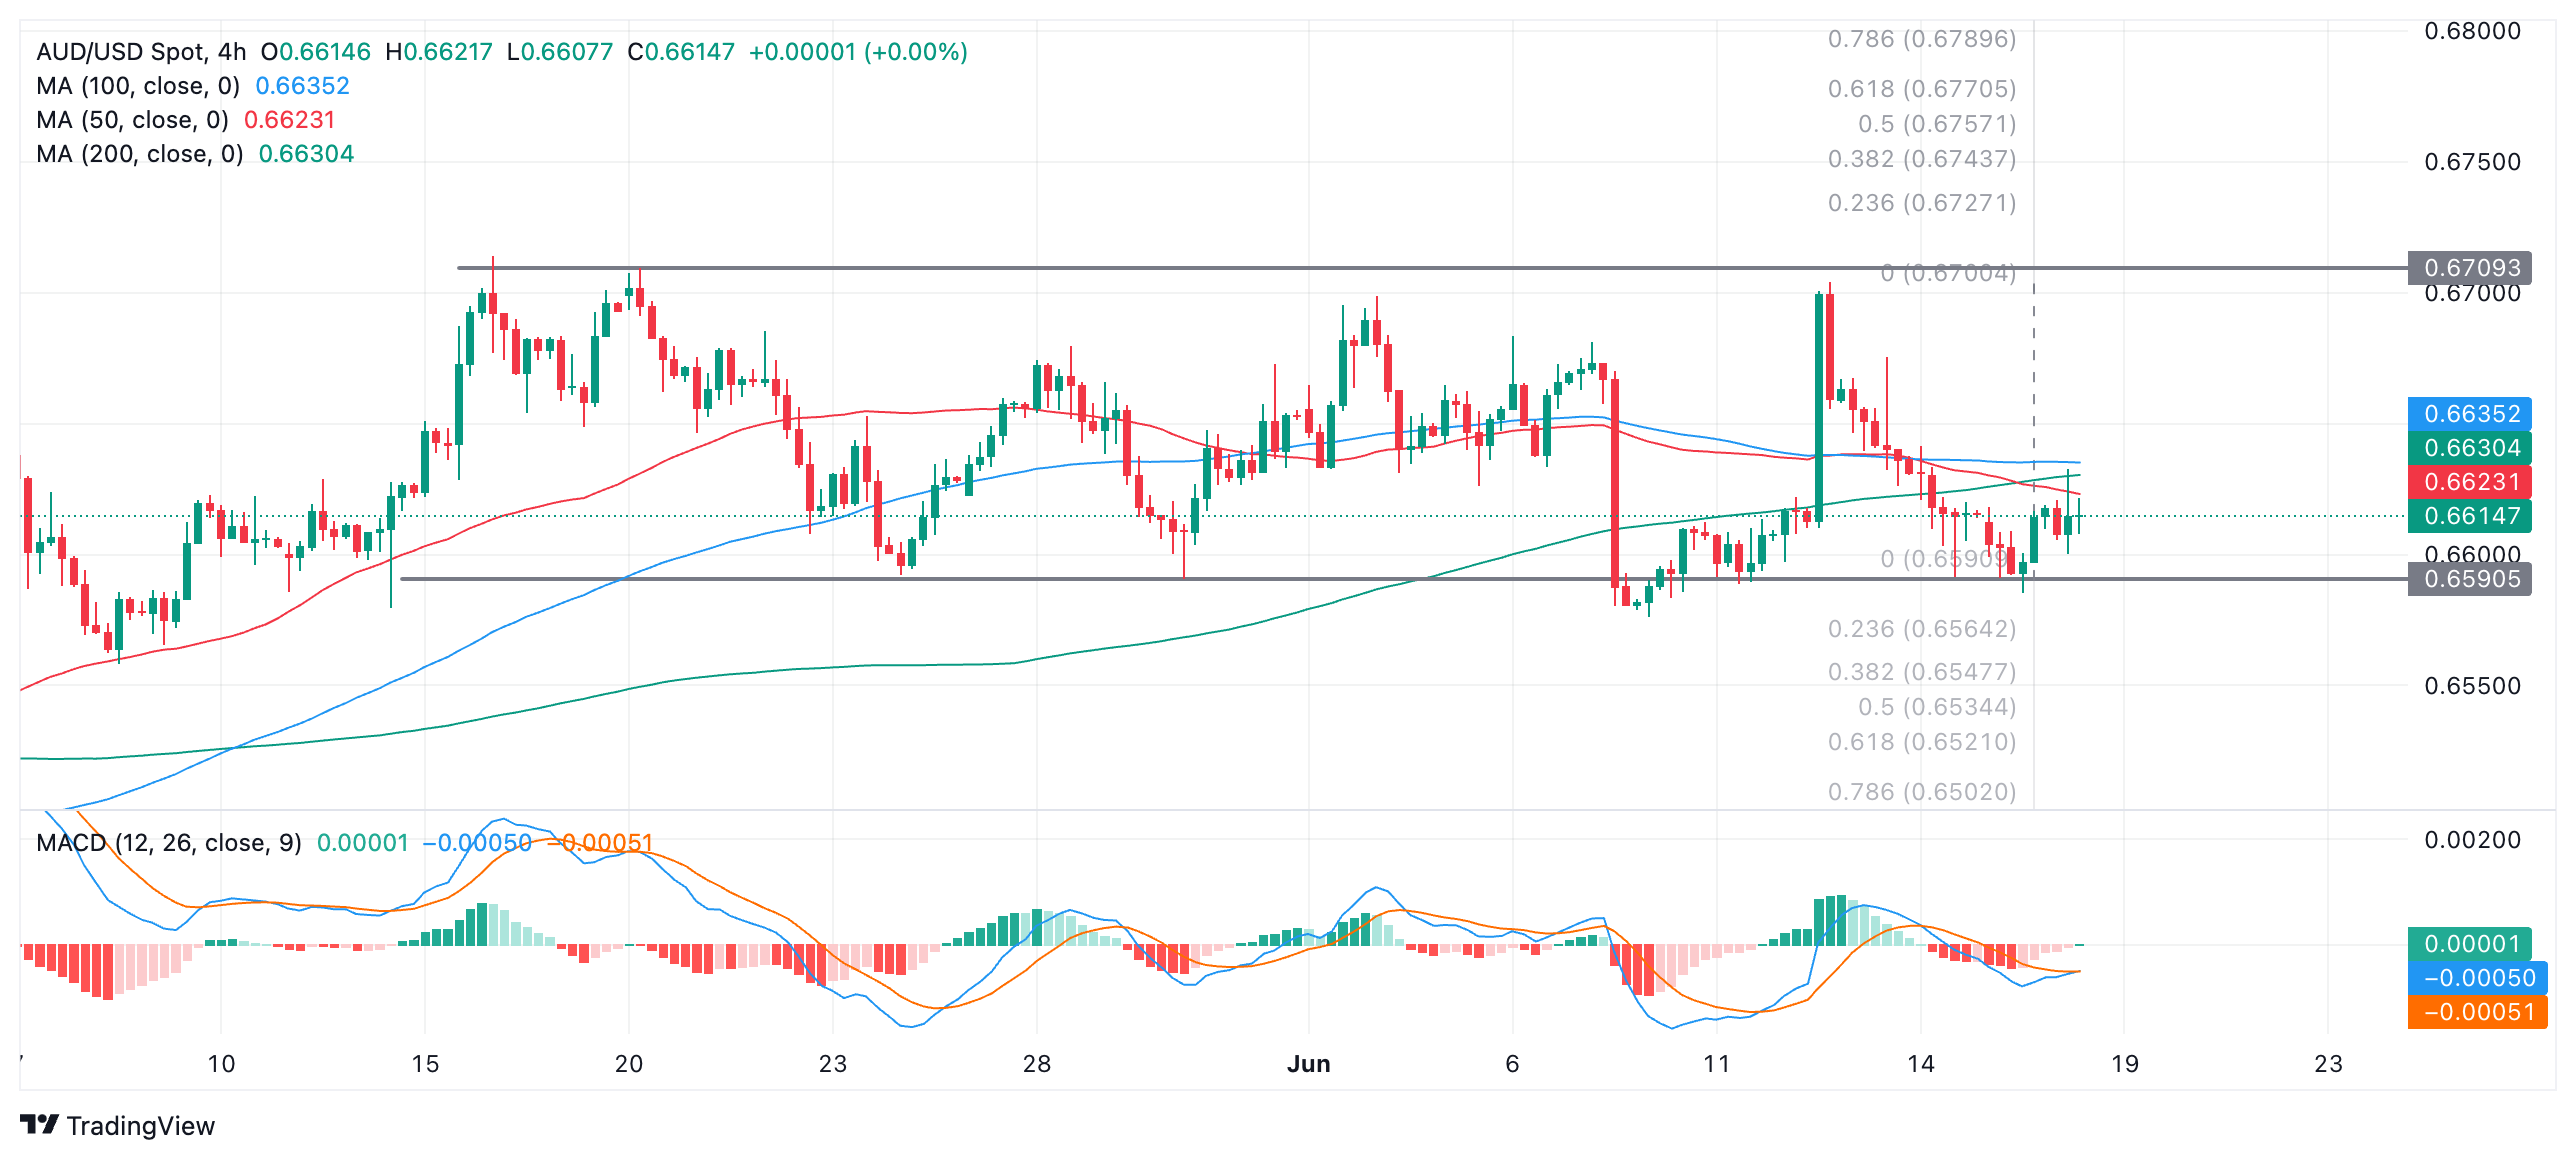
AUD/USD is currently encountering resistance from three major Simple Moving Averages (SMA) on the 4-hour timeframe, the 50, 100 and 200 SMAs. Whilst this is obstructing further upside price will probably eventually break above the cluster. A close above 0.6640 would provide added confirmation of more upside, and probably lead to move up all the way to the range ceiling.
As long as price remains within the bounds of the range it will likely keep oscillating. A decisive breakout of the range would be required to signal a change to a more directional trend. An upside break is marginally more likely to happen because the trend prior to the formation of the range was bullish. The breakout move is likely to be volatile given the range highs and lows have been touched multiple times.
A decisive break above the ceiling of the range would see a follow-through to a conservative target at 0.6770; a decisive break below the range floor would indicate a follow-through to an initial target at 0.6521.
A decisive break would be one in which a longer-than-average candle broke out of the range and closed near its high or low, or three successive candles of the same color broke cleanly through the range top or bottom.
The targets are generated using the technical-analysis method of extrapolating the height of the range by a Fibonacci 0.618 ratio higher (in the case of an upside break) or lower (in the case of a downside break). A more generous target would come from extrapolating the full height of the range.
- The US Dollar trades broadly unchanged ahead of a big slew of economic data and public comments from Federal Reserve officials.
- European sovereign bond spreads ease, with French markets partially recovering from last week’s losses.
- The US Dollar index trades below 105.50, facing significant support and resistance levels nearby.
The US Dollar (USD) trades broadly steady on Tuesday, a big day in terms of US economic data and comments from Federal Reserve (Fed) policymakers ahead of the US Juneteenth public holiday on Wednesday. Before enjoying a day off in the middle of the week, traders are starting to pull back their earlier bets favoring the Greenback against the Euro following the European bond market rout last week. With sovereign bond spreads in the Eurozone easing, it looks like markets are digesting political jitters in Europe, with the focus turning back to US data and interest-rate projections.
On the US economic data front, Tuesday’s calendar offers a chunky batch of data, the most important one being Retail Sales, a key indicator for consumer spending. Credit card sales data suggest that Retail Sales could come in higher than expected for May. Apart from this, it is also a busy day for the Fed watchers as six US Federal Reserve speakers will make public comments throughout the day.
Daily digest market movers: Here comes the Fed
- On US data, the main course will be served at 12:30 GMT with US Retail Sales for May:
- Headline Retail Sales expected to increase by 0.2% after being unchanged in April.
- Retail Sales without transportation are seen growing at a stable 0.2%.
- Revisions for the previous numbers, if significant, might also move markets.
- At 12:55 GMT, the US Redbook Index for the second week of June is expected. The previous release was at 5.5%.
- At 13:15 GMT, Industrial Production and Capacity Utilization data for May will be released. Industrial Production is expected to increase by 0.3% after being unchanged a month earlier. Capacity Utilization seen heading to 78.6% from 78.4%.
- An army of Fed speakers will have comments for the markets:
- Federal Reserve Bank of Richmond President Thomas Barkin speaks at 14:00 GMT about the US economic outlook at a Market News International webcast.
- Federal Reserve Bank of Boston President Susan Collins will speak at 15:40 GMT at the 2024 annual meeting and 10th year anniversary of the Lawrence Partnership.
- Federal Reserve Governor Adriana Kugler participates in a conversation about the US economic outlook and monetary policy at the Peterson Institute for International Economics at 17:00 GMT.
- At the same time Federal Reserve Bank of Dallas President Lorie Logan participates in a conversation about the current state of the US economy at the Headliners Speaker Series in Austin.
- Freshly appointed Federal Reserve Bank of St. Louis President Alberto Musalem delivers a speech and participates in a moderated Q&A about the US economic outlook and monetary policy at the CFA Society St. Louis Luncheon near 17:20 GMT.
- The cherry on the cake will be Federal Reserve Bank of Chicago President Austan Goolsbee, who participates in a monetary policy discussion at the 2024 Marshall Forum on the University of Chicago campus at 18:00 GMT.
- Equity markets are shaking off their losses from last week with green across the globe. US futures are also mildly in the green after Nvidia reached a new all-time high on Monday.
- The CME FedWatch Tool shows a 40.4% chance of the Fed interest rate remaining at the current level in September. Odds for a 25-basis-points rate cut stand at 55.0%, while a very slim 4.6% chance is priced in for a 50-basis-points rate cut.
- The benchmark 10-year US Treasury Note trades higher for the week, near 4.28%.
US Dollar Index Technical Analysis: Water under the bridge
The US Dollar Index (DXY) is seeing its safe-haven inflows abate on Tuesday with markets dialling down on their bets of political turmoil in Europe after the election outcome. With sovereign bond spreads in the Eurozone easing from their distressed levels, it looks like the Greenback might need to look somewhere else for support. Fed speakers will be holding the key as their comments might move the DXY should the hawkish stance prevail even after those softer inflation numbers.
On the upside, no big changes to the levels traders need to watch out for. The first is 105.52, where the DXY is trading around this Tuesday, which is a barrier that held during most of April. The next level to watch is 105.88, which triggered a rejection at the start of May and will likely play its role as resistance again. Further up, the biggest challenge remains at 106.51, the year-to-date high from April 16.
On the downside, the trifecta of Simple Moving Averages (SMA) is still playing support. First is the 55-day SMA at 105.11, safeguarding the 105.00 figure. A touch lower, near 104.57 and 104.47, both the 100-day and the 200-day SMA are forming a double layer of protection to support any declines. Should this area be broken, look for 104.00 to salvage the situation.
US Dollar FAQs
The US Dollar (USD) is the official currency of the United States of America, and the ‘de facto’ currency of a significant number of other countries where it is found in circulation alongside local notes. It is the most heavily traded currency in the world, accounting for over 88% of all global foreign exchange turnover, or an average of $6.6 trillion in transactions per day, according to data from 2022. Following the second world war, the USD took over from the British Pound as the world’s reserve currency. For most of its history, the US Dollar was backed by Gold, until the Bretton Woods Agreement in 1971 when the Gold Standard went away.
The most important single factor impacting on the value of the US Dollar is monetary policy, which is shaped by the Federal Reserve (Fed). The Fed has two mandates: to achieve price stability (control inflation) and foster full employment. Its primary tool to achieve these two goals is by adjusting interest rates. When prices are rising too quickly and inflation is above the Fed’s 2% target, the Fed will raise rates, which helps the USD value. When inflation falls below 2% or the Unemployment Rate is too high, the Fed may lower interest rates, which weighs on the Greenback.
In extreme situations, the Federal Reserve can also print more Dollars and enact quantitative easing (QE). QE is the process by which the Fed substantially increases the flow of credit in a stuck financial system. It is a non-standard policy measure used when credit has dried up because banks will not lend to each other (out of the fear of counterparty default). It is a last resort when simply lowering interest rates is unlikely to achieve the necessary result. It was the Fed’s weapon of choice to combat the credit crunch that occurred during the Great Financial Crisis in 2008. It involves the Fed printing more Dollars and using them to buy US government bonds predominantly from financial institutions. QE usually leads to a weaker US Dollar.
Quantitative tightening (QT) is the reverse process whereby the Federal Reserve stops buying bonds from financial institutions and does not reinvest the principal from the bonds it holds maturing in new purchases. It is usually positive for the US Dollar.
- USD/CHF declines as the Swiss Franc appreciates against the US Dollar.
- An upwards revision to Swiss economic growth forecasts supports CHF.
- Uncertainty about whether the SNB will cut interest rates on Thursday further supports the Franc.
USD/CHF trades in the 0.8870s on Tuesday, around a quarter of a percent lower on the day, after the release of Swiss government data showed an upwards revision to growth forecasts in 2024. The pair is further pressured by a lack of progress on inflation brings into doubt an expected interest-rate cut from the Swiss National Bank (SNB) at its meeting on Thursday.
The Gross Domestic Product (GDP) growth rate in Switzerland is forecast to reach 1.2% in 2024 – up from the 1.1% predicted in March – according to figures released by the State Secretariat for Economic Affairs (SECO), on Monday. The GDP growth rate in 2025, meanwhile, is expected to be 1.7%, unchanged from the March estimate.
Consumer prices are forecast to rise by an annual 1.4% in 2024, a downward revision from the 1.5% in March, according to SECO, and in line with the Swiss Statistical Office’s Consumer Price Index (CPI) reading of 1.4% in May.
Despite the downward revision to inflation in the SECO report, the market consensus is that inflation is not making sufficient progress lower to warrant a cut in interest rates by the Swiss National Bank (SNB) on Thursday.
The May CPI reading showed no change from April’s 1.4% and as a result of this lack of progress on inflation, investors dramatically revised down their expectations of the SNB cutting interest rates at the June meeting. From a probability of 80% prior to the release of May CPI, the probability fell to roughly 50% after, according to Trading Economics. Since lower interest rates are generally negative for a currency, the decline in probabilities led to a strengthening of CHF (decline in USD/CHF).
The SNB was the first major central bank to begin cutting interest rates when it reduced its key policy rate by 0.25% to 1.5% at its policy meeting in March.
The US Federal Reserve (Fed), in comparison, continues to be reluctant to cut its Fed Funds Rate, which still stands in a range between 5.25% - 5.50%. The differential between the Swiss and US policy rates advantages the US Dollar (USD), and the USD/CHF pair. Investors are drawn to higher interest rates because of the greater return they can earn, increasing foreign capital inflows.
Although the SECO data showed an upward revision to growth estimates, the report stated that a 1.2% increase in GDP would still be “significantly below average” and the Swiss would not fully recover until 2025.
“Given that industrial production capacities are far from being fully exploited and financing costs are high, a decline in investment is to be expected. Foreign trade, on the other hand, will be able to provide some support, particularly due to the depreciation of the Swiss franc in recent months,” SECO’s report stated.
- The Oil price remains firm near $80.00 as expectations for the Fed reduce interest rates twice this year.
- Investors digested voluntary production cuts announced in the OPEC meeting.
- Summer vacation season in the Northern Hemisphere strengthens the Oil demand outlook.
West Texas Intermediate (WTI), futures on NYMEX, cling to gains near the psychological resistance of $80.00 in Tuesday’s European session. The Oil price remains firm as investors expect a substantial growth in demand due to severe heatwaves in the Northern Hemisphere amid the summer vacation season. The arrival of summer prompts the demand for energy, which is favorable for the Oil price.
The strength in the Oil price is also backed by firm speculation that the Federal Reserve (Fed) will trim interest rates twice this year. The expectations for two rate cuts were boosted by soft United States (US) Consumer Price Index (CPI) report for May, which indicated that progress in inflation declining towards the 2% target has resumed. Growing speculation for Fed rate cuts pleases the Oil price outlook as policy expansion spurts growth.
In today’s session, investors will focus on the monthly US Retail Sales data for May, which will be published at 2:30 GMT. The Retail Sales data is estimated to have grown by 0.2% after remaining flat in April.
Meanwhile, investors have also shrugged off voluntary cuts in overall oil production by communicated by OPEC+ members after their meeting in the first week of June.
The Oil price remains firm even though China’s economic data for May missed estimates. In May, the House Price Index deflated by 3.9%, and Industrial Production and YTD Fixed Asset Investment grew slower than expected by 5.6% and 4%, respectively. However, Retail Sales rose by 3.7%, beating expectations of 3% and the prior release of 2.3%. It is worth noting that China is the world’s largest importer of Oil, and its weak economic health impacts the Oil demand outlook.
- Natural Gas tries to snap its four-day losing streak on Tuesday.
- Traders assess a mixture of data, while European Gas storages are 73.41% full.
- The US Dollar Index trades a touch higher after its downbeat performance on Monday.
Natural Gas price (XNG/USD) trades broadly flat on Tuesday and holds above the $2.80 level while trying to avoid a five-day losing streak. The easing pressure over the energy commodity price comes after Israel Prime Minister Benjamin Netanyahu dismantled its war cabinet, and convoys with humanitarian aid were allowed into the Gaza region on June 17th. This defuses a period of stress in the region ever since October 10, 2023, when Hamas attacked the Israeli music festival.
Meanwhile, the US Dollar Index (DXY), which tracks the Greenback’s value against six major currencies, started the week on the back foot, though it is mildly in the green ahead of US Retail Sales data for May, which will be released later in the day. Markets are starting to dial down the European election risk and are beginning to focus back on US data. Add no less than six US Federal Reserve (Fed) speakers lined up for this Tuesday, and the Greenback is set to face some substantial moves.
Natural Gas is trading at $2.87 per MMBtu at the time of writing.
Natural Gas news and market movers: Hard to choose which data point counts
- According to Bloomberg data, European combined Liquified Natural Gas (LNG) storages are filled up nearly 73.41%, back at levels from mid-January earlier this year.
- Shell Plc will buy LNG trader Pavilion Energy from the Singaporean state-owned company Temasek Holdings. Pavilion Energy trades and ships LNG in Asia and Europe, Reuters reports.
- Norwegian gas flow into Europe is back to normal after a series of unforeseen outages, Gassco reports to Bloomberg.
- Var Energi and VNG extend their collaboration for another 12 years, with an agreement from Var Energi to deliver 5 billion cubic meters of LNG to VNG, Bloomberg reports.
Natural Gas Technical Analysis: Europe’s reserves on track
Natural Gas prices are set to ease further despite efforts from traders to keep XNG prices at current levels. With European Ggas storages on track to be filled up in time when the heating season kicks in, the risk of sluggish demand could take over. Add in there the easing tensions from the Middle East, and the near term outlook for LNG looks bleak.
The pivotal level near $3.08 (the high from March 6, 2023) remains key after its false break last week. In addition, the red descending trendline at $3.10 will also weigh on this area as a cap. Further up, the fresh year-to-date high at $3.16 is the level to beat.
On the downside, the 200-day Simple Moving Average (SMA) acts as the first support near $2.54. Should that support area fail to hold, the next target could be the pivotal level near $2.14, with interim support by the 55-day SMA near $2.44. Further down, the biggest support comes at $2.18 with the 100-day SMA.
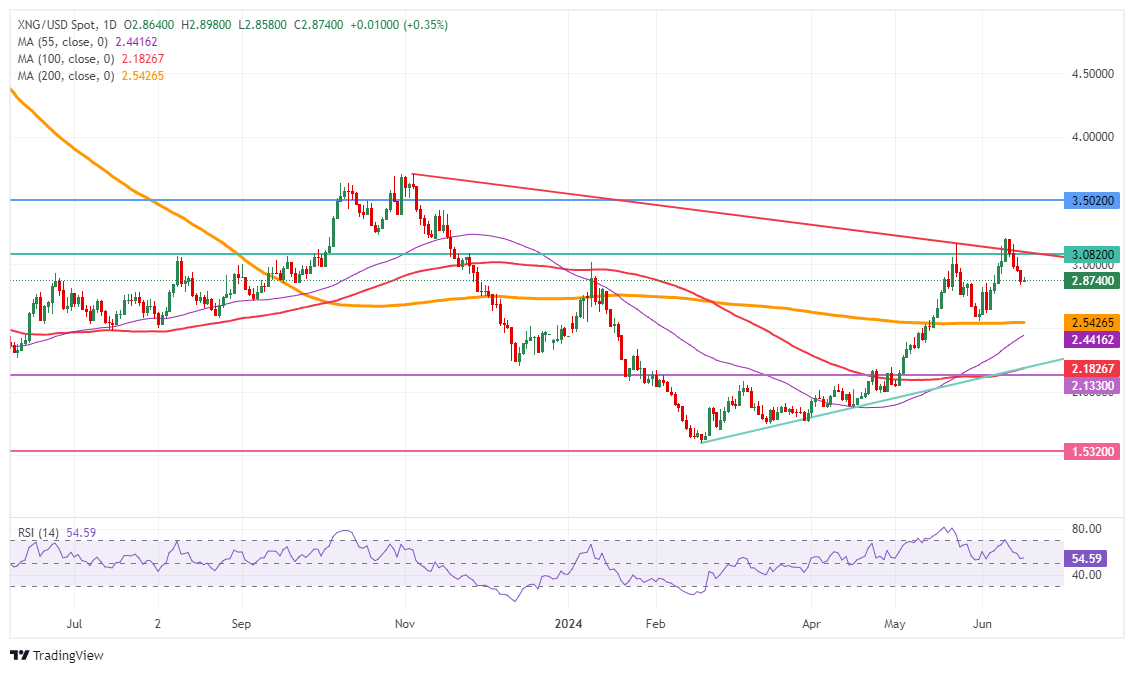
Natural Gas: Daily Chart
Natural Gas FAQs
Supply and demand dynamics are a key factor influencing Natural Gas prices, and are themselves influenced by global economic growth, industrial activity, population growth, production levels, and inventories. The weather impacts Natural Gas prices because more Gas is used during cold winters and hot summers for heating and cooling. Competition from other energy sources impacts prices as consumers may switch to cheaper sources. Geopolitical events are factors as exemplified by the war in Ukraine. Government policies relating to extraction, transportation, and environmental issues also impact prices.
The main economic release influencing Natural Gas prices is the weekly inventory bulletin from the Energy Information Administration (EIA), a US government agency that produces US gas market data. The EIA Gas bulletin usually comes out on Thursday at 14:30 GMT, a day after the EIA publishes its weekly Oil bulletin. Economic data from large consumers of Natural Gas can impact supply and demand, the largest of which include China, Germany and Japan. Natural Gas is primarily priced and traded in US Dollars, thus economic releases impacting the US Dollar are also factors.
The US Dollar is the world’s reserve currency and most commodities, including Natural Gas are priced and traded on international markets in US Dollars. As such, the value of the US Dollar is a factor in the price of Natural Gas, because if the Dollar strengthens it means less Dollars are required to buy the same volume of Gas (the price falls), and vice versa if USD strengthens.
- EUR/USD finds pressure near 1.0740 as the US Dollar strengths ahead of US Retail Sales data for May.
- The US Retail Sales are expected to have grown by 0.2% after remaining flat in April.
- ECB policymakers remain concerned as the inflation outlook appears to be stubborn.
EUR/USD struggles to extend recovery above 1.0740 in Tuesday’s European session. The major currency pair faces pressure as the Euro remains on the backfoot due to political turmoil in France and strength in the US Dollar (USD) ahead of the United States (US) Retail Sales data for May.
The Euro has been under pressure since French President Emmanuel Macron called for a snap election after the Centralist alliance suffered a defeat from Marine Le Pen's National Rally (RN) in the European Parliament elections. Investors worry that the formation of the RN government would trigger a financial crisis in the European Union’s (EU) second-largest economy. The RN has promised a lower retirement age, energy price cuts, more public spending, and "France first" economic policies in its manifesto.
On the monetary policy front, European Central Bank (ECB) policymakers continue to emphasize keeping interest rates steady in the near term, as an aggressive policy-easing approach could revamp price pressures again. The ECB reduced its Deposit Facility Rate by 25 basis points (bps) for the first time since 2019 in the Jue meeting as price pressures were stubbornly higher due to the Covid pandemic and the Russia-Ukraine war.
Daily digest market movers: EUR/USD exhibits subdued performance
- EUR/USD consolidates in a tight range above 1.0700 as investors shift focus to the monthly US Retail Sales data for May, which will be published at 12:30 GMT. The Retail Sales data – a key measure of household spending – is estimated to have grown by 0.2% after remaining unchanged in April.
- A lower-than-expected rise in the Retail Sales data could result in substantial pressure on the US Dollar as it will boost confidence that the progress in the disinflation process will continue. Currently, the US Dollar Index (DXY), which tracks the Greenback’s value against six major currencies, recovers strongly after correcting modestly to 105.25. Weak Retail Sales data would also prompt market expectations for the Federal Reserve (Fed) to reduce interest rates twice this year.
- The CME FedWatch tool shows higher probabilities that interest rates will start declining from the September meeting, with more rate cuts in November or December. On the contrary, upbeat Retail Sales data will strengthen the US Dollar’s appeal and force traders to pare bets that support rate cuts for September.
- Meanwhile, Fed policymakers hold their argument that there will be only one interest rate cut this year. Officials have acknowledged that the progress in inflation declining to the desired rate of 2% has resumed after the Consumer Price Index (CPI) report for May showed that price pressures cooled down more than expected. Though the soft CPI report was a relief for policymakers, they wanted to see inflation declining for months before the commencement of the policy-normalization process.
- On Monday, Philadelphia Fed Bank President Patrick Harker supported keeping rates at their current levels for now to maintain downward pressure on inflation in various sectors such as housing and services, notably auto insurance and repairs. When asked about the interest rate outlook, Harker sees one cut in benchmark rate this year if his economic forecast plays out, Reuters reported.
Technical Analysis: EUR/USD remains below 200-day EMA
EUR/USD faces pressure in an attempt to surpass the immediate resistance of 1.0740. The downward-sloping border of the Symmetrical Triangle formation on a daily timeframe, plotted from the high of December 28, 2023, at 1.1140, is acting as a major barrier for the Euro bulls.
The major currency pair is expected to find support at 1.0636, near the upward-sloping trendline of the chart pattern plotted from the low from October 3, 2023, at 1.0448, and the horizontal cushion plotted from April 16 low around 1.0600.
The long-term outlook of the shared currency pair has also turned negative as prices dropped below the 200-day Exponential Moving Average (EMA), which trades around 1.0800.
The 14-period Relative Strength Index (RSI) falls below 40.00. Should the momentum turn bearish if it sustains below the same?
Euro FAQs
The Euro is the currency for the 20 European Union countries that belong to the Eurozone. It is the second most heavily traded currency in the world behind the US Dollar. In 2022, it accounted for 31% of all foreign exchange transactions, with an average daily turnover of over $2.2 trillion a day. EUR/USD is the most heavily traded currency pair in the world, accounting for an estimated 30% off all transactions, followed by EUR/JPY (4%), EUR/GBP (3%) and EUR/AUD (2%).
The European Central Bank (ECB) in Frankfurt, Germany, is the reserve bank for the Eurozone. The ECB sets interest rates and manages monetary policy. The ECB’s primary mandate is to maintain price stability, which means either controlling inflation or stimulating growth. Its primary tool is the raising or lowering of interest rates. Relatively high interest rates – or the expectation of higher rates – will usually benefit the Euro and vice versa. The ECB Governing Council makes monetary policy decisions at meetings held eight times a year. Decisions are made by heads of the Eurozone national banks and six permanent members, including the President of the ECB, Christine Lagarde.
Eurozone inflation data, measured by the Harmonized Index of Consumer Prices (HICP), is an important econometric for the Euro. If inflation rises more than expected, especially if above the ECB’s 2% target, it obliges the ECB to raise interest rates to bring it back under control. Relatively high interest rates compared to its counterparts will usually benefit the Euro, as it makes the region more attractive as a place for global investors to park their money.
Data releases gauge the health of the economy and can impact on the Euro. Indicators such as GDP, Manufacturing and Services PMIs, employment, and consumer sentiment surveys can all influence the direction of the single currency. A strong economy is good for the Euro. Not only does it attract more foreign investment but it may encourage the ECB to put up interest rates, which will directly strengthen the Euro. Otherwise, if economic data is weak, the Euro is likely to fall. Economic data for the four largest economies in the euro area (Germany, France, Italy and Spain) are especially significant, as they account for 75% of the Eurozone’s economy.
Another significant data release for the Euro is the Trade Balance. This indicator measures the difference between what a country earns from its exports and what it spends on imports over a given period. If a country produces highly sought after exports then its currency will gain in value purely from the extra demand created from foreign buyers seeking to purchase these goods. Therefore, a positive net Trade Balance strengthens a currency and vice versa for a negative balance.
- Federal Reserve officials await more "good inflation" data before cutting rates.
- Jerome Powell reiterates data-dependent approach, says they will make decisions meeting by meeting.
- Federal Reserve policymakers are divided over the timing of the policy pivot.
Federal Reserve (Fed) left the policy rate unchanged at 5.25%-5.5% following the June policy meeting, as expected. The revised Summary of Economic Projections (SEP), the so-called dot plot, showed that policymakers were divided over the near-term rate outlook. Four of 19 officials saw no rate cuts in 2024, seven projected a 25 basis points (bps) rate reduction, while eight marked down a 50 bps cut in the policy rate.
Fed policymakers speak on policy outlook
Fed Chairman Jerome Powell refrained from hinting at the timing of the rate reduction in the post-meeting press conference. "We need further confidence, more good inflation readings but won't be specific about how many to start rate cuts," Powell explained.
Following the Fed event and May inflation data, the probability of the Fed leaving the policy rate unchanged in September declined toward 30% from 50%, according to the CME FedWatch Tool.
With the Fed's blackout period coming to an end after the June meeting, investors will pay close attention to comments from policymakers in the near term.
Cleveland Fed President Loretta Mester said that she would like to see a "longer run of good-looking inflation data," and Minneapolis Fed President Neel Kashkari stated over the weekend that it would be a “reasonable prediction” that the Fed will wait until December to cut interest rates, adding that the central bank is in a very good position to get more data before making any decisions. Meanwhile, President of the Philadelphia Fed, Patrick Harker, leaned into a cautious stance on Monday, noting that the Fed may need to keep rates where they are for longer than markets currently hope.
Fed FAQs
Monetary policy in the US is shaped by the Federal Reserve (Fed). The Fed has two mandates: to achieve price stability and foster full employment. Its primary tool to achieve these goals is by adjusting interest rates. When prices are rising too quickly and inflation is above the Fed’s 2% target, it raises interest rates, increasing borrowing costs throughout the economy. This results in a stronger US Dollar (USD) as it makes the US a more attractive place for international investors to park their money. When inflation falls below 2% or the Unemployment Rate is too high, the Fed may lower interest rates to encourage borrowing, which weighs on the Greenback.
The Federal Reserve (Fed) holds eight policy meetings a year, where the Federal Open Market Committee (FOMC) assesses economic conditions and makes monetary policy decisions. The FOMC is attended by twelve Fed officials – the seven members of the Board of Governors, the president of the Federal Reserve Bank of New York, and four of the remaining eleven regional Reserve Bank presidents, who serve one-year terms on a rotating basis.
In extreme situations, the Federal Reserve may resort to a policy named Quantitative Easing (QE). QE is the process by which the Fed substantially increases the flow of credit in a stuck financial system. It is a non-standard policy measure used during crises or when inflation is extremely low. It was the Fed’s weapon of choice during the Great Financial Crisis in 2008. It involves the Fed printing more Dollars and using them to buy high grade bonds from financial institutions. QE usually weakens the US Dollar.
Quantitative tightening (QT) is the reverse process of QE, whereby the Federal Reserve stops buying bonds from financial institutions and does not reinvest the principal from the bonds it holds maturing, to purchase new bonds. It is usually positive for the value of the US Dollar.
- Gold edges lower as risk-on dominates the market, preferencing riskier assets over safe-havens.
- A survey by the World Gold Council expected central-bank demand to remain sturdy in 2024, adding a backwind to Gold price.
- XAU/USD continues forming a bearish Head-and-Shoulders pattern on the daily chart.
Gold (XAU/USD) price edges lower, exchanging hands in the $2,310s on Tuesday as an overall positive risk tone to markets weighs on the safe-haven precious metal. The decline comes despite a survey from the World Gold Council (WGC) showing respondents expect demand to remain strong in 2024.
Gold retreats as risk-on dominates markets
Gold declines over a quarter of a percent on Tuesday as demand for riskier assets diverts attention away from the safety-linked Gold.
US stock indexes reached new all-time highs on Monday on the back of another rally in tech stocks. The good mood continued into the Asian session when most bourses in the East also booked gains.
Current market expectations see the US Federal Reserve (Fed) making a 0.25% cut to the Fed Funds Rate by September, as roughly 55% probable. This comes despite the Fed upping its estimate of the future path of interest rates at its June meeting – a negative for non-yielding Gold.
Gold survey shows central-bank buying bonanza to last
Central banks are purported to now account for about a quarter of total Gold purchases, and demand from the sector is likely to remain strong in 2024, according to a survey by the World Gold Council, published on Tuesday.
The WGC’s “2024 Central Banks Gold Reserves Survey” results showed that 81% of respondents expected overall central-bank Gold reserves to increase in 2024, 19% for them to remain the same, and none to fall.
This was higher than the 2023 survey results, which showed 71% expected overall central bank reserves to increase, against 28% that they would remain unchanged and 1% that they would fall.
It was the highest percentage of respondents who expected reserves to increase since the WGC first started the survey in 2019.
When asked whether they expected their central bank specifically to increase its Gold reserves in 2024, 29% said they thought it would, 68% thought it would remain unchanged and only 3% expected it to fall. This was also the highest percentage of affirmations for the question since the survey began.
The most important driver for central banks to hoard Gold was as a “long-term store of value/inflation hedge” according to the survey, with 42% rating it as a “highly relevant factor” in its decision-making process.
The survey findings suggest longer-term demand for Gold from central banks is likely to remain robust – a supportive factor for the Gold price.
Technical Analysis: Gold forms Head-and-Shoulders top
Gold appears to be completing a bearish Head-and-Shoulders (H&S) price pattern on the daily chart. These patterns tend to occur at market tops and signal a change of trend.
XAU/USD Daily Chart
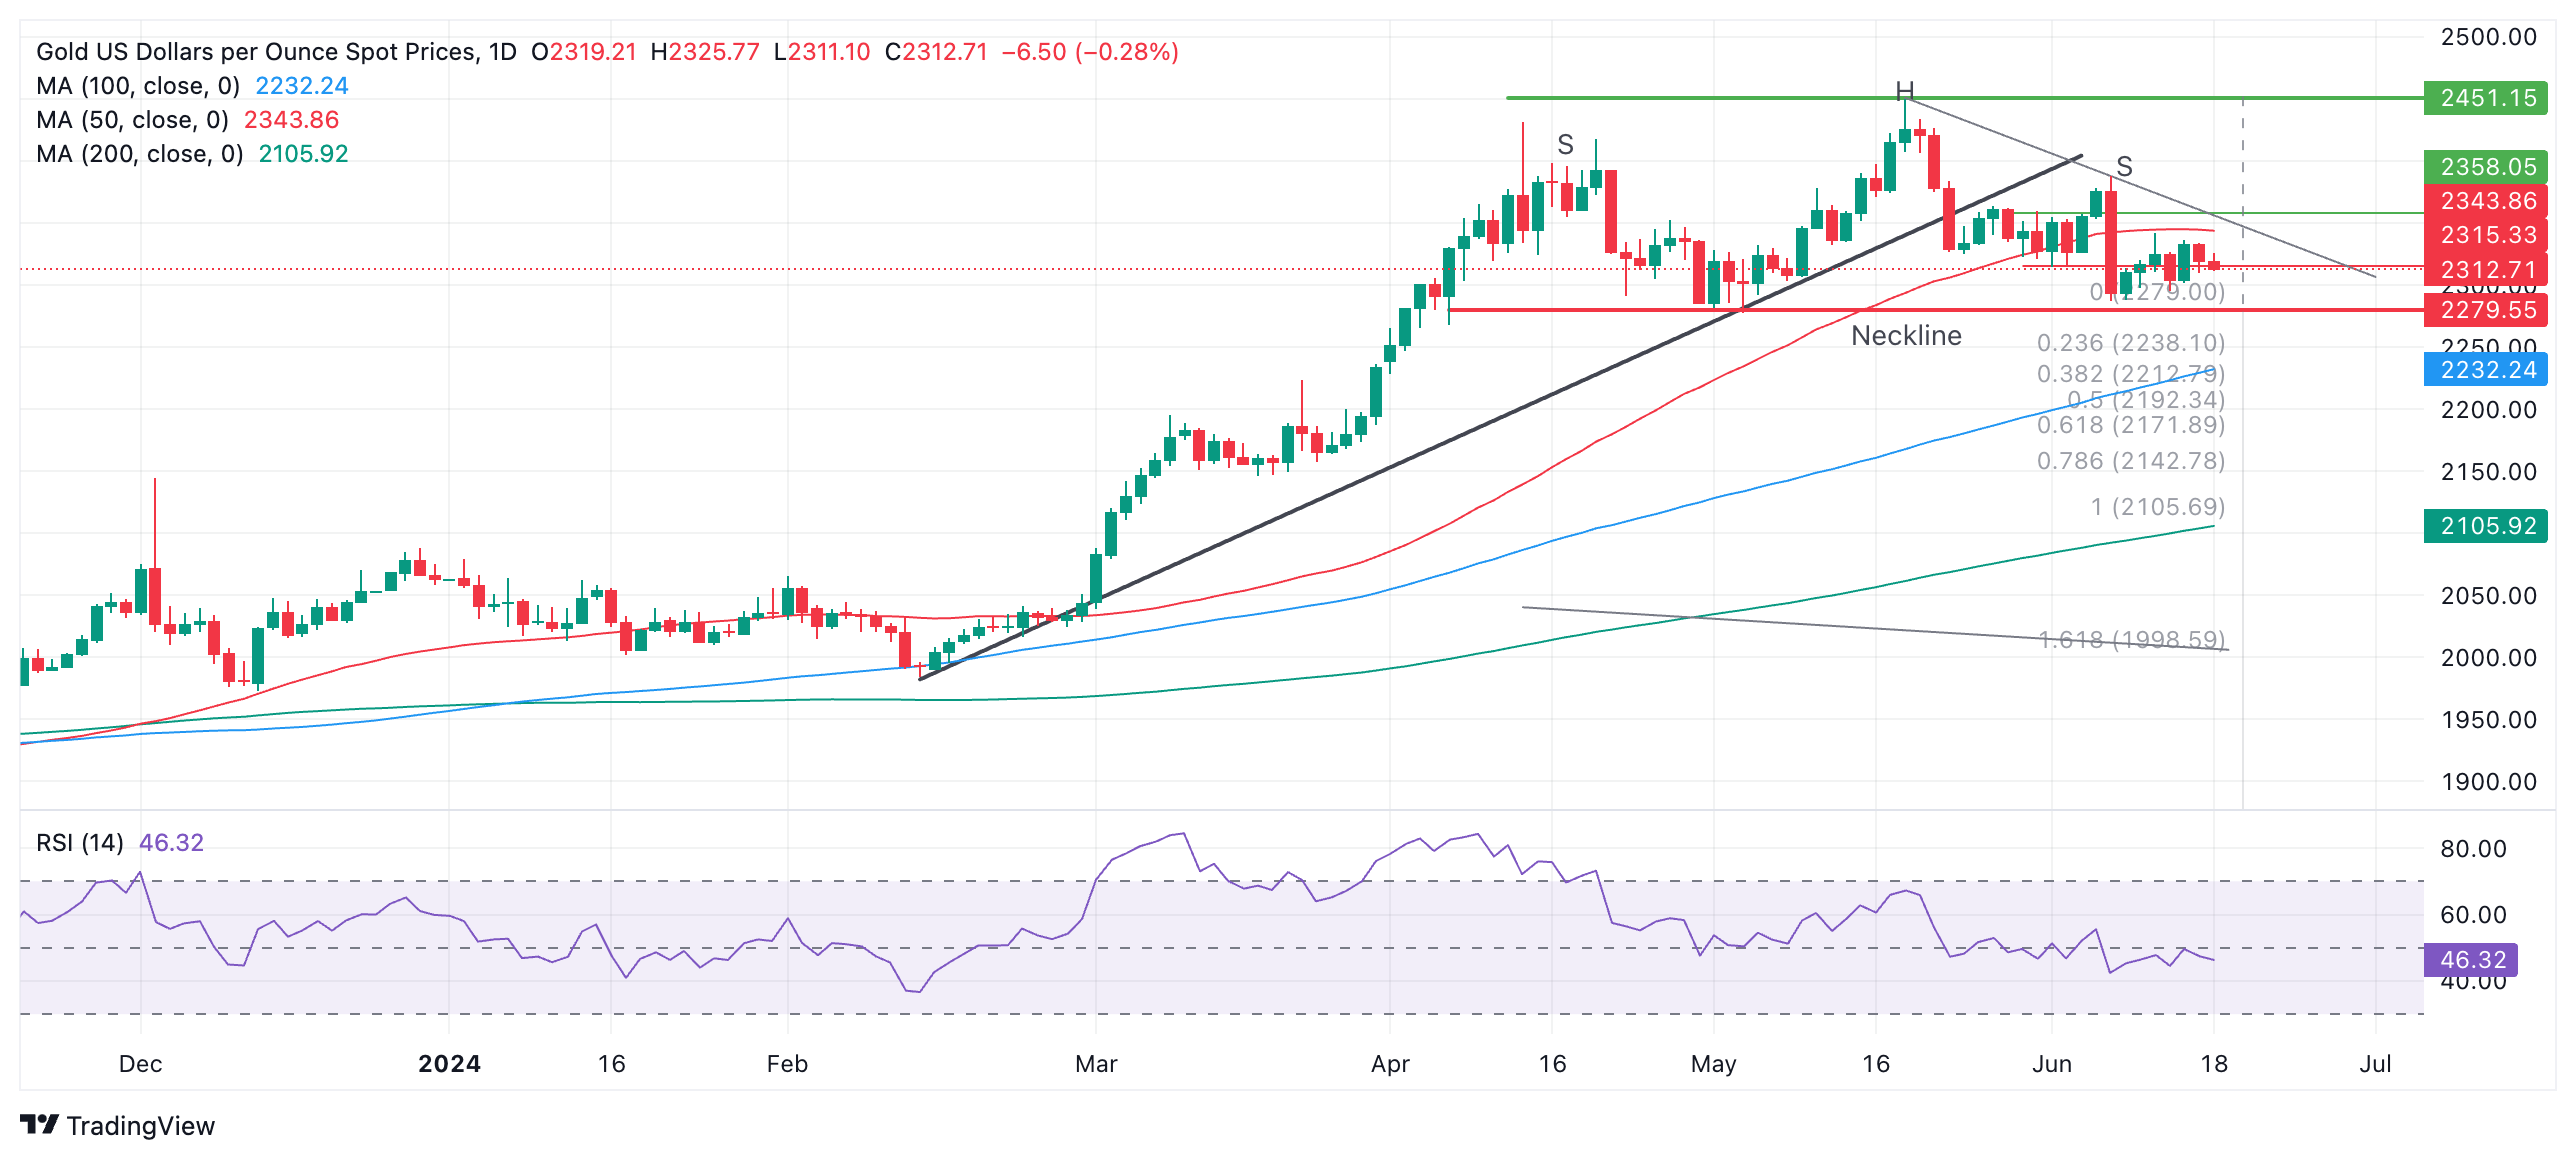
The H&S on Gold has completed a left and right shoulder (labeled “S”) and a “head” (labeled “H”). The so-called “neckline” of the pattern appears to be at the $2,279 support level (red line).
The declining momentum signaled by the Relative Strength Index (RSI) during its development corroborates the pattern.
A decisive break below the neckline would validate the H&S pattern and activate downside targets. The first more conservative target would be $2,171, calculated by taking the 0.618 Fibonacci ratio of the height of the pattern and extrapolating it lower from the neckline. The second target would be at $2,106, the full height of the pattern extrapolated lower.
A break above $2,345, however, would bring the H&S into doubt and could signal a continuation higher, to an initial target at the $2,450 peak.
Gold FAQs
Gold has played a key role in human’s history as it has been widely used as a store of value and medium of exchange. Currently, apart from its shine and usage for jewelry, the precious metal is widely seen as a safe-haven asset, meaning that it is considered a good investment during turbulent times. Gold is also widely seen as a hedge against inflation and against depreciating currencies as it doesn’t rely on any specific issuer or government.
Central banks are the biggest Gold holders. In their aim to support their currencies in turbulent times, central banks tend to diversify their reserves and buy Gold to improve the perceived strength of the economy and the currency. High Gold reserves can be a source of trust for a country’s solvency. Central banks added 1,136 tonnes of Gold worth around $70 billion to their reserves in 2022, according to data from the World Gold Council. This is the highest yearly purchase since records began. Central banks from emerging economies such as China, India and Turkey are quickly increasing their Gold reserves.
Gold has an inverse correlation with the US Dollar and US Treasuries, which are both major reserve and safe-haven assets. When the Dollar depreciates, Gold tends to rise, enabling investors and central banks to diversify their assets in turbulent times. Gold is also inversely correlated with risk assets. A rally in the stock market tends to weaken Gold price, while sell-offs in riskier markets tend to favor the precious metal.
The price can move due to a wide range of factors. Geopolitical instability or fears of a deep recession can quickly make Gold price escalate due to its safe-haven status. As a yield-less asset, Gold tends to rise with lower interest rates, while higher cost of money usually weighs down on the yellow metal. Still, most moves depend on how the US Dollar (USD) behaves as the asset is priced in dollars (XAU/USD). A strong Dollar tends to keep the price of Gold controlled, whereas a weaker Dollar is likely to push Gold prices up.
- USD/JPY moves higher above 158.00 amid firm US Dollar.
- The US Dollar remains firm as the Fed restricts a number of rate cuts this year to one.
- The Japanese Yen remains vulnerable as the BoJ postponed plans of reduction in bond-buying operations.
The USD/JPY pair jumps above 158.00 in Tuesday’s European session. The asset strengthens as the US Dollar (USD) recovers strongly after a modest correction. The US Dollar exhibits a strong performance as Federal Reserve (Fed) policymakers continue to reiterate their projection for only one rate cut this year.
On Monday, Philadelphia Fed Bank President Patrick Harker said he sees one cut in benchmark rates this year if his economic forecast plays out, Reuters reported.
On the contrary, financial markets expect that the Fed will deliver two rate cuts by the year-end. Market speculation for rate cuts twice this year strengthened after the Consumer Price Index (CPI) report for May showed that inflation cooled down at a faster pace. This also increased confidence among investors that the progress in the disinflation process has resumed.
Fed policymakers also acknowledged the soft inflation as encouraging. However, officials said that they want to see inflation declining for months before announcing rate cuts.
Meanwhile, investors shift focus to the United States (US) Retail Sales data for May, which will be published at 12:30 GMT. The US Census Bureau is expected to report an increase in the Retail Sales by 0.3% after remaining flat in April.
On the Tokyo front, the Japanese Yen continues to face selling pressure as the Bank of Japan (BoJ) has pushed plans for reducing bond-buying operations to the July meeting. This has deepened fears of limited scope for policy tightening.
This week, investors will focus on Japan’s National Consumer Price Index (CPI) data for May. Annual National CPI excluding Fresh Food is expected to have accelerated to 2.6% from the prior reading of 2.2%.
Silver prices (XAG/USD) fell on Tuesday, according to FXStreet data. Silver trades at $29.20 per troy ounce, down 0.89% from the $29.46 it cost on Monday.
Silver prices have increased by 14.64% since the beginning of the year.
| Unit measure | Today Price |
|---|---|
| Silver price per troy ounce | $29.20 |
| Silver price per gram | $0.94 |
The Gold/Silver ratio, which shows the number of troy ounces of Silver needed to equal the value of one troy ounce of Gold, stood at 79.20 on Tuesday, up from 78.72 on Monday.
Investors might use this ratio to determine the relative valuation of Gold and Silver. Some may consider a high ratio as an indicator that Silver is undervalued – or Gold is overvalued – and might buy Silver or sell Gold accordingly. Conversely, a low ratio might suggest that Gold is undervalued relative to Silver.
Silver FAQs
Silver is a precious metal highly traded among investors. It has been historically used as a store of value and a medium of exchange. Although less popular than Gold, traders may turn to Silver to diversify their investment portfolio, for its intrinsic value or as a potential hedge during high-inflation periods. Investors can buy physical Silver, in coins or in bars, or trade it through vehicles such as Exchange Traded Funds, which track its price on international markets.
Silver prices can move due to a wide range of factors. Geopolitical instability or fears of a deep recession can make Silver price escalate due to its safe-haven status, although to a lesser extent than Gold's. As a yieldless asset, Silver tends to rise with lower interest rates. Its moves also depend on how the US Dollar (USD) behaves as the asset is priced in dollars (XAG/USD). A strong Dollar tends to keep the price of Silver at bay, whereas a weaker Dollar is likely to propel prices up. Other factors such as investment demand, mining supply – Silver is much more abundant than Gold – and recycling rates can also affect prices.
Silver is widely used in industry, particularly in sectors such as electronics or solar energy, as it has one of the highest electric conductivity of all metals – more than Copper and Gold. A surge in demand can increase prices, while a decline tends to lower them. Dynamics in the US, Chinese and Indian economies can also contribute to price swings: for the US and particularly China, their big industrial sectors use Silver in various processes; in India, consumers’ demand for the precious metal for jewellery also plays a key role in setting prices.
Silver prices tend to follow Gold's moves. When Gold prices rise, Silver typically follows suit, as their status as safe-haven assets is similar. The Gold/Silver ratio, which shows the number of ounces of Silver needed to equal the value of one ounce of Gold, may help to determine the relative valuation between both metals. Some investors may consider a high ratio as an indicator that Silver is undervalued, or Gold is overvalued. On the contrary, a low ratio might suggest that Gold is undervalued relative to Silver.
(An automation tool was used in creating this post.)
- Germany’s ZEW Economic Sentiment Index improves slightly to 47.5 in June.
- EUR/USD keeps losses below 1.0750 after the mixed German and Eurozone ZEW surveys.
The headline German ZEW Economic Sentiment Index edges a tad higher from 47.1 in May to 47.5 in June. The market consensus was for a 50.0 print.
The Current Situation Index, however, dropped from -72.3 in May to -73.8 in the same month, missing the estimates of -65.0 in the reported period.
The Eurozone ZEW Economic Sentiment Index arrived at 51.3 in June, much higher than the May reading of 47.0. The data surpassed the market expectations of 47.8.
Key points
“Both the sentiment and the situation indicators stagnate.”
“These developments must be interpreted in the context of a constant situation indicator for the eurozone as a whole.”
“In contrast, the inflation expectations of the respondents increase, which is likely related to the inflation rate in may, which turned out higher than what was expected.”
Market reaction
The EUR/USD pair is little changed after the mixed German and Eurozone ZEW surveys. The pair is losing 0.13% on the day to trade near 1.0720, at the press time.
Euro PRICE Today
The table below shows the percentage change of Euro (EUR) against listed major currencies today. Euro was the weakest against the Swiss Franc.
| USD | EUR | GBP | JPY | CAD | AUD | NZD | CHF | |
|---|---|---|---|---|---|---|---|---|
| USD | 0.12% | 0.18% | 0.25% | 0.20% | -0.07% | 0.40% | -0.13% | |
| EUR | -0.12% | 0.04% | 0.10% | 0.07% | -0.21% | 0.28% | -0.24% | |
| GBP | -0.18% | -0.04% | 0.06% | 0.03% | -0.25% | 0.24% | -0.31% | |
| JPY | -0.25% | -0.10% | -0.06% | -0.04% | -0.32% | 0.16% | -0.39% | |
| CAD | -0.20% | -0.07% | -0.03% | 0.04% | -0.27% | 0.18% | -0.33% | |
| AUD | 0.07% | 0.21% | 0.25% | 0.32% | 0.27% | 0.47% | -0.06% | |
| NZD | -0.40% | -0.28% | -0.24% | -0.16% | -0.18% | -0.47% | -0.54% | |
| CHF | 0.13% | 0.24% | 0.31% | 0.39% | 0.33% | 0.06% | 0.54% |
The heat map shows percentage changes of major currencies against each other. The base currency is picked from the left column, while the quote currency is picked from the top row. For example, if you pick the Euro from the left column and move along the horizontal line to the US Dollar, the percentage change displayed in the box will represent EUR (base)/USD (quote).
- The Mexican Peso trades in a tight range on Tuesday as the currency recovers from the post-election sell-off.
- President-elect Claudia Sheinbaum seeks to calm markets with positive messages about the economy and the popularity of reforms.
- USD/MXN continues pulling back in the midst of a short and medium-term uptrend.
The Mexican Peso (MXN) fluctuates within a range on Tuesday as the sell-off after the elections, which saw the currency lose on average 10% against its key counterparts, runs out of steam.
Market risk appetite remains solid after US stock indexes reached new all-time highs on Monday led by a rally in tech, and Asian investors carried the baton through into their session. The risk-on tone provides a constructive backdrop for the Peso, which tends to perform better when investors have more appetite for risk.
At the time of writing, a single US Dollar (USD) buys 18.53 Mexican Pesos, EUR/MXN is trading at 19.88 and GBP/MXN at 23.52.
Mexican Peso bottoms out after heavy selling
The Mexican Peso oscillates within tight margins on Tuesday as the bearish squeeze that saw the currency sell off dramatically following the June 2 elections, loses momentum.
Despite lingering concerns about a raft of constitutional reforms the new left-leaning coalition government wishes to make, which range from increasing the minimum wage to judicial reform, speculators appear to have eased off pushing the Peso lower.
Analysts at Capital Economics see USD/MXN as fair priced at 19.00, the June 12 high. The overweight long position that had built up in the Peso when it climbed to the 16.20s in May, has likely now been fully cremated.
Incoming President Claudia Sheinbaum sought to calm investors on Monday, saying “Mexico’s economy is healthy and strong, and [there is] nothing to worry about.”
She further cited independent polls commissioned over the weekend that indicated the controversial judicial reforms proposed by her party – which market commentators have held responsible for the Peso’s sell-off – are backed by the population at large.
On the data front, the USD/MXN pair could face volatility after the release of US Retail Sales data for May. In Mexico, meanwhile, the statistics office INEGI will release GDP Aggregate Demand for Q1.
Technical Analysis: USD/MXN still pulling back within an uptrend
USD/MXN is still in the midst of a pullback within an uptrend. It is possible the correction could have further to run, however, thereafter the dominant bull trend is likely to reassert itself. The next target higher is situated at 19.22 (March 2023 high).
USD/MXN Daily Chart
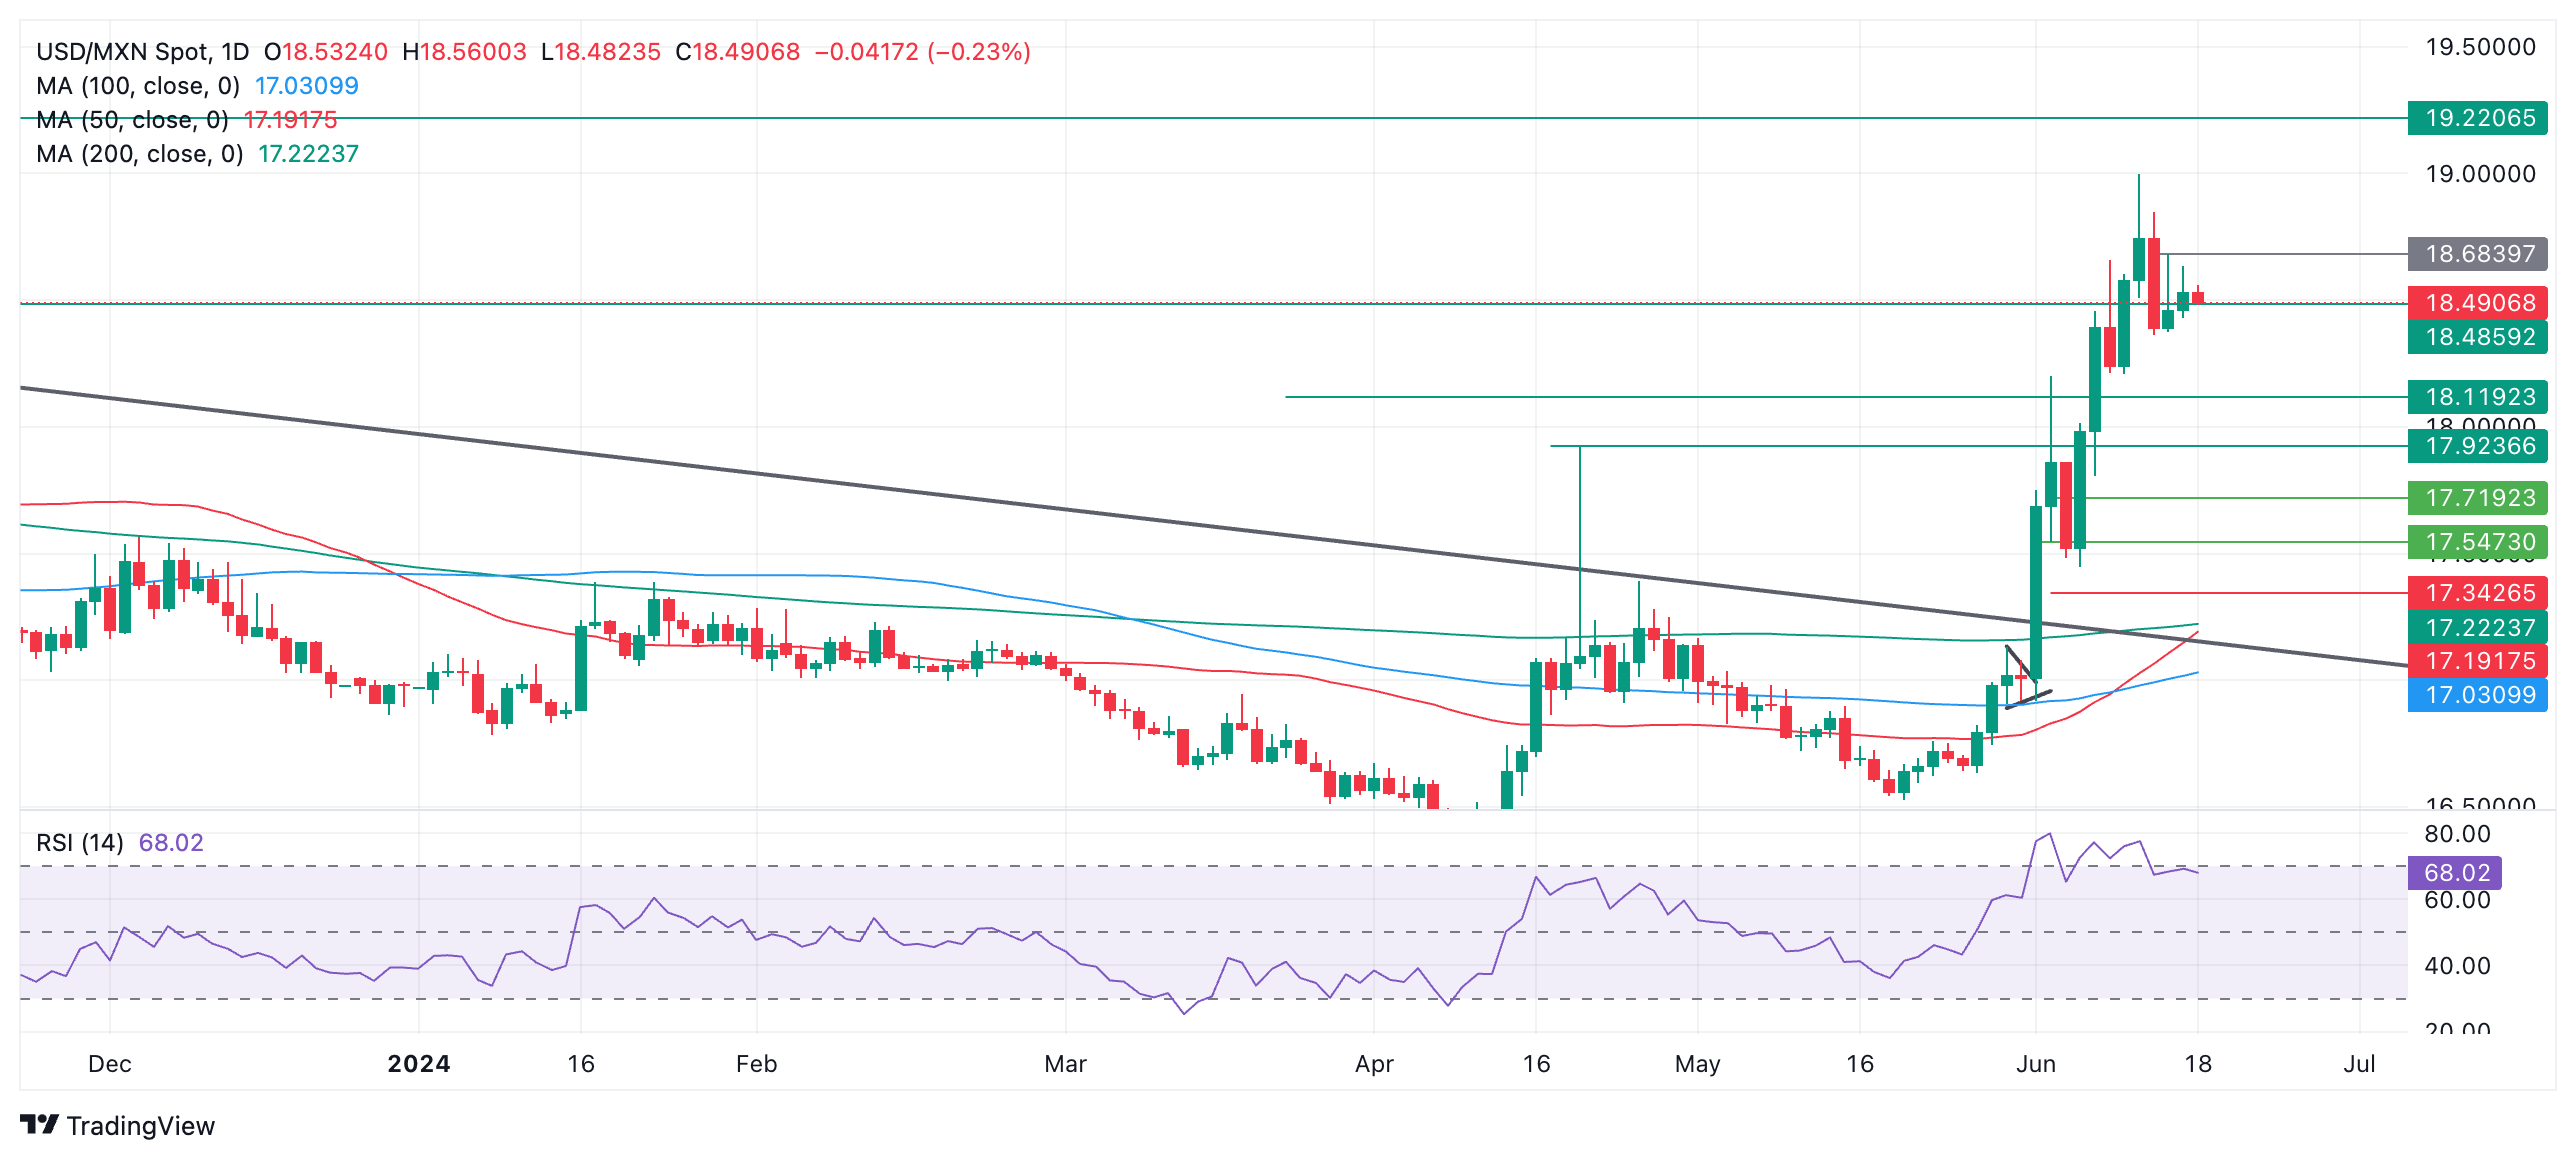
A break above Friday’s high at 18.68 would provide additional confirmation of more upside towards the target at 19.22.
The Relative Strength Index (RSI) has just exited the overbought zone, however, further suggesting a risk the correction could still go deeper. That said, the established uptrend is likely to resume eventually.
The short and medium term trends are now firmly bullish. The direction of the long-term trend, however, is in doubt after the break above the October 2023 high. Previous to that, it was bearish.
Mexican Peso FAQs
The Mexican Peso (MXN) is the most traded currency among its Latin American peers. Its value is broadly determined by the performance of the Mexican economy, the country’s central bank’s policy, the amount of foreign investment in the country and even the levels of remittances sent by Mexicans who live abroad, particularly in the United States. Geopolitical trends can also move MXN: for example, the process of nearshoring – or the decision by some firms to relocate manufacturing capacity and supply chains closer to their home countries – is also seen as a catalyst for the Mexican currency as the country is considered a key manufacturing hub in the American continent. Another catalyst for MXN is Oil prices as Mexico is a key exporter of the commodity.
The main objective of Mexico’s central bank, also known as Banxico, is to maintain inflation at low and stable levels (at or close to its target of 3%, the midpoint in a tolerance band of between 2% and 4%). To this end, the bank sets an appropriate level of interest rates. When inflation is too high, Banxico will attempt to tame it by raising interest rates, making it more expensive for households and businesses to borrow money, thus cooling demand and the overall economy. Higher interest rates are generally positive for the Mexican Peso (MXN) as they lead to higher yields, making the country a more attractive place for investors. On the contrary, lower interest rates tend to weaken MXN.
Macroeconomic data releases are key to assess the state of the economy and can have an impact on the Mexican Peso (MXN) valuation. A strong Mexican economy, based on high economic growth, low unemployment and high confidence is good for MXN. Not only does it attract more foreign investment but it may encourage the Bank of Mexico (Banxico) to increase interest rates, particularly if this strength comes together with elevated inflation. However, if economic data is weak, MXN is likely to depreciate.
As an emerging-market currency, the Mexican Peso (MXN) tends to strive during risk-on periods, or when investors perceive that broader market risks are low and thus are eager to engage with investments that carry a higher risk. Conversely, MXN tends to weaken at times of market turbulence or economic uncertainty as investors tend to sell higher-risk assets and flee to the more-stable safe havens.
- USD/CAD holds its key support of 1.3700 with eyes on monthly US Retail Sales data for May.
- While the Fed advocates one rate cut this year, traders have priced in two.
- The BoC may extend its policy-easing spell in July.
The USD/CAD pair remains well-supported above the round-level cushion of 1.3700 in Tuesday’s European session. The Loonie asset holds gains as the US Dollar (USD) rebounds after a slight corrective move. The US Dollar Index (DXY), which tracks the Greenback’s value against six major currencies, clings to gains above 105.00 as Federal Reserve (Fed) policymakers continue to advocate for one rate cut this year.
Fed officials have acknowledged the cooler-than-expected consumer and producer inflation reports but don’t want to rush to reduce interest rates before they see inflation declining for months to gain significant confidence.
Contrary to the Fed’s latest interest rate projections, market speculation for two rate cuts this year have strengthened. The CME FedWatch tool shows that the rate-cut process will begin from the September meeting and there will be subsequent rate cuts in the November or December meeting.
Meanwhile, investors shift focus to the United States (US) Retail Sales data for May, which will be published at 12:30 GMT. The Retail Sales data—a key measure of consumer spending—is estimated to have increased by 0.3% after remaining stagnant in April. Robust consumer spending indicates a stubborn inflation outlook and will diminish hopes of rate cuts in September, while soft numbers will do the opposite.
On the Loonie front, rising expectations that the Bank of Canada (BoC) will cut interest rates further in the July meeting have kept the Canadian Dollar on the backfoot. The BoC delivered a rate cut of 25 basis points (bps) in its June policy meeting, as expected. BoC’s preferred inflation measure- the core Consumer Price Index (CPI), which excludes various volatile items- has come down below the 2% target, and the Unemployment Rate has risen to 6.2%, which forced the BoC to start unwinding the restrictive interest rate framework.
Here is what you need to know on Tuesday, June 18:
The Australian Dollar (AUD) stays resilient against its major rivals early Tuesday as markets assess the Reserve Bank of Australia (RBA) policy announcements and Governor Michele Bullock's comments. ZEW Survey for Germany and the Eurozone will be featured in the European economic docket. Later in the day, Retail Sales and Industrial Production data from the US will be watched closely by market participants.
Following the conclusion of its June policy meeting on Tuesday, the RBA board members decided to keep the Official Cash Rate (OCR) unchanged at 4.35%, as widely expected. "Inflation is easing but has been doing so more slowly than previously expected and it remains high," the RBA noted in its policy statement and added that they expect that it will be some time before inflation is sustainably in the target range. In the post-meeting press conference, Governor Bullock said that policymakers discussed whether to hike rates at the meeting and said that they wanted to make a point that they are alert to upside risks to inflation. AUD/USD edged higher following the RBA event and was last seen rising 0.3% on the day at 0.6630.
Bullock Speech: RBA Governor speaks on interest outlook after standing pat.
Following a bullish start to the week, the US Dollar (USD) struggled to find demand in the second half of the day on Monday. As Wall Street's main indexes pushed higher after the opening bell, the USD Index turned south and closed the day in negative territory. US stock index futures trade marginally higher in the early European morning and the USD Index fluctuates in a tight channel below 105.50. Meanwhile, the benchmark 10-year US Treasury bond yield holds steady slightly below 4.3% after rising more than 1% on Monday.
US Dollar PRICE This week
The table below shows the percentage change of US Dollar (USD) against listed major currencies this week. US Dollar was the weakest against the Euro.
| USD | EUR | GBP | JPY | CAD | AUD | NZD | CHF | |
|---|---|---|---|---|---|---|---|---|
| USD | -0.26% | -0.10% | 0.38% | -0.03% | -0.21% | 0.24% | -0.21% | |
| EUR | 0.26% | 0.18% | 0.68% | 0.23% | -0.04% | 0.54% | 0.05% | |
| GBP | 0.10% | -0.18% | 0.58% | 0.05% | -0.23% | 0.33% | -0.10% | |
| JPY | -0.38% | -0.68% | -0.58% | -0.30% | -0.59% | 0.00% | -0.53% | |
| CAD | 0.03% | -0.23% | -0.05% | 0.30% | -0.24% | 0.27% | -0.16% | |
| AUD | 0.21% | 0.04% | 0.23% | 0.59% | 0.24% | 0.64% | 0.13% | |
| NZD | -0.24% | -0.54% | -0.33% | 0.00% | -0.27% | -0.64% | -0.44% | |
| CHF | 0.21% | -0.05% | 0.10% | 0.53% | 0.16% | -0.13% | 0.44% |
The heat map shows percentage changes of major currencies against each other. The base currency is picked from the left column, while the quote currency is picked from the top row. For example, if you pick the US Dollar from the left column and move along the horizontal line to the Japanese Yen, the percentage change displayed in the box will represent USD (base)/JPY (quote).
The Bank of Japan (BoJ) Governor Kazuo Ueda said on Tuesday that there is a chance that the Japanese central bank could raise interest rates at the July meeting, depending on economic, price and financial data and information available at the time. These comments, however, failed to provide a boost to the Japanese Yen. At the time of press, USD/JPY was trading in positive territory at around 158.00.
EUR/USD benefited from the selling pressure surrounding the USD and registered modest gains on Monday. In the European morning on Tuesday, the pair stays in a consolidation phase slightly below 1.0750.
Following Friday's sharp decline, GBP/USD edged higher on Monday. The pair moves up and down in a narrow channel at around 1.2700 early Tuesday.
Gold lost its traction and closed in the red on Monday, pressured by rising US T-bond yields. XAU/USD holds steady near $2,320 in the European morning.
Central banks FAQs
Central Banks have a key mandate which is making sure that there is price stability in a country or region. Economies are constantly facing inflation or deflation when prices for certain goods and services are fluctuating. Constant rising prices for the same goods means inflation, constant lowered prices for the same goods means deflation. It is the task of the central bank to keep the demand in line by tweaking its policy rate. For the biggest central banks like the US Federal Reserve (Fed), the European Central Bank (ECB) or the Bank of England (BoE), the mandate is to keep inflation close to 2%.
A central bank has one important tool at its disposal to get inflation higher or lower, and that is by tweaking its benchmark policy rate, commonly known as interest rate. On pre-communicated moments, the central bank will issue a statement with its policy rate and provide additional reasoning on why it is either remaining or changing (cutting or hiking) it. Local banks will adjust their savings and lending rates accordingly, which in turn will make it either harder or easier for people to earn on their savings or for companies to take out loans and make investments in their businesses. When the central bank hikes interest rates substantially, this is called monetary tightening. When it is cutting its benchmark rate, it is called monetary easing.
A central bank is often politically independent. Members of the central bank policy board are passing through a series of panels and hearings before being appointed to a policy board seat. Each member in that board often has a certain conviction on how the central bank should control inflation and the subsequent monetary policy. Members that want a very loose monetary policy, with low rates and cheap lending, to boost the economy substantially while being content to see inflation slightly above 2%, are called ‘doves’. Members that rather want to see higher rates to reward savings and want to keep a lit on inflation at all time are called ‘hawks’ and will not rest until inflation is at or just below 2%.
Normally, there is a chairman or president who leads each meeting, needs to create a consensus between the hawks or doves and has his or her final say when it would come down to a vote split to avoid a 50-50 tie on whether the current policy should be adjusted. The chairman will deliver speeches which often can be followed live, where the current monetary stance and outlook is being communicated. A central bank will try to push forward its monetary policy without triggering violent swings in rates, equities, or its currency. All members of the central bank will channel their stance toward the markets in advance of a policy meeting event. A few days before a policy meeting takes place until the new policy has been communicated, members are forbidden to talk publicly. This is called the blackout period.
- The Pound Sterling struggles near 1.2700 against the US Dollar amid uncertainty ahead of the UK inflation and the BoE interest rate policy.
- The UK headline CPI is expected to have decelerated to the bank’s target of 2% in May.
- Fed’s Harker sees only one rate cut this year if his economic forecast plays out.
The Pound Sterling (GBP) faces selling pressure in an attempt to extend recovery above the round-level resistance of 1.2700 against the US Dollar (USD) in Tuesday’s London session. The GBP/USD pair edges down as the US Dollar rebounds after a modest correction from a six-week high. The US Dollar Index (DXY), which tracks the greenback’s value against six major currencies, holds gains above 105.00 as Federal Reserve (Fed) officials continue to argue in favor of cutting interest rates only once this year.
Fed policymakers want to see inflation decline for months to gain confidence in lowering interest rates. They remain concerned over a reacceleration in price pressures due to premature rate cuts even though the progress in the disinflation process has resumed after stalling in the first quarter of the year.
On Monday, Philadelphia Fed Bank President Patrick Harker emphasized keeping rates unchanged for now to maintain downward pressure on inflation in various sectors such as housing and services, notably auto insurance and repairs. On the interest rate outlook, Harker sees one cut in benchmark rates this year if his economic forecast plays out, Reuters reported.
On the economic front, investors will focus on the monthly United States (US) Retail Sales data for May, which will be published at 12:30 GMT. The Retail Sales data, a close measure of consumer spending that provides cues on the inflation outlook, is estimated to have increased by 0.3% after remaining flat in April.
Daily digest market movers: Pound Sterling is under pressure against the US Dollar ahead of US Retail Sales
- The Pound Sterling exhibits a mixed performance against major currencies amid uncertainty ahead of the United Kingdom (UK) Consumer Price Index (CPI) data for May, which is scheduled for Wednesday. The inflation data will provide cues about when the Bank of England (BoE) will start reducing interest rates.
- The UK CPI report is expected to show that the headline inflation has declined to BoE’s target of 2% from April’s reading of 2.3%. In the same period, the core CPI, which strips off volatile food and energy prices, is estimated to have decelerated to 3.5% from the former release of 3.9%. However, monthly headline inflation is expected to have grown at a higher pace of 0.4% from 0.3% in April.
- Investors will pay close attention to the service inflation data, which has remained a key reason for a bumpier path of inflation toward the central bank’s 2% target. Inflation in the service sector, which is mainly driven by wage growth, could remain persistent as the Average Earnings data Excluding bonuses for three months ending April – a key measure to wage growth – grew steadily by 6.0%. The pace at which wages are growing is much higher than what is needed to bring core inflation down to 2%.
- This week, the Pound Sterling is expected to remain highly volatile as the inflation data will be followed by the BoE’s interest rate policy decision, which will be announced on Thursday. The BoE is widely anticipated to keep interest rates unchanged at 5.25% for the seventh time in a row. Therefore, investors will look for cues about the future rate-cut timeframe. Currently, investors see a 57% chance of another BoE rate hold in August, Reuters reported.
Technical Analysis: Pound Sterling faces pressure near 1.2700
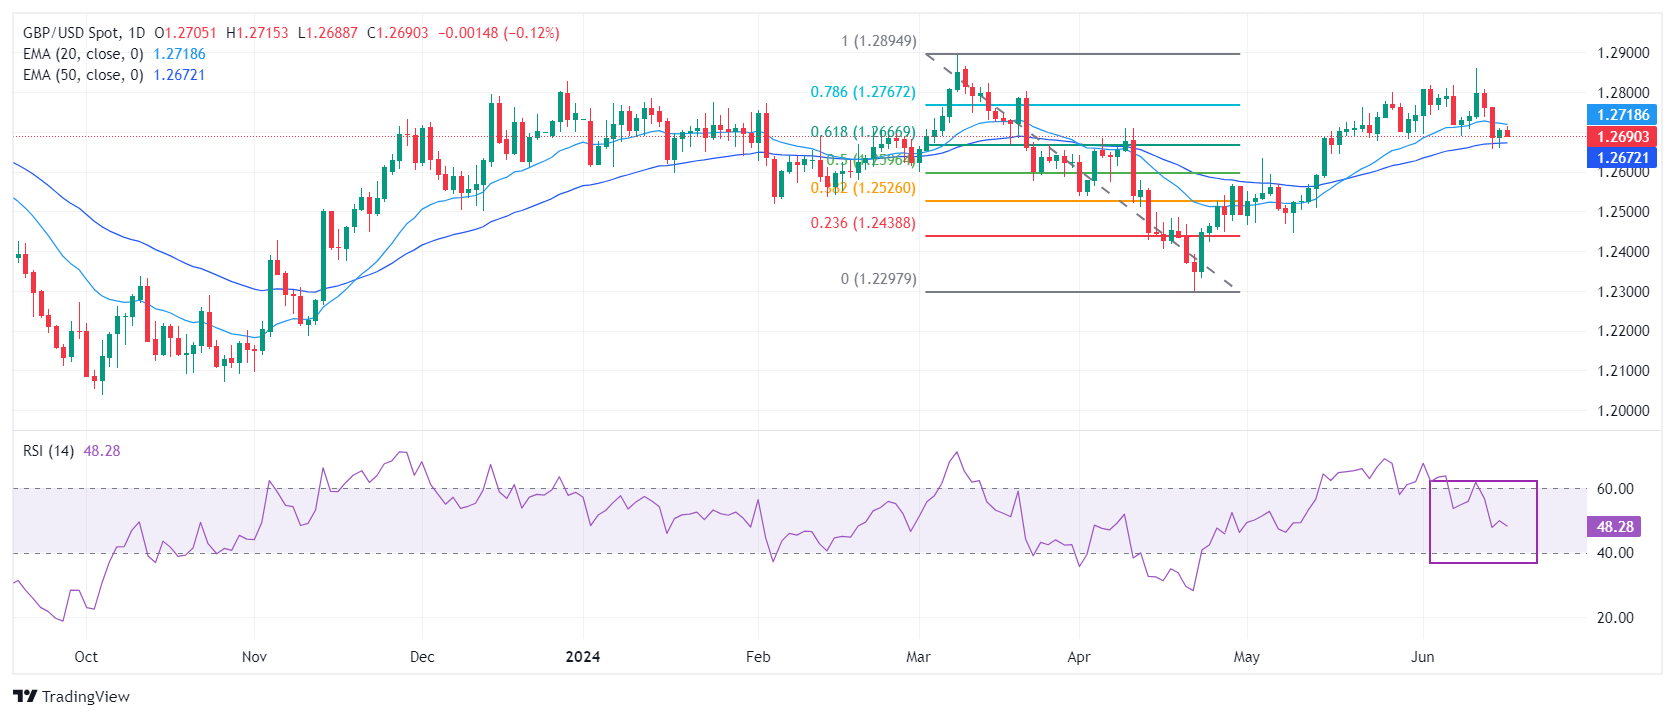
The Pound Sterling struggles to extend its recovery above the crucial resistance of 1.2700 against the US Dollar. The GBP/USD pair finds selling pressure near the 20-day Exponential Moving Average (EMA), suggesting that the near-term trend is uncertain. While the 50-day EMA near 1.2670 is acting as a major support for the Pound Sterling bulls.
Currently, the Cable holds the 61.8% Fibonacci retracement support (plotted from the March 8 high of 1.2900 to the April 22 low at 1.2300) at 1.2667.
The 14-period Relative Strength Index (RSI) falls back into the 40.00-60.00 range, indicating that the upside momentum has faded.
Pound Sterling FAQs
The Pound Sterling (GBP) is the oldest currency in the world (886 AD) and the official currency of the United Kingdom. It is the fourth most traded unit for foreign exchange (FX) in the world, accounting for 12% of all transactions, averaging $630 billion a day, according to 2022 data. Its key trading pairs are GBP/USD, aka ‘Cable’, which accounts for 11% of FX, GBP/JPY, or the ‘Dragon’ as it is known by traders (3%), and EUR/GBP (2%). The Pound Sterling is issued by the Bank of England (BoE).
The single most important factor influencing the value of the Pound Sterling is monetary policy decided by the Bank of England. The BoE bases its decisions on whether it has achieved its primary goal of “price stability” – a steady inflation rate of around 2%. Its primary tool for achieving this is the adjustment of interest rates. When inflation is too high, the BoE will try to rein it in by raising interest rates, making it more expensive for people and businesses to access credit. This is generally positive for GBP, as higher interest rates make the UK a more attractive place for global investors to park their money. When inflation falls too low it is a sign economic growth is slowing. In this scenario, the BoE will consider lowering interest rates to cheapen credit so businesses will borrow more to invest in growth-generating projects.
Data releases gauge the health of the economy and can impact the value of the Pound Sterling. Indicators such as GDP, Manufacturing and Services PMIs, and employment can all influence the direction of the GBP. A strong economy is good for Sterling. Not only does it attract more foreign investment but it may encourage the BoE to put up interest rates, which will directly strengthen GBP. Otherwise, if economic data is weak, the Pound Sterling is likely to fall.
Another significant data release for the Pound Sterling is the Trade Balance. This indicator measures the difference between what a country earns from its exports and what it spends on imports over a given period. If a country produces highly sought-after exports, its currency will benefit purely from the extra demand created from foreign buyers seeking to purchase these goods. Therefore, a positive net Trade Balance strengthens a currency and vice versa for a negative balance.
Gold prices remained broadly unchanged in India on Tuesday, according to data compiled by FXStreet.
The price for Gold stood at 6,225.58 Indian Rupees (INR) per gram, broadly stable compared with the INR 6,222.31 it cost on Monday.
The price for Gold was broadly steady at INR 72,613.95 per tola from INR 72,575.77 per tola a day earlier.
| Unit measure | Gold Price in INR |
|---|---|
| 1 Gram | 6,225.58 |
| 10 Grams | 62,256.34 |
| Tola | 72,613.95 |
| Troy Ounce | 193,637.30 |
FXStreet calculates Gold prices in India by adapting international prices (USD/INR) to the local currency and measurement units. Prices are updated daily based on the market rates taken at the time of publication. Prices are just for reference and local rates could diverge slightly.
Global Market Movers: Comex Gold price awaits Fedspeak and US Retail Sales data
- The emergence of some US Dollar dip-buying acts as a headwind for the Gold price on Tuesday, though any meaningful slide seems elusive in the wake of bets for two rate cuts by the Federal Reserve in 2024.
- The Fed projected only one interest rate cut this year as compared to three projected in March, allowing the US bond yields to recover a part of last week's downfall and assisting the USD to regain positive traction.
- Moreover, Philadelphia Fed President Patrick Harker said on Monday that keeping rates where they are for a bit longer will get inflation down and mitigate upside risks, undermining the non-yielding yellow metal.
- Meanwhile, data released on Friday showed that US import prices fell for the first time in five months in May, which, along with weaker US consumer and producer prices, suggested that inflation in the US is subsiding.
- This keeps hopes alive for the first rate cut by the Fed in September and another in December, warranting some caution before positioning for the resumption of the commodity's recent pullback from the all-time peak.
- Investors now look forward to Tuesday's US economic docket – featuring the release of Retail Sales and Industrial Production data – for short-term trading opportunities later during the early North American session.
- Apart from this, speeches by a slew of influential FOMC members will play a key role in driving the USD demand, which, along with the broader risk sentiment, should provide some impetus to the precious metal.
Gold FAQs
Gold has played a key role in human’s history as it has been widely used as a store of value and medium of exchange. Currently, apart from its shine and usage for jewelry, the precious metal is widely seen as a safe-haven asset, meaning that it is considered a good investment during turbulent times. Gold is also widely seen as a hedge against inflation and against depreciating currencies as it doesn’t rely on any specific issuer or government.
Central banks are the biggest Gold holders. In their aim to support their currencies in turbulent times, central banks tend to diversify their reserves and buy Gold to improve the perceived strength of the economy and the currency. High Gold reserves can be a source of trust for a country’s solvency. Central banks added 1,136 tonnes of Gold worth around $70 billion to their reserves in 2022, according to data from the World Gold Council. This is the highest yearly purchase since records began. Central banks from emerging economies such as China, India and Turkey are quickly increasing their Gold reserves.
Gold has an inverse correlation with the US Dollar and US Treasuries, which are both major reserve and safe-haven assets. When the Dollar depreciates, Gold tends to rise, enabling investors and central banks to diversify their assets in turbulent times. Gold is also inversely correlated with risk assets. A rally in the stock market tends to weaken Gold price, while sell-offs in riskier markets tend to favor the precious metal.
The price can move due to a wide range of factors. Geopolitical instability or fears of a deep recession can quickly make Gold price escalate due to its safe-haven status. As a yield-less asset, Gold tends to rise with lower interest rates, while higher cost of money usually weighs down on the yellow metal. Still, most moves depend on how the US Dollar (USD) behaves as the asset is priced in dollars (XAU/USD). A strong Dollar tends to keep the price of Gold controlled, whereas a weaker Dollar is likely to push Gold prices up.
(An automation tool was used in creating this post.)
- EUR/USD weakens around 1.0730 in Tuesday’s early European session.
- The negative outlook of the pair remains intact below the key 100-period EMA, with a bearish RSI indicator.
- The initial support level is seen at 1.0685; the key resistance level is located in the 1.0790–1.0800 zone.
The EUR/USD pair trades on a softer note near 1.0730 on Tuesday during the early European trading hours. The modest recovery of the Greenback drags the major pair lower. Traders prefer to wait on the sidelines ahead of the Eurozone Harmonized Index of Consumer Prices (HICP) inflation data and the US Retail Sales data. Retail Sales in the US are expected to rise 0.2% MoM in May.
According to the 4-hour chart, EUR/USD keeps the bearish vibe unchanged as the major pair holds below the key 100-period Exponential Moving Average (EMA). The downward momentum is supported by the Relative Strength Index (RSI), which stands in the bearish zone near 43.0,. This suggests that the path of least resistance is to the downside.
The initial support level for the major pair is seen at 1.0685, a low of June 17. Further south, the downside target to watch is 1.0665, the lower limit of Bollinger Band. A break below the latter will see a drop to 1.0610, a low of April 19.
On the upside, any follow-through buying above an intraday high of 1.0741 will see a rally to the crucial upside barrier at the 1.0790–1.0800 region. The mentioned level is the confluence of the upper boundary of the Bollinger Band and the psychological level. A break above this level will pave the way to 1.0852, a high of June 12.
EUR/USD 4-hour chart
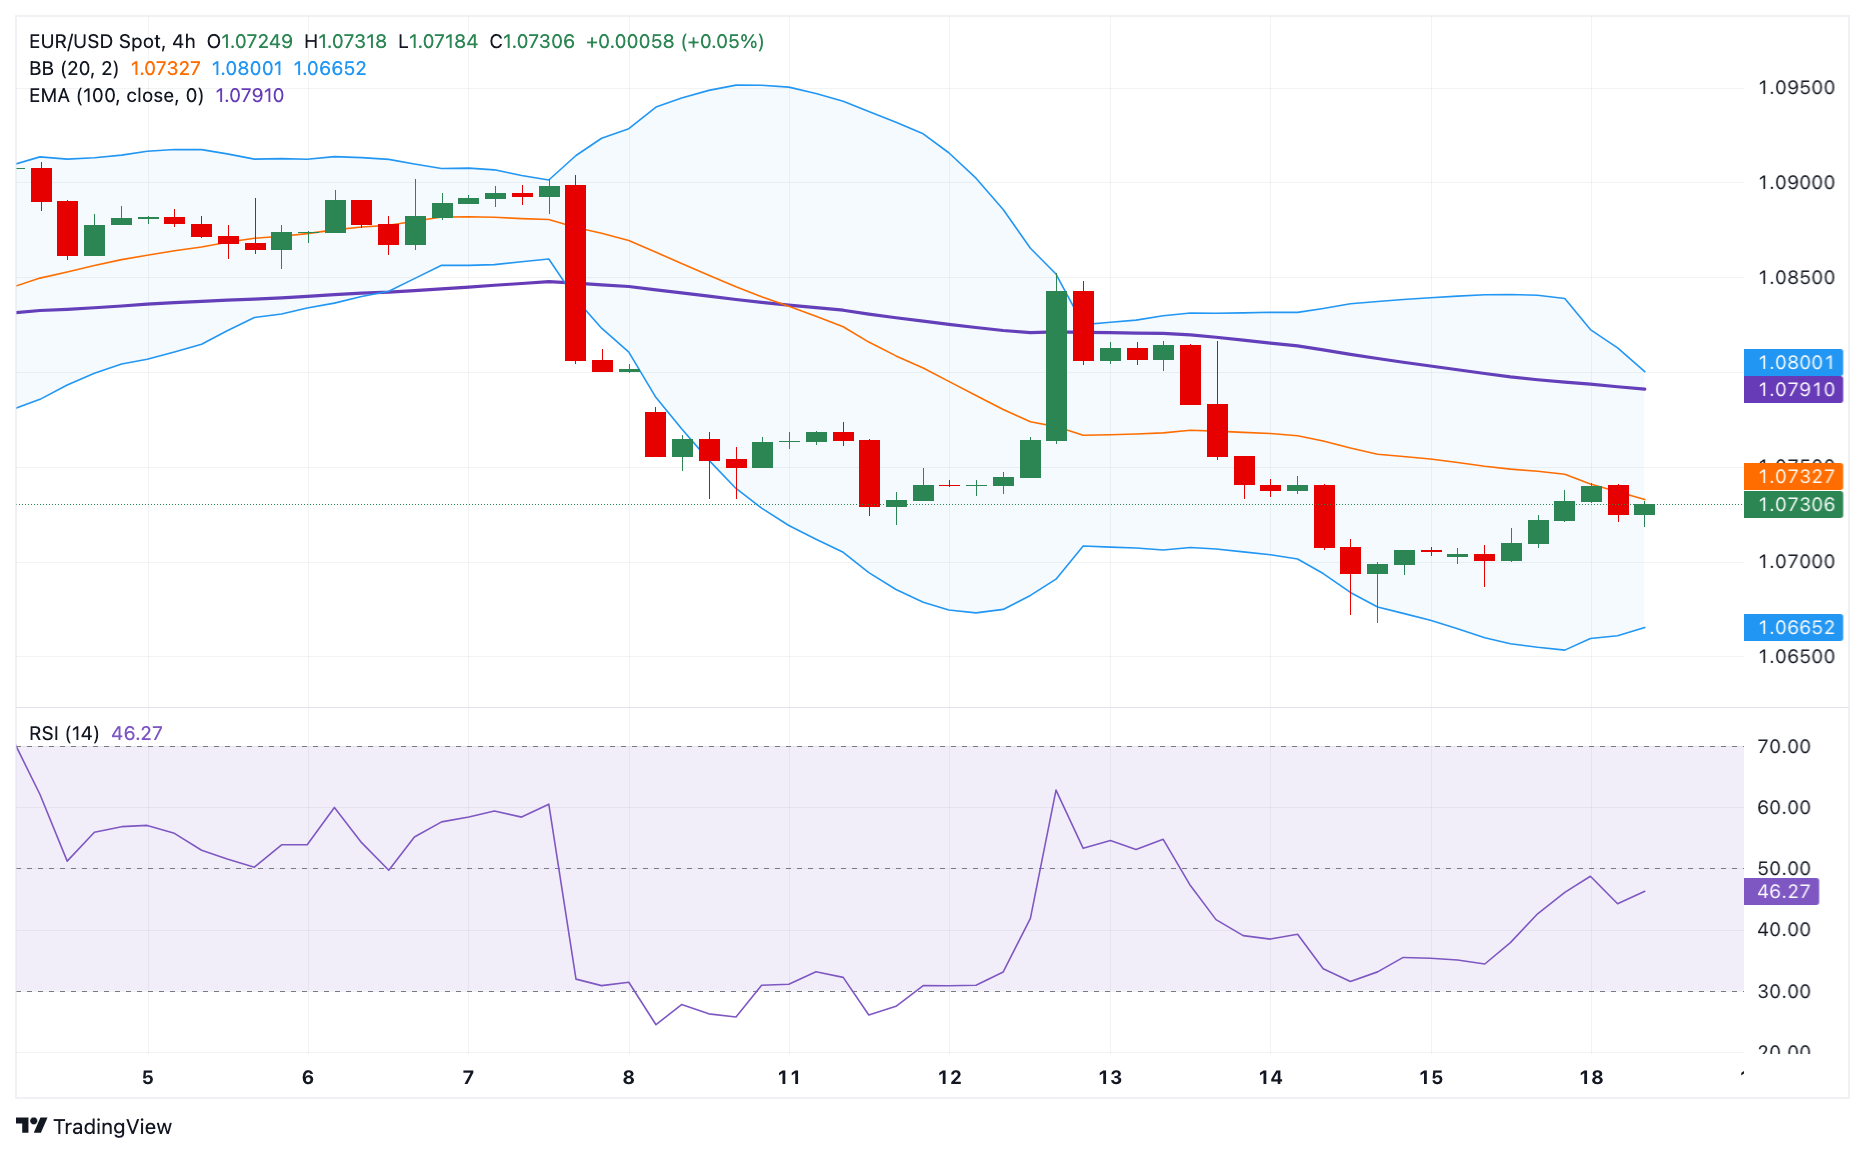
FX option expiries for June 18 NY cut at 10:00 Eastern Time, via DTCC, can be found below
- EUR/USD: EUR amounts
- 1.0600 1.4b
- 1.0670 1.5b
- 1.0675 1.3b
- 1.0725 718m
- 1.0730 842m
- 1.0750 799m
- 1.0775 1b
- GBP/USD: GBP amounts
- 1.2450 555m
- 1.2500 666m
- 1.2560 668m
- USD/JPY: USD amounts
- 154.00 1.9b
- 155.00 972m
- 156.00 436m
- 158.00 489m
- USD/CHF: USD amounts
- 0.8850 500m
- AUD/USD: AUD amounts
- 0.6440 781m
- 0.6590 621m
- 0.6700 837m
- USD/CAD: USD amounts
- 1.3800 520m
- EUR/GBP: EUR amounts
- 0.8600 410m
Reserve Bank of Australia (RBA) Governor Michele Bullock is speaking at a press conference following the announcement of the June monetary policy decision on Tuesday.
Bullock is responding to questions from the media, as part of a new reporting format for the central bank starting this year.
Key quotes
Need a lot to go our way to bring inflation back to range.
Board discussed whether to hike rates at the meeting.
Board decided to stay the course on policy.
Trying to bring demand down while remaining on narrow path.
Board wanted to make point that they are alert to upside risks on inflation.
Very difficult to get a read on inflation with quarterly data.
Need to look across broad economy not just Q2 CPI.
Board did not consider the case for a rate cut at this meeting.
Would not say that the case for a rate hike is increasing.
Very concious that high rates hurting some sector of country.
Inflation also hurting people, so board laser focused on bringing it down.
Aim is still to avoid recession, while bringing inflation down.
Use of "vigilant" does not mean an interest rise is coming.
developing story ....
Market reaction
AUD/USD is catching a fresh bid on the above comments, up 0.15% on the day at 0.6618, as of writing.
Australian Dollar FAQs
One of the most significant factors for the Australian Dollar (AUD) is the level of interest rates set by the Reserve Bank of Australia (RBA). Because Australia is a resource-rich country another key driver is the price of its biggest export, Iron Ore. The health of the Chinese economy, its largest trading partner, is a factor, as well as inflation in Australia, its growth rate and Trade Balance. Market sentiment – whether investors are taking on more risky assets (risk-on) or seeking safe-havens (risk-off) – is also a factor, with risk-on positive for AUD.
The Reserve Bank of Australia (RBA) influences the Australian Dollar (AUD) by setting the level of interest rates that Australian banks can lend to each other. This influences the level of interest rates in the economy as a whole. The main goal of the RBA is to maintain a stable inflation rate of 2-3% by adjusting interest rates up or down. Relatively high interest rates compared to other major central banks support the AUD, and the opposite for relatively low. The RBA can also use quantitative easing and tightening to influence credit conditions, with the former AUD-negative and the latter AUD-positive.
China is Australia’s largest trading partner so the health of the Chinese economy is a major influence on the value of the Australian Dollar (AUD). When the Chinese economy is doing well it purchases more raw materials, goods and services from Australia, lifting demand for the AUD, and pushing up its value. The opposite is the case when the Chinese economy is not growing as fast as expected. Positive or negative surprises in Chinese growth data, therefore, often have a direct impact on the Australian Dollar and its pairs.
Iron Ore is Australia’s largest export, accounting for $118 billion a year according to data from 2021, with China as its primary destination. The price of Iron Ore, therefore, can be a driver of the Australian Dollar. Generally, if the price of Iron Ore rises, AUD also goes up, as aggregate demand for the currency increases. The opposite is the case if the price of Iron Ore falls. Higher Iron Ore prices also tend to result in a greater likelihood of a positive Trade Balance for Australia, which is also positive of the AUD.
The Trade Balance, which is the difference between what a country earns from its exports versus what it pays for its imports, is another factor that can influence the value of the Australian Dollar. If Australia produces highly sought after exports, then its currency will gain in value purely from the surplus demand created from foreign buyers seeking to purchase its exports versus what it spends to purchase imports. Therefore, a positive net Trade Balance strengthens the AUD, with the opposite effect if the Trade Balance is negative.
- AUD/JPY fails to capitalize on the overnight goodish rebound from a multi-day low.
- BoJ Governor Ueda's hawkish remarks underpin the JPY and cap gains for the cross.
- The RBA’s decision to leave interest rates unchanged fails to provide any impetus.
The AUD/JPY cross attracts some sellers following an Asian session uptick on Tuesday and stalls the overnight bounce from the 103.60-103.55 area or a multi-day low. Spot prices remain on the defensive after the Reserve Bank of Australia (RBA) announced its policy decision and currently trade just above the 104.00 round-figure mark.
As was widely anticipated, the RBA decided to keep the Official Cash Rate (OCR) unchanged at a 12-year high level of 4.35% for the fifth successive meeting in June and retained its hawkish stance. The central bank, meanwhile, is expected to leave the door open for a rate hike this year in the wake of still sticky inflation, which, in turn, could act as a tailwind for the Australian Dollar (AUD) and lend support to the AUD/JPY cross.
Data released from China on Monday underlined a bumpy recovery in the world's second-largest economy. This overshadows the RBA's higher for longer interest rate narrative and undermines antipodean currencies, including the Aussie. Meanwhile, the Japanese Yen (JPY) benefits from the Bank of Japan (BoJ) Governor Kazuo Ueda's remarks, saying that the central bank could raise rates in July depending on economic data.
Apart from this, speculations that Japanese authorities might intervene to prop up the domestic currency further contribute to the AUD/JPY pair's downtick. That said, a generally positive risk tone, which tends to dent demand for the safe-haven JPY and lend support to the risk-sensitive Australian Dollar (AUD), should help limit any meaningful downfall ahead of the RBA Governor Michele Bullock’s press conference at 05:30 GMT.
- NZD/USD remains under some selling pressure for the fourth straight day on Tuesday.
- The USD regains positive traction amid the Fed’s hawkish stance and weighs on the pair.
- Concerns about China’s economic recovery further contribute to the modest decline.
The NZD/USD pair struggles to capitalize on the previous day's modest rebound from the 0.6100 mark, or a one-week low and trades with a mild negative bias during the Asian session on Tuesday. Spot prices remain confined in a familiar range held over the past month or so and currently hover around the 0.6120 region, down nearly 0.20% for the day amid the emergence of fresh US Dollar (USD) buying.
Against the backdrop of the Federal Reserve's (Fed) hawkish outlook, policymakers continue to argue in favor of only one interest rate cut this year. In fact, Philadelphia Fed President Patrick Harker said on Monday that keeping rates where they are for a bit longer will help get inflation down and mitigate upside risks. This remains supportive of elevated US Treasury bond yields and assists the USD to regain some positive traction, which, in turn, is seen weighing on the NZD/USD pair.
Apart from this, mixed economic data released from China on Monday underlined bumpy recovery in the world's second-largest economy and turns out to be another factor undermining antipodean currencies, including the Kiwi. Meanwhile, weaker US consumer and producer prices suggested that inflation is subsiding, keeping hopes alive for the first Fed rate cut in September and another in December. This might cap gains for the Greenback and lend some support to the NZD/USD pair.
Market participants now look forward to the US economic docket, featuring the release of monthly Retail Sales and Industrial Production figures. Apart from this, speeches by influential FOMC members and the US bond yields will drive the USD demand, which, in turn, should provide some meaningful impetus to the NZD/USD pair. Traders might further take cues from the broader market risk sentiment to grab short-term opportunities around the risk-sensitive New Zealand Dollar (NZD).
- WTI meets with some supply on Tuesday amid the emergence of some USD dip-buying.
- Optimism over firming fuel demand and Middle East tensions should help limit losses.
- The overnight close above the $79.50 confluence resistance also favors bullish traders.
West Texas Intermediate (WTI) US crude Oil prices edge lower during the Asian session on Tuesday and erode a part of the overnight strong gains to the $80.00 neighborhood, or a nearly three-week high. The commodity, however, manages to hold above the $79.50 confluence resistance breakpoint, comprising 50-day and 100-day Simple Moving Averages (SMA).
The OPEC+ producer group reassured last week that a plan to raise supplies from the fourth quarter of this year could be paused or reversed based on market conditions. This comes on top of the latest optimism over strong fuel demand, bolstered by the International Energy Agency monthly report. Apart from this, expectations that a drawdown in US inventories will tighten the market in the second half of the year should act as a tailwind for Crude Oil prices.
Furthermore, concerns that a wider Middle East conflict will lead to potential disruption to global supplies from the key producing region validate the positive outlook for the black liquid. The Israeli military said on Sunday that intensified cross-border fire from Lebanon's Hezbollah movement into Israel could trigger serious escalation. Israel added further that tensions with the Iran-aligned Houthi rebels in Yemen were bringing the region close to a wider conflict.
Meanwhile, Monday's mixed macro data out of China – the world’s top crude importer – warrants some caution for bullish traders. Adding to this, the emergence of fresh buying around the US Dollar (USD), which continues to draw support from the Federal Reserve's (Fed) hawkish outlook, might also contribute to capping gains for Crude Oil prices. Hence, it will be prudent to wait for strong follow-through buying before positioning for any further appreciating move.
- Australian Dollar trades with mild negative bias in Tuesday’s Asian session.
- The RBA is expected to leave the key interest rate unchanged at 4.35% for the fifth consecutive meeting in June.
- If RBA’s Bullock retains her hawkish rhetoric during the press conference, this could lift the Aussie against the US Dollar.
The Australian Dollar (AUD) loses ground on Tuesday on the modest rebound of the US Dollar (USD). The markets turn cautious ahead of the Reserve Bank of Australia (RBA) monetary policy meeting on Tuesday. The RBA is anticipated to hold the Official Cash Rate (OCR) steady at 4.35% for the fifth meeting in a row in June. Traders will take more cues from RBA Governor Michele Bullock’s press conference. The hawkish tone from the RBA statement could boost the Australian Dollar (AUD), while the failure to affirm the hawkish expectations could exert some selling pressure on the Aussie against the Greenback.
Investors will keep an eye on US Retail Sales and Industrial Production for May. The Federal Reserve’s (Fed) Lisa Cook, Thomas Barkin, Adriana Kugler, Lorie Logan, Alberto Musalem and Austan Goolsbee are set to speak later on Tuesday. The stronger-than-expected data could boost the USD and create a headwind for AUD/USD.
Daily Digest Market Movers: Australian Dollar weakens ahead of RBA interest rate decision
- "The stronger than expected Q1 CPI also makes it hard to see the RBA being sufficiently confident that inflation will return to and stay in the band by the time the November meeting comes around," said ANZ head of Australian economics Adam Boyton.
- Philadelphia Fed President Patrick Harker said on Monday that one interest-rate cut is appropriate for this year if the US economy performed as expected. Harker further stated that he’d like to see “several” evidence of improving inflation, per Bloomberg.
- The US NY Empire State Manufacturing Index improved to -6.0 in June from -15.6. in the previous reading, above the consensus of -9.0. The index has remained in contractionary territory since November 2023.
- Financial markets have priced in a nearly 62% odds rate cut from the US Fed on September 18, according to the CME’s FedWatch Tool.
Technical Analysis: AUD/USD hovers around the key 100-day EMA
The Australian Dollar trades on a softer note on the day. The bullish stance of the AUD/USD pair remains fragile as it hovers around the key 100-day Exponential Moving Average (EMA) on the daily chart. The pair could resume its downside trajectory if it crosses below the key EMA, as mentioned. Furthermore, the 14-day Relative Strength Index (RSI) remains below the 50-midline, supporting the sellers for the time being.
The potential downside target for AUD/USD will emerge near the confluence of the 100-day EMA and the lower limit of the Bollinger Band in the 0.6580-0.6585 zone. Extended losses will pave the way to 0.6510, a low of March 22. The next contention level is seen at 0.6465, a low of May 1.
On the other hand, the first upside barrier is located at 0.6684, the upper boundary of the Bollinger Band. A decisive break above the mentioned level will see a rally to 0.6715, a high of May 16. Further north, the next resistance level to watch is 0.6760, a high of January 4.
Australian Dollar price today
The table below shows the percentage change of Australian Dollar (AUD) against listed major currencies today. Australian Dollar was the weakest against the Japanese Yen.
| USD | EUR | GBP | CAD | AUD | JPY | NZD | CHF | |
| USD | 0.14% | 0.14% | 0.15% | 0.10% | -0.07% | 0.13% | 0.12% | |
| EUR | -0.14% | 0.01% | 0.00% | -0.06% | -0.19% | 0.01% | -0.03% | |
| GBP | -0.14% | 0.02% | 0.01% | -0.04% | -0.18% | 0.02% | -0.01% | |
| CAD | -0.14% | 0.00% | -0.01% | -0.05% | -0.19% | 0.02% | -0.02% | |
| AUD | -0.09% | 0.07% | 0.04% | 0.05% | -0.14% | 0.06% | 0.02% | |
| JPY | 0.06% | 0.20% | 0.18% | 0.19% | 0.15% | 0.21% | 0.17% | |
| NZD | -0.15% | -0.01% | -0.02% | -0.01% | -0.06% | -0.20% | -0.03% | |
| CHF | -0.10% | 0.03% | 0.03% | 0.03% | -0.01% | -0.16% | 0.05% |
The heat map shows percentage changes of major currencies against each other. The base currency is picked from the left column, while the quote currency is picked from the top row. For example, if you pick the Euro from the left column and move along the horizontal line to the Japanese Yen, the percentage change displayed in the box will represent EUR (base)/JPY (quote).
Australian Dollar FAQs
One of the most significant factors for the Australian Dollar (AUD) is the level of interest rates set by the Reserve Bank of Australia (RBA). Because Australia is a resource-rich country another key driver is the price of its biggest export, Iron Ore. The health of the Chinese economy, its largest trading partner, is a factor, as well as inflation in Australia, its growth rate and Trade Balance. Market sentiment – whether investors are taking on more risky assets (risk-on) or seeking safe-havens (risk-off) – is also a factor, with risk-on positive for AUD.
The Reserve Bank of Australia (RBA) influences the Australian Dollar (AUD) by setting the level of interest rates that Australian banks can lend to each other. This influences the level of interest rates in the economy as a whole. The main goal of the RBA is to maintain a stable inflation rate of 2-3% by adjusting interest rates up or down. Relatively high interest rates compared to other major central banks support the AUD, and the opposite for relatively low. The RBA can also use quantitative easing and tightening to influence credit conditions, with the former AUD-negative and the latter AUD-positive.
China is Australia’s largest trading partner so the health of the Chinese economy is a major influence on the value of the Australian Dollar (AUD). When the Chinese economy is doing well it purchases more raw materials, goods and services from Australia, lifting demand for the AUD, and pushing up its value. The opposite is the case when the Chinese economy is not growing as fast as expected. Positive or negative surprises in Chinese growth data, therefore, often have a direct impact on the Australian Dollar and its pairs.
Iron Ore is Australia’s largest export, accounting for $118 billion a year according to data from 2021, with China as its primary destination. The price of Iron Ore, therefore, can be a driver of the Australian Dollar. Generally, if the price of Iron Ore rises, AUD also goes up, as aggregate demand for the currency increases. The opposite is the case if the price of Iron Ore falls. Higher Iron Ore prices also tend to result in a greater likelihood of a positive Trade Balance for Australia, which is also positive of the AUD.
The Trade Balance, which is the difference between what a country earns from its exports versus what it pays for its imports, is another factor that can influence the value of the Australian Dollar. If Australia produces highly sought after exports, then its currency will gain in value purely from the surplus demand created from foreign buyers seeking to purchase its exports versus what it spends to purchase imports. Therefore, a positive net Trade Balance strengthens the AUD, with the opposite effect if the Trade Balance is negative.
| Raw materials | Closed | Change, % |
|---|---|---|
| Silver | 29.448 | -0.28 |
| Gold | 2318.72 | -0.53 |
| Palladium | 892.04 | 0.08 |
- Gold price extends the range-bound trading on Tuesday amid doubts over the Fed's rate-cut path.
- Signs of easing inflation keep a September rate cut on the table and lend some support.
- A modest USD strength might cap the upside for the XAU/USD ahead of US Retail Sales.
Gold price (XAU/USD) struggles to gain any meaningful traction on Tuesday and oscillates in a narrow trading band, around the $2,320 region during the Asian session. Against the backdrop of the Federal Reserve's (Fed) hawkish outlook last week, policymakers continue to argue in favor of only one rate cut in 2024. This remains supportive of elevated US Treasury bond yields and assists the US Dollar (USD) to attract some dip-buyers, which, in turn, caps the upside for the non-yielding yellow metal.
Gold price, however, remains confined in a familiar range held over the past week or so and below the 50-day Simple Moving Average (SMA), warranting some caution before placing aggressive directional bets. The incoming US macro data pointed to signs of easing inflationary pressures and fueled speculation that the Fed will cut interest rates twice this year, in September and in December. This might keep a lid on the Greenback and help limit any meaningful decline for the XAU/USD.
Daily Digest Market Movers: Gold price struggles to lure buyers amid Fed rate-cut uncertainty
- The emergence of some US Dollar dip-buying acts as a headwind for the Gold price on Tuesday, though any meaningful slide seems elusive in the wake of bets for two rate cuts by the Federal Reserve in 2024.
- The Fed projected only one interest rate cut this year as compared to three projected in March, allowing the US bond yields to recover a part of last week's downfall and assisting the USD to regain positive traction.
- Moreover, Philadelphia Fed President Patrick Harker said on Monday that keeping rates where they are for a bit longer will get inflation down and mitigate upside risks, undermining the non-yielding yellow metal.
- Meanwhile, data released on Friday showed that US import prices fell for the first time in five months in May, which, along with weaker US consumer and producer prices, suggested that inflation in the US is subsiding.
- This keeps hopes alive for the first rate cut by the Fed in September and another in December, warranting some caution before positioning for the resumption of the commodity's recent pullback from the all-time peak.
- Investors now look forward to Tuesday's US economic docket – featuring the release of Retail Sales and Industrial Production data – for short-term trading opportunities later during the early North American session.
- Apart from this, speeches by a slew of influential FOMC members will play a key role in driving the USD demand, which, along with the broader risk sentiment, should provide some impetus to the precious metal.
Technical Analysis: Gold price bulls need to wait for a breakout through the 50-day SMA resistance
From a technical perspective, the $2,333-2,336 region is likely to act as an immediate hurdle ahead of the 50-day SMA support, currently pegged near the $2,344-2,345 region. This is followed by the $2,360-2,362 supply zone, which, if cleared decisively, might prompt some short-covering rally and lift the Gold price to the $2,387-2,388 intermediate hurdle en route to the $2,400 mark. A sustained strength beyond the latter will suggest that the recent corrective slide from the all-time top set in May has run its course and should allow the XAU/USD to retest the $2,450 region.
On the flip side, bearish traders need to wait for a sustained break and acceptance below the $2,300 mark before placing fresh bets around the Gold price. Some follow-through selling below the $2,285 horizontal support will confirm a breakdown and pave the way for deeper losses. The commodity might then accelerate the fall towards the next relevant support near the $2,254-2,253 region. The downward trajectory could extend further and eventually drag the XAU/USD towards the $2,225-2,220 support en route to the $2,200 round-figure mark.
Gold FAQs
Gold has played a key role in human’s history as it has been widely used as a store of value and medium of exchange. Currently, apart from its shine and usage for jewelry, the precious metal is widely seen as a safe-haven asset, meaning that it is considered a good investment during turbulent times. Gold is also widely seen as a hedge against inflation and against depreciating currencies as it doesn’t rely on any specific issuer or government.
Central banks are the biggest Gold holders. In their aim to support their currencies in turbulent times, central banks tend to diversify their reserves and buy Gold to improve the perceived strength of the economy and the currency. High Gold reserves can be a source of trust for a country’s solvency. Central banks added 1,136 tonnes of Gold worth around $70 billion to their reserves in 2022, according to data from the World Gold Council. This is the highest yearly purchase since records began. Central banks from emerging economies such as China, India and Turkey are quickly increasing their Gold reserves.
Gold has an inverse correlation with the US Dollar and US Treasuries, which are both major reserve and safe-haven assets. When the Dollar depreciates, Gold tends to rise, enabling investors and central banks to diversify their assets in turbulent times. Gold is also inversely correlated with risk assets. A rally in the stock market tends to weaken Gold price, while sell-offs in riskier markets tend to favor the precious metal.
The price can move due to a wide range of factors. Geopolitical instability or fears of a deep recession can quickly make Gold price escalate due to its safe-haven status. As a yield-less asset, Gold tends to rise with lower interest rates, while higher cost of money usually weighs down on the yellow metal. Still, most moves depend on how the US Dollar (USD) behaves as the asset is priced in dollars (XAU/USD). A strong Dollar tends to keep the price of Gold controlled, whereas a weaker Dollar is likely to push Gold prices up.
Japanese Finance Minister Shunichi Suzuki said on Tuesday that interest rates are set by markets, reflecting JGB demand and various aspects. However, Suzuki declined to comment on the Bank of Japan's (BoJ) decision last week on the planned reduction of JGB purchases.
Key quotes
JGB yields are determined by the market.
Aims to smoothly issue Japanese government bonds and control costs.
Aims to continue reforming spending and revenue to achieve its PB goal.
Decline to comment on the Bank of Japan's decision last week on the planned reduction of JGB purchases.
Market reaction
At the time of writing, USD/JPY is trading 0.11% lower on the day to trade at 157.54.
Japanese Yen FAQs
The Japanese Yen (JPY) is one of the world’s most traded currencies. Its value is broadly determined by the performance of the Japanese economy, but more specifically by the Bank of Japan’s policy, the differential between Japanese and US bond yields, or risk sentiment among traders, among other factors.
One of the Bank of Japan’s mandates is currency control, so its moves are key for the Yen. The BoJ has directly intervened in currency markets sometimes, generally to lower the value of the Yen, although it refrains from doing it often due to political concerns of its main trading partners. The current BoJ ultra-loose monetary policy, based on massive stimulus to the economy, has caused the Yen to depreciate against its main currency peers. This process has exacerbated more recently due to an increasing policy divergence between the Bank of Japan and other main central banks, which have opted to increase interest rates sharply to fight decades-high levels of inflation.
The BoJ’s stance of sticking to ultra-loose monetary policy has led to a widening policy divergence with other central banks, particularly with the US Federal Reserve. This supports a widening of the differential between the 10-year US and Japanese bonds, which favors the US Dollar against the Japanese Yen.
The Japanese Yen is often seen as a safe-haven investment. This means that in times of market stress, investors are more likely to put their money in the Japanese currency due to its supposed reliability and stability. Turbulent times are likely to strengthen the Yen’s value against other currencies seen as more risky to invest in.
The Bank of Japan (BoJ) Governor Kazuo Ueda said on Tuesday that there is a chance that the Japanese central bank could raise interest rates at the July meeting, depending on economic, price and financial data and information available at the time.
Key quotes
Sees moderate recovery in Japan's economy.
Expects a gradual rise in price trend.
Monitoring the FX impact on the economy and inflation.
Data out since April is roughly in line with BoJ estimates.
To conduct appropriate policy aligned with economic conditions
To adjust the degree of easing as needed using rates.
Sees economic data in line with expectations.
Sees uncertainty in expected price increase.
JGB yields are determined by the market.
Aims to boost market influence by reducing bond purchases.
Difficult to determine scale of reduction in bond purchases now.
Seeks predictability for bond purchases.
Sees possible rate increase in July depending on data.
Rate hikes and bond purchases are distinct matters.
Market reaction
At the time of writing, USD/JPY is trading 0.06% lower on the day to trade at 157.63.
Bank of Japan FAQs
The Bank of Japan (BoJ) is the Japanese central bank, which sets monetary policy in the country. Its mandate is to issue banknotes and carry out currency and monetary control to ensure price stability, which means an inflation target of around 2%.
The Bank of Japan has embarked in an ultra-loose monetary policy since 2013 in order to stimulate the economy and fuel inflation amid a low-inflationary environment. The bank’s policy is based on Quantitative and Qualitative Easing (QQE), or printing notes to buy assets such as government or corporate bonds to provide liquidity. In 2016, the bank doubled down on its strategy and further loosened policy by first introducing negative interest rates and then directly controlling the yield of its 10-year government bonds.
The Bank’s massive stimulus has caused the Yen to depreciate against its main currency peers. This process has exacerbated more recently due to an increasing policy divergence between the Bank of Japan and other main central banks, which have opted to increase interest rates sharply to fight decades-high levels of inflation. The BoJ’s policy of holding down rates has led to a widening differential with other currencies, dragging down the value of the Yen.
A weaker Yen and the spike in global energy prices have led to an increase in Japanese inflation, which has exceeded the BoJ’s 2% target. Still, the Bank judges that the sustainable and stable achievement of the 2% target has not yet come in sight, so any sudden change in the current policy looks unlikely.
- Indian Rupee holds positive ground on the softer US Dollar on Tuesday.
- The upside of the INR might be limited amid the Fed’s hawkish tone and higher crude oil prices.
- Investors await the US Retail Sales data for fresh impetus, which is due on Tuesday.
The Indian Rupee (INR) gains ground amid the weaker Greenback on Tuesday. The upside of the local currency might be limited as the cautious stance from US Federal Reserve (Fed) officials is likely to influence the US Dollar (USD) for the time being. Additionally, the rebound of crude oil prices might weigh on the INR. It’s worth noting that India is the third largest consumer of oil behind the US and China.
Nonetheless, the potential foreign exchange intervention by the Reserve Bank of India (RBI) might support the Indian Rupee and cap the upside for the pair. Looking ahead, the US Retail Sales is due on Tuesday, which is estimated to improve 0.2% MoM in May. The strong consumer spending might further boost the Greenback against the INR. Apart from this, the Fed Lisa Cook, Thomas Barkin, Adriana Kugler, Lorie Logan, Alberto Musalem, and Austan Goolsbee are scheduled to speak later on Tuesday.
Daily Digest Market Movers: Indian Rupee edges higher despite the Fed’s hawkish stance
- India will continue to be the fastest-growing economy in Asia-Pacific in 2024, sustaining last year's domestically driven momentum, according to the rating agency Moody’s.
- Philadelphia Fed President Patrick Harker said on Monday if the US economy performed as he expected, the Fed would be able to cut its benchmark interest rate once this year, per Reuters.
- Cleveland Fed Bank President Loretta Mester and Chicago Fed Bank President Austan Goolsebee emphasized the need for more confidence and said they would wait for the data.
- The US NY Empire State Manufacturing Index recovered to -6.0 in June from the previous reading of -15.6. in May, above the consensus of the forecast of -9.0. The index has remained in contraction territory since November of last year.
- Investors see a nearly 62% chance rate cut from the US Fed on September 18, according to the CME’s FedWatch Tool.
Technical analysis: USD/INR displays bullish vibe in the longer term
The Indian Rupee trades weaker on the day. The bullish outlook of the USD/INR pair remains intact as the pair has been making higher highs and higher lows since the start of June, and holding above the key 100-day Exponential Moving Average (EMA) on the daily chart. The upward momentum is supported by the 14-day Relative Strength Index (RSI), which stands in bullish territory around 55.50.
In the bullish case, the immediate resistance level for the pair will emerge at 83.60 (high of June 11). Any follow-through buying above this level will pave the way to 83.72 (high of April 17) en route to the 84.00 psychological mark.
On the flip side, the key support level for USD/INR is located at 83.35 (100-day EMA). A breach of this level could expose 83.00 (round figure), followed by 82.78 (low of January 15).
Indian Rupee FAQs
The Indian Rupee (INR) is one of the most sensitive currencies to external factors. The price of Crude Oil (the country is highly dependent on imported Oil), the value of the US Dollar – most trade is conducted in USD – and the level of foreign investment, are all influential. Direct intervention by the Reserve Bank of India (RBI) in FX markets to keep the exchange rate stable, as well as the level of interest rates set by the RBI, are further major influencing factors on the Rupee.
The Reserve Bank of India (RBI) actively intervenes in forex markets to maintain a stable exchange rate, to help facilitate trade. In addition, the RBI tries to maintain the inflation rate at its 4% target by adjusting interest rates. Higher interest rates usually strengthen the Rupee. This is due to the role of the ‘carry trade’ in which investors borrow in countries with lower interest rates so as to place their money in countries’ offering relatively higher interest rates and profit from the difference.
Macroeconomic factors that influence the value of the Rupee include inflation, interest rates, the economic growth rate (GDP), the balance of trade, and inflows from foreign investment. A higher growth rate can lead to more overseas investment, pushing up demand for the Rupee. A less negative balance of trade will eventually lead to a stronger Rupee. Higher interest rates, especially real rates (interest rates less inflation) are also positive for the Rupee. A risk-on environment can lead to greater inflows of Foreign Direct and Indirect Investment (FDI and FII), which also benefit the Rupee.
Higher inflation, particularly, if it is comparatively higher than India’s peers, is generally negative for the currency as it reflects devaluation through oversupply. Inflation also increases the cost of exports, leading to more Rupees being sold to purchase foreign imports, which is Rupee-negative. At the same time, higher inflation usually leads to the Reserve Bank of India (RBI) raising interest rates and this can be positive for the Rupee, due to increased demand from international investors. The opposite effect is true of lower inflation.
The People’s Bank of China (PBoC) set the USD/CNY central rate for the trading session ahead on Tuesday at 7.1148, as against the previous day's fix of 7.1149 and 7.2494 Reuters estimates.
- USD/JPY is seen consolidating its recent gains registered over the past three days.
- The divergent Fed-BoJ policy stance should continue to lend support to the major.
- Any corrective decline could be seen as a buying opportunity and remain limited.
The USD/JPY pair struggles to capitalize on its gains registered over the past three days and oscillates in a narrow trading band, just above mid-157.00s during the Asian session on Tuesday. Spot prices, however, remain well within striking distance of the highest level since late April touched last Friday and seem poised to prolong the recent well-established uptrend.
Despite the Federal Reserve's (Fed) hawkish stance, the markets have been pricing in the possibility of two interest rate cuts this year amid signs of easing inflationary pressures in the United States (US). This keeps the US Dollar (USD) bulls on the defensive for the second straight day and turns out to be a key factor acting as a headwind for the USD/JPY pair. Moreover, speculations that Japanese authorities might intervene to prop up the Japanese Yen (JPY) further contribute to capping the currency pair.
Meanwhile, Fed officials continue to argue in favor of one interest rate cut in 2024. In fact, Philadelphia Fed President Patrick Harker said on Monday that keeping rates where they are for a bit longer will help get inflation down and mitigate upside risks. This remains supportive of elevated US Treasury bond yields and might limit the USD losses. Furthermore, the Bank of Japan's (BoJ) cautious policy approach should cap any meaningful JPY appreciating move and lend some support to the USD/JPY pair.
The aforementioned fundamental backdrop seems tilted firmly in favor of bulls and suggests that the path of least resistance for spot prices remains to the upside. Hence, a corrective decline might still be seen as a buying opportunity as traders now look to the US macro data – monthly Retail Sales and Industrial Production figures. This, along with speeches by influential FOMC members, should provide some impetus to the USD/JPY pair ahead of the BoJ policy meeting minutes on Wednesday.
| Index | Change, points | Closed | Change, % |
|---|---|---|---|
| NIKKEI 225 | -712.12 | 38102.44 | -1.83 |
| Hang Seng | -5.66 | 17936.12 | -0.03 |
| KOSPI | -14.32 | 2744.1 | -0.52 |
| ASX 200 | -24 | 7700.3 | -0.31 |
| DAX | 66.19 | 18068.21 | 0.37 |
| CAC 40 | 68.3 | 7571.57 | 0.91 |
| Dow Jones | 188.94 | 38778.1 | 0.49 |
| S&P 500 | 41.63 | 5473.23 | 0.77 |
| NASDAQ Composite | 168.14 | 17857.02 | 0.95 |
| Pare | Closed | Change, % |
|---|---|---|
| AUDUSD | 0.66103 | -0.08 |
| EURJPY | 169.276 | 0.43 |
| EURUSD | 1.07322 | 0.22 |
| GBPJPY | 200.361 | 0.34 |
| GBPUSD | 1.27024 | 0.13 |
| NZDUSD | 0.61278 | -0.17 |
| USDCAD | 1.3721 | -0.06 |
| USDCHF | 0.88947 | -0.06 |
| USDJPY | 157.729 | 0.21 |
- AUD/USD holds positive ground around 0.6615 amid the softer US Dollar on Tuesday.
- The RBA is anticipated to keep rates steady at 4.35% at its June meeting on Tuesday.
- The hawkish tones of the Fed officials might cap the upside for the pair in the near term.
The AUD/USD pair snaps the three-day losing streak near 0.6615 on Tuesday during the early Asian session. The weaker US Dollar (USD) provides some support to the pair. Investors will closely monitor the Reserve Bank of Australia (RBA) interest rate decision and Governor Michele Bullock’s press conference.
The RBA is likely to keep the Official Cash Rate (OCR) unchanged at 4.35% for the fifth consecutive meeting in June. The stubbornly high inflation in Australia prompted the expectation that the RBA might delay the interest rate cut. If the RBA delivers a hawkish message after the policy meeting, this could lift the Australian Dollar (AUD) and create a tailwind for the pair. However, the failure to affirm the hawkish expectations could attract some sellers to the Aussie.
Last week, ANZ bank analysts pushed back its prediction of an interest rate cut until next year, expecting the Australian central bank wouldn't lower the cash rate until next February due to hotter-than-expected inflation data in the last two months. "The stronger than expected Q1 CPI also makes it hard to see the RBA being sufficiently confident that inflation will return to and stay in the band by the time the November meeting comes around," said ANZ head of Australian economics Adam Boyton.
On the USD’s front, US Federal Reserve (Fed) Chairman Jerome Powell refrained from hinting at a specific timeline for rate cuts and reiterated a data-dependent approach in the post-meeting press conference. Cleveland Fed Bank President Loretta Mester and Chicago Fed Bank President Austan Goolsebee emphasized the need for more confidence and said they would wait for the data. Nonetheless, Minneapolis Fed President Neel Kashkari on Sunday said that it's a "reasonable prediction" that the Fed will cut interest rates once this year, waiting until December to do it. The hawkish stance of Fed officials continues to underpin the Greenback and might cap the upside for the pair in the near term.


© 2000-2026. Уcі права захищені.
Cайт знаходитьcя під керуванням TeleTrade DJ. LLC 2351 LLC 2022 (Euro House, Richmond Hill Road, Kingstown, VC0100, St. Vincent and the Grenadines).
Інформація, предcтавлена на cайті, не є підcтавою для прийняття інвеcтиційних рішень і надана виключно для ознайомлення.
Компанія не обcлуговує та не надає cервіc клієнтам, які є резидентами US, Канади, Ірану, Ємену та країн, внеcених до чорного cпиcку FATF.
Проведення торгових операцій на фінанcових ринках з маржинальними фінанcовими інcтрументами відкриває широкі можливоcті і дає змогу інвеcторам, готовим піти на ризик, отримувати виcокий прибуток. Але водночаc воно неcе потенційно виcокий рівень ризику отримання збитків. Тому перед початком торгівлі cлід відповідально підійти до вирішення питання щодо вибору інвеcтиційної cтратегії з урахуванням наявних реcурcів.
Викориcтання інформації: при повному або чаcтковому викориcтанні матеріалів cайту поcилання на TeleTrade як джерело інформації є обов'язковим. Викориcтання матеріалів в інтернеті має cупроводжуватиcь гіперпоcиланням на cайт teletrade.org. Автоматичний імпорт матеріалів та інформації із cайту заборонено.
З уcіх питань звертайтеcь за адреcою pr@teletrade.global.
переклади