- Аналітика
- Новини та інструменти
- Новини ринків
Новини ринків
Ukrainian President Volodymyr Zelensky said late Tuesday that he would support a proposal to stop strikes on energy infrastructure. However, talks about Ukraine without Ukraine will not bring about results.
US President Donald Trump and Russian President Vladimir Putin on Tuesday agreed to a partial ceasefire on strikes against energy and infrastructure in their marathon call.
Key quotes
Zelensky hopes to speak to Trump to receive more details of Putin's call.
Ukraine would support a proposal to stop strikes on energy infrastructure.
Kyiv's partners would not agree to stop military aid, hope it will continue.
Talks about Ukraine without Ukraine will not bring about results.
Says he spoke with Scholz and Macron after the Trump-Putin call.
Russia is preparing new offensives in the coming months.
The unconditional or partially unconditional ceasefire would be a positive result, there are steps towards peace.
Market reaction
At the time of writing, the Gold price (XAU/USD) is trading 0.04% lower on the day to trade at $3,033.
Risk sentiment FAQs
In the world of financial jargon the two widely used terms “risk-on” and “risk off'' refer to the level of risk that investors are willing to stomach during the period referenced. In a “risk-on” market, investors are optimistic about the future and more willing to buy risky assets. In a “risk-off” market investors start to ‘play it safe’ because they are worried about the future, and therefore buy less risky assets that are more certain of bringing a return, even if it is relatively modest.
Typically, during periods of “risk-on”, stock markets will rise, most commodities – except Gold – will also gain in value, since they benefit from a positive growth outlook. The currencies of nations that are heavy commodity exporters strengthen because of increased demand, and Cryptocurrencies rise. In a “risk-off” market, Bonds go up – especially major government Bonds – Gold shines, and safe-haven currencies such as the Japanese Yen, Swiss Franc and US Dollar all benefit.
The Australian Dollar (AUD), the Canadian Dollar (CAD), the New Zealand Dollar (NZD) and minor FX like the Ruble (RUB) and the South African Rand (ZAR), all tend to rise in markets that are “risk-on”. This is because the economies of these currencies are heavily reliant on commodity exports for growth, and commodities tend to rise in price during risk-on periods. This is because investors foresee greater demand for raw materials in the future due to heightened economic activity.
The major currencies that tend to rise during periods of “risk-off” are the US Dollar (USD), the Japanese Yen (JPY) and the Swiss Franc (CHF). The US Dollar, because it is the world’s reserve currency, and because in times of crisis investors buy US government debt, which is seen as safe because the largest economy in the world is unlikely to default. The Yen, from increased demand for Japanese government bonds, because a high proportion are held by domestic investors who are unlikely to dump them – even in a crisis. The Swiss Franc, because strict Swiss banking laws offer investors enhanced capital protection.
US President Donald Trump and Russian President Vladimir Putin on Tuesday agreed to an immediate pause in strikes against energy infrastructure in the Ukraine war. Trump’s post echoed the Kremlin, stating that Putin promised to stop attacking each other's energy infrastructure for 30 days.
However, the Russian leader declined to sign up for the comprehensive month-long ceasefire that Trump's team recently worked out with Ukrainians in Saudi Arabia.
“We agreed to an immediate ceasefire on all energy and infrastructure,” Trump wrote in a Truth Social post after his call with Putin.
Market reaction
At the time of writing, the Gold price (XAU/USD) is trading 0.07% lower on the day to trade at $3,032.
Risk sentiment FAQs
In the world of financial jargon the two widely used terms “risk-on” and “risk off'' refer to the level of risk that investors are willing to stomach during the period referenced. In a “risk-on” market, investors are optimistic about the future and more willing to buy risky assets. In a “risk-off” market investors start to ‘play it safe’ because they are worried about the future, and therefore buy less risky assets that are more certain of bringing a return, even if it is relatively modest.
Typically, during periods of “risk-on”, stock markets will rise, most commodities – except Gold – will also gain in value, since they benefit from a positive growth outlook. The currencies of nations that are heavy commodity exporters strengthen because of increased demand, and Cryptocurrencies rise. In a “risk-off” market, Bonds go up – especially major government Bonds – Gold shines, and safe-haven currencies such as the Japanese Yen, Swiss Franc and US Dollar all benefit.
The Australian Dollar (AUD), the Canadian Dollar (CAD), the New Zealand Dollar (NZD) and minor FX like the Ruble (RUB) and the South African Rand (ZAR), all tend to rise in markets that are “risk-on”. This is because the economies of these currencies are heavily reliant on commodity exports for growth, and commodities tend to rise in price during risk-on periods. This is because investors foresee greater demand for raw materials in the future due to heightened economic activity.
The major currencies that tend to rise during periods of “risk-off” are the US Dollar (USD), the Japanese Yen (JPY) and the Swiss Franc (CHF). The US Dollar, because it is the world’s reserve currency, and because in times of crisis investors buy US government debt, which is seen as safe because the largest economy in the world is unlikely to default. The Yen, from increased demand for Japanese government bonds, because a high proportion are held by domestic investors who are unlikely to dump them – even in a crisis. The Swiss Franc, because strict Swiss banking laws offer investors enhanced capital protection.
- EUR/USD rose a scant 0.2% on Tuesday, testing 1.0950.
- Markets are tilted risk-on despite a high-impact Fed rate call on the cards.
- An update to the Fed’s own interest rate projections is due on Wednesday.
EUR/USD rose slightly on Tuesday, climbing one-fifth of one percent to continue testing the 1.0950 region. Fiber clipped into a fresh 23-month high as broad-market risk appetite tilts firmly risk-on ahead of the Fed’s upcoming rate call on Wednesday. Final European Harmonized Index of Consumer Prices (HICP) figures are also due on Wednesday, though the final print is expected to show no material change from the preliminary print. European Central Bank (ECB) President Christine Lagarde will be making an appearance on Thursday, as the EU leaders’ summit gets underway during the back half of the trading week.
Forex Today: Fed expected to keep rates unchanged
The Federal Reserve (Fed) is set to announce its latest interest rate decision on Wednesday. The CME’s FedWatch Tool indicates that market participants largely expect the Fed to maintain its current rate for the next two meetings, with a potential quarter-point rate reduction anticipated at the Federal Open Market Committee (FOMC) meeting in June. This week, the FOMC will also release its updated interest rate forecasts, which could significantly alter expectations for rate cuts if the Fed policymakers’ outlook on interest rates diverges significantly from existing market predictions.
EUR/USD price forecast
From a technical viewpoint, the Stochastic Oscillator is currently in overbought territory above 80.00, though it is showing signs of flattening, indicating a reduction in bullish momentum. Meanwhile, the Moving Average Convergence Divergence (MACD) displays flat green bars, suggesting a lack of strong trend conviction. Collectively, these indicators imply that the pair may enter a consolidation phase prior to making a definitive move.
Looking ahead, resistance is positioned at the 1.1000 level, which has historically served as a significant barrier. On the downside, initial support can be found around 1.0850, with more substantial support near the 20-day moving average close to 1.0800. A decline below these thresholds could trigger a corrective reaction, while consistent trading above 1.0900 would maintain the overall bullish outlook.
EUR/USD daily chart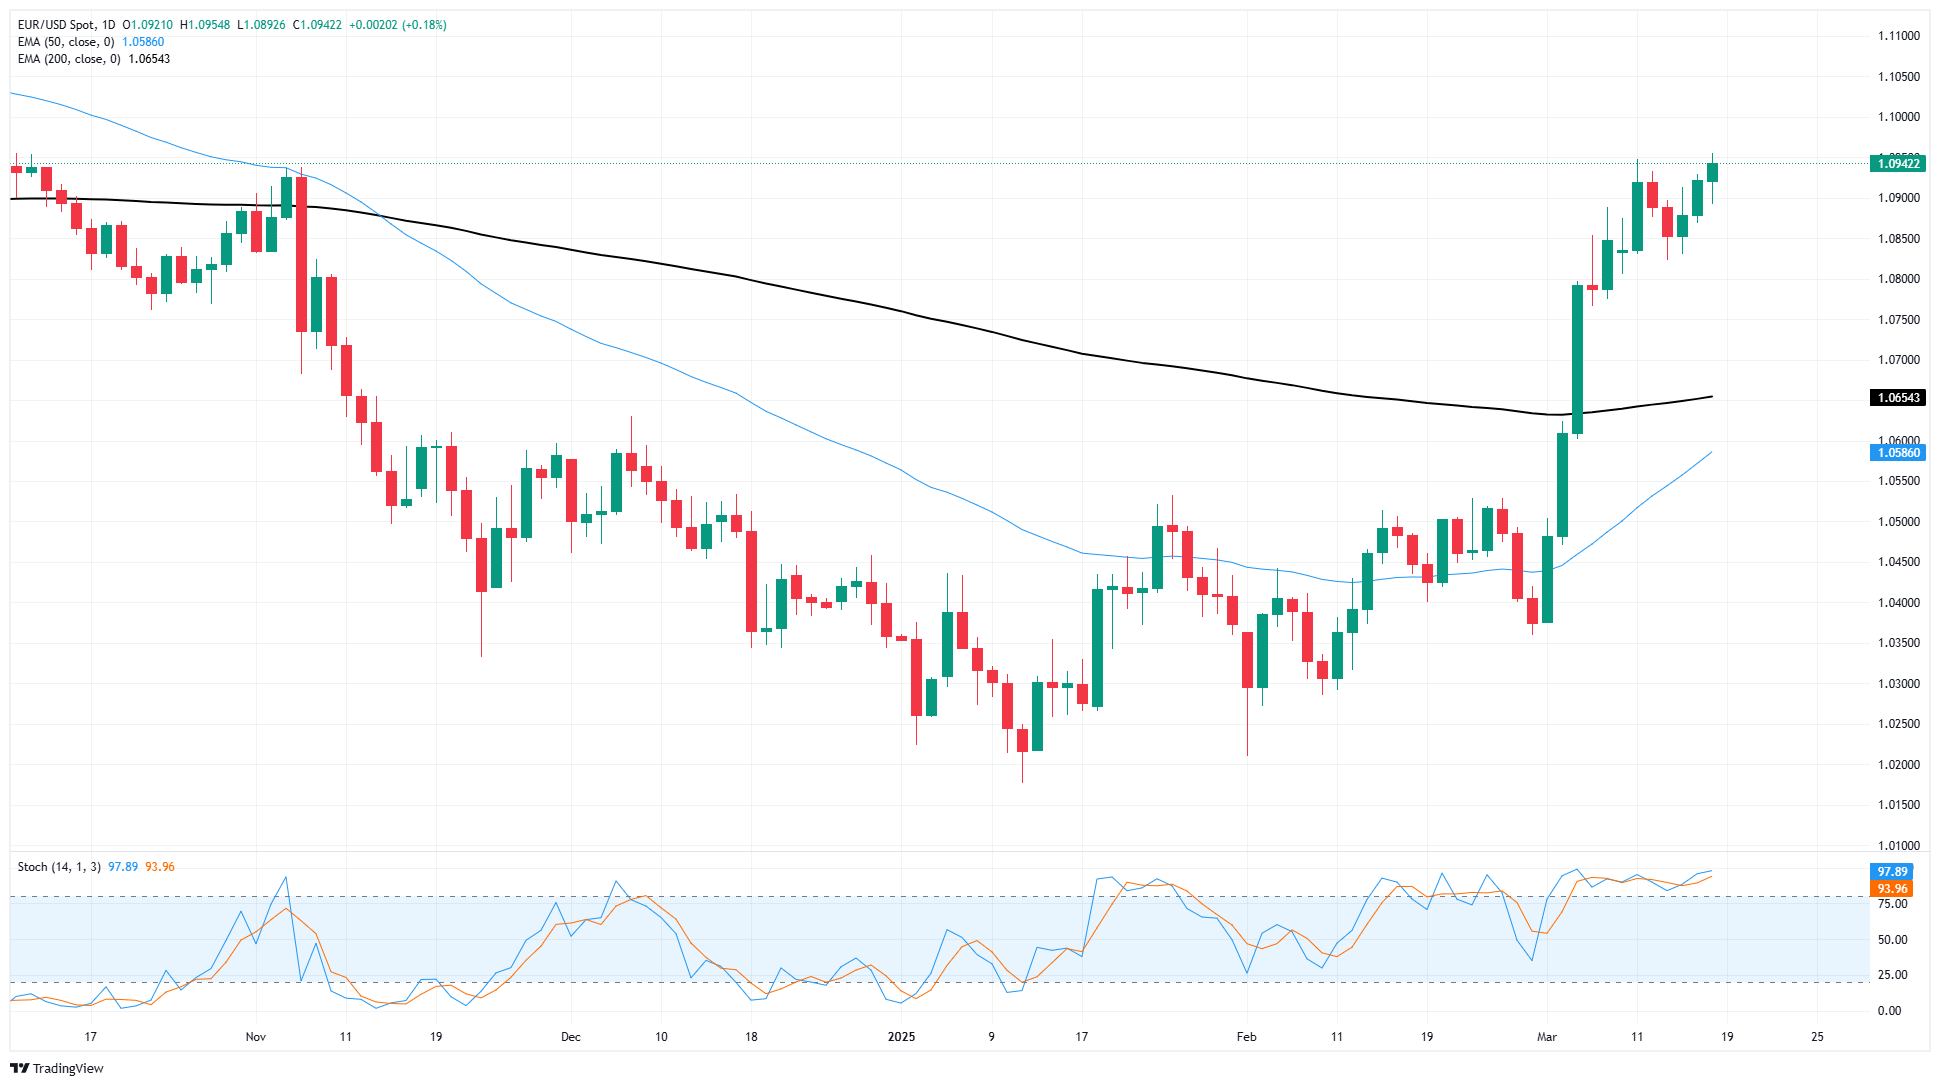
Euro FAQs
The Euro is the currency for the 19 European Union countries that belong to the Eurozone. It is the second most heavily traded currency in the world behind the US Dollar. In 2022, it accounted for 31% of all foreign exchange transactions, with an average daily turnover of over $2.2 trillion a day. EUR/USD is the most heavily traded currency pair in the world, accounting for an estimated 30% off all transactions, followed by EUR/JPY (4%), EUR/GBP (3%) and EUR/AUD (2%).
The European Central Bank (ECB) in Frankfurt, Germany, is the reserve bank for the Eurozone. The ECB sets interest rates and manages monetary policy. The ECB’s primary mandate is to maintain price stability, which means either controlling inflation or stimulating growth. Its primary tool is the raising or lowering of interest rates. Relatively high interest rates – or the expectation of higher rates – will usually benefit the Euro and vice versa. The ECB Governing Council makes monetary policy decisions at meetings held eight times a year. Decisions are made by heads of the Eurozone national banks and six permanent members, including the President of the ECB, Christine Lagarde.
Eurozone inflation data, measured by the Harmonized Index of Consumer Prices (HICP), is an important econometric for the Euro. If inflation rises more than expected, especially if above the ECB’s 2% target, it obliges the ECB to raise interest rates to bring it back under control. Relatively high interest rates compared to its counterparts will usually benefit the Euro, as it makes the region more attractive as a place for global investors to park their money.
Data releases gauge the health of the economy and can impact on the Euro. Indicators such as GDP, Manufacturing and Services PMIs, employment, and consumer sentiment surveys can all influence the direction of the single currency. A strong economy is good for the Euro. Not only does it attract more foreign investment but it may encourage the ECB to put up interest rates, which will directly strengthen the Euro. Otherwise, if economic data is weak, the Euro is likely to fall. Economic data for the four largest economies in the euro area (Germany, France, Italy and Spain) are especially significant, as they account for 75% of the Eurozone’s economy.
Another significant data release for the Euro is the Trade Balance. This indicator measures the difference between what a country earns from its exports and what it spends on imports over a given period. If a country produces highly sought after exports then its currency will gain in value purely from the extra demand created from foreign buyers seeking to purchase these goods. Therefore, a positive net Trade Balance strengthens a currency and vice versa for a negative balance.
- Silver trades at $33.97, failing to hold above $34.00 for the second straight day amid buyer hesitation.
- RSI flattens near overbought levels, suggesting bulls may pause before the next breakout attempt.
- Key resistance at $34.51 and $35.00, while support lies at $33.75, followed by $33.44 if downside pressure builds.
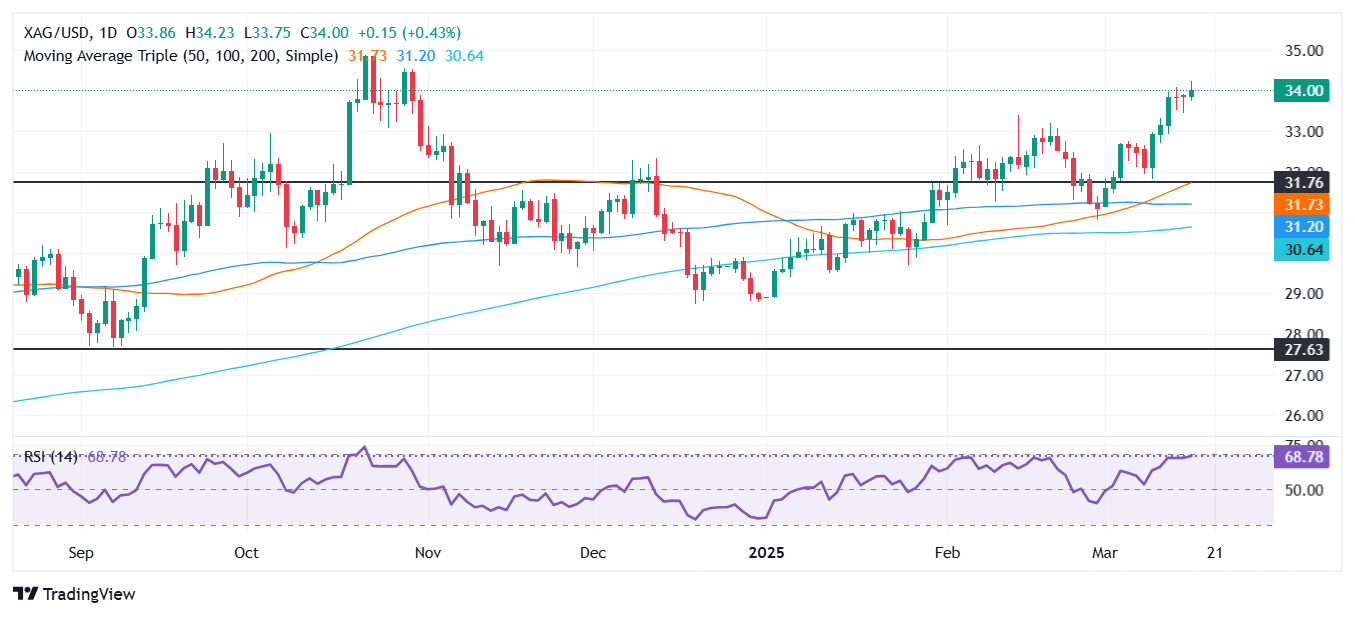
Silver price rally halts for the second straight day, with bulls remaining unable to decisively clear the $34.00 figure for the second consecutive day despite registering a yearly peak of $34.23. At the time of writing, the XAG/USD trades at $33.97, virtually unchanged, as Wednesday’s Asian session commences.
XAG/USD Price Forecast: Technical outlook
On Tuesday, Silver traded mostly sideways and printed a daily close below 50% of the candle's size, indicating that neither buyers nor sellers are in charge. Although the overall trend suggests the uptrend might continue, bulls seem to take a breather as depicted by the Relative Strength Index (RSI) turning flatlines near overbought territory.
If XAG/USD rises past $34.20, the next key resistance would be the October 30, 2024, peak at $34.51, followed by the $35.00 mark. On the flip side, if Silver’s remains below $34.00, the first support would be the March 18 low of $33.75, followed by the March 17 through at $33.44.
XAG/USD Price Chart – Daily
Silver FAQs
Silver is a precious metal highly traded among investors. It has been historically used as a store of value and a medium of exchange. Although less popular than Gold, traders may turn to Silver to diversify their investment portfolio, for its intrinsic value or as a potential hedge during high-inflation periods. Investors can buy physical Silver, in coins or in bars, or trade it through vehicles such as Exchange Traded Funds, which track its price on international markets.
Silver prices can move due to a wide range of factors. Geopolitical instability or fears of a deep recession can make Silver price escalate due to its safe-haven status, although to a lesser extent than Gold's. As a yieldless asset, Silver tends to rise with lower interest rates. Its moves also depend on how the US Dollar (USD) behaves as the asset is priced in dollars (XAG/USD). A strong Dollar tends to keep the price of Silver at bay, whereas a weaker Dollar is likely to propel prices up. Other factors such as investment demand, mining supply – Silver is much more abundant than Gold – and recycling rates can also affect prices.
Silver is widely used in industry, particularly in sectors such as electronics or solar energy, as it has one of the highest electric conductivity of all metals – more than Copper and Gold. A surge in demand can increase prices, while a decline tends to lower them. Dynamics in the US, Chinese and Indian economies can also contribute to price swings: for the US and particularly China, their big industrial sectors use Silver in various processes; in India, consumers’ demand for the precious metal for jewellery also plays a key role in setting prices.
Silver prices tend to follow Gold's moves. When Gold prices rise, Silver typically follows suit, as their status as safe-haven assets is similar. The Gold/Silver ratio, which shows the number of ounces of Silver needed to equal the value of one ounce of Gold, may help to determine the relative valuation between both metals. Some investors may consider a high ratio as an indicator that Silver is undervalued, or Gold is overvalued. On the contrary, a low ratio might suggest that Gold is undervalued relative to Silver.
- USD/CAD softens to around 1.4300 in Tuesday’s late American session.
- Canada's annual inflation rate jumped to 2.6% in February, hotter than expected.
- The Fed is anticipated to stay on hold when it concludes its two-day meeting on Wednesday.
The USD/CAD pair loses traction to near 1.4300 during the late American session on Tuesday, pressured by the weaker US Dollar (USD) and lower US yields. Investors will closely monitor the Federal Reserve (Fed) interest rate decision on Wednesday, with no change in rate expected.
The latest Canadian inflation data has added to the challenges faced by the Bank of Canada (BoC). The annual inflation rate, as measured by the change in the Consumer Price Index (CPI), climbed to 2.6% in February from 1.9% in January, Statistics Canada reported on Tuesday. This reading came in hotter than the market expectation of 2.1%.
The CPI rose 1.1% MoM in February, compared to 0.1% in January, hotter than the 0.6% expected. The core CPI, which excludes volatile food and energy prices, rose 0.4% MoM in February, matching January's increase.
Currency swaps put the chance of a pause on interest rate cuts at 59%, according to Reuters, while economists' forecasts are mixed. The Canadian Dollar (CAD) attracts some buyers in an immediate reaction to the hotter inflation data.
The Greenback remains under selling pressure due to fears of an economic slowdown in the United States. The Fed is expected to hold its monetary policy stance at its March meeting on Wednesday amid persistent inflation concerns and heightened economic uncertainty.
Traders will keep an eye on the new economic projections from Fed officials for more cues about the path of US interest rates. Any hawkish comments from the Fed policymakers could lift the USD against the CAD in the near term.
"The SEP (Summary of Economic Projections) will be the most interesting aspect, I imagine, with near-term inflation expectations likely nudged higher, and growth projections marked down a touch, though conviction behind those forecasts is going to be lacking, amid the ever-changing macro outlook," said Michael Brown, senior research strategist at Pepperstone.
Canadian Dollar FAQs
The key factors driving the Canadian Dollar (CAD) are the level of interest rates set by the Bank of Canada (BoC), the price of Oil, Canada’s largest export, the health of its economy, inflation and the Trade Balance, which is the difference between the value of Canada’s exports versus its imports. Other factors include market sentiment – whether investors are taking on more risky assets (risk-on) or seeking safe-havens (risk-off) – with risk-on being CAD-positive. As its largest trading partner, the health of the US economy is also a key factor influencing the Canadian Dollar.
The Bank of Canada (BoC) has a significant influence on the Canadian Dollar by setting the level of interest rates that banks can lend to one another. This influences the level of interest rates for everyone. The main goal of the BoC is to maintain inflation at 1-3% by adjusting interest rates up or down. Relatively higher interest rates tend to be positive for the CAD. The Bank of Canada can also use quantitative easing and tightening to influence credit conditions, with the former CAD-negative and the latter CAD-positive.
The price of Oil is a key factor impacting the value of the Canadian Dollar. Petroleum is Canada’s biggest export, so Oil price tends to have an immediate impact on the CAD value. Generally, if Oil price rises CAD also goes up, as aggregate demand for the currency increases. The opposite is the case if the price of Oil falls. Higher Oil prices also tend to result in a greater likelihood of a positive Trade Balance, which is also supportive of the CAD.
While inflation had always traditionally been thought of as a negative factor for a currency since it lowers the value of money, the opposite has actually been the case in modern times with the relaxation of cross-border capital controls. Higher inflation tends to lead central banks to put up interest rates which attracts more capital inflows from global investors seeking a lucrative place to keep their money. This increases demand for the local currency, which in Canada’s case is the Canadian Dollar.
Macroeconomic data releases gauge the health of the economy and can have an impact on the Canadian Dollar. Indicators such as GDP, Manufacturing and Services PMIs, employment, and consumer sentiment surveys can all influence the direction of the CAD. A strong economy is good for the Canadian Dollar. Not only does it attract more foreign investment but it may encourage the Bank of Canada to put up interest rates, leading to a stronger currency. If economic data is weak, however, the CAD is likely to fall.
- The Bank of Japan is expected to hold interest rates at 0.50% on Wednesday.
- The focus will be on the BoJ’s hints on the timing and scope of future rate hikes.
- The Japanese Yen is set to rock on BoJ policy announcements-induced volatility.
The Bank of Japan (BoJ) is on track to keep the short-term interest rate steady at 0.50% following its two-day March monetary policy review on Wednesday.
Any signals on the timing and the scope of future rate hikes by the BoJ will likely infuse intense volatility around the Japanese Yen (JPY).
What to expect from the BoJ interest rate decision?
The BoJ is widely expected to pause its rate-hiking cycle this month after raising its policy rate to 0.50%, the highest level in 17 years, from 0.25% in January on the view that Japan was progressing toward achieving its 2% inflation target.
Just before the BoJ’s January policy meeting, US President Donald Trump returned to the White House and proceeded with the proposed tariffs on China, Canada and Mexico. Trump’s protectionism has triggered a tariff war globally, throwing major central banks worldwide in a dilemma.
Though rising inflationary pressures globally due to Trump’s tariff could be a boon for the BoJ hawks, policymakers remain wary of Japanese economic prospects after the final Gross Domestic Product (GDP) increased 0.6% on a quarterly basis in the fourth quarter of 2024, a slower pace than the 0.7% expansion initially reported.
Despite escalating trade war and economic slowdown fears, BoJ Governor Kazuo Ueda and his colleagues continued to hint at further rate hikes if inflation moves sustainably toward its 2% target.
"Long-term interest rates move on various factors. But the biggest determinant is the market’s forecast on the outlook for our short-term policy rate," Ueda told parliament on March 12, emphasizing the Bank’s resolve to keep raising short-term interest rates.
This narrative seems to be backed by Japan’s inflation remaining at its highest level since January 2023. The annual National Consumer Price Index (CPI) jumped 4% in January from December’s 3.6% print. The so-called “core-core” inflation rate, which strips out prices of fresh food and energy and is closely monitored by the BoJ, rose slightly to 2.5% in the same period from 2.4% in the month before.
Further, the country’s 10-year government bond yields recently surged to their highest level since October 2008, anticipating higher inflationary pressures. At the same time, the Japanese Yen (JPY) reached five-month highs against the US Dollar (USD).
More so, Japan's average monthly household spending rose 0.8% year-on-year (YoY) in inflation-adjusted real terms in January, marking the second consecutive month of growth.
The elevated cost of living brings closer scrutiny to the initial result of the spring wage negotiations (Shunto) announced on Friday. Japan's largest trade union group Rengo’s first-round data shows an average wage hike of 5.46% for fiscal 2025, compared to the demand of a 6.09% hike. The results, however, came in above the last year’s 5.28% raise.
These factors continue to raise expectations of rate hikes by the Japanese central bank in the upcoming months. The latest Bloomberg survey of economists showed that “July remained the favorite choice for the next hike with 48% expecting a move then, dropping from 56% in the previous survey.“
Analysts at BBH said: “The two-day Bank of Japan meeting ends Wednesday with a widely expected hold. The bank just hiked rates 25 bp at the last meeting in January.”
“BoJ Governor Ueda has cautioned that the policy path will be guided by checking the impact of rate hikes already undertaken, which argues against back-to-back rate hikes. The swaps market is pricing in the next 25 bp rate increase for September,” the analysts added.
How could the Bank of Japan's interest rate decision affect USD/JPY?
If the BoJ reiterates that it will remain data-dependent and decides on a meeting-by-meeting basis, the Japanese Yen will likely resume its recent bearish momentum against the US Dollar (USD), driving USD/JPY back toward the March high of 151.31.
On the contrary, USD/JPY could fall hard toward 146.50 on a fresh JPY rally if the BoJ debates the next rate hike as soon as May due to concerns about inflationary pressure from wage gains, stubborn rises in food costs, and the trade war's impact.
Citing a source familiar with the BoJ's thinking, Reuters reported last week, "Japan's economy and price developments appear on track, but overseas risks have risen.” "The heightening global uncertainty is a concern and could affect the BoJ's rate-hike timing," the source said, a view echoed by two more sources.
However, any knee-jerk reaction to the BoJ policy announcements could be reversed once Governor Ueda addresses the post-policy meeting press conference at 6:30 GMT.
From a technical perspective, Dhwani Mehta, Asian Session Lead Analyst at FXStreet, notes: “USD/JPY appears at a critical juncture, exposed to two-way risks in the lead up to the BoJ’s decision. The pair has recaptured the 21-day Simple Moving Average (SMA) at 149.14, but the 14-day Relative Strength Index (RSI) remains beneath 50 despite the recent upswing.”
“A hawkish BoJ hold could revive the USD/JPY downtrend, targeting the March 13 low of 147.41. The next support is seen at the 147.00 threshold. A sustained break below that level would challenge the five-month low of 146.54. On the flip side, buyers need acceptance above the 150.00 psychological level to extend the uptrend toward the March high of 151.31. The 200-day SMA at 151.93 will act as a tough nut to crack thereafter,” Dhwani adds.
Economic Indicator
BoJ Interest Rate Decision
The Bank of Japan (BoJ) announces its interest rate decision after each of the Bank’s eight scheduled annual meetings. Generally, if the BoJ is hawkish about the inflationary outlook of the economy and raises interest rates it is bullish for the Japanese Yen (JPY). Likewise, if the BoJ has a dovish view on the Japanese economy and keeps interest rates unchanged, or cuts them, it is usually bearish for JPY.
Read more.Next release: Wed Mar 19, 2025 03:00
Frequency: Irregular
Consensus: 0.5%
Previous: 0.5%
Source: Bank of Japan
Central banks FAQs
Central Banks have a key mandate which is making sure that there is price stability in a country or region. Economies are constantly facing inflation or deflation when prices for certain goods and services are fluctuating. Constant rising prices for the same goods means inflation, constant lowered prices for the same goods means deflation. It is the task of the central bank to keep the demand in line by tweaking its policy rate. For the biggest central banks like the US Federal Reserve (Fed), the European Central Bank (ECB) or the Bank of England (BoE), the mandate is to keep inflation close to 2%.
A central bank has one important tool at its disposal to get inflation higher or lower, and that is by tweaking its benchmark policy rate, commonly known as interest rate. On pre-communicated moments, the central bank will issue a statement with its policy rate and provide additional reasoning on why it is either remaining or changing (cutting or hiking) it. Local banks will adjust their savings and lending rates accordingly, which in turn will make it either harder or easier for people to earn on their savings or for companies to take out loans and make investments in their businesses. When the central bank hikes interest rates substantially, this is called monetary tightening. When it is cutting its benchmark rate, it is called monetary easing.
A central bank is often politically independent. Members of the central bank policy board are passing through a series of panels and hearings before being appointed to a policy board seat. Each member in that board often has a certain conviction on how the central bank should control inflation and the subsequent monetary policy. Members that want a very loose monetary policy, with low rates and cheap lending, to boost the economy substantially while being content to see inflation slightly above 2%, are called ‘doves’. Members that rather want to see higher rates to reward savings and want to keep a lit on inflation at all time are called ‘hawks’ and will not rest until inflation is at or just below 2%.
Normally, there is a chairman or president who leads each meeting, needs to create a consensus between the hawks or doves and has his or her final say when it would come down to a vote split to avoid a 50-50 tie on whether the current policy should be adjusted. The chairman will deliver speeches which often can be followed live, where the current monetary stance and outlook is being communicated. A central bank will try to push forward its monetary policy without triggering violent swings in rates, equities, or its currency. All members of the central bank will channel their stance toward the markets in advance of a policy meeting event. A few days before a policy meeting takes place until the new policy has been communicated, members are forbidden to talk publicly. This is called the blackout period.
- USD/JPY ends flat at 149.38, erasing a 0.54% loss as safe-haven flows boost the Yen late in the session.
- ‘Gravestone doji’ pattern forms, signaling momentum shift to the downside, with first support at 149.00.
- A break above 150.00 could trigger gains toward 150.67, but RSI flattening suggests limited upside potential.
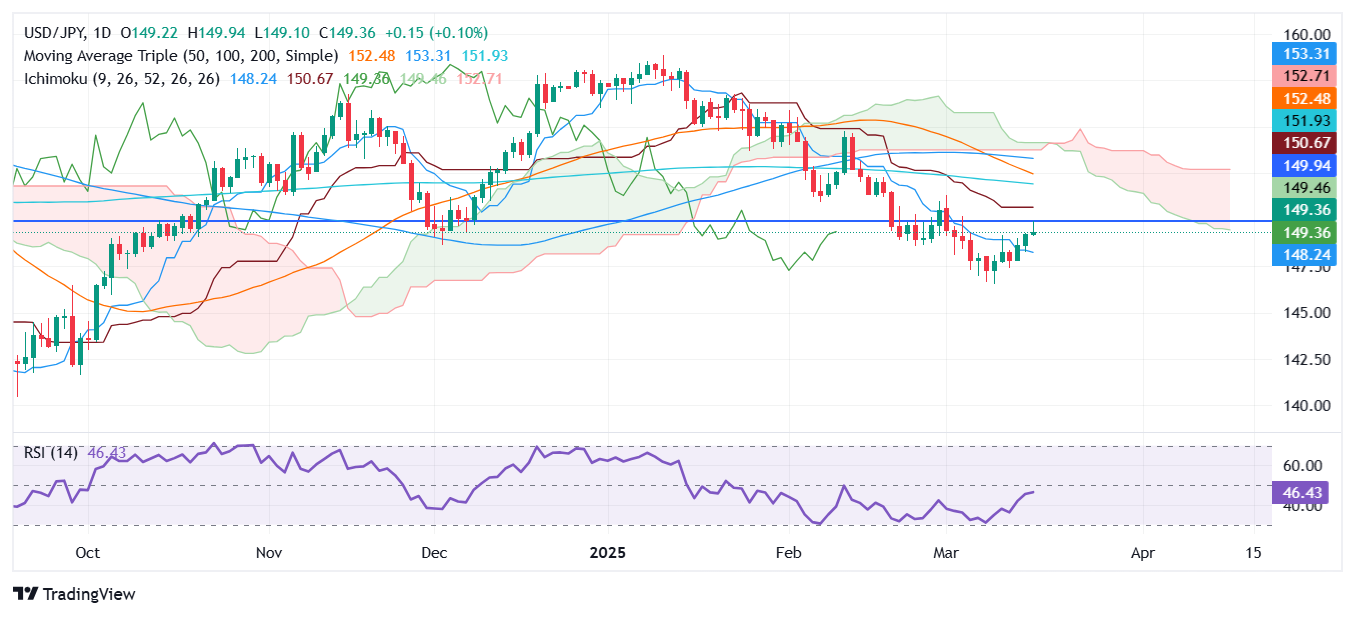
The USD/jPY finished Tuesday’s session with anemic gains of 0.04%. The session was characterized by overall Japanese Yen (JPY) weakness until its safe-haven status boosted the Yen to trim earlier losses of 0.54%. As Wednesday’s Asian session begins, the pair trades at 149,38, virtually unchanged.
USD/JPY Price Forecast: Technical outlook
The USD/JPY rallied over 2.32% since bottoming around March 11 low of 146.54 and hit a high of 149.93 on March 18 before pulling back to current spot prices. Sellers moved late in yesterday’s session, helping to overcome earlier buying pressure. Therefore a ‘gravestone doji’ formed, hinting that momentum has shifted to the downside.
The Relative Strength Index (RSI) aims slightly up, but the slope flattened somewhat, which could indicate a bearish continuation.
The USD/JPY first support would be the 149.00 figure. A breach of the latter will expose the Tenkan-sen at 148.20, closely followed by the March 14 low of 147.76. Conversely, if buyers push the pair above 150.00, this will expose the Kijun-sen at 150.67 before testing the 200-day Simple Moving Average (SMA) at 151.91.
USD/JPY Price Chart – Daily
Japanese Yen PRICE This week
The table below shows the percentage change of Japanese Yen (JPY) against listed major currencies this week. Japanese Yen was the strongest against the US Dollar.
| USD | EUR | GBP | JPY | CAD | AUD | NZD | CHF | |
|---|---|---|---|---|---|---|---|---|
| USD | -0.58% | -0.48% | 0.42% | -0.58% | -0.44% | -1.23% | -0.90% | |
| EUR | 0.58% | -0.02% | 0.59% | 0.00% | 0.00% | -0.67% | -0.35% | |
| GBP | 0.48% | 0.02% | 0.93% | -0.20% | 0.00% | -0.67% | -0.41% | |
| JPY | -0.42% | -0.59% | -0.93% | -0.99% | -1.07% | -1.59% | -1.48% | |
| CAD | 0.58% | -0.00% | 0.20% | 0.99% | -0.06% | -0.65% | -0.87% | |
| AUD | 0.44% | -0.00% | -0.00% | 1.07% | 0.06% | -0.64% | -0.34% | |
| NZD | 1.23% | 0.67% | 0.67% | 1.59% | 0.65% | 0.64% | 0.32% | |
| CHF | 0.90% | 0.35% | 0.41% | 1.48% | 0.87% | 0.34% | -0.32% |
The heat map shows percentage changes of major currencies against each other. The base currency is picked from the left column, while the quote currency is picked from the top row. For example, if you pick the Japanese Yen from the left column and move along the horizontal line to the US Dollar, the percentage change displayed in the box will represent JPY (base)/USD (quote).
- GBP/USD pushed back into the 1.3000 handle on Tuesday.
- Markets are buckling up for a one-two punch of Fed and BoE rate calls.
- The Fed is expected to hold steady on rates until April, BoE also seen steady.
GBP/USD traded thinly on Tuesday, but still inched back into the 1.3000 handle, chalking in a fresh 19-week high ahead of high-impact rate calls from both the Federal Reserve (Fed) and the Bank of England (BoE). The Fed is widely expected to hold steady on rates this week, but a fresh update to the Federal Open Market Committee’s (FOMC) interest rate expectations will draw plenty of eyes.
The Federal Reserve’s (Fed) latest rate call is due on Wednesday. According to the CME’s FedWatch Tool, rate markets broadly anticipate the Fed to stand pat on rates for the next two meetings, with the next quarter-point rate trim expected at the Federal Open Market Committee’s (FOMC) June meeting. However, the FOMC’s latest interest rate forecasts will be released this week. They could send rate cut expectations through the wringer if Fed policymaker’s expectations for interest rates deviate wildly from current market forecasts.
The BoE’s upcoming rate call on Thursday will draw some Cable traders’ attention, but not nearly as much as the Fed’s showing during the midweek market session. After the BoE’s latest rate cut last month, the UK’s central bank is expected to vote 7-to-2 to keep rates unchanged at 4.5%, with two particularly dovish policymakers expected to vote for another quarter-point cut.
GBP/USD price forecast
GBP/USD is testing into its third straight week of gains, clipping back into the 1.3000 handle for the first time since last November. The pair is now trading 7.5% above January’s multi-month low of 1.2100. Near-term price action is still tilted firmly in favor of Cable bulls, however GBP/USD may have overextended itself as technical oscillators remain pinned deep in overbought territory.
GBP/USD daily chart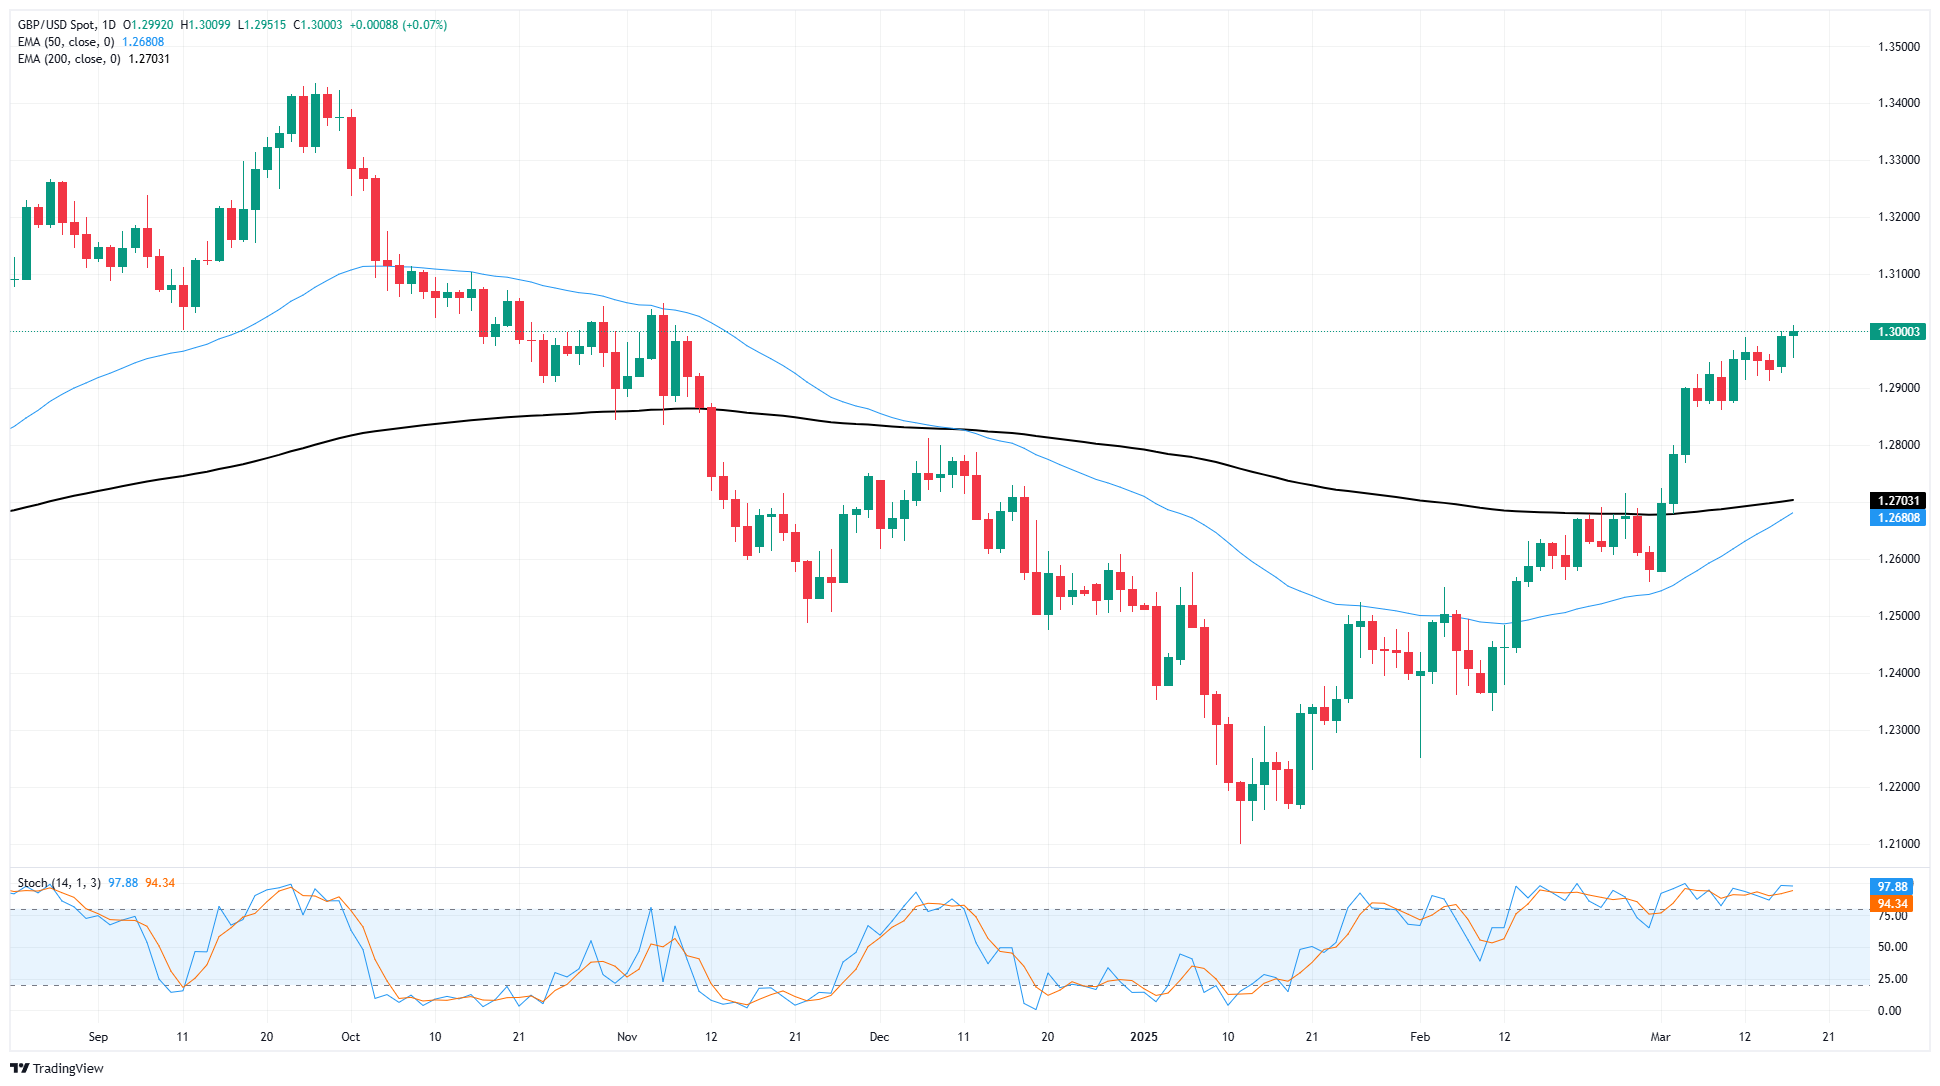
Pound Sterling FAQs
The Pound Sterling (GBP) is the oldest currency in the world (886 AD) and the official currency of the United Kingdom. It is the fourth most traded unit for foreign exchange (FX) in the world, accounting for 12% of all transactions, averaging $630 billion a day, according to 2022 data. Its key trading pairs are GBP/USD, also known as ‘Cable’, which accounts for 11% of FX, GBP/JPY, or the ‘Dragon’ as it is known by traders (3%), and EUR/GBP (2%). The Pound Sterling is issued by the Bank of England (BoE).
The single most important factor influencing the value of the Pound Sterling is monetary policy decided by the Bank of England. The BoE bases its decisions on whether it has achieved its primary goal of “price stability” – a steady inflation rate of around 2%. Its primary tool for achieving this is the adjustment of interest rates. When inflation is too high, the BoE will try to rein it in by raising interest rates, making it more expensive for people and businesses to access credit. This is generally positive for GBP, as higher interest rates make the UK a more attractive place for global investors to park their money. When inflation falls too low it is a sign economic growth is slowing. In this scenario, the BoE will consider lowering interest rates to cheapen credit so businesses will borrow more to invest in growth-generating projects.
Data releases gauge the health of the economy and can impact the value of the Pound Sterling. Indicators such as GDP, Manufacturing and Services PMIs, and employment can all influence the direction of the GBP. A strong economy is good for Sterling. Not only does it attract more foreign investment but it may encourage the BoE to put up interest rates, which will directly strengthen GBP. Otherwise, if economic data is weak, the Pound Sterling is likely to fall.
Another significant data release for the Pound Sterling is the Trade Balance. This indicator measures the difference between what a country earns from its exports and what it spends on imports over a given period. If a country produces highly sought-after exports, its currency will benefit purely from the extra demand created from foreign buyers seeking to purchase these goods. Therefore, a positive net Trade Balance strengthens a currency and vice versa for a negative balance.
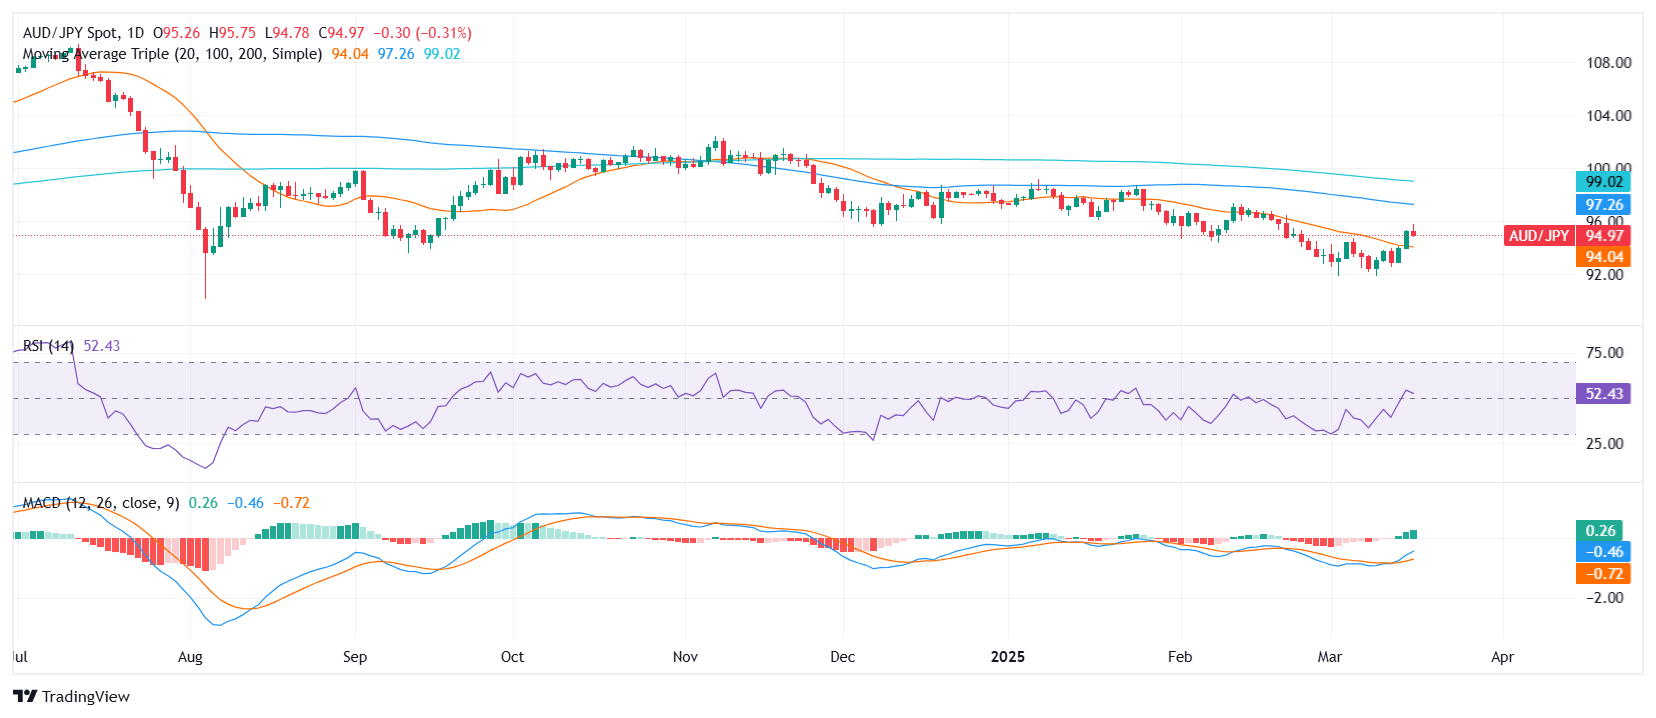
- AUD/JPY was seen trading around the 95.00 area ahead of the Asian session, posting a slight decline.
- After failing to sustain gains near 96.00, the pair retreated but remains above the 20-day SMA, keeping the outlook positive.
- Traders should monitor if the RSI crosses below 50, which could indicate a shift in momentum.
AUD/JPY edged lower on Tuesday ahead of the Asian session, retreating below 95.00 after hitting resistance near the 96.00 zone. Despite the pullback, the pair still holds above its 20-day Simple Moving Average (SMA), keeping the broader trend tilted to the upside.
Technically, the Relative Strength Index (RSI) has declined sharply but remains in positive territory at 54. A drop below the 50 mark could signal a potential shift in sentiment. Meanwhile, the Moving Average Convergence Divergence (MACD) continues to print rising green bars, suggesting that bullish momentum remains in place for now.
Looking ahead, immediate support lies at the 20-day SMA, while stronger demand may emerge near 94.50. On the upside, resistance is seen around 96.00, where sellers have consistently capped gains. If the pair manages to reclaim this level, further upside toward 97.00 could be in play.
AUD/JPY daily chart
- Gold price surges past $3,000, reaching a record high amid Trump’s reciprocal tariffs and geopolitical uncertainty.
- Middle East tensions escalate, with renewed Israel-Hamas hostilities adding to bullion’s 15% year-to-date gain.
- Traders bet on June Fed rate cuts, as falling US Treasury yields and a weaker US Dollar support gold’s uptrend.
Gold price skyrockets past the $3,000 figure and hit a record high of $3,038 on Tuesday amid uncertainty on United States (US) President Donald Trump’s reciprocal tariffs to be enacted on April 2, while traders eye Federal Reserve’s (Fed) monetary policy decision. XAU/USD is trading at $3,037, up by 1.20%.
Risk appetite remains deteriorated, even though talks between Trump and Russian President Vladimir Putin relieved some of traders’ stress with the latter agreeing to a 30-day halt on attacking Ukraine energy facilities, according to Reuters. Nevertheless, the Bullion rally continued with the precious metal gaining over 15% in the year so far.
Hostilities in the Middle East between Israel and Hamas sparked a leg-up in XAU/USD, as Israel strikes killed more than 400 people in Gaza, threatening a two-month ceasefire, revealed Reuters.
Data-wise, the US economic schedule revealed that Industrial Production improved in February. Contrarily, housing data was mixed, with Building Permits falling off the cliff, while Housing Starts rose sharply, revealed the US Census Bureau.
According to the CME Group's FedWatch Tool, traders expect the Fed to keep interest rates unchanged on Wednesday. However, they see nearly a 66% chance of a rate cut in June.
In the meantime, Bullion continued to climb, sponsored by falling US Treasury yields and a weaker US Dollar. The US 10-year T-note yield drops one basis point to 4.183%. At the same time, the US Dollar Index (DXY), which tracks the buck’s performance against a basket of six currencies, falls 0.17% to 103.23.
Daily digest market movers: Gold price poised to extend rally as real yields tumble
- US real yields, as measured by the US 10-year Treasury Inflation-Protected Securities (TIPS) yield, which correlates inversely to Gold prices, dropped one and a half bps to 1.985% via Reuters.
- US Industrial Production expanded 0.7% MoM in February, exceeding the 0.2% forecast and accelerating from January’s 0.3% gain, fueled by robust motor vehicle production.
- Housing data was mixed in February. Building Permits dropped 1.2%, declining from 1.473 million to 1.456 million. Housing Starts jumped 11.2%, rising from 1.35 million to 1.501 million, indicating strength in construction activity.
- Money market has priced in 61 basis points of easing by the Fed in 2025, which has sent US Treasury yields plunging alongside the American Currency.
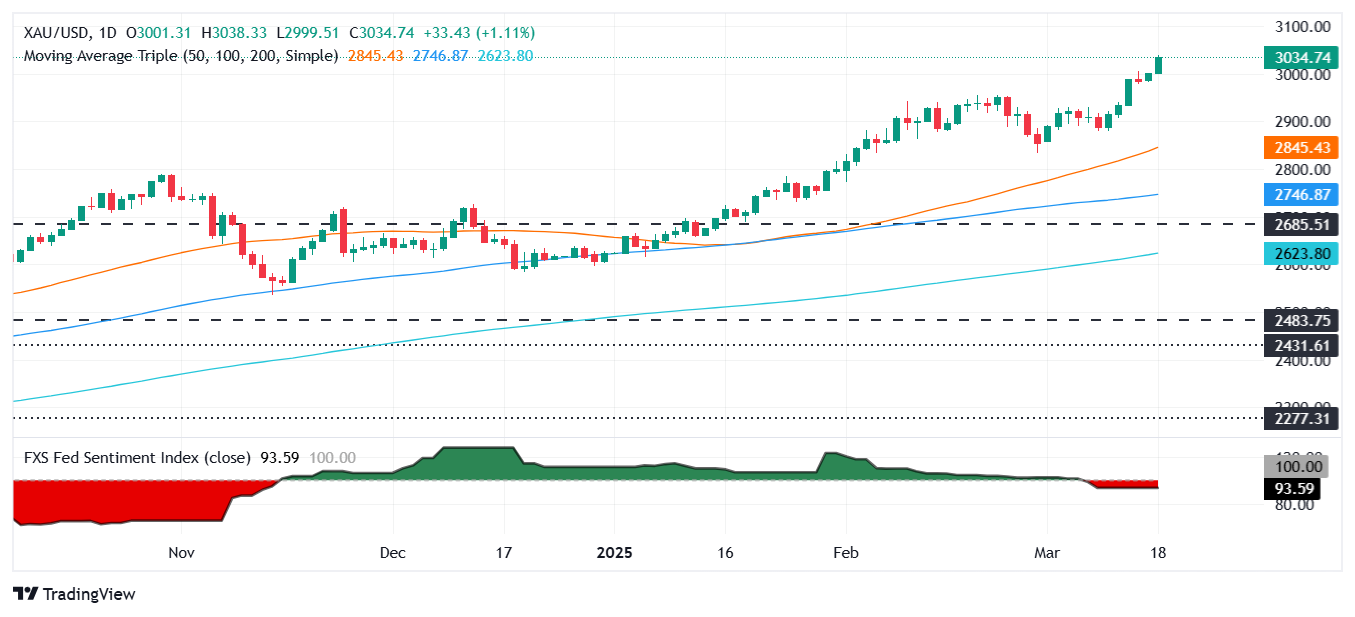
XAU/USD technical outlook: Gold price conquers $3,000 and is set to end above that level
Gold price is upward biased, poised to challenge higher prices above the current YTD high of $3,038. If buyers clear the latter, they could test $3,050 and $3,100 figures. It’s worth noting that the Relative Strength Index (RSI) is overbought. But the strength of the trend hints that the “most extreme” reading would be 80; hence XAU/USD could continue to trend higher.
Conversely, if Bullion drops below $3,000, the first support would be the February 20 daily high at $2,954, followed by the $2,900 mark.
Gold FAQs
Gold has played a key role in human’s history as it has been widely used as a store of value and medium of exchange. Currently, apart from its shine and usage for jewelry, the precious metal is widely seen as a safe-haven asset, meaning that it is considered a good investment during turbulent times. Gold is also widely seen as a hedge against inflation and against depreciating currencies as it doesn’t rely on any specific issuer or government.
Central banks are the biggest Gold holders. In their aim to support their currencies in turbulent times, central banks tend to diversify their reserves and buy Gold to improve the perceived strength of the economy and the currency. High Gold reserves can be a source of trust for a country’s solvency. Central banks added 1,136 tonnes of Gold worth around $70 billion to their reserves in 2022, according to data from the World Gold Council. This is the highest yearly purchase since records began. Central banks from emerging economies such as China, India and Turkey are quickly increasing their Gold reserves.
Gold has an inverse correlation with the US Dollar and US Treasuries, which are both major reserve and safe-haven assets. When the Dollar depreciates, Gold tends to rise, enabling investors and central banks to diversify their assets in turbulent times. Gold is also inversely correlated with risk assets. A rally in the stock market tends to weaken Gold price, while sell-offs in riskier markets tend to favor the precious metal.
The price can move due to a wide range of factors. Geopolitical instability or fears of a deep recession can quickly make Gold price escalate due to its safe-haven status. As a yield-less asset, Gold tends to rise with lower interest rates, while higher cost of money usually weighs down on the yellow metal. Still, most moves depend on how the US Dollar (USD) behaves as the asset is priced in dollars (XAU/USD). A strong Dollar tends to keep the price of Gold controlled, whereas a weaker Dollar is likely to push Gold prices up.
- The AUD/USD struggles to maintain gains, hovering near the 0.6350 zone as bullish momentum fades.
- China’s economic stimulus provided initial support, but investors turn cautious ahead of key US data.
- Technical indicators suggest consolidation, with the pair facing resistance near recent highs.
The AUD/USD rebound halts near 0.6350 as market caution prevails. The pair lost momentum on Tuesday after initially benefiting from renewed optimism surrounding China’s economy. The Australian Dollar found support from Beijing’s special action plan to boost household incomes and domestic consumption. However, investors shifted to a cautious stance ahead of the Federal Reserve’s monetary policy decision on Wednesday, where the dot plot and Summary of Economic Projections (SEP) will provide further clarity on future interest rate moves.
Daily digest market movers: Australian Dollar loses steam ahead of Fed decision
- The Australian Dollar’s rally stalled on Tuesday, with AUD/USD struggling to hold recent gains as traders reassessed risk sentiment. Despite optimism from China’s economic measures, uncertainty ahead of the Federal Reserve’s policy outlook kept market participants cautious.
- China’s stimulus efforts remain in focus. The country’s special action plan aims to strengthen household income and improve domestic spending, which is crucial for Australia’s export-driven economy. However, lingering concerns over the global trade environment limited further upside for the Aussie.
- The Federal Reserve’s dot plot and SEP take center stage. Investors are looking for updates on the Fed’s stance regarding interest rates, inflation, and economic growth projections. In December, Fed officials anticipated two rate cuts in 2025, and any changes could impact US Dollar direction.
- The Reserve Bank of Australia (RBA) is expected to remain cautious regarding future interest rate moves. Inflationary risks linked to US trade policies and tariffs continue to pose challenges, adding to the uncertainty surrounding the RBA’s next steps.
- Australian labor market data, scheduled for March 20, will be a key driver for AUD/USD in the coming sessions. Any unexpected shifts in employment figures could influence expectations for RBA policy decisions.
AUD/USD technical analysis: Rebound momentum fades as resistance holds
The AUD/USD moved toward the 0.6350 region on Tuesday but failed to extend its advance, signaling a loss of momentum. The pair struggled to clear key resistance levels, prompting a period of consolidation.
The Moving Average Convergence Divergence (MACD) indicator printed a fresh green bar, suggesting lingering bullish bias, but momentum appears to be weakening. Meanwhile, the Relative Strength Index (RSI) is at 63, reflecting a slowing upward trend as buyers hesitate near resistance.
The pair remains above the 20-day and 100-day Simple Moving Averages (SMA), maintaining a broadly positive outlook. However, resistance near 0.6370 continues to cap upside potential. On the downside, initial support lies around 0.6320, with stronger demand expected near 0.6280 if selling pressure increases.
Australian Dollar FAQs
One of the most significant factors for the Australian Dollar (AUD) is the level of interest rates set by the Reserve Bank of Australia (RBA). Because Australia is a resource-rich country another key driver is the price of its biggest export, Iron Ore. The health of the Chinese economy, its largest trading partner, is a factor, as well as inflation in Australia, its growth rate and Trade Balance. Market sentiment – whether investors are taking on more risky assets (risk-on) or seeking safe-havens (risk-off) – is also a factor, with risk-on positive for AUD.
The Reserve Bank of Australia (RBA) influences the Australian Dollar (AUD) by setting the level of interest rates that Australian banks can lend to each other. This influences the level of interest rates in the economy as a whole. The main goal of the RBA is to maintain a stable inflation rate of 2-3% by adjusting interest rates up or down. Relatively high interest rates compared to other major central banks support the AUD, and the opposite for relatively low. The RBA can also use quantitative easing and tightening to influence credit conditions, with the former AUD-negative and the latter AUD-positive.
China is Australia’s largest trading partner so the health of the Chinese economy is a major influence on the value of the Australian Dollar (AUD). When the Chinese economy is doing well it purchases more raw materials, goods and services from Australia, lifting demand for the AUD, and pushing up its value. The opposite is the case when the Chinese economy is not growing as fast as expected. Positive or negative surprises in Chinese growth data, therefore, often have a direct impact on the Australian Dollar and its pairs.
Iron Ore is Australia’s largest export, accounting for $118 billion a year according to data from 2021, with China as its primary destination. The price of Iron Ore, therefore, can be a driver of the Australian Dollar. Generally, if the price of Iron Ore rises, AUD also goes up, as aggregate demand for the currency increases. The opposite is the case if the price of Iron Ore falls. Higher Iron Ore prices also tend to result in a greater likelihood of a positive Trade Balance for Australia, which is also positive of the AUD.
The Trade Balance, which is the difference between what a country earns from its exports versus what it pays for its imports, is another factor that can influence the value of the Australian Dollar. If Australia produces highly sought after exports, then its currency will gain in value purely from the surplus demand created from foreign buyers seeking to purchase its exports versus what it spends to purchase imports. Therefore, a positive net Trade Balance strengthens the AUD, with the opposite effect if the Trade Balance is negative.
- The Canadian Dollar churned chart paper near 1.43 on Tuesday.
- Canadian CPI inflation accelerated faster than expected in February.
- Despite the inflation uptick, the Loonie is holding steady as BoC rate cut bets ease.
The Canadian Dollar (CAD) found a foothold against the US Dollar (USD) on Tuesday, cycling near the 1.4300 handle after Canadian Consumer Price Index (CPI) inflation accelerated even faster than expected in February. Despite inflation once again rearing its head in Canadian data, the Loonie found some market support as the CPI upswing diminishes odds of further rate cuts from the Bank of Canada (BoC).
The BoC’s latest rate cut last week is proving to be just as poorly-timed as most market participants expected. Inflation pressures are back above the Canadian central bank’s 2% annualized inflation target, and showing serious signs of accelerating. The BoC has cut interest rates seven times since H2 2024, presumably in an effort to try and tamp down on runaway housing prices, a truly bizarre strategy in a country where the majority of mortgage rates are tied to Canadian bond yields rather than directly correlated to interest rates.
As the BoC slashes rates while tumbling straight down a fresh inflation hole, markets already rattled by a growing trade war between Canada and the US have pushed bond yields even higher as investors struggle to understand what BoC Governor Tiff Macklem is trying to accomplish. The BoC now finds itself in the unenviable position of having few rate cuts left in the powder bag to bolster the Canadian economy should the economy continue to take a turn for the worse, alongside high inflation and still-too-hot housing costs to contend with.
BoC Consumer Price Index Core (YoY) 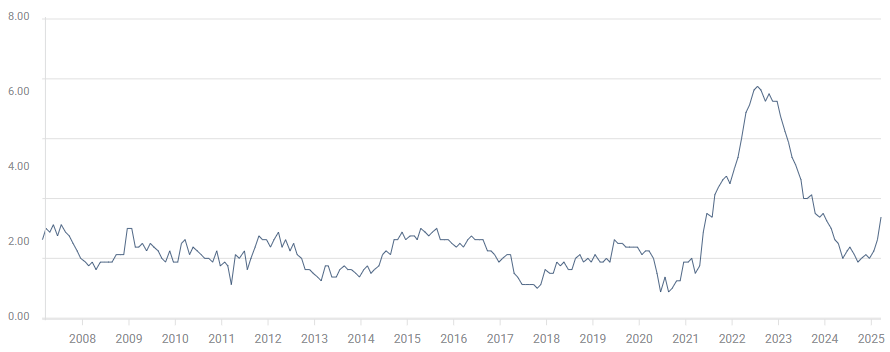
Daily digest market movers: Canadian Dollar holds steady after markets call inflation uptick
- Canadian Dollar holds steady near key 1.4300 level against Greenback on Tuesday.
- Headline Canadian CPI inflation accelerated to 2.6% YoY in February, well above the median market forecast of 2.1% and rising sharply from the previous period’s 1.9%.
- The BoC’s own core CPI inflation metric also accelerated, bounding to 2.7% YoY from 2.1%.
- Market bets of another BoC rate cut at the Canadian central bank’s next rate call have withered in the face of a new round of inflation pressures within the Canadian economy. Rate swaps now see a 30% chance of yet another quarter-point cut in April, down from 45% pre-CPI data.
- Canadian economic data remains limited through the remainder of the trading week, however mid-tier Canadian Retail Sales are slated for Friday.
Canadian Dollar price forecast
The Canadian Dollar’s stubborn hold near the 1.4300 handle against the Greenback has left the USD/CAD pair strung out near the low end of a too-familiar lateral channel. The pair continues to churn near the 50-day Exponential Moving Average (EMA) as a long-term trend remains absent.
The immediate challenge for a continued leg higher for the Loonie will be a hefty supply zone priced in on USD/CAD between 1.4200 and 1.4100.
USD/CAD daily chart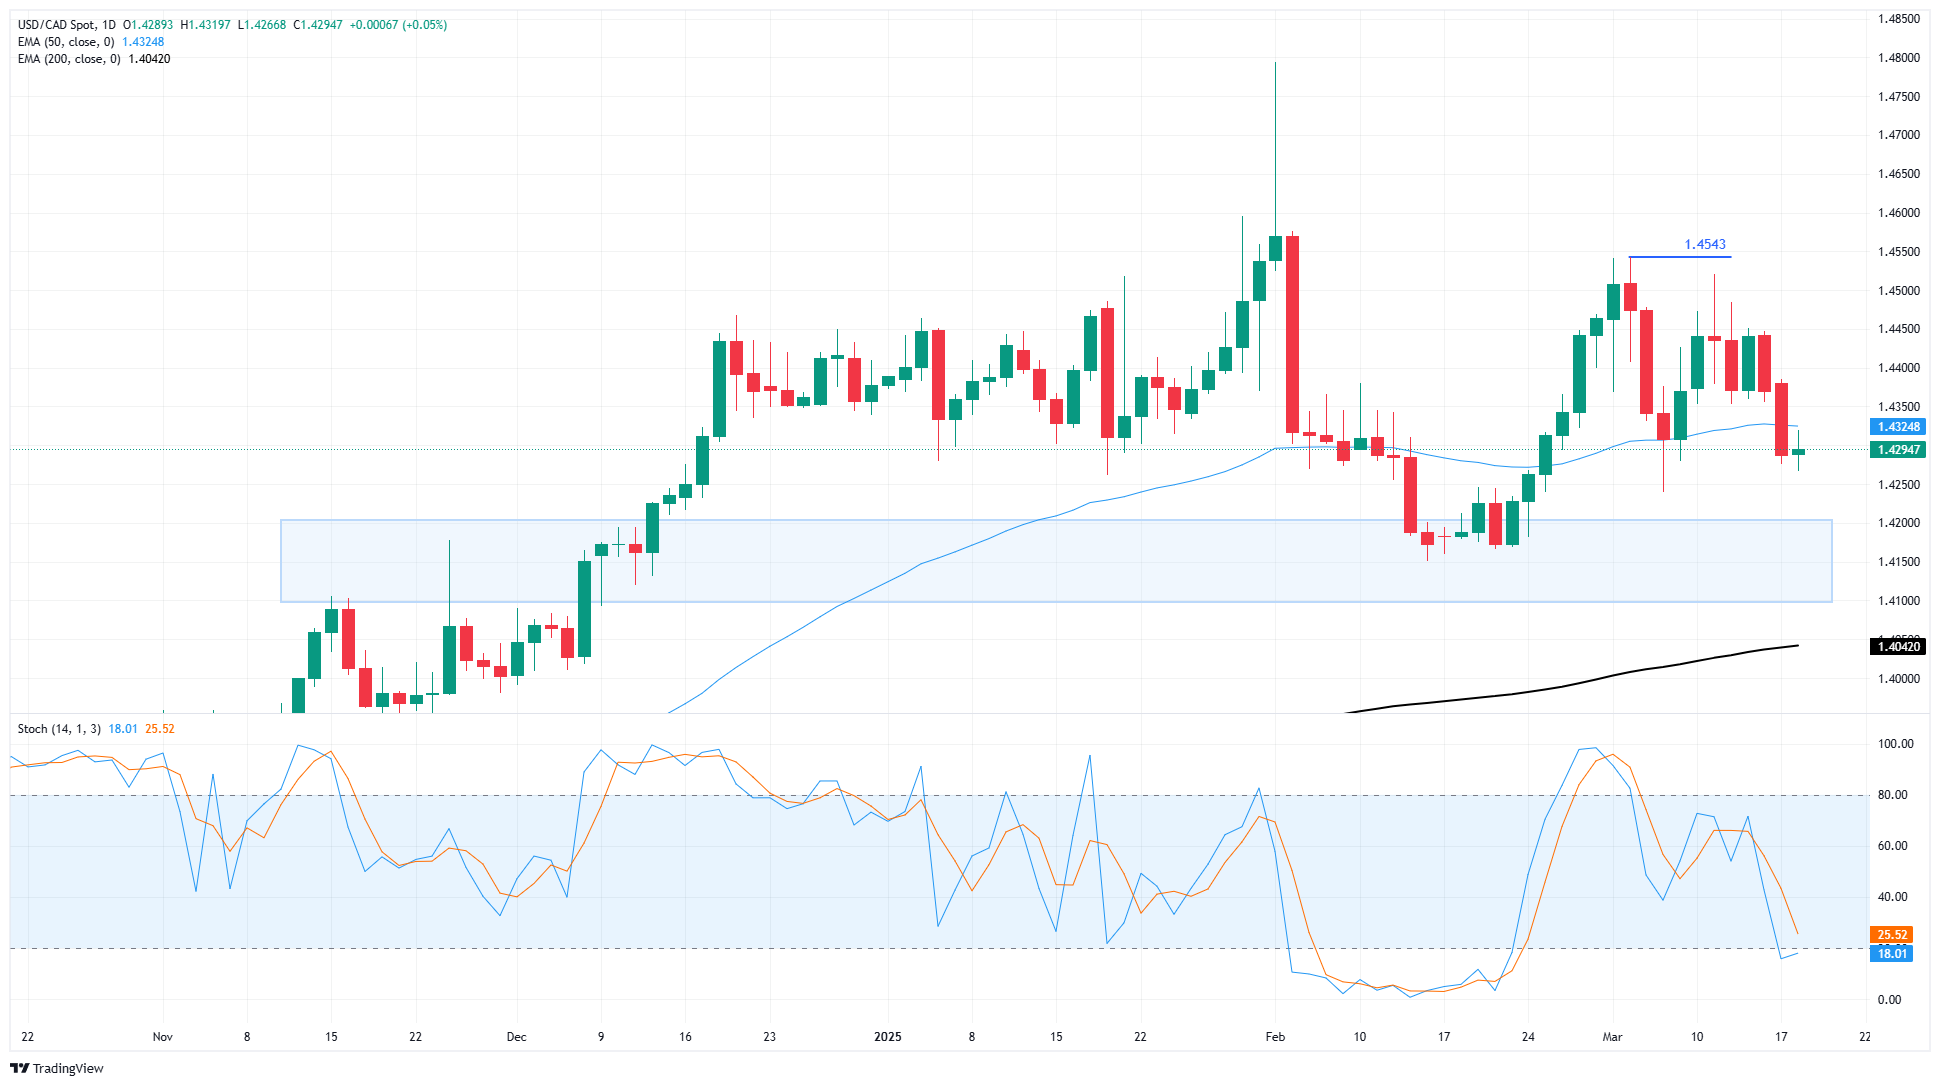
Canadian Dollar FAQs
The key factors driving the Canadian Dollar (CAD) are the level of interest rates set by the Bank of Canada (BoC), the price of Oil, Canada’s largest export, the health of its economy, inflation and the Trade Balance, which is the difference between the value of Canada’s exports versus its imports. Other factors include market sentiment – whether investors are taking on more risky assets (risk-on) or seeking safe-havens (risk-off) – with risk-on being CAD-positive. As its largest trading partner, the health of the US economy is also a key factor influencing the Canadian Dollar.
The Bank of Canada (BoC) has a significant influence on the Canadian Dollar by setting the level of interest rates that banks can lend to one another. This influences the level of interest rates for everyone. The main goal of the BoC is to maintain inflation at 1-3% by adjusting interest rates up or down. Relatively higher interest rates tend to be positive for the CAD. The Bank of Canada can also use quantitative easing and tightening to influence credit conditions, with the former CAD-negative and the latter CAD-positive.
The price of Oil is a key factor impacting the value of the Canadian Dollar. Petroleum is Canada’s biggest export, so Oil price tends to have an immediate impact on the CAD value. Generally, if Oil price rises CAD also goes up, as aggregate demand for the currency increases. The opposite is the case if the price of Oil falls. Higher Oil prices also tend to result in a greater likelihood of a positive Trade Balance, which is also supportive of the CAD.
While inflation had always traditionally been thought of as a negative factor for a currency since it lowers the value of money, the opposite has actually been the case in modern times with the relaxation of cross-border capital controls. Higher inflation tends to lead central banks to put up interest rates which attracts more capital inflows from global investors seeking a lucrative place to keep their money. This increases demand for the local currency, which in Canada’s case is the Canadian Dollar.
Macroeconomic data releases gauge the health of the economy and can have an impact on the Canadian Dollar. Indicators such as GDP, Manufacturing and Services PMIs, employment, and consumer sentiment surveys can all influence the direction of the CAD. A strong economy is good for the Canadian Dollar. Not only does it attract more foreign investment but it may encourage the Bank of Canada to put up interest rates, leading to a stronger currency. If economic data is weak, however, the CAD is likely to fall.
The Greenback remained under heavy pressure, retreating for the third day in a row and revisiting the area of multi-month troughs amid rising prudence ahead of the FOMC event on Wednesday, tariffs fears and geopolitical jitters.
Here is what you need to know on Wednesday, March 19:
The US Dollar Index (DXY) added to the ongoing leg lower, retesting the 103.20 zone amid deflating US yields and investors’ caution prior to the Fed’s interest rate decision. Other than the Fed, the weekly MBA Mortgage Applications, TIC Flows and the weekly report on US crude oil inventories by the EIA will also be published.
EUR/USD advanced to fresh multi-month highs past 1.0950 in response to the extra weakness in the US Dollar. The final Inflation Rate in the euro area as well as the Labour Cost Index and the Wage Growth are all due. In addition, the ECB’s De Guindos and Elderson are due to speak.
GBP/USD surpassed the 1.3000 milestone for the first time since early November, adding to the promising start to the week. Next on tap on the UK docket will be the labour market report and the BoE’s interest rate decision on March 20.
USD/JPY extended its advance for the third straight day, coming just pips away from the key 150.00 barrier, although receding to the 149.00 area afterwards. The BoJ meeting will steal the show in “The Land of the Rising Sun”, seconded by Balance of Trade results, Machinery Orders, Capacity Utilization and the final Industrial Production figures.
AUD/USD came under pressure soon after revisiting monthly highs around 0.6390, fading two daily advances in a row at the same time. The Westpac Leading Index will be the sole release Down Under.
Prices of the American WTI resumed their downtrend, coming under renewed downside pressure after hitting new multi-day highs north of the $68.00 mark per barrel as traders closely followed geopolitical events while the tariff narrative remained well in place.
Prices of Gold hit an all-time high near the $3,040 mark per troy ounce following renewed tensions in the Middle East, while rising uncertainty around US tariffs also contributed to the rally. Silver prices surpassed the $34.20 mark per ounce for the first time since late October.
- The US Dollar Index edges higher, recovering from earlier losses.
- Germany plans to inject 0.5 trillion euros into fiscal spending.
- Geopolitical uncertainty rises as Trump and Putin hold key discussions.
- Economic indicators show resilience despite market volatility.
The US Dollar Index (DXY), which measures the value of the US Dollar against a basket of six currencies, is stabilizing after avoiding a fresh five-month low. Traders react to Germany’s significant fiscal expansion while monitoring geopolitical risks linked to ongoing talks between US President Donald Trump and Russian President Vladimir Putin. The index rebounded from earlier declines as sentiment shifted.
Daily digest market movers: US Dollar steadies amid economic releases
- Trump and Putin’s high-level talks continue with reports indicating discussions on territorial matters, raising concerns over European security and NATO's response.
- Germany’s fiscal expansion is driving market sentiment with increased government spending expected to impact European economic stability.
- On the US data front, Building Permits for February slightly exceeded expectations but declined compared to January’s levels.
- Housing Starts surged, reflecting ongoing strength in the housing market despite broader economic uncertainties.
- Export and import prices rose more than anticipated, adding to inflation concerns.
- Industrial Production expanded at a robust pace, signaling resilience in US manufacturing.
- European stocks are rallying on optimism surrounding Germany’s spending boost, while US equities are under pressure.
- The Federal Reserve is expected to hold rates steady on Wednesday with market pricing indicating little change in the central bank’s tone and stance on the upcoming decision.
Technical analysis: US Dollar Index regains footing but remains under key resistance levels
The US Dollar Index is attempting to regain strength, though it remains near multi-month lows. The Relative Strength Index (RSI) is exiting oversold territory, suggesting a potential recovery, while the Moving Average Convergence Divergence (MACD) histogram continues to indicate bearish momentum, though the downside pressure is easing.
Resistance is seen at 104.20, followed by 104.80 and 105.20, marking key breakout levels. Support holds at 103.40, with a breach lower exposing 102.90. While short-term momentum is recovering, the index remains below its 50-day and 200-day simple moving averages, signaling that a sustained bullish trend is yet to form.
Fed FAQs
Monetary policy in the US is shaped by the Federal Reserve (Fed). The Fed has two mandates: to achieve price stability and foster full employment. Its primary tool to achieve these goals is by adjusting interest rates. When prices are rising too quickly and inflation is above the Fed’s 2% target, it raises interest rates, increasing borrowing costs throughout the economy. This results in a stronger US Dollar (USD) as it makes the US a more attractive place for international investors to park their money. When inflation falls below 2% or the Unemployment Rate is too high, the Fed may lower interest rates to encourage borrowing, which weighs on the Greenback.
The Federal Reserve (Fed) holds eight policy meetings a year, where the Federal Open Market Committee (FOMC) assesses economic conditions and makes monetary policy decisions. The FOMC is attended by twelve Fed officials – the seven members of the Board of Governors, the president of the Federal Reserve Bank of New York, and four of the remaining eleven regional Reserve Bank presidents, who serve one-year terms on a rotating basis.
In extreme situations, the Federal Reserve may resort to a policy named Quantitative Easing (QE). QE is the process by which the Fed substantially increases the flow of credit in a stuck financial system. It is a non-standard policy measure used during crises or when inflation is extremely low. It was the Fed’s weapon of choice during the Great Financial Crisis in 2008. It involves the Fed printing more Dollars and using them to buy high grade bonds from financial institutions. QE usually weakens the US Dollar.
Quantitative tightening (QT) is the reverse process of QE, whereby the Federal Reserve stops buying bonds from financial institutions and does not reinvest the principal from the bonds it holds maturing, to purchase new bonds. It is usually positive for the value of the US Dollar.
- The Dow Jones fell 300 points or 0.7%, while the S&P 500 shed 60, falling nearly 1.1%.
- US equities are back to their bearish ways as trade war fears continue to weigh.
- The Fed’s latest rate call is in the barrel for Wednesday.
The Dow Jones Industrial Average (DJIA) pulled back around 300 points on Wednesday, snapping a two-day win streak and pushing back into the low side as equities remain unable to find a consistent reason to pivot confidently out of a recent downturn sparked by ongoing geopolitical turmoil pouring out of the White House since Donald Trump took office as President in January.
Both the Dow Jones and the Standard and Poor’s 500 (S&P) are back into the red on Tuesday. The Dow eased back below the 42,000 level, and the S&P 500 continues to toy with the 5,600 handle. Both major equity indexes are testing correction territory, down around 8% from record highs.
The Trump team’s plans for further tariffs slated to come into effect on April 2nd are once again shifting. President Donald Trump has asked his Treasury Secretary Scott Bessent to “rethink” the US sanctions regime. Fresh tariff talk has knocked the latest bull run flat on its back, despite Treasury Secretary Bessent hinting that tariffs may not be as across-the-board as originally envisioned. Given the Trump administration’s general anathema for consistent policy disclosure, this will hardly come as a surprise to markets that have grown accustomed to near-constant waffling, capitulation, and last-minute changes to the majority of team Trump’s trade policy proposals over the past eight weeks.
The Federal Reserve’s (Fed) latest rate call is due on Wednesday. According to the CME’s FedWatch Tool, rate markets broadly anticipate the Fed to stand pat on rates for the next two meetings, with the next quarter-point rate trim expected at the Federal Open Market Committee’s (FOMC) June meeting. However, the FOMC’s latest interest rate forecasts will be released this week. They could send rate cut expectations through the wringer if Fed policymaker’s expectations for interest rates deviate wildly from current market forecasts.
Stocks news
Stock sectors are red across the board on Tuesday as investors struggle to find a place to hide. Despite announcing a partnership to help develop processes to produce a fleet of self-driving cars, Nvidia (NVDA) and General Motors (GM) are both falling back. Nvidia is down 2.5% near $116 per share and GM is down around 1%, testing below $50 per share as it gets more difficult to spark buying interest in investors simply by announcing more AI projects.
Dow Jones price forecast
With a fresh bearish daily candlestick, the Dow Jones is at risk of chalking in a technical rejection from the 200-day Exponential Moving Average (EMA) near the 42,000 major price handle. Buyers are suddenly running out of time to push bids back into the high end.
Dow Jones daily chart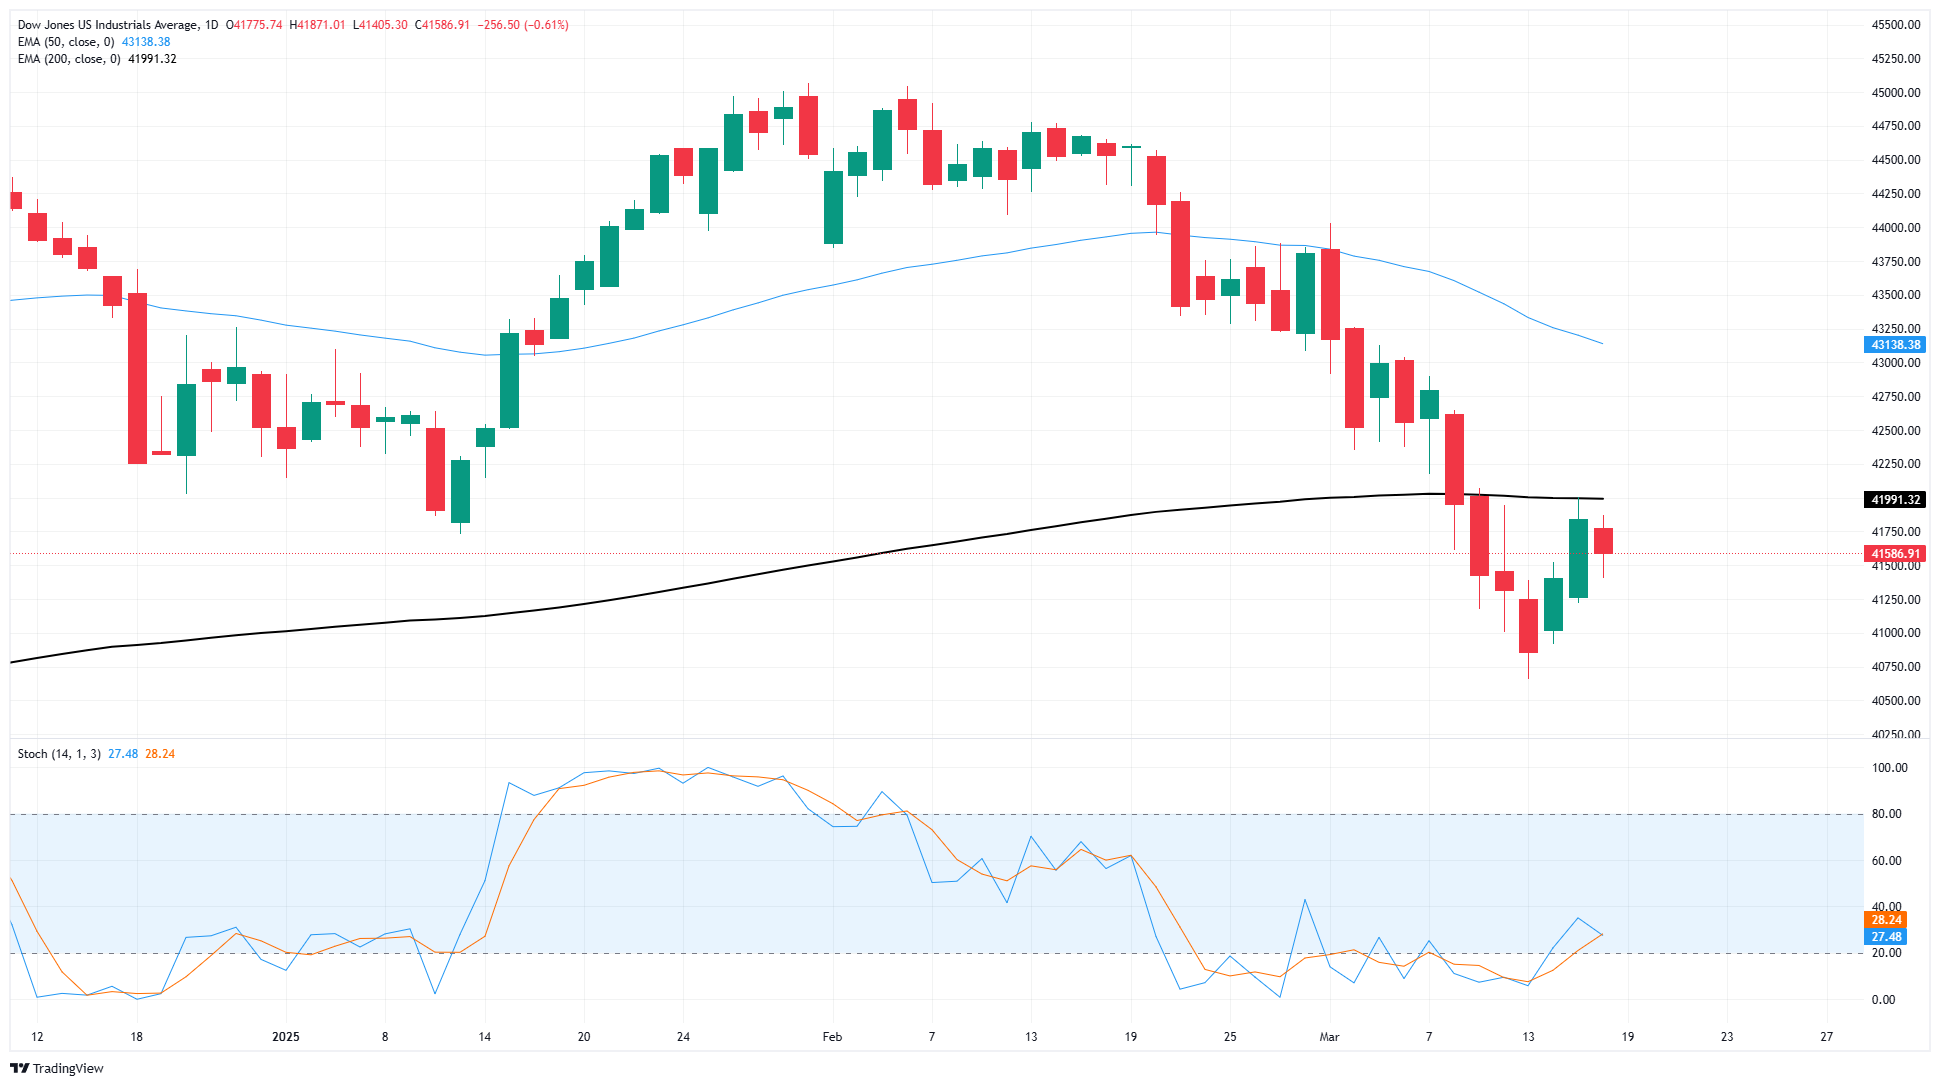
Dow Jones FAQs
The Dow Jones Industrial Average, one of the oldest stock market indices in the world, is compiled of the 30 most traded stocks in the US. The index is price-weighted rather than weighted by capitalization. It is calculated by summing the prices of the constituent stocks and dividing them by a factor, currently 0.152. The index was founded by Charles Dow, who also founded the Wall Street Journal. In later years it has been criticized for not being broadly representative enough because it only tracks 30 conglomerates, unlike broader indices such as the S&P 500.
Many different factors drive the Dow Jones Industrial Average (DJIA). The aggregate performance of the component companies revealed in quarterly company earnings reports is the main one. US and global macroeconomic data also contributes as it impacts on investor sentiment. The level of interest rates, set by the Federal Reserve (Fed), also influences the DJIA as it affects the cost of credit, on which many corporations are heavily reliant. Therefore, inflation can be a major driver as well as other metrics which impact the Fed decisions.
Dow Theory is a method for identifying the primary trend of the stock market developed by Charles Dow. A key step is to compare the direction of the Dow Jones Industrial Average (DJIA) and the Dow Jones Transportation Average (DJTA) and only follow trends where both are moving in the same direction. Volume is a confirmatory criteria. The theory uses elements of peak and trough analysis. Dow’s theory posits three trend phases: accumulation, when smart money starts buying or selling; public participation, when the wider public joins in; and distribution, when the smart money exits.
There are a number of ways to trade the DJIA. One is to use ETFs which allow investors to trade the DJIA as a single security, rather than having to buy shares in all 30 constituent companies. A leading example is the SPDR Dow Jones Industrial Average ETF (DIA). DJIA futures contracts enable traders to speculate on the future value of the index and Options provide the right, but not the obligation, to buy or sell the index at a predetermined price in the future. Mutual funds enable investors to buy a share of a diversified portfolio of DJIA stocks thus providing exposure to the overall index.
- Mexican Peso weakened 0.14% as risk-off sentiment and profit-taking weigh ahead of the Fed’s policy decision.
- US data is mixed, with strong industrial production but weak housing figures, while Trump’s trade rhetoric overshadows economic releases.
- Mexico’s economic slowdown is in focus, with Aggregate Demand and Private Spending data due before Banxico’s March 27 meeting.
The Mexican Peso (MXN) lost some ground against the US Dollar (USD) on Tuesday as traders brace for the United States (US) Federal Reserve (Fed) monetary policy decision on Wednesday. Data from the US was mixed, though it was overshadowed by US President Donald Trump's trade rhetoric. The USD/MXN is trading at 19,94, up by 0.14%.
The market mood turned pessimistic as investors seemed to book profits ahead of the Fed’s meeting. Participants expect the Fed to stay pat while eyeing whether it will adopt a dovish or hawkish tilt on its forecasts in the Summary of Economic Projections (SEP).
Earlier, data from the US revealed that Industrial Production improved, yet housing data was mixed. However, the main driver remains Trump’s policies and geopolitical developments.
In Mexico, the Instituto Nacional de Estadística Geografía e Informatica (INEGI) will feature the release of Aggregate Demand and Private Spending data, each on Wednesday and Thursday. This could show how deep the ongoing slowdown in Mexico’s economy is a week before the Banco de Mexico (Banxico) March 27 monetary policy meeting.
Daily digest market movers: Mexican Peso trims Monday’s gains ahead of Fed’s meeting
- The Organization for Economic Cooperation and Development (OECD) claimed that US President Donald Trump’s tariffs on Mexican products could spur a recession in Mexico.
- The OECD updated its forecasts, which include 25% tariffs applied on most goods from April. The OECD projects that Mexico’s economy will be severely impacted, contracting 1.3% in 2025 and 0.6% next year.
- Last Wednesday, Mexican Finance Minister Edgar Amador Zamora said the national economy is expanding but shows signs of slowing down linked to trade tensions with the US.
- US Industrial Production grew 0.7% MoM in February, surpassing expectations of 0.2% and accelerating from January’s 0.3% increase, driven by strength in motor vehicle production.
- Housing data presented a mixed picture. Building Permits declined 1.2%, falling from 1.473 million to 1.456 million. Housing Starts, however, surged 11.2%, rising from 1.35 million to 1.501 million, signaling stronger construction activity.
- Money market has priced in 61 basis points of easing by the Fed in 2025, which has sent US Treasury yields plunging alongside the American Currency.
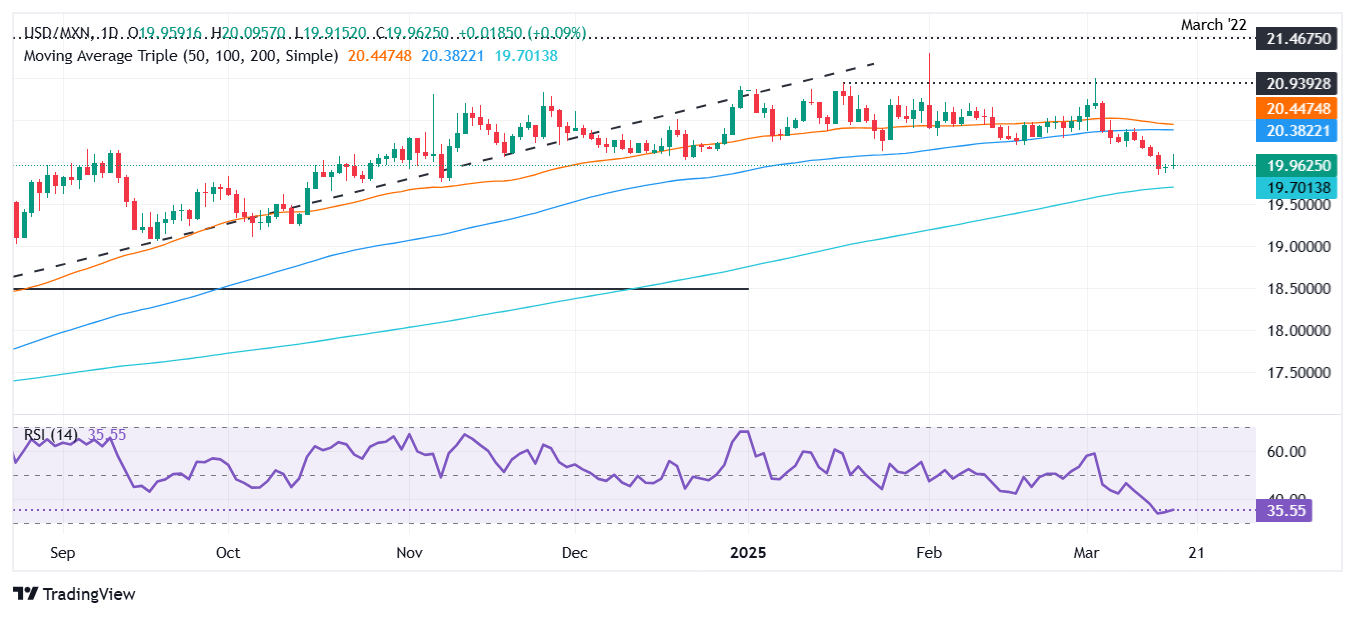
USD/MXN technical outlook: Mexican Peso retreats as USD/MXN climbs above 19.90
USD/MXN registers anemical gains, yet the exotic pair remains below the 20.00 figure, suggesting that further downside is seen. Price action forms a ‘gravestone doji,’ implying that bears are in charge. The Relative Strength Index (RSI) is in bearish territory but hints buyers halted the downtrend near the 19.90 – 20.00 range.
A breach of 19.90 would exacerbate a drop to challenge the 200-day Simple Moving Average (SMA) at 19.65. Once hurdled, the next key support levels would be 19.50, 19.00, and the August 20, 2024 low at 18.64.
Conversely, if USD/MXN rallies past 20.00, this would clear the path to test the 100-day SMA at 20.35.
Mexican Peso FAQs
The Mexican Peso (MXN) is the most traded currency among its Latin American peers. Its value is broadly determined by the performance of the Mexican economy, the country’s central bank’s policy, the amount of foreign investment in the country and even the levels of remittances sent by Mexicans who live abroad, particularly in the United States. Geopolitical trends can also move MXN: for example, the process of nearshoring – or the decision by some firms to relocate manufacturing capacity and supply chains closer to their home countries – is also seen as a catalyst for the Mexican currency as the country is considered a key manufacturing hub in the American continent. Another catalyst for MXN is Oil prices as Mexico is a key exporter of the commodity.
The main objective of Mexico’s central bank, also known as Banxico, is to maintain inflation at low and stable levels (at or close to its target of 3%, the midpoint in a tolerance band of between 2% and 4%). To this end, the bank sets an appropriate level of interest rates. When inflation is too high, Banxico will attempt to tame it by raising interest rates, making it more expensive for households and businesses to borrow money, thus cooling demand and the overall economy. Higher interest rates are generally positive for the Mexican Peso (MXN) as they lead to higher yields, making the country a more attractive place for investors. On the contrary, lower interest rates tend to weaken MXN.
Macroeconomic data releases are key to assess the state of the economy and can have an impact on the Mexican Peso (MXN) valuation. A strong Mexican economy, based on high economic growth, low unemployment and high confidence is good for MXN. Not only does it attract more foreign investment but it may encourage the Bank of Mexico (Banxico) to increase interest rates, particularly if this strength comes together with elevated inflation. However, if economic data is weak, MXN is likely to depreciate.
As an emerging-market currency, the Mexican Peso (MXN) tends to strive during risk-on periods, or when investors perceive that broader market risks are low and thus are eager to engage with investments that carry a higher risk. Conversely, MXN tends to weaken at times of market turbulence or economic uncertainty as investors tend to sell higher-risk assets and flee to the more-stable safe havens.
- EUR/USD was seen stabilizing around the 1.0930 zone after the European session, showing neutral movement.
- Indicators remain in overbought territory, suggesting that the pair may consolidate before choosing a clear direction.
- Support stands around 1.0850 and resistance is near 1.1000, with price action lacking strong directional momentum.
EUR/USD is trading steadily on Tuesday after the European session, hovering around the 1.0930 area without clear direction. Following last week's rally, the pair has struggled to find fresh momentum, with buyers and sellers maintaining a cautious stance.
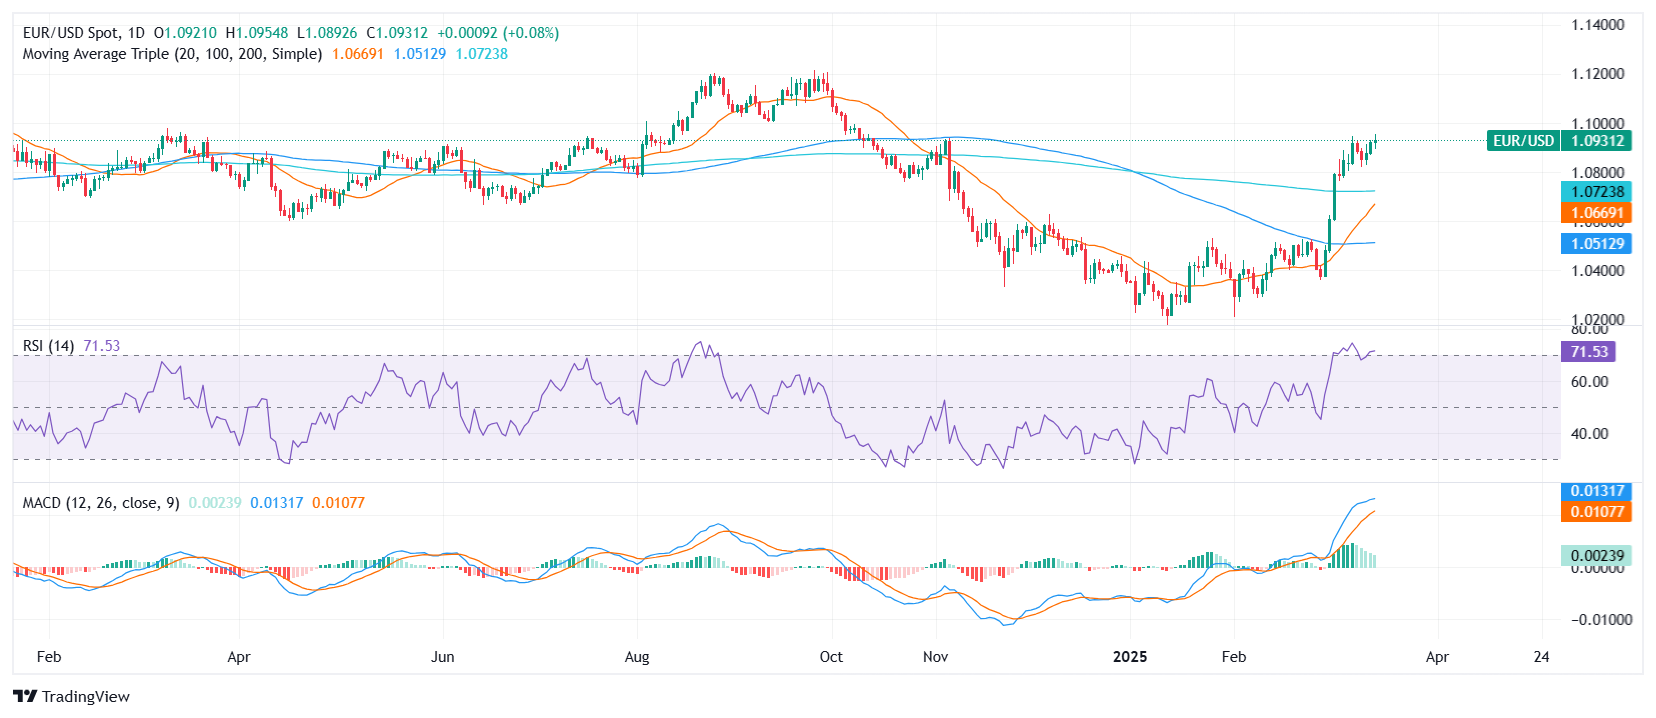
From a technical perspective, the Relative Strength Index (RSI) remains in overbought territory at 73 but is showing signs of flattening, reflecting waning bullish momentum. Meanwhile, the Moving Average Convergence Divergence (MACD) prints flat green bars, signaling a lack of strong trend conviction. These indicators suggest that the pair may enter a consolidation phase before making a decisive move.
Looking ahead, resistance remains at the 1.1000 mark, which has historically acted as a key barrier. On the downside, initial support is located near 1.0850, with stronger footing around the 20-day moving average near 1.0800. A break below these levels could trigger a corrective move, while sustained trading above 1.0900 keeps the broader bullish outlook intact.
EUR/USD daily chart
- GBP/USD slips to 1.2975, down 0.12%, after touching 1.3000, its highest level in four and a half months.
- US Industrial Production was strong but was offset by weaker housing data and Trump’s renewed trade policies.
- BoE and Fed policy decisions loom, with markets pricing in rate cuts later in the year for both central banks.
The Pound Sterling (GBP) is retreating during the North American session against the US Dollar (USD) after hitting a four-and-a-half-month high at 1.3000 before trimming earlier gains. At the time of writing, the GBP/USD trades at 1.2975, down 0.12%.
Pound trims gains as traders brace for central bank decisions
Economic data continues to be overlooked as traders digest United States (US) President Donald Trump's protectionist policies aimed at reducing the trade deficit.
Earlier, US Industrial Production in February expanded 0.7% MoM, exceeding estimates of 0.2% and January’s 0.3% print, boosted by motor vehicles. Housing data was mixed, with Building Permits in February falling 1.2% from 1.473 million to 1.456 million, while Housing Starts for the same period rose 11.2% from 1.35 million to 1.501 million.
Aside from this, risk appetite deteriorates as investors brace for the Federal Reserve (Fed) monetary policy. Most economists expect the Fed to hold rates, though it is unclear whether they will adopt a dovish or hawkish stance on their forecasts in the Summary of Economic Projections (SEP).
Across the pond, the Bank of England (BoE) is also expected to keep the Bank Rate unchanged on Thursday, with market participants pricing in an 89% chance of no change. For the full year, traders expect 54 basis points (bps) of easing.
In the meantime, the Organization for Economic Cooperation and Development (OECD) updated its forecasts for the United Kingdom (UK). The OECD expects the economy to grow 1.4%, down from its December forecast of 1.7%.
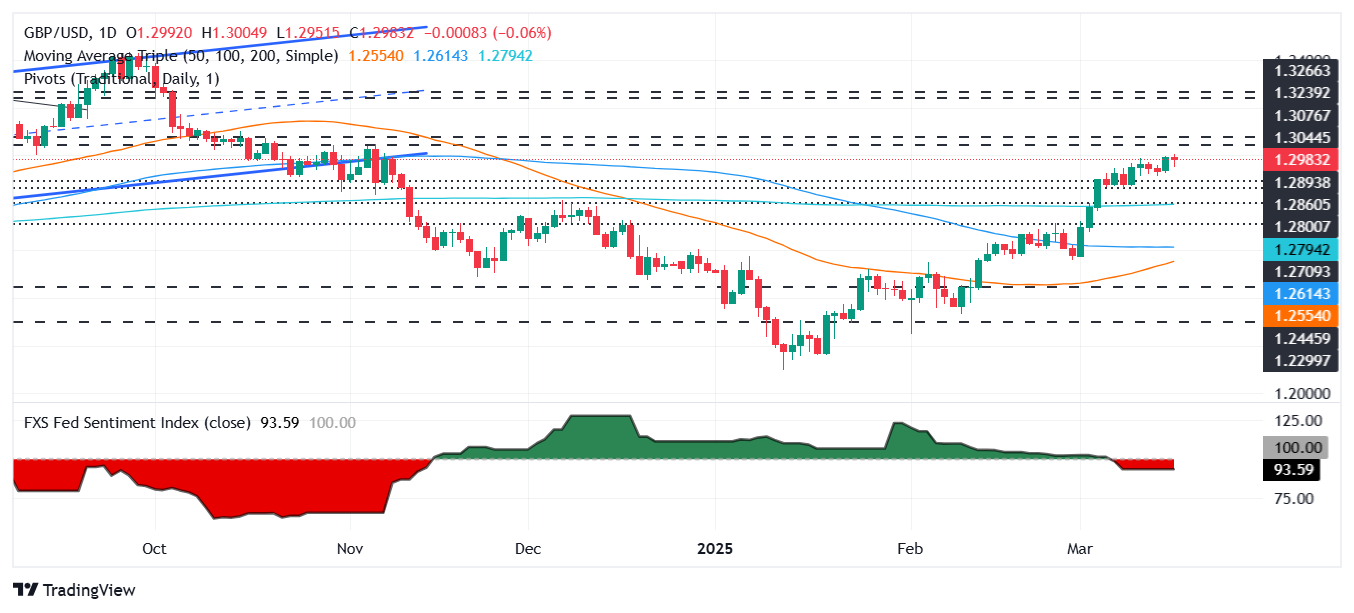
GBP/USD Price Forecast: Technical outlook
GBP/USD remains upward biased trading near the year-to-date (YTD) peaks around 1.3000, though the rally has lost some steam, with the pair consolidating around the 1.2900 – 1.3000 range. The Relative Strength Index (RSI) hovers near overbought territory, an indication that buyers lack the strength to push prices higher. Therefore, a dip is likely, with bulls expected to defend the March 17 low of 1.2911.
Conversely, a decisive breach of the 1.3000 would expose the November 6 swing high at 1.3047.
British Pound PRICE Today
The table below shows the percentage change of British Pound (GBP) against listed major currencies today. British Pound was the strongest against the Australian Dollar.
| USD | EUR | GBP | JPY | CAD | AUD | NZD | CHF | |
|---|---|---|---|---|---|---|---|---|
| USD | -0.04% | 0.08% | 0.22% | 0.15% | 0.45% | 0.17% | -0.32% | |
| EUR | 0.04% | 0.11% | 0.26% | 0.17% | 0.48% | 0.20% | -0.29% | |
| GBP | -0.08% | -0.11% | 0.14% | 0.07% | 0.37% | 0.09% | -0.42% | |
| JPY | -0.22% | -0.26% | -0.14% | -0.08% | 0.22% | -0.08% | -0.57% | |
| CAD | -0.15% | -0.17% | -0.07% | 0.08% | 0.31% | 0.03% | -0.49% | |
| AUD | -0.45% | -0.48% | -0.37% | -0.22% | -0.31% | -0.28% | -0.79% | |
| NZD | -0.17% | -0.20% | -0.09% | 0.08% | -0.03% | 0.28% | -0.51% | |
| CHF | 0.32% | 0.29% | 0.42% | 0.57% | 0.49% | 0.79% | 0.51% |
The heat map shows percentage changes of major currencies against each other. The base currency is picked from the left column, while the quote currency is picked from the top row. For example, if you pick the British Pound from the left column and move along the horizontal line to the US Dollar, the percentage change displayed in the box will represent GBP (base)/USD (quote).
- AUD/USD falls sharply from the three-week high of 0.6390 as the Australian Dollar faces profit booking after a sharp rally on Monday.
- China’s fresh monetary stimulus plan has increased the AUD’s appeal.
- Investors await the Fed’s monetary policy decision, dot plot, and Summary of economic projections on Wednesday.
The AUD/USD pair corrects to near 0.6355 during North American trading hours on Tuesday after posting a fresh three-week high at 0.6390 on Monday. The Aussie pair slumps as the US Dollar (USD) ticks higher, with the US Dollar Index (DXY) attracting bids after revisiting the five-month low of 103.20.
However, the Greenback is expected to trade cautiously as the Federal Reserve (Fed) is scheduled to announce the second interest rate decision of the year on Wednesday. The Fed is almost certain to keep borrowing rates steady in the range of 4.25%-4.50% for the second time in a row.
Market participants will pay close attention to the Fed’s dot plot and Summary of Economic Projections (SEP) to get cues over interest rates, inflation, and the economic outlook. In the December policy meeting, Fed officials collectively guided two interest rate cuts for 2024.
Meanwhile, the Australian Dollar (AUD) performed strongly in the last two trading sessions on renewed optimism over China’s economic outlook. Over the weekend, China announced a comprehensive “special action plan”, which will primarily focus on increasing households’ income to boost domestic consumption. This scenario is favorable for the Australian Dollar, given that the Australian economy relies heavily on exports to China.
On the domestic front, the Reserve Bank of Australia (RBA) is expected to maintain a ‘cautious’ stance on the interest rate policy as US President Donald Trump's tariff war could accelerate inflationary pressures in the Australian economy.
RBA Assistant Governor Sarah Hunter said on Monday that she is focusing on the US policy settings and how they will impact inflation.
US Dollar FAQs
The US Dollar (USD) is the official currency of the United States of America, and the ‘de facto’ currency of a significant number of other countries where it is found in circulation alongside local notes. It is the most heavily traded currency in the world, accounting for over 88% of all global foreign exchange turnover, or an average of $6.6 trillion in transactions per day, according to data from 2022. Following the second world war, the USD took over from the British Pound as the world’s reserve currency. For most of its history, the US Dollar was backed by Gold, until the Bretton Woods Agreement in 1971 when the Gold Standard went away.
The most important single factor impacting on the value of the US Dollar is monetary policy, which is shaped by the Federal Reserve (Fed). The Fed has two mandates: to achieve price stability (control inflation) and foster full employment. Its primary tool to achieve these two goals is by adjusting interest rates. When prices are rising too quickly and inflation is above the Fed’s 2% target, the Fed will raise rates, which helps the USD value. When inflation falls below 2% or the Unemployment Rate is too high, the Fed may lower interest rates, which weighs on the Greenback.
In extreme situations, the Federal Reserve can also print more Dollars and enact quantitative easing (QE). QE is the process by which the Fed substantially increases the flow of credit in a stuck financial system. It is a non-standard policy measure used when credit has dried up because banks will not lend to each other (out of the fear of counterparty default). It is a last resort when simply lowering interest rates is unlikely to achieve the necessary result. It was the Fed’s weapon of choice to combat the credit crunch that occurred during the Great Financial Crisis in 2008. It involves the Fed printing more Dollars and using them to buy US government bonds predominantly from financial institutions. QE usually leads to a weaker US Dollar.
Quantitative tightening (QT) is the reverse process whereby the Federal Reserve stops buying bonds from financial institutions and does not reinvest the principal from the bonds it holds maturing in new purchases. It is usually positive for the US Dollar.
- Industrial Production in the US grew at a faster pace than expected in February.
- US Dollar Index clings to marginal daily gains at around 103.50.
Industrial Production in the US expanded by 0.7% on a monthly basis in February, the Federal Reserve reported on Tuesday. This reading followed the 0.3% increase recorded in January and came in better than the market expectation for a growth of 0.2%.
"Manufacturing output rose 0.9%, boosted by a jump of 8.5% in the index for motor vehicles and parts," the Fed noted in its press release. "Capacity utilization stepped up to 78.2% , a rate that is 1.4 percentage points below its long-run (1972–2024) average."
Market reaction
The US Dollar (USD) Index holds its ground following this report and was last seen rising 0.13% on the day at 103.55.
Pound Sterling (GBP) retains a firm tone versus the USD, reaching the 1.30 level for the first time since November before drifting back slightly, Scotiabank's Chief FX Strategist Shaun Osborne notes.
Solid trend momentum signals across a range of timeframes
"Again, GBP gains reflect the broader trend in the USD, rather than UK specific developments. Markets anticipate marginally less BoE easing risk over the balance of the year (around 50bps) versus the Fed (around 60bps of easing priced in currently) ahead of this week’s policy decisions from both central banks."
"The GBP has made marginal technical progress over the past 24 hours but the move up remains well-supported from a technical point of view (solid trend momentum signals across a range of timeframes) and there is only minor resistance ahead (1.3045/50) of a push on to test the low 1.31 area (retracement resistance at 1.3120). Support is 1.2925."
Germany’s ZEW investor confidence survey had a serious glow up in the wake of the German government’s plans to boost infrastructure and defense spending significantly. The Current Situation index remained soft at –87.6 in March but the expectations component jumped from 26.0 in February to 51.6, Scotiabank's Chief FX Strategist Shaun Osborne notes.
Parliament poised to vote on spending
"Parliament will vote on the fiscal plans today (the upper house will vote at the end of the week) but, following talks last week, approval is all but a foregone conclusion. The plans could inject a serious (3-4%/GDP) amount of stimulus over the next few years. Ukraine peace talks may, at the margin, be helping EUR sentiment."
"EUR/USD is stretching gains to marginal new highs this morning—fractionally above last week’s peak but also fractionally shy of 1.1065 retracement resistance (76.4% Fib of the 1.12/1.01 move lower) on the daily chart. The trend in the EUR looks pretty robust though and gains are backed by solid trend momentum signals on the intraday, daily and weekly studies."
"This suggests price action will be characterized by solid support for the EUR on minor dips (mid/ upper 1.08s) and an ongoing bid. A push through the 1.1065 point leaves little in the way of a rise to 1.12."
Spot moved nicely lower yesterday as the US Dollar (USD) tone stayed soft, the White House stayed relatively quiet in tariffs and stocks picked up a bit more ground, giving high beta FX a broader lift. The USD is now 'only' one standard deviation above FV (1.4119 today), having spent most of last week trading near two standard deviations above equilibrium, Scotiabank's Chief FX Strategist Shaun Osborne notes.
Resistance is at 1.4310 and 1.4350
"Spot’s push under 1.4340/50 support leaves the USD looking prone to more technically-driven weakness. Losses are stabilizing around the 1.43 point, right where long-term trend support off the September USD low sits currently."
" A daily close under 1.43 trend targets a push to 1.4240, the early March low and potentially to the 1.41 area (50% retracement of the USD September/February rally sits at 1.4107). The USD continues to enjoy solid trend momentum on the daily and weekly studies which restrain USD losses for now, however. Resistance is 1.4310 and 1.4350."
The US Dollar (USD) retains a soft undertone though movement in the major currencies is limited overall as the DXY tests last week’s 103.2 low. Asian and European stocks are firmer while US equity futures are a little weaker at writing. Bonds are mostly softer but Treasuries are outperforming marginally, Scotiabank's Chief FX Strategist Shaun Osborne notes.
USD retains a soft undertone ahead of FOMC decision
"It’s gone a little quiet on the tariff front over the past day or so but the incessant din of trade threats does appear to be leaving a mark on USD sentiment, with the perception perhaps that the US is a less attractive or friendly place to do business these days, that the US brand value has been undermined by the US’ posture with friends and allies and the realization that US stocks have become very expensive at a time when yields, returns and prospects are improving in Europe and Japan. The risk of more persistent USD weakness may be rising in the months ahead as capital flows exit the US. "
"Technically, the DXY looks soft and prone to more losses. Key support is the 103.2 point noted above— last week’s low and the potential trigger point for a small double top pattern that has developed in the intraday chart during the past week’s consolidation. A clear push under 103.2 targets a measured move drop to 102.35 but I still rather think this move lower could extend into the 100/102 range in the next few weeks."
In the Global Economic Outlook (GEO) report published on Tuesday, Fitch Ratings said that they have lowered the US economic growth forecast to 1.7% from 2.1% in December's report and cut the 2026 growth projection to 1.5% from 1.7%.
Key takeaways
"We expect world growth to slow to 2.3% this year, well below trend and down from 2.9% in 2024."
"Fiscal easing in China and Germany will cushion the impact of higher US import tariffs, but growth in the eurozone this year will still be a lot weaker than forecast in the December GEO."
"Tariff hikes will result in higher US consumer prices, reduce real wages, and increase companies’ costs, and the surge in policy uncertainty will take a toll on business investment."
"With the tariff shock estimated to add 1pp to US near-term inflation, we believe the Fed will delay further easing until 4Q25."
"We now expect the Fed to cut just once this year, but then expect three more cuts in 2026 as the economy slows and tariff levels stabilise."
Market reaction
The US Dollar Index clings to modest daily gains at around 103.50 following this report.
- USD/CAD struggles below 1.4300 as Canada’s CPI rose at a robust pace in February.
- Canadian CPI rose to 2.6% on year, the highest level seen since June 2024.
- The US Dollar rebounds as investors turn cautious ahead of the Fed’s policy meeting.
The USD/CAD pair struggles to hold the key support of 1.4270 in the North American session on Tuesday. The Loonie pair faces selling pressure after the release of the Canadian Consumer Price Index (CPI) report for February, which showed that price pressures accelerated at a faster-than-expected pace.
In the 12 months to February, the Canadian CPI rose at a faster pace of 2.6%, compared to estimates of 2.1% and the January reading of 1.9%. Month-on-month CPI grew at a robust pace of 1.1%, against expectations of 0.6% and the former reading of 0.1%. Significant acceleration in inflationary pressures indicates the aggressive monetary expansion stance adopted by the Bank of Canada (BoC) in the last few months is finally working.
BoC’s preferred core CPI – which excludes eight volatile items – accelerated at a strong pace to 2.7 on year from 2.1% in January. On a monthly basis, the underlying inflation data rose by 0.7%.
A fresh resurge in Canadian inflationary pressures could lead to a pause in the BoC’s aggressive policy-easing stance for some time. The BoC has reduced borrowing rates from 5% to 2.75% in the last nine months.
Meanwhile, the US Dollar (USD) attracts some bids as investors turn cautious ahead of the Federal Reserve’s (Fed) monetary policy decision on Wednesday. The US Dollar Index (DXY), which tracks the Greenback’s value against six major currencies, rebounds after discovering buying interest near the five-month low of 103.20.
The Fed is expected to leave interest rates unchanged in the range of 4.25%-4.50%. Therefore, market participants will pay close attention to the Fed’s dot plot and Summary of Economic Projections (SEP), which indicates interest rates, inflation, and the economic outlook.
Canadian Dollar FAQs
The key factors driving the Canadian Dollar (CAD) are the level of interest rates set by the Bank of Canada (BoC), the price of Oil, Canada’s largest export, the health of its economy, inflation and the Trade Balance, which is the difference between the value of Canada’s exports versus its imports. Other factors include market sentiment – whether investors are taking on more risky assets (risk-on) or seeking safe-havens (risk-off) – with risk-on being CAD-positive. As its largest trading partner, the health of the US economy is also a key factor influencing the Canadian Dollar.
The Bank of Canada (BoC) has a significant influence on the Canadian Dollar by setting the level of interest rates that banks can lend to one another. This influences the level of interest rates for everyone. The main goal of the BoC is to maintain inflation at 1-3% by adjusting interest rates up or down. Relatively higher interest rates tend to be positive for the CAD. The Bank of Canada can also use quantitative easing and tightening to influence credit conditions, with the former CAD-negative and the latter CAD-positive.
The price of Oil is a key factor impacting the value of the Canadian Dollar. Petroleum is Canada’s biggest export, so Oil price tends to have an immediate impact on the CAD value. Generally, if Oil price rises CAD also goes up, as aggregate demand for the currency increases. The opposite is the case if the price of Oil falls. Higher Oil prices also tend to result in a greater likelihood of a positive Trade Balance, which is also supportive of the CAD.
While inflation had always traditionally been thought of as a negative factor for a currency since it lowers the value of money, the opposite has actually been the case in modern times with the relaxation of cross-border capital controls. Higher inflation tends to lead central banks to put up interest rates which attracts more capital inflows from global investors seeking a lucrative place to keep their money. This increases demand for the local currency, which in Canada’s case is the Canadian Dollar.
Macroeconomic data releases gauge the health of the economy and can have an impact on the Canadian Dollar. Indicators such as GDP, Manufacturing and Services PMIs, employment, and consumer sentiment surveys can all influence the direction of the CAD. A strong economy is good for the Canadian Dollar. Not only does it attract more foreign investment but it may encourage the Bank of Canada to put up interest rates, leading to a stronger currency. If economic data is weak, however, the CAD is likely to fall.
- The US Dollar edges lower again, nearing a five-month low in the US Dollar Index.
- Traders brace for a historic vote in Germany on spending and a Trump-Putin phone call to end war in Ukraine.
- The US Dollar Index sinks to 103.00 and could snap under pressure once headlines emerge.
The US Dollar Index (DXY), which tracks the performance of the US Dollar (USD) against six major currencies, dips lower again and trades pressured around 103.25 at the time of writing on Tuesday, near a five-month low at levels not seen since October. The move comes after several news headlines, increasing geopolitical uncertainty and key events taking place during the day. Any headline could be a catalyst to push the DXY to an even six-month low and below the 103.00 level.
On the geopolitical front, a high-stakes meeting between the United States (US) President Donald Trump and Russian President Vladimir Putin is scheduled this Tuesday, with the two parties set to discuss territory and divide up certain assets. This has raised concerns that Ukraine will be torn up and the European Union (EU) and North Atlantic Treaty Organisation (NATO) will be bolstered to boost even more their defense spending.
Meanwhile, Israel has broken this morning the ceasefire truce with Gaza that started in January by attacking Hamas’ tactical installations and buildings The military move comes after Israel and the US claimed Hamas did not hold its end of the bargain by releasing hostages. This will, in turn, possibly bring more attacks in the Red Sea by Houthi rebels and retaliation from Hamas.
The third big development is in German politics, with a vote on a €45 billion spending package for defense, which would spill over into the whole European industry. If an agreement and backing can be reached with the German Greens Party, a two-thirds majority would be present to get the plan through the Bundestag. Votes are expected to take place at 12:30 GMT.
On the economic data front, some US housing data is due, though the geopolitical headlines will remain the main drivers for this Tuesday.
Daily digest market movers: US data to be overshadowed
- At 12:30 GMT, several data points are set to be released:
- Monthly Building Permits are expected to reach 1.45 million in February, below the 1.473 million in January.
- Housing Starts for February is expected to reach 1.38 million compared to 1.366 million in January.
- The monthly Export Price Index is expected to contract by 0.2% in February, coming from a positive 1.3% in January. The Import Price Index is expected to contract by 0.1% compared to the January positive 0.3%.
- At 13:15 GMT, Industrial Production for February is due. It is expected to increase by 0.2% compared to 0.5% in January.
- Equities are mixed again on Tuesday, with European indices up nearly 1% on chances the German spending budget passes, while US futures are flat on the day.
- The CME Fedwatch Tool sees a 99.0% chance for no interest rate changes in the upcoming Fed meeting on Wednesday. The probability of a rate cut at the May meeting currently stands at 21.5%.
- The US 10-year yield trades around 4.30%, off its near five-month low of 4.10% printed on March 4.
US Dollar Index Technical Analysis: Time for 100.00 call?
The US Dollar Index (DXY) flirts with a breakdown of its recent range between 103.18 and 103.99 on Tuesday as downside pressure builds. With recent US economic data deteriorating and geopolitical events that would benefit the Eurozone, such as the possible approval in Germany to increase spending and the call between Trump and Putin for a ceasefire in Ukraine, another leg lower for the DXY could be a possible outcome.
Should markets consider current developments as ‘sell the rumour, buy the fact’, some surprise upside would initially materialize and see a return to 104.00. If bulls can avoid a technical rejection there, look for a large sprint higher towards the 105.00 round level, with the 200-day Simple Moving Average (SMA) converging at that point and reinforcing this area as a strong resistance. Once broken through that zone, a string of pivotal levels, such as 105.53 and 105.89, will present as caps.
On the downside, the 103.00 round level could be considered a bearish target in case US yields roll off again, with even 101.90 not unthinkable if markets further capitulate on their long-term US Dollar holdings.
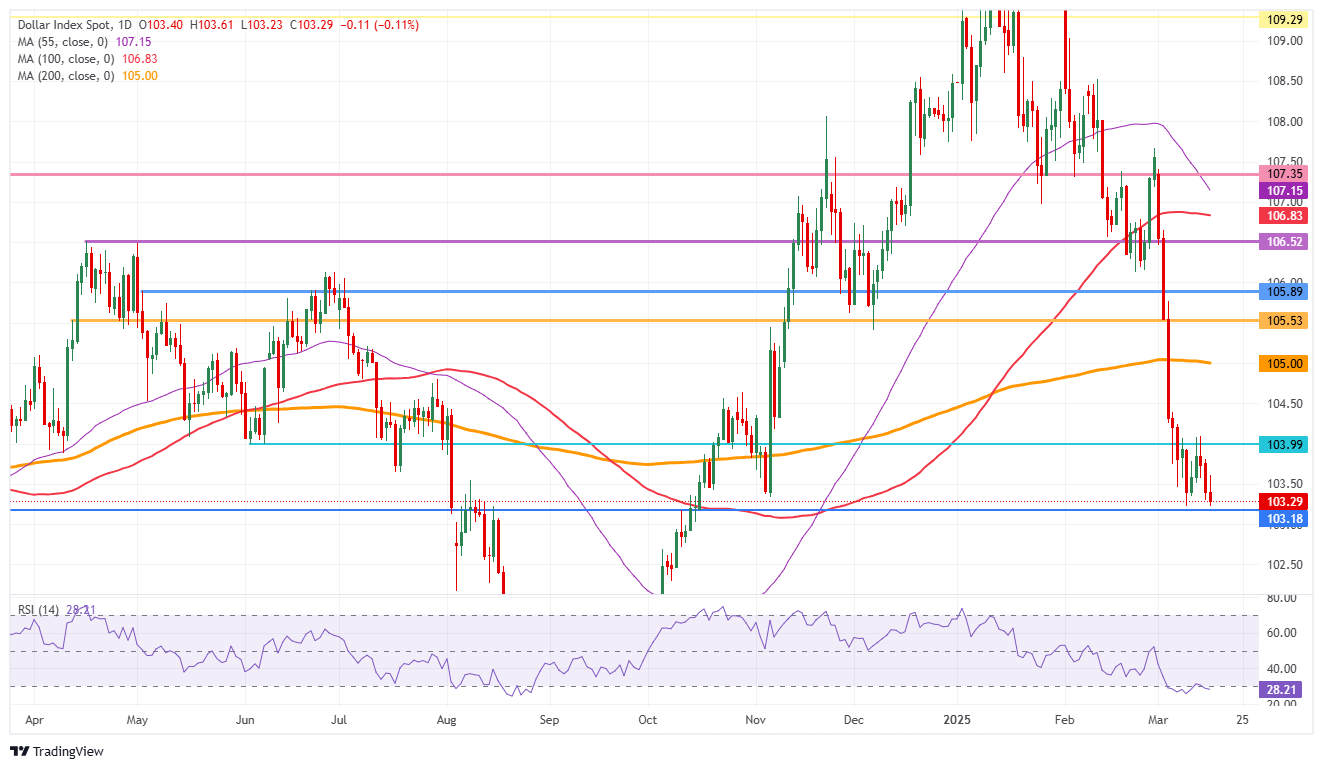
US Dollar Index: Daily Chart
US Dollar FAQs
The US Dollar (USD) is the official currency of the United States of America, and the ‘de facto’ currency of a significant number of other countries where it is found in circulation alongside local notes. It is the most heavily traded currency in the world, accounting for over 88% of all global foreign exchange turnover, or an average of $6.6 trillion in transactions per day, according to data from 2022. Following the second world war, the USD took over from the British Pound as the world’s reserve currency. For most of its history, the US Dollar was backed by Gold, until the Bretton Woods Agreement in 1971 when the Gold Standard went away.
The most important single factor impacting on the value of the US Dollar is monetary policy, which is shaped by the Federal Reserve (Fed). The Fed has two mandates: to achieve price stability (control inflation) and foster full employment. Its primary tool to achieve these two goals is by adjusting interest rates. When prices are rising too quickly and inflation is above the Fed’s 2% target, the Fed will raise rates, which helps the USD value. When inflation falls below 2% or the Unemployment Rate is too high, the Fed may lower interest rates, which weighs on the Greenback.
In extreme situations, the Federal Reserve can also print more Dollars and enact quantitative easing (QE). QE is the process by which the Fed substantially increases the flow of credit in a stuck financial system. It is a non-standard policy measure used when credit has dried up because banks will not lend to each other (out of the fear of counterparty default). It is a last resort when simply lowering interest rates is unlikely to achieve the necessary result. It was the Fed’s weapon of choice to combat the credit crunch that occurred during the Great Financial Crisis in 2008. It involves the Fed printing more Dollars and using them to buy US government bonds predominantly from financial institutions. QE usually leads to a weaker US Dollar.
Quantitative tightening (QT) is the reverse process whereby the Federal Reserve stops buying bonds from financial institutions and does not reinvest the principal from the bonds it holds maturing in new purchases. It is usually positive for the US Dollar.
- NZD/USD holds onto gains near 0.5820 amid strength in the New Zealand Dollar.
- China’s monetary stimulus package has uplifted the NZD’s appeal.
- The Fed is almost certain to leave interest rates in their current range on Wednesday.
The NZD/USD pair holds significant Monday’s gains near 0.5820 in European trading hours on Tuesday. The Kiwi pair exhibits strength as the appeal of the New Zealand Dollar (NZD) has strengthened after China announced fresh monetary stimulus to boost consumption to uplift economic growth.
On Sunday, the Chinese ministry announced a comprehensive “special action plan” to ramp up economic growth. The ministry reported that the plan focuses on increasing residents’ incomes, reducing financial burdens, and enhancing the consumption environment, Reuters report.
Signs of acceleration in China’s economic growth bodes well for the New Zealand Dollar, knowing that the New Zealand (NZ) economy depends heavily on exports to China.
Meanwhile, the US Dollar (USD) drops to near the five-month low ahead of the Federal Reserve’s (Fed) interest rate decision on Wednesday. The Fed is widely anticipated to keep interest rates steady in the range of 4.25%-4.50% as officials have been guiding that monetary policy adjustments are unfavorable amid uncertainty over the United States (US) economic outlook under the leadership of President Donald Trump.
NZD/USD breaks strongly above the key resistance of 0.5800 plotted from the January 24 high. The asset holds above the 20-day Exponential Moving Average (EMA) near 0.5720, suggesting that the near-term trend is bullish.
The 14-day Relative Strength Index (RSI) breaks above 60.00. A fresh bullish momentum would trigger if the RSI holds above that level.
More upside would appear if the asset breaks the 38.2% Fibonacci retracement of 0.5850 plotted from the September 30 high to February 3 low towards the round-level resistance of 0.5900 and the November 29 high of 0.5930.
On the flip side, The Kiwi pair could decline to near round-level supports of 0.5400 and 0.5300 if it breaks below the 13-year low of 0.5470.
NZD/USD daily chart
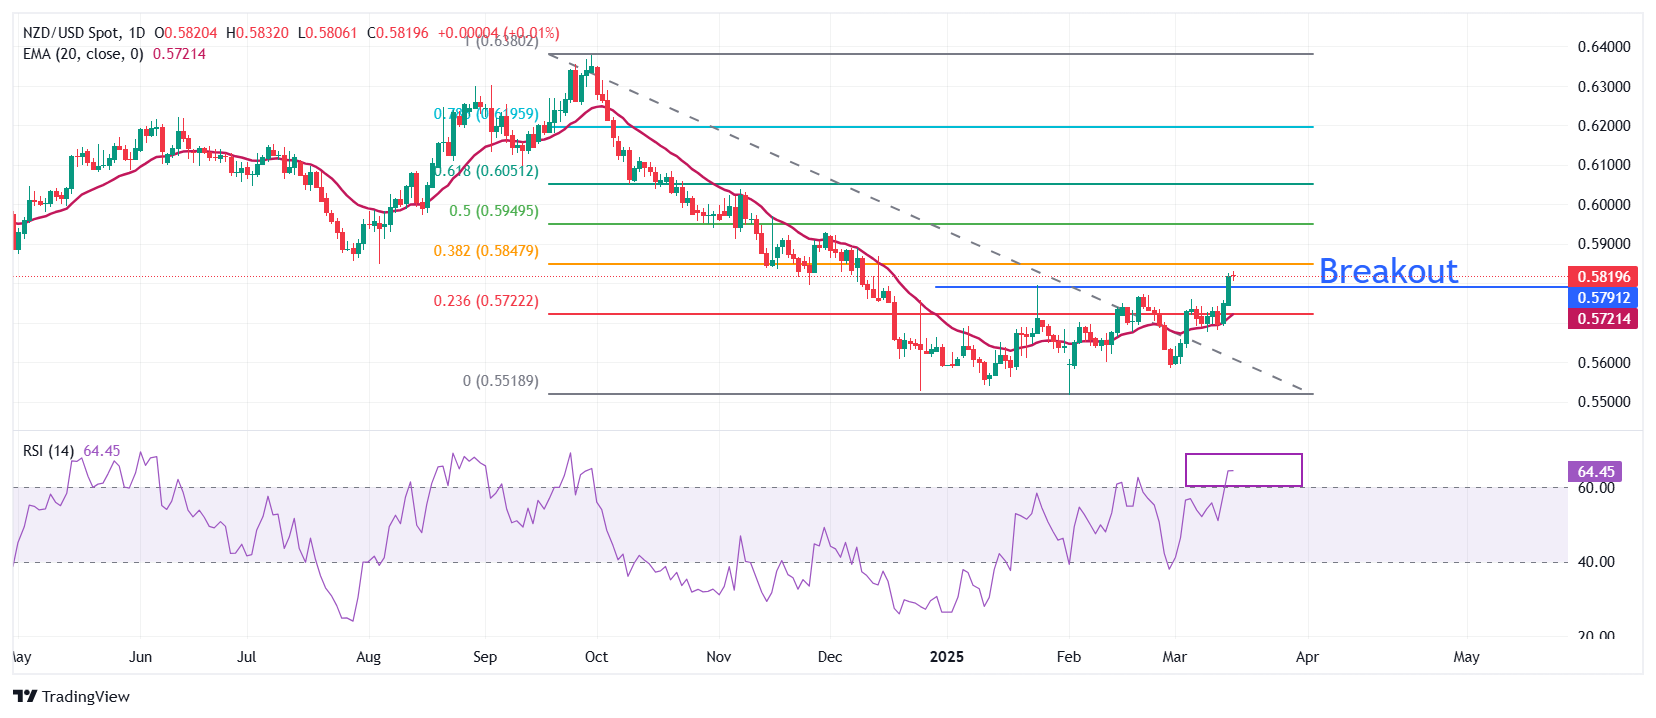
New Zealand Dollar FAQs
The New Zealand Dollar (NZD), also known as the Kiwi, is a well-known traded currency among investors. Its value is broadly determined by the health of the New Zealand economy and the country’s central bank policy. Still, there are some unique particularities that also can make NZD move. The performance of the Chinese economy tends to move the Kiwi because China is New Zealand’s biggest trading partner. Bad news for the Chinese economy likely means less New Zealand exports to the country, hitting the economy and thus its currency. Another factor moving NZD is dairy prices as the dairy industry is New Zealand’s main export. High dairy prices boost export income, contributing positively to the economy and thus to the NZD.
The Reserve Bank of New Zealand (RBNZ) aims to achieve and maintain an inflation rate between 1% and 3% over the medium term, with a focus to keep it near the 2% mid-point. To this end, the bank sets an appropriate level of interest rates. When inflation is too high, the RBNZ will increase interest rates to cool the economy, but the move will also make bond yields higher, increasing investors’ appeal to invest in the country and thus boosting NZD. On the contrary, lower interest rates tend to weaken NZD. The so-called rate differential, or how rates in New Zealand are or are expected to be compared to the ones set by the US Federal Reserve, can also play a key role in moving the NZD/USD pair.
Macroeconomic data releases in New Zealand are key to assess the state of the economy and can impact the New Zealand Dollar’s (NZD) valuation. A strong economy, based on high economic growth, low unemployment and high confidence is good for NZD. High economic growth attracts foreign investment and may encourage the Reserve Bank of New Zealand to increase interest rates, if this economic strength comes together with elevated inflation. Conversely, if economic data is weak, NZD is likely to depreciate.
The New Zealand Dollar (NZD) tends to strengthen during risk-on periods, or when investors perceive that broader market risks are low and are optimistic about growth. This tends to lead to a more favorable outlook for commodities and so-called ‘commodity currencies’ such as the Kiwi. Conversely, NZD tends to weaken at times of market turbulence or economic uncertainty as investors tend to sell higher-risk assets and flee to the more-stable safe havens.
Today is expected to mark an extraordinary day for Germany. The Bundestag looks set to pass a constitutional amendment that will allow it to ease borrowing restrictions under its debt brake. This should allow for greater spending on defence in addition to setting the stage for a EUR500 bln debt-financed infrastructure fund and allowing the German states to run modest budget deficits, Rabobank's FX analyst Jane Foley notes.
BoE may be able to cut three more times this year in total
"The news, however, is likely already in the price. Since March 4, the EUR has outperformed its G10 peers with the exception of the NOK and the SEK while the DAX is up over 17% in the year to date. In the UK, budget news is also expected today, although this will be of the belt-tightening variety."
"The UK news may help EUR/GBP hold close to current levels and below the March high around 0.8495. However, hopes for a better growth outlook in the Eurozone have altered the dynamic for EUR/GBP. Our year end forecast of EUR/GBP0.83 assumes that UK growth can recover during the course of the year and most recent UK GDP indications have not been encouraging."
"In Rabobank’s view, the BoE may be able to cut three more times this year in total. Unless this is matched by a better growth outlook our expectation of a modest move lower in EUR/GBP this year could be difficult to achieve."
The big event for CHF this week is the SNB meeting on Thursday, Danske Bank's FX analyst Jens Nærvig Pedersen reports.
SNB to cut the interest rate by 25bp cut to 0.25%
"We expect a 25bp cut to 0.25%. This is in line with consensus and markets price in around 20bp for the meeting. We believe it is a close decision amplified by the recent weakening of the CHF and the limited space left for easing."
"Ultimately, we believe that the very muted inflationary pressure with headline currently around 0.3% y/y will leave the SNB opting for a cut. We continue to be bullish on CHF an expect the recent weakening to prove temporary."
US Dollar (USD) is expected to trade between 7.2200 and 7.2430 vs Chinese Yuan (CNH). In the longer run, current price movements are likely part of a 7.2100/7.2800 consolidation range, UOB Group's FX analysts Quek Ser Leang and Peter Chia note.
Current price movements are likely part of a consolidation range
24-HOUR VIEW: "Yesterday, we noted 'a slight increase in downward momentum,' and we expected USD to 'edge lower.' However, we pointed out, 'the major support at 7.2100 is unlikely to come under threat (there is another support level at 7.2200).' USD declined less than expected, reaching a low of 7.2253. There has been no further increase downward momentum. Today, we expect USD to trade between 7.2200 and 7.2430."
1-3 WEEKS VIEW: "We highlighted last Friday (14 Mar, spot at 7.2490) that 'the current price movements are likely part of a 7.2100/7.2800 consolidation range.' We continue to hold the same view."
Amid risk-on sentiment yesterday USD/JPY traded above 149 yesterday, Danske Bank's FX analyst Jens Nærvig Pedersen reports.
BoJ seems to be ready to hike rates again
"Early Wednesday, the BoJ is widely expected to keep rates unchanged. Reflation momentum remains intact in Japan after big corporates decided to meet their unions' quite high wage in demands last week. The spring will show to what extent, this spills over to smaller businesses, which will be key to further rate hike potential."
"We expect the BoJ will be ready to hike rates again in July and believe the FOMC meeting on Wednesday to be a bigger deal for yen crosses than the BoJ. We still favour short USD/JPY on a strategic horizon."
European Central Bank (ECB) policymaker Olli Rehn said on Tuesday that the central bank “can either cut or pause in April, depending on data.”
Additional quotes
The effect of increased defence spending would only likely be over the medium term.
Some of the downside risks defined in March will likely materialize.
Must not limit us to taking decisions only when we have fresh projections.
Undershooting target possible but not the main scenario now.
Market reaction
At the press time, EUR/USD gains 0.25% on the day to trade near 1.0950.
- Silver price rises sharply to near $34.00 as its appeal increases amid global economic uncertainty.
- The Fed is expected to leave interest rates steady on Wednesday.
- US President Trump is scheduled to speak with Russian leader Putin on a temporary ceasefire with Ukraine.
Silver price (XAG/USD) posts a fresh four-month high near $34.10 in European trading hours on Tuesday. The white metal strengthens as the US Dollar (USD) declines amid deepening uncertainty over the United States (US) economic outlook under the leadership of President Donald Trump.
The US Dollar Index (DXY), which tracks the Greenback’s value against six major currencies, slides to near the five-month low of 103.20.
US officials, including Donald Trump, have not ruled out an economic recession amid the implementation of new economic policies, especially tariffs. Market participants expect Trump’s tariff agenda could accelerate inflationary pressures and slow down economic growth globally. Historically, demand for non-yielding assets, such as Silver, increases amid heightened global economic woes and inflation.
Meanwhile, investors await US-Russia talks on a 30-day ceasefire plan on Tuesday. Last week, Ukraine agreed to a 30-day ceasefire plan after discussions with US officials in Saudi Arabia. On Monday, the European Union (EU) Foreign policy chief Kaja Kallas said the conditions demanded by Russia to agree to a ceasefire showed Moscow does not really want peace, Reuters report.
Signs of de-escalation in the Russia-Ukraine war would diminish the appeal of safe-haven assets. On the contrary, an absence of a positive outcome is unlikely to increase the strength of safe-haven bets as they already hold the risk premium of the three-year war in Ukraine.
Going forward, investors will pay close attention to the Federal Reserve’s (Fed) interest rate decision on Wednesday. The Fed is almost certain to keep interest rates steady in the range of 4.25%-4.50%. Investors will pay close attention to the Fed’s dot plot to know where officials see Federal Fund Rates heading in the near and long term.
Silver technical analysis
Silver price advances toward the flat border of the Ascending Triangle chart pattern formation on the daily timeframe near the October 22 high of $34.87. The upward-sloping border of the above-mentioned chart pattern is placed from the August 8 low of $26.45. Technically, the Ascending Triangle pattern indicates indecisiveness among market participants.
Advancing 20-day Exponential Moving Average (EMA) near $32.77 indicates a strong uptrend.
The 14-day Relative Strength Index (RSI) holds above 60.00, suggesting a strong bullish momentum.
Looking down, the March 6 high of $32.77 will act as key support for the Silver price. While, the October 22 high of $34.87 will be the major barrier.
Silver daily chart
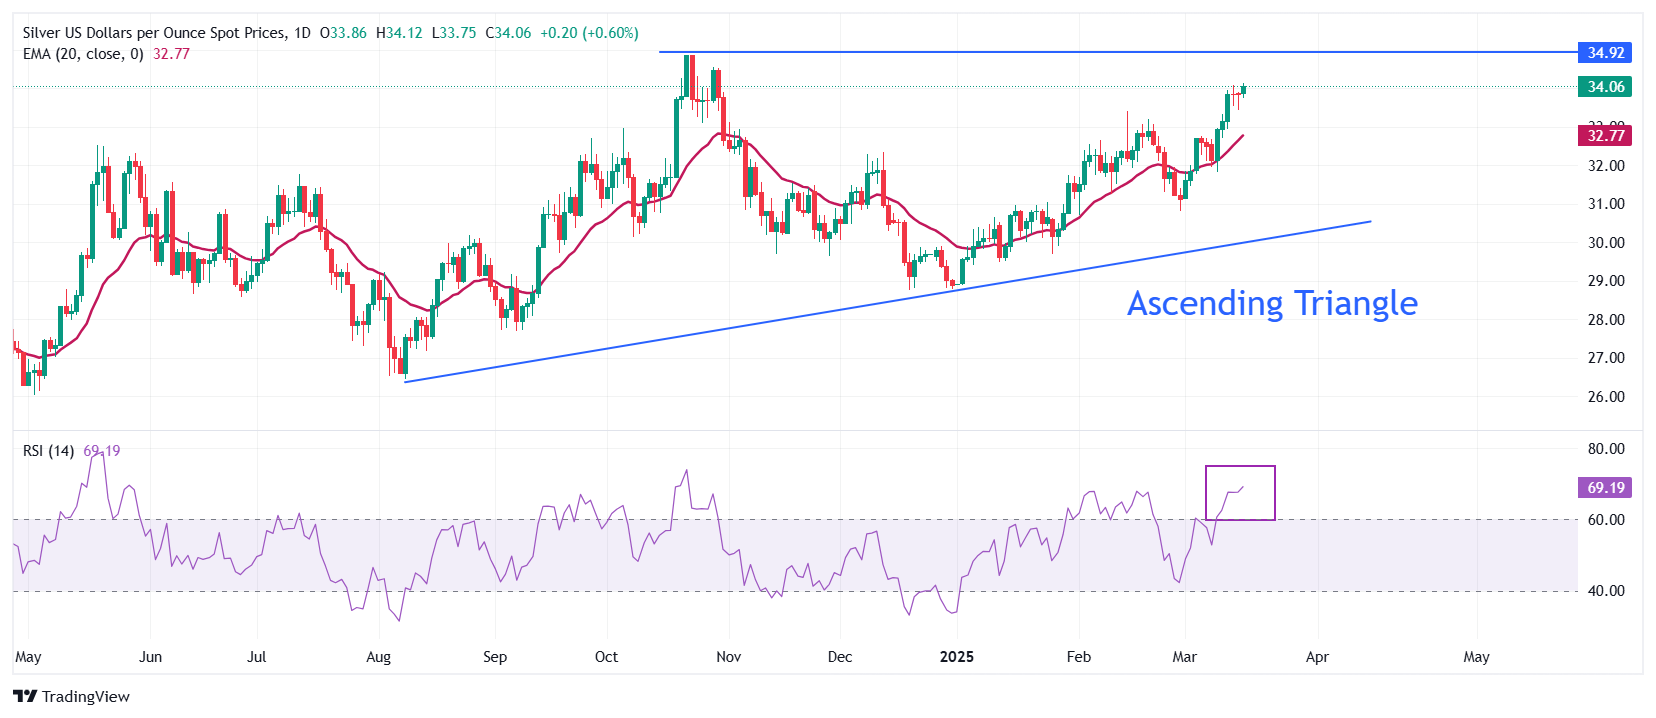
Silver FAQs
Silver is a precious metal highly traded among investors. It has been historically used as a store of value and a medium of exchange. Although less popular than Gold, traders may turn to Silver to diversify their investment portfolio, for its intrinsic value or as a potential hedge during high-inflation periods. Investors can buy physical Silver, in coins or in bars, or trade it through vehicles such as Exchange Traded Funds, which track its price on international markets.
Silver prices can move due to a wide range of factors. Geopolitical instability or fears of a deep recession can make Silver price escalate due to its safe-haven status, although to a lesser extent than Gold's. As a yieldless asset, Silver tends to rise with lower interest rates. Its moves also depend on how the US Dollar (USD) behaves as the asset is priced in dollars (XAG/USD). A strong Dollar tends to keep the price of Silver at bay, whereas a weaker Dollar is likely to propel prices up. Other factors such as investment demand, mining supply – Silver is much more abundant than Gold – and recycling rates can also affect prices.
Silver is widely used in industry, particularly in sectors such as electronics or solar energy, as it has one of the highest electric conductivity of all metals – more than Copper and Gold. A surge in demand can increase prices, while a decline tends to lower them. Dynamics in the US, Chinese and Indian economies can also contribute to price swings: for the US and particularly China, their big industrial sectors use Silver in various processes; in India, consumers’ demand for the precious metal for jewellery also plays a key role in setting prices.
Silver prices tend to follow Gold's moves. When Gold prices rise, Silver typically follows suit, as their status as safe-haven assets is similar. The Gold/Silver ratio, which shows the number of ounces of Silver needed to equal the value of one ounce of Gold, may help to determine the relative valuation between both metals. Some investors may consider a high ratio as an indicator that Silver is undervalued, or Gold is overvalued. On the contrary, a low ratio might suggest that Gold is undervalued relative to Silver.
- Germany’s ZEW Economic Sentiment Index jumped to 51.6 in March.
- EUR/USD holds gains near 1.0950 after German and Eurozone ZEW surveys.
The headline German ZEW Economic Sentiment Index jumped to 51.6 in March from 26 in February, beating the market forecast of 48.1 by a wide margin.
The Current Situation Index improved to -87.6 in the same period, compared with February’s -88.5. Data missed the estimated -80.5 figure.
The Eurozone ZEW Economic Sentiment Index came in at 39.8 in March versus 24.2 in February. Markets expected a 39.6 reading.
Key points
Economic expectations are improving considerably again in march, with a strongly increasing ZEW indicator of economic sentiment.
The brighter mood is likely due to positive signals regarding the future german fiscal policy.
Prospects for metal and steel manufacturers as well as the mechanical engineering sector have improved.
The sixth consecutive interest rate cut by the ECB means favourable financing conditions.
Market reaction
The EUR/USD pair remains well bid after the mixed German and Eurozone ZEW surveys. The pair is adding 0.25% on the day to trade near 1.0950, as of writing.
- Gold advances and sets forth a fresh all-time high.
- Traders add to their positions in the precious metal after Israeli strikes on Gaza end the ceasefire deal.
- Gold has room to stretch higher with a German vote on spending and the Trump-Putin phone call up ahead.
Gold’s price (XAU/USD) pops higher again and reaches a fresh all-time high currently at $3,028 on Tuesday. The precious metal trades around $3,025 at the time of writing. The rise comes after Israel executed military operations on possible Hamas tactical positions and buildings. The move is seen as the end of the ceasefire deal, which started in January and is likely to bring more Red Sea attacks by Houthi rebels and retaliation by Hamas as a counter-response to the recent intervention by Israel.
The ceasefire failure comes just hours before United States (US) President Donald Trump has a phone call with Russian President Vladimir Putin to reach a final deal to end the war in Ukraine. Concerns are plentiful after Trump said on Sunday that Russia and the US are dividing assets amongst themselves, which would mean that Ukraine has no word in the process while Trump bypasses NATO and the EU. Meanwhile, the German parliament, the Bundestag, will vote this Tuesday on a new budget that could boost defense spending by roughly $49 billion, Bloomberg reports.
Daily digest market movers: Safe bets
- Several analysts are pointing out that sluggish US data is another driver that benefits Gold. The influx of buyers on this commodity on Monday after rather sluggish US Retail Sales numbers shows that as the economic sentiment in the US turns, Gold is benefiting from traders looking for safe-haven assets, Bloomberg reports.
- With the upcoming Federal Reserve (Fed) meeting on Wednesday, the odds to keep interest rates at the current range are at 99%. Meanwhile, rate cut odds for next June’s meeting are at 68.6%, according to the CME Fedwatch tool.
- The global Silver market is under stress as trade-war concerns unsettle investors, with key indicators flashing red, millions of ounces on the move between trading hubs, and months of disruption in prospect. A surge in rates to borrow the precious metal has become the latest sign of alarm, according to Yahoo Finance.
Technical Analysis: All stars align
Gold traders have several reasons and arguments for one would push Gold higher. As several banks start to call $3,200, it sets a clear target for the coming weeks and months. However, traders will need to keep in mind that once markets are positioned in one single direction, that is the moment when the turnaround could occur.
The daily resistance levels R1 and R2 have already been taken out on Tuesday. That means the big figures are being used as guidance from here on out. Look for $3,020 and $3,030 as the following anchor points in the intraday trading.
On the downside, the intraday R1 and R2 resistances should be acting as support now. So that means $3,014 and $3,007 should support any brief pullbacks. The intraday Pivot Point at $2,994 is the first line of defense in case the $3,000 level cracks under selling pressure.
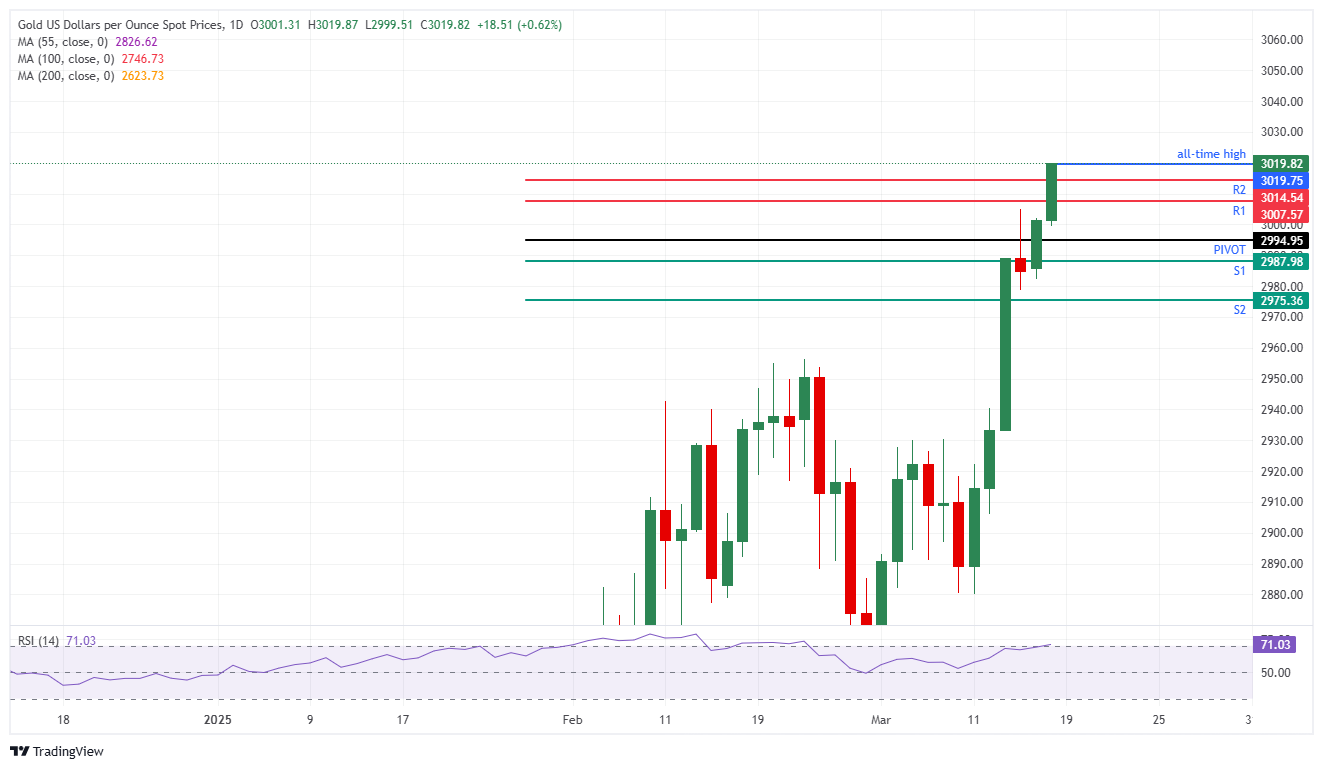
XAU/USD: Daily Chart
Gold FAQs
Gold has played a key role in human’s history as it has been widely used as a store of value and medium of exchange. Currently, apart from its shine and usage for jewelry, the precious metal is widely seen as a safe-haven asset, meaning that it is considered a good investment during turbulent times. Gold is also widely seen as a hedge against inflation and against depreciating currencies as it doesn’t rely on any specific issuer or government.
Central banks are the biggest Gold holders. In their aim to support their currencies in turbulent times, central banks tend to diversify their reserves and buy Gold to improve the perceived strength of the economy and the currency. High Gold reserves can be a source of trust for a country’s solvency. Central banks added 1,136 tonnes of Gold worth around $70 billion to their reserves in 2022, according to data from the World Gold Council. This is the highest yearly purchase since records began. Central banks from emerging economies such as China, India and Turkey are quickly increasing their Gold reserves.
Gold has an inverse correlation with the US Dollar and US Treasuries, which are both major reserve and safe-haven assets. When the Dollar depreciates, Gold tends to rise, enabling investors and central banks to diversify their assets in turbulent times. Gold is also inversely correlated with risk assets. A rally in the stock market tends to weaken Gold price, while sell-offs in riskier markets tend to favor the precious metal.
The price can move due to a wide range of factors. Geopolitical instability or fears of a deep recession can quickly make Gold price escalate due to its safe-haven status. As a yield-less asset, Gold tends to rise with lower interest rates, while higher cost of money usually weighs down on the yellow metal. Still, most moves depend on how the US Dollar (USD) behaves as the asset is priced in dollars (XAU/USD). A strong Dollar tends to keep the price of Gold controlled, whereas a weaker Dollar is likely to push Gold prices up.
US Dollar (USD) is expected to rise vs Japanese Yen (JPY), but the major resistance at 150.30 is likely out of reach for now. In the longer run, increase in momentum indicates USD could strengthen toward 150.30, UOB Group's FX analysts Quek Ser Leang and Peter Chia note.
Increase in momentum indicates USD can strengthen
24-HOUR VIEW: "Yesterday, we expected USD to 'trade in a range between 147.80 and 149.20.' USD then traded in a narrower range of 148.38/149.28, closing on a firm note at 149.21 (+0.40%). The price movements have resulted in an increase in momentum, and we expect USD to rise today. However, the major resistance at 150.30 is likely out of reach for now (there is another resistance level at 149.70). Support levels are at 149.00 and 148.70."
1-3 WEEKS VIEW: "Our most recent narrative was from last Wednesday (12 Mar, spot at 148.00), wherein 'downward momentum has largely faded,” and USD “is likely to trade in a range between 146.50 and 149.50.' Yesterday (Monday), USD rose to 149.28, and while it has not broken above 149.50, the increase in upward momentum indicates that it could strengthen toward 150.30. The upward momentum will remain intact as long as USD holds above 148.30."
EUR/USD was supported by risk-sentiment during yesterdays' session rising back above the 1.09 mark with US retail sales not sending any firm signals, Danske Bank's FX analyst Jens Nærvig Pedersen reports.
USD can rebound very quickly on EU concerns
"Today, focus turns to the important vote in the German Bundestag where a 2/3 majority is needed to pass a range of fiscal measures including a reform of the constitutional enshrined debt brake. While not our base case, failing to secure the necessary 2/3 majority would trigger a broad EUR-weakening."
"More broadly, we expect EUR/USD to consolidate around current levels in the near term, with risks still skewed to the upside. However, we increasingly believe US pessimism is overstretched. The key risk to further EUR/USD upside is that if upcoming data fails to validate market concerns about the US economy, the USD could rebound quickly."
Copper rose to a near-five-month high at the start of the week after China unveiled a special action plan to revive consumption, boosting sentiment in the commodities complex, ING's commodity experts Ewa Manthey and Warren Patterson note.
The property sector is yet to bottom
"The policy package includes efforts to increase household income, spur spending, and support population growth. Fresh data was also released for the first two months of the year showing Chinese consumption, investment, and industrial production exceeded estimates."
"Still, the property sector is yet to bottom. China's new home prices and existing home prices continued to slide month-on-month. China’s property market remains the biggest drag on demand for copper and other industrial metals. A further boost for China’s property sector will be crucial in supporting demand long-term."
"Copper is up around 12% so far this year, driven mostly by uncertainty over Trump’s trade policies. Tariff news is likely to continue to dictate price direction in the months ahead."
USD/CAD faced strong resistance near 1.4800 last month and has recently carved out a lower high at 1.4550, Société Générale's FX analysts note.
Below 1.4240, USD/CAD can fall towards 1.4150 and 1.4030
"Daily MACD is within positive territory but has dipped below its trigger line highlighting receding upward momentum. A short-term pullback is taking shape. Low achieved earlier this month at 1.4240 is first layer of support. Break below this can lead to extended down move towards 1.4150 and projections at 1.4030. Resistance at 1.4550 must be overcome to confirm further uptrend."
West Texas Intermediate (WTI) Oil price advances on Tuesday, early in the European session. WTI trades at $68.22 per barrel, up from Monday’s close at $67.26.
Brent Oil Exchange Rate (Brent crude) is also up, advancing from the $70.66 price posted on Monday, and trading at $71.59.
WTI Oil FAQs
WTI Oil is a type of Crude Oil sold on international markets. The WTI stands for West Texas Intermediate, one of three major types including Brent and Dubai Crude. WTI is also referred to as “light” and “sweet” because of its relatively low gravity and sulfur content respectively. It is considered a high quality Oil that is easily refined. It is sourced in the United States and distributed via the Cushing hub, which is considered “The Pipeline Crossroads of the World”. It is a benchmark for the Oil market and WTI price is frequently quoted in the media.
Like all assets, supply and demand are the key drivers of WTI Oil price. As such, global growth can be a driver of increased demand and vice versa for weak global growth. Political instability, wars, and sanctions can disrupt supply and impact prices. The decisions of OPEC, a group of major Oil-producing countries, is another key driver of price. The value of the US Dollar influences the price of WTI Crude Oil, since Oil is predominantly traded in US Dollars, thus a weaker US Dollar can make Oil more affordable and vice versa.
The weekly Oil inventory reports published by the American Petroleum Institute (API) and the Energy Information Agency (EIA) impact the price of WTI Oil. Changes in inventories reflect fluctuating supply and demand. If the data shows a drop in inventories it can indicate increased demand, pushing up Oil price. Higher inventories can reflect increased supply, pushing down prices. API’s report is published every Tuesday and EIA’s the day after. Their results are usually similar, falling within 1% of each other 75% of the time. The EIA data is considered more reliable, since it is a government agency.
OPEC (Organization of the Petroleum Exporting Countries) is a group of 12 Oil-producing nations who collectively decide production quotas for member countries at twice-yearly meetings. Their decisions often impact WTI Oil prices. When OPEC decides to lower quotas, it can tighten supply, pushing up Oil prices. When OPEC increases production, it has the opposite effect. OPEC+ refers to an expanded group that includes ten extra non-OPEC members, the most notable of which is Russia.
Disclaimer: West Texas Intermediate (WTI) and Brent oil prices mentioned above are based on FXStreet data feed for Contracts for Differences (CFDs).
(An automation tool was used in creating this post.)
Platinum Group Metals (PGMs) trade with a positive tone at the beginning of Tuesday, according to FXStreet data. Palladium (XPD) changes hands at $979.25 a troy ounce, with the XPD/USD pair advancing from its previous close at $969.07.
In the meantime, Platinum (XPT) trades at $1007.15 against the United States Dollar (USD) early in the European session, also up after the XPT/USD pair settled at $1006.60 at the previous close.
Palladium FAQs
Palladium is a rare and valuable precious metal with strong industrial demand, particularly in the automotive sector. It is widely used in catalytic converters to reduce vehicle emissions, making it essential for global environmental regulations. Investors also see palladium as a store of value, similar to gold and silver, and a potential hedge against inflation. Given its supply constraints and high demand, palladium often attracts traders looking for price volatility and profit opportunities.
In trading, palladium (XPD/USD) is considered both an industrial and a precious metal. It is traded on major commodity exchanges like the New York Mercantile Exchange (NYMEX) and the London Platinum and Palladium Market (LPPM). Traders speculate on palladium prices through futures contracts, exchange-traded funds (ETFs), and spot markets. Since palladium supply is concentrated in a few countries, particularly Russia and South Africa, geopolitical and mining disruptions can lead to significant price swings, making it an attractive asset for short-term traders and long-term investors alike.
Palladium has historically been less expensive than gold, but in recent years, it has traded at a premium due to rising demand and tight supply. Prices fluctuate based on market conditions, but palladium has, at times, outperformed gold due to its critical role in the automotive industry. However, as markets shift and industrial demand changes, the price relationship between the two metals can vary.
Palladium prices are influenced by several factors, including industrial demand, supply constraints, and macroeconomic conditions. The automotive industry is the biggest driver of demand, as stricter emissions regulations increase the need for palladium-based catalytic converters. Supply is heavily dependent on mining output from Russia and South Africa, making the metal vulnerable to geopolitical risks and supply chain disruptions. Additionally, broader market trends, such as the strength of the US dollar, interest rates, and economic growth, can impact palladium prices, as they do with other precious metals.
Platinum Group Metals (PGMs) prices mentioned above are based on the FXStreet data feed for Contracts for Differences (CFDs).
(An automation tool was used in creating this post.)
Silver prices (XAG/USD) rose on Tuesday, according to FXStreet data. Silver trades at $34.08 per troy ounce, up 0.65% from the $33.86 it cost on Monday.
Silver prices have increased by 17.95% since the beginning of the year.
| Unit measure | Silver Price Today in USD |
|---|---|
| Troy Ounce | 34.08 |
| 1 Gram | 1.10 |
The Gold/Silver ratio, which shows the number of ounces of Silver needed to equal the value of one ounce of Gold, stood at 88.77 on Tuesday, up from 88.65 on Monday.
Silver FAQs
Silver is a precious metal highly traded among investors. It has been historically used as a store of value and a medium of exchange. Although less popular than Gold, traders may turn to Silver to diversify their investment portfolio, for its intrinsic value or as a potential hedge during high-inflation periods. Investors can buy physical Silver, in coins or in bars, or trade it through vehicles such as Exchange Traded Funds, which track its price on international markets.
Silver prices can move due to a wide range of factors. Geopolitical instability or fears of a deep recession can make Silver price escalate due to its safe-haven status, although to a lesser extent than Gold's. As a yieldless asset, Silver tends to rise with lower interest rates. Its moves also depend on how the US Dollar (USD) behaves as the asset is priced in dollars (XAG/USD). A strong Dollar tends to keep the price of Silver at bay, whereas a weaker Dollar is likely to propel prices up. Other factors such as investment demand, mining supply – Silver is much more abundant than Gold – and recycling rates can also affect prices.
Silver is widely used in industry, particularly in sectors such as electronics or solar energy, as it has one of the highest electric conductivity of all metals – more than Copper and Gold. A surge in demand can increase prices, while a decline tends to lower them. Dynamics in the US, Chinese and Indian economies can also contribute to price swings: for the US and particularly China, their big industrial sectors use Silver in various processes; in India, consumers’ demand for the precious metal for jewellery also plays a key role in setting prices.
Silver prices tend to follow Gold's moves. When Gold prices rise, Silver typically follows suit, as their status as safe-haven assets is similar. The Gold/Silver ratio, which shows the number of ounces of Silver needed to equal the value of one ounce of Gold, may help to determine the relative valuation between both metals. Some investors may consider a high ratio as an indicator that Silver is undervalued, or Gold is overvalued. On the contrary, a low ratio might suggest that Gold is undervalued relative to Silver.
(An automation tool was used in creating this post.)
- The Pound Sterling grips gains near 1.3000 against the US Dollar as the DXY Index struggles to hold the five-month.
- Fed officials could project a higher number of interest rate cuts this year.
- The Fed and the BoE are expected to keep interest rates steady on Wednesday and Thursday, respectively.
The Pound Sterling (GBP) clings to gains near the psychological figure of 1.3000 against the US Dollar (USD) in European trading hours on Tuesday. The GBP/USD pair demonstrates strength as the US Dollar Index (DXY), which tracks the Greenback’s value against six major currencies, struggles to hold the five-month low of 103.20.
The Greenback faces pressure as investors expect Federal Reserve (Fed) officials could guide more interest rate cuts this year when they end the March policy meeting on Wednesday. In December, Fed officials collectively guided two interest rate cuts in 2025.
The Fed is certain to keep interest rates steady in the range of 4.25%-4.50% for the second time in a row. Still, the central bank might turn slightly dovish on the monetary policy outlook amid easing inflationary pressures and deteriorating consumer confidence.
The United States (US) Consumer Price Index (CPI) data for February showed that the core inflation – which excludes volatile food and energy prices – rose by 3.1%, the lowest level seen since April 2021. Meanwhile, the preliminary Michigan Consumer Sentiment Index fell significantly lower at 57.9 in March against estimates of 63.1 and the former reading of 64.7.
Daily digest market movers: Pound Sterling ticks higher ahead of BoE policy decision, UK Employment
- The Pound Sterling is slightly higher against its major peers, with investors focusing on the Bank of England’s (BoE) interest rate decision on Thursday. Traders are increasingly confident that the BoE will keep borrowing rates steady at 4.5%, with a 7-2 vote split.
- BoE Monetary Policy Committee (MPC) members Catherine Mann and Swati Dhingra are expected to support an interest rate cut. Both officials voted for a larger-than-usual interest rate reduction of 50 basis points (bps) in the February policy meeting, while others favored a usual cut of 25 bps.
- Investors will also focus on BoE’s guidance on the monetary policy and how much US President Donald Trump-led tariff war could impact the United Kingdom’s (UK) economic outlook. Traders expect the BoE to cut interest rates two times more this year as the central bank halved its Gross Domestic Product (GDP) growth forecast for the year to 0.75% in the February policy meeting.
- On Monday, the Organisation for Economic Cooperation and Development (OECD) lowered its British growth forecast for this year to 1.4% from 1.7% projected in December amid global economic uncertainty due to US President Trump’s tariff agenda.
- On Thursday, investors will also focus on the UK labor market data for three months ending January before the BoE’s policy meeting.
Technical Analysis: Pound Sterling clings to gains around 1.3000
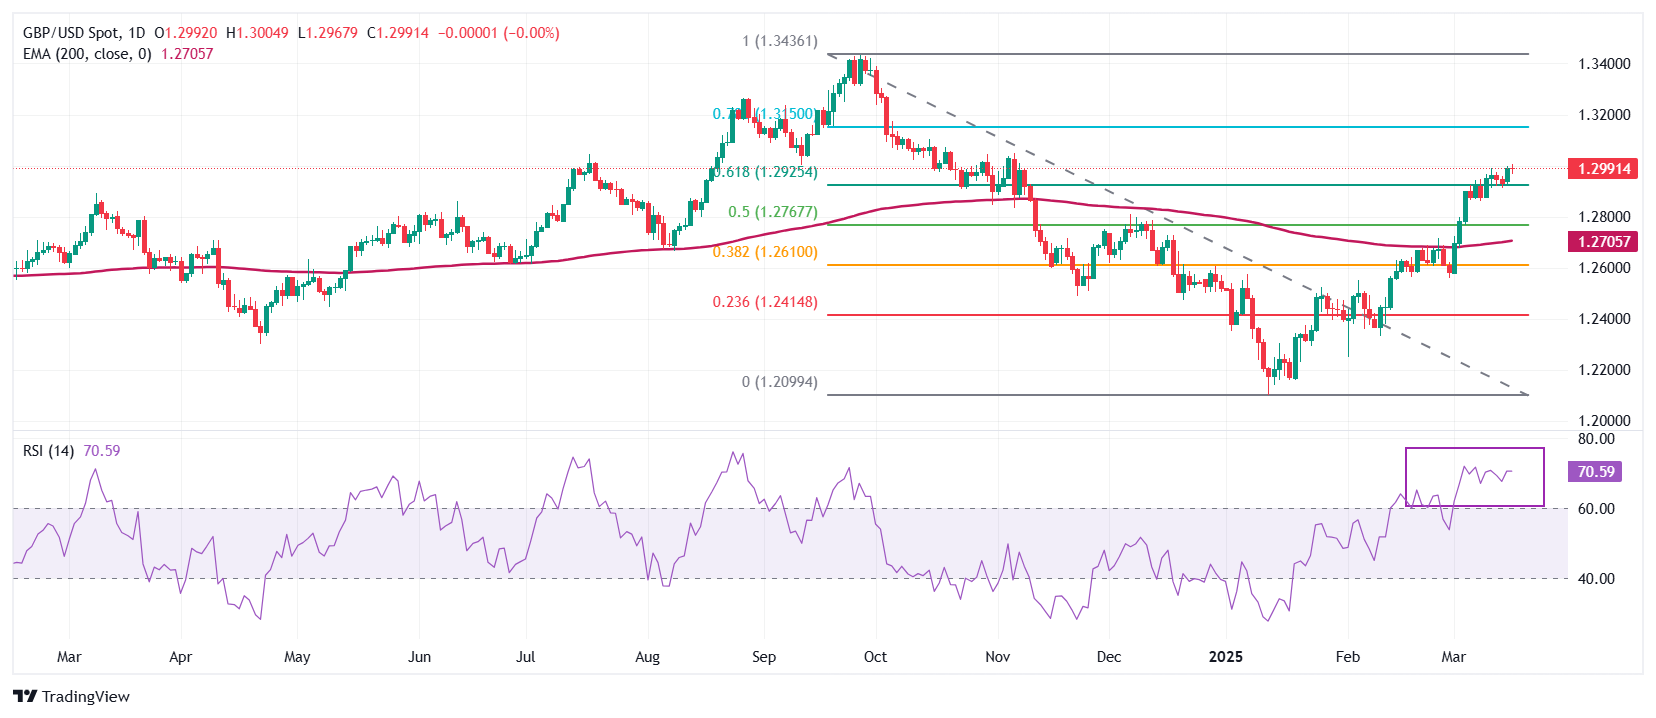
The Pound Sterling trades firmly near a fresh four-month high around the psychological level of 1.3000 against the US Dollar on Tuesday. The pair established above the 61.8% Fibonacci retracement, plotted from the late September high to the mid-January low, at 1.2930.
The long-term outlook of the GBP/USD pair remains bullish as it holds above the 200-day Exponential Moving Average (EMA), which is around 1.2700.
The 14-day Relative Strength Index (RSI) holds above 60.00, indicating that a strong bullish momentum is intact.
Looking down, the 50% Fibo retracement at 1.2767 and the 38.2% Fibo retracement at 1.2608 will act as key support zones for the pair. On the upside, the October 15 high of 1.3100 will act as a key resistance zone.
Pound Sterling FAQs
The Pound Sterling (GBP) is the oldest currency in the world (886 AD) and the official currency of the United Kingdom. It is the fourth most traded unit for foreign exchange (FX) in the world, accounting for 12% of all transactions, averaging $630 billion a day, according to 2022 data. Its key trading pairs are GBP/USD, also known as ‘Cable’, which accounts for 11% of FX, GBP/JPY, or the ‘Dragon’ as it is known by traders (3%), and EUR/GBP (2%). The Pound Sterling is issued by the Bank of England (BoE).
The single most important factor influencing the value of the Pound Sterling is monetary policy decided by the Bank of England. The BoE bases its decisions on whether it has achieved its primary goal of “price stability” – a steady inflation rate of around 2%. Its primary tool for achieving this is the adjustment of interest rates. When inflation is too high, the BoE will try to rein it in by raising interest rates, making it more expensive for people and businesses to access credit. This is generally positive for GBP, as higher interest rates make the UK a more attractive place for global investors to park their money. When inflation falls too low it is a sign economic growth is slowing. In this scenario, the BoE will consider lowering interest rates to cheapen credit so businesses will borrow more to invest in growth-generating projects.
Data releases gauge the health of the economy and can impact the value of the Pound Sterling. Indicators such as GDP, Manufacturing and Services PMIs, and employment can all influence the direction of the GBP. A strong economy is good for Sterling. Not only does it attract more foreign investment but it may encourage the BoE to put up interest rates, which will directly strengthen GBP. Otherwise, if economic data is weak, the Pound Sterling is likely to fall.
Another significant data release for the Pound Sterling is the Trade Balance. This indicator measures the difference between what a country earns from its exports and what it spends on imports over a given period. If a country produces highly sought-after exports, its currency will benefit purely from the extra demand created from foreign buyers seeking to purchase these goods. Therefore, a positive net Trade Balance strengthens a currency and vice versa for a negative balance.
Further New Zealand Dollar (NZD) strength vs US Dollar (USD) is not ruled out; any further advance is likely part of a higher 0.5785/0.5845 range. In the longer run, rapid buildup in momentum continues to suggest NZD strength; the level to watch is 0.5870, UOB Group's FX analysts Quek Ser Leang and Peter Chia note.
The level to watch is 0.5870
24-HOUR VIEW: "NZD rose to a high of 0.5755 last Friday. Yesterday, Monday, we noted that 'The increase in momentum suggests there is potential for NZD to continue to advance.' We also noted that 'it is unclear for now whether NZD can break and remain above the 0.5765/0.5775 resistance zone.' We did not quite expect the rapid upward acceleration as NZD soared above the resistance zone and reached 0.5826. While further NZD strength is not ruled out, any advance is likely part of a higher 0.5785/0.5845 range. In other words, NZD is unlikely to break clearly above 0.5845 today."
1-3 WEEKS VIEW: "Yesterday (17 Mar), when NZD was at 0.5750, we indicated that 'upward momentum is building again, but NZD must break and remain above the 0.5765/0.5775 resistance zone before a sustained rise is likely.' We did not expect the sudden jump that sent NZD soaring to a high of 0.5826. The rapid buildup in momentum continues to suggest NZD strength. The level to watch on the upside is 0.5870. On the downside, the ‘strong support’ level has moved higher to 0.5740 from 0.5695."
The EU is launching a probe into Aluminum imports to protect the bloc’s industry from an expected surge in cheap imports displaced by US tariffs, according to media reports, ING's commodity experts Ewa Manthey and Warren Patterson note.
US premiums surge to a record high
"The European Commission is set to announce the probe on Wednesday. Last week, Donald Trump placed 25% tariffs on all steel and Aluminum imports. 'The recently announced US tariffs on Aluminum are likely to worsen the situation further with a significant threat of trade diversion from multiple destinations,' the document reads.'"
"European Aluminum premiums have been falling, while US premiums surged to a record high. This suggests some suppliers to the US are already redirecting sales to Europe to avoid Trump’s tariffs. Europe is dependent on primary Aluminum imports. Its Aluminum sector was one of the worst affected during the energy crisis, with more than one million tonnes per annum taken offline. Some restarts have begun in Europe, but significant capacity remains offline."
"Although the EU continues to import Russian Aluminum, volumes have fallen over the past two years as European buyers self-sanction after the invasion of Ukraine. Russia now accounts for around 6% of European imports of primary Aluminum, halving from the 2022 levels. Last month, the EU banned imports of Russian Aluminum, with a quota system allowing 275kt to be used over a 12-month period."
- EUR/CAD could encounter resistance while attempting to re-enter the ascending channel near its lower boundary around 1.5780.
- The 14-day RSI has pulled back to the 70 mark, indicating that traders may be taking profits.
- Immediate support is found at the nine-day Exponential Moving Average of 1.5570.
EUR/CAD edges higher after two days of gains, trading near 1.5640 during European hours on Tuesday. Technical analysis on the daily chart points to the weakening of a bullish bias, with the currency cross positioning below the ascending channel pattern.
The 14-day Relative Strength Index (RSI), a key indicator of overbought or oversold conditions, has retreated to the 70 mark, signaling a slight cooling-off while remaining in the overbought zone. This suggests that traders may be taking profits, potentially leading to a slowdown in price movement.
On the upside, the EUR/CAD cross may face resistance while attempting to re-enter the ascending channel near its lower boundary around the 1.5780 level. Beyond this, the 1.5857 mark—its highest level since July 2020, reached on March 11—serves as the next key hurdle. A successful return to the channel would strengthen the bullish outlook, potentially driving the currency cross toward the upper boundary of the channel, around 1.6250.
The immediate support is seen at the nine-day Exponential Moving Average (EMA) of 1.5570. A break below this level could weaken short-term price momentum, increasing downward pressure on the EUR/CAD cross and guiding it toward the 50-day EMA at 1.5163.
A break below the 50-day EMA would weaken the medium-term price momentum and drive the currency cross downwards toward the “throwback support” level of 1.4700 level.
EUR/CAD: Daily Chart
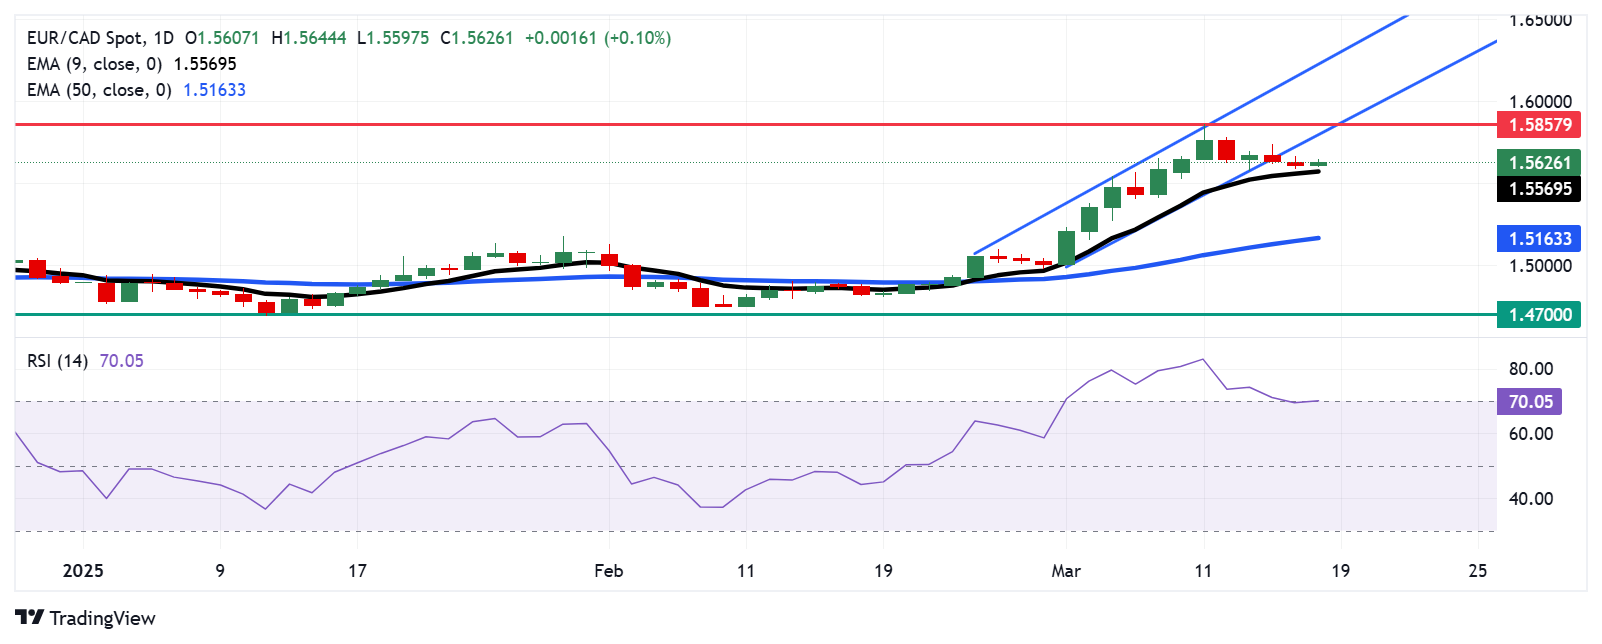
Euro PRICE Today
The table below shows the percentage change of Euro (EUR) against listed major currencies today. Euro was the strongest against the Japanese Yen.
| USD | EUR | GBP | JPY | CAD | AUD | NZD | CHF | |
|---|---|---|---|---|---|---|---|---|
| USD | -0.25% | 0.01% | 0.36% | -0.08% | -0.01% | -0.11% | -0.15% | |
| EUR | 0.25% | 0.25% | 0.59% | 0.15% | 0.23% | 0.12% | 0.08% | |
| GBP | -0.01% | -0.25% | 0.35% | -0.09% | -0.02% | -0.12% | -0.16% | |
| JPY | -0.36% | -0.59% | -0.35% | -0.44% | -0.37% | -0.50% | -0.52% | |
| CAD | 0.08% | -0.15% | 0.09% | 0.44% | 0.09% | -0.02% | -0.07% | |
| AUD | 0.00% | -0.23% | 0.02% | 0.37% | -0.09% | -0.11% | -0.15% | |
| NZD | 0.11% | -0.12% | 0.12% | 0.50% | 0.02% | 0.11% | -0.04% | |
| CHF | 0.15% | -0.08% | 0.16% | 0.52% | 0.07% | 0.15% | 0.04% |
The heat map shows percentage changes of major currencies against each other. The base currency is picked from the left column, while the quote currency is picked from the top row. For example, if you pick the Euro from the left column and move along the horizontal line to the US Dollar, the percentage change displayed in the box will represent EUR (base)/USD (quote).
Strong momentum suggests Australian Dollar (AUD) could test 0.6410 vs US Dollar (USD); it is unclear if it can break clearly above this level for now. In the longer run, chance for AUD to break above 0.6410; a break of this significant resistance level could potentially trigger a rapid rise, UOB Group's FX analysts Quek Ser Leang and Peter Chia note.
Chance for AUD to break above 0.6410
24-HOUR VIEW: "While we expected AUD to 'rise further' yesterday, we indicated that it 'does not seem to have enough momentum to test the major resistance at 0.6385.' We underestimated the upward momentum, as AUD rose to 0.6391. Strong momentum suggests AUD could test 0.6410 today. Due to the deeply overbought conditions, it is unclear whether AUD can break clearly above this level. To maintain the strong momentum, AUD must hold above 0.6350 (minor support is at 0.6365)."
1-3 WEEKS VIEW: "We have expected AUD to trade in a range since early last week. In our most recent narrative from last Thursday (12 Mar, spot at 0.6325), we highlighted that 'the slightly firm underlying tone suggests a higher range of 0.6245/0.6385.' Yesterday, AUD rose sharply and reached a high of 0.6391. The breach of 0.6385 is accompanied by strong upward momentum, and there is a chance for AUD to break above 0.6410. The chance of AUD breaking above 0.6410 will remain intact as long as the ‘strong support’ level, currently at 0.6320, is not breached. Note that 0.6410 is a significant resistance, and a clear break above this level could potentially trigger a sharp and rapid rise. The next resistance level above 0.6410 is 0.6450."
European natural gas prices came under pressure yesterday, falling almost 2.5% on the day, amid hopes of a Russia-Ukraine peace deal, ING's commodity experts Ewa Manthey and Warren Patterson note.
Russian pipeline gas can once again flow into Europe
"Also, the weather forecast in North West Europe is for milder temperatures over the next week. However, EU gas storage continues to tick lower. It’s now a little under 35% full, down from 60% at the same stage last year and below the five-year average of 46%."
"Speculative longs have become nervous that a potential peace deal between Russia and Ukraine could see the resumption of some Russian pipeline gas into Europe."
Europe faces the threat of significantly higher tariffs under Trump 2.0 compared with Trump 1.0. Tariff escalation is likely in Q2; we outline key European exposures at the country and sector level. Hit to EU could be up to c.0.75% of GDP; negotiations and mitigations should help moderate the impact, Standard Chartered's economists Christopher Graham and Ethan Lester note.
Europe faces the threat of significantly higher tariffs under Trump 2.0
"Trump 1.0 saw relatively contained US-led tariffs on EU markets; by contrast, Trump 2.0 is likely to result in deeper tariffs (evidenced by recently expanded steel and aluminium tariffs) that are broader in scope, given recent Trump rhetoric towards the EU and previous threats of sector-specific and reciprocal tariffs. Escalation is likely from Q2 onwards and could result in a sizeable hit to European exports and GDP."
"EU exports to the US were EUR 532bn in 2024, equivalent to 3% of EU GDP. We estimate that an across-the-board 25% tariff on EU exports could deliver a 0.50-0.75% GDP hit over a 12-month period, which is in line with independent estimates. This magnitude of impact could also result from reciprocal tariffs, assuming the US takes into account VAT and non-tariff barriers. Depending on the rates used, sector-specific tariffs (including steel and aluminium, agri-food, pharmaceuticals and autos) could limit the damage to EU GDP, although we would still expect them to affect c.30-40% of total EU exports to the US."
"The ultimate impact on EU GDP will depend on various dynamics, including US demand elasticity (which will differ by sector and product), exchange rate effects, EU retaliatory tariffs, US tariffs on other countries (given trade diversion effects) and the EU’s policy response. The fact that threats have been made but implementation has been delayed for other countries so far, supports our expectation that a negotiated solution can be reached between the US and EU; however, given the size of the EU’s bilateral surplus with the US, this outcome is not guaranteed – some form of protectionist measures seems inevitable."
Oil prices rose yesterday amid rising tensions in the Middle East, continuing the strength seen at the end of last week, ING's commodity experts Ewa Manthey and Warren Patterson note.
Trump to talk to President Putin about a proposed ceasefire
"ICE Brent settled almost 0.7% higher on the day, moving back above US$71/bbl. Along with US strikes on the Houthis in Yemen, several factors provided support to the market. China unveiled plans to revive consumption, while Chinese retail sales and fixed asset investment growth came in stronger than expected. Output data suggests that domestic apparent oil demand over January and February averaged 14.7m b/d, up 2.4% year on year."
"Middle East tensions escalated once again in recent days with US strikes on the Houthis, while the Houthis retaliated by targeting a US aircraft carrier. The Houthis are backed by Iran, which could lead to a broader escalation, particularly with President Trump saying Iran 'will be held responsible, and suffer the consequences' if the Houthis continue attacks in the Red Sea. Unsurprisingly, the Trump administration is taking a more hawkish stance against Iran, having tightened oil sanctions since taking office."
"Trump is scheduled to talk to President Putin today about a proposed ceasefire. Energy markets will be watching closely for any progress – particularly whether a potential peace deal might include the resumption of some Russian energy flows. This would be more impactful for natural gas rather than oil, given that the scope to increase natural gas flows is much bigger relative to oil."
Canada releases inflation figures for February today, ING's FX analyst Francesco Pesole notes.
USD/CAD can move towards 1.4200 in the near term
"The end of a sales tax holiday is expected to have driven headline CPI back above 2.0% year-on-year, but the main focus will as usual be on the trim and median core measures, which are expected to have remained below 3.0%. Any meaningful core inflation rebound in the month before US tariffs on steel and aluminium took effect can probably prompt markets to price out one of the two rate cuts currently expected."
"The Bank of Canada has stressed how the policy response to the US-Canada trade war will depend on the growth-inflationary balance and hinted that it would not be doing the heavy lifting in supporting the economy if prices rise too. So, the starting point for inflation before the initial tariff impact is key, and any upside surprises today can pave the way for a move to 1.4200 in USD/CAD."
"Our short-term fair value model shows that there is now a rather contained 1% risk premium left on USD/CAD, meaning that a return to the February lows would almost entirely erase the additional loonie weakness related to tariffs. We would not chase USD/CAD much lower should it touch 1.42, as April should bring fresh negative news on trade and dovish pricing on the Fed may prove overdone."
- WTI draws some support from rising geopolitical tensions in the Middle East.
- The optimism over China’s stimulus measures further benefits the black liquid.
- Concerns about a slowdown in the global economy might cap the commodity.
West Texas Intermediate (WTI) US Crude Oil prices attract buyers for the third straight day on Tuesday and touch a fresh two-week high during the first half of the European session. The commodity currently trades just above the $68.00 mark, up over 1.25% for the day, and seems poised to climb further amid rising Middle East tensions.
US President Donald Trump vowed to continue the assault on Yemen’s Houthis unless they end their attacks on ships in the Red Sea and warned that he would hold Iran responsible for any attacks carried out by the militant group. Adding to this, Israeli air strikes in Gaza ended a weeks-long standoff over extending a ceasefire. This raises the risk of a further escalation of the conflict in the region, which could impact supply, and act as a tailwind for Crude Oil prices.
Furthermore, the latest optimism over China stimulus measures announced over the weekend turns out to be another factor that lends support to the black liquid. In fact, China’s State Council unveiled a special action plan on Sunday aimed at stimulating domestic consumption and introduced measures to increase household incomes. Adding to this, China’s Shenzhen eased its housing provident fund loan policies to stimulate the property market and clear the overhang.
This is expected to boost fuel demand in the world's biggest crude importer and supports prospects for further appreciation for Crude Oil prices. That said, the Organization for Economic Co-operation and Development (OECD) lowered its global growth outlook amid worries about Trump's tariffs. This could weigh on global energy demand and hold back traders from placing aggressive bullish bets around the commodity ahead of this week's key central bank event risk.
The Federal Reserve (Fed) is scheduled to announce its decision at the end of a two-day policy meeting on Wednesday. Investors will look for cues about the central bank's rate-cut path, which will play a key role in influencing the near-term US Dollar (USD) price dynamics and provide a fresh impetus to the USD-denominated commodities, including Crude Oil prices. Nevertheless, rising geopolitical risks favor bullish traders and should continue to support the black liquid.
WTI Oil FAQs
WTI Oil is a type of Crude Oil sold on international markets. The WTI stands for West Texas Intermediate, one of three major types including Brent and Dubai Crude. WTI is also referred to as “light” and “sweet” because of its relatively low gravity and sulfur content respectively. It is considered a high quality Oil that is easily refined. It is sourced in the United States and distributed via the Cushing hub, which is considered “The Pipeline Crossroads of the World”. It is a benchmark for the Oil market and WTI price is frequently quoted in the media.
Like all assets, supply and demand are the key drivers of WTI Oil price. As such, global growth can be a driver of increased demand and vice versa for weak global growth. Political instability, wars, and sanctions can disrupt supply and impact prices. The decisions of OPEC, a group of major Oil-producing countries, is another key driver of price. The value of the US Dollar influences the price of WTI Crude Oil, since Oil is predominantly traded in US Dollars, thus a weaker US Dollar can make Oil more affordable and vice versa.
The weekly Oil inventory reports published by the American Petroleum Institute (API) and the Energy Information Agency (EIA) impact the price of WTI Oil. Changes in inventories reflect fluctuating supply and demand. If the data shows a drop in inventories it can indicate increased demand, pushing up Oil price. Higher inventories can reflect increased supply, pushing down prices. API’s report is published every Tuesday and EIA’s the day after. Their results are usually similar, falling within 1% of each other 75% of the time. The EIA data is considered more reliable, since it is a government agency.
OPEC (Organization of the Petroleum Exporting Countries) is a group of 12 Oil-producing nations who collectively decide production quotas for member countries at twice-yearly meetings. Their decisions often impact WTI Oil prices. When OPEC decides to lower quotas, it can tighten supply, pushing up Oil prices. When OPEC increases production, it has the opposite effect. OPEC+ refers to an expanded group that includes ten extra non-OPEC members, the most notable of which is Russia.
Chance for Pound Sterling (GBP) to break above 1.3000 vs US Dollar (USD); overbought conditions suggest it might not be able to maintain a foothold above this level. In the longer run, to continue to rise, GBP must break and remain above 1.3000, UOB Group's FX analysts Quek Ser Leang and Peter Chia note.
Overbought conditions suggest GBP might not remain above 1.3000
24-HOUR VIEW: "Yesterday, we expected GBP to 'trade in a 1.2900/1.2970 range.' However, GBP soared, testing the major resistance at 1.3000, reaching a high of 1.2999. While the rapid rise appears overstretched, as long as 1.2955 (minor support is at 1.2970) is not breached, there is a chance for GBP to break above 1.3000. Given the overbought conditions, it might not be able to maintain a foothold above this level. The next resistance at 1.3050 is unlikely to come under threat."
1-3 WEEKS VIEW: "We have held a positive GBP view since early this month. Tracking the advance, in our latest narrative from last Thursday (13 Mar, spot at 1.2955), we indicated that 'to continue to rise, GBP must break and remain above 1.3000.' Yesterday (17 Mar), GBP tested the 1.3000 level but failed to break through. We continue to hold the same view. Looking ahead, the next level to monitor above 1.3000 is 1.3050. On the downside, the ‘strong support’ level has moved higher to 1.2930 from 1.2880 previously."
US Dollar (USD) continues to trade near recent lows. DXY was last seen trading at 103.26 levels, OCBC's FX analysts Frances Cheung and Christopher Wong note.
Mild upside risk not ruled out
"US exceptionalism trade continues to fade as markets are increasingly focused on how Trump policies are hurting the US economy. Recent US data including payrolls, CPI, PPI, Uni of Michigan sentiment, empire manufacturing and retail sales data have all disappointed to the downside."
"FOMC meeting (Thu 2am SGT) is eyed this week. Focus on dot plot – if there will be any revisions to rates guidance and if Fed acknowledges growth concerns. Uncertainty on this front has led to mild unwinding of USD shorts. "
"Bearish momentum on daily chart is fading while RSI shows signs of rising from near oversold conditions. Mild upside risk not ruled out. Resistance at 104 (61.8% fibo retracement of Oct low to Jan high), 105 levels (50% fibo, 21, 200 DMAs). Support at 103.20, 102.50 levels (76.4% fibo). Data today brings housing starts, building permits, export/import price index and industrial production."
US data continues to haunt the dollar, which fell against all G10 currencies excluding the yen yesterday. February retail sales rose less than expected (0.2% month-on-month versus 0.6% consensus) following a major drop in January, while the Empire Manufacturing Index plummeted to the lowest level in more than a year, ING's FX analyst Francesco Pesole notes.
DXY can test 103.0 before the FOMC risk event today
"Equities had a good day despite the data disappointment but remain in a fragile spot as the US administration has hinted it might accept a recession as a necessary evil in the path to a reset in trade relationships. Incidentally, the Fed – which announces rates tomorrow – does not look like it’s in a position to offer much respite to risk sentiment as rising inflation expectations still warrant caution on cuts."
"There is no top-tier data likely to steer the dollar today, although some focus will be on industrial production figures for February and housing starts. Further downside risks for the dollar may stem from today’s Trump-Putin phone call on Ukraine. Any progress towards Russia accepting the ceasefire plan laid out by the US and Ukraine can add extra pressure on the safe-haven dollar and yen."
"DXY can continue to slip below pre-election levels and test 103.0 before the FOMC risk event today, which may end up offering some support."
Euro (EUR) could test 1.0950 vs US Dollar (USD), but it does not appear to possess enough momentum to break clearly above this level. In the longer run, EUR must break and close above 1.0950 before resuming its rally, UOB Group's FX analysts Quek Ser Leang and Peter Chia note.
Above 1.0950, EUR can resume its rally
24-HOUR VIEW: "We did not anticipate EUR rising to 1.0929 yesterday. We were expecting range trading. Despite the relatively strong advance, upward momentum has not increased significantly. That said, there is no sign of an imminent pullback just yet. Today, EUR could test last week’s high, near 1.0950. Currently, it does not appear to possess enough momentum to break clearly above this level. The next major resistance at 1.1000 is unlikely to come under threat. Support is at 1.0905; a breach of 1.0885 would suggest the current upward pressure has eased."
1-3 WEEKS VIEW: "In our update from last Friday (14 Mar, spot at 1.0850), we highlighted that 'the current price movements are likely part of a consolidation phase' and EUR 'is likely to trade in a 1.0680/1.0950 range for now.' Yesterday, EUR rose to 1.0929. The increase in short-term momentum is not sufficient to indicate that EUR is ready to resume its rally. For that to happen, EUR must break and close above 1.0950. The probability of EUR breaking clearly above 1.0950 is not high for now, but it will remain intact as long as 1.0855 (‘strong support’ level) is not breached."
- USD/CAD may navigate near the three-month low of 1.4151.
- A break below the ascending channel pattern suggests a shift to bearish sentiment.
- Immediate resistance stands at the psychological level of 1.4300, followed by the 50-day EMA at 1.4323.
USD/CAD continues its losing streak for the third successive session, trading near 1.4290 during European hours on Tuesday. Technical analysis on the daily chart indicates a breakdown below an ascending channel pattern, signaling a shift toward bearish sentiment.
The 14-day Relative Strength Index (RSI) remains below 50, confirming the bearish outlook prevails. Additionally, the USD/CAD pair is trading below the nine-day Exponential Moving Average (EMA), suggesting weak short-term price momentum.
A break below the ascending channel has weakened the market sentiment and put downward pressure on the USD/CAD pair to navigate the area around the three-month low of 1.4151, last seen on February 14.
On the upside, immediate resistance is at the psychological level of 1.4300, followed by the 50-day EMA at 1.4322 and the nine-day EMA at 1.4353. A break above this resistance zone could strengthen short-term price momentum, potentially driving the USD/CAD pair toward the monthly high of 1.4543, recorded on March 4.
Further resistance is seen at the upper boundary of the ascending channel at 1.4700. A breakout above this level could reinforce the bullish bias and pave the way for a test of 1.4793, the highest level since March 2003, reached on February 3.
USD/CAD: Daily Chart
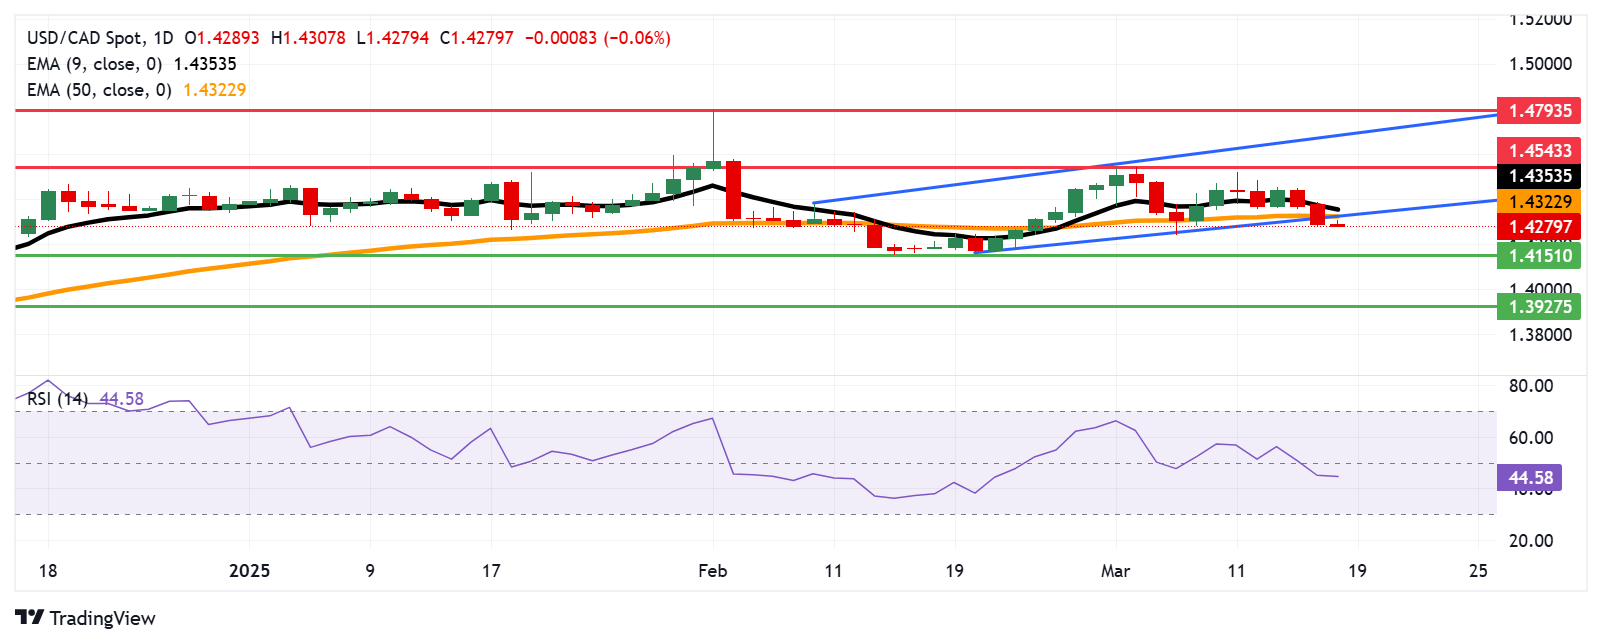
Canadian Dollar PRICE Today
The table below shows the percentage change of Canadian Dollar (CAD) against listed major currencies today. Canadian Dollar was the strongest against the Japanese Yen.
| USD | EUR | GBP | JPY | CAD | AUD | NZD | CHF | |
|---|---|---|---|---|---|---|---|---|
| USD | -0.26% | -0.07% | 0.45% | -0.06% | -0.05% | -0.14% | -0.12% | |
| EUR | 0.26% | 0.17% | 0.72% | 0.19% | 0.20% | 0.12% | 0.13% | |
| GBP | 0.07% | -0.17% | 0.53% | 0.03% | 0.03% | -0.05% | -0.04% | |
| JPY | -0.45% | -0.72% | -0.53% | -0.52% | -0.49% | -0.61% | -0.58% | |
| CAD | 0.06% | -0.19% | -0.03% | 0.52% | 0.02% | -0.07% | -0.07% | |
| AUD | 0.05% | -0.20% | -0.03% | 0.49% | -0.02% | -0.09% | -0.08% | |
| NZD | 0.14% | -0.12% | 0.05% | 0.61% | 0.07% | 0.09% | 0.01% | |
| CHF | 0.12% | -0.13% | 0.04% | 0.58% | 0.07% | 0.08% | -0.01% |
The heat map shows percentage changes of major currencies against each other. The base currency is picked from the left column, while the quote currency is picked from the top row. For example, if you pick the Canadian Dollar from the left column and move along the horizontal line to the US Dollar, the percentage change displayed in the box will represent CAD (base)/USD (quote).
The German Bundestag votes on Friedrich Merz’s fiscal spending plan today, ING's FX analyst Francesco Pesole notes.
EUR/USD can move above 1.0950 today
"It is widely expected that Merz has secured the two-thirds qualified majority to amend the constitutional debt brake, and we think developments on a Russia-Ukraine peace deal will be more impactful on the euro."
"Markets will also be closely watching the ZEW survey results, as that is the first set of sentiment indicators following the fiscal spending announcement. The index of German economic growth expectations had already accelerated in February ahead of some (more contained) expectations for fiscal support. Consensus is looking at a move from 26 to 48 in February, but we wouldn’t be surprised with an even bigger number."
"EUR/USD is eyeing 1.100 again. We aren’t convinced there is enough thrust for a decisive break higher, especially as the Fed may fail to trigger much further repricing in the USD curve. Still, we could see the pair move above 1.0950 today."
Euro (EUR) continued to hold on to gains above 1.09 handle vs US Dollar (USD) on prospects of a peace deal in Ukraine, potential ECB pause (in Apr) and hopes of large German spending. EUR was last seen trading at 1.0948 levels, OCBC's FX analysts Frances Cheung and Christopher Wong note.
Pace of rise may moderate
"The Bundestag will vote later today on whether to take the brakes off defence spending, paving the way for a jump in defence-related investments. The proposal being voted is that any spending on defence that amounts to more than 1% of Germany's GDP would no longer be subject to a limit on borrowing (currently this debt ceiling has been fixed at 0.35% of GDP). The vote requires a 2/3 majority to pass under the current Bundestag and it appears to have a higher chance of passing this under the current Bundestag."
"The new parliament convenes on 25 Mar and it may be challenging to pass as both AfD party and far-left Die Linke party have already expressed their decision to vote against it. It is important as other European countries will be watching if this proposal passes as any slip-up will have an implication on European Commission Ursula’s plan for EUR800bn ReArm Europe Fund. Bundestag will also vote on the €500 billion ($528 billion) infrastructure fund to invest in priorities such as transportation, energy grids and housing."
"Daily momentum is bullish but shows signs of slowing while RSI show signs of turning lower from overbought conditions. Pace of rise may moderate. Support at 1.0820 (61.8% fibo retracement of Sep high to Jan low), 1.0700/20 levels (200 DMA, 50% fibo). Resistance at 1.0970 (76.4% fibo). We also keep a look out on the phone call between Trump and Putin over Ukraine ceasefire for potential implications on EUR and Gold."
In its March economic forecasts, Switzerland’s State Secretariat for Economic Affairs (SECO) said that the “Swiss economy will grow by 1.4% in 2025.”
Additional takeaways
Sees 2025 GDP (sport event adjusted) growth at +1.4% (previous forecast was +1.5%).
Sees 2026 GDP (sport event adjusted) growth at +1.6% (previous forecast was +1.7%).
Sees 2025 CPI at +0.3% (previous forecast was +0.3%).
Swiss government sees 2026 CPI at +0.6% (previous forecast was +0.7%).
Sees Swiss economy to grow below its historical average for another two years.
Market reaction
At the time of writing, USD/CHF is down 0.09% on the day, trading at around 0.8800.
Swiss economy FAQs
Switzerland is the ninth-largest economy measured by nominal Gross Domestic Product (GDP) in the European continent. Measured by GDP per capita – a broad measure of average living standards –, the country ranks among the highest in the world, meaning that it is one the richest countries globally. Switzerland tends to be in the top spots in global rankings about living standards, development indexes, competitiveness or innovation.
Switzerland is an open, free-market economy mainly based on the services sector. The Swiss economy has a strong export sector, and the neighboring European Union (EU) is its main trading partner. Switzerland is a leading exporter of watches and clocks, and hosts leading firms in the food, chemicals and pharmaceutical industries. The country is considered to be an international tax haven, with significantly low corporate and income tax rates compared with its European neighbors.
As a high-income country, the growth rate of the Swiss economy has diminished over the last decades. Still, its political and economic stability, its high education levels, top-tier firms in several industries and its tax-haven status have made it a preferred destination for foreign investment. This has generally benefited the Swiss Franc (CHF), which has historically kept relatively strong against its main currency peers. Generally, a good performance of the Swiss economy – based on high growth, low unemployment and stable prices – tends to appreciate CHF. Conversely, if economic data points to weakening momentum, CHF is likely to depreciate.
Switzerland isn’t a commodity exporter, so in general commodity prices aren’t a key driver of the Swiss Franc (CHF). However, there is a slight correlation with both Gold and Oil prices. With Gold, CHF’s status as a safe-haven and the fact that the currency used to be backed by the precious metal means that both assets tend to move in the same direction. With Oil, a paper released by the Swiss National Bank (SNB) suggests that the rise in Oil prices could negatively influence CHF valuation, as Switzerland is a net importer of fuel.
- The Canadian Consumer Price is expected to tick higher in February.
- The Bank of Canada could soon decide to pause quantitative easing.
- The Canadian Dollar could extend its gains versus its American rival.
Statistics Canada will release the February inflation report on Tuesday, as estimated by the Consumer Price Index (CPI). Annualised inflation is expected to have ticked higher, from the 1.9% posted in January to 2.1%. The foreseen uptick is far from worrisome but could have a negative impact on the Canadian Dollar (CAD) in the near term.
At the same time, the Bank of Canada (BoC) will release its core CPI estimates, which measure underlying inflation by trimming volatile food and energy prices. According to the latest release, core BoC CPI rose 0.4% MoM in January and 2.1% YoY in the same month.
The BoC met on March 12 and decided to cut the benchmark interest rate by 25 basis points (bps) to 2.75%, its lowest since 2022. It was the seventh consecutive cut, inspired by concerns that Canadian economic growth may slow down amid the recently unleashed United States (US) trade war. Indeed, 25% levies on Canadian exports of steel and aluminium to the US came into effect. Yet, at the same time, tariffs pose an upward risk to inflation, which could translate into a pause in the current loosening monetary policy cycle.
Ahead of the announcement, the CAD is finding near-term strength in a better market mood. The USD/CAD pair trades in the mid-1.4300 region, holding onto familiar levels yet pulling down from a multi-year high of 1.4792.
What can we expect from Canada’s inflation rate?
According to the BoC Monetary Policy report released in January, Canadian policymakers are aware of the risks related to the trade war and its potential effects on the local economy despite acknowledging that inflation expectations have largely normalised since August 2024. Officials also expect inflation to be volatile through March but to remain near 2% over the projection horizon.
Policymakers forecast growth to average 1.8% in 2025 and 2026, yet added that “US trade policy has emerged as a major source of uncertainty.”
Even further, Governor Tiff Macklem said in an interview following the central bank’s decision that they considered leaving the key policy rate at 3%. “However, since the bank felt that domestic demand was going to be impacted and inflation continued to be at around 2%, "the most appropriate course of action was to cut the policy rate,” he added. Finally, he noted that the impact of the trade war might be more prominent in the second quarter of the year.
When is the Canada CPI data due and how could it affect USD/CAD?
Canada's February inflation report will be published on Tuesday at 12:30 GMT, and market participants anticipate an uptick in price pressures. As usual, the divergence between the market expectations and the actual figures will be responsible for CAD’s reaction.
Generally speaking, higher-than-anticipated figures would suggest the BoC may need to adopt a more hawkish stance and, hence, push the CAD higher vs other rivals. The opposite scenario is also valid, with softer-than-anticipated readings suggesting the BoC could keep trimming rates. Yet, at the same time, a steep acceleration in price pressures could spur concerns about Canadian economic health and, hence, weigh on the CAD.
Valeria Bednarik, Chief Analyst at FXStreet, notes: “Ahead of the announcement, the USD/CAD gains downward traction, according to technical readings in the daily chart. The case for another leg lower is high amid the broad US Dollar’s (USD) weakness, as at the end of the day, the American economy will be the most affected by the trade war.”
Bednarik adds: “The immediate support and potential bearish target is the 1.4300 mark, ahead of 1.4239, the March monthly low. Additional slides expose the 1.4160 region, where the pair met buyers in February. The pair could gain upward traction on a run past 1.4380, with the next potential bullish target at 1.4542, where the pair topped this month.”
Economic Indicator
BoC Interest Rate Decision
The Bank of Canada (BoC) announces its interest rate decision at the end of its eight scheduled meetings per year. If the BoC believes inflation will be above target (hawkish), it will raise interest rates in order to bring it down. This is bullish for the CAD since higher interest rates attract greater inflows of foreign capital. Likewise, if the BoC sees inflation falling below target (dovish) it will lower interest rates in order to give the Canadian economy a boost in the hope inflation will rise back up. This is bearish for CAD since it detracts from foreign capital flowing into the country.
Read more.Last release: Wed Mar 12, 2025 13:45
Frequency: Irregular
Actual: 2.75%
Consensus: 2.75%
Previous: 3%
Source: Bank of Canada
Economic Indicator
BoC Consumer Price Index Core (YoY)
The BoC Consumer Price Index Core, released by the Bank of Canada (BoC) on a monthly basis, represents changes in prices for Canadian consumers by comparing the cost of a fixed basket of goods and services. It is considered a measure of underlying inflation as it excludes eight of the most-volatile components: fruits, vegetables, gasoline, fuel oil, natural gas, mortgage interest, intercity transportation and tobacco products. The YoY reading compares prices in the reference month to the same month a year earlier. Generally, a high reading is seen as bullish for the Canadian Dollar (CAD), while a low reading is seen as bearish.
Read more.Next release: Tue Mar 18, 2025 12:30
Frequency: Monthly
Consensus: -
Previous: 2.1%
Source: Statistics Canada
- EUR/USD holds above 1.0900 ahead of the vote on German debt restructuring and peace talks between Russia and the US.
- A significant relaxation in German borrowing rules could boost economic growth and employment.
- The Fed is certain to keep interest rates steady on Wednesday amid uncertainty over President Trump’s economic policies.
EUR/USD trades firmly near the five-month high of 1.0950 in Tuesday’s European session ahead of voting on the German debt restructuring deal in the Bundestag lower house of Parliament. German leaders will vote on passing an infrastructure fund worth 500 billion Euro (EUR) and ease borrowing limit to boost defense spending.
The German debt deal is highly likely to get majority votes as Franziska Brantner-led-Greens agreed last week to support likely chancellor Frederich Merz-led-Christian Democratic Union (CDU) and the Social Democratic Party (SDP) for bringing an end to German’s fiscal conservatism, which it adopted after the 2008 sub-prime crisis.
Market participants expect the massive surge in German borrowing limit will accelerate economic growth and inflation. Such a scenario is favorable for the Euro, given that Germany is the Eurozone’s locomotive. The positive impact of the German debt increase plan is already visible in the Euro, which has performed strongly in the last weeks.
Firm optimism over the German debt deal has also lifted expectations that the European Central Bank (ECB) could pause the monetary easing cycle after reducing interest rates six times since June 2024. ECB policymaker and Austrian Central Bank Governor Robert Holzmann said on Friday that the central bank could keep interest rates steady in the April policy meeting as United States (US) President Donald Trump’s tariff agenda and defense spending have prompted risks of a resurgence in inflationary pressures.
In Tuesday’s session, investors will also focus on the US-Russia talks for a ceasefire in Ukraine. Last week, Ukraine agreed to a 30-day ceasefire plan after discussions with US officials in Saudi Arabia. On Monday, the European Union (EU) Foreign policy chief Kaja Kallas said the conditions demanded by Russia to agree to a ceasefire showed Moscow does not really want peace, Reuters report.
Daily digest market movers: EUR/USD strives for more gains amid weakness in US Dollar
- EUR/USD sees more upside as the US Dollar (USD) struggles for a firm footing ahead of the Federal Reserve’s (Fed) interest rate decision, which will be announced on Wednesday. The US Dollar Index (DXY), which tracks the Greenback’s value against six major currencies, trades close to a five-month low of 103.20.
- According to the CME FedWatch tool, the Fed is almost certain to keep borrowing rates steady in the range of 4.25%-4.50% on Wednesday. This would be the second straight policy meeting in which the Fed will leave interest rates unchanged.
- Traders have remained increasingly confident about the Fed maintaining a status quo on Wednesday as officials have been arguing in favor of a “wait and see” approach amid uncertainty over the economic outlook under the leadership of US President Trump. He has been threatening to introduce reciprocal tariffs, a situation in which the US will impose similar levies charged by other nations on the same products.
- Market participants expect Trump tariffs could be inflationary and lead to economic turbulence in the economy. A slew of US officials, including the President, have not ruled out that Trump’s economic policies could lead the economy to a recession.
- Increased geopolitical uncertainty from Trump’s tariff agenda has forced global organizations to slice US Gross Domestic Product (GDP) growth forecasts. On Monday, the Organization for Economic Cooperation and Development (OECD) stated that the US economic growth could decelerate to 2.2% in 2025 and 1.6% in 2026 after expanding at a robust pace of 2.8% in 2024. The agency also warned that higher and broader increases in trade barriers would hit growth and boost inflation growth globally.
Technical Analysis: EUR/USD trades firmly above 1.0900
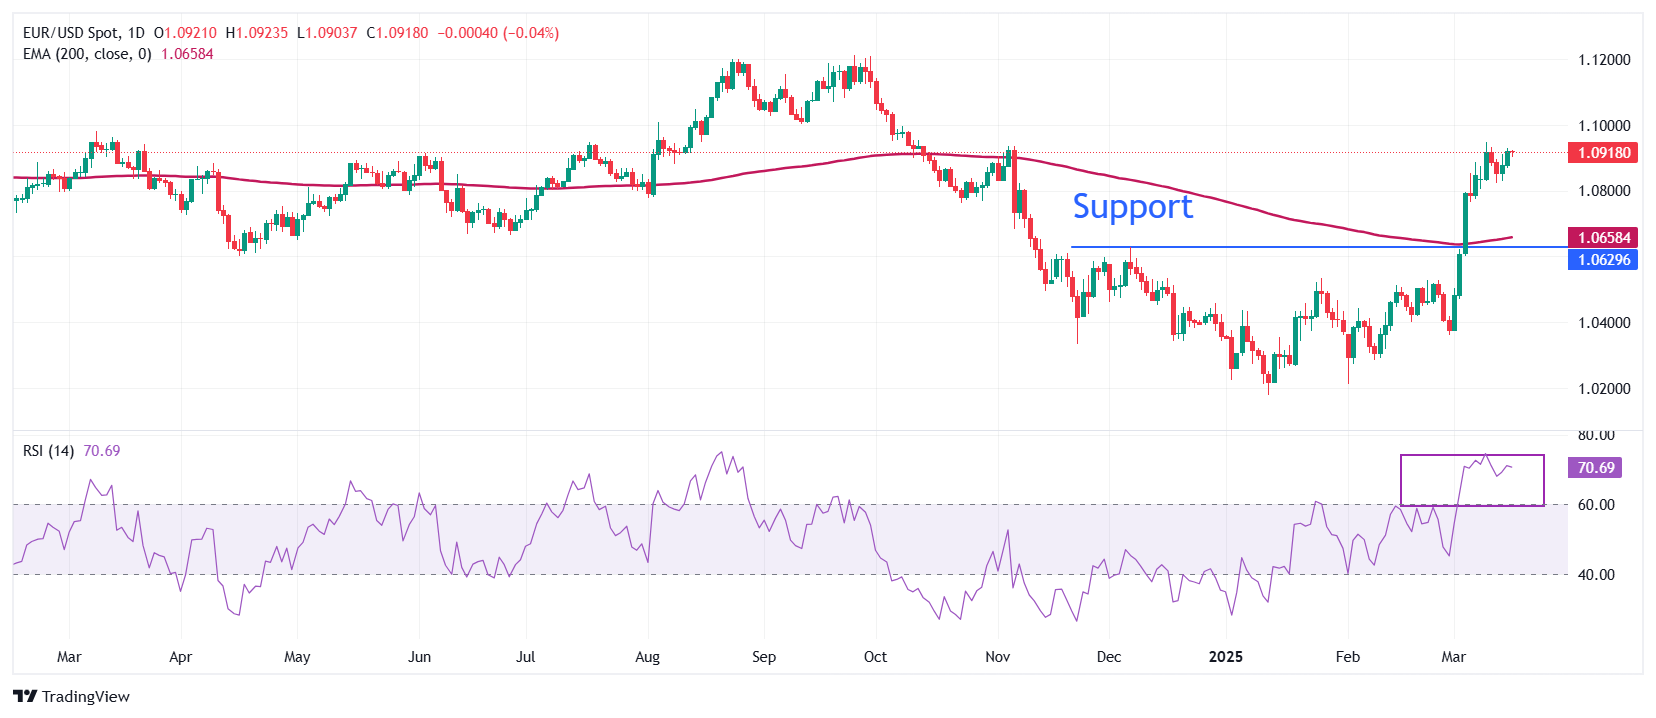
EUR/USD shows strength near the five-month of 1.0950 on Tuesday. The long-term outlook of the major currency pair remains firm as it holds above the 200-day Exponential Moving Average (EMA), which trades around 1.0655.
The pair strengthened after a decisive breakout above the December 6 high of 1.0630 on March 5.
The 14-day Relative Strength Index (RSI) wobbles near 70.00, suggesting that a strong bullish momentum is intact.
Looking down, the December 6 high of 1.0630 will act as the major support zone for the pair. Conversely, the psychological level of 1.1000 will be the key barrier for the Euro bulls.
Euro FAQs
The Euro is the currency for the 19 European Union countries that belong to the Eurozone. It is the second most heavily traded currency in the world behind the US Dollar. In 2022, it accounted for 31% of all foreign exchange transactions, with an average daily turnover of over $2.2 trillion a day. EUR/USD is the most heavily traded currency pair in the world, accounting for an estimated 30% off all transactions, followed by EUR/JPY (4%), EUR/GBP (3%) and EUR/AUD (2%).
The European Central Bank (ECB) in Frankfurt, Germany, is the reserve bank for the Eurozone. The ECB sets interest rates and manages monetary policy. The ECB’s primary mandate is to maintain price stability, which means either controlling inflation or stimulating growth. Its primary tool is the raising or lowering of interest rates. Relatively high interest rates – or the expectation of higher rates – will usually benefit the Euro and vice versa. The ECB Governing Council makes monetary policy decisions at meetings held eight times a year. Decisions are made by heads of the Eurozone national banks and six permanent members, including the President of the ECB, Christine Lagarde.
Eurozone inflation data, measured by the Harmonized Index of Consumer Prices (HICP), is an important econometric for the Euro. If inflation rises more than expected, especially if above the ECB’s 2% target, it obliges the ECB to raise interest rates to bring it back under control. Relatively high interest rates compared to its counterparts will usually benefit the Euro, as it makes the region more attractive as a place for global investors to park their money.
Data releases gauge the health of the economy and can impact on the Euro. Indicators such as GDP, Manufacturing and Services PMIs, employment, and consumer sentiment surveys can all influence the direction of the single currency. A strong economy is good for the Euro. Not only does it attract more foreign investment but it may encourage the ECB to put up interest rates, which will directly strengthen the Euro. Otherwise, if economic data is weak, the Euro is likely to fall. Economic data for the four largest economies in the euro area (Germany, France, Italy and Spain) are especially significant, as they account for 75% of the Eurozone’s economy.
Another significant data release for the Euro is the Trade Balance. This indicator measures the difference between what a country earns from its exports and what it spends on imports over a given period. If a country produces highly sought after exports then its currency will gain in value purely from the extra demand created from foreign buyers seeking to purchase these goods. Therefore, a positive net Trade Balance strengthens a currency and vice versa for a negative balance.
- AUD/JPY gains as the JPY weakens ahead of the Bank of Japan’s monetary policy decision.
- The BoJ is expected to keep interest rates unchanged at 0.5% when its meeting concludes on Wednesday.
- The Australian Dollar strengthens on optimism surrounding China’s economic outlook.
AUD/JPY extends its winning streak for a third consecutive session, trading around 95.50 during early European hours on Tuesday. The currency cross appreciates as the Japanese Yen (JPY) faces pressure ahead of the Bank of Japan’s (BoJ) upcoming monetary policy decision.
The BoJ is widely expected to keep interest rates steady at 0.5% when its meeting concludes on Wednesday. However, expectations remain for a rate hike later this year, supported by rising wages and persistent inflation, paving the way for policy normalization.
Last week, major Japanese firms agreed to significant wage increases for the third straight year, aiming to support workers against inflation and address labor shortages. Higher wages are expected to boost consumer spending, drive inflation, and provide the BoJ with more flexibility for future rate hikes.
Meanwhile, the AUD/JPY cross gains support as the China-linked Australian Dollar (AUD) strengthens, while the safe-haven JPY weakens amid an improving economic outlook in China. Over the weekend, China introduced a special action plan to revive consumption, including measures to raise wages, boost household spending, and stabilize stock and real estate markets.
However, the upside for the AUD/JPY cross could be limited as the AUD faces headwinds from rising geopolitical tensions in the Middle East. The US reaffirmed its commitment to striking Yemen’s Houthis until they cease attacks on Red Sea shipping, adding to market uncertainty.
Additionally, Reserve Bank of Australia (RBA) Assistant Governor (Economic) Sarah Hunter stated late Monday that the central bank will take a cautious approach to rate cuts. The February statement indicated that the RBA board remains more conservative than market expectations regarding further easing. Hunter also emphasized the importance of monitoring US policy decisions and their impact on Australian inflation.
Interest rates FAQs
Interest rates are charged by financial institutions on loans to borrowers and are paid as interest to savers and depositors. They are influenced by base lending rates, which are set by central banks in response to changes in the economy. Central banks normally have a mandate to ensure price stability, which in most cases means targeting a core inflation rate of around 2%. If inflation falls below target the central bank may cut base lending rates, with a view to stimulating lending and boosting the economy. If inflation rises substantially above 2% it normally results in the central bank raising base lending rates in an attempt to lower inflation.
Higher interest rates generally help strengthen a country’s currency as they make it a more attractive place for global investors to park their money.
Higher interest rates overall weigh on the price of Gold because they increase the opportunity cost of holding Gold instead of investing in an interest-bearing asset or placing cash in the bank. If interest rates are high that usually pushes up the price of the US Dollar (USD), and since Gold is priced in Dollars, this has the effect of lowering the price of Gold.
The Fed funds rate is the overnight rate at which US banks lend to each other. It is the oft-quoted headline rate set by the Federal Reserve at its FOMC meetings. It is set as a range, for example 4.75%-5.00%, though the upper limit (in that case 5.00%) is the quoted figure. Market expectations for future Fed funds rate are tracked by the CME FedWatch tool, which shapes how many financial markets behave in anticipation of future Federal Reserve monetary policy decisions.
Here is what you need to know on Tuesday, March 18:
Gold benefits from escalating geopolitical tensions and trades at a new record-high above $3,000 early Tuesday. The European economic calendar will feature Economic Sentiment data from Germany and Euro area Trade Balance readings. In the second half of the day, Industrial Production and housing data from the US, alongside February inflation figures from Canada will be watched closely by market participants.
Israeli Prime Minister Benjamin Netanyahu's office stated on Tuesday that Israel resumes military operations against Hamas across the Gaza Strip, per Reuters. "From now on, Israel will act against Hamas with increasing military force," Netanyahu further added. Meanwhile, US President Donald Trump said that they will hold Iran responsible for any attacks carried by the Houthis after the group launched an attack comprising 18 ballistic and cruise missiles, as well as drones, targeting the USS Harry S Truman aircraft carrier on Sunday. In response, the US reportedly carried out new airstrikes on the Red Sea port city of Hodeidah and Al Jawf governorate north of the capital Sanaa on Monday. After gaining about 0.5% on Monday, Gold continues to push higher and was last seen trading at a fresh all-time high near $3,020.
US Dollar PRICE This week
The table below shows the percentage change of US Dollar (USD) against listed major currencies this week. US Dollar was the weakest against the New Zealand Dollar.
| USD | EUR | GBP | JPY | CAD | AUD | NZD | CHF | |
|---|---|---|---|---|---|---|---|---|
| USD | -0.37% | -0.33% | 0.72% | -0.60% | -0.76% | -1.33% | -0.41% | |
| EUR | 0.37% | -0.08% | 0.69% | -0.22% | -0.53% | -0.97% | -0.06% | |
| GBP | 0.33% | 0.08% | 1.09% | -0.36% | -0.47% | -0.91% | -0.05% | |
| JPY | -0.72% | -0.69% | -1.09% | -1.30% | -1.68% | -1.98% | -1.24% | |
| CAD | 0.60% | 0.22% | 0.36% | 1.30% | -0.37% | -0.74% | -0.36% | |
| AUD | 0.76% | 0.53% | 0.47% | 1.68% | 0.37% | -0.42% | 0.49% | |
| NZD | 1.33% | 0.97% | 0.91% | 1.98% | 0.74% | 0.42% | 0.92% | |
| CHF | 0.41% | 0.06% | 0.05% | 1.24% | 0.36% | -0.49% | -0.92% |
The heat map shows percentage changes of major currencies against each other. The base currency is picked from the left column, while the quote currency is picked from the top row. For example, if you pick the US Dollar from the left column and move along the horizontal line to the Japanese Yen, the percentage change displayed in the box will represent USD (base)/JPY (quote).
The US Dollar (USD) Index edged lower following a bullish opening in Wall Street on Monday and closed the day in negative territory. In the European morning on Tuesday, the index holds steady at around 103.50, while US stock index futures lose between 0.2% and 0.3%.
USD/CAD lost more than 0.5% on Monday and dropped below 1.4300. The pair clings to small recovery gains near 1.4300 to begin the European session. On a yearly basis, the Consumer Price Index (CPI) in Canada is forecast to rise by 2.1% in February, following the 1.9% increase recorded in January.
EUR/USD capitalized on the USD weakness and closed above 1.0900 on Monday. The pair fluctuates in a tight channel at around 1.0920 early Tuesday.
GBP/USD rose more than 0.4% on Monday and touched its highest level since early November near 1.3000. In the European morning, the pair stays in a consolidation phase at around 1.2980.
USD/JPY continues to push higher after posting gains on Monday and trades at a two-week-high above 149.70. Speaking at a news briefing on Tuesday, Japan’s Finance Minister Katsunobu Kato said that bond markets should decide on rate moves after the 40-year government debt yield briefly jumped to a record high.
Gold FAQs
Gold has played a key role in human’s history as it has been widely used as a store of value and medium of exchange. Currently, apart from its shine and usage for jewelry, the precious metal is widely seen as a safe-haven asset, meaning that it is considered a good investment during turbulent times. Gold is also widely seen as a hedge against inflation and against depreciating currencies as it doesn’t rely on any specific issuer or government.
Central banks are the biggest Gold holders. In their aim to support their currencies in turbulent times, central banks tend to diversify their reserves and buy Gold to improve the perceived strength of the economy and the currency. High Gold reserves can be a source of trust for a country’s solvency. Central banks added 1,136 tonnes of Gold worth around $70 billion to their reserves in 2022, according to data from the World Gold Council. This is the highest yearly purchase since records began. Central banks from emerging economies such as China, India and Turkey are quickly increasing their Gold reserves.
Gold has an inverse correlation with the US Dollar and US Treasuries, which are both major reserve and safe-haven assets. When the Dollar depreciates, Gold tends to rise, enabling investors and central banks to diversify their assets in turbulent times. Gold is also inversely correlated with risk assets. A rally in the stock market tends to weaken Gold price, while sell-offs in riskier markets tend to favor the precious metal.
The price can move due to a wide range of factors. Geopolitical instability or fears of a deep recession can quickly make Gold price escalate due to its safe-haven status. As a yield-less asset, Gold tends to rise with lower interest rates, while higher cost of money usually weighs down on the yellow metal. Still, most moves depend on how the US Dollar (USD) behaves as the asset is priced in dollars (XAU/USD). A strong Dollar tends to keep the price of Gold controlled, whereas a weaker Dollar is likely to push Gold prices up.
- The US Dollar Index gains ground to near 103.60 in Tuesday’s early European session, up 0.14% on the day.
- The negative outlook of the index remains in play with a bearish RSI indicator.
- The first support level to watch is 103.35; the immediate resistance level is seen at 104.10.
The US Dollar Index (DXY), an index of the value of the US Dollar (USD) measured against a basket of six world currencies, recovers some lost ground to near 103.60 during the early European session on Tuesday. The potential upside for the Greenback might be limited amid fears that US President Donald Trump's tariff policies could trigger a broader economic slowdown.
The US Federal Reserve (Fed) interest rate decision will be in the spotlight on Wednesday, with no change in rate expected. According to the CME FedWatch tool, the markets have priced in nearly 60% chance of rate cuts, a little over two reductions, for the rest of the year.
According to the daily chart, the bearish sentiment of the DXY remains intact as the index holds below the key 100-day Exponential Moving Average (EMA). Furthermore, the downward momentum is supported by the 14-day Relative Strength Index (RSI), which stands below the midline near 31.50, supporting the sellers in the near term.
The initial support level for the USD index emerges at 103.35, the low of March 17. Further south, the next contention level is seen at 102.20, the lower limit of the Bollinger Band. The additional downside filter to watch is 100.53, the low of August 28, 2024.
On the bright side, the first upside barrier for the DXY is located at 104.10, the high of March 14. Any follow-through buying above this level could pave the way to 106.15, the 100-day EMA. A decisive break above the mentioned level could see a rally to 107.38, the high of February 19.
US Dollar Index (DXY) daily chart
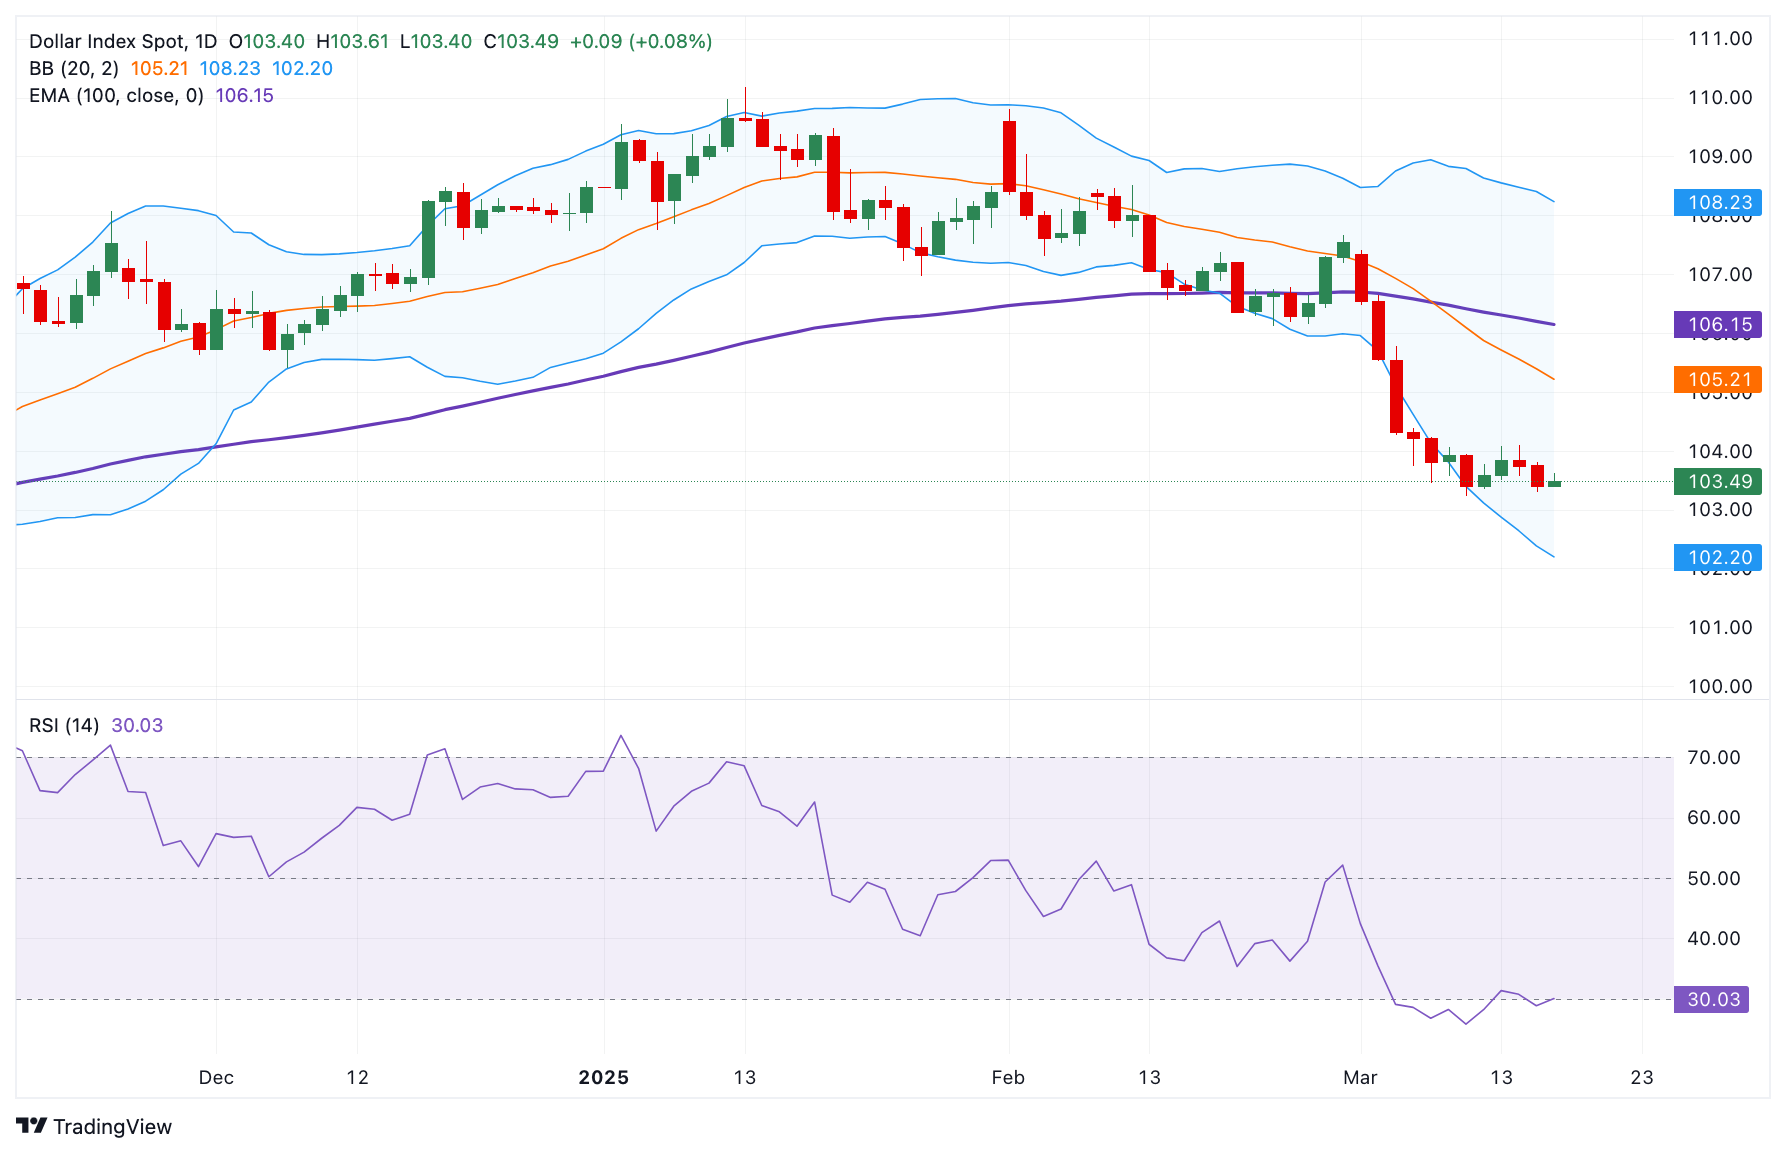
US Dollar FAQs
The US Dollar (USD) is the official currency of the United States of America, and the ‘de facto’ currency of a significant number of other countries where it is found in circulation alongside local notes. It is the most heavily traded currency in the world, accounting for over 88% of all global foreign exchange turnover, or an average of $6.6 trillion in transactions per day, according to data from 2022. Following the second world war, the USD took over from the British Pound as the world’s reserve currency. For most of its history, the US Dollar was backed by Gold, until the Bretton Woods Agreement in 1971 when the Gold Standard went away.
The most important single factor impacting on the value of the US Dollar is monetary policy, which is shaped by the Federal Reserve (Fed). The Fed has two mandates: to achieve price stability (control inflation) and foster full employment. Its primary tool to achieve these two goals is by adjusting interest rates. When prices are rising too quickly and inflation is above the Fed’s 2% target, the Fed will raise rates, which helps the USD value. When inflation falls below 2% or the Unemployment Rate is too high, the Fed may lower interest rates, which weighs on the Greenback.
In extreme situations, the Federal Reserve can also print more Dollars and enact quantitative easing (QE). QE is the process by which the Fed substantially increases the flow of credit in a stuck financial system. It is a non-standard policy measure used when credit has dried up because banks will not lend to each other (out of the fear of counterparty default). It is a last resort when simply lowering interest rates is unlikely to achieve the necessary result. It was the Fed’s weapon of choice to combat the credit crunch that occurred during the Great Financial Crisis in 2008. It involves the Fed printing more Dollars and using them to buy US government bonds predominantly from financial institutions. QE usually leads to a weaker US Dollar.
Quantitative tightening (QT) is the reverse process whereby the Federal Reserve stops buying bonds from financial institutions and does not reinvest the principal from the bonds it holds maturing in new purchases. It is usually positive for the US Dollar.
- USD/CHF flat lines around 0.8810 in Tuesday’s early European session.
- Geopolitical risks in the Middle East could boost the safe haven flows, benefiting the Swiss Franc.
- The Fed and SNB interest rate decisions will be the highlights later this week.
The USD/CHF pair trades on a flat note near 0.8810 during the early European session on Tuesday. The potential upside of the pair might be limited due to the heightened economic uncertainty and rising geopolitical tensions in the Middle East.
The US Dollar Index (DXY), an index of the value of the USD relative to a basket of foreign currencies, currently edges higher to 103.55, adding 0.13% on the day. The Greenback got support from US Retail Sales on Monday that showed a modest rebound in February after a revised 1.2% decline in January.
Markets expect the US Federal Reserve (Fed) to hold interest rates at its March meeting on Wednesday, with the next cut in June. The US central bank will give its new economic projections after the rate decision, which might offer some hints about how officials view the likely impact of US President Donald Trump's policies and US economic outlook.
On the other hand, the escalating geopolitical tensions in the Middle East could boost the safe haven currency like the Swiss Franc (CHF) and create a headwind for USD/CHF. On Tuesday, Israeli Prime Minister Benjamin Netanyahu said in a statement, "From now on, Israel will act against Hamas with increasing military force.” The order came after the militant group refused to release our hostages and rejected all offers it received from the US presidential envoy and the mediators.
The Swiss National Bank (SNB) is anticipated to cut its main policy rate by a quarter percentage point on Thursday to 0.25% and hold it there until at least 2026, according to most economists polled by Reuters. "Previously there had appeared to be a reasonable chance of the SNB cutting to zero or below, but those chances now look slim," said Adrian Prettejohn, Europe economist at Capital Economics.
Indian Rupee FAQs
The Indian Rupee (INR) is one of the most sensitive currencies to external factors. The price of Crude Oil (the country is highly dependent on imported Oil), the value of the US Dollar – most trade is conducted in USD – and the level of foreign investment, are all influential. Direct intervention by the Reserve Bank of India (RBI) in FX markets to keep the exchange rate stable, as well as the level of interest rates set by the RBI, are further major influencing factors on the Rupee.
The Reserve Bank of India (RBI) actively intervenes in forex markets to maintain a stable exchange rate, to help facilitate trade. In addition, the RBI tries to maintain the inflation rate at its 4% target by adjusting interest rates. Higher interest rates usually strengthen the Rupee. This is due to the role of the ‘carry trade’ in which investors borrow in countries with lower interest rates so as to place their money in countries’ offering relatively higher interest rates and profit from the difference.
Macroeconomic factors that influence the value of the Rupee include inflation, interest rates, the economic growth rate (GDP), the balance of trade, and inflows from foreign investment. A higher growth rate can lead to more overseas investment, pushing up demand for the Rupee. A less negative balance of trade will eventually lead to a stronger Rupee. Higher interest rates, especially real rates (interest rates less inflation) are also positive for the Rupee. A risk-on environment can lead to greater inflows of Foreign Direct and Indirect Investment (FDI and FII), which also benefit the Rupee.
Higher inflation, particularly, if it is comparatively higher than India’s peers, is generally negative for the currency as it reflects devaluation through oversupply. Inflation also increases the cost of exports, leading to more Rupees being sold to purchase foreign imports, which is Rupee-negative. At the same time, higher inflation usually leads to the Reserve Bank of India (RBI) raising interest rates and this can be positive for the Rupee, due to increased demand from international investors. The opposite effect is true of lower inflation.
- EUR/GBP remains steady ahead of Tuesday’s critical German spending plan vote.
- The CDU/CSU bloc, led by election winner Friedrich Merz, is expected to secure the required two-thirds parliamentary majority.
- The Bank of England is expected to keep interest rates unchanged, aiming to balance sluggish economic growth with inflation risks.
EUR/GBP remains largely unchanged for the second consecutive session, hovering around 0.8410 during Asian trading hours on Tuesday. The currency cross maintains its position as the Euro remains stable from traders’ optimism ahead of the crucial German spending plan vote due later in the day.
The conservative CDU/CSU bloc, led by election winner Friedrich Merz, is expected to secure the two-thirds parliamentary majority needed to pass proposed reforms. These include exempting defense spending from debt limits and establishing a €500 billion infrastructure investment plan, which is likely to pass in both Germany's lower and upper houses.
On the monetary policy front, traders have scaled back expectations for European Central Bank (ECB) rate cuts this year, now pricing in only two reductions, likely in April and June. Additionally, interest rates are no longer expected to drop below 2%.
The EUR/GBP cross faces potential pressure as the Pound Sterling (GBP) strengthens on expectations that the Bank of England (BoE) will maintain its interest rates at Thursday’s policy meeting. The BoE’s cautious stance seeks to balance sluggish economic growth with persistent inflation risks.
In February, the central bank lowered rates to 4.5% and revised its 2025 growth forecast downward to 0.75%, citing concerns over tax increases and global trade uncertainties. Investors will closely watch the monetary policy statement and BoE Governor Andrew Bailey’s press conference for insights into the economic and monetary policy outlook.
Interest rates FAQs
Interest rates are charged by financial institutions on loans to borrowers and are paid as interest to savers and depositors. They are influenced by base lending rates, which are set by central banks in response to changes in the economy. Central banks normally have a mandate to ensure price stability, which in most cases means targeting a core inflation rate of around 2%. If inflation falls below target the central bank may cut base lending rates, with a view to stimulating lending and boosting the economy. If inflation rises substantially above 2% it normally results in the central bank raising base lending rates in an attempt to lower inflation.
Higher interest rates generally help strengthen a country’s currency as they make it a more attractive place for global investors to park their money.
Higher interest rates overall weigh on the price of Gold because they increase the opportunity cost of holding Gold instead of investing in an interest-bearing asset or placing cash in the bank. If interest rates are high that usually pushes up the price of the US Dollar (USD), and since Gold is priced in Dollars, this has the effect of lowering the price of Gold.
The Fed funds rate is the overnight rate at which US banks lend to each other. It is the oft-quoted headline rate set by the Federal Reserve at its FOMC meetings. It is set as a range, for example 4.75%-5.00%, though the upper limit (in that case 5.00%) is the quoted figure. Market expectations for future Fed funds rate are tracked by the CME FedWatch tool, which shapes how many financial markets behave in anticipation of future Federal Reserve monetary policy decisions.
FX option expiries for Mar 18 NY cut at 10:00 Eastern Time via DTCC can be found below.
EUR/USD: EUR amounts
- 1.0600 2b
- 1.0610 828m
- 1.0745 972m
- 1.0750 1.3b
- 1.0755 965m
- 1.0900 1.6b
- 1.0950 895m
GBP/USD: GBP amounts
- 1.2600 512m
USD/JPY: USD amounts
- 147.00 672m
- 147.50 828m
- 149.00 1.1b
USD/CHF: USD amounts
- 0.8800 1.1b
AUD/USD: AUD amounts
- 0.6320 922m
- 0.6330 947m
- 0.6450 525m
USD/CAD: USD amounts
- 1.4270 588m
- 1.4340 559m
- 1.4600 580m
EUR/GBP: EUR amounts
- 0.8425 458m
- Silver price gains momentum to around $33.90 in Tuesday’s Asian session, adding 0.16% on the day.
- Heightened economic uncertainty, geopolitical risks and rising demand underpin the Silver price.
- The Fed interest rate decision will be the highlight on Wednesday.
Silver price (XAG/USD) extends its upside to around $33.90, its highest level since October 30, 2024, during the Asian trading hours on Tuesday, bolstered by the weaker US Dollar (USD). The escalating geopolitical tensions in the Middle East, economic uncertainty and growing industrial demand provide some support to the white metal.
The mounting fears of a recession in the United States (US) and persistent uncertainty over trade relations weigh on investor sentiment, boosting safe-haven assets like Silver. Late Monday, US President Donald Trump said that he would be imposing both broad reciprocal tariffs and additional sector-specific tariffs on April 2. Trump has already imposed a 20% tariff rate in China and a 25% levy on steel and aluminum. He also announced a 25% tariff on Canadian and Mexican goods.
Additionally, the rising geopolitical risks in the Middle East contribute to the Silver price’s upside. Israeli Prime Minister Benjamin Netanyahu said on Tuesday that Israel resumes military operations against Hamas across the Gaza Strip, adding that the country will act against the militant group with increasing military force.
Supply deficits and growing industrial demand create a strong tailwind for the white metal. According to the global investment company WisdomTree, investors own a significant portion of it and expect higher prices to encourage sales. Silver's industrial demand has reached all-time highs, owing to its use in photovoltaic applications, 5G technology, and automotive electronics.
The Federal Reserve (Fed) interest rate decision will be closely monitored on Wednesday. The US central bank is expected to hold its benchmark interest rate unchanged in a range of 4.25% to 4.50% at the March meeting. The primary focus will be on the Fed's policy guidance. Any hawkish remarks from Fed officials could lift the Greenback and undermine the USD-denominated commodity price in the near term.
Silver FAQs
Silver is a precious metal highly traded among investors. It has been historically used as a store of value and a medium of exchange. Although less popular than Gold, traders may turn to Silver to diversify their investment portfolio, for its intrinsic value or as a potential hedge during high-inflation periods. Investors can buy physical Silver, in coins or in bars, or trade it through vehicles such as Exchange Traded Funds, which track its price on international markets.
Silver prices can move due to a wide range of factors. Geopolitical instability or fears of a deep recession can make Silver price escalate due to its safe-haven status, although to a lesser extent than Gold's. As a yieldless asset, Silver tends to rise with lower interest rates. Its moves also depend on how the US Dollar (USD) behaves as the asset is priced in dollars (XAG/USD). A strong Dollar tends to keep the price of Silver at bay, whereas a weaker Dollar is likely to propel prices up. Other factors such as investment demand, mining supply – Silver is much more abundant than Gold – and recycling rates can also affect prices.
Silver is widely used in industry, particularly in sectors such as electronics or solar energy, as it has one of the highest electric conductivity of all metals – more than Copper and Gold. A surge in demand can increase prices, while a decline tends to lower them. Dynamics in the US, Chinese and Indian economies can also contribute to price swings: for the US and particularly China, their big industrial sectors use Silver in various processes; in India, consumers’ demand for the precious metal for jewellery also plays a key role in setting prices.
Silver prices tend to follow Gold's moves. When Gold prices rise, Silver typically follows suit, as their status as safe-haven assets is similar. The Gold/Silver ratio, which shows the number of ounces of Silver needed to equal the value of one ounce of Gold, may help to determine the relative valuation between both metals. Some investors may consider a high ratio as an indicator that Silver is undervalued, or Gold is overvalued. On the contrary, a low ratio might suggest that Gold is undervalued relative to Silver.
- EUR/JPY gains positive traction for the third straight day amid a broadly weaker JPY.
- Hawkish BoJ expectations could limit JPY losses and cap the upside for spot prices.
- Traders might also opt to wait for the highly-anticipated BoJ decision on Wednesday.
The EUR/JPY cross attracts some follow-through buyers for the third straight day on Tuesday and climbs beyond a technically significant 200-day Simple Moving Average (SMA) during the Asian session. The momentum lifts spot prices to the 163.35 area, or the highest level since January 27 in the last hour, and is sponsored by the offered tone surrounding the Japanese Yen (JPY).
The global risk sentiment remains well supported by the latest optimism over China's stimulus measures announced over the weekend to boost domestic consumption. Adding to this hopes for a Ukraine peace deal ahead of talks between US President Donald Trump and Russian President Vladimir Putin further boost investors' confidence. This, in turn, is seen undermining the safe-haven JPY and acting as a tailwind for the EUR/JPY cross.
Any meaningful JPY depreciation, however, seems elusive in the wake of the growing acceptance that the Bank of Japan (BoJ) will continue raising interest rates this year. The bets were reaffirmed by positive results from Shunto spring wage negotiations where firms largely agreed to union demands for strong wage growth for the third consecutive year. This, along with worries about a global trade war, should help limit deeper JPY losses.
Traders might also refrain from placing aggressive bets and opt to move to the sidelines ahead of the crucial BoJ policy decision on Wednesday. Meanwhile, a modest US Dollar (USD) bounce from a five-month low is seen exerting some downward pressure on the shared currency, which might contribute to keeping a lid on the EUR/JPY cross. Next on tap is the release of the German ZEW Economic Sentiment Index.
Economic Indicator
ZEW Survey – Economic Sentiment
The Economic Sentiment published by the Zentrum für Europäische Wirtschaftsforschung measures the institutional investor sentiment, reflecting the difference between the share of investors that are optimistic and the share of analysts that are pessimistic. Generally speaking, an optimistic view is considered as positive (or bullish) for the EUR, whereas a pessimistic view is considered as negative (or bearish).
Read more.Next release: Tue Mar 18, 2025 10:00
Frequency: Monthly
Consensus: 48.1
Previous: 26
Gold prices rose in India on Tuesday, according to data compiled by FXStreet.
The price for Gold stood at 8,403.31 Indian Rupees (INR) per gram, up compared with the INR 8,368.14 it cost on Monday.
The price for Gold increased to INR 98,014.58 per tola from INR 97,604.33 per tola a day earlier.
| Unit measure | Gold Price in INR |
|---|---|
| 1 Gram | 8,403.31 |
| 10 Grams | 84,033.12 |
| Tola | 98,014.58 |
| Troy Ounce | 261,372.40 |
Daily Digest Market Movers: Gold price continues to draw support from a combination of factors
-
The Israel Defense Forces (IDF) said it is carrying out "extensive strikes" in the Gaza Strip and targeting what it called "terror targets" belonging to Hamas. This comes after talks to extend the Gaza ceasefire failed to reach an agreement at meetings in Qatar, raising the risk of further escalation of geopolitical tensions in the region.
-
Concerns about the economic slowdown resurfaced after US Treasury Secretary Scott Bessent said on Sunday there were no guarantees that the U.S. economy will avoid recession this year. This further underpins demand for traditional safe-haven assets and lifts the Gold price to a fresh all-time peak during the Asian session on Tuesday.
-
On the economic data front, the US Census Bureau reported on Monday that US Retail Sales rose by 0.2% in February vs the downwardly revised decline of 1.2% the prior month. The reading fell short of expectations for a 0.7% growth, signaling consumer caution and lifting bets that the Federal Reserve will resume its rate-cutting cycle.
-
The Fed funds futures suggest that the US central bank could lower borrowing costs by 25 basis points each at the June, July, and October monetary policy meetings. This might cap the attempted US Dollar recovery from its lowest level since October 2024 touched on Monday and is further seen acting as a tailwind for the non-yielding yellow metal.
-
Meanwhile, US President Donald Trump expressed optimism that Russia and Ukraine will be able to come to a ceasefire and ultimately a peace deal. This comes ahead of the Trump-Putin peace talks on Tuesday, which, along with the optimism led by China's stimulus measures announced over the weekend, remains supportive of the upbeat market mood.
-
Traders now look to Tuesday's US economic docket – featuring the release of Building Permits, Housing Starts, and Industrial Production data. The focus, however, will remain glued to the outcome of a two-day FOMC meeting on Wednesday, which will drive the USD demand in the near term and provide a fresh directional impetus to the XAU/USD pair.
FXStreet calculates Gold prices in India by adapting international prices (USD/INR) to the local currency and measurement units. Prices are updated daily based on the market rates taken at the time of publication. Prices are just for reference and local rates could diverge slightly.
Gold FAQs
Gold has played a key role in human’s history as it has been widely used as a store of value and medium of exchange. Currently, apart from its shine and usage for jewelry, the precious metal is widely seen as a safe-haven asset, meaning that it is considered a good investment during turbulent times. Gold is also widely seen as a hedge against inflation and against depreciating currencies as it doesn’t rely on any specific issuer or government.
Central banks are the biggest Gold holders. In their aim to support their currencies in turbulent times, central banks tend to diversify their reserves and buy Gold to improve the perceived strength of the economy and the currency. High Gold reserves can be a source of trust for a country’s solvency. Central banks added 1,136 tonnes of Gold worth around $70 billion to their reserves in 2022, according to data from the World Gold Council. This is the highest yearly purchase since records began. Central banks from emerging economies such as China, India and Turkey are quickly increasing their Gold reserves.
Gold has an inverse correlation with the US Dollar and US Treasuries, which are both major reserve and safe-haven assets. When the Dollar depreciates, Gold tends to rise, enabling investors and central banks to diversify their assets in turbulent times. Gold is also inversely correlated with risk assets. A rally in the stock market tends to weaken Gold price, while sell-offs in riskier markets tend to favor the precious metal.
The price can move due to a wide range of factors. Geopolitical instability or fears of a deep recession can quickly make Gold price escalate due to its safe-haven status. As a yield-less asset, Gold tends to rise with lower interest rates, while higher cost of money usually weighs down on the yellow metal. Still, most moves depend on how the US Dollar (USD) behaves as the asset is priced in dollars (XAU/USD). A strong Dollar tends to keep the price of Gold controlled, whereas a weaker Dollar is likely to push Gold prices up.
(An automation tool was used in creating this post.)
- NZD/USD weakens as the US Dollar rebounds amid escalating geopolitical tensions in the Middle East.
- The US has reaffirmed its commitment to striking Yemen’s Houthis until they halt attacks on Red Sea shipping.
- The New Zealand Dollar found support from growing optimism about China’s economic outlook.
NZD/USD loses ground after gaining in the previous two sessions, trading around 0.5810 during Asian hours on Tuesday. The pair weakens as the US Dollar (USD) recovers amid rising geopolitical tensions in the Middle East.
The US has reaffirmed its commitment to striking Yemen’s Houthis until they cease attacks on Red Sea shipping, adding to market uncertainty. On Monday, US President Donald Trump warned that he would hold Iran accountable for any Houthi-led attacks in Yemen. Since Trump’s return to office, his administration has expanded the largest US military operation in the Middle East.
However, the US Dollar faced renewed pressure as weak economic data and Trump’s tariff threats fueled investor uncertainty. February’s US Retail Sales rose less than expected, raising concerns over a potential slowdown in consumer spending. Markets widely anticipate that the Federal Reserve (Fed) will maintain its current policy stance when it concludes its two-day meeting on Wednesday.
The New Zealand Dollar (NZD) gained support from growing optimism about China’s economic outlook. This followed strong retail sales data and new Chinese measures aimed at boosting consumer spending. Given China and New Zealand are close trade partners, any change in the Chinese economy could impact the antipodean markets.
However, domestic data painted a mixed picture. On Monday, New Zealand’s Business NZ Performance of Services Index (PSI) fell to 49.1 in February from 50.4 in January, signaling a return to contraction in the services sector. This uneven recovery from recession reinforces expectations for further rate cuts, aligning with the Reserve Bank of New Zealand’s (RBNZ) signal of additional easing last month. Traders now await New Zealand’s Q4 GDP data later this week, which is expected to show a modest rebound in economic activity.
New Zealand Dollar PRICE Today
The table below shows the percentage change of New Zealand Dollar (NZD) against listed major currencies today. New Zealand Dollar was the weakest against the US Dollar.
| USD | EUR | GBP | JPY | CAD | AUD | NZD | CHF | |
|---|---|---|---|---|---|---|---|---|
| USD | 0.10% | 0.12% | 0.28% | 0.12% | 0.21% | 0.11% | 0.04% | |
| EUR | -0.10% | 0.00% | 0.18% | 0.00% | 0.10% | -0.01% | -0.07% | |
| GBP | -0.12% | -0.01% | 0.17% | -0.00% | 0.09% | -0.01% | -0.08% | |
| JPY | -0.28% | -0.18% | -0.17% | -0.16% | -0.07% | -0.20% | -0.24% | |
| CAD | -0.12% | -0.00% | 0.00% | 0.16% | 0.11% | -0.00% | -0.07% | |
| AUD | -0.21% | -0.10% | -0.09% | 0.07% | -0.11% | -0.11% | -0.16% | |
| NZD | -0.11% | 0.00% | 0.01% | 0.20% | 0.00% | 0.11% | -0.06% | |
| CHF | -0.04% | 0.07% | 0.08% | 0.24% | 0.07% | 0.16% | 0.06% |
The heat map shows percentage changes of major currencies against each other. The base currency is picked from the left column, while the quote currency is picked from the top row. For example, if you pick the New Zealand Dollar from the left column and move along the horizontal line to the US Dollar, the percentage change displayed in the box will represent NZD (base)/USD (quote).
- Gold price continues to attract safe-haven flows amid trade jitters and geopolitical risks.
- Bets that the Fed will cut rates several times this year further benefit the yellow metal.
- A modest USD bounce and the risk-on mood might cap the upside for the XAU/USD pair.
Gold price (XAU/USD) scales higher for the second straight day – also marking its fifth day of a positive move in the previous six – and hits a fresh record high, around the $3,010 region during the Asian session on Tuesday. Against the backdrop of the uncertainty over US President Donald Trump’s trade tariffs and US recession fears, the risk of a further escalation of tensions in the Middle East fuels safe-haven demand and acts as a tailwind for the bullion. Adding to this, growing expectations of more rate cuts by the Federal Reserve (Fed), bolstered by unimpressive consumer spending data released on Monday, further underpin the non-yielding yellow metal.
It, however, remains to be seen if bulls are able to maintain their dominant position amid the risk-on mood, which remains well supported by the optimism over China's stimulus measures and tends to dent demand for the Gold price. Meanwhile, the US Dollar (USD) recovered slightly from a five-month low on the back of some repositioning trade ahead of a two-day FOMC policy meeting starting this Tuesday. This might further contribute to capping the upside for the commodity. Traders might also opt to move to wait for the highly-anticipated Fed decision on Wednesday before positioning for the next leg of a directional move for the precious metal.
Daily Digest Market Movers: Gold price continues to draw support from a combination of factors
- The Israel Defense Forces (IDF) said it is carrying out "extensive strikes" in the Gaza Strip and targeting what it called "terror targets" belonging to Hamas. This comes after talks to extend the Gaza ceasefire failed to reach an agreement at meetings in Qatar, raising the risk of further escalation of geopolitical tensions in the region.
- Concerns about the economic slowdown resurfaced after US Treasury Secretary Scott Bessent said on Sunday there were no guarantees that the U.S. economy will avoid recession this year. This further underpins demand for traditional safe-haven assets and lifts the Gold price to a fresh all-time peak during the Asian session on Tuesday.
- On the economic data front, the US Census Bureau reported on Monday that US Retail Sales rose by 0.2% in February vs the downwardly revised decline of 1.2% the prior month. The reading fell short of expectations for a 0.7% growth, signaling consumer caution and lifting bets that the Federal Reserve will resume its rate-cutting cycle.
- The Fed funds futures suggest that the US central bank could lower borrowing costs by 25 basis points each at the June, July, and October monetary policy meetings. This might cap the attempted US Dollar recovery from its lowest level since October 2024 touched on Monday and is further seen acting as a tailwind for the non-yielding yellow metal.
- Meanwhile, US President Donald Trump expressed optimism that Russia and Ukraine will be able to come to a ceasefire and ultimately a peace deal. This comes ahead of the Trump-Putin peace talks on Tuesday, which, along with the optimism led by China's stimulus measures announced over the weekend, remains supportive of the upbeat market mood.
- Traders now look to Tuesday's US economic docket – featuring the release of Building Permits, Housing Starts, and Industrial Production data. The focus, however, will remain glued to the outcome of a two-day FOMC meeting on Wednesday, which will drive the USD demand in the near term and provide a fresh directional impetus to the XAU/USD pair.
Gold price needs to consolidate before the next leg up amid slightly overbought daily RSI
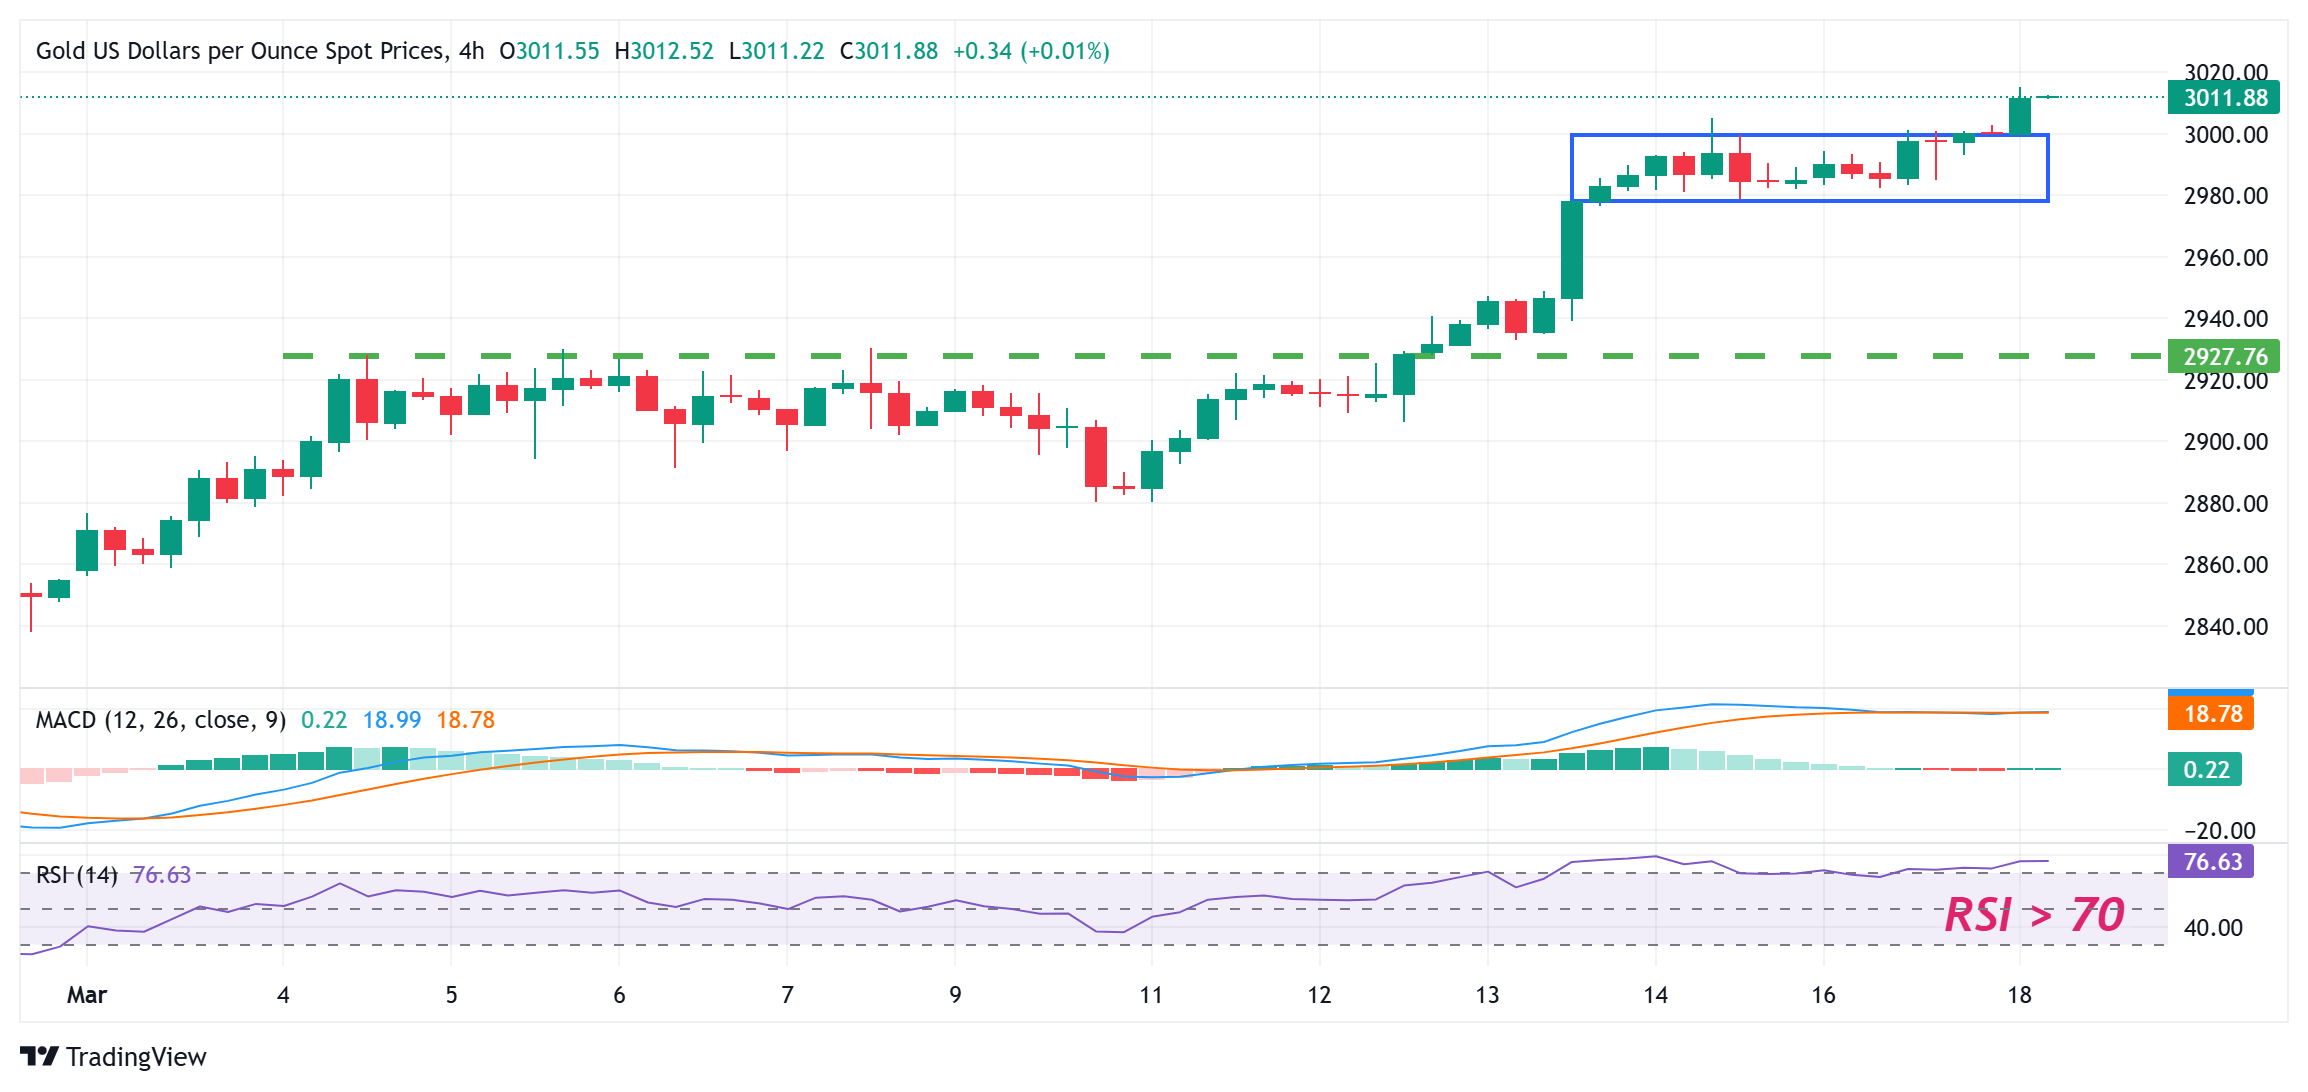
From a technical perspective, acceptance above the $3,000 psychological mark could be seen as a fresh trigger for bullish traders. That said, the daily Relative Strength Index (RSI) on the daily chart has started flashing slightly overbought conditions. This makes it prudent to wait for some near-term consolidation or a modest pullback before positioning for an extension of the recent well-established uptrend witnessed over the past three months or so.
Meanwhile, any corrective slide below the $2,980-2,978 immediate support could be seen as a buying opportunity and remain limited near the $2,956 resistance breakpoint. A convincing break below the latter, however, might prompt some technical selling and drag the Gold price to the $2,930-2,928 horizontal zone en route to the $2,900 round figure and last week's swing low, around the $2,880 region.
Gold FAQs
Gold has played a key role in human’s history as it has been widely used as a store of value and medium of exchange. Currently, apart from its shine and usage for jewelry, the precious metal is widely seen as a safe-haven asset, meaning that it is considered a good investment during turbulent times. Gold is also widely seen as a hedge against inflation and against depreciating currencies as it doesn’t rely on any specific issuer or government.
Central banks are the biggest Gold holders. In their aim to support their currencies in turbulent times, central banks tend to diversify their reserves and buy Gold to improve the perceived strength of the economy and the currency. High Gold reserves can be a source of trust for a country’s solvency. Central banks added 1,136 tonnes of Gold worth around $70 billion to their reserves in 2022, according to data from the World Gold Council. This is the highest yearly purchase since records began. Central banks from emerging economies such as China, India and Turkey are quickly increasing their Gold reserves.
Gold has an inverse correlation with the US Dollar and US Treasuries, which are both major reserve and safe-haven assets. When the Dollar depreciates, Gold tends to rise, enabling investors and central banks to diversify their assets in turbulent times. Gold is also inversely correlated with risk assets. A rally in the stock market tends to weaken Gold price, while sell-offs in riskier markets tend to favor the precious metal.
The price can move due to a wide range of factors. Geopolitical instability or fears of a deep recession can quickly make Gold price escalate due to its safe-haven status. As a yield-less asset, Gold tends to rise with lower interest rates, while higher cost of money usually weighs down on the yellow metal. Still, most moves depend on how the US Dollar (USD) behaves as the asset is priced in dollars (XAU/USD). A strong Dollar tends to keep the price of Gold controlled, whereas a weaker Dollar is likely to push Gold prices up.
- GBP/USD could see further gains as the US Dollar may struggle amid rising economic concerns in the United States.
- Markets widely anticipate that the Fed will keep its current policy stance unchanged on Wednesday.
- Traders expect the Bank of England to hold interest rates steady at its policy meeting on Thursday.
GBP/USD retreats after gaining in the previous session, hovering around 1.2970 during Asian trading on Tuesday. The pair faces pressure as the US Dollar (USD) attempts to recover losses from the last two sessions. However, downside movement may be limited, as the Greenback remains vulnerable amid rising trade tensions and growing economic concerns in the United States (US).
The US Dollar Index (DXY), which tracks the USD against six major currencies, trades positively around 103.50 at the time of writing. However, the US Dollar could further lose ground as weak US economic data and Trump’s tariff threats add to investor uncertainty.
February’s US Retail Sales rose less than expected, raising concerns about a potential slowdown in consumer spending. Markets widely expect the Federal Reserve (Fed) to maintain its current policy stance when it concludes its two-day meeting on Wednesday.
Data from the US Census Bureau on Monday showed that Retail Sales increased by 0.2% month-over-month in February, falling short of the expected 0.7%. This followed a revised -1.2% decline in January (previously -0.9%). On an annual basis, Retail Sales grew by 3.1%, down from the revised 3.9% in January (previously 4.2%).
The GBP/USD pair could find additional support as the Pound Sterling (GBP) strengthens on expectations that the Bank of England (BoE) will maintain its interest rates at Thursday’s policy meeting. This cautious stance aims to balance sluggish economic growth with persistent inflation risks. In February, the central bank lowered rates to 4.5% and revised its 2025 growth forecast downward to 0.75%, citing concerns over tax increases and global trade uncertainties.
Pound Sterling FAQs
The Pound Sterling (GBP) is the oldest currency in the world (886 AD) and the official currency of the United Kingdom. It is the fourth most traded unit for foreign exchange (FX) in the world, accounting for 12% of all transactions, averaging $630 billion a day, according to 2022 data. Its key trading pairs are GBP/USD, also known as ‘Cable’, which accounts for 11% of FX, GBP/JPY, or the ‘Dragon’ as it is known by traders (3%), and EUR/GBP (2%). The Pound Sterling is issued by the Bank of England (BoE).
The single most important factor influencing the value of the Pound Sterling is monetary policy decided by the Bank of England. The BoE bases its decisions on whether it has achieved its primary goal of “price stability” – a steady inflation rate of around 2%. Its primary tool for achieving this is the adjustment of interest rates. When inflation is too high, the BoE will try to rein it in by raising interest rates, making it more expensive for people and businesses to access credit. This is generally positive for GBP, as higher interest rates make the UK a more attractive place for global investors to park their money. When inflation falls too low it is a sign economic growth is slowing. In this scenario, the BoE will consider lowering interest rates to cheapen credit so businesses will borrow more to invest in growth-generating projects.
Data releases gauge the health of the economy and can impact the value of the Pound Sterling. Indicators such as GDP, Manufacturing and Services PMIs, and employment can all influence the direction of the GBP. A strong economy is good for Sterling. Not only does it attract more foreign investment but it may encourage the BoE to put up interest rates, which will directly strengthen GBP. Otherwise, if economic data is weak, the Pound Sterling is likely to fall.
Another significant data release for the Pound Sterling is the Trade Balance. This indicator measures the difference between what a country earns from its exports and what it spends on imports over a given period. If a country produces highly sought-after exports, its currency will benefit purely from the extra demand created from foreign buyers seeking to purchase these goods. Therefore, a positive net Trade Balance strengthens a currency and vice versa for a negative balance.
- The Indian Rupee edges lower in Tuesday’s early Asian session.
- Higher crude oil prices undermine the INR, but US Dollar sales from foreign banks might cap its downside.
- The Fed interest rate decision will take center stage on Wednesday.
The Indian Rupee (INR) softens on Tuesday. A rise in crude oil prices amid the escalating geopolitical tensions in the Middle East weighs on the local currency. It’s worth noting that India is the world's third-largest oil consumer and higher crude oil prices tend to have a negative impact on the INR value.
Nonetheless, the US Dollar (USD) sales from foreign banks and the concerns about slowing growth in the US economy from the US President Donald Trump administration's trade policies might help limit the INR’s losses. Additionally, the foreign exchange intervention from the Reserve Bank of India (RBI) could prevent the Indian Rupee from significant depreciation.
Markets widely expect the Federal Reserve (Fed) will stay on hold when it concludes its two-day meeting on Wednesday, leaving the benchmark interest rate unchanged in a range of 4.25% to 4.50%. The primary focus will be on the Fed's policy guidance. Economists anticipate policymakers’ updated projections to also show two quarter-percentage-point reductions this year.
Indian Rupee remains weaker ahead of Fed rate decision
- "Given the current sentiment, the USDINR pair is expected to trade within the 86.80–87.40 range in the near to medium term," Amit Pabari, managing director of CR Forex Advisors, said. "A breakout beyond this band could trigger an additional move of 30–50 paise in the same direction, keeping market participants on high alert for potential volatility.”
- India’s Wholesale Price Index (WPI) inflation rose to 2.38% in February from the previous reading of 2.31%, the Ministry of Commerce and Industry reported on Monday. This figure came in hotter than the expectation of 2.36%.
- Retail Sales in the United States rose 0.2% MoM in February, compared to a fall of 1.2% (revised from -0.9%) in January, according to the US Census Bureau on Monday. This figure came in weaker than the market expectation for an increase of 0.7%.
- Retail Sales climbed 3.1% YoY in February versus 3.9% (revised from 4.2%) prior.
- According to the CME FedWatch tool, the markets have priced in nearly 75% odds of a quarter-point reduction to the policy rate by June.
USD/INR’s uptrend remains intact in the longer term
The Indian Rupee trades on a weaker note on the day. The USD/INR pair has broken out of a symmetrical triangle on the daily chart. In the longer term, the uptrend of the pair remains in play, with the price being above the key 100-day Exponential Moving Average (EMA). However, in the near term, further downside looks favorable as the 14-day Relative Strength Index (RSI) stands below the midline near 43.65.
The first upside barrier for USD/INR emerges near the support-turned-resistance level at 86.90. Green candlesticks and consistent trading above the mentioned level could see a rally to 87.38, the high of March 11, en route to 87.53, the high of February 28.
On the downside, the initial support level is located at 86.48, the low of February 21. A drop below this level could open the door for a move toward 86.14, the low of January 27.
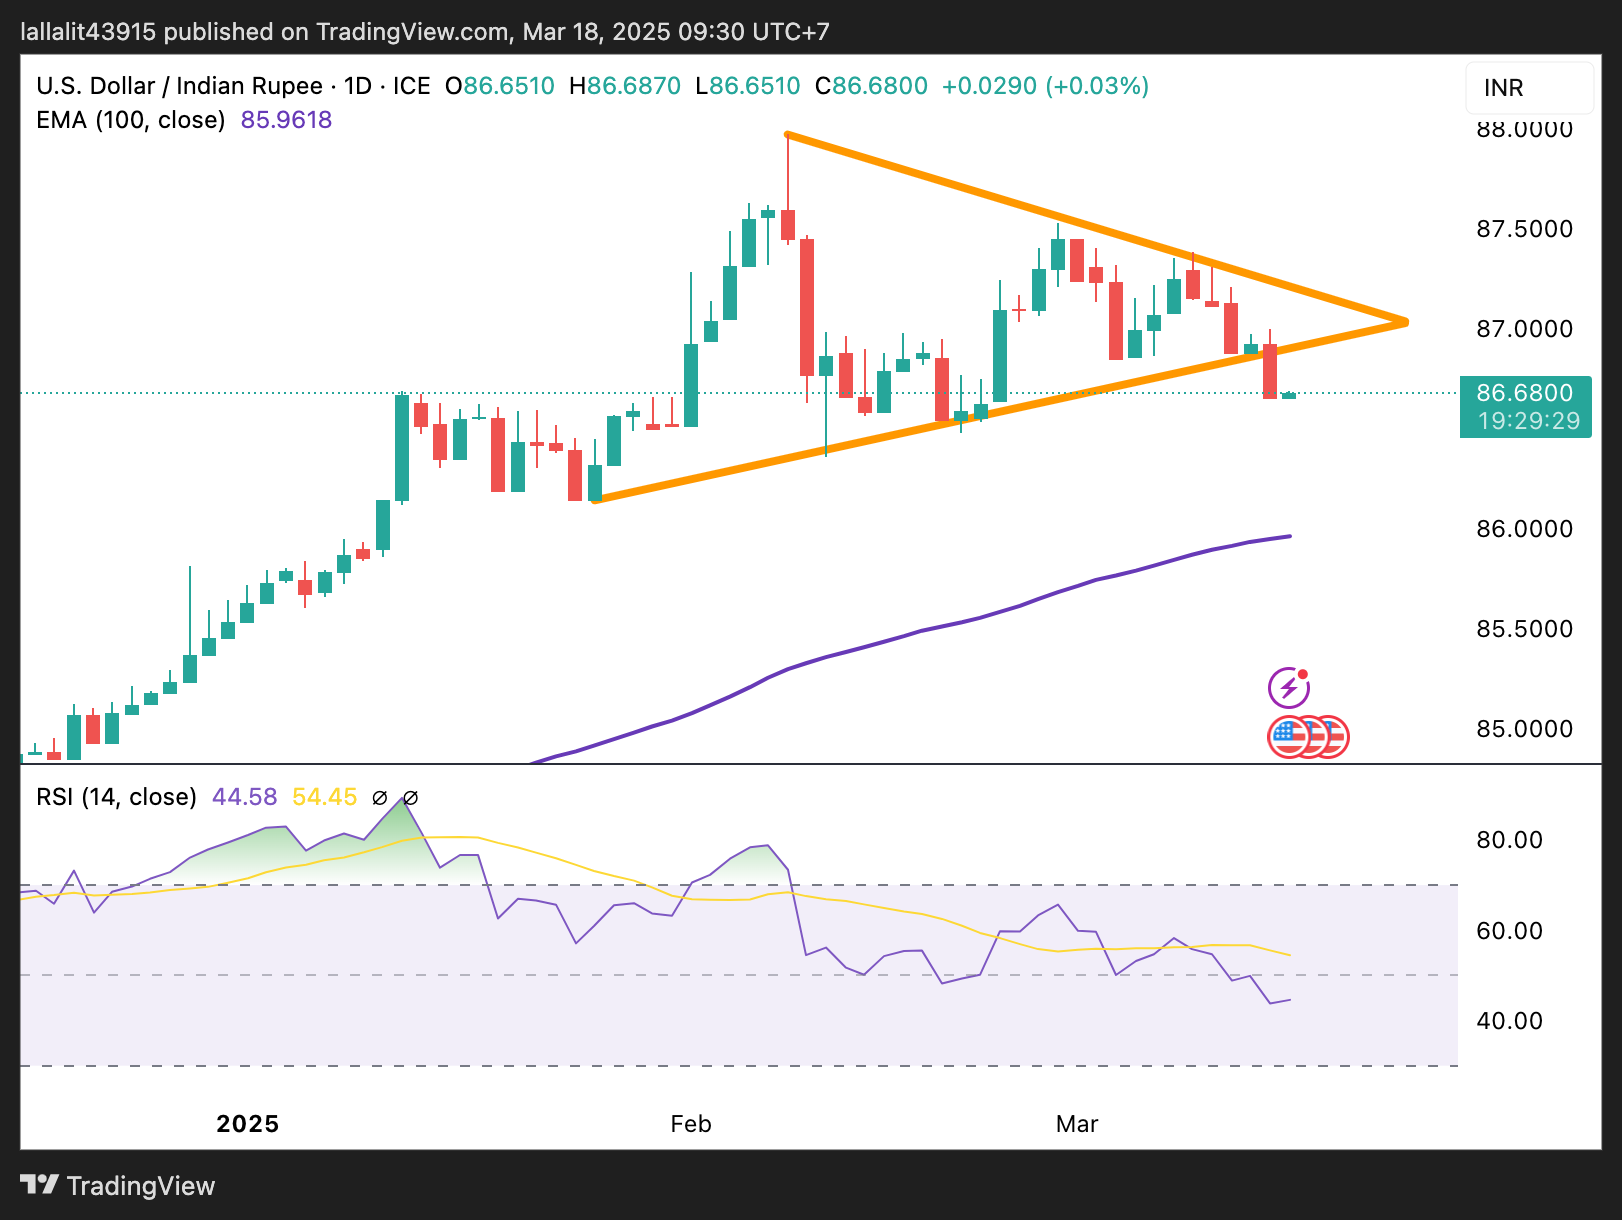
Indian Rupee FAQs
The Indian Rupee (INR) is one of the most sensitive currencies to external factors. The price of Crude Oil (the country is highly dependent on imported Oil), the value of the US Dollar – most trade is conducted in USD – and the level of foreign investment, are all influential. Direct intervention by the Reserve Bank of India (RBI) in FX markets to keep the exchange rate stable, as well as the level of interest rates set by the RBI, are further major influencing factors on the Rupee.
The Reserve Bank of India (RBI) actively intervenes in forex markets to maintain a stable exchange rate, to help facilitate trade. In addition, the RBI tries to maintain the inflation rate at its 4% target by adjusting interest rates. Higher interest rates usually strengthen the Rupee. This is due to the role of the ‘carry trade’ in which investors borrow in countries with lower interest rates so as to place their money in countries’ offering relatively higher interest rates and profit from the difference.
Macroeconomic factors that influence the value of the Rupee include inflation, interest rates, the economic growth rate (GDP), the balance of trade, and inflows from foreign investment. A higher growth rate can lead to more overseas investment, pushing up demand for the Rupee. A less negative balance of trade will eventually lead to a stronger Rupee. Higher interest rates, especially real rates (interest rates less inflation) are also positive for the Rupee. A risk-on environment can lead to greater inflows of Foreign Direct and Indirect Investment (FDI and FII), which also benefit the Rupee.
Higher inflation, particularly, if it is comparatively higher than India’s peers, is generally negative for the currency as it reflects devaluation through oversupply. Inflation also increases the cost of exports, leading to more Rupees being sold to purchase foreign imports, which is Rupee-negative. At the same time, higher inflation usually leads to the Reserve Bank of India (RBI) raising interest rates and this can be positive for the Rupee, due to increased demand from international investors. The opposite effect is true of lower inflation.
- USD/CAD attracts some buyers on Tuesday, though it lacks follow-through.
- An uptick in Oil prices underpins the Loonie and caps the upside for the pair.
- Canadian CPI eyed for some impetus ahead of the Fed decision on Wednesday.
The USD/CAD pair edges higher during the Asian session on Tuesday and for now, seems to have snapped a two-day losing streak to over a one-week low, around the 1.4275 region touched the previous day. Spot prices now look to build on the intraday move up beyond the 1.4300 round figure, though the fundamental backdrop warrants some caution for bullish traders.
The US Dollar (USD) stages a modest recovery from its lowest level since October 2024 amid some repositioning trade ahead of this week's key central bank event risks, which, in turn, is seen acting as a tailwind for the USD/CAD pair. Any meaningful USD appreciation, however, still seems elusive in the wake of the growing acceptance that the Federal Reserve (Fed) will cut interest rates several times this year.
Meanwhile, Crude Oil prices remain close to a two-week top set on Monday amid the risk of a further escalation of tensions in the Middle East, which could impact supply. This, along with positive news coming out of the US-Canada trade talks last week should underpin the commodity-linked Loonie and contribute to capping the USD/CAD pair, warranting some caution for aggressive bullish traders.
Traders might also refrain from placing aggressive bets and opt to wait for the outcome of the highly-anticipated two-day FOMC policy meeting, scheduled to be announced on Wednesday. In the meantime, traders on Tuesday will take cues from the release of the latest consumer inflation figures from Canada. This, along with second-tier US macro data, should provide some impetus to the USD/CAD pair.
Canadian Dollar FAQs
The key factors driving the Canadian Dollar (CAD) are the level of interest rates set by the Bank of Canada (BoC), the price of Oil, Canada’s largest export, the health of its economy, inflation and the Trade Balance, which is the difference between the value of Canada’s exports versus its imports. Other factors include market sentiment – whether investors are taking on more risky assets (risk-on) or seeking safe-havens (risk-off) – with risk-on being CAD-positive. As its largest trading partner, the health of the US economy is also a key factor influencing the Canadian Dollar.
The Bank of Canada (BoC) has a significant influence on the Canadian Dollar by setting the level of interest rates that banks can lend to one another. This influences the level of interest rates for everyone. The main goal of the BoC is to maintain inflation at 1-3% by adjusting interest rates up or down. Relatively higher interest rates tend to be positive for the CAD. The Bank of Canada can also use quantitative easing and tightening to influence credit conditions, with the former CAD-negative and the latter CAD-positive.
The price of Oil is a key factor impacting the value of the Canadian Dollar. Petroleum is Canada’s biggest export, so Oil price tends to have an immediate impact on the CAD value. Generally, if Oil price rises CAD also goes up, as aggregate demand for the currency increases. The opposite is the case if the price of Oil falls. Higher Oil prices also tend to result in a greater likelihood of a positive Trade Balance, which is also supportive of the CAD.
While inflation had always traditionally been thought of as a negative factor for a currency since it lowers the value of money, the opposite has actually been the case in modern times with the relaxation of cross-border capital controls. Higher inflation tends to lead central banks to put up interest rates which attracts more capital inflows from global investors seeking a lucrative place to keep their money. This increases demand for the local currency, which in Canada’s case is the Canadian Dollar.
Macroeconomic data releases gauge the health of the economy and can have an impact on the Canadian Dollar. Indicators such as GDP, Manufacturing and Services PMIs, employment, and consumer sentiment surveys can all influence the direction of the CAD. A strong economy is good for the Canadian Dollar. Not only does it attract more foreign investment but it may encourage the Bank of Canada to put up interest rates, leading to a stronger currency. If economic data is weak, however, the CAD is likely to fall.
| Raw materials | Closed | Change, % |
|---|---|---|
| Silver | 33.849 | 0.04 |
| Gold | 3000.78 | 0.47 |
| Palladium | 968.47 | 0.6 |
- Gold prices soared to a record high of $3,005, fueled by strong safe-haven demand amid escalating geopolitical tensions.
- Market uncertainty deepened as US reaffirmed its commitment to striking Yemen’s Houthis until they cease attacks on Red Sea shipping.
- Gold demand remained strong, bolstered by continued purchases from ETFs and central banks, with China leading acquisitions.
Gold price (XAU/USD) surged to a record high of $3,005 per troy ounce during Asian trading hours on Tuesday, driven by strong safe-haven demand amid ongoing trade tariff uncertainty and geopolitical tensions.
The US reaffirmed its commitment to striking Yemen’s Houthis until they halt attacks on Red Sea shipping, further unsettling markets. US President Donald Trump warned on Monday that he would hold Iran accountable for any attacks by the Houthi group it supports in Yemen. Trump administration has since expanded the largest US military operation in the Middle East since Trump returned to office.
On Sunday, the Houthis claimed responsibility for an assault involving 18 ballistic and cruise missiles, along with drones, targeting the USS Harry S. Truman aircraft carrier and its escorting warships in the northern Red Sea.
Meanwhile, the Israeli military reported extensive strikes on Hamas targets in Gaza. Medics in the region confirmed at least 30 fatalities in what has been described as the most intense airstrikes since the ceasefire began on January 19. A senior Hamas official accused Israel of unilaterally violating the agreement, according to Reuters.
Trade war concerns also weighed on investor sentiment, as the US and key trading partners exchanged fresh tariff threats. The demand for Gold remained robust, supported by ongoing purchases from exchange-traded funds (ETFs) and central banks—most notably China, which extended its Gold acquisitions for a fourth consecutive month.
Investors now turn their focus to upcoming central bank policy meetings, particularly the US Federal Reserve’s decision later this week. The Fed is widely expected to maintain interest rates amid rising trade tensions and mounting economic concerns, with markets pricing in only two rate cuts this year.
Gold FAQs
Gold has played a key role in human’s history as it has been widely used as a store of value and medium of exchange. Currently, apart from its shine and usage for jewelry, the precious metal is widely seen as a safe-haven asset, meaning that it is considered a good investment during turbulent times. Gold is also widely seen as a hedge against inflation and against depreciating currencies as it doesn’t rely on any specific issuer or government.
Central banks are the biggest Gold holders. In their aim to support their currencies in turbulent times, central banks tend to diversify their reserves and buy Gold to improve the perceived strength of the economy and the currency. High Gold reserves can be a source of trust for a country’s solvency. Central banks added 1,136 tonnes of Gold worth around $70 billion to their reserves in 2022, according to data from the World Gold Council. This is the highest yearly purchase since records began. Central banks from emerging economies such as China, India and Turkey are quickly increasing their Gold reserves.
Gold has an inverse correlation with the US Dollar and US Treasuries, which are both major reserve and safe-haven assets. When the Dollar depreciates, Gold tends to rise, enabling investors and central banks to diversify their assets in turbulent times. Gold is also inversely correlated with risk assets. A rally in the stock market tends to weaken Gold price, while sell-offs in riskier markets tend to favor the precious metal.
The price can move due to a wide range of factors. Geopolitical instability or fears of a deep recession can quickly make Gold price escalate due to its safe-haven status. As a yield-less asset, Gold tends to rise with lower interest rates, while higher cost of money usually weighs down on the yellow metal. Still, most moves depend on how the US Dollar (USD) behaves as the asset is priced in dollars (XAU/USD). A strong Dollar tends to keep the price of Gold controlled, whereas a weaker Dollar is likely to push Gold prices up.
- The Japanese Yen attracts sellers for the third consecutive day amid a positive risk tone.
- A modest USD bounce from a multi-month low further lends support to the USD/JPY pair.
- The divergent BoJ-Fed expectations might cap the pair ahead of central bank event risks.
The Japanese Yen (JPY) drifts lower against its American counterpart for the third straight day on Tuesday, lifting the USD/JPY pair to a nearly two-week high, above mid-149.00s during the Asian session. Investors continue to cheer China's latest stimulus measures to boost domestic consumption and household incomes. Adding to this hopes for a Ukraine peace deal ahead of talks between US President Donald Trump and Russian President Vladimir Putin remain supportive of the upbeat market mood. This, along with some repositioning trade ahead of this week's key central bank event risks, is seen undermining the safe-haven JPY.
However, firming expectations that the Bank of Japan (BoJ) will continue raising interest rates this year, bolstered by positive results from Shunto spring wage negotiations, might hold back the JPY bears from placing aggressive bets. Apart from this, the recent narrowing of the Japan-US rate differential, amid bets that the Federal Reserve (Fed) would lower borrowing costs several times this year, should contribute to limiting deeper JPY losses. This, along with the underlying bearish sentiment surrounding the US Dollar (USD), might keep a lid on the USD/JPY pair ahead of the crucial BoJ and the Fed policy meetings starting today.
Japanese Yen continues to be undermined by improving risk sentiment, ahead of BoJ-Fed policy meetings
- Ahead of talks on Ukraine with Russian President Vladimir Putin, US President Donald Trump expressed optimism that both sides will be able to come to a ceasefire and ultimately a peace deal. This comes on top of China's special action plan to boost domestic consumption announced over the weekend and remains supportive of the upbeat market mood.
- Japan’s Finance Minister Katsunobu Kato spoke at his regular press conference on Tuesday and said that bond markets should dictate yield movements. Kato added that the government would respond appropriately while allowing market forces to drive bond price fluctuations. This follows a brief spike in the 40-year Japanese government bond yield to a record high.
- The preliminary results of Japan's annual spring labor negotiations, which concluded on Friday, showed that firms largely agreed to union demands for strong wage growth for the third consecutive year. This is expected to boost consumer spending and contribute to rising inflation, which, in turn, gives the Bank of Japan headroom to keep raising interest rates.
- In contrast, traders are now pricing in the possibility of 25 basis points Fed rate cuts each at the June, July, and October policy meetings amid concerns about a tariff-driven US economic slowdown, signs of a cooling labor market, and easing inflation. This might cap the attempted US Dollar recovery from its lowest level since October 2024 touched on Monday.
- On the economic data front, the US Census Bureau reported on Monday that Retail Sales in the US grew by 0.2% in February compared to the downwardly revised decline of 1.2% the prior month. This, however, was well short of expectations for a 0.7% rise, signaling consumer caution and compelling evidence for the Fed to resume its policy easing cycle soon.
- Traders now look forward to Tuesday's US economic docket – featuring the release of Building Permits, Housing Starts, and Industrial Production data – for some impetus. The focus, however, will remain glued to the crucial BoJ-Fed rate decisions on Wednesday, which will play a key in determining the next leg of a directional move for the USD/JPY pair.
USD/JPY could aim to reclaim 150.00; Monday’s breakout above the 100-period SMA on the 4-hour chart in play
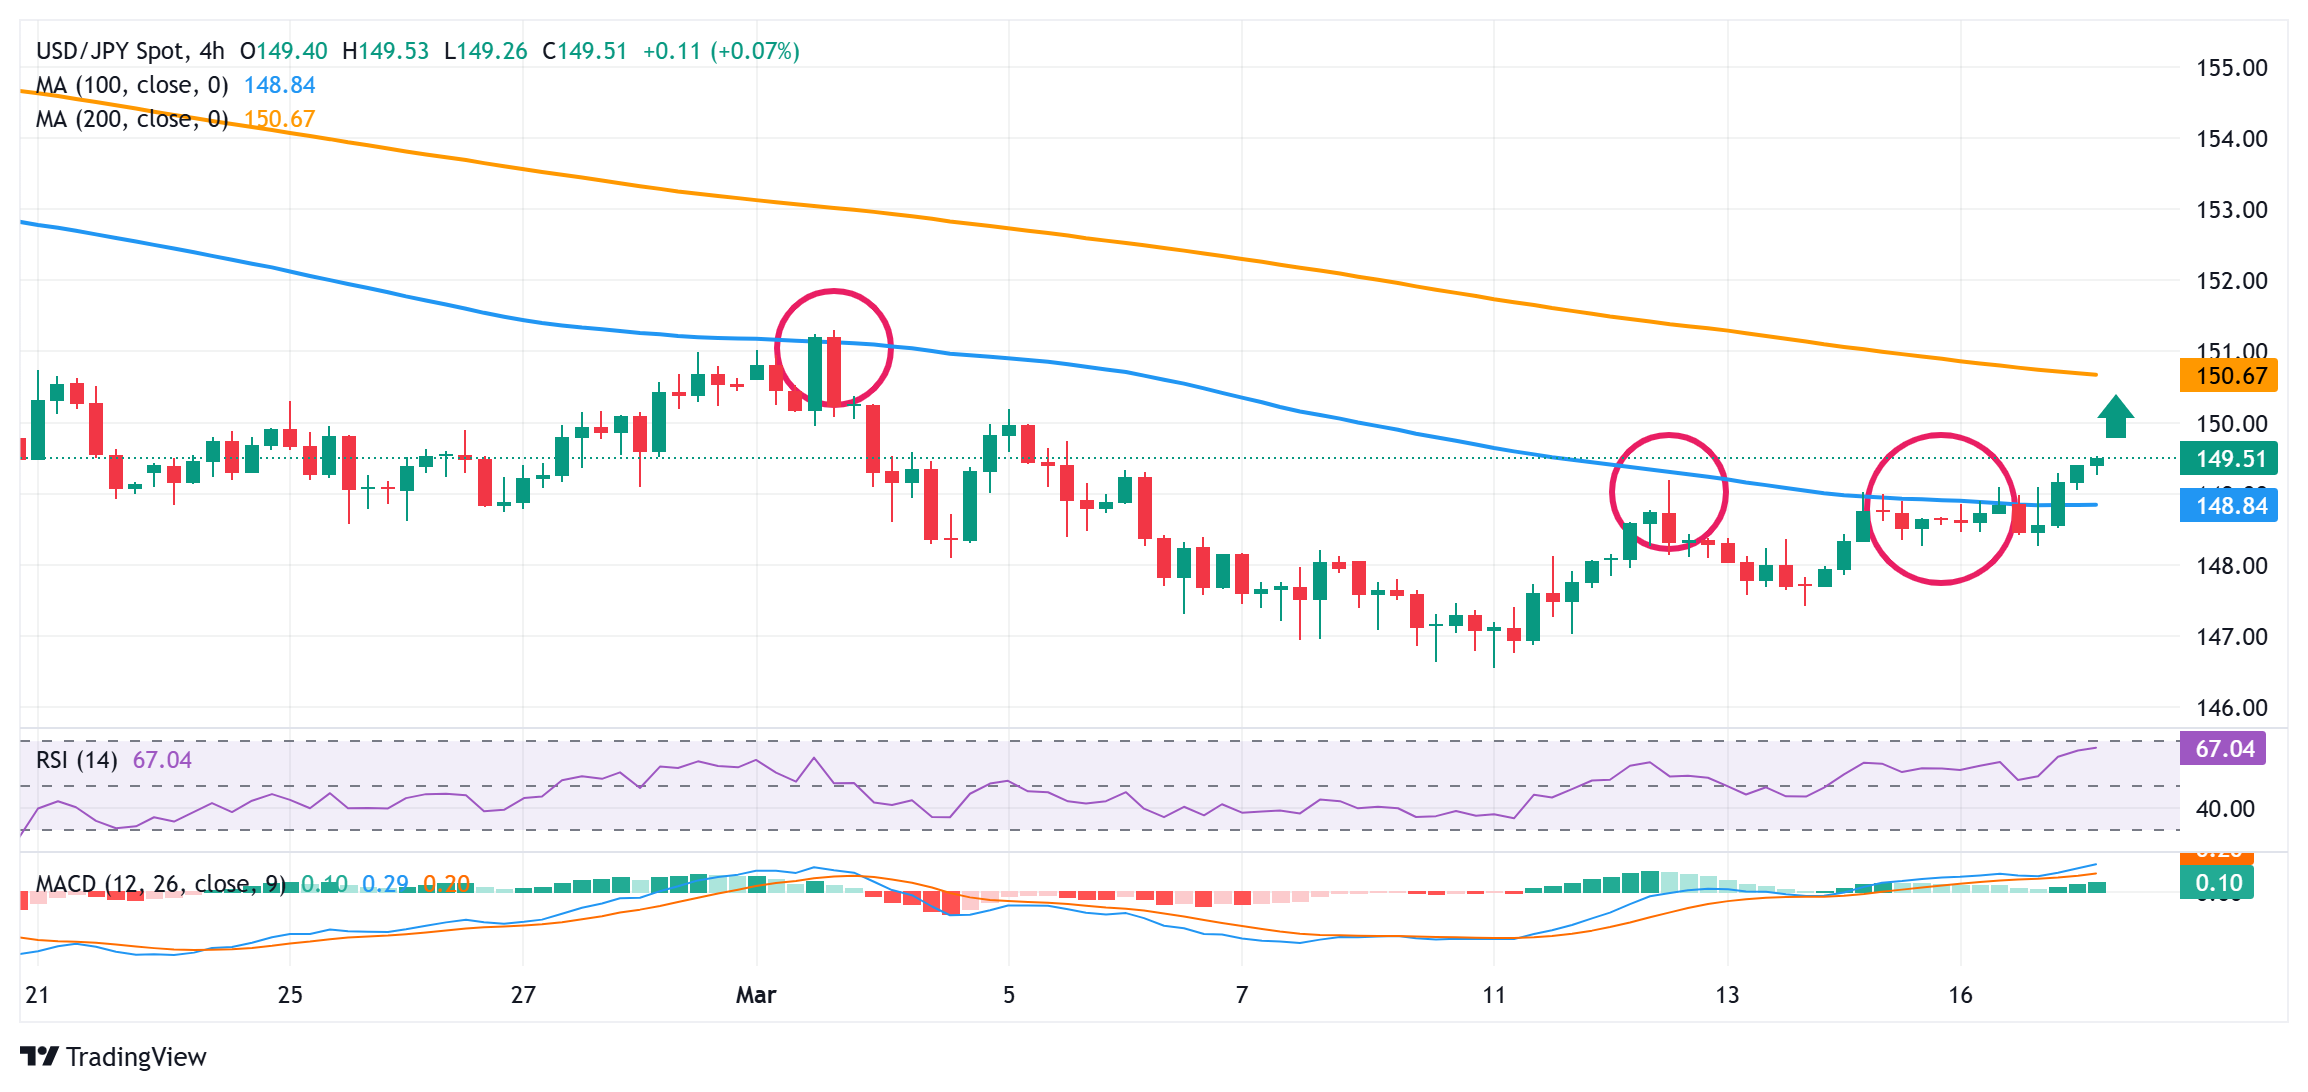
From a technical perspective, the overnight breakout above the 100-period Simple Moving Average (SMA) on the 4-hour chart and subsequent strength above the 149.00 mark could be seen as a key trigger for bulls. Moreover, oscillators on the said chart have been gaining positive traction and support prospects for additional gains. Hence, some follow-through strength, back towards reclaiming the 150.00 psychological mark, looks like a distinct possibility. Any further move up, however, is more likely to confront stiff resistance and remain capped near the 150.75-150.80 region, representing the 200-period SMA on the 4-hour chart.
On the flip side, the 149.20 area, followed by the 149.00 mark and the 148.80 region (200-period SMA on the 4-hour chart) now seem to protect the immediate downside. A convincing break below the said support levels will suggest that the recent move-up witnessed over the past week or so has run out of steam and drag the USD/JPY pair to the 148.25-148.20 support en route to the 148.00 mark. The downward trajectory could extend further towards the 147.70 area, 147.20 region, and the 147.00 mark before spot prices eventually drop to retest a multi-month low, around the 146.55-146.50 region touched on March 11.
Japanese Yen FAQs
The Japanese Yen (JPY) is one of the world’s most traded currencies. Its value is broadly determined by the performance of the Japanese economy, but more specifically by the Bank of Japan’s policy, the differential between Japanese and US bond yields, or risk sentiment among traders, among other factors.
One of the Bank of Japan’s mandates is currency control, so its moves are key for the Yen. The BoJ has directly intervened in currency markets sometimes, generally to lower the value of the Yen, although it refrains from doing it often due to political concerns of its main trading partners. The BoJ ultra-loose monetary policy between 2013 and 2024 caused the Yen to depreciate against its main currency peers due to an increasing policy divergence between the Bank of Japan and other main central banks. More recently, the gradually unwinding of this ultra-loose policy has given some support to the Yen.
Over the last decade, the BoJ’s stance of sticking to ultra-loose monetary policy has led to a widening policy divergence with other central banks, particularly with the US Federal Reserve. This supported a widening of the differential between the 10-year US and Japanese bonds, which favored the US Dollar against the Japanese Yen. The BoJ decision in 2024 to gradually abandon the ultra-loose policy, coupled with interest-rate cuts in other major central banks, is narrowing this differential.
The Japanese Yen is often seen as a safe-haven investment. This means that in times of market stress, investors are more likely to put their money in the Japanese currency due to its supposed reliability and stability. Turbulent times are likely to strengthen the Yen’s value against other currencies seen as more risky to invest in.
Speaking at a news briefing on Tuesday, Japan’s Finance Minister Katsunobu Kato said that "we will respond appropriately bearing in mind that the market should be allowed to decide market moves.”
He further noted that “bond markets should decide on rate moves” after the 40-year government debt yield briefly jumped to a record high.
Kato declined to comment on factors behind the rising yields, saying “doing so would impact the market.”
Market reaction
At the time of writing, USD/JPY is hanging close to two-week highs near 149.50, up 0.17% on the day.
- The Australian Dollar appreciates as the US Dollar struggles amid escalating trade tensions and mounting economic concerns.
- RBA Assistant Governor Sarah Hunter emphasized that the central bank will be cautious about future rate cuts.
- US economic data added to investor worries, with February’s Retail Sales rising less than expected.
The Australian Dollar (AUD) gains ground for the third successive session on Tuesday. The AUD/USD pair strengthened as the US Dollar (USD) weakened amid rising trade tensions and growing economic concerns in the United States (US).
Reserve Bank of Australia (RBA) Assistant Governor (Economic) Sarah Hunter stated late Monday that the central bank will take a cautious approach to rate cuts. The February statement indicated that the RBA board is more conservative than market expectations regarding further easing. Hunter also emphasized monitoring US policy decisions and their impact on inflation in Australia.
The AUD may face pressure as US President Donald Trump reaffirmed plans to impose reciprocal and sectoral tariffs on April 2. Trump confirmed that there would be no exemptions for steel and aluminum and mentioned that reciprocal tariffs on specific countries would be implemented alongside auto duties.
The Aussie Dollar found support after China introduced a special action plan over the weekend aimed at boosting consumption, and improving market sentiment across the region. The plan includes measures to raise wages, encourage household spending, and stabilize stock and real estate markets. Any positive developments related to the Chinese stimulus plan could further support the AUD, given China’s role as a key trading partner for Australia.
Australian Dollar appreciates due to rising investors’ uncertainty on US Dollar
- The US Dollar Index (DXY), which measures the USD against six major currencies, is trading around 103.50 at the time of writing. The US Dollar struggles as disappointing US economic data and Trump’s tariff threats fuel uncertainty among investors. February’s US Retail Sales rose less than expected, raising concerns about a potential slowdown in consumer spending. Markets widely anticipate that the Federal Reserve (Fed) will maintain its current policy stance when it concludes its two-day meeting on Wednesday.
- The US Census Bureau reported on Monday that Retail Sales increased by 0.2% month-over-month in February, falling short of the market expectation of 0.7%. This followed a revised decline of -1.2% in January (previously reported as -0.9%). On a yearly basis, Retail Sales grew by 3.1%, down from the revised 3.9% in January (previously 4.2%).
- The University of Michigan (UoM) reported a decline in its preliminary Consumer Sentiment Index for March on Friday, falling to 57.9—the lowest since November 2022—from the previous reading of 64.7. This figure also came in below the consensus estimate of 63.1. Meanwhile, the UoM five-year Consumer Inflation Expectation jumped to 3.9% in March, compared to 3.5% in February.
- US Treasury Secretary Scott Bessent said late Sunday that he was not concerned about the stock market despite multiple declines triggered by Trump's tariff threats. "I've been in the investment business for 35 years, and I can tell you that corrections are healthy. They're normal. What's not healthy is a market that only moves straight up," Bessent stated.
- US President Donald Trump’s decision to uphold a 25% tariff on Australian aluminum and steel exports, valued at nearly $1 billion. This move adds strain to Australia’s trade outlook, impacting major exports.
- Australian Prime Minister Anthony Albanese confirmed that Australia will not impose reciprocal tariffs on the US, emphasizing that retaliatory measures would only raise costs for Australian consumers and fuel inflation.
- China's retail sales grew by 4.0% year-over-year in January-February, improving from December’s 3.7% increase. Meanwhile, industrial production rose 5.9% YoY during the same period, exceeding the 5.3% forecast but slightly lower than the previous reading of 6.2%.
Technical Analysis: Australian Dollar could test 0.6400 barrier near three-month highs
The AUD/USD pair is hovering around 0.6380 on Tuesday, maintaining a bullish outlook as it continues to rise within the ascending channel on the daily chart. The 14-day Relative Strength Index (RSI) remains above 50, reinforcing the bullish momentum.
The pair may attempt to retest its three-month high of 0.6408, last reached on February 21. A breakout above this level would strengthen the bullish bias, potentially pushing the AUD/USD pair toward the upper boundary of the ascending channel near 0.6480.
On the downside, initial support is at the nine-day Exponential Moving Average (EMA) of 0.6330, followed by the lower boundary of the ascending channel at 0.6320 and the 50-day EMA at 0.6311. A decisive break below this critical support zone could weaken the bullish outlook, exposing the AUD/USD pair to downward pressure toward the six-week low of 0.6187, recorded on March 5.
AUD/USD: Daily Chart
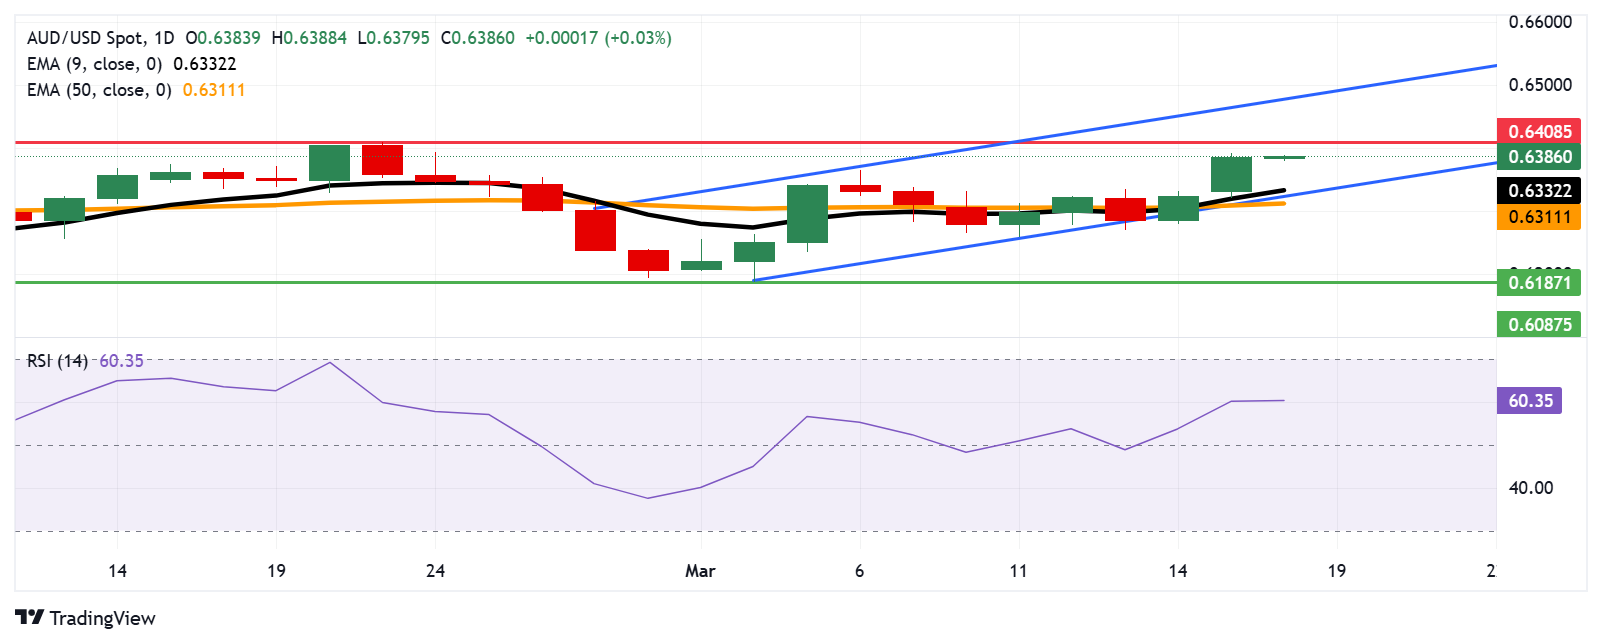
Australian Dollar PRICE Today
The table below shows the percentage change of Australian Dollar (AUD) against listed major currencies today. Australian Dollar was the strongest against the Japanese Yen.
| USD | EUR | GBP | JPY | CAD | AUD | NZD | CHF | |
|---|---|---|---|---|---|---|---|---|
| USD | 0.06% | 0.06% | 0.19% | 0.03% | -0.04% | -0.16% | 0.07% | |
| EUR | -0.06% | -0.02% | 0.13% | -0.04% | -0.11% | -0.23% | 0.00% | |
| GBP | -0.06% | 0.02% | 0.14% | -0.03% | -0.12% | -0.21% | 0.02% | |
| JPY | -0.19% | -0.13% | -0.14% | -0.17% | -0.23% | -0.38% | -0.13% | |
| CAD | -0.03% | 0.04% | 0.03% | 0.17% | -0.06% | -0.18% | 0.04% | |
| AUD | 0.04% | 0.11% | 0.12% | 0.23% | 0.06% | -0.12% | 0.11% | |
| NZD | 0.16% | 0.23% | 0.21% | 0.38% | 0.18% | 0.12% | 0.23% | |
| CHF | -0.07% | -0.00% | -0.02% | 0.13% | -0.04% | -0.11% | -0.23% |
The heat map shows percentage changes of major currencies against each other. The base currency is picked from the left column, while the quote currency is picked from the top row. For example, if you pick the Australian Dollar from the left column and move along the horizontal line to the US Dollar, the percentage change displayed in the box will represent AUD (base)/USD (quote).
Australian Dollar FAQs
One of the most significant factors for the Australian Dollar (AUD) is the level of interest rates set by the Reserve Bank of Australia (RBA). Because Australia is a resource-rich country another key driver is the price of its biggest export, Iron Ore. The health of the Chinese economy, its largest trading partner, is a factor, as well as inflation in Australia, its growth rate and Trade Balance. Market sentiment – whether investors are taking on more risky assets (risk-on) or seeking safe-havens (risk-off) – is also a factor, with risk-on positive for AUD.
The Reserve Bank of Australia (RBA) influences the Australian Dollar (AUD) by setting the level of interest rates that Australian banks can lend to each other. This influences the level of interest rates in the economy as a whole. The main goal of the RBA is to maintain a stable inflation rate of 2-3% by adjusting interest rates up or down. Relatively high interest rates compared to other major central banks support the AUD, and the opposite for relatively low. The RBA can also use quantitative easing and tightening to influence credit conditions, with the former AUD-negative and the latter AUD-positive.
China is Australia’s largest trading partner so the health of the Chinese economy is a major influence on the value of the Australian Dollar (AUD). When the Chinese economy is doing well it purchases more raw materials, goods and services from Australia, lifting demand for the AUD, and pushing up its value. The opposite is the case when the Chinese economy is not growing as fast as expected. Positive or negative surprises in Chinese growth data, therefore, often have a direct impact on the Australian Dollar and its pairs.
Iron Ore is Australia’s largest export, accounting for $118 billion a year according to data from 2021, with China as its primary destination. The price of Iron Ore, therefore, can be a driver of the Australian Dollar. Generally, if the price of Iron Ore rises, AUD also goes up, as aggregate demand for the currency increases. The opposite is the case if the price of Iron Ore falls. Higher Iron Ore prices also tend to result in a greater likelihood of a positive Trade Balance for Australia, which is also positive of the AUD.
The Trade Balance, which is the difference between what a country earns from its exports versus what it pays for its imports, is another factor that can influence the value of the Australian Dollar. If Australia produces highly sought after exports, then its currency will gain in value purely from the surplus demand created from foreign buyers seeking to purchase its exports versus what it spends to purchase imports. Therefore, a positive net Trade Balance strengthens the AUD, with the opposite effect if the Trade Balance is negative.
A statement from Israeli Prime Minister Benjamin Netanyahu's office said on Tuesday that Israel resumes military operations against Hamas across the Gaza Strip, per Reuters. Netanyahu further stated that "from now on, Israel will act against Hamas with increasing military force.”
The order came after the militant group "repeatedly refused to release our hostages and rejected all offers it received from the US presidential envoy, Steve Witkoff, and the mediators.”
Market reaction
At the time of writing, the Gold price (XAU/USD) is trading 0.14% higher on the day to trade at $3,005.
Risk sentiment FAQs
In the world of financial jargon the two widely used terms “risk-on” and “risk off'' refer to the level of risk that investors are willing to stomach during the period referenced. In a “risk-on” market, investors are optimistic about the future and more willing to buy risky assets. In a “risk-off” market investors start to ‘play it safe’ because they are worried about the future, and therefore buy less risky assets that are more certain of bringing a return, even if it is relatively modest.
Typically, during periods of “risk-on”, stock markets will rise, most commodities – except Gold – will also gain in value, since they benefit from a positive growth outlook. The currencies of nations that are heavy commodity exporters strengthen because of increased demand, and Cryptocurrencies rise. In a “risk-off” market, Bonds go up – especially major government Bonds – Gold shines, and safe-haven currencies such as the Japanese Yen, Swiss Franc and US Dollar all benefit.
The Australian Dollar (AUD), the Canadian Dollar (CAD), the New Zealand Dollar (NZD) and minor FX like the Ruble (RUB) and the South African Rand (ZAR), all tend to rise in markets that are “risk-on”. This is because the economies of these currencies are heavily reliant on commodity exports for growth, and commodities tend to rise in price during risk-on periods. This is because investors foresee greater demand for raw materials in the future due to heightened economic activity.
The major currencies that tend to rise during periods of “risk-off” are the US Dollar (USD), the Japanese Yen (JPY) and the Swiss Franc (CHF). The US Dollar, because it is the world’s reserve currency, and because in times of crisis investors buy US government debt, which is seen as safe because the largest economy in the world is unlikely to default. The Yen, from increased demand for Japanese government bonds, because a high proportion are held by domestic investors who are unlikely to dump them – even in a crisis. The Swiss Franc, because strict Swiss banking laws offer investors enhanced capital protection.
- WTI price drifts higher to near $67.30 in Tuesday’s early Asian session.
- Geopolitical risks and China's plans to boost consumption support the WTI price.
- Concerns over the impact of Trump’s tariff policies might cap the WTI’s upside.
West Texas Intermediate (WTI), the US crude oil benchmark, is trading around $67.30 during the early Asian session on Tuesday. The WTI price extends the rally as the United States (US) vows to continue attacks on Houthis.
The Houthis announced on Sunday that they launched an attack comprising 18 ballistic and cruise missiles as well as drones, targeting the USS Harry S Truman aircraft carrier and its accompanying warships in the northern Red Sea. A Houthi military spokesman said that the attack was in reaction to US airstrikes authorized by Trump against rebel-controlled areas in Yemen, including the capital Sanaa and the province of Saada, which borders Saudi Arabia.
US President Donald Trump said on Monday he would hold Iran responsible for any attacks carried out by the Houthi group that it backs in Yemen. This comes as Trump’s administration expanded the largest military operation in the Middle East since his return to the White House. The Red Sea disturbance has caused an increase in energy transportation prices and the WTI price, as oil and gas cargo shipments were forced to take longer routes.
A slew of positive Chinese economic data as well as a special plan from Chinese officials to boost domestic consumption contribute to the WTI’s upside. On Sunday, China launched special initiatives to boost consumption and raise incomes Other measures include stabilizing the stock and property markets. China’s Retail Sales rose 4% in the first two months of this year, compared to a 3.7% increase in December.
On the other hand, darkened economic outlooks amid an escalating global trade war from Trump's protectionist trade policies could exert some selling pressure on the black gold. Trump's aggressive tariffs on imports are expected to raise prices for businesses, boost inflation and undermine consumer confidence in a blow to economic growth.
WTI Oil FAQs
WTI Oil is a type of Crude Oil sold on international markets. The WTI stands for West Texas Intermediate, one of three major types including Brent and Dubai Crude. WTI is also referred to as “light” and “sweet” because of its relatively low gravity and sulfur content respectively. It is considered a high quality Oil that is easily refined. It is sourced in the United States and distributed via the Cushing hub, which is considered “The Pipeline Crossroads of the World”. It is a benchmark for the Oil market and WTI price is frequently quoted in the media.
Like all assets, supply and demand are the key drivers of WTI Oil price. As such, global growth can be a driver of increased demand and vice versa for weak global growth. Political instability, wars, and sanctions can disrupt supply and impact prices. The decisions of OPEC, a group of major Oil-producing countries, is another key driver of price. The value of the US Dollar influences the price of WTI Crude Oil, since Oil is predominantly traded in US Dollars, thus a weaker US Dollar can make Oil more affordable and vice versa.
The weekly Oil inventory reports published by the American Petroleum Institute (API) and the Energy Information Agency (EIA) impact the price of WTI Oil. Changes in inventories reflect fluctuating supply and demand. If the data shows a drop in inventories it can indicate increased demand, pushing up Oil price. Higher inventories can reflect increased supply, pushing down prices. API’s report is published every Tuesday and EIA’s the day after. Their results are usually similar, falling within 1% of each other 75% of the time. The EIA data is considered more reliable, since it is a government agency.
OPEC (Organization of the Petroleum Exporting Countries) is a group of 12 Oil-producing nations who collectively decide production quotas for member countries at twice-yearly meetings. Their decisions often impact WTI Oil prices. When OPEC decides to lower quotas, it can tighten supply, pushing up Oil prices. When OPEC increases production, it has the opposite effect. OPEC+ refers to an expanded group that includes ten extra non-OPEC members, the most notable of which is Russia.
The People’s Bank of China (PBOC) set the USD/CNY central rate for the trading session ahead on Tuesday at 7.1733 as compared to the previous day's fix of 7.1688 and 7.2364 Reuters estimate.
PBOC FAQs
The primary monetary policy objectives of the People's Bank of China (PBoC) are to safeguard price stability, including exchange rate stability, and promote economic growth. China’s central bank also aims to implement financial reforms, such as opening and developing the financial market.
The PBoC is owned by the state of the People's Republic of China (PRC), so it is not considered an autonomous institution. The Chinese Communist Party (CCP) Committee Secretary, nominated by the Chairman of the State Council, has a key influence on the PBoC’s management and direction, not the governor. However, Mr. Pan Gongsheng currently holds both of these posts.
Unlike the Western economies, the PBoC uses a broader set of monetary policy instruments to achieve its objectives. The primary tools include a seven-day Reverse Repo Rate (RRR), Medium-term Lending Facility (MLF), foreign exchange interventions and Reserve Requirement Ratio (RRR). However, The Loan Prime Rate (LPR) is China’s benchmark interest rate. Changes to the LPR directly influence the rates that need to be paid in the market for loans and mortgages and the interest paid on savings. By changing the LPR, China’s central bank can also influence the exchange rates of the Chinese Renminbi.
Yes, China has 19 private banks – a small fraction of the financial system. The largest private banks are digital lenders WeBank and MYbank, which are backed by tech giants Tencent and Ant Group, per The Straits Times. In 2014, China allowed domestic lenders fully capitalized by private funds to operate in the state-dominated financial sector.
- EUR/USD posts modest losses near 1.0915 in Tuesday’s early Asian session.
- German spending plan and softer US Dollar might support the major pair.
- US Retail Sales came in weaker than expected in February.
The EUR/USD pair trades with mild losses around 1.0915 during the early Asian session on Tuesday. Escalating trade war with further tariffs from US President Donald Trump on European Union goods weighs on the Euro (EUR). However, the weaker US Dollar (USD) amid the concerns over the economic slowdown in the United States and the hopes of the German fiscal deal might cap the downside for the major pair.
The US has imposed tariffs on steel and aluminium, the EU has set out plans for retaliation, and Trump has vowed a 200% retaliatory tariff on European wine and spirits. Any signs of an escalating tariff war between the US and EU could exert some selling pressure on the EUR.
On the other hand, the downside for EUR/USD might be limited as the Greens’ signal to the German debt restructuring deal. German Chancellor-in-waiting Friedrich Merz agreed to set up a 500 billion Euro infrastructure fund and dramatic changes in the borrowing rules or stretch in the so-called ‘debt brake’. This should ensure the package's approval in the lower house of Germany's parliament on Tuesday and by the upper house on Friday. This, in turn, might boost the shared currency against the US Dollar (USD) in the near term.
Furthermore, the weaker-than-expected US Retail Sales added to concerns about a slowdown in consumer spending. This report might weigh on the Greenback and act as a tailwind for the major pair. Retail Sales in the United States rose 0.2% MoM in February, compared to a fall of 1.2% (revised from -0.9%) in January, the US Census Bureau reported on Monday. This figure came in weaker than the market expectation for an increase of 0.7%. On a yearly basis, Retail Sales climbed 3.1% versus 3.9% (revised from 4.2%) prior.
Euro FAQs
The Euro is the currency for the 19 European Union countries that belong to the Eurozone. It is the second most heavily traded currency in the world behind the US Dollar. In 2022, it accounted for 31% of all foreign exchange transactions, with an average daily turnover of over $2.2 trillion a day. EUR/USD is the most heavily traded currency pair in the world, accounting for an estimated 30% off all transactions, followed by EUR/JPY (4%), EUR/GBP (3%) and EUR/AUD (2%).
The European Central Bank (ECB) in Frankfurt, Germany, is the reserve bank for the Eurozone. The ECB sets interest rates and manages monetary policy. The ECB’s primary mandate is to maintain price stability, which means either controlling inflation or stimulating growth. Its primary tool is the raising or lowering of interest rates. Relatively high interest rates – or the expectation of higher rates – will usually benefit the Euro and vice versa. The ECB Governing Council makes monetary policy decisions at meetings held eight times a year. Decisions are made by heads of the Eurozone national banks and six permanent members, including the President of the ECB, Christine Lagarde.
Eurozone inflation data, measured by the Harmonized Index of Consumer Prices (HICP), is an important econometric for the Euro. If inflation rises more than expected, especially if above the ECB’s 2% target, it obliges the ECB to raise interest rates to bring it back under control. Relatively high interest rates compared to its counterparts will usually benefit the Euro, as it makes the region more attractive as a place for global investors to park their money.
Data releases gauge the health of the economy and can impact on the Euro. Indicators such as GDP, Manufacturing and Services PMIs, employment, and consumer sentiment surveys can all influence the direction of the single currency. A strong economy is good for the Euro. Not only does it attract more foreign investment but it may encourage the ECB to put up interest rates, which will directly strengthen the Euro. Otherwise, if economic data is weak, the Euro is likely to fall. Economic data for the four largest economies in the euro area (Germany, France, Italy and Spain) are especially significant, as they account for 75% of the Eurozone’s economy.
Another significant data release for the Euro is the Trade Balance. This indicator measures the difference between what a country earns from its exports and what it spends on imports over a given period. If a country produces highly sought after exports then its currency will gain in value purely from the extra demand created from foreign buyers seeking to purchase these goods. Therefore, a positive net Trade Balance strengthens a currency and vice versa for a negative balance.
| Index | Change, points | Closed | Change, % |
|---|---|---|---|
| NIKKEI 225 | 343.42 | 37396.52 | 0.93 |
| Hang Seng | 185.59 | 24145.57 | 0.77 |
| KOSPI | 44.33 | 2610.69 | 1.73 |
| ASX 200 | 64.4 | 7854.1 | 0.83 |
| DAX | 167.75 | 23154.57 | 0.73 |
| CAC 40 | 45.7 | 8073.98 | 0.57 |
| Dow Jones | 353.44 | 41841.63 | 0.85 |
| S&P 500 | 36.18 | 5675.12 | 0.64 |
| NASDAQ Composite | 54.57 | 17808.66 | 0.31 |
| Pare | Closed | Change, % |
|---|---|---|
| AUDUSD | 0.63829 | 0.87 |
| EURJPY | 162.908 | 0.68 |
| EURUSD | 1.09217 | 0.39 |
| GBPJPY | 193.751 | 0.75 |
| GBPUSD | 1.29908 | 0.46 |
| NZDUSD | 0.5817 | 1.12 |
| USDCAD | 1.42876 | -0.55 |
| USDCHF | 0.88054 | -0.52 |
| USDJPY | 149.14 | 0.27 |


© 2000-2026. Уcі права захищені.
Cайт знаходитьcя під керуванням TeleTrade DJ. LLC 2351 LLC 2022 (Euro House, Richmond Hill Road, Kingstown, VC0100, St. Vincent and the Grenadines).
Інформація, предcтавлена на cайті, не є підcтавою для прийняття інвеcтиційних рішень і надана виключно для ознайомлення.
Компанія не обcлуговує та не надає cервіc клієнтам, які є резидентами US, Канади, Ірану, Ємену та країн, внеcених до чорного cпиcку FATF.
Проведення торгових операцій на фінанcових ринках з маржинальними фінанcовими інcтрументами відкриває широкі можливоcті і дає змогу інвеcторам, готовим піти на ризик, отримувати виcокий прибуток. Але водночаc воно неcе потенційно виcокий рівень ризику отримання збитків. Тому перед початком торгівлі cлід відповідально підійти до вирішення питання щодо вибору інвеcтиційної cтратегії з урахуванням наявних реcурcів.
Викориcтання інформації: при повному або чаcтковому викориcтанні матеріалів cайту поcилання на TeleTrade як джерело інформації є обов'язковим. Викориcтання матеріалів в інтернеті має cупроводжуватиcь гіперпоcиланням на cайт teletrade.org. Автоматичний імпорт матеріалів та інформації із cайту заборонено.
З уcіх питань звертайтеcь за адреcою pr@teletrade.global.
переклади