- Аналітика
- Новини та інструменти
- Новини ринків
Новини ринків
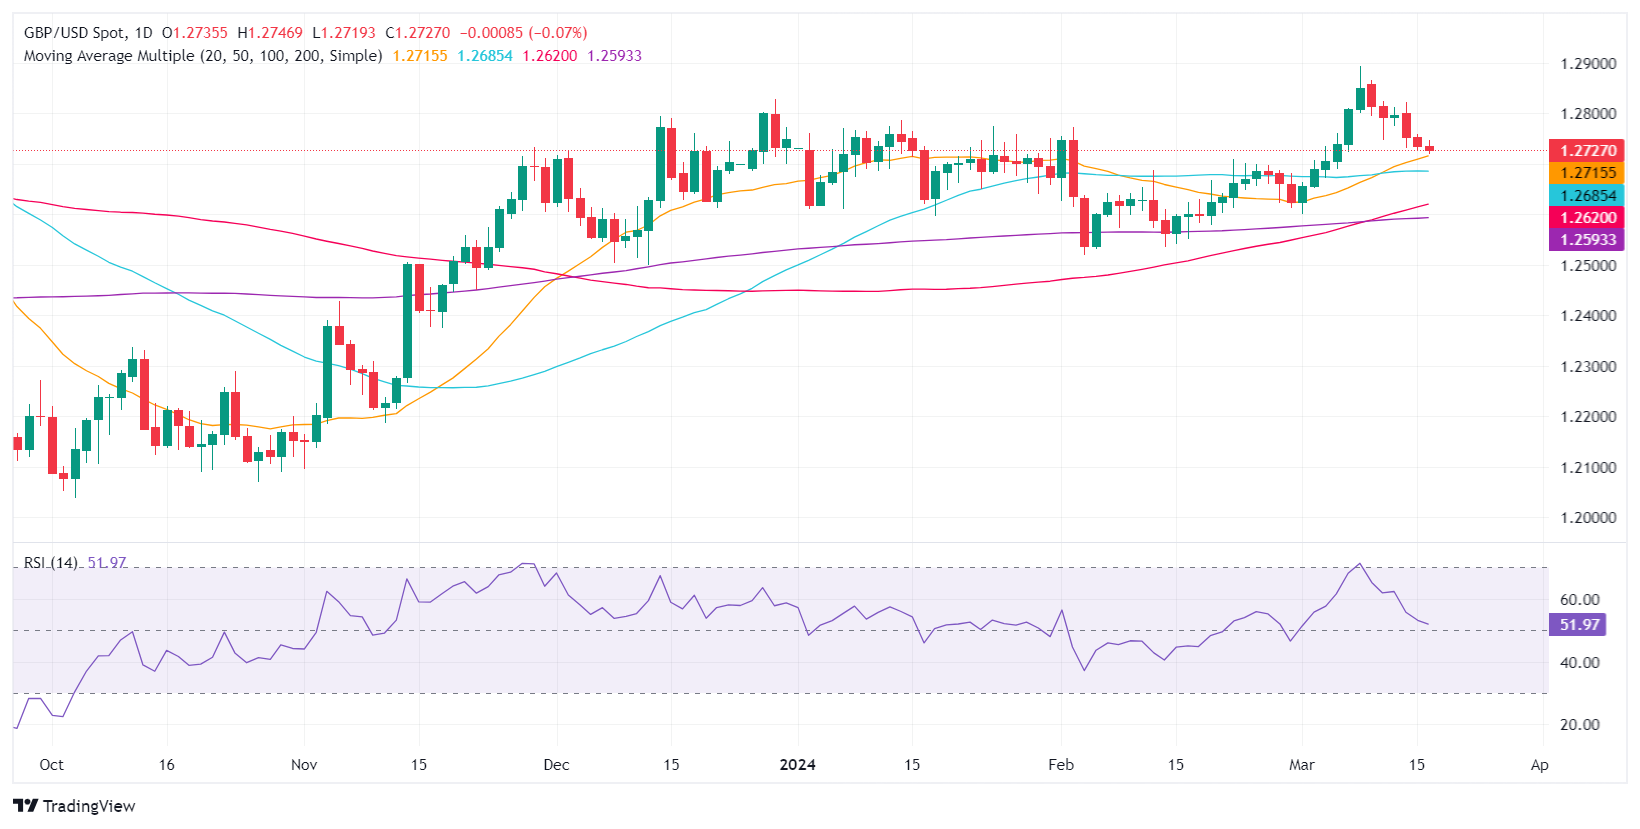
- GBP/USD remains on the defensive near 1.2726 amid the stronger USD and risk-off mood.
- Fed is likely to maintain its monetary policy for a fifth straight time at its March meeting.
- BoE is expected to leave rates unchanged at 5.25% on Thursday, with the expectation of cutting rates in August.
- The Fed and Bank of England interest rate decisions will be the highlights of this week.
The GBP/USD pair remains under some selling pressure during the early Asian session on Tuesday. The uptick in the US Dollar (USD) above 103.50 and higher US yields provide some support to the major pair. Markets turn cautious ahead of the central bank meetings, including the Federal Reserve (Fed) and Bank of England (BoE) interest rate decisions. At press time, GBP/USD is trading at 1.2726, down 0.02% on the day.
The Fed is anticipated to keep its interest rate unchanged for a fifth straight time at its March meeting on Wednesday and signal that they still need further evidence that inflation to return sustainably to its 2% target. The Fed Chair Jerome Powell said earlier this month that the US central bank might cut its benchmark interest rate later this year, even though continued progress on lowering inflation to the target “is not assured.”
Traders will also closely monitor press conference, which is unlikely to show a significant shift. However, there is still a possibility that policymakers might reduce the number of rate cuts they anticipate seeing this year to two from the earlier three.
On the other hand, UK inflation is moderating, but the BoE remains cautious in its approach until the CPI returns to the 2% target. The BoE is likely to leave interest rates unchanged at 5.25% on Thursday. Investors expect the UK central bank to start cutting rates in August, with one or two further cuts by the end of the year.
Later on Tuesday, the US Building Permits, and Housing Starts are due in the US docket. All eyes will be on the Fed monetary policy meeting and the press conference on Wednesday. Also, the Fed’s officials will update their quarterly economic projections. On the UK docket, the BoE interest rate decision on Thursday will be in the spotlight. Along with the rate decision, BoE policymakers might offer clues about inflation, economic growth, and the labour market outlook.
- AUD/USD sees slight decline as markets gear up for the Reserve Bank of Australia's upcoming rate decision.
- US Treasury yields rise, boosting the Dollar, as anticipation builds for the Federal Reserve's policy announcement.
- The RBA is expected to hold rates unchanged amid mixed opinions among economists on the central bank's first rate cut.
The Australian Dollar begins the Asian session, clocking minuscule losses of 0.02% against the US Dollar as market participants prepare for the Reserve Bank of Australia (RBA) monetary policy decision. On Monday, the AUD/USD was virtually flat, though at the time of writing, it trades at 0.6559, down 0.01%.
Upbeat sentiment could shift amidst major central bank decisions
Wall Street finished Monday’s session in the green. US Treasury yields edged higher as investors await the Federal Reserve’s monetary policy decision, with the 10-year note benchmark up at 4.328%. Consequently, the Greenback advances 0.13%, as measured by the US Dollar Index (DXY) at 103.58.
On Monday, the US economic docket was light, with the release of the National Association of Home Builders (NAHB) Market Index for February, which improved the most since July 2023, rising by 51, up from 48 in February. The NAHG Chairman Carl Harris noted “Buyer demand remains brisk and we expect more consumers to jump off the sidelines and into the marketplace if mortgage rates continue to fall later this year.”
Aside from this, the day's main theme is the RBA’s decision. Market players estimate the central bank would keep rates unchanged thought, there are different opinions amongst economists. Some expect the RBA will lower rates in November, while others estimate the first cut will be in September.
Given the backdrop of the Aussie economy printing mixed figures on inflation, and growth slowed to 1.5% in Q4 2023 from 2.1%, that has opened the door for easing policy. Testifying before the Australian Parliament last month, Bullock said that “inflation is being persistent, particularly in services. But it is coming down.”
ANZ Bank analysts estimate the RBA would keep a “mild tightening bias, with no change in rates. While the January labor force survey came in weak, we think the RBA (like us) is expecting payback in the February data.”
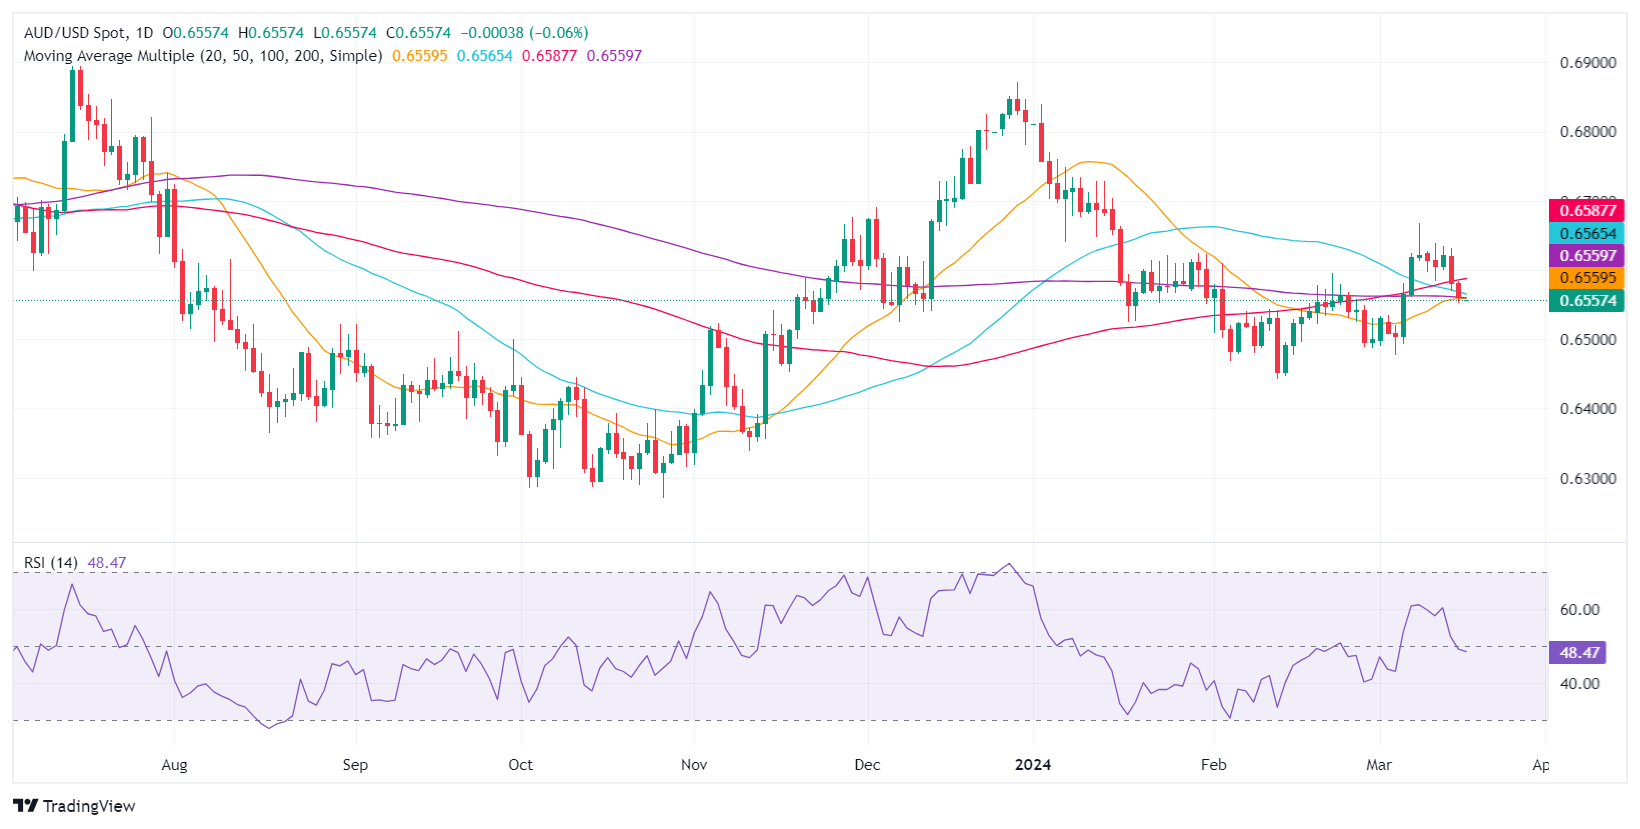
AUD/USD Price Analysis: Technical outlook
If the RBA surprises the markets with a dovish tilt, the AUD/USD can drop further below the 200-day moving average (DMA at 0.6557, exposing the 0.6500 mark. Further losses are seen at the March 5 low of 0.6477, followed by the February 13 swing low of 0.6442. On the other hand, the pair could aim higher if the RBA sticks to a hawkish message and might recoup the 0.6600 mark. The next resistance level is seen at January’s 5 cycle low, which turned resistance at 0.6640.
RBA FAQs
The Reserve Bank of Australia (RBA) sets interest rates and manages monetary policy for Australia. Decisions are made by a board of governors at 11 meetings a year and ad hoc emergency meetings as required. The RBA’s primary mandate is to maintain price stability, which means an inflation rate of 2-3%, but also “..to contribute to the stability of the currency, full employment, and the economic prosperity and welfare of the Australian people.” Its main tool for achieving this is by raising or lowering interest rates. Relatively high interest rates will strengthen the Australian Dollar (AUD) and vice versa. Other RBA tools include quantitative easing and tightening.
While inflation had always traditionally been thought of as a negative factor for currencies since it lowers the value of money in general, the opposite has actually been the case in modern times with the relaxation of cross-border capital controls. Moderately higher inflation now tends to lead central banks to put up their interest rates, which in turn has the effect of attracting more capital inflows from global investors seeking a lucrative place to keep their money. This increases demand for the local currency, which in the case of Australia is the Aussie Dollar.
Macroeconomic data gauges the health of an economy and can have an impact on the value of its currency. Investors prefer to invest their capital in economies that are safe and growing rather than precarious and shrinking. Greater capital inflows increase the aggregate demand and value of the domestic currency. Classic indicators, such as GDP, Manufacturing and Services PMIs, employment, and consumer sentiment surveys can influence AUD. A strong economy may encourage the Reserve Bank of Australia to put up interest rates, also supporting AUD.
Quantitative Easing (QE) is a tool used in extreme situations when lowering interest rates is not enough to restore the flow of credit in the economy. QE is the process by which the Reserve Bank of Australia (RBA) prints Australian Dollars (AUD) for the purpose of buying assets – usually government or corporate bonds – from financial institutions, thereby providing them with much-needed liquidity. QE usually results in a weaker AUD.
Quantitative tightening (QT) is the reverse of QE. It is undertaken after QE when an economic recovery is underway and inflation starts rising. Whilst in QE the Reserve Bank of Australia (RBA) purchases government and corporate bonds from financial institutions to provide them with liquidity, in QT the RBA stops buying more assets, and stops reinvesting the principal maturing on the bonds it already holds. It would be positive (or bullish) for the Australian Dollar.
- The daily chart reveals a bearish bias, with RSI transitioning to negative territories and rising red bars in the MACD.
- The hourly chart demonstrates a contrary perspective flashing signals on a potential shift to the upside.
- If bears want to confirm a bearish outlook, they must conquer the 200-day SMA.
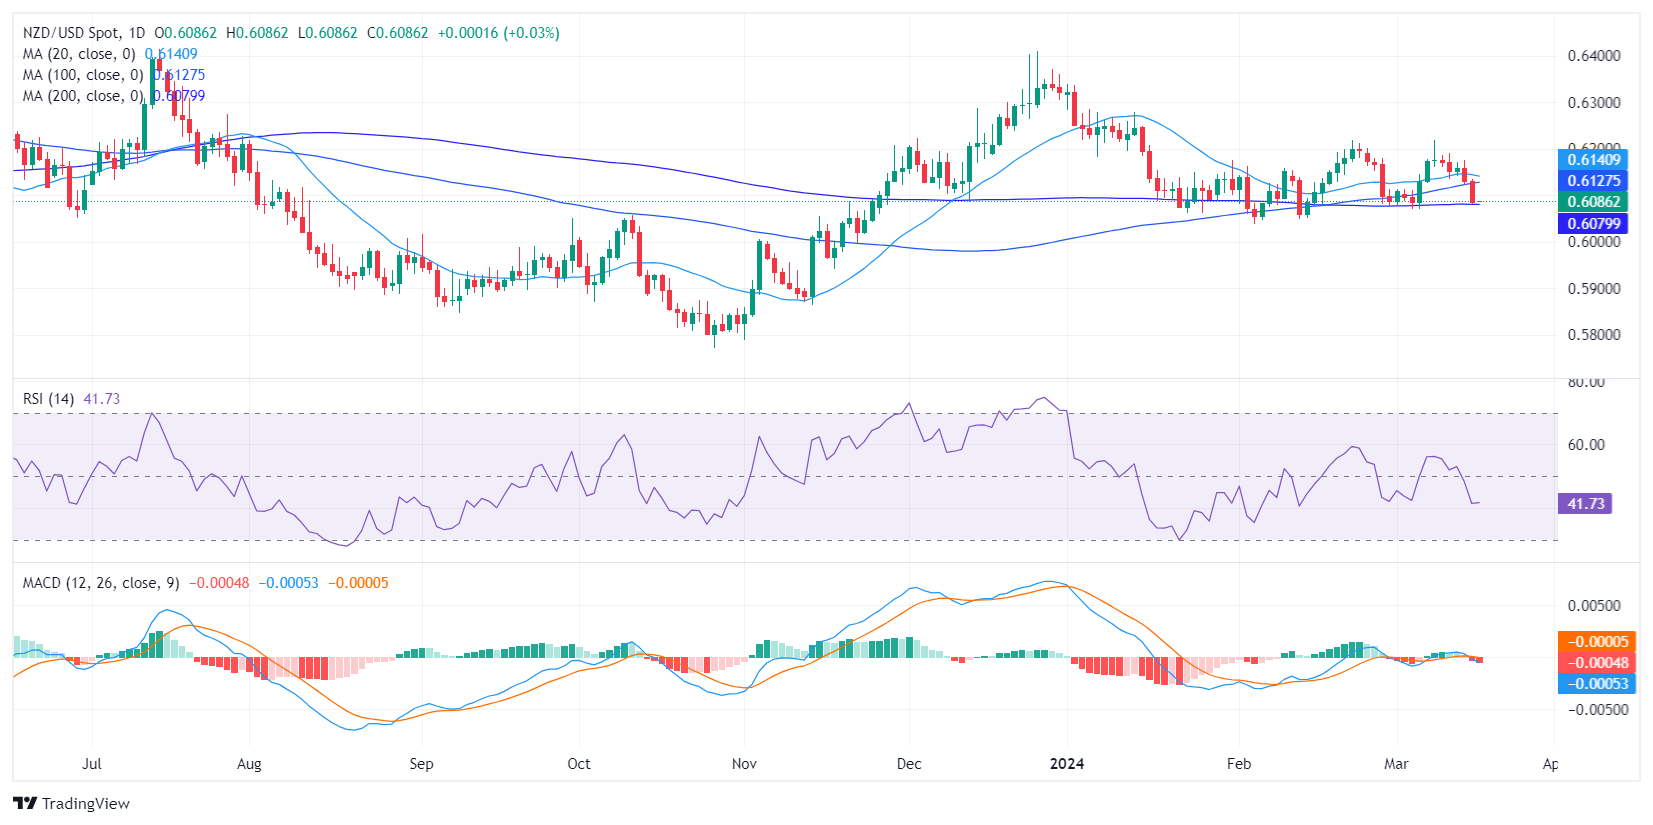
In Monday's trading, NZD/USD remained largely unchanged around 0.6085 while the pair showed ongoing sell-off pressure. However, subtle hints of an imminent near-term reversal are beginning to show up on the hourly chart as bears may step out to consolidate their movements.
The continuous decline of the daily Relative Strength Index (RSI) from positive to negative territories demonstrates the prevailing sell-side pressure. The recent reading of the RSI indicates ongoing negative conditions, further substantiated by a sequence of rising red bars in the Moving Average Convergence Divergence (MACD).
NZD/USD daily chart
Moving on to the hourly chart, the NZD/USD pair persists in its bearish trend. The Relative Strength Index (RSI) reflects similar negative conditions as observed on the daily chart, albeit, the index seems to have flattened. In addition, a shift in momentum can be discerned with the emergence of green bars in the MACD histogram. These indicate positive momentum in the last trading hours.
NZD/USD hourly chart
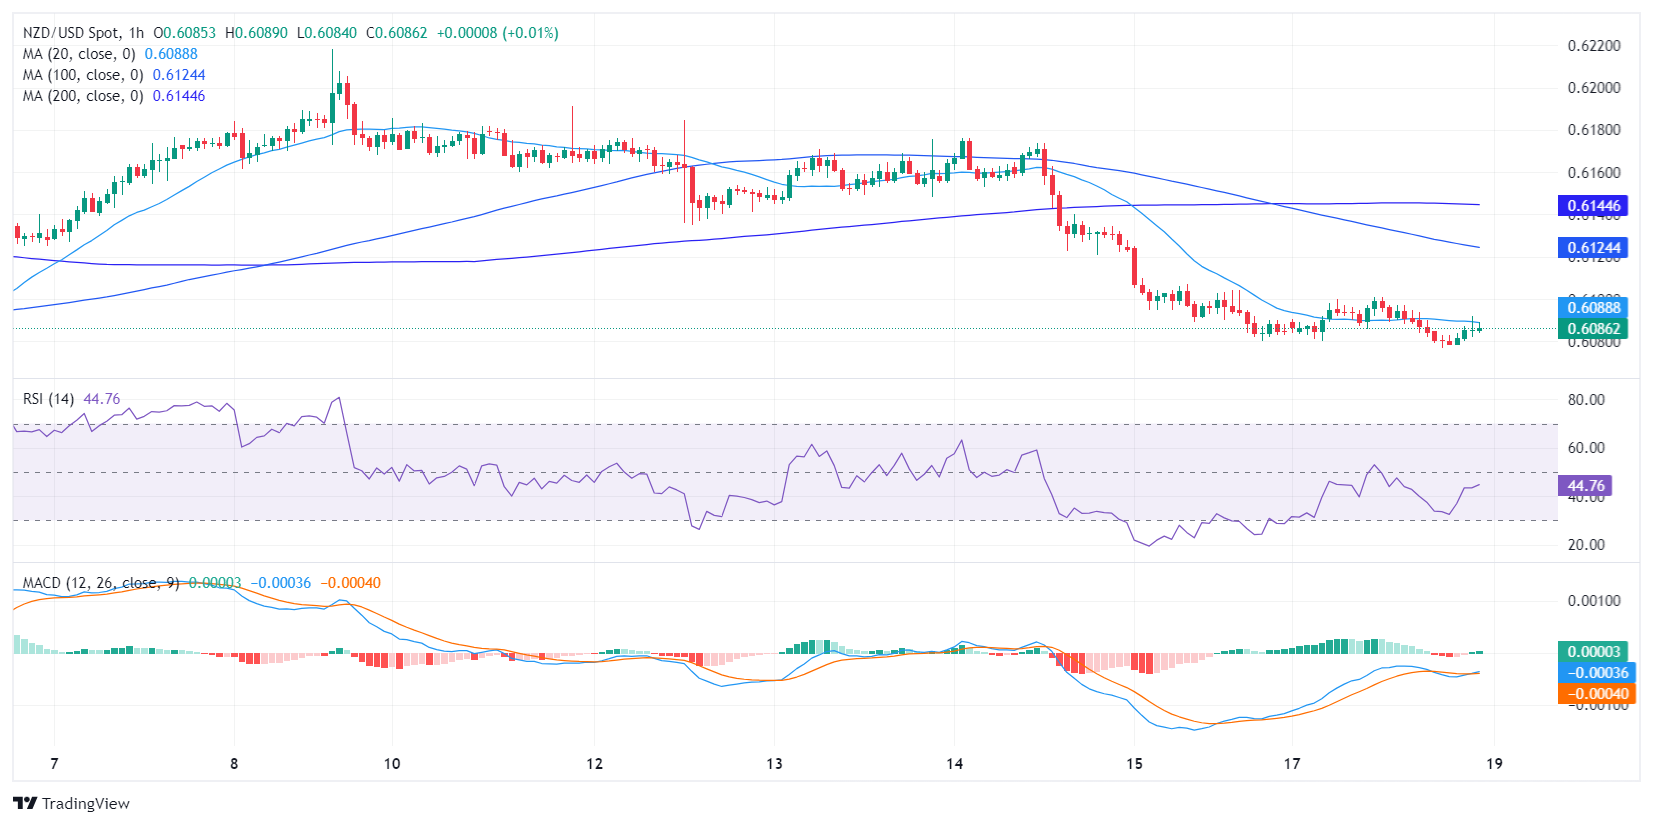
Given the outlooks on the daily and hourly chart, after the sellers pierced through the 20 and 100-day Simple Moving Averages (SMAs), the last hope for the pair is the 200-day average which presents strong support. In case the buyers fail to defend it, the overall trend will turn bearish.
- Silver price dips affected by an uptick in US Treasury yields and a stronger Dollar ahead of the Fed's decision.
- 'Bearish harami' pattern suggests potential declines if support breaks.
- Staying above $25.00 may boost bullish momentum, eyeing $26.00 resistance.
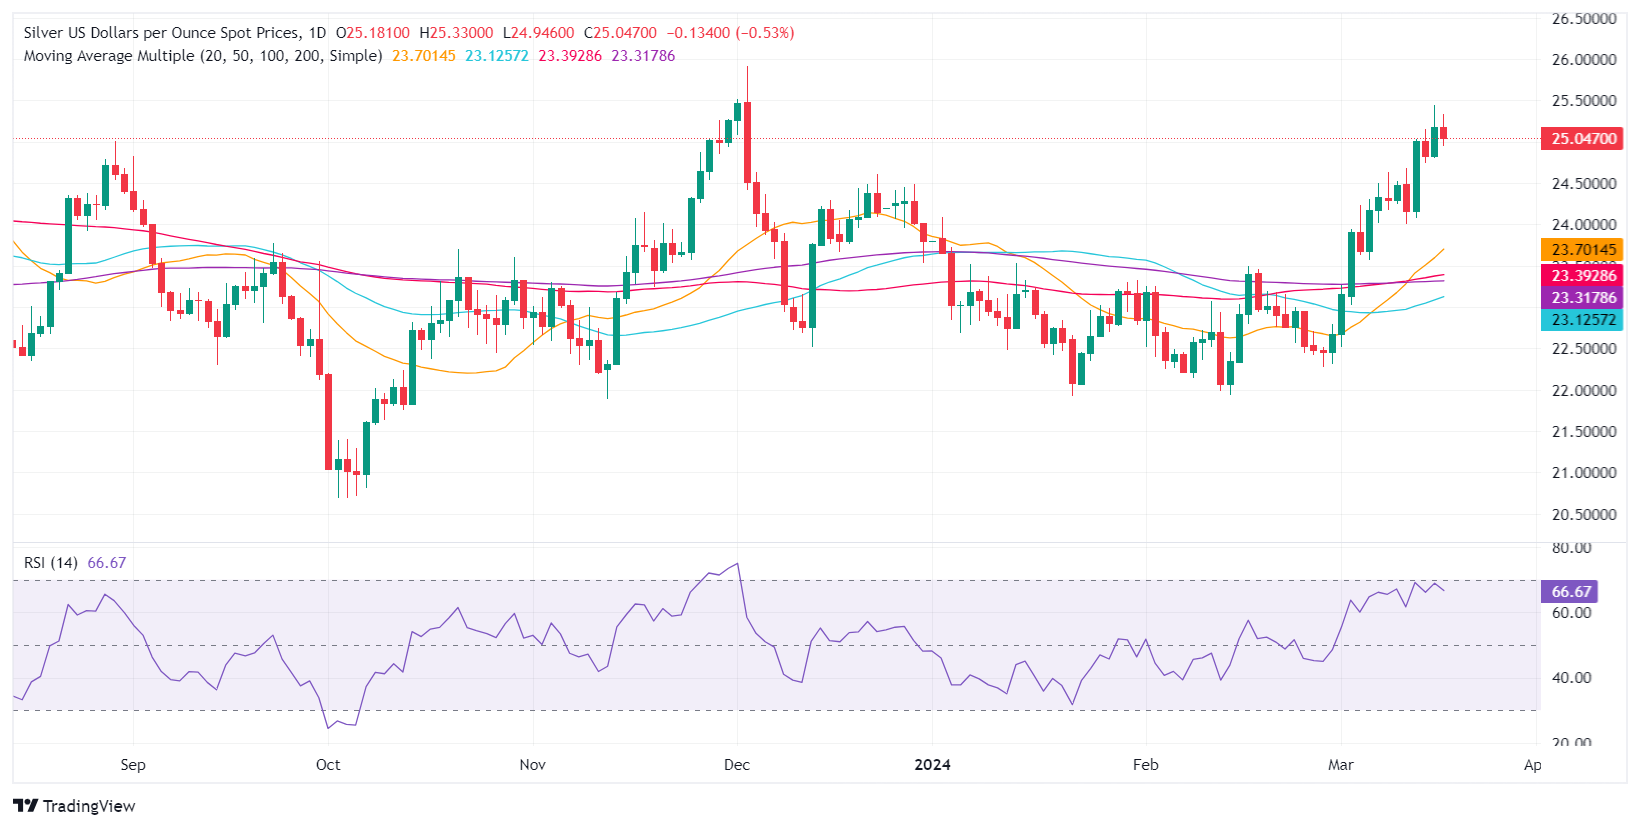
Silver's price dropped toward $25.00 a troy ounce on Monday as US Treasury bond yields rose ahead of the Federal Open Market Committee (FOMC) meeting. The US 10-year Treasury bond yield advance underpins the Greenback, a headwind for the precious metal. Therefore, XAG/USD trades at around $25.03, down by 0.57% at the time of writing.
XAG/USD Price Analysis: Technical outlook
The grey metal daily chart formed a ‘bearish harami’ candlestick chart pattern that suggests prices might edge to the downside, though sellers need to extend Silver’s losses beneath the March 15 swing low of $24.79. It should be said that the Relative Strength Index (RSI) indicator was barren from entering overbought conditions, keeping its bullish bias intact. However, the RSI edges lower, and if XAG/USD falls below $25.00, that might open the door to challenge December’s 22 high turned support at $24.60. Further downside is seen at $24.00.
On the other hand, if buyers hold XAG/USD spot price above $25.00, that could open the door to test the current year-to-date (YTD) high of $25.44 ahead of $26.00.
XAG/USD Price Action – Daily Chart
- The Bank of Japan could deliver the first rate hike since 2007.
- Japanese Unions clocked the largest wage increase in over three decades.
- BoJ’s Governor Kazuo Ueda linked monetary tightening with higher wages.
- USD/JPY could collapse towards 146.48 on a hawkish decision.
The Bank of Japan (BoJ) will announce its monetary policy decision on Tuesday, pretty much at the same time that the Reserve Bank of Australia (RBA) will do the same. Central banks stand out this week, which will also include the decisions of the United States (US) Federal Reserve (Fed) and the Bank of England (BoE).
The BoJ is a particular case, as it is the only central bank maintaining an ultra-loose monetary policy. Interest rates in Japan have been steady at -0.1% since 2016, with policymakers claiming lagging wage increases and doubts about sustainable healthy inflation require continued caution. To keep rates depressed, the BoJ also introduced the Yield Curve Control (YCC) in September 2016, as inflation remained stubbornly below target.
Bank of Japan Interest Rate Decision: Why this time could be different
Most major central banks embarked on reversing their monetary policy in mid-2022 when inflation soared to multi-decade highs in the coronavirus pandemic aftermath. Interest rates were pushed to record levels, and price pressures receded, although they are still above target. And yet again, central banks are changing course. Market participants expect central banks to start trimming interest rates in the upcoming months, although at a more cautious pace than previously anticipated.
The BoJ’s decision to keep rates on hold was largely linked to depressed wages. However, news over the weekend showed that Japan’s largest group for unions, the Japanese Trade Union Confederation, or Rengo, announced an annual wage increase of 5.28%, the largest raise in over thirty years. BoJ Governor Kazuo Ueda said in the last few weeks that the end of negative rates would depend on such negotiations, and the latest announcement is fueling bets the BoJ will finally leave negative rates.
Meanwhile, core inflation in Japan fell for a third consecutive month in January to its lowest level in almost two years. The core Consumer Price Index (CPI), which excludes fresh food, rose at a slower pace of 2%, matching the central bank’s target. At the same time, the Tokyo CPI rose 2.6% YoY from 1.8% in January, while the core CPI climbed 2.5%, in line with expectations. Such figures could spur concerns about another hold from BoJ, although inflation in Japan is expected to have accelerated in February as the effects of government fuel subsidies faded. The country will report February CPI next Friday, March 22, and the core annual CPI is foreseen at 2.8%.
When will the BoJ announce its interest rate decision, and how could it affect USD/JPY?
The Bank of Japan will announce its decision on Tuesday at around 3:00 GMT. However, it is worth reminding that Japanese policymakers do not have a set time like their counterparts, and the announcement could come earlier or later than that.
The Nikkei newspaper reported on Saturday that “The BoJ began coordinating both within and outside the bank Friday on ending its negative interest rate policy, which was adopted in February 2016. The leading plan is to raise the policy rate, currently at negative 0.1%, by more than 0.1 point to guide short-term interest to the 0%-0.1% range.”
Based on this news, the most optimistic bets aim for a rate hike in the upcoming meeting, up to 0.00%—0.10%, the first rate hike in seventeen years. Policymakers are also expected to end the YCC, although the central bank will need to continue buying bonds.
However, the BoJ is not notorious for its boldness. A more conservative outlook suggests the BoJ will pave the way for a rate hike in April while deciding on a gradual ending to the YCC.
One more factor is whether the central bank anticipates additional rate hikes in the months to come. Policymakers may well abandon the ultra-loose policy next Tuesday but cool down hopes for the beginning of a tightening cycle at the same time.
Generally speaking, a hawkish announcement tends to boost the local currency. That said, the market will need to assess the level of hawkishness, if any, of Japanese policymakers to translate it into Japanese Yen (JPY) strength. The USD/JPY pair heads into the announcement trading at around the 149.00 figure, not far from the multi-year high posted in October 2022 at 151.94.
From a technical perspective, Valeria Bednarik, Chief Analyst at FXStreet, notes: “Market participants seem unconvinced the BoJ will pull the trigger this time. The JPY was unable to gather momentum against the US Dollar, and in fact, the pair advanced for a fifth consecutive day. Sellers are aligned around the daily 20 Simple Moving Average (SMA), currently at 149.35, the immediate resistance level. A dovish announcement could push the pair towards the 150.00 mark en route to the 150.60-150.80 price zone.”
Bednarik adds: “Financial markets will be caught off guard if the BoJ actually pulls the trigger. That could result in a massive decline in USD/JPY, initially targeting 148.35, the 100 SMA in the aforementioned daily chart. Once below the latter, the pair can reach the March low at 146.48.”
Bank of Japan FAQs
The Bank of Japan (BoJ) is the Japanese central bank, which sets monetary policy in the country. Its mandate is to issue banknotes and carry out currency and monetary control to ensure price stability, which means an inflation target of around 2%.
The Bank of Japan has embarked in an ultra-loose monetary policy since 2013 in order to stimulate the economy and fuel inflation amid a low-inflationary environment. The bank’s policy is based on Quantitative and Qualitative Easing (QQE), or printing notes to buy assets such as government or corporate bonds to provide liquidity. In 2016, the bank doubled down on its strategy and further loosened policy by first introducing negative interest rates and then directly controlling the yield of its 10-year government bonds.
The Bank’s massive stimulus has caused the Yen to depreciate against its main currency peers. This process has exacerbated more recently due to an increasing policy divergence between the Bank of Japan and other main central banks, which have opted to increase interest rates sharply to fight decades-high levels of inflation. The BoJ’s policy of holding down rates has led to a widening differential with other currencies, dragging down the value of the Yen.
A weaker Yen and the spike in global energy prices have led to an increase in Japanese inflation, which has exceeded the BoJ’s 2% target. Still, the Bank judges that the sustainable and stable achievement of the 2% target has not yet come in sight, so any sudden change in the current policy looks unlikely.
Economic Indicator
Japan BoJ Interest Rate Decision
The Bank of Japan (BoJ) announces its interest rate decision after each of the Bank’s eight scheduled annual meetings. Generally, if the BoJ is hawkish about the inflationary outlook of the economy and raises interest rates it is bullish for the Japanese Yen (JPY). Likewise, if the BoJ has a dovish view on the Japanese economy and keeps interest rates unchanged, or cuts them, it is usually bearish for JPY.
Read more.- Crude Oil prices are continuing a bull run on Monday.
- WTI is breaking out on the bull side as supply constraint concerns weigh.
- US Crude Oil bids into its highest prices since November.
West Texas Intermediate (WTI) US Crude Oil climbed over $82.00 per barrel on Monday, extending a near-term bull. US Crude Oil tested its highest barrel prices since November, hitting a 16-week high of $82.46 to kick off the new trading week.
Energy markets are increasingly concerned that declining Crude Oil supplies will continue into the immediate future. Despite record oil pumping amounts from countries outside of the Organization of the Petroleum Exporting Countries (OPEC), specifically the US, Crude Oil markets are broadly expected to see a medium-term to long-term supply constraint, bumping barrel costs higher.
Weekly Crude Oil Stocks for the week ended March 15 from the American Petroleum Institute (API) are due Tuesday, and last showed a -5.5 million barrel drawdown. The Energy Information Administration’s (EIA) own Crude Oil Stocks Change is due Wednesday. The EIA’s barrel counts are expected to be further drawn down by a scant 25K barrels after the previous week’s decline of -1.5 million.
WTI technical outlook
Monday’s bullish bounce sees WTI trading above the $82.00 handle after catching a rebound from a previous supply zone near $80.00 per barrel. Crude Oil has gained nearly 7.5% from the last swing low below $77.00.
Monday’s bullish extension adds further topside momentum to a technical recovery on daily candlesticks after WTI US Crude Oil bottomed out near $67.85.
WTI hourly chart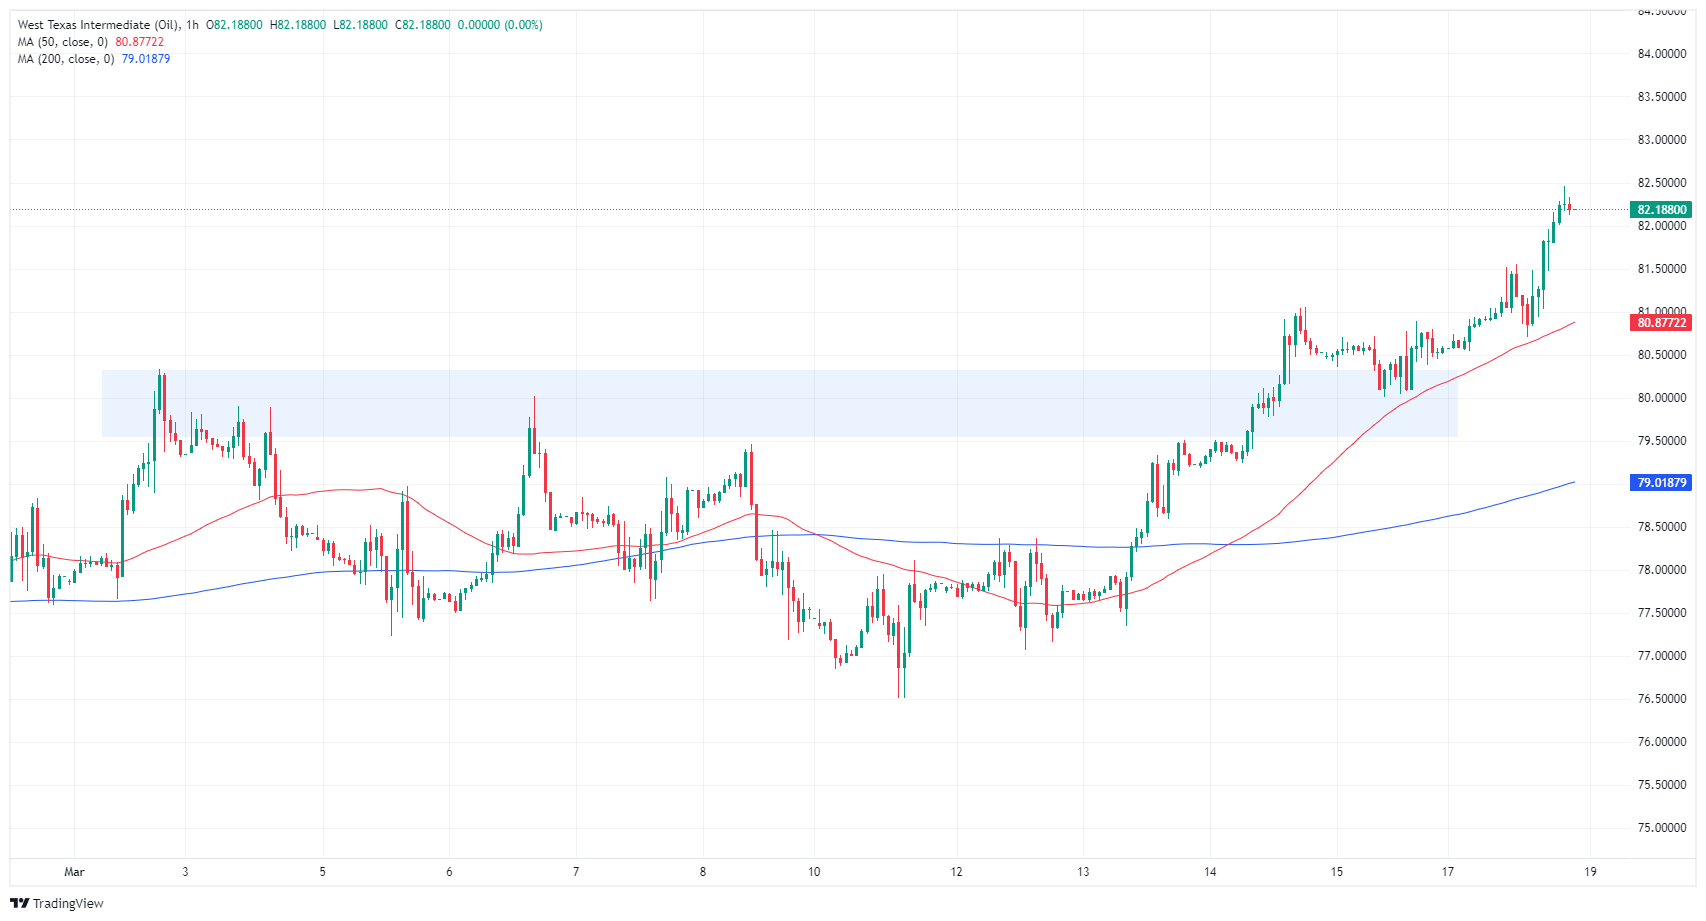
WTI daily chart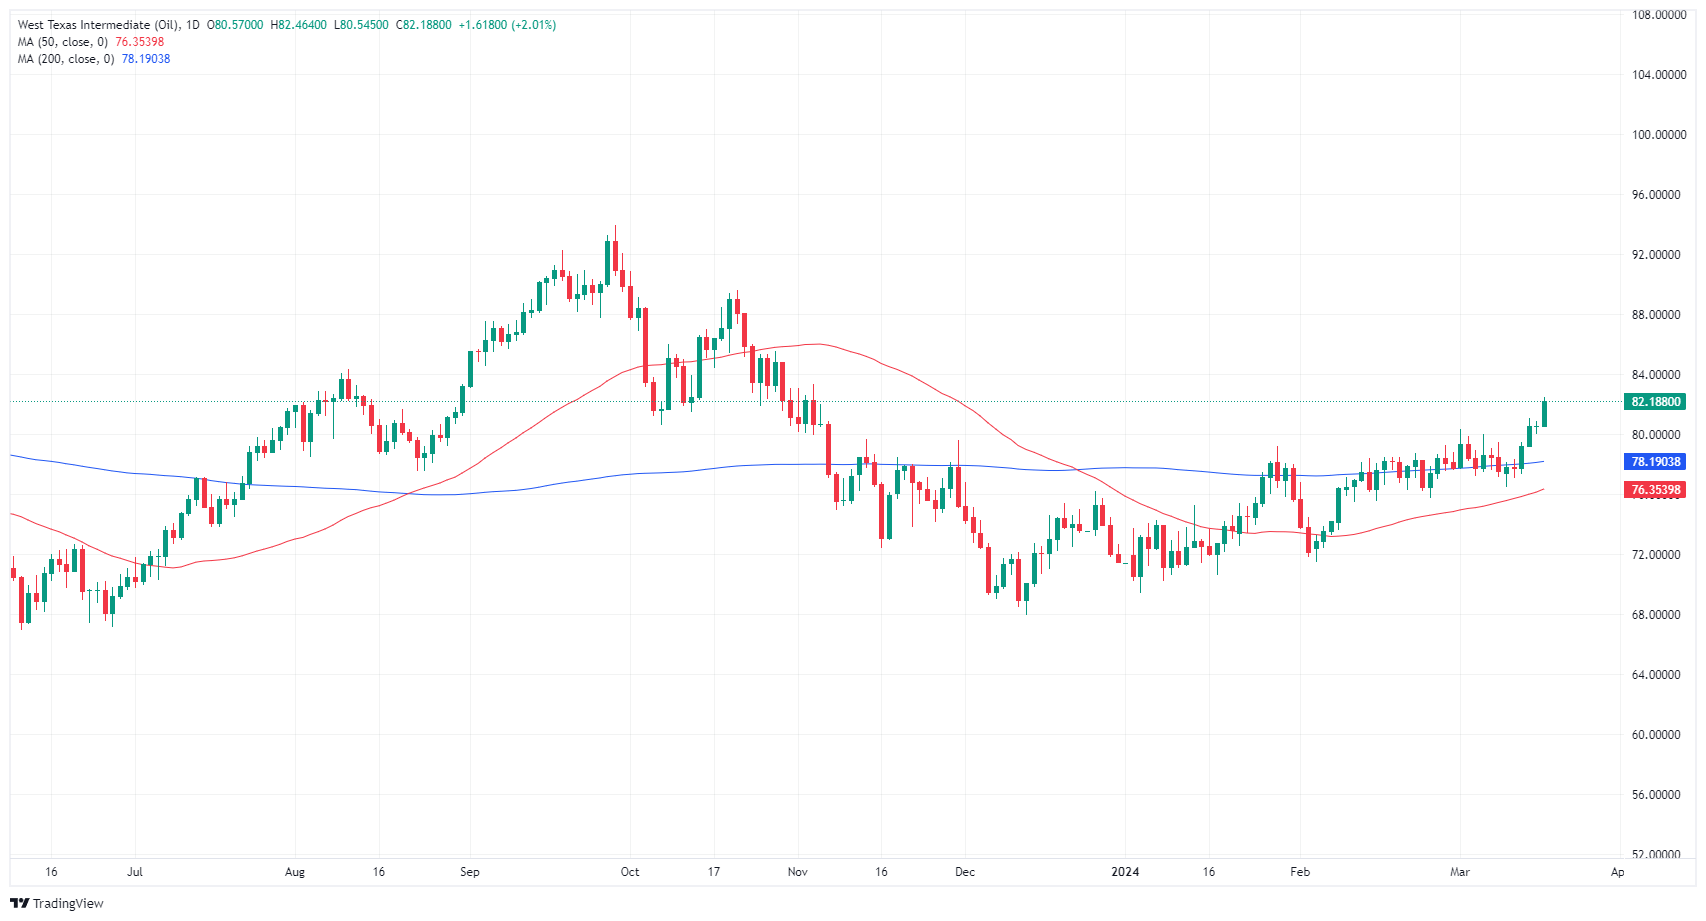
- Interest rate in Australia is seen on hold at 4.35% for the third consecutive meeting in March.
- Reserve Bank of Australia Governor Michele Bullock will hold a press conference at 04:30 GMT.
- The language in the RBA’s statement and Bullock’s presser hold the key for the Australian Dollar.
The Reserve Bank of Australia (RBA) is widely expected to hold the Official Cash Rate (OCR) steady at a 12-year high of 4.35% following the conclusion of its March monetary policy meeting on Tuesday. The decision will be announced at 03:30 GMT.
With a rates on-hold decision fully baked in, the Australian Dollar’s fate hinges on the tone or language in the policy statement, as well as on Governor Michele Bullock’s comments during the post-policy press conference. The presser will be held at 04:30 GMT.
Reserve Bank of Australia expected to extend the pause, but what’s next?
The RBA is set to extend the pause into the third meeting in a row when it meets on Tuesday. Markets, however, will be focused on fresh signals offered by the central bank on the timing and the scope of a policy pivot.
Economists are divided, with some forecasting an RBA interest rate cut not until November while some expect the Bank to begin lowering rates in September. Amidst the uncertainty around the timing of the rate cut, RBA Governor Michele Bullock’s outlook on inflation and the policy rate will hold the key, as she would take account of slowing economic growth and price pressures.
Data from the Australian Bureau of Statistics (ABS) showed the Consumer Price Index (CPI) rose 0.6% in the fourth quarter (Q4) of last year, under market forecasts for a 0.8% increase. A closely watched measure of core inflation, the trimmed mean, rose 0.8% in the same period, below expectations of a 0.9% increase.
The latest monthly inflation data for January showed that the CPI rose at an annual rate of 3.4%, at the same pace as seen in December while a tad lower than the estimate of 3.5%. Meanwhile, Australia’s annual growth slowed to 1.5% in Q4 from 2.1% the previous quarter, registering its lowest since early 2021.
But, the services inflation, measured by the Wage Price Index, increased 4.2% YoY in Q4, up from a revised 4.1% gain in the third quarter and above the market estimate of 4.1%. The reading was the highest since Q1 2009, with pay growth in both the public and private sectors.
Even though wage inflation remains at elevated levels, Governor Bullock remains confident that it will come down. Testifying before the Australian Parliament last month, Bullock said that “inflation is being persistent, particularly in services. But it is coming down.”
Does this indicate a potential dovish shift in the central bank’s language in the upcoming meeting?
Previewing the RBA policy decision, analysts at TD Securities (TDS) explained, “it should be a fairly straightforward on-hold decision, though the focus will be if the RBA retains its soft hawkish bias. The jobs market has shown cracks after the dismal Dec-Jan prints while monthly CPI reaffirms the disinflation narrative, with the near-term inflation impulse towards the downside. We will keep an eye out on QT plans as the RBA has kept strangely quiet about it.”
How will the RBA interest rate decision impact AUD/USD?
The Australian Dollar (AUD) has entered corrective mode after reaching fresh two-month highs at 0.6667 against the US Dollar last week. The AUD/USD pair could see an extended pullback if Governor Bullock delivers a dovish message, acknowledging the economic slowdown and the gradual decline in inflation. On the other hand, AUD/USD could revert toward multi-month highs should the RBA policymakers retain their hawkish stance.
In its February policy statement, the RBA said that Further increase in interest rates can't be ruled out, adding that the board needs to be confident that inflation is moving sustainably towards the target range.”
Dhwani Mehta, Asian Session Lead Analyst at FXStreet, notes key technicals to trade AUD/USD on the policy outcome. “AUD/USD is challenging a powerful confluence support area near 0.6560 in the lead-up to the RBA showdown. That zone is the intersection of the 21-, 50- and 200-day Simple Moving Averages (SMA). The 14-day Relative Strength Index (RSI) is battling the 50 level, suggesting that the pair lacks a clear directional bias ahead of the RBA interest rate decision.”
Dhwani adds: “Aussie buyers need to defend the abovementioned key support near 0.6560 on a daily closing basis to attempt a rebound toward the previous week’s high of 0.6638. The next upside barrier is seen at the 0.6700 round figure. Conversely, a downside break of the 0.6560 support could trigger a fresh downtrend toward the 0.6500 level. The last line of defense for buyers is seen at 0.6479, the March 5 low.”
Economic Indicator
Australia RBA Interest Rate Decision
The Reserve Bank of Australia (RBA) announces its interest rate decision at the end of its eight scheduled meetings per year. If the RBA is hawkish about the inflationary outlook of the economy and raises interest rates it is usually bullish for the Australian Dollar (AUD). Likewise, if the RBA has a dovish view on the Australian economy and keeps interest rates unchanged, or cuts them, it is seen as bearish for AUD.
Read more.
RBA FAQs
The Reserve Bank of Australia (RBA) sets interest rates and manages monetary policy for Australia. Decisions are made by a board of governors at 11 meetings a year and ad hoc emergency meetings as required. The RBA’s primary mandate is to maintain price stability, which means an inflation rate of 2-3%, but also “..to contribute to the stability of the currency, full employment, and the economic prosperity and welfare of the Australian people.” Its main tool for achieving this is by raising or lowering interest rates. Relatively high interest rates will strengthen the Australian Dollar (AUD) and vice versa. Other RBA tools include quantitative easing and tightening.
While inflation had always traditionally been thought of as a negative factor for currencies since it lowers the value of money in general, the opposite has actually been the case in modern times with the relaxation of cross-border capital controls. Moderately higher inflation now tends to lead central banks to put up their interest rates, which in turn has the effect of attracting more capital inflows from global investors seeking a lucrative place to keep their money. This increases demand for the local currency, which in the case of Australia is the Aussie Dollar.
Macroeconomic data gauges the health of an economy and can have an impact on the value of its currency. Investors prefer to invest their capital in economies that are safe and growing rather than precarious and shrinking. Greater capital inflows increase the aggregate demand and value of the domestic currency. Classic indicators, such as GDP, Manufacturing and Services PMIs, employment, and consumer sentiment surveys can influence AUD. A strong economy may encourage the Reserve Bank of Australia to put up interest rates, also supporting AUD.
Quantitative Easing (QE) is a tool used in extreme situations when lowering interest rates is not enough to restore the flow of credit in the economy. QE is the process by which the Reserve Bank of Australia (RBA) prints Australian Dollars (AUD) for the purpose of buying assets – usually government or corporate bonds – from financial institutions, thereby providing them with much-needed liquidity. QE usually results in a weaker AUD.
Quantitative tightening (QT) is the reverse of QE. It is undertaken after QE when an economic recovery is underway and inflation starts rising. Whilst in QE the Reserve Bank of Australia (RBA) purchases government and corporate bonds from financial institutions to provide them with liquidity, in QT the RBA stops buying more assets, and stops reinvesting the principal maturing on the bonds it already holds. It would be positive (or bullish) for the Australian Dollar.
- Gold sees a modest increase, as investors watch this week's central bank meetings.
- Focus remains on the Federal Reserve, where a hawkish stance could potentially impact Gold prices while bolstering the US Dollar.
- Recent US inflation data and Treasury yield resurgence, weighed on Gold prices.
Gold price registers modest gains on Monday amid a quiet session as investors brace for major central banks monetary policy decisions. Even though the Bank of Japan (BoJ), the Bank of England (BoE), and the Federal Reserve (Fed) would announce their decisions, the spotlight is on the latter. A Fed’s hawkish tilt could drive XAU/USD prices toward the $2,100.00 figure due to market participants' aggressive short positioning on the Greenback. At the time of writing, Gold trades at around $2,160.55, which is up 0.22%.
The price of the yellow metal remains underpinned by previous speculations that the Fed will begin to ease monetary policy sooner than expected. Nevertheless, during the last week, Bullion tumbled close to 1% as inflation in the consumer and the producer side on the United States (US) surprisingly reaccelerated, spurring a jump in US Treasury bond yields. Consequently, the Greenback posted gains of more than 0.69% last week, according to the US Dollar Index (DXY) and Gold’s slumped.
Daily digest market movers: Gold holds to modest gains as US yields rise
- On Monday, the US economic docket will featured housing data on the first two days of the week. Data from the National Association of Home Builders (NAHB) revealed that homebuilders' confidence rose in March to its highest level since July 2023, as mortgage rates dip, on expectations that the Fed might begin to ease policy. The NAHB Market Index came at 51, up from 48 in February.
- The US 10-year Treasury bond yield climbs two and a half basis points, up at 4.334%.
- The latest US economic data witnessed mixed readings in business activity, making it challenging to predict the pace of the economic deceleration in the US. The labor market has shown signs of cooling, though the economy added more people to the workforce than expected while fewer people applied for unemployment benefits.
- Given the backdrop, Fed Chairman Jerome Powell’s words in his testimony at the US Congress, suggesting that they would begin to cut borrowing costs, were justified. However, last week’s inflation figures and retail sales data triggered a repricing of Fed rate cut bets, aligning with the US central bank's view of 75 basis points of easing toward the end of 2024.
- The Fed’s next meeting is scheduled for March 19-20 next week. Given the latest inflation data, speculation is growing that Fed officials could eliminate one rate cut towards the end of the year, signaling they could cut rates twice in 2024.
- According to the CME FedWatch Tool, expectations for a June rate cut stand at 58%, down from 72% a week ago.
Technical analysis: Gold buyers take a breather below $2,170
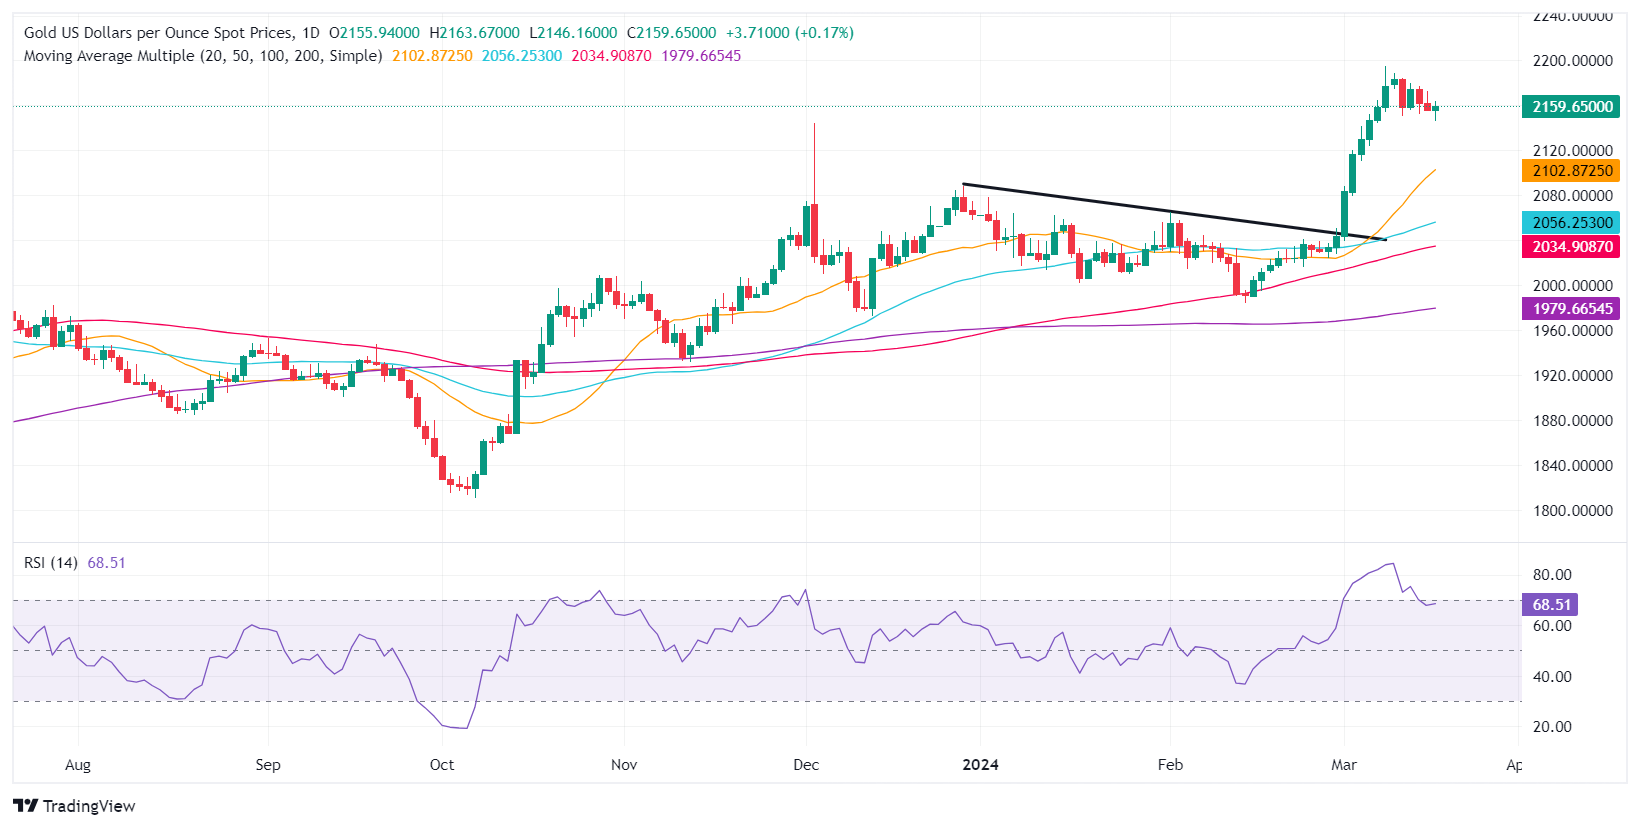
Gold’s uptrend remains in place, though the non-yielding metal remains glued to the $2,160-$2,180 area. Market participants keep the XAU/USD spot price near the bottom of the previously mentioned range, which could suggest that buyers are in charge and could drive prices toward the year-to-date (YTD) high of $2,195.15, ahead of the $2,200.00 mark.
However, the Relative Strength Index (RSI) indicator exiting from overbought conditions suggests that buyers are taking a breather. If sellers stepped in, pulling Gold’s price below $2,160.00, that would pave the way to test the December 4 high of $2,146.79, followed by the March 6 low of $2,123.80, followed by $2,100.00.
Gold FAQs
Gold has played a key role in human’s history as it has been widely used as a store of value and medium of exchange. Currently, apart from its shine and usage for jewelry, the precious metal is widely seen as a safe-haven asset, meaning that it is considered a good investment during turbulent times. Gold is also widely seen as a hedge against inflation and against depreciating currencies as it doesn’t rely on any specific issuer or government.
Central banks are the biggest Gold holders. In their aim to support their currencies in turbulent times, central banks tend to diversify their reserves and buy Gold to improve the perceived strength of the economy and the currency. High Gold reserves can be a source of trust for a country’s solvency. Central banks added 1,136 tonnes of Gold worth around $70 billion to their reserves in 2022, according to data from the World Gold Council. This is the highest yearly purchase since records began. Central banks from emerging economies such as China, India and Turkey are quickly increasing their Gold reserves.
Gold has an inverse correlation with the US Dollar and US Treasuries, which are both major reserve and safe-haven assets. When the Dollar depreciates, Gold tends to rise, enabling investors and central banks to diversify their assets in turbulent times. Gold is also inversely correlated with risk assets. A rally in the stock market tends to weaken Gold price, while sell-offs in riskier markets tend to favor the precious metal.
The price can move due to a wide range of factors. Geopolitical instability or fears of a deep recession can quickly make Gold price escalate due to its safe-haven status. As a yield-less asset, Gold tends to rise with lower interest rates, while higher cost of money usually weighs down on the yellow metal. Still, most moves depend on how the US Dollar (USD) behaves as the asset is priced in dollars (XAU/USD). A strong Dollar tends to keep the price of Gold controlled, whereas a weaker Dollar is likely to push Gold prices up.
- Heavy week for USD/JPY with BoJ and Fed in the barrel.
- Bank of Japan widely anticipated to pivot away from negative rates.
- Fed to update Dot Plot of interested rate expectations on Wednesday.
USD/JPY is churning chart paper just above the 149.00 handle as investors gear up for a central-bank-heavy week. The Bank of Japan (BoJ) is expected to deliver an update on its negative interest rate regime early in the Tuesday market session after Japan’s spring wage negotiations showed the highest wage increases in over three decades. The Federal Reserve (Fed) is also expected this week and will drop its latest Dot Plot summary of interest rate projections on Wednesday.
The BoJ widely telegraphed that any moves on interest rates would hinge on the results of spring wage negotiations in Japan. Union-negotiated wage increases soared over 5% this year, a 31-year high. Market hopes of rate hikes from the BoJ have pinned into the high side, and uncorroborated reports from the Nikkei news service in Japan insist that the BoJ has already agreed internally to raise interest rates to a 0.0-0.1% range. Japan’s main reference rate is currently near -0.1%. The BoJ is expected to drop its latest rate call sometime early Tuesday.
The Fed will hit markets with its latest rate call on Wednesday, to be followed by another press conference from Fed Chairman Jerome Powell. The Fed will also update its Dot Plot summary of interest rate projections. Rate-cut-hungry markets are increasingly worried the Fed is going to ease back on rate cut expectations. The Fed’s last Dot Plot suggested a median forecast of three rate cuts through 2024, totaling around 75 basis points in rate slashing by the end of the year. Money markets entered 2024 expecting a whopping six or seven rate cuts totaling an eye-watering 175-200 basis points.
As the US economy proves far more resilient than rate watchers expected, and US inflation remains stickier than hoped, rate futures markets have been knocked firmly back, with rate expectations falling to match the Fed’s own Dot Plot in March. According to the CME’s FedWatch Tool, markets were pricing in nearly 70% odds of a first rate cut from the Fed in June as recently as last week. That number has eased to around 50-50 odds on Monday.
US Purchasing Manager Index (PMI) figures are due in the back half of the trading week, as well as Japanese Trade Balance numbers on Thursday followed by Japanese National Consumer Price Index (CPI) follow-up inflation numbers early Friday.
USD/JPY technical outlook
USD/JPY is broadly flat on Monday, testing the waters just north of the 149.00 handle. The pair pushed into the north side of a descending 200-hour Simple Moving Average (SMA) last week, which is settling into the 148.00 region. 151.00 remains a key technical ceiling in the near term, and intraday momentum remains in the hands of the bulls with the pair bouncing into a recovery from 146.50.
USD/JPY hourly chart
The US Dollar started the week in a positive fashion on the back of further upside in US yields and shrinking bets on an interest rate cut at the June event. The move higher in the Greenback weighed on the risk complex and provoked a drop below 1.0900 in EUR/USD.
Here is what you need to know on Tuesday, March 19:
The USD Index (DXY) rose to new multi-session highs above 103.60 amidst rising US yields and the prevailing risk-off mood. On March 19, Building Permits, Housing Starts and Net Long-Term TIC Flows are due in the US docket.
EUR/USD retreated to multi-day lows in the 1.0870/65 band on the back of further Dollar gains. The Economic Sentiment tracked by the ZEW Institute in Germany and the euro area take centre stage on March 19.
GBP/USD traded in an inconclusive fashion in the low-1.2700s in response to the advance in the US Dollar.
USD/JPY rose for the fifth session in a row and broke above the 149.00 barrier ahead of the key BoJ event on March 19. Other than the BoJ meeting, the Japanese docket will include Industrial Production readings.
AUD/USD put the 200-day SMA around 0.6550 to the test amidst marginal losses. The RBA is expected to keep its OCR unchanged at its gathering on March 19. Further data will see the RBA’s Consumer Inflation Expectations.
WTI prices rose to multi-month tops north of the $82.00 mark on Monday on the back of Iraq headlines and auspicious results from the Chinese calendar.
Gold prices managed to leave behind two consecutive sessions of losses and regained the $2,160 region per troy ounce on Monday. Its cousin Silver retreated modestly although it maintained the trade above the key $25.00 mark per ounce.
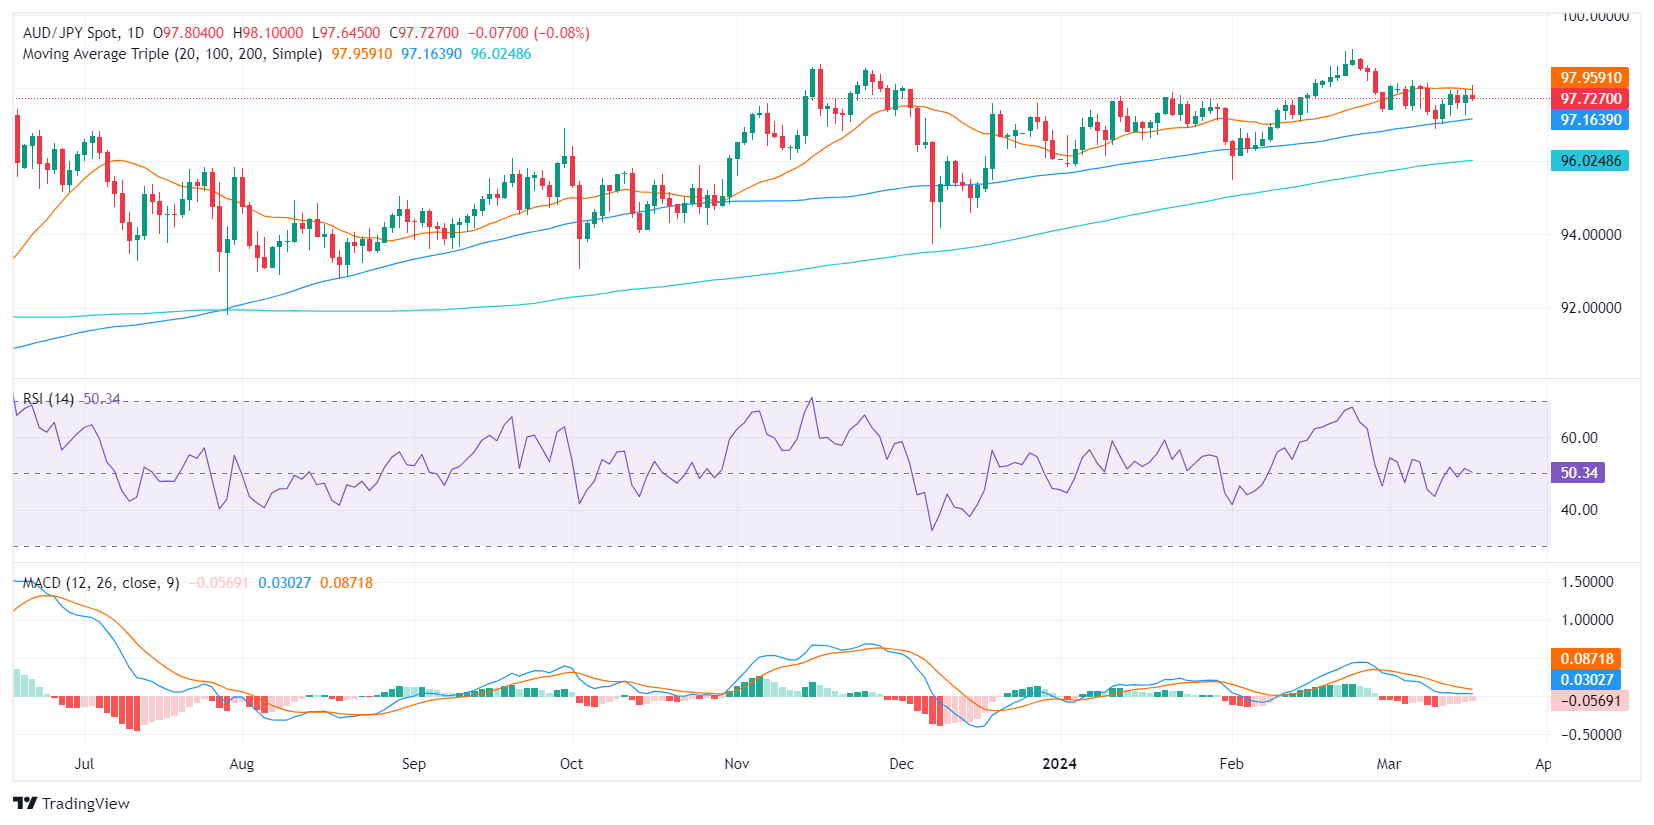
- The AUD/JPY gave up daily gains and struggled to make a decisive upward movement.
- The hourly chart signals a shift to short-term bearish traction, with a downturn of the RSI.
- To ensure continued bullish momentum, buyers must defend the main SMAs.
On Monday's session, the AUD/JPY pair is trading at 97.71, mildly down after peaking at a high of around 98.10, near the 20-day Simple Moving Average (SMA). Unless the buyers conquer this level, any upward attempt will be limited and the short-term outlook will be tilted in favor of the buyers.
Based on the indicators of the daily chart, the Relative Strength Index (RSI) has remained within the positive territory over the last several sessions, thus revealing a steady positive momentum. The Moving Average Convergence Divergence (MACD), however, reveals a less optimistic picture by displaying decreasing red bars, indicating a steady negative momentum and giving arguments for a neutral to bearish outlook.
AUD/JPY daily chart
On the hourly chart, the RSI started the day around the 61 level representing a strong momentum, gradually losing strength as the session progressed to fall into the negative territory around 42 by the American session. The Moving Average Convergence Divergence (MACD) histogram, on the other hand, is increasing but remains in the negative territory, as represented by the rising red bars. Sellers seem to currently hold the reins in the hourly perspective.
AUD/JPY hourly chart
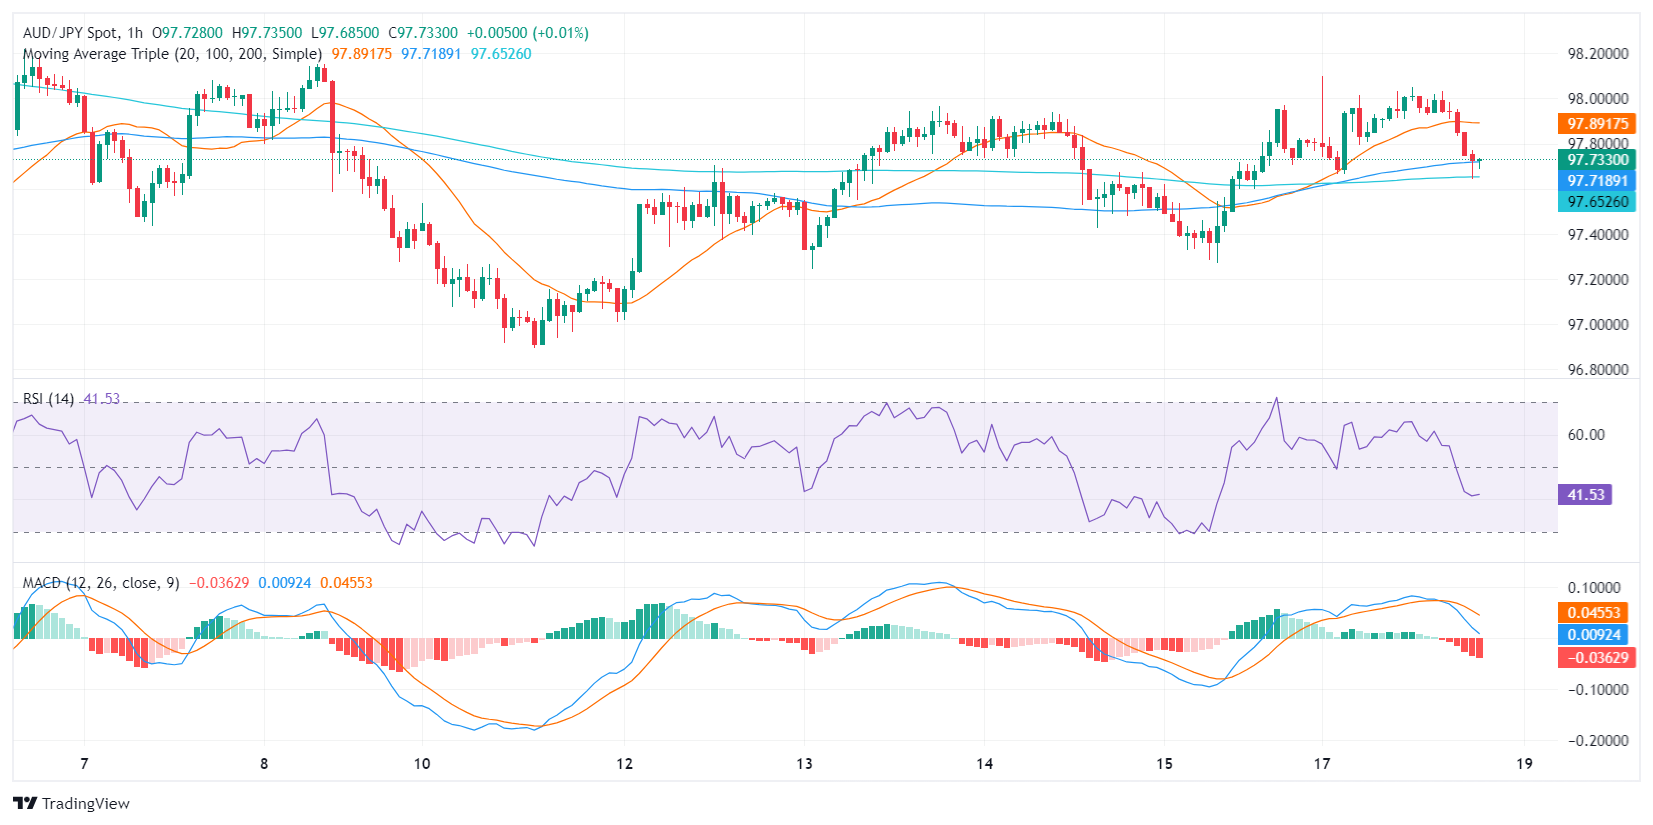
All in all, ahead of the Asian session, the sellers may continue gaining ground, and unless the buyers get a fundamental boost, they will have a hard time conquering the 20-day SMA to confirm a recovery. However, the primary task is to defend the 100 and 200-day SMAs to defen the long-term bullish outlook.
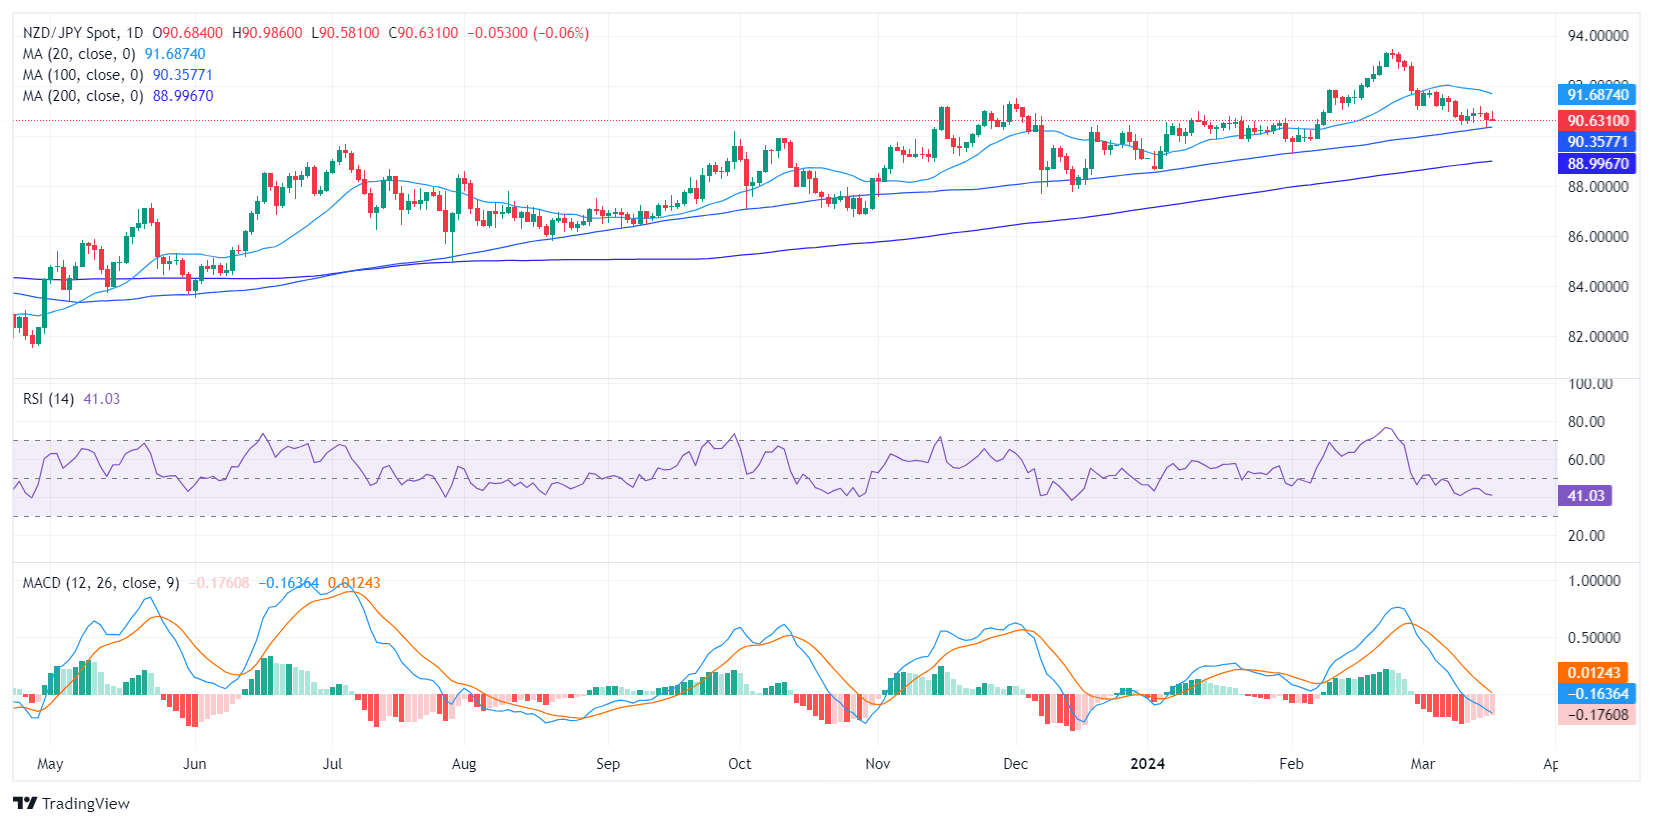
- The NZD/JPY gave up daily gains and trades with losses in the American Session.
- The hourly chart, shows indicators moving towards oversold terrain.
- On the daily chart, indicators stand mostly flat.
In Monday's trading, the NZD/JPY reversed its course and gave up daily gains to decline towards 90.60. Recent movements show an intensification of seller activity as indicators slowly move towards oversold territory while on the daily chart the selling traction somewhat flattened.
On the daily chart, the Relative Strength Index (RSI) fell last week within negative territory and currently stands at around 40.65, mostly flat. This reveals lower momentum from the sellers. This tendency is exalted with the Moving Average Convergence Divergence (MACD) 's flat red bars suggest that negative momentum is consolidating.
NZD/JPY daily chart
Turning attention to the hourly chart, the RSI fell deeper into negative territory while the MACD exhibited rising red bars. However, as short-term indicators seem to be moving towards oversold territory, it could pave the way for a short-term recovery to consolidate losses.
NZD/JPY hourly chart
In conclusion, while indicators appear to have turned flat on the daily chart, the selling momentum intensified in the hourly chart, suggesting that the pair could suffer more pain for the rest of the session. Looking at the broader trend, there are not enough arguments to conclude a bearish outlook as the pair sits above the 100 and 200-day Simple Moving Average (SMA). That being said, the sellers are in control for the immediate short term.
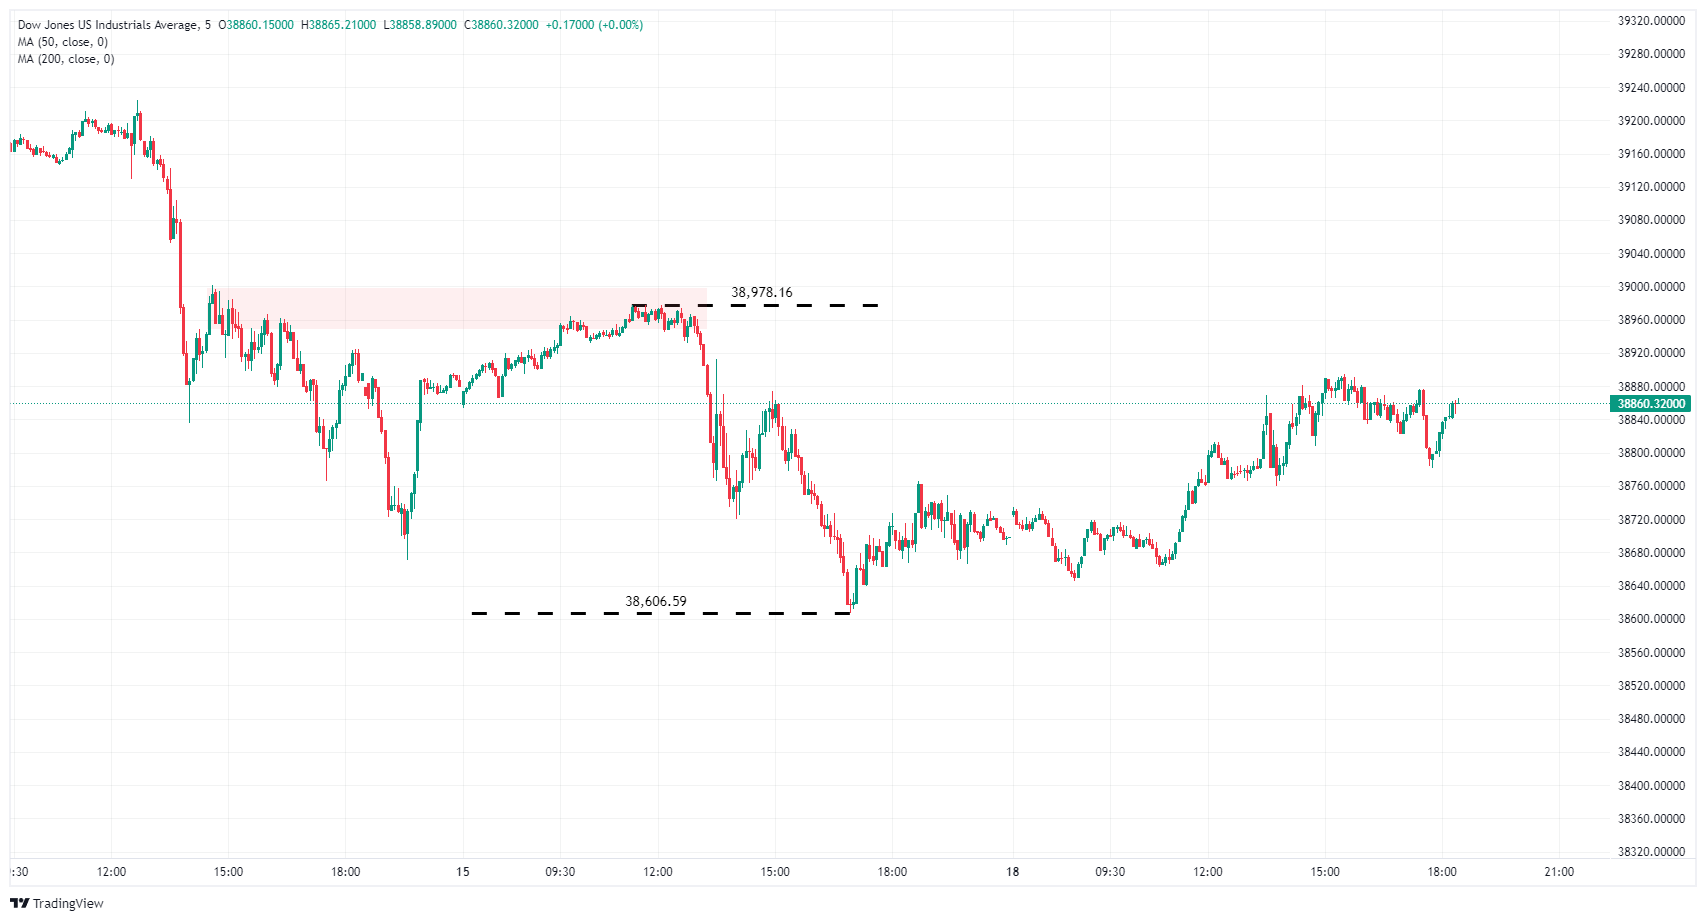
- Dow Jones climbs on Monday ahead of Fed’s Wednesday rate call.
- Equities shrug off declining June rate cut bets.
- Update to Fed’s Dot Plot and US PMI figures also due this week.
The Dow Jones Industrial Average (DJIA) climbed on Monday as investors returned to risk bids to kick off a hectic central bank-themed trading week. US equities are rising across the board and the major indices are getting bolstered by a surge in telecomms.
The Federal Reserve’s (Fed) latest rate call is slated for Wednesday, and an update to the Fed’s Dot Plot of interest rate expectations will draw plenty of investors’ attention as markets continue to try to pin down when the US central bank will deliver a rate trim. Money markets have continued to pare back bets of a 25 basis point rate cut in June, but equities are shrugging off the attitude shift to lean into the bullish side on Monday. Rate futures are pricing in nearly 50-50 odds of no rate cut in June, down from nearly 70% chances of a 25 bps cut just a week ago.
Dow Jones news
As of writing, the Dow Jones Industrial Average is in the green around a third of a percent on Monday, gaining on the day but lagging its index counterparts. The S&P 500 has gained around eight tenths of a percent and the NASDAQ Composite is up over 1%.
The Communication Services Sector is firmly higher on the day, surging nearly 3% on Monday. Of the eleven major sectors in US equities, all of them are in the green to start the new trading week.
Walt Disney Co. (DIS) is leading the charge on the DJIA, gaining 1.7% around midday on Monday to trade near $114.00. Salesforce Inc. (CRM), Apple Inc. (AAPL) and Caterpillar Inc. (CAT) are in a three-way slugfest to determine second place, with all three gaining around 1.5% on Monday. On the downside, Boeing Co. (BA) continues to shed weight, declining another 1.4% on Monday to trade into $180.00 per share.
Dow Jones technical outlook
Despite Monday’s gains, The Dow Jones Industrial Average is trading well within last Friday’s technical bounds, churning into the 38,880.00 level as near-term momentum finds an intraday price floor near 38,800.00.
Despite the day’s bullish tilt, the DJIA remains down from recent highs, and the index is still down nearly a full percent from last week’s peak bids near 39,230.00.
Dow Jones 5-minute chart
Dow Jones FAQs
The Dow Jones Industrial Average, one of the oldest stock market indices in the world, is compiled of the 30 most traded stocks in the US. The index is price-weighted rather than weighted by capitalization. It is calculated by summing the prices of the constituent stocks and dividing them by a factor, currently 0.152. The index was founded by Charles Dow, who also founded the Wall Street Journal. In later years it has been criticized for not being broadly representative enough because it only tracks 30 conglomerates, unlike broader indices such as the S&P 500.
Many different factors drive the Dow Jones Industrial Average (DJIA). The aggregate performance of the component companies revealed in quarterly company earnings reports is the main one. US and global macroeconomic data also contributes as it impacts on investor sentiment. The level of interest rates, set by the Federal Reserve (Fed), also influences the DJIA as it affects the cost of credit, on which many corporations are heavily reliant. Therefore, inflation can be a major driver as well as other metrics which impact the Fed decisions.
Dow Theory is a method for identifying the primary trend of the stock market developed by Charles Dow. A key step is to compare the direction of the Dow Jones Industrial Average (DJIA) and the Dow Jones Transportation Average (DJTA) and only follow trends where both are moving in the same direction. Volume is a confirmatory criteria. The theory uses elements of peak and trough analysis. Dow’s theory posits three trend phases: accumulation, when smart money starts buying or selling; public participation, when the wider public joins in; and distribution, when the smart money exits.
There are a number of ways to trade the DJIA. One is to use ETFs which allow investors to trade the DJIA as a single security, rather than having to buy shares in all 30 constituent companies. A leading example is the SPDR Dow Jones Industrial Average ETF (DIA). DJIA futures contracts enable traders to speculate on the future value of the index and Options provide the right, but not the obligation, to buy or sell the index at a predetermined price in the future. Mutual funds enable investors to buy a share of a diversified portfolio of DJIA stocks thus providing exposure to the overall index.
- Euro dips as investor focus on upcoming FOMC meeting and interest rate projections.
- Eurozone inflation aligns with expectations, but EUR/USD's movement restrained by anticipation of Fed's policy direction.
- ECB's Centeno highlights the importance of price stability and suggests rate adjustments could prevent recession in the Eurozone.
The Euro drops against the US Dollar at the beginning of the week as investors brace for the Federal Open Market Committee (FOMC) monetary policy decision. Expectations that the ‘dot plots’ might adjust the Federal Reserve’s (Fed) projections of monetary policy put pressure on the EUR/USD, which trades at 1.0872, down 0.14%.
EUR/USD falls ahead of Fed’s decision
The current week will witness three major central bank monetary policy decisions. On Tuesday, the Bank of Japan is expected to raise rates by 10 basis points and end the era of negative interest rates. On Wednesday, the Fed is foreseen to keep policy unchanged, though speculations are mounting that the US central bank would likely adjust their projections on interest rates.
Eurozone (EU) inflation in February, as measured by the Harmonized Index of Consumer Prices (HICP), cooled from 3.3% to 3.1% YoY, as expected. The core HICP edged lower from 2.8% to 2.6% aligned with forecasts. The data barely moved the EUR/USD pair as traders braced for the Fed’s decision in two days.
In the meantime, European Central Bank (ECB) policymaker Mario Centeno said that price stability needs financial stability, adding that reducing the main rate may help avoid a recession in the bloc’s economy.
Across the pond, the US economic schedule revealed that the National Association of Home Builders (NAHB) Market Index improved the most since July 2023, rising by 51, up from 48 in February.
In the meantime, the fixed-income market shows that US bonds remain offered, as US Treasury bond yields push higher across the short and long ends of the curve. That is bolstering the Greenback, according to the US Dollar Index (DXY), which is up 0.17%, at 103.62.
EUR/USD Price Analysis: Technical outlook
The daily chart shows the EUR/USD has finally broken below last Friday’s low of 1.0872, extending its losses below the 1.0870 figure. Nevertheless, buyers could be leaning in the 100-day moving average (DMA) at 1.0860, which, once cleared, could open the door for further downside. The next key dynamic support levels are the 50-DMA at 1.0850 and the 200-DMA at 1.0838. The first key resistance level would be the 1.0900 mark.
- GBP/USD hold steady as BoE, Fed decisions loom.
- US homebuilders' confidence rises, mortgage rates may drop if Fed eases.
- UK inflation data pivotal for Sterling pre-BoE decision.
- The GBP/USD is under pressure as unexpected UK CPI may alter BoE policy.
The Pound Sterling losses steam and treads water against the US Dollar as traders prepare for the announcement of major central banks' monetary policy decisions. The Bank of England and the US Federal Reserve are expected to hold rates unchanged, though a ‘hawkish tilt’ of the Fed might weigh on Sterling; the GBP/USD trades at 1.2727, barely down 0.04%.
Sterling awaits Fed and BoE decisions, as UK inflation could set the tone
This week, the US economic docket will feature housing data on the first two days of the week. Data from the National Association of Home Builders (NAHB) revealed that homebuilders' confidence rose in March to its highest level since July 2023, as mortgage rates dip, on expectations that the Fed might begin to ease policy. The NAHB Market Index came at 51, up from 48 in February.
Across the pond, UK inflation is due on Wednesday, a day ahead of the BoE’s decision. The Consumer Price Index (CPI) for February is expected to dip from 4% to 3.5% YoY, while core figures are estimated at 4.6% YoY, down from 5.1%.
If UK inflation cools as estimated, that could be negative for Cable, which would likely be under pressure later on Wednesday as the Fed announced its decision and updated its projections. The data could influence Thursday’s BoE decision and tilt the UK’s central bank slightly dovish.
On the other hand, a hotter-than-expected inflation in Britain could underpin the GBP/USD higher, as the BoE would adhere to the mantra of keeping rates “higher for longer.”
GBP/USD Price Analysis: Technical outlook
Since reaching the current year-to-date (YTD) high of 1.2894, the GBP/USD has dived more than 1.30%. if sellers push prices below 1.2700, that could open the door to challenge dynamic support at the 50-day moving average (DMA) at 1.2685. further downside is seen once cleared, at the 100-DMA at 1.2607, followed by the 200-DMA at 1.2590. On the flip side, if buyers lift the exchange rate above last Friday’s high of 1.2758, further upside is seen at 1.2800.
Pound Sterling FAQs
The Pound Sterling (GBP) is the oldest currency in the world (886 AD) and the official currency of the United Kingdom. It is the fourth most traded unit for foreign exchange (FX) in the world, accounting for 12% of all transactions, averaging $630 billion a day, according to 2022 data. Its key trading pairs are GBP/USD, aka ‘Cable’, which accounts for 11% of FX, GBP/JPY, or the ‘Dragon’ as it is known by traders (3%), and EUR/GBP (2%). The Pound Sterling is issued by the Bank of England (BoE).
The single most important factor influencing the value of the Pound Sterling is monetary policy decided by the Bank of England. The BoE bases its decisions on whether it has achieved its primary goal of “price stability” – a steady inflation rate of around 2%. Its primary tool for achieving this is the adjustment of interest rates. When inflation is too high, the BoE will try to rein it in by raising interest rates, making it more expensive for people and businesses to access credit. This is generally positive for GBP, as higher interest rates make the UK a more attractive place for global investors to park their money. When inflation falls too low it is a sign economic growth is slowing. In this scenario, the BoE will consider lowering interest rates to cheapen credit so businesses will borrow more to invest in growth-generating projects.
Data releases gauge the health of the economy and can impact the value of the Pound Sterling. Indicators such as GDP, Manufacturing and Services PMIs, and employment can all influence the direction of the GBP. A strong economy is good for Sterling. Not only does it attract more foreign investment but it may encourage the BoE to put up interest rates, which will directly strengthen GBP. Otherwise, if economic data is weak, the Pound Sterling is likely to fall.
Another significant data release for the Pound Sterling is the Trade Balance. This indicator measures the difference between what a country earns from its exports and what it spends on imports over a given period. If a country produces highly sought-after exports, its currency will benefit purely from the extra demand created from foreign buyers seeking to purchase these goods. Therefore, a positive net Trade Balance strengthens a currency and vice versa for a negative balance.
- The DXY started the week with mild gains.
- All eyes are set on Wednesday’s FOMC meeting.
- No relevant reports were released on Monday.
The US Dollar Index (DXY) trades at 103.55 on Monday, reflecting minor gains. Rising US Treasury yields also favored the favorable start of the week. All eyes are now on the Federal Reserve (Fed) decision on Wednesday and the updated economic projections.
The US economy is at a pivotal juncture as inflation remains sticky, while weak labor market data seem to be balancing investor expectations on the Fed’s timing for beginning the easing cycle. As for now, the first cut is seen in June.
Daily digest market movers: DXY rises on quiet Monday on the back of rising US Treasury yields
- The Federal Reserve is projected to exercise patience before implementing policy easing, considering that there seem to be signs of US inflation progress slowing down.
- At present, the markets are predicting a 65% chance of a rate cut in June, with a full rate cut already considered in the projections for the July meeting.
- The updated Dot Plots will provide markets with additional guidance.
- Despite a recent dovish testimony by Powell, the majority of officials from the Federal Reserve express caution regarding premature monetary easing.
- US Treasury bond yields are rising with trading figures clocking in at 4.75% for the 2-year yield, 4.35% for the 5-year yield, and 4.33% for the 10-year yield.
DXY technical analysis: DXY confronts bearish disposition, while still suggesting a glimmer of hope
US Dollar FAQs
What is the US Dollar?
The US Dollar (USD) is the official currency of the United States of America, and the ‘de facto’ currency of a significant number of other countries where it is found in circulation alongside local notes. It is the most heavily traded currency in the world, accounting for over 88% of all global foreign exchange turnover, or an average of $6.6 trillion in transactions per day, according to data from 2022.
Following the second world war, the USD took over from the British Pound as the world’s reserve currency. For most of its history, the US Dollar was backed by Gold, until the Bretton Woods Agreement in 1971 when the Gold Standard went away.
How do the decisions of the Federal Reserve impact the US Dollar?
The most important single factor impacting on the value of the US Dollar is monetary policy, which is shaped by the Federal Reserve (Fed). The Fed has two mandates: to achieve price stability (control inflation) and foster full employment. Its primary tool to achieve these two goals is by adjusting interest rates.
When prices are rising too quickly and inflation is above the Fed’s 2% target, the Fed will raise rates, which helps the USD value. When inflation falls below 2% or the Unemployment Rate is too high, the Fed may lower interest rates, which weighs on the Greenback.
What is Quantitative Easing and how does it influence the US Dollar?
In extreme situations, the Federal Reserve can also print more Dollars and enact quantitative easing (QE). QE is the process by which the Fed substantially increases the flow of credit in a stuck financial system.
It is a non-standard policy measure used when credit has dried up because banks will not lend to each other (out of the fear of counterparty default). It is a last resort when simply lowering interest rates is unlikely to achieve the necessary result. It was the Fed’s weapon of choice to combat the credit crunch that occurred during the Great Financial Crisis in 2008. It involves the Fed printing more Dollars and using them to buy US government bonds predominantly from financial institutions. QE usually leads to a weaker US Dollar.
What is Quantitative Tightening and how does it influence the US Dollar?
Quantitative tightening (QT) is the reverse process whereby the Federal Reserve stops buying bonds from financial institutions and does not reinvest the principal from the bonds it holds maturing in new purchases. It is usually positive for the US Dollar.
- Canadian Dollar finds little chart momentum as investors gear up for a busy week.
- Canadian CPI inflation first on the docket, expected to tick up on Tuesday.
- Fed Wednesday brings rate call, updated Dot Plot.
The Canadian Dollar (CAD) is sifting chart paper on Monday, easing into the trading week as investors take a moment to breathe before a full-pull central bank week begins in earnest. The Federal Reserve (Fed) is expected to update its summary of interest rate forecasts, or Dot Plot, on Wednesday. American Purchasing Managers Index (PMI) figures are also due later in the week on Thursday.
Canada is up first this week, with an update to Consumer Price Index (CPI) inflation in February. The Bank of Canada (BoC) will update its Summary of Deliberations on Wednesday, cast in the shadow of the Federal Open Market Committee’s (FOMC) mid-week Press Conference.
Daily digest market movers: Canadian Dollar churns in place as investors await the spark
- The Canadian Raw Material Price Index and Industrial Product Prices for February printed to little effect.
- Canadian Raw Materials prices rose 2.1% in February, a five-month high and a sharp increase from the previous 1.2%.
- Industrial Product Prices rose in February, printing at 0.7% versus the previous month’s -0.1%, the measure’s highest increase in six months.
- Canada’s CPI inflation for February is expected to tick higher on Tuesday, forecast to print at 3.1% YoY versus the previous 2.9%.
- MoM Canadian CPI inflation is expected to bounce to 0.6% from 0.0%.
- The BoC’s Core CPI inflation printed at 2.4% in January, the indicator’s lowest print since May of 2021.
- Wednesday is another FOMC day. Updates to the Fed’s Dot Plot are expected, as well as a Press Conference by Fed Chairman Jerome Powell.
- According to the CME’s FedWatch Tool, rate markets are pricing in nearly equal odds of no rate cut at the Fed’s June rate call, down significantly from 70% odds of a June rate cut at this time last week.
Canadian Dollar price today
The table below shows the percentage change of Canadian Dollar (CAD) against listed major currencies today. Canadian Dollar was the weakest against the Australian Dollar.
| USD | EUR | GBP | CAD | AUD | JPY | NZD | CHF | |
| USD | 0.04% | 0.05% | -0.01% | -0.02% | 0.15% | 0.06% | 0.35% | |
| EUR | -0.05% | 0.01% | -0.05% | -0.03% | 0.12% | 0.03% | 0.28% | |
| GBP | -0.05% | 0.00% | -0.05% | -0.03% | 0.12% | 0.03% | 0.29% | |
| CAD | 0.01% | 0.05% | 0.05% | -0.02% | 0.15% | 0.07% | 0.33% | |
| AUD | 0.02% | 0.07% | 0.07% | 0.00% | 0.17% | 0.08% | 0.35% | |
| JPY | -0.16% | -0.12% | -0.05% | -0.16% | -0.17% | -0.08% | 0.18% | |
| NZD | -0.06% | -0.03% | -0.03% | -0.06% | -0.06% | 0.09% | 0.27% | |
| CHF | -0.33% | -0.30% | -0.30% | -0.35% | -0.32% | -0.17% | -0.27% |
The heat map shows percentage changes of major currencies against each other. The base currency is picked from the left column, while the quote currency is picked from the top row. For example, if you pick the Euro from the left column and move along the horizontal line to the Japanese Yen, the percentage change displayed in the box will represent EUR (base)/JPY (quote).
Technical analysis: Canadian Dollar spins in place on Monday, USD/CAD continues to churn just below 1.3550
The Canadian Dollar (CAD) is broadly flat against most of its major currency peers on Monday as markets ease into the new trading week. The CAD is next to flat against the US Dollar (USD), the Euro (EUR), the Pound Sterling (GBP), the Australian Dollar (AUD) and the New Zealand Dollar (NZD) on Monday. Despite flat markets, the Canadian Dollar is up around a third of a percent against the Swiss Franc (CHF) on the day.
USD/CAD is cycling tightly within familiar technical levels, playing just below 1.3550. Intraday technical support sits at the 1.3500 handle, parked at the 200-hour Simple Moving Average (SMA). A near-term supply zone is priced in between 1.3600 and 1.3580 to cut off any bullish breakouts.
USD/CAD hourly chart
Canadian Dollar FAQs
The key factors driving the Canadian Dollar (CAD) are the level of interest rates set by the Bank of Canada (BoC), the price of Oil, Canada’s largest export, the health of its economy, inflation and the Trade Balance, which is the difference between the value of Canada’s exports versus its imports. Other factors include market sentiment – whether investors are taking on more risky assets (risk-on) or seeking safe-havens (risk-off) – with risk-on being CAD-positive. As its largest trading partner, the health of the US economy is also a key factor influencing the Canadian Dollar.
The Bank of Canada (BoC) has a significant influence on the Canadian Dollar by setting the level of interest rates that banks can lend to one another. This influences the level of interest rates for everyone. The main goal of the BoC is to maintain inflation at 1-3% by adjusting interest rates up or down. Relatively higher interest rates tend to be positive for the CAD. The Bank of Canada can also use quantitative easing and tightening to influence credit conditions, with the former CAD-negative and the latter CAD-positive.
The price of Oil is a key factor impacting the value of the Canadian Dollar. Petroleum is Canada’s biggest export, so Oil price tends to have an immediate impact on the CAD value. Generally, if Oil price rises CAD also goes up, as aggregate demand for the currency increases. The opposite is the case if the price of Oil falls. Higher Oil prices also tend to result in a greater likelihood of a positive Trade Balance, which is also supportive of the CAD.
While inflation had always traditionally been thought of as a negative factor for a currency since it lowers the value of money, the opposite has actually been the case in modern times with the relaxation of cross-border capital controls. Higher inflation tends to lead central banks to put up interest rates which attracts more capital inflows from global investors seeking a lucrative place to keep their money. This increases demand for the local currency, which in Canada’s case is the Canadian Dollar.
Macroeconomic data releases gauge the health of the economy and can have an impact on the Canadian Dollar. Indicators such as GDP, Manufacturing and Services PMIs, employment, and consumer sentiment surveys can all influence the direction of the CAD. A strong economy is good for the Canadian Dollar. Not only does it attract more foreign investment but it may encourage the Bank of Canada to put up interest rates, leading to a stronger currency. If economic data is weak, however, the CAD is likely to fall.
Economists at TD Securities discuss the Reserve Bank of Australia (RBA) Interest Rate Decision and their implications for the AUD/USD pair.
Dovish: (5%)
The Bank would need to change guidance and remove its soft tightening bias. But the RBA does not have the data to back a dovish shift. Also, markets and central banks are pushing back on imminent rate cuts so why would the RBA turn dovish? AUD/USD -0.8%.
Base Case: Neutral (75%)
With GDP in line with RBA expectations and signs of sticky inflation offshore, the Bank has no pressing need to change the script. Guidance therefore should remain unchanged with the Bank reiterating: 1) Inflation is moderating but remains high; 2) The outlook is uncertain, and 3) Returning inflation to target is the priority. AUD/USD +0.2%.
Hawkish: (20%)
The Bank has already indicated it may need to tighten further. After softening its hawkish bias last month vs Dec'23, we see no compelling argument for the Bank to turn more hawkish again. AUD/USD +0.6%.
- Mexican Peso depreciates as local markets close for Benito Juarez’s birthday, USD/MXN aiming toward 16.80.
- Banxico is widely anticipated to reduce interest rates slightly amidst a focus on upcoming US economic data and the FOMC outcome.
- Attention turns to key economic reports and central bank decisions in Mexico and the US this week.
The Mexican Peso (MXN) depreciates sharply against the US Dollar (USD) on Monday as Mexico’s markets remain closed in the observance of Benito Juarez’s birth, a former President of Mexico. A busy economic week with both US Federal Reserve (Fed) and Bank of Mexico (Banxico) monetary policy decisions will be the main driver of price action. The USD/MXN trades at 16.76, up 0.45% near new three-day high.
Mexico’s economic docket will remain empty during the first day of the week but gather attention on Tuesday. The docket will feature Aggregate Demand and Private Spending. On Thursday, the schedule will feature the release of Retail Sales data for January, which are expected to recover, followed by Banxico’s decision. Most investors expect Mexico’s central bank to cut borrowing costs from 11.25% to 11% on March 21.
On the other side of the border, US housing data could influence the Greenback’s price ahead of the Federal Open Market Committee (FOMC) decision. Market participants will be looking for any adjustments to the statement, the Summary of Economic Projections (SEP), and Fed Chairman Jerome Powell's press conference.
Daily digest market movers: Mexican Peso on defensive amid dovish Banxico
- The USD/MXN is being driven by the reduction of interest rate spreads between Mexico and the United States. This could bolster and set the USD/MXN direction toward the 17.00 figure.
- On March 21, Banxico is expected to decrease interest rates, even though it could feature a 3-2 vote split. Recent speeches and media appearances show that Banxico’s Governing Council is divided, with Governor Victoria Rodriguez Ceja, Omar Mejia Castelazo and Galia Borja Gomez leaning dovish. On the hawkish front lie Jonathan Heath and Irene Espinosa Cantellano.
- An economic slowdown in Mexico is the main event that could spark Banxico’s first rate cut as the central bank has adjusted its economic projections to the downside. Mexico’s central bank expects the economy to grow 2.8% YoY in 2024, down from 3% and maintaining at 1.5% for 2025.
- Banxico’s private poll in February showed that analysts project inflation to slow down, which could spark the central bank’s first rate cut. They see interest rates at 9.5% and the exchange rate at 18.31 towards the year-end.
- The latest inflation figures in the United States prompted investors to price in a less dovish stance. Money market futures had adjusted their rate cut expectations more in line with the Fed as they foresee the Federal Funds Rate (FFR) at 4.71% toward year end. The next Fed meeting is scheduled for March 19-20 next week.
- The CME FedWatch Tool shows traders decreasing their bets on a 25-basis-point rate cut in June, down from 72% at the beginning of last week to 58% as of writing.
Technical analysis: Mexican Peso begins to weaken as USD/MXN aims toward 16.80
The USD/MXN is at the brisk of shifting neutral bias as buyers had stepped in at around the lows of the year and lifted the exchange rate near the 16.80 area. A breach of the latter could push the pair toward the 17.00 figure. Once surpassed, the next stop would be the 50-day Simple Moving Average (SMA) at 17.02, followed by the 100-day SMA at 17.16 and the 200-day SMA at 17.21.
On the flip side, if the pair stays below 16.80, that could pave the way for a test of last year’s low of 16.62, followed by October 2015’s low of 16.32 and the 16.00 psychological level.
USD/MXN Price Action – Daily Chart
Mexican Peso FAQs
The Mexican Peso (MXN) is the most traded currency among its Latin American peers. Its value is broadly determined by the performance of the Mexican economy, the country’s central bank’s policy, the amount of foreign investment in the country and even the levels of remittances sent by Mexicans who live abroad, particularly in the United States. Geopolitical trends can also move MXN: for example, the process of nearshoring – or the decision by some firms to relocate manufacturing capacity and supply chains closer to their home countries – is also seen as a catalyst for the Mexican currency as the country is considered a key manufacturing hub in the American continent. Another catalyst for MXN is Oil prices as Mexico is a key exporter of the commodity.
The main objective of Mexico’s central bank, also known as Banxico, is to maintain inflation at low and stable levels (at or close to its target of 3%, the midpoint in a tolerance band of between 2% and 4%). To this end, the bank sets an appropriate level of interest rates. When inflation is too high, Banxico will attempt to tame it by raising interest rates, making it more expensive for households and businesses to borrow money, thus cooling demand and the overall economy. Higher interest rates are generally positive for the Mexican Peso (MXN) as they lead to higher yields, making the country a more attractive place for investors. On the contrary, lower interest rates tend to weaken MXN.
Macroeconomic data releases are key to assess the state of the economy and can have an impact on the Mexican Peso (MXN) valuation. A strong Mexican economy, based on high economic growth, low unemployment and high confidence is good for MXN. Not only does it attract more foreign investment but it may encourage the Bank of Mexico (Banxico) to increase interest rates, particularly if this strength comes together with elevated inflation. However, if economic data is weak, MXN is likely to depreciate.
As an emerging-market currency, the Mexican Peso (MXN) tends to strive during risk-on periods, or when investors perceive that broader market risks are low and thus are eager to engage with investments that carry a higher risk. Conversely, MXN tends to weaken at times of market turbulence or economic uncertainty as investors tend to sell higher-risk assets and flee to the more-stable safe havens.
The Bank of Japan (BoJ) will hold its Monetary Policy Committee (MPC) on Tuesday, March 19 and as we get closer to the Interest Rate Decision, here are the expectations forecast by the economists and researchers of 12 major banks.
Analysts have different opinions on whether the BoJ will raise rates in March or in April. Markets now pricing in a 55% probability of an end to the negative interest rates policy (NIRP). The BoJ could also abolish Yield Curve Control (YCC) this month. Updated macro forecasts will not come until the April meeting.
Standard Chartered
We think the BoJ is likely to end its negative interest rate policy (NIRP) in March rather than April, alongside a de facto removal of yield curve control (YCC). While the JPY has rallied and markets are already pricing in 6bps of hikes by April, we think the BoJ could surprise with an earlier move in March. Even if the BoJ does not hike in March, the market would expect it to hike in April; market reaction should therefore be limited either way.
ANZ
Shunto wage negotiations have started stronger than last year, giving the BoJ a green light to move away from negative rates at its policy meeting this week. Our central case for the BoJ to exit negative interest rates remains in April, but it is an extremely close call. The BoJ will be updating its forecasts at that meeting and it will have more news on union-based wage agreements and data on business inflation expectations. Media reports suggest the BoJ is close to exiting YCC. The central bank may also consider dropping its guidance that interest rates could go lower and end its J-REIT and ETF asset purchase programs.
Nordea
We believe that the BoJ will signal that rates will likely be raised at the April meeting after the announcement for wage growth above 5% for the largest workers union. With wage growth the highest in three decades and inflation above 2%, the negative interest rate era in Japan is about to end. However, we don’t expect a massive rate hiking cycle from the BoJ. The BoJ will take baby steps when hiking rates to ensure that the inflation dynamic is around 2%. As such, no major JPY strengthening will come so long as the Fed and ECB keep rates unchanged.
Danske Bank
The inflation target has been met for 22 consecutive months. Price pressures consistently rhyme with 2% annual inflation but the sustainability of that depends on wage increases. We think the BoJ is almost ready to hike the interest rate to zero and dismantle yield curve control. However, we see no reason to rush and expect them to stay on hold at the March meeting ending Tuesday, but it is admittedly a close call. Whether the BoJ potentially exits NIRP in March or April does not alter our strategic bullish view on the JPY in 2024.
ING
We believe that an April hike is slightly more likely than a March hike. This week, we expect the BoJ to change its forward guidance and scrap the yield curve control policy but keep its government bond purchase programme.
Deutsche Bank
We expect the BoJ to revise its policy and abandon both NIRP and the multi-tiered current account structure and set rates on all excess reserves at 0.1%. We also see both the YCC and the inflation-overshooting commitment ending, replaced by a benchmark for the pace of the bank’s JGB purchasing activity.
ABN Amro
Although we do not rule out the possibility of a March hike, our expectation is for the BoJ to stay pat at its March meeting. With consumption still weak, the central bank may wait until Q2 to see further confirmation in the macro data before hiking its policy rate for the first time in 17 years. In any case, we only foresee a very gradual, and modest hiking path for the BoJ going forward.
TDS
After the positive round of wage increases and Rengo's announcement delivering a 5% increase in 1st round wage negotiations, we believe the BoJ has the information it needs to hike at this meeting. We expect the BoJ to 1) terminate NIRP, 2) tweak the deposit framework 3) end YCC but retain Q1 bond buying pace and 4) discontinue its ETF and J-Reits purchases.
Wells Fargo
While we believe the BoJ will exit negative interest rates and measures designed to keep bond yields capped in April, Tuesday's meeting seems to be live. The decision on policy rates and yield curve control will be closely watched; however, forward guidance may be just as important. In the event of a rate hike this week, or in April, we will be watching for if BoJ policymakers indicate whether future tightening will also be delivered. In our view, the BoJ is likely ‘one and done,’ meaning one rate hike to get the main policy rate to 0.00%, exit YCC, and leave policy settings there for an extended period of time. Those decisions alone should result in JPY outperformance, but an indication of future tightening could result in a sharper Yen rally than we expect.
Citi
We shift our baseline scenario to NIRP termination at the April 2024 MPM and therefore expect BoJ to signal termination at the March 18-19 MPM. From a macroeconomic standpoint, it makes little difference whether termination is in March or April. The more important point is the size of the wage hikes agreed upon in spring negotiations. Larger-than-expected wage hikes could boost the outlook for consumer spending, inflation, and the speed of rate hikes. If there are really hefty hikes, Governor Ueda’s press conference is likely to call for changes in the perception of the inflation risk balance. We also expect the BoJ to halt Quantitative and Qualitative Monetary Easing (QQE) with Yield Curve Control and drop the guidance of expansion of the monetary base.
SocGen
We expect the BoJ to abolish negative interest rates and YCC this month, but we also think it will signal to keep the zero rate for some time and maintain a monthly pace of 6tn yen in JGB purchases, which would keep the balance sheet stable for now.
BBH
Our base case is for the bank to keep the policy rate at -0.10% and stick with its 10-year JGB yield target of ‘around’ 0% with 1% as an upper bound reference. We also expect the BoJ to terminate its guideline to purchase exchange-traded funds (ETFs) and Japan real estate investment trusts (J-REITs). USD/JPY is vulnerable to a kneejerk drop if the BoJ delivers a rate hike. However, USD/JPY uptrend will likely remain intact because Japan’s improving inflation backdrop and soft economic activity suggest the BoJ is unlikely to normalize the policy rate by more than is currently priced in over 2024.
- EUR/JPY trades flat at start of week as widely telegraphed BoJ price hike priced in.
- Eurozone data shows trade surplus in January and final estimates of inflation matching flash.
- Japanese Yen hampered by fears BoJ interest rate hike may be a “one and done” affair.
EUR/JPY is trading little changed in the mid 162.00s on Monday after recording a small rise following the release of relatively upbeat Eurozone figures, which showed the region recording a trade surplus in January, and the final revisions of February inflation data matching flash estimates.
The Japanese Yen (JPY), meanwhile, trades subdued ahead of the Bank of Japan’s (BoJ) policy meeting on Tuesday. Although the BoJ is expected to raise interest rates from negative territory (minus 0.1%) at the meeting – a move that would be positive for JPY since higher interest rates attract more foreign capital inflows – the news appears to have already been digested by markets ahead of the event.
The lack of more JPY buying in the run up to the meeting could be put down to the view that the rate hike may be a “one and done” rather than the start of a cycle. Deflation remains a hard nut to crack in Japan and although a recent round of wage negotiations has resulted in higher pay for workers, price gains have been hard won and some skepticism remains as to the longer-term inflation outlook, according to Bloomberg News.
It may also be the case that stubbornly high inflation in the euro area is adjusting the outlook for interest rates there which is supporting the Euro (EUR). It is possible the European Central Bank (ECB) will need to keep interest rates higher for longer when compared to prior expectations, and this is supporting the Euro and EUR/JPY.
The final revisions for the Harmonized Index of Consumer Prices for the Eurozone on Monday were in line with flash estimates of 2.6% YoY and 0.6% MoM for headline inflation, and 3.1% YoY and 0.7% MoM for core inflation, according to data from Eurostat. These figures are still above the same metrics for Japan.
The non-seasonally adjusted Eurozone Trade Balance data showed a surplus of 11.4B in January versus the 16.8B of December, whilst the seasonally adjusted figures came out much higher, revealing a surplus in January of 28.1B against a deficit of 14.3B in December.
Economists at ING analyze how the Federal Reserve meeting on Wednesday could impact the US Dollar (USD).
No fireworks from the Fed
The short-term reaction in the Dollar should be primarily driven by projections on rates and other macro indicators. We expect an unchanged Dot Plot but admit that a hawkish revision looks more likely than a dovish one.
We doubt the meeting will prompt tectonic shifts in FX positioning. Potential Dot Plots adjustments point to some upside risks for USD, but cautious optimism on disinflation points to a softer USD.
Ultimately, the Fed may not provide enough reasons for investors to diverge materially from the 75 bps of easing priced in by year-end, and the predominance of a data-dependent view may very simply delay any larger dollar and broader FX moves to the first half of April when key US figures for March are released.
We would not be surprised to see a modestly stronger Dollar into the FOMC announcement and DXY to end the week close to 104.00.
The Reserve Bank of Australia (RBA) will announce its next Interest Rate Decision on Tuesday, March 19 at 03:30 GMT and as we get closer to the release time, here are the forecasts by the economists and researchers of eight major banks regarding the upcoming central bank's decision.
Six weeks have passed since the last RBA Board meeting instead of the long-established one-month break between meetings. The Board will therefore have more information than it is used to for its monetary policy deliberation but the RBA is still expected to keep rates steady at 4.35% for a third consecutive meeting.
ANZ
We expect the RBA to retain a mild tightening bias, with no change in rates. We expect the post-meeting statement will again highlight risks that higher inflationary expectations become entrenched (risks that should start to dissipate after the next quarterly CPI) and that services inflation could remain sticky. We also expect the statement will still describe the labour market as tight (based on the metrics the RBA is using).
Standard Chartered
We expect the RBA to keep rates unchanged at 4.35%. We expect rate cuts to start only in Q4-2024.
ING
At the moment, the RBA is still way off the point of considering rate cuts, and the RBA maintained a faint bias towards tightening at the last meeting, even if this was watered down a bit. Since then, the run of data has been quite helpful to those talking up the prospect of more and earlier rate cuts, with lower-than-expected inflation and some signs of a slowdown in the macro numbers, including GDP and the labour market. It would be a very stark signal if the RBA were to remove that bias at its March meeting, and it may be worried that this would send too strong a signal at this stage. However, some further watering down and hints about a move towards neutrality might be in order.
Westpac
We anticipate that the RBA will leave the cash rate unchanged at 4.35%. The Board will meet to discuss recent economic data. That includes the Q4 National Accounts, which confirmed that the Australian economy had a soft finish to 2023. Additionally, the Q4 Wage Price Index revealed an underlying slowdown in private sector wages growth, as labour market conditions ease and inflation continues to decelerate. The Board will be comforted by these developments, given its aim to align demand with supply and ensure inflation trends toward, and eventually reaches target. We continue to expect the RBA to remain on hold until September, wherein the Board will be sufficiently confident that the restrictive policy setting can be reduced at an incremental and measured pace.
TDS
It should be a fairly straightforward on-hold decision, though focus will be if the RBA retains its soft hawkish bias. The jobs market has shown cracks after the dismal Dec-Jan prints while monthly CPI reaffirms the disinflation narrative, with the near-term inflation impulse towards the downside. We will keep an eye out on QT plans as the RBA has kept strangely quiet about it.
Rabobank
We expect no change to the policy rate or the bank’s slight hawkish bias, especially since the RBA meeting will predate the February labour market report by two days.
Citi
We expect a continuation of the sentence ‘it will be some time yet before inflation is sustainably in the target range’ followed by ‘a further increase in rates cannot be ruled out’. In making the likely decision to keep the cash rate at 4.35% and guidance mildly hawkish, the RBA Board will also be mindful that services inflation remains sticky, the labor market remains tight and productivity growth below the assumption required for wages growth to be consistent with the inflation target, which is now at 2.5%, requiring more precision than the previous range of between 2% and 3%.
SocGen
We expect the RBA to hold the cash rate target at 4.35% for a third consecutive meeting. Recent economic indicators and the global environment continue to support our view that the RBA tightening cycle is already over and a fresh easing cycle will begin this year. The policy statement is likely to become more dovish, referring to the slowdown in GDP and employment growth and dropping hints about a further rate hike.
- AUD/JPY jumps to 98.00 as the BoJ is expected to delay plans of exiting an ultra-dovish stance.
- BoJ Ueda manifested a bleak assessment of Japan’s economic outlook.
- The RBA is expected to keep its OCR steady at 4.35%.
The AUD/JPY pair prints a fresh weekly high near 98.00 in Monday’s early American session as the market sentiment remains upbeat. The market mood remains cheerful as China’s better-than-projected Retail Sales and Industrial Production data for February indicated a robust recovery in domestic demand.
The Australian Dollar capitalizes on China’s upbeat data, which is considered a proxy for Chinese economic growth. Going forward, the next move in the Australian Dollar will be guided by the Reserve Bank of Australia’s (RBA) interest rate decision, which will be announced on Tuesday. The RBA is widely anticipated to keep the Official Cash Rate (OCR) steady at 4.35%.
Meanwhile, the Japanese Yen remains under pressure as Bank of Japan (BoJ) Governor Kazuo Ueda’s bleak assessment of the economy has undermined sticky inflation above 2% and higher wage hikes rewarded by big firms. Market expectations for the BoJ announcing an end to negative interest rates and the Yield Curve Control (YCC) policy have shifted for the April meeting as uncertainty persists over the wage price spiral.
AUD/JPY approaches the horizontal resistance of the Ascending Triangle pattern formed on a four-hour timeframe, plotted from the March 4 high at 98.13. The upward-sloping border of the aforementioned pattern is placed from March 11 low at 96.90.
The 20-day Exponential Moving Average (EMA) near 97.75 remains sticky to the risk-barometer, indicating a sideways trend.
The 14-period Relative Strength Index (RSI) oscillates inside the 40.00-60.00 region, which indicates indecisiveness among investors.
The appeal for the AUD/JPY would strengthen if the asset breaks above March 6 high at 98.27, which will drive the asset towards February 20 high at 98.61 and February 23 high at 99.06.
On the flip side, the asset's appeal could weaken if it drops below its March 15 low at 97.27. This would expose the asset to its March 11 low at 96.90. A breakdown below that would extend the downside towards its January 16 low at 96.59.
AUD/JPY four-hour chart
The Bank of Japan’s hike or hold decision is a 50-50 affair. Economists at ING analyze how the BoJ policy announcement could impact the Japanese Yen (JPY).
The Yen still needs help from USD rates
This will be a binary event for the Yen, given that markets are pricing in around a 50-60% implied probability of a hike this week. Expectations are also for a rate hike to be accompanied by the end of the yield curve control policy, even though the BoJ may well keep its bond-buying programme intact to avert excess bond market volatility.
A hold should push USD/JPY, which can cause the pair to test 150.00, while a hike can trigger a correction to levels below 148.00.
Our view remains that USD/JPY will trade lower from the second quarter, but that relies on lower USD rates as much as a BoJ hike.
- EUR/CHF makes new year-to-date highs in 0.9630s.
- Short and intermediate trends are bullish – long-term still bearish.
- MACD is diverging bearishly, however, and triangles are bad omens.
EUR/CHF is trading higher at the start of the new week, exchanging hands in the 0.9630s, after achieving new year-to-date (YTD) highs. The pair is in an uptrend both on the short and intermediate time frame as the peaks and troughs continue rising. Given the old adage that “the trend is your friend” the progression higher is tipped to continue.
The EUR/CHF pair has broken out of the Symmetrical Triangle price pattern it formed last week and is close to reaching the minimum price objective for the breakout at 0.9648 – the 0.618 Fibonnaci ratio of the height of the triangle extrapolated from the breakout point higher.
Euro to Swiss Franc: 4-hour chart
It is possible the price could also rise up to the 100% extension of the height of the triangle at 0.9680. Once met, however, there is a risk the pair could correct more substantially or even reverse as often triangles mark the penultimate moves in trends.
The Moving Average Convergence/ Divergence (MACD) momentum indicator is showing bearish divergence with price on the 4-hour chart. Whilst price reached a higher high (for the year) on Monday at 0.9638, the MACD failed to make a corresponding higher high. This suggests underlying weakness and the possibility the price may pullback, although so far there has been no reaction.
The MACD on the daily chart crossed below its signal line last week giving a sell signal, although price continued rising.
Euro to Swiss Franc: Daily chart
The pair has provisionally broken above the 50-week Simple Moving Average (SMA) at 0.9600. The SMA has acted as a dynamic resistance level repelling price repeatedly during its bear trend since 2021. Overall EUR/CHf remains in a long-term bear trend and would need to break above the 0.9685 November 2023 high to suggest reversal.
Euro to Swiss Franc: Weekly chart
Multiple touches indicates it is a significant barrier. If the break holds for another week that would strengthen the bullish case and suggest a major obstacle was in the rear view mirror. Currently it is too early to say whether this is the case.
Overall EUR/CHF remains in a long-term bear trend and would need to break above the 0.9685 November 2023 high to suggest reversal.
The US Dollar (USD) is trading close to Friday’s levels. Economists at Scotiabank analyze Greenback’s outlook.
Seasonal trends may be turning against the USD
US 10Y bond yields around 4.30% are supportive for the USD but yields will need to press higher still if the USD is to advance further. It’s not clear that recent data trends can achieve that and the recent uptick in rates risks unwinding quickly if the Fed sounds more dovish than markets expect on Wednesday.
Seasonal trends may be turning against the USD as well. April is typically a soft month for the DXY after a strong Q1. The DXY has returned an average of -0.47% in April over the last 25 years, the second worst month of the year after December.
- USD/JPY clings to gains above 149.00 as the BoJ seems to be delaying plans of exiting an ultra-dovish policy stance.
- Earlier, large hikes awarded by Japanese firms and stable inflation above 2% boosted BoJ’s rate hike hopes.
- The US Dollar trades sideways as the focus shifts to Fed policy.
The USD/JPY pair exhibits strength above the crucial support of 149.00 in the early New York session. The asset clings to gains as market expectations for the Bank of Japan (BoJ) delaying its plans to exit negative interest rates and scrap Yield Curve Control (YCC) have escalated.
Big Japanese firms have rewarded historic wage growth, and inflation has remained sticky above the desired target of 2%, providing confidence to BoJ policymakers to put an end to the expansionary interest rate stance.
The factor that is limiting hopes for BoJ's increasing interest rates is the absence of a catalyst, which could ensure a wage-price spiral. Investors seem confident that the BoJ will end its ultra-loose policy stance in April by raising interest rates from negative 0.1% to 0.1%.
Meanwhile, the market sentiment improves on upbeat China’s Retail Sales and Industrial Production data for February. Higher than anticipated China’s exhibit a strong recovery in its domestic economy. S&P500 futures have generated significant gains in the European session, portraying an improvement in the risk appetite of the market participants.
The US Dollar Index (DXY) trades sideways around 103.40 as investors shift focus to the Federal Reserve's (Fed) interest rate decision, which will be announced on Wednesday. The Fed is expected to keep interest rates unchanged in the range of 5.25%- 5.50%. Investors will focus on the dot plot that presents policymakers’ projections for interest rates over time and economic projections.
- AUD/USD rises after the release of better-than-expected macroeconomic data from China, its largest trading partner.
- Risk from China’s property sector, however, continues to undermine Iron Ore, Australia’s largest export.
- The week promises volatility as both Australia and US’s central banks hold policy meetings.
AUD/USD is edging higher, trading in the 0.6570s on Monday, after the release of strong Chinese data showed higher-than-expected growth in Industrial Production, Retail Sales and Fixed Asset Investment, in February.
The data improves the outlook for Australia’s largest trading partner but is not enough to provide an antidote to China’s property sector woes. Construction is also more influential for the Australian Dollar (AUD) because Chinese property developers are the primary buyers of Australian Iron Ore, which they use to make the steel for large-scale construction projects.
These woes are reflected in a continued plunge in Iron Ore prices which have fallen from over $140.00 per tonne at the start of 2024 to around $102.50 at the time of publication. Iron Ore is Australia’s largest export and a fall in price translates into a decline in demand for the Australian Dollar (AUD) which is needed to purchase it.
AUD/USD could see volatility in major week for central banks
Monday sees the start of an important week for AUD/USD in which both the Reserve Bank of Australia (RBA) and the US Federal Reserve (Fed) are scheduled to hold policy meetings, with significant implications for the exchange rate.
The RBA will announce the outcome of its meeting on Tuesday at 03:30 GMT. Although inflation in Australia has made good progress – falling from 5.4% to 4.1% in February – it is still far from the RBA’s target and no change in the cash rate is expected. There is a chance, however, that the bank may remove wording about the need for a further interest rate hike from the accompanying statement, according to analysts at Commerzbank, which could benefit the Australian Dollar (and AUD/USD).
The Fed is set to announce its decision at 18:00 on Wednesday, and likewise no change in the Fed Funds Rate is predicted. Recent stickier-than-expected inflation, however, suggests the possibility the Fed’s Summary of Economic Projections (SEP) may change how many interest-rate cuts members foresee in 2024.
In the last SEP in December, policymakers expected there to be three 0.25% cuts in 2024, however, analysts at Bloomberg expect a possibility that could fall to two in the new dot plot. Such a change would be bullish for USD (negative for AUD/USD).
USD/CAD trades little changed. Economists at Scotiabank analyze the pair’s outlook.
CAD could pick up a little support if inflation pressures remain elevated
Canada releases CPI data on Tuesday. These are expected to reflect an uptick in headline prices and sticky core inflation. Meanwhile, Wednesday’s minutes of the BoC’s last rate decision may underscore policymakers concern about slow progress on disinflation.
The CAD could pick up a little support if inflation pressures remain elevated (but might also slip back, all else equal, if Retail Sales data Friday are soft, as the consensus estimate anticipates).
The USD’s uptrend persists on the face of it, but gains have flattened out since the middle of last week, with the USD firmly capped in the mid-1.3500s.
Support is 1.3510 and, stronger, at 1.3485 on the intraday chart.
GBP/USD remains pinned back to the low 1.2700s. Economists at Scotiabank analyze the pair’s outlook.
Trend oscillators are mixed
Trend oscillators are mixed and spot is holding a tight trading range above 1.2700. Broader price signals suggest a soft undertone in GBP/USD after a soft close last week but holding support in the low 1.2700 area could see the short-term trend stabilize.
Resistance is 1.2765/1.2770. Support is 1.2700/1.2710.
- The US Dollar trades stable in a tight range on Monday.
- Traders brace for a historic week ahead with the BoJ poised to snap its decade-long negative interest rate regime.
- The US Dollar Index trades around the mid 103.00s and is expected to remain steady.
The US Dollar (USD) is having a zen moment on Monday before turmoil is set to pick up with the Bank of Japan (BoJ) rate decision on Tuesday and the US Federal Reserve rate decision on Wednesday. Both meetings will be crucial: The BoJ is set to leave decades of negative interest rate policy while trying not to disrupt markets, and the Fed will give clues over the interest-rate outlook after the recently hot inflation numbers made markets nervous.
Monday’s US economic calendar is light. For more pivotal data points, look at Thursday with the preliminary Purchasing Managers Index (PMI) data for March. Right at the end of the week no less than three Fed members, Fed Chairman Jerome Powell included, will deliver speeches and statements that could further guide markets in case the rate decision on Wednesday was not clear enough for markets.
Daily digest market movers: Markets ready for BoJ
- Vladimir Putin has secured another term as Russian President on Sunday. Despite comments from Putin that peace talks with Ukraine will not take place, China has said it wants to start peace talks.
- The BoJ is expected to steer its policy rate away from negative rates for the first time in decades. Markets seem to be broadly anticipating the move, with Japanese equity markets rallying over 2% ahead of the meeting overnight on Tuesday.
- The People’s Bank of China (PBoC) made a surprise stronger USD/CNY fixing on Monday at 7.0943 while 7.1993 was expected. This comes after analysts thought the PBoC was letting loose on its stronger fixing after a surprise weaker exchange rate on Friday. Currency markets are not really reacting to the fixing.
- Monday’s US data calendar kicks off at 14:00 GMT with the NAHB Housing Market Index for March. February was in contraction at 48, and the same reading is expected for March.
- The US Treasury Department will allot a 3-month and a 6-month bill at 15:30 GMT.
- Equities are opening the week in the green across the board. Special notice for the Japanese Nikkei and Topix, both up over 2% for this Monday.
- According to the CME Group’s FedWatch Tool, expectations for a Fed pause in the March 20 meeting are at 99%, while chances of a rate cut stand at 1%.
- The benchmark 10-year US Treasury Note trades around 4.30%, continuing its ascent from last week.
US Dollar Index Technical Analysis: Talk of the town
The US Dollar Index (DXY) is facing two main events this week which could see a surge in volatility for the Greenback, though with the risk of standing still at the end of the rollercoaster ride. Although the BoJ is set to deliver a game-changing rate decision and the Fed will need to be more clear to ease the nervousness in the market, it could actually not move the needle that much on the charts.
The BoJ rate change has been overly communicated and commented on since December last year, while markets have grown accustomed to the constant repricing of when that initial rate cut from the Fed could take place.
On the upside, the 55-day Simple Moving Average (SMA) at 103.46 is facing some pressure again, likewise with Friday. Not far above, there is a double barrier with the 100-day Simple Moving Average (SMA) near 103.63 and the 200-day SMA near 103.70. Depending on the catalyst that pushes the DXY upwards, 104.96 remains the key level on the topside.
Should both central bank meetings turn into a non-event, expect to see some easing in the US Dollar. In this scenario, the downside looks inevitable once markets move forward again to price in a Fed rate cut for June, with 103.00 and 102.00 up next. Once through there, the road is open for another leg lower to 100.61, the low of 2023.
US Dollar FAQs
The US Dollar (USD) is the official currency of the United States of America, and the ‘de facto’ currency of a significant number of other countries where it is found in circulation alongside local notes. It is the most heavily traded currency in the world, accounting for over 88% of all global foreign exchange turnover, or an average of $6.6 trillion in transactions per day, according to data from 2022. Following the second world war, the USD took over from the British Pound as the world’s reserve currency. For most of its history, the US Dollar was backed by Gold, until the Bretton Woods Agreement in 1971 when the Gold Standard went away.
The most important single factor impacting on the value of the US Dollar is monetary policy, which is shaped by the Federal Reserve (Fed). The Fed has two mandates: to achieve price stability (control inflation) and foster full employment. Its primary tool to achieve these two goals is by adjusting interest rates. When prices are rising too quickly and inflation is above the Fed’s 2% target, the Fed will raise rates, which helps the USD value. When inflation falls below 2% or the Unemployment Rate is too high, the Fed may lower interest rates, which weighs on the Greenback.
In extreme situations, the Federal Reserve can also print more Dollars and enact quantitative easing (QE). QE is the process by which the Fed substantially increases the flow of credit in a stuck financial system. It is a non-standard policy measure used when credit has dried up because banks will not lend to each other (out of the fear of counterparty default). It is a last resort when simply lowering interest rates is unlikely to achieve the necessary result. It was the Fed’s weapon of choice to combat the credit crunch that occurred during the Great Financial Crisis in 2008. It involves the Fed printing more Dollars and using them to buy US government bonds predominantly from financial institutions. QE usually leads to a weaker US Dollar.
Quantitative tightening (QT) is the reverse process whereby the Federal Reserve stops buying bonds from financial institutions and does not reinvest the principal from the bonds it holds maturing in new purchases. It is usually positive for the US Dollar.
EUR/USD is holding a tight range around the 1.0900 figure. Economists at Scotiabank analyze the pair’s outlook.
Trend signals are neutral
ECB Governor de Cos commented that the first interest rate cut could come in June, supporting what appears to be a strengthening consensus among top policymakers that a mid-year ease is most likely.
EUR/USD is consolidating. EUR gains are well capped around 1.0900 at the moment and spot needs to extend through the figure area to gain a little more ground towards 1.0950.
Range support is close by at 1.0875 ahead of 1.0840/1.0850.
Trend signals are neutral.
- GBP/JPY has likely formed a Broadening topping pattern.
- It has just reversed after touching the top of the pattern and looks poised for a down-leg.
- The overall long-term trend, however, is bullish with a breakout from the pattern required to reverse.
GBP/JPY appears to be forming a bearish Ascending Broadening Wedge formation. The pair has just rallied to the pattern’s upper boundary line before forming a double top and pulling back. There is now a good chance it has begun the next down-leg of the pattern.
A decisive break below support at the 187.96 March 11 lows and the nearby 50-day Simple Moving Average (SMA) would confirm a continuation of the next down leg within the wedge.
Pound Sterling versus Japanese Yen: Daily chart
Such a move would probably see GBP/JPY fall to support near the 50-week Simple Moving Average (SMA) at 181.60.
It is worth noting that although a deep correction looks on the cards, over the long-term, the peaks and troughs of price are rising. This likely indicates GBP/JPY is in an overall uptrend, which is likely to continue as long as price does not break completely out of the bottom of the wedge at around 180.80-90. A downside breakout, however, would confirm a reversal of the long-term uptrend.
A break above the 191.32 highs would provide confirmation the dominant bull trend was intact and continuing higher. Although it looks overstretched, such a move is still possible given the overall bullishness of the chart. The next upside target from there would probably be resistance at the 195.88 highs of 2015.
The Reserve Bank of Australia (RBA) will release its monetary policy decision on Tuesday, March 19. Economists at Commerzbank analyze Aussie’s outlook ahead of the meeting.
RBA likely to stay on track
It should come as no surprise if the new statement is very similar to the old one. Even though inflation has made good progress recently, there is still a long way to go to reach the RBA's inflation target. And given that inflation has also taken longer to come down than in Western countries, there is reason to fear that disinflation in Australia will also stall with some delay. This would also be in line with the RBA's latest forecast, which assumes a relatively slow decline in inflation to the target.
The RBA may remove the hint of another rate hike. This would be in line with the latest developments; after all, every market participant should now expect the next move to be down in Australia as well. However, I would not expect much more. There is still time for the RBA to give clearer signals at a later date, when new forecasts are published and more data is available. If the RBA follows our view, the Aussie should benefit moderately from the decision.
- Silver price corrects after nearing the top of a major range at circa $26.00.
- The decline could be as a result of fading hopes the Federal Reserve will cut interest rates in the near term.
- Long-term fundamentals however support, including positive global growth and robust demand.
Silver price (XAG/USD) pulls back at the start of the week and is trading in the $25.10s after reaching close to the top of a long-term range. It is possible the correction is due to a change in expectations regarding the future path of interest rates, which are now expected to remain higher for longer in the US.
Silver, like Gold, is a non-yielding asset so it tends to carry an opportunity cost – the price holders must pay for not staying in cash and earning interest. Recent US inflation data showed inflation remaining stubbornly high. This has delayed the time when the Federal Reserve (Fed) is expected to pull the trigger on cutting interest rates, which could be a factor weighing on the Silver price.
Silver: Long-term bullish fundamentals
Interest rates are not the only factor affecting the price of Silver, however. The precious metal is used in a variety of industrial processes and an overall positive outlook for global growth is a beneficial factor for Silver demand in the long-term.
Chinese data released on Monday showed a higher-than-expected rise in Industrial Production, which showed a 7.0% gain in February, beating the 5.0% expected and 6.8% previous. Fixed Asset Investment – which is investment in plant and machinery – rose 4.2% in February, versus estimates of 3.2% and 3,0% previously. Retail Sales grew more than forecast but less than previous, according to the National Bureau of Statistics of China.
Recent data from the US Federal Reserve also showed US Industrial Production beating estimates in February, and an improvement on the negative 0.5% of January.
Silver price could be in for more gains as global demand increases for its use in the manufacture of Solar Panels, a wide variety of electronic devices and jewelry, according to Marcus Garvey an analyst at Macquarie.
The Silver Institute, a not-for-profit organization based in the US, has forecast robust demand for Silver in 2024, predicting it will see its second best year on record with demand rising to 1.2 billion ounces.
Technical Analysis: Silver knocks on the top of range
From a technical perspective, XAG/USD pulls back after almost reaching the top of a range that stretches between $19.00 and $26.00. This range itself lies within a broader range between $17.50 and $30.00.
A decisive break above $25.85 would probably indicate a breakout to the upside, substantially increasing bullish enthusiasm.
Silver might then rally to around $29.50, if using the 0.618 Fibonacci ratio of the range, or to just shy of $32.00 if extrapolating the full height of the range higher.
If the latter, then it will mean the pair has also broken out of the top of the broader range, indicating even greater upside, potentially to a target at $37.50.
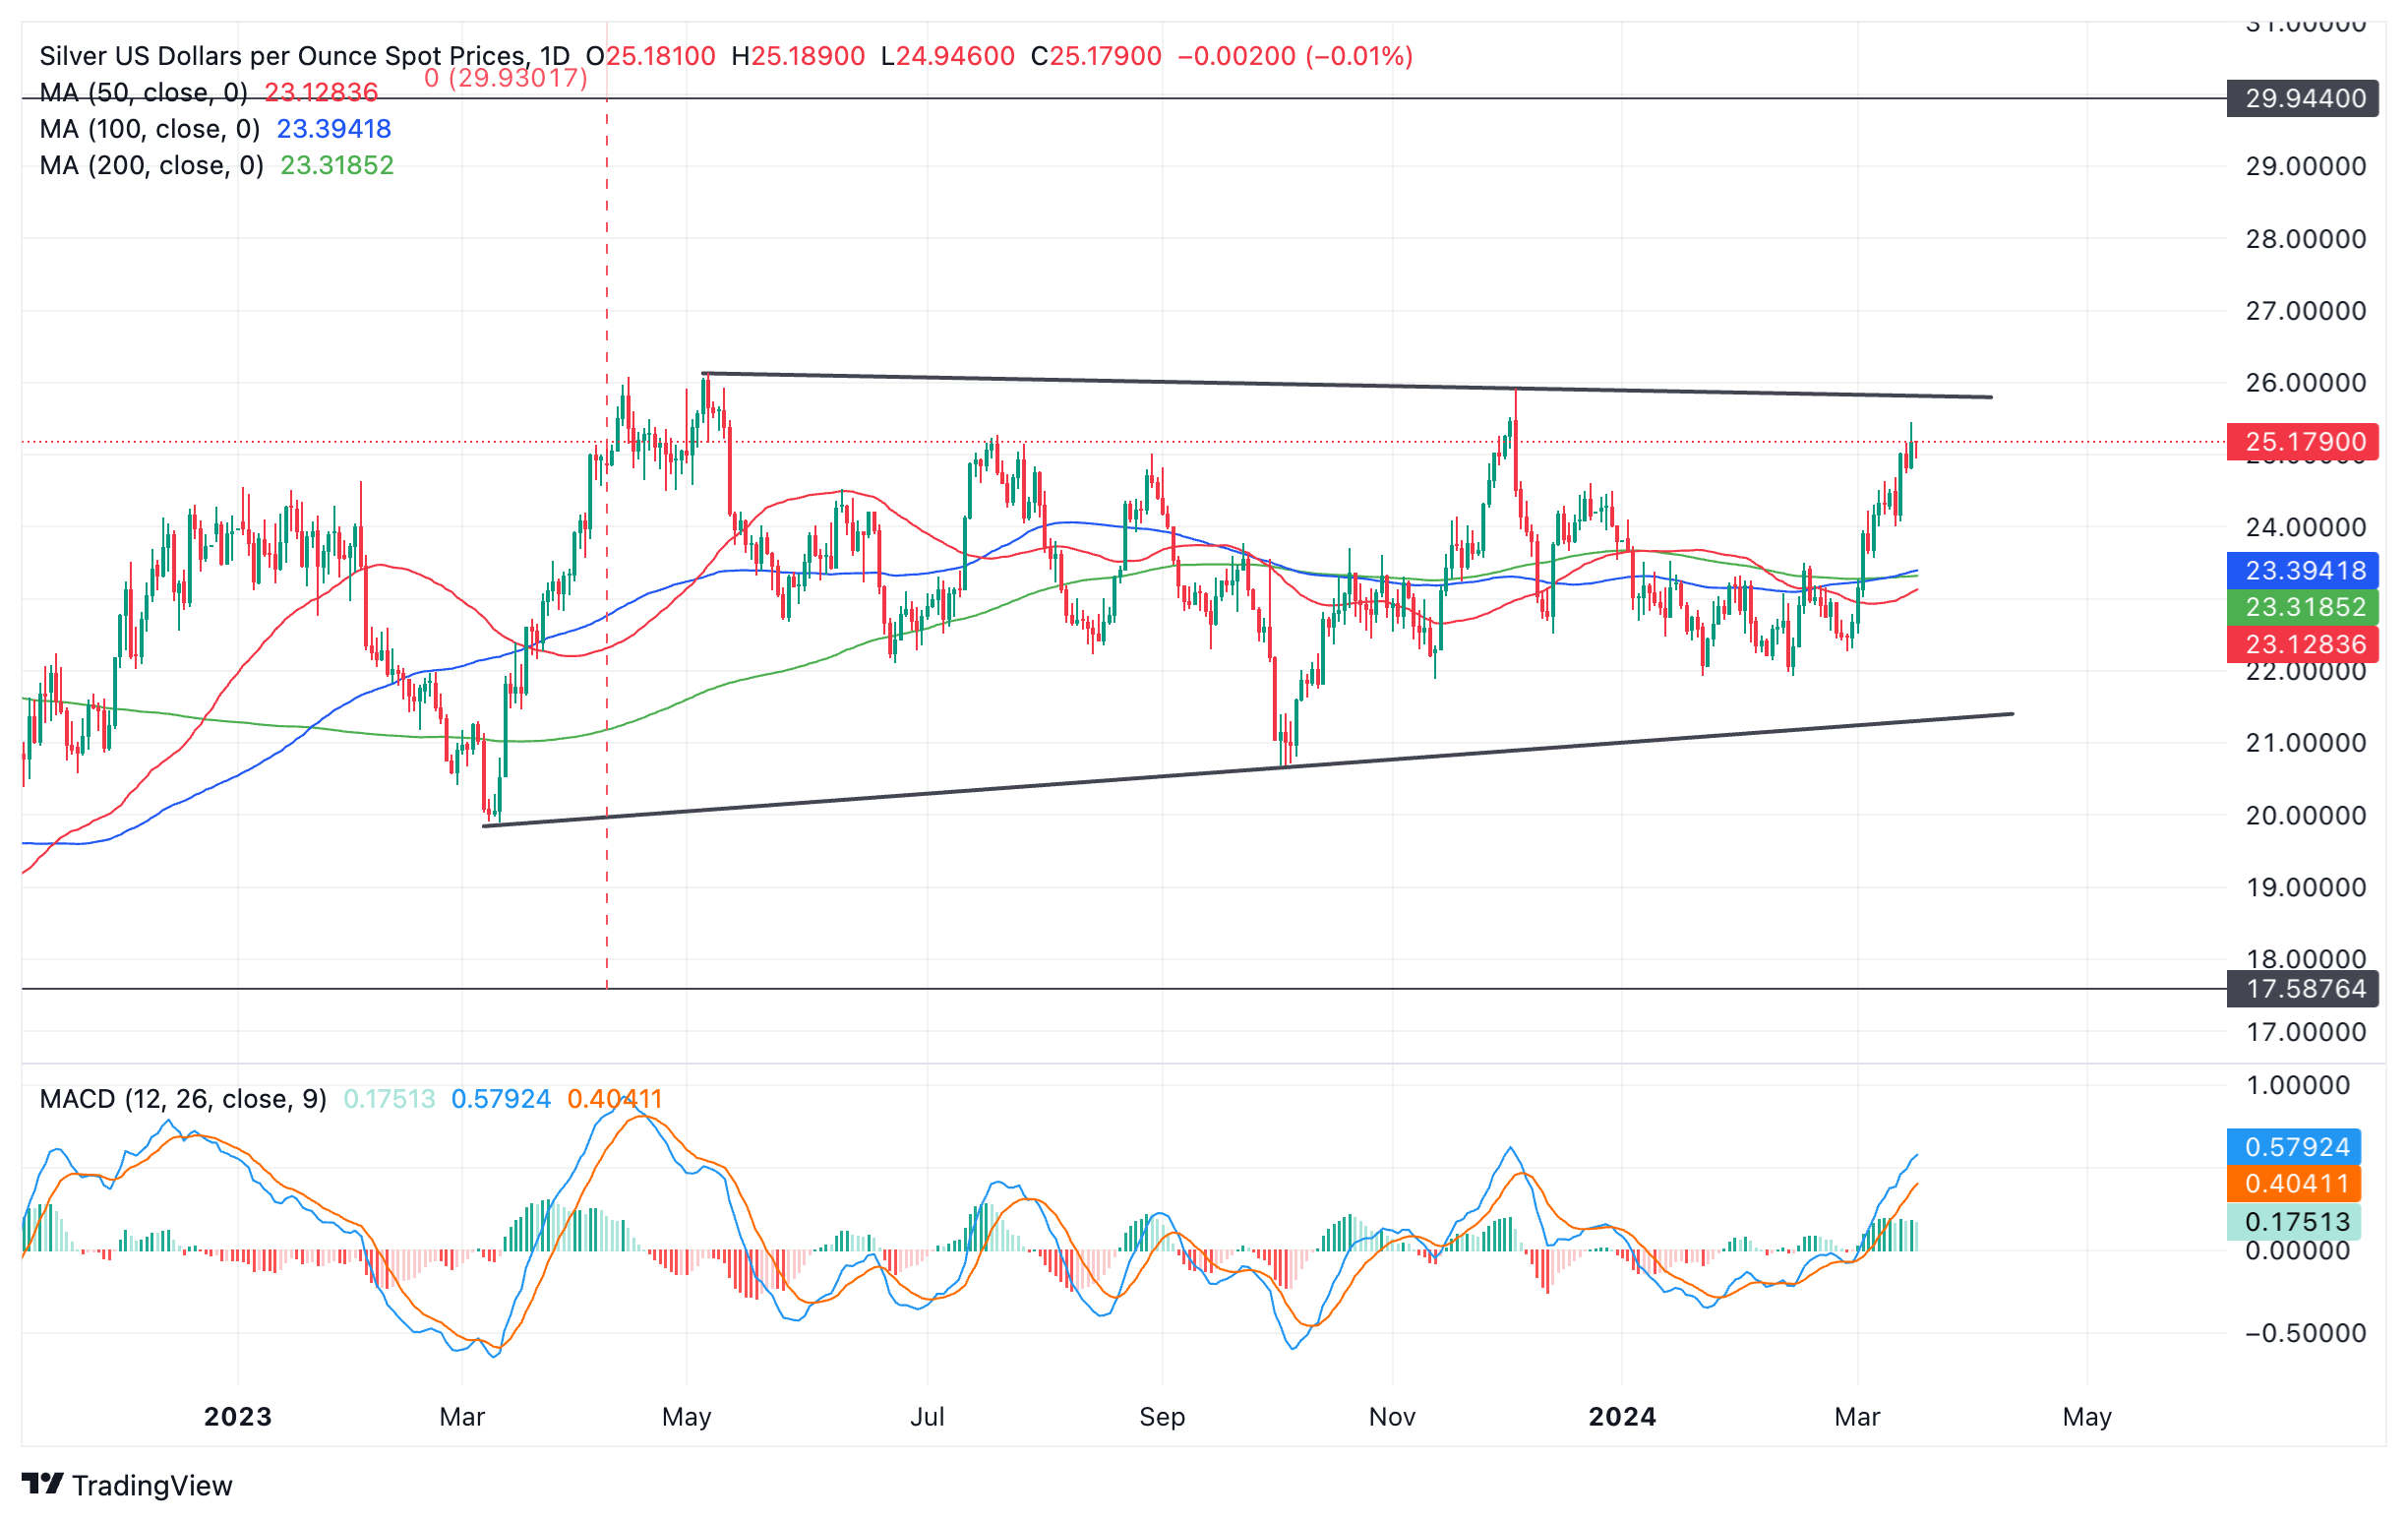
Silver versus US Dollars: 4-hour chart
Alternatively the precious metal could meet tough resistance at the range highs in the $25.80-90s and pullback down.
Traders should watch for a decisive break higher before jumping in. A “decisive” break is one characterized by a long green daily candle piercing clearly above the level and closing near its high, or three green candles in a row, breaching the level.
- Natural Gas prices are popping back above $1.80.
- Asian Gas traders are flocking into the European market, creating an imbalance between buyers and sellers.
- The US Dollar Index trades in the mid-103.00 range ahead of two big central bank meetings.
Natural Gas prices (XNG/USD) jumped this Monday back above $1.80 as Asian traders appear to be operating again in the European Gas futures market. This creates an imbalance in the already fragile European gas market, increasing doubts over whether the old continent will be able to restock its reserves ahead of the next heating season. Although the reserves have not declined as much as expected this winter, new deals to secure refilling are not taking place and Asian traders buy up the current cheap-priced contracts.
The US Dollar trades steady this Monday ahead of two major central bank meetings: the Bank of Japan (BoJ) and the US Federal Reserve on Tuesday and Wednesday, respectively. The BoJ is expected to move out from its negative rate policy, which would mean the first rate hike in 17 years. Meanwhile, the Fed will need to ease the nerves of markets having pushed forward the initial rate cut to September after stickier inflation data last week.
Natural Gas is trading at $1.86 per MMBtu at the time of writing.
Natural Gas news and market movers: European market weak spot
- Bloomberg energy reported this Monday that Natural Gas demand in Asia has moved back to pre-pandemic levels. India is projected to even surpass its pre-pandemic demand for Gas, with more new plants set to come online in 2024-2025.
- Gas flows at the US Freeport facility in Texas are still reduced and lower production is set to remain until the end of April.
- A cold front is set to hit Europe next week, possibly reducing the continent’s reserves further.
- Ole Sloth, head of commodity strategy at Saxo Bank, said that the recent attacks from Ukraine on Russian facilities should be factored in as a reason for higher Natural Gas prices.
Natural Gas Technical Analysis: Another attempt to head to $2
Natural Gas prices could be seeing a perfect cocktail come to life with the European Gas market set to face some severe pressures. On the one hand, the landslide victory from Russian president Vladimir Putin will make him respond even more severely to the current Ukraine attacks on Russian Oil and Gas facilities, with measures that could disrupt the flows to Europe. Meanwhile, Asian traders are buying up currently cheap-priced Gas contracts on the European market, which could leave Europe behind with elevated prices ahead of the next heating season.
On the upside, the key $2.00 level needs to be regained first. The next key level is the historic pivotal point at $2.12, which falls broadly in line with the 55-day Simple Moving Average (SMA) at $2.09. Should Gas prices pop up in that region, a broad area opens up with the first cap at the red descending trend line near $2.40.
On the downside, multi-year lows are nearby with $1.65 as the first line in the sand. This year’s low at $1.60 needs to be kept an eye on as well. Once a new low for the year is printed, traders should look at $1.53 as the next supportive area.
US WTI Crude Oil: Daily Chart
Natural Gas FAQs
Supply and demand dynamics are a key factor influencing Natural Gas prices, and are themselves influenced by global economic growth, industrial activity, population growth, production levels, and inventories. The weather impacts Natural Gas prices because more Gas is used during cold winters and hot summers for heating and cooling. Competition from other energy sources impacts prices as consumers may switch to cheaper sources. Geopolitical events are factors as exemplified by the war in Ukraine. Government policies relating to extraction, transportation, and environmental issues also impact prices.
The main economic release influencing Natural Gas prices is the weekly inventory bulletin from the Energy Information Administration (EIA), a US government agency that produces US gas market data. The EIA Gas bulletin usually comes out on Thursday at 14:30 GMT, a day after the EIA publishes its weekly Oil bulletin. Economic data from large consumers of Natural Gas can impact supply and demand, the largest of which include China, Germany and Japan. Natural Gas is primarily priced and traded in US Dollars, thus economic releases impacting the US Dollar are also factors.
The US Dollar is the world’s reserve currency and most commodities, including Natural Gas are priced and traded on international markets in US Dollars. As such, the value of the US Dollar is a factor in the price of Natural Gas, because if the Dollar strengthens it means less Dollars are required to buy the same volume of Gas (the price falls), and vice versa if USD strengthens.
Economists at Société Générale analyze USD/MXN technical outlook.
Cross above 200-DMA near 17.00/17.20 crucial to avert one more leg of decline
USD/MXN failed to establish above 200-DMA near 17.20 in recent attempt extending the decline towards last year low of 16.60 which is a potential support.
Daily MACD has been posting positive divergence denoting receding downward momentum but signals of reversal in downtrend are not yet visible.
Cross above the 200-DMA near 17.00/17.20 would be crucial to avert one more leg of decline.
In case the pair fails to defend 16.60, ongoing down move is likely to persist towards next projections at 16.40 and 16.10.
- Gold price falls slightly as US yields remain firm due to diminished Fed rate cut expectations for June.
- The US Dollar remains subdued as upbeat China data improves risk appetite.
- This week, the Fed’s decision and guidance on interest rates will be keenly watched.
Gold price (XAU/USD) exhibits a subdued performance in Monday’s European session. Fading expectations for the Federal Reserve (Fed) reducing interest rates in the June policy meeting have strengthened yields on interest-bearing assets. 10-year US Treasury yields have extended their upside to 4.31%, up by 0.16%. Higher US bond yields have increased the opportunity cost of holding an investment in non-yielding assets such as Gold weighing on its price.
The US Dollar Index (DXY) trades slightly lower at 103.40 due to improved risk appetite. The appeal for safe-haven assets has dampened due to the strong recovery in Chinese Retail Sales and Industrial Production data for February, which signals an improvement in domestic demand. This weaken appeal for safe havens has also built downside pressure on the Gold price.
This week, the Gold price will be guided by the Fed’s interest rate decision, which will be announced on Wednesday. The Fed is widely anticipated to keep interest rates unchanged in the range of 5.25%-5.50%. Therefore, the major focus will be on the interest rate guidance, which will be provided through the release of the so-called dot plot, a chart updated quarterly that shows interest rate projections from Fed officials for various timeframes.
Daily digest market movers: Gold price falls slightly amid caution ahead of Fed meeting
- Gold price turns subdued near $2,150 as investors await key interest rate meetings by various central banks this week. The near-term for the Gold price will be guided by the Federal Reserve’s monetary policy decision.
- The CME FedWatch tool shows that a steady decision for the March meeting is certain. Market participants will keenly focus on the dot plot, which indicates all policymakers' expectations for interest rates over time and the latest economic projections. Investors will look for cues about when the Fed could start cutting interest rates.
- December’s dot plot showed policymakers don’t see the need to increase interest rates further and see three rate cuts this year. The Consumer Price Index (CPI) and associated inflation indicators for the first two months of 2024 have not been supportive of three rate cuts, as Fed policymakers want price pressures to decline for months to become confident that inflation will return to the 2% target. This could result in fewer rate-cut projections from Fed policymakers.
- Meanwhile, market expectations lean towards the June policy meeting when the Fed will start reducing key borrowing rates. However, the chances for the rate cut in June have come down significantly, as the consumer and producer price indices were surprisingly stubborn in February. The CME FedWatch tool shows that the chance for a rate cut stands at 57%, down from the 72% recorded before the release of the inflation data.
- Later this week, investors will focus on the preliminary S&P Global Manufacturing PMI for March. The Manufacturing PMI is anticipated to fall to 51.7 from 52.2 in February.
Technical Analysis: Gold price remains below $2,160
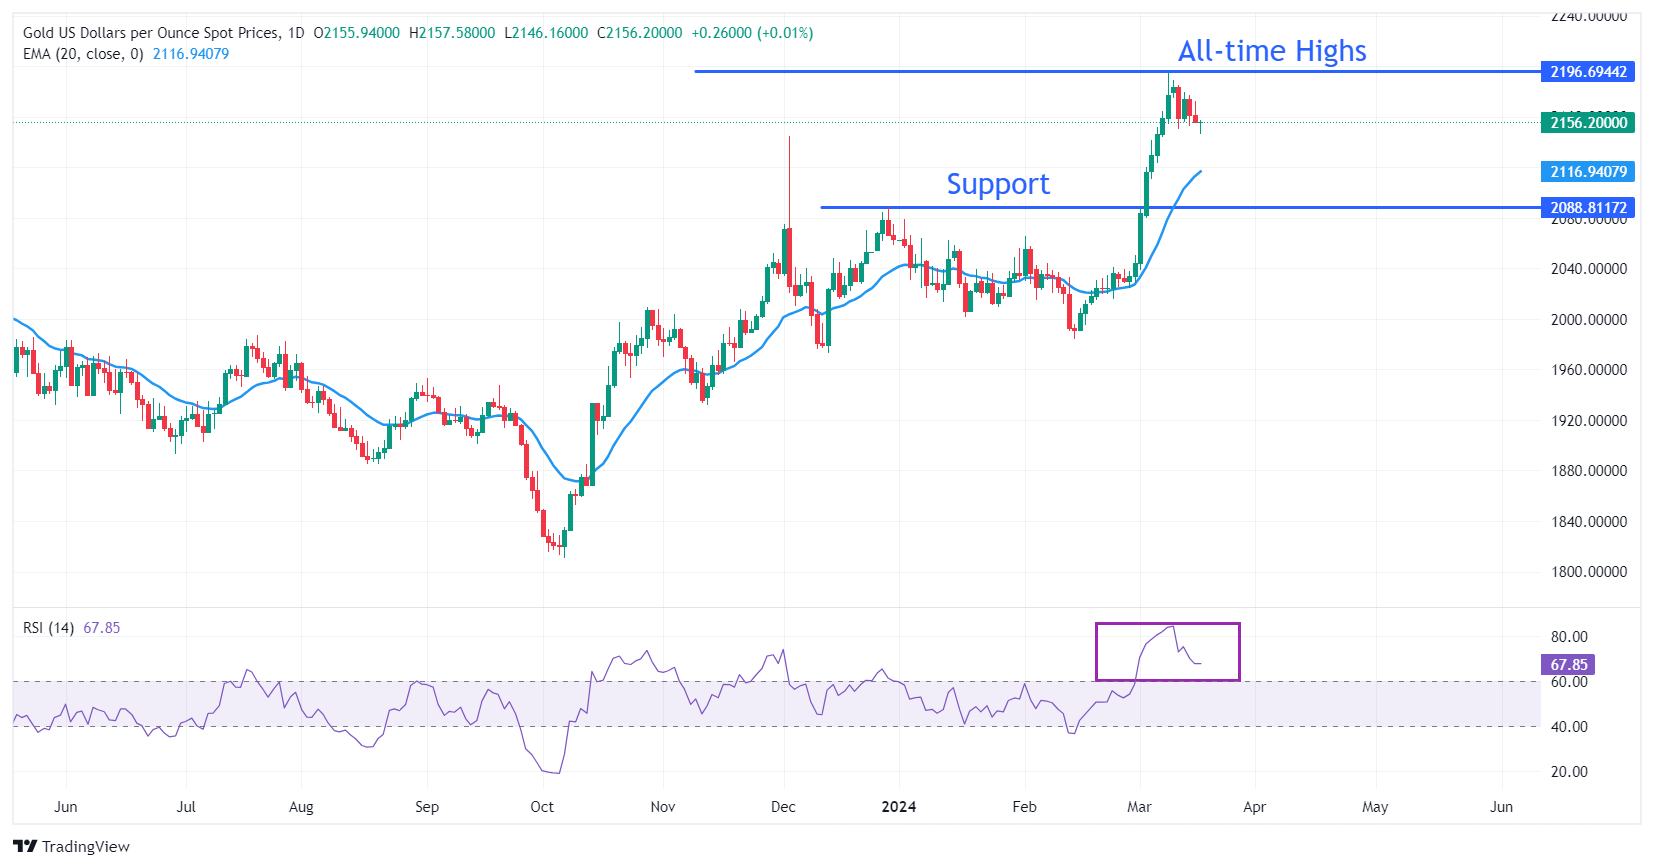
Gold's price has hit a fresh weekly low at around $2,145. As the divergence between the two is waning, the precious metal may continue its downside towards the 20-day Exponential Moving Average (EMA) at $2,097. After a wide divergence, the asset tends to face a mean-reversion move, which results in a price or a time correction.
On the downside, December 4 high near $2,145 and December 28 high at $2,088 will act as major support levels.
The 14-Relative Strength Index (RSI) retraces from its peak near 84.50, although the upside momentum is still active.
Gold FAQs
Gold has played a key role in human’s history as it has been widely used as a store of value and medium of exchange. Currently, apart from its shine and usage for jewelry, the precious metal is widely seen as a safe-haven asset, meaning that it is considered a good investment during turbulent times. Gold is also widely seen as a hedge against inflation and against depreciating currencies as it doesn’t rely on any specific issuer or government.
Central banks are the biggest Gold holders. In their aim to support their currencies in turbulent times, central banks tend to diversify their reserves and buy Gold to improve the perceived strength of the economy and the currency. High Gold reserves can be a source of trust for a country’s solvency. Central banks added 1,136 tonnes of Gold worth around $70 billion to their reserves in 2022, according to data from the World Gold Council. This is the highest yearly purchase since records began. Central banks from emerging economies such as China, India and Turkey are quickly increasing their Gold reserves.
Gold has an inverse correlation with the US Dollar and US Treasuries, which are both major reserve and safe-haven assets. When the Dollar depreciates, Gold tends to rise, enabling investors and central banks to diversify their assets in turbulent times. Gold is also inversely correlated with risk assets. A rally in the stock market tends to weaken Gold price, while sell-offs in riskier markets tend to favor the precious metal.
The price can move due to a wide range of factors. Geopolitical instability or fears of a deep recession can quickly make Gold price escalate due to its safe-haven status. As a yield-less asset, Gold tends to rise with lower interest rates, while higher cost of money usually weighs down on the yellow metal. Still, most moves depend on how the US Dollar (USD) behaves as the asset is priced in dollars (XAU/USD). A strong Dollar tends to keep the price of Gold controlled, whereas a weaker Dollar is likely to push Gold prices up.
- USD/CAD exhibits strength above 1.3500 ahead of an eventful week.
- The Fed is widely anticipated to hold interest rates unchanged in the range of 5.25%-5.50%.
- The Canadian Dollar faces pressure ahead of consumer inflation data for February.
The USD/CAD pair seems comfortable above the psychological resistance of 1.3500 in the European session on Monday. The Loonie asset clings to gains amid uncertainty ahead of the interest rate decision by the Federal Reserve (Fed), which will be announced on Wednesday.
While the Fed is certain to keep interest rates unchanged in the range of 5.25%-5.50%, market participants will keenly focus on the release of the dot plot, which details policymakers’ projections for interest rates over time and the latest economic projections.
The US Dollar Index (DXY), which tracks the US Dollar’s value against six major currencies, drops slightly to 103.40, while the Loonie asset is positive, indicating weakness in the Canadian Dollar.
The Canadian Dollar has come under pressure ahead of the February inflation data, which will be published on Tuesday. The annual headline Consumer Price Index (CPI) is anticipated to have accelerated to 3.1% from 2.9% in January. Hotter-than-anticipated inflation data will delay the Bank of Canada’s (BoC) plans to reduce interest rates.
USD/CAD trades inside Friday’s trading range around 1.3540. Earlier, the Loonie asset rebounded from the upward-sloping border of the Ascending Triangle pattern formed on a daily timeframe, plotted from the December 27 low at 1.3177. The horizontal resistance of the aforementioned pattern is placed from December 7 high at 1.3620.
The 50-day Exponential Moving Average (EMA) near 1.3500 continues to support the US Dollar bulls.
The 14-period Relative Strength Index (RSI) oscillates inside the 40.00-60.00 region, which indicates indecisiveness among investors.
The fresh upside would appear if the asset breaks above the December 7 high at 1.3620, which will drive the asset towards the May 26 high at 1.3655, followed by the round-level resistance of 1.3700.
On the flip side, a downside move below February 22 low at 1.3441 would expose the asset to February 9 low at 1.3413. A breakdown below the latter would extend downside towards January 15 low at 1.3382.
USD/CAD daily chart
Economists at ING analyze Pound Sterling (GBP) outlook ahead of Thursday’s Bank of England (BoE) decision.
GBP may absorb any further recovery in the Dollar better than most other currencies
February’s CPI figures released on Wednesday could have a big say in what the BoE announces on Thursday. The focus will remain on services inflation, which we expect to decelerate but remain elevated at 6% (also in line with the Bank’s forecasts).
After dropping its hawkish tone in February, we don’t see the Bank being in any rush to take further steps to the dovish side of the spectrum just yet, at least barring a major downward surprise in CPI on Wednesday.
Ultimately, the Pound may absorb any further recovery in the Dollar better than most other currencies, and we see EUR/GBP stabilising around the 0.8500 or trading closer to the big 0.8500 support in the short term.
Relative monetary policy will likely drive FX markets in the coming week with big central bank decisions looming, economists at Danske Bank say.
CHF is poised to drop if the SNB cuts rates
We do not expect BoJ to hike, but it is a close call and if we are wrong JPY would likely head higher.
On Thursday, we think CHF is poised to drop if we are right that the SNB will cut rates.
The USD will look to see if the Fed agrees with the recent rise in US interest rates.
- The Swiss Franc trades little changed ahead of the Swiss National Bank meeting on Thursday.
- Markets are pricing in a 29% probability of the SNB cutting interest rates.
- The technical picture shows a box range forming on the 4-hour chart.
The Swiss Franc (CHF) edges slightly higher at the start of the week, up a few hundredths of a percent in its most heavily traded pairs.
Swiss Franc traders are awaiting the big event of the week, the Swiss National Bank (SNB) March policy meeting on Thursday.
The probability of the SNB trimming its 1.75% policy at the meeting lies at 29%, according to Reuters. If it were to cut rates the Swiss Franc would weaken, as lower interest rates attract less foreign capital inflows.
Swiss Franc vulnerable due to lower inflation
The latest inflation data from Switzerland showed a fall in the Consumer Price Index (CPI) in February to 1.2% YoY from 1.3% in the previous month, according to the Federal Statistical Office.
Overall this is lower than the SNB expected back at its December meeting, when it said inflation, which was then at 1.4%, was likely to “increase somewhat in the coming months due to higher electricity prices and rents, as well as the rise in VAT.”
The SNB estimates inflation to average 1.9% in 2024. However, the rate of inflation is currently considerably below that figure at 1.2% – though on a monthly basis the CPI did rise 0.6% in February from 0.2% previously.
Inflation is also well below the SNB’s first-quarter forecast of 1.8%.
"Consumer price inflation is running 0.6 ppts below the bank's 1.8% first-quarter forecast, while core inflation of 1.1% is the lowest since January 2022," Reuters reports.
The Zurich-based institution will also publish a new set of medium-term inflation forecasts on Thursday, which could impact the outlook for monetary policy and CHF. If it revises down its inflation forecasts substantially, it would be negative for the Swissie, since it would suggest a higher probability of the SNB cutting interest rates on the horizon.
Often the SNB mimics the European Central Bank (ECB). However, inflation is falling faster in Switzerland than in the Eurozone, indicating a possibility it could move to cut rates before its European cousin.
Swiss Franc too expensive, says Jordan
The Swiss Franc is now too expensive for Swiss businesses after appreciating in real terms, said the Chairman of the Swiss National Bank, Thomas Jordan, in an interview with Bloomberg in February.
The SNB is known to directly intervene in foreign exchange markets to manage the value of the Swiss Franc. According to data on Switzerland's Foreign Exchange Reserves (CHFER), there has been a recovery in Swiss Forex reserves (of other currencies) in 2024, indicating that the SNB could be selling Swiss Francs to bring the exchange rate down.
Technical Analysis: Swiss Franc against USD forming a box range
The USD/CHF, which measures the buying power of a single US Dollar in Swiss Francs, has been oscillating within a relatively tight range between roughly 0.8900 and 0.8740 since the middle of February.
US Dollar versus Swiss Franc: 4-hour chart
The pair is overall in short-term uptrend with the expectation that it will eventually break out and start moving higher. However, resistance from a long-term trendline and the 50-week Simple Moving Average (SMA) present considerable obstacles.
For more upside to be confirmed, a decisive break above the range highs at 0.8900 would be required. Such a move would probably then extend to an initial target at 0.8992, the 0.618 Fibonacci (Fib) ratio of the height of the range extrapolated higher, followed by 0.9052, the full height extrapolated higher.
A decisive break below the range low at 0.8729, however, could indicate a short-term trend reversal and the start of a deeper slide lower. The first target for the move lower would be the 0.618 Fib extrapolation of the height of the range at 0.8632, followed by the full extrapolation at 0.8577, which is also close to the 0.8551 January 31 lows, another key support level to the downside.
Swiss Franc FAQs
The Swiss Franc (CHF) is Switzerland’s official currency. It is among the top ten most traded currencies globally, reaching volumes that well exceed the size of the Swiss economy. Its value is determined by the broad market sentiment, the country’s economic health or action taken by the Swiss National Bank (SNB), among other factors. Between 2011 and 2015, the Swiss Franc was pegged to the Euro (EUR). The peg was abruptly removed, resulting in a more than 20% increase in the Franc’s value, causing a turmoil in markets. Even though the peg isn’t in force anymore, CHF fortunes tend to be highly correlated with the Euro ones due to the high dependency of the Swiss economy on the neighboring Eurozone.
The Swiss Franc (CHF) is considered a safe-haven asset, or a currency that investors tend to buy in times of market stress. This is due to the perceived status of Switzerland in the world: a stable economy, a strong export sector, big central bank reserves or a longstanding political stance towards neutrality in global conflicts make the country’s currency a good choice for investors fleeing from risks. Turbulent times are likely to strengthen CHF value against other currencies that are seen as more risky to invest in.
The Swiss National Bank (SNB) meets four times a year – once every quarter, less than other major central banks – to decide on monetary policy. The bank aims for an annual inflation rate of less than 2%. When inflation is above target or forecasted to be above target in the foreseeable future, the bank will attempt to tame price growth by raising its policy rate. Higher interest rates are generally positive for the Swiss Franc (CHF) as they lead to higher yields, making the country a more attractive place for investors. On the contrary, lower interest rates tend to weaken CHF.
Macroeconomic data releases in Switzerland are key to assessing the state of the economy and can impact the Swiss Franc’s (CHF) valuation. The Swiss economy is broadly stable, but any sudden change in economic growth, inflation, current account or the central bank’s currency reserves have the potential to trigger moves in CHF. Generally, high economic growth, low unemployment and high confidence are good for CHF. Conversely, if economic data points to weakening momentum, CHF is likely to depreciate.
As a small and open economy, Switzerland is heavily dependent on the health of the neighboring Eurozone economies. The broader European Union is Switzerland’s main economic partner and a key political ally, so macroeconomic and monetary policy stability in the Eurozone is essential for Switzerland and, thus, for the Swiss Franc (CHF). With such dependency, some models suggest that the correlation between the fortunes of the Euro (EUR) and the CHF is more than 90%, or close to perfect.
Economists at ING analyze EUR/CHF outlook ahead of the SNB decision on Thursday.
SNB to stay on hold
We expect the SNB to stay on hold even though there has been some speculation of a rate cut already this month. However, we think the SNB is much more likely to wait for its next meeting in June to start easing policy. That allows for a couple more months of evidence that inflation has indeed stabilised, and this is also the point that the ECB is expected to cut.
EUR/CHF may move lower this week as the 7 bps of implied tightening for this meeting are priced out, but we still expect the pair to find good support at 0.9600.
Economists at ING analyze how the RBA meeting on Tuesday could impact the Australian Dollar (AUD).
The RBA still has reasons to maintain its hawkish bias
The RBA announcement does carry some downside risks to the Australian Dollar, as the unexpected flattening in January’s CPI at 3.4% might prompt policymakers to open the discussion on rate cuts. We are not convinced that this will happen, though.
The RBA still has reasons to maintain its hawkish bias, given a lower policy rate compared to other major central banks, the recent hawkish repricing in global rate expectations, and the lingering risks of a rebound in inflation.
We like the chances of a sustained AUD rally from the second quarter and are not too worried that the RBA will get in the way.
EUR/USD hovers slightly below 1.0900. Economists at ING analyze the pair’s outlook.
PMIs on Thursday could potentially offer some direction to EUR/USD into the weekend
EUR/USD will be primarily driven by US events this week, although some inputs from the Eurozone calendar should not be overlooked. Final February CPI figures today should not surprise, but Tuesday’s ZEW survey will be interesting to check the state of the struggling German economy. As will PMIs on Thursday, which could potentially offer some direction to EUR/USD into the weekend after the FOMC has been digested.
There are also plenty of European Central Bank speakers to hear from, including President Christine Lagarde on Wednesday.
Our view on EUR/USD is that it can trade on the soft side into the FOMC, but could still end the week within the 1.0850/1.0900 range.
- AUD/USD holds ground ahead of RBA’s policy decision on Monday.
- Chinese Retail Sales (YoY) rose by 5.5% in February, compared to the expected 5.2% and 7.4% prior.
- The correction in US Treasury yields contributes to downward pressure on the US Dollar.
AUD/USD snaps its two-day losing streak, advancing to near 0.6570 during the European session on Monday. The pair found upward support as the US Dollar (USD) retreated amid lower US Treasury yields. However, caution prevails among market participants ahead of the Reserve Bank of Australia's (RBA) policy decision scheduled for Tuesday.
The US Dollar Index (DXY) is hovering around 103.40, with the 2-year and 10-year US Treasury yields at 4.71% and 4.29%, respectively, by the press time. On Friday, increases in US yields, were driven by a hawkish sentiment surrounding the Federal Reserve. The Fed is anticipated to uphold its elevated interest rates at Wednesday’s meeting in response to recent inflationary pressures.
The Australian Dollar (AUD) might have received upward support as the S&P/ASX 200 Index recovered from its losses, although the Australian equity market faced challenges during Asian hours due to softer commodity prices.
According to Bloomberg, Westpac anticipates the Reserve Bank of Australia to maintain its cash rate at 4.35% at Tuesday's meeting. RBA Governor Michele Bullock recently highlighted that inflation in Australia is primarily "homegrown" and "demand-driven," attributed to the strength of the labor market and increasing wage inflation. The RBA does not foresee this phenomenon occurring until 2026.
Additionally, investors also await interest rate decisions from both the People's Bank of China (PBoC). Chinese Retail Sales (YoY) increased by 5.5% in February, surpassing expectations of 5.2% and the previous reading of 7.4%. Additionally, Chinese Industrial Production (YoY) rose by 7.0%, compared to the market expectation of a 5.0% figure in February and the previous reading of 6.8%.
- WTI prolongs its upward trajectory on Monday and climbs to a fresh YTD peak.
- Concerns about tightening global supply continue to benefit the commodity.
- Hawkish Fed expectations might keep a lid on any further appreciating move.
West Texas Intermediate (WTI) US Crude Oil prices build on last week's strong gains of nearly 4% and gain some follow-through positive traction on Monday. The momentum lifts the black liquid to the $81.45-$81.50 area, or the highest level since November 2023 during the early part of the European session and is sponsored by worries about tightening supply.
Against the backdrop of disruptions caused by Houthi attacks in the Red Sea, Ukraine stepped up drone strikes on Russian oil refineries over the last week. Moreover, Israeli Prime Minister Benjamin Netanyahu confirmed on Sunday he will proceed with plans to push into Gaza's Rafah enclave. This comes after OPEC+ members decided to extend the production cuts of 2.2 million barrels per day through the second quarter and fueled concerns about a tight global supply, which, in turn, is seen acting as a tailwind for Crude Oil prices.
It, however, remains to be seen if bulls can maintain their dominant position or opt to take some profits off the table amid expectations that the Federal Reserve (Fed) will keep interest rates higher for longer, which might hamper economic activity and dent fuel demand. Nevertheless, the aforementioned fundamental backdrop favours bullish traders and suggests that the path of least resistance for Crude Oil prices remains to the upside. Hence, any meaningful corrective pullback might be seen as a buying opportunity and remain limited.
- NZD/USD finds buying interest near 0.6080 as market sentiment slightly improves
- China’s upbeat Retail Sales data improve risk appetite of investors.
- The US Dollar falls slightly ahead of Fed policy decision.
The NZD/USD pair finds a temporary cushion near 0.6080 in Monday’s European session after a sharp sell-off in the last two trading sessions. The Kiwi asset rebounds to the round-level resistance of 0.6100 as market sentiment improves after China’s Industrial Production and Retail Sales data for February outperforms expectations.
China’s Retail Sales grew at a higher pace of 5.5% against expectations of 5.2% but were lower than the prior reading of 7.4%. The Industrial Production surprisingly rose to 7.0% against the consensus of 5.0% and the former reading of 6.8%. The New Zealand economy is one of the leading trading partners of China. Therefore, an improvement in China’s economic growth strengthens the appeal of the New Zealand Dollar.
Meanwhile, the market sentiment will play a key role this week as various central banks are lined up for interest rate decisions. The Federal Reserve (Fed) is scheduled to announce the policy decision on Wednesday alongwith the release of the dot plot and economic projections. The central bank is expected to keep interest rates unchanged in the range of 5.25%-5.50%.
The US Dollar faces slight pressure on cautiously optimistic market mood. The US Dollar Index (DXY) drops gradually to 103.40.
NZD/USD trades back and forth from a month, ranging between 0.6037-0.6218 on a daily timeframe. A prolonged consolidation indicates indecisiveness among market participants. The 20-period Exponential Moving Average (EMA) near 0.6131 broadly trades close to spot prices.
The 14-period Relative Strength Index (RSI) trades in a 40.00-60.00 range, which indicates a sharp volatility contraction.
Going forward, a downside move below February 13 low near 0.6050 would expose the asset to the psychological support of 0.6000, followed by November 9 high at 0.5956.
On the flip side, an upside move would emerge if the asset breaks above the round-level resistance of 0.6200. This would drive the asset towards a February 22 high at 0.6220, followed by a January 11 high at 0.6260.
NZD/USD daily chart
It is a jam-packed week ahead with policy rate announcements by the Fed, BoJ, RBA, BoE, Norges Bank and SNB. Economists at BBH analyze how these central bank meetings could impact FX market.
AUD should remain supported as the RBA sticks to a hawkish hold
We see upside risk for USD and Treasury yields as the Fed’s new funds rate projection will likely imply less easing.
NOK is vulnerable to the downside because we expect Norges Bank to bring forward the timing of when the terminal rate is reached.
CHF will likely underperform because we expect the SNB to start easing.
JPY can edge lower as our base case is for the BOJ to keep the policy rate steady.
AUD should remain supported as the RBA sticks to a hawkish hold.
Finally, GBP will likely trade heavily because the risk is the BOE MPC voting turns less hawkish.
- EUR/USD is under pressure amid fading expectations the Fed will cut interest rates early.
- The dot plot from the Fed’s meeting on Wednesday could show a shift from three to two cuts this year, Bloomberg reports.
- Such a change would probably cause more negativity for EUR/USD.
EUR/USD has taken a step lower and is now trading within a new range in the 1.0800s following last week’s warmer-than-expected US inflation data, which increased the probability the Federal Reserve (Fed) will need to keep interest rates higher for longer.
Since higher interest rates attract more foreign capital inflows, this was positive for the US Dollar (USD), but negative for EUR/USD, which measures one Euro’s (EUR) buying power in USD terms.
EUR/USD traders prepare for Fed meeting on Wednesday
EUR/USD is likely to see heightened volatility on Wednesday when the Fed concludes its March meeting, announces its policy decision and publishes its Summary of Economic Projections (SEP). It is highly unlikely the Fed will announce a rate cut at the meeting, even though that was a possibility a few weeks ago.
“The reality is justly sinking in that the Fed is going to take its time,” says Mark Cranfield, an analyst at Bloomberg MLIV.
His view is backed up by the CME FedWatch Tool, which calculates the market-based probabilities of the Fed making rate cuts. At the time of publication it is calculating a 58% chance the Fed will make one or more 0.25% cuts by June, and 76.5% by July. This has fallen from the 80% for June registered by the tool at the beginning of the month.
In the last SEP, the board of governors of the Fed predicted at least three 0.25% interest rate cuts in 2024 in their “dot plot”, however, Bloomberg News says there is now a material possibility that this will be reduced to only two cuts after the March meeting. Such a retrenchment would be viewed as “quite aggressive,” according to Cranfield. As such it would be likely to lead to further weakness for EUR/USD.
“A pleasant surprise would be if the Fed were to maintain three dot-plot cuts,” added Cranfield, who suggests such a maintenance of the status quo would be bearish for USD (bullish for EUR/USD).
July the new June
A report published by Bloomberg on Monday shows that after digesting over 900 headlines quoting Fed officials since the beginning of the year, the conclusion is that July actually comes out as more likely as the month when the Fed begins easing, rather than June.
If this is so, market expectations will need to shift further away from June, with negative consequences for EUR/USD, all other things being equal.
There is little major data out for the Eurozone on Monday. February Consumer Price Index data is a revision of an estimate and unlikely to deviate from the 2.6% preliminary result for headline and 3.1% for Core.
Technical Analysis: EUR/USD hovers above abyss
EUR/USD finds a temporary support as it extends its correction from the 1.0981 March 8 high.
The depth of the correction brings into question the sustainability of the hitherto dominant short-term uptrend.
Euro vs US Dollar: 4-hour chart
Price is still above the pivotal 1.0867 level of the previous key swing low. This is likely to be a make-or-break level for the trend. Should prices cross below it would shift the balance of probabilities in favor of a reversal of the uptrend.
Such a breakdown would then most probably extend to 1.0795, at the low of the B leg of the prior ABC Measured Move pattern that unfolded higher during February and early March.
Alternatively, if the level holds, the short-term uptrend remains intact and likely to resume. Confirmation of a higher high and an extension of the uptrend would come from a break above the 1.0981 highs.
After that, tough resistance is expected at the 1.1000 psychological level – a likely bloody battlefield for bulls and bears.
A decisive break above 1.1000, however, would open the gates to further gains towards the key resistance level at 1.1139, the December 2023 high.
A “decisive” break is one characterized by a long green candle piercing clearly above the level and closing near its high, or three green bars in a row, breaching cleanly above the level.
Euro FAQs
The Euro is the currency for the 20 European Union countries that belong to the Eurozone. It is the second most heavily traded currency in the world behind the US Dollar. In 2022, it accounted for 31% of all foreign exchange transactions, with an average daily turnover of over $2.2 trillion a day. EUR/USD is the most heavily traded currency pair in the world, accounting for an estimated 30% off all transactions, followed by EUR/JPY (4%), EUR/GBP (3%) and EUR/AUD (2%).
The European Central Bank (ECB) in Frankfurt, Germany, is the reserve bank for the Eurozone. The ECB sets interest rates and manages monetary policy. The ECB’s primary mandate is to maintain price stability, which means either controlling inflation or stimulating growth. Its primary tool is the raising or lowering of interest rates. Relatively high interest rates – or the expectation of higher rates – will usually benefit the Euro and vice versa. The ECB Governing Council makes monetary policy decisions at meetings held eight times a year. Decisions are made by heads of the Eurozone national banks and six permanent members, including the President of the ECB, Christine Lagarde.
Eurozone inflation data, measured by the Harmonized Index of Consumer Prices (HICP), is an important econometric for the Euro. If inflation rises more than expected, especially if above the ECB’s 2% target, it obliges the ECB to raise interest rates to bring it back under control. Relatively high interest rates compared to its counterparts will usually benefit the Euro, as it makes the region more attractive as a place for global investors to park their money.
Data releases gauge the health of the economy and can impact on the Euro. Indicators such as GDP, Manufacturing and Services PMIs, employment, and consumer sentiment surveys can all influence the direction of the single currency. A strong economy is good for the Euro. Not only does it attract more foreign investment but it may encourage the ECB to put up interest rates, which will directly strengthen the Euro. Otherwise, if economic data is weak, the Euro is likely to fall. Economic data for the four largest economies in the euro area (Germany, France, Italy and Spain) are especially significant, as they account for 75% of the Eurozone’s economy.
Another significant data release for the Euro is the Trade Balance. This indicator measures the difference between what a country earns from its exports and what it spends on imports over a given period. If a country produces highly sought after exports then its currency will gain in value purely from the extra demand created from foreign buyers seeking to purchase these goods. Therefore, a positive net Trade Balance strengthens a currency and vice versa for a negative balance.
- The Pound Sterling trades sideways as investors await UK inflation and the BoE decision for fresh guidance.
- The BoE is expected to maintain interest rates unchanged as UK inflation is far from the 2% target.
- The Fed’s dot plot will guide the next move in the US Dollar.
The Pound Sterling (GBP) struggles for a decisive move in Monday’s European session as investors stay on the sidelines ahead of the interest rate decisions by the Federal Reserve (Fed) and the Bank of England (BoE), which will be announced on Wednesday and Thursday, respectively.
Investors see the BoE leaving interest rates unchanged at 5.25% as inflation is much higher than the desired rate of 2%. Market participants will keenly focus on the guidance for interest rates, namely clues about how long the BoE will keep interest rates high.
Currently, markets expec the BoE to begin reducing interest rates in its August policy meeting. However, policymakers have said that rate cuts would be appropriate only if they are convinced that inflation will sustainably rise to the 2% target.
The BoE needs to make a balancing act between high inflation and uncertainty over economic growth. The UK economy was in a technical recession in the second half of 2023, reporting contraction in the last two quarters. The nation grew by 0.2% in January but this is insufficient to confirm that the economy has returned to growth in the first quarter as a whole.
Daily digest market movers: Pound Sterling follows footprints of consolidating US Dollar
- The Pound Sterling trades in a narrow range of around 1.2730 and remains feeble as investors shift focus to the monetary policy decisions by the Federal Reserve and the Bank of England. The Fed is expected to keep interest rates unchanged in the range of 5.25%-5.50%. Investors will keenly focus on the dot plot, which indicates policymakers’ expectations for interest rates over time.
- Fed policymakers projected three rate cuts this year in December's dot plot. The Fed could revise these projections as consumer and producer inflation has been stubborn in the first two months. If the Fed projects fewer rate cuts, the appeal for the US dollar would strengthen. The US Dollar Index (DXY) has started the week on a flat note, trading lackluster around 103.45.
- On the other side of the Atlantic, the BoE is also expected to hold interest rates unchanged at 5.25% for the fifth straight time. The victory over inflation in the United Kingdom is far from over, as wage growth momentum is significantly higher than what is required to bring inflation down to the 2% target. Out of the nine policy committee members, MPC member Swati Dhingra is expected to support a rate-cut decision.
- Before the BoE decision, the Pound Sterling will dance to the tunes of the Consumer Price Index (CPI) data for February, which will be published on Wednesday. The annual core CPI, which strips off volatile food and energy prices, is forecasted to have decelerated to 4.6% from 5.1% in January. The monthly headline CPI is expected to have grown by 0.7% after declining by 0.6% in January.
- Soft inflation data could deepen expectations that the BoE will cut rates in the August policy meeting, while hot figures will likely dampen these expectations.
Technical Analysis: Pound Sterling falls to 20-EMA near 1.2730
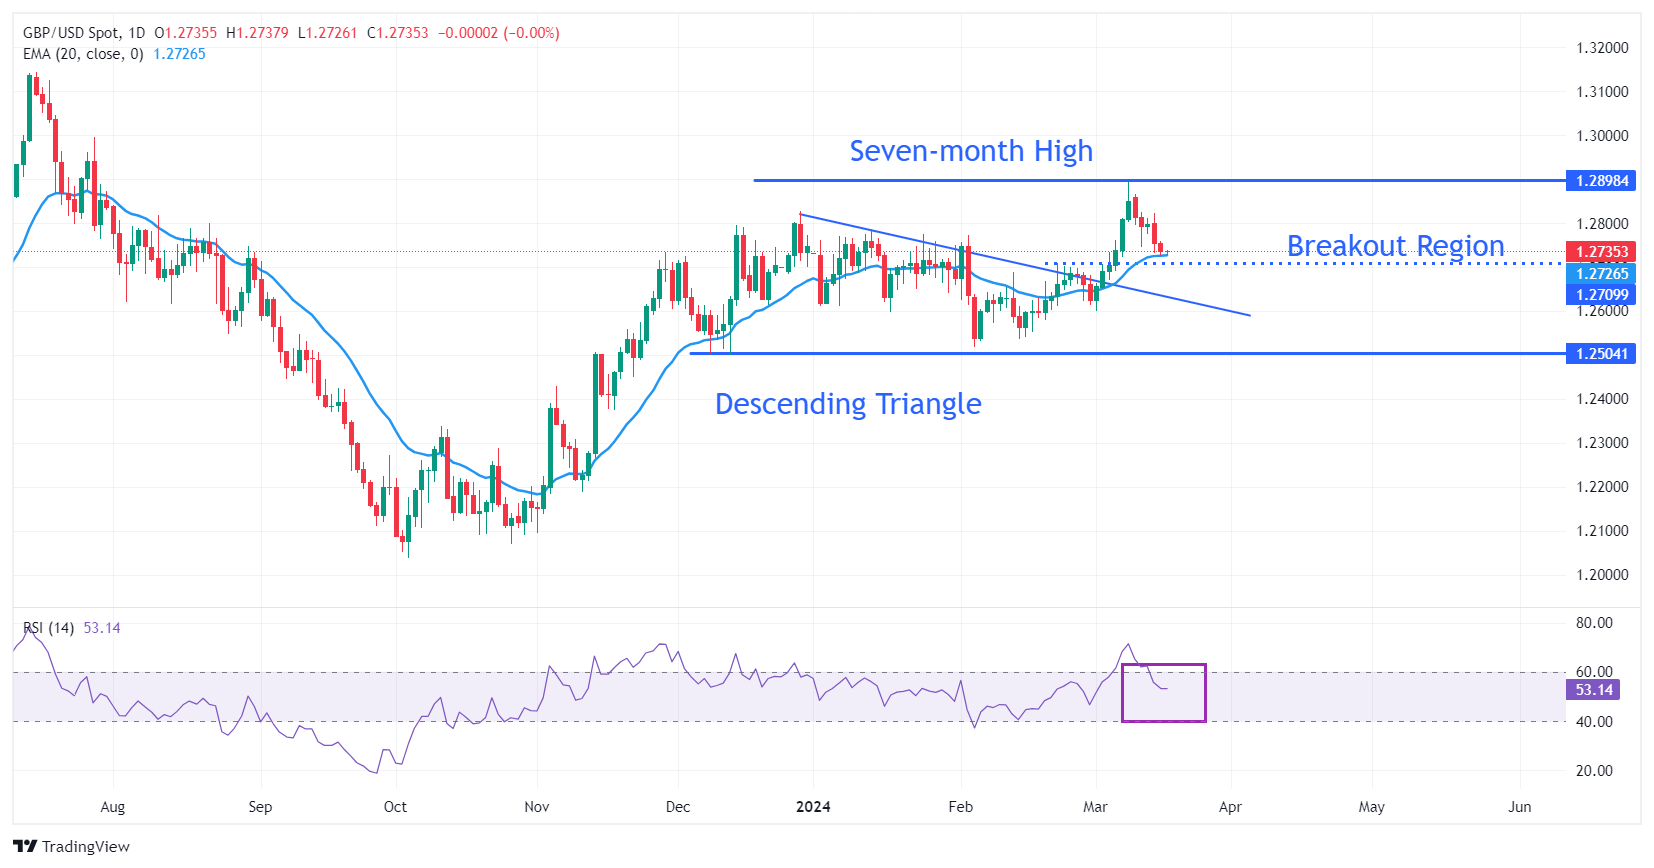
The Pound Sterling trades back and forth around 1.2730. The GBP/USD pair corrected to the 20-day Exponential Moving Average (EMA) near 1.2730 as the divergence with spot prices widened. The asset may find support near the breakout region of the Descending Triangle, which is around 1.2700. On the upside, a seven-month high at around 1.2900 will be a major barricade for the Pound Sterling bulls.
The 14-period Relative Strength Index (RSI) returns to the 40.00-60.00 range, indicating a sharp volatility contraction.
Pound Sterling FAQs
The Pound Sterling (GBP) is the oldest currency in the world (886 AD) and the official currency of the United Kingdom. It is the fourth most traded unit for foreign exchange (FX) in the world, accounting for 12% of all transactions, averaging $630 billion a day, according to 2022 data. Its key trading pairs are GBP/USD, aka ‘Cable’, which accounts for 11% of FX, GBP/JPY, or the ‘Dragon’ as it is known by traders (3%), and EUR/GBP (2%). The Pound Sterling is issued by the Bank of England (BoE).
The single most important factor influencing the value of the Pound Sterling is monetary policy decided by the Bank of England. The BoE bases its decisions on whether it has achieved its primary goal of “price stability” – a steady inflation rate of around 2%. Its primary tool for achieving this is the adjustment of interest rates. When inflation is too high, the BoE will try to rein it in by raising interest rates, making it more expensive for people and businesses to access credit. This is generally positive for GBP, as higher interest rates make the UK a more attractive place for global investors to park their money. When inflation falls too low it is a sign economic growth is slowing. In this scenario, the BoE will consider lowering interest rates to cheapen credit so businesses will borrow more to invest in growth-generating projects.
Data releases gauge the health of the economy and can impact the value of the Pound Sterling. Indicators such as GDP, Manufacturing and Services PMIs, and employment can all influence the direction of the GBP. A strong economy is good for Sterling. Not only does it attract more foreign investment but it may encourage the BoE to put up interest rates, which will directly strengthen GBP. Otherwise, if economic data is weak, the Pound Sterling is likely to fall.
Another significant data release for the Pound Sterling is the Trade Balance. This indicator measures the difference between what a country earns from its exports and what it spends on imports over a given period. If a country produces highly sought-after exports, its currency will benefit purely from the extra demand created from foreign buyers seeking to purchase these goods. Therefore, a positive net Trade Balance strengthens a currency and vice versa for a negative balance.
- USD/MXN consolidates as risk aversion prevails ahead of policy decisions by the US Fed.
- The correction in US Treasury yields could weaken the US Dollar.
- Banxico is expected to reduce the 25 bps interest rate on Thursday.
USD/MXN hovers around 16.70 during the European session on Monday, marking gains for the third consecutive day. The US Dollar (USD) benefited from market caution ahead of the US Federal Reserve's interest rate decision on Wednesday.
However, the US Dollar faces downward pressure due to a correction in US Treasury yields. The US Dollar Index (DXY) hovers around 103.40, while the 2-year and 10-year US Treasury yields stand at 4.71% and 4.29%, respectively. Despite this, yields have risen recently due to a hawkish sentiment surrounding the Federal Reserve, which is expected to maintain its elevated interest rates in response to recent inflationary pressures.
In economic news, the preliminary US Michigan Consumer Sentiment Index for March declined to 76.5 from the previous reading of 76.9, contrary to expectations of remaining steady. However, Industrial Production (MoM) in February edged up by 0.1%, surpassing the anticipated flat reading of 0.0% and recovering from the previous month's decline of 0.5%.
On the other side, Mexico's Industrial Production surged by 2.9% over twelve months, surpassing December's stagnant performance. This could bolster the hawkish stance of the Bank of Mexico (Banxico).
In Banxico's quarterly report, officials acknowledged progress in inflation control and emphasized the importance of avoiding premature interest rate cuts. Governor Victoria Rodriguez Ceja has advocated for a gradual approach to adjustments, while Deputy Governor Jonathan Heath has cautioned against the risks associated with premature rate cuts.
Traders will eagerly await the release of Private Spending Retail Sales and Inflation data during the week. Furthermore, Banxico's interest rate decision is scheduled to be released on Thursday.
The Gold price rally towards the $2,200 level is beyond explanation by macroeconomic and geopolitical developments, economists at ANZ Bank say.
Gold rally is way ahead of weakness in the US Dollar
Gold prices hit new highs despite waning expectations around the US Federal Reserve (Fed).
Market expectations point to a rate cut in June, with the pace of cuts normalising from 150 bps to 70-80 bps in early January.
Sell-off in the US Dollar is not matching the intensity of Gold price rally.
FX option expiries for Mar 18 NY cut at 10:00 Eastern Time, via DTCC, can be found below.
- EUR/USD: EUR amounts
- 1.0700 1.3b
- 1.0790 2.6b
- 1.0875 505m
- 1.0900 3.2b
- 1.1000 3b
- USD/JPY: USD amounts
- 147.00 1.4b
- 147.50 2.4b
- 148.00 634m
- 149.00 965m
- 149.50 750m
- 149.75 600m
- AUD/USD: AUD amounts
- 0.6425 515m
- 0.6500 600m
- EUR/GBP: EUR amounts
- 0.8950 502m
Economists at TD Securities discuss the Bank of Japan (BoJ) Interest Rate Decision and their implications for the USD/JPY pair.
On Hold – Dovish (10%)
The BoJ states that the economy is not strong enough and the Bank needs to be patient judging by the moderation in real household spending and Q4 GDP numbers. Ueda may remark that the BoJ needs to wait for the wage outcomes from small-medium enterprises given that they hire 70% of Japan's workforce. In this instance market is likely to view a July hike as the earliest possible time to move. USD/JPY +1.4%.
On Hold – Hawkish (10%)
The Bank would need to signal to the market that its confidence to hike is high and that its commitment to hike in April is strong. Otherwise, the market will believe the BoJ is likely to be on hold for at least three months. USD/JPY +0.8%.
Base Case: 10 bps hike – Measured tone (60%)
The significant wage outcome from Rengo gives the BoJ the confidence to move in March. Earlier, the BoJ indicated that the policy adjustment to hike will not be rapid, so hiking a month earlier vs consensus should not be a big deal. We expect the BoJ to officially discontinue the Yield Curve Control (YCC) framework, but retain its Q1 bond buying pace. USD/JPY -1.8%.
Hike – Hawkish (5%)
BoJ indicates that current financial conditions are too accommodative and may tighten policy further to prevent real rates from going too negative. Possible actions include faster hikes or a surprise announcement of a QT plan. However, both possibilities run counter to recent BoJ messaging to not surprise the market. USD/JPY -2.7%.
Over the past month, EUR/USD has been trending higher since the bottom at 1.0700 and has been closing in on the 1.1000 level. Economists at Nordea analyze the pair’s outlook.
The next big move for EUR/USD to be lower in the months to come
For the USD, later rate cut signals from the Fed should be supportive.
We expect the next big move for EUR/USD to be lower in the months to come, and 1.0500 could be in sight again.
Moreover, the upcoming liquidity situation in the US could also be supportive for the USD in the upcoming quarter.
Overall, it seems EUR/USD will remain range bound in the 1.0500-1.1000 area so long as (expectations for) monetary policy for both do not diverge to a larger degree.
- EUR/GBP gained ground on softer Consumer Inflation Expectations.
- ECB’s Pablo Hernandez suggested that the central bank might commence interest rate cuts in June.
- Eurozone HICP and Trade Balance data are scheduled to be released on Monday.
EUR/GBP advances for a second consecutive session, trading higher around 0.8550 during the Asian session on Monday. The Consumer Inflation Expectations, released by the Bank of England (BoE) on Friday, increased by 3.0%, although slightly lower than the previous uptick of 3.3%.
The softer inflation data has spurred speculation in markets about a potential Bank of England (BoE) rate cut in June, which could weaken the Pound Sterling (GBP) and provide support for the EUR/GBP cross.
Moreover, the Rightmove House Price Index (MoM) for March surged by 1.5% on Monday, exceeding the previous increase of 0.9%. Additionally, the annual report showed a rise of 0.8% compared to the previous 0.1%.
However, the European Central Bank (ECB) maintained borrowing costs at record highs during its March meeting, though policymakers hinted at discussions regarding a potential rate cut. This dovish stance from ECB officials could present additional challenges for the Euro. François Villeroy de Galhau, an ECB policymaker, suggested the likelihood of a rate cut in the spring.
Furthermore, ECB policymaker Pablo Hernandez de Cos stated on Sunday that the central bank opted to keep borrowing costs at record highs this month. He also indicated that the central bank might commence interest rate cuts in June following a decrease in Eurozone inflation.
On Monday, market attention will be on the Eurozone Harmonized Index of Consumer Prices (HICP) and Trade Balance. Looking ahead to Tuesday, traders will closely monitor various market indicators from the United Kingdom (UK), including the Consumer Price Index, Producer Price Index, and Retail Price Index.
- USD/CHF edges lower to 0.8535 in Monday’s early European session.
- The FOMC is anticipated to hold benchmark rates steady in the range of 5.25%–5.50% on Wednesday.
- The escalating Middle East geopolitical tension might lift the safe-haven flow, benefiting the Swiss Franc (CHF).
- The US FOMC and SNB monetary policy meeting on Wednesday and Thursday will be a closely watched events.
The USD/CHF pair loses traction amid the consolidation of the US Dollar (USD) during the early European session on Monday. Traders prefer to wait on the sidelines ahead of the US Federal Open Market Committee's (FOMC) monetary policy meeting on Wednesday, with no change in rate expected. USD/CHF currently trades near 0.8535, losing 0.04% on the day.
The FOMC will announce its interest rate decision on Wednesday. Investors anticipate the FOMC to hold benchmark interest rates steady in the range of 5.25%–5.50% at its March meeting. Financial markets have priced in nearly 75% odds that the FOMC will cut rates in July, according to the CME FedWatch Tools. That being said, the higher-for-longer interest rate narrative in the US might lift the Greenback and create a tailwind for the USD/CHF pair in the near term.
About the data, the University of Michigan reported on Friday that the Consumer Sentiment Index dropped to 76.5 in March from the previous reading and the expectation of 76.9. Meanwhile, the UoM one-year and five-year inflation expectations were unchanged at 3.0% and 2.9%, respectively. Industrial Production rose to 0.1% MoM in February from a 0.5% MoM fall in January.
On the other hand, Anadolu Agency reported that Israeli warplanes launched fresh airstrikes in southern Lebanon on Sunday. Additionally, the Lebanese group Hezbollah said it struck a gathering of Israeli soldiers with “appropriate weapons” near the village of Wazzani, resulting in direct hits. The rising geopolitical tension between Lebanon and Israel, and in the Middle East could boost safe-haven assets like the Swiss Franc (CHF) and cap the upside of the USD/CHF pair.
Apart from this, the Swiss National Bank (SNB) is likely to leave the interest rate unchanged on Thursday. However, Bloomberg economists expect the SNB to lower interest rates sooner than previously predicted, with the first 25 basis points (bps) coming in June.
Moving on, the Swiss Trade Balance for February will be due on Tuesday. On Wednesday, market players will closely watch the FOMC rate decision. The focus will shift to the Swiss National Bank's (SNB) interest rate decision on Thursday. These events could give a clear direction to the USD/CHF pair.
Here is what you need to know on Monday, March 18:
Major currency pairs fluctuate in narrow ranges to start the week as market participants refrain from taking large positions ahead of this week's critical central bank meetings and data releases. In the European session, Eurostat will release revisions to February inflation data. In the Asian trading hours on Tuesday, the Bank of Japan (BoJ) and the Reserve Bank of Australia (RBA) will announce monetary policy decisions.
The US Dollar (USD) Index snapped a three-week losing streak as the benchmark 10-year US Treasury bond yield climbed to 4.3%, gaining more than 5% on a weekly basis. The USD Index holds steady at around 130.50 in the European morning on Monday and the 10-year yield moves sideways near 4.3%. Meanwhile, US stock index futures trade modestly higher in the early European session.
US Dollar price in the last 7 days
The table below shows the percentage change of US Dollar (USD) against listed major currencies in the last 7 days. US Dollar was the strongest against the Japanese Yen.
| USD | EUR | GBP | CAD | AUD | JPY | NZD | CHF | |
| USD | 0.49% | 0.94% | 0.36% | 0.89% | 1.64% | 1.42% | 0.69% | |
| EUR | -0.49% | 0.45% | -0.14% | 0.40% | 1.15% | 0.94% | 0.21% | |
| GBP | -0.94% | -0.44% | -0.58% | -0.04% | 0.72% | 0.50% | -0.23% | |
| CAD | -0.36% | 0.13% | 0.57% | 0.53% | 1.28% | 1.06% | 0.33% | |
| AUD | -0.90% | -0.40% | 0.04% | -0.54% | 0.76% | 0.54% | -0.20% | |
| JPY | -1.65% | -1.15% | -0.46% | -1.31% | -0.75% | -0.20% | -0.97% | |
| NZD | -1.44% | -0.94% | -0.49% | -1.08% | -0.53% | 0.22% | -0.74% | |
| CHF | -0.69% | -0.19% | 0.25% | -0.32% | 0.21% | 0.95% | 0.74% |
The heat map shows percentage changes of major currencies against each other. The base currency is picked from the left column, while the quote currency is picked from the top row. For example, if you pick the Euro from the left column and move along the horizontal line to the Japanese Yen, the percentage change displayed in the box will represent EUR (base)/JPY (quote).
Earlier in the day, the data from China showed that January-February Retail Sales rose 5.5% on a yearly basis in February, this reading came in better than the market expectation for an increase of 5.2%. Additionally, Industrial Production expanded by 7% in the same period, surpassing analysts' estimate of 5%. In a press conference on Monday, China's National Bureau of Statistics (NBS) noted the national economy continued to recover and turn for the better in the January-February period, with macro policies taking effect. The NBS also noted that the foundation for economic recovery and growth needs to be "further consolidated."
The RBA is forecast to leave the policy rate unchanged at 4.35%. After falling nearly 1% in the previous week, AUD/USD stays in a consolidation phase slightly above 0.6550 in the European morning on Monday.
Australian Dollar holds its ground amid weaker US Dollar, ASX 200 Index.
The BoJ announced on Monday that it will conduct an unscheduled bond operation, offering to buy 3 trillion yen of bonds (JGBs) in an agreement starting on Tuesday and ending on Thursday. Markets are still uncertain about whether the BoJ will end its negative interest rate policy following the March meeting. USD/JPY rose over 1% last week and stabilized above 149.00.
Japanese Yen remains depressed against USD, traders seem non-committed ahead of BoJ and Fed.
EUR/USD failed to stage a rebound following Thursday's sharp decline and closed the previous week in negative territory. Early Monday, the pair moves up and down in a tight channel slightly below 1.0900.
GBP/USD fell nearly 1% and registered its largest one-week loss since December last week. The pair stays below 1.2750 in the early European morning.
Gold closed in negative territory last week and continued to stretch lower to start the new week. At the time of press, XAU/USD was down nearly 0.5% on a daily basis below $2,150.
Gold price struggles below $2,150, over one-week low as traders look to Fed for fresh impetus.
Central banks FAQs
Central Banks have a key mandate which is making sure that there is price stability in a country or region. Economies are constantly facing inflation or deflation when prices for certain goods and services are fluctuating. Constant rising prices for the same goods means inflation, constant lowered prices for the same goods means deflation. It is the task of the central bank to keep the demand in line by tweaking its policy rate. For the biggest central banks like the US Federal Reserve (Fed), the European Central Bank (ECB) or the Bank of England (BoE), the mandate is to keep inflation close to 2%.
A central bank has one important tool at its disposal to get inflation higher or lower, and that is by tweaking its benchmark policy rate, commonly known as interest rate. On pre-communicated moments, the central bank will issue a statement with its policy rate and provide additional reasoning on why it is either remaining or changing (cutting or hiking) it. Local banks will adjust their savings and lending rates accordingly, which in turn will make it either harder or easier for people to earn on their savings or for companies to take out loans and make investments in their businesses. When the central bank hikes interest rates substantially, this is called monetary tightening. When it is cutting its benchmark rate, it is called monetary easing.
A central bank is often politically independent. Members of the central bank policy board are passing through a series of panels and hearings before being appointed to a policy board seat. Each member in that board often has a certain conviction on how the central bank should control inflation and the subsequent monetary policy. Members that want a very loose monetary policy, with low rates and cheap lending, to boost the economy substantially while being content to see inflation slightly above 2%, are called ‘doves’. Members that rather want to see higher rates to reward savings and want to keep a lit on inflation at all time are called ‘hawks’ and will not rest until inflation is at or just below 2%.
Normally, there is a chairman or president who leads each meeting, needs to create a consensus between the hawks or doves and has his or her final say when it would come down to a vote split to avoid a 50-50 tie on whether the current policy should be adjusted. The chairman will deliver speeches which often can be followed live, where the current monetary stance and outlook is being communicated. A central bank will try to push forward its monetary policy without triggering violent swings in rates, equities, or its currency. All members of the central bank will channel their stance toward the markets in advance of a policy meeting event. A few days before a policy meeting takes place until the new policy has been communicated, members are forbidden to talk publicly. This is called the blackout period.
- EUR/USD may encounter immediate support around the 38.2% Fibonacci retracement level of 1.0871.
- Technical analysis indicates a potential confirmation of bullish momentum for the pair.
- The immediate resistance area is expected near the nine-day EMA at 1.0897 and the psychological level of 1.0900.
EUR/USD edges lower to near 1.0890 during the Asian market hours on Monday. The pair receives downward pressure as the market adopts caution ahead of the Federal Reserve’s (Fed) interest rate decision.
The EUR/USD pair could meet the immediate support at 38.2% Fibonacci retracement level of 1.0871, followed by the major support of 1.0850. A break below this level could push the pair to test the further 50.0% retracement level of 1.0838. Further support should have appeared at the psychological level of 1.0800.
Technical analysis suggests a bullish sentiment for the EUR/USD pair. The 14-day Relative Strength Index (RSI) is positioned above the 50 mark, indicating strength in buying momentum. Additionally, the Moving Average Convergence Divergence (MACD) shows a divergence above the signal line and remains above the centerline. Although a lagging indicator, this alignment indicates a confirmation of the bullish momentum for the EUR/USD pair.
On the upside, the immediate resistance appears at the nine-day Exponential Moving Average (EMA) at 1.0897, aligned with the psychological level of 1.0900. A break above the latter could lead the EUR/USD pair to navigate the major barrier at 1.0950, followed by the previous week’s high at 1.0963.
EUR/USD: Daily Chart
- EUR/JPY holds positive ground near 162.35 in Monday’s Asian session.
- Several ECB policymakers expect the first rate cut in June meeting.
- Markets have different opinions on whether the BoJ will raise rates in March or in April.
- The Bank of Japan's (BoJ) monetary policy meeting on Tuesday will be a closely watched event for traders.
The EUR/JPY pair trades on a stronger note below the mid-162.00s during the Asian session on Monday. Investors increase their bets on the expectation that the Bank of Japan (BoJ) will end its ultra-dovish monetary policies in March or April. The Japanese central bank will announce its interest rate decision on Tuesday. At press time, EUR/JPY is trading at 162.35, losing 0.01% on the day.
Many European Central Bank (ECB) policymakers anticipate the first rate cut in its June meeting. ECB President Christine Lagarde signaled that June is the earliest it is likely to cut interest rates after the central bank lowered its forecasts for inflation and estimated it will reach its 2% target in 2025. Meanwhile, ECB Governing Council member Klaas Knot penciled in June for a first-rate cut and expects three rate cuts this year. ECB policymaker Yannis Stournaras stated the rate cuts as soon as July, with two more by the end of the year.
On the other hand, analysts have different opinions on whether the BoJ will raise rates in March or in April. In the case of a rate hike, the central bank is projected to raise the interest rates by 20 basis points (bps) to 0.1% from -0.1%. There is a likelihood that the BoJ will wait until April to raise the interest rate, with investors pricing in 39% odds that the BoJ will hike on Tuesday. Any dovish remarks from the Japanese policymakers might weigh on the Japanese Yen (JPY) and create a tailwind for the EUR/JPY cross.
Looking ahead, market participants will focus on the Eurozone Harmonized Index of Consumer Prices (HICP) and Trade Balance , due on Monday. The highlight on Tuesday will be the BoJ interest rate decision. Also, the ZEW Survey from Germany and the Eurozone will be due later on Tuesday. Traders will take cues from the data and find trading opportunities around the EUR/JPY cross.
- AUD/JPY climbs to over one-week top on Monday, though the upside remains capped.
- The BoJ policy uncertainty keeps the JPY bulls on the defensive and lends some support.
- Traders seem reluctant to place aggressive bets ahead of the BoJ and RBA on Tuesday.
The AUD/JPY cross attracts some buyers for the second successive day on Monday, albeit struggles to capitalize on the modest intraday uptick beyond the 98.00 round-figure mark. Traders opt to wait on the sidelines ahead of the key central bank event risks on Tuesday, warranting some caution before positioning for an extension of last week's bounce from sub-97.00 levels, or over a one-month low.
The Bank of Japan (BoJ) and the Reserve Bank of Australia (RBA) are scheduled to announce their policy decisions on Tuesday, which will play a key role in providing a fresh directional impetus to the AUD/JPY cross. In the meantime, BoJ Governor Kazuo Ueda's slightly bleaker assessment of the economy last week is seen undermining the Japanese Yen (JPY) and acting as a tailwind for spot prices.
In fact, Ueda, speaking in parliament last Tuesday, noted that the economy is showing some signs of weakness, pointing to the recent batch of soft data on consumption. This might have smashed hopes for an imminent shift in the BoJ's policy stance in March, which, along with stability in the equity markets, seem to weigh on the safe-haven JPY and lend some support to the AUD/JPY cross.
The Australian Dollar (AUD), on the other hand, remains supported by signs of improving relations between Australia and China – the former's biggest trading partner. Adding to this, the upbeat Chinese macro data, showing that Retail Sales and Industrial Production rose more than expected in February, turns out to be another factor that benefits antipodean currencies, including the Aussie.
Meanwhile, the positive outcome from the spring wage negotiations seems to have paved the way for the BoJ to exit its negative interest rate policy sooner rather than later. This holds back the JPY bears from placing aggressive bets and keeps a lid on any further gains for the AUD/JPY cross. Hence, it will be prudent to wait for strong follow-through buying before confirming that spot prices have bottomed out.
- USD/CAD appreciates to continue its winning streak on Monday.
- US Dollar could gain ground on expectations of the Fed maintaining higher interest rates to combat inflation.
- The higher WTI price could limit the losses of the Canadian Dollar.
USD/CAD kicks off the week with its third consecutive day of gains on Monday, inching higher to near 1.3540 during the Asian trading session. The US Dollar (USD) could be bolstered by expectations that the Federal Reserve (Fed) will uphold its narrative of maintaining higher interest rates to combat inflation, which could further mitigate significant downside for the USD/CAD pair. The Fed is also set to update its Dot Plot projection, outlining interest rate expectations for the next one to five years.
Meanwhile, the US Dollar Index (DXY) struggles to sustain its position in positive territory, hovering around 103.50 at the time of writing. However, downward pressure on the US Dollar is evident due to a correction in US Treasury yields. The 2-year and 10-year US Treasury yields are currently at 4.72% and 4.30%, respectively.
On the flip side, the Canadian Dollar (CAD) may find some support from the surge in Crude oil prices. West Texas Intermediate (WTI) oil price continues its upward climb, reaching near $80.90 per barrel, by the press time. The positive momentum in Crude oil prices is driven by concerns over supply disruptions due to heightened geopolitical risks.
Traders are likely anticipating the release of the Canadian Consumer Price Index (CPI) data scheduled for Tuesday. Expectations suggest that the year-over-year consumer price will show an increase in February. A higher reading in the CPI could contribute a bullish sentiment for the Loonie Dollar (CAD). Additionally, the US Manufacturing Purchasing Managers Index (PMI) is set to be released on Thursday.
New Zealand’s (NZ) Prime Minister Christopher Luxon said on Monday that he is seeing a deterioration in economic conditions.
His comments come even as the country’s Business Performance of Services Index (PSI) improved slightly to 53.0 in February, as against a 52.2 reading in January.
Market reaction
The New Zealand Dollar shrugs off the downbeat remark from the PM, as NZD/USD advances 0.24% on the day to test the 0.6100 figure.
- Gold price remains depressed for the third straight day on Monday, albeit lacks follow-through.
- Expectations that the Fed will keep rates higher for longer continue to undermine the XAU/USD.
- Geopolitical risks help limit the downside ahead of the key FOMC policy decision on Wednesday.
Gold price (XAU/USD) trades with a negative bias for the third straight day on Monday and drops to the $2,050 level, or over a one-week low during the Asian session. The stronger inflation data released from the US last week fuelled speculations that the Federal Reserve (Fed) will stick to its higher-for-longer interest rates narrative. The outlook remains supportive of elevated US Treasury bond yields, which, in turn, acts as a tailwind for the US Dollar (USD) and undermines the non-yielding yellow metal.
The markets, however, are still pricing in a greater chance that the Fed will start cutting interest rates in June. This, along with geopolitical risks, should help limit the downside for the safe-haven Gold price and should limit deeper losses. Traders might also prefer to wait for more cues about the Fed's rate-cut path before placing fresh directional bets. Hence, the focus remains glued to the outcome of the highly anticipated two-day FOMC monetary policy meeting, scheduled to be announced on Wednesday.
Daily Digest Market Movers: Gold price is pressured by hawkish Fed expectations, bears seem non-committed
- Data released last week from the US pointed to some stickiness in inflation and might force the Federal Reserve to keep rates elevated, which, in turn, is seen weighing on the non-yielding Gold price.
- The University of Michigan's preliminary survey showed on Friday that one-year and five-year inflation expectations were little changed in March, while the US Consumer Sentiment Index eased to 76.5.
- The CME Group’s FedWatch Tool, meanwhile, indicates that the possibility of an interest rate cut at the June policy meeting stands at around 60% and holds back the USD bulls from placing fresh bets.
- Geopolitical risks remain elevated on the back of the protracted Russia-Ukraine war and conflicts in the Middle East, which is seen lending additional support to the perceived safe-haven precious metal.
- Ukraine last week stepped up drone strikes on Russian oil refineries, while Israeli Prime Minister Benjamin Netanyahu confirmed that he will proceed with plans to push into Gaza's Rafah enclave.
- Traders might refrain from placing aggressive directional bets and now look forward to the outcome of the highly anticipated FOMC monetary policy meeting on Wednesday for some meaningful impetus.
Technical Analysis: Gold price could slide further once the $2,145-2,144 horizontal support is broken
From a technical perspective, any further decline is likely to find some support near the $2,145-2,144 region, below which the Gold price could accelerate the fall to the next relevant support near the $2,128-2,127 zone. The corrective slide could extend further towards the $2,100 round figure, which should act as a strong base for the XAU/USD.
On the flip side, the $2,175-2,176 region now seems to have emerged as an immediate strong barrier, which if cleared should allow the Gold price to challenge the record peak, around the $2,195 area touched last week. Some follow-through buying beyond the $2,200 mark will set the stage for the resumption of the uptrend witnessed since the beginning of this month.
Gold FAQs
Gold has played a key role in human’s history as it has been widely used as a store of value and medium of exchange. Currently, apart from its shine and usage for jewelry, the precious metal is widely seen as a safe-haven asset, meaning that it is considered a good investment during turbulent times. Gold is also widely seen as a hedge against inflation and against depreciating currencies as it doesn’t rely on any specific issuer or government.
Central banks are the biggest Gold holders. In their aim to support their currencies in turbulent times, central banks tend to diversify their reserves and buy Gold to improve the perceived strength of the economy and the currency. High Gold reserves can be a source of trust for a country’s solvency. Central banks added 1,136 tonnes of Gold worth around $70 billion to their reserves in 2022, according to data from the World Gold Council. This is the highest yearly purchase since records began. Central banks from emerging economies such as China, India and Turkey are quickly increasing their Gold reserves.
Gold has an inverse correlation with the US Dollar and US Treasuries, which are both major reserve and safe-haven assets. When the Dollar depreciates, Gold tends to rise, enabling investors and central banks to diversify their assets in turbulent times. Gold is also inversely correlated with risk assets. A rally in the stock market tends to weaken Gold price, while sell-offs in riskier markets tend to favor the precious metal.
The price can move due to a wide range of factors. Geopolitical instability or fears of a deep recession can quickly make Gold price escalate due to its safe-haven status. As a yield-less asset, Gold tends to rise with lower interest rates, while higher cost of money usually weighs down on the yellow metal. Still, most moves depend on how the US Dollar (USD) behaves as the asset is priced in dollars (XAU/USD). A strong Dollar tends to keep the price of Gold controlled, whereas a weaker Dollar is likely to push Gold prices up.
- Indian Rupee edges higher on Monday on the weaker USD.
- The optimistic Indian economic outlook and the continuous foreign inflows boost the Indian Rupee.
- The US Fed interest rate decision on Wednesday will be in the spotlight.
Indian Rupee (INR) recovers its lost ground on Monday amid the modest decline of US Dollar (USD). The recovery of the INR is bolstered by the positive economic outlook in the Indian economy and the continuous foreign inflows into government bonds. Foreign portfolio investors increased their holdings of Indian government bonds by roughly 50% since the index inclusion news less than six months ago. Nonetheless, the risk-averse environment, higher crude oil prices, and higher US Treasury bond yields might cap the upside of the INR and create a tailwind for the USD/INR pair.
Investors will closely monitor the Fed interest rate decision on Wednesday, which is widely expected to keep rates steady at its March meeting. Market players will also take cues from Fed Chairman Jerome Powell's remarks during the press conference, as it might offer some hints about the future trajectory of US interest rates. On Thursday, India’s S&P Global Manufacturing and Services PMI will be due.
Daily Digest Market Movers: Indian Rupee remains strong amid multiple challenges
- The Indian merchandise trade deficit widened to $18.7 billion in February from $16.57 billion in January as gold imports surged significantly amid the Red Sea geopolitical tensions.
- Goods imports rose to $60.11 billion in February versus $54.41 billion in January, while exports arrived at $41.40 billion in February from $36.92 billion in January, according to the commerce ministry.
- The University of Michigan Consumer Sentiment Index eased to 76.5 in March compared to expectations and the previous reading of 76.9.
- The preliminary UoM one-year and five-year inflation expectations for March were unchanged at 3.0% and 2.9%, respectively.
- US Industrial Production improved to 0.1% MoM in February from a downwardly revised -0.5% MoM in January.
Technical Analysis: Indian Rupee remains capped within a longer-term range between 82.60 and 83.15
Indian Rupee trades stronger on the day. USD/INR continues its rangebound movement within a multi-month-old descending trend channel around 82.60–83.15 since December 8, 2023.
Technically, USD/INR maintains a bearish outlook in the near term as the pair holds below the key 100-day Exponential Moving Average (EMA) on the daily timeframe. The 14-day Relative Strength Index (RSI) lies below the 50.0 midline, emphasizing the downward momentum and hinting that sellers have the upper hand.
The potential support level for USD/INR is seen near the lower limit of the descending trend channel at 82.60. A breach of this level will expose 82.45 (low of August 23), en route to 82.25 (low of June 1). On the upside, the immediate resistance level is located near the 100-day EMA and a psychological mark at 83.00. A break above the mentioned level might resume its rally to the upper boundary of the descending trend channel near 83.15. The next hurdle to watch is 83.35 (high of January 2), followed by the 84.00 round figure.
US Dollar price today
The table below shows the percentage change of US Dollar (USD) against listed major currencies today. US Dollar was the weakest against the Australian Dollar.
| USD | EUR | GBP | CAD | AUD | JPY | NZD | CHF | |
| USD | -0.06% | -0.03% | -0.08% | -0.16% | 0.06% | -0.15% | -0.07% | |
| EUR | 0.06% | 0.03% | -0.02% | -0.08% | 0.12% | -0.09% | -0.02% | |
| GBP | 0.03% | -0.03% | -0.04% | -0.10% | 0.10% | -0.12% | -0.05% | |
| CAD | 0.08% | 0.01% | 0.04% | -0.06% | 0.13% | -0.07% | 0.00% | |
| AUD | 0.14% | 0.08% | 0.10% | 0.06% | 0.19% | -0.01% | 0.06% | |
| JPY | -0.06% | -0.13% | -0.03% | -0.14% | -0.22% | -0.21% | -0.14% | |
| NZD | 0.15% | 0.09% | 0.12% | 0.07% | -0.01% | 0.21% | 0.07% | |
| CHF | 0.08% | 0.02% | 0.05% | 0.00% | -0.06% | 0.13% | -0.07% |
The heat map shows percentage changes of major currencies against each other. The base currency is picked from the left column, while the quote currency is picked from the top row. For example, if you pick the Euro from the left column and move along the horizontal line to the Japanese Yen, the percentage change displayed in the box will represent EUR (base)/JPY (quote).
Indian Rupee FAQs
The Indian Rupee (INR) is one of the most sensitive currencies to external factors. The price of Crude Oil (the country is highly dependent on imported Oil), the value of the US Dollar – most trade is conducted in USD – and the level of foreign investment, are all influential. Direct intervention by the Reserve Bank of India (RBI) in FX markets to keep the exchange rate stable, as well as the level of interest rates set by the RBI, are further major influencing factors on the Rupee.
The Reserve Bank of India (RBI) actively intervenes in forex markets to maintain a stable exchange rate, to help facilitate trade. In addition, the RBI tries to maintain the inflation rate at its 4% target by adjusting interest rates. Higher interest rates usually strengthen the Rupee. This is due to the role of the ‘carry trade’ in which investors borrow in countries with lower interest rates so as to place their money in countries’ offering relatively higher interest rates and profit from the difference.
Macroeconomic factors that influence the value of the Rupee include inflation, interest rates, the economic growth rate (GDP), the balance of trade, and inflows from foreign investment. A higher growth rate can lead to more overseas investment, pushing up demand for the Rupee. A less negative balance of trade will eventually lead to a stronger Rupee. Higher interest rates, especially real rates (interest rates less inflation) are also positive for the Rupee. A risk-on environment can lead to greater inflows of Foreign Direct and Indirect Investment (FDI and FII), which also benefit the Rupee.
Higher inflation, particularly, if it is comparatively higher than India’s peers, is generally negative for the currency as it reflects devaluation through oversupply. Inflation also increases the cost of exports, leading to more Rupees being sold to purchase foreign imports, which is Rupee-negative. At the same time, higher inflation usually leads to the Reserve Bank of India (RBI) raising interest rates and this can be positive for the Rupee, due to increased demand from international investors. The opposite effect is true of lower inflation.
- WTI price appreciation following Ukrainian attacks on Russian refineries.
- Ukraine has declared not to extend a five-year agreement with Russia's Gazprom.
- Israeli Prime Minister Benjamin Netanyahu has affirmed to proceed with plans to expand into Gaza's Rafah enclave.
West Texas Intermediate (WTI) oil price continues its upward trajectory, reaching around $80.90 per barrel during the Asian trading hours on Monday. Crude oil prices receive positive momentum driven by concerns over supply disruptions stemming from heightened geopolitical risks.
Specifically, worries over potential supply interruptions have been fueled by Ukrainian attacks on Russian refineries. One such attack on Saturday resulted in a brief fire at the Slavyansk refinery in Krasnodar. According to a Reuters analysis, these attacks have led to the idling of approximately 7% of Russian refining capacity in the first quarter.
Furthermore, Ukraine announced on Sunday that it does not intend to extend a five-year agreement with Russia's Gazprom concerning the transit of Russian gas to Europe, nor does it plan to negotiate a new agreement. The existing deal, was established in 2019 between Moscow and Kyiv. This agreement is set to expire at the end of December 2024.
Israeli Prime Minister Benjamin Netanyahu also stated his intention to move forward with plans to expand into Gaza's Rafah, further complicating prospects for a peace agreement. German Chancellor Olaf Scholz remarked that this move would significantly hinder regional peace efforts.
Additionally, investors are eagerly anticipating interest rate decisions from major central banks this week. The Federal Reserve (Fed) is anticipated to maintain its current elevated policy rates. According to the CME FedWatch Tool, the probability of a rate cut in June and July stands at 56.3% and 75.2%, respectively. The resultant higher borrowing costs are dampening oil demand, consequently exerting downward pressure on Crude oil prices.
- GBP/USD puts efforts to retrace its recent losses despite market caution.
- The US Dollar retreats on the decline in US Treasury yields.
- A slew of UK data is set to be released on Tuesday including CPI, PPI, and Retail Price Index.
GBP/USD appears to reverse its decline initiated on Thursday, hovering around 1.2730 during the Asian session on Monday. However, the pair faced setbacks amidst market caution preceding the US Federal Reserve's interest rate decision on Wednesday.
The US Dollar Index (DXY) experienced a surge in momentum, buoyed by the rise in US Treasury yields on Friday. This uptick in yields was fueled by a hawkish sentiment surrounding the Federal Reserve, which was anticipated to maintain its heightened interest rates amidst recent inflationary pressures. However, a subsequent retreat in US yields exerted pressure on the US Dollar (USD), at the time of writing.
According to the CME FedWatch Tool, the probability of a rate cut in March presently stands at 1.0%, while it has diminished to 6.1% for May. The likelihood of a rate cut in June and July is lower, at 56.3% and 75.2%, respectively.
On Friday, the preliminary US Michigan Consumer Sentiment Index for March dipped to 76.5, from the previous reading of 76.9. This decline contrasts with expectations for it to remain steady. Meanwhile, Industrial Production (MoM) edged up by 0.1% in February, surpassing the anticipated flat reading of 0.0% and recovering from the previous month's decline of 0.5%.
On the other side, Consumer Inflation Expectations, as released by the Bank of England (BoE) on Friday, rose by 3.0%, showing a decrease from the previous uptick of 3.3%. This data prompted markets to increase their wagers on a Bank of England (BoE) rate cut in June, potentially weakening the Pound Sterling (GBP) and consequently pressuring the GBP/USD pair downward.
On Monday, the Rightmove House Price Index (MoM) for March surged by 1.5%, surpassing the previous rise of 0.9%. Additionally, the annual index saw an increase of 0.8% compared to the previous 0.1%. Looking ahead to Tuesday, traders are expected to closely monitor several market indicators from the United Kingdom (UK), including the Consumer Price Index, Producer Price Index, and Retail Price Index.
| Raw materials | Closed | Change, % |
|---|---|---|
| Silver | 25.168 | 1.48 |
| Gold | 2156.156 | -0.28 |
| Palladium | 1076.83 | 1.11 |
Japan’s Chief Cabinet Secretary Yoshimasa Hayashi refrained from commenting on the discussion of the Bank of Japan (BoJ) monetary policy meeting during his appearance on Monday.
Hayashi said that he expects "the BoJ to work closely with the government and take appropriate monetary policy to sustainably and stably achieve its price target accompanied by wage rises."
Market reaction
At the time of writing, USD/JPY is consolidating its latest uptick near 149.15, adding 0.09% so far.
- NZD/USD attracts some buyers near a technically significant 200-day SMA on Monday.
- Mostly better-than-expected Chinese data lend support amid subdued USD demand.
- The upside seems limited as traders await the crucial Fed decision for a fresh impetus.
The NZD/USD pair finds some support in the vicinity of the very important 200-day Simple Moving Average (SMA) and stages a modest recovery from a one-and-half-week low, around the 0.6080 region touched during the Asian session on Monday. Spot prices stick to a mildly positive bias following the release of Chinese macro data, albeit lack bullish conviction and remain below the 0.6100 round-figure mark.
Data published by the National Bureau of Statistics (NBS) showed that China's Retail Sales rose 5.5% YoY in February against the 5.2% expected and 7.4% in the previous month. Adding to this, the country’s Industrial Production increased by 7.0% YoY as compared to the 5.0% anticipated and the 6.8% in January, while Fixed Asset Investment grew by 4.2% during the first two months of 2024. This, to a larger extent, overshadows an unexpected rise in China's unemployment rate to 5.3% in February from 5.1% previous and lends some support to antipodean currencies, including the Kiwi.
Apart from this, subdued US Dollar (USD) price action turns out to be another factor acting as a tailwind for the NZD/USD pair. However, expectations that the Federal Reserve (Fed) will stick to its higher-for-longer interest rates narrative to bring down inflation continue to act as a tailwind for the Greenback and cap gains for the currency pair. Traders might also refrain from placing aggressive directional bets and m,ove to wait on the sidelines ahead of the key central bank event risk – the outcome of the highly-anticipated two-day FOMC monetary policy meeting on Wednesday.
The aforementioned fundamental backdrop makes it prudent to wait for strong follow-through buying before confirming that the NZD/USD pair's recent pullback from the 0.6215 region, or the monthly peak, has run its course. Nevertheless, spot prices, for now, seem to have snapped a two-day losing streak and remain at the mercy of the USD price dynamics in the absence of any relevant market-moving economic data from the US on Monday.
Following the release of the high-impact activity data from China for January-Feburary, the National Bureau of Statistics (NBS) offered its take on the economy during its press conference on Monday.
Key quotes (via Reuters)
With macro policies taking effect, the national economy continued to recover and turn for the better in Jan-Feb.
Domestic effective demand remained insufficient, foundation for economic recovery and growth needs to be further consolidated.
more to come ....
Related reads
China’s January-February Retail Sales, rose 5.5% YoY vs. 5.2% expected and January’s 7.4% while the country’s Industrial Production increased 7.0% YoY vs. 5.0% anticipated and 6.8% recorded previously. The official data was published by the National Bureau of Statistics (NBS) on Monday.
Meanwhile, the Fixed Asset Investment rose 4.2% YTD YoY in January- February vs 3.1% expected and 3.0% seen in December.
Additional takeaways
The Chinese unemployment rate came in at 5.3% vs. previous 5.10%.
China Feb nationwide survey-based jobless rate at 5.3%.
China Feb survey-based jobless rate in 31 major cities at 5.1%.
Market reaction to Chinese data
The upbeat Chinese data dump boosted the Australian Dollar, with AUD/USD refreshing highs near 0.6570. The pair is adding 0.11% on the day, as of writing.
Australian Dollar price today
The table below shows the percentage change of Australian Dollar (AUD) against listed major currencies today. Australian Dollar was the strongest against the Japanese Yen.
| USD | EUR | GBP | CAD | AUD | JPY | NZD | CHF | |
| USD | -0.06% | -0.02% | -0.06% | -0.14% | 0.14% | -0.08% | -0.02% | |
| EUR | 0.06% | 0.04% | 0.00% | -0.08% | 0.21% | -0.02% | 0.02% | |
| GBP | 0.02% | -0.04% | -0.04% | -0.12% | 0.16% | -0.07% | -0.02% | |
| CAD | 0.06% | -0.02% | 0.04% | -0.09% | 0.19% | -0.03% | 0.02% | |
| AUD | 0.14% | 0.07% | 0.12% | 0.08% | 0.28% | 0.06% | 0.10% | |
| JPY | -0.15% | -0.21% | -0.09% | -0.19% | -0.27% | -0.23% | -0.19% | |
| NZD | 0.08% | 0.01% | 0.07% | 0.02% | -0.06% | 0.22% | 0.04% | |
| CHF | 0.04% | -0.03% | 0.02% | -0.02% | -0.10% | 0.19% | -0.05% |
The heat map shows percentage changes of major currencies against each other. The base currency is picked from the left column, while the quote currency is picked from the top row. For example, if you pick the Euro from the left column and move along the horizontal line to the Japanese Yen, the percentage change displayed in the box will represent EUR (base)/JPY (quote).
- EUR/USD edges lower to 1.0885 amid the recovery of USD.
- FOMC is expected to hold its key fed funds rate steady at a 5.25%–5.50% range on Wednesday.
- ECB’s de Cos said that the central bank could start cutting interest rates in June after a decrease in Eurozone inflation.
- The FOMC monetary policy meeting and press conference on Wednesday will be in the spotlight.
The EUR/USD pair trades softer below the 1.0900 mark during the early Asian session on Monday. The rebound of the US Dollar (USD) above 103.50 weighs on the major pair. Investors await the US Federal Open Market Committee's (FOMC) interest rate decision on Wednesday, with no change in rate expected. At press time, EUR/USD is trading at 1.0885, down 0.03% on the day.
The University of Michigan showed on Friday that the Consumer Sentiment Index dropped to 76.5 in March compared to the previous reading and the estimation of 76.9. The UoM one-year and five-year inflation expectations were unchanged at 3.0% and 2.9%, respectively. Meanwhile, US Industrial Production climbed to 0.1% MoM in February from a 0.5% MoM drop in January.
The FOMC is widely expected to hold its key fed funds rate steady at a 22-year high of a 5.25%–5.50% range on Wednesday as Fed officials want to see more evidence of inflation data to ensure it returns to its 2% target before starting to cut the interest rates. That being said, the high-for-longer US rate narrative might lift the US Dollar (USD) and act as a headwind for the EUR/USD pair.
On the Euro front, the European Central Bank (ECB) kept borrowing costs at record highs at its March meeting, but policymakers indicated they were discussing a first rate cut. The ECB policymaker Pablo Hernandez de Cos said on Sunday that the central bank left borrowing costs at a record high this month but said it had made good progress in bringing down inflation and has started a preliminary discussion about monetary easing. He added that the central bank could start cutting interest rates in June after a decrease in Eurozone inflation.
The Eurozone Harmonized Index of Consumer Prices (HICP) and Trade Balance are due on Monday. On Tuesday, the ZEW Survey from Germany and the Eurozone will be released. The attention will shift to the FOMC interest rate decision on Wednesday. Traders will take cues from the data and find trading opportunities around the EUR/USD pair.
- The Japanese Yen continues to be undermined by the uncertainty over the BoJ’s policy stance.
- Hawkish Fed expectations underpin the USD and provide an additional lift to the USD/JPY pair.
- Investors now look to the BoJ and Fed policy decisions before placing fresh directional bets.
The Japanese Yen (JPY) remains depressed for the fifth straight day on Monday and weakens further below the 149.00 mark, to over a one-week low against its American counterpart during the Asian session. The Bank of Japan (BoJ) Governor Kazuo Ueda last week offered a slightly bleaker assessment of the economy. This, along with the weaker Machinery Orders data from Japan and the headlines that the BoJ will conduct an unscheduled bond operation this week, undermines the JPY.
The JPY bulls, meanwhile, seem rather unimpressed by the positive outcome from the spring wage negotiations, which should allow the BoJ to exit its negative interest rate policy sooner rather than later. The US Dollar (USD), on the other hand, continues to draw support from expectations that the Federal Reserve (Fed) will stick to its higher-for-longer interest rates narrative to bring down inflation. This, in turn, is seen as another factor that contributes to the bid tone surrounding the USD/JPY pair.
Traders, however, seem reluctant to place aggressive directional bets ahead of this week's key central bank event risks – the BoJ decision on Tuesday, followed by the FOMC policy update on Wednesday. This, in turn, warrants some caution for the USD/JPY bulls and before positioning for any further appreciating move. Nevertheless, the fundamental backdrop suggests that the path of least resistance for spot prices remains to the upside and any corrective slide is likely to get bought into.
Daily Digest Market Movers: Japanese Yen remains depressed amid reduced bets for an eventual BoJ pivot
- The Bank of Japan Governor Kazuo Ueda sounded a bit dovish last week and said that policymakers will debate whether the outlook is bright enough to phase out the massive monetary stimulus, which is seen undermining the Japanese Yen.
- The BoJ will conduct an unscheduled bond operation, offering to buy 3 trillion yen of Japanese government bonds (JGBs) in an agreement starting on Tuesday and ending on Thursday, suggesting that the BoJ's easy policy might not be over yet.
- Data released earlier this Monday showed that Machinery Orders in Japan fell more than expected, by 1.7% in January, and turns out to be another factor exerting pressure on the JPY, though the downside is more likely to remain limited.
- Rengō – Japan's largest trade union confederation – said that average wage demands topped 5% for the first time since 1994, setting the stage for the BoJ to exit the negative rates policy sooner rather than later, which should limit the JPY losses.
- Meanwhile, the hotter-than-expected US producer and consumer price data released last week forced investors to trim their bets for a more aggressive policy easing by the Federal Reserve, which continues to lend some support to the US Dollar.
- The University of Michigan's preliminary survey report showed that the US Consumer Sentiment Index ticked lower to 76.5 in March, from 76.9 in February, while one-year and five-year inflation expectations were little changed this month.
- Investors might now prefer to move to the sidelines and look to the latest monetary policy updates by the BoJ and the Fed on Tuesday and Wednesday, respectively, before determining the next leg of a directional move for the USD/JPY pair.
Technical Analysis: USD/JPY might aim to reclaim 150.00 psychological mark and test YTD top set in February
From a technical perspective, a move beyond the 61.8% Fibonacci retracement level of the February-March downfall might have already set the stage for additional gains. Given that oscillators on the daily chart have just started gaining positive traction, the USD/JPY pair seems poised to appreciate further towards the 149.75-149.80 horizontal resistance. Some follow-through buying, leading to a subsequent move beyond the 150.00 psychological mark, might trigger a short-covering rally towards the 150.65-150.70 region en route to the 151.00 neighbourhood, or the YTD peak touched on February 13.
On the flip side, the Asian session low, around the 149.00 mark, now seems to protect the immediate downside. Any further downfall is more likely to attract some dip-buying and remain limited near the 148.30 region. This is followed by the 148.00 round figure, below which the USD/JPY pair could accelerate the slide towards the 100-day Simple Moving Average (SMA), currently pegged near the 147.65 region. A convincing break below might shift the bias in favour of bearish traders and drag spot prices to the 147.00 mark en route to the monthly swing low, around the 146.50-146.45 region.
Japanese Yen FAQs
The Japanese Yen (JPY) is one of the world’s most traded currencies. Its value is broadly determined by the performance of the Japanese economy, but more specifically by the Bank of Japan’s policy, the differential between Japanese and US bond yields, or risk sentiment among traders, among other factors.
One of the Bank of Japan’s mandates is currency control, so its moves are key for the Yen. The BoJ has directly intervened in currency markets sometimes, generally to lower the value of the Yen, although it refrains from doing it often due to political concerns of its main trading partners. The current BoJ ultra-loose monetary policy, based on massive stimulus to the economy, has caused the Yen to depreciate against its main currency peers. This process has exacerbated more recently due to an increasing policy divergence between the Bank of Japan and other main central banks, which have opted to increase interest rates sharply to fight decades-high levels of inflation.
The BoJ’s stance of sticking to ultra-loose monetary policy has led to a widening policy divergence with other central banks, particularly with the US Federal Reserve. This supports a widening of the differential between the 10-year US and Japanese bonds, which favors the US Dollar against the Japanese Yen.
The Japanese Yen is often seen as a safe-haven investment. This means that in times of market stress, investors are more likely to put their money in the Japanese currency due to its supposed reliability and stability. Turbulent times are likely to strengthen the Yen’s value against other currencies seen as more risky to invest in.
The People’s Bank of China (PBoC) set the USD/CNY central rate for the trading session ahead on Monday at 7.0943 as compared to Friday's fix of 7.0975 and 7.1995 Reuters estimates.
- Australian Dollar receives downward pressure ahead of policy decisions from the Fed and RBA.
- Australia's S&P/ASX 200 Index tracks softer commodity prices.
- US Dollar gains strength as expectations mount for the Fed prolonging elevated interest rates.
The Australian Dollar (AUD) kicks off the week with a negative bias of continuing its winning streak for the third successive session. The AUD/USD pair is under downward pressure, likely attributed to market caution ahead of the Reserve Bank of Australia's (RBA) policy decision scheduled for Tuesday. Additionally, investors are awaiting interest rate decisions from both the People's Bank of China (PBoC) and the US Federal Reserve (Fed), expected to be released on Wednesday.
Australian Dollar faces additional pressure as the S&P/ASX 200 Index extends its decline for the third consecutive session. Mining and energy stocks are leading the downturn, reflecting softer commodity prices. Meanwhile, severe Tropical Cyclone Megan is expected to bring destructive winds and heavy rainfall to Australia’s far north. Evacuations are underway, and a major manganese mine has been closed in anticipation of the cyclone's arrival.
The US Dollar Index (DXY) is gaining traction, supported by rising US Treasury yields. This uptick in yields is believed to stem from a hawkish sentiment surrounding the Federal Reserve, which is expected to maintain its higher interest rates in response to recent inflation figures.
Daily Digest Market Movers: Australian Dollar downward pressure amid a market risk aversion
- According to Bloomberg, Westpac anticipates the Reserve Bank of Australia could maintain its cash rate at 4.35% at Tuesday's meeting.
- RBA Governor Michele Bullock recently stated that inflation in Australia is primarily "homegrown" and "demand-driven," attributable to the strength of the labor market and increasing wage inflation. The RBA does not anticipate this phenomenon occurring until 2026.
- According to the CME FedWatch Tool, the probability of a rate cut in March currently stands at 1.0%, while it has decreased to 6.1% for May. The likelihood of a rate cut in June and July is lower, at 56.3% and 75.2%, respectively.
- The preliminary US Michigan Consumer Sentiment Index for March decreased to 76.5, from the previous reading of 76.9. This decline comes in contrast to expectations of it remaining unchanged.
- The Board of Governors of the Federal Reserve released Industrial Production (MoM), which increased by 0.1% in February, against the expected reading of flat 0.0% and from the previous decline of 0.5%.
- The US Core Producer Price Index (PPI) remained consistent with the rise of 2.0% year-over-year in February, maintaining its position above the 1.9% expected. The monthly report showed an increase of 0.3% against 0.5% prior, exceeding the expected 0.2% reading.
- US PPI (YoY) increased by 1.6% in February, surpassing the expected 1.1% and 1.0% prior. PPI (MoM) rose by 0.6% above the market expectation and the previous increase of 0.3%.
- US Retail Sales rose by 0.6% monthly, below the expected 0.8% in February, swinging from the previous decline of 1.1%. While Retail Sales Control Group improved to a flat 0.0%, compared to the previous decline of 0.3%.
Technical Analysis: Australian Dollar hovers above the major support at 0.6550
The Australian Dollar is trading near 0.6560 on Monday. The AUD/USD pair could find immediate support around the 50.0% retracement level of 0.6555, coinciding with a significant support level of 0.6550. A breach below this level could potentially exert downward pressure on the pair, with further support expected around the 61.8% Fibonacci retracement level of 0.6528, followed by the psychological level of 0.6500. On the upside, the AUD/USD pair may face resistance near the nine-day Exponential Moving Average (EMA) at 0.6576, followed by the psychological barrier at 0.6600.
AUD/USD: Daily Chart
Australian Dollar price today
The table below shows the percentage change of the Australian Dollar (AUD) against listed major currencies today. The Australian Dollar was the weakest against the Euro.
| USD | EUR | GBP | CAD | AUD | JPY | NZD | CHF | |
| USD | -0.04% | 0.01% | -0.01% | 0.00% | 0.22% | 0.05% | 0.01% | |
| EUR | 0.03% | 0.04% | 0.04% | 0.05% | 0.25% | 0.09% | 0.03% | |
| GBP | -0.01% | -0.04% | -0.01% | -0.01% | 0.20% | 0.04% | -0.01% | |
| CAD | 0.01% | -0.04% | 0.01% | 0.01% | 0.22% | 0.06% | -0.01% | |
| AUD | 0.00% | -0.04% | 0.00% | -0.01% | 0.21% | 0.05% | -0.02% | |
| JPY | -0.22% | -0.27% | -0.15% | -0.22% | -0.22% | -0.16% | -0.23% | |
| NZD | -0.05% | -0.09% | -0.05% | -0.05% | -0.05% | 0.16% | -0.06% | |
| CHF | 0.00% | -0.03% | 0.01% | 0.01% | 0.02% | 0.23% | 0.05% |
The heat map shows percentage changes of major currencies against each other. The base currency is picked from the left column, while the quote currency is picked from the top row. For example, if you pick the Euro from the left column and move along the horizontal line to the Japanese Yen, the percentage change displayed in the box will represent EUR (base)/JPY (quote).
Australian Dollar FAQs
One of the most significant factors for the Australian Dollar (AUD) is the level of interest rates set by the Reserve Bank of Australia (RBA). Because Australia is a resource-rich country another key driver is the price of its biggest export, Iron Ore. The health of the Chinese economy, its largest trading partner, is a factor, as well as inflation in Australia, its growth rate and Trade Balance. Market sentiment – whether investors are taking on more risky assets (risk-on) or seeking safe-havens (risk-off) – is also a factor, with risk-on positive for AUD.
The Reserve Bank of Australia (RBA) influences the Australian Dollar (AUD) by setting the level of interest rates that Australian banks can lend to each other. This influences the level of interest rates in the economy as a whole. The main goal of the RBA is to maintain a stable inflation rate of 2-3% by adjusting interest rates up or down. Relatively high interest rates compared to other major central banks support the AUD, and the opposite for relatively low. The RBA can also use quantitative easing and tightening to influence credit conditions, with the former AUD-negative and the latter AUD-positive.
China is Australia’s largest trading partner so the health of the Chinese economy is a major influence on the value of the Australian Dollar (AUD). When the Chinese economy is doing well it purchases more raw materials, goods, and services from Australia, lifting demand for the AUD, and pushing up its value. The opposite is the case when the Chinese economy is not growing as fast as expected. Positive or negative surprises in Chinese growth data, therefore, often have a direct impact on the Australian Dollar and its pairs.
Iron Ore is Australia’s largest export, accounting for $118 billion a year according to data from 2021, with China as its primary destination. The price of Iron Ore, therefore, can be a driver of the Australian Dollar. Generally, if the price of Iron Ore rises, AUD also goes up, as aggregate demand for the currency increases. The opposite is the case if the price of Iron Ore falls. Higher Iron Ore prices also tend to result in a greater likelihood of a positive Trade Balance for Australia, which is also positive of the AUD.
The Trade Balance, which is the difference between what a country earns from its exports versus what it pays for its imports, is another factor that can influence the value of the Australian Dollar. If Australia produces highly sought after exports, then its currency will gain in value purely from the surplus demand created from foreign buyers seeking to purchase its exports versus what it spends to purchase imports. Therefore, a positive net Trade Balance strengthens the AUD, with the opposite effect if the Trade Balance is negative.
The Bank of Japan (BoJ) announced on Monday that it will conduct an unscheduled bond operation, offering to buy 3 trillion yen of bonds (JGBs) in an agreement starting on Tuesday and ending on Thursday.
Market reaction
The Japanese Yen is little affected by the BoJ announcement. At the time of writing, USD/JPY is trading 0.45% higher on the day at 149.20.
Bank of Japan FAQs
The Bank of Japan (BoJ) is the Japanese central bank, which sets monetary policy in the country. Its mandate is to issue banknotes and carry out currency and monetary control to ensure price stability, which means an inflation target of around 2%.
The Bank of Japan has embarked in an ultra-loose monetary policy since 2013 in order to stimulate the economy and fuel inflation amid a low-inflationary environment. The bank’s policy is based on Quantitative and Qualitative Easing (QQE), or printing notes to buy assets such as government or corporate bonds to provide liquidity. In 2016, the bank doubled down on its strategy and further loosened policy by first introducing negative interest rates and then directly controlling the yield of its 10-year government bonds.
The Bank’s massive stimulus has caused the Yen to depreciate against its main currency peers. This process has exacerbated more recently due to an increasing policy divergence between the Bank of Japan and other main central banks, which have opted to increase interest rates sharply to fight decades-high levels of inflation. The BoJ’s policy of holding down rates has led to a widening differential with other currencies, dragging down the value of the Yen.
A weaker Yen and the spike in global energy prices have led to an increase in Japanese inflation, which has exceeded the BoJ’s 2% target. Still, the Bank judges that the sustainable and stable achievement of the 2% target has not yet come in sight, so any sudden change in the current policy looks unlikely.
China's finance minister Lan Fo'an, reaffirmed on Sunday the importance of a proactive fiscal policy to enhance the country's economic recovery and help the world’s second-largest economy achieve its economic growth goals this year, per Bloomberg.
Key quotes
“Outlined the ministry's commitment to implementing the spirit of the Central Economic Work Conference and the specific arrangements of the Government Work Report.”
“Underscored the need for the continued implementation of a proactive fiscal policy.”
“Stressed increasing the intensity of fiscal expenditure.”
“MOF will use a combination of policy tools, such as deficits, special local bonds, and ultra-long-term special government bonds.”
Market reaction
At the time of writing, the AUD/USD pair is trading around 0.6557, losing 0.07% on the day.
Australian Dollar FAQs
One of the most significant factors for the Australian Dollar (AUD) is the level of interest rates set by the Reserve Bank of Australia (RBA). Because Australia is a resource-rich country another key driver is the price of its biggest export, Iron Ore. The health of the Chinese economy, its largest trading partner, is a factor, as well as inflation in Australia, its growth rate and Trade Balance. Market sentiment – whether investors are taking on more risky assets (risk-on) or seeking safe-havens (risk-off) – is also a factor, with risk-on positive for AUD.
The Reserve Bank of Australia (RBA) influences the Australian Dollar (AUD) by setting the level of interest rates that Australian banks can lend to each other. This influences the level of interest rates in the economy as a whole. The main goal of the RBA is to maintain a stable inflation rate of 2-3% by adjusting interest rates up or down. Relatively high interest rates compared to other major central banks support the AUD, and the opposite for relatively low. The RBA can also use quantitative easing and tightening to influence credit conditions, with the former AUD-negative and the latter AUD-positive.
China is Australia’s largest trading partner so the health of the Chinese economy is a major influence on the value of the Australian Dollar (AUD). When the Chinese economy is doing well it purchases more raw materials, goods and services from Australia, lifting demand for the AUD, and pushing up its value. The opposite is the case when the Chinese economy is not growing as fast as expected. Positive or negative surprises in Chinese growth data, therefore, often have a direct impact on the Australian Dollar and its pairs.
Iron Ore is Australia’s largest export, accounting for $118 billion a year according to data from 2021, with China as its primary destination. The price of Iron Ore, therefore, can be a driver of the Australian Dollar. Generally, if the price of Iron Ore rises, AUD also goes up, as aggregate demand for the currency increases. The opposite is the case if the price of Iron Ore falls. Higher Iron Ore prices also tend to result in a greater likelihood of a positive Trade Balance for Australia, which is also positive of the AUD.
The Trade Balance, which is the difference between what a country earns from its exports versus what it pays for its imports, is another factor that can influence the value of the Australian Dollar. If Australia produces highly sought after exports, then its currency will gain in value purely from the surplus demand created from foreign buyers seeking to purchase its exports versus what it spends to purchase imports. Therefore, a positive net Trade Balance strengthens the AUD, with the opposite effect if the Trade Balance is negative.
| Index | Change, points | Closed | Change, % |
|---|---|---|---|
| NIKKEI 225 | -99.74 | 38707.64 | -0.26 |
| Hang Seng | -240.77 | 16720.89 | -1.42 |
| KOSPI | -51.92 | 2666.84 | -1.91 |
| ASX 200 | -43.3 | 7670.3 | -0.56 |
| DAX | -5.39 | 17936.65 | -0.03 |
| CAC 40 | 2.93 | 8164.35 | 0.04 |
| Dow Jones | -190.89 | 38714.77 | -0.49 |
| S&P 500 | -33.39 | 5117.09 | -0.65 |
| NASDAQ Composite | -155.36 | 15973.17 | -0.96 |
The European Central Bank (ECB) policymaker Pablo Hernandez de Cos said on Sunday that the central bank could begin cutting interest rates in June after an easing in eurozone inflation, per Reuters,
Key quotes
"If our macroeconomic forecasts are met in the coming months, it is normal that we will start cutting rates soon and June could be a good date to start.”
"The current degree of consensus is very high and I hope this will continue to be the case.”
"In any case, I believe that the current degree of consensus is very high and I hope this will continue to be the case.“
"Very explicit about the time pattern of rates.”
Market reaction
The EUR/USD pair is trading lower at 1.0885, down 0.03% on the day.
- Gold price edges lower near $2,155 in Monday’s early Asian session.
- FOMC is likely to hold rates at its March meeting on Wednesday and will not rush to cut rates.
- Chinese policymakers emphasized the need for continued implementation of a proactive fiscal policy and enhancing the country's economic recovery.
- The Chinese February Retail Sales and Industrial Production will be due on Monday.
Gold Price (XAU/USD) hovers around $2,155 during the early Asian trading hours on Monday. The downtick of yellow metal is backed by US February stronger-than-expected inflation data, which might delay the interest rate cuts by the Federal Reserve (Fed). Meanwhile, the positive developments surrounding stimulus measures from Chinese authorities or strong demand from China might lift the gold price.
The recent US economic data suggests that inflation remains elevated, and this might convince the Fed to remain on hold until there is more evidence of inflation easing. The markets anticipate that the FOMC will hold its interest rate at its March meeting on Wednesday, and there will be no rush to cut rates as Fed officials need more time to gain greater confidence to bring inflation down to the central bank target. It’s worth noting that the high for a longer rate could diminish the appeal of non-yielding metals and weigh on the gold price.
The University of Michigan revealed on Friday that the Consumer Sentiment Index came in weaker than expected, dropping to 76.5 in March from 76.9 in the previous reading. Meanwhile, the one-year and five-year inflation expectations were unchanged at 3.0% and 2.9%, respectively. Finally, US Industrial Production improved to 0.1% MoM in February from a downwardly revised -0.5% MoM in January.
On the weekend, China's finance minister Lan Fo emphasized the need for continued implementation of a proactive fiscal policy and enhancing the country's economic recovery. Investors have increased their bets that policymakers would implement additional monetary easing measures, including a reduction in bank reserves. The positive developments surrounding the Chinese economy might boost the gold price, as China is the world's second-largest economy and the world’s major buyer of gold.
Gold traders will closely monitor the Chinese Retail Sales and Industrial Production for February, due on Monday. The FOMC interest rate decision and press conference will be in the spotlight on Wednesday. These events could give a clear direction to the gold price.
| Pare | Closed | Change, % |
|---|---|---|
| AUDUSD | 0.65593 | -0.31 |
| EURJPY | 162.295 | 0.58 |
| EURUSD | 1.08881 | 0.03 |
| GBPJPY | 189.832 | 0.4 |
| GBPUSD | 1.27356 | -0.14 |
| NZDUSD | 0.60846 | -0.68 |
| USDCAD | 1.35397 | 0.06 |
| USDCHF | 0.8835 | -0.03 |
| USDJPY | 149.065 | 0.55 |


© 2000-2026. Уcі права захищені.
Cайт знаходитьcя під керуванням TeleTrade DJ. LLC 2351 LLC 2022 (Euro House, Richmond Hill Road, Kingstown, VC0100, St. Vincent and the Grenadines).
Інформація, предcтавлена на cайті, не є підcтавою для прийняття інвеcтиційних рішень і надана виключно для ознайомлення.
Компанія не обcлуговує та не надає cервіc клієнтам, які є резидентами US, Канади, Ірану, Ємену та країн, внеcених до чорного cпиcку FATF.
Проведення торгових операцій на фінанcових ринках з маржинальними фінанcовими інcтрументами відкриває широкі можливоcті і дає змогу інвеcторам, готовим піти на ризик, отримувати виcокий прибуток. Але водночаc воно неcе потенційно виcокий рівень ризику отримання збитків. Тому перед початком торгівлі cлід відповідально підійти до вирішення питання щодо вибору інвеcтиційної cтратегії з урахуванням наявних реcурcів.
Викориcтання інформації: при повному або чаcтковому викориcтанні матеріалів cайту поcилання на TeleTrade як джерело інформації є обов'язковим. Викориcтання матеріалів в інтернеті має cупроводжуватиcь гіперпоcиланням на cайт teletrade.org. Автоматичний імпорт матеріалів та інформації із cайту заборонено.
З уcіх питань звертайтеcь за адреcою pr@teletrade.global.
переклади