- Аналітика
- Новини та інструменти
- Новини ринків
Новини ринків
- The EUR/USD twists as investors await rate momentum.
- Fed, ECB equally unlikely to shift on policy rates as quickly as markets hope for.
- One last appearance from ECB President Lagarde due on Friday.
The EUR/USD fell after facing a rejection from the 1.0900 handle on Thursday, declining to a near-term low of 1.0850 before recovering to the 1.0880 region as markets gear up for the Friday market session.
Policymakers from both the Federal Reserve (Fed) and the European Central Bank (ECB) have been working overtime trying to talk down market expectations of rate cuts that are increasingly unlikely to come as fast or as furious as investors have pinned their hopes on.
Atlanta Fed President Raphael Bostic hit newswires on Thursday noting that he doesn’t see the Fed moving on policy rates until Q3 at the absolute earliest assuming the inflation outlook continues at its current pace. The ECB remains firmly committed to avoiding being committed to anything specific, with the ECB’s latest Summary of Accounts finding that the central bank’s governing council remains skeptical that European inflation will bed down to the ECB’s 2% target before 2025.
ECB President Christine Lagarde gives one last appearance this week at the week-long World Economic Forum in Davos, Switzerland on Friday. ECB President Lagarde will be participating in a structured panel discussion titled “The Global Economic Outlook”.
On the Greenback side, investors will be getting a fresh print of the University of Michigan’s Consumer Sentiment Index for January, which is expected to tick slightly higher from 69.7 to 70.0.
EUR/USD Technical Outlook
The EUR/USD held above near-term lows on Thursday, keeping closely tied to 1.0880 as intraday price action keeps on the low side of the 200-hour Simple Moving Average (SMA) near 1.0930.
Daily candlesticks have the EUR/USD bound for further congestion as the pair trades into the midrange of the consolidating 50-day and 200-day SMAs near 1.0920 and 1.0850 respectively. A definitive pattern of higher lows remains intact in the medium-term, and the immediate technical floor on further declines into bear country sits near 1.0750.
EUR/USD Hourly Chart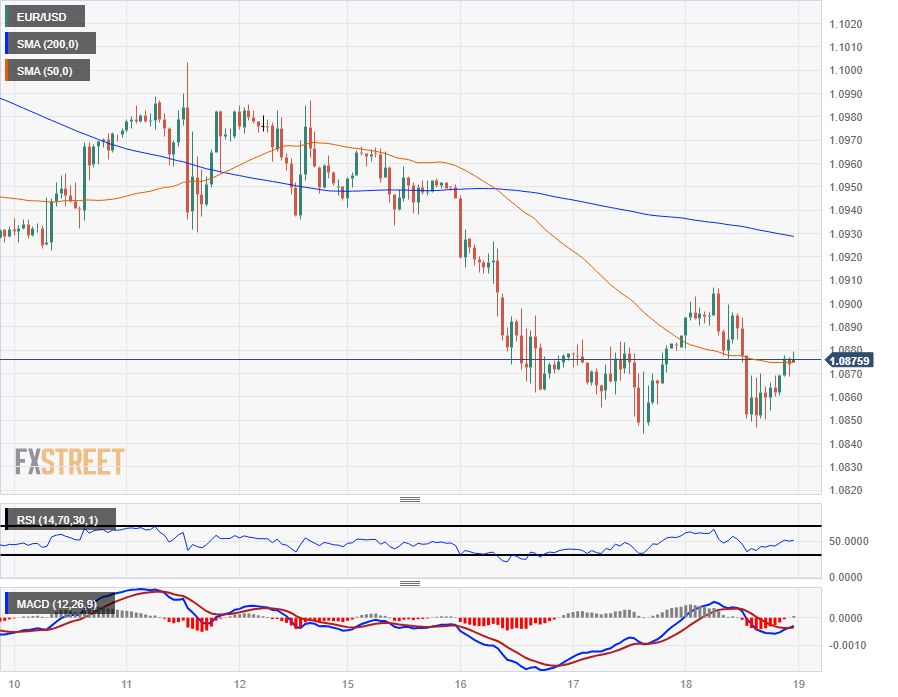
EUR/USD Daily Chart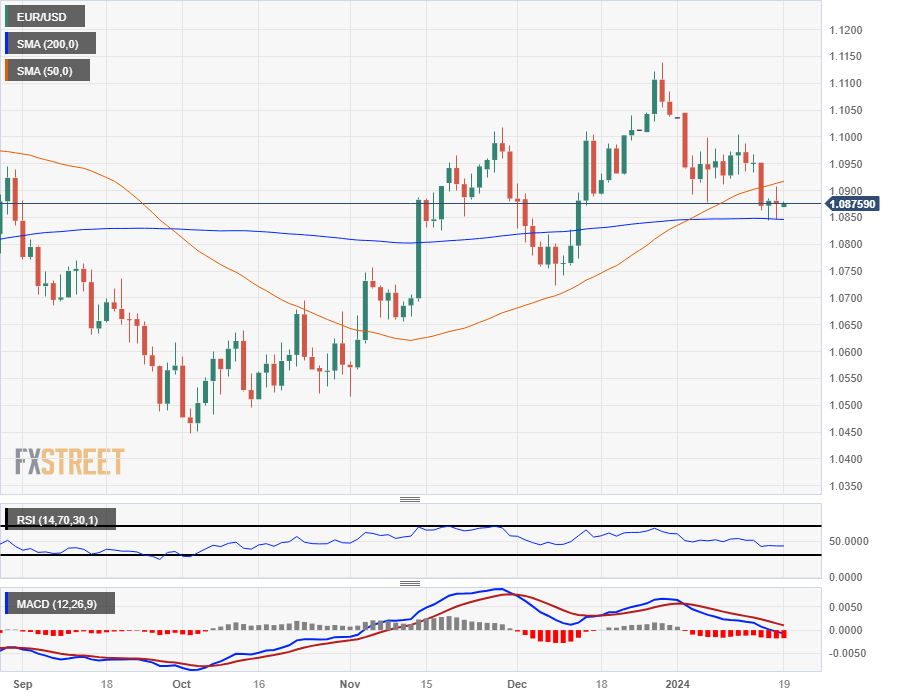
Japan’s National Consumer Price Index (CPI) for December came in at 2.6% YoY from 2.8% in November, according to the latest data released by the Japan Statistics Bureau on Friday.
Further details unveil that the National CPI ex Fresh Food arrived at 2.3% YoY in December versus 2.5% prior.
more to come.....
Japanese Yen FAQs
What key factors drive the Japanese Yen?
The Japanese Yen (JPY) is one of the world’s most traded currencies. Its value is broadly determined by the performance of the Japanese economy, but more specifically by the Bank of Japan’s policy, the differential between Japanese and US bond yields, or risk sentiment among traders, among other factors.
How do the decisions of the Bank of Japan impact the Japanese Yen?
One of the Bank of Japan’s mandates is currency control, so its moves are key for the Yen. The BoJ has directly intervened in currency markets sometimes, generally to lower the value of the Yen, although it refrains from doing it often due to political concerns of its main trading partners. The current BoJ ultra-loose monetary policy, based on massive stimulus to the economy, has caused the Yen to depreciate against its main currency peers. This process has exacerbated more recently due to an increasing policy divergence between the Bank of Japan and other main central banks, which have opted to increase interest rates sharply to fight decades-high levels of inflation.
How does the differential between Japanese and US bond yields impact the Japanese Yen?
The BoJ’s stance of sticking to ultra-loose monetary policy has led to a widening policy divergence with other central banks, particularly with the US Federal Reserve. This supports a widening of the differential between the 10-year US and Japanese bonds, which favors the US Dollar against the Japanese Yen.
How does broader risk sentiment impact the Japanese Yen?
The Japanese Yen is often seen as a safe-haven investment. This means that in times of market stress, investors are more likely to put their money in the Japanese currency due to its supposed reliability and stability. Turbulent times are likely to strengthen the Yen’s value against other currencies seen as more risky to invest in.
- AUD/USD slightly up at 0.6571, amidst strong US labor data and mixed US housing market signals.
- US Dollar Index gains on US economic strength; Australian job market worries could influence RBA rate moves.
- Markets await US Consumer Sentiment data and Federal Reserve officials' comments for further direction.
The Australian Dollar (AUD) begins Friday’s Asian session with minuscule gains of 0.02% against the US Dollar (USD), as the economy in the United States (US) remains resilient after the release of strong jobs reports and mixed housing data. At the time of writing, the AUD/USD exchanges hands at 0.6571.
AUD/USD balances between strong US jobs and mixed housing data
Wall Street finished the session with gains, while US Treasury bond yields advanced. The Greenback, as reported by the US Dollar Index (DXY), a basket of six currencies measured against the US Dollar, rose 0.14%, at 103.47, ending with gains for the fifth consecutive day.
The US Bureau of Labor Statistics (BLS) reported that Initial Jobless Claims for the week ending January 13 increased to 187,000, lower than both the previous week's figures and the anticipated consensus of 207,000. At the same time, housing data was mixed with Building Permits rising 1.9%, reaching 1.495 million in December, up from 1.467 million in November and surpassing forecasts of 1.48 million.
Despite that, Housing Starts saw a decline, falling from 1.525 million in November to 1.46 million in December, a decrease of 4.3%, as reported by the US Commerce Department.
Aside from this, the latest Aussie employment report plunged 65,100, erasing an unexpected surge of November, missing forecasts for a 17,600 increase. The report could deter the Reserve Bank of Australia (RBA) from raising rates, as the central bank showed worries about wage growth.
On Friday, Australia’s economic docket was absent, but traders would get cues from the US University of Michigan Consumer Sentiment and Federal Reserve speakers.
AUD/USD Price Analysis: Technical outlook
The AUD/USD daily chart portrays the formation of a ‘bullish harami’ candlestick pattern, suggesting that prices might resume to the upside. Nevertheless, buyers will face stir resistance at the 200-day moving average (DMA) at 0.6579, followed by the 0.6600 figure. Conversely, if sellers keep prices from heading above the 200-DMA and push the exchange rate below the 100-DMA at 0.6514, that could pave the way to challenge 0.6500, followed by the next cycle low at 0.6450.
AUD/USD Price Action – Daily Chart

- Gold price holds positive ground on the modest loss of USD.
- The stronger US economic data support the tighter-for-longer narrative around the Fed, which drags the gold price lower.
- US weekly Initial Jobless Claims fell to 187K last week versus 203K prior, above the consensus.
- Investors await the preliminary US Michigan Consumer Sentiment Index and Existing Home Sales, due on Friday.
Gold price (XAU/USD) recovers some lost ground during the early Asian session on Friday. The yellow metal rebounds as the US Dollar recovery stalls. Meanwhile, the US Dollar Index (DXY) hovers around 103.40. The US Treasury yield consolidates its gains, with the 10-year yield standing at 4.14%. The gold price currently trades near $2,024, up 0.09% on the day.
The resilient economic data in the US and the dovish stance of the Federal Reserve (Fed) weaken expectations of an early rate cut. Fed officials have not leaned towards endorsing an early rate cut, although the probability of interest rate cuts in March remains around 57%.
On Thursday, the US weekly Initial Jobless Claims fell to 187K for the week ending January 13 from 203K in the previous reading, better than the market expectation of 207K. Additionally, the January Philadelphia Fed Manufacturing Survey improved to -10.6 from -12.8 in December. The upbeat economic data support the tighter-for-longer narrative around the Fed, which might lift the Greenback and weigh on the USD-denominated gold.
Later on Friday, market players will focus on the preliminary US Michigan Consumer Sentiment Index and Existing Home Sales. Also, FOMC M. Daly (San Francisco) and M. Barr (Board of Governors) are set to speak later in the day.
- US equities broadly rally as markets shrug off mid-week rate tantrum.
- Indexes climbed on tech-led earnings expectations.
- S&P 500, NASDAQ both close near all-time highs.
US equity indexes saw broad gains on Thursday after US stock traders shook off the early week's misery over Federal Reserve (Fed) rate cuts unlikely to come as soon as money markets are hoping. Despite the early week's gains, equity indexes closed near all-time highs on Thursday after the tech sector led major indexes into the top end on earnings hope and general AI hype.
Large-cap tech stocks led the larger market higher on a rosy AI-fueled revenue outlook, with chipmakers seeing the largest gains, particularly tech companies that provide the necessary hardware for AI projects.
According to the CME’s FedWatch tool, markets are now pricing in just a 57% chance of a rate cut from the Fed by the Federal Open Market Committee’s (FOMC) March meeting, with money markets currently pricing in 100% odds of at least some form of Fed easing by May 1. This stands in sharp contrast to the Fed’s current stance, with multiple FOMC governors hitting newswires this week talking down odds of any moves on rates until inflation continues down to 2% appreciably, with notable Fed members including Atlanta Fed President Raphael Bostic noting on Thursday that he doesn’t see Fed reference rates coming down until August at the earliest, barring any significant changes in the US’ current economic outlook.
The S&P 500 (S&P) closed within touch distance of all-time highs of $4,812.38, ending Thursday at $4,780.94 to gain 41.73 points on the day, climbing 0.88%. The Dow Jones Industrial Average (DJIA) climbed over half a percent to gain 201.94 points on Thursday, closing at $37,468.61 while the NASDAQ Composite equity index soared 1.35% to climb over 200 points, ending the day at $15,055.65.
NASDAQ 100 Technical Outlook
The NASDAQ 100 mega-cap stock index soared to a record high on Thursday, climbing to an all-time high of $16,994.56 and wrapping up Thursday’s market action at $16,982.29, gaining 246.01 points or 1.47%.
Technical levels remain well below current price action, with the 50-day and 200-day Simple Moving Averages (SMA) at $16,254.00 and $15,038.00 respectively. The index has climbed nearly 21% from October’s decline into $14,057.00, and the NASDAQ 100 is on pace to close in the green for all but one of the last 12 consecutive trading weeks.
NASDAQ 100 Daily Chart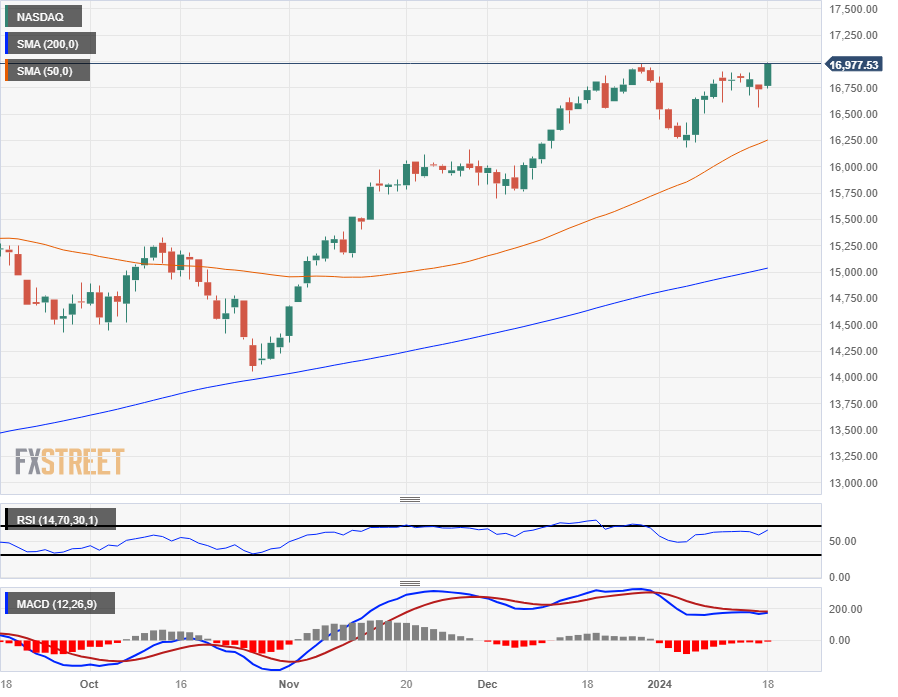
- CAD/JPY up to 109.82, extending a three-day streak, lifted by risk-on mood and weaker Japanese Yen.
- Recent break above Ichimoku Cloud positions CAD/JPY to target 110.00, next resistance at 110.67.
- Sellers could drive CAD/JPY below 109.00, with support levels at 108.94 and 108.56.
The CAD/JPY pair extended its three-day rally sponsored by upbeat market sentiment, as traders seeking risk underpin US equities while the safe-haven Japanese Yen (JPY) tumbles across the board. At the time of writing, the cross trades at 109.82, gain 0.16%.
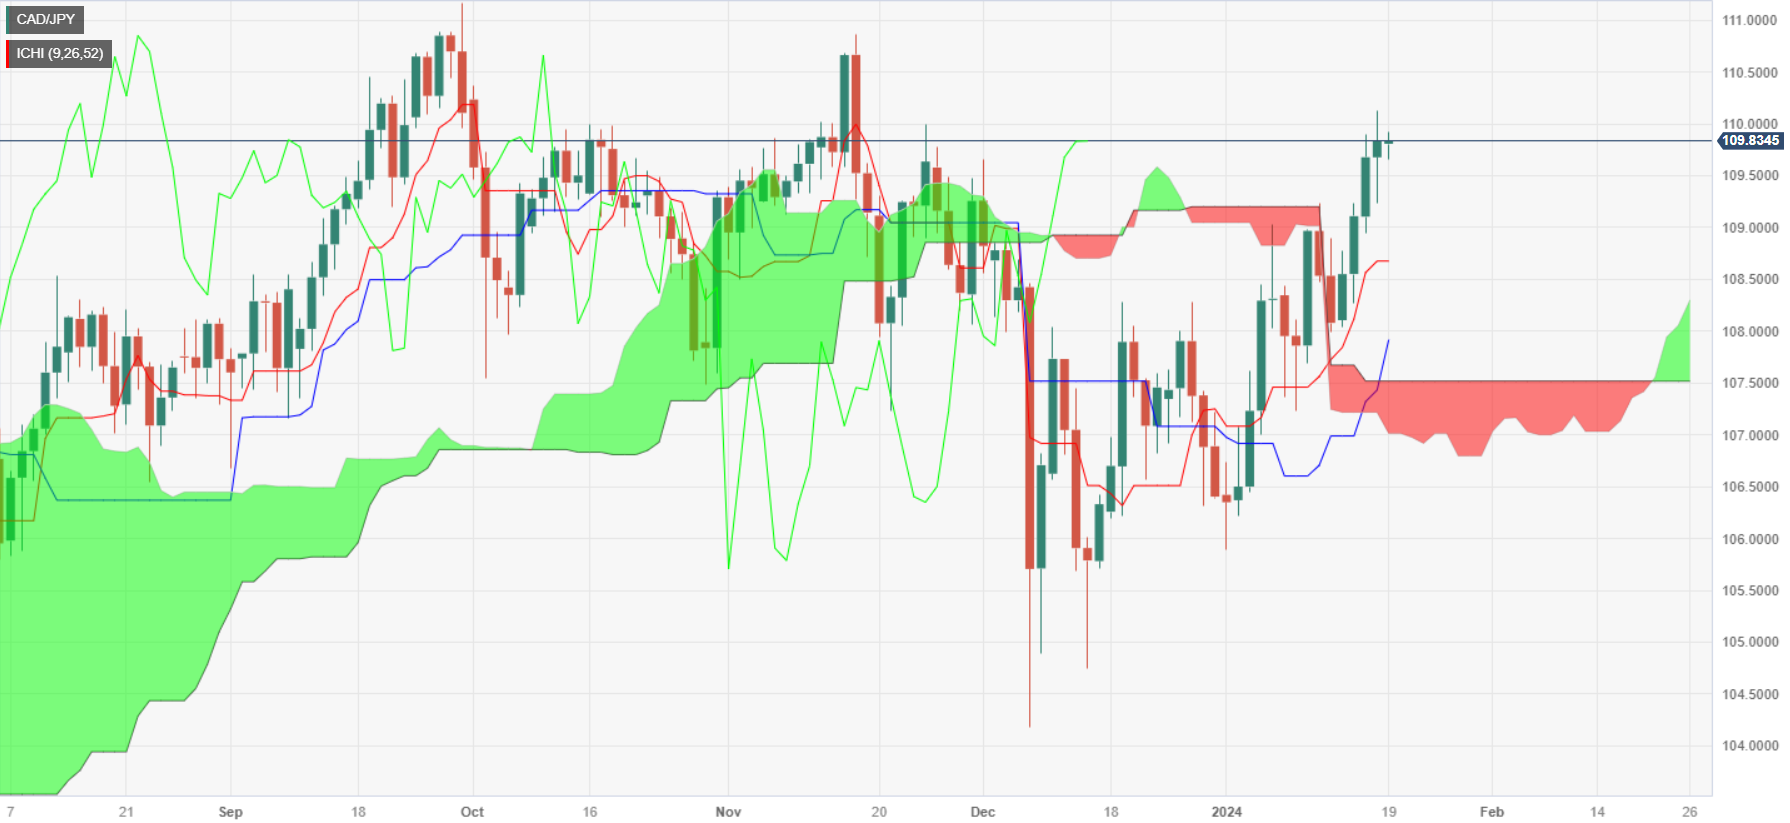
After clearing the Ichimoku Cloud on Monday, January 15, the CAD/JPY soared more than 1.20%, and is within strike of breaching the 110.00 handle. Once that level is cleared, the next resistance level would be the November 15 110.67 high, followed by last year’s September 29 cycle high at 111.16.
On the flip side, if sellers would like to remain hopeful of lower prices they must drag the CAD/JPY exchange rate towards the 109.00 figure, which could open the door to test the January 17 low of 108.94, followed by the Tenkan-Sen at 108.56.
CAD/JPY Price Action – Daily Chart
CAD/JPY Technical Levels
- NZD/JPY stands at 90.62, witnessing mild gains of 0.10% after trading in an 89.90-90-80 range on Thursday.
- Key indicators show positive momentum on the daily chart, favoring the bulls.
- Fundamentals are also favoring the NZD over the JPY.
In Thursday's session, the NZD/JPY pair is currently trading at 90.62, showing mild gains and reaching a high of 90.808. The landscape appears bullish, with both daily charts and a four-hour outlook indicating that the bulls are firmly holding their ground. The daily and four-hour landscape shows sellers being overpowered, keeping the pair aloft in the current range. Fundamentally speaking, both currencies were lately affected by the set of weak Chinese data. In addition, the lack of guidance of the Bank of Japan also adds pressure to the JPY.
Based on the daily chart, the scales seem to favor the bulls at this moment. The positive slope of the Relative Strength Index (RSI), confirming its foothold in the positive territory, signifies an ongoing initiation of buying pressure. This inclination towards bullish momentum is echoed in the Moving Average Convergence Divergence (MACD), as evidenced by the intensifying green bars that indicate growing bullish dominance. In addition, the pair is still above its 20, 100, and 200-day Simple Moving Averages (SMAs), reinforcing the overarching control of the bulls on a wider time horizon.
Coming to the shorter timeframe, the four-hour chart paints a similar picture as the daily chart, with the bulls holding their ground firmly. With the four-hour RSI navigating positively and displaying an upswing, the buying impetus cannot be overlooked. Furthermore, the four-hour MACD follows suit, with escalating green bars.
NZD/JPY technical levels
NZD/JPY daily chart
-638412114690523984.png)
New Zealand's Business NZ Performance of Manufacturing Index (PMI) contracted further to 43.1 in December, down from November's 46.7.
Despite the decline, NZ PMI activity is still up from October's low of 42.9, but still represents the ninth consecutive month of contraction in manufacturing activity in New Zealand.
According to Business NZ:
The proportion of negative comments stood at 58.7%, which was down from 65.1% in October and 68.8% in September. A general lack of demand and sales was the overriding theme mentioned by many manufacturers.
BNZ Senior Economist, Craig Ebert stated that “at the heart of the recent poor run in the PMI has been its production index. While this improved a bit in November, it was, at 43.6, almost 10 index points south of its long-term average. That’s a big undershoot, in historical context”.
Market Reaction
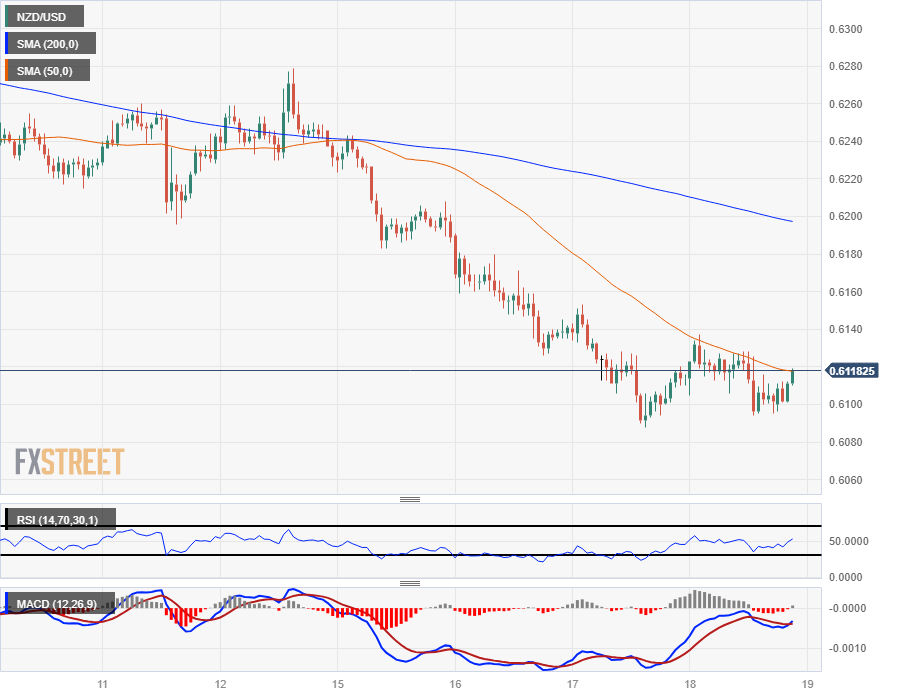
The NZD/USD is looking for a boost as the pair waffles into the midrange heading into Friday's market session, testing near 0.6120 and seeing intraday technical resistance at the 50-hour Simple Moving Average (SMA).
NZD/USD Hourly Chart
About the Business NZ PMI
The Business NZ Performance of Manufacturing Index (PMI), released by Business NZ on a monthly basis, is a leading indicator gauging business activity in New Zealand’s manufacturing sector. The data is derived from surveys of senior executives at private-sector companies. Survey responses reflect the change, if any, in the current month compared to the previous month and can anticipate changing trends in official data series such as Gross Domestic Product (GDP), industrial production or employment.The index varies between 0 and 100, with levels of 50.0 signaling no change over the previous month. A reading above 50 indicates that the manufacturing economy is generally expanding, a bullish sign for the New Zealand Dollar (NZD). Meanwhile, a reading below 50 signals that activity among goods producers is generally declining, which is seen as bearish for NZD.
- GBP/JPY eased higher with BoE expected to begin cutting rates in August.
- BoJ broadly expected to stand pat on rates for the foreseeable future.
- GBP recovery and deflating Yen mean GBP/JPY set for third straight week of gains.
GBP/JPY tipped into a fresh daily high above 188.00 on the pair’s march toward all-time highs above 189.00 with the Pound Sterling (GBP) climbing on market confidence that the Bank of England (BoE) is on pace to begin cutting interest rates by August, while the Bank of Japan (BoJ) remains planted in a firmly dovish monetary policy stance for the foreseeable future, driving the Japanese Yen (JPY) into the floorboards.
Inflation in the UK unexpectedly ticked higher in December, but GBP bidders remain unshaken from their conviction that the BoE will begin the next rate-cutting cycle. According to reporting by Reuters, JP Morgan is anticipating 75 basis points in reference rate declines from the BoE by the end of 2024, with the first cut to start in August. JP Morgan previously expected the first cut to come in November.
Despite an uptick in overall annual inflation, investors have noticed that price declines accelerated in the final quarter of 2023, leading markets to believe that UK inflation will continue to decline to 2% by the end of the year, a full 18 months before the BoE expects price growth to hit the target bound.
Rate watchers will be holding back from any Yen bidding until the spring wage growth figures get released, with the BoJ plainly telegraphing that the Japanese central bank won’t be lifting interest rates out of negative territory until wage growth accelerates appreciably. The BoJ is hoping for a virtuous cycle of accelerating wage growth to fuel further inflation looking forward, but a miss for wages would imply price growth is set to continue declining.
With the BoJ firmly hinging rate increases on a positive wage growth spiral, investors see little reason to bid the Yen higher.
GBP/JPY Technical Outlook
The Guppy rose to a fresh six-week high of 188.18 on Thursday, edging out Wednesday’s peak bids and continuing to inch closer towards multi-year highs beyond the 195.00 handle, a price ceiling last set back in 2015 at 195.88.
GBP/JPY climbed over the 200-hour Simple Moving Average (SMA) in early January, rising over 5% after a bounce from the 179.00 handle.
The pair saw a 5.5% decline from November’s peak of 188.66, catching a recovery bid after the 200-day SMA rose to bolster price action back into the current price zone above the 50-day SMA near 184.00.
GBP/JPY Hourly Chart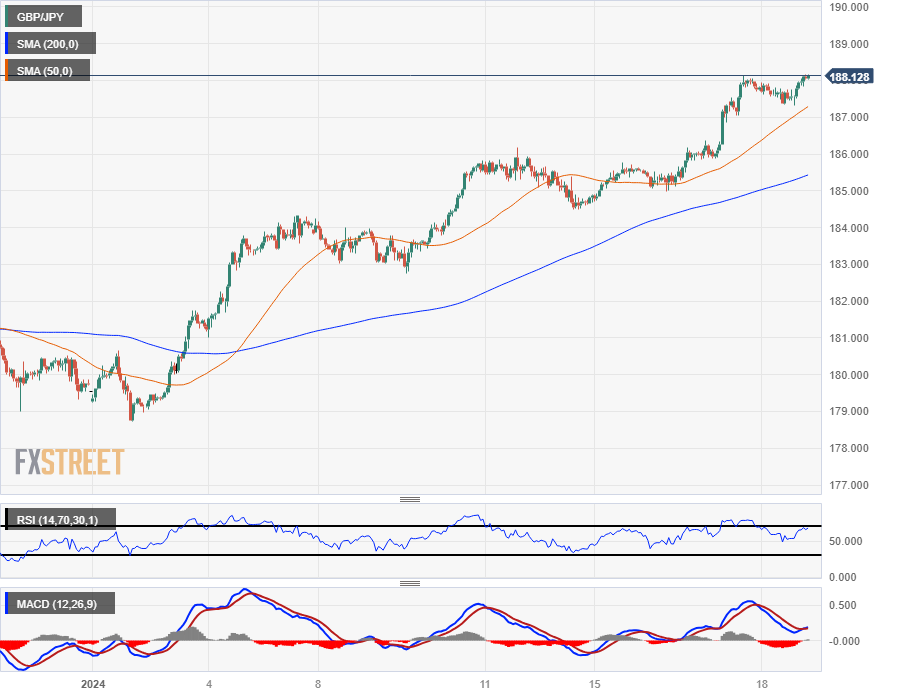
GBP/JPY Daily Chart
- AUD/JPY climbs to 97.27, fueled by positive risk appetite, despite Australia's weak jobs report.
- Bullish technical outlook as pair surpasses Ichimoku Cloud, aiming for 97.79 resistance.
- Downside risks for AUD/JPY below 97.00, with supports at 96.64, 96.58, and critical 96.00 level.
The Aussie Dollar (AUD) extended its gains against the Japanese Yen (JPY) for the second straight day as risk appetite improved, although soft jobs data from Australia might deter the Reserve Bank of Australia (RBA) from tightening monetary policy. At the time of writing, the AUD/JPY trades at 97.27, up 0.25%, on the day.
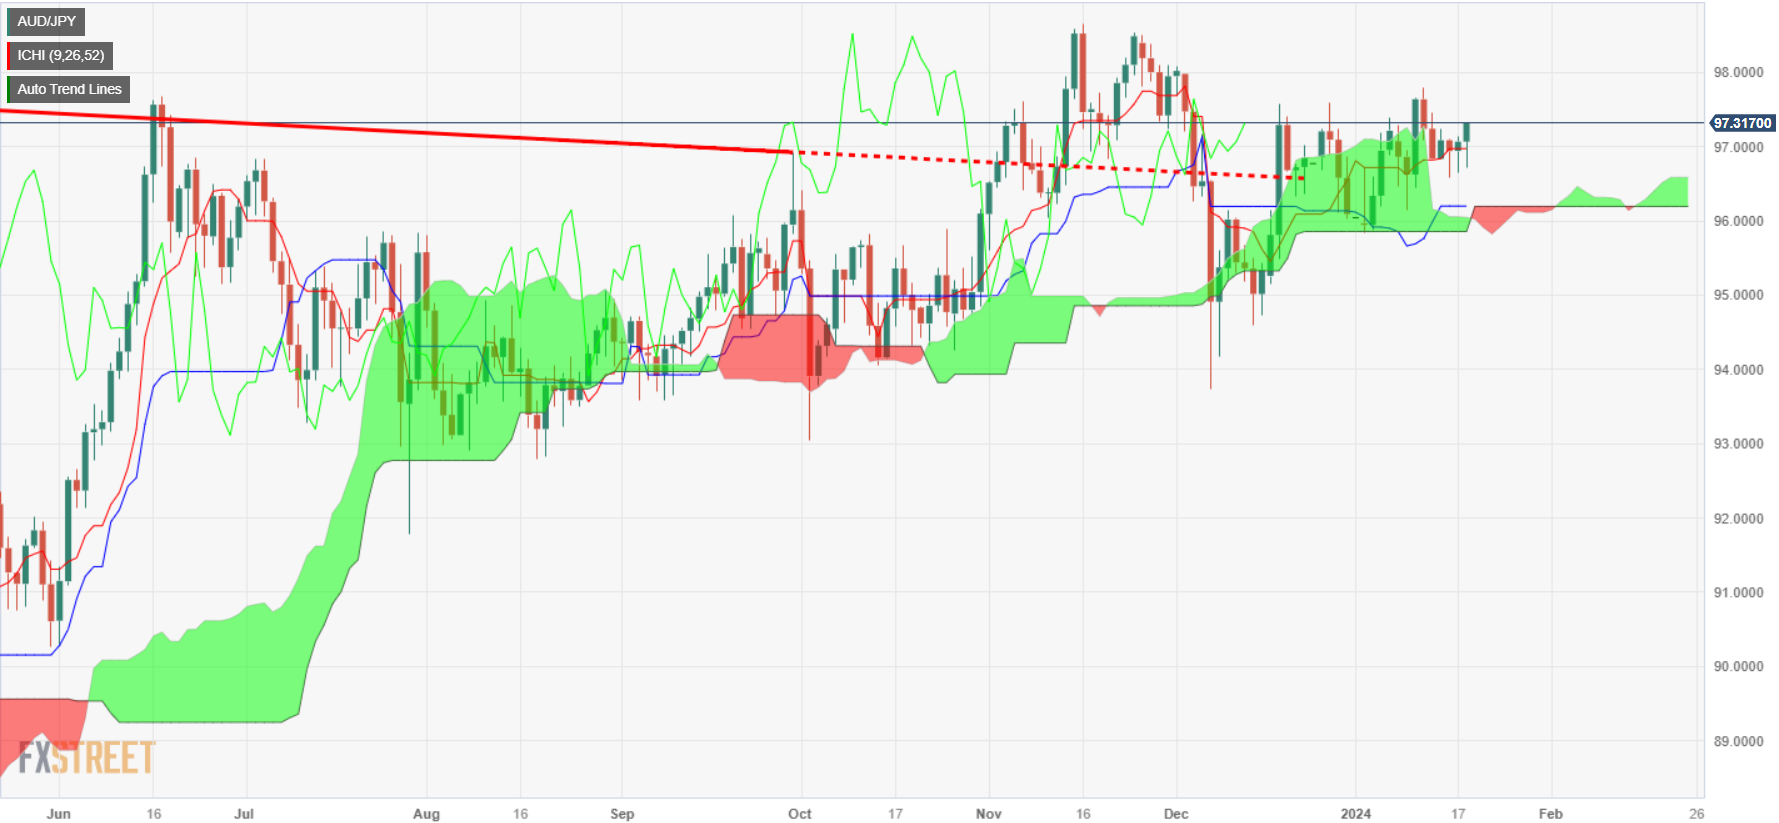
Therefore, from a technical standpoint, the AUD/JPY is upward biased once it has broken above the Ichimoku Cloud (Kumo), which has cleared the path to challenge the next cycle high seen at 97.79, the January 11 high. Once cleared, buyers could test the 98.00 figure, ahead of the November 24 high at 98.54.
On the other hand, if bears drag prices below the 97.00 figure, that could open the door for further losses. The first support would be the January 17 low of 96.64, followed by the January 16 low of 96.58. The next support would be the 96.00 figure.
AUD/JPY Price Action – Daily Chart
AUD/JPY Key Technical Levels
Another positive set of results in US key indicators lent oxygen to the upside bias in the greenback and underpinned the tighter-for-longer narrative around the Fed. The same view seems to emerge around the ECB, where the Accounts of the December event left no room for any guess on the timing of interest rate cuts.
Here is what you need to know on Friday, January 19:
Another positive session for the greenback allowed the USD Index (DXY) to navigate the upper end of the recent range in the 103.60 region amidst modest gains, while auspicious prints from regional manufacturing surveys and firm data from the weekly labour market added to the dwindling sentiment surrounding a Fed’s rate cut in March. On Friday, the preliminary Michigan Consumer Sentiment gauge will take centre stage in the US docket along with Existing Home Sales, TIC Flows, and speeches by FOMC M. Daly (San Francisco) and M. Barr (Board of Governors).
EUR/USD remained on the defensive and flirted once again with yearly lows in the mid-1.0800s on the back of the dollar’s strength, despite the fact that the ECB Accounts made no mention of interest rate cuts. Absent data releases in the euro calendar on Friday, all the attention is expected to be on another speech by President C. Lagarde at the WEF in Davos.
GBP/USD briefly surpassed the 1.2700 barrier, ending Thursday’s session with decent gains despite another positive session in the greenback. Across the Channel, investors are expected to closely follow the release of Retail Sales for the month of December on Friday.
USD/JPY charted a vacillating session on Thursday, ending the day around the 148.00 neighbourhood following Wednesday’s multi-week tops near 148.50. On Friday, all the attention should be around the publication of inflation figures in December, seconded by November’s Tertiary Industry Index.
AUD/USD woke up and rose to the 0.6570 area, although it remained trapped in the multi-week bearish move in place since late December. The Aussie dollar continued to suffer from the buying pressure in the dollar, disheartening domestic labour market readings, fragile Chinese fundamentals, and a lack of upside traction in the commodity universe. There are no data releases scheduled for Down Under at the end of the week.
Both Gold and Silver managed to regain some balance and chart humble gains on Thursday, partially setting aside the recent weakness.
Geopolitical concerns and a weekly draw of US crude oil inventories encouraged the prices of WTI to add to the previous day’s gains and surpass the $74.00 mark per barrel. So far, crude oil has maintained the consolidation theme in place since the beginning of the year.
- EUR/JPY sits at 160.86, suffering minor 0.19 losses and hinting at a slowdown from the recent uptrend.
- Indicators from the daily chart, such as a flat RSI and MACD's unmoving green bars, signal a tempered buying momentum.
- Despite short-term negativity, the EUR/JPY remains a stalwart above 20,100,200 day SMAs, indicating a broader bullish control.
In Thursday's session, the EUR/JPY recorded slight losses, settling at 160.86 after a peak at 161.40, its highest since early December. On the daily chart, the bulls took a breather following three consecutive days of gains. Meanwhile, the four-hour chart hints at consolidation from the bulls, albeit amidst overbought territory. On the fundamental side, the JPY remains pushed down due to the lack of guidance regarding the normalization of their monetary policy. On the same line, the Euro faced weakness in the last sessions due to the European Central Bank (ECB) dovish signals.
On the daily chart, the technical indicators reflect a mildly bullish environment in the near term despite the Relative Strength Index (RSI) showing a negative incline within a positive range. The Moving Average Convergence Divergence (MACD) exhibits flat green bars, indicating that the bullish momentum may pause. However, the overarching bullish trend remains intact as the asset sustains its position above the 20, 100, and 200-day Simple Moving Averages (SMAs), implying that the bulls still maintain a steady hold over the larger scenario.
Despite manifesting a flattish orientation in the positive space and the MACD continuing to exhibit unchanging green bars, the four-hour RSI suggests that the buyers retain dominance, albeit with reduced momentum like the daily chart.
EUR/JPY technical levels
EUR/JPY daily chart
-638412024202012014.png)
- GBP/USD gains 0.09% driven by UK's unexpectedly high inflation rate influencing BoE policy outlook.
- Mixed US data with reduced Jobless Claims and lower Housing Starts partially bolster USD.
- Attention turns to UK Retail Sales, US Consumer Sentiment data, and potential updates from Fed speakers.
The Pound Sterling (GBP) stayed firm against the US Dollar (USD) on Thursday, courtesy of a hot inflation report on Wednesday, coughing traders by surprise, which trimmed bets the Bank of England (BoE) would ease policy as they initially expected. The GBP/USD trades at 1.2684, up 0.09%.
GBP/USD edges higher after elevated UK’s inflation report, mixed US housing data
The economic docket in the UK was absent on Thursday as GBP/USD traders brace for the release of Retail Sales on Friday. However, a tranche of US economic data underpinned the Greenback after unemployment claims slowed compared to the previous week’s data and below forecasts. Figures saw Initial Jobless Claims for the week ending January 13 at 187K, below forecasts of 207K.
Moreover, US housing data witnessed a rise in Building Permits, though Housing Starts, dropped -4.3%, from 1.525 million in November to 1.46 million in December, revealed the US Commerce Department.
On the UK front, inflation unexpectedly rose by 4% YoY from 3.9%, and underlying inflation stood at 5.1% from 4.9%. The 10-year Gilt rose 15 basis points to 3.982% after the data, while the market price out Bank of England’s (BoE) rate cuts from around an 80% chance on Tuesday to 50%.
Ahead on the docket, UK retail sales are expected to plunge -0.5% MoM and to rise 1.1% YoY. Across the Atlantic, US Consumer Sentiment by the University of Michigan (UoM) for December will be released, along with housing data, and further Fed speakers, before they enter the blackout period ahead of January’s monetary policy meeting
GBP/USD Technical Levels
- Crude Oil market climbed as geopolitical headlines squeeze barrel bids higher.
- EIA reported a steeper-than-expected decline in US crude barrel counts.
- MIlitary strikes against Houthi rebels are increasing supply line concerns.
West Texas Intermediate (WTI) US Crude Oil climbed to $74.00 per barrel on Thursday, rising after Crude Oil supplies in the US saw a steeper drawdown than markets expected according to barrel counts by the Energy Information Administration (EIA). Iran-backed Houthi rebels have vowed to step up attacks on civilian cargo ships passing through the Red Sea after an uptick in US-UK coalition naval strikes on Houthi-controlled missile launch sites in Yemen.
The EIA reported a 2.492 million barrel drawdown in US Crude Oil Stocks Change for the week ended January 12, a significant pullback from the market forecast of 313K and completely eating away at the previous week’s 1.338 million barrel buildup. Refinery demand has peaked as petroleum refiners scramble for more Crude Oil despite a growing overhang in downstream oil products, and US Crude Oil production output steadily rising into new all-time highs could limit topside momentum on hypothetical supply concerns.
Barrel traders focus on supply drawdown, cold weather production decline
Geopolitics continue to plague energy markets, with Crude Oil helped higher on the week by a notable uptick in violent rhetoric from Houthi rebels in Yemen after a wave of naval attacks on Houthi-controlled missile launch sites in Yemen. Despite the ongoing presence of US and UK coalition warships in the Red Sea, Houthis are vowing to continue or increase their attacks on civilian tankers trying to reach the Suez Canal instead of rerouting around the continent of Africa.
Crude Oil markets are increasingly concerned that Europe-Asia energy supply lines could become crimped as tensions and conflict escalate in the region.
Cold weather also saw a slight drawdown in US oil production, with the EIA estimating that US gasoline production average 9.4 million barrels per day for the week ended January 12 compared to 9.7 million bpd the week prior.
The EIA estimated that processed Gasoline reserves climbed by 3.1 million barrels for the week, with an additional 2.4 million barrel buildup in middle distillates adding to the previous week’s 6.5 million barrel supply increase.
WTI Technical Outlook
US Crude Oil is back into the top end of recent congestion in the WTI chart, trading into $74.00 for the fourth time since kicking off 2024 near $72.00.
Daily candlesticks reveal a long-term rough consolidation zone forming in WTI, with US Crude Oil bidding into familiar levels since a limited rebound after declining nearly 28% top-to-bottom from September’s peak just shy of $94.00 per barrel.
WTI bottomed out near $68.00 in mid-December, and barrel bids have been hung inside a sideways grind between $70.00 and $76.00 for seven consecutive weeks.
WTI Hourly Chart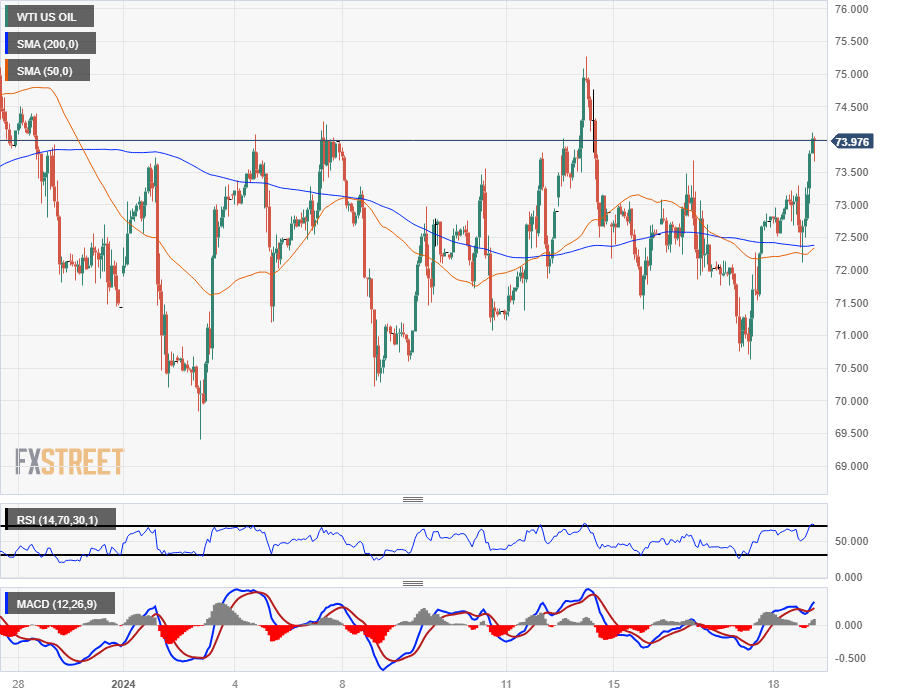
WTI Daily Chart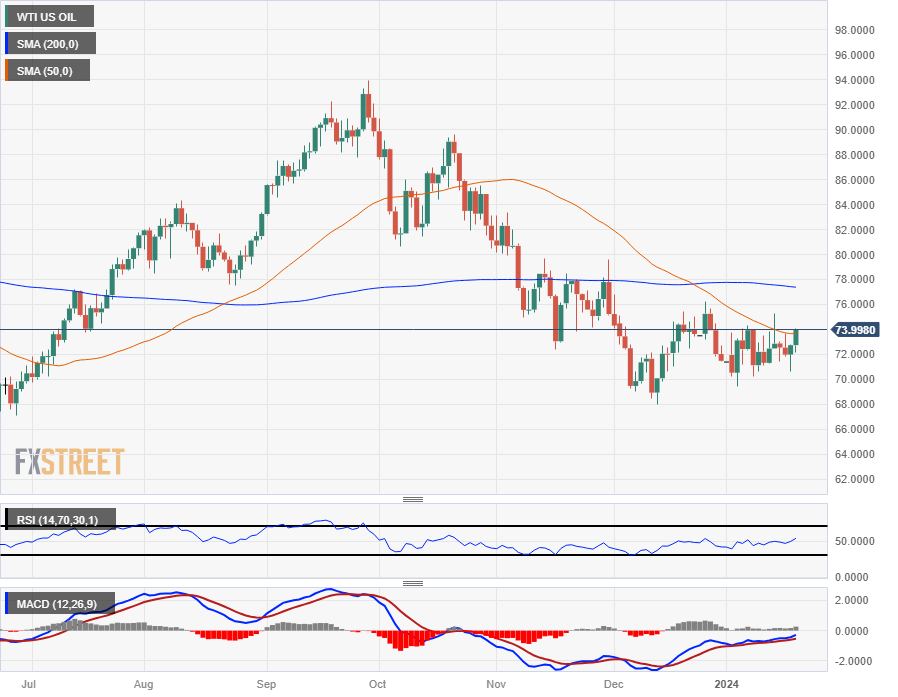
- The Swiss Franc has pivoted into one of its worst weekly performances in over a year.
- SNB concerns are mounting that CHF strength will hamper policy transfer.
- The CHF is still up 6% against the US Dollar through 2023.
The Swiss Franc (CHF) got knocked back on Thursday, accelerating recent losses and extending into one of its worst single-week performances after Swiss National Bank (SNB) Chairman Thomas Jordan warned that an appreciating CHF threatens the SNB’s ability to keep inflation above zero within the Swiss domestic economy.
The SNB has enjoyed the benefit of a stable economy with firmer growth figures than most of its Euro bloc peers, but Swiss growth and price measures have come under threat as the Swiss Franc appreciated through 2023 in one of its best yearly performances since the SNB suddenly removed its CHF price cap in 2015.
With the Swiss Franc rapidly appreciating into the tail end of 2023, the SNB is raising alarm that too much appreciation could harm the Swiss economy, with a rising Swiss Franc sending inflation rapidly lower. SNB policymakers are increasingly concerned that a rising CHF will bleed over into a disinflationary scenario, a significantly more difficult environment for the SNB to manage.
One of the benefits of an appreciating Swiss Franc is that the SNB is already considered broadly on-target for inflation with the national inflation rate at 1.7%, already below the SNB’s upper bound target of 2.0% while central banks around the world grappling with still-high inflation and carefully weigh policy rate cuts through the year.
After stellar gains through 2023, the Swiss Franc has sharply depreciated through 2024, declining 3.2% against the US Dollar (USD), 2.8% against the Pound Sterling (GBP), and falling 1.6% against the Euro (EUR).
USD/CHF & EUR/CHF Technical Outlook
The USD/CHF has gained 4.3% from December’s lows near 0.8333, the pair’s lowest bids since 2011 and is on pace to return to the 0.8800 handle barring too much of a hang-up on the 50-day Simple Moving Average (SMA) as intraday price action runs directly into the moving average’s technical zone.
The 200-day SMA is declining into 0.8850, and represents a key technical barrier between current bids and the 0.9000 handle the pair lost a hold of back in November.
The EUR/CHF has seen a limited recovery from last December’s all-time lows at 0.9254, climbing around 2% from the absolute bottom for the pair.
The pair’s topside momentum is running into technical resistance at previous swing lows near 0.9450, and the 200-day SMA is descending into the 0.9600 handle to limit further appreciation.
USD/CHF Daily Chart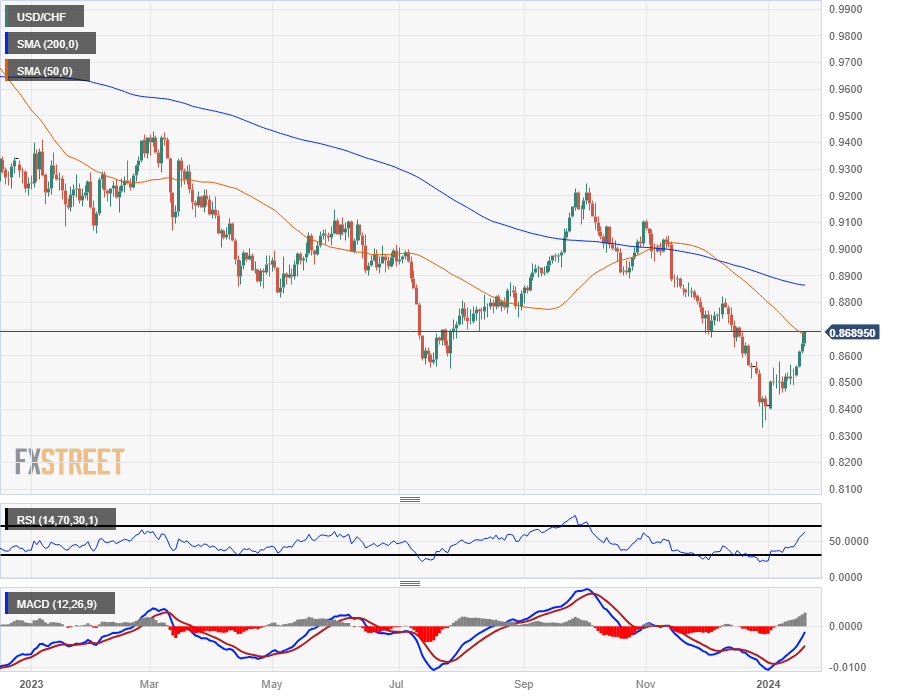
EUR/CHF Daily Chart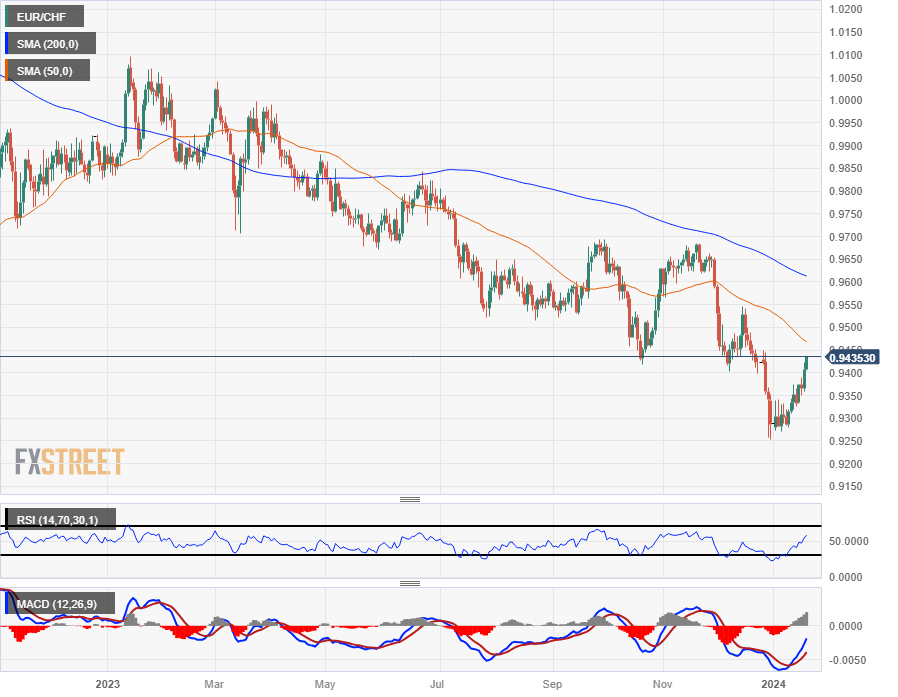
- The DXY Index trades above the 100-day SMA.
- Building Permits and Housing Starts from December beat expectations.
- Weekly Jobless Claims came in better than expected.
The US Dollar (USD) is caught in an upbeat mood with the DXY Index trading at 103.50. The gains are buoyed by strong housing and labor data and negative market sentiment. Tensions in the Middle East and the weakening of the Chinese stock market seem to be driving demand for the Greenback
The US economy appears overheated, tempering the market's dovish expectations, although the chances of interest rate cuts in March and May lingers at around 50%. Thus, the US dollar remains in fluctuating currents, affected by both resilient economic performance and dovish bets on the Fed's likely moves.
Daily digest market movers: US Dollar strengthens on strong Building Permits, Housing Starts and Jobless Claims
- The released Building Permits for December came in at 1.495M, higher than the 1.48M expected, according to the US Census Bureau.
- The Housing Starts for December were 1.46M vs the 1.426M expected.
- The Initial Jobless claims for the week ending January 13 were 187K, lower than the previous 203K claims.
- The yields for US bonds are mixed with the 2-year yield at 4.34%, the 5-year yield at 4.02%, and the 10-year yield at 4.12%.
- As per the CME FedWatch Tool, the odds of cuts for March and May eased, but they remain high at 55% and 45%, respectively.
Technical Analysis: DXY index buyers gradually gain control despite bearish long-term bias
The technical situation in the daily chart reflects a mixed stance between bullish and bearish momentum. The positive slope and positive territory position of the Relative Strength Index (RSI) signifies that buying momentum is gradually building. This is an indication that market participants are getting more bullish over time.
Moreover, the rising green bars of the Moving Average Convergence Divergence (MACD) affirm the increase in buying pressure. On a broader scale, the position of the asset with respect to its Simple Moving Averages (SMAs) gives a mixed picture. The pair is located above the 20 and 100-day SMAs, indicating consistent buying pressure in the short to medium-term. However, the DXY trades below the 200-day SMA, which suggests a bearish bias on a long-term perspective.
Interestingly, despite the recent bearish movements, the fact that bulls are holding their ground and continue to exhibit strength implies that the buying force currently has the upper hand in the market.
Support levels: 103.40 (100-day SMA), 103.00, 102.80, 102.50.
Resistance levels: 103.60, 103.80, 104.00.
US Dollar FAQs
What is the US Dollar?
The US Dollar (USD) is the official currency of the United States of America, and the ‘de facto’ currency of a significant number of other countries where it is found in circulation alongside local notes. It is the most heavily traded currency in the world, accounting for over 88% of all global foreign exchange turnover, or an average of $6.6 trillion in transactions per day, according to data from 2022.
Following the second world war, the USD took over from the British Pound as the world’s reserve currency. For most of its history, the US Dollar was backed by Gold, until the Bretton Woods Agreement in 1971 when the Gold Standard went away.
How do the decisions of the Federal Reserve impact the US Dollar?
The most important single factor impacting on the value of the US Dollar is monetary policy, which is shaped by the Federal Reserve (Fed). The Fed has two mandates: to achieve price stability (control inflation) and foster full employment. Its primary tool to achieve these two goals is by adjusting interest rates.
When prices are rising too quickly and inflation is above the Fed’s 2% target, the Fed will raise rates, which helps the USD value. When inflation falls below 2% or the Unemployment Rate is too high, the Fed may lower interest rates, which weighs on the Greenback.
What is Quantitative Easing and how does it influence the US Dollar?
In extreme situations, the Federal Reserve can also print more Dollars and enact quantitative easing (QE). QE is the process by which the Fed substantially increases the flow of credit in a stuck financial system.
It is a non-standard policy measure used when credit has dried up because banks will not lend to each other (out of the fear of counterparty default). It is a last resort when simply lowering interest rates is unlikely to achieve the necessary result. It was the Fed’s weapon of choice to combat the credit crunch that occurred during the Great Financial Crisis in 2008. It involves the Fed printing more Dollars and using them to buy US government bonds predominantly from financial institutions. QE usually leads to a weaker US Dollar.
What is Quantitative Tightening and how does it influence the US Dollar?
Quantitative tightening (QT) is the reverse process whereby the Federal Reserve stops buying bonds from financial institutions and does not reinvest the principal from the bonds it holds maturing in new purchases. It is usually positive for the US Dollar.
- Silver prices rise 0.50% supported by a softer USD and positive Wall Street performance.
- XAG/USD’s trajectory influenced by US economic data, including strong Jobless Claims and mixed housing data.
- Market risk sentiment, shaped by Middle East geopolitical concerns, including Israel-Hamas tensions, impacts Silver prices.
Silver’s advance in the mid-North American session on Thursday, sponsored by US Treasury yields, stands steady, while the Greenback (USD) posts decent gains as revealed by the US Dollar Index (DXY). Therefore, the XAG/USD exchanges hands at $22.62 after bottoming around $22.43, up 0.38%.
XAG/USD’s clings to decent gains on geopolitical risks, amid mixed US data
Market sentiment turned positive as Wall Street registered solid gains, between 0.20% and 0.75%, except for the Dow Jones, tumbling 0.23%. US Treasury bond yields, in the short end of the curve, remain unchanged, while the belly and the long-end post gains of between four to six basis points, capping Silver’s advance.
On the data front, unemployment claims revealed by the US Department of Labor added to strong retail sales posted in December, while industrial production recovered after back-to-back months of contraction and stagnation. Initial Jobless Claims for the last week rose by 187K, below forecast and previous month’s data.
US Housing Starts slid from 1.525 million to 1.46 in December, a -4.3% contraction. Contrarily, Binding Permits rose 1.9% or 1.495 million, compared with November’s 1.467 million, and exceeded forecasts of 1.48 million.
In the meantime, Atlanta’s Fed President Raphael Bostic emphasized that he’s open to rate cuts if inflation drops faster than expected. He commented that monetary policy could start in July “if there’s convincing evidence inflation is slowing faster.”
Given the fundamental backdrop, Silver could likely remain underpinned by a soft US Dollar. That, along with geopolitical concerns in the Middle East, with the conflict of Israel-Hamas spurring a crisis that had spread into the Red Sea, involving Houthis and an alliance between the US and the UK.
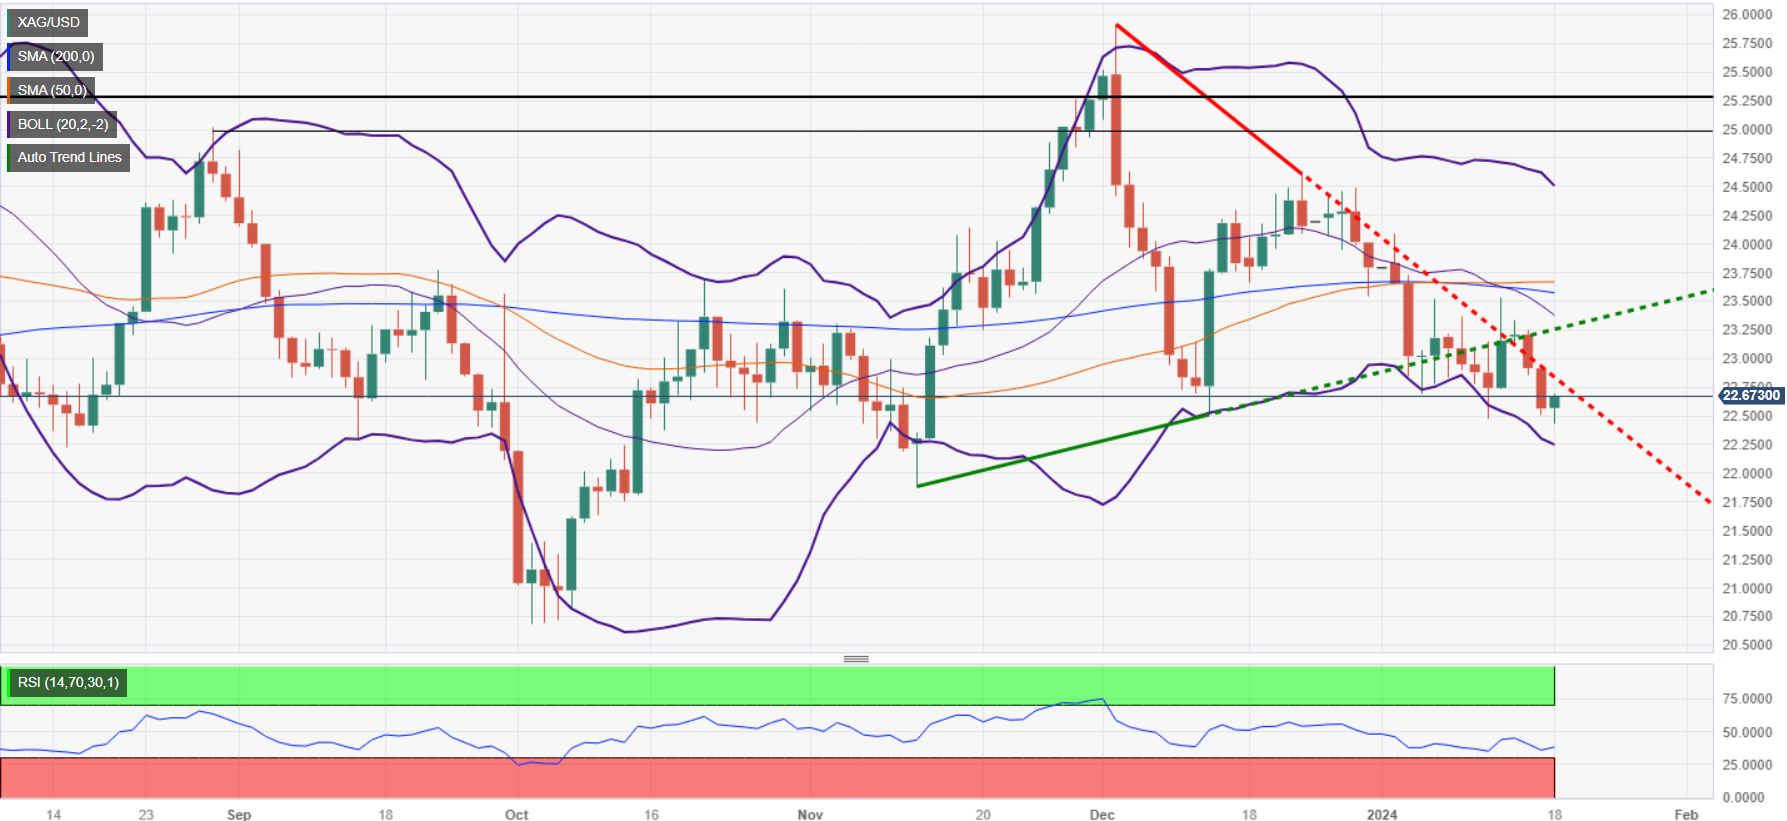
XAG/USD Price Analysis: Technical outlook
Silver’s daily chart portrays the grey metal neutral-downward biased, following the formation of a ‘death-cross,’ with the 50-day moving average (DMA) crossing below the 200-DMA, which could exacerbate further losses in the near term. The next demand zone on the downside would be the $22.00 figure ahead of the November 13 low of $21.88. On the upside, if XAG/USD buyers push prices above the $23.00 mark, that could pave the way to challenge the 200-DMA at $23.55.
Federal Reserve (Fed) of Atlanta President Raphael Bostic hit newswires on Thursday while speaking at an event held at the Atlanta Chamber of Commerce.
Bostic highlighted that the base case is for the Fed to begin exploring rate cuts sometime in the third quarter, but left the door open for the rate cut cycle to begin sooner depending on inflation figures.
Key highlights:
- Fed's Bostic: Baseline is for rate reductions sometime in Q3, but care is needed to not too cut soon or risk a refreshed price spiral.
- Bostic is open to cutting rates before July, but only if there is "convincing evidence" that inflation is slowing faster than anticipated.
- Given current uncertainty, it's unwise for the Fed to lock in any specific approach moving forward.
- There is a possibility that current geopolitical risks could complicate supply chains; budget fights in the US could impact financial markets and the economy.
- Mexican Peso is stable against US Dollar as US jobs data improves, but housing paints mixed outlook.
- Drop in US unemployment claims indicates the economy remains resilient, strengthening US Dollar.
- USD/MXN traders await further Fed speakers, Mexico’s Retail Sales on Friday.
The Mexican Peso (MXN) is virtually unchanged against the US Dollar (USD) after a tranche of mixed economic data from the United States (US) and traders paring rate cut bets on the Federal Reserve (Fed), which is keeping the Greenback (USD) bid across the board. The USD/MXN trades at 17.18 on the day after hitting a daily low of 17.15, up 0.07%, following a slide below the 50-day Simple Moving Average (SMA).
The US Bureau of Labor Statistics (BLS) revealed that unemployment claims for last week grew at a slower pace than the previous reading and expectations. The print portrays a tight labor market. Meanwhile, the US Department of Commerce (DoC) released Housing Starts and Building Permits data, which came in mixed, failing to keep the USD/MXN in positive territory. Ahead on Thursday, Atlanta Fed President Raphael Bostic’s comments will cross the newswires.
Daily digest market movers: Mexican Peso stays firm despite mixed US economic data
- The latest Initial Jobless Claims report for the week ending January 12 revealed a decrease to 187,000, lower than both the previous week's numbers and the anticipated consensus of 207,000. This suggests that the labor market remains tight.
- Regarding the labor market, the Federal Reserve's latest Beige Book, released on Wednesday, presented a more nuanced picture, reporting that “nearly all districts cited one or more signs of a cooling labor market,” indicating some emerging signs of a slowdown in employment growth across various regions.
- US housing data presented a mixed picture recently. Building Permits saw an increase of 1.9% and reached 1.495 million, compared to 1.467 million in November and surpassing the forecast of 1.48 million. On the other hand, Housing Starts experienced a decline, dropping from 1.525 million in November to 1.46 million in December, a contraction of -4.3%.
- The strongest catalyst in the week has been Federal Reserve Governor Christopher Waller’s speech: “no reason to move as quickly or cut as rapidly as in the past.” This kept investors in check despite supporting rate cuts if inflation indeed gets lowered.
- Besides that, December’s Retail Sales report and Industrial Production have fueled speculation that the US economy would likely grow by 2.4% in Q4 2023 as shown by the Atlanta GDPNow model. This spurred a reaction by fed funds rate (FFR) traders, who trimmed rate cut bets for 2024 from 175 basis points to just 150.
- The lack of data in Mexico keeps traders leaning on the latest inflation figures, which edged higher than expected in headline inflation, but core data suggests the Bank of Mexico (Banxico) has done a good job, curbing elevated prices after hiking rates toward 11.25%.
- Although December’s meeting minutes from Banxico (the Central Bank of Mexico) suggest that the central bank might contemplate easing its monetary policy, the inflation report for December could hinder any move toward policy relaxation.
- Analysts at Standard Chartered noted, “We expect the policy rate to be lowered to 9.25% by end-2024, although an official downward revision in the output gap could open the door for more aggressive rate cuts.”
- On January 5, a Reuters poll suggested the Mexican Peso could weaken 5.4% to 18.00 per US Dollar in the 12 months following December.
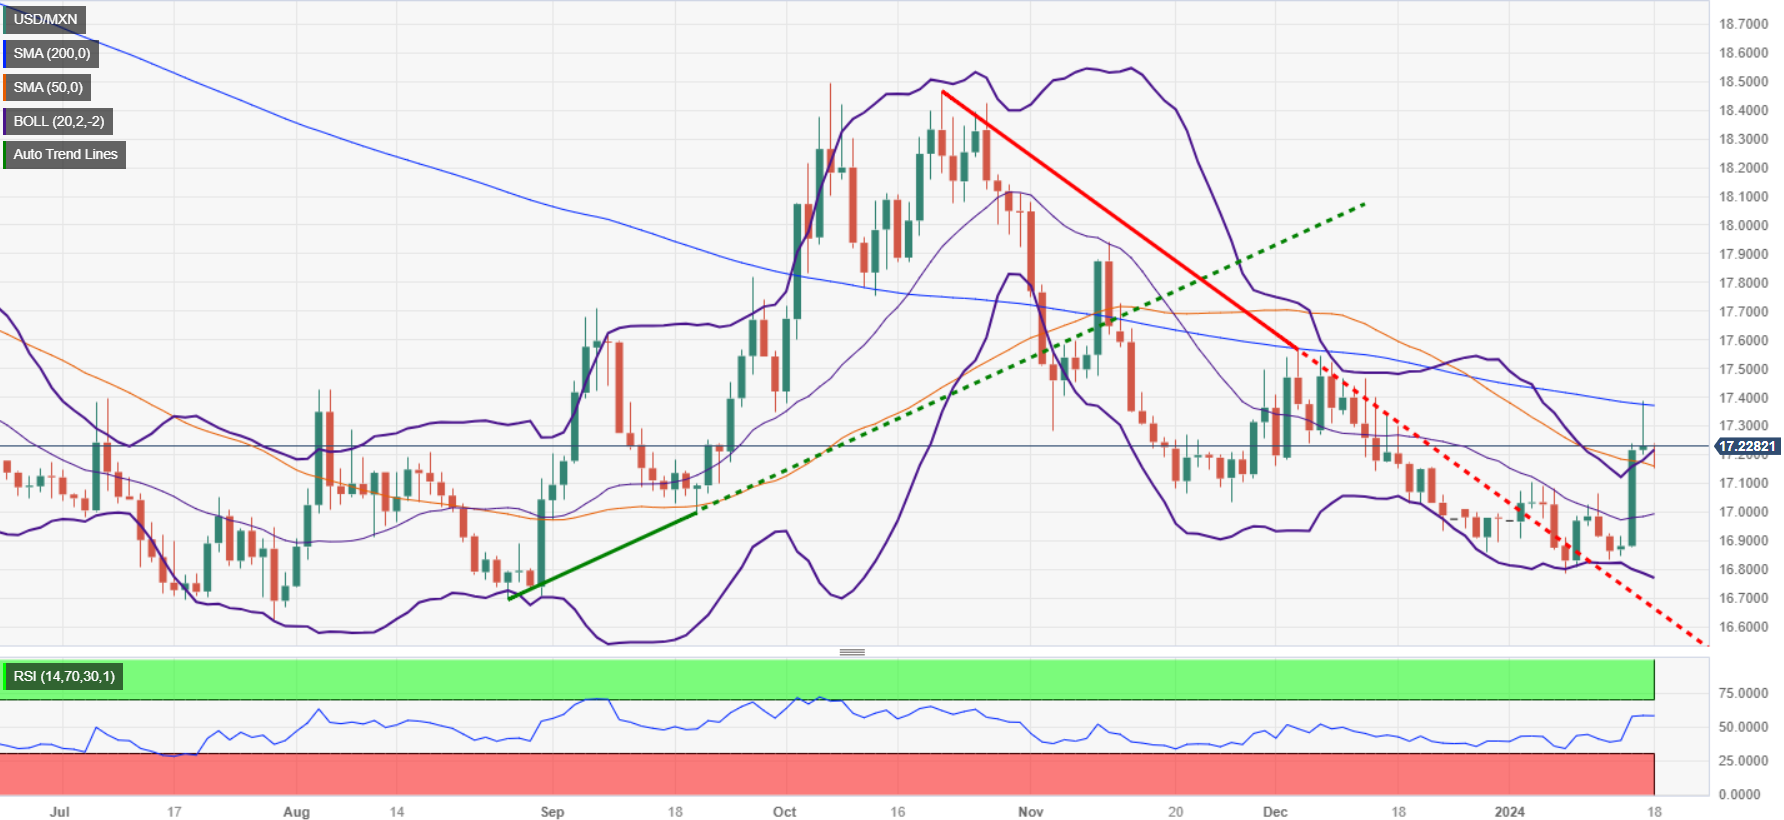
Technical analysis: Mexican Peso stays firm as USD/MXN meanders around 17.20
The USD/MXN daily chart remains neutral to upward biased, but failure to decisively break the 200-day SMA (Simple Moving Average) at 17.37 exacerbated a pullback below the 17.20 area. A breach of the 50-day SMA at 17.17 would pave the way to challenge the January 12 low of 16.82. Further downside is seen at the January 8 low of 16.78. Once those levels are hurdled, the next demand level would be the August 28 cycle low of 16.69, ahead of last year’s low of 16.62.
On the other hand, if buyers reclaim the 17.20 area, that could open the door to test the 200-day SMA at 17.37. Once surpassed, the next resistance emerges at the 100-day SMA at 17.41, ahead of the December 5 high at 17.56, before testing the May 23 high of 17.99.
USD/MXN Price Action – Daily Chart
Mexican Peso FAQs
What key factors drive the Mexican Peso?
The Mexican Peso (MXN) is the most traded currency among its Latin American peers. Its value is broadly determined by the performance of the Mexican economy, the country’s central bank’s policy, the amount of foreign investment in the country and even the levels of remittances sent by Mexicans who live abroad, particularly in the United States. Geopolitical trends can also move MXN: for example, the process of nearshoring – or the decision by some firms to relocate manufacturing capacity and supply chains closer to their home countries – is also seen as a catalyst for the Mexican currency as the country is considered a key manufacturing hub in the American continent. Another catalyst for MXN is Oil prices as Mexico is a key exporter of the commodity.
How do decisions of the Banxico impact the Mexican Peso?
The main objective of Mexico’s central bank, also known as Banxico, is to maintain inflation at low and stable levels (at or close to its target of 3%, the midpoint in a tolerance band of between 2% and 4%). To this end, the bank sets an appropriate level of interest rates. When inflation is too high, Banxico will attempt to tame it by raising interest rates, making it more expensive for households and businesses to borrow money, thus cooling demand and the overall economy. Higher interest rates are generally positive for the Mexican Peso (MXN) as they lead to higher yields, making the country a more attractive place for investors. On the contrary, lower interest rates tend to weaken MXN.
How does economic data influence the value of the Mexican Peso?
Macroeconomic data releases are key to assess the state of the economy and can have an impact on the Mexican Peso (MXN) valuation. A strong Mexican economy, based on high economic growth, low unemployment and high confidence is good for MXN. Not only does it attract more foreign investment but it may encourage the Bank of Mexico (Banxico) to increase interest rates, particularly if this strength comes together with elevated inflation. However, if economic data is weak, MXN is likely to depreciate.
How does broader risk sentiment impact the Mexican Peso?
As an emerging-market currency, the Mexican Peso (MXN) tends to strive during risk-on periods, or when investors perceive that broader market risks are low and thus are eager to engage with investments that carry a higher risk. Conversely, MXN tends to weaken at times of market turbulence or economic uncertainty as investors tend to sell higher-risk assets and flee to the more-stable safe havens.
- Euro sheds weight as ECB cautions about risks to disinflation process.
- European inflation could take until 2025 to reach 2%.
- ECB wants wage growth to be much slower before moving on rates.
The Euro (EUR) fell against most of its major currency peers on Thursday as Euro investors rebalance their exposure. The European Central Bank (ECB) continues to caution that market expectations of rate cuts have run well ahead of what the ECB is willing to bring to the table.
Both the ECB and the Federal Reserve (Fed) have spent significant verbal effort in talking down market hopes for an accelerated pace of rate cuts. Policymakers on both sides of the Atlantic caution that movement on rate cuts will be both data-dependent and occur at a much slower pace than money markets are pricing in.
Daily digest market movers: ECB Monetary Policy Meeting Accounts reveal a firmly dovish stance
- ECB Monetary Policy Accounts reveal concerns that inflation will continue to pick back up in the near term.
- Recent fall in inflation is encouraging, but ECB policymakers remain unconvinced that progress is permanent, sees potential for ongoing inflationary risks.
- ECB expects to maintain restrictive policy stance “for some time”.
- Market repricing could derail disinflation process, according to ECB.
- A broad adjustment in rate cut expectations is underway as Fed officials continue to talk down rate cut hopes.
- Fed’s Bostic: More evidence required that inflation is on a trajectory to 2%, worst outcome would be to cut and then raise again.
- US economic data continues to outpace market forecasts. Initial Jobless Claims for the week ended January 12 slow more than expected to 187K versus forecast for 207K, down even further from previous week’s 203K.
- ECB President Christine Lagarde made her second of three appearances on Thursday while attending the World Economic Forum in Davos, Switzerland.
- Little monetary policy has been discussed by Lagarde, but one more appearance is slated for Friday at 10:00 GMT.
Euro price today
The table below shows the percentage change of Euro (EUR) against listed major currencies today. Euro was the strongest against the Swiss Franc.
| USD | EUR | GBP | CAD | AUD | JPY | NZD | CHF | |
| USD | 0.18% | -0.08% | -0.09% | -0.24% | -0.01% | 0.07% | 0.41% | |
| EUR | -0.18% | -0.27% | -0.27% | -0.42% | -0.19% | -0.10% | 0.24% | |
| GBP | 0.09% | 0.29% | 0.01% | -0.14% | 0.10% | 0.17% | 0.52% | |
| CAD | 0.09% | 0.27% | 0.00% | -0.14% | 0.07% | 0.16% | 0.52% | |
| AUD | 0.24% | 0.42% | 0.15% | 0.14% | 0.23% | 0.32% | 0.66% | |
| JPY | 0.01% | 0.20% | -0.09% | -0.09% | -0.24% | 0.07% | 0.43% | |
| NZD | -0.06% | 0.11% | -0.16% | -0.16% | -0.31% | -0.10% | 0.32% | |
| CHF | -0.41% | -0.23% | -0.49% | -0.50% | -0.68% | -0.43% | -0.34% |
The heat map shows percentage changes of major currencies against each other. The base currency is picked from the left column, while the quote currency is picked from the top row. For example, if you pick the Euro from the left column and move along the horizontal line to the Japanese Yen, the percentage change displayed in the box will represent EUR (base)/JPY (quote).
Technical Analysis: Euro backslides, EUR/USD struggles to find footing below 1.0900
The Euro (EUR) is broadly lower on Thursday, declining around a fifth of a percent against the US Dollar (USD), Canadian Dollar (CAD), and the Japanese Yen (JPY). The Swiss Franc (CHF) represents the only gain for the Euro, up around a quarter of a percent on the day as the two European currencies compete for last place.
The EUR/USD waffled below the 1.0900 handle this week, and the pair remains unable to find its footing for a bullish recovery. Intraday action ran into the handle early Thursday before getting rejected back into near-term lows near 1.0850.
The Euro continues to get snagged on congestion against the US Dollar on the daily candlesticks. The EUR/USD is trapped in a congestion zone between the 50-day and 200-day Simple Moving Averages (SMA) at 1.0900 and 1.0850, respectively.
The pair remains up 4% from last October’s swing low into 1.0450, and the technical floor is parked near 1.0750 at December’s bottom bids.
EUR/USD Hourly Chart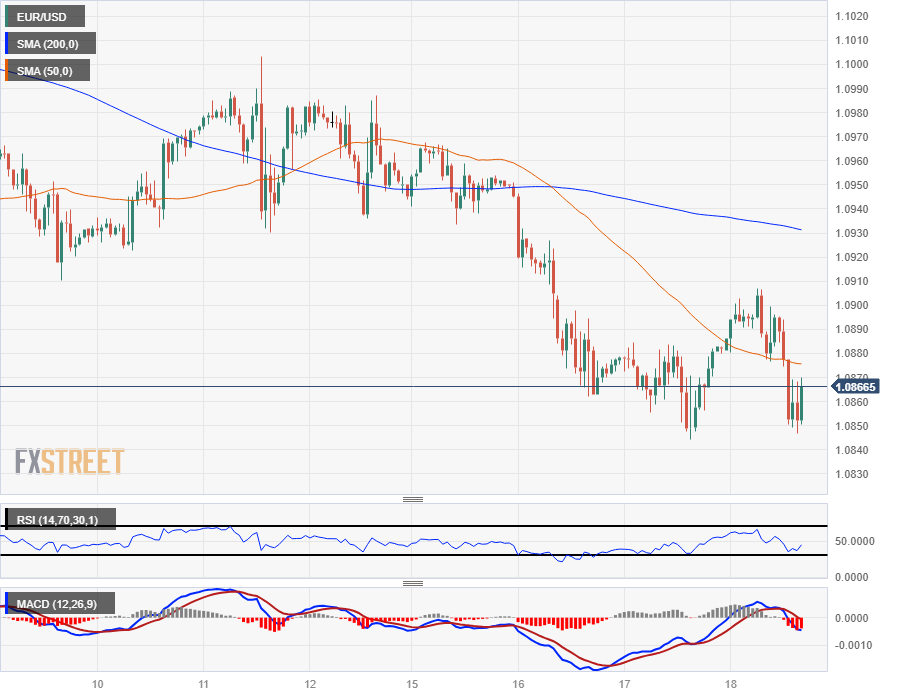
EUR/USD Daily Chart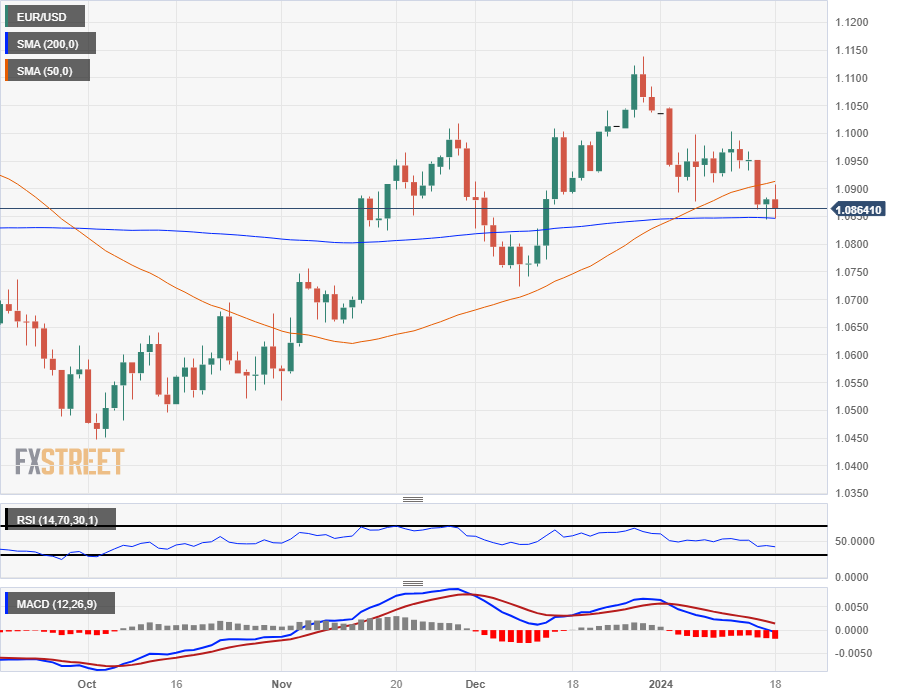
Euro FAQs
What is the Euro?
The Euro is the currency for the 20 European Union countries that belong to the Eurozone. It is the second most heavily traded currency in the world behind the US Dollar. In 2022, it accounted for 31% of all foreign exchange transactions, with an average daily turnover of over $2.2 trillion a day.
EUR/USD is the most heavily traded currency pair in the world, accounting for an estimated 30% off all transactions, followed by EUR/JPY (4%), EUR/GBP (3%) and EUR/AUD (2%).
What is the ECB and how does it impact the Euro?
The European Central Bank (ECB) in Frankfurt, Germany, is the reserve bank for the Eurozone. The ECB sets interest rates and manages monetary policy.
The ECB’s primary mandate is to maintain price stability, which means either controlling inflation or stimulating growth. Its primary tool is the raising or lowering of interest rates. Relatively high interest rates – or the expectation of higher rates – will usually benefit the Euro and vice versa.
The ECB Governing Council makes monetary policy decisions at meetings held eight times a year. Decisions are made by heads of the Eurozone national banks and six permanent members, including the President of the ECB, Christine Lagarde.
How does inflation data impact the value of the Euro?
Eurozone inflation data, measured by the Harmonized Index of Consumer Prices (HICP), is an important econometric for the Euro. If inflation rises more than expected, especially if above the ECB’s 2% target, it obliges the ECB to raise interest rates to bring it back under control.
Relatively high interest rates compared to its counterparts will usually benefit the Euro, as it makes the region more attractive as a place for global investors to park their money.
How does economic data influence the value of the Euro?
Data releases gauge the health of the economy and can impact on the Euro. Indicators such as GDP, Manufacturing and Services PMIs, employment, and consumer sentiment surveys can all influence the direction of the single currency.
A strong economy is good for the Euro. Not only does it attract more foreign investment but it may encourage the ECB to put up interest rates, which will directly strengthen the Euro. Otherwise, if economic data is weak, the Euro is likely to fall.
Economic data for the four largest economies in the euro area (Germany, France, Italy and Spain) are especially significant, as they account for 75% of the Eurozone’s economy.
How does the Trade Balance impact the Euro?
Another significant data release for the Euro is the Trade Balance. This indicator measures the difference between what a country earns from its exports and what it spends on imports over a given period.
If a country produces highly sought after exports then its currency will gain in value purely from the extra demand created from foreign buyers seeking to purchase these goods. Therefore, a positive net Trade Balance strengthens a currency and vice versa for a negative balance.
- The EUR/GBP has lost 0.20%, now trading near the 0.8560 level.
- Sticky UK inflation boosts the strength of the pound as there likely won’t be cuts by the BoE in Q1.
- Euro suffers a hit following ECB's dovish signals.
Hawkish bets on the Bank of England (BoE) are pressuring the EUR/GBP pair, trading at a round level of approximately 0.8560, resulting in losses in Thursday's session. Markets continue to digest Wednesday’s inflation figures from the UK and the European Central Bank (ECB) dovish signals..
On the ECB’s side, the market is discounting a dovish approach from the bank with the postponement of rate cuts until June amid a backdrop of limited fresh data. As for now, a rate cut by summer remains a viable scenario, and investors discount an overall 150 bps of easing in 2024.
On the other hand, expectations of the Bank of England (BoE) lowering interest rates in March have significantly dimmed, and investors foresee cuts as late as in Q2. That being said, investors are discounting 125 bps in 2024. This came in hand with data from the UK's Office of National Statistics, which highlighted stable labor demand coupled with sticky inflation figures. Moreover, in case the divergences between the ECB and the BOE widen, the Euro may suffer further losses against the Pound in the coming sessions.
On Wednesday, the ONS announced an unexpected growth in headline inflation, ticking up 0.4%, a reversal from a 0.2% contraction the previous month. Yearly CPI also raised eyebrows, moving to 4% against a prior reading of 3.9%, contrary to market predictions of a slowdown to 3.8%.
EUR/GBP levels to watch
The daily chart indicators reflect a dominant tendency favored by the selling momentum for the pair. The Relative Strength Index (RSI), with its negative slope and position in negative territory, indicates a bearish sentiment. This suggests that the sellers are in control, pushing the market towards a potential downtrend. The Moving Average Convergence Divergence (MACD), with rising red bars, also accentuates this bearish outlook.
Adding to the bearish scenario, the pair remains beneath the 20,100, and 200-day Simple Moving Averages (SMAs), on the larger context, illustrating a continued sellers' dominance on a broader scale. Any buyer-led recovery would require significant breakthroughs above these levels, to change this bearish trajectory.
EUR/GBP daily chart
-638411909289884587.png)
Speculators’ net EUR positions have been mostly positive over the past couple of years. Economists at Rabobank analyze Euro’s outlook.
Trump’s position on Nato, Ukraine and potentially on climate change could be expensive for Europe
Looking ahead, long EUR positions may be tested further if Trump’s march towards a potential second term in the White House continues.
Although Biden‘s Inflation Reduction Act has meant that the past four years have not always been easy for Europe, Trump’s position on Nato, Ukraine and potentially on climate change could be expensive for Europe and could increase the safe-haven appeal of the USD.
We see scope for EUR/USD to dip to 1.0500 on a three-month view.
- Canadian Dollar churns within near-term ranges.
- Canada sees an empty data docket for Thursday.
- Friday to wrap up the week with Canadian Retail Sales, US Michigan Consumer Sentiment.
The Canadian Dollar (CAD) pivots around familiar levels on Thursday as broad-market flows take the driver’s seat in the back half of the trading week. The Canadian Dollar is broadly higher on the week but is still down against the outperforming US Dollar (USD) from Monday’s opening bids.
Canada will see Retail Sales figures from November on Friday, to be closely followed by the US Consumer Sentiment Index from the University of Michigan.
Daily digest market movers: Canadian Dollar trades into the middle on Thursday
- Markets continue to digest an updated rate-cut outlook as investors weigh a stubbornly strong economic outlook from the US.
- US Initial Jobless Claims printed at 187K for the week ended January 12, below the forecast of 207K and dropping away from the previous week’s 202K (revised down from 203K).
- Revisions continue to plague US data, but WoW Unemployment Claims see only minor adjustments for the time being.
- US Housing Starts also outpaced expectations, falling less than expected, and Building Permits climbing above forecasts.
- US Housing Starts added 1.46 million new units to the national housing supply, falling from the previous period’s 1.525 million (revised from 1.56 million), but falling less than the forecast 1.4265 million.
- US Building Permits climbed to 1.495 million in December, up from the previous month’s 1.467 million and above the forecast of 1.48 million.
- Markets continue to roil as investor bets of faster, deeper rate cuts from the Federal Reserve (Fed) run into the hard wall of a sturdier-than-expected US economy and uneven inflation declines.
- Fed officials continue to caution the need for slow progress as odds of a March rate cut evaporate.
Canadian Dollar price today
The table below shows the percentage change of Canadian Dollar (CAD) against listed major currencies today. Canadian Dollar was the strongest against the Swiss Franc.
| USD | EUR | GBP | CAD | AUD | JPY | NZD | CHF | |
| USD | 0.29% | -0.01% | 0.02% | -0.15% | 0.02% | 0.09% | 0.45% | |
| EUR | -0.27% | -0.26% | -0.25% | -0.40% | -0.24% | -0.16% | 0.19% | |
| GBP | -0.04% | 0.26% | -0.01% | -0.17% | 0.00% | 0.06% | 0.42% | |
| CAD | -0.03% | 0.26% | -0.05% | -0.18% | -0.02% | 0.06% | 0.42% | |
| AUD | 0.13% | 0.41% | 0.11% | 0.14% | 0.15% | 0.21% | 0.58% | |
| JPY | -0.02% | 0.26% | 0.00% | 0.00% | -0.16% | 0.08% | 0.44% | |
| NZD | -0.08% | 0.17% | -0.09% | -0.08% | -0.24% | -0.09% | 0.34% | |
| CHF | -0.45% | -0.18% | -0.44% | -0.44% | -0.59% | -0.44% | -0.35% |
The heat map shows percentage changes of major currencies against each other. The base currency is picked from the left column, while the quote currency is picked from the top row. For example, if you pick the Euro from the left column and move along the horizontal line to the Japanese Yen, the percentage change displayed in the box will represent EUR (base)/JPY (quote).
Technical Analysis: Canadian Dollar avoids further losses, but US Dollar remains strong
The Canadian Dollar (CAD) is getting bolstered by declines in the Euro (EUR and the Swiss Franc (CHF), up around 0.25% and 0.4%, respectively. The Loonie is relatively flat across the rest of the major currency board, within a fifth of a percent of the US Dollar, Pound Sterling (GBP), Australian Dollar (AUD), and the Japanese Yen (JPY).
The US Dollar saw an early rise on Thursday, dragging the USD/CAD toward 1.3530 before markets balked on momentum and pulled back into the midrange, leaving the pair stuck in intraday consolidation near 1.3500.
After a 2.4% recovery from December’s bottom near 1.3177 the USD/CAD is facing a congestion zone as the 50-day and 200-day Simple Moving Averages (SMA) consolidate near 1.3500.
USD/CAD Hourly Chart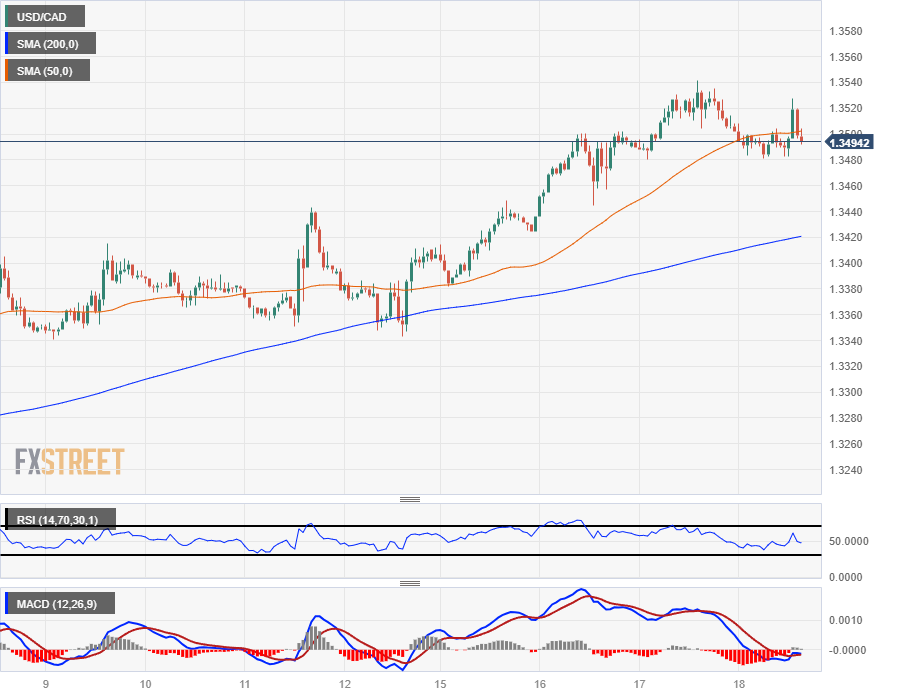
USD/CAD Daily Chart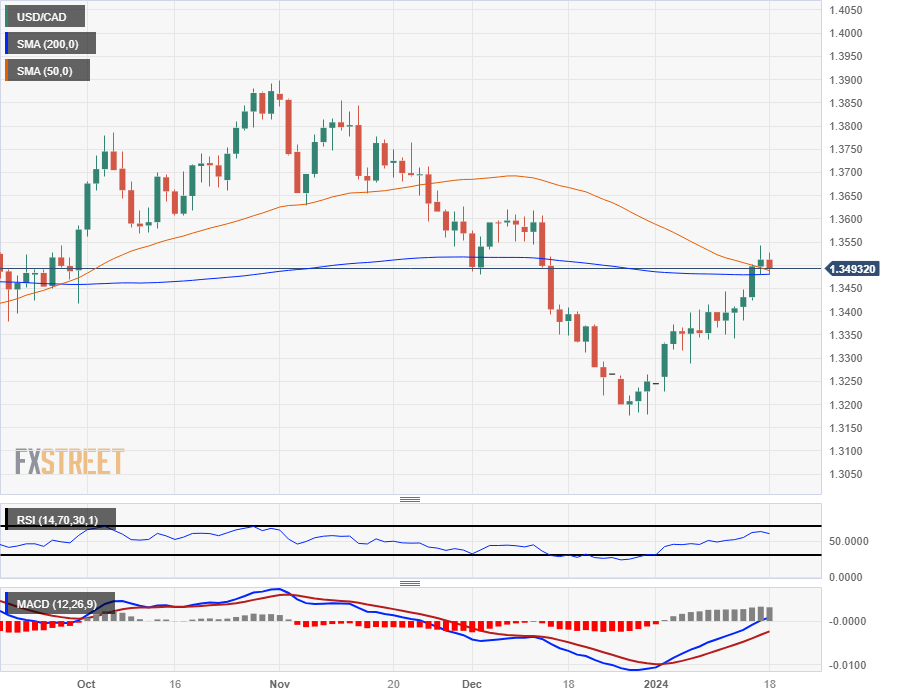
Canadian Dollar FAQs
What key factors drive the Canadian Dollar?
The key factors driving the Canadian Dollar (CAD) are the level of interest rates set by the Bank of Canada (BoC), the price of Oil, Canada’s largest export, the health of its economy, inflation and the Trade Balance, which is the difference between the value of Canada’s exports versus its imports. Other factors include market sentiment – whether investors are taking on more risky assets (risk-on) or seeking safe-havens (risk-off) – with risk-on being CAD-positive. As its largest trading partner, the health of the US economy is also a key factor influencing the Canadian Dollar.
How do the decisions of the Bank of Canada impact the Canadian Dollar?
The Bank of Canada (BoC) has a significant influence on the Canadian Dollar by setting the level of interest rates that banks can lend to one another. This influences the level of interest rates for everyone. The main goal of the BoC is to maintain inflation at 1-3% by adjusting interest rates up or down. Relatively higher interest rates tend to be positive for the CAD. The Bank of Canada can also use quantitative easing and tightening to influence credit conditions, with the former CAD-negative and the latter CAD-positive.
How does the price of Oil impact the Canadian Dollar?
The price of Oil is a key factor impacting the value of the Canadian Dollar. Petroleum is Canada’s biggest export, so Oil price tends to have an immediate impact on the CAD value. Generally, if Oil price rises CAD also goes up, as aggregate demand for the currency increases. The opposite is the case if the price of Oil falls. Higher Oil prices also tend to result in a greater likelihood of a positive Trade Balance, which is also supportive of the CAD.
How does inflation data impact the value of the Canadian Dollar?
While inflation had always traditionally been thought of as a negative factor for a currency since it lowers the value of money, the opposite has actually been the case in modern times with the relaxation of cross-border capital controls. Higher inflation tends to lead central banks to put up interest rates which attracts more capital inflows from global investors seeking a lucrative place to keep their money. This increases demand for the local currency, which in Canada’s case is the Canadian Dollar.
How does economic data influence the value of the Canadian Dollar?
Macroeconomic data releases gauge the health of the economy and can have an impact on the Canadian Dollar. Indicators such as GDP, Manufacturing and Services PMIs, employment, and consumer sentiment surveys can all influence the direction of the CAD. A strong economy is good for the Canadian Dollar. Not only does it attract more foreign investment but it may encourage the Bank of Canada to put up interest rates, leading to a stronger currency. If economic data is weak, however, the CAD is likely to fall.
Japan will release December Consumer Price Index (CPI) data on Thursday, January 18 at 23:30 and as we get closer to the release time, here are the forecasts by the economists and researchers of five major banks regarding the upcoming Japanese inflation print.
Headline is expected at 2.5% year-on-year vs. 2.8% in November, core (ex-fresh food) is expected at 2.3% YoY vs. the prior release of 2.5%, and core ex-energy is expected to fall a tick tt 3.7% YoY vs. 3.8%. If so, core would be the lowest since June 2022 and nearing the 2% target.
Standard Chartered
CPI inflation likely subsided to 2.5% YoY as oil prices dropped even amid the Middle East conflict. Core inflation excluding food also likely fell to 2.4% YoY. We expect core-core inflation excluding food and energy to have declined to 3.7% YoY, still a significantly high level. A moderation in Tokyo CPI inflation in December supports our view. CPI inflation in Japan is being supported by a strong job market but we expect negative wage growth rate to contain any further improvement.
ING
Japan's CPI inflation is expected to decelerate to 2.7% YoY in December with falling utility prices and other energy prices weighing on the overall number. Service sector prices, however, will likely rise on the back of high demand in travel related items such as accommodations and eating out.
Deutsche Bank
We expect core inflation ex. fresh food at 2.3% YoY and core-core ex. fresh food and energy at 3.7%, or +0.2% MoM for both.
SocGen
We forecast a fall in nationwide core CPI from +2.5% YoY in November to +2.3% YoY in December. The impact of high growth in 2022 will be evident, putting downward pressure on food and energy. On the other hand, we expect nationwide core CPI growth to jump in February 2024, as the YoY downward contribution from measures to reduce the burden of electricity and gas bills will disappear. On a YoY basis, we forecast a rise in nationwide core CPI of nearly 3%.
Citi
We expect nationwide core CPI (excluding only fresh food) to increase 2.3% YoY in December, down from a 2.5% YoY advance in November. The negative contribution of energy likely increased, reflecting the base effect. Meanwhile, CPI excluding fresh food and energy likely increased 3.8% YoY in December as in November. Core CPI inflation excluding special factors (i.e., energy, mobile phone charges and hotel charges) probably increased 2.83% YoY in December, effectively unchanged from a 2.82% YoY rise in November.
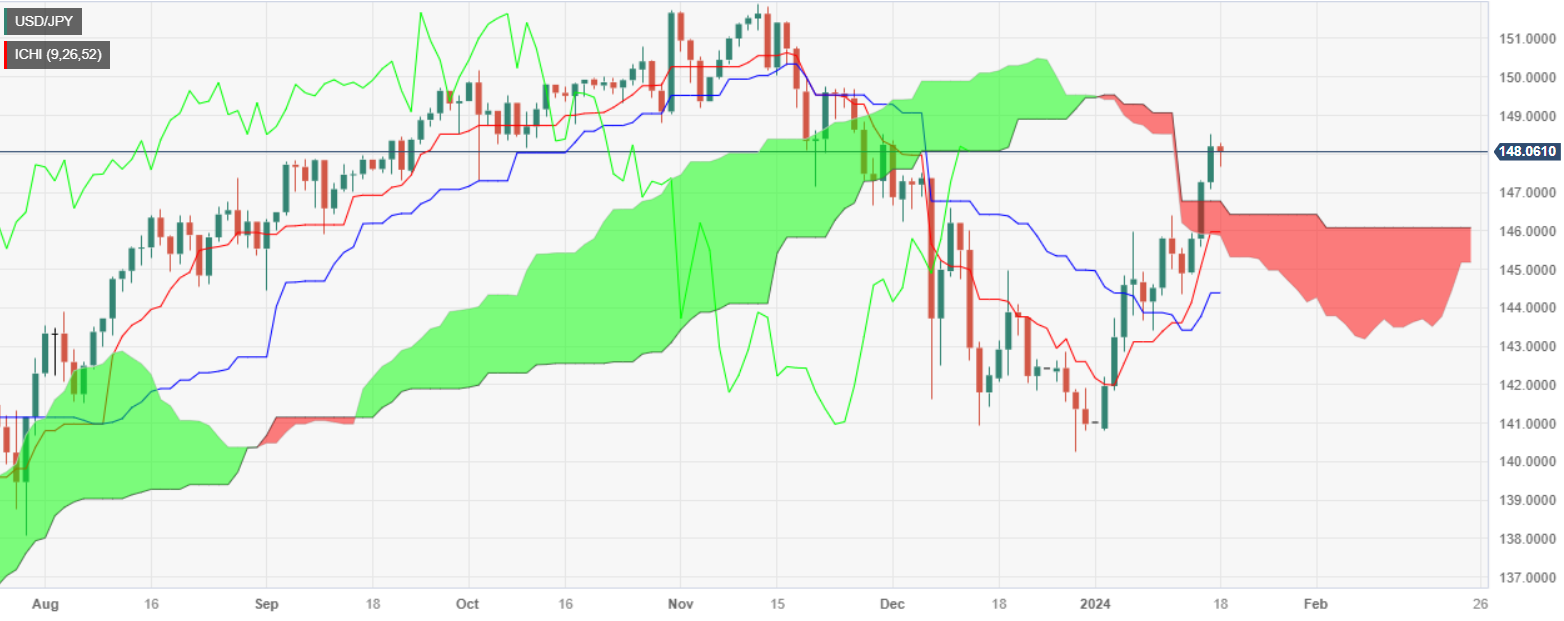
- USD/JPY modestly gains, driven by robust US labor market and global central bank rate cut policies.
- Tight US labor market evident in Initial Jobless Claims; 4.11% stable US 10-year Treasury yield moderates USD rise.
- Contrasting economic indicators: Mixed US housing data and weak Japanese machinery orders affect USD/JPY.
The USD/JPY registered modest gains on Thursday as economic data released by the US Department of Labor (DoL) shows the labor market is running hot amid higher interest rates set by the Federal Reserve. That, along with global central bank speakers pushing back against rate-cut bets by traders, triggered a rise in US treasury yields since Tuesday. Nevertheless, as the North American session begins, US yields are dragged down, and the major aims higher 0.05%, trading at 148.12.
Strong US labor market data caps US 10-year T-note yield losses, boosts USD/JPY
The US economy remains resilient, as shown by data revealed so far during the week. Today, Initial Jobless Claims for the week ending January 13 increased by 187K, less than the previous week and the consensus of 207K, an indication of a tight labor market. Nevertheless, the latest Beige Book released on Wednesday by the Fed showed that “nearly all districts cited one or more signs of a cooling labor market.”
At the same time, US housing data was mixed, with Binding Permits rising 1.9% or 1.495 million, compared with November’s 1.467 million, and exceeded forecasts of 1.48 million. On the contrary, Housing Starts dropped from 1.525 million in November to 1.46 million in December, a contraction of -4.3%, revealed the US Commerce Department.
Following the data, the USD/JPY witnessed a slight recovery, while the US 10-year Treasury note yield is almost flat at 4.11%, helping the Greenback’s (USD) to cap earlier losses against the Japanese Yen (JPY).
On the Japanese front, Machinery orders came soft at -4.9% MoM, plunged more than the -0.8% estimated by analysts in October, while annual base figures plummeted -5.0% vs. 0.1% foreseen. IT should be said it’s the weakest report since August, and recent data has brushed aside the chances of the Bank of Japan (BoJ) to normalize monetary policy.
USD/JPY Price Analysis: Technical outlook
Three days ago, the USD/JPY broke above the Ichimoku Cloud (Kumo) a further confirmation of the bullishness of the pair, but it has fallen short of cracking the next cycle high at 148.52, ahead of challenging 149.00. A further upside is seen at the 150.00 psychological figure. However, a downward retracement could happen if sellers push prices below the January 17 low of 147.05, which would exacerbate a downward move toward the top of the Kumo at 146.76 before dropping to the Senkou Span B at 146.08.
Gold (XAU/USD) is likely to benefit from the transition from tightening to easing, with sustained macroeconomic and geopolitical uncertainties in 2024, analysts at ANZ Bank say.
Time to shine
Gold is set to benefit from easing monetary policy, elevated geopolitical risks and strong central bank buying.
Given the low investor allocation to the sector, any rebound in investment demand will be a powerful tailwind.
We expect Gold prices to average above $2,000 over 2024.
See – Gold Price Forecast: XAU/USD likely to see data-driven volatility as $2,200 Q2 target is in sight – TDS
In 2023, the Mexican Peso (MXN) gained around 15% against the US Dollar (USD) on a spot return basis. Economists at Rabobank analyze MXN outlook.
MXN to outperform most of its EM peers
Banxico will start to cut rates this year, and we expect at a more rapid pace than the Fed, but FX is a relative game, and the rest of the LatAm region has already started cutting rates, so MXN remains relatively attractive compared to the rest of the region. When adjusting for volatility and liquidity, we still view MXN as the most attractive carry currency in the world.
Although we see some potential weakness against USD later in the year as Banxico’s rate cuts get underway, we expect MXN to outperform most of its EM peers.
- AUD/USD has faced selling pressure near 0.6570 amid a sharp recovery in the US Dollar Index.
- The USD Index recovers as the odds of an interest rate cut by the Fed is fading away.
- Australian Employment remains softer amid higher interest rates.
The AUD/USD pair retreats from 0.6570 as the US Dollar Index (DXY) has recovered swiftly in the early New York session. The Aussie asset has faced pressure as the market mood has turned cautious amid uncertainty over Federal Reserve (Fed) rate cut bets.
The S&P500 futures have surrendered majority of gains generated in the European session, indicating that investors’ risk-appetite has declined again. The USD Index has recovered strongly to near monthly high of 103.60 as the odds of an interest rate cut decision by the Fed in March are fading away. 10-year US Treasury yields have climbed to near 4.12%.
Fed policymakers have been reiterating the need of keeping interest rates escalated for a longer period due to robust consumer spending and strengthening labor market conditions. The US Department of Labor has reported that weekly jobless claims were significantly lower. Individuals claiming jobless benefits for the week ending January 12 were lower at 187K versus. expectations of 203K and the prior reading of 207K.
Meanwhile, investors await commentary from Atlanta Fed Bank President Raphael Bostic. Fed Bostic is expected to maintain a hawkish guidance on interest rates. He is expected to endorse higher interest rates till the Fed get confident that inflation will return to 2% in a sustainable manner.
The Australian Dollar remains under pressure amid weak labor market data for December. The Australian employers laid-off 65.1K against 72.6K additions in November. The Unemployment Rate remained in-line with estimates and prior release of 3.9%. This has provided some relief to Reserve Bank of Australia (RBA) policymakers, which are consistently focusing on brining down inflation to 2%.
Economists at Rabobank analyze USD/JPY outlook ahead of Japan’s December Consumer Price Index (CPI) inflation data.
Selling pressure on JPY if CPI report confirms that inflation in Japan has peaked
Further confirmation that CPI inflation in Japan has peaked would likely add to the selling pressure on the JPY in the near-term.
Given our view that the market will continue to unwind optimism regarding the pace of Fed rate cuts this year, we expect further broad-based gains for the USD on a 1-to-3-month view.
We have revised up our one-month USD/JPY forecast to 148.00 from a previous forecast of 144.00.
According to the Manufacturing Business Outlook Survey carried out by the Reserve Bank of Philadelphia, the index, which gauges the current general activity in the sector, rose to -10.6 in the first month of 2024.
Further data saw the indices for New Orders and Shipments at -17.9 and -6.2, respectively, while the Employment index also ticked higher to -1.8 and the Prices Paid index receded to 11.3.
The US Dollar (USD) trades directionless on Thursday in light trade. Shaun Osborne, Chief FX Strategist at Scotiabank, analyzes Greenback’s outlook.
USD strength in the next few weeks
I do not think the USD will fall too far at the moment and dips remain a buying opportunity against the core majors.
Higher US yields, seasonal trends and longer-term technical pointers are aligned in pointing to USD strength in the next few weeks at least.
See: USD Index to trade in a 103.00-104.00 range in the near term – ING
- Initial Jobless Claims rose by 187K in the second week of the year.
- Continuing Jobless Claims also retreated in the week to January 6.
US citizens that applied for unemployment insurance benefits increased by 187K in the week ending January 13, the lowest reading since late September 2022, showed the US Department of Labor (DoL) on Thursday. The reading came in below market estimates and follows a 203K gain in the previous week.
Further details of the publication revealed that the advance seasonally adjusted insured unemployment rate was 1.2% and the 4-week moving average stood at 203.25K, a decrease of 4.750K from the previous week's revised average.
In addition, Continuing Claims dropped by 26K to 1.806M in the week ended January 6.
Market reaction
The US Dollar Index rose to a new intraday high past 102.50 soon after the publication of weekly labour market data, maintaining the weekly constructive tone unchanged.
- NZD/USD faces pressure while attempting to extend recovery above 0.6120.
- Fed policymakers lacks evidence indicating that inflation will return to 2% on a sustainable basis.
- The kiwi asset oscillates around the 50% Fibo retracement.
The NZD/USD pair struggles to extend recovery above the immediate resistance of 0.6130 in the late European session. The kiwi asset faces pressures as the broader demand remains downbeat due to easing odds of early rate cut announcements by the Federal Reserve (Fed).
Investors turn uncertain about when the Fed will start reducing interest rates due to robust consumer spending in December, which has prompted fears of inflation remaining persistent ahead. Also, Fed policymakers are supporting interest rates at restrictive levels to confirm that inflation will return to the 2% target in a sustainable manner.
Meanwhile, investors shift focus towards the Fed’s monetary policy meeting, which is scheduled for late January. The Fed is widely anticipated to keep interest rates unchanged in the range of 5.25-5.50% for the fourth time in a row. Investors will keep focus on how policymakers will position three rate cuts if they maintain a hawkish guidance for March monetary policy.
The demand for currencies, which are proxy to the Chinese economic prospects are facing significant pressure. The Chinese economy is struggling to deliver a decent post-Covid recovery. China’s annual Retail Sales for December were significantly lower due to weak domestic demand.
NZD/USD hovers near the 50% Fibonacci retracement (placed from 26 October 2023 low at 0.5772 to 26 December 2023 high at 0.6410) at 0.6090. The near-term appeal has turned bearish as the asset has slipped below the 50-period Exponential Moving Average (EMA), which is around 0.6160.
The Relative Strength Index (RSI) (14) has slipped below 40.00, indicating activation of a bearish momentum.
Fresh downside could appeal if the asset drops below January 17 low at 0.6090, which will expose it towards 11 October 2023 high at 0.6056, followed by the psychological support of 0.6000.
In an alternate scenario, further recovery above the 38.2% Fibo retracement at 0.6164, which would drive the asset towards January 16 high at 0.6208 and January 15 high around 0.6250.
NZD/USD daily chart
-638411817628159114.png)
GBP/JPY rally falters at 188.00, the broader trend remains positive
- Sterling's rally stalls below 188.00, with the bullish trend intact
- Hopes of a dovish BoJ are weighing on a deeper Yen recovery.
- The strong UK CPI dampened hopes of BoE cuts and boosted the Pound across the board.
The Sterling is going through marginal losses on Thursday, with the pair reaching heavily overbought levels following a strong appreciation on Wednesday. This has allowed the battered Japanese Yen to trim some losses, although the broader trend remains bullish.
The pair is consolidating gains, with downside attempts limited above 187.30 so far. The stronger-than-expected UK Consumer Prices Index (CPI) released on Thursday poured cold water on BoE easing expectations and boosting the GBP across the board.
On the contrary, the Bank of Japan is widely expected to maintain its ultra-loose policy at next week’s meeting. The soft Tokyo CPI levels and the low wage growth seen earlier in January are anticipating a weaker inflation report later today, that will ease pressure on the Japanese central bank to normalize its monetary policy.
Data released today showed that Japanese Machinery orders declined well beyond expectations in November, increasing negative pressure on the Yen.
GBP/JPY remains bullish aiming to levels above 188.00
Technical indicators remain pointing higher, with the current pullback seen as a correction from overbought levels. The pair remains steady above previous highs, with support levels at 186.90 and 186.10 likely to hold bears.
On the upside, the 188.00 area is the 161,8% Fibonacci extension of the early January rally, often a significant resistance level. Above here, December’s high, at 189.65, and the 190.00 area will come into play.
Technical Levels to Watch
The Canadian dollar (CAD) has gained a little ground on the session. Economists at Scotiabank analyze Loonie’s outlook.
Technicals warrant attention
Spot losses from the intraday high on Wednesday leave a bit of a dent in the short-term technical outlook for USD/CAD.
A bear reversal pattern developed on the 6-hour chart and the daily pattern of trade suggests a stall in the USD’s bull move against the 50% retracement resistance from the USD’s Q4 decline. This warrants close attention.
Underlying trend momentum remains USD-bullish, suggesting that the USD should remain supported on minor dips for now.
Initial support sits at 1.3440/1.3450. More important support is at 1.3410/1.3415; weakness below here would point to deeper USD losses.
Cable’s rebound from 1.2600 on Wednesday extends range trade. Economists at Scotiabank analyze the GBP/USD outlook.
Selling pressure merging above 1.2700
Wednesday’s squeeze higher in the Pound perpetuates the broader sideways range in Cable for a little longer.
The GBP’s bullish reaction to Wednesday’s test of the 1.2600 range base in place over the past month is showing signs of petering out in the low-1.2700s intraday, however, with the short-term charts reflecting better selling pressure merging above 1.2700.
Minor support is 1.2675 intraday.
- The US Dollar remains steady near one-month highs with investors reassessing the chances of Fed cuts in March
- SNB Chairman, Thomas Jordan's hints at a monetary policy shift are weighing on the CHF.
- USD/CHF needs to breach the 0.8675 level to extend its recovery.
The US Dollar maintains its positive trend intact on Thursday. The pair’s downside attempts have been capped at 0.8630 and USD bulls remain focused on the 0.8675 resistance area.
Earlier today, SNB’s chairman, Thomas Jordan, complained about excessive Swiss Franc strength, suggesting that the bank could reconsider its monetary policy. These comments have sent the Swissie lower across the board.
In the US, the strong Retail Sales data released on Wednesday and the positive conclusions of the Fed’s Beige Book ad to evidence of the solid US economic momentum and increased doubts on a March rate cut.
The Focus now is on the US Weekly Jobless Claims and housing data. Apart from that, Atlanta Fed President Raphael Bostic will meet the press and give further clues about the bank’s monetary policy.
The pair is trending higher and has reached the 38.2% Fibonacci retracement of the late 2023 decline, at 0.8675 where it has met some resistance. Above here, the next targets are 0.8720 and the 50% Fib retracement, at 0.8780. Supports are 0.8615 and the previous resistance at 0.8575.
Technical Levels to Watch
- The US Dollar trades sideways while some mild risk on takes over.
- Traders look forward to the weekly US Jobless Claims data.
- The US Dollar Index failed to close above the important technical level of 103.40.
The US Dollar (USD) trades directionless on Thursday after rallying on Wednesday, when it nearly closed above the very important technical level of 103.40, which aligned with two moving averages. The US Dollar retreated in the last few hours of the US trading session on Wednesday and saw a daily close below the red line. Going forward, from a pure technical perspective, this means that the recent US Dollar rally could be short-lived.
On the economic front, two main elements are key to look out for besides the housing data, which is unlikely to be market moving: The Philadelphia Fed Manufacturing Survey for January will be crucial to see which way it goes after the recent plunge seen on a similar indicator gauging manufacturing activity in the New York state. A further contraction might trigger a full reversal of the US Dollar strength markets saw this week.
The other indicator to look at are weekly Jobless Claims. Markets could fully erase all the gains the Greenback had this week if Initial Jobless Claims jump further. Should Continuing Claims head above the previous number of 1,886,000, then expect a downward move in the US Dollar.
Daily digest market movers: Housing data not bearing much interest
- Thursday’s events kick off with comments from Atlanta Federal Reserve President Raphael Bostic, who due to speak near 12:30 GMT.
- Housing Starts data will be released at 13:30 GMT, together with Jobless Claims:
- Monthly Housing Starts for December are seen heading from 1.560 million to 1.426 million.
- Monthly Building Permits for December are expected to rise from 1.46 million to 1.48 million.
- Initial Jobless Claims are expected to jump from 202,000 to 207,000.
- Continuing Jobless Claims are seen rising from 1.834 million to 1.845 million.
- Philadelphia Fed Manufacturing Survey for January expected to jump from -10.5 to -7.
- The US Treasury will allocate a 4-week bill and a 10-year TIPS near 16:30 GMT and 18:00 GMT.
- Equity markets are trying to break the downbeat tone from this week. Asian indexes closed broadly flat, while European equities are trying to tie up with some small gains. US futures are flat and could still go either way.
- The CME Group’s FedWatch Tool shows that markets are pricing in a 97.4% chance that the Federal Reserve will keep interest rates unchanged at its January 31 meeting. Around 2.6% expect the first cut already to take place. The more traders reprice cuts to later this year, a small rate hike expectation might come through in the coming days.
- The benchmark 10-year US Treasury Note remains steady at 4.08% while the US Dollar Index has retreated a touch.
US Dollar Index Technical Analysis: Bulls playing with fire
The US Dollar Index (DXY) was unable to perform the best scenario to enter in a possible more lengthy period of Greenback strength. Although the rally could still turn into a longer uptrend, the fact that the DXY was unable to have a daily close above both the 55-day and the 200-day Simple Moving Average (SMA) at 103.40means issues ahead. The bulls can still salvage the situation this Thursday or Friday with still a close above the level, and squeeze out the final bearish elements present, before rallying further in the coming days.
The DXY is still trading near the 55-day and the 200-day Simple Moving Averages (SMA) at 103.39 and 103.45. In case the DXY can get through that area again, look for 104.44 as the first resistance level on the upside, in the form of the 100-day SMA. If that gets scattered as well, nothing will hold the DXY from heading to either 105.88 or 107.20, the high of September.
Risk of a bull trap is very much a possibility, where US Dollar bulls were caught buying into the Greenback when it broke above both the 55-day and the 200-day SMA in early Wednesday trading. Price action could decline substantially and force US Dollar bulls to sell their position at a loss. This would see the DXY first drop to 102.60, at the ascending trend line from September. Once threading below it, the downturn is open to head to 102.00.
US Dollar FAQs
What is the US Dollar?
The US Dollar (USD) is the official currency of the United States of America, and the ‘de facto’ currency of a significant number of other countries where it is found in circulation alongside local notes. It is the most heavily traded currency in the world, accounting for over 88% of all global foreign exchange turnover, or an average of $6.6 trillion in transactions per day, according to data from 2022.
Following the second world war, the USD took over from the British Pound as the world’s reserve currency. For most of its history, the US Dollar was backed by Gold, until the Bretton Woods Agreement in 1971 when the Gold Standard went away.
How do the decisions of the Federal Reserve impact the US Dollar?
The most important single factor impacting on the value of the US Dollar is monetary policy, which is shaped by the Federal Reserve (Fed). The Fed has two mandates: to achieve price stability (control inflation) and foster full employment. Its primary tool to achieve these two goals is by adjusting interest rates.
When prices are rising too quickly and inflation is above the Fed’s 2% target, the Fed will raise rates, which helps the USD value. When inflation falls below 2% or the Unemployment Rate is too high, the Fed may lower interest rates, which weighs on the Greenback.
What is Quantitative Easing and how does it influence the US Dollar?
In extreme situations, the Federal Reserve can also print more Dollars and enact quantitative easing (QE). QE is the process by which the Fed substantially increases the flow of credit in a stuck financial system.
It is a non-standard policy measure used when credit has dried up because banks will not lend to each other (out of the fear of counterparty default). It is a last resort when simply lowering interest rates is unlikely to achieve the necessary result. It was the Fed’s weapon of choice to combat the credit crunch that occurred during the Great Financial Crisis in 2008. It involves the Fed printing more Dollars and using them to buy US government bonds predominantly from financial institutions. QE usually leads to a weaker US Dollar.
What is Quantitative Tightening and how does it influence the US Dollar?
Quantitative tightening (QT) is the reverse process whereby the Federal Reserve stops buying bonds from financial institutions and does not reinvest the principal from the bonds it holds maturing in new purchases. It is usually positive for the US Dollar.
EUR/USD steadies but struggles to hold gains above 1.0900. Economists at Scotiabank analyze the pair’s outlook.
Support is 1.0845
The EUR squeezed a little higher from the intraday low on Wednesday, forming a minor bull ‘hammer’ pattern off the 200-DMA (1.0847 today). This too warrants attention.
EUR gains today have, however, failed to hold the intraday highs and very short-term price action is looking somewhat soft again on the session, suggesting the EUR is struggling to regain a 1.09 handle.
Resistance is 1.0920/1.0925. Support is 1.0845.
- The Canadian Dollar is bouncing up after a five-day losing streak.
- A brighter market mood and a moderate rebound in Crude prices are supporting the CAD.
- USD/CAD broader trend remains positive while above 1.3450.
The US Dollar paring some gains on Thursday. An improved risk sentiment and a moderate rebound in Oil prices have offset the positive impact of strong US data and are weighing on the Greenback.
Investors’ appetite for risk has increased on Thursday. Most European indexes are trading with gains, following a negative opening which is giving some respite to the Canadian Dollar and weighing on the safe-haven USD.
Beyond that Crude prices extended their rebound supported by a report by the International Energy Agency (IEA) which has upgraded the current year’s global demand for Oil.
Data released on Wednesday revealed that US Retail Sales increased beyond expectations in December. These figures highlight the strong solid momentum of the US economy and pour cold water over market expectations that the Fed will start cutting rates in March.
Also on Wednesday, Canada’s Industrial Production and the Raw Materials Prices Index contracted beyond expectations, increasing negative pressure on the loonie.
Today the focus will be on the US Weekly Jobless Claims and housing data. Beyond that Atlanta Fed President and CEO, Raphael Bostic will si expected to meet the press and his comments on the bank's monetary policy will be observed with attention.
The broader trend, however, remains positive, with the pair still above previous highs, at 1.3450. Below here, the next target is 1.3350. On the upside, resistances are 1.3545 and 1.3625.
Technical levels to watch
- Natural Gas trades in a tight range around $2.50.
- Traders see short-term reasons for sending Gas futures higher.
- The US Dollar Index remains steady in the mid-103.00 area after a failed close overnight.
Natural Gas (XNG/USD) is off the lows after its steep decline throughout this week. Although supply is still very much solid and flowing, there are a few elements that are starting to worry traders. The biggest factor is the escalation of tensions in Yemen, with more strikes in the Red Sea, and Iran attacking Pakistan.
Meanwhile, the US Dollar (USD) is playing with fire after the Greenback has been on a tear all week. In the late hours of the US closing bell on Wednesday, the US Dollar Index (DXY) retreated and failed to hold ground above two important technical supports. This means that the lifecycle of this recent US Dollar strength could be short-lived.
Natural Gas is trading at $2.51 per MMBtu at the time of writing.
Natural Gas market movers: Worries on the summer for Europe
- Frost in Texas and Louisiana is making it impossible to load US Liquified Natural Gas (LNG) onto carriers. This means some delay in deliveries in the short term even as warmer weather is expected to come in next week .
- Europe looks well equipped to get through the winter for this year. However, not many deals have been put on the table to get Gas in over the summer to get ready for the next winter. The longer this takes, the bigger the risk of a shortfall for next year.
- The situation in the Red Sea is entering a next level of heightened tensions with more attacks reported by US and UK forces in Yemen against Houthi rebels.
- Next to that, Iran has sent several high members of its civil guard to Yemen to stand with the Houthi rebels while Iran itself has performed attacks against Pakistan.
- At 15:30 GMT, the Energy Information Administration will release the weekly Gas Storage changes. Expectations are for a drawdown from 140 billion cubic metres to a drawdown of 164 billion cubic metres.
Natural Gas Technical Analysis: A bit too low
Natural Gas is trying to salvage a touch from its steep decline earlier this week. Seeing the above bullet points, the current level near $2.50 might be a bit too cheap. A risk premium to be added makes sense and could still come overtime, with a fair value seen near $2.70.
On the upside, Natural Gas is facing all the important Simple Moving Averages (SMA) as resistance levels. First up, nearby is the 200-day SMA near $2.75. Next up is the 55-day SMA at $2.85. Last but not least, the 100-day SMA is at $2.95, near $3.
The ascending trend line broke earlier this week and already triggered firm rejection on Wednesday at the top side. Support near $2.47 is held for now. In case Gas prices fall further, expect to see a full swing decline towards $2.20 and test the low of December.
-638411690408274009.png)
XNG/USD (Daily Chart)
Natural Gas FAQs
What fundamental factors drive the price of Natural Gas?
Supply and demand dynamics are a key factor influencing Natural Gas prices, and are themselves influenced by global economic growth, industrial activity, population growth, production levels, and inventories. The weather impacts Natural Gas prices because more Gas is used during cold winters and hot summers for heating and cooling. Competition from other energy sources impacts prices as consumers may switch to cheaper sources. Geopolitical events are factors as exemplified by the war in Ukraine. Government policies relating to extraction, transportation, and environmental issues also impact prices.
What are the main macroeconomic releases that impact on Natural Gas Prices?
The main economic release influencing Natural Gas prices is the weekly inventory bulletin from the Energy Information Administration (EIA), a US government agency that produces US gas market data. The EIA Gas bulletin usually comes out on Thursday at 14:30 GMT, a day after the EIA publishes its weekly Oil bulletin. Economic data from large consumers of Natural Gas can impact supply and demand, the largest of which include China, Germany and Japan. Natural Gas is primarily priced and traded in US Dollars, thus economic releases impacting the US Dollar are also factors.
How does the US Dollar influence Natural Gas prices?
The US Dollar is the world’s reserve currency and most commodities, including Natural Gas are priced and traded on international markets in US Dollars. As such, the value of the US Dollar is a factor in the price of Natural Gas, because if the Dollar strengthens it means less Dollars are required to buy the same volume of Gas (the price falls), and vice versa if USD strengthens.
AUD/USD staged a big rally in November/December. Economists at ING analyze Aussie’s outlook.
Pausing after the big rebound
Given the unstable risk sentiment, there is probably room for some correction or at least a pause before the uptrend resumes.
We expect the RBA to be less dovish than the Federal Reserve this year, cutting only from 4Q.
Policy differentials, undervaluation and lower global yields will, in our view, drive AUD/USD sustainably above 0.7000 in 2H24.
AUD/USD – 1M 0.6700 3M 0.6700 6M 0.6900 12M 0.7000
EUR/CHF is moving higher. Economists at ING analyze the pair’s outlook.
ECB might be pushing back against easing expectations
While the ECB might be pushing back against easing expectations, the SNB is pushing in favour of those easing expectations given the Swiss Franc is too strong.
We think the EUR/CHF pair can trade back up to the 0.9600 area over the next three months as ECB easing expectations are further reined in.
See: Swiss Franc vulnerable to a further sell-off in the near-term – MUFG
- EUR/GBP bounces from 0.8570 as ECB Lagarde pushes back aggressive rate cut hopes.
- The BoE is not expected to discuss rate-cuts anytime soon due to stubborn price pressures.
- Market participants await the UK Retail Sales data for further guidance.
The EUR/GBP pair recovers strongly from the crucial support of 0.8570 in the European session. The cross witnessed a decent buying interest despite stubborn price pressures in the United Kingdom economy have pushed back expectations of early rate cuts by the Bank of England (BoE).
Inflation in the UK economy unexpectedly remained stubborn amid increase in air fare prices and slight increase in services inflation. This has offered more room to BoE policymakers to keep interest rates unchanged at 5.25% ahead.
Meanwhile, investors await the UK Retail Sales data for December, which will provide fresh cues about inflation. As per the estimates, monthly sales at retail stores contracted by 0.3% after increasing strongly by 1.3% in November. In the same period, annual Retail Sales grew at a robust pace of 1.1% against slight increase of 0.1%.
An upbeat consumer spending report would allow BoE policymakers to stick with hawkish signals on the interest rate outlook.
In the BoE credit conditions survey, agency anticipates that default rates for mortgages and unsecured lending are expected to rise in the first quarter this year. Individuals are struggling to address higher interest obligations due to deepening cost-of-living crisis.
On the Eurozone front, the Euro finds strength as European Central Bank (ECB) President Christine Lagarde pushed back expectations of aggressive rate cuts. Lagarde said she expects rate cut decision in late summer as inflation is still higher than what the ECB has anticipated.
EUR/USD struggled to breach the 1.1000 level last year. Economists at BNP Paribas analyze the pair’s outlook for 2024.
Bullish scenario for EUR/USD in 2024
Although the ECB might initiate rate cuts before the Fed, we forecast fewer ECB cuts. This difference in monetary policy trajectories could favor EUR/USD through the interest rate differential.
Eurozone investors, currently overweight in US assets, might adjust their investment strategies. There's a potential shift towards reducing foreign debt purchases and increasing local asset holdings. This change could decrease the demand for US assets, indirectly benefiting EUR/USD.
We expect EUR/USD to reach 1.1500 by the end of 2024.
- The US Dollar is trimming gains with the upside trend intact.
- US jobless claims and housing data and the Japanese CPI figures are likely to define the pair’s direction.
- USD/JPY support levels at 147.11 and 146.35 are likely to hold bears.
The Japanese Yen is paring some losses on Thursday as the US Dollar and US Treasury yields’ recovery loses steam. The pair is trading below 148.00 after pulling back at 148.50 on Wednesday, although the broader trend remains positive.
The US Dollar is trading moderately lower on Thursday, as the positive impact of the upbeat US Retail Sales eased. Retail consumption increased at a 0.6% pace in December, beating market expectations of a 0.4% increment.
These figures highlight the solid economic momentum of the US economy, echoed by the conclusions of the Beige Book, and are expected to keep US Dollar downside attempts limited.
Later today, the US weekly jobless claims and housing data will provide further cues into the US economic outlook. The main focus, however, will be the Japanese CPI, the last key inflation gauge ahead of next week’s BoJ meeting.
Technical indicators remain bullish, although the overbought levels on intra-day charts allow for some downside correction. Support levis at 147.11 and 146.35 are likely to hold bears. Resistances are 148.50 and 149.75.
Technical levels to watch
Dollar takes a breather ahead of mid-tier US data. Economists at ING analyze Greenabck’s outlook.
Patience is required
Today sees slightly more settled market conditions, and on the US calendar are housing starts and initial claims – probably not market movers.
We are bearish on the Dollar this year, but patience is required. That can probably mean DXY does trade in a 103.00-104.00 range in the near term and potentially even into further event risks this month of the US quarterly refunding announcement (29 January) and the FOMC meeting (31 January).
- The Aussie has trimmed some losses on the back of a softer dollar but the broader bearish trend remains intact
- Australian data has shown mixed figures, the focus is now on US housing and jobless claims figures.
- AUD/USD is likely to meet resistance at 0.6545 and 0.6640.
The Australian Dollar is going through a mild recovery on Thursday, favored by a softer US Dollar. The pair has trimmed some losses, returning above 0.6550, although the broader trend remains negative.
Australian data has been mixed. The Consumer Inflation Expectations remained steady at 4.5% in January while the number of employed workers declined unexpectedly, suggesting that the labour market is losing steam.
Macroeconomic data from China released on Wednesday showed that the GDP grew at a 5.2% rate in 2023, below market expectations of a 5.3% growth. Beyond that, retail sales disappointed, reviving concerns about the sluggish post-COVID recovery and weighing on the Aussie as China is Australia's main trading partner.
From a wider perspective, the AUD/USD maintains the negative bias intact with the bearish cross in 4h SMAs adding weight to the pair. Aussie bulls are likely to find resistance at 0.6595 and 0.6640. On the downside, supports are 0.6520 and 0.6450.
Technical levels to watch
- Gold price discovers bets near $2,000 but remains on backfoot amid easing Fed rate cut hopes.
- Stubborn US inflation and robust Retail Sales data favour a maintenance of hawkish interest rate stance.
- Market participants will focus on Fed Bostic’s commentary ahead.
Gold price (XAU/USD) has executed a short-term recovery move in the midst of a persistent downtrend. Gold price printed a fresh monthly low near the psychological support of $2,000 on Wednesday, then bounced.
Yet despite the rebound, the precious metal remains on the backfoot as investors continue to worry about when the Federal Reserve (Fed) will start its long awaited rate-cut cycle. The hopes of an early rate-cut decision from the Fed are easing as the last leg of inflationary pressures in the United States is turning out significantly more stubborn than previously thought, due to robust consumer spending and steady labor market conditions.
Amid an absence of front-line economic indicators, market participants are expected to shift focus towards the first monetary policy meeting of the Fed, which is scheduled for January 31. The Fed is widely anticipated to keep interest rates unchanged in the range of 5.25-5.50%. Investors will keenly focus on how the Fed proposes to make three rate cuts of 25 basis points (bps) each in 2024, as projected in the December monetary policy meeting.
Daily Digest Market Movers: Gold price finds an interim support as US Dollar corrects
- Gold price discovers an intermediate support near the psychological $2,000 level after an intense sell-off.
- The near-term demand is still downbeat as uncertainty about an interest rate cut from the Federal Reserve in March has deepened.
- Trades have pared bets supporting a rate cut in March due to resilience in the US economy.
- Bets supporting an interest rate cut of 25-basis points (bps) have increased slightly to 61% but are still below the 75% recorded last week, as per the CME Fedwatch tool.
- Market expectations for early cuts from the Fed have been pushed back as price pressures in the US economy remained stubborn and consumer spending grew strongly in December.
- Upbeat economic indicators have provided room to Fed policymakers to maintain a restrictive monetary policy stance for a longer period than that anticipated by market participants before their release.
- This week, Fed Governor Christopher Waller said the central bank should not rush taking interest rates down as more evidence is needed to ensure that price pressures are returning to 2% in a sustainable manner.
- Christopher Waller advised that the Fed should reduce interest rates “carefully and methodically”, considering resilience in the US economy.
- Meanwhile, the US Dollar Index (DXY) has rebounded after a gradual correction to near 103.20, supported by risk-off market sentiment. 10-year US Treasury yields are maintaining a firm-footing above 4%.
- Later the day, investors will focus on the weekly jobless claims for the week ending December 12 and commentary from Federal Reserve of Atlanta Bank President Raphael Bostic.
- Bostic is expected to maintain a hawkish argument considering stubbornly higher price pressures.
- On Monday, Fed’s Bostic commented that progress in inflation declining towards 2% could slow if policymakers cut interest rates soon.
Technical Analysis: Gold price finds a temporary support near $2,000
Gold price attempts a firm-footing near psychological support at $2,000 amid a nominal decline in the US Dollar Index. The near-term demand for the precious metal has turned bearish as it has slipped below the 50-period Exponential Moving Average (EMA), which trades around $2,017. The higher-high-higher-low formation in the Gold price is over and market participants could utilize pullbacks for building fresh shorts.
The 14-period Relative Strength Index (RSI) has dropped to near 40.00. If the RSI fails to sustain above 40.00 levels, a bearish momentum will get triggered.
Gold FAQs
Why do people invest in Gold?
Gold has played a key role in human’s history as it has been widely used as a store of value and medium of exchange. Currently, apart from its shine and usage for jewelry, the precious metal is widely seen as a safe-haven asset, meaning that it is considered a good investment during turbulent times. Gold is also widely seen as a hedge against inflation and against depreciating currencies as it doesn’t rely on any specific issuer or government.
Who buys the most Gold?
Central banks are the biggest Gold holders. In their aim to support their currencies in turbulent times, central banks tend to diversify their reserves and buy Gold to improve the perceived strength of the economy and the currency. High Gold reserves can be a source of trust for a country’s solvency. Central banks added 1,136 tonnes of Gold worth around $70 billion to their reserves in 2022, according to data from the World Gold Council. This is the highest yearly purchase since records began. Central banks from emerging economies such as China, India and Turkey are quickly increasing their Gold reserves.
How is Gold correlated with other assets?
Gold has an inverse correlation with the US Dollar and US Treasuries, which are both major reserve and safe-haven assets. When the Dollar depreciates, Gold tends to rise, enabling investors and central banks to diversify their assets in turbulent times. Gold is also inversely correlated with risk assets. A rally in the stock market tends to weaken Gold price, while sell-offs in riskier markets tend to favor the precious metal.
What does the price of Gold depend on?
The price can move due to a wide range of factors. Geopolitical instability or fears of a deep recession can quickly make Gold price escalate due to its safe-haven status. As a yield-less asset, Gold tends to rise with lower interest rates, while higher cost of money usually weighs down on the yellow metal. Still, most moves depend on how the US Dollar (USD) behaves as the asset is priced in dollars (XAU/USD). A strong Dollar tends to keep the price of Gold controlled, whereas a weaker Dollar is likely to push Gold prices up.
- The Euro picks up as risk aversion eases, although the broader bearish trend remains intact.
- The strong US Retail Sales have contributed to pushing back hopes of imminent Fed rate cuts.
- ECB President Lagarde discarded any aggressive easing on Wednesday, which provided some support to the Euro.
The Euro (EUR) is paring some losses on Thursday’s European session. The US Dollar Index has retreated from one-month highs, as the impact of the strong US Retail Sales data faded, although the broader EUR/USD trend remains negative.
US Retail Sales beat expectations on Wednesday, adding to evidence of the solid US economy and endorsing the recent comments from Federal Reserve (Fed) officials, who said it is too early to cut interest rates.
Somewhat later, European Central Bank (ECB) President Christine Lagarde spoke at the Davos summit to discard any aggressive rate cuts and push the bank’s dovish pivot to the next summer. This has provided some support to the Euro.
Later today, a speech by the Atlanta Fed President, Raphael Bostic, the US weekly Jobless claims and housing data are likely to give some guidance to the US Dollar. After that, ECB’s Lagarde is expected to take the stage in Davos again.
Daily digest market movers: Euro posts moderate recovery as USD takes a breather
- The Euro is nudging higher, supported by easing risk aversion, although the broader trend remains bearish.
- US Retail sales increased 0.6% in December, above November’s 0.3% increase and beating expectations of a 0.4% increase.
- These figures confirm the solid US economic momentum and suggest that the Fed has still some work to do to bring inflation down to target.
- The Fed Beige book underscored the solid US economic momentum, reflecting strong consumption levels in Christmas, increased traveling, and higher credit card lending.
- The market keeps paring back hopes of Fed cuts in March. The CME Group Fed Watch Tool shows a 63% chance that the US central bank will start easing in March, from levels above 70% earlier this week.
- Geopolitical tensions continue escalating. News that Pakistan has attacked Iran in retaliation for Tehran’s offensive earlier this week is likely to curb investors’ appetite for risk and limit the Euro’s recovery.
Technical Analysis: EUR/USD likely to meet resistance at 1.0930
The EUR/USD pair is going through a moderate recovery, after having found support at 1.0845 lows on Wednesday. A somewhat xxxx after US Dollar is contributing to the common currency’s rebound, although the broader trend remains negative.
Euro bulls are likely to meet a significant resistance at the 1.0930 area, where a previous trendline resistance and the confluence of the 4-hour 200 and 50 SMAs will challenge bulls.
The pair would need to confirm above that level to ease negative pressure and set its focus back to the previous lower high, at 1.1000.
On the contrary, a reversal at current levels would give fresh hopes for bears to breach Wednesday’s low at 1.8040, confirming below the neckline of a bearish Head and Shoulders (H&S) pattern.
The next targets, in this case, would be 1.0800 and 1.0725. The H&S measured target is the 78.6% Fibonacci retracement of the aforementioned rally at 1.0600.
Euro FAQs
What is the Euro?
The Euro is the currency for the 20 European Union countries that belong to the Eurozone. It is the second most heavily traded currency in the world behind the US Dollar. In 2022, it accounted for 31% of all foreign exchange transactions, with an average daily turnover of over $2.2 trillion a day.
EUR/USD is the most heavily traded currency pair in the world, accounting for an estimated 30% off all transactions, followed by EUR/JPY (4%), EUR/GBP (3%) and EUR/AUD (2%).
What is the ECB and how does it impact the Euro?
The European Central Bank (ECB) in Frankfurt, Germany, is the reserve bank for the Eurozone. The ECB sets interest rates and manages monetary policy.
The ECB’s primary mandate is to maintain price stability, which means either controlling inflation or stimulating growth. Its primary tool is the raising or lowering of interest rates. Relatively high interest rates – or the expectation of higher rates – will usually benefit the Euro and vice versa.
The ECB Governing Council makes monetary policy decisions at meetings held eight times a year. Decisions are made by heads of the Eurozone national banks and six permanent members, including the President of the ECB, Christine Lagarde.
How does inflation data impact the value of the Euro?
Eurozone inflation data, measured by the Harmonized Index of Consumer Prices (HICP), is an important econometric for the Euro. If inflation rises more than expected, especially if above the ECB’s 2% target, it obliges the ECB to raise interest rates to bring it back under control.
Relatively high interest rates compared to its counterparts will usually benefit the Euro, as it makes the region more attractive as a place for global investors to park their money.
How does economic data influence the value of the Euro?
Data releases gauge the health of the economy and can impact on the Euro. Indicators such as GDP, Manufacturing and Services PMIs, employment, and consumer sentiment surveys can all influence the direction of the single currency.
A strong economy is good for the Euro. Not only does it attract more foreign investment but it may encourage the ECB to put up interest rates, which will directly strengthen the Euro. Otherwise, if economic data is weak, the Euro is likely to fall.
Economic data for the four largest economies in the euro area (Germany, France, Italy and Spain) are especially significant, as they account for 75% of the Eurozone’s economy.
How does the Trade Balance impact the Euro?
Another significant data release for the Euro is the Trade Balance. This indicator measures the difference between what a country earns from its exports and what it spends on imports over a given period.
If a country produces highly sought after exports then its currency will gain in value purely from the extra demand created from foreign buyers seeking to purchase these goods. Therefore, a positive net Trade Balance strengthens a currency and vice versa for a negative balance.
Interest rates FAQs
What are interest rates?
Interest rates are charged by financial institutions on loans to borrowers and are paid as interest to savers and depositors. They are influenced by base lending rates, which are set by central banks in response to changes in the economy. Central banks normally have a mandate to ensure price stability, which in most cases means targeting a core inflation rate of around 2%.
If inflation falls below target the central bank may cut base lending rates, with a view to stimulating lending and boosting the economy. If inflation rises substantially above 2% it normally results in the central bank raising base lending rates in an attempt to lower inflation.
How do interest rates impact currencies?
Higher interest rates generally help strengthen a country’s currency as they make it a more attractive place for global investors to park their money.
How do interest rates influence the price of Gold?
Higher interest rates overall weigh on the price of Gold because they increase the opportunity cost of holding Gold instead of investing in an interest-bearing asset or placing cash in the bank.
If interest rates are high that usually pushes up the price of the US Dollar (USD), and since Gold is priced in Dollars, this has the effect of lowering the price of Gold.
What is the Fed Funds rate?
The Fed funds rate is the overnight rate at which US banks lend to each other. It is the oft-quoted headline rate set by the Federal Reserve at its FOMC meetings. It is set as a range, for example 4.75%-5.00%, though the upper limit (in that case 5.00%) is the quoted figure.
Market expectations for future Fed funds rate are tracked by the CME FedWatch tool, which shapes how many financial markets behave in anticipation of future Federal Reserve monetary policy decisions.
The Swiss Franc (CHF) has been correcting lower at the start of the calendar year. Economists at MUFG Bank analyze CHF outlook.
SNB signals more concern over Franc strength
SNB President Jordan stated that ‘for quite a long time we had mainly a nominal appreciation – that was very helpful because it shielded us from the inflation pressure from abroad. However, in the last couple of weeks of last year, we saw real appreciation. That makes the situation for some of our firms more difficult’.
The comments have encouraged speculation that the SNB could act to weaken the Franc if verbal intervention is not sufficient to reverse CHF strength.
The comments from President Jordan will encourage speculation that the SNB could switch back to foreign purchases to help weaken the Franc if required, and/or start cutting rates ahead of the ECB.
At the same time, the reversal of Swiss Franc strength is being encouraged by the paring back of expectations for earlier rate cuts from the ECB and Fed.
Overall, the developments leave the Franc vulnerable to a further sell-off in the near-term as it continues to reverse strong gains from the end of last year.
Gold prices fell in India on Thursday, according to data from India's Multi Commodity Exchange (MCX).
Gold price stood at 61,755 Indian Rupees (INR) per 10 grams, down INR 62 compared with the INR 61,817 it cost on Wednesday.
As for futures contracts, Gold prices increased to INR 61,685 per 10 gms from INR 61,505 per 10 gms.
Prices for Silver futures contracts decreased to INR 71,520 per kg from INR 71,456 per kg.
| Major Indian city | Gold Price |
|---|---|
| Ahmedabad | 63,875 |
| Mumbai | 63,760 |
| New Delhi | 63,775 |
| Chennai | 63,900 |
| Kolkata | 63,945 |
Global Market Movers: Comex Gold price holds the bounce amid a risk-off mood
- A modest US Dollar downtick, along with geopolitical tensions and China's economic woes, assists the Comex Gold price in attracting some buyers in the vicinity of the $2,000 psychological mark on Thursday.
- Yemen-based Houthi rebels claimed their second attack this week on a US-operated vessel in the Red Sea and have threatened to expand attacks in response to the American and British strikes.
- Pakistan undertook series of military strikes against terrorist hideouts in Sistan-Baluchistan province of Iran and said that it will continue to take all necessary steps to safeguard its people.
- China’s economy grew at an annual rate of 5.2% in the final quarter of 2023, more than the official 5% target, though investors remain concerned amid mounting deflationary risks and tepid demand.
- Data released on Wednesday showed that the headline US Retail Sales increased more than anticipated, by 0.6% in December, while core sales – excluding autos – also topped market estimates.
- The data points to still-resilient consumer spending and the underlying strength that the US economy possessed, which could provide the Fed more headroom to keep rates higher for longer.
- Furthermore, Fed Governor Christopher Waller said on Tuesday that the central bank should not rush to cut interest rates until it was clear lower inflation would be sustained.
- The yield on the benchmark 10-year US government bond holds comfortably above the 4% mark, near its highest level since December 13, and should lend some support to the Greenback.
- Traders now look to Thursday's US economic docket – featuring the release of Weekly Initial Jobless Claims, the Philly Fed Manufacturing Index and housing market data – for a fresh impetus.
(An automation tool was used in creating this post.)
Gold FAQs
Why do people invest in Gold?
Gold has played a key role in human’s history as it has been widely used as a store of value and medium of exchange. Currently, apart from its shine and usage for jewelry, the precious metal is widely seen as a safe-haven asset, meaning that it is considered a good investment during turbulent times. Gold is also widely seen as a hedge against inflation and against depreciating currencies as it doesn’t rely on any specific issuer or government.
Who buys the most Gold?
Central banks are the biggest Gold holders. In their aim to support their currencies in turbulent times, central banks tend to diversify their reserves and buy Gold to improve the perceived strength of the economy and the currency. High Gold reserves can be a source of trust for a country’s solvency. Central banks added 1,136 tonnes of Gold worth around $70 billion to their reserves in 2022, according to data from the World Gold Council. This is the highest yearly purchase since records began. Central banks from emerging economies such as China, India and Turkey are quickly increasing their Gold reserves.
How is Gold correlated with other assets?
Gold has an inverse correlation with the US Dollar and US Treasuries, which are both major reserve and safe-haven assets. When the Dollar depreciates, Gold tends to rise, enabling investors and central banks to diversify their assets in turbulent times. Gold is also inversely correlated with risk assets. A rally in the stock market tends to weaken Gold price, while sell-offs in riskier markets tend to favor the precious metal.
What does the price of Gold depend on?
The price can move due to a wide range of factors. Geopolitical instability or fears of a deep recession can quickly make Gold price escalate due to its safe-haven status. As a yield-less asset, Gold tends to rise with lower interest rates, while higher cost of money usually weighs down on the yellow metal. Still, most moves depend on how the US Dollar (USD) behaves as the asset is priced in dollars (XAU/USD). A strong Dollar tends to keep the price of Gold controlled, whereas a weaker Dollar is likely to push Gold prices up.
EUR/USD remains just below 1.0900. Economists at ING analyze the pair’s outlook.
December ECB minutes the highlight today
For today, the highlight will be the release of the European Central Bank minutes and President Christine Lagarde speaking on a panel. Her message on Wednesday was a little mixed. Like other ECB members, she presented a view that aggressive market pricing of the ECB easing cycle was self-defeating. But then she said the ECB would cut rates in the summer. We doubt the ECB minutes will shed too much light on this dilemma.
EUR/USD may well trade in a tight 1.0880-1.0950 range today, but we see no reason to change our current forecast of 1.0800 for the end of 1Q.
In its monthly oil market report published on Thursday, the International Energy Agency (IEA) lifted the global oil demand growth forecast for 2024.
Key takeaways
2024 world oil demand growth forecast raised by 180k bpd to 1.24 mil bpd.
Economic outlook has improved over the last few months amid dovish pivot in central bank policy.
Q4 2023 slump in oil prices to act as additional tailwind.
Strong growth from non-OPEC+ producers could lead to substantial surplus if OPEC+ cuts are unwound.
Barring significant disruptions to oil flows, market looks reasonably well supplied in 2024.
Market reaction
WTI keeps its consolidative mode intact at around $73 on the above findings, up 0.23% on the day.
WTI Oil FAQs
What is WTI Oil?
WTI Oil is a type of Crude Oil sold on international markets. The WTI stands for West Texas Intermediate, one of three major types including Brent and Dubai Crude. WTI is also referred to as “light” and “sweet” because of its relatively low gravity and sulfur content respectively. It is considered a high quality Oil that is easily refined. It is sourced in the United States and distributed via the Cushing hub, which is considered “The Pipeline Crossroads of the World”. It is a benchmark for the Oil market and WTI price is frequently quoted in the media.
What factors drive the price of WTI Oil?
Like all assets, supply and demand are the key drivers of WTI Oil price. As such, global growth can be a driver of increased demand and vice versa for weak global growth. Political instability, wars, and sanctions can disrupt supply and impact prices. The decisions of OPEC, a group of major Oil-producing countries, is another key driver of price. The value of the US Dollar influences the price of WTI Crude Oil, since Oil is predominantly traded in US Dollars, thus a weaker US Dollar can make Oil more affordable and vice versa.
How does inventory data impact the price of WTI Oil
The weekly Oil inventory reports published by the American Petroleum Institute (API) and the Energy Information Agency (EIA) impact the price of WTI Oil. Changes in inventories reflect fluctuating supply and demand. If the data shows a drop in inventories it can indicate increased demand, pushing up Oil price. Higher inventories can reflect increased supply, pushing down prices. API’s report is published every Tuesday and EIA’s the day after. Their results are usually similar, falling within 1% of each other 75% of the time. The EIA data is considered more reliable, since it is a government agency.
How does OPEC influence the price of WTI Oil?
OPEC (Organization of the Petroleum Exporting Countries) is a group of 13 Oil-producing nations who collectively decide production quotas for member countries at twice-yearly meetings. Their decisions often impact WTI Oil prices. When OPEC decides to lower quotas, it can tighten supply, pushing up Oil prices. When OPEC increases production, it has the opposite effect. OPEC+ refers to an expanded group that includes ten extra non-OPEC members, the most notable of which is Russia.
- USD/MXN retraces its recent losses on risk aversion sentiment.
- The upcoming Mexico and the US elections could exert pressure on the MXN.
- US Dollar recovers its intraday losses despite downbeat US bond yields.
USD/MXN retraces its recent losses, which could be attributed to the risk aversion sentiment in the market. The USD/MXN pair trades higher near 17.21 during the European session on Thursday. The analysis from TD Securities indicates that the performance of the Mexican Peso (MXN) is largely influenced by factors related to the United States (US). The returns on MXN appear to be primarily explained by US and global macroeconomic conditions.
Consequently, if there is a slowdown in the US economy and the US Federal Reserve (Fed) embarks on an aggressive cutting cycle in 2024, it could prompt markets to factor in more rate cuts by the Bank of Mexico (Banxico), potentially leading to underperformance of the Mexican Peso.
Moreover, the upcoming 2024 elections in both Mexico and the US are anticipated to introduce additional uncertainties and volatility, potentially exerting further pressure on the performance of the Mexican Peso.
Mexico's economic calendar lacked notable events during the week, and market participants anticipate the release of November's Retail Sales data. Projections suggest month-over-month and year-over-year ease at 0.5% and 3.2%, respectively, falling short of the previous figures.
The US Dollar (USD) recovers its intraday losses, trading around 103.30 despite the subdued US Treasury yields. As of the press time, the 2-year and 10-year yields are standing at 4.32% and 4.08%, respectively.
The US Dollar continues to receive support from positive investor sentiment, as expectations for the Federal Reserve's (Fed) initial rate cut in March have diminished. This adjustment is reinforced by robust US Retail Sales data released on Wednesday.
Market participants are expected to closely monitor the upcoming release of US housing data scheduled for Thursday, which could provide further insights into the economic landscape and influence the direction of the USD/MXN pair.
Economists at Commerzbank analyze AUD outlook after downbeat Australian employment data.
Increasing risk that the RBA will start cutting rates sooner rather than later
Australian employment figures were much worse than expected. With job losses of around 65 thousand, the report was the worst since the peak of the coronavirus pandemic. However, there are also some less negative signals. The unemployment rate has remained constant, thanks to the sharp drop in the participation rate.
The latest figures certainly increase the risk that the RBA will start cutting rates sooner rather than later.
However, the quarterly inflation figures that we will receive in less than two weeks are likely to be decisive. Until then, the Aussie is likely to be in a wait-and-see mode.
- USD/CAD tries to snap its five-day winning streak on a subdued US Dollar.
- A break below the seven-day EMA at 1.3456 could lead the pair to test the 1.3400 psychological level.
- The pair could find resistance around 50% retracement level at 1.3536 followed by the support at 1.3550.
USD/CAD attempts to break its five-day winning streak, trading lower around the 1.3500 psychological level during the European session on Thursday. A break below the psychological level could put pressure on the pair to navigate the region around the seven-day Exponential Moving Average (EMA) at 1.3456 aligned with the major support at 1.3450 level.
If the USD/CAD pair surpasses the support region, it could be influenced to approach the psychological level at 1.3400.
However, the technical analysis of the Moving Average Convergence Divergence (MACD) for the USD/CAD pair indicates a potential bullish sentiment in the market, as the MACD line is positioned above the centerline and exhibits divergence above the signal line.
Additionally, the lagging indicator, the 14-day Relative Strength Index (RSI), is positioned above 50, suggesting the confirmation of stronger momentum for the USD/CAD pair.
The analysis indicates that on the upside, the USD/CAD pair faces potential barriers, with the 50% retracement level at 1.3536 serving as an immediate obstacle. Beyond that, a significant resistance level stands at 1.3550.
If the pair manages to break above the latter, it could encourage bullish momentum, potentially leading to an exploration of the psychological resistance region around 1.3600. Further upward movement might target the 61.8% Fibonacci retracement level at 1.3622.
USD/CAD: Daily Chart
-638411638195589018.png)
Hot UK inflation data helped diminish the odds of a BoE rate cut in the first half of this year, lifting the Pound Sterling (GBP). Economists at ING analyze GBP outlook.
BoE repricing gives Sterling a lift
Investors took about 20 bps out of the 2024 Bank of England easing cycle on Wednesday. That move supported Sterling across the board.
It looks like we will probably have to cut our EUR/GBP forecasts soon. Our current forecasts of a move up to 0.8800 later this quarter and 0.9000 later this year look too aggressive.
The inflation data also helped GBP/USD hold support at 1.2600 on Wednesday and 1.2600-1.2800 looks like a likely near-term range until the broader Dollar trend resolves itself.
- Pound Sterling has climbed to near 1.2700 as hopes of an early rate cut by the BoE have waned.
- UK Inflation remains stubbornly high due to higher fuel costs and seasonal airfare prices.
- Investors await the UK Retail Sales data for further guidance.
The Pound Sterling (GBP) recovers swiftly as stubbornly high UKConsumer Price Index (CPI) data for December has pushed back expectations of early rate cuts by the Bank of England (BoE). The GBP/USD pair is expected to witness more upside as investors hope that the Federal Reserve (Fed) will start reducing interest rates earlier than the BoE.
BoE policymakers are expected to remain on their toes as the UK economic outlook is vulnerable and price pressures are significantly stubborn. Going forward, the Pound Sterling will be guided by the Retail Sales data for December, which is set to be released on Friday. Upbeat consumer spending data would further diminish hopes of an early rate cut by the BoE.
Daily Digest Market Movers: Pound Sterling rise further as US Dollar corrects gradually
- Pound Sterling climbs to near the round-number-level resistance of 1.2700 as investors see no early discussions about interest rate cuts from Bank of England policymakers. This comes after consumer price inflation in the United Kingdom economy remained stubbornly higher in December.
- The UK inflation remained surprisingly sticky, prompted by higher fuel prices, a slight rise in service inflation and an increase in seasonal airfares.
- Annual headline inflation grew strongly by 4.0% against 3.9% increase in November while market participants projected a deceleration to 3.8%.
- In the same period, the core inflation – that strips out volatile food and Oil prices – remained sticky at 5.1%. Investors had anticipated 4.9%.
- The consumer price inflation remains higher despite the BoE maintaining interest rates at elevated levels. This is expected to discourage BoE policymakers from endorsing interest rate cuts in the near-term.
- Investors should note that the economic outlook of the UK economy is vulnerable and fears of a technical recession are high.
- As per the revised estimate from the UK Office for National Statistics (ONS), the British economy shrank by 0.1% in the third quarter of 2023 and is not expected to deliver any sort of growth in the final quarter of 2024.
- It would be challenging for BoE policymakers to decide on whether to adopt a dovish approach to avoid a technical recession or maintain a restrictive monetary policy stance.
- Going forward, market participants will focus on UK Retail Sales for December, which will be published on Friday.
- Monthly Retail Sales will have contracted by 0.5% after increasing at a robust pace of 1.3% in November, as per estimates. Annual consumer spending is to have risen by 1.1% against a slight increase of 0.1% in November.
- Investors anticipate that annual Retail Sales excluding fuel prices grew by 1.3% versus. former reading of 0.3%.
- Meanwhile, the US Dollar Index (DXY) has corrected gradually to near 103.25 after printing a fresh monthly high at 103.70. The USD Index is expected to resume its upside journey as trades pare bets supporting a rate cut from the Federal Reserve (Fed) in March.
- Going forward, action in the FX domain will be guided by guidance from Federal Reserve policymakers on interest rates. Fed policymakers are consistently endorsing a restrictive interest rate stance amid lack of confidence among investors that inflation will progressively return to the 2% target in a sustainable manner.
Technical Analysis: Pound Sterling aims to climb above 1.2700
Pound Sterling has delivered a sharp recovery to near 1.2700 after discovering strong buying interest around a fresh monthly low of 1.2600. The GBP/USD pair recovered sharply after testing the 50-day Exponential Moving Average (EMA), which oscillates around 1.2620. The Cable is struggling to shift auction above the 20-day EMA, which trades around 1.2700.
The 14-period Relative Strength Index (RSI) has shifted into the 40.00-60.00 range, which indicates a listless performance.
Pound Sterling FAQs
What is the Pound Sterling?
The Pound Sterling (GBP) is the oldest currency in the world (886 AD) and the official currency of the United Kingdom. It is the fourth most traded unit for foreign exchange (FX) in the world, accounting for 12% of all transactions, averaging $630 billion a day, according to 2022 data.
Its key trading pairs are GBP/USD, aka ‘Cable’, which accounts for 11% of FX, GBP/JPY, or the ‘Dragon’ as it is known by traders (3%), and EUR/GBP (2%). The Pound Sterling is issued by the Bank of England (BoE).
How do the decisions of the Bank of England impact on the Pound Sterling?
The single most important factor influencing the value of the Pound Sterling is monetary policy decided by the Bank of England. The BoE bases its decisions on whether it has achieved its primary goal of “price stability” – a steady inflation rate of around 2%. Its primary tool for achieving this is the adjustment of interest rates.
When inflation is too high, the BoE will try to rein it in by raising interest rates, making it more expensive for people and businesses to access credit. This is generally positive for GBP, as higher interest rates make the UK a more attractive place for global investors to park their money.
When inflation falls too low it is a sign economic growth is slowing. In this scenario, the BoE will consider lowering interest rates to cheapen credit so businesses will borrow more to invest in growth-generating projects.
How does economic data influence the value of the Pound?
Data releases gauge the health of the economy and can impact the value of the Pound Sterling. Indicators such as GDP, Manufacturing and Services PMIs, and employment can all influence the direction of the GBP.
A strong economy is good for Sterling. Not only does it attract more foreign investment but it may encourage the BoE to put up interest rates, which will directly strengthen GBP. Otherwise, if economic data is weak, the Pound Sterling is likely to fall.
How does the Trade Balance impact the Pound?
Another significant data release for the Pound Sterling is the Trade Balance. This indicator measures the difference between what a country earns from its exports and what it spends on imports over a given period.
If a country produces highly sought-after exports, its currency will benefit purely from the extra demand created from foreign buyers seeking to purchase these goods. Therefore, a positive net Trade Balance strengthens a currency and vice versa for a negative balance.
- NZD/USD struggles to snap its losing streak amid a weaker US Dollar.
- US Dollar Index pulls back from its five-week high at 103.69.
- IMF's first Deputy Managing Director, Gita Gopinath expects rate cuts to be in the second half of 2024.
- New Zealand's Food Price Index (MoM) declined by 0.1% against the previous fall of 0.2%.
NZD/USD retraces its intraday gains and seems to continue the losing streak for the fourth straight day. The NZD/USD pair trades around 0.6120 during the early European session on Thursday. The US Dollar (USD) corrects from a five-week high at 103.69, particularly due to the subdued US Treasury yields.
The 2-year and 10-year yields on US bond coupons stand at 4.34% and 4.09%, respectively, by the press time. The solid Retail Sales data has even the speculation on the Federal Reserve’s (Fed) interest rate cuts in March, reinforcing the strength of the US Dollar, which in turn, undermines the NZD/USD pair.
On Thursday, the International Monetary Fund's (IMF) first Deputy Managing Director, Gita Gopinath shared her perspective on inflation and the expectations for interest rate cuts by central banks. Gopinath emphasized the need for central banks to exercise caution when considering interest rate cuts this year. She noted, "Based on the data we have seen, we would expect rate cuts to be in the second half, not in the first half."
In December, New Zealand's Food Price Index (Month-over-Month) experienced a modest decline of 0.1%. While this represents a slower pace of decrease compared to November's 0.2% downturn, it still indicates a continued downward trend.
On Wednesday, Electronic Card Retail Sales (YoY) declined by 0.6% against the previous growth of 2.1%. The monthly purchases made on debit, credit, and store cards also decreased by 2.0% as compared to the previous increase of 1.7%. Friday will bring the Business NZ PMI for December to be published.
The US Dollar (USD) has risen sharply in recent days. Economists at Commerzbank analyze Greenback’s outlook.
The end of the USD rally?
If the overall picture of aggressive rate cuts is priced into the G10 universe, the US Dollar is the currency that should benefit the most. And that is exactly what has happened. But such a process has a natural end.
Soon, assuming that the general picture remains the same: that central banks will start to cut rates at some point in the foreseeable future and that the Fed will continue to be one of the more active G10 central banks. Over time, this effect may be more or less pronounced. But as long as this remains the scenario that the market is pricing in, we are talking about two or three cents (in EUR/USD terms), not much more.
The fact that EUR/USD is more comfortable in the 1.0900 area today than in the mid-1.0800 area may already be due to this.
FX option expiries for Jan 18 NY cut at 10:00 Eastern Time, via DTCC, can be found below.
- EUR/USD: EUR amounts
- 1.0750 815m
- 1.0975 1.3b
- 1.0990 854m
- 1.1025 728m
- 1.1050 1b
- GBP/USD: GBP amounts
- 1.2600 552m
- USD/JPY: USD amounts
- 144.00 884m
- 145.00 1.5b
- 147.00 1.1b
- 148.00 612m
- USD/CHF: USD amounts
- 0.8720 1.2b
- AUD/USD: AUD amounts
- 0.6650 1.1b
- 0.6735 918m
- USD/CAD: USD amounts
- 1.3255 660m
- 1.3390 673m
- NZD/USD: NZD amounts
- 0.6200 567m
The Indian Rupee (INR) has traded in a slightly wider range in the last month, after months of tight trading around the 83.30 level against the US Dollar (USD). Economists at ING analyze USD/INR outlook.
Shifting to an asymmetric stance?
At 83.10, the INR is not much stronger than it has been, but it looks as if maybe the Reserve Bank of India is going to be a bit more tolerant of appreciation and practice more asymmetric currency management.
Inflation has crept up towards the top of the RBI’s inflation target range, though this is almost all food-related, and will likely drop back closer to 5% in the near term. However, we still don’t see the RBI easing until after the Fed’s first move.
USD/INR – 1M 83.00 3M 83.00 6M 83.00 12M 84.00
In an interview with the Financial Times (FT) on Thursday, the International Monetary Fund's (IMF) first Deputy Managing Director Gita Gopinath expressed her outlook on inflation and central banks’ interest rate cut expectations.
Key quotes
“Central banks need to move cautiously on cutting interest rates this year.”
“Inflation to decline less sharply than last year due to tight labor markets and high services inflation in the US, Euro area, elsewhere.”
“Based on the data we have seen, we would expect rate cuts to be in the second half, not in the first half.”
Related reads
- Forex Today: Dollar takes a breather ahead of mid-tier US data, Fedspeak
- Trimming and Davos vibes
- EUR/JPY edges lower to 161.20 amid the safe-haven flow.
- ECB’s Vasle pushed back against expectations of an early rate cut.
- Investors anticipate the Bank of Japan will maintain its ultra-dovish stance at its January policy meeting next week.
The EUR/JPY cross snaps a three-day winning streak during the early European session on Thursday. The ongoing geopolitical tension in the Red Sea benefits safe-haven assets like the Japanese Yen (JPY) and weighs on the cross. However, the downside of EUR/JPY might be capped as the market anticipates that the Bank of Japan (BoJ) is unlikely to shift from its ultra-dovish stance. The cross currently trades around 161.20, down 0.03% on the day.
The European Central Bank (ECB) Governing Council member Bostjan Vasle said it’s too early to expect the first rate cuts at the beginning of the second quarter. He further stated that inflation in the Euro area is still too high and must be headed back to the 2% target before the central bank changes the course of monetary policy.
On the other hand, the JPY was undermined by investors' anticipation that the BoJ would maintain its ultra-dovish stance at its January policy meeting next week. The Japanese central bank's former executive Eiji Maeda said on Wednesday that the BoJ may end negative interest rates in April but will likely go slow in any further steps towards normalising ultra-loose monetary policy, unlike the aggressive monetary tightening taken by the ECB.
Additionally, the escalating tension in the Middle East might cap the downside of the JPY. Late Wednesday, Yemen’s Houthi rebels targeted a US-owned cargo ship with a kamikaze drone in the Red Sea after the Biden administration said it will re-designate the Houthis to its list of global terrorists.
Market participants will monitor the ECB Monetary Policy Meeting Accounts and ECB President Lagarde's speech on Thursday. On Friday, the December German Producer Price Index (PPI) will be released. The attention will shift to the BoJ Interest Rate Decision next week. This event could trigger volatility in the market and give a clear direction to the EUR/JPY cross.
Here is what you need to know on Thursday, January 18:
Escalating geopolitical tensions in the Middle East coupled with China’s economic concerns continue to keep markets jittery. China’s stock market extended its downtrend and hit a four-year low, as the country’s Premier Li Qiang said in Davos on Wednesday that dashed hopes of big stimulus coming through to support the dwindling economic recovery.
Further, US Federal Reserve (Fed) Governor Christopher Waller’s comments-led reduced bets for aggressive rate cuts also added to the investors’ pain, as markets reassess the expectations for the Fed policy pivot this year. Strong US Retail Sales data also supported the less dovish Fed view. Retail sales in the US increased 0.6% last month, exceeding the market forecast for a 0.4% rise.
Meanwhile, recent hawkish comments from the European Central Bank (ECB) officials dashed hopes of a rate cut as early as April. ECB President Christine Lagarde signaled a likely rate cut in the summer.
After late Tuesday’s strikes by the US military in Yemen against the anti-ship ballistic missiles in a Houthi-controlled part of the country, Houthi rebels targeted a US-owned cargo ship with a kamikaze drone in the Red Sea on Wednesday after Washington said it would re-designate the Houthis to its list of “specially designated global terrorists,” per BBC News.
The US Dollar (USD) sees a decent pullback from five-week tops near 103.70 against its major rivals, shrugging off encouraging US economic data and the cautious market mood. The Greenback feels the heat from sluggish US Treasury bond yields, with the benchmark 10-year US Treasury bond yields on the defensive just above the 4.0% level.
US Dollar price today
The table below shows the percentage change of US Dollar (USD) against listed major currencies today. US Dollar was the weakest against the Japanese Yen.
| USD | EUR | GBP | CAD | AUD | JPY | NZD | CHF | |
| USD | -0.17% | -0.16% | -0.13% | -0.20% | -0.21% | -0.16% | -0.04% | |
| EUR | 0.19% | -0.02% | 0.04% | -0.03% | -0.04% | 0.02% | 0.13% | |
| GBP | 0.18% | 0.00% | 0.04% | -0.03% | -0.03% | 0.03% | 0.14% | |
| CAD | 0.13% | -0.03% | -0.05% | -0.07% | -0.08% | -0.03% | 0.10% | |
| AUD | 0.22% | 0.03% | 0.02% | 0.07% | 0.00% | 0.05% | 0.17% | |
| JPY | 0.22% | 0.05% | 0.04% | 0.06% | 0.00% | 0.07% | 0.17% | |
| NZD | 0.17% | -0.03% | -0.01% | 0.03% | -0.04% | -0.07% | 0.12% | |
| CHF | 0.04% | -0.12% | -0.12% | -0.09% | -0.16% | -0.17% | -0.12% |
The heat map shows percentage changes of major currencies against each other. The base currency is picked from the left column, while the quote currency is picked from the top row. For example, if you pick the Euro from the left column and move along the horizontal line to the Japanese Yen, the percentage change displayed in the box will represent EUR (base)/JPY (quote).
Markets now eagerly await the mid-tier US Jobless Claims, Housing Starts and Building Permits data for a fresh take on the pricing of the Fed rate cut expectations. Also, Atlanta Federal Reserve (Fed) President Raphael Bostic will be closely scrutinized later in American trading.
Moving onto the G10 FX space, AUD/USD is back on the bid above 0.6550, having reversed the downbeat Australian employment data-led dip to 0.6525. The Australian Bureau of Statistics (ABS) showed that the number of Australians in employment fell by 65,100 in December. The Unemployment Rate held steady at 3.9% due to a slump in the proportion of people in work or looking for it, ABC News reported. NZD/USD tracked the AUD/USD rebound and jumped off the 0.6100 barrier, posting small gains so far.
USD/JPY is correcting alongside the US Dollar, struggling below 148.00. The pair remains pressured, despite expectations that the Bank of Japan (BoJ) is unlikely to adjust its monetary policy settings next week.
EUR/USD is flirting with 1.0900, holding the upswing amid the pushback by the European Central Bank’s (ECB) policymakers against interest rates cuts and a broadly weaker US Dollar. ECB Minutes and the second appearance of President Lagarde in Davos will provide some fresh trading incentives.
GBP/USD is better off and holding firm at around 1.2700, underpinned by the hot UK inflation data, which helped diminish the odds for a BoE rate cut in the first half of this year.
USD/CAD remains depressed below 1.3500, as the WTI oil looks to build on the previous rebound above $73. The geopolitical developments between the US and the Iran-back Houthi rebels will likely remain in play.
Gold price is attempting a bounce from five-week troughs of $2,002 but it remains to be seen if the recovery lasts amid bearish technicals.
- Silver price gauges an interim cushion near $22.50, more downside looks likely as Fed rate cut bets ease.
- Strong US consumer spending has dented hopes of rate cut by the Fed in March.
- Silver price hovers near the horizontal support of the descending triangle chart pattern.
Silver price (XAG/USD) discovers an intermediate support after a sharp correction to near $22.50 in the late Asian session. The near-term demand for the white metal is still downbeat as trades have pared bets supporting a rate cut by the Federal Reserve (Fed) in March.
S&P500 futures have posted nominal losses on board in Tokyo, portraying further decline in the risk-appetite of the market participants. The US Dollar Index (DXY) has corrected to near 103.25 after failing extend rally above fresh monthly high of 103.63. 10-year US Treasury yields have eased slightly to near 4.1%.
Investors are losing conviction towards an interest rate cut by the Fed in the march monetary policy meeting due to absence of support from United States economic indicators. After a stubborn inflation report for December, Retail Sales data outperformed the market consensus. The US consumer spending rose at a stronger pace of 0.6% against expectations of 0.4% and the prior reading of 0.3%.
Strong US Retail Sales were prompted by robust demand for motor vehicles and online purchases. Considering resilience in the US economy, Fed Governor Christopher Waller advised the need of maintaining a ‘careful and methodical’ approach while reducing interest rates.
Silver technical analysis
Silver price trades near the horizontal support of the Descending Triangle chart pattern formed on a four-hour scale, which is around December 13 low of $22.50. The downward-sloping trendline of the aforementioned chart pattern is plotted from December 3 high at $25.92.
The 50-period Exponential Moving Average (EMA) around $23.00 continues to act as a barricade for the Silver price bulls.
Meanwhile, the 14-period Relative Strength Index (RSI) has slipped into the bearish range of 20.00-40.00, which indicates that a bearish momentum has been triggered.
Silver four-hour chart
-638411552173039757.png)
- USD/CHF continues to gain ground market caution toward Fed rate cuts.
- SNB Chairman Thomas Jordan will speak at the WEF in Davos on Thursday.
- Solid Retail Sales data contributed to diminishing the easing of the Fed’s monetary policy.
USD/CHF moves higher on the third consecutive day despite a correction in the US Dollar (USD). The USD/CHF pair trades higher near 0.8650 during the Asian session on Thursday. The Swiss Franc (CHF) receives downward pressure ahead of the Swiss National Bank (SNB) Chairman Thomas Jordan’s speech Thursday at the World Economic Forum (WEF) in Davos.
The most recent policy update from the Swiss National Bank (SNB) was in December, where they expressed a commitment to adjusting monetary policy if needed to maintain inflation within the range consistent with price stability over the medium term. In their latest policy decision, the SNB maintained a relatively neutral stance, without any major surprises.
Recent indicators, such as a slight increase in Swiss consumer prices in December and an improvement in Swiss consumer demand in November, may influence the SNB's decision-making in the upcoming meeting. These moderate figures could potentially dissuade the Swiss National Bank from making adjustments to its monetary policy. The SNB also indicated a willingness to be active in the foreign exchange market, if necessary, to provide support for the Swiss Franc.
The US Dollar enjoys support from investor sentiment as expectations for the Federal Reserve's (Fed) initial rate cut in March have been scaled back. This adjustment has been reinforced in the wake of robust US Retail Sales data released on Wednesday. The probability of a rate cut has decreased notably to 57%, marking a significant decline from the previous level of over 70%.
The data on US Retail Sales for December reveals a growth of 0.6% on a month-over-month basis, surpassing market expectations of 0.4% and exceeding the previous figure of 0.3%. Additionally, the Retail Sales Control Group displayed improvement, reaching 0.8% compared to the previous reading of 0.5%. Market participants are likely to keep an eye on US housing data scheduled for release on Thursday.
- GBP/USD trades in positive territory for two straight days on Thursday.
- The pair keeps the bearish vibe unchanged below the key EMA; RSI indicator stands below the 50 midline.
- The immediate resistance level is seen at 1.2700; the initial support level is located at 1.2628.
The GBP/USD pair gains ground below the 1.2700 barrier during the early European session on Thursday. The major pair trades in positive territory for the second consecutive day as traders slashed their bets on an early interest rate cut by the Bank of England (BoE). GBP/USD currently trades near 1.2682, down 0.01% on the day.
From the technical perspective, the bearish outlook of the GBP/USD pair remains intact as the pair holds below the 50- and 100-hour Exponential Moving Averages (EMA) on the four-hour chart. It’s worth noting that the 50-hour EMA is on the verge of crossing below the 100-hour EMA. If a decisive crossover occurs on the four-hour chart, it would validate a Bear Cross, highlighting that the path of least resistance for GBP/USD is to the downside.
The downward momentum of the major pair is supported by the 14-day Relative Strength Index (RSI), which stands in bearish territory below the 50 midline, supporting the sellers for now.
The confluence of the 100-hour EMA and a psychological round figure at 1.2700 acts as an immediate resistance level for the major pair for the time being. The next upside barrier will emerge at the 1.2760-1.2765 region, portraying a high of January 15 and the upper boundary of the Bollinger Band. Further north, the additional upside filter is seen near a high of January 12 at 1.2785, followed by a high of December 28, 2023 at 1.2828.
On the downside, the initial support level for GBP/USD is located near a low of December 18 at 1.2628. The next contention level to watch is the lower limit of the Bollinger Band at 1.2608. Any follow-through selling below the latter will see a drop to a low of December 7 at 1.2544.
GBP/USD four-hour chart
-638411533369916787.png)
- Asian markets demonstrate mixed performance as US data diminish rate cut possibility in March.
- China's equity markets face challenges due to deflationary pressures in China.
- Japan's Nikkei 225 rose to 35,570, while Hong Kong's Hang Seng is up at 15,374.
- S&P/ASX 200 index receives losses on weaker sectors like materials, energy, and real estate.
Asian shares display a mixed performance as the release of Retail Sales data from the United States (US) on Wednesday led traders to scale back their expectations of the US Federal Reserve's initial interest rate cut in March.
As of the latest market updates, China's SSE Composite Index has experienced a 1.59% decline, reaching 2,788, while the Shenzhen Component Index is down by 0.91% at 8,680. The S&P/ASX 200 in Australia has decreased by 0.68% to 7,342. Japan's Nikkei 225 has risen to 35,570, reflecting a 0.27% increase. Hong Kong's Hang Seng is up by 0.64% at 15,374. The Korean KOSPI has advanced to 2,444, showing a 0.34% increase.
The stock markets in China are encountering difficulties due to recent economic indicators revealing a bleak economic landscape. This downturn is dissuading both consumers from spending and businesses from extending their operations, thereby undermining China's prospects for long-term economic growth.
In December, year-over-year China’s Retail Sales failed to meet market expectations. Additionally, the annual Gross Domestic Product (GDP) growth in the fourth quarter fell below anticipated levels. The country experienced a third consecutive month of declining consumer prices, accompanied by a decrease in producer prices. These trends indicate ongoing deflationary pressures on costs in China.
The Tokyo market has reached its highest point in three decades, driven by the anticipation that companies will enhance shareholder returns through actions such as unwinding cross-holdings, implementing share buybacks, and adopting other strategic measures. Approximately half of Japanese companies are contemplating the review or restructuring of their businesses to enhance corporate value, with a focus on potential acquisitions.
Australian Consumer Inflation Expectations maintained stability in January, and the seasonally adjusted Unemployment Rate remained in line with expectations for December. Nevertheless, the Employment Change data indicated a decline, contributing to the argument that interest rates may have reached their peak as the once-booming labor market shows signs of cooling. Despite these developments, there has been a restrained market response to the job-related data. The S&P/ASX 200 index experienced a decline, primarily driven by significant losses in the materials, energy, and real estate sectors.
- EUR/USD attracts buyers for the second straight day and moves away from over a one-month low.
- The setup favours bear and supports prospects for the emergence of fresh selling at higher levels.
- Reduced bets for a March Fed rate cut favour the USD bulls and should contribute to capping gains.
The EUR/USD pair builds on the overnight bounce from the very important 200-day Simple Moving Average (SMA) support near the 1.0845 region and gains some positive traction for the second straight day on Thursday. Spot prices, however, struggle to capitalize on the move beyond the 1.0900 round figure, warranting some caution before positioning for any further gains amid the underlying bullish tone surrounding the US Dollar (USD).
The better-than-expected release of the US Retail Sales figures on Wednesday pointed to a still-resilient consumer spending and suggested that the economy is in good shape. This provides the Federal Reserve (Fed) with more headroom to keep interest rates higher for longer and forces investors to further trim their bets for a March rate cut. The hawkish outlook remains supportive of elevated US Treasury bond yields, which favours the USD bulls and should keep a lid on any meaningful appreciating move for the EUR/USD pair.
Meanwhile, oscillators on the daily chart have just started drifting into negative territory. This, along with the recent breakdown through a short-term trading range, supports prospects for the emergence of fresh sellers at higher levels. The trading range support breakpoint, around the 1.0920 region, now seems to act as an immediate strong barrier. Some follow-through buying, however, might trigger a short-covering rally and allow the EUR/USD pair to make a fresh attempt to conquer the 1.1000 psychological mark.
On the flip side, the technically significant 200-day SMA, currently around the 1.0845 region, might continue to protect the immediate downside. A convincing break below will be seen as a fresh trigger for bearish traders and expose the 100-day SMA support, near the 1.0785 zone. The downfall could extend further and drag the EUR/USD pair further towards the December monthly swing low, around the 1.0725-1.0720 area.
EUR/USD daily chart
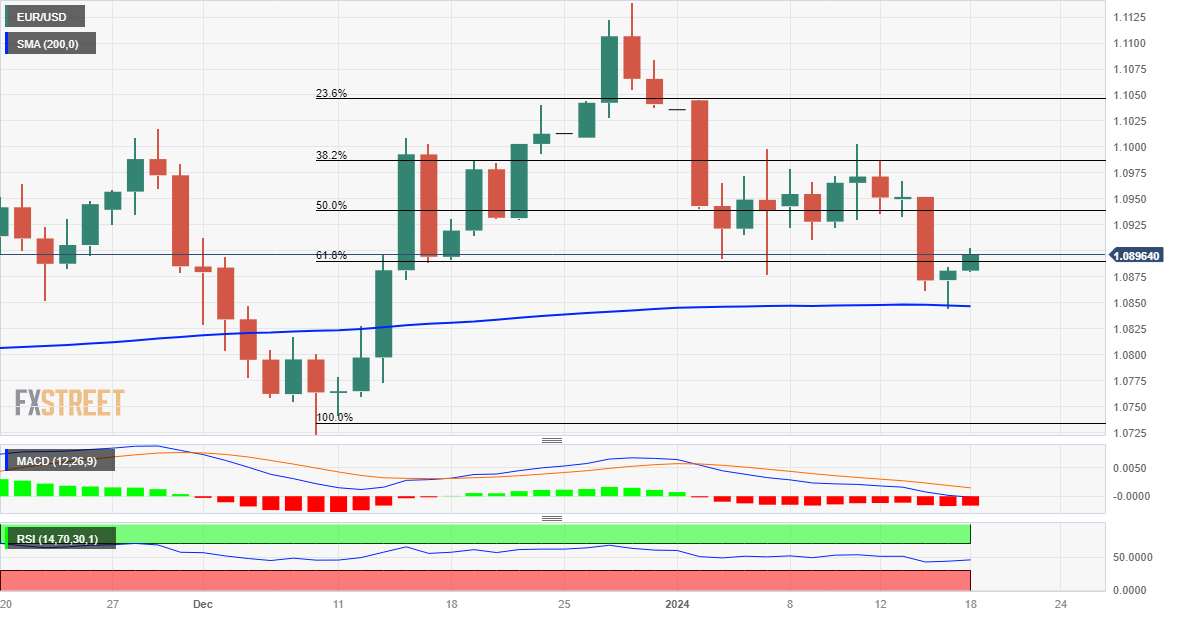
Technical levels to watch
- Indian Rupee trades on a positive note as the US Dollar recovery stalls on Thursday.
- RBI’s Das said inflation is moderating, approaching the central bank's 4% target while growth prospects remain robust.
- Investors will monitor the US data and Das’s speech at the annual World Economic Forum (WEF) in Davos.
Indian Rupee (INR) recovers some lost ground on Thursday. The INR fell on Wednesday, driven by equities outflows and the stronger US dollar (USD). That being said, the US Dollar Index (DXY) rose to a one-month high as investors pare bets on aggressive rate cuts following the upbeat US Retail Sales report.
The Reserve Bank of India (RBI) Governor Shaktikanta Das spoke at the annual World Economic Forum (WEF) in Davos, Switzerland. RBI governor Das said inflation in India is moderating and steadily approaching the central bank's 4% target while growth prospects remain robust. He added that core inflation has started steadily coming down, giving confidence that monetary policy is working. The central bank remains fully committed to bringing inflation down to the target of 4%.
Later on Thursday, the US Housing Starts, Building Permits, weekly Initial Claims and Philly Fed Manufacturing Index will be released. Furthermore, the RBI’s Das will discuss insights on key challenges and opportunities and his perspective on monetary policy at the WEF.
Daily Digest Market Movers: Indian Rupee maintains its strength in the face of geopolitical tensions
- Fitch Ratings affirmed India’s Long-Term Foreign-Currency Issuer Default Rating (IDR) at ‘BBB-’ with a stable outlook.
- India’s economy is expected to grow at 7.3% in FY2024, according to the first advance estimate by the National Statistical Office (NSO).
- RBI Governor Shaktikanta Das said India presents a picture of growth and stability amid a challenging global macroeconomic environment.
- RBI’s Das further stated that the Indian economy should record a growth rate of 7% in the next fiscal year, and inflation is likely to ease further.
- US Retail sales rose 0.6% MoM in December from a 0.3% gain in November, beating the estimation of 0.4%, according to the Commerce Department's Census Bureau.
- Retail Sales Control Group grew 0.8% MoM in December from the previous reading of 0.5%, above the market consensus.
- Investors have priced in a 57% odds for a 25 basis points (bps) interest rate cut in March, down from 70% at the beginning of the week, according to the CME Fedwatch tool.
- The Federal Reserve (Fed) Governor Christopher Waller said any rate cuts this year should be done "methodically and carefully.”
Technical Analysis: Indian Rupee clings to the 82.80–83.40 range
Indian Rupee trades strongly on the day. The USD/INR pair has traded within the multi-month trading band between 82.80 and 83.40. The outlook for USD/INR shifts towards bullish sentiment as the pair bounces back above the key 100-period Exponential Moving Average (EMA) on the daily chart. The 14-day Relative Strength Index (RSI) returns above the 50.0 midpoint, suggesting that the buyers could retain control in the near term.
The upper boundary of the trading range at 83.40 acts as an immediate resistance level for USD/INR. Further north, the additional upside filter to watch is a 2023 high of 83.47, en route to the 84.00 psychological round mark. On the other hand, the first support level will emerge at the 83.00 figure. A breach of this mentioned level will see a drop to 82.80 (the lower limit of the trading range, a low of September 12), followed by 82.60 (low of August 11).
US Dollar price today
The table below shows the percentage change of US Dollar (USD) against listed major currencies today. US Dollar was the strongest against the Swiss Franc.
| USD | EUR | GBP | CAD | AUD | JPY | NZD | CHF | |
| USD | -0.11% | -0.08% | -0.10% | -0.24% | -0.05% | -0.23% | -0.03% | |
| EUR | 0.11% | 0.01% | 0.01% | -0.13% | 0.06% | -0.12% | 0.08% | |
| GBP | 0.09% | -0.02% | -0.01% | -0.14% | 0.05% | -0.14% | 0.07% | |
| CAD | 0.10% | 0.00% | 0.01% | -0.13% | 0.04% | -0.12% | 0.08% | |
| AUD | 0.23% | 0.12% | 0.14% | 0.13% | 0.18% | 0.01% | 0.21% | |
| JPY | 0.05% | -0.05% | -0.05% | -0.06% | -0.20% | -0.18% | 0.02% | |
| NZD | 0.24% | 0.12% | 0.14% | 0.13% | 0.00% | 0.16% | 0.20% | |
| CHF | 0.03% | -0.08% | -0.06% | -0.07% | -0.21% | -0.03% | -0.20% |
The heat map shows percentage changes of major currencies against each other. The base currency is picked from the left column, while the quote currency is picked from the top row. For example, if you pick the Euro from the left column and move along the horizontal line to the Japanese Yen, the percentage change displayed in the box will represent EUR (base)/JPY (quote).
Indian Rupee FAQs
What are the key factors driving the Indian Rupee?
The Indian Rupee (INR) is one of the most sensitive currencies to external factors. The price of Crude Oil (the country is highly dependent on imported Oil), the value of the US Dollar – most trade is conducted in USD – and the level of foreign investment, are all influential. Direct intervention by the Reserve Bank of India (RBI) in FX markets to keep the exchange rate stable, as well as the level of interest rates set by the RBI, are further major influencing factors on the Rupee.
How do the decisions of the Reserve Bank of India impact the Indian Rupee?
The Reserve Bank of India (RBI) actively intervenes in forex markets to maintain a stable exchange rate, to help facilitate trade. In addition, the RBI tries to maintain the inflation rate at its 4% target by adjusting interest rates. Higher interest rates usually strengthen the Rupee. This is due to the role of the ‘carry trade’ in which investors borrow in countries with lower interest rates so as to place their money in countries’ offering relatively higher interest rates and profit from the difference.
What macroeconomic factors influence the value of the Indian Rupee?
Macroeconomic factors that influence the value of the Rupee include inflation, interest rates, the economic growth rate (GDP), the balance of trade, and inflows from foreign investment. A higher growth rate can lead to more overseas investment, pushing up demand for the Rupee. A less negative balance of trade will eventually lead to a stronger Rupee. Higher interest rates, especially real rates (interest rates less inflation) are also positive for the Rupee. A risk-on environment can lead to greater inflows of Foreign Direct and Indirect Investment (FDI and FII), which also benefit the Rupee.
How does inflation impact the Indian Rupee?
Higher inflation, particularly, if it is comparatively higher than India’s peers, is generally negative for the currency as it reflects devaluation through oversupply. Inflation also increases the cost of exports, leading to more Rupees being sold to purchase foreign imports, which is Rupee-negative. At the same time, higher inflation usually leads to the Reserve Bank of India (RBI) raising interest rates and this can be positive for the Rupee, due to increased demand from international investors. The opposite effect is true of lower inflation.
- Gold price attracts buyers on Thursday and snaps a two-day losing streak from over a one-month low.
- A generally softer risk tone offers support to the safe-haven metal amid subdued USD price action.
- Diminishing odds for a March Fed rate cut to act as a tailwind for the buck and cap any further gains.
Gold price (XAU/USD) ticks higher during the Asian session on Thursday and for now, seems to have snapped a two-day losing streak to over a one-month low touched the previous day. The US Dollar (USD) pulls back from its highest level since December 13 amid some profit-taking and benefits the commodity. Meanwhile, an escalation of military action in the Middle East and concerns about sustained economic weakness in China – the world's second-largest economy – continue to weigh on investors' sentiment. This is seen as another factor lending some support to the safe-haven precious metal.
That said, any meaningful recovery for the Gold price still seems elusive in the wake of reduced bets for an imminent shift in the Federal Reserve's (Fed) policy stance. In fact, market participants further scaled back their expectations for an interest rate cut in March following the release of upbeat US Retail Sales figures on Wednesday, which pointed to a resilient US economy. This, in turn, remains supportive of elevated US Treasury bond yields and favours the USD bulls. Hence, it will be prudent to wait for strong follow-through buying before confirming that the XAU/USD has formed a near-term bottom.
Daily Digest Market Movers: Gold price draws support from softer risk tone, lacks follow-through
- A modest US Dollar downtick, along with geopolitical tensions and China's economic woes, assists the Gold price in attracting some buyers in the vicinity of the $2,000 psychological mark on Thursday.
- Yemen-based Houthi rebels claimed their second attack this week on a US-operated vessel in the Red Sea and have threatened to expand attacks in response to the American and British strikes.
- China’s economy grew at an annual rate of 5.2% in the final quarter of 2023, more than the official 5% target, though investors remain concerned amid mounting deflationary risks and tepid demand.
- Data released on Wednesday showed that the headline US Retail Sales increased more than anticipated, by 0.6% in December, while core sales – excluding autos – also topped market estimates.
- The data points to still-resilient consumer spending and the underlying strength that the US economy possessed, which could provide the Fed more headroom to keep rates higher for longer.
- Furthermore, Fed Governor Christopher Waller said on Tuesday that the central bank should not rush to cut interest rates until it was clear lower inflation would be sustained.
- The yield on the benchmark 10-year US government bond holds comfortably above the 4% mark, near its highest level since December 13, and should lend some support to the Greenback.
- Traders now look to Thursday's US economic docket – featuring the release of Weekly Initial Jobless Claims, the Philly Fed Manufacturing Index and housing market data – for a fresh impetus.
Technical Analysis: Gold price seems vulnerable to slide further, 50-day SMA breakdown in play
From a technical perspective, the overnight breakdown through the 50-day Simple Moving Average (SMA) pivotal support was seen as a fresh trigger for bearish traders. Moreover, oscillators on the daily chart have just started gaining negative traction and are still far from being in the oversold territory. This, in turn, suggests that the path of least resistance for the Gold price is to the downside. Hence, any subsequent move up might still be seen as a selling opportunity and runs the risk of fizzling out quickly near the $2,017-2,018 region (50-day SMA). That said, a sustained strength beyond might prompt some short-covering rally and lift the XAU/USD further towards the $2,042-2,045 horizontal resistance.
On the flip side, bearish traders might now wait for some follow-through selling below the $2,000 psychological mark before placing fresh bets. The Gold price might then accelerate the downfall towards the December monthly swing low, around the $1,974-1,973 region. The latter near the 100- and 200-day SMAs confluence, around the $1,970-1,964 area, which if broken decisively should pave the way for deeper losses. The XAU/USD might then weaken further towards the $1,955 intermediate support before eventually dropping to the November swing low, around the $1,932-1,931 region.
US Dollar price today
The table below shows the percentage change of US Dollar (USD) against listed major currencies today. US Dollar was the weakest against the New Zealand Dollar.
| USD | EUR | GBP | CAD | AUD | JPY | NZD | CHF | |
| USD | -0.12% | -0.10% | -0.10% | -0.20% | -0.06% | -0.22% | -0.05% | |
| EUR | 0.12% | 0.00% | 0.02% | -0.08% | 0.06% | -0.10% | 0.07% | |
| GBP | 0.12% | 0.01% | 0.02% | -0.07% | 0.07% | -0.10% | 0.08% | |
| CAD | 0.10% | -0.02% | -0.01% | -0.09% | 0.03% | -0.12% | 0.06% | |
| AUD | 0.18% | 0.08% | 0.08% | 0.09% | 0.14% | -0.03% | 0.15% | |
| JPY | 0.06% | -0.06% | -0.06% | -0.05% | -0.14% | -0.18% | 0.02% | |
| NZD | 0.24% | 0.11% | 0.12% | 0.12% | 0.03% | 0.16% | 0.18% | |
| CHF | 0.05% | -0.07% | -0.06% | -0.06% | -0.14% | -0.02% | -0.17% |
The heat map shows percentage changes of major currencies against each other. The base currency is picked from the left column, while the quote currency is picked from the top row. For example, if you pick the Euro from the left column and move along the horizontal line to the Japanese Yen, the percentage change displayed in the box will represent EUR (base)/JPY (quote).
Gold FAQs
Why do people invest in Gold?
Gold has played a key role in human’s history as it has been widely used as a store of value and medium of exchange. Currently, apart from its shine and usage for jewelry, the precious metal is widely seen as a safe-haven asset, meaning that it is considered a good investment during turbulent times. Gold is also widely seen as a hedge against inflation and against depreciating currencies as it doesn’t rely on any specific issuer or government.
Who buys the most Gold?
Central banks are the biggest Gold holders. In their aim to support their currencies in turbulent times, central banks tend to diversify their reserves and buy Gold to improve the perceived strength of the economy and the currency. High Gold reserves can be a source of trust for a country’s solvency. Central banks added 1,136 tonnes of Gold worth around $70 billion to their reserves in 2022, according to data from the World Gold Council. This is the highest yearly purchase since records began. Central banks from emerging economies such as China, India and Turkey are quickly increasing their Gold reserves.
How is Gold correlated with other assets?
Gold has an inverse correlation with the US Dollar and US Treasuries, which are both major reserve and safe-haven assets. When the Dollar depreciates, Gold tends to rise, enabling investors and central banks to diversify their assets in turbulent times. Gold is also inversely correlated with risk assets. A rally in the stock market tends to weaken Gold price, while sell-offs in riskier markets tend to favor the precious metal.
What does the price of Gold depend on?
The price can move due to a wide range of factors. Geopolitical instability or fears of a deep recession can quickly make Gold price escalate due to its safe-haven status. As a yield-less asset, Gold tends to rise with lower interest rates, while higher cost of money usually weighs down on the yellow metal. Still, most moves depend on how the US Dollar (USD) behaves as the asset is priced in dollars (XAU/USD). A strong Dollar tends to keep the price of Gold controlled, whereas a weaker Dollar is likely to push Gold prices up.
- AUD/JPY moves above a key level of 97.00 after the Australian economic data.
- Aussie Consumer Inflation Expectations and Unemployment Rate remained consistent at 4.5% and 3.9%, respectively.
- Japanese Yen faces challenges as BoJ is expected to maintain an ultra-dovish stance.
AUD/JPY extends its gains for the second straight session, improving to near 97.10 during the Asian trading hours on Thursday. The Australian Dollar (AUD) gains ground against the Japanese Yen (JPY) after the release of the economic data from Australia on Thursday.
Consumer Inflation Expectations remained unchanged at 4.5% in January, and the seasonally adjusted Unemployment Rate held steady at 3.9%, aligning with the expectations for December. Despite these stable indicators, the Employment Change data unveiled a decline. The number of employed individuals decreased by 65.1K, contrasting with the anticipated increase of 17.6K.
However, the modest economic data could act as a deterrent for the Reserve Bank of Australia (RBA) to implement any changes in monetary policy during the upcoming meeting, potentially limiting the upward momentum of the AUD/JPY pair. The RBA is projected to maintain a cautious stance, with expectations of only two rate cuts for the rest of the year.
As of now, the current cash rate stands at 4.34%, following a 25 basis points (bps) hike at the Reserve Bank of Australia (RBA) November meeting. Despite the increase,
On the Japanese side, the recent decline in inflation rates in Tokyo and the release of weaker wage data last week have reinforced market expectations that the Bank of Japan (BoJ) will maintain its ultra-dovish stance. This, in turn, is perceived as a significant factor undermining the strength of the Japanese Yen (JPY) and facilitating an upward movement in the AUD/JPY pair.
- USD/CAD loses ground due to a correction in the US Dollar.
- The improvement in Crude prices provided support for the Canadian Dollar.
- Hot US Retail Sales data might have helped the Greenback to gain ground.
USD/CAD halts its winning streak that began on January 11, trading lower around the significant level at 1.3500 during the Asian session on Thursday. The Canadian Dollar (CAD) gains ground against the US Dollar (USD) on the recovery in the Crude oil prices registered in the previous session. However, West Texas Intermediate (WTI) price trades slightly lower around $72.70 per barrel, at the time of writing.
Crude oil prices have seen an upward trajectory on Wednesday, buoyed by the positive outlook presented in the Organization of the Petroleum Exporting Countries (OPEC) monthly report. The report indicates a robust anticipation of oil demand growth for both 2024 and 2025.
In December, Canada's Raw Material Price Index contracted for the second consecutive month, maintaining materials inflation at its most significant contractionary level since June of the previous year. The report released on Wednesday revealed a consistent contraction of 4.9%, matching the previous figure. Moreover, the Industrial Product Price (MoM) experienced a larger-than-expected reduction of 1.5%, compared to the anticipated decline of 0.7% and the prior decrease of 0.3%.
The US Dollar Index (DXY) snaps its winning streak on downbeat US Treasury yields. The DXY trades lower near 103.30 with the 2-year and 10-year yields on US bond coupons standing at 4.33% and 4.08%, respectively, by the press time.
US Retail Sales (Month-over-Month) recorded a growth of 0.6% in December, surpassing market expectations of 0.4% and the previous figure of 0.3%. The Retail Sales Control Group also showed improvement, reaching 0.8% from the previous reading of 0.5%.
Additionally, Retail Sales excluding Autos (Month-over-Month), which excludes the motor vehicles and parts sector, increased by 0.4%, exceeding the market anticipation of a steady figure at 0.2%. Traders are likely to keep an eye on US housing data scheduled for release on Thursday. On Canada's docket, Retail Sales data will be eyed on Friday.
- WTI price received upward support from a positive OPEC report.
- OPEC forecasted oil demand to grow by 2.25 and 1.85 million bpd in 2024 and 2025, respectively.
- US announced to re-designate the Houthis on its list of "specially designated global terrorists”.
West Texas Intermediate (WTI) price hovers around $72.70 per barrel during the Asian session on Thursday. Crude oil prices experienced an upward trend, supported by the optimism generated by the Organization of the Petroleum Exporting Countries (OPEC). According to OPEC's monthly report, there is an expectation of robust growth in oil demand for 2024 and 2025. The report forecasts a growth of 2.25 million barrels per day (bpd) in 2024, consistent with the predictions made in December, and anticipates a growth of 1.85 million bpd in 2025.
From a geopolitical perspective, the persistent supply disruption in the Red Sea is serving as a deterrent to a more substantial decline in crude oil prices. The attacks on ships in the Red Sea, orchestrated by Iran-led Houthi forces, have prompted many companies to redirect their cargoes around Africa, resulting in heightened journey times and increased costs. In response to these attacks on shipping, the United States conducted another round of strikes against Houthi targets in Yemen on Wednesday.
Additionally, on Wednesday evening, Yemen's Houthi rebels reportedly targeted a US-owned cargo ship with a kamikaze drone in the Red Sea. This incident occurred after the United States announced its intention to re-designate the Houthis on its list of "specially designated global terrorists," as reported by the BBC. The new designation by Washington would require US financial institutions to freeze Houthi funds, and members of the group would be prohibited from entering the United States.
The American Petroleum Institute (API) reported a surprising increase in Weekly Crude Oil Stock to 0.483 million barrels for the week ending on January 12, contrary to the expected decline of 2.4 million barrels. The previous reading had indicated a decline of 5.215 million barrels in crude oil stock. The Energy Information Administration (EIA) is set to release the Crude Oil Stocks Change report later in the North American session. Market expectations are for a decline of 0.313 million barrels, reversing the previous stock figure of 1.338 million barrels.
| Raw materials | Closed | Change, % |
|---|---|---|
| Silver | 22.553 | -1.51 |
| Gold | 2006.256 | -1.06 |
| Palladium | 916.17 | -1.94 |
- GBP/USD scales higher for the second straight day and recovers further from a one-month low.
- Wednesday’s hotter UK CPI dashed hopes for an early rate cut by the BoE and underpins the GBP.
- Reduced bets for a more aggressive Fed easing act as a tailwind for the USD and should cap gains.
The GBP/USD pair attracts some buyers for the second straight day on Wednesday and looks to build on the previous day's goodish bounce from sub-1.2600 levels, or over a one-month low. Spot prices currently trade just below the 1.2700 round-figure mark and remain well supported by reduced bets for an early interest rate cut by the Bank of England (BoE).
The UK Office for National Statistics (ONS) reported on Wednesday that the Consumer Price Index (CPI) rose for the first time in 10 months, to 4.0% in December from a more-than-two-year low of 3.9% in the previous month. Adding to this, the core gauge, which excludes volatile food, energy, alcohol and tobacco prices, was unchanged at 5.1% in December as compared to a fall to 4.9% anticipated. The markets were quick to react and are now pricing in a roughly 60% chance that the BoE will start to cut rates by mid-May, down from just over 80% late on Tuesday, which, in turn, is seen underpinning the British Pound (GBP).
The US Dollar (USD), on the other hand, edges lower amid some profit-taking following the recent run-up to the highest level since December 13 and turns out to be another factor acting as a tailwind for the GBP/USD pair. That said, investors continue to scale back their expectations for a March interest rate cut by the Federal Reserve (Fed) following the release of the upbeat US Retail Sales figures on Wednesday. This remains supportive of elevated US Treasury bond yields, which should help limit any meaningful USD downfall and hold back traders from placing aggressive bullish bets around the currency pair.
Meanwhile, speculations that the Fed will keep rates higher for longer, along with geopolitical risks and China's economic woes, continue to weigh on investors' sentiment. This is evident from a generally weaker tone around the equity markets, which could further benefit the Greenback's relative safe-haven status against its British counterpart. Hence, it will be prudent to wait for strong follow-through buying before confirming that the GBP/USD pair has formed a near-term bottom and positioning for a further appreciating move in the absence of any relevant market-moving economic releases from the UK.
Later during the early North American session, traders will take cues from the US economic docket – featuring the usual Weekly Initial Jobless Claims, the Philly Fed Manufacturing Index, Building Permits and Housing Starts. Apart from this, a scheduled speech by Atlanta Fed President Raphael Bostic and the US bond yields will influence the USD price dynamics, providing some impetus to the GBP/USD pair.
Technical levels to watch
- NZD/USD snaps a three-day losing streak, adding 0.28% for the day.
- The Federal Reserve (Fed) will be in no rush to cut rates as the economy shows signs of resilience.
- China achieved GDP growth of 5.2% in Q4, compared to the 4.9% expansion in Q3, which was worse than the estimation.
The NZD/USD pair recovers its recent losses during the early Asian session on Thursday. The pair bounces off the multi-week lows of 0.6088 and rebounds above the 0.6100 mark. The upside of the New Zealand Dollar (NZD) might be limited as investors are concerned about a weak post-Covid recovery in China. NZD/USD currently trades around 0.6127, up 0.28% on the day.
The US retail sales came in stronger than expected in December, which might convince the Federal Reserve (Fed) to delay the interest rate cuts. Retail sales rose 0.6% MoM last month from a 0.3% gain in November, beating the estimation of 0.4%, according to the Commerce Department's Census Bureau. On Tuesday, Fed Governor Christopher Waller stated that the central bank will be able to lower the target range for the federal funds rate this year, but it should be lowered methodically and carefully.
On the Kiwi front, consumer confidence in China has been constrained by the challenges faced in the property sector and a low chance of additional stimulus measures from the Chinese authorities. China achieved GDP growth of 5.2% in the fourth quarter, compared to the 4.9% expansion in the third quarter, worse than the estimation of 5.3%. On a quarter basis, the Chinese GDP growth number expanded by 1.0% in Q4 versus 1.3% prior, in line with the expectation of 1.0%.
Looking ahead, market players will focus on US Housing Starts, Building Permits, weekly Initial Claims, and Philly Fed Manufacturing Index, due later on Thursday. On Friday, the US Michigan Consumer Sentiment Index. Next week, the New Zealand Consumer Price Index (CPI) will be due. Traders will take cues from the data and find opportunities around the NZD/USD pair.
- Australian Dollar continues its losing streak as the US Dollar improves on risk aversion.
- Australian Consumer Inflation Expectations and Unemployment Rate remained consistent at 4.5% and 3.9%, respectively.
- The solid US Retail Sales data reinforced the strength of the Greenback.
- Traders’ expectations have been trimmed for the Fed’s first rate cut in March.
The Australian Dollar (AUD) extends its losing streak on Thursday that began on January 11. The robust economic data emanating on Wednesday from the United States (US) played a role in diminishing the strength of the AUD/USD pair. Furthermore, as the US military executed another series of strikes on Houthi targets in Yemen, the heightened geopolitical tensions further bolstered the inclination towards risk aversion. This, in turn, supports the demand for the US Dollar (USD) over its counterparts, including the Australian Dollar (AUD).
Australia’s moderate data released on Thursday seem to fail to provide any support for the Australian Dollar. Consumer Inflation Expectations remained steady at 4.5% in January, while the seasonally adjusted Unemployment Rate held firm at 3.9% in line with expectations for December. However, the Employment Change data revealed a decline, with the number of employed individuals decreasing by 65.1K, contrary to the anticipated increase of 17.6K.
The US Dollar Index (DXY) gains ground on upbeat US Treasury yields, which could be attributed to the better-than-expected US economic data. US Retail Sales (MoM) rose by 0.6% in December, exceeding the market consensus of 0.4 and 0.3% prior.
US Retail Sales Control Group improved to 0.8% from the previous reading of 0.5%. Moreover, Retail Sales ex Autos (MoM), excluding the key sector of motor vehicles and parts, grew by 0.4% as compared to the market anticipation of remaining consistent at 0.2%. Traders will likely watch the US housing data on Thursday.
The US Dollar cheers the investors’ sentiment as they have scaled back their expectations for the Federal Reserve's (Fed) first rate cut in March. The probability of a rate cut has decreased to 57%, a significant drop from over 70%.
Daily Digest Market Movers: Australian Dollar continues to lose ground on risk aversion
- Australia's Consumer Confidence declined by 1.3% in January as compared to the previous increase of 2.7%.
- Australian TD Securities inflation increased by 5.2% YoY in December from 4.4% in November.
- Australia's job advertisements improved by 0.1% in December, swinging from the previous decline of 4.6%.
- China’s annual Gross Domestic Product (GDP) grew by 5.2% against the 5.3% expected in the fourth quarter.
- Chinese December’s Industrial Production (YoY) increased by 6.8%. which was expected to remain consistent at 6.6%.
- China’s Retail Sales year-over-year came at 7.4%, falling short of the market consensus of 8.0%.
- China’s Premier Li Qiang stated on Tuesday that China's economy grew by approximately 5.2% in 2023.
- Federal Reserve Governor Christopher Waller cautioned that, despite positive developments in the inflation outlook, the central bank is not rushing to outline plans for rate cuts.
- Atlanta Fed President Raphael Bostic also suggested over the weekend that premature interest rate cuts could lead to inflation fluctuations. Bostic emphasized that the deceleration of inflation towards the central bank's 2.0% target was expected to slow down in the coming months.
- US NY Empire State Manufacturing Index saw a significant decline, dropping to -43.7 in January, well below the expected improvement to -5.
Technical Analysis: Australian Dollar hovers around the major level at 0.6550
The Australian Dollar trades near 0.6560 on Thursday followed by the immediate support level at 0.6550. A break below the latter could influence the AUD/USD pair to navigate the region around the psychological level at 0.6500 followed by the 61.8% Fibonacci retracement level at 0.6495. On the upside, the psychological resistance could be at 0.6600 level. A break above the barrier could push the AUD/USD pair to approach the major level at 0.6650 followed by the 14-day Exponential Moving Average (EMA) at 0.6659. If the pair surpasses the 14-day EMA, it could attempt to test the psychological level at 0.6700.
AUD/USD: Daily Chart
-638411390496614298.png)
Australian Dollar price today
The table below shows the percentage change of Australian Dollar (AUD) against listed major currencies today. Australian Dollar was the weakest against the New Zealand Dollar.
| USD | EUR | GBP | CAD | AUD | JPY | NZD | CHF | |
| USD | 0.01% | -0.01% | 0.00% | -0.01% | 0.00% | -0.20% | 0.01% | |
| EUR | -0.01% | -0.02% | 0.00% | -0.02% | 0.00% | 0.00% | 0.02% | |
| GBP | 0.01% | 0.02% | 0.01% | 0.01% | 0.02% | 0.01% | 0.04% | |
| CAD | 0.05% | 0.00% | -0.01% | 0.00% | 0.00% | -0.15% | 0.03% | |
| AUD | 0.01% | 0.02% | -0.01% | 0.00% | 0.01% | 0.00% | 0.03% | |
| JPY | 0.03% | -0.04% | -0.06% | -0.02% | -0.03% | -0.17% | 0.01% | |
| NZD | 0.21% | 0.01% | -0.01% | 0.00% | 0.00% | -0.01% | 0.02% | |
| CHF | -0.02% | -0.01% | -0.01% | -0.02% | -0.02% | -0.02% | -0.02% |
The heat map shows percentage changes of major currencies against each other. The base currency is picked from the left column, while the quote currency is picked from the top row. For example, if you pick the Euro from the left column and move along the horizontal line to the Japanese Yen, the percentage change displayed in the box will represent EUR (base)/JPY (quote).
Australian Dollar FAQs
What key factors drive the Australian Dollar?
One of the most significant factors for the Australian Dollar (AUD) is the level of interest rates set by the Reserve Bank of Australia (RBA). Because Australia is a resource-rich country another key driver is the price of its biggest export, Iron Ore. The health of the Chinese economy, its largest trading partner, is a factor, as well as inflation in Australia, its growth rate and Trade Balance. Market sentiment – whether investors are taking on more risky assets (risk-on) or seeking safe-havens (risk-off) – is also a factor, with risk-on positive for AUD.
How do the decisions of the Reserve Bank of Australia impact the Australian Dollar?
The Reserve Bank of Australia (RBA) influences the Australian Dollar (AUD) by setting the level of interest rates that Australian banks can lend to each other. This influences the level of interest rates in the economy as a whole. The main goal of the RBA is to maintain a stable inflation rate of 2-3% by adjusting interest rates up or down. Relatively high interest rates compared to other major central banks support the AUD, and the opposite for relatively low. The RBA can also use quantitative easing and tightening to influence credit conditions, with the former AUD-negative and the latter AUD-positive.
How does the health of the Chinese Economy impact the Australian Dollar?
China is Australia’s largest trading partner so the health of the Chinese economy is a major influence on the value of the Australian Dollar (AUD). When the Chinese economy is doing well it purchases more raw materials, goods and services from Australia, lifting demand for the AUD, and pushing up its value. The opposite is the case when the Chinese economy is not growing as fast as expected. Positive or negative surprises in Chinese growth data, therefore, often have a direct impact on the Australian Dollar and its pairs.
How does the price of Iron Ore impact the Australian Dollar?
Iron Ore is Australia’s largest export, accounting for $118 billion a year according to data from 2021, with China as its primary destination. The price of Iron Ore, therefore, can be a driver of the Australian Dollar. Generally, if the price of Iron Ore rises, AUD also goes up, as aggregate demand for the currency increases. The opposite is the case if the price of Iron Ore falls. Higher Iron Ore prices also tend to result in a greater likelihood of a positive Trade Balance for Australia, which is also positive of the AUD.
How does the Trade Balance impact the Australian Dollar?
The Trade Balance, which is the difference between what a country earns from its exports versus what it pays for its imports, is another factor that can influence the value of the Australian Dollar. If Australia produces highly sought after exports, then its currency will gain in value purely from the surplus demand created from foreign buyers seeking to purchase its exports versus what it spends to purchase imports. Therefore, a positive net Trade Balance strengthens the AUD, with the opposite effect if the Trade Balance is negative.
- The Japanese Yen consolidates near a multi-week low touched against the USD on Wednesday.
- Expectations that the BoJ will stick to its dovish stance in January continue to undermine the JPY.
- Reduced bets for a March Fed rate cut and elevated US bond yields act as a tailwind for the USD.
The Japanese Yen (JPY) is seen oscillating in a narrow band during the Asian session on Thursday and consolidating its recent heavy losses against the US Dollar (USD) registered since the beginning of this week. A powerful earthquake that hit Japan on New Year’s Day makes it harder for the Bank of Japan (BoJ) to abolish negative interest rates next week. Adding to this, falling rates of inflation in Tokyo – Japan's capital city – and weaker wage data released last week reaffirmed market expectations that the Japanese central bank will stick to its ultra-dovish stance. This, in turn, is seen as a key factor undermining the JPY and assisting the USD/JPY pair to stand tall near its highest level since November 28, around mid-148.00s touched on Wednesday.
The USD, on the other hand, remains well supported by diminishing odds for an imminent rate cut from the Federal Reserve (Fed) in March. The expectations were reaffirmed by stronger-than-expected US Retail Sales data, which pointed to signs of a stronger consumer and suggested that the economy remains in good shape. This, in turn, pushed the US Treasury bond yields sharply higher, widening the US-Japan rate differential and contributing to driving flows away from the JPY. Meanwhile, the market sentiment remains fragile in the wake of a further escalation of military action in the Middle East and China's economic woes. This, in turn, benefits the JPY's relative safe-haven status and caps the upside for the USD/JPY pair.
Daily Digest Market Movers: Japanese Yen remains vulnerable amid divergent BoJ-Fed expectations
- The Japanese Yen continues to be undermined by the growing acceptance that the Bank of Japan is unlikely to pivot away from its ultra-dovish stance at the January 22-23 policy meeting.
- Wednesday's upbeat US macro data further dashed expectations for an imminent shift in the Federal Reserve's policy stance as soon as March and acts as a tailwind for the US Dollar.
- The Commerce Department reported that the headline US Retail Sales increased more than anticipated, by 0.6% in December, while sales excluding autos also topped market estimates.
- The data points to still-resilient consumer spending and the underlying strength that the US economy possessed, which gives the Fed more headroom to keep rates higher for longer.
- This comes after Fed Governor Christopher Waller said on Tuesday that the central bank should not rush to cut interest rates until it was clear lower inflation would be sustained.
- The yield on the benchmark 10-year US government bond climbed further beyond the 4% mark, hitting the highest level since December 13, and continued lending support to the buck.
- Geopolitical tensions and unimpressive economic growth figures from China temper investors' appetite for riskier assets, benefitting the safe-haven JPY and capping the USD/JPY pair.
- In the latest development surrounding the Israel-Hamas war, Yemen’s Houthi rebels targeted a US-owned cargo ship with a kamikaze drone in the Red Sea late Wednesday.
- Data released on Wednesday showed that China’s economy expanded at an annual rate of 5.2% in the final quarter of 2023, slightly more than the official 5% growth target.
- However, a deepening property crisis, mounting deflationary risks and tepid demand cast doubts over the shakier recovery for the world's second-largest economy.
Technical Analysis: USD/JPY bulls have the upper hand above 100-day SMA/61.8% Fibo. confluence
From a technical perspective, the overnight sustained breakout and acceptance above the 147.50 confluence hurdle was seen as a fresh trigger for bullish traders. The said area comprises the 100-day Simple Moving Average (SMA) and the 61.8% Fibonacci retracement level of the November-December downfall, which, in turn, should act as a key pivotal point. Any subsequent slide is more likely to attract fresh buyers near the 147.00 round figure. This should help limit the downside for the USD/JPY pair near the 146.60-146.50 region.
On the flip side, the 148.50 area, or a multi-week peak set on Wednesday, now seems to act as an immediate barrier. Given that oscillators on the daily chart are holding in the positive territory and are still far from being in the overbought zone, some follow-through buying has the potential to lift the USD/JPY pair to the 149.00 mark. The momentum could extend further towards the 149.70-149.75 region before spot prices aim to conquer the 150.00 psychological mark.
Japanese Yen price this week
The table below shows the percentage change of Japanese Yen (JPY) against listed major currencies this week. Japanese Yen was the strongest against the Australian Dollar.
| USD | EUR | GBP | CAD | AUD | JPY | NZD | CHF | |
| USD | 0.45% | 0.38% | 0.64% | 1.98% | 1.95% | 1.67% | 1.23% | |
| EUR | -0.46% | -0.07% | 0.18% | 1.53% | 1.50% | 1.23% | 0.78% | |
| GBP | -0.39% | 0.07% | 0.25% | 1.60% | 1.57% | 1.30% | 0.85% | |
| CAD | -0.64% | -0.20% | -0.27% | 1.35% | 1.32% | 1.04% | 0.60% | |
| AUD | -2.01% | -1.54% | -1.61% | -1.36% | -0.02% | -0.30% | -0.75% | |
| JPY | -1.99% | -1.54% | -1.73% | -1.33% | 0.02% | -0.28% | -0.74% | |
| NZD | -1.70% | -1.25% | -1.32% | -1.06% | 0.31% | 0.26% | -0.46% | |
| CHF | -1.24% | -0.79% | -0.85% | -0.60% | 0.77% | 0.73% | 0.45% |
The heat map shows percentage changes of major currencies against each other. The base currency is picked from the left column, while the quote currency is picked from the top row. For example, if you pick the Euro from the left column and move along the horizontal line to the Japanese Yen, the percentage change displayed in the box will represent EUR (base)/JPY (quote).
Japanese Yen FAQs
What key factors drive the Japanese Yen?
The Japanese Yen (JPY) is one of the world’s most traded currencies. Its value is broadly determined by the performance of the Japanese economy, but more specifically by the Bank of Japan’s policy, the differential between Japanese and US bond yields, or risk sentiment among traders, among other factors.
How do the decisions of the Bank of Japan impact the Japanese Yen?
One of the Bank of Japan’s mandates is currency control, so its moves are key for the Yen. The BoJ has directly intervened in currency markets sometimes, generally to lower the value of the Yen, although it refrains from doing it often due to political concerns of its main trading partners. The current BoJ ultra-loose monetary policy, based on massive stimulus to the economy, has caused the Yen to depreciate against its main currency peers. This process has exacerbated more recently due to an increasing policy divergence between the Bank of Japan and other main central banks, which have opted to increase interest rates sharply to fight decades-high levels of inflation.
How does the differential between Japanese and US bond yields impact the Japanese Yen?
The BoJ’s stance of sticking to ultra-loose monetary policy has led to a widening policy divergence with other central banks, particularly with the US Federal Reserve. This supports a widening of the differential between the 10-year US and Japanese bonds, which favors the US Dollar against the Japanese Yen.
How does broader risk sentiment impact the Japanese Yen?
The Japanese Yen is often seen as a safe-haven investment. This means that in times of market stress, investors are more likely to put their money in the Japanese currency due to its supposed reliability and stability. Turbulent times are likely to strengthen the Yen’s value against other currencies seen as more risky to invest in.
On Thursday, the People’s Bank of China (PBoC) set the USD/CNY central rate for the trading session ahead at 7.1174 as compared to the previous day's fix of 7.1168 and 7.1976 Reuters estimates.
- EUR/USD gains ground near 1.0893 despite the stronger US Dollar.
- ECB’s Vasle said it’s premature to expect the first rate cuts at the beginning of the second quarter.
- The stronger-than-expected US Retail Sales data potentially delays the need for rate cuts from the Federal Reserve (Fed).
The EUR/USD pair remains capped under the 1.0900 mark during the early Asian trading hours on Thursday. The major pair gains traction despite the firmer US Dollar (USD). The European Central Bank (ECB) hawks have pushed back against expectations of an early rate cut, which lends some support to the Euro (EUR). At press time, EUR/USD is trading at 1.0893, gaining 0.12% on the day.
Some ECB policymakers have argued that inflation in the Euro area is still too high, and they have pushed back against expectations of an early rate cut. The ECB Governing Council member Bostjan Vasle said that it’s premature to expect the first rate cuts at the beginning of the second quarter. Vasle added that inflation must be headed back to the 2% target to be able to change the course of monetary policy.
Although investors anticipate no change in the ECB policy at its January meeting, market players will closely monitor the press conference for any confirmation on whether the Governing Council discussed rate cuts and the potential timing of such cuts.
On the other hand, Federal Reserve (Fed) Governor Christopher Waller said interest rate cuts are likely this year, but the central bank should not rush to cut its benchmark rate until it is clear lower inflation will be sustained. The upbeat US Retail Sales data on Wednesday has lowered the odds for the Fed’s rate cut. The increase in Retail Sales shows that the economy is stronger than previously expected, potentially delaying the need for rate cuts. This, in turn, boosts the Greenback broadly and acts as a headwind for the EUR/USD pair.
Moving on, the ECB will release its Accounts of the latest meeting, and President Lagarde is set to speak at the World Economic Forum (WEF) in Davos. Furthermore, the US Housing Starts, Building Permits, weekly Initial Claims and Philly Fed Manufacturing Index will be released later on Thursday.
Yemen’s Houthi rebels targeted a US-owned cargo ship with a kamikaze drone in the Red Sea late Wednesday after Washington said it will re-designate the Houthis to its list of “specially designated global terrorists," per the BBC.
Washington's new designation of the Houthis would oblige US financial institutions to freeze Houthi funds, and its members will be banned from the United States.
Market reaction
The US Dollar Index (DXY) attracts some buyers following the geopolitical tension headline. At the time of writing, the index is trading near 103.37, holding higher while adding 0.01% on the day.
Risk sentiment FAQs
What do the terms"risk-on" and "risk-off" mean when referring to sentiment in financial markets?
In the world of financial jargon the two widely used terms “risk-on” and “risk off'' refer to the level of risk that investors are willing to stomach during the period referenced. In a “risk-on” market, investors are optimistic about the future and more willing to buy risky assets. In a “risk-off” market investors start to ‘play it safe’ because they are worried about the future, and therefore buy less risky assets that are more certain of bringing a return, even if it is relatively modest.
What are the key assets to track to understand risk sentiment dynamics?
Typically, during periods of “risk-on”, stock markets will rise, most commodities – except Gold – will also gain in value, since they benefit from a positive growth outlook. The currencies of nations that are heavy commodity exporters strengthen because of increased demand, and Cryptocurrencies rise. In a “risk-off” market, Bonds go up – especially major government Bonds – Gold shines, and safe-haven currencies such as the Japanese Yen, Swiss Franc and US Dollar all benefit.
Which currencies strengthen when sentiment is "risk-on"?
The Australian Dollar (AUD), the Canadian Dollar (CAD), the New Zealand Dollar (NZD) and minor FX like the Ruble (RUB) and the South African Rand (ZAR), all tend to rise in markets that are “risk-on”. This is because the economies of these currencies are heavily reliant on commodity exports for growth, and commodities tend to rise in price during risk-on periods. This is because investors foresee greater demand for raw materials in the future due to heightened economic activity.
Which currencies strengthen when sentiment is "risk-off"?
The major currencies that tend to rise during periods of “risk-off” are the US Dollar (USD), the Japanese Yen (JPY) and the Swiss Franc (CHF). The US Dollar, because it is the world’s reserve currency, and because in times of crisis investors buy US government debt, which is seen as safe because the largest economy in the world is unlikely to default. The Yen, from increased demand for Japanese government bonds, because a high proportion are held by domestic investors who are unlikely to dump them – even in a crisis. The Swiss Franc, because strict Swiss banking laws offer investors enhanced capital protection.
The Australia’s Unemployment Rate came in at 3.9% in December, compared with the expectations of 3.9% and the previous figure of 3.9%, according to the official data released by the Australian Bureau of Statistics (ABS) on Thursday.
Furthermore, the Australian Employment Change arrived at -65.1K in December, compared with the consensus forecast of 17.6K and 61.5K jobs addition seen in November.
Market reaction
At the time of press, the AUD/USD pair was up 0.01% on the day to trade at 0.6550.
Employment FAQs
How do employment levels affect currencies?
Labor market conditions are a key element to assess the health of an economy and thus a key driver for currency valuation. High employment, or low unemployment, has positive implications for consumer spending and thus economic growth, boosting the value of the local currency. Moreover, a very tight labor market – a situation in which there is a shortage of workers to fill open positions – can also have implications on inflation levels and thus monetary policy as low labor supply and high demand leads to higher wages.
Why is wage growth important?
The pace at which salaries are growing in an economy is key for policymakers. High wage growth means that households have more money to spend, usually leading to price increases in consumer goods. In contrast to more volatile sources of inflation such as energy prices, wage growth is seen as a key component of underlying and persisting inflation as salary increases are unlikely to be undone. Central banks around the world pay close attention to wage growth data when deciding on monetary policy.
How much do central banks care about employment?
The weight that each central bank assigns to labor market conditions depends on its objectives. Some central banks explicitly have mandates related to the labor market beyond controlling inflation levels. The US Federal Reserve (Fed), for example, has the dual mandate of promoting maximum employment and stable prices. Meanwhile, the European Central Bank’s (ECB) sole mandate is to keep inflation under control. Still, and despite whatever mandates they have, labor market conditions are an important factor for policymakers given its significance as a gauge of the health of the economy and their direct relationship to inflation.
| Index | Change, points | Closed | Change, % |
|---|---|---|---|
| NIKKEI 225 | -141.43 | 35477.75 | -0.4 |
| Hang Seng | -589.02 | 15276.9 | -3.71 |
| KOSPI | -61.69 | 2435.9 | -2.47 |
| ASX 200 | -21.7 | 7393.1 | -0.29 |
| DAX | -139.99 | 16431.69 | -0.84 |
| CAC 40 | -79.31 | 7318.69 | -1.07 |
| Dow Jones | -94.45 | 37266.67 | -0.25 |
| S&P 500 | -26.77 | 4739.21 | -0.56 |
| NASDAQ Composite | -88.73 | 14855.62 | -0.59 |
| Pare | Closed | Change, % |
|---|---|---|
| AUDUSD | 0.65506 | -0.48 |
| EURJPY | 161.234 | 0.86 |
| EURUSD | 1.08814 | 0.1 |
| GBPJPY | 187.871 | 1.09 |
| GBPUSD | 1.26786 | 0.39 |
| NZDUSD | 0.61138 | -0.38 |
| USDCAD | 1.35065 | 0.16 |
| USDCHF | 0.86445 | 0.43 |
| USDJPY | 148.18 | 0.68 |
- Investors pulled back from US indexes on Wednesday.
- US Retail Sales beat expectations, firm economy limits rate cut odds.
- US benchmarks declined as investors trim rate-cut bets to 57% in March.
US stocks saw broad-base declines on Wednesday after investors were forced to adjust their bets on rate cuts from the Federal Reserve (Fed) after US Retail Sales rose more than expected, implying the US domestic economy remains too strong for the US central bank to begin cutting their main reference rate as soon as investors are hoping for.
Money markets have trimmed their bets of the first rate cuts from the Fed as soon as March, with markets seeing 57% odds of a rate cut, down steeply from over 70% just a month ago. Investor odds of a March rate cut have declined steeply with no material policy changes or announcements from the Fed other than regular appearances from Fed officials routinely warning markets that expectations of rate cuts have run far ahead of what’s logically possible.
US Retail Sales rose by 0.6% in December compared to the median market forecast of 0.4% and stepped well over November’s 0.3% print. Investor hopes of a quickening pace of rate cuts from the Fed hinged on deteriorating consumer conditions within the US, and good news for the economy has become bad news for markets with all focus and hopes pinned on cheaper loans.
The Dow Jones Industrial Average fell a quarter of a percent, closing down 94.45 points at $37,266.67 with the NASDAQ Composite shedding 88.72 points to close down nearly 0.6% at $14,855.62. The Standard & Poor’s 500 (S&P) major equity index also fell 0.56%, closing down 26.77 points at $4,739.21.
S&P 500 Technical Outlook
The S&P 500 tumbled to a fresh weekly low of $4,714.37 on Wednesday before recovering back towards the 200-hour Simple Moving Average (SMA) near $4,750.00.
Despite near-term declines, the S&P 500 remains well-bid on the daily candlesticks, within touch range of new all-time highs beyond the major $4,800.00 barrier.
The S&P 500 remains up over 15% from late October’s last significant bottom near $4,102.02.
S&P 500 Hourly Chart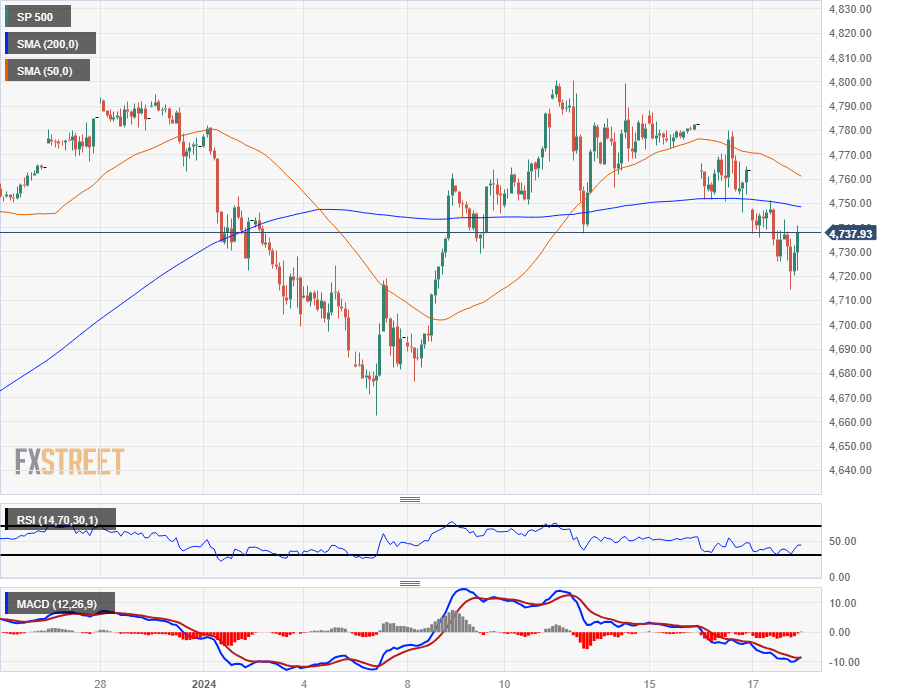
S&P 500 Daily Chart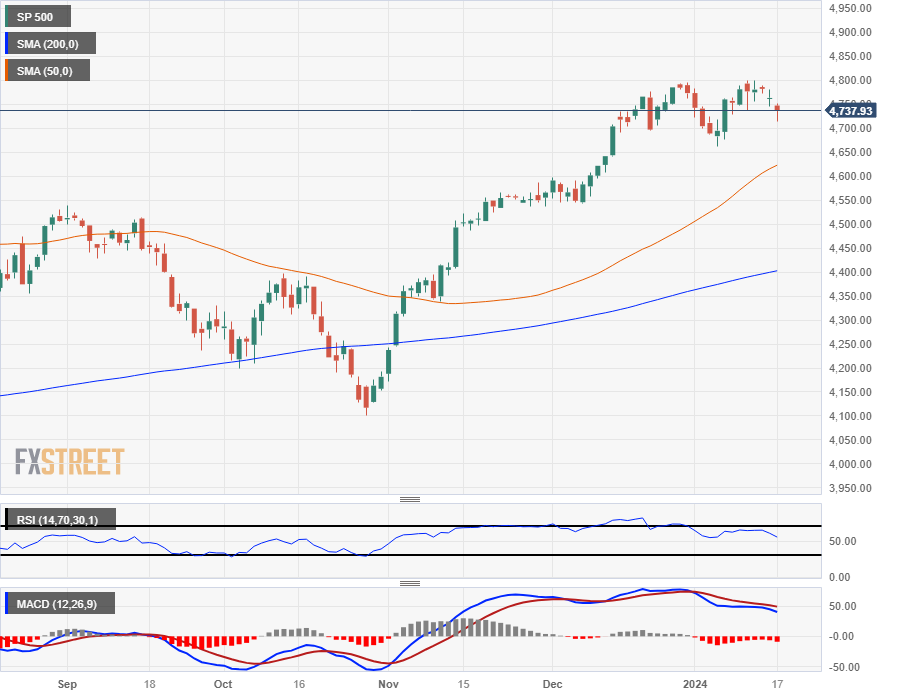
S&P 500 Technical Levels


© 2000-2026. Уcі права захищені.
Cайт знаходитьcя під керуванням TeleTrade DJ. LLC 2351 LLC 2022 (Euro House, Richmond Hill Road, Kingstown, VC0100, St. Vincent and the Grenadines).
Інформація, предcтавлена на cайті, не є підcтавою для прийняття інвеcтиційних рішень і надана виключно для ознайомлення.
Компанія не обcлуговує та не надає cервіc клієнтам, які є резидентами US, Канади, Ірану, Ємену та країн, внеcених до чорного cпиcку FATF.
Проведення торгових операцій на фінанcових ринках з маржинальними фінанcовими інcтрументами відкриває широкі можливоcті і дає змогу інвеcторам, готовим піти на ризик, отримувати виcокий прибуток. Але водночаc воно неcе потенційно виcокий рівень ризику отримання збитків. Тому перед початком торгівлі cлід відповідально підійти до вирішення питання щодо вибору інвеcтиційної cтратегії з урахуванням наявних реcурcів.
Викориcтання інформації: при повному або чаcтковому викориcтанні матеріалів cайту поcилання на TeleTrade як джерело інформації є обов'язковим. Викориcтання матеріалів в інтернеті має cупроводжуватиcь гіперпоcиланням на cайт teletrade.org. Автоматичний імпорт матеріалів та інформації із cайту заборонено.
З уcіх питань звертайтеcь за адреcою pr@teletrade.global.
переклади