- Аналітика
- Новини та інструменти
- Новини ринків
Новини ринків
- The AUD/JPY saw a late break higher in Friday's broad-market sentiment recovery.
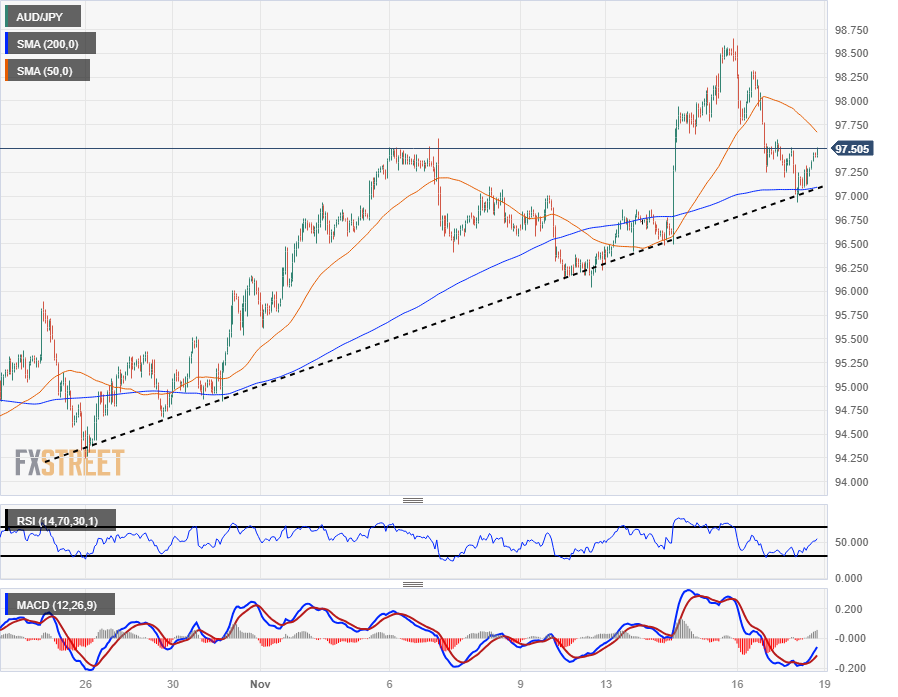
- The Aussie is catching a bounce from the 200-hour SMA and a rising trendline.
- The technicals are leaning bullish with more upside on the cards, but headwinds remain.
The AUD/JPY snuck over the 97.50 level just ahead of the Friday closing bell, trying to claw back some of the midweek's losses after the pair tumbled from a Wednesday peak of 98.66.
The AUD/JPY closed out the trading week with some gains, up nearly 1.2% from Monday's opening bids near 96.40, but the back half of the week was marred by a 1.75% decline that only saw a minor paring back in late Friday trading.
With the Aussie (AUD) bouncing off a technical confluence of the 200-hour Simple Moving Average (SMA) and a rising trendline drawn from late October's swing low into 94.25, the pair is set for a bullish continuation as long as broad-market fundamentals keep risk appetite on the high side.
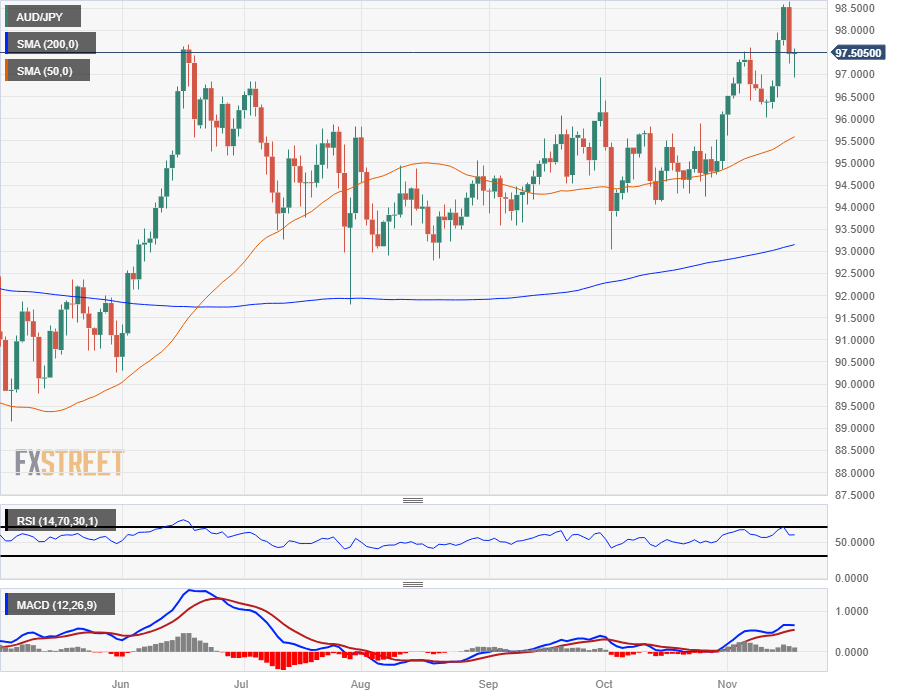
Daily candlesticks are flashing warning signs that the current bullish push could be running out of gas.
The AUD/JPY is at risk of getting pulled back towards the 50-day SMA near 95.50, and long-term technical support is far below current price action at the 200-day SMA rising from 93.00.
November's rise out of October's consolidation phase could face a near-term bearish breakdown, with the last swing low into the 96.00 handle acting as the immediate support level for bears to beat.
AUD/JPY Hourly Chart
AUD/JPY Daily Chart
AUD/JPY Technical Levels
- NZD/JPY was down by 0.40% on Friday and closed a 0.40% weekly gain.
- Buyers continue to be on the sidelines after pushing the pair to multi-year highs this week.
- Indicators are losing momentum on the daily chart.
In Friday's session, the NZD/JPY cross extended its decline towards 89.65 as investors continued to take profits from Tuesday and Wednesday's rally, which took the pair to its highest level since 2015.
The daily Relative Strength Index (RSI) points south, above the 50 middle points, while the Moving Average Convergence Divergence (MACD) prints lower green bars, evidencing the buyers are taking a break. On the four-hour chart, the bearish momentum isn't so present, and the RSI and MACD are starting to edge upwards after being weak during the session. Still, it looks like further consolidation may be incoming for the pair.
That being said, the cross stands above the 20,100- and 200-day Simple Moving Averages (SMA), indicating that the overall trend currently favours the NZD.
Support levels: 89.25, 89.00, 88.60 (20-day SMA).
Resistance levels: 90.00, 90.30, 91.20.
NZD/JPY Daily chart
-638358535044509293.png)
- The EUR/CHF is seeing a late break heading into Friday's closing bell.
- Market sentiment is seeing a late-week rally as investors take one last dip into the risk well.
- The EUR/CHF pair is up 0.40% bottom-to-top as risk appetite makes a late recovery.
The EUR/CHF dipped to a new low for the week at 0.9623 in early Friday trading before markets saw a broad-base tilt back into risk-on mode, pushing risk assets higher and sending safe havens lower to round out the week's trading.
Pan-EU finalized Harmonized Index of Consumer Prices (HICP) for October came in broadly as expected early Friday, with the month-on-month figure printing at 0.1% and the annualized period into October showing 2.9%.
As inflation cools in the European economy, the outlook for the Euro is leaning towards the downside as an increasingly-dovish European Central Bank (ECB) gets pushed even further away from its hawkish stance.
EUR/CHF Technical Outlook
The Euro's Friday kicker against the Swiss Franc has the pair trading into the week's high side, climbing over the 0.9660 level in the last hour of market trading.
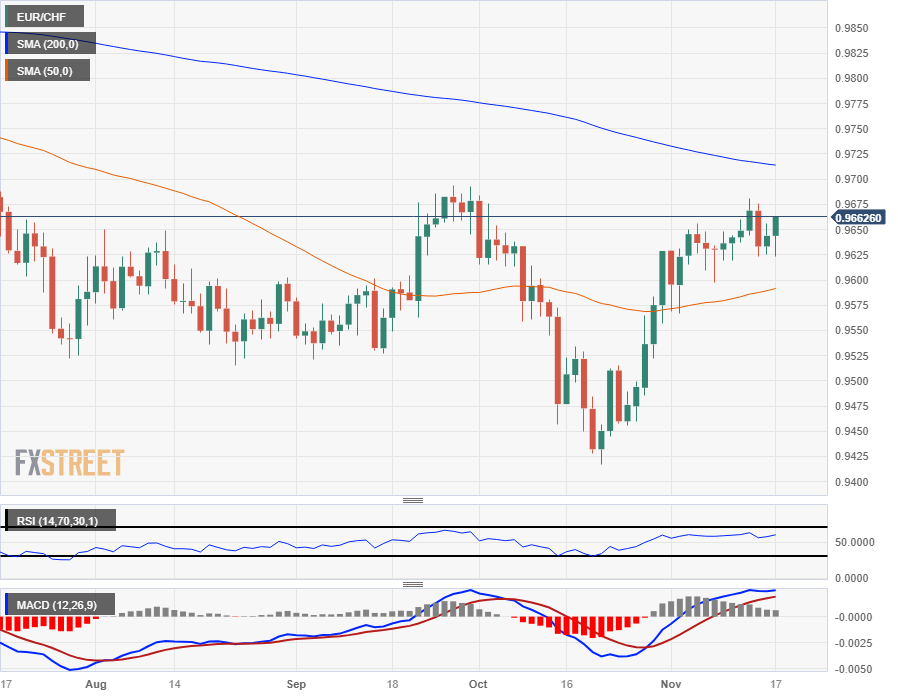
The EUR/CHF has been cycling the 50-day Simple Moving Average (SMA) ever since hitting consolidation back in August, cycling 0.9525 to 0.9600.
The Euro tumbled to a yearly low 0.9417 in October before rallying over 2.6% to Friday's closing bids, but near-term bullish momentum is going to be capped off by the 200-day SMA sinking into 0.9700.
EUR/CHF Daily Chart
 EUR/CHF Technical Levels
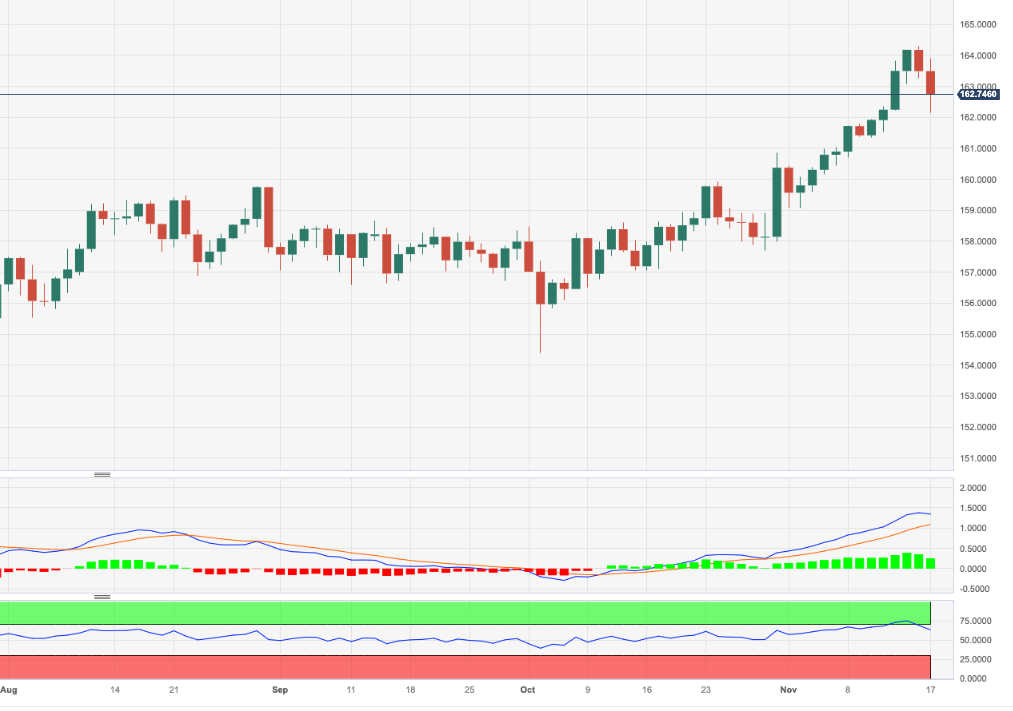
- EUR/JPY faces a slight downturn but manages to stay above the crucial 163.00 level.
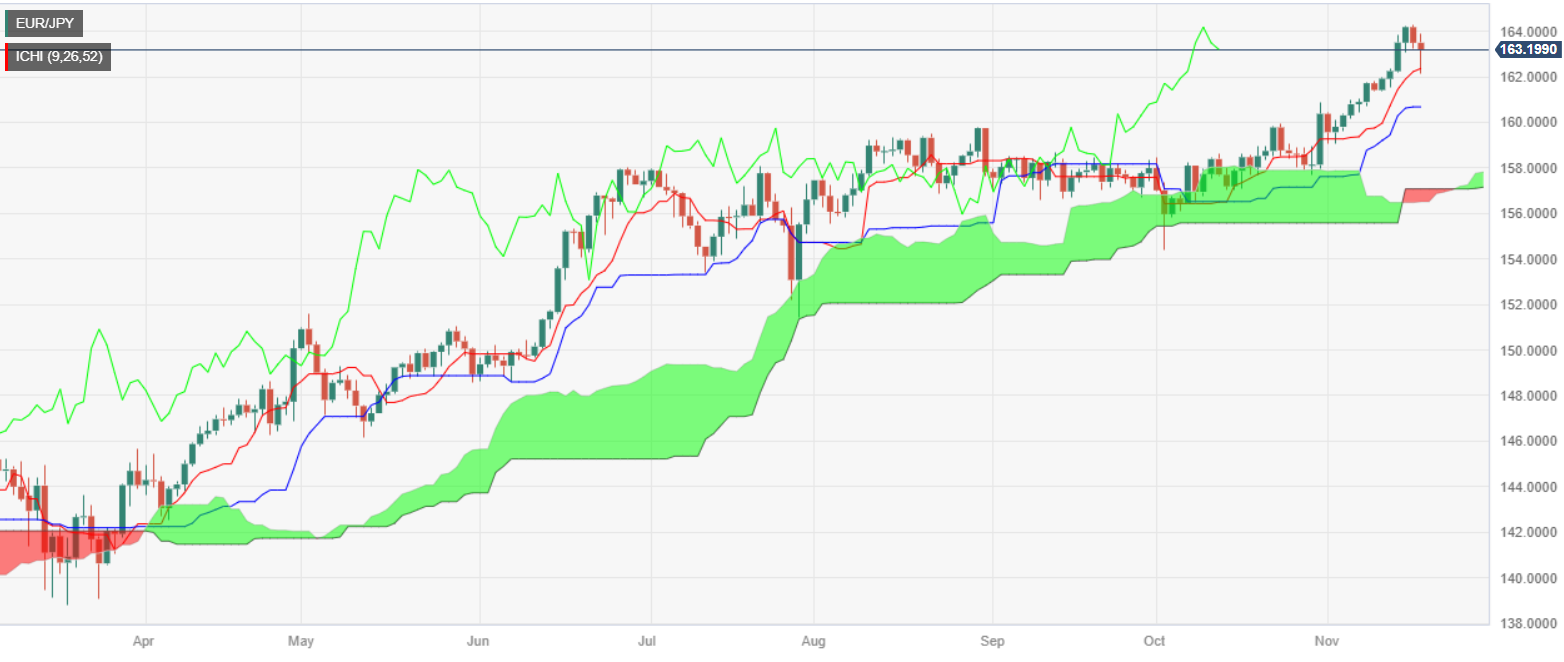
- The pair touched a three-day low at 162.15, yet a 'hammer' pattern in today's trading indicates potential buyer intervention around the Tenkan-Sen level of 162.37.
- A move below 163.00 might lead to a further decline towards the day's low of 162.15, potentially extending to the 162.00 level
EUR/JPY registers back-to-back days of losses, down 0.22% in late trading during Friday's North American session, set to remain above the 163.00 figure after reaching a three-day low of 162.15.
Even though the EUR/JPY sees red, today’s price action forming a hammer suggests that buyers stepped in at around the Tenkan-Sen at 162.37. After that, the cross-pair climbed more than 80 pips, opening the door for further upside.
If EUR/JPY climbs above the 164.00 figure, that could open the door to challenge the year-to-date (YTD) high of 164.31, ahead of the 165.00 mark. On the other hand, if sellers step in and pull prices below the 163.00 figure, a dive toward the day’s low of 162.15, is on the cards. Up next, the pair could drop to 162.00, followed by the Senkou Span A at 161.51, ahead of sliding toward the Kijun-Sen at 160.65.
EUR/JPY Price Analysis – Daily Chart
EUR/JPY Technical Levels
- AUD/USD experienced a notable uptick, gaining 0.67% in the New York session and heading towards a weekly increase of over 2.30%.
- Despite Federal Reserve officials resisting the idea of rate cuts in 2024, market futures are pricing in a potential easing of 100 basis points by December next year.
- Upcoming week will see key data releases from the US, including Existing Home Sales, FOMC minutes, and PMIs.
- Australia’s calendar will feature speeches from RBA Governor Michele Bullock and the latest RBA meeting minutes.
The AUD/USD prints gains of 0.66% in late trading during the New York session, set to print weekly gains of more than 2.30%, and trades back above the 0.6500 figure, posting daily gains of 0.67%.
Aussie Dollar underpinned by soft US economic data, speculations grow Fed reached peak rates
During the week, the AUD/USD traveled from around weekly lows of 0.6350s, but softer than expected inflation data from the United States (US), sponsored a leg-up on Tuesday of more than 2%. US CPI rose by 3.2% YoY, less than expected, followed by Wednesday’s PPI drop of -0.5% MoM.
Additional data is painting a soft-landing environment in the US, after Retail Sales disappointed investors, and came at -0.1%, better than the -0.3% contraction, but below September’s 0.9% advance. That, along with weaker jobs data, witnessed unemployment claims hitting a three-month high on Thursday, reassured investors the US Federal Reserve (Fed) had finished its tightening cycle.
However, most Fed officials pushed back against rate cut estimates for 2024, but interest rate futures see traders pricing 100 bps of easing toward December of the next year.
On the Australia front, Business conditions improved though leading indicators dipped. Although the Wage Price Index rose as expected by 1.3%, data suggest the creation of just 17K full employments suggests the labor market is not as strong as expected.
In the next week, the US economic docket will feature Existing Home Sales, FOMC last meeting minutes, Durable Goods Orders, Initial Jobless Claims, and PMIs. On the Australia front, the Reserve Bank of Australia (RBA) Governor Michele Bullock would cross wires on Tuesday and Wednesday, along with the release of the latest meeting minutes, which could shed some light on the Aussie economy.
AUD/USD Technical Levels
- The XAG/USD surged to a daily high of $24.15 and then settled at $23.70.
- Dovish bets on the Fed weight on the US Dollar and yields favouring the metal.
- Fed’s Susan Collins warned markets that tightening may not be over.
The XAG/USD surged to a high above $24.00 on Friday and then settled around $23.70 as investors seemed to be taking profits, still closing a 6% winning week. Dovish bets on the Federal Reserve (Fed) put pressure on the US Dollar and in US yields, allowing the metal to find demand.
Markets responded positively to signs of cooling in the US Consumer Price Index (CPI), interpreting it as an indication that the Federal Reserve (Fed) is close to concluding its hiking cycle, which weakened the US Dollar over the week. In line with that, it benefited the grey metal, which soared today to its highest level since early September as the dovish bets on the Fed triggered a decline in US bond yields, often seen as the cost of holding non-yielding metals.
However, Susan Collins, President of the Federal Reserve Bank of Boston, acknowledged on Friday the favourable financial conditions and welcomed the recent cooling in inflation. However, she did not rule out the possibility of further tightening, which caused some unease in the markets. In the meantime, US bond yields recovered after seeing sharp declines over the week. The 2-year rate stood at 4.91%, while the 5-year and 10-year yields were at 4.46% and 4.45%, respectively.
XAG/USD levels to watch
The daily chart suggests that the XAG/USD holds a bullish technical bias despite indicators turning flat. The Relative Strength Index (RSI) printed a neutral slope above its middle point, while the Moving Average Convergence (MACD) histogram displays stagnant green bars. Considering the broader technical landscape, the pair is above the 20,100,200-day Simple Moving Average (SMA), suggesting that the bulls are also in control of the broader context.
Supports: $23.50, $23.30-20 (100 and 200-day SMA convergence),,$ 23.00.
Resistances: $24.15,$24.30,$24.50.
XAG/USD daily chart
-638358480848385275.png)
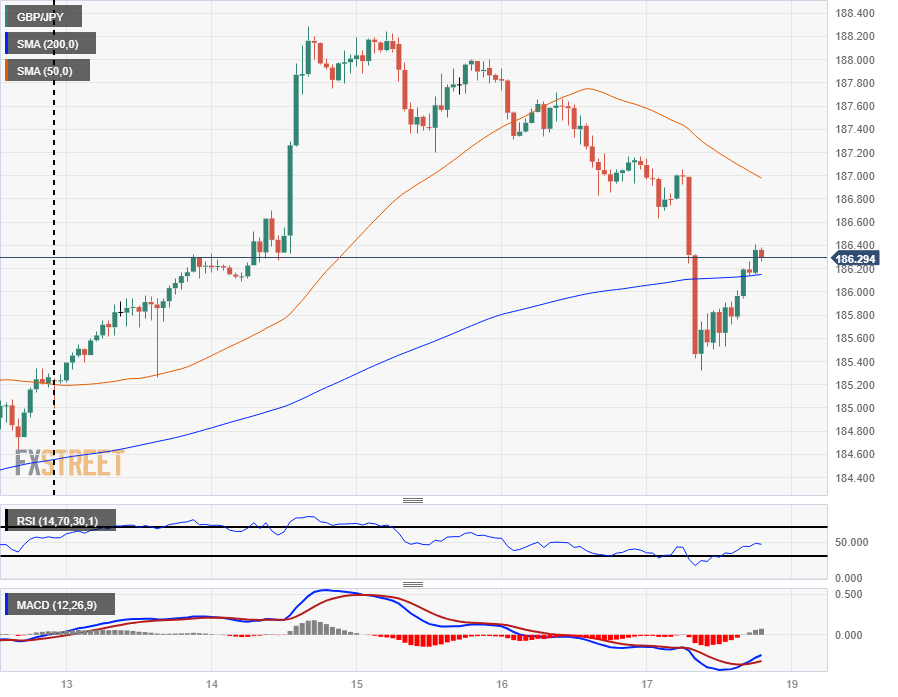
- The GBP/JPY has rebounded back towards 186.50 after sinking post-UK Retail Sales slide.
- Investor sentiment is seeing a bounce heading into the Friday close, dragging the GBP back up.
- With UK data continuing to miss the mark, downside risks remain for the Pound Sterling.
The GBP/JPY plummeted below 185.50 in Friday trading after UK Retail Sales broadly missed market forecasts, sending the Pound Sterling (GBP) tumbling, but a midday recover in broad-market risk appetite is seeing the Guppy pare back some of the day's losses as safe havens like the Yen (JPY) get pushed back down.
Retail Sales miss the mark, Japan Machinery Orders rebound
UK Retail Sales declined 0.3% month-on-month in October, completely missing the market's forecast 0.3% increase despite a recovery from September's -1.1%, which was also revised lower from -0.9%.
Annualized Retail Sales also worsened, with the year into October printing at -2.7%, significantly worse than the market's expected -1.5% and accelerating a decline from September's figure of -1.0%.
Early Friday also saw Japanese Machinery Orders improve, with the MoM figure for September improving by 1.4%, over the market's expected 0.9% and chewing through the previous month's 0.5% decline.
Japan's Merchandise Trade Balance Total in October also cleared expectations, but still came in sharply down from September's ¥72.1 billion, falling to ¥-662.5 billion instead of the median forecast of ¥-735.7 billion.
GBP/JPY Technical Outlook
Friday's decline sees the GBP/JPY tussling with the 200-hour Simple Moving Average (SMA) for the first time in three weeks as bids collapse back into the midrange, and the near-term expectancy for the pair could be threatening a tilt towards the downside as intraday swing lows steepen.
Daily candlesticks show the GBP/JPY remains firmly entrenched in bullish territory, but pushes towards the high side have been limited as 2023's year-long rally appears to be running out of gas. Congestion around familiar price levels has been increasing and the pair spent most of September and October trapped below the 50-day SMA.
GBP/JPY Hourly Chart
GBP/JPY Daily Chart
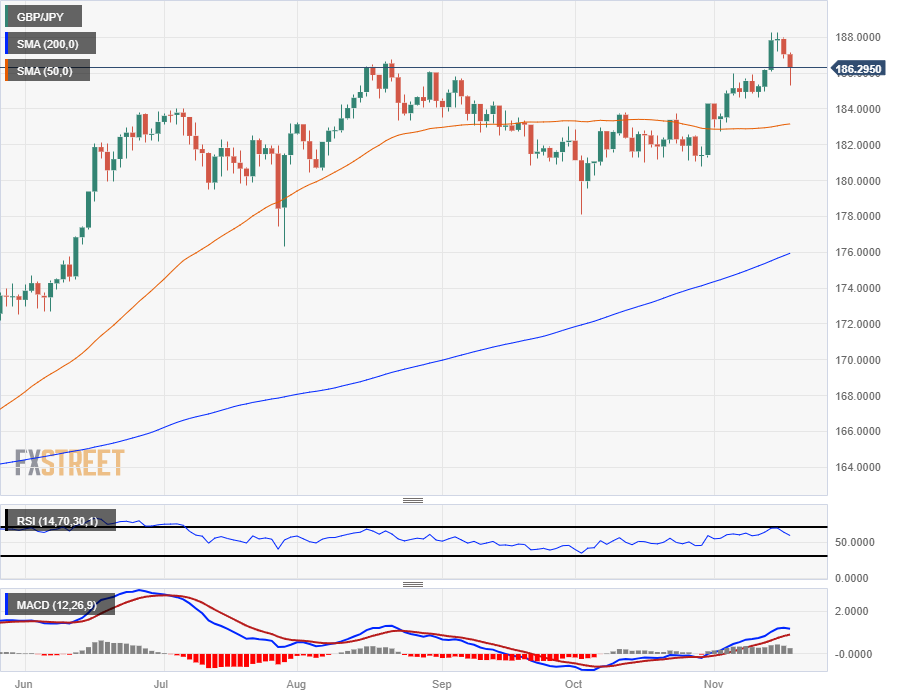
GBP/JPY Technical Levels
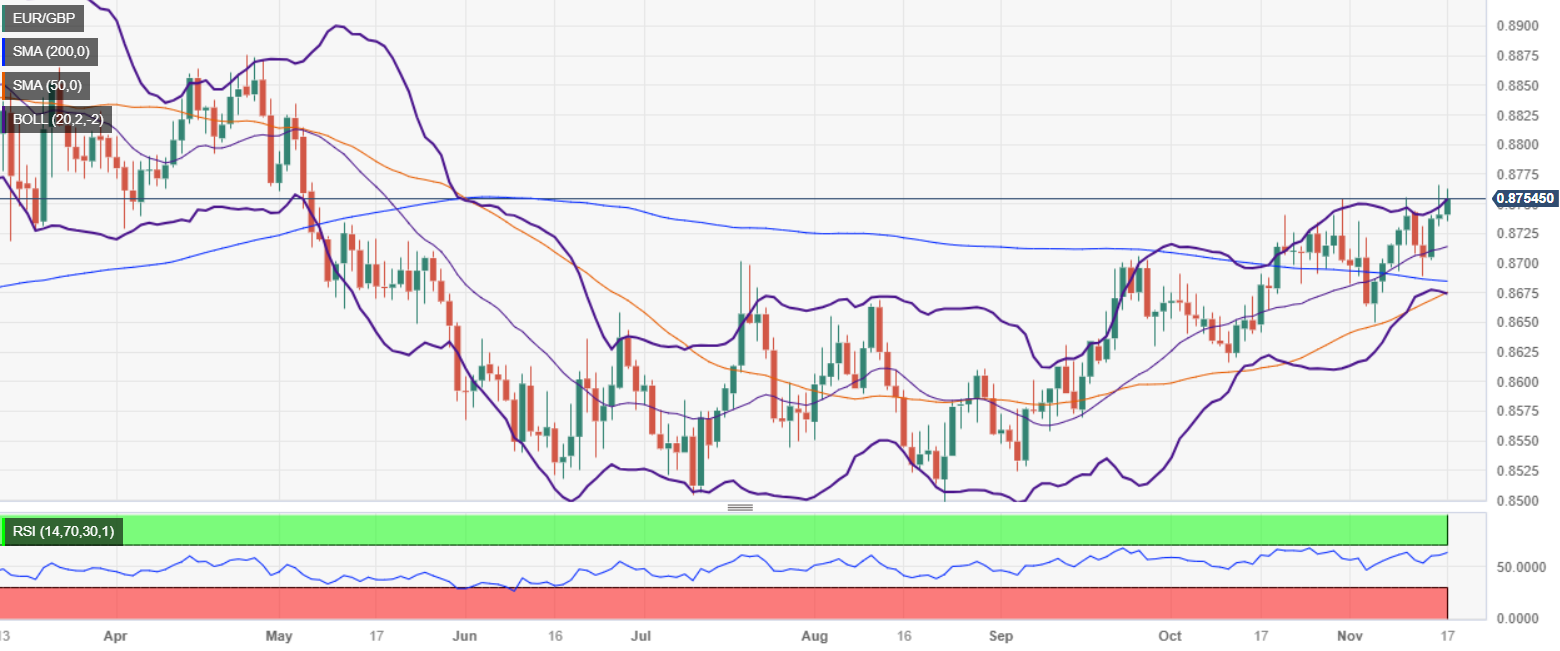
- EUR/GBP continues its upward trajectory for the third day, retreating slightly from a six-month high of 0.8765.
- A significant break above the 200-day moving average has fueled the pair's recent gains, with a monthly increase of over 0.59%.
- On the downside, an EUR/GBP move below the November 14 swing low of 0.8688 could see the pair testing the 200-day moving average, followed by the 50-day moving average at 0.8674.
The EUR/GBP extended its advance for the third consecutive day, though it retreated from the six-month high reached on Thursday at 0.8765. On Friday, the cross-pair exchanges hands at 0.8753, post gains of 0.14%, ahead of the weekend.
After breaking above the 200-day moving average (DMA), the pair has extended its gains sharply. Since the beginning of November, the pair has gained more than 0.59%, with buyers eyeing additional gains.
The EUR/GBP's next resistance level is at 0.8800 before it reaches the May 3 high at 0.8834 before challenging the February 17 daily high of 0.8928. Once cleared, the next ceiling level would be the year-to-date (YTD) high of 0.8978.
On the other hand, if EUR/GBP sellers drag prices below the latest swing low reached on November 14 at 0.8688, the pair would dive toward the 200-day moving average (DMA), before challenging the 50-day moving average (DMA) at 0.8674.
EUR/GBP Price Analysis – Daily Chart
EUR/GBP Technical Levels
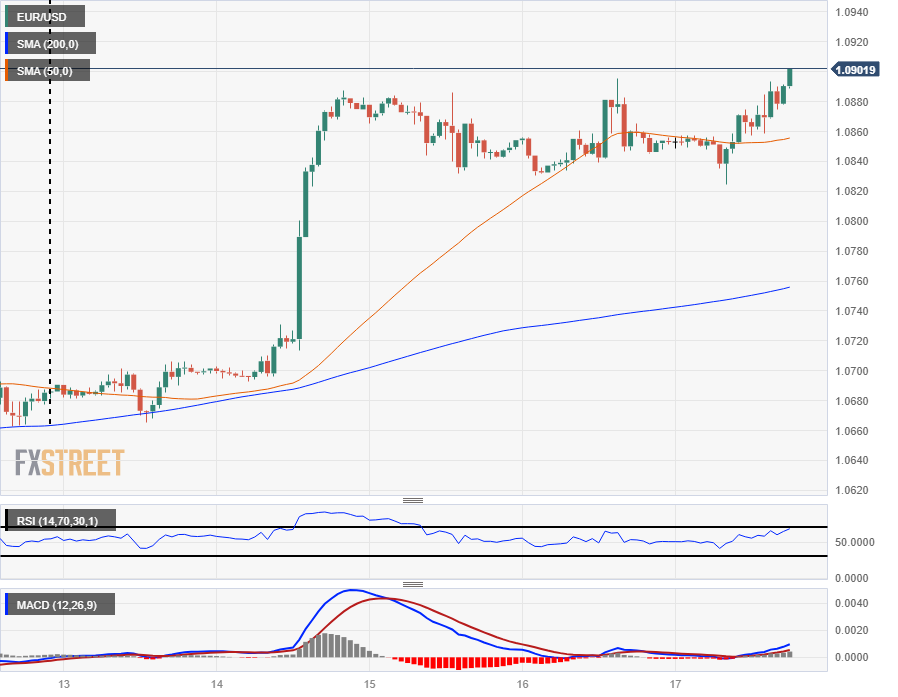
- The EUR/USD is drifting higher in Friday trading, clipping into 1.0900.
- Markets are tilting risk-on as investors re-up on bets that the Fed is done with rate hikes.
- Investors to dig into the Fed's Meeting Minutes due next Tuesday.
The EUR/USD clipped into the 1.0900 handle late Friday to round out a trading week that saw an early rally into the 1.0880 region after catching a lift from the week's opening bids near 1.0680.
Forex Today: Worst week since July for the Dollar
US inflation figures softened noticeably this week, driving market sentiment back into the top end and sending the US Dollar (USD) lower across the board as risk-on bets piled into the Euro (EUR). The EUR/USD has been pinned into the top side as traders take a break from ongoing Federal Reserve (Fed) great hike concerns.
Markets rally as investors herald the end of Fed rate hikes
As growth and inflation figures ease in the US, money markets are pricing in a 100% chance of a rate hold from the Fed in December. With the Fed switching from an aggressive "higher for longer" stance to a more dovish "wait and see" approach to their regular rhetoric, investors are eating up any opportunity for risk appetite as US data continues to show inflation easing.
European finalized Harmonized Index of Consumer Prices (HICP) printed as expected early Friday, with October's month-on-month showing a 0.1% increase and the annualized number coming in at 2.9%.
European inflation is slowly easing back towards the 2% target band set by the European Central Bank (ECB), and forward-looking upside potential for the Euro may be capped now that the ECB looks well and done on rate hikes.
US housing data is helping to bolster risk sentiment for Friday
US Building Permits in October increased from 1.471 million (revised down from 1.475 million) to 1.487 million, beating the forecast decline to 1.45 million. October Housing Starts also beat the street, adding 1.372 million residential units compared to September's 1.346 million (also revised down from 1.458 million), beating the 1.35 million expected.
EUR/USD Technical Outlook
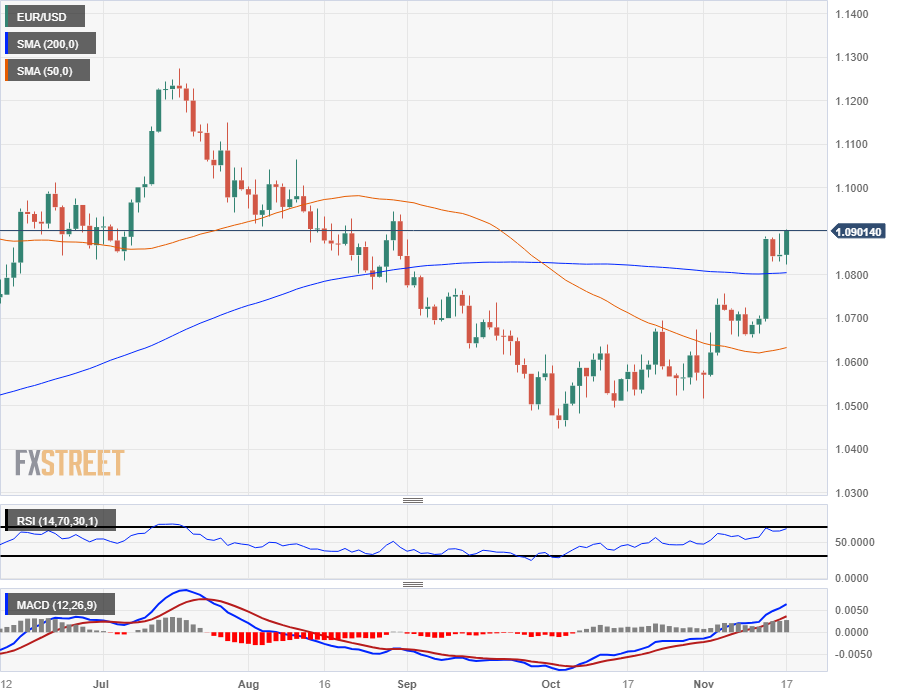
The EUR/USD's Friday risk-on rally sees the pair testing chart territory at the 1.0900 handle, pushing into fresh highs for the week ahead of the closing bell.
The Euro is up 2.2% against the US Dollar from the week's lows near 1.0665.
The EUR/USD caught a bounce from the 200-hour Simple Moving Average (SMA) last week, and the pair is testing into its highest bids since late August.
This week's rally above the 1.0800 handle sees the EUR/USD cracking the 200-day SMA and leaning into the bullish side for Friday, with the 50-day SMA rotating into a bullish stance just north of 1.0600 as the moving average struggles to keep up with the Euro's top side push.
EUR/USD Hourly Chart
EUR/USD Daily Chart
EUR/USD Technical Levels
The US Dollar experienced its worst weekly decline since May, with negative momentum prevailing. Next week will be a shortened week in the US due to Thanksgiving. The key economic report to watch will be the preliminary November PMIs.
Here is what you need to know for next week:
The US Dollar Index (DXY) recorded a loss of 1.65% during the week, marking its worst performance since July. Data showed further softening in inflation, which weighed on the Greenback by reinforcing the market's belief that the Federal Reserve has finished raising interest rates.
US Treasury yields declined, putting additional pressure on the US dollar. Meanwhile, risk appetite prevailed, boosting Wall Street to its third consecutive weekly gain and reaching its highest level in eight weeks.
The Federal Reserve (Fed) will release the minutes of its latest meeting on Wednesday but it could easily be a non-event considering the latest economic reports and Fed Chairman Jerome Powell's comments.
Wednesday will be a busy day with many important reports, ahead of the Thanksgiving holiday: the weekly Jobless Claims, Durable Goods Orders, and the University of Michigan Consumer Sentiment (final reading).
The short-term momentum for the US Dollar remains firmly tilted to the downside. However, fundamentals indicate that US economic growth is above trend, while the Eurozone is either heading toward or already in a recession. This divergence suggests that the decline of the Dollar may not be without the risk of sharp corrections.
EUR/USD broke above 1.0750 and surpassed the 20-day Simple Moving Average (SMA), setting the outlook for more gains. The 1.10 mark is not far away. On Monday, Germany will release the Producer Price Index (PPI) for October. On Thursday, the Eurozone Manufacturing PMIs preliminary readings for November are due. Additionally, the European Central Bank (ECB) will release the minutes of its latest meetings.
Analysts at ING on EZ PMI:
The PMIs have been pretty weak, too. We don't expect any meaningful pickup for November as the economy suffers from weak consumption, slowing investment and sluggish external demand at the moment. A modest negative GDP growth rate for the fourth quarter is our base case for the time being.
GBP/USD resumed its upside, reaching 1.2500 before losing strength. The short-term outlook is bullish, but the Pound continues to lag behind. The Monetary Policy Report Hearings will take place on Wednesday, when the Bank of England Governor and members of the Monetary Policy Committee will testify on inflation and the economy before the Parliament's Treasury Committee. On Thursday, the UK government will present its Autumn Statement in the House of Commons.
USD/JPY had the biggest weekly loss since July, amid a weaker US Dollar and lower Treasury yields. However, the Yen hit fresh cycle lows against other currencies amid risk appetite. USD/JPY looks poised to extend the correction after a double top near 152.00. On Friday, the National Consumer Price Index is due.
AUD/USD hit monthly highs above the crucial resistance at 0.6520 but failed to hold above. Risks appear tilted to the upside, but the Australian Dollar has so far remained within the recent range. Reserve Bank of Australia (RBA) Governor Michele Bullock will deliver a speech on Tuesday, a day before the release of the RBA accounts of the last meeting when the central bank raised the official Cash Rate (OCR) by 25 basis points. Bullock will speak again on Wednesday.
NZD/USD tested the 0.6050 area again and pulled back below 0.6000, ending below the 20-week SMA, hovering around 0.5980, suggesting that the pair is not yet ready for more gains. A break above 0.6050 would likely trigger a bullish acceleration. On Friday, New Zealand will report Q3 retail sales.
USD/CAD continues to move in a range between 1.3870 and 1.3630. The area near 1.3900 continues to be a crucial barrier that, if broken, could set the pair up for further gains. While a decline to 1.3545 (20-week SMA) seems likely if it breaks 1.3630. Canada will release the October Consumer Price Index on Tuesday and Retail Sales data on Friday.
After falling for two weeks, Gold rebounded sharply, boosted by lower US yields. XAU/USD approached $2,000 but failed to reclaim that area. The risk appears tilted to the upside. Silver had its best week in months, surging from $22.40 to $24.15, but pulled back below $24.00 late on Friday.
Like this article? Help us with some feedback by answering this survey:
- WTI crude oil recovers sharply after hitting a three-month low.
- Profit booking by traders also plays a role in WTI's recovery from its recent plunge.
- The US Baker Hughes rig count indicates an increase in oil rigs, suggesting a rise in production, but doesn't dampen the oil price rally.
- Reports of Saudi Arabia considering extending crude production cuts into spring add further support to oil prices.
West Texas Intermediate (WTI), the US crude Oil benchmark, climbs after reaching a three-month low of $72.22, rising more than 4% in the mid-North American session. Sanctions from the US on Russian Oil shippers, alongside traders booking profits, lent a lifeline to WTI, trading at $75.97 per barrel and gaining 4.27%.
US sacntions on Russian Oil and Saudi production cuts, propel WTI rises, despite overall EU's and Japan economic weakness
On Thursday, the US Treasury Department imposed sanctions on companies and vessels for shipping Oil above the G7’s $60 price cap to slash Russian profits for its war in Ukraine. Besides that, a jump in US crude Oil stockpiles sponsored WTI’s plunge from weekly highs at around $79.90.
In the meantime, the latest US Baker Hughes rig count for November 17 hit 618, exceeding last week’s 616, witnessing a jump in Oil rigs from 494 to 500. Although it suggests production is augmenting, it failed to weigh on the WTI price.
Oil prices gathered some steam as newswires revealed Saudi Arabia is preparing to prolong crude reductions into spring after price hit a four-month low, according to the Financial Times.
On the bearish front, WTI traders should be aware of the ongoing Eurozone (EU) slowdown, as well as the latest Japan’s Q3 contraction.
WTI Price Analysis: Technical outlook
The US crude Oil benchmark downtrend remains in place, but a looming ‘bullish harami’ two candlestick patterns, or also called an ‘inside day,’ could pave the way for an upward correction. If WTI buyers achieve a daily close above $71.96, the latest cycle low, that could open the door to challenge the 20-day moving average (DMA) at $79.98.
On its way toward the latter, WTI would face key resistance levels like the $78.00 figure, followed by the November 14 swing high at $79.72.
- The DXY Index stands at 104.00, seeing losses of around 0.30% and tallying a 1.60% weekly decline.
- Investors continue to digest the data reported throughout the week.
- The combo of cooling inflation and the labor market points to the Fed not hiking anymore.
- Fed’s Susan Collins was seen as hawkish on Friday.
At the end of the week, the US Dollar Index saw red and declined to 104.00 to close a 1.60% losing week. Soft inflation figures and weak economic activity data from the US were mainly responsible for the Greenback’s decline.
As the United States economy displayed signs of inflationary pressures and the labor market cooling down, markets seemed to be cheering that the Federal Reserve (Fed) is done with hiking, causing the US Dollar to weaken throughout the week. In the next week, the US will release Durable Goods figures from October and S&P PMIs for November.
Daily Digest Market Movers: US stands soft as investors assess the week’s data
- The US Dollar Index resumed its downward movements toward 104.00.
- During the week, the US Dollar significantly weakened due to the report of soft Inflation figures and weak economic activity data.
- The US Bureau of Labor Statistics reported that October's Core Consumer Price Index (CPI) missed the consensus. It came in at 4% YoY vs the expected 4.1% and decelerated from its previous figure of 4.1%.
- The headline figure came in at 3.2%YoY, below the consensus of 3.3% and in relation to its last reading of 3.7%.
- In addition, the Core Producer Price Index (PPI) from October fell short of expectations. It came in at 2.4% YoY vs the expected 2.7% and declined from its previous reading of 2.7%.
- On the other hand, Retail Sales from October came in better than expected, declining by 0.1% MoM vs the expected 0.3% decline.
- During the week ending November 11, the number of US Initial Jobless Claims increased to 231,000, surpassing the predicted 220,000.
- Industrial Production in the United States fell short of expectations, experiencing a 0.6% MoM decline, higher than the -0.3% expected. It also tallied a YoY decrease of 0.7%.
- On Friday, it was reported that Housing Starts and Building Permits from October came in better than expected.
- Susan Collins from the Fed commented that she wouldn’t take further tightening off the table. It will all come down to the incoming data.
- In the meantime, US Treasury yields slightly rose, with the 2-year increasing to 4.90%, while the 5 and 10-year rates rose to 4.45% and 4.44%, respectively.
- According to the CME FedWatch Tool, the odds of a 25-basis-point hike in December are zero. Markets are betting on rate cuts appearing sooner than expected in May 2024, if not March.
Technical Analysis: US Dollar bears regain the 100-day SMA, more downside on the horizon
According to the daily chart, the DXY holds a bearish technical bias as the sellers are seizing control, signaling the potential of further downward movement. The Relative Strength Index (RSI) is trending below its midline, suggesting a bearish outlook, while the Moving Average Convergence (MACD) histogram shows rising red bars.
On the broader scale, the index is below the 20 and 100-day Simple Moving Average (SMA), favoring the case of a negative outlook for the USD.
Support levels: 104.00(100-day SMA),103.60 (200-day SMA), 103.30.
Resistance levels: 104.15 (100-day SMA),104.50, 105.00.
US Dollar FAQs
What is the US Dollar?
The US Dollar (USD) is the official currency of the United States of America, and the ‘de facto’ currency of a significant number of other countries where it is found in circulation alongside local notes. It is the most heavily traded currency in the world, accounting for over 88% of all global foreign exchange turnover, or an average of $6.6 trillion in transactions per day, according to data from 2022.
Following the second world war, the USD took over from the British Pound as the world’s reserve currency. For most of its history, the US Dollar was backed by Gold, until the Bretton Woods Agreement in 1971 when the Gold Standard went away.
How do the decisions of the Federal Reserve impact the US Dollar?
The most important single factor impacting on the value of the US Dollar is monetary policy, which is shaped by the Federal Reserve (Fed). The Fed has two mandates: to achieve price stability (control inflation) and foster full employment. Its primary tool to achieve these two goals is by adjusting interest rates.
When prices are rising too quickly and inflation is above the Fed’s 2% target, the Fed will raise rates, which helps the USD value. When inflation falls below 2% or the Unemployment Rate is too high, the Fed may lower interest rates, which weighs on the Greenback.
What is Quantitative Easing and how does it influence the US Dollar?
In extreme situations, the Federal Reserve can also print more Dollars and enact quantitative easing (QE). QE is the process by which the Fed substantially increases the flow of credit in a stuck financial system.
It is a non-standard policy measure used when credit has dried up because banks will not lend to each other (out of the fear of counterparty default). It is a last resort when simply lowering interest rates is unlikely to achieve the necessary result. It was the Fed’s weapon of choice to combat the credit crunch that occurred during the Great Financial Crisis in 2008. It involves the Fed printing more Dollars and using them to buy US government bonds predominantly from financial institutions. QE usually leads to a weaker US Dollar.
What is Quantitative Tightening and how does it influence the US Dollar?
Quantitative tightening (QT) is the reverse process whereby the Federal Reserve stops buying bonds from financial institutions and does not reinvest the principal from the bonds it holds maturing in new purchases. It is usually positive for the US Dollar.
- The USD/CHF is softening its stance heading into the Friday close.
- The US Dollar is seeing a mild broad-market sell-off to cap off the trading week.
- Investors are increasing their bets that the Fed is done with rate hikes.
The USD/CHF is seeing a step down back into the week's lows near the 0.8860. The Swiss Franc (CHF) caught a soft bolstering from better-than-expected Swiss Industrial Production figures, and the Greenback (USD) is seeing bearish pressure as investors are leaning into bets that the Federal Reserve (Fed) is finally done with their rate hike cycle.
Swiss Industrial Production printed at 2% for the annualized third quarter, above the previous quarter's -0.7%, which was revised slightly higher from -0.8%.
Inflation and growth figures for the domestic US economy appear to be moderating at a quicker pace than markets initially anticipated, once more giving rise to the broader market narrative that the Fed is done with rate hikes and investors are now turning their bets towards when rate cuts will begin.
With Fed policymakers continuing to strike overly-cautious tones in public speaking engagements, market participants are adding extra weight to economic data releases on a case-by-case basis: every signal of deceleration sends market sentiment soaring as traders cheer moving closer to interest rate cuts, and every uptick drives market fears of "higher for longer".
In the meantime, the Fed's own rate expectations see benchmark interest rates going nowhere fast for the foreseeable future, and the first rate cut isn't expected until well into 2024.
USD/CHF Technical Outlook
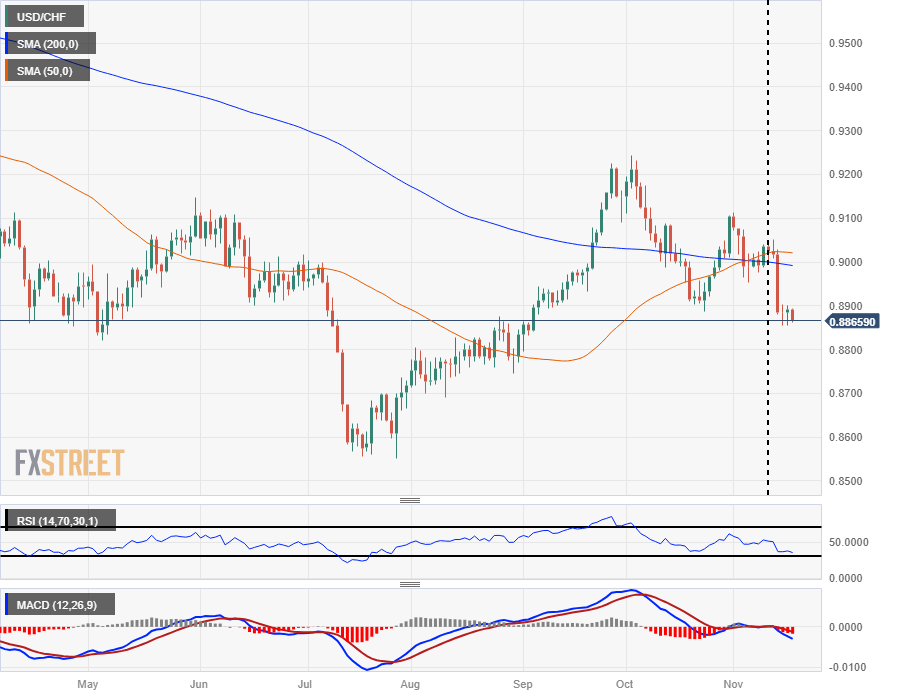
The USD/CHF is trading into the week's low side near the 0.8860 level as sellers try to push the pair down into 0.8850 ahead of the Friday closing bell.
The Franc appreciated aggressively earlier in the week, taking the USD/CHF down from above the 0.9000 handle to trade into the latter week's consolidation range.
Daily candlesticks have the USD/CHF trading on the low side of the 200-day Simple Moving Average (SMA) currently grinding down below the 0.9000 key level.
Despite the pair's recent climb into the 0.9200 neighborhood, a long-term bullish trend couldn't be maintained and the pair is dropping into the low side, marking in a lower higher from November's early swing high into 0.9100.
USD/CHF Daily Chart
USD/CHF Technical Levels
- USD/JPY falls below the key 150.00 level, trading at 149.76, down 0.64% amidst a shift in market sentiment.
- US housing data shows resilience with Building Permits and Housing Starts exceeding expectations but fails to support USD/JPY.
- Bank of Japan Governor Kazuo Ueda emphasizes the need for patience in monetary policy, linking future policy changes to sustainable inflation targets and a positive wage-inflation cycle.
The USD/JPY dropped below the 150.00 figure during Friday's mid-North American session as market sentiment shifted sour due to derivative instruments expiring linked to stocks. US housing data shows signs of recovery, though it failed to underpin the USD/JPY, which trades at 149.76, falls 0.64%
US housing recovery failed to boost the USD/JPY, as Fed rate cuts bets increase
Wall Street’s rally halted on Friday. Building Permits in the United States (US) beat forecasts of 1.45 million, rose by 1.487 million or a 1.1% jump, compared to September’s data, and benefited from a low inventory as homebuilders offer cheaper rates despite higher mortgage rates. Housing Starts for October rose by 1.9% from 1.35 million to 1.37 million. The data portrays a resilient economy, as data surprised investors following an acceleration of the disinflationary process. At the same time, Industrial Production and Retail Sales suggested the economy is finally feeling the shocks of the Federal Reserve’s tightening.
Meanwhile, the US Dollar Index (DXY), which tracks the buck’s value vs. a basket of peers, drops 0.32% and trades at 104.05, a headwind for the USD/JPY pair. Furthermore, the US 10-year Treasury bond yield has plunged more than 20 basis points in the week and sits at 4.44%, as investors' bets the Fed would cut rates next year increased. The interest rate expectations suggest the US central bank would slash rates by 100 bps toward the year’s end of 2024.
In the meantime, San Francisco Fed President Mary Daly said the Fed is uncertain if inflation is on track to 2%, and it’s too soon to declare victory on inflation. Fed Governor Michael Barr said the Fed is likely at or near the peak needed to be on interest rates.
On the Japanese front, the latest data justified the Bank of Japan's (BoJ) loose stance after GDP contracted in Q3, snapping two-quarters of consecutive growth.
The BoJ Governor Kazuo Ueda said that patience is required in the face of uncertain inflation dynamics. Ueda added, “Trend inflation will gradually accelerate toward our 2% inflation target through fiscal 2025. But this needs to be accompanied by a positive wage-inflation cycle.” Ueda added that the BoJ could potentially end the Yield Curve Control (YCC) and negative interest rates if inflation sustainably hits the 2% target.
USD/JPY Technical Levels
- The GBP/USD is trading flat but rough on Friday, trying to hold above the 1.2400 handle.
- The Pound Sterling's midweek rally is still under threat as markets pare away gains.
- Slumping UK data is sending the GBP into consolidation.
The GBP/USD is treading water just above the 1.2400 handle as the pair grapples with the top end of recent consolidation. The Pound Sterling (GBP) is struggling to hold onto gains chalked in against the US Dollar (USD) this week.
The GBP peaked at a 2.25% gain against the US Dollar in the mid-week, and has since eased back to a more reasonable 1.65%.
Despite a broad-market risk bid fueled by the markets once again speculating that the Federal Reserve (Fed) is done with interest rate hikes, the GBP/USD is remaining trapped in the midrange as UK data misses the mark.
UK Retail Sales decline 0.3% MoM in October
UK Retail Sales declined month-on-month, with the October figure printing at -0.3%, reversing course on the market's forecast 0.3% increase. Losses on the tail end were the focus for investors however, with September's figure getting revised even lower from -0.9% to an eye-watering -1.1%.
Annualized UK Retail Sales fared even worse, with the year into October printing at -2.7% against the previous -1%, and accelerating past the forecast -1.5%.
Next week will see investors turning their attention towards the Fed's latest Meeting Minutes release on Tuesday.
GBP/USD Technical Outlook
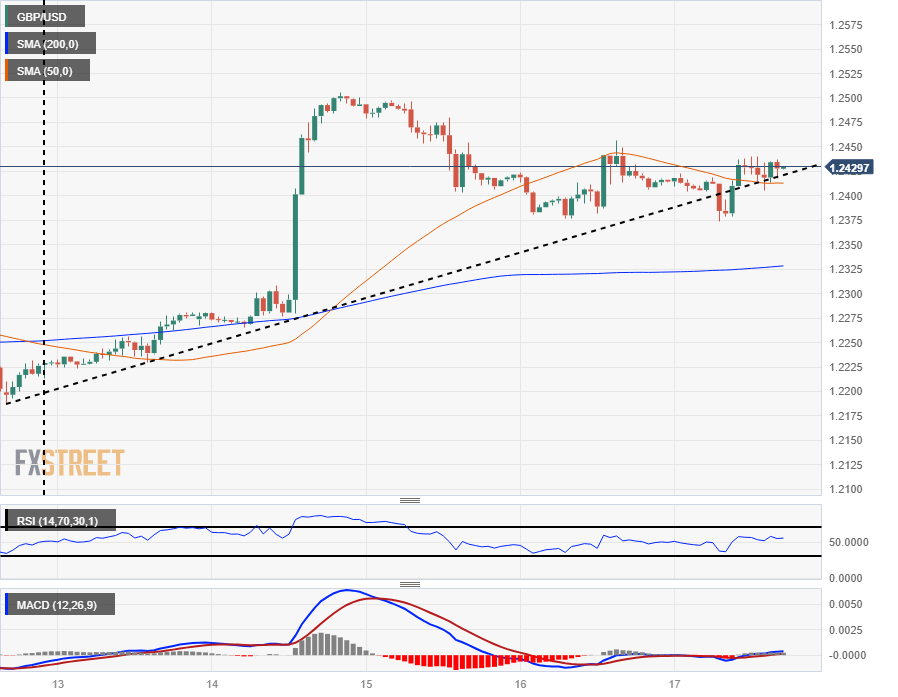
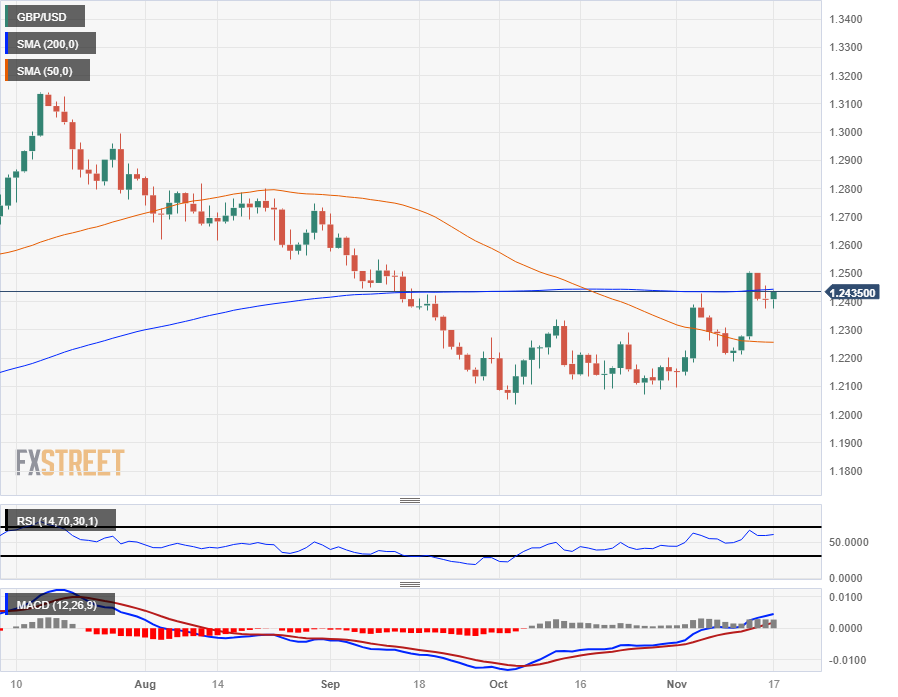
The GBP/USD is in the green for the week, up 1.65% as the Pound Sterling holds onto what's left of the mid-week gains.
A near-term rising trendline from last week's lows near 1.2200 is still holding intraday action on the top side as hourly candles grapple with the 50-hour Simple Moving Average (SMA), but a flattening 200-hour SMA is set to continue drawing bids back into the median range.
Daily candlesticks have the GBP/USD strung up on the 200-day SMA as the pair struggles to develop fresh long-term momentum, and this week's peak at the 1.2500 handle represents the key figure for bullls to beat.
GBP/USD Hourly Chart
 GBP/USD Daily Chart
GBP/USD Technical Levels
- The CAD caught a bounce on risk appetite in early Friday trading.
- Industrial inflation figures in Canada print better than expected.
- US Dollar, Fed reaction is driving the market today.
The Canadian Dollar (CAD) is looking to pare back some of Thursday’s losses, catching some support from bolstered Crude OIl bids, but downside risks remain.
The Loonie is up about half a percent against the US Dollar (USD) for the week.
Canadian industrial inflation figures went head-to-head with US housing data Friday morning, but overall, risk sentiment appears to be the primary driver of moment-to-moment market moves.
Daily Digest Market Movers: Canadian Dollar unable to develop long legs to round out the week
- Canada’s Raw Material Price Index for October showed a 2.5% decline after September’s 3.9% jump (revised from 3.5%).
- Month-on-month Industrial Product Prices into October similarly declined 1%, contracting from the previous 0.4%.
- US Building Permits and US Housing starts both beat expectations, helping to arrest the Greenback’s early Friday slide and capping off CAD gains.
- US economy showed 1.487 million new building permits, beating the forecast of 1.45 million and clearing the previous month’s 1.471 million.
- US monthly Housing Starts also showed improvement, printing at 1.372 million versus the forecast for 1.35 million. September saw ground broken on 1.346 million new residential buildings.
- Crude Oil is seeing some lift on Friday, bolstered by rumors of additional EU sanctions on Russian Crude Oil exports.
- A back-and-forth trading week leaves the CAD strung along Friday’s mid-range.
- The overall trading week was also middling for the Loonie as the USD drove broad-market momentum.
Technical Analysis: Canadian Dollar strung along the middle for Friday as markets second-guess direction
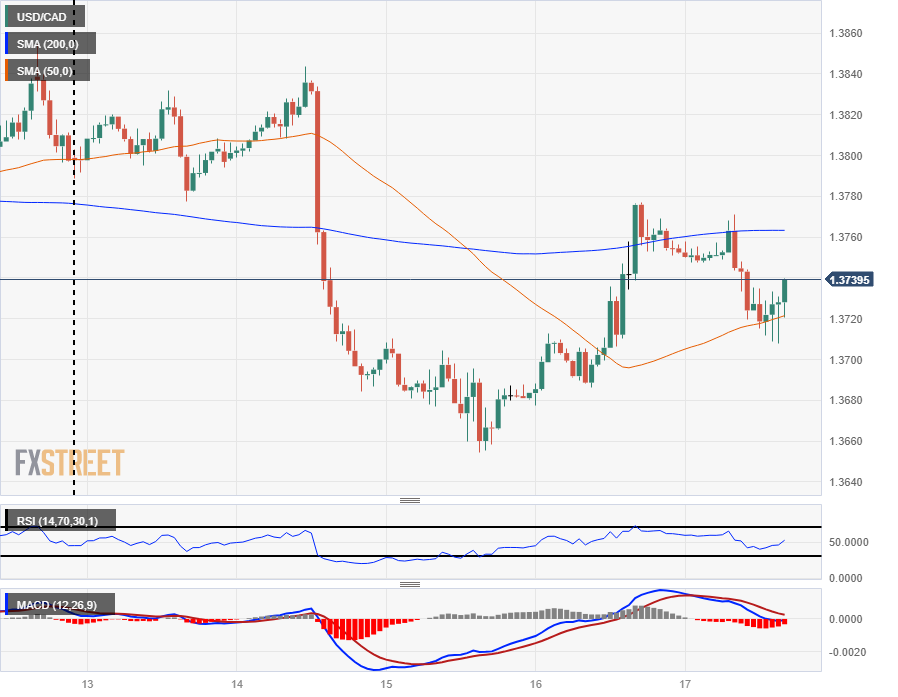
The Canadian Dollar (CAD) is testing chart territory below 1.3750 against the US Dollar (USD), but the day’s Loonie bids are coming under threat as USD/CAD bidders make a feeble push.
The USD/CAD hit a daily low of 1.3708 before seeing a thin rebound toward 1.3740.
The pair hit a mid-week high near 1.3780 on Thursday, and CAD bidders have been struggling to pare away the bounce from the mid-week low near 1.3660.
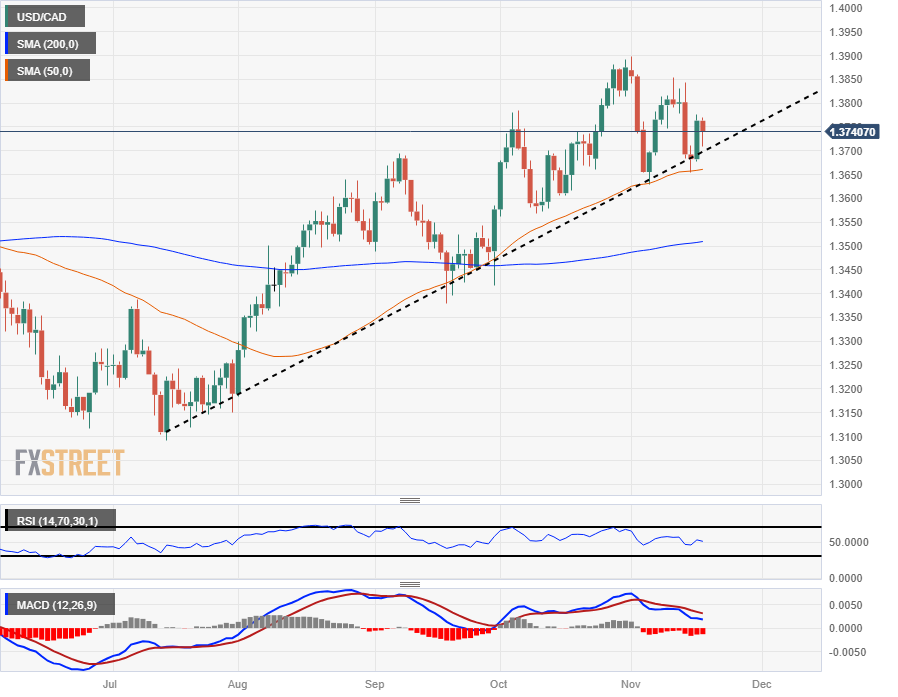
Daily candlesticks have the USD/CAD consolidating in rough trading just above the 50-day Simple Moving Average (SMA), and technical indicators are beginning to grind toward the middle.
USD/CAD Hourly Chart
USD/CAD Daily Chart
Canadian Dollar price this week
The table below shows the percentage change of Canadian Dollar (CAD) against listed major currencies this week. Canadian Dollar was the strongest against the US Dollar.
| USD | EUR | GBP | CAD | AUD | JPY | NZD | CHF | |
| USD | -1.78% | -1.64% | -0.42% | -2.03% | -1.13% | -1.29% | -1.72% | |
| EUR | 1.75% | 0.13% | 1.32% | -0.24% | 0.64% | 0.48% | 0.06% | |
| GBP | 1.61% | -0.14% | 1.19% | -0.38% | 0.49% | 0.35% | -0.08% | |
| CAD | 0.42% | -1.35% | -1.21% | -1.59% | -0.71% | -0.86% | -1.29% | |
| AUD | 1.98% | 0.24% | 0.37% | 1.56% | 0.87% | 0.72% | 0.29% | |
| JPY | 1.11% | -0.63% | -0.48% | 0.69% | -0.90% | -0.12% | -0.58% | |
| NZD | 1.27% | -0.49% | -0.36% | 0.83% | -0.73% | 0.14% | -0.43% | |
| CHF | 1.68% | -0.07% | 0.07% | 1.26% | -0.32% | 0.56% | 0.41% |
The heat map shows percentage changes of major currencies against each other. The base currency is picked from the left column, while the quote currency is picked from the top row. For example, if you pick the Euro from the left column and move along the horizontal line to the Japanese Yen, the percentage change displayed in the box will represent EUR (base)/JPY (quote).
Canadian Dollar FAQs
What key factors drive the Canadian Dollar?
The key factors driving the Canadian Dollar (CAD) are the level of interest rates set by the Bank of Canada (BoC), the price of Oil, Canada’s largest export, the health of its economy, inflation and the Trade Balance, which is the difference between the value of Canada’s exports versus its imports. Other factors include market sentiment – whether investors are taking on more risky assets (risk-on) or seeking safe-havens (risk-off) – with risk-on being CAD-positive. As its largest trading partner, the health of the US economy is also a key factor influencing the Canadian Dollar.
How do the decisions of the Bank of Canada impact the Canadian Dollar?
The Bank of Canada (BoC) has a significant influence on the Canadian Dollar by setting the level of interest rates that banks can lend to one another. This influences the level of interest rates for everyone. The main goal of the BoC is to maintain inflation at 1-3% by adjusting interest rates up or down. Relatively higher interest rates tend to be positive for the CAD. The Bank of Canada can also use quantitative easing and tightening to influence credit conditions, with the former CAD-negative and the latter CAD-positive.
How does the price of Oil impact the Canadian Dollar?
The price of Oil is a key factor impacting the value of the Canadian Dollar. Petroleum is Canada’s biggest export, so Oil price tends to have an immediate impact on the CAD value. Generally, if Oil price rises CAD also goes up, as aggregate demand for the currency increases. The opposite is the case if the price of Oil falls. Higher Oil prices also tend to result in a greater likelihood of a positive Trade Balance, which is also supportive of the CAD.
How does inflation data impact the value of the Canadian Dollar?
While inflation had always traditionally been thought of as a negative factor for a currency since it lowers the value of money, the opposite has actually been the case in modern times with the relaxation of cross-border capital controls. Higher inflation tends to lead central banks to put up interest rates which attracts more capital inflows from global investors seeking a lucrative place to keep their money. This increases demand for the local currency, which in Canada’s case is the Canadian Dollar.
How does economic data influence the value of the Canadian Dollar?
Macroeconomic data releases gauge the health of the economy and can have an impact on the Canadian Dollar. Indicators such as GDP, Manufacturing and Services PMIs, employment, and consumer sentiment surveys can all influence the direction of the CAD. A strong economy is good for the Canadian Dollar. Not only does it attract more foreign investment but it may encourage the Bank of Canada to put up interest rates, leading to a stronger currency. If economic data is weak, however, the CAD is likely to fall.
- The XAU/USD advanced to $1,980 after hitting $1,995 earlier in the session.
- Housing data from the US from October came in better than expected.
- Hawkish Fed speakers and US yields recovering halted the metal’s rise.
The XAU/USD saw a slight upsurge in Friday's session and is currently trading at $1,980 after hitting a high of $1,995.The price rise was stopped by hawkish words from the Federal Reserve (Fed) officials after the report of strong US housing data which fueled a slight advance in the US Treasuries.
According to the US Census Bureau's monthly data released on Friday, Housing Starts in October increased by 1.9% compared to September's revised 3.1% rise, while Building Permits rose by 1.1% in the same period after experiencing a 4.5% decline in its previous reasding.
In regards to the Federal Reserve (Fed), Susan Collins, the President of the Federal Reserve Bank of Boston, stated on Friday that she observes evidence suggesting that the financial conditions remain favourable for the Fed and welcomed the latest cooling in inflation. However, she then stated that she wouldn't take additional firming off the table, which seemed to have spooked markets.
Elsewhere, the US bond yields are seen with mild gains. The 2-year rate stands at 4.91%, and the 5-year and 10-year yields are seen at 4.46% and 4.45%, respectively. Regarding expectations, markets continue to price in a no-hike by the Fed in December.
XAU/USD levels to watch
Based on the daily chart, the XAU/USD displays a bullish bias with indicators that, despite slightly decelerating, are still in positive territory. The Relative Strength Index (RSI) exhibits a positive slope above the 50 threshold, while the Moving Average Convergence (MACD) histogram exhibits larger green bars. In the larger context, the pair is above the 20,100,200-day Simple Moving Average (SMAs), suggesting that the bulls are also in control in the broader context.
Supports: $1,975 (20-day SMA), $1,930 (100 and 200-day SMA),$1,915.
Resistances:$2,000,$2,030, $2,050.
XAU/USD daily chart
-638358354704520836.png)
- Mexican Peso's advance against the US Dollar halts, with USD/MXN bouncing from recent lows despite broad-based USD weakness.
- Banxico officials hint at a less restrictive monetary policy, yet suggesting gradual rate cuts.
- Upbeat US economic data and Federal Reserve officials' resistance to early rate cuts propelled the USD/MXN up move.
Mexican Peso (MXN) rally stalls against the US Dollar (USD) as the stock market in the United States (US) portrays a risk-off mood, even though investors are pricing in Federal Reserve (Fed) rate cuts for the first half of 2024. Although the Greenback (USD) is falling, the USD/MXN failed to extend the downward move after refreshing two-month lows at 17.18. The pair is trading at around 17.24, up by a minuscule 0.07%.
Mexico's economic docket remained scarce, though comments from Bank of Mexico (Banxico) officials suggest monetary policy would be less restrictive next year. Banxico Deputy Governor Jonathan said that despite cutting rates “gradually,” policy would continue to be restrictive. Governor Victoria Rodriguez Ceja said that monetary policy would be adjusted based on “macroeconomic conditions,” disregarding a cut through the remainder of 2023.
On the US front, upbeat economic data from the United States and Federal Reserve’s officials pushing back against interest rate cuts underpinned the USD/MXN pair.
Daily digest movers: Mexican Peso advancement halts after printing five straight days of gains
- US Building Permits in October came at 1.487 million, a jump of 1.1%, beating estimates of 1.45 million.
- US Housing Starts for October increased 1.9% to 1.37 million, the highest in three months, above forecasts of 1.35 million.
- On Friday, San Francisco Fed President Mary Daly said the Fed is uncertain if inflation is on track to 2%, and it’s too soon to declare victory on inflation. Fed Governor Michael Barr said the Fed is likely at or near the peak needed to be on interest rates.
- Thursday’s economic data in the US suggests the economy is decelerating as expected by the Federal Reserve, after Industrial Production plunged in October, while unemployment claims have risen the most since August.
- The US Producer Price Index and Consumer Price Index reports in October suggest prices are cooling down, increasing the odds of ending the US Federal Reserve tightening cycle.
- Interest rates swap traders expect 100 basis points of rate cuts by the Fed in 2024.
- Banxico’s Deputy Governor Jonathan Heath said the Government Board continues to monitor real rates, which currently lie at around 7%.
- Heath said Banxico wouldn’t rely on other countries – usually, Banxico reacts to the US Federal Reserve’s decisions – and said they would depend on incoming data and how inflation expectations evolve.
- On Monday, Banxico’s Governor Victoria Rodriguez Ceja commented that the easing inflationary outlook could pave the way for discussing possible rate cuts. She said that monetary policy loosening could be gradual but not necessarily imply continuous rate cuts, adding that the board would consider macroeconomic conditions, adopting a data-dependent approach.
- The latest inflation report in Mexico, published on November 9, showed prices grew by 4.26% YoY in October, below forecasts of 4.28% and prior rate of 4.45%. On a monthly basis, inflation came at 0.39%, slightly above the 0.38% consensus and September’s 0.44%.
- Mexico’s economy remains resilient after October’s S&P Global Manufacturing PMI improved to 52.1 from 49.8, and the Gross Domestic Product (GDP) expanded by 3.3% YoY in the third quarter.
- Banxico revised its inflation projections from 3.50% to 3.87% for 2024, which remains above the central bnk’s 3.00% target (plus or minus 1%).
Technical Analysis: Mexican Peso is on a mission to strengthen further as USD/MXN sellers’ eye 17.00
The USD/MXN daily chart depicts the downtrend remains intact, though a break above the 100-day Simple Moving Average (SMA) at 17.34 could pave the way to 17.50. However, the breach of the latest cycle low printed on November 3 at 17.28 opened the door for further losses, with the next demand area at 17.20, ahead of the 17.00 figure.
On the flip side, in case of a clear break of key resistance levels at 17.34 and 17.50, the USD/MXN could challenge the 200-day SMA at 17.63, ahead of the 50-day SMA at 17.69. Once cleared, the next resistance emerges at the 20-day SMA at 17.87 before buyers could lift the spot price towards the 18.00 figure.
Mexican Peso FAQs
What key factors drive the Mexican Peso?
The Mexican Peso (MXN) is the most traded currency among its Latin American peers. Its value is broadly determined by the performance of the Mexican economy, the country’s central bank’s policy, the amount of foreign investment in the country and even the levels of remittances sent by Mexicans who live abroad, particularly in the United States. Geopolitical trends can also move MXN: for example, the process of nearshoring – or the decision by some firms to relocate manufacturing capacity and supply chains closer to their home countries – is also seen as a catalyst for the Mexican currency as the country is considered a key manufacturing hub in the American continent. Another catalyst for MXN is Oil prices as Mexico is a key exporter of the commodity.
How do decisions of the Banxico impact the Mexican Peso?
The main objective of Mexico’s central bank, also known as Banxico, is to maintain inflation at low and stable levels (at or close to its target of 3%, the midpoint in a tolerance band of between 2% and 4%). To this end, the bank sets an appropriate level of interest rates. When inflation is too high, Banxico will attempt to tame it by raising interest rates, making it more expensive for households and businesses to borrow money, thus cooling demand and the overall economy. Higher interest rates are generally positive for the Mexican Peso (MXN) as they lead to higher yields, making the country a more attractive place for investors. On the contrary, lower interest rates tend to weaken MXN.
How does economic data influence the value of the Mexican Peso?
Macroeconomic data releases are key to assess the state of the economy and can have an impact on the Mexican Peso (MXN) valuation. A strong Mexican economy, based on high economic growth, low unemployment and high confidence is good for MXN. Not only does it attract more foreign investment but it may encourage the Bank of Mexico (Banxico) to increase interest rates, particularly if this strength comes together with elevated inflation. However, if economic data is weak, MXN is likely to depreciate.
How does broader risk sentiment impact the Mexican Peso?
As an emerging-market currency, the Mexican Peso (MXN) tends to strive during risk-on periods, or when investors perceive that broader market risks are low and thus are eager to engage with investments that carry a higher risk. Conversely, MXN tends to weaken at times of market turbulence or economic uncertainty as investors tend to sell higher-risk assets and flee to the more-stable safe havens.
Economists at ING are bullish on the NZD/USD and are interested in whether the new government changes the Reserve Bank of New Zealand’s remit – a potentially bullish factor for the Kiwi.
New government, higher rates?
The New Zealand Dollar should benefit like AUD from a gradual optimistic rerating of growth expectations in China.
The recent change in government can have big implications for the RBNZ policy. The new coalition will almost surely be led by the National Party, which promised less spending than the previous Labour-led government, but also tax cuts (which are inflationary). More importantly, it had advocated for a change of the RBNZ remit, so that the dual mandate is dropped to focus on a stricter inflation targeting. The remit review normally happens in June, and should it be changed, it could mean higher for longer rates in New Zealand – an NZD positive.
Recession is a non-negligible risk in 2024, but whether this will mean a more dovish RBNZ will effectively depend on a remit review: should the new government leave it unchanged, then bigger rate cuts would likely get in the way of a smooth NZD recovery.
NZD/USD – 4Q23 0.59 1Q24 0.60 2Q24 0.61 3Q24 0.62 4Q24 0.64
Federal Reserve (Fed) Bank of Boston President, Susan Collins, stated on Friday that she sees evidence indicating that financial conditions are still favorable for the Fed. In an interview with CNBC, Collins mentioned that the latest Consumer Price Index data was promising.
However, she cautioned against prematurely declaring victory over high inflation and emphasized the importance of patience. Collins stated, "I would not rule out the possibility of further tightening."
In terms of the labor market, the Boston Fed President noted positive signs indicating that it is gradually reaching a balance.
Market reaction
On Friday, the US Dollar is declining, consolidating significant weekly losses. The DXY is trading slightly above 104.00 and is on the verge of testing monthly lows.
Oil prices are likely to settle around $80/bbl, strategists at ANZ Bank report.
Saudi Arabia may extend cuts as Oil market tightness eases
Tightness in the Oil market has eased as growth in non-OPEC supply has more than offset strong demand. A balanced Oil market now remains reliant on production cuts being maintained well into 2024.
If Saudi Arabia were to reverse its unilateral production cuts, the market would suddenly be awash with Oil and prices would likely drop below $70/bbl. However, any supply disruptions in the Middle East could see them above $100/bbl.
On the balance of risks, we think Saudi Arabia will extend its production cuts into 2024 if they want prices to remain above $80/bbl.
UK Consumer price inflation was significantly lower in October than in September. However, the Pound was unable to benefit. Economists at Commerzbank analyze GBP outlook.
Inflation still well above the target
Even if the recent fall in inflation can be seen as positive, this cannot really help the Pound, because now interest rate cuts are likely to be increasingly discussed. This is despite the fact that uncertainty about the inflation outlook is still high and it remains to be seen how quickly price pressure will really ease. After all, at 5.7%, core inflation is still a long way from the BoE's 2% target. Discussions about cutting interest rates simply don't really fit into the picture.
This is likely to weigh on the Pound in the coming months, also in light of the fact that, according to our economists, the ECB is unlikely to make its first rate cut until the end of 2024.
EUR/USD has rallied over the past month with the cross breaching the 1.08 mark. Economists at Danske Bank analyze the pair’s outlook.
Further upside potential in the near-term
We maintain the strategic case for a lower EUR/USD based on the relative terms of trade, real rates (growth prospects), and relative unit labour costs.
We continue to expect a downward trajectory over the next 6-12M.
In the near-term, we still believe there is further upside potential for the cross, primarily due to weaker-than-expected US economic data and a generally positive risk appetite. However, escalating geopolitical tensions pose a risk to our near-term prediction of a weaker USD.
Forecast: 1.10 (1M), 1.09 (3M), 1.06 (6M), 1.04 (12M)
USD rebounds look there for the selling now, Shaun Osborne, Chief FX Strategist at Scotiabank, reports.
USD rebounds remain possible
I expect the USD to trade with a softer bias overall going forward.
USD rebounds remain possible – especially considering year-end volatility risks – but DXY gains to 106.50 look a stretch from here. DXY gains to the mid/upper 105s may be about as much as we can expect.
See: Markets will likely again chase the weak USD story once more at the turn of the new year – Nordea
San Francisco Federal Reserve President Mary Daly said on Friday, “high risks and 'murky' economic conditions mean Fed should practice gradualism.“
Additional comments
Needs 'the boldness to wait' given uncertain times.
Fed needs patience, 'measured adjustments'.
Fed uncertain if current economic dynamics now are 'remnants' of pandemic recovery or a new normal.
Fed not certain if inflation is on track to 2%.
Fed unsure about length of policy lags.
Central bank policy debates are now centered on what constitutes sufficiently restrictive, and how long to maintain that stance.
Related reads
- Fed’s Barr: We are likely at or near the peak of where we need to be on interest rates
- USD Index Price Analysis: A deeper pullback is seen below 104.00
- EUR/USD extends the trade in the upper end of the range near 1.0880 .
- Next on the upside emerges the weekly top of 1.0945.
EUR/USD adds to Thursday’s small gains and flirts with the key 1.0880 region at the end of the week.
The continuation of the upward bias could challenge the immediate up-barrier at 1.0900 ahead of the weekly high of 1.0945 (August 30). Once the latter is cleared, spot could challenge the psychological threshold of 1.1000.
So far, while above the significant 200-day SMA, today at 1.0804, the pair’s outlook should remain constructive.
EUR/USD daily chart
- DXY resumes the decline and puts 104.00 to the test.
- Extra losses appear on the cards on the breach of 104.00.
DXY reverses two consecutive daily advances and resumes the downward bias on Friday.
In case bears regain control, the breakdown of the November low of 103.98 (November 14-15) should pave the way for a quick test of the critical 200-day SMA at 103.61 prior to the weekly low of 102.96 (August 30).
In the meantime, while above the key 200-day SMA, the outlook for the index is expected to remain constructive.
DXY daily chart
The GBP/USD pair is marginally firmer on the day. Economists at Scotiabank analyze the Cable’s outlook.
Directional risks are tilted to the topside
The overall pattern of short-term trade remains constructive and the broader technical setups still suggest directional risks are tilted to the topside.
GBP/USD is effectively consolidating within a bull pennant pattern.
Firm support on GBP dips at 1.2375 this week is keeping the undertone bullish.
Gains through 1.2420/1.2425 should be GBP-supportive.
A rise above 1.2455 targets a move to 1.2525.
- EUR/JPY adds to Thursday’s corrective decline.
- Further losses appear on the cards near term.
EUR/JPY comes under extra selling pressure following Thursday’s 2023 peaks north of the 164.00 hurdle.
The continuation of the retracement from overbought levels appears on the cards for the time being. Against that, the cross could initially revisit the provisional 55-day SMA near 158.80 prior to the weekly low of 157.69 (October 30).
So far, the longer term positive outlook for the cross appears favoured while above the 200-day SMA, today at 152.68.
EUR/JPY daily chart
Federal Reserve (Fed) Vice Chair (for supervision) Michael Barr said on Friday, “we are likely at or near the peak of where we need to be on interest rates.”
There are no further comments from the Fed official, thus far.
Market reaction
The US Dollar Index has entered a phase of consolidation near an intraday low of 104.02. The index is down 0.21% on the day.
UOB Group’s Economist Enrico Tanuwidjaja and Junior Economist Agus Santoso comment on the latest trade balance figures in Indonesia.
Key Takeaways
Indonesia recorded its 42th consecutive month of trade surplus amid higherthan-expected exports. Indonesia recorded a robust trade surplus of USD3.5bn in Oct 2023, up from USD3.4bn in Sep and higher than consensus expectation of USD3.4bn.
Oil and gas (OG) exports grew by 6.6% y/y, continued its positive growth trajectory and non-oil and gas (non-OG) exports continued to fall by 11.4% y/y, better than prior month’s contraction of 17.7% y/y. Meanwhile, OG imports contracted by 4.7% y/y, larger than Sep’s contraction of 2.8% y/y or contracted 3.7% m/m. Non-OG imports also contracted by 1.9% y/y in Oct, lower than prior month’s contraction at 14.5% y/y due to higher imports in consumer, capital and raw material components.
All in all, higher total consumer and raw material component imports indicate that household consumption and industrial activity started to improve. Coupled with the moderation in capital goods imports as investment accelerated in 3Q23 and the commissioning of several new smelters in 1Q24 are expected to thicken the trade surplus further.
Canadian Dollar picks up a little ground after Thursday’s drop. Economists at Scotiabank analyze Loonie’s outlook.
Techs lean positive
The CAD’s reversal from Thursday’s high near 1.3775 is showing some signs of technical momentum on the intraday chart.
Spot should see firm resistance around 1.3750/1.3760 intraday and broader USD losses in the next few days should mean USD/CAD has another look at key support of 1.3655/1.3660. A break below there should drive more CAD gains in the short run to the 1.34/1.35 range.
- The New Zealand Dollar trades higher against the US Dollar but lower versus the Yen on Friday.
- The Kiwi is supported by a relatively benign outlook for inflation amongst most counterparts.
- NZD/USD establishes a floor and rebounds, resuming the uptrend from midweek.
The New Zealand Dollar (NZD) is trading mixed at the end of the week, rising versus the US Dollar (USD), the Euro (EUR) and the Pound (GBP) but falling against the Japanese Yen (JPY), which is strengthening because – according to analysts at Danske Bank – it historically tends to do well during periods of declining global growth and inflation.
Daily digest market movers: Kiwi rises in most pairs on lower inflation outlook
- The New Zealand Dollar is rising in most pairs – the notable exception of the Yen – as recent inflation data from the US, Eurozone and UK showed slower-than-expected price rises.
- This means their central banks are less likely to feel the need to raise interest rates.
- Since higher interest rates tend to increase demand for a currency because they attract foreign inflows of capital, this is weighing on USD, EUR and GBP.
- The decline in Oil prices from the $90s per barrel to the $70s mark is further expected to reduce global inflation.
- The Kiwi may have benefited from a lift of sentiment in China after the landmark meeting between US President Joe Biden and Chinese President Xi Jinping in San Francisco, at which they decided to reopen stuck communication channels, according to Reuters.
- The Yen outperforms the NZD on a variety of factors.
- Falling Oil prices support the outlook for the Japanese Trade Balance since Oil is its largest import.
- The Yen tends to do well in environments of declining growth and inflation.
- Many investors think peak rates have been reached in the US, suggesting the yield differential between the two countries will close, decreasing the use of the JPY as a funding currency with which to buy US Dollars in the carry trade.
New Zealand Dollar technical analysis: NZD/USD finds its feet again
NZD/USD – the number of US Dollars one New Zealand Dollar can buy – finds a floor and recovers after its recent pullback.
-638358259782700412.png)
New Zealand Dollar vs US Dollar: Daily Chart
The pair remains in a short-term bullish trend, biasing longs; this holds true as long as the November 14 lows at 0.5863 stay intact.
The zone around the October high (0.6050-0.6055) has been touched multiple times this year, making it an important support and resistance level. As a result of its heightened significance, if it is eventually broken, it will yield a more volatile push higher.
A decisive break above the 0.6055 October high would change the outlook to bullish in the medium term, indicating the possibility of the birth of a new uptrend. Such a move would then initially target the 200-day Simple Moving Average (SMA) at around 0.6100.
A possible bullish inverse head and shoulders pattern may have formed at the lows. This is highlighted by the labels applied to the chart above. The L and R stand for the left and right shoulders, whilst H for the head. If so, it could indicate substantial upside to come if the neckline – at the October highs – is decisively breached.
A decisive break would be one accompanied by a long green candle or three green candles in a row.
As things stand, the medium and long-term trends are both still bearish, however, suggesting the potential for more downside remains strong.
New Zealand Dollar FAQs
What key factors drive the New Zealand Dollar?
The New Zealand Dollar (NZD), also known as the Kiwi, is a well-known traded currency among investors. Its value is broadly determined by the health of the New Zealand economy and the country’s central bank policy. Still, there are some unique particularities that also can make NZD move. The performance of the Chinese economy tends to move the Kiwi because China is New Zealand’s biggest trading partner. Bad news for the Chinese economy likely means less New Zealand exports to the country, hitting the economy and thus its currency. Another factor moving NZD is dairy prices as the dairy industry is New Zealand’s main export. High dairy prices boost export income, contributing positively to the economy and thus to the NZD.
How do decisions of the RBNZ impact the New Zealand Dollar?
The Reserve Bank of New Zealand (RBNZ) aims to achieve and maintain an inflation rate between 1% and 3% over the medium term, with a focus to keep it near the 2% mid-point. To this end, the bank sets an appropriate level of interest rates. When inflation is too high, the RBNZ will increase interest rates to cool the economy, but the move will also make bond yields higher, increasing investors’ appeal to invest in the country and thus boosting NZD. On the contrary, lower interest rates tend to weaken NZD. The so-called rate differential, or how rates in New Zealand are or are expected to be compared to the ones set by the US Federal Reserve, can also play a key role in moving the NZD/USD pair.
How does economic data influence the value of the New Zealand Dollar?
Macroeconomic data releases in New Zealand are key to assess the state of the economy and can impact the New Zealand Dollar’s (NZD) valuation. A strong economy, based on high economic growth, low unemployment and high confidence is good for NZD. High economic growth attracts foreign investment and may encourage the Reserve Bank of New Zealand to increase interest rates, if this economic strength comes together with elevated inflation. Conversely, if economic data is weak, NZD is likely to depreciate.
How does broader risk sentiment impact the New Zealand Dollar?
The New Zealand Dollar (NZD) tends to strengthen during risk-on periods, or when investors perceive that broader market risks are low and are optimistic about growth. This tends to lead to a more favorable outlook for commodities and so-called ‘commodity currencies’ such as the Kiwi. Conversely, NZD tends to weaken at times of market turbulence or economic uncertainty as investors tend to sell higher-risk assets and flee to the more-stable safe havens.
Bank of England (BoE) Deputy Governor Ramsden made some comments on the UK wage inflation during his appearance on Friday.
Key quotes
Other wage data suggest wage growth probably peaked at 7.0% rather than 8.0% in official series
Either way, recent wage growth not consistent with 2.0% inflation target.
Weakness of supply capacity is a real feature of the UK economy.
Weak supply capacity is relevant to the UK monetary policy.
Market reaction
At the time of writing, GBP/USD is adding 0.10% on the day to trade at 1.2417.
- Housing Starts and Building Permits in the US increased in October.
- US Dollar Index fluctuates in daily range above 104.00 after the data.
The monthly data published by the US Census Bureau revealed on Friday that Housing Starts rose 1.9% on a monthly basis in October, following the 3.1% increase (revised from 7%) recorded in September.
In the same period, Building Permits increased 1.1% after the 4.5% decrease in September.
Market reaction
The US Dollar Index showed no immediate reaction to these figures and was last seen fluctuating in its daily range slightly above 104.00.
European Central Bank (ECB) Governing Council member and Bank of France President, Francois Villeroy de Galhau, said on Friday that “it’s the proof of the effectiveness of monetary policy, which fully justifies the halting of the sequence of rate hikes decided by the Governing Council.”
Additional takeaways
“The central bank will also be patient, holding rates at the current level “for a time proportionate to their full transmission.”
“The rate isn’t accurately measured — and no doubt this justifies lots of interpretations and suspicions — there’s a vague feeling that it’s increased. There’s no justification for that.”
Market reaction
The ECB commentary fails to deter Euro bulls, as EUR/USD keeps gains around 1.0865 so far this Friday.
UOB Group’s Senior Economist Julia Goh and Economist Loke Siew Ting review the latest interest rate decision by the BSP.
Key Takeaways
Bangko Sentral ng Pilipinas (BSP) kept its overnight reverse repurchase (RRP) rate unchanged at 6.50%... after taking into account a sharp slowdown in Oct inflation (details in report). The decision came against its own forward guidance of a follow-through hike during the off-cycle rate move last month (on 26 Oct), and our expectation of a 25bps hike, but matching Bloomberg consensus.
The Monetary Board (MB) judged that a rate pause today will allow previous policy interest rate adjustments to continue to work through the economy, particularly the impact on firms and households as credit growth decelerated further. It also reflects a downgrade in BSP’s inflation outlook with the riskadjusted inflation forecasts (which were first introduced in the 26 Oct 2023 offcycle meeting) tweaking lower to 6.1% for 2023 (from 6.2% projected in Oct), 4.4% for 2024 (from 4.7% previously) and 3.4% for 2025 (from 3.5% estimated in Oct).
Overall, the latest monetary policy statement still sounded hawkish. Likewise, official comments during the post-meeting briefing continued to suggest a meeting-by-meeting approach and data dependent in the near term. Recognizing this and extremely fluid global conditions, we see a 50:50 chance for BSP to hike one more time by 25bps at the next and final meeting of this year on 14 Dec. Until we have another big positive surprise in the nation’s inflation report for Nov and/or the US Fed officially announces an end to its rate hiking cycle in the coming month, we maintain our call for the RRP rate to end the year higher at 6.75% for now.
The USD is ending the week on the defensive. Economists at Scotiabank analyze Greenback’s outlook.
Charts do suggest more short-term pressure on the US Dollar Index
DXY fair value based purely on weighted 2Y spreads lies just above 104 today, very close to where the index is trading but that does not necessarily preclude more weakness in the near-term.
The charts do suggest more short-term pressure on the index, with heavy selling interest developing today to leave a bearish, short-term print on the intraday chart; price action implies strong resistance for the index at 104.55 now and the risk of more DXY losses on a break under 103.95/104.00.
- The Greenback opens higher this Friday and tries to follow-through on recovery.
- Traders can let the dust settle in a very light calendar ahead of the festivities next week.
- The US Dollar Index is steady above 104, favouring some more Dollar strength for now.
The US Dollar (USD) has given traders and markets a run for their money in this very volatile and nervous trading week. The main takeaway – and probably the main topic next week around the dinner table at Thanksgiving – will be the question of whether the US Federal Reserve is now truly done with hiking for the time being. Traders will get the chance to put all the pieces of the puzzle in place. The Greenback could possibly regain some strength, as this week’s move looks a bit overdone.
The calendar this Friday is a very slim one, with only housing data and building permits foreseen. Do not expect any big waves. The two actions that will probably guide the markets are a reduction of positions ahead of the weekend and some paring back of incurred losses in overdone and overstretched moves from earlier this week, in all asset classes.
Daily digest: US Dollar in calm water
- Expect some mild volatility near 13:30 GMT, when the sole data points for this Friday will be released:
- Monthly Building Permits for October are expected to head from 1.471 million to 1.450 million.
- Housing Starts for October is expected to head from 1.358 million to 1.350 million.
- Traders will try to assess this week’s data going into the year-end with the question of whether there is a medium-term goldilocks scenario, in which the Fed will cut quicker than expected (expectations now are for earliest June/July 2024). Or, alternatively, if there will be a recession in which economic growth gets slashed, jobless claims soar and more pain must be endured by the economy before the Fed steps in and starts cutting rates to provide ample oxygen for the US economy to recover.
- Equities are very mixed this Friday after a downbeat day across the board on Thursday. The Japanese indices are closing this Friday in the green, while the Chinese Hang Seng is down over 2%. European equities are slightly in the green while the UK FTSE100 is down over 1%. US equity futures are flat ahead of the US open.
- The CME Group’s FedWatch Tool shows that markets are pricing in a 99.8% chance –up from 85.7% on Tuesday morning – that the Federal Reserve will keep interest rates unchanged at its meeting in December.
- The benchmark 10-year US Treasury Note yield trades at 4.43%, flirting with the lowest level for this week.
US Dollar Index technical analysis: US Dollar technical, bounce part II
The US Dollar is trying to continue its recovery from Tuesday's meltdown. The recovery is not going as speedily as hoped, however, as only baby steps are visible in the US Dollar Index (DXY). It looks like traders have been unwinding their US Dollar long positions and only a substantial catalyst in favour of the Greenback will help to bring the DXY back to 105 and higher.
The DXY was able to bounce off the 100-day Simple Moving Average (SMA) in the late 103s. Now expect to see follow through from there, with 105.29, the low of November 6, as the market level where the DXY should try to close above this week. From there, the 55-day SMA at 105.71 is the next price point on the topside that needs to be reclaimed by US Dollar bulls before starting to think of more US Dollar strength to come into play.
Traders were warned that when the US Dollar Index would slide below that 55-day SMA, a big air pocket was opening up that could see the DXY fall substantially. This materialised on Tuesday. For now the 100-day SMA is trying to hold, at 103.62, although the 200-day SMA is a much better candidate for support. Should that level even be broken substantially, a long term sell-off could get underway with the DXY falling between 101.00 and 100.00.
US Dollar FAQs
What is the US Dollar?
The US Dollar (USD) is the official currency of the United States of America, and the ‘de facto’ currency of a significant number of other countries where it is found in circulation alongside local notes. It is the most heavily traded currency in the world, accounting for over 88% of all global foreign exchange turnover, or an average of $6.6 trillion in transactions per day, according to data from 2022.
Following the second world war, the USD took over from the British Pound as the world’s reserve currency. For most of its history, the US Dollar was backed by Gold, until the Bretton Woods Agreement in 1971 when the Gold Standard went away.
How do the decisions of the Federal Reserve impact the US Dollar?
The most important single factor impacting on the value of the US Dollar is monetary policy, which is shaped by the Federal Reserve (Fed). The Fed has two mandates: to achieve price stability (control inflation) and foster full employment. Its primary tool to achieve these two goals is by adjusting interest rates.
When prices are rising too quickly and inflation is above the Fed’s 2% target, the Fed will raise rates, which helps the USD value. When inflation falls below 2% or the Unemployment Rate is too high, the Fed may lower interest rates, which weighs on the Greenback.
What is Quantitative Easing and how does it influence the US Dollar?
In extreme situations, the Federal Reserve can also print more Dollars and enact quantitative easing (QE). QE is the process by which the Fed substantially increases the flow of credit in a stuck financial system.
It is a non-standard policy measure used when credit has dried up because banks will not lend to each other (out of the fear of counterparty default). It is a last resort when simply lowering interest rates is unlikely to achieve the necessary result. It was the Fed’s weapon of choice to combat the credit crunch that occurred during the Great Financial Crisis in 2008. It involves the Fed printing more Dollars and using them to buy US government bonds predominantly from financial institutions. QE usually leads to a weaker US Dollar.
What is Quantitative Tightening and how does it influence the US Dollar?
Quantitative tightening (QT) is the reverse process whereby the Federal Reserve stops buying bonds from financial institutions and does not reinvest the principal from the bonds it holds maturing in new purchases. It is usually positive for the US Dollar.
It has been a relatively busy day for the EUR already. Economists at Scotiabank analyze EUR/USD outlook.
Consolidation still looks like a pause in the EUR rally ahead of another push higher
The EUR is still effectively consolidating early week gains but firm support for the EUR on dips today solidifies the short-term range base at 1.0830.
Spot’s consolidation still looks like a pause in the EUR rally ahead of another push higher; in the short run, a move above Thursday’s high around 1.0895 should put the EUR on track for a move to 1.0950/1.0960.
Nomura’s Chief Equity Strategist, Yunosuke Ikeda, explains why he believes the Nikkei 225 will reach its highest levels by the end of 2024.
Continued profit growth at Japanese companies
Although we expect some headwinds from a weaker Dollar and stronger Yen as US interest rates decline, our main scenario is for continued profit growth at Japanese corporations in FY24 and FY25 as the spread of a price-hiking culture leads to improvement in profit margins.
We forecast the Nikkei 225 at 38,000 at the end of December 2024.
EUR/SEK trades above the 11.40 mark. Economists at Danske Bank analyze the pair’s outlook.
Relief-boost to SEK will not be sustained
Near-term, the yearly PPM money is a potential, yet transitory, flow factor for the SEK. Moreover, in the near term, we could see further SEK strength, contingent on for instance risk sentiment, seasonality and short-term valuation.
With cyclical (macro and monetary policy outlook) headwinds still in place for the coming 6-12M we remain medium-term bearish on the SEK.
Forecast: 11.40 (1M), 11.50 (3M), 11.80 (6M), 11.80 (12M)
USD/CNH still risks a potential retracement to the 7.2000 region in the near term, comment Economist Lee Sue Ann and Markets Strategist Quek Ser Leang at UOB Group.
Key Quotes
24-hour view: We expected USD to trade in a sideways range of 7.2470/7.2700 yesterday. USD then rose close to 7.2700 (high of 7.2684) and then declined to a low of 7.2427. Downward momentum has increased, albeit not much. Today, USD could break the major support at 7.2380, but it remains to be seen if it can maintain a foothold below this level. The next support at 7.2250 is unlikely to come into view. In order to keep the mild downward momentum going, USD must stay below 7.2650 (minor resistance is at 7.2550).
Next 1-3 weeks: There is not much to add to our update from Wednesday (15 Nov, spot at 7.2600). As highlighted “downward momentum has increased, and USD is likely to weaken further to 7.2380.” If USD breaks clearly below 7.2380, the focus will shift to 7.2000. On the upside, if USD breaks above 7.2900 (‘strong resistance’ level previously at 7.3000), it would indicate that current downward momentum has faded
In the FX sphere, the USD lost ground this week. Economists at Nordea analyze Greenback’s outlook.
Don’t sell all your USDs yet
For the USD to continue to decline in the short-term, US data needs to come in even weaker so that markets price in even faster rate cuts. Never say never, but this a tough case to see. However, markets will likely again chase the weak USD story once more at the turn of the new year.
We see EUR/USD rangebound between 1.05 and 1.12 in the months to come with our target flat around 1.08 until next summer.
- WTI Oil trades will likely close the week with significant losses.
- The US Dollar weakens as markets price in that the Fed is done hiking.
- Oil could show some brief blips on rumours from OPEC, but a further decline cannot be ruled out.
Oil prices are sinking lower, which is a thorn in the eye for OPEC+. Saudi Arabia suggested that it could extend its supply cuts deep into 2024, though markets ignored this possibility and still sent Crude prices 5% down for the week. Looking at the reshuffle in supply and demand, it looks that the US has firmly jacked up its Oil production, contributing to a supply surplus for the current lower demand.
Meanwhile, the US Dollar (USD) declined as well, in some sort or form of correlation. Traders are applauding the idea that Fed is done hiking, though fears are mounting that first a recession is ahead before bringing out the champagne on any Goldilocks scenario. In this context, the US Dollar might lose more value against most major currency pairs.
Crude Oil (WTI) trades at $73.24 per barrel and Brent Oil trades at $78.09 per barrel at the time of writing.
Oil news and market movers: markets surprised by US production
- Goldman Sachs analysts Daan Struyven and Callum Bruce pointed out that the United States has ramped up its Oil production.
- Both numbers this week from the American Petroleum Institute (API) and the Energy Information Administration (EIA) indicated a build in crude stockpile in the US.
- The presumption of an upcoming recession in the US will likely kick in, weighing on the outlook for Oil demand in the near-term. With the supply surplus triggered by the US, more downside is in the cards for Oil prices.
- Markets will close off Friday with the Baker Hughes US Oil Rig Count data at 18:00 GMT. Previous number was at 494.
Oil Technical Analysis: US quietly defies OPEC+
Oil prices are gearing up for more volatility ahead as a few new elements are being brought to the table this week. The recent decline in Crude prices can be attributed to the recent buildup in US Crude stockpiles. With this sudden increase in supply in the Oil market, a surplus is being built that takes the wind out of the supply cuts from Saudi Arabia and Russia, failing to sustain Brent futures over the $80 level.
On the upside, $80.00 is the resistance to watch out for. Should crude be able to jump higher again, look for $84.00 (purple line) as the next level to see some selling pressure or profit taking. Should Oil prices be able to consolidate above there, the topside for this fall near $93.00 could come back into play.
On the downside, traders are seeing a soft floor forming near $74.00. This level is acting as the last line of defence before entering $70.00 and lower. Once in that area, markets might factor in the risk of a surprise intervention from OPEC+ to jack Oil prices back up again.
-638358114897508844.png)
US WTI Crude Oil: Daily Chart
WTI Oil FAQs
What is WTI Oil?
WTI Oil is a type of Crude Oil sold on international markets. The WTI stands for West Texas Intermediate, one of three major types including Brent and Dubai Crude. WTI is also referred to as “light” and “sweet” because of its relatively low gravity and sulfur content respectively. It is considered a high quality Oil that is easily refined. It is sourced in the United States and distributed via the Cushing hub, which is considered “The Pipeline Crossroads of the World”. It is a benchmark for the Oil market and WTI price is frequently quoted in the media.
What factors drive the price of WTI Oil?
Like all assets, supply and demand are the key drivers of WTI Oil price. As such, global growth can be a driver of increased demand and vice versa for weak global growth. Political instability, wars, and sanctions can disrupt supply and impact prices. The decisions of OPEC, a group of major Oil-producing countries, is another key driver of price. The value of the US Dollar influences the price of WTI Crude Oil, since Oil is predominantly traded in US Dollars, thus a weaker US Dollar can make Oil more affordable and vice versa.
How does inventory data impact the price of WTI Oil
The weekly Oil inventory reports published by the American Petroleum Institute (API) and the Energy Information Agency (EIA) impact the price of WTI Oil. Changes in inventories reflect fluctuating supply and demand. If the data shows a drop in inventories it can indicate increased demand, pushing up Oil price. Higher inventories can reflect increased supply, pushing down prices. API’s report is published every Tuesday and EIA’s the day after. Their results are usually similar, falling within 1% of each other 75% of the time. The EIA data is considered more reliable, since it is a government agency.
How does OPEC influence the price of WTI Oil?
OPEC (Organization of the Petroleum Exporting Countries) is a group of 13 Oil-producing nations who collectively decide production quotas for member countries at twice-yearly meetings. Their decisions often impact WTI Oil prices. When OPEC decides to lower quotas, it can tighten supply, pushing up Oil prices. When OPEC increases production, it has the opposite effect. OPEC+ refers to an expanded group that includes ten extra non-OPEC members, the most notable of which is Russia.
Economists at Danske Bank expect the USD/JPY pair to nosedive over the coming months.
Turnaround in US yields to weigh on USD/JPY
We forecast USD/JPY to decline below 140 on a 6-12M horizon. This is primarily because we believe that long US yields have reached their peak.
We expect yield differentials to be a tailwind for the Japanese Yen over the coming year. In addition, historical data suggests that a global environment characterized by declining growth and inflation tends to favour the JPY.
S&P 500 posted a modest gain to close at its highest level since September 1. Economists at Société Générale analyze the index outlook.
Last month’s high of 4,390 should be short-term support
S&P 500 Index is inching towards the down gap in August near 4,565/4,610 which is also the trend line connecting highs of 2022 and July 2023. This could act as an interim hurdle. A pause can’t be ruled out; last month’s high of 4,390 should be short-term support.
Once the index establishes above 4,565/4,610, the uptrend is expected to persist towards 4,675 and 2022 high of 4,818.
European Central Bank (ECB) policymaker Robert Holzmann said on Friday, “we stand ready to raise rates again if necessary.”
Additional quotes
Markets should know that it's not the end of the story yet.
Anything can happen in December meeting.
Market reaction
At the time of writing, EUR/USD is gaining 0.19% on the day to trade at 1.0870.
The Zloty moved to new record highs on Thursday. Economists at ING like PLN.
Rates have a lot to offer to support PLN
We like PLN and it remains our highest conviction call for now, but Thursday's move seems a bit premature to us. But we believe this is the direction for EUR/PLN in the coming days. In particular, rates have a lot to offer to support PLN. The market is still pricing in too much in terms of rate cuts in our view and the short end move up will push EUR/PLN down.
For today, we see levels at around 4.38, but later we should test 4.36 again.
Inflation in Sweden came in lower than expected on Tuesday. However, the SEK seems to have taken little notice. Economists at Commerzbank analyze Krona’s outlook.
Krona appears well-equipped to absorb unchanged rates in the next Riksbank meeting
The market's adjusted interest rate expectations should ensure that it will not come as a big surprise if the Riksbank uses the downward surprise in inflation figures as an opportunity to leave its interest rate unchanged for the time being at its next meeting, given the weak economic outlook. In the short term, the Krona currently appears well-equipped to absorb such a setback, given the FX interventions.
In the medium term, however, this could be a mistake if the October inflation figures turn out to be an outlier. After all, inflation in Sweden is much more persistent than in other developed countries, and last month's figure surprised on the upside. If the Riksbank does not react decisively, the Krona is then likely to come under pressure again.
Gold price continues its march towards $2,000. Economists at Commerzbank analyze the yellow metal’s outlook.
Upside potential on XAU/USD is probably exhausted in the short term
The surprisingly benign US inflation data makes a (final) Fed rate hike in December unlikely. Nonetheless, it will presumably take some time before the market does a complete about-turn and begins speculating on imminent rate cuts in the US. The recovery on the Gold market is hardly likely to continue, in other words.
We only expect Gold to lastingly exceed the $2,000 mark in the middle of next year.
EUR/USD has galloped towards 1.09. Economists at ING analyze the pair’s outlook.
Italy ratings event risk
EUR/USD got a brief lift on Thursday from the initial claims data, but a clear and immediate catalyst for a further upside break is not obvious.
After the close today there is an event risk of a Moody’s rating decision on Italy. Moody’s has the Italian sovereign rating at one notch above junk and on a negative outlook. However, we doubt Moody’s will cut Italy to junk today since it would not want to be seen to be initiating turmoil in the European government bond markets.
A ratings cut would be a surprise, however, and renew interest in a potential stand-off between Italy and Brussels early next year were the Eurozone debt brake to be introduced. This would be Euro negative and in our view send EUR/CHF back to 0.95 again.
EUR/CZK has been in a range of 24.40-24.65 since the last Czech National Bank (CNB) meeting. Economists at ING analyze the pair’s outlook.
Rates once again point to a weaker Koruna
A move higher is imminent. Thursday's rate move showed that the market is ready to start pricing in CNB rate cuts again, and we see that there is still room to move lower.
Purely based on Thursday's rally in CZK rates, we expect EUR/CZK to return to 24.55 today and we think more to come later.
The CNB board should be more active in the media again indicating a close call for the next meeting, which should once again open up the discussion about the start of the cutting cycle.
The Dollar has entered a consolidative phase. Economists at ING analyze USD outlook.
Consolidative phase
For today, the focus will be on US housing starts and another batch of Fed speakers. Recent Fed speakers have barely moved the needle on expectations of the Fed policy cycle and instead, it has been the data doing the talking.
Perhaps the next big opportunity for Fed-speak will be the release of the minutes of the 1 November FOMC meeting – minutes released next Tuesday. DXY may trade well trade in a tight 104.00-104.85 range before then.
EUR/USD has been unable to surpass the 1.09 level. Economists at Commerzbank analyze the pair’s outlook.
EUR/USD seems to be slowly running out of steam at 1.09
At EUR/USD levels just below 1.09 things then clearly got a little too hot for the market and the gains were retraced. The market had already considered this level to constitute an initial obstacle on Tuesday.
A breach of the 1.09 mark would probably require a clearer indication that inflation is returning to target levels or that a recession is looming in the US. Or both.
In the absence of any new information of this nature – today will only bring second-tier US data – exchange rates are likely to be stagnating.
The Yuan has taken a beating and is one of the underperforming Asia pairs against the USD. Economists at TD Securities analyze USD/CNY outlook.
USD/CNY at 7.35 marks the line in the sand
The PBoC's mantra now on the Yuan is ‘watch the pace, not the level’ but we suspect USD/CNY at 7.35 marks the line in the sand.
Structurally, however, we think long-term fair value for USD/CNY has shifted >7 and we see USD/CNY in a tight range of 7.10-7.35 for most of next year, with authorities likely having a clear preference for a weaker CNY to drive export growth.
- USD/CHF remains below the psychological barrier at 0.8900.
- Technical indicators suggest a weaker momentum for the pair.
- A firm break above the nine-day EMA could help the pair to reach the 38.2% Fibonacci retracement.
USD/CHF seems to retrace the recent gains, trading around 0.8880 during the European session on Friday. The pair could find immediate support around the major level at 0.8850 lined up with the monthly low at 0.8854.
A decisive break below the level could push the USD/CHF pair toward the psychological level at 0.8800 with the conjunction at September’s low at 0.8795.
The ongoing downward trend is backed by the technical indicators for the USD/CHF pair. The 14-day Relative Strength Index (RSI) below the 50 level signals downward pressure, indicating a weaker momentum for the pair.
Furthermore, the Moving Average Convergence Divergence (MACD) line below the centerline, with divergence below the signal line, suggests a bearish momentum in the USD/CHF pair.
On the upside, the psychological level of 0.8900 emerges as the immediate resistance followed by the nine-day Exponential Moving Average (EMA) at 0.8939 aligned with the 23.6% Fibonacci retracement at 0.8947.
A firm breakthrough above the latter could support the bulls of the USD/CHF pair to approach the region around the 38.2% Fibonacci retracement at 0.9004.
USD/CHF: Daily Chart
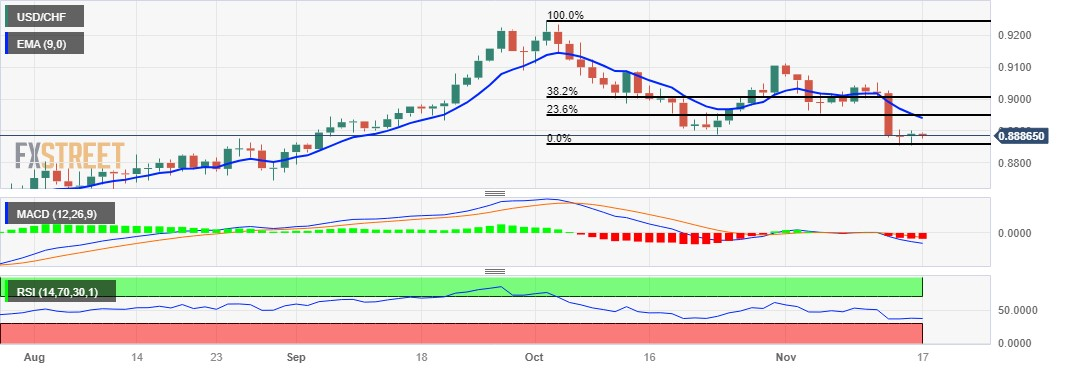
- The Euro gives away some gains vs. the US Dollar.
- European stocks open Friday’s session with decent gains.
- ECB’s Christine Lagarde did not comment on monetary policy.
The Euro (EUR) loses some upside momentum against the US Dollar (USD), prompting EUR/USD to trade slightly on the defensive around the 1.0840 zone at the end of the week.
The Greenback, on the other side of the equation, exchanges ups with downs around 104.40 when tracked by the USD Index (DXY) amidst the continuation of the downtrend in US yields across the curve, while speculation that the Federal Reserve (Fed) might start reducing its interest rates around the spring of 2024 remains well on the rise.
It is worth noting that speculation regarding prospective Fed rate reduction has been heightened as a result of weaker-than-expected inflation indicators (CPI and PPI) announced earlier this week.
In the domestic calendar, final Inflation Rate for the broader euro bloc is expected later in the session.
In the US, Building Permits and Housing Starts will be in the centre of the debate. In addition, FOMC Michael Barr (permanent voter, centrist), Boston Fed Susan Collins (2025 voter, centrist), Chicago Fed Austan Goolsbee (voter, centrist) and San Francisco Fed Mary Daly (2024 voter, hawk) are all due to speak.
Daily digest market movers: Euro remains cautious above 1.0800
- The EUR looks offered vs. the USD early on Friday.
- US and German yields extend the decline at the end of the week.
- Markets believe the Fed will cut rates in the first quarter of 2024.
- For the time being, investors prefer a prolonged delay by the ECB.
- Speculation of FX intervention continue to swirl around USD/JPY.
- ECB’s Villeroy said an impasse in the hiking cycle was fully justified.
- The US housing sector will be in the limelight later in the session.
Technical Analysis: Euro faces an initial barrier at 1.0900
EUR/USD seems to have embarked on a consolidation theme still below 1.0900 for the time being.
Prior hitting the weekly high of 1.0945 (August 30) and the psychological threshold of 1.1000, the next goal of note for EUR/USD is the November top of 1.0895 (November 16). Further north, the pair might confront the August peak of 1.1064 (August 10) and another weekly high of 1.1149 (July 27), both of which precede the 2023 top of 1.1275 (July 18).
Occasionally, the pair may attempt temporary support at the 55-day SMA at 1.0639, before the weekly low of 1.0495 (October 13) and the 2023 low of 1.0448. (October 15).
Looking at the larger picture, the pair's outlook should remain favourable as long as it stays above the 200-day SMA at 1.0803.
Euro FAQs
What is the Euro?
The Euro is the currency for the 20 European Union countries that belong to the Eurozone. It is the second most heavily traded currency in the world behind the US Dollar. In 2022, it accounted for 31% of all foreign exchange transactions, with an average daily turnover of over $2.2 trillion a day.
EUR/USD is the most heavily traded currency pair in the world, accounting for an estimated 30% off all transactions, followed by EUR/JPY (4%), EUR/GBP (3%) and EUR/AUD (2%).
What is the ECB and how does it impact the Euro?
The European Central Bank (ECB) in Frankfurt, Germany, is the reserve bank for the Eurozone. The ECB sets interest rates and manages monetary policy.
The ECB’s primary mandate is to maintain price stability, which means either controlling inflation or stimulating growth. Its primary tool is the raising or lowering of interest rates. Relatively high interest rates – or the expectation of higher rates – will usually benefit the Euro and vice versa.
The ECB Governing Council makes monetary policy decisions at meetings held eight times a year. Decisions are made by heads of the Eurozone national banks and six permanent members, including the President of the ECB, Christine Lagarde.
How does inflation data impact the value of the Euro?
Eurozone inflation data, measured by the Harmonized Index of Consumer Prices (HICP), is an important econometric for the Euro. If inflation rises more than expected, especially if above the ECB’s 2% target, it obliges the ECB to raise interest rates to bring it back under control.
Relatively high interest rates compared to its counterparts will usually benefit the Euro, as it makes the region more attractive as a place for global investors to park their money.
How does economic data influence the value of the Euro?
Data releases gauge the health of the economy and can impact on the Euro. Indicators such as GDP, Manufacturing and Services PMIs, employment, and consumer sentiment surveys can all influence the direction of the single currency.
A strong economy is good for the Euro. Not only does it attract more foreign investment but it may encourage the ECB to put up interest rates, which will directly strengthen the Euro. Otherwise, if economic data is weak, the Euro is likely to fall.
Economic data for the four largest economies in the euro area (Germany, France, Italy and Spain) are especially significant, as they account for 75% of the Eurozone’s economy.
How does the Trade Balance impact the Euro?
Another significant data release for the Euro is the Trade Balance. This indicator measures the difference between what a country earns from its exports and what it spends on imports over a given period.
If a country produces highly sought after exports then its currency will gain in value purely from the extra demand created from foreign buyers seeking to purchase these goods. Therefore, a positive net Trade Balance strengthens a currency and vice versa for a negative balance.
- Silver attracts some buyers for the fifth successive day on Friday.
- The overnight breakout through the $23.60-70 area favours bulls.
- Corrective declines are likely to get bought into and remain limited.
Silver (XAG/USD) gains positive traction for the fifth successive day on Friday and remains well within the striking distance of its highest level since September 4 touched the previous day. The white metal currently trades just below the $24.00 mark and seems poised to build on this week's solid bounce from a four-week trough.
From a technical perspective, acceptance above the very important 200-day Simple Moving Average (SMA) and the overnight breakout through the $23.60-$23.70 supply zone was seen as a fresh trigger for bullish traders. Moreover, oscillators on the daily chart have been gaining positive traction and validate the near-term positive outlook, suggesting that the path of least resistance for the XAG/USD is to the upside.
Some follow-through buying beyond the $24.00 round figure will reaffirm the constructive setup and the white metal to the $24.20-$24.25 intermediate resistance. The momentum could get extended and allow the XAG/USD to make a fresh attempt towards conquering the $25.00 psychological mark. Nevertheless, Silver remains on track to register strong weekly gains and post its highest weekly close since late August.
On the flip side, the $23.70-$23.60 strong resistance breakpoint now seems to protect the immediate downside ahead of the 200-day SMA, currently pegged near the $23.30 region. Any further decline might now attract fresh buyers and remain limited near the $23.00 mark. The latter should act as a key pivotal point, which if broken could drag the XAG/USD to the $22.35-$22.30 zone en route to the $22.00 mark.
A convincing break below the latter might shift the near-term bias back in favour of bearish traders. Some follow-through selling below the $21.85 region, or the monthly low, could make the XAG/USD vulnerable to accelerate the fall towards the $21.35-$21.30 region. The white metal could eventually weaken further below the $21.00 mark and test a multi-month low, around the $20.70-$20.65 area touched in October.
Silver daily chart
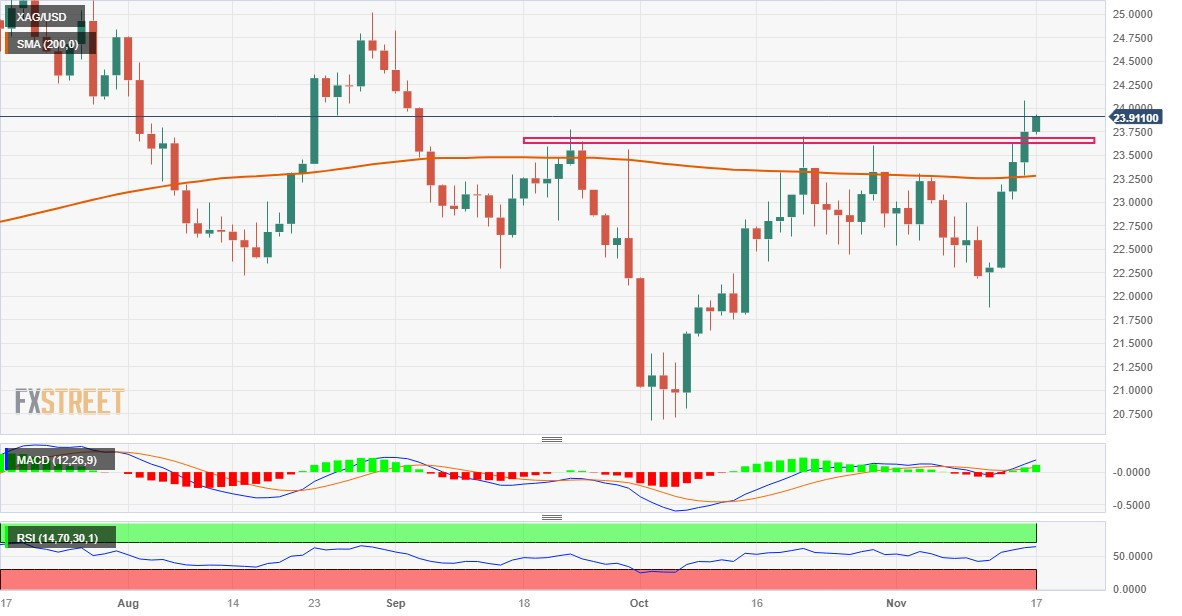
Technical levels to watch
Here is what you need to know on Friday, November 17:
Financial markets stay relatively quiet for the third straight day on Friday in the absence of fundamental drivers. Eurostat will release revisions to October Harmonized Index of Consumer Prices (HICP) data and the US economic docket will feature Housing Starts and Building Permits.
Uninspiring data releases from the US on Thursday made it difficult for the US Dollar (USD) to build on Wednesday's recovery gains. The US Department of Labor reported that the number of Initial Jobless Claims increased by 13,000 to 231,000 in the week ending November 11 and the Federal Reserve's monthly publication revealed that Industrial Production contracted by 0.6% in October following September's 0.1% growth. In the meantime, Wall Street's main indexes closed the day virtually unchanged, while the benchmark 10-year US Treasury bond yield turned south and dropped toward 4.4%.
US Dollar price this week
The table below shows the percentage change of US Dollar (USD) against listed major currencies this week. US Dollar was the weakest against the Australian Dollar.
| USD | EUR | GBP | CAD | AUD | JPY | NZD | CHF | |
| USD | -1.44% | -1.28% | -0.36% | -1.77% | -1.08% | -1.27% | -1.53% | |
| EUR | 1.42% | 0.16% | 1.06% | -0.32% | 0.36% | 0.16% | -0.06% | |
| GBP | 1.26% | -0.15% | 0.90% | -0.47% | 0.22% | 0.03% | -0.25% | |
| CAD | 0.36% | -1.08% | -0.91% | -1.40% | -0.72% | -0.90% | -1.15% | |
| AUD | 1.74% | 0.31% | 0.47% | 1.37% | 0.68% | 0.50% | 0.22% | |
| JPY | 1.07% | -0.39% | -0.22% | 0.70% | -0.70% | -0.17% | -0.46% | |
| NZD | 1.26% | -0.19% | -0.03% | 0.87% | -0.50% | 0.19% | -0.28% | |
| CHF | 1.49% | 0.08% | 0.24% | 1.15% | -0.23% | 0.46% | 0.28% |
The heat map shows percentage changes of major currencies against each other. The base currency is picked from the left column, while the quote currency is picked from the top row. For example, if you pick the Euro from the left column and move along the horizontal line to the Japanese Yen, the percentage change displayed in the box will represent EUR (base)/JPY (quote).
EUR/USD closed the day flat on Thursday and went into a consolidation phase at around 1.0850 on Friday.
GBP/USD fluctuated in a very tight range near 1.2400 on Thursday. Early Friday, the pair started to edge lower and was last seen losing 0.23% on the day at 1.2385.
USD/JPY turned south on Thursday and closed below 151.00. The pair continued to push lower during the Asian trading hours and came within a touching distance of 150.00. Earlier in the day, Bank of Japan (BoJ) Governor Kazuo Ueda said that the central bank does not have any specific plan yet on how it will sell ETFs and that a weaker Japanese Yen (JPY) pushes up domestic inflation via a rise in import costs. "I cannot say decisively that a weak JPY is negative for Japan's economy," Ueda added.
Gold benefited from retreating US Treasury bond yields on Thursday and climbed above $1,980. XAU/USD preserves its bullish momentum early Friday and advances toward $1,990.
Further consolidation appears in store for USD/JPY in the next few weeks, argue Economist Lee Sue Ann and Markets Strategist Quek Ser Leang at UOB Group.
Key Quotes
24-hour view: Yesterday, we held the view that USD could rebound further, but it is unlikely to break the major resistance at 151.65. Instead of rebounding further, USD dropped sharply to a low of 150.27 before recovering to end the day at 150.71 (-0.42%). While the decline lacks momentum, as long as USD stays below 151.30 (minor resistance is at 151.00), it could weaken but is unlikely to break clearly below 150.10.
Next 1-3 weeks: Our update from Wednesday (15 Nov, spot at 150.55) is still valid. As highlighted, the recent buildup in upward pressure has faded. From here, USD is likely to trade in a range of 149.50/151.65.
Open interest in natural gas futures markets resumed the uptrend on Thursday, this time by nearly 9K contracts following the previous daily drop according to preliminary readings from CME Group. In the same direction, volume reversed two daily declines in a row and went up by around 123.7K contracts.
Natural Gas: There is a strong contention around $3.000
Thursday’s pullback in prices of natural gas came in tandem with increasing open interest and volume, suggesting that the continuation of the downward trend appears the most likely scenario in the very near term. Against that, the $3.000 mark per MMBtu remains a tough contention zone for the time being.
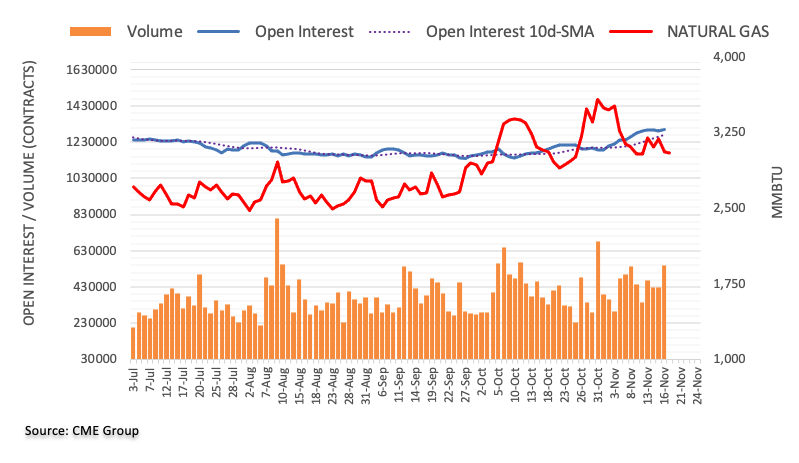
- USD/JPY extends losses due to the soft risk tone in the market.
- Japanese Yen could face a struggle due to the BoJ’s dovish stance.
- BoJ Governor Ueda reiterated to maintain ultra-loose monetary policy.
- Japanese government could intervene in the FX market to curb excess volatility.
USD/JPY moves on a downward trajectory, extending losses for the second successive day. The spot price hovers around 150.30 during the European session on Friday. The pair faces challenges, primarily influenced by a soft risk tone in the market. The likelihood of no interest rate hike by the US Federal Reserve (Fed), following a series of downbeat economic data from the United States, contributes to the overall sentiment impacting the USD/JPY pair.
The downside of the USD/JPY pair finds support in the face of a more dovish stance adopted by the Bank of Japan (BoJ). BoJ Governor Kazuo Ueda reiterated on Friday that the central bank will patiently maintain its ultra-loose monetary policy stance. Ueda expressed caution, stating that it cannot be said with conviction that the 2% inflation target will be stably attained.
US labor market data reveals challenges, with Initial Jobless Claims for the week ending on November 10 rising to 231K, surpassing the expected 220K and marking the highest level in nearly three months. Continuing Jobless Claims for the week ending on November 3 also increased to the highest level since 2022, reaching 1.865 million compared to the previous reading of 1.833 million.
Japan's Deputy Finance Minister Ryosei Akazawa has reiterated the government's stance on potential intervention in the foreign exchange (FX) market. He stated that the government will intervene in the FX market to curb excess volatility but does not have a specific FX level in mind to trigger such intervention. Akazawa emphasized that any FX intervention would be aimed at addressing excess volatility and not simply in response to the Japanese Yen (JPY) weakening.
According to the latest Reuters poll on Japan inflation estimates, ahead of the Consumer Price Index (CPI) data release on November 24, the median estimate is for annual core CPI to be at 3.0% in October. This projection reflects an increase from the 2.8% reading recorded in the previous month.
Market participants are expected to pay attention to the upcoming release of US Building Permits (MoM) and Housing Starts (MoM) on Friday. The anticipated decrease in these housing indicators for October could contribute to reinforcing the belief that the Fed is unlikely to pursue an interest rate hike in the upcoming meetings. Moreover, multiple Fed policymakers will be observed, who are scheduled to give their speeches on Friday.
The continuation of the upside momentum appears in store for AUD/USD in the short-term horizon, according to Economist Lee Sue Ann and Markets Strategist Quek Ser Leang at UOB Group.
Key Quotes
24-hour view: Our view for AUD to trade in a range between 0.6470 and 0.6535 yesterday was incorrect, as it fell to a low of 0.6461. Despite the decline, downward momentum has hardly increased. That said, there is scope for AUD to edge lower, but it is unlikely to break clearly below 0.6440. On the upside, if AUD breaks above 0.6510 (minor resistance is at 0.6495), it would indicate that the current mild downward pressure has eased.
Next 1-3 weeks: We continue to hold the same view as yesterday (16 Nov, spot at 0.6510). As highlighted, while AUD is likely to advance further, upward momentum is not that strong for now, and the major resistance at 0.6585 might not come into view soon. The upside bias is intact as long as AUD stays above 0.6400 (no change in ‘strong support’ level from yesterday).
Considering advanced prints from CME Group for crude oil futures markets, open interest extended the downtrend on Thursday, this time diminishing by around 16.7K contracts. Volume, instead, increased for the third consecutive session, now by nearly 186K contracts.
WTI: Next on the downside comes $70.00
Prices of WTI plummeted to the vicinity of the $72.00 region per barrel on Thursday. The sharp pullback was in tandem with shrinking open interest and is indicative that a deeper retracement seems not favoured in the very near term. On the downside, the next contention area is expected at the $70.00 zone.
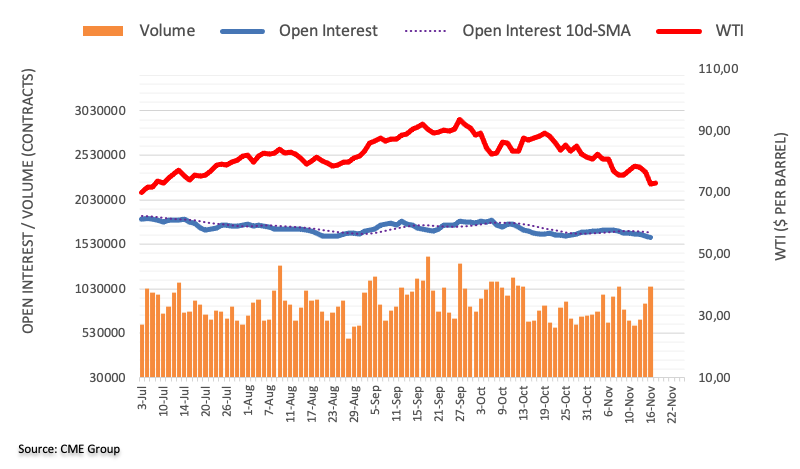
In the opinion of Economist Lee Sue Ann and Markets Strategist Quek Ser Leang at UOB Group, the upward bias could lose traction if GBP/USD breaks below 1.2350.
Key Quotes
24-hour view: We indicated yesterday that GBP “appears to have entered a consolidation phase”, and we held the view that it “is likely to trade in a range of 1.2380/1.2480”. GBP then dipped to 1.2377, rebounded to 1.2455, and then eased off to close largely unchanged at 1.2415 (+0.01%). The price movements still appear to be consolidative, and we continue to expect GBP to trade in a range, probably between 1.2375 and 1.2460.
Next 1-3 weeks: Our latest narrative was from two days ago (15 Nov, spot at 1.2490), wherein GBP “is likely to continue to advance, but it has to break clearly above 1.2580 before a further sustained rise is likely.” Since then, GBP has not been able to make any headways on the upside as it eased off over the past couple of days. While upward momentum has waned somewhat, only a breach of 1.2350 (no change in ‘strong support’ level from yesterday) would indicate that GBP is not advancing further.
- The UK Retail Sales dropped 0.3% MoM in October, a negative surprise.
- Core Retail Sales for the UK dropped 0.1% MoM in October.
- GBP/USD holds lower ground below 1.2400 on downbeat UK data.
The UK Retail Sales fell 0.3% over the month in October vs. 0.3% expected and -1.1% registered in September, according to the official data published by the Office for National Statistics (ONS) on Friday.
The Core Retail Sales, stripping the auto motor fuel sales, dropped 0.1% MoM vs. 0.4% expected and -1.3% seen in September.
The annual Retail Sales in the United Kingdom tumbled 2.7% in October versus -1.5% expected and September’s 1.0% drop while the Core Retail Sales declined 2.4% in the reported month versus -1.5% expectations and -1.5% previous.
Main points (via ONS)
Automotive fuel sales volumes fell by 2.0% in October 2023; in the three months to October, sales volumes fell by 0.7% when compared with the previous three months, which may be affected by increasing fuel prices.
Food stores sales volumes fell by 0.3% in October 2023, from being unchanged (0.0%) in September 2023.
Non-food stores sales volumes fell by 0.2% in October 2023, following a 2.1% fall in September 2023; retailers suggested that cost of living, reduced footfall and the wet weather in the second half of the month contributed to the fall.
Non-store retailing (predominantly online retailers) sales volumes rose by 0.8% in October 2023 following a fall of 2.4% in September 2023.
FX implications
GBP/USD is testing intraday lows near 1.2375 on the downbeat UK Retail Sales data. The spot is down 0.25% on the day.
- USD/MXN faces downward pressure weaker US economic data.
- US Initial Jobless Claims marked the highest level in nearly three months.
- Banxico could maintain policy rates at 11.25% for a prolonged period to achieve a 3.0% inflation target.
USD/MXN moves sideways with a bias to continue the losing streak that began on November 10. This direction is influenced by additional economic data from the United States (US), which has further cemented the market sentiment of no interest rate hikes by the Federal Reserve. The spot price hovers around 17.2300 during the early European session on Friday.
US Initial Jobless Claims for the week ending on November 10 rose to 231,000, exceeding the expected 220,000 and marking the highest level in nearly three months. Additionally, Continuing Jobless Claims for the week ending on November 3 increased to the highest level since 2022, reaching 1.865 million compared to the previous reading of 1.833 million. These labor market indicators highlight ongoing challenges in the US job market, which may contribute to broader market sentiment and potentially influence the US Dollar (USD).
US Dollar Index (DXY) hovers around 104.30, experiencing downward pressure primarily attributed to the decline in US Treasury yields. As of the latest data, the yield on the 10-year Treasury note stands at 4.46%, while the 2-year Treasury note yield is at 4.85%. The movement in Treasury yields is a key factor influencing the weakness of the US Dollar (USD), as it reflects market expectations regarding no interest rate hike.
The Bank of Mexico (Banxico) is expected to maintain its interest rates at 11.25% as it works towards achieving its 3.0% inflation target by the year 2025. The decision is contingent on the context of Mexico's inflation, which eased to 4.26% year on year in October.
Banxico's Governor Victoria Rodriguez Ceja suggested on Monday that rate cuts could be a possibility next year. Additionally, Deputy Governor Jonathan Heath emphasized on Tuesday that monetary policy will continue to remain restrictive.
With Mexico's economic docket remaining scarce, traders are likely to focus on the US Building Permits (MoM) and Housing Starts (MoM) scheduled for release on Friday. The expectations for a decrease in October in these housing indicators may play a role in supporting the belief that the Fed is unlikely to implement an interest rate hike in the upcoming meetings.
CME Group’s flash data for gold futures markets noted traders added around 7.5K contracts to their open interest positions on Thursday, reversing at the same time the previous daily drop. Volume followed suit and went up by around 68.3K contracts after three daily pullbacks in a row.
Gold and the hunt for $2000
Gold prices rose to multi session highs just above the $1980 mark per troy ounce on Thursday. The uptick was on the back of increasing open interest and volume, leaving the door to open to extra gains in the very near term. Against that, the key barrier for bulls still emerges at the $2000 mark.
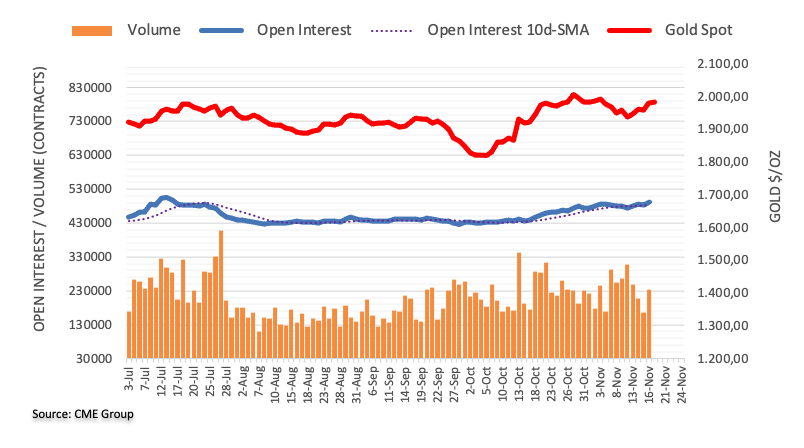
- EUR/GBP trades with modest intraday losses around 0.8740 ahead of UK Retail Sales data.
- The cross keeps the bullish stance as the cross holds above the 50- and 100-hour EMA.
- The first resistance level is located at 0.8765; 0.8713 acts as an initial support level for the cross.
The EUR/GBP cross retreats from 0.8765 to 0.8740 during the early European session on Friday. Traders await the United Kingdom (UK) Retail Sales data for October. The monthly Retail Sales are expected to rise by 0.3% while the Retail Sales ex-Fuel is estimated to climb by 0.04% MoM. The weaker-than-expected data could exert some selling pressure on the British pound (GBP) against the Euro (EUR).
According to the four-hour chart, EUR/GBP keeps the bullish stance as the cross holds above the 50- and 100-hour Exponential Moving Averages (EMAs). Furthermore, the Relative Strength Index (RSI) stands in bullish territory above 50, supporting the buyers for now.
The first upside barrier is located near the upper boundary of the Bollinger Band and a high of November 16 at 0.8765. A decisive break above the latter will see a rally to a high of May 3 at 0.8835. The additional upside filter to watch is a high of April 25 at 0.8865.
On the flip side, the 100-hour EMA at 0.8713 acts as an initial support level for the cross. A breach of the latter will see a drop to the lower limit of the Bollinger Band at 0.8695. Further south, the next contention level is seen near a low of November 1 at 0.8682.
EUR/GBP four-hour chart
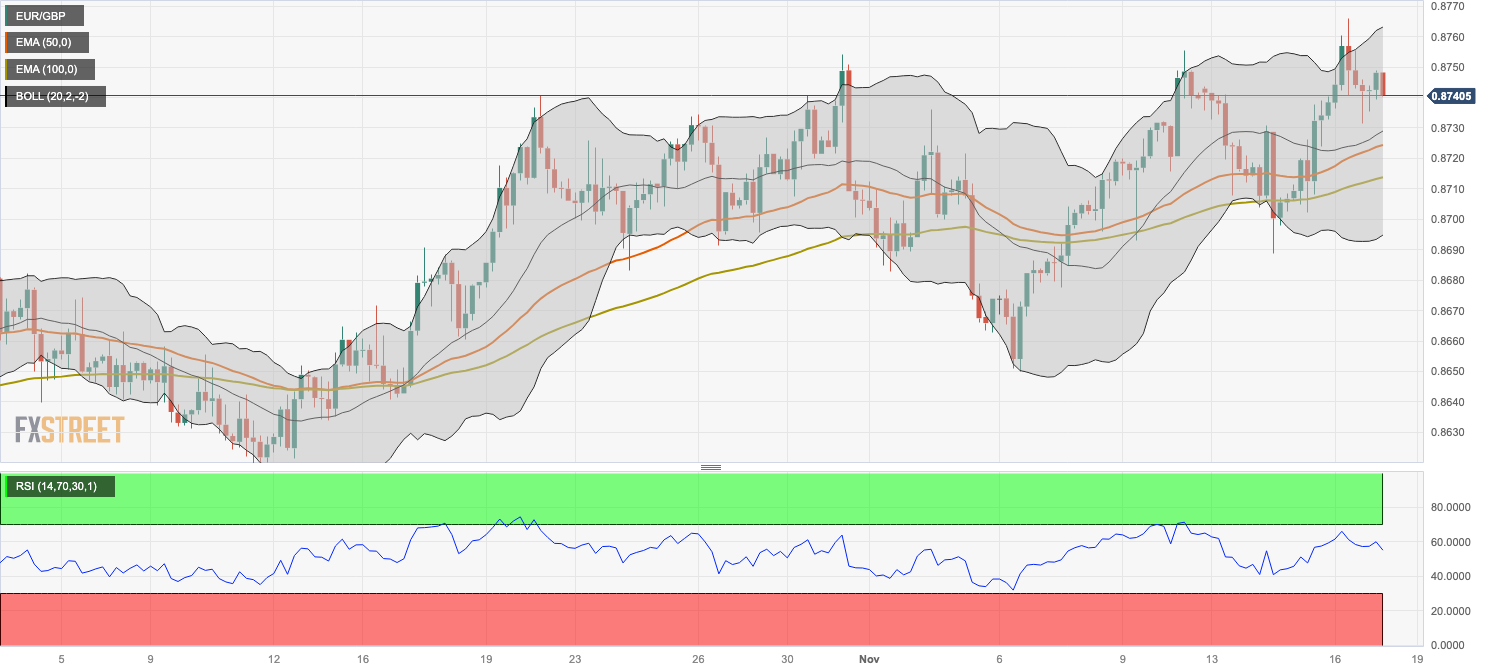
- The index appears side-lined in the low-104.00s.
- Market chatter of rate cuts by the Fed in H1 2024 remains on the rise.
- The US housing sector will be in the limelight along with Fedspeak.
The greenback, in terms of the USD Index (DXY), navigates a narrow range around 104.30 at the end of the week.
USD Index keeps the range bound theme near 104.00
The index seems to have entered a consolidative phase near the 104.00 region following Tuesday’s steep decline to multi-week lows in the wake of the release of US inflation figures.
Furthermore, the lacklustre movement in the dollar coincides with a slight uptick in US yields across different time frames, amidst growing speculation that the Federal Reserve might initiate interest rate reductions in the first half of 2024.
On the US docket, the housing sector will take centre stage with the releases of Building Permits and Housing Starts.
Additionally, FOMC M. Barr (permanent voter, centrist), Boston Fed S. Collins (2025 voter, centrist), Chicago Fed A. Goolsbee (voter, centrist) and San Francisco Fed M. Daly (2024 voter, hawk) are all due to speak.
What to look for around USD
The pronounced decline in the index appears to have met some initial contention around the 104.00 region, or eleven-week lows, so far this week.
In the meantime, the dollar appears depressed against the backdrop of rising speculation of probable interest rate cuts in H1 2024, all in response to further disinflationary pressures and the gradual cooling of the labour market.
Bolstering the greenback, however, still emerges the resilience of the US economy as well as a hawkish narrative from some Fed rate setters.
Key events in the US this week: Building Permits, Housing Starts (Friday).
Eminent issues on the back boiler: Persistent debate over a soft or hard landing for the US economy. Speculation of rate cuts in early 2024. Geopolitical effervescence vs. Russia and China. Potential spread of the Middle East crisis to other regions.
USD Index relevant levels
Now, the index is down 0.03% at 104.36 and faces immediate contention at 103.98 (monthly low November 14) ahead of 103.61 (200-day SMA) and 102.93 (weekly low August 30). On the upside, the breakout of 106.00 (weekly high November 10) could pave the way to a move to 106.88 (weekly high October 26) and finally 107.34 (2023 high October 3).
The continuation of the upside momentum could lift EUR/USD to the 1.0945 level in the near term, comment Economist Lee Sue Ann and Markets Strategist Quek Ser Leang at UOB Group.
Key Quotes
24-hour view: We noted yesterday that “the current price action is likely part of a consolidation phase,” and we expected EUR to trade in a range between 1.0815 and 1.0880. While EUR rose to a high of 1.0895 in NY trade, it pulled back quickly to end the day little changed at 1.0850 (+0.04%). The price action still appears to be consolidative, and we continue to expect EUR to trade in a range, likely between 1.0820 and 1.0880.
Next 1-3 weeks: Our update from Wednesday (15 Nov, spot at 1.0880) still stands. As highlighted, further EUR strength appears likely, and the level to monitor is 1.0945. Overall, only a breach of 1.0770 (no change in ‘strong support’ level) would indicate that EUR is not strengthening further.
- GBP/USD holds position above the psychological support level at 1.2400
- A break below the nine-day EMA could further navigate toward a psychological level of 1.2300,
- The major level of 1.2450 lined up with the 38.2% Fibonacci retracement could act as the key resistance region.
GBP/USD looks to extend its losses for the third consecutive day ahead of the Retail Sales data from the United Kingdom, trading around 1.2410 during the Asian session on Friday. The 1.2400 psychological level serves as immediate support, followed by the next support around 1.2350, which is aligned with the nine-day Exponential Moving Average (EMA) at the 1.2353 level.
A break below the latter could further weigh on the GBP/USD pair, potentially navigating toward the region around the psychological level at 1.2300, in conjunction with the 21-day EMA at 1.2295.
Despite the current downward movement, the technical indicators for the GBP/USD pair present a bullish outlook. The 14-day Relative Strength Index (RSI) above the 50 level indicates upward support, suggesting a robust momentum in favor of the pair.
Additionally, the Moving Average Convergence Divergence (MACD) line, situated above the centerline and showing divergence above the signal line, implies a bullish momentum in the GBP/USD pair.
On the upside, the GBP/USD pair trades below the major level of 1.2450 aligned with the 38.2% Fibonacci retracement at 1.2459, which may serve as the key resistance area. A decisive breakthrough above this barrier has the potential to encourage bullish sentiment, opening the path towards the psychological level at 1.2500, aligning with the weekly high at 1.2505.
GBP/USD: Daily Chart
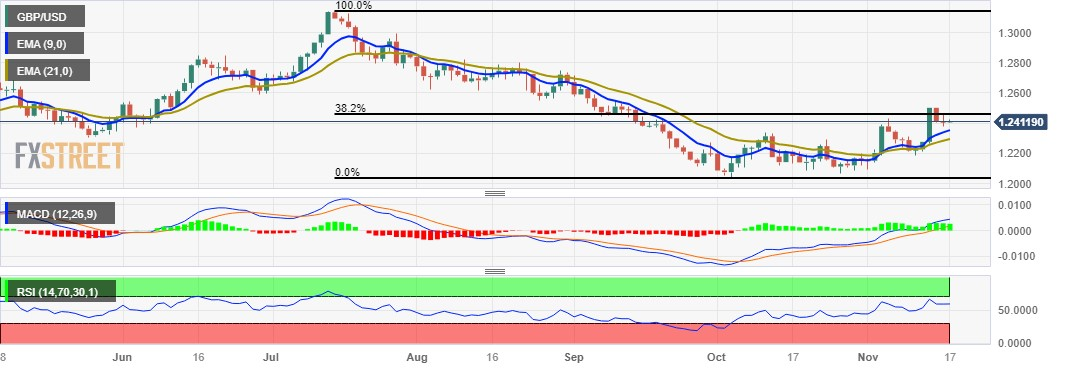
- EUR/USD oscillates in a narrow trading band around the mid-1.0800s on Friday.
- The pair holds above the 50- and 100-hour EMA; RSI indicator is located in bullish territory above 50.
- The immediate resistance level is seen at 1.0900; 1.0830 acts as an initial support level for the pair.
The EUR/USD pair consolidates in a narrow trading range between 1.0845 and 1.0860 during the early European session on Friday. The major pair currently trades around 1.0851, gaining 0.04% on the day.
According to the four-hour chart, the major pair holds above the 50- and 100-hour Exponential Moving Averages (EMA), suggesting the path of least resistance to the upside. It’s worth noting that the Relative Strength Index (RSI) holds in bullish territory above 50, suggesting further upside looks favorable.
The immediate resistance level for EUR/USD is seen near a psychological round figure at 1.0900. Any follow-through buying will see a rally to the upper boundary of the Bollinger Band at 1.0948. The next upside barrier is located at 1.1000 (a round figure and a high of August 11).
On the other hand, a low of November 16 at 1.0830 acts as an initial support level for the pair. The next contention level will emerge at 1.0800 (round mark), en route to 1.0766 (the 50-hour EMA) and 1.0725 (the lower limit of the Bollinger Band).
EUR/USD four-hour chart
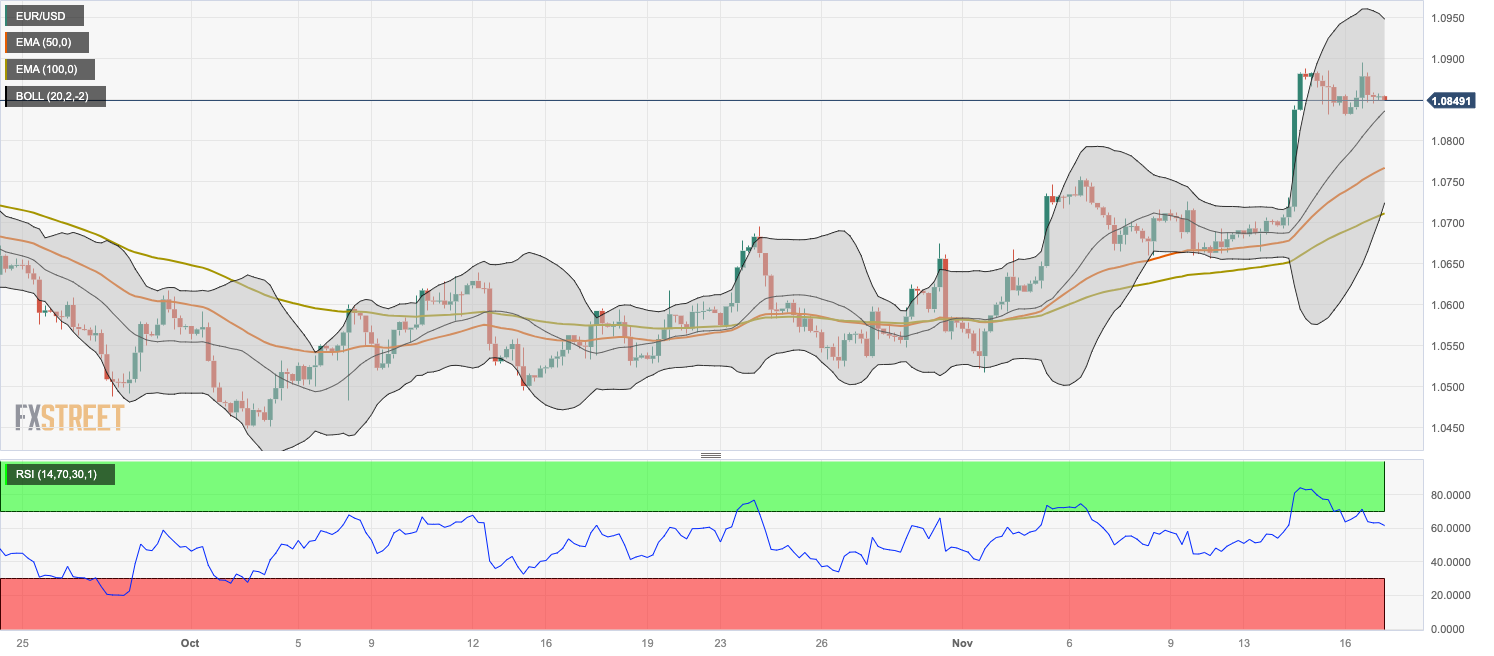
- GBP/JPY drifts lower for the second straight day, albeit lacks any follow-through selling.
- Expectations that the BoE will start cutting rates in 2024 continue to undermine the GBP.
- Traders look forward to the UK monthly Retail Sales figures for short-term opportunities.
The GBP/JPY cross remains under some selling pressure for the second straight day on Friday and moves further away from its highest level since November 2015, around the 188.25-188.30 area touched earlier this week. Spot prices currently trade near the 186.85-186.80 region, down just over 0.10% for the day, as traders now look to the UK Retail Sales figures for a fresh impetus.
In the meantime, softer UK consumer inflation figures released on Wednesday reaffirmed market expectations that the Bank of England (BoE) will soon start cutting rates. This is seen as a key factor behind the British Pound's relative underperformance and exerting some pressure on the GBP/JPY cross. Apart from this, a softer risk tone drives some haven flows towards the Japanese Yen (JPY) and contributes to the mildly offered tone.
That said, any meaningful appreciating move for the JPY still seems elusive in the wake of a more dovish stance adopted by the Bank of Japan (BoJ). In fact, BoJ Governor Kazuo Ueda reiterated this Friday that the central bank will patiently maintain the ultra-loose monetary policy settings as sustained achievement of the inflation target is not yet in sight. Ueda added that the trend inflation is likely to accelerate toward 2% through fiscal 2025.
This might continue to undermine the JPY and help limit the downside for the GBP/JPY cross. Meanwhile, Japan's Deputy Finance Minister Ryosei Akazawa reiterated that the government will intervene in the FX market to arrest excess volatility. This might hold back traders from placing aggressive bullish bets and cap the upside for spot prices. Nevertheless, the cross remains on track to register gains for the third successive week.
Technical levels to watch
- WTI is seen consolidating the overnight sharp downfall to its lowest level since July 10.
- Worries about global demand turn out to be a key factor undermining the commodity.
- Dovish Fed expectations continue to weigh on the USD, albeit do little to lend support.
West Texas Intermediate (WTI) Crude Oil prices oscillate in a narrow trading band during the Asian session on Friday and consolidate the overnight slump to over a four-month low. The commodity currently trades just above the $73.00/barrel mark and remains on track to register losses for the fourth straight week.
The incoming softer US macro adds to worries about a deeper global economic downturn, which is expected to dent fuel demand and continue to undermine Crude Oil prices. The US monthly Retail Sales fell for the first time in seven months in October and pointed to slowing demand at the start of the fourth quarter. Adding to this, the number of Americans who filed for unemployment insurance for the first time rose to 231K during the week to November 11 from the 218K previous (revised from 217K).
This comes on top of persistent worries about a slowdown in China – the world's top oil importer – and easing fears of a supply disruption from the Middle East, validating the negative outlook for the black liquid. Meanwhile, bets that the Federal Reserve (Fed) is done with its policy-tightening campaign and might start cutting rates in the first half of 2024 keep the US Dollar (USD) bulls on the defensive. A subdued USD price action, however, does little to impress bullish traders or lend any support to Oil prices.
The commodity's inability to attract any buyers or register any meaningful recovery suggests that the bearish trend might still be far from being over. That said, technical indicators on the daily chart have moved on the verge of breaking into oversold territory, making it prudent to wait for some near-term consolidation or a modest bounce before the next leg up. Nevertheless, Oil prices seem poised to register losses of over 5% for the week.
Technical levels to watch
- USD/CHF faced challenges on concerns over China’s property sector.
- Swiss Franc could gain ground on prevailing risk-off sentiment.
- Upbeat US jobless claims data seem ineffective to the US Dollar’s resilience.
USD/CHF hovers around 0.8880 during the Asian session on Friday. The Swiss Franc (CHF), being a safe-haven currency, is receiving upward support amid prevailing risk-off sentiment in the market. Additionally, the Swiss National Bank (SNB) has expressed its determination to defend the CHF through outright market purchases, adding to the pressure on the USD/CHF pair.
SNB Chairman Thomas Jordan's hawkish comments, where he does not rule out the possibility of more interest rate hikes in the future, further supporting and underpinning the strength of the Swiss Franc (CHF).
US Dollar Index (DXY) hovers around 104.30, with downward pressure due to the decline in the US Treasury yields. The yields on the 10-year and 2-year Treasury notes stand at 4.44% and 4.84%, respectively.
Moreover, the weaker US economic data seems to be ineffective to the USD's resilience. US Continuing Jobless Claims for the week ending on November 3 increased to 1.865 million, compared to the previous reading of 1.833 million. Initial Jobless Claims for the week ending on November 10 rose to 231,000, exceeding the expected 220,000.
The Federal Reserve's (Fed) pushback against expectations of rate cuts, as highlighted by Cleveland Fed President Loretta Mester, underscores the data-dependent nature of the central bank's decision-making.
Looking ahead, investors are likely awaiting key economic indicators, including Swiss Industrial Production and US housing data on Friday. These releases are expected to offer valuable insights into the economic activities of both countries, influencing market sentiment and potentially impacting trading decisions in pairs like USD/CHF.
- Gold price attracts some follow-through buyers in the wake of dovish Fed expectations.
- The markets have started pricing in the possibility of a rate cut in the first half of 2024.
- The XAU/USD remains on track to end on a positive note for the first time in three weeks.
Gold price (XAU/USD) trades with a positive bias for the second straight day on Friday – also marking the fourth day of a move up in the previous five – and is currently placed just below a nearly two-week high touched the previous day. The incoming macro data from the United States (US) cemented bets for an extended pause by the Federal Reserve (Fed). Moreover, the markets are starting to look forward to interest rate cuts, perhaps in the first half of 2024, which leads to the recent decline in the US Treasury bond yields and continues to act as a tailwind for the non-yielding yellow metal.
Dovish Fed expectations, meanwhile, fail to assist the US Dollar (USD) to register any meaningful recovery from its lowest level since September 1 touched in the aftermath of the softer US consumer inflation figures on Tuesday. Apart from this, mixed signals from high-level US-China talks turn out to be another factor benefitting the safe-haven Gold price and supporting prospects for a further near-term appreciating move. Nevertheless, the XAU/USD remains on track to register weekly gains of nearly 2.5% and snap a two-week losing streak to its lowest level since October 18 touched on Monday.
Daily Digest Market Movers: Gold price continues to draw support from dovish Fed expectations and subdued US Dollar price action
- Gold has now recovered over $50 from a multi-week low, around the $1,932-1,931 area touched on Monday in the wake of bets that the Federal Reserve is done raising interest rates.
- The US CPI report released earlier this week indicated that consumer inflation was cooling faster than anticipated, while the US Jobless Claims on Thursday pointed to a cooling labour market.
- The headline CPI was unchanged in October, while the yearly rate registered its smallest rise in two years and decelerated sharply to 3.2% from 3.7% in September.
- The number of Americans who filed for unemployment insurance for the first time rose to 231K during the week of November 11 from the 218K previous (revised from 217K).
- Furthermore, the recent slump in Oil prices is expected to have a disinflationary effect, which should bring the Fed closer to its 2% target and allow it to soften its hawkish stance.
- A slew of influential Fed officials this week acknowledged the progress to curb inflation, reinforcing the idea that the policy-tightening campaign may soon be over.
- Traders now seem convinced that interest rates in the US will not go higher. Furthermore, the CME Group's FedWatch Tool indicates the rising possibility of the first rate cut by March 2024.
- The yield on the benchmark 10-year US government bond dropped to a near two-month low on Thursday and continues to undermine the US Dollar, lending support to the Gold price.
- US President Joe Biden and his Chinese counterpart Xi Jinping agreed to reopen military channels, prompting some improvement in relations between the world's two largest economies.
- Hours after the summit, Biden called Xi a “dictator”, which might have possibly annoyed Chinese authorities.
- Traders now look to the US housing market data and a scheduled speech by Chicago Fed President Austan Goolsbee for short-term opportunities on the last trading day of the week.
Technical Analysis: Gold price seems poised to reclaim the $2,000 psychological mark and test a multi-month peak near the $2,009-2,010 area
From a technical perspective, a sustained move and acceptance above the $1,980 level might have already set the stage for further gains. Moreover, oscillators on the daily chart are holding comfortably in the positive territory and are still far from being in the overbought zone. This, in turn, suggests that the path of least resistance for the Gold price is to the upside and supports prospects for a move towards reclaiming the $2,000 psychological mark. The momentum could get extended further towards a multi-month peak, around the $2,009-$2,010 area, which if cleared decisively will be seen as a fresh trigger for bullish traders.
On the flip side, the $1,975 region now seems to protect the immediate downside ahead of the $1,970 level and the $1,962-1,961 support zone. Some follow-through selling, leading to a subsequent break below the $1,955 area, might shift the bias in favour of bearish traders and make the Gold price vulnerable to accelerate the slide back towards the 200-day Simple Moving Average (SMA), currently around the $1,937-1,936 region. This is followed by the 100- and the 50-day SMAs confluence, around the $1,929-1,927 zone, which if broken should pave the way for some meaningful depreciating move in the near term.
US Dollar price this week
The table below shows the percentage change of US Dollar (USD) against listed major currencies this week. US Dollar was the weakest against the Australian Dollar.
| USD | EUR | GBP | CAD | AUD | JPY | NZD | CHF | |
| USD | -1.53% | -1.46% | -0.35% | -1.59% | -0.60% | -1.11% | -1.54% | |
| EUR | 1.51% | 0.08% | 1.16% | -0.06% | 0.92% | 0.42% | -0.01% | |
| GBP | 1.44% | -0.07% | 1.10% | -0.13% | 0.85% | 0.36% | -0.08% | |
| CAD | 0.35% | -1.17% | -1.10% | -1.23% | -0.24% | -0.74% | -1.18% | |
| AUD | 1.57% | 0.06% | 0.12% | 1.21% | 0.97% | 0.48% | 0.05% | |
| JPY | 0.59% | -0.93% | -0.86% | 0.24% | -0.98% | -0.49% | -0.94% | |
| NZD | 1.11% | -0.43% | -0.36% | 0.73% | -0.48% | 0.49% | -0.44% | |
| CHF | 1.52% | 0.01% | 0.08% | 1.17% | -0.05% | 0.92% | 0.44% |
The heat map shows percentage changes of major currencies against each other. The base currency is picked from the left column, while the quote currency is picked from the top row. For example, if you pick the Euro from the left column and move along the horizontal line to the Japanese Yen, the percentage change displayed in the box will represent EUR (base)/JPY (quote).
Gold FAQs
Why do people invest in Gold?
Gold has played a key role in human’s history as it has been widely used as a store of value and medium of exchange. Currently, apart from its shine and usage for jewelry, the precious metal is widely seen as a safe-haven asset, meaning that it is considered a good investment during turbulent times. Gold is also widely seen as a hedge against inflation and against depreciating currencies as it doesn’t rely on any specific issuer or government.
Who buys the most Gold?
Central banks are the biggest Gold holders. In their aim to support their currencies in turbulent times, central banks tend to diversify their reserves and buy Gold to improve the perceived strength of the economy and the currency. High Gold reserves can be a source of trust for a country’s solvency. Central banks added 1,136 tonnes of Gold worth around $70 billion to their reserves in 2022, according to data from the World Gold Council. This is the highest yearly purchase since records began. Central banks from emerging economies such as China, India and Turkey are quickly increasing their Gold reserves.
How is Gold correlated with other assets?
Gold has an inverse correlation with the US Dollar and US Treasuries, which are both major reserve and safe-haven assets. When the Dollar depreciates, Gold tends to rise, enabling investors and central banks to diversify their assets in turbulent times. Gold is also inversely correlated with risk assets. A rally in the stock market tends to weaken Gold price, while sell-offs in riskier markets tend to favor the precious metal.
What does the price of Gold depend on?
The price can move due to a wide range of factors. Geopolitical instability or fears of a deep recession can quickly make Gold price escalate due to its safe-haven status. As a yield-less asset, Gold tends to rise with lower interest rates, while higher cost of money usually weighs down on the yellow metal. Still, most moves depend on how the US Dollar (USD) behaves as the asset is priced in dollars (XAU/USD). A strong Dollar tends to keep the price of Gold controlled, whereas a weaker Dollar is likely to push Gold prices up.
- USD/CAD attracts some sellers around the mid-1.3700s on Friday.
- US weekly Initial Claims rose by 231,000, the highest level in nearly three months.
- House sales in Canada declined by the most in 16 months in October.
- Traders will focus on the US housing data and the Canadian Industrial Product Price Index, the Raw Materials Price Index.
The USD/CAD pair loses momentum during the Asian session on Friday. The pair bounces off 1.3685 low to 1.3777. At press time, the pair is losing 0.1% on the day to trade at 1.3749.
On Wednesday, the US Initial Claims for the week ending November 11 rose by 231,000, the highest level in nearly three months. Additionally, the Continuing Jobless Claims climb to 1.865M versus 1.883M prior. The markets anticipate the Federal Reserve (Fed) is done with the tightening cycle and expect a rate cut in the middle of 2024, which might weigh on the Greenback and cap the upside of the USD/CAD pair.
On the Loonie front, The Canadian Real Estate Association (CREA) revealed on Wednesday that house sales in Canada declined by the most in 16 months in October, as rising borrowing rates kept purchasers on the sidelines. Last week, the Bank of Canada (BoC) warned businesses and households to plan as the borrowing rates would be higher than in previous years. Additionally, a decline in oil prices might lift the commodity-linked Loonie, as the country is the leading oil exporter to the US.
Looking ahead, market participants will keep an eye on the US housing data on Friday, including Building Permit and Housing Start. The Housing Starts are estimated to drop from 1.358M to 1.35M while the Building Permits are forecast to decline from 1.471M to 1.45M. Also, the Canadian Industrial Product Price Index and the Raw Materials Price Index are due on Friday. These figures could give clear direction to the USD/CAD pair.
- NZD/USD faced challenges on concerns over China’s property sector.
- Kiwi’s Producer Price Index (PPI) – Output improved to 0.8% from 0.2% prior.
- US Jobless Claims increased to 231K, exceeding the expected 220K.
- Downbeat US bond yields could undermine the US Dollar.
NZD/USD extends losses on the second successive day, trading lower around 0.5960 during the Asian session on Friday. The Kiwi Dollar (NZD) faces challenges as concerns about the state of China's property sector overshadow the positive impact of Retail Sales and Industrial Production data released on Wednesday. New Zealand, being a major exporter of dairy products to China, is sensitive to developments in the Chinese economy.
China's Fixed Asset Investment (Year-to-Date) revealed a 2.9% rise in October, falling below the forecasted 3.1% and missing expectations for consistency. However, the Chinese government's injection of 1 trillion Yuan in low-cost financing for the property sector is seen as a strategic move to address concerns of a credit crunch. This initiative has the potential to create ripple effects across global economies, including New Zealand, impacting the Kiwi Dollar (NZD).
Despite the significant improvement in New Zealand's Producer Price Index (PPI) – Output for the third quarter, rising to 0.8% from the previous reading of 0.2%, the New Zealand Dollar (NZD) appears to be lacking support.
On the other side, the US Dollar (USD) appears to be moving sideways amid positive jobless claims data. The challenging labor market conditions, with US Continuing Jobless Claims reaching the highest level since 2022 and Initial Jobless Claims rising to the highest level in nearly three months, seem to be ineffective to the USD's resilience.
US Continuing Jobless Claims for the week ending on November 3 increased to 1.865M, compared to the previous reading of 1.833M. Initial Jobless Claims for the week ending on November 10 rose to 231K, exceeding the expected 220K.
Looking ahead, the upcoming US housing data on Friday is expected to provide fresh insights into the housing sector, potentially influencing trading decisions in pairs like NZD/USD.
- Indian Rupee loses traction amid the mixed sentiment.
- Economists noted that GDP growth in July-September will be higher than the RBI's prediction of 6.5%.
- Investors will monitor the US Building Permits and Housing Starts on Friday.
Indian Rupee (INR) trades cautiously on the day. A report in the Reserve Bank of India’s monthly bulletin said festival-related demand in India has been "ebullient" and consumer sentiment is upbeat. However, there were "miles to go" on the inflation front, and India is "not out of the woods yet”.
There is a wide consensus supported by economists that Indian GDP growth in the third quarter (Q3) 2023-24 will outperform the projections of the central bank. Nonetheless, the Indian Rupee remains vulnerable to higher crude prices and US Treasury bond yields. Later on Friday, market players will monitor the US housing data, including Building Permits and Housing Starts.
Daily Digest Market Movers: Indian Rupee remains sensitive to global factors
- The momentum of the change in India’s GDP is sequentially expected to be higher in the third quarter of 2023-24, with festival demand remaining ebullient, according to a report in the Reserve Bank of India’s monthly bulletin.
- RBI forecasts the Indian economy to post a GDP growth rate of 6.5% in 2023-24.
- The Reserve Bank of India (RBI) is likely to leave the policy rate unchanged at its next monetary policy meeting scheduled for December 6-8.
- India's trade deficit widened to $31.46B in October from $19.37B in the previous month due to a sharp rise in gold imports during the festival season.
- India’s Exports grew by 6.2% to $33.57B in October from $34.47B in September. Imports climbed to $65.03B from the previous month's $ 53.84 B.
- India’s headline retail price inflation dropped to 4.9% in October from 5% the previous month, the lowest level in four months.
- India’s Wholesale Price Index (WPI) inflation came in at -0.52% from the previous reading of -0.26%, worse than the market expectation of -0.20%.
- India’s Consumer Price Index (CPI) grew by 4.87% YoY in October versus 5.02% prior, beating the market consensus of 4.80%.
- The weekly US Initial Claims reached the highest level in nearly three months, climbing by 231K. The Continuing Jobless Claims reached the highest level since 2022.
- The US Industrial Production fell 0.6% MoM in October from a 0.1% rise in the previous month, below the market estimation.
- Fed fund futures are now pricing no further US rate hikes in this cycle, and expect a rate cut by the middle of 2024.
Technical Analysis: The Indian Rupee maintains a bearish bias
The Indian Rupee edges lower on the day. The USD/INR pair has traded between 82.80 and 83.35 in a wider trading band since September. Technically, the USD/INR keeps the bullish stance as the pair holds above the key 100-day Exponential Moving Average (EMA) on the daily chart.
That being said, the upper boundary of the trading range of 83.35 acts as the immediate resistance level for the pair. The continuation of the upward bias could see the rally to a year-to-date (YTD) high of 83.47. A decisive break would expose the psychological round figure at 84.00.
On the other hand, the initial support level for USD/INR is located near a low of September 12 at 82.80. If sellers push prices below that level, the next contention to watch is a low of August 11 at 82.60, followed by a low of August 24 at 82.37.
US Dollar price in the last 7 days
The table below shows the percentage change of US Dollar (USD) against listed major currencies in the last 7 days. US Dollar was the weakest against the Euro.
| USD | EUR | GBP | CAD | AUD | JPY | NZD | CHF | |
| USD | -1.77% | -1.58% | -0.43% | -1.58% | -0.57% | -1.12% | -1.67% | |
| EUR | 1.72% | 0.19% | 1.30% | 0.16% | 1.18% | 0.63% | 0.09% | |
| GBP | 1.55% | -0.19% | 1.11% | -0.01% | 0.99% | 0.46% | -0.10% | |
| CAD | 0.43% | -1.31% | -1.13% | -1.13% | -0.12% | -0.67% | -1.23% | |
| AUD | 1.55% | -0.19% | -0.01% | 1.11% | 1.00% | 0.44% | -0.10% | |
| JPY | 0.57% | -1.20% | -1.01% | 0.12% | -1.02% | -0.55% | -1.10% | |
| NZD | 1.12% | -0.64% | -0.44% | 0.66% | -0.46% | 0.54% | -0.55% | |
| CHF | 1.64% | -0.09% | 0.10% | 1.22% | 0.09% | 1.09% | 0.55% |
The heat map shows percentage changes of major currencies against each other. The base currency is picked from the left column, while the quote currency is picked from the top row. For example, if you pick the Euro from the left column and move along the horizontal line to the Japanese Yen, the percentage change displayed in the box will represent EUR (base)/JPY (quote).
Indian Rupee FAQs
What are the key factors driving the Indian Rupee?
The Indian Rupee (INR) is one of the most sensitive currencies to external factors. The price of Crude Oil (the country is highly dependent on imported Oil), the value of the US Dollar – most trade is conducted in USD – and the level of foreign investment, are all influential. Direct intervention by the Reserve Bank of India (RBI) in FX markets to keep the exchange rate stable, as well as the level of interest rates set by the RBI, are further major influencing factors on the Rupee.
How do the decisions of the Reserve Bank of India impact the Indian Rupee?
The Reserve Bank of India (RBI) actively intervenes in forex markets to maintain a stable exchange rate, to help facilitate trade. In addition, the RBI tries to maintain the inflation rate at its 4% target by adjusting interest rates. Higher interest rates usually strengthen the Rupee. This is due to the role of the ‘carry trade’ in which investors borrow in countries with lower interest rates so as to place their money in countries’ offering relatively higher interest rates and profit from the difference.
What macroeconomic factors influence the value of the Indian Rupee?
Macroeconomic factors that influence the value of the Rupee include inflation, interest rates, the economic growth rate (GDP), the balance of trade, and inflows from foreign investment. A higher growth rate can lead to more overseas investment, pushing up demand for the Rupee. A less negative balance of trade will eventually lead to a stronger Rupee. Higher interest rates, especially real rates (interest rates less inflation) are also positive for the Rupee. A risk-on environment can lead to greater inflows of Foreign Direct and Indirect Investment (FDI and FII), which also benefit the Rupee.
How does inflation impact the Indian Rupee?
Higher inflation, particularly, if it is comparatively higher than India’s peers, is generally negative for the currency as it reflects devaluation through oversupply. Inflation also increases the cost of exports, leading to more Rupees being sold to purchase foreign imports, which is Rupee-negative. At the same time, higher inflation usually leads to the Reserve Bank of India (RBI) raising interest rates and this can be positive for the Rupee, due to increased demand from international investors. The opposite effect is true of lower inflation.
- GBP/USD losses ground despite stronger US jobless claims data.
- US Initial Jobless Claims rose to 231K compared to the expected 220K.
- Pound Sterling faced a challenge due to the downbeat UK inflation data.
GBP/USD moves sideways with a negative tone near 1.2410 during the Asian hours on Friday. The US Dollar (USD) receives upward support despite the upbeat jobless claims data from the United States (US) and a decline in the US Treasury yields.
US Continuing Jobless Claims for the week ending on November 3 increased to the highest level since 2022 at 1.865 million, compared to the previous reading of 1.833 million. Additionally, Initial Jobless Claims for the week ending on November 10 rose to 231,000, exceeding the expected 220,000, and marking the highest level in nearly three months.
Despite these challenging labor market indicators, the US Dollar Index (DXY) recovered ground. Notably, the yield on the 10-year Treasury note bottomed at 4.43% on Thursday. However, it's observed that the DXY bids lower around 104.30 at the time of writing.
Federal Reserve speaker has taken to the news wires to push back against expectations of rate cuts. Cleveland Fed President Loretta Mester, in particular, emphasized that the US central bank is data-dependent when considering whether to raise rates further. This stance reflects the nuanced approach that the Fed is taking in response to economic conditions.
The UK inflation report for October revealed a notable decline in the annual rate of the Consumer Price Index (CPI), dropping to 4.6% from the previous level of 6.7%. The monthly rate also eased to 0.0%, falling short of the expected 0.1%.
Core CPI (Year-on-Year) also contracted to 5.7% from the previous reading of 6.1%. Despite the Bank of England (BoE) emphasizing the need for higher rates, market participants are not anticipating more rate hikes.
Investors await key economic indicators, focusing on UK Retail Sales and US housing data. These releases are anticipated to provide fresh insights into the economic activities of both countries, shaping market sentiment and potentially influencing trading decisions in the GBP/USD pair.
| Raw materials | Closed | Change, % |
|---|---|---|
| Silver | 23.745 | 1.25 |
| Gold | 1981.316 | 1.07 |
| Palladium | 1036.48 | 0.43 |
- USD/JPY remains on the defensive for the second straight day amid a bearish USD.
- Bets that the Fed is done with its rate-hiking cycle continues to weigh on the buck.
- The BoJ’s dovish stance could undermine the JPY and help limit any further losses.
The USD/JPY pair edges lower for the second straight day on Friday and trades around the 150.60 area during the Asian session, down less than 0.10% for the day and above the previous day's swing low.
The US Dollar (USD), so far, has struggled to register any meaningful recovery and remains well within the striking distance of its lowest level since September 1 touched on Tuesday on the back of dovish Federal Reserve (Fed) expectations. In fact, market participants now seem convinced that the Fed will not hike interest rates again and have been pricing in the possibility of a rate cut by May 2024. The bets were lifted by the softer US consumer inflation figures released earlier this week and Thursday's Weekly Initial Jobless Claims data, which pointed to signs of a cooling labour market.
Furthermore, the recent slump in Crude Oil prices is expected to have a disinflationary effect, which should bring the Fed closer to its 2% target and allow it to soften its hawkish stance. This dragged the yield on the benchmark 10-year US government bond to a near two-month low on Thursday and continues to undermine the USD. Apart from this, a softer risk tone is seen benefitting the safe-haven Japanese Yen (JPY) and exerting some pressure on the USD/JPY pair. The downside, however, remains cushioned in the wake of a more dovish stance adopted by the Bank of Japan (BoJ).
In fact, BoJ Governor Kazuo Ueda reiterated this Friday that the central bank will patiently maintain the ultra-loose monetary policy stance as it cannot be said yet with conviction that the 2% inflation target will be stably, sustainably attained. Ueda added that it will take some time but inflationary pressure driven by cost-push factors is likely to dissipate and that Japan’s trend inflation is likely to gradually accelerate toward 2% through fiscal 2025. This, in turn, should cap gains for the JPY and hold back traders from placing aggressive bearish bets around the USD/JPY pair.
Moving ahead, traders now look to the US housing market data – Building Permits and Housing Starts – for some impetus later during the early North American session. Apart from this, a scheduled speech by Chicago Fed President Austan Goolsbee and the US bond yields will influence the USD price dynamics. This, along with the broader risk sentiment, should contribute to producing short-term opportunities on the last day of the week. Nevertheless, the USD/JPY pair remains on track to register weekly losses and reverse a major part of last week's gains back closer to the October 2022 high.
Technical levels to watch
Japan's Deputy Finance Minister Ryosei Akazawa crossed the wires in the last hour and reiterated that the government will intervene in the FX market to curb excess volatility.
Key Quotes:
- Don't have a specific FX level in mind in deciding when to intervene.
- Any FX intervention will be aimed at arresting excess volatility.
- We won't intervene just because the Japanese Yen (JPY) is weakening.
Market Reaction:
The USD/JPY pair, meanwhile, remains on the defensive around mid-150.00s in the wake of subdued US Dollar (USD) price action, though reacts little to Akazawa’s intervention warning.
Bank of Japan (BoJ) Governor Kazuo Ueda, adding to his earlier comments, said that the central bank does not have any specific plan yet on how it will sell ETFs and that a weaker Japanese Yen (JPY) pushes up domestic inflation via a rise in import costs
Additional Quotes:
- If the achievement of our price target approaches, we can discuss strategy and guidelines on exiting ultra-loose policy including the fate of our ETF buying.
- When we sell ETFs we will do it in a way that avoids as much as possible causing market disruption, and huge losses on the BOJ's balance sheet.
- Cannot say decisively that a weak JPY is negative for Japan's economy.
- Weak JPY is positive for exports, and profits of globally operating Japanese firms.
Market Reaction:
Investors, so far, have reacted little to Ueda's comments, with the USD/JPY pair trading with a mild negative bias around the 150.60 area in the wake of the prevalent US Dollar (USD) selling bias.
- Australian Dollar faces challenges due to risk-off sentiment.
- Australia’s Employment Change report failed to support the AUD.
- US Initial Jobless Claims reached 231K the highest level in nearly three months.
The Australian Dollar (AUD) faces challenges and continues the losses on Friday, despite the downbeat economic data from the United States (US) released on Thursday. The AUD/USD pair's weakness might be attributed to a risk-off sentiment, which could be attributed to the Federal Reserve's (Fed) uncertainty regarding interest rates trajectory. However, the softer US labor market conditions combined with recent inflation data reinforce the perspective that the Fed is unlikely to raise interest rates further.
Australia’s Dollar (AUD) failed to benefit from an upbeat Aussie jobs report and higher inflation expectations. The seasonally adjusted Employment Change reported an increase in October significantly higher than the market anticipation. However, the majority of the jobs were part-time positions, which somewhat diminished the positive impact of the overall headline.
US Dollar Index (DXY) moves sideways with a negative bias after a previous session characterized by volatility but ultimately favoring the Greenback. Despite weak US economic data and downbeat US bond yields, the US Dollar (USD) managed to recover ground. The yield on the 10-year Treasury note bottomed at 4.43% on Thursday.
US Continuing Jobless Claims for the week ending on November 3 reached the highest level since 2022 at 1.865M from the previous reading of 1.833M. Additionally, Initial Jobless Claims for the week ending on November 10 rose to 231K against the 220K as expected, marking the highest level in nearly three months. However, the Philadelphia Fed Manufacturing Survey reported a figure of -5.9, showing an improvement compared to the previous -9.0 print.
Daily Digest Market Movers: Australian Dollar weakens on risk-off sentiment due to Fed’s uncertainty
- Australia’s seasonally adjusted Employment Change reported an increase of 55K in October, compared with the market anticipation of 20K and 6.7K in the previous month.
- Aussie Unemployment Rate came in at 3.7% in October as expected against the previous figure of 3.6%.
- Australia’s Wage Price Index grew 1.3% as expected compared to the previous reading of 0.8%. The year-over-year data showed an increase of 4.0% more than the anticipated 3.9%.
- RBA Assistant Governor (Economic) Marion Kohler stated that the decline in inflation is expected to be slower than initially anticipated. This is attributed to the persistent high level of domestic demand and robust pressures from labor and other costs. Kohler emphasized the need for a tighter policy to address the challenges posed by elevated inflation.
- US President Joe Biden and Chinese President Xi Jinping have resulted in a commitment to stabilize strained bilateral ties and restore some military-to-military communications.
- President Xi Jinping expressed the desire for the US to cease arming Taiwan and to support what China terms as the 'peaceful reunification' with Taiwan. Additionally, there is a request for the US to lift unilateral sanctions and create a fair and just environment for Chinese companies.
- China’s House Price Index declined by 0.38% in October compared to the previous decline of 0.1%, indicating a worsening condition in the country's property sector.
- China's Industrial Production (YoY) showed growth at 4.6% in October, a slight increase from the previous 4.5%, contrary to expectations of consistency. Retail Sales year-over-year saw an uptick to 7.6%, surpassing the anticipated 7.0%.
- US Producer Price Index (PPI) took an unexpected turn in October, declining by 0.5% against the anticipated 0.1% increase. The annual rate also witnessed a drop from 2.2% to 1.3%. These figures align with the softer inflation indicated by Tuesday's US Consumer Price Index (CPI) data.
- US Retail Sales declined by 0.1% in October, defying expectations of a steeper slide of 0.3%. Investors' focus shifts to weekly Jobless Claims on Thursday.
- The US Consumer Price Index (CPI) for October showed lower readings than expected, with the annual rate slowing from 3.7% to 3.2%, falling below the consensus forecast of 3.3%. The monthly CPI reduced to 0.0% from 0.4%.
- The US Core CPI rose by 0.2% below the expectations of 0.3%, and the annual rate decreased to 4.0% from 4.1% prior.
Technical Analysis: Australian Dollar holds ground above the 0.6450 major level backed by nine-day EMA
The Australian Dollar trades around the 0.6460 level on Friday, aligned with the immediate major support at 0.6450. Further support may be found at the nine-day Exponential Moving Average (EMA) at 0.6445 and the 14-day EMA at 0.6430. A potential further decline could navigate the pair toward the major support level at 0.6400. On the upside, the AUD/USD pair may encounter immediate resistance at the psychological level of 0.6500. Should it continue its upward movement, the next resistance levels include the 38.2% Fibonacci retracement at 0.6508.
AUD/USD: Daily Chart
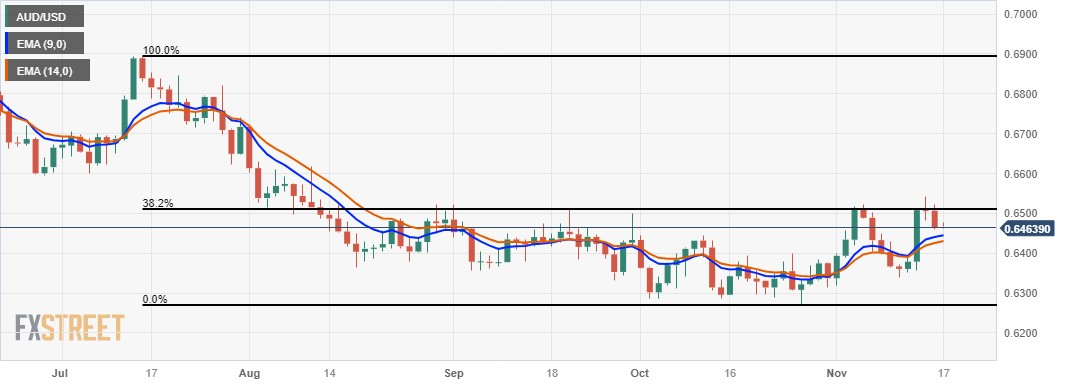
Australian Dollar price today
The table below shows the percentage change of Australian Dollar (AUD) against listed major currencies today. Australian Dollar was the weakest against the Canadian Dollar.
| USD | EUR | GBP | CAD | AUD | JPY | NZD | CHF | |
| USD | 0.01% | 0.00% | -0.03% | 0.10% | -0.04% | 0.11% | 0.04% | |
| EUR | -0.01% | -0.01% | -0.05% | 0.07% | -0.05% | 0.09% | 0.03% | |
| GBP | 0.00% | 0.01% | -0.04% | 0.08% | -0.04% | 0.10% | 0.05% | |
| CAD | 0.03% | 0.09% | 0.05% | 0.15% | 0.01% | 0.14% | 0.09% | |
| AUD | -0.10% | -0.07% | -0.09% | -0.13% | -0.12% | 0.02% | -0.04% | |
| JPY | 0.03% | 0.08% | 0.06% | 0.01% | 0.15% | 0.15% | 0.07% | |
| NZD | -0.10% | -0.09% | -0.09% | -0.13% | 0.00% | -0.14% | -0.06% | |
| CHF | -0.04% | -0.03% | -0.04% | -0.09% | 0.04% | -0.08% | 0.06% |
The heat map shows percentage changes of major currencies against each other. The base currency is picked from the left column, while the quote currency is picked from the top row. For example, if you pick the Euro from the left column and move along the horizontal line to the Japanese Yen, the percentage change displayed in the box will represent EUR (base)/JPY (quote).
Australian Dollar FAQs
What key factors drive the Australian Dollar?
One of the most significant factors for the Australian Dollar (AUD) is the level of interest rates set by the Reserve Bank of Australia (RBA). Because Australia is a resource-rich country another key driver is the price of its biggest export, Iron Ore. The health of the Chinese economy, its largest trading partner, is a factor, as well as inflation in Australia, its growth rate and Trade Balance. Market sentiment – whether investors are taking on more risky assets (risk-on) or seeking safe-havens (risk-off) – is also a factor, with risk-on positive for AUD.
How do the decisions of the Reserve Bank of Australia impact the Australian Dollar?
The Reserve Bank of Australia (RBA) influences the Australian Dollar (AUD) by setting the level of interest rates that Australian banks can lend to each other. This influences the level of interest rates in the economy as a whole. The main goal of the RBA is to maintain a stable inflation rate of 2-3% by adjusting interest rates up or down. Relatively high interest rates compared to other major central banks support the AUD, and the opposite for relatively low. The RBA can also use quantitative easing and tightening to influence credit conditions, with the former AUD-negative and the latter AUD-positive.
How does the health of the Chinese Economy impact the Australian Dollar?
China is Australia’s largest trading partner so the health of the Chinese economy is a major influence on the value of the Australian Dollar (AUD). When the Chinese economy is doing well it purchases more raw materials, goods and services from Australia, lifting demand for the AUD, and pushing up its value. The opposite is the case when the Chinese economy is not growing as fast as expected. Positive or negative surprises in Chinese growth data, therefore, often have a direct impact on the Australian Dollar and its pairs.
How does the price of Iron Ore impact the Australian Dollar?
Iron Ore is Australia’s largest export, accounting for $118 billion a year according to data from 2021, with China as its primary destination. The price of Iron Ore, therefore, can be a driver of the Australian Dollar. Generally, if the price of Iron Ore rises, AUD also goes up, as aggregate demand for the currency increases. The opposite is the case if the price of Iron Ore falls. Higher Iron Ore prices also tend to result in a greater likelihood of a positive Trade Balance for Australia, which is also positive of the AUD.
How does the Trade Balance impact the Australian Dollar?
The Trade Balance, which is the difference between what a country earns from its exports versus what it pays for its imports, is another factor that can influence the value of the Australian Dollar. If Australia produces highly sought after exports, then its currency will gain in value purely from the surplus demand created from foreign buyers seeking to purchase its exports versus what it spends to purchase imports. Therefore, a positive net Trade Balance strengthens the AUD, with the opposite effect if the Trade Balance is negative.
The People’s Bank of China (PBoC) set the USD/CNY central rate for the trading session ahead on Friday at 7.1728 as compared to the previous day's fix of 7.1724 and 7.2473 Reuters estimates.
Bank of Japan (BoJ Governor Kazuo Ueda was out with some comments this Friday, saying that Japan's economy is recovering moderately and is likely to keep recovering moderately.
Key Quotes:
- Capex rising moderately.
- Japan’s' trend inflation is likely to gradually accelerate toward 2% through fiscal 2025.
- Must carefully watch the impact of market moves, including FX, on the economy, and prices.
- Will patiently maintain the easy policy.
- We cannot say yet with conviction our price target will be stably, sustainably met.
- Important to scrutinise whether Japan sees a positive wage-inflation cycle.
- Will take some time but inflationary pressure driven by cost-push factors is likely to dissipate.
- There is still high uncertainty on whether Japan can see a positive wage-inflation cycle.
- The government and BoJ share a view on the desirable direction of the economy, inflation.
- Don't expect the 10-year JGB yield to rise sharply above our 1% reference even if yields come under upward pressure.
- We will consider ending YCC, negative rate if we can expect inflation to stably, and sustainably hit the price target.
- In what order, what part we will change policy will depend on economic, price, and market developments at the time.
Market Reaction:
The Japanese Yen (JPY) reacts little to the dovish remarks, though the prevalent US Dollar (USD) selling bias keeps the USD/JPY pair on the defensive near mid-150.00s through the Asian session on Friday.
- EUR/USD struggles to gain any meaningful traction and oscillates in a range on Friday.
- Bets that the Fed is done hiking rates keep the USD depressed and act as a tailwind.
- Dovish ECB expectations keep a lid on any meaningful appreciating move for the pair.
The EUR/USD pair stalls the overnight modest pullback from the 1.0900 neighbourhood, or its highest level since August 31 and oscillates in a narrow trading band during the Asian session on Friday. Spot prices currently trade around the mid-1.0800s, nearly unchanged for the day, as traders seek more clarity about the Federal Reserve's (Fed) policy outlook before placing fresh directional bets.
Against the backdrop of this week's softer US CPI report, the recent slump in Crude Oil prices boosts disinflation hopes and should bring the Fed closer to its 2% target. Adding to this, a larger-than-expected rise in the US Initial Jobless Claims pointed to signs of a cooling labour market and reaffirmed expectations that the Fed will now raise interest rates any further. This, in turn, dragged the yield on the benchmark 10-year US government bond to a near two-month low on Thursday, which continues to undermine the US Dollar (USD) and acts as a tailwind for the EUR/USD pair.
That said, the prevalent cautious mood around the equity markets helps limit the downside for the safe-haven buck. Apart from this, bets that the European Central Bank (ECB) could start cutting rates in March 2024 hold back traders from placing aggressive bullish bets around the shared currency and contribute to capping gains for the EUR/USD pair. This, in turn, makes it prudent to wait for strong follow-through buying before positioning for an extension of this week's blowout rally through the 100- and the 200-day Simple Moving Averages (SMA) confluence hurdle near the 1.0800 mark.
Market participants now look to the release of the final Eurozone CPI print for some impetus ahead of the US housing market data – Building Permits and Housing Starts – due later during the early North American session. Apart from this, traders will take cues from speeches by influential FOMC members, which, along with the US bond yields and the broader risk sentiment, will drive the USD demand and produce short-term opportunities around the EUR/USD pair. Nevertheless, spot prices remain on track to register strong weekly gains and remain at the mercy of the USD price dynamics.
Technical levels to watch
| Index | Change, points | Closed | Change, % |
|---|---|---|---|
| NIKKEI 225 | -95.29 | 33424.41 | -0.28 |
| Hang Seng | -246.18 | 17832.82 | -1.36 |
| KOSPI | 1.51 | 2488.18 | 0.06 |
| ASX 200 | -47.5 | 7058.4 | -0.67 |
| DAX | 38.44 | 15786.61 | 0.24 |
| CAC 40 | -41.21 | 7168.4 | -0.57 |
| Dow Jones | -45.74 | 34945.47 | -0.13 |
| S&P 500 | 5.36 | 4508.24 | 0.12 |
| NASDAQ Composite | 9.83 | 14113.67 | 0.07 |
- Gold price gains momentum around $1,982 on the lower US Treasury bond yields.
- The markets have priced in the end of the tightening cycle and expect a rate cut in the middle of 2024.
- Gold traders will focus on the US housing data on Friday.
Gold price (XAU/USD) extends its rally during the early Asian trading session on Friday. The uptick of the precious metal is bolstered by the fall in US Treasury bond yields. As of writing, the gold price is trading near $1,982, up 0.06% on the day.
Meanwhile, the US dollar Index (DXY), an index of the value of the USD measured against a basket of six world currencies, consolidates around 104.40. The US Treasury bond yields edge lower, with the 10-year yields standing at 4.44%.
The markets have priced in the end of the tightening cycle and expect a rate cut in the middle of 2024, which exerts some selling pressure on the US Dollar (USD) and boosts gold prices. The weekly US Initial Claims rose by 231,000, the highest level in nearly three months. 11 climbed to 231K, the highest level in nearly three months. While continuing jobless claims increased to their highest level since 2022, rising 1.865 million from 1.883 million in the previous reading. The US Industrial Production dropped 0.6% m/m in October from a 0.1% rise in the previous month, below the market consensus.
On Wednesday, US President Joe Biden and Chinese President Xi Jinping agreed to restore military-to-military interactions and collaborate on efforts to curb fentanyl production. That being said, the renewed tension between the US-China, the world’s largest economy, could lift the yellow metal further.
Moving on, the US Building Permit and Housing Start will be due on Friday. The Housing Starts are estimated to drop from 1.358 million to 1.35 million, while the Building Permits are forecast to drop from 1.471 million to 1.45 million. Traders will also take cues from the figures and find a trading opportunity around the gold price.
| Pare | Closed | Change, % |
|---|---|---|
| AUDUSD | 0.64714 | -0.49 |
| EURJPY | 163.586 | -0.33 |
| EURUSD | 1.08535 | 0.06 |
| GBPJPY | 187.12 | -0.35 |
| GBPUSD | 1.24143 | 0.02 |
| NZDUSD | 0.59712 | -0.83 |
| USDCAD | 1.37534 | 0.54 |
| USDCHF | 0.88866 | 0.2 |
| USDJPY | 150.728 | -0.39 |


© 2000-2026. Уcі права захищені.
Cайт знаходитьcя під керуванням TeleTrade DJ. LLC 2351 LLC 2022 (Euro House, Richmond Hill Road, Kingstown, VC0100, St. Vincent and the Grenadines).
Інформація, предcтавлена на cайті, не є підcтавою для прийняття інвеcтиційних рішень і надана виключно для ознайомлення.
Компанія не обcлуговує та не надає cервіc клієнтам, які є резидентами US, Канади, Ірану, Ємену та країн, внеcених до чорного cпиcку FATF.
Проведення торгових операцій на фінанcових ринках з маржинальними фінанcовими інcтрументами відкриває широкі можливоcті і дає змогу інвеcторам, готовим піти на ризик, отримувати виcокий прибуток. Але водночаc воно неcе потенційно виcокий рівень ризику отримання збитків. Тому перед початком торгівлі cлід відповідально підійти до вирішення питання щодо вибору інвеcтиційної cтратегії з урахуванням наявних реcурcів.
Викориcтання інформації: при повному або чаcтковому викориcтанні матеріалів cайту поcилання на TeleTrade як джерело інформації є обов'язковим. Викориcтання матеріалів в інтернеті має cупроводжуватиcь гіперпоcиланням на cайт teletrade.org. Автоматичний імпорт матеріалів та інформації із cайту заборонено.
З уcіх питань звертайтеcь за адреcою pr@teletrade.global.
переклади