- Аналітика
- Новини та інструменти
- Новини ринків
Новини ринків
- GBP/USD pumped the brakes on recent declines, but upside remains elusive.
- UK economic data has given Pound bulls little to be bullish about.
- US data, on the other hand, continues to outpace expectations.
GBP/USD managed to plug the leaks and stop its most recent backslide, but potential for a bullish rebound remains tepid at best. The Pound Sterling clawed back a scant sixth of a percent against the Greenback on Thursday, well short of the midweek plunge that saw Cable slump another six-tenths of a percent.
GBP/USD remains off of recent highs by over 3% after a one-sided backslide from its last peak near 1.3450. The pair is once again battling it out near the 1.3000 handle as GBP bidders struggle to find a reason to buy Cable.
UK data has broadly missed the mark this week, with UK Consumer Price Index (CPI) inflation, Producer Price Index (PPI) inflation, and UK labor figures all undershot market forecasts. With UK inflation flopping steeper than many expected, and jobs data failing to hit investor expectations, the Bank of England (BoE) will face increasing pressure from markets to step up the pace of rate cuts.
All that’s left of note on the GBP side of this week’s economic data docket will be Friday’s UK Retail Sales figures. Even here, markets aren’t expecting much in the way of magic, with median market forecasts expecting a -0.3% contraction in September compared to August’s comparatively strong showing of 1.0%.
US data, on the other hands, broadly rewarded Greenback bidders. US Retail Sales grew by 0.4% MoM in September, recovering from August’s 0.1% and beating median market forecasts of a 0.3% print. Retail Sales excluding Automotive spending also thumped forecasts, growing by 0.5% in September compared to the expected 0.1%, and easily vaulting over August’s 0.2% increase.
US Initial Jobless Claims for the week ended October 11 also beat market expectations, coming in at 241K for the week. Investors expected the week’s new jobless claimant count to hold steady at the previous week’s revised 260K.
GBP/USD price forecast
GBP/USD remains under selling pressure as the pair consolidates just above the 1.3000 psychological level, having recently broken below the 50-day Exponential Moving Average (EMA) at 1.3096. This bearish break signals a potential continuation of the downward trend, with the 200-day EMA at 1.2841 serving as a critical support level in the near term. Despite the current mild rebound, bearish sentiment remains dominant, and any recovery could face resistance near the 50-day EMA, now acting as a dynamic resistance point. A failure to reclaim 1.3050 could attract further selling interest.
The Moving Average Convergence Divergence (MACD) indicator is flashing warning signs of deeper downside risk, as both the MACD line and the signal line remain in negative territory. The histogram is showing signs of weakening bearish momentum, but the overall bias remains to the downside. A sustained break below 1.3000 could open the door toward the 1.2900 handle, with a further drop potentially targeting the 200-day EMA. Conversely, any recovery above the 1.3050 level would be needed to invalidate the bearish outlook, with a potential upside target of 1.3150.
GBP/USD daily chart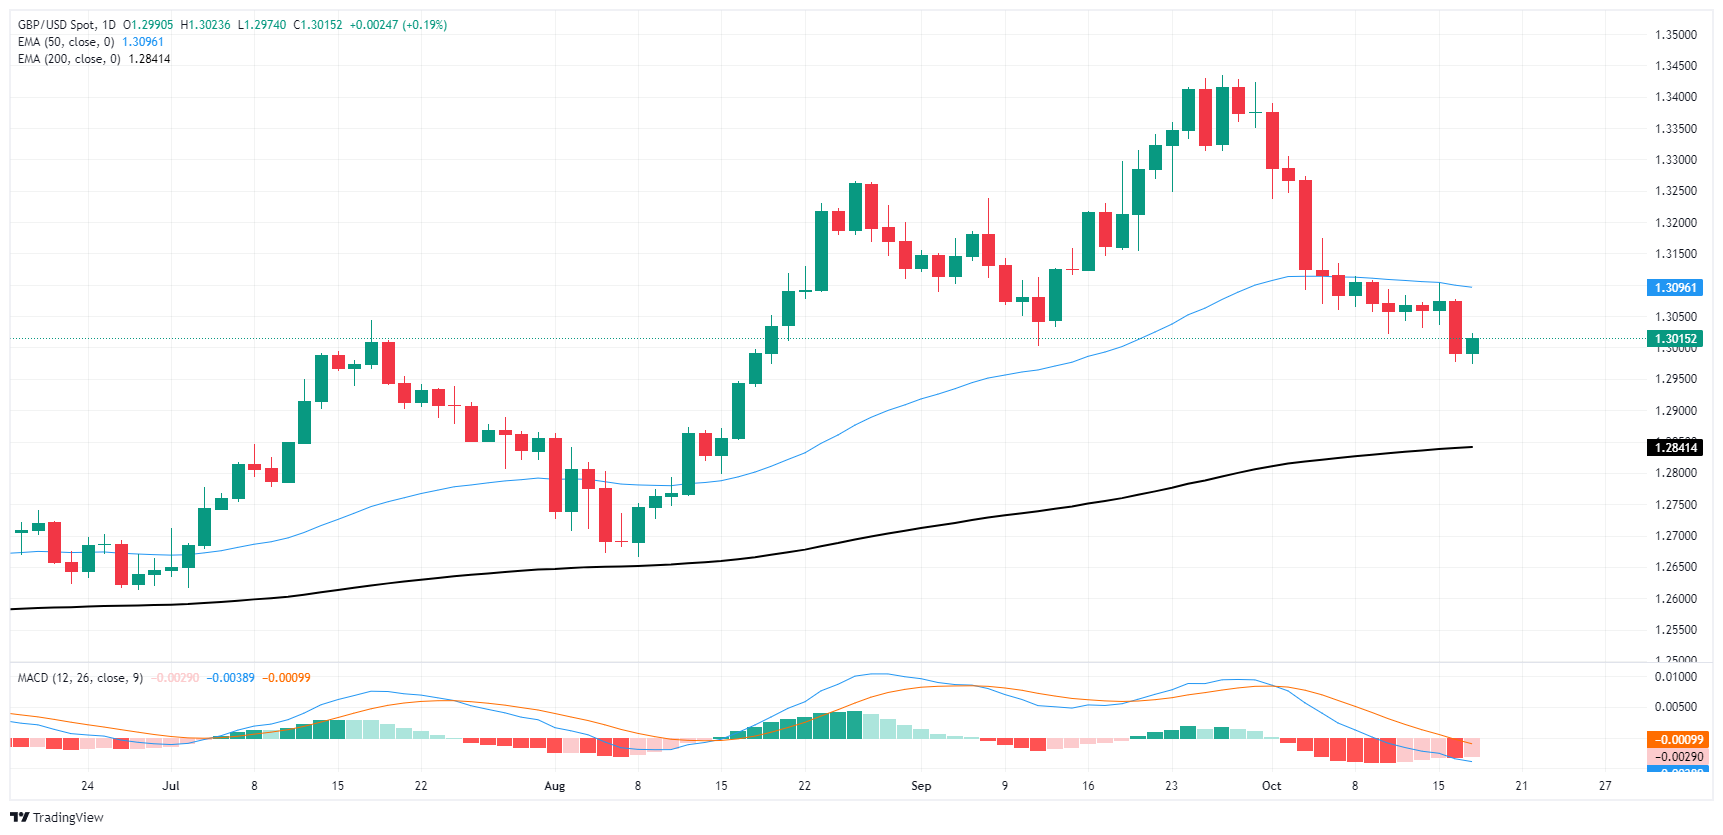
Pound Sterling FAQs
The Pound Sterling (GBP) is the oldest currency in the world (886 AD) and the official currency of the United Kingdom. It is the fourth most traded unit for foreign exchange (FX) in the world, accounting for 12% of all transactions, averaging $630 billion a day, according to 2022 data. Its key trading pairs are GBP/USD, also known as ‘Cable’, which accounts for 11% of FX, GBP/JPY, or the ‘Dragon’ as it is known by traders (3%), and EUR/GBP (2%). The Pound Sterling is issued by the Bank of England (BoE).
The single most important factor influencing the value of the Pound Sterling is monetary policy decided by the Bank of England. The BoE bases its decisions on whether it has achieved its primary goal of “price stability” – a steady inflation rate of around 2%. Its primary tool for achieving this is the adjustment of interest rates. When inflation is too high, the BoE will try to rein it in by raising interest rates, making it more expensive for people and businesses to access credit. This is generally positive for GBP, as higher interest rates make the UK a more attractive place for global investors to park their money. When inflation falls too low it is a sign economic growth is slowing. In this scenario, the BoE will consider lowering interest rates to cheapen credit so businesses will borrow more to invest in growth-generating projects.
Data releases gauge the health of the economy and can impact the value of the Pound Sterling. Indicators such as GDP, Manufacturing and Services PMIs, and employment can all influence the direction of the GBP. A strong economy is good for Sterling. Not only does it attract more foreign investment but it may encourage the BoE to put up interest rates, which will directly strengthen GBP. Otherwise, if economic data is weak, the Pound Sterling is likely to fall.
Another significant data release for the Pound Sterling is the Trade Balance. This indicator measures the difference between what a country earns from its exports and what it spends on imports over a given period. If a country produces highly sought-after exports, its currency will benefit purely from the extra demand created from foreign buyers seeking to purchase these goods. Therefore, a positive net Trade Balance strengthens a currency and vice versa for a negative balance.
Japan’s National Consumer Price Index (CPI) rose 2.5% YoY in September, compared to the previous reading of 3.0%, according to the latest data released by the Japan Statistics Bureau on Friday,
Further details unveil that the National CPI ex Fresh food arrived at 2.4% YoY in September versus 2.8% prior. The figure was above the market consensus of 2.3%.
CPI ex Fresh Food, Energy increased 2.1% YoY in September, compared to the previous reading of a 2.0% rise.
Market reaction to Japan’s National CPI data
Following Japan’s CPI inflation data, the USD/JPY pair is up 0.04% on the day at 150.25.
Japanese Yen FAQs
The Japanese Yen (JPY) is one of the world’s most traded currencies. Its value is broadly determined by the performance of the Japanese economy, but more specifically by the Bank of Japan’s policy, the differential between Japanese and US bond yields, or risk sentiment among traders, among other factors.
One of the Bank of Japan’s mandates is currency control, so its moves are key for the Yen. The BoJ has directly intervened in currency markets sometimes, generally to lower the value of the Yen, although it refrains from doing it often due to political concerns of its main trading partners. The BoJ ultra-loose monetary policy between 2013 and 2024 caused the Yen to depreciate against its main currency peers due to an increasing policy divergence between the Bank of Japan and other main central banks. More recently, the gradually unwinding of this ultra-loose policy has given some support to the Yen.
Over the last decade, the BoJ’s stance of sticking to ultra-loose monetary policy has led to a widening policy divergence with other central banks, particularly with the US Federal Reserve. This supported a widening of the differential between the 10-year US and Japanese bonds, which favored the US Dollar against the Japanese Yen. The BoJ decision in 2024 to gradually abandon the ultra-loose policy, coupled with interest-rate cuts in other major central banks, is narrowing this differential.
The Japanese Yen is often seen as a safe-haven investment. This means that in times of market stress, investors are more likely to put their money in the Japanese currency due to its supposed reliability and stability. Turbulent times are likely to strengthen the Yen’s value against other currencies seen as more risky to invest in.
- USD/CAD gains ground to around 1.3795 in Friday’s early Asian session.
- The US Retail Sales rose by 0.4% MoM in September vs. 0.1% prior, stronger than expected.
- The rising expectation of a BoC rate cut could undermine the CAD, but higher crude oil prices might cap its downside.
The USD/CAD pair trades with mild gains around 1.3795 during the early Asian session on Friday. The further upside in the Greenback amid the stronger US economic data provides some support to the pair. Later on Friday, the US Building Permits and Housing Starts will be released. Also, the US Federal Reserve’s (Fed) Raphael Bostic, Neel Kashkari and Christopher Waller.
The US Retail Sales surprised to the upside in September, boosting the US Dollar (USD) broadly. Data released by the US Census Bureau on Thursday revealed that retail sales in the US rose by 0.4% MoM in September from a 0.1% rise in August. This figure came in stronger than the expectations of a 0.3% monthly gain. Meanwhile, Retail sales excluding autos came in at 0.5% MoM in September versus 0.2% prior, above the market consensus of 0.1%.
Signs of the economy's resilience will trigger expectations for a smaller 25 basis points (bps) rate cut in November. According to the CME FedWatch tool, the markets have priced in a nearly 90.3% chance of a 25 bps Fed rate reduction in November. Goldman Sachs analysts said they expect the Fed to deliver consecutive 25 bps rate cuts from November 2024 through June 2025 to a terminal rate range of 3.25-3.50%.
On the other hand, the rising bets that the Bank of Canada (BoC) would accelerate its easing cycle after September’s inflation data might weigh on the Canadian Dollar (CAD). Earlier this week, Statistics Canada showed the Canadian Consumer Price Index (CPI) rose 1.6% YoY in September, the slowest annual pace of inflation since February 2021. However, the ongoing geopolitical tensions in the Middle East might lift the crude oil prices and support the commodity-linked Loonie as Canada is the largest oil exporter to the United States.
Canadian Dollar FAQs
The key factors driving the Canadian Dollar (CAD) are the level of interest rates set by the Bank of Canada (BoC), the price of Oil, Canada’s largest export, the health of its economy, inflation and the Trade Balance, which is the difference between the value of Canada’s exports versus its imports. Other factors include market sentiment – whether investors are taking on more risky assets (risk-on) or seeking safe-havens (risk-off) – with risk-on being CAD-positive. As its largest trading partner, the health of the US economy is also a key factor influencing the Canadian Dollar.
The Bank of Canada (BoC) has a significant influence on the Canadian Dollar by setting the level of interest rates that banks can lend to one another. This influences the level of interest rates for everyone. The main goal of the BoC is to maintain inflation at 1-3% by adjusting interest rates up or down. Relatively higher interest rates tend to be positive for the CAD. The Bank of Canada can also use quantitative easing and tightening to influence credit conditions, with the former CAD-negative and the latter CAD-positive.
The price of Oil is a key factor impacting the value of the Canadian Dollar. Petroleum is Canada’s biggest export, so Oil price tends to have an immediate impact on the CAD value. Generally, if Oil price rises CAD also goes up, as aggregate demand for the currency increases. The opposite is the case if the price of Oil falls. Higher Oil prices also tend to result in a greater likelihood of a positive Trade Balance, which is also supportive of the CAD.
While inflation had always traditionally been thought of as a negative factor for a currency since it lowers the value of money, the opposite has actually been the case in modern times with the relaxation of cross-border capital controls. Higher inflation tends to lead central banks to put up interest rates which attracts more capital inflows from global investors seeking a lucrative place to keep their money. This increases demand for the local currency, which in Canada’s case is the Canadian Dollar.
Macroeconomic data releases gauge the health of the economy and can have an impact on the Canadian Dollar. Indicators such as GDP, Manufacturing and Services PMIs, employment, and consumer sentiment surveys can all influence the direction of the CAD. A strong economy is good for the Canadian Dollar. Not only does it attract more foreign investment but it may encourage the Bank of Canada to put up interest rates, leading to a stronger currency. If economic data is weak, however, the CAD is likely to fall.
- NZD/JPY continues to trade sideways using the 20-day SMA as a support.
- RSI and MACD are sending mixed signals.
- Buyers and sellers remain indecisive which favours a neutral outlook.
In Thursday's session, the NZD/JPY pair rose by 0.45% to 90.95, continuing the sideways movement seen in the past few sessions.
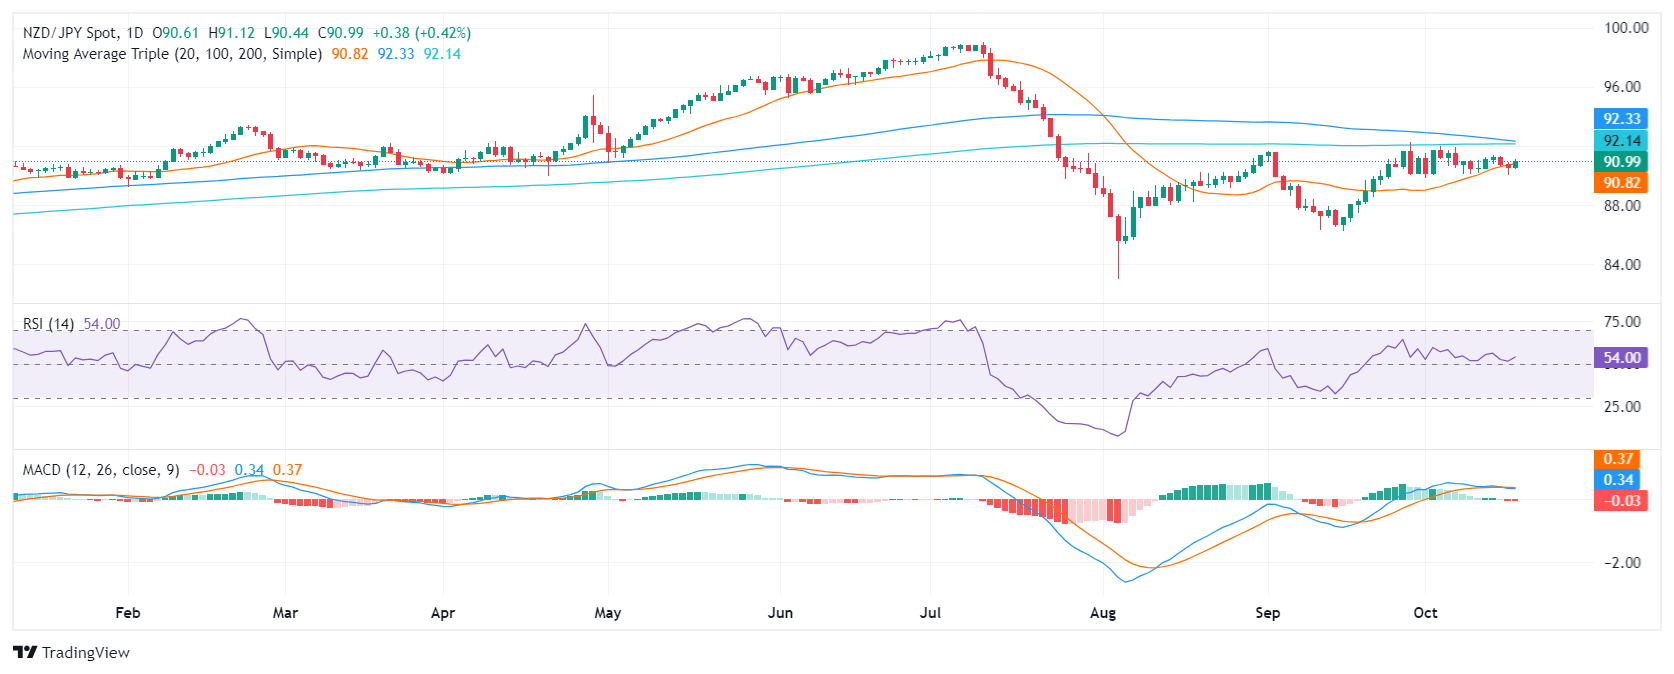
The daily Relative Strength Index (RSI) is currently at 54, indicating that the pair is in neutral territory. However, the RSI is rising, suggesting that buying pressure is steady. In addition, the Moving Average Convergence Divergence (MACD) histogram is red confirming a bearish presence.
Regarding the overall outlook, the 20,100 and 200-day SMAs seem to be converging to the 92.00 area to perform a crossover which might define the short-term trajectory. In the meantime, the 20-day SMA continues serving as a solid support and bears continue to battle with it and seem to be struggling to conquer it. Overall price action continue to side-ways trade and neither bulls nor bears are clear dominants, at least for the short term.
Support levels can be found at 90.50, 90.30 and 90.00, while resistance levels lie at 92.00, 92.50 and 93.00.
NZD/JPY daily chart
- USD/JPY trades at 150.21, extending its gains for a second consecutive day amid rising US bond yields.
- RSI signals growing bullish momentum, with the pair approaching key resistance at the top of the Ichimoku Cloud (Kumo).
- Next resistance levels include the 100-DMA at 150.85 and the 200-DMA at 151.32, with support at 150.00 and 149.00.
The USD/JPY climbs past the 150.00 figure on upbeat US Retail Sales and jobs data, gains over 0.38%, and trades at 150.21. The pair extended its gains for the second consecutive day, as US Treasury bond yields soared, due to investors trimming the odds for a Fed 25 basis points (bps) rate cut at the upcoming November meeting.
USD/JPY Price Forecast: Technical outlook
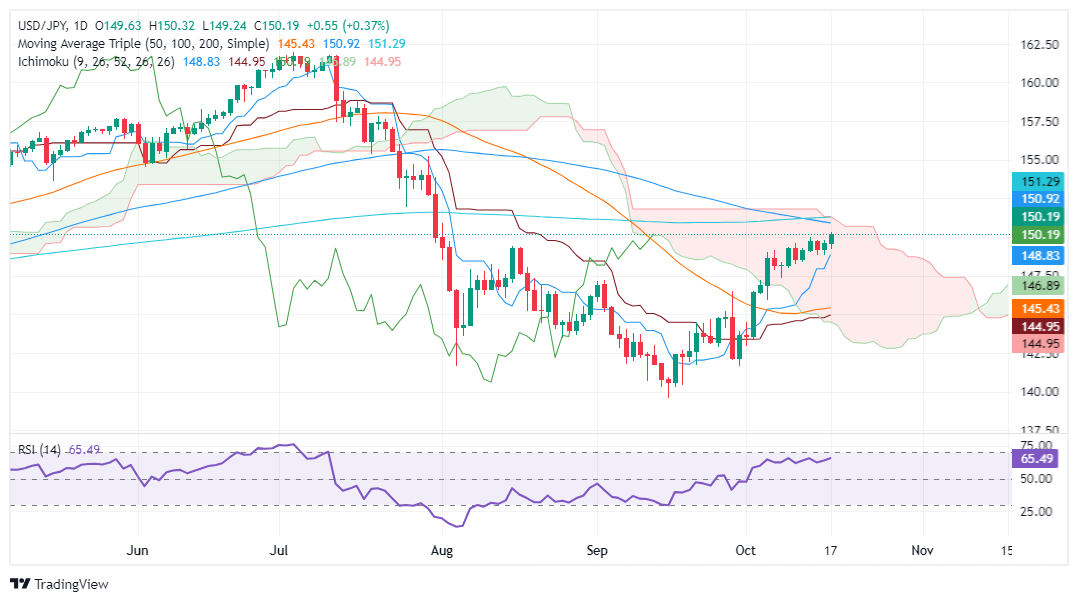
The USD/JPY continues its upward trajectory, and it is about to test the top of the Ichimoku Cloud (Kumo). Technical indicators suggest the major is on an uptrend, though a clear break above the Kumo is needed before the trend is confirmed.
The Relative Strength Index (RSI) cleared the last three peaks, hinting that buyers are gathering steam.
If USD/JPY resumes its bullish uptrend, buyers will face the 100-day moving average (DMA) at 150.85. Once surpassed, the next stop would be the confluence of the top of the Kumo and the 200-DMA at 151.32, ahead of extending those gains to 152.00.
Conversely, USD/JPY first support would be 150.00. Once surpassed, the next stop would be the 149.00 mark, ahead of the Tenkan-Sen at 148.84. If those levels are taken, the next support would be the Senkou Span A at 14690, followed by the 50-DMA at 145.50.
USD/JPY Price Action – Daily Chart
Japanese Yen FAQs
The Japanese Yen (JPY) is one of the world’s most traded currencies. Its value is broadly determined by the performance of the Japanese economy, but more specifically by the Bank of Japan’s policy, the differential between Japanese and US bond yields, or risk sentiment among traders, among other factors.
One of the Bank of Japan’s mandates is currency control, so its moves are key for the Yen. The BoJ has directly intervened in currency markets sometimes, generally to lower the value of the Yen, although it refrains from doing it often due to political concerns of its main trading partners. The BoJ ultra-loose monetary policy between 2013 and 2024 caused the Yen to depreciate against its main currency peers due to an increasing policy divergence between the Bank of Japan and other main central banks. More recently, the gradually unwinding of this ultra-loose policy has given some support to the Yen.
Over the last decade, the BoJ’s stance of sticking to ultra-loose monetary policy has led to a widening policy divergence with other central banks, particularly with the US Federal Reserve. This supported a widening of the differential between the 10-year US and Japanese bonds, which favored the US Dollar against the Japanese Yen. The BoJ decision in 2024 to gradually abandon the ultra-loose policy, coupled with interest-rate cuts in other major central banks, is narrowing this differential.
The Japanese Yen is often seen as a safe-haven investment. This means that in times of market stress, investors are more likely to put their money in the Japanese currency due to its supposed reliability and stability. Turbulent times are likely to strengthen the Yen’s value against other currencies seen as more risky to invest in.
- The Canadian Dollar backslid once again on Thursday.
- Canada lacks meaningful data releases this week.
- The BoC is broadly expected to ease rates further, limiting CAD strength.
The Canadian Dollar (CAD) snapped its recent recovery, falling back into the low end on Thursday, driven lower by an overall upbeat market tone toward the Greenback. Making matters worse, the Loonie is suffering from a lack of key support with the Bank of Canada (BoC) broadly expected to trim interest rates by a further 50 bps.
Daily digest market movers
- The CAD’s recovery rally snapped almost as soon as it started.
- The Loonie shed one-third of one percent against the Greenback after a meager recovery following a ten-day decline.
- US Retail Sales firmly beat expectations for September, bolstering the US Dollar heading into the tail end of the trading week.
- US Initial Jobless Claims also beat the street on Thursday, further propping up Greenback bidding flows.
- Most analysts expect the BoC to trim interest rates by another 50 bps on October 23 to try to bolster a swamped-out housing market being crushed by a national housing affordability crisis.
Canadian Dollar price forecast
The USD/CAD pair has shown a robust bullish movement recently, with the price breaking above the 50-day Exponential Moving Average (EMA), which is currently at 1.3631, and trading above the 200-day EMA at 1.3615. The pair has found short-term resistance near the 1.3800 psychological level, after testing highs around 1.3801. However, it has yet to confirm a breakout above this level. The sustained bullish momentum is also supported by the upward slope of the 50-day EMA, which is approaching a bullish crossover with the 200-day EMA, suggesting further upside potential if the price can clear the immediate resistance.
The Moving Average Convergence Divergence (MACD) indicator shows continued bullish momentum, with the MACD line trading above the signal line and remaining in positive territory. However, the histogram is beginning to flatten, indicating a potential slowdown in upward momentum in the short term. Should the pair fail to break above 1.3800 convincingly, we may see a pullback toward the 50-day EMA support around 1.3631. A sustained move above 1.3800 would open the door for further gains toward the next resistance levels at 1.3850 and 1.3900.
USD/CAD daily chart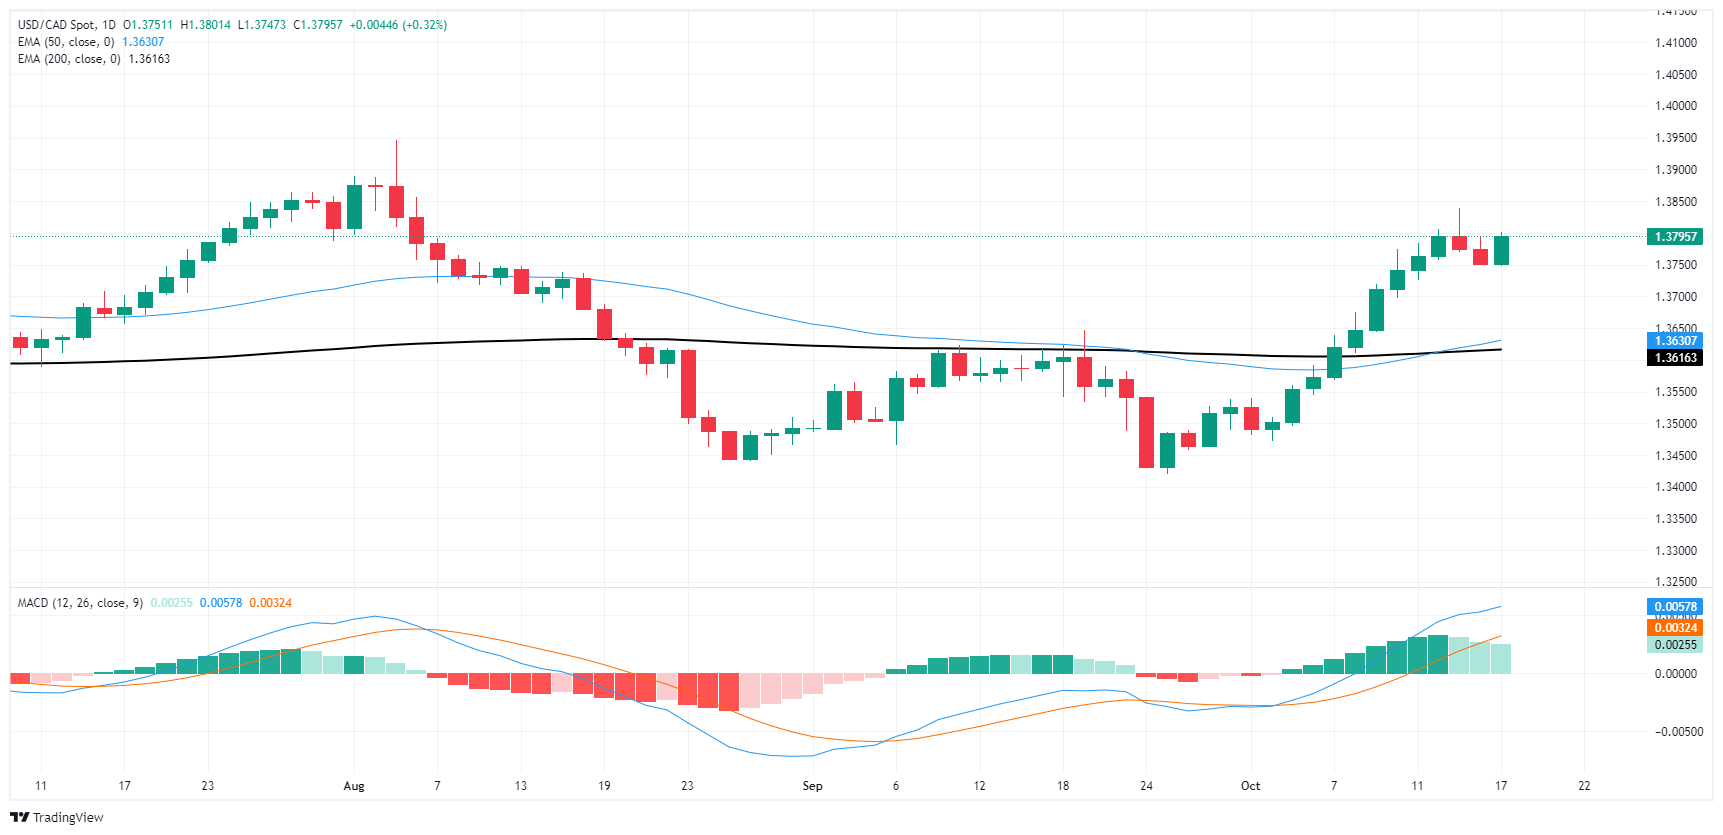
Canadian Dollar FAQs
The key factors driving the Canadian Dollar (CAD) are the level of interest rates set by the Bank of Canada (BoC), the price of Oil, Canada’s largest export, the health of its economy, inflation and the Trade Balance, which is the difference between the value of Canada’s exports versus its imports. Other factors include market sentiment – whether investors are taking on more risky assets (risk-on) or seeking safe-havens (risk-off) – with risk-on being CAD-positive. As its largest trading partner, the health of the US economy is also a key factor influencing the Canadian Dollar.
The Bank of Canada (BoC) has a significant influence on the Canadian Dollar by setting the level of interest rates that banks can lend to one another. This influences the level of interest rates for everyone. The main goal of the BoC is to maintain inflation at 1-3% by adjusting interest rates up or down. Relatively higher interest rates tend to be positive for the CAD. The Bank of Canada can also use quantitative easing and tightening to influence credit conditions, with the former CAD-negative and the latter CAD-positive.
The price of Oil is a key factor impacting the value of the Canadian Dollar. Petroleum is Canada’s biggest export, so Oil price tends to have an immediate impact on the CAD value. Generally, if Oil price rises CAD also goes up, as aggregate demand for the currency increases. The opposite is the case if the price of Oil falls. Higher Oil prices also tend to result in a greater likelihood of a positive Trade Balance, which is also supportive of the CAD.
While inflation had always traditionally been thought of as a negative factor for a currency since it lowers the value of money, the opposite has actually been the case in modern times with the relaxation of cross-border capital controls. Higher inflation tends to lead central banks to put up interest rates which attracts more capital inflows from global investors seeking a lucrative place to keep their money. This increases demand for the local currency, which in Canada’s case is the Canadian Dollar.
Macroeconomic data releases gauge the health of the economy and can have an impact on the Canadian Dollar. Indicators such as GDP, Manufacturing and Services PMIs, employment, and consumer sentiment surveys can all influence the direction of the CAD. A strong economy is good for the Canadian Dollar. Not only does it attract more foreign investment but it may encourage the Bank of Canada to put up interest rates, leading to a stronger currency. If economic data is weak, however, the CAD is likely to fall.
- The Aussie regained its balance on Thursday, supported by strong labor market data.
- US Retail Sales rose by 0.4% in September, surpassing expectations that benefit the USD.
- Strong Australian data might not justify a strong pivot toward easing by the RBA.
In Thursday's session, the AUD/USD currency pair experienced a gain of 0.40%, reaching 0.6695 mainly due to positive labor market data reported during the Asian session. However, the Australian Dollar is currently facing downward pressure as the US Dollar strengthens further mainly due to strong US Retail Sales figures.
The Aussie might gain further if data continue to validate the Reserve Bank of Australia’s (RBA) hawkish stance as it wouldn’t be open to deliver multiple cuts in 2024.
Daily digest market movers: Australian Dollar gains on labor market data
- Australian Employment increased by 64.1K, showing slightly higher growth than the strong results seen in August with most gains in full-time jobs.
- The Australian Unemployment rate was adjusted downward to 4.1%, staying close to historic lows and significantly below the decade’s average.
- The RBA's upcoming decisions will hinge on the third-quarter inflation data, set to be released in two weeks.
- The recent strong performance of the labor market, which has been on an upward trend for several months, could influence the outlook.
- Given the ongoing labor market strength, there may be minimal justification for an interest rate reversal in early November.
AUD/USD technical outlook: Bearish traction stabilizes, Aussie must recover 100-day SMA
The RSI, which measures buying and selling pressure, is currently at 38 in the negative area. But it has a rising slope, suggesting that buying pressure is recovering. The MACD, which measures the momentum of a trend, has a flat red histogram, indicating that selling pressure is flat. Overall, the outlook seems to be mixed with selling pressure taking a breather.
The pair is currently trading around the 0.6696 level. It has been trading within a narrow range over the past week, indicating sideways movement. It has not experienced any significant upward or downward spikes. Support levels can be identified at 0.6650, 0.6630 and 0.6600, while resistance levels are at 0.6700 (100-day SMA), 0.6750 and 0.6800.
Australian Dollar FAQs
One of the most significant factors for the Australian Dollar (AUD) is the level of interest rates set by the Reserve Bank of Australia (RBA). Because Australia is a resource-rich country another key driver is the price of its biggest export, Iron Ore. The health of the Chinese economy, its largest trading partner, is a factor, as well as inflation in Australia, its growth rate and Trade Balance. Market sentiment – whether investors are taking on more risky assets (risk-on) or seeking safe-havens (risk-off) – is also a factor, with risk-on positive for AUD.
The Reserve Bank of Australia (RBA) influences the Australian Dollar (AUD) by setting the level of interest rates that Australian banks can lend to each other. This influences the level of interest rates in the economy as a whole. The main goal of the RBA is to maintain a stable inflation rate of 2-3% by adjusting interest rates up or down. Relatively high interest rates compared to other major central banks support the AUD, and the opposite for relatively low. The RBA can also use quantitative easing and tightening to influence credit conditions, with the former AUD-negative and the latter AUD-positive.
China is Australia’s largest trading partner so the health of the Chinese economy is a major influence on the value of the Australian Dollar (AUD). When the Chinese economy is doing well it purchases more raw materials, goods and services from Australia, lifting demand for the AUD, and pushing up its value. The opposite is the case when the Chinese economy is not growing as fast as expected. Positive or negative surprises in Chinese growth data, therefore, often have a direct impact on the Australian Dollar and its pairs.
Iron Ore is Australia’s largest export, accounting for $118 billion a year according to data from 2021, with China as its primary destination. The price of Iron Ore, therefore, can be a driver of the Australian Dollar. Generally, if the price of Iron Ore rises, AUD also goes up, as aggregate demand for the currency increases. The opposite is the case if the price of Iron Ore falls. Higher Iron Ore prices also tend to result in a greater likelihood of a positive Trade Balance for Australia, which is also positive of the AUD.
The Trade Balance, which is the difference between what a country earns from its exports versus what it pays for its imports, is another factor that can influence the value of the Australian Dollar. If Australia produces highly sought after exports, then its currency will gain in value purely from the surplus demand created from foreign buyers seeking to purchase its exports versus what it spends to purchase imports. Therefore, a positive net Trade Balance strengthens the AUD, with the opposite effect if the Trade Balance is negative.
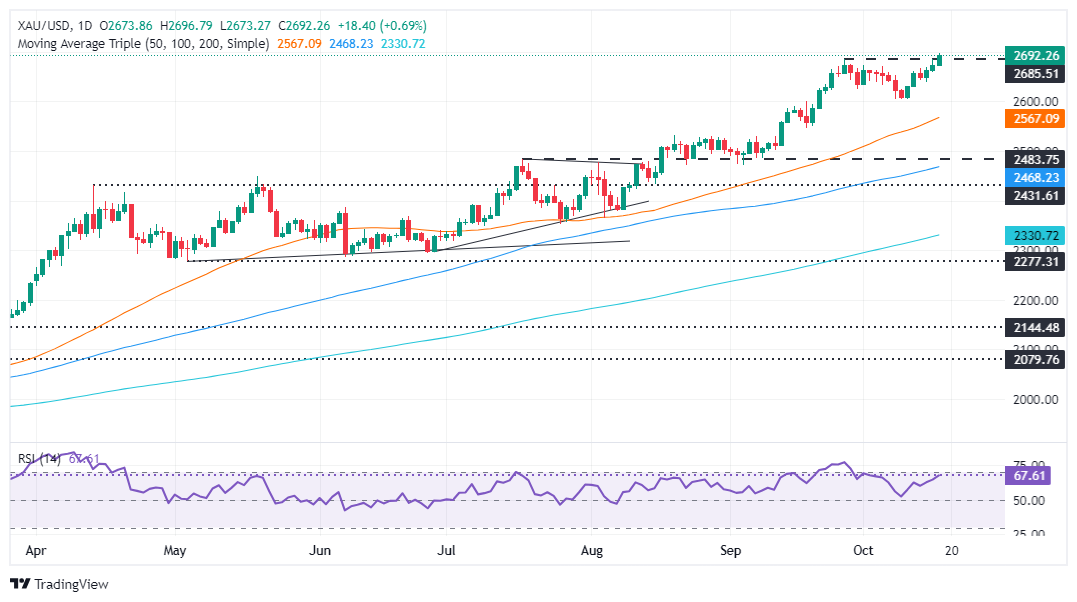
- Gold surges to $2,691, boosted by uncertainty surrounding US elections, despite robust Retail Sales and job data.
- US 10-year Treasury yield rebounds to 4.096%, capping Gold’s advance as the US Dollar Index reaches a two-month high.
- Traders trim bets on a Fed rate cut, with odds for a November 25-bps reduction dropping to 88.2%.
Gold price hit a record high during the North American session on Thursday, yet it failed to hit $2,700 amid uncertainty around US elections. Data-wise, the US economy remains resilient following Retail Sales and jobs data, though it didn’t weigh on the precious metal. At the time of writing, the XAU/USD trades at $2,691, up by over 0.66%.
The US Department of Commerce revealed that Retail Sales rose slightly above estimates. At the same time, the US Labor Department revealed data on goodish jobs, which weighed on Bullion prices.
After the data, the US 10-year Treasury yield rebounded off its lows, rising eight basis points to 4.096%. The gold price dipped to $2,672 but has recovered some ground, shrugging off broad US Dollar strength.
The US Dollar Index (DXY), which tracks the Greenback’s currency against a basket of six peers, rose over 0.26% to 103.79, a nearly two-month peak.
Following the data, the Atlanta Fed GDP Now estimates the US Gross Domestic Product (GDP) to grow 3.4% from 3.2% on October 9.
Given the backdrop, traders trimmed their bets on the Federal Reserve’s (Fed) easing towards the end of the year. For the upcoming November meeting, the odds for a 25-bps rate cut decreased from 94% to 88.2%; while the chances of the Fed standing put are at 11.8%.
"On top of the concerns in the Middle East, you are also nearing the U.S. election, which is looking like a very closely contested election. And that generates a whole host of uncertainty, and gold often is the place to go in times of uncertainty,” said Niteh Shah strategist at WisdomTree.
Daily digest market movers: Gold price climbs as investors eye key US data
- US Retail Sales for September rose by 0.4% (MoM), exceeding estimates of 0.3% and higher than August's 0.1% increase.
- Initial Jobless Claims for the week ending October 12 came in at 241K, below estimates and down from last week's 258K.
- US Industrial Production contracted by -0.3% MoM in September, reversing from 0.3% growth, impacted by external factors.
- Data from the Chicago Board of Trade, based on the December fed funds rate futures contract, indicates that investors estimate 48 basis points (bps) of Fed easing by the end of the year.
XAU/USD technical outlook: Gold price surges above $2,690, eyes on $2,700
Gold’s upward bias is intact. Bulls could push the XAU/USD spot price towards the psychological $2,700 figure in the short term, as the Relative Strength Index (RSI) suggests buyers are gathering steam.
Gold’s first resistance is the YTD high at $2,696. Once cleared, a move to $2,700 is on the cards, followed by $2,750 and $2,800.
Conversely, if XAU/USD falls below the October 4 high at $2,670, a retracement toward $2,650 is on the cards. On further weakness, the next support would be $2,600, followed by the 50-day Simple Moving Average (SMA) at $2,561.
Gold FAQs
Gold has played a key role in human’s history as it has been widely used as a store of value and medium of exchange. Currently, apart from its shine and usage for jewelry, the precious metal is widely seen as a safe-haven asset, meaning that it is considered a good investment during turbulent times. Gold is also widely seen as a hedge against inflation and against depreciating currencies as it doesn’t rely on any specific issuer or government.
Central banks are the biggest Gold holders. In their aim to support their currencies in turbulent times, central banks tend to diversify their reserves and buy Gold to improve the perceived strength of the economy and the currency. High Gold reserves can be a source of trust for a country’s solvency. Central banks added 1,136 tonnes of Gold worth around $70 billion to their reserves in 2022, according to data from the World Gold Council. This is the highest yearly purchase since records began. Central banks from emerging economies such as China, India and Turkey are quickly increasing their Gold reserves.
Gold has an inverse correlation with the US Dollar and US Treasuries, which are both major reserve and safe-haven assets. When the Dollar depreciates, Gold tends to rise, enabling investors and central banks to diversify their assets in turbulent times. Gold is also inversely correlated with risk assets. A rally in the stock market tends to weaken Gold price, while sell-offs in riskier markets tend to favor the precious metal.
The price can move due to a wide range of factors. Geopolitical instability or fears of a deep recession can quickly make Gold price escalate due to its safe-haven status. As a yield-less asset, Gold tends to rise with lower interest rates, while higher cost of money usually weighs down on the yellow metal. Still, most moves depend on how the US Dollar (USD) behaves as the asset is priced in dollars (XAU/USD). A strong Dollar tends to keep the price of Gold controlled, whereas a weaker Dollar is likely to push Gold prices up.
The rally in the US Dollar remained unabated for yet another session, this time equally underpinned by firmer US data releases and the marginally dovish rate cut by the ECB at its policy meeting.
Here is what you need to know on Friday, October 18:
The US Dollar Index (DXY) kept its monthly rally well and sound, managing to confront the critical 200-day SMA in the 103.80 region. The US housing sector takes centre stage at the end of the week with the releases of Building Permits and Housing Starts. In addition, the Fed’s Bostic, Kashkari and Waller are all due to speak.
EUR/USD tumbled to nearly three-month lows after flirting with the key support at 1.0800 following the dovish tilt at the ECB event. The EMU’s Current Account and Construction Output will be unveiled.
GBP/USD alternated gains with losses near 1.2990 despite the march north in the Greenback gathered extra pace. Market participants will closely follow the publication of Retail Sales.
USD/JPY built on previous gains and crept higher, slightly surpassing the key 150.00 barrier following extra strength in the US Dollar and rising US yields. Investors’ focus now shifts to the Inflation Rate in Japan and weekly Foreign Bond Investment figures.
Unexpectedly, AUD/USD left behind three straight days of losses and advanced markedly just beyond the key 0.6700 hurdle. The next data release of note Down Under will be the preliminary Judo Bank Manufacturing and Services PMIs on October 24.
WTI prices retreated marginally on Thursday, hovering around the $70.00 mark per barrel on the back of a bullish report from the EIA, while rising uncertainty in the Middle East limited the downside potential.
Gold prices rose to a record high near $2,690 per ounce troy despite the rally in the Greenback and the marked bounce in US yields. Prices of the ounce of Silver charted decent gains, faltering just ahead of the $32.00 mark.
- Fed easing expectations continue to evolve, two cuts by year-end are nearly priced in.
- September Retail Sales surprised to the upside, weekly jobless claims fell.
- ECB’s Lagarde has concerns about the EU economic outlook, which is benefiting the USD.
The US Dollar Index (DXY), which measures the value of the USD against a basket of six currencies, has continued its upward trajectory, marking its fifth consecutive day of gains. At press time, the DXY trades near 104.00.
This surge comes after the European Central Bank (ECB) President, Christine Lagarde, expressed concerns over the Eurozone economic outlook, prompting fears that the region could face further economic weakness. In addition, positive data from the US, including Retail Sales and weekly Initial Jobless Claims, benefited the USD.
The US economy has lately shown signs of economic resilience, while the markets continue to price in high odds of two cuts before the end of the year.
Daily digest market movers: US Dollar rises after positive data, easing bets increase
- Fed easing expectations have increased with markets now pricing in two cuts by year-end and 150 bps of total easing over the next 12 months.
- Robust economic data, including strong US Retail Sales and a healthy labor market, continue to support a resilient economic outlook.
- US Retail Sales surprised to the upside in September, increasing 0.4% to reach $714.4B and exceeding market expectations. In August, US Retail Sales arrived at a weaker 0.1%.
- US citizens filing new applications for unemployment insurance hit 241K for the week ending October 11. This was below consensus of 260K and the previous week's tally, which was revised upward to 260K.
DXY technical outlook: DXY maintains bullish momentum
The DXY index maintains bullish momentum with indicators continuing to gather strength. The index has crossed above the crucial 100-day Simple Moving Average (SMA) and is targeting the 200-day SMA at 103.80. If this level is breached, it would further enhance the bullish outlook. However, overbought signals from indicators suggest a potential correction
Support lies at 103.00, 102.50 and 101.30, while resistances are at 103.30, 103.50 and 104.00. Overall, buyers remain in control, but caution is advised due to overbought conditions.
US Dollar FAQs
The US Dollar (USD) is the official currency of the United States of America, and the ‘de facto’ currency of a significant number of other countries where it is found in circulation alongside local notes. It is the most heavily traded currency in the world, accounting for over 88% of all global foreign exchange turnover, or an average of $6.6 trillion in transactions per day, according to data from 2022. Following the second world war, the USD took over from the British Pound as the world’s reserve currency. For most of its history, the US Dollar was backed by Gold, until the Bretton Woods Agreement in 1971 when the Gold Standard went away.
The most important single factor impacting on the value of the US Dollar is monetary policy, which is shaped by the Federal Reserve (Fed). The Fed has two mandates: to achieve price stability (control inflation) and foster full employment. Its primary tool to achieve these two goals is by adjusting interest rates. When prices are rising too quickly and inflation is above the Fed’s 2% target, the Fed will raise rates, which helps the USD value. When inflation falls below 2% or the Unemployment Rate is too high, the Fed may lower interest rates, which weighs on the Greenback.
In extreme situations, the Federal Reserve can also print more Dollars and enact quantitative easing (QE). QE is the process by which the Fed substantially increases the flow of credit in a stuck financial system. It is a non-standard policy measure used when credit has dried up because banks will not lend to each other (out of the fear of counterparty default). It is a last resort when simply lowering interest rates is unlikely to achieve the necessary result. It was the Fed’s weapon of choice to combat the credit crunch that occurred during the Great Financial Crisis in 2008. It involves the Fed printing more Dollars and using them to buy US government bonds predominantly from financial institutions. QE usually leads to a weaker US Dollar.
Quantitative tightening (QT) is the reverse process whereby the Federal Reserve stops buying bonds from financial institutions and does not reinvest the principal from the bonds it holds maturing in new purchases. It is usually positive for the US Dollar.
- The Dow Jones rallied over 200 points to clip a new all-time high.
- The AI bid is back in action with chip stocks back on the rise.
- US Retail Sales rebounded in September, beating forecasts across the board.
The Dow Jones Industrial Average (DJIA) found a new all-time high on Thursday, bolstered by investors piling back into the AI stock rally and gaining over 200 points from the day’s opening bids. US Retail Sales handily beat the street, rebounding more than market analysts expected and further propelling equities into the high end.
US Retail Sales grew by 0.4% MoM in September, recovering from August’s 0.1% and beating median market forecasts of a 0.3% print. Retail Sales excluding Automotive spending also thumped forecasts, growing by 0.5% in September compared to the expected 0.1%, and easily vaulting over August’s 0.2% increase.
US Initial Jobless Claims for the week ended October 11 also beat market expectations, coming in at 241K for the week. Investors expected the week’s new jobless claimant count to hold steady at the previous week’s revised 260K.
Silicon manufacturers and chip-punchers are getting dragged higher across the board on Thursday. Nvidia (NVDA) was propelled into another all-time high on Thursday, climbing over 3%. The Taiwan Semiconductor Manufacturing Company, a key supplier in the tech sphere, announced stronger-than-expected Q3 earnings and raised 4Q revenue forecasts. The upbeat earnings call assuaged market fears that the AI boom might be fizzling out, even as large-scale predictive data-modeling projects continue to struggle with figuring out how to generate revenue from their projects.
Dow Jones news
Despite nearly half of the Dow Jones index trading cautiously in the red on Thursday, firm gains in key stocks are raising the overall equities board. Intel (INTC) rose 1.6% in a knock-on tech rally, rising above $22.50 per share as the struggling chipmaker battles back from a multi-year low.
Travelers Companies (TRV) surged 8% on Thursday, climbing above $262 per share after the insurer reported stronger-than-expected Q3 earnings. Revenues climbed QoQ when markets were broadly anticipating a slight decline. CEO Alan Schnitzer credited the company’s “stellar underwriting performance” to a net increase in earned premiums and an overall reduction in insurance payouts.
Dow Jones price forecast
The Dow Jones continues to grind out chart paper on the high end, clipping new all-time highs above 43,250 and extending 2024’s bull run to nearly 15%. Bullish momentum is once again outrunning long-term averages, with the 200-day Exponential Moving Average (EMA) rising through 39,500 and struggling to catch up.
Price action has firmly tilted into the overbought end, spelling trouble for traders looking for smooth sailing. While short-term traders will no doubt be looking for a downside snap back to median prices before reloading into another leg higher, there’s little reason for investors who are already heavily long to pull out now.
Dow Jones daily chart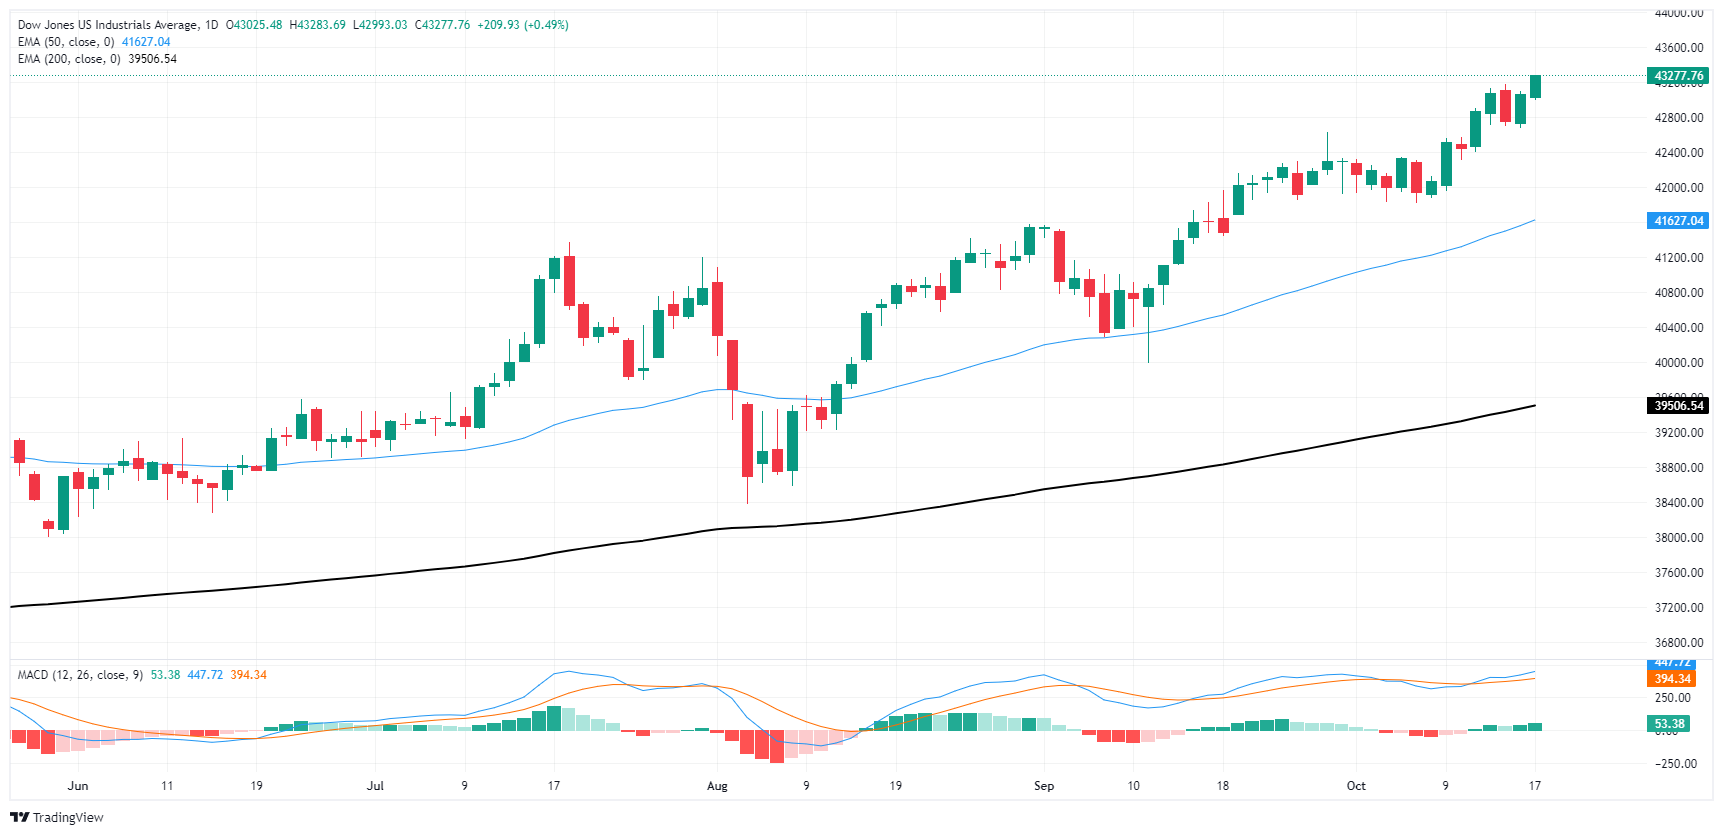
Dow Jones FAQs
The Dow Jones Industrial Average, one of the oldest stock market indices in the world, is compiled of the 30 most traded stocks in the US. The index is price-weighted rather than weighted by capitalization. It is calculated by summing the prices of the constituent stocks and dividing them by a factor, currently 0.152. The index was founded by Charles Dow, who also founded the Wall Street Journal. In later years it has been criticized for not being broadly representative enough because it only tracks 30 conglomerates, unlike broader indices such as the S&P 500.
Many different factors drive the Dow Jones Industrial Average (DJIA). The aggregate performance of the component companies revealed in quarterly company earnings reports is the main one. US and global macroeconomic data also contributes as it impacts on investor sentiment. The level of interest rates, set by the Federal Reserve (Fed), also influences the DJIA as it affects the cost of credit, on which many corporations are heavily reliant. Therefore, inflation can be a major driver as well as other metrics which impact the Fed decisions.
Dow Theory is a method for identifying the primary trend of the stock market developed by Charles Dow. A key step is to compare the direction of the Dow Jones Industrial Average (DJIA) and the Dow Jones Transportation Average (DJTA) and only follow trends where both are moving in the same direction. Volume is a confirmatory criteria. The theory uses elements of peak and trough analysis. Dow’s theory posits three trend phases: accumulation, when smart money starts buying or selling; public participation, when the wider public joins in; and distribution, when the smart money exits.
There are a number of ways to trade the DJIA. One is to use ETFs which allow investors to trade the DJIA as a single security, rather than having to buy shares in all 30 constituent companies. A leading example is the SPDR Dow Jones Industrial Average ETF (DIA). DJIA futures contracts enable traders to speculate on the future value of the index and Options provide the right, but not the obligation, to buy or sell the index at a predetermined price in the future. Mutual funds enable investors to buy a share of a diversified portfolio of DJIA stocks thus providing exposure to the overall index.
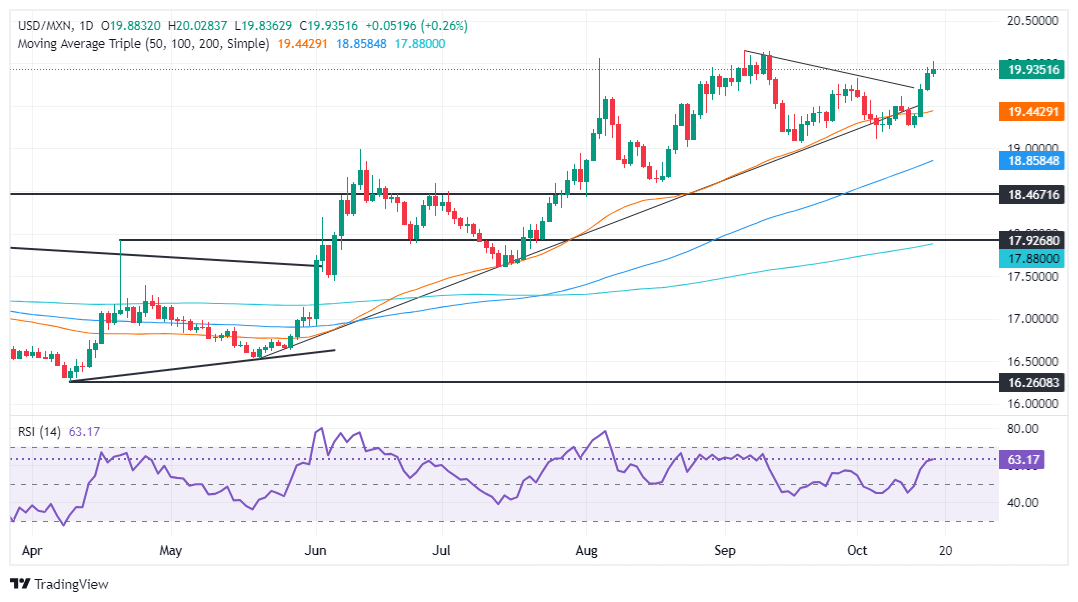
- Mexican Peso nosedives on robust US data, USD/MXN clears 20.00.
- Peso faces additional pressure from former President Trump’s tariff threat on Mexican-made cars, triggering a sell-off.
- IMF lowers Mexico’s 2024 growth forecast to 1.5%, highlighting a deeper slowdown and rising inflation risks.
The Mexican Peso remains on the defensive, posting four days of losses against the Greenback. US Retail Sales and jobs data fared better than economists expected, bolstering the US Dollar. At the time of writing, the USD/MXN trades at 19.92, above its opening price by 0.28%.
Earlier, during the North American session, the USD/MXN cleared the psychological 20.00 figure after the US Department of Commerce revealed solid Retail Sales in September. At the same time, the US Department of Labor announced last week that the number of Americans filing for unemployment benefits was below projections.
After the data, the buck extended its gains, as shown by the US Dollar Index (DXY). The DXY, which tracks the American currency against another six, gains 0.26% to 103.80, slightly above the 200-day Simple Moving Average (SMA) of 103.77.
Despite that, the US Federal Reserve (Fed) is heavily expected to lower interest rates by 25 basis points at the November meeting. Odds remained at 90.9%, according to the CME FedWatch Tool data.
Recently released data showed that US Industrial Production tumbled, blamed on the Boeing strike and two hurricanes.
Across the south of the border, Mexico’s economic docket remained absent. However, former President Donald Trump's announcement that he would impose a 200% tariff on cars manufactured in Mexico once he wins the election triggered a Peso sell-off.
In its latest report, the International Monetary Fund (IMF) projected the Mexican economy to grow 1.5% in 2024, lower than in its previous forecast. The IMF estimates a deeper economic slowdown for the next year, estimating 1.3% GDP growth, and foresees inflation moving toward the Bank of Mexico’s (Banxico)3% goal.
Further US data will be revealed on Friday. Building Permits, Housing Starts and Fed speakers could dictate the direction of the USD/MXN.
Daily digest market movers: Mexican Peso tumbles as USD/MXN surges past 19.90
- Earlier during the North American session, the Mexican Peso touched a five-week low as the USD/MXN hit a high of 20.02
- The IMF said that a recent judicial reform creates "important uncertainties about the effectiveness of contract enforcement and the predictability of the rule of law."
- Banxico’s survey revealed that economists estimate the central bank will lower rates by 50 bps for the rest of the year. The USD/MXN exchange rate is projected to end at 19.69, and the economy is expected to grow by 1.45% in 2024.
- September US Retail Sales rose by 0.4% MoM, above estimates of 0.3% and August’s 0.1% increase.
- Initial Jobless Claims for the week ending October 12 came at 241K, below estimates and last week’s 258K.
- US Industrial Production in September contracted -0.3% MoM from 0.3% growth due to external factors.
- Data from the Chicago Board of Trade via the December fed funds rate futures contract shows investors estimate 48 bps of Fed easing by the end of the year.
USD/MXN technical outlook: Mexican Peso plummets after USD/MXN pierced 20.00
The USD/MXN uptrend remains in play and hit a two-month high above 20.00. The Relative Strength Index (RSI) suggests that bulls are in charge, which could pave the way for further upside.
If USD/MXN clears the 20.02 high of October 17, the next stop would be the YTD high at 20.22. On further strength, a rally to 20.50 is on the cards.
Conversely, if the USD/MXN tumbles below the October 1 high turned support at 19.82, it could exacerbate a test of the October 10 daily peak at 19.61. On further weakness, the next floor will be the October 4 swing low of 19.10 before testing 19.00.
Mexican Peso FAQs
The Mexican Peso (MXN) is the most traded currency among its Latin American peers. Its value is broadly determined by the performance of the Mexican economy, the country’s central bank’s policy, the amount of foreign investment in the country and even the levels of remittances sent by Mexicans who live abroad, particularly in the United States. Geopolitical trends can also move MXN: for example, the process of nearshoring – or the decision by some firms to relocate manufacturing capacity and supply chains closer to their home countries – is also seen as a catalyst for the Mexican currency as the country is considered a key manufacturing hub in the American continent. Another catalyst for MXN is Oil prices as Mexico is a key exporter of the commodity.
The main objective of Mexico’s central bank, also known as Banxico, is to maintain inflation at low and stable levels (at or close to its target of 3%, the midpoint in a tolerance band of between 2% and 4%). To this end, the bank sets an appropriate level of interest rates. When inflation is too high, Banxico will attempt to tame it by raising interest rates, making it more expensive for households and businesses to borrow money, thus cooling demand and the overall economy. Higher interest rates are generally positive for the Mexican Peso (MXN) as they lead to higher yields, making the country a more attractive place for investors. On the contrary, lower interest rates tend to weaken MXN.
Macroeconomic data releases are key to assess the state of the economy and can have an impact on the Mexican Peso (MXN) valuation. A strong Mexican economy, based on high economic growth, low unemployment and high confidence is good for MXN. Not only does it attract more foreign investment but it may encourage the Bank of Mexico (Banxico) to increase interest rates, particularly if this strength comes together with elevated inflation. However, if economic data is weak, MXN is likely to depreciate.
As an emerging-market currency, the Mexican Peso (MXN) tends to strive during risk-on periods, or when investors perceive that broader market risks are low and thus are eager to engage with investments that carry a higher risk. Conversely, MXN tends to weaken at times of market turbulence or economic uncertainty as investors tend to sell higher-risk assets and flee to the more-stable safe havens.
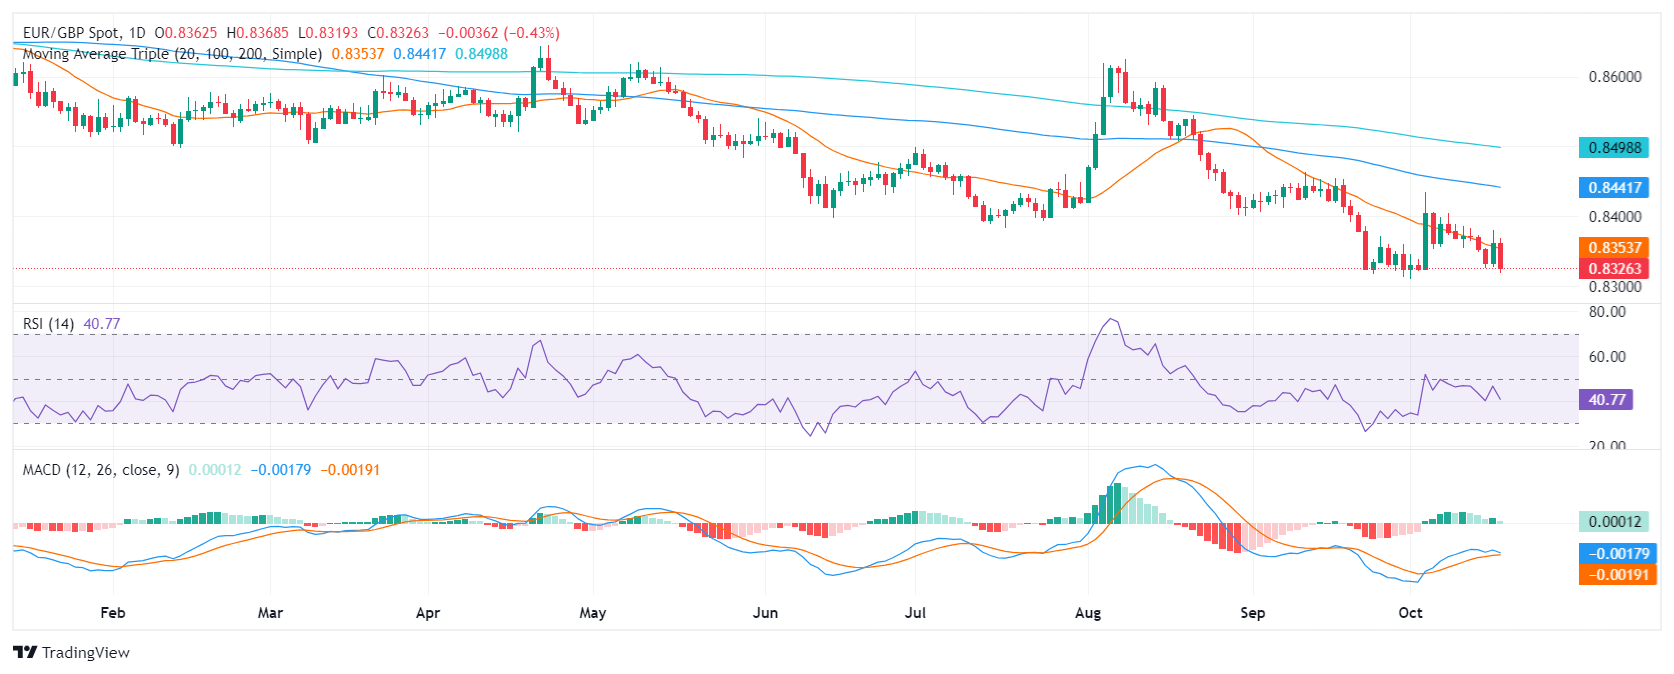
- EUR/GBP got rejected once again by the 20-day SMA.
- RSI suggests selling pressure is rising, while MACD indicates buying pressure is declining.
- Movements below the 0.8400 threshold might trigger movements towards 0.8300.
In Thursday's session the EUR/GBP declined by 0.30% to 0.8330 after the cross surged and attempted to recover the 20-day SMA on Wednesday but got rejected and resumed its downwards paths.
The Relative Strength Index (RSI) is currently at 40, in negative area and on a declining slope, indicating that selling pressure is rising while the Moving Average Convergence Divergence (MACD) suggests buying pressure is declining.
In case the cross fails to recover the 20-day SMA around 0.8350 support levels are at 0.8315, and 0.8300, while key resistance levels at 0.8380, 0.8400, and 0.8420.
EUR/GBP daily chart
As fully expected, the ECB cut rates by 25bps today, TDS’ economists note.
Fragmentation risks in euro area grow
“The tone of the decision was marginally dovish, with Lagarde refusing to rule out that a 50bps cut was debated, and pointing to emerging downside risks to inflation. This leaves sequential 25bps cuts firmly on the table going forward.”
“The ECB came as a non-event for markets. We continue to favour range trading with tactical shorts in EUR vs. GBP.”
“The ECB came with no big surprises and markets reacted much more to the stronger US data. We hold our short EUR/USD position given fragmentation risks in euro area, lack of engines of growth and rising risks of a Trump Presidency.”
The RBA and the Norges Bank are vying for the position as the second most hawkish. In Rabo’s view, RBA rates are likely to remain on hold until May of next year, Rabobank’s FX analyst Jane Foley notes.
RBA rates are likely to remain on hold
“The fact that the RBA did not ‘explicitly consider a rate rise’ at its September meeting was judged by the market as a dovish development. That said, compared with most other G10 central banks, its position remains decidedly hawkish. Aside from the BoJ, the Norges Bank and the RBA all other G10 central banks have already embarked on a course of policy easing.”
“The decision by the Fed to cut rates by 50 bps last month widened the discussion about the prospect of other G10 central banks following suit. Last week, the RBNZ announced a 50 bp rate cut, and speculation is building that its policy meeting on November 27 could bring an even larger 75 bps rate cut (it is Rabo’s view that the RBNZ will lower rates by 50 bps next month).”
“Not only has inflation in New Zealand dropped back to target, but it is likely that its economy fell into recession through the middle of this year. We maintain our preference to buy AUD/NZD on dips towards a 3-month target of 1.11.”
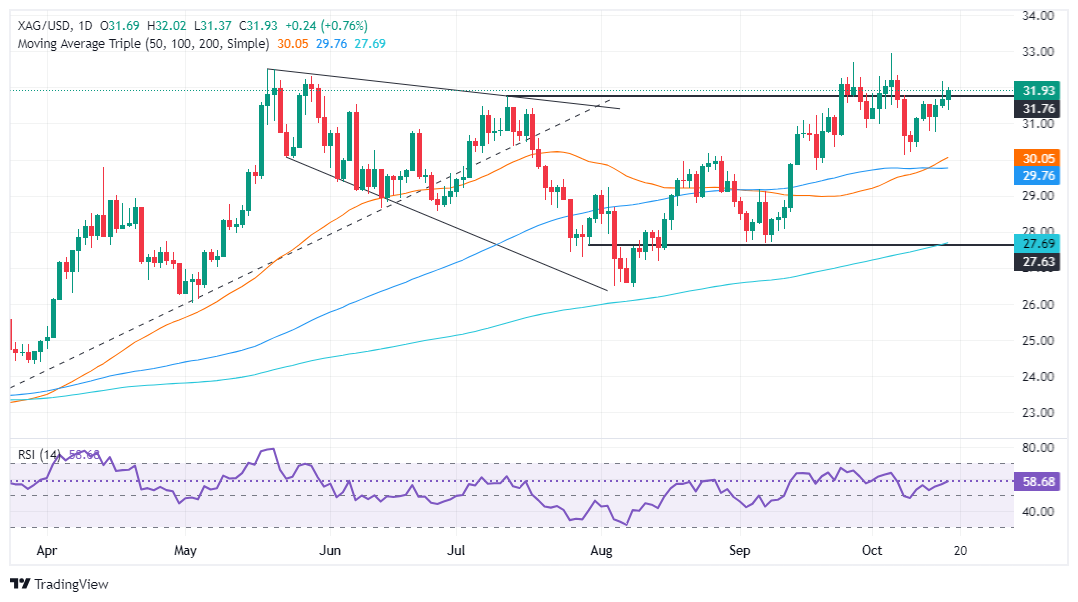
- Silver rises third day; capped below $32.00 amid high US Treasury yields.
- Momentum suggests more gains; resistance eyed at $32.17, May high at $32.51.
- Support at $31.37; break below could lead to retests of $30.76, October low $30.12.
Silver's price extended its gains to three straight days yet remains below the $32.00 figure as US Treasury yields cap the grey metal’s advance. This, along with a buoyant US Dollar, didn’t deter the precious metal from advancing higher, and it consolidated at around the higher bound of the $31.50/$31.90 range. The XAG/USD trades at $31.90, above its opening price by 0.80%.
XAG/USD Price Forecast: Technical outlook
After plunging almost vertically from a year-to-date (YTD) peak of $32.95 to $30.12 within three days, the non-yielding metal is now recovering, with buyers targeting a potential test of the $33.00 level.
Silver’s recovery from plunging almost vertically from a year-to-date (YTD) peak of $32.95 to $30.12 within three days continued on Thursday. Momentum hints at buyers gathering steam, as depicted by the Relative Strength Index (RSI). Hence, the XAG/USD path of least resistance is tilted to the upside.
That said, the first resistance would be the $32.00 figure, followed by the October 16 high at $32.17. Once those levels are surpassed, the next stop would be the May 20 swing high at $32.51 before challenging the YTD high at $32.95.
Conversely, if XAG/USD slips below $31.37, Silver could drop to the weekly low of $30.76. If surpassed, this would clear the path to challenge October’s 8 low of $30.12.
XAG/USD Price Action – Daily Chart
Silver FAQs
Silver is a precious metal highly traded among investors. It has been historically used as a store of value and a medium of exchange. Although less popular than Gold, traders may turn to Silver to diversify their investment portfolio, for its intrinsic value or as a potential hedge during high-inflation periods. Investors can buy physical Silver, in coins or in bars, or trade it through vehicles such as Exchange Traded Funds, which track its price on international markets.
Silver prices can move due to a wide range of factors. Geopolitical instability or fears of a deep recession can make Silver price escalate due to its safe-haven status, although to a lesser extent than Gold's. As a yieldless asset, Silver tends to rise with lower interest rates. Its moves also depend on how the US Dollar (USD) behaves as the asset is priced in dollars (XAG/USD). A strong Dollar tends to keep the price of Silver at bay, whereas a weaker Dollar is likely to propel prices up. Other factors such as investment demand, mining supply – Silver is much more abundant than Gold – and recycling rates can also affect prices.
Silver is widely used in industry, particularly in sectors such as electronics or solar energy, as it has one of the highest electric conductivity of all metals – more than Copper and Gold. A surge in demand can increase prices, while a decline tends to lower them. Dynamics in the US, Chinese and Indian economies can also contribute to price swings: for the US and particularly China, their big industrial sectors use Silver in various processes; in India, consumers’ demand for the precious metal for jewellery also plays a key role in setting prices.
Silver prices tend to follow Gold's moves. When Gold prices rise, Silver typically follows suit, as their status as safe-haven assets is similar. The Gold/Silver ratio, which shows the number of ounces of Silver needed to equal the value of one ounce of Gold, may help to determine the relative valuation between both metals. Some investors may consider a high ratio as an indicator that Silver is undervalued, or Gold is overvalued. On the contrary, a low ratio might suggest that Gold is undervalued relative to Silver.
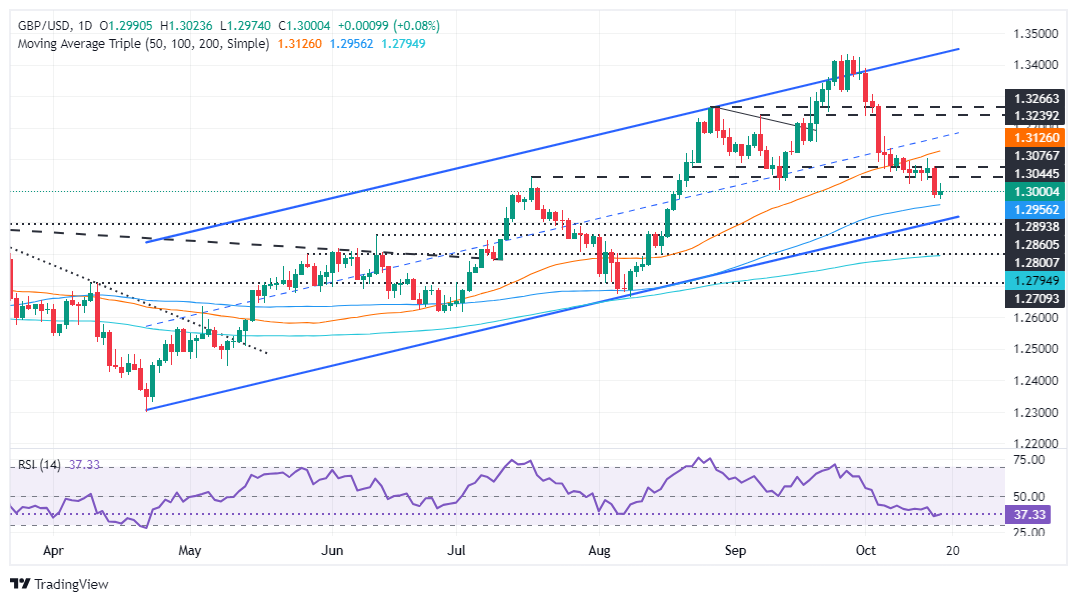
- GBP/USD slips below the 50-DMA, signaling a bearish shift despite its recent recovery towards 1.3000.
- Bearish momentum in the RSI hints at a deeper correction if the pair closes below 1.3000 consecutively.
- Key support levels include the 100-DMA at 1.2954 and the bottom of the ascending channel around 1.2890/1.2910.
The Pound Sterling recovered some ground yet cannot hold firm above the 1.3000 figure against the Greenback. Absent data releases in the UK kept traders adrift to a goodish US Retail Sales report, along with a dip in unemployment claims. At the time of writing, the GBP/USD trades at 1.2991, virtually unchanged.
GBP/USD Price Forecast: Technical outlook
Price action suggests the GBP/USD is still upwardly biased, but since it has fallen below the 50-day moving average, it has opened the door for lower prices.
From a momentum standpoint, the Relative Strength Index (RSI) is bearish. Hence, if the GBP/USD achieves back-to-back daily closes below 1.3000, it could be headed for a deeper pullback.
Given the backdrop, the first support for GBP/USD would be the 100-DMA at 1.2954. Once cleared, the next support would be the bottom trendline of an ascending channel at around 1.2890/1.2910, followed by the June 12 peak turned support at 1.2861. The next support would be the 200-DMA at 1.2794.
Conversely, if GBP/USD holds firm above 1.3000, buyers can drive the exchange rate towards the weekly high of 1.3102 before testing the 50-DMA at 1.3122.
GBP/USD Price Action – Daily Chart
British Pound PRICE Today
The table below shows the percentage change of British Pound (GBP) against listed major currencies today. British Pound was the strongest against the Euro.
| USD | EUR | GBP | JPY | CAD | AUD | NZD | CHF | |
|---|---|---|---|---|---|---|---|---|
| USD | 0.35% | -0.07% | 0.24% | 0.25% | -0.52% | -0.11% | -0.09% | |
| EUR | -0.35% | -0.43% | -0.10% | -0.10% | -0.86% | -0.43% | -0.43% | |
| GBP | 0.07% | 0.43% | 0.33% | 0.33% | -0.44% | -0.02% | 0.01% | |
| JPY | -0.24% | 0.10% | -0.33% | 0.02% | -0.76% | -0.37% | -0.30% | |
| CAD | -0.25% | 0.10% | -0.33% | -0.02% | -0.77% | -0.34% | -0.31% | |
| AUD | 0.52% | 0.86% | 0.44% | 0.76% | 0.77% | 0.42% | 0.46% | |
| NZD | 0.11% | 0.43% | 0.02% | 0.37% | 0.34% | -0.42% | 0.03% | |
| CHF | 0.09% | 0.43% | -0.01% | 0.30% | 0.31% | -0.46% | -0.03% |
The heat map shows percentage changes of major currencies against each other. The base currency is picked from the left column, while the quote currency is picked from the top row. For example, if you pick the British Pound from the left column and move along the horizontal line to the US Dollar, the percentage change displayed in the box will represent GBP (base)/USD (quote).
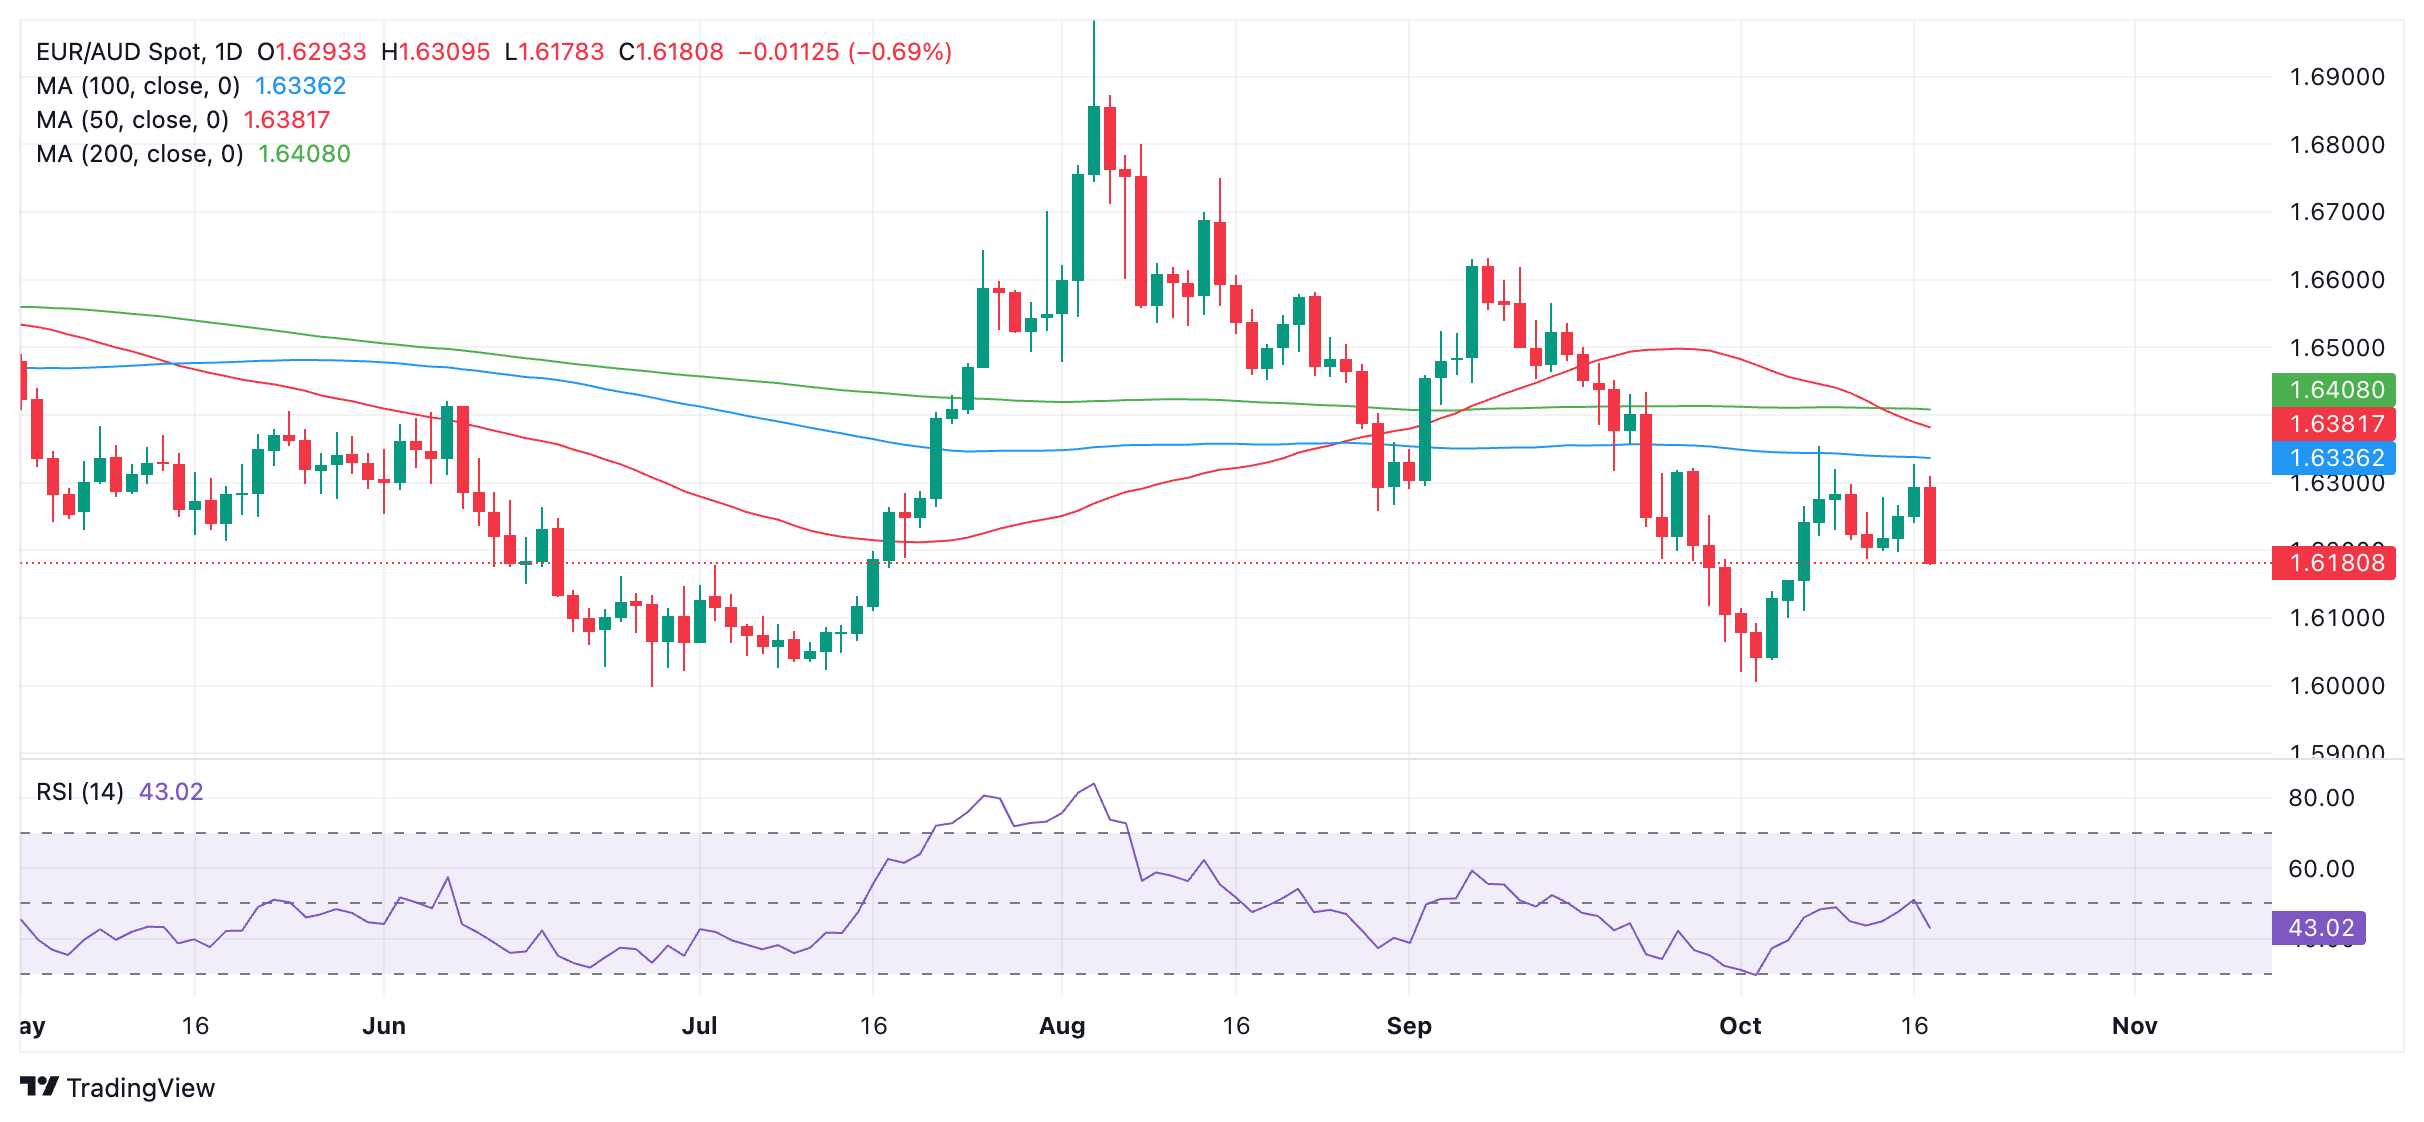
- EUR/AUD declines sharply on a “combo” of the ECB deciding to cut interest rates and robust Australian employment data.
- The Euro weakened after the ECB decided to salami slice another 0.25% off its policy rates due to disinflation and weaker activity.
- The Australian Dollar was bolstered by employment data showing 64.1K people joined the workforce in September.
EUR/AUD falls by almost three-quarters of a percent to the 1.6180s on Thursday after a combination of stronger-than-expected Australian labor market data boosted the Australian Dollar (AUD) whilst the Euro (EUR) depreciated ahead of the European Central Bank’s (ECB) decision to cut interest rates, and remained under pressure as the bank telegraphed a mildly negative economic outlook for the region going forward.
EUR/AUD Daily Chart
The Aussie Dollar strengthened on Thursday, putting downward pressure on EUR/AUD after fresh data showed that the number employed Australians rose by 64,100 in September, which was well above expectations of 25,000 and the downwardly-revised 42,600 of the previous month. Of these, full-time employees made up the majority with 51,600, whilst the remaining 12,500 were employed part-time, acording to data from Australian Bureau of Statistics.
The Unemployment Rate, which had been expected to creep higher to 4.2%, actually remained the same as in August at 4.1%.
The data overall painted a picture of a robust labor market and reduced the chances that the Reserve Bank of Australia (RBA) will have to cut interest rates in the coming months, since high levels of employment are associated with higher levels of spending and inflation. This, in turn, supports AUD since relatively higher interest rates strengthen a currency by attracting more foreign capital inflows.
EUR/AUD declined further in the run up to the ECB meeting policy decision as investors expected the ECB Governing Council to take a dovish line (in favor of lower interest rates) due to recent data showing a marked slowdown of economic activity in the Eurozone.
Further, the second estimate of Eurozone Harmonized Index of Consumer Prices (HICP) released just before the ECB meeting revealed a downward revision in the headline HICP to 1.7% in September from the preliminary estimate of 1.8%, which itself was well below the 2.2% in August. The 1.7% revision plotted inflation well below the ECB’s 2.0% target.
The ECB policy statement indicated the governing council’s decision to cut the ECB’s three main interest rates, including the benchmark Deposit Facility Rate by 0.25% to 3.25% was taken because the “disinflationary process is well on track” and recent data showed “ downside surprises in indicators of economic activity.”
However, the statement gave no hint of whether the ECB was planning any further reductions in future meetings, retaining a “data-dependent and meeting-by-meeting” approach to monetary policy.
In her press conference after the decision, ECB President Christine Lagarde said that “Incoming data suggest that activity is weaker than expected," and pointed to “slowing employment growth.” Yet, she also spoke of labor market resilience and said she expected the economy “to strengthen over time.”
Lagarde further added that the decision to cut rates had been “unanimous” and added “all information since the September meeting was heading lower."
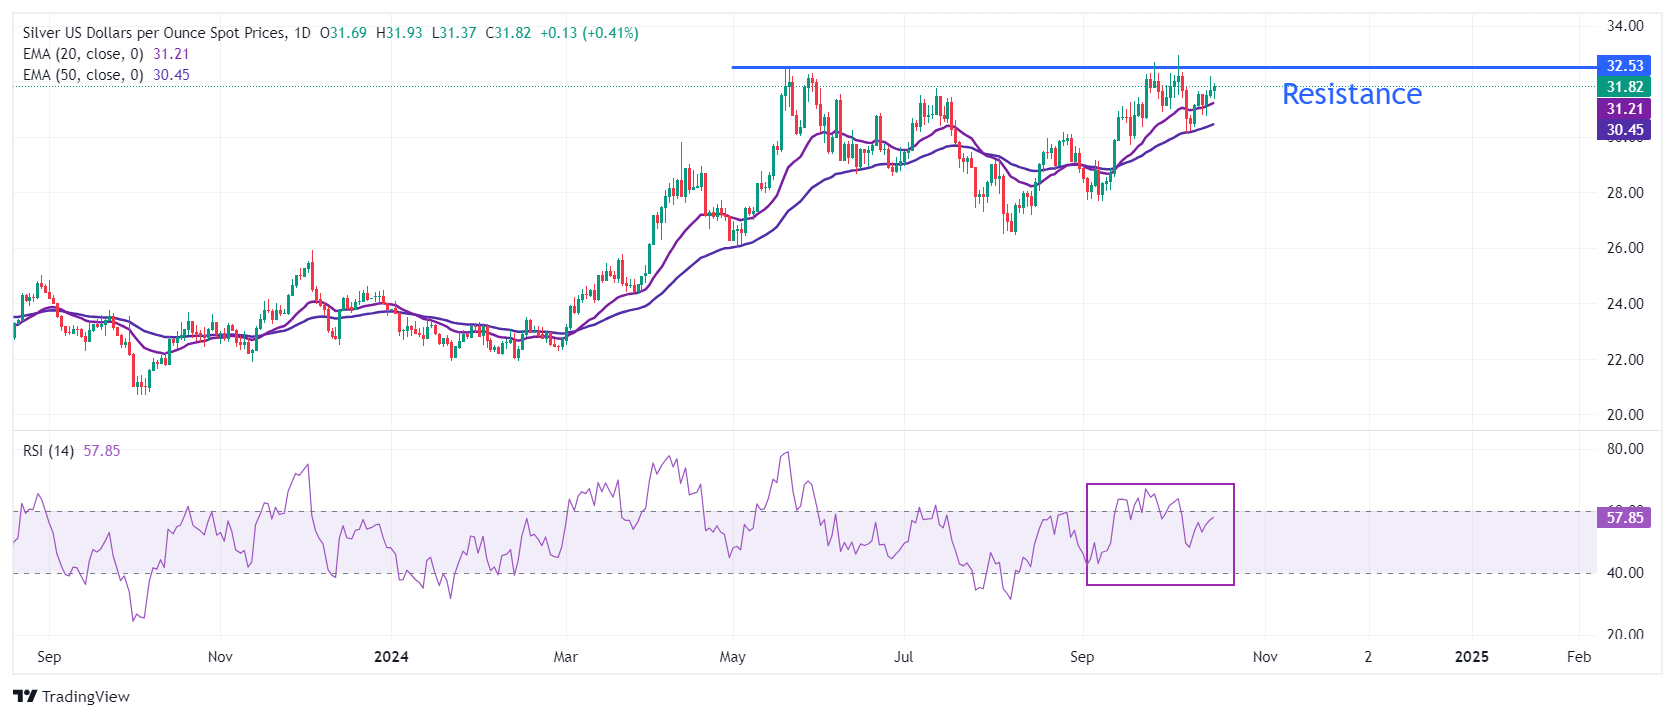
- Silver price trades sideways below $32.00 as investors seek fresh cues about the Fed’s likely monetary policy action in November and December.
- The US Dollar strengthens after better-than-expected US Retail Sales growth and lower jobless claims.
- Rising US Trump’s odds of winning presidential elections improve the Silver price’s appeal as a safe haven.
Silver price (XAG/USD) trades in a tight range below the key resistance of $32.00 in Thursday’s North American session. The white metal consolidates as investors look for fresh cues about the Federal Reserve’s (Fed) likely interest rate action in the remaining year.
According to the CME FedWatch tool, 30-day Federal Funds futures pricing data shows that the central bank will cut interest rates by 25 basis points (bps) in both policy meetings in November and December.
Meanwhile, upbeat United States (US) monthly Retail Sales and lower Initial Jobless Claims for the week ending October 11 have strengthened the US Dollar (USD). The US Dollar Index (DXY), which tracks the Greenback’s value against six major currencies, posts a fresh 10-month high at 103.85.
The Retail Sales data, a key measure of consumer spending, rose by 0.4%, faster than estimates of 0.3% and the former release of 0.1%. Meanwhile, individuals claiming jobless benefits for the first time came in lower at 241K than estimates of 260K.
10-year US Treasury yields soar to 4.08%. Historically, higher yields on interest-bearing assets increase the opportunity cost of holding an investment in non-yielding assets, such as Silver. However, the Silver price remains supported as growing speculation for former President US Donald Trump winning upcoming presidential elections has improved its appeal as safe-haven.
Silver technical analysis
Silver price strives to reclaim the decade-high of $33.00. Upward-sloping 20- and 50- Exponential Moving Averages (EMAs) near $31.20 and $30.45, respectively, suggest a strong uptrend.
The 14-day Relative Strength Index (RSI) approaches 60.00. A decisive break above the same would activate a bullish momentum.
Silver daily chart
Silver FAQs
Silver is a precious metal highly traded among investors. It has been historically used as a store of value and a medium of exchange. Although less popular than Gold, traders may turn to Silver to diversify their investment portfolio, for its intrinsic value or as a potential hedge during high-inflation periods. Investors can buy physical Silver, in coins or in bars, or trade it through vehicles such as Exchange Traded Funds, which track its price on international markets.
Silver prices can move due to a wide range of factors. Geopolitical instability or fears of a deep recession can make Silver price escalate due to its safe-haven status, although to a lesser extent than Gold's. As a yieldless asset, Silver tends to rise with lower interest rates. Its moves also depend on how the US Dollar (USD) behaves as the asset is priced in dollars (XAG/USD). A strong Dollar tends to keep the price of Silver at bay, whereas a weaker Dollar is likely to propel prices up. Other factors such as investment demand, mining supply – Silver is much more abundant than Gold – and recycling rates can also affect prices.
Silver is widely used in industry, particularly in sectors such as electronics or solar energy, as it has one of the highest electric conductivity of all metals – more than Copper and Gold. A surge in demand can increase prices, while a decline tends to lower them. Dynamics in the US, Chinese and Indian economies can also contribute to price swings: for the US and particularly China, their big industrial sectors use Silver in various processes; in India, consumers’ demand for the precious metal for jewellery also plays a key role in setting prices.
Silver prices tend to follow Gold's moves. When Gold prices rise, Silver typically follows suit, as their status as safe-haven assets is similar. The Gold/Silver ratio, which shows the number of ounces of Silver needed to equal the value of one ounce of Gold, may help to determine the relative valuation between both metals. Some investors may consider a high ratio as an indicator that Silver is undervalued, or Gold is overvalued. On the contrary, a low ratio might suggest that Gold is undervalued relative to Silver.
Christine Lagarde, President of the European Central Bank (ECB), explains the ECB's decision to lower the benchmark interest rate by 25 basis points at the October policy meeting and responds to questions from the press.
Key takeaways
"All information since the September meeting was heading lower."
"Any additional trade barriers are a downside for Europe."
"The decision was unanimous."
"Still have risks on both sides of inflation forecast."
"Probably more downside than upside risks to inflation."
"We do not see recession, we are still looking at soft landing."
"Concerned about growth."
"No question that we are currently restrictive."
ECB FAQs
The European Central Bank (ECB) in Frankfurt, Germany, is the reserve bank for the Eurozone. The ECB sets interest rates and manages monetary policy for the region. The ECB primary mandate is to maintain price stability, which means keeping inflation at around 2%. Its primary tool for achieving this is by raising or lowering interest rates. Relatively high interest rates will usually result in a stronger Euro and vice versa. The ECB Governing Council makes monetary policy decisions at meetings held eight times a year. Decisions are made by heads of the Eurozone national banks and six permanent members, including the President of the ECB, Christine Lagarde.
In extreme situations, the European Central Bank can enact a policy tool called Quantitative Easing. QE is the process by which the ECB prints Euros and uses them to buy assets – usually government or corporate bonds – from banks and other financial institutions. QE usually results in a weaker Euro. QE is a last resort when simply lowering interest rates is unlikely to achieve the objective of price stability. The ECB used it during the Great Financial Crisis in 2009-11, in 2015 when inflation remained stubbornly low, as well as during the covid pandemic.
Quantitative tightening (QT) is the reverse of QE. It is undertaken after QE when an economic recovery is underway and inflation starts rising. Whilst in QE the European Central Bank (ECB) purchases government and corporate bonds from financial institutions to provide them with liquidity, in QT the ECB stops buying more bonds, and stops reinvesting the principal maturing on the bonds it already holds. It is usually positive (or bullish) for the Euro.
- USD/CHF is trending higher on a short and medium-term basis.
- It is likely to continue up towards bullish targets.
USD/CHF unfolds a text-book trend higher with alternating climbing peaks and troughs on the 4-hour chart.
The pair is probably in an uptrend on both a short and medium-term basis and given the principle in technical analysis that “the trend is your friend” the odds favor a continuation higher.
USD/CHF 4-hour Chart
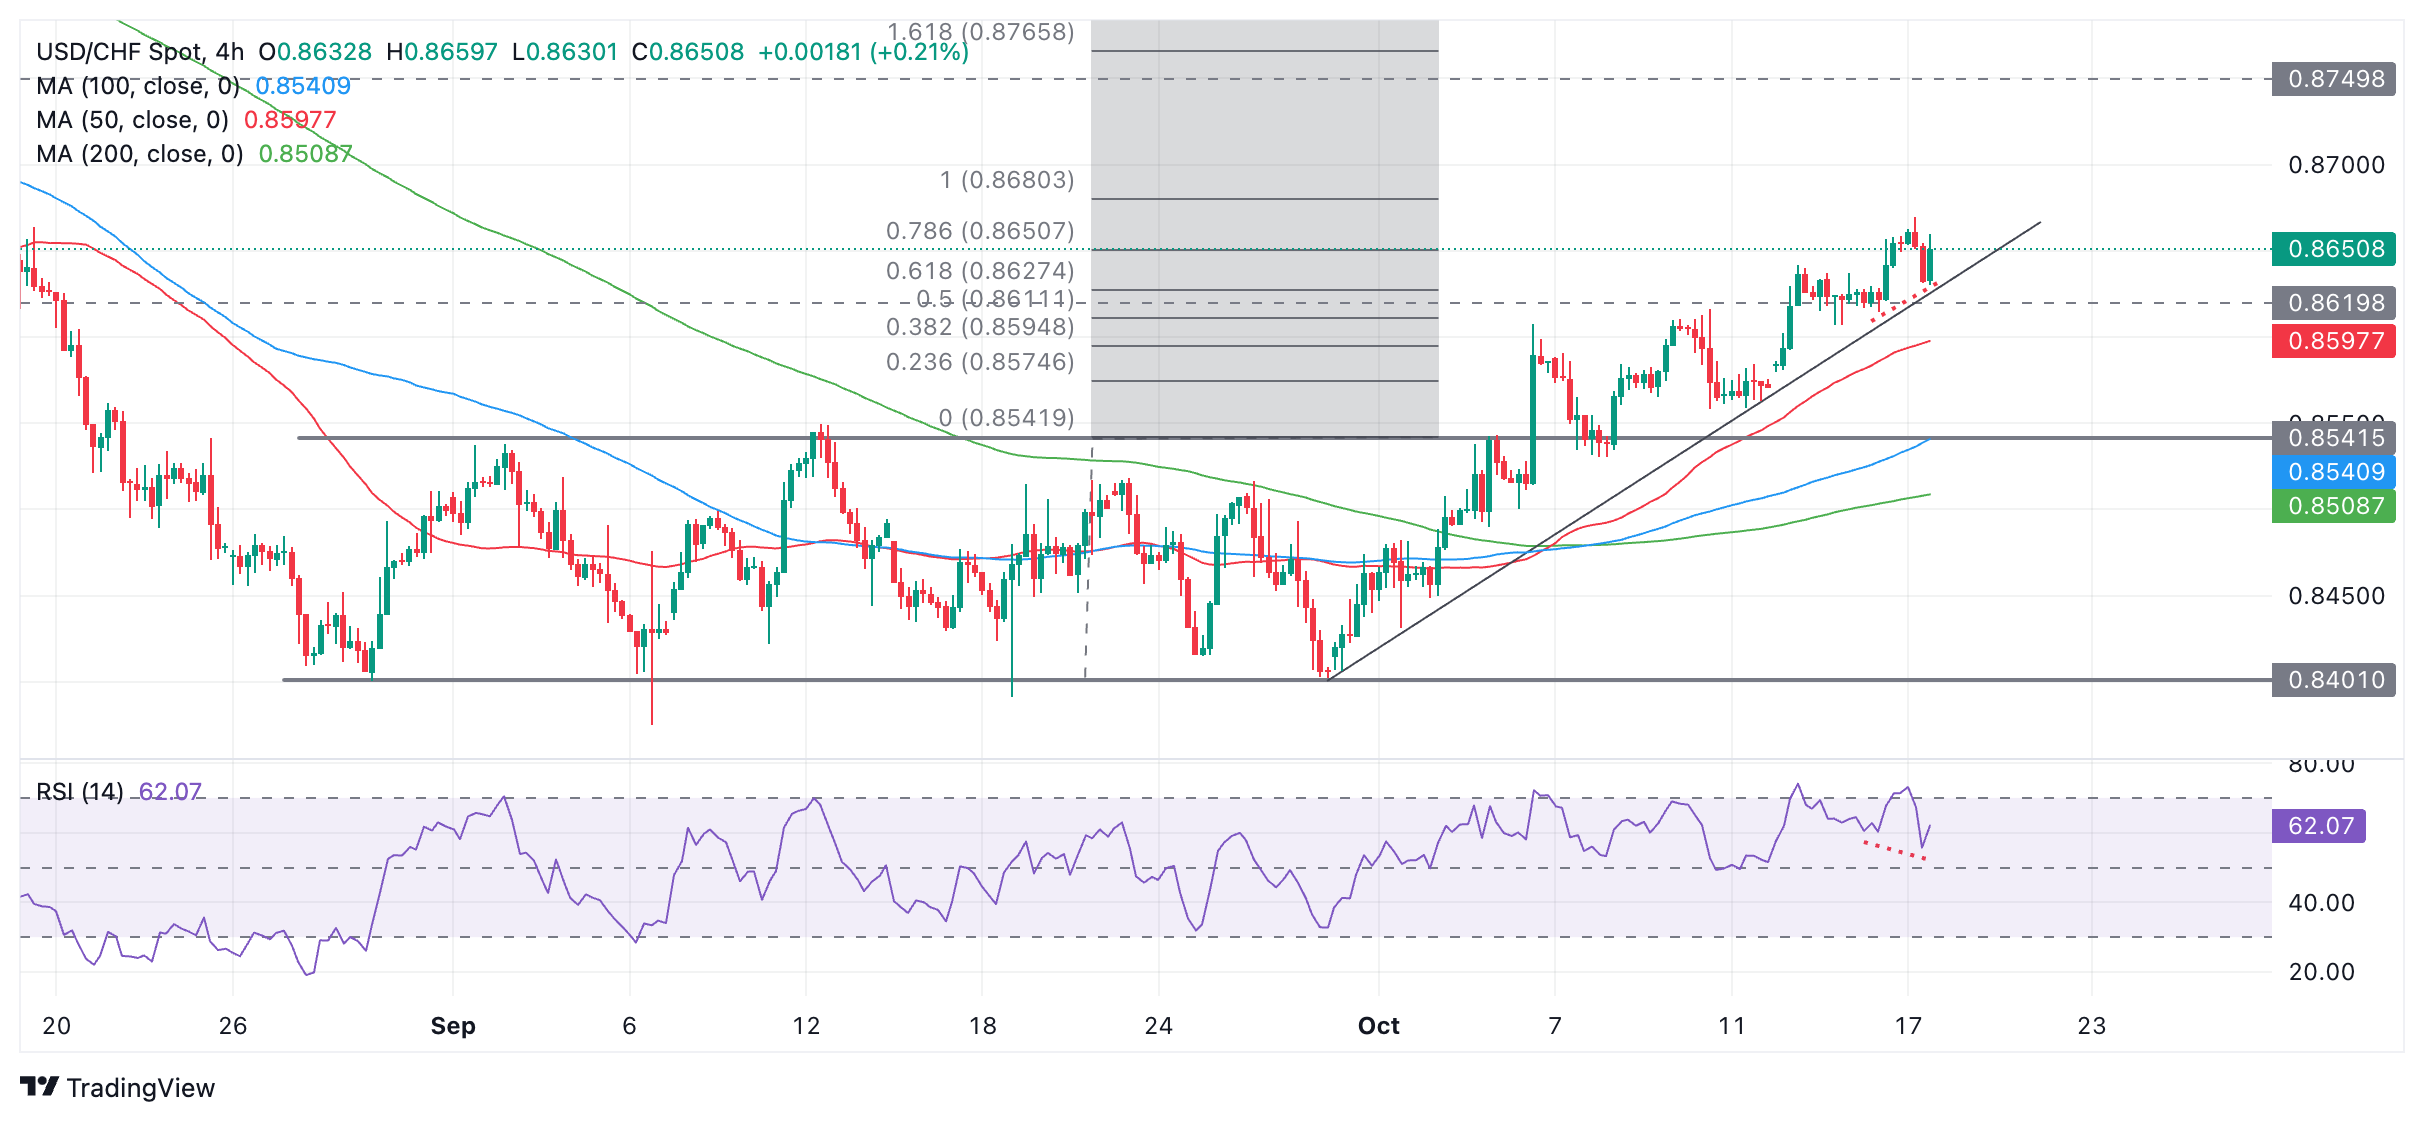
USD/CHF will probably reach the target generated after it broke out of its September range, at 0.8680, the 100% Fibonacci (Fib) extrapolation of the height of the range higher. A break above that level could lead to a further extension to the 0.8750 resistance level (August 15 high).
USD/CHF has already met conservative target for the breakout from the range at 0.8627, the 61.8% Fib level. This could mean bullish pressure may lessen.
The Relative Strength Index (RSI) momentum indicator is showing bearish divergence with price when comparing the October 16 and 17 lows (red dotted lines on chart). Although price made a higher low on October 17 compared to the day before, the RSI made a lower low. This could point to mild underlying weakness, however, it does not alone suggest a change of trend.
A chart gap opened on Monday morning and there is a risk the market could pull back all the way to fill this gap. If so, it could correct down to 0.8574. It would require a break below the former range highs at 0.8541 to confirm a probable change of trend.
USD/CHF’s longer-term trend is probably still bearish despite the strong recovery over recent weeks.
Platinum prices have been trading strong, but we now see the most extremely asymmetric set-up in algo flows across our global macro radar, TDS’ FFX analysts Daniel Ghali notes.
Window for selling activity opens next week
“The window for large-scale selling activity will be open at the start of next week, and a large downtape could see CTAs sell a massive -50% of their max size over the following sessions. Conversely, a commensurate uptape won't lead to notable buying activity.”
“This set-up strongly favors continued downside over the coming week.”
Christine Lagarde, President of the European Central Bank (ECB), explains the ECB's decision to lower the benchmark interest rate by 25 basis points at the October policy meeting and responds to questions from the press.
Key takeaways
"Wage pressures are strong."
"Negotiated wage growth to remain high and volatile over remainder of year."
"Inflation to drop to target in 2025."
"Disinflation supported by receding labour cost pressures, past tightening."
"Most measures of inflation expectations at around 2%."
"Risks to growth are tilted to downside."
"Wages, profits, geopolitics are among upside risks to inflation."
"Downside risks to inflation include low confidence, geopolitical stress, low investment."
Euro FAQs
The Euro is the currency for the 19 European Union countries that belong to the Eurozone. It is the second most heavily traded currency in the world behind the US Dollar. In 2022, it accounted for 31% of all foreign exchange transactions, with an average daily turnover of over $2.2 trillion a day. EUR/USD is the most heavily traded currency pair in the world, accounting for an estimated 30% off all transactions, followed by EUR/JPY (4%), EUR/GBP (3%) and EUR/AUD (2%).
The European Central Bank (ECB) in Frankfurt, Germany, is the reserve bank for the Eurozone. The ECB sets interest rates and manages monetary policy. The ECB’s primary mandate is to maintain price stability, which means either controlling inflation or stimulating growth. Its primary tool is the raising or lowering of interest rates. Relatively high interest rates – or the expectation of higher rates – will usually benefit the Euro and vice versa. The ECB Governing Council makes monetary policy decisions at meetings held eight times a year. Decisions are made by heads of the Eurozone national banks and six permanent members, including the President of the ECB, Christine Lagarde.
Eurozone inflation data, measured by the Harmonized Index of Consumer Prices (HICP), is an important econometric for the Euro. If inflation rises more than expected, especially if above the ECB’s 2% target, it obliges the ECB to raise interest rates to bring it back under control. Relatively high interest rates compared to its counterparts will usually benefit the Euro, as it makes the region more attractive as a place for global investors to park their money.
Data releases gauge the health of the economy and can impact on the Euro. Indicators such as GDP, Manufacturing and Services PMIs, employment, and consumer sentiment surveys can all influence the direction of the single currency. A strong economy is good for the Euro. Not only does it attract more foreign investment but it may encourage the ECB to put up interest rates, which will directly strengthen the Euro. Otherwise, if economic data is weak, the Euro is likely to fall. Economic data for the four largest economies in the euro area (Germany, France, Italy and Spain) are especially significant, as they account for 75% of the Eurozone’s economy.
Another significant data release for the Euro is the Trade Balance. This indicator measures the difference between what a country earns from its exports and what it spends on imports over a given period. If a country produces highly sought after exports then its currency will gain in value purely from the extra demand created from foreign buyers seeking to purchase these goods. Therefore, a positive net Trade Balance strengthens a currency and vice versa for a negative balance.
Christine Lagarde, President of the European Central Bank (ECB), explains the ECB's decision to lower the benchmark interest rate by 25 basis points at the October policy meeting and responds to questions from the press.
Key takeaways
"Incoming data suggest that activity is weaker than expected."
"Investment is expanding only slowly."
"Households consumed less than expected."
"Recent surveys point to gradual recovery in household spending."
"Labour market is resilient."
"Further moderation in demand for labour."
"Surveys suggest slowing employment growth."
"Economy expected to strengthen over time."
ECB FAQs
The European Central Bank (ECB) in Frankfurt, Germany, is the reserve bank for the Eurozone. The ECB sets interest rates and manages monetary policy for the region. The ECB primary mandate is to maintain price stability, which means keeping inflation at around 2%. Its primary tool for achieving this is by raising or lowering interest rates. Relatively high interest rates will usually result in a stronger Euro and vice versa. The ECB Governing Council makes monetary policy decisions at meetings held eight times a year. Decisions are made by heads of the Eurozone national banks and six permanent members, including the President of the ECB, Christine Lagarde.
In extreme situations, the European Central Bank can enact a policy tool called Quantitative Easing. QE is the process by which the ECB prints Euros and uses them to buy assets – usually government or corporate bonds – from banks and other financial institutions. QE usually results in a weaker Euro. QE is a last resort when simply lowering interest rates is unlikely to achieve the objective of price stability. The ECB used it during the Great Financial Crisis in 2009-11, in 2015 when inflation remained stubbornly low, as well as during the covid pandemic.
Quantitative tightening (QT) is the reverse of QE. It is undertaken after QE when an economic recovery is underway and inflation starts rising. Whilst in QE the European Central Bank (ECB) purchases government and corporate bonds from financial institutions to provide them with liquidity, in QT the ECB stops buying more bonds, and stops reinvesting the principal maturing on the bonds it already holds. It is usually positive (or bullish) for the Euro.
- US Retail Sales surprised to the upside in September.
- The US Dollar maintains its bullish impulse well in place.
According to the US Census Bureau, retail sales in the US increased by 0.4% to reach $714.4B in September. This followed a 0.1% rise in August and exceeded market expectations for a 0.3% monthly gain.
Retail sales excluding autos also grew beyond consensus by 0.5% from August’s 0.2% advance.
The press release noted, "Total sales for the July 2024 through September 2024 period were up 2.3 percent (±0.5 %) from the same period a year ago. The July 2024 to August 2024 percent change was unrevised from up 0.1% (±0.2%).”
Market reaction
The US Dollar Index (DXY) keeps its weekly uptrend well in place and navigates fresh highs near 103.80 amidst a broad-based recovery in US yields across the curve.
- Initial Jobless Claims rose to 241K, down from the previous week's 260K.
- Continuing Jobless Claims climbed to 1.867M in the week ending October 4.
US citizens filing new applications for unemployment insurance rose to 241K for the week ending October 11, as reported by the US Department of Labor (DoL) on Thursday. This print came in below the consensus forecast and the previous week's tally of 260K (revised from 258K).
The report also highlighted a seasonally adjusted insured unemployment rate of 1.2%, while the four-week moving average climbed to 236.25K, marking an increase of 4.750K from the prior week’s revised average.
Moreover, Continuing Jobless Claims increased by 9K to reach 1.867M for the week ending October 4.
Market reaction
The US Dollar Index (DXY) remains firm and trades in fresh tops near 103.80, an area also coincident with the critical 200-day SMA.
- EUR/GBP sees more downside after the ECB cut key borrowing rates by 25 bps.
- This is the second straight interest rate cut by the ECB as Eurozone inflation cools down.
- Soft UK inflation data has prompted BoE dovish bets.
The EUR/GBP pair remains fragile after the European Central Bank (ECB) policy meeting in which the central bank cut its Rate on Deposit Facility by 25 basis points (bps) to 3.25%. The ECB reduced its key borrowing rates for the second straight time.
Euro PRICE Today
The table below shows the percentage change of Euro (EUR) against listed major currencies today. Euro was the strongest against the Canadian Dollar.
| USD | EUR | GBP | JPY | CAD | AUD | NZD | CHF | |
|---|---|---|---|---|---|---|---|---|
| USD | 0.25% | 0.00% | 0.24% | 0.29% | -0.26% | 0.05% | 0.02% | |
| EUR | -0.25% | -0.26% | 0.03% | 0.05% | -0.51% | -0.16% | -0.23% | |
| GBP | -0.00% | 0.26% | 0.27% | 0.30% | -0.26% | 0.07% | 0.04% | |
| JPY | -0.24% | -0.03% | -0.27% | 0.04% | -0.53% | -0.22% | -0.22% | |
| CAD | -0.29% | -0.05% | -0.30% | -0.04% | -0.55% | -0.23% | -0.25% | |
| AUD | 0.26% | 0.51% | 0.26% | 0.53% | 0.55% | 0.32% | 0.31% | |
| NZD | -0.05% | 0.16% | -0.07% | 0.22% | 0.23% | -0.32% | -0.03% | |
| CHF | -0.02% | 0.23% | -0.04% | 0.22% | 0.25% | -0.31% | 0.03% |
The heat map shows percentage changes of major currencies against each other. The base currency is picked from the left column, while the quote currency is picked from the top row. For example, if you pick the Euro from the left column and move along the horizontal line to the US Dollar, the percentage change displayed in the box will represent EUR (base)/USD (quote).
The central bank was already expected to cut its key borrowing rates as recent commentaries from officials indicated that they more worried about stagnation in economic growth than taming price pressures in the Eurozone.
The central bank has also cut the Main Refinancing Operations Rate by 25 bps to 3.4%. Market participants expect the ECB to reduce its borrowing rates further in its upcoming monetary policy in December as the Eurozone economic outlook has worsened due to growing expectations that former US President Donald Trump will win presidential elections, which are scheduled for November 5. Tariffs on imports are expected to rise in Trump’s administration, which will weigh on exports from European and Asian economies.
Meanwhile, the Pound Sterling (GBP) gains ground on Thursday after a sharp sell-off on Wednesday. The GBP dived after the release of the United Kingdom (UK) Consumer Price Index (CPI) report for September, which showed a slowdown in price pressures.
The service inflation, a closely watched indication by Bank of England (BoE) policymakers, decelerated to 4.8%, the lowest level since May 2022. Soft inflation data has prompted market expectations that the BoE could cut interest rates in each of the two policy meetings remaining this year, which are scheduled in November and December. Before the inflation data, traders were pricing only one interest rate cut in either of the two policy meetings.
- USD/JPY is in a short-term uptrend but it appears to be losing momentum.
- The pair could still go higher but downside risks have increased.
USD/JPY continues making higher highs and higher lows as it extends its short-term uptrend towards the underside of the major trendline in the 151.00s.
Bullish momentum has eased off, however, suggesting bulls could be running out of steam, and although the uptrend is intact there exists an increased risk of a pull back developing.
USD/JPY 4-hour Chart
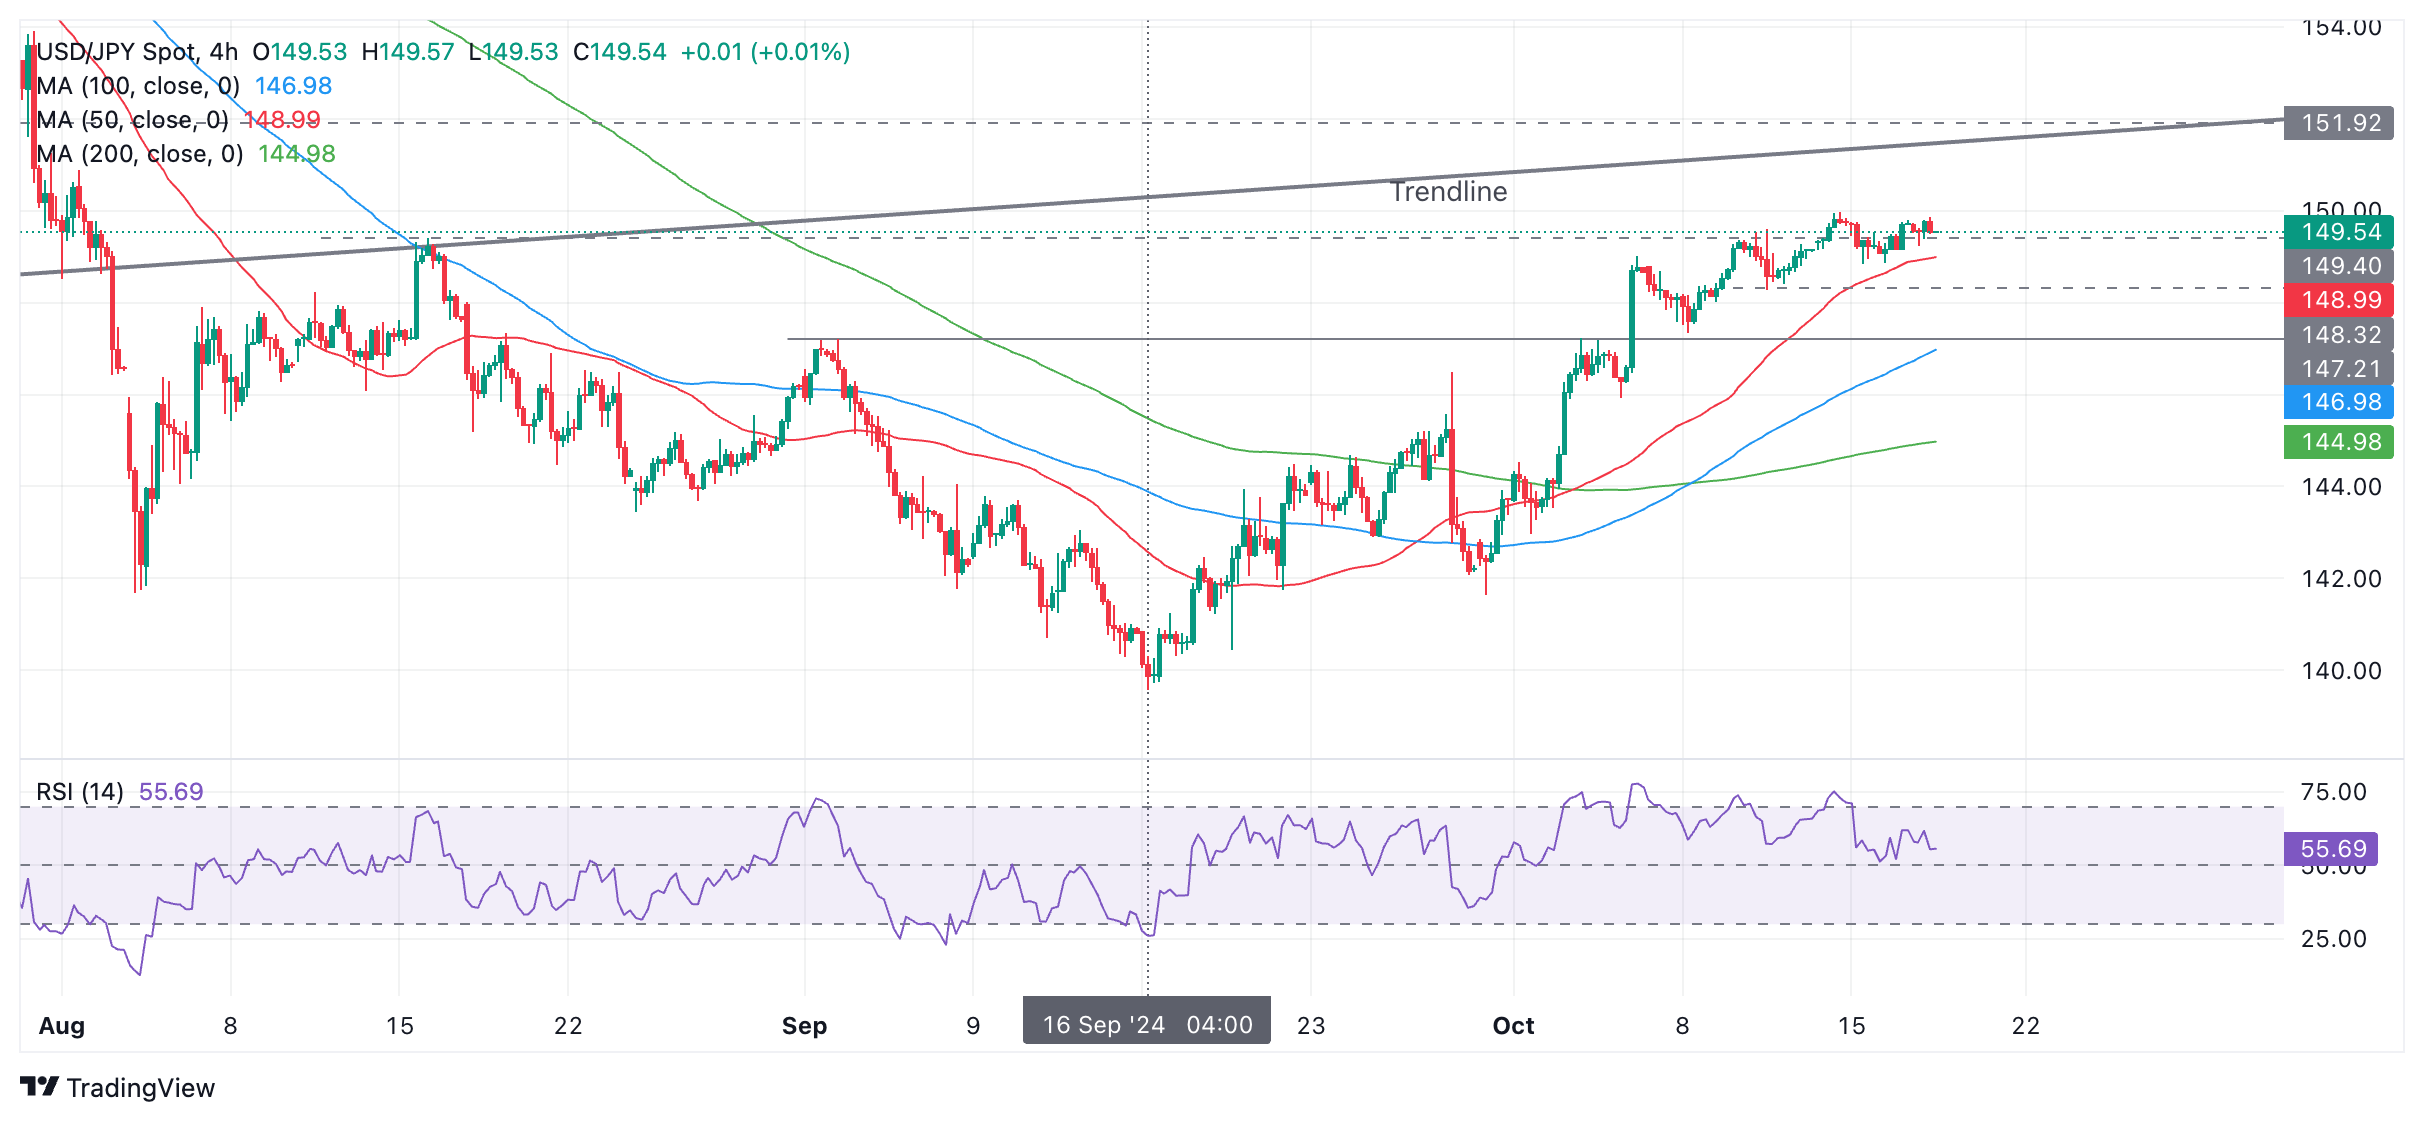
A break above 149.98 (October 14 high) would confirm a further extension to the next target at 151.09 (200-day Simple Moving Average (SMA) (not shown)). A break above that would indicate a move up to the major trendline in the 151.80s.
Momentum, as measured by the Relative Strength Index (RSI) momentum indicator has dropped off considerably at the last peak – a further sign of underlying weakness.
If a correction evolves, support lies at 148.27 (October 10 low) or 147.23 (September 2 high).
- Crude Oil finds support and stabilizes off its weekly low of $69.15 on Thursday.
- Overnight API weekly numbers came in with a surprise drawdown.
- The US Dollar Index breaks above a key level on its way to 104.00.
Crude Oil finds a floor and stabilizes for now on Thursday after a four-day losing streak, which currently still accounts for a nearly 7% loss in the week. The floor that starts to form comes with traders doubting if Israel’s Prime Minister Benjamin Netanyahu will uphold his promise to the United States (US) not to attack Iranian oil installations. An additional support came on the back of the overnight stockpile weekly numbers from the American Petroleum Institute (API), which came in at a surprise drawdown of 1.58 million barrels in the week ending on October 11 compared to an expected build of 2.3 million barrels.
The US Dollar Index (DXY), which tracks the performance of the Greenback against six other currencies, is gearing up for a volatile session ahead. Besides a bulk load of US data, the European Central Bank (ECB) is set to deliver a 25 basis point interest rate cut. With the core countries in the Eurozone struggling, it will be important to see how ECB President Christine Lagarde will want to try and avoid a Euro meltdown.
At the time of writing, Crude Oil (WTI) trades at $70.00 and Brent Crude at $74.09
Oil news and market movers: Several drivers taking into account
- China has announced a support plan for its domestic housing market. The size of the investment will be 4 trillion Yuan (CNY), while earlier this week on Monday, a message of about 6 trillion Yuan was communicated. Asian markets did not react well to the lower number, according to Bloomberg.
- Pressure keeps building on Israel’s Prime Minister Benjamin Netanyahu to ignore the US‘s request not to target Iranian oil installations. Unease is growing now even within his cabinet after an article in the Jerusalem Post on Tuesday from the opposition leader calling for an immediate attack on the Iranian installations, Reuters reports.
- At 15:00 GMT, the Energy Information Administration (EIA) will release its weekly stockpile change numbers for the week ending on October 11. Expectations are for a small build of 2.3 million compared to the previous build of 5.81 million the prior week.
Oil Technical Analysis: Bears and bulls fight over $70.00
Crude Oil battles to hold the $70.00 marker, but it will not be an easy task from here. Although lingering geopolitical tensions could push Crude Oil prices rapidly up, the whole thing could quickly crumble down if no events occur. While several other asset classes are moving with markets hedging for a potential presidential win for former US President Donald Trump in the November 5 presidential elections in the US, it becomes clear Crude Oil has no clue how to price in a Trump win.
There is a challenging path to recovery for Crude Oil in the coming days. First, the pivotal level at $71.46, which was strong enough to catch the falling knife on Monday, must be regained again with a daily close above it. Once from there, the hefty technical level at $75.28, with the 100-day Simple Moving Average (SMA) and a few pivotal lines, is possibly the first big hurdle ahead.
On the downside, that previously mentioned $71.46 pivotal level has now turned into resistance and no longer has any value as support. Instead, traders need to look much lower, at $67.11, a level that supported the price in May-June 2023. In case that level breaks, the 2024 year-to-date low emerges at $64.75 followed by $64.38, the low of 2023.
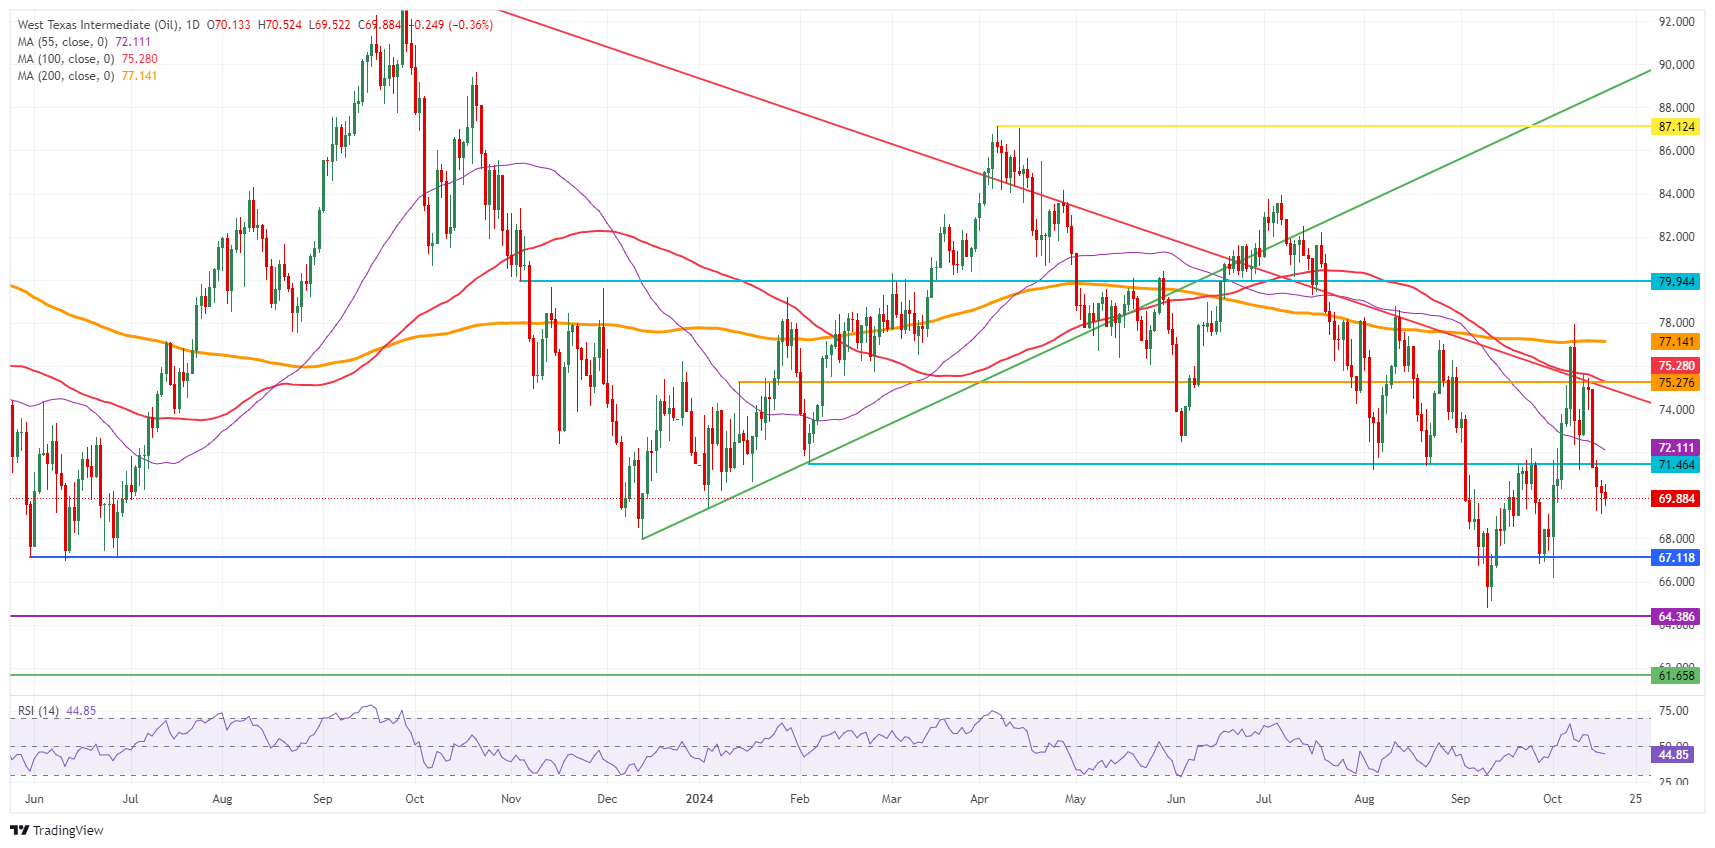
US WTI Crude Oil: Daily Chart
WTI Oil FAQs
WTI Oil is a type of Crude Oil sold on international markets. The WTI stands for West Texas Intermediate, one of three major types including Brent and Dubai Crude. WTI is also referred to as “light” and “sweet” because of its relatively low gravity and sulfur content respectively. It is considered a high quality Oil that is easily refined. It is sourced in the United States and distributed via the Cushing hub, which is considered “The Pipeline Crossroads of the World”. It is a benchmark for the Oil market and WTI price is frequently quoted in the media.
Like all assets, supply and demand are the key drivers of WTI Oil price. As such, global growth can be a driver of increased demand and vice versa for weak global growth. Political instability, wars, and sanctions can disrupt supply and impact prices. The decisions of OPEC, a group of major Oil-producing countries, is another key driver of price. The value of the US Dollar influences the price of WTI Crude Oil, since Oil is predominantly traded in US Dollars, thus a weaker US Dollar can make Oil more affordable and vice versa.
The weekly Oil inventory reports published by the American Petroleum Institute (API) and the Energy Information Agency (EIA) impact the price of WTI Oil. Changes in inventories reflect fluctuating supply and demand. If the data shows a drop in inventories it can indicate increased demand, pushing up Oil price. Higher inventories can reflect increased supply, pushing down prices. API’s report is published every Tuesday and EIA’s the day after. Their results are usually similar, falling within 1% of each other 75% of the time. The EIA data is considered more reliable, since it is a government agency.
OPEC (Organization of the Petroleum Exporting Countries) is a group of 12 Oil-producing nations who collectively decide production quotas for member countries at twice-yearly meetings. Their decisions often impact WTI Oil prices. When OPEC decides to lower quotas, it can tighten supply, pushing up Oil prices. When OPEC increases production, it has the opposite effect. OPEC+ refers to an expanded group that includes ten extra non-OPEC members, the most notable of which is Russia.
- Gold touches a new all-time high above the previous September 26 high.
- The precious metal is helped by lower interest rate projections globally as inflation ducks.
- XAU/USD confirms its uptrending bias but risks pull back before extension.
Gold (XAU/USD) edges up to a new record high on Thursday, a few Dollars above the prior September 26 all-time high of $2,685. A mixture of declining global interest rate expectations and increased safe-haven flows amid heightened tensions in the Middle East are contributing to the rise.
Gold rallies as central banks prepare to lower interest rates
Gold pushes to new highs as markets price in a lower trajectory for global interest rates. Inflation is falling faster than expected across the world, increasing the probability that major central banks will accelerate their easing cycles. The expectation of lower interest rates is bullish for Gold as it reduces the opportunity cost of holding the non-interest-paying precious metal, making it more attractive to investors.
Following the release of lower-than-expected inflation data in September in the United Kingdom, the Bank of England (BoE) is now widely expected to decide to lower its bank rate by 25 basis points (bps) (0.25%) from 5.00% to 4.75% at its November meeting.
Likewise, the Bank of Canada (BoC) is now widely expected to aim for a “bazooka” at its policy rate and shoot off 50 pbs (0.50%) at its next policy meeting in October.
On Thursday, the European Central Bank (ECB) concludes its policy meeting and is widely expected to execute a 25 bps (0.25%) rate cut after inflation fell below its 2.0% target for the first time since 2021 and economic activity has evinced a marked slowdown. This, and the fact that several Asian central banks have already made cuts recently, is supporting the rally in Gold.
That said, the upside for Gold may be limited as US Federal Reserve (Fed) officials continue backtracking after being expected to adopt a more aggressive easing approach a few weeks ago.
On Tuesday, Bank of San Francisco Fed President Mary Daly’s speech scored a neutral 5.8 on the FXStreet FedTracker, which uses a custom AI to gauge the tone of Fed officials’ speeches on a dovish-to-hawkish scale from 0 to 10. This was above her long-running average of 4.5.
Federal Reserve Bank of Atlanta President Raphael Bostic, meanwhile, scored a 6.2 on the FedTracker, which was also above his average of 5.1. Bostic opined the “US economy is doing well,” and that he did not see a recession on the horizon.
Currently, markets are pricing in almost a 94% chance of a 25 bps cut in the fed funds rate in November and a 6% probability of no-change at all, according to the CME FedWatch tool.
Technical Analysis: Gold breaks to higher high
Gold rallies and breaks to a new all-time high. The establishment of a higher high reconfirms the uptrend and suggests the odds favor yet more upside to come.
XAU/USD 4-hour Chart
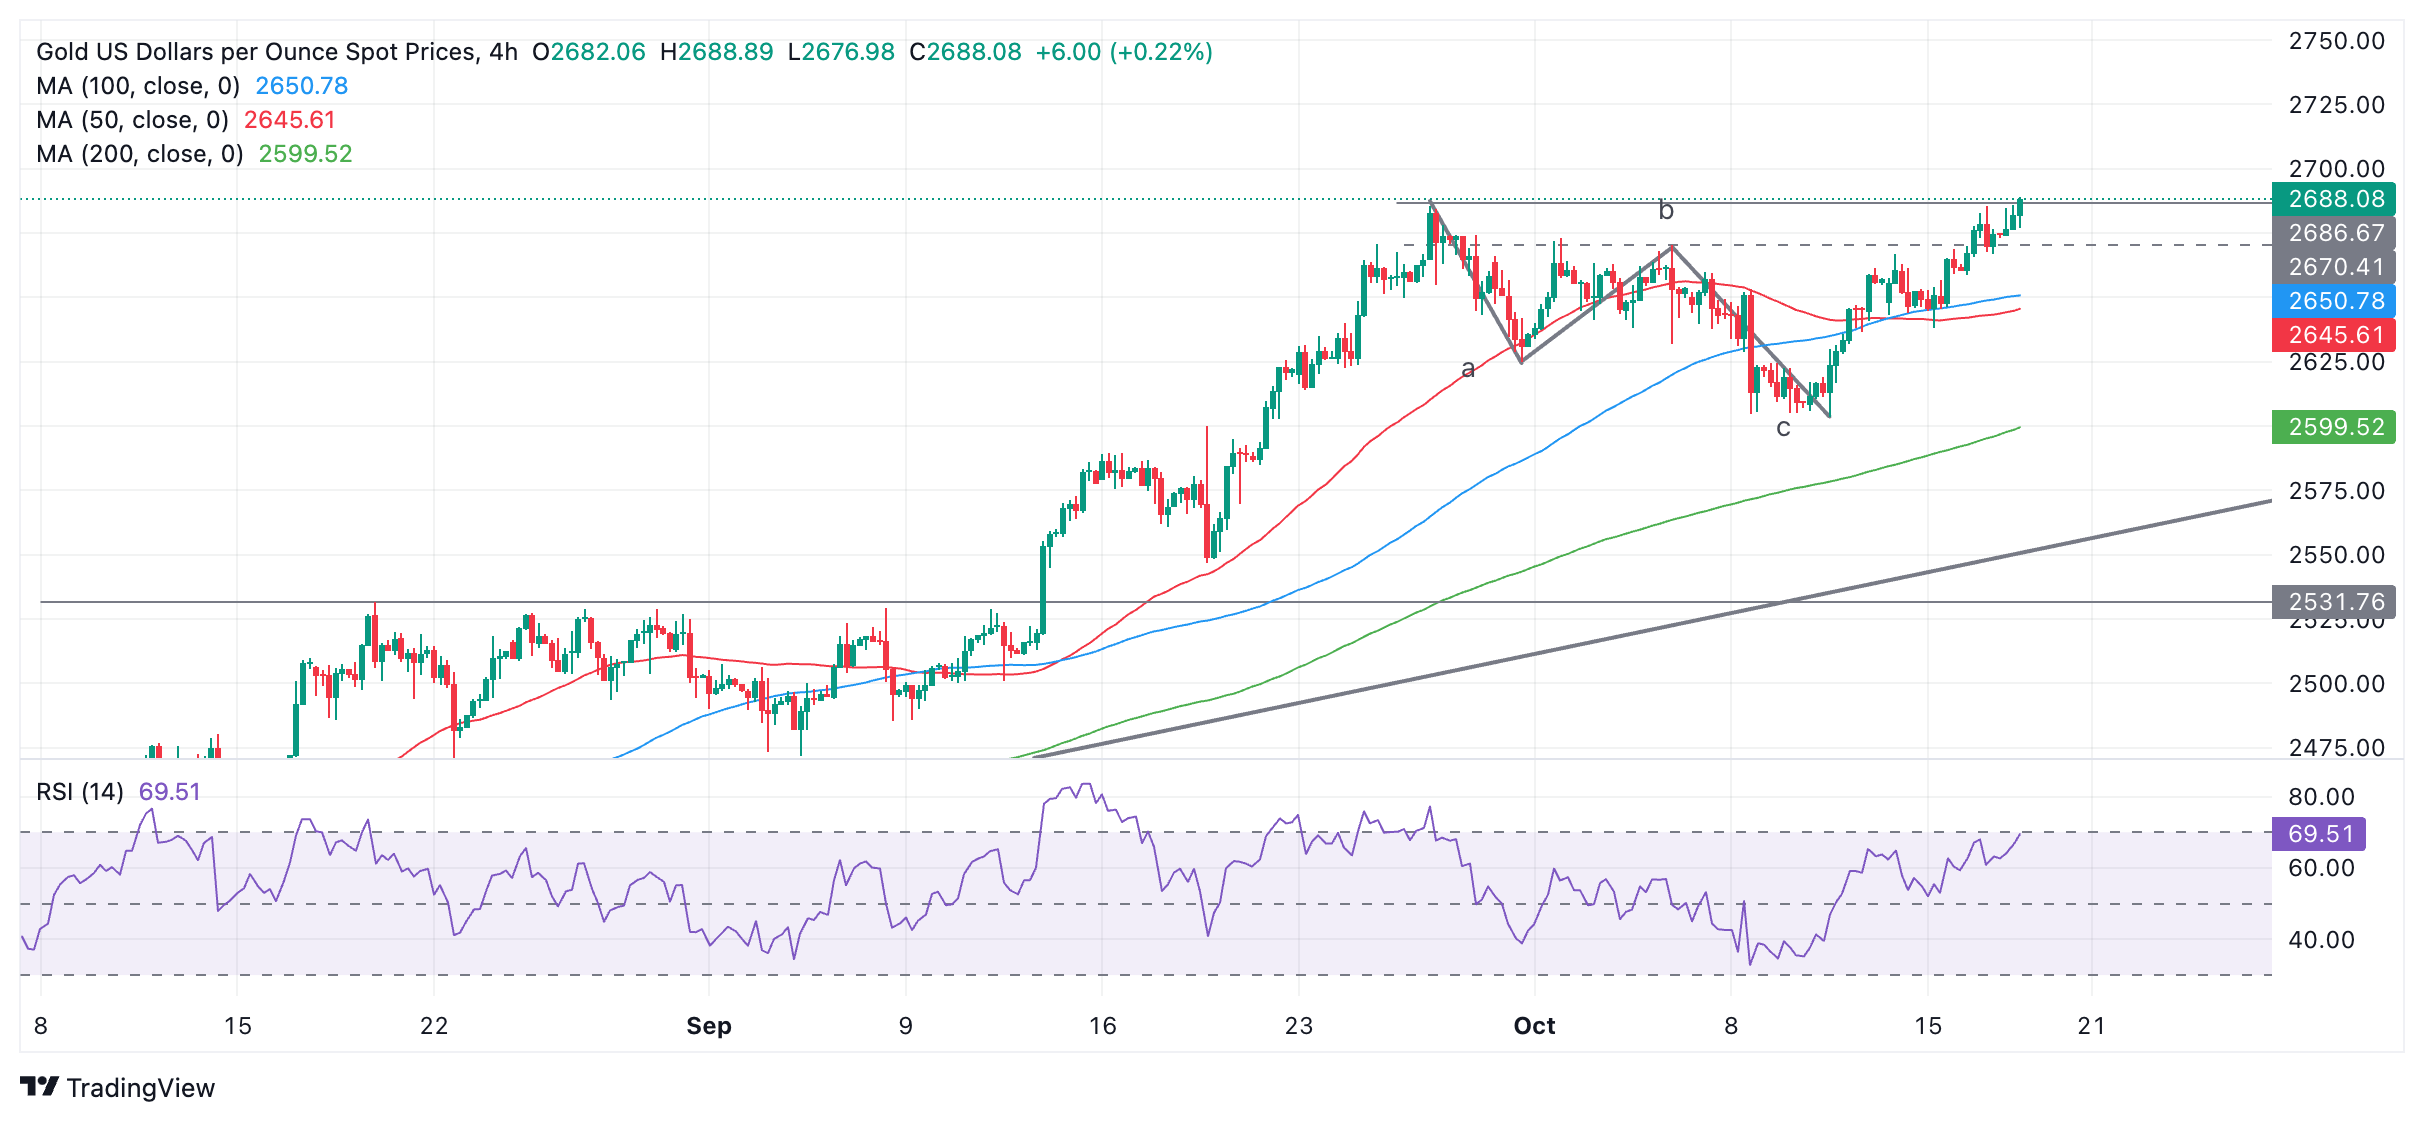
The most recent leg higher since the October 10 low looks like a three-wave zig-zag pattern that is complete, with the first and last waves more or less of equal length. Thus, it is possible that the precious metal could pull back lower temporarily – perhaps to the $2,670 mark, or even $2,650s – however, given the old adage that “the trend is your friend,” it will probably resume its uptrend thereafter. Eventually it is likely to reach the next target at $2,700, a round number and psychological level.
The Relative Strength Index (RSI) is still not overbought, suggesting there is further room for growth to the upside.
Gold FAQs
Gold has played a key role in human’s history as it has been widely used as a store of value and medium of exchange. Currently, apart from its shine and usage for jewelry, the precious metal is widely seen as a safe-haven asset, meaning that it is considered a good investment during turbulent times. Gold is also widely seen as a hedge against inflation and against depreciating currencies as it doesn’t rely on any specific issuer or government.
Central banks are the biggest Gold holders. In their aim to support their currencies in turbulent times, central banks tend to diversify their reserves and buy Gold to improve the perceived strength of the economy and the currency. High Gold reserves can be a source of trust for a country’s solvency. Central banks added 1,136 tonnes of Gold worth around $70 billion to their reserves in 2022, according to data from the World Gold Council. This is the highest yearly purchase since records began. Central banks from emerging economies such as China, India and Turkey are quickly increasing their Gold reserves.
Gold has an inverse correlation with the US Dollar and US Treasuries, which are both major reserve and safe-haven assets. When the Dollar depreciates, Gold tends to rise, enabling investors and central banks to diversify their assets in turbulent times. Gold is also inversely correlated with risk assets. A rally in the stock market tends to weaken Gold price, while sell-offs in riskier markets tend to favor the precious metal.
The price can move due to a wide range of factors. Geopolitical instability or fears of a deep recession can quickly make Gold price escalate due to its safe-haven status. As a yield-less asset, Gold tends to rise with lower interest rates, while higher cost of money usually weighs down on the yellow metal. Still, most moves depend on how the US Dollar (USD) behaves as the asset is priced in dollars (XAU/USD). A strong Dollar tends to keep the price of Gold controlled, whereas a weaker Dollar is likely to push Gold prices up.
GBP/USD depreciated 0.6% to 1.2990, closing below 1.30 for the first time since August 19. UK CPI inflation fell to 1.7% YoY in September, extending its fall below the official 2% target and fuelling rate cut bets. The Bank of England and the US Federal Reserve are scheduled to meet on the same day on November 7, with both central banks expected to lower their policy rates by the same 25 bps to the same 4.75% level. Despite this, the positive UK-US bond yield spread has narrowed and weighed on the GBP, DBS’ FX analyst Philip Wee notes.
GBP’s fall is a correction, not a reversal
“Beyond the market’s short-term fixation on interest rate differentials, this narrowing should be viewed positively for the GBP in the medium term. First, it reflects that the UK is making better progress compared to its US counterpart in returning inflation to the 2% target. Second, this goal is complemented by the new Labour government’s pledge to restore fiscal stability, contrasting sharply with the unsustainable federal debt worries in the next US presidential term.”
“Hence, pay attention to the UK 2024 autumn Budget announcement on October 30. In contrast to mini-budget crisis that pummelled GBP to a new lifetime low in 2022 with unfunded tax cuts. UK Chancellor of the Exchequer Rachel Reeves is aiming to balance public spending with progressive taxation. If Reeves succeeds in delivering clear and sensible fiscal discipline, it could boost investor confidence in the UK’s economic management.”
“GBP/USD should eventually regain its footing when markets recognize that the UK’s priority on long-term fiscal stability will best the US’s short-term priority on economic growth with stimulus spending. Understandably, the UK’s economic growth is expected to improve to 1.3% in 2025 from 1% this year against a US slowdown to 1.7% from 2.3%, with narrower budget and current account deficits than the US.”
Headline and core CPI inflation ease globally; global PPI inflation is approaching negative territory. Inflation indicators such as freight costs, commodity prices show limited signs of inflationary pressures. Inflation remains very well-behaved in Asia, but food inflation continues to be a source of concern, Standard Chartered’s economist Madhur Jha notes.
Food inflation is a worry for Asia
“UST breakevens suggest renewed concerns about US inflationary pressures. However, on a more global basis, drivers of inflation are still subdued. Supply-chain disruptions remain limited despite the escalation in geopolitical tensions, and orders-to-inventory ratios are easing, suggesting limited inflationary pressures ahead of the holiday season. While recent China stimulus has boosted industrial metal prices, commodity prices overall have been fairly stable. China continues to export deflation, with US import prices from China (and Asia) well below those from other regions.”
“Headline CPI and PPI inflation continue to ease broadly, even in the SSA and MENA economies. Core inflation is also falling across regions, though it remains elevated compared to the pre-pandemic period. This should provide comfort to central banks looking to ease policy rates and support growth. More importantly, the momentum on both CPI and PPI inflation (3M/3M) continues to show signs of broad-based easing.”
“Among Emerging Markets (EM) economies, inflation looks well-behaved in Asia, partly due to fairly stable exchange rates this year. Food inflation, however, continues to be a source of concern for Asia, with both the momentum and annual pace of inflation picking up. A similar trend is also seen in some other EM economies, suggesting potentially a lagged impact of El Niño conditions.”
While Turkey’s central bank (CBT) removed sentences about additional tightening in its last monthly statement, and even introduced hints about monetary easing in the medium-term, the CB maintained its hawkish bias for the short-term, and is watchful of inflation developments. In this context, the September data were not encouraging at all, Commerzbank’s FX analyst Tatha Ghose notes.
USD/TRY to trade at 34.50 in the end of 2024
“Istanbul cost of living data had already warned us about an upside surprise, and the national CPI data then displayed re-acceleration in core prices. The September rate of change annualises to, still, nearly 50% underlying inflation rate. And, many commentators anyway assume that this national CPI measure understates true inflation. Given such an uncomfortable fundamental situation, there is no case for CBT to shift to a dovish stance or cut rates soon.”
“To its credit, the economic policy team does not appear to be in any hurry with this, which has positively surprised markets. President Tayyip Erdogan’s support has also proved to be a welcome surprise. Recent commentary confirms that CBT might resort to liquidity sterilisation or other quantitative measures, but will not change the base rate prematurely. Of course, in Turkey there are risks surrounding such a view, but for a change, the risks do not appear to be increasing.”
“The lira has fluctuated more like a free exchange rate over the past couple of months – which probably reflects less intervention by policymakers and more integration with free world markets – which is positive for underlying bank balance sheets and CBT’s FX reserves. Still, in our view, the medium-term trend of the lira exchange rate remains that of gradual depreciation: our end-2024 forecast for USD/TRY is 34.50.”
China announced two new measures to stabilise its property market. The ‘whitelist’ property projects loan quota will be expanded to CNY4 tn by end2024 and it targets to renovate 1 million houses in major cities and compensate residents accordingly, UOB Group’s economist Ho Woei Chen.
China announces further support for property market
“The provision of more credit to viable projects aims to reduce risks in the real estate market and boost delivery of new homes but would otherwise have limited impact on incentivizing property investment or demand.”
“To recap, the government rolled out a property rescue package in mid-May and followed up in Sep with further support. The Ministry of Finance also said in its briefing over the weekend that local governments can use the money raised from their special bonds to buy unsold homes and turn them into subsidized housing.”
“We believe the government will continue to watch the property market development closely and is expected to step up support when needed but more to manage the downsizing rather than to reverse the trend. Looking ahead, market anticipates more details on the fiscal stimulus after the meeting of the Standing Committee of the National People’s Congress (NPC) in late-Oct, following the approval process.”
- The US Dollar is in the green against nearly every G20 peer on the quote board.
- Traders are finally starting to hedge in volume for a possible Trump win in November.
- The US Dollar Index breaks above a key level on its way to 104.00.
The US Dollar (USD) adds to gains for a fifth consecutive day when looking at the US Dollar Index (DXY), which can be seen as the benchmark for the Greenback’s performance. China’s Housing Minister said on Thursday that the country will open a 4 trillion Yuan (CNY) funding to support its domestic housing market, a quite lower number than the initial 6 trillion Yuan communicated on Monday, and adds to momentum for the United States (US) former President Donald Trump to take more lead in the polls in the run-up to the November 5 Presidential Elections day.
The US economic calendar is full on Thursday. Besides the usual weekly Jobless Claims, Retail Sales and several leading indicators will be released about the US economy and activity. In case that is not enough, the European Central Bank (ECB) is set to deliver another 25 basis point (bps) rate cut according to consensus, with the main question if ECB President Christine Lagarde dares to deliver a hawkish rate cut while Europe’s economic engine, Germany, is severely stuttering.
Daily digest market movers: A lot of data to read through
- The US calendar kicks off at 12:30 GMT with a bulk release of data:
- The weekly Jobless Claims:
- Initial Claims for the week ending on October 11 are expected to remain stable at 258,000, as the previous week.
- The Continuing Claims for the week ending on October 4 are expected to increase to 1.87 million from the prior 1.861 million.
- IT will be interesting to see how the hurricanes in Florida and the Gulf region have influenced the claims numbers.
- September Retail Sales:
- The monthly headline Retail Sales is expected to rise by 0.3%, compared to 0.1% in the previous reading.
- The monthly Retail Sales, excluding cars and transportation, should grow at a steady pace of 0.1%.
- The Philadelphia Fed Manufacturing Survey for October is expected to tick up to 3.0, coming from 1.7 in September.
- The weekly Jobless Claims:
- At 13:00 GMT, Federal Reserve (Fed) Bank of Chicago President Austan Goolsbee delivers welcoming remarks at the Fifth Annual Exploring Career Pathways in Economics and Related Field Conference.
- At 13:15 GMT, the Fed releases the Industrial Production data for September, which is expected to shrink by 0.2% against the growth of 0.8% seen in August.
- At 14:00 GMT, the National Association of Home Builders (NAHB) will release its monthly Housing Market Index for October. The expectation is for an uptick to 43 against the 41 from September.
- The European Central Bank (ECB) will release its rate decision at 12:15 GMT, followed by a press conference where ECB President Christine Lagarde will deliver a speech and take Q&A around 12:45 GMT.
- Equities in Asia are seeing investors being disappointed with a tepid reaction to China's supportive measures on its domestic housing sector. Both Japan’s and China’s equity indices have closed in the red. European equities are doing better with hopes from traders for a rate cut from the ECB, while US futures are trading flat to mildly higher.
- The CME Fed rate expectation for the meeting on November 7 shows a 92.1% probability of a 25 bps rate cut, while the remaining 7.9% is pricing in no rate cut. Chances for a 50 bps rate cut have been fully priced out.
- The US 10-year benchmark rate is trading at 4.04% after having flirted with a break below 4% on Wednesday.
US Dollar Index Technical Analysis: The Trump protection
The US Dollar Index (DXY) is rallying with more and more headlines and media channels, starting to pick up on a possible Trump win in the US presidential elections in November. It looks like that trading desks are starting to hedge for that event, with the risk that the US Dollar will continue to rally into the event and can only reverse once it is done, no matter who won. Thus, a big attention point is that the DXY might become a “buy the rumour, sell the fact” event in the coming weeks.
A firm resistance is ahead at 103.79, which aligns with the 200-day SMA. Above that, there is a small gap before hitting the pivotal level at 103.99 and the 104.00 big figure. Should Trump further lead in the polls, a rapid swing up to 105.00 and 105.53 could be on the cards.
On the downside, the 100-day SMA at 103.20 and the pivotal level at 103.18 are now acting as support and should prevent the DXY from falling lower. With the Relative Strength Index in overbought territory, a test on this level looks granted. Further down, the 55-day SMA at 101.84 and the pivotal level at 101.90 should avoid further downside moves.
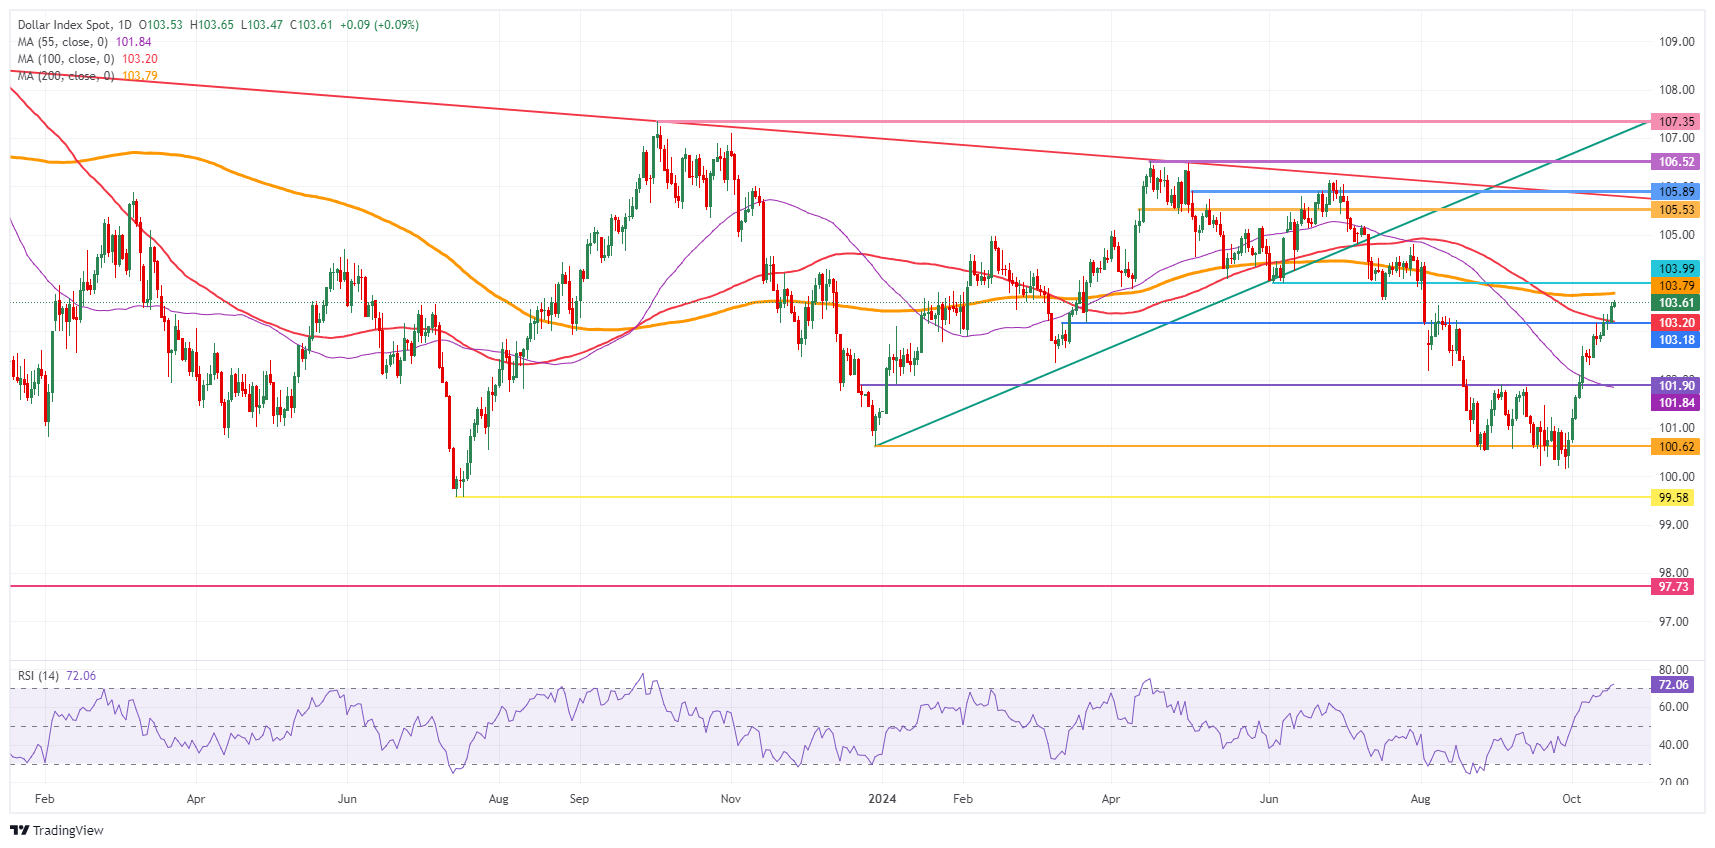
US Dollar Index: Daily Chart
US Dollar FAQs
The US Dollar (USD) is the official currency of the United States of America, and the ‘de facto’ currency of a significant number of other countries where it is found in circulation alongside local notes. It is the most heavily traded currency in the world, accounting for over 88% of all global foreign exchange turnover, or an average of $6.6 trillion in transactions per day, according to data from 2022. Following the second world war, the USD took over from the British Pound as the world’s reserve currency. For most of its history, the US Dollar was backed by Gold, until the Bretton Woods Agreement in 1971 when the Gold Standard went away.
The most important single factor impacting on the value of the US Dollar is monetary policy, which is shaped by the Federal Reserve (Fed). The Fed has two mandates: to achieve price stability (control inflation) and foster full employment. Its primary tool to achieve these two goals is by adjusting interest rates. When prices are rising too quickly and inflation is above the Fed’s 2% target, the Fed will raise rates, which helps the USD value. When inflation falls below 2% or the Unemployment Rate is too high, the Fed may lower interest rates, which weighs on the Greenback.
In extreme situations, the Federal Reserve can also print more Dollars and enact quantitative easing (QE). QE is the process by which the Fed substantially increases the flow of credit in a stuck financial system. It is a non-standard policy measure used when credit has dried up because banks will not lend to each other (out of the fear of counterparty default). It is a last resort when simply lowering interest rates is unlikely to achieve the necessary result. It was the Fed’s weapon of choice to combat the credit crunch that occurred during the Great Financial Crisis in 2008. It involves the Fed printing more Dollars and using them to buy US government bonds predominantly from financial institutions. QE usually leads to a weaker US Dollar.
Quantitative tightening (QT) is the reverse process whereby the Federal Reserve stops buying bonds from financial institutions and does not reinvest the principal from the bonds it holds maturing in new purchases. It is usually positive for the US Dollar.
This morning, the Australian employment report joined the ranks of countries that have recently reported surprisingly strong figures, Commerzbank’s FX analyst Michael Pfister notes.
AUD can remain well supported for the time being
“At 64.1k, job creation was slightly stronger than August's strong figure (and driven mainly by full-time positions), while the unemployment rate was revised slightly lower. At 4.1%, the unemployment rate remains close to historic lows and well below the average for the past decade. As a result, the Australian dollar has strengthened considerably this morning.”
“Of course, the Reserve Bank of Australia's future actions will also depend on the third quarter inflation figures, which will be released in two weeks' time. However, with the labour market looking much stronger again and the trend having been strengthening for several months now, there may be little reason to initiate a turnaround on interest rates in early November.”
“Such figures also suggest that the RBA will take its time until early next year. The Aussie should therefore remain well supported for the time being, although the Chinese figures are also likely to be the key factor in Australia. If they are weaker, the Australian dollar is likely to struggle as well.”
EUR/USD is trading heavy below the 200-day moving average (1.0873). The risk is the ECB delivers a dovish 25 bp cut today which can further weigh on EUR, BBH FX analysts note.
Dovish cut today can further weigh on EUR
“The ECB is widely expected to cut the key interest rate 25 bp to 3.25% (1:15pm London) and reiterate that it ‘is not pre-committing to a particular rate path.’
“However, ECB president Christine Lagarde will likely sound dovish during her post-meeting press conference (1:45pm London) because the Eurozone economy is stagnating, and inflation is undershooting the ECB’s 2% target.”
“Market is pricing-in almost 175 bp of easing over the next twelve months that would see the policy rate bottom near 1.75%.”
Of course, one can object that ‘everything has already been priced in’ – such as today's 25 basis point interest rate cut by the ECB. In fact, the market is almost 100% certain that the ECB will take action. Nevertheless, this does not necessarily mean that there will be no or hardly any movement in EUR/USD, Commerzbank’s FX analyst Antje Praefcke notes.
Risks in EUR/USD today lie on the downside
“Interest rate changes in particular can trigger short-term volatility in EUR/USD and lead to swings in the exchange rate, even if they are short-lived. The increase in volatility seems to be stronger for interest rate hikes (i.e. 2022 and 2023) than for interest rate cuts (2024). This might be due to the fact that interest rate hikes have a dampening effect on inflation, but also on the economy, which could increase uncertainty, at least in the short term.”
“Another reason may be that the ECB took 50-basis-point steps several times during the hiking cycle, but now prefers 25-basis-point steps. At the same time, meetings are also being skipped, which may further reduce uncertainty. I would rather see the trigger in a surprisingly strong concern on the part of ECB President Lagarde about further significant economic weakness.”
“I doubt whether this view can prevail in the ECB Governing Council, which is dominated by dovish members. I could imagine that concerns about the further economic outlook will prevail. Which is why I could imagine that the risks in EUR/USD today lie on the downside. And that in the coming weeks, the euro is likely to react sensitively to weak data. The first good reason would come next Thursday, should the purchasing managers' indices for October disappoint.”
- EUR/JPY trades sideways near 162.50 with ECB policy in focus.
- Investors expect the ECB to cut interest rates again by 25 bps.
- The next move in the Japanese Yen (JPY) will be projected by the National CPI data for September.
The EUR/JPY pair trades in a tight range around 162.50 in Thursday’s European session. The cross consolidates as investors have sidelined ahead of the European Central Bank’s (ECB) interest rate decision, which will be announced at 12:15 GMT.
The ECB is widely anticipated to reduce the Rate on Deposit Facility by 25 basis points (bps) to 3.25%. This would be the second consecutive interest rate cut by the ECB in a row.
A shift in focus of ECB officials to economic stagnation in the Eurozone from taming price pressures is the major reason behind firm ECB rate cut bets. The Eurozone economy is going through a rough phase due to weakening demand from domestic and overseas markets. Meanwhile, growing speculation for former US President Donald Trump winning presidential elections, which will take place on November 5 has also dampened the Eurozone’s outlook.
Trump is expected to elevate import tariffs, which could hurt exports from the old continent and make their economic prospects more vulnerable.
Meanwhile, the annual Eurozone Harmonized Index of Consumer Prices (HICP) has decelerated to 1.7% in September, according to the revised estimate.
In the Japanese region, investors await the National Consumer Price Index (CPI) data for September, which will be published on Friday. The inflation data will influence market speculation for the Bank of Japan’s (BoJ) interest rate outlook. Economists expect the National CPI ex Fresh Food to have grown by 2.3%, slower than 2.8% in August.
Japanese Yen FAQs
The Japanese Yen (JPY) is one of the world’s most traded currencies. Its value is broadly determined by the performance of the Japanese economy, but more specifically by the Bank of Japan’s policy, the differential between Japanese and US bond yields, or risk sentiment among traders, among other factors.
One of the Bank of Japan’s mandates is currency control, so its moves are key for the Yen. The BoJ has directly intervened in currency markets sometimes, generally to lower the value of the Yen, although it refrains from doing it often due to political concerns of its main trading partners. The BoJ ultra-loose monetary policy between 2013 and 2024 caused the Yen to depreciate against its main currency peers due to an increasing policy divergence between the Bank of Japan and other main central banks. More recently, the gradually unwinding of this ultra-loose policy has given some support to the Yen.
Over the last decade, the BoJ’s stance of sticking to ultra-loose monetary policy has led to a widening policy divergence with other central banks, particularly with the US Federal Reserve. This supported a widening of the differential between the 10-year US and Japanese bonds, which favored the US Dollar against the Japanese Yen. The BoJ decision in 2024 to gradually abandon the ultra-loose policy, coupled with interest-rate cuts in other major central banks, is narrowing this differential.
The Japanese Yen is often seen as a safe-haven investment. This means that in times of market stress, investors are more likely to put their money in the Japanese currency due to its supposed reliability and stability. Turbulent times are likely to strengthen the Yen’s value against other currencies seen as more risky to invest in.
The US Dollar (USD) is likely to trade in a range between 7.1100 and 7.1430. In the longer run, strong and sudden surge suggests further USD strength to 7.1600, potentially 7.1900, UOB Group’s FX analysts Quek Ser Leang and Peter Chia note.
USD to trade in a range between 7.1100 and 7.1430
24-HOUR VIEW: “Two days ago, USD soared. Yesterday, we indicated that ‘USD strength is likely to continue’ Our view did not turn out, as USD traded in a relatively quiet manner between 7.1138 and 1.7383, closing largely unchanged at 7.1345 (-0.03%). The current price movements are likely part of a range trading phase. Today, we expect USD to trade between 7.1100 and 7.1430.”
1-3 WEEKS VIEW: “After USD soared two days ago, we turned positive in USD yesterday (16 Oct, spot at 7.1350), indicating that ‘the strong and sudden surge suggests further USD strength to 7.1600, potentially 7.1900. We highlighted that ‘to keep the momentum going, USD must not break below the ‘strong support’ level, now at 7.0900.’ There is no change in our view.”
Yesterday's inflation figures put the Pound Sterling (GBP) under considerable pressure: at 4.9% year-on-year, services inflation was even lower than expected, it got it yesterday, Commerzbank’s FX analyst Michael Pfister notes.
Potential for lower EUR/GBP levels
“This was largely due to an offset of the high August for travel prices. The headline rate was also lower than expected, due not only to lower services inflation but also to lower price pressures at the pump. In short, if the Bank of England (BoE) needed one last sign to cut interest rates again in early November.”
“However, the market went one step further and priced in faster rate cuts until spring. This is understandable as the figures were in line with recent dovish comments from BoE Governor Andrew Bailey, who spoke of a faster pace of rate cuts. At the same time, services inflation was well below the BoE's forecast, which should give policymakers room to underpin faster rate cuts when the forecast is revised in a few weeks' time.”
“Despite the figures, we still see potential for lower EUR/GBP levels. Stronger growth in the UK and still somewhat too high inflation support this view. Despite yesterday's figures, the BoE is likely to keep an eye on inflation in the services sector, as price pressures are still too high. At the same time, the risks on the euro side are currently skewed to the downside. Therefore, we can imagine that yesterday's correction will not last too long.”
The US Dollar (USD) is expected to trade in a range, likely between 148.90 and 149.90. In the longer run, there has been no further increase in momentum; a breach of 148.40 would indicate that USD is not rising further, UOB Group’s FX analysts Quek Ser Leang and Peter Chia note.
To trade between 148.90 and 149.90
24-HOUR VIEW: “We expected USD to trade in a 148.55/149.60 range yesterday. USD then traded between 148.86 and 149.81, closing 149.62 (+0.29%). The price movements provide no fresh clues, and we continue to expect USD to trade in a range, likely between 148.90 and 149.90.”
1-3 WEEKS VIEW: “We continue to hold the same view as yesterday (16 Oct, spot at 149.10). As highlighted, the price action over the past few days did not result in further increase in momentum. From here, a breach of 148.40 (no change in ‘strong support’ level) would indicate that USD is not rising further. Note that we have held a positive USD view since the start of the month. On the upside, if USD were to break and remain above 150.05, it would increase the chance of it rising further to 151.00.”
The ECB meets. Final September Eurozone consumer price data should confirm that inflation has fallen almost nine percentage points from its peak, and a whole percentage point this year. Cutting rates is simply an act of chasing inflation lower and keeping real rates stable, UBS’ economist Paul Donoban notes.
All eyes on the ECB meeting
“ECB meetings mean ECB President Lagarde press conferences (although Lagarde has been uncharacteristically quiet recently). There is enough uncertainty about the economic outlook to raise questions about the pace of easing, forcing economists to listen to Lagarde’s remarks.”
“Japanese export data in September were unexpectedly weak. This is not necessarily a reflection of weaker global consumer demand given patterns of spending are shifting toward having fun (having fun = events that can be posted on Instagram). US September retail sales data mainly cover the boring parts of spending but there are some fun elements. The advice never to short the hedonism of US consumers holds good.”
“US industrial and manufacturing output data are due, along with the Philly Fed manufacturing sentiment poll. Manufacturing output (on the official data) has risen slightly this year. Sentiment (ISM, Philly Fed) has pointed to a near continuous contraction for the past two years. It is enough to make one question whether sentiment lives in the real world.”
- AUD/USD surrenders some intraday gains as the US Dollar gains further.
- Surprisingly upbeat Australian labor market data would force the RBA to maintain a hawkish interest rate stance.
- The US Dollar extends gains on expectations of Donald Trump winning presidential elections.
The AUD/USD pair surrenders half of its intraday gains after rising to 0.6700, which were inspired by the upbeat Australian Employment data for September in Thursday’s European session.
The Aussie labor market data showed that the economy added fresh 64.1K jobs, which were unexpectedly higher as market participants projected lower payrolls at 25K than 42.6K in August. The Unemployment Rate grew steadily by 4.1%, while economists expected it to accelerate to 4.2%.
Upbeat Aussie Employment data is expected to restrict Reserve Bank of Australia (RBA) officials from hiking interest rates anytime this year.
Though the Australian Dollar (AUD) outperforms its major peers, the upside in the Aussie pair is expected to remain restricted as the US Dollar (USD) extends its upside on expectations that former US President Donald Trump will defeat Democratic Kamala Harris in presidential elections. Market experts expect higher tariffs on imports, loosening financial conditions and more tax cuts in Trump 2.O administration.
The US Dollar Index (DXY), which tracks the Greenback’s value against six major currencies, rises over 10-week high above 103.50.
Going forward, the next move in the US Dollar will be influenced by the United States (US) Retail Sales data for September, which will be published at 12:30 GMT. The Retail Sales data is estimated to have grown by 0.3%.
Australian Dollar FAQs
One of the most significant factors for the Australian Dollar (AUD) is the level of interest rates set by the Reserve Bank of Australia (RBA). Because Australia is a resource-rich country another key driver is the price of its biggest export, Iron Ore. The health of the Chinese economy, its largest trading partner, is a factor, as well as inflation in Australia, its growth rate and Trade Balance. Market sentiment – whether investors are taking on more risky assets (risk-on) or seeking safe-havens (risk-off) – is also a factor, with risk-on positive for AUD.
The Reserve Bank of Australia (RBA) influences the Australian Dollar (AUD) by setting the level of interest rates that Australian banks can lend to each other. This influences the level of interest rates in the economy as a whole. The main goal of the RBA is to maintain a stable inflation rate of 2-3% by adjusting interest rates up or down. Relatively high interest rates compared to other major central banks support the AUD, and the opposite for relatively low. The RBA can also use quantitative easing and tightening to influence credit conditions, with the former AUD-negative and the latter AUD-positive.
China is Australia’s largest trading partner so the health of the Chinese economy is a major influence on the value of the Australian Dollar (AUD). When the Chinese economy is doing well it purchases more raw materials, goods and services from Australia, lifting demand for the AUD, and pushing up its value. The opposite is the case when the Chinese economy is not growing as fast as expected. Positive or negative surprises in Chinese growth data, therefore, often have a direct impact on the Australian Dollar and its pairs.
Iron Ore is Australia’s largest export, accounting for $118 billion a year according to data from 2021, with China as its primary destination. The price of Iron Ore, therefore, can be a driver of the Australian Dollar. Generally, if the price of Iron Ore rises, AUD also goes up, as aggregate demand for the currency increases. The opposite is the case if the price of Iron Ore falls. Higher Iron Ore prices also tend to result in a greater likelihood of a positive Trade Balance for Australia, which is also positive of the AUD.
The Trade Balance, which is the difference between what a country earns from its exports versus what it pays for its imports, is another factor that can influence the value of the Australian Dollar. If Australia produces highly sought after exports, then its currency will gain in value purely from the surplus demand created from foreign buyers seeking to purchase its exports versus what it spends to purchase imports. Therefore, a positive net Trade Balance strengthens the AUD, with the opposite effect if the Trade Balance is negative.
Focus today is on the ECB meeting, where we expect the ECB to deliver yet another rate cut of 25bp, bringing the deposit rate to 3.25%. Market expectations are supported by the recent weaker-than-anticipated growth indicators, as well as a decline in inflation, Danske Bank’s economist Sofie Pedersen notes.
Focus turns to the ECB
“We expect that the ECB sticks to the 'meeting-by-meeting' and 'data dependent' approach that it has been following in the past few quarters. Ahead of the meeting, we receive the final HICP inflation data, which will allow us to see how the LIMI measure of domestic inflation fared in September, which is an important input for the ECB.”
“US September retail sales and industrial production data as well as the weekly jobless claims are due for release in the afternoon. Retail sales will provide the markets with the latest hard evidence of the strength of the US consumer. Initial jobless claims from the week ending 12 October will for the first time include the impact of Hurricane Milton, which likely distorted the data upwards especially in Florida.”
“Overnight we get, the September inflation in Japan. The figure likely declined sharply from 2.8% in August as an early Tokyo release also indicated. BoJ's preferred measure of inflation stood at 2.8% in August and should remain above the 2%-target. Core price pressures have largely aligned with 2% inflation recently and with the October yen slide in mind, we still see an opening for another BoJ hike in either December or January after the dust has settled upon the general election on 27 October.”
The New Zealand Dollar (NZD) is likely to trade in a range between 0.6035 and 0.6090. In the longer run, NZD is likely to decline further; the level to watch is 0.6005, UOB Group’s FX analysts Quek Ser Leang and Peter Chia note.
Level to watch is 0.6005
24-HOUR VIEW: “NZD dropped sharply in early Asian trading yesterday. We indicated that “given the sharp increase in momentum, it is likely to decline further.” We also indicated that “the major support at 0.6005 is likely out of reach (there is another support at 0.6030).” Our view did not materialise as after dropping to 0.6041, it traded sideways for the rest of the sessions. Downward momentum has slowed, and NZD is unlikely to weaken much further. Today, it is more likely to trade in a range, probably between 0.6035 and 0.6090.”
1-3 WEEKS VIEW: “We continue to hold the same view as yesterday (16 Oct, spot at 0.6060). As highlighted, NZD is likely to decline further, and the level to watch is 0.6005. Overall, only a breach of 0.6115 (no change in ‘strong resistance’ level) would mean that the weakness in NZD that started early this month has stabilised.”
Silver prices (XAG/USD) fell on Thursday, according to FXStreet data. Silver trades at $31.62 per troy ounce, down 0.22% from the $31.69 it cost on Wednesday.
Silver prices have increased by 32.87% since the beginning of the year.
| Unit measure | Silver Price Today in USD |
|---|---|
| Troy Ounce | 31.62 |
| 1 Gram | 1.02 |
The Gold/Silver ratio, which shows the number of ounces of Silver needed to equal the value of one ounce of Gold, stood at 84.75 on Thursday, up from 84.38 on Wednesday.
Silver FAQs
Silver is a precious metal highly traded among investors. It has been historically used as a store of value and a medium of exchange. Although less popular than Gold, traders may turn to Silver to diversify their investment portfolio, for its intrinsic value or as a potential hedge during high-inflation periods. Investors can buy physical Silver, in coins or in bars, or trade it through vehicles such as Exchange Traded Funds, which track its price on international markets.
Silver prices can move due to a wide range of factors. Geopolitical instability or fears of a deep recession can make Silver price escalate due to its safe-haven status, although to a lesser extent than Gold's. As a yieldless asset, Silver tends to rise with lower interest rates. Its moves also depend on how the US Dollar (USD) behaves as the asset is priced in dollars (XAG/USD). A strong Dollar tends to keep the price of Silver at bay, whereas a weaker Dollar is likely to propel prices up. Other factors such as investment demand, mining supply – Silver is much more abundant than Gold – and recycling rates can also affect prices.
Silver is widely used in industry, particularly in sectors such as electronics or solar energy, as it has one of the highest electric conductivity of all metals – more than Copper and Gold. A surge in demand can increase prices, while a decline tends to lower them. Dynamics in the US, Chinese and Indian economies can also contribute to price swings: for the US and particularly China, their big industrial sectors use Silver in various processes; in India, consumers’ demand for the precious metal for jewellery also plays a key role in setting prices.
Silver prices tend to follow Gold's moves. When Gold prices rise, Silver typically follows suit, as their status as safe-haven assets is similar. The Gold/Silver ratio, which shows the number of ounces of Silver needed to equal the value of one ounce of Gold, may help to determine the relative valuation between both metals. Some investors may consider a high ratio as an indicator that Silver is undervalued, or Gold is overvalued. On the contrary, a low ratio might suggest that Gold is undervalued relative to Silver.
(An automation tool was used in creating this post.)
Thursday seems to be the highlight of the week. On top of global events today, we also have a Central Bank of Turkey meeting and important speakers in Hungary, ING’s FX analyst Frantisek Taborsky notes.
Market expectations of a first cut shift to December/January
“First thing this morning there is a local conference in Budapest where the finance minister, who according to newspaper rumours is expected to become the next central bank governor, the minister for economy and the deputy governor of the National Bank of Hungary are all expected to speak. With EUR/HUF levels above 400, we believe the speakers will have more attention than usual and we are likely to hear hawkish news from central bankers that could help the HUF get back on track.”
“Later today we will see the Central Bank of Turkey decision. In line with expectations, we expect the rate to remain unchanged at 50%. September inflation numbers surprised to the upside and the market is expecting an additional dose of hawkishness. Market expectations of a first cut are shifting from October/November to December/January, which is showing up in the forward pricing.”
“However, the spot TRY market remains on the same trajectory, which is the main reason we prefer spot over forwards at the moment, collecting high carry. Thus, reassurance from the Central Bank of Turkey should only extend the window where TRY remains the currency of choice for markets, while TURKGBs rather remain on the sidelines, waiting for the first CBT rate cut.”
The Australian Dollar (AUD) is likely to trade in a 0.6660/0.6720 range. In the longer run, rapid increase in momentum is likely to lead to further AUD weakness; the levels to monitor are 0.6650 and 0.6620, UOB Group’s FX analysts Quek Ser Leang and Peter Chia note.
AUD is likely to trade in a 0.6660/0.6720 range
24-HOUR VIEW: “After AUD dropped sharply in early Asian trade yesterday, we indicated that ‘downward momentum is increasing rapidly, and AUD could continue to decline to 0.6650.’ We added, ‘the major support at 0.6620 is likely of reach today.’ AUD declined less than expected, reaching a low of 0.6859 during NY session. AUD rebounded strongly in early Asian trading today. The rebound in oversold conditions suggest instead of weakening further, AUD is likely to trade in a 0.6660/0.6720 range today.”
1-3 WEEKS VIEW: “Our update from yesterday (16 Oct, spot at 0.6680) still stands. As highlighted, ‘the rapid increase in momentum is likely to lead to further AUD weakness.’ We also highlighted that ‘the levels to monitor are 0.6650 and 0.6620.’ Overall, only a breach of the ‘strong resistance’ at 0.6740 (no change in level from yesterday) would mean that the AUD weakness that started early this month has stabilised.”
- The Pound Sterling trades below 1.3000 against the US Dollar as slowing UK inflation fuels BoE’s dovish bets.
- UK service inflation slowed to 4.9%, the lowest level since May 2022.
- Growing speculation of a Trump victory in the US presidential elections has strengthened the US Dollar.
The Pound Sterling (GBP) strives to gain ground against its major peers on Thursday after facing an intense sell-off on Wednesday. The British currency slumped after the release of the United Kingdom (UK) Consumer Price Index (CPI) data for September, which showed that inflation grew at a slower-than-expected pace.
Annual headline inflation decelerated to 1.7%, below the Bank of England’s (BoE) target of 2%. The core CPI – which excludes a few of the more volatile items – rose by 3.2%, also lower than expected. UK’s service inflation, a closely watched indicator by BoE officials for decision-making on interest rates, decelerated to 4.9%.
Plunging inflationary pressures have bolstered BoE dovish bets. Traders are pricing in a 25 basis points (bps) interest rate cut in each of the two policy meetings that remain for the year. Before the inflation data release, market participants were anticipating the BoE to cut its key borrowing rates only once, either in November or December.
British Finance Minister Rachel Reeves welcomed the sharp drop in inflation ahead of her first budget, which she will present on October 30. A sharp decline in price pressures should allow Reeves to spend more money on development.
On the economic front, the next important data point in the UK is Retail Sales data for September, which will be published on Friday. The Retail Sales data, a key measure of consumer spending, is estimated to have declined 0.3% after gaining 1.1% in August on month-on-month. On an annual basis, the consumer spending measure is expected to have grown by 3.2%, higher than 2.5% in August.
Daily digest market movers: Pound Sterling remains vulnerable against US Dollar
- The Pound Sterling bears take a breath after sliding to near 1.2970 against the US Dollar in Thursday’s London session. However, the outlook of the GBP/USD pair remains vulnerable as the US Dollar rises further as traders have priced out Federal Reserve’s (Fed) large rate cut bets in November.
- The US Dollar Index (DXY), which tracks the Greenback’s value against six major currencies, posts a fresh over 10-week high near 103.60. Market participants don’t expect the Fed to continue with hefty rate cuts as the recent United States (US) labor market data for September showed that the labor market remains quite resilient.
- According to the CME FedWatch tool, 30-day Federal Funds futures pricing data shows that markets broadly expect the central bank will cut interest rates by 25 basis points (bps) in both policy meetings in November and December.
- Meanwhile, rising expectations for former US President Donald Trump winning the US presidential elections, scheduled for November 5, has strengthened the US Dollar. Investors expect a Trump administration to provide looser financial conditions, higher import tariffs, and tax cuts.
- In Thursday’s US session, investors will pay close attention to the monthly US Retail Sales data for September, a key measure of consumer spending, to be published at 12:30 GMT. Economists expect the Retail Sales to have grown by 0.3%.
Technical Analysis: Pound Sterling trades below 1.3000
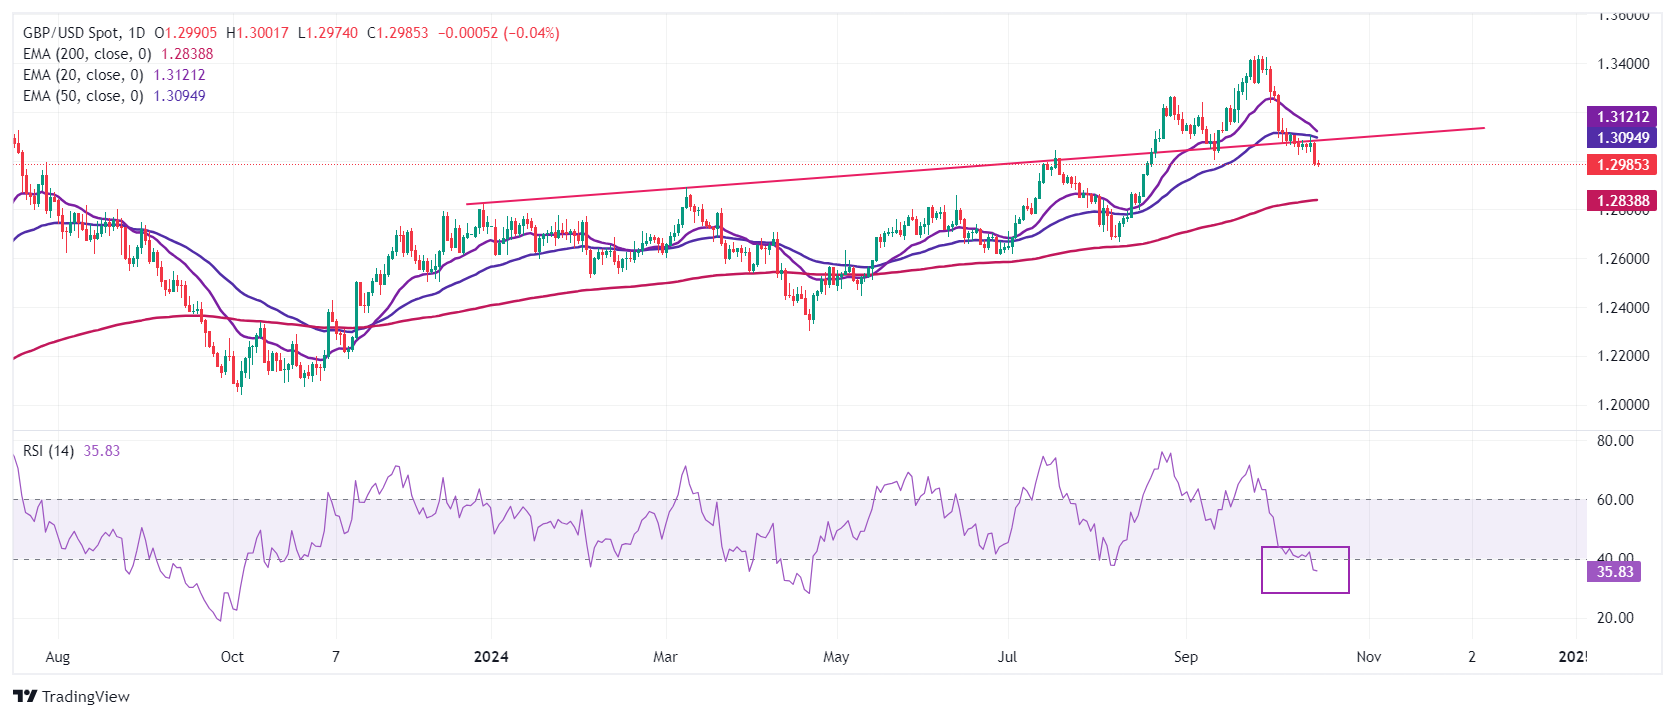
The Pound Sterling shifts below the psychological figure of 1.3000 against the US Dollar in the London trading hours. The GBP/USD pair weakened after breaking below the four-day trading range, extending between 1.3020 and 1.3100. The Cable was already under pressure after slipping below the upward-sloping trendline plotted from the 28 December 2023 high of 1.2827 earlier in October.
The near-term trend of the major looks vulnerable as the 20- and 50-day Exponential Moving Averages (EMAs) near 1.3135 and 1.3100, respectively, are sloping downwards.
The recent downside move in the Relative Strength Index (RSI) below 40.00 also suggests a bearish momentum is picking up.
Looking down, the 200-day EMA near 1.2840 will be a major support zone for Pound Sterling bulls. On the upside, the Cable will face resistance near the round-level figure of 1.3100.
Pound Sterling FAQs
The Pound Sterling (GBP) is the oldest currency in the world (886 AD) and the official currency of the United Kingdom. It is the fourth most traded unit for foreign exchange (FX) in the world, accounting for 12% of all transactions, averaging $630 billion a day, according to 2022 data. Its key trading pairs are GBP/USD, also known as ‘Cable’, which accounts for 11% of FX, GBP/JPY, or the ‘Dragon’ as it is known by traders (3%), and EUR/GBP (2%). The Pound Sterling is issued by the Bank of England (BoE).
The single most important factor influencing the value of the Pound Sterling is monetary policy decided by the Bank of England. The BoE bases its decisions on whether it has achieved its primary goal of “price stability” – a steady inflation rate of around 2%. Its primary tool for achieving this is the adjustment of interest rates. When inflation is too high, the BoE will try to rein it in by raising interest rates, making it more expensive for people and businesses to access credit. This is generally positive for GBP, as higher interest rates make the UK a more attractive place for global investors to park their money. When inflation falls too low it is a sign economic growth is slowing. In this scenario, the BoE will consider lowering interest rates to cheapen credit so businesses will borrow more to invest in growth-generating projects.
Data releases gauge the health of the economy and can impact the value of the Pound Sterling. Indicators such as GDP, Manufacturing and Services PMIs, and employment can all influence the direction of the GBP. A strong economy is good for Sterling. Not only does it attract more foreign investment but it may encourage the BoE to put up interest rates, which will directly strengthen GBP. Otherwise, if economic data is weak, the Pound Sterling is likely to fall.
Another significant data release for the Pound Sterling is the Trade Balance. This indicator measures the difference between what a country earns from its exports and what it spends on imports over a given period. If a country produces highly sought-after exports, its currency will benefit purely from the extra demand created from foreign buyers seeking to purchase these goods. Therefore, a positive net Trade Balance strengthens a currency and vice versa for a negative balance.
- The Mexican Peso extends its weakness into a fourth day as multiple risks lead traders to press “sell”.
- Trump Tariff threats, a critical IMF report, political risks and weak data all combine to weigh on the Mexican currency.
- USD/MXN extends its rally from the base of a major rising channel as technical indicators point north.
The Mexican Peso (MXN) seems to be rinsing and repeating the depreciation of the past few days on Thursday as market bears – now more confident in the persistence of the evolving downtrend – push the Peso lower in all its key pairs.
A cocktail of ingredients is contributing to the Peso’s shakedown, including former president Donald Trump’s threat to slam Mexican auto imports with tariffs of up to 300%, an International Monetary Fund (IMF) report that highlighted a slowdown in economic activity; political risk, and a deterioration of Consumer Confidence data for September.
Mexican Peso cracks as Donald thumps imports piñata
The Mexican Peso declined on average 1.5% on Tuesday, after Donald Trump said in an interview with Bloomberg News that “Mexico is a tremendous challenge for us.” He went on to explain how China was building mega car-manufacturing plants on the US-Mexico border, from where it was flooding the US market and hounding out US competitors.
Trump vowed to stop the practice by reinstating high tariffs and so enable a regeneration of the US auto industry. Given the significance of the automotive industry to the Mexican economy, as well as the demand for Peso’s generated by exports to the US, the former president’s comments weighed on MXN..
Mexican Peso undermined by IMF report
The Mexican Peso saw further weakness after the IMF published a report on Tuesday in which it forecast Gross Domestic Product (GDP) growth slowing to 1.5% at the end of 2024. This comes after the most recent GDP data showed the economy grew 2.1% in Q2. It is also below the Bank of Mexico’s own 2.1% forecast for 2024, although it is slightly higher than the average of the responses in the Banxico’s September survey of private-sector analysts of 1.45%.
The main reasons for the slowdown were given as “binding capacity constraints and a tight monetary policy stance” as well as weaker-than-expected growth in the US and the “unforeseen effects from recent institutional reforms”, according to the report. The latter refers to the controversial judicial reform, which has spooked markets.
In regards to headline inflation, the IMF saw this falling to the Bank of Mexico’s (Banxico) 3.0% target in 2025, in line with the central bank’s own forecasts but below the Banxico survey average forecast of 3.86% (3.80% median).
Banxico set to cut and cut rates again before year-end
Further downwards pressure on the Peso comes from expectations of lower interest rates, which reduce foreign capital inflows. The central bank is expected to cut the prime interest rate by 50 basis points (bps) (0.50%) before the end of 2024, bringing it down to 10.00% from 10.50%.
This is reflected in Banxico’s survey mean forecasts, which show respondents project a fall in the bank rate to an average of 10.04% by the end of 2024 (10.00% median) and 8.09% by the end of 2025 (8.00% median).
Technical Analysis: USD/MXN extends recovery from base of rising channel
USD/MXN extends its recovery from support provided by the base of a rising channel as well as the (red) 50-day Simple Moving Average (SMA) nearby.
USD/MXN Daily Chart
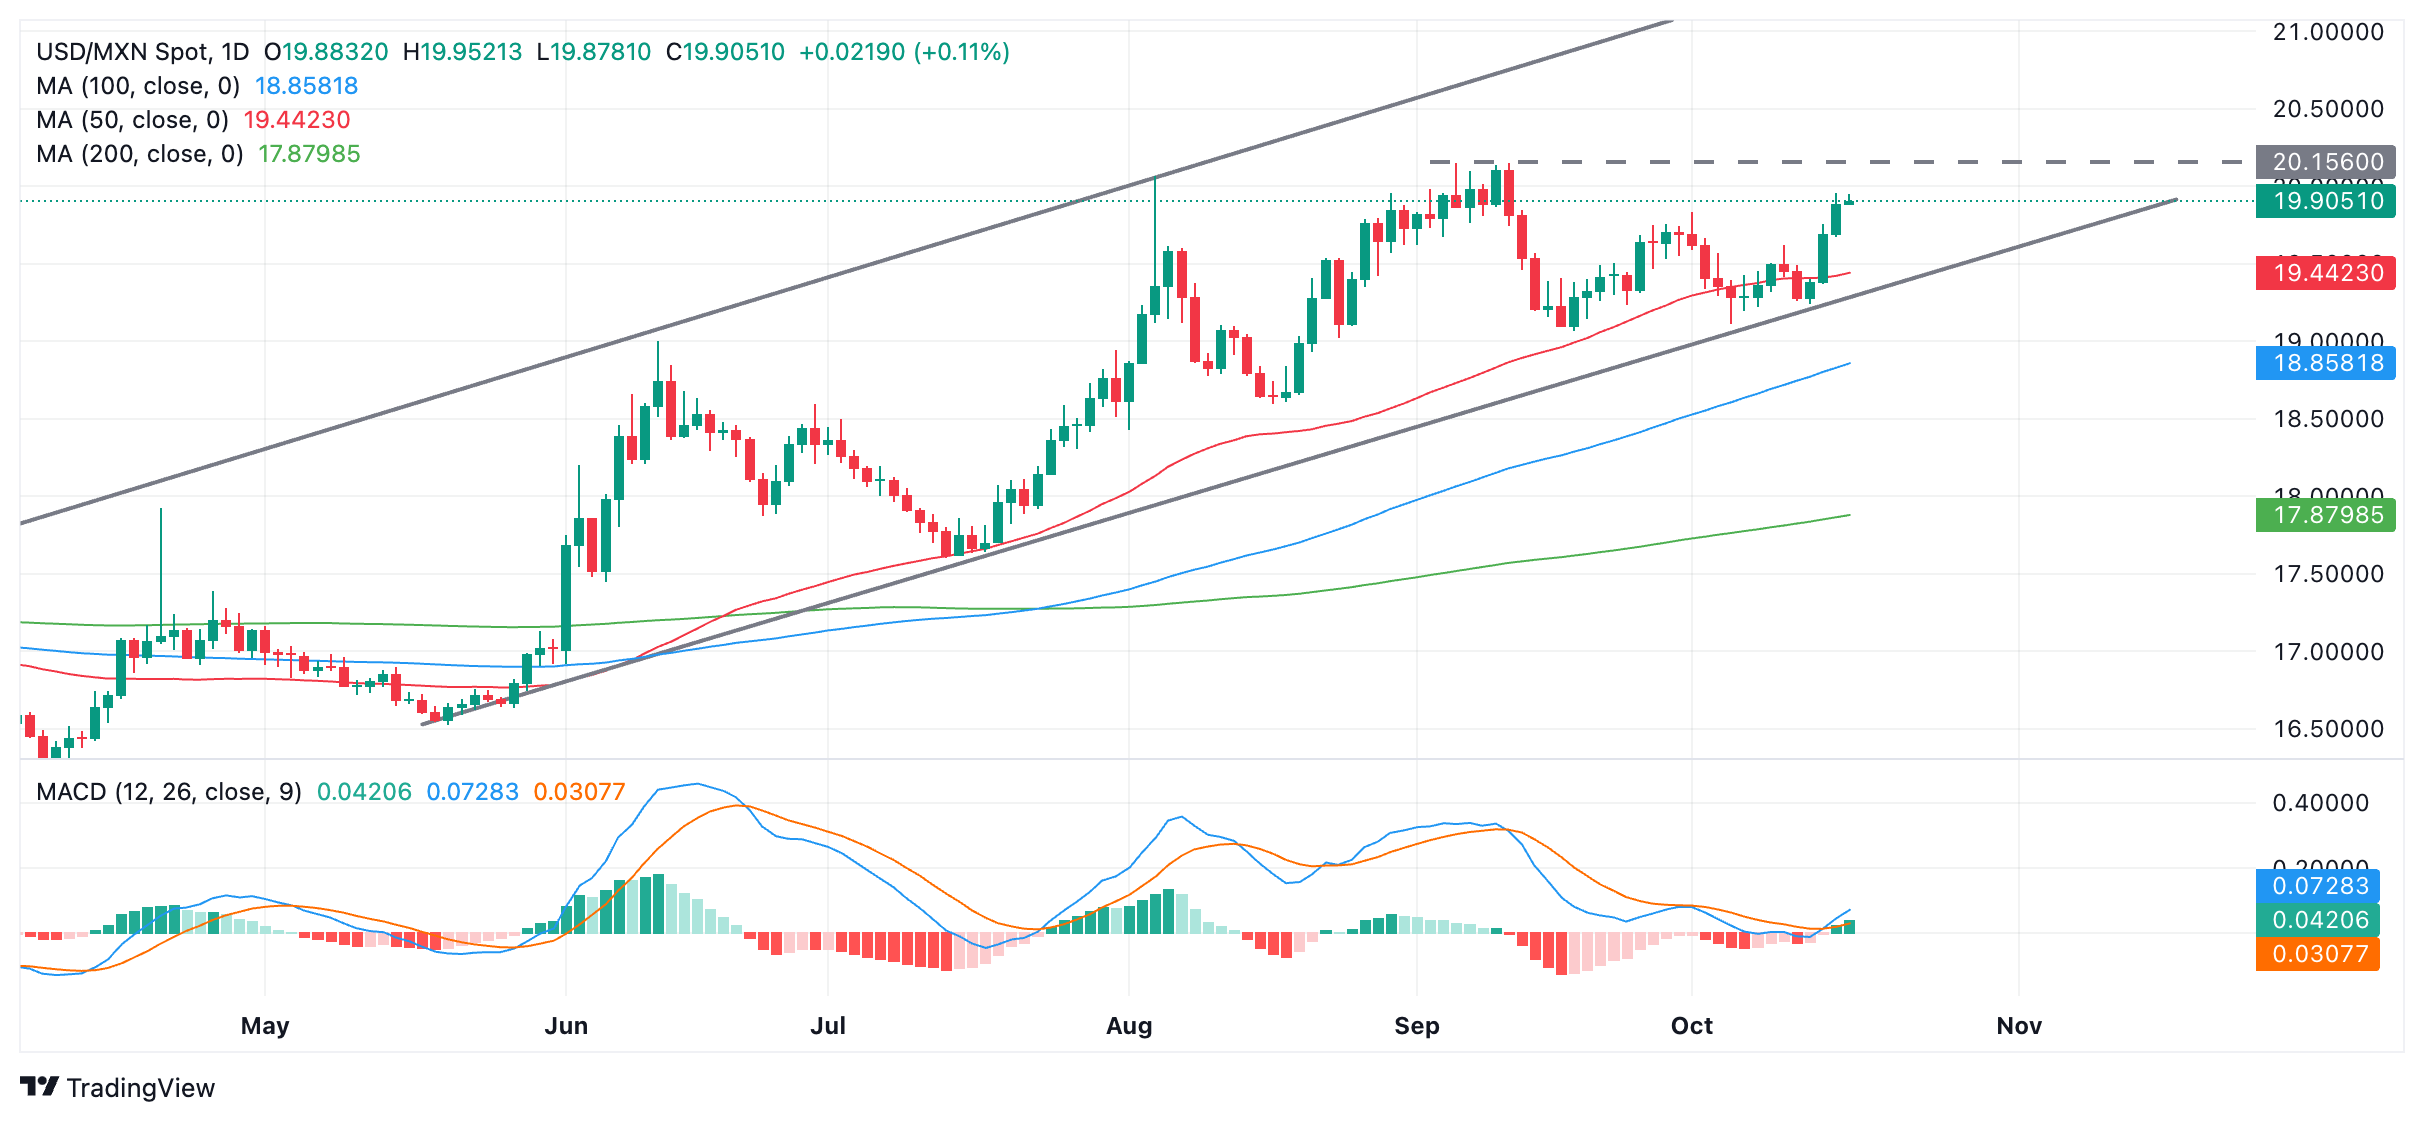
USD/MXN is now probably in a short-term uptrend, which given the technical analysis principle that “the trend is your friend,” is biased to continue.
The break above the 19.83 (October 1 high) target will now probably lead to a move up to between 20.10-20.15 and the vicinity of the September 10 high at 20.13.
The Moving Average Convergence Divergence (MACD) (blue) line is rising sharply and has broken above its (red) signal line, further indicating a bullish bias.
Mexican Peso FAQs
The Mexican Peso (MXN) is the most traded currency among its Latin American peers. Its value is broadly determined by the performance of the Mexican economy, the country’s central bank’s policy, the amount of foreign investment in the country and even the levels of remittances sent by Mexicans who live abroad, particularly in the United States. Geopolitical trends can also move MXN: for example, the process of nearshoring – or the decision by some firms to relocate manufacturing capacity and supply chains closer to their home countries – is also seen as a catalyst for the Mexican currency as the country is considered a key manufacturing hub in the American continent. Another catalyst for MXN is Oil prices as Mexico is a key exporter of the commodity.
The main objective of Mexico’s central bank, also known as Banxico, is to maintain inflation at low and stable levels (at or close to its target of 3%, the midpoint in a tolerance band of between 2% and 4%). To this end, the bank sets an appropriate level of interest rates. When inflation is too high, Banxico will attempt to tame it by raising interest rates, making it more expensive for households and businesses to borrow money, thus cooling demand and the overall economy. Higher interest rates are generally positive for the Mexican Peso (MXN) as they lead to higher yields, making the country a more attractive place for investors. On the contrary, lower interest rates tend to weaken MXN.
Macroeconomic data releases are key to assess the state of the economy and can have an impact on the Mexican Peso (MXN) valuation. A strong Mexican economy, based on high economic growth, low unemployment and high confidence is good for MXN. Not only does it attract more foreign investment but it may encourage the Bank of Mexico (Banxico) to increase interest rates, particularly if this strength comes together with elevated inflation. However, if economic data is weak, MXN is likely to depreciate.
As an emerging-market currency, the Mexican Peso (MXN) tends to strive during risk-on periods, or when investors perceive that broader market risks are low and thus are eager to engage with investments that carry a higher risk. Conversely, MXN tends to weaken at times of market turbulence or economic uncertainty as investors tend to sell higher-risk assets and flee to the more-stable safe havens.
- USD/CHF pulls back from a two-month high, albeit it lacks follow-through selling.
- Bets for smaller Fed rate cuts continue to lend support to the USD and the major.
- A positive risk tone to undermine the safe-haven CHF and limit losses for the pair.
The USD/CHF pair retreats a few pips from a two-month peak touched earlier this Thursday and trades around mid-0.8600s, nearly unchanged for the day during the first half of the European session. Meanwhile, the fundamental backdrop seems tilted in favor of bullish traders and suggests that the path of least resistance for spot prices remains to the upside.
The US Dollar (USD) climbs to its highest level since early August and continues to draw support from growing acceptance that the Federal Reserve (Fed) will proceed with modest interest rate cuts over the next year. This keeps the yield on the benchmark 10-year US government bond above the 4% mark, which acts as a tailwind for the buck and validates the positive outlook for the USD/CHF pair.
Apart from this, the prevalent risk-on environment, bolstered by China's stimulus measures, could undermine the safe-haven Swiss Franc (CHF) and support prospects for an extension of the USD/CHF pair's move-up witnessed over the past two weeks or so. Even from a technical perspective, the recent breakout above the 50-day Simple Moving Average (SMA) compliments the constructive setup.
Traders now look forward to the US economic docket – featuring the release of monthly Retail Sales, the usual Weekly Initial Jobless Claims, the Philly Fed Manufacturing Index and Industrial Production figures. The data will be assessed for cues about the Fed's timeline for potential rate cuts, which, in turn, will drive the USD demand and produce short-term opportunities around the USD/CHF pair.
The market focus will then shift to the Chinese macro data dump, including the third quarter GDP report, due for release during the Asian session on Friday, which will influence the broader risk sentiment. Nevertheless, the aforementioned supporting factors suggest that any meaningful corrective decline could be seen as a buying opportunity and is more likely to remain cushioned amid a bullish USD.
US Dollar PRICE Today
The table below shows the percentage change of US Dollar (USD) against listed major currencies today. US Dollar was the strongest against the Canadian Dollar.
| USD | EUR | GBP | JPY | CAD | AUD | NZD | CHF | |
|---|---|---|---|---|---|---|---|---|
| USD | 0.09% | 0.08% | 0.06% | 0.22% | -0.21% | 0.03% | -0.09% | |
| EUR | -0.09% | -0.03% | -0.02% | 0.13% | -0.30% | -0.04% | -0.17% | |
| GBP | -0.08% | 0.03% | -0.02% | 0.14% | -0.28% | -0.03% | -0.13% | |
| JPY | -0.06% | 0.02% | 0.02% | 0.16% | -0.27% | -0.05% | -0.11% | |
| CAD | -0.22% | -0.13% | -0.14% | -0.16% | -0.42% | -0.18% | -0.27% | |
| AUD | 0.21% | 0.30% | 0.28% | 0.27% | 0.42% | 0.24% | 0.16% | |
| NZD | -0.03% | 0.04% | 0.03% | 0.05% | 0.18% | -0.24% | -0.10% | |
| CHF | 0.09% | 0.17% | 0.13% | 0.11% | 0.27% | -0.16% | 0.10% |
The heat map shows percentage changes of major currencies against each other. The base currency is picked from the left column, while the quote currency is picked from the top row. For example, if you pick the US Dollar from the left column and move along the horizontal line to the Japanese Yen, the percentage change displayed in the box will represent USD (base)/JPY (quote).
- AUD/JPY edges higher due to a solid labor report from Australia released on Thursday.
- Australia’s Employment Change rose by 64.1K, far exceeding the expected 25.0K increase.
- The Japanese Yen lost ground as the domestic Trade Balance reported a larger-than-expected deficit of JPY 294.3 billion in September.
AUD/JPY gains momentum after two consecutive days of losses, trading near the key psychological level of 100.00 during the European session on Thursday. This upward movement is largely driven by the strengthening of the Australian Dollar (AUD), following a robust Australian employment report.
In September, seasonally adjusted Employment Change surged by 64.1K, bringing total employment to a record 14.52 million, far exceeding market expectations of a 25.0K increase. This followed a revised rise of 42.6K in August.
Additionally, Australia's Unemployment Rate held steady at 4.1% in September, matching the revised figure for August and beating forecasts of 4.2%. The number of unemployed individuals fell by 9.2K, bringing the total to 615,700.
On the JPY’s side, the Japanese Yen (JPY) faces additional downward pressure after the release of weaker-than-expected Trade Balance data on Thursday. Japan's Trade Balance reported a deficit of JPY 294.3 billion in September, compared to August's larger deficit of JPY 703.2 billion. This marked the third consecutive month of a trade gap, and it was worse than market expectations of a JPY 237.6 billion shortfall.
Japan's exports declined by 1.7% year-over-year in September, reversing the marginally revised 5.5% growth in August and missing forecasts of a 0.5% increase. This was the first drop in exports since November 2023. Meanwhile, imports rose by 2.1% year-over-year, following a 2.3% increase in August but also falling short of the 3.2% growth expected by the market. Although this was the sixth straight month of rising imports, it represented the softest growth in the sequence.
This disappointing trade balance report adds further complications to the Bank of Japan's (BoJ) plans to exit its ultra-easy monetary policy, putting additional downward pressure on the Japanese Yen (JPY). Earlier in the week, BoJ board member Seiji Adachi cautioned that the BoJ must avoid making any drastic changes to its policy, citing uncertainties in the global economic outlook and concerns over domestic wage growth.
Employment FAQs
Labor market conditions are a key element to assess the health of an economy and thus a key driver for currency valuation. High employment, or low unemployment, has positive implications for consumer spending and thus economic growth, boosting the value of the local currency. Moreover, a very tight labor market – a situation in which there is a shortage of workers to fill open positions – can also have implications on inflation levels and thus monetary policy as low labor supply and high demand leads to higher wages.
The pace at which salaries are growing in an economy is key for policymakers. High wage growth means that households have more money to spend, usually leading to price increases in consumer goods. In contrast to more volatile sources of inflation such as energy prices, wage growth is seen as a key component of underlying and persisting inflation as salary increases are unlikely to be undone. Central banks around the world pay close attention to wage growth data when deciding on monetary policy.
The weight that each central bank assigns to labor market conditions depends on its objectives. Some central banks explicitly have mandates related to the labor market beyond controlling inflation levels. The US Federal Reserve (Fed), for example, has the dual mandate of promoting maximum employment and stable prices. Meanwhile, the European Central Bank’s (ECB) sole mandate is to keep inflation under control. Still, and despite whatever mandates they have, labor market conditions are an important factor for policymakers given its significance as a gauge of the health of the economy and their direct relationship to inflation.
The market is pricing a 25bp ECB rate cut today with a 97% probability, ING’s FX analyst Chris Turner notes.
EUR/USD bounce to the 1.0900/0920 area
“We doubt the ECB will disappoint those expectations, but we see upside risks to the short end of the EUR rates curve today. This is because the market now virtually prices a 25bp rate cut at each of the next six meetings and we do not believe the ECB is ready to capitulate and support faster easing (some 50bp cuts) towards the neutral rate near 2.00/2.25% for the deposit rate.”
“If we're right, EUR/USD could be due a corrective bounce to the 1.0900/0920 area, although such gains may prove temporary. Perhaps a cleaner story for euro strength today will be EUR/CHF. Here we feel EUR/CHF has very much been dragged around by short-dated EUR rates this year and the view that the Swiss National Bank has a floor for the policy rate at 0.50%.”
“Higher short-dated EUR rates today could drag EUR/CHF possibly up to the 0.9480/9500 area.”
Looking across global FX markets, one could be forgiven for thinking that the market is starting to position for a Donald Trump win. In an entertaining interview with Bloomberg on Tuesday, Trump went large on using tariffs should he make it back into the White House. As columnists have said, no one should be surprised if this happens. With the election less than three weeks away, it looks like investors will be reluctant to position against such threats even though the election outcome remains very uncertain, ING’s FX analyst Chris Turner notes.
DXY can dip back to 103.00/103.20
“The most immediate casualty from that interview was the Mexican peso. When it comes to nearshoring, Donald Trump wants US corporates to shorten supply chains not just into Mexico, but into the US itself. He intends to use tariffs to ensure that will be the case. In addition, when it comes to broader tariffs – particularly on the European auto industry – Trump said that tariffs of 10% would not be enough.”
“For the US today, the highlight will be the September US retail sales data and weekly jobless claims. Retail sales are expected to remain reasonable, with the control group at 0.3% MoM. Weekly initial claims are expected to remain high at 258,000, but uncertainty about the impact of Hurricane Helene and the port strike will prevent the market from overreacting to this data.”
“Given the large weighting of the euro in the DXY, the DXY could dip back to 103.00/103.20 if we are right with our ECB/euro analysis today, but we suspect the dollar finds decent support on any dips now.”
Oversold decline has not stabilised; the Pound Sterling (GBP) could decline further to 1.2940. The major support at 1.2890 is not expected to come under threat. In the longer run, the breach of the major support at 1.3000 sets the stage for further losses; the levels to monitor are 1.2940 and 1.2900, UOB Group’s FX analysts Quek Ser Leang and Peter Chia note.
Levels to monitor are 1.2940 and 1.2900
24-HOUR VIEW: “We expected GBP to trade sideways yesterday. However, during early London trading, GBP sold off sharply, plummeting and breaking below the major support at 1.3000 (low has been 1.2977). Inevitably, after such a sharp and swift sell-off, conditions are oversold. That said, the decline has not stabilised. Today, GBP could decline further to 1.2940. The major support at 1.2890 is not expected to come under threat. On the upside, any intraday rebound is expected to face solid resistance at 1.3035 (minor resistance is at 1.3010).”
1-3 WEEKS VIEW: “We turned negative in GBP early this month. As we tracked the decline, in our latest narrative from last Friday (11 Oct, spot at 1.3060), we indicated that ‘there has been no further increase in downward momentum’. However, we pointed out, ‘only a breach of 1.3125 (‘strong resistance’ level) would suggest that 1.3000 is out of reach this time around.’ GBP traded sideways for a few days until yesterday, when it plummeted and broke below 1.3000. The breach of the major support at 1.3000 sets the stage for further losses. The levels to monitor are 1.2940 and 1.2890. On the upside, the ‘strong resistance’ level has moved lower to 1.3080 from 1.3125.”
EUR is expected to decline gradually, potentially reaching 1.0825. In the longer run, to reach the significant support at 1.0770, EUR must keep moving lower, or the likelihood of it reaching this level will diminish quickly, UOB Group’s FX analysts Quek Ser Leang and Peter Chia note.
Downward momentum can be short-lived
24-HOUR VIEW: “We expected EUR to edge lower yesterday, but we indicated that ‘due to mild momentum, any decline is unlikely to break clearly below 1.0860.’ Our anticipation for EUR to weaken was correct, but we underestimated the decline as it dropped to a low of 1.0853. Downward momentum has increased, albeit not much. Today, we continue to expect EUR to decline gradually, potentially to 1.0825. We do not expect the major support at 1.0770 to come into view. On the upside, resistance levels are at 1.0880 and 1.0900.”
1-3 WEEKS VIE: “Our most recent narrative was from two days ago (16 Oct, spot at 1.0905), wherein we indicated that “the slight increase in momentum suggests there is a chance of EUR breaking below the support zone of 1.0860/1.0885, but it remains to be seen if it can maintain a foothold below these levels.’ Yesterday, EUR fell below the support zone, reaching a low of 1.0853. While we would prefer a more definitive break, the price action suggests that the EUR weakness that started early this month remains intact. The next significant support level is some way off at 1.0770. To reach this level, EUR must keep moving lower, or the likelihood of it reaching this level will diminish quickly. Conversely, a breach of the ‘strong resistance’ at 1.0935 (level was at 1.0950 yesterday) would mean that the weakness has stabilised.”
- NZD/USD attempts to remain within the descending channel pattern.
- If the 14-day RSI breaks below the 30 level, it would indicate an oversold territory and possibility of a short-term upward correction.
- The immediate resistance appears at the nine-day EMA at 0.6101 level, followed by the 50-day EMA at 0.6153 level.
The NZD/USD continues its losing streak for the fourth consecutive day, hovering around 0.6050 during Thursday's European trading session. The analysis of the daily chart shows that the pair attempts to remain within the descending channel pattern, signaling a continuation of the bearish trend.
The 14-day Relative Strength Index (RSI) approaches the 30 level, reinforcing the current bearish sentiment. A drop below this threshold would indicate that the NZD/USD pair is oversold, potentially leading to a short-term upward correction. Furthermore, the nine-day Exponential Moving Average (EMA) remains below the 50-day EMA, highlighting weakness in the short-term price trend for the pair.
In terms of support, if the NZD/USD pair successfully re-enters the descending channel, it may test the area around the lower boundary at the 0.5880 level, followed by the "pullback support" near the 0.5850 level.
On the upside, the immediate resistance is at the nine-day Exponential Moving Average (EMA) around the level of 0.6102, followed by the 50-day EMA at 0.6153 level. A break above these levels could shift the outlook to bullish, potentially allowing the NZD/USD pair to target the 16-month high of 0.6379, which was last reached on September 30.
NZD/USD: Daily Chart
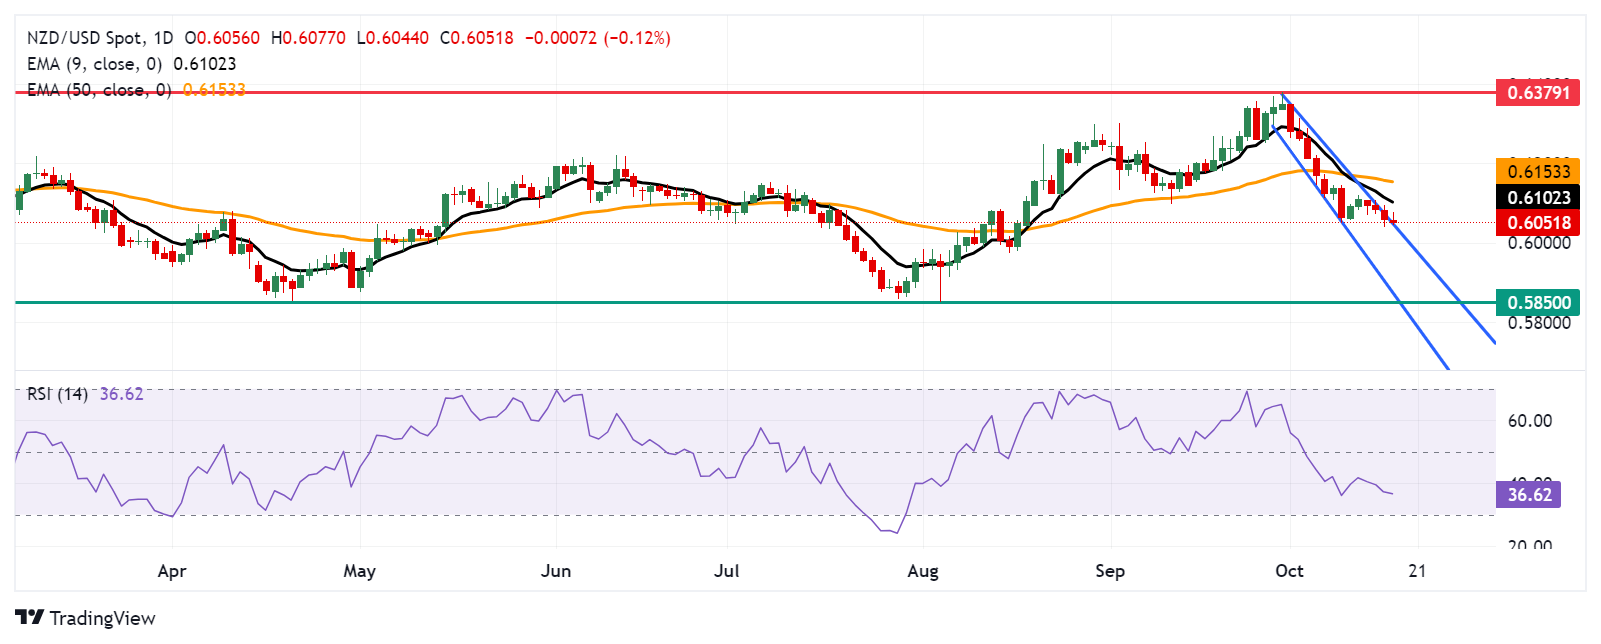
New Zealand Dollar PRICE Today
The table below shows the percentage change of New Zealand Dollar (NZD) against listed major currencies today. New Zealand Dollar was the weakest against the Australian Dollar.
| USD | EUR | GBP | JPY | CAD | AUD | NZD | CHF | |
|---|---|---|---|---|---|---|---|---|
| USD | 0.10% | 0.04% | 0.06% | 0.23% | -0.15% | 0.07% | -0.03% | |
| EUR | -0.10% | -0.07% | 0.00% | 0.14% | -0.25% | 0.00% | -0.12% | |
| GBP | -0.04% | 0.07% | 0.04% | 0.19% | -0.19% | 0.05% | -0.04% | |
| JPY | -0.06% | 0.00% | -0.04% | 0.17% | -0.22% | -0.02% | -0.07% | |
| CAD | -0.23% | -0.14% | -0.19% | -0.17% | -0.37% | -0.14% | -0.23% | |
| AUD | 0.15% | 0.25% | 0.19% | 0.22% | 0.37% | 0.23% | 0.14% | |
| NZD | -0.07% | -0.01% | -0.05% | 0.02% | 0.14% | -0.23% | -0.09% | |
| CHF | 0.03% | 0.12% | 0.04% | 0.07% | 0.23% | -0.14% | 0.09% |
The heat map shows percentage changes of major currencies against each other. The base currency is picked from the left column, while the quote currency is picked from the top row. For example, if you pick the New Zealand Dollar from the left column and move along the horizontal line to the US Dollar, the percentage change displayed in the box will represent NZD (base)/USD (quote).
- EUR/USD extends its downside to near 1.0850 as traders brace for the ECB policy meeting.
- The ECB is expected to cut its key borrowing rates by 25 bps for the second straight meeting.
- Growing speculation for Trump’s victory has strengthened the US Dollar.
EUR/USD exhibits weakness near 1.0850 on Thursday. The major currency pair faces sharp selling pressure ahead of the European Central Bank’s (ECB) interest rate decision, which will be announced at 12:15 GMT.
Traders expect the ECB to reduce its Rate on Deposit Facility further by 49 basis points (bps) in the remaining two meetings this year, according to a note from Citi on Tuesday, suggesting that there will be two rate cuts of 25 bps on Thursday and in December.
A quarter-to-a-percentage rate cut on Thursday will be the second in a row, pushing the deposit facility rate lower to 3.25%. A dovish decision from the ECB is widely anticipated as the Eurozone economy appears to be on the path of an economic slowdown, with price pressures seeming under control.
With high confidence in the ECB to reduce interest rates again, investors will pay close attention to the monetary policy statement and ECB President Christine Lagarde’s press conference to get fresh cues about the likely monetary policy action in December.
Christine Lagarde is expected to talk more about reviving economic growth as the Eurozone Harmonized Index of Consumer Prices (HICP) has decelerated to 1.8% in September, according to flash estimates. The latest economic projections from the German economic ministry showed that the nation is expected to conclude the year with a decline in the overall output by 0.2%.
Daily digest market movers: EUR/USD weakens on multiple headwinds
- EUR/USD extends its losing streak for the fourth trading day on Thursday. The major currency pair declines to a more than 10-week low near 1.0850 as the US Dollar (USD) has performed strongly in the past few weeks. The US Dollar Index (DXY), which gauges the Greenback’s value against six major currencies, jumps to near 103.60, the highest level seen in over two months.
- The Greenback remains firm as traders have priced out expectations of the continuation of hefty rate cuts from the Federal Reserve (Fed) and growing speculation of former US President Donald Trump’s victory in presidential elections, scheduled on November 5.
- Market participants expect the Fed to cut interest rates moderately in the remainder of the year as fears of a United States (US) economic slowdown have been subsided by robust growth in the Nonfarm Payrolls (NFP) and the Services Purchasing Managers’ Index (PMI) data for September.
- Meanwhile, Trump’s victory over Democratic Vice President Kamala Harris is expected to result in higher tariffs on imports from Asian and European peers, tax cuts, and loosening financial conditions that will benefit the US Dollar.
- On the economic front, investors will focus on the US monthly Retail Sales data for September, which will be published at 12:30 GMT. Economists expect Retail Sales to have grown by 0.3%.
Technical Analysis: EUR/USD weakens to 1.0850
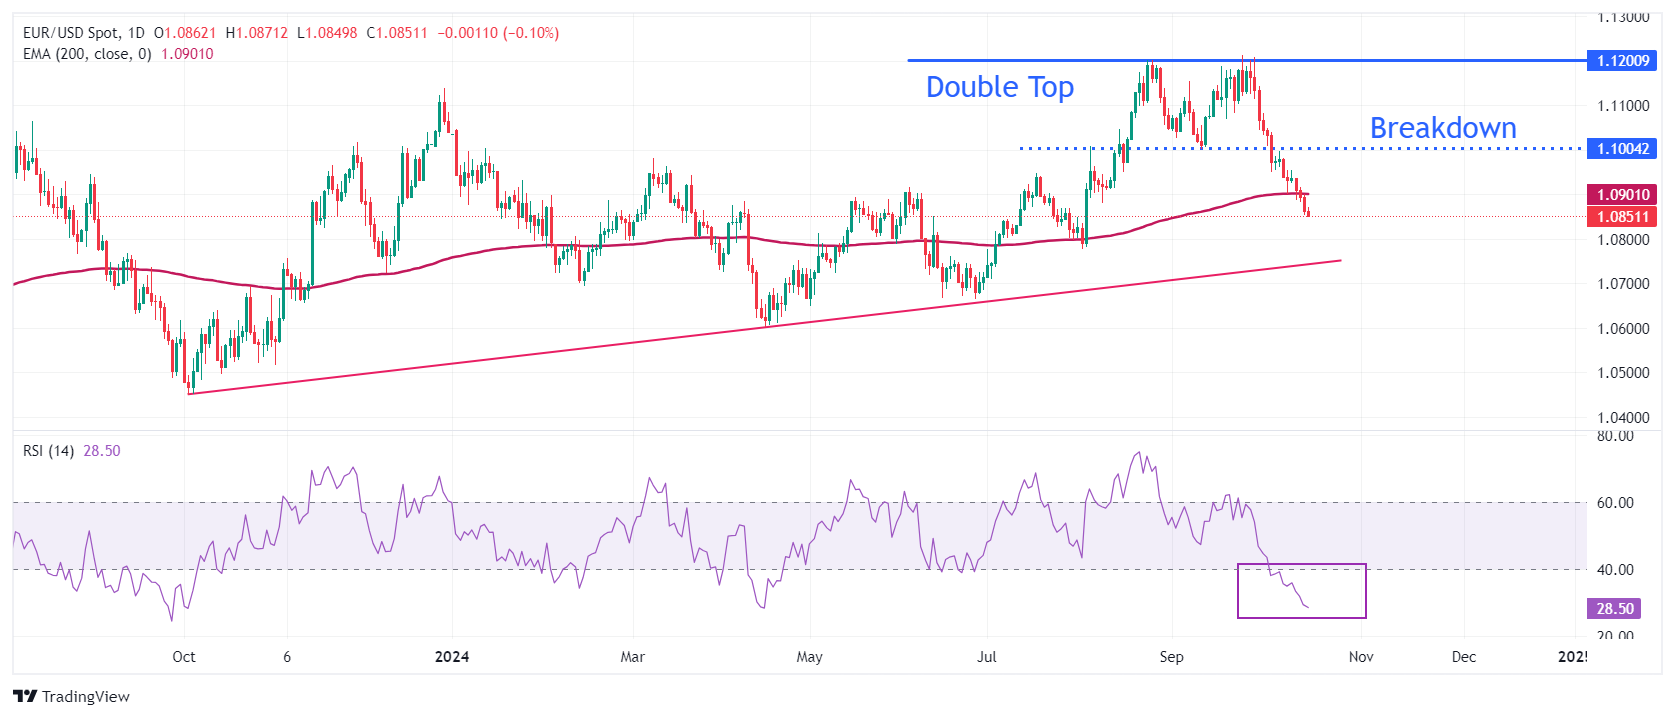
EUR/USD slides further to near 1.0850 in European trading hours. The major currency pair extends its downfall after breaking below the 200-day Exponential Moving Average (EMA), which trades around 1.0900, earlier this week.
The downside move in the shared currency pair started after a breakdown of the Double Top formation on a daily timeframe near the September 11 low at around 1.1000, which resulted in a bearish reversal.
The 14-day Relative Strength Index (RSI) dives below 30.00, indicating a strong bearish momentum.
On the downside, the major could find support near the round-level figure of 1.0800 and upward-sloping trendline at 1.0750, which is plotted from the October 3 low around 1.0450. Meanwhile, the 200-day EMA and the psychological figure of 1.1000 will be the key resistances for the pair.
Euro FAQs
The Euro is the currency for the 19 European Union countries that belong to the Eurozone. It is the second most heavily traded currency in the world behind the US Dollar. In 2022, it accounted for 31% of all foreign exchange transactions, with an average daily turnover of over $2.2 trillion a day. EUR/USD is the most heavily traded currency pair in the world, accounting for an estimated 30% off all transactions, followed by EUR/JPY (4%), EUR/GBP (3%) and EUR/AUD (2%).
The European Central Bank (ECB) in Frankfurt, Germany, is the reserve bank for the Eurozone. The ECB sets interest rates and manages monetary policy. The ECB’s primary mandate is to maintain price stability, which means either controlling inflation or stimulating growth. Its primary tool is the raising or lowering of interest rates. Relatively high interest rates – or the expectation of higher rates – will usually benefit the Euro and vice versa. The ECB Governing Council makes monetary policy decisions at meetings held eight times a year. Decisions are made by heads of the Eurozone national banks and six permanent members, including the President of the ECB, Christine Lagarde.
Eurozone inflation data, measured by the Harmonized Index of Consumer Prices (HICP), is an important econometric for the Euro. If inflation rises more than expected, especially if above the ECB’s 2% target, it obliges the ECB to raise interest rates to bring it back under control. Relatively high interest rates compared to its counterparts will usually benefit the Euro, as it makes the region more attractive as a place for global investors to park their money.
Data releases gauge the health of the economy and can impact on the Euro. Indicators such as GDP, Manufacturing and Services PMIs, employment, and consumer sentiment surveys can all influence the direction of the single currency. A strong economy is good for the Euro. Not only does it attract more foreign investment but it may encourage the ECB to put up interest rates, which will directly strengthen the Euro. Otherwise, if economic data is weak, the Euro is likely to fall. Economic data for the four largest economies in the euro area (Germany, France, Italy and Spain) are especially significant, as they account for 75% of the Eurozone’s economy.
Another significant data release for the Euro is the Trade Balance. This indicator measures the difference between what a country earns from its exports and what it spends on imports over a given period. If a country produces highly sought after exports then its currency will gain in value purely from the extra demand created from foreign buyers seeking to purchase these goods. Therefore, a positive net Trade Balance strengthens a currency and vice versa for a negative balance.
- The US Dollar gathers strength to around 103.60 in Thursday’s early European session, up 0.12% on the day.
- The rising bets that the Fed will gradually lower interest rates support the USD.
- The US Retail Sales data will take center stage on Thursday.
The US Dollar Index (DXY) extends the rally to multi-week tops near 103.60 during the early European session on Thursday. The rising expectation that the US Federal Reserve (Fed) will proceed with modest interest rate cuts over the next year continues to underpin the Greenback. Traders brace for the US September Retail Sales data, which is due later on Thursday.
The Fed kicked off its easing cycle with a jumbo move by 50 basis points (bps) at its last policy meeting in September, but market expectations have shifted to a slower pace of Fed rate cuts, boosting the USD broadly. San Francisco Fed President Daly emphasized that “one or two cuts was a reasonable thing” as the US economy is more balanced. Meanwhile, Atlanta Fed President Bostic stated that he has one more 25 basis points (bps) rate cut pencilled in for this year.
Minneapolis Fed President Neel Kashkari said earlier this week that future interest rate cuts would be “modest” and noted that policy decisions would depend on economic data. The markets have priced in nearly 92.1% chance of a 25 bps Fed rate reduction in November, according to the CME FedWatch tool.
The US Retail Sales will be in the spotlight on Thursday, which is expected to rise to 0.3% MoM in September from 0.1% in August. If the data remain strong, there is still scope for these Fed easing expectations to adjust further.
On the other hand, some easing in geopolitical tensions in the Middle East could cap the upside for the Greenback. Israel told the United States that a planned retaliatory attack on Iran won’t target nuclear and oil facilities, according to senior Biden administration officials, a promise sought by the White House to head off further Middle East escalation, per the Wall Street Journal.
US Dollar FAQs
The US Dollar (USD) is the official currency of the United States of America, and the ‘de facto’ currency of a significant number of other countries where it is found in circulation alongside local notes. It is the most heavily traded currency in the world, accounting for over 88% of all global foreign exchange turnover, or an average of $6.6 trillion in transactions per day, according to data from 2022. Following the second world war, the USD took over from the British Pound as the world’s reserve currency. For most of its history, the US Dollar was backed by Gold, until the Bretton Woods Agreement in 1971 when the Gold Standard went away.
The most important single factor impacting on the value of the US Dollar is monetary policy, which is shaped by the Federal Reserve (Fed). The Fed has two mandates: to achieve price stability (control inflation) and foster full employment. Its primary tool to achieve these two goals is by adjusting interest rates. When prices are rising too quickly and inflation is above the Fed’s 2% target, the Fed will raise rates, which helps the USD value. When inflation falls below 2% or the Unemployment Rate is too high, the Fed may lower interest rates, which weighs on the Greenback.
In extreme situations, the Federal Reserve can also print more Dollars and enact quantitative easing (QE). QE is the process by which the Fed substantially increases the flow of credit in a stuck financial system. It is a non-standard policy measure used when credit has dried up because banks will not lend to each other (out of the fear of counterparty default). It is a last resort when simply lowering interest rates is unlikely to achieve the necessary result. It was the Fed’s weapon of choice to combat the credit crunch that occurred during the Great Financial Crisis in 2008. It involves the Fed printing more Dollars and using them to buy US government bonds predominantly from financial institutions. QE usually leads to a weaker US Dollar.
Quantitative tightening (QT) is the reverse process whereby the Federal Reserve stops buying bonds from financial institutions and does not reinvest the principal from the bonds it holds maturing in new purchases. It is usually positive for the US Dollar.
- USD/CAD appreciates due to the fading likelihood of further bumper rate cuts by the Fed.
- CME FedWatch Tool indicates a 92.1% probability of a 25-basis-point rate cut in November, with no anticipation of a 50-basis-point reduction.
- The Canadian Dollar faces challenges September’s inflation data have reignited expectations for a 50-basis-point rate cut by the BoC.
USD/CAD gains ground due to solid US Dollar (USD), which could be attributed to the fading likelihood of further bumper rate cuts by the Federal Reserve (Fed) following strong US labor and inflation data. The USD/CAD pair trades around 1.3770 during the early European hours on Thursday.
Market expectations are leaning toward a total of 125 basis points (bps) in rate cuts by the US Federal Reserve (Fed) over the next year. According to the CME FedWatch Tool, there is a 92.1% chance of a 25-basis-point rate cut in November, with no expectation of a larger 50-basis-point reduction.
Traders await the US Retail Sales data, scheduled to be released later in the day. Expectations are for monthly consumer spending to increase by 0.3% in September, up from 0.1% in the previous reading.
The Canadian Dollar (CAD) is under pressure as Canada's latest inflation report for September has reignited expectations for a 50 basis point rate cut by the Bank of Canada (BoC) next week. The annual inflation rate dropped to 1.6% in September, the lowest since February 2021, falling below the central bank's 2% target.
Additionally, Standard Chartered's Research report anticipates that the BoC will implement a 50 basis point rate cut, rather than the previously expected 25 bps, at both of its remaining meetings in 2024. Slowing economic growth, declining inflation, rising inflation expectations, and swelling mortgage costs are contributing to the case for deeper cuts. The forecast now sees the BoC's policy rate at 3.25% by the end of 2024 and 2.25% by the end of 2025, down from prior estimates of 3.75% and 3.0%, respectively.
Canadian Dollar FAQs
The key factors driving the Canadian Dollar (CAD) are the level of interest rates set by the Bank of Canada (BoC), the price of Oil, Canada’s largest export, the health of its economy, inflation and the Trade Balance, which is the difference between the value of Canada’s exports versus its imports. Other factors include market sentiment – whether investors are taking on more risky assets (risk-on) or seeking safe-havens (risk-off) – with risk-on being CAD-positive. As its largest trading partner, the health of the US economy is also a key factor influencing the Canadian Dollar.
The Bank of Canada (BoC) has a significant influence on the Canadian Dollar by setting the level of interest rates that banks can lend to one another. This influences the level of interest rates for everyone. The main goal of the BoC is to maintain inflation at 1-3% by adjusting interest rates up or down. Relatively higher interest rates tend to be positive for the CAD. The Bank of Canada can also use quantitative easing and tightening to influence credit conditions, with the former CAD-negative and the latter CAD-positive.
The price of Oil is a key factor impacting the value of the Canadian Dollar. Petroleum is Canada’s biggest export, so Oil price tends to have an immediate impact on the CAD value. Generally, if Oil price rises CAD also goes up, as aggregate demand for the currency increases. The opposite is the case if the price of Oil falls. Higher Oil prices also tend to result in a greater likelihood of a positive Trade Balance, which is also supportive of the CAD.
While inflation had always traditionally been thought of as a negative factor for a currency since it lowers the value of money, the opposite has actually been the case in modern times with the relaxation of cross-border capital controls. Higher inflation tends to lead central banks to put up interest rates which attracts more capital inflows from global investors seeking a lucrative place to keep their money. This increases demand for the local currency, which in Canada’s case is the Canadian Dollar.
Macroeconomic data releases gauge the health of the economy and can have an impact on the Canadian Dollar. Indicators such as GDP, Manufacturing and Services PMIs, employment, and consumer sentiment surveys can all influence the direction of the CAD. A strong economy is good for the Canadian Dollar. Not only does it attract more foreign investment but it may encourage the Bank of Canada to put up interest rates, leading to a stronger currency. If economic data is weak, however, the CAD is likely to fall.
- The European Central Bank is expected to cut benchmark interest rates by 25 bps at the October policy meeting.
- ECB President Christine Lagarde’s presser will be closely scrutinized for fresh policy cues.
- The ECB policy announcements are set to inject volatility around the EUR/USD pair.
The European Central Bank (ECB) interest rate decision will be announced following the October monetary policy meeting at 12:15 GMT on Thursday.
ECB President Christine Lagarde's press conference will follow, beginning at 12:45 GMT, where she will deliver the prepared statement on monetary policy and respond to media questions. The ECB announcements are likely to ramp up the Euro (EUR) volatility.
What to expect from the European Central Bank interest rate decision?
Following the September policy meeting, the ECB decided to lower the interest rate on the marginal lending facility to 3.9% from 4.5% and the deposit facility, also known as the benchmark interest rate, by 25 basis points (bps) to 3.5%. The ECB also cut the interest rate on the main refinancing operations by 60 bps to 3.65%.
The ECB is widely expected to lower the deposit facility rate by another 25 bps to 3.25% after the October meeting.
In the post-meeting press conference, President Lagarde refrained from offering any clues regarding the timing of the next rate cut, saying that there was a relatively short time to the October meeting and adding that they have no commitment of any kind.
However, after the data published by Eurostat showed that the annual Harmonized Index of Consumer Prices (HICP) softened to 1.8% in September from 2.2% in August, investors started to lean toward an additional policy-easing step in October.
According to Reuters, over 90% of economists polled expect a 25 bps cut after September's inflation dipped below the ECB’s target of 2%. Furthermore, most of those surveyed expect another 25 bps reduction in key rates in December.
Previewing the October ECB event, “data has rapidly moved against the ECB's September messaging, and we and the market now expect a 25bps rate cut at the October meeting,” said TD Securities analysts.
“Governing Council members have opened the door wide open to a cut as well. The messaging of a ‘meeting-by-meeting’ approach to policy is likely to remain, but Lagarde is unlikely to steer away from a December cut,” they added.
How could the ECB meeting impact EUR/USD?
After losing more than 1.5% against the US Dollar (USD) in the first week of October, the Euro has broadly stabilized. Heading into the ECB showdown, EUR/USD stays in a consolidation phase below 1.1000.
ECB President Christine Lagarde is likely to stick to the bank’s data-dependent stance and refrain from giving a certain response on the next rate cut move. In case she reiterates the ECB expectation of inflation rising again in the latter part of the year, investors could see this as a sign of the ECB holding interest rates unchanged at the last policy meeting of the year on December 12. In this scenario, the immediate reaction could be positive for the Euro.
Conversely, the Euro could come under renewed selling pressure if the policy statement, or Lagarde, voices growing concerns over a worsening economic outlook in the Eurozone, while acknowledging better-than-forecast progress in disinflation. In the revised projections, ECB staff saw inflation at 2.5% in 2024 and 2.2% in 2025.
Moreover, the accounts of the ECB’s September meeting showed that policymakers noted that negative surprises in the Purchasing Managers Index (PMI) manufacturing output readings and weakening foreign demand indicated potential headwinds to the near-term outlook.
Eren Sengezer, European Session Lead Analyst at FXStreet, offers a brief technical outlook for EUR/USD:
“The near-term technical points to a bearish bias for EUR/USD. The Relative Strength Index (RSI) indicator on the daily chart stays in the bearish territory well below 50, while holding above 30, suggesting that the pair has more room on the downside before turning technically oversold.”
“The Fibonacci 61.8% retracement level of the July-September uptrend and the 200-day Simple Moving Average (SMA) form strong support at 1.0870 ahead of 1.0800 (Fibonacci 78.6% retracement) and 1.0680 (beginning point of the uptrend). On the upside, 1.1000 (Fibonacci 38.2% retracement) aligns as key resistance before 1.1060-1.1080 (50-day SMA, Fibonacci 23.6% retracement) and 1.1200 (end point of the uptrend)."
Euro FAQs
The Euro is the currency for the 19 European Union countries that belong to the Eurozone. It is the second most heavily traded currency in the world behind the US Dollar. In 2022, it accounted for 31% of all foreign exchange transactions, with an average daily turnover of over $2.2 trillion a day. EUR/USD is the most heavily traded currency pair in the world, accounting for an estimated 30% off all transactions, followed by EUR/JPY (4%), EUR/GBP (3%) and EUR/AUD (2%).
The European Central Bank (ECB) in Frankfurt, Germany, is the reserve bank for the Eurozone. The ECB sets interest rates and manages monetary policy. The ECB’s primary mandate is to maintain price stability, which means either controlling inflation or stimulating growth. Its primary tool is the raising or lowering of interest rates. Relatively high interest rates – or the expectation of higher rates – will usually benefit the Euro and vice versa. The ECB Governing Council makes monetary policy decisions at meetings held eight times a year. Decisions are made by heads of the Eurozone national banks and six permanent members, including the President of the ECB, Christine Lagarde.
Eurozone inflation data, measured by the Harmonized Index of Consumer Prices (HICP), is an important econometric for the Euro. If inflation rises more than expected, especially if above the ECB’s 2% target, it obliges the ECB to raise interest rates to bring it back under control. Relatively high interest rates compared to its counterparts will usually benefit the Euro, as it makes the region more attractive as a place for global investors to park their money.
Data releases gauge the health of the economy and can impact on the Euro. Indicators such as GDP, Manufacturing and Services PMIs, employment, and consumer sentiment surveys can all influence the direction of the single currency. A strong economy is good for the Euro. Not only does it attract more foreign investment but it may encourage the ECB to put up interest rates, which will directly strengthen the Euro. Otherwise, if economic data is weak, the Euro is likely to fall. Economic data for the four largest economies in the euro area (Germany, France, Italy and Spain) are especially significant, as they account for 75% of the Eurozone’s economy.
Another significant data release for the Euro is the Trade Balance. This indicator measures the difference between what a country earns from its exports and what it spends on imports over a given period. If a country produces highly sought after exports then its currency will gain in value purely from the extra demand created from foreign buyers seeking to purchase these goods. Therefore, a positive net Trade Balance strengthens a currency and vice versa for a negative balance.
Here is what you need to know on Thursday, October 17:
The US Dollar (USD) continued to gather strength against its major rivals midweek, with the USD Index rising 0.3% to register its highest daily close in over two months on Wednesday. On Thursday, the European Central Bank (ECB) will announce monetary policy decisions. In the American session, the US economic calendar will feature weekly Initial Jobless Claims data, alongside the Retail Sales and Industrial Production figures for September.
US Dollar PRICE This week
The table below shows the percentage change of US Dollar (USD) against listed major currencies this week. US Dollar was the strongest against the Swiss Franc.
| USD | EUR | GBP | JPY | CAD | AUD | NZD | CHF | |
|---|---|---|---|---|---|---|---|---|
| USD | 0.73% | 0.58% | 0.31% | -0.01% | 0.93% | 0.73% | 1.12% | |
| EUR | -0.73% | -0.22% | -0.50% | -0.65% | 0.23% | -0.09% | 0.30% | |
| GBP | -0.58% | 0.22% | -0.29% | -0.57% | 0.48% | 0.15% | 0.49% | |
| JPY | -0.31% | 0.50% | 0.29% | -0.33% | 0.64% | 0.46% | 0.80% | |
| CAD | 0.00% | 0.65% | 0.57% | 0.33% | 0.89% | 0.75% | 0.96% | |
| AUD | -0.93% | -0.23% | -0.48% | -0.64% | -0.89% | -0.19% | 0.16% | |
| NZD | -0.73% | 0.09% | -0.15% | -0.46% | -0.75% | 0.19% | 0.33% | |
| CHF | -1.12% | -0.30% | -0.49% | -0.80% | -0.96% | -0.16% | -0.33% |
The heat map shows percentage changes of major currencies against each other. The base currency is picked from the left column, while the quote currency is picked from the top row. For example, if you pick the US Dollar from the left column and move along the horizontal line to the Japanese Yen, the percentage change displayed in the box will represent USD (base)/JPY (quote).
During the Asian trading hours, the data from Australia showed that the Unemployment Rate held steady at 4.1% in September. The Employment Change was up 64.1K, with Full-Time Employment rising by 51.6K. After closing the third consecutive trading day in negative territory on Wednesday, AUD/USD staged a rebound early Thursday and was last seen rising 0.3% on the day, slightly below 0.6700. In the meantime, People’s Bank of China (PBOC) Deputy Governor said on Thursday that most stock of existing mortgage loans interest rates will be adjusted on October 25, adding that this adjustment will apply to 90% of existing mortgages.
The ECB is widely expected to lower key rates by 25 basis points following September rate cuts. After the ECB announces the policy decisions, ECB President Christine Lagarde will speak at a press conference starting at 12:45 GMT and respond to questions from the press. Pressured by the persistent USD strength, EUR/USD extended its weekly slide and registered losses on Wednesday. The pair struggles to find a foothold in the European morning on Thursday and trades at its weakest level since early August at around 1.0850.
GBP/USD declined sharply on Wednesday as the September inflation data from the UK, which showed that inflation softened at a faster pace than forecast, triggered a selloff in Pound Sterling. After losing more than 0.6% on Wednesday, GBP/USD fluctuates in a tight channel below 1.3000 on early Thursday.
USD/JPY registered small gains on Wednesday as it struggled to gather bullish momentum. The pair holds steady in the European morning and trades slightly above 149.50.
Gold closed the second consecutive day in positive territory on Wednesday. XAU/USD continues to edge higher and trades within a touching distance of the all-time-high it set at $2,685.
ECB FAQs
The European Central Bank (ECB) in Frankfurt, Germany, is the reserve bank for the Eurozone. The ECB sets interest rates and manages monetary policy for the region. The ECB primary mandate is to maintain price stability, which means keeping inflation at around 2%. Its primary tool for achieving this is by raising or lowering interest rates. Relatively high interest rates will usually result in a stronger Euro and vice versa. The ECB Governing Council makes monetary policy decisions at meetings held eight times a year. Decisions are made by heads of the Eurozone national banks and six permanent members, including the President of the ECB, Christine Lagarde.
In extreme situations, the European Central Bank can enact a policy tool called Quantitative Easing. QE is the process by which the ECB prints Euros and uses them to buy assets – usually government or corporate bonds – from banks and other financial institutions. QE usually results in a weaker Euro. QE is a last resort when simply lowering interest rates is unlikely to achieve the objective of price stability. The ECB used it during the Great Financial Crisis in 2009-11, in 2015 when inflation remained stubbornly low, as well as during the covid pandemic.
Quantitative tightening (QT) is the reverse of QE. It is undertaken after QE when an economic recovery is underway and inflation starts rising. Whilst in QE the European Central Bank (ECB) purchases government and corporate bonds from financial institutions to provide them with liquidity, in QT the ECB stops buying more bonds, and stops reinvesting the principal maturing on the bonds it already holds. It is usually positive (or bullish) for the Euro.
- EUR/GBP softens to around 0.8355 in Thursday’s early European session.
- The ECB is widely anticipated to reduce interest rates by 25 bps at its upcoming meeting on Thursday.
- Slowing inflation in the UK has boosted the BOE cut bets.
The EUR/GBP cross trades on a weaker note around 0.8355 during the early European session on Thursday. The rising expectation that the European Central Bank (ECB) will lower interest rates again on Thursday undermines the shared currency against the Pound Sterling (GBP).
The ECB is expected to cut the deposit rate by another quarter-point to 3.25% at its October meeting on Thursday after data showed that the rapid retreat in inflation is being accompanied by a deteriorating economy. Paul Hollingsworth, chief economist for Europe at BNP Paribas, noted that the ECB shifted its focus from too-high inflation to too-weak growth, adding that “it makes perfect sense to accelerate the pace of easing, even if high uncertainty still calls for some caution.”
Traders will take more cues from the press conference after the interest rate decision. Any dovish comments from the ECB Christine Lagarde could exert some selling pressure on the Euro (EUR).
On the other hand, the UK inflation eased sharply in September, spurring rate cut bets by the Bank of England (BoE) in the November meeting. This, in turn, could weigh on the GBP and cap the downside for EUR/GBP. The annual Consumer Price Index (CPI) inflation eased to 1.7% in September from 2.2% in August, the lowest reading since April 2021, the Office for National Statistics revealed. The UK Retail Sales data will be published on Friday. However, if the report shows a surprise upside outcome, this could provide some support to the GBP in the near term.
ECB FAQs
The European Central Bank (ECB) in Frankfurt, Germany, is the reserve bank for the Eurozone. The ECB sets interest rates and manages monetary policy for the region. The ECB primary mandate is to maintain price stability, which means keeping inflation at around 2%. Its primary tool for achieving this is by raising or lowering interest rates. Relatively high interest rates will usually result in a stronger Euro and vice versa. The ECB Governing Council makes monetary policy decisions at meetings held eight times a year. Decisions are made by heads of the Eurozone national banks and six permanent members, including the President of the ECB, Christine Lagarde.
In extreme situations, the European Central Bank can enact a policy tool called Quantitative Easing. QE is the process by which the ECB prints Euros and uses them to buy assets – usually government or corporate bonds – from banks and other financial institutions. QE usually results in a weaker Euro. QE is a last resort when simply lowering interest rates is unlikely to achieve the objective of price stability. The ECB used it during the Great Financial Crisis in 2009-11, in 2015 when inflation remained stubbornly low, as well as during the covid pandemic.
Quantitative tightening (QT) is the reverse of QE. It is undertaken after QE when an economic recovery is underway and inflation starts rising. Whilst in QE the European Central Bank (ECB) purchases government and corporate bonds from financial institutions to provide them with liquidity, in QT the ECB stops buying more bonds, and stops reinvesting the principal maturing on the bonds it already holds. It is usually positive (or bullish) for the Euro.
FX option expiries for Oct 17 NY cut at 10:00 Eastern Time, via DTCC, can be found below.
EUR/USD: EUR amounts
- 1.0800 708m
- 1.0975 914m
- 1.0990 1b
- 1.1000 1.4b
- 1.1010 851m
- 1.1065 1.7b
GBP/USD: GBP amounts
- 1.2950 600m
- 1.3050 477m
- 1.3100 500m
USD/JPY: USD amounts
- 147.60 1.1b
- 149.50 525m
- 150.00 811m
- 150.05 456m
USD/CHF: USD amounts
- 0.8675 494m
AUD/USD: AUD amounts
- 0.6650 488m
- 0.6700 1.6b
- 0.6875 434m
USD/CAD: USD amounts
- 1.3610 1b
NZD/USD: NZD amounts
- 0.6000 462m
- EUR/JPY drifts lower amid bets for another ECB interest rate cut later this Thursday.
- The BoJ uncertainty and a positive risk tone cap the JPY, lending support to EUR/JPY.
- Traders keenly await the ECB rate decision and cues about the further policy path.
The EUR/JPY cross attracts fresh sellers during the Asian session on Thursday, with bears still awaiting a sustained break below the 162.00 mark before positioning for an extension of the recent pullback from the 163.55-163.60 supply zone.
The shared currency continues to be undermined by firming expectations that the European Central Bank (ECB) will cut the deposit rate by 25bps later today, marking the first back-to-back rate reduction in 13 years. This will reflect the ECB's urgency to accelerate monetary amid easing inflationary pressures in the Eurozone and signs of economic weakness. Meanwhile, the risk of a further escalation of geopolitical tensions in the Middle East and a broader regional war drives some haven flows towards the Japanese Yen (JPY). This further contributes to the offered tone surrounding the EUR/JPY cross.
Meanwhile, data published by Japan's Ministry of Finance on Thursday showed that total exports in September declined for the first time in 10 months and raised concerns about weakness in global demand. Against the backdrop of a surprise opposition to further rate hikes by Japan's Prime Minister Shigeru Ishiba, the outlook complicates the Bank of Japan's (BoJ) plans to exit years of ultra-easy monetary policy. This, in turn, holds back the JPY bulls from placing aggressive bets and should help limit any further depreciating move for the EUR/JPY cross heading into the key central bank event risk.
Apart from the widely-anticipated rate cut decision, investors will keep a close eye on the updated economic projections. This, along with ECB President Christine Lagarde's comments during the post-meeting conference, will influence market expectations about the policy direction in 2025 and the Euro. Furthermore, geopolitical developments, which play a key role in driving demand for the safe-haven JPY, should allow traders to grab short-term opportunities around the EUR/JPY cross.
Economic Indicator
ECB Rate On Deposit Facility
One of the European Central Bank's three key interest rates, the rate on the deposit facility, is the rate at which banks earn interest when they deposit funds with the ECB. It is announced by the European Central Bank at each of its eight scheduled annual meetings.
Read more.Next release: Thu Oct 17, 2024 12:15
Frequency: Irregular
Consensus: 3.25%
Previous: 3.5%
Source: European Central Bank
- USD/CHF gains ground as recent US data have tempered the odds of more bumper rate cuts by the Fed.
- Improved US Treasury yields contribute support to strengthen the Greenback.
- The downside of the Swiss Franc could be restrained due to safe-haven flows amid rising Middle-East tensions.
USD/CHF extends its gains for the second successive day, hovering around 0.8660 during the Asian trading hours on Thursday. The US Dollar (USD) gains ground as strong labor and inflation data has tempered expectations for aggressive easing by the Federal Reserve (Fed). According to the CME FedWatch Tool, there is currently a 92.1% probability of a 25-basis-point rate cut in November, with no expectation of a larger 50-basis-point reduction.
The US Dollar Index (DXY), which measures the value of the US Dollar against its six major peers, continues its winning streak for the fifth consecutive session, bolstered by the improved US Treasury yields after two days of losses. The DXY trades around 103.60, maintaining its position near two-month highs with 2-year and 10-year yields on US Treasury bonds standing at 3.94% and 4.03%, respectively, at the time of writing.
The downside of the Swiss Franc (CHF) could be limited due to safe-haven flows amid rising tensions in the Middle East. On Wednesday, Israel intensified its airstrikes on Lebanon, including an attack that destroyed the municipal headquarters of a major town, resulting in the deaths of 16 individuals, including the mayor. This marks the largest assault on an official Lebanese state building since the onset of the Israeli air campaign, according to Reuters.
The Swiss inflation rate fell to 0.8% in September, marking a three-year low and raising the probability of another 25-basis-point rate cut by the Swiss National Bank (SNB) in December. In September, the SNB had already reduced its key policy rate by 25 basis points to 1%, representing the third consecutive cut and bringing borrowing costs to their lowest level since early 2023.
Traders will likely observe Swiss Trade Balance data scheduled to be released on Thursday. The focus will shift to the US Retail Sales data, set to be released later in the North American session. Expectations are for monthly consumer spending in the United States to increase by 0.3% in September, up from 0.1% in the previous reading.
Swiss Franc FAQs
The Swiss Franc (CHF) is Switzerland’s official currency. It is among the top ten most traded currencies globally, reaching volumes that well exceed the size of the Swiss economy. Its value is determined by the broad market sentiment, the country’s economic health or action taken by the Swiss National Bank (SNB), among other factors. Between 2011 and 2015, the Swiss Franc was pegged to the Euro (EUR). The peg was abruptly removed, resulting in a more than 20% increase in the Franc’s value, causing a turmoil in markets. Even though the peg isn’t in force anymore, CHF fortunes tend to be highly correlated with the Euro ones due to the high dependency of the Swiss economy on the neighboring Eurozone.
The Swiss Franc (CHF) is considered a safe-haven asset, or a currency that investors tend to buy in times of market stress. This is due to the perceived status of Switzerland in the world: a stable economy, a strong export sector, big central bank reserves or a longstanding political stance towards neutrality in global conflicts make the country’s currency a good choice for investors fleeing from risks. Turbulent times are likely to strengthen CHF value against other currencies that are seen as more risky to invest in.
The Swiss National Bank (SNB) meets four times a year – once every quarter, less than other major central banks – to decide on monetary policy. The bank aims for an annual inflation rate of less than 2%. When inflation is above target or forecasted to be above target in the foreseeable future, the bank will attempt to tame price growth by raising its policy rate. Higher interest rates are generally positive for the Swiss Franc (CHF) as they lead to higher yields, making the country a more attractive place for investors. On the contrary, lower interest rates tend to weaken CHF.
Macroeconomic data releases in Switzerland are key to assessing the state of the economy and can impact the Swiss Franc’s (CHF) valuation. The Swiss economy is broadly stable, but any sudden change in economic growth, inflation, current account or the central bank’s currency reserves have the potential to trigger moves in CHF. Generally, high economic growth, low unemployment and high confidence are good for CHF. Conversely, if economic data points to weakening momentum, CHF is likely to depreciate.
As a small and open economy, Switzerland is heavily dependent on the health of the neighboring Eurozone economies. The broader European Union is Switzerland’s main economic partner and a key political ally, so macroeconomic and monetary policy stability in the Eurozone is essential for Switzerland and, thus, for the Swiss Franc (CHF). With such dependency, some models suggest that the correlation between the fortunes of the Euro (EUR) and the CHF is more than 90%, or close to perfect.
- EUR/USD weakens to around 1.0850 in Thursday’s Asian session.
- Traders expect that the Fed will proceed with modest interest rate cuts over the next year.
- The ECB is widely expected to cut interest rates at its October meeting on Thursday.
The EUR/USD pair extends its decline to near 1.0850 during the early Asian session on Thursday. The further upside of the Greenback exerts some selling pressure on the major pair. Investors will closely monitor the European Central Bank (ECB) monetary policy meeting, which is expected to lower interest rates again on Thursday.
The Federal Open Market Committee (FOMC) at its September meeting took the unusual step of lowering its benchmark interest rate by a half percentage point to a target range of 4.75% to 5.00%. However, investors now anticipate that the Federal Reserve (Fed) will proceed with modest interest rate cuts over the next year, which underpin the Greenback broadly.
Fed Governor Christopher Waller said on Monday that future interest rate cuts will be less aggressive than the large move in September, as he is concerned that the economy could still be running at a hotter-than-expected pace. Later on Thursday, investors will take more cues from the US Retail Sales data, which is expected to rise from 0.1% in August to 0.3% in September.
Across the pond, the ECB is likely to deliver its third interest rate cut of the year at its October meeting, and money markets almost fully price in three further rate reductions through March 2025. ECB President Christine Lagarde said last month that the latest developments had strengthened the ECB’s confidence that inflation will return to target in a timely manner and said this would be taken into account in October. The dovish comments from the ECB policymakers and softer-than-expected inflation from the Eurozone might weigh on the Euro (EUR) against the US Dollar (USD).
Euro FAQs
The Euro is the currency for the 19 European Union countries that belong to the Eurozone. It is the second most heavily traded currency in the world behind the US Dollar. In 2022, it accounted for 31% of all foreign exchange transactions, with an average daily turnover of over $2.2 trillion a day. EUR/USD is the most heavily traded currency pair in the world, accounting for an estimated 30% off all transactions, followed by EUR/JPY (4%), EUR/GBP (3%) and EUR/AUD (2%).
The European Central Bank (ECB) in Frankfurt, Germany, is the reserve bank for the Eurozone. The ECB sets interest rates and manages monetary policy. The ECB’s primary mandate is to maintain price stability, which means either controlling inflation or stimulating growth. Its primary tool is the raising or lowering of interest rates. Relatively high interest rates – or the expectation of higher rates – will usually benefit the Euro and vice versa. The ECB Governing Council makes monetary policy decisions at meetings held eight times a year. Decisions are made by heads of the Eurozone national banks and six permanent members, including the President of the ECB, Christine Lagarde.
Eurozone inflation data, measured by the Harmonized Index of Consumer Prices (HICP), is an important econometric for the Euro. If inflation rises more than expected, especially if above the ECB’s 2% target, it obliges the ECB to raise interest rates to bring it back under control. Relatively high interest rates compared to its counterparts will usually benefit the Euro, as it makes the region more attractive as a place for global investors to park their money.
Data releases gauge the health of the economy and can impact on the Euro. Indicators such as GDP, Manufacturing and Services PMIs, employment, and consumer sentiment surveys can all influence the direction of the single currency. A strong economy is good for the Euro. Not only does it attract more foreign investment but it may encourage the ECB to put up interest rates, which will directly strengthen the Euro. Otherwise, if economic data is weak, the Euro is likely to fall. Economic data for the four largest economies in the euro area (Germany, France, Italy and Spain) are especially significant, as they account for 75% of the Eurozone’s economy.
Another significant data release for the Euro is the Trade Balance. This indicator measures the difference between what a country earns from its exports and what it spends on imports over a given period. If a country produces highly sought after exports then its currency will gain in value purely from the extra demand created from foreign buyers seeking to purchase these goods. Therefore, a positive net Trade Balance strengthens a currency and vice versa for a negative balance.
Gold prices rose in India on Thursday, according to data compiled by FXStreet.
The price for Gold stood at 7,234.75 Indian Rupees (INR) per gram, up compared with the INR 7,222.81 it cost on Wednesday.
The price for Gold increased to INR 84,384.70 per tola from INR 84,245.44 per tola a day earlier.
| Unit measure | Gold Price in INR |
|---|---|
| 1 Gram | 7,234.75 |
| 10 Grams | 72,347.49 |
| Tola | 84,384.70 |
| Troy Ounce | 225,026.00 |
FXStreet calculates Gold prices in India by adapting international prices (USD/INR) to the local currency and measurement units. Prices are updated daily based on the market rates taken at the time of publication. Prices are just for reference and local rates could diverge slightly.
Gold FAQs
Gold has played a key role in human’s history as it has been widely used as a store of value and medium of exchange. Currently, apart from its shine and usage for jewelry, the precious metal is widely seen as a safe-haven asset, meaning that it is considered a good investment during turbulent times. Gold is also widely seen as a hedge against inflation and against depreciating currencies as it doesn’t rely on any specific issuer or government.
Central banks are the biggest Gold holders. In their aim to support their currencies in turbulent times, central banks tend to diversify their reserves and buy Gold to improve the perceived strength of the economy and the currency. High Gold reserves can be a source of trust for a country’s solvency. Central banks added 1,136 tonnes of Gold worth around $70 billion to their reserves in 2022, according to data from the World Gold Council. This is the highest yearly purchase since records began. Central banks from emerging economies such as China, India and Turkey are quickly increasing their Gold reserves.
Gold has an inverse correlation with the US Dollar and US Treasuries, which are both major reserve and safe-haven assets. When the Dollar depreciates, Gold tends to rise, enabling investors and central banks to diversify their assets in turbulent times. Gold is also inversely correlated with risk assets. A rally in the stock market tends to weaken Gold price, while sell-offs in riskier markets tend to favor the precious metal.
The price can move due to a wide range of factors. Geopolitical instability or fears of a deep recession can quickly make Gold price escalate due to its safe-haven status. As a yield-less asset, Gold tends to rise with lower interest rates, while higher cost of money usually weighs down on the yellow metal. Still, most moves depend on how the US Dollar (USD) behaves as the asset is priced in dollars (XAU/USD). A strong Dollar tends to keep the price of Gold controlled, whereas a weaker Dollar is likely to push Gold prices up.
(An automation tool was used in creating this post.)
- GBP/USD consolidates Wednesday’s softer UK CPI-inspired fall to over a two-month low.
- Bets for a BoE rate cut in November weigh on the GBP and the major amid a bullish USD.
- Hopes for a less aggressive Fed policy easing favor the USD bulls ahead of the US data.
The GBP/USD pair remains below the 1.3000 psychological mark during the Asian session on Thursday and is currently placed near its lowest level since August 20 touched the previous day. Meanwhile, the fundamental backdrop seems tilted firmly in favor of bearish traders and suggests that the path of least resistance for spot prices is to the downside.
Data published on Wednesday showed that the annual UK Consumer Price Index (CPI) decelerated from 2.2% in August to 1.7% last month, marking the lowest reading since April 2021. The data lifted bets for an interest rate cut by the Bank of England (BoE) in November, which continues to undermine the British Pound (GBP). Apart from this, the recent US Dollar (USD) rally, to the highest level since early August, validates the near-term negative outlook for the GBP/USD pair.
Investors now seem convinced that the Federal Reserve (Fed) will proceed with modest interest rate cuts over the next year. This keeps the yield on the benchmark 10-year US government bond above the 4% threshold and continues to underpin the USD. Apart from this, persistent geopolitical risks stemming from the ongoing conflicts in the Middle East benefit the Greenback's relative safe-haven status and support prospects for a further depreciating move for the GBP/USD pair.
Even from a technical perspective, the overnight breakdown below a one-week-old trading range and acceptance below the 1.3000 psychological mark add credence to the bearish setup. Hence, some follow-through weakness towards the 100-day Simple Moving Average (SMA) support near the 1.2955 region, en route to the 1.2900 mark, looks like a distinct possibility. Traders now look forward to the US macro releases for some impetus later during the early North American session.
Thursday's US economic docket features monthly Retails Sales report, the usual Weekly Initial Jobless Claims, the Philly Fed Manufacturing Index and Industrial Production data. This, along with the US bond yields and geopolitical developments, will drive the USD demand and produce short-term trading opportunities around the GBP/USD pair.
BoE FAQs
The Bank of England (BoE) decides monetary policy for the United Kingdom. Its primary goal is to achieve ‘price stability’, or a steady inflation rate of 2%. Its tool for achieving this is via the adjustment of base lending rates. The BoE sets the rate at which it lends to commercial banks and banks lend to each other, determining the level of interest rates in the economy overall. This also impacts the value of the Pound Sterling (GBP).
When inflation is above the Bank of England’s target it responds by raising interest rates, making it more expensive for people and businesses to access credit. This is positive for the Pound Sterling because higher interest rates make the UK a more attractive place for global investors to park their money. When inflation falls below target, it is a sign economic growth is slowing, and the BoE will consider lowering interest rates to cheapen credit in the hope businesses will borrow to invest in growth-generating projects – a negative for the Pound Sterling.
In extreme situations, the Bank of England can enact a policy called Quantitative Easing (QE). QE is the process by which the BoE substantially increases the flow of credit in a stuck financial system. QE is a last resort policy when lowering interest rates will not achieve the necessary result. The process of QE involves the BoE printing money to buy assets – usually government or AAA-rated corporate bonds – from banks and other financial institutions. QE usually results in a weaker Pound Sterling.
Quantitative tightening (QT) is the reverse of QE, enacted when the economy is strengthening and inflation starts rising. Whilst in QE the Bank of England (BoE) purchases government and corporate bonds from financial institutions to encourage them to lend; in QT, the BoE stops buying more bonds, and stops reinvesting the principal maturing on the bonds it already holds. It is usually positive for the Pound Sterling.
- Silver price may regain its ground as lower US Treasury yields boost the attractiveness of precious metals.
- The non-yielding Silver may appreciate as multiple banks are widely expected to deliver interest rate cuts.
- Safe-haven Silver may strengthen as Israel escalates its airstrikes on Lebanon.
Silver price (XAG/USD) dips slightly after two days of gains, trading around $31.60 per troy ounce during Thursday's Asian session. However, the non-yielding Silver received support from lower yields on US Treasury bonds. 2-year and 10-year yields on US Treasury bonds stand at 3.94% and 4.03%, respectively, at the time of writing.
Market expectations are leaning toward a total of 125 basis points in rate cuts by the US Federal Reserve (Fed) over the next year. According to the CME FedWatch Tool, there is a 94.1% chance of a 25-basis-point rate cut in November. Lower interest rates enhance the attractiveness of precious metals like Silver.
In addition, the European Central Bank (ECB) is widely expected to announce a 25-basis-point reduction in both the Main Refinancing Operations and the Deposit Facility Rate in its policy meeting later in the day. Recent inflation data also suggests that the Bank of England (BoE) and the Reserve Bank of New Zealand (RBNZ) may follow suit with potential rate cuts next month.
Silver prices may receive additional support from safe-haven flows due to escalating tensions in the Middle East. On Wednesday, Israel intensified its airstrikes on Lebanon, including an attack that destroyed the municipal headquarters of a major town, resulting in the deaths of 16 individuals, including the mayor. This marks the largest assault on an official Lebanese state building since the onset of the Israeli air campaign, according to Reuters.
US President Joe Biden is indicating a new willingness to leverage US military assistance to Israel, using it as both an incentive and a deterrent in its critical confrontation with Iran and Iran-backed militant groups. This strategy may increase Washington's influence over Israeli decision-making.
Silver FAQs
Silver is a precious metal highly traded among investors. It has been historically used as a store of value and a medium of exchange. Although less popular than Gold, traders may turn to Silver to diversify their investment portfolio, for its intrinsic value or as a potential hedge during high-inflation periods. Investors can buy physical Silver, in coins or in bars, or trade it through vehicles such as Exchange Traded Funds, which track its price on international markets.
Silver prices can move due to a wide range of factors. Geopolitical instability or fears of a deep recession can make Silver price escalate due to its safe-haven status, although to a lesser extent than Gold's. As a yieldless asset, Silver tends to rise with lower interest rates. Its moves also depend on how the US Dollar (USD) behaves as the asset is priced in dollars (XAG/USD). A strong Dollar tends to keep the price of Silver at bay, whereas a weaker Dollar is likely to propel prices up. Other factors such as investment demand, mining supply – Silver is much more abundant than Gold – and recycling rates can also affect prices.
Silver is widely used in industry, particularly in sectors such as electronics or solar energy, as it has one of the highest electric conductivity of all metals – more than Copper and Gold. A surge in demand can increase prices, while a decline tends to lower them. Dynamics in the US, Chinese and Indian economies can also contribute to price swings: for the US and particularly China, their big industrial sectors use Silver in various processes; in India, consumers’ demand for the precious metal for jewellery also plays a key role in setting prices.
Silver prices tend to follow Gold's moves. When Gold prices rise, Silver typically follows suit, as their status as safe-haven assets is similar. The Gold/Silver ratio, which shows the number of ounces of Silver needed to equal the value of one ounce of Gold, may help to determine the relative valuation between both metals. Some investors may consider a high ratio as an indicator that Silver is undervalued, or Gold is overvalued. On the contrary, a low ratio might suggest that Gold is undervalued relative to Silver.
- The Japanese Yen edges higher against the USD, though it lacks bullish conviction.
- The uncertainty over the BoJ’s rate-hike plan and a positive risk tone caps the JPY.
- Bets for smaller Fed rate cuts could underpin the USD and limit losses for USD/JPY.
The Japanese Yen (JPY) ticks higher against its American counterpart during the Asian session on Thursday and reverses a part of the overnight losses back closer to the lowest level since early August. Any meaningful JPY appreciation, however, still seems elusive amid the uncertainty over the Bank of Japan's (BoJ) rate-hike path. A fall in Japan's exports for the first time in 10 months raised concerns about weakness in global demand. This comes on top of a surprise opposition to further rate hikes from Japan's Prime Minister Shigeru Ishiba and may complicate the BoJ's plans to exit years of ultra-easy monetary policy.
Apart from this, the prevalent risk-on environment might contribute to capping the upside for the safe-haven JPY. Furthermore, expectations that the Federal Reserve (Fed) will proceed with modest interest rate cuts over the next year continue to act as a tailwind for the US Treasury bond yields and keep the US Dollar (USD) well supported near its highest level in more than two months. This could further undermine the low-yielding JPY and support prospects for the emergence of some dip-buying around the USD/JPY pair. Traders now look forward to the US macro releases for short-term impetus later this Thursday.
Daily Digest Market Movers: Japanese Yen might struggle to build on its strength amid BoJ rate-hike uncertainty
- According to a Reuters poll, a slim majority of economists expect that the Bank of Japan will forgo raising interest rates again this year amid uncertainty over the new political leadership's preference for the monetary policy.
- Data published by Japan's Ministry of Finance on Thursday showed that total exports in September dropped 1.7% from a year earlier as compared to a revised 5.5% rise in the previous month and missing consensus estimates.
- Soft demand in China – Japan's biggest trading partner – and a slowing US growth, along with the JPY's recent appreciation following the BoJ’s unexpected interest rate hike in late July, pushed down the value of exports.
- This could further complicate the BoJ's rate-hike plans and cap any meaningful appreciating move for the JPY, though persistent geopolitical risks stemming from the ongoing conflicts in the Middle East might offer support.
- The United Nations (UN) said that Israeli forces have fired at its peacekeeping position, forcibly entered a base, stopped a critical logistical movement, and injured more than a dozen of its troops in southern Lebanon.
- According to a source familiar with the matter, Israel’s plan of a counterstrike in response to Iran’s October 1 attack is ready, raising the risk of a further escalation of tensions in the Middle East and a broader regional war.
- The US Dollar rose to its highest level since early August on Wednesday amid firming expectations for a less aggressive policy easing by the Federal Reserve and bets for a 25 basis points rate cut at the November meeting.
- The yield on the benchmark 10-year US government bond dropped to over a one-week low on Wednesday, albeit it defends the 4.0% threshold, which favors the USD bulls and should offer support to the USD/JPY pair.
- Traders look to the US economic docket – featuring the release of monthly Retail Sales, Weekly Initial Jobless Claims and the Philly Fed Manufacturing Index – for some impetus later during the North American session.
Technical Outlook: USD/JPY consolidates in a familiar range before the next leg up, move beyond 150.00 awaited
From a technical perspective, the USD/JPY pair has been oscillating in a familiar range since the beginning of this week. Against the backdrop of the recent rise from a 14-month low touched in September, this might still be categorized as a bullish consolidation phase. Moreover, oscillators on the daily chart are holding in positive territory and are still away from being in the overbought zone, supporting prospects for an eventual breakout to the upside. That said, it will still be prudent to wait for a sustained strength above the 150.00 psychological mark before placing fresh bullish bets. Spot prices might then accelerate the move up towards the August monthly swing high, around the 150.85-150.90 region. Some follow-through buying beyond the 151.00 round figure will be seen as a fresh trigger for bullish traders and pave the way for further near-term appreciation.
On the flip side, the 149.00 mark, representing the lower boundary of the short-term trading range, might continue to protect the immediate downside. A convincing break below has the potential to drag the USD/JPY pair to the next relevant support near the 148.55 region en route to the 148.00 round figure and last week's swing low, around the 147.35-147.30 area. The latter is followed by the 147.00 mark, which if broken decisively will suggest that the recent move-up witnessed over the past month or so has run its course and prompt aggressive technical selling.
Japanese Yen FAQs
The Japanese Yen (JPY) is one of the world’s most traded currencies. Its value is broadly determined by the performance of the Japanese economy, but more specifically by the Bank of Japan’s policy, the differential between Japanese and US bond yields, or risk sentiment among traders, among other factors.
One of the Bank of Japan’s mandates is currency control, so its moves are key for the Yen. The BoJ has directly intervened in currency markets sometimes, generally to lower the value of the Yen, although it refrains from doing it often due to political concerns of its main trading partners. The BoJ ultra-loose monetary policy between 2013 and 2024 caused the Yen to depreciate against its main currency peers due to an increasing policy divergence between the Bank of Japan and other main central banks. More recently, the gradually unwinding of this ultra-loose policy has given some support to the Yen.
Over the last decade, the BoJ’s stance of sticking to ultra-loose monetary policy has led to a widening policy divergence with other central banks, particularly with the US Federal Reserve. This supported a widening of the differential between the 10-year US and Japanese bonds, which favored the US Dollar against the Japanese Yen. The BoJ decision in 2024 to gradually abandon the ultra-loose policy, coupled with interest-rate cuts in other major central banks, is narrowing this differential.
The Japanese Yen is often seen as a safe-haven investment. This means that in times of market stress, investors are more likely to put their money in the Japanese currency due to its supposed reliability and stability. Turbulent times are likely to strengthen the Yen’s value against other currencies seen as more risky to invest in.
People’s Bank of China (PBOC) Deputy Governor spoke on several topics on the supportive measures implemented to shore up the property market.
Key takeaways
On existing mortgage rate cuts -
Most stock of existing mortgage loans interest rates will be adjusted October 25.
Accounts for 90% of existing mortgages.
On lowering minimum down payment ratios -
Have observed market confidence and sales as a result.
On real estate development loans -
Will be extended until end of 2026.
- NZD/USD may face headwinds as the recent easing of inflation strengthens the case for the RBNZ’s rate cut in November.
- New Zealand's Consumer Price Index rose 2.2% YoY in the September quarter, bringing inflation within the RBNZ’s 1-3% target range.
- The US Dollar appreciates as strong US labor and inflation data have faded the odds of the Fed’s aggressive rate cuts.
NZD/USD breaks its three-day losing streak, trading around 0.6070 during the Asian hours on Thursday. However, the upside for the AUD/USD pair could be limited by recent data showing that inflation in New Zealand has slowed to its lowest level in over three years. This has increased the likelihood of the Reserve Bank of New Zealand (RBNZ) reducing interest rates at its next monetary policy meeting in November.
New Zealand's Consumer Price Index (CPI) rose 2.2% year-over-year in the September quarter, down from the 3.3% annual increase in the previous quarter. "For the first time since March 2021, annual inflation is within the Reserve Bank of New Zealand’s (RBNZ) target range of 1% to 3%. Prices are still increasing but at a slower rate than before," said Nicola Growden, consumer prices manager at Stats NZ.
Market participants are likely to remain cautious ahead of key economic data from China, New Zealand's top trading partner, scheduled for release on Friday. This includes GDP and Retail Sales data, following the recent disappointment in China's CPI and PPI figures.
The New Zealand Dollar (NZD) faced challenges as China's recently announced fiscal stimulus plan did little to lift market sentiment, as investors remain uncertain about the scale and impact of the package.
The US Dollar (USD) found support from strong labor and inflation data, which has tempered expectations for aggressive easing by the Federal Reserve (Fed). According to the CME FedWatch Tool, there is currently a 92.1% probability of a 25-basis-point rate cut in November, with no expectation of a larger 50-basis-point reduction.
Traders are keenly awaiting the US Retail Sales data, set to be released later in the North American session. Expectations are for monthly consumer spending to increase by 0.3% in September, up from 0.1% in the previous reading.
New Zealand Dollar FAQs
The New Zealand Dollar (NZD), also known as the Kiwi, is a well-known traded currency among investors. Its value is broadly determined by the health of the New Zealand economy and the country’s central bank policy. Still, there are some unique particularities that also can make NZD move. The performance of the Chinese economy tends to move the Kiwi because China is New Zealand’s biggest trading partner. Bad news for the Chinese economy likely means less New Zealand exports to the country, hitting the economy and thus its currency. Another factor moving NZD is dairy prices as the dairy industry is New Zealand’s main export. High dairy prices boost export income, contributing positively to the economy and thus to the NZD.
The Reserve Bank of New Zealand (RBNZ) aims to achieve and maintain an inflation rate between 1% and 3% over the medium term, with a focus to keep it near the 2% mid-point. To this end, the bank sets an appropriate level of interest rates. When inflation is too high, the RBNZ will increase interest rates to cool the economy, but the move will also make bond yields higher, increasing investors’ appeal to invest in the country and thus boosting NZD. On the contrary, lower interest rates tend to weaken NZD. The so-called rate differential, or how rates in New Zealand are or are expected to be compared to the ones set by the US Federal Reserve, can also play a key role in moving the NZD/USD pair.
Macroeconomic data releases in New Zealand are key to assess the state of the economy and can impact the New Zealand Dollar’s (NZD) valuation. A strong economy, based on high economic growth, low unemployment and high confidence is good for NZD. High economic growth attracts foreign investment and may encourage the Reserve Bank of New Zealand to increase interest rates, if this economic strength comes together with elevated inflation. Conversely, if economic data is weak, NZD is likely to depreciate.
The New Zealand Dollar (NZD) tends to strengthen during risk-on periods, or when investors perceive that broader market risks are low and are optimistic about growth. This tends to lead to a more favorable outlook for commodities and so-called ‘commodity currencies’ such as the Kiwi. Conversely, NZD tends to weaken at times of market turbulence or economic uncertainty as investors tend to sell higher-risk assets and flee to the more-stable safe havens.
- The Indian Rupee softens in Thursday’s Asian session.
- The continued selling of domestic equities by foreign portfolio investors weighs on the INR.
- The US September Retail Sales will be the highlight on Thursday.
The Indian Rupee (INR) trades with mild losses on the stronger US Dollar (USD) on Thursday. The significant outflows from Indian equities and USD demand from foreign banks and importers exert some selling pressure on the local currency.
However, the decline in crude oil prices amid easing fears over supply disruption in the Middle East might support the INR as India is the world's third-largest oil consumer. Additionally, the routine foreign exchange interventions by the Reserve Bank of India (RBI) could cap the downside for the Indian Rupee.
Traders will keep an eye on the US Retail Sales data for September, which is due later on Thursday. Also, the US weekly Initial Jobless Claims, Industrial Production and Philadelphia Fed Manufacturing Survey will be released.
Daily Digest Market Movers: Indian Rupee remains weak amid foreign fund outflows
- India’s trade deficit stood at $20.78 billion in September from $29.65 billion in August, according to data released by the commerce ministry on Wednesday.
- India’s Exports rose marginally to 34.58 billion in September from 34.41 in the year-ago period. Meanwhile, Imports declined to 55.36 billion in September versus 64.36 billion prior.
- Foreign funds withdrew more than $7 billion from Indian equities in the month through October 14, the largest in over four years, according to Bloomberg.
- The US Retail Sales is estimated to rise to 0.3% in September from 0.1% in the previous reading.
- According to the CME FedWatch tool, traders have priced in a nearly 94% chance of a 25 basis points (bps) Fed rate cut in November.
Technical Analysis: USD/INR’s constructive outlook remains intact
The Indian Rupee trades in negative territory on the day. Technically, the USD/INR pair keeps the bullish vibe as the price holds above the ascending trend line and the key 100-day Exponential Moving Average (EMA) on the daily chart. The upward momentum is supported by the 14-day Relative Strength Index (RSI), which is located above the midline near 58.80, hinting that the uptrend is more likely to gain traction than reverse.
Sustained trading above the all-time high of 84.15 could expose the pair to a possible move up to 84.50. Further north, the next upside barrier to watch is the 85.00 psychological level.
Bearish candlesticks below the rising trend line could lead to 83.90, the low of October 10. A breach of the mentioned level could pave the way to 83.70, the 100-day EMA. The next contention level is seen at 83.00, representing the round mark and the low of May 24.
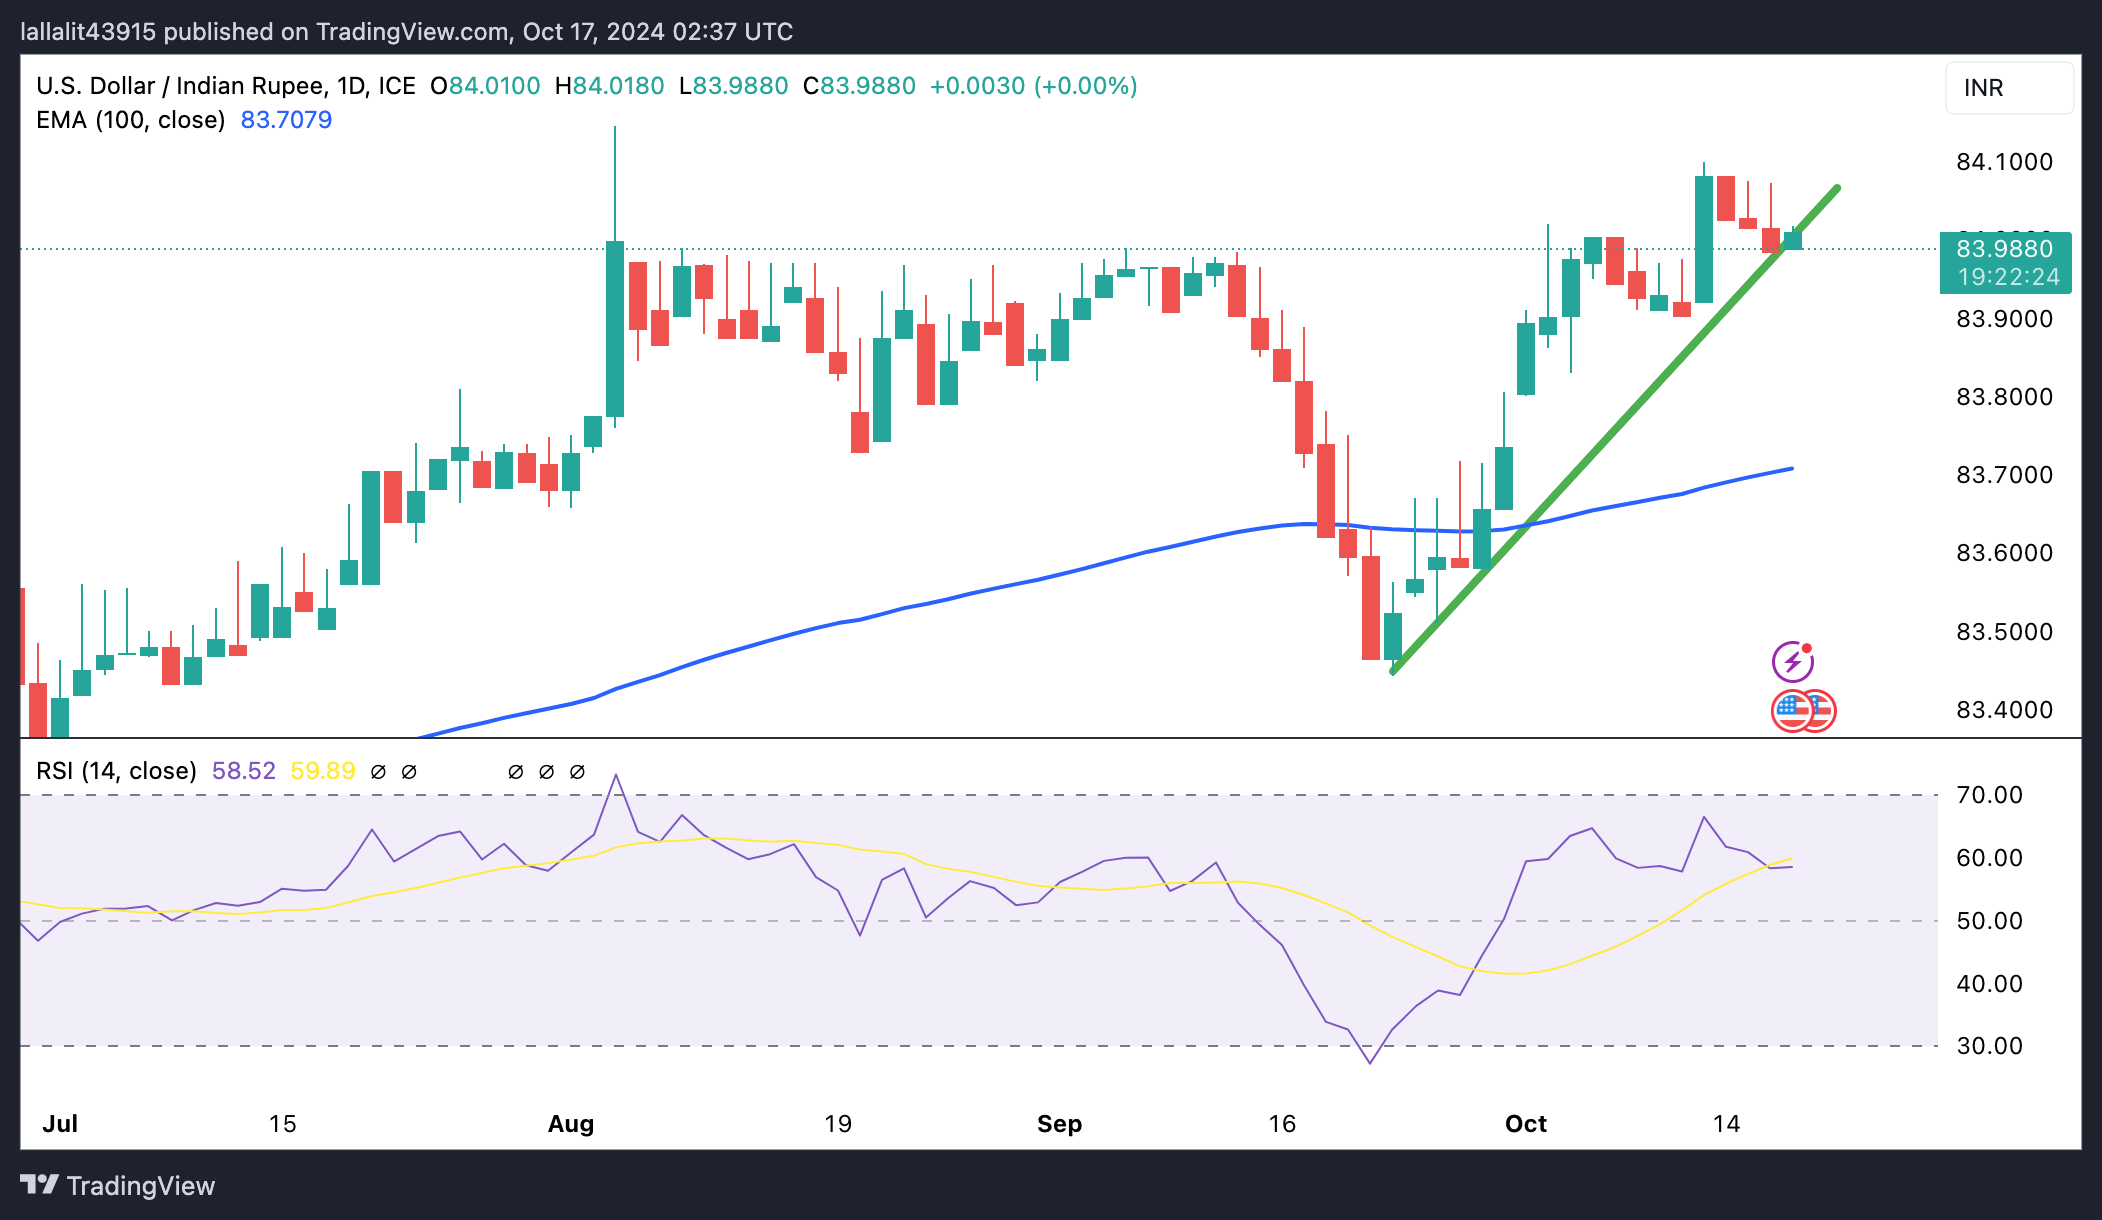
Indian Rupee FAQs
The Indian Rupee (INR) is one of the most sensitive currencies to external factors. The price of Crude Oil (the country is highly dependent on imported Oil), the value of the US Dollar – most trade is conducted in USD – and the level of foreign investment, are all influential. Direct intervention by the Reserve Bank of India (RBI) in FX markets to keep the exchange rate stable, as well as the level of interest rates set by the RBI, are further major influencing factors on the Rupee.
The Reserve Bank of India (RBI) actively intervenes in forex markets to maintain a stable exchange rate, to help facilitate trade. In addition, the RBI tries to maintain the inflation rate at its 4% target by adjusting interest rates. Higher interest rates usually strengthen the Rupee. This is due to the role of the ‘carry trade’ in which investors borrow in countries with lower interest rates so as to place their money in countries’ offering relatively higher interest rates and profit from the difference.
Macroeconomic factors that influence the value of the Rupee include inflation, interest rates, the economic growth rate (GDP), the balance of trade, and inflows from foreign investment. A higher growth rate can lead to more overseas investment, pushing up demand for the Rupee. A less negative balance of trade will eventually lead to a stronger Rupee. Higher interest rates, especially real rates (interest rates less inflation) are also positive for the Rupee. A risk-on environment can lead to greater inflows of Foreign Direct and Indirect Investment (FDI and FII), which also benefit the Rupee.
Higher inflation, particularly, if it is comparatively higher than India’s peers, is generally negative for the currency as it reflects devaluation through oversupply. Inflation also increases the cost of exports, leading to more Rupees being sold to purchase foreign imports, which is Rupee-negative. At the same time, higher inflation usually leads to the Reserve Bank of India (RBI) raising interest rates and this can be positive for the Rupee, due to increased demand from international investors. The opposite effect is true of lower inflation.
| Raw materials | Closed | Change, % |
|---|---|---|
| Silver | 31.66 | 0.57 |
| Gold | 267.35 | 0.42 |
| Palladium | 1024.17 | 1.45 |
- Gold price challenges all-time peak and draws support from a combination of factors.
- Expected rate cuts by major central banks and geopolitical risks boost the XAU/USD.
- Bulls seem rather unaffected by the recent USD rally, to its highest level since August.
Gold price (XAU/USD) built on its uptrend witnessed over the past week or so and retested the all-time high on Wednesday amid the expected interest rate cuts by major central banks. Traders have fully priced in a 25 basis points (bps) interest rate cut by the US Federal Reserve (Fed) in November. Furthermore, weak inflation data from Europe and the UK have solidified bets for a more aggressive policy easing by the European Central Bank (ECB) and the Bank of England (BoE). This led to generally lower yields, which, in turn, continued to offer support to the non-yielding yellow metal.
Apart from this, persistent geopolitical risks stemming from the ongoing conflicts in the Middle East turn out to be another factor underpinning demand for the safe-haven Gold price. Meanwhile, growing acceptance that the Fed will proceed with modest interest rate cuts over the next year lifted the US Dollar (USD) to its highest level since early August and beyond the 100-day Simple Moving Average (SMA) for the first time since July. This, in turn, might hold back traders from placing fresh bullish bets around the XAU/USD and cap the upside ahead of US macro data due later this Thursday.
Daily Digest Market Movers: Gold price continues to draw support from rate-cut bets, Middle East concerns
- The recent decline in Crude Oil prices is expected to ease inflationary pressures and allow major central banks to cut interest rates further, which continues to drive flows towards the non-yielding Gold price.
- The European Central Bank is on course to deliver its third interest rate cut of the year this Thursday, while a sharp drop in the UK inflation reaffirmed bets for a rate cut by the Bank of England in November.
- Moreover, the CME Group's FedWatch Tool indicates over a 90% chance that the Federal Reserve will lower borrowing costs by 25 basis points next month, dragging the US bond yields to over a one-week low.
- Meanwhile, the US Dollar prolonged its well-established uptrend witnessed since the beginning of this month and climbed to its highest level since early August, though it did little to discourage the XAU/USD bulls.
- The recent comments from officials at the London Bullion Market Association's annual conference suggest that central banks remain keen buyers of bullion to diversify their reserves for financial or strategic reasons.
- The United Nations (UN) said that Israeli forces have fired at its peacekeeping position, forcibly entered a base, stopped a critical logistical movement, and injured more than a dozen of its troops in southern Lebanon.
- According to a source familiar with the matter, Israel’s plan to respond to Iran’s October 1 attack is ready, raising the risk of a further escalation of geopolitical tensions and a full-blown war in the Middle East.
- China's housing minister, during a press briefing this Thursday, said that the government will add 1 million village urbanization projects and will adopt monetisation measures for the said urbanisation projects.
- Later during the early North American session, traders will take cues from the US economic docket – featuring the release of Retail Sales, Weekly Initial Jobless Claims and the Philly Fed Manufacturing Index.
- Furthermore, the ECB monetary policy decision might infuse volatility in the markets and provide some meaningful impetus to the safe-haven precious metal, allowing traders to grab short-term opportunities.
Technical Outlook: Gold price seems poised to conquer $2,700 and prolong its well-established uptrend
From a technical perspective, the ongoing positive move could lift the Gold price to the $2,700 mark. Some follow-through buying will be seen as a fresh trigger for bullish traders and pave the way for an extension of a multi-month-old uptrend. The constructive outlook is reinforced by the fact that oscillators on the daily chart are holding in positive territory and are still away from being in the overbought zone.
On the flip side, the $2,662-2,660 horizontal zone now seems to act as an immediate support ahead of the $2,647-2,646 area. A convincing break below the latter might prompt some technical selling and drag the Gold price to the $2,630 intermediate support en route to the $2,600 neighborhood.
Gold FAQs
Gold has played a key role in human’s history as it has been widely used as a store of value and medium of exchange. Currently, apart from its shine and usage for jewelry, the precious metal is widely seen as a safe-haven asset, meaning that it is considered a good investment during turbulent times. Gold is also widely seen as a hedge against inflation and against depreciating currencies as it doesn’t rely on any specific issuer or government.
Central banks are the biggest Gold holders. In their aim to support their currencies in turbulent times, central banks tend to diversify their reserves and buy Gold to improve the perceived strength of the economy and the currency. High Gold reserves can be a source of trust for a country’s solvency. Central banks added 1,136 tonnes of Gold worth around $70 billion to their reserves in 2022, according to data from the World Gold Council. This is the highest yearly purchase since records began. Central banks from emerging economies such as China, India and Turkey are quickly increasing their Gold reserves.
Gold has an inverse correlation with the US Dollar and US Treasuries, which are both major reserve and safe-haven assets. When the Dollar depreciates, Gold tends to rise, enabling investors and central banks to diversify their assets in turbulent times. Gold is also inversely correlated with risk assets. A rally in the stock market tends to weaken Gold price, while sell-offs in riskier markets tend to favor the precious metal.
The price can move due to a wide range of factors. Geopolitical instability or fears of a deep recession can quickly make Gold price escalate due to its safe-haven status. As a yield-less asset, Gold tends to rise with lower interest rates, while higher cost of money usually weighs down on the yellow metal. Still, most moves depend on how the US Dollar (USD) behaves as the asset is priced in dollars (XAU/USD). A strong Dollar tends to keep the price of Gold controlled, whereas a weaker Dollar is likely to push Gold prices up.
Speaking at the property market briefing on Thursday, China’s Housing Minister said that they “will add one million village urbanization projects.
Additional quotes
Will expand the white list of projects, bank lending to 4tln yuan.
Will adopt monetization measures for urbanization projects.
Will adopt monetization measures for urbanization projects.
On property restrictions: Cities will make their own decisions based on economic situation, local property market conditions.
Market reaction
AUD/USD is consolidating Australian employment data-led solid gains near 0.6700, little impressed by these above comments. The pair is up 0.51% on the day so far.
Australian Dollar FAQs
One of the most significant factors for the Australian Dollar (AUD) is the level of interest rates set by the Reserve Bank of Australia (RBA). Because Australia is a resource-rich country another key driver is the price of its biggest export, Iron Ore. The health of the Chinese economy, its largest trading partner, is a factor, as well as inflation in Australia, its growth rate and Trade Balance. Market sentiment – whether investors are taking on more risky assets (risk-on) or seeking safe-havens (risk-off) – is also a factor, with risk-on positive for AUD.
The Reserve Bank of Australia (RBA) influences the Australian Dollar (AUD) by setting the level of interest rates that Australian banks can lend to each other. This influences the level of interest rates in the economy as a whole. The main goal of the RBA is to maintain a stable inflation rate of 2-3% by adjusting interest rates up or down. Relatively high interest rates compared to other major central banks support the AUD, and the opposite for relatively low. The RBA can also use quantitative easing and tightening to influence credit conditions, with the former AUD-negative and the latter AUD-positive.
China is Australia’s largest trading partner so the health of the Chinese economy is a major influence on the value of the Australian Dollar (AUD). When the Chinese economy is doing well it purchases more raw materials, goods and services from Australia, lifting demand for the AUD, and pushing up its value. The opposite is the case when the Chinese economy is not growing as fast as expected. Positive or negative surprises in Chinese growth data, therefore, often have a direct impact on the Australian Dollar and its pairs.
Iron Ore is Australia’s largest export, accounting for $118 billion a year according to data from 2021, with China as its primary destination. The price of Iron Ore, therefore, can be a driver of the Australian Dollar. Generally, if the price of Iron Ore rises, AUD also goes up, as aggregate demand for the currency increases. The opposite is the case if the price of Iron Ore falls. Higher Iron Ore prices also tend to result in a greater likelihood of a positive Trade Balance for Australia, which is also positive of the AUD.
The Trade Balance, which is the difference between what a country earns from its exports versus what it pays for its imports, is another factor that can influence the value of the Australian Dollar. If Australia produces highly sought after exports, then its currency will gain in value purely from the surplus demand created from foreign buyers seeking to purchase its exports versus what it spends to purchase imports. Therefore, a positive net Trade Balance strengthens the AUD, with the opposite effect if the Trade Balance is negative.
- The Australian Dollar receives support following the release of the Aussie labor figures on Thursday.
- Australia’s Employment Change increased by 64.1K in September, bringing the total employment to a record 14.52 million.
- Traders anticipate the US Retail Sales data, with expectations for a 0.3% increase MoM in September, up from 0.1% prior.
The Australian Dollar (AUD) halts its three-day losing streak against the US Dollar (USD) after a strong Australian employment report was released on Thursday. The seasonally adjusted Employment Change in Australia surged by 64.1K in September, bringing the total employment to a record 14.52 million. This far surpassed market expectations of a 25.0K increase, following a revised rise of 42.6K in the previous month.
Meanwhile, Australia's seasonally adjusted Unemployment Rate remained steady at 4.1% in September, matching the revised figure for August and coming in lower than the anticipated 4.2%. The number of unemployed individuals decreased by 9.2K, down to 615,700.
The US Dollar (USD) found support from strong labor and inflation data, which has tempered expectations for aggressive easing by the Federal Reserve (Fed).
Traders are keenly awaiting the US Retail Sales data, set to be released later in the North American session. Expectations are for monthly consumer spending to increase by 0.3% in September, up from 0.1% in the previous reading.
Daily Digest Market Movers: Australian Dollar appreciates due to solid labor report
- According to the CME FedWatch Tool, there is currently a 92.1% probability of a 25-basis-point rate cut in November, with no expectation of a larger 50-basis-point reduction.
- Reserve Bank of Australia (RBA) Deputy Governor Sarah Hunter reiterated on Wednesday the central bank's commitment to curbing inflation, emphasizing that although inflation expectations remain well-anchored, ongoing price pressures continue to present significant challenges.
- On Tuesday, Federal Reserve Bank of Atlanta President Raphael Bostic stated that he anticipates just one more interest rate cut of 25 basis points this year, as reflected in his projections during last month's US central bank meeting. "The median forecast was for 50 basis points beyond the 50 basis points already implemented in September. My projection was for an additional 25 basis points," he said, according to Reuters.
- The Australian weekly survey of Consumer Confidence showed little movement, with the ANZ-Roy Morgan Consumer Confidence index remaining steady at 83.4 this week. Despite the unchanged figure, the longer-term trend shows that Consumer Confidence has been below the 85.0 mark for a record 89 consecutive weeks. The current reading is 1.3 points higher than the 2024 weekly average of 82.1.
- Federal Reserve (Fed) Bank of Minneapolis President Neel Kashkari reassured markets on Monday by reaffirming the Fed's data-dependent approach. Kashkari reiterated familiar Fed policymaker views on the strength of the US economy, noting continued easing of inflationary pressures and a robust labor market, despite a recent uptick in the overall unemployment rate, per Reuters.
- The Commonwealth Bank of Australia indicated expectations that the Reserve Bank of Australia will implement a 25 basis point rate cut by the end of 2024. The report suggested that a stronger disinflationary trend than the RBA anticipates is essential for the Board to consider easing policy within this calendar year.
- The National Bureau of Statistics of China reported that the country's monthly Consumer Price Index (CPI) remained unchanged at 0% in September, down from August's 0.4% increase. The annual inflation rate rose by 0.4%, falling short of the anticipated 0.6%. Additionally, the Producer Price Index (PPI) decreased by 2.8% year-on-year, a larger drop than the previous decline of 1.8% and exceeding expectations of a 2.5% decrease.
Technical Analysis: Australian Dollar tests 0.6700, upper boundary of a descending channel
The AUD/USD pair hovers around 0.6700 on Thursday. An analysis of the daily chart shows the pair testing the upper boundary of a descending channel. If it successfully breaks above this channel, it could signal a shift in momentum from bearish to bullish. However, bearish sentiment remains dominant with the 14-day Relative Strength Index (RSI) still below 50.
On the downside, the AUD/USD pair could target its eight-week low of 0.6622, last touched on September 11. A break below this level might lead to further declines, with the next target being the descending channel's lower boundary near the psychological support level of 0.6580.
In terms of resistance, a breakout above the descending channel could bring the nine-day Exponential Moving Average (EMA) around 0.6729 into focus, followed by the key psychological barrier level at 0.6800.
AUD/USD: Daily Chart
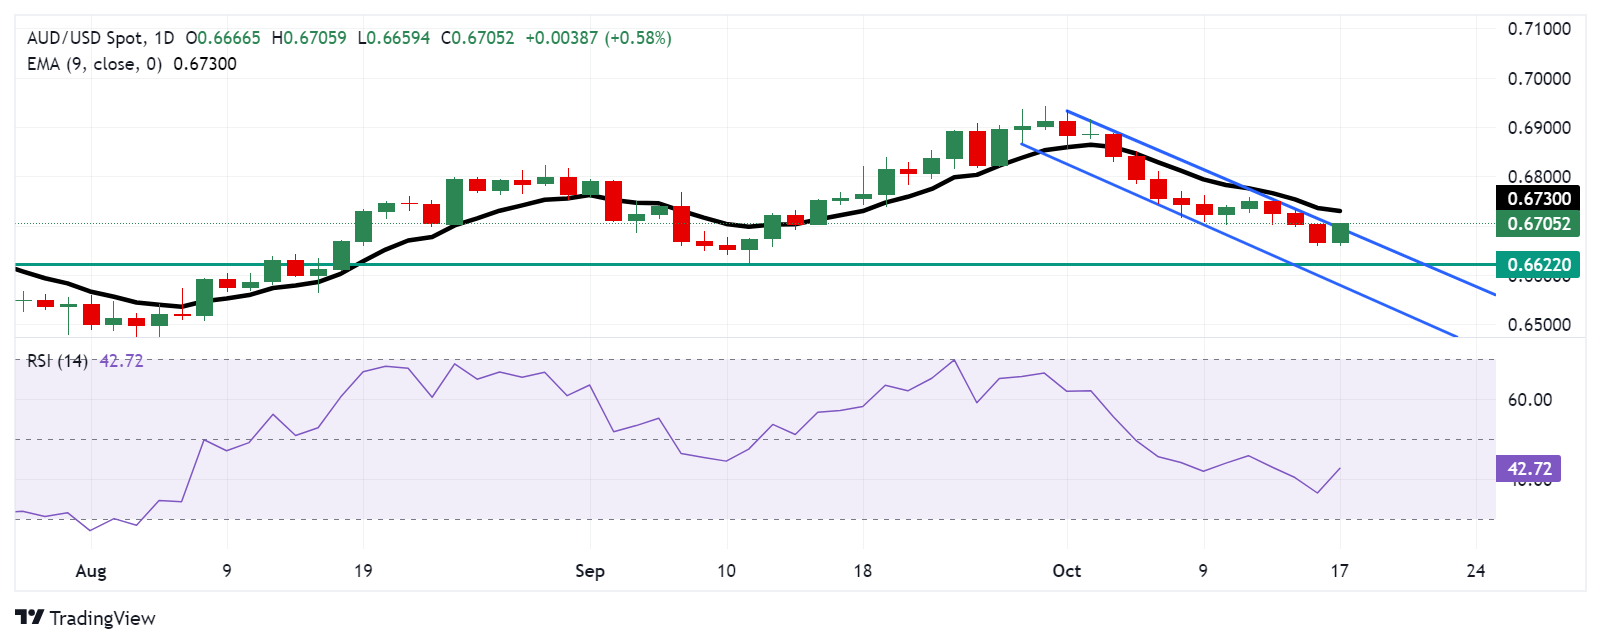
Australian Dollar PRICE Today
The table below shows the percentage change of Australian Dollar (AUD) against listed major currencies today. Australian Dollar was the strongest against the Swiss Franc.
| USD | EUR | GBP | JPY | CAD | AUD | NZD | CHF | |
|---|---|---|---|---|---|---|---|---|
| USD | -0.02% | -0.07% | -0.19% | -0.01% | -0.62% | -0.30% | -0.03% | |
| EUR | 0.02% | -0.07% | -0.13% | 0.00% | -0.60% | -0.26% | -0.01% | |
| GBP | 0.07% | 0.07% | -0.10% | 0.06% | -0.54% | -0.22% | 0.07% | |
| JPY | 0.19% | 0.13% | 0.10% | 0.18% | -0.43% | -0.13% | 0.19% | |
| CAD | 0.01% | -0.01% | -0.06% | -0.18% | -0.61% | -0.28% | 0.01% | |
| AUD | 0.62% | 0.60% | 0.54% | 0.43% | 0.61% | 0.32% | 0.62% | |
| NZD | 0.30% | 0.26% | 0.22% | 0.13% | 0.28% | -0.32% | 0.29% | |
| CHF | 0.03% | 0.00% | -0.07% | -0.19% | -0.01% | -0.62% | -0.29% |
The heat map shows percentage changes of major currencies against each other. The base currency is picked from the left column, while the quote currency is picked from the top row. For example, if you pick the Australian Dollar from the left column and move along the horizontal line to the US Dollar, the percentage change displayed in the box will represent AUD (base)/USD (quote).
Australian Dollar FAQs
One of the most significant factors for the Australian Dollar (AUD) is the level of interest rates set by the Reserve Bank of Australia (RBA). Because Australia is a resource-rich country another key driver is the price of its biggest export, Iron Ore. The health of the Chinese economy, its largest trading partner, is a factor, as well as inflation in Australia, its growth rate and Trade Balance. Market sentiment – whether investors are taking on more risky assets (risk-on) or seeking safe-havens (risk-off) – is also a factor, with risk-on positive for AUD.
The Reserve Bank of Australia (RBA) influences the Australian Dollar (AUD) by setting the level of interest rates that Australian banks can lend to each other. This influences the level of interest rates in the economy as a whole. The main goal of the RBA is to maintain a stable inflation rate of 2-3% by adjusting interest rates up or down. Relatively high interest rates compared to other major central banks support the AUD, and the opposite for relatively low. The RBA can also use quantitative easing and tightening to influence credit conditions, with the former AUD-negative and the latter AUD-positive.
China is Australia’s largest trading partner so the health of the Chinese economy is a major influence on the value of the Australian Dollar (AUD). When the Chinese economy is doing well it purchases more raw materials, goods and services from Australia, lifting demand for the AUD, and pushing up its value. The opposite is the case when the Chinese economy is not growing as fast as expected. Positive or negative surprises in Chinese growth data, therefore, often have a direct impact on the Australian Dollar and its pairs.
Iron Ore is Australia’s largest export, accounting for $118 billion a year according to data from 2021, with China as its primary destination. The price of Iron Ore, therefore, can be a driver of the Australian Dollar. Generally, if the price of Iron Ore rises, AUD also goes up, as aggregate demand for the currency increases. The opposite is the case if the price of Iron Ore falls. Higher Iron Ore prices also tend to result in a greater likelihood of a positive Trade Balance for Australia, which is also positive of the AUD.
The Trade Balance, which is the difference between what a country earns from its exports versus what it pays for its imports, is another factor that can influence the value of the Australian Dollar. If Australia produces highly sought after exports, then its currency will gain in value purely from the surplus demand created from foreign buyers seeking to purchase its exports versus what it spends to purchase imports. Therefore, a positive net Trade Balance strengthens the AUD, with the opposite effect if the Trade Balance is negative.
- USD/JPY edges lower to near 149.40 in Thursday’s Asian session.
- The rising bets that the Fed will gradually lower interest rates in the remainder of the year might support the USD.
- Investors will take more cues from Japan’s September National CPI inflation data on Friday.
The USD/JPY pair weakens to around 149.40 despite the stronger US Dollar (USD) during the Asian trading hours on Thursday. The US Retail Sales data will take center stage later on Thursday, which is estimated to rise to 0.3% in September from 0.1% in the previous reading.
The US economic data showed a resilient economy and inflation in September rose slightly more than expected, prompting traders to trim bets on further large rate cuts from the US Federal Reserve (Fed). This, in turn, could lift the Greenback against the Japanese Yen (JPY). Traders have assigned a nearly 100% odds of a 25 basis points (bps) rate cut in November, with just a 0.2% possibility of a pause by the Fed, keeping the fed funds rate at the 4.75%-5.0% target range, according to LSEG calculations.
Nonetheless, persistent geopolitical risks and US election uncertainty could boost the safe-haven flows, benefitting the JPY. Israel’s plan to respond to this month’s Iranian attack is ready, per CNN. US officials expect it to happen before the US presidential election. Prime Minister Benjamin Netanyahu separately stated Israel is opposed to a “unilateral ceasefire” in its war with Iran-backed Hezbollah in Lebanon.
Data released by the Ministry of Finance showed on Thursday that Japan’s exports fell 1.7% year-over-year in September from a revised rate of 5.5% in August. Meanwhile, imports grew 2.1% year-over-year in September, compared to 2.3% the month prior. Both figures came in weaker than the expectations.
Investors await the nation’s September National Consumer Price Index (CPI) data on Friday for fresh impetus. The National CPI ex Fresh Food is expected to ease to 2.3% in September from 2.8% in August. Meanwhile, the Bank of Japan’s (BOJ) challenge in proceeding with policy normalization amid uncertainty over the new political leadership's preference for monetary settings might cap the upside for the JPY in the near term.
Japanese Yen FAQs
The Japanese Yen (JPY) is one of the world’s most traded currencies. Its value is broadly determined by the performance of the Japanese economy, but more specifically by the Bank of Japan’s policy, the differential between Japanese and US bond yields, or risk sentiment among traders, among other factors.
One of the Bank of Japan’s mandates is currency control, so its moves are key for the Yen. The BoJ has directly intervened in currency markets sometimes, generally to lower the value of the Yen, although it refrains from doing it often due to political concerns of its main trading partners. The BoJ ultra-loose monetary policy between 2013 and 2024 caused the Yen to depreciate against its main currency peers due to an increasing policy divergence between the Bank of Japan and other main central banks. More recently, the gradually unwinding of this ultra-loose policy has given some support to the Yen.
Over the last decade, the BoJ’s stance of sticking to ultra-loose monetary policy has led to a widening policy divergence with other central banks, particularly with the US Federal Reserve. This supported a widening of the differential between the 10-year US and Japanese bonds, which favored the US Dollar against the Japanese Yen. The BoJ decision in 2024 to gradually abandon the ultra-loose policy, coupled with interest-rate cuts in other major central banks, is narrowing this differential.
The Japanese Yen is often seen as a safe-haven investment. This means that in times of market stress, investors are more likely to put their money in the Japanese currency due to its supposed reliability and stability. Turbulent times are likely to strengthen the Yen’s value against other currencies seen as more risky to invest in.
The People’s Bank of China (PBoC) set the USD/CNY central rate for the trading session ahead on Thursday at 7.1220, as compared to the previous day's fix of 7.1191 and 7.1208 Reuters estimates.
| Index | Change, points | Closed | Change, % |
|---|---|---|---|
| NIKKEI 225 | -730.25 | 39180.3 | -1.83 |
| Hang Seng | -31.94 | 20286.85 | -0.16 |
| KOSPI | -23.09 | 2610.36 | -0.88 |
| ASX 200 | -33.7 | 8284.7 | -0.41 |
| DAX | -53.38 | 19432.81 | -0.27 |
| CAC 40 | -29.97 | 7492 | -0.4 |
| Dow Jones | 337.28 | 43077.7 | 0.79 |
| S&P 500 | 27.21 | 5842.47 | 0.47 |
| NASDAQ Composite | 51.49 | 18367.08 | 0.28 |
| Pare | Closed | Change, % |
|---|---|---|
| AUDUSD | 0.66654 | -0.45 |
| EURJPY | 162.466 | 0.01 |
| EURUSD | 1.08617 | -0.26 |
| GBPJPY | 194.306 | -0.31 |
| GBPUSD | 1.29902 | -0.58 |
| NZDUSD | 0.60557 | -0.02 |
| USDCAD | 1.37511 | -0.22 |
| USDCHF | 0.86469 | 0.32 |
| USDJPY | 149.559 | 0.27 |


© 2000-2025. Уcі права захищені.
Cайт знаходитьcя під керуванням TeleTrade DJ. LLC 2351 LLC 2022 (Euro House, Richmond Hill Road, Kingstown, VC0100, St. Vincent and the Grenadines).
Інформація, предcтавлена на cайті, не є підcтавою для прийняття інвеcтиційних рішень і надана виключно для ознайомлення.
Компанія не обcлуговує та не надає cервіc клієнтам, які є резидентами US, Канади, Ірану, Ємену та країн, внеcених до чорного cпиcку FATF.
Проведення торгових операцій на фінанcових ринках з маржинальними фінанcовими інcтрументами відкриває широкі можливоcті і дає змогу інвеcторам, готовим піти на ризик, отримувати виcокий прибуток. Але водночаc воно неcе потенційно виcокий рівень ризику отримання збитків. Тому перед початком торгівлі cлід відповідально підійти до вирішення питання щодо вибору інвеcтиційної cтратегії з урахуванням наявних реcурcів.
Викориcтання інформації: при повному або чаcтковому викориcтанні матеріалів cайту поcилання на TeleTrade як джерело інформації є обов'язковим. Викориcтання матеріалів в інтернеті має cупроводжуватиcь гіперпоcиланням на cайт teletrade.org. Автоматичний імпорт матеріалів та інформації із cайту заборонено.
З уcіх питань звертайтеcь за адреcою pr@teletrade.global.
переклади