- Analytics
- News and Tools
- Market News
Новини ринків
- The EUR/GBP bounded into 0.8680 after EU data beats climbed over UK earnings miss.
- EU sentiment came in above expectations, while UK wages failed to meet the market median forecast.
- EUR/GBP traders will be looking ahead to Wednesday's joint CPI inflation reading for both the EU and the UK.
The EUR/GBP climbed around 0.4% on Tuesday in one of the pair's single-best trading days since early September, rising from the opening bids near 0.8648 to close out around 0.8682, and setting a high for the day at 0.8690.
With only inches to go from the 0.8700 handle, the Euro (EUR) finds itself heading into Wednesday's double-feature of UK and EU inflation figures.
UK Average Earnings missed the mark on Tuesday, with wages including bonuses for the quarter into August growing by 8.1% against the forecast 8.3% and coming in below the previous reading of 8.5%.
On the EU side, the ZEW Economic Sentiment Survey for October showed an unexpected rebound in economic confidence, with the index printing a firm 2.3 compared to the forecast -8 and previous reading of -8.9.
Wednesday sees UK Consumer Price Index (CPI) inflation numbers, with the headline annualized inflation reading expected to tick down from 6.7% to 6.5% for September.
On the EU side, EU CPI inflation is broadly expecting to hold steady, with the Core CPI reading for September to show flat at 0.2% for the month.
The European Central Bank (ECB) President Christine Lagarde is also expected to make an appearance, and investors will be keeping an eye out for any statements about the ECB's forecasts on possible interest rate moves.
EUR/GBP Technical Outlook
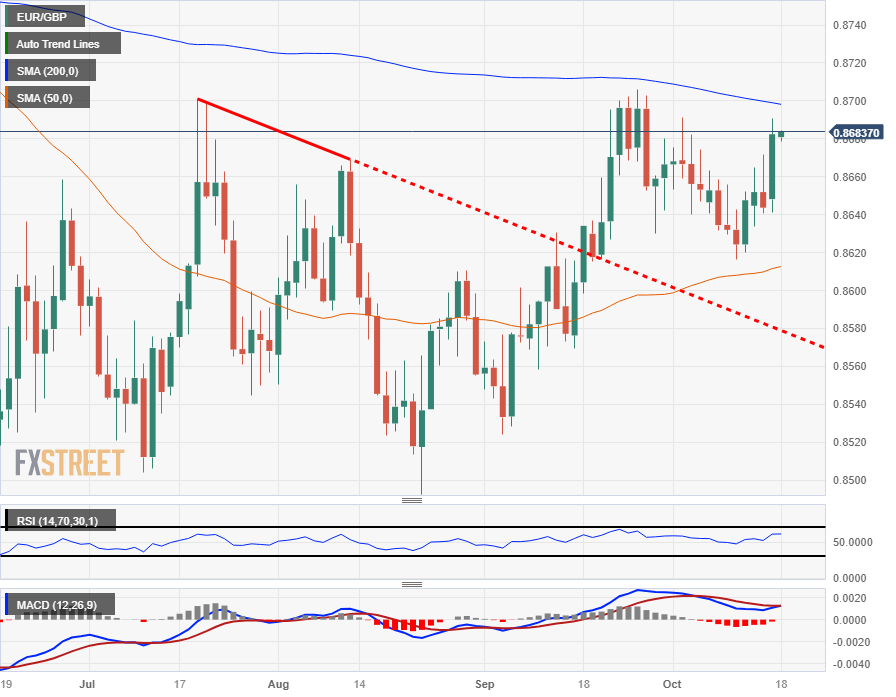
Despite Tuesday's bumper green bar for the day, the EUR/GBP remains trapped within familiar price action, with September's swing high into the 0.8700 handle seeing constraining technical resistance from a slowly descending 200-day Simple Moving Average (SMA).
On the downside the 50-day SMA is seeing some lift into the 0.8620, keeping bids trapped in the middle, and the last swing low into 0.8620 will be the level to beat for EUR/GBP sellers in the near-term.
EUR/GBP Daily Chart
EUR/GBP Technical Levels
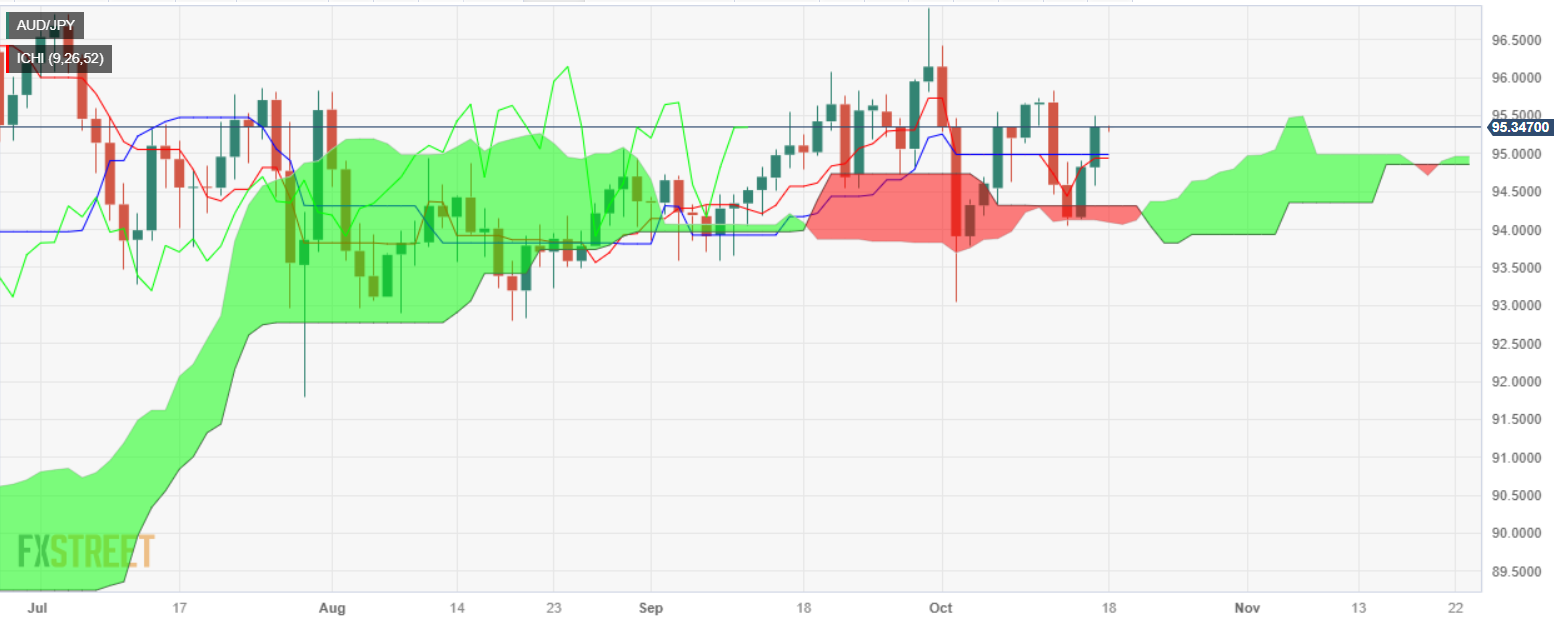
- AUD/JPY rises and prints a new weekly high of 95.50 but remains within the 93.00/96.40 consolidation range.
- Immediate resistance for AUD/JPY stands at 95.50, followed by the 96.00 psychological level.
- Key supports are located at the top of the Kumo at 94.31 and 94.00.
The Australian Dollar (AUD) registers solid gains against the Japanese Yen (JPY) after minutes of the latest Reserve Bank of Australia (RBA) showed the central bank kept the door open for further tightening. The AUD/JPY is trading at 95.33, up 0.54%.
Despite rising towards a weekly high of 95.50, the AUD/JPY pair remains consolidated but unable to break below/above the 93.00/96.40 range, though as price action remains above the Kumo, the bias is mildly bullish. Therefore, the first resistance would be 95.50, Tuesday’s high, followed by the psychological 96.00 mark. A breach of the latter would expose the top of the aforementioned resistance level at 96.40 and the year-to-date (YTD) high of 97.67.
On the flip side, the AUD/JPY first support would be the top of the Kumo at 94.31, followed by the 94.00 figure. Once cleared, the cross would die towards the October 3 daily low of 93.01.
AUD/JPY Price Action – Daily chart
AUD/JPY Technical Levels
According to the Reserve Bank of Australia (RBA) Governor Michele Bullock's speech on Wednesday, Bullock said if inflation remains higher than expected, RBA will respond with policy.
Key quotes
“Bit more worried about inflation impact from supply shocks.”
“We are seeing demand slow, per capita consumption is declining.”
“Have not yet seen full impact of past rate rises on consumption.”
“If inflation remains higher than expected, will have to respond with policy.”
“We think we are running narrow path, but very alert to upside inflation risks.”
Market reaction
At the time of writing, the AUD/USD pair is trading near 0.6365,holding higher while adding 0.02% on the day.
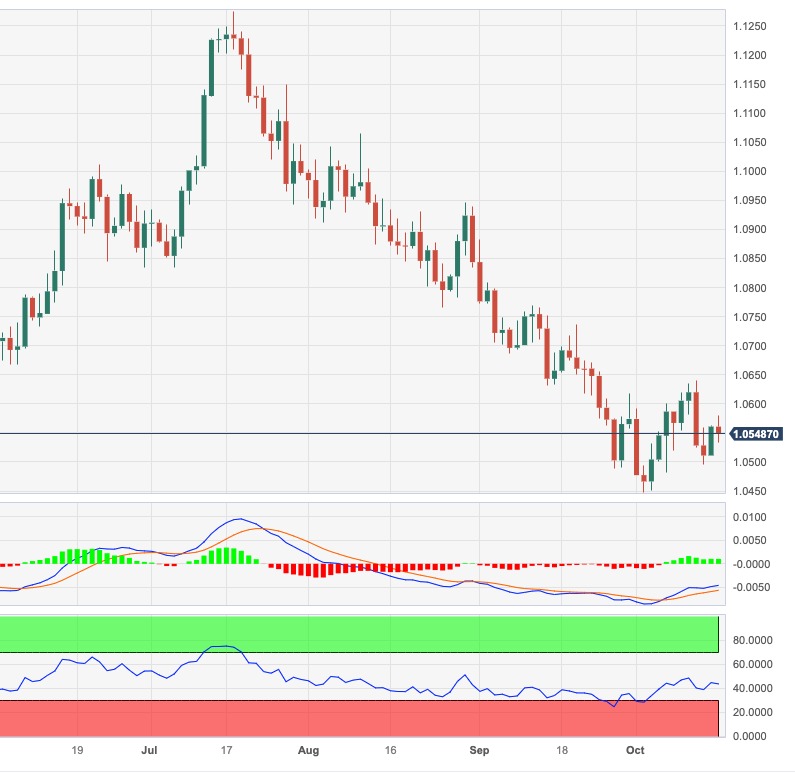
- EURUSD currently trades around 1.0575 amid the risk-on mood and the softer USD.
- EU and German ZEW Economic Sentiment Survey for October came in better than expected.
- US Retail Sales for September rose 0.7% MoM, stronger than the 0.3% estimated.
- Market players await the Eurozone inflation data, US housing data.
The EURUSD pair hovers around 1.0575 after retreating from the 1.0600 mark during the early Asian session on Wednesday. The risk-on flows dominate the market and weigh on the US Dollar (USD) lower. Meanwhile, the US Dollar Index (DXY) corrects lower to 106.20 and US Treasury yields surges sharply, with the 10-year Treasury yield reaching 4.83%.
On Tuesday, the EU's ZEW Economic Sentiment Survey came in at 2.3 in October from an 8.9 drop in the previous reading, beating the market expectations. German ZEW Survey Economic Sentiment also showed an improvement by climbing to -1.1 from -11.4 in the previous reading.
The European Central Bank (ECB) President Christine Lagarde said that the ECB is watching energy prices and the Israel-Hamas conflict for inflation risks. Meanwhile, ECB's chief economist Philip Lane stated that they will keep interest rates high until inflation returns to 2%, but this may take time longer than expected due to several factors.
The economic data released by the US Census Bureau revealed that the Retail Sales for September came in at 0.7% MoM, beating the market expectation of 0.3%. Retail Sales Control Group climbed 0.6% MoM versus 0.2% prior. The data suggest strong momentum in consumption. Additionally, US Industrial Production rose by 0.3% MoM, stronger than expected. Capacity Utilization improved to 79.7, better than estimated.
The Greenback edged higher on the back of the upbeat US data, but the impact was short-lived. However, higher US Treasury yields might cap the downside of the USD.
Minneapolis Federal Reserve Bank President Neel Kashkari on Tuesday said that inflation has taken considerably longer than expected and is still too high. Earlier, Chicago Fed President Austan Goolsbee and Philadelphia Fed President Patrick Harker maintained their dovish stance. Harker stated that the central bank should not create new pressures in the economy by increasing the cost of borrowing. Traders will take more cues from the Fed officials this week. The hawkish comments might lift the USD and act as a headwind for the EUR/USD pair.
Looking ahead, market players will monitor the final reading of the Eurozone Consumer Price Index (CPI) for September and Construction Output for August due later in the day. Also, ECB's President Lagarde's speech could offer some hints about the further monetary policy path. On the US docket, the US Housing Starts and Building Permits will be released on Wednesday. These events could give a clear direction to the EUR/USD pair.
- US equities ended Tuesday mixed as Wall Street spreads on US Retail Sales beat.
- Tech stocks see losses after US restricts chip sales to China.
- Treasury yields spiked once again, 10-year yield sees 4.836%.
The Standard & Poor's (S&P) 500 major equity index closed Tuesday trading largely flat on the day, ending in the red a scant 0.01% to close at $4,373.20, down -0.43 points. The NASDAQ Composite saw a 0.25% loss to end the day down 34.24 points into $13,533.75, while the Dow Jones Industrial Average (DJIA) eked out a minor gain of 0.04%, rising 13.11 points to end the day at $33,997.65.
Equities mixed following the bumper US Retail Sales figures, with equity investors concerned about the Federal Reserve (Fed) failing to cut interest rates as quickly as markets would like.
US Retail Sales rose 0.7% in September vs. 0.3% anticipated
Chip stocks saw the majority of the day's declines after the US Presidential Administration announced plans to halt shipments to China of AI-based chip tech, with NVIDIA leading the way down for major chip makers, declining over 4% on the day.
The US Retail Sales data beat, coupled with solid earnings beats for both Bank of America and Goldman Sachs, sent US Treasury yields into 17-year highs as strong consumer activity and bumping summer profits show the Fed's interest rate hikes may not be tying down the US domestic economy as many investors would be hoping for in order to get the rate cut cycle started, and continued upbeat data printings will see the Fed punished even further out on anticipated rate cuts, which are currently seen not until the third quarter of 2024.
S&P 500 Technical Outlook
The S&P 500 remains strung up in near-term familiar territory, and remains capped below last week's swing high into $4,396, with the 50-day Simple Moving Average pressing down from $4,400.
October's early bounce from $4,199 sees the S&P index climbing from the 200-day SMA with prices caught between scissor handles from the 50- and 200-day SMAs.
S&P 500 Daily Chart

S&P 500 Technical Levels
- The AUD/NZD sees its single best trading day since June, climbing nearly 0.9% on Tuesday.
- The RBA's meeting minutes proved to be hawkish with the Aussie central bank seeing higher inflation risks.
- the Kiwi struggled after Monday's CPI inflation miss.
The AUD/NZD hustled up the charts to close Tuesday trading just shy of the 1.0800 major handle, driving the pair decisively back into prices not seen since September, with the Aussie (AUD) catching a firm bid from a hawkish Reserve Bank of Australia (RBA) while the Kiwi (NZD) struggles to find some pickup after missing Consumer Price Index (CPI) inflation expectations on Monday.
RBA Minutes: Case to hold was stronger, upside risks to inflation were a significant concern
The RBA's latest Meeting Minutes paved the way for the Australian reserve bank to hold interest rates higher for even longer than previously anticipated, driving the Aussie higher as markets firmly bid the AUD against its Antipodean neighbor.
Forex Today: Dollar slides despite upbeat US data
The Kiwi broadly missed the mark in late Monday's CPI inflation reading, with the annualized figure into the third quarter flubbing the 5.9% forecast to print at 5.6% against the previous quarter's 6%.
Next up on the economic calendar data docket will be Thursday's Australian employment figures, followed by New Zealand trade balance figures late in the day.
The Australian Unemployment Rate for September is expected to print flat at 3.7%, while the Unemployment Change figure for the same period is expected to decline from 64.9K to 20K.
The Kiwi Trade Balance reading is slated for late Thursday at 21:45 GMT, when the NZ markets are heading into the early Friday Asia market session. NZ Trade Balance for the year into September last printed at $-15.54B.
AUD/NZD Technical Outlook
Tuesday's bullish pump in the AUD/NZD sent the pair straight into the 50-day Simple Moving Average (SMA), with the pair hanging just south of the 1.0800 major handle. Overall bids still remain in bearish territory, but only slightly, with the 200-day SMA hanging just overhead at 1.0820.
Despite the day's solid green bar for the Aussie, the pair remains firmly entrenched in the middle of 2023's consolidation, with the AUD/NZD testing into price levels that have plagued the pair for most of the year.
AUD/NZD Daily Chart

AUD/NZD Technical Levels
- EUR/GBP rose by more than 0.46% to monthly highs around 0.8680.
- The bulls gathered enough momentum and breached through the 20-day SMA.
- RSI and MACD indicate strong bullish momentum for the short term.
The EUR/GBP cross broke out on Tuesday and rose to a monthly high of 0.8690. Indicators gained ground on the daily chart and indicate that further upside may be on the horizon.
The Relative Strength Index (RSI) points north in positive territory, while the Moving Average Convergence (MACD) now exhibits green bars. On the four-hour chart, the RSI rose near the overbought threshold and was quickly rejected, while the MACD’s histogram prints rising bullish bars, indicating that the buyers have strong momentum in the short term. Back to the daily chart, the pair is above the 20 and 100-day Simple Moving Averages (SMA) but is still below the 200-day average, which is the next target for the bulls at the 0.8700 area. That being said, this overall outlook favours a neutral to bullish technical outlook for the EUR/GBP.
Support levels: 0.8660 (20-day SMA), 0.8630, 0.8615.
Resistance levels: 0.8680, 0.8700 (200-day SMA), 0.8730.
EUR/GBP Daily Chart
-638331756352115535.png)
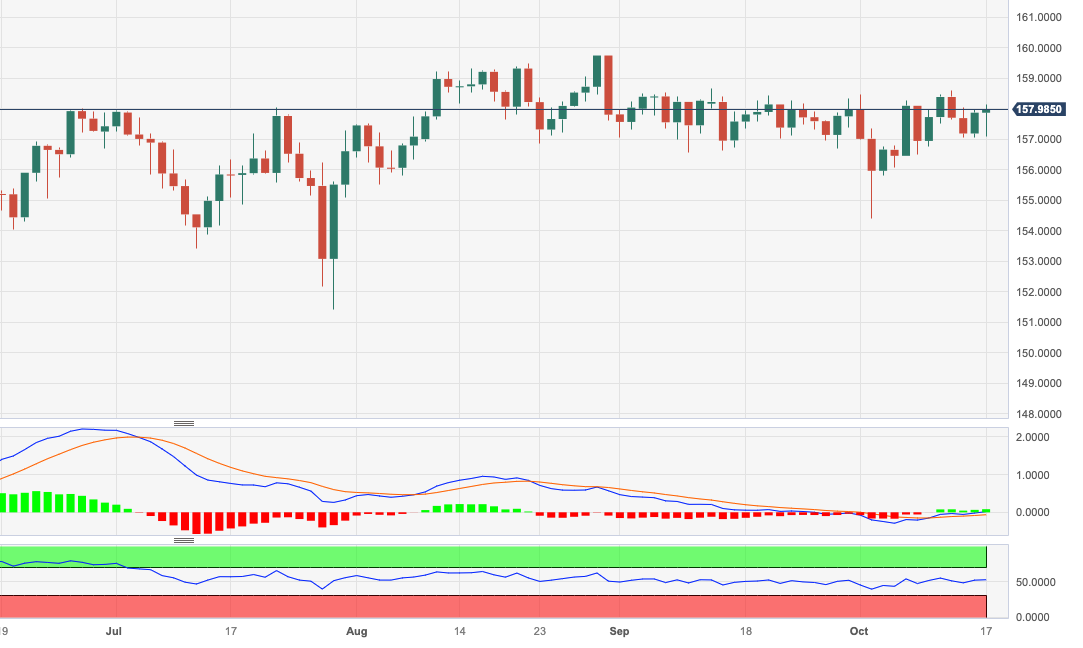
- The EUR/JPY pushed higher in risk-off bidding on Tuesday, climbing into 158.6.
- The pair started off with an early dump into 157.10, but markets quickly reversed direction.
- Wednesday brings EU CPI inflation, Japan Trade Balance.
The EUR/JPY started Wednesday with a dip into 157.10 before broad-market risk appetite turn higher, sending the Euro (EUR) back into near-term highs against the Japanese Yen (JPY), and the pair is heading into Wednesday's trading session near 158.50.
the EU's ZRE Economic Sentiment Survey for October came in well above expectations, printing at 2.3 versus the expected -8, reversing the previous reading of -8.9.
Wednesday brings European Harmonized Index of Consumer Prices (CPI) inflation figures for September, with the month-on-month figure expected to hold steady at 0.3%.
Late in the day will be Japan's Trade Balance, during the early Asia Thursday market session, where Japan's Exports are expected to recover from -0.8% to 3.1% for the year into September, while Imports are expected to bounce from -17.8% to -12.9% for the same period.
EUR/JPY Technical Outlook
EUR/JPY remains well-bid on intraday candles with prices remaining buoyed above the 200-hour Simple Moving Average (SMA) currently rising into 157.60.
Tuesday's high of 158.62 represents a new five-week high for the pair, and the pair is set to resume knocking against the ceiling of long-running consolidation that has kept the EUR/JPY constrained since first climbing into the 158.00 neighborhood in June of this year.
Despite a lack of meaningful momentum, the EUR/JPY remains overall well-bid, refusing to sink too far from the 50-day SMA and prices squeezing into a consolidation tunnel between 157.00 and 15850.
EUR/JPY Daily Chart

EUR/JPY Technical Levels
During the Asian session, the key highlight will be the release of Chinese economic data, including GDP figures. Additionally, RBA Bullock is scheduled to participate in a panel discussion. During European trading hours, the focus will shift to the release of UK inflation data.
Here is what you need to know on Wednesday, October 18:
Another round of upbeat US economic data was released. Retail sales in September rose 0.7%, surpassing the market consensus of 0.3%. August numbers were revised higher. Industrial Production in September increased by 0.3%, exceeding expectations of a flat reading. These positive figures initially boosted the US Dollar, but the impact was short-lived. The DXY closed with minor losses around 106.20.
While US Treasury yields rose sharply, higher yields across the Atlantic offset the impact on the dollar. The 10-year Treasury yield reached 4.86%, while the German benchmark yield climbed 3.50% to 2.88%.
Despite the positive economic news, Wall Street's reception was mixed. The Dow Jones rose 0.04%, while the Nasdaq declined 0.25%. The earnings season continues on Wednesday, with Tesla, Morgan Stanley, Abbott, Netflix, and other companies reporting their results.
Wells Fargo on US Retail Sales:
Consumers are spending more at bars & restaurants, at auto dealers and online. That's true on both a monthly basis and on trend over the past year. Consumers are looking for nothing but a good time, and it is hard to resist seeing the upside risk to the outlook.
During the European session, the Japanese Yen (JPY) experienced a sharp spike in response to reports suggesting that the Bank of Japan (BoJ) was likely to revise its inflation forecast for the fiscal years 2023 and 2024. However, the Yen's momentum was short-lived, and it subsequently pulled back, erasing all its gains. The USD/JPY pair found support around 148.75 and, following upbeat US retail sales data, gained strength, breaking above 149.70. The pair is now approaching the 150.00 level, which is considered a potentially significant area for intervention by the authorities.
The Euro (EUR) strengthened against the Swiss Franc (CHF) and the Pound (GBP), supported by higher Eurozone bond yields. The EUR/USD pair briefly peaked near 1.0600 before pulling back, but it held above the 1.0560 level. Eurozone will release the final readings of September's Consumer Price Index (CPI) and Construction Output for August.
GBP/USD pair continues to trade within a range of 1.2130 and 1.2225 without a clear direction. Market focus now turns to the UK inflation data scheduled for release on Wednesday.
The Canadian Dollar (CAD) declined across the board after Canada reported a 0.1% decline in the Consumer Price Index (CPI) for September, contrary to expectations of a 0.1% increase. The annual inflation rate slowed from 4% to 3.8%. USD/CAD initially traded above 1.3700 but then pulled back to the 1.3640 area, trimming its gains.
During the Asian session, the New Zealand Dollar (NZD) remained weak, continuing to be impacted by the lower-than-expected New Zealand Q3 inflation reading. The NZD/USD pair trimmed losses during the American session but ultimately finished lower, slightly below 0.5900. The pair is currently trading near the key support area of 0.5860.
On Tuesday, the Australian Dollar (AUD) outperformed, bolstered by the hawkish minutes from the latest Reserve Bank of Australia (RBA) meetings. The AUD/USD pair saw gains for the second consecutive day, but it faced resistance upon reaching the 20-day Simple Moving Average (SMA) at 0.6380 and subsequently retraced to 0.6360. On Wednesday, RBA Governor Bullock will speak at the Australian Financial Security Authority Annual Summit Panel.
Gold rose despite higher yields but failed to retake levels above $1,930. Silver rebounded sharply at $22.35, rising toward $23.00.
Like this article? Help us with some feedback by answering this survey:
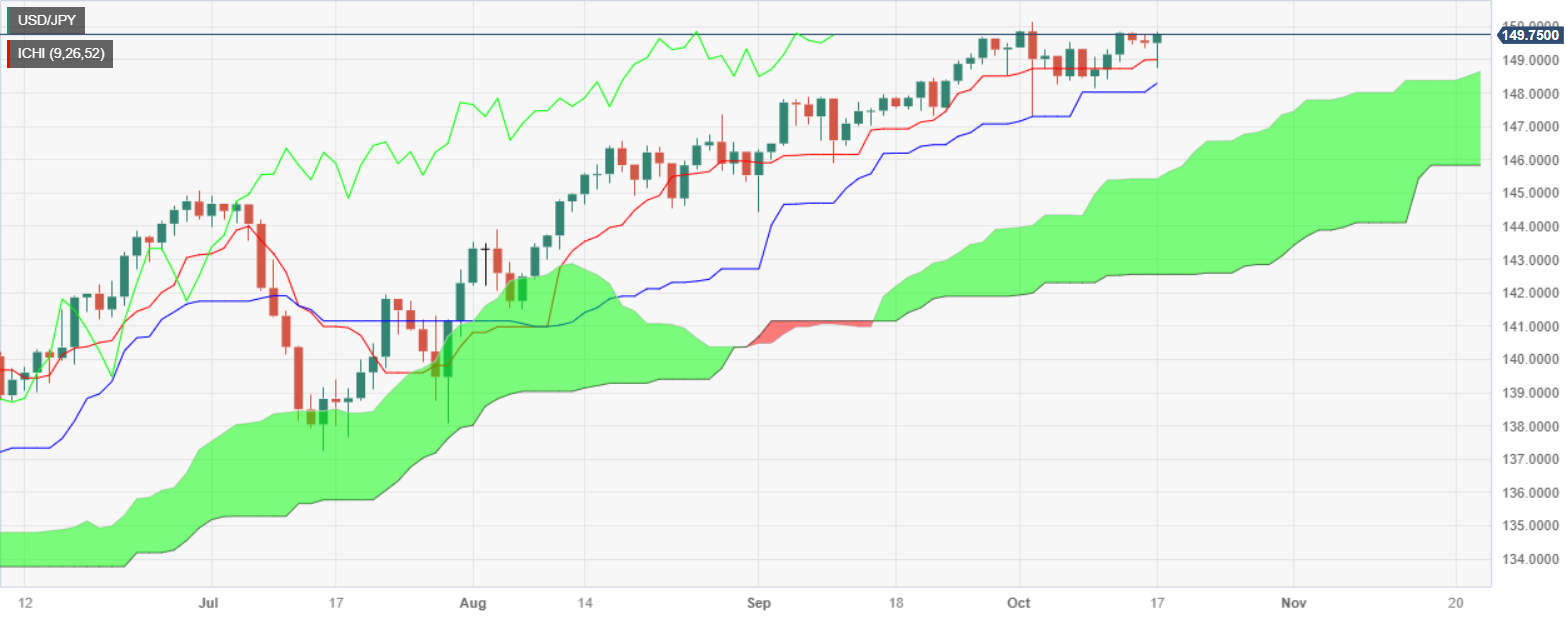
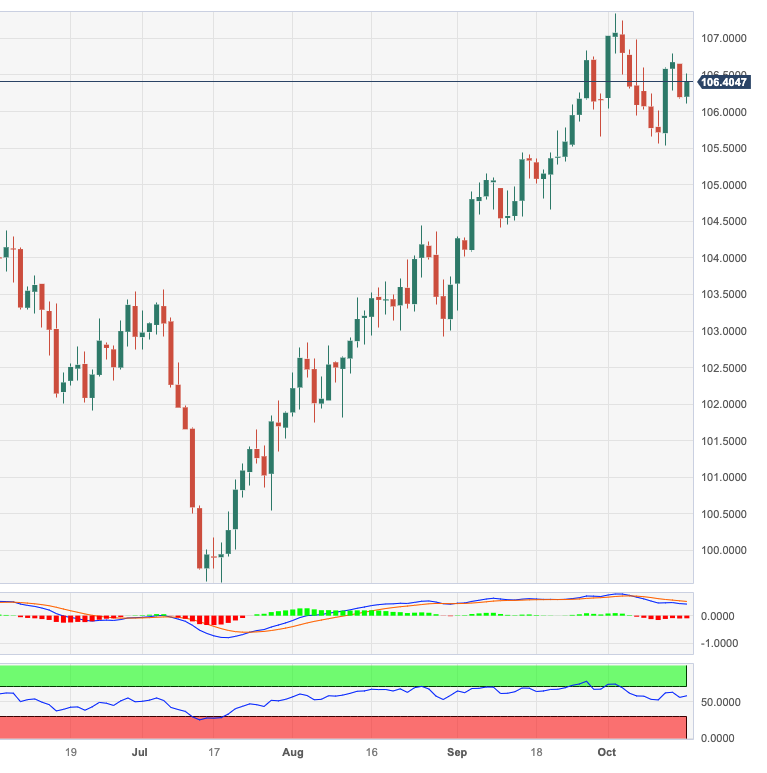
- USD/JPY trades steadily around 149.70, a slight gain of 0.14%.
- Concerns about potential intervention by Japanese authorities cap the upside.
- Rising US Treasury bond yields provide support to the pair.
The USD/JPY remains steady at around 149.70, capped on the upside by fears of intervention threats by Japanese authorities. the rise in US Treasury bond yields underpinned the major, though it remains exchanging hands below the 150.00 figure, with minuscule gains of 0.14%.
The pair is consolidated within the 149.00/150.00 mark, unable to break below/above the range decisively. Nevertheless, if USD/JPY aims above 150.00, the next resistance would be the 150.16 year-to-date (YTD) high, followed by the latest year high at 151.94.
Conversely, if USD/JPY drops below 149.00, first support would emerge at the Kijun-Sen line at 148.29. If the pair slides below that level, October 3, swing low at 147.37, would be up next.
USD/JPY Price Action – Daily chart
USD/JPY Key Technical Levels
- UK wage growth data comes in below expectations, casting doubts on further BoE rate hikes.
- US Retail Sales for September surpass expectations, with August data revised upwards.
- Speculations rise on a potential Fed rate hike in December; CME FedWatch Tool indicates a 42.90% probability.
The Pound Sterling (GBP) remains on the defensive vs. the US Dollar (USD) after data from the United Kingdom showed wages are decelerating. That and a solid Retail Sales report in the United States (US) weighed on Sterling. Therefore, the GBP/USD dipped below 1.2200, a loss of 0.25%.
GBP/USD weighed by BoE’s expected rate hike pause, solid US economic data
In the European session, jobs data from the UK showed that wages came slightly below estimates, reinforcing market participants' thesis that the Bank of England (BoE) is done raising rates. In the latest BoE meeting, the central bank decided to stay put in rates on a 5-4 vote split, even though inflation levels remain at three times the BoE’s target.
Before Wall Street opened, a tranche of US economic data showed that American consumers remain resilient, despite the 525 basis points of tightening by the Federal Reserve. US Retail Sales in September exceeded forecasts, though it trailed August’s upward-revised figures. That stirred speculations the Fed could hike rates at the December meeting, as shown by the CME FedWatch Tool with odds for a quarter of a percent hike at 42.90%.
Consequently, US Treasury bond yields skyrocketed, with the US 10-year benchmark note climbing twelve basis points at 4.83%. Still, the Greenback remained trading softer, as shown by the US Dollar Index (DXY), dropping 0.05%, at 106.15.
Meanwhile, Federal Reserve officials remained hawkish, as Richmond Fed President Thomas Barkin emphasized the US central bank's restrictive policy while adding he’s uncertain where rates would be three weeks from now.
Ahead of the week, GBP/USD traders are eyeing inflation figures for September, to be revealed on Wednesday. Across the pond, US housing data and Fed speakers would provide a fresh catalyst to the major.
GBP/USD Price Analysis: Technical outlook
The daily chart portrays the GBP/USD as neutral to downward biased. The 50=day moving average (DMA) crossing below the 200-DMA, formed a death-cross a bearish sign, warranting further downside. The first support would be last week's low of 1.2122 before diving towards 1.2100. A breach of the latter would expose the October 4 swing low of 1.2037.
- Spot Gold prices are slipping back into the middle after Tuesday saw a push above $1,930.
- XAU/USD remains well-bid, sticking to the high end of last week's rally.
- Inflation fears remain a key factor in Gold prices as investors keep one foot in safety.
XAU/USD kicked off Tuesday trading near $1,919 before seeing a steady rise into an intraday high of $1,931.65, but the day's momentum is proving short-lived as Gold bids settle back into near-term consolidation $1,920.
US Retail Sales broadly beat market estimates, with the headline figure for September printing at 0.7% versus the forecast 0.3%, with the previous period also seeing an upwards revision from 0.6% to 0.8%.
US Retail Sales rose 0.7% in September vs. 0.3% anticipated
The Retail Sales beat sent the US Dollar (USD) broadly lower against the market, giving risk assets a solid push up the charts, and while spot Gold prices saw some bullish play as investors remain concerned about a bumper US economy threatening to push the Federal Reserve (Fed) further away from anticipated rate cuts in 2024, the US Retail Sales figure isn't a solid indicator of possible inflation.
XAU/USD Technical Outlook
Near-term action sees spot Gold prices bidding into the 50-hour Simple Moving Average (SMA), with action hobbled near $1,920 and bidders struggling to take XAU/USD higher, while short-sellers are seeing significant headwinds with Gold prices firmly bullish and trading well above the 200-hour SMA.
Daily candlesticks see XAU/USD facing a technical rejection from the 200-hour SMA near $1,930 after a 6.8% climb from the last swing low into $1,810, and near-term technical indicators are warning of possible consolidation on the charts with a flat 50-day SMA trapping prices in the middle.
XAU/USD Daily Chart
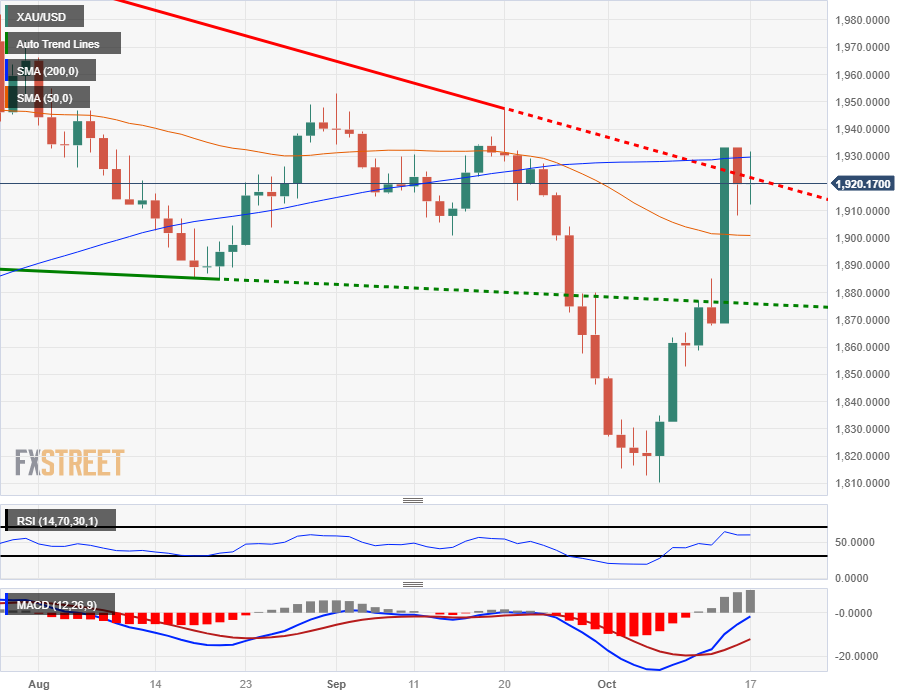
XAU/USD Technical Levels
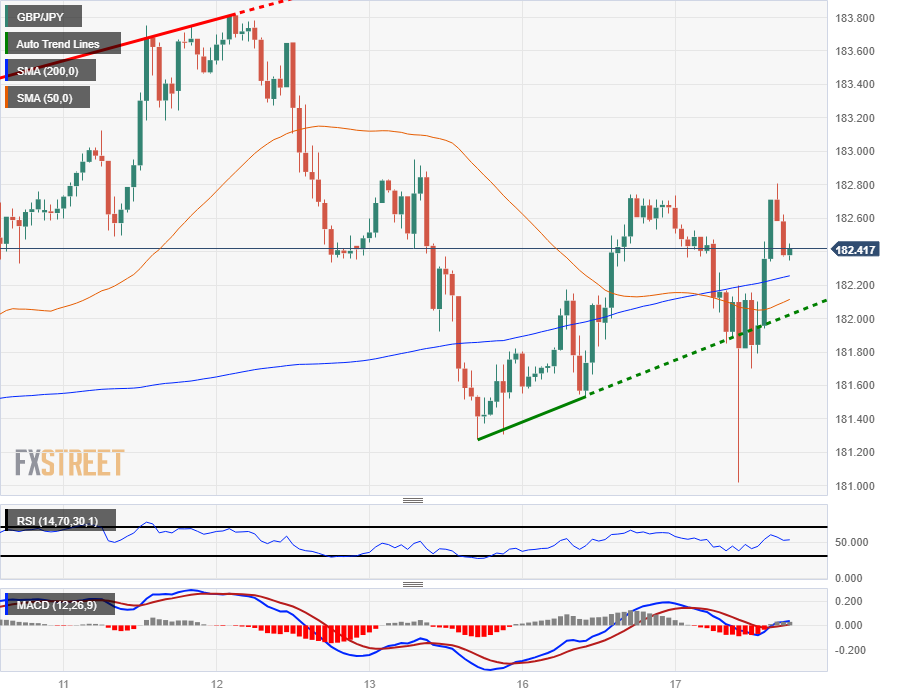
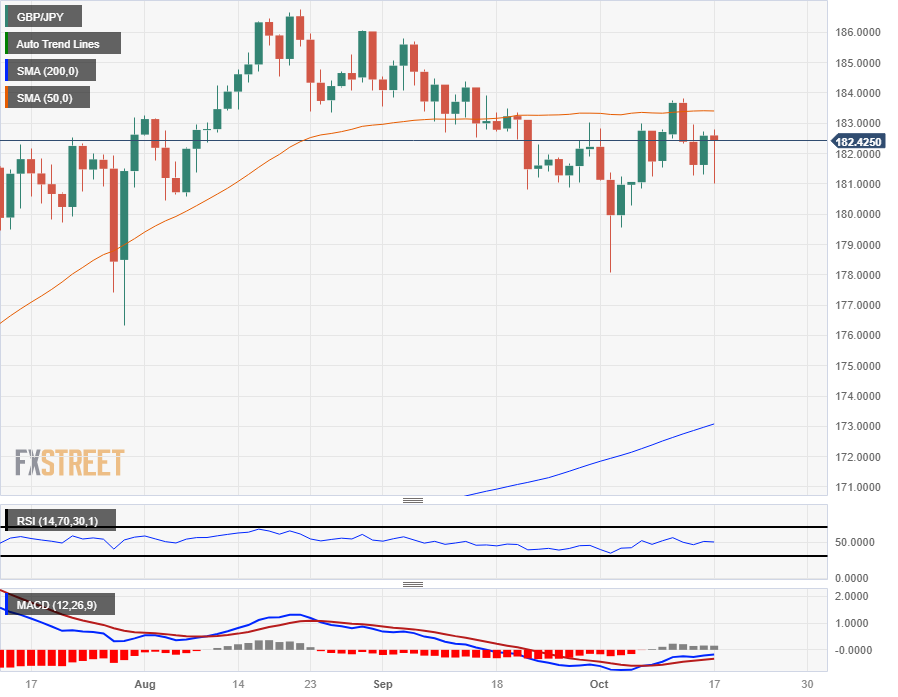
- GBP/JPY took an initial ride down the charts into 181.02 in early Tuesday trading.
- A firm rebound sent the Guppy back into the day's highs near 182.80.
- Intraday action is caught in the middle with prices cycling the neutral pivot.
The GBP/JPY kicked off Tuesday trading near 182.66 before seeing a plunge lower, just missing the 181.00 handle before a quick snap rebound sent the pair into a fresh high for the day at 182.80, and the pair is now waffling into the midrange near the week's P0 neutral pivot point.
Near-term action has been sticking close to the median, with hourly candles routinely tapping the 50-hour Simple Moving Average (SMA) that is currently testing into 182.25.
Last week's declining overall momentum sees weekly pivots tightening their range, with R1 capped at 183.32 and S1 parked at 180.76.
4-hour candles likewise show the pair strung up in the middle with bids constrained between the 200-period SMA and a rising 50-period SMA.
On the daily candlesticks the Guppy is stuck closely to the 50-day SMA and trading far above the 200-day SMA with the pair up over 15% from the year's opening bids near 158.40. The pair remains incredibly well-bid in the long term, but a lack of continued momentum sees prices failing to make a decisive break for the last major swing high into 186.77, and the immediate bearish target currently sits at early October's low of 178.08.
GBP/JPY Hourly Chart
GBP/JPY Daily Chart
GBP/JPY Technical Levels
- The USD/CHF reversed its course after jumping to a daily high of 0.9032 and then settling slightly above 0.9000.
- The USD is struggling to gather momentum on a positive market mood.
- The US reported strong economic activity figures from September.
- Rising US Treasury yields may limit the downside for the pair.
In Tuesday’s session, the USD/CHF saw volatility, and after initially rising to a high above the 200-day Simple Moving Average (SMA) of 0.9032, it retreated towards 0.9000, still holding some daily gains. The market movers for the pair included US economic activity figures from September, while the Swiss economic calendar had nothing relevant to offer.
The US Census Bureau reported that Retail Sales came in at 0.7% MoM in September, higher than the 0.3% expected but decelerated from 0.8%. Furthermore, Industrial Production rose by 0.3% MoM in the same month versus the 0% expected, and both data points suggest that the US economy is resilient despite the Federal Reserve's (Fed) contractive monetary policy.
As a reaction, US yields continued rising, and the 2, 5, and 10-year rates rose to 5.22%, 4.88%, and 4.85%, respectively, with all three seeing more than 1.50% increases and approaching multi-week highs. In line with that, investors may be gearing up for another hike by the Federal Reserve as the combination of strong economic activity and inflation accelerating in September may justify one more 25 basis point (bps) increase in 2023. According to the CME FedWatch tool, the odds of a 25 bps hike in the December meeting rose to nearly 42%, while a pause in September is nearly to be priced in. For the rest of the week, the Federal Reserve’s Beige Book will provide further clues on Wednesday's US economic outlook and the weekly Jobless Claims report on Thursday.
USD/CHF Levels to watch
Observing the daily chart, the outlook is starting to tilt in favour of the bears, but they still have some work to do. The Relative Strength Index (RSI) has a negative slope below its midline, while the Moving Average Convergence (MACD) histogram presents bigger red bars. Additionally, the pair is below the 20 and 200-day Simple Moving Averages (SMAs) but above the 100-day SMA, indicating that the bulls still have some gas left in the tank in the broader picture.
Support levels: 0.8980, 0.8950, 0.8930.
Resistance levels: 0.9018 (200-day SMA), 0.9040, 0.9070.
USD/CHF Daily Chart
-638331640319594549.png)
- Crude Oil prices are seeing some froth on Tuesday as energies get pulled in multiple directions.
- WTI barrel bids bounce between $86 and $84.50.
- Crude supply constraints may not be as bad as originally thought, but geopolitical stress continues to weigh.
West Texas Intermediary (WTI) is seeing some back-and-forth on Tuesday, but remains constrained near the $85.00/bbl price point as energies markets weigh inconsistent outcomes for crude oil markets.
The Israel-Hamas conflict escalation continues to stress out Crude Oil traders, but lack of immediate negative impact is keeping prices capped off. Geopolitical spillover could threaten stability in the nearby Strait of Hormuz, a major energy supply flow-through point that sees nearly a fifth of all global energy trade.
Deep supply cuts from member states of the Organization of the Petroleum Exporting Countries (OPEC) continue to keep crude barrel prices pinned higher, specifically Saudi Arabia and Russia's combined 1.3 million bpd production and export cuts. Despite major supply constraints that threaten to undershoot global demand, China's fossil fuels demand continues to wane as their domestic economy slows down more than expected, leaving more oil barrels on the table.
Iran recently re-entered global oil markets after the US eased export restrictions on the country, and lack of evidence that Iran was directly involved in the recent Israel-Hamas conflict escalation sees the US avoiding re-instating restrictions for the time being.
Hopes for a US-Venezuela crude oil exporting deal remain high with the US reaching a preliminary deal to allow the South American country to return to global oil exporting markets in exchange for a monitored presidential election next year in Venezuela.
A return for Venezuelan crude exports would be a surge for oil markets that already sees crude reserves rebounding firmer and faster than expected as global demand struggles to eat up enough of the already-constrained supply.
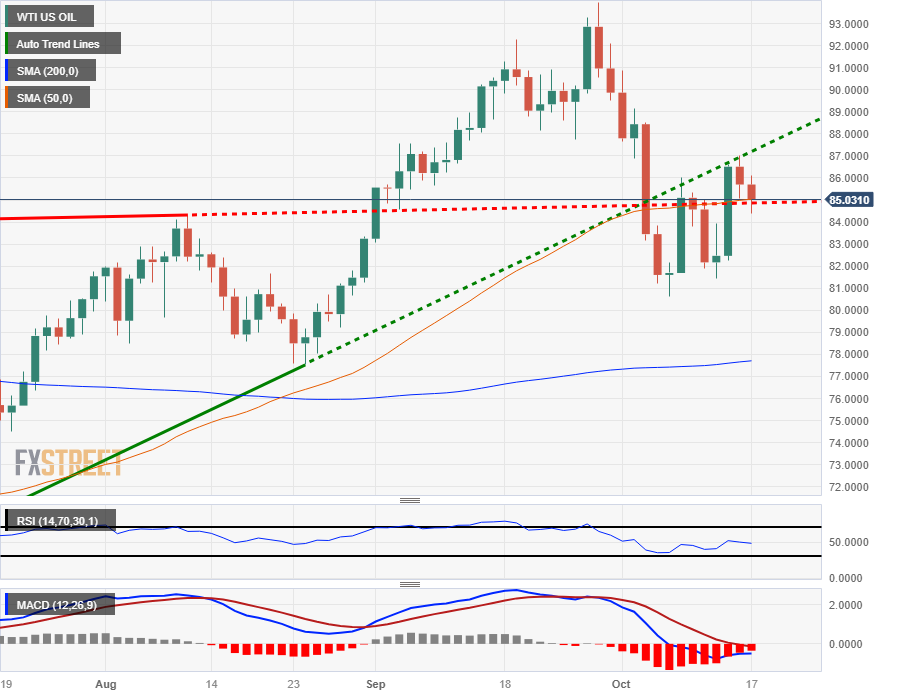
WTI Technical Outlook
Intraday action on the WTI chart is getting capped off by the 50-hour Simple Moving Average (SMA) near $85.75 as Crude Oil prices struggle to regain last week's late swing into the $87.00 handle, and Tuesday's early push into $86.00 proved to be short-lived as WTI Crude Oil barrels get stuck to the $85.00 level.
Daily candlesticks see WTI bids stuck to the 50-day SMA as energies struggle to push prices in either direction meaningfully. Crude Oil initially rose for four consecutive months from a 2023 low of $64.31 to a thirteen-month high of $93.98, but WTI is set to flub the trend and see softening prices for October as forward-looking supply constraint fears fail to solidify.
WTI Daily Chart
WTI Technical Levels
- AUD/USD advances, trading around 0.6371 after bouncing from daily lows.
- Richmond Fed President Thomas Barkin's comments on the restrictive policy stance, remains undecided for the upcoming FOMC meeting.
- Hawkish RBA meeting minutes hint at a potential rate hike in November, with a focus on Q3 inflation data.
The Aussie Dollar (AUD) edges higher vs. the US Dollar (USD) in the mid-North American session, rising more than 0.50% after hitting a daily low of 0.6332. Even though upbeat economic data from the United States (US) warranted lower exchange rates, tilted hawkish Reserve Bank of Australia’s (RBA) minutes bolstered the AUD. At the time of writing, the AUD/USD is trading at 0.6371.
AUD/USD gains momentum despite strong US Retail Sales, eyes on Chinese GDP data
The US economic docket recently featured the Richmond Fed President Thomas Barkin, who said that policy is already restrictive and he’s undecided regarding the upcoming FOMC monetary policy meeting in November. He added the US central bank can’t rely in longer-term higher bond yields to tighten monetary conditions.
Earlier, the US Bureau of Economic Analysis (BEA) revealed that Retail Sales in September crushed estimates of 0.3% MoM as figures jumped 0.7%, as consumers remain resilient. Later, the Federal Reserve announced that Industrial Production picked up despite having interest rates at higher levels.
During the Asian session, the latest Reserve Bank of Australia (RBA) meeting minutes portray the bank as hawkish, keeping the door open for a November hike as RBA officials eye Q3’s inflation report. Aside from this, Chiina’s data would reveal if the second largest economy continues to lose traction, as most analysts expect a slowdown in growth, with estimates circa 4.4% YoY, below the Chinese government projections of 5%.
A weak number on Chinese GDP could weigh on market sentiment, therefore dragging Aussie Dollar (AUD) prices lower. Otherwise, upbeat figures could trigger another AUD/USD pair leg-up.
AUD/USD Price Analysis: Technical outlook
After forming a bullish-piercing pattern, the AUD/USD extends its gains past Monday’s daily high of 0.6345, though shy of reclaiming 0.6400. A breach of the latter, the pair would test the 50-day moving average (DMA) at 0.6416 before threatening to crack the latest cycle high of 0.6445. On the other hand, the pair would resume its downtrend, towards 0.6300, before the AUD/USD challenges the year-to-date (YTD) low of 0.6285.
- The US Dollar cleared daily gains despite better-than-expected Retail Sales and Industrial Production figures from September.
- A positive market and risk-on flows weakened the USD.
- The US Treasury yields on the 2, 5, and 10-year bonds are approaching two-week highs, limiting the downside potential.
- The odds of a hike by the Fed in December rose to 42% according to the CME FedWatch tool.
The US Dollar (USD) measured by the US Dollar DXY Index rose to a high of 106.52 and then declined towards 106.15, below the 20-day Simple Moving Average (SMA) after the release of September’s Retail Sales and Industrial Production figures from the US. Both reports came in higher than expected, but risk-on flows dominate the market which isn’t allowing the green currency to gather momentum. However, higher US Treasury yields and rising hawkish bets on the Federal Reserve (Fed) may limit the downside for the USD.
The United State’s economic activity is still holding strong despite the Federal Reserve’s aggressive manoeuvres, and inflation figures revealed that the Consumer Price Index (CPI) slightly accelerated in September.
As Jerome Powell stated during the press conference from September’s decision, the Fed is still ready to resume hiking as long as data justifies another hike so this current outlook is making investors gear up for one last hike in 2023.
Daily Digest Market Movers: US Dollar continues weakening despite positive economic figures
- The US Dollar DXY rose to a high of 106.52 and then settled around 106.15, paring back its daily gains.
- US retail Sales came in at 0.7% MoM in September, higher than the 0.3% expected but decelerated from 0.8% in the previous month.
- Industrial Production rose by 0.3% MoM in the same month, vs the 0.0% expected.
- US yields continue rising, and the 2, 5 and 10-year rates rose to 5.18%, 4.84% and 4.83% respectively, with all three seeing more than 1.50% increases.
- According to the CME FedWatch tool, the odds of a 25 bps hike in the December meeting rose to nearly 42%.
- The Federal Reserve’s Beige Book, released on Wednesday, will provide further clues on the outlook for the US economy.
Technical analysis: US Dollar Index’s bears breach the 20-day SMA but 105.50 is the make-or-break level
The DXY index failed to hold on to its early bullish momentum which took it to a high of around 106.52 before declining to negative territory at around 106.05. Nevertheless, the index arguably remains in a bullish trend overall, holding above the key 200 and 100-day Simple Moving Averages (SMA).
Indicators on the daily chart point towards a strengthening bearish momentum, with the Moving Average Convergence Divergence (MACD) printing red bars after performing a bearish cross on October 6.
As the bulls have failed to defend the 20-day SMA, more downside may be on the horizon although 105.50 low is the key ‘line in the sand’ that would need to be crossed to turn the outlook particularly bearish.
Supports: 106.00, 105.80, 105.50.
Resistances: 106.20 (20-day SMA), 106.55, 107.00.
US Dollar FAQs
What is the US Dollar?
The US Dollar (USD) is the official currency of the United States of America, and the ‘de facto’ currency of a significant number of other countries where it is found in circulation alongside local notes. It is the most heavily traded currency in the world, accounting for over 88% of all global foreign exchange turnover, or an average of $6.6 trillion in transactions per day, according to data from 2022.
Following the second world war, the USD took over from the British Pound as the world’s reserve currency. For most of its history, the US Dollar was backed by Gold, until the Bretton Woods Agreement in 1971 when the Gold Standard went away.
How do the decisions of the Federal Reserve impact the US Dollar?
The most important single factor impacting on the value of the US Dollar is monetary policy, which is shaped by the Federal Reserve (Fed). The Fed has two mandates: to achieve price stability (control inflation) and foster full employment. Its primary tool to achieve these two goals is by adjusting interest rates.
When prices are rising too quickly and inflation is above the Fed’s 2% target, the Fed will raise rates, which helps the USD value. When inflation falls below 2% or the Unemployment Rate is too high, the Fed may lower interest rates, which weighs on the Greenback.
What is Quantitative Easing and how does it influence the US Dollar?
In extreme situations, the Federal Reserve can also print more Dollars and enact quantitative easing (QE). QE is the process by which the Fed substantially increases the flow of credit in a stuck financial system.
It is a non-standard policy measure used when credit has dried up because banks will not lend to each other (out of the fear of counterparty default). It is a last resort when simply lowering interest rates is unlikely to achieve the necessary result. It was the Fed’s weapon of choice to combat the credit crunch that occurred during the Great Financial Crisis in 2008. It involves the Fed printing more Dollars and using them to buy US government bonds predominantly from financial institutions. QE usually leads to a weaker US Dollar.
What is Quantitative Tightening and how does it influence the US Dollar?
Quantitative tightening (QT) is the reverse process whereby the Federal Reserve stops buying bonds from financial institutions and does not reinvest the principal from the bonds it holds maturing in new purchases. It is usually positive for the US Dollar.
- NZD/USD bounces off a two-week low, trading around 0.5908.
- US Retail Sales for September surpass expectations; Industrial Production also beats forecasts.
- New Zealand's Q3 CPI comes in below estimates, with a yearly rate easing to 5.6%.
The New Zealand Dollar (NZD) remains defensive against the US Dollar (USD) and registers solid losses after dropping to a two-week low of 0.5870. However, buyers reclaim the 0.5900 figure, targeting a challenge of 0.5942, the 50-day moving average (DMA). At the time of writing, the NZD/USD is trading at 0.5908.
Kiwi Dollar reclaims 0.5900amid mixed economic data, eyes on Fed policymakers
The US Dollar stages a comeback after the US Bureau of Economic Analysis (BEA) revealed that Retail Sales rose above forecasts of 0.3%, at 0.7% MoM in September, though below upward revised August’s figures from 0.6% to 0.8%. Recently, the Fed revealed that Industrial Production exceeded forecast and August’s data of 0%, expanding at a 0.3% MoM pace.
Consequently, US Treasury bond yields advanced nine basis points at 4.80%, contrary to the Greenback as seen by the US Dollar Index (DXY). The DXY, which tracks the performance of the US Dollar vs. six currencies, drops 0.15%, at 106.05.
Meanwhile, Fed officials are crossing newswires, led by Richmond Fed President Thomas Barkin, saying the Fed has a restrictive policy stance and that despite longer-term rates having risen, the Fed can’t rely on them for further tightening. Barkin added that he’s unsure of his view on the upcoming monetary policy meeting.
Earlier in the Asian session, the New Zealand docket featured the Consumer Price Index (CPI), which rose by 1.8% in Q3, below estimates of 2%. Still, the yearly rate eased to 5.6% from 6%, the estimated 5.9%.
NZD/USD Price Analysis: Technical outlook
The NZD/SUD daily chart portrays the pair jumping off the weekly lows, though shy of challenging the 50-DMA At 0.5942. NZD buyers must reclaim the latter so they can threaten to claim 0.6000 before challenging the latest cycle high of 0.6055, October 11 high. Conversely, failure at the 50-DMA could open the door to test the year-to-date (YTD) lows of 0.5859.
- The EUR/USD is climbing for Tuesday after risk appetite in the broader markets returns.
- A clean beat for US Retail Sales figures is seeing investor sentiment improve, taking the USD lower.
- The Euro is getting pushed higher in the broad-market Greenback slump, heading back into 1.0600.
The EUR/USD firmly in the green for Tuesday after US Retail Sales beat market expectations and saw upside revision to previous figures, sending investor risk appetite into the ceiling and sending the US Dollar (USD) broadly lower, bolstering the Euro (EUR) and taking the EUR/USD up from the day's early low of 1.0532 and sending it within inches of the 1.0600 major handle.
Headline US Retail Sales figures for September broadly beat median market forecasts of 0.3%, printing at 0.7% and seeing an upwards revision in the previous month's reading from 0.6% to 0.8%.
US Retail Sales rose 0.7% in September vs. 0.3% anticipated
Earlier on Tuesday the EU's ZEW Economic Sentiment Survey also soundly beat expectations, coming in at 2.3, soundly beating the forecast -8 and marking in a full bounceback from the previous print of -8.9.
Market sentiment has gone full risk-on, sending the Greenback down across the board and bolstering the EUR/USD back into levels that the currency pair initially lost a hold of following last week's risk-off souring.
Coming up next on Wednesday will be European Harmonized Index of Consumer Prices for September, where the headline monthly figure is forecast to hold steady at 0.3%.
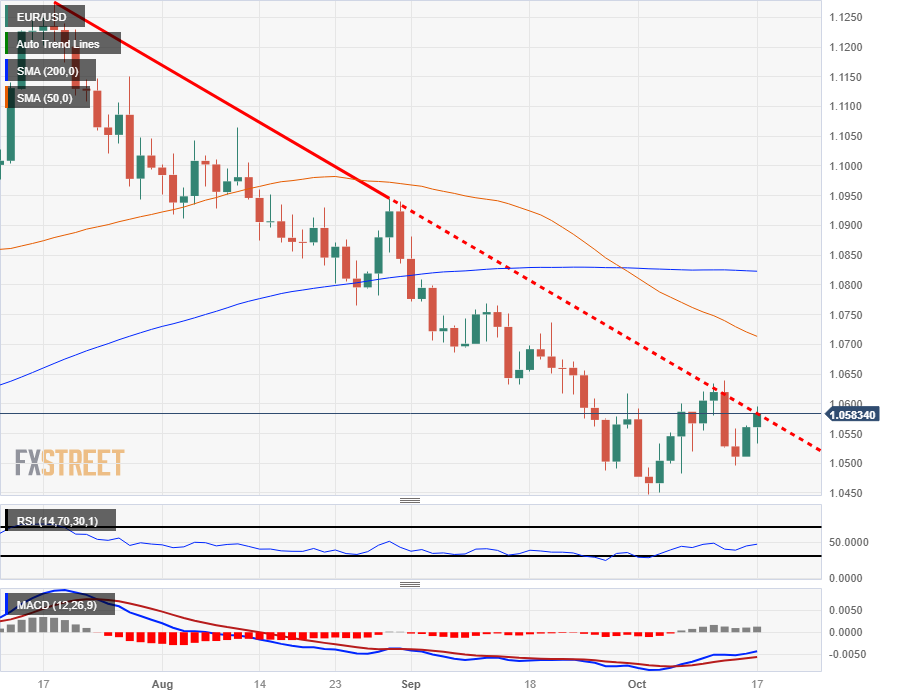
EUR/USD Technical Outlook
Intraday action for the EUR/USD sees the pair busting out of recent price levels, clearing over the 200-hour Simple Moving Average (SMA), but an overextension could quickly see near-term bids strung out in no-man's-land with little technical support.
Near-term price action is closing in on a heavy support/resistance zone from 1.0600 to 1.0620, while intraday swings are providing an intraday higher-lows support pattern.
Tuesday's reaction bid sees the EUR/USD re-challenging a descending trendline from 1.1250, and the EUR/USD remains firmly bearish, trading well below the 50-day SMA which is settling into 1.0700, forming technical resistance for any bullish breakouts.
EUR/USD Hourly Chart

EUR/USD Daily Chart
EUR/USD Technical Levels
- Canadian Dollar slumped 0.65% from the day’s open after US Retail Sales beat the market.
- Canada CPI inflation missed expectations, but Loonie traders are shrugging off the miss as the US Dollar recedes across the board.
- Crude Oil spot prices are dipping for Tuesday, hobbling excess gains for the CAD.
The Canadian Dollar (CAD) went V-shaped after markets saw a large run-up in the US Dollar (USD) ahead of Tuesday’s US Retail Sales reading, and a beat on the expected figure is seeing broad-market sentiment improving, sending the USD lower across the board, with the CAD shrugging off a miss for Canadian Consumer Price Index (CPI) figures.
Canada CPI inflation came in below expectations, but the Loonie is getting bolstered back into the day’s opening prices as investors pull out of the Greenback in a risk appetite bid. Crude Oil prices are also on the low side for Tuesday, pulling support out from beneath the CAD and constraining additional gains for the day.
Daily Digest Market Movers: Canadian Dollar plunges then recovers as markets corkscrew
- The USD/CAD spiked past 1.3700 in the runup to the US Retail Sales/Canada CPI data double-header.
- A solid beat for US Retail Sales on Tuesday, with the headline figure for September coming in at 0.7%, well above the forecast 0.3% and the previous figure getting revised from 0.6% to 0.8%.
- Canadian CPI inflation missed the mark, printing at 3.8% for the annualized period into September, under the 4% forecast-steady reading.
- A solid beat for US Retail Sales sent risk-hungry investors piling out of the USD and into riskier assets, sending the Greenback down across the board.
- USD/CAD recovered the day’s bids back towards the 1.3600 handle.
- A miss for Canadian CPI inflation is capping off Loonie gains against the Greenback.
- Crude Oil prices are also seeing downside pressure for Tuesday, limiting CAD upside momentum.
- CAD traders will be looking ahead to Friday’s Canadian Retail Sales to make up ground.
Technical Analysis: Canadian Dollar rebounds from pre-US Retail Sales runup, USD/CAD looking for 1.36
The USD/CAD spiked to a seven-month high in the early Tuesday session, before dropping back into Monday’s trading range after markets turned broadly risk-on, taking the pair back towards 1.3620, and intraday action is now tussling with the 50-hour Simple Moving Average (SMA) near 1.3635.
Tuesday’s spike-and-tumble for the USD/CAD leaves the pair constrained in near-term levels on the daily candlesticks, with technical support coming from the 50-day SMA near 1.3575, while last week’s swing high into the 1.3700 handle represents the figure to beat for USD/CAD bidders.
Canadian Dollar price today
The table below shows the percentage change of Canadian Dollar (CAD) against listed major currencies today. Canadian Dollar was the weakest against the Australian Dollar.
| USD | EUR | GBP | CAD | AUD | JPY | NZD | CHF | |
| USD | -0.38% | 0.01% | 0.09% | -0.62% | 0.08% | -0.11% | -0.08% | |
| EUR | 0.38% | 0.39% | 0.46% | -0.25% | 0.44% | 0.29% | 0.29% | |
| GBP | -0.03% | -0.41% | 0.07% | -0.65% | 0.04% | -0.13% | -0.12% | |
| CAD | -0.10% | -0.46% | -0.08% | -0.71% | -0.01% | -0.18% | -0.18% | |
| AUD | 0.62% | 0.23% | 0.63% | 0.71% | 0.69% | 0.52% | 0.54% | |
| JPY | -0.08% | -0.46% | -0.04% | 0.02% | -0.67% | -0.17% | -0.16% | |
| NZD | 0.12% | -0.26% | 0.12% | 0.18% | -0.52% | 0.17% | 0.00% | |
| CHF | 0.09% | -0.29% | 0.10% | 0.18% | -0.50% | 0.15% | 0.00% |
The heat map shows percentage changes of major currencies against each other. The base currency is picked from the left column, while the quote currency is picked from the top row. For example, if you pick the Euro from the left column and move along the horizontal line to the Japanese Yen, the percentage change displayed in the box will represent EUR (base)/JPY (quote).
Canadian Dollar FAQs
What key factors drive the Canadian Dollar?
The key factors driving the Canadian Dollar (CAD) are the level of interest rates set by the Bank of Canada (BoC), the price of Oil, Canada’s largest export, the health of its economy, inflation and the Trade Balance, which is the difference between the value of Canada’s exports versus its imports. Other factors include market sentiment – whether investors are taking on more risky assets (risk-on) or seeking safe-havens (risk-off) – with risk-on being CAD-positive. As its largest trading partner, the health of the US economy is also a key factor influencing the Canadian Dollar.
How do the decisions of the Bank of Canada impact the Canadian Dollar?
The Bank of Canada (BoC) has a significant influence on the Canadian Dollar by setting the level of interest rates that banks can lend to one another. This influences the level of interest rates for everyone. The main goal of the BoC is to maintain inflation at 1-3% by adjusting interest rates up or down. Relatively higher interest rates tend to be positive for the CAD. The Bank of Canada can also use quantitative easing and tightening to influence credit conditions, with the former CAD-negative and the latter CAD-positive.
How does the price of Oil impact the Canadian Dollar?
The price of Oil is a key factor impacting the value of the Canadian Dollar. Petroleum is Canada’s biggest export, so Oil price tends to have an immediate impact on the CAD value. Generally, if Oil price rises CAD also goes up, as aggregate demand for the currency increases. The opposite is the case if the price of Oil falls. Higher Oil prices also tend to result in a greater likelihood of a positive Trade Balance, which is also supportive of the CAD.
How does inflation data impact the value of the Canadian Dollar?
While inflation had always traditionally been thought of as a negative factor for a currency since it lowers the value of money, the opposite has actually been the case in modern times with the relaxation of cross-border capital controls. Higher inflation tends to lead central banks to put up interest rates which attracts more capital inflows from global investors seeking a lucrative place to keep their money. This increases demand for the local currency, which in Canada’s case is the Canadian Dollar.
How does economic data influence the value of the Canadian Dollar?
Macroeconomic data releases gauge the health of the economy and can have an impact on the Canadian Dollar. Indicators such as GDP, Manufacturing and Services PMIs, employment, and consumer sentiment surveys can all influence the direction of the CAD. A strong economy is good for the Canadian Dollar. Not only does it attract more foreign investment but it may encourage the Bank of Canada to put up interest rates, leading to a stronger currency. If economic data is weak, however, the CAD is likely to fall.
When asked if he will vote in favor of holding policy rate unchanged at the next meeting, "policymakers will have a good debate," Federal Reserve Bank of Richmond President Thomas Barkin said on Tuesday.
Key takeaways
"Recent inflation report was only one report, after several good ones."
"Rate moves work through financial conditions."
"Longer-term rates have moved up, that has tightened conditions."
"The challenge with depending on rates is they can move."
"Don't know where rates will be three weeks from now, given what's happening globally."
"I believe we have a restrictive policy stance."
Market reaction
The US Dollar Index stays under modest bearish pressure following these comments and was last seen losing 0.15% on the day at 106.05.
- Mexican Peso is on the defensive, as the USD/MXN trades at around 17.90.
- Mexico’s economic calendar is light, with August’s Retail Sales awaited on Friday.
- Robust US Retail Sales and Industrial output lift US Dollar amid Fed Rate hike speculation.
Mexican Peso (MXN) is trimming some of its Monday gains against the US Dollar (USD) after a tranche of economic data from the United States (US) spurred a jump in US Treasury bond yields, which lifted the Dollar. Therefore, the USD/MXN reclaimed the psychological 18.00 figure, though it has retreated and hovers around 17.91, still posting gains of 0.25%.
The economic docket in Mexico is empty, except for August’s Retail Sales data on Friday, with estimates for a monthly basis at 0%, while annual figures are foreseen at 4.4%. Across the border, Retail Sales in September crushed estimates, and August numbers were upward revised, which could potentially influence US Federal Reserve (Fed) officials to reassess their current stance. Recently, Industrial Production exceeded last month’s figures and was unchanged annually.
Regarding geopolitical developments, which could sour market sentiment, US President Joe Biden is traveling to Israel to support the country and will meet with Israel Prime Minister Benjamin Netanyahu and Arab leaders.
Daily Digest Market Movers: Mexican Peso at the brisk of depreciating towards 18.00
- US Retail Sales in September grew by 0.7% MoM, above forecasts of 0.3%, but trailed upward revised August of 0.8%.
- Industrial Production rose 0.3% MoM, better than expected, and the previous month's 0.0% reading.
- Mexico’s 2023 GDP is expected to hit 3.2%, according to the World Bank and the International Monetary Fund.
- New York Fed Empire State Manufacturing Index for October plunged to -4.6, higher than forecasts of -7 but worse than September’s 1.9 expansion.
- Philadelphia Fed President Patrick Harker commented the current level of rates kept house buyers on the sideline, highlighting that the Fed is likely done hiking rates.
- Chicago Fed President Austan Goolsbee said the fall in US inflation is not a bleep, according to the Financial Times.
- Inflation expectations for one year rose from 3.2% to 3.8%, while for five years jumped to 3% from 2.8%.
- Mexico's Industrial Production (IP) for August improved by 5.2% YoY, exceeding forecasts of 4.6% and July’s 4.8% increase.
- Monthly, IP in Mexico rose 0.3% as expected but trailed the previous 0.5% reading.
- The US Consumer Price Index increased 3.7% YoY in September, unchanged from August but above forecasts of 3.6%.
- US core CPI dipped as expected to 4.1% from 4.3% in August.
- Mexico’s Consumer Price Index (CPI) grew by 4.45% YoY in September, slightly below the 4.47% estimated.
- The core CPI inflation in Mexico stood at a stickier 5.76% YoY, as widely estimated, but has broken below the 6% threshold.
- The Bank of Mexico (Banxico) held rates at 11.25% in September and revised its inflation projections from 3.5% to 3.87% for 2024, above the central bank’s 3% target (plus or minus 1%).
Technical Analysis: Mexican Peso drops as technical signs support a USD/MXN bullish bias
The Mexican Peso is trimming some of its Monday gains, but it remains below the 18.00 figure, maintaining its upward bias, unless the USD/MXN drops below the 200-day Simple Moving Average (SMA) at 17.75. In that case, the exotic pair could aim towards 17.50, followed by the 50-day SMA at 17.35. Contrarily, if the pair could re-test the 18.00 figure, which once broke, the pair could rally and test 18.20. Next resistance would be the October 6 high of 18.48.
Mexican Peso FAQs
What key factors drive the Mexican Peso?
The Mexican Peso (MXN) is the most traded currency among its Latin American peers. Its value is broadly determined by the performance of the Mexican economy, the country’s central bank’s policy, the amount of foreign investment in the country and even the levels of remittances sent by Mexicans who live abroad, particularly in the United States. Geopolitical trends can also move MXN: for example, the process of nearshoring – or the decision by some firms to relocate manufacturing capacity and supply chains closer to their home countries – is also seen as a catalyst for the Mexican currency as the country is considered a key manufacturing hub in the American continent. Another catalyst for MXN is Oil prices as Mexico is a key exporter of the commodity.
How do decisions of the Banxico impact the Mexican Peso?
The main objective of Mexico’s central bank, also known as Banxico, is to maintain inflation at low and stable levels (at or close to its target of 3%, the midpoint in a tolerance band of between 2% and 4%). To this end, the bank sets an appropriate level of interest rates. When inflation is too high, Banxico will attempt to tame it by raising interest rates, making it more expensive for households and businesses to borrow money, thus cooling demand and the overall economy. Higher interest rates are generally positive for the Mexican Peso (MXN) as they lead to higher yields, making the country a more attractive place for investors. On the contrary, lower interest rates tend to weaken MXN.
How does economic data influence the value of the Mexican Peso?
Macroeconomic data releases are key to assess the state of the economy and can have an impact on the Mexican Peso (MXN) valuation. A strong Mexican economy, based on high economic growth, low unemployment and high confidence is good for MXN. Not only does it attract more foreign investment but it may encourage the Bank of Mexico (Banxico) to increase interest rates, particularly if this strength comes together with elevated inflation. However, if economic data is weak, MXN is likely to depreciate.
How does broader risk sentiment impact the Mexican Peso?
As an emerging-market currency, the Mexican Peso (MXN) tends to strive during risk-on periods, or when investors perceive that broader market risks are low and thus are eager to engage with investments that carry a higher risk. Conversely, MXN tends to weaken at times of market turbulence or economic uncertainty as investors tend to sell higher-risk assets and flee to the more-stable safe havens.
The United Kingdom will release the Consumer Price Index (CPI) data on Wednesday, October 18 at 06:00 GMT and as we get closer to the release time, here are the forecasts by the economists and researchers of four major banks regarding the upcoming UK inflation print.
Headline CPI is expected to decline to 6.5% year-on-year vs. 6.7% in August while Core is also expected to fall two ticks to 6%. If so, headline inflation would be the lowest since March 2022 but still well above the 2% target.
Nomura
We forecast headline and services inflation to remain unchanged between August and September (at 6.7% and 6.8% respectively) but see a small fall in core inflation from 6.2% to 6.1%. 0.2pp. Looking further ahead, we expect headline inflation to fall to just under 4.5% by the end of this year, just over 2.5% at the end of next and a little below the 2% target at the end of 2025. As for core, we have 5.8%, 3.0% and 1.9% for the end of 2023, 2024 and 2025 respectively.
TDS
We look for September inflation data to echo the August data, with the headline rate remaining at 6.7% YoY and core edging down to 6.1% YoY. Focus for the MPC will continue to be on the services number, and here we see the YoY rate remaining 20 bps below the MPC's forecast (TDS: 6.8% YoY, BoE: 7.0%). Overall, further signs of improvements in inflation, and most importantly, a lack of a rebound after August's significant downside miss, would continue to suggest that the MPC will keep Bank Rate on hold at its November meeting.
Deutsche Bank
We expect September CPI to inch lower to 6.61% YoY and see the core gauge declining to 6.0%.
SocGen
We think the disinflationary trend should continue in September with headline inflation falling 0.2pp to 6.5% and core by 0.2pp to 6.0%.
Gold has been on a rollercoaster ride over the past month. Economists at Commerzbank analyze the yellow metal’s outlook.
Gold still expected to reach new record high of $2,100 by end-2024
We expect the Gold price to continue trending upwards in the medium to long term. That said, the recovery is likely to begin at a lower level, not to mention later than we had previously predicted. We now envisage a Gold price of roughly $1,900 at the end of December (previously $2,000).
As soon as there are clearer signs of an imminent recession in the US, i.e. from roughly next spring, rate cut speculation should increase and lend greater buoyancy to Gold. Our forecast for the Gold price at the end of 2024 therefore remains unchanged at a new record high of $2,100.
FOMC could cut rates in Q3 2024 if unfolding trends hold, according to economists at ANZ Bank.
Policy is now restrictive enough to get inflation back to 2%
We maintain our baseline view that the Fed Funds Rate (FFR) has peaked. US Federal Reserve officials appear to be gravitating toward the view that policy is now restrictive enough to get inflation back to 2%.
As confidence in peak rates builds, the question for policymakers is how long they will need to hold rates at that level. Ongoing strength in activity, employment and some inflation components imply no quick pivot.
We now expect the FOMC to first cut rates in Q3 2024. By then, we expect core inflation to be on a sustainable path towards target and there would be no reason for the FOMC to squeeze the economy with higher real rates.
- Silver price climbs to $23.00 as deepening Middle East tensions improve the safe-haven appeal.
- The US Dollar and long-term bond yields have recovered strongly after upbeat US Retail Sales data.
- Silver price jumps above the 50% Fibo retracement at $22.85.
Silver price (XAG/USD) prints a fresh two-week high at $23.00 as the appeal for bullion improves due to deepening Middle East tensions. Israel is ready for the ground invasion of the Gaza Strip from terror attacks from the Hamas military group.
The uncertainty over US President Joe Biden’s visit to Israel to support it in the war situation against Palestine and ensure the safety of civilians in Gaza has strengthened the demand for Gold and Silver.
Meanwhile, the US Dollar and long-term bond yields have recovered strongly after upbeat United States Retail Sales data. The US Census Bureau reported that consumer spending momentum expanded at a higher pace of 0.7% in September against estimates of 0.3%. Robust retail sales were prompted by upbeat demand for automobiles and dining out.
For fresh guidance on interest rates, investors shift focus to the speech from Federal Reserve (Fed) Chair Jerome Powell, which is scheduled for Thursday. It would be interesting to know whether Jerome Powell would join other teammates and support a steady interest rate policy due to rising Treasury yields or will consider some further policy-tightening appropriate.
Silver technical analysis
Silver price climbs above the 50% Fibonacci retracement (plotted from August 30 high at $25.00 to October low around $20.70) at $22.85. The white metal continues to find support from the 20-period Exponential Moving Average (EMA), which trades around $22.60.
The Relative Strength Index (RSI) (14) climbs into the bullish range of 60.00-80.00, which indicates that the bullish impulse has been activated.
Silver two-hour chart
-638331492930481587.png)
The trade-weighted US Dollar Index against a basket of 26 currencies is up more than 5% from its July low. Economists at the National Bank of Canada analyze Greenback’s outlook.
Interest rate differentials support Dollar appreciation
The USD's strength has been supported by widening interest rate differentials with its major trading partners. US yields were driven higher by resilient inflation and stronger-than-expected payroll job creation.
At this point, we still expect some USD appreciation until early 2024, which could be further boosted by renewed geopolitical tensions with the opening of a new front in an armed conflict, this time in the Middle East.
- EUR/USD partially reverses Monday’s marked gains.
- The pair could trade in a range bound theme in the short term.
EUR/USD fades the earlier bullish attempt to the 1.0580 region on Tuesday.
In case bulls regain the upper hand, the pair should surpass the monthly peak of 1.0639 (October 12) to allow for extra gains to, initially, the interim 55-day SMA at 1.0735 ahead of the weekly top of 1.0767 (September 12).
Meanwhile, further losses remain on the table as long as the pair navigates the area below the key 200-day SMA
EUR/USD daily chart
- USD/CAD jumped to near 1.3700 as US Retail Sales remained robust in September.
- The Canadian Dollar weakened as soft inflation data prompted hopes of a steady BoC policy.
- The market mood remains cautious amid deepening Middle East tensions.
The USD/CAD pair finds stellar buying interest and jumps to near the round-level resistance of 1.3700 after the United States Census Bureau reported robust consumer spending data and Statistics Canada reported a decline in price pressures in September.
US Retail Sales expanded at a robust pace of 0.7%, boosted by higher automobile demand and spending on dining out. The economic data excluding automobiles rose by 0.6%, almost at a double pace from expectations. Robust retail demand could spurt consumer inflation expectations and create discomfort for Federal Reserve (Fed) policymakers.
After upbeat US Retail Sales data, the US Dollar Index (DXY) recovered strongly to near 106.50. While expectations for interest rates at 5.25-5.50% seem unchanged for November monetary policy as Fed policymakers see higher long-term bond yields sufficient to restrict spending and investment.
Going forward, the US Dollar will dance to the tune of the speech from Fed Chair Jerome Powell, which is scheduled for Thursday. Fed Powell is expected to provide cues about the likely monetary policy action.
The market mood remains downbeat amid deepening Middle East tensions. Persistent risks of intervention by Iran and Yemen in the Israel-Palestine conflict could worsen the situation further.
On the Canadian Dollar front, a decline in consumer inflation has prompted expectations that the Bank of Canada (BoC) will keep interest rates unchanged ahead. The monthly headline and core Consumer Price Index (CPI) contracted by 0.1% while investors forecasted a growth of 0.1%. The annual headline and core CPI softened to 3.8% and 2.8% respectively.
Economists at Commerzbank analyze GBP outlook ahead of the UK Consumer Price Index (CPI) and labour market data.
Speculation about a further rate hike might gather momentum on unfavourable data
If the labour market and inflation data turn out to be unfavourable, speculation about a further rate hike might gather momentum again on the market. This would support Sterling temporarily.
However, we remain sceptical regarding the BoE’s determination to fight high levels of inflation – as the September meeting once again demonstrated – and therefore expect Sterling to ease over the coming months.
- DXY reverses Monday’s negative performance and retests 106.50.
- Further gains could see the 106.80 area revisited in the near term.
DXY manages to regain balance and advance to the 106.50 region on Tuesday.
Considering the ongoing price action, the surpass of the weekly high of 106.78 (October 12) could encourage the index to embark on a potential test of the 2023 top of 107.34 (October 3) in the short-term horizon.
In the meantime, while above the key 200-day SMA, today at 103.23, the outlook for the index is expected to remain constructive.
DXY daily chart
Economists at Rabobank expect poor levels of risk appetite to cap upside potential in AUD/USD in the months ahead.
AUD is sensitive to broad levels of risk appetite
If forthcoming domestic data releases suggest that the economic backdrop remains relatively resilient, further upside potential is likely for AUD/USD near-term as the market reassesses the risk of another RBA rate hike.
That said, the AUD is sensitive to broad levels of risk appetite. We expect that concerns over global growth and in particular the outlook for the Chinese economy, will limit upside potential for AUD/USD in the coming months.
- Industrial Production in the US continued to expand in September.
- US Dollar Index stays in positive territory after the data.
Industrial Production in the United States (US) grew 0.3% on a monthly basis in September, the Federal Reserve reported on Tuesday. This reading following the 0.4% expansion recorded in August and came in better than the market expectation for a no change.
Other details of the report revealed that the Capacity Utilization held steady at 79.7%.
Market reaction
The US Dollar Index clings to modest daily gains slightly below 106.50 after this report.
Gold may gain from risk aversion and lower opportunity costs but its path may be bumpy, strategists at UBS report.
Choppy prices in the near term
Many investors seek Gold as a portfolio diversifier in times of geopolitical tension. Gold may also gain from shifting market expectations that the Fed hiking cycle has already come to an end and that US rates could potentially come down faster next year if the implications of the war cause a faster-than-anticipated slowing in US economic activity.
Investors should note that uncertainty over both the war and the outlook for US rates may lead to choppy prices for Gold in the near term. But equally, we believe those who have long Gold positions should hold these in anticipation of a recovery over the next 6-12 months. Our forecast is for Gold to reach $1,950 by end-June 2024.
The upward trend in USD/CAD is set to continue for the rest of the year. However, economists at CIBC Capital Markets expect Loonie to recover in 2024.
More weakness before a revival in 2024
With markets almost fully priced for another quarter point BoC hike this year, and not placing high enough odds on cuts next year, a recalibration will see the Loonie end 2023 weaker, with USD/CAD likely reaching 1.39 by then.
As the market shifts to account for what we see as a higher likelihood of Fed cuts next year, that will weigh on the broad USD in 2024, supporting the Loonie in the process, with USD/CAD likely ending 2024 at 1.31.
- US Retail Sales rise by 0.7% in September, above the 0.3% of market consensus.
- Core Retail Sales increase by 0.6%, the same as Control Group Sales.
- US Dollar gains momentum after the data, DXY climbs toward daily highs.
Retail Sales in the US rose 0.7% on a monthly basis in September to $704.9 billion, the data published by US Census Bureau showed on Tuesday. This reading followed the 0.8% (revised from 0.6%) increase recorded in August and came in better than the market expectation of 0.3%.
Retail Sales Ex-Autos rose 0.6% in the same period, compared to analysts' estimate of 0.2% . Retail Sales Control Group increased 0.6%.
Market reaction
The US Dollar gathered strength against its rivals. The US Dollar Index (DXY) rebounded from 106.15 and climbed to 106.40, approaching daily highs. The next US economic report is September Industrial Production at 13:15 GMT.
- USD/JPY delivered a volatile spike as BoJ set to raise inflation forecasts for the fiscal year of 2023 and 2024.
- The market mood is risk-averse due to deepening Middle East tensions.
- Fed Daly suggested that the recent surge in long-term bond yields is equivalent to one 25 bps interest rate hike.
The USD/JPY pair cracked to near 148.80 but recovered quickly to its broader trading range around 149.50 as the Bank of Japan (BoJ) is expected to announce inflation forecasts for the fiscal year of 2023 and 2024 sooner.
Bloomberg reported on Tuesday that BoJ’s new Core CPI forecast for the fiscal year 2023 is likely to approach 3%, up from 2.5% as of July, and be set at 2% or more in sight for the fiscal year 2024. A higher inflation forecast indicates that the BoJ is confident about an increase in wages, which would drive inflation higher.
The hopes of an intervention from the Japanese authority into the FX domain are diminishing. Japanese authorities are worried about further sell-off in the Japanese Yen and are holding volatile moves responsible for them. Historically, volatility spikes remain for days for a few weeks but the appeal for the Japanese Yen is weak from some quarters due to the adaptation of easy monetary policy by the BoJ. Therefore the authorities cannot reverse the tide against weak appeal for the Japanese Yen backed by expansionary monetary policy.
Meanwhile, S&P500 futures have posted significant losses in the European session, portraying a risk-off market mood due to deepening Middle East tensions. The US Dollar Index (DXY) retreated from 106.50 as Federal Reserve (Fed) policymakers supported keeping interest rates unchanged in November.
San Francisco Fed Bank President Mary Daly suggested that the recent surge in long-term bond yields is equivalent to one 25 basis points (bps) interest rate hike. The risk of lifting interest rates further could push the economy into a recession.
USD firms modestly. Economists at Scotiabank analyze Greenback’s outlook.
Soft data risks for the US may be rising
The USD is trading firmer overall but the ‘market-weighted’ DXY is trading off its earlier highs ahead of the North American session and effectively continues to consolidate within the October trading range.
Soft data risks for the US may be rising as interest rates start to bite on the USD economy and the broader USD rally still looks prone to some technical retrenchment after the DXY’s slide back from the low 107 medium-term resistance point at the start of the month.
EUR/USD rebounds on firmer than expected ZEW survey results. Economists at Scotiabank analyze the pair’s outlook.
Firm support on dips to the 1.0500 area
Germany’s ZEW survey for October delivered better-than-expected results. The current assessment reading softened – but less than expected – to 79.9 (from 79.4 last month) while the expectations component improved to -1.1 (from -11.4), also better than forecast. The data suggest clear improvement in sentiment as the ECB rate cycle (likely) peaks. This may be a prelude to a slightly better economic performance.
Intraday EUR gains have been capped around 1.0560/1.0565 resistance again but a firm close on Monday tilts technical risks towards a bit more pressure on the upper 1.05s and firm support on EUR dips to the 1.0500 area.
A push through 1.0560 should allow the EUR to retest 1.06+.
GBP/USD slips as wage data hint at moderation. Economists at Scotiabank analyze the pair’s outlook.
UK wage data for August came in a bit softer than expected
Average earnings eased to 8.1% YoY over the August quarter, down from 8.5% in July. Ex-bonus earnings eased to 7.8%, but from an upwardly-revised 7.9% in July. Markets view the break in the rising wage trend as tilting risks against another BoE hike before year-end but wage growth remains very strong overall and there is still some key data ahead (e.g. CPI on Wednesday) which may sway thinking again.
Loss of support at 1.2125 will edge risks towards a retest of 1.20 area in the next day or so, given soft/bearish underlying momentum.
Resistance is 1.2215/1.2225.
- EUR/JPY alternates gains with losses around 158.00.
- The continuation of the side-lined trade appears on the cards.
EUR/JPY navigates within a narrow range in the 158.00 region so far on Tuesday.
Considering the ongoing performance, further consolidation appears in store for the cross for the time being. In the meantime, the breakout of this range could put the September high of 158.65 (September 13) to the test ahead of the 2023 top at 159.76 (August 30).
So far, the longer term positive outlook for the cross appears favoured while above the 200-day SMA, today at 150.42.
EUR/JPY daily chart
The USD has been strengthening again but in a gradual manner, unlike the path seen last year. In the view of economists at HSBC, USD strength could be stickier this time round.
Stickier USD strength
The countercyclical support to the USD from slowing global growth should continue, but the fastest part of the latter’s deterioration may be behind us.
Global equity market performance has held up, benefiting from the earlier optimism of central banks reaching the end of their tightening cycles. Nonetheless, the grounds for significant optimism are not as compelling as they used to be, which could end up giving the USD more support than has been the case lately.
Some may believe that USD strength will reverse soon, especially given its overvaluation. However, the USD has been steadily strengthening over the past decade and it has been overvalued, as measured by the real effective exchange rate (REER), over the same period. We believe USD strength will be sturdier this time round.
- The Greenback trades sideways as Monday was full of geopolitical headlines.
- Expect some fireworks around 12:30 GMT with US Retail Sales numbers.
- The US Dollar Index is in the middle of October’s range.
The US Dollar (USD) was the steady boyfriend on Monday in a market that had seen a wild ride in commodities. Foremost, the energy complex had a wild ride on a bunch of comments from Iran, Turkey and the US on the Israeli-Palestinian situation. The US Dollar remained steady despite the headlines and made equities soar.
On the data front, traders can sink their teeth into US Retail Sales, which are due this Tuesday an hour before the US stock market opens. As always, the print could produce a knee-jerk reaction as often the initial moves get contradicted by the revision of the previous number. In other words, brace yourself for some volatility either way.
Daily digest: US Dollar becoming data-driven
- At the start for this Tuesday, the President of the New York Fed, John Williams, is due to speak around 12:00 GMT.
- In terms of data, this Tuesday is kicking off near 12:30 GMT with the Retail Sales numbers: The monthly Retail Sales for September are expected to head lower from 0.6% to 0.3%. The Control Group number was previously at 0.1% with no expectation foreseen this time around. Retail Sales ex Autos is heading from 0.6% to 0.2%.
- At 12:55 GMT, the Redbook Index is due to come out for the week of October 13. Previous reading was 4%.
- Around 13:15 GMT, the monthly Industrial Production release for September is due. Expectations are for the print to head from 0.4% to 0%.
- Expect some headlines from Michelle Bowman, a governor on the Federal Reserve’s board, around 13:20 GMT.
- Another two numbers due to come out near 14:00 GMT: US Business Inventories for August, expected to head from 0.% to 0.3%. Additionally, the National Association of Home Builders (NAHB) is due to print the monthly Housing Market Index for October, which is expected to head from 45 to 44.
- Around 14:45 GMT, some headlines are expected from Thomas Barkin from the Federal Reserve Bank of Richmond.
- Equities are very much mixed with European and US equities on the back foot, while Asian equities advancenear 1%.
- The CME Group’s FedWatch Tool shows that markets are pricing in a 90.1% chance that the Federal Reserve will keep interest rates unchanged at its meeting in November.
- The benchmark 10-year US Treasury yield soared to 4.75% and is ticking up further as the bond sell-off continues.
US Dollar Index technical analysis: Awaiting to choose sides
The US Dollar looks to have reached the end of the line of its relentless rally since July. It comes as no surprise that the price action is cooling down and that the US Dollar Index (DXY) has retreated from its peak. With the DXY in the middle of this month’s range, the outcome will depend on three things: the rate differential of US yields against other currencies, the risk sentiment driven by geopolitical headlines and Powell’s speech on Thursday.
A bounce above the daily trendline from July 18 might still materialize. On the topside, 107.19 is important to reach. If this is the case, 109.30 is the next level to watch.
On the downside, the recent resistance at 105.88 did not do a good job supporting any downturn. Instead, look for 105.12 to keep the DXY above 105.00. If that does not do the trick, 104.33 will be the best level to look for some resurgence in US Dollar strength with the 55-day Simple Moving Average (SMA) as a support level.
US Dollar FAQs
What is the US Dollar?
The US Dollar (USD) is the official currency of the United States of America, and the ‘de facto’ currency of a significant number of other countries where it is found in circulation alongside local notes. It is the most heavily traded currency in the world, accounting for over 88% of all global foreign exchange turnover, or an average of $6.6 trillion in transactions per day, according to data from 2022.
Following the second world war, the USD took over from the British Pound as the world’s reserve currency. For most of its history, the US Dollar was backed by Gold, until the Bretton Woods Agreement in 1971 when the Gold Standard went away.
How do the decisions of the Federal Reserve impact the US Dollar?
The most important single factor impacting on the value of the US Dollar is monetary policy, which is shaped by the Federal Reserve (Fed). The Fed has two mandates: to achieve price stability (control inflation) and foster full employment. Its primary tool to achieve these two goals is by adjusting interest rates.
When prices are rising too quickly and inflation is above the Fed’s 2% target, the Fed will raise rates, which helps the USD value. When inflation falls below 2% or the Unemployment Rate is too high, the Fed may lower interest rates, which weighs on the Greenback.
What is Quantitative Easing and how does it influence the US Dollar?
In extreme situations, the Federal Reserve can also print more Dollars and enact quantitative easing (QE). QE is the process by which the Fed substantially increases the flow of credit in a stuck financial system.
It is a non-standard policy measure used when credit has dried up because banks will not lend to each other (out of the fear of counterparty default). It is a last resort when simply lowering interest rates is unlikely to achieve the necessary result. It was the Fed’s weapon of choice to combat the credit crunch that occurred during the Great Financial Crisis in 2008. It involves the Fed printing more Dollars and using them to buy US government bonds predominantly from financial institutions. QE usually leads to a weaker US Dollar.
What is Quantitative Tightening and how does it influence the US Dollar?
Quantitative tightening (QT) is the reverse process whereby the Federal Reserve stops buying bonds from financial institutions and does not reinvest the principal from the bonds it holds maturing in new purchases. It is usually positive for the US Dollar.
EUR/USD has been on a slide after reaching a high of 1.12 in mid-July. Economists at the National Bank of Canada analyze the pair’s outlook.
Economic conditions worsening in the Eurozone
A combination of a less hawkish central bank, weaker economic indicators and deteriorating market conditions have certainly played their part in the last two months.
Combining our call for continued US Dollar strength and with economic conditions worsening in the Eurozone, we hold the view that the current Euro weakness could intensify. That said, we do see some improvement further out in our forecast horizon.
EUR/USD – Q4 2023 1.04 Q1 2024 1.03 Q2 2024 1.07 Q3 2024 1.08
Economists at MUFG Bank discuss GBP outlook ahead of the UK Consumer Price Index (CPI) data.
Big upside inflation surprise required to shake up expectations that the BoE will stay on hold next month
The UK rate market is currently pricing in only around 6 bps of hikes and 11 bps hikes by the December MPC meeting. It highlights that market participants are not yet as confident that the BoE’s tightening cycle is over. It would though take a big upside inflation surprise in Wednesday’s CPI for September to shake up expectations that the BoE will stay on hold next month.
We expect the report to show further evidence that inflation pressures are easing. A softer CPI reading would drag the Pound towards the bottom of its recent trading ranges against the EUR and USD.
The Bank of Japan (BoJ) is highly likely to revise the year-on-year Core Consumer Price Index (CPI) forecasts for the fiscal year of 2023 and 2024 higher, Bloomberg reported on Tuesday.
The BoJ's new Core CPI forecast for the fiscal year 2023 is likely to approach 3%, up from 2.5% as of July, and be set at 2% or more in sight for the fiscal year 2024, Bloomberg added.
Market reaction
USD/JPY dropped below 149.00 with the immediate reaction to this report but quickly recovered to 149.50 area afterward.
- Natural Gas prices are paring back losses from Monday.
- The US Dollar trades sideways, in the middle of October’s price range.
- US Natural Gas prices are increasing on Middle East tensions despite weak demand .
Natural Gas prices are increasing by around 1% on Tuesday, paring back partial losses from Monday. The upward move is due to the announcement that US President Joe Biden will visit Israel in a push for a diplomatic solution amid the escalating tensions between Israel and Palestine. Natural Gas prices also respond to the possibility of a proxy war, which is still on the cards as Iran warned on Monday that the time for talks is ending and war could be the only way out.
Meanwhile, the US Dollar (USD) was a steady beacon on Monday in a market that saw a wild ride unfold in commodities. The energy complex performed a wild ride on several comments from Iran, Turkey and the US on the Israeli-Palestinian tensions. The US Dollar traded in a small range despite the headlines and gave way to equities to jump higher.
Natural Gas is trading at $3.45 per MMBtu at the time of writing.
Natural Gas news and market movers
- European gas prices are dropping lower with traders on the lookout for Joe Biden’s visit to Israel on Wednesday in an effort to contain any further escalation in the region. The total price decline since last week for European Gas prices amounts to 40%.
- The surge in American gas prices could spur a switch to fuel oil instead.
- European Gas demand remains muted, with gas inventories filled up to 98%.
- Data from Norwegian Gas company Gassco showed gas flow towards Northern Europe and the UK are at their normal average.
- The Suez Canal will raise transit fees by 5% to 15% for LNG and LPG carriers in the strait.
Natural Gas Technical Analysis: Any uprising remains difficult
Natural Gas tries to pare losses from Monday, though if the European Gas prices are any guidance, more pain is to come into the American Gas prices. Some upticks might be still granted due to the fragile equilibrium in the Middle East, though a firm uptrend does not seem to be at hand. With the expected mild temperatures ahead and European and American gas storages well-equipped to face the winter, rather look for the lower levels to come into play.
With the firm peak and breakthrough out of the trend channel, it will be crucial that the upper band of that same trend channel acts as support. There aren’t any significant resistance levels except for $3.65, the peak of January 17. From there, the high of 2023 near $4.3080 comes into play.
On the downside, the trend channel needs to act as support near $3.30. In case this level breaks down again, Natural Gas prices could sink to $.3.07, with that orange line identified from the double top around mid-August. Should the drop become a broader sell-off, prices could sink below $3 toward $2.85, near the 55-day Simple Moving Average.
-638331335951254852.png)
XNG/USD (Daily Chart)
Natural Gas FAQs
What fundamental factors drive the price of Natural Gas?
Supply and demand dynamics are a key factor influencing Natural Gas prices, and are themselves influenced by global economic growth, industrial activity, population growth, production levels, and inventories. The weather impacts Natural Gas prices because more Gas is used during cold winters and hot summers for heating and cooling. Competition from other energy sources impacts prices as consumers may switch to cheaper sources. Geopolitical events are factors as exemplified by the war in Ukraine. Government policies relating to extraction, transportation, and environmental issues also impact prices.
What are the main macroeconomic releases that impact on Natural Gas Prices?
The main economic release influencing Natural Gas prices is the weekly inventory bulletin from the Energy Information Administration (EIA), a US government agency that produces US gas market data. The EIA Gas bulletin usually comes out on Thursday at 14:30 GMT, a day after the EIA publishes its weekly Oil bulletin. Economic data from large consumers of Natural Gas can impact supply and demand, the largest of which include China, Germany and Japan. Natural Gas is primarily priced and traded in US Dollars, thus economic releases impacting the US Dollar are also factors.
How does the US Dollar influence Natural Gas prices?
The US Dollar is the world’s reserve currency and most commodities, including Natural Gas are priced and traded on international markets in US Dollars. As such, the value of the US Dollar is a factor in the price of Natural Gas, because if the Dollar strengthens it means less Dollars are required to buy the same volume of Gas (the price falls), and vice versa if USD strengthens.
- USD/CAD struggles to extend upside above 1.3640 ahead of key economic data.
- The market mood is broadly risk-off amid deepening Middle East tensions.
- Fed policymakers are advocating for stable monetary policy as long-term bond yields are near multi-year highs.
The USD/CAD pair finds some selling pressure after recovering to near 1.3640 from the round-level support of 1.3600. The Loonie asset is expected to remain on the tenterhooks as investors are awaiting Canada’s inflation data and United States Retail Sales data for September.
S&P500 futures added some losses in the European session, portraying a decline in the risk appetite of the market participants. The risk-perceived assets are under pressure amid deepening Middle East tensions as Israel's military is preparing for a ground offensive in Gaza against Hamas.
Meanwhile, the visit of US President Joe Biden to Israel to evacuate civilians from Gaza safely amid military attacks from Palestine military group will be in focus.
The US Dollar Index (DXY) consolidates around 106.60 as investors hope that the Federal Reserve (Fed) keep interest rates unchanged on November 1. Fed policymakers are advocating for keeping interest rates unchanged at 5.25-5.50% as long-term bond yields are hovering near multi-year highs and are sufficient to keep pressure on spending and investments.
Going forward, investors await the US Retail Sales data for September. As per the consensus, the consumer spending momentum expanded at 0.3%, almost half of August’s growth rate.
On the Canadian Dollar front, investors await the inflation data for September. On a monthly basis, the headline Consumer Price Index (CPI) is seen up by 0.1%, declining from the previous 0.4% increase. The annual headline CPI is seen growing at a steady pace of 4%. The core figures are seen expanding at a steady pace of 0.1% and 3.3% on a monthly and an annual basis respectively.
Economists at Commerzbank maintain their outlook and see moderate CAD recovery potential in the medium term.
EUR/CAD to edge lower in the medium term
The CAD should benefit if, as we expect, the BoC keeps its key rate at a higher level for longer and cuts it less than the Fed. This would reduce the interest rate differential between the Fed and the BoC and it could turn positive in the medium term.
In the short term, EUR/CAD should reflect the fact that the ECB has ended its interest rate cycle, while the BoC could deliver another rate hike. In the medium term, however, the interim EUR strength we expect should be reflected. The key factor here is our economists' expectation that the ECB will not cut interest rates, contrary to current market expectations – a hawkish signal from which the Euro should benefit.

Source: Commerzbank Research
Gold prices jumped 6% in the past week, primarily due to the Israel-Hamas war. Economists at ANZ Bank analyze the yellow metal’s outlook.
The Israel-Hamas war will heighten haven demand
While the Israel-Hamas war will drive haven flows towards Gold, our positive view for the price hinges on the Fed rate cycle nearing an end. This will result in a retreating US yield, reducing the opportunity cost of Gold.
Haven-induced upside in the USD would not have a negative impact on the Gold price. We hold our long-term bearish stance for the USD, which will support Gold going into 2024.
Central bank purchases are likely to be strong, and demand for physical Gold gets a seasonal boost in Q4.
- WTI trades in a narrow range around $86.00 ahead of US Biden’s visit to Israel.
- The broader outlook of the oil price is bullish as risks of potential intervention from other Middle East players are persistent.
- WTI aims to shift above the 50% Fibo retracement at $85.77.
West Texas Intermediate (WTI), futures on NYMEX, consolidate in a tight range of $85-86 as investors keenly watch for US President Joe Biden’s visit to Israel to discuss the need to eradicate Palestine military group Hamas without escalating civilian casualties.
The broader outlook of the oil price is bullish as risks of potential intervention from other Middle East players such as Iran and Yemen are persistent. This would disrupt the global supply chain for oil significantly.
Meanwhile, the US Dollar consolidated around 106.60 ahead of the speech from Federal Reserve (Fed) Chair Jerome Powell, which will provide cues about the likely monetary policy action in November. Before that US Retail Sales data for September will be keenly watched, which will be published at 12:30 GMT.
WTI aims to shift above the 50% Fibonacci retracement (plotted from August 24 low at $77.53 to September 28 high around $94) at $85.77 on a four-hour scale. The 20-period Exponential Moving Average (EMA) is at $85.10 supporting the oil price bulls.
The Relative Strength Index (RSI) (14) has delivered a range shift move from a bearish to a bullish trajectory. The broader range for the momentum oscillator is expected to be 40.00-80.00 ahead.
A fresh upside would appear if the oil price breaks above October 16 high at $87.00, which would drive the asset toward September 26 low at $87.74, followed by the psychological resistance at $90.00.
In an alternate scenario, a breakdown below October 6 low at $80.63 would expose the asset to August 29 low at $79.21 and August 24 low at $77.53.
WTI four-hour chart
-638331320904842599.png)
Bank of England (BoE) policymaker Swati Dhingra said on Tuesday, “labor market is really loosening, I do not see further wage growth momentum.”
Additional quotes
Average weekly earnings data appear to give a more inflated picture of wage outlook than other measures.
I expect some letting-up of wage growth.
We should see some relenting of domestic inflation pressures.
Market reaction
GBP/USD is consolidating losses following the above comments, keeping its range at around 1.2160, down 0.42% on the day.
Saudi Arabian oil giant Aramco’s CEO Amin Nasser said on Tuesday, “we're seeing oil-market balance despite an economic slowdown.”
Additional comments
If you don't invest in oil and gas, you will lose 5-7 mln bpd of oil a year.
There are 3 mln bpd spare capacity in the oil market today.
Canada releases inflation figures for September today. Economists at ING analyze USD/CAD outlook ahead of the Consumer Price Index (CPI) report.
BoC might be more tolerant of inflation bumps
Expectations are for no MoM change after the 0.4% August print, which would leave the YoY rate at 4.0%. Core measures are expected to slow down very marginally and stay close to 4.0%.
Market expectations for Bank of Canada tightening have remained high compared to the Fed, with 20 bps priced in for January. The still very tight jobs market argues against having a dovish turn, but there is a good chance that with higher market rates doing the tightening in Canada, the BoC will be more tolerant of bumps in the disinflation path.
Given market pricing, the balance of risks appears tilted to the upside today. USD/CAD has moved back to the 1.3600 area, but there is some room for a rebound in the near term.
See – Canada CPI Preview: Forecasts from five major banks, decelerating trend
- USD/CHF trades higher amid escalating Middle-East conflict.
- American naval vessels are en route to Israel, sending a message of deterrence to both Iran and the Lebanese militant group.
- The Greenback faces hurdles amid dovish comments from multiple Federal Reserve officials.
USD/CHF trades higher around 0.9020 during the European session on Tuesday, snapping the two-day losing streak. The escalating geopolitical conflicts between Israel and Hamas could strengthen the Swiss Franc, a classic safe-haven currency, and pose a challenge for the USD/CHF pair.
The US Marine Rapid Response force is en route to the waters near Israel. A swift-response contingent comprising 2,000 Marines and sailors is being deployed, aligning with a growing fleet of US warships heading towards Israel. This strategic move aims to convey a deterrence message to Iran and the Lebanese militant group Hezbollah, as reported by CNN.
The US Dollar Index (DXY) is bouncing back from recent losses, trading higher around 106.50. Despite the recovery, the Greenback faced pressure as several Federal Reserve officials expressed dovish views on the trajectory of interest rates.
Federal Reserve Bank of Philadelphia President Patrick Harker echoed these sentiments on Monday, advising against introducing new economic pressures through increased borrowing costs. Harker emphasized the stance that, unless there's a significant shift in the data, the Fed should maintain interest rates at their current levels.
Meanwhile, US Treasury yields continue to rise, with the 10-year US Treasury bond yield reaching 4.74% at the moment.
Looking ahead, market participants are likely to closely monitor the upcoming US Retail Sales data. Additionally, Tuesday's focus will include the release of the Fed Beige Book report. On Thursday, the Swiss Trade Balance for September will be eyed.
Citing sources with knowledge of the matter, Reuters reports that the People’s Bank of China (PBOC) instructed state banks to roll over local government loans with a longer term at lower interest rates.
Additional takeaways
New interest rates should not be lower than China's treasury bonds, with terms no longer than 10 years.
Pboc to set up an emergency liquidity tool with banks, loans made via the tool should be repaid in two years.
Market reaction
AUD/USD is little impressed by the above report, adding 0.15% on the day to trade at 0.6350.
- Gold price trades in a narrow range as investors digest tensions in the Middle East.
- Fed policymakers see interest rates as sufficiently restrictive due to higher US Treasury yields.
- US Retail Sales growth is seen slowing to 0.3% in September.
Gold price (XAU/USD) trades directionless ahead of US President Joe Biden’s visit to Israel amid deepening Middle-East tensions and the speech from Federal Reserve (Fed) Chair Jerome Powell, which is expected to provide significant guidance on interest rates. Investors hope that Powell will favor a neutral monetary policy and join other Fed officials who recently said higher bond yields are sufficient to tame inflation.
Before key events in the economic calendar and the geopolitical front, investors will watch the United States Retail Sales data for September, which is one main gauge of consumer spending, the main driver of the US economy. Investors expect sales to grow at a slower pace than the previous month despite higher gasoline prices (Retail Sales data aren’t adjusted for inflation and thus reflect price changes). The volatility in the US Dollar is expected to diminish ahead of Retail Sales data.
Daily Digest Market Movers: Gold price juggles ahead of US Retail Sales data
- Gold price consolidates in a tight range around $1,920.00 as investors await the speech from Federal Reserve Chair Jerome Powell, which is scheduled for Thursday.
- The speech from Powell will provide meaningful cues about the upcoming interest rate decision, set for November 1.
- Investors will watch whether Powell joins other Fed officials and supports keeping interest rates unchanged for the second time in a row due to rising US Treasury yields.
- The 10-year US Treasury yields are hovering near multi-year highs at 4.75% and Fed policymakers are of the view that higher yields are sufficient to ease overall spending and investment.
- San Francisco Fed President Mary Daly suggested that the recent surge in long-term bond yields is equivalent to one 25 basis points rate hike. The risk of lifting interest rates further could push the economy into a recession.
- Philadelphia Fed Bank President Patrick Harker said Monday that the central bank should not build new pressures on the economy by increasing borrowing costs further. Harker reiterated that the Fed is done hiking interest rates in an environment where inflationary pressures are ebbing.
- Harker pointed out that the economy is resilient due to a stabilizing labor market and easing inflation, but warned that first-time homebuyers have vanished from the market due to higher interest rates.
- As per the CME Group Fedwatch tool, traders see a 90% chance of the Fed keeping interest rates unchanged at 5.25%-5.50%. The odds of one more interest rate increase in any of the two remaining monetary policy meetings in 2023 are unchanged at 30%.
- Apart from the Fed policy, US President Joe Biden’s visit to Israel amid the deepening conflict in the region is likely to keep the market on edge. Further escalation in the Israel-Hamas war would improve the appeal for Gold.
- US Secretary of State Antony Blinken confirmed that President Biden will visit Israel on Wednesday, emphasizing the need to save civilians. Meanwhile, Israel is preparing for the ground offensive in Gaza against Hamas.
- The US Dollar index (DXY) finds buying interest near 106.20. A sideways move is anticipated ahead of the Retail Sales data for September. Analysts at SocGen expect a mild 0.3% MoM increase for Retail Sales for the aggregate but note that higher gasoline prices are partially responsible for the gain.
- Higher-than-expected consumer spending figures could lift chances of more interest rate increases from the Fed.
Technical Analysis: Gold price oscillates near $1,920
Gold price trades sideways near $1,920.00 ahead of multiple events. The precious metal has turned directionless after a sharp upside move to near an almost four-week high at $1,932.00. The yellow metal has climbed above all short-term Exponential Moving Averages (EMAs), indicating that the overall trend is bullish. Momentum oscillators have also shifted into the bullish range, which suggests an increasing likelihood of an upward price move.
Gold FAQs
Why do people invest in Gold?
Gold has played a key role in human’s history as it has been widely used as a store of value and medium of exchange. Currently, apart from its shine and usage for jewelry, the precious metal is widely seen as a safe-haven asset, meaning that it is considered a good investment during turbulent times. Gold is also widely seen as a hedge against inflation and against depreciating currencies as it doesn’t rely on any specific issuer or government.
Who buys the most Gold?
Central banks are the biggest Gold holders. In their aim to support their currencies in turbulent times, central banks tend to diversify their reserves and buy Gold to improve the perceived strength of the economy and the currency. High Gold reserves can be a source of trust for a country’s solvency. Central banks added 1,136 tonnes of Gold worth around $70 billion to their reserves in 2022, according to data from the World Gold Council. This is the highest yearly purchase since records began. Central banks from emerging economies such as China, India and Turkey are quickly increasing their Gold reserves.
How is Gold correlated with other assets?
Gold has an inverse correlation with the US Dollar and US Treasuries, which are both major reserve and safe-haven assets. When the Dollar depreciates, Gold tends to rise, enabling investors and central banks to diversify their assets in turbulent times. Gold is also inversely correlated with risk assets. A rally in the stock market tends to weaken Gold price, while sell-offs in riskier markets tend to favor the precious metal.
What does the price of Gold depend on?
The price can move due to a wide range of factors. Geopolitical instability or fears of a deep recession can quickly make Gold price escalate due to its safe-haven status. As a yield-less asset, Gold tends to rise with lower interest rates, while higher cost of money usually weighs down on the yellow metal. Still, most moves depend on how the US Dollar (USD) behaves as the asset is priced in dollars (XAU/USD). A strong Dollar tends to keep the price of Gold controlled, whereas a weaker Dollar is likely to push Gold prices up.
- Germany’s ZEW Economic Sentiment Index improved to -1.1 in October.
- EUR/USD is keeping the red near 1.0550 after the upbeat ZEW surveys.
The German ZEW headline number showed that the Economic Sentiment Index improved sharply in October, arriving at -1.1 from -11.4 in September while beating the market expectation of -9.
However, the Current Situation Index edged a tad higher to -79.9 from -79.4 prior, beating estimates of -80.5.
During the same period, the Eurozone ZEW Economic Sentiment Index rose to 2.3 from -8.9 recorded in September. The market consensus was for a reading of -8.
Key points
It seems that we have passed the lowest point.
Noticeable uptick in the economic expectations of financial market experts in October 2023.
Assessment of the current economic situation in Germany has barely changed.
Heightened economic expectations are accompanied by the anticipation that inflation rates will decrease further.
Negative factors such as the Israel conflict, cited by some respondents as a reason for revising their growth forecasts downward, had only limited impact on the overall more optimistic outlook.
Market reaction
The EUR/USD pair is holding lower ground near 1.0550 despite the encouraging data, down 0.16% on the day.
Economists at ANZ Bank analyze the details of the RBA Minutes.
A rate rise in November would require an uncomfortably high CPI print
The minutes of the October RBA Board meeting read more hawkishly than the September set, particularly the comment toward the end that the ‘Board has a low tolerance for a slower return of inflation to target than currently expected’.
Our view is that a rate rise in November would require an uncomfortably high CPI print, possibly combined with some sign of strength in the labour market.
Pending the upcoming labour market and inflation data, we continue to expect the cash rate to remain at 4.1%. Risks of RBA action appear to be rising, however.
- GBP/JPY pulls back from the recent gains amid moderate UK earning data.
- UK CPI (YoY) is expected to decrease; monthly figures could report a notable increase.
- BoJ could intervene in the foreign exchange market to protect the Japanese Yen.
GBP/JPY retreats from the recent gains, trading lower around 182.10 during the European session on Tuesday. Moderate earning data from the United Kingdom could exert pressure on the Pound Sterling (GBP), which diminishes the GBP/JPY pair.
Average Earnings Excluding Bonus (3Mo/Yr) remained consistent at 7.8% in August as expected. Pay levels Including Bonus for the said quarter, decelerate at 8.1%, compared to the market consensus of 8.3%.
Investors await the UK Consumer Price Index (CPI) on Wednesday, the report is predicted to exhibit a slight decrease in the annual figure, shifting from 6.7% to 6.5%. Core CPI is projected to be at 6%, down from September's 6.2%. Despite this moderation in the annual figures, there is an anticipation of a notable increase in the monthly CPI, rising from 0.3% to 0.4%.
Such an uptick in the monthly inflation figures could fuel speculations for another interest rate hike by the Bank of England (BoE). Currently, interest rate probabilities for the BoE remain around a 50% chance of a 25 basis points hike in this cycle.
The Bank of Japan (BoJ) maintains its view that inflation is transient and has no plans to phase out its massive monetary stimulus. The dovish outlook, coupled with an overall positive risk sentiment, could continue to weaken the safe-haven Japanese Yen (JPY), suggesting that the GBP/JPY cross is more likely to trend upward.
The anticipation of Japanese authorities intervening in the foreign exchange market to bolster their currency adds downward pressure for the GBP/JPY pair.
The highlight of today's FX session should be the release of September's US Retail Sales data. Economists at ING analyze how the figures could impact EUR/USD.
EUR/USD will be largely determined by the US Retail Sales release
EUR/USD has edged slightly higher on the back of a mildly positive equity environment. In the background, we also see China-linked commodities such as Iron Ore doing quite well – perhaps on the back of more fiscal and monetary stimulus expected from China. This is slightly supportive for the growth-oriented Euro.
We suspect today's path for EUR/USD will be largely determined by the US Retail Sales release. If we're right about the risks of a softer number, EUR/USD could push through intra-day resistance at 1.0575/1.0585 towards the 1.0610/1.0615 area. Any close above there suggests EUR/USD could be in for a decent correction after all.
See – US Retail Sales Preview: Forecasts from six major banks, tepid gains after surging since spring
- The Euro trades slightly on the defensive against the US Dollar.
- Stocks in Europe open Tuesday’s session with decent gains.
- EUR/USD’s upside falters around weekly highs near 1.0560.
- The USD Index (DXY) remains propped up by the 106.20 zone.
- Germany, Eurozone ZEW survey takes centre stage in the old continent.
- US Retail Sales, Industrial Production, Fedspeak will be in the limelight.
The Euro (EUR) commences the European session with modest losses against the US Dollar (USD), prompting EUR/USD to gyrate around the 1.0550 region on Tuesday.
The Greenback experiences a slight advance to the 106.30–106.40 band when tracked by the USD Index (DXY), setting aside Monday’s negative performance as selling pressure in the US fixed-income market persists.
Continuing to centre attention on monetary policy, investors anticipate that the Federal Reserve (Fed) will uphold its position of not implementing any interest rate adjustments throughout the remainder of the year. Meanwhile, participants in the financial markets contemplate the possibility of the European Central Bank (ECB) halting its interest-rate policy as well, despite inflation levels surpassing the bank's target and mounting concerns about an economic downturn or stagflation in the European region.
On the euro docket, the Economic Sentiment in both Germany and the broader euro area tracked by the ZEW Institute is due later.
In the US, Retail Sales take centre stage along with Industrial Production, the NAHB Housing Market Index, Business Inventories and speeches by FOMC Governor Michelle Bowman (permanent voter, hawk), NY Fed President John Williams (permanent voter, centrist), and Richmond Fed President Thomas Barkin (2024 voter, centrist).
Daily digest market movers: Euro comes under pressure on Dollar’s bounce
- The EUR faces some selling pressure against the USD.
- US and German yields keep the uptrend well in place.
- Investors see the Fed leaving interest rates steady in the next few months.
- Investors anticipate that the ECB will pause its rate-hiking cycle.
- Middle-Eastern geopolitical tensions remain high.
- The RBA Minutes showed a hawkish stance from policymakers.
Technical Analysis: Euro meets initial hurdle around 1.0560
EUR/USD comes under some mild downside pressure and returns to the 1.0550 region on Tuesday.
Should the current upward trend persist, EUR/USD may revisit the October 12 high at 1.0639 ahead of the September 20 top of 1.0736 and the noteworthy 200-day Simple Moving Average (SMA) at 1.0821. A break above this point could lead to an attempt to surpass the August 30 peak of 1.0945 and approach the psychological milestone of 1.1000. Any further advances beyond the August 10 high of 1.1064 might potentially propel the pair towards the July 27 pinnacle at 1.1149 and even reach the 2023 top of 1.1275 seen on July 18.
Conversely, in the event that selling pressure resumes, there is a chance of revisiting the 2023 low at 1.0448 seen on October 3 and possibly testing the significant support of 1.0400. If this threshold is breached, it could open the path to a retest of the lows at 1.0290 (November 30, 2022) and 1.0222 (November 21, 2022).
As long as EUR/USD remains below the 200-day SMA, the potential for sustained downward pressure persists.
Euro FAQs
What is the Euro?
The Euro is the currency for the 20 European Union countries that belong to the Eurozone. It is the second most heavily traded currency in the world behind the US Dollar. In 2022, it accounted for 31% of all foreign exchange transactions, with an average daily turnover of over $2.2 trillion a day.
EUR/USD is the most heavily traded currency pair in the world, accounting for an estimated 30% off all transactions, followed by EUR/JPY (4%), EUR/GBP (3%) and EUR/AUD (2%).
What is the ECB and how does it impact the Euro?
The European Central Bank (ECB) in Frankfurt, Germany, is the reserve bank for the Eurozone. The ECB sets interest rates and manages monetary policy.
The ECB’s primary mandate is to maintain price stability, which means either controlling inflation or stimulating growth. Its primary tool is the raising or lowering of interest rates. Relatively high interest rates – or the expectation of higher rates – will usually benefit the Euro and vice versa.
The ECB Governing Council makes monetary policy decisions at meetings held eight times a year. Decisions are made by heads of the Eurozone national banks and six permanent members, including the President of the ECB, Christine Lagarde.
How does inflation data impact the value of the Euro?
Eurozone inflation data, measured by the Harmonized Index of Consumer Prices (HICP), is an important econometric for the Euro. If inflation rises more than expected, especially if above the ECB’s 2% target, it obliges the ECB to raise interest rates to bring it back under control.
Relatively high interest rates compared to its counterparts will usually benefit the Euro, as it makes the region more attractive as a place for global investors to park their money.
How does economic data influence the value of the Euro?
Data releases gauge the health of the economy and can impact on the Euro. Indicators such as GDP, Manufacturing and Services PMIs, employment, and consumer sentiment surveys can all influence the direction of the single currency.
A strong economy is good for the Euro. Not only does it attract more foreign investment but it may encourage the ECB to put up interest rates, which will directly strengthen the Euro. Otherwise, if economic data is weak, the Euro is likely to fall.
Economic data for the four largest economies in the euro area (Germany, France, Italy and Spain) are especially significant, as they account for 75% of the Eurozone’s economy.
How does the Trade Balance impact the Euro?
Another significant data release for the Euro is the Trade Balance. This indicator measures the difference between what a country earns from its exports and what it spends on imports over a given period.
If a country produces highly sought after exports then its currency will gain in value purely from the extra demand created from foreign buyers seeking to purchase these goods. Therefore, a positive net Trade Balance strengthens a currency and vice versa for a negative balance.
- The Canadian Consumer Price Index is foreseen at 4% YoY in September.
- Bank of Canada Core CPI has been on the rise, although currently at 3.3% YoY.
- The BoC paused rate hikes after reaching 5%, the highest in 22 years.
Canada will release inflation-related data on Tuesday, October 17. Statistics Canada will publish the September Consumer Price Index (CPI), which is foreseen to increase 4% YoY, the same pace it rose in August. On a monthly basis, price pressures are seen up by 0.1%, declining from the previous 0.4% increase.
Additionally, the Bank of Canada (BoC) will publish the Consumer Price Index Core, which excludes the most volatile components such as food and energy prices. In August, the annual BoC core CPI increased by 0.1% MoM and 3.3% YoY. As usual, the figures will be closely watched for the Canadian Dollar (CAD) potential direction.
Inflation in Canada, as measured by the change in the CPI, rose to 4% on a yearly basis in August from 3.3% in July. On a monthly basis, the CPI rose 0.4%, surpassing the market’s estimates of a 0.2% increase.
What to expect from Canada’s inflation rate?
The BoC has battled skyrocketing inflation by hiking the policy rate to the current 5%, the highest in over two decades. Still, policymakers held the key interest rate steady when they met in September amid signs of a weakening economy.
Nevertheless, the central bank’s statement showed policymakers will monitor incoming economic data and assess whether rates need to rise further, wary of indicating the end of the tightening cycle. Additionally, the statement read: "They [policymakers] agreed that they did not want to raise expectations of a near-term reduction in interest rates."
Finally, the BoC reiterated it is concerned that underlying inflation is not moving down fast enough. In fact, core measures of inflation accelerated last month, as it happened in other major economies.
With that in mind, higher-than-anticipated readings for September could fuel speculation the BoC may opt for another rate hike in the near future.
Speaking at the International Monetary Fund (IMF) over the weekend, BoC Governor Tiff Macklem expressed concerns about geopolitical unrest in the Middle East affecting inflationary levels. He also noted that the fight against inflation “is not over,” although he added he is not expecting a recession. Finally, and opposing his American counterparts, he said that surging bond yields may not be a substitute for further rate hikes.
How could the Consumer Price Index data affect USD/CAD?
Usually, mounting inflationary pressures tend to boost the local currency as it suggests the central bank will turn more hawkish. However, the BoC, like most of its counterparts, has been extremely aggressive for roughly a year and a half in an effort to bring inflation down from the multi-decade highs achieved in mid-2022. And despite Governor Macklem's words, fears of a recession pend over all economies amid the truculent monetary tightening.
Last week, the US Dollar soared after the local CPI rose by more than anticipated amid risk-off flows. With that in mind, USD/CAD may edge lower if Canadian inflation figures come in much higher than anticipated, suggesting the BoC will need to act more.
USD/CAD bottomed for 2023 at 1.3092 in July, recovering afterwards to reach 1.3785 in early October. The pair trades a handful of pips above the 1.3600 mark heading into the release of the Consumer Price Index, easing amid decreased demand for safety.
The Canadian Dollar advances against its American counterpart for a second consecutive day, although the technical picture is far from bearish. USD/CAD daily chart shows a bullish 20-day Simple Moving Average (SMA) advancing well above directionless 100-day and 200-day SMAs. At the same time, technical indicators have lost their bullish momentum but hold above their midlines, limiting the scope for a bearish run.
USD/CAD established a minimum of 1.3568 in the previous week, and sellers will likely become more courageous on a break below the level. The next relevant support area comes at around 1.3520, a potential downward target should the CAD surge with the news.
On the upside, bulls will likely retake control of the pair if it runs past 1.3700. An intermediate resistance can be found at around 1.3750, en route to the aforementioned 1.3785 multi-month high seen in early October.
Economic Indicator
Canada Consumer Price Index (YoY)
The Consumer Price Index (CPI) released by the Statistics Canada is a measure of price movements by the comparison between the retail prices of a representative shopping basket of goods and services. The purchase power of CAD is dragged down by inflation. The Bank of Canada aims at an inflation range (1%-3%). Generally speaking, a high reading is seen as anticipatory of a rate hike and is positive (or bullish) for the CAD.
Read more.Next release: 10/17/2023 12:30:00 GMT
Frequency: Monthly
Source: Statistics Canada
Inflation FAQs
What is inflation?
Inflation measures the rise in the price of a representative basket of goods and services. Headline inflation is usually expressed as a percentage change on a month-on-month (MoM) and year-on-year (YoY) basis. Core inflation excludes more volatile elements such as food and fuel which can fluctuate because of geopolitical and seasonal factors. Core inflation is the figure economists focus on and is the level targeted by central banks, which are mandated to keep inflation at a manageable level, usually around 2%.
What is the Consumer Price Index (CPI)?
The Consumer Price Index (CPI) measures the change in prices of a basket of goods and services over a period of time. It is usually expressed as a percentage change on a month-on-month (MoM) and year-on-year (YoY) basis. Core CPI is the figure targeted by central banks as it excludes volatile food and fuel inputs. When Core CPI rises above 2% it usually results in higher interest rates and vice versa when it falls below 2%. Since higher interest rates are positive for a currency, higher inflation usually results in a stronger currency. The opposite is true when inflation falls.
What is the impact of inflation on foreign exchange?
Although it may seem counter-intuitive, high inflation in a country pushes up the value of its currency and vice versa for lower inflation. This is because the central bank will normally raise interest rates to combat the higher inflation, which attract more global capital inflows from investors looking for a lucrative place to park their money.
How does inflation influence the price of Gold?
Formerly, Gold was the asset investors turned to in times of high inflation because it preserved its value, and whilst investors will often still buy Gold for its safe-haven properties in times of extreme market turmoil, this is not the case most of the time. This is because when inflation is high, central banks will put up interest rates to combat it.
Higher interest rates are negative for Gold because they increase the opportunity-cost of holding Gold vis-a-vis an interest-bearing asset or placing the money in a cash deposit account. On the flipside, lower inflation tends to be positive for Gold as it brings interest rates down, making the bright metal a more viable investment alternative.
Will US Retail Sales slow and will the Dollar soften? Economists at ING analyze USD outlook.
Consumer resilience to test the Dollar
Given that powerful US growth and the US 'exceptionalism' story have largely been based on the US consumer staying in work and spending, a softer Retail Sales figure could test some of the late arrivals to the long Dollar trade. That should mean that DXY will struggle to break 106.75 resistance and instead may end up pressing intra-day support at 106.00.
In addition to retail sales, today also sees US Industrial Production and several Fed speakers. Again, we are on the lookout for any consistent language from the Fed that tighter financial conditions (from the rise in bond yields) mean that the Fed does not need to tighten any further.
Later in the US day, we get to see Treasury International Capital (TIC) flow data for August. Chinese holdings of US Treasuries have fallen to $821bn from $1.04tn at the start of 2022. A further decline could add to woes in the US bond market and also start to question whether a rise in US Treasury yields on the back of a higher term premium really is good news for the Dollar after all.
See – US Retail Sales Preview: Forecasts from six major banks, tepid gains after surging since spring
Economists at Commerzbank analyze CAD outlook ahead of inflation data from Canada.
CAD is likely to struggle to make any ground
Today’s inflation data for September might provide more clarity as to whether the BoC might have to take further action. According to the Bloomberg consensus, an improvement in inflation data is not expected. Against this background, speculation about further rate hikes might continue. The BoC kept the door open for that due to the stubbornly high core inflation. Principally this might provide support for CAD.
In the current environment, CAD is likely to struggle to make any ground though. The robust economic data from the US supports USD. In addition, USD benefits from the increased uncertainty due to the conflict in the Middle East. That means a sustainable recovery of CAD against USD seems unlikely for now.
See – Canada CPI Preview: Forecasts from five major banks, decelerating trend
- The index leaves behind Monday’s downtick and revisits 106.40.
- Retail Sales will take centre stage later in the NA session.
- FOMC Bowman, Barkin are also due to speak.
The greenback regains some balance following Monday’s drop and revisits the 106.40 region when measured by the USD Index (DXY) on turnaround Tuesday.
USD Index appears bid ahead of data, Fedspeak
The index picks up pace and manages well to keep the trade above the key 106.00 barrier following the opening bell in the old continent on Tuesday.
The resumption of the upward bias in the dollar also comes amidst the continuation of the uptrend in US yields across different maturities, which in turn appears underpinned by steady speculation of the Fed’s tighter-for-longer stance.
In the US data space, Retail Sales will be in the centre of the debate seconded by Industrial Production, the NAHB Index and Monthly Budget Statement. In addition, FOMC Governor M. Bowman (permanent voter, hawk) is due to speak along with Richmond Fed T. Barkin (2024 voter, centrist).
What to look for around USD
The index finds some fresh buying interest in the low-106.00s for the time being ahead of key US data releases on Tuesday.
In the meantime, support for the dollar keeps coming from the good health of the US economy, which at the same time appears underpinned by the renewed tighter-for-longer stance narrative from the Federal Reserve.
Key events in the US this week: Retail Sales, Industrial Production, NAHB Index, Business Inventories (Tuesday) – MBA Mortgage Applications, Building Permits, Housing Starts, Fed Beige Book, TIC Flows (Wednesday) - Initial Jobless Claims, Philly Fed Manufacturing Index, CB Leading Index, Existing Home Sales, Fed Powell (Thursday).
Eminent issues on the back boiler: Persevering debate over a soft or hard landing for the US economy. Incipient speculation of rate cuts in early 2024. Geopolitical effervescence vs. Russia and China and the Middle East.
USD Index relevant levels
Now, the index is up 0.12% at 106.33 and a breakout of 106.78 (weekly peak October 13) could expose 107.34 (2023 high October 3) and finally 107.99 (weekly high November 21 2022). On the other hand, the next support emerges at 105.53 (monthly low October 12) ahead of 104.42 (weekly low September 11) and then 103.23 (200-day SMA).
Here is what you need to know on Tuesday, October 17:
The US Dollar (USD) weakened against its rivals on Monday as risk flows dominated the action in financial markets following a bullish opening in Wall Street. The cautious market stance helps the USD holds its ground early Tuesday as investors await September Retail Sales and Industrial Production data from the US. Several Federal Policymakers are scheduled to speak later in the session as well.
Despite escalating geopolitical tensions, major equity indexes in the US registered strong gains on Monday. In the European morning, US stock index futures trade modestly lower. According to the latest headlines surrounding the Israel-Hamas conflict, heavy bombardments took place in southern Gaza - Khan Younis, Rafah and Deir el-Balah. Meanwhile, US President Joe Biden will travel to Israel on Wednesday. Israel Defense Forces international spokesperson Lt. Col. Jonathan Conricus told CNN that Biden's visit would not complicate or delay a ground operation in Gaza.
US Dollar price today
The table below shows the percentage change of US Dollar (USD) against listed major currencies today. US Dollar was the strongest against the Pound Sterling.
| USD | EUR | GBP | CAD | AUD | JPY | NZD | CHF | |
| USD | 0.05% | 0.28% | 0.08% | -0.32% | 0.02% | 0.08% | 0.12% | |
| EUR | -0.04% | 0.24% | 0.04% | -0.37% | -0.04% | 0.03% | 0.09% | |
| GBP | -0.29% | -0.24% | -0.21% | -0.61% | -0.27% | -0.21% | -0.17% | |
| CAD | -0.07% | -0.01% | 0.21% | -0.39% | -0.06% | 0.01% | 0.04% | |
| AUD | 0.32% | 0.36% | 0.59% | 0.39% | 0.33% | 0.38% | 0.43% | |
| JPY | -0.02% | 0.03% | 0.28% | 0.06% | -0.33% | 0.07% | 0.10% | |
| NZD | -0.08% | -0.02% | 0.22% | -0.01% | -0.39% | -0.06% | 0.03% | |
| CHF | -0.12% | -0.07% | 0.17% | -0.03% | -0.44% | -0.09% | -0.03% |
The heat map shows percentage changes of major currencies against each other. The base currency is picked from the left column, while the quote currency is picked from the top row. For example, if you pick the Euro from the left column and move along the horizontal line to the Japanese Yen, the percentage change displayed in the box will represent EUR (base)/JPY (quote).
USD/CAD closed deep in negative territory on Monday before stabilized slightly above 1.3600 early Tuesday. Statistics Canada will release Consumer Price Index (CPI) data for September and the Bank of Canada (BoC) will publish core inflation figures.
During the Asian trading hours, the data from New Zealand revealed that inflation in the third quarter, as measured by the change in the Consumer Price Index (CPI), rose to 1.8% on a quarterly basis from 1.1% in the second quarter. This reading came in below the market expectation of 2%. NZD/USD came under heavy bearish pressure after this data and the pair was last seen trading near 0.5900, losing 0.5% on a daily basis.
The Reserve Bank of Australia's (RBA) minutes of the October policy meeting showed on Tuesday that policymakers considered raising the policy rate by another 25 basis points or holding it steady before deciding to leave it unchanged. “Members acknowledged upside risks to inflation were a significant concern," the RBA noted. AUD/USD gained traction in the Asian session and climbed above 0.6350.
EUR/USD closed in positive territory on Monday but struggled to extend its rebound. In the early European session, the pair went into a consolidation phase at around 1.0550.
Annual wage inflation in the UK, as measured by the change in Average Earnings Excluding Bonus, edged lower to 7.8% in August from 7.9% in July, the UK's Office for National Statistics reported on Tuesday. GBP/USD came under modest bearish pressure after this data and was last seen losing 0.3% on the day at 1.2175.
USD/JPY failed to make a decisive move in either direction on Monday and extended its sideways grind at around 149.50 early Tuesday.
Gold registered losses despite the USD weakness on Monday as US Treasury bond yields pushed higher. XAU/USD consolidates its losses near $1,920 on Tuesday and the 10-year US Treasury bond yield clings to daily gains near 4.75%.
EUR/GBP ticked slightly higher as lower UK wage growth points to another Bank of England pause, economists at ING report.
Wages heading in the right direction for the BoE
While wage growth is still much too strong for the Bank of England's liking, there's nothing in the latest data that's likely to push the committee into a rate hike at the November meeting.
It looks like EUR/GBP can grind towards 0.8700 – should Wednesday's release of September CPI also point to a benign outcome.
- NZD/USD retraces recent gains after weaker economic data from New Zealand.
- Kiwi headline CPI (Q3) rose to 1.8%, compared to the 2.0% expected; the yearly rate decelerated.
- US Dollar could admire the improved US Treasury yields.
NZD/USD trades lower around 0.5900 during the early European session on Tuesday, pulling back from the recent gains following the release of downbeat consumer inflation data from New Zealand.
The headline CPI rose to 1.8% for the third quarter, compared to the 2.0% expected. The yearly rate decelerated to 5.6% from 6.0% in the previous quarter, and fell short of consensus estimates of 5.9% readings.
The data is compelling investors to reduce their expectations for an interest rate hike by the Reserve Bank of New Zealand (RBNZ) in November, putting downward pressure on the NZD/USD pair.
The Reserve Bank of New Zealand (RBNZ) unveiled its Sectoral Factor Model Inflation gauge. The inflation figures came in at 5.2% YoY in Q3 2023, marking a notable decline from the 5.7% recorded in Q2.
The US Dollar Index (DXY) recovers from the recent losses, trading higher around 106.40. Many Federal Reserve officials made dovish remarks about the Fed’s interest rates trajectory, which exerts pressure on the Greenback.
Federal Reserve Bank of Philadelphia President Patrick Harker echoed this sentiment on Monday, suggesting that the central bank should avoid introducing new economic pressures by increasing borrowing costs. Harker emphasized the view that unless there is a significant shift in the data, the Fed should maintain interest rates at their current levels.
US Treasury yields extend gains, with the 10-year US Treasury bond yield standing at 4.74%, by the press time.
Market participants will likely keep a close eye on the US Retail Sales data, and the Fed Beige Book report will also be a focal point on Tuesday. On Friday, New Zealand’s Trade Balance will be eyed.
Economists at Commerzbank analyze USD outlook ahead of the release of the US September retail sales and industrial production data.
USD to strengthen if the signs of a soft landing become stronger
As far as the data calendar is concerned, retail sales and industrial production data are due to be published in the US, which should at least attract some attention on the market. If the signs of a soft landing become stronger, this would also be positive for the USD, because it would mean that the Fed would probably not cut its key interest rate any time soon.
Of course, the data could disappoint today. But this would hardly be enough to dissuade economic optimists. This would therefore hardly weigh on the USD.
And as long as there is no easing of the Middle East conflict, the USD is likely to remain in demand anyway.
See – US Retail Sales Preview: Forecasts from six major banks, tepid gains after surging since spring
- USD/JPY attracts some buyers above the mid-149.00s on Tuesday.
- US NY Empire State Manufacturing Index for October fell to 4.6 vs. a 1.9 rise prior, better than expected.
- Japanese Finance Minister denied comment about currency intervention.
- Traders will focus on the US Retail Sales, Industrial Production, and Fed speakers later on Tuesday.
The USD/JPY pair holds positive ground around 149.60 during the early European trading hours on Tuesday. A renewed US Dollar (USD) demand and a recovery in US treasury yields lend some support to the pair. Investors await the US Retail Sales data on Tuesday for fresh impetus. The monthly figure is expected to rise by 0.3% in September.
The dovish comments from the Federal Reserve (Fed) capped the upside of the USD/JPY pair on Tuesday. Chicago Fed President Austan Goolsbee maintained his dovish stance by saying that a fall in US inflation is not a bleep, while Philadelphia Fed President Patrick Harker said that in the absence of some turn in the data, the Fed should hold rates steady. However, traders will take more cues from the Fed speakers on Tuesday, which include Williams, Bowman, Barkin, and Kashkari, which might offer some hints about further monetary policy paths.
About the data, the US NY Empire State Manufacturing Index for October fell to 4.6 from a 1.9 rise in the previous reading, above the market estimation of a 7.0 decline. Last week, the US Consumer Price Index (CPI) annually and monthly for September came in at 3.7% and 0.4%, respectively. Both figures exceeded the market expectations.
On the JPY, Japanese Finance Minister Shunichi Suzuki denied to comment on Tuesday's statements about currency intervention by an International Monetary Fund (IMF) official. Suzuki went on to say that there was no need to go into detail about the factors that would
Looking ahead, market players will keep an eye on the US Retail Sales, Industrial Production, and Fed speakers later on Tuesday. On Wednesday, the Japanese trade data will be released, followed by the National Consumer Price Index (CPI) reports on Friday. These figures could give a clear direction to the USD/JPY pair.
FX option expiries for Oct 17 NY cut at 10:00 Eastern Time, via DTCC, can be found below.
- EUR/USD: EUR amounts
- 1.0475 355m
- 1.0500 1.3b
- 1.0525 807m
- 1.0600 810m
- GBP/USD: GBP amounts
- 1.2040 933m
- 1.2400 1b
- USD/JPY: USD amounts
- 148.00 778m
- 148.65 520n
- 150.00 1b
- 150.25 505m
- USD/CHF: USD amounts
- 0.8965 690m
- 0.9055 493m
- USD/CAD: USD amounts
- 1.3500 964m
- 1.3800 1.1b
- NZD/USD: NZD amounts
- 0.6000 410m
- Pound Sterling remains on backfoot after UK wage report remains soft.
- BoE Pill kept doors open for further policy-tightening.
- The UK’s consumer inflation report for September is expected to remain soft.
The Pound Sterling (GBP) retreats after soft wage data dampens consumer spending outlook and elevate hopes of continuation of a neutral interest rate decision by the Bank of England (BoE) in its November monetary policy. The GBP/USD pair remains on backfoot as the cascading effects of elevating energy prices could trigger a rebound in inflationary pressures in the United Kingdom economy.
After labor earnings data, investors will focus on the inflation data for September, which will set the undertone of the BoE policy. Inflation in the UK economy is highest in comparison with other G7 economies. Therefore, further softening of consumer inflation would bring some relief for BoE policymakers. Market participants would keep an eye on US President Joe Biden’s visit to Israel about defending themselves against attacks from Palestine.
Daily Digest Market Movers: Pound Sterling falls back after soft wage data
- Pound Sterling drops after failing to climb above the round-level resistance of 1.2200 as the United Kingdom wage data remains softer than anticipated.
- Three month-to-August Average Earnings excluding bonuses softened to 7.8% as expected from the former release of 7.9%. In the same period, the Average Earnings data including bonuses decelerated to 8.1% from the consensus of 8.3% and the prior release of 8.5%.
- Soft wage data would dampen the overall consumer spending.
- The UK’s Office for National Statistics (ONS) reported that the publication of employment numbers was postponed by a week to October 24 due to a delay in covering more respondents by the LFS survey.
- The ONS reported that the delay would "give us additional time to produce the best possible estimates of the labor market using the best available data sources," as reported by Reuters.
- After wage data, investors will shift their focus on the inflation data for September, which will set the undertone for November monetary policy.
- As per the consensus, the core Consumer Price Index (CPI) data is seen softening to 6.0% from 6.2% recorded in August. Monthly headline CPI expanded at a higher pace of 0.4% vs. August reading of 0.3%. The annual data is seen decelerating to 6.5% against former reading of 6.7%.
- Investors seem baffled whether the central bank will focus on supporting the economic prospects or return back to the agenda of bringing down inflation to 2%.
- A slowdown in progress in inflation returning to 2% could prompt BoE policymakers to look for raising interest rates further by 25 basis points (bps) to 5.50%.
- If the BoE manages to raise interest rates by a quarter-to-a-basis points, the policy divergence between the Federal Reserve (Fed) and the BoE would square-off.
- On Monday, BoE chief economist, Huw Pill, emphasized on maintaining high interest rates to tame inflation. Pill added that future decisions regarding interest rates would be "finely balanced", kept doors open for further policy tightening.
- The interest rate decision by the BoE for November monetary policy is expected to be impacted by the Israel-Palestine war as supply chain would disrupt and potential cascading effects of rising oil prices could keep headline inflation persistent.
- The market mood remains cautious amid deepening Israel-Hamas war as the former is set to carry out ground assault in Gaza. This could result in an intervention of more Middle East players, which could elevate conflicts.
- US Secretary of State Anthony Blinken said on Monday that President Joe Biden will visit to Israel to meet Prime Minister Benjamin Netanyahu on Wednesday.
- The US Dollar Index (DXY) finds cushion near 106.20 after correcting from weekly high at 106.80 amid cautious market mood.
- Meanwhile, investors await the speech from Fed Chair Jerome Powell, which is scheduled for Oct 19 before the Economic Club of New York. Investors would watch for November’s monetary policy framework and the outlook on inflation and the economy.
Technical Analysis: Pound Sterling faces sell-off near 1.2200
Pound Sterling faces selling pressure near 1.2200 after soft wage data. The GBP/USD pair trades inside Monday’s trading range as investors await the UK inflation data. The short-term and broader outlook of the GBP/USD pair is bearish as it is trading below the 20-day Exponential Moving Average (EMA) and the 50 and 200-day EMAs have already delivered a death cross. The Cable could decline towards the psychological support of 1.2000.
Pound Sterling FAQs
What is the Pound Sterling?
The Pound Sterling (GBP) is the oldest currency in the world (886 AD) and the official currency of the United Kingdom. It is the fourth most traded unit for foreign exchange (FX) in the world, accounting for 12% of all transactions, averaging $630 billion a day, according to 2022 data.
Its key trading pairs are GBP/USD, aka ‘Cable’, which accounts for 11% of FX, GBP/JPY, or the ‘Dragon’ as it is known by traders (3%), and EUR/GBP (2%). The Pound Sterling is issued by the Bank of England (BoE).
How do the decisions of the Bank of England impact on the Pound Sterling?
The single most important factor influencing the value of the Pound Sterling is monetary policy decided by the Bank of England. The BoE bases its decisions on whether it has achieved its primary goal of “price stability” – a steady inflation rate of around 2%. Its primary tool for achieving this is the adjustment of interest rates.
When inflation is too high, the BoE will try to rein it in by raising interest rates, making it more expensive for people and businesses to access credit. This is generally positive for GBP, as higher interest rates make the UK a more attractive place for global investors to park their money.
When inflation falls too low it is a sign economic growth is slowing. In this scenario, the BoE will consider lowering interest rates to cheapen credit so businesses will borrow more to invest in growth-generating projects.
How does economic data influence the value of the Pound?
Data releases gauge the health of the economy and can impact the value of the Pound Sterling. Indicators such as GDP, Manufacturing and Services PMIs, and employment can all influence the direction of the GBP.
A strong economy is good for Sterling. Not only does it attract more foreign investment but it may encourage the BoE to put up interest rates, which will directly strengthen GBP. Otherwise, if economic data is weak, the Pound Sterling is likely to fall.
How does the Trade Balance impact the Pound?
Another significant data release for the Pound Sterling is the Trade Balance. This indicator measures the difference between what a country earns from its exports and what it spends on imports over a given period.
If a country produces highly sought-after exports, its currency will benefit purely from the extra demand created from foreign buyers seeking to purchase these goods. Therefore, a positive net Trade Balance strengthens a currency and vice versa for a negative balance.
The US Census Bureau will release the September Retail Sales report on Tuesday, October 17 at 12:30 GMT and as we get closer to the release time, here are the forecasts of economists and researchers of six major banks regarding the upcoming data.
Retail Sales in the US are expected to rise 0.3% month-on-month vs. 0.6% in August. Meanwhile, sales ex-autos are expected at 0.2% MoM vs. the prior release of 0.6%.
Deutsche Bank
We expect retail sales to decline (-0.1%) after two strong months.
NBF
We expect total sales to have risen 0.4%. Ex-auto outlays could have been a tad weaker, advancing 0.3%.
RBC Economics
September US retail sales likely ticked up 0.1% from the prior month. Unit auto sales recovered (+2%) in September after two consecutive declines in prior months. Gas prices were still high, but growing at a slower pace; sales at gas stations likely remained flat during that month.
SocGen
We expect a mild 0.3% MoM increase for retail sales for the aggregate but note that higher gasoline prices are partially responsible for the gain. Ex-auto and ex-gasoline, we expect just a 0.2% increase. The increase implies a drop in volumes for September after an earlier decline of 0.2% in real terms for August.
Citi
We expect a modest 0.1% MoM increase in total retail sales in September, which follows a couple of months of strong increases. Autos should boost retail sales this month after unit auto sales increased in September following two months of declines. Gasoline sales could also provide a modest boost since gas prices increased in seasonally adjusted terms. We expect control group sales to remain unchanged this month, with non-store sales increasing but most other control group categories declining. Despite September retail sales being on the softer side, goods consumption growth has been much stronger in the third quarter overall compared to the second and has boosted Q3 GDP. If real goods consumption continues to be strong in the coming months, that would add to the evidence that the rotation from goods to services has come to an end.
Wells Fargo
We forecast retail sales growth in September was 0.3%, and our call is for retail sales excluding autos to grow 0.2%. Adjusting for inflation, we look for real retail sales to grow 0.2% in September.
EUR/NOK has spiked back above 11.50. Economists at ING analyze the pair’s outlook.
The global bond sell-off is negative for NOK
Norges Bank is set to deliver another hike in December. That should be the last one but, if NOK depreciates, NB can easily add more tightening: the domestic economic picture isn’t worrying.
The global bond sell-off is negative for NOK, and while tighter monetary policy helped ease the pain, the recent Oil price correction left the Krone without a floor.
Also, daily FX sales will remain high into year-end, and NOK downside risks remain tangible before any turn in US data boosts pro-cyclicals.
- EUR/GBP trades with modest gains near 0.8648 following the UK wage inflation data.
- UK’s Average Earnings, excluding bonuses, came in at 7.8%, while the gauge including bonuses climbed 8.1% vs. 8.5% prior.
- ECB's chief economist said they will keep interest rates high until inflation returns to 2%.
- Investors will monitor the ZEW Economic Sentiment Survey for October, ECB's De Guindos speech on Tuesday.
The EUR/GBP cross posts modest gains around the mid-0.8600s during the early European session on Tuesday. The recovery of the cross is supported by the mixed UK wage inflation data. The cross currently trades near 0.8648, up 0.05% on the day.
The latest data from the UK’s National Statistics revealed on Tuesday that the UK’s Average Earnings, excluding bonuses, came in at 7.8% 3Mo/YoY August from the previous reading of 7.8% and 7.8% expected. The gauge including bonuses climbed 8.1% 3Mo/YoY versus 8.5% prior and below the market consensus of 8.3%.
On Monday, the Bank of England (BoE) Chief Economist Huw Pill said that the central bank has done a lot on interest rates. He further stated that if the economy has a persistent component of inflation, BoE will need a persistent monetary policy response. Additionally, BoE Governor Andrew Bailey said on the weekend that rising borrowing costs were affecting the housing market and employment. He indicated that interest rates will likely remain around the current 5.25%, given that restrictive policy is required to return inflation to 2%.
On the Euro front, the European Central Bank (ECB) President Christine Lagarde told euro-area finance ministers that the ECB is monitoring energy prices and the Israel-Hamas conflict for inflation risks. , ECB's chief economist Philip Lane said in an interview that the ECB will keep interest rates high until inflation returns to 2%, but this may take some time.
Looking ahead, market players will focus on the ZEW Economic Sentiment Survey for October and ECB's De Guindos speech later on Tuesday. On Wednesday, UK Consumer Price Index (CPI) data and ECB’s President Lagarde speech will be closely watched events. These events could give a clear direction to the EUR/GBP cross.
Considering advanced prints from CME Group for natural gas futures markets, open interest increased for the fourth session in a row at the beginning of the week, now by around 2.5K contracts. In the same line, volume reversed two daily drops in a row and rose by around 81.1K contracts.
Natural Gas: Initial support emerges around $3.00
Monday’s decline in prices of natural gas was in tandem with rising open interest and volume, which is indicative that extra retracements remain in store for the commodity in the very near term. In the meantime, there is a decent contention around the key $3.00 mark per MMBtu.
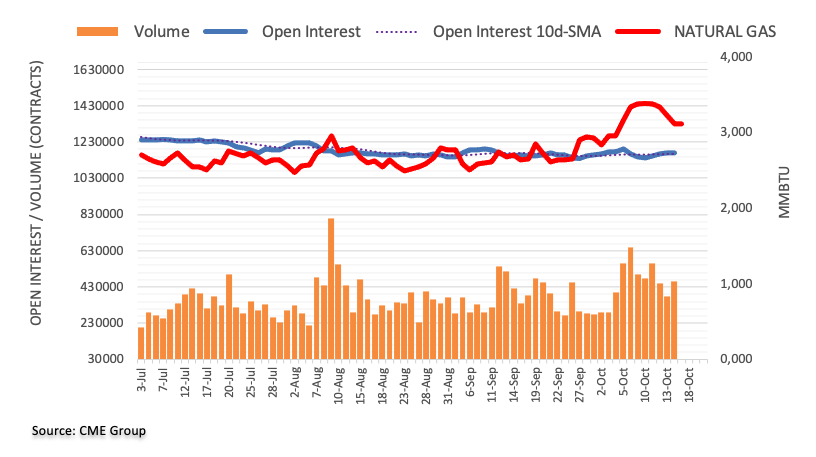
Wage inflation in the United Kingdom (UK), as measured by the change in the Average Earnings Excluding Bonus, rose 7.8% 3M YoY in August, as against a 7.9% increase registered in July, the partial labor data released by the Office for National Statistics (NBS) showed on Tuesday. The market expectation was for a 7.8% increase.
Average Earnings Including Bonus rose 8.1% in the same period, at a slightly weaker pace than analysts' estimate of 8.3%. The August increase in pay growth was of 8.5%.
In September, 11,000 fewer people were in payrolled employment when compared with August.
Additional details
UK vacancies 988,000 in three months to Sept.
UK vacancies 988,000 in three months to Sept.
UK real regular pay, using CPI measure of inflation, +0.7% yy in 3 months to August.
UK real total pay, using CPI measure of inflation, +0.8% yy in 3 months to August.
The ONS delayed the release of employment data by a week to improve the quality of the data, wage data was released as planned.
Pound Sterling reaction to the UK wage inflation data
With the immediate market reaction, the Pound Sterling tested intraday lows below 1.2200 on mixed inflation readings. As of writing, GBP/USD was down 0.20% on the day at 1.2190.
The data was expected to have little impact on the Pound Sterling as the Bank of England (BoE) Monetary Policy Committee (MPC) threw cold water on pay growth data at the September meeting.
Pound Sterling price today
The table below shows the percentage change of Pound Sterling (GBP) against listed major currencies today. Pound Sterling was the weakest against the Australian Dollar.
| USD | EUR | GBP | CAD | AUD | JPY | NZD | CHF | |
| USD | 0.11% | 0.16% | 0.06% | -0.24% | 0.02% | 0.04% | 0.09% | |
| EUR | -0.10% | 0.07% | -0.04% | -0.34% | -0.09% | -0.05% | 0.00% | |
| GBP | -0.17% | -0.08% | -0.13% | -0.42% | -0.16% | -0.12% | -0.08% | |
| CAD | -0.07% | 0.03% | 0.10% | -0.31% | -0.04% | -0.01% | 0.03% | |
| AUD | 0.24% | 0.34% | 0.41% | 0.29% | 0.25% | 0.28% | 0.33% | |
| JPY | -0.02% | 0.07% | 0.18% | 0.04% | -0.26% | 0.05% | 0.10% | |
| NZD | -0.06% | 0.06% | 0.12% | 0.01% | -0.29% | -0.02% | 0.03% | |
| CHF | -0.09% | 0.02% | 0.08% | -0.01% | -0.30% | -0.08% | -0.04% |
The heat map shows percentage changes of major currencies against each other. The base currency is picked from the left column, while the quote currency is picked from the top row. For example, if you pick the Euro from the left column and move along the horizontal line to the Japanese Yen, the percentage change displayed in the box will represent EUR (base)/JPY (quote).
Open interest in crude oil futures markets dropped for the third consecutive session on Monday, now by around 9.2K contracts according to preliminary readings from CME Group. In the same direction, volume went down for the third straight session, this time by around 397.5K contracts.
WTI: Gains appear limited around $88.00
Prices of WTI rose to new highs just past $88.00 mark per barrel before closing Monday’s session with modest losses. The daily pullback, however, was accompanied by shrinking open interest and volume and suggests that a more sustained retracement in the commodity now seems not favoured for the time being.
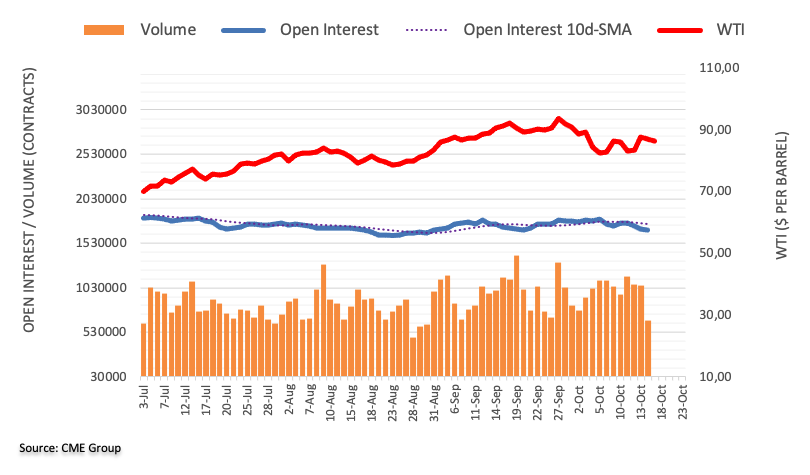
- USD/INR could face trouble as RBI $5B swap deal is set to mature on October 23.
- Traders are concerned about the availability of US Dollars in the Indian banking system.
- Greenback encounters challenges due to the dovish remarks from several Fed officials.
USD/INR trades higher above 83.20 during the Asian session on Tuesday. The Indian Rupee (INR) may face challenges as a $5 billion RBI swap deal is set to mature on October 23. This maturity could lead to a dollar shortage in the market as the RBI intends to buy these dollars for its reserves rather than extending the deal.
This situation has resulted in a 10 basis points drop in premiums over one year, with the cash spot trading at -0.05 recently. This dynamic may be influencing the increased buying of dollars in the market. Moreover, traders have expressed concerns about the availability of dollars in the Indian banking system.
The Indian rupee declined to 83.28 against the US dollar on Monday, reaching its lowest level in one year against the greenback.
Asian currencies displayed mixed trading as the United States intensified efforts to prevent the Israel-Hamas conflict from escalating into a regional crisis. President Joe Biden is scheduled to visit Israel on Wednesday, aiming to signify US solidarity with its closest Middle East ally and avert the widening of the conflict.
Safe-haven Greenback tends to attract demand during periods of heightened uncertainty and geopolitical risks.
The US Dollar Index (DXY) efforts to recover from recent losses, trades higher around 106.30. However, the US Dollar (USD) has been under downward pressure, largely influenced by dovish comments from multiple Federal Reserve officials.
These comments signal that no further interest rate hikes are anticipated for the remainder of 2023, emphasizing a cautious approach by the central bank and a reluctance to tighten monetary policy in the current economic climate.
Federal Reserve Bank of Philadelphia President Patrick Harker echoed this sentiment on Monday, suggesting that the central bank should avoid introducing new economic pressures by increasing borrowing costs. Harker emphasized the view that unless there is a significant shift in the data, the Fed should maintain interest rates at their current levels.
While the recovery in US Treasury yields from recent losses could lend support to the US Dollar, with the 10-year US Treasury bond yield standing at 4.75%, by the press time.
Market participants will likely keep a close eye on the US Retail Sales data, and the Fed Beige Book report will also be a focal point on Tuesday.
- USD/CAD attracts some buyers around 1.3630 amid the recovery in US bond yields.
- The pair holds above the 50- and 100-day EMAs; RSI indicator is located in the bullish territory above 50.
- The key resistance level is seen at 1.3700; 1.3566 acts as an initial support.
The USD/CAD pair snaps a two-day losing streak during the Asian session on Tuesday. A rebound of the pair is bolstered by a rally of the US Treasury yields and a decline in oil prices. Traders will closely monitor the US Retail Sales and the Canadian inflation data. At the time of writing, USD/CAD is trading near 1.3630, holding higher while adding 0.15% on the day.
The US Retail Sales figure is expected to rise by 0.3% MoM whereas the annual and monthly Canadian Consumer Price Index (CPI) for September is expected to rise by 4.0% and 0.1%, respectively.
From the technical perspective, USD/CAD holds above the 50- and 100-day Exponential Moving Averages (EMAs) on the daily chart, which supports the buyers for the time being. Furthermore, the Relative Strength Index (RSI) is located in the bullish territory above 50, which means the path of the least resistance of USD/CAD is to the upside.
That said, the key resistance level for the pair is seen near the confluence of the psychological round figure and a high of October 12 of 1.3700. Any decisive follow-through buying above the latter will see a rally to the upper boundary of the Bollinger Band of 1.3770. The additional upside filter to watch is near a high of October 5 at 1.3785. Further north, the pair will see a rally to a high of March 10 at 1.3860.
On the flip side, a low of October 10 at 1.3566 acts as an initial support for USD/CAD. The next contention level is located near the 50-day EMA at 1.3545, followed by the 100-day EMA at 1.3493. A break below the latter will see a drop to the next downside stop at 1.3410, representing the lower limit of the Bollinger Band. Further south, a low of September 19 at 1.3379 will be the next level to watch.
USD/CAD daily chart
-638331177861560964.png)
CME Group’s flash data for gold futures markets noted traders reduced their open interest positions by around 5.2K contracts at the beginning of the week, reversing the previous daily build. Volume followed suit and shrank by nearly 150K contracts.
Gold faces decent support around $1900
Monday’s downtick in gold prices was on the back of shrinking open interest and volume, which removes strength from a potential deeper pullback in the very near term. Against that, the yellow metal is expected to meet firm contention around the $1900 region per troy ounce.
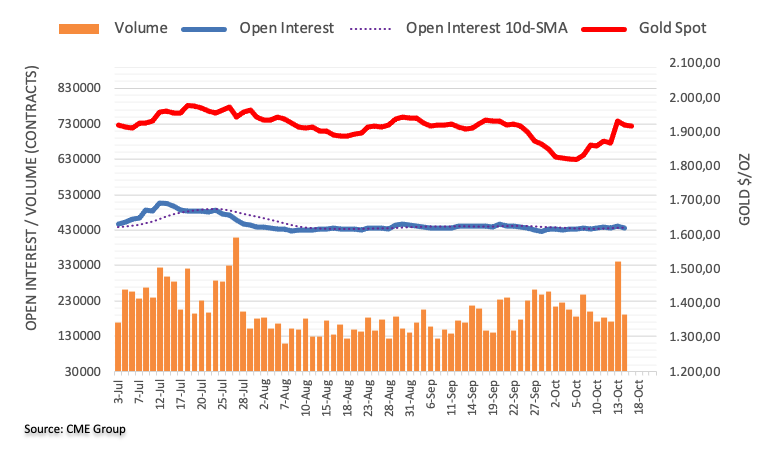
- USD/CHF holds above the 0.9000 psychological mark in the Asian session on Monday.
- US NY Empire State Manufacturing Index for October fell to 4.6 vs. 1.9 rise prior.
- The escalating geopolitical tensions between Israel-Hamas might lift the traditional safe-haven Swiss Franc.
- Market players will monitor US Retail Sales on Tuesday and Swiss trade data on Thursday.
The USD/CHF pair snaps a two-day losing streak during the early Asian session on Tuesday. The recovery of US Treasury yields lends some support to the pair. At the time of writing, USD/CHF is trading near 0.9011, holding higher while adding 0.12% on the day.
Meanwhile, the US Dollar Index (DXY), a measure of the value of the USD relative to a basket of foreign currencies, attracts some buyers to 106.32. The US Treasury yield recovers its losses, with the US 10-Y yield staying at 4.746% by press time.
On Monday, the US NY Empire State Manufacturing Index for October fell to 4.6 versus a 1.9 rise prior, above the market consensus of a 7.0 decline. The upbeat low-tier US economic data failed to boost the Greenback and the dovish comments from the Federal Reserve (Fed) still exert pressure on the pair.
Chicago Fed President Austan Goolsbee maintained his dovish stance by saying that a fall in US inflation is not a bleep, while Philadelphia Fed President Patrick Harker said that in the absence of some turn in the data, the Fed should hold rates steady. Traders will take more cues from the Fed speakers on Tuesday, which include Williams, Bowman, Barkin, and Kashkari, which might offer some hints about further monetary policy paths.
Early Tuesday, the US Marine Rapid Response force is headed to the waters off the coast of Israel. A rapid response force of 2,000 Marines and sailors is being sent. It will join an increasing number of US warships en route to Israel in an effort to send a deterrent message to Iran and the Lebanese militant group Hezbollah, according to a CNN report. That said, the rising geopolitical tensions between Israel and Hamas might boost the traditional safe-haven Swiss Franc and act as a headwind for the USD/CHF pair.
About the data, the Swiss Federal Statistical Office revealed on Friday that the nation’s Producer and Import Prices fell 1.0% YoY in September from the previous reading of a 0.8% drop. On a monthly basis, the figures dropped 0.1% versus a 0.8% drop prior.
Investors will keep an eye on the Israel-Hamas conflict headline. The US Retail Sales for September will be released on Tuesday, with the figure expected to rise by 0.2%. The Swiss Trade Balance for September will be due on Thursday. These figures could give a clear direction to the USD/CHF pair.
- Asian shares rise on Tuesday and recover a part of the recent heavy losses.
- Geopolitical risks should cap any optimism ahead of the key Chinese data.
- Investors this week will further take cues from Fed Chair Powell’s speech.
Asian shares track the overnight strength in the US equity markets and rise higher on Tuesday, recovering a part of the recent losses led by the recent developments in the Middle East. The broader risk sentiment, meanwhile, remains fragile in the wake of the risk of broadening the Israel-Hamas conflict into a wider proxy war with Iran and ahead of this week's important Chinese macro data.
Israeli forces continued their bombardment of Gaza after efforts to arrange a cease-fire stalled. Furthermore, the Israel Defence Forces chief said the army will soon enter the Gaza Strip to decimate the Hamas terror group. Iran, meanwhile, repeated its warning that a ground invasion of the long-blockaded Gaza would be met with a response from other fronts. Israel also faces the possibility of a separate conflict on its northern border with Lebanon after artillery exchanges with the Iran-backed Hezbollah group. This could keep a lid on any optimism in the markets.
Traders might also prefer to wait on the sidelines and look to Wednesday's release of the third-quarter GDP data from China – Asia’s largest economy – before placing fresh bets. The data is expected to show continued weakness in economic growth and further fuel concerns about the worsening conditions in China. Hence, any disappointing Chinese data might take its toll on the global risk sentiment and weigh heavily on Asian stocks. Investors this week will further take cues from Federal Reserve (Fed) Chair Jerome Powell's scheduled speech on Thursday.
In the meantime, elevated US Treasury bond yields might continue to fuel worries about economic headwinds stemming from rising borrowing costs and contribute to capping gains in the equity markets ahead of the quarterly earnings. Market participants now look to the US economic docket, featuring the release of monthly Retail Sales data and Industrial Production figures later during the early North American session. This, along with geopolitics and the US bond yields, will influence the market sentiment and allow traders to grab short-term opportunities.
- USD/MXN recovers some lost ground and hovers around 17.90.
- Chicago Fed and Philadelphia Fed President maintained their dovish stances, which weigh on the US Dollar.
- World Bank raised its economic growth projection for Mexico to 3.2% in 2023.
- Investors await the US Retail Sales for September.
USD/MXN posts modest gains around 17.90 during the Asian session on Tuesday. The rebound of the pair is bolstered by the renewed demand for US Treasury yields. In the absence of top-tier economic data released from Mexico, the USD/MXN pair remains at the mercy of USD price dynamics and risk sentiment. Furthermore, a rise in geopolitical tension between Israel and Hamas might cap the downside of the pair and boost the US Dollar (USD), a safe-haven asset.
That said, the dovish remarks from many Federal Reserve (Fed) officials weigh on the US Dollar (USD). Chicago Fed President Austan Goolsbee maintained his dovish stance by saying that a fall in US inflation is not a bleep, while Philadelphia Fed President Patrick Harker said that in the absence of some turn in the data, the Fed should hold rates steady.
Meanwhile, the US Dollar Index (DXY), a measure of the value of the USD relative to a basket of foreign currencies, catches a minor bid into 106.30. The US Treasury yield recovers its losses, with the US 10-Y yield staying at 4.748% by press time.
About the data, the Federal Reserve Bank of New York revealed on Monday that the US NY Empire State Manufacturing Index for October dropped to 4.6 from the previous reading of 1.9 rise, beating the estimation of a 7.0 decline. Last week, the US Consumer Price Index (CPI) annually and monthly for September came in at 3.7% and 0.4%, respectively. Both figures exceeded market expectations.
In accordance with the International Monetary Fund (IMF), the World Bank raised its economic growth projection for Mexico to 3.2% in 2023. This forecast surpasses the Ministry of Finance of Mexico's expectations. It’s worth noting that the Bank of Mexico’s committee decided to maintain the interest rate at a record high of 11.25% for the fourth consecutive time at its September meeting, citing an uncertain inflationary outlook.
Looking ahead, the US Retail Sales will be released later on Tuesday, which is expected to rise 0.2%. The Fed speakers on Tuesday, including Williams, Bowman, Barkin, and Kashkari, could offer some hints about further monetary policy paths. On Friday, Mexico's Retail Sales for August will be due. Traders will take cues from these data and find trading opportunities around the USD/MXN pair.
- EUR/USD trades lower ahead of the ZEW Economic Sentiment Survey.
- MACD indicated a shift in momentum towards a bullish trend.
- 21-day EMA appears as the barrier, followed by the 1.0600 psychological level.
EUR/USD pulls back from the recent gains, trading lower around 1.0550 psychological level during the Asian session on Tuesday. Investors anticipate the release of the ZEW Economic Sentiment Survey for October, with expectations pointing toward an improvement from -8.9 to -8.0.
Additionally, the European Central Bank (ECB) President Christine Lagarde has informed euro-area finance ministers that the ECB is closely monitoring energy prices and the conflict between Israel and Hamas as potential sources of inflation risks.
The 21-day Exponential Moving Average (EMA) at 1.0587 emerges as the immediate resistance. A break above the latter could support the EUR/USD pair to explore the region near the 1.0600 major level, followed by the 23.6% Fibonacci retracement at the 1.0643 level.
On the flip side, the weekly low at 1.0508 could act as immediate support lined up with the 1.0500 psychological level.
The Moving Average Convergence Divergence (MACD) line lies below the centerline indicating that the short-term average is beneath the long-term average. However, a noteworthy development is observed as the line diverges above the signal line, signaling a potential shift in momentum toward a bullish trend.
However, the EUR/USD pair maintains a prevailing bearish momentum, underscoring a weaker bias. This is evidenced by the 14-day Relative Strength Index (RSI) holding below the 50 level.
EUR/USD: Daily Chart
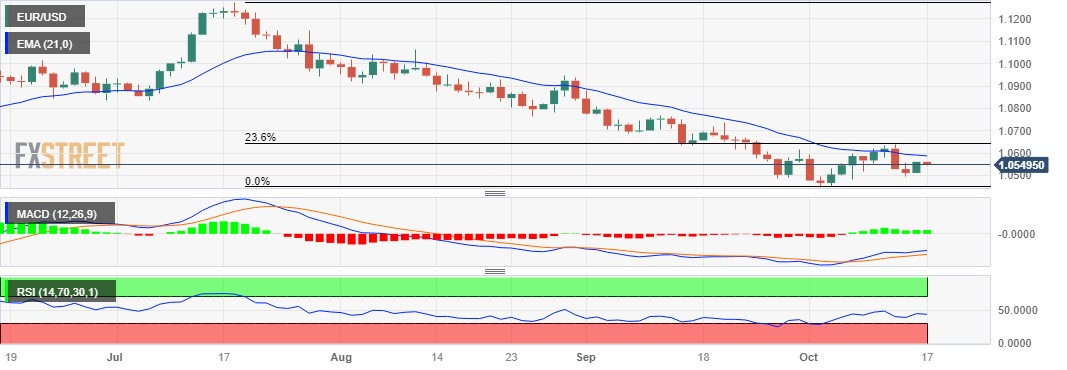
- Gold price remains under some selling pressure for the second successive day on Tuesday.
- A positive risk tone, along with elevated US bond yields, continues to weigh on the metal.
- Geopolitical risk and the uncertainty over the Fed’s rate-hike path should help limit losses.
Gold price (XAU/USD) struggles to capitalize on the previous day's late rebound from the $1,908 area and meets with a fresh supply during the Asian session on Tuesday. This marks the second successive day of a negative move for the precious metal and is sponsored by a positive risk tone, which tends to undermine traditional safe-haven assets. Apart from this, elevated US Treasury bond yields, bolstered by expectations for further policy tightening by the Federal Reserve (Fed), turn out to be another factor weighing on the non-yielding yellow metal.
That said, the raging Israel-Hamas conflict might continue to benefit the Gold price. This, along with growing acceptance that the Federal Reserve (Fed) will keep interest rates unchanged for the second straight time in November, should lend some support to the XAU/USD. Dovish Fed expectations, meanwhile, keep the US Dollar (USD) bulls on the defensive and should further help limit losses for the US Dollar-denominated commodity. Traders might also prefer to wait on the sidelines ahead of Fed Chair Jerome Powell's scheduled speech on Thursday.
Powell's comments will be scrutinized closely for cues about the future interest rate decisions, which, in turn, will play a key role in determining the next leg of a directional move for the Gold price. In the meantime, the recent failure near a technically significant 200-day Simple Moving Average (SMA) warrants caution before positioning for the resumption of a strong recovery move from the $1,810 region, or a multi-month low touched on October 6.
Daily Digest Market Movers: Gold price remains under some selling pressure for the second straight day
- Gold price might continue to attract some haven flows in the wake of the ongoing conflict between Israel and Hamas, which might broaden into a wider proxy war with Iran.
- The Israel Defence Forces chief said the army will soon enter the Gaza Strip to decimate the Hamas terror group.
- Israel had urged Palestinians to evacuate to the southern area of the Gaza City enclave ahead of an expected large-scale ground assault against the terror attacks,
- The US military ordered a second carrier strike group to the Eastern Mediterranean as part of its efforts to deter Iran and its proxies from expanding the conflict.
- Iran has repeatedly warned that a ground invasion of the long-blockaded Gaza would be met with a response from other fronts.
- "The possibility of pre-emptive action by the resistance axis is expected in the coming hours," Iran's foreign minister, Hossein Amir-Abdollahian said on Monday.
- Philadelphia Fed President Patrick Harker stated on Monday that the central bank should hold rates steady in the absence of some turn in the data.
- The US consumer inflation figures released last week, however, kept the door open for one more Fed rate hike move by the year-end.
- The prospects for further policy tightening by the Fed remain supportive of elevated US bond yields and continue to act as a tailwind for the US Dollar.
- Traders now look to the US Retail Sales data for some impetus, though the focus will remain glued to Fed Chair Jerome Powell's scheduled speech on Thursday.
- The US Retail Sales possibly grew by 0.3% in September, while sales excluding automobiles are expected to register a modest rise of 0.2% during the reported month.
Technical Analysis: Gold price manages to hold above 100-day SMA support near the $1,900 round-figure mark
From a technical perspective, any subsequent decline is likely to attract fresh buyers and remain limited near the $1,900 round-figure mark, which coincides with the 100-day SMA. This, in turn, should act as a key pivotal point, which if broken will make the Gold price vulnerable to slide further towards the next relevant support near the $1,868 horizontal zone en route to the $1,860-1,855 region.
On the flip side, the 200-day SMA, nearing Friday’s swing high, around the $1,932-1,933 zone, might continue to act as an immediate strong barrier. Some follow-through buying will be seen as a fresh trigger for bulls and lift the Gold price towards the $1,945-1,947 supply zone. A sustained strength beyond the latter will set the stage for a further appreciating move towards the $1,970 region.
US Dollar price this week
The table below shows the percentage change of US Dollar (USD) against listed major currencies this week. US Dollar was the strongest against the New Zealand Dollar.
| USD | EUR | GBP | CAD | AUD | JPY | NZD | CHF | |
| USD | -0.27% | -0.39% | -0.14% | -0.70% | -0.03% | 0.06% | -0.19% | |
| EUR | 0.27% | -0.12% | 0.13% | -0.48% | 0.24% | 0.34% | 0.06% | |
| GBP | 0.38% | 0.11% | 0.22% | -0.32% | 0.34% | 0.44% | 0.19% | |
| CAD | 0.14% | -0.13% | -0.22% | -0.55% | 0.11% | 0.20% | -0.05% | |
| AUD | 0.72% | 0.44% | 0.33% | 0.57% | 0.67% | 0.77% | 0.49% | |
| JPY | 0.04% | -0.21% | -0.35% | -0.14% | -0.71% | 0.09% | -0.16% | |
| NZD | -0.06% | -0.30% | -0.45% | -0.20% | -0.75% | -0.09% | -0.28% | |
| CHF | 0.20% | -0.06% | -0.20% | 0.05% | -0.48% | 0.17% | 0.26% |
The heat map shows percentage changes of major currencies against each other. The base currency is picked from the left column, while the quote currency is picked from the top row. For example, if you pick the Euro from the left column and move along the horizontal line to the Japanese Yen, the percentage change displayed in the box will represent EUR (base)/JPY (quote).
Gold FAQs
Why do people invest in Gold?
Gold has played a key role in human’s history as it has been widely used as a store of value and medium of exchange. Currently, apart from its shine and usage for jewelry, the precious metal is widely seen as a safe-haven asset, meaning that it is considered a good investment during turbulent times. Gold is also widely seen as a hedge against inflation and against depreciating currencies as it doesn’t rely on any specific issuer or government.
Who buys the most Gold?
Central banks are the biggest Gold holders. In their aim to support their currencies in turbulent times, central banks tend to diversify their reserves and buy Gold to improve the perceived strength of the economy and the currency. High Gold reserves can be a source of trust for a country’s solvency. Central banks added 1,136 tonnes of Gold worth around $70 billion to their reserves in 2022, according to data from the World Gold Council. This is the highest yearly purchase since records began. Central banks from emerging economies such as China, India and Turkey are quickly increasing their Gold reserves.
How is Gold correlated with other assets?
Gold has an inverse correlation with the US Dollar and US Treasuries, which are both major reserve and safe-haven assets. When the Dollar depreciates, Gold tends to rise, enabling investors and central banks to diversify their assets in turbulent times. Gold is also inversely correlated with risk assets. A rally in the stock market tends to weaken Gold price, while sell-offs in riskier markets tend to favor the precious metal.
What does the price of Gold depend on?
The price can move due to a wide range of factors. Geopolitical instability or fears of a deep recession can quickly make Gold price escalate due to its safe-haven status. As a yield-less asset, Gold tends to rise with lower interest rates, while higher cost of money usually weighs down on the yellow metal. Still, most moves depend on how the US Dollar (USD) behaves as the asset is priced in dollars (XAU/USD). A strong Dollar tends to keep the price of Gold controlled, whereas a weaker Dollar is likely to push Gold prices up.
- GBP/USD recovers from the recent losses ahead of UK CPI.
- The monthly inflation could fuel speculation for another interest rate hike by BoE.
- US Dollar encounters difficulties amid dovish remarks from several Federal Reserve members.
GBP/USD retraces the recent gains registered in the previous session, trading lower around 1.2200 during the Asian session on Tuesday. The pair moves in consolidation possibly due to the market indecision about the trajectory of the US Federal Reserve's (Fed) monetary policy.
On Monday, the Rightmove House Price Index (MoM) increased to 0.5% in October from the previous 0.4%. The yearly data showed that residential property prices declined by 0.8% compared to the 0.4% decline in the previous report.
The UK Consumer Price Index (CPI) is anticipated to show a slight dip in the annual figure, moving from 6.7% to 6.5%. Core CPI is expected to come in at 6%, down from September's 6.2%. Despite this moderation in the annual figures, there is an expectation for a notable increase in the monthly CPI, rising from 0.3% to 0.4%.
Such an uptick in the monthly inflation figures could fuel speculations for another interest rate hike by the Bank of England (BoE). Currently, interest rate probabilities for the BoE remain around a 50% chance of a 25 basis points hike in this cycle.
The US Dollar Index (DXY) attempts to retrace the recent losses, trading slightly higher around 106.30 at the time of writing. However, the US Dollar (USD) faced downward pressure, and this can be attributed to the dovish comments from various Federal Reserve officials, indicating that no further interest rate hikes are expected for the remainder of 2023. The dovish stance reflects a cautious approach by the central bank, highlighting a reluctance to tighten monetary policy in the current economic context.
Federal Reserve Bank of Philadelphia President Patrick Harker reinforced this sentiment by suggesting on Monday that the central bank should refrain from creating new economic pressures by increasing the cost of borrowing. Harker further expressed the view that unless there is a significant shift in the data, the Fed should maintain interest rates at their current levels.
The recovery in US Treasury yields from recent losses is seen as a potential factor that could provide support to the US Dollar. The 10-year US Treasury bond yield stands at 4.73%, by the press time.
However, the USD continues to benefit from safe-haven flows amid rising geopolitical tensions between Israel and Palestine. Safe-haven currencies, including the US Dollar, tend to attract demand during periods of heightened uncertainty and geopolitical risks.
Market participants will likely watch the US Retail Sales and the Fed Beige Book report will also be eyed on Tuesday.
- Crude oil prices continue the losses after news on the US-Venezuela Oil deal.
- US could sign a pact with the Venezuelan government involving easing sanctions on its oil industry.
- Traders appear to be adopting a wait-and-see approach; seeking more cues related to the Middle East conflict.
The Western Texas Intermediate (WTI) oil price experiences a consecutive decline on the second day, trading lower around $85.10 per barrel during the Asian session on Tuesday. The easing of crude oil prices is likely associated with reports indicating that the US and Venezuela could potentially reach a deal that would result in an increase in global oil production.
News surfaced that the US and Venezuelan governments could potentially sign a pact as early as Tuesday. This agreement would involve easing sanctions on Venezuela's oil industry in exchange for a "competitive, monitored presidential election" in the country, according to Reuters.
The prospect of such a deal has implications for the oil market, as it could lead to an increase in oil supply and potentially cap higher prices. This development comes in the context of output cuts by major oil-producing countries such as Saudi Arabia and Russia, shaping the dynamics of the global oil industry.
However, the market appears to be adopting a wait-and-see approach among traders, who are anticipating more cues and developments related to the Middle East conflict.
Furthermore, the ongoing Middle East conflict between Israel and Hamas is contributing to the upward movement in oil prices. Despite diplomatic efforts to arrange a ceasefire, they have so far been unsuccessful.
The heightened geopolitical tension in the region raises the risk of a broader conflict in the Middle East, with potential implications for oil supplies from the world's top oil-producing region. These developments are perceived as a potential tailwind for Crude Oil prices, as concerns over potential supply disruptions contribute to market uncertainties.
Recent developments involve the United States (US) adopting a more stringent stance against Russia by imposing sanctions on two shipping companies. Given Russia's significant role in global crude oil exports, increased scrutiny from the US on its shipments has the potential to impact the global oil supply.
According to the latest Reuters poll, there is an expectation of a slowdown in China's economy during the third quarter. The forecast indicates a year-on-year GDP growth rate of 4.4%, down from 6.3% in the second quarter. Additionally, the quarter-on-quarter GDP forecast for Q3 is 1.0%. The poll anticipates China's economy to grow by 5.0% in 2023.
These data points collectively suggest a progressively softer outlook for the Chinese economy, primarily attributed to weakening domestic demand conditions. The potential impact extends beyond the domestic economy, as China holds the position of the largest oil importer globally.
| Raw materials | Closed | Change, % |
|---|---|---|
| Silver | 22.596 | -0.38 |
| Gold | 1919.816 | -0.4 |
| Palladium | 1149.02 | 0.41 |
- USD/JPY struggles for a firm direction and oscillates in a narrow band for the second straight day.
- The divergent Fed-BoJ policy outlook continues to act as a tailwind and should limit the downside.
- The technical setup also favours bulls and supports prospects for a move towards the 150.00 mark.
The USD/JPY pair extends its sideways consolidative price move for the second straight day and remains confined in a narrow range around mid-149.00s through the Asian session on Tuesday.
The uncertainty over the Federal Reserve’s (Fed) next policy move keeps the US Dollar (USD) bulls on the defensive. This, along with speculations that Japanese authorities will intervene in the foreign exchange market to support the domestic currency, acts as a headwind for the USD/JPY pair. The downside, however, remains cushioned in the wake of a more dovish stance adopted by the Bank of Japan (BoJ), which might continue to undermine the Japanese Yen (JPY).
From a technical perspective, the USD/JPY pair is holding above an ascending trend-line extending from the monthly swing low. The said support, currently pegged around the 149.15 area, now coincides with the 100-period Simple Moving Average (SMA) on the 4-hour chart and should act as a pivotal point. Oscillators on the daily chart, meanwhile, are still holding in the positive territory and support prospects for the emergence of some dip-buying at lower levels.
Hence, it will be prudent to wait for a convincing break below the aforementioned trend-line support before placing bearish bets. Some follow-through selling below the 149.00 round figure might then drag the USD/JPY pair towards the 200-period SMA support near the 148.15 region. This is closely followed by the 148.00 mark, below which the downward trajectory could get extended towards retesting the October 3 swing low, around the 147.30-147.25 region.
On the flip side, the 149.80-149.85 region is likely to act as an immediate hurdle ahead of the 150.00 psychological mark or the potential intervention level. A sustained strength beyond will be seen as a fresh trigger for bullish traders and pave the way for a further appreciating move towards the 151.00 round figure. The momentum could get extended and eventually push the USD/JPY pair closer to the 152.00 mark, or a multi-decade high touched in October 2022.
USD/JPY 4-hour chart
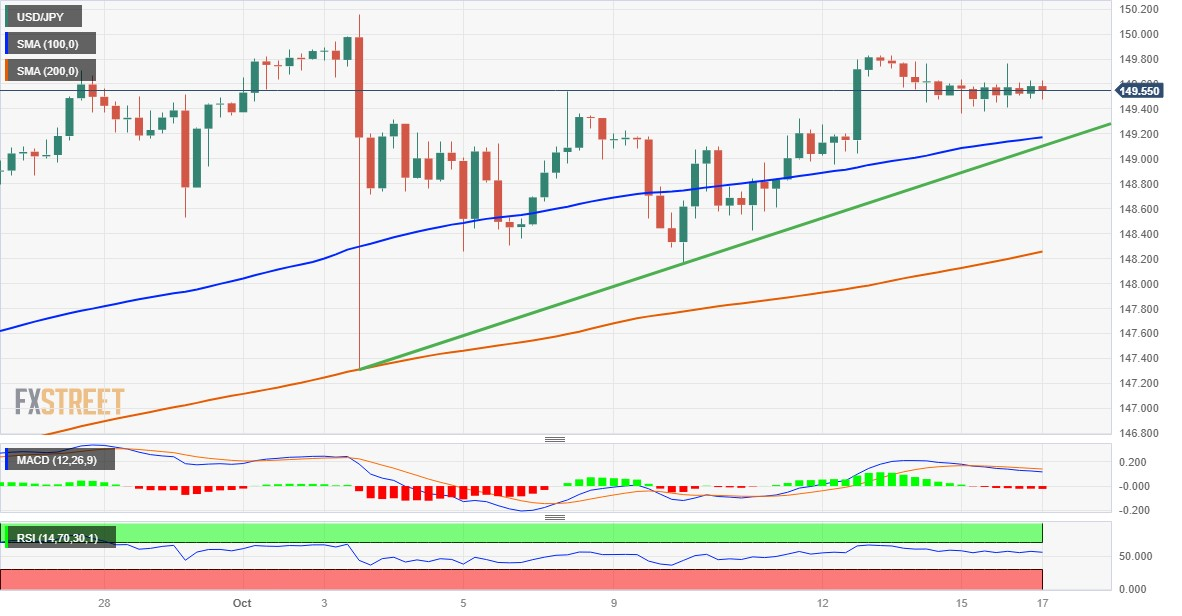
Technical levels to watch
Declining to comment on recent remarks by an International Monetary Fund (IMF) official on currency intervention, Japanese Finance Minister Shunichi Suzuki on Tuesday that there was no need to elaborate on what factors would determine currencies.
No further comments are crossing thr wires from the Japanese official.
The IMF official said over the weekend, “the Yen's recent declines are driven by fundamentals, criteria not met for intervention.”
Market reaction
At the time of writing, USD/JPY is holding steady at 149.50, having retreated from intraday highs of 149.65.
- Gold price loses momentum around $1,915 as market sentiment rebounds.
- The rising geopolitical tensions in the Middle East could lift the safe-haven demand like Gold.
- US Retail Sales and Chinese growth numbers for Q3 will be closely watched events.
Gold price (XAU/USD) trades in negative territory for the second consecutive day during the early Asian session on Tuesday. Market participants shrug off the conflict in the Middle East and look for a fresh impetus. The precious gold currently trades near $1,915, down 0.28% on the day.
Meanwhile, the US Dollar Index (DXY), a measure of the value of the USD relative to a basket of foreign currencies, edges lower to 106.28 after retreating from last week’s high of 106.78. US Treasury yields trade higher, with the 10-year Treasury yield surging to 4.71%. While the YS 2-year stays at 5.10%.
Many Federal Reserve (Fed) officials including Chicago Fed President Austan Goolsbee and Philadelphia Fed President Patrick Harker maintained their dovish stance. Harker stated on Monday that in the absence of some turn in the data Fed should hold rates steady. However, The upbeat US inflation report and higher inflation expectation data last week have prompted investors to price in a possible rate rise by the Federal Reserve (Fed). This, in turn, might lift the US Dollar (USD) and weigh on the gold price.
The Federal Reserve Bank of New York reported on Monday that the US NY Empire State Manufacturing Index for October dropped to 4.6 from the previous reading of 1.9 rise, above the expectation of a 7.0 decline. Last week, the US Consumer Price Index (CPI) annually and monthly for September came in at 3.7% and 0.4%, respectively. Both figures exceeded the market expectations.
Apart from this, the key Chinese economic data On Wednesday could give a clearer direction to gold price. The Chinese Gross Domestic Product (GDP) for the third quarter, Industrial Production, and Retail Sales will be released on Wednesday. The weaker-than-expected could drag gold price lower as China is the world's largest gold producer and consumer.
On the other hand, the escalating geopolitical tensions between Israel and Hamas could boost the demand for a traditional safe-haven asset like Gold. Early Tuesday, the US Marine Rapid Response force is headed to the waters off the coast of Israel. The rapid response force of 2,000 Marines and sailors is being sent. It will join an increasing number of US warships en route to Israel in an effort to send a deterrent message to Iran and the Lebanese militant group Hezbollah, according to a CNN report.
Gold traders will monitor the US Retail Sales due on Tuesday. The figure is expected to rise 0.2%. On Wednesday, The Chinese GDP for Q3 will be due. The annual growth number is estimated to grow 4.4% while the monthly figure is expected to expand 1.0%. Traders will take cues from these events and find trading opportunities around the gold price.
The Reserve Bank of New Zealand (RBNZ) released its Sectoral Factor Model Inflation gauge for the third quarter of 2023 on Tuesday.
The inflation data arrived at 5.2% YoY in Q2 2023, dropping sharply from a 5.7% print recorded in Q2.

The official data published by the New Zealand Statistics (Stats NZ) early Tuesday, New Zealand’s Consumer Price Index (CPI) rose 5.6% YoY in Q3, much lower than the expected 5.9% increase in the reported period. In the second quarter, the country’s CPI rose 6.0%.
Both measures are closely watched by the RBNZ.
FX Implications
The Kiwi Dollar is under heavy selling pressure near 0.5900 after the release of the RBNZ inflation gauge. NZD/USD is trading 0.42% lower on the day at 0.5900, as of writing.
About the RBNZ Sectoral Factor Model Inflation
The Reserve Bank of New Zealand has a set of models that produce core inflation estimates. The sectoral factor model estimates a measure of core inflation based on co-movements - the extent to which individual price series move together. It takes a sectoral approach, estimating core inflation based on two sets of prices: prices of tradable items, which are either imported or exposed to international competition, and prices of non-tradable items, which are those produced domestically and not facing competition from imports.
- Australian Dollar continues to gain post-release of the RBA Meeting Minutes.
- RBA board members favored to maintain the current interest rates.
- US Dollar faces challenges due to the dovish comments made by multiple Fed members.
The Australian Dollar (AUD) extends its gains on the second successive day, remaining firmer against the US Dollar on Tuesday. The pair receives upward support after the hawkish Reserve Bank of Australia (RBA) minutes for the October 2023 meeting were released on Tuesday.
Australia’s central bank board was involved in the consideration of whether to raise interest rates by 25 basis points (bps) or to maintain the current rate. However, the board members concluded that the stronger case was to keep the rates steady. They made this judgment based on factors such as inflation data, employment figures, and updated forecasts, which would be available at the November meeting.
RBA’s board members acknowledged that there were significant concerns about upside risks to inflation. This suggests that the board is cautious about potential factors that could lead to an increase in inflation
Australian Weekly ANZ Roy Morgan Consumer Confidence survey, released on Tuesday, indicates a decline in the nation's Consumer Confidence. The reading fell to 76.4 compared to the previous figure of 80.1. The decline is observed across all sub-indices, reflecting a more cautious or negative sentiment among consumers.
The US Dollar Index (DXY) faces downward pressure, and this is attributed to the dovish comments made by multiple Federal Reserve officials indicating that no further interest rate hikes are anticipated for the remainder of 2023. The dovish stance suggests a cautious approach by the central bank, emphasizing a reluctance to tighten monetary policy in the current economic environment.
Federal Reserve Bank of Philadelphia President Patrick Harker added to this sentiment by stating on Monday that the central bank should avoid creating new pressures in the economy by increasing the cost of borrowing. Harker further expressed the view that in the absence of a significant shift in the data, the Fed should maintain interest rates at their current levels.
Daily Digest Market Movers: Australian Dollar continues to gain on hawkish RBA minutes
- RBA could introduce a central bank digital currency (CBDC). Brad Jones, Assistant Governor (Financial System) at the RBA, discussed the tokenization of assets and money in the digital era at The Australian Financial Review Cryptocurrency Summit.
- Australian Consumer Inflation Expectations for October were reported at 4.8% on Thursday, reflecting a slight increase from the September figure of 4.6%. The rebound in inflation observed in August, primarily influenced by elevated oil prices, raises the likelihood of another interest rate hike by the RBA.
- The National Bureau of Statistics of China reported on Friday that Chinese inflation experienced a decrease in September. This development could exert pressure on the Australian Dollar (AUD). The Chinese data indicates ongoing economic challenges despite the recent government stimulus plan aimed at supporting the nation in achieving its 5% growth target.
- The ongoing conflict in the Middle East introduces an additional layer of complexity to the situation. This geopolitical factor could potentially prompt the RBA to implement a 25 basis points (bps) interest rate hike, reaching 4.35% by the end of the year.
- Investors appear to be exercising caution in making aggressive bets on the US Dollar (USD), given the uncertainty surrounding the Fed policy rate trajectory. The lack of a clear direction from the Fed on interest rates is influencing market sentiment and contributing to hesitancy among investors.
- The recovery in US Treasury yields from recent losses is seen as a potential factor that could provide support to the US Dollar. The 10-year US Treasury bond yield stands at 4.72%, by the press time.
- Additionally, the USD continues to benefit from safe-haven flows amid rising geopolitical tensions between Israel and Palestine. Safe-haven currencies, including the US Dollar, tend to attract demand during periods of heightened uncertainty and geopolitical risks.
- According to an undisclosed source to Reuters, US officials and Israel have engaged in discussions about the possibility of a visit by US President Joe Biden to Israel. The invitation for the visit reportedly came from Israeli Prime Minister Benjamin Netanyahu.
- Market participants will likely monitor the US Retail Sales and the Fed Beige Book report will also be eyed on Tuesday. The Australian employment data will be released on Thursday. Traders will take cues from these figures and find the trading opportunities around the AUD/USD pair.
Technical Analysis: Australian Dollar hovers around the psychological level at 0.6350 level
The Australian Dollar trades higher around the major level of 0.6350 during the Asian session on Tuesday. The 0.6300 emerges as the significant support level, which aligns with the monthly low at 0.6285. On the upside, a crucial resistance is observed at the major level of 0.6400. This level coincides with the 23.6% Fibonacci retracement level at 0.6429 and is lined up with the 50-day Exponential Moving Average (EMA) around the 0.6436 level. These technical indicators provide traders with insights into potential resistance zones that could influence the direction of the Australian Dollar.
AUD/USD: Daily Chart
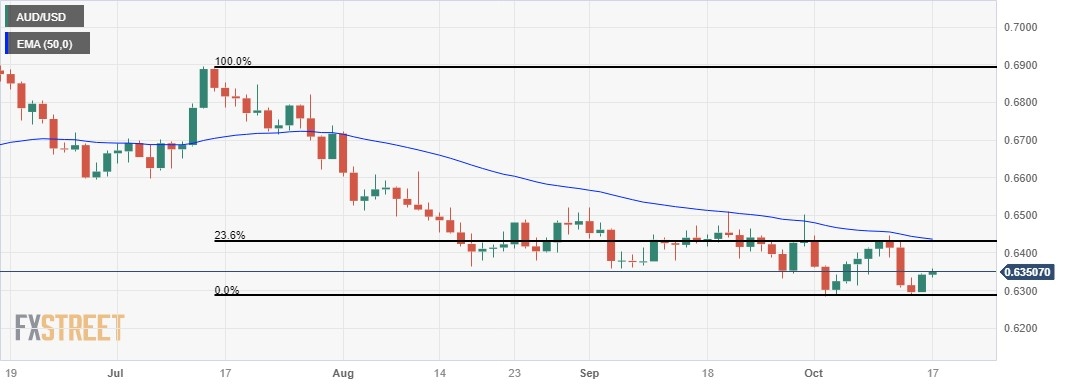
Australian Dollar price today
The table below shows the percentage change of Australian Dollar (AUD) against listed major currencies today. Australian Dollar was the strongest against the Pound Sterling.
| USD | EUR | GBP | CAD | AUD | JPY | NZD | CHF | |
| USD | 0.02% | 0.09% | 0.07% | -0.15% | -0.03% | -0.03% | 0.04% | |
| EUR | -0.03% | 0.07% | 0.05% | -0.18% | -0.05% | -0.05% | 0.02% | |
| GBP | -0.10% | -0.08% | -0.02% | -0.25% | -0.12% | -0.12% | -0.06% | |
| CAD | -0.07% | -0.05% | 0.01% | -0.23% | -0.10% | -0.10% | -0.04% | |
| AUD | 0.15% | 0.17% | 0.24% | 0.23% | 0.11% | 0.13% | 0.19% | |
| JPY | 0.03% | 0.04% | 0.13% | 0.12% | -0.13% | -0.02% | 0.07% | |
| NZD | 0.03% | 0.05% | 0.13% | 0.09% | -0.12% | 0.01% | 0.07% | |
| CHF | -0.04% | -0.01% | 0.06% | 0.03% | -0.19% | -0.07% | -0.06% |
The heat map shows percentage changes of major currencies against each other. The base currency is picked from the left column, while the quote currency is picked from the top row. For example, if you pick the Euro from the left column and move along the horizontal line to the Japanese Yen, the percentage change displayed in the box will represent EUR (base)/JPY (quote).
Australian Dollar FAQs
What key factors drive the Australian Dollar?
One of the most significant factors for the Australian Dollar (AUD) is the level of interest rates set by the Reserve Bank of Australia (RBA). Because Australia is a resource-rich country another key driver is the price of its biggest export, Iron Ore. The health of the Chinese economy, its largest trading partner, is a factor, as well as inflation in Australia, its growth rate and Trade Balance. Market sentiment – whether investors are taking on more risky assets (risk-on) or seeking safe-havens (risk-off) – is also a factor, with risk-on positive for AUD.
How do the decisions of the Reserve Bank of Australia impact the Australian Dollar?
The Reserve Bank of Australia (RBA) influences the Australian Dollar (AUD) by setting the level of interest rates that Australian banks can lend to each other. This influences the level of interest rates in the economy as a whole. The main goal of the RBA is to maintain a stable inflation rate of 2-3% by adjusting interest rates up or down. Relatively high interest rates compared to other major central banks support the AUD, and the opposite for relatively low. The RBA can also use quantitative easing and tightening to influence credit conditions, with the former AUD-negative and the latter AUD-positive.
How does the health of the Chinese Economy impact the Australian Dollar?
China is Australia’s largest trading partner so the health of the Chinese economy is a major influence on the value of the Australian Dollar (AUD). When the Chinese economy is doing well it purchases more raw materials, goods and services from Australia, lifting demand for the AUD, and pushing up its value. The opposite is the case when the Chinese economy is not growing as fast as expected. Positive or negative surprises in Chinese growth data, therefore, often have a direct impact on the Australian Dollar and its pairs.
How does the price of Iron Ore impact the Australian Dollar?
Iron Ore is Australia’s largest export, accounting for $118 billion a year according to data from 2021, with China as its primary destination. The price of Iron Ore, therefore, can be a driver of the Australian Dollar. Generally, if the price of Iron Ore rises, AUD also goes up, as aggregate demand for the currency increases. The opposite is the case if the price of Iron Ore falls. Higher Iron Ore prices also tend to result in a greater likelihood of a positive Trade Balance for Australia, which is also positive of the AUD.
How does the Trade Balance impact the Australian Dollar?
The Trade Balance, which is the difference between what a country earns from its exports versus what it pays for its imports, is another factor that can influence the value of the Australian Dollar. If Australia produces highly sought after exports, then its currency will gain in value purely from the surplus demand created from foreign buyers seeking to purchase its exports versus what it spends to purchase imports. Therefore, a positive net Trade Balance strengthens the AUD, with the opposite effect if the Trade Balance is negative.
- GBP/JPY is seen oscillating in a narrow trading band during the Asian session on Tuesday.
- Traders now await the release of the UK wage growth data for some meaningful impetus.
- The BoJ’s dovish stance might continue to undermine the JPY and lend support to the cross.
The GBP/JPY cross struggles to capitalize on the previous day's goodish intraday recovery of over 150 pips from the 181.15 area, or over a one-week low and oscillates in a narrow range during the Asian session on Tuesday. Spot prices currently trade just above mid-182.00s as traders now look to the UK wage growth data for a fresh impetus.
UK Average Earnings Excluding Bonuses is anticipated to rise by 7.8% YoY rate during the three months to August, matching the previous month's reading. Meanwhile, the gauge including bonuses is seen declining from 8.5% to 8.3% during the reported period. A stronger-than-expected report might fuel concerns about inflationary pressures and revive bets for further policy tightening by the Bank of England (BoE), which, in turn, should provide a strong boost to the British Pound (GBP) and the GBP/JPY cross.
Conversely, a softer print will reaffirm expectations that the BoE will maintain the status quo in November, though the immediate market reaction is more likely to be limited. The Bank of Japan (BoJ) sticks to its view that inflation is transient and has no plans to phase out its massive monetary stimulus. The dovish outlook, along with a generally positive risk tone, might continue to undermine the safe-haven Japanese Yen (JPY), suggesting that the path of least resistance for the GBP/JPY cross remains to the upside.
That said, speculations that Japanese authorities will intervene in the foreign exchange market to support the domestic currency might hold back traders from placing aggressive bullish bets. Traders might also prefer to wait on the sidelines ahead of the UK consumer inflation figures on Wednesday, which will play a key role in influencing expectations of the BoE's next policy move. Nevertheless, the aforementioned fundamental backdrop supports prospects for some meaningful appreciating move for the GBP/JPY cross.
Technical levels to watch
On Tuesday, the People’s Bank of China (PBOC) fixed the USD/CNY central rate at 7.1796, compared with Friday’s fix of 7.3108 and market expectations of 7.3038.
- USD/CAD holds positive ground around 1.3620 on Tuesday.
- Philadelphia Fed President Patrick Harker maintained their dovish stance, by saying that the Fed should hold rates steady.
- A correction of oil prices exerts pressure on the commodity-linked Loonie.
- Traders will monitor the US Retail Sales, and Canadian inflation on Tuesday.
The USD/CAD pair posts modest gains during the early Asian session on Tuesday. Market players await the Canadian inflation data due later in the day. The annual and monthly Canadian Consumer Price Index (CPI) for September is expected to rise 4.0% and 0.1%, respectively, The pair currently trades around 1.3620, gaining 0.07% on the day.
Many Federal Reserve (Fed) officials including Chicago Fed President Austan Goolsbee and Philadelphia Fed President Patrick Harker maintained their dovish stance. Harker stated on Monday that the central bank should not create new pressures in the economy by increasing the cost of borrowing. Harker added that in the absence of some turn in the data Fed should hold rates steady. The additional dovish comments from the Fed officials this week might weigh on the Greenback and cap the upside for the USD/CAD pair.
The Federal Reserve Bank of New York reported on Monday that the US NY Empire State Manufacturing Index for October dropped to 4.6 from the previous reading of 1.9 rise, above the expectation of a 7.0 decline. The data suggest a possible softening in manufacturing activity at the start of the fourth quarter. Meanwhile, a decline in oil prices undermines the commodity-linked Loonie as the country is the leading oil exporter to the US.
On the CAD’s front, data released from Statistics Canada on Monday revealed that the nation’s Manufacturing Sales for August came in at 0.7% MoM from 1.6% in the previous reading, below the market expectation of 1.0%. Meanwhile, Wholesale Sales dropped 2.3% versus 0% prior, worse than the market consensus of 2.6%.
On Friday, Bank of Canada (BoC) Governor Tiff Macklem said that the recent rise in long-term bond rates is not a substitute for monetary policy and the economy is not headed for an imminent recession. Macklem went on to say that the central bank would consider the tighter financial conditions due to rising long-term bond rates before its forthcoming policy meeting on October 25.
Market participants will keep an eye on the US Retail Sales data, which is expected to rise 0.2%. Additionally, the Canadian Consumer Price Index (CPI) for September will also be released. These figures could trigger the volatility in the market and give a clear direction to the USD/CAD pair.
- NZD/USD meets with a fresh supply in reaction to the softer New Zealand CPI report.
- The uncertainty over the Fed’s rate-hike path weighs on the USD and lends support.
- The fundamental backdrop favours bears and supports prospects for further losses.
The NZD/USD pair comes under heavy selling pressure during the Asian session on Tuesday, with bears now looking to extend the downfall further below the 0.5900 mark.
The New Zealand Dollar (NZD) weakens across the board following the release of softer consumer inflation figures from New Zealand, which showed that the headline CPI rose to 1.8% in the three months to September. Adding to this, the yearly rate decelerated to 5.6% from 6% in the previous quarter and also fell short of consensus estimates pointing to a reading of 5.9%. The data forces investors to trim their bets for an interest rate hike by the Reserve Bank of New Zealand (RBNZ) in November and is seen weighing on the NZD/USD pair.
The US Dollar (USD), on the other hand, struggles to gain any meaningful traction and remains on the defensive in the wake of the uncertainty about the Federal Reserve's (Fed) future rate hike path. The recent dovish remarks by several Fed officials ensured that the US central bank will maintain the status quo for the second successive time in November. In fact, Philadelphia Fed President Patrick Harker stated on Monday that that interest rate hikes are likely over and that the US central bank should hold rates steady in the absence of some turn in the data.
Firming expectations for a shift in the Fed's policy stance, along with the upbeat market mood, hold back traders from placing fresh bullish bets around the safe-haven Greenback. That said, the latest US consumer inflation figures released last week kept the door open for one more Fed rate hike move by the year-end. This remains supportive of elevated US Treasury bond yields, which act as a tailwind for the USD and favours the NZD/USD bears. However, a sustained break and acceptance below the 0.5900 mark is needed to confirm the negative outlook.
Market participants now look to the US economic docket, featuring the release of monthly Retail Sales data and Industrial Production figures, due later during the early North American session. This, along with the US bond yields and the broader risk sentiment, might influence the USD and provide a fresh impetus to the NZD/USD pair. Nevertheless, the aforementioned fundamental backdrop suggests that the path of least resistance for spot prices is to the downside.
Technical levels to watch
The Reserve Bank of Australia (RBA) published the Minutes of its October monetary policy meeting on Tuesday, highlighting that case for holding rate steady was stronger. Additional details of the RBA Minutes suggest that data on inflation, jobs and updated forecasts would be available at November meeting.
Key takeaways
“At October meeting board considered raising rates by 25bp or holding steady.”
“Board members judged that case for holding steady was the stronger one.”
“Members noted data on inflation, jobs and updated forecasts would be available at November meeting.”
“Members acknowledged upside risks to inflation were a "significant concern.“
“Progress in lowering service sector inflation was slow.”
“Board had low tolerance for a slower return of inflation to target.”
“Further tightening may be required if inflation more persistent than expected.”
“Rising house prices could support consumption, might be signal policy not as tight as assumed.”
“Full effects of past hikes would not be evident in data for some months.”
“Data suggested economy continued to grow modestly in the September quarter.”
“Members believed the labour market had reached a turning point.”
“Members noted there were few signs of wage price spiral materialising.”
“Fall in A$ vs US$ had eased monetary conditions, though only at the margin.”
“Trade weighted a$ only slightly lower than at start of year, limiting impact on imported inflation.”
“Challenges to China economy could impact Australia if not contained.”
Market reaction
At the time of writing, the AUD/USD pair is trading near 0.6356, holding higher while adding 0.22% on the day.
About RBA Minutes
The minutes of the Reserve Bank of Australia meetings are published two weeks after the interest rate decision. The minutes give a full account of the policy discussion, including differences of view. They also record the votes of the individual members of the Committee. Generally speaking, if the RBA is hawkish about the inflationary outlook for the economy, then the markets see a higher possibility of a rate increase, and that is positive for the AUD.
| Index | Change, points | Closed | Change, % |
|---|---|---|---|
| NIKKEI 225 | -656.96 | 31659.03 | -2.03 |
| Hang Seng | -173.09 | 17640.36 | -0.97 |
| KOSPI | -19.91 | 2436.24 | -0.81 |
| ASX 200 | -24.5 | 7026.5 | -0.35 |
| DAX | 51.33 | 15237.99 | 0.34 |
| CAC 40 | 18.66 | 7022.19 | 0.27 |
| Dow Jones | 314.25 | 33984.54 | 0.93 |
| S&P 500 | 45.85 | 4373.63 | 1.06 |
| NASDAQ Composite | 160.75 | 13567.98 | 1.2 |
- EUR/USD takes a breather after recent gains around 1.0559 in early Monday.
- European Central Bank (ECB) President Lagarde said the ECB is watching energy prices and the Israel-Hamas conflict for inflation risks.
- US NY Empire State Manufacturing Index for October fell to 4.6 vs. 1.9 rise prior, better than expected.
- Investors will monitor the ZEW Economic Sentiment Survey for October, the US Retail Sales for fresh impetus.
The EUR/USD pair consolidates its recent gains during the early Asian trading hours on Tuesday. Market players await the ZEW Economic Sentiment Survey for October, which is expected to improve from -8.9 to -8.0. The major pair currently trades around 1.0559, losing 0.02% for the day.
The European Central Bank (ECB) President Christine Lagarde told euro-area finance ministers that the ECB is watching energy prices and the Israel-Hamas conflict for inflation risks. Meanwhile, ECB's chief economist Philip Lane said in an interview that the ECB's decision to raise interest rates took longer than the Fed due to several factors. Lane further stated that they will keep interest rates high until inflation returns to 2%, but this may take some time.
Economic data on Monday revealed that German Wholesale Prices grew 0.2% MoM in September, worse than the market consensus of a 0.3% rise. On an annual basis, the figure fell -4.1% from the previous reading of -2.7%.
Across the pond, many Federal Reserve (Fed) officials including Chicago Fed President Austan Goolsbee and Philadelphia Fed President Patrick Harker maintained their dovish stance. Harker stated on Monday that the central bank should not create new pressures in the economy by increasing the cost of borrowing. Harker added that in the absence of some turn in the data Fed should hold rates steady. The additional dovish comments from the Fed officials this week might weigh on the US Dollar (USD) and act as a tailwind for the EUR/USD pair.
About the data, the US NY Empire State Manufacturing Index for October fell to 4.6 from 1.9 rise in the previous reading, better than the expectation of a 7.0 decline, the Federal Reserve Bank of New York reported on Monday. The data suggest a possible softening in manufacturing activity at the start of the fourth quarter.
Moving on, market participants will monitor the ZEW Economic Sentiment Survey for October and the US Retail Sales due later on Tuesday. Later this week, the European Central Bank (ECB) President Lagarde's speech and Federal Reserve officials' speech could offer hints about the interest rate path and give a clear direction to the EUR/USD pair.
| Pare | Closed | Change, % |
|---|---|---|
| AUDUSD | 0.63384 | 0.55 |
| EURJPY | 157.855 | 0.37 |
| EURUSD | 1.05577 | 0.38 |
| GBPJPY | 182.628 | 0.56 |
| GBPUSD | 1.22135 | 0.56 |
| NZDUSD | 0.59067 | 0.05 |
| USDCAD | 1.3608 | -0.34 |
| USDCHF | 0.89978 | -0.24 |
| USDJPY | 149.524 | -0 |


© 2000-2024. Уcі права захищені.
Cайт знаходитьcя під керуванням TeleTrade DJ. LLC 2351 LLC 2022 (Euro House, Richmond Hill Road, Kingstown, VC0100, St. Vincent and the Grenadines).
Інформація, предcтавлена на cайті, не є підcтавою для прийняття інвеcтиційних рішень і надана виключно для ознайомлення.
Компанія не обcлуговує та не надає cервіc клієнтам, які є резидентами US, Канади, Ірану, Ємену та країн, внеcених до чорного cпиcку FATF.
Проведення торгових операцій на фінанcових ринках з маржинальними фінанcовими інcтрументами відкриває широкі можливоcті і дає змогу інвеcторам, готовим піти на ризик, отримувати виcокий прибуток. Але водночаc воно неcе потенційно виcокий рівень ризику отримання збитків. Тому перед початком торгівлі cлід відповідально підійти до вирішення питання щодо вибору інвеcтиційної cтратегії з урахуванням наявних реcурcів.
Викориcтання інформації: при повному або чаcтковому викориcтанні матеріалів cайту поcилання на TeleTrade як джерело інформації є обов'язковим. Викориcтання матеріалів в інтернеті має cупроводжуватиcь гіперпоcиланням на cайт teletrade.org. Автоматичний імпорт матеріалів та інформації із cайту заборонено.
З уcіх питань звертайтеcь за адреcою pr@teletrade.global.
переклади