- Аналітика
- Новини та інструменти
- Новини ринків
Новини ринків
- WTI crude oil fades bounce off two-week low, sidelined of late.
- China’s Evergrande files for bankruptcy protection and bolsters debt woes amid economic fears about the Dragon Nation.
- Upbeat US data, risk-off mood propels yields and prods Oil buyers.
- Risk catalysts are the key, China, yields in the spotlight.
WTI crude oil lacks clear directions around $79.60 as bulls fail to extend the previous day’s corrective bounce off the lowest level in a fortnight amid the risk-off mood. It’s worth noting that the black gold posted the first daily gain in four the previous day amid hopes of China stimulus and a pullback in the US Dollar from the multi-day high. However, the latest fears about the world’s biggest energy customer, namely China, prod the WTI bulls.
The recent headlines from Beijing suggest that China’s second-large realtor, as well as the world's most heavily indebted property developer, Evergrande filed for protection from creditors in a US bankruptcy court on Thursday, per Reuters. The same escalate fears surrounding the world’s second-largest economy, as well as the global economic transition, as it battles with the slowing economic recovery and fuels concerns about the financial health of China’s biggest realtor, namely Country Garden.
Apart from the challenges to sentiment, firmer US data also weigh on the Oil price, via upbeat yields. That said, US Philadelphia Fed Manufacturing Survey marked the strongest print since April 2022, as well as the first positive outcome in a year, while rising to 12.0 for August from -13.5 prior and -10.0 expected. On the same line, the US Initial Jobless Claims also edged lower to 239K for the week ended on August 11 versus a revised up 250K prior and the market expectations of 240K. It should be noted that the four-week average of the Initial Jobless Claims and the weekly figures of the Continuing Claims for the period ended on August 04 edged higher. Earlier in the week, the US Industrial Production and Retail Sales for July marked surprising growth but the housing numbers were mixed.
It should be noted that the latest Fed Minutes showed that most policymakers preferred supporting the battle again the ‘sticky’ inflation, despite being divided on the imminent rate hike, which in turn challenges the market’s previous policy pivot concerns about the US central bank and favors the Greenback.
Alternatively, the People’s Bank of China (PBOC) released its second-quarter monetary policy report and said it “will resolutely prevent over-adjustment risks of Yuan exchange rate.” Before that, the PBoC and Chinese officials indirectly pledged more stimulus to defend the economy from slipping back into the jaws of recession.
Against this backdrop, Wall Street again closed in the red and the US 10-year Treasury bond yields march toward the levels marked in 2007. It should be noted that such high levels of yields previously triggered fears of global recession and drowned the riskier assets like equities and commodities previously.
Looking forward, a light calendar may push the WTI crude oil traders to watch for more risk catalysts for clear directions.
Technical analysis
WTI’s failure to provide a daily closing beyond the 21-day Exponential Moving Average (EMA) level of around $79.90, not to forget its inability to cross the $80.00 threshold, despite bouncing off a three-week-old rising support of around $78.80, keeps Oil sellers hopeful.
- USD/CHF struggles to gain any meaningful traction on Friday.
- Unemployment claims increased to 239K, below the market expectation of 240K; Philly Fed Manufacturing Survey improved to 12, above -10 expected.
- China's second-largest real estate company filed for bankruptcy in a US court under Chapter 15 on Thursday.
- The headline surrounding China’s debt crisis and real-estate woes remains in focus.
The USD/CHF pair edges lower to 0.8781 after retreating from the 0.8803 high during the early Asian session on Friday. Meanwhile, the US Dollar Index (DXY), a measure of the value of USD against six other major currencies, consolidates its gains around 103.40 in the quiet day for economic calendar.
The labor US data on Thursday showed that the number of unemployment claims increased to 239K for the week ending on August 12. The figure came in slightly below the market expectation of 240K and suggests that the US labor market is robust. The Continuing Jobless Claims increased to 1.716 million, the highest level seen in the last four weeks. Lastly, the Philadelphia Federal Reserve's Manufacturing Survey for August improved to 12, above the expectation of -10 and the previous month of -12.
The upbeat labor data on Thursday might convince the Federal Reserve (Fed) for further tightening of monetary policy. That said, FOMC Minutes emphasized that inflation remained unacceptably high. The Fed official saw significant inflationary risks, and it may need additional rate hikes to bring inflation to the longer-run target. Federal Reserve officials endorsed that future rate decisions would be based on the incoming data, but they would be more cautious in the coming months.
On the other hand, markets turn cautious following China’s economic woes. Evergrande, China's second-largest real estate company filed for bankruptcy in a US court under Chapter 15 on Thursday, according to Reuters. This report fuels the fear of a potential Chinese property catastrophe. Additionally, Fitch Ratings might reconsider China's A+ sovereign. The fear of a debt crisis in China might weigh on the risk sentiment which benefits the safe-haven Swiss Franc and act as a headwind for the USD/CHF pair.
Looking ahead, the USD/CHF pair remains at the mercy of USD price dynamics due to the lack of economic data released from both Switzerland and the US. Traders will also focus on the headline surrounding China’s debt crisis and real-estate woes.
USD/MXN remains on the back foot around 17.10 as it pares the weekly gains after declining in the last two consecutive days. It’s worth noting, however, that the mixed signals from the options market and broad US Dollar strength troubles the Mexican Peso (MXN) traders of late.
That said, the Mexican Peso (MXN) pair dropped in the last week despite the broad US Dollar’s strength as market players sensed more odds of the Fed’s policy pivot than the Banxico. However, the latest firmer US data and yields underpin hawkish hopes from the US central bank and recall the USD/MXN buyers.
However, the options market data from Reuters prints a different story as the one-month Risk Reversal (RR) of the USD/MXN pair, a measure of the spread between call and put prices, dropped in the last two consecutive days to -0.0100 by the end of Thursday North American trading session.
On the same line, the weekly RR braces for the first negative close in five with the latest prints being -0.035.
Also read: USD/MXN edges lower amid risk-off impulse due to China’s woes
Early Friday in Asia, Japan Statistics Bureau released National Consumer Price Index (CPI) for July, reprinting a 3.3% YoY figure versus 2.5% expected.
Further details unveil the fact that the National CPI ex Fresh Food matches 3.1% YoY forecasts, easing from 3.3% prior whereas the National CPI ex Food, Energy edges higher to 4.3% figures compared to 4.2% previous readings.
Market reaction
Despite the upbeat Japan inflation data, USD/JPY bounced off intraday low while picking up bids to 145.80 at the latest, down for the second consecutive day after refreshing the yearly top.
Also read: USD/JPY softens despite rising US yields, global economic concerns
- GBP/USD remains sidelined around short-term key resistance confluence after posting three-day winning streak.
- Cable trader’s preparations for UK Retail Sales for July allowed Pound Sterling to remain sidelined.
- Upbeat oscillators, sustained trading beyond seven-week-old rising support line favors pair buyers.
- Convergence of 100-SMA, five-week-old falling resistance line challenge recovery moves ahead of the key UK data.
GBP/USD jostles with a short-term key resistance while making rounds to 1.2760 amid the early Asian session on Friday. In doing so, the Cable pair prods the three-day winning streak ahead of the UK Retail Sales for July.
That said, the Cable pair’s successful trading above a seven-week-old rising support line, around 1.2675 by the press time, joins the bullish MACD signals and gradually rising the RSI (14) line to keep the GBP/USD buyers hopeful.
However, a downward-sloping resistance line from July 14 and the 100-SMA together constitute the 1.275-60 zone as a tough nut to crack for the Cable pair buyers.
Following that, the 1.2800 and the 200-SMA level of around 1.2830 will act as the last defense of the GBP/USD bears.
It’s worth noting that the downbeat expectations from the UK Retail Sales, expected -0.5% MoM in July versus 0.7% expected, can join the risk-off mood to prod the Cable buyers.
On the other hand, a daily closing below the multi-day-old support line surrounding 1.2675 becomes necessary for the GBP/USD bears to retake control.
Even so, multiple supports around 1.2600 may test the Pound Sterling bears before giving control to them.
GBP/USD: Four-hour chart
-18082023-638279112813402368.png)
Trend: Limited recovery expected
- NZD/USD struggles to gain amid the US dollar strength, China’s economic woes.
- The upbeat labor data opens the door for additional rate hikes by the Federal Reserve (Fed).
- Evergrande filed for bankruptcy in a US court, raising fear about a potential Chinese property catastrophe.
The NZD/USD pair remains on the defensive above the 0.5900 mark in the early Asian session. The pair trades in negative territory for the eighth consecutive day on Friday amid the stronger US Dollar and higher US yields. NZD/USD currently trades near 0.5926, losing 0.03% on the day.
The US Bureau of Labour Statistics (BLS) showed on Thursday that the number of jobless claims increased to 239K for the week ending on August 12. The figure came in slightly below the market expectation of 240K and suggests that the US labor market is robust. The Continuing Jobless Claims increased to 1.716 million, the highest level seen in the last four weeks. Lastly, the Philadelphia Federal Reserve's Manufacturing Survey for August improved to 12, above the expectation of -10 and the previous month of -12.
The upbeat data opens the door for additional rate hikes by the Federal Reserve (Fed) and boosts the US dollar across the board. The Federal Open Market Committee (FOMC) Minutes emphasized that inflation remained unacceptably high. The Fed official saw significant inflationary risks, and it may need additional tightening of monetary policy to bring inflation to the longer-run target. Federal Reserve officials endorsed that future rate decisions would be based on the incoming data, but they would be more cautious in the coming months.
On the other hand, the Reserve Bank of New Zealand (RBNZ) kept the benchmark interest rates unchanged at 5.5%, as expected on Wednesday. RBNZ Governor Adrian Orr also offered a hawkish signal to rein in rising inflation expectations. Orr stated that the drivers of inflation have changed over time, but they have all been skewed towards higher inflation than otherwise.
Furthermore, Evergrande, China's second-largest real estate company filed for bankruptcy in a US court on Thursday, according to Reuters. This report fuels the fear of a potential Chinese property catastrophe. On Thursday, Fitch Ratings might reconsider China's A+ sovereign credit rating in the face of intensifying economic headwinds. This, in turn, might cap the upside of the China-proxy Kiwi and acts as a headwind for NZD/USD.
In the absence of the top-tier economic data release from both New Zealand and the US, market participants will digest the data from this week. However, the headlines surrounding China’s economic woes remain in focus.
- EUR/USD struggles to defend corrective bounce off six-week low, sidelined of late.
- Unimpressive Eurozone statistics contrast with upbeat US data to weigh on Euro pair.
- Recently hawkish FOMC Minutes, improvement in US statistics challenge Fed policy pivot concerns and weigh on EUR/USD.
- Yields cheer hawkish Fed bias, market’s economic fears to keep the pair sellers hopeful amid mixed concerns about bloc.
EUR/USD lacks recovery momentum despite bouncing off the multi-day low as it seesaws around 1.0870-75 amid early hours of Friday’s Asian session, after refreshing the six-week low the previous day. In doing so, the Euro pair justifies the market’s risk-off mood, as well as the recently altered concerns about the Federal Reserve (Fed), to keep sellers on board.
The recently firmer US data contrasts with unimpressive Eurozone statistics and the looming concerns about German recession to keep the Euro bears hopeful. Also, the latest shift in the Fed bias joins the broad risk aversion wave to propel the yields and exert additional downside pressure on the EUR/USD pair, via firmer US Dollar.
That said, the US Dollar Index (DXY) refreshed two-month high the previous day before closing around 103.42 on Thursday.
Talking about the US data, US Philadelphia Fed Manufacturing Survey marked the strongest print since April 2022, as well as the first positive outcome in a year, while rising to 12.0 for August from -13.5 prior and -10.0 expected. On the same line, the US Initial Jobless Claims also edged lower to 239K for the week ended on August 11 versus a revised up 250K prior and the market expectations of 240K. It should be noted that the four-week average of the Initial Jobless Claims and the weekly figures of the Continuing Claims for the period ended on August 04 edged higher. Earlier in the week, the US Industrial Production and Retail Sales for July marked surprised growth but the housing numbers were mixed.
Additionally, the latest Fed Minutes showed that the most policymakers preferred supporting the battle again the ‘sticky’ inflation, despite being divided on the imminent rate hike, which in turn challenges the market’s previous policy pivot concerns about the US central bank and favor the Greenback.
At home, Eurozone trade surplus improved on seasonally adjusted (s.a) and non-seasonally adjusted (n.s.a) for June. That said, the former grew to €12.5B while the latter rose to €23B versus €0.2B and €-0.3B respective priors. Earlier in the week, Eurozone Industrial Production marked a surprise growth for June but the second readings of the Eurozone Gross Domestic Product (GDP) for the second quarter (Q2) confirmed initial forecasts whereas the Employment Change eased for the said period.
It’s worth noting that China’s second-large realtor, as well as the world's most heavily indebted property developer, Evergrande filed for protection from creditors in a US bankruptcy court on Thursday, per Reuters. The same escalate fears surrounding the world’s second-largest economy, as well as the global economic transition, as it battles with the slowing economic recovery and concerns about the financial health of China’s biggest realtor, namely Country Garden, propel market woes of late. The same joins the hawkish Fed bias to propel the yields and the US Dollar.
Looking ahead, the final readings of Eurozone inflation data will entertain EUR/USD traders while the bond market moves and risk catalysts gain major attention.
Technical analysis
Failure to cross the 1.0935-30 resistance confluence comprising the 100-DMA and a one-month-old falling trend line, despite the latest corrective bounce, keeps the EUR/USD bears hopeful of witnessing further downside of the pair. The same highlights July’s low of 1.0833 as an immediate support.
- Despite concerns of overtightening, USD/CAD was buoyed by the Fed’s unanimous vote for a rate hike.
- US unemployment claims slightly below estimates at 239K, showcasing a resilient labor landscape.
- Atlanta Fed’s GDPNow model projects 5.8% growth for US Q3 2023, hinting at a potential rate hike in November.
USD/CAD advanced to fresh two-month highs on Thursday as investors digested the US Federal Reserve’s (Fed) latest monetary policy meeting minutes, which portray board members as committed to achieving the Fed’s inflation target. Even though some board members are worried about overtightening, all the participants voted for a rate hike. The USD/CAD is trading at 1.3546, almost flat.
Federal Reserve's commitment to inflation target and resilient US labor market data bolster the greenback against the Canadian dollar.
Wall Street finished the session with losses, while the greenback is trading almost flat, as shown by the US Dollar Index (DXY) exchanging hands at 103.437. Data from the US Bureau of Labor Statistics (BLS) reported a rise in unemployment claims last week, reaching 239K. This number was slightly below the estimated figure of 240K, indicating a resilient labor market. Simultaneously, the Philadelphia Fed disclosed its Manufacturing Index for August, which stood at 12, surpassing the anticipated -10 contraction that analysts had predicted.
On Wednesday, the Fed unveiled the minutes from its July meeting. Minutes revealed that Federal Reserve members still perceive the presence of upward risks related to inflation. This suggests that further tightening measures might be necessary. However, they also emphasized their commitment to factoring in upcoming data of the forthcoming meetings. Several regional Fed Presidents, including Bostic, Goolsbee, Harker, and Barkin, have expressed that the time has come to halt rate hikes.
In the wake of Wednesday’s data release, the Atlanta Fed GDPNow model has projected a growth rate of approximately 5.8% for the US Q3 2023 GDP. This is an increase from the 4.1% estimate recorded on August 8. Given these events, the swaps market has indicated an elevated likelihood of a 25 bps rate hike by the Federal Reserve at the impending November meeting.
Given a robust US economy, further upside is expected in the USD/CAD pair. Nevertheless, the recent inflation report in Canada can increase the odds of additional tightening by the Bank of Canada (BoC).
USD/CAD Price Analysis: Technical outlook
From a technical standpoint, the uptrend in the USD/CAD pair remains intact but is about to face solid resistance at 1.3600. A decisive break will expose the May 31 daily high of 1.3651, followed by the psychological 1.3700 mark. Conversely, if USD/CAD fails to reclaim 1.3600, the first support would be the 1.3500 mark, followed by the 200-day Moving Average (DMA) at 1.3451.
- AUD/USD fades corrective bounce off yearly low after posting eight-day losing streak.
- Upbeat US data, China woes underpin firmer yields and weigh on sentiment, as well as Aussie pair.
- Australia employment numbers favor dovish concerns about RBA and keep pair sellers hopeful.
- No major data/events on calendar for release but bond market moves will be crucial to watch for intraday directions.
AUD/USD licks its wounds at the lowest level in a year, especially following the successive fall in the last eight days, as traders seek more clues to extend the latest fall. With this, the Aussie pair seesaws around 0.6400 while fading the late Thursday’s corrective bounce off the yearly low during early Friday in Asia.
The Aussie pair’s latest fall could be linked to the downbeat Australian data and strong Treasury bond yields, as well as fears surrounding the biggest customer China. It’s worth noting that the firmer US macros recently renewed hawkish bias about the Fed and underpin the US Dollar’s strength, together with the firmer bond coupons, which in turn weighs on the AUD/USD price.
Recently, China’s second-large realtor, as well as the world's most heavily indebted property developer, Evergrande filed for protection from creditors in a US bankruptcy court on Thursday, per Reuters. The same escalate fears surrounding Australia’s biggest customer China as it battles with the slowing economic recovery and concerns about the financial health of China’s biggest realtor, namely Country Garden, propel market woes of late.
On Thursday, Australia’s headline Employment Change slumped to -14.6K for July on a seasonally adjusted basis versus 15.0K expected and 32.6K prior whereas the Unemployment Rate edges higher to 3.7% compared to the market’s expectations of once again witnessing a 3.5% figure.
With the looming economic fears about China and the downbeat Aussie jobs report, the Reserve Bank of Australia (RBA) might not risk another rate hike as the policymakers highlighted the data dependency in the latest Minutes, which in turn favors Aussie bears.
On the other hand, US Philadelphia Fed Manufacturing Survey marked the strongest print since April 2022, as well as the first positive outcome in a year, while rising to 12.0 for August from -13.5 prior and -10.0 expected. On the same line, the US Initial Jobless Claims also edged lower to 239K for the week ended on August 11 versus a revised up 250K prior and the market expectations of 240K. It should be noted that the four-week average of the Initial Jobless Claims and the weekly figures of the Continuing Claims for the period ended on August 04 edged higher.
It’s worth noting that the People’s Bank of China (PBOC) released its second-quarter monetary policy report and said it “will resolutely prevent over-adjustment risks of Yuan exchange rate.”
Amid these plays, Wall Street again closed in the red and the US 10-year Treasury bond yields march toward the levels marked in 2007. It should be noted that such high levels of yields previously triggered fears of global recession and drowned the riskier assets like equities and Australian Dollar.
Moving on, a light calendar may push the AUD/USD pair to watch for more risk catalysts for clear directions.
Technical analysis
AUD/USD pair’s sustained trading below a three-week-old falling resistance line, around 0.6440 by the press time, directs the bears toward the November 2022 low of near 0.6270.
China’s second-large realtor, as well as the world's most heavily indebted property developer, Evergrande filed for protection from creditors in a US bankruptcy court on Thursday, per Reuters.
The news came in after the real-estate company posted a combined $81 billion loss for 2021 and 2022 at the latest.
Along with the Evergrande, Tianji Holdings, a related company, also sought Chapter 15 protection in Manhattan bankruptcy court, said the news.
That said, Evergrande shares are not trading since 2022 as the company shook markets by missing bond payments.
It’s worth noting that the news crosses wires amid concerns about the financial health of China’s biggest realtor, namely Country Garden, as it missed the bond payment and is undergoing a 30-day grace period.
Market reaction
Given the looming concerns about China’s debt crisis and the real-estate woes, the news could add strength to the present risk aversion. However, the AUD/USD awaits more clues to react to the updates, making rounds to 0.6400 at the latest.
- XAU/USD dropped towards the $1,890 area, its lowest since March 13.
- A stronger USD and higher US yields are responsible for the metal’s downward trajectory.
On Thursday, the XAU/USD gold spot price traded below $1,900 and faced renewed selling pressure amid stronger USD and higher US treasury bond yields.
In line with that, on Wednesday, the Federal Open Market Committee (FOMC) minutes revealed that members were open to continuing hiking due to upside risks related to inflation, pointing out that the labour market remains extremely tight, which boosts hawkish bets on the Federal Reserve (Fed).
In that sense, the 10-year yield, which could be seen as the opportunity cost of holding gold, rose to a multi-month high of 4.28%, while the 2 and 5-year bond rates rose more than 1% to 4.93% and 4.41%. This rise may be attributed to the odds of a hike, as per the CME FedWatch tool, in November of the Fed of 25 basis points, rising near 40%.
XAU/USD Levels to watch
Analysing the daily chart, XAU/USD presents a bearish outlook for the short term. Both Relative Strength Index (RSI) and Moving Average Convergence Divergence (MACD) remain in negative territory, with the RSI positioned below its midline and showcasing a southward slope. The MACD also displays red bars, further supporting the intensifying bearish momentum. Furthermore, the pair is below the 20,100 and 200-day Simple Moving Averages (SMAs), suggesting that the bears are firmly in control of the bigger picture.
Support levels: $1,870, $1,850, $1,830
Resistance levels: $1,900, $1,906 (200-day SMA), $1,930.
XAU/USD Daily chart
-638279067881507561.png)
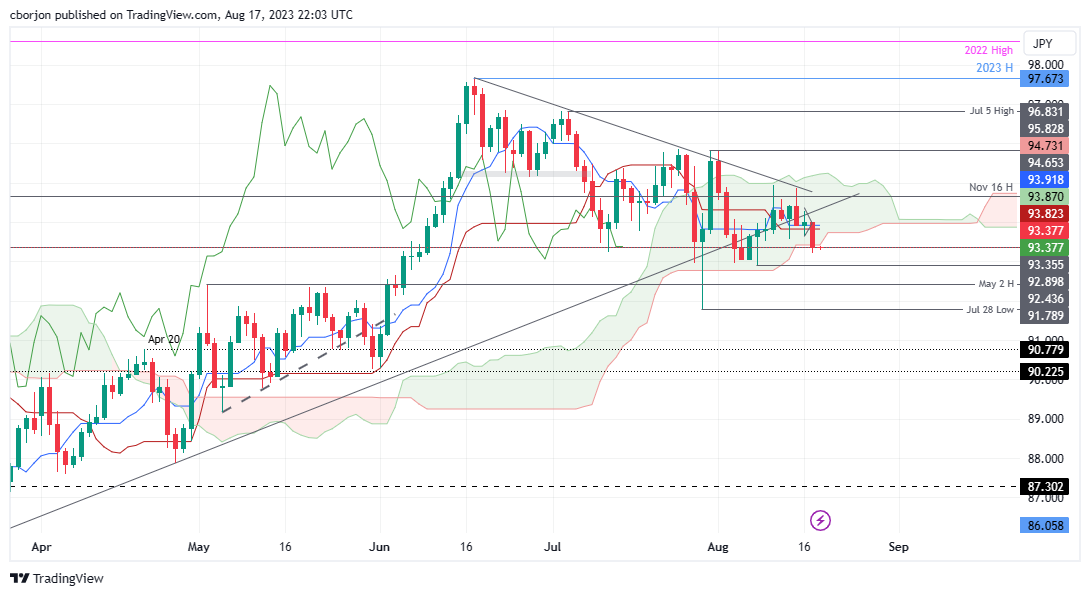
- AUD/JPY's decline was influenced by China's deepening property crisis and potential central bank tightening.
- Australian Dollar dampened by rising unemployment, signaling RBA may maintain current rates.
- Technical indicators suggest bearish momentum, with key support levels identified at 93.21, 92.89, and 91.78.
AUD/JPY drops in early trading in the Asian session, following Thursday’s 0.66% fall, spurred by risk-aversion amid a deep property crisis in China and speculations that central banks would keep tightening monetary conditions. Consequently, the risk-sensitive AUD/JPY pair edged down and traded at 93.34, losing 0.03%.
Another factor that underwhelmed the Australian Dollar (AUD) was a soft jobs report, with unemployment rising, a signal the labor market is cooling. This means the Reserve Bank of Australia (RBA) would keep rates unchanged towards the next monetary policy decision.
AUD/JPY Price Analysis: Technical outlook
The bias turned bearish with the daily chart showing the pair falling below the Ichimoku Cloud (Kumo). In addition, the Tenkan-Sen crossed below the Kijun-Sen, while the Chikou Span sits below the price action.
Given the backdrop, the AUD/JPY’s path of least resistance is downwards, and first support emerges at the August 17 daily low of 93.21. A breach of the latter will expose the August 8 swing low of 92.89, followed by the July 20 swing low of 91.78. Once those intermediate support levels are cleared, buyers’ next line of defense is the May 31 daily low of 90.26.
AUD/JPY Price Action – Daily chart
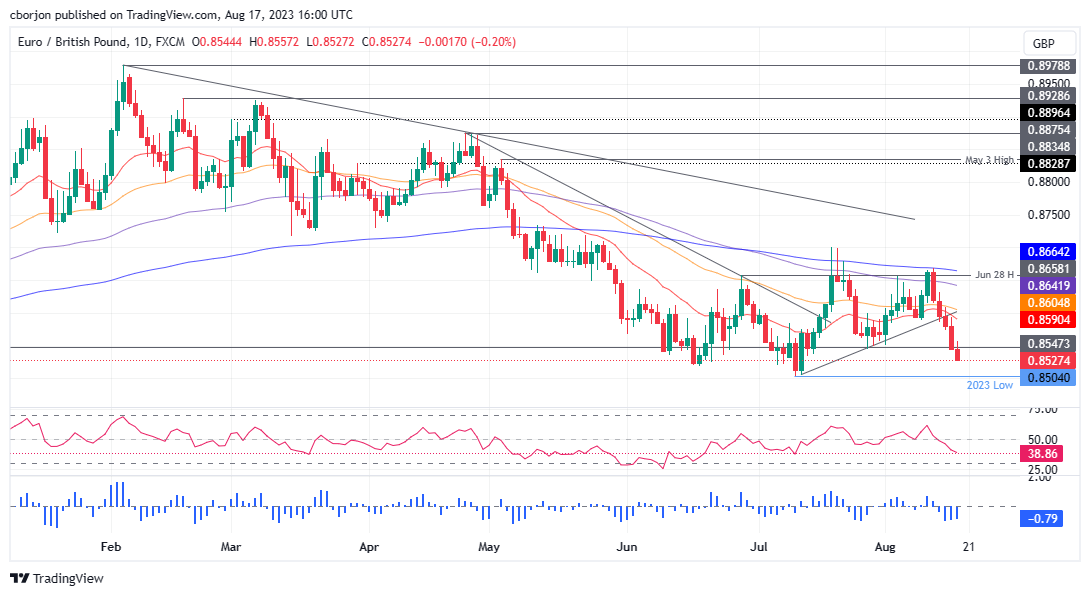
- Sterling gains strength as UK inflation data, although showing signs of easing, remains high, suggesting further action by the BoE.
- Technical analysis indicates a bearish tilt for EUR/GBP after breaking past the July 27 daily low of 0.8544.
- Immediate support lies at the YTD low of 0.8504. A breach of this level could see the pair target the August 14, 2022, low of 0.8408.
- On the upside, resistance is found at the August 15 high of 0.8593
The EUR/GBP prolongs its losses to five consecutive trading days as sellers eye a challenge of the year-to-date (YTD) low of 0.8504, sponsored by overall Sterling (GBP) strength. Although UK’s inflation figures show signs of easing, is still high, warranting further tightening by the Bank of England (BoE). Therefore, the GBP remains strong, as witnessed by the EUR/GBP trading at 0.8530, down 0.17%.
EUR/GBP Price Analysis: Technical Outlook
The EUR/GBP daily chart portrays the pair as subdued but slightly tilted bearish after breaking previous support, cracking the July 27 daily low of 0.8544, opening the door for a deeper correction. Up next, the EUR/GBP would test the YTD low of 0.8504, which once cleared, and it would expose the 2022 August 14 low of 0.8408.
Conversely, if EUR/GBP stays above 0.8500, the next resistance would emerge at the August 15 high of 0.8593. if buyers push prices above that level, next would be the 0.8600 figure, followed by the 50 and 100-day Exponential Moving Averages (EMAs) at 0.8605 and 0.8640.
EUR/GBP Price Action – Daily chart
- GBP/JPY continues to trade in cycle highs near the 186.30 area.
- GBP continues to trade strong against its rivals due to hawkish bets on the BoE.
- Japanese weak economic data reinforces the Bank of Japan's (BoJ) dovish stance.
On Thursday, the GBP/JPY fell below 186.00 as investors seemed to be taking profits after eight straight days of gains. On the one hand, the Pound gains interest in hawkish bets on the Bank of England (BoE), while the Bank of Japan’s (BoJ) extremely dovish stance continues to pressure the JPY. Eyes on Japanese inflation figures from July to be reported on Friday.
The GBP continues to trade strong against its rivals, mainly driven by rising wages in the UK and hot inflation figures from July reported in Wednesday’s session. In that sense, the Pound gained interest on the back of hawkish bets on the Bank of England (BoE) as investors are now betting on a terminal rate of 6% which would mean an additional 75 bps of tightening vs last week where markets expected a terminal rate of 5.75%.
On the other hand, Japan reported soft data. Imports dropped in July by 13.5% and reported a higher than expected Trade Balance Deficit in the same month. In addition, Machinery Orders declined by 5.8% YoY in June, higher than expected. In that sense, as economic activity continues to weaken, the Bank of Japan (BoJ) won’t have any rush to pivot its monetary policy, which will leave the JPY vulnerable against its rivals.
GBP/JPY Levels to watch
The daily chart analysis indicates a bullish outlook for the GBP/JPY in the short term. The Relative Strength Index (RSI) is above its midline in positive territory, with a positive slope, aligning with the positive signal from the Moving Average Convergence Divergence (MACD), which displays green bars, reinforcing the strong bullish sentiment. Additionally, the pair is above the 20,100,200-day SMAs, suggesting that the bears struggle to challenge the bullish trend.
Plus, bullish signals on the four-hour chart indicate a strong buying momentum, establishing a marked bull dominance over sellers.
Support levels: 185.50, 185.00, 184.00.
Resistance levels: 187.00, 187.50, 188.00.
GBP/JPY Daily chart
-638279023785519734.png)
Friday will be a relatively quiet day in terms of economic data. During the Asian session, Japan will release the National Consumer Price Index, which is expected to show a slowdown from 3.3% to 2.5%. Later in the day, the UK will report retail sales.
Here is what you need to know on Friday, August 18:
During the American session, the US Dollar strengthened across the board amid risk aversion and higher Treasury yields. The Dow Jones index declined by 0.85%, marking its third consecutive day of losses and posting its lowest close in a month. Concerns over the outlook for the Chinese economy, coupled with expectations of higher interest rates for a longer period, contributed to market worries.
US Treasury yields ended the session with a mixed performance. The 10-year yield reached a peak at 4.32%, the highest level since 2007, before pulling back, while the 30-year yield rose to 4.42%, the highest since 2011. The US Dollar Index finished the day flat at 103.40 after reaching two-month highs at 103.59.
US Initial Jobless Claims declined to 239,000 in the week ended August 12, which exceeded expectations. However, Continuing Jobless Claims rose to 1.716 million in the week ended August 5, reaching the highest level in four weeks. The Philadelphia Fed Manufacturing Survey showed a significant positive surprise by rising from -13.5 to 12.
No top-tier releases are expected from the US on Friday. The focus is turning to the Jackson Hole Symposium, which will be underway a week from now.
EUR/USD initially rose to 1.0920 but pulled back during American trading hours, falling to 1.0855, marking a fresh six-week low. The Eurozone will release the final reading of the July Consumer Price Index, which is expected to be a non-event with no surprises. The annual rate stands at 5.5% in July. Eurostat will also release Construction Output data for June.
The Japanese Yen managed to recover ground despite rising government bond yields. The decline in equity markets supported the Yen, along with the some loss of momentum in the US Dollar. USD/JPY experienced its worst daily loss in two weeks and fell below 146.00. On Friday, Japan will release the National Consumer Price Index, which is expected to show a 2.5% increase from a year ago, lower than the 3.3% observed in June.
GBP/USD rose significantly on Thursday. However, the pair failed to hold above the 20-day Simple Moving Average (SMA) and fell below 1.2750. The round of UK economic data will conclude on Friday with the release of Retail Sales. Sales are expected to have declined by 0.5% in July after a 0.7% gain in June. So far, the Pound is the top-performing currency of the week among the major currencies.
USD/CHF maintains a bullish bias, although the upward momentum remains limited, as the pair has been unable to consolidate above 0.8800. Switzerland is set to report Q2 Industrial Production data.
The Australian jobs report had a negative impact on the Aussie, leading to underperformance on Thursday. However, the losses were trimmed later in the day. AUD/USD bottomed at 0.6365, the lowest level since November, before experiencing a rebound towards 0.6450. However, it later pulled back due to a stronger US Dollar, extending its negative streak to eight days.
USD/CAD rose for the fourth consecutive day and posted its highest daily close since late May, near 1.3550. The pair is showing overbought conditions, and a correction is overdue. However, negative sentiment and a stronger US Dollar currently favor the upside. Inflation data is due in Canada with the Industrial Product Price and the Raw Material Price Index for July.
NZD/USD fell again but closed slightly away from the lows. It reached a low point at 0.5903 and closed at 0.5925.
Like this article? Help us with some feedback by answering this survey:
- GBP/USD marks a three-day uptrend, gaining 0.14%, trading at 1.2740 within a range of 1.2702/1.2787.
- UK data this week, including unemployment and inflation figures, bolster GBP/USD, hinting at a potential BoE rate hike.
- US data: Initial Jobless Claims at 239K, better than expected; Philadelphia Fed Manufacturing Index for August shows improvement.
The Pound Sterling (GBP) prolongs its uptrend to three straight days, as seen by the GBP/USD gaining 0.14%, despite market sentiment shifting sour due to global bond yields edging higher. Expectations that central banks would keep borrowing costs higher for longer are taking their toll on equities. The GBP/USD exchanges hands at 1.2740 after seesawing within a low and high of 1.2702/1.2787.
Pound Sterling rides on positive UK data, while US Treasury bond yields cap the pair's gains
Current week data has bolstered the GBP/USD pair, though it remains capped by high US Treasury bond yields. Even though the UK’s Unemployment Rate edged above the 4% forecast at 4.2%, the wage jump increased the chances of a Bank of England (BoE) rate hike. Wednesday’s data further reinforced that, as UK inflation decelerated as expected to 6.8% YoY, core inflation exceeded forecasts of 6.8%, rising to 6.9%. Consequently, the GBP/USD advanced.
Across the pond, the US Bureau of Labor Statistics (BLS) reported that last week’s unemployment claims rose to 239K, below estimates of 240K, still portraying a robust labor market. At the same time, the Philadelphia Fed revealed its Manufacturing Index for August came at 12, improving above the -10 contraction expected by analysts.
On Wednesday, the Fed released its July meeting minutes which showed Fed members still see upside risks on inflation, suggesting that further tightening would be needed. However, they would take into account upcoming data for the following meetings. Of note, Fed officials have expressed the need to stop hiking rates, led by some regional Fed Presidents, like Bostic, Goolsbee, Harker, and Barkin.
Following Wednesday’s data release, the Atlanta Fed GDPNow model portrays the US Q3 2023 GDP at around 5.8%, up from 4.1% on August 8. Given those developments, the swaps market has shown increased chances for a Federal Reserve 25 bps rate hike at the upcoming November meeting.
Sterling is trading slightly higher near $1.2750 but remains on track to test the late June low near $1.2590
What to watch?
The US economic docket is empty, while the UK would reveal the Gfk Consumer Confidence alongside Retail Sales for July.
GBP/USD Price Analysis: Technical outlook
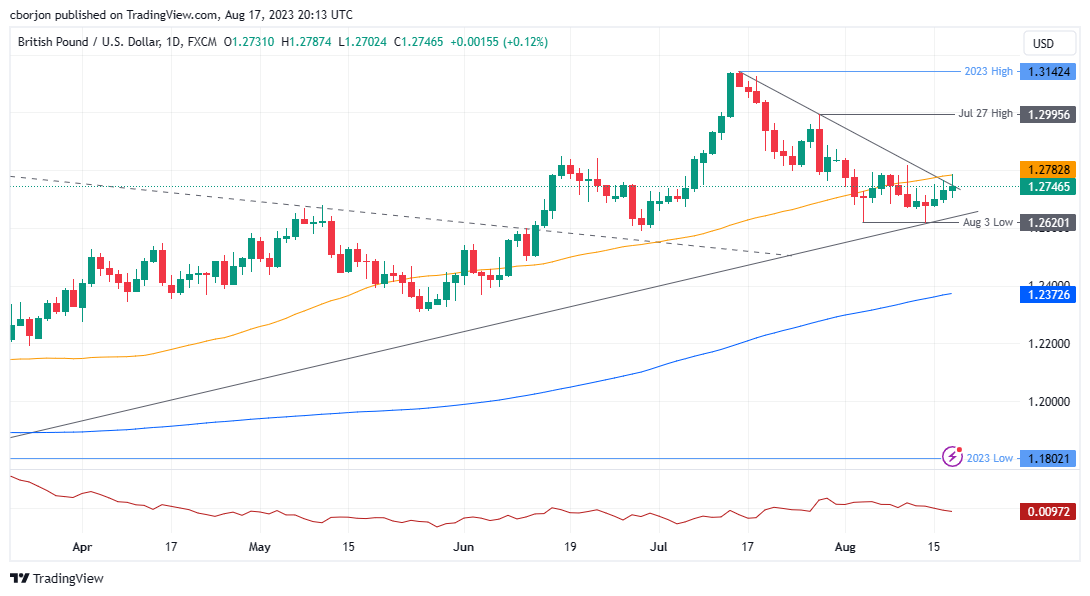
The GBP/USD daily chart portrays the pair bottomed around 1.2620 and remains tilted to the upside but capped by technical indicators. As of writing, the GBP/USD pair remained below a downslope resistance trendline and tested the 50-day Moving Average (DMA) at 1.2782, two levels aggressively defended by sellers. If GBP/USD fails to conquer 1.2800, the path of least resistance could push the price towards the low of the week at 1.2620. Otherwise, if GBP/USD reclaims the 50-DMA, the 1.2800 would be up for grabs.
- Global market sentiment is cautious, with equities declining and bond yields rising, as investors anticipate further monetary tightening by central banks.
- July’s Fed minutes reveal a unanimous decision for a rate hike but growing caution among board members about potential over-tightening.
- US data: Initial Jobless Claims slightly better than expected at 239K; Philadelphia Fed Manufacturing Index for August shows improvement.
- Eurozone reports a trade surplus of €23B, surpassing expectations. Upcoming data includes July’s Harmonized Index of Consumer Prices (HICP).
EUR/USD registers modest losses for the fifth straight day, widening its distance from the 1.0900 figure amid a risk-off impulse spurred by the Federal Reserve (Fed) meeting minutes, as well as woes of China’s economic slowdown.
Federal Reserve minutes and China’s economic slowdown weigh on the pair, while positive US data and EU trade balance provide limited support
The market sentiment remains downbeat, with global equities slumping while bond yields rise. Investors continued to assess that central banks could continue to tighten monetary conditions.
July’s Fed minutes showed the board members raised rates unanimously, even though some are leaning neutral, expressing worries about lifting rates too high. Most policymakers still see upside inflation risks, yet officials are taking a cautious approach to setting monetary policy, as they emphasized they would consider the “totality” of data to “help clarify the extent to which the disinflation process was continuing.”
Following Wednesday’s data release, the Atlanta Fed GDPNow model portrays the US Q3 2023 GDP at around 5.8%, up from 4.1% on August 8. Given those developments, the swaps market has shown increased chances for a Federal Reserve 25 bps rate hike at the upcoming November meeting.
On Thursday, the US Bureau of Labor Statistics (BLS) showed the last week’s Initial Jobless Claims, which fell to 239K, a tick lower than forecasts of 240K. At the same, the Philadelphia Fed Manufacturing Index for August improved, with numbers hitting 12, exceeding the -10 contraction expected by analysts.
On the Eurozone (EU) front, the Trade Balance depicted a surplus of €23B, exceeding estimates of €18.3B. Before the weekend, the EU would report the Harmonized Index of Consumer Prices (HICP) for July, with estimates of 5.3% YoY and 0.3% MoM. Core HICP is expected to remain sticky at 5.5% YoY.
EUR/USD Price Analysis: Technical outlook
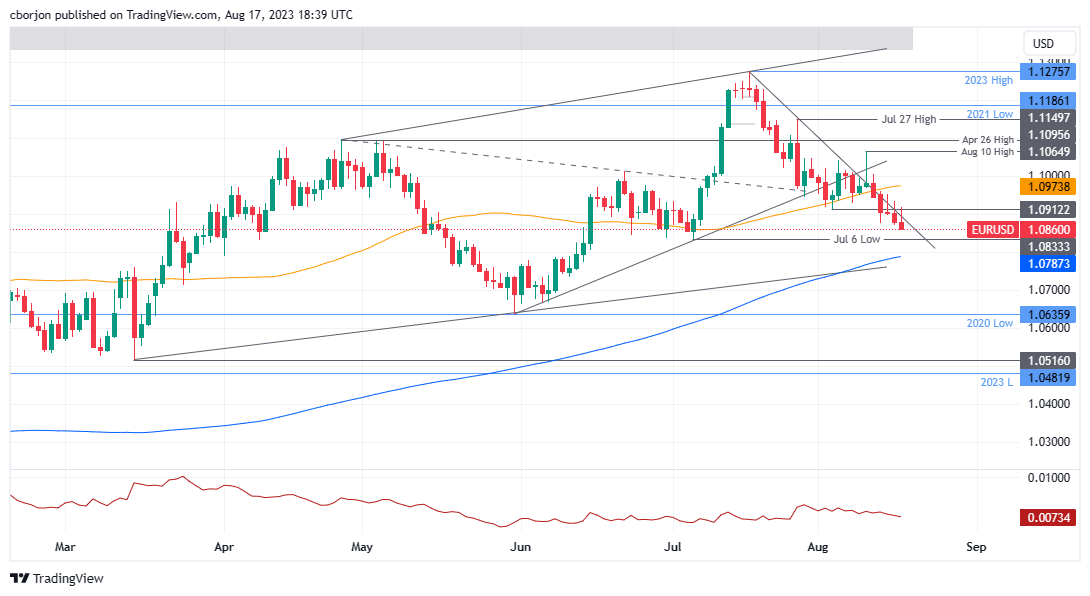
EURUSD is set to test the July 6 daily low of 1.0833 in the near term. Still, the EUR/USD 1.0800 figure should be up for grabs, followed by the 200-day Moving Average (DMA) at 1.0787. further downside is expected below the latter, as the 1.0700 psychological level would be up next. Conversely, the EUR/USD first resistance emerges at 1.0900, followed by the 50-DMA at 1.0974.
- XAG/USD surged to a daily high of $23.00 and settled near $22.60.
- DXY rose to its highest level since January at 103.60.
- The US 10-year benchmark Treasury yield rose to October 2022 highs.
On Thursday, the XAG/USD seems to be correcting oversold conditions rising to $23.00 and settling at $22.60. That said, hawkish bets on the Federal Reserve (Fed) are fuelling US treasury bond yields, limiting Silver’s upside.
Following the release of the Federal Open Market Committee (FOMC) minutes from the July meeting, markets are confident that the Fed will hike in September and November. In line with that, the minutes showed that the members were concerned with the upside risks of inflation and left the door open for another hike.
Those remarks fueled US bond yields, often seen as the opportunity cost of holding non-yielding metals. The US 10-year bond rate to its highest level since October 2022 at 4.28%, while the other shorter-term yields stand at monthly highs with the 2 and 5-year rates at 4.98% and 4.46%, respectively. As for now, according to the CME FedWatch tool, investors discount that the Fed will pause in September and then bet on 40% odds of a 25 basis point (bps) hike in November.
XAG/USD Levels to watch
The technical analysis of the daily chart points to a neutral to a bearish outlook for XAG/USD, indicating the potential for further bearish movement. The Relative Strength Index (RSI) indicates a neutral stance below its midline, displaying a flat slope in the negative territory, while the Moving Average Convergence (MACD) shows stagnant red bars. Furthermore, the pair is below the 20,100 and 200-day Simple Moving Averages (SMAs), suggesting that the bears are firmly in control of the bigger picture.
Support levels: $22.50, $22.30, $22.00.
Resistance levels: $22.80, $23.00, $23.15.
XAG/USD Daily chart
-638278937619423565.png)
- Global market sentiment remains cautious due to China’s economic slowdown, evident from recent data on retail sales, exports, and property market turmoil.
- The recent Federal Reserve minutes show a unanimous decision for a rate hike, but there’s a growing divide among board members on the pace of future hikes.
- USD/MXN dynamics are currently influenced more by the US Dollar and global sentiment, with the pair seeming to stabilize between 16.6000 and 17.0000.
The Mexican Peso (MXN) appreciates against the US Dollar (USD) after hitting a weekly low of 17.2073. However, the USD/MXN retraced below the 17.1000 figure despite US bond yields advance and global economic woes and expectations of additional tightening. The USD/MXN is trading at 17.0884, down 0.27%.
USD/MXN dips below 17.1000 despite rising US bond yields and expectations of further Fed tightening
Market sentiment is still depressed amid China’s ongoing economic slowdown, as shown by data. Retail sales slowing, exports falling, and turmoil in its property market keeps investors nervous. The Fed’s latest meeting minutes were revealed, tilted hawkish amid growing division amongst its board members.
The most recent Federal Reserve minutes indicated that board members uniformly approved a rate increase. However, a growing trend of more neutral voices expressing concerns about the potential of pushing rates excessively. This sentiment persists even though most policymakers perceive inflation risks as leaning toward the upside. Nevertheless, the officials are adopting a prudent stance when shaping monetary policy. This is evident as they emphasized their commitment to assessing the “totality” of data before making any decisions.
Still, chances for additional tightening in November increased compared to a week ago, as shown by the CME FedWatch Tool, with odds at 34.6%, above last week’s 27.8%.
Data-wise, the US Department of Labor (DoL) revealed the last week’s Initial Jobless Claims, which came at 239K below estimates of 240K. At the same, the Philadelphia Fed Manufacturing Index for August improved, with numbers hitting 12, exceeding the -10 contraction expected by analysts.
The lack of economic data on the Mexican front keeps USD/MXN traders adrift to US Dollar (USD) dynamics and market sentiment. However, it appears the pair had found a bottom at around the 16.6000/17.0000 range, awaiting a fresh catalyst.
USD/MXN Price Analysis: Technical outlook
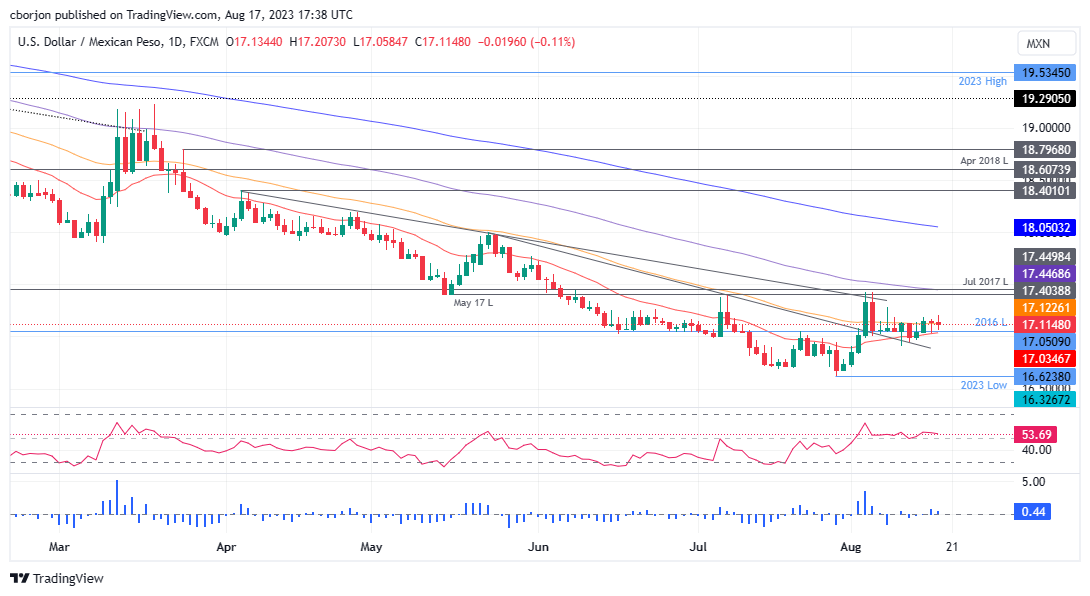
The USD/MXN daily chart portrays the pair oscillating around 17.0000, with the 20-day Moving Average (DMA) acting as support at 17.0337, while the 50-day Moving Average (DMA) stands as resistance at 17.1222. A breach of the latter, and the USD/MXN would rally towards the 100-DMA at 17.4466m ahead of the psychological 17.5000 figure. Conversely, a daily close below 17.0000 would expose the YTD low of 16.6238.
- USD/CHF fell below 0.8800 and hit a daily low of 0.8760.
- FOMC minutes from the July meeting left the door open for another hike.
- Rising US yields limit the downside for the USD.
On Thursday, the USD/CHF lost ground as the USD seemed to be consolidating gains. The USD DXY index rose to its highest level since January at 103.60, mainly driven by hawkish bets on the Federal Reserve (Fed) and rising US yields. On the CHF’s side, investors await Friday’s Industrial Production figures from Q2.
The strength of the USD is propelled by the rising US yields due to investors betting on the Fed hiking at least once more in this cycle. The US 10-year bond yield surged to its highest level since October 2022, standing at 4.28%, and the 2 and 5-year yields have also experienced upward movements, hitting monthly peaks of 4.95% and 4.40%, respectively.
In line with that, the Federal Open Market Committee (FOMC) minutes showed that members are concerned with a hot labour market threatening inflation, leaving the door open to another hike. That said, the Jobless Claims for the second week of August from the US rose to 239,000 compared to the projected 240,000, marking a decline from the preceding weekly figure of 250,000. As for now, markets are confident that the Fed won’t hike in September, but the probabilities of an increase in November rise to nearly 40%, according to the CME FedWatch tool.
USD/CHF Levels to watch
Analysing the daily chart, USD/CHF exhibits signs of bullish exhaustion, contributing to a neutral to bearish technical perspective. The Relative Strength Index (RSI) maintains a negative slope above its midline, while the Moving Average Convergence Divergence (MACD) displays fading green bars. Additionally, the pair is above the 20-day Simple Moving Average (SMA), but below the 100 and 200-day Simple Moving Average (SMAs), indicating that the bulls aren't done yet and that the outlook is still positive for the short term.
Support levels: 0.8760, 0.8750, 0.8725 (20-day SMA).
Resistance levels: 0.8800, 0.8815, 0.8830.
USD/CHF Daily chart
-638278893625111199.png)
- NZD/USD trades flat near 0.5930 after a consecutive week of losses.
- US Treasury yields are edging higher after hawkish FOMC minutes.
- Governor Orr from the RBNZ commented that a mild recession is needed.
On Thursday, the NZD/USD traded with mild losses near 0.5930. On the one hand, the US reported Jobless Claims data from the second week of August and seemed to get traction on the back of higher US yields after the release of the Federal Open Market Committee (FOMC) minutes from the July meeting. On the other hand, the NZD trades weak against most of its rivals amid the spooky outlook given by the Reserve Bank of New Zealand’s Governor.
On the data front, Jobless Claims for the second week of August came in lower than expected at 239,000 vs the 240,000 expected and lower from the previous weekly reading of 250,000. In addition, the Philadelphia Federal Reserve’s (Fed) manufacturing index came in higher than expected at 12 vs the expectations of -10.
What is driving to the upside, the USD is the US 10-year bond yield rising to its highest level since October 2022 at 4.28% while the other othe shorter-term yields stand at monthly highs with the 2 and 5-year rates at 4.95% and 4.40%, respectively. This could be attributed to higher tightening expectations for the Fed as the US economy holds firm, and the Federal Open Market Committee (FOMC) minutes from the July meeting showed that members were concerned with the upside risks of inflation and left the door open to another hike.
On the Kiwi’s side, the RBNZ held rates on Wednesday at 5.5%, as expected. Regarding forward guidance, the statement mentioned that the decisions would be data-driven and seem to have left the door open to another hike if inflation resurges. On the negative side, Governor Orr commented that a mild recession “is the bare minimum we need to see” to bring back inflation to target. In that sense, this negative outlook seems to be weighing on the NZD.
NZD/USD Levels to watch
The current technical outlook for NZD/USD is bearish but as indicators are in oversold territory, it suggests a potential short-term technical recovery is on the horizon as buying pressure might increase. Exhibiting a pronounced downward trend below its midline, the Relative Strength Index (RSI) points to significant oversold conditions, while the Moving Average Convergence (MACD) histogram exhibits rising red bars. Also, the pair is below the 20,100 and 200-day Simple Moving Averages (SMAs), suggesting that the bears are firmly in control of the bigger picture. Additionally, the four-hour chart displays bearish indicators, highlighting a solid selling momentum and a clear bear dominance over the buyers.
Support levels: 0.5930, 0.5910, 0.5900.
Resistance levels: 0.6000, 0.6020, 0.6050.
NZD/USD Daily chart
-638278852361687281.png)
- USD/JPY hits YTD highs of 145.56 but trades softer at 146.12, marking a 0.15% decline.
- Economic concerns in China, including a slowdown in consumption, property market troubles, and shadow banking issues, weigh on global sentiment.
- US Initial Jobless Claims are slightly better than expected, while the Philadelphia Fed Manufacturing Index shows improvement.
USD/JPY trades with a softer tone after hitting year-to-date (YTD) highs of 145.56 amid UST bond yields climbing as investors speculate further tightening by the US Federal Reserve (Fed) lies ahead. Global bond yields advanced, but the greenback failed to gain traction. The USD/JPY is trading at 146.12, with losses of 0.15%.
Japanese Yen recovers as investors speculate on the Fed's next moves and China's economic slowdown
The Japanese Yen (JPY) is recovering ground amid risk-aversion, spurred by investors expecting the Fed could skip from hiking rates in September. Still, chances for additional tightening in November increased compared to a week ago, as shown by the CME FedWatch Tool, with odds at 34.6%, above last week’s 27.8%.
The latest Fed minutes showed the board members unanimously raised rates, despite voices becoming more neutral and worried about pushing rates too far, even though most policymakers still see upside inflation risks. Yet officials are taking a cautious approach to setting monetary policy, as they emphasized they would consider the “totality” of data to “help clarify the extent to which the disinflation process was continuing.”
Another reason that boosted the JPY is the ongoing economic deceleration in China. Recent data from the second-largest economy showed that consumption is slowing down, its exports are taking a hit, and trouble In the property market spurred outflows from Chinese equities. Additionally, China’s shadow bank’s $3 trillion turmoil continues to weigh on its economy.
Aside from this, the US Department of Labor (DoL) revealed the last week’s Initial Jobless Claims, which came at 239K below estimates of 240K. At the same, the Philadelphia Fed Manufacturing Index for August improved, with numbers hitting 12, exceeding the -10 contraction expected by analysts.
The Japanese docket showed that exports fell for the first time since 2021, sparking economic worries. Exports fell -0.3% in July YoY, above s forecast for a -0.8% plunge, but trailed June’s 1.5% rise. USD/JPY focus shifts towards releasing inflation data, with the Consumer Price Index (CPI) for July expected at 2.5% and core CPI at 3.1%.
USD/JPY Price Analysis: Technical outlook
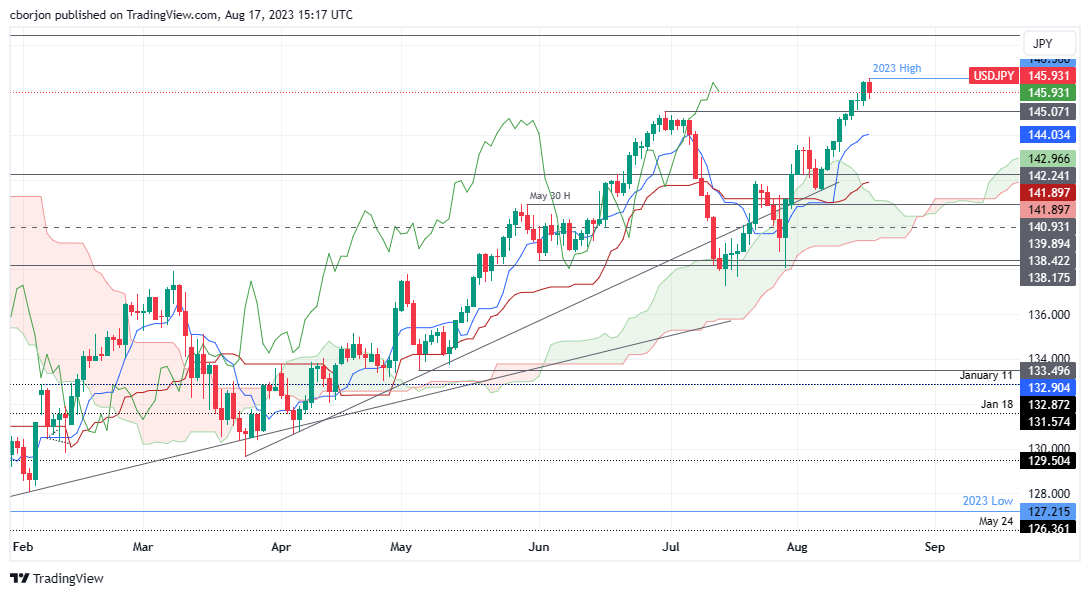
After reaching YTD highs, the USD/JPY retraced somewhat, towards the 146.00 mark, but remained above the latter, keeping buyers hopeful of higher prices. If USD/JPY achieves a daily close below 146.00, that will trigger a correction, with the June 30 inflection high turned support at 145.07, ahead of the figure. Up next, the Tenkan-Sen emerges as the next support at 144.03. Conversely, if USD/JPY stays bullish, the 147.00 mark would be next, followed by the November 3 daily high at 148.45.
Economists at ANZ Bank outline shifts in US economic expectations and their impact on the Gold outlook.
Macro signals are capping upside of Gold prices
The first shift is the ‘Goldilocks’ scenario. The US economy remains resilient as evidenced by strong economic data. As a result, the market has pushed out the possibility of a hard landing. This diminishes safe haven flows for Gold.
The second economic shift is the higher-for-longer interest rate regime. Our baseline forecast is rates are at their peak, but we do not rule out the possibility of one more rate hike, depending on the data. Either way, real rates are likely to lift amid easing inflation. As a non-yielding asset Gold inversely tracks US real interest rates.
Overall, we see short-term headwinds to the Gold price. However, our medium-and long-term view on Gold remains positive. We shift our price target of $2,100 to the end of Q1 2024.
USD/CNY has ended its high-level consolidation phase for a resumption of its core uptrend, in the view of analysts at Credit Suisse.
USD/CNY to test the 7.3274 high of 2022
USD/CNY has been well supported by its rising 55-DMA and the break above 7.2680 suggests its high-level consolidation phase is over and core uptrend resumed.
We stay bullish and look for a test of the 7.3274 high of 2022 next, then a break above here for strength to our core target of resistance at 7.47/7.50.
Ulrich Leuchtmann, Head of FX and Commodity Research, has had a lot of calls enquiring about the reasons why Emerging Market (EM) currencies are doing badly at present. In his view, it simply is not true that we see EM weakness.
EM weakness? What EM weakness?
Those who think they are seeing EM weakness are confusing USD strength with EM weakness. This analysis is distorted simply because currencies are quoted against the Dollar. Everything the USD prices of the EM currencies are doing is allocated to the EM currencies and nothing to the Dollar. If one uses a more suitable fix point (in this case the mean of the other G10 currencies) this mistake is easier to avoid.
So, let me repeat slowly for everyone to take on board: there is no EM weakness at present. That does not mean that individual currencies might not be easing due to idiosyncratic reasons, but EMs as a whole are doing quite well. Just not as well as Greenback.
- Silver price climbs to near $23.00 as the US Dollar remains subdued.
- Investors hope that the impact of higher interest rates by the Fed will be lower than keeping them higher for a longer period.
- Silver price delivers a breakout of the Falling Wedge chart pattern.
Silver price (XAG/USD) extends upside sharply to near the crucial resistance of $23.00 as the upside momentum in the US Dollar Index (DXY) fades after failing to sustain above 103.50. The white metal strengthens as investors hope that the impact of higher interest rates by the Federal Reserve (Fed) will be lower than keeping them higher for a longer period.
S&P500 opens on a mildly positive note as investors’ risk appetite improves. Overall market mood is still cautious as the United States inflation outlook turns extremely sticky due to stronger wage growth. The 10-year US Treasury yields continue to trade around 4.30% as robust consumer spending momentum elevates upside risks to inflation.
The US Dollar Index (DXY) finds some support near 103.00 as the US Department of Labor reported lower-than-expected jobless claims. Individuals claiming jobless benefits for the first time dropped to 239K vs. expectations of 240K and the former release of 250K for the week ending August 11.
Meanwhile, Federal Open Market Committee (FOMC) minutes released on Wednesday delivered a clear message that the inflationary environment is still uncertain and further policy action will be more dependent on the incoming data.
Silver technical analysis
Silver price delivers a breakout of the Falling Wedge chart pattern formed on an hourly scale. A breakout of the aforementioned chart pattern results in a bullish reversal. Silver price climbs above the 50-period Exponential Moving Average (EMA) around $22.63.
A break by the Relative Strength Index (RSI) (14) above 60.00 will activate the bullish momentum.
Silver hourly chart
-638278786940438151.png)
Platinum fell below $900 recently. Economists at ANZ Bank analyze the metal’s outlook.
Platinum looks inexpensive
We believe this heavy sell-off makes its valuation cheap against constructive fundamentals. Investors have liquidated nearly 140koz of ETF holdings since May amid a broad sell-off in bullion space.
Sustained power outages in South Africa, which contributes 75% of global mine supply, pose a downside risk for mine supply recovery this year.
The demand is supported by the auto sector and emerging use as an electrolyser in hydrogen fuel. Platinum is also set to benefit from the accelerated pace of energy transition with hydrogen fuel and Fuel Cell Electric Vehicles (FCEV). This could be structural demand support for Platinum.
The Pound rose after the publication of inflation data on Wednesday. Economists at Commerzbank analyze GBP outlook.
The BoE will have to deliver
Inflation remained above expectations. Moreover, the core rate remained unchanged at 6.9%. That increases the likelihood that the BoE will hike key rates another two times until year-end. It might have to take further action in 2024 as well.
The market is confident that the BoE will take action, but it will have to deliver.
If, over the coming weeks, the market gets the impression that the BoE might hesitate after all to fight inflation risks in order not to dampen the economy too much, that would be disastrous for Sterling.
AUD/USD touched levels below 0.64 after the release of the softer-than-expected Australian July labour report. Economists at Rabobank analyze Aussie outlook.
Under pressure
It is possible that the jobs report is showing signs of seasonal volatility and it remains the case that policymakers are still set to be very mindful of inflationary risks. That said, the bigger picture is dominated by weakness in China’s economy. On the back of that, the AUD/USD looks vulnerable.
There is risk of further dips in the value of AUD/USD and we have revised down our forecast for AUD/USD to 0.62 on a three-month view. That said, we see the relative strength of Australian fundamentals as suggesting a recovery back to 0.70 on a 12-month view. This assumes an improved outlook for Chinese growth next year.
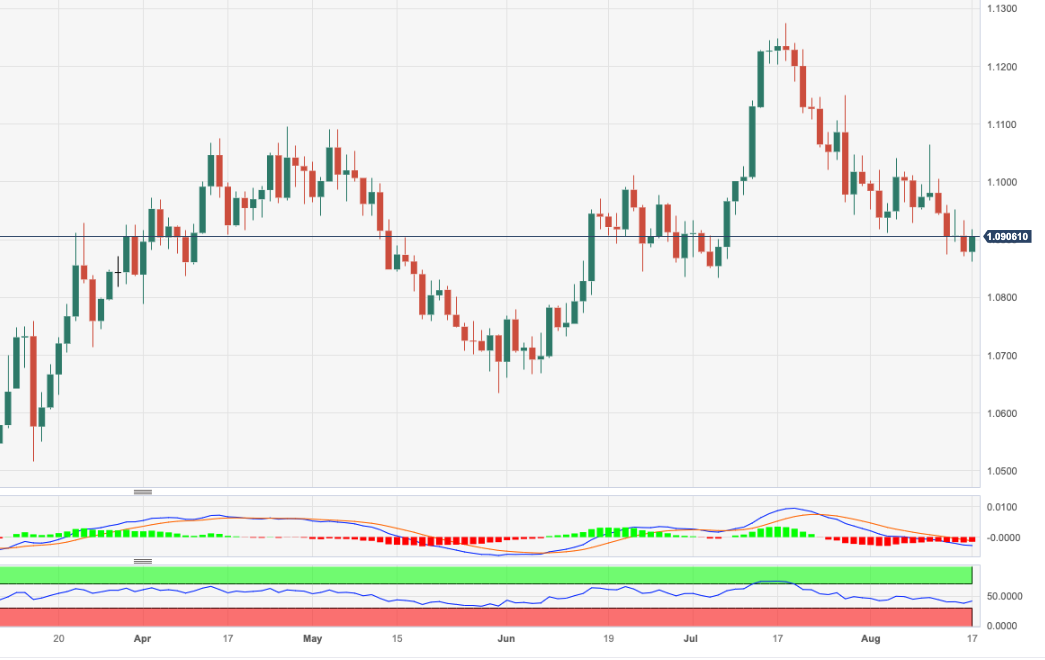
- EUR/USD regains traction after bottoming out near 1.0860.
- Further recovery should initially target the mid-1.0900s.
EUR/USD reverses four consecutive sessions of losses and regains the area beyond 1.0900 the figure on Thursday.
If the rebound gathers extra steam, it could encourage the pair to dispute the interim 55-day SMA at 1.0951 prior to the weekly peak at 1.1065 (August 10). Further north from here comes the weekly high of 1.1149 (July 27). Once this region is cleared, the pair’s downside pressure is expected to mitigate.
Looking at the longer run, the positive view remains unchanged while above the 200-day SMA, today at 1.0787.
EUR/USD daily chart
NOK is stronger after the Norges Bank announcement. Economists at ING remain constructive about a broad-based rally.
The domestic backdrop continues to improve for NOK
External factors are set to remain dominant for the illiquid NOK, but a period of stabilisation in risk sentiment can make domestic drivers emerge and dramatically increase the attractiveness of the Krone.
We remain constructive about a broad-based rally in the undervalued NOK before the end of the year and in early 2024, and the commitment to more tightening by Norges Bank likely limits the scope of any large corrections.
We expect the 11.00 level in EUR/NOK to be tested before the end of the year.
The US Dollar took another leg stronger after the release of the minutes from the FOMC meeting in July. Economists at MUFG Bank analyze USD strength and its implications for the USD/JPY pair.
The short-term bias remains favourable for the Dollar
The short-term bias remains favourable for the Dollar and the minutes and the data support that view.
The further strengthening of the Dollar has brought USD/JPY into the danger zone for intervention to halt the move higher. Resistance to a higher USD/JPY could at least involve allowing the 10-year JGB yield to drift further higher. You cannot fight a weaker Yen and higher yields in a credible manner.
From an intra-day low on 28th July, USD/JPY is 8 big figures higher so this move is of a scale that could justify action.
- USD/CAD corrects to near 1.3500, following the footprints of the US Dollar.
- Investors seem confident that the Fed will not raise interest rates further despite resilience in the US economy.
- USD/CAD trades in a Rising Channel pattern in which each pullback is considered buying opportunity.
The USD/CAD pair finds selling pressure to near 1.3552 after a three-day winning spell and corrects to near the psychological support of 1.3500. The Loonie asset faces pressure amid a correction in the US Dollar Index (DXY) as the risk-aversion theme starts fading.
S&P500 futures generate some gains in the European session as investors seem confident that the Federal Reserve (Fed) will not raise interest rates further despite resilience in the United States economy. As per the CME FedWatch Tool, more than 88% of chances are in favor of a steady interest rate decision for the September policy.
The USD Index extends correction to near 103.20 as the US Department of Labor reported a decline in individuals claiming jobless benefits for the first time to 239K vs. expectations of 240K and the former release of 250K for the week ending August 11.
USD/CAD trades in a Rising Channel chart pattern on an hourly scale in which each pullback is considered as buying opportunities by the market participants. The Loonie asset has corrected to near the immediate support plotted from August 8 high around 1.3500. Also, the upward-sloping 50-period Exponential Moving Average (EMA) at 1.3505 is providing support to the US Dollar bulls.
The Relative Strength Index (RSI) (14) seems edgy around 40.00. A breakdown below the same will activate the bearish impulse.
Going forward, a decisive break above the intraday high at 1.3552 will drive the major toward June high at 1.3585, followed by May high at 1.3650.
In an alternate scenario, a downside move below July 18 high at 1.3288 would drag the asset toward July 27 low around 1.3160 and July 14 low marginally below 1.3100.
USD/CAD four-hour chart
-638278738779041985.png)
- Philadelphia Fed Manufacturing Index rose into positive territory for the first time since August 2022.
- US Dollar Index stays in the red despite the upbeat data.
The diffusion index for current general activity of the Federal Reserve Bank of Philadelphia's Manufacturing Survey improved sharply to 12 in August from -13.5 in July. This reading marked the first positive reading in a year and came in much better than the market expectation of -10.
"The index for new orders — which had been negative for 14 consecutive months — climbed 32 points to 16.0, and the shipments index rose 18 points to 5.7," the Philadelphia Fed noted in its press release. "On balance, the firms reported a decline in employment, and the employment index moved down 5 points to -6.0."
Market reaction
The US Dollar struggles to find demand despite the upbeat data. As of writing, the US Dollar Index was down 0.25% on the day at 103.20.
- Initial Jobless Claims in the US decreased by 11,000 in the week ending August 12.
- US Dollar Index stays in negative territory slighty above 103.00.
There were 239,000 initial jobless claims in the week ending August 12, the weekly data published by the US Department of Labor (DOL) showed on Thursday. This print followed the previous week's print of 250,000 (revised from 248,000) and came in slightly below the market expectation of 240,000.
Further details of the publication revealed that the advance seasonally adjusted insured unemployment rate was 1.2% and the 4-week moving average was 234,250, an increase of 2,750 previous week's revised average.
"The advance number for seasonally adjusted insured unemployment during the week ending August 5 was 1,716,000, an increase of 32,000 from the previous week's unrevised level of 1,684,000," the DOL further noted in its publication.
Market reaction
The US Dollar stays on the back foot after this report, with the US Dollar Index losing 0.35% on the day slightly above 103.00.
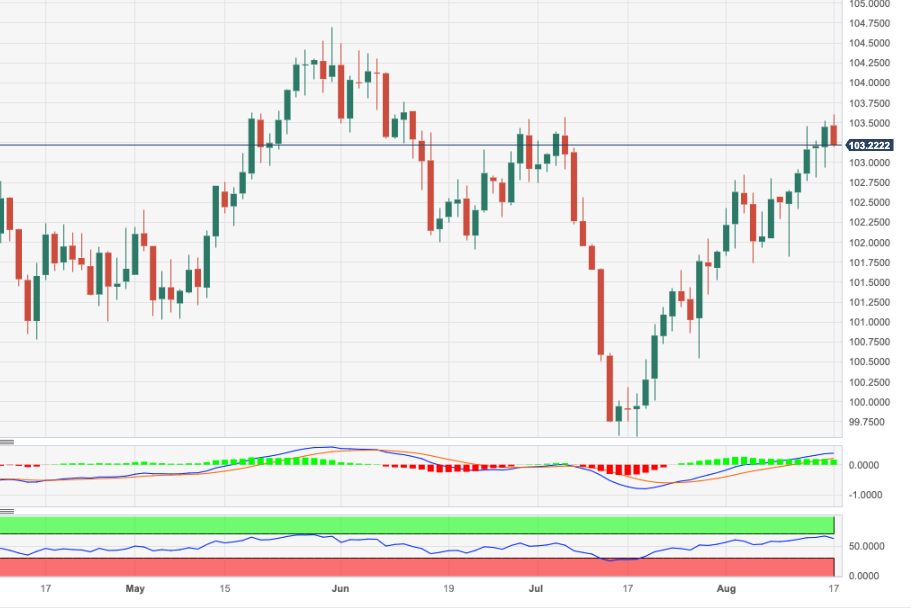
- DXY faces some headwinds soon after hitting fresh tops near 103.60.
- Next on the upside emerges the May high around 104.70.
DXY now succumbs to some renewed selling pressure and abandons the area of multi-week highs around 103.60 on Thursday.
In the meantime, the index maintains the bullish view well in place with the immediate hurdle now emerging at the May top of 104.69 (May 31) ahead of the 2023 peak of 105.88 (March 8).
It is worth noting that this area of monthly highs appears reinforced by the key 200-day SMA, today at 103.21.
Looking at the broader picture, while below the latter, the outlook for the index is expected to remain negative.
DXY daily chart
GBP/USD gains some technical momentum above 1.2725 trend resistance, analysts at Scotiabank report.
1.2725 should now provide some intraday support
Solid intraday gains for the GBP off the early session low are putting a positive spin on the short-term charts.
The Pound is trading above short-term bear trend resistance at 1.2725 (off the mid-July high) which should now provide some intraday support. Solid support noted at 1.2620/1.2630 noted previously sets up a potential double bottom which would be triggered by gains through the neckline at 1.2810 (for a measured move rally to 1.3010/1.3020).
USD mixed in thin, choppy trade but yields provide support, economists at Scotiabank report.
USD supported by rising yields
Higher term yields are working in the USD’s favour, with the 10Y Treasury settling at 4.25% (a new closing high) on Wednesday.
So far today, the USD is trading mixed to marginally lower overall but the US Dollar Index (DXY) is trading above its 200-DMA for the first time in a while which rather tilts risks towards the USD remaining generally strong for now.
- EUR/JPY maintains the side-lined trading in place around 159.00.
- Further range bound appears on the cards in the near term.
EUR/JPY fades part of Wednesday’s advance and trades with mild losses just below the 159.00 yardstick on Thursday.
So far, the emergence of some consolidation seems probable in the very near term ahead of the continuation of the upside. Against that, the immediate target is expected at the round level of 160.00, while the surpass of this level should not see any resistance level of note until the 2008 high at 169.96 (July 23)
So far, the longer term positive outlook for the cross appears favoured while above the 200-day SMA, today at 147.24.
EUR/JPY daily chart
USD/CAD is nearing technical support at 1.3495. Economists at Scotiabank analyze the pair’s outlook.
A minor peak/reversal may be developing
USD/CAD is trading lower in the session and, if the market closed right here, it would be the USD’s biggest intraday loss since the end of July.
The USD has been on a bit of a tear and so we are loath to read too much into intraday losses at the moment. However, short-term price action does suggest a minor peak/reversal may be developing at least on the intraday chart from the mid-1.35 intraday high and spot is challenging short-term trend support at 1.3495 – off the July 31 low.
A clear push under 1.3495 may see USD losses pick up a little more momentum toward the low/mid 1.34s.
- US Dollar price action is mixed this Thursday after a firm three-day rally.
- Markets were caught by surprise from a hawkish FOMC minutes publication.
- The US Dollar Index consolidates near the monthly high.
The US Dollar (USD) is in good shape again this week and is holding cards to close this week again in the green. Markets added some more strength to the Greenback on Wednesday after the publication of the US Federal Reserve (Fed) Minutes from its latest interest-rate increase. Markets were caught by surprise as the minutes showed plenty of members in the FOMC are still seeing upside risks for inflation and consider that more needs to be done (more hikes or rates steady for longer) in order to keep inflation under control.
A few second-tier data points on Thursday could possibly let off some steam from this US Dollar rally. The weekly Jobless Claims could be a game changer as an uptick in unemployment could twist the arm of the Fed and might rather need some easing of the current monetary policy. The Philadelphia Fed Manufacturing Survey is due as well and could confirm current sentiment.
Daily digest: US Dollar taking a breather
- Main headlines this morning are about the US Federal Reserve Minutes from its latest rate decision. The committee sees risk of inflation picking up again and more monetary tightening is needed, a stance that surprised markets.
- Jobless claims are to be published at 12:30 GMT: Initial claims are expected to decline from 248K to 240K, while continuing claims are expected to jump from 1.684M to 1.7M.
- The Philadelphia Fed Manufacturing Survey for August is due as well at 12:30 GMT. Market expectations are still for a contraction, though less firm compared with the previous month. The index is expected to rise slightly from -13.5 to -10.
- The US Treasury will tap the market for a 4-week bill auction.
- Another red day again this Thursday in equity markets. Investors are starting to realise that several major central banks are not done hiking interest rates, which means more bearish pressure on equities and growth. Still, losses seem to be contained and markets could still flip to the green.
- The CME Group FedWatch Tool shows that markets are pricing in an 86.5% chance that the Federal Reserve will keep interest rates unchanged at its meeting in September.
- The benchmark 10-year US Treasury bond yield trades at 4.28%, jumping significantly on the back of the Fed Minutes. The whole yield curve got plotted higher on the back of the statement.
US Dollar Index technical analysis: hold the floor
The US Dollar is taking a small pause at the monthly high in the US Dollar Index (DXY). The Greenback itself is printing overall monthly highs in most major crosses, and even a 6-month high against a few. The Commonwealth and Scandinavian currencies are the biggest losers these past few days.
On the upside, 104.00 is the topside level to head to. The high of July at 103.57 is vital and needs to get a daily close above in order for the DXY to eke out more monthly gains. Should this US Dollar strength persist for the last part of this year, May’s peak at 104.70 could become reality again.
On the downside, several floors are likely to prevent a steep decline in the DXY. The first one is the 200-day Simple Moving Average (SMA) at 103.26. Passing below the 103.00 big figure, some room opens up for a turbulent drop lower. However, around 102.34 both the 55-day and the 100-day SMA are awaiting to catch any falling knives.
What is US Dollar Index (DXY)?
The US Dollar Index, also known as DXY or USDX, is a benchmark index that was established by the US Federal Reserve in 1973. DXY is widely used as a tool measuring the US Dollar (USD) value in global markets. The index is calculated by measuring the US Dollar’s performance against a basket of six foreign currencies, the Euro, the Japanese Yen (JPY), Swedish Krona (SEK), the British Pound (GBP), the Swiss Franc (CHF) and the Canadian Dollar (CAD).
With 57.6%, the Euro has the biggest weight in the index followed by the JPY (13.6%), GBP (11.9%), CAD (9.1%), SEK (4.2%), and CHF (3.6%). Hence, a sharp decline in the EUR/USD pair could help the US Dollar Index rise even if the US Dollar weakens against some of the other currencies in the basket.
EUR/USD gains modestly. Economists at Scotiabank analyze the pair’s outlook.
Potential base developing around the 1.0860/1.0865 area
EUR price action seems to reflect rather thin and choppy trading but there is a hint of a potential base developing around the 1.0860/1.0865 area that might develop a little more lift above 1.0885/1.0890.
There is resistance at 1.0915/1.0920, however, and only EUR/USD gains above 1.0950 would signal short-term strength in the pair from here at this point.
See: EUR/USD should keep hovering around 1.0850/1.0900 – ING
Gold remains under pressure. Economists at Credit Suisse analyze XAU/USD technical outlook.
Gold spotlight turns back to the $1,904/$1,893 key support cluster
Spotlight is back on key support and the 38.2% retracement of the 2022/2023 uptrend, 200-DMA and June low at $1,904/$1,893. We maintain our bias to look for this to hold again, but with a break above $1,947 seen needed to ease the pressure off this support and above $1,988 to clear the way for a retest of major resistance at the $2,063/$2,075 record highs to be seen.
A weekly close below $1,893 though would be seen to mark a more important top to reinforce the longer-term sideways range, and a fall to support next at $1,810/$1,805.
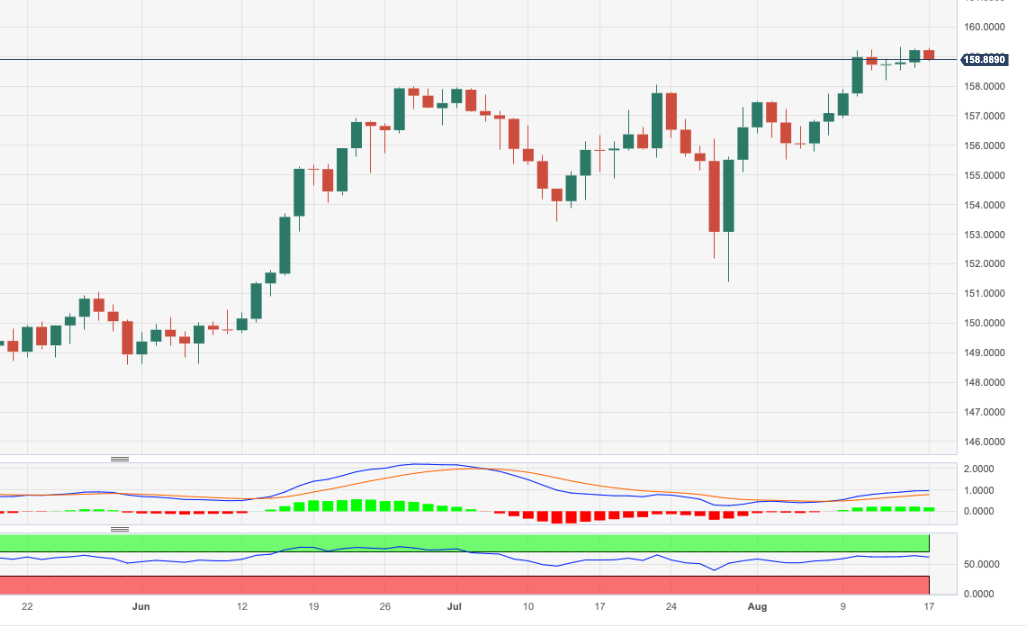
USD/JPY has touched the 146.50 mark. Economists at Commerzbank anlayze JPY outlook ahead of the Japanese inflation data for July.
A rate of inflation well above expectations
The overall rate is likely to remain well above 3%, the core rate excluding energy and fresh food will likely remain well above 4%. There is no sign of improvement, both rates have remained above the target for several quarters, so the development can be seen as ‘sustainable’.
I see the possibility of the Yen weakening further following the publication of the data which in turn will then worry the Ministry of Finance (MOF) and might cause it to move from verbal to actual interventions. The latter will remain without effect in our view as they constitute a ‘leaning against the wind’.
- Natural Gas slides lower on the back of fears for less demand.
- The US Dollar is firmly stronger after FOMC minutes reveal the Fed is still not happy with current inflation levels.
- The overall technical picture still shows a longer-term ascending trend channel.
Natural Gas price declines more than 8% since its opening price on Tuesday with traders pencilling in a weaker demand than currently foreseen. Talks in Australia on wage disputes are still under way and could still bring a compromise soon, an outcome that would lift the current strike in place. Meanwhile, less demand is foreseen locally in the US as the FOMC minutes showed that the US Federal Reserve (Fed) is not happy yet with where inflation is and many policy makers consider that more needs to be done.
A firmly stronger US Dollar weighs on the Natural Gas price as well, making it a double whammy of weaker demand and a stronger Greenback. With the FOMC minutes showing that the Fed wants to do more by either additional interest-rate hikes or keeping current levels steady for longer, a slump in demand could start to trickle into Natural Gas prices. Weaker demand against steady supply means lower prices.
At the time of writing, Natural Gas is trading at $2.719 per MMBtu.
Natural Gas news and market movers
- Traders will be looking forward to the weekly Gas Storage Changes at 14:30 GMT. The US Energy Information Administration will publish the change from the previous 29B. Expectations are for a rise to 34B, which could put more pressure to the downside for Natural Gas prices.
- There is a big divergence between the European and US gas prices. Europe saw a firm spike after headlines that Australian unions went on strike and halted gas deliveries to Europe.
- In some good news for Europe, gas storages in the continent are nearly full. The German stockpile is up to 92%.
- Current weather projections point to an elevated possibility of a cold winter in Europe, which would underpin current gas price levels even as storages are already almost full.
- Gas company ADNOC gas signed a deal with Japan Petroleum Exploration (JAPEX) for a 5-year LNG supply pact worth between $450M and $550M.
- Tropical storm Hilary is on its way to the Baja California peninsula and will be closely monitored as it will grow into a hurricane by Friday.
- Latest FOMC minutes show that the US Federal Reserve is still not happy with where or how inflation is behaving. This could mean that policy makers will either keep interest rates steady for longer or will perform one or two more hikes.
Natural Gas Technical Analysis: longer-term uptrend still intact
Natural Gas has received a beating these past few trading days on Tuesday and Wednesday. With an overall 8% decline since its opening price on Tuesday, it becomes clear that the equilibrium between supply and demand is very fragile and the slightest shift on any side moves the needle in any direction. In this case, the FOMC minutes tripped the markets, which are erasing potential future demand as elevated rates could cap or diminish the usage of Natural Gas.
On the upside, $3 is still the level to watch as the overall ascending trend channel since April is being well respected. Should Natural Gas prices be able to recover, look for a close above $2.935, the high of Tuesday, in order to confirm that demand is picking up again. More upside towards $3 and $3.065 (high of August 9) would be targets or levels to watch.
On the downside, the trend channel is doing its work with a 55-day Simple Moving Average (SMA) at $2.639, which is underpinning the price. In case more downside pressure builds, look for $2.579, which is the lower trend line of the trend channel.
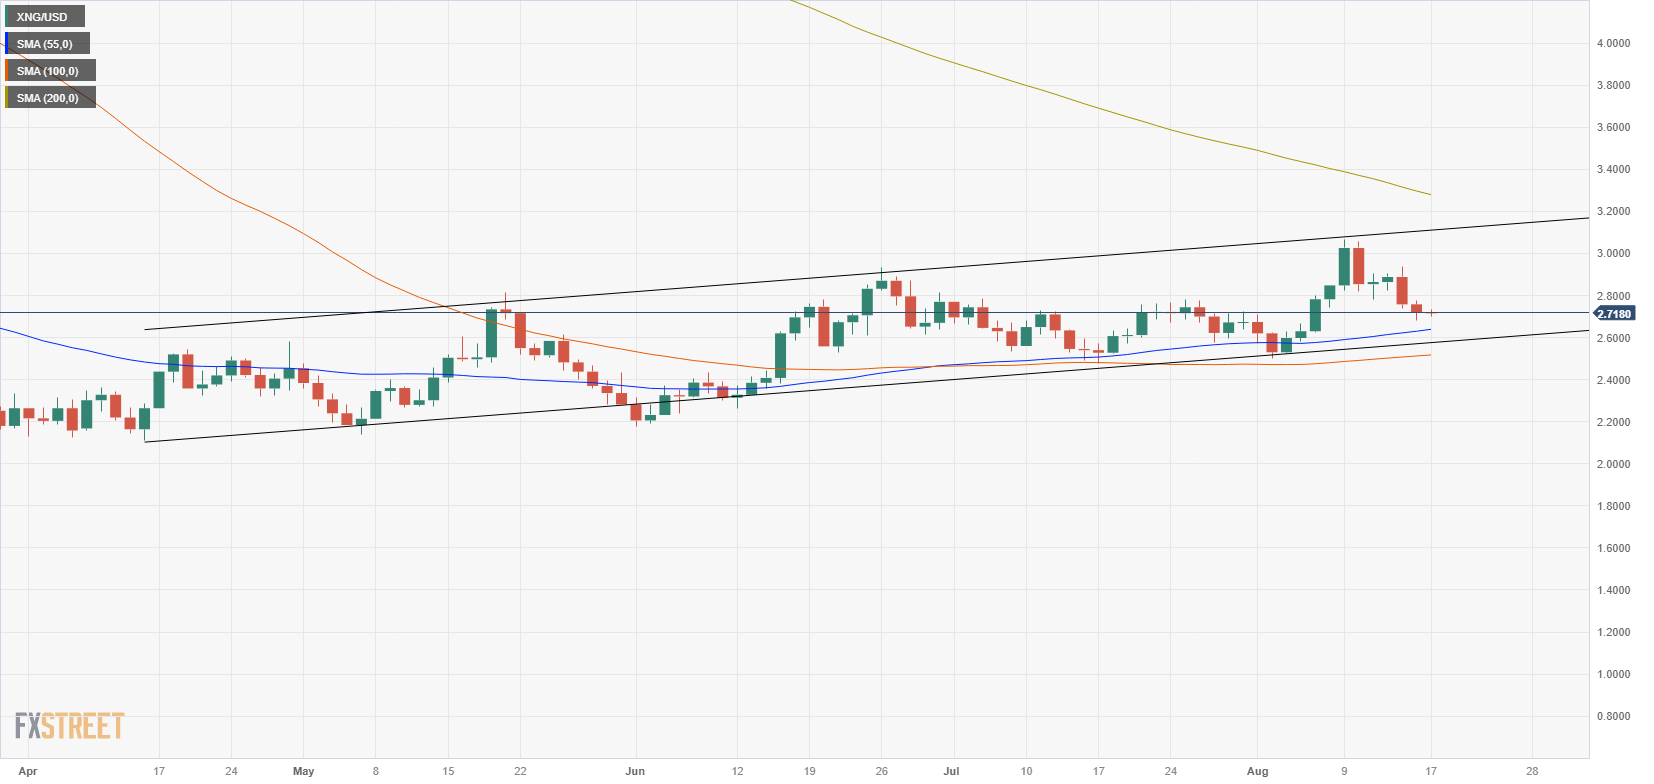
XNG/USD (Daily Chart)
Natural Gas FAQs
What fundamental factors drive the price of Natural Gas?
Supply and demand dynamics are a key factor influencing Natural Gas prices, and are themselves influenced by global economic growth, industrial activity, population growth, production levels, and inventories. The weather impacts Natural Gas prices because more Gas is used during cold winters and hot summers for heating and cooling. Competition from other energy sources impacts prices as consumers may switch to cheaper sources. Geopolitical events are factors as exemplified by the war in Ukraine. Government policies relating to extraction, transportation, and environmental issues also impact prices.
What are the main macroeconomic releases that impact on Natural Gas Prices?
The main economic release influencing Natural Gas prices is the weekly inventory bulletin from the Energy Information Administration (EIA), a US government agency that produces US gas market data. The EIA Gas bulletin usually comes out on Thursday at 14:30 GMT, a day after the EIA publishes its weekly Oil bulletin. Economic data from large consumers of Natural Gas can impact supply and demand, the largest of which include China, Germany and Japan. Natural Gas is primarily priced and traded in US Dollars, thus economic releases impacting the US Dollar are also factors.
How does the US Dollar influence Natural Gas prices?
The US Dollar is the world’s reserve currency and most commodities, including Natural Gas are priced and traded on international markets in US Dollars. As such, the value of the US Dollar is a factor in the price of Natural Gas, because if the Dollar strengthens it means less Dollars are required to buy the same volume of Gas (the price falls), and vice versa if USD strengthens.
- AUD/USD stretches recovery above 0.6400 as investors see more policy support coming from China.
- Overall market sentiment is still bearish and has pushed 10-year US Treasury yields to 4.30%.
- The USD Index prints a fresh two-month high as Fed policymakers remained cautious about significant upside risks to inflation.
The AUD/USD pair extends its recovery above the round-level resistance of 0.6400 in the European session. The Aussie asset manages to challenge the downside bias as investors hope for fresh policy support from the Chinese authority to diminish threats of an economic slowdown prompted by the vulnerable housing sector and poor household demand.
S&P500 futures post some gains in London, portraying an improvement in the risk appetite of the market participants. Nominal improvement in the risk-taking capability of investors is fragile amid rising deflation risks in China. Overall market sentiment is still bearish and has supported US Treasury yields. The returns offered on 10-year US Treasuries jumped to 4.30%.
A sense of optimism among investors has stemmed from expectations of more supportive fiscal policy from the Chinese government, which looks set to deliver a weak growth rate in the July-September quarter. Investment banking firm Morgan Stanley lowered its forecast of China’s Gross Domestic Product (GDP) for the current year to 4.7% vs. an earlier projection of 5.0%.
Policymakers in a Cabinet meeting on Wednesday said China would continue to introduce policies to boost consumption and promote investment, following mounting economic woes with a prolonged property crisis, deflationary pressure, and slower growth in retail sales and industrial output, reported Reuters. The Australian Dollar as a proxy to China’s economic growth capitalizes on the announcement.
Meanwhile, the US Dollar Index (DXY) delivers a lackluster performance after printing a fresh two-month high around 103.60. The strength in the US Dollar came after Federal Reserve (Fed) policymakers remained cautious about significant upside risks to inflation due to upbeat consumer spending and wage growth.
Economists at TD Securities analyze AUD outlook after weaker than expected Australian jobs report.
RBA to stay on hold next month at 4.1%
July jobs report disappointed, with jobs growth at -14.6K contrary to expectations of gains over the month. Full-time jobs took the main hit, down by 24.2K which was partially offset by gains in part-time jobs of +9.6K.
On balance, today's report gives the RBA one more reason to stay on hold next month at 4.1% given the uncertainty over the growth outlook (e.g., weaker China recovery) and broadly balanced inflation risks.
AUD/USD is trading more closely to risk sentiment, commodities weakness and China's narrative and we will watch to see if Aussie closes below the 0.6420 (23.6% Fib) by end-week as there is little support for the AUD till 0.62 (0% Fib) based on the daily over the past year.
The Dollar found some support after the release of July’s FOMC minutes. Economists at ING analyze Greenback’s outlook.
Clear openness to more tightening
The minutes of July’s FOMC policy meeting showed the majority of members kept seeing upside risks to the inflation outlook and left the door open for more tightening. But we think that the encouraging developments on the disinflation side mean the Fed won’t have to hike again and will instead opt for a long pause before cutting in 2024.
The Dollar is enjoying some modest bullish momentum – also helped by more worrying news from China’s real estate sector – but it may be lacking a clear catalyst to break above 104.00 (DXY) before the end of the week.
- NZD/USD marked the low at 0.5903 since November, 2022.
- RBNZ’s decision to keep interest rates unchanged resulted in a weakening of the New Zealand Dollar.
- Investors await US data to gain a clear sight of Fed policy.
NZD/USD continues its losing streak and has marked the low at 0.5903 during the Asian session on Thursday, a level not seen since November, 2022. Currently, the spot trades around 0.5930. Stronger United States (US) data could reinforce the downward pressure in the NZD/USD pair.
On the other side, softer economic data released from New Zealand could support the weakness in the NZD/USD pair. The data showed that Producer Price Index (PPI) - Input declined to -0.2% in the second quarter from 0.0% prior and PPI Output remained consistent at 0.2%, compared to 0.7% as expected.
On Wednesday, the Reserve Bank of New Zealand (RBNZ) maintained the current interest rate at 5.5%. This decision potentially affected the value of the New Zealand Dollar (NZD). Additionally, the NZD/USD pair is facing downward pressure due to China's woes on economic overview. China's economic performance is significant for China-proxy Kiwi, as it is a major trading partner of New Zealand.
US Dollar Index (DXY), which gauges the strength of the US Dollar (USD) against a basket of six major currencies, hovers around 103.40 during the early trades in the European session. Investors aim to gather extra momentum from upcoming US economic indicators to enhance their understanding of the possible interest rate hikes that the US Federal Reserve (Fed) might contemplate during its September meeting. These indicators are anticipated to offer a more distinct view of the situation, aiding investors in assessing the potential course of action by the Fed.
- Gold price refreshes five-month low under $1,900 as US Dollar strengthens.
- Resilience in the United States economy will keep inflationary pressures stubborn.
- Atlanta Fed’s GDPNow forecast model predicts annualized Q3 growth rate of 5.8%.
Gold price (XAU/USD) remains in bearish territory on Thursday as US economic resilience underpins the US Dollar and Treasury yields. The precious metal senses the pain of rising inflation expectations due to robust consumer spending momentum. Federal Reserve (Fed) policymakers noted that while the pace of fresh payroll additions is slow, the Unemployment Rate continues to remain near historic lows and strong wage growth will keep inflation persistent.
In spite of higher borrowing costs and tight credit conditions by United States commercial banks, housing demand, and construction activities expand, and retail demand remains upbeat, which will keep Fed policymakers on their toes. Severe strength in the US Dollar is also backed by declining Gross Domestic Product (GDP) projections for China due to poor demand from households and a vulnerable housing sector.
Daily Digest Market Movers: Gold price awaits weekly jobless claims data
- Gold price finds nominal bets after printing a fresh five-month low around $1,890.00 as Federal Reserve minutes for the July meeting released on Wednesday conveyed that the central bank could raise interest rates further.
- The precious metal faces severe selling pressure amid strength in the US Dollar and higher Treasury yields. The reasoning behind the strength in the Greenback and bond yields is rising upside risks to inflation.
- 10-year US Treasury yields rose sharply to near 4.30% as the Fed remains cautious as the “last mile” of inflation seems persistent.
- In addition to stubborn inflation expectations, the US Dollar is enjoying bids as the Chinese economic outlook remains bleak.
- A rising Unemployment Rate, a slowdown in the housing sector, and weak overall demand demonstrate deflation risks in the Chinese economy, which improves the appeal of the US Dollar as a safe haven.
- Fed Minutes from July’s FOMC meeting conveyed that two policymakers favored an unchanged interest rate decision, while others supported one more interest rate hike.
- A majority of Fed policymakers remained worried about upside risks to inflation, which indicates that the job of achieving price stability is not done yet.
- No signs of victory against inflation indicate that the interest rate policy could be tightened ahead.
- Fed policymakers agreed that the level of uncertainty remained high and that future interest rate decisions would depend on the "totality" of data arriving in "coming months".
- Policymakers said that payroll additions have slowed recently, but the Unemployment Rate remains unchanged and is consistent with the objective of bringing core inflation down to 2%.
- The US economy is quite resilient due to robust consumer spending momentum, which might keep inflation elevated.
- US housing data for July released on Wednesday remained upbeat despite higher borrowing costs. Nuclear homebuilding rose by 3.9% against the forecast of 2.7%. In addition, future construction approvals rose nominally against the contraction recorded in June.
- Apart from that, monthly Industrial Production came out of contraction in June and expanded by 1.0% in July vs. estimates of 0.3%.
- Atlanta Fed’s GDPNow forecast model predicted an annualized growth rate of 5.8% for the third quarter vs. 5.0% estimate earlier. Also, Deutsche Bank increased its estimate for Q3 real Gross Domestic Product (GDP) to 3.1% from the former prediction of 1.5%.
- On Thursday, investors will focus on the weekly Jobless benefits data for the week ending August 11. The economic data is seen at 240K, lower than the previous week’s reading of 248K.
Technical Analysis: Gold price prints fresh five-month low near $1,890
Gold price delivers a fresh swing low, printing a fresh five-month low at $1,889.60 as upside risks to inflation grow amid resilience in the US economy. The precious metal trades below the 200-day Exponential Moving Average (EMA) for the third straight trading session, suggesting that bears have an upper hand. Deviation between the declining 20 and 50-day EMAs is widening further, indicating that the bearish impulse is strengthening.
Fed FAQs
What does the Federal Reserve do, how does it impact the US Dollar?
Monetary policy in the US is shaped by the Federal Reserve (Fed). The Fed has two mandates: to achieve price stability and foster full employment. Its primary tool to achieve these goals is by adjusting interest rates.
When prices are rising too quickly and inflation is above the Fed’s 2% target, it raises interest rates, increasing borrowing costs throughout the economy. This results in a stronger US Dollar (USD) as it makes the US a more attractive place for international investors to park their money.
When inflation falls below 2% or the Unemployment Rate is too high, the Fed may lower interest rates to encourage borrowing, which weighs on the Greenback.
How often does the Fed hold monetary policy meetings?
The Federal Reserve (Fed) holds eight policy meetings a year, where the Federal Open Market Committee (FOMC) assesses economic conditions and makes monetary policy decisions.
The FOMC is attended by twelve Fed officials – the seven members of the Board of Governors, the president of the Federal Reserve Bank of New York, and four of the remaining eleven regional Reserve Bank presidents, who serve one-year terms on a rotating basis.
What is Quantitative Easing (QE) and how does it impact USD?
In extreme situations, the Federal Reserve may resort to a policy named Quantitative Easing (QE). QE is the process by which the Fed substantially increases the flow of credit in a stuck financial system.
It is a non-standard policy measure used during crises or when inflation is extremely low. It was the Fed’s weapon of choice during the Great Financial Crisis in 2008. It involves the Fed printing more Dollars and using them to buy high grade bonds from financial institutions. QE usually weakens the US Dollar.
What is Quantitative Tightening (QT) and how does it impact the US Dollar?
Quantitative tightening (QT) is the reverse process of QE, whereby the Federal Reserve stops buying bonds from financial institutions and does not reinvest the principal from the bonds it holds maturing, to purchase new bonds. It is usually positive for the value of the US Dollar.
The People’s Bank of China (PBOC) said in its second-quarter monetary policy report published on Thursday, it “will resolutely prevent over-adjustment risks of Yuan exchange rate.”
Additional takeaways
Prudent monetary policy will be precise and forceful.
Will keep liquidity reasonably ample.
Will keep Yuan exchange rate basically stable.
Will fend off systemic financial risks.
Will adjust, optimize property policies in a timely manner.
Will keep prices basicially stable.
Will give full play of finance in promoting consumption, stabillizing investment, expanding domestic demand.
Related reads
- USD/CNH stays on the way to refresh record high even as China banks, PBoC defend Yuan
- CNY could face more headwinds over the near term – HSBC
Economists at Société Générale expect Bank Indonesia to keep the policy rate unchanged at 5.75% in its monetary policy meeting next week and see upside risks for the USD/IDR pair.
BI likely to wait for the Fed
Bank Indonesia looks set to maintain the policy rate unchanged in the upcoming meeting.
The sensitivity of FX to interest rate differentials could progressively increase and especially in the context of Bank Indonesia staying pat and the Fed remaining hawkish.
In the near term, upside risks to the USD/IDR are likely to persist.
Economists at Rabobank analyze Fed policy outlook following the minutes of the FOMC meeting on July 25-26.
There is a wide range of opinions in the Committee
The minutes of the July 25-26 meeting of the FOMC reveal that there is a wide range of opinions in the Committee. A couple of participants actually favored leaving the target range for the federal funds rate unchanged in July. At the same time, a large majority in the FOMC sees upside risks to inflation, which would require further tightening after July.
The minutes confirm the data dependence indicated by Powell during the post-meeting press conference on July 26. According to the minutes, participants expected that the data arriving in the coming months would help clarify the extent to which the disinflation process was continuing.
Looking ahead, we still expect the FOMC to remain on hold for the remainder of the year as core inflation continues to decline gradually and the economy deteriorates in the second half of the year. The risk to our baseline forecast is still to the upside if core inflation fails to decline further or the economy remains resilient through the end of the year.
- GBP/JPY pulls back from a multi-year peak amid reviving demand for the safe-haven JPY.
- The BoJ’s dovish stance should cap gains for the JPY and limit the downside for the cross.
- Bets for more BoE rate hikes suggest that the path of least resistance remains to the upside.
The GBP/JPY cross ticks lower after touching its highest level since November 2015, around the 186.45 area, this Thursday and trades with a mild negative bias during the early part of the European session. The supportive fundamental backdrop, however, assists spot prices to hold above the 186.00 mark and supports prospects for an extension of the recent breakout momentum through the 184.00 round figure, or the previous YTD peak.
Speculations that the recent weakness in the domestic currency might prompt some jawboning from Japanese authorities, or a possible intervention in the foreign exchange markets, along with the risk-off mood, benefits the safe-haven Japanese Yen (JPY). This, in turn, is seen as a key factor that caps the upside for the GBP/JPY cross. It is worth recalling Japan's top forex diplomat Masato Kanda said on Tuesday that he would take appropriate steps against excessive currency moves. Meanwhile, concerns about the worsening economic conditions in China and fresh worries about headwinds stemming from rapidly rising borrowing costs revive recession fears. This, in turn, tempers investors' appetite for riskier assets and drives some haven flows towards the JPY.
That said, a more dovish stance adopted by the Bank of Japan (BoJ), which is the only major central bank in the world to maintain negative interest rates, might keep a lid on any meaningful gains for the JPY. Moreover, policymakers have stressed that steps taken in July to make the BoJ's Yield Curve Control (YCC) measures more flexible and allow yield on the 10-year Japanese government bond to move up toward 1% was a technical tweak aimed at extending the shelf life of stimulus. This marks a big divergence in comparison to other major central banks, including the Bank of England (BoE), which is expected to raise interest rates again at its next monetary policy meeting in September. The bets were reaffirmed by the stronger UK macro data released recently.
In fact, the UK jobs report showed on Tuesday that British wages grew at a record pace in the second quarter, which added to worries about long-term inflation. This, along with last week's upbeat UK GDP report and Wednesday's slightly higher-than-expected UK CPI print, should allow the BoE to continue tightening its monetary policy. This might continue to lend some support to the British Pound and suggests that the path of least resistance for the GBP/JPY cross is to the upside. Hence, any subsequent corrective slide might still be seen as a buying opportunity and is more likely to remain limited ahead of the UK retail Sales data on Friday.
Technical levels to watch
EUR/USD appears stuck in a relatively low volatility environment. Economists at ING analyze the pair’s outlook.
Lack of strong support
With forward-looking indicators pointing at an economic slowdown in key parts of the Euro area, a EUR/USD rally later this year (which is still our base case) should rely primarily on a decreasing attractiveness of the Dollar rather than on an idiosyncratic EUR boom.
It may be yet another rather quiet day in FX today, and barring a major surprise on the US data side – and considering the Eurozone calendar is quite light – EUR/USD should keep hovering around 1.0850/1.0900.
The outcome of Norges Bank’s August meeting was as widely expected. Economists at Nordea expect a final rate hike to 4.25% from Norges Bank in September.
One more to come
Norges Bank increased the key rate by 25 bps to 4.0% and signalled another hike in September.
We expect a final rate hike to 4.25% in September, however, markets are leaning towards a peak rate at 4.5% in December.
There were almost no reactions to the outcome in rate markets, while the NOK strengthened minorly with EUR/NOK falling to 11.50 from 11.56.
Somehow it is all about the Dollar. Antje Praefcke, FX Analyst at Commerzbank, analyzes Greenback’s outlook.
Focus remains on the Dollar
As the FOMC decisions depend on the data I assume that mainly price and economic data will have the potential to move the Dollar. Therefore, data results that raise hopes of a soft landing could support the USD, but not so much because of monetary policy, but rather because the US economy seems more resilient than other economies in this interest rate cycle.
At the same time, there is a lack of information on the Euro side. The ECB is not commenting, the first speakers will only communicate at the end of August. Hardly surprising therefore that the focus remains on the Dollar. However, I have my doubts that the second-tier data really will have the power to move EUR/USD away from the 1.09 mark.
- Gold price hovers near $1,900, awaiting fresh cues about Fed policy.
- China's gloomy economic prospects could put pressure on Gold's ability to sustain its value.
- Investors await US Initial Jobless Claims, seeking fresh insights into the economic outlook.
Gold price recovered its losses registered on Wednesday, currently trying to hold the ground near the $1,900 per troy ounce during the early trading hours in the European session on Thursday. The recent release of strong macroeconomic data from the United States (US) on Wednesday exerted downward pressure on the price of gold. Investors seek additional momentum from upcoming US economic indicators in order to gain a clearer perspective on the potential further tightening of monetary policy by the US Federal Reserve (Fed).
Wednesday’s US economic calendar included the release of the US Housing Starts (MoM) data for July, which increased to 1.452M from the previous month's 1.398M. This exceeded the expected figure of 1.448M. Additionally, the Monthly Industrial Production rose of 1%, surpassing the projected growth of 0.3% and swinging from the previous month’s 0.8% decline. However, US Building Permits experienced a minor rise to 1.442 million in July from the prior 1.441 million, falling short of the anticipated 1.463 million.
Concerns about China's deteriorating economic prospects could put pressure on Gold's ability to sustain its value. Moreover, robust US economic performance triggered the US Treasury bond yields, bolstering the US Dollar (USD). This upward momentum in the USD could exert downward pressure on the price of Gold.
Investors will closely monitor upcoming US data releases, namely Initial Jobless Claims and the Philadelphia Fed Manufacturing Survey. These datasets could provide fresh insights into the overall US economic outlook, helping Gold traders in obtaining a clearer understanding of the market dynamics.
Here is what you need to know on Thursday, August 17:
Major currency pairs trade near Wednesday's closing levels early Thursday amid a lack of catalysts. The US Dollar Index, which touched its highest level since January at 103.60 earlier in the day, consolidates its weekly gains below 103.50 in the European session and US stock index futures trade modestly higher following the selloff seen in Wall Street on Wednesday. Weekly Initial Jobless Claims and Federal Reserve Bank of Philadelphia's Manufacturing Survey will be featured in the US economic docket later in the day.
US Dollar price today
The table below shows the percentage change of US Dollar (USD) against listed major currencies today. US Dollar was the strongest against the Australian Dollar.
| USD | EUR | GBP | CAD | AUD | JPY | NZD | CHF | |
| USD | -0.06% | -0.06% | -0.07% | 0.27% | -0.07% | 0.07% | -0.05% | |
| EUR | 0.06% | -0.01% | -0.01% | 0.33% | -0.02% | 0.13% | 0.00% | |
| GBP | 0.06% | 0.00% | -0.01% | 0.34% | -0.01% | 0.14% | 0.01% | |
| CAD | 0.07% | 0.02% | 0.01% | 0.35% | 0.00% | 0.15% | 0.02% | |
| AUD | -0.25% | -0.33% | -0.34% | -0.35% | -0.34% | -0.20% | -0.30% | |
| JPY | 0.06% | 0.01% | -0.01% | -0.01% | 0.33% | 0.15% | 0.01% | |
| NZD | -0.06% | -0.14% | -0.14% | -0.14% | 0.19% | -0.15% | -0.13% | |
| CHF | 0.06% | 0.00% | 0.00% | -0.02% | 0.31% | -0.01% | 0.13% |
The heat map shows percentage changes of major currencies against each other. The base currency is picked from the left column, while the quote currency is picked from the top row. For example, if you pick the Euro from the left column and move along the horizontal line to the Japanese Yen, the percentage change displayed in the box will represent EUR (base)/JPY (quote).
Minutes of the Federal Reserve's July policy meeting showed late Wednesday that a couple of policymakers indicated that they favored leaving the policy rate unchanged. Nevertheless, the publication further noted participants agreed inflation risks could require further policy tightening. According to the CME Group FedWatch Tool, markets are currently pricing in a more than 30% probability of the Fed raising the policy rate once again by 25 basis points before the end of the year. Meanwhile, the benchmark 10-year US yield stays in positive territory near 4.3%.
During the Asian trading hours, the Australian Bureau of Statistics (ABS) reported that the Unemployment Rate rose to 3.7% in July from 3.5% in June. Full-time Employment declined more than 24,000 in the same period and the Participation Rate ticked down to 66.7%. AUD/USD came under bearish pressure after the jobs report and was last seen losing nearly 0.5% on the day at around 0.6400.
The data from Japan revealed that Machinery Orders contracted by 5.8% on a yearly basis in June. Imports and Exports decreased 13.5% and 0.3%, respectively, in the same period. USD/JPY showed no reaction to these figures and touched its highest level since November at 146.56 in the Asian session before retreating to the 146.20 area.
EUR/USD dropped to a multi-week low below 1.0900 and failed to stage a rebound in the Asian session. The pair stays relatively quiet below that level in the European morning.
Despite the broad-based USD strength, GBP/USD managed to post modest daily gains on Wednesday, supported by the UK inflation data. The pair fluctuates in a tight range below 1.2750 on Thursday. The UK's Office for National Statistics will release Retail Sales data for July on Friday.
Pressured by rising US T-bond yields, Gold price continued to push lower on Wednesday and touched its weakest level since March below $1,890. Early Thursday, XAU/USD recovers modestly but remains below $1,900.
Bitcoin broke below its three-week-old trading range on Wednesday and dropped to its lowest level since early June near $28,300. Early Thursday, BTC/USD seems to have stabilizes slightly above $28,500. Ethereum lost more than 1% on Wednesday and was last seen trading modestly lower on the day below $1,800.
- Pound Sterling drifts sideways above 1.2700 as the focus shifts to UK consumer spending data.
- UK’s strong wage growth and sticky core inflation elevate hawkish BoE bets.
- Rishi Sunak’s promise of halving inflation to 5% seems uncertain.
The Pound Sterling (GBP) struggles to find a decisive move as the upside seems restricted due to deepening recession woes, while the downside is supported due to expectations of more interest rate hikes from the Bank of England (BoE). The GBP/USD pair trades inside Wednesday’s range as investors await British Retail Sales data for July. The release of the entire economic indicators will provide lucid guidance to investors about further policy action.
Bets in favor of a hawkish BoE interest rate decision for the September policy meeting rose sharply as the United Kingdom’s strong wage growth and stubborn core inflation makes further policy tightening more necessary. Meanwhile, Friday’s Retail Sales data is expected to demonstrate a slowdown in consumer spending momentum due to wet weather.
Daily Digest Market Movers: Pound Sterling consolidates ahead of UK Retail Sales
- Pound Sterling demonstrates a squeeze in volatility above 1.2700 as sticky core inflation and a disappointing labor market deepen recession fears.
- Headline CPI for July softened in line with expectations, but stubborn core inflation discomforted Bank of England policymakers.
- Core inflation is marginally lower at 6.9% than its recent peak of 7.1%, which indicates that UK PM Rishi Sunak could fail to fulfill his promise of halving inflation to 5%.
- UK’s headline inflation contracted in June due to a sheer decline in gas prices. Fuel sellers passed on the benefit of lower oil prices to end consumers.
- Last month, BoE Governor Andrew Bailey warned fuel sellers for overcharging customers.
- The decline in UK headline inflation was also contributed by easing grocery inflation. The economic data eased for a fifth straight month, softening to 12.7% through August 6 vs. the former print of 14.9%.
- Considering strong wage growth and stubborn core inflation, the BOE will continue tightening interest rates further to restrict inflationary pressures.
- Individuals paying shelter rents are expected to face more outflows as demand for new homes dropped sharply due to rising borrowing costs.
- After inflation and employment data, investors shift their focus toward the Retail Sales data for July, which will be published at 06:00 GMT.
- Per estimates, monthly Retail Sales contracted by 0.5% due to wet weather versus an expansion of 0.7% in June. Annual economic data contracted sharply to 2.1% against June’s print of -1.0%.
- Ex-fuel Retail Sales are seen contracting at a higher pace, which indicates that consumer spending on durables and non-durables, was extremely weak.
- Meanwhile, the market mood is quite jittery as the economic outlook for China remains bleak due to poor demand and weak exports. Western nations are lowering their dependency on China for input.
- Investment banking firm Morgan Stanley lowered its forecast of China’s Gross Domestic Product (GDP) for the current year to 4.7% vs. an earlier projection of 5.0%.
- The US Dollar Index (DXY) prints a fresh seven-week high at 103.60 as fears of a recession in developing nations deepen.
- Rising expectations of further policy tightening by the Federal Reserve (Fed) as Federal Reserve (Fed) policymakers see significant upside risks to inflation, infusing strength in the US Dollar.
- Federal Open Market Committee (FOMC) minutes delivered a clear message that the inflationary environment is still uncertain and further policy action will be more dependent on the incoming data.
- On Wednesday, the US housing market showed a significant jump in nuclear family homebuyers by 3.9% against the forecast of 2.7%. In addition, future construction approvals rose nominally despite rising borrowing costs.
Technical Analysis: Pound Sterling seems established above 1.2700
Pound Sterling looks well-established above the crucial support of 1.2700. However, further action is uncertain as investors seem baffled between hawkish BoE bets and deepening recession fears. The asset is consistently facing offers near the 50-day Exponential Moving Average (EMA) while the 20-day EMA is still trading higher. Broadly, the Cable is oscillating in a range of 1.2620-1.2770 and trades inside the previous day’s range.
Pound Sterling FAQs
What is the Pound Sterling?
The Pound Sterling (GBP) is the oldest currency in the world (886 AD) and the official currency of the United Kingdom. It is the fourth most traded unit for foreign exchange (FX) in the world, accounting for 12% of all transactions, averaging $630 billion a day, according to 2022 data.
Its key trading pairs are GBP/USD, aka ‘Cable’, which accounts for 11% of FX, GBP/JPY, or the ‘Dragon’ as it is known by traders (3%), and EUR/GBP (2%). The Pound Sterling is issued by the Bank of England (BoE).
How do the decisions of the Bank of England impact on the Pound Sterling?
The single most important factor influencing the value of the Pound Sterling is monetary policy decided by the Bank of England. The BoE bases its decisions on whether it has achieved its primary goal of “price stability” – a steady inflation rate of around 2%. Its primary tool for achieving this is the adjustment of interest rates.
When inflation is too high, the BoE will try to rein it in by raising interest rates, making it more expensive for people and businesses to access credit. This is generally positive for GBP, as higher interest rates make the UK a more attractive place for global investors to park their money.
When inflation falls too low it is a sign economic growth is slowing. In this scenario, the BoE will consider lowering interest rates to cheapen credit so businesses will borrow more to invest in growth-generating projects.
How does economic data influence the value of the Pound?
Data releases gauge the health of the economy and can impact the value of the Pound Sterling. Indicators such as GDP, Manufacturing and Services PMIs, and employment can all influence the direction of the GBP.
A strong economy is good for Sterling. Not only does it attract more foreign investment but it may encourage the BoE to put up interest rates, which will directly strengthen GBP. Otherwise, if economic data is weak, the Pound Sterling is likely to fall.
How does the Trade Balance impact the Pound?
Another significant data release for the Pound Sterling is the Trade Balance. This indicator measures the difference between what a country earns from its exports and what it spends on imports over a given period.
If a country produces highly sought-after exports, its currency will benefit purely from the extra demand created from foreign buyers seeking to purchase these goods. Therefore, a positive net Trade Balance strengthens a currency and vice versa for a negative balance.
Open interest in natural gas futures markets shrank for the second session in a row on Wednesday, this time by around 2.3K contracts according to preliminary readings from CME Group. Volume followed suit and dropped by nearly 111K contracts, resuming the recent downtrend.
Natural Gas remains capped by $3.00
Prices of natural gas extended the marked weekly pullback on Wednesday amidst shrinking open interest and volume, which is indicative that extra losses seem unlikely and opening the door to a potential short-term rebound instead. On the upside, the commodity remains capped by the key $3.00 region per MMBtu.
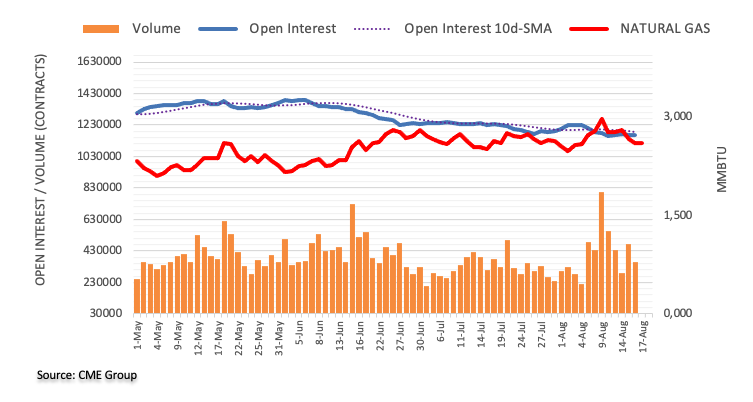
Economists at ING expect the EUR/GBP pair to extend its decline and challenge the 0.8505 July lows.
EUR/GBP ready to test the lows
While a 25 bps September hike should be a done deal, we still think a November move is an open question, given indications of abating price pressures in other parts of the economy.
Still, the Pound is now enjoying a post-repricing strength that looks unlikely to abate rapidly, given the lack of market-moving data and BoE speakers.
EUR/GBP looks on track to retest the 0.8505 July lows, also given the lack of strong idiosyncratic defence for the Euro.
- Euro remains under pressure below 1.0900 vs. the US Dollar.
- Stocks in Europe kick off the session in the red territory.
- EUR/USD drops to fresh lows near 1.0860 early on Thursday.
- The USD Index (DXY) meets initial resistance around 103.60.
- EMU Balance of Trade figures come next on the domestic docket.
- Initial Jobless Claims, Philly Fed index take centre stage in the NA session.
The Euro (EUR) has managed to regain some stability against the US Dollar (USD) and is now showing signs of gaining momentum for EUR/USD after it dropped to fresh six-week lows around 1.0860 on Thursday.
Meanwhile, the continuous upward movement of the Greenback is pushing the USD Index (DXY) to reach new highs that have not been seen in several weeks, approximately at 103.60. This rise is being supported by the similarly strong upward trend in US yields across various maturity periods.
The ongoing weakness in the EUR/USD pair is also in line with investors' interpretation of the FOMC Minutes, which were released late on Wednesday. The prevailing sentiment among most participants is that due to the inflation-related risks, there might be a need to further increase interest rates.
Looking at the broader context of monetary policy, the discussion around the Federal Reserve's stance of maintaining a tighter policy for an extended period seems to have been revived. This is in response to the resilience displayed by the US economy, despite some easing in the labour market and lower inflation readings in recent months.
Within the European Central Bank's realm (ECB), internal disagreements among its Council members regarding the continuation of tightening measures after the summer period are causing renewed weakness that is impacting the Euro negatively.
As for the euro schedule, the Balance of Trade figures in the broader euro area for June will be the primary noteworthy release on Thursday.
On the US calendar, the focus will be on the weekly Initial Jobless Claims and the Philly Fed Manufacturing Index, with secondary attention on the Conference Board's Leading Index for July.
Daily digest market movers: Euro appears under scrutiny in the sub-1.0900 area
- The EUR looks offered vs. the USD below 1.0900.
- Concerns surrounding the Chinese economic economy weigh on sentiment.
- The Australian job report disappoint expectations in July.
- The Norges Bank is expected to hike rates by 25 bps.
- Markets’ focus remains on the US Claims and Philly index.
Technical Analysis: Euro could slip back to the 1.0830 region
EUR/USD faces extra headwinds and retreats to new lows in the 1.0860 region on Thursday, opening the door to a potential visit to the July low near 1.0830 sooner rather than later.
In case of further losses, EUR/USD could retest the July low of 1.0833 (July 6) ahead of the significant 200-day SMA at 1.0787, and eventually the May low of 1.0635 (May 31). Deeper down, there are additional support levels at the March low of 1.0516 (March 15) and the 2023 low at 1.0481 (January 6).
Occasional bullish attempts, in the meantime, are expected to meet initial hurdle at the August high at 1.1064 (August 10) prior to the weekly top at 1.1149 (July 27). If the pair clears the latter, it could alleviate some of the downward pressure and potentially visit the 2023 peak of 1.1275 (July 18). Once this region is surpassed, significant resistance levels become less prominent until the 2022 high at 1.1495 (February 10), which is closely followed by the round level of 1.1500.
Furthermore, the positive outlook for EUR/USD remains valid as long as it remains above the important 200-day SMA.
Euro FAQs
What is the Euro?
The Euro is the currency for the 20 European Union countries that belong to the Eurozone. It is the second most heavily traded currency in the world behind the US Dollar. In 2022, it accounted for 31% of all foreign exchange transactions, with an average daily turnover of over $2.2 trillion a day.
EUR/USD is the most heavily traded currency pair in the world, accounting for an estimated 30% off all transactions, followed by EUR/JPY (4%), EUR/GBP (3%) and EUR/AUD (2%).
What is the ECB and how does it impact the Euro?
The European Central Bank (ECB) in Frankfurt, Germany, is the reserve bank for the Eurozone. The ECB sets interest rates and manages monetary policy.
The ECB’s primary mandate is to maintain price stability, which means either controlling inflation or stimulating growth. Its primary tool is the raising or lowering of interest rates. Relatively high interest rates – or the expectation of higher rates – will usually benefit the Euro and vice versa.
The ECB Governing Council makes monetary policy decisions at meetings held eight times a year. Decisions are made by heads of the Eurozone national banks and six permanent members, including the President of the ECB, Christine Lagarde.
How does inflation data impact the value of the Euro?
Eurozone inflation data, measured by the Harmonized Index of Consumer Prices (HICP), is an important econometric for the Euro. If inflation rises more than expected, especially if above the ECB’s 2% target, it obliges the ECB to raise interest rates to bring it back under control.
Relatively high interest rates compared to its counterparts will usually benefit the Euro, as it makes the region more attractive as a place for global investors to park their money.
How does economic data influence the value of the Euro?
Data releases gauge the health of the economy and can impact on the Euro. Indicators such as GDP, Manufacturing and Services PMIs, employment, and consumer sentiment surveys can all influence the direction of the single currency.
A strong economy is good for the Euro. Not only does it attract more foreign investment but it may encourage the ECB to put up interest rates, which will directly strengthen the Euro. Otherwise, if economic data is weak, the Euro is likely to fall.
Economic data for the four largest economies in the euro area (Germany, France, Italy and Spain) are especially significant, as they account for 75% of the Eurozone’s economy.
How does the Trade Balance impact the Euro?
Another significant data release for the Euro is the Trade Balance. This indicator measures the difference between what a country earns from its exports and what it spends on imports over a given period.
If a country produces highly sought after exports then its currency will gain in value purely from the extra demand created from foreign buyers seeking to purchase these goods. Therefore, a positive net Trade Balance strengthens a currency and vice versa for a negative balance.
- USD/CAD pulls back from its highest level since early June touched this Thursday.
- Rebounding Oil prices underpins the Loonie and caps the upside amid a softer USD.
- The Fed’s hawkish outlook should help limit deeper losses for the USD and the pair.
The USD/CAD pair retreats a few pips from the vicinity of mid-1.3500s, or the highest level since June touched this Thursday and drops to a fresh daily low during the early part of the European session. Spot prices, however, manage to hold above the 1.3500 psychological mark and seem poised to prolong the recent strong upward trajectory witnessed since the beginning of this month.
Crude Oil prices stage a modest recovery from a two-week low and for now, seem to have snapped a three-day losing streak, which, in turn, is seen underpinning the commodity-linked Loonie. The US Dollar (USD), on the other hand, eases from over a two-month peak and turns out to be another factor acting as a headwind for the USD/CAD pair. the fundamental backdrop, however, seems tilted firmly in favour of bearish traders and warrants some caution before positioning for any meaningful corrective decline.
Investors remain concerned about the worsening economic conditions in China - the world's top Oil importer. This, along with worries that economic headwinds stemming from rapidly rising borrowing costs will dent demand, should keep a lid on any meaningful upside for the black liquid. Furthermore, firming expectations that the Federal Reserve (Fed) will keep interest rates higher for longer favour the USD bulls and further contribute to limiting the downside for the USD/CAD pair, at least for the time being.
It is worth recalling that the minutes of the July 25-26 FOMC policy meeting released on Wednesday revealed that policymakers continued to prioritize the battle against inflation, though were divided over the need for more rate hikes. Moreover, the incoming US macro data pointed to an extremely resilient economy and should allow the Fed to stick to its hawkish stance. This pushes the yield on the benchmark 10-year US government bond back closer to its highest level since 2008 touched in October 2022.
Apart from this, the prevalent risk-off environment – as depicted by a generally weaker tone around the equity markets – adds credence to the positive outlook for the safe-haven Greenback. This, in turn, suggests that the path of least resistance for the USD/CAD pair is to the upside. Traders now look to the US economic docket, featuring the release of the usual Weekly Initial Jobless Claims and the Philly Fed Manufacturing Index. The data might influence the USD price dynamics and provide some impetus to the major.
Technical levels to watch
Norges Bank should hike by 25 bps today, and this may not even be their last move – economists at ING still see NOK gains ahead.
25 bps by Norges Bank
We expect Norges Bank to hike by 25 bps today, in line with previous guidance.
Markets are pricing in a peak in Norwegian rates after today’s 25 bps hike, but we feel they are underestimating the chances of another hike in September.
Anyway, today is an interim meeting with no new rate projections. We cannot exclude Norges Bank will hint at openness to more tightening, and we see upside risks for NOK anyway, given the rather flat market pricing.
Economists at Commerzbank expect the Reserve Bank of Australia (RBA) to stand pat following the publication of Australian jobs report.
RBA might stay on hold in September
The Australian labor market report for July should support the RBA’s view that it can take another pause in the interest rate cycle.
If the inflation figures for July, which will be released at the end of the month, also signal further easing, the RBA should see itself on a good path.
Finally, the news from China should make the RBA cautious about further rate hikes, as they pose a risk to the Australian economy. In this respect, it is little surprise that the market sees little chance of a further rate hike and that the AUD is trading weaker against the USD.
FX option expiries for Aug 17 NY cut at 10:00 Eastern Time, via DTCC, can be found below.
- EUR/USD: EUR amounts
- 1.0780 510m
- 1.0850 699m
- 1.0880 1.1b
- 1.0900 489m
- 1.0950 3.8b
- 1.1000 2.1b
- 1.1050 432m
- GBP/USD: GBP amounts
- 1.2500 600m
- 1.2530 387m
- 1.2700 726m
- 1.2845 467m
- USD/JPY: USD amounts
- 143.00 1.5b
- 145.00 1.2b
- 145.50 1.1b
- 146.00 601m
- 146.50 491m
- USD/CHF: USD amounts
- 0.8700 1.2b
- 0.8860 768m
- AUD/USD: AUD amounts
- 0.6550 1.5b
- USD/CAD: USD amounts
- 1.3200 866m
- 1.3450 433m
- 1.3490 1.2b
- EUR/GBP: EUR amounts
- 0.8600 461m
- 0.8750 1.3b
- Silver regains positive traction on Thursday and climbs closer to trend-channel resistance.
- The mixed technical indicators on hourly/daily charts warrant caution for bullish traders.
- A move beyond the 200-hour SMA is needed to support prospects for any further gains.
Silver attracts fresh buying near the $22.35 region on Thursday and sticks to its modest intraday gains through the early part of the European session. The white metal currently trades around the $22.60-$22.65 area, up just over 1.0% for the day, though remains well within the striking distance of a nearly two-month low touched on Tuesday.
Looking at a slightly broader picture, the XAG/USD has been drifting lower along a downward-sloping channel over the past one-and-half-week or so. The top end of the said channel, currently pegged around the $22.70 region, might continue to cap any subsequent move up beyond the 100-hour Simple Moving Average (SMA). This is followed by the 200-hour SMA, near the $22.75-$22.80 region, which if cleared decisively will set the stage for some meaningful appreciating move.
Technical indicators on the 4-hour chart, though have recovered from the bearish territory, are yet to confirm a positive bias and are still holding deep in the negative zone on the daily chart. This makes it prudent to wait for a sustained strength beyond the aforementioned barrier before confirming that the XAG/USD has formed a near-term bottom and placing fresh bets. The subsequent move up could lift the white metal beyond the $23.00 round figure, towards the $23.25 region.
The latter represents the very important 200-day SMA and should act as a pivotal point. A sustained strength beyond might trigger a fresh bout of a short-covering move and lift the XAG/USD to the $23.60-$23.65 horizontal barrier. The momentum could get extended further and allow bulls to aim to reclaim the $24.00 round figure.
On the flip side, the weekly low, around the $22.20 area, followed by the $22.10 zone, or the multi-month trough touched in June, which coincides with the trend-channel support, could protect the immediate downside ahead of the $22.00 mark. Some follow-through selling could accelerate the fall towards the $21.55-$21.50 area en route to the $21.00 round figure. The XAG/USD might then weaken the $20.60 support before dropping to the $20.00 psychological mark.
Silver 1-hour chart
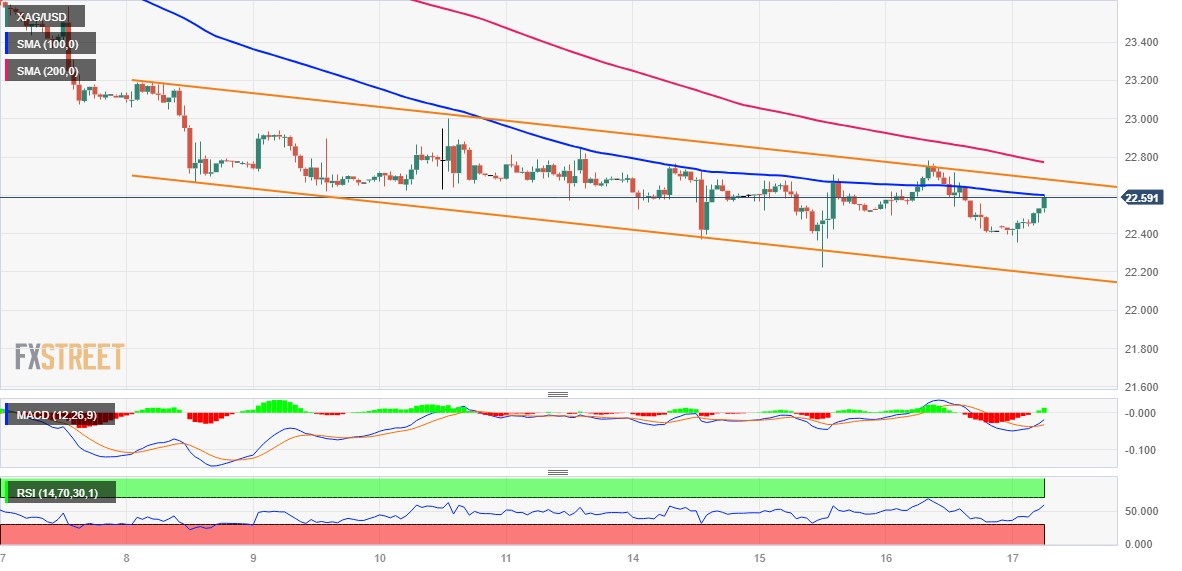
Technical levels to watch
The Kiwi made a new 2023 low. Economists at ANZ Bank analyze the NZD/USD pair outlook.
The focus remains global
With the Reserve Bank of New Zealand out of the way and no hike delivered, the focus remains global (which favours the US Dollar for now), poor price action, and technicals.
Markets are watching the 0.5904 support (61.8% Fibo of the 2022 rally from 0.5512 to 0.6538) closely.
Support 0.5512/0.5750/0.5904 Resistance 0.6365/0.6540.
See: NZD/USD: Doubts on any significant rebound for Kiwi in the near-term – TDS
- Russian Ruble prints the first daily loss in four while bouncing off 11-week-old support line.
- Risk-off mood, upbeat Treasury bond yields trigger USD/RUB rebound.
- Geopolitical concerns about Russia keep Ruble on bear’s radar despite CBR’s solid defense.
Russian Ruble snaps a three-day losing streak as it bounces off short-term key technical supports to reclaim the 95.00 round figure early Thursday, near 95.30 by the press time. In doing so, the USD/RUB pair justifies the broad risk aversion and firmer Treasury bond yields, as well as takes clues from downbeat concerns surrounding Russia.
Russian Ruble returns to bear’s radar
Be it the sour sentiment or the firmer yields, not to forget the hawkish Fed concerns and mostly upbeat US data, the USD/RUB pair appears to have all it needs to rebound from the below-mentioned technical support. Adding strength to the corrective bounce is the market’s doubts about the Central Bank of Russian Federation’s (CBR) capacity to defend the Russian Ruble despite a heavy emergency rate hike.
It should be noted that the latest US Federal Reserve (Fed) monetary policy meeting minutes highlighted the policymakers’ discussion on the inflation pressure, despite marking a division on the rate hike decision. Also, the Minutes conveyed that most policymakers preferred supporting the battle against the ‘sticky’ inflation and favored hawkish bias about the US central bank’s next move, which in turn underpinned the US Dollar’s run-up to a multi-day high. While helping the markets to justify hawkish Fed bias, US Industrial Production traced upbeat Retail Sales figures. With this, the US Dollar Index (DXY) rose to the highest level in two months before retreating to 103.40 at the latest.
Apart from the hawkish Fed concerns, the geopolitical/economic woes emanating from China and Russia join the Fitch Ratings’ downward revision of the 10 developed economies’ medium-term growth projections to weigh on the sentiment and trigger the USD/RUB recovery.
Further, the US 10-year Treasury bond yields remain firmer at the highest level since October 2022 marked earlier in the day, around 4.30% by the press time. It should be noted that such a high level of bond coupons triggered fears of economic slowdown.
That said, the CBR called an emergency monetary policy meeting and lifted the benchmark rates by 350 basis points (bps) to 12.0% on Tuesday amid concerns that the central bank’s easy-money policies are responsible for the Ruble’s latest fall to the lowest level since March 2022, past 102.00.
Moving on, a light calendar may allow the USD/RUB buyers to take a breather and wait for more clues to extend the latest run-up, which in turn highlights the US weekly jobless claims and Philadelphia Fed Manufacturing Survey for August for a clear guide.
Russian Ruble Technical Analysis
Russia Ruble bears cheered Monday’s bearish Doji and overbought RSI (14) line to entertain the pair sellers so far during the week.
However, the 21-DMA and an upward-sloping support line from May 31, close to 94.20 and 93.90 in that order, restrict the immediate downside of the USD/RUB pair.
With this, the Russian Ruble is likely to revisit Monday’s bottom of around 97.00 but any further upside needs validation from the 100.00 psychological magnet.
Meanwhile, a downside break of 93.90 can quickly drag the USD/RUB pair toward the late July swing high surrounding 92.00.
Russian Ruble: Daily chart
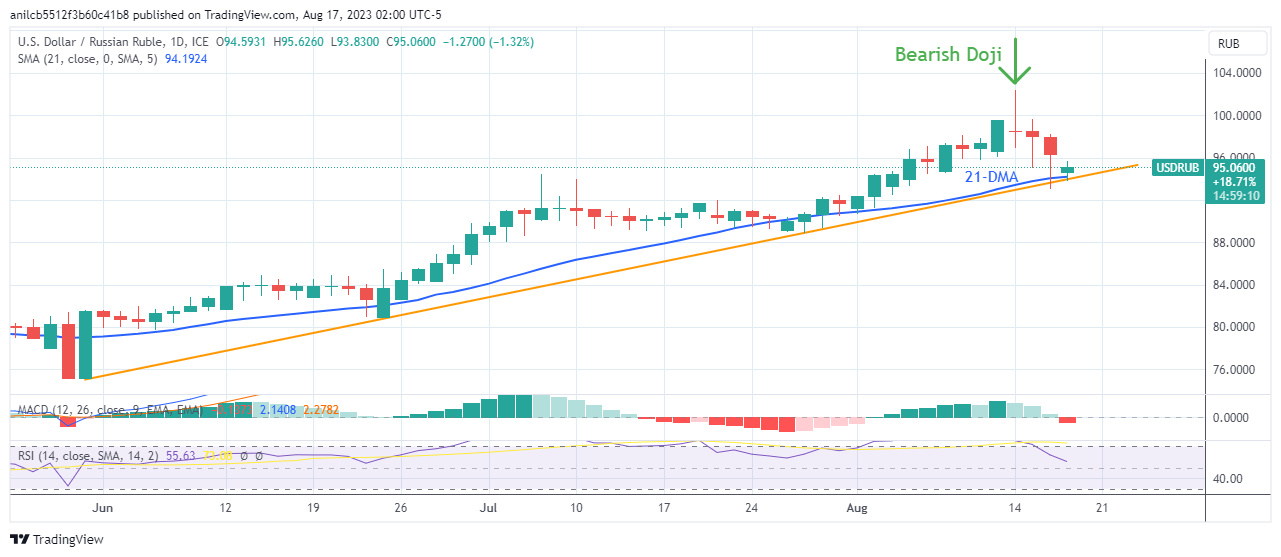
Trend: Limited recovery expected
Today's main event is the Norges Bank meeting. Economists at Commerzbank analyze how the Interest Rate Decision could impact Krone.
Norges Bank will deliver
At its meeting in June Norges Bank had sent out a restrictive signal. It hiked the key rate by 50 bps to 3.75% and signalled a further rate step for August. It is likely to deliver that today.
As the market has priced in today’s step, it is likely to have a limited effect on NOK.
If the accompanying statement sounds hawkish the market might raise its expectations for September slightly, which would support NOK.
If future price data surprise on the upside whereas economic data illustrates that the Norwegian economy is resilient, the market will increasingly share Norges Bank’s view – a terminal rate of 4.25% – in support of NOK.
- AUD/JPY trades within a descending trend channel line on the four-hour chart.
- The Relative Strength Index (RSI) and MACD stand in bearish territory.
- The immediate resistance level is seen at 94.00; the initial support level to watch is 93.20.
From a technical perspective, AUD/JPY trades within a descending trend channel line from the middle of June on the four-hour chart. That said, the path of least resistance for the AUD/JPY is to the downside as the cross holds below the 50- and 100-hour Exponential Moving Averages (EMAs).
The latest data from Japan’s Ministry of Finance showed on Thursday that Exports declined 0.3% YoY, the first drop in 29 months, with a significant decline in shipments to China. While Imports dipped 13.5%, versus the 14.7% decline expected. Meanwhile, the Japanese trade deficit totaled 78.7 billion yen versus the estimation of a 24.6 billion yen deficit.
That said, the Relative Strength Index (RSI) holds below 50 while the Moving Average Convergence/Divergence (MACD) stands in bearish territory, supporting the sellers for now.
The immediate resistance level for AUD/JPY is seen at 94.00 (the 50-hour EMA, a psychological round mark). The next barrier to watch is 94.20 (the 100-hour EMA), en route to 94.60 (the upper boundary of a descending trend channel). Any meaningful follow-through buying above the latter will see a rally to 95.40 (high of July 14).
On the downside, the initial support level to watch is 93.20 (low of July 12). The key contention level is located at 93.00, representing a psychological round figure, a low of August 4. The next downside stop appears at 92.50 (low of July 18), followed by 92.15 (low of June 6). A breach of the latter will see a drop to 91.80 (the lower limit of a descending trend channel).
AUD/JPY four-hour chart
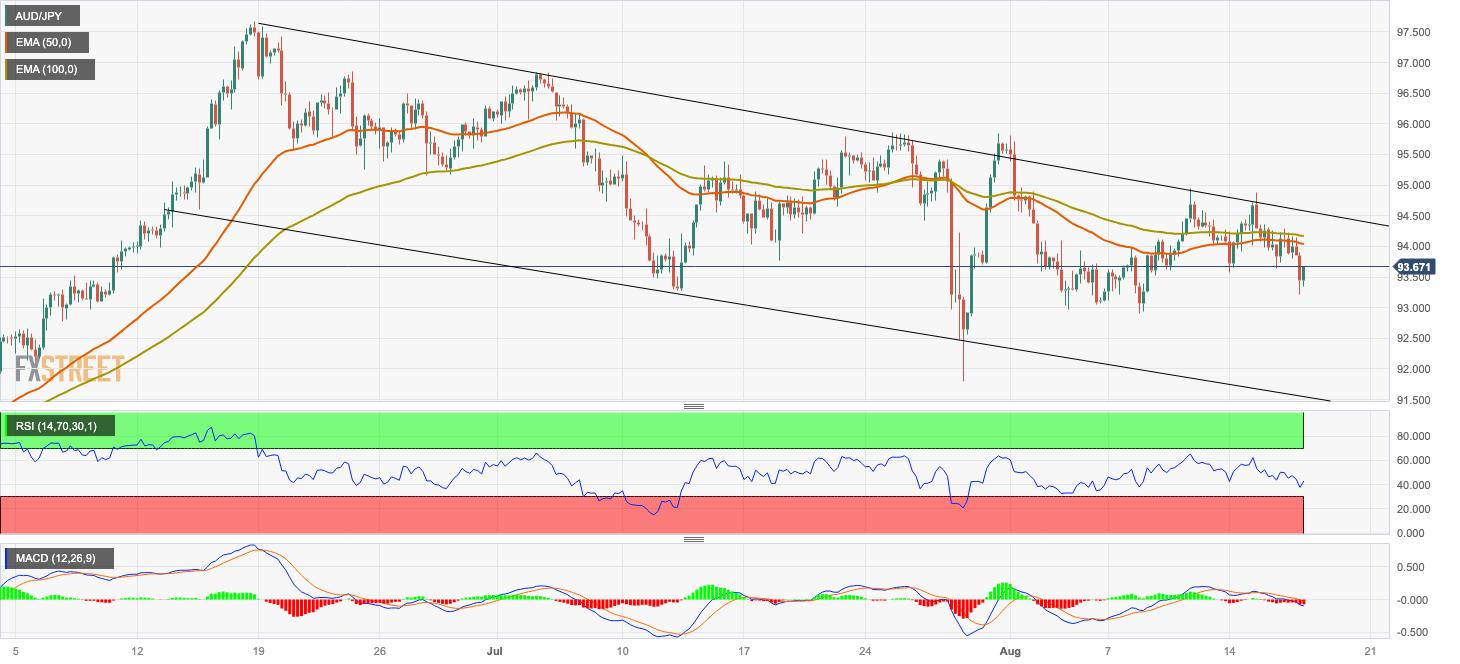
- EUR/GBP extends its losses due to better-than-expected UK inflation figures.
- Eurozone moderate GDP numbers were not helpful to stem Euro’s weakness.
- Traders await UK Retail Sales, seeking fresh insights into the interest rate decision by BoE.
EUR/GBP continues to experience losses, currently trading near the monthly low at 0.8540 during the Asian session on Thursday. The EUR/GBP downward trajectory is further driven by better-than-expected inflation figures originating from the United Kingdom (UK) on Wednesday.
UK's economic indicators are potentially intensifying worries about the likelihood of interest rate hikes by the Bank of England (BoE) during the September meeting. That said, the UK Consumer Price Index (CPI) for the month of July registered a figure of -0.4%, which was slightly better than the projected -0.5% and a decrease from the previous 0.1%. On an annual basis, the CPI demonstrated a reading of 6.8%, consistent with expectations and a slight decrease from the prior 7.9%. Furthermore, the Core CPI, which excludes volatile items, remained steady at a rate of 6.9%, aligning with the anticipated 6.8%.
On the other hand, the Eurozone released top-tier data on Wednesday, revealing moderate numbers. The Gross Domestic Product (GDP) seasonally adjusted (s.a.) matched expectations, with the report displaying unchanged numbers. The GDP (quarter-on-quarter) and (year-on-year) held steady at 0.3% and 0.6%, respectively. Additionally, Europe witnessed a decline in Employment Change to the projected 0.2% during the second quarter, following the previous quarter's reading of 0.6%. This dataset did not contribute to stemming the Euro's weakness against the Cable.
The market participants will closely watch the upcoming data release from Eurozone Trade Balance later in the day, following the Harmonized Index of Consumer Prices (HICP) scheduled to release on Friday. Friday will also witness the scheduled speech by Chief Economist Philip Richard Lane from European Central Bank (ECB) and UK Retail Sales. These event releases are expected to offer valuable insights into the economic outlook of both countries, potentially influencing trading decisions involving the EUR/GBP pair.
Market participants will closely monitor the forthcoming data releases, beginning with the Eurozone Trade Balance later in the day, followed by the Harmonized Index of Consumer Prices (HICP) scheduled for release on Friday. Additionally, Friday's agenda includes a speech by Chief Economist Philip Richard Lane from the European Central Bank (ECB) and UK Retail Sales data. These events are anticipated to provide valuable perspectives on the economic trajectories of both countries. As a result, they could have a significant impact on trading decisions concerning the EUR/GBP pair.
Economists at Commerzbank do not see much upward potential for the Swedish Krona until the end of the year.
No more upside potential for the time being
Although the Riksbank raised the key interest rate in June, it is not acting decisively enough against inflation risks compared to the European Central Bank. Therefore, the SEK will probably not have much upside potential this year.
Only next year, when the tide turns in favour of the Riksbank, should the Krona appreciate again.

Source: Commerzbank Research
- WTI crude oil seesaws at the lowest level in a fortnight, prods three-day losing streak but lacks downside momentum.
- Multiple downside supports, oversold RSI (14) line test Oil sellers.
- WTI recovery remains elusive below $81.20; further downside appears limited unless breaking $77.20.
- US Dollar’s pause after refreshing multi-day high allows Oil price to consolidate weekly losses.
WTI crude oil licks its wounds at the lowest level in two weeks, defensive around $78.90 heading into Thursday’s European session.
In doing so, the black gold prints the first daily gains in four while portraying a corrective bounce off a three-week-long horizontal support zone amid the oversold RSI (14) line.
With this, the energy benchmark braces for further recovery towards the previous weekly low of around $79.65–70. However, a convergence of the 100-SMA and a downward-sloping trend line from August 10, close to $81.20, appears a tough nut to crack for the Oil buyers to crack.
In a case whereas the WTI bulls manage to keep the reins past $77.20, the odds of witnessing a run-up towards the monthly peak surrounding $84.35 can’t be ruled out.
On the flip side, a clear break of a horizontal area comprising multiple levels marked since late July, around $78.20-55, restricts immediate downside of the WTI crude oil price.
Following that, the 200-SMA level of $78.00 and a horizontal line comprising tops marked during July 13 and 21, close to $77.20, will act as the last defense of the Oil buyers.
WTI crude oil: Four-hour chart
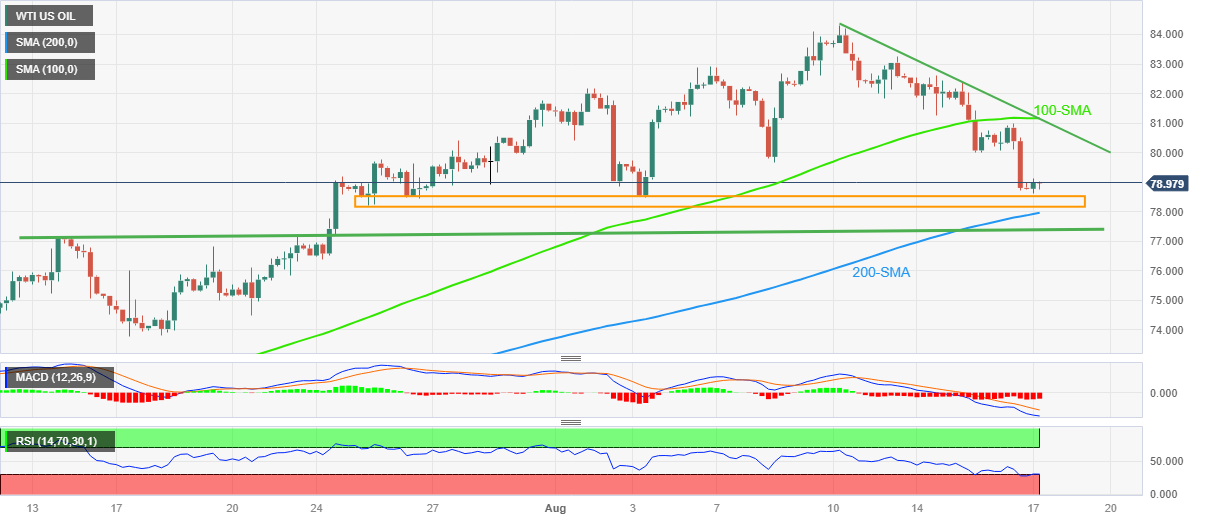
Trend: Limited recovery expected
- USD/CHF remains confined in a narrow range with mild gains above the 0.8800 area.
- The pair holds above the 50- and 100-hour EMAs; RSI and MACD hold above the bullish territory.
- The immediate resistance level will emerge at 0.8830; 0.8770 acts as an initial support level.
The USD/CHF pair trades flat with mild gains above the 0.8800 area heading into the early European session on Thursday. The pair has been trading within a consolidation phase since July 27.
That said, the upbeat US data and the possibility of a further tightening cycle from the Federal Reserve (Fed) are the main drivers of the US Dollar's (USD) strength and boost USD/CHF higher. The Federal Open Market Committee (FOMC) Minutes emphasised that inflation remained unacceptably high while Fed officials opened the door for additional tightening of monetary policy to bring inflation to the longer-run target.
From the technical perspective, USD/CHF holds above the 50- and 100-hour Exponential Moving Averages (EMAs) with an upward slope, which means the path of least resistance for the pair is to the upside. Additionally, the Relative Strength Index (RSI) stands above 50, while the Moving Average Convergence/Divergence (MACD) holds above bullish territory, supporting the buyers for the time being.
The immediate resistance level for USD/CHF will emerge at 0.8830 (high of August 14). The additional upside filter is located at 0.8875 (high of July 7) en route to a psychological round mark at 0.8900. A break above the latter will see the next barrier at 0.8920 (high of July 10).
Looking at the downside, 0.8770 acts as an initial support level for the pair, portraying the 50-hour EMA and a low of August 15. Further south, the next stop of the USD/CHF pair is located at 0.8755 (the 100-hour EMA, a low of August 11). Any intraday pullback below the latter would expose the next critical contention level at 0.8700. The mentioned level represents a low of August 4 and a psychological round figure. The next downside stop emerged at 0.8665 (low of July 31).
- EUR/JPY snaps three-day winning streak but lacks follow-through.
- Treasury bond yields approach worrisome tops, stock futures drop amid sour sentiment.
- Looming concerns about Japan’s meddling to defend Yen, German economic woes prod pair buyers.
- Eurozone Trade Balance will decorate calendar but yields, risk catalysts will be more important for clear directions.
EUR/JPY clings to mild losses around the intraday low of 159.03 as it prints the first daily fall in four heading into Thursday’s European session. In doing so, the cross-currency pair fails to justify the firmer Treasury bond yields amid fears of the Japanese intervention to defend the Yen, as well as chatters that Germany can continue weighing on the Eurozone’s economic optimism.
That said, the US 10-year Treasury bond yields remain firmer at the highest level since October 2022 marked earlier in the day, around 4.29% by the press time. It should be noted that such a high level of bond coupons triggered fears of economic slowdown and drowned the riskier assets, while also underpinning the US Dollar, during late 2022.
On the other hand, global rating agency Fitch Ratings lowered medium-term Gross Domestic Product (GDP) projections for 10 developed economies, including Germany, in its quarterly Global Economic Outlook published Wednesday.
Additionally, mixed EU data also prod the EUR/JPY buyers amid looming concerns that the Japanese policymakers stand ready to intervene in the money markets to defend the Yen. On Wednesday, Eurozone Industrial Production for June marked an unexpected growth of 0.5% MoM versus -0.1% market forecasts and 0.0% previous readings. On the same line, the yearly Industrial Output figures improved to -1.2% YoY from -2.5% marked in May, versus -4.2% anticipated. Further, the second readings of the Eurozone Gross Domestic Product (GDP) for the second quarter (Q2) confirmed the 0.3% QoQ and 0.6% YoY initial estimations but the first readings of the Employment Change eased for the said period.
On the other hand, Japan marked the mixed prints of Merchandise Trade Balance for July and upbeat Machinery Orders for June, which in turn defends the Bank of Japan (BoJ) officials’ support for the ultra-easy monetary policy. Additionally, Japan’s Tertiary Industry Index for June drops to -0.4% MoM versus 1.2% prior.
Elsewhere, hawkish Fed concerns join fears of China’s slower economic recovery to also weigh on the sentiment and prod the EUR/JPY pair’s upside, via the risk-off mood. While portraying the sentiment, S&P500 Futures dropped to the lowest level in five weeks whereas the Eurostoxx 50 Futures also remain depressed at the latest.
Looking ahead, Eurozone Trade Balance for June will act as the immediate catalyst but the risk factors will be crucial for a clear guide.
Technical analysis
Bearish RSI divergence on the daily chart suggests a pullback in the EUR/JPY price towards the seven-week-old resistance-turned-support area surrounding 158.00–15.
- The index extends its rally to the 103.60 region.
- The greenback advances as investors digest the FOMC Minutes.
- Weekly Claims, Philly Fed index next of note in the docket.
The greenback, when tracked by the USD Index (DXY), maintains the bullish stance well in place and advances to new multi-week highs around 103.60 ahead of the opening bell in the old continent on Thursday.
USD Index bolstered by FOMC, looks at data
The index continues its relentless march north and extends further its recent breakout of the critical 200-day SMA (103.21).
The so far multi-week rally in the dollar appears well propped up by the equally strong rebound in US yields across different maturities, all against the backdrop of rising speculation that the Federal Reserve might keep its restrictive monetary stance for longer than initially anticipated.
The resilience of the US economy, as seen in recent results from key fundamentals, sustains that view despite current disinflationary pressures and some cracks in the (still tight) labour market.
Further strength in the buck also appeared following the publication of the FOMC Minutes late on Wednesday. On this, most of the participants shared the opinion that there are significant potential risks that could lead to higher inflation. They noted that the current level of inflation was considered too high and believed that additional proof was needed to be confident that the pressures driving prices upward were truly diminishing. The prevailing feeling among the majority of participants was that, due to the risks associated with inflation, it might be necessary to raise interest rates further.
Later in the US calendar, the usual weekly Initial Jobless Claims are due, seconded by the always relevant Philly Fed Manufacturing Index and the Leading Index tracked by the Conference Board.
What to look for around USD
The index keeps the bid bias well and sound and climbs to fresh tops further north of 103.00 the figure in the second half of the week, always amidst higher US yields and persistent weakness in the risk complex.
Extra support for the dollar also comes from the good health of the US economy, which seems to have reignited the narrative around the tighter-for-longer stance from the Federal Reserve.
Furthermore, the idea that the dollar could face headwinds in response to the data-dependent stance from the Fed against the current backdrop of persistent disinflation and cooling of the labour market appears to be losing traction as of late.
Key events in the US this week: MBA Mortgage Applications, Building Permits, Housing Starts, Industrial Production, FOMC Minutes (Wednesday) – Initial Jobless Claims, Philly Fed Manufacturing Index, CB Leading Index (Thursday).
Eminent issues on the back boiler: Persistent debate over a soft or hard landing for the US economy. Incipient speculation of rate cuts in early 2024. Geopolitical effervescence vs. Russia and China.
USD Index relevant levels
Now, the index is up 0.10% at 103.55 and the breakout of 103.59 (monthly high August 16) would open the door to 104.69 (monthly high May 31) and finally 105.88 (2023 high March 8). On the flip side, initial support emerges at 102.34 (55-day SMA) followed by 101.74 (monthly low August 4) and then 100.55 (weekly low July 27).
- AUD/USD remains depressed at YTD low, prints eight-day downtrend.
- RSI (14) line, 78.6% Fibonacci retracement prod south-run aiming theoretical target of “Double Tops”.
- Corrective bounce can aim for May’s peak but buyers remain off guard below 0.6600.
AUD/USD bears take a breather after refreshing the yearly low as oversold RSI joins the key Fibonacci ratio to mark an unimpressive effort to prod downside. That said, the Aussie pair dropped to 0.6364 before recently poking 0.6390 heading into Thursday’s European session.
That said, the RSI (14) line stays deep into the oversold territory suggesting an imminent corrective bounce. Also challenging the quote’s further weakness is the 78.6% Fibonacci retracement of the AUD/USD pair’s upside from October 2022 to February 2023, close to 0.6375.
With this, the quote could pare some of its latest losses, which in turn highlights the May month’s bottom of around 0.6460 as an immediate upside hurdle. However, lows marked in late June and early July around the 0.6600 round figure appear the key resistance for the AUD/USD buyers to cross to retake control.
It’s worth noting that the AUD/USD pair’s confirmed the “Double Tops” bearish chart formation earlier in the month by breaking the 0.6600 mark. The same suggests the theoretical target of 0.6300 unless the quote stays beneath 0.6600.
In a case where the AUD/USD pair rises past 0.6600, its run-up towards the early July swing high of around 0.6700 and the monthly peak of 0.6725 can’t be ruled out.
Alternatively, a downside break of the 0.6300 theoretical target will direct AUD/USD toward the previous yearly low of around 0.6170.
AUD/USD: Daily chart
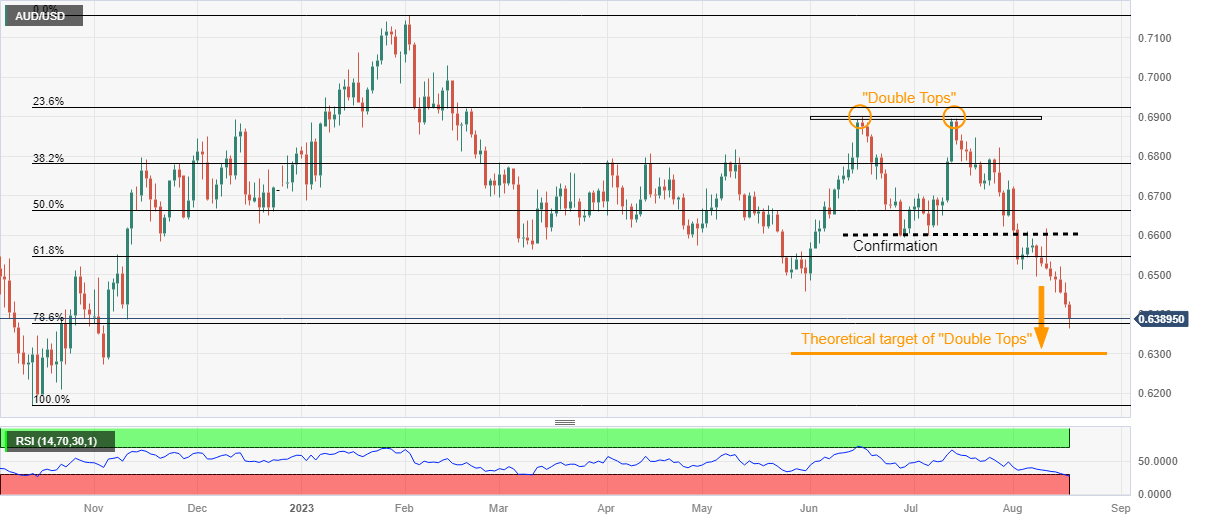
Trend: Further downside expected
CME Group’s flash data for crude oil futures markets noted traders trimmed their open interest positions for the second session in a row on Wednesday, this time by around 10.8K contracts. On the other hand, volume added around 188.5K contracts to its previous daily build.
WTI: Gains remain capped by $85.00
WTI prices extended the weekly leg lower and broke below the key $80.00 mark per barrel on Wednesday. The marked downtick was amidst shrinking open interest, however, bolstering the idea that a sustained decline seems out of favour for the time being. On the upside, the 2023 peak near $85.00 emerges as quite a decent resistance for bulls so far.
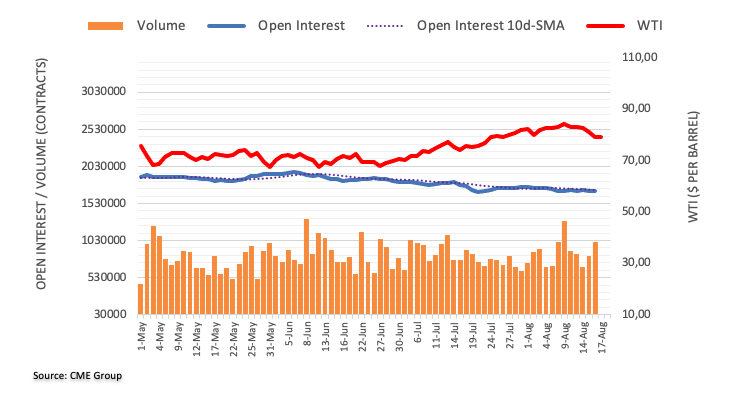
UOB Group’s Economist Lee Sue Ann expects the Bank Indonesia to keep its policy rate unchanged at 5.75% at its meeting on August 24.
Key Quotes
BI remains of the view that inflation expectations are “wellanchored” to BI’s target range of 2-4% until the end of this year. Jun’s inflation continued to ease and rupiah remains the strongest currency in Asia year-to-date.
We keep our view for policy rates to remain unchanged for the rest of this year.
- Asian stock markets trade mixed on Thursday amid concern about US inflation fear, Chinese debt crisis.
- Fitch Ratings might reconsider China's A+ sovereign credit rating in the face of intensifying economic headwinds.
- Japanese equities trade lower after the unexpected trade deficit data in July.
Asian equities trade mixed followed Wall Street lower on Thursday following the release of minutes from the Federal Open Market Committee (FOMC) meeting. Investors are concerned about mounting evidence of China's deterioration and the possibility of rising US interest rates.
The Federal Open Market Committee (FOMC) Minutes emphasised that inflation remained unacceptably high and may need additional tightening of monetary policy. This, in turn, weighs on regional stock equities and risky assets on Thursday.
At press time, China’s Shanghai is up 0.01% to 3,150, the Shenzhen Component Index rises 0.46% to 10,628, and Hong Kong’s Hang Sang falls 0.12% to 18,308. India’s NIFTY 50 declined 0.29%, South Korea’s Kospi dips 0.45%, and Japan’s Nikkei loses 0.38%.
In China, stock markets trade in negative territory for the fifth consecutive day. On Wednesday, the Chinese House Price Index for July decreased to -0.1% from 0% prior. The data raises fears about a potential Chinese property catastrophe, especially as large developer Country Garden Holdings struggles to pay its loan commitments. Furthermore, Fitch Ratings might reconsider China's A+ sovereign credit rating in the face of intensifying economic headwinds.
In Japan, the Nikkei 225 trades lower following the country's unexpected trade deficit in July. In addition, Japan's exports decreased for the first time in two years, with a significant decline in shipments to China.
Moving on, market participants will closely watch the headlines surrounding China’s economic woes. The US weekly Initial Jobless Claims and the Philadelphia Fed Manufacturing Survey for August will be due later in the day. Also, the annual Japanese National Consumer Price Index for July will be released on Friday. The events could provide hints for further Fed monetary policy and give a direction for riskier assets like equities, risk-sensitive currencies, etc.
Considering advanced prints from CME Group for gold futures markets, open interest extended its uptrend and went up by around 1.7K contracts on Wednesday. Volume, instead, resumed the decline and shrank by around 38.1K contracts following the previous daily build.
Gold: Next on the downside appears $1800
Gold prices retreated for the third session in a row on Wednesday, challenging once again the key contention area around $1900 per troy ounce. The downtick was amidst rising open interest and leaves the yellow metal vulnerable to further losses in the very near term. Against that, a convincing breakdown of the $1900 mark should not meet any noticeable support until the 2023 low of $1804 (February 28).
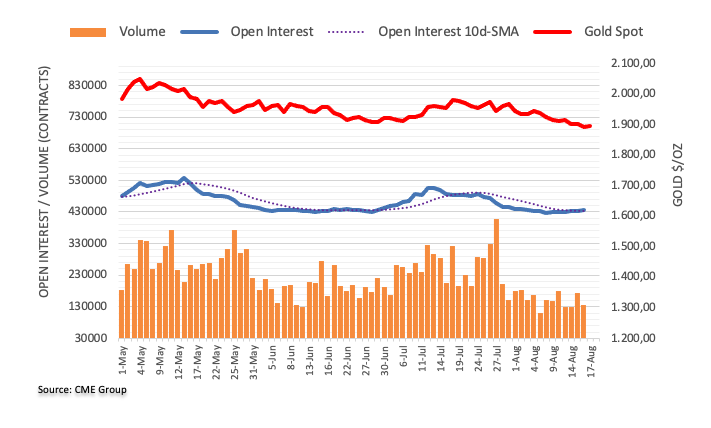
- Gold Price stabilizes at the lowest level in five months.
- Hawkish Federal Reserve bias, China woes join mostly upbeat US data to propel US Dollar and yields.
- Risk catalysts, bond market moves eyed as global economic fears tease XAU/USD bears.
Gold Price (XAU/USD) drops to a fresh low in five months before consolidating around $1,890 as market players seek more clues to extend the previous downturn, backed by the hawkish Federal Reserve (Fed) concerns and the risk-off mood. That said, fears of economic slowdown in China and softer growth numbers in developed economies join firmer US data to propel the US Treasury bond yields and the US Dollar, which in turn weigh on the XAU/USD. It’s worth noting that the US 10-year Treasury bond yields rise to the highest level since October 2022, around 4.29% at the latest. It should be noted that such a high level of bond coupons triggered fears of economic slowdown and drowned the riskier assets, while also underpinning the US Dollar, during late 2022. Apart from the yields, downbeat economic projections from Fitch Ratings also exert downside pressure on the sentiment and Gold Price.
Moving on, an absence of major data/events may allow the Gold Price to consolidate recent losses at the multi-day low. However, the risk aversion wave and firmer yields can keep the US Dollar on the front foot, which in turn will prod the XAU/USD rebound unless witnessing any strong positive data/news that can weigh on the Greenback and improve the mood.
Also read: Gold Price Forecast: XAU/USD sees a dead cat bounce, downside favored whilst below 200 DMA
Gold Price: Key levels to watch
As per our Technical Confluence, the Gold Price stays well beneath the $1,917-18 resistance confluence, comprising the Fibonacci 161.8% on one-day, 200-HMA and Pivot Point one-month S1.
Also keeping the XAU/USD bears hopeful is the metal’s sustained trading below the $1,905 support, now resistance, encompassing the convergence of the 200-DMA and 50-DMA, as well as the middle band of the Bollinger on the four-hour (4H) play.
It’s worth noting, however, that the $1,888 level including the lower band of the Bollinger on the hourly play and the Pivot Point one-week S2 restricts the immediate downside of the Gold Price.
Following that, there prevails a smooth run for the XAU/USD bears unless hitting the $1,870 support including Pivot Point one-day S3. During the fall, the Pivot point one-day S2 may prod the Gold sellers around $1,882.
Should the Gold bears remain dominant past $1,870, the odds of witnessing a slump toward an early March swing high of around $1,858 can’t be ruled out.
Here is how it looks on the tool
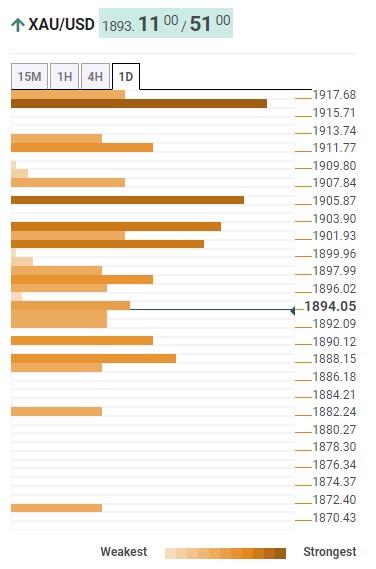
About Technical Confluences Detector
The TCD (Technical Confluences Detector) is a tool to locate and point out those price levels where there is a congestion of indicators, moving averages, Fibonacci levels, Pivot Points, etc. If you are a short-term trader, you will find entry points for counter-trend strategies and hunt a few points at a time. If you are a medium-to-long-term trader, this tool will allow you to know in advance the price levels where a medium-to-long-term trend may stop and rest, where to unwind positions, or where to increase your position size.
- GBP/USD meets with a fresh supply on Thursday and is pressured by sustained USD buying.
- Bets for one more Fed rate hike in 2023 and a weaker risk tone underpin the safe-haven buck.
- Expectations for further policy tightening by the BoE to limit losses for the GBP and the pair.
The GBP/USD pair edges lower during the Asian session on Thursday and extends the overnight pullback from the 1.2765 area, or a multi-day peak. The downtick is exclusively sponsored by the underlying bullish sentiment surrounding the US Dollar (USD), though spot prices manage to hold above the 1.2700 mark in the wake of rising bets for further interest rate hikes by the Bank of England (BoE).
The USD Index (DXY), which tracks the Greenback against a basket of currencies, climbs to its highest level since June 12 and is supported by the Federal Reserve's (Fed) hawkish outlook. the In fact, the minutes of the July 25-26 FOMC meeting released on Wednesday revealed that policymakers were divided over the need for more rate hikes, though continued to prioritize the battle against inflation. Moreover, the incoming stronger US macro data points to an extremely resilient economy and keeps the door open for one more 25 bps lift-off later this year.
The outlook pushes the yield in the benchmark 10-year US government bond to its highest level since 2008 and acts as a tailwind for the buck. Apart from this, a generally weaker tone around the equity markets turns out to be another factor that benefits the Greenback's relative safe-haven status and exerts some pressure on the GBP/USD pair. Against the backdrop of concerns about the worsening economic conditions in China, worries about headwinds stemming from rapidly rising borrowing costs fuel recession fears and weigh on investors' sentiment.
The downside for the GBP/USD pair, however, seems cushioned, at least for the time being, amid growing acceptance that the UK central bank will raise interest rates again at its next monetary policy meeting in September. The expectations were reaffirmed by stronger UK wage growth data released on Tuesday, which added to worries about long-term inflation. This, along with the upbeat UK GDP report released last week and Wednesday's slightly higher-than-expected UK CPI print, should allow the BoE to continue tightening its monetary policy.
The aforementioned mixed fundamental backdrop makes it prudent to wait for strong follow-through selling before confirming that the recent bounce from the 100-day Simple Moving Average (SMA), around the 1.2615 region, or the lowest level since June touched last week, has run its course. Market participants now look to the US economic docket, featuring the usual Weekly Initial Jobless Claims and the Philly Fed Manufacturing Index. This, along with the US bond yields will influence the USD and provide some impetus to the GBP/USD pair.
Technical levels to watch
- EUR/USD pair extends its loss below the 1.0870 level, a multi-week low.
- Stronger-than-expected Eurozone data failed to support the Euro as economic growth and inflation forecasts remain ambiguous.
- Fed officials emphasised significant inflationary risks and the need for additional tightening of monetary policy.
The EUR/USD pair remains under selling pressure and trades on a negative note for the fifth consecutive day during the Asian session on Thursday. The major pair currently trades around 1.0863, losing 0.14% on the day.
On Wednesday, the preliminary Eurozone Gross Domestic Product (GDP) for the second quarter came in at 0.3% and 0.6% YoY, matching expectations. Meanwhile, Eurozone Industrial Production for June MoM improved to 0.5% versus -0.1% market consensus and 0.0% prior. The monthly Industrial Output data rose by 0.5% versus the estimation of a 0.1% decline.
Earlier this week, the Eurozone ZEW Survey Economic Sentiment for August came in at -5.5, better than the estimation of -12 and the previous reading of -12.2. While the German ZEW Survey Economic Sentiment for August improved to -12.3 versus -14.4 expected and -14.7 prior. The stronger-than-expected data from the Eurozone failed to lift the Euro against its rivals as the prospects for economic growth and inflation are still uncertain.
That said, the upbeat US data and the possibility of a further tightening cycle from the Federal Reserve (Fed) are the main drivers of the US Dollar's (USD) strength. US Industrial Production rose 1.0% in July, better than market expectations of 0.3% and a prior decrease of 0.8%. Additionally, Building Permits for July increased from 1.44 million to 1.44 million, while Housing Starts increased from 1.39 million in June to 1.45 million, above expectations of 1.48 million. Both reports came in above market expectations and prior readings.
Furthermore, the Federal Open Market Committee (FOMC) Minutes emphasised that inflation remained unacceptably high. The Fed official saw significant inflationary risks, and it may need additional tightening of monetary policy to bring inflation to the longer-run target. In response to the data, the Euro continued to weaken against the US Dollar which acts as a headwind for the EUR/USD pair.
Federal Reserve officials endorsed that future rate decisions would be based on the incoming data, but they would be more cautious in the coming months. Hence, market participants will focus on the US weekly Initial Jobless Claims and the Philadelphia Fed Manufacturing Survey for August, due later in the day. On the Euro docket, Eurozone Trade Balance, the European Central Bank (ECB) Philip Lane speech, and the monthly Harmonized Index of Consumer Prices (HICP) for July will be released in the rest of the week.
- USD/CAD continues to gain due to robust US economic indicators.
- Elevated Treasury yields supported the strength of the Greenback.
- FOMC’s minutes revealed a divergence among Fed officials concerning interest rate hikes.
- USD/JPY seesaws at YTD top amid fears of Japan intervention, mixed data from Tokyo.
- Yields approach 2022 peak that triggered global recession woes.
- Hawkish Fed bets, economic jitters weigh on sentiment, underpinning US Dollar strength.
- Risk catalysts, mid-tier US data eyed for clear directions.
USD/JPY refreshes the Year-To-Date (YTD) high to 146.55 but lacks follow-through amid fears of the Japanese policymakers’ market intervention to defend the Yen. That said, broad risk aversion and hawkish Fed concerns underpin the major currency pair’s run-up early Thursday.
Market sentiment sours as traders fear hawkish Fed bias amid global economic woes. Also challenging the sentiment could be the geopolitical/economic woes emanating from China, as well as the recently mixed US data.
The latest Fed meeting minutes highlighted the policymakers’ discussion on the inflation pressure, despite marking a division on the rate hike decision. That said, the Minutes also conveyed that most policymakers preferred supporting the battle again the ‘sticky’ inflation. While helping the markets to justify hawkish Fed bias, US Industrial Production traced upbeat Retail Sales figures.
Additionally, a slump in China’s housing prices marked the first fall of the year in June and joins the fears about another bond market crisis in the Dragon Nation, as the biggest private realtor Country Garden struggles to pay bond payments.
To portray the mood, S&P500 Futures dropped to the lowest level in five weeks, indecisive around the multi-day bottom surrounding 4,415-20 by the press time. In doing so, the US stock futures trace losses made by the Wall Street benchmark.
It’s worth noting that, the US 10-year Treasury bond yields rise to the highest level since October 2022, around 4.298% at the latest. It should be noted that such a high level of bond coupons triggered fears of economic slowdown and drowned the riskier assets, while also underpinning the US Dollar, during late 2022.
On a different page, the mostly firmer US data and mixed Japan numbers also test the USD/JPY pair of late. Earlier in the day, Japan marked the mixed prints of Merchandise Trade Balance for July and upbeat Machinery Orders for June, which in turn defends the Bank of Japan (BoJ) officials’ support for the ultra-easy monetary policy.
Moving forward, the risk catalysts will be the key to determining the near-term AUD/JPY moves amid a light calendar elsewhere.
Technical analysis
Overbought RSI joins ascending resistance line from July 21, close to 146.55 by the press time, to challenge USD/JPY buyers. The pullback moves, however, remain elusive beyond June’s peak of 145.05.
- USD/INR meets with some supply on Thursday and retreats further from the record high.
- A strong bullish tone surrounding the USD should limit any meaningful corrective slide.
- This week's breakout through the 83.00 stiff barrier adds credence to the positive outlook.
The USD/INR pair edges lower during the Asian session on Thursday and moves further away from the record high touched earlier this week. Spot prices slide back to the 83.00 strong horizontal resistance breakpoint, though seems poised to prolong the recent upward trajectory witnessed over the past three weeks or so.
The minutes of the July 25-26 FOMC policy meeting signalled that a further rate hike remains in play later this year, which remains supportive of a further rise in the US Treasury bond yields and continues to underpin the US Dollar (USD). Apart from this, the prevalent risk-off environment could further benefit the safe-haven Greenback and help limit any meaningful corrective decline for the USD/INR pair, at least for the time being.
Even from a technical perspective, this week's breakout through the 83.00 round-figure mark, which has been acting as a strong barrier since November 2022, supports prospects for a further near-term appreciating move for the USD/INR pair. Hence, any subsequent slide is likely to attract fresh buyers near the 82.80-82.75 region. This is followed by the 82.60-82.55 support, which should now act as a strong base for spot prices.
The positive outlook is reinforced by the fact that the Relative Strength Index (RSI) on the daily chart has already pulled back from the vicinity of the overbought territory. This, in turn, suggests that the path of least resistance for the USD/INR pair is to the upside. That said, bulls might now wait for some follow-through buying beyond the 83.40 area, or the record high before positioning for a move towards the 84.00 round-figure mark.
USD/INR daily chart
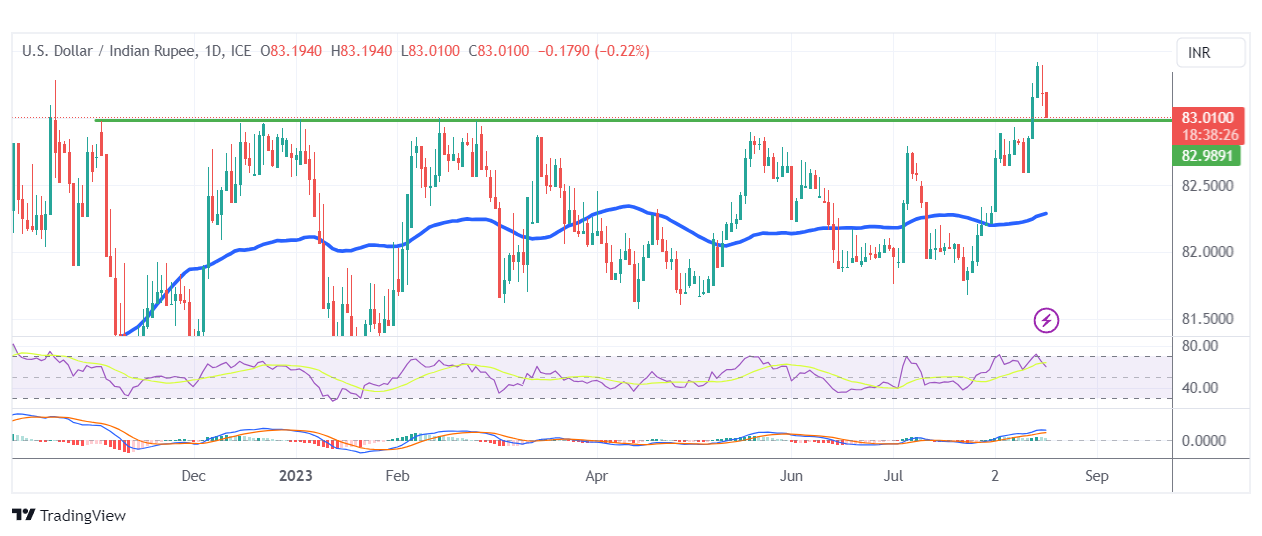
Technical levels to watch
- Natural Gas rebounds from weekly low, snaps two-day losing streak.
- Hawkish Fed Minutes, economic woes underpin US Dollar strength and prod commodity buyers.
- 100-SMA, bearish MACD signals check corrective bounce; rising support line from early June adds to additional downside filters.
Natural Gas Price (XNG/USD) ignores firmer US Dollar and the risk-off mood to post the first daily gains so far in three days amid early Thursday. In doing so, the energy instrument bounces off the 200-SMA while printing mild gains to around $2.73 by the press time.
Also read: S&P500 Futures drop to five-week low, yields refresh yearly top on hawkish Fed Minutes, global economic woes
It’s worth noting, however, that the 100-SMA and the bearish MACD signals join the broad pessimism about the energy market to challenge the XNG/USD buyers around $2.74.
Even if the Natural Gas buyers manage to cross the 100-SMA hurdle, the XNG/USD buyers will be cautious as a downward-sloping resistance line from August 10, close to $2.84 at the latest, will challenge the quote’s further run-up.
Following that, a horizontal area comprising the late July tops and the monthly high, surrounding $2.93–94, will precede the monthly peak of $3.07 to prod the bulls.
On the other hand, a downside break of the 200-SMA support of $2.69 will direct the XNG/USD sellers toward an upward-sloping support line from June 01, near $2.57 at the latest.
In a case where the Natural Gas sellers keep the reins past $2.57, the monthly low of $2.50 will be in danger.
Natural Gas Price: Four-hour chart
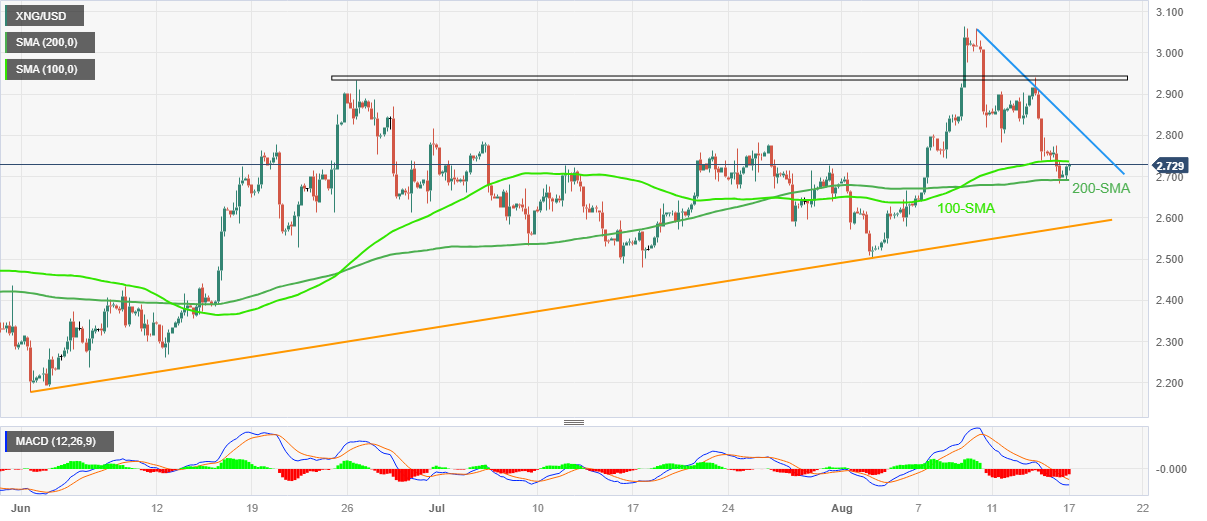
Trend: Pullback expected
- Market sentiment remains sour as Fed hawks shows determination to battle with inflation despite looming economic fears.
- Fitch ratings revised down growth forecasts of 10 developed economies, China woes stay on the table.
- S&P500 Futures trace Wall Street to print three-day downtrend and refresh monthly low.
- US 10-year Treasury bond yields prod 2022 peak that triggered recession fears.
The risk appetite remains downbeat early Thursday as market players fear hawkish Fed bias amid global economic woes. Also challenging the sentiment could be the geopolitical/economic woes emanating from China, as well as the recently mixed US data.
While portraying the mood, S&P500 Futures dropped to the lowest level in five weeks, indecisive around the multi-day bottom surrounding 4,415-20 by the press time. In doing so, the US stock futures trace losses made by the Wall Street benchmark.
Elsewhere, the US 10-year Treasury bond yields rise to the highest level since October 2022, around 4.298% at the latest. It should be noted that such a high level of bond coupons triggered fears of economic slowdown and drowned the riskier assets, while also underpinning the US Dollar, during the late 2022.
Apart from the status of the benchmark bond coupon, fears of witnessing a slowdown in the economic transition of the 10 developed economies, backed by the Fitch Ratings’ quarterly Global Economic Outlook report, also weigh on sentiment.
With this, the US Dollar Index renews the two-month high while the prices of Gold and WTI crude oil remains pressured.
It’s worth noting that the latest Fed meeting minutes highlighted the policymakers’ discussion on the inflation pressure, despite marking a division on the rate hike decision. That said, the Minutes also conveyed that most policymakers preferred supporting the battle again the ‘sticky’ inflation. While helping the markets to justify hawkish Fed bias, US Industrial Production traced upbeat Retail Sales figures.
Elsewhere, a slump in China’s housing prices marked the first fall of the year in June and joins the fears about another bond market crisis in the Dragon Nation, as the biggest private realtor Country Garden struggles to pay bond payments, to propel the USD/CNH price.
It should be observed that the Chinese policymakers have been trying by all means to defy the concerns about easing economic recovery but no meaningful market reaction has been witnessed of late, which in turn flags concerns about the recession of the world’s second-largest economy.
Looking ahead, the US weekly jobless claims and Philadelphia Fed Manufacturing Survey for August should be watched for intermediate directions while the risk catalysts are the key for a clear guide.
Also read: Forex Today: Dollar keeps rising after Fed minutes, Pound outperforms
- The USD climbs to its highest level since June 12 during the Asian session on Thursday.
- The Fed's hawkish stance lifts the US bond yields to a multi-year top and lends support.
- The overnight break through the 103.00 confluence was seen as a fresh trigger for bulls.
The US Dollar (USD) builds on the previous day's positive move beyond the 103.20-103.25 hurdle and touches its highest level since June 12 during the Asian session on Thursday. The USD Index (DXY), which tracks the Greenback against a basket of currencies, currently trades just below mid-103.00s and seems poised to prolong the recent strong upward trajectory witnessed over the past month or so.
The minutes of the July 25-26 FOMC policy meeting revealed that policymakers remained divided over the need for more rate hikes, though continued to prioritize the battle against inflation. This, along with the recent stronger US macro data, which pointed to an extremely resilient economy, keeps the door open for one more 25 bps lift-off by Fed later this year. The outlook lifts the yield on the benchmark 10-year US government bond to its highest level since 2008 and continues to underpin the buck.
Moreover, fresh worries about headwinds stemming from rapidly rising borrowing costs and the worsening economic conditions in China turn out to be another factor that benefits the Greenback's status as the global reserve currency. That said, a slightly overbought Relative Strength Index (RSI) on the daily chart is holding back the USD bulls from placing fresh bets and capping any further gains, though the broader technical setup supports prospects for a further near-term appreciating move.
The overnight breakout through a descending trend-line hurdle extending from the March swing high and a close above the very important 200-day Simple Moving Average (SMA) – for the first time since November 30 – was seen as a fresh trigger for bullish traders. This, in turn, suggests that the path of least resistance for the USD remains to the upside. Hence, a subsequent strength towards the 103.75 horizontal resistance, en route to the 104.00 round-figure mark, looks like a distinct possibility.
On the flip side, any meaningful corrective slide is likely to attract fresh buying and remain limited near the 103.00 confluence resistance breakpoint, comprising the aforementioned descending trend-line and the 200-day SMA. The said handle should act as a strong base for the DXY, which if broken might prompt some technical selling. Spot prices might then slide to the 102.70-102.65 support before sliding further towards the next relevant support near the 102.30 area and the 102.00 round figure.
US Dollar Index (DXY) daily chart

Technical levels to watch
- NZD/USD takes offers to refresh yearly low during eight-day downtrend.
- Oversold RSI, key technical levels can challenge Kiwi bears.
- Corrective bounce can aim for May’s bottom but remains elusive below 0.6045.
NZD/USD bears keep the reins for the eighth consecutive day as they refresh the yearly low to 0.5902 amid early Thursday.
In doing so, the Kiwi pair justifies the previous week’s downside break of the 0.5985 support comprising May’s low while poking the 61.8% Fibonacci retracement of October 2022 to February 2023 upside, near 0.5900 by the press time, also known as the golden Fibonacci ratio.
It’s worth noting, however, that the RSI (14) line hits the oversold territory and joins the key Fibonacci support around 0.5900 to challenge the NZD/USD bears.
Also acting as a downside filter is a descending support line from early March, close to 0.5885 by the press time.
In a case where the Kiwi pair drops below 0.5885, the early October swing high near 0.5815 may act as the final defense of the bulls.
Alternatively, an upside clearance of the support-turned-resistance line surrounding 0.5985, closely followed by the 0.6000 psychological magnet, becomes necessary for the NZD/USD buyers to return to the desk.
Even so, a downward-sloping resistance line from July 14, around 0.6045 at the latest, can challenge the run-up before pushing back the bears.
NZD/USD: Daily chart
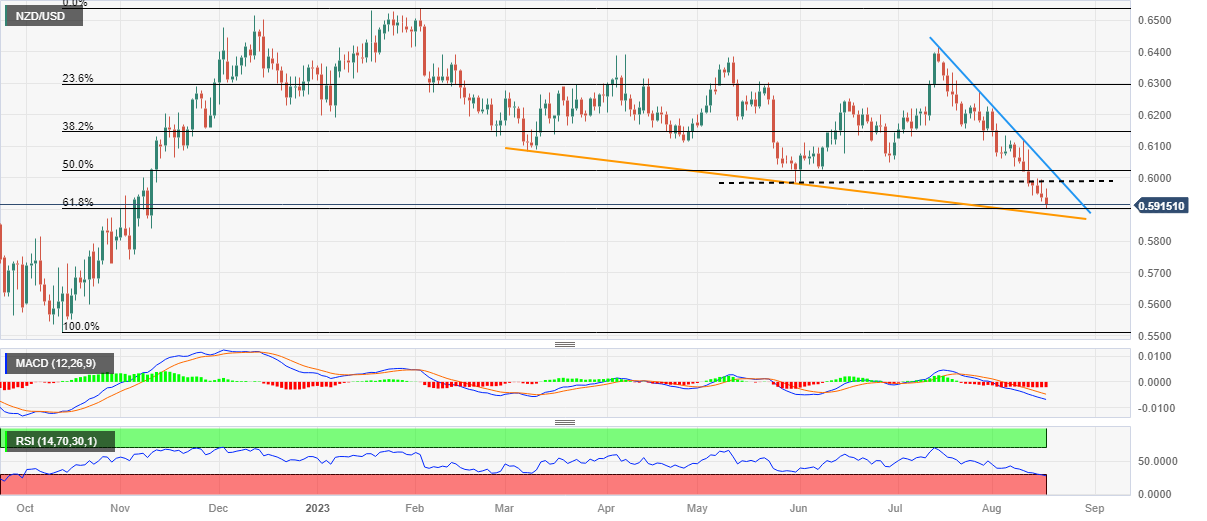
Trend: Limited downside expected
| Raw materials | Closed | Change, % |
|---|---|---|
| Silver | 22.414 | -0.48 |
| Gold | 1892.486 | -0.49 |
| Palladium | 1208.8 | -2.24 |
- USD/CNH remains sidelined after refreshing nine-month high, braces for all-time peak amid firmer US Dollar, risk aversion.
- US Dollar cheers hawkish Fed concerns, mostly upbeat US data to favor Yuan sellers.
- PBOC’s defense of currency, economic fears about China propel prices toward the record high marked in 2022.
- Risk catalysts eyed for clear directions amid light calendar.
USD/CNH remains on the front foot as bulls flirt with 7.3400 after refreshing the yearly high early Thursday. In doing so, the offshore Chinese Yuan (CNY) not only justifies the US Dollar’s strength but also the downbeat concerns about China and the People’s Bank of China’s (PBoC) struggle to defend the domestic currency.
PBoC has been trying to tame the onshore Chinese Yuan (CNY) fix for many days, as perceived by the wide gap between the daily closing of the USD/CNY and the daily fix. Recently, the PBoC set the USD/CNY central rate at 7.2076 , versus the previous fix of 7.1986 and market expectations of 7.3047. It's worth noting that the USD/CNY closed near 7.2990 the previous day. On the same line are the latest talks that some state banks from Beijing are actively selling the US Dollar to defend the Yuan.
On the other hand, a slump in China’s housing prices marked the first fall of the year in June and joins the fears about another bond market crisis in the Dragon Nation, as the biggest private realtor Country Garden struggles to pay bond payments, to propel the USD/CNH price.
It should be observed that the Chinese policymakers have been trying by all means to defy the concerns about easing economic recovery but no meaningful market reaction has been witnessed of late, which in turn flags concerns about the recession of the world’s second-largest economy and fuels the USD/CNH.
Elsewhere, the latest Fed meeting minutes highlighted the policymakers’ discussion on the inflation pressure, despite marking a division on the rate hike decision. That said, the Minutes also conveyed that most policymakers preferred supporting the battle again the ‘sticky’ inflation.
Furthermore, the recently firmer US data also and fears of global economic consolidation also underpin the USD/CNH run-up.
The latest Fed meeting minutes highlighted the policymakers’ discussion on the inflation pressure, despite marking a division on the rate hike decision. That said, the Minutes also conveyed that most policymakers preferred supporting the battle again the ‘sticky’ inflation.
On Wednesday, the US Industrial Production marked a surprise 1.0% growth for July versus 0.3% expected and -0.8% prior while the Capacity Utilization for the said month also improved to 79.3% from 78.6%, compared to market forecasts of 79.1%. Further, the Building Permits edged higher to 1.442M for July from 1.441M whereas the Housing Starts rose to 1.452M for the said month versus 1.398M prior and 1.448M expected. It’s worth noting that both the Building Permits Change and Housing Starts Change improved more than market forecasts and previous readings.
It’s worth mentioning that the global rating agency Fitch Ratings lowered medium-term Gross Domestic Product (GDP) projections for 10 developed economies in its quarterly Global Economic Outlook.
While portraying the mood, Wall Street closed in the red while the US 10-year Treasury bond yields refreshed the yearly top to 4.278%. It should be noted that S&P500 Futures dropped to the lowest level in seven weeks by the press time and keep the USD/CNH bulls hopeful of witnessing further upside.
Technical analysis
An ascending resistance line from late December 2022, close to 7.3530 at the latest, joins the overbought RSI (14) line to prod the USD/CNH bulls. The pullback moves, however, remain elusive unless breaking June’s peak of around 7.2860.
- AUD/NZD drifts lower for the third straight day and drops to a one-week low on Thursday.
- The disappointing Australian jobs data weighs on the AUD and exerts pressure on the cross.
- The RBNZ's hawkish outlook on Wednesday contributes to the NZD's relative outperformance.
The AUD/NZD cross remains under some selling pressure for the third successive day and retreats further from a two-and-half-week high, around the 1.0875-1.0880 region touched on Tuesday. The downfall picks up pace during the Asian session on Thursday and drags spot prices to a one-week low, around the 1.0780 area in the last hour.
The Australian Dollar (AUD) weakens across the board in reaction to the disappointing release of the domestic employment data and turns out to be a key factor exerting pressure on the AUD/NZD cross. In fact, the Australian Bureau of Statistics (ABS) reported that the economy lost a net 14,600 jobs in July and the Unemployment Rate unexpectedly rose to 3.7% during the reported month. This should allow the Reserve Bank of Australia (RBA) to leave interest rates unchanged for the third successive month at its meeting in September.
The New Zealand Dollar (NZD), on the other hand, continues with its relative outperformance against its Australian counterpart in the wake of the Reserve Bank of New Zealand's (RBNZ) hawkish outlook. This is seen as another factor that contributes to the offered tone surrounding the AUD/NZD cross. It is worth recalling that the RBNZ indicated on Wednesday that interest rates will remain at a restrictive level for some time and now forecasts the key Official Cash Rate (OCR) to remain at 5.5% through December 2024.
The downward trajectory, meanwhile, takes along some short-term trading stops placed near the 1.0800 confluence support, comprising the 100-day and the 200-day Simple Moving Averages (SMAs). This, in turn, prompts some technical selling around the AUD/NZD cross and supports prospects for a further near-term depreciating move. That said, any subsequent slide is more likely to find decent support near the 1.0755-1.0750 horizontal zone, which if broken will be seen as a fresh trigger for bears and validate the negative outlook.
Technical levels to watch
- USD/MXN holds positive ground above 17.15, close to the weekly high.
- The FOMC Minutes indicated significant inflationary risks, and an additional tightening of monetary policy may be required.
- The US Initial Jobless Claims, Philadelphia Fed Manufacturing Survey, Mexican Retail Sales will be in focus.
USD/MXN gains momentum above the 17.00 area amid the firmer US dollar (USD) broadly. The FOMC Minutes suggest the possibility of a further tightening cycle from the Federal Reserve (Fed), and it boosts the Greenback to the highest level since June, above 103.50. The pair currently trades near 17.1730, up 0.22% on the day.
That said, the Mexican Peso weakened against the US Dollar following the release of FOMC Minutes. The report emphasised that inflation remained unacceptably high. Additionally, the Fed official saw significant inflationary risks, and it may need additional tightening of monetary policy to bring inflation to the longer-run target. This, in turn, weighs on the Mexican Peso and acts as a tailwind for the USD/MXN.
Furthermore, the upbeat US data is another driver for the Dollar strengthen. US Industrial Production rose 1.0% in July, better than market expectations of 0.3% and a prior decrease of 0.8%. In July, Building Permits increased from 1.44 million to 1.44 million, while Housing Starts increased from 1.39 million in June to 1.45 million, above expectations of 1.48 million. Both the Change in Building Permits and the Change in Housing Starts exceeded both market expectations and prior readings.
Moving on, traders will keep an eye on the US weekly Initial Jobless Claims and the Philadelphia Fed Manufacturing Survey for August, due later in the day. Also, the Mexican Retail Sales data for June will be released on Friday. The annual Retail Sales data is expected to rise by 2.9%, while the monthly figure is expected to grow by 0.9%. The data will be critical for determining a clear movement for the USD/MXN.
- AUD/JPY takes offers to refresh weekly low on downbeat Aussie employment report.
- Fears of Japan's intervention, risk-off mood also favors pair sellers.
- Firmer yields, BoJ’s defense of easy-money policy prod downside bias.
AUD/JPY slumps 50 pips on the downbeat Australian employment report for July during early Thursday. Adding strength to the bearish bias are the fears of the Japanese intervention to defend the Yen. The same joins sour sentiment to exert downside pressure on the risk-barometer pair, down 0.67% intraday near 93.35 by the press time.
As per the July month data from the Australia Bureau of Statistics (ABS), the headline Employment Change slumped to -14.6K on a seasonally adjusted basis versus 15.0K expected and 32.6K prior whereas the Unemployment Rate edges higher to 3.7% compared to the market’s expectations of once again witnessing 3.5% figure.
On the other hand, Japan’s mixed prints of Merchandise Trade Balance for July and upbeat Machinery Orders for June justifies the latest push to the Japanese policymakers to defend the Yen, which in turn weighs on the AUD/JPY price.
Further, the market’s risk-off mood, mainly due to the hawkish Fed concerns and fears surrounding China, not to forget the recently downbeat global economic concerns, also keep the AUD/JPY bears hopeful.
Alternatively, the Bank of Japan (BoJ) officials’ defense of the ultra-easy monetary policy and the recently firmer Treasury bond yields put a floor under the AUD/JPY prices. That said, Wall Street closed in the red while the US 10-year Treasury bond yields refreshed the yearly top to 4.278%. It should be noted that S&P500 Futures dropped to the lowest level in seven weeks by the press time and keep the Aussie bears hopeful of witnessing further downside.
Looking ahead, the risk catalysts will be the key to determining the near-term AUD/JPY moves amid a light calendar elsewhere.
Technical analysis
A clear downside break of a three-week-old rising support line, now immediate resistance around the 94.00 threshold, directs AUD/JPY bears toward an ascending support line from late April, near 92.60 at the latest.
- GBP/JPY achieved a historical peak on the back of better-than-expected UK inflation data.
- Japan’s trade data could cap the upward movement of the GBP/JPY pair.
- Traders await UK Retail Sales, seeking fresh impetus to place new bets on GBP/JPY pair.
GBP/JPY achieved a historical peak of 186.41 during the early trading hours in the Asian session on Thursday. Currently, the pair hovers around 186.20 as it seeks to extend its ongoing winning streak. The British Pound (GBP) is showing strength against the Japanese Yen (JPY), primarily driven by better-than-expected inflation figures originating from the United Kingdom (UK) on Wednesday.
This resilient economic data could amplify the concerns over interest rate hikes by the Bank of England (BoE) in the September meeting. That said, UK Consumer Price Index (CPI) (MoM) printed the figure of -0.4% for the month of July against the expected -0.5% and 0.1% prior. At the annual rate, the CPI posted a reading of 6.8% same as anticipated, against the 7.9% previously. Core CPI remained consistent at the rate of 6.9%, against the expected 6.8%.
On the other hand, the Reuters Tankan, a quarterly survey outlining the business sentiment among Japanese companies, was revealed on Wednesday. This dataset contributed to the strength of the Japanese Yen (JPY) as it indicated improvements in both Large Manufacturing and Non-manufacturing sentiments. Additionally, there is ongoing market speculation concerning the potential intervention by Japanese authorities to protect the Japanese currency from further appreciation against the US Dollar (USD). Such intervention could significantly impact the price movement of GBP/JPY, influencing its overall price action.
Furthermore, the moderate trade data released from Japan on Thursday might serve as a limiting factor, potentially capping the upward movement of the GBP/JPY pair. Japan's year-on-year exports experienced a contraction, with the reading declining to -0.3% from the previous 1.5% in July. This result was better than the projected decline of -0.8%. At the same time, year-on-year imports also declined, reaching -13.5% in July. This figure was slightly better than the expected reading of -14.7%, representing a decrease from the previous reading of -12.9%.
Market participants will closely observe the upcoming data release scheduled for Friday. In the Japanese economic calendar, particular attention will be directed toward the National Consumer Price Index. Likewise, there will be a focus on Retail Sales data from the UK. These data releases are expected to offer valuable insights into the economic outlook of Japan and the UK, potentially influencing trading decisions involving the GBP/JPY pair.
- GBP/USD holds above the 1.2700 area amid a firmer Dollar.
- The UK Consumer Price Index (CPI) came in stronger than expected.
- FOMC Minutes stated inflation remained unacceptably high, additional tightening of monetary policy may be required.
- Investors will keep an eye on the US Initial Jobless Claims, the Philadelphia Fed Manufacturing Survey, the UK Retail Sales.
The GBP/USD pair struggles to gain and remains well-supported above 1.2700 during the early Asian session on Thursday. The odds for a further tightening cycle from the Federal Reserve (Fed) boost the US Dollar Index above 103.50, the highest level since June. The major pair currently trades near 1.2717, losing 0.12% on the day.
On Wednesday, the UK’s National Statistics reported that the nation's Consumer Price Index (CPI) MoM came in at -0.4%, above the market consensus of -0.5% versus the previous reading of 0.1%. On a yearly basis, British CPI inflation rose 6.8% for June, as expected of 6.8%. The core CPI, which excludes volatile oil and food prices for July, increased 6.9%, better than the 6.8% estimation. Meanwhile, the UK Retail Price Index (RPI) for July came in at -0.6% MoM and 9.0% YoY. The stronger-than-expected data from the UK might convince the Bank of England (BoE) to raise an additional rate.
Across the pond, the hawkish statement from FOMC Minutes and the upbeat US data lift the US Dollar broardly, That said, the Federal Open Market Committee (FOMC) Minutes stated that inflation remained unacceptably high. The Fed official saw significant inflationary risks, and it may need additional tightening of monetary policy to bring inflation to the longer-run target.
About the data, US Industrial Production increased 1.0% in July, beating market expectations of 0.3% and a prior decrease of 0.8%. In July, Building Permits increased from 1.44 million to 1.44 million, while Housing Starts increased from 1.39 million in June to 1.45 million, exceeding expectations of 1.48 million. Both the Change in Building Permits and the Change in Housing Starts exceeded both market expectations and prior readings. This, in turn, boosts the Greenback and acts as a headwind for the GBP/USD pair.
Looking ahead, market players will monitor the US weekly Initial Jobless Claims for the week ending August 11 and the Philadelphia Fed Manufacturing Survey for August, due later in the American session. The focus will shift to UK Retail Sales for July, due on Friday. The monthly figure is expected to drop 0.5%.
According to the latest data published by the Australian Bureau of Statistics (ABS) on Thursday, the Unemployment Rate in Australia ticked higher to 3.7% in July, as against the expectations of 3.5% and the previous reading of 3.5%.
The Australian Employment Change arrived at -14.6K in July, compared with the consensus forecast of 15K and 32.6K jobs addition seen in June.
Additional details revealed that Full-Time Employment decreased by 24.2K in the reported month vs. June’s growth of 39.3K. However, Part-Time Employment jumped by 9.6K as against a drop of 6.7K in June.
The Participation Rate edged lower to 66.7% in July vs. 66.8% expected and 66.8% previous.
Market reaction
AUD/USD accelerated declines on the downbeat Australian jobs data, falling 0.39% on the day to trade at 0.6367, as of writing.
Australian Dollar price today
The table below shows the percentage change of Australian Dollar (AUD) against listed major currencies today. Australian Dollar was the weakest against the Japanese Yen.
| USD | EUR | GBP | CAD | AUD | JPY | NZD | CHF | |
| USD | 0.11% | 0.13% | 0.11% | 0.71% | 0.10% | 0.45% | 0.09% | |
| EUR | -0.11% | 0.02% | 0.00% | 0.60% | -0.02% | 0.33% | -0.02% | |
| GBP | -0.14% | -0.03% | -0.03% | 0.58% | -0.04% | 0.31% | -0.05% | |
| CAD | -0.11% | 0.00% | 0.01% | 0.63% | -0.02% | 0.24% | -0.04% | |
| AUD | -0.62% | -0.60% | -0.59% | -0.61% | -0.63% | -0.16% | -0.51% | |
| JPY | -0.09% | 0.03% | 0.02% | 0.02% | 0.63% | 0.38% | 0.00% | |
| NZD | -0.45% | -0.36% | -0.33% | -0.23% | 0.26% | -0.36% | -0.36% | |
| CHF | -0.07% | 0.04% | 0.02% | 0.02% | 0.62% | 0.02% | 0.37% |
The heat map shows percentage changes of major currencies against each other. The base currency is picked from the left column, while the quote currency is picked from the top row. For example, if you pick the Euro from the left column and move along the horizontal line to the Japanese Yen, the percentage change displayed in the box will represent EUR (base)/JPY (quote).
Australian Dollar FAQs
What key factors drive the Australian Dollar?
One of the most significant factors for the Australian Dollar (AUD) is the level of interest rates set by the Reserve Bank of Australia (RBA). Because Australia is a resource-rich country another key driver is the price of its biggest export, Iron Ore. The health of the Chinese economy, its largest trading partner, is a factor, as well as inflation in Australia, its growth rate and Trade Balance. Market sentiment – whether investors are taking on more risky assets (risk-on) or seeking safe-havens (risk-off) – is also a factor, with risk-on positive for AUD.
How do the decisions of the Reserve Bank of Australia impact the Australian Dollar?
The Reserve Bank of Australia (RBA) influences the Australian Dollar (AUD) by setting the level of interest rates that Australian banks can lend to each other. This influences the level of interest rates in the economy as a whole. The main goal of the RBA is to maintain a stable inflation rate of 2-3% by adjusting interest rates up or down. Relatively high interest rates compared to other major central banks support the AUD, and the opposite for relatively low. The RBA can also use quantitative easing and tightening to influence credit conditions, with the former AUD-negative and the latter AUD-positive.
How does the health of the Chinese Economy impact the Australian Dollar?
China is Australia’s largest trading partner so the health of the Chinese economy is a major influence on the value of the Australian Dollar (AUD). When the Chinese economy is doing well it purchases more raw materials, goods and services from Australia, lifting demand for the AUD, and pushing up its value. The opposite is the case when the Chinese economy is not growing as fast as expected. Positive or negative surprises in Chinese growth data, therefore, often have a direct impact on the Australian Dollar and its pairs.
How does the price of Iron Ore impact the Australian Dollar?
Iron Ore is Australia’s largest export, accounting for $118 billion a year according to data from 2021, with China as its primary destination. The price of Iron Ore, therefore, can be a driver of the Australian Dollar. Generally, if the price of Iron Ore rises, AUD also goes up, as aggregate demand for the currency increases. The opposite is the case if the price of Iron Ore falls. Higher Iron Ore prices also tend to result in a greater likelihood of a positive Trade Balance for Australia, which is also positive of the AUD.
How does the Trade Balance impact the Australian Dollar?
The Trade Balance, which is the difference between what a country earns from its exports versus what it pays for its imports, is another factor that can influence the value of the Australian Dollar. If Australia produces highly sought after exports, then its currency will gain in value purely from the surplus demand created from foreign buyers seeking to purchase its exports versus what it spends to purchase imports. Therefore, a positive net Trade Balance strengthens the AUD, with the opposite effect if the Trade Balance is negative.
- Gold price touches a fresh multi-month low and is pressured by modest US Dollar strength.
- Bets for more rate hikes by Federal Reserve remain supportive of the recent USD bullish run.
- The prevalent risk-off mood could lend support to the safe-haven XAU/USD and limit losses.
Gold price struggles to gain any meaningful traction on Thursday and languishes near its lowest level since mid-March touched during the Asian session. The XAU/USD currently trades around the $1,890 level and seems vulnerable in the wake of the overnight bearish break through the very important 200-day Simple Moving Average (SMA) for the first time since November 2022.
The US Dollar (USD) prolongs its recent upward trajectory witnessed over the past month or so and remains well supported by the Federal Reserve's (Fed) hawkish outlook, which is seen as a key factor acting as a headwind for the Gold price. In fact, the minutes of the July 25-26 Federal Open Market Committee (FOMC) policy meeting revealed that policymakers remained divided over the need for more rate hikes, though continued to prioritize the battle against inflation. It is worth recalling that the United States (US) Consumer Price Index (CPI) showed a moderate rise in consumer prices in July. Moreover, the US Producer Price Index (PPI) climbed slightly more than expected last month and suggested that the battle to bring inflation back to the Fed's 2% target is far from being won.
Adding to this, the upbeat US Retail Sales data released earlier this week indicated that consumer spending held up well in July. Furthermore, the incoming stronger US macro data, including Housing Starts and Industrial Production figures on Wednesday, points to an extremely resilient economy and keeps the door for a further rate hike later this year wide open. This, in turn, remains supportive of a further rise in the US Treasury bond yields and turns out to be another factor that contributes to capping the upside for the non-yielding Gold price. In fact, the yield on the benchmark 10-year US government bond touched its highest level since 2008 and lifts the USD to a two-and-half-month peak, which tends to dent demand for the US Dollar-denominated commodities like the XAU/USD.
The prospects for further policy tightening by the Fed, meanwhile, add to worries about economic headwinds stemming from rising borrowing costs. This, along with growing concerns about the worsening economic conditions in China, tempers investors' appetite for riskier assets. The anti-risk flow is evident from a generally weaker tone around the equity markets, which is holding back traders from placing aggressive bearish bets around the safe-haven Gold price. This seems to be the only factor helping limit the downside, though the aforementioned fundamental backdrop and acceptance below a technically significant 200-day SMA suggest that the path of least resistance for the XAU/USD is to the downside. Hence, any attempted recovery might still be seen as a selling opportunity.
Technical levels to watch
- AUD/USD drops for the eighth consecutive day after downbeat Australia job numbers for July.
- Australia Employment Change slumps to -14.6K, Unemployment Rate rises to 3.7% in July.
- Hawkish Fed Minutes, China woes also exert downside pressure on Aussie pair.
- Light calendar, oversold RSI may allow bears to take a breather but risk catalysts are the key to watch for clear directions.
AUD/USD justifies downbeat Australian employment data, as well as the broad risk-off mood, by refreshing the Year-To-Date (YTD) low near 0.6370 during early Thursday. In doing so, the Aussie pair drops for the eighth consecutive day amid a broadly firmer US Dollar.
Australia’s headline Employment Change slumped to -14.6K for July on a seasonally adjusted basis versus 15.0K expected and 32.6K prior whereas the Unemployment Rate edges higher to 3.7% compared to the market’s expectations of once again witnessing 3.5% figure.
Apart from the mostly downbeat Aussie jobs report, economic concerns surrounding Australia’s biggest customer China and the recent hawkish Minutes of the Federal Open Market Committee’s (FOMC) July 25-26 meeting weigh on the AUD/USD prices.
That said, the latest Fed meeting minutes highlighted the policymakers’ discussion on the inflation pressure, despite marking a division on the rate hike decision. That said, the Minutes also conveyed that most policymakers preferred supporting the battle again the ‘sticky’ inflation.
Not only the hawkish Fed Minutes but the mostly upbeat US data and firmer US Treasury bond yields also inspire the AUD/USD bears. On Wednesday, the US Industrial Production marked a surprise 1.0% growth for July versus 0.3% expected and -0.8% prior while the Capacity Utilization for the said month also improved to 79.3% from 78.6%, compared to market forecasts of 79.1%. Further, the Building Permits edged higher to 1.442M for July from 1.441M whereas the Housing Starts rose to 1.452M for the said month versus 1.398M prior and 1.448M expected. It’s worth noting that both the Building Permits Change and Housing Starts Change improved more than market forecasts and previous readings. Previously, the US Retail Sales grew 0.7% MoM in July versus the 0.4% expected and 0.3% reported in June (revised from 0.2%) and suggested strong consumer spending, mainly due to improved wages, which in turn favored the Greenback to stay firmer during early weekdays.
At home, Australia’s Westpac Leading Index slid to -0.02% MoM for July from a downwardly revised prior of 0.07%. Further, China’s Housing Price Index dropped to -0.1% for July from 0.0% prior.
On a different page, a slump in China’s housing prices, triggered in June joins the fears about another bond market crisis in the Dragon Nation as the biggest private realtor Country Garden struggles to pay bond payments. It should be observed that the Chinese policymakers have been trying by all means to defy the concerns about easing economic recovery but no meaningful market reaction has been witnessed of late, which in turn flags concerns about the recession of the world’s second-largest economy and weighs on the AUD/USD price.
Additionally weakening the sentiment and the AUD/USD price is the news that the global rating agency Fitch Ratings lowered medium-term Gross Domestic Product (GDP) projections for 10 developed economies in its quarterly Global Economic Outlook.
Against this backdrop, Wall Street closed in the red while the US 10-year Treasury bond yields refreshed the yearly top to 4.278%. It should be noted that S&P500 Futures dropped to the lowest level in seven weeks by the press time and keep the Aussie bears hopeful of witnessing further downside.
Moving on, a light calendar may allow the Aussie bears to take a breather in case where any risk-positive headlines erupt. However, the downside bias isn’t likely to be reversed anytime soon. That said, the US weekly jobless claims and Philadelphia Fed Manufacturing Survey for August should also be watched for clear directions.
Technical analysis
The AUD/USD pair’s sustained downside break of an ascending support line from November 2022, now resistance around 0.6490, directs bears toward the late 2022 swing low of around 0.6275.
People’s Bank of China (PBoC) set the USD/CNY central rate at 7.2076 on Thursday, versus the previous fix of 7.1986 and market expectations of 7.3047. It's worth noting that the USD/CNY closed near 7.2990 the previous day.
Apart from the USD/CNY fix, the PBoC also unveiled details of its Open Market Operations (OMO) while saying that the Chinese central bank injects 168 billion Yuan via 7-day reverse repos (RRs) at 1.80% vs. prior 1.80%.
However, with the 5 billion Yuan of RRs maturing today, there prevails a net injection of around 163 billion Yuan injection on the day in OMO.
About PBOC fix
China maintains strict control of the yuan’s rate on the mainland.
The onshore yuan (CNY) differs from the offshore one (CNH) in trading restrictions, this last one is not as tightly controlled.
Each morning, the People’s Bank of China (PBOC) sets a so-called daily midpoint fix, based on the yuan’s previous day's closing level and quotations taken from the inter-bank dealer.
- EUR/USD takes offers to refresh six-week low as US Dollar extends FOMC Minutes inspired gains.
- Three-week-old falling support line, multiple levels marked since late June joins oversold RSI to prod Euro bears.
- Bearish MACD signals, sustained trading below key trend lines, SMAs keep sellers hopeful of witnessing further downside.
EUR/USD slides to the fresh low since early July as US Dollar extends the latest run-up during early Thursday. In doing so, the Euro pair drops for the second consecutive day to 1.0866, refreshing the 1.5-month low amid market’s risk-off mood and the firmer US Treasury bond yields.
Also read: EUR/USD licks its wounds at six-week low under 1.0900 as Fed minutes, yields propel US Dollar
Technically, the EUR/USD pair’s sustained trading below the 200-SMA, as well as the previous support line stretched from late May, joins the bearish MACD signals to suggest the major currency pair’s further downside.
However, the oversold RSI (14) line joins a two-month-old horizontal support zone and a descending support line from July 28 to highlight 1.0845-35 as the short-term key support for the pair bears to watch.
In a case where the Euro pair drops below 1.0835, the early June swing high around 1.0780 may act as an intermediate halt for the pair’s fall toward May’s bottom surrounding 1.0635.
On the flip side, the latest swing high of around 1.0930 and 1.1000 round figure may entertain the EUR/USD buyers during a corrective bounce.
However, a downward-sloping resistance line from July 18 and the 200-SMA, respectively near 1.1010 and 1.1025, can challenge the Euro pair’s further recovery.
It’s worth noting that the aforementioned support-turned-resistance line from late May, close to 1.1060 at the latest, acts as the final defense of the EUR/USD sellers.
EUR/USD: Four-hour chart
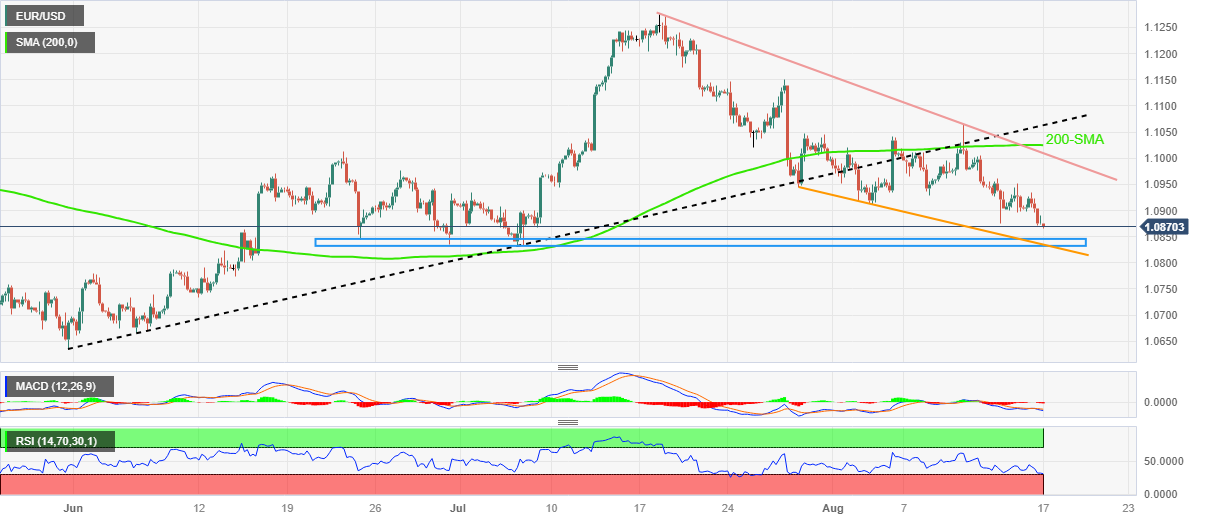
Trend: Limited downside expected
- USD/JPY hits a fresh YTD peak on Thursday and remains well supported by a bullish USD.
- The hawkish FOMC meeting minutes reaffirm bets for one more rate hike and lift the buck.
- The BoJ's dovish stance, along with the widening US-Japan yield spread, weighs on the JPY.
The USD/JPY pair builds on this week's breakout momentum through the 145.00 psychological mark and climbs to a fresh YTD top during the Asian session on Thursday. Spot prices currently trade around mid-146.00s, up 0.10% for the day, and remain well supported by the underlying bullish sentiment surrounding the US Dollar.
The USD Index (DXY), which tracks the Greenback against a basket of currencies, touches its highest level since July 6 and validates the overnight break through the very important 200-day Simple Moving Average (SMA) for the first time since November 30. The stronger US macro data released on Wednesday – Housing Starts and Industrial Production figures – and a more hawkish Federal Reserve (Fed) continue to act as a tailwind for the buck. This, along with the Bank of Japan's (BoJ) dovish stance weighs on the Japanese Yen (JPY) and lends additional support to the USD/JPY pair.
The minutes of the July 25-26 FOMC policy meeting signalled that a further rate hike remains in play later this year. Moreover, Fed officials no longer expect a “mild” recession this year, reaffirming market bets for higher rates for longer rates, pushing the US Treasury bond yields higher. In fact, the yield on the benchmark 10-year US government bond jumps to its highest level since October and is seen underpinning the USD. The resultant widening of the US-Japan rate-differential, meanwhile, is seen as another factor driving flows away from the JPY and pushing the USD/JPY pair higher.
Spot prices, meanwhile, have moved beyond the level that triggered an intervention by Japanese authorities in September and October last year. Moreover, Japan's top forex diplomat Masato Kanda said on Tuesday that he would take appropriate steps against excessive currency moves. Japan's Finance Minister Shunichi Suzuki, however, said that authorities are not targeting absolute currency levels when it comes to intervening in the market. Nevertheless, speculations that the recent weakness in the JPY might prompt some jawboning from authorities could cap the USD/JPY pair.
Apart from this, the prevalent risk-off environment might lend some support to the safe-haven JPY and hold back traders from placing fresh bullish bets. Market participants now look to the US economic docket, featuring the release of the usual Weekly Initial Jobless Claims data and the Philly Fed Manufacturing Index later during the early North American session. This, along with the US bond yields, will influence the USD price dynamics and provide some impetus to the USD/JPY pair.
Technical levels to watch
- WTI prices trade in negative territory for the fourth consecutive day on Thursday.
- Crude oil inventories fell by nearly 6 million barrels last week.
- Concerns about the Chinese economic slowdown and property crisis remain in focus.
- Oil traders will watch the US weekly Initial Jobless Claims, the Philadelphia Fed Manufacturing, China's sluggish economy headlines.
Western Texas Intermediate (WTI), the US crude oil benchmark, is trading around the $78.60 mark so far on Thursday. WTI prices trade in negative territory for the fourth consecutive day on Thursday amid the possible further tightening of monetary policy by the Federal Reserve (Fed) and China’s economic woes.
The US Energy Information Administration (EIA) reported on Wednesday that crude oil inventories fell by nearly 6 million barrels in the week ending August 11, above the 2.3 million-barrel contraction expected. Meanwhile, crude oil production has reached its peak since the coronavirus outbreak destroyed the demand for oil.
That said, the minutes of July’s meeting of the Federal Open Market Committee (FOMC) emphasised that inflation remained unacceptably high. The Fed official saw significant inflationary risks, and it may need additional tightening of monetary policy to bring inflation to the longer-run target. The hawkish stance of Fed officials capped the upside for WTI prices. It’s worth noting that higher interest rates raise borrowing costs, which can slow the economy and diminish oil demand.
Furthermore, concern about the economic slowdown and property crisis in China remains in focus. On Wednesday, the Chinese House Price Index for July fell to -0.1% versus 0% prior. The data raises concerns about a possible property crisis in China, particularly as big developer Country Garden Holdings struggles to meet its debt obligations. Meanwhile, Chinese Retail Sales for July came in at 2.5% YoY compared to 4.8% expected and 3.1% previously, while the country's Industrial Production fell to 3.7% YoY compared to 4.5% expected and 4.1% previously. More evidence of China's economic deterioration might drag the black gold lower.
On the other hand, the tightening supply could further contribute to upward pressure on WTI prices. Saudi Arabia announced it would extend its voluntary oil output cut of one million barrels per day (bpd) through September. In the meantime, Russia's oil exports will also decrease by 300,000 bps in September. The report on Wednesday revealed that Saudi Arabia's oil exports fell below 7 million barrels per day for the first time this year, reaching their lowest level since September 2021.
Moving on, oil traders will shift their focus to the US weekly Initial Jobless Claims for the week ending August 11 and the Philadelphia Fed Manufacturing Survey for August, due later in the American session. Also, the headline surrounding China's sluggish economy remains in the spotlight. These events could significantly impact the USD-denominated WTI price. Oil traders will take cues from the data and find trading opportunities around the WTI price.
July month employment statistics from the Australian Bureau of Statistics, up for publishing at 01:30 GMT on Thursday, will be the immediate catalyst for the AUD/USD pair traders.
Market consensus suggests that the headline Unemployment Rate may remain unchanged at 3.5% on a seasonally adjusted basis whereas the Employment Change could rise by 15.0K versus the previous contraction of 32.6K. Further, the Participation Rate is expected to remain unchanged at 66.8% during the stated month.
Considering the Reserve Bank of Australia’s (RBA) latest pause in the rate hike trajectory, as well as the mixed inflation clues from Australia and unimpressive RBA Minutes, today’s Aussie inflation expectations and employment numbers appear more important for the AUD/USD pair.
Ahead of the event, FXStreet’s Yohay Elam mentioned,
Australia's monthly jobs report is a critical mover for the currency and may trigger high volatility. There is a greater chance of a fall than of a rise, given data patterns and market trends.
How could the data affect AUD/USD?
AUD/USD takes offers to refresh the Year-To-Date (YTD) low during its eight-day losing streak amid broad US Dollar strength, as well as fears surrounding Australia’s biggest customer China. Furthermore, the recent hawkish Fed Minutes and the contrasting RBA Minutes also exert downside pressure on the Aussie pair ahead of the top-tier jobs report for July.
That said, today’s Australian employment report is less likely to work as a positive catalyst for the AUD/USD unless posting an extremely upbeat outcome. The reason could be linked to the market’s current favor of the US Dollar amid the hawkish Federal Reserve (Fed) concerns and mixed US data. However, a knee-jerk reaction to the top-tier statistic can’t be ruled out.
Technically, the pair’s sustained downside break of an ascending support line from November 2022, now immediate resistance around 0.6490, directs AUD/USD bears toward the late 2022 swing low of around 0.6275.
Key Notes
AUD/USD faces downward pressure on Fed’s hawkish minutes, Aussie’s labor market data eyed
Australian Jobs Report Preview: Pattern points to disappointing data, downing the Aussie
AUD/USD Forecast: Under pressure, 0.6400 on sight
About the Employment Change
The Employment Change released by the Australian Bureau of Statistics is a measure of the change in the number of employed people in Australia. Generally speaking, a rise in this indicator has positive implications for consumer spending which stimulates economic growth. Therefore, a high reading is seen as positive (or bullish) for the AUD, while a low reading is seen as negative (or bearish).
About the Unemployment Rate
The Unemployment Rate released by the Australian Bureau of Statistics is the number of unemployed workers divided by the total civilian labor force. If the rate hikes, indicates a lack of expansion within the Australian labor market. As a result, a rise leads to weaken the Australian economy. A decrease of the figure is seen as positive (or bullish) for the AUD, while an increase is seen as negative (or bearish).
| Index | Change, points | Closed | Change, % |
|---|---|---|---|
| Hang Seng | -251.81 | 18329.3 | -1.36 |
| KOSPI | -45.23 | 2525.64 | -1.76 |
| ASX 200 | -109.8 | 7195.2 | -1.5 |
| DAX | 22.17 | 15789.45 | 0.14 |
| CAC 40 | -7.45 | 7260.25 | -0.1 |
| Dow Jones | -180.65 | 34765.74 | -0.52 |
| S&P 500 | -33.53 | 4404.33 | -0.76 |
| NASDAQ Composite | -156.42 | 13474.63 | -1.15 |
Silver Price (XAG/USD) remains pressured at the lowest level in nearly two months after falling in the last four consecutive days, making rounds to $22.40 amid the early hours of Thursday’s Asian session.
In doing so, the Silver bears take a breather after justifying the bearish signals from the options markets amid the broad US Dollar strength. However, a lack of major data/events prods the US Dollar bulls and the XAG/USD sellers of late.
Also read: US Dollar Index: DXY renews six-week high around mid-103.00s as Fed Minutes flag inflation woes
That said, the one-month risk reversal (RR) of the Silver price, a gauge of the spread between the call and put options, dropped in the last three consecutive days to -0.110 by the end of Wednesday’s North American session.
With this, the weekly RR braces for the third consecutive negative figures, at -0.350 by the press time, which in turn keeps the Silver bears hopeful. It’s worth noting that the weekly RR drops the most, so far, since late June.
Also read: Silver Price Analysis: XAG/USD continues dips below $22.50 as US yields rise
| Pare | Closed | Change, % |
|---|---|---|
| AUDUSD | 0.64228 | -0.48 |
| EURJPY | 159.162 | 0.3 |
| EURUSD | 1.08811 | -0.21 |
| GBPJPY | 186.224 | 0.75 |
| GBPUSD | 1.27301 | 0.23 |
| NZDUSD | 0.59386 | -0.21 |
| USDCAD | 1.3527 | 0.21 |
| USDCHF | 0.87984 | 0.17 |
| USDJPY | 146.279 | 0.52 |
- US Dollar Index seesaws around 1.5-month high after refreshing multi-day top post Fed Minutes.
- FOMC Minutes suggest that ‘most’ policymakers prioritize the battle against inflation.
- Global economic fears, upbeat Treasury bond yields also favored DXY bulls.
- Light calendar may allow Greenback to pare recent gains as it approaches key technical resistances.
US Dollar Index (DXY) bulls take a breather after refreshing the six-week high, making rounds to 103.50 amid Thursday’s Asian session, as market players seek more clues to defend the latest run-up. That said, the DXY cheered hawkish Minutes of the Federal Reserve’s (Fed) latest monetary policy meeting, as well as the risk-off mood to print a five-day uptrend by the end of Wednesday’s North American session.
On Wednesday, the Monetary Policy Meeting Minutes of the Federal Open Market Committee’s (FOMC) July 25-26 meeting highlighted the policymakers’ discussion on the inflation pressure, despite marking a division on the rate hike decision. That said, the Minutes also conveyed that most policymakers preferred supporting the battle again the ‘sticky’ inflation.
It should be noted that the recently firmer US data also underpin the hawkish bias about the Federal Reserve’s (Fed) next moves and propel the DXY. That said, the US Industrial Production marked a surprise 1.0% growth for July versus 0.3% expected and -0.8% prior while the Capacity Utilization for the said month also improved to 79.3% from 78.6%, compared to market forecasts of 79.1%. Further, the Building Permits edged higher to 1.442M for July from 1.441M whereas the Housing Starts rose to 1.452M for the said month versus 1.398M prior and 1.448M expected. It’s worth noting that both the Building Permits Change and Housing Starts Change improved more than market forecasts and previous readings. Previously, the US Retail Sales grew 0.7% MoM in July versus 0.4% expected and 0.3% reported in June (revised from 0.2%) and suggested strong consumer spending, mainly due to improved wages, which in turn favored the Greenback to stay firmer during early weekdays.
On a different page, fears emanating from China also underpin the US Dollar’s haven demand. That said, Chinese policymakers have been trying by all means to defy the concerns about easing economic recovery but no meaningful market reaction has been witnessed of late, which in turn flags concerns about the recession of the world’s second-largest economy and weighs on the sentiment.
Furthermore, global rating agency Fitch Ratings lowered medium-term Gross Domestic Product (GDP) projections for 10 developed economies in its quarterly Global Economic Outlook, which in turn spoiled the risk appetite and favor the DXY bulls.
While portraying the mood, Wall Street closed in the red while the US 10-year Treasury bond yields refreshed the yearly top to 4.278%.
Looking forward, a light calendar requires the traders to observe headlines surrounding China’s economic growth, as well as the Fed talks, for clear directions. Also important will be the US weekly jobless claims and Philadelphia Fed Manufacturing Survey for August.
Technical analysis
Although a clear upside break of the 200-DMA, around 103.20 by the press time, keeps the US Dollar Index buyers hopeful, overbought RSI may join a 5.5-month-old descending resistance line, close to 103.65 at the latest, to prod the DXY bulls. Following that, a rising trend line from June 14 surrounding 103.85 will precede the 104.00 round figure to challenge the upside momentum.


© 2000-2026. Уcі права захищені.
Cайт знаходитьcя під керуванням TeleTrade DJ. LLC 2351 LLC 2022 (Euro House, Richmond Hill Road, Kingstown, VC0100, St. Vincent and the Grenadines).
Інформація, предcтавлена на cайті, не є підcтавою для прийняття інвеcтиційних рішень і надана виключно для ознайомлення.
Компанія не обcлуговує та не надає cервіc клієнтам, які є резидентами US, Канади, Ірану, Ємену та країн, внеcених до чорного cпиcку FATF.
Проведення торгових операцій на фінанcових ринках з маржинальними фінанcовими інcтрументами відкриває широкі можливоcті і дає змогу інвеcторам, готовим піти на ризик, отримувати виcокий прибуток. Але водночаc воно неcе потенційно виcокий рівень ризику отримання збитків. Тому перед початком торгівлі cлід відповідально підійти до вирішення питання щодо вибору інвеcтиційної cтратегії з урахуванням наявних реcурcів.
Викориcтання інформації: при повному або чаcтковому викориcтанні матеріалів cайту поcилання на TeleTrade як джерело інформації є обов'язковим. Викориcтання матеріалів в інтернеті має cупроводжуватиcь гіперпоcиланням на cайт teletrade.org. Автоматичний імпорт матеріалів та інформації із cайту заборонено.
З уcіх питань звертайтеcь за адреcою pr@teletrade.global.
переклади