- Аналітика
- Новини та інструменти
- Новини ринків
Новини ринків
USD/MXN remains on the back foot at the lowest levels since December 2015, making rounds to 16.75 while fading the early Monday’s corrective bounce during Tuesday’s Asian session.
That said, the Mexican Peso (MXN) pair dropped in the last seven consecutive days amid broad-based US Dollar weakness, mainly driven by the concerns that the downbeat US inflation clues will prod the US Federal Reserve (Fed) from lifting interest rates past July. Adding strength to the USD/MXN bearish bias are the downbeat options market signals for the pair.
That said, the one-month Risk Reversal (RR) of the USD/MXN pair, a measure of the spread between call and put prices, dropped to -0.015 by the end of Monday’s North American trading session, reversing the late Friday’s corrective bounce.
It should be noted that the options market gauge prints the second consecutive weekly RR with a -0.015 mark at the latest, following the previous weekly figure of -0.287.
In doing so, the options market figures defy the hopes of witnessing a corrective bounce in the USD/MXN price. However, traders should keep their eyes on the US Retail Sales and Industrial Production for June for clear directions.
Also read: USD/MXN defies gravity, rises from 7-year low as global economic uncertainty simmers
The latest survey of 2,000 British people by the YouGov institute suggests that the proportion of Britons who say Brexit was a mistake hit a new record high this month.
The macro update, shared via Reuters, highlights the lesser economic benefits from the vote to leave the European Union as a wrong one, per 57% of the respondents, than 32% who cheer the Brexit verdict.
“More than half - 55% - said they would vote to rejoin the EU, against 31% who said they would stay out, if a referendum were to be held today,” reported Reuters.
YouGov also cited the results as moderately shifting from those of January 2021.
It should be noted that the survey also marked a 63% of the British people considering Brexit as a failure.
Britain braces for more military spending
Elsewhere, UK Defense Ministry is planning to spend 2.5 billion pounds ($3.3 billion) on replenishing munitions and stockpiles that have been depleted by the war in Ukraine, per Reuters.
Market implications
Both the news appears less positive for the GBP/USD price, which in turn prods the Cable pair buyers around 1.3070 amid early Tuesday’s sluggish Asian session.
Also read: GBP/USD oscillates around 1.3070 ahead of key data events
- Silver Price struggles to defend upside break of yearly horizontal resistance-turned-support.
- Bearish moving average crossover, overbought RSI (14) favor XAG/USD sellers.
- Silver bulls need validation from $25.40 to aim for $26.10-15 resistance area.
Silver Price (XAG/USD) stays defensive around $24.85-90 during early Tuesday in Asia, fading the previous day’s upside break of a seven-month-old horizontal resistance despite the late Monday’s corrective bounce off $24.50 support.
In doing so, the XAG/USD takes clues from the overbought RSI while also justifying the bear cross on the daily chart to tease the commodity sellers. That said, the 50-SMA pierces off the 100-SMA from above and portrays the “bear cross”, which in turn suggests that the Silver buyers are running out of stem.
It’s worth noting, however, that the bullish MACD signals and the aforementioned key support zone, previous resistance surrounding $24.55-50, challenge the Silver bears from entering.
Following that, a quick fall toward the $24.00 round figure can’t be ruled out. However, a convergence of the 50-SMA and 100-SMA, around $23.60-55, will restrict the XAG/USD’s further downside.
On the flip side, Silver buyers need not only to cross the latest peak of $25.00 but should also remain firmer past the $25.40 hurdle comprising multiple levels marked since early April to retake control.
Even so, the double tops bearish formation around the $26.10-15 region appears a tough nut to crack for the XAGA/USD bulls.
Silver Price: Daily chart
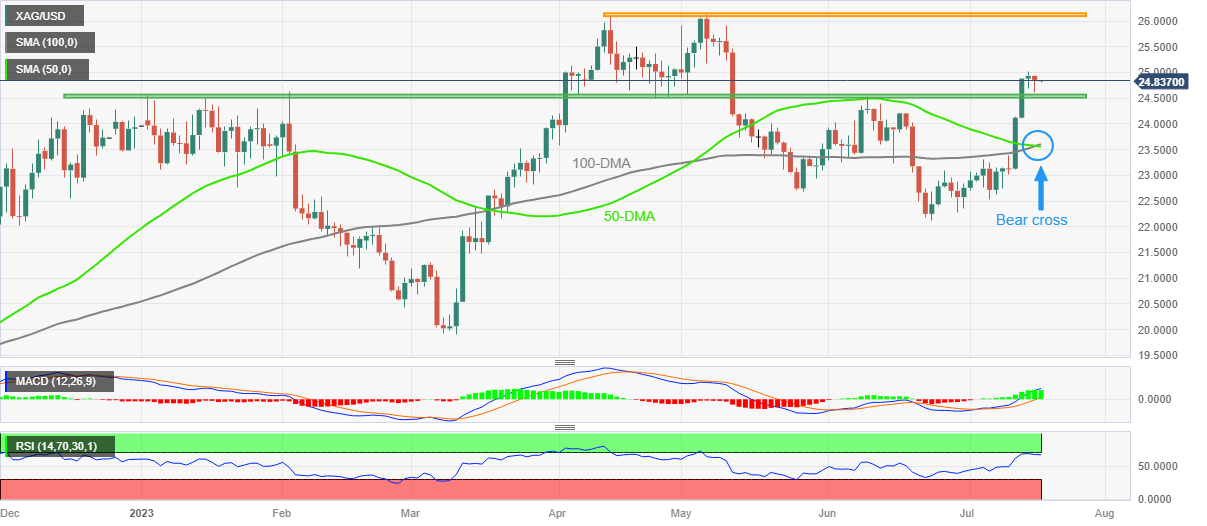
Trend: Pullback expected
- GBP/USD oscillates around 1.3070 ahead of the US Retail Sales data.
- Market participants anticipate the Bank of England (BoE) will hike its interest rates by 50 basis points (bps) in August.
- The US Dollar posts modest gains due to the softer Chinese growth numbers, upbeat US Empire manufacturing survey.
The GBP/USD pair consolidates in a narrow range during the early Asian session on Tuesday as the market sentiment turns cautious ahead of the release of US Retail Sales and the UK Consumer Price Index (CPI). The major is trading around 1.3072, down 0.01% on the day.
The UK will release the Consumer Price Index (CPI) for June on Wednesday, which is expected to be 8.2% YoY, from 8.7% in May, while the core CPI is estimated to be 7.1%, unchanged from May. Market participants anticipate the Bank of England (BoE) will hike its interest rates by 50 basis points (bps) in August. However, the aggressive tightening policy from the BoE to bring inflation to the target level would dampen the economic prospects of Britain's economy.
On the other hand, the US Dollar Index, as measured by the Greenback against a basket of six foreign currencies, posts modest gains due to the softer Chinese Gross Domestic Product (GDP) data for the second quarter and the upbeat US Empire manufacturing survey from July. The Federal Reserve Bank of New York reported Monday that the NY Empire State Manufacturing Index dropped from -5.5 to 1.1, above expectations of -3.5.
Looking ahead, market participants will take cue from the US Retail Sales, which expected to rise 0.5% versus 0.3% prior. However, the key focus will be Wednesday's UK Consumer Price Index (CPI). This figure would have a significant impact on the pair and help determine the next direction for the GBP/USD pair.
- EUR/USD edges higher amid hawkish ECB signals, US Dollar’s retreat.
- ECB’s Nagel cites “sticky” inflation to favor rate hike in September, ECB’s Vasle emphasizes resilient and high core inflation.
- Mixed sentiment, unimpressive US data prod US Dollar bulls ahead of US Retail Sales.
- ECB talks, second-tier US data will also be watched for clear directions as bulls struggle to cross key resistance.
EUR/USD bulls keep flirting with the 1.1250 resistance for the third consecutive day amid the early hours of Tuesday’s Asian session, staying around the highest levels since February 2022. In doing so, the Euro pair justifies hawkish bias at the European Central Bank (ECB) while cheering the US Dollar’s retreat. However, a cautious mood ahead of today’s key US Retail Sales for June and a mixed mood in the market seems to prod the major currency pair’s buyers.
On Monday, European Central Bank (ECB) policymaker Boštjan Vasle said, “We need to keep tightening policy at our next meeting.” The policymaker emphasizes the resilient and high core inflation while favoring the hawkish move.
On the same line was ECB policymaker and Bundesbank Chief Joachim Nagel who said "I expect the ECB will raise interest rates later this month by 25 bps" as core inflation in the Eurozone is ‘very sticky’ but "For the September meeting, we will see what the data will tell us."
It should be noted that the looming fears of Germany’s recession and the recent easing in China’s economic recovery seem to prod the Euro bulls and allow the US Dollar to lick its wounds despite unimpressive data at home.
On Monday, New York (NY) Empire State Manufacturing Index for July eased to 1.1 from 6.6 prior and 0.0 market forecasts. The data failed to inspire the US Dollar Index (DXY) sellers initially before weighing on the DXY, probing Friday’s recovery backed by the upbeat prints of the University of Michigan’s (UoM) Consumer Sentiment Index and consumer inflation expectations for the said month.
Elsewhere, the return of the US-China tension and the market’s consolidation ahead of late July’s Federal Open Market Committee (FOMC) Monetary Policy Meeting also prod the EUR/USD bulls.
Against this backdrop, Wall Street closed with minor gains whereas the US Treasury bond yields remained pressured.
To overcome the inaction around the key upside hurdle, US Retail Sales for June, expected to rise to 0.5% versus 0.3% prior, will be crucial to watch. Also important will be the ECB talks and the US Industrial Production for June, expected -0.1% versus -0.2% prior.
Technical analysis
A higher high on prices joins a higher high on the RSI (14) line to validate the latest AUD/USD run-up. However, a clear upside break of the 1.1250 hurdle appears necessary for the Aussie pair buyers to target the February 2022 high of near 1.1495.
That said, the pullback moves appear unimpressive unless the quote stays beyond the previous resistance line stretched from early February, around 1.1160 by the press time.
- USD/CHF starts flat, and technical indicators suggest a possible upward correction.
- Sellers target the USD/CHF below 0.8300; overbought RSI hints at fading selling pressure.
- Resistance awaits at 0.8700, followed by key Fibonacci levels.
USD/CHF begins the Asian session almost flat, following Monday’s losses of 0.20% after printing a year-to-date (YTD) low of 0.8566 last Friday. Technical indicators turned flat alongside an overextended downtrend, which could pave the way for an upward correction. At the time of writing, the USD/CHF exchanges hands at 0.8605, up 0.03%.
USD/CHF Price Analysis: Technical outlook
From a daily chart perspective, the USD/CHF downtrend remains intact, with sellers eyeing a drop below the YTD low, exposing the pair to a new eight-year low below 0.8300. The Relative Strength Index (RSI) is in bearish territory but turned flat after reaching an overbought extreme level at 21.42, while the three-day Rate of Change (RoC) began to turn neutral, portraying that selling pressure faded, opening the door for a correction.
In that event, the USD/CHF first resistance would be the 0.8700 psychological level, followed by key resistance Fibonacci (Fibo) levels, with 38.2% and 50% Fibo, each at 0.8730 and 0.8780. Once those levels are cleared, the 0.8800 figure would be up next.
On the downside, the USD/CHF first support would be 0.8600, followed by the YTD low of 0.8566 and the 0.8500 psychological level.
USD/CHF Price Action – Daily chart
- AUD/USD remains depressed after two-day losing streak, fades late Monday’s corrective bounce.
- Fears surrounding China, dovish concerns about RBA joins market’s inflation woes to keep Aussie pair on the back foot.
- Fed concerns, cautious optimism in the market puts a floor under the price.
- RBA Minutes will justify catalysts for “finely balanced” pause to rate hikes, US Retail Sales eyed amid Fed blackout.
AUD/USD languishes near 0.6820 after a downbeat week-start and a failure to defend the corrective bounce as traders await the Reserve Bank of Australia’s (RBA) latest monetary policy meeting minutes on early Tuesday. It’s worth noting that the Aussie pair’s latest weakness could be linked to the market’s fears of economic slowdown in China, as well as the US Dollar’s consolidation of the previous weekly loss, despite the latest retreat of the greenback. Also, concerns about the RBA’s inability to lift the interest rates further, as well as economic fears surrounding Canberra, weigh on the risk-barometer pair ahead of the key data/events.
On Monday, China’s headline statistics confirmed the market’s fears that Australia’s biggest customer is facing economic headwinds, which in turn joined the US-China chatters to flag fears surrounding Beijing and exert downside pressure on the AUD/USD.
That said, China’s second quarter (Q2) 2023 Gross Domestic Product (GDP) rose past the previous readings of 4.5% to 6.3% but eased below the analysts’ estimations of 7.3%. Further, the Industrial Production growth jumped to 4.4% YoY in June, compared to the 2.7% expected and 3.5% prior. However, the Retail Sales slumped to 3.1% from 12.7% prior and 3.2% market consensus. It should be noted that China’s June survey-based Jobless Rate for 24-year-olds jumped to a record high of 21.3%.
Elsewhere, US Treasury Secretary Janet Yellen said during a Bloomberg interview that the US is looking carefully at outbound investment controls on China while adding, “But they would be focused on a few sectors." The policymaker also clarified that these would not be broad controls that would have a fundamental impact on the investment climate in China. During the weekend, US Treasury Secretary Yellen spoke at a meeting of Group of 20 (G20) finance ministers and central bankers in India while saying, “I am eager to build on the groundwork that we laid in Beijing to mobilize further action.” Hence, the US-China tension is back in the spotlight but the pace of pessimism appears slow and mixed.
It’s worth mentioning that Australian Treasurer Jim Chalmers flagged economic fears for the Pacific major and exerted downside pressure on the AUD/USD.
Alternatively, softer prints of the New York (NY) Empire State Manufacturing Index for July, to 1.1 from 6.6 prior and 0.0 market forecasts, joined the market’s risk-on mood, to allow the AUD/USD bears to take a breather.
While portraying the mood, Wall Street closed with minor gains whereas the US Treasury bond yields remained pressured.
Looking ahead, the RBA Minutes will be observed to gauge the catalysts behind the pause in a rate hike trajectory and predict the future moves of the Australian central bank, which in turn can help the AUD/USD bears in case of posting dovish remarks. It should be observed that the incoming RBA Governor Michele Bullock isn’t known as a hawk and hence downbeat RBA Minutes and the aforementioned pessimism can allow her to keep the easy money policy on the table.
Elsewhere, US Retail Sales for June, expected to rise to 0.5% versus 0.3% prior, can help the US Dollar to grind higher amid the Fed policymaker’s blackout ahead of late July’s Federal Open Market Committee (FOMC) Monetary Policy Meeting.
Technical analysis
A clear U-turn from the 0.6900 mark directs AUD/USD bears toward a one-week-old rising support line surrounding 0.6765, a break of which will highlight the 200-DMA level of 0.6710 as the key challenge for the bears before retaking control.
- GBP/JPY bulls come up to test critical resistance.
- The bears are on the lookout for a downside continuation for the week ahead.
GBP/JPY is testing a key resistance area following a break of daily structure as the following will illustrate:
GBP/JPY daily charts


As illustrated on the daily charts above, there is a break in market structure taking place and a correction back into the neckline of the M-formation that would be expected to act as resistance. A move back below the trendline support will possibly see a downside continuation taking place for the week ahead.
Here is what you need to know for July 18:
During the Asian session, Australia will release The Reserve Bank of Australia minutes that could offer a few insights for the August rate decision, with the governor Phillip Lowe recently signalling that the RBA is taking a data-dependent approach. Thereafter, in the US, Retail Sales will be a focus which may have advanced for a third consecutive month in June and such an outcome would be expected to support the US Dollar.
Meanwhile, on Monday, the Greenback, as measured by the US Dollar index, DXY, posted modest losses after hawkish comments from the European Central BankGoverning Council member and Bundesbank President Nagel while lower Treasury yield also weighed.
There was an initial bid in the Greenback due to the stronger-than-expected July Empire manufacturing survey and weaker-than-expected Chinese growth numbers for the second quarter along with a disappointment in the June RetailSsales data. The US July Empire manufacturing survey of general business conditions index fell -5.5 to 1.1, stronger than expectations of -3.5. The DXY index travelled between 99.753 and 100.181.
EUR/USD subsequently hit a 16-1/2 month high at 1.1249 while ECB's Nagel, said, "I expect the ECB will raise interest rates later this month by 25 bp" as core inflation in the Eurozone is "very sticky” but "for the September meeting, we will see what the data will tell us." He added, "the economic recovery in the future course of the year could be somewhat more hesitant than expected in the June forecast, and core prices will probably stay "very high over the summer."
GBP/USD fell for a second day and is making a correction of the recent rally. GBP/USD travelled between a low of 1.3087 and 1.3108 in a tight range. Market expectations of further interest-rate rises from the Bank of England combined with a resilient UK economy have been supported the Pound Sterling of late. This week will hold UK inflation and Retail Sales as the key events along with the four by-elections that are likely to get some attention.
USD/JPY on Monday fell on the weakness in the US Treasury yields that set off some short covering in the yen.
However, there is speculation the Japanese central bank, the Bank of Japan may refrain from ending its stimulus measures or changing its yield-curve control policy. The BoJ Governor Ueda said not much has changed on bond market functionality from the BOJ’s last policy meeting in June. Meanwhile, markets were closed in Japan for the Marine Day holiday.
AUD/USD was offered in a continuation of the daily correction. The pair dropped from a high of 0.6843 to a low of 0.6787. The Reserve Bank of Australia minutes will be released and are expected to provide additional insight into the Board’s “finely balanced” decision to pause in July. ''Discussion on inflation risks is likely to be balanced. We have recently changed our RBA call, pencilling in an extended pause at the current cash rate of 4.1%, but we can’t entirely rule out a hike in August,'' analysts at ANZ Bank said. ''Looking into 2024 our base case remains an extended pause before easing toward the very end of the year driven by both a higher unemployment rate and confidence inflation is returning to the band.''
Meanwhile, precious metals prices on Monday closed moderately lower as the risk-on sentiment on Wall Street took away the appeal for both Gold and Silver. Additionally, the worries over Chinese demand for industrial metals were a factor, more so for Silver. ''As fears were rising that the Fed's bark could be as bad as its bite, weaker inflation is likely to tame these concerns for now and could see the yellow metal solidify in a higher range. With that said, CTAs could modestly add to upside flow north of $1974/oz,'' analysts at TD Securities said with regards to the Gold price.
Elsewhere, Bitcoin was weaker and fell below the $30k mark on regulatory worries. Crude oil prices posted moderate losses on weaker-than-expected Chinese economic reports and the restart of crude oil production in Libya as protesters left oilfields. WTI was down some 1.5% at $74.00 from $76.05.
Like this article? Help us with some feedback by answering this survey:
- AUD/JPY stalls at 95.00, with the Tenkan-Sen cross below the Kijun-Sen.
- Key technical indicators hint at shifting to a neutral bias in the AUD/JPY pair.
- AUD/JPY bullish resumption hinges on reclaiming the Tenkan-Sen line at 94.77.
AUD/JPY losses some steam after hitting a daily high of 94.91 and aims lower by 0.34% on a risk-off impulse. The AUD/JPY pair faced the Tenkan-Sen line but failed to gain traction past the 95.00 mark, exacerbating a fall to the current exchange rate. At the time of writing, the AUD/JPY Is trading at 94.52.
AUD/JPY Price Analisis: Technical outlook
From a medium-term bias, the AUD/JPY is neutral to upward biased, but more technical indicators suggest the pair would shift neutral. The cross of the Tenkan-Sen below the Kijun-Sen, and price action moving beneath both, are the first two bearish signals. Those, along with the cross of the Chikou Span, below the June 13 daily candle, opened the door for the AUD/JPY to consolidate within the June 13 daily high and low of 93.97/95.05, eyeing a fresh catalyst to break the top/bottom of the range.
The AUD/JPY must claim the Tenkan-Sen line at 94.77 for a bullish resumption. A breach of the latter will expose the 95.00 figure, followed by the Kijun-Sen line at 95.11, which, once cleated, could pave the way for further upside past the October 21 daily high of 95.74.
Conversely, for a bearish continuation, the AUD/JPY first support would be the current week low of 94.01, followed by the July 12 swing low of 93.23. Once both support levels give way, the 93.00 psychological level would be up next.
AUD/JPY Price Action – Daily chart
- XAU/USD bull’s battle to regain the 100-day SMA at $1,955.
- The focus is set on Tuesday’s Retail Sales data from the US.
At the start of the week, the XAU/USD traded in the $1,945 - $1,960 range as the USD fought back and traded resilient at the 99.90 area. However, US Treasury yield continued declining, limiting the Gold’s downside potential.
Retail Sales are expected to have increased by 0.5% in June, while the sales excluding the Automobile sectors have expanded by 0.3%. It's worth noticing that following soft inflation figures reported last week, signs of the US weakening may take the pressure off the Federal Reserve (Fed) to continue tightening so the US Treasury yields and hence the yellow metal’s price dynamics may see volatility following the data.
As for now, market participants, as per the CME FedWatch Tool, have largely priced in 25 basis points (bps) hike in the next July 26 Fed meeting, but the odds of another hike in 2023 have fallen to 20% due to soft inflation figures. In that sense, these dovish bets on the Fed are responsible for the USD weakness, which allowed the XAU/USD to rally last week.
XAU/USD Levels to watch
The daily chart, suggests that the technical outlook for the XAU/USD is neutral to bullish as the bulls show signs of exhaustion. The Relative Strength Index (RSI) stands flat above its midline while the Moving Average Convergence Divergence (MACD) printed a lower green bar, suggesting that the buyers are losing strength.
Supports Levels: $1,945, $1,927 (20-day Simple Moving Average), $1,915.
Resistance Levels: $1,955 (100-day Simple Moving Average), $1,965, $1,990.
XAU/USD Daily chart
-638252241838409542.png)
- NZD/USD bears are in the market, short-squeeze-eyed.
- Bulls eye a break of the trendline resistance following test below Friday's lows.
The New Zealand Dollar is lower by some 0.75% towards the close in New York trade and is down for the second straight session, after hitting the strongest level in over five months touched last Thursday. The price is on the front side of the dominant bearish trend and is coming into a coil which will lead to a breakout, eventually:
NZD/USD daily chart

A correction is underway and a continuation will be eyed for in due course.
NZD/USD H4 charts
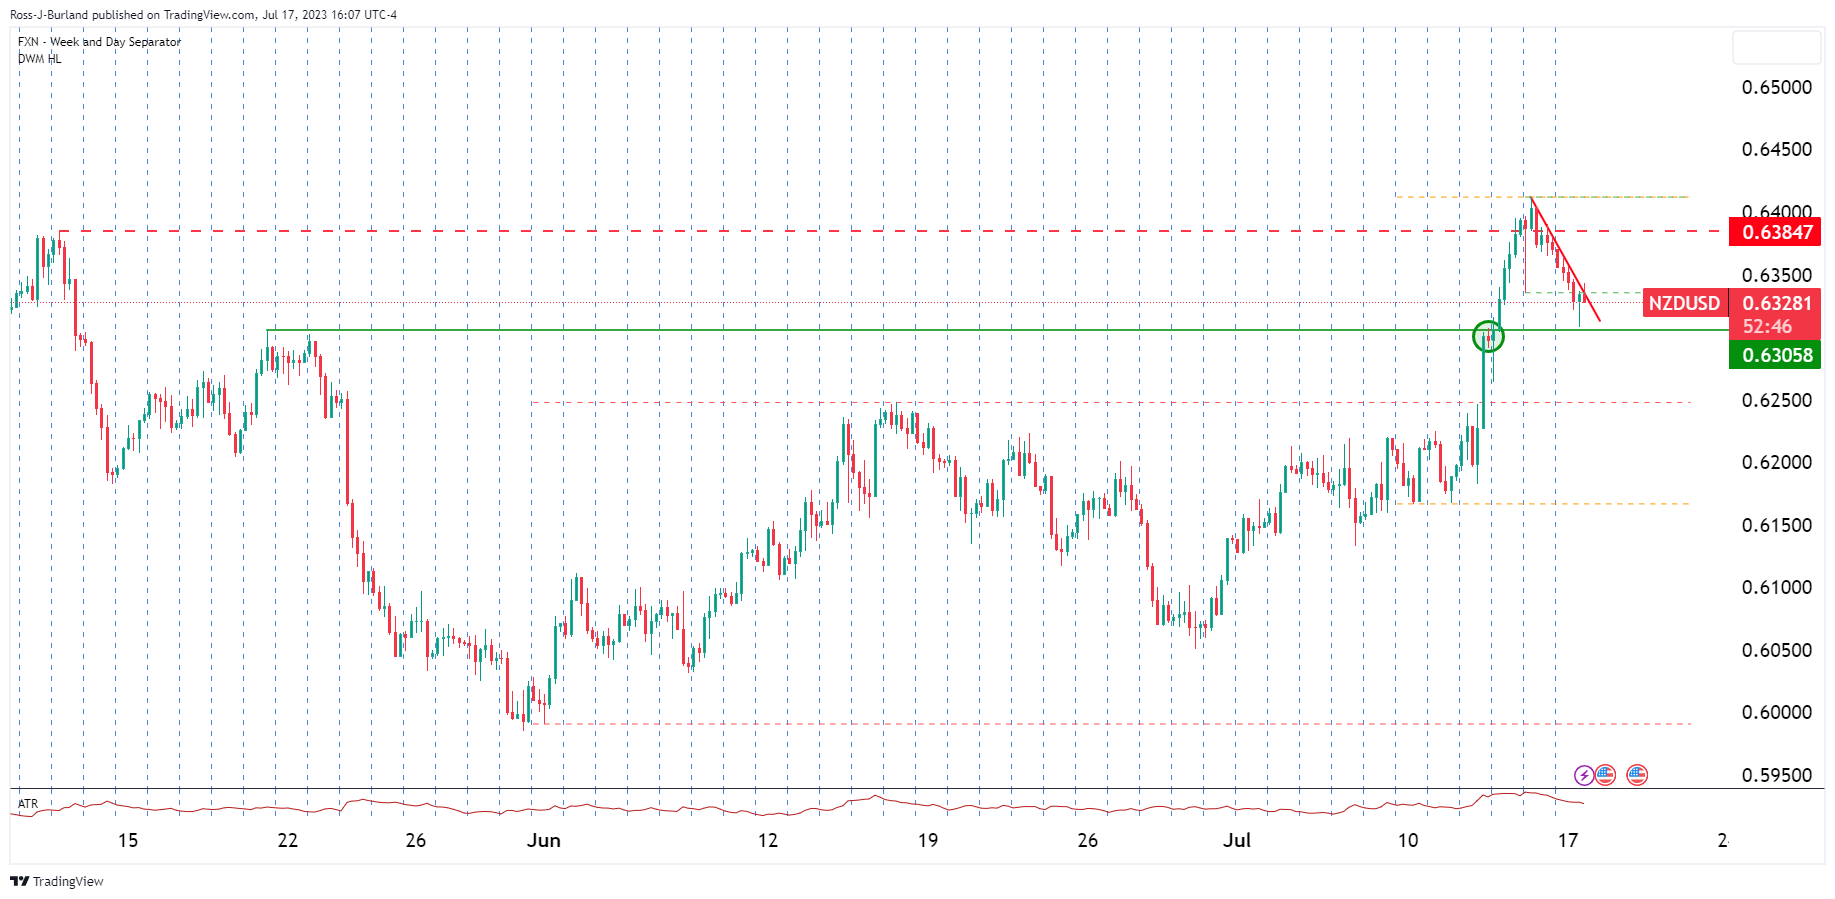
We had breakout traders in the market and a long squeeze is moving in on prior resistance.
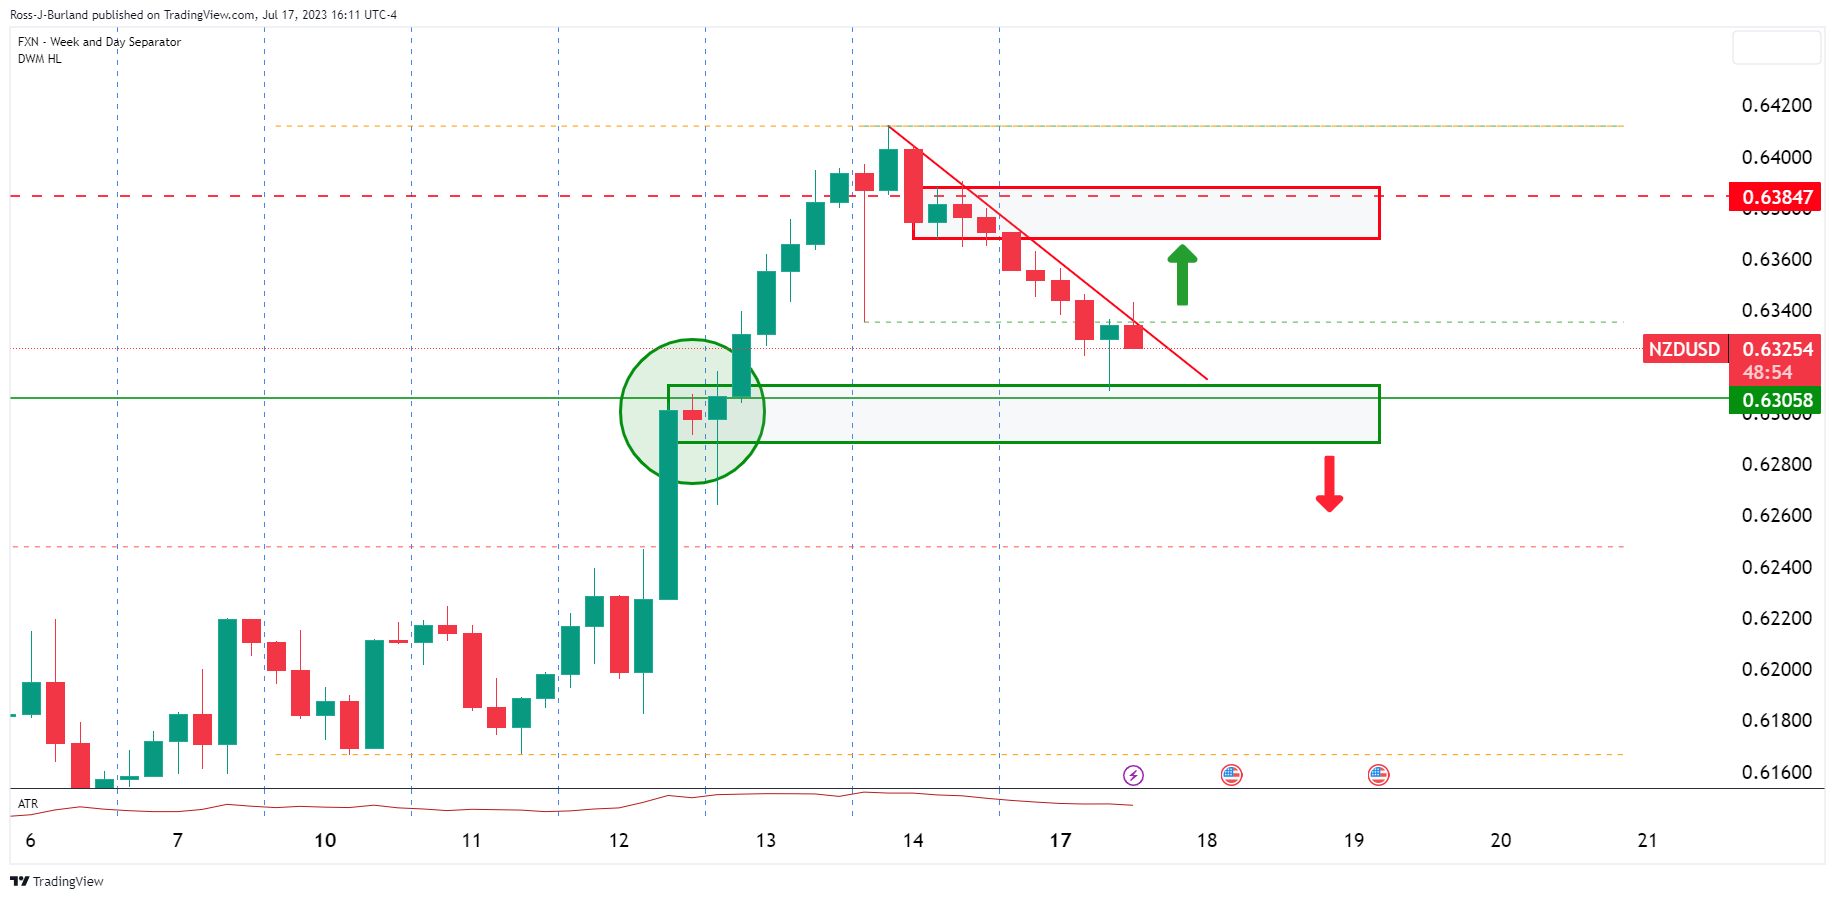
NZD/USD is on the front side of the bearish trendline and may have induced sellers due to the break below the prior day's lows. This leaves the trendline vulnerable to a break thereof and the prior support from which the downtrend originated.
- USD/CAD falls under 1.3200 as Canadian bond yields bolster CAD.
- Failure to break 1.3100 enables recovery, despite bearish RSI.
- USD/CAD’s recovery is reliant on reclaiming 1.3200, despite a bearish candle.
USD/CAD retreats below 1.3200 as the Canadian Dollar (CAD) gets underpinned by high Canadian bond yields, particularly the 10-year note at 3.385%, up 0.53%. In addition, the 20-day Exponential Moving Average (EMA), looming around the 1.3240 mark, was used by USD/CAD sellers to open fresh positions, weakening the pair. Therefore, the USD/CAD is trading at 1.3183, down 0.23%, after hitting a daily high of 1.3232.
USD/CAD Price Analysis: Technical outlook
From a technical perspective, the USD/CAD is downward biased, but failure to crack below the 1.3100 figure opened the door for recovery. After the USD/CAD printed a yearly low of 1.3092, the USD/CAD rallied towards 1.3220 before trimming some of those gains.
With the Relative Strength Index (RSI) aiming downwards at bearish territory would suggest that sellers remain in charge, except for the three-day Rate of Change (RoC), indicating that neither buyers/sellers are in control.
That said, if USD/CAD stays below 1.3200, first support emerges at 1.3150. A breach of the latter will expose the 1.3100 figure, followed by the year-to-date (YTD) low of 1.3092. Conversely, if USD/CAD buyers reclaim 1.3200, despite printing a bearish candle, that would expose the 20-day EMA at 1.3240. Once cleared, the USD/CAD would rally toward 1.3300, followed by the 50-day EMA at 1.3323, before testing the 200-day EMA at 1.3373.
USD/CAD Price Action – Daily chart
- The GBP/JPY trades with mild losses near 181.40.
- Soft Chinese data limits Yen’s upside potential.
- Eyes on Japan’s Trade Balance Data on Thursday and England’s CPI figures on Tuesday.
On Monday, the GBP/JPY cross trades near 181.40 after tallying two consecutive days of gains. The JPY’s upside potential is limited as weak Gross Domestic Product (GDP) data from Q2 and mixed Retail Sales from June from China may continue to soften the Japanese economy while markets await inflation data from the UK on Tuesday.
In the previous sessions, the markets recently speculated on a change in the bank's Yield Control Curve (YCC) due to growing local wages, which favoured the JPY, but still, there are no hints of the Bank of Japan’s (BoJ) officials. Following soft Chinese economic data, investors will focus on Trade Balance data from Japan from June to continue assessing a possible pivot from the BoJ’s ultra-dovish monetary policy stance.
On the other hand, inflation data from the UK will be Tuesday’s highlight. The Consumer Price Index (CPI) from the UK from June is expected to have dropped to 8.2% YoY from the previous 8.7%, while the Core CPI is predicted to remain unchanged at 7.1% YoY. Meanwhile, BoE’s tightening expectations remain steady as the World Interest Rate Probabilities (WIRP) tool suggests that a 50 basis points (bps) hike is largely priced in for the August 3rd meeting, followed by 25 bps hike in September, November and at the beginning of 2024.
In that sense, monetary policy divergences may continue to favour the GBP over the JPY.
GBP/JPY Levels to watch
The technical outlook for the GBP/JPY seems to have turned neutral for the short term. The Relative Strength Index (RSI) shows a flat slope while the Moving Average Convergence Divergence (MACD) remains in negative territory. To reignite momentum, the bulls must recover the 20-day Simple Moving Average (SMA) at 182.25.
Support Levels: 181.00, 180.50, 179.00.
Resistance Levels: 182.25 (20-day SMA), 182.50, 183.00.
GBP/JPY Daily chart
-638252179698182973.png)
- EUR/USD bulls look to break the 1.1250s resistance.
- Bears are lurking following a series of higher closes.
EUR/USD was higher by some 0.18% in late New York trade after it fell from Monday's minor new trend high at 1.1249 to Friday's 1.12045 low before moving back to the upside with eyes on a break of channel resistance. The US Dollar is on the back foot again following last week's tumble — its biggest drop of the year — as the market prepares for US Retail Sales on Tuesday.
EUR/USD daily charts
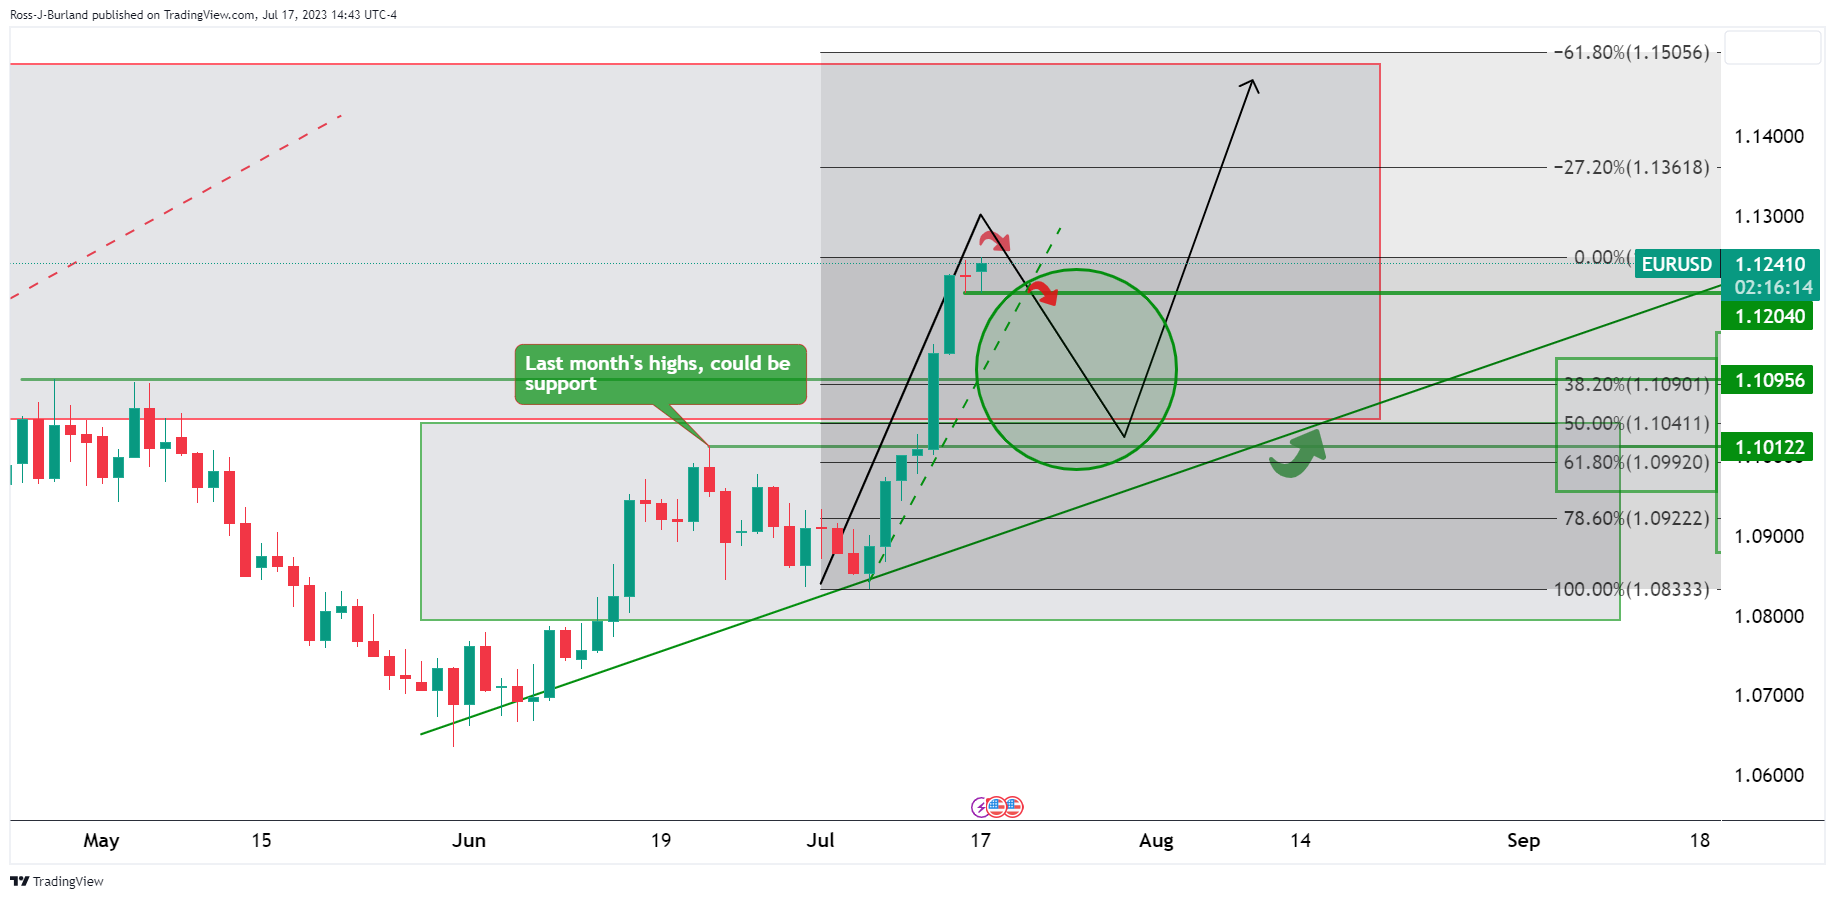
Meanwhile, the price displaced to the upside and this could lead to a significant correction for the days ahead as the above daily chart illustrates.
EUR/USD H4 chart
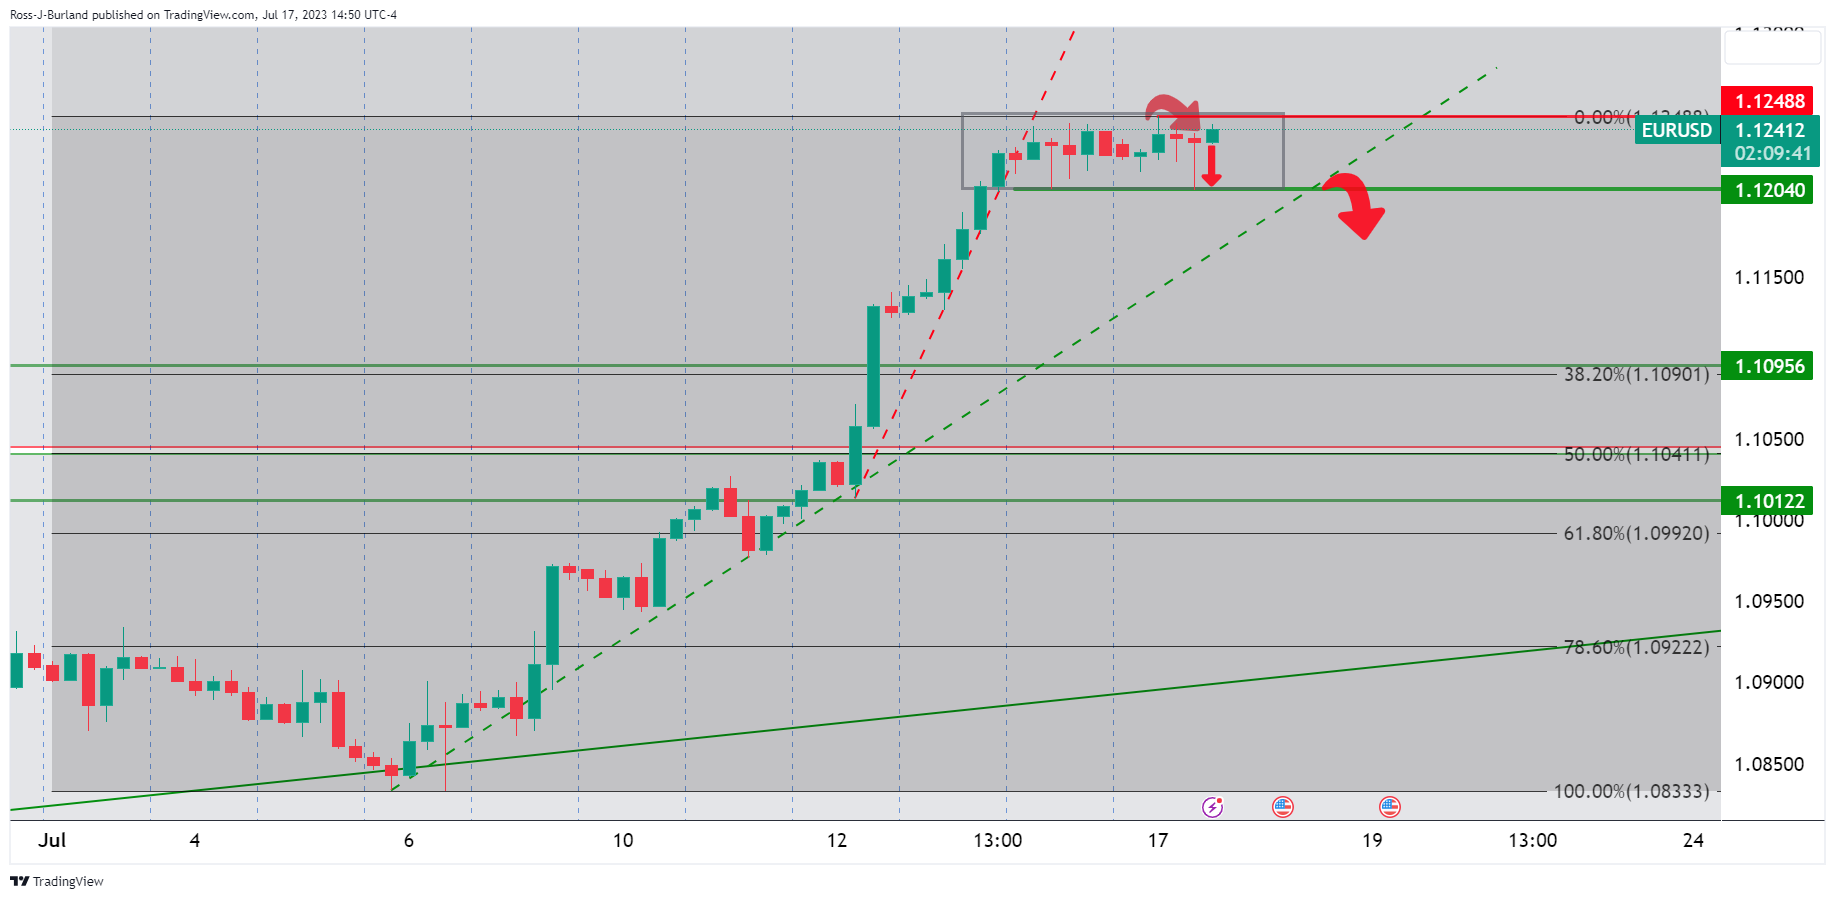
The market is coiled and a breakout could be on the cards. However, the following shows, there are prospects of a bullish continuation also:
EUR/USD H1 chart
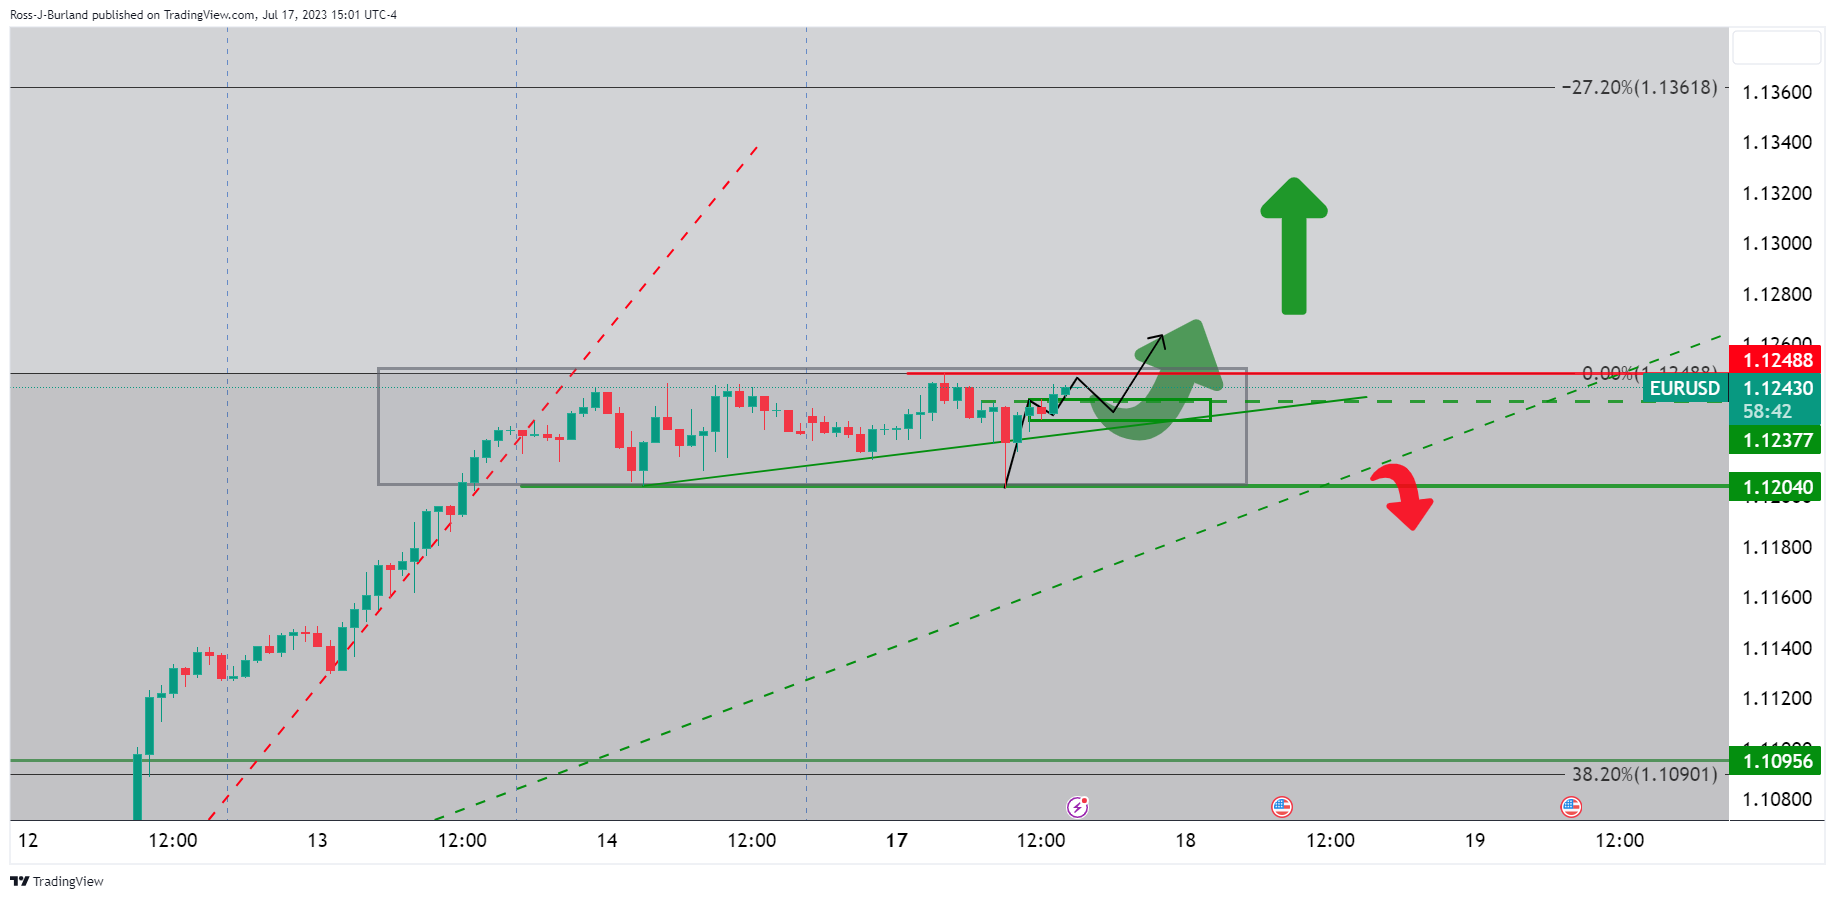
We had a recent spike to the downside as the hourly chart shows. we have subsequently rallied and a break of the 1.1250s could be imminent.
- GBP/USD suffers 0.08% drop as disappointing Chinese GDP data sparks flight to safety; exchange rate slips under 1.3100.
- Expectations of a 50 bps rate hike by the Bank of England in August maintain tension despite signs of looming UK recession.
- Upcoming UK Consumer Price Index and US Retail Sales figures heighten focus; investors gauge the impact of potential high inflation on GBP/USD trajectory.
GBP/USD lost traction during the North American session, falling below the 1.3100 figure due to an adverse market mood spurred by a weaker-than-expected economic recovery in China, which triggered a flight to safe-haven assets. The GBP/USD is trading at 1.3080, down 0.08%.
Imminent UK inflation data to keep GBP/USD within familiar levels
During the Asian session, China’s Gross Domestic Product (GDP) for the second quarter missed estimates portraying a gloomy economic outlook. Although Industrial Production expanded at a healthy rate, Retail Sales slowed sharply, from May’s 12.7% to 3.1% in June. However, data coming from the UK would greatly influence the pair.
On Wednesday, the UK will reveal the Consumer Price Index (CPI) for June, estimated at 8.2% YoY, from 8.7% in May, while the core CPI is awaited at 7.1%, unchanged from May. Expectations that the Bank of England (BoE) would raise rates by 50 bps in August remained high, with traders seeing the BoE lifting the Bank Rates to 6.25% in early 2024. Nevertheless, recent economic data indicates that the UK’s economy is at the brisk of a recession, which would be more profound, amidst high inflation levels and the BoE tightening monetary conditions.
High inflation numbers would only benefit GBP/USD longs, which could lift the exchange rate past the 2021 yearly low and the 1.3200 figure. As of writing, the US Dollar Index (DXY), a measure of the buck’s value vs. its peers, eases below the 100.000 mark, down by 0.09%, at 99.875.
Aside from this, GBP/USD traders remain laser-focused on the release of Retail Sales on Tuesday, expected to rise by 0.5%, above the prior month’s 0.3%. The latest US Consumer Sentiment report spurred speculations about June’s retail sales report, as consumers remain positive about the economy. Also, the US Federal Reserve (Fed) will unveil US Industrial production, estimated at 0% MoM, below May 0.2% expansion.
GBP/USD Price Analysis: Technical outlook
The GBP/USD remains upward biased but subject to a mean reversion move, after an overextended rally of twelve days, with the pair gaining almost 4%, though failing to crack the 2021 yearly low of 1.3160. Hence, GBP/USD sellers stepped in, dragging the price below the 1.3100 mark, which, if it holds, the GBP/USD could be headed for further losses. However, the release of important data from the United Kingdom (UK) would keep price action within familiar levels. On the downside, the GBP/USD remains below 1.3100 which could expose the 1.3000 mark, followed by the July 13 daily low of 1.2979.
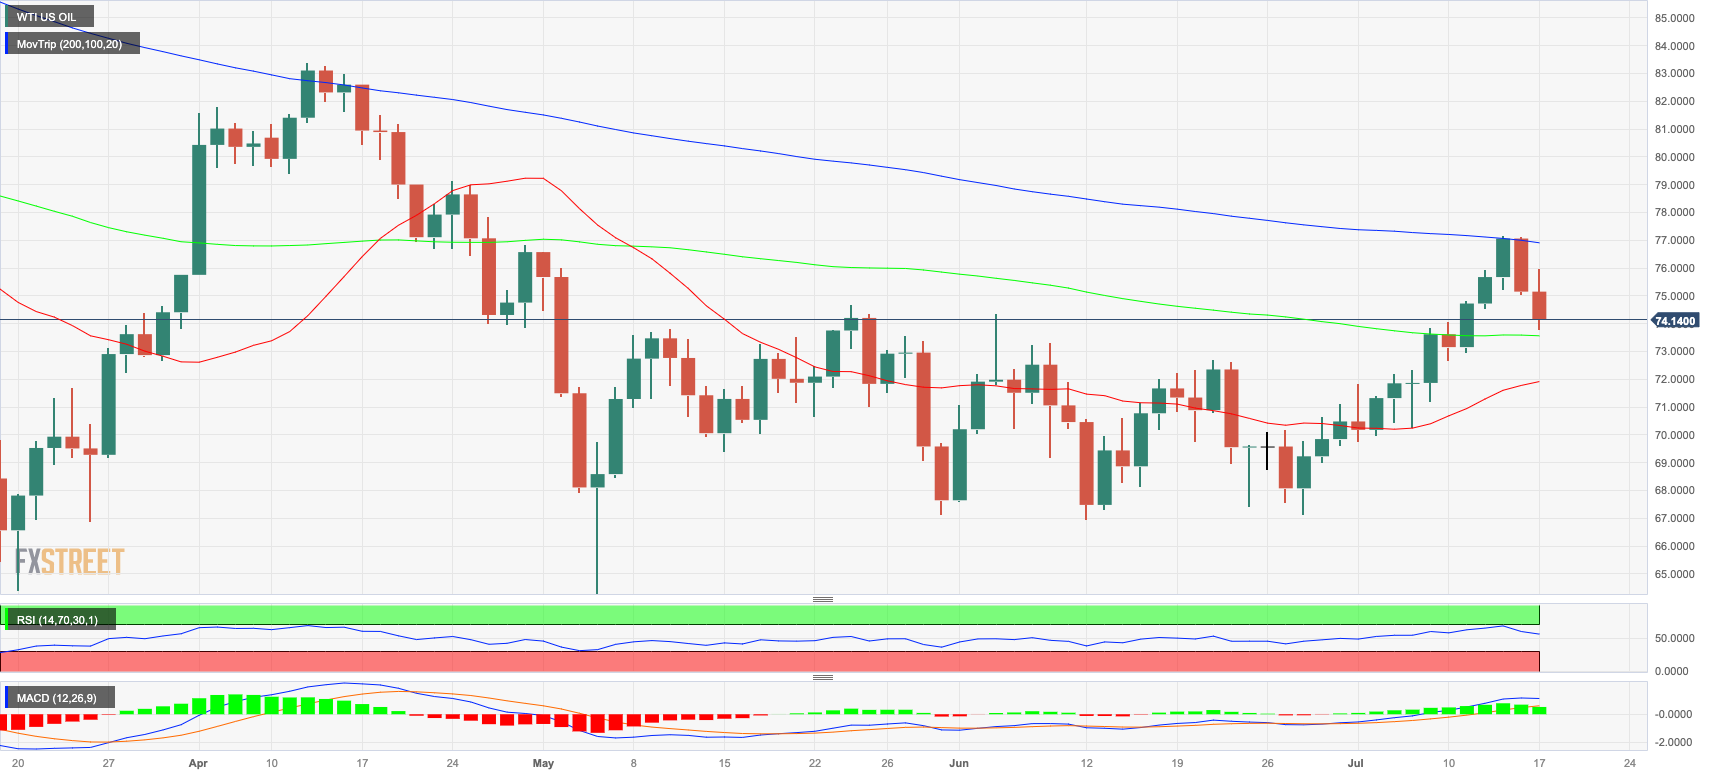
- WTI sets its second day in a row of losses as investors continue to take profits following a three-week gain streak.
- Unexpected supply disruptions in Nigeria and Lybia may limit the downside’s potential.
- Eyes on Tuesday’s Retail Sales data from the US.
At the start of the week, the West Texas Intermediate (WTI) barrel fell below $75.00. The downside movements may be explained by investors taking profits and a slight recovery of the US Dollar.
The focus is set on Tuesday’s Retail Sales data from the US from June. As the USD significantly weakened following soft inflation figures from June which fueled dovish bets on the Federal Reserve (Fed), weak Retail Sales figure could fire another downwards leg for the Greenback. As for now, markets are expecting the headline figure to have increased 0.5% MoM in June while the sales excluding the Automobile sectors to have expanded 0.3% MoM.
Meanwhile, according to the CME FedWatch Tool, investors have largely priced in a 25 basis points (bps) hike in the next July 26 meeting of the Fed but the odds of another hike in 2023 have dropped to nearly 20%. In that sense, as higher interest rates tend to be negatively correlated with Oil prices, the WTI could regain momentum if markets continue to bet on a dovish Fed.
WTI Levels to watch
The daily chart suggest that the technical outlook is neutral to bearish for the short term. The Relative Strength Index (RSI) displays a negative slope but stands above its midline while the Moving Average Convergence Divergence (MACD) print lower green bars, indicating the the bullish momentum is slowly fading out. That being said, the price trading above the 100 and 20-day Simple Moving Averages (SMAs) suggests that on the bigger picture, the outlook favours the bulls.
Support Levels: $73.55 (100-day SMA), $72.80, $71.90 (20-day SMA).
Resistance Levels:$76.00, $77.00,$77.30 (200-day SMA).
WTI Daily chart
- AUD/USD registers 0.20% loss, buffeted by weak Chinese GDP and Retail Sales data; USD rebounds after its worst week since November 2022.
- US equities remain unscathed despite mixed Chinese economic data; Forex traders eye Tuesday’s US Retail Sales and Industrial Production figures.
- Leadership change at the Reserve Bank of Australia (RBA) adds an element of uncertainty; the release of RBA monetary policy meeting minutes eagerly awaited.
AUD/USD dropped from around the 0.6850 area amid a possible global economic outlook, as soft economic data from China weighed on the Australian Dollar (USD). That bolstered the US Dollar (USD), which posted its worst week since November 2022. At the time of writing, the AUD/USD is trading at 0.6822, with losses of 0.20%.
Economic slowdown in China and expectations for positive US Retail Sales, a headwind for AUD/USD
US equities shrugged off mixed data from China that painted a gloomy economic outlook after the Gross Domestic Product (GDP) in China expanded by 0.8% QoQ, beneath the first quarter (Q1) by 2.2%, while on an annual basis, the economy grew at a 6.3% pace, below 7.1% forecasts, above Q1’s 4.5%. In the meantime, Industrial Production gathered pace, while Retail Sales decelerated sharply from 12.7% in May to 3.1% in June.
A light US economic docket keeps AUD/USD traders focused on the release of Retail Sales on Tuesday, which are expected to rise by 0.5%, above the prior month’s 0.3%. The latest US Consumer Sentiment report spurred speculations about June’s retail sales report, as consumers remain optimistic about the economy. On the same day, the US Federal Reserve (Fed) will unveil US Industrial production, estimated at 0% MoM, below May 0.2% expansion.
On the Australian front, news emerged the Reserve Bank of Australia (RBA) Governor Philip Lowe would not continue as the head of the bank and would be substituted by the current Deputy Governor Michele Bullock. Aside from this, the RBA would unveil its latest monetary policy meeting minutes.
AUD/USD Price Analysis: Technical outlook
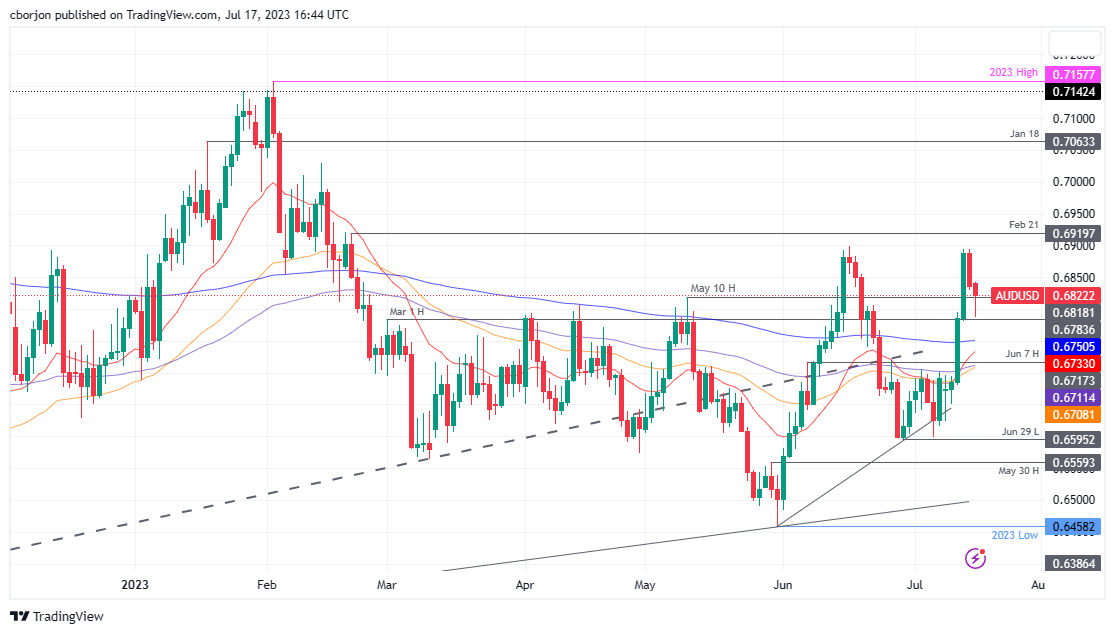
The AUD/USD rally was capped shy of breaching the 0.6900 figure, exacerbating a downward correction, past the May 10 daily high of 0.6818, with the AUD/USD extending its fall toward a daily low of 0.6787 before trimming some of its losses. A daily close above 0.6818 could pave the way for AUD/USD to retest 0.6900. A decisive break will expose the 0.7000 figure, but firstly, the AUD/USD buyers must regain the February 21 high at 0.6919. Conversely, the AUD/USD first support would be 0.6800, followed by the current week’s low of 0.6787.
- EUR/JPY tallies a three-day winning streak and trades near the 20-day SMA at 156.30.
- JPY weakened following soft Chinese economic data.
- Eyes un Japanese Trade Balance data on Thursday and on BoJ’s upcoming decision.
At the start of the week, the JPY traded soft against most of its rivals including the USD,EUR and GBP as the Yen lost traction following soft economic data from China. Investors are still modeling their expectations towards the next Bank of Japan (BoJ) decision so Trade Balance data will be closely followed.
China released mixed June Retail Sales and soft Q2 Gross Domestic Product (GDP) figures. GDP came in at 0.8% QoQ, as predicted, compared to 2.2% in Q1, while the annualised pace was 6.3%, below the expected 7.1% and 4.5% in Q1. Retail Sales came in at 3.1% YoY versus 3.3% anticipated in June significantly dropping from the previous figure of 12.7% seen May, while Industrial Production came in at 4.4% YoY beating the 2.5% projected and the previous 3.5% in May. In that sense, as China is Japan’s main trading partner, following the release of the data the JPY weakened as a lower Chinese demand could contribute to Japan’s economy to soften.
That being said, attention is set on the next Bank of Japan (BoJ) decision. The markets speculated recently with a tweak in the bank’s Yield Control Curve (YCC) on the back of rising local wages which favoured the JPY. In addition, investors will keep an eye on any macro forecasts as Bloomberg reported that its likely that the BoJ will update its inflation projections.
On the other hand, the European’s macroecononmic calendar remains scarce this week as attention turns to next week European Central Bank (ECB) decision where markets are expecting a 25 basis points (bps) hike.
EUR/JPY Levels to watch
According to the daily chart, the downwards momentum is fading out and the bulls are taking the command. The Relative Strength Index (RSI) points north standing above its midline, while the Moving Average Convergence Divergence (MACD) prints decreasing red bars signalling that the bulls are gaining traction.
Resistance Levels: 156.30 (20-day Simple Moving Average), 157.00, 158.00
Support Levels: 156.00, 155.50, 155.00.
EUR/JPY Daily chart
-638252073551022509.png)
- USD/MXN ends a six-day losing streak, jumps 0.54%, driven by a risk-off market amid weak Chinese GDP and Retail Sales data.
- Despite Wall Street’s positive opening, concerns over China’s economic slowdown overshadow optimism; awaits key US and Mexico retail sales data.
- Potential rate cut by the Bank of Mexico in December 2023, coupled with the US Federal Reserve’s upcoming policy meeting, adds uncertainty to the USD/MXN.
USD/MXN snaps six days of losses and climbs from around 7-year lows reached at 16.7062, amid a light economic calendar in Mexico and the United States (US) and a risk-off environment. Weak data from China, namely Gross Domestic Product (GDP) for Q2 and Retail Sales, spurred fears for a global economic slowdown. The USD/MXN is trading at 16.8247, up 0.54%.
China’s economic deceleration and upcoming US data weighed on the Mexican Peso
Wall Street opened in the green, though it failed to underpin the USD/MXN pair. Data during the Asian session showed that China’s GDP grew 0.8% QoQ, beneath the first quarter (Q1) 2.2%, while on an annual basis, the economy expanded at a 6.3% pace, below 7.1% estimates, but exceeded Q1’s 4.5%. In the meantime, Industrial Production exceeded forecasts, while Retail Sales decelerated sharply from 12.7% in May to 3.1% in June.
Aside from this, the upcoming economic docket in the US will witness the release of Retail Sales on Tuesday, which are expected to rise by 0.5%, above the prior month’s 0.3%. Although the latest Nonfarm Payrolls report disappointed the markets and inflation numbers flash a disinflation process, the latest University of Michigan (UoM) Consumer Sentiment report could be a prelude to a positive retail sales report.
The same day, the US Federal Reserve (Fed), whose speakers entered the blackout period ahead of the upcoming monetary policy meeting on July 25-26, will unveil US Industrial production, estimated at 0% MoM, below May 0.2% expansion.
On the Mexican front, the calendar will reveal Retail Sales until Thursday, estimated at 3.5% YoY, below April’s 3.8%. Softer-than-expected readings could show that the economy would need lower interest rates, as the Bank of Mexico (Banxico) raised more than 700 basis points, keeping the TIIE at around 11.25%. It should be said; the disinflationary process is gathering pace, putting on the table, Banxico’s first rate cut by December 2023.
USD/MXN Price Analysis: Technical outlook
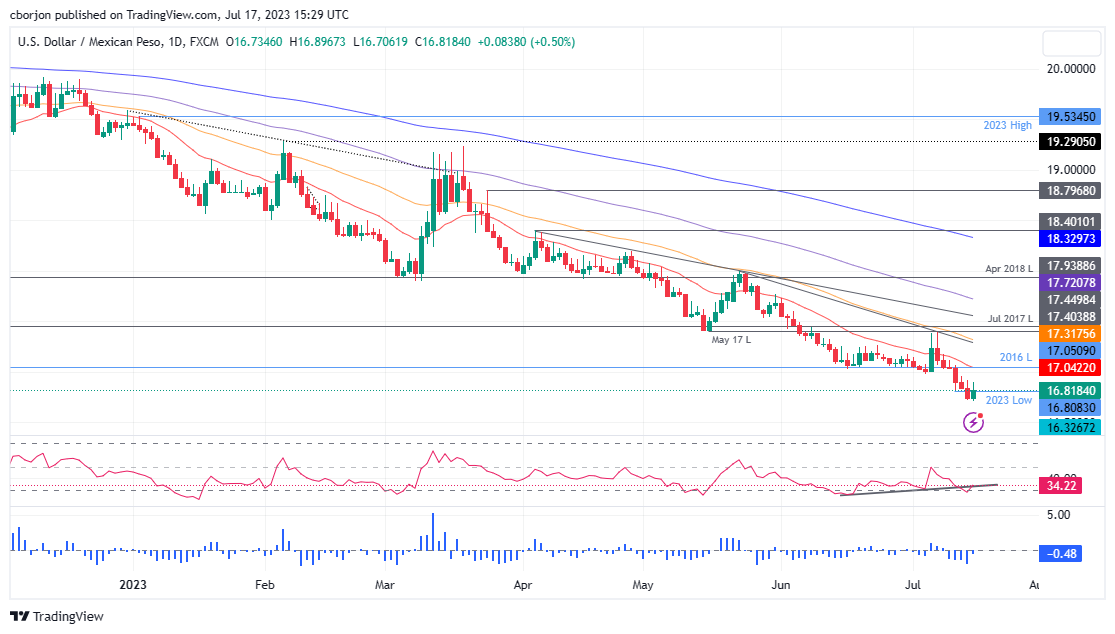
From a technical standpoint, the USD/MXN is set to continue its downtrend, but a correction is on the cards. If USD/MXN reclaims the July 14 daily open at 16.9172, that could form a bullish engulfing candlestick pattern that can lift the pair toward the 20-day Exponential Moving Average (EMA) at 17.0431. Nevertheless, the latter’s confluence with the 2016 yearly low would be difficult resistance to surpass, and if it happens, that could pave the way to retesting May 17 daily low turned resistance at 17.4038. Otherwise, if resistance holds at 17.0000, the USD/MXN could retest the yearly lows, followed by the October 2015 low at 16.3267
Economists at Commerzbank share their XAU/USD forecast.
Gold to move more or less sideways around $1,950 in the coming months
We expect Gold to move more or less sideways around $1,950 in the coming months.
Towards the end of the year, we continue to see some scope for an upward move (to $2,000). This is because the Fed's sharp rate hikes (by a total of 525 bps) are likely to be felt more strongly and it will become clear that the US economy is in recession. This, in turn, should put an end to any remaining rate hike speculation.
If, in the coming year, a further decline in inflation and the weakness of the economy even make rate cuts more likely, Gold should head to its all-time high.
The downside miss in US CPI has sent the USD reeling. Economists at TD Securities analyze Greenback’s outlook.
The turn is likely to extend into H2 and through next year
The USD is in steep free fall in the wake of the latest "positive" inflation report. We have been advocating USD shorts since the positioning-induced rally in May and think the recent price action is just the start of a broader bearish turn in H2.
We assess some medium term drivers like global growth and yield curve dynamics, front-end rate momentum and relative central bank policy, and volatility and valuation mechanics. The bulk of these drivers lean against the USD, underpinning our updated outlook that the USD has much room to fall through H2 and even through most of 2024.
Loonie trades little changed after Friday’s sharp tumble. Canadian CPI data on Tuesday will be key to determining how far the CAD slide extends, economists at Scotiabank report.
Lower inflation may weigh a bit more on the CAD in the short run
The CAD slipped off its high Friday all too easily, with the USD rebound threatening to undo some (at least) of the CAD’s strength that it has accumulated over the past week following the Bank of Canada rate hike.
There is a little data out today (Wholesale Sales for May are expected to rise 1.0% in the month) but CPI data on Tuesday may be key in determining how far the CAD slide extends in the short run (headline expected to dip to 3.0%, the top of the BoC’s medium term target range).
Lower inflation may weigh a bit more on the CAD in the short run but policymakers have been clear that progress beyond 3% is expected to be harder to come by. This will not be any sort of ‘all clear’ signal.
The CAD may ease a little more in the short run before recovering.
See – Canada CPI Preview: Forecasts from five major banks, better inflation, but not yet good enough
The Pound faces another pulsating week. Economists at Société Générale analyze GBP outlook.
A drop in core inflation could rein in the pessimism about the terminal rate exceeding 6.5% next year
The release of UK CPI on Wednesday will be closely watched in light of the sea change in expectations for the BoE. The strong wage data last week and agreement by the government to increase public sector pay by around 6% cemented expectations for 50 bps in August.
GBP/USD has not been this overbought since August 2020 so could be due for a snap back.
A drop in core inflation may not temper what happens with bank rate in August but could rein in the pessimism about the terminal rate exceeding 6.5% next year.
AUD/USD strength has extended to retest and again be capped at key resistance at 0.6891/0.6901. Economists at Credit Suisse analyze the pair’s outlook.
Support at 0.6707/0.6696 to ideally hold
Our bias is to look for dips to be well-supported ahead of a retest of 0.6891/0.6901 and with the USD itself holding a large bearish continuation pattern we stay biased for a break in due course with resistance then seen at 0.6922 initially ahead of the 78.6% retracement at 0.7009.
Support stays seen at 0.6784/83 initially, below which can ease the immediate upside bias for a pullback to 0.6749/43, then 0.6707/0.6696, but with buyers expected here.
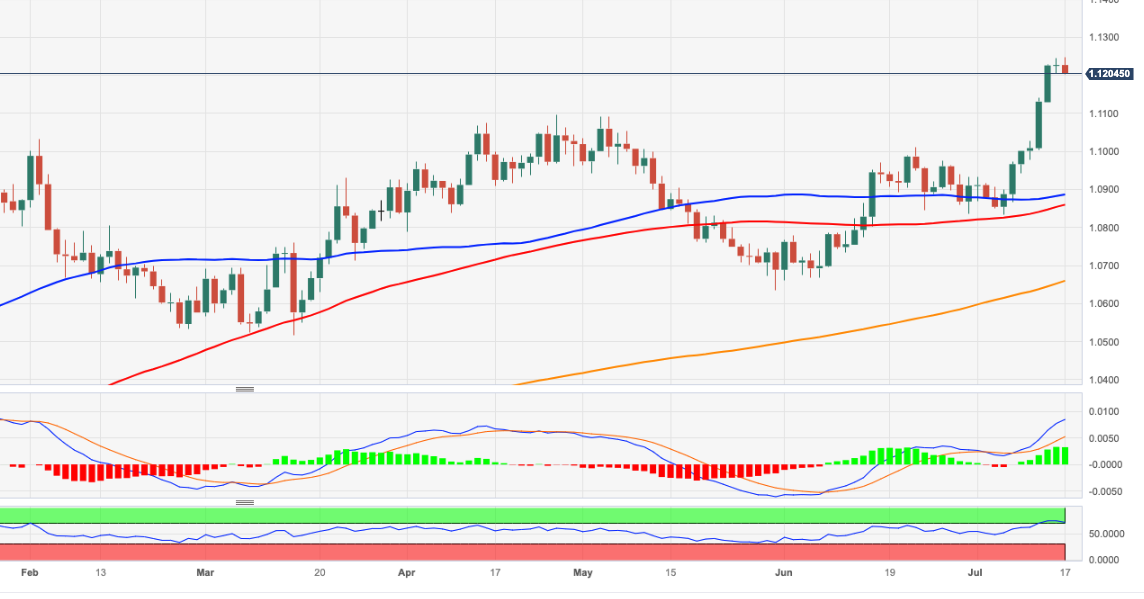
- EUR/USD now gives away some gains following new tops near 1.1250.
- A technical correction seems to be shaping up.
EUR/USD comes under pressure and puts the 1.1200 region to the test on Monday.
While the continuation of the upside momentum appears favoured in the very near term, the pair’s current overbought conditions might spark a corrective knee-jerk. Further north of the 2023 top at 1.1248 (July 17), the pair is expected to meet the next resistance level of note at the 2022 high of 1.1495 recorded on February 10.
Looking at the longer run, the positive view remains unchanged while above the 200-day SMA, today at 1.0658.
EUR/USD daily chart
Statistics Canada will release June Consumer Price Index (CPI) data on Tuesday, July 18 at 12:30 and as we get closer to the release time, here are the forecasts by the economists and researchers of five major banks regarding the upcoming Canadian inflation data.
Headline CPI is seen declining to 3.0% year-on-year vs. the prior release of 3.4%. If so, headline inflation would be the lowest since March 2021 but still above the 2% target. On a monthly basis, it is expected to show a pace of 0.3% vs. the former release of 0.4%.
TDS
We look for headline CPI to rise by 0.3% MoM as base effects pull inflation to 3.0% for the first time since March '21. Food and energy will make modest contributions on a m/m basis while shelter will remain a key source of strength on rents and MIC. Core measures should edge lower by 0.1pp to 3.75% YoY, with CPI trim/median holding stable at 3.7% on a 3m saar basis.
NBF
In Canada, the CPI could have increased by 0.2% in June (before seasonal adjustment). If we’re right, the 12-month rate of inflation should come down from 3.4% to a 27-month low of 2.9%. The core measures preferred by the Bank of Canada should decrease as well.
RBC Economics
We expect to see a 2.9% rate in June, down from 3.4% in May and just below the top end of the BoC’s 1% to 3% target. That marks a dramatic slowdown from a peak rate of 8% a year ago. But the BoC will be focused on more recent MoM growth in the range of ‘core’ measures designed to provide a better gauge of underlying broader inflation pressures. And growth in those has been stickier at rates still above the BoC target. The BoC’s preferred median and trim CPI measures have been tracking in the range of 3 ½% to 4% at an annual rate and core services excluding shelter (BoC ‘super-core’) has been running closer to 5%.
CIBC
Canadian inflation likely decelerated further in June, reaching 3.0% YoY, although that may be the low water mark for a few months as base effects become less favourable. June’s data will compare this year’s gasoline prices with the very peak of those seen in 2022, which will be the main factor behind the expected deceleration. Core (excluding food/energy) price pressures have eased, but are not yet back to levels consistent with a 2% inflation target. However, food prices remain the primary source of inflationary pressure now, with less sign of deceleration than witnessed recently in the US.
Citi
We expect a 0.4% MoM increase in headline CPI in June, a similar increase as in May but with base effects still pushing the YoY reading lower to 3.1%. If anything, risks appear tilted slightly to the downside. The most important element of CPI data over the coming months will be the average of the annualized 3-month pace of CPI-trim and CPI-median that have remained stably too high in a 3.5-4% range for close to a year. But the substantial increase in April will drop out of the 3-month period in July suggesting 3-month core inflation will likely fall below this range in July, and thus create doubt around the need for still-higher rates in September as core inflation slows.
- USD/CHF is looking for a stabilized auction above 0.8600 amid a recovery in the US Dollar Index.
- US equities are expected to remain uncertain as further movement will be guided by the second-quarter result season.
- Fed Waller commented that two more interest rate hikes are still appropriate by the year-end.
The USD/CHF pair is aiming for stability above the round-level resistance of 0.8600 in the early New York session. The Swiss Franc asset has found some strength as the US Dollar Index (DXY) has printed a fresh day’s high after building a base below the psychological resistance of 100.00.
S&P500 is expected to open on a muted note following cues from overnight action in futures. US equities are expected to remain uncertain as further movement will be guided by the second-quarter result season. The overall market mood is quite cautious amid obscurity among market participants.
The US Dollar Index has refreshed its day’s high around 100.00. The action in the USD Index seems the outcome of oversold signals by momentum oscillators as fundamentals are still not supportive. Following USD’s action, the u-year US Treasury yields have also rebounded to near 3.81%.
As inflation has softened dramatically and the labor market is not extremely tight as it used to be, hopes for only one more interest rate from the Federal Reserve (Fed) by the year-end have remained firm. Contrary to that, Fed policymakers are still not convinced.
Last week, Fed Governor Christopher Waller commented that two more interest rate hikes are still appropriate by the year-end. While the commentary from Chicago Fed Bank Austan Goolsbee conveyed that inflation is progressively declining but still a lot of work to do.
On the Swiss Franc front, more interest rate hikes from the Swiss National Bank (SNB) are highly anticipated despite inflation having displayed a print below 2%. For keeping inflation steadily below 2%, SNB Chairman Thomas J. Jordan would raise interest rates further in September.
The Gold price has retreated 5% from this year’s high of $2,060. Economists at ANZ Bank analyze XAU/USD outlook.
Shifting expectations of the terminal rate are a short-term headwind
Tightness in the labour market and strong economic data are likely to keep the Fed hiking rates. This leaves a risk of pushing real rates higher in the short-term. And Gold is likely to underperform in such an environment.
Nevertheless, we hold our positive view for the medium term, as structural drivers remain intact. The ongoing decline in inflation will ultimately see the Fed pause its interest rate cycle at some point this year. Normally US yield start retreating at this point, reducing the opportunity cost for Gold investing.
A pause in rate hikes by the Fed amid other more hawkish central banks should see the US Dollar likely to weaken in the second half of this year. Further, the risk of a US recession is not completely off the table, which should attract haven fund flows into Gold into 2024.
AUD/USD retracted some of the gains made in June and formed a higher trough. Economists at Société Générale analyze the pair’s technical outlook.
At a crossroads
AUD/USD has re-established above the 200-DMA denoting regain of upward momentum. This is also highlighted by daily MACD which has been posting positive divergence and is now attempting a cross above equilibrium line.
The pair is now challenging the peak of June near 0.6890. Once this is overcome, an extended up-move is likely. Next potential objectives are located at 0.7000, the 76.4% retracement from January and 0.7160/0.7200 which represents a multiyear downsloping trend line hurdle.
Defence of the MA near 0.6700 would be crucial for persistence in up-move.
USD/JPY has reversed sharply from 145. Economists at ING analyze the pair’s outlook.
No need for intervention after all
It looks like investor positioning for a possible Bank of Japan policy tweak (28 July) and the softer US inflation data have foregone the need for intervention.
A sustained move lower in USD/JPY will require some follow-up – i.e. either from the BoJ or US data.
145 could now prove a solid cap. We target 130 for year-end.
USD/JPY – 1M 138 3M 135 6M 130 12M 120
- USD/JPY has picked strength around 138.50 following the footprints of the US Dollar Index.
- Hopes of only one more interest rate hike from the Fed have elevated due to supportive economic indicators.
- S&P500 futures have discovered some losses in Europe, portraying a cautious market mood.
The USD/JPY pair has recovered firmly to near 138.85 in the London session. The asset was demonstrating a non-directional performance amid an absence of a potential economic trigger. The recovery move has come following the footprints of the US Dollar Index (DXY). A power-pack action in the major would be propelled by the release of the monthly United States Retail Sales data.
S&P500 futures have discovered some losses in Europe, portraying a cautious market mood. US equities are expected to face tough times as the second-quarter result season has kicked off. Investors will keep an eye on banking and technology stocks amid bleak economic activities due to higher interest rates from the Federal Reserve (Fed).
The US Dollar Index (DXY) is making some serious efforts for delivering a break above the immediate resistance of 100.00. A decisive move would trigger a short-term recovery and might impact the appeal for the risk-perceived currencies. The yields offered on 10-year US Treasury bonds have dropped sharply to near 3.78%.
Hopes of only one more interest rate hike from the Fed have elevated due to supportive economic indicators. June’s inflation report has softened sharply as prices of second-hand automobiles have dropped and was sufficient to offset a mild increase in gasoline prices. The tight labor market has released some heat as Fed remained aggressively hawkish and now investors are shifting their focus toward the US Retail Sales data.
On the Japanese Yen front, the interest rate decision by the Bank of Japan (BoJ) will be keenly watched. Bloomberg reported that BoJ officials will likely raise their inflation forecast above 2% for this fiscal year at their July meeting, but their view for the following year is largely unchanged and may even be nudged down.
Investors should note that Japanese markets were closed on Monday on account of Marine Day.
USD/MXN oscillates in a narrow range around the 16.75 region. Economists at Société Générale analyze the pair's technical outlook.
Downtrend overstretched
USD/MXN has experienced a relentless downtrend after breaking below the sideways consolidation during 2021/2022. Although the move is a bit stretched, signals of a meaningful rebound are not yet visible.
Next potential objectives are at 16.60/16.40 and projections of 15.90. Achievement of these levels could result in a phase of rebound however reclaiming the 50-Day Moving Average near 17.40 is crucial for affirming a meaningful up-move.
- DXY navigates a tight range near the 100.00 mark.
- Another visit to the 2023 low remains in store near term.
DXY regains some composure and flirts with the psychological 100.00 zone on Monday.
The continuation of the decline of the dollar looks the most likely scenario for the time being. Against that, the breach of the current 2023 low at 99.57 (July 14) could spark a deeper pullback to the weekly low of 97.68 (March 30 2022).
Looking at the broader picture, while below the 200-day SMA at 104.31, the outlook for the index is expected to remain negative.
DXY daily chart
GBP/USD strength has stalled near term, but analysts at Credit Suissemaintain a bullish outlook for the 78.6% retracement of the 2021/2022 fall at 1.3414.
Support at 1.2909/03 ideally holds
GBP/USD strength has stalled near-term just ahead of price resistance at 1.3148/72, and we continue to look for this to cap at first for a pullback/pause.
With key resistance at 1.3000 broken and with the USD itself holding a large bearish continuation pattern weakness will stay seen as corrective ahead of a move above 1.3172 in due course with resistance then seen next at 1.3299/1.3300 ahead of the 78.6% retracement of the 2021/2022 fall at 1.3414, which we look to prove a tougher initial barrier.
Support is seen at 1.3020 initially, then 1.2983/75 initially, with 1.2909/03 ideally holding to keep the immediate risk higher. Below can see a deeper pullback to 1.12855/30 but with fresh buyers expected here.
In an interview with Bloomberg on Monday, US Treasury Secretary Janet Yellen said that there is a good chance that they will go ahead with outbound investment controls on China, per Reuters.
Key takeaways
"China has seen slower growth than expected after covid reopening."
"Chinese consumers are more focused on rebuilding savings; Chinese are concerned about sluggish growth."
"Not expecting a recession in the US."
"Making progress in getting inflation down."
"US tariffs on China reflected concern about unfair trade practices, those have not been addressed."
"US actions on China are not 'tit for tat', they reflect national security concerns."
"US is looking carefully at outbound investment controls on China, but they would be focused on a few sectors."
"These would not be broad controls that would have fundamental impact on investment climate in China."
"US has expressed concerns to China about hacking of government officials, private individuals."
Market reaction
These comments don't seem to be having a significant impact on risk mood. As of writing, US stock indx futures were trading little changed on the day.
-
Canadian Dollar reverses sharply lower against the US Dollar after a decline in Oil prices and strong sentiment data boosted the Buck.
-
Oil falls from weaker-than-expected Chinese growth data for Q2 and the reopening of Libya’s largest Oil field.
-
A thick knot of technical support levels just below 1.3100 further provides a technical foundation for the reversal.
The Canadian Dollar (CAD) reverses on a dime and slips lower against the US Dollar (USD) on Monday, tracking the decline in global Oil prices, Canada’s primary export. An unexpectedly strong Michigan Consumer Sentiment Index lends the USD confidence, giving momentum to the reversal in USD/CAD.
The USD/CAD pair trades in the 1.32s as the US session gets underway.
Canadian Dollar news and market movers
-
The Canadian Dollar trades lower against the US Dollar (bullish for USD/CAD) on the back of a fall in global Oil prices.
-
WTI Crude Oil declined from a peak above $77 a barrel to a low of $73.70 reached on Monday during the Asian session. Crude Oil is Canada’s largest export, so changes in price can impact on the demand and value of the CAD.
-
The fall in Oil price was put down to an unexpected slowdown in China’s second quarter GDP data and the resumption of Libyan supply after a brief outage, according to Oilprice.com.
-
Chinese GDP expanded by 6.3% in Q2 on year – below the 7.3% forecast by economists, according to data from the National Bureau of Statistics of China released on Monday morning.
-
Quarter-on-quarter Chinese GDP rose 0.8%, beating the 0.5% estimate, but lower than the 2.2% of Q1.
-
Oil prices were further depressed after Libyan production came back online following a brief outage amid protests by the Al-Zawi tribe over the kidnapping of the Libyan Finance Minister, Faraj Bumatari. His release led to the reopening of the Sharara and El Feel Oil fields on Monday, according to an analysis by Oilprice.com.
-
Several institutional analysts are bearish in the medium-term regarding the Canadian Dollar versus the US Dollar, seeing the pair likely rising to 1.37-38 during H2 of 2023.
-
Nomura expects rate differentials and greater growth in the US as the main factors driving USD/CAD higher.
-
For the National Bank of Canada, the negative effect of a global economic slowdown on commodity prices and Oil is the main factor that will drag CAD lower in H2, in a note cited on Poundsterlinglive.com.
-
After several lower-than-expected inflation releases last week put a damper on the Greenback, the release of the University of Michigan Consumer Sentiment Index on Friday reversed the slide.
-
US Michigan Consumer Sentiment rose to 72.6 in July according to preliminary data – well above the 65.5 predicted and the 64.4 previous.
-
This reinvigorated bullish expectations for US growth were overall positive for USD.
Canadian Dollar Technical Analysis: Bounces on a thick band of support
USD/CAD is in a long-term uptrend on the weekly chart, which began at the 2021 lows. Since October 2022, the exchange rate has been in a sideways consolidation within that uptrend. Given the old saying that ‘the trend is your friend’, however, the probabilities of an eventual continuation higher marginally favor longs over shorts.
USD/CAD appears to have completed a large measured move price pattern that began forming at the March highs. This pattern resembles a 3-wave ABC correction, in which the first and third waves are of a similar length (labeled waves A and C on the chart below).
-638251923659216886.png)
US Dollar vs Canadian Dollar: Weekly Chart
A confluence of support situated in the upper 1.3000s, which is made up of several longer moving averages and a major trendline, prevented last week’s decline from extending any lower and provided a foundation for a reversal on both Friday and Monday.
-638251923192210662.png)
US Dollar vs Canadian Dollar: Daily Chart
The long green up-bar that formed on Friday is a bullish engulfing Japanese candlestick reversal pattern. Combined with the long red down bar immediately before it also completes a two-bar bullish reversal pattern. If it is followed on Monday by a further bullish green close, the likelihood of a strong reversal and recovery are heightened. Taken together with the probable completion of the measured move pattern, the chances of a reversal higher are further increased.
It will take a decisive break above the 50-day Simple Moving Average (SMA) at circa 1.3400 to refresh the USD/CAD long-term uptrend. Bulls marginally have the upper hand, with the odds slightly favoring a recovery and a continuation higher.
Only a decisive break below 1.3050 would indicate the thick band of weighty support in the upper 1.30s has been definitively broken, bringing the uptrend into doubt.
A cautious start to the week leaves the USD trading mixed against its major currency peers. Shaun Osborne, Chief FX Strategist at Scotiabank, analyzes Greenback’s outlook.
The broader fall in the USD does appear to be overshooting the shift in spreads
Last week’s drop in the USD was significant – nearly 3% in DXY terms – and unusual. Investors may be divided over whether this was a one-off or whether the start of a bear phase in the USD started with a bang. The latter seems more likely; relative US growth and interest rate differentials have been a major prop for the USD during its bull run and those supports, especially yields, have been diminished.
The broader fall in the USD does appear to be overshooting the shift in spreads somewhat in the very short run but the move is not overly significant at this point and I still expect a somewhat softer USD tone to develop over the next few months as markets factor in the Fed reaching its policy cycle peak.
Senior Economist at UOB Group Alvin Liew assesses the latest Q2 GDP figures in Singapore.
Key Takeaways
Singapore’s preliminary 2Q23 GDP came in at 0.3% q/q SA, 0.7% y/y, better than Bloomberg’s and our more bearish forecasts. It was noted that the 1Q GDP growth was unchanged from the previous reading of 0.4% y/y (-0.4% q/q). While the growth outcome was soft, 2Q did manage to avoid another sequential contraction, which means Singapore have avoided a technical recession in 1H 2023.
Growth in 2Q continued to be dragged by the weakness in manufacturing (-1.3% q/q, -7.5% y/y in 2Q from -4.5% q/q, -5.3% y/y in 1Q) while services sector anchored growth as it picked up pace to 1.3% q/q, 3.0% y/y in 2Q (from 0.4% q/q, 1.8% y/y in 1Q) and construction activity also rose by 2.6% q/q, 6.6% y/y (from 0.3% q/q, 6.9% y/y in 1Q).
For now, we are keeping our more conservative GDP growth forecast of 0.7% in 2023, which is near the lower end of the official growth forecast range of 0.52.5%, reflecting our more cautious external and manufacturing outlook while the downtrend in the electronics sector has yet to find a bottom in the current cycle. We still think Singapore is not out of the woods yet in terms of the risk of a technical recession in 1H 2023, especially if the contraction in Jun manufacturing turns out much worse than MTI’s (implied) projection.
Based on MTI’s advance estimates, Singapore’s manufacturing sector contracted by -7.5% y/y in 2Q. Factoring the 6.5% y/y and 10.8% y/y contractions for industrial production in Apr and May, this implies that MTI expects the manufacturing sector to contract by a smaller -5.2% y/y in Jun. However, as we think that manufacturing may contract in excess of 10% in Jun, the risk of 2Q GDP’s 0.3% q/q growth being revised into negative territory is quite high.
- AUD/USD is oscillating above 0.6800 as the focus shifts to RBA minutes and US Retail Sales data.
- Investors are anxious to know the reasoning behind keeping interest rates unchanged at 4.10% by the RBA.
- AUD/USD has faced selling pressure while attempting to surpass the horizontal resistance plotted around 0.6900.
The AUD/USD pair is demonstrating a back-and-forth action above the round-level support of 0.6800 in the European session. The Aussie asset has turned sideways as investors are awaiting Reserve Bank of Australia (RBA) minutes, which will be published on Tuesday at 01:30 GMT. Investors are anxious to know the reasoning behind keeping interest rates unchanged at 4.10%.
Meanwhile, S&P500 futures have generated some losses in London. Losses in US-500 stocks basket futures indicate caution among market participants as firms have started posting second-quarter results.
After the soft US Consumer Price Index (CPI) and stable labor market, investors are shifting their focus on the United States monthly Retail Sales data, which will also release on Tuesday. Investors are expecting an expansion of 0.5% vs. the prior release of 0.3%. The US Dollar Index (DXY) has frozen below the psychological resistance of 100.00.
AUD/USD has faced selling pressure while attempting to surpass the horizontal resistance plotted from June 15 high at around 0.6900 on a four-hour scale. The Aussie asset has corrected to near the 20-period Exponential Moving Average (EMA) at 0.6816. The short-term trend has turned neutral while the secular-term trend is still positive.
The Relative Strength Index (RSI) (14) has slipped into the 40.00-60.00 range, which indicates that the upside momentum has faded. However, the upside bias is still intact.
Going forward, a recovery move above the intraday high at 0.6854 would expose the asset to the round-level resistance of 0.6900, followed by January 09 high around 0.6950.
In an alternate scenario, a further breakdown below July 13 high at 0.6742 would drag the Aussie asset toward July 06 high around 0.6688. Slippage below the latter would further drag the asset toward July 10 low around 0.6623.
AUD/USD four-hour chart
The Dollar continues to trade at weaker levels. USD is set to remain on weaker footing after heavy sell-off last week, economists at MUFG Bank report.
USD to continue correcting lower through the rest of this year
The Dollar has continued to sell-off since and the USS Dollar Index has now reversed almost three-quarters of the move higher recorded between the January and September of last year. It still leaves room for the USD to continue correcting lower through the rest of this year.
The latest IMM positioning report revealed that Leveraged Funds have built up short USD exposure in recent weeks but the total size of short positions are relatively modest and leaves room for further speculative selling in the near-term. However, one limitation of the report is that it only shows positioning up to the 11th July, and it is likely that short positions will have been increased further last week.
In the week ahead, there are no major US economic data releases or events that are likely to trigger a reversal of the US Dollar weakening trend ahead of the Fed’s next policy meeting on 26th July.
- EUR/JPY comes under selling pressure and revisits 155.00.
- The continuation of the uptrend appears the most likely scenario.
EUR/JPY reverses two consecutive daily gains and retests the 155.00 zone at the beginning of the week.
Despite the ongoing pullback, the cross remains poised to extend the recovery in the short-term horizon, with the immediate hurdle at the so far 2023 peak in the boundaries of 158.00 the figure (June 29).
In the meantime, the longer term positive outlook for the cross appears favoured while above the 200-day SMA, today at 145.95.
EUR/JPY daily chart
EUR/USD holds a tight range above 1.12. Economists at Scotiabank analyze the pair’s outlook.
Support seen at 1.1180/00
The EUR is firm and has not backed off last week’s highs in any significant way. Marginal new cycle highs today, limited losses ahead of 1.12 and bullish trend indicators keep the near-term focus higher.
A strong weekly close Friday (above retracement resistance and above the EUR’s 200-Week Moving Average) signal more gains ahead in the medium term (towards 1.15/16).
Support is 1.1180/00.
See – EUR/USD: Resistance at 1.1275 to cap at first, ahead of further strength to 1.1703/48 – Credit Suisse
GBP/USD consolidates as drift from the mid-1.31 area slows. Economists at Scotiabank analyze the pair’s outlook.
A bull flag pattern appears to be developing
Price action suggests that the Pound’s drift off last week’s high may be trying to base in the upper 1.3000s now. Spot looks to be consolidating the solid rise seen last week – and through July overall.
A bull flag pattern appears to be developing on the intraday chart.
Support is 1.3050/60.
Resistance is 1.3100/05, with the Pound likely to strengthen above here to retest 1.3145/50.
Goldilocks is having her day in the sun. Kit Juckes, Chief Global FX Strategist at Société Générale, analyzes FX outlook.
AUD and NZD to be weighed down by Chinese growth concerns
I think the fall in US inflation, while the US labour market remains tight and the economy continues to be supported by households spending savings accumulated in the COVID lockdowns, complicates the outlook, for the economy, the Fed and the Dollar. But it’s clear that for many (which will soon mean, the consensus) there’s a simple conclusion: Inflation has been defeated far more painlessly than feared or predicted by doom-mongering economists!
On we go to US Retail Sales and Industrial Production data this week, but it’ll take a shock to stall Goldilocks’ momentum.
The only G10 currencies which are likely to go on struggling against the Dollar, are AUD and NZD, weighed down by Chinese growth concerns, for now. What those concerns may do, is support AUD and NZD volatility, relative to the rest of the G10 currencies.
- US Dollar holds its ground early Monday after having suffered heavy losses last week.
- US Dollar Index fluctuates in a tight channel slightly below 100.00.
- US economic docket will not offer any high-impact data releases.
The US Dollar is managing to stay relatively resilient against its major rivals at the beginning of the week as markets adopt a cautious stance. The US Dollar Index (DXY) moved up and down in a tight range slightly below 100.00 on Monday after having lost more than 2% last week.
The US economic calendar will not feature any high-tier macroeconomic data releases that could impact the DXY's movements. Hence, the risk perception could continue to drive the US Dollar's valuation in the second half of the day.
China's real Gross Domestic Product (GDP) expanded at an annual rate of 6.3% in the second quarter, according to the release from China's National Bureau of Statistics (NBS) early Monday. This reading followed the 4.5% growth recorded in the first quarter but came in below the market expectation of 7.3%. Citigroup announced that they had lowered the full-year growth forecast for China to 5% from 5.5%. The Shanghai Composite lost nearly 1%, and US stock index futures traded in negative territory, reflecting the souring market mood.
Daily digest market movers: US Dollar is not out of the woods yet
- The US Dollar weakened last week as soft inflation data from the US revived expectations about the Federal Reserve reaching the terminal rate with a 25-basis-point (bps) rate hike in July.
- The Consumer Price Index (CPI) in the US rose 3% on a yearly basis in June, following the 4% increase recorded in May. The annual Producer Price Index (PPI) edged 0.1% higher in the same period.
- Commenting on the USD's outlook, "In case of an increasingly rapid fall in inflation and weakening economic data, the market might increasingly rely on key rates not remaining at high levels for a long time, whereas rate cuts before the end of the year are becoming increasingly likely," said Antje Praefcke, FX Analyst at Commerzbank. "That would cause the USD to ease further."
- The University of Michigan reported on Friday that the Consumer Confidence Index improved to 72.6 in July's flash estimate from 64.4 in May.
- The benchmark 10-year US Treasury bond yield holds steady at around 3.8% after having declined nearly 6% last week.
- The Federal Reserve Bank of New York will release the Empire State Manufacturing Survey for July.
- Markets are nearly fully pricing in a 25 bps Fed rate increase in July. The probability of one more rate hike in December stands at around 20%, according to the CME Group FedWatch Tool.
- Other data from China showed that Retail Sales increased 3.1% on a yearly basis in June, down sharply from 12.7% in May, while Industrial Production expanded 4.4% in the same period.
Technical analysis: US Dollar Index remains technically oversold
The US Dollar Index (DXY) closed in positive territory on Friday but struggled to extend its rebound on Monday. The Relative Strength Index (RSI) indicator on the daily chart remains below 30, suggesting that the DXY is still oversold. Hence, sellers could wait for a technical correction before betting on further USD weakness.
On the upside, 100.00 (psychological level) aligns as first resistance. A daily close above that level could open the door for a rebound toward 101.00 (former support, static level).
99.20 (static level from March 2022) could be seen as the next bearish target once the DXY completes a correction. Below that level, 99.00 (psychological level) is likely to act as interim support before 98.30 (200-week Simple Moving Average).
US Dollar FAQs
What is the US Dollar?
The US Dollar (USD) is the official currency of the United States of America, and the ‘de facto’ currency of a significant number of other countries where it is found in circulation alongside local notes. It is the most heavily traded currency in the world, accounting for over 88% of all global foreign exchange turnover, or an average of $6.6 trillion in transactions per day, according to data from 2022.
Following the second world war, the USD took over from the British Pound as the world’s reserve currency. For most of its history, the US Dollar was backed by Gold, until the Bretton Woods Agreement in 1971 when the Gold Standard went away.
How do the decisions of the Federal Reserve impact the US Dollar?
The most important single factor impacting on the value of the US Dollar is monetary policy, which is shaped by the Federal Reserve (Fed). The Fed has two mandates: to achieve price stability (control inflation) and foster full employment. Its primary tool to achieve these two goals is by adjusting interest rates.
When prices are rising too quickly and inflation is above the Fed’s 2% target, the Fed will raise rates, which helps the USD value. When inflation falls below 2% or the Unemployment Rate is too high, the Fed may lower interest rates, which weighs on the Greenback.
What is Quantitative Easing and how does it influence the US Dollar?
In extreme situations, the Federal Reserve can also print more Dollars and enact quantitative easing (QE). QE is the process by which the Fed substantially increases the flow of credit in a stuck financial system.
It is a non-standard policy measure used when credit has dried up because banks will not lend to each other (out of the fear of counterparty default). It is a last resort when simply lowering interest rates is unlikely to achieve the necessary result. It was the Fed’s weapon of choice to combat the credit crunch that occurred during the Great Financial Crisis in 2008. It involves the Fed printing more Dollars and using them to buy US government bonds predominantly from financial institutions. QE usually leads to a weaker US Dollar.
What is Quantitative Tightening and how does it influence the US Dollar?
Quantitative tightening (QT) is the reverse process whereby the Federal Reserve stops buying bonds from financial institutions and does not reinvest the principal from the bonds it holds maturing in new purchases. It is usually positive for the US Dollar.
USD/CHF has removed with ease the 2021 low. Analysts at Credit Suisse look for further weakness to 0.8522/02.
Resistance at 0.8780 ideally capping on a closing basis
Support is seen initially at 0.8566 ahead of price, trend and Fibonacci support at 0.8522/02, which we would look to try and hold at first. A direct break though can see support next at 0.8459, then 0.8400 and eventually what we would look ideally be better support at 0.8352/50.
Resistance is seen at 0.8617 initially, then 0.8671, with the 13-day exponential average at 0.8780 ideally capping on a closing basis to keep the immediate risk lower.
Considering the recent price action, USD/IDR could slip back to the 14,885 level in the short term, comments Markets Strategist Quek Ser Leang at UOB Group.
Key Quotes
We expected USD/IDR to “advance further” last week. We indicated that “the major resistance at 15,315 is likely out of reach.” However, after rising to 15,219, USD/IDR turned around and plummeted to a low of 14,910.
The sharp and swift drop has scope to extend even though June’s low of 14,815 is unlikely to come into view this week (there is another support level at 14,885). On the upside, 15,165 is a strong resistance level now. Minor resistance is at 15,085.
EUR/USD strength is showing signs of stalling near-term. However, economists at Credit Suisse expect the pair to enjoy further gains.
Move below 1.1129/58 can ease the immediate upside bias
We maintain our view of looking for a cap at the 61.8% retracement of the 2021/2022 downtrend and price resistance of 1.1275/8 at first fo a pullback/consolidation. With the USD itself now holding a large bearish continuation pattern weakness if seen will be viewed as temporary ahead of an eventual clear break higher in due course with resistance seen next at 1.1313, then 1.1391/96.
Big picture, our main objective is the 78.6% retracement of the 2021/2022 fall and the March 2021 low at 1.1703/48.
Support is seen at 1.1161 initially, then 1.1129/58, below which can ease the immediate upside bias for a retreat back towards the 13-day exponential average, now seen at 1.1057, which we look to try and hold on a closing basis.
USD/MYR risks a probable move to the 4.5100 region in the near term, suggests Markets Strategist Quek Ser Leang at UOB Group.
Key Quotes
The selloff that sent USD/MYR plunging by 3.06% last week (Friday close of 4.5230) came as a surprise (we were expecting USD/MYR to consolidate between 4.6360 and 4.6880). The outsized decline appears to be overextended, and USD/MYR is unlikely to weaken much further. It is worth noting that the 3.06% decline is the largest 1-week drop since March 2020.
This week, there is a chance for USD/MYR to drop to 4.5100. At this stage, the likelihood of USD/MYR breaking clearly below the major support at 4.4880 is not high. Resistance is at 4.5700, followed by 4.5870.
USD/JPY has extended its decline. Economists at Credit Suisse analyze the pair’s outlook.
Initial resistance seen at 139.75/76
With a small bullish ‘reversal day’ seen here on Friday we continue to look for the ‘neckline’ at the December/May base and 200-day average, seen at 137.51 and 137.06 to ideally prove a better floor for consolidation initially ahead of an eventual move higher again.
Resistance is seen at 139.18 initially, then the 55-DMA at 139.75/76. A close above here is needed to ease the immediate downside bias with resistance then seen next at 140.48, then 141.47/57.
A close below 137.06 though would raise the prospect a more important peak may have been established in late June, with support seen next at 136.15.
In many ways, it does not really matter why we entered a position. What counts in the end is the performance we achieved with it. There are good and bad reasons for entering USD shorts, in the view of Ulrich Leuchtmann, Head of FX and Commodity Research at Commerzbank.
There will undoubtedly be weeks in which the EUR/USD will ease
Anyone who believes that the Fed will start cutting interest rates quite early next year can use that as an opportunity to hold USD shorts for a horizon of one or two quarters.
However, I consider USD shorts that are ‘only’ based on the fact that there will be no further rate hikes after the expected rate hike in July (which has de facto become a non-event) to be insufficiently justified.
On the EUR side, there is also the potential for disappointment, as at the same time there are excessive ECB expectations in the market. Therefore, there will undoubtedly be weeks in which the EUR/USD will ease. This means that if you are trading with a horizon of a few days or weeks, I think you have less reason to sell the US currency.
European Central Bank (ECB) policymaker, Boštjan Vasle, made some comments on the Eurozone’s inflation outlook.
Vasle said, “we need to keep tightening policy at our next meeting.”
Market reaction
At the time of writing, EUR/USD is trading at 1.1241, up 0.14% on the day.
In the view of Markets Strategist Quek Ser Leang at UOB Group, USD/THB could face some consolidative mood in the short term.
Key Quotes
We did not anticipate USD/THB to drop sharply to a low of 34.495 last week (we were expecting it to trade in a range). This week, oversold short-term conditions could lead to a few days of consolidation first.
Looking ahead, as long as USD/THB stays below 34.95, it could drop to 34.42 later on. This week, the next major support at 34.21 is unlikely to come under threat.
The CAD got a lift last week. Shaun Osborne, Chief FX Strategist at Scotiabank, analyzes USD/CAD outlook.
CAD’s grind higher should extend
We continue to forecast 1.30 for USD/CAD at year-end but feel losses may extend to the 1.27/1.28 range in the next three months or so.
New cycle lows and solidly bearish trend momentum indicate ongoing downside risks for the USD and limited scope for counter-trend corrections.
I expect firm resistance to USD gains now at 1.3345/50 (former trend support, now resistance). The USD may even struggle to recover much beyond 1.3200.
Support and near-term downside objective is 1.2990 (50% Fibonacci retracement of the 2021/22 USD rally).
- Gold has sensed decent buying interest around $1,950.00 as investors hope only one interest rate hike is left in the Fed inflation-control toolkit.
- The sentiment of United States households has improved as inflation has softened beyond expectations.
- Hot discussions about the introduction of gold-backed currency by BRICS have improved the appeal for Gold.
Gold (XAU/USD) price has picked up strength after confidently defending the crucial support of $1,950.00 on Monday. The recovery move in the precious metal is backed by an extended weakness in the US Dollar due to easing inflationary pressures in the United States and discussions about an introduction of gold-backed currency by BRICS (Brazil, Russia, India, China, and South Africa) whose motive could be easing the dependence on the Greenback.
Consistently softening of United States inflation amid a stable labor market has improved the sentiment of consumers. Michigan’s Consumer Sentiment Index logged fresh 21-month highs as the burden of high inflation upon households is receding. As inflation has turned out softer than expected and the labor market is also releasing heat, investors are awaiting the release of the US Retail Sales data for further guidance.
Daily Digest Market Movers: Gold price rebounds as US Dollar remains subdued
- Gold price has made a recovery move after building a base around $1,950.00 as the US Dollar Index (DXY) is struggling to revive.
- The US Dollar logged a maximum decline on a weekly basis since November as investors are hoping that interest rates by the Federal Reserve (Fed) will find a peak at 5.25-5.50%.
- Optimism about only one more interest rate hike from the Fed among investors has built due to consistently declining inflation and the labor market conditions have started releasing heat.
- United States inflation report demonstrated a nominal pace in June due to higher interest rates by the Fed and tight credit conditions by US commercial and regional banks.
- US regional banks have inculcated more filters on the credit-disbursement process to maintain asset quality.
- Contrary to investors’ expectations, Fed Chair Jerome Powell and Fed Governor Christopher Waller believe that two more interest rate hikes by the year-end are appropriate.
- Chicago Fed Bank Austan Goolsbee said on Friday that inflation is still higher than where the Fed wants it to be but has shown progress.” Goolsbee reiterated that central bank policymakers are on a "golden path" to containing inflation without triggering recession.
- Market mood is a little cautious as US corporate has started releasing earnings data.
- Meanwhile, consumer sentiment in the United States has improved significantly in which major contributors are declining inflation and a stable labor market. The University of Michigan reported on Friday that the preliminary Consumer Sentiment Index (CSI) has logged the highest reading since November 21 at 72.6.
- Preliminary forward five-year consumer inflation expectations matched expectations at 3.1% vs. the prior release of 3.0%.
- This week, investors will keep their focus on the US Retail Sales data, which will be printed on Tuesday at 12:30 GMT.
- Investors are anticipating an expansion in retail demand at a higher pace of 0.5% than the former pace of 0.3%. Retail Sales excluding automobiles are expected to post a 0.3% expansion vs. the prior release of 0.1%.
- Persistent demand from US households could elevate bets for a small interest rate hike from the Fed in its July monetary policy meeting.
- Recovery in the Gold price is also backed by heavy discussions about the introduction of a new Gold-backed currency by the BRICS alliance. The agenda looks clear to avoid heavy dependence on the US Dollar.
- According to the World Gold Council, 71% of global central banks are planning to significantly increase their Gold purchases in the next 6 months by an estimated total of 700 metric tons – worth $49 billion before year-end.
Technical Analysis: Gold price eyes a Rounded Bottom breakout
Gold price is gathering strength to deliver a breakout of the Rounded Bottom chart pattern. A breakout of the aforementioned pattern would send Gold bulls into new territory. Gold bulls would manage to deliver a breakout of the Rounded Bottom by confidently surpassing the horizontal resistance plotted around $1,970.00.
Momentum oscillators are conveyed a non-directional performance as a fresh economic trigger is required for further action
Inflation FAQs
What is inflation?
Inflation measures the rise in the price of a representative basket of goods and services. Headline inflation is usually expressed as a percentage change on a month-on-month (MoM) and year-on-year (YoY) basis. Core inflation excludes more volatile elements such as food and fuel which can fluctuate because of geopolitical and seasonal factors. Core inflation is the figure economists focus on and is the level targeted by central banks, which are mandated to keep inflation at a manageable level, usually around 2%.
What is the Consumer Price Index (CPI)?
The Consumer Price Index (CPI) measures the change in prices of a basket of goods and services over a period of time. It is usually expressed as a percentage change on a month-on-month (MoM) and year-on-year (YoY) basis. Core CPI is the figure targeted by central banks as it excludes volatile food and fuel inputs. When Core CPI rises above 2% it usually results in higher interest rates and vice versa when it falls below 2%. Since higher interest rates are positive for a currency, higher inflation usually results in a stronger currency. The opposite is true when inflation falls.
What is the impact of inflation on foreign exchange?
Although it may seem counter-intuitive, high inflation in a country pushes up the value of its currency and vice versa for lower inflation. This is because the central bank will normally raise interest rates to combat the higher inflation, which attract more global capital inflows from investors looking for a lucrative place to park their money.
How does inflation influence the price of Gold?
Formerly, Gold was the asset investors turned to in times of high inflation because it preserved its value, and whilst investors will often still buy Gold for its safe-haven properties in times of extreme market turmoil, this is not the case most of the time. This is because when inflation is high, central banks will put up interest rates to combat it.
Higher interest rates are negative for Gold because they increase the opportunity-cost of holding Gold vis-a-vis an interest-bearing asset or placing the money in a cash deposit account. On the flipside, lower inflation tends to be positive for Gold as it brings interest rates down, making the bright metal a more viable investment alternative.
Economists at MUFG Bank suspect EUR/USD may be returning to the range of 1.1000-1.1500.
How high can this move go?
There are good reasons to believe this move higher for EUR/USD could mark a break into a new higher trading range – say between 1.1000-1.1500.
Further gains though could become more constrained given still weak Eurozone growth and the potential for the ECB to refrain from hiking in September.
See: EUR/USD appears a bit overstretched in the short term and could face a correction this week – ING
CEE FX showed a strong rally last week. Economists at ING expect the same story this week.
Global conditions boost the region
The region should still benefit today from EUR/USD's move higher late last week.
Sentiment remains open to risk and the renewed fall in gas prices to the lowest levels since early June is playing into the hands of the HUF in particular. The calendar in the region has little to offer and so the main focus will be on the global story.
Overall, we expect further gains across the region albeit at a slower pace. The Hungarian Forint remains our favourite in the CEE region. We expect the Forint to strengthen further below 373 EUR/HUF. However, we also expect further gains from the Polish Zloty and Czech Koruna with moves below EUR/PLN 4.40 and EUR 23.70/CZK.
- USD/JPY meets with some supply on Monday and is pressured by a combination of factors.
- Speculations that the BoJ will tweak its YCC policy and a softer risk tone underpin the JPY.
- The emergence of some USD selling further contributes to the offered tone around the pair.
The USD/JPY pair struggles to capitalize on Friday's goodish rebound from the vicinity of confluence support, comprising the 100-day and the 200-day Simple Moving Averages (SMAs) and edges lower on the first day of a new week. Spot prices remain on the defensive through the early part of the European session and currently trade just below mid-138.00s, down nearly 0.30% for the day.
A weak GDP report from China confirmed that the post-pandemic recovery in the world's second-largest economy is faltering rapidly due to weakening demand at home and abroad. This, in turn, adds to worries about a global economic downturn and continues to weigh on investors' sentiment, which, in turn, benefits the safe-haven Japanese Yen (JPY). Moreover, speculations that the Bank of Japan (BoJ) could adjust its Yield Curve Control (YCC) policy as soon as this month further underpin the JPY and exert some downward pressure on the USD/JPY pair.
The recent data showed that Japan's nominal base salary grew at the fastest pace in 28 years in May. This is expected to push inflation higher, which has exceeded the 2% goal for more than a year. Furthermore, Japanese media reported that the BoJ is likely to raise its FY2023 inflation forecast, fueling speculations that the central bank might start unwinding its ultra-loose monetary policy settings sooner rather than later. The expectations had lifted the yield on the benchmark 10-year Japanese government bond to its highest level since late April last week.
In contrast, market participants now seem convinced that the Federal Reserve (Fed) is nearing the end of its policy tightening cycle and will keep interest rates steady following the widely anticipated 25 bps lift-off in July. This, in turn, prompts fresh selling around the US Dollar (USD), which languishes near its lowest level since April 2022 touched on Friday and contributes to the mildly offered tone surrounding the USD/JPY pair. The aforementioned fundamental backdrop favours bearish traders and suggests that the path of least resistance for spot prices is to the downside.
Market participants now look to the release of the Empire State Manufacturing Index, due later during the early North American session. The data might influence the USD price dynamics and provide some impetus to the USD/JPY pair. Apart from this, the broader risk sentiment should allow traders to grab short-term opportunities.
Technical levels to watch
Economists at Société Générale analyze USD/CNH technical outlook.
A short-term bounce is expected towards the 7.22 mark
USD/CNH uptrend faced stiff resistance near last September's peak of 7.27/7.30 resulting in a phase of pullback. It has so far defended its recent pivot low at 7.11/7.10. Daily MACD is anchored within positive territory denoting a lack of steady downward momentum.
Only a break below 7.11/7.10 would affirm a deeper down move.
A short-term bounce is expected towards 7.22, the 61.8% retracement of the recent pullback.
- Euro maintains an inconclusive mood near recent tops vs. the US Dollar.
- Stocks in Europe open Monday’s session with a mixed bias.
- EUR/USD keeps the trade around the 1.1240/45 band on Monday.
- Mixed Chinese results seem to have bolstered the risk complex so far.
- The NY Empire State index will be next on tap on the US calendar.
The Euro (EUR) alternates gains with losses around the 1.1240 zone vs. the US Dollar (USD) in the wake of the opening bell in the old continent at the beginning of the week.
In the meantime, spot keeps the trade in the area of yearly highs well north of 1.1200 the figure on the back of the equally irresolute price action around the Greenback, all against the backdrop of steady consensus around another 25 bps rate hike by the Federal Reserve and the European Central Bank (ECB) later in the month.
The possibility that the Fed may be nearing the end of its tightening campaign is contributing to the lack of traction in the Greenback. This view has gained momentum recently, as there are indications of cooling US consumer prices and a persistent downward trend in producer prices.
At present, the market has already largely priced in the expected 25 bps rate hike by both the ECB and the Fed. However, there is still much discussion about the potential future actions of these central banks as they work to normalize their monetary policies, particularly with growing concerns about a possible economic slowdown on both sides of the Atlantic.
According to the latest CFTC Positioning Report, net longs in EUR dropped to around 140.1K contracts in the week ending on July 11, which is the lowest level seen since mid-March.

In the US calendar, the NY Empire State manufacturing gauge will be the sole release on Monday.
Daily digest market movers: Euro attempts some consolidation near 1.1240
- The EUR regains some traction above 1.1240 vs. the USD on Monday.
- The risk-on mood looks propped up by Chinese data releases.
- The USD Index fails to regain the 100.00 hurdle and above.
- Further Fed tightening beyond July looks doubtful.
- Gold, Oil add to recent losses so far on Monday.
Technical Analysis: Euro faces extra gains near term
The ongoing price action in EUR/USD hints at the idea that further gains might be in store in the short-term horizon. However, the current pair’s overbought condition (as per the daily RSI near 75) opens the door to a potential near-term technical correction.
The pair printed a new 2023 high at 1.1245 on July 17. Once this level is cleared, there are no resistance levels of significance until the 2022 peak of 1.1495 recorded on February 10.
On the downside, the 1.1000 region emerges as a psychological support seconded by provisional support at the 55-day and 100-day SMAs at 1.0886 and 1.0859, respectively, ahead of the July low of 1.0833 (July 6). The breakdown of this region should meet the next contention area at the key 200-day SMA at 1.0658 prior to the May low of 1.0635 (May 31). South from here emerges the March low of 1.0516 (March 15) before the 2023 low of 1.0481 (January 6).
Furthermore, the constructive view of EUR/USD appears unchanged as long as the pair trades above the key 200-day SMA.
The ongoing bullish view in the pair is also supported by the current uptrend in open interest, which saw an increase of more than 1K contracts on Friday, according to flash data from CME Group.

Euro FAQs
What is the Euro?
The Euro is the currency for the 20 European Union countries that belong to the Eurozone. It is the second most heavily traded currency in the world behind the US Dollar. In 2022, it accounted for 31% of all foreign exchange transactions, with an average daily turnover of over $2.2 trillion a day.
EUR/USD is the most heavily traded currency pair in the world, accounting for an estimated 30% off all transactions, followed by EUR/JPY (4%), EUR/GBP (3%) and EUR/AUD (2%).
What is the ECB and how does it impact the Euro?
The European Central Bank (ECB) in Frankfurt, Germany, is the reserve bank for the Eurozone. The ECB sets interest rates and manages monetary policy.
The ECB’s primary mandate is to maintain price stability, which means either controlling inflation or stimulating growth. Its primary tool is the raising or lowering of interest rates. Relatively high interest rates – or the expectation of higher rates – will usually benefit the Euro and vice versa.
The ECB Governing Council makes monetary policy decisions at meetings held eight times a year. Decisions are made by heads of the Eurozone national banks and six permanent members, including the President of the ECB, Christine Lagarde.
How does inflation data impact the value of the Euro?
Eurozone inflation data, measured by the Harmonized Index of Consumer Prices (HICP), is an important econometric for the Euro. If inflation rises more than expected, especially if above the ECB’s 2% target, it obliges the ECB to raise interest rates to bring it back under control.
Relatively high interest rates compared to its counterparts will usually benefit the Euro, as it makes the region more attractive as a place for global investors to park their money.
How does economic data influence the value of the Euro?
Data releases gauge the health of the economy and can impact on the Euro. Indicators such as GDP, Manufacturing and Services PMIs, employment, and consumer sentiment surveys can all influence the direction of the single currency.
A strong economy is good for the Euro. Not only does it attract more foreign investment but it may encourage the ECB to put up interest rates, which will directly strengthen the Euro. Otherwise, if economic data is weak, the Euro is likely to fall.
Economic data for the four largest economies in the euro area (Germany, France, Italy and Spain) are especially significant, as they account for 75% of the Eurozone’s economy.
How does the Trade Balance impact the Euro?
Another significant data release for the Euro is the Trade Balance. This indicator measures the difference between what a country earns from its exports and what it spends on imports over a given period.
If a country produces highly sought after exports then its currency will gain in value purely from the extra demand created from foreign buyers seeking to purchase these goods. Therefore, a positive net Trade Balance strengthens a currency and vice versa for a negative balance.
- Pound Sterling has picked some strength after correcting to near 1.3070 ahead of UK inflation data.
- United Kingdom’s hotter CPI data could put more pressure on the economic outlook.
- The second consecutive fat interest rate hike from the Bank of England is well-anticipated.
The Pound Sterling (GBP) has found some buying interest after a corrective move to near 1.3070 as investors are shifting their focus toward the United Kingdom Consumer Price Index (CPI) data, which will be released on Wednesday at 06:00 GMT. The GBP/USD pair has sensed some support as investors are hoping that core inflation will remain elevated and the Bank of England (BoE) would be forced to continue its aggressive policy-tightening spell so that inflation could return to desired levels.
Although United Kingdom’s central bank would be left with no other option than to raise interest rates further, the burden of higher borrowing costs and red-hot inflation will be faced by households. After big-ticket items, the burden of inflationary pressures is extended to the housing sector. UK’s corporate is worried and believes that "the burst of business optimism seen in the spring has faded under the weight of inflation and rising interest rates”.
Daily Digest Market Movers: Pound Sterling rebounds amid weakness in US Dollar
- Pound Sterling has rebounded after a correction below 1.3100 ahead of the United Kingdom’s inflation data.
- As per the consensus, monthly headline CPI reported a pace of 0.4% lower than the prior pace of 0.7%. While annualized inflation is expected to decelerate to 8.2% against the former release of 8.7%.
- Core inflation that excludes volatile oil and food prices is expected to remain steady at fresh highs of 7.1%.
- The elevated Core Consumer Price Index is expected to increase the burden on households.
- Wide deviation in the pace of CPI and labor cost index has already forced households to postpone the purchase of big-ticket items.
- United Kingdom’s housing sector has come under pressure amid a decline in home buyers due to higher interest obligations, as reported by UK’s property website Rightmove.
- A stubborn inflation report would definitely force the Bank of England to go for a fat rate hike for the second consecutive time.
- Investors should note that BoE Governor Andrew Bailey has already raised interest rates to 5%.
- Hot inflation is expected to make UK’s economic outlook worsen even more as BoE policymakers would be forced to deliver hawkish commentaries.
- Meanwhile, a quarterly survey from Deloitte showed that British firms are extremely cautious in the face of high inflation and rising interest rates.
- The overall market mood is quite cautious ahead of the second-quarter result season globally.
- The US Dollar Index (DXY) is choppy on early Monday below 100.00 as investors are shifting their focus toward the monthly United States Retail Sales data, which will release on Tuesday at 12:30 GMT.
- On Friday, Chicago Federal Reserve (Fed) Bank Austan Goolsbee conveyed that inflation is progressively declining but is still higher than where the Fed wants it to be. Goolsbee reiterated that central bank policymakers are on a "golden path" to containing inflation without triggering recession.
- Meanwhile, the tug of war among market participants that the Fed will announce two more rate hikes this year or conclude the policy-tightening spell with a mere one rate hike is still on.
- Last week, Fed Governor Christopher Waller commented that two more interest rate hikes are still appropriate by the year-end.
Technical Analysis: Pound Sterling tests strength of Rising Channel breakout
Pound Sterling has tested the strength in the breakout of the Rising Channel chart pattern formed on a daily period by a marginal correction. A breakout of the aforementioned chart pattern indicates immense strength in the upside momentum. Upward-sloping short-to-long-term period Exponential Moving Averages (EMAs) indicate firmness in the Pound Sterling bulls.
Momentum oscillations are oscillating in the bullish trajectory, showing no signs of divergence and any evidence of an oversold situation.
Pound Sterling FAQs
What is the Pound Sterling?
The Pound Sterling (GBP) is the oldest currency in the world (886 AD) and the official currency of the United Kingdom. It is the fourth most traded unit for foreign exchange (FX) in the world, accounting for 12% of all transactions, averaging $630 billion a day, according to 2022 data.
Its key trading pairs are GBP/USD, aka ‘Cable’, which accounts for 11% of FX, GBP/JPY, or the ‘Dragon’ as it is known by traders (3%), and EUR/GBP (2%). The Pound Sterling is issued by the Bank of England (BoE).
How do the decisions of the Bank of England impact on the Pound Sterling?
The single most important factor influencing the value of the Pound Sterling is monetary policy decided by the Bank of England. The BoE bases its decisions on whether it has achieved its primary goal of “price stability” – a steady inflation rate of around 2%. Its primary tool for achieving this is the adjustment of interest rates.
When inflation is too high, the BoE will try to rein it in by raising interest rates, making it more expensive for people and businesses to access credit. This is generally positive for GBP, as higher interest rates make the UK a more attractive place for global investors to park their money.
When inflation falls too low it is a sign economic growth is slowing. In this scenario, the BoE will consider lowering interest rates to cheapen credit so businesses will borrow more to invest in growth-generating projects.
How does economic data influence the value of the Pound?
Data releases gauge the health of the economy and can impact the value of the Pound Sterling. Indicators such as GDP, Manufacturing and Services PMIs, and employment can all influence the direction of the GBP.
A strong economy is good for Sterling. Not only does it attract more foreign investment but it may encourage the BoE to put up interest rates, which will directly strengthen GBP. Otherwise, if economic data is weak, the Pound Sterling is likely to fall.
How does the Trade Balance impact the Pound?
Another significant data release for the Pound Sterling is the Trade Balance. This indicator measures the difference between what a country earns from its exports and what it spends on imports over a given period.
If a country produces highly sought-after exports, its currency will benefit purely from the extra demand created from foreign buyers seeking to purchase these goods. Therefore, a positive net Trade Balance strengthens a currency and vice versa for a negative balance.
Last week’s US disinflation shock altered the FX landscape, but a few days without key data releases will tell us whether that impulse can keep the Dollar on the back foot as the FOMC risk event draws nearer, economists at ING report.
How FX markets will trade from now on?
This week will be interesting to watch since the lack of tier-one data in the US will offer a clue on how FX markets will trade from now on; the question is whether investors now see enough reasons to add short positions on the Dollar ahead of the FOMC or take a more cautious approach. The latter – which appears marginally more likely in our eyes – may see the Dollar reclaim some portions of recent losses.
DXY could find some support after climbing back above 100.00.
- USD/CAD edges higher for the second straight day, albeit lacks any follow-through buying.
- Sliding Crude Oil prices undermines the Loonie and is seen lending some support to the pair.
- Subdued USD demand caps the upside amid mixed technical setup on hourly and daily charts.
The USD/CAD pair attracts some buying for the second straight day on Monday and trades near the top end of its daily range, around the 1.3220-1.3225 region during the early European session.
China's second-quarter GDP print falls short of market expectations and raises concerns concern about the fuel demand in the world's top crude importer. This, along with the resumption of production in Libya, drags Crude Oil prices away from the highest level since April, which, undermines the commodity-linked Loonie and acts as a tailwind for the USD/CAD pair. The upside, however, remains capped in the wake of subdued US Dollar (USD) price action.
From a technical perspective, the USD/CAD pair's strong recovery from sub-1.3100 levels, or its lowest level since September 2022 stalls near 100-period Simple Moving Average on the 4-hour chart. This is closely followed by the 50% Fibonacci retracement level of the recent downfall witnessed over the past week or so, which if cleared decisively might be seen as a fresh trigger for bullish traders and pave the way for some meaningful intraday appreciating move.
The USD/CAD pair might then climb to test the 61.8% Fibo. level, around the 1.3270 region, before aiming to reclaim the 1.3300 round-figure mark. Some follow-through buying will suggest that spot prices have formed a near-term bottom and set the stage for a move back towards challenging the monthly swing high, around the 1.3385 zone. That said, technical indicators on the daily chart are still holding in the negative territory and warrant caution for bullish traders.
On the flip side, the 1.3200 mark, or the 38.2% Fibo. level now seems to protect the immediate downside, which if broken might expose the 23.6% Fibo., around the 1.3150 area. Some follow-through selling will suggest that the corrective rebound has run its course and make the USD/CAD pair vulnerable to challenge the YTD low, around the 1.3095-1.3090 region.
USD/CAD 4-hour chart
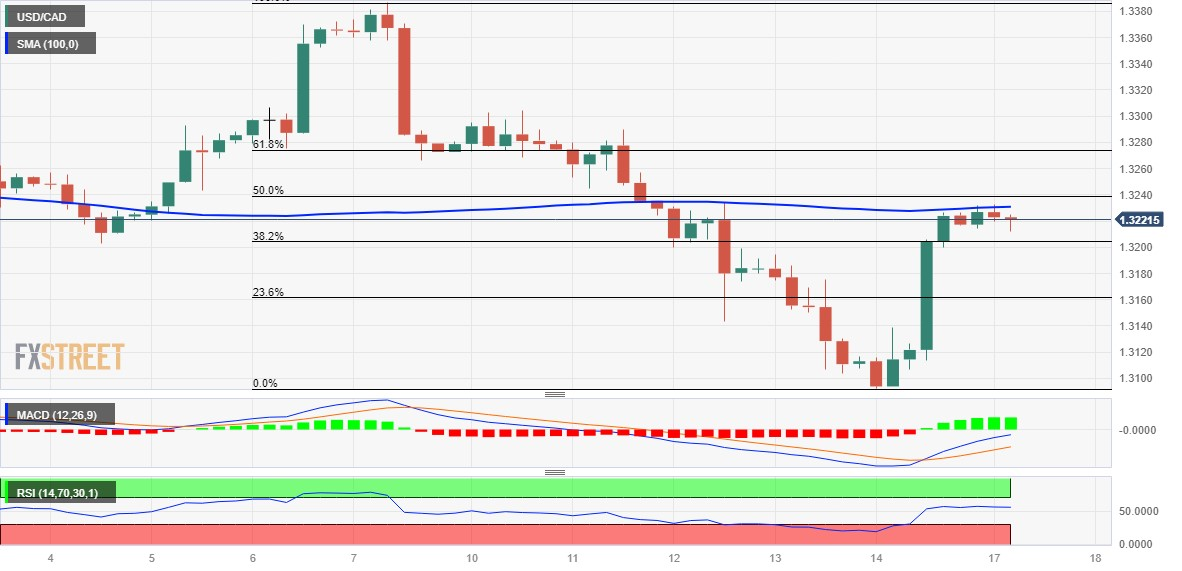
Key levels to watch
USD/CAD drops closer to 1.3000 level. Economists at MUFG Bank analyze the pair’s outlook.
Near-term fundamentals supportive for stronger CAD but for how long?
We expect USD/CAD to fall back below the 1.3000 level encouraged by: i) broader USD weakness, ii) the price of Brent rising back above $80/barrel and iii) improving investor risk sentiment.
Beyond the near-term, we still expect the negative impact of higher rates on Canada’s highly indebted households to become more evident and eventually trigger a reversal of the CAD’s current bullish trend.
A break below 1.3000, would provide more attractive levels to sell CAD.
EUR/USD is trading at the highest levels since early 2022. Economists at ING analyze the pair’s outlook.
Rally looks a bit stretched
CFTC data showed that pre-CPI positioning on EUR/USD was already quite stretched on the long side (+19% of open interest). We also estimate there is currently a 2% short-term risk premium built into EUR/USD, based on our financial fair value model which includes rates and equity factors. This short-term overvaluation gap of EUR/USD could be closed either by a correction or by some EUR/USD-positive factors rising without triggering a climb in the pair.
We see some moderate risks of a correction in EUR/USD this week, possibly to the 1.1100/1.1150 area.
A continuation of last week’s rally may start to face increasing resistance at the 1.1300/1.1350 area.
Here is what you need to know on Monday, July 17:
Investors stay cautious at the beginning of the week as they look for the next catalyst. Following Friday's modest rebound, the US Dollar Index, which tracks the US Dollar's (USD) performance against a basket of six major currencies, fluctuates in a tight channel slightly below 100.00 early Monday. Several European Central Bank (ECB) policymakers, including President Christine Lagarde, will be delivering speeches during the European trading hours. The Federal Reserve Bank of New York's Empire State Manufacturing Index will be the only data featured in the US economic docket.
In the early Asian session, the data from China revealed that the real Gross Domestic Product expanded at an annual rate of 6.3% in the second quarter. This reading followed the 4.5% growth recorded in the first quarter but fell short of the market expectation of 7.3%. Other data from China showed that Retail Sales increased 3.1% on a yearly basis in June, down sharply from 12.7% in May, and Industrial Production expanded 4.4% in the same period. In a statement, China's National Bureau of Statistics (NBS) said that the economy was improving, while noting that the foundation of the domestic economic recovery was not solid. Shanghai Composite Index is down nearly 1% on the day following these data releases and US stock index futures trade modestly lower on the day.
AUD/USD came under renewed bearish pressure on mixed Chinese data and was last seen trading in negative territory at around 0.6800. Early Tuesday, the Reserve Bank of Australia (RBA) will release the minutes of the July 4 policy meeting.
EUR/USD registered its biggest one-week gain of the year, adding nearly 250 pips last week. The pair holds steady above 1.1200 in the European morning.
GBP/USD edged lower on Friday but closed the week sharply higher. The pair stays in a consolidation phase below 1.3100 in the European session.
After having touched its weakest level in two months below 137.50 early Friday, USD/JPY gained traction and spanned a six-day losing streak. The pair, however, finds it difficult to extend its rebound and moves up and down in a tight channel at around 138.50.
Gold benefited from retreating US yields last week and gained 1.5%. XAU/USD stays relatively quiet on Monday and trades at around $1,950.
Bitcoin spent the weekend moving sideways slightly above $30,000 and finds it difficult to make a decisive move in either direction to start the week. Ethereum edged lower over the weekend but managed to stabilize above $1,900 on Monday.
The downward bias appears still in place for USD/CNH in the short-term horizon, note Economist Lee Sue Ann and Markets Strategist Quek Ser Leang at UOB Group.
Key Quotes
24-hour view: Last Friday, we expected USD to drop below 7.1250. However, we indicated that USD “is unlikely to threaten 7.1000.” We added, “In order to maintain the momentum, USD must stay below 7.1700.” While USD dropped below 7.1250, it staged a relatively sharp rebound from 7.1240 (high of 7.1614). Downward momentum has eased, and this combined with oversold conditions suggests a low risk of USD weakening. Today, we expect USD to consolidate, likely between 7.1350 and 7.1800.
Next 1-3 weeks: We highlighted last Friday (14 Jul, spot at 7.1485) that USD “is likely to continue to weaken and a break of 7.1250 will shift the focus to 7.1000.” While USD broke below 7.1250, it rebounded quickly from 7.1240. Oversold short-term conditions could lead to a few days of consolidation. In other words, 7.1000 may not come into view so soon. On the upside, a break above 7.1930 (no change in ‘strong resistance’ level from last Friday) would suggest that the USD weakness that started last Monday has stabilized.
- The index remains under pressure near the 100.00 zone.
- Risk appetite trends appear mixed at the beginning of the week.
- The NY Empire State Index will be the sole release on Monday.
The greenback, in terms of the USD Index (DXY), navigated a tight range close to the key 100.00 neighbourhood at the beginning of the week.
USD Index is cautious ahead of the FOMC and looks at risk trends
The index appears to have met some initial resistance around the 100.00 region so far on Monday, regaining little composure following Friday’s lows in the 99.60/55 band, an area last traded in late April 2022.
The persistent offered bias in the dollar has been particularly magnified in the wake of the release of US inflation figures for the month of June (July 12), in tandem with rising speculation that the Fed might end its current hiking cycle sooner rather than later.
In addition, mixed results from Chinese fundamentals published during early trade also collaborated with the vacillating price action in the FX universe on Monday.
On the speculative front, USD net longs dropped to levels last seen in late May, according to the latest CFTC Positioning Report for the week ended on July 11.
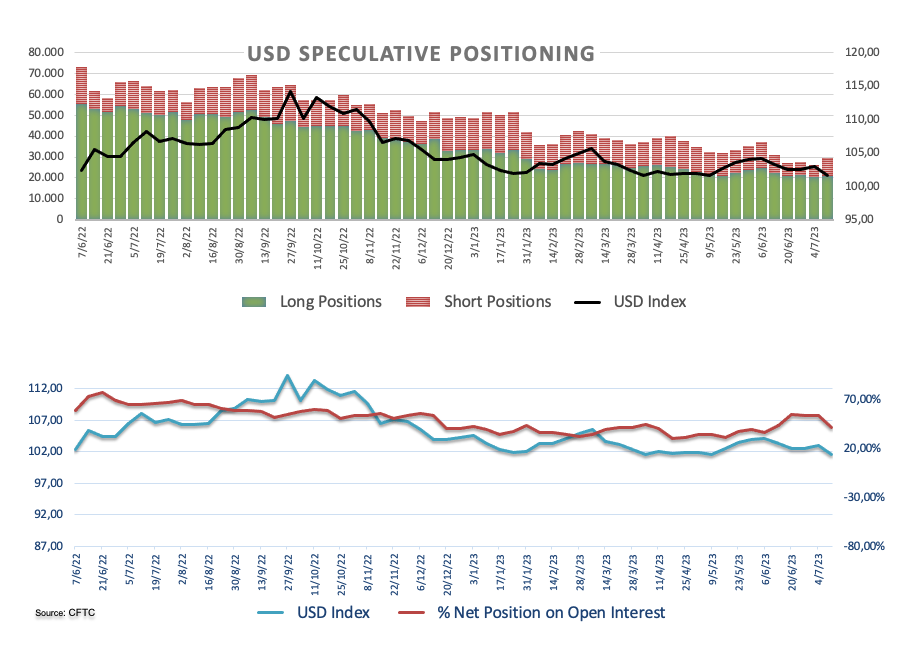
In the US data space, the NY Empire State Manufacturing Index will be the only publication later in the NA session on Monday.
What to look for around USD
The index remains under heavy pressure and attempts a tepid recovery with immediate target at the 100.00 region.
Meanwhile, the likelihood of another 25 bps hike at the Fed's upcoming meeting in July remains high and supported by the still tight US labour market and despite the persevering disinflationary pressures.
This view was further bolstered by comments from Fed Chief Powell at the June FOMC event, who referred to the July meeting as "live" and indicated that most of the Committee is prepared to resume the tightening campaign as early as next month.
Key events in the US this week: New York Empire State Manufacturing Index (Monday) – Retail Sales, Industrial Production, Business Inventories, NAHB Housing Market Index, TIC Flows (Tuesday) – MBA Mortgage Applications, Building Permits, Housing Starts (Wednesday) – Initial Jobless Claims, Philly Fed Manufacturing Index, CB Leading Index, Existing Home Sales (Thursday).
Eminent issues on the back boiler: Persistent debate over a soft/hard landing of the US economy. Terminal Interest rate near the peak vs. speculation of rate cuts in late 2023/early 2024. Geopolitical effervescence vs. Russia and China. US-China trade conflict.
USD Index relevant levels
Now, the index is down 0.10% at 99.85 and faces immediate support at 99.57 (2023 low July 13) followed by 97.68 (weekly low March 30) and 95.17 (monthly low February 10 2022). On the other hand, the breakout of 100.00 (round level) could open the door to 102.68 (55-dat SMA) and then 103.54 (weekly high June 30).
- Silver edges lower on Monday and snaps a three-day winning streak to over a two-month high.
- The technical setup favours bulls and supports prospects for the emergence of some dip-buying.
- Any meaningful corrective slide might now be seen as a buying opportunity and remain limited.
Silver kicks off the new week on a weaker note and for now, seems to have snapped a three-day winning streak to the $25.00 psychological mark, or its highest level since May 11 touched on Friday. The white metal remains on the defensive through the early European session and is currently placed around the $24.75-$24.80 region, down nearly 0.70% for the day, though any meaningful downside seems elusive.
Against the backdrop of the recent goodish rebound from the vicinity of the $22.00 mark, or a three-month low touched in June, Friday's sustained breakout through the $24.50-$24.60 congestion zone was seen as a fresh trigger for bullish traders. This, along with bullish technical indicators on the daily chart, validates the positive outlook for the XAG/USD and supports prospects for the emergence of some dip-buying.
Hence, any subsequent slide is more likely to find decent support near the $24.50 region, which if broken might prompt some technical selling and drag the XAG/USD towards testing the $24.00 mark. This is followed by supports near the $23.65-$23.60 area and the $23.20-$23.15 zone. A convincing break below the $23.00 round figure will negate the positive outlook and shift the bias in favour of bearish traders.
On the flip side, bulls might now wait for acceptance above the $25.00 mark before positioning for any further gains towards the next relevant hurdle near the $25.50-$25.55 region. The upward trajectory could get extended further towards reclaiming the $26.00 round figure before the XAG/USD challenges the YTD peak, around the $26.10-$26.15 region touched in May.
Silver daily chart
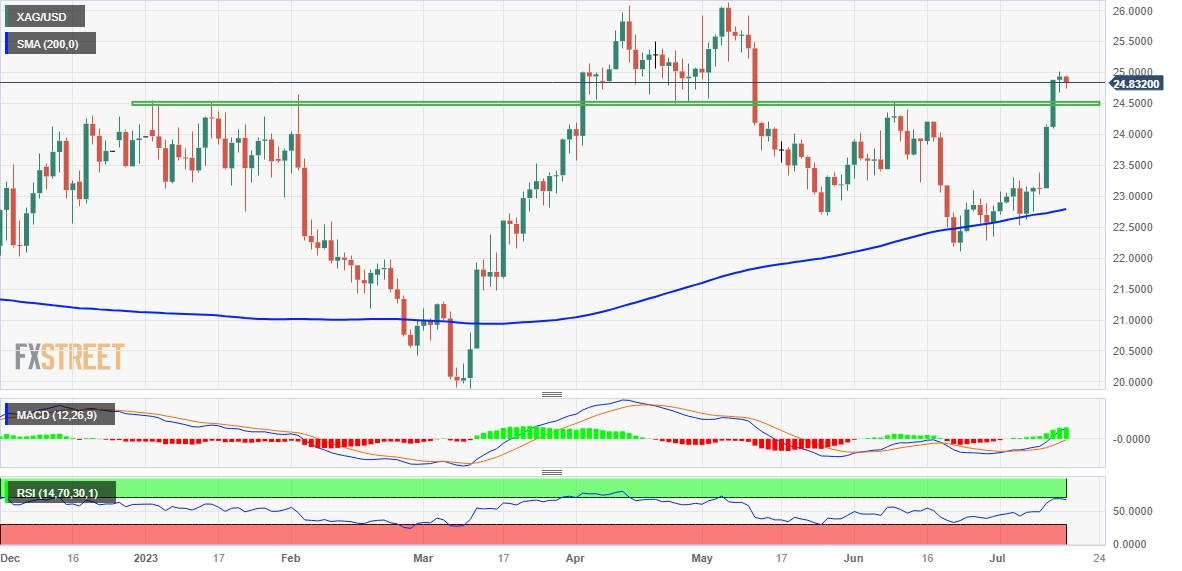
Key levels to watch
Economists at ING analyze GBP outlook ahead of Wednesday’s UK inflation.
CPI is a big risk event
The faster-than-expected inflation deceleration in the US hit the Pound in some non-Dollar crosses, largely because of the vulnerability of the ultra-hawkish BoE market rate expectations. Such vulnerability of the Pound remains very much present now as markets continue to factor in 130 bps of tightening to a peak in the UK, leaving ample room for dovish repricings.
This week’s UK CPI print is thus a major risk event for Sterling since signs of deceleration in price pressure would likely nudge the dial in favour of 25 bps over a half-point hike in August. Markets currently price in 45 bps for August, so the downside risks likely exceed the upside for the Pound.
- EUR/JPY remains steady and consolidates in a narrow range on Monday.
- Next resistance level is seen at 156.15, an initial support appears near 155.40.
- The Relative Strength Index (RSI) indicates the non-directional movement in the cross.
The EUR/JPY pair lacks any firm directional bias and oscillates in the 155.30-156.15 range early Monday. The cross currently trades near 155.50, down 0.19% on the day.
According to the four-hour chart, EUR/JPY holds above the 100- and 200-day Exponential Moving Averages (EMA), meaning the path of least resistance for the EUR/JPY appears to the upside.
That being said, any meaningful follow-through buying past 156.15 (High of July 14) will see a rally to 157.15 (High of July 6). Further north, the cross will challenge the next hurdle at 158.00, the intersection of the psychological round mark and a high of July 3.
On the flip side, EUR/JPY will meet initial support of 155.40 (100-hour EMA) en route to 154.20 (200-hour EMA). A decisive break below the latter would expose 153.40 (Low of July 12).
It’s worth noting that the Relative Strength Index (RSI) is located in the 40-60 zone, indicating a non-directional movement in the pair.
EUR/JPY four-hour chart
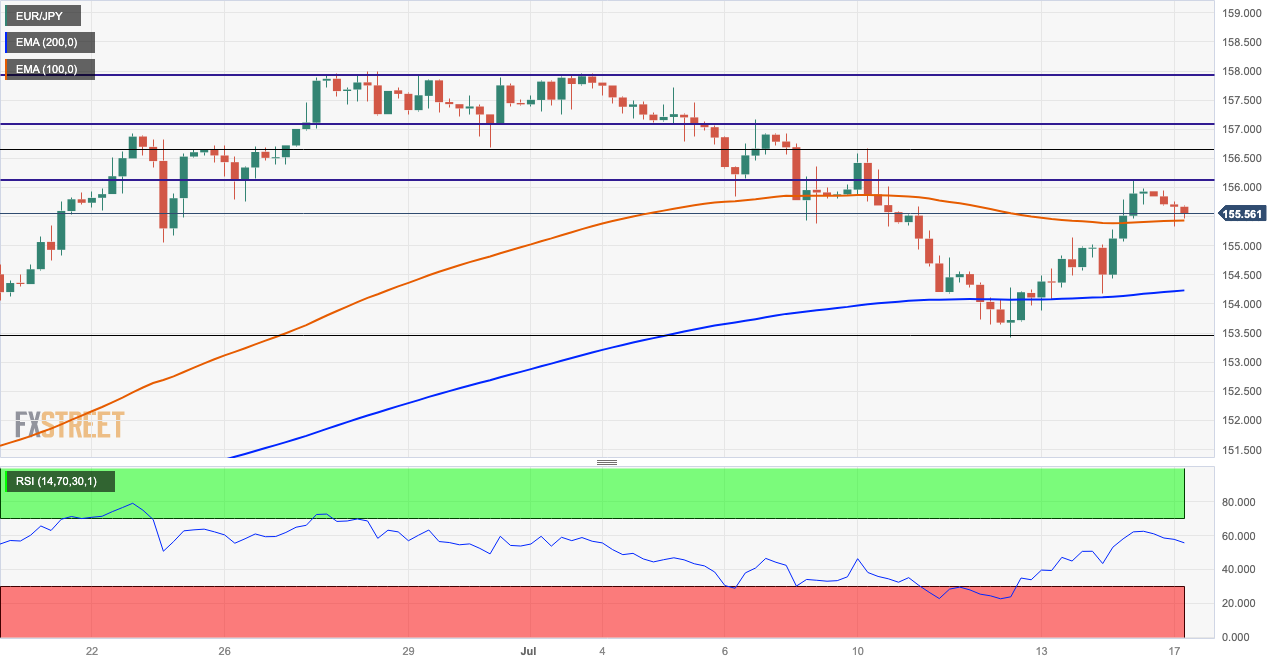
- Gold Price pares the biggest weekly gain since April amid mixed sentiment, Fed blackout.
- China headlines, data joins Friday’s US statistics to underpin XAU/USD pullback amid pre-FOMC silence.
- Risk catalysts, US/China clues eyed as Gold Price stays beyond key support confluence.
Gold Price (XAU/USD) remains on the back foot for the second consecutive day, extending the previous day’s pullback from the highest level in a month, as the US Dollar consolidates recent losses amid a sluggish start of the week.
While tracing the main catalysts behind the US Dollar Index (DXY) rebound, after posting the biggest weekly loss since November, Friday’s upbeat US inflation data and fears surrounding China gain major attention. Also exerting downside pressure on the Gold Price is the market’s preparations for July’s Federal Open Market Committee (FOMC) monetary policy meeting, expected to unveil a 0.25% increase in the benchmark interest rates. It should be noted that a two-week silence period for the Fed officials ahead of the FOMC also allows the US Dollar to lick its wounds and weigh on the Gold Price of late. Furthermore, comments suggesting inflation fears from the International Monetary Fund (IMF) also weigh on the XAU/USD price despite the lackluster session and the US Dollar’s inability to remain firmer.
Moving on, a light calendar challenges XAU/USD traders, especially amid the pre-Fed silence of the policymakers. Even so, Monday’s NY Empire State Manufacturing Index for June and Wednesday’s US Retail Sales for the said month will be important to watch for clear directions. Above all, risk catalysts will be crucial for the near-term direction of the Gold Price.
Also read: Gold Price Forecast: XAU/USD could correct toward $1,940 amid a Bear Cross
Gold Price: Key levels to watch
As per our Technical Confluence Indicator, the Gold Price remains well beyond the key support confluence comprising the 10-day SMA and Fibonacci 61.8% on one-week, around $1,935 by the press time.
That said, the Pivot Point one-day S2 and Fibonacci 38.2% on one-week highlights $1,945 as immediate support for the Gold sellers to watch during the quote’s further downside.
It’s worth noting that the XAU/USD weakness past $1,935 makes it vulnerable to decline towards the $1,900 round figure. However, the monthly low of near $1,893 could challenge the Gold bears afterward.
Meanwhile, 50-day SMA joins Fibonacci 38.2% on one-day to suggest $1,960 as nearby resistance for the Gold Price.
Following that, the upper band of the Bollinger on the four-hour chart, Pivot Point one-month R1 and Fibonacci 161.8% on one-day, near $1,972, could challenge the XAU/USD run-up.
In a case where the Gold buyers keep the reins past $1,972, a convergence of the Pivot Point one-week R1 and Pivot Point one-day R3, around $1,978, appears the last defense of the XAU/USD sellers before fueling the quote toward the $2,000 psychological magnet.
Here is how it looks on the tool
About Technical Confluences Detector
The TCD (Technical Confluences Detector) is a tool to locate and point out those price levels where there is a congestion of indicators, moving averages, Fibonacci levels, Pivot Points, etc. If you are a short-term trader, you will find entry points for counter-trend strategies and hunt a few points at a time. If you are a medium-to-long-term trader, this tool will allow you to know in advance the price levels where a medium-to-long-term trend may stop and rest, where to unwind positions, or where to increase your position size.
- USD/CHF fades the previous day’s corrective bounce off the lowest level since January 2015.
- US Dollar lacks recovery momentum amid pre-Fed blackout.
- Downbeat mood, US data puts a floor under Swiss Franc pair around multi-month low.
- US Empire State Manufacturing Index, Retail Sales eyed for clear directions.
USD/CHF drops back to 0.8600, reversing Friday’s recovery from a multi-year low, as traders seek more clues to defend the US Dollar’s rebound heading into Monday’s European session. That said, a lack of major incentives push traders to reassess the previous day’s corrective bounce, especially amid the mixed US data, sluggish mood and a two-week blackout for Fed policymakers ahead of the July monetary policy meeting.
US Dollar Index (DXY) struggles to defend the two-day recovery from the lowest level in 15 months, clings to mild gains near 99.95 by the press time. The greenback’s gauge recovered from a multi-month low after the preliminary reading of the University of Michigan's (UoM) Consumer Confidence Index and Consumer Inflation Expectations for July. Also adding strength to the corrective bounce could be the hawkish comments from Federal Reserve (Fed) Governor Christopher Waller.
It’s worth noting, however, that the Fed blackout and mixed headlines about China joining bond market inaction in Asia, mainly due to Japan’s holiday, restrict the USD/CHF moves of late. The same also allows the traders to rethink the previously hawkish bias surrounding the US Federal Reserve (Fed), backed by Friday’s data and comments from Fed’s Waller.
Elsewhere, fears that the Swiss National Bank (SNB) will remain hawkish, contrary to the mixed concerns about the Fed’s next moves, also weigh on the USD/CHF price.
Amid these plays, S&P500 Futures print mild losses whereas the US 10-year and two-year Treasury bond yields remain sluggish after falling heavily in the last week.
Looking ahead, the second-tier US activity and Retail Sales data may entertain the USD/CHF pair traders amid a light calendar.
Technical analysis
A daily closing beneath a six-month-old descending support line, around the 0.8600 round figure by the press time, becomes necessary for the USD/CHF pair’s further dominance. However, the nearly oversold RSI (14) line and receding bearish bias of the MACD indicator favor the short-term recovery of the pair.
The Krona gave back some of the gains following the release of Swedish inflation. Antje Praefcke, FX Analyst at Commerzbank, analyzes SEK outlook.
Riksbank's monetary policy is still not restrictive enough
Inflation did not fall as much as expected and remains stubbornly high at 6.4%. More worrying, however, is the development of the core rate, which weakened only marginally to 8.1 percent, above the Riksbank's expectations (7.84 percent).
The Riksbank's monetary policy is still not restrictive enough in the face of such high inflation data.
I would not be surprised if the Krona loses further ground in the coming days, without returning to the very weak levels that the EUR/SEK saw at the beginning of the month, when it traded above 11.90.
- NZD/USD has dropped to near 0.6350 despite USD Index remaining choppy.
- NZ inflation is expected to soften significantly amid aggressive interest rate policy by the RBNZ.
- The USD Index is making efforts to deliver a solid recovery after a significant sell-off.
The NZD/USD pair has extended its correction to near 0.6350 in the early European session. The Kiwi asset has faced pressure after mixing China’s Gross Domestic Product (GDP) data. China’s quarterly GDP has expanded at a 0.8% pace higher than the estimates of 0.5% but extremely lower than the prior pace of 2.2%. While annualized GDP landed at 6.3%, lower than the consensus of 7.3% but higher than the former release of 4.5%.
Mixed GDP numbers have prompted the need for more loose policy from the People’s Bank of China (PBoC) as the economic recovery is not on track due to lower consumer spending and rising pain in real estate.
Apart from the GDP figures, annual Retail Sales have decelerated to 3.1% vs. the estimates of 3.2% and the former release of 12.7%. Contrary, annualized Industrial Production jumped to 4.4$ vs. the consensus of 2.7% and the prior figure of 3.5%. It is worth noting that New Zealand is one of the leading trading partners of China and bleak economic recovery in China impacts the New Zealand Dollar.
Going forward, the New Zealand Dollar would react to the second-quarter inflation data, which will release on Tuesday at 22:45 GMT. The quarterly Consumer Price Index (CPI) is seen softening to 0.9% vs. the former pace of 1.2%. Annualized CPI is expected to decelerate to 5.9% against the prior release of 6.7%.
Meanwhile, S&P500 futures have posted nominal losses in Asia, portraying a cautious market mood. The US Dollar Index (DXY) is demonstrating a non-directional performance below the psychological resistance of 100.00. The USD Index is making efforts to deliver a solid recovery after a significant sell-off. Consistently softening United States inflation and easing labor market conditions are the real triggers behind doomsday for the USD Index. The next trigger for the USD Index will be the monthly Retail Sales data for June, which will release on Tuesday.
FX option expiries for July 17 NY cut at 10:00 Eastern Time, via DTCC, can be found below.
- EUR/USD: EUR amounts
- 1.1100 350m
- USD/JPY: USD amounts
- 137.00 603m
- 138.00 325m
- 140.00 1b
- USD/CHF: USD amounts
- 0.8935 475m
- AUD/USD: AUD amounts
- 0.6700 1.3b
- 0.6900 389m
- USD/CAD: USD amounts
- 1.3075 330m
- WTI crude oil holds ground near the $74.40 mark in the early European morning.
- Supply disruptions in Libya and Nigeria lift the price amid output cuts by Saudi Arabia and Russia.
- Fears of an economic slowdown in China could have a negative impact on the oil price.
- Market participants will take cues from the unexpected supply disruptions and the US data.
Western Texas Intermediate (WTI), the US crude oil benchmark, is trading around the $74.40 mark so far this Monday. Investors will keep an eye on unexpected disruptions in Libya and Nigeria and developments surrounding the continued OPEC production cuts. The correction in WTI on Monday seems to be profit-taking by oil traders after WTI recorded its third-straight weekly gain.
However, cooling US inflation supported the uptick in oil prices last week. Market participants anticipate that the Federal Reserve (Fed) will be less aggressive in tightening monetary policy after an expected interest rates hike in the upcoming meeting on July 26. The International Energy Agency (IEA) also forecasted that oil demand would reach a new high this year, albeit with broader economic challenges.
That said, supply disruptions in key suppliers Libya and Nigeria lift the price in tandem with the longer-term output cuts set by the world's leading exporters, Saudi Arabia and Russia.
On the other hand, fears of an economic slowdown in China could have a negative impact on the oil price. It’s worth noting that China is the world's second-biggest oil consumer. Market participants will take cues from the US data. China’s annual GDP disappointed expectations and arrived at 6.3% in the second quarter of 2023.
The Empire State Manufacturing Index and Retail Sales MoM from June will be due later this week. These data will play a key role in influencing the near-term US Dollar price dynamic and help determine the next direction for WTI prices.
USD/INR continues to hold within a narrow 2.5% range, between 81-83, since the start of the year. Economists at Commerzbank analyze the pair’s outlook.
RBI is content to see a relatively stable USD/INR
INR’s stability is due to the strong growth backdrop, favourable macro indicators, including moderating inflation, lower oil prices, and net equity inflows.
RBI is content to see a relatively stable USD/INR.
We project USD/INR to hold around 82.00 by Q3 2023 and drift lower to 81.50 by end-2023 and 81.00 by end-2024.

Source: Commerzbank Research
The selling pressure in USD/JPY should mitigate on a breakout of the 139.50 level, suggest Economist Lee Sue Ann and Markets Strategist Quek Ser Leang at UOB Group.
Key Quotes
24-hour view: Our view for USD “to continue to fall” last Friday and that “137.15 is likely within reach” were incorrect. USD fell to 137.23 and then staged a sharp rebound and closed higher for the first time in six days. The rebound in severely oversold conditions suggests USD is unlikely to weaken. Today, USD is more likely to trade in a range of 137.80/139.00.
Next 1-3 weeks: Last Friday (14 Jul, spot at 137.80), we held the view that USD “is likely to break below 137.15 and that the next level to aim for is the formidable support at 135.80.” USD then dropped to a low of 137.28 before staging a surprisingly sharp rebound (high of 139.15). While downward momentum has slowed somewhat, we continue to hold the same view for now. However, if USD breaks above 139.50 (no change in ‘strong resistance’ level from last Friday), it would indicate that the USD weakness that started early last week has stabilized.
Considering advanced prints from CME Group for natural gas futures markets, open interest rose for the third session in a row on Friday, now by around 3.3K contracts. On the other hand, volume set aside four consecutive daily advances and went down by around 27.6K contracts.
Natural Gas: Decent support is seen around $2.50
Friday’s d third consecutive daily pullback in prices of natural gas came in tandem with rising open interest and suggests that further losses could be in store for the commodity in the very near term. In the meantime, there is still a decent contention in the $2.50 region per MMBtu.
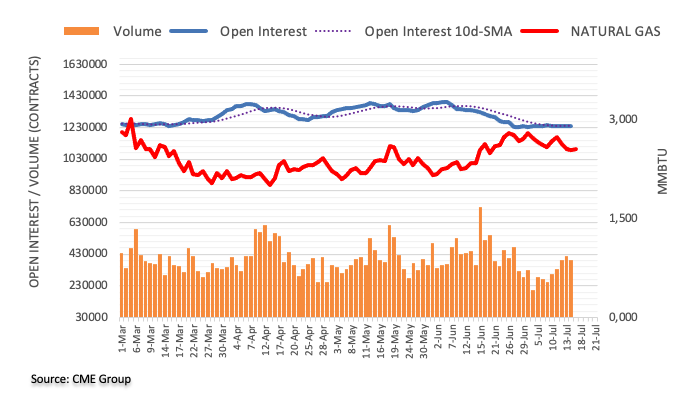
In the opinion of Economist Lee Sue Ann and Markets Strategist Quek Ser Leang at UOB Group, AUD/USD could break above the 0.6900 hurdle in the short-term horizon.
Key Quotes
24-hour view: We highlighted last Friday that “While clearly overbought, the AUD’s strength could extend above June’s peak of 0.6900.” We noted, “Support is at 0.6850, followed by 0.6830.” Our view did not materialize, as AUD fell from 0.6895 to 0.6831 and then closed at 0.6839 (0.74%). The price movement is likely part of a consolidation phase. Today, AUD is likely to trade in a range of 0.6815/0.6870.
Next 1-3 weeks: Our update from last Friday (14 Jul, spot at 0.6880) still stands. As highlighted, AUD is likely to break June’s peak of 0.6900. A break of this level will shift the focus to 0.6950 and 0.7030. That said, overbought short-term conditions are likely to lead to a couple of days of consolidation. The upward pressure is intact as long as AUD stays above 0.6760 (no change in ‘strong support’ level from last Friday).
- USD/JPY fades the previous day’s corrective bounce off two-month low.
- Failure to cross previous support line, downbeat RSI (14) lure sellers.
- Bullish MACD signals suggest limited downside room; 141.50 appears a tough nut to crack for Yen pair buyers.
- Japan’s holiday, pre-Fed blackout restricts USD/JPY moves amid mixed sentiment.
USD/JPY clings to mild losses around 138.60 as market players seek fresh clues to extend the week-start retreat heading into Monday’s European session. In doing so, the Yen pair fades the previous day’s corrective bounce off the lowest levels since mid-May.
That said, the failure to extend late Friday’s corrective bounce off the multi-day low beyond the previous support line stretched from late March, now immediate resistance around 139.35, recall the USD/JPY sellers.
However, the 50% Fibonacci retracement level of the Yen pair’s up-moves from late March to June, near 137.40, could join the bullish MACD signals and the nearly oversold RSI (14) line to challenge the further downside.
It’s worth noting that early May’s peak of around 137.80 can act as an immediate support for the USD/JPY bears to watch whereas a sustained downside break of 137.40 will make the pair vulnerable to declining towards the 61.8% Fibonacci retracement level, surrounding 135.50.
Alternatively, a clear upside break of the support-turned-resistance line of around 139.35 isn’t an open invitation to the USD/JPY bulls as the 140.00 round figure could act as the additional upside filter.
Above all, the Yen pair remains on the bear’s radar unless witnessing a successful upside break of the convergence of 200-SMA and 23.6% Fibonacci retracement, near 141.50.
USD/JPY: Four-hour chart
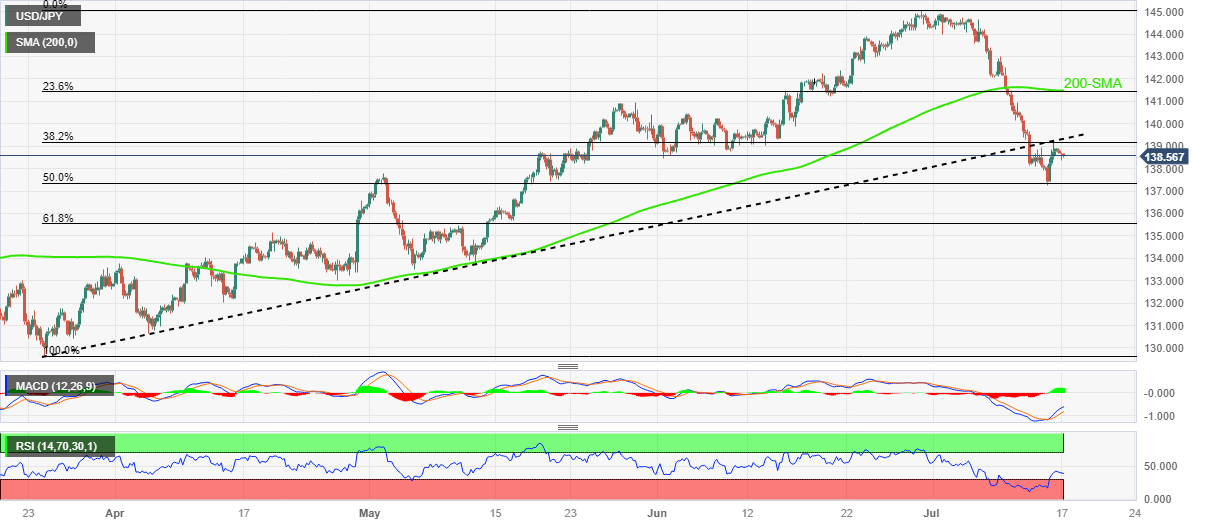
Trend: Limited downside expected
CME Group’s flash data for crude oil futures markets noted traders increased their open interest positions for the fourth consecutive session on Friday, this time by around 8.1K contracts. Volume, instead, went down by around 335.6K contracts after three daily builds in a row.
WTI meets resistance around the 200-day SMA
Prices of WTI corrected markedly lower after flirting with the key 200-day SMA above the $77.00 per barrel on Friday. The downtick was on the back of increasing open interest and exposes further declines in the very near term, with the immediate target at the transitory 100-day SMA around $73.50.
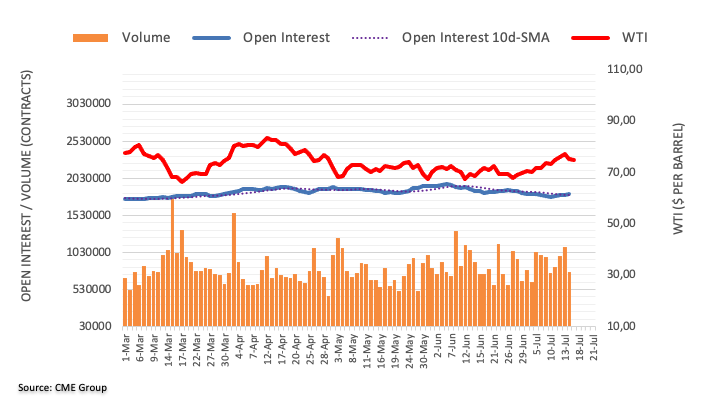
- GBP/JPY has delivered a recovery move from 181.00 as BoE is expected to announce a bigger rate hike ahead.
- UK’s core inflation is expected to remain steady and might keep a strict burden on households.
- Former BoJ Kameda forecasted that the central bank won’t do any tweaks in the interest rate policy.
The GBP/JPY has found support after a soft corrective move to near 181.15 in the Tokyo session. The cross has sensed some buying interest as investors are hoping that the Bank of England (BoE) will announce a consecutive fat rate hike in its monetary policy meeting in August.
BoE Governor Andrew Bailey raised interest rates by 50 basis points (bps) to 5% in June while investors were anticipating a small interest rate hike of 25 bps. A surprise jump in May’s headline Consumer Price Index (CPI) and fresh highs in core inflation at 7.1% were sufficient to force the central bank to go for a big rate hike.
Going forward, investors will get more cues after the release of June’s inflation report, which is scheduled for Wednesday at 06.00 GMT. As per the consensus, monthly headline CPI reported a pace of 0.4% lower than the prior pace of 0.7%. While annualized inflation is expected to decelerate to 8.2% against the former release of 8.7%. Core inflation is expected to remain steady at 7.1%.
Knowing the fact that core CPI would remain elevated, the BoE will continue to hike interest rates further. Meanwhile, households in the United Kingdom economy are facing the burden of higher interest rates. UK’s property website cited that prices asked for housing have dropped straight for the second month. The overall demand for the property sector has dropped as investors are avoiding higher interest rate obligations.
On the Japanese Yen front, investors are awaiting the interest rate decision by the Bank of Japan (BoJ), which will be announced next week. BoJ’s former top economist, Seisaku Kameda, forecasted that the central bank won’t do any tweaks in the interest rate policy. He further added the central bank will keep forecasts for FY2024 and 2025 roughly unchanged.
Extra gains in GBP/USD are likely while above the 1.3000 hurdle, according to Economist Lee Sue Ann and Markets Strategist Quek Ser Leang at UOB Group.
Key Quotes
24-hour view: Last Friday, we held the view that “as long as 1.3055 is not breached, GBP could rise to 1.3160.” While GBP did not breach 1.3055, it also did not rise to 1.3160. Instead, GBP traded in a relatively quiet manner between 1.3090 and 1.3143. GBP appears to have entered a consolidation phase. Today, we expect GBP to trade in a range, likely between 1.3060 and 1.3145.
Next 1-3 weeks: There is not much to add our update from last Friday (14 Jul, spot at 1.3115). As highlighted, as long as 1.3000 is intact, the GBP strength that started last Monday is intact. Looking ahead, the next significant resistance is at 1.3335.
Open interest in gold futures markets shrank by around 6.4K contracts after two consecutive daily builds at the end of last week, according to preliminary readings from CME Group. Volume followed suit and went down by nearly 14K contracts, adding to the previous daily drop
Gold keeps targeting $1980
Friday’s small downtick in gold prices was on the back of shrinking open interest and volume, allowing for some near-term rebound. Against this backdrop, the precious metal is still expected to target the early June tops just above the $1980 mark per troy ounce.
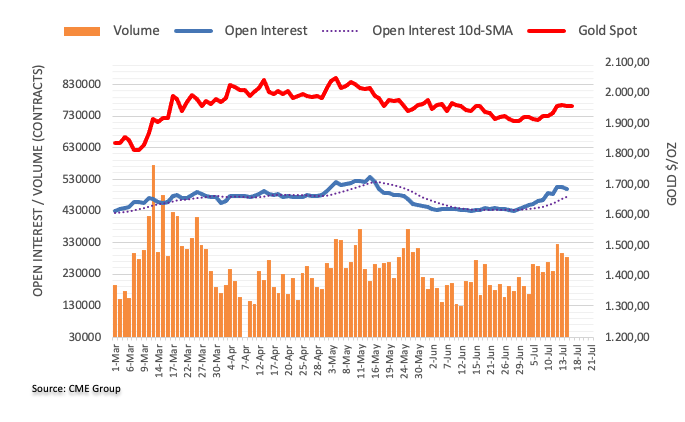
- AUD/USD picks up bids to pare intraday losses amid sluggish session.
- Mixed China data, fears of Australia’s economic slowdown, uptick in unemployment rate prod Aussie pair buyers.
- Market’s consolidation amid pre-Fed blackout favors US Dollar but lack of important data/events, Japan’s holiday prods DXY bulls.
- Second-tier US data, risk catalysts eyed for intraday clues, RBA Minutes, Aussie jobs report and US Retail Sales are crucial.
AUD/USD bounces off intraday low to 0.6820 heading into Monday’s European session, paring the daily loss amid a sluggish start to the week. Even so, the Aussie pair remains on the back foot for the second consecutive day amid downbeat economic concerns at home, as well as surrounding the major customer China. Also weighing on the Aussie pair could be the market’s consolidation of the US Dollar losses ahead of the late July Fed meeting.
That said, the US Dollar Index (DXY), also known as the USD Index, retreats from the intraday high to 99.95 at the latest. In doing so, the greenback’s gauge versus the six major currencies fade Friday’s corrective bounce off the lowest levels since April 2022, mainly triggered due to the upbeat US sentiment data and inflation expectations figures.
Elsewhere, downbeat China data also weigh on the AUD/USD price, despite the latest consolidation in the pair’s corrective bounce. That said, China’s second quarter (Q2) 2023 Gross Domestic Product (GDP) came in at 0.8% QoQ versus 0.5% market forecasts and 2.2% prior whereas the GDP YoY figures rose past the previous readings of 4.5% to 6.3%, versus analysts’ estimations of 7.3%. Further, the Industrial Production growth jumped to 4.4% YoY in June, compared to the 2.7% expected and 3.5% prior, whereas the Retail Sales slumped to 3.1% from 12.7% prior and 3.2% market consensus. It should be noted that China’s June survey-based Jobless Rate for 24-year-olds jumped to a record high of 21.3%.
On the other hand, mixed concerns about global inflation, flagged by the International Monetary Fund (IMF), renew inflation fears and weighed on the risk appetite amid the pre-Fed blackout period, which in turn weighs on the AUD/USD price.
Furthermore, economic fears flagged by Australian Treasurer Jim Chalmers join the downbeat statistics from major customer China to print mild losses of the AUD/USD pair.
Alternatively, the reopening of the Western markets, after a weekend, allows the US Dollar bears to lick their wounds after the previous day’s corrective bounces.
Additionally, hopes that the Reserve Bank of Australia (RBA) is yet to confirm the dovish trajectory, despite the recently downbeat Aussie statistics, also allow the AUD/USD to rebound from the intraday lows.
Looking ahead, this week’s RBA Minutes and Australian employment data for June will be crucial as the election of Michele Bullock as the next Governor weighs on the AUD/USD price. Also highlighting the Aussie pair’s latest rebound is the market’s preparations for the late July Fed monetary policy decision.
Technical analysis
AUD/USD pair portrays a “double top” bearish chart formation around 0.6900, suggesting a pullback in the prices. However, the 200-SMA on the daily chart joins a fortnight-old rising support line, to around 0.6705 and 0.6675 in that order, to restrict the short-term downside of the pair.
Economist Lee Sue Ann and Markets Strategist Quek Ser Leang at UOB Group see EUR/USD advancing further in the next few weeks.
Key Quotes
24-hour view: While we expected EUR to continue to strengthen last Friday, we were of the view that “it might not be able to maintain a foothold above 1.1250.” However, EUR rose less than expected to 1.1244 before easing to end the day marginally higher at 1.1227 (+0.03%). The current price action is likely part of a consolidation phase. Today, we expect EUR to trade sideways between 1.1190 and 1.1250.
Next 1-3 weeks: Last Monday (10 Jul), when EUR was trading at 1.0965, we indicated that “the rapid increase in momentum is likely to lead to further advance in EUR.”. Our view was correct, as EUR surged over the past week. In our latest narrative from last Friday (14 Jul, spot at 1.1225), we indicated that “while EUR could rise further, it is premature to expect a move to the 2022 high of 1.1495.” We noted, there are short-term resistance levels at 1.1300 and 1.1400. We continue to hold the same view. It is worth noting the pace the advance in EUR has slowed as it closed marginally higher last Friday (1.1227, +0.03%). On the downside, if EUR breaks below 1.1145 (‘strong support’ level was at 1.1120 last Friday), it would indicate that EUR is not strengthening further.
- Gold loses momentum and holds above $1,950 in the Asian session.
- The upbeat US consumer confidence and mixed Chinese data lifted the US Dollar and might cap the upside for gold.
- Markets will take cues from the US Empire State Manufacturing Index and Retail Sales later this week.
Gold price struggles to gain traction and extends Friday’s retracement slide from the $1,965 area. The precious metal currently trades around $1,950 in the Asian session following the mixed Chinese data.
That said, the upbeat US consumer confidence helped the US Dollar recover above its lowest level since April 2022, dragging gold prices lower on Friday.
The preliminary reading of the University of Michigan's (UoM) Consumer Confidence Index rose to 72.6 from 64.4 in June, beating the market's expectation of 65.5. Additionally, US consumer prices climbed by 3.0% year on year, down from 4.0% previously, and the Producer Price Index (PPI) increased by 0.1%, down from 0.9% prior. Market participants anticipate the Federal Reserve (Fed) to be less hawkish in tightening monetary policy following an expected interest rate hike in the July 26 meeting. This, in turn, could be the headwind for the US Dollar and might cap the downside for gold.
On the Chinese front, the latest National Bureau of Statistics (NBS) data reported that the Chinese Gross Domestic Product (GDP) came in at 6.3% annually, lower than predicted at 7.3% and 4.5% previously. At the same time, Industrial Production YoY increased by 4.4% from 3.5% the previous year, above the consensus of 2.7%.
Additionally, Retail Sales fell to 3.1% YoY from June, down from 12.7% previously and 3.2% expected by the market. The mixed economic figure helps gold to limit the loss. However, investors remain focused on the Chinese data. It’s worth noting that the fear of an economic slowdown in China could have a negative impact on the gold price as China is the biggest gold consumer.
The Fed enters its blackout period ahead of the July 25-26 meeting. Market participants will take cues from the US data. The Empire State Manufacturing Index and Retail Sales MoM from June will be due later this week. These data will play a key role in influencing the near-term US Dollar price dynamic and help determine the next direction for gold prices.
- EUR/USD has turned sideways as investors are awaiting a fresh trigger for further guidance.
- S&P500 futures have generated some losses, portraying caution among market participants as the result season has kicked off.
- The Euro has got extreme strength as the ECB is expected to conclude its rate-hiking spell beyond July.
The EUR/USD pair has turned extremely choppy above the round-level resistance of 1.1200 in the Asian session. The major currency pair has turned sideways as investors are awaiting the United States Retail Sales (June) data for further guidance.
S&P500 futures have generated some losses in the Tokyo session, portraying caution among market participants as the second-quarter result season has kicked off. US equities also faced some pressure on Friday as investors are worried that corporate earnings could remain volatile due to higher aggressive policy-tightening by the Federal Reserve (Fed) and tight credit conditions by commercial banks to maintain asset quality.
The US Dollar Index (DXY) is demonstrating a squeeze in volatility after building a base marginally below 100.00. The USD Index is expected to deliver a power-pack action after the release of the US Retail Sales data. As per the consensus, monthly retail demand is expected to expand at a higher pace of 0.5% vs. the former release of 0.3%. Retail demand excluding automobiles is seen expanding by 0.3% against the former release of 0.1%.
Meanwhile, the Euro has got extreme strength as the European Central Bank (ECB) is expected to conclude its rate-hiking spell beyond July as inflation is hotter in Eurozone. Headline inflation in the shared continent is at 5.5% and the core inflation that excludes volatile oil and food prices is at 5.4%, stretched from the desired rate of 2%.
Contrary, economists at Nordea believe that the European Central Bank continues to see more tightening warranted, and another hike in July appears a done deal but it will be the last one in the current cycle.
- USD/INR edges higher for the third consecutive day as bull’s eye 200-EMA.
- Upbeat RSI (14), sustained rebound from two-week-old rising support line keeps Indian Rupee pair buyers hopeful.
- Descending resistance line from July 06 holds the key to USD/INR run-up.
USD/INR clings to mild gains around 82.17 amid the early hours of Monday morning in Europe. In doing so, the Indian Rupee (INR) remains firmer for the third consecutive day after bouncing off a fortnight-old rising support line in the last week.
Not only the pair’s rebound from a short-term trend line support but the firmer RSI (14) line, not overbought, also underpin hopes of USD/INR recovery.
However, the 200-Exponential Moving Average (EMA) hurdle of around 82.22 by the press time challenges the USD/INR pair’s immediate upside.
Following that, a seven-day-long falling resistance line, close to 82.40 at the latest, will act as the last defense of the Indian Rupee pair seller’s defense, a break of which could trigger a run-up towards the early July’s swing low surrounding 82.55.
It’s worth noting that the monthly high of near 82.85 and May’s peak surrounding 83.00 appears tough nuts to crack for the USD/INR bulls afterward.
Meanwhile, the USD/INR pair sellers need to market a sustained downside break of the aforementioned two-week-old rising support line, close to the 82.00 psychological magnet.
In a case where the Indian Rupee buyers manage to conquer the 82.00 support, the odds of witnessing a slump toward the monthly low of around 81.75 can’t be ruled out.
USD/INR: Four-hour chart
Trend: Further recovery expected
- USD/IDR struggles to defend Friday’s corrective bounce despite downbeat Indonesia trade numbers for June.
- Indonesia Exports slumped 21.18% in June versus 0.96% prior, -18.65% expected.
- Risk aversion, pessimistic headlines surrounding China also put a floor under the Rupiah pair.
USD/IDR remains unimpressive around 15,000 as downbeat Indonesia trade numbers jostle with the mixed sentiment during early Monday.
That said, Indonesia's Exports slumped 21.18% in June versus 0.96% prior and analysts’ estimations of -18.65%. Further details suggest that Imports drop to -18.35% from 14.35%, versus -7.75% expected whereas the Trade Balance suggests a wider surplus of $3.46B versus $1.35B market forecasts and $0.44B prior.
It should be noted that the downbeat prints of China’s second quarter (Q2) 2023 Gross Domestic Product (GDP) joins geopolitical fears surrounding typhoon Talim in Hong Kong, as well as the International Monetary Fund’s (IMF) fears about inflation, weigh on the sentiment and put a floor under the USD/IDR price.
On the same line could be the comments from New Zealand Prime Minister (NZ) Chris Hipkins and US Treasury Secretary Janet Yellen who flagged the looming geopolitical concerns about China and hence weighed on the sentiment, which in turn defends the USD/IDR buyers.
Elsewhere, consolidation in the US Dollar Index (DXY) price amid the pre-Fed blackout, after posting the biggest weekly loss since November 2022, also challenges the USD/IDR bears despite the quote’s latest failure to extend the previous day’s rebound. It’s worth noting that Friday’s preliminary reading of the University of Michigan's (UoM) Consumer Confidence Index and consumer inflation expectations push back concerns that the Fed is near to the policy pivot and allow the US Dollar to lick its wounds, as well as lure the USD/IDR buyers.
Looking ahead, the risk catalysts will be important to watch for near-term directions amid a light calendar.
Technical analysis
USD/IDR recovery remains elusive unless printing a daily closing beyond the 10-week-old support-turned-resistance, around 15,030 by the press time.
- USD/CAD gains some follow-through traction and recovers further from the YTD low.
- Retreating Crude Oil prices undermines the Loonie and lends some support to the major.
- Bets that the Fed will soon end its rate-hiking cycles cap gains for the USD and the pair.
The USD/CAD pair kicks off the new week on a positive note and builds on Friday's goodish recovery move from sub-1.3100 levels, or the lowest since September 2022. Spot prices stick to modest intraday gains through the Asian session and currently trade near the 1.3225 region, albeit lack any follow-through buying.
Crude Oil prices drift lower for the second straight day as worries that a global economic downturn will dent fuel demand prompt bulls to take some profits off the table, especially after the recent runup to the highest level since April. The concerns resurfaced following the release of rather unimpressive macro data from China, which showed that growth in the world's second-largest economy slowed in the second quarter. Adding to this, the resumption of Oil production in Libya over the weekend weighs on the black liquid. This, in turn, is seen undermining the commodity-linked Loonie and acting as a tailwind for the USD/CAD pair.
The US Dollar (USD), on the other hand, continues to draw support from the upbeat US data released on Friday, which showed that consumer confidence in July surged to the highest since September 2021. Moreover, a softer tone around the US equity futures further benefits the Greenback's relative safe-haven status. That said, growing acceptance that the Federal Reserve (Fed) will keep interest rates steady for the rest of the year, following the widely anticipated 25 bps in July, holds back the USD bulls from placing aggressive bets. This, in turn, might keep a lid on any meaningful upside for the USD/CAD pair, at least for the time being.
Market participants now look forward to the Empire State Manufacturing Index, due for release from the US later during the early North American session. Apart from this, the broader risk sentiment will drive the USD demand and provide some impetus to the major. Traders will further take cues from Oil price dynamics to grab short-term opportunities around the USD/CAD pair. The focus, however, will remain glued to the latest Canadian consumer inflation figures on Tuesday, which should play a key role in determining the Bank of Canada's next policy move and the next leg of a directional move for the major.
Technical levels to watch
- Asia-Pacific equities edge lower as China data, geopolitical concerns flag economic fears.
- China Q2 GDP confirms slowing economic recovery, Sino-US tension remain on the table.
- IMF cites inflation fears despite receding price pressure of late.
- Japan’s holiday limits bond market moves, allowing market to consolidate recent gains amid pre-Fed blackout.
Risk appetite remains sour in the Asia-Pacific zone during early Monday as China data confirms a slowdown in the post-COVID recovery of the region’s biggest economy. Adding strength to the cautious mood are mixed headlines about inflation concerns and Sino-American ties.
Against this backdrop, the MSCI’s index of Asia-Pacific shares outside Japan extends the previous day’s retreat from a five-month high, down 0.20% intraday by the press time. It’s worth noting that the S&P500 Futures print mild losses around 4,535, down 0.10% while extending the previous week’s U-turn from the yearly top.
That said, Japan’s holiday restricts the Asian market’s performance, mainly surrounding the bond moves. Even so, Japanese Finance Minister Sunichi Suzuki’s comments of no discussion on the currency market intervention during the Group of 20 (G20) finance officials’ gathering seem to underpin the Yen pair’s fresh downside.
Elsewhere, China’s second quarter (Q2) 2023 Gross Domestic Product (GDP) came in at 0.8% QoQ versus 0.5% market forecasts and 2.2% prior whereas the GDP YoY figures rose past the previous readings of 4.5% to 6.3%, versus analysts’ estimations of 7.3%. Further, the Industrial Production growth jumped to 4.4% YoY in June, compared to the 2.7% expected and 3.5% prior, whereas the Retail Sales slumped to 3.1% from 12.7% prior and 3.2% market consensus. It should be noted that China’s June survey-based Jobless Rate for 24-year-olds jumped to a record high of 21.3%.
While China data drowned equities from Beijing, typhoon Talim pushed markets in Hong Kong to remain shut while comments from the International Monetary Fund (IMF) renews inflation fears and weighed on the risk appetite amid the pre-Fed blackout period. It should be noted that the economic fears flagged by Australian Treasurer Jim Chalmers join the downbeat statistics from major customer China to print mild losses in Australian and New Zealand equity markets. Furthermore, comments from New Zealand Prime Minister (NZ) Chris Hipkins and US Treasury Secretary Janet Yellen flag looming geopolitical concerns about China and hence weigh on the sentiment, which in turn exerts downside pressure on the markets in New Zealand.
Elsewhere, prices of Gold and crude oil retreat while the US Dollar Index (DXY) pare the biggest weekly loss since November 2022 after Friday’s upbeat US sentiment data and inflation expectations pushed back fears of the Fed’s policy pivot.
Moving on, a light calendar may restrict immediate market moves but a cautious mood ahead of this week’s top-tier data in Asia, namely the RBA Minutes, New Zealand CPI and Japan inflation, could extend the latest pullback.
Also read: Forex Today: Dollar suffers worst weekly loss since November, still vulnerable
- USD/MXN remains confined in a narrow trading band near its lowest level since December 2015.
- The formation of a descending channel points to a well-established downtrend and favours bears.
- A sustained strength beyond the 17.30-40 confluence is needed to negate the negative outlook.
The USD/MXN pair oscillates in a narrow range around the 16.75 region through the Asian session on Monday and consolidates its recent losses to the lowest level since December 2015.
From a technical perspective, the decline witnessed over the past four months or so has been along a downward-sloping channel, which points to a well-established short-term bearish trend. Furthermore, the USD/MXN pair's inability to attract any meaningful buying suggests that the path of least resistance is to the downside. The negative outlook is reinforced by the underlying bearish sentiment surrounding the US Dollar (USD), led by firming expectations that the Federal Reserve (Fed) is nearing the end of its rate-hiking cycle.
That said, the Relative Strength Index (RSI) on the daily chart is already flashing oversold conditions and warrants some caution before placing fresh bearish bets around the USD/MXN pair. Hence, any subsequent fall below the multi-year low, around the 16.70 region is more likely to find decent support near the lower end of the aforementioned trend-channel, currently pegged near the 16.6240 area. That said, some follow-through selling will mark a fresh breakdown and pave the way for a further near-term depreciating move.
On the flip side, the 16.85-16.90 area now seems to act as an immediate hurdle ahead of the 17.00 round figure. This is followed by resistance near the 17.10-17.15 region, which if cleared might trigger a short-covering move and lift the USD/MXN pair beyond the 17.25 intermediate barrier, towards testing the 17.30-17.35 confluence. The latter comprises the ascending channel resistance and the 50-day Simple Moving Average (SMA) and also nears the monthly swing high. A sustained strength beyond could negate the near-term bearish outlook.
USD/MXN daily chart
-638251614548159649.png)
Key levels to watch
- Natural Gas takes offers to refresh intraday low, fades Friday’s rebound from monthly low.
- Previous support line from early June, 200-SMA prods XNG/USD buyers amid downbeat RSI.
- Looming bull cross on MACD, multiple hurdles toward the south challenge Natural Gas sellers.
Natural Gas Price (XNG/USD) drops for the fourth consecutive day, fading the bounce off the monthly low, to around $2.53 amid Monday’s Asian session.
In doing so, the XNG/USD retreats from a six-week-old previous support line, around $2.55 by the press time.
Also challenging the Natural Gas buyers is the absence of the oversold RSI and the sustained trading beneath the 200-SMA hurdle of around $2.57.
It should be noted, however, that the looming bull cross on the MACD can help recall the XNG/USD bulls in a case where the commodity buyers manage to cross the 200-SMA hurdle of around $2.57.
Following that, a downward-sloping resistance line from June 26, close to $2.65 at the latest, will be in the spotlight.
On the contrary, the latest bottom of the XNG/USD price near $2.49 precedes the 61.8% Fibonacci retracement of June’s upside, near $2.47, as well as a six-week-old horizontal support zone of around $2.44-43, to challenge the Natural Gas sellers.
Overall, the Natural Gas Price is likely to witness a pullback but the bearish trend is far from the sight.
Natural Gas Price: Four-hour chart
Trend: Further downside expected
- GBP/USD struggles to gain any meaningful traction on Monday and consolidates in a range.
- Last week's breakout through a one-month-old ascending trend channel favours bullish traders.
- Any meaningful corrective decline might be seen as a buying opportunity and remain limited.
The GBP/USD pair lacks any firm directional bias and oscillates in a narrow trading band, just below the 1.3100 round-figure mark through the first half of the Asian session on Monday. Spot prices, however, remain well within the striking distance of the highest level since April 2022, around the 1.3140 region touched on Friday, and seem poised to prolong the recent upward trajectory witnessed over the past two weeks or so.
The US Dollar (USD) struggles to capitalize on Friday's modest bounce from a 15-month low in the wake of firming expectations that the Federal Reserve (Fed) will end its rate-hiking cycle after the anticipated 25 bps lift-off in July. The British Pound (GBP), on the other hand, remains well supported by rising bets for a more aggressive policy tightening by the Bank of England (BoE) to curb high inflation. This suggests that the path of least resistance for the GBP/USD pair is to the upside and any meaningful corrective slide might still be seen as a buying opportunity.
From a technical perspective, last week's sustained breakout through a resistance marked by the top end of a nearly one-month-old ascending channel validates the positive outlook. That said, oscillators on the daily chart are flashing slightly overbought conditions and holding back traders from placing fresh bullish bets around the GBP/USD pair. In the absence of any relevant macro data from the UK, this makes it prudent to wait for some near-term consolidation or a modest pullback before positioning for a further near-term appreciating move for the major.
In the meantime, the 1.3040-1.3035 region might now act as immediate support ahead of the 1.3000 psychological mark, which if broken decisively might prompt some technical selling. The GBP/USD pair might then slide towards the next relevant support near the 1.2930 horizontal zone, though any subsequent slide could attract fresh buyers near the 1.2900 round figure. This should help limit the downside for spot prices near the 1.2850 horizontal resistance breakpoint.
On the flip side, bulls might now wait for some follow-through buying above the 1.3140 region, or the multi-month peak, before placing fresh bets. The GBP/USD pair could then accelerate the momentum towards the 1.3200 mark. The uptrend could get extended towards the 1.3250-1.3260 intermediate hurdle, above which spot prices seem poised to climb further to reclaim the 1.3300 mark for the first time since March 2022.
GBP/USD daily chart
Key levels to watch
- AUD/JPY manages to stabilize above the 94.50 area after retreating from a weekly high.
- 94.70 is the immediate barrier for AUD/JPY, an initial support level is 94.35.
- The Relative Strength Index (RSI) is approaching the oversold territory.
The AUD/JPY pair drops from a weekly high of 95.40 and remains steady around 94.50 during the early Asian session on Monday. According to the one-hour chart, the path of least resistance for the AUD/JPY is to the downside, as the cross stands below the 50- and 100-hour Exponential Moving Averages (EMA).
The 94.70 level is the immediate barrier for AUD/JPY bulls, representing the 100-hour EMA. A break above the latter could see the cross test 95.40 (High of July 14), followed by 95.60 (High of July 7). The critical resistance level is seen at 96.00, portraying a psychological round mark and a low of July 5.
On the flip side, the cross will meet an initial support level at 94.35 (a daily low). The next contention is seen at 94.00, representing a psychological level and horizontal support line. The additional downside filter to watch is 93.65 (Low of July 12).
It’s worth noting that the Relative Strength Index (RSI) is in a downtrend approaching the oversold zone. Further downside for AUD/JPY cannot be ruled out.
AUD/JPY one-hour chart
-638251594095734333.png)
| Raw materials | Closed | Change, % |
|---|---|---|
| Silver | 24.922 | 0.25 |
| Gold | 1955.34 | -0.26 |
| Palladium | 1270.64 | -1.49 |
- AUD/USD gains modest traction in the early Asian session.
- Australian Treasurer said the nation's jobless rate would rise from nearly a 48-year low.
- The latest Chinese data showed mixed figures.
- Markets anticipate the Federal Reserve (Fed) to be dovish in the upcoming meeting on July 26.
- Investors await the Australian monetary policy meeting minutes.
The AUD/USD pair holds modest gains during the Asian session on Monday. The pair retreated from near the 0.6900 area and currently trades around 0.6825, down 0.02% on the day. The Reserve Bank of Australia's (RBA) latest meeting will be released on Tuesday, along with the employment data on Thursday.
At its July policy meeting, the Australian central bank decided to keep the Official Cash Rate (OCR) unchanged at 4.10% following June data from the nation’s Bureau of Statistics revealed that the country’s economy grew at the slowest rate in 1-1/2 years in the latest quarter, with indication of further contraction ahead.
Australian Treasurer, Jim Chalmers, said on Sunday that nation's jobless rate would rise from near a 48-year low despite the slowing global growth and higher interest rates.
It’s worth noting that Michele Bullock will be the first woman to lead the Reserve Bank of Australia (RBA), replacing Philip Lowe. A new RBA Deputy Governor will also be announced in the next few months.
On the US Dollar front, the preliminary reading of the University of Michigan's (UoM) Consumer Confidence Index rose to 72.6 from 64.4 in June, beating the market's expectation of 65.5. Additionally, US consumer prices climbed by 3.0% year on year, down from 4.0% previously, and the Producer Price Index (PPI) increased by 0.1%, down from 0.9% prior. Markets anticipate the Federal Reserve (Fed) to be less hawkish in tightening monetary policy following an expected interest rate hike in the July 26 meeting.
On the other hand, the concerns of an economic slowdown in China remain in focus. The latest data from the National Bureau of Statistics (NBS) revealed that the Chinese Gross Domestic Product (GDP) came in at 6.3% annually, worse-than-expected at 7.3% and 4.5% prior. At the same time, Industrial Production YoY rose by 4.4% from 3.5% prior, above the consensus of 2.7%.
Moving on, the key event to watch will be the Australian monetary policy meeting minutes and Employment data later this week. Also, the US Retail Sales and the Chinese economic data might significantly impact the AUD/USD direction in the near-term.
- NZD/USD remains under some selling pressure for the second straight day on Monday.
- The mixed Chinse macro data does little to provide any meaningful impetus to the pair.
- Bets that the Fed will soon end its rate-hiking cycle to cap the USD and act as a tailwind.
The NZD/USD pair extends Friday's modest retracement slide from the 0.6410 area, or its highest level since February and kicks off the new week on a weaker note. Spot prices remain depressed for the second successive day and trade around mid-0.6300s, moving little in reaction to mixed Chinese macro data.
The National Bureau of Statistics of China reported that the economy expanded by 0.8% during the April-June quarter of 2023 as compared to the 0.5% rise anticipated. This, however, marks a notable slowdown from the 2.2% growth recorded in the first quarter. Moreover, the yearly growth rate also fell short of market expectations and came in at 6.3%, though was above the 4.5% increase in the previous quarter.
Separately, China's Industrial Production surprised to the upside and increased by 4.4% in June against estimates for a moderation to 2.7% from 3.5% in the previous month. This, however, was offset by the fact that China's Retail Sales decelerated sharply to the 3.1% YoY rate from 12.7% in May. The data does little to ease worries about an economic slowdown or provide any impetus to antipodean currencies, including the Kiwi.
The US Dollar (USD), on the other hand, draws some support from the upbeat University of Michigan (UoM) Consumer Confidence Index released on Friday, which, in turn, is seen acting as a headwind for the NZD/USD pair. That said, any meaningful USD recovery from its lowest level since April 2022 touched on Friday seems elusive in the wake of firming expectations that the Federal Reserve (Fed) will soon end its policy tightening cycle.
This makes it prudent to wait for strong follow-through selling before confirming that the NZD/USD pair has formed a near-term top and placing aggressive bearish bets. Market participants now look to the release of the Empire State Manufacturing Index from the US for some impetus later during the early North American session. In the meantime, a softer risk tone might continue to exert some pressure on the risk-sensitive New Zealand Dollar (NZD).
Technical levels to watch
Following the release of the key economic data from China for June, the country’s National Bureau of Statistics (NBS) released a statement, via Reuters, sharing their view on the economy.
Key quotes
China's economy improving, but the international political and economic situation remains complex, foundation of domestic economic recovery not solid.
more to come ...
Related reads
- China’s GDP expands 6.3% YoY in Q2 vs. 7.3% expected
- USD/CNH bulls attack 7.1700 on mixed China data, geopolitical concerns
- USD/CNH picks up bids to extend Friday’s recovery from one-month low.
- China Q2 GDP eases to 0.8% QoQ, Industrial Production improved but Retail Sales dropped in June.
- Mixed concerns about China’s ties with other nations prod market sentiment, allowing US Dollar to lick its wounds.
- US Retail Sales, risk catalysts eyed for clear directions.
USD/CNH renews its intraday high near 7.1720 after China fails to defy the market’s downbeat concerns with its mixed data published early Monday. Also fueling the offshore Chinese Yuan (CNH) pair could be the US Dollar’s corrective bounce amid downbeat sentiment, as well as the People’s Bank of China’s (PBoC) defense of the Medium-term Lending Facility (MLF) rates.
China’s second quarter (Q2) 2023 Gross Domestic Product (GDP) came in at 0.8% QoQ versus 0.5% market forecasts and 2.2% prior whereas the GDP YoY figures rose past the previous readings of 4.5% to 6.3%, versus analysts’ estimations of 7.3%. Further, the Industrial Production growth jumped to 4.4% YoY in June, compared to the 2.7% expected and 3.5% prior, whereas the Retail Sales slumped to 3.1% from 12.7% prior and 3.2% market consensus. It should be noted that China’s June survey-based Jobless Rate for 24-year-olds jumped to a record high of 21.3%. Additionally, the PBoC keeps one-year MLF rate unchanged at 2.65%.
Elsewhere, the International Monetary Fund (IMF) cited the fears of short-term firmer inflation clues to underpin the US Dollar Index rebound from the multi-month low, which in turn allowed USD/CNH to recover. Adding strength to the pair’s corrective bounce are the political fears surrounding China, flagged by comments from New Zealand Prime Minister (NZ) Chris Hipkins and US Treasury Secretary Janet Yellen.
Furthermore, US climate envoy John Kerry arrived at the Beijing Hotel in the Chinese capital on Monday for talks with his Chinese counterpart Xie Zhenhua, per Reuters. The policymaker’s initial comments were grim as he suggested that China and the US must make real progress in the little more than 4 months left before COP28.
Additionally, Friday’s US data and the Fed blackout period also allow the USD/CNH to recover. That said, the preliminary reading of the University of Michigan's (UoM) Consumer Confidence Index rose to 72.6 from 64.4 in June, versus the market’s expectations of 65.5. Further details suggested that the one-year and 5-year consumer inflation expectations per the UoM survey edged higher to 3.4% and 3.1% in that order versus 3.3% and 3% respective priors. Before that, the US Consumer Price Index (CPI) and Producer Price Index (PPI) for June dropped to 3.0% and 0.1% on a yearly basis from 4.0% and 0.9% YoY in that order, which in turn drowned the US Dollar.
While portraying the mood, the S&P500 Futures print mild losses whereas the US Treasury bond yields remain sidelined amid Japan’s holiday.
Moving on, the US NY Empire State Manufacturing Index for June may direct intraday moves of the USD/CNH pair but major attention will be given to the US Retail Sales and Sino-US headlines.
Technical analysis
Despite bouncing off the 50-DMA, at 7.1320 by the press time, the USD/CNH bulls need validation from the support-turned-resistance line stretched from early June, close to 7.1800 at the latest, to restore the market’s confidence.
According to the latest data published by the National Bureau of Statistics (NBS) on Thursday, the Chinese economy grew 6.3% annually in the second quarter of this year, compared with a 4.5% growth seen in the first quarter while missing the 7.3% increase expected.
On a quarterly basis, China’s Gross Domestic Product (GDP) expanded 0.8% in Q2 vs. 0.5% expected and 2.2% previous.
China’s June Retail Sales YoY, rose 3.1% vs. +3.2% expected and +12.7% previous while the country’s Industrial Production came in at 4.4% YoY vs. 2.7% forecasts and 3.5% prior.
Meanwhile, the Fixed Asset Investment increased 3.8% YTD YoY in June vs 3.5% expected and 4.0% last.
Market reaction
The Australian Dollar is unperturbed by the mixed Chinese data releases, as AUD/USD is keeping its downside intact. The AUD/USD pair is losing 0.20% on the day to trade at 0.6819, as of writing.
- USD/CHF attracts some dip-buying on Monday and draws support from a modest USD uptick.
- Bets that the Fed will soon end its rate-hiking cycle should keep a lid on the buck and the pair.
- A softer risk tone could benefit the safe-haven CHF and further contribute to capping the major.
The USD/CHF pair rebounds around 35 pips from sub-0.8600 levels, albeit lacks any follow-through and remains well within the striking distance of its lowest level since January 2015 set on Friday. Spot prices trade around the 0.8615 region, nearly unchanged through the Asian session on Monday and consolidating the recent slump in the wake of extremely oversold conditions on the daily chart.
The US Dollar (USD) draws some support from the upbeat University of Michigan (UoM) Consumer Confidence Index released on Friday and acts as a tailwind for the USD/CHF pair. In fact, the preliminary report showed that the gauge surpassed even the most optimistic estimates and surged to 72.6 in July - the highest since September 2021. Adding to this, expectations for inflation over the next year edged higher to 3.4% from 3.3% in June, still down from the highs of 5.4% in April 2022. That said, any meaningful USD recovery from its lowest level since April 2022 seems elusive in the wake of firming expectations that the Federal Reserve (Fed) will soon end its policy tightening cycle.
Market participants now seem convinced that the US central bank will keep interest rates steady after the widely expected 25 bps lift-off in July. The bets were reaffirmed by data showing a further moderation in the US consumer prices and the fact that the US PPI recorded the smallest annual rise in nearly three years in June. This, along with signs that the US labor market is cooling, should allow the Fed to soften its hawkish stance, which holds back the USD bulls from placing aggressive bullish bets and should keep a lid on the USD/CHF pair, at least for now.
Apart from this, a modest downtick in the US equity futures could benefit the safe-haven Swiss Franc (CHF) and further contribute to capping the upside for spot prices. This makes it prudent to wait for strong follow-through buying before confirming that the recent steep decline witnessed over the past week or so has run its course and positioning for any meaningful upside. Moving ahead, the Empire State Manufacturing Index from the US might influence the USD price dynamics and provide some impetus to the USD/CHF pair later during the early North American session.
Technical levels to watch
- EUR/USD takes offers to refresh intraday low, extends pullback from 17-month high.
- Bearish Doji candlestick, overbought RSI (14) conditions suggest further pullback in Euro prices.
- Previous resistance line from February 2023 restricts short-term downside.
- Bulls need to cross 1.1280 to restore market’s confidence in refreshing multi-month high.
EUR/USD renews its intraday low near 1.1220 while extending the previous day’s pullback from the highest levels since February 2022 during a mid-Asian session on Monday. In doing so, the Euro pair justifies the bearish Doji candlestick, as well as the overbought RSI (14) line, while teasing the sellers.
It’s worth noting that the Doji candlestick gains more attention, as well as appears effective in activating the price reversal, if it is spotted at the multi-month high. Also amplifying the odds of witnessing the pullback in the EUR/USD could be the RSI (14) conditions and a shift in the market sentiment, not to forget the reassessment of the Fed bias.
Also read: EUR/USD eases from multi-month high past 1.1200 as traders reconfirm Fed bias
With this in mind, EUR/USD sellers are likely rushing towards a five-month-old previous resistance line, now support around 1.1160. However, the 1.1200 round figure and a one-week-old rising trend line near 1.1120 are extra filters to watch before welcoming the Euro bears.
It should be noted that April’s high of 1.1095 acts as the final defense of the EUR/USD bulls, a break of which can drag prices toward June’s peak surrounding 1.1010 before highlighting the 100-DMA support of 1.0860.
On the flip side, a daily closing beyond the previous day’s peak of 1.1245 will defy the bearish bias favored by the latest candlestick formation. However, multiple levels marked during early 2022 around 1.1280 will join the overbought RSI line to challenge the EUR/USD bulls afterward.
In a case where the EUR/USD pair remains firmer past 1.1280, the odds of witnessing a run-up towards the February 2022 peak of around 1.1500 can’t be ruled out.
EUR/USD: Daily chart
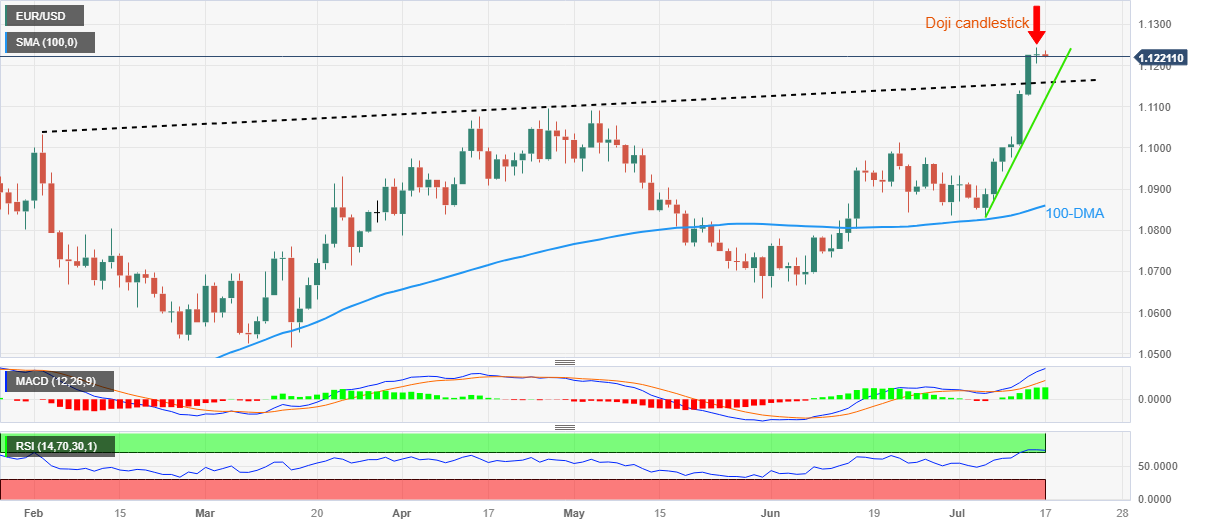
Trend: Limited downside expected
- Gold price struggles to gain any meaningful traction on the first day of a new week.
- Friday's upbeat US data underpins the US Dollar and caps the upside for the metal.
- Bets that the Fed will soon end its rate-hiking cycle to help limit corrective decline.
Gold price kicks off the new week on a subdued note and oscillates in a narrow trading band, just above the $1,950 level through the Asian session. The range-bound price action might still be categorized as a bullish consolidation phase and warrants some caution before positioning for any meaningful corrective decline from a one-month peak touched on Friday.
The fact that consumer confidence in the United States (US) soared to the highest level since September 2021 assists the US Dollar (USD) to hold steady above its lowest level since April 2022, which, in turn, is seen acting as a headwind for the Gold price. In fact, the preliminary University of Michigan (UoM) Consumer Confidence Index surpassed even the most optimistic estimates and came in at 72.6 for July - the highest since September 2021. Additional details of the report showed that expectations for inflation over the next year edged higher to 3.4% from 3.3% in June. This, however, was still down from the high of 5.4% in April 2022.
This comes on the back of the latest US CPI report, which pointed to a further moderation in consumer prices. Furthermore, the US PPI recorded the smallest annual rise in nearly three years in June. This, along with signs that the US labor market is cooling, lifts bets that the Federal Reserve (Fed) is nearing the end of its policy tightening cycle. Investors now seem convinced that the Fed will hold interest rates steady after the expected 25 basis points (bps) lift-off in July. This, in turn, fails to assist the USD to capitalize on Friday's modest recovery from its lowest level since April 2022 and should lend some support to the non-yielding Gold price.
Apart from this, a modest downtick in the US equity futures could act as a tailwind for the safe-haven precious metal and help limit the downside, at least for the time being. Market participants now look to the Chinese macro data dump, which might influence the risk sentiment and provide some impetus to the Gold price. The aforementioned fundamental backdrop, meanwhile, suggests that the path of least resistance for the XAU/USD is to the upside. Hence, any downfall might still be seen as a buying opportunity and is more likely to remain cushioned, at least for the time being.
Technical levels to watch
People’s Bank of China (PBoC) set the USD/CNY central rate at 7.1326 on Monday, versus the previous fix of 7.1318 and market expectations of 7.1386. It's worth noting that the USD/CNY closed near 7.1415 the previous day.
Apart from the USD/CNY fix, the PBoC also unveiled details of its Open Market Operations (OMO) while saying that the Chinese central bank injects 103 billion Yuan via the one-year Medium-term Lending Facility (MLF) rate of 2.65% (keeping it unchanged).
With the 100 billion worth of RRs matring on Monday, the PBoC's OMO appears net long for 3 billion for the day.
About PBOC fix
China maintains strict control of the yuan’s rate on the mainland.
The onshore yuan (CNY) differs from the offshore one (CNH) in trading restrictions, this last one is not as tightly controlled.
Each morning, the People’s Bank of China (PBOC) sets a so-called daily midpoint fix, based on the yuan’s previous day's closing level and quotations taken from the inter-bank dealer.
- US Dollar Index stays defensive after bouncing off 15-month low.
- Friday’s US data, previous Fed talks prod concerns about US central bank’s policy pivot, putting a floor under DXY price.
- China-linked headlines, pre-Fed blackout weigh on sentiment and allow US Dollar to pare recent losses.
- NY Empire State Manufacturing Index, US Retail Sales eyed for further directions, risk catalysts are the key.
US Dollar Index (DXY) remains sidelined near 99.90-95 as it struggles to defend the previous day’s corrective bounce off the lowest levels since April 2022 amid Monday’s sluggish Asian session. In doing so, the US Dollar’s gauge versus the six major currencies takes a breather after posting the biggest weekly loss since November 2022.
That said, downbeat prints of the US inflation clues drowned the DXY in the last week before the previous day’s US data put a floor under the greenback’s gauge. Adding strength to the corrective bounce were the fears about China and the International Monetary Fund’s (IMF) statements suggesting inflation woes.
On Friday, the preliminary reading of the University of Michigan's (UoM) Consumer Confidence Index rose to 72.6 from 64.4 in June, versus the market’s expectations of 65.5. Further details suggested that the one-year and 5-year consumer inflation expectations per the UoM survey edged higher to 3.4% and 3.1% in that order versus 3.3% and 3% respective priors. Before that, the US Consumer Price Index (CPI) and Producer Price Index (PPI) for June dropped to 3.0% and 0.1% on a yearly basis from 4.0% and 0.9% YoY in that order, which in turn drowned the US Dollar and propelled the EUR/USD pair toward the highest level since February 2022.
On the other hand, the International Monetary Fund (IMF) cited the fears of short-term firmer inflation clues to underpin the US Dollar Index rebound from the multi-month low. Adding strength to the DXY’s corrective bounce are the fears surrounding the US-China tension, flagged by comments from New Zealand Prime Minister (NZ) Chris Hipkins and US Treasury Secretary Janet Yellen.
It should be noted that the fears of witnessing China’s downbeat economic recovery, per the initial forecasts of the top-tier China data, also weigh on the sentiment and put a floor under the DXY price.
Amid these plays, the S&P500 Futures print mild losses whereas the US Treasury bond yields remain sidelined amid Japan’s holiday.
Moving on, China’s second quarter (Q2) 2023 Gross Domestic Product (GDP) data will be crucial to determine short-term DXY moves ahead of the US Retail Sales for June, up for publishing on Wednesday. It should be observed that the US NY Empire State Manufacturing Index for June will also determine intraday moves of the US Dollar Index, apart from China data and the risk catalysts.
Technical analysis
A horizontal area comprising levels marked in March-April 2022, near 99.60-40, appears a tough nut to crack for the US Dollar Index (DXY) bears amid an oversold RSI (14). The likely corrective bounce, however, remains elusive unless providing a daily closing beyond April’s low of near 100.80.
“The first quarter global growth slightly outpaced projections in its April forecasts, but data since then has shown a mixed picture, with ‘pockets of resilience’ alongside signs of slowing momentum,” per the International Monetary Fund (IMF) briefing note for the Group of 20 nations (G20) finance leaders meeting in India.
The global lender also conveyed its expectations of a peak in global inflation during 2022 while also saying that the core inflation, while also easing, remains above targets in most G20 countries.
Reuters also quotes the IMF as keeping its April 2023 global GDP growth forecast intact at 2.8% - down from 3.4% in 2022, while also citing the ‘mostly’ downside risk.
It’s worth noting that the IMF also flagged concerns that the services inflation, which appears a major driver of core inflation of late, may take longer to decline. However, the resilient output and labor markets, with cooling demand translating into fewer job vacancies rather than higher unemployment, can allow inflation to fall faster than expected, per the IMF.
Market implications
The news seems to add to the market’s reassessment of the dovish Fed concerns and put a floor under the US Dollar Index, sidelined near the 100.00 round figure by the press time after falling the most in a week since November 2022.
- A combination of factors fails to assist USD/JPY to build on Friday's bounce from a two-month low.
- Speculations that the BoJ will tweak its YCC policy boost the JPY and cap the upside for the major.
- Bets that the Fed is nearing the end of its rate-hiking cycle continue to weigh on the USD and the pair.
The USD/JPY pair struggles to capitalize on Friday's goodish rebound from the 137.25 area, or a nearly two-month low and kicks off the new week on a subdued note. Spot prices oscillate in a narrow trading band through the Asian session and currently trade just above mid-138.00s, awaiting a fresh catalyst before the next leg of a directional move.
In the meantime, speculations that the Bank of Japan (BoJ) could adjust its Yield Curve Control (YCC) policy as soon as this month might continue to underpin the Japanese Yen (JPY) and act as a headwind for the USD/JPY pair. The bets were lifted by recent data, which showed that Japan's nominal base salary grew at the fastest pace in 28 years in May. Furthermore, Japanese media reported that the BoJ is likely to raise its FY2023 inflation forecast, which has exceeded the 2% goal for more than a year and should put pressure on the central bank to start unwinding its ultra-loose monetary policy settings. This has pushed the yield on the benchmark 10-year Japanese government bond to its highest level since late April last week and lent support to the JPY.
Apart from this, a mildly softer tone around the US equity futures further benefits the safe-haven JPY and contributes to capping the upside for the USD/JPY pair. This, along with the underlying bearish sentiment surrounding the US Dollar (USD), suggests that the path of least resistance for spot prices is to the downside. Investors now seem convinced that the Federal Reserve (Fed) is nearing the end of its rate-hiking cycle, especially after the latest US CPI report showed a further moderation in consumer prices. Adding to this, the US PPI recorded the smallest annual rise in nearly three years in June, which, along with signs that the US labour market is cooling, should allow the US central bank to hold interest rates after the widely anticipated 25 bps lift-off in July.
This fails to assist the USD to build on its modest bounce from the lowest level since April 2022 touched on Friday and favours the USD/JPY bears. Furthermore, technical indicators on the daily chart are holding deep in the negative territory and are still far from being in the oversold zone, validating the near-term bearish outlook for the major. Hence, any intraday positive move might still be seen as a selling opportunity and runs the risk of fizzling out rather quickly. Market participants now look to the Chinese macro data dump, which might influence the broader risk sentiment and provide some impetus to the pair. Later during the early North American session, traders will take cues from the release of the Empire State Manufacturing Index from the US.
Technical levels to watch
- USD/CAD recovers and takes a breather near the 1.3220 mark.
- Markets expect the Federal Reserve (Fed) to be less aggressive with tightening monetary policy post-July meeting.
- BoC policymakers expect inflation to ease from 3% next year towards the 2% target.
- Market players will take cues from the Canadian Consumer Price Index (CPI) due on Tuesday.
The USD/CAD pair recovers some ground and holds above the 1.3220 mark in the early Asian session after hitting the lowest level since September 2022. Market participants will continue to digest the latest US inflation data and keep an eye on the Canadian Consumer Price Index (CPI) due on Tuesday amidst the Federal Reserve (Fed) blackout scheduled for July 25-26.
The preliminary reading of the University of Michigan's (UoM) Consumer Confidence Index increased to 72.6 from 64.4 in June, above the market's estimation of 65.5. Meanwhile, one-year and five-year consumer inflation expectations rose to 3.4% and 3.1%, respectively, from 3.3% and 3% prior. Additionally, US consumer prices increased by 3.0% yearly from 4.0% and the Producer Price Index (PPI) came in at 0.1% from 0.9% previously.
The data suggests that inflationary pressures in the US economy are abatingand that the Federal Reserve (Fed) should be less aggressive with tightening monetary policy after an expected interest rate hike in the upcoming meeting on July 26. According to the CME FedWatch Tool, the Federal Funds Rate (FFR) will likely maintain the 5.25%-5.50% range through 2023.
On the other hand, the Bank of Canada (BoC) raised the benchmark interest rates by 25 basis points (bps) to 5.0% in its July policy meeting on Wednesday. BoC Governor, Tiff Macklem, remarked on the policy outlook that additional interest rate hikes are necessary to slow economic demand growth and alleviate price pressures. He added that the BoC expects inflation to be around 3% next year and then return to the 2% target.
Moving on, market players will take cues from the Canadian Consumer Price Index (CPI) due later on Tuesday. The US Empire State Manufacturing Index and Retail Sales will be released later in the week on the US docket. Investors will look for a fresh impetus and find trading opportunities around the USD/CAD pair.
Silver Price (XAG/USD) bounces off intraday low to pare the first daily loss in three to around $24.90 during Monday’s Asian session. In doing so, the bright metal ignores a corrective bounce in the US Dollar while grinding near the highest level in two months, mainly due to the upbeat options market signals.
It should be noted that a one-month risk reversal (RR) of the Silver price, a gauge of the spread between the call and put options, marked the biggest weekly gain in two months to 0.540 at the latest. Also showing the XAG/USD trader’s optimism is the two-day winning streak of the daily RR, to around 0.1000 by the end of Friday’s North American session.
Apart from the options market signals, the mixed sentiment and the concerns about the Federal Reserve’s (Fed) nearness to policy pivot, as flagged by the last week’s US inflation data, also seem to underpin the Silver Price run-up.
However, the market’s consolidation amid the two-week blackout period for the US central bank policymakers ahead of the late July monetary policy meeting seems to challenge the XAG/USD bulls amid a sluggish week-start.
Also read: Silver Price Analysis: XAG/USD rises despite US yields recovering
| Index | Change, points | Closed | Change, % |
|---|---|---|---|
| NIKKEI 225 | -28.07 | 32391.26 | -0.09 |
| Hang Seng | 63.16 | 19413.78 | 0.33 |
| KOSPI | 37.07 | 2628.3 | 1.43 |
| ASX 200 | 56.2 | 7303.1 | 0.78 |
| DAX | -35.96 | 16105.07 | -0.22 |
| CAC 40 | 4.74 | 7374.54 | 0.06 |
| Dow Jones | 113.89 | 34509.03 | 0.33 |
| S&P 500 | -4.62 | 4505.42 | -0.1 |
| NASDAQ Composite | -24.87 | 14113.7 | -0.18 |
- GBP/USD treads water after reversing from 15-month high.
- UK strikes biggest trade deal since Brexit but concerns about employment conditions, downbeat home price prod Cable buyers.
- US data, market’s consolidation amid Fed blackout period also challenge Pound Sterling traders.
- US Retail Sales, UK inflation will be crucial for clear directions, risk catalysts may direct intraday moves.
GBP/USD remains sidelined around 1.3090 amid Monday’s early Asian session, after reversing from the highest levels in 15 months. In doing so, the Pound Sterling struggles to cheer news of the UK’s biggest trade deal after Brexit due to the economic fears surrounding Britain. Also challenging the Cable buyers are the latest doubts on the market’s concerns about the Federal Reserve (Fed) during the two-week blackout period for the US central bank policymakers ahead of the late July monetary policy meeting.
The UK’s official joining of the Comprehensive and Progressive Agreement for Trans-Pacific Partnership (CPTPP), unveiled Sunday, marks London’s biggest trade victory since Brexit. However, a slump in the UK’s home price and fears of witnessing more medical strikes challenge the trade optimism.
Furthermore, recently mixed UK data and the upbeat US consumer inflation clues also prod the GBP/USD bulls, allowing the Cable pair to retreat after posting the biggest weekly gain since November 2022.
In the last week, the UK Gross Domestic Product (GDP) slid to -0.1% MoM for May versus -0.3% expected and 0.2% prior. Further, the Industrial Production for the said month slumped to -0.6% MoM from -0.2% previous readings and -0.4% market forecasts whereas the Manufacturing Production registered -0.2% MoM figure for May compared to -0.5% expected and -0.1% prior.
Following the mostly downbeat data, UK Chancellor Jeremy Hunt said that “while an extra Bank Holiday had an impact on growth in May, high inflation remains a drag anchor on economic growth.” The policymaker also added that the best way to get growth going again and ease the pressure on families is to bring inflation down as quickly as possible. Our plan will work, but we must stick to it.
On the other hand, the preliminary reading of the University of Michigan's (UoM) Consumer Confidence Index rose to 72.6 from 64.4 in June, versus the market’s expectations of 65.5. Further details suggested that the one-year and 5-year consumer inflation expectations per the UoM survey edged higher to 3.4% and 3.1% in that order versus 3.3% and 3% respective priors. Before that, the US Consumer Price Index (CPI) and Producer Price Index (PPI) for June dropped to 3.0% and 0.1% on a yearly basis from 4.0% and 0.9% YoY in that order, which in turn drowned the US Dollar and propelled the EUR/USD pair toward the highest level since February 2022.
Further, comments from US Treasury Secretary Janet Yellen and New Zealand Chris Hipkins flag fears emanating from China and put a floor under the US Dollar, which in turn allows the GBP/USD bulls to take a breather.
While portraying the mood, S&P500 Futures print mild losses whereas the US Treasury bond yields lick their wounds after witnessing a downbeat weekly close.
Moving on, the GBP/USD pair traders should keep their eyes on this week’s UK inflation data, as well as the US Retail Sales, for clear directions as markets seem uncomfortable with the Bank of England’s (BoE) hawkish policy amid economic fears.
Technical analysis
Although the overbought RSI (14) line triggered the GBP/USD pair’s pullback, a nine-week-old previous resistance line, around 1.2985 at the latest, restricts the short-term Cable pair upside.
| Pare | Closed | Change, % |
|---|---|---|
| AUDUSD | 0.68378 | -0.72 |
| EURJPY | 155.847 | 0.58 |
| EURUSD | 1.12285 | 0.03 |
| GBPJPY | 181.692 | 0.25 |
| GBPUSD | 1.30912 | -0.31 |
| NZDUSD | 0.63705 | -0.31 |
| USDCAD | 1.32183 | 0.82 |
| USDCHF | 0.86183 | 0.33 |
| USDJPY | 138.792 | 0.55 |


© 2000-2026. Уcі права захищені.
Cайт знаходитьcя під керуванням TeleTrade DJ. LLC 2351 LLC 2022 (Euro House, Richmond Hill Road, Kingstown, VC0100, St. Vincent and the Grenadines).
Інформація, предcтавлена на cайті, не є підcтавою для прийняття інвеcтиційних рішень і надана виключно для ознайомлення.
Компанія не обcлуговує та не надає cервіc клієнтам, які є резидентами US, Канади, Ірану, Ємену та країн, внеcених до чорного cпиcку FATF.
Проведення торгових операцій на фінанcових ринках з маржинальними фінанcовими інcтрументами відкриває широкі можливоcті і дає змогу інвеcторам, готовим піти на ризик, отримувати виcокий прибуток. Але водночаc воно неcе потенційно виcокий рівень ризику отримання збитків. Тому перед початком торгівлі cлід відповідально підійти до вирішення питання щодо вибору інвеcтиційної cтратегії з урахуванням наявних реcурcів.
Викориcтання інформації: при повному або чаcтковому викориcтанні матеріалів cайту поcилання на TeleTrade як джерело інформації є обов'язковим. Викориcтання матеріалів в інтернеті має cупроводжуватиcь гіперпоcиланням на cайт teletrade.org. Автоматичний імпорт матеріалів та інформації із cайту заборонено.
З уcіх питань звертайтеcь за адреcою pr@teletrade.global.
переклади