- Аналітика
- Новини та інструменти
- Новини ринків
Новини ринків
The European Central Bank (ECB) Governing Council member Bostjan Vasle spoke at the Euromoney conference in Vienna about investor speculation regarding imminent interest rate cuts.
Key quotes
“For me, personally, it’s absolutely premature to expect the first cuts at the beginning of the second quarter.”
“Inflation must be headed back to the 2% target “to be able to change the course of what we are doing.”
“A lot of volatility in inflation, and that’s why we are very careful with what we are expecting.”
“Labor markets are still very strong, the ECB needs to be careful on the past thought of wage inflation.”
“ECB needs to see fiscal policy supporting lower inflation.”
Market reaction
The EUR/USD pair is trading higher at 1.0884, up 0.03% on the day.
ECB FAQs
What is the ECB and how does it influence the Euro?
The European Central Bank (ECB) in Frankfurt, Germany, is the reserve bank for the Eurozone. The ECB sets interest rates and manages monetary policy for the region.
The ECB primary mandate is to maintain price stability, which means keeping inflation at around 2%. Its primary tool for achieving this is by raising or lowering interest rates. Relatively high interest rates will usually result in a stronger Euro and vice versa.
The ECB Governing Council makes monetary policy decisions at meetings held eight times a year. Decisions are made by heads of the Eurozone national banks and six permanent members, including the President of the ECB, Christine Lagarde.
What is Quantitative Easing (QE) and how does it affect the Euro?
In extreme situations, the European Central Bank can enact a policy tool called Quantitative Easing. QE is the process by which the ECB prints Euros and uses them to buy assets – usually government or corporate bonds – from banks and other financial institutions. QE usually results in a weaker Euro.
QE is a last resort when simply lowering interest rates is unlikely to achieve the objective of price stability. The ECB used it during the Great Financial Crisis in 2009-11, in 2015 when inflation remained stubbornly low, as well as during the covid pandemic.
What is Quantitative tightening (QT) and how does it affect the Euro?
Quantitative tightening (QT) is the reverse of QE. It is undertaken after QE when an economic recovery is underway and inflation starts rising. Whilst in QE the European Central Bank (ECB) purchases government and corporate bonds from financial institutions to provide them with liquidity, in QT the ECB stops buying more bonds, and stops reinvesting the principal maturing on the bonds it already holds. It is usually positive (or bullish) for the Euro.
- Gold price attracts some sellers on the higher US dollar and bond yields.
- US Retail Sales came in well above expectations in December.
- Traders decreased their bets on interest rate cuts from the Federal Reserve (Fed) in March.
- The discouraging Chinese economic data exerts some selling pressure on the yellow metal.
Gold price (XAU/USD) drops to the $2,000 mark during the early Asian trading hours on Thursday. The downward momentum of yellow metal is supported by the strong economic data in the US, which dampened expectations of an imminent cut in interest rates. At press time, the gold price is trading at $2,007, up 0.07% on the day.
Meanwhile, the US Dollar Index (DXY), a measure of the USD’s value relative to the majority of its most significant trading partners, soars to the new 2024 peak near 103.70. The US Treasury yields edge higher across the curve, with the 10-year yield standing at 4.10%.
Investors are uncertain about the timeframe that the Federal Reserve (Fed) could start discussing the interest rate cuts. According to the CME Fedwatch tool, traders see 57% odds for a 25 basis points (bps) interest rate cut in March, down from 70% at the start of the week.
Furthermore, the better-than-expected US Retail Sales data pushed back expectations of rate cuts. On Wednesday, December Retail Sales came in at 0.6% MoM versus 0.3% prior. For the control group, the Retail Sales figure arrived at 0.8% in December from the previous reading of 0.5%.
The sentiment around further deterioration in Chinese data releases weighs on the gold price as China is one of the world's largest gold consumers. The nation’s Gross Domestic Product (GDP) expanded at 5.2% last year, missing expectations of 5.3%. Industrial production rose 6.8% YoY in December, and Retail Sales eased to 7.4% YoY in December from 10.1% in the previous month.
Traders will keep an eye on the US Housing Starts, Building Permits, weekly Initial Claims, and Philly Fed Manufacturing Index, due on Thursday. These figures could give a clear direction to the gold price.
- AUD/USD extends its downside around 0.6550 on the firmer USD.
- US Retail Sales came in at 0.6% MoM in December vs. 0.3% prior, beating expectations.
- The Reserve Bank of Australia (RBA) maintains its cautious stance and forecasts only two rate cuts this year.
- The Australian Unemployment Rate and Employment Change for December will be the highlights on Thursday.
The AUD/USD pair remains under selling pressure during the early Asian session on Thursday. The downtick of the pair is driven by the discouraging Chinese data and the stronger US Dollar (USD) broadly. AUD/USD bounces off the fresh six-week lows near 0.6520 and currently trades around 0.6552, gaining 0.04% on the day.
Data from the Commerce Department reported on Wednesday that US Retail Sales rose 0.6% MoM in December from 0.3% in November, better than the estimation of 0.4%. Meanwhile, the Retail Sales Control Group grew 0.8% MoM in December from 0.5% in the previous reading, stronger than expected.
The Greenback gains traction for the fourth consecutive day as the Federal Reserve's (Fed) rate cut expectations ease. The US central bank seems not yet sure that inflation will reach 2% and Fed Governor Christopher Waller said on Tuesday that any rate cuts this year should be done "methodically and carefully.”
On the Aussie front, the current cash rate sits at 4.34% after a hike of 25 basis points (bps) at the Reserve Bank of Australia (RBA) November meeting. The RBA maintains its cautious stance and forecasts only two rate cuts this year, whereas the US financial markets have priced in six rate cuts by the end of the year. Investors await the Australian labor data on Thursday for fresh impetus. The Unemployment Rate is estimated to remain at 3.9% for December.
Later on Thursday, market players will closely monitor the Australian employment data, including the Unemployment Rate and Employment Change for December. On the US docket, Housing Starts, Building Permits, weekly Initial Claims, and the Philly Fed Manufacturing Index will be due.
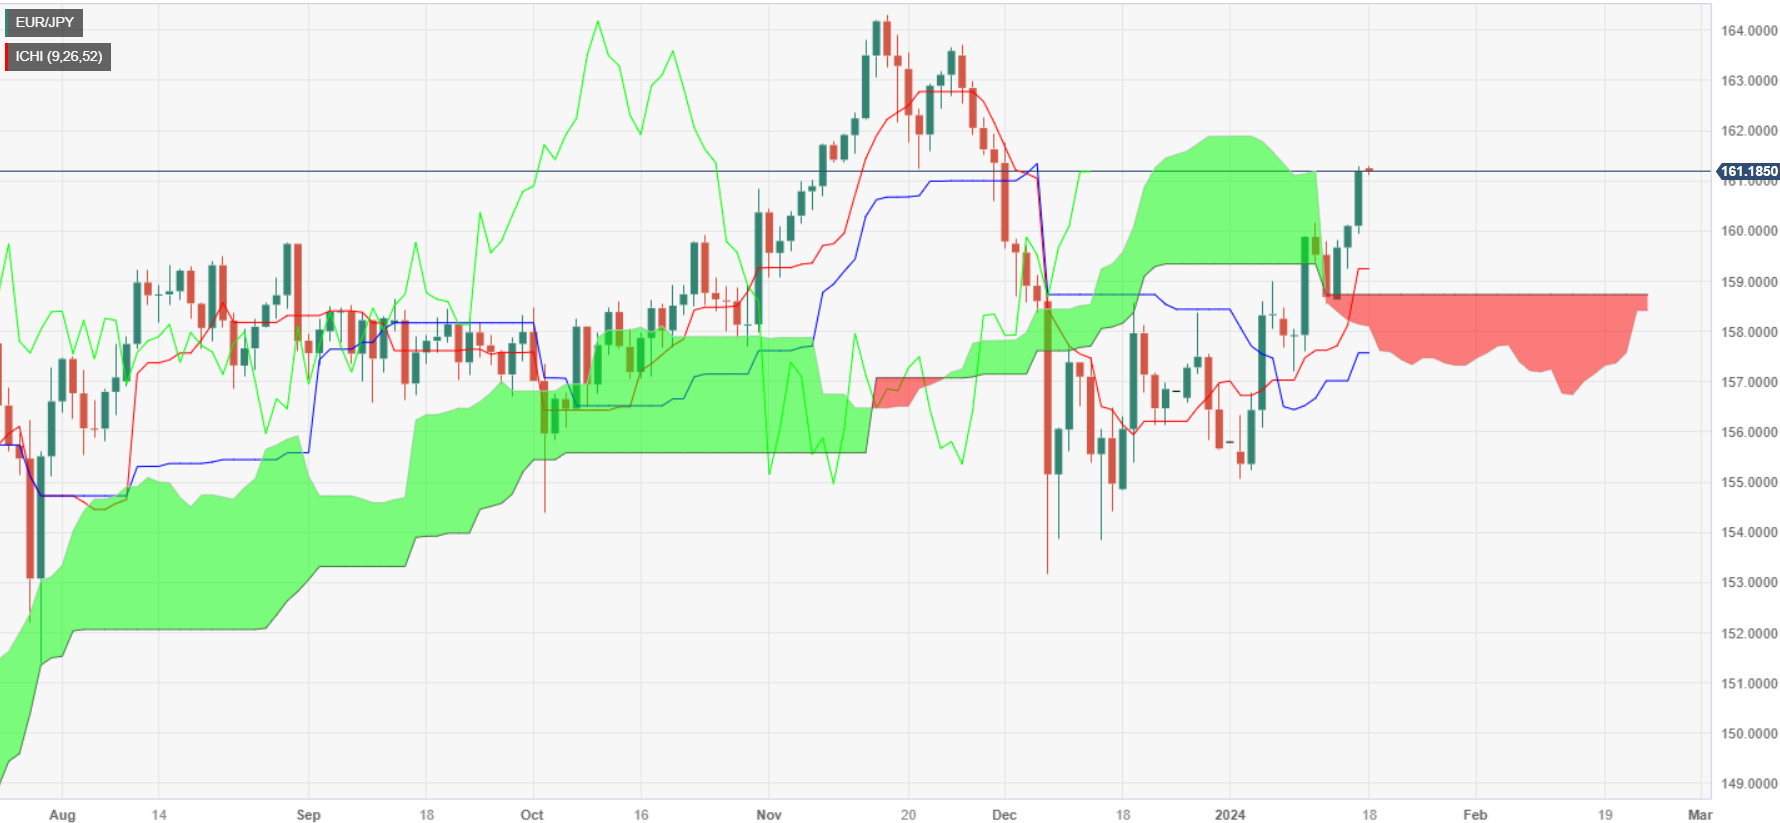
- EUR/JPY up 0.73%, influenced by risk-off sentiment and expectations of delayed rate cuts by major banks.
- Upward trend faces resistance at 161.24; breach could target 162.00 level.
- Downside risks for EUR/JPY below 161.00, with supports at 159.95 and key confluence at 159.23.
The Euro (EUR) rose sharply against the Japanese Yen (JPY) on Wednesday, up 0.73% amid a risk-off impulse and economic data suggesting that major central banks would deter cutting rates in the near term. At the time of writing, the EUR/JPY trades at 161.12, posting minuscule losses of 0.07% as Thursday’s Asian session begins.
From a technical standpoint, the EUR/JPY daily chart portrays the pair as upward biased, extending its gains past the 161.00 figure, but its advance was capped at previous support turned resistance at around 161.24, the November 21 swing low. A breach of the latter will expose the 162.00 figure, followed by the November 27 high at 163.72.
On the flip side, if sellers drag the EUR/JPY below the 161.00 mark, that can pave the way for further losses. But they would face immediate support at the January 17 low of 159.95, followed by the confluence of the January 16 daily low and the Tenkan-Sen at around 159.23, ahead of the Senkou Span B at 158.71
EUR/JPY Price Action – Daily Chart
EUR/JPY Technical Levels
New Zealand's Food Price Index (FPI) saw its lowest annual food price increase since December of 2021 according to StatsNZ. While food prices were broadly higher across the five main categories for the year ended December, December also saw a fourth consecutive month of MoM declines in food inflation.
Monthly food prices fell 0.1% in December, a slowly pace of declines than November's 0.2% downturn, but still a step lower.
Food prices still remain notably higher than this time last year, despite a total of 5 out of 12 months of headline FPI declines.
Grocers and non-alcoholic beverages were up 5.4 and 5.5% over the year respectively, while restaurants and ready-to-eat foods saw the biggest gains of 7.1%. Fruits and vegetables kept the overall numbers from going much higher, seeing only 1.5% in overall price gains YoY.
Market Reaction
The NZD/USD is trading in-line with near-term momentum in early Thursday trading, holding onto a recovery back above the 0.6100 handle from earlier Wednesday.
About New Zealand's Food Price Index
The Food Price Index (FPI) released by the Statistics New Zealand measures price changes of food bought by households. New Zealand depends upon exporting agricultural goods and food products. Thus, high food prices relatively suggest an increase of trade interests. A high reading is seen as positive (or bullish) for the NZD, while a low reading is negative (or Bearish)
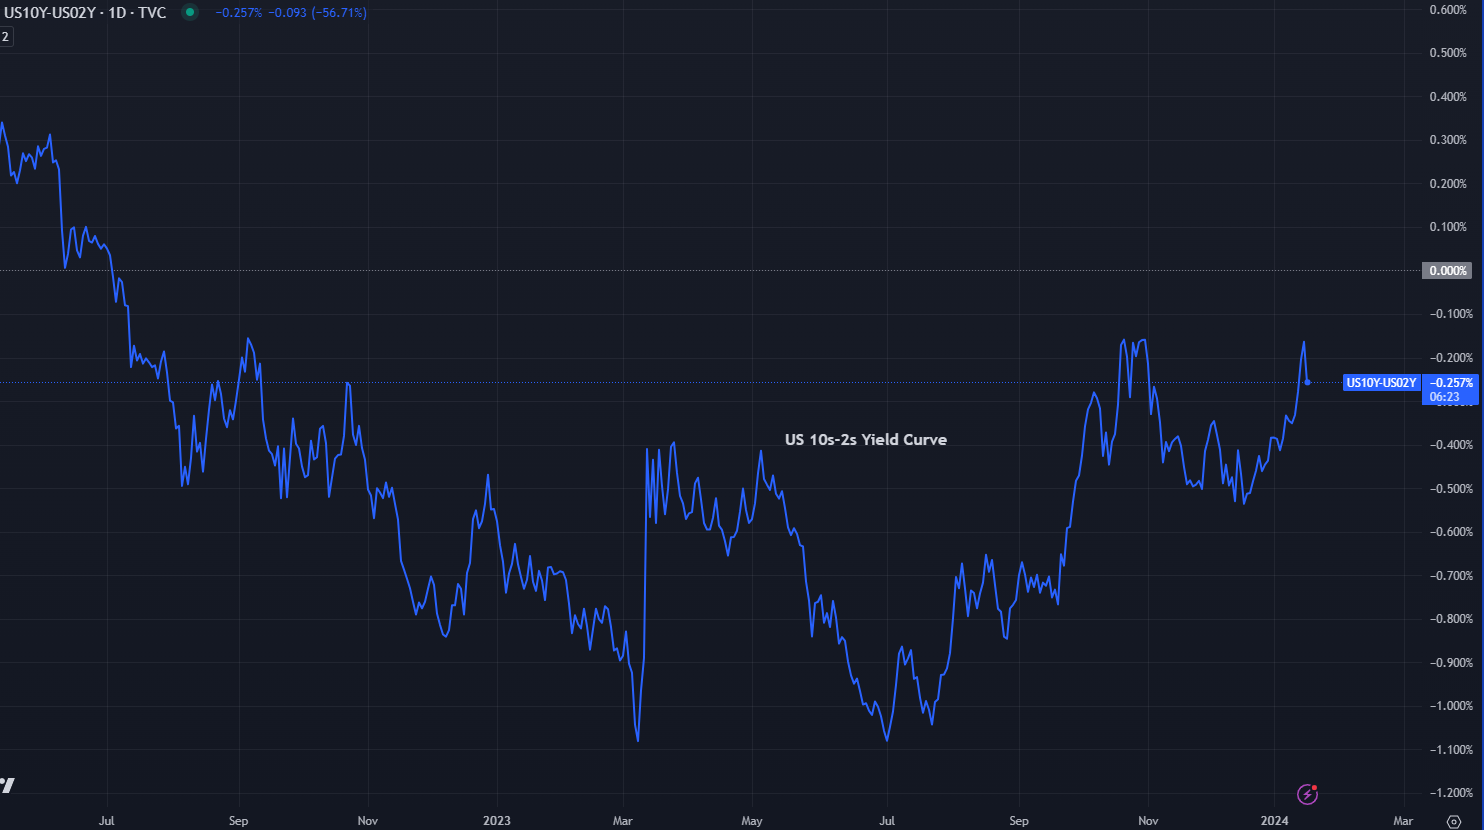
- 10-year Treasury note yields climb to 4.129%, and 30-year bonds reach 4.344%, reflecting investors' alignment with the Fed's cautious policy outlook.
- Positive US Retail Sales and Industrial Production data contribute to rising bond yields and slight gains in the USD, currently at 103.38.
- Fed Governor Waller's emphasis on a methodical approach to easing monetary policy prompts market recalibration, reducing bets on aggressive rate cuts.
US Treasury yields across the yield curve climbed to five-week highs as the 10-year note rose to 4.129%, while the 30-year bond jumped as high as 4.344%, on investors adhering to the US Federal Reserve (Fed) “higher for longer” mantra. Consequently, that sponsored a leg-up in the Greenback (USD) though pared some of its gain, clings to minuscule gains of 0.05%, at 103.38.
Investors adopt the “higher-for-longer” mantra as US 2-year yields skyrocketed
Traders during the US session witnessed the release of US Retail Sales for December, which saw an increase of 0.6%, surpassing both the forecasted rise of 0.4% and the figures from November. Later, the US Federal Reserve reported a modest improvement in Industrial Production, which grew by 0.1%. This marks a positive shift after a period of contraction and stagnation in October and November of the previous year.
In addition to that, earlier data revealed during the European session revealed that the UK’s inflation exceeded forecasts, sparking a jump in global bond yields.
At the beginning of the week, investors were expecting 175 basis points of rate cuts by the Fed in 2024. But throughout the session, they adjusted their bets, and now expect 145 basis points of monetary easing, which means they trimmed one rate cut.
On Tuesday, Federal Reserve Governor Christopher Waller said the Fed is not in a hurry to ease its monetary policy, as inflation is "within striking distance" of their target. While he is open to the idea of reducing interest rates, Waller cautioned that any such policy changes need to be "carefully calibrated and not rushed," emphasizing the importance of waiting until the risks of inflation reigniting have significantly diminished.
The US 10-year Treasury note climbed four basis points, up to 4.106%, while the 30-year bond rose five basis points toward 4.344%, before retreating to 4.323%. Meanwhile, the diversion of the US 10s-2s yield curve, halted, as the 2-year Treasury note climbed 13 basis points of expectations that the Fed would remain reluctant to easy policy as the markets expected.
Ahead of the week, the US economic docket will feature US Initial Jobless Claims, and further Fed speakers will cross the wires on Thursday, followed by Friday’s University of Michigan (UoM) Consumer Sentiment.
US 10s-2s Spread Chart
Interest rates FAQs
What are interest rates?
Interest rates are charged by financial institutions on loans to borrowers and are paid as interest to savers and depositors. They are influenced by base lending rates, which are set by central banks in response to changes in the economy. Central banks normally have a mandate to ensure price stability, which in most cases means targeting a core inflation rate of around 2%.
If inflation falls below target the central bank may cut base lending rates, with a view to stimulating lending and boosting the economy. If inflation rises substantially above 2% it normally results in the central bank raising base lending rates in an attempt to lower inflation.
How do interest rates impact currencies?
Higher interest rates generally help strengthen a country’s currency as they make it a more attractive place for global investors to park their money.
How do interest rates influence the price of Gold?
Higher interest rates overall weigh on the price of Gold because they increase the opportunity cost of holding Gold instead of investing in an interest-bearing asset or placing cash in the bank.
If interest rates are high that usually pushes up the price of the US Dollar (USD), and since Gold is priced in Dollars, this has the effect of lowering the price of Gold.
What is the Fed Funds rate?
The Fed funds rate is the overnight rate at which US banks lend to each other. It is the oft-quoted headline rate set by the Federal Reserve at its FOMC meetings. It is set as a range, for example 4.75%-5.00%, though the upper limit (in that case 5.00%) is the quoted figure.
Market expectations for future Fed funds rate are tracked by the CME FedWatch tool, which shapes how many financial markets behave in anticipation of future Federal Reserve monetary policy decisions.
- The NZD/JPY rose by 0.20% towards 90.47.
- Indicators on the daily chart suggest that the bulls are holding strong.
- The Yen was one of the worst-performing currencies in the session.
- The SMAs indicate firm control of bulls over the longer term.
In Wednesday's session, the NZD/JPY was seen trading at 90.47, showing modest gains of 0.20%. Despite a neutral to bullish outlook on the daily chart, bulls maintain a tenacious grip. With sellers momentarily silenced, the buyers also dominate the four-hour chart, albeit taking a breather, hinting at the possibility of further upside momentum.
The daily chart reveals a somewhat balanced playing field in the market but tilted to the upside. The Relative Strength Index (RSI) portrays an upward trajectory within the positive territory, indicating an increasing buying momentum. Simultaneously, the Moving Average Convergence Divergence (MACD) shows flat green bars, suggesting a flat momentum with a bullish bias. In the meantime, the pair is trading above the 20, 100, and 200-day Simple Moving Averages (SMAs), confirming that the bullish sentiments may still hold in the larger time frame despite some negative waves in the short run. In essence, the overall daily technical patterns exhibit a scenario where the bulls hold their ground and have a slight upper hand over the sellers.
Moving toward the four-hour chart, the pictures are similar. The RSI appears flat but remains positive, unveiling a short-term stagnancy in buying pressure lining with the MACD. Although the bulls are taking a breather at this juncture, they still seem to maintain control.
NZD/JPY technical levels
NZD/JPY daily chart
-638411241247094376.png)
- The GBP/JPY found additional topside on Wednesday as Yen recedes further.
- Japanese Yen continues to get pulled under by BoJ policy stance.
- UK CPI beat the street, UK Retail Sales slated for Friday.
The GBP/JPY found fresh chart paper on the high side towards the 190.00 major handle, climbing over a full percent on the day as the Pound Sterling (GBP) catches a lift against the beleaguered Japanese Yen (JPY) after a better-than-expected print in the UK’s Consumer Price Index (CPI) inflation.
UK CPI inflation printed better than markets expected early Wednesday, showing MoM CPI in December climbed 0.4%, double the median market forecast of 0.2% and eating away at the previous period’s downside print of -0.2%. With inflation stickier than investors expected, odds of the Bank of England (BoE) kicking off a round of rate cuts are vanishing into the ether, pulling down risk assets and sending the GBPbroadly higher on repatriation flows.
The UK Retail Price Index in December also rose 0.5% versus the forecast 0.4% and previous -0.1%, adding to rate-hungry investors’ chagrin.
The Bank of Japan (BoJ) remains firmly committed to a hyper-easy monetary policy stance, and the BoJ is determined to continue dragging the Yen under the bow as policymakers at the Japanese central bank fear a possible decline in inflation below the BoJ’s 2% target sometime in the future.
Figures on Japanese Machinery Orders in November are expected early in Thursday’s Asia market session, with MoM Machinery Orders expected to decline 0.8% compared to October’s 0.7% growth. The annualized YoY Machinery Orders through November are expected to recover from the previous period’s -2.2% to 0.2% as near-term declines enter the data series from the near end.
GBP traders will get one more crack at the data calendar on Friday when UK Retail sales figures for December print, and median market forecasts are calling for a MoM print of -0.5% (last 1.3%) and a YoY print of 1.1% (previous 0.1%) for the year through December.
GBP/JPY Technical Outlook
The GBP/JPY’s recent rise through the 186.00 handle has the pair set for a challenge of 189.00 if selling pressure doesn’t set in to bring the pair back down to the median. In the near-time, average prices are far below current price action with the 200-hour Simple Moving Average (SMA) lagging momentum back at 185.00, and it’ll take a 1.6% decline from current bids to bring the pair back in-line with the median.
The GBP/JPY remains well-bid on daily candlesticks, continuing to push higher after January’s early rebound from the 200-day SMA near 180.00. Continued bullish momentum will see the pair making multi-year highs above 188.66, while the downside is capped off by a technical floor at the 50-day SMA near 184.00.
GBP/JPY Hourly Chart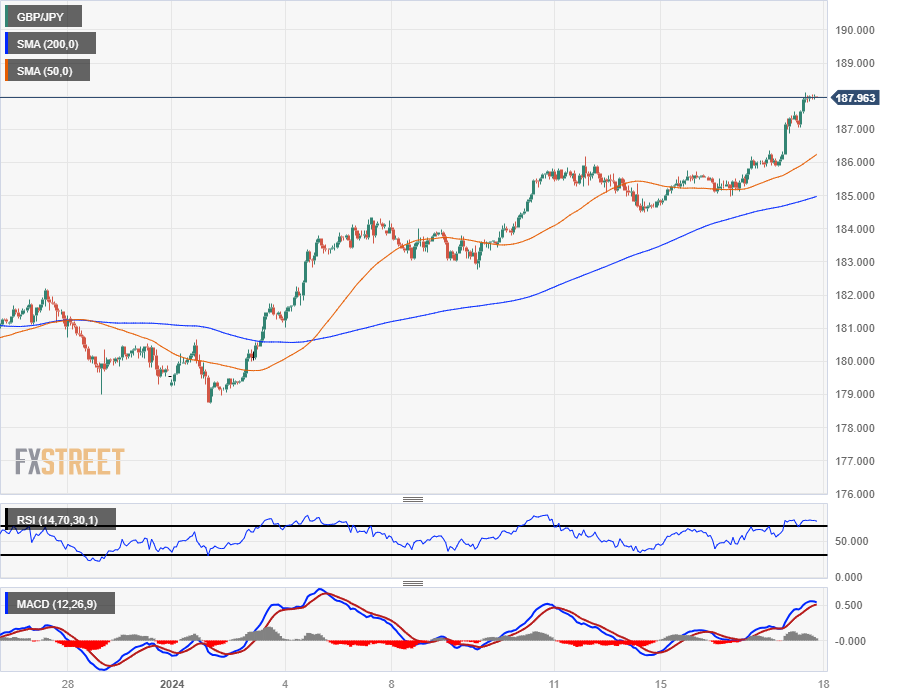
GBP/JPY Daily Chart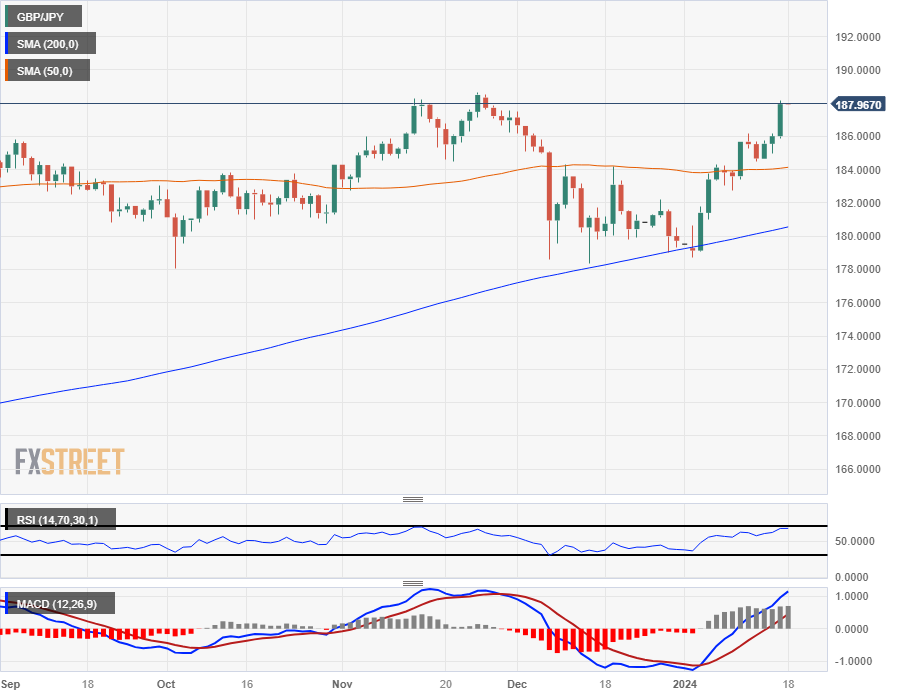
GBP/JPY Technical Levels
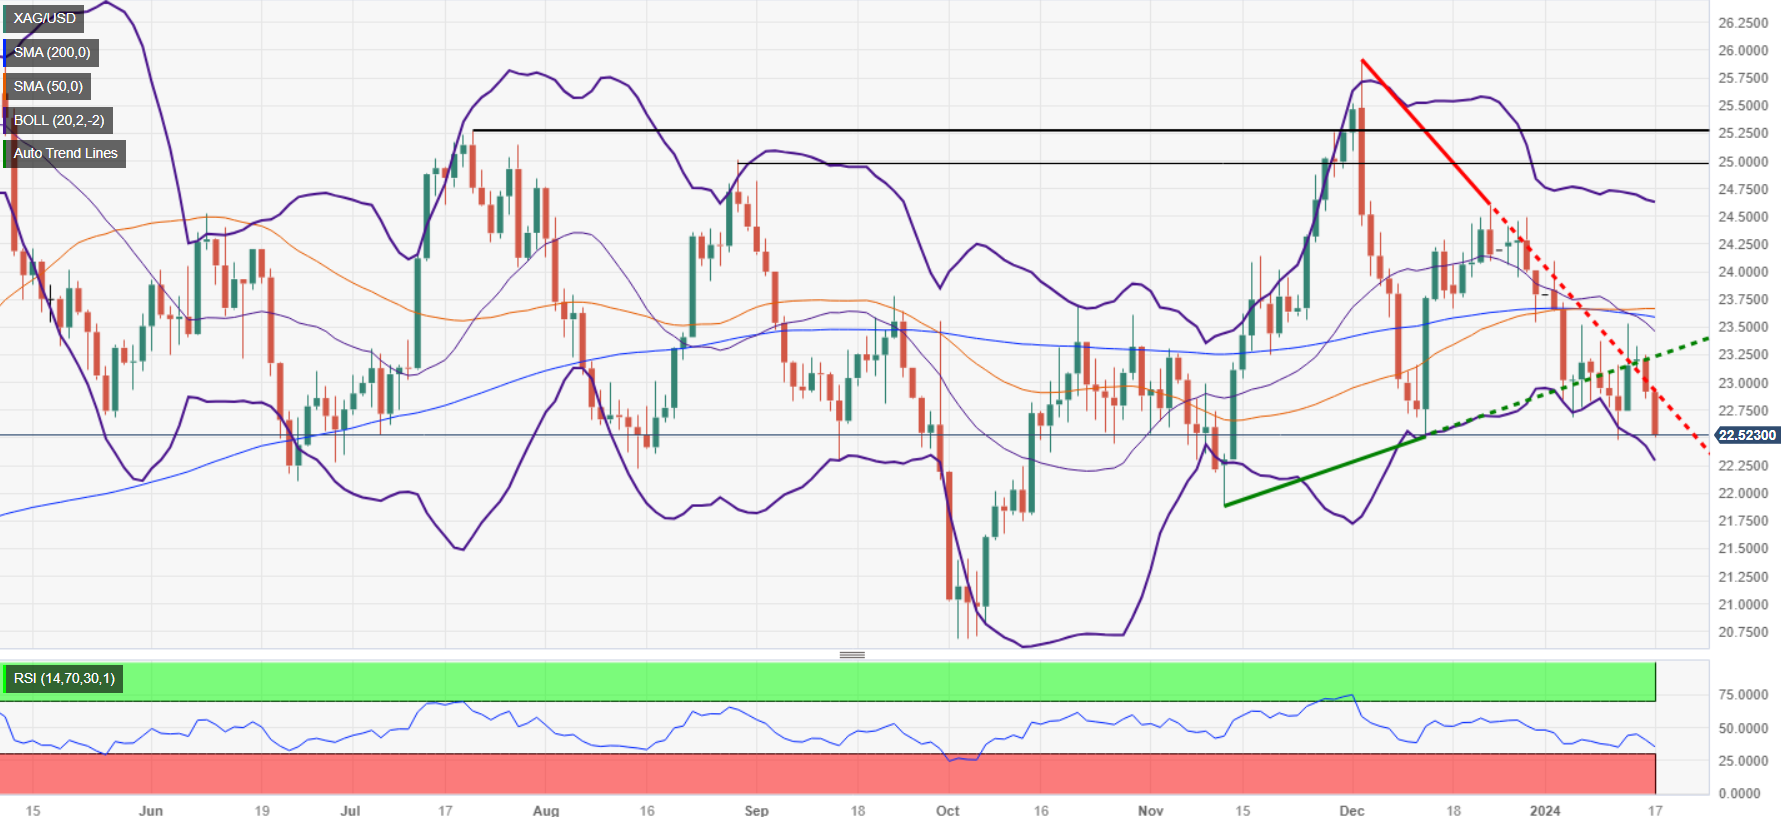
- Silver price down 1.58%, nearing $22.50, amid strong US Retail Sales and Industrial Production data.
- Waller's comments on cautious rate cuts prompt market to rethink Fed easing expectations."
- Technical outlook: Further silver price decline possible, with focus on $22.00 and $21.88; $23.00 critical for recovery.
Silver price stays depressed for the second straight day, though it appears to have bottomed at around the $22.50 area for the third occasion during the last couple of months, as it loses 1.58% after hitting a daily high of $22.94.
XAG/USD falters, bottoms at around $22.50 as investors adjust Fed rate cut trajectory
Fundamentally speaking, solid economic data from the United States (US) bolstered the Greenback (USD) as US Treasury yields resumed to the upside. Retail Sales for December rose by 0.6%, exceeding forecasts of a 0.4% jump and November’s reading. Lately, the US Federal Reserve announced that Industrial Production improved modestly by 0.1%, after contracting and stagnating in October and November of last year.
Meanwhile, Fed officials continued to push back against aggressive rate cuts, even though most of them see at least three rate cuts, as portrayed by December’s Summary of Economic Projections (SEP). Yesterday’s comments of Fed Governor Christopher Waller, who said that he supports rate cuts but added the US central bank is in no rush to relax policy. That sparked a reaction on bets that the Fed would ease policy faster than expected, as seen with investors trimming odds from 175 basis points of rate cuts at the beginning of the week to 148.
XAG/USD Price Analysis: Technical outlook
Therefore, further Silver’s weakness is expected, though sellers must push prices below $22.50. A breach of that level will expose the $22.00 a troy ounce figure, followed by the November 13 swing low of $21.88. Further downside is seen at the October 3 low of $20.69. Contrarily, if buyers regain $23.00, that could pav the way for challenging the 100-day moving average (DMA) at $23.20.
XAG/USD Technical Levels
Further reduction of bets on an interest rate cut by the Fed in March propelled the USD Index (DXY) to a new yearly high and aligned with the extra narrative suggesting the ECB could wait until the summer to trim its rates, which eventually appears to have bolstered the late bounce in the single currency. By the same token, higher-than-expected UK inflation figures seem to have lent support to the view of a steady hand by the BoE in the next few months.
Here is what you need to know on Thursday, January 18:
The Greenback gathered extra pace on Wednesday and pushed the USD Index (DXY) to new 2024 peaks near 103.70 against the backdrop of further gains in US yields across different maturities. The resilience of the US economy will be put to the test on Thursday with the releases of Housing Starts, Building Permits, usual weekly Initial Claims and the always-relevant Philly Fed Manufacturing Index.
EUR/USD dropped to new multi-week lows near 1.0840 band on the back of persistent strength in the greenback, while ECB officials continued to pour cold water over expectations of interest rate cuts by the bank in H1 2024. Moving forward, the ECB will release its Accounts of the latest meeting, while President Lagarde is due to speak at the WEF in Davos.
Despite the dollar’s dominance, the British pound managed to derive support from higher-than-expected UK inflation figures in December, which in turn helped GBP/USD chart decent gains at the end of the day. There will be no data releases across the Channel on Thursday.
The needle-like march north in USD/JPY surpassed the 148.00 barrier amidst the continuation of the upside momentum in the greenback in combination with another firm session in US yields across the board. On Thursday, Machinery Orders and final Industrial Production readings, coupled with weekly Foreign Bond Investment should keep traders entertained early in Asia.
There was no respite for the selling pressure around the Aussie dollar on Wednesday. That said, AUD/USD sank to fresh six-week lows near 0.6520 in response to usual dollar dynamics and discouraging results from the Chinese docket. Next of note in Australia is the labour market report for the month of December.
The intense move higher in the dollar, coupled with rising US yields across the curve, weighed further on both Gold and Silver. The sentiment around the latter further deteriorated in the wake of Chinese data releases.
Prices of the WTI rose past the $72.00 mark per barrel and partially reversed the recent weakness on the back of an upbeat report from the OPEC despite the poor prints from China and the stronger dollar. Traders’ focus will be on the release of the usual weekly report on US crude oil inventories by the EIA.
- US Dollar strength is hampering Crude Oil barrel bids.
- Disappointing growth figures from China depress energy markets on demand concerns.
- A late-day rebound brought Crude Oil back on-balance for Wednesday.
Lagging growth from China, steadily increasing global Crude Oil production, and a rising US Dollar (USD) saw West Texas Intermediate (WTI) US Crude Oil fall into a fresh low for the week near $70.60.
Chinese growth figures disappointed early Wednesday, with China’s annualized Gross Domestic Product (GDP) through the fourth quarter missing expectations of 5.3%, printing at 5.2% compared to the previous quarter’s 4.9%.
With Chinese growth failing to hit market expectations, concerns are mounting that China’s demand for fossil fuels will decline looking forward, widening the gap between global demand for Crude Oil and current production rates that are already outpacing demand despite steep production cuts from the Organization for the Petroleum Exporting Countries (OPEC).
With US production continuing to increase Crude Oil production into new all-time highs, OPEC is going to have to commit to even steeper production caps moving forward, a move that will become increasingly undesirable for smaller member states within the oil cartel who are already depressing Crude Oil output as much as their government budgets can afford.
Despite downside pressures, including a rising US Dollar on Wednesday, Crude Oil markets found a leg up on ongoing geopolitical concerns with Iran-backed Houthi rebel is Yemen determined to continue attacking civilian cargo ships passing through the Red Sea en route for the Suez Canal.
Many private logistics companies have rerouted shipping lanes around the continent of Africa to connect Europe and Asia, limiting the potential for supply constraints, but energies markets remain determined to fear the possibility of Crude Oil supply being unable to make it to market amidst Red Sea tensions.
WTI Technical Outlook
WTI’s early decline on Wednesday saw a rebound back above the 200-hour Simple Moving Average (SMA) near $72.40 as US Crude Oil heads back towards the $73.00 handle.
Crude Oil’s back-and-forth on Wednesday sees WTI pushing into the middle of a long-term congestion pattern forming up on daily candlesticks with a nearly-flat 200-day SMA near $78.00 and a declining 50-day SMA pressing down on intraday price action from $74.00.
WTI Hourly Chart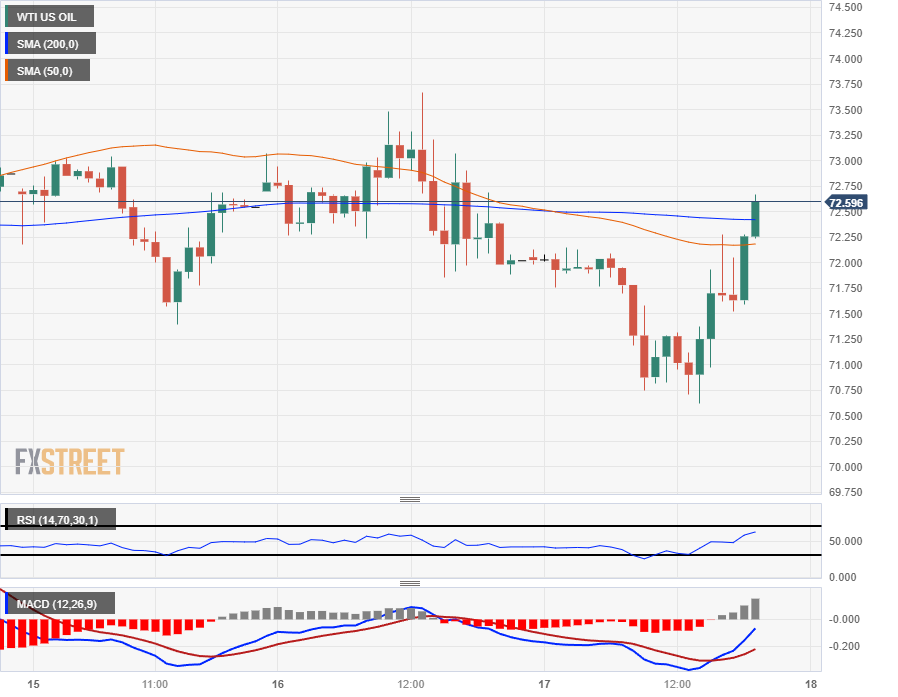
WTI Daily Chart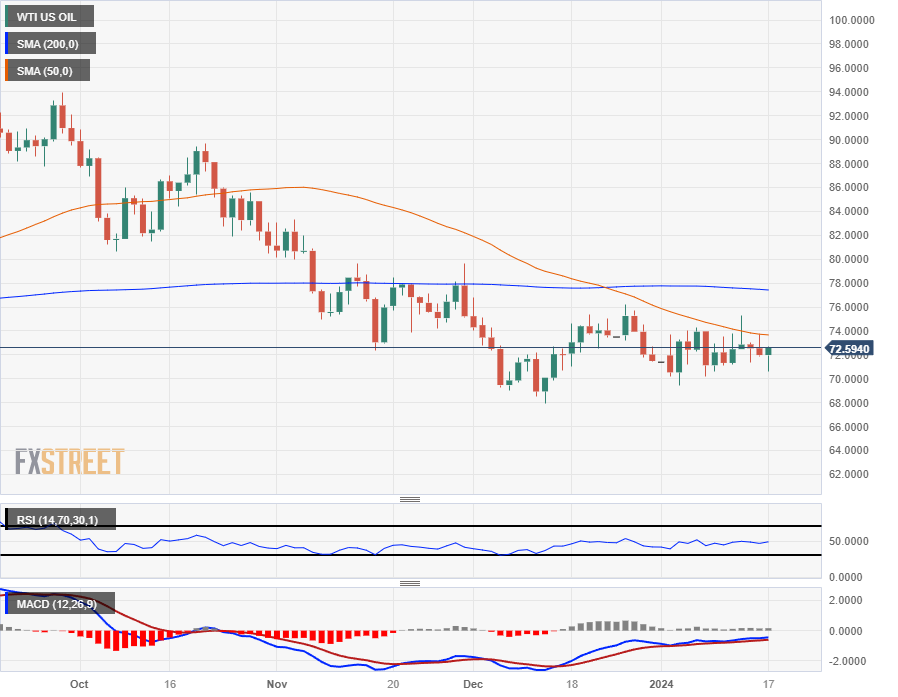
WTI Technical Levels
- Gold's downward trend continues, losing more than 1% due to strong US Retail Sales data and a surge in US Treasury yields.
- The upward trajectory of the US Dollar Index to a five-week high and hawkish Fed comments contribute to Gold's decline.
- Traders focus shift on upcoming US unemployment and consumer sentiment data as they recalibrate the Fed’s interest rate cuts expectations.
Gold price is on the back foot, losing more than 1% in the back-to-back trading sessions on Wednesday, as solid economic data from the United States (US) sent US yields rising while traders scramble to pare Federal Reserve’s rate cut bets.
XAU/USD losses amid rising US yields, as traders price out almost a 50% chance of Fed rate cut in March
A solid US Retail Sales report was the main reason for Gold’s fall as US Treasury bond yields continued to aim higher. The US Department of Commerce showed that sales in December exceeded forecasts of 0.4% and jumped 0.6%. The data boosted the Greenback to a five-week high of 103.69, according to the US Dollar Index (DXY), and US Treasury bond yields continued to advance.
Expectations for an interest rate cut by the Federal Reserve (Fed) plunged from 63% a day ago to 52% after today’s data and Tuesday's remarks of Fed Governor Waller that there is "no reason to move as quickly or cut [interest rates] as rapidly as in the past," suggesting a more cautious approach to monetary policy adjustments. Despite this caution, he is willing to support rate cuts if there is a definitive decrease in inflation.
Lately, Industrial Production (IP) in the US has expanded by 0.1%, exceeding the forecast and the previous month's 0% increase, helped by a pickup in motor-vehicle production linked to the United Auto Workers (UAW) strike.
Sources cited by Reuters said, “Markets were betting that the Fed was starting to cut rates already at the end of the first quarter of this year, and now they're recalibrating a bit after hawkish comments from some members of the Federal Reserve.”
Ahead of the week, the US calendar will feature further Fed speakers, along with unemployment claims data on Thursday and the release of the University of Michigan’s (UoM) Consumer Sentiment poll.
XAU/USD Price Analysis: Technical outlook
The XAU/USD diving below the 50-day moving average (DMA) exacerbated the drop toward the $2001 year-to-date (YTD) low. Although buyers of the non-yielding metal moved in and lifted the spot price to current levels, Gold is at the brisk of extending its losses, below the $2000 mark. A decisive break of that level will expose the confluence of the 100 and 200-DMAs at around $1971/$1963, respectively.

- DXY Index rises decisively, trading with gains around 103.50 level above the 100-day SMA.
- US Retail Sales in the last month of 2023 rose higher than expected.
- Markets ease their dovish bets on the Fed for March and May FOMC meetings.
The US Dollar (USD) reached a notable stride, trading at 103.50 while confidently deflecting the pressures of the 100-day SMA. This robust stride has been primarily fueled by the strong US Retail Sales data from December and a notable rise in US Treasury yields, both of which show that markets are adjusting their bets on the Federal Reserve’s (Fed) rate-cutting timeline.
The resilient US economy, evidenced by the latest data, is making adjustments to the market's dovish bets, albeit odds for rate cuts in March and May still hover around 50%. In December, CPI inflation picked up, as well as the job creation pace and wages, while economic activity remains strong, which is making markets believe that the Fed might not consider cutting rates too soon.
Daily Digest Market Movers: US Dollar ascends, bolstered by strong Retail Sales from December
- December's Retail Sales reported by the US Census Bureau outperformed consensus, registering 0.6% growth versus the 0.4% forecast and 0.3% from the previous period.
- The Fed's Beige book report didn't trigger any movements on the Greenback. It stated that the majority of the twelve Federal Reserve districts reported little or no change in economic since the last release.
- An uptick was observed in US bond yields as 2-year, 5-year, and 10-year notes currently trade at 4.30%, 4.02%, and 4.09%, respectively.
- As per the CME FedWatch Tool, the odds of cuts for March and May eased, but they remain high at around 50%.
Technical Analysis: DXY bulls step in and regain the 100-day SMA but now must defend it
The indicators on the daily chart reflect a somewhat bullish bias. The Relative Strength Index (RSI) demonstrates a positive slope in positive territory, endorsing growing buying momentum. The Moving Average Convergence Divergence (MACD) shows rising green bars, indicating the continuance of upward traction in favor of bulls.
The position of the index regarding Simple Moving Averages (SMAs) reveals a mixed picture. The DXY is now positioned above the 20 and 100-day SMAs, an encouraging sight for the buyers. However, it remains below the 200-day SMA, suggesting an undercurrent of bearish sentiment. Despite the recent bearish movements, bulls appear to be gaining ground.
Support levels: 103.40 (100-day SMA), 103.00, 102.80, 102.50.
Resistance levels: 103.60, 103.80, 104.00.
US Dollar FAQs
What is the US Dollar?
The US Dollar (USD) is the official currency of the United States of America, and the ‘de facto’ currency of a significant number of other countries where it is found in circulation alongside local notes. It is the most heavily traded currency in the world, accounting for over 88% of all global foreign exchange turnover, or an average of $6.6 trillion in transactions per day, according to data from 2022.
Following the second world war, the USD took over from the British Pound as the world’s reserve currency. For most of its history, the US Dollar was backed by Gold, until the Bretton Woods Agreement in 1971 when the Gold Standard went away.
How do the decisions of the Federal Reserve impact the US Dollar?
The most important single factor impacting on the value of the US Dollar is monetary policy, which is shaped by the Federal Reserve (Fed). The Fed has two mandates: to achieve price stability (control inflation) and foster full employment. Its primary tool to achieve these two goals is by adjusting interest rates.
When prices are rising too quickly and inflation is above the Fed’s 2% target, the Fed will raise rates, which helps the USD value. When inflation falls below 2% or the Unemployment Rate is too high, the Fed may lower interest rates, which weighs on the Greenback.
What is Quantitative Easing and how does it influence the US Dollar?
In extreme situations, the Federal Reserve can also print more Dollars and enact quantitative easing (QE). QE is the process by which the Fed substantially increases the flow of credit in a stuck financial system.
It is a non-standard policy measure used when credit has dried up because banks will not lend to each other (out of the fear of counterparty default). It is a last resort when simply lowering interest rates is unlikely to achieve the necessary result. It was the Fed’s weapon of choice to combat the credit crunch that occurred during the Great Financial Crisis in 2008. It involves the Fed printing more Dollars and using them to buy US government bonds predominantly from financial institutions. QE usually leads to a weaker US Dollar.
What is Quantitative Tightening and how does it influence the US Dollar?
Quantitative tightening (QT) is the reverse process whereby the Federal Reserve stops buying bonds from financial institutions and does not reinvest the principal from the bonds it holds maturing in new purchases. It is usually positive for the US Dollar.
- The AUD/JPY currently trades at 96.97, gaining a marginal 0.10%.
- Weak Chinese data weakened both the AUD and JPY.
- Indicators on the daily chart favor the bulls.
In Wednesday's session, the AUD/JPY was spotted at 96.97, gaining a subtle 0.10% gain, and it seems buyers remain in control with the daily chart appearing neutral to bullish and bulls proving their strength in the four-hour chart framework. On the fundamental side, both the AUD and JPY weakened during the sessions due to the report of soft Chinese economic figures, which contributed to their being the worst-performing currencies amongst their peers.
Examining the daily chart indicators, the Relative Strength Index (RSI) depicts a flat position within the positive territory, signifying a balanced momentum, while the Moving Average Convergence Divergence (MACD) also exhibits a similar pattern, depicting flat green bars. Additionally, the pair currently sails above its 20, 100, and 200-day Simple Moving Averages (SMAs), a potent sign of bullish dominance. This scenario suggests that despite a near-term balance in buying momentum, the broader spectrum remains favorable for the bulls, who seem to be assertively holding their ground.
Moving onto a shorter time frame, the four-hour chart paints a picture of more evident bullish momentum. Indicators highlight the strengthening buying force, with a positive slope and territory for the four-hour Relative Strength Index (RSI), hinting at the continuation of the upward momentum. The Moving Average Convergence Divergence (MACD) on this chart manifests flat green bars, confirming the existing bullish strength. Therefore, in this shorter time frame, there's a clear presence of buying momentum, accentuating the prevailing bullish outlook.
AUD/JPY technical levels
AUD/JPY daily chart
-638411156345136008.png)
- GBP/USD up 0.25%, buoyed by UK's unexpected inflation increase to 4% year-on-year.
- US Retail Sales growth, Fed's slow rate cut approach pose challenges, capping GBP's upside.
- UK's rising inflation pressures Bank of England, contrasting with anticipated Fed rate cut in March.
The Pound Sterling (GBP) registered decent gains versus the US Dollar (USD) on Wednesday after a solid report from the Office for National Statistics (ONS) outshone US Retail Sales data for December. Nevertheless, not all has been said, as the GBP/USD pared some of its gains, but it remains up 0.25%, at 1.2667, after hitting a low of 1.2596.
Jump in UK inflation, could deter the BoE from cutting rates, tailwind for GBP/USD
Data from the US Department of Commerce revealed that Retail Sales in December expanded above estimates in month-over-month numbers, at 0.6%. At the same time, in 12 months to December data, sales grew at a 5.6% rate, crushing November’s 4%. Lately, the US Federal Reserve (Fed) revealed that Industrial Production for the same period edged up by 0.1%, a substantial recovery after plunging 0.0.8% in October and printing a 0% reading in the next month.
After the data, the Greenback remained in the driver’s seat, a headwind for the GBP/USD pair. The US Dollar gained momentum following remarks from Fed Governor Waller, who stressed there’s “no reason to move as quickly or cut as rapidly as in the past,” keeping investors in check despite supporting rate cuts if inflation continued to trend sustainably towards its 2% goal.
Across the pond, the ONS in the UK revealed that inflation jumped the most in December, for the first time in 10-months, and increased the pressure on the Bank of England (BoE). Consequently, the Pound Sterling, rose against the US Dollar and the Euro (EUR). Figures showed that yearly inflation rose 4%, above the consensus of 3..8%, while underlying inflation surpassed the 5% threshold.
Sources cited by Reuters said “The stronger than expected reading for both core and services inflation in December .. are disappointing and will discourage the BoE from beginning to cut rates sooner.” Market participants expect the BoE to cut rates 80% in May, while odds for a Fed rate cut are seen at 60% in March¸ lower than yesterday’s 76.3%.
GBP/USD Price Analysis: Technical outlook
The GBP/USD daily chart portrays the pair as neutral to downward biased, even thought price action on Wednesday, could complete a ‘bullish piercing’ pattern, which would suggest further upside is seen. Nevertheless, given that the most important UK data is on the rearview mirror, that could pave the way to challenge the 50-day moving average at 1.2599, below the 1.2600 as sellers could test the 200-day moving average (DMA) at 1.2545. On the other hand, if buyers lift the pair above 1.2700, that could shift the bias to neutral, and open the door for a 1.2800 test.

Pound Sterling price today
The table below shows the percentage change of Pound Sterling (GBP) against listed major currencies today. Pound Sterling was the strongest against the Australian Dollar.
| USD | EUR | GBP | CAD | AUD | JPY | NZD | CHF | |
| USD | 0.13% | -0.27% | 0.25% | 0.75% | 0.73% | 0.63% | 0.50% | |
| EUR | -0.13% | -0.41% | 0.12% | 0.62% | 0.60% | 0.53% | 0.37% | |
| GBP | 0.28% | 0.40% | 0.51% | 1.02% | 1.00% | 0.90% | 0.77% | |
| CAD | -0.25% | -0.12% | -0.54% | 0.50% | 0.48% | 0.38% | 0.23% | |
| AUD | -0.76% | -0.63% | -1.03% | -0.50% | -0.04% | -0.11% | -0.27% | |
| JPY | -0.73% | -0.58% | -1.00% | -0.47% | 0.03% | -0.10% | -0.22% | |
| NZD | -0.64% | -0.50% | -0.91% | -0.39% | 0.12% | 0.05% | -0.18% | |
| CHF | -0.50% | -0.36% | -0.76% | -0.23% | 0.27% | 0.23% | 0.15% |
The heat map shows percentage changes of major currencies against each other. The base currency is picked from the left column, while the quote currency is picked from the top row. For example, if you pick the Euro from the left column and move along the horizontal line to the Japanese Yen, the percentage change displayed in the box will represent EUR (base)/JPY (quote).
- DXY Index rises decisively, trading with gains around 103.50 level above the 100-day SMA.
- US Retail Sales in the last month of 2023 rose higher than expected.
- Markets ease their dovish bets on the Fed for March and May FOMC meetings.
The US Dollar (USD) reached a notable stride, trading at 103.50 while confidently deflecting the pressures of the 100-day SMA. This robust stride has been primarily fueled by the strong US Retail Sales data from December and a notable rise in US Treasury yields, both of which show that markets are adjusting their bets on the Federal Reserve’s (Fed) rate-cutting timeline.
The resilient US economy, evidenced by the latest data, is making adjustments to the market's dovish bets, albeit odds for rate cuts in March and May still hover around 50%. In December, CPI inflation picked up, as well as the job creation pace and wages, while economic activity remains strong, which is making markets believe that the Fed might not consider cutting rates too soon.
Daily digest market movers: US Dollar ascends, bolstered by strong Retail Sales from December
- December's Retail Sales reported by the US Census Bureau outperformed consensus, registering 0.6% growth versus the 0.4% forecast and 0.3% from the previous period.
- Later in the session, the Fed will release its Beige Book to provide markets further insight on the US economy’s situation.
- An uptick was observed in US bond yields as 2-year, 5-year and 10-year notes currently trade at 4.30%, 4.02%, and 4.09%, respectively.
- As per the CME FedWatch Tool, the odds of cuts for March and May eased, but they remain high at around 50%.
Technical Analysis: DXY bulls step in and regain the 100-day SMA but now must defend it
The indicators on the daily chart reflect a somewhat bullish bias. The Relative Strength Index (RSI) demonstrates a positive slope in positive territory, endorsing growing buying momentum. The Moving Average Convergence Divergence (MACD) shows rising green bars, indicating the continuance of upward traction in favor of bulls.
The position of the index regarding Simple Moving Averages (SMAs) reveals a mixed picture. The DXY is now positioned above the 20 and 100-day SMAs, an encouraging sight for the buyers. However, it remains below the 200-day SMA, suggesting an undercurrent of bearish sentiment. Despite the recent bearish movements, bulls appear to be gaining ground.
Support levels: 103.40 (100-day SMA), 103.00, 102.80, 102.50.
Resistance levels: 103.60, 103.80, 104.00.
US Dollar FAQs
What is the US Dollar?
The US Dollar (USD) is the official currency of the United States of America, and the ‘de facto’ currency of a significant number of other countries where it is found in circulation alongside local notes. It is the most heavily traded currency in the world, accounting for over 88% of all global foreign exchange turnover, or an average of $6.6 trillion in transactions per day, according to data from 2022.
Following the second world war, the USD took over from the British Pound as the world’s reserve currency. For most of its history, the US Dollar was backed by Gold, until the Bretton Woods Agreement in 1971 when the Gold Standard went away.
How do the decisions of the Federal Reserve impact the US Dollar?
The most important single factor impacting on the value of the US Dollar is monetary policy, which is shaped by the Federal Reserve (Fed). The Fed has two mandates: to achieve price stability (control inflation) and foster full employment. Its primary tool to achieve these two goals is by adjusting interest rates.
When prices are rising too quickly and inflation is above the Fed’s 2% target, the Fed will raise rates, which helps the USD value. When inflation falls below 2% or the Unemployment Rate is too high, the Fed may lower interest rates, which weighs on the Greenback.
What is Quantitative Easing and how does it influence the US Dollar?
In extreme situations, the Federal Reserve can also print more Dollars and enact quantitative easing (QE). QE is the process by which the Fed substantially increases the flow of credit in a stuck financial system.
It is a non-standard policy measure used when credit has dried up because banks will not lend to each other (out of the fear of counterparty default). It is a last resort when simply lowering interest rates is unlikely to achieve the necessary result. It was the Fed’s weapon of choice to combat the credit crunch that occurred during the Great Financial Crisis in 2008. It involves the Fed printing more Dollars and using them to buy US government bonds predominantly from financial institutions. QE usually leads to a weaker US Dollar.
What is Quantitative Tightening and how does it influence the US Dollar?
Quantitative tightening (QT) is the reverse process whereby the Federal Reserve stops buying bonds from financial institutions and does not reinvest the principal from the bonds it holds maturing in new purchases. It is usually positive for the US Dollar.
- European indexes saw declines across the board in the mid-week.
- Inflation, policymaker talking points continue to flummox rate cut hopes.
- Stubborn inflation remains a key policy roadblock for both the EU and the UK.
European stocks shed weight on Wednesday, dragging broad indexes down into the red and sending Germany’s DAX index into its lowest bids of the year thus far and challenging prices not seen since early December.
UK inflation unexpectedly rose to 4% in December, driving back market hopes of near-term rate cuts from the Bank of England (BoE) with money markets angling for the first round of rate trimming from both the BoE and the European Central Bank (ECB) sometime around the end of the first quarter. With UK inflation plaguing BoE policymakers and officials from the ECB talking down rate cut hopes at the World Economic Forum (WEF) in Davos, Switzerland, markets are caught looking incredibly over-invested in rate cut expectations.
ECB President Christine Lagarde noted that a summer rate cut could be “likely” from the ECB, tentatively falling in-line with rate outlooks from other ECB officials, but the ECB President leaned heavier into a cautionary stance. ECB President Lagarde noted specifically that Services sector inflation remains above 4%, a price growth level that will need to come down before the ECB can even begin to consider rate cuts.
The pan-European STOXX600 major equity index declined 1.13% on Wednesday, falling 5.35 points to close at €467.71 while France’s CAC40 shed nearly 80 points to close down 1.07% at €7,318.69.
Germany’s DAX index fell a comparatively sedate 0.84% as one of the better-performing indexes from Europe, declining just under 140 points to close at €16,431.69.
London’s FTSE tumbled nearly 1.5% for the mid-week market session, falling 112 points and ending the day at £7,446.29.
DAX Technical Outlook
The German DAX equity index fell to a six-week low near €16,330 and is set for one of its worst weeks since August, down peak-to-trough 2.4% from Monday’s opening bids near €16,730.
The equity index caught a late rebound into the €16,400 region to finish Wednesday slightly up from the floor, but the DAX still sees accelerating declines in the near-term as bearish price action tumbles away from the 200-hour Simple Moving Average (SMA) near €16,640.
Wednesday’s declines bring the DAX within touch distance of the 50-day SMA just above €16,200, and the equity index is down 3.4% from December’s peak just below the €17,000 handle.
DAX Hourly Chart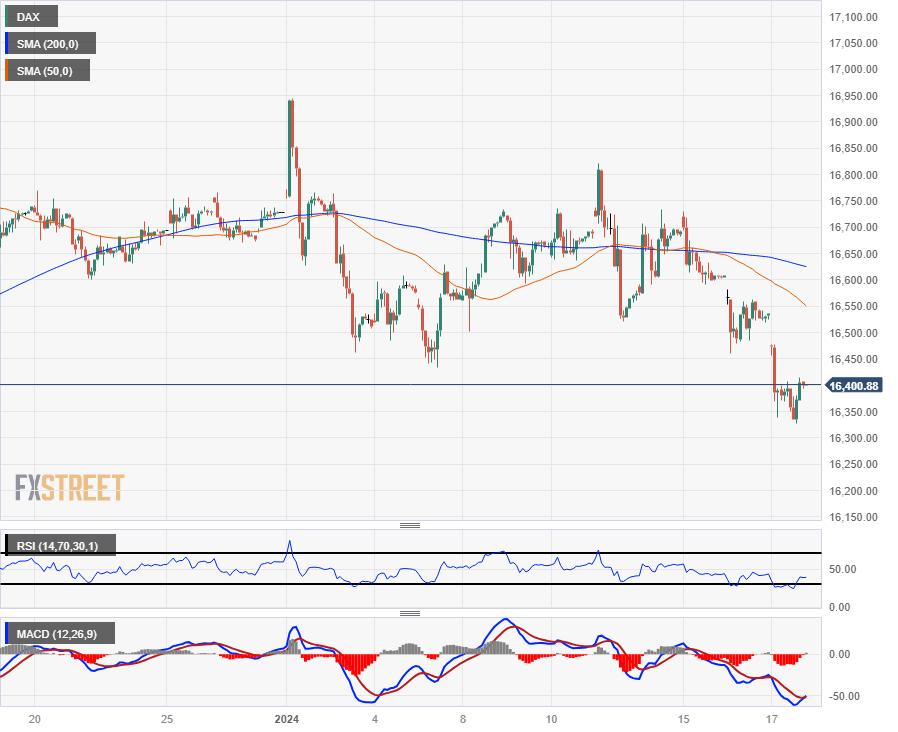
DAX Daily Chart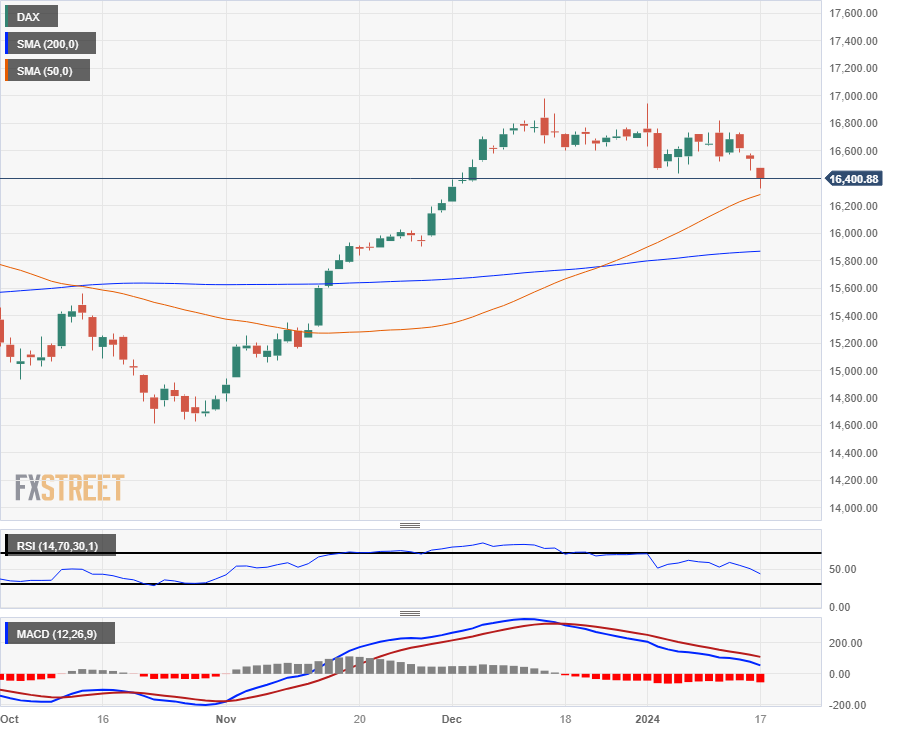
DAX Technical Levels
- The Euro is mixed on Wednesday, sees lopsided gains overall.
- Europe saw a slight uptick in final HICP inflation in December.
- ECB continues to stamp out rate cut bets, US Fed lets data do the work for them.
The Euro (EUR) saw some gains on Wednesday, but still found room to the downside against the US Dollar (USD) as hotter-than-expected US Retail Sales triggered safety flows back into the US Dollar.
Final Core Harmonized Index of Consumer Prices (HICP) from Europe saw a slight uptick in the MoM figure in December, but overall printed as expected, and European Central Bank (ECB) officials continue to bat down rate cut expectations from money markets. On the US side, Retail Sales climbed much more than investors anticipated in December, leaving rate betters in the lurch as swaps trim bets on how many rate cuts the Federal Reserve (Fed) will see in 2024.
Daily digest market movers: Euro sees some gains but declines further against USD
- Finalized Core HICP inflation from Europe saw a slight uptick in December MoM, up to 0.5% from the preliminary 0.4%.
- Annualized Core HICP inflation held steady at 3.4%.
- ECB officials continue to run the circuit of talking down market expectations of ECB rate cuts.
- On Wednesday, ECB’s President Lagarde made her first of three appearances at the World Economic Forum in Davos, Switzerland.
- ECB President Lagarde didn’t rule out the possibility of a rate cut either before or during the summer season, but leaned heavily into “data-dependency” rhetoric, highlighting that Services sector inflation remains near 4%, well above targets.
- US Retail Sales figures dominated market flows in the mid-week market session, climbing to 0.6% in December, well above the previous print of 0.3% and beating the forecast of 0.4%.
- With retail activity on the rise and the US economy still posting healthy employment figures, market expectations of several rate cuts from the Fed are coming under intense pressure.
- Fed swaps have trimmed bets of a March cut from the Fed to just 50%, well down from the peak of 90% in December.
Euro price today
The table below shows the percentage change of Euro (EUR) against listed major currencies today. Euro was the strongest against the Australian Dollar.
| USD | EUR | GBP | CAD | AUD | JPY | NZD | CHF | |
| USD | 0.16% | -0.23% | 0.31% | 0.84% | 0.71% | 0.70% | 0.57% | |
| EUR | -0.16% | -0.40% | 0.15% | 0.68% | 0.54% | 0.53% | 0.41% | |
| GBP | 0.23% | 0.39% | 0.53% | 1.06% | 0.93% | 0.91% | 0.80% | |
| CAD | -0.30% | -0.16% | -0.54% | 0.53% | 0.39% | 0.37% | 0.25% | |
| AUD | -0.85% | -0.68% | -1.07% | -0.53% | -0.16% | -0.15% | -0.26% | |
| JPY | -0.72% | -0.55% | -0.94% | -0.41% | 0.15% | -0.02% | -0.13% | |
| NZD | -0.70% | -0.52% | -0.92% | -0.38% | 0.15% | 0.01% | -0.11% | |
| CHF | -0.58% | -0.41% | -0.81% | -0.27% | 0.26% | 0.13% | 0.11% |
The heat map shows percentage changes of major currencies against each other. The base currency is picked from the left column, while the quote currency is picked from the top row. For example, if you pick the Euro from the left column and move along the horizontal line to the Japanese Yen, the percentage change displayed in the box will represent EUR (base)/JPY (quote).
Technical Analysis: EUR/USD touches below 1.0850 for the first time in over a month
The Euro (EUR) remains well-bid on Wednesday, climbing around two-thirds of a percent against the Australian Dollar (AUD) and the Japanese Yen (JPY). The Euro clipped into the low side against the US Dollar and the Pound Sterling (GBP), shedding around a fifth of a percent and four-tenths of a percent respectively.
The EUR/USD tumbled into the 1.0850 region in intraday action on Wednesday, getting pushed further away from the 200-hour Simple Moving Average (SMA) near 1.0940. The pair is testing into one-month lows, down about 1.3% from early January’s test into the 1.1000 major handle.
Wednesday’s downside momentum sees the EUR/USD exploring the 200-day Simple Moving Average, running into technical support at the key moving average and falling into a potential congestion zone between the 50-day and 200-day SMAs just below 1.0900.
EUR/USD Hourly Chart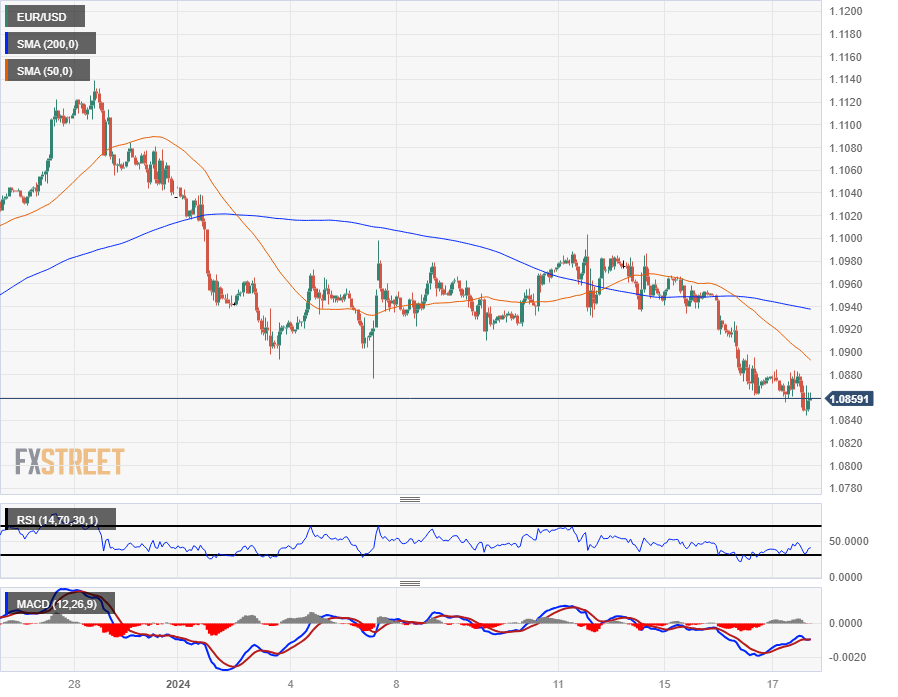
EUR/USD Daily Chart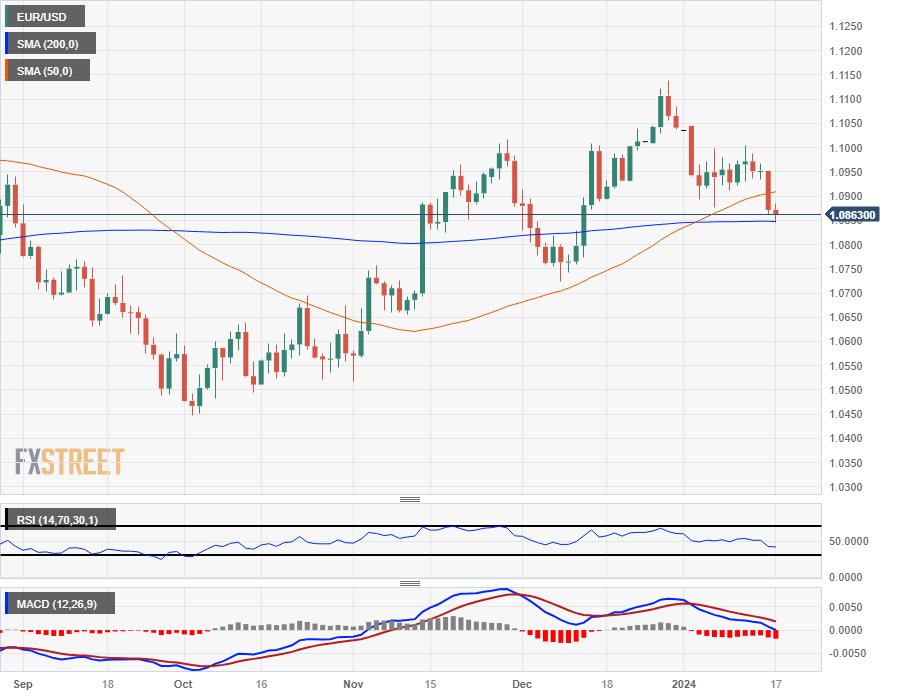
Euro FAQs
What is the Euro?
The Euro is the currency for the 20 European Union countries that belong to the Eurozone. It is the second most heavily traded currency in the world behind the US Dollar. In 2022, it accounted for 31% of all foreign exchange transactions, with an average daily turnover of over $2.2 trillion a day.
EUR/USD is the most heavily traded currency pair in the world, accounting for an estimated 30% off all transactions, followed by EUR/JPY (4%), EUR/GBP (3%) and EUR/AUD (2%).
What is the ECB and how does it impact the Euro?
The European Central Bank (ECB) in Frankfurt, Germany, is the reserve bank for the Eurozone. The ECB sets interest rates and manages monetary policy.
The ECB’s primary mandate is to maintain price stability, which means either controlling inflation or stimulating growth. Its primary tool is the raising or lowering of interest rates. Relatively high interest rates – or the expectation of higher rates – will usually benefit the Euro and vice versa.
The ECB Governing Council makes monetary policy decisions at meetings held eight times a year. Decisions are made by heads of the Eurozone national banks and six permanent members, including the President of the ECB, Christine Lagarde.
How does inflation data impact the value of the Euro?
Eurozone inflation data, measured by the Harmonized Index of Consumer Prices (HICP), is an important econometric for the Euro. If inflation rises more than expected, especially if above the ECB’s 2% target, it obliges the ECB to raise interest rates to bring it back under control.
Relatively high interest rates compared to its counterparts will usually benefit the Euro, as it makes the region more attractive as a place for global investors to park their money.
How does economic data influence the value of the Euro?
Data releases gauge the health of the economy and can impact on the Euro. Indicators such as GDP, Manufacturing and Services PMIs, employment, and consumer sentiment surveys can all influence the direction of the single currency.
A strong economy is good for the Euro. Not only does it attract more foreign investment but it may encourage the ECB to put up interest rates, which will directly strengthen the Euro. Otherwise, if economic data is weak, the Euro is likely to fall.
Economic data for the four largest economies in the euro area (Germany, France, Italy and Spain) are especially significant, as they account for 75% of the Eurozone’s economy.
How does the Trade Balance impact the Euro?
Another significant data release for the Euro is the Trade Balance. This indicator measures the difference between what a country earns from its exports and what it spends on imports over a given period.
If a country produces highly sought after exports then its currency will gain in value purely from the extra demand created from foreign buyers seeking to purchase these goods. Therefore, a positive net Trade Balance strengthens a currency and vice versa for a negative balance.
- Mexican Peso down 0.38% vs. US Dollar, extending loss to three days due to global risk aversion.
- USD/MXN tests but doesn't break 200-day SMA at 17.37 as market anticipates Mexico's November Retail Sales.
- Strong US economic data and Fed's slow rate cut stance drive USD to five-week high, affecting Peso.
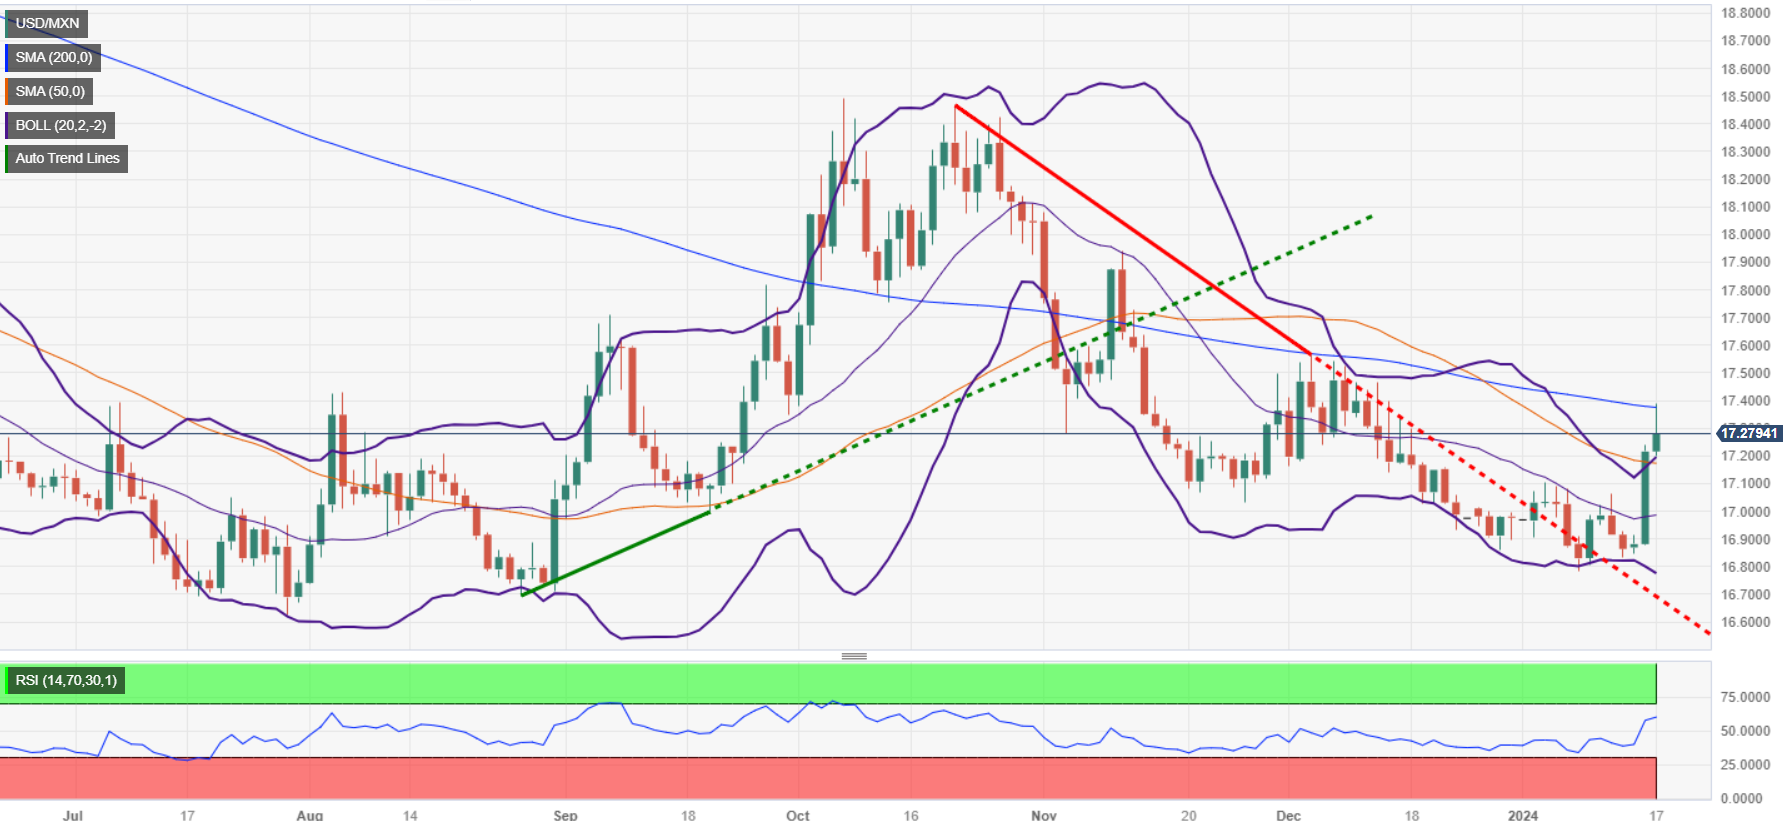
The Mexican Peso extends its losses to three consecutive days against the US Dollar as risk aversion weighs on risk-perceived currencies like the Peso, which tested stir resistance at the 200-day Simple Moving Average (SMA) near 17.37. Still, the exotic pair has trimmed some of its losses, but it remains down on the day by 0.38% as the USD/MXN exchanges hands at 17.28.
Mexico’s economic docket remains absent, with traders looking for the release of November’s Retail Sales, expected to dip to 0.5% MoM and grow 3.2% on a yearly basis.
Across the border, solid economic data from the United States (US) and Federal Reserve (Fed) speakers pushing back against investors' speculations on rate cuts bolstered the Greenback, which, as shown by the US Dollar Index (DXY), gained 0.21% and hit a five-week high of 103.69.
Daily digest market movers: Mexican Peso falls as Fed rate cut bets are trimmed
- US Retail Sales in December smashed estimates, according to data revealed by the US Department of Commerce. Sales on a monthly basis rose by 0.6%, above forecasts of 0.4% and November’s figure of 0.3%. Yearly data jumped 5.6%, surpassing the previous month’s 4%.
- Industrial Production in December expanded above the forecast of 0%, coming in at 0.1% MoM and avoiding back-to-back prints suggesting the economy is stagnating. On a 12-month basis from December, the reading increased by 1%, well above November’s -0.4% drop.
- The USD/MXN advance on Wednesday is sponsored by the jump in US Treasury bond yields, reflecting that traders might have gone too far, pricing more than 150 basis points of rate cuts by the Fed for 2024. The latest comments from Fed Governor Christopher Waller saying there’s “no reason to move as quickly or cut as rapidly as in the past,” kept investors in check despite supporting rate cuts if inflation indeed gets lowered.
- The lack of data in Mexico keeps traders leaning on the latest inflation figures, which edged higher than expected in headline inflation, but core data suggests the Bank of Mexico (Banxico) has done a good job, curbing elevated prices after hiking rates toward 11.25%.
- Although December’s meeting minutes from Banxico (the Central Bank of Mexico) suggest that the central bank might contemplate easing its monetary policy, the inflation report for December could hinder any move toward policy relaxation.
- Analysts at Standard Chartered noted, “We expect the policy rate to be lowered to 9.25% by end-2024, although an official downward revision in the output gap could open the door for more aggressive rate cuts.”
- On January 5, a Reuters poll suggested the Mexican Peso could weaken 5.4% to 18.00 per US Dollar in the 12 months following December.
Technical analysis: Mexican Peso slumps sharply as USD/MXN challenges the 200-day SMA
The USD/MXN is neutrally biased, though the earlier test of the 200-day SMA at 17.37 put sellers in danger of losing that level. Once cleared, it could open the door to challenge higher prices. Up next is the 100-day SMA at 17.41, followed by the December 5 high at 17.56, before testing the May 23 high of 17.99.
On the contrary, sellers need to pull prices below 17.00, which could exacerbate a retest of the January 12 low of 16.82, followed by the January 8 low of 16.78. Once those levels are hurdled, the next demand level would be the August 28 cycle low of 16.69, ahead of last year’s low of 16.62.
USD/MXN Price Action – Daily Chart
Mexican Peso FAQs
What key factors drive the Mexican Peso?
The Mexican Peso (MXN) is the most traded currency among its Latin American peers. Its value is broadly determined by the performance of the Mexican economy, the country’s central bank’s policy, the amount of foreign investment in the country and even the levels of remittances sent by Mexicans who live abroad, particularly in the United States. Geopolitical trends can also move MXN: for example, the process of nearshoring – or the decision by some firms to relocate manufacturing capacity and supply chains closer to their home countries – is also seen as a catalyst for the Mexican currency as the country is considered a key manufacturing hub in the American continent. Another catalyst for MXN is Oil prices as Mexico is a key exporter of the commodity.
How do decisions of the Banxico impact the Mexican Peso?
The main objective of Mexico’s central bank, also known as Banxico, is to maintain inflation at low and stable levels (at or close to its target of 3%, the midpoint in a tolerance band of between 2% and 4%). To this end, the bank sets an appropriate level of interest rates. When inflation is too high, Banxico will attempt to tame it by raising interest rates, making it more expensive for households and businesses to borrow money, thus cooling demand and the overall economy. Higher interest rates are generally positive for the Mexican Peso (MXN) as they lead to higher yields, making the country a more attractive place for investors. On the contrary, lower interest rates tend to weaken MXN.
How does economic data influence the value of the Mexican Peso?
Macroeconomic data releases are key to assess the state of the economy and can have an impact on the Mexican Peso (MXN) valuation. A strong Mexican economy, based on high economic growth, low unemployment and high confidence is good for MXN. Not only does it attract more foreign investment but it may encourage the Bank of Mexico (Banxico) to increase interest rates, particularly if this strength comes together with elevated inflation. However, if economic data is weak, MXN is likely to depreciate.
How does broader risk sentiment impact the Mexican Peso?
As an emerging-market currency, the Mexican Peso (MXN) tends to strive during risk-on periods, or when investors perceive that broader market risks are low and thus are eager to engage with investments that carry a higher risk. Conversely, MXN tends to weaken at times of market turbulence or economic uncertainty as investors tend to sell higher-risk assets and flee to the more-stable safe havens.
- Canadian Dollar sees some gains but loses further ground against US Dollar.
- Low-impact Canada economic data fails to move the needle as investors focus on US data.
- Crude Oil bids struggle to hold steady, limit Loonie gains.
The Canadian Dollar (CAD) found some gains against most of its major currency peers, but saw further declines against the US Dollar (USD) on Wednesday after US Retail Sales ran hotter than markets anticipated.
Canada’s Raw Material Price Index shrank in December for the second month in a row, keeping materials inflation at its steepest contractionary level since last June, while Foreign Investment in Canadian Securities slightly undershot Canadian investment outflows.
Market focus was squarely on US Retail Sales, which jumped much higher than anticipated, making it difficult for investors to continue betting on a faster pace of rate hikes from the Federal Reserve (Fed).
Daily digest market movers: Canadian Dollar firms up, but not enough to overcome Greenback flows
- Canada’s Raw Material Price Index fell 4.9% in December, in-line with the previous figure (revised down from -4.2%) and completely missing the market forecast of -1.6%.
- Canadian Industrial Product Prices also declined in December, falling 1.5% versus the forecast of -0.7% and declining even further from the previous month’s -0.3% (revised down slightly from -0.4%).
- US Retail Sales climbed 0.6% in December, with Retail Sales excluding automobiles also gaining 0.4% over the same period; median market forecasts expected Retail Sales to come in at 0.4% versus the previous 0.3%.
- US Industrial Production grew 0.1% in December, a scant figure but more than the forecasted flat reading of 0.0% and November’s 0.0% (revised down from 0.2%).
- With the US domestic economy continuing to show signs of strength, money markets are pulling away from Fed rate cut bets in frustration, bolstering the US Dollar across the board.
- Crude Oil markets continue to struggle, weakening the Canadian Dollar’s strength base.
- China’s faltering growth outlook early Wednesday pushed Crude Oil lower as barrel traders grow concerned about China’s fossil fuel demand outlook, while a strengthening US Dollar waters down barrel bids.
- Crude Oil markets continue to see upside shocks as geopolitical concerns weigh on investor sentiment, but faltering Crude Oil momentum sees little support transfer to the Loonie.
Canadian Dollar price today
The table below shows the percentage change of Canadian Dollar (CAD) against listed major currencies today. Canadian Dollar was the weakest against the Pound Sterling.
| USD | EUR | GBP | CAD | AUD | JPY | NZD | CHF | |
| USD | 0.27% | -0.17% | 0.21% | 0.87% | 0.82% | 0.75% | 0.68% | |
| EUR | -0.28% | -0.45% | -0.06% | 0.58% | 0.56% | 0.46% | 0.41% | |
| GBP | 0.18% | 0.44% | 0.37% | 1.01% | 0.99% | 0.90% | 0.84% | |
| CAD | -0.20% | 0.07% | -0.37% | 0.67% | 0.62% | 0.55% | 0.46% | |
| AUD | -0.87% | -0.60% | -1.05% | -0.66% | -0.04% | -0.12% | -0.20% | |
| JPY | -0.83% | -0.56% | -1.01% | -0.63% | 0.05% | -0.08% | -0.14% | |
| NZD | -0.75% | -0.47% | -0.91% | -0.52% | 0.13% | 0.10% | -0.08% | |
| CHF | -0.68% | -0.41% | -0.85% | -0.47% | 0.17% | 0.15% | 0.05% |
The heat map shows percentage changes of major currencies against each other. The base currency is picked from the left column, while the quote currency is picked from the top row. For example, if you pick the Euro from the left column and move along the horizontal line to the Japanese Yen, the percentage change displayed in the box will represent EUR (base)/JPY (quote).
Technical Analysis: Canadian Dollar struggles to recover after USD/CAD hits 1.3540
The Canadian Dollar (CAD) is down a fifth of a percent against the US Dollar on Wednesday, shedding around half a percent against the Pound Sterling (GBP), while the CAD gained around two-thirds of a percent against the Australian Dollar (AUD) and the Japanese Yen (JPY).
The Canadian Dollar saw further declines against the US Dollar, with the USD/CAD hitting a five-week high of 1.3540. Intraday momentum is leaning into the top side as US Dollar strength continues to push the pair higher. In the near term, the USD/CAD is trading well above the 200-hour Simple Moving Average (SMA) near 1.3400.
Continued bullish momentum in the USD/CAD has the pair challenging a congestion zone that sees the 50-day and 200-day SMAs consolidating near the 1.3500 handle, and the pair has closed close to flat or in the green for all but one of the last 14 consecutive trading days.
USD/CAD Hourly Chart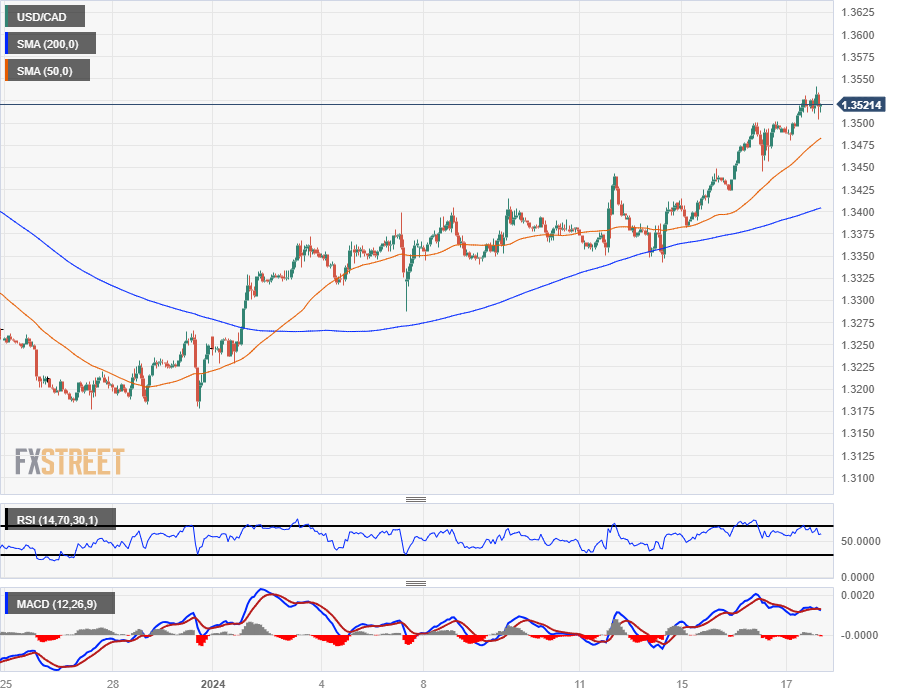
USD/CAD Daily Chart
Canadian Dollar FAQs
What key factors drive the Canadian Dollar?
The key factors driving the Canadian Dollar (CAD) are the level of interest rates set by the Bank of Canada (BoC), the price of Oil, Canada’s largest export, the health of its economy, inflation and the Trade Balance, which is the difference between the value of Canada’s exports versus its imports. Other factors include market sentiment – whether investors are taking on more risky assets (risk-on) or seeking safe-havens (risk-off) – with risk-on being CAD-positive. As its largest trading partner, the health of the US economy is also a key factor influencing the Canadian Dollar.
How do the decisions of the Bank of Canada impact the Canadian Dollar?
The Bank of Canada (BoC) has a significant influence on the Canadian Dollar by setting the level of interest rates that banks can lend to one another. This influences the level of interest rates for everyone. The main goal of the BoC is to maintain inflation at 1-3% by adjusting interest rates up or down. Relatively higher interest rates tend to be positive for the CAD. The Bank of Canada can also use quantitative easing and tightening to influence credit conditions, with the former CAD-negative and the latter CAD-positive.
How does the price of Oil impact the Canadian Dollar?
The price of Oil is a key factor impacting the value of the Canadian Dollar. Petroleum is Canada’s biggest export, so Oil price tends to have an immediate impact on the CAD value. Generally, if Oil price rises CAD also goes up, as aggregate demand for the currency increases. The opposite is the case if the price of Oil falls. Higher Oil prices also tend to result in a greater likelihood of a positive Trade Balance, which is also supportive of the CAD.
How does inflation data impact the value of the Canadian Dollar?
While inflation had always traditionally been thought of as a negative factor for a currency since it lowers the value of money, the opposite has actually been the case in modern times with the relaxation of cross-border capital controls. Higher inflation tends to lead central banks to put up interest rates which attracts more capital inflows from global investors seeking a lucrative place to keep their money. This increases demand for the local currency, which in Canada’s case is the Canadian Dollar.
How does economic data influence the value of the Canadian Dollar?
Macroeconomic data releases gauge the health of the economy and can have an impact on the Canadian Dollar. Indicators such as GDP, Manufacturing and Services PMIs, employment, and consumer sentiment surveys can all influence the direction of the CAD. A strong economy is good for the Canadian Dollar. Not only does it attract more foreign investment but it may encourage the Bank of Canada to put up interest rates, leading to a stronger currency. If economic data is weak, however, the CAD is likely to fall.
- The EUR/GBP navigates below the 0.8600 level after recording losses of 0.40%.
- Persistent UK inflation bolsters the Pound as dovish bets on the BoE fade.
- The Euro weakens due to the ECB's dovish signals.
The EUR/GBP declined in Wednesday's session, mainly influenced by the dovish stance from the European Central Bank (ECB) and UK inflation data, which surpassed expectations, boosting the Pound.
The UK Office for National Statistics (ONS) ONS has announced a faster growth rate for headline inflation at 0.4%, rebounding from November's 0.2% contraction. In addition, the yearly headline CPI surged to 4%, outperforming the previous 3.9% and the expected 3.8%. As a reaction, market bets are leaning towards less odds of the Bank of England starting its easing cycle in March, but investors are confident that the bank will still cut by 125 bps in 2024.
On the other hand, the ECB Governing Council, led by President Lagarde, sent signals of an early rate cut in summer, reshaping market expectations. However, it emphasized the importance of the number of rate cuts rather than the first cut's timing or the pace of subsequent reductions. As for now, markets are betting on high odds of a first-rate cut in April and, overall, a total of 150 bps of easing in 2024. In that sense, if the BoE and ECB monetary policies diverge, the cross may face further downsides.
EUR/GBP levels to watch
The daily chart suggests that the pair has a strong bearish momentum. The sinking Relative Strength Index (RSI), which is currently in negative territory along with a negative slope, illustrates continual seller influence on the pair. Furthermore, the Moving Average Convergence Divergence (MACD) manifests itself as rising red bars, indicating that the selling pressure is building..
Moreover, the pair's position in relevance to the Simple Moving Averages (SMAs) amplifies this bearish sentiment. Struggling under the pressure of 20, 100, and 200-day SMAs, the pair is desperately crying out for a guiding hand from the buyers. This, however, seems unlikely due to the continued dominance of the bears on a broader scale, as reflected in the daily chart analysis.
EUR/GBP daily chart
-638411052661950944.png)
From the ECB's perspective, wage settlements will play a significant role in interest rate decisions in the coming months, economists at Commerzbank report.
ECB unlikely to cut key interest rates in April
The ECB is unlikely to cut key interest rates in April, as the markets expect. Because wages are still rising sharply, it is likely to wait until June.
We expect three 25 bps rate cuts by the end of the year.
We believe that the market's expectations of an interest rate cut of almost 150 bps this year are clearly exaggerated.
The Pound Sterling (GBP) has been able to hold onto its late year gains pretty well. Economists at ING analyze the pair’s outlook.
Loose fiscal, tight monetary could help GBP
There is focus on the UK budget on 6 March, where tax cuts are on the agenda. Unlike September 2022, we believe that these are credible tax cuts funded by the lower environment for debt servicing costs. They could add 0.2-0.3% to the UK GDP this year and make the case for the BoE keeping rates tighter for longer.
A 100 bps BoE easing cycle is the reason why we think GBP will be contained this year – but there are growing upside risks for GBP.
GBP/USD – 1M 1.2300 3M 1.2300 6M 1.2400 12M 1.2800
The Australian labor market figures for December will be released on Thursday, January 18 at 00:30 GMT. Economists at Commerzbank analyze Aussie’s outlook ahead of the employment report.
Is the labor market still robust?
There is certainly a risk that we will see a lower figure due to seasonal effects from the summer in Australia. However, these effects have been somewhat stronger in January in recent years (and were largely revised in retrospect), so I would be skeptical of assuming a significant slowdown tonight.
This does not necessarily mean that the RBA will raise rates again due to the robust labor market. But any positive number should make it more likely that the RBA won't cut rates anytime soon.
If I am right with my arguments, the Aussie could benefit again and recoup some of Tuesday's losses vs. the US Dollar.
- AUD/USD drops weighed down by strong US economy and China's weak GDP.
- US retail sales grow 0.6% monthly; Industrial Production up 0.1%, strengthening USD.
- Fed Governor Waller's cautious rate cut remarks and China's poor GDP, retail sales spike market uncertainty.
The Australian Dollar (AUD) plunges for the third consecutive day against the US Dollar (USD) on risk aversion following earlier data in the Asian session on China’s GDP. Besides that, robust economic data from the United States (US) accelerated the AUD/USD’s downtrend, and trades at 0.6534, down 0.76%
AUD/USD weighed by solid US Retail Sales, sponsoring a repricing of Fed’s rate cuts
Retail sales in the US exceeded analysts' forecasts in December, according to the US Department of Commerce. On a monthly basis, consumers continued to spend at a healthy rate, with sales topping at 0.6%, above forecasts of 0.4% and November’s data, while on an annual basis, increased by 5.6%, surpassing the previous month’s 4%.
The US Federal Reserve (Fed) recently announced that Industrial Production grew at a 0.1% MoM, exceeding forecasts for stagnation at 0%, while year-over-year figures rose by 1%, crushing November’s -0.4% drop. AUD/USD traders extended the pair’s losses, while the Greenback advanced 0.24%, as shown by the US Dollar Index (DXY) at 103.59.
Additionally, US Treasury bond yields continued to climb, reflecting that investors might have gone too far, pricing more than 150 basis points of rate cuts by the Fed for 2024. The latest comments from Fed Governor Christopher Waller, saying there’s “no reason to move as quickly or cut as rapidly as in the past,” kept investors in check despite supporting rate cuts if inflation indeed gets lowered.
Aside from this, China’s data shifted sentiment sour as GDP rose by a modest 5.2% YoY in December but missed forecasts of 5.3%. That, alongside not being as strong as expected, retail sales hit 7.4% from 8% estimates, worrying market participants as the country goes through a property crisis.
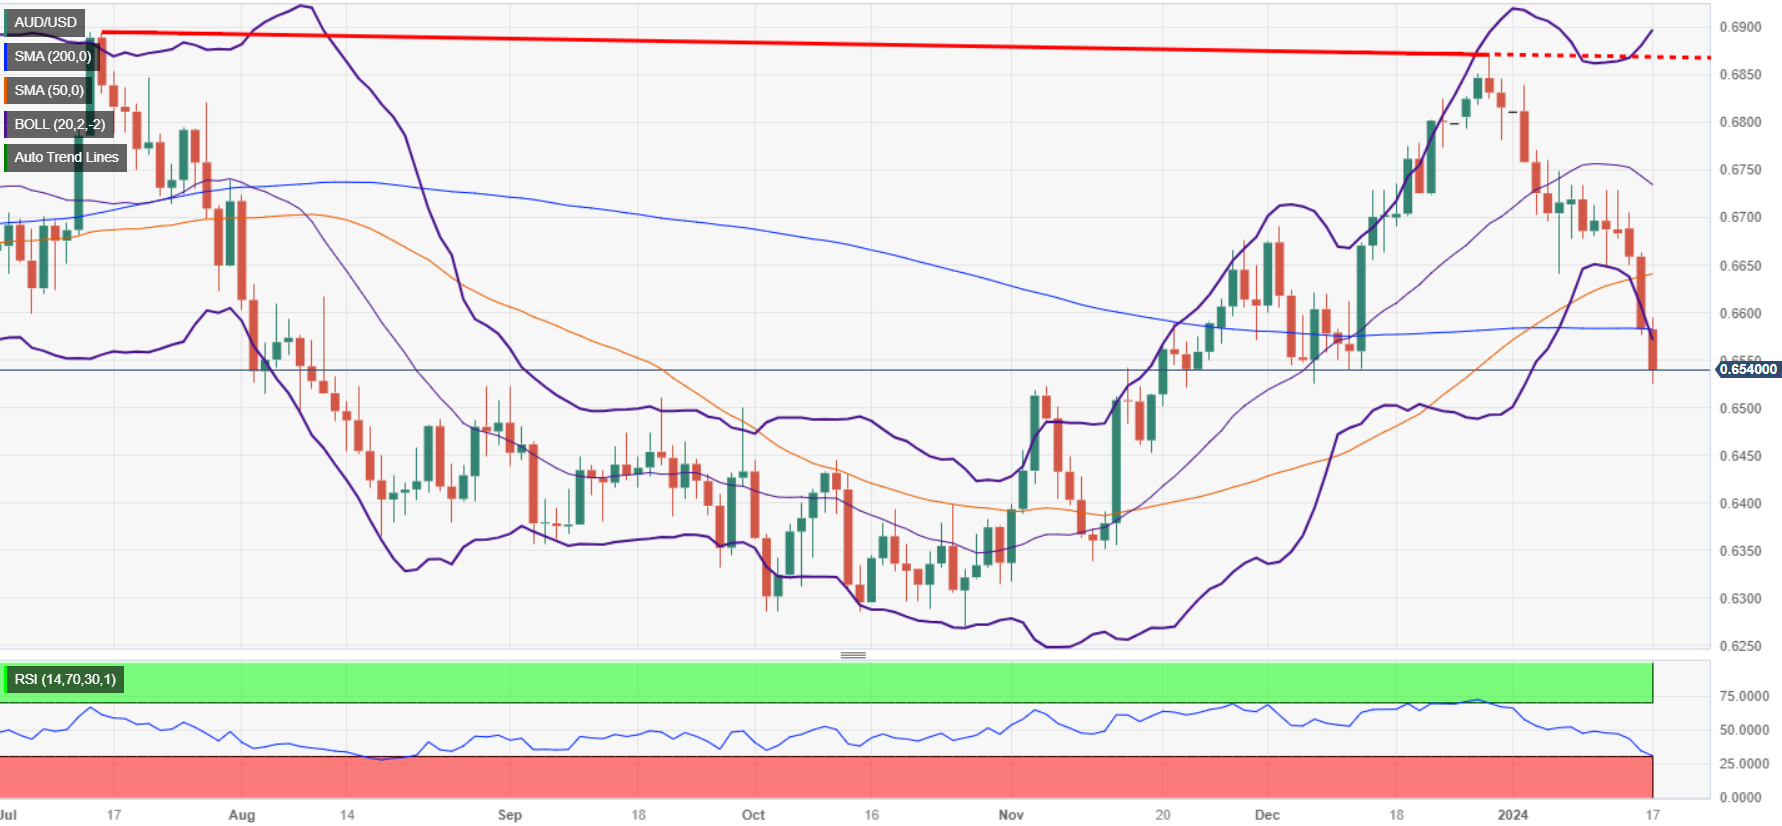
AUD/USD Price Analysis: Technical outlook
At the time of writing, the pair has fallen below the 200-day moving average (DMA) at 0.6580, which opens the door for further losses. However, buyers are capping the plunge near the 100-DMA at 0.6512, which, once hurdled, would clear the path toward the 0.6500 figure. A breach of the latter would be the last nail in the coffin, with sellers having a clear shot of pushing the price toward the next major support at 0.6338, November’s 10 low. On the other hand, if buyers lift spot prices above the 200-DMA, they would have a shot at 0.6600.
Mexican Peso’s (MXN) returns can be explained entirely by US factors. Economists at TD Securities analyze MXN outlook.
US slowdown and a steep Fed cutting cycle in 2024 will allow markets to price in more cuts by Banxico
MXN returns can almost be solely explained by US and global macro factors. Hence, a US slowdown and a steep Fed cutting cycle in 2024 will allow markets to price in more cuts by Banxico and bring MXN underperformance.
Moreover, the Mexican and US 2024 elections will add noise and can weigh on the Peso.
Despite this week’s move by EUR/USD below the 1.09 level, the Euro (EUR) remains the third best performing G10 currency in the year to date after the US Dollar (USD) and the Pound Sterling (GBP). Economists at Rabobank analyze Euro’s outlook.
Potential for the EUR to slip vs. the GBP and against both the SEK and the NOK
While we note that EUR/USD is currently trading well below most model-based predictions of fair value, we are concerned that the relative buoyancy of the EUR belies sour growth fundamentals in the Eurozone and specifically in Germany.
We see scope for the EUR to lose ground against the USD in the coming months. Additionally, we see potential for the EUR to slip vs. the GBP and against both the SEK and the NOK.
- Industrial Production surprised to the upside in December.
- Manufacturing Production also came in above estimates.
Industrial Production (MoM) in the United States gained 0.1% in December, up from the 0.0% expected by markets. In November, United States Industrial Production (MoM) had advanced by a 0.2%. On a yearly basis, Industrial Production expanded by 1.0%.
In addition, Manufacturing Production increased by a monthly 0.1% in the same period and Capacity Utilization held steady at 78.6%.
What is the United States Industrial Production (MoM)?
The Industrial Production released by the Board of Governors of the Federal Reserve shows the volume of production of US industries such as factories and manufacturing. Up trend is regarded as inflationary which may anticipate interest rates to rise. If High industrial production growth comes out, this may generate a positive sentiment (or bullish) for the USD.
Market reaction
The Greenback receded some ground following the Industrial Production report, although the USD Index (DXY) remained near recent peaks in the 103.50-103.60 band.
- The Greenback pushes higher as US Retail Sales beat expectations.
- These figures strengthen the case for higher for longer interest rates and provide additional support to the USD.
- The focus now is on the Fed speakers scheduled later today.
The US Dollar has turned higher again on Wednesday, to test resistance at the 148.00 psychological level, boosted by higher-than-expected US Retail Sales figures.
Retail Consumption increased at a 0.5% pace in December, above November’s 0.3% increase and beating expectations of a 0.4% increase. Excluding automobiles, sales of other products rose at a 0.4% pace, twice as fast as the 0.2% forecasted by the market.
These figures confirm that the US economy remains resilient and dampens investors’ hopes of rate cuts in March. In this context, Fed Governor Christopher Waller's comments, warning that it is too early to discuss rate cuts as inflation is still too high, are being reinforced.
Later today, Fed officials Michelle Bowman, Michael Barr, and John Williams are expected to meet the press. The risk for the US Dollar is skewed to the upside, as the BoJ is widely expected to stand pat next week.
The near-term trend remains bullish, after having breached the 61.8% retracement of the late 2023 sell-off. Immediate resistances are at 148.00 and 148.50. Supports lie at 147.11 and 146.35.
Technical levels to watch
- NZD/USD falls sharply on robust US consumer spending momentum.
- Fed policymakers are expected to maintain interest rates higher to ensure inflation declining towards 2%.
- The market mood remains downbeat as China’s GDP fails to meet estimates.
The NZD/USD pair has extended its downside to near 0.6100 as the United States Census Bureau has reported a better-than-projected Retail Sales report for December. The agency reported that consumer spending grew at a strong momentum of 0.6%, doubled from 0.3% growth in November. Investors projected that sales ticket at retailers rose by 0.4%.
An upbeat US Retail Sales data is expected to strengthen Federal Reserve (Fed) policymakers’ stance of maintaining interest rates at restricted levels for a period longer than expected by market participants.
The S&P500 is expected to open on a negative mood, considering weak cues from overnight futures. The US Dollar Index (DXY) has printed a fresh monthly high at 103.60 as investors seem uncertain about when the Fed will start reducing interest rates.
Meanwhile, investors await fresh guidance on interest rates from Federal Reserve (Fed) policymakers: Michael Barr, Michelle Bowman and John William. Fed policymakers are expected to deliver a hawkish guidance as inflationary pressures remain stubbornly higher in the December month.
The market mood remains downbeat due to weak post Covid recovery of the Chinese economy. The annual Q4 Gross Domestic Product (GDP) at 5.2%, missed market expectations of 5.3% but remained higher than the former reading of 4.9%. Quarter GDP grew at a slower pace of 1% as expected. In the third quarter, the Chinese economy was expanded by 1.3%. Being a proxy to China’s economic prospects, the New Zealand Dollar faces an intense sell-off.
The downbeat Electronic Retail Sales data for December has also impacted the New Zealand Dollar. The economic data was contracted by 2% and 0.6% on a monthly and an annual basis respectively.
USD/CAD gains are nearing the 50% Fibonacci retracement of the USD’s Q4 slide at 1.3538. Economists at Scotiabank analyze the pair’s outlook.
Technical point to more losses
If markets continue to reprice March Fed risks, the USD is likely to remain well-supported.
Solidly bullish intraday and daily trend strength signals suggest the USD rebound, signaled by bullish price action around the turn of the year, has further to run still.
Above 1.3540/1.3550, USD gains are liable to run on to the low/mid-1.36 range.
Intraday support is 1.3480/1.3490 and 1.3445/1.3450.
GBP/USD soars on higher-than-expected UK Consumer Price Index (CPI) data. Economists at Scotiabank analyze the pair’s outlook.
Markets pared BoE rate cut expectations further in response to upside CPI surprise
UK CPI for December came in at 0.4% MoM, double the market consensus. Prices rose 4.0% in the year, up from 3.9% in November (versus 3.8% expected). Markets pared BoE rate cut expectations further in response to the data.
Sterling’s snap higher from the intraday low just under 1.2600 preserves the broader 1.2600/1.2825 trading range for the past month for a little longer.
Intraday price action is supportive and may see the Pound’s rebound extend modestly (to the mid-1.27s) in the near-term.
- US Retail Sales rose by 0.6% in December, compared to the 0.4% gain of market consensus.
- Core Retail Sales increased by 0.4%, and Control Group Sales by 0.8%.
Retail Sales in the US rose 0.6% on a monthly basis in December to $709.9 billion, the data published by the US Census Bureau showed on Wednesday. This reading followed the 0.3% gain recorded in November ($706.0 billion) and came in better than the market expectation of a 0.4% gain.
Retail Sales Ex-Autos rose 0.4% in the same period. Retail Sales Control Group increased 0.8%.
Market reaction
The Greenback recovered some ground following the Retail Sales report. The USD Index (DXY) climbed to a new 2024 peak of 103.60.
This message was edited at 13:47GMT to show that market expectation was 0.4% and not 0.3%, while Retail Sales ex-Autos rose 0.4% instead of 0.6%.
- Silver remains under pressure, with upside attempts limited below $23.00.
- The Dollar is showing muscle with investors awaiting the US Retail Sales report.
- XAG/USD: Below $22.50 bearish momentum will increase.
Silver (XAG/USD), is trading lower for the second consecutive day on Wednesday. The US Dollar remains bid with investors scaling back hopes of Fed easing in 2024 and risk-averse trading, which is acting as a headwind for precious metals.
Fed Governor Christofer Waller discarded any rate cut as long as inflation remains at “striking distance” to the bank’s 2% target, which cast further doubt on investors’ hopes of a major policy shift.
The focus today is on the US Retail Sales. Consumption is expected to have improved in December adding to evidence that the economy remains resilient and strengthening the US-Dollar supportive soft landing narrative.
Somewhat later an array of Fed policymakers will meet the press, likely to strengthen the “higher for longer “ rhetoric.
XAG/USD remains hovering above $22.50 support
The pair is trading within a falling triangle, with price action unable to put a significant distance from the $22.50 support area. Below here, selling pressure might increase, with bears focusing on the $21.90 level.
On the upside, a bullish reaction above $23.53 would ease downside pressure and expose the $24.60 level.
Technical levels to watch
- EUR/GBP tumbles to near 0.8570 as BoE rate cut bets dive after high UK inflation data.
- The BoE is less-likely to guide interest rates cut in February meeting.
- ECB Lagarge sees no victory on inflation yet until it declines in a sustainable manner.
The EUR/GBP pair has witnessed an intense sell-off as the consumer price inflation in the United Kingdom economy for December remained surprisingly stubborn. The cross has dropped to near 0.8570 and is struggling for a firm-footing due as it has provided a strong argument to Bank of England (BoE) policymakers for sticking with restrictive interest rate stance.
The UK Office for National Statistics (ONS) has reported that the headline inflation grew at a stronger pace of 0.4% after contracting 0.2% in November on a monthly basis. The annual headline Consumer Price Index (CPI) accelerated surprisingly to 4% against the former reading of 3.9%. Investors anticipated that annual price pressures will decelerate to 3.8%.
Price pressures were boosted by higher fuel prices, seasonal air fare increase and a slight increase in services inflation. A sticky inflation data has deepened fears of price pressures remaining persistent, allowing the BoE to maintain interest rates unchanged at 5.25% in its February meeting for the fourth time in a row.
Investors’ confidence for the BoE reducing interest rates from March has been faded significantly. This week, the UK ONS reported a steady labor demand and slower wage growth for three months, which improved conviction among investors that the BoE could discuss for rate cuts sooner.
Going forward, market participants will focus on the UK Retail Sales data for December, which will be published on Friday.
On the Eurozone front, European Central Bank (ECB) President Christine Lagarde see rate cuts from summer while speaking at the sidelines of the World economic Forum (WEF) annual meeting in Davos. The statement seems contradicting from other policymakers who have been reiterating the need of maintain a restrictive interest rate stance for longer.
While asked about the outlook on inflation, Lagarde said that a victory over inflation cannot be announced until it declines sustainably to 2%.
The US Dollar (USD) is firmer today but has edged off earlier highs versus the majors. Economists at Scotiabank analyze Greenback’s outlook.
Weak risk mood adds to USD support
While the January data round for the US got off to a poor start on Tuesday, with a much weaker-than-expected Empire Manufacturing Survey, the USD barely flinched. Higher US yields and supportive comments from the Fed’s Waller – who at the very least sounded in no rush to cut rates – helped keep the USD supported.
Soft stocks and firm or firmer US yields (Treasurys are little changed on the day) will keep the USD supported in the short run and help extend the USD’s corrective rebound in the early part of this year.
EUR/USD losses steady in the upper 1.08s. Economists at Scotiabank analyze the pair’s outlook.
More corrective losses are ahead
Bear trend momentum on the intraday and daily DMI oscillators is picking up but the lack of follow through selling on the EUR today so far may delay a deeper sell-off in the short run.
Weakness below trend support – now resistance – at 1.0930 on Tuesday implies more softness ahead and a deeper retracement of the EUR’s Q4 gains.
EUR/USD is holding up around the 38.2% Fibonacci support from the EUR’s late year rally (1.0875) but risks are tilted toward a drop back to the 1.0700/1.0800 range.
- The US Dollar trades in the green across the board after comments from Fed’s Waller.
- Traders are repricing the number and timing of cuts further down the line for the Fed, ECB and BoE.
- The US Dollar Index jumps to mid-103 and is at a technical turning point for more upside.
The US Dollar (USD) roars with the US Dollar Index (DXY) popping above a few important technical levels. The move comes with markets finally realizing that rate cuts will not take place before June for either the US Federal Reserve (Fed), the European Central Bank (ECB) and the Bank of England (BoE). US Federal Reserve member Christopher Waller backtracked on his comments from early November and nuanced that rate cuts will come, though only when inflation does not pick up again.
On the economic front there will be a lot to digest, with a bulk release near 13:30 GMT when US Retail Sales comes out. Meanwhile headlines are being released out of Davos where the World Economic Forum (WEF) is taking place. When that is still not enough, traders can dig their teeth into no less than three Fed speakers throughout this Wednesday.
Daily digest market movers: What a line up
- The World Economic Forum in Davos is entering its third day with a lot of headline risk from senior people – central bankers and leaders – making comments, statements and holding interviews.
- ECB’s Christine Lagarde said that enthusiasm in the markets on rate cuts is not helping to reduce inflation. A rate cut might be likely by the summer. That statement is curious seeing the ECB always shouted they were data dependent, that cuts were not foreseen for 2024 and that forward guidance was impossible. Although rate cuts are negative for a currency, in this case it would mean good news for the EU economy, which sees the Euro off the lows against the US Dollar (EUR/USD).
- Commodity traders will brace for the release of the monthly OPEC market report. Normally foreseen near 12:00 GMT, though seems to be facing delays.
- As well near 12:00, the Mortgage Bankers Association released its weekly MBA Mortgage Applications. Previous number was a rise of 9.9% with this week a rise of 10.4%..
- Bulk data release with Retail Sales at 13:30 GMT:
- Monthly Import Price Index for December expected to head from -0.4% to -0.5%.
- Yearly Import Price Index for December seen heading from -1.4% to -2%.
- Monthly Export Price Index for December to head from -0.9% to -0.6%.
- Yearly Export Price Index for December will go from -5.2% to -0.7%.
- Monthly Retail Sales for December expected to head from 0.3% to 0.4%.
- Retail Sales without Cars is expected to stay steady near 0.2%
- As always for Retail Sales, the previous number’s revision can often be more important and market moving than the actual number coming out.
- Fed speakers making their way to the stage this Wednesday:
- At 14:00 GMT both Fed members Vice Chairman Michael Barr and Fed’s Board of Governors member Michelle Bowman are speaking.
- Later this evening at 20:00 GMT, New York Fed’s John Williams will be speaking.
- Near 14:15 GMT both Industrial Production and Capacity Utilisation will be released. Industrial Production is seen heading to 0% from 0.2% for December, while Capacity Utilisation for December remains quite steady from 78.8% to 78.7%.
- Around 15:00 the National Association of Home Builders (NAHB) will release its Housing Market Index for January. Previous was at 37, with 39 projected. In that same time slot, Business Inventories will be released, with a steady -0.10% expected for November.
- Right at the end of this packed Wednesday, near 18:00 GMT the US Treasury is allocating a 20-year Bond and the Fed’s Beige Book will be released near 19:00 GMT.
- Equity markets are not thriving in this growing yield environment. The goldilocks scenario for rate cuts as of March was fully priced in, and needs to be revalued now. This means a downturn for equities, with Chinese stock indices down across the board near 3%. European equities are nosediving over 1% and US equity futures are holding just above that 1% decline.
- The CME Group’s FedWatch Tool shows that markets are pricing in a 97.4% chance that the Federal Reserve will keep interest rates unchanged at its January 31 meeting. Around 2.6% expect the first cut already to take place. The more traders reprice cuts to later this year, a small rate hike expectation might come through in the coming days.
- The benchmark 10-year US Treasury Note jumps to 4.07% and is fueling a stronger US Dollar with its jump in yields.
US Dollar Index Technical Analysis: Crossroad as we speak
The US Dollar Index (DXY) has made a run for it and is trading near the mid-103 area. A crucial point with no less than two important moving averages being nearby and both just a few pips away from each other. From a pure technical angle, if the DXY can pull off a daily close above these two moving averages, the Greenback can gain no less than 1% towards 104.45.
The DXY is trading near the 55-day and the 200-day Simple Moving Averages (SMA) at 104.45. In case the DXY can get through that area, look for 104.44 as the first resistance level on the upside, in the form of the 100-day SMA. If that gets scattered as well, nothing will hold the DXY from heading to either 105.88 or 107.20, the high of September.
The break from this Wednesday could turn into a bull trap, where US Dollar bulls are caught buying into the Greenback when it broke above both the 55-day and the 200-day SMA in early Wednesday trading. Price action would decline substantially and force US Dollar bulls to sell their position at a loss. This would see the DXY first drop to 102.60 at the ascending trend line from September. Once threading below it, the downturn is open to head to 102.
US Dollar FAQs
What is the US Dollar?
The US Dollar (USD) is the official currency of the United States of America, and the ‘de facto’ currency of a significant number of other countries where it is found in circulation alongside local notes. It is the most heavily traded currency in the world, accounting for over 88% of all global foreign exchange turnover, or an average of $6.6 trillion in transactions per day, according to data from 2022.
Following the second world war, the USD took over from the British Pound as the world’s reserve currency. For most of its history, the US Dollar was backed by Gold, until the Bretton Woods Agreement in 1971 when the Gold Standard went away.
How do the decisions of the Federal Reserve impact the US Dollar?
The most important single factor impacting on the value of the US Dollar is monetary policy, which is shaped by the Federal Reserve (Fed). The Fed has two mandates: to achieve price stability (control inflation) and foster full employment. Its primary tool to achieve these two goals is by adjusting interest rates.
When prices are rising too quickly and inflation is above the Fed’s 2% target, the Fed will raise rates, which helps the USD value. When inflation falls below 2% or the Unemployment Rate is too high, the Fed may lower interest rates, which weighs on the Greenback.
What is Quantitative Easing and how does it influence the US Dollar?
In extreme situations, the Federal Reserve can also print more Dollars and enact quantitative easing (QE). QE is the process by which the Fed substantially increases the flow of credit in a stuck financial system.
It is a non-standard policy measure used when credit has dried up because banks will not lend to each other (out of the fear of counterparty default). It is a last resort when simply lowering interest rates is unlikely to achieve the necessary result. It was the Fed’s weapon of choice to combat the credit crunch that occurred during the Great Financial Crisis in 2008. It involves the Fed printing more Dollars and using them to buy US government bonds predominantly from financial institutions. QE usually leads to a weaker US Dollar.
What is Quantitative Tightening and how does it influence the US Dollar?
Quantitative tightening (QT) is the reverse process whereby the Federal Reserve stops buying bonds from financial institutions and does not reinvest the principal from the bonds it holds maturing in new purchases. It is usually positive for the US Dollar.
- The US Dollar rallies to fresh one-month highs on dwindling hopes of Fed cuts.
- Later today, the US Retail Sales and an array of Fed speakers will be observed with attention.
- USD/CHF recovery might find resistance at the 0.8665 area.
The US Dollar keeps marching higher after having rallied 1.5% over the last five trading days. The pair has reached its highest price in the mid-range of 0.8650 with investors scaling back Feed rate cut expectations, ahead of the release of US Retail Sales figures.
Retail consumption is expected to have increased at a faster 0.4% pace in December, with the mild weather pushing shoppers to the high street. This is likely to confirm that the US economy remains resilient and that the Fed has still some work to do to bring inflation to target.
After the release, the focus will shift to the speeches of Fed policymakers. NY Fed president John Williams and Board member Michelle Bowman, traditional hawks, plus vice-chair Michael Bar, with a more neutral profile, are likely to share their views on the monetary policy outlook.
A wider perspective shows the pair in a corrective recovery after having depreciated nearly 10% in the last quarter of 2023. The pair is approaching the 38.2% Fibonacci retracement of the mentioned decline, at 0.8665 where it might find some sellers. Above here, the next target is 0.8720.
Supports are at 0.8575 previous resistance area and 0.8460.
Technical levels to watch
The US Dollar (USD) is likely to remain strong in the months ahead, according to economists at HSBC.
Not run out of gas yet
The US Dollar will not be strengthening against most other currencies like it did when the Fed was in a rapid hiking cycle, but it has not run out of gas yet.
We expect the USD to outperform the Euro (EUR) and the Pound Sterling (GBP), but to underperform the Japanese Yen (JPY) and some commodity currencies, like the Canadian Dollar (CAD) and the Australian Dollar (AUD).
- Christine Lagarde will participate in the World Economic Forum, in Davos.
- ECB President’s speech will be scrutinized for fresh insights on the economy and policy.
- European Central Bank held rates for the second straight meeting in December.
Christine Lagarde, President of the European Central Bank (ECB), is set to speak on Wednesday at 15:15 GMT at the World Economic Forum (WEF), in Davos. It will be the first of her three appearances at the WEF Annual Meeting this week.
Lagarde is due to participate in a town hall titled "How to Trust Economics" on Wednesday, followed by a panel discussion titled "Uniting Europe's Markets" on Thursday. On Friday, the ECB President will be part of a panel discussion on "The Global Economic Outlook."
Wednesday’s town hall is likely to be an interactive event, with Lagarde expected to share her thoughts on how to ensure long-term and equitable growth while adapting to new economic realities. She might touch upon the topic of monetary policy and inflation during her commentary on the economic outlook.
Ahead of that event, Lagarde already spoke on the sidelines of the WEF Annual Meeting in Davos, suggesting in a Bloomberg interview that “it is likely that we will cut rates by the summer.”
Christine Lagarde’s remarks still will be closely scrutinized for affirming the pace and the timings of the interest rate cuts expected in the second half of this year. Money markets are currently pricing the ECB to lower policy rates as early as April. However, ECB policymakers have continued to push back against aggressive rate cut expectations, suggesting that the central bank will remain data-dependent on its interest rate outlook.
The European Central Bank held rates for the second meeting in a row in December, as it revised down its growth and inflation forecasts. “The Governing Council’s future decisions will ensure that its policy rates will be set at sufficiently restrictive levels for as long as necessary,” the ECB said in its accompanying statement.
Last Thursday, ECB President Christine Lagarde maintained her hawkish rhetoric, noting that “despite progress, it doesn't mean inflation decline will be smooth,” implying a ‘higher rates for longer’ narrative. Lagarde, however, said that she believes rates have probably peaked.
About Christine Lagarde
Christine Lagarde was born in 1956 in Paris, France. Graduated from Paris West University Nanterre La Défense and became President of the European Central Bank on November 1st 2019. Prior to that, she served as Chairman and Managing Director of the International Monetary Fund between 2011 and 2019. Lagarde previously held various senior ministerial posts in the Government of France: she was Minister of the Economy, Finance and Industry (2007–2011), Minister of Agriculture and Fishing (2007) and Minister of Commerce (2005–2007).
ECB FAQs
What is the ECB and how does it influence the Euro?
The European Central Bank (ECB) in Frankfurt, Germany, is the reserve bank for the Eurozone. The ECB sets interest rates and manages monetary policy for the region.
The ECB primary mandate is to maintain price stability, which means keeping inflation at around 2%. Its primary tool for achieving this is by raising or lowering interest rates. Relatively high interest rates will usually result in a stronger Euro and vice versa.
The ECB Governing Council makes monetary policy decisions at meetings held eight times a year. Decisions are made by heads of the Eurozone national banks and six permanent members, including the President of the ECB, Christine Lagarde.
What is Quantitative Easing (QE) and how does it affect the Euro?
In extreme situations, the European Central Bank can enact a policy tool called Quantitative Easing. QE is the process by which the ECB prints Euros and uses them to buy assets – usually government or corporate bonds – from banks and other financial institutions. QE usually results in a weaker Euro.
QE is a last resort when simply lowering interest rates is unlikely to achieve the objective of price stability. The ECB used it during the Great Financial Crisis in 2009-11, in 2015 when inflation remained stubbornly low, as well as during the covid pandemic.
What is Quantitative tightening (QT) and how does it affect the Euro?
Quantitative tightening (QT) is the reverse of QE. It is undertaken after QE when an economic recovery is underway and inflation starts rising. Whilst in QE the European Central Bank (ECB) purchases government and corporate bonds from financial institutions to provide them with liquidity, in QT the ECB stops buying more bonds, and stops reinvesting the principal maturing on the bonds it already holds. It is usually positive (or bullish) for the Euro.
- The US Dollar has reached fresh six-week highs at 148.00.
- The widening gap between US and Japanese bond yields, as the market pares back Fed cuts' hopes, is hurting the Yen.
- Later today, the US Retail sales and more Fed speakers might give a fresh impulse to the USD.
The US Dollar is consolidating gains below the 148.00 area on Wednesday. The pair has appreciated nearly 2% so far this week, with Fed policymakers pushing back hopes of interest rate cuts in the coming months.
On Tuesday, Fed Governor Christopher Waller backed last week’s comments from some of his colleagues warning that is too early to discuss rate cuts with inflation still at high levels.
Higher US Treasury yields are hurting the Yen
Investors’ reassessment of the timing and the intensity of the Fed’s easing cycle has pushed US Treasury yields somewhat higher, increasing the gap with the Japanese bonds and weighing on the Yen.
In Japan, the weak inflation and wage growth levels seen last week have eased pressure on the BoJ to exit its ultra-loose policy. This practically discards any relevant decision at next week’s monetary policy meeting, which is an additional weight on the JPY.
The focus today is on December’s US Retail sales, which are expected to have improved by 0.4%, after a 0.3% reading in November. After that, an array of Fed speakers will provide more info about the bank’s policy plans.
The near-term trend remains bullish, after having breached the 61.8% retracement of the late 2023 sell-off. Immediate resistances are at 148.00 and 148.50. Supports lie at 147.11 and 146.35.
Technical levels to watch
- WTI Oil sinks further as oversupply keeps hitting markets.
- Despite Red Sea tensions, Oil is still flowing.
- The US Dollar Index popped above 103 and is at crossroads with more upside on the radar.
Oil prices are dropping nearly 1% again this Wednesday with Oil traders sending the black fuel cheaper. The move comes on recent numbers from Russia that reveal it is not complying with the production cuts it agreed upon in the last OPEC+ meeting last year. With Russia’s seaborne crude hitting a near 3.43 million barrels per day, it is breaching its commitment to lower its production by 500,000 barrels per day with instead only 134,000 barrels per day.
Meanwhile, the DXY US Dollar Index is back on the map with first the victory of the former US President Donald Trump in Iowa triggering a substantial appreciation of the Greenback. A second appreciation came overnight with US Federal Reserve’s Christopher Waller who backtracked on earlier dovish comments and now pushed back against the enthusiasm of the markets. In a repricing towards interest rates remaining steady for longer, equities are dropping, yields are soaring and the Greenback has the wind in its sails.
Crude Oil (WTI) trades at $71.05 per barrel, and Brent Oil trades at $76.58 per barrel at the time of writing.
Oil News and Market Movers: A lot of moving parts
- The World Economic Forum in Davos is entering its third day with already quite a few comments from central bankers coming out.
- The Monthly OPEC Market report is due to be released near 12:00 GMT.
- Near 21:30, the American Petroleum Institute (API) is due to release the weekly Crude Oil Stockpile. Previous number was a big drawdown of 5.215 million barrels.
- Local Oil prices in the US are seeing a wider differential with the Bakken shale production facing an outage. Prices near Houston went up by $2.20 per barrel against Cushing (Oklahoma) prices. Substantial drawdowns might occur at Cushing as well, as Midwest refiners will need to revert to Cushing, in order to replace lost supply out of Bakken via the Dakota pipeline.
Oil Technical Analysis: Can the OPEC report move the needle?
Oil prices are being hit again, for a third day this week. While already trading at a weekly loss, the revelation that Russia is breaching the production cuts it committed to, means bad news for the balance between supply and demand. Another surge in supply means the balance is titled again to lower prices with refiners and buyers have the luxury to pick out the cheapest one to buy from in an overcrowded market of sellers.
On the upside, $74 continues to act as a line in the sand after yet another failed break above it on Friday. Although quite far off, $80 comes into the picture should tensions build further. Once $80 is broken, $84 is next on the topside once Oil sees a few daily closes above the $80 level.
Below $74, the $67 level could still come into play as the next support to trade at, as it aligns with a triple bottom from June. Should that triple bottom break, a new low for 2023 could be close at $64.35 – the low of May and March – as the last line of defence. Although still quite far off, $57.45 is worth mentioning as the next level to keep an eye on if prices fall sharply.
-638410823476959536.png)
US WTI Crude Oil: Daily Chart
WTI Oil FAQs
What is WTI Oil?
WTI Oil is a type of Crude Oil sold on international markets. The WTI stands for West Texas Intermediate, one of three major types including Brent and Dubai Crude. WTI is also referred to as “light” and “sweet” because of its relatively low gravity and sulfur content respectively. It is considered a high quality Oil that is easily refined. It is sourced in the United States and distributed via the Cushing hub, which is considered “The Pipeline Crossroads of the World”. It is a benchmark for the Oil market and WTI price is frequently quoted in the media.
What factors drive the price of WTI Oil?
Like all assets, supply and demand are the key drivers of WTI Oil price. As such, global growth can be a driver of increased demand and vice versa for weak global growth. Political instability, wars, and sanctions can disrupt supply and impact prices. The decisions of OPEC, a group of major Oil-producing countries, is another key driver of price. The value of the US Dollar influences the price of WTI Crude Oil, since Oil is predominantly traded in US Dollars, thus a weaker US Dollar can make Oil more affordable and vice versa.
How does inventory data impact the price of WTI Oil
The weekly Oil inventory reports published by the American Petroleum Institute (API) and the Energy Information Agency (EIA) impact the price of WTI Oil. Changes in inventories reflect fluctuating supply and demand. If the data shows a drop in inventories it can indicate increased demand, pushing up Oil price. Higher inventories can reflect increased supply, pushing down prices. API’s report is published every Tuesday and EIA’s the day after. Their results are usually similar, falling within 1% of each other 75% of the time. The EIA data is considered more reliable, since it is a government agency.
How does OPEC influence the price of WTI Oil?
OPEC (Organization of the Petroleum Exporting Countries) is a group of 13 Oil-producing nations who collectively decide production quotas for member countries at twice-yearly meetings. Their decisions often impact WTI Oil prices. When OPEC decides to lower quotas, it can tighten supply, pushing up Oil prices. When OPEC increases production, it has the opposite effect. OPEC+ refers to an expanded group that includes ten extra non-OPEC members, the most notable of which is Russia.
EUR/CHF clawed back losses last week. Economists at ING analyze the pair’s outlook.
Looking for the correction higher
EUR/CHF looks too low to us. It looks to have traded down to these 0.9200/0.9300 levels on the back of the excessive pricing of the ECB easing cycle. Our team looks for a mere 75 bps compared to current pricing of 150 bps. If we are right – and given that rate differentials have been a bigger driver over recent months – we see EUR/CHF correcting back up to the 0.9500/0.9600 area.
We now expect the SNB to be FX buyers.
Geopolitics is a bearish risk, but macro favours a higher EUR/CHF.
USD rebound is unfolding given the richness of US rates curve. Economists at MUFG Bank analyze Greenack’s outlook.
EUR/USD could move back down to around the 1.06/1.07 area in February
While inflation is falling quite quickly now for the FOMC to cut we will need to see some clearer evidence of a deteriorating labour market that would prompt increased fears of recession. That of course may well come in either the February or March payrolls reports but if not in February we may well see a full retracement of the EUR/USD rally in November/December, taking spot back down to around the 1.06/1.07 area.
The Dollar sell-off into year-end looked overdone and hence there remains scope for further USD strength, especially on days like Tuesday when we see bigger jumps in yields.
- The Aussie is under increasing bearish pressure amid the unfavorable risk environment
- Hawkish Fed rhetoric is prompting investors to reassess Fed easing expectations and boosting the US Dollar.
- A string of weak Chinese data has increased bearish pressure for the Aussie.
Aussie is trading under strong selling pressure. The pair has lost more than 4% so far in January to reach a key support area at the 0.6520/40 range with all eyes on the US Retail Sales data.
US Consumption is expected to have grown 0.4% in December, up from the 0.3% increase seen in November. After that, a slew of Fed policymakers are crossing wires.
Fed speakers are likely to support the US Dollar
Fed speakers are likely to endorse the view of their colleagues, who have warned that is too early to consider rate cuts, with inflation well above the 2% rate of price stability. These comments, mixed with the risk-off environment amid concerns that the situation in the Red Sea will strangle global trade, are underpinning support for the safe-haven Dollar.
Beyond that, data from China, a key Australian partner disappointed earlier today. The Gross Domestic Product grew at a 5.2% pace below expectations of 5.3% and retail sales went 7.4% up below the 8% market consensus and well below November’s 10.1% increase.
These figures revive investors' concerns about the anemic post-COVID recovery in China and cast doubt on Australia’s economic outlook, ultimately increasing negative pressure on the Aussie.
In Australia, recent data has shown that consumer confidence deteriorated in January, which has increased negative pressure on the Aussie.
Technical levels to watch
- EUR/JPY faces barricades near 161.00 as ECB Lagarde sees a rate cut in late spring.
- Oil supply disruptions from Red Sea could lead to upside risks to energy prices in Eurozone.
- The BoJ could postpone BoJ plans of exiting ultra-dovish monetary policy.
The EUR/JPY pair has found an intermediate resistance near 161.00 in the European session. The asset has sensed nominal selling pressure as European Central Bank (ECB) President Christine Lagarde has signalled that the central bank could start the ‘rate-cut’ cycle in summer.
ECB Lagarde refrained herself from announcing a victory over inflation as she believes that price pressures are far from the required rate of 2%. But added that collective wage agreements, which will release after late spring, will provide an idea where households’ income is going. ECB policymakers have been emphasizing on maintaining a restrictive interest rate stance, stating that it is too early to announce rate cuts.
Meanwhile, uncertainty over Middle East tensions have deepened upside risks to energy prices. Iran-backed Houthi group has threatened to retaliate for airstrikes by the US military on their bases in Yemen. Houthi rebels are expected to disrupt the commercial shipments through Red Sea, which could lead to a sharp increase in the oil prices. This can accelerate price pressures in the Eurozone and could delay potential rate cuts.
On the Japanese Yen front, investors await the National Consumer Price Index (CPI) data for December, which will be published on Friday. Price pressures are expected to remain above 2% but are not expected to move needle in favour of an early exit from the ultra-dovish interest rate policy. Earthquake in Japan, easing inflation in Tokyo and bleak wage growth would restrict the BoJ for unwinding the expansionary monetary policy.
- The Dollar has accelerated its recovery, buoyed by fading hopes of early Fed cuts.
- The focus today is on the US Retail Sales figures before more Fed officials meet the press.
- USD/CAD is approaching 1.3545, where it might find some resistance
The US Dollar is trading higher against its Canadian Counterpart, with downside attempts finding buyers, as investors reassess their expectations of early and aggressive Fed rate cuts in 2024.
The pair pulled back on Tuesday, with the Canadian Dollar picking up following mixed Canadian CPI and weaker-than-expected US Manufacturing figures. Buyers, however, showed up at 1.3450 and boosted the pair to the 1.3500 area after Fed’s Waller reiterated that the Fed is unlikely to trim rates with inflation well above the 2% target.
The focus today is on the US Retail Sales, which are expected to have increased 0.4% in December, following a 0.3% rise in the previous month. After that, a slew of Fed officials are likely to provide further insight into the bank’s next monetary policy steps.
The technical picture shows the pair correcting higher after a two-month sell-off. Price action is nearing the 50% retracement of the mentioned decline, at 1.3545 where it might find some resistance. Above here, the next target is 1.3625.
Immediate support is at 1.3450, and below here, 1.3340.
Technical levels to watch
The Canadian Dollar’s (CAD) reaction to the latest inflation print for December was rather muted. Economists at Commerzbank analyze Loonie’s outlook.
The BoC is unlikely to cut rates soon
The figures did not surprise to the extent that the Bank of Canada (BoC) is likely to discuss a rate hike again next week. At the same time, however, the figures confirm our view that the BoC is likely to take a wait-and-see approach and is therefore unlikely to cut rates in the near future.
The market still seems to think otherwise and, despite the surprise, expects the first rate cuts in the spring. Together with the small number of participants, this probably explains the moderate reaction of the CAD.
Given the more hawkish BoC and the fact that core inflation is once again proving surprisingly resilient, we would still be somewhat cautious. Accordingly, we remain comfortable with our forecast of a moderately appreciating CAD even after Tuesday's figures.
- The Euro languishes at one-month lows amid broad-based Dollar strength.
- Dwindling hopes of Fed rate cuts and geopolitical tensions are underpinning support for the US Dollar.
- Later today the US Retail Sales and a slew of Fed speakers might boost EUR/USD volatility.
The Euro (EUR) is practically flat near one-month lows on Wednesday, consolidating losses after a sharp reversal on Tuesday. The increasing geopolitical tensions in the Middle East and central banker’s rhetoric have pushed back hopes of rate cuts in early 2024, sending investors rushing into safe assets like the US Dollar (USD), which is weighing on the Euro.
On Tuesday, the Federal Reserve (Fed) Governor, Christopher Waller, warned that the bank is unlikely to trim rates while consumer inflation remains at a “striking distance” of the 2% target of price stability. Waller echoed last week’s comments by other Fed policymakers, demonstrating that the market got ahead of itself with the global central banks’ easing expectations.
In this context, and with the increasing tensions in the Red Sea underpinning the safe-haven US Dollar, the focus is now on the US Calendar. Later today, December’s US Retail sales and an array of Fed speakers are likely to boost USD volatility.
Daily digest market movers: Euro succumbs on US Dollar strength as risk appetite falters
- The Euro is hovering near one-month lows against a stronger USD with all eyes on US consumption figures.
- Fed Governor, Christopher Waller struck a hawkish tone on Tuesday and cast further doubt about the possibility of a Fed rate cut in March.
- Futures markets are pricing a 63% chance that the Fed will start easing in March, down from 75% at the start of the week.
- Later today US Retail sales are expected to show a 0.4% increase in December, following a 0.3% rise in the previous months.
- Shortly after the US data is released, Fed board members Michael Barr and Michelle Bowman are likely to give further insight into the bank’s monetary policy outlook.
- In the Euro Area, Consumer inflation is expected to confirm the preliminary data which showed an increase in price pressures in December.
- Somewhat later, European Central Bank President, Christine Lagarde, and Bundesbank Governor Joachim Nagel will speak. Their comments about the bank’s policy plans will be observed with interest.
- The uncertainty in the Red Sea persists, forcing shipping firms to find alternative routes for their cargo. This increases shipping costs and will translate into higher inflationary pressures.
- Data from China seen earlier today has added to evidence of the frail growth in the world’s second-largest economy. The third quarter GDP grew at 5.2% year on year, below the 5.3% expected, with retail sales also disappointing.
Technical Analysis: EUR/USD is under increasing bearish pressure below 1.0880 support
The EUR/USD has confirmed its near-term bearish trend with price action piercing the bottom of the last two week’s trading range, and the 38.2% retracement of the October - December rally, at 1.0880.
In so doing, the pair resumes its downtrend from late December highs, activating a bearish Head and Shoulders pattern. The next support levels are 1.0780 and 1.0725. The H&S measured target is 78.6% Fibonacci retracement of the aforementioned rally, at 1.0600.
On the upside, the pair should regain 1.0880 and the reverse trendline support, now at 1.0925 in order to shift its focus back to the 1.1000 area.
EUR/USD 4 Hour Chart
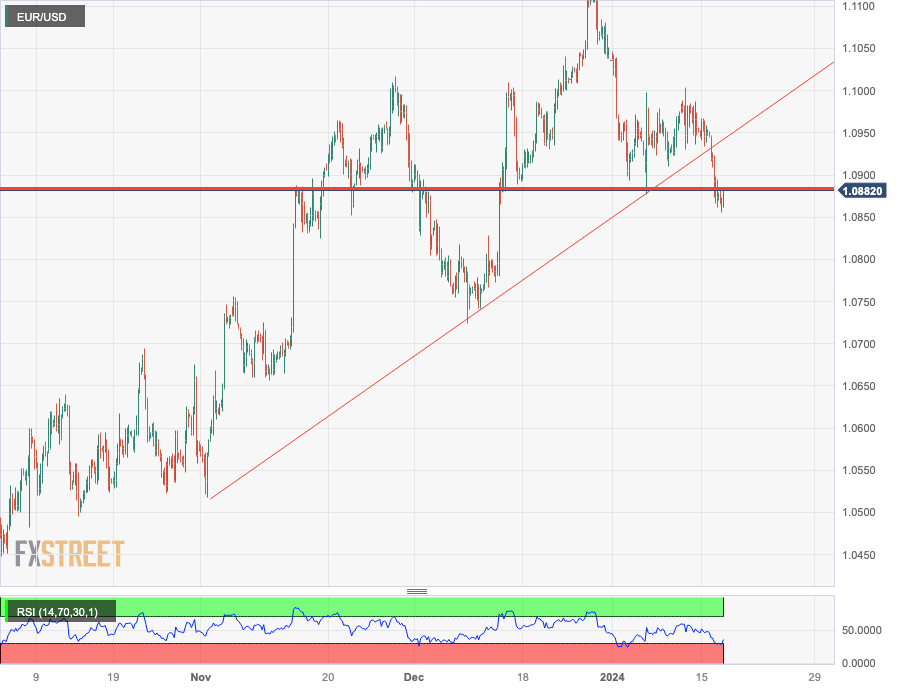
Euro FAQs
What is the Euro?
The Euro is the currency for the 20 European Union countries that belong to the Eurozone. It is the second most heavily traded currency in the world behind the US Dollar. In 2022, it accounted for 31% of all foreign exchange transactions, with an average daily turnover of over $2.2 trillion a day.
EUR/USD is the most heavily traded currency pair in the world, accounting for an estimated 30% off all transactions, followed by EUR/JPY (4%), EUR/GBP (3%) and EUR/AUD (2%).
What is the ECB and how does it impact the Euro?
The European Central Bank (ECB) in Frankfurt, Germany, is the reserve bank for the Eurozone. The ECB sets interest rates and manages monetary policy.
The ECB’s primary mandate is to maintain price stability, which means either controlling inflation or stimulating growth. Its primary tool is the raising or lowering of interest rates. Relatively high interest rates – or the expectation of higher rates – will usually benefit the Euro and vice versa.
The ECB Governing Council makes monetary policy decisions at meetings held eight times a year. Decisions are made by heads of the Eurozone national banks and six permanent members, including the President of the ECB, Christine Lagarde.
How does inflation data impact the value of the Euro?
Eurozone inflation data, measured by the Harmonized Index of Consumer Prices (HICP), is an important econometric for the Euro. If inflation rises more than expected, especially if above the ECB’s 2% target, it obliges the ECB to raise interest rates to bring it back under control.
Relatively high interest rates compared to its counterparts will usually benefit the Euro, as it makes the region more attractive as a place for global investors to park their money.
How does economic data influence the value of the Euro?
Data releases gauge the health of the economy and can impact on the Euro. Indicators such as GDP, Manufacturing and Services PMIs, employment, and consumer sentiment surveys can all influence the direction of the single currency.
A strong economy is good for the Euro. Not only does it attract more foreign investment but it may encourage the ECB to put up interest rates, which will directly strengthen the Euro. Otherwise, if economic data is weak, the Euro is likely to fall.
Economic data for the four largest economies in the euro area (Germany, France, Italy and Spain) are especially significant, as they account for 75% of the Eurozone’s economy.
How does the Trade Balance impact the Euro?
Another significant data release for the Euro is the Trade Balance. This indicator measures the difference between what a country earns from its exports and what it spends on imports over a given period.
If a country produces highly sought after exports then its currency will gain in value purely from the extra demand created from foreign buyers seeking to purchase these goods. Therefore, a positive net Trade Balance strengthens a currency and vice versa for a negative balance.
Interest rates FAQs
What are interest rates?
Interest rates are charged by financial institutions on loans to borrowers and are paid as interest to savers and depositors. They are influenced by base lending rates, which are set by central banks in response to changes in the economy. Central banks normally have a mandate to ensure price stability, which in most cases means targeting a core inflation rate of around 2%.
If inflation falls below target the central bank may cut base lending rates, with a view to stimulating lending and boosting the economy. If inflation rises substantially above 2% it normally results in the central bank raising base lending rates in an attempt to lower inflation.
How do interest rates impact currencies?
Higher interest rates generally help strengthen a country’s currency as they make it a more attractive place for global investors to park their money.
How do interest rates influence the price of Gold?
Higher interest rates overall weigh on the price of Gold because they increase the opportunity cost of holding Gold instead of investing in an interest-bearing asset or placing cash in the bank.
If interest rates are high that usually pushes up the price of the US Dollar (USD), and since Gold is priced in Dollars, this has the effect of lowering the price of Gold.
What is the Fed Funds rate?
The Fed funds rate is the overnight rate at which US banks lend to each other. It is the oft-quoted headline rate set by the Federal Reserve at its FOMC meetings. It is set as a range, for example 4.75%-5.00%, though the upper limit (in that case 5.00%) is the quoted figure.
Market expectations for future Fed funds rate are tracked by the CME FedWatch tool, which shapes how many financial markets behave in anticipation of future Federal Reserve monetary policy decisions.
- Gold price falls sharply as Fed Waller maintains a higher for longer interest-rates narrative.
- The last leg of high US inflation has turned out to be significantly stubborn.
- Guidance from three Fed policymakers and US Retail Sales data are due on Wednesday.
Gold price (XAU/USD) has extended its correction on Wednesday as a hawkish commentary from Federal Reserve (Fed) Governor Christopher Waller has casted doubts about a rate cut by the central bank in the March meeting. Fed policymakers have been favouring interest rates to remain higher for longer, defying market expectations, amid a lack of confidence in inflation returning towards the 2% target in a timely and sustainable manner.
The Consumer Price Index (CPI) data for December indicated that the last leg of high price pressures is quite challenging for Fed policymakers, likely due to steady labor market conditions and decent consumer spending momentum. A quick rate cut decision by the Fed can lead to persistence in inflationary pressures and dampen the work done to achieve price stability.
Later in the day, the performance of the US Dollar, Treasury yields and bullions will be guided by the United States Retail Sales and Industrial Production data for December. The chances for the Fed cutting interest rates in March could ease further if the Retail Sales report comes in stronger than projected.
Daily digest market movers: Gold price falls further ahead of US Retail Sales data
- Gold price has extended its losses to near $2,017 and is expected to decline further towards the psychological support of $2,000.
- The downside bias to the Gold price has strengthened as investors are uncertain about when the Federal Reserve could start discussing the timeframe for interest rate cuts.
- A hawkish commentary from Fed Governor Christopher Waller has raised doubts about whether the central bank will cut interest rates in March.
- Christopher Waller commented that the Fed should not rush to take interest rates down until it is ensured that inflation will return to the 2% target in a sustainable manner.
- Waller added that the Fed should proceed with rate cuts “methodically and carefully” to bail out the economy from an expected slowdown. He further added that resilience in the US economy could delay potential reductions in borrowing costs.
- Fed policymakers have become more determined to maintain a restrictive interest rate stance as the December inflation data turned out surprisingly stubborn.
- After Waller’s commentary, Investment banking firm Goldman Sachs said the Fed could cut rates somewhat later or might announce one cut each quarter from April.
- Meanwhile, bets supporting a rate cut by the Fed in March have dropped further. As per the CME Fedwatch tool, trades see a 61.4% chance for a 25-basis points (bps) interest rate cut in March, down from 70% at the start of the week.
- The increase in the US Dollar Index (DXY) also weighed on Gold price. The USD Index has slightly corrected after posting a fresh monthly high above 103.50.
- Further action in the US Dollar will be guided by the United States Retail Sales and Industrial Production data for December.
- Investors have projected that Retail Sales increased was 0.4%, higher than the 0.3% rise in November. Industrial Production is seen stagnant after rising 0.2% in November.
- Apart from the US economic data, Fed’s Beige Book and fresh outlook on interest rates from Fed speakers will be keenly watched. On Wednesday, Fed’s Michael Barr, Michelle Bowman, and John Williams are due to speak.
- Fed policymakers are expected to endorse a restrictive monetary policy stance for a longer period than what is anticipated by market participants.
Technical Analysis: Gold price drops to near 50-day EMA
Gold price continues its downside below $2,020 after Fed Waller’s hawkish remarks about interest rates. The near-term demand for Gold is not bullish anymore as price has dropped below the 20-day Exponential Moving Average (EMA), which trades around $2,036. The yellow metal has found interim support after sliding to near the 50-day EMA, which oscillates near $2,017. The 14-period Relative Strength Index (RSI) is declining towards 40.00, which could offer some cushion. However, a breakdown below the same will lead to the activation of bearish momentum.
Gold FAQs
Why do people invest in Gold?
Gold has played a key role in human’s history as it has been widely used as a store of value and medium of exchange. Currently, apart from its shine and usage for jewelry, the precious metal is widely seen as a safe-haven asset, meaning that it is considered a good investment during turbulent times. Gold is also widely seen as a hedge against inflation and against depreciating currencies as it doesn’t rely on any specific issuer or government.
Who buys the most Gold?
Central banks are the biggest Gold holders. In their aim to support their currencies in turbulent times, central banks tend to diversify their reserves and buy Gold to improve the perceived strength of the economy and the currency. High Gold reserves can be a source of trust for a country’s solvency. Central banks added 1,136 tonnes of Gold worth around $70 billion to their reserves in 2022, according to data from the World Gold Council. This is the highest yearly purchase since records began. Central banks from emerging economies such as China, India and Turkey are quickly increasing their Gold reserves.
How is Gold correlated with other assets?
Gold has an inverse correlation with the US Dollar and US Treasuries, which are both major reserve and safe-haven assets. When the Dollar depreciates, Gold tends to rise, enabling investors and central banks to diversify their assets in turbulent times. Gold is also inversely correlated with risk assets. A rally in the stock market tends to weaken Gold price, while sell-offs in riskier markets tend to favor the precious metal.
What does the price of Gold depend on?
The price can move due to a wide range of factors. Geopolitical instability or fears of a deep recession can quickly make Gold price escalate due to its safe-haven status. As a yield-less asset, Gold tends to rise with lower interest rates, while higher cost of money usually weighs down on the yellow metal. Still, most moves depend on how the US Dollar (USD) behaves as the asset is priced in dollars (XAU/USD). A strong Dollar tends to keep the price of Gold controlled, whereas a weaker Dollar is likely to push Gold prices up.
Gold prices fell in India on Wednesday, according to data from India's Multi Commodity Exchange (MCX).
Gold price stood at 61,817 Indian Rupees (INR) per 10 grams, down INR 616 compared with the INR 62,433 it cost on Tuesday.
As for futures contracts, Gold prices decreased to INR 61,893 per 10 gms from INR 62,015 per 10 gms.
Prices for Silver futures contracts decreased to INR 71,700 per kg from INR 72,093 per kg.
| Major Indian city | Gold Price |
|---|---|
| Ahmedabad | 63,975 |
| Mumbai | 63,850 |
| New Delhi | 63,915 |
| Chennai | 63,980 |
| Kolkata | 64,020 |
Global Market Movers: Comex Gold price falls on Fed rate cut uncertainty
- Federal Reserve (Fed) Governor Christopher Waller's remarks on Tuesday further tempered expectations for a March rate cut and act as a headwind for the non-yielding Comex Gold price.
- Waller added that the Fed needs to be cautious and cannot rush into rate cuts as the economy remains in good shape, pushing the US Treasury bond yields sharply higher.
- The yield on the benchmark 10-year US government bond holds steady above the 4.0% threshold, underpinning the US Dollar and capping the non-yielding yellow metal.
- The risk of a further escalation of tensions in the Middle East does little to provide any respite to the safe-haven XAU/USD or impress bullish traders.
- In the latest development, the US carried out another airstrike targeting a Houthi missile facility in Yemen, noting a threat to merchant vessels and US Navy ships.
- The official data released by the National Bureau of Statistics (NBS) showed that China’s economy grew at an annual rate of 5.2% in the final quarter of 2023.
- On a quarterly basis, Chinese GDP expanded by 1.0% in Q3 vs. 1.0% expected, while December Retail Sales and Industrial Production rose by 7.4% YoY and 6.8% YoY, respectively.
- Following the release of the high-impact data, the NBS noted that China's economy faces a complex external environment and low consumer prices reflect insufficient domestic demand.
- The geopolitical risks, along with China's economic woes, might hold back traders from placing aggressive bearish bets around the metal and help limit any further losses.
- Traders now look to the US macro data, which is expected to show that monthly Retail Sales grew by 0.4% in December and Industrial Production remained flat.
- Apart from this, scheduled speeches by Fed Governors Michael Barr and Michelle Bowman might influence the USD and provide some impetus to the commodity.
(An automation tool was used in creating this post.)
Gold FAQs
Why do people invest in Gold?
Gold has played a key role in human’s history as it has been widely used as a store of value and medium of exchange. Currently, apart from its shine and usage for jewelry, the precious metal is widely seen as a safe-haven asset, meaning that it is considered a good investment during turbulent times. Gold is also widely seen as a hedge against inflation and against depreciating currencies as it doesn’t rely on any specific issuer or government.
Who buys the most Gold?
Central banks are the biggest Gold holders. In their aim to support their currencies in turbulent times, central banks tend to diversify their reserves and buy Gold to improve the perceived strength of the economy and the currency. High Gold reserves can be a source of trust for a country’s solvency. Central banks added 1,136 tonnes of Gold worth around $70 billion to their reserves in 2022, according to data from the World Gold Council. This is the highest yearly purchase since records began. Central banks from emerging economies such as China, India and Turkey are quickly increasing their Gold reserves.
How is Gold correlated with other assets?
Gold has an inverse correlation with the US Dollar and US Treasuries, which are both major reserve and safe-haven assets. When the Dollar depreciates, Gold tends to rise, enabling investors and central banks to diversify their assets in turbulent times. Gold is also inversely correlated with risk assets. A rally in the stock market tends to weaken Gold price, while sell-offs in riskier markets tend to favor the precious metal.
What does the price of Gold depend on?
The price can move due to a wide range of factors. Geopolitical instability or fears of a deep recession can quickly make Gold price escalate due to its safe-haven status. As a yield-less asset, Gold tends to rise with lower interest rates, while higher cost of money usually weighs down on the yellow metal. Still, most moves depend on how the US Dollar (USD) behaves as the asset is priced in dollars (XAU/USD). A strong Dollar tends to keep the price of Gold controlled, whereas a weaker Dollar is likely to push Gold prices up.
In a busy week for European Central Bank speakers, today sees ECB President Christine Lagarde speak twice. Economists at ING analyze EUR/USD outlook ahead of the speeches.
Let's see what Lagarde has to say
A whole host of ECB speakers have pushed back against the market's pricing of 15 0bps of rate cuts this year – but market pricing has proved quite stubborn. Let's see whether President Lagarde can move the needle when she speaks today.
EUR/USD is working its way lower on the higher US rate/softer risk environment.
1.0800 looks to be the near-term bias for EUR/USD and we are pleased that, despite the geopolitical environment, EUR/CHF is moving higher in line with a thesis of higher Euro rates being the dominant factor here.
US Dollar Index refreshes five-month highs. Economists at ING analyze Greenback’s outlook ahead of the US Retail Sales report.
DXY to extend gains to the 104.00/104.25 area
A combination of weakish China data and a pushback by both ECB and Fed officials against early easing is weighing on risk sentiment and supporting the Dollar.
It is hard to see that sentiment changing today should US December Retail Sales come in on the strong side.
It was not our baseline call on Tuesday, but the US Dollar Index (DXY) did break resistance around 103.10/103.15 (now support) and the upside bias to US rates and a mixed risk environment warns of DXY extending to the 104.00/104.25 area.
See – US Retail Sales Preview: Forecasts from nine major banks, consumers continued spending in December
- GBP/JPY extends its gains on the upbeat UK economic data.
- UK inflation and retail sales data reinforce the strength of the Pound Sterling.
- Traders await Friday’s National Consumer Price Index data from Japan.
GBP/JPY moves on its upward trajectory for the third successive day, trading around 187.10 during the European session on Wednesday. The Pound Sterling (GBP) gained ground following solid economic data from the United Kingdom (UK) released on Wednesday, which in turn, underpinned the GBP/JPY cross. The likelihood of an early rate cut by the Bank of England (BoE) has diminished due to higher price pressures which could deter the central bank from implementing monetary policy easing. Instead, the BoE may adopt a more cautious approach to manage inflation and maintain price stability.
UK Consumer Price Index (CPI) year-over-year rose by 4.0% against the 3.9% prior, exceeding the expected reading of 3.8% in December. The monthly CPI increased by 0.4% against the 0.2% as expected, swinging from the previous decline of 0.2%. Meanwhile, the annual Core CPI remained consistent at 5.1% against the market expectation of 4.9%.
Moreover, the UK Retail Price Index (MoM) grew by 0.5% as compared to the expected 0.4% figure. The annual report showed a growth of 5.2% against the 5.1% expectations in December. However, Producer Price Index - Output (YoY) increased to 0.1% from the previous decrease of 0.1%, falling short of the expected 0.4% reading.
On the flip side, the Japanese Yen (JPY) continues to decline against the British Pound (GBP) due to decreasing consumer prices in Tokyo and weak labor data released last week. This has solidified expectations that the Bank of Japan (BoJ) will postpone its plan to shift away from its extremely accommodative monetary policy stance.
Additionally, the JPY has not found relief from a generally bearish sentiment in equity markets and ongoing geopolitical tensions arising from the Middle East conflict. Traders await Japan’s National Consumer Price Index data to be released on Friday.
China’s GDP growth met official target, but underlying data is a mixed bag. Economists at Commerzbank analyze Yuan’s outlook.
GDP exceeded target, but challenges remained strong
The 2023 full-year GDP of 5.2% is faster than the official target of ‘around 5%’. However, this was boosted by the low base in 2022, with a growth rate of just 3% when the zero-Covid policy was still in place.
The underlying data suggest China’s economic challenges remain significant, notably the housing slump, debt clean-up of property developers and local governments, and weak private sector confidence.
To shore up growth this year, policymakers will likely continue with their somewhat more aggressive stimulus stance towards the end of last year compared to the start of 2023.
Since the start of the year, the PBoC has been setting daily USD-CNY fixings that were higher than what they were towards the end of last year. This suggests that the central bank is tolerating a slightly weaker Yuan and taking a more pro-growth stance.
- USD/MXN could find resistance around the 38.2% Fibonacci retracement at 17.43.
- MACD indicates a shift towards bullish momentum for the pair.
- The 21-day EMA at 17.04 aligned with the psychological level at 17.00 could act as a key support region.
USD/MXN continues to gain ground for the third consecutive session on Wednesday, trading higher around 17.25 during the European session followed by the immediate resistance level around the 38.2% Fibonacci retracement at 17.43.
The 14-day Relative Strength Index (RSI), a momentum oscillator that measures the speed and change of price movements is positioned above the 50 mark, indicating the bullish momentum for the USD/MXN pair.
Additionally, Additionally, the lagging indicator “Moving Average Convergence Divergence (MACD)” lies below the centerline but shows divergence above the signal line, which suggests a potential shift in momentum towards an upward trend.
A breakthrough above the Fibonacci retracement level could influence the USD/MXN pair to test the major level at 17.50 aligned with December’s high at 17.56. if the pair surpasses the latter, it could explore the psychological region around the 18.00 level.
On the downside, the 21-day Exponential Moving Average (EMA) at 17.04 could act as a key support level in conjunction with psychological support at 17.00. A break below the latter could influence the bears of the USD/MXN pair to revisit the weekly low at 16.84 level.
USD/MXN: Daily Chart
-638410770279932677.png)
The Pound Sterling (GBP) is enjoying a bounce after the December UK Consumer Price Index (CPI) figure came in higher than expected. Economists at ING analyze Cable’s outlook.
EUR/GBP can probably trade closer to 0.8550/0.8600
In focus was the services reading at 6.4% year-on-year versus 6.1% expected. In theory, this could see the Bank of England towards the back of the pack of the central banks looking to cut this year. However, we warn that airfares and package holidays/hotels have been a big driver of today's number – factors the BoE thinks 'may not provide a good signal of underlying trends'.
Given the prospect of renewed fiscal stimulus in March, however, it may be hard to position for a weaker pound on the 2024 BoE easing cycle. Combined with our bullish EUR/CHF view, GBP/CHF (carry positive) could be embarking on a recovery to the 1.11/1.12 area.
For the time being, EUR/GBP can probably trade closer to 0.8550/0.8600 and it looks like the better Dollar/softer risk environment can drag GBP/USD back to the 1.2500 area.
On Tuesday, the Dollar appreciated quite a bit and EUR/USD declined below 1.09. Economists at Commerzbank analyze the pair’s outlook.
The market remains on course with its expectations
The market is unlikely to be dissuaded from the view that rate cuts are on the agenda in the near term, given the difficult economic situation and falling inflation.
Without new data pointing to a renewed rise in inflation or a more robust Eurozone economy, the market is unlikely to adjust its current expectations.
With secondary data due before the next central bank meetings, our expected correction in the EUR is probably likely to take some time.
European Central Bank (ECB) Governing Council member Klaas Knot said on Wednesday, “the rate path priced by markets can be self-defeating.”
Additional comments
Markets are getting ahead of themselves on rate cuts.
A lot must go well for inflation to hit 2.0% in 2025.
We need to see a turnaround in wages.
Policy easing, if and when it happens, will be very gradual.
The more easing markets are doing, the less likely we'll cut.
Related reads
- Lagarde speech: Inflation is not where the ECB wants it
- Forex Today: Dollar stands tall, as US Retail Sales data grab eyeballs
- NZD/USD loses ground as investors turn back toward US Dollar.
- The mixed Chinese data failed to improve the Kiwi Dollar.
- Traders await December’s US Retail Sales data to gain fresh impetus on the US economic landscape.
NZD/USD extends its losses on the third consecutive day, trading lower to near 0.6120 during the early European hours on Wednesday. The NZD/USD pair experiences downward pressure, influenced by risk aversion related to the geopolitical conflict in the Middle East. Additionally, there appears to be a slowdown in speculations over Federal Reserve (Fed) interest rate cuts in March, contributing to the downward pressure on the pair.
The New Zealand Dollar (NZD) faces downward pressure despite mixed data from China. China's annual Gross Domestic Product (GDP) grew by 5.2% in the fourth quarter, slightly below the expected 5.3%. December's Industrial Production (YoY) increased by 6.8%, surpassing the expected 6.6%. However, Retail Sales year-over-year came in at 7.4%, falling short of the market consensus of 8.0%.
The fear of weaker demand in China weighed on the Kiwi Dollar (NZD). The decline in Chinese consumer prices for a third consecutive month in December, along with a decrease in producer prices, contributed to concerns about economic conditions and demand in New Zealand's major trading partner, given the close economic ties between the two countries.
The US Dollar Index (DXY) holds steady around 103.50, supported by improved US Treasury yields, where the 2-year and 10-year yields stand at 4.26% and 4.07%, respectively. The risk-off sentiment is boosting demand for the US Dollar (USD), along with some assertive remarks from Federal Reserve (Fed) officials.
Traders are closely monitoring the upcoming US Retail Sales data for December, scheduled for release later in the day. This economic indicator provides insights into consumer spending patterns. Additionally, the release of the Fed's Beige Book and a speech by Fed's John C. Williams will be closely watched for further insights into the central bank's monetary policy stance.
- Pound Sterling has discovered strong buying interest as the UK inflation turned out highly stubborn.
- Higher fuel prices and service price index boosted UK consumer price inflation.
- The market mood remains downbeat as investors are uncertain about Fed rate cuts.
The Pound Sterling (GBP) delivers a stalwart recovery after the release of the surprisingly stubborn United Kingdom consumer price inflation data for December. The GBP/USD pair recovers their entire losses as hopes of an early rate cut by the Bank of England (BoE) have waned amid higher price pressures. The Consumer Price Index (CPI) in the UK economy remained stubborn amid significant rise in oil prices due to Russia-Ukraine war and slightly higher service inflation.
A sticky UK inflation report has provided more room to the BoE policymakers to maintain interest rates higher at 5.25% for a longer period. BoE policymakers have been warning from long that it is too early to discuss about the unwinding of higher interest rates as price pressures are far above the required rate of 2%.
Meanwhile, a sharp recovery in the Pound Sterling could stall as the market mood is quite cautious. The market sentiment has turned downbeat as investors are uncertain about when the Federal Reserve (Fed) will start the rate-cut campaign. Going forward, market participants will keenly focus on the United States Retail Sales data for December, which will be published at 13:30 GMT.
Daily Digest Market Movers: Pound Sterling rises on sticky UK Inflation report
- Pound Sterling delivers a V-shape recovery as the United Kingdom inflation data for December has turned out stubbornly higher while investors anticipated to remain soft.
- The UK ONS has reported that monthly headline inflation grew at a stronger pace of 0.4% against expectations of 0.2%. In November, headline price pressures were contracted by 0.2%.
- The annual headline inflation rose by 4.0% against 3.9% growth in November. Market participants anticipated a deceleration to 3.8%.
- Core consumer price inflation that excludes volatile food and oil prices remained sticky at 5.1% while investors projected it softening to 4.9%.
- A sharp increase in price pressures has indicated that the last leg of high inflation is expected to be a challenging task for Bank of England policymakers.
- This will offer a strong argument to BoE policymakers to maintain a restrictive monetary policy stance for a longer period.
- Traders are expected to pare higher bets supporting an early rate cut from the BoE, which were boosted by a sharp decline in wage growth data, released on Tuesday.
- The Pound Sterling witnessed a sharp sell-off in Tuesday’s session on slower wage growth and dismal market mood.
- While labor demand remained steady, UK employers slashes wage growth due to vulnerable demand conditions in the domestic and the overseas market.
- The market mood remains downbeat as traders pare bets in favour of rate cuts by the Federal Reserve from March after the hawkish commentary from Governor Christopher Waller.
- Christopher Waller said the Fed should not rush to reduce interest rates until it get confident that inflation will return to the 2% target in a sustainable manner.
- The US Dollar Index (DXY) has printed a fresh monthly high above 103.50 as investors’ confident for Fed rate cut in March is fading.
- Going forward, the USD Index will be guided by the United States Retail Sales and the Industrial Production data for December.
- As per the estimates, monthly Retail Sales grew at a pace of 0.4% against 0.3% in November. The Industrial Production remained stagnant against 0.2% growth.
Technical Analysis: Pound Sterling recovers from 50-DEMA
Pound Sterling delivers a swift recovery after discovering strong buying interest near the round-level support of 1.2600. The GBP/USD pair has rebounded after testing the 50-day Exponential Moving Average (EMA), which trades around 1.2600. The near-term demand for the Cable would improve if it manages to climb above the 20-day EMA, which oscillates around 1.2690.
The GBP/USD pair manages to hold auction above the 50% Fibonacci retracement at 1.2590 (of the move from 13 July 2023 high at 1.3142 to 4 October 2023 low at 1.2037). The 14-period Relative Strength Index (RSI) oscillates in the 40.00-60.00, which indicates a listless performance.
Pound Sterling FAQs
What is the Pound Sterling?
The Pound Sterling (GBP) is the oldest currency in the world (886 AD) and the official currency of the United Kingdom. It is the fourth most traded unit for foreign exchange (FX) in the world, accounting for 12% of all transactions, averaging $630 billion a day, according to 2022 data.
Its key trading pairs are GBP/USD, aka ‘Cable’, which accounts for 11% of FX, GBP/JPY, or the ‘Dragon’ as it is known by traders (3%), and EUR/GBP (2%). The Pound Sterling is issued by the Bank of England (BoE).
How do the decisions of the Bank of England impact on the Pound Sterling?
The single most important factor influencing the value of the Pound Sterling is monetary policy decided by the Bank of England. The BoE bases its decisions on whether it has achieved its primary goal of “price stability” – a steady inflation rate of around 2%. Its primary tool for achieving this is the adjustment of interest rates.
When inflation is too high, the BoE will try to rein it in by raising interest rates, making it more expensive for people and businesses to access credit. This is generally positive for GBP, as higher interest rates make the UK a more attractive place for global investors to park their money.
When inflation falls too low it is a sign economic growth is slowing. In this scenario, the BoE will consider lowering interest rates to cheapen credit so businesses will borrow more to invest in growth-generating projects.
How does economic data influence the value of the Pound?
Data releases gauge the health of the economy and can impact the value of the Pound Sterling. Indicators such as GDP, Manufacturing and Services PMIs, and employment can all influence the direction of the GBP.
A strong economy is good for Sterling. Not only does it attract more foreign investment but it may encourage the BoE to put up interest rates, which will directly strengthen GBP. Otherwise, if economic data is weak, the Pound Sterling is likely to fall.
How does the Trade Balance impact the Pound?
Another significant data release for the Pound Sterling is the Trade Balance. This indicator measures the difference between what a country earns from its exports and what it spends on imports over a given period.
If a country produces highly sought-after exports, its currency will benefit purely from the extra demand created from foreign buyers seeking to purchase these goods. Therefore, a positive net Trade Balance strengthens a currency and vice versa for a negative balance.
Here is what you need to know on Wednesday, January 17:
The US Dollar (USD) continues to maintain its upper hand across the board, as markets remain jittery on the back of China’s economic concerns and persisting Middle East geopolitical tensions. China’s fourth-quarter Gross Domestic Product (GDP) showed that the economic recovery clearly remains shaky.
The world’s second-largest economy expanded 5.2% YoY in the fourth quarter of 2024 but missed the market estimates of a 5.3% growth. On a quarterly basis, the Chinese GDP lost its momentum and rose 1.0% in Q4, as expected. China’s Retail Sales grew 7.4% YoY in December, below the expectations of 8.0%. Industrial Production increased 6.8% YoY in the same period vs. 6.6% expected.
On the geopolitical front, Iran-backed Houthi rebels struck a US-owned cargo vessel with an anti-ship ballistic missile off the coast of Yemen, keeping investors on the edge.
The US Dollar also finds support from the recent less dovish remarks from US Federal Reserve (Fed) Governor Christopher Waller. Waller walked back on his previous view on the dovish policy pivot, noting on Tuesday that while inflation was approaching the central bank's 2.0% target, the Fed should not rush to cut interest rates until lower inflation can clearly be sustained.
Markets are now pricing in a 62% probability of a rate cut by the Fed in March, according to the CME Group’s FedWatch tool, compared with the 81% likelihood at the start of the week. The Greenback continues to capitalize on easing bets of aggressive Fed rate cuts, courtesy of the hawkish Fed chorus.
That said, the upcoming US Retail Sales data will hold the key for the next leg higher in the USD, as it could help reprice the market’s expectations of the Fed rate cuts this year.
At the time of writing, the US Dollar Index is flirting with five-week highs above 103.50, despite a muted performance in the US Treasury bond yields. Meanwhile, a barometer of risk sentiment, US S&P 500 futures, are down 0.33% on the day, justifying the risk-off market mood.
US Dollar price today
The table below shows the percentage change of US Dollar (USD) against listed major currencies today. US Dollar was the strongest against the Australian Dollar.
| USD | EUR | GBP | CAD | AUD | JPY | NZD | CHF | |
| USD | 0.17% | -0.03% | 0.21% | 0.56% | 0.44% | 0.39% | 0.19% | |
| EUR | -0.17% | -0.17% | 0.09% | 0.44% | 0.32% | 0.27% | 0.02% | |
| GBP | 0.03% | 0.20% | 0.23% | 0.59% | 0.47% | 0.42% | 0.21% | |
| CAD | -0.21% | -0.04% | -0.24% | 0.35% | 0.23% | 0.18% | -0.02% | |
| AUD | -0.57% | -0.44% | -0.59% | -0.35% | -0.12% | -0.17% | -0.42% | |
| JPY | -0.44% | -0.27% | -0.47% | -0.23% | 0.11% | -0.04% | -0.25% | |
| NZD | -0.39% | -0.22% | -0.42% | -0.17% | 0.18% | 0.06% | -0.21% | |
| CHF | -0.19% | -0.01% | -0.17% | 0.03% | 0.42% | 0.30% | 0.25% |
The heat map shows percentage changes of major currencies against each other. The base currency is picked from the left column, while the quote currency is picked from the top row. For example, if you pick the Euro from the left column and move along the horizontal line to the Japanese Yen, the percentage change displayed in the box will represent EUR (base)/JPY (quote).
Within the G10 currency basket, risk aversion is taking its toll on the Antipodeans, as they extend their downward spiral. AUD/USD is shedding 0.55% on the day to trade near 0.6550 while the NZD/USD is closing in on the 0.6100 level, down 0.30% so far.
USD/JPY keeps pushing higher, alongside the US Dollar, currently approaching 148.00. The pair is up 0.47% on a daily basis.
EUR/USD is trading close to over one-month lows near 1.0850, despite the latest pushback by the European Central Bank’s (ECB) policymakers against interest rates cuts. A mixed German ZEW survey added to the grim Eurozone economic outlook, exerting additional pressure on the Euro. All eyes remain on ECB President Christine Lagarde’s speech at the World Economic Forum (WEF) Annual Meeting in Davos.
GBP/USD is staging a rebound to test 1.2650 after the headline UK annual CPI inflation surprised with an increase to 4.0% in December, against a drop to 3.8% expected.
USD/CAD is holding higher ground above 1.3500, as the WTI oil price trades listlessly at around the $72 mark. The geopolitical developments surrounding the Red Sea will continue to grab attention. Meanwhile, the Canadian Dollar has reversed the hotter-than-expected Canadian CPI inflation-led rebound, which poured cold water on early rate-cut bets by the Bank of Canada (BoC).
Gold price is hitting weekly lows near $2,020, extending the previous decline on fading hopes of aggressive Fed rate cuts.
The US Census Bureau will release the December Retail Sales report on Wednesday, January 17 at 13:30 GMT and as we get closer to the release time, here are the forecasts of economists and researchers of nine major banks regarding the upcoming data.
Retail Sales are expected to have grown at a higher pace of 0.4% against 0.3% increase in November. Consumer spending ex-automobiles is expected to remain steady at 0.2% MoM. The so-called control group used for GDP calculations is expected at 0.2% MoM vs. the prior release of 0.4% in November.
Commerzbank
The fact that the US economy has not slipped into recession so far is also due to robust private consumption. This is unlikely to have changed much in December. Retail sales are likely to have increased by 0.4% compared to November. Our forecast is based, among other things, on data from the automotive industry, which reported a 3% increase in unit sales. At the same time, the mild weather should have boosted sales of building materials. The price of gasoline had no major impact this time, remaining at the November level after adjustment for seasonal influences. We expect a slight increase of 0.3% in core category, sales excluding autos, gasoline and building materials, and thus a certain calming after the strong increase of 0.6% in November.
ING
US retail sales are likely to have grown solidly in December, with consumer confidence buoyed by rising equity markets. We know that auto volumes rose 3% to an annualised 15.8m units while weekly credit card spending numbers held up well, with prices rising 0.3% MoM, according to CPI data – remember this is a dollar value figure report. Industrial production won’t be as robust though, expanding perhaps 0.1%, with manufacturing set to be close to flat on the month given the ISM manufacturing report has been in contraction territory since October 2022. Autos may be a bright spot as output continues to recover from earlier strike action, but weak order books are an issue for most other sub-sectors. Utilities output will be a drag given warm weather implies less heating demand while oil and gas extraction may have been helped by those warmer weather conditions.
Deutsche Bank
We expect a MoM uptick of +0.4%, up from +0.3% in November.
RBC Economics
US retail sales likely ticked higher in December (+0.5% MoM), with slightly stronger growth than November (+0.3%) thanks to strong unit auto sales and higher gasoline prices.
NBF
Judging from previously released data on auto sales, motor vehicles and parts dealers could have contributed positively to the headline figure. Outlays at gasoline stations, on the other hand, may have dropped, reflecting lower pump prices. All told, we expect total sales to have expanded 0.5%. Ex-auto outlays could have been a tad weaker, advancing 0.2% MoM.
SocGen
We look for total sales to rise by 0.5%. Excluding autos, we expect a 0.3% increase.
Citi
We expect a solid retail sales report for December with total retail sales increasing by 0.5% MoM primarily driven by autos. Excluding autos, retail sales should increase by a more modest 0.2% MoM. Control group sales should also increase by a modest 0.2% MoM. Overall, this report would be consistent with consumption continuing to grow as the labor market remains solid (although there are some weaker signs under the surface) and incomes increase.
Wells Fargo
We forecast retail sales rose 0.4% in December. Excluding autos, we expect a more modest 0.2% uptick. Should our point estimate come to fruition, our estimate of holiday sales will come in over 4% on a YoY basis, which is a respectable but muted gain relative to the past few years of exceptional spending growth.
CIBC
High-frequency credit card spending suggests retail sales likely ended 2023 not with a bang, but a whimper. Despite the solid labour market conditions, consumers are coming off a splurge in Q3 which would have pulled forward some consumption for durables. Combined with a saving rate that has started to drift up over the past few months, these signals add up to a US consumer due for a much needed breather. Our expectation is a modest 0.1% MoM growth for both headline sales and the control group. Our views on retail sales are somewhat below consensus but that should not mean too much. Surprises in retail sales – in either direction – likely have modest consequences for monetary policy in the near-term.
Speaking on the sidelines of the World Economic Forum (WEF) Annual Meeting in Davos, European Central Bank (ECB) President Christine Lagarde said that she is “confident inflation will reach the 2.0% target.”
Additional quotes
Inflation is not where the ECB wants it.
But on the right path towards the 2.0% target, though no victory yet.
Too optimistic markets not helpful in fight against inflation.
We can't shout victory until inflation sustainably at 2.0%.
We're watching wages, profit margins, energy and supply chains.
Second-round effects would be cause for concern.
The ECB has achieved peak rates, short of a major shock.
Market reaction
At the time of writing, EUR/USD is off the five-week lows of 1.0855, trading flat at 1.0868.
Euro price today
The table below shows the percentage change of Euro (EUR) against listed major currencies today. Euro was the weakest against the US Dollar.
| USD | EUR | GBP | CAD | AUD | JPY | NZD | CHF | |
| USD | 0.08% | 0.03% | 0.18% | 0.49% | 0.42% | 0.32% | 0.16% | |
| EUR | -0.08% | -0.05% | 0.10% | 0.43% | 0.35% | 0.21% | 0.08% | |
| GBP | -0.04% | 0.05% | 0.09% | 0.45% | 0.40% | 0.28% | 0.12% | |
| CAD | -0.18% | -0.10% | -0.15% | 0.31% | 0.24% | 0.14% | -0.03% | |
| AUD | -0.49% | -0.41% | -0.45% | -0.31% | -0.07% | -0.17% | -0.33% | |
| JPY | -0.45% | -0.37% | -0.39% | -0.32% | 0.08% | -0.13% | -0.28% | |
| NZD | -0.32% | -0.22% | -0.29% | -0.17% | 0.17% | 0.13% | -0.15% | |
| CHF | -0.16% | -0.08% | -0.12% | 0.02% | 0.33% | 0.26% | 0.17% |
The heat map shows percentage changes of major currencies against each other. The base currency is picked from the left column, while the quote currency is picked from the top row. For example, if you pick the Euro from the left column and move along the horizontal line to the Japanese Yen, the percentage change displayed in the box will represent EUR (base)/JPY (quote).
- EUR/GBP loses momentum to 0.8595 following stronger UK CPI data.
- The United Kingdom CPI rose 4.0% YoY in December vs. 3.9% prior, stronger than expected.
- German Economic Confidence Unexpectedly improved in January.
- The December Eurozone Harmonized Index of Consumer Prices (HICP) will be due on Wednesday.
The EUR/GBP cross drops below the 0.8600 psychological mark during the early European session on Wednesday. The downtick of the cross is backed by the upbeat December UK inflation. The cross will face the initial support level near a low of 0.8580 and a key resistance level near the 100-day Exponential Moving Averages (EMA) on the daily chart. At press time, EUR/GBP is trading at 0.8595, down 0.11% on the day.
The latest data from the Office for National Statistics on Wednesday revealed that the UK Consumer Price Index rose by 4.0% YoY in December from 3.9% in the previous reading, while the Core CPI arrived at 5.1% YoY versus 5.1% prior. Both figures came in better than market expectations. On a monthly basis, the headline CPI figure grew by 0.4% MoM in December from a 0.2% drop in November, above the consensus of a 0.2% increase. In response to the data, the Pound Sterling (GBP) attracts some buyers and acts as a headwind for the EUR/GBP cross.
On the Euro docket, German Economic Confidence Unexpectedly improved in January. The German ZEW Indicator of Economic Sentiment grew to 15.2 in January from 12.8 in December, better than the market expectation of 12.8. The current situation index dropped to -77.3 versus -77.1 prior, lower than the consensus of -77.0. Meanwhile, the ZEW survey showed that confidence in the Eurozone experienced a slight decrease in January. The figure came in at 22.7 versus 23.0 prior, better than the 21.9 estimated.
An upsurge in inflation in Germany and the Eurozone in December has no impact on monetary policy expectations. The European Central Bank (ECB) officials emphasized the uncertainty over interest rates and inflation and said they would begin cutting interest rates this spring. Nonetheless, ECB chief Mario Centeno said that a rate cut should be part of the discussion and no option should be taken off the table.
Looking ahead, the Eurozone Harmonized Index of Consumer Prices (HICP) for December will be due later on Wednesday. On Friday, investors will monitor the German Producer Price Index (PPI) and UK Retail Sales. These figures could give a clear direction to the EUR/GBP cross.
- Silver price falls sharply to near $22.70 as Fed Waller denied early rate cut discussions.
- The USD Index has climbed to near 103.50 amid a risk-off mood.
- Investors await the US Retail Sales and the Industrial Production data for further guidance.
Silver price (XAG/USD) faces an intense sell-off as Federal Reserve (Fed) policymakers are maintaining the narrative of keeping interest rates higher for a longer period. The white metal has extended its downside to near $22.70 and is expected to remain on the tenterhooks ahead of the United States Retail Sales and Industrial Production data.
S&P500 futures have posted some losses in the Asian session, portraying further decline in the risk-appetite of the market participants.
The US Dollar Index (DXY) has rallied to near 103.50 as Fed Governor Christopher Waller said the central bank could not rush to rate cuts amid revision risks in inflation prints. He added that the Fed will reduce interest rates only if inflation continues to moderate. While the 10-year US Treasury yields have dropped marginally to little above 4.0%.
As per the CME Fedwatch tool, chances in favour of an interest rate cut by 25 basis points (bps) have declined to 62% after a hawkish commentary from Fed Waller.
Going forward, market participants will focus on the US monthly Retail Sales data for December, which will be published at 13:30 GMT. The economic data is seen growing by 0.4% against 0.3% increase in November. The Industrial Production is expected to remain stagnant.
Silver technical analysis
Silver price is declining towards the crucial support that is plotted from December 13 low around $22.51 on a four-hour scale. The 200-period Exponential Moving Average (EMA) around $23.48 has been acting as a major barricade for the Silver price bulls.
The 14-period Relative Strength Index (RSI) has slipped below 40.00, which indicates that a bearish momentum has been triggered.
Silver four-hour chart
-638410691898269060.png)
- GBP/USD trades in negative territory for two straight days on Wednesday.
- The major pair holds below the key EMA with an oversold RSI condition.
- The critical support level will emerge at the 1.2600 mark; 1.2686 acts as an immediate resistance level for GBP/USD.
The GBP/USD pair faces some selling pressure above 1.2600 during the early European session on Wednesday. Investors await the UK Consumer Price Index (CPI) for December for fresh impetus. The headline UK inflation is estimated to grow 3.8% YoY, while the Core CPI is expected to rise 4.9% YoY. GBP/USD currently trades near 1.2607, losing 0.18% on the day.
Technically, GBP/USD holds below the 100-hour Exponential Moving Averages (EMAs) on the four-hour chart, which means further downside looks favorable.
The key contention level will emerge at the 1.2600 mark, representing the psychological round level and the lower limit of the Bollinger Band. Any decisive follow-through selling below the latter will see a drop to a low of December 7 at 1.2544, followed by the confluence of the round mark and a low of December 13 at 1.2500.
On the upside, a low of January 8 at 1.2686 acts as an immediate resistance level for GBP/USD. The additional upside filter to watch is a high of January 8 at 1.2767, and finally the upper boundary of the Bollinger Band at the 1.2800 mark.
It’s worth noting that the Relative Strength Index (RSI) holds in bearish territory below 50. However, the oversold RSI condition indicates that further consolidation cannot be ruled out before positioning for any near-term GBP/USD depreciation.
GBP/USD four-hour chart
-638410674758581775.png)
- USD/CHF moves on an upward trajectory as traders adopt a cautious stance.
- US has conducted a third military strike on a Houthi missile facility in Yemen.
- The recent Swiss inflation data could deter the SNB from reducing policy rates in the next policy meeting.
The USD/CHF pair continues its winning streak that started on Thursday, influenced by a cautious market stance due to concerns over the Israel-Gaza conflict potentially spreading in the region. Amid this geopolitical tension, the USD/CHF pair trades higher around 0.8620 during the Asian session on Wednesday.
The US Central Command has reported another airstrike targeting a Houthi missile facility in Yemen. The reason for this third military strike against Houthi targets is cited as an imminent threat posed by four missiles to merchant vessels and US Navy ships in the Red Sea.
The risk-off sentiment boosts demand for the US Dollar (USD), with the US Dollar Index (DXY) trading higher around 103.40. The recovery in US Treasury yields contributes to the support for the Greenback, along with some assertive remarks from Federal Reserve (Fed) officials.
US Federal Reserve Governor Christopher Waller emphasized that, despite positive developments in the inflation outlook, the central bank is not in a hurry to outline plans for rate cuts. Additionally, Atlanta Federal Reserve President Raphael Bostic suggested over the weekend that premature interest rate cuts could result in fluctuations in inflation.
The recent Swiss economic data, including a slight increase in consumer prices in December and an improvement in Swiss consumer demand in November according to Real Retail Sales figures, could potentially deter the Swiss National Bank (SNB) from reducing interest rates in the upcoming monetary policy meeting.
With the absence of the high-impact data on the Swiss economic calendar, traders observing the ongoing 54th World Economic Forum Annual Meeting in Davos, where over 28,000 leaders from around the world are participating. Global economic discussions and insights shared during the meeting can influence market sentiments. On the US economic front, traders are closely monitoring the upcoming US Retail Sales data for December, scheduled for release on Wednesday.
- EUR/USD extends its losses to near 38.2% Fibonacci retracement level at 1.0867.
- A break below the 1.0850 level could prompt the pair to reach the psychological region around the 1.0800 level.
- The selling interest could outweigh the buying interest at the psychological level of 1.0900.
EUR/USD continues to move on a downward trajectory for the second successive session, trading lower near 1.0870 during the Asian session on Wednesday as the US Dollar (USD) continues to extend its gains. The strength of the USD is attributed to the market caution on the geopolitical situation and upbeat US bond yields. The current level aligns with the 38.2% Fibonacci retracement at the 1.0867 level followed by the major support at the 1.0850 level.
The 14-day Relative Strength Index (RSI), a momentum oscillator that measures the speed and change of price movements, for the EUR/USD pair, is positioned below the 50 mark, indicating a bearish momentum in the market. A break below the support region could put downward pressure on the pair to navigate the area around the psychological support at 1.0800 followed by the 50% retracement level at 1.0787.
Additionally, the trend-following momentum indicator “Moving Average Convergence Divergence (MACD)” line lies above the centerline, but shows a divergence below the signal line for the EUR/USD pair. This divergence indicates a potential shift in momentum towards a downward trend.
On the upside, the psychological level at 1.0900 serves as the immediate resistance, followed by the 14-day Exponential Moving Average (EMA) at 1.0938 and the major barrier at 1.0950 level, where the selling interest tends to outweigh the buying interest. If the EUR/USD pair manages to break above the 1.0950 level, it could inspire bullish momentum, allowing traders to explore the region around the psychological level at 1.1000. Beyond that, attention may turn to January's high at 1.1038 as a further resistance level.
EUR/USD: Daily Chart
-638410636605976621.png)
- GBP/JPY pulls back after rising to over a one-month top, though the downside seems limited.
- Bets that the BoE will cut rates sharply in 2024 undermine the GBP and exert some pressure.
- Dovish BoJ expectations and a bullish technical setup should limit losses ahead of the UK CPI.
The GBP/JPY cross retreats from its highest level since December 4, around the 186.35 area touched during the Asian session on Wednesday and for now, seems to have snapped a two-day winning streak. Spot prices, however, lack any follow-through selling and currently trade just below the 186.00 mark, nearly unchanged for the day, as traders look to UK Consumer inflation figures before placing fresh directional bets.
Heading into the key data risk, expectations that the Bank of Japan (BoJ) is unlikely to pivot away from its ultra-dovish policy settings continue to undermine the Japanese Yen (JPY) and act as a tailwind for the GBP/JPY cross. Meanwhile, slower wage growth in the UK reinforced market expectations that the Bank of England (BoE) will cut interest rates sharply this year. This, in turn, might hold back traders from placing aggressive bullish bets around the British Pound (GBP).
From a technical perspective, the recent solid rebound from the very important 200-day Simple Moving Average (SMA) and a subsequent breakout through the 100-day SMA favours bullish traders. Moreover, oscillators on the daily chart are holding comfortably in the positive territory and are still far from being in the overbought zone. This further validates the constructive setup and suggests that the path of least resistance for the GBP/JPY cross remains to the upside.
Hence, any meaningful downside might still be seen as a buying opportunity near the 185.40-185.35 region. This should help limit the downside for the GBP/JPY cross near the 185.00 psychological mark. That said, some follow-through selling could expose the weekly swing low, around mid-184.00s, below which spot prices could weaken further below the 184.00 round-figure mark and challenge the 100-day SMA resistance breakpoint, now turned support near the 183.50 zone.
On the flip side, bulls might now wait for a move beyond the 186.35 region, or the monthly peak, before placing fresh bets. The GBP/JPY cross might then aim to reclaim the 187.00 mark with some intermediate resistance near the 186.75-186.80 zone. The upward trajectory could extend further and lift spot prices to the next relevant barrier near the 187.55-187.60 region. en route to the 188.00 round figure and a multi-month top, around the 188.65 area touched in November.
GBP/JPY daily chart
-638410624067002131.png)
Technical levels to watch
- USD/CAD continues its winning streak on the upbeat US Dollar.
- The decline in the WTI price weakens the Canadian Dollar.
- US Dollar cheers the market sentiment change due to the Middle East conflict.
USD/CAD extends its gains for the fifth successive session, trading higher near to the 1.3500 psychological level during the Asian session on Wednesday. The geopolitical situation in the Middle East is prompting investors to adopt a cautious stance, which is in turn supporting the US Dollar (USD) against other major currencies, including the Canadian Dollar (CAD).
The decline in Crude oil prices is exerting pressure on the Canadian Dollar (CAD), consequently providing support to the USD/CAD pair. Canada, being the largest oil exporter to the United States (US), is particularly sensitive to fluctuations in oil prices. West Texas Intermediate (WTI) crude oil is hovering around $72.10 per barrel after recent losses.
The downward pressure on WTI prices is attributed, in part, to a slight increase in net output from US Crude oil production facilities during the week. Additionally, the completion and expansion of the Trans Mountain pipeline in Canada play a significant role in transporting Crude oil from production areas to refineries and export terminals. Canada's increased Crude oil production in November has positioned the country as the fourth-largest global producer of barrels.
On the US side, the US Dollar Index (DXY) maintains its winning streak, propelled by improved US bond yields. Traders are showing restraint in pricing in potential interest rate cuts by the Federal Reserve (Fed), providing upward support for the Greenback. The ongoing possibility of an escalation in the Israel-Gaza conflict has shifted the positive market sentiment to caution, leading to increased demand for the US Dollar.
- Gold price languishes near the weekly low amid the underlying bullish tone around the USD.
- Reduced bets for a March Fed rate cut push the US bond yields higher and underpin the buck.
- The geopolitical risks and China’s economic woes could limit losses for the safe-haven metal.
Gold price (XAU/USD) struggles to gain any meaningful traction during the Asian session on Wednesday and consolidates the previous day's downfall to the weekly low. Investors further scaled back their expectations for an early interest rate cut by the US central bank in reaction to Federal Reserve (Fed) Christopher Waller's remarks on Tuesday. This, in turn, remains supportive of elevated US Treasury bond yields, which assists the US Dollar (USD) to stand tall near its highest level since December 13 and is seen acting as a headwind for the non-yielding yellow metal.
That said, an escalation of military action in the Middle East, along with persistent worries about slowing growth in China, helps limit the downside for the safe-haven Gold price. Moreover, the precious metal, so far, has managed to hold above the 50-day Simple Moving Average (SMA) support and the monthly trough touched last Thursday. This, in turn, warrants some caution for bearish traders and before positioning for deeper losses. Traders now look to the US macro data and speeches by influential FOMC members for some impetus later during the North American session.
Daily Digest Market Movers: Gold price is undermined by receding bets for an early Fed rate cut and a bullish USD
- Federal Reserve (Fed) Governor Christopher Waller's remarks on Tuesday further tempered expectations for a March rate cut and act as a headwind for the non-yielding Gold price.
- Waller added that the Fed needs to be cautious and cannot rush into rate cuts as the economy remains in good shape, pushing the US Treasury bond yields sharply higher.
- The yield on the benchmark 10-year US government bond holds steady above the 4.0% threshold, underpinning the US Dollar and capping the non-yielding yellow metal.
- The risk of a further escalation of tensions in the Middle East does little to provide any respite to the safe-haven XAU/USD or impress bullish traders.
- In the latest development, the US carried out another airstrike targeting a Houthi missile facility in Yemen, noting a threat to merchant vessels and US Navy ships.
- The official data released by the National Bureau of Statistics (NBS) showed that China’s economy grew at an annual rate of 5.2% in the final quarter of 2023.
- On a quarterly basis, Chinese GDP expanded by 1.0% in Q3 vs. 1.0% expected, while December Retail Sales and Industrial Production rose by 7.4% YoY and 6.8% YoY, respectively.
- Following the release of the high-impact data, the NBS noted that China's economy faces a complex external environment and low consumer prices reflect insufficient domestic demand.
- The geopolitical risks, along with China's economic woes, might hold back traders from placing aggressive bearish bets around the metal and help limit any further losses.
- Traders now look to the US macro data, which is expected to show that monthly Retail Sales grew by 0.4% in December and Industrial Production remained flat.
- Apart from this, scheduled speeches by Fed Governors Michael Barr and Michelle Bowman might influence the USD and provide some impetus to the commodity.
Technical Analysis: Gold price needs to break through the 50-day SMA support for bears to seize near-term control
From a technical perspective, the 50-day SMA, currently around the $2,017 area, followed by the $2,013 region, or the monthly low, could protect the immediate downside ahead of the $2,000 psychological mark. A convincing break below the latter will be seen as a fresh trigger for bearish traders and drag the Gold price towards the December swing low, around the $1,973 zone. The XAU/USD could eventually drop to the $1,969-1,963 confluence, comprising the 100- and 200-day SMAs.
On the flip side, the $2,040-2,045 region now seems to act as an immediate strong barrier ahead of the $2,061-2,062 supply zone. Some follow-through buying has the potential to lift the Gold price further towards the $2,077 area, which if cleared decisively will negate any near-term negative bias. Bullish traders might then aim towards reclaiming the $2,100 psychological mark.
US Dollar price this week
The table below shows the percentage change of US Dollar (USD) against listed major currencies this week. US Dollar was the weakest against the Canadian Dollar.
| USD | EUR | GBP | CAD | AUD | JPY | NZD | CHF | |
| USD | 0.71% | 0.92% | 0.65% | 1.77% | 1.51% | 1.59% | 1.04% | |
| EUR | -0.72% | 0.21% | -0.07% | 1.06% | 0.79% | 0.88% | 0.31% | |
| GBP | -0.94% | -0.20% | -0.28% | 0.85% | 0.59% | 0.68% | 0.12% | |
| CAD | -0.66% | 0.07% | 0.28% | 1.11% | 0.86% | 0.94% | 0.39% | |
| AUD | -1.80% | -1.06% | -0.85% | -1.13% | -0.26% | -0.17% | -0.74% | |
| JPY | -1.53% | -0.81% | -0.72% | -0.87% | 0.26% | 0.09% | -0.48% | |
| NZD | -1.62% | -0.89% | -0.69% | -0.96% | 0.17% | -0.09% | -0.57% | |
| CHF | -1.04% | -0.31% | -0.12% | -0.39% | 0.74% | 0.47% | 0.56% |
The heat map shows percentage changes of major currencies against each other. The base currency is picked from the left column, while the quote currency is picked from the top row. For example, if you pick the Euro from the left column and move along the horizontal line to the Japanese Yen, the percentage change displayed in the box will represent EUR (base)/JPY (quote).
Gold FAQs
Why do people invest in Gold?
Gold has played a key role in human’s history as it has been widely used as a store of value and medium of exchange. Currently, apart from its shine and usage for jewelry, the precious metal is widely seen as a safe-haven asset, meaning that it is considered a good investment during turbulent times. Gold is also widely seen as a hedge against inflation and against depreciating currencies as it doesn’t rely on any specific issuer or government.
Who buys the most Gold?
Central banks are the biggest Gold holders. In their aim to support their currencies in turbulent times, central banks tend to diversify their reserves and buy Gold to improve the perceived strength of the economy and the currency. High Gold reserves can be a source of trust for a country’s solvency. Central banks added 1,136 tonnes of Gold worth around $70 billion to their reserves in 2022, according to data from the World Gold Council. This is the highest yearly purchase since records began. Central banks from emerging economies such as China, India and Turkey are quickly increasing their Gold reserves.
How is Gold correlated with other assets?
Gold has an inverse correlation with the US Dollar and US Treasuries, which are both major reserve and safe-haven assets. When the Dollar depreciates, Gold tends to rise, enabling investors and central banks to diversify their assets in turbulent times. Gold is also inversely correlated with risk assets. A rally in the stock market tends to weaken Gold price, while sell-offs in riskier markets tend to favor the precious metal.
What does the price of Gold depend on?
The price can move due to a wide range of factors. Geopolitical instability or fears of a deep recession can quickly make Gold price escalate due to its safe-haven status. As a yield-less asset, Gold tends to rise with lower interest rates, while higher cost of money usually weighs down on the yellow metal. Still, most moves depend on how the US Dollar (USD) behaves as the asset is priced in dollars (XAU/USD). A strong Dollar tends to keep the price of Gold controlled, whereas a weaker Dollar is likely to push Gold prices up.
- Indian Rupee drifts lower on the higher US Dollar and bond yields.
- The Reserve Bank of India’s Das said food inflation will be at the top of the central bank’s agenda.
- Investors await US Retail Sales ahead of the RBI’s Das speech at the World Economic Forum Annual Meeting 2024 on Thursday.
Indian Rupee (INR) trades on a softer note on Wednesday amid the extended rally of the US Dollar (USD). Nonetheless, traders place their bets that the INR will break out of its trading range and rally this year as India gains the confidence of foreign exchange investors who believe the Indian Rupee could trample the Greenback.
The Reserve Bank of India (RBI) Governor Shaktikanta Das said at the World Economic Forum (WEF) in Davos on Tuesday that food inflation can be volatile and will be on the top of the central bank’s agenda. WEF president Borge Brende stated that he sees India's growth story intact and running amid geopolitical tensions and a weak investment cycle.
Looking ahead, investors will keep an eye on US Retail Sales on Wednesday, which is estimated to show an increase of 0.4% MoM. On Thursday, the RBI governor Shaktikanta Das will share insights on key challenges and opportunities and his view on monetary policy at the World Economic Forum Annual Meeting 2024 at Davos.
Daily Digest Market Movers: Indian Rupee remains resilient amid geopolitical tensions
- The Reserve Bank of India (RBI) governor Shaktikanta Das said India's economic growth prospects remain robust and retail inflation is slowly moderating towards the 4% target.
- India’s December WPI inflation rose by 0.73% YoY from the previous reading of 0.26%, worse than the market expectation of 0.90%.
- India’s Wholesale Price Food Index arrived at 5.39% YoY in December.
- The Indian economy is predicted to grow by 8% this year, according to World Economic Forum (WEF) president Borge Brende.
- WEF’s Brende expects India will reach a $10 trillion economy, at least in the coming two decades.
- The US NY Empire State Index for January registered the lowest reading since 2020, coming in at -43.7 versus -14.5 prior, below the market consensus of -5.
- Fed Governor Christopher Waller said interest rate cuts are likely this year, but the central bank should not rush to cut its benchmark rate until it is clear lower inflation will be sustained.
Technical Analysis: Indian Rupee keeps the negative view intact in the short term
Indian Rupee trades weaker on the day. The USD/INR pair has maintained the 141.40-144.70 trading range since September 2023. The bearish mood prevails for USD/INR as the pair holds below the key 100-period Exponential Moving Average (EMA) on the daily chart. The short-term patterns lean somewhat negative, supported by the 14-day Relative Strength Index (RSI) which stands below the 50.0 midpoint.
The immediate resistance level for USD/INR will emerge at the upper boundary of the trading range at 83.40. A decisive break above 83.40 will see extended gains to a psychological round mark at 84.00. On the downside, the initial support level is seen at the 83.00 figure. The key contention level to watch is near the confluence of the lower limit of the trading range and a low of September 12 at 82.80. Any follow-through selling will see a drop to a low of August 11 at 82.60, followed by a low of August 24 at 82.40.
US Dollar price today
The table below shows the percentage change of US Dollar (USD) against listed major currencies today. US Dollar was the strongest against the Australian Dollar.
| USD | EUR | GBP | CAD | AUD | JPY | NZD | CHF | |
| USD | 0.11% | 0.16% | 0.06% | 0.31% | 0.08% | 0.14% | 0.10% | |
| EUR | -0.11% | 0.05% | -0.05% | 0.20% | -0.01% | 0.06% | -0.01% | |
| GBP | -0.16% | -0.05% | -0.11% | 0.15% | -0.06% | 0.00% | -0.06% | |
| CAD | -0.06% | 0.05% | 0.09% | 0.25% | 0.03% | 0.09% | 0.02% | |
| AUD | -0.31% | -0.20% | -0.15% | -0.25% | -0.22% | -0.15% | -0.21% | |
| JPY | -0.10% | 0.02% | 0.07% | -0.04% | 0.22% | 0.05% | 0.00% | |
| NZD | -0.14% | -0.05% | 0.00% | -0.10% | 0.15% | -0.07% | -0.06% | |
| CHF | -0.09% | 0.01% | 0.06% | -0.03% | 0.22% | 0.00% | 0.06% |
The heat map shows percentage changes of major currencies against each other. The base currency is picked from the left column, while the quote currency is picked from the top row. For example, if you pick the Euro from the left column and move along the horizontal line to the Japanese Yen, the percentage change displayed in the box will represent EUR (base)/JPY (quote).
Indian Rupee FAQs
What are the key factors driving the Indian Rupee?
The Indian Rupee (INR) is one of the most sensitive currencies to external factors. The price of Crude Oil (the country is highly dependent on imported Oil), the value of the US Dollar – most trade is conducted in USD – and the level of foreign investment, are all influential. Direct intervention by the Reserve Bank of India (RBI) in FX markets to keep the exchange rate stable, as well as the level of interest rates set by the RBI, are further major influencing factors on the Rupee.
How do the decisions of the Reserve Bank of India impact the Indian Rupee?
The Reserve Bank of India (RBI) actively intervenes in forex markets to maintain a stable exchange rate, to help facilitate trade. In addition, the RBI tries to maintain the inflation rate at its 4% target by adjusting interest rates. Higher interest rates usually strengthen the Rupee. This is due to the role of the ‘carry trade’ in which investors borrow in countries with lower interest rates so as to place their money in countries’ offering relatively higher interest rates and profit from the difference.
What macroeconomic factors influence the value of the Indian Rupee?
Macroeconomic factors that influence the value of the Rupee include inflation, interest rates, the economic growth rate (GDP), the balance of trade, and inflows from foreign investment. A higher growth rate can lead to more overseas investment, pushing up demand for the Rupee. A less negative balance of trade will eventually lead to a stronger Rupee. Higher interest rates, especially real rates (interest rates less inflation) are also positive for the Rupee. A risk-on environment can lead to greater inflows of Foreign Direct and Indirect Investment (FDI and FII), which also benefit the Rupee.
How does inflation impact the Indian Rupee?
Higher inflation, particularly, if it is comparatively higher than India’s peers, is generally negative for the currency as it reflects devaluation through oversupply. Inflation also increases the cost of exports, leading to more Rupees being sold to purchase foreign imports, which is Rupee-negative. At the same time, higher inflation usually leads to the Reserve Bank of India (RBI) raising interest rates and this can be positive for the Rupee, due to increased demand from international investors. The opposite effect is true of lower inflation.
- WTI price moves sideways with a negative bias as US oil facilities increase output.
- EIA revealed that the Permian Basin production rose by 5.5 thousand bpd to 5.9 million bpd.
- US Central Command has reported about targeting a Houthi missile facility in Yemen.
- Improved US Dollar impacts the demand for dollar-denominated Crude oil among other countries.
West Texas Intermediate (WTI) price hovers around $72.10 per barrel during the Asian session on Wednesday. The price of the WTI Crude oil experienced downward pressure as United States (US) Crude oil production facilities slightly increased net output during the week. The Energy Information Administration (EIA) disclosed that production in the Permian Basin rose by 5.5 thousand barrels per day to 5.9 million barrels per day.
Moreover, the completion and expansion of the Trans Mountain pipeline, in Canada, play a significant role in facilitating the transportation of Crude oil from production areas to refineries and export terminals. This will ramp up the North American crude oil output. The rise in Canadian crude oil production observed in November has positioned Canada as the fourth-largest global producer of barrels.
The continued supply disruption in the Red Sea is acting as a deterrent to a more significant downward movement in Crude oil prices. In response to the situation, the US Central Command has reported another airstrike targeting a Houthi missile facility in Yemen. The rationale behind this third military strike against Houthi targets is cited as an imminent threat posed by four missiles to merchant vessels and US Navy ships in the region.
The US Dollar Index (DXY) gains upward support following recent remarks from Federal Reserve (Fed) officials. Fed Governor Christopher Waller emphasized that, despite positive developments in the inflation outlook, the central bank is not in a hurry to outline plans for rate cuts. Atlanta Fed President Raphael Bostic also suggested over the weekend that premature interest rate cuts could result in fluctuations in inflation.
The strengthened Greenback is countering the impact of the Red Sea disruption. A stronger US Dollar has implications for the demand for dollar-denominated commodities, including oil, among countries that use other currencies. It can make such commodities more expensive for buyers using alternative currencies.
Shell, the British energy pioneer, has agreed to sell its Nigerian onshore oil and gas subsidiary to a consortium of five primarily local companies for up to $2.4 billion. This move comes as the subsidiary has faced challenges over the years, including issues with theft, sabotage, and operational difficulties, leading to costly repairs and high-profile lawsuits.
Following the release of the high-impact economic data from China for December, the National Bureau of Statistics (NBS) offered its view on the economy during its press conference on Wednesday.
Key quotes (via Reuters)
Final consumption accounted for 82.5% of 2023 GDP growth.
China's 2023 economic growth 'hard won'.
China's economy faces complex external environment, insufficient demand in 2024.
Capital formation accounted for 28.9% of 2023 GDP growth.
Net exports accounted for -11.4% of 2023 GDP growth.
Final consumption accounted for 80% of Q4 GDP growth.
Capital formation accounted for 23.1% of Q4 GDP growth.
Net exports accounted for -3.1% of Q4 GDP growth.
Low consumer prices reflect insufficient effective demand.
Expects modest consumer price rise in 2024.
China's economy at crucial stage of recovery.
China's economy at crucial stage of recovery.
China's property market showing some positive changes.
There is still relatively big room for China's property sector to develop.
China's economy faces more favourable conditions than challenges and difficulties in 2024.
Expects china's economy to continue to recover in 2024.
Related reads
- China’s GDP expands 5.2% YoY in Q4 vs. 5.3% expected
- Australian Dollar hovers below a psychological level after mixed Chinese data
| Raw materials | Closed | Change, % |
|---|---|---|
| Silver | 22.915 | -1.3 |
| Gold | 2028.246 | -1.3 |
| Palladium | 935.2 | -3.74 |
- EUR/USD attempts a modest recovery from over a one-month low touched on Tuesday.
- Mixed signals from ECB policymakers might hold back bulls from placing aggressive bets.
- Diminishing odds for an early Fed rate cut underpin the USD and should cap the upside.
The EUR/USD pair ticks higher during the Asian session on Wednesday and recovers a part of the previous day's downfall to over a one-month low. Spot prices currently trade with modest intraday gains, around the 1.0880 region, though the fundamental backdrop favours bearish traders and suggests that the path of least resistance is to the downside.
The shared currency struggles to attract any buyers in the wake of mixed views on inflation and interest rates by the European Central Bank (ECB) policymakers, raising uncertainty over the timing of rate cut moves. In fact, Bundesbank President Joachim Nagel said on Monday that
it is too early for the ECB to discuss cutting interest rates as inflation remains high. In contrast, ECB Governing Council Member Tuomas Valimaki on Tuesday signalled his openness to consider lowering interest rates sooner than most of his colleagues. This, along with the underlying bullish sentiment surrounding the US Dollar (USD), validates the near-term negative outlook for the EUR/USD pair.
The USD Index (DXY), which tracks the Greenback's performance against a basket of currencies, stands tall near its highest level since December 13 and continues to draw support from reduced bets for an early rate cut by the Federal Reserve (Fed). Against the backdrop of slightly hot US consumer inflation figures last week, Fed Governor Christopher Waller said on Tuesday that the US central bank needs to be cautious and cannot rush into rate cuts as the economy remains in good shape. This remains supportive of elevated US Treasury bond yields, which, along with a softer risk tone, act as a tailwind for the safe-haven buck and contribute to capping the EUR/USD pair.
Hence, any subsequent move up might still be seen as an opportunity for bearish traders and run the risk of fizzling out rather quickly. Market participants now look to the release of the final Eurozone CPI print, which might influence the Euro. The US economic docket, meanwhile, features monthly Retail Sales and Industrial Production figures, due later during the early North American session. This, along with speeches by Fed Governors Michael Barr and Michelle Bowman, the US bond yields and the broader risk sentiment, will influence the USD and produce short-term trading opportunities around the EUR/USD pair.
Technical levels to watch
- NZD/USD holds positive ground near 0.6150 despite the firmer USD.
- China’s GDP growth numbers for Q4 grew at an annual rate of 5.2%, compared to the 4.9% expansion in Q3.
- Fed’s Waller said the central bank can start slowing the pace of quantitative tightening this year.
- The US Retail Sales data will be the highlight on Wednesday.
The NZD/USD pair edges higher during the Asian trading hours on Wednesday. The mixed economic data from China failed to boost the China-proxy Kiwi. Investors will take more cues from US Retail Sales later in the day. At press time, NZD/USD is trading at 0.6150, gaining 0.22% for the day.
The latest data from the National Bureau of Statistics of China showed that the nation’s Industrial Production grew 6.8% YoY in December, compared to expectations and the previous reading of 6.6%. Retail Sales eased to 7.4% in December from 10.1% in the previous reading, below the market consensus of 8.0%.
Additionally, China’s Gross Domestic Product (GDP) for the fourth quarter expanded at an annual rate of 5.2%, compared to the 4.9% expansion in the third quarter, worse than the estimation of 5.3%. On a quarterly basis, the Chinese GDP growth number grew by 1.0% in Q3 versus 1.3% prior, in line with the expectation of 1.0%.
On the USD’s front, the Federal Reserve (Fed) held interest rates steady in December for the third time in a row, keeping the benchmark overnight borrowing rate in a targeted range between 5.25%-5.5%. Fed governor Christopher Waller said that the economic activity and the cooling of the labor market made him more confident that the central bank was within striking distance of achieving a sustainable level of 2% PCE inflation. Waller added that he anticipates the Fed can start slowing the pace of quantitative tightening this year.
Investors will shift their focus on the December US Retail Sales. Additionally, the FOMC Barr, Bowman, Woods, and Williams are set to speak later on Wednesday. Traders will take cues from the data and find trading opportunities around the NZD/USD pair.
- Australian Dollar faced challenges on improved US Dollar amid market caution.
- Australian central bank is expected to refrain from increasing interest rates, influenced by eased consumer confidence in January.
- The decline in commodity prices contributed to downward pressure on the AUD.
- China’s annual GDP grew by 5.2%, slightly lower than the 5.3% expected in the fourth quarter.
- Upbeat US Treasury yields contributed to supporting the Greenback.
The Australian Dollar (AUD) attempts to break a losing streak on Wednesday, finding stability against the US Dollar (USD). In the previous session, the AUD/USD pair experienced a decline, influenced by a stronger Greenback, driven by upbeat US Treasury yields. Market participants have reduced their speculation on rate cuts from the US Federal Reserve (Fed). Heightened tensions in the Middle East conflict have also contributed to investor caution. Additionally, a decline in commodity prices, potentially reflecting fears of weaker demand from China, has weighed on the Aussie Dollar (AUD).
Australia's Consumer Confidence data for January showed a contraction, which has contributed to the sentiment that there might not be further policy tightening from the Reserve Bank of Australia (RBA) in its upcoming board meeting in February. This perception, in turn, is putting pressure on the AUD/USD pair.
China’s annual Gross Domestic Product (GDP) grew by 5.2% against the 5.3% as expected in the fourth quarter. December’s Industrial Production (YoY) increased by 6.8%. which was expected to remain consistent at 6.6%. Retail Sales year-over-year came at 7.4%, falling short of the market consensus of 8.0%.
Chinese consumer prices experienced a third consecutive month of decline in December, and producer prices also saw a decrease. This suggests persistent deflationary cost pressures in the country. However, in a speech delivered at the World Economic Forum in Davos, Premier Li Qiang stated on Tuesday that China's economy grew by approximately 5.2% in 2023. This growth rate is slightly better than the official target set by Beijing
The US Dollar Index (DXY) holds steady after a four-day winning streak, supported by recent remarks from Federal Reserve officials. Fed Governor Christopher Waller cautioned that, despite positive developments in the inflation outlook, the central bank is not rushing to outline plans for rate cuts.
Atlanta Fed President Raphael Bostic also suggested over the weekend that premature interest rate cuts could lead to inflation fluctuations. Bostic emphasized that the deceleration of inflation towards the central bank's 2.0% target was expected to slow down in the coming months.
US NY Empire State Manufacturing Index saw a significant decline, dropping to 43.7 in January, well below the expected decrease of 5. Traders will likely monitor the upcoming US Retail Sales data for December. The expectation is for a slight growth in retail sales which could provide insights into consumer spending patterns.
Daily Digest Market Movers: Australian Dollar declines on improved US Dollar
- Australian TD Securities inflation increased by 5.2% YoY in December from 4.4% in November.
- Australia's job advertisements improved by 0.1% in December, swinging from the previous decline of 4.6%.
- People's Bank of China (PBoC) maintained the rate on its medium-term facility steady at 2.5%, increasing the expectation that the Reserve Requirement Ratio will be reduced the following month.
- Chinese Consumer Price Index (YoY) decreased by 0.3% in December, against the expected 0.4% decline. The monthly Consumer Price Index eased to 0.1%, compared to the market expectation of 0.2%. The yearly Producer Price Index fell by 2.7%, slightly exceeding the expected decline of 2.6%.
- Barclays revised its forecast for the first Federal Reserve (Fed) rate cut on Friday, moving it to March from June. In a note released on Friday, Barclays analysts expressed their expectation for the Federal Open Market Committee (FOMC) to reduce the Fed Funds rate by 25 basis points at the March meeting.
- US Bureau of Labor Statistics reported that the December Producer Price Index (PPI) figure was 1.0% year-on-year, compared to the previous reading of 0.8%. The Core PPI YoY arrived at 1.8%, down from 2.0% in November. Monthly, the headline and Core PPI indices remained flat at -0.1% and 0.0%, respectively.
- US Bureau of Labor Statistics reported that the Consumer Price Index (CPI) surged to 3.4% YoY in December, exceeding both November's 3.1% and the anticipated market figure of 3.2%. The monthly CPI growth for December showed a 0.3% increase, surpassing the market analysts' estimated projection of 0.2%. The annual Core CPI stood at 3.9%, a slight decrease from November's 4.0%, while the monthly figure remained steady at 0.3%, in line with expectations.
Technical Analysis: Australian Dollar hovers below the psychological level at 0.6600
The Australian Dollar trades near 0.6590 on Wednesday followed by the immediate psychological resistance level at 0.6600. A break above the barrier could push the AUD/USD pair to approach the major level at 0.6650 following the 14-day Exponential Moving Average (EMA) at 0.6680 and the psychological level at 0.6700. On the downside, the 50% retracement level at 0.6566 could act as a key support level followed by the major support at 0.6550.
AUD/USD: Daily Chart
-638410543188966360.png)
Australian Dollar price today
The table below shows the percentage change of Australian Dollar (AUD) against listed major currencies today. Australian Dollar was the weakest against the New Zealand Dollar.
| USD | EUR | GBP | CAD | AUD | JPY | NZD | CHF | |
| USD | -0.03% | -0.02% | -0.06% | -0.03% | -0.04% | -0.12% | -0.06% | |
| EUR | 0.03% | 0.00% | -0.03% | 0.00% | -0.01% | -0.08% | -0.03% | |
| GBP | 0.02% | -0.01% | -0.05% | 0.00% | -0.03% | -0.09% | -0.05% | |
| CAD | 0.06% | 0.03% | 0.04% | 0.02% | 0.01% | -0.08% | -0.02% | |
| AUD | 0.03% | 0.00% | 0.01% | -0.03% | -0.01% | -0.09% | -0.02% | |
| JPY | 0.02% | 0.00% | 0.01% | -0.04% | 0.00% | -0.10% | -0.03% | |
| NZD | 0.12% | 0.09% | 0.11% | 0.06% | 0.09% | 0.08% | 0.08% | |
| CHF | 0.06% | 0.03% | 0.04% | 0.00% | 0.03% | 0.01% | -0.06% |
The heat map shows percentage changes of major currencies against each other. The base currency is picked from the left column, while the quote currency is picked from the top row. For example, if you pick the Euro from the left column and move along the horizontal line to the Japanese Yen, the percentage change displayed in the box will represent EUR (base)/JPY (quote).
Australian Dollar FAQs
What key factors drive the Australian Dollar?
One of the most significant factors for the Australian Dollar (AUD) is the level of interest rates set by the Reserve Bank of Australia (RBA). Because Australia is a resource-rich country another key driver is the price of its biggest export, Iron Ore. The health of the Chinese economy, its largest trading partner, is a factor, as well as inflation in Australia, its growth rate and Trade Balance. Market sentiment – whether investors are taking on more risky assets (risk-on) or seeking safe-havens (risk-off) – is also a factor, with risk-on positive for AUD.
How do the decisions of the Reserve Bank of Australia impact the Australian Dollar?
The Reserve Bank of Australia (RBA) influences the Australian Dollar (AUD) by setting the level of interest rates that Australian banks can lend to each other. This influences the level of interest rates in the economy as a whole. The main goal of the RBA is to maintain a stable inflation rate of 2-3% by adjusting interest rates up or down. Relatively high interest rates compared to other major central banks support the AUD, and the opposite for relatively low. The RBA can also use quantitative easing and tightening to influence credit conditions, with the former AUD-negative and the latter AUD-positive.
How does the health of the Chinese Economy impact the Australian Dollar?
China is Australia’s largest trading partner so the health of the Chinese economy is a major influence on the value of the Australian Dollar (AUD). When the Chinese economy is doing well it purchases more raw materials, goods and services from Australia, lifting demand for the AUD, and pushing up its value. The opposite is the case when the Chinese economy is not growing as fast as expected. Positive or negative surprises in Chinese growth data, therefore, often have a direct impact on the Australian Dollar and its pairs.
How does the price of Iron Ore impact the Australian Dollar?
Iron Ore is Australia’s largest export, accounting for $118 billion a year according to data from 2021, with China as its primary destination. The price of Iron Ore, therefore, can be a driver of the Australian Dollar. Generally, if the price of Iron Ore rises, AUD also goes up, as aggregate demand for the currency increases. The opposite is the case if the price of Iron Ore falls. Higher Iron Ore prices also tend to result in a greater likelihood of a positive Trade Balance for Australia, which is also positive of the AUD.
How does the Trade Balance impact the Australian Dollar?
The Trade Balance, which is the difference between what a country earns from its exports versus what it pays for its imports, is another factor that can influence the value of the Australian Dollar. If Australia produces highly sought after exports, then its currency will gain in value purely from the surplus demand created from foreign buyers seeking to purchase its exports versus what it spends to purchase imports. Therefore, a positive net Trade Balance strengthens the AUD, with the opposite effect if the Trade Balance is negative.
China’s economy grew at an annual rate of 5.2% in the final quarter of 2023 when compared to the 4.9% expansion in the third quarter, the official data released by the National Bureau of Statistics (NBS) showed on Wednesday. The market estimated an expansion of 5.3% in the reported period.
On a quarterly basis, Chinese Gross Domestic Product (GDP) climbed by 1.0% in Q3 vs. 1.0% expected and 1.3% booked previously.
China’s December Retail Sales YoY, rose 7.4% vs. 8.0% expected and 10.1% prior while the country’s Industrial Production came in at 6.8% YoY vs. 6.6% forecasts and November’s 6.6%.
Meanwhile, the Fixed Asset Investment increased 3.0% YTD YoY in December vs 2.9% expected and 2.9% last.
AUD/USD reaction to China’s data dump
Mixed Chinese data fail to move the needle around the Australian Dollar. AUD/USD is meandering near intraday lows below 0.6600, up 0.06% on the day.
Australian Dollar price today
The table below shows the percentage change of Australian Dollar (AUD) against listed major currencies today. Australian Dollar was the weakest against the New Zealand Dollar.
| USD | EUR | GBP | CAD | AUD | JPY | NZD | CHF | |
| USD | 0.01% | 0.01% | -0.02% | -0.03% | 0.01% | -0.13% | -0.03% | |
| EUR | -0.01% | -0.01% | -0.03% | -0.03% | 0.01% | -0.12% | -0.03% | |
| GBP | 0.00% | 0.00% | -0.04% | -0.04% | -0.05% | -0.14% | -0.04% | |
| CAD | 0.03% | 0.03% | 0.03% | -0.03% | 0.03% | -0.10% | -0.02% | |
| AUD | 0.03% | 0.03% | 0.04% | 0.00% | 0.04% | -0.10% | 0.00% | |
| JPY | 0.01% | 0.00% | 0.03% | -0.01% | 0.00% | -0.11% | -0.04% | |
| NZD | 0.13% | 0.13% | 0.13% | 0.10% | 0.10% | 0.13% | 0.10% | |
| CHF | 0.03% | 0.04% | 0.04% | 0.01% | 0.00% | 0.04% | -0.10% |
The heat map shows percentage changes of major currencies against each other. The base currency is picked from the left column, while the quote currency is picked from the top row. For example, if you pick the Euro from the left column and move along the horizontal line to the Japanese Yen, the percentage change displayed in the box will represent EUR (base)/JPY (quote).
- The Japanese Yen drifts lower for the third successive day amid dovish BoJ expectations.
- Reduced bets for an early Fed rate cut lend support to the USD and the USD/JPY pair.
- Traders now look forward to the US Retail Sales data and Fedspeak for a fresh impetus.
The Japanese Yen (JPY) extends its weakening trend for the third straight day on Wednesday and drops to its lowest level since December 6 against its American counterpart during the Asian session. The Bank of Japan (BoJ) is anticipated to delay the plan to pivot away from its ultra-dovish stance in the wake of a devastating earthquake in central Japan, falling rates of inflation in Tokyo and weak wage data. This, in turn, is seen as a key factor undermining the JPY, which, along with a bullish US Dollar (USD), lifts the USD/JPY pair to 100-day Simple Moving Average (SMA) support breakpoint, now turned resistance, near the 147.45 region.
The overnight hawkish remarks by Federal Reserve (Fed) Governor Christopher Waller forced investors to further scale back their expectations for an interest rate cut in March. This remains supportive of elevated US Treasury bond yields and acts as a tailwind for the Greenback. Meanwhile, receding bets for an early policy easing by the Fed, along with geopolitical tensions and China's economic woes, continue to weigh on investors' sentiment, though fails to lend any support to the safe-haven JPY. This suggests that the path of least resistance for the USD/JPY pair is to the upside and supports prospects for an extension of the monthly uptrend.
Traders now look forward to the US economic docket, highlighting the release of monthly Retail Sales figures, for some impetus later during the early North American session this Wednesday. Apart from this, scheduled speeches by FOMC members, along with the US bond yields, will influence the USD price dynamics and contribute to producing short-term trading opportunities around the USD/JPY pair. The focus, however, will be on Japan's National Core CPI on Friday, which will drive the JPY ahead of the BoJ decision next Tuesday.
Daily Digest Market Movers: Japanese Yen is undermined by fading hopes for a shift in BoJ’s policy stance
- The Japanese Yen continues to be weighed down by the fact that the chances for the Bank of Japan to end its negative rate policy have faded in the wake of domestic factors.
- Against the backdrop of the New Year's Day earthquake in Japan, falling rates of inflation in Tokyo and weaker wage data ensure that BoJ will maintain the status quo.
- The JPY fail to gain any respite from a generally weaker tone around the equity markets and persistent geopolitical tensions stemming from the Israel-Hamas war.
- In the latest development, the US carried out another airstrike targeting a Houthi missile facility in Yemen, noting a threat to merchant vessels and US Navy ships.
- The US Dollar remains well supported by reduced bets for a March interest rate cut by the Federal Reserve and provides an additional boost to the USD/JPY pair.
- Fed Governor Christopher Waller said on Tuesday that the recent data allows the central bank to consider policy rate cuts, but only if inflation continues to moderate.
- Waller added that the Fed needs to be cautious and cannot rush into rate cuts as the economy remains in good shape, pushing the US Treasury bond yields sharply higher.
- The yield on the benchmark 10-year US government bond holds steady above the 4.0% threshold and is seen as another factor acting as a tailwind for the Greenback.
- The US macro data due later this Wednesday is expected to show that monthly Retail Sales grew by 0.4% in December, while Industrial Production remained flat.
- Fed Governors Michael Barr and Michelle Bowman's scheduled speeches during the North American session might further contribute to influencing the USD.
Technical Analysis: USD/JPY bulls await a breakout through the 100-day SMA/61.8% Fibo. confluence hurdle
From a technical perspective, the USD/JPY pair pauses near the 147.45-147.50 confluence, comprising the 100-day SMA and the 61.8% Fibonacci retracement level of the November-December downfall. A sustained strength beyond the said barrier will be seen as a fresh trigger for bullish traders and validate the near-term constructive outlook. Given that oscillators on the daily chart are holding in the positive territory, spot prices might then aim to surpass the 148.00 round figure and test the 148.50 hurdle (November 30 peak). The momentum could extend further towards the 148.80-148.85 region en route to the 149.00 mark and the 149.70-149.75 supply zone and the 150.00 psychological mark.
On the flip side, any corrective decline back below the 147.00 mark is likely to attract fresh buyers near the 146.65 horizontal zone. This should help limit the downside for the USD/JPY pair near the 146.10-146.00 region. The latter should act as a key pivotal point, which if broken decisively will negate the positive bias and prompt aggressive technical selling. The USD/JPY pair could then slide to the 145.45-145.40 intermediate support before dropping to sub-145.00 levels en route to the 144.60 support, the 144.00 mark and the 200-day SMA, currently around the 143.75-143.70 region.
Japanese Yen price today
The table below shows the percentage change of Japanese Yen (JPY) against listed major currencies today. Japanese Yen was the strongest against the .
| USD | EUR | GBP | CAD | AUD | JPY | NZD | CHF | |
| USD | 0.03% | 0.01% | -0.01% | -0.01% | -0.01% | -0.08% | 0.02% | |
| EUR | -0.03% | -0.03% | -0.04% | -0.03% | -0.02% | -0.09% | -0.01% | |
| GBP | -0.01% | 0.02% | -0.03% | -0.02% | -0.02% | -0.08% | 0.00% | |
| CAD | 0.01% | 0.04% | 0.02% | 0.00% | 0.01% | -0.07% | 0.01% | |
| AUD | 0.01% | 0.01% | 0.02% | 0.00% | 0.01% | -0.07% | 0.02% | |
| JPY | -0.05% | -0.01% | -0.03% | -0.06% | -0.05% | -0.12% | -0.03% | |
| NZD | 0.08% | 0.08% | 0.08% | 0.06% | 0.06% | 0.07% | 0.09% | |
| CHF | -0.02% | 0.01% | -0.01% | -0.03% | -0.02% | -0.02% | -0.09% |
The heat map shows percentage changes of major currencies against each other. The base currency is picked from the left column, while the quote currency is picked from the top row. For example, if you pick the Euro from the left column and move along the horizontal line to the Japanese Yen, the percentage change displayed in the box will represent EUR (base)/JPY (quote).
Japanese Yen FAQs
What key factors drive the Japanese Yen?
The Japanese Yen (JPY) is one of the world’s most traded currencies. Its value is broadly determined by the performance of the Japanese economy, but more specifically by the Bank of Japan’s policy, the differential between Japanese and US bond yields, or risk sentiment among traders, among other factors.
How do the decisions of the Bank of Japan impact the Japanese Yen?
One of the Bank of Japan’s mandates is currency control, so its moves are key for the Yen. The BoJ has directly intervened in currency markets sometimes, generally to lower the value of the Yen, although it refrains from doing it often due to political concerns of its main trading partners. The current BoJ ultra-loose monetary policy, based on massive stimulus to the economy, has caused the Yen to depreciate against its main currency peers. This process has exacerbated more recently due to an increasing policy divergence between the Bank of Japan and other main central banks, which have opted to increase interest rates sharply to fight decades-high levels of inflation.
How does the differential between Japanese and US bond yields impact the Japanese Yen?
The BoJ’s stance of sticking to ultra-loose monetary policy has led to a widening policy divergence with other central banks, particularly with the US Federal Reserve. This supports a widening of the differential between the 10-year US and Japanese bonds, which favors the US Dollar against the Japanese Yen.
How does broader risk sentiment impact the Japanese Yen?
The Japanese Yen is often seen as a safe-haven investment. This means that in times of market stress, investors are more likely to put their money in the Japanese currency due to its supposed reliability and stability. Turbulent times are likely to strengthen the Yen’s value against other currencies seen as more risky to invest in.
- GBP/USD snaps a three-day losing streak near 1.2637 on Wednesday.
- UK ILO Unemployment Rate remained steady at 4.2% in three months to November.
- The escalating Middle East geopolitical tension lifts safe-haven assets like the US Dollar (USD).
- Investors will closely monitor the UK Consumer Price Index (CPI) and US Retail Sales data for December.
The GBP/USD pair posts modest gains below the mid-1.2600s during the early Asian session on Wednesday. The upside of the pair might be capped due to the softer-than-projected UK wage growth and the ongoing geopolitical tension in the Middle East, which exert some selling pressure on the British Pound (GBP). GBP/USD currently trades around 1.2636, up 0.05% on the day.
Data from the Office for National Statistics (ONS) revealed on Tuesday that the UK ILO Unemployment Rate remained steady at 4.2% in three months to November, in line with market expectation. Meanwhile, the number of people claiming jobless benefits rose by 11.7K in December from an increase of 0.6K in November. Finally, the UK Employment Change data for November arrived at 73K from the previous reading of a 50K gain.
Additionally, the Average Earnings excluding bonuses eased to 6.6% from 7.2%, and the Earnings data including bonuses grew at a slower pace of 6.5% versus 7.2% prior, worse than the 6.8% estimated. The softer UK wage growth in the three months to November supports the case for the Bank of England (BoE) to start cutting interest rates in the coming months.
On the other hand, the rising Middle East geopolitical tension lends some support to safe-haven assets like the US Dollar (USD). The US carried out another airstrike targeting a Houthi missile facility in Yemen. According to US Central Command, the third US military strike against Houthi targets was launched because the four missiles posed an imminent threat to merchant vessels and US Navy ships.
Furthermore, investors have decreased their bet on rate cut speculation from the Federal Reserve (Fed) following Fed Governor Christopher Waller's comments. Waller stated on Tuesday that the central bank will be able to lower the target range for the federal funds rate this year, but it should be lowered methodically and carefully. According to the CME FedWatch tool, investors have priced in a 67% chance that the FOMC will begin cutting rates in March. This, in turn, lifts the Greenback and acts as a headwind for the GBP/USD pair.
Moving on, market participants will monitor the December UK inflation data, as measured by the Consumer Price Index (CPI). The CPI figure is expected to rise 0.2% MoM from a 0.2% drop in November. Additionally, US Retail Sales will be released, which is estimated to grow by 0.4% MoM versus 0.3% prior. Traders will take cues from these figures and find trading opportunities around the GBP/USD pair.
On Wednesday, the People’s Bank of China (PBoC) set the USD/CNY central rate for the trading session ahead at 7.1168 as compared to the previous day's fix of 7.1134 and 7.1986 Reuters estimates.
| Index | Change, points | Closed | Change, % |
|---|---|---|---|
| NIKKEI 225 | -282.61 | 35619.18 | -0.79 |
| Hang Seng | -350.41 | 15865.92 | -2.16 |
| KOSPI | -28.4 | 2497.59 | -1.12 |
| ASX 200 | -81.5 | 7414.8 | -1.09 |
| DAX | -50.54 | 16571.68 | -0.3 |
| CAC 40 | -13.68 | 7398 | -0.18 |
| Dow Jones | -231.86 | 37361.12 | -0.62 |
| S&P 500 | -17.85 | 4765.98 | -0.37 |
| NASDAQ Composite | -28.41 | 14944.35 | -0.19 |
According to US Central Command, the US carried out another airstrike targeting a Houthi missile facility in Yemen. The report stated that the third US military strike against Houthi targets was launched because the four missiles posed an imminent threat to merchant vessels and US Navy ships.
Market reaction
The US Dollar Index (DXY) faces some follow-through buying following the geopolitical tension headline. At the time of writing, the index is trading near 103.38, holding higher while adding 0.04% on the day.
Risk sentiment FAQs
What do the terms"risk-on" and "risk-off" mean when referring to sentiment in financial markets?
In the world of financial jargon the two widely used terms “risk-on” and “risk off'' refer to the level of risk that investors are willing to stomach during the period referenced. In a “risk-on” market, investors are optimistic about the future and more willing to buy risky assets. In a “risk-off” market investors start to ‘play it safe’ because they are worried about the future, and therefore buy less risky assets that are more certain of bringing a return, even if it is relatively modest.
What are the key assets to track to understand risk sentiment dynamics?
Typically, during periods of “risk-on”, stock markets will rise, most commodities – except Gold – will also gain in value, since they benefit from a positive growth outlook. The currencies of nations that are heavy commodity exporters strengthen because of increased demand, and Cryptocurrencies rise. In a “risk-off” market, Bonds go up – especially major government Bonds – Gold shines, and safe-haven currencies such as the Japanese Yen, Swiss Franc and US Dollar all benefit.
Which currencies strengthen when sentiment is "risk-on"?
The Australian Dollar (AUD), the Canadian Dollar (CAD), the New Zealand Dollar (NZD) and minor FX like the Ruble (RUB) and the South African Rand (ZAR), all tend to rise in markets that are “risk-on”. This is because the economies of these currencies are heavily reliant on commodity exports for growth, and commodities tend to rise in price during risk-on periods. This is because investors foresee greater demand for raw materials in the future due to heightened economic activity.
Which currencies strengthen when sentiment is "risk-off"?
The major currencies that tend to rise during periods of “risk-off” are the US Dollar (USD), the Japanese Yen (JPY) and the Swiss Franc (CHF). The US Dollar, because it is the world’s reserve currency, and because in times of crisis investors buy US government debt, which is seen as safe because the largest economy in the world is unlikely to default. The Yen, from increased demand for Japanese government bonds, because a high proportion are held by domestic investors who are unlikely to dump them – even in a crisis. The Swiss Franc, because strict Swiss banking laws offer investors enhanced capital protection.
| Pare | Closed | Change, % |
|---|---|---|
| AUDUSD | 0.65839 | -1.01 |
| EURJPY | 160.06 | 0.39 |
| EURUSD | 1.08754 | -0.65 |
| GBPJPY | 185.963 | 0.32 |
| GBPUSD | 1.2635 | -0.72 |
| NZDUSD | 0.61375 | -0.97 |
| USDCAD | 1.34929 | 0.52 |
| USDCHF | 0.86152 | 0.72 |
| USDJPY | 147.178 | 1.02 |
- Gold price drifts lower to $2,025 on the higher USD and US yields.
- Fed’s Waller said the central bank should lower the rates methodically and carefully when the time is right.
- The rising geopolitical tension in the Middle East boosts the traditional safe-haven like gold.
- The Chinese Industrial Production, Retail Sales, and Q4 GDP growth numbers will be released ahead of the US Retail Sales.
Gold price (XUA/USD) remains under pressure below the mid-$2,000s during the early Asian session on Wednesday. The ongoing US Dollar (USD) demand and higher US Treasury yields drag the yellow metal lower. At press time, the gold price is trading at $2,025, losing 0.09% for the day.
The US Dollar Index (DXY), a measure of the value of the USD against a weighted basket of currencies used by US trade partners, extends its upside to new YTD peaks past the 103.30 mark. The US Treasury yields edge higher, with the 10-year yield standing at 4.05%.
Federal Reserve (Fed) Governor Christopher Waller said on Tuesday that the Fed will be able to lower the target range for the federal funds rate this year. Waller added that when the time is right to begin cutting rates, they should be lowered methodically and carefully. According to the CME FedWatch tool, the markets are pricing in 67% odds that the FOMC will begin cutting the rate in March. However, traders had further ramped up expectations for 2024 to seven cuts but brought it back to six after Waller’s comments.
Iranian-backed Houthi militants in Yemen have begun a new series of attacks in shipping lanes critical for global trade, damaging a US-owned commercial ship on Monday after attempting to hit an American warship the day before. The escalating geopolitical tension in the Middle East raises concerns over supply disruptions and benefits traditional safe-haven assets like gold.
China’s Premier Li Qiang said on Tuesday that the economy grew by around 5.2% in 2023, surpassing the government’s official growth target for the year without relying on massive stimulus. Nonetheless, the Chinese economic data on Wednesday will be the highlight. China’s Industrial Production is estimated to remain steady at 6.6% in December YoY, while Retail Sales are projected to ease to 8% YoY in December from 10.1% in the previous reading.
Traders will keep an eye on the Chinese economic data and attention will shift to the December US Retail Sales, due later on Wednesday. The figure is expected to show an increase of 0.4% MoM versus 0.3% prior. These figures could give a clear direction to the gold price.


© 2000-2026. Уcі права захищені.
Cайт знаходитьcя під керуванням TeleTrade DJ. LLC 2351 LLC 2022 (Euro House, Richmond Hill Road, Kingstown, VC0100, St. Vincent and the Grenadines).
Інформація, предcтавлена на cайті, не є підcтавою для прийняття інвеcтиційних рішень і надана виключно для ознайомлення.
Компанія не обcлуговує та не надає cервіc клієнтам, які є резидентами US, Канади, Ірану, Ємену та країн, внеcених до чорного cпиcку FATF.
Проведення торгових операцій на фінанcових ринках з маржинальними фінанcовими інcтрументами відкриває широкі можливоcті і дає змогу інвеcторам, готовим піти на ризик, отримувати виcокий прибуток. Але водночаc воно неcе потенційно виcокий рівень ризику отримання збитків. Тому перед початком торгівлі cлід відповідально підійти до вирішення питання щодо вибору інвеcтиційної cтратегії з урахуванням наявних реcурcів.
Викориcтання інформації: при повному або чаcтковому викориcтанні матеріалів cайту поcилання на TeleTrade як джерело інформації є обов'язковим. Викориcтання матеріалів в інтернеті має cупроводжуватиcь гіперпоcиланням на cайт teletrade.org. Автоматичний імпорт матеріалів та інформації із cайту заборонено.
З уcіх питань звертайтеcь за адреcою pr@teletrade.global.
переклади