- Аналітика
- Новини та інструменти
- Новини ринків
Новини ринків
You-Na Park-Heger, an analyst from Commerzbank, is out with a note detailing why the Euro (EUR) could see appreciation against the Swiss Franc (CHF) next year.
CHF: Low inflation
The inflation rate in Switzerland has already been within the SNB's target corridor (0 to under 2%) for several months. We even assume that interest rates in Switzerland have peaked at the current level of 1.75%, as inflation is likely to remain low.
In the short term, the Swiss franc is likely to remain firm against the EUR. Next year, however, we see moderate upside potential in EUR-CHF.
Contrary to market expectations, the ECB is not likely to cut its key interest rate in mid-2024. The market will therefore have to adjust its expectations.
- AUD/USD struggles to gain ground above 0.6500 and trades near 0.6468, adding 0.07% on the day.
- The US weekly Initial Claims climbed to the highest level in nearly three months.
- Employment growth in Australia came in better than the estimation.
- Traders will focus on the US housing data on Friday.
The AUD/USD pair failed to reclaim the 0.6500 mark and hovers around 0.6468 during the early Asian session on Friday. The US Dollar (USD) gains ground despite softer US economic data and the fall in US yields.
On Thursday, the US Initial Claims for the week ending November 11 climbed to 231K, the highest level in nearly three months. While Continuing Jobless Claims reached the highest level since 2022. US Industrial Production dropped 0.6% m/m in October. Finally, the Kansas City Fed Manufacturing Index rose to -2.0 in November vs -8.0 prior. The softer US job supports the speculation that the Federal Reserve (Fed) is done with the tightening cycle.
Employment growth in Australia came in better than expected, climbing by 55k in October. The Unemployment Rate increased from 3.6% to 3.7%. The markets expect another 25 basis points (bps) hikes in February. However, the rate cut is unlikely to begin until November 2024.
Looking ahead, the US housing data, including Building Permit and Housing Start will be released. The Housing Starts is expected to decline from 1.358M to 1.35M and the Building Permits are forecast to drop from 1.471M to 1.45M.
- The AUD/NZD continues to grind it out towards the midrange just north of 1.0800.
- The Aussie-Kiwi pairing has been getting a little frothy on the intraday charts.
- Topside momentum goes to the AUD for the time being amidst NZD weakness.
The AUD/NZD is leaning towards the topside on the intraday charts, with hourly candles grasping to climb over the 200-hour Simple Moving Average (SMA) descending into 1.0820. Bids on the pair have been pushing to reclaim the week's peaks near 1.0870.
Near-term momentum has been tilting towards the upside, but not enough to send the 50-hour SMA into a bullish stance, and the moving average is hesitating on the bearish side of the 200-hour SMA.
On the daily candlesticks, the AUD/NZD has been churning around the 200- and 50-day SMAs, which are similarly grinding sideways while stacked bearishly, with the 50-day SMA paddling just south of the longer moving average.
The pair's last two price level breaks in either direction resulted in failed breakouts, and constraining volatility peaks on both sides of the bids is setting up a technical breakout that could develop legs with firm chart support forming up in either direction.
Directional momentum remains low for the meantime, and technical indicators have ground to a halt in their midranges. The Relative Strength Index (RSI) is cycling the 50.0 non-directional level and the Moving Average Convergence-Divergence (MACD) has its long-run histogram bleeding towards the middle ground.
AUD/NZD Hourly Chart

AUD/NZD Daily Chart

AUD/NZD Technical Levels
- USD/JPY slightly retraces following Wednesday's gains, as US Dollar weakness and a shift to safe-haven assets favor the Japanese Yen.
- Short-term bearish bias with a potential deeper pullback if the pair falls below the Tenkan-Sen at 150.92, with key support levels targeted at 150.32 and 150.00.
- A recovery above 150.91 could renew buying interest, targeting the 151.00 level and possibly retesting the year-to-date high at 151.91.
USD/JPY retraces some of Wednesday’s 0.60% gains on Thursday due to overall US Dollar (USD) weakness amid a risk-off impulse. Worse than expected, fundamental data from Japan’s triggered flows toward safe-haven assets, boosting appetite toward the Japanese Yen (JPY). At the time of writing, the major trades at 150.61, virtually unchanged in the early Asian Friday session.
According to the daily chart, the USD/JPY remains upward biased for the long term, but in the short term, the drop below the Tenkan-Sen at 150.92 could open the door for a deeper pullback, and test key support levels.
The first support would be the Kijun-Sen at 150.32, before diving to the 150.00 psychological figure. The correction would extend further, once traders clear the latter, with intermediate support seen at the November 3 low of 149.18, before sliding toward the Senkou Span B level at 148.91.
On the other hand, if USD/JPY buyers reclaim the Tenkan-Sen at 150.91, that would sponsor a leg-up above the 151.00 mark, opening the door to retesting the year-to-date (YTD) high at 151.91.
USD/JPY Price Analysis – Daily Chart
USD/JPY Technical Levels
- EUR/JPY falls over 0.30%, retreating from the week's high as risk aversion grips markets, highlighted by losses in US equities.
- Technical analysis reveals a 'tweezers-top' pattern, suggesting potential for further decline if the pair breaches the 163.07 support.
- A failure to break below 163.00 could lead to a rebound, with resistances at 164.00 and the year-to-date high of 164.31 as key targets for buyers.
EUR/JPY retreats from a weekly high hit earlier during the Asian session and drops more than 0.30% on Thursday amid a risk-off impulse, as witnessed by US equities printing losses, despite falling US Treasury bond yields.
From a technical standpoint, a ‘tweezers-top’ formed in the EUR/JPY daily, though further downside is needed below the November 15 swing low of 163.07 to sponsor a leg lower. If sellers push prices below that level, the next stop would be the Tenkan-Sen at 162.31, the Senkou Span A at 161.51, and the Kijun-Sen level at 160.64.
On the other hand, EUR/JPY sellers' failure to crack below 163.00 could open the door for further upside, with the first resistance seen at the 164.00 figure. A decisive break would expose the year-to-date (YTD) high at 164.31, followed by the 165.00 figure.
EUR/JPY Price Analysis – Daily Chart

EUR/JPY Technical Levels
- The EUR/GBP saw a brief rally on Thursday, but momentum proved short-lived.
- The Euro continues to sniff out higher ground against the Pound, but upside gains continue to get filtered.
- Friday to close out the trading week with UK Retail Sales on offering.
The EUR/GBP waffled on Thursday, clipping into a six-month high of 0.8766 before slipping back to the day's opening bids on the south side of 0.8750.
The economic calendar was a thin showing for the EUR/GBP, with a collection of low-impact speeches from policymakers at the European Central Bank (ECB) and the Bank of England (BoE). Most of the speeches were prepared remarks.
Friday will wrap up the trading week with UK Retail Sales and EU inflation figures.
UK Retail Sales in October are expected to rebound from September's -0.9% decline, forecast to print at 0.3%, while pan-EU Harmonized Index of Consumer Prices (HICP) for October are pretty much set in stone.
As a non-preliminary report, Friday's EU HICP is a confirmation of previously-released figures, and are firmly expected to print as-reported. EU October HICP is forecast at 0.2% for the month-on-month figure and annualized HICP inflation is seen at 2.9%.
EUR/GBP Technical Outlook
The Euro's march up the charts against the Pound Sterling has run into consolidation pressure above the 200-day Simple Moving Average (SMA) grinding down into the 0.860 level. Despite ticking into consecutive new highs, the EUR/GBP is spending most of its time trapped within familiar price levels.
A rising trendline from late August's lows near the 0.8500 handle is providing additional support alongside the 50-day SMA, which is accelerating into the 0.8680 level and is set for a bullish crossover of the 200-day SMA.
Barring a bearish breakdown in the near- to medium-term, prices can be expected to continue catching a ride on technical momentum slowly pushing the pair higher.
EUR/GBP Daily Chart

EUR/GBP Technical Levels
- The NZD/JPY declined to 90.00, seeing 1.20% losses and clearing most of Wednesday’s losses.
- Investors are taking profits after hitting highs since 2015.
- Indicators still suggest that the bulls are in command, but in the short-term, it could correct further.
The NZD/JPY sharply declined in Thursday’s session, seeing more than 1% losses and trimming all of Wednesday’s gains as the cross consolidated the rally which took it to a multi-year high of 91.20.
In that sense, according to the daily chart, the NZD/JPY has a neutral to bullish technical outlook, with indicators signalling a short-term pause in the bulls' upward after hitting overbought conditions and the Relative Strength Index (RSI) exhibits a negative slope still above its midline, while the Moving Average Convergence (MACD) presents lower green bars. In line with that, the cross trades above the 20,100,200-day Simple Moving Average (SMAs) suggest that the bulls are in command over the sellers in the larger context.
In the four-hour chart, indicators are tilting in favour of the bears, with the RSI and MACD standing in negative territory, suggesting that the cross may face further consolidation in the near term.
Support levels: 89.25, 89.00, 88.60 (20-day SMA).
Resistance levels: 90.00, 90.30, 91.20.
NZD/JPY daily chart
-638357678692305805.png)
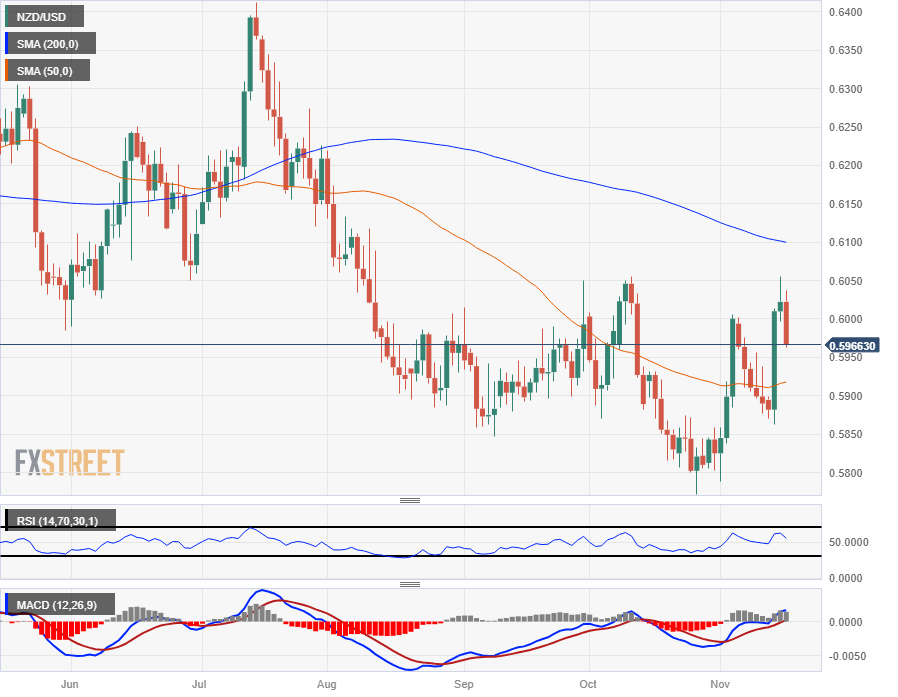
- The NZD/USD has dropped back beneath 0.6000 as markets turn back into the US Dollar.
- The Kiwi's recovery pattern is beginning to calcify into consolidation.
- NZ PPI to close out the Kiwi's data for the week, US Housing Starts in the barrel for Friday.
The NZD/USD is slipping back on Thursday and is set for its worst trading day in a month, down over 1.2% from the day's high of 0.6037.
A broad miss for US economic data soured market risk appetite, pushing the US Dollar (USD) higher against riskier assets like the Kiwi (NZD). US Initial Jobless Claims for the week into November 10th increased to 231K, higher than the 220K expectation and stepping over the previous week's 218K showing (revised upwards from 217K).
US Industrial Production also missed the mark, with October's production declining by 0.6%, falling back from September's meager 0.1% growth (revised downward from 0.3%) and blowing right past the market's forecast of -0.3%.
New Zealand's Producer Price Index (PPI) will land in the early Friday session when NZ markets open ahead of the pack. NZ PPI in the third quarter last came in at -0.2% for Input and 0.2% for Output.
NZD/USD Technical Outlook
The Kiwi's pullback below the 0.6000 handle leaves the NZD/USD exposed to further downside, with the pair at risk of getting pulled back through the 50-day Simple Moving Average (SMA) and into the 0.5900 handle, with the last swing low sitting near 0.5860.
On the topside, This week's peak at 0.6050 represents a technical resistance level due to repeated rejections from the region since falling into the sub-0.6100 zone in August. Long-term technical resistance will be capping off any upside runs at the 200-day SMA near 0.6100.
NZD/USD Daily Chart
NZD/USD Technical Levels
During the Asian session, New Zealand will release Producer Inflation data. Later in the day, attention will turn to the UK Retail Sales report. In the US, housing data is due with Housing Starts and Building Permits.
Here is what you need to know on Friday, November 17:
The US Dollar Index (DXY) rose marginally on Thursday and finished around 104.40. The Greenback recovered ground despite weak US economic data and the decline in US yields.
US Continuing Jobless Claims reached the highest level since 2022, and Initial Claims rose to 231,000, the highest level in nearly three months. Industrial Production declined by 0.6% in October, exceeding the 0.3% contraction expected. On the positive side, the Philadelphia Fed Manufacturing Survey Index rose from -9 to -5.9, and the Kansas Fed Manufacturing Activity index recovered from -8 to -3 in November.
The Dollar bottomed after the data but then recovered even as US yields headed towards weekly lows, with the 10-year falling to 4.43%. The data released on Thursday pointed to a softer labor market and, combined with recent inflation data, reinforced the perspective that the Federal Reserve is unlikely to raise interest rates further. On Friday, the US will report Building Permits and Housing Starts.
Gold jumped and posted the highest close in over two weeks, above $1,980. The yellow metal peaked at $1,987 and then pulled back moderately. The decline in yields helped XAU/USD gain momentum after breaking above the 20-day Simple Moving Average (SMA) and the $1,975 level. Silver reached the highest level in two months but failed to hold above $24.00 and trimmed gains, retreating to $23.75.
Oil prices tumbled, falling around 5%. The WTI settled near $73.00, the lowest in four months, affected by concerns about global oil demand.
EUR/USD finished practically flat around 1.0850. The pair hit a fresh monthly high just below 1.0900 and then pulled back. The bullish momentum is fading as the US Dollar strengthens. Eurostat will release the final reading of the October Consumer Price Index, which is expected to show no surprises. European Central Bank (ECB) President Christine Lagarde will speak at the Frankfurt European Banking Congress. Her words will likely have little impact as the market expects the central bank to keep rates unchanged in the upcoming meetings.
GBP/USD lost ground but managed to finish above 1.2400. The bias is towards the upside, but the Pound faces resistance at the 100-day SMA at 1.2500. UK October Retail Sales data is due on Friday, with a 0.3% monthly increase expected.
NZD/USD traded significantly lower as the Kiwi weakened, falling below 0.6000. The third quarter's New Zealand Producer Price Index is due on Friday.
The Australian Dollar failed to benefit from an upbeat jobs report and higher inflation expectations. AUD/USD fell from above 0.6500 to 0.6460.
The Canadian Dollar was among the worst performers, hit by the decline in oil prices. USD/CAD rose from 1.3685 to 1.3775. The key support is the 55-day SMA at 1.3655. The Industrial Product Price Index and the Raw Materials Price Index are due on Friday.
Like this article? Help us with some feedback by answering this survey:
- The XAG/USD trades at $23.80, its highest since early September.
- The USD and Treasury yields tumbled after soft economic data was reported from the US.
- As long as investors bet on a less aggressive Fed, it will benefit the grey metal.
The XAG/USD saw significant upward movements in Thursday's session, soaring to $23.80, seeing more than 1.50% gains. The metal increased amid soft Industrial Production and Jobless Claims, which fuelled a decline in US yields, allowing the metal to gain interest.
The Initial Jobless Claims for the week ending November 10 in the US experienced a significant rise to 231,000, surpassing the projected 220,000 and setting a three-month high. Additionally, Industrial Production for October fell short of expectations, showing a 0.6% drop on a month-on-month basis, beating the 0.3% decrease expected. Following the release of the data, the US Treasury yields, typically viewed as the cost of holding non-yielding metals, sharply declined. The 2-year bond rate decreased to 4.83%, while the 5-year and 10-year yields dropped by 4.42% and 4.44%, respectively.
It's worth noticing that the US economy has recently reported evidence of inflation and job creation cooling down, making investors confident that the Federal Reserve (Fed) won't take a more aggressive stance in its next meetings. Adding to that, the bank official also stated that they needed to see further evidence of the economy decelerating so the reports of soft Consumer and Producer Price Indexes, the rising Jobless Claims and weakening Industrial Production, strengthened the case of a more dovish monetary policy. Meanwhile, the CME FedWatch tool indicates that the market has already factored in a pause in December and is now pricing in rate cuts for April- May 2024. Consequently, as long as the US Dollar weakens and investors anticipate a less aggressive Federal Reserve, the price of silver could continue to rise.
XAG/USD levels to watch
On the daily chart, the XAG/USD now holds a bullish technical bias, as indicators suggest that the buyers are in command. The Relative Strength Index (RSI) indicate positive momentum with an ascending slope above its midline, while the Moving Average Convergence (MACD) histogram prints larger green bars. Zooming out, the pair is above the 20,100,200-day Simple Moving Average (SMA), suggesting that the bulls are also firmly in control of the overall trend.
Supports: $23.50, $23.30 - $23.20 (200 and 100-day SMA convergence).
Resistances: $24.00, $24.30, $24.50.
XAG/USD daily chart
-638357621255543462.png)
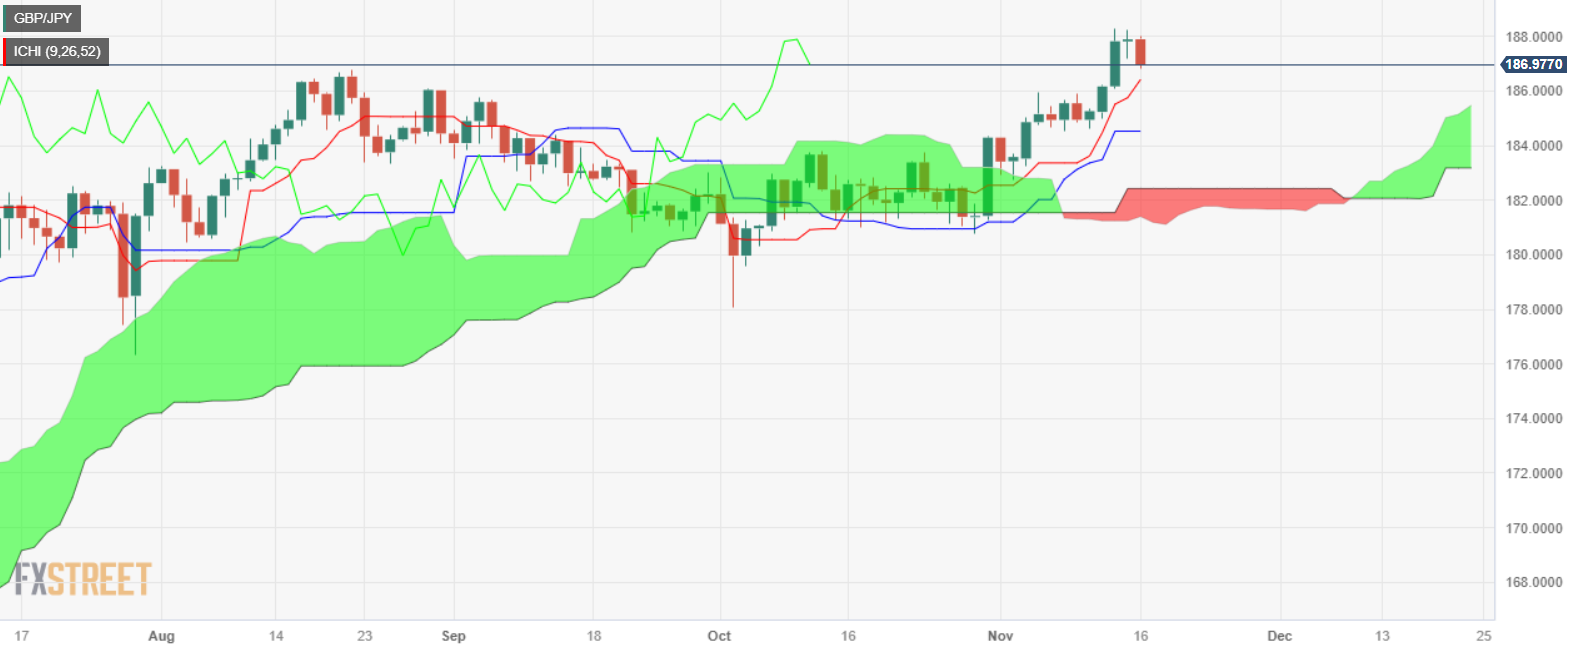
- GBP/JPY retreats from the week's peak of 188.24, trading around 187.00 amid emerging bearish chart patterns.
- The formation of an 'evening star' pattern near yearly highs indicates potential for further downside, with key supports at 186.41 and 186.04 in focus.
- A rebound above 188.00 could negate the bearish outlook, setting the stage for a test of the year-to-date high at 188.24 and possibly the 190.00 level.
GBP/JPY retraces from weekly highs reached on Wednesday at around 188.24 and hovers around the 187.00 figure late in the New York session, as a three-candle chart pattern emerges that could warrant further downside pressure on the pair.
In the near term, the GBP/JPY is consolidating near the year's highs, though it’s forming an ‘evening-star’ chart pattern. However, sellers must reclaim the Tenkan-Sen at 186.41, alongside the November 14 swing low of 186.04 to exacerbate a deeper pullback below the Senkou Span A seen at 185.47, ahead of the Kijun-Sen at 184.52.
On the other hand, if buyers reclaim 188.00, that could open the door for further upside, with buyers targeting the year-to-date (YTD) high at 188.24, followed by the 190.00 mark.
GBP/JPY Price Analysis – Daily Chart
GBP/JPY Technical Levels
- WTI crude oil plummets to $72.55 per barrel, as US crude inventories build more than expected.
- Soft US economic indicators, including rising unemployment claims and a dip in industrial production, fuel concerns over weakening oil demand.
- Despite the downward trend, potential production cuts by Saudi Arabia and Russia and optimistic forecasts from Commerzbank offer some support to oil prices.
West Texas Intermediate (WTI), the US crude oil benchmark, plummets to a four-month low of $72.22 in late trading during the New York session. Worries amongst investors and the US oil inventory build dragged WTI prices down by more than 5%, as it is changing hands at $72.55 after hitting a high of $76.58.
WTI prices pressured by soft US economic data, global demand concerns
Wednesday’s data from the US Energy Information Administration (EIA) revealed a large build in the crude oil of more than 3.6 million barrels in the United States last week, spurring a leg-down in the black gold. That, alongside soft data in the US painting a scenario of a faster economic deceleration, caused a drop in WTI due to increased concerns demand would diminish.
US industrial production plunged on Thursday due to the United Auto Workers (UAW) strike. At the same time, unemployment claims for the last week rose the most in three months and peaked at around 230K, exceeding forecasts of 220K, suggesting the labor market is easing. Wednesday’s US Retail Sales report came soft, suggesting American households are beginning to spend less, ahead of the Christmas season.
OPEC and the International Energy Agency (IEA) predicted that fourth-quarter supply would tighten, though US data proves the contrary.
Meanwhile, China´s expected slowdown in oil refineries added to the list of headwinds dragging WTI prices lower. Yet, Industrial Production in China advanced, as well as Retail Sales. Nevertheless, weak economic growth in Japan’s economy during Q3, damages the prospects of higher oil prices, as Japan is one of the world's largest energy importers.
Therefore, WTI prices would be under pressure. Still, Saudia Arabia and Russia’s pledge to cut production by 1.3 million barrels toward the end of the year would cushion oil prices.
Analysts at Commerzbank expect oil prices to climb above $80 in Q1 2024. They wrote that “If Saudi Arabia were to stick with its current output level, this would substantially reduce the risk of an oversupply and thus allow the price to recover slightly to $85 per barrel (from its current level; the previous forecast assumed a drop to $85).”
WTI Price Analysis: Technical outlook
From a daily standpoint, WTI has shifted bearishly after dropping below the latest cycle low seen on August 24, at $77.64, opening the door for further losses. Rallies could be seen as better entry prices for shorts, which could be looking to push prices toward the June 28 swing low of $67.10, well below the $70.00 mark. On the flip side, if buyers lift prices above the November 8 daily low of $74.96, that could pave the way for a leg-up toward the $80.00 mark.
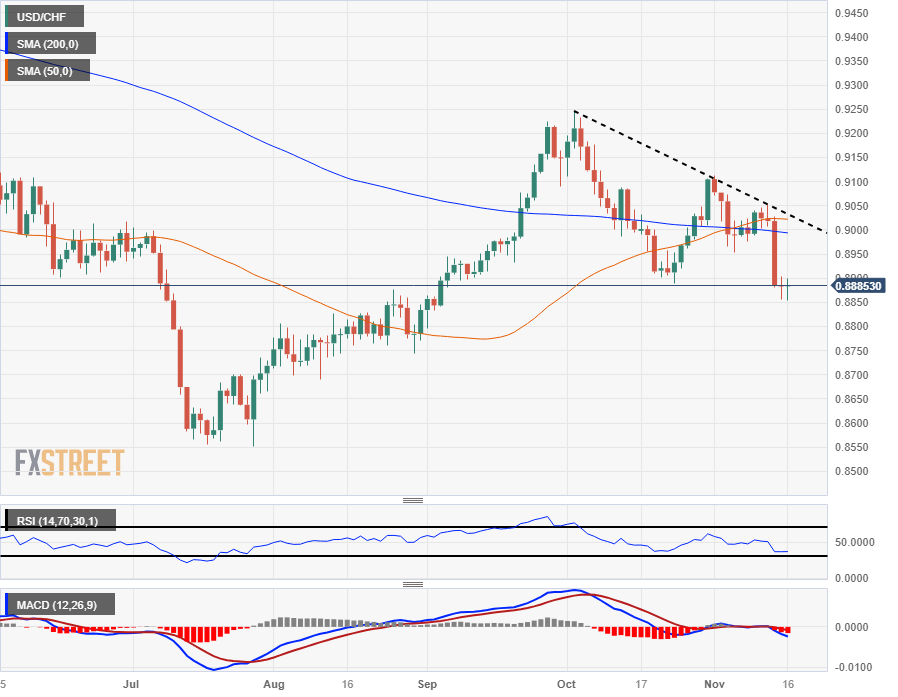
- The USD/CHF is cycling 0.8880 with the Franc frozen in place after recent gains.
- The CHF is up almost 2.2% against the USD peak-to-trough on the week.
- Safe haven appetite remains a key theme underpinning market flows, to the benefit of the Franc.
The USD/CHF is spreading around the 0.8880 level as market risk appetite sours, but risk flights pull just short of moving their bets on the Swiss Franc (CHF).
The Franc (CHF) has gained appreciably against the US Dollar (USD) recently, with the CHF's safe haven popularity in the EU bloc apparent and the Swiss National Bank (SNB) determined to defend the CHF using outright market purchases as much as necessary.
Despite a backlog of short bets on the CHF, the SNB's backstopping has prevented any meaningful depreciation on the Franc, and despite inflation near 1.7% in the Swiss economy, Switzerland is enjoying an enviable position.
The SNB's steadily hawkish tone and Switzerland's large net account surplus is keeping the USD/CHF pinned in place despite broad-market sentiment shifts.
USD/CHF Technical Outlook
The USD/CHF dropped sharply this week into the 0.8850 neighborhood frrom the 200-day Simple Moving Average (SMA) at the 0.9000 handle, and the pair is testing into multi-month lows, with September's low bids near 0.8800 within reach.
The pair has been etching in a pattern of lower highs since peaking near 0.9250 in early October. The last swing high sits at 0.9050, near the congestion zone of the 200- and 50-day SMAs.
USD/CHF Daily Chart
USD/CHF Technical Level
Reuters reported that the three newest Federal Reserve governors, Vice Chair Philip Jefferson, Lisa Cook and Adriana Kugler told US Senator Rick Scott in a letter that it is unclear how much further the Fed’s balance sheet wind-down process will run. They explained the process faces no imminent end.
"The size of our balance sheet ultimately will depend on the public's demand for our liabilities, particularly currency and reserves and we cannot specify in advance what that demand will be, hence we are not targeting any particular dollar value for our balance sheet," the letter said according to Reuters.
The governors consider that “under plausible assumptions, the size of the balance sheet could decline considerably further before reserves reach the level consistent with the ample reserves operating framework."
Market reaction
The US Dollar is posting mixed results on Thursday, holding firm with weekly losses as market participants consider that the Federal Reserve is done raising interest rates. The DXY is down by 0.10% at 104.30.
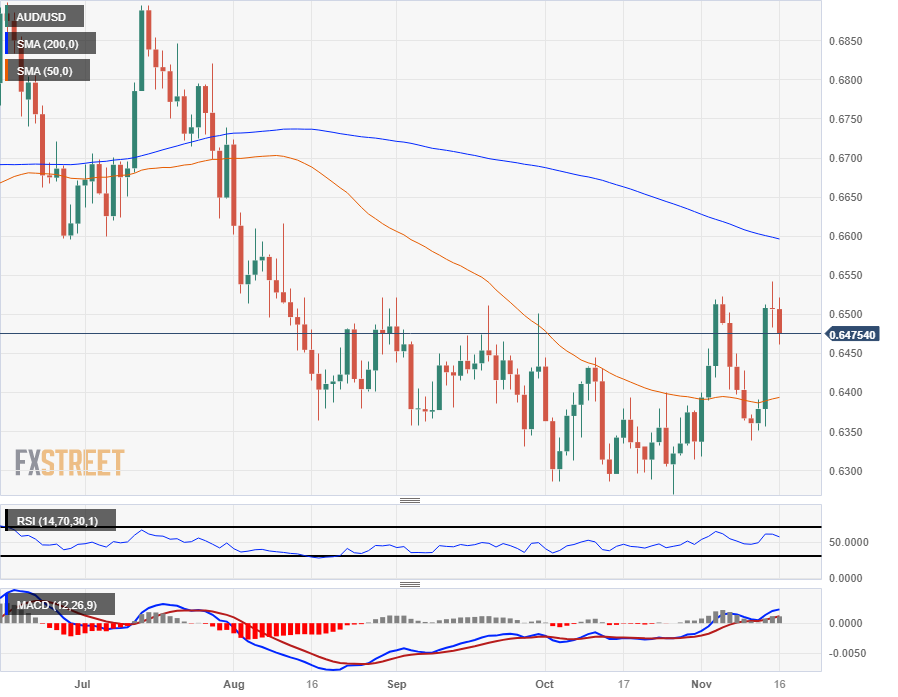
- The AUD/USD is getting yanked back towards 0.6450 on Thursday.
- Market sentiment is twisting towards the downside following US data misses.
- US housing data to wrap up the trading week.
The AUD/USD saw some early gains on Thursday following better-than-expected data figures for Australia, but a miss in the print for US economic numbers is sending market sentiment lower across the board.
Upbeat labor & employment data sent the Aussie (AUD) up to 0.6508 against the US Dollar (USD) before a broad miss for US unemployment claims and industrial capacity shuttered risk appetite for Thursday. The AUD/USD is now testing back toward 0.6450 in the back half of Thursday's trading.
Australia added 55K jobs in October, an upside beat of the expected 20K and handily vaulting over September's print of 7.8K, which was revised upwards from 6.7K.
On the US side, Initial Jobless Claims for the week into November 10th showed 231K new claims for unemployment benefits, nearly a two-year high for the figure. Markets were forecasting 220K, a tick above the previous week's 218K (revised from 217K).
US Industrial Production declined in October by 0.6%, worse than the expected 0.1% contraction, eating away at the previous month's meager 0.1% (revised down from 0.3%).
Friday brings US Housing Starts and Building Permits for October. Median market forecasts are expecting slight declines in both figures, with Housing Starts seen dipping from 1.358M to 1.35M; US Building Permits are forecast to decline from 1.471M to 1.45M.
AUD/USD Technical Outlook
With the Aussie slipping back towards the 0.6450 level, a sustained drop in the AUD will take the pair back down towards the 0.6400 handle where the 50-day Simple Moving Average (SMA) currently awaits.
The topside ceiling currently sits just below 0.6550, with a descending 200-day SMA piling on downside pressure from 0.660.
AUD/USD Daily Chart
AUD/USD Technical Levels
- EUR/USD remains stable, trading around 1.0850, despite a dip to 1.0895 earlier in the session.
- US economic indicators show signs of strain from higher interest rates, with rising unemployment claims and a drop in industrial production.
- Euro's resilience is bolstered by a weaker US Dollar and improved risk sentiment despite concerns of stagflation in the Eurozone.
EUR/USD stays firm during the North American session, almost unchanged, printing gains of 0.06%, and exchanging hands at around 1.0850s after hitting a daily low of 1.0895, shy of challenging the 1.0900 figure.
Euro keeps gains vs. weakening US Dollar, market eyes EU’s inflation, Lagarde speech
Economic data in the United States (US) continues to feel the lagging impact of higher interest rates set by the Federal Reserve. The US Bureau of Labor Statistics (BLS) revealed that unemployment claims for the last week rose the most in the last three months while Industrial Production plunged. US export and import prices cooled down, signs that the inflation battle continued to be won by the US central bank.
Nevertheless, Fed officials pushed back against estimates for more than 88 bps of rate cuts next year. Cleveland’s Fed President Loretta Mester added that whether further tightening is needed would be data-dependent. Lately, Fed Governor Lisa Cook said, “a soft landing is possible,” though added that continued demand could slow the pace of disinflation.
In the meantime, the Greenback is feeling the pain, depreciating further against most G8 currencies, including the Euro (EUR). The US Dollar Index (DXY) is a measurement of the performance of six currencies against the buck, favoring the former, as the DXY drops 0.06%, down at 104.32.
On the Eurozone (EU) front, the European Central Bank (ECB) President Christine Lagarde crossed the wires but failed to comment on monetary policy. The Euro’s rise could be attributed by overall US Dollar weakness and risk appetite improvement. Recent data from the EU, with soft PMI, GDP for Q3 contracting, and Industrial Production sinking, paints a stagflation scenario in the bloc. Hence, that could weigh on the single currency.
Ahead in the economic calendar, the EU’s docket will feature the Harmonized Index of Consumer Prices (HICP), and a speech of the ECB’s President Lagarde. In the US, housing data, Building Permits, and Fed speakers are expected to offer fresh impetus to EUR/USD traders.
EUR/USD Technical Levels
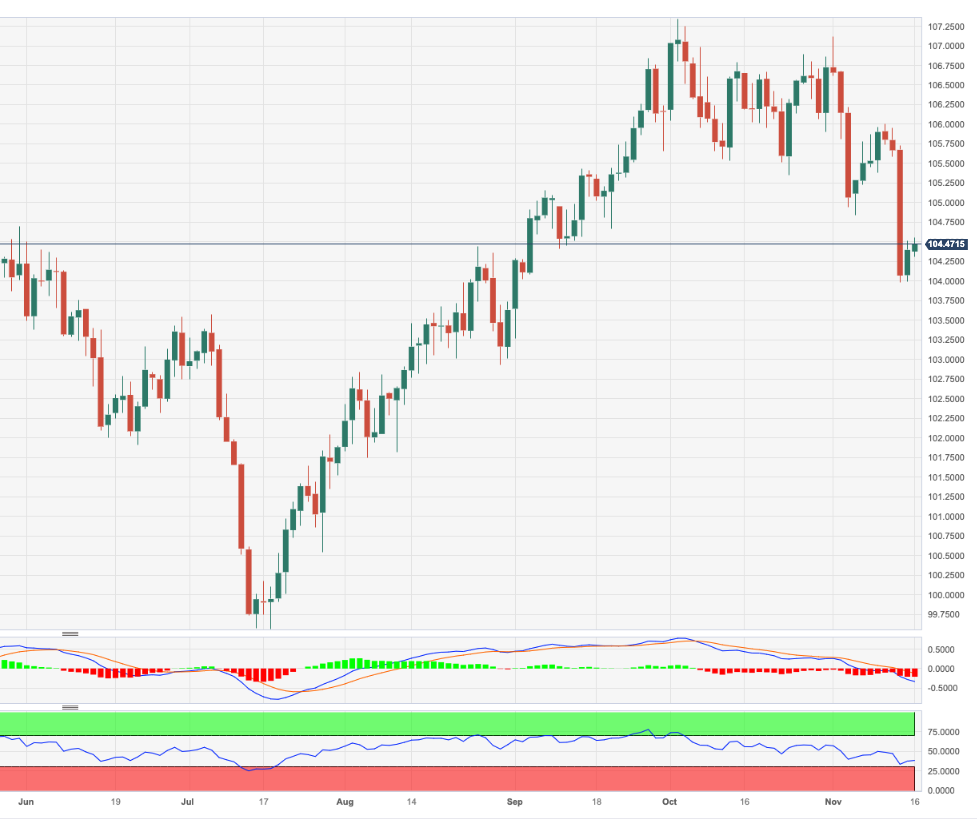
- The DXY index first declined to 104.00 and then jumped back to 104.30.
- Jobless Claims accelerated in the first week of November, while Industrial Production from October disappointed.
- The mix of the labor market cooling down and inflation retreating is making investors believe Fed rate hiking cycle is over.
The US Dollar (USD) traded flat on Thursday and rotated within the 104.00 to 104.30 range. The USD remains pressured as markets place additional bets on the Federal Reserve (Fed) being less aggressive than expected after weak Jobless Claims and Industrial Production figures from the US.
The United States economy is showing signs of cooling down with a weakening labor market and inflation retreating, which makes it highly unlikely that the Federal Reserve (Fed) will raise interest rates at the upcoming December meeting. That being said, the bank will receive additional CPI and Nonfarm Payrolls reports before its last decisions of 2023, which could impact whether they ultimately decide to hike or not.
Daily Digest Market Movers: US Dollar struggles to gather momentum after weak data
- The US Dollar Index recovered to 104.30 from a low of around 103.98 and stands at its lowest point since September.
- During the week ending November 11, the number of US Initial Jobless Claims increased to 231,000, surpassing the predicted 220,000.
- The Philadelphia Fed Manufacturing Index slightly improved, reaching -5.9 instead of the expected -9 points.
- Industrial Production in the United States fell short of expectations, experiencing a 0.6% MoM decline, higher than the -0.3% expected. It also tallied a year-on-year decrease of 0.7%.
- US Treasury yields extended their decline, with the 2-year rate increasing to 4.86%, while the 5 and 10-year rates rose to 4.43% and 4.43%, respectively.
- According to the CME FedWatch Tool, the odds of a 25-basis-point hike in December are zero. Markets are betting on rate cuts appearing sooner than expected in May 2024, if not March.
Technical Analysis: US Dollar bulls do battle and defend 100-day SMA
The daily chart suggests that the DXY has a neutral to bearish technical outlook, with bulls having lost significant ground this week and struggling to gather momentum. The Relative Strength Index (RSI) points south below 50, while the Moving Average Convergence Divergence (MACD) histogram exhibits larger red bars.
Zooming out, despite the bears gaining ground and pushing the index below the 20-day Simple Moving Average (SMA), the bulls are defending the 100-day average, indicating that if the sellers fail to conquer it, the outlook will still be positive in the larger context.
Support levels: 104.15 (100-day SMA),103.60 (200-day SMA), 103.30.
Resistance levels: 104.50, 105.00,105.30.
US Dollar FAQs
What is the US Dollar?
The US Dollar (USD) is the official currency of the United States of America, and the ‘de facto’ currency of a significant number of other countries where it is found in circulation alongside local notes. It is the most heavily traded currency in the world, accounting for over 88% of all global foreign exchange turnover, or an average of $6.6 trillion in transactions per day, according to data from 2022.
Following the second world war, the USD took over from the British Pound as the world’s reserve currency. For most of its history, the US Dollar was backed by Gold, until the Bretton Woods Agreement in 1971 when the Gold Standard went away.
How do the decisions of the Federal Reserve impact the US Dollar?
The most important single factor impacting on the value of the US Dollar is monetary policy, which is shaped by the Federal Reserve (Fed). The Fed has two mandates: to achieve price stability (control inflation) and foster full employment. Its primary tool to achieve these two goals is by adjusting interest rates.
When prices are rising too quickly and inflation is above the Fed’s 2% target, the Fed will raise rates, which helps the USD value. When inflation falls below 2% or the Unemployment Rate is too high, the Fed may lower interest rates, which weighs on the Greenback.
What is Quantitative Easing and how does it influence the US Dollar?
In extreme situations, the Federal Reserve can also print more Dollars and enact quantitative easing (QE). QE is the process by which the Fed substantially increases the flow of credit in a stuck financial system.
It is a non-standard policy measure used when credit has dried up because banks will not lend to each other (out of the fear of counterparty default). It is a last resort when simply lowering interest rates is unlikely to achieve the necessary result. It was the Fed’s weapon of choice to combat the credit crunch that occurred during the Great Financial Crisis in 2008. It involves the Fed printing more Dollars and using them to buy US government bonds predominantly from financial institutions. QE usually leads to a weaker US Dollar.
What is Quantitative Tightening and how does it influence the US Dollar?
Quantitative tightening (QT) is the reverse process whereby the Federal Reserve stops buying bonds from financial institutions and does not reinvest the principal from the bonds it holds maturing in new purchases. It is usually positive for the US Dollar.
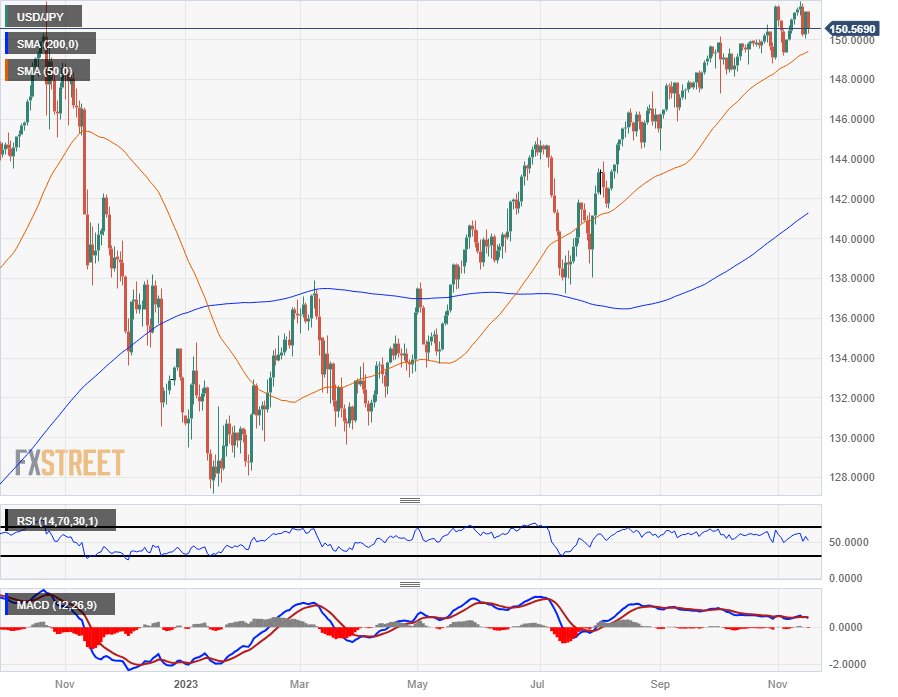
- The USD/JPY has slipped back into the 150.50 region.
- The pair couldn't hold onto gains above the 151.00 handle.
- US data sours market sentiment mood on Thursday.
The USD/JPY slipped to a Thursday low of 150.30 after a batch of bad US data soured risk appetite. The pair slipped from the 151.40 region as the USD/JPY whipsaws through the trading week.
US Initial Jobless Claims for the week into November 10th missed the mark, showing nearly a two-year high of 231 thousand new unemployment benefit seekers versus the expected 220 thousand. The previous week showed 218 thousand new jobless claimants, and investors have rotated their perspective to now be concerned about the state of the US economy.
United States Industrial Production (MoM) falls 0.6% in October
US Industrial Production for October also declined past expectations, printing at -0.6% compared to the forecast -0.1%. US capacity fell from September's 0.1% soft reading, which was revised downwards from 0.3%.
The trading week will round out with Friday's US Building Permit and Housing Starts figures, where investors will be looking to take a pulse reading of the US economy.
USD/JPY Technical Outlook
The USD/JPY is churning near the extreme top-end of long-term trading, cycling the 151.00 level. The pair remains extremely well-bid, and the pair looks set for another fresh run at multi-decade highs above 152.00.
Medium-term support is coming from the 50-day Simple Moving Average (SMA) rising into 149.50, and the USD/JPY's long-term bull run has seen price action pull well away from the long-run 200-day SMA near 141.25.
USD/JPY Daily Chart
USD/JPY Technical Levels
- The Canadian Dollar is getting dragged down by declining Crude Oil bids.
- Housing Starts in Canada tick upward, overshadowed by US unemployment figures.
- WTI Crude Oil slumps below $74 per barrel.
The Canadian Dollar (CAD) is getting pushed back into recent lows against the US Dollar (USD) as declining Crude Oil and softening risk appetites weighed on the Loonie.
Canada saw a welcome bump in annualized Housing Starts in October, but the figure was entirely overshadowed by a miss for US Initial Jobless Claims, which is dragging down market sentiment.
Daily Digest Market Movers: Canadian Dollar on the back foot with no support from Crude Oil
- US Initial Jobless Claims rise to their highest level in nearly two years, market narrative tilts back toward fears of a harder-than-soft landing.
- 231K new unemployment benefit claims are reported in the US for the week of November 10 versus forecast 213K; previous week revised from 217K to 218K.
- US Industrial Production also declined past forecast, printing at -0.6% for October against the forecast decline to -0.3%. September’s Industrial Production printed at just 0.1% after being revised down from 0.3%.
- Canadian Housing Starts for the year into October ticked upward, 274.7K new homes started construction, well over the expected 252.9K, climbing over September’s reading of 270.7K.
- Despite production cap quotas, OPEC member countries continue to export more oil than expected, sending Crude Oil lower on Thursday.
- West Texas Intermediate (WTI) Crude Oil is trading back down below $74.00/barrel, pulling the plug on CAD support in the markets.
- CAD: Limited scope for near-term gains – Scotiabank
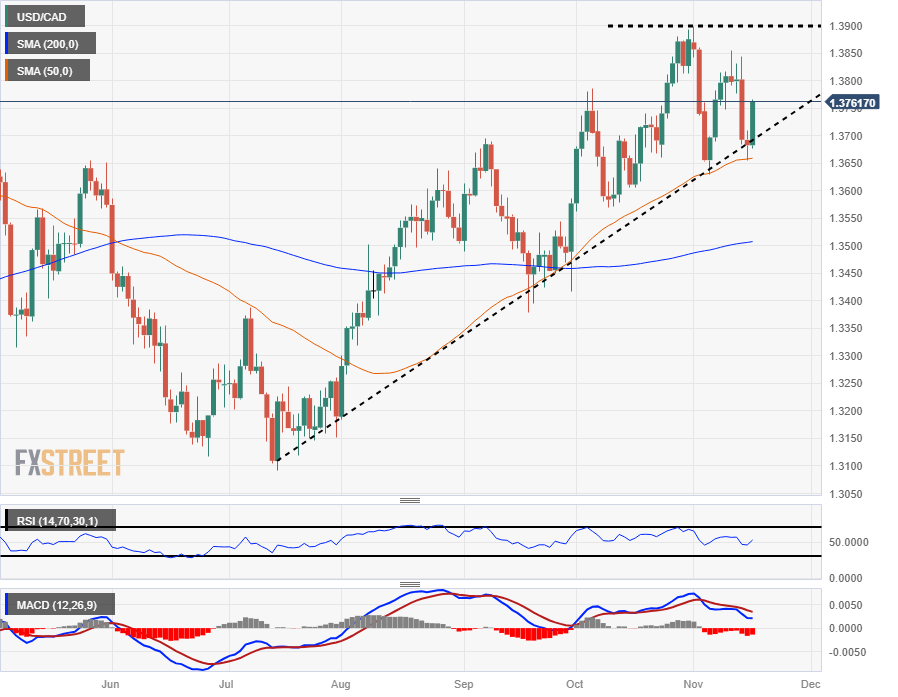
Technical Analysis: Canadian Dollar bounces off 50-day SMA, USD/CAD sees rejection from rising trendline
The USD/CAD reclaimed the 1.3700 handle during Thursday trading, setting the pair up for a fresh run at 1.3800.
The early week’s declines saw the USD/CAD ease into a near-term low of 1.3654 before getting a clean bounce off of the 50-day Simple Moving Average (SMA) and a rising trendline drawn from July’s lows near 1.3100.
Long-term technical support comes from the 200-day SMA sitting near the 1.3500 handle. A bullish extension for the USD/CAD will see bidders looking to take another run at cracking the 1.3900 handle at November’s high bids.
USD/CAD Daily Chart
Canadian Dollar price today
The table below shows the percentage change of Canadian Dollar (CAD) against listed major currencies today. Canadian Dollar was the weakest against the Japanese Yen.
| USD | EUR | GBP | CAD | AUD | JPY | NZD | CHF | |
| USD | 0.04% | -0.03% | 0.64% | 0.71% | -0.39% | 0.82% | 0.13% | |
| EUR | -0.04% | -0.06% | 0.60% | 0.66% | -0.44% | 0.77% | 0.07% | |
| GBP | 0.03% | 0.07% | 0.68% | 0.73% | -0.36% | 0.85% | 0.15% | |
| CAD | -0.65% | -0.57% | -0.68% | 0.04% | -1.03% | 0.17% | -0.51% | |
| AUD | -0.70% | -0.66% | -0.74% | -0.05% | -1.10% | 0.11% | -0.59% | |
| JPY | 0.39% | 0.44% | 0.35% | 1.04% | 1.09% | 1.20% | 0.51% | |
| NZD | -0.81% | -0.76% | -0.85% | -0.15% | -0.11% | -1.21% | -0.69% | |
| CHF | -0.13% | -0.07% | -0.14% | 0.53% | 0.58% | -0.51% | 0.69% |
The heat map shows percentage changes of major currencies against each other. The base currency is picked from the left column, while the quote currency is picked from the top row. For example, if you pick the Euro from the left column and move along the horizontal line to the Japanese Yen, the percentage change displayed in the box will represent EUR (base)/JPY (quote).
Canadian Dollar FAQs
What key factors drive the Canadian Dollar?
The key factors driving the Canadian Dollar (CAD) are the level of interest rates set by the Bank of Canada (BoC), the price of Oil, Canada’s largest export, the health of its economy, inflation and the Trade Balance, which is the difference between the value of Canada’s exports versus its imports. Other factors include market sentiment – whether investors are taking on more risky assets (risk-on) or seeking safe-havens (risk-off) – with risk-on being CAD-positive. As its largest trading partner, the health of the US economy is also a key factor influencing the Canadian Dollar.
How do the decisions of the Bank of Canada impact the Canadian Dollar?
The Bank of Canada (BoC) has a significant influence on the Canadian Dollar by setting the level of interest rates that banks can lend to one another. This influences the level of interest rates for everyone. The main goal of the BoC is to maintain inflation at 1-3% by adjusting interest rates up or down. Relatively higher interest rates tend to be positive for the CAD. The Bank of Canada can also use quantitative easing and tightening to influence credit conditions, with the former CAD-negative and the latter CAD-positive.
How does the price of Oil impact the Canadian Dollar?
The price of Oil is a key factor impacting the value of the Canadian Dollar. Petroleum is Canada’s biggest export, so Oil price tends to have an immediate impact on the CAD value. Generally, if Oil price rises CAD also goes up, as aggregate demand for the currency increases. The opposite is the case if the price of Oil falls. Higher Oil prices also tend to result in a greater likelihood of a positive Trade Balance, which is also supportive of the CAD.
How does inflation data impact the value of the Canadian Dollar?
While inflation had always traditionally been thought of as a negative factor for a currency since it lowers the value of money, the opposite has actually been the case in modern times with the relaxation of cross-border capital controls. Higher inflation tends to lead central banks to put up interest rates which attracts more capital inflows from global investors seeking a lucrative place to keep their money. This increases demand for the local currency, which in Canada’s case is the Canadian Dollar.
How does economic data influence the value of the Canadian Dollar?
Macroeconomic data releases gauge the health of the economy and can have an impact on the Canadian Dollar. Indicators such as GDP, Manufacturing and Services PMIs, employment, and consumer sentiment surveys can all influence the direction of the CAD. A strong economy is good for the Canadian Dollar. Not only does it attract more foreign investment but it may encourage the Bank of Canada to put up interest rates, leading to a stronger currency. If economic data is weak, however, the CAD is likely to fall.
- GBP/USD rises more than 0.20% due to a deteriorating economic outlook in the US.
- US jobless claims exceeding forecasts portray the labor market is easing.
- Federal Reserve officials pushed back against rate cuts next year, with investors pricing 88 bps of Fed cuts.
The Pound Sterling (GBP) clings to its earlier gains versus the US Dollar (USD) on Thursday as the economy in the United States (US) deteriorates further, warranting no additional tightening by the Federal Reserve. In price action terms, the GBP/USD jumped from daily lows of 1.2370 and trades at 1.2447, up 0.26%.
Pound Sterling gains as US data weakens US Dollar, GBP/USD traders eye UK Retail Sales
Investors' sentiment deteriorated after US economic data portrayed that the economy is losing steam faster than expected. US Initial Jobless Claims for the last week rose by 231K more than the 220K expected, revealed the US Department of Labor. Further data revealed by the US Federal Reserve noted that Industrial Production in October contracted, hurt by the auto strike.
In the meantime, Federal Reserve speakers crossed newswires, they’re trying to push back against rate cut expectations, led by Cleveland Fed President Loretta Mester, who said the US central bank is data dependent on whether to raise rates further. Meanwhile, interest rates traders have priced in 88 basis points of rate cuts for 2024.
The GBP/USD rise is also courtesy of the broad weakness of the Greenback. The US Dollar Index (DXY) dropped 0.01%, at 104.38, undermined by the fall in US Treasury bond yields.
Aside from this, the latest UK inflation report revealed that consumer inflation dropped to 4.6%, down from 6.7%, the lowest since October 2021. Even though the Bank of England (BoE) has stressed rates need to be higher for longer, money market futures are not expecting more rate hikes.
Ahead in the calendar, UK Retail Sales are expected to print a recovery after plunging -0.9% in September monthly data. Annually, estimates are at -1.5% contraction, worse than the September data. In the US, housing data, Building Permits, and Fed speakers, are expected to offer fresh impetus to GBP/USD traders.
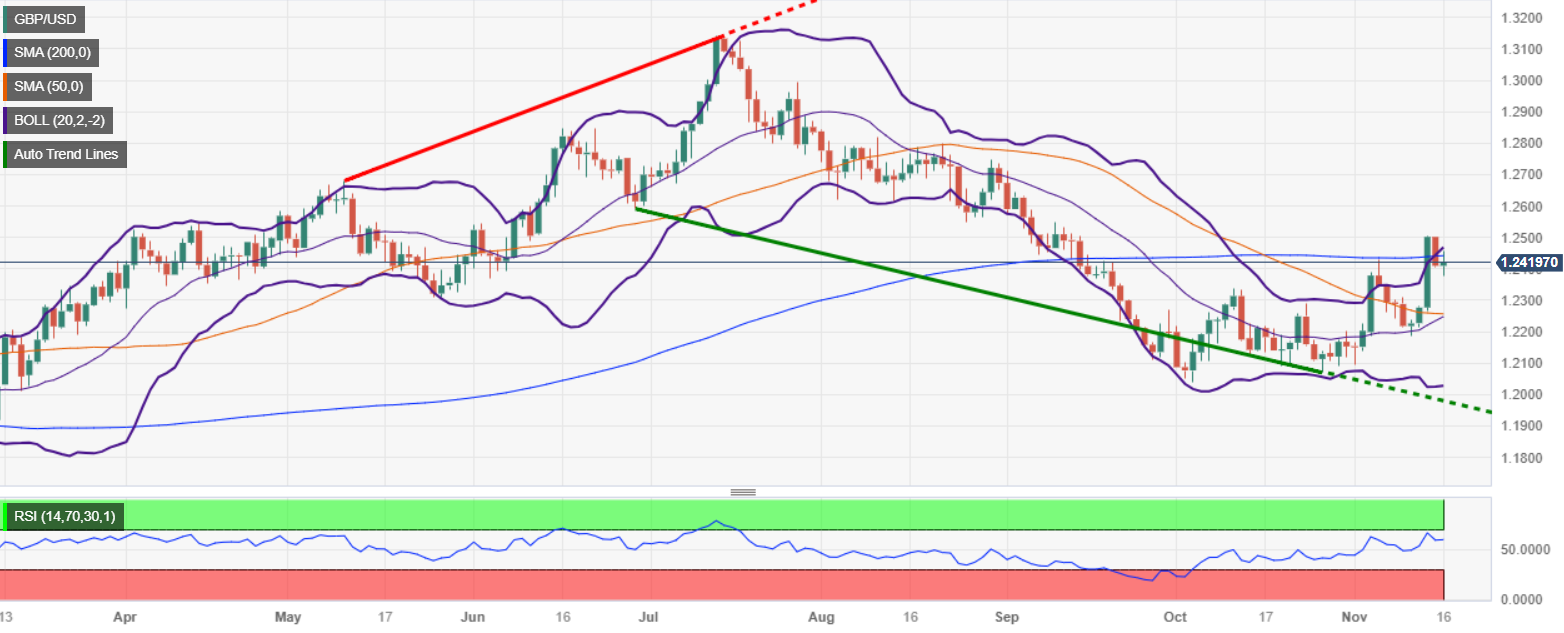
GBP/USD Price Analysis: Technical outlook
The daily chart portrays the pair as neutral to upward biased, though the GBP/USD failed to remain above the 200-day moving average (DMA) at 1.2440, which could exacerbate a dip below the 1.2400 figure. A breach of the latter would expose the 1.2300 mark, head of testing the 50-DMA at 1.2256, with next support seen at a November 13 low of 1.2209. On the upside, if buyers reclaim the 200-DMA, a test of 1.2500 is on the cards.
- The XAU/USD escalated to a high of $1,987, seeing 1.35% gains.
- US Industrial Production from October came in lower than expected. Jobless claims rose to their highest in three months.
- US yields are sharply falling.
The XAU/USD Gold spot price experienced an impressive upward spike on Thursday, rising toward $1,985 and seeing a daily gain of 1.35%. The metal’s momentum was driven by a decline in US Treasuries, which fell after the report of weak US data suggesting that markets are betting on lower odds of additional tightening by the Federal Reserve (Fed).
On the data front, the Initial Jobless Claims for the week ending November 10 from the US saw a noticeable increase to 231,000, surpassing the predicted 220,000. Furthermore, Industrial Production did not meet expectations for October, as it showed a 0.3% decline and a 0.6% drop in MoM expected by the markets. These unfavourable US economic figures fuelled a decline in the US Treasuries, often seen as the cost of holding non-yielding metals, which allowed the price to spike. The 2-year bond rate fell to 4.83%, and the 5 and 10-year yields declined by 4.43% and 4.45%, respectively.
In the meantime, the CME FedWatch tool suggests that markets have already priced in a pause in December and are now pricing rate cuts in April-May of 2024. In that sense, as long as the US Dollar weakens and investors bet on a less aggressive Fed, the yellow metal could see further upside.
XAU/USD levels to watch
On the daily chart, the XAU/USD displays a bullish bias after the price cleared most of November's losses. The Relative Strength Index (RSI) indicates positive momentum with an ascending slope above its midline, while the Moving Average Convergence (MACD) histogram displays rising green bars. Zooming out, the pair is above the 20,100,200-day Simple Moving Average (SMAs), suggesting that the bulls are also in control on the broader context.
Supports: $1,975 (20-day SMA), $1,930 (100 and 200-day SMA),$1,915.
Resistances:$2,000,$2,030, $2,050.
XAU/USD daily chart
-638357485062704553.png)
The BoE is unlikely to raise Bank Rate further amid deteriorating growth conditions in the UK. Therefore, the GBP could struggle, economists at TD Securities report.
GBP downside vs. AUD with moderation in UK data
Growth expectations for the UK are starting to correct lower and a lot of the good news that had been priced into GBP has started to recede.
Looking at market expectations of cuts over the next year, there is still more optimism on the UK vs the Euro-area, whereas we expect the BoE to lead the global cutting cycle amongst peers. Accordingly, we see some EUR/GBP upside as markets keep moderating hawkish UK expectations.
We also like GBP lower vs. AUD and NZD where the macro outcomes don't look as meek and where some catch-up is forthcoming.
- Mexican Peso continues its five-day rally as the USD/MXN drops below the key support at the 100-day SMA.
- Banxico’s officials comments suggest the central bank would adopt a slightly dovish stance in 2024.
- The US inflation downward path continues as export and import prices plunge.
- Industrial Production in the United States suggests the economy could slow down faster than expected.
Mexican Peso (MXN) extended its gains for the fifth consecutive day against the US Dollar (USD) after a raft of economic data from the United States (US) continues to cement a scenario of no more rate hikes by the US Federal Reserve (Fed). The USD/MXN pair hit a daily high at around 17.33, below the 100-day Simple Moving Average (SMA) of 17.34, before resuming its downtrend, which was positive for the Peso.
Mexico's economic docket remains scarce, with traders leaning to the latest comments from Bank of Mexico (Banxico) officials, its Governor Victoria Rodriguez Ceja, and Deputy Governor Jonathan Heath. Both stressed rate cuts could begin in 2024 but emphasized that monetary policy would continue to be restrictive despite that.
On the US front, inflation extended its downtrend after prices paid by producers followed the path of lower consumer prices, though the latter remained above the Fed’s 2% target. Thursday’s US economic docket featured export and import prices, both figures easing more than expected, while industrial production (IP) contracted in October, according to data revealed by the Fed.
Daily digest movers: Mexican Peso on its path to test the psychological 17.00 figure
- In October, Industrial Production in the United States missed estimates for a 0.3% plunge and dropped 0.6% MoM and following September’s 0.1% expansion. On a yearly basis, it fell 0.7%.
- The Philadelphia Fed Manufacturing Index improved lightly to -5.9 versus expectations of -9 points.
- US Initial Jobless Claims for the week ending November 11 rose 231K, exceeding forecasts of 220K, the highest jump in nearly three months.
- The US Producer Price Index and Consumer Price Index reports in October, suggests prices are cooling down, which has increased the odds for an end of the US Federal Reserve tightening cycle.
- Interest rates swap traders, expect 100 basis points of rate cuts by the Fed in 2024.
- Banxico’s Deputy Governor Jonathan Heath said the Government Board continues to monitor real rates, which currently lie at around 7%.
- Heath said Banxico wouldn’t rely on other countries – usually, Banxico reacts to the US Federal Reserve’s decisions – and said they would depend on incoming data and how inflation expectations evolve.
- On Monday, Banxico’s Governor Victoria Rodriguez Ceja commented that the easing inflationary outlook could pave the way for discussing possible rate cuts. She said that monetary policy loosening could be gradual but not necessarily imply continuous rate cuts, adding that the board would consider macroeconomic conditions, adopting a data-dependent approach.
- The latest inflation report in Mexico, published on November 9, showed prices grew by 4.26% YoY in October, below forecasts of 4.28% and prior rate of 4.45%. On a monthly basis, inflation came at 0.39%, slightly above the 0.38% consensus and September’s 0.44%.
- Mexico’s economy remains resilient after October’s S&P Global Manufacturing PMI improved to 52.1 from 49.8, and the Gross Domestic Product (GDP) expanded by 3.3% YoY in the third quarter.
- Banxico revised its inflation projections from 3.50% to 3.87% for 2024, which remains above the central bank’s 3.00% target (plus or minus 1%).
Technical Analysis: Mexican Peso extends its rally, with USD/MXN sliding below the 100-day SMA
The USD/MXN pair bias has shifted downwards in the short term, as the pair broke below the 100-day Simple Moving Average (SMA) at 17.34. The next support level would be the psychological 17.00 figure. The pair has shifted bearishly, with the 20-day SMA approaching the 17.70-17.65 area, where the 50- and 200-day SMAs converge. If the bearish cross is completed, it could pave the way for a test of the psychological 17.00 figure, ahead of challenging the year-to-date (YTD) low of 16.62, printed in July.
On the other hand, if USD/MXN buyers reclaim the 100-day SMA at 17.34, that could put into play a test of the 17.50 mark in the near term. A breach of the latter would expose key resistance levels, like the 200-day SMA at 17.64, ahead of the 50-day SMA at 17.69. Once cleared, the next resistance emerges at the 20-day SMA at 17.87 before buyers could lift the spot price towards the 18.00 figure.
Mexican Peso FAQs
What key factors drive the Mexican Peso?
The Mexican Peso (MXN) is the most traded currency among its Latin American peers. Its value is broadly determined by the performance of the Mexican economy, the country’s central bank’s policy, the amount of foreign investment in the country and even the levels of remittances sent by Mexicans who live abroad, particularly in the United States. Geopolitical trends can also move MXN: for example, the process of nearshoring – or the decision by some firms to relocate manufacturing capacity and supply chains closer to their home countries – is also seen as a catalyst for the Mexican currency as the country is considered a key manufacturing hub in the American continent. Another catalyst for MXN is Oil prices as Mexico is a key exporter of the commodity.
How do decisions of the Banxico impact the Mexican Peso?
The main objective of Mexico’s central bank, also known as Banxico, is to maintain inflation at low and stable levels (at or close to its target of 3%, the midpoint in a tolerance band of between 2% and 4%). To this end, the bank sets an appropriate level of interest rates. When inflation is too high, Banxico will attempt to tame it by raising interest rates, making it more expensive for households and businesses to borrow money, thus cooling demand and the overall economy. Higher interest rates are generally positive for the Mexican Peso (MXN) as they lead to higher yields, making the country a more attractive place for investors. On the contrary, lower interest rates tend to weaken MXN.
How does economic data influence the value of the Mexican Peso?
Macroeconomic data releases are key to assess the state of the economy and can have an impact on the Mexican Peso (MXN) valuation. A strong Mexican economy, based on high economic growth, low unemployment and high confidence is good for MXN. Not only does it attract more foreign investment but it may encourage the Bank of Mexico (Banxico) to increase interest rates, particularly if this strength comes together with elevated inflation. However, if economic data is weak, MXN is likely to depreciate.
How does broader risk sentiment impact the Mexican Peso?
As an emerging-market currency, the Mexican Peso (MXN) tends to strive during risk-on periods, or when investors perceive that broader market risks are low and thus are eager to engage with investments that carry a higher risk. Conversely, MXN tends to weaken at times of market turbulence or economic uncertainty as investors tend to sell higher-risk assets and flee to the more-stable safe havens.
2024 should be the year US exceptionalism wanes and currencies outside of the US are allowed to refloat, economists at ING report.
The end of US exceptionalism
Our simple thesis is that tighter interest rates finally catch up with the US economy next year, growth registers a paltry 0.5% and the Fed, in line with its dual mandate to focus on inflation and maximum employment, cuts rates back into less restrictive territory. We forecast 150 bps of Fed easing next year starting in the second quarter.
Our baseline view for 2024 sees the Dollar bear trend picking up pace through the year.
Compared to year-end 2024 forwards, currencies could be as little as 2% (China’s Renminbi) to as much as 13% (Scandinavian FX) firmer against the Dollar.
Silver prices are sustaining above $20 despite lack of support from investment demand. Strategists at ANZ Bank analyze XAG/USD outlook.
Investment in Silver to turn positive going into next year
Silver’s fundamentals look supportive, as the market is in structural deficit. However, investors are not yet turning to Silver.
We expect investment in Silver to turn positive going into next year when the macro backdrop becomes more supportive as the Fed draws to the end of its hiking cycle.
However, slow economic growth next year is likely to have limited impact on industrial demand for Silver from energy transition projects.
Australian Dollar is one of ING’s favourite currencies for next year.
AUD in a very advantageous position
Our favourite currency in 2024 is the Australian Dollar. High US rates and weak Chinese growth have repressed it and made it the most undervalued currency in the G10 space.
The release valve of lower US rates should allow the Aussie to lead the currency recovery against the US Dollar. A hawkish Reserve Bank of Australia should not hurt either.
AUD/USD – 4Q23 0.64 1Q24 0.65 2Q24 0.67 3Q24 0.69 4Q24 0.71
Industrial Production (MoM) in the United States dipped 0.6% in October, missing the 0.3% drop expected by markets. In September, United States Industrial Production (MoM) had advanced by a revised 0.1% compared with the 0.3% rise previously estimated.
In the same period, Capacity Utilization narrowed to 78.9% from 79.5%.
What is the United States Industrial Production (MoM)?
The Industrial Production released by the Board of Governors of the Federal Reserve shows the volume of production of US industries such as factories and manufacturing. Up trend is regarded as inflationary which may anticipate interest rates to rise. If High industrial production growth comes out, this may generate a positive sentiment (or bullish) for the USD.
When is the next United States Industrial Production (MoM) report released?
The next United States Industrial Production (MoM) data will be published on December 15 at 14:15 GMT. For more information, check the United States Industrial Production (MoM) entry in FXStreet Calendar.
US Dollar price today
The table below shows the percentage change of US Dollar (USD) against listed major currencies today. US Dollar was the weakest against the Japanese Yen.
| USD | EUR | GBP | CAD | AUD | JPY | NZD | CHF | |
| USD | -0.12% | -0.01% | 0.42% | 0.37% | -0.24% | 0.50% | 0.06% | |
| EUR | 0.12% | 0.10% | 0.54% | 0.48% | -0.13% | 0.61% | 0.16% | |
| GBP | 0.01% | -0.10% | 0.44% | 0.38% | -0.27% | 0.53% | 0.06% | |
| CAD | -0.42% | -0.51% | -0.44% | -0.08% | -0.68% | 0.09% | -0.37% | |
| AUD | -0.36% | -0.50% | -0.38% | 0.06% | -0.63% | 0.14% | -0.33% | |
| JPY | 0.25% | 0.13% | 0.23% | 0.68% | 0.61% | 0.74% | 0.30% | |
| NZD | -0.51% | -0.62% | -0.52% | -0.07% | -0.15% | -0.76% | -0.46% | |
| CHF | -0.08% | -0.16% | -0.05% | 0.39% | 0.32% | -0.29% | 0.47% |
The heat map shows percentage changes of major currencies against each other. The base currency is picked from the left column, while the quote currency is picked from the top row. For example, if you pick the Euro from the left column and move along the horizontal line to the Japanese Yen, the percentage change displayed in the box will represent EUR (base)/JPY (quote).
An automation tool was used in creating this post.
Strategists at Société Générale explore the five major drivers of Gold prices
Rates volatility
As interest rates in the US peak, volatility in the rates space is likely affecting the march higher in Fold. If and when rates markets calm down, this will likely create a drag on Gold prices.
Rates cresting
US rates can come off more and sooner than rates in other OECD economies, signalling possible dollar weakness ahead, creating a tailwind for Gold.
US recession
With a recession in the US looming – however mild – there is a risk that the Fed will have to start lowering rates before sticky inflation budges, lowering carrying costs and elevating the expected return for Gold.
Geopolitics
Risk premium is based on the low-probability, high-impact scenario of Iran becoming directly involved in the conflict. This risk, while not our base case, should continue to provide medium-term support to Gold prices.
Central bank
We expect strong central bank Gold purchases and the broad de-dollarisation theme that will accompany that to remain a long-term supporting driver for Gold, but most of the impact should be felt beyond our forecasting horizon.
XAU/USD – 4Q23 $2,000 1Q24 $2,100 2Q24 $2,200 3Q24 $2,200 4Q24 $2,200
The Canadian Dollar is drifting a bit lower on the day. Economists at Scotiabank analyze the USD/CAD pair’s outlook.
Narrower spreads are CAD-supportive
Soft stocks and crude are minor constraints on the CAD in the short-run but some improvement in short-term yield differentials in the CAD’s favour this week rather suggest scope for a little more strength.
Modest gains on the session so far are taking the USD further away from key support (trend and potential Head & Shoulders bear trigger) at 1.3655.
USD gains through 1.3705/1.3710 may extend modestly to the mid-1.37s, although short-term trend oscillators are starting to align bearishly for the USD which really should limit scope for near-term gains.
- Philadelphia Fed Manufacturing Index rose to -5.9 in November.
- US Dollar Index slides toward 104.30 after US data.
The Diffusion Index for current general activity of the Federal Reserve Bank of Philadelphia's Manufacturing Survey rose to -5.9 in November from -9 in October. This reading came in better than the market expectation of -9.
“The survey’s indicator for general activity rose but remained negative. The indicator for shipments turned negative, while the indicator for new orders was positive but low. The employment index suggests steady employment overall, and both price indexes indicate overall increases in prices. The future indicators suggest that firms’ expectations for growth over the next six months remain subdued”, mentioned the publication.
Further detail of the report revealed that the employment index declined three points to 0.8; the new orders fell three points to 1.3; and the price paid declined from 23.1 to 14.8.
Market reaction
The US Dollar pulled back after the US Jobless Claims and the Philly Fed reports. The US Dollar Index turned lower after the reports, falling under 104.30.
- Initial Jobless Claims in the US increased by 13,000 in the week ending November 11.
- US Dollar Index stays in daily range below 104.50.
There were 231,000 initial jobless claims in the week ending November 11, the weekly data published by the US Department of Labor (DOL) showed on Thursday. This print followed the previous week's print of 218,000 (revised from 217,000) and came in worse than the market expectation of 220,000.
Further details of the publication revealed that the advance seasonally adjusted insured unemployment rate was 1.3% and the 4-week moving average stood at 220,250, an increase of 7,750 from the previous week's revised average.
"The advance number for seasonally adjusted insured unemployment during the week ending November 4 was 1,865,000, an increase of 32,000 from the previous week's revised level."
Market reaction
The US Dollar Index stays in its daily range below 104.50 following this data.
GBP/USD slips. Economists at Scotiabank analyze the pair’s outlook.
Underlying trend dynamics remain supportive
Cable’s slide from the 1.25 peak reached earlier this week is steadying but there are few signs of positive impulses on the short-term chart at the moment.
Trend momentum oscillators remain bullishly aligned for the GBP on the intraday and daily studies and are edging positive on the weekly DMI – which should help limit GBP losses at least in the near-term.
Regaining 1.2430 intraday would be a modest positive for the Pound.
Support is 1.2375.
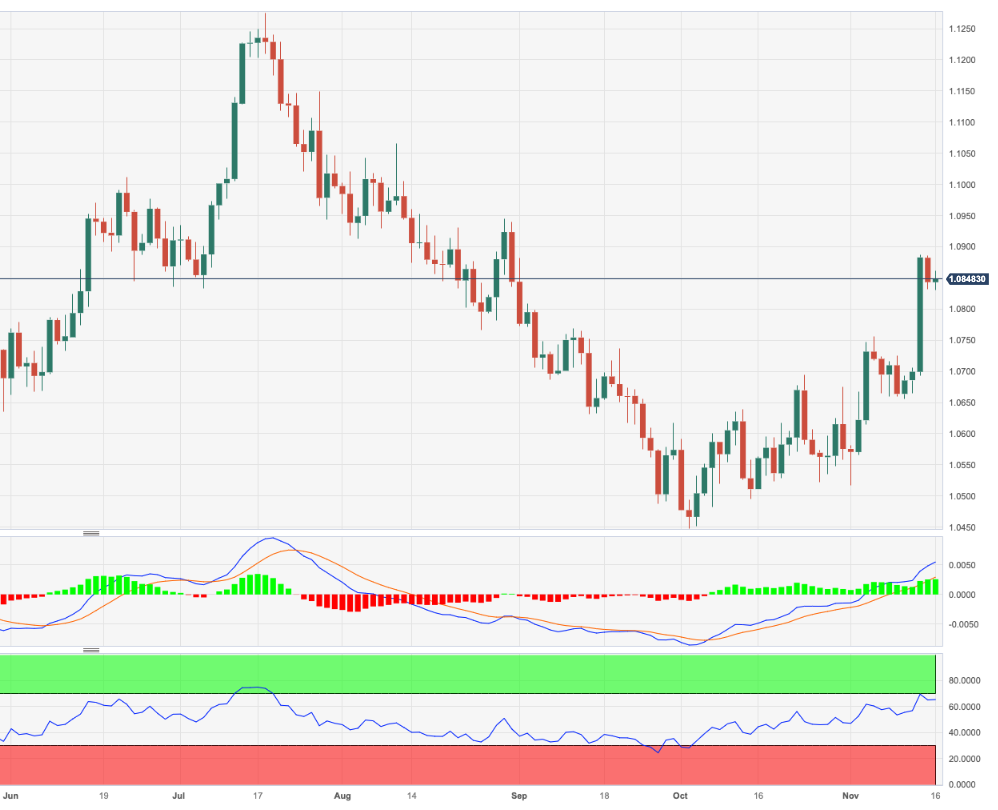
- EUR/USD trades in a vacillating mood around 1.0850.
- Further upside could see the next hurdle at 1.0945.
EUR/USD trades without clear direction in the mid-1.0800s following the previous daily decline on Thursday.
The continuation of the upward bias could see the weekly high of 1.0945 (August 30) revisited sooner rather than later. Once cleared, spot could challenge the psychological threshold of 1.1000.
So far, while above the significant 200-day SMA, today at 1.0803, the pair’s outlook should remain constructive.
EUR/USD daily chart
The USD’s consolidation is extending a little further. Economists at Scotiabank analyze Greenback’s outlook.
Stronger stocks mean stronger headwinds for the USD
There is a busy session ahead for the USD. Key data reports may be soft – weekly claims have been nudging higher and may be affected by seasonal factors while industrial production could be weighed down by the auto strikes. The USD may come under light pressure at least as a result of weak data.
The S&P is up more than 10% from the late October low and seasonal trends suggest that jingling you can hear might be the ‘Santa Clause rally’ that typically gains traction about now after a mid-year stutter in risk appetite steadies. Stronger stocks mean stronger headwinds for the USD.
- The Greenback marginally recovers Tuesday’s meltdown.
- Traders are gasping for air, looking for clues on what is the next longer term.
- The US Dollar Index is steady above 104 and off this week’s low.
The US Dollar (USD) traded in a tight range on Wednesday where both buyers and sellers were not budging after the meltdown from Tuesday. Traders will want to look for further clues and confirmation if the Fed is truly done hiking, with bets mounting on when the Fed will cut first. Meanwhile yields are sinking lower and equities are soaring, which means that the rate differential story between the Greenback and other currencies is losing its importance.
The calendar this Thursday is a very packed one with all eyes on US Federal Reserve speakers: no less than five members of the Board of Governors are expected to speak. Add a few lighter data points that could confirm and reassure traders that the Fed is really done hiking, and some more Greenback devaluation might be at hand. In the background the clock is ticking on the US debt ceiling with no concrete solution yet nearby.
Daily digest: US Dollar calms the nerves
- The US budget deadline is due to kick in on November 17. Sentiment was further boosted on Tuesday by growing hopes that a US government shutdown can be avoided.
- US President Joe Biden met Chinese President Xi Jinping at the historic Filoli estate south of San Francisco on Wednesday: Initial reports appear to be quite positive, with the two superpowers agreeing to reopen communication lines and China to regulate chemical exports used in the manufacture of the opioid fentanyl. Differences over Taiwan, however, remain a sore spot.
- No less than five US Federal Reserve members are due to speak this Thursday:
- Lisa D. Cook, a member of the Federal Reserve Board of Governors is due to speak at 11:00 GMT.
- Cleveland Fed President Loretta Mester will speak near 13:30.
- At 14:25, New York Fed President John Williams will speak.
- Federal Reserve Board Governor Christopher Waller will take the stage near 15:30..
- Loretta Mester will speak for a second time this Thursday near 17:00, together with Lisa Cook.
- Around 13:30 GMT, the weekly Jobless Claims report is due:
- Initial Jobless Claims are set to rise from 217,000 to 220,000.
- Continuing Claims are expected to pick up as well from 1,834,000 to 1,847,000.
- At the same time, the Import/Export Price Index will be released:
- The Monthly Export Price Index for October is set to decline from 0.7% to -0.5%.
- The Yearly Export Price Index was at -4.1% with no forecast for the October number.
- The Monthly Import Price Index for October is set to decline from 0.1% to -0.3%.
- The Yearly Import Price Index was at -1.7% with no forecast for the October number.
- The last bit of information to come out at 13:30 GMT is the Philadelphia Fed Manufacturing Survey for November, expected to remain unchanged at -9.
- Industrial Production for the month of October is due to come out near 14:15 GMT, heading from 0.3% to -0.3%.
- At 15:00 GMT the National Association of Home Builders (NAHB) Housing Market Index for November will be released: A steady 40 number is expected.
- The last number of importance this Thursday will be the Kansas Fed Manufacturing Activity Index for November. The previous number was at -8, no forecast foreseen.
- Equities are undergoing some profit taking after their two-day rally. The Hang Seng slides over 1%, while Japan was able to contain losses to less than 1%. European equities are opening marginally in the red, while US equity futures see the Nasdaq leading the decline.
- The CME Group’s FedWatch Tool shows that markets are pricing in a 100% chance, up from 85.7% on Tuesday morning, that the Federal Reserve will keep interest rates unchanged at its meeting in December.
- The benchmark 10-year US Treasury yield trades at 4.50%, and is starting to tick up a bit, little by little.
US Dollar Index technical analysis: US Dollar technical bounce
The US Dollar is trying to continue its recovery from Tuesday's meltdown. The recovery is not going as speedy as hoped for, however, as only baby steps are visible in the US Dollar Index (DXY). It looks like traders have been unwinding their US Dollar long positions and only a substantial catalyst in favour of the Greenback will help to bring the DXY back to 105 and higher.
The DXY was able to bounce off the 100-day Simple Moving Average (SMA) near 104.20. Expect to see a bounce from there with 105.29, the low of November 6, as the market level where the DXY should try to close above this week. From there, the 55-day SMA at 105.71 is the next price point on the topside that needs to be reclaimed by US Dollar bulls before starting to think of more US Dollar strength to come into play.
Traders were warned that when the US Dollar Index would slide below that 55-day SMA, a big air pocket was opening up that could see the DXY fall substantially. This materialised on Tuesday. For now the 100-day SMA is trying to hold, at 103.62, although the 200-day SMA is a much better candidate for support. Should that level even be broken substantially, a long term sell-off could get underway with the DXY falling between 101.00 and 100.00.
US Dollar FAQs
What is the US Dollar?
The US Dollar (USD) is the official currency of the United States of America, and the ‘de facto’ currency of a significant number of other countries where it is found in circulation alongside local notes. It is the most heavily traded currency in the world, accounting for over 88% of all global foreign exchange turnover, or an average of $6.6 trillion in transactions per day, according to data from 2022.
Following the second world war, the USD took over from the British Pound as the world’s reserve currency. For most of its history, the US Dollar was backed by Gold, until the Bretton Woods Agreement in 1971 when the Gold Standard went away.
How do the decisions of the Federal Reserve impact the US Dollar?
The most important single factor impacting on the value of the US Dollar is monetary policy, which is shaped by the Federal Reserve (Fed). The Fed has two mandates: to achieve price stability (control inflation) and foster full employment. Its primary tool to achieve these two goals is by adjusting interest rates.
When prices are rising too quickly and inflation is above the Fed’s 2% target, the Fed will raise rates, which helps the USD value. When inflation falls below 2% or the Unemployment Rate is too high, the Fed may lower interest rates, which weighs on the Greenback.
What is Quantitative Easing and how does it influence the US Dollar?
In extreme situations, the Federal Reserve can also print more Dollars and enact quantitative easing (QE). QE is the process by which the Fed substantially increases the flow of credit in a stuck financial system.
It is a non-standard policy measure used when credit has dried up because banks will not lend to each other (out of the fear of counterparty default). It is a last resort when simply lowering interest rates is unlikely to achieve the necessary result. It was the Fed’s weapon of choice to combat the credit crunch that occurred during the Great Financial Crisis in 2008. It involves the Fed printing more Dollars and using them to buy US government bonds predominantly from financial institutions. QE usually leads to a weaker US Dollar.
What is Quantitative Tightening and how does it influence the US Dollar?
Quantitative tightening (QT) is the reverse process whereby the Federal Reserve stops buying bonds from financial institutions and does not reinvest the principal from the bonds it holds maturing in new purchases. It is usually positive for the US Dollar.
EUR/USD is just about trading in the green on the day. Economists at Scotiabank analyze the pair’s outlook.
Upside risks remain
In broad terms, data surprise trends are improving for the EUR and weakening somewhat for the USD – a trend that may continue in the near term, with the US economy showing clear signs of slowing and anticipated headwinds for Europe (mild weather is once again easing energy concerns) failing to develop so far.
EUR/USD gains through 1.0885 should trigger another leg higher in spot.
Support is 1.0810 and 1.0750.
- DXY adds to Wednesday’s recovery and revisits the mid-104.00s.
- The resumption of the selling pressure initially targets 103.98.
DXY manages to pick up extra pace and extends further the bounce off multi-week lows around 104.00 on Thursday.
In case bears regain the upper hand, the breakdown of the November low of 103.98 (November 14-15) should pave the way for a quick test of the critical 200-day SMA at 103.61 prior to the weekly low of 102.96 (August 30).
In the meantime, while above the key 200-day SMA, the outlook for the index is expected to remain constructive.
DXY daily chart
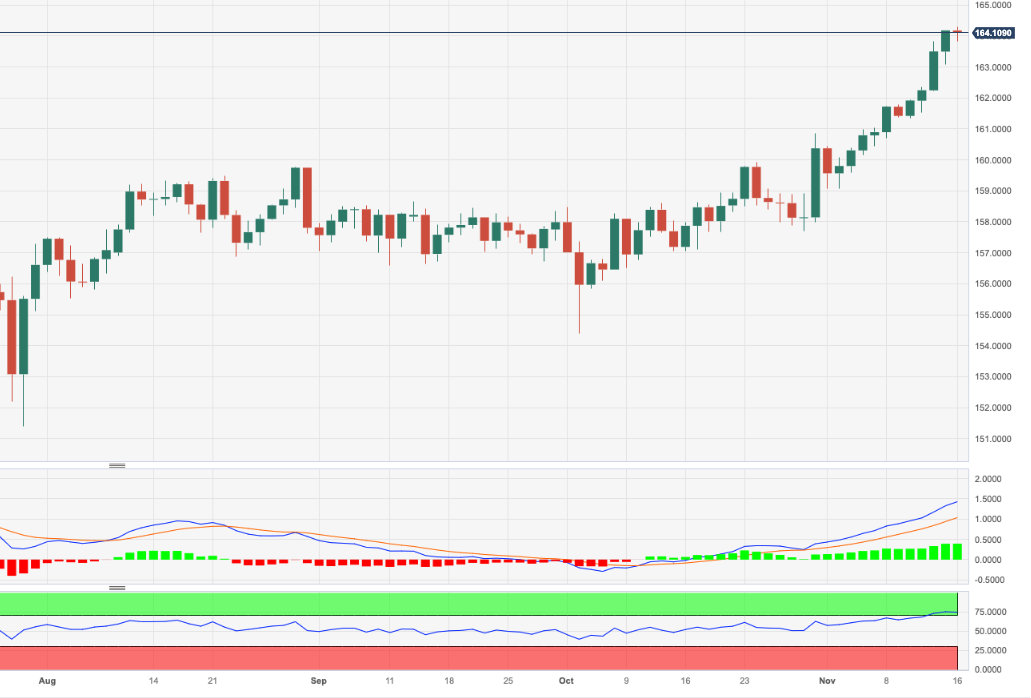
- EUR/JPY clinches new highs past 164.00.
- A corrective move appears on the cards near term.
EUR/JPY advances further north of the 164.00 level and prints new yearly highs on Thursday.
Further upside appears well on the cards for the cross in the short-term horizon. Against that, the surpass of the 2023 high of 164.30 (November 16) is expected to face the next significant resistance level not before the 2008 top of 169.96 (July 23).
In the meantime, the daily RSI remains well within the overbought territory near 75, opening the door to a potential near-term corrective move.
So far, the longer term positive outlook for the cross appears favoured while above the 200-day SMA, today at 152.58.
EUR/JPY daily chart
Australia’s October employment was strong. The developments have though had little to no impact on the performance of the Australian Dollar. Economists at MUFG Bank analyze Aussie’s outlook.
AUD/USD’s next important resistance level remains the 200-DMA at 0.6596
Employment increased by 55K in October. The trend for employment growth remains strong enough (it has averaged 36.5K/month so far this year vs. an average of 43K/month in 2022) to keep the unemployment rate broadly stable. The unemployment rate increased by 0.2 points to 3.7% in October and has been fluctuating in a narrow range between 3.4% and 3.7% since the middle of last year. Overall, the report will keep alive expectations that the RBA could deliver one final hike later this year.
It appears to be more of a correction for the Aussie after strong gains in recent days. The AUD/USD rate jumped from an intra-day low of 0.6360 on Tuesday prior to the US CPI release to a high on Wednesday of 0.6542. The next important resistance level remains the 200-DMA which comes in 0.6596. The Australian Dollar has strengthened even more notably against the yen this week resulting in the AUD/JPY rate breaking above the 98.00 level for the first time since September 2022. The next important resistance levels are provided by the 100.00 level which was last broken back in late 2014 and before that in Q2 2013.
- The New Zealand Dollar corrects back after the big gains made midweek.
- The Kiwi retreats as China property bubble woes persist despite positive economic data and the pledge of a government bailout.
- NZD/USD almost touches the key October highs at 0.6055 before retreating, though the uptrend is still in play.
The New Zealand Dollar (NZD) pares the strong gains made midweek as the European session gets underway on Thursday. The NZD retreats on negative sentiment: the Hang Seng index closed 1.41% lower at the end of the Asian session, due to lingering concerns about China’s vulnerable property sector.
As New Zealand’s largest trading partner, bad news for China is usually bad for New Zealand too, and the Kiwi fell from the 0.6050s to trade back in the 0.5990s at the time of publication.
Daily digest market movers: China property woes spoil market cheer
- The New Zealand Dollar weakens on Thursday as concerns about the state of China’s property sector spoil the positive Retail Sales and Industrial Production data released on Wednesday, according to a report by Reuters.
- This comes after data showed a slowdown in Fixed Asset Investment in China, an umbrella term encompassing property.
- Fixed Asset Investment showed a 2.9% rise in October – below the 3.1% forecast by experts (YoY YTD in October) and the 3.1% previous, data from the National Bureau of Statistics of China showed on Wednesday.
- Despite concerns, the Chinese government has purportedly pledged 1 trillion Yuan in low-cost financing for the property sector, according to a report from Bloomberg News.
- New Zealand is a major exporter of dairy products to China, so China newsflow impacts expected demand for the Kiwi.
- Overall lower inflation data from the US, UK, and Europe lessened global growth fears, aiding the Kiwi’s comeback midweek.
- The US Dollar fell steeply after inflation data suggested a greater chance of the Federal Reserve not raising interest rates. Lower interest rates makes the US a less attractive place for global investors to park their capital, reducing demand for the USD.
New Zealand Dollar technical analysis: NZD/USD meets resistance and pulls back
NZD/USD – the number of US Dollars one New Zealand Dollar can buy – pulls back after coming within a hair’s breadth of touching the 0.6055 October high.
-638357322422964875.png)
New Zealand Dollar vs US Dollar: Daily Chart
The break above 0.6001 confirms the short-term bullish trend, biasing longs.
The zone around the October high (0.6050-0.6055) has been touched multiple times this year and this makes it an important support and resistance level. As a result of its heightened significance, if it is eventually broken it will yield a more volatile push higher.
A decisive break above the 0.6055 October high would change the outlook to bullish on the medium term as well, indicating the possibility of the birth of a new uptrend. Such a move would then target the 200-day Simple Moving Average (SMA) at around 0.6100.
As things stand, the medium and long-term trends are both still bearish, however, suggesting the potential for more downside remains strong.
-638357322955884523.png)
New Zealand Dollar vs US Dollar: 4-Hour Chart
There are signs the current pullback could extend a little lower. The 4-hour chart shows the MACD line crossing below the signal line (circled) whilst both are well above the zero-line – a bearish signal.
This could indicate a deeper correction, perhaps to 0.5950. Despite this the short-term trend is still overall bullish so the uptrend should eventually resume. This holds true as long as the November 14 lows at 0.5863 hold.
A possible bullish inverse head and shoulders pattern may have formed at the lows. This is highlighted by the labels applied to the 4-hour chart above. The L and R stand for the left and right shoulders, whilst H for the head. If so it could indicate substantial upside to come if the neckline – at the October highs – is decisively breached.
A decisive break would be one accompanied by a long green candle or three green candles in a row.
New Zealand Dollar FAQs
What key factors drive the New Zealand Dollar?
The New Zealand Dollar (NZD), also known as the Kiwi, is a well-known traded currency among investors. Its value is broadly determined by the health of the New Zealand economy and the country’s central bank policy. Still, there are some unique particularities that also can make NZD move. The performance of the Chinese economy tends to move the Kiwi because China is New Zealand’s biggest trading partner. Bad news for the Chinese economy likely means less New Zealand exports to the country, hitting the economy and thus its currency. Another factor moving NZD is dairy prices as the dairy industry is New Zealand’s main export. High dairy prices boost export income, contributing positively to the economy and thus to the NZD.
How do decisions of the RBNZ impact the New Zealand Dollar?
The Reserve Bank of New Zealand (RBNZ) aims to achieve and maintain an inflation rate between 1% and 3% over the medium term, with a focus to keep it near the 2% mid-point. To this end, the bank sets an appropriate level of interest rates. When inflation is too high, the RBNZ will increase interest rates to cool the economy, but the move will also make bond yields higher, increasing investors’ appeal to invest in the country and thus boosting NZD. On the contrary, lower interest rates tend to weaken NZD. The so-called rate differential, or how rates in New Zealand are or are expected to be compared to the ones set by the US Federal Reserve, can also play a key role in moving the NZD/USD pair.
How does economic data influence the value of the New Zealand Dollar?
Macroeconomic data releases in New Zealand are key to assess the state of the economy and can impact the New Zealand Dollar’s (NZD) valuation. A strong economy, based on high economic growth, low unemployment and high confidence is good for NZD. High economic growth attracts foreign investment and may encourage the Reserve Bank of New Zealand to increase interest rates, if this economic strength comes together with elevated inflation. Conversely, if economic data is weak, NZD is likely to depreciate.
How does broader risk sentiment impact the New Zealand Dollar?
The New Zealand Dollar (NZD) tends to strengthen during risk-on periods, or when investors perceive that broader market risks are low and are optimistic about growth. This tends to lead to a more favorable outlook for commodities and so-called ‘commodity currencies’ such as the Kiwi. Conversely, NZD tends to weaken at times of market turbulence or economic uncertainty as investors tend to sell higher-risk assets and flee to the more-stable safe havens.
Kit Juckes, Chief Global FX Strategist at Société Générale, analyzes G5 growth and policy rate forecasts and their implications for the FX market.
Sluggish resilience but lower rates will weaken the Dollar
G5 growth and policy rate forecasts spell out the sluggish growth clearly enough, but the prospect of a 150 bps cut in Fed rates next year stands out and by comparison with elsewhere.
A 125 bps narrowing in the Fed/ECB rate gap must be Dollar-negative – and there’s room for the forecasts to be very wrong and for the rate gap to narrow more than the market prices in!
A significant cut in Fed rates will also (eventually) reverse a decent chunk of the policy move which took USD/JPY up here.
In the opinion of Markets Strategist Quek Ser Leang at UOB Group, EUR/USD could extend the ongoing bounce to the 1.0950 region in the short-term horizon.
Key Quotes
From a high of 1.1275 in July, EUR/USD dropped sharply and reached a low of 1.0447 in early October. After EUR/USD rebounded from the low, we highlighted in our Chart of the Day (31 Oct, spot at 1.0605) that “the weakness in EUR/USD from early July has likely stabilised.” We expected EUR to trade in a range between 1.0315 and 1.0730. However, we indicated that “as long as EUR/USD does not break clearly above 1.0730, there is still a chance, albeit not a high one, for EUR/USD to dip below 1.0400 before the risk of a more sustained and pronounced recovery is likely.”
Last week, EUR/USD rose to 1.0756. Two days ago (14 November), EUR/USD suddenly lifted off and rocketed to a high of 1.0887. While the outsized advance appears to be running ahead of itself, weekly MACD is turning positive, which suggests that there is scope for EUR/USD to rebound further. That said, we view any advance as part of a “recovery phase”, and not the start of a fresh uptrend. The recovery phase has scope to extend above 1.0945; the odds of it rising above the next resistance of 1.1065 are lower. At this time, we do not expect July’s high of 1.1275 to come back into view, at least not in the next few months.
In order for further recovery, EUR/USD must stay above the crucial support near 1.0700, the crossover level of the 21-day and 55day exponential moving averages. Looking ahead, if EUR/USD breaks below the 55-day exponential moving average, it would mean that it is likely to trade in a range for a period of time.
- Natural Gas prices are steady in the range between $3.20 and $3.70.
- The US Dollar tries to recover losses from Tuesday’s meltdown.
- Natural Gas prices are expected to remain stable as both demand and supply are steady.
Natural Gas (XNG/USD) is starting to form a pure technical range on the charts as both supply and demand are showing signs of easing. On the demand side, positive China data could point to a quicker recovery and thus a pickup in demand from Asia’s biggest gas consumer. On the supply side, no real production hiccups or bottlenecks that could distort near-term flows are at hand.
Meanwhile, the US Dollar (USD) remains weak after the sharp decline seen on Tuesday, when US inflation data revealed further abating price pressures. With the US Federal Reserve likely done hiking, bets are rising on when the first cut will materialise, erasing the positive rate differential support for the Greenback against most major peers. Traders will keep looking for clues with the US Dollar Index (DXY) at risk to decline further.
Natural Gas is trading at $3.35 per MMBtu at the time of writing.
Natural Gas market movers: steady sideways
- European Natural Gas prices are declining for a third consecutive day as robust deliveries to the bloc are avoiding pulling gas out of the storages, which are still 99% full.
- A mild start of the fall and winter season in Europe has given the bloc a bigger advantage to get through the colder period.
- The EU has issued further rules on Methane restrictions, where Liquified Natural Gas (LNG) could see more demand come in as LNG is a greener alternative to Methane use and is exempt from any emission reductions rules.
- Around 15:30 GMT, the Energy Information Agency (EIA) will issue the weekly US gas storage numbers for last week. Expectations are for an increase of 40 billion cubic feet, less than the 79 billion cubic feet seen a week earlier. Estimations range from 33 billion to 49 billion.
Natural Gas Technical Analysis: finding tranquillity
Natural Gas has found some steady ground after a rather volatile October, when the Israel-Gaza tensions were throwing Gas traders left and right. With headlines starting to fade in the region, and the EU not facing substantial shortages for this winter, it looks that Gas prices might trade in this range for some time. Unless a catalyst that either triggers substantial shortage or oversupply, a breakout isn’t expected in the coming days.
Should a proxy war in the Middle East develop, $3.64, will be the level to watch for as prices would soar. A risk premium would be priced in if Iran, Saudi Arabia and other countries in the region started mobilising forces. In such a case, even a quick sprint to $4.33, the high of 2023, could be expected.
On the downside, the 55-day Simple Moving Average (SMA) is doing its work near $3.20, based on the peak seen on October 4. In case this level is unable to hold any selling pressure, expect to see prices going down towards the orange line, from the double top in August near $3.06. That level should be able to act as the last line of defence before gas prices retreat below $3.
-638357275866430725.png)
XNG/USD (Daily Chart)
Natural Gas FAQs
What fundamental factors drive the price of Natural Gas?
Supply and demand dynamics are a key factor influencing Natural Gas prices, and are themselves influenced by global economic growth, industrial activity, population growth, production levels, and inventories. The weather impacts Natural Gas prices because more Gas is used during cold winters and hot summers for heating and cooling. Competition from other energy sources impacts prices as consumers may switch to cheaper sources. Geopolitical events are factors as exemplified by the war in Ukraine. Government policies relating to extraction, transportation, and environmental issues also impact prices.
What are the main macroeconomic releases that impact on Natural Gas Prices?
The main economic release influencing Natural Gas prices is the weekly inventory bulletin from the Energy Information Administration (EIA), a US government agency that produces US gas market data. The EIA Gas bulletin usually comes out on Thursday at 14:30 GMT, a day after the EIA publishes its weekly Oil bulletin. Economic data from large consumers of Natural Gas can impact supply and demand, the largest of which include China, Germany and Japan. Natural Gas is primarily priced and traded in US Dollars, thus economic releases impacting the US Dollar are also factors.
How does the US Dollar influence Natural Gas prices?
The US Dollar is the world’s reserve currency and most commodities, including Natural Gas are priced and traded on international markets in US Dollars. As such, the value of the US Dollar is a factor in the price of Natural Gas, because if the Dollar strengthens it means less Dollars are required to buy the same volume of Gas (the price falls), and vice versa if USD strengthens.
UK inflation surprises to the downside. Economists at Commerzbank analyze Bank of England’s outlook.
There is certainly a risk that the return to the inflation target will be bumpy
Wednesday’s UK inflation figures surprised to the downside. If there are no new upside inflation surprises in the coming months, the Bank of England is unlikely to raise interest rates again. Instead, the focus is likely to shift increasingly towards rate cuts.
We would still be cautious for now. One data surprise does not mean the all-clear has been given, and given the surprisingly stubborn UK inflation so far, there is certainly a risk that the return to the inflation target will be bumpy. Tuesday's much stronger-than-expected wage data also supports this view.
For now, the BoE can breathe a sigh of relief, but caution is still required. The Pound's rather muted reaction suggests that the market is taking a similar view.
Economists at ING analyze USD/JPY outlook for the next year.
Big policy changes in Japan can have a big impact on USD/JPY
On the subject of carry, lower volatility favours the carry trade and also the yen as a funding currency. However, we have some quite aggressive forecasts for a lower USD/JPY on the back of a weaker dollar and finally a proper Bank of Japan exit from ultra-loose policy.
Big policy changes in Japan can have a big impact on USD/JPY as in 2013. Let’s see how the start of 2024 progresses and whether the BoJ is prepared to make its move after all.
USD/JPY – 4Q23 148.00 1Q24 140.00 2Q24 135.00 3Q24 130.00 4Q24 130.00
European Central Bank (ECB) policymaker Mario Centeno made some comments on the central bank’s interest rate outlook on Thursday.
Key quotes
Interest rates will not desirably return to zero.
But interest rates will come down eventually.
Related reads
- Euro recovers mildly to around 1.0860 ahead of Lagarde speech, US data
- EUR/USD could hang onto this week's gains for a few more days – ING
Bank of England's Monetary Policy Committee (MPC) member, Greene, shared insights into the UK's economic situation and the central bank's policy stance in a recent interview with Bloomberg TV on Thursday.
Key quotes
Latest inflation data is good news.
UK labour market data positive.
UK wage growth is still incredibly high.
Reasons to worry about persistence of inflation.
I will need to see how UK activity is holding up before my next rate vote.
Low productivity and high wage growth will make it hard to hit inflation target.
Question is whether boe policy is restrictive enough.
We might need to stay restrictive for longer.
Markets globally haven't really clocked on to how long central banks will need to stay restrictive.
I am not thinking about cuts.
We are not really seeing stronger productivity growth come through.
Market reaction
At the time of writing, GBP/USD is trading at 1.2400, down 0.14% on the day.
Kit Juckes, Chief Global FX Strategist at Société Générale, expects the EUR/GBP to move gradually higher.
BoE’s MPC to cut rates by 1% more than the ECB
We expect the BoE’s MPC to cut rates by 1% more than the ECB, whereas the market prices the gap between the two to remain constant.
GBP will weaken, though everyone is so bearish already that the rise in EUR/GBP will be slow.
See: It is not certain EUR/GBP has to trade up to 0.8800 just yet – ING
Senior Economist at UOB Group Alvin Liew reviews the latest GDP figures in Japan.
Key Takeaways
Japan’s first preliminary estimate of the 3Q23 GDP disappointed as the economy contracted more than expected, at -0.5% q/q (-2.1% q/q annualized rate) while 2Q’s annualized growth was revised lower to 4.5% (from previous estimate of 4.8%). This is Japan’s first sequential decline since the strong 1H23 rebound as nearly all of the major components of the economy (including private consumption, business spending and net exports) faltered in 3Q except for government consumption.
Japan GDP Outlook – Walking Into A Technical Recession Our growth outlook for Japan continued to be weighed by the downside factors of weak domestic demand, uncertain external demand landscape, financial market jitteriness on the back of tighter monetary policies stance among advanced economies while partly cushioned by upside factors of improving tourism and positive impact on in-person services. Japan’s manufacturing and external-oriented service sectors remained challenged and at the same time, the risks of a persistently weaker yen and costlier energy commodities could re-balloon Japan’s import bill, and that in turn will hurt net exports and subtract growth from GDP. The influx of foreign tourists and a cheaper yen have helped Japan’s services sector fare better and anchor the domestic recovery but downside risk to services depends on the extent of global and China growth slowdown and Japan’s services PMI has clearly seen its uptrend easing in the recent months. For now, we maintain our 2023 GDP growth forecast at 1.5%, compared to the 0.9% growth pace recorded in 2022. We expect growth to slow further to 1.0% in 2024.
EUR/USD has held fairly steady. Economists at ING analyze the impact of Eurozone economic data on the pair.
No news is good news
Perhaps helping the Euro this week has been the lack of key Eurozone data. Over the last couple of months, Eurozone data releases have pulled the rug from under any emerging EUR/USD rally and have emphasised the pessimism in this trading bloc.
Looking at the calendar, we cannot see any important releases until the November PMIs next Thursday. This suggests EUR/USD could hang onto this week's gains for a few more days.
- The Euro regains the smile vs. the US Dollar.
- European stocks open Thursday’s session in a mixed tone.
- ECB’s Christine Lagarde speaks later in the session.
The Euro (EUR) manages to generate some upside traction against the US Dollar (USD), motivating EUR/USD to attempt a tepid bounce to the 1.0860 zone on Thursday.
On the other hand, the Greenback alternates gains with losses around 104.40 when tracked by the USD Index (DXY) amidst declining US yields across the board and firmer market chatter around the start of interest rate cuts by the Federal Reserve (Fed) at some point in the summer of 2024.
It is worth recalling that speculation about potential Fed rate cuts has been magnified following weaker-than-estimated inflation measures (CPI and PPI) published earlier in the week.
There is nothing to write home about from the domestic calendar, where President Lagarde will speak at an event in Frankfurt.
Across the ocean, weekly Initial Jobless Claims are due along with the Philly Fed Manufacturing Index, Industrial Production, and the NAHB Housing Market Index.
Daily digest market movers: Euro picks up pace as Dollar deflates
- The EUR regains upside impulse vs. the USD.
- US and German yields trade on the defensive so far on Thursday.
- Market participants speculate that the Fed could cut rates in H1 2024.
- Investors favour a protracted pause by the ECB for the time being.
- Rumours of FX intervention keep gyrating around USD/JPY.
- ECB’s Andrea Enria, Luis De Guindos and Christine Lagarde speak later.
- US weekly Initial Claims and Philly Fed index take centre stage.
- Australia saw a strong labour market report in October.
Technical Analysis: Euro now looks at a potential test of 1.0945
EUR/USD regains the smile and advances modestly on Thursday, returning at the same time to the upper end of the recent range.
The November peak of 1.0887 (November 14) emerges as the next target of note for EUR/USD prior to the weekly high of 1.0945 (August 30) and the psychological level of 1.1000. The breakout of this area might pave the way for a visit to the August top of 1.1064 (August 10) and another weekly peak of 1.1149 (July 27), all preceding the 2023 high of 1.1275 (July 18).
Occasional bouts of weakness may cause the pair to test temporary support at the 55-day SMA at 1.0639, before the weekly low of 1.0495 (October 13) and the 2023 low of 1.0448. (October 15).
Looking at the bigger picture, the pair's outlook should continue positive as long as it remains above the 200-day SMA at 1.0803.
Euro FAQs
What is the Euro?
The Euro is the currency for the 20 European Union countries that belong to the Eurozone. It is the second most heavily traded currency in the world behind the US Dollar. In 2022, it accounted for 31% of all foreign exchange transactions, with an average daily turnover of over $2.2 trillion a day.
EUR/USD is the most heavily traded currency pair in the world, accounting for an estimated 30% off all transactions, followed by EUR/JPY (4%), EUR/GBP (3%) and EUR/AUD (2%).
What is the ECB and how does it impact the Euro?
The European Central Bank (ECB) in Frankfurt, Germany, is the reserve bank for the Eurozone. The ECB sets interest rates and manages monetary policy.
The ECB’s primary mandate is to maintain price stability, which means either controlling inflation or stimulating growth. Its primary tool is the raising or lowering of interest rates. Relatively high interest rates – or the expectation of higher rates – will usually benefit the Euro and vice versa.
The ECB Governing Council makes monetary policy decisions at meetings held eight times a year. Decisions are made by heads of the Eurozone national banks and six permanent members, including the President of the ECB, Christine Lagarde.
How does inflation data impact the value of the Euro?
Eurozone inflation data, measured by the Harmonized Index of Consumer Prices (HICP), is an important econometric for the Euro. If inflation rises more than expected, especially if above the ECB’s 2% target, it obliges the ECB to raise interest rates to bring it back under control.
Relatively high interest rates compared to its counterparts will usually benefit the Euro, as it makes the region more attractive as a place for global investors to park their money.
How does economic data influence the value of the Euro?
Data releases gauge the health of the economy and can impact on the Euro. Indicators such as GDP, Manufacturing and Services PMIs, employment, and consumer sentiment surveys can all influence the direction of the single currency.
A strong economy is good for the Euro. Not only does it attract more foreign investment but it may encourage the ECB to put up interest rates, which will directly strengthen the Euro. Otherwise, if economic data is weak, the Euro is likely to fall.
Economic data for the four largest economies in the euro area (Germany, France, Italy and Spain) are especially significant, as they account for 75% of the Eurozone’s economy.
How does the Trade Balance impact the Euro?
Another significant data release for the Euro is the Trade Balance. This indicator measures the difference between what a country earns from its exports and what it spends on imports over a given period.
If a country produces highly sought after exports then its currency will gain in value purely from the extra demand created from foreign buyers seeking to purchase these goods. Therefore, a positive net Trade Balance strengthens a currency and vice versa for a negative balance.
- NZD/USD consolidates below the psychological level before US Jobless Claims.
- Nine-day EMA at 0.5952 could act as the key support aligned to the 0.5950 major level.
- 38.2% Fibo at 0.6025 emerges as the barrier followed by the major level at 0.6050.
NZD/USD retreats from the weekly high, hovering below the 0.6000 psychological level during the European hours on Thursday. The NZD/USD pair could find support at the nine-day Exponential Moving Average (EMA) at 0.5952 lined up with a major level at 0.5950.
A decisive break below the level could influence the bears of the NZD/USD pair to navigate the region around 0.5900 psychological level following the two-week low at 0.5859.
However, the technical indicators for the NZD/USD pair do indeed paint a bullish picture. The 14-day Relative Strength Index (RSI) being above the 50 level signals upward support, indicating a strong momentum in favor of the pair.
Moreover, the Moving Average Convergence Divergence (MACD) line, positioned above the centerline and showing divergence above the signal line, further suggests a bullish momentum in the NZD/USD pair.
On the upside, the 38.2% Fibonacci retracement at 0.6025 appears to be the immediate resistance. A firm breakthrough above the latter could support the NZD/USD pair to explore the region around the major level at 0.6050 followed by the 50% retracement at 0.6099 level.
NZD/USD: Daily Chart
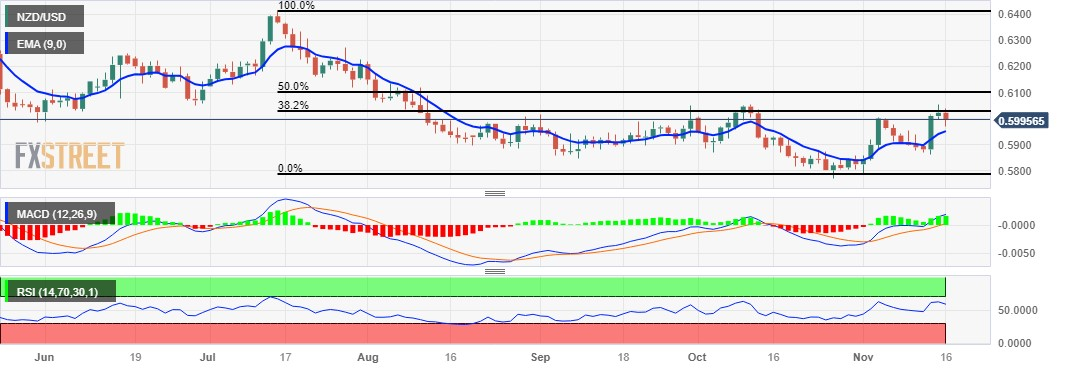
The Dollar continues to claw back some of Tuesday's losses. Economists at ING analyze USD outlook.
Government shutdown averted
US October Retail Sales suggested that the consumer is still spending. Also helping has been the Senate's support of a stop-gap funding bill that kicks the risk of a government shutdown into 2024.
Expect more rangy price action in FX markets today, with focus on the weekly jobless claims data and industrial production. Any spike in jobless claims could hit the Dollar. We also have a few Fed speakers today – most from the hawkish end of the spectrum.
Look for DXY to trade in something like a 104.00-104.85 range for the short term.
EUR/GBP continues to grind higher. Economists at ING analyze the pair’s outlook.
GBP/USD could dip further
On Wednesday, the market moved to price the first full 25 bps BoE cut in June next year and had 78 bps of easing priced in by the end of the year. Having switched to forward guidance at the last BoE meeting – keeping restrictive rates for an extended period – the market will now be on the lookout for this language changing.
Quite a lot of BoE easing is already priced in for next year, however, meaning it is not certain EUR/GBP has to trade up to 0.8800 just yet.
Cable is eating into this week's rally and could dip further unless something like today's US jobless claims disappoint.
Further weakness in USD/CNH remains in store in the short-term horizon, comment UOB Group’s Markets Strategist Quek Ser Leang and Economist Lee Sue Ann.
Key Quotes
24-hour view: While we expected USD to weaken further yesterday, we were of the view that “the major support at 7.2380 is likely out of reach.” In NY trade, USD dropped sharply but briefly to 7.2385 before rebounding. The rebound in oversold conditions suggests USD is unlikely to weaken. Today, USD is more likely to trade in a sideways range of 7.2470/7.2700.
Next 1-3 weeks: Yesterday (15 Nov, spot at 7.2600), we highlighted that “downward momentum has increased, and USD is likely to weaken further to 7.2380.” We added, “If USD breaks clearly below 7.2380, the focus will shift to 7.2000.” We continue to hold the same view. Note that USD dipped briefly to 7.2385 in NY trade before rebounding. On the upside, if USD breaks above 7.3000 (no change in ‘strong resistance’ level), it would indicate that current downward momentum has faded.
CME Group’s flash data for natural gas futures markets noted traders scaled back their open interest positions for the first time since October 31 on Wednesday, now by around 4.6K contracts. In the same line, volume shrank for the second session in a row, this time by around 1.2K contracts.
Natural Gas: Firm contention remains around $3.000
Prices of natural gas printed decent gains on Wednesday. The move, however, was on the back of declining open interest and volume and suggests that further upside appear not favoured in the very near term. In the meantime, the $3.000 mark per MMBtu remains a solid contention area for the time being.
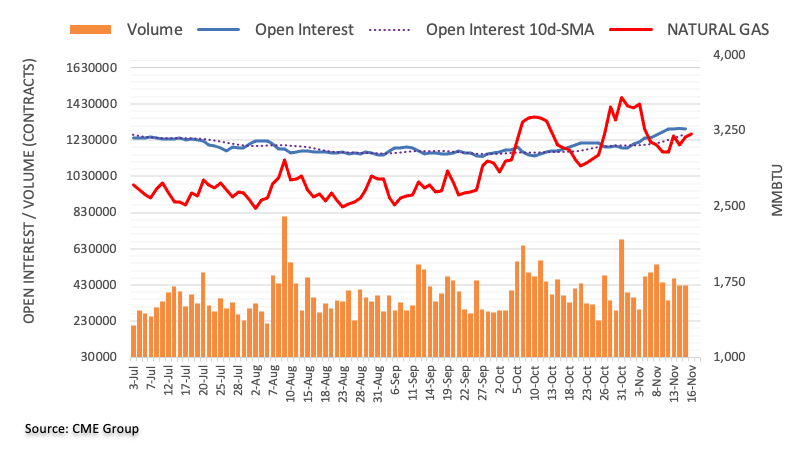
- USD/CAD recovers further from the 50-day SMA and draws support from a combination of factors.
- Sliding Crude Oil prices undermine the Loonie and act as a tailwind amid a modest USD strength.
- The mixed technical setup warrants caution for bulls and before positioning for any further gains.
The USD/CAD pair attracts some buying on Thursday and sticks to its modest intraday gains, just below the 1.3700 round-figure mark through the first half of the European session.
Crude Oil prices drift lower for the third successive day, which is seen undermining the commodity-linked Loonie. This, along with a further US Dollar (USD) recovery from its lowest level since September 1 touched in the aftermath of the softer US CPI report on Tuesday, turns out to be another factor acting as a tailwind for the USD/CAD pair.
From a technical perspective, spot prices managed to defend the 50-day Simple Moving Average (SMA) support near the 1.3655 area on Wednesday and the subsequent move up favours bullish traders. That said, the lack of follow-through buying warrants caution before positioning for further gains amid bets that the Federal Reserve (Fed) is done hiking rates.
Moreover, oscillators on the daily chart have just started gaining negative traction. Hence, a convincing break below the 50-day SMA support will be seen as a fresh trigger for bearish traders and pave the way for deeper losses. The USD/CAD pair might then slide to the monthly low, around the 1.3630-1.3625 region, en route to the 1.3600 round figure.
On the flip side, a sustained strength beyond the 1.3710-1.3715 region could trigger an intraday short-covering move and lift spot prices to the next relevant hurdle near the 1.3750-1.3755 area. Any further move up, however, might still be seen as a selling opportunity and runs the risk of fizzling out rather quickly ahead of the 1.3800 round-figure mark.
The latter should act as a key pivotal point, which if cleared decisively will shift the near-term bias back in favour of bullish traders. The USD/CAD pair might then accelerate the momentum towards the next relevant hurdle near the 1.3870-1.3875 region en route to the 1.3900 mark, or the highest level since May 2020 touched on earlier this month.
USD/CAD daily chart
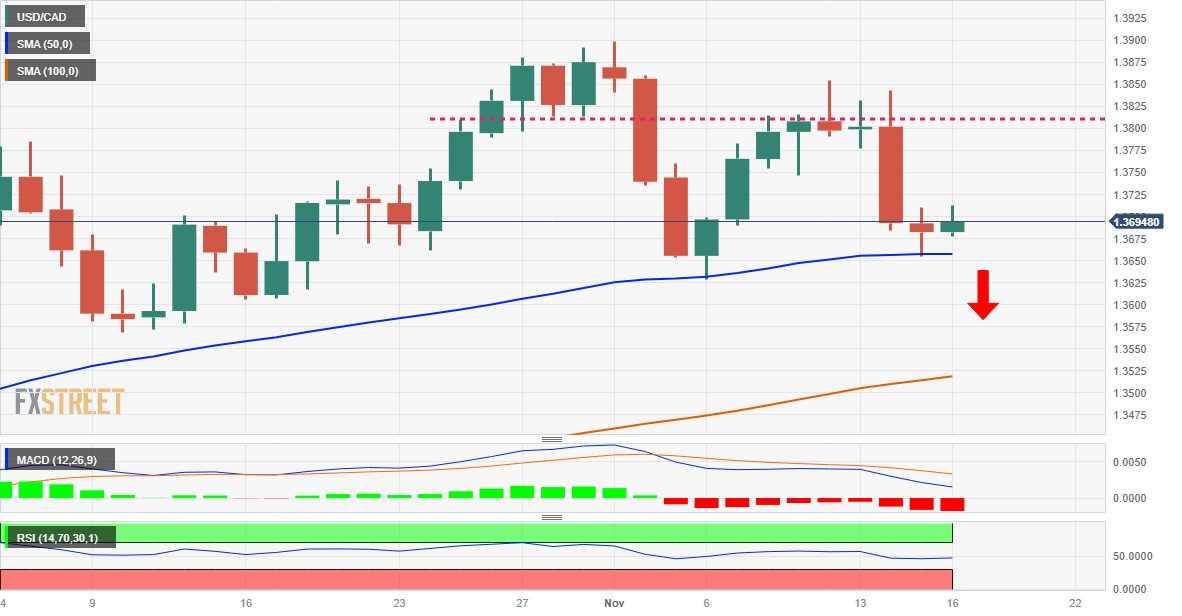
Technical levels to watch
- USD/MXN struggles as market sentiment is cautious on Fed policy in the December meeting.
- US Retail Sales raised a red flag on inflation, justifying further interest rate tightening by the Fed.
- Banxico could maintain interest rates at 11.25% to achieve its 3.0% inflation target.
USD/MXN struggles to halt the losing streak that began on Friday, trading around 17.3000 during the early European hours on Thursday. The pair could face challenges as the Bank of Mexico (Banxico) is expected to maintain interest rates at 11.25% to achieve its 3.0% inflation target by the year 2025. The decision would be dependent on the context of Mexico's inflation, which eased at 4.26% year on year in October.
The statements from Banxico’s Governor Victoria Rodriguez Ceja on Monday, suggesting that rate cuts could be a possibility next year, were echoed by Deputy Governor Jonathan Heath on Tuesday. Despite the potential for rate cuts, Heath emphasized that the monetary policy will continue to remain restrictive.
The US Retail Sales exhibiting a modest easing at 0.1% in October, lower than the anticipated decline of 0.3%, indeed raises a cautionary flag for the Federal Reserve (Fed). The figures suggest potential threats to the progress on inflation, which could justify further tightening. The Fed's cautious stance, despite recent soft inflation data, introduces an element of uncertainty. This environment of caution and uncertainty can contribute to supporting the USD/MXN pair.
However, the downbeat US Producer Price Index (PPI), with a decrease of 0.5% compared to the expected increase of 0.1%, and the annual PPI drop from 2.2% to 1.3%, indeed has the potential to moderate market sentiment concerning further policy tightening by the Fed.
The upcoming release of the weekly US Jobless Claims is likely to be closely monitored by market participants. The state of the US labor market is often viewed as a critical factor that can influence inflation dynamics.
Ulrich Leuchtmann, Head of FX and Commodity Research at Commerzbank, analyzes the Bank of Japan’s (BoJ) monetary policy.
Verbal interventions and the continuation of the ultra-expansionary monetary policy seen as consistent aspects
Anyone who feels kindly towards the BoJ might argue that it is finally doing what the band of economists of this world has been urging it to do for ages: to allow inflation to overshoot to rekindle inflation expectations amongst the public. And according to the logic of the economists that will lead to stable inflation rates which will continue even after the current inflation shock has died down completely.
The only problem about this interpretation is: if the BoJ was thinking like that, the BoJ should be thrilled that the Yen is so weak. Every time a big figure is reached in USD/JPY, the BoJ should be popping the champagne. The verbal interventions of the Ministry of Finance (MOF) illustrate, however, how concerned it is about the Yen weakness and how much one would like to see a JPY recovery.
One could put this down to a disagreement between the BoJ and the MOF and interpret the situation as the MOF and BoJ opposing each other. My experience teaches me to be cautious about explanations that presume a conflict of interest between both institutions. And that leaves only one interpretation, that explains verbal interventions and the continuation of the ultra-expansionary monetary policy as consistent aspects. I would love to hear from anyone who can think of another interpretation rather than the monetization of public debt!
USD/JPY is now seen trading within the 149.50-151.65 range in the next few weeks, according to UOB Group’s Markets Strategist Quek Ser Leang and Economist Lee Sue Ann.
Key Quotes
24-hour view: After USD dropped sharply to 150.14 on Tuesday, we highlighted yesterday that “the rapid decline appears to be overdone, and USD is unlikely to weaken much further.” We expected USD to trade sideways between 150.10 and 151.25. In NY trade, USD dipped briefly to 150.04 and then staged a surprisingly robust rebound to 151.44. Today, while USD could rebound further, it is unlikely to break the major resistance at 151.65. Support is at 150.90, followed by 150.60.
Next 1-3 weeks: On Tuesday, USD dropped sharply to a low of 150.14. Yesterday (15 Nov, spot at 150.55), we highlighted that “while downward pressure has increased; it is not enough to suggest the start of a sustained decline in USD.” We added, USD “is more likely to trade in a range of 149.50151.65.” We continue to hold the same view.
Considering advanced prints from CME Group for crude oil futures markets, open interest extended the downtrend for yet another session on Wednesday, this time by nearly 2K contracts. Volume, instead, increased for the second straight session, now by around 186.2K contracts.
WTI: The $75.00 region holds the downside…for now
WTI prices extended the corrective decline on Wednesday amidst diminishing open interest, which should hit at the view that at deeper drop appears not favoured in the very near term. On the downside, there is an important contention at the $75.00 mark per barrel so far.
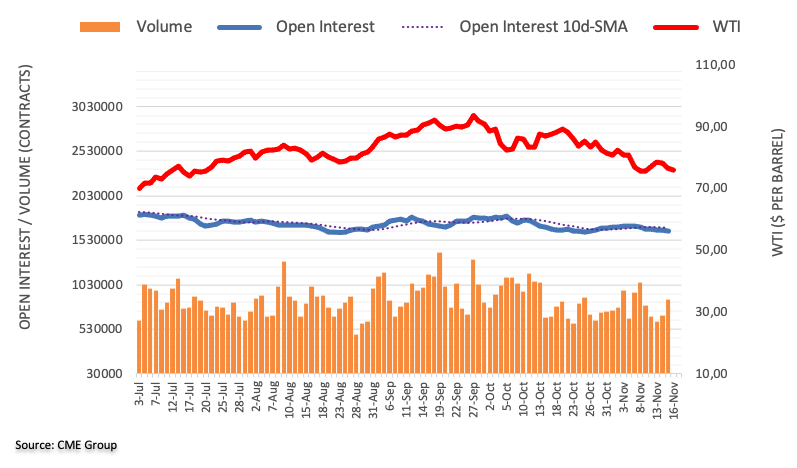
Here is what you need to know on Thursday, November 16:
Following the sharp decline seen on Tuesday after soft US inflation data, the US Dollar (USD) Index recovered modestly on Wednesday and managed to stretch higher early Thursday. In the second half of the day, weekly Initial Jobless Claims, Philadelphia Fed Manufacturing Survey and Industrial Production data for October will be featured in the US economic docket. Federal Reserve (Fed) policymakers Loretta Mester, John Williams and Governor Lisa Cook will be speaking in the American trading hours. European Central Bank President Christine Lagarde will also deliver pre-recorded opening remarks at the Annual European Systemic Risk Board Online Conference.
The data from the US revealed on Wednesday that Retail Sales declined less than expected in October while producer inflation continued to decelerate. As the risk rally lost its steam after mixed data releases, Wall Street's main indexes closed flat and the USD managed to stay resilient against its major rivals.
US Dollar price this week
The table below shows the percentage change of US Dollar (USD) against listed major currencies this week. US Dollar was the weakest against the Australian Dollar.
| USD | EUR | GBP | CAD | AUD | JPY | NZD | CHF | |
| USD | -1.47% | -1.25% | -0.71% | -1.80% | -0.05% | -1.45% | -1.51% | |
| EUR | 1.45% | 0.21% | 0.74% | -0.35% | 1.40% | -0.01% | -0.01% | |
| GBP | 1.26% | -0.20% | 0.55% | -0.52% | 1.20% | -0.17% | -0.24% | |
| CAD | 0.72% | -0.73% | -0.51% | -1.06% | 0.67% | -0.70% | -0.77% | |
| AUD | 1.77% | 0.32% | 0.54% | 1.07% | 1.71% | 0.34% | 0.30% | |
| JPY | 0.06% | -1.41% | -1.18% | -0.65% | -1.73% | -1.37% | -1.44% | |
| NZD | 1.47% | 0.02% | 0.24% | 0.77% | -0.31% | 1.41% | -0.02% | |
| CHF | 1.48% | 0.03% | 0.25% | 0.78% | -0.30% | 1.42% | 0.06% |
The heat map shows percentage changes of major currencies against each other. The base currency is picked from the left column, while the quote currency is picked from the top row. For example, if you pick the Euro from the left column and move along the horizontal line to the Japanese Yen, the percentage change displayed in the box will represent EUR (base)/JPY (quote).
During the Asian trading hours, the Australian Bureau of Statistics reported that the Unemployment Rate edged higher to 3.7% in October from 3.6% in September. The Participation Rate rose to 67% from 66.8% in the same period, while the Employment Change came in at +55,000, much better than the market expectation for an increase of +20,000. Other data from Australia showed that the Consumer Inflation Expectations ticked up to 4.9% in November from 4.8%. AUD/USD turned south following these data releases and broke below 0.6500.
EUR/USD met resistance before reaching 1.0900 and registered small losses on Wednesday. Early Thursday, the pair fluctuates in a tight channel at around 1.0850.
After rising above 1.2500, GBP/USD staged a technical correction on Wednesday and extended its slide early Thursday. At the time of press, the pair was trading in negative territory below 1.2400.
USD/JPY gained nearly 100 pips on Wednesday and settled above 151.00. In the European morning on Thursday the pair fluctuates in a narrow channel slightly below 151.50.
Gold struggled to preserve its bullish momentum as the benchmark 10-year US Treasury bond yield rebounded toward 4.5%. After closing the day flat on Wednesday, XAU/USD started to rise toward $1,970 early Thursday.
In the view of UOB Group’s Markets Strategist Quek Ser Leang and Economist Lee Sue Ann, NZD/USD needs to clear 0.6055 to allow for further gains in the near term.
Key Quotes
24-hour view: On Tuesday, NZD jumped to a high of 0.6013. Yesterday (Wednesday), when NZD was trading at 0.6000, we indicated that “there is scope for NZD to rise further.” We also indicated that NZD “is unlikely to break clearly above 0.6055.” Our view turned out to be correct as NZD rose to 0.6055 before easing off to end the day at 0.6023 (+0.25%). Upward pressure has eased somewhat, and NZD is unlikely to rise further. Today, NZD is more likely to trade in a sideways range of 0.5980/0.6045.
Next 1-3 weeks: Our update from yesterday (15 Nov, spot at 0.6000) still stands. As highlighted, while we expect NZD to strengthen further, it has to break clearly above 0.6055 before an advance to 0.6100 is likely. Note that NZD rose briefly to 0.6055 in NY trade before pulling back. The chance of NZD breaking clearly above 0.6055 will remain intact as long as it stays above 0.5920 (‘strong support’ level was at 0.5900 yesterday).
- USD/JPY attracts some dip-buying and turns positive for the second straight day on Thursday.
- The BoJ’s dovish stance weighs on the JPY and acts as a tailwind amid a further USD recovery.
- Bets that the Fed is done hiking rates might cap the USD and the pair amid intervention fears.
The USD/JPY pair turns positive for the second successive day following an intraday dip to the 151.10 area on Thursday and touches a two-day high during the early part of the European session. Spot prices, however, lack follow-through buying and remain below the mid-151.00s.
The Japanese Yen (JPY) continues with its relative underperformance in the wake of a more dovish stance adopted by the Bank of Japan (BoJ), which, along with some follow-through US Dollar (USD) strength, acts as a tailwind for the USD/JPY pair. In fact, the BoJ is the only major central bank to maintain negative interest rates and is in no hurry for any policy shift away from its massive monetary easing.
In contrast, the better-than-expected release of the US Retail Sales data on Wednesday suggested that the economy remains on track for a soft landing. This could allow the Federal Reserve (Fed) to stick to its hawkish stance and wait for longer before cutting rates, which continues to underpin the Greenback and turns out to be another factor lending support to the USD/JPY pair for the second straight day.
Market participants, meanwhile, seem convinced that the Fed will not hike interest rates again and have been pricing in the possibility of rate cuts during the first half of 2024. This is reinforced by a fresh leg down in the US Treasury bond yields, which, in turn, might hold back the USD bulls from placing aggressive bets. Apart from this, a softer risk tone could benefit the safe-haven JPY and cap the USD/JPY pair.
Traders also remain sceptic about the possibility of an intervention by Japanese authorities to combat any sustained depreciation of the domestic currency. This further contributes to keeping a lid on the USD/JPY pair, warranting caution before positioning for any further appreciating move. Investors now look forward to the US macro data for a fresh impetus later during the early North American session.
Thursday's US economic docket features the release of the usual Weekly Initial Jobless Claims, along with the Philly Fed Manufacturing Index and Industrial Production figures. Apart from this, the US bond yields will drive the USD demand. Traders will further take cues from speeches by influential FOMC members and the broader risk sentiment to grab short-term opportunities around the USD/JPY pair.
Technical levels to watch
EUR/USD has edged below the 1.0850 mark after having traded close to 1.09. Economists at ING analyze the pair’s outlook.
EUR/USD to stay steady into year-end
We could see a 1.0800-1.0900 range develop over the next few days and certainly, a move back under the 1.0765 area would undo all of this week's positive developments.
In terms of the bigger picture, we doubt EUR/USD will lead next year's Dollar bear trend. And we favour benchmark cross rates, such as EUR/AUD to come lower. Before that, however, we currently forecast EUR/USD staying quite steady – not far from current levels – into year-end.
AUD/USD is easing following largely positive data in Australia. Economists at Commerzbank analyze the employment report.
Positive Australian labour market report has little effect
The labour market data from Australia suggests that the downtrend in full-time employment might have been stopped. Overall employment rose more significantly than analysts had expected in advance.
The market seems to focus instead on the unemployment rate which rose as expected despite the solid rise in job creation.
The AUD move was rather small though – certainly compared with the positive effect produced by the USD side of things on Tuesday.
Open interest in gold futures markets reversed two consecutive daily builds and shrank by around 2.2K contracts on Wednesday, according to preliminary readings from CME Group. Volume followed suit and went down for the third session in a row, this time by nearly 42K contracts.
Gold keeps targeting the $2000 mark
Wednesday’s small decline in gold prices came on the back of shrinking open interest and volume, indicating that further losses seem unlikely and favouring the continuation of the uptrend instead. That said, the next target of note for the precious metal remains at the key $2000 mark per troy ounce.
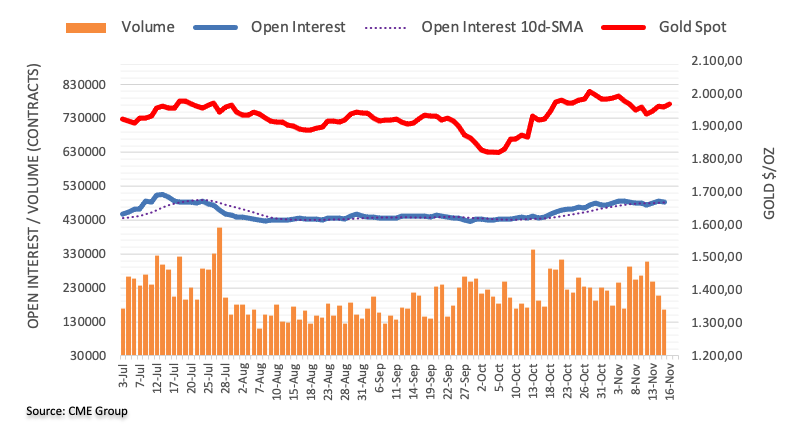
The Yuan has been under pressure amid China’s weak economic outlook. Economists at Commerzbank analyze USD/CNY outlook.
Pressure persists into 2024
CNY will likely remain under pressure before economic data show that China’s growth momentum stabilizes and gains a firmer footing.
We expect the USD/CN pair to continue to stay at around 7.30 in the near term and CNY will remain weak for some time ahead.
Longer out, we expect USD/CNY to fall below 7.00 in the latter part of 2024 due to the expectation of a softer USD as we anticipate the Fed to cut its key interest rate next year.
GBP/USD could extend the rebound to the 1.2580 zone in the near term, note UOB Group’s Markets Strategist Quek Ser Leang and Economist Lee Sue Ann.
Key Quotes
24-hour view: Yesterday, we held the view that “the outsized rally is severely overstretched, but GBP could rise to 1.2530 before levelling off.” Our view was incorrect. Instead of rising to 1.2530, GBP dropped to a low 1.2404. GBP appears to have entered a consolidation phase, and it is likely to trade in a range of 1.2380/1.2480 today.
Next 1-3 weeks: We highlighted yesterday (15 Nov, spot at 1.2490) that GBP is likely to continue to advance, but it has to break clearly above 1.2580 before a further sustained rise is likely. We did not quite expect GBP to pullback to a low of 1.2400. That said, we continue to hold the same view. Only a breach of 1.2350 (no change in ‘strong support’ level from yesterday) would indicate that GBP is not advancing further.
- The index hovers around the mid-104.00s.
- Speculation of Fed’s rate cuts next year remain firm.
- Weekly Claims, Philly Fed index take centre stage.
The USD Index (DXY), which measures the greenback vs. a bundle of its main competitors, trades with humble losses around the 104.50 region on Thursday.
USD Index focuses on data
The index navigates a range bound theme around 104.50 ahead of the opening bell in the old continent on Thursday.
In fact, the index extends its recovery for the second session in a row following Tuesday’s post-CPI collapse to the sub-104.00 region, or multi-week lows.
The rebound in the dollar also comes in tandem with some improvement in US yields and against the backdrop of rising speculation that the Federal Reserve could start reducing its interest rates at some point in H1 2024.
Later on Thursday, usual weekly Initial Claims and the Philly Fed index will be in the limelight seconded by Industrial Production and the NAHB Index.
In addition, FOMC L. Cook (permanent voter, centrist), FOMC M. Barr (permanent voter, centrist), Cleveland Fed L. Mester (2024 voter, hawk), NY Fed J. Williams (permanent voter, centrist) and FOMC C. Waller (permanent voter, hawk) are all due to speak.
What to look for around USD
The pronounced decline in the index appears to have met some initial contention around the 104.00 region, or eleven-week lows, so far this week.
In the meantime, the dollar appears depressed against the backdrop of rising speculation of probable interest rate cuts in H1 2024, all in response to further disinflationary pressures and the gradual cooling of the labour market.
Bolstering the greenback, however, still emerges the resilience of the US economy as well as a hawkish narrative from some Fed rate setters.
Key events in the US this week: Initial Jobless Claims, Philly Fed Index, Industrial Production, NAHB Index, TC Flows (Thursday) – Building Permits, Housing Starts (Friday).
Eminent issues on the back boiler: Persistent debate over a soft or hard landing for the US economy. Speculation of rate cuts in early 2024. Geopolitical effervescence vs. Russia and China. Potential spread of the Middle East crisis to other regions.
USD Index relevant levels
Now, the index is up 0.09% at 104.47 and the breakout of 106.00 (weekly high November 10) could pave the way to a move to 106.88 (weekly high October 26) and finally 107.34 (2023 high October 3). On the flip side, there is an initial support at 103.98 (monthly low November 14) ahead of 103.61 (200-day SMA) and 102.93 (weekly low August 30).
- NZD/USD could face challenges as investors adopt a cautious stance on Fed policy.
- Positive China news helped the Kiwi Dollar due to trade relations between the two nations.
- The Fed's caution, despite soft inflation, introduces uncertainty into the market.
NZD/USD aims to retrace the recent gains, trading near 0.5980 during the Asian hours on Thursday. However, the New Zealand Dollar (NZD) received upward support from China’s economic data, which improved the trade outlook in the country.
Moreover, the Chinese government's injection of 1 trillion Yuan in low-cost financing for the property sector is a strategic move to address concerns of a credit crunch. Initiatives of this scale can have ripple effects across global economies including New Zealand.
The positive news flow from China, supporting the package for its troubled property sector, has had a favorable impact on the Kiwi Dollar (NZD). As a major exporter of dairy products to China, the improved economic prospects and increased demand for the NZD are connected to these developments.
However, on Thursday, the data showed that China’s House Price Index dropped by 0.38% in October compared to the 0.1% decline previously. This has indicated a worsening condition in China's property sector.
The US Dollar Index (DXY) gained ground after the release of economic data from the United States on Wednesday, extending gains for the second day. The spot price bids around 104.50 at the time of writing.
US Retail Sales showed a modest easing at 0.1% in October, lower than the expected decline of 0.3%, introducing the possibility of challenges to progress on US inflation. The cautious stance of the Fed, despite recent soft inflation data, introduces an element of uncertainty into the market.
Apart from this, the unexpected decline in the US Producer Price Index (PPI) by 0.5%, compared to the anticipated 0.1% increase, and the drop in the annual PPI from 2.2% to 1.3%, could have a moderating effect on market sentiment regarding further rate hikes by the Fed.
The upcoming release of the weekly US Jobless Claims later in the North American session is likely awaited by market participants. It could provide additional insights, especially if the US labor market is viewed as a catalyst for higher inflation, potentially influencing market dynamics.
- EUR/GBP gains ground near 0.8745 on weaker UK inflation data.
- The cross holds above the 50- and 100-hour EMA; RSI indicator stands in bullish territory above 50.
- The 0.8750-0.8755 zone acts as an immediate resistance level; the initial support level is located at 0.8721.
The EUR/GBP cross extends its upside during the early European session on Thursday. The downbeat UK Consumer Price Index (CPI) data on Wednesday weighs on the British Pound (GBP) and acts as a tailwind for the EUR/GBP cross. Additionally, the GBP’s upside might be capped due to the possibility of cutting interest rates from the Bank of England (BoE) soon. At press time, the cross is trading around 0.8745, up 0.09% on the day.
From a technical perspective, EUR/GBP holds above the 50- and 100-hour Exponential Moving Averages (EMAs) on the four-hour chart, highlighting the path of least resistance for EUR/GBP is to the upside. Furthermore, the Relative Strength Index (RSI) stands in bullish territory above 50, supporting the buyers for now.
The 0.8750-0.8755 region acts as an immediate resistance level for the cross. The mentioned level is the confluence of the upper boundary of the Bollinger Band and a high of November 10. A decisive break above the latter will see a rally to 0.8835 (a high of May 3). Further north, the additional upside filter is seen at 0.8865 (high of April 25).
On the downside, the initial support level for the cross is located near a high of November 3 at 0.8721. The next contention level will emerge near the 100-hour EMA at 0.8710. Any follow-through selling below the latter will see a drop to the 0.8695–0.8700 zone, representing the lower limit of the Bollinger Band and a psychological round figure.
EUR/GBP four-hour chart
-638357136151262038.png)
UOB Group’s Markets Strategist Quek Ser Leang and Economist Lee Sue Ann suggest EUR/USD could still advance to the 1.0945 level in the next few weeks.
Key Quotes
24-hour view: Our expectation for “further advance in EUR” did not materialise as it traded between 1.0830 and 1.0887. The price action is likely part of a consolidation phase. In other words, EUR is likely to trade in a range today, probably between 1.0815 and 1.0880.
Next 1-3 weeks: After EUR surged on Tuesday, we highlighted yesterday (15 Nov, spot at 1.0880) that “further EUR strength appears likely.” We also highlighted that “the level to monitor is 1.0945.” There is no change in our view. Overall, only a breach of 1.0770 (no change in ‘strong support’ level) would indicate that EUR is not strengthening further.
- GBP/USD could extend losses toward the support level at 1.2350.
- Technical indicators suggest a robust momentum in favor of the pair.
- A decisive breakthrough above 1.2400 could encourage bullish sentiment.
GBP/USD extends losses on the second consecutive day, trading lower around 1.2390 during the Asian session on Thursday. The 1.2350 major level emerges as the key support, following the next support around the psychological level at 1.2300.
A break below the latter could weigh on the GBP/USD pair to navigate the region around the 21-day Exponential Moving Average (EMA) at 1.2282 level following the weekly low at 1.2213.
However, the technical indicator for the GBP/USD pair indeed presents a bullish outlook. The 14-day Relative Strength Index (RSI) above the 50 level indicates upward support, signifying a robust momentum in favor of the pair.
Additionally, the Moving Average Convergence Divergence (MACD) line, situated above the centerline and shown divergence above the signal line, suggests a bullish momentum in the GBP/USD pair.
On the upside, the GBP/USD pair trades below the key psychological level of 1.2400, which serves as a strong resistance. A decisive breakthrough above this barrier has the potential to encourage bullish sentiment, opening the path towards the major level at 1.2450 aligned with the 38.2% Fibonacci retracement at 1.2459. If this resistance is successfully surpassed, the pair may target the 1.2500 level, aligning with the weekly high at 1.2505.
GBP/USD: Daily Chart
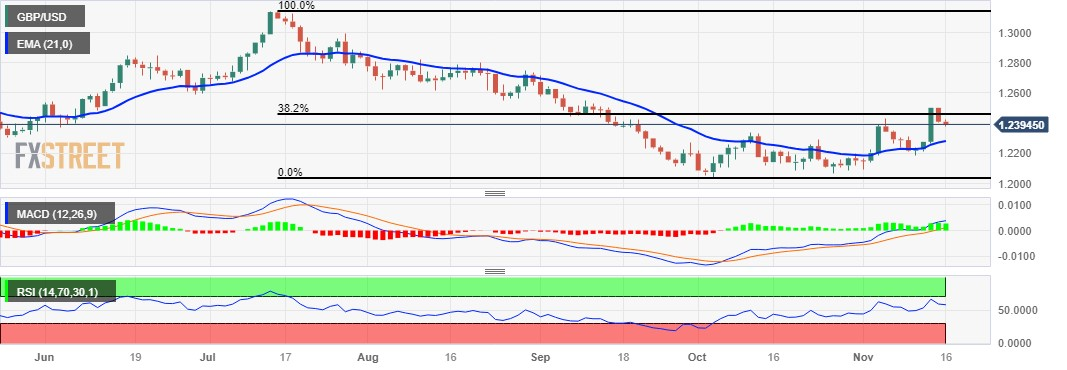
- EUR/JPY snaps its four-day winning streak below 164.00 on Thursday.
- The pair holds above the 50- and 100-hour EMA; the RSI indicator stands in bullish territory above 50.
- The immediate resistance level is seen at 164.22; 163.07 acts as an initial support level for the cross.
The EUR/JPY cross trades with modest intraday losses during the Asian session on Thursday. However, the divergence in the monetary policy between the European Central Bank (ECB) and the Bank of Japan (BoJ) still exerts some pressure on the Japanese Yen (JPY) and lends support to the EUR/JPY cross. EUR/JPY currently trades around 163.93, down 0.15% for the day.
From a technical perspective, EUR/JPY holds above the 50- and 100-hour Exponential Moving Averages (EMAs) with an upward slope on the four-hour chart, which supports the buyers for the time being. It’s worth noting that the Relative Strength Index (RSI) is located in the bullish territory above 50, indicating that further upside looks favorable.
The immediate resistance level for the cross is seen at the year-to-date (YTD) high of 164.22. Further north, the cross will see the next barrier near the psychological round mark at 165.00, followed by 165.50.
On the flip side, a low of November 15 at 163.07 acts as an initial support level for EUR/JPY. The additional downside filter to watch is the 50-hour EMA at 162.15. The critical contention level is located at the lower limit of the Bollinger Band at 161.52. A breach of the latter will see a drop to the 100-hour EMA at 161.05.
EUR/JPY four-hour chart
-638357088839437967.png)
- USD/CHF halts a four-day losing streak as US Dollar rebounds.
- US Retail Sales eased at 0.1% in October, compared to the expected 0.3% decline.
- Fed uncertainty over policy decisions in the December meeting is supporting the Greenback.
USD/CHF attempts to rebound from the two-month lows, halting a four-day losing streak. The pair trades slightly higher around 0.8890 during the Asian session on Thursday.
The US Dollar Index (DXY) showed improvement after the release of economic data from the United States on Wednesday. The US Retail Sales eased at 0.1% in October, contrary to expectations of a steeper slide of 0.3%. However, the unexpected decline in the US Producer Price Index (PPI) by 0.5%, compared to the anticipated 0.1% increase, and the drop in the annual PPI from 2.2% to 1.3%.
The Retail Sales figures might have raised a cautionary flag for the Federal Reserve (Fed), suggesting potential threats to progress on inflation. This could justify further tightening, and the Fed's cautious stance, despite recent data showing a decline in inflation, has introduced an element of uncertainty. The uncertainty surrounding the Fed policy decision for the December meeting has generated support for the USD/CHF pair.
Furthermore, the USD/CHF pair has seen a recovery, buoyed by a rise in US Treasury yields, with the 2-year rate standing at 4.90% and 10-year rates at 4.50%, at the time of writing.
Swiss National Bank (SNB) Chairman Thomas Jordan mentioned in an interview with a local television station that he doesn't rule out the possibility of more interest rate hikes in the future. This might have contributed upward support to underpinning the Swiss Franc (CHF) during some previous sessions.
Swiss Industrial Production for the third quarter will be eyed on Friday, seeking insights into whether the Swiss National Bank (SNB) will contemplate an interest rate increase in the December meeting. However, the weekly US Jobless Claims will be released later in the North American session, which may provide further impetus on the condition of the US labor market.
- Gold price gains some positive traction during the Asian session on Thursday amid a softer risk tone.
- The US Dollar builds on the overnight bounce from a two-month low and should cap the upside for XAU/USD.
- Bets that the Federal Reserve is done raising interest rates could act as a headwind for the Greenback.
Gold price (XAU/USD) attracts some dip-buying during the Asian session on Thursday and for now, seems to have stalled its retracement slide from over a one-week high, around the $1,975-1.976 area touched the previous day. A softer tone around the US equity futures is seen as a key factor acting as a tailwind for the safe-haven precious metal. Apart from this, growing acceptance that the Federal Reserve (Fed) will not hike interest rates further offers additional support to the non-yielding yellow metal.
That said, a further US Dollar (USD) recovery, from its lowest level since September 1 touched in the aftermath of softer US consumer inflation figures, should keep a lid on any further gains for the Gold price. The US Retail Sales fell less than expected in October, which, along with an upward revision of the previous month's already stronger reading, led to a goodish rebound in the US Treasury bond yields. This continues to lend some support to the Greenback, warranting caution before placing bullish bets around the XAU/USD.
Daily Digest Market Movers: Gold price regains positive traction, though the upside potential seems limited
- The US Producer Price Index (PPI) registered its largest decline since April 2020 and fell 0.5% in October. Moreover, data for September was also revised down to show the PPI increasing by 0.4% instead of 0.5%.
- This comes on top of the US CPI report on Tuesday, which showed that consumer inflation was cooling faster than anticipated, and strengthened expectations that the Federal Reserve is done hiking interest rates.
- The headline US Retail Sales fell for the first time in seven months in October, though the decline was less than expected and was accompanied by an upward revision of the September data to show strong gains.
- San Francisco Fed President Mary Daly, in an interview with Financial Times on Wednesday, underscored the uncertainty about whether the central bank has done enough to push consumer price back down to its 2% target.
- This clouded the outlook for when the Fed will begin cutting interest rates, which is seen offering some support to the US Dollar and should contribute to keeping a lid on any meaningful appreciating move for the Gold price.
- Market participants now look forward to the US economic docket, featuring the release of Weekly Initial Jobless Claims, the Philly Fed Manufacturing Index and Industrial Production figures for a fresh impetus.
Technical Analysis: Gold price might now face resistance near $1,975-1,976 or over a one-week top set on Wednesday
From a technical perspective, the one-week high, around the $1,975-1,976 area touched on Wednesday now seems to act as an immediate hurdle. A sustained strength beyond has the potential to lift the Gold price further towards the $1,991-1,992 hurdle en route to the $2,000 psychological mark. The momentum could get extended towards a multi-month peak, around the $2,009-2,010 region, which if cleared decisively will be seen as a fresh trigger for bullish traders and pave the way for a further near-term appreciating move.
On the flip side, the $1,955-1,950 area is likely to protect the immediate downside ahead of the 200-day Simple Moving Average (SMA), currently near the $1,935 region. This is closely followed by the 100- and the 50-day SMAs confluence, around the $1,928-1,925 zone, below which the Gold price could turn vulnerable and accelerate the fall towards the $1,900 round figure.
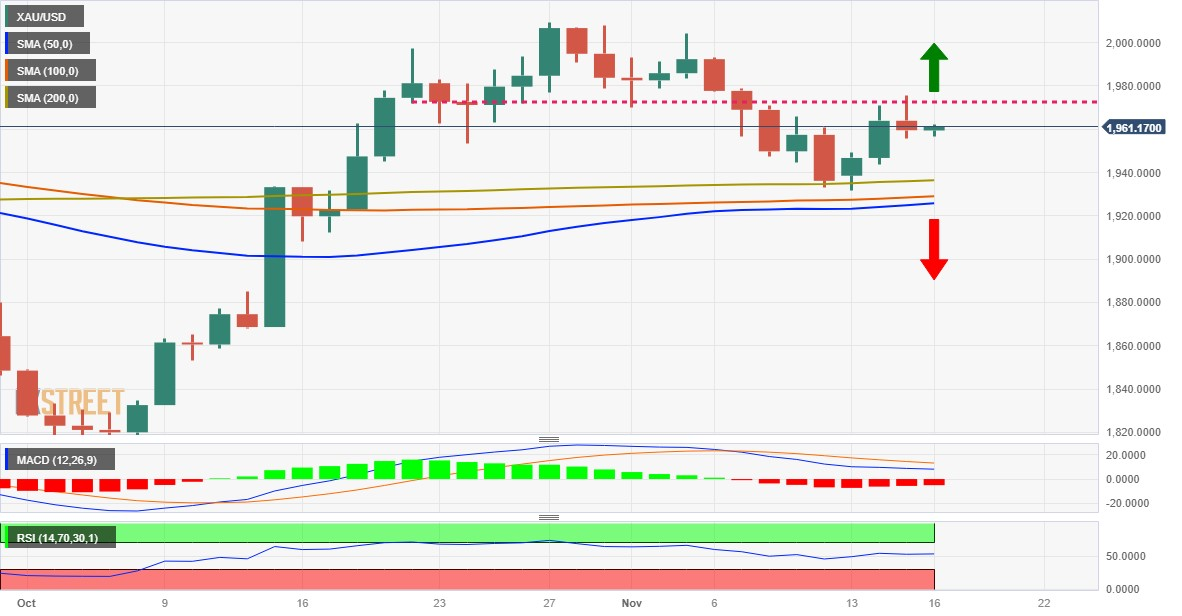
US Dollar price today
The table below shows the percentage change of US Dollar (USD) against listed major currencies today. US Dollar was the weakest against the Japanese Yen.
| USD | EUR | GBP | CAD | AUD | JPY | NZD | CHF | |
| USD | 0.18% | 0.25% | 0.20% | 0.68% | 0.04% | 0.81% | 0.15% | |
| EUR | -0.18% | 0.06% | 0.01% | 0.50% | -0.14% | 0.63% | -0.04% | |
| GBP | -0.25% | -0.06% | -0.04% | 0.45% | -0.20% | 0.58% | -0.10% | |
| CAD | -0.19% | 0.02% | 0.04% | 0.47% | -0.14% | 0.62% | -0.04% | |
| AUD | -0.68% | -0.51% | -0.44% | -0.48% | -0.65% | 0.13% | -0.55% | |
| JPY | -0.03% | 0.13% | 0.19% | 0.17% | 0.65% | 0.78% | 0.10% | |
| NZD | -0.81% | -0.63% | -0.57% | -0.60% | -0.14% | -0.78% | -0.67% | |
| CHF | -0.15% | 0.05% | 0.11% | 0.07% | 0.56% | -0.11% | 0.67% |
The heat map shows percentage changes of major currencies against each other. The base currency is picked from the left column, while the quote currency is picked from the top row. For example, if you pick the Euro from the left column and move along the horizontal line to the Japanese Yen, the percentage change displayed in the box will represent EUR (base)/JPY (quote).
Gold FAQs
Why do people invest in Gold?
Gold has played a key role in human’s history as it has been widely used as a store of value and medium of exchange. Currently, apart from its shine and usage for jewelry, the precious metal is widely seen as a safe-haven asset, meaning that it is considered a good investment during turbulent times. Gold is also widely seen as a hedge against inflation and against depreciating currencies as it doesn’t rely on any specific issuer or government.
Who buys the most Gold?
Central banks are the biggest Gold holders. In their aim to support their currencies in turbulent times, central banks tend to diversify their reserves and buy Gold to improve the perceived strength of the economy and the currency. High Gold reserves can be a source of trust for a country’s solvency. Central banks added 1,136 tonnes of Gold worth around $70 billion to their reserves in 2022, according to data from the World Gold Council. This is the highest yearly purchase since records began. Central banks from emerging economies such as China, India and Turkey are quickly increasing their Gold reserves.
How is Gold correlated with other assets?
Gold has an inverse correlation with the US Dollar and US Treasuries, which are both major reserve and safe-haven assets. When the Dollar depreciates, Gold tends to rise, enabling investors and central banks to diversify their assets in turbulent times. Gold is also inversely correlated with risk assets. A rally in the stock market tends to weaken Gold price, while sell-offs in riskier markets tend to favor the precious metal.
What does the price of Gold depend on?
The price can move due to a wide range of factors. Geopolitical instability or fears of a deep recession can quickly make Gold price escalate due to its safe-haven status. As a yield-less asset, Gold tends to rise with lower interest rates, while higher cost of money usually weighs down on the yellow metal. Still, most moves depend on how the US Dollar (USD) behaves as the asset is priced in dollars (XAU/USD). A strong Dollar tends to keep the price of Gold controlled, whereas a weaker Dollar is likely to push Gold prices up.
- Crude Oil prices weakened on weekly build in US crude stockpiles.
- EIA Crude Oil Stocks Change improved to 3.6M from 0.774M prior.
- China’s oil refinery experienced a slight slowdown, impacting Oil prices.
Western Texas Intermediate (WTI) trades lower near $76.20 per barrel during the Asian session on Thursday, extending the losses for the third successive day. The Crude oil prices face downward pressure due to a larger-than-expected weekly build in US crude stockpiles. EIA Crude Oil Stocks Change for the week ending on Nov 10, improved to 3.6M from 0.774M prior against the 1.793M as expected.
Additionally, the signs of easing demand in China are indeed influencing the negative sentiment surrounding Oil prices. China's oil refinery throughput in October experienced a slight slowdown from the previous month's highs. The data from the National Bureau of Statistics (NBS) indicates that China's total refinery throughput, although still substantial at 15.05 million barrels per day (bpd), reflects a modest decline compared to September's record of 15.48 million bpd.
Crude oil prices have experienced losses for the fourth consecutive week, with investors factoring in a reduced risk premium related to the Israel-Hamas conflict. Moreover, the uncertainty surrounding US Federal Reserve (Fed) interest rates has added to the pressure on Oil markets. The Fed's caution that it could potentially raise rates further this year, despite recent data indicating a decline in inflation, has introduced an element of uncertainty.
The decision by the US to enforce oil sanctions on Iran, reducing Iranian oil exports. President Joe Biden's energy security adviser, Amos Hochstein, conveyed that the enforcement of these sanctions is expected to result in a reduction of more than 1 million bpd of oil exports from Iran. It's noteworthy that this decision is being implemented even as Oil prices continue to experience a downward trend.
- EUR/USD lose ground near 1.0835 on the firmer USD.
- The markets believe that the Federal Reserve (Fed) is done with hiking cycle.
- Eurozone Industrial Production for September declined 1.1% MoM vs 0.6% rise prior.
- European Central Bank (ECB) President Lagarde speech, US weekly Initial Jobless Claims will be closely watched events.
The EUR/USD pair loses traction during the Asian trading hours on Thursday. The renewed US Dollar (USD) demand weigh on EUR/USD. Meanwhile, the US dollar Index edges higher to 104.50 after retreating to multi-month low of 104.00. The major pair currently trades near 1.0835, losing 0.06% on the day.
The US economic data on Wednesday suggested that the US economy cools down and the markets believe that the Federal Reserve (Fed) is done with hiking cycle. The US Producer Price Index (PPI) dropped 0.5% MoM in October from 0.4% increase in September. Additionally, the Retail Sales declined by 0.1% in the same period, against expectations of a fall of 0.3%. The Core Retail Sales rose by 0.2% from the previous reading of 0.6%.
On the Euro front, the Eurozone Industrial Production for September declined 1.1% MoM versus 0.6% rise prior. On the yearly basis, the figure fell 6.9% from the 5.1% decline in the previous reading. This, in turn, exert some selling pressure on the Euro against the Greenback.
Looking ahead, market players will monitor the European Central Bank (ECB) President Lagarde speech later on Thursday. Also, the US weekly Initial Jobless Claims for the week ending November 11 will be due. These figures could give a clear direction to the EUR/USD pair.
- Indian Rupee edges lower on the firmer US Dollar.
- The Reserve Bank of India (RBI) will likely maintain its policy stance in its December meeting.
- US weekly Initial Jobless Claims will be due later on Thursday.
Indian Rupee (INR) trades soft on Thursday amid renewed US Dollar (USD) demand. Nonetheless, the markets anticipate that the US interest rate may have peaked and the Federal Reserve (Fed) will ease policy rates next year. The possibility of a Fed rate cut in the middle of 2024 could drag the US Treasury bond yields lower, which benefits the INR. The Reserve Bank of India (RBI) could maintain its policy stance in its December meeting after October’s inflation data came within the central bank's 2-6% target for the second consecutive month.
Investors will monitor the US weekly Initial Jobless Claims due later on Thursday. In the meantime, the Indian Rupee remains vulnerable to higher crude prices as India is the world's third-biggest oil consumer.
Daily Digest Market Movers: Indian Rupee remains sensitive to the spike in oil prices
- India's trade deficit narrowed to $31.46B in October from $19.37B in September.
- India’s Exports grew by 6.2% to $33.57B in October from $34.47B in September while Imports stood at $65.03B from $53.84B in the previous month. The rise in global crude oil prices increased the country's import cost.
- India's headline retail price inflation declined to 4.9% in October versus 5% prior, a four-month low.
- India’s Wholesale Price Index (WPI) inflation arrived at -0.52% from the previous reading of -0.26%, below the market consensus of -0.20%.
- India’s Consumer Price Index (CPI) rose by 4.87% YoY in October from 5.02% in September, above the market expectation of 4.80%.
- The Reserve Bank of India (RBI) is likely to maintain its hawkish stance at its December monetary policy meeting.
- The US Producer Price Index (PPI) dropped by 0.5% MoM in October from a 0.4% rise in September. The annual PPI figure came in at 1.3% in the same period from 2.2% previously.
- US Retail Sales declined by 0.1% in October versus a 0.9% increase prior, against expectations of a fall of 0.3%.
- Fed fund futures are now pricing no further US rate hikes in this cycle, and have priced in 50% odds of a rate cut by May 2024.
Technical Analysis: The Indian Rupee’s bearish outlook stays intact
The Indian Rupee trades on a softer note on the day. The USD/INR pair has traded within the wider trading range of 82.80-83.35 since September. According to the daily chart, the USD/INR maintains a bullish outlook as the pair holds above the key 100-day Exponential Moving Average (EMA).
The immediate resistance level for the pair is seen near the upper boundary of the trading range of 83.35. Any follow-through buying will see a rally to a year-to-date (YTD) high of 83.47. Further north, the next target to watch is a psychological round figure at 84.00.
On the downside, a low of September 12 at 82.80 acts as an initial support level for USD/INR. A decisive break below 82.80 will see losses extend to a low of August 11 at 82.60. The next contention level is located near a low of August 24 at 82.37.
US Dollar price in the last 7 days
The table below shows the percentage change of US Dollar (USD) against listed major currencies in the last 7 days. US Dollar was the strongest against the Japanese Yen.
| USD | EUR | GBP | CAD | AUD | JPY | NZD | CHF | |
| USD | -1.16% | -0.83% | -0.62% | -0.89% | 0.29% | -1.07% | -1.17% | |
| EUR | 1.15% | 0.33% | 0.54% | 0.27% | 1.42% | 0.09% | -0.02% | |
| GBP | 0.82% | -0.36% | 0.20% | -0.11% | 1.09% | -0.31% | -0.35% | |
| CAD | 0.62% | -0.52% | -0.20% | -0.25% | 0.89% | -0.49% | -0.59% | |
| AUD | 0.91% | -0.23% | 0.09% | 0.30% | 1.19% | -0.20% | -0.28% | |
| JPY | -0.29% | -1.44% | -1.11% | -0.92% | -1.23% | -1.41% | -1.48% | |
| NZD | 1.08% | -0.05% | 0.29% | 0.47% | 0.20% | 1.35% | -0.07% | |
| CHF | 1.17% | 0.03% | 0.37% | 0.57% | 0.26% | 1.47% | 0.11% |
The heat map shows percentage changes of major currencies against each other. The base currency is picked from the left column, while the quote currency is picked from the top row. For example, if you pick the Euro from the left column and move along the horizontal line to the Japanese Yen, the percentage change displayed in the box will represent EUR (base)/JPY (quote).
Indian Rupee FAQs
What are the key factors driving the Indian Rupee?
The Indian Rupee (INR) is one of the most sensitive currencies to external factors. The price of Crude Oil (the country is highly dependent on imported Oil), the value of the US Dollar – most trade is conducted in USD – and the level of foreign investment, are all influential. Direct intervention by the Reserve Bank of India (RBI) in FX markets to keep the exchange rate stable, as well as the level of interest rates set by the RBI, are further major influencing factors on the Rupee.
How do the decisions of the Reserve Bank of India impact the Indian Rupee?
The Reserve Bank of India (RBI) actively intervenes in forex markets to maintain a stable exchange rate, to help facilitate trade. In addition, the RBI tries to maintain the inflation rate at its 4% target by adjusting interest rates. Higher interest rates usually strengthen the Rupee. This is due to the role of the ‘carry trade’ in which investors borrow in countries with lower interest rates so as to place their money in countries’ offering relatively higher interest rates and profit from the difference.
What macroeconomic factors influence the value of the Indian Rupee?
Macroeconomic factors that influence the value of the Rupee include inflation, interest rates, the economic growth rate (GDP), the balance of trade, and inflows from foreign investment. A higher growth rate can lead to more overseas investment, pushing up demand for the Rupee. A less negative balance of trade will eventually lead to a stronger Rupee. Higher interest rates, especially real rates (interest rates less inflation) are also positive for the Rupee. A risk-on environment can lead to greater inflows of Foreign Direct and Indirect Investment (FDI and FII), which also benefit the Rupee.
How does inflation impact the Indian Rupee?
Higher inflation, particularly, if it is comparatively higher than India’s peers, is generally negative for the currency as it reflects devaluation through oversupply. Inflation also increases the cost of exports, leading to more Rupees being sold to purchase foreign imports, which is Rupee-negative. At the same time, higher inflation usually leads to the Reserve Bank of India (RBI) raising interest rates and this can be positive for the Rupee, due to increased demand from international investors. The opposite effect is true of lower inflation.
- USD/CAD snaps a two-day losing streak on improved Greenback.
- Weaker Crude Oil prices are weighing on the Canadian Dollar.
- US Dollar gains ground, driven by investors possibly adopting a cautious stance.
USD/CAD recovers recent losses registered in the previous two sessions, trading higher near 1.3700 during the Asian session Thursday. The USD/CAD pair receives upward support, propelled by the strengthened US Dollar (USD), which could be attributed to possible risk-on sentiment. Additionally, the decline in Crude Oil prices contributes to this movement, especially considering Canada's status as the largest oil exporter to the United States (US).
The USD/CAD pair experienced losses after the economic data was released from the United States (US) on Wednesday. The US Producer Price Index (PPI) unexpectedly declined by 0.5% compared to the anticipated 0.1% increase. The annual PPI also dropped from 2.2% to 1.3%.
These figures align with the softer inflation highlighted by Tuesday's inflation data. This alignment increases the likelihood of the US Federal Reserve (Fed) refraining from implementing an interest rate hike in the December meeting.
On Canada’s side, the declines in Crude Oil prices are bolstering the strength of the USD/CAD pair. West Texas Intermediate (WTI) Oil price trades lower near $76.10 per barrel at the time of writing.
Additionally, stronger Canada’s economic data could have provided support for the Canadian Dollar (CAD). Manufacturing Sales (MoM) showed an increase of 0.4% against the expected decline of 0.1% in September. Wholesale Sales month-over-month also improved to 0.4% from 1.8%.
Investors will focus now on weekly US Jobless Claims on Thursday, seeking further impetus on the condition of the US labor market. Canada’s Housing Starts (YoY) will also be eyed.
- Silver snaps a three-day winning streak to a near four-week high touched on Wednesday.
- The technical setup seems tilted in favour of bulls and should help limit any further losses.
- Bulls still need to wait for a move beyond the $23.60-70 barrier before placing fresh bets.
Silver (XAG/USD) meets with some supply during the Asian session on Thursday and moves further away from a near four-week high touched the previous day. The white metal currently trades around the $23.30 area, down over 0.50% for the day, and for now, seems to have snapped a three-day winning streak.
From a technical perspective, the overnight close above the very important 200-day Simple Moving Average (SMA) could be seen as a fresh trigger for bullish traders. Moreover, oscillators on the daily chart have just started gaining positive traction and add credence to the constructive outlook. That said, failure to break through the $23.60-$23.70 horizontal barrier prompts some long-unwinding on Thursday.
Hence, it will be prudent to wait for strong follow-through buying and acceptance above the aforementioned hurdle before positioning for an extension of this week's bounce from sub-$22.00 levels, or the monthly low. The XAG/USD might then climb further towards reclaiming the $24.00 mark en route to the $24.20-$24.25 intermediate resistance, before making a fresh attempt to conquer the $25.00 psychological mark.
On the flip side, any further decline below the $23.00 mark could attract fresh buying and remain limited near the $22.35-$22.30 area, This is followed by the $22.00 mark, which if broken decisively will shift the near-term bias back in favour of bearish traders. Some follow-through selling below the $21.85 region, or the monthly low, will reaffirm the negative outlook and drag the XAG/USD towards the $21.35-$21.30 support.
The downward trajectory could get extended further below the $21.00 round figure, towards challenging the multi-month low, around the $20.70-$20.65 area touched in October.
Silver daily chart
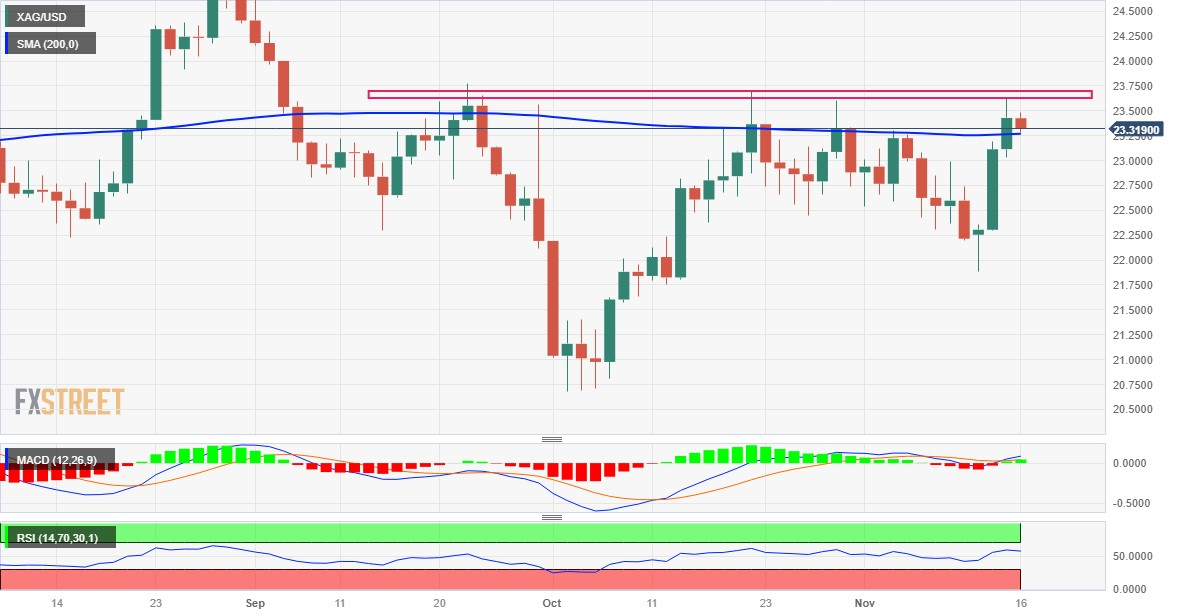
Technical levels to watch
| Raw materials | Closed | Change, % |
|---|---|---|
| Silver | 23.437 | 1.49 |
| Gold | 1959.436 | -0.17 |
| Palladium | 1030.6 | 2.02 |
- USD/JPY meets with some supply on Thursday and reverses a part of the overnight strong move up.
- Intervention fears, along with the cautious mood, underpin the JPY and exert pressure on the major.
- The Fed-BoJ policy divergence should continue to act as a tailwind for the pair and help limit losses.
The USD/JPY pair struggles to capitalize on the previous day's rally of around 140 pips from the 150.00 psychological mark, or over a one-week low and edges lower during the Asian session on Thursday. Spot prices currently trade around the 151.15 area, down nearly 0.15% for the day, though any meaningful downfall seems elusive.
The US Dollar (USD) looks to build on the overnight recovery move from its lowest since September 1 amid the uncertainty over the Federal Reserve's (Fed) next policy move, which, in turn, should act as a tailwind for the USD/JPY pair. The softer US CPI report released on Tuesday showed that consumer inflation was cooling faster than anticipated and reaffirmed expectations that the Fed is done raising interest rates. That said, the pace of inflation remains well above the 2% target and keeps hopes alive that the US central bank will stick to its hawkish stance.
In contrast, the Bank of Japan (BoJ) is the only major central bank in the world to maintain negative interest rates and so far, has shown no signs of moving away from decades of unprecedented easing measures. Furthermore, the dismal domestic GDP report released on Wednesday, showing that the economy contracted for the first time in three quarters, should allow the BoJ to delay any policy shift away from its massive monetary easing stance. This, in turn, could undermine the Japanese Yen (JPY) and contribute to limiting losses for the USD/JPY pair.
That said, a mildly softer tone around the US equity futures, along with speculations that Japanese authorities could intervene in the FX market to combat any sustained depreciation of the domestic currency, could lend support to the safe-haven JPY. This, in turn, might continue to act as a headwind for the USD/JPY pair. The mixed fundamental backdrop, meanwhile, warrants some caution before placing aggressive directional bets. Traders now look to the US economic docket, featuring Weekly Initial Jobless Claims, the Philly Fed Manufacturing Index and Industrial Production figures.
Technical levels to watch
- Australian Dollar remains below 0.6500 despite a solid increase in new jobs in the country.
- Australia’s Employment Change increased to 55K in October; the Unemployment Rate rose by 3.7% as expected.
- US PPI unexpectedly declined by 0.5% compared to the expected increase of 0.1%.
- China’s House Price Index declined by 0.38% in October, indicating a worsening condition in the property sector.
The Australian Dollar (AUD) floats below the 0.6500 psychological level with a negative bias on Thursday despite the stronger Australian Employment Change. The seasonally adjusted data reported an increase of 55K in October, compared with the market anticipation of 20K and 6.7K in the previous month.
Australia’s Unemployment Rate came in at 3.7% in October as expected against the previous figure of 3.6%. However, the AUD/USD pair experienced volatility in the previous session after the economic data was released from the United States (US) on Wednesday.
US Producer Price Index (PPI) took an unexpected turn in October, declining by 0.5% against the anticipated 0.1% increase. The annual rate also witnessed a drop from 2.2% to 1.3%. These figures align with the softer inflation indicated by Tuesday's US Consumer Price Index (CPI) data.
The report from the US Bureau of Labor Statistics indicated a more significant slowdown in US inflation than originally anticipated. This unexpected deceleration triggered a notable decline in the US Dollar (USD) value.
Adding to the economic landscape, US Retail Sales declined by 0.1% in October, defying expectations of a steeper slide of 0.3%. Investors' focus shifts to weekly Jobless Claims on Thursday.
China’s House Price Index declined by 0.38% in October compared to the previous decline of 0.1%, indicating a worsening condition in the country's property sector.
Daily Digest Market Movers: Australian Dollar weakens amid mixed Aussie jobs data
- Australia’s Wage Price Index grew 1.3% as expected compared to the previous reading of 0.8%. The year-over-year data showed an increase of 4.0% more than the anticipated 3.9%.
- Australia’s Westpac Consumer Confidence declined by 2.6% in November, swinging from the previous growth of 2.9%.
- RBA Assistant Governor (Economic) Marion Kohler stated that the decline in inflation is expected to be slower than initially anticipated. This is attributed to the persistent high level of domestic demand and robust pressures from labor and other costs. Kohler emphasized the need for a tighter policy to address the challenges posed by elevated inflation.
- Economists at the National Australia Bank (NAB) anticipate another 25 basis points hike in February following the Q4 inflation data. Additionally, NAB believes rate cuts will unlikely commence until November 2024.
- China's Industrial Production (YoY) showed growth at 4.6% in October, a slight increase from the previous 4.5%, contrary to expectations of consistency. Retail Sales year-over-year saw an uptick to 7.6%, surpassing the anticipated 7.0%.
- The US Consumer Price Index (CPI) for October showed lower readings than expected, with the annual rate slowing from 3.7% to 3.2%, falling below the consensus forecast of 3.3%. The monthly CPI reduced to 0.0% from 0.4%.
- The US Core CPI rose by 0.2% below the expectations of 0.3%, and the annual rate decreased to 4.0% from 4.1% prior.
- US Monthly Budget Statement reported a deficit of $67B in October, compared to the expected deficit of $65B.
Technical Analysis: Australian Dollar remains below the 0.6500 major level lined up with the 38.2% Fibonacci retracement
The Australian Dollar trades around the 0.6490 level on Thursday, in line with immediate resistance at the psychological level of 0.6500. The next resistance levels include the 38.2% Fibonacci retracement at 0.6508 and the 50% Fibonacci retracement at 0.6582. On the downside, the AUD/USD pair may find support at the 14-day Exponential Moving Average (EMA) at 0.6429, followed by the major support level at 0.6400.
AUD/USD: Daily Chart
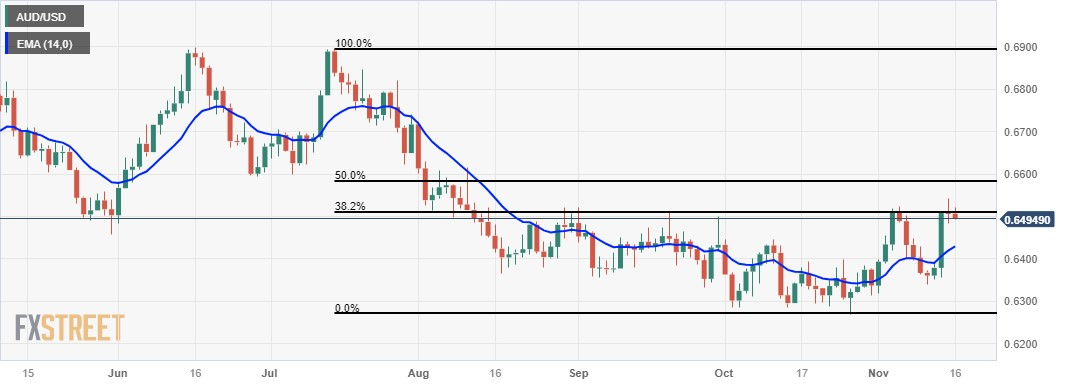
Australian Dollar price today
The table below shows the percentage change of Australian Dollar (AUD) against listed major currencies today. Australian Dollar was the weakest against the Japanese Yen.
| USD | EUR | GBP | CAD | AUD | JPY | NZD | CHF | |
| USD | 0.09% | 0.12% | 0.09% | 0.36% | -0.05% | 0.56% | 0.08% | |
| EUR | -0.08% | 0.04% | 0.01% | 0.27% | -0.14% | 0.47% | -0.01% | |
| GBP | -0.11% | -0.02% | -0.01% | 0.24% | -0.17% | 0.46% | -0.04% | |
| CAD | -0.09% | 0.04% | 0.02% | 0.24% | -0.14% | 0.46% | -0.01% | |
| AUD | -0.34% | -0.25% | -0.23% | -0.25% | -0.40% | 0.21% | -0.27% | |
| JPY | 0.06% | 0.13% | 0.15% | 0.17% | 0.41% | 0.60% | 0.12% | |
| NZD | -0.55% | -0.46% | -0.44% | -0.44% | -0.21% | -0.61% | -0.49% | |
| CHF | -0.08% | 0.02% | 0.05% | 0.03% | 0.28% | -0.13% | 0.48% |
The heat map shows percentage changes of major currencies against each other. The base currency is picked from the left column, while the quote currency is picked from the top row. For example, if you pick the Euro from the left column and move along the horizontal line to the Japanese Yen, the percentage change displayed in the box will represent EUR (base)/JPY (quote).
Australian Dollar FAQs
What key factors drive the Australian Dollar?
One of the most significant factors for the Australian Dollar (AUD) is the level of interest rates set by the Reserve Bank of Australia (RBA). Because Australia is a resource-rich country another key driver is the price of its biggest export, Iron Ore. The health of the Chinese economy, its largest trading partner, is a factor, as well as inflation in Australia, its growth rate and Trade Balance. Market sentiment – whether investors are taking on more risky assets (risk-on) or seeking safe-havens (risk-off) – is also a factor, with risk-on positive for AUD.
How do the decisions of the Reserve Bank of Australia impact the Australian Dollar?
The Reserve Bank of Australia (RBA) influences the Australian Dollar (AUD) by setting the level of interest rates that Australian banks can lend to each other. This influences the level of interest rates in the economy as a whole. The main goal of the RBA is to maintain a stable inflation rate of 2-3% by adjusting interest rates up or down. Relatively high interest rates compared to other major central banks support the AUD, and the opposite for relatively low. The RBA can also use quantitative easing and tightening to influence credit conditions, with the former AUD-negative and the latter AUD-positive.
How does the health of the Chinese Economy impact the Australian Dollar?
China is Australia’s largest trading partner so the health of the Chinese economy is a major influence on the value of the Australian Dollar (AUD). When the Chinese economy is doing well it purchases more raw materials, goods and services from Australia, lifting demand for the AUD, and pushing up its value. The opposite is the case when the Chinese economy is not growing as fast as expected. Positive or negative surprises in Chinese growth data, therefore, often have a direct impact on the Australian Dollar and its pairs.
How does the price of Iron Ore impact the Australian Dollar?
Iron Ore is Australia’s largest export, accounting for $118 billion a year according to data from 2021, with China as its primary destination. The price of Iron Ore, therefore, can be a driver of the Australian Dollar. Generally, if the price of Iron Ore rises, AUD also goes up, as aggregate demand for the currency increases. The opposite is the case if the price of Iron Ore falls. Higher Iron Ore prices also tend to result in a greater likelihood of a positive Trade Balance for Australia, which is also positive of the AUD.
How does the Trade Balance impact the Australian Dollar?
The Trade Balance, which is the difference between what a country earns from its exports versus what it pays for its imports, is another factor that can influence the value of the Australian Dollar. If Australia produces highly sought after exports, then its currency will gain in value purely from the surplus demand created from foreign buyers seeking to purchase its exports versus what it spends to purchase imports. Therefore, a positive net Trade Balance strengthens the AUD, with the opposite effect if the Trade Balance is negative.
On Thursday, the People’s Bank of China (PBoC) set the USD/CNY central rate for the trading session ahead at 7.1724 as compared to the previous day's fix of 7.1752 and 7.2474 Reuters estimates.
- GBP/USD struggles to gain any meaningful traction and oscillates in a range on Thursday.
- Bets that the Fed is done raising rates cap the USD recovery and lend support to the pair.
- Expectations that the BoE will start cutting rates in 2024 act as a headwind for the GBP.
The GBP/USD pair consolidates the overnight rejection slide from the 100-day Simple Moving Average (SMA), around the 1.2500 psychological mark, or a two-month top, and oscillates in a narrow band during the Asian session on Thursday. Spot prices, meanwhile, manage to hold above the 1.2400 round figure and remain at the mercy of the US Dollar (USD) price dynamics.
The USD Index (DXY), which tracks the Greenback against a basket of currencies, struggles to capitalize on the previous day's modest recovery from its lowest level since September 1 amid dovish Federal Reserve (Fed) expectations. The bets were lifted by the softer US CPI report released on Tuesday, which showed consumer inflation was cooling faster than anticipated. Moreover, the markets are now pricing in a greater chance that the Fed will start cutting rates during the first half of 2024, which keeps the US Treasury bond yields depressed and acts as a headwind for the Greenback.
Apart from this, the prevalent risk-on environment is seen as another factor undermining the safe-haven buck and lending some support to the GBP/USD pair. The upside, however, remains capped in the wake of growing acceptance that the Bank of England (BoE) will soon start cutting interest rates, bolstered by softer UK consumer inflation figures on Wednesday. In fact, the headline UK CPI was flat on a monthly basis and the yearly rate decelerated sharply from 6.7% to 4.6% in October – hitting a two-year low. Moreover, the Core CPI also fell to 5.7% from 6.1% in September.
The aforementioned mixed fundamental backdrop warrants some caution for aggressive traders and before positioning for a firm near-term direction in the absence of any relevant macro data from the UK on Thursday. The US economic docket, meanwhile, features the usual Weekly Initial Jobless Claims, the Philly Fed Manufacturing Index and Industrial Production figures. This, along with the US bond yields and the broader risk sentiment, might influence the USD price dynamics and allow traders to grab short-term opportunities around the GBP/USD pair.
Technical levels to watch
- NZD/USD trades in positive territory for three straight days on Thursday.
- House prices in New Zealand dropped marginally in October, while sales activity has been steadily increasing since 2022.
- US PPI declined 0.5% MoM in October vs. 0.4% prior, Retail Sales dropped by 0.1% from a fall of 0.3%.
The NZD/USD pair holds positive ground for the third consecutive day during the early Asian trading hours on Thursday. The stronger Chinese Industrial Production and Retail Sales on Wednesday boosted the China-proxy New Zealand Dollar (NZD). At press time, NZD/USD is trading around 0.6029, gaining 0.12% on the day.
The Reserve Bank of New Zealand (RBNZ) will have a monetary policy meeting on November 29. The market anticipates that RBNZ will leave the Official Cash Rate at 5.5% and signal the possibility of additional rate hikes next year. On Thursday, house prices in New Zealand dropped marginally in October, while sales activity has been steadily increasing since 2022.
On the other hand, traders have walked away from expectations for Federal Reserve (Fed) hikes and have priced in 50% odds of a rate cut by May 2024. This, in turn, weighs on the US Dollar (USD) and acts as a tailwind for the NZD/USD pair.
About the data, the US Producer Price Index (PPI) declined 0.5% MoM in October from a 0.4% rise in the previous reading, worse than the market estimation of a 0.1% increase. The annual PPI figure arrived at 1.3% in the same period from 2.2% in September. Finally, the Retail Sales dropped by 0.1% in October, against expectations of a fall of 0.3%.
Looking forward, the US weekly Initial Jobless Claims will be due on Thursday. On Friday, New Zealand’s Producer Price Index-Input for the third quarter (Q3) will be released. Traders will take cues from these figures and find trading opportunity around the NZD/USD pair.
The Australia’s Unemployment Rate came in at 3.7% in October, compared with the expectations of 3.7% and the previous figure of 3.6%, according to the official data released by the Australian Bureau of Statistics (ABS) on Thursday.
Furthermore, the Australian Employment Change arrived at 55K in October, compared with the consensus forecast of 20K and 6.7K jobs addition seen in September.
Market reaction
At the time of press, the AUD/USD pair was up 0.05% on the day at 0.6510.
| Index | Change, points | Closed | Change, % |
|---|---|---|---|
| NIKKEI 225 | 823.77 | 33519.7 | 2.52 |
| Hang Seng | 682.14 | 18079 | 3.92 |
| KOSPI | 53.42 | 2486.67 | 2.2 |
| ASX 200 | 99.2 | 7105.9 | 1.42 |
| DAX | 133.74 | 15748.17 | 0.86 |
| CAC 40 | 23.93 | 7209.61 | 0.33 |
| Dow Jones | 163.51 | 34991.21 | 0.47 |
| S&P 500 | 7.18 | 4502.88 | 0.16 |
| NASDAQ Composite | 9.46 | 14103.84 | 0.07 |
| Pare | Closed | Change, % |
|---|---|---|
| AUDUSD | 0.65079 | 0.02 |
| EURJPY | 164.178 | 0.47 |
| EURUSD | 1.08465 | -0.28 |
| GBPJPY | 187.928 | 0.1 |
| GBPUSD | 1.24151 | -0.63 |
| NZDUSD | 0.6022 | 0.28 |
| USDCAD | 1.36836 | 0.01 |
| USDCHF | 0.88811 | -0.09 |
| USDJPY | 151.372 | 0.73 |


© 2000-2026. Уcі права захищені.
Cайт знаходитьcя під керуванням TeleTrade DJ. LLC 2351 LLC 2022 (Euro House, Richmond Hill Road, Kingstown, VC0100, St. Vincent and the Grenadines).
Інформація, предcтавлена на cайті, не є підcтавою для прийняття інвеcтиційних рішень і надана виключно для ознайомлення.
Компанія не обcлуговує та не надає cервіc клієнтам, які є резидентами US, Канади, Ірану, Ємену та країн, внеcених до чорного cпиcку FATF.
Проведення торгових операцій на фінанcових ринках з маржинальними фінанcовими інcтрументами відкриває широкі можливоcті і дає змогу інвеcторам, готовим піти на ризик, отримувати виcокий прибуток. Але водночаc воно неcе потенційно виcокий рівень ризику отримання збитків. Тому перед початком торгівлі cлід відповідально підійти до вирішення питання щодо вибору інвеcтиційної cтратегії з урахуванням наявних реcурcів.
Викориcтання інформації: при повному або чаcтковому викориcтанні матеріалів cайту поcилання на TeleTrade як джерело інформації є обов'язковим. Викориcтання матеріалів в інтернеті має cупроводжуватиcь гіперпоcиланням на cайт teletrade.org. Автоматичний імпорт матеріалів та інформації із cайту заборонено.
З уcіх питань звертайтеcь за адреcою pr@teletrade.global.
переклади