- Аналітика
- Новини та інструменти
- Новини ринків
Новини ринків
- USD/CHF gains momentum around the 0.8800 mark, bolstered by the strengthening of the Dollar.
- The FOMC Minutes emphasised that inflation remained unacceptably high.
- The American bipartisans support imposing higher tariffs on Chinese imports.
- Investors await the US weekly Initial Jobless Claim, the Philadelphia Fed Manufacturing Survey (Aug) due on Thursday.
The USD/CHF pair edges higher to the 0.8800 area during the early Asian trading hours on Thursday. Meanwhile, the US Dollar Index (DXY), a measure of the value of USD against six other major currencies, extends its upside above 103.45, the highest level since June.
The minutes of July’s meeting of the Federal Open Market Committee (FOMC), The report emphasised that inflation remained unacceptably high. The Fed official saw significant inflationary risks, and it may need additional tightening of monetary policy to bring inflation to the longer-run target.
The economic data released on Wednesday showed that the US Industrial Production increased 1.0% in July, beating market expectations of 0.3% and a prior decrease of 0.8%. In July, Building Permits increased from 1.44 million to 1.44 million, while Housing Starts increased from 1.39 million in June to 1.45 million, exceeding expectations of 1.48 million. Both the Change in Building Permits and the Change in Housing Starts exceeded both market expectations and prior readings. The US Dollar gains momentum across the board, supported by the hawkish statement by FOMC and the upbeat US data.
The Swiss Federal Statistical Office reported on Tuesday that Producer and Import Prices YoY for July came in at -0.6%, against the expectation of 0.5%. On a monthly basis, the figure contracted at 0.1% versus 0% prior. According to Bloomberg, the Swiss National Bank (SNB) will hike interest rates by 25 basis points (bps) to 2% in its September meeting.
On Wednesday, the American bipartisans supported imposing higher tariffs on Chinese imports and believed that the US must intensify preparations for military threats from China, according to a new Reuters/Ipsos survey. The renewed tension between the US and China might benefit the safe-haven Swiss Franc and act as a headwind for the USD/CHF pair.
In the absence of any relevant market-moving economic releases from Switzerland, the USD/CHF pair remains at the mercy of USD price dynamics. The US weekly Initial Jobless Claims for the week ending August 11 and the Philadelphia Fed Manufacturing Survey for August will be due in the American session. Traders will also focus on the US-China tension headlines for fresh cues.
- USD/CAD grinds at the highest level in 11 weeks as bulls take a breather after three-day uptrend.
- Overbought RSI (14) line, 1.5-month-long rising trend line prod buyers but 200-DMA puts a floor under Loonie prices.
- Horizontal resistance area from late February, 10-month-old falling resistance line add to upside filters.
USD/CAD seesaws around the highest level since early June, marked the previous day, as bulls jostle with the key upside hurdle amid overbought RSI conditions. Even so, the Loonie pair defends the early-week breakout of the 200-DMA while flirting with the 1.3530-35 amid Thursday’s Asian session, after a three-day uptrend.
That said, an upward-sloping resistance line from July 07 restricts the immediate USD/CAD upside near 1.3540 as the overbought RSI and the lack of major data/events check the Loonie pair buyers.
However, a sustained upside break of the 200-DMA and the bullion MACD signals keep the buyers hopeful unless the quote drops below 1.3450 DMA support.
Even if the quote breaks the stated 1.3450 support, the early July swing high of around 1.3385 and late 2022 bottom surrounding 1.3325 may prod the USD/CAD bears.
It’s worth mentioning that a nine-month-old falling support line, close to 1.3085 at the latest, will challenge the quote’s weakness past 1.3325.
On the flip side, a daily closing beyond the immediate 1.3450 hurdle could quickly direct the USD/CAD buyers toward a horizontal area comprising multiple levels marked since late February around 1.3655–65.
Following that, a descending resistance line from October 2022, around 1.3690 by the press time, will challenge the Loonie pair buyers.
USD/CAD: Daily chart
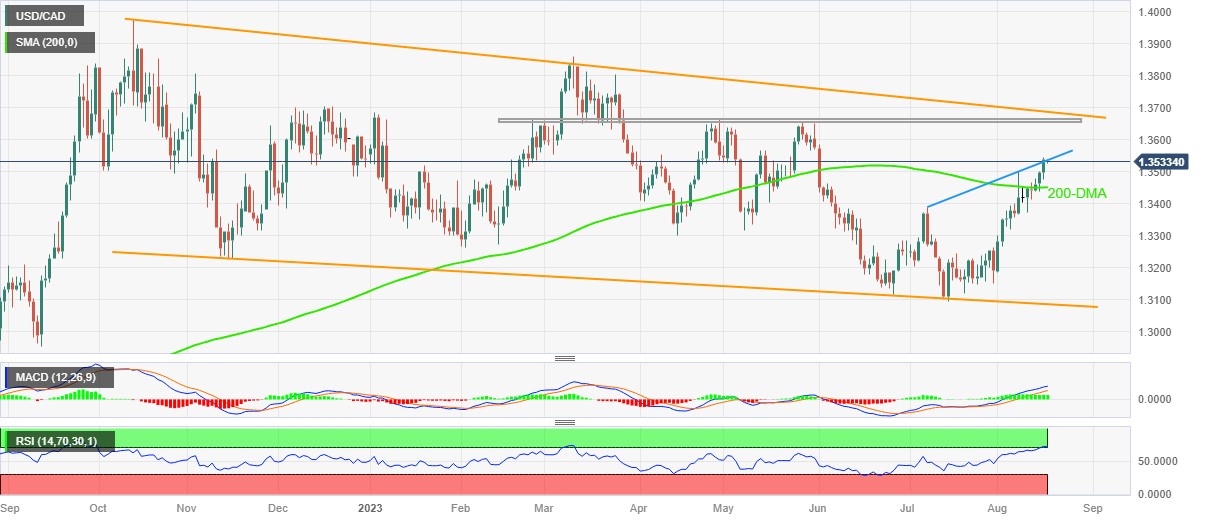
Trend: Pullback expected
- AUD/JPY trades near the week’s lows, with a potential move toward the bottom of the Ichimoku Cloud (Kumo).
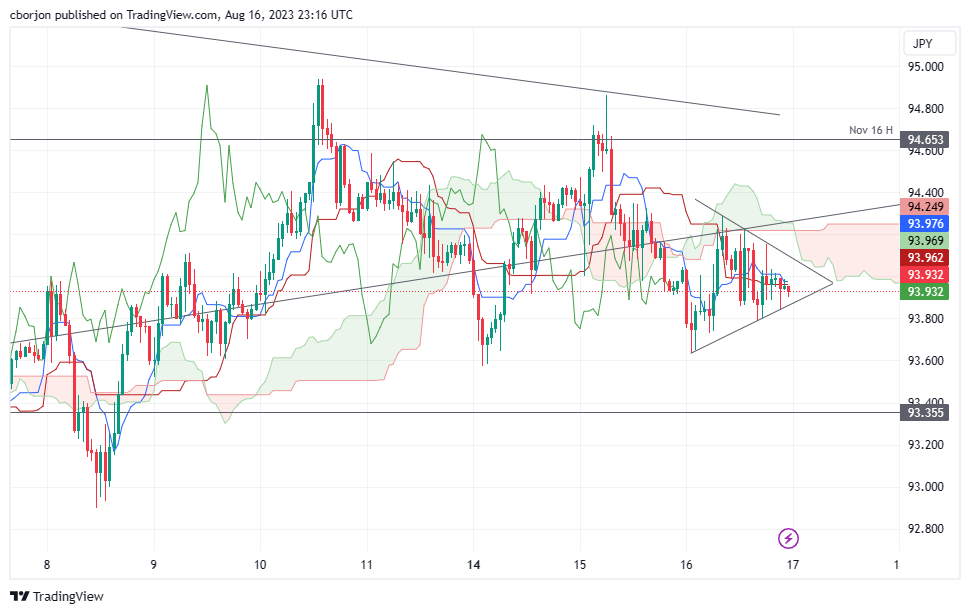
- Tenkan and Kijun-Sen lines set immediate resistance levels at 93.95 and 93.97, respectively.
- Descending triangle formation on the hourly chart suggests potential for further downside.
- AUD/JPY key support levels to watch: 93.79, 93.63, and 92.89.
AUD/JPY sits near the week’s lows and threatens to extend its losses toward the bottom of the Ichimoku Cloud (Kumo) as Thursday’s Asian session begins. At the time of writing, the AUD/JPY is exchanging hands at 93.97, registering minuscule losses of 0.03%.
AUD/JPY Price Analysis: Technical outlook
The AUD/JPY daily chart portrays the pair neutral-bearish, set to stay within the Kumo amid the lack of a catalyst that could trigger a downward break. The AUD/JPY remains in a downward mode after achieving successive series of lower highs and lower lows, seeing as a sign of a downtrend. Unless buyers reclaim the July 31 daily high of 95.82, the AUD/JPY pair could test the bottom of the Kumo at 93.40.
Short term, the AUD/JPY hourly chart portrays the pair as bearish biased, as price action lies below the Kumo. In addition, the Tenkan and Kijun-Sen lines lie above the spot price, acting as resistance levels, each at 93.95 and 93.97.
Nevertheless, from a pure price action point of view, the AUD/JPY is forming a descending triangle, which could pave the way for further losses. A breach of the bottom trendline will expose 93.79 as the first support, followed by the August 16 daily low of 93.63. Once those levels are cleared, the next support would emerge at an August 8 daily low of 92.89.
AUD/JPY Price Action – Hourly chart
- Gold Price recovers from the lowest level in five months but lack follow-through.
- US Dollar cheers hawkish Federal Reserve Minutes before the yields prod buyers, underpinning corrective bounce of XAU/USD.
- China woes join Fitch Ratings’ downward revision of growth forecasts for 10 developed economies to prod Gold buyers.
- Fed concerns, China headlines and mid-tier US data eyed for fresh impulse about XAU/USD.
Gold Price (XAU/USD) prods a three-day losing streak while posting a corrective bounce from the lowest level since mid-March. In doing so, the XAU/USD cheers the latest inaction of the US Treasury bond yields, as well as the US Dollar, to recover from $1,891 to $1,894 amid the early hours of Thursday’s Asian session. That said, the Federal Reserve (Fed) Minutes underpinned a run-up in the Greenback that drowned the bullion prices to the multi-day low a few hours back. It’s worth noting, however, that the technical and fundamentals both flag doubts about the latest Gold Price recovery amid a lack of major supportive catalysts, except for the recently lackluster US Treasury bond yields.
Gold Price rebound amid market consolidation
Gold Price prints the first daily gains, so far, in four as it bounces off the five-month low. It’s worth noting that the XAU/USD’s latest corrective bounce could best be considered a consolidation amid an absence of major data/events that could have supported the move. On the contrary, many negatives from the US Federal Reserve, United States data and China prod the Gold buyers, not to forget the fears of the slowing growth in top-tier economies.
Among the key negatives, the Monetary Policy Meeting Minutes of the Federal Open Market Committee’s (FOMC) July 25-26 meeting recently drowned the Gold Price by highlighting the discussion on the inflation pressure, despite marking a division on the rate hike. That said, the Minutes also conveyed that most policymakers preferred supporting the battle again the ‘sticky’ inflation.
Elsewhere, mostly firmer United States data also underpinned the XAU/USD’s fall to the previous day. That said, the US Industrial Production marked a surprise 1.0% growth for July versus 0.3% expected and -0.8% prior while the Capacity Utilization for the said month also improved to 79.3% from 78.6%, compared to market forecasts of 79.1%. Further, the Building Permits edged higher to 1.442M for July from 1.441M whereas the Housing Starts rose to 1.452M for the said month versus 1.398M prior and 1.448M expected. It’s worth noting that both the Building Permits Change and Housing Starts Change improved more than market forecasts and previous readings. Previously, the US Retail Sales grew 0.7% MoM in July versus 0.4% expected and 0.3% reported in June (revised from 0.2%) and suggested strong consumer spending, mainly due to improved wages, which in turn favored the US Dollar to stay firmer amid early weekdays.
Furthermore, the growing fears from China, one of the biggest Gold customers, join the chatters about the softer growth in developed economies, backed by the global rating agency Fitch Ratings, weigh on the sentiment. The same defends the US Dollar bulls and challenges the XAU/USD rebound.
It’s worth noting that the recent downbeat closing of Wall Street and the firmer US Treasury bond yields, despite the latest retreat from the yearly high by the 10-year benchmark, question the Gold buyers.
China, Fed concerns eyed for XAU/USD directions
Given the light calendar ahead, Gold traders should pay attention to headlines surrounding China’s economic growth, as well as the Fed talks, for clear directions. Also important will be the US weekly jobless claims and Philadelphia Fed Manufacturing Survey for August.
Also read: Gold Price Forecast: XAU/USD pierces $1,900 ahead of FOMC Minutes
Gold Price Technical Analysis
Gold Price stays on the bear’s radar despite the latest corrective bounce from the bottom line of a three-week-long descending trend channel.
It’s worth noting that the nearly oversold conditions of the Relative Strength Index (RSI) line, placed at 14, underpins the XAU/USD’s bottom-picking as the Moving Average Convergence and Divergence (MACD) indicator signals the trader’s indecision.
With this, a slight recovery in the Gold Price toward a downward-sloping resistance line from July 31, close to $1,906, can’t be ruled out. However, the XAU/USD buyers remain off the table unless witnessing a clear upside break of the stated channel’s top line, close to $1,930 by the press time.
Even so, the 200-SMA hurdle surrounding $1,942 acts as the final defense of the Gold bears.
Meanwhile, a horizontal area comprising the lows marked since late June near the $1,896-93 zone, as well as the stated channel’s bottom line near $1,890, puts a floor under the Gold Price.
In a case where the XAU/USD remains bearish past $1,890, the odds of witnessing a slump toward an early March swing high of around $1,858 can’t be ruled out.
Gold Price: Four-hour chart
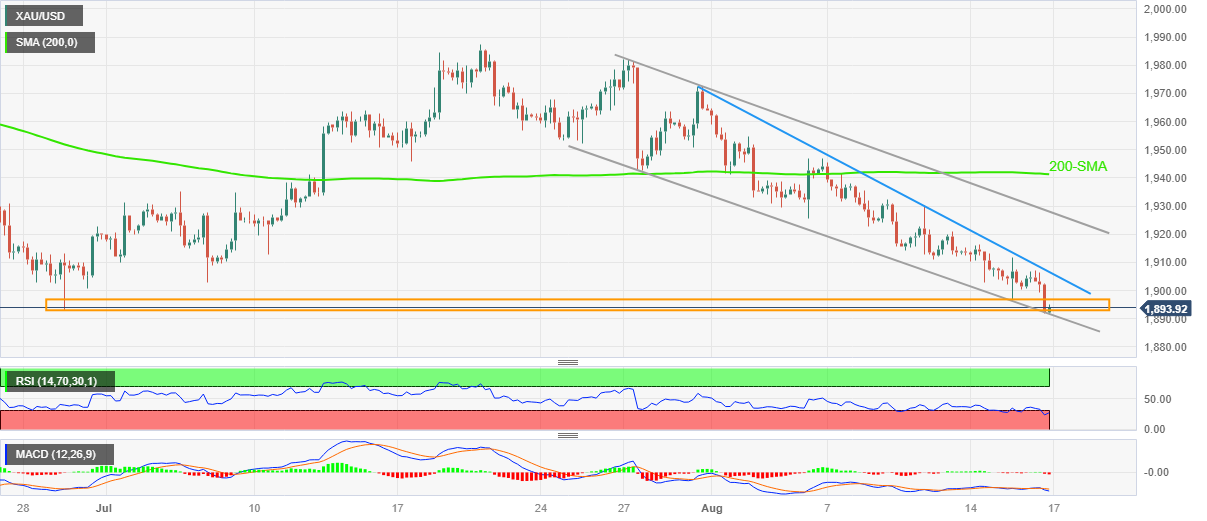
Trend: Limited recovery expected
- NZD/USD extends its downside, currently trades near 0.5938 in the early Asian session.
- RBNZ Governor Adrian Orr also offered a hawkish signal to rein in rising inflation expectations.
- Federal Reserve (Fed) official saw significant inflationary risks, additional tightening of monetary policy may be required.
- Market players will keep an eye on the US weekly jobless claims, Philadelphia Fed Manufacturing Survey.
The NZD/USD pair loses ground and breaks below the 0.5650 area during the early Asian session on Thursday. The pair trades in negative territory for the seventh consecutive day after retreating from a weekly high of 0.5993. NZD/USD currently trades around 0.5938, up 0.02% on the day.
The Reserve Bank of New Zealand (RBNZ) kept the benchmark interest rates unchanged at 5.5%, as expected on Wednesday. According to the World Interest Rate Possibilities Tool (WIRP), markets anticipate that RBNZ will not hike additional rates and will begin to ease in H2 2024.
Earlier on Thursday, RBNZ Governor Adrian Orr also offered a hawkish signal to rein in rising inflation expectations. Orr stated that the drivers of inflation have changed over time, but they have all been skewed towards higher inflation than otherwise.
The latest data from Statistics New Zealand showed that the Q2 Producer Price Index Input QoQ came in at -0.2% versus 0.2% prior. On the same line, the output figure declined to 0.2%, worse than the 0.7% expected and the previous reading of 0.3%.
The Federal Open Market Committee (FOMC) released the minutes of its July meeting. The Fed official saw significant inflationary risks and it may need additional tightening of monetary policy to bring inflation to the longer-run target. The hawkish statement and the stronger US economic data are the main drivers for the strengthening of the Greenback. The US Dollar Index (DXY), a measure of the value of USD against six other major currencies, extends its upside above 103.45, the highest level since June.
On Wednesday, US Industrial Production increased 1.0% in July, against market expectations of 0.3% and -0.8% prior. Meanwhile, Building Permits for July climbed to 1.442 million from 1.441 million, while Housing Starts rose to 1.452 million from 1.398 million in June, and 1.448 million expected. Both the Change in Building Permits and the Change in Housing Starts exceeded market expectations and previous readings.
Looking ahead, investors will monitor the US weekly Initial Jobless Claims for the week ending August 11 and the Philadelphia Fed Manufacturing Survey for August. The data will be critical for determining a clear movement for the NZD/USD pair.
- GBP/USD defends rebound from 100-DMA at weekly top, prods one-month-old falling resistance line.
- 50-DMA, multi-day-old previous support line add to the upside filters.
- Looming bull cross on MACD adds strength to recovery hopes but US Dollar’s strength tests Cable buyers.
- Late June’s low will challenge Pound Sterling sellers past 100-DMA.
GBP/USD edges higher past 1.2700 as it flirts with the weekly top surrounding 1.2730 amid the early hours of Thursday’s Asian session. In doing so, the Cable pair defends Monday’s U-turn from the 100-DMA while approaching a downward-sloping resistance line from July 14 after a three-day winning streak.
Not only a rebound from the 100-DMA but the impending bull cross on the MACD also underpins the upside bias about the Pound Sterling.
However, a clear break of the stated resistance line, close to 1.2750 by the press time, isn’t an open invitation to the Cable buyers as the 50-DMA hurdle of around 1.2785 prods the short-term advances of the quote.
Following that, a 5.5-month-old previous support line, now resistance around 1.2850, acts as the final defense of the GBP/USD bears.
Meanwhile, the broadly firmer US Dollar, backed by the upbeat Fed Minutes and yields of late, challenge the Pound Sterling buyers and tease a pullback toward the 100-DMA retest, especially amid a light calendar on Thursday. That said, the 100-DMA level is around 1.2625 by the press time.
In a case where the GBP/USD pair remains bearish past 1.2625, the weekly bottom of 1.2616 and the late June trough surrounding 1.2590 will test the sellers before giving them control.
GBP/USD: Daily chart
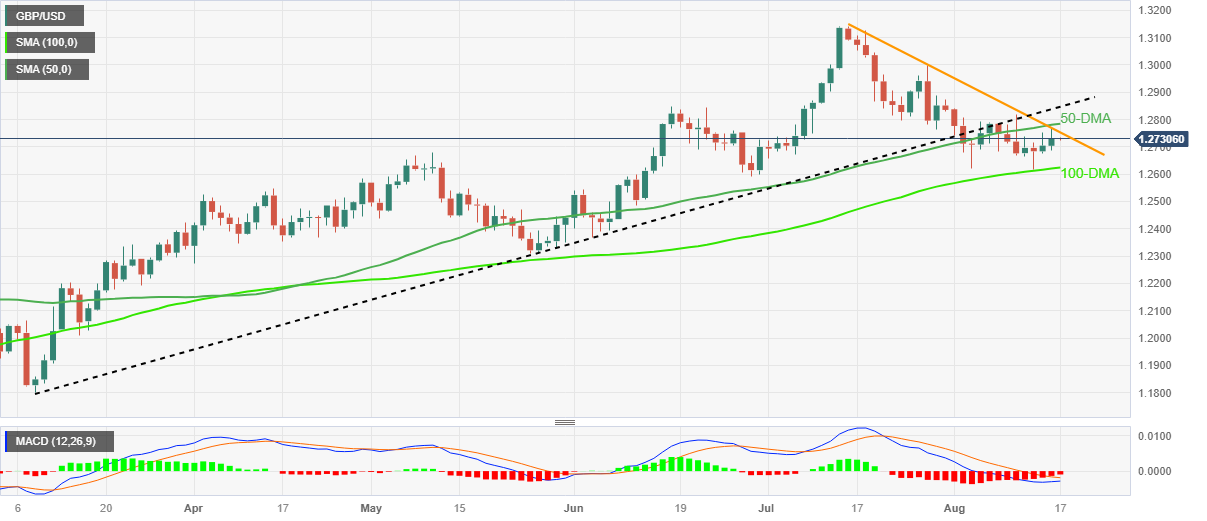
Trend: Limited upside expected
- Fed minutes reveal a commitment to the 2% inflation target, with most of the board acknowledging lingering inflation risks.
- Despite the unanimous decision to raise rates, some officials cautioned, suggesting a potential pause in September’s rate hike.
- US Treasury bond yields rise, with the 10-year benchmark note at 4.258%, boosting the USD.
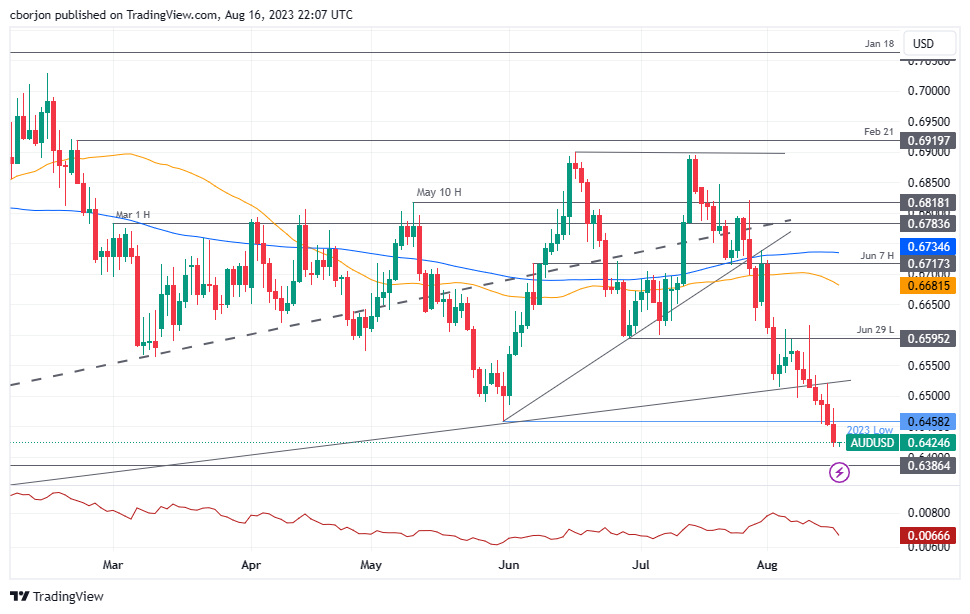
AUD/USD prolonged its losses on Wednesday after the US Federal Reserve (Fed) revealed its July meeting minutes, which bolstered the US Dollar (USD) as investors perceived a hawkish tilt in the minutes, as shown by money market futures. Consequently, the AUD/USD edges lower, with the pair trading at 0.6421, down 0.04% as the Asian session begins.
US Dollar strengthens as Federal Reserve minutes hint at potential rate hikes, while upcoming Australian employment data remains in focus
The minutes showcased the Fed’s board commitment to attain its 2% inflation target, with the majority of the board seeing risks of inflation lingering that could require action by the Fed. Even though officials elected to raise rates unanimously, cautious voices emerged, providing a dovish opinion and could pave the way for skipping a rate hike at the upcoming September meeting.
In regards to a recession, Fed staff no longers foresee a mild recession, though policymakers continued to stress downside risks to growth and upside risks to the unemployment rate. Federal Reserve officials agreed that forthcoming rate decisions would be based on a comprehensive assessment of incoming data while adopting a cautious approach in the upcoming months.
The market’s reaction to those plays saw an uptick in US Treasury bond yields, with the 10-year benchmark note yielding 4.258% gaining two basis points, underpinning the greenback, which according to the US Dollar Index (DXY), ended Wednesday’s session gaining 0.24% at 103.446.
On the Australian front, the release of July’s employment report on Thursday would be the week’s highlight. Labor market data is expected to show signs of weakness, which could ease pressure on the Reserve Bank of Australia (RBA), which, despite raising rates up to 4.10%, has paused its tightening cycle in the last two meetings.
Given the backdrop, the AUD/USD might continue to edge lower. It could be exacerbated by bad economic news from China, Australia’s largest trading partner. Recent data published by the National Bureau of Statistics (NBS) showed China’s economic recovery remains bumpy as domestic consumption remains soft, industrial production slowed down, and a deflationary scenario could dampen its economic growth.
AUD/USD Price Analysis: Technical outlook
The AUD/USD has fallen to new year-to-date (YTD) lows of 0.6415m threatening to extend its losses toward the 0.6400 figure. If that support gives way, the November 10 daily low of 0.6386 is up next before testing the November 2022 lows of 0.6272. Nevertheless, buyers keeping the AUD/USD pair above 0.6400 could pave the way for a recovery, with eyes set at 0.6500. A breach of the latter will expose a previous support-trendline turned resistance at 0.6525.
After defending the Reserve Bank of New Zealand’s (RBNZ) status quo the previous day, Governor Adrian Orr tried again to justify the central bank’s inaction by suggesting the easy inflation pressured of late. On the same line was RBNZ Chief Economist Paul Conway.
While speaking in front of the government committee, RBNZ’s Orr said that the drivers for inflation have been changing through time but they have all been biased to higher than otherwise inflation.
The policymaker, however, conveyed easing inflation pressured regardless of the next shock.
Elsewhere, Chief Economist Paul Conway said net migration, currently at record levels, had not been as inflationary as it had been previously.
RBNZ’s Conway also defended the central bank’s inaction by stating that the revision of the neutral rate to 2.0%–2.25% range is as restrictive as needed.
“Some industries were being worse hit by monetary policy and global factors, including construction, commercial property and agriculture,” added RBNZ’s Convay.
Also read: NZD/USD retreats from daily highs ahead of FOMC minutes
- EUR/USD languishes at 1.5-month low amid broad US Dollar strength.
- Fed Minutes highlights live discussion on inflation pressure, some FOMC members favored rate hikes.
- Upbeat US Treasury bond yields add strength to Euro pair’s bearish bias amid mostly firmer data from US, Eurozone.
- Second-tier economics eyed for clear directions, risk catalysts are important too as bears approach key support.
EUR/USD bears take a breather at the lowest level in six weeks while seeking fresh clues to extend the previous day’s fall amid early Thursday morning in Asia. That said, the Euro pair refreshed the multi-day low to 1.0871 late Wednesday after the Monetary Policy Meeting Minutes of the Federal Open Market Committee (FOMC) appeared hawkish. Also weighing on the pair was the major US Dollar strength backed by the firmer US Treasury bond yields and sour sentiment, not to forget mostly upbeat US data.
The late Fed Minutes showed the FOMC members’ division about the rate hike trajectory but marked union when it came to the inflation fears, which in turn appeared hawkish and favored the US Dollar. “Federal Reserve officials were divided over the need for more interest rate hikes at the U.S. central bank's July 25–26 meeting, with ‘some participants’ citing the risks to the economy of pushing rates too far even as ‘most’ policymakers continued to prioritize the battle against inflation,” said Reuters.
That said, the US Industrial Production marked a surprise 1.0% growth for July versus 0.3% expected and -0.8% prior while the Capacity Utilization for the said month also improved to 79.3% from 78.6%, compared to market forecasts of 79.1%. Further, the Building Permits edged higher to 1.442M for July from 1.441M whereas the Housing Starts rose to 1.452M for the said month versus 1.398M prior and 1.448M expected. It’s worth noting that both the
Building Permits Change and Housing Starts Change improved more than market forecasts and previous readings. Previously, the US Retail Sales grew 0.7% MoM in July versus 0.4% expected and 0.3% reported in June (revised from 0.2%) and suggested strong consumer spending, mainly due to improved wages, which in turn favored the US Dollar to stay firmer amid early weekdays.
On the other hand, Eurozone Industrial Production for June marked an unexpected growth of 0.5% MoM versus -0.1% market forecasts and 0.0% previous readings. On the same line, the yearly Industrial Output figures improved to -1.2% YoY from -2.5% marked in May, versus -4.2% anticipated. Further, the second readings of the Eurozone Gross Domestic Product (GDP) for the second quarter (Q2) confirmed the 0.3% QoQ and 0.6% YoY initial estimations but the first readings of the Employment Change eased for the said period.
It’s worth mentioning that the growing fears from China and the chatters about the softer growth in developed economies, backed by the global rating agency Fitch Ratings, weigh on the sentiment and allowed the US Dollar to remain firmer at the highest level in a month.
Against this backdrop, Wall Street closed in the red and the US 10-year Treasury bond yields refreshed their yearly high during the five-day uptrend.
Moving on, a light calendar may allow the Euro pair to consolidate the latest moves but that needs validation from the Eurozone trade numbers, US weekly jobless claims and Philadelphia Fed Manufacturing Survey, not to forget the aforementioned risk catalysts.
Technical analysis
A sustained downside break of the 100-DMA, around 1.0935 by the press time, directs EUR/USD toward an ascending support line stretched from November 2022, close to 1.0830 amid bearish MACD signals. That said, the RSI conditions prod the Euro pair’s downside afterward.
- GBP/JPY rose to a daily high near 186.20, displaying nearly 0.70% gains.
- GBP traded strongly against most of its rivals following hot inflation figures from the UK in July.
- The extreme dovish position of the BoJ leaves the JPY vulnerable.
In Wednesday's session, the GBP/JPY advanced to new cycle highs, near 186.20, mainly driven by the GBP’s strengths. The UK revealed higher-than-expected Consumer Price Index Figures from July, which boosted hawkish bets on the Bank of England (BoE) and British yields making the Pound gain interest. On the other hand, the Bank of Japan (BoJ) divergences against its peers, making the JPY weaker.
Investors digest UK’s CPI and now foresee an additional 75 bps of tightening
The British Consumer Price Index (CPI) declined to 6.8% YoY in July, as expected from its previous 7.9%. In addition, the Core CPI slightly accelerated to 6.9% YoY in the same month, above the expected 6.8% from its previous 6.9%. The Bank of England (BoE) tightening expectations continue to rise as a reaction. Instead of discounting a 5.75% at the start of the week, investors foresee a terminal rate of 6%, meaning an additional 75 basis points (bps) of tightening for this cycle. In that sense, the GBP got a boost and traded strongly against most of its rivals.
GBP/JPY Levels to watch
From a technical standpoint, the GBP/JPY maintains a bullish outlook for the short term, as observed on the daily chart. The Relative Strength Index (RSI) is comfortably positioned in the positive territory above its midline. It has a northward slope, complemented by a positive signal from the Moving Average Convergence Divergence (MACD), showing green bars, signalling a growing bullish momentum. Also, the pair is above the 20,100,200-day SMAs, implying that the bulls retain control on a broader scale.
Support levels: 184.00, 183.00, 182.15 (20-day SMA)
Resistance levels: 186.50, 187.00, 188.00.
GBP/JPY Daily chart
-638278177219952499.png)
- XAG/USD is about to approach oversold conditions, trading below the $22.50 area.
- The USD strengthened after the released of hawkish FOMC Minutes from the July meeting.
- Increasing US yields fuel the USD´s upward momentum.
In Wednesday's session, the silver spot price XAG/USD continued losing traction and traded below the $22.50 zone, showing around 0.50% losses on the day. The US dollar, measured by the DXY index, is gaining ground, driven by the July Federal Open Market Committee (FOMC) minutes from July's meeting, which revealed that the members are open to potential interest rate hikes, exerting downward pressure on the grey metal.
The recent FOMC minutes from July revealed that many participants were worried about inflation pressures due to a strong US economy. This led some members to consider raising interest rates again if the incoming data contributes to inflationary pressures. As a result, the market participants bet on a hawkish Federal Reserve (Fed), and the US treasury yields for 2,5 and 10-year, which could be seen as the opportunity cost of holding non-yielding metals, are trading with gains at 4.98%, 4.42% and 4.25%, respectively.
XAG/USD Levels to watch
The short-term view for XAG/USD suggests a bearish outlook based on the daily chart analysis. Both Relative Strength Index (RSI) and Moving Average Convergence Divergence (MACD) remain in negative territory, with Relative Strength Index (RSI) positioned below its midline and displaying a southward slope. Moving Average Convergence Divergence (MACD) also exhibits red bars, signalling bearish momentum. Furthermore, the pair is below the 20,100,200-day SMAs, indicating that the sellers command the broader perspective.
Support levels: $22.30,$22.15,$22.00.
Resistance levels: $22.50, $22.80, $23.00.
XAG/USD Daily chart
-638278170660868537.png)
During the Asian session, a key report to watch will be the Australian employment report. Additionally, wholesale inflation data will be released in New Zealand and Machinery Orders in Japan. Later in the day, the US will release the weekly Jobless Claims and the Philly Fed report.
Here is what you need to know on Thursday, August 17:
The US Dollar continues to strengthen amidst risk aversion and higher Treasury yields. The DXY index reached its highest level since June, nearing 103.50, and extended its positive streak to five days. Despite this rally, the momentum of the Greenback remains firm.
The FOMC minutes revealed that some members remain concerned about inflation risks. Two members expressed a preference for keeping rates unchanged at the July meeting. Overall, the minutes indicated that the possibility of further rate hikes is still being considered if there is a rebound in inflation.
Later in the trading session, Wall Street stocks decisively turned downward. The Dow Jones lost 0.52%, marking its lowest close in a month. In the bond market, traders interpreted a hawkish message. The 10-year Treasury yield settled at 4.26%, the highest level since 2007, while the 2-year yield approached 5%.
The Pound outperformed, buoyed by positive UK inflation and retail sales data. GBP/USD finished off its highs but managed to hold above 1.2700. However, the strength of the US Dollar is limiting the upside potential for the pair.
EUR/USD broke below the 1.0900 level, increasing bearish pressure and closing at its lowest level in a month. Despite positive data from the Eurozone, it did not decisively impact the Euro. Euro area trade balance data is scheduled to be released on Thursday.
- Eurozone Industrial Production jumps 0.5% MoM in June vs. -0.1% expected
- Eurozone Preliminary GDP grows 0.3% QoQ in Q2 vs. 0.3% expected
USD/JPY has risen for eight consecutive days, climbing above 146.00. The depreciation of the Japanese Yen has drawn market participants' attention to Japanese officials and the possibility of intervention.
USD/CAD broke above 1.3500, rising towards 1.3550, reaching its highest level since early June. The pair is overbought but is seeking a new equilibrium level. The decline in crude oil prices (WTI lost 2.15%) has added weight to the Loonie.
AUD/USD extended its decline towards the 0.6400 area. The weakness is likely to persist while it remains below 0.6500. Australian labor data is set to be released on Thursday, with an expected increase of 15,000 in employment.
Australian Jobs Report Preview: Pattern points to disappointing data, downing the Aussie
The Reserve Bank of New Zealand (RBNZ) kept interest rates unchanged at 5.5% as expected, which was perceived as a "hawkish hold" and briefly boosted NZD/USD. However, after the pair reached 0.5993, it resumed its decline and broke below the 0.5950 support area. It has lost ground for the seventh consecutive day.
Analysts at TD Securities on Antipodean currencies and NZD strategy:
The Antipodean currencies are having a horrid month since mid-July and there seems to be little reprieve given the shift in market sentiment. We note that the Antipodean currencies are trading more closely to the China growth narrative, risk-off sentiment and drop in equities rather than the domestic story and recent price action reflects that. We don't expect any of these factors to show a reversal soon, which puts doubt on any significant rebound for NZD in the near-term, and we are biased to selling the NZD on rallies instead of chasing it lower as NZD is in oversold territory based on the RSI daily.
Metals are facing downward pressure again. Gold is currently trading below $1,900, at five-month lows. Silver has also experienced some losses, but it is still trading above the August lows, hovering around $22.40.
Like this article? Help us with some feedback by answering this survey:
- Fed officials unanimously aim for the 2% inflation target, but divisions arise on the next steps.
- The US Dollar Index (DXY) reflects the greenback’s strength, rising 0.29% to 103.497, supported by rising US Treasury bond yields.
- USD/CAD’s bullish momentum is evident as it trades above the 200-day Moving Average, with key levels around the 1.3545 high and the R1 pivot at 1.3520.
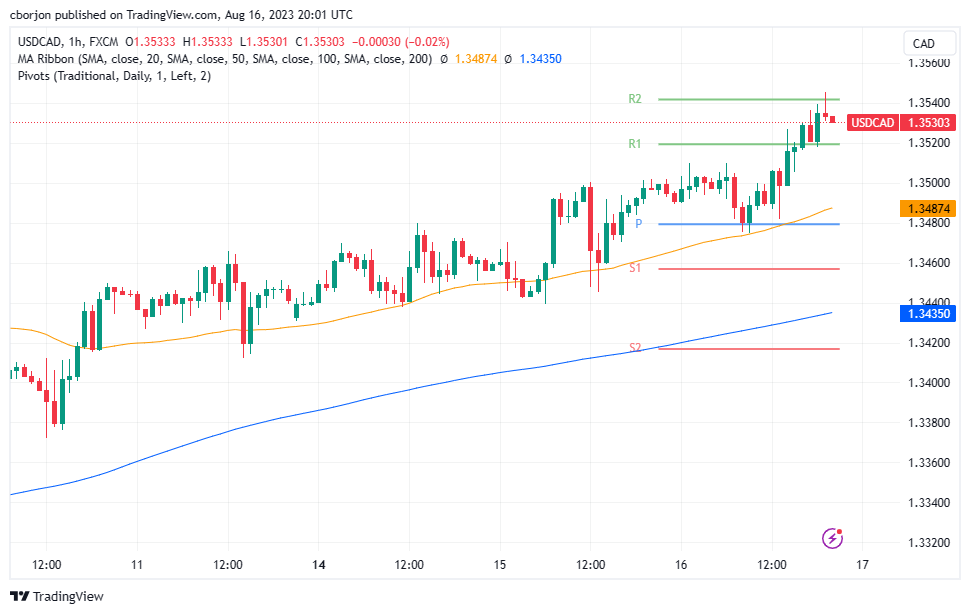
USD/CAD climbs above 1.3500 and refreshes a three-month high at 1.3539 after the Federal Open Market Committee (FOMC) revealed its July monetary policy minutes, offering split views amongst Fed board members while committing to its goal of inflation of 2%. The USD/CAD is trading at around 1.3520/40 amidst a volatile session, with more than 0.20% gains.
Federal Reserve’s divided stance on rate hikes propels the pair above the 1.3500 mark, with the greenback gaining ground
The minutes highlighted a unanimous commitment among all Federal Reserve officials to their goal of reducing inflation to the targeted 2%. Concurrently, most participants evaluated that the potential for elevated inflation risks would necessitate additional tightening measures.
However, a division within the Fed board became evident regarding monetary policy, as a “few” members advocated for maintaining the existing interest rates. Among them, Atlanta’s Fed President Raphael Bostic consistently voiced his stance in favor of unchanged rates. Recently, Philadelphia’s Fed President Patrick Harker echoed some of Bostic’s comments as it turned more neutral.
Despite the economy’s demonstrated resilience, lingering concerns remain about potential downward impacts on economic activity and the potential risks associated with a rise in the unemployment rate.
Federal Reserve officials agreed that forthcoming rate decisions would be based on a comprehensive assessment of incoming data while adopting a cautious approach in the upcoming months.
Amid these developments, the greenback is recovering some ground, as shown by the US Dollar Index (DXY) gaining 0.29%, at 103.497, underpinned by higher US Treasury bond yields.
USD/CAD Reaction
Following the data release, the USD/CAD edged towards its daily high of 1.3545, followed by a dip towards the R1 pivot at 1.3520, before edging towards the current exchange rate. The USD/CAD is trading back above the 200-day Moving Average (DMA), which sits at 1.3448, portraying a bullish bias.
USD/CAD Technical Levels
- USD/JPY trades near 146.30, seeing more than 0.50% gains on the day.
- The July FOMC Meeting Minutes showed members opening the door for further interest rate hikes.
- Rising yields are tractioning the USD.
On Wednesday, the USJ/JPY pair jumped above 146.00, showing more than 0.50% of daily gains and continues to trade in its highest levels in nine months. On the one hand, the Greenback strengthened on the back of investors placing hawkish bets on the Federal Reserve (Fed), after the release of the Minutes of the Federal Open Market Committee (FOMC) for the July meeting, which showed members considering another hike amid the upwards risks of inflation. On the Yen's side, it continues to trade vulnerable against its rivals amid monetary policy divergences.
The FOMC published its minutes from the July meeting and revealed that participants still perceive inflationary pressure as quite high. In that sense, members referred to keeping the door open for more interest rate hikes if upcoming data shows robustness. On the other hand, some participants show a less aggressive stance favouring holding interest rates steady for the time being. That being said, it will all come down to the incoming data, just as Jerome Powell stated in its last press conference and the US economy is giving reasons for the FOMC members to be concerned with inflation remaining sticky as the rising economic activity and the hot labour market may eventually lead to more inflationary pressures.
In response to these developments, the US treasury yields for the 2-year, 5-year, and 10-year bonds are up, increasing between 0.50% and 1%, contributing to a 0.20% daily gain in the US dollar, as measured by the DXY index.
USD/JPY Levels to watch
Analyzing the daily chart, it is evident that USD/JPY is bullish in the short term. Relative Strength Index (RSI) is comfortably settled above its midline in positive territory, exhibiting an upward trajectory. The presence of green bars on Moving Average Convergence Divergence (MACD) reinforces the growing bullish momentum. Furthermore, the pair is above the 20,100,200-day SMAs, implying that the bulls retain control on a broader scale. However, traders should be aware that indicators are near overbought conditions so a downward correction may be on the horizon.
Support levels: 145.00, 144.50, 144.00.
Resistance levels: 146.50, 147.00, 147.50.
USD/JPY Daily chart
-638278119566288150.png)
- Fed officials unanimously aim to achieve the 2% inflation target, but divisions emerge on the path forward.
- XAU/USD reacts with a sharp drop, testing the S1 daily pivot point, while US Treasury yields and the greenback see upward movement.
- Key levels to watch include the $1,900 psychological mark and the 50-hour Moving Average at $1,904.34
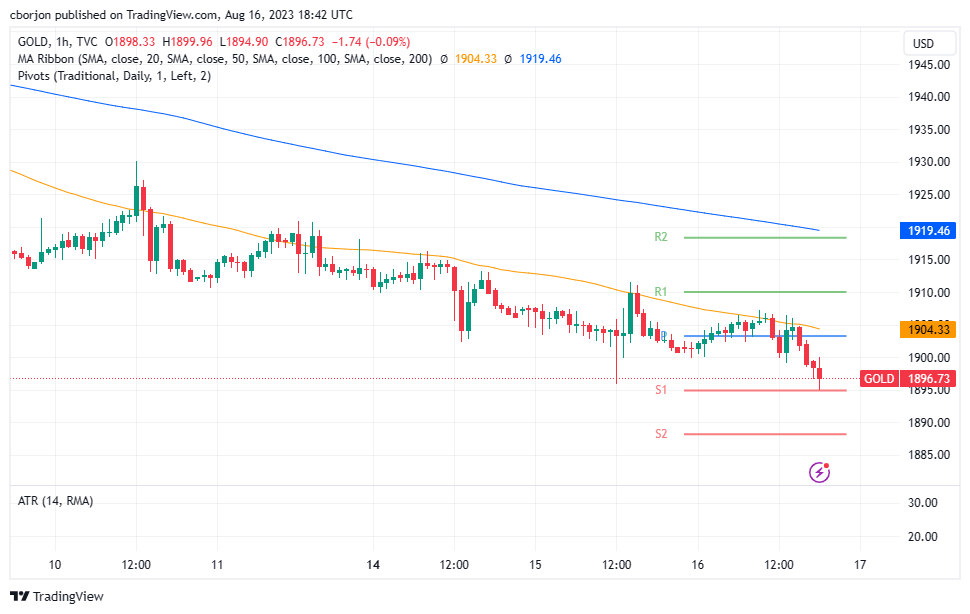
Gold price treads water after the latest Federal Reserve’s (Fed) meeting minutes showed board officials were split between raising rates or keeping them unchanged at the July meeting. After the data release, XAU/USD trades volatile, hit a fresh 7-week low at $1,895.48 and is seesawing at around the $1,900-$1,890 area.
XAU/USD seesaws around the $1,900 mark as Federal Reserve minutes reveal split opinions on monetary policy
The minutes revealed a unanimous determination among all Federal Reserve officials to persist in their objective of lowering inflation to the targeted 2%, while most participants assessed that upside risks on inflation would require additional tightening.
However, a division within the Fed board became evident regarding monetary policy, as a “few” members advocated for maintaining the existing interest rates. Among them, Atlanta’s Fed President Raphael Bostic consistently voiced his stance in favor of unchanged rates.
The minutes showed that while the economy has displayed resilience, concerns persist about potential downsides to economic activity and possible risks of an increase in the unemployment rate.
Federal Reserve officials agreed that forthcoming rate decisions would be based on a comprehensive assessment of incoming data while adopting a cautious approach in the upcoming months.
XAU/USD reaction on hourly chart
As the minutes were released, the XAU/USD dropped sharply towards the S1 daily pivot point at $1,894.89 and bounced off that level. At the same time, US Treasury bond yields climbed with the 10-year benchmark note edging toward 4.246%, while the greenback hit a daily high of 103.457 before trimming some of its gains.
If XAU/USD achieves a daily close below $1,900, that could expose March’s 13 daily low of $1,867.17 as the next support, ahead of dropping towards the latest swing low of $1,809.48. Contrarily, if buyers reclaim $1,900, that could expose the 50-hour Moving Average (HMA) at $1,904.34, slightly above the daily pivot point.
XAU/USD Technical Levels
- GBP/USD trades near 1.2740, after hitting a daily high of 1.2766 previously in the session.
- FOMC minutes showed that members were deeply concerned with upside inflation risks.
- GBP is holding strong after hot inflation figures from July from the UK reported during the European session.
After the release of July’s Federal Open Market Committee (FOMC) minutes, the GBP/USD saw little change. Despite members sounding hawkish, if failed to trigger a significant reaction on the USD, the GBP continues to trade strong amid hot inflation figures from the UK and hawkish bets on the Bank of England.
Minutes showed that members were concerned with the upside inflation risks due to a hot labour market and left the door open for another hike, at least for this cycle. The immediate reaction was a slightly upwards movement of the US DXY index and the US Treasury bond yields, but the GBP/USD held its ground.
It will all come down to incoming data. Overall the US economy shows strong economic activity and a robust labour market while inflation retreats. Before the September meeting, the Federal Reserve (Fed) will receive an additional Nonfarm Payrroll and Consumer Price Index (CPI) report and medium-tier economic activity figures from August. As for now, according to the CME FedWatch tool, markets bet that the Fed will pause in September and foresee 40% odds of a 25 basis points hike in November.
GBP/USD Levels to watch
According to the daily chart, the technical outlook for the GBP/USD remains neutral to bullish as the bulls are recovering ground. With an ascending slope below its midline, the Relative Strength Index (RSI) suggests a potential increase in buying pressure, while the Moving Average Convergence (MACD) exhibits lower red bars. On the other hand, the pair is above the 20-day Simple Moving Average (SMA), below the 100-day SMA, but above the 200-day SMA, indicating that the bulls still have the upper hand looking at the broader picture.
Support levels: 1.2730, 1.2715, 1.2700.
Resistance levels: 1.2760, 1.2780, 1.2800.
GBP/USD Daily chart
-638278073661283991.png)
- Fed officials emphasize commitment to achieving the 2% inflation objective, with many seeing the need for further tightening.
- A split emerges among policymakers, with some advocating for unchanged rates, highlighting the economy’s resilience and potential risks.
- EUR/USD reacts with a drop, hovering around the 1.0880s, marking its lowest point since mid-August.
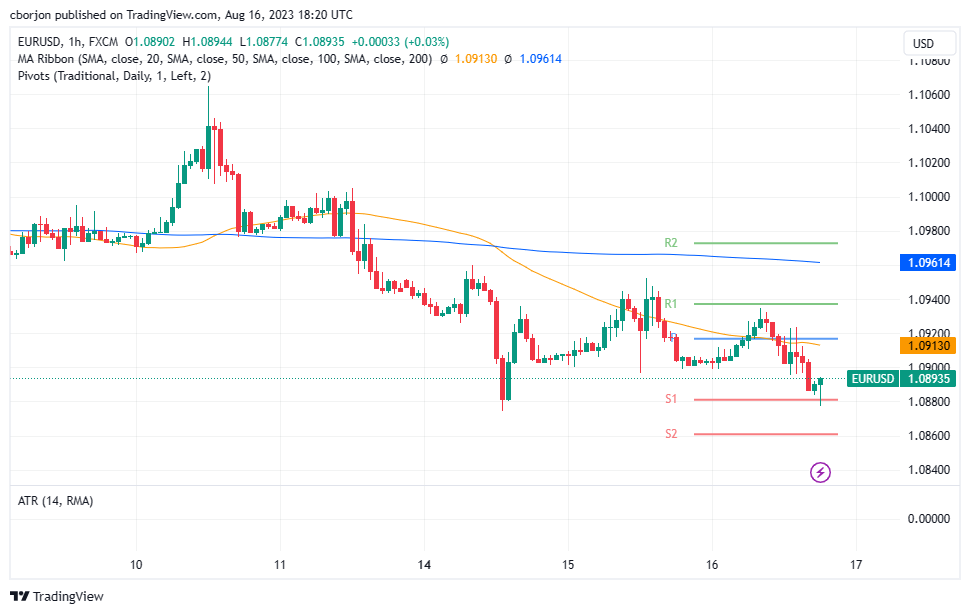
EUR/USD dropped below 1.0900 for the second straight day, as the latest Federal Reserve (Fed) monetary policy minutes began to show policymakers are split between overtightening while others prioritize the fight against inflation. The EUR/USD trades volatile, between the daily low of 1.0870s and the 1.0900 figure.
Federal Reserve minutes reveal a divided board on rate decisions, with inflation concerns at the forefront
The minutes showed that all the Fed officials remain “resolute in their commitment to bring inflation down to the …2% objective,” with most participants estimating that upside risks on inflation would require additional tightening.
Nevertheless, the Fed board began to show a split stance regarding monetary policy as a “couple” of participants wanted rates to be left unchanged, with one of the members, Atlanta’s Fed President Raphael Bostic, having remained vocal about holding rates unchanged.
The minutes showed that even though the economy’s remained resilient, downside risks to economic activity are lingering, and upside risks to the unemployment rate.
Federal Reserve officials agreed that future rate decisions would depend on the “totality” of incoming data while taking a more cautious approach in the coming months.
EUR/USD Reaction
The EUR/USD dropped below the 1.0900 figure, extending its losses below the 1.0880 area, a level last seen on August 14, slightly below the S1 pivot, which acted as support, as the EUR/USD sits at around the 1.0880s area.
EUR/USD Technical Levels
- Federal Reserve released the minutes from its July 25-26 meeting.
- The minutes showed most fed officials saw a “significant” upside risk to inflation.
- US Dollar rises modestly after the minutes.
The Federal Open Market Committee (FOMC) released the minutes of its July meeting, triggering a limited reaction across financial markets. According to the document, most federal reserve officials saw "significant" upside risks to inflation. Those risks could require further tightening. Two officials favored holding interest rates steady in July.
At the July meeting, as expected, the Fed raised interest rates by 25 basis points to 5.25%-5.50%, the highest since 2001, after a pause in June. The minutes showed that participants still see below-trend growth and a softer labor market as necessary to restore economic balance.
Key takeaways from the minutes:
Participants commented that monetary policy tightening appeared to be working broadly as intended and that a continued gradual slowing in real GDP growth would help reduce demand–supply imbalances in the economy.
Participants noted the recent reduction in total and core inflation rates. However, they stressed that inflation remained unacceptably high and that further evidence would be required for them to be confident that inflation was clearly on a path toward the Committee's 2 percent objective.
Participants also observed, however, that although growth in payrolls had slowed recently, it continued to exceed values consistent over time with an unchanged unemployment rate, and that nominal wages were still rising at rates above levels assessed to be consistent with the sustained achievement of the Committee's 2 percent inflation objective.
Amid these economic conditions, almost all participants judged it appropriate to raise the target range for the federal funds rate to 5-1/4 to 5-1/2 percent at this meeting. Participants noted that this action would put the stance of monetary policy further into restrictive territory, consistent with reducing demand–supply imbalances in the economy and helping to restore price stability.
A couple of participants indicated that they favored leaving the target range for the federal funds rate unchanged or that they could have supported such a proposal. They judged that maintaining the current degree of restrictiveness at this time would likely result in further progress toward the Committee's goals while allowing the Committee time to further evaluate this progress.
With inflation still well above the Committee's longer-run goal and the labor market remaining tight, most participants continued to see significant upside risks to inflation, which could require further tightening of monetary policy.
Members concurred that the U.S. banking system was sound and resilient.
Market reaction:
The US Dollar rose modestly after the minutes, reaching fresh highs against the EUR, AUD, NZD, CAD, and JPY. The US Dollar Index is trading at daily highs around 103.40, near weekly highs, up 0.20% for the day.
- US EIA data reveals a significant drop in oil stockpiles, with a contraction of 5.96 million barrels last week.
- China’s disappointing economic indicators, including retail sales and investment figures, raise concerns about global oil demand.
- Saudi Arabia and Russia’s supply cuts provide a buffer, while the Fed’s monetary policy stance could influence the US Dollar and commodity prices.
Western Texas Intermediate (WTI), the US crude oil benchmark, extends its losses below the $80.00 psychological figure amidst a drop in US oil stockpiles while woes about China’s economic deceleration could dent oil’s demand, as reflected by WTI’s price. At the time of writing, WTI exchanges hands at around $79.70 per barrel after reaching a daily high of $81.39.
US crude production surges as inventories fall; China’s economic slowdown poses demand challenges for oil
On Wednesday, data from the US Energy Information Administration (EIA) showed that inventories fell as exports surged, even though crude production hit its highest levels since the Covid-19 pandemic weighed fuel consumption. Stockpiles dropped by 5.96 million barrels in the week of August 11 to 439.7 million barrels, above estimates for a 2.3 million-barrel contraction.
Oil prices are also being affected by recent data from China, the second largest economy in the world, as business activity is constrained, retail sales disappointed, investments figures missed estimates, and a deflationary scenario threatens to hit China’s government growth estimates of 5%.
Nevertheless, Saudi Arabia and Russia’s supply cuts cushioned oil prices fall, as WTI remains trading at around July high price levels.
Aside from this, WTI traders would take cues from the latest Federal Reserve (Fed) monetary policy minutes, as a strong US Dollar (USD), weighed on commodity prices. Investors are looking for clear signs that could reassure the Fed’s tightening cycle has ended. The latest Fed speeches have shown that officials are turning neutral, as previous hawks members like Atlanta Fed President Raphael Bostic and Philadelphia Fed President Patrick Harker said no more increases were needed.
WTI Technical Levels
- USD/CHF trades with mild gains around 0.8790, tallying a third consecutive day of gains.
- The USD trades flat as investors await clues for the next Fed decisions in the FOMC minutes.
- Housing data from the US came in strong.
The USD/CHF pair trades flat on Wednesday with mild gains near the 0.8790 area. On the USD side, strong Building Permits and Housing starts from July failed to trigger a reaction in the Greenback as markets are focused on the Federal Open Market Committee (FOMC) minutes from the July meeting, to be released later in the session.
As the US economy is holding strong and inflation is decelerating, investors want to see the FOMC member's stance regarding the following decisions. Jerome Powell stated that the decision will depend on incoming data so the recent data points out that the Federal Reserve (Fed) will probability hike on more time this cycle. In line with that, the odds of a 25 basis point hike in the next November meeting rose nearly to 40% according to the World Interest Rate Possibilities (WIRP) tool.
USD/CHF Levels to watch
Analysing the daily chart, the technical outlook for the USD/CHF is neutral to bullish, suggesting that the bulls are gaining momentum but still do not have the upperhand in the short term. The Relative Strength Index (RSI) displays a bullish bias with an ascending slope above its middle point, while the Moving Average Convergence (MACD) shows neutral green bars. To add to that, the pair is above the 20-day Simple Moving Average (SMA) but below the 100 and 200-day SMAs, suggesting that despite the recent bearish sentiment, the bulls are still resilient, holding some momentum but that the bears are in command on the bigger picture.
Support levels: 0.8760, 0.8750, 0.8725 (20-day SMA).
Resistance levels: 0.8790, 0.8800, 0.8815.
USD/CHF Daily chart
-638278015601700807.png)
- US Housing Starts for July show positive momentum, indicating stabilization in the housing market post-Fed tightening.
- USD/MXN remains subdued despite the Greenback’s rise, with the DXY index gaining 0.12% influenced by rising US Treasury yields.
- Market eagerly awaits Fed meeting minutes for clarity on the central bank’s stance, with recent speeches hinting at a neutral shift.
USD/MXN trims some of its Tuesday’s losses amid overall US Dollar (USD) weakness across the FX board, as data from the United States was mixed, while traders brace for the release of the latest US Federal Reserve (Fed) meeting minutes. Hence, the USD/MXN is trading at 17.0697 after hitting a daily high of 17.1568.
Mexican Peso’s gains limited despite US Dollar’s broad weakness; housing and industrial data in focus
A risk-off impulse was not an excuse for the Mexican Peso (MXN) to appreciate further. US data revealed by the US Census Bureau showed the housing market continues to stabilize amidst 525 basis points of tightening by the Fed. Housing Starts for July rose by 3.9% MoM at a rate of 1.452 million exceeding June’s -11.7% plunge, which was downward revised from -8%. Further data showed that Building Permits climbed 0.1% in July, exceeding June -3.7% plunge.
Although the data was positive, the USD/MXN had a muted reaction. The Fed revealed that Industrial Production in the US grew 1% in July in month-over-months (MoM) figures, exceeding June’s drop, while annually based, plummeted -0.2%.
Aside from this, investors are flocking to the Greenback, which has shifted upwards, gaining 0.12%, as shown by the US Dollar Index (DXY) standing at 103.321, influenced by US Treasury bond yields resuming their uptrend.
Traders’ focus shifts towards the release of the latest Fed meeting minutes. Investors are looking for clear signs that could reassure the Fed’s tightening cycle has ended. The latest Fed speeches have shown that officials are turning neutral, as previous hawks members like Atlanta Fed President Raphael Bostic and Philadelphia Fed President Patrick Harker said no more increases were needed.
USD/MXN Price Analysis: Technical outlook
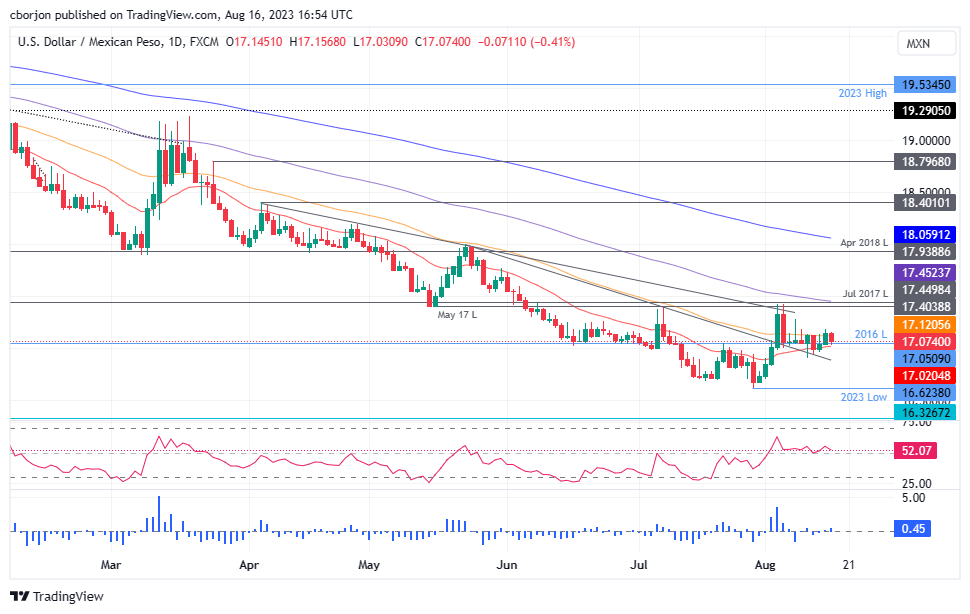
The daily chart portrays the USD/MXN consolidated within 17.0000/17.150000, unable to break above or below the range decisively. The lack of economic data from Mexico, and the interest rate differential, keeps the pair from rallying sharply. Nevertheless, it should be said that the daily Moving Averages (DMAs) are closing into the spot price, putting at risk the previous downtrend. If USD/MXN breaches the top of the range, the next stop would be the 100-DMA at 17.4525 before challenging the psychological 18.00 figure. If USD/MXN sellers reclaim 17.0000, a re-test of the year-to-date (YTD) low of 16.6238 is on the cards.
- NZD/USD rose to a high of near 0.6000 but settled near 0.5950.
- RBNZ held rates steady at 5.5% as expected but sounded hawkish.
- Investors await key FOMC minutes for forward guidance.
On Wednesday, the NZD/USD traded strongly following the Reserve Bank of New Zealand (RBNZ) decision but failed to maintain its momentum and backed away towards 0.5950. On the other hand, the USD measured by the DXY trades flat, ahead of the Federal Open Market Committee (FOMC) minutes from the July meeting. Housing data from July didn’t impact the USD across the board.
The Reserve Bank of New Zealand (RBNZ) held its rates at 5.5%, as expected, but there were some hawkish signals in the statement. The Committee stated that the Official Cash Rate (OCR) “show remains at restrictive levels” for the foreseeable future and pointed out that economic activity and inflationary pressures do not slow down much as expected. In that sense, markets will model their expectations on incoming data to see whether the RBNZ is eventually forced to hike again; as for now, the World Interest Rate Possibilities tool (WIRP) suggests that the markets are confident that the bank won’t hike this cycle again and will start to ease in H2 2024.
Housing data from the US from July came in strong. Building permits rose by 0.1% vs the expected 1.7% contraction, while housing starts increased by 3.9%, also higher than the 2.7% expected. That being said, the session's highlight will be the release the FOMC minutes from July, where investors will look for clues regarding forward guidance. The latest data from the US revealed that the economy is clearly strong and that inflation is somewhat softish but still has some upside risk. As for now, markets expect the Federal Reserve (Fed) to skip in September, and the odds of a 25 bps hike in the November meeting rose to nearly 40%, according to the WIRP tool.
NZD/USD Levels to watch
Based on the daily chart, the NZD/USD exhibits a bearish outlook for the short term. Both the Relative Strength Index (RSI) and Moving Average Convergence Divergence (MACD) remain in negative territory, with the RSI below its midline and showing a southward slope. The MACD is also displaying red bars, indicating a strengthening bearish momentum. Additionally, the pair is below the 20,100 and 200-day Simple Moving Averages (SMAs), suggesting that the bears are firmly in control of the bigger picture, leaving the buyers with tasks to accomplish.
Support levels: 0.5950, 0.5930, 0.5920.
Resistance levels: 0.6000, 0.6020, 0.6050.
NZD/USD Daily chart
-638277980515275969.png)
- US housing starts rebound in July, though rising mortgage rates may hinder sector recovery.
- Japan’s Q2 GDP growth doubles expectations, but concerns over China’s economic slowdown loom.
- USD/JPY’s upward momentum may be limited by potential Japanese intervention and BoJ’s anticipated policy normalization.
USD/JPY aims higher but remains trading within a narrow range as threats of a possible intervention by Japanese authorities loom. Housing data from the United States (US) shows the construction sector stabilizing after the US Federal Reserve (Fed) lifted rates aggressively, dampening house demand. The USD/JPY is exchanging hands at 145.85 after hitting a daily low of 145.30.
Positive housing data from the US meets robust Japanese GDP growth, keeping the pair in a tight range
The US Census Bureau revealed that housing starts jumped at a 3.9% rate of 1.452 million in July, crashing June’s -11.7% plunge, which was downward revised from -8%. Although data is encouraging, higher mortgage rates for 30-year hitting 6.96% over the last week, can curtail the sector’s recovery. At the same time, Building Permits rose 0.1% in July, above June’s -3.7% slide.
Even though the data was positive, the Greenback failed to gain traction as expected, as shown by the US Dollar Index (DXY) losing 0.02% at 103.187. Consequently, the USD/JPY uptrend was capped at spot price, as the US 10-year Treasury bond yield is unchanged at 4.211%.
On the Japanese front, the latest Gross Domestic Product (GDP) report for Q2 2023 smashed estimates of 3.1%, with the economy growing at an outstanding 6%, doubling forecasts, as reported on August 14. Furthermore, as reported by the Reuters Tankan Index, business activity shows an improvement from July’s 3 reading to 12 in August. Although the report was positive, many firms remain cautious about the economic outlook, as slowing growth in China could dent demand for Japanese products. Traders should be aware that China is Japan’s largest partner.
Given the backdrop, the USD/JPY trades sideways, as the US and Japan have posted solid data. Though, expectations for monetary policy normalization of the Bank of Japan (BoJ) could favor the Japanese Yen (JPY) in the medium term. In the meantime, further USD/JPY upside is expected, but intervention jitters could cap the pair’s uptrend.
USD/JPY Price Analysis: Technical outlook
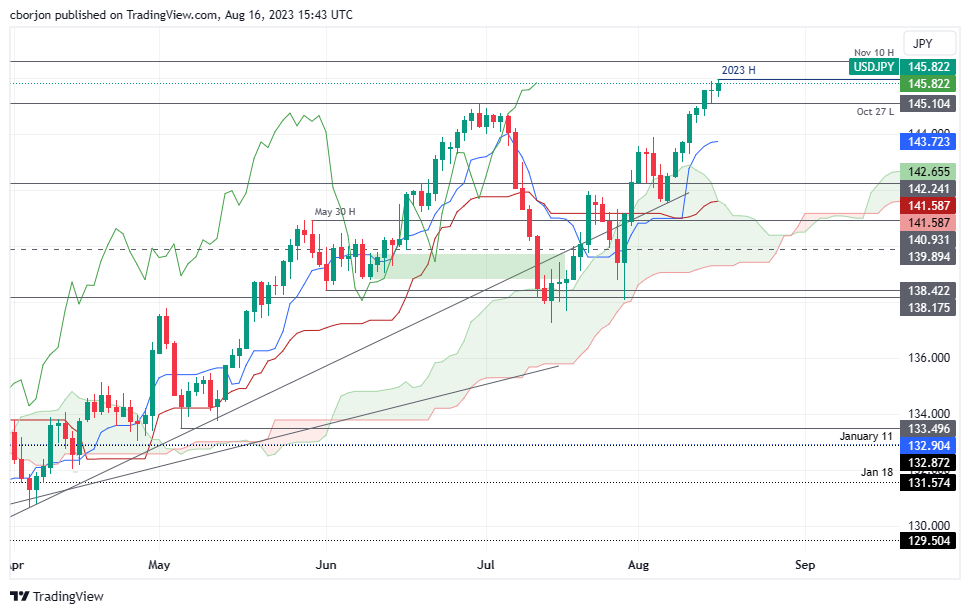
The USD/JPY daily chart portrays the pair peaking around current exchange rates after hitting a year-to-date (YTD) high of 145.94, shy of the 146.00 figure. A breach of the latter will expose higher resistance levels above the 146.00 mark, like the November 10 daily high at 146.59, followed by the November 8 high of 146.94, before reaching 147.00. Conversely, the USD/JPY first support would be today’s low of 145.30, followed by the August 15 low of 145.10, before sliding to the 145.00 figure.
Since the spring, the value of the NOK has improved. Economists at Rabobank analyze Krone’s outlook.
Selling EUR/NOK on rallies into the 100-DMA at 11.54
Failure to break below the 200-DMA at EUR/NOK 11.15 has resulted in a pop higher in the currency pair. The 100-DMA is positioned at the 11.54 level. We favour selling EUR/NOK on rallies into this resistance level in anticipation of a hawkish tone from the central bank on Thursday.
We expect a move back to EUR/NOK 11.00 on a three-month view on the assumption that the Norges Bank’s rate hiking cycle persists into the autumn.
The People’s Bank of China (PBoC) unexpectedly reduced its key rates on 15 August – which drove USD/CNY to a fresh year-to-date high. Economists at HSBC analyze Yuan’s outlook.
PBoC may smooth volatility
The PBoC unexpectedly lowered the rate on its one-year loans, or medium-term lending facility (MLF), by 15 bps to 2.5%, together with a reduction of 10 bps in its 7-day reverse repurchase rate (a short-term policy rate) to 1.8%. The rate cut opens room for a reduction in 1-year or even 5-year loan prime rates on 21 August.
The CNY could face more headwinds from China’s persistent run of weak data and further widened yield disadvantage.
The PBoC may continue to smooth volatility, but we do not expect it to draw a firm line in the sand when the tide keeps coming in.
- Silver price consolidates around $22.60 as investors await FOMC minutes for further guidance.
- Investors hope that the Fed would keep interest rates higher for a longer period.
- Silver price gathers strength to deliver a breakout of the Falling Wedge pattern.
Silver price (XAG/USD) remains sideways around $22.50 in the early New York session ahead of the release of the Federal Open Market Committee (FOMC) minutes. The white metal consolidates as FOMC minutes will provide more clarity about the interest rate guidance.
S&P500 adds some gains after opening as investors digest Fitch downgrade warning for US banks. The 10-year US Treasury yields rebounded above 4.20% as investors hope that inflation will remain sticky due to fading recession fears.
The US Dollar Index (DXY) seems misguided amid mixed cues about the interest rate outlook. Market participants hope that the Federal Reserve (Fed) would keep interest rates higher for a longer period. Discussions about rate cuts are scheduled any time for next year.
Meanwhile, the Fed reported that monthly Industrial Production rose sharply by 1.0% while investors forecasted expansion by 0.3%. In June, the economic data contracted by 0.8%. Monthly House Starts rose by 3.6% in July.
Silver technical analysis
Silver price gathers strength to deliver a breakout of the Falling Wedge chart pattern, which indicates fading downside momentum, formed on a two-hour scale. A breakout of the aforementioned chart pattern will result in a bullish reversal. The 50-period Exponential Moving Average (EMA) at $22.65 continues to act as a barricade for the Silver bulls.
The Relative Strength Index (RSI) (14) oscillates in the 40.00-60.00 range, portraying a lackluster action.
Silver two-hour chart
-638277920132110987.png)
Gold price came under renewed pressure after briefly touching $1,980. Economists at ANZ Bank analyze XAU/USD outlook.
Short-term headwinds to the yellow metal
A ‘Goldilocks’ scenario or ideal balance in the US macroeconomic landscape will be a short-term drag for the Gold market. The Fed continues to hold its hawkish stance alongside easing inflation, leaving risk for higher real rates. Renewed strength in the US Dollar is another headwind.
That said, we believe the Fed is near the end of its hiking cycle, the USD remains in a structural downtrend and tightening credit conditions could be an economic risk. These present a supportive backdrop for Gold.
Brent Crude prices stand at around $85/bbl, about 3% below the year-to-date highs reached on 9 August. Oil price declines mask improving fundamentals, economists at UBS report.
Brent to hit $95 and the WTI to rise to $91 by end-December
We do not expect recent price falls to persist, in light of the oil market’s firming fundamentals: We expect global oil demand to hit a record high in August. Oil inventories are declining, tightening the market. OPEC+ production is near a two-year low and supply looks set to stay tight.
So, we still see scope for global Oil prices to rally. We now expect Brent to hit $95/bbl and the US WTI benchmark to rise to $91/bbl by end-December.
Economists at Wells Fargo expect the British Pound (GBP) to remain under pressure as tough times are still ahead for the UK economy
GBP seen as an underperformer over the medium term
The further 50 bps of rate increase we forecast is less than that currently implied by market pricing, while more broadly we do not view a combination of low growth, high inflation and high interest rates as particularly favorable for the UK currency.
We continue to view the Pound as an underperformer over the medium term. We see the GBP/USD pair falling to 1.26 or below by Q1-2024, and recovering only very modestly to 1.29 by the end of next year.
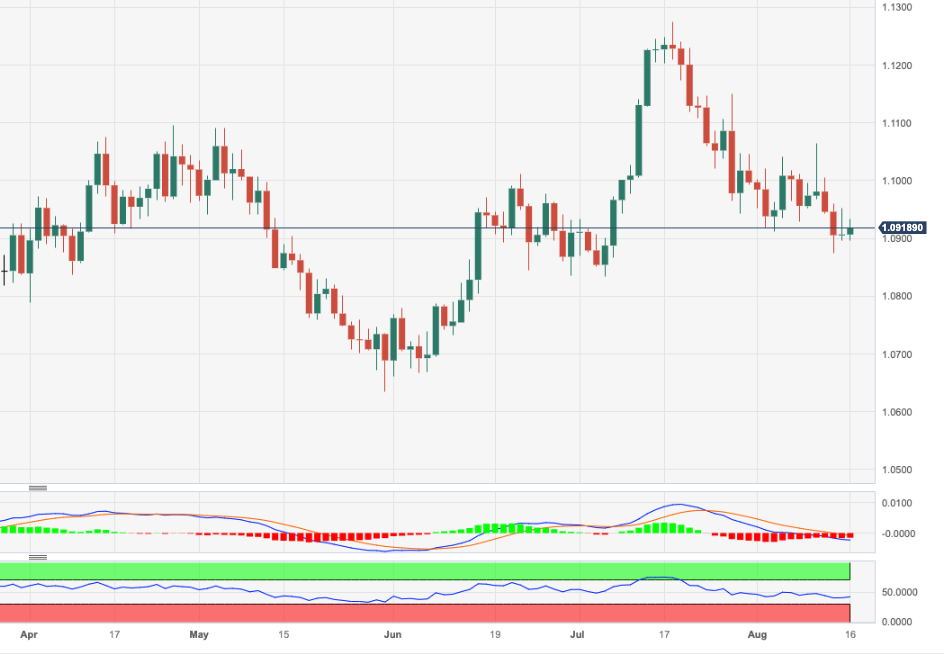
- EUR/USD fades the earlier advance to the 1.0930 zone.
- The continuation of the rebound targets 1.1065.
EUR/USD attempts to leave behind three consecutive sessions of losses on Wednesday.
If the rebound gathers extra steam, it could encourage the pair to dispute the weekly peak at 1.1065 (August 10). Further north from here comes the weekly high of 1.1149 (July 27). Once this region is cleared, the pair’s downside pressure is expected to alleviate.
Looking at the longer run, the positive view remains unchanged while above the 200-day SMA, today at 1.0784.
EUR/USD daily chart
- AUD/USD trades below 0.6500 amid cautions ahead of the FOMC minutes.
- Stickiness in the US core CPI and robust consumer spending momentum could force the Fed to consider one final interest rate hike.
- The Australian Dollar is facing the wrath of the economic slowdown in China.
The AUD/USD pair shifts its auction below the psychological support of 0.6500 in the early New York session. The Aussie asset faces immense selling pressure amid strength in the US Dollar due to America’s economic resilience and rising deflation risks in China due to poor demand.
S&P500 is expected to open on a mildly bearish note, following subdued cues from overnight futures. US equities are expected to face severe heat as Fitch warned downgrading of US banks including JP Morgan Chase. The US Dollar Index (DXY) continues to trade around 103.00 as investors await Federal Open Market Committee (FOMC) minutes for further guidance.
The release of the FOMC minutes will provide more clarity to investors about the interest rate guidance. Stickiness in the US core inflation and robust consumer spending momentum could force Federal Reserve (Fed) policymakers to consider one final interest rate hike. Also, Minneapolis Fed President Neel Kashkari said on Tuesday that more interest rate hikes are needed to rid of the ‘last mile’ in the journey towards achieving 2% inflation.
Meanwhile, the Australian Dollar is facing the wrath of the economic slowdown in China. Beijing’s new home prices fell in June for the first time this year, portraying a vulnerable realty outlook. Market sentiment also turned cautious after the Chinese government said it would no longer release monthly data about unemployment in young people, which had risen each month this year and reached 21.3 percent, NYT reported.
It is worth noting that Australia is the leading trading partner of China and a bleak economic outlook of China impacts the Australian Dollar.
This week, the Australian Dollar will show action after the release of the labor market report for July. According to the estimates, the Unemployment Rate is seen unchanged at 3.5% and fresh payroll additions were 15K, lower than the former release of 32.6K.
USD/RUB has suddenly gone exponential. Economists at Commerzbank analyze Ruble’s outlook after the Russian central bank (CBR) extraordinary meeting.
Russia’s key rate hike that serves nobody
It did not do much for the Ruble that the CBR hiked its key rate from 8.5% to 12%. The Ruble’s problems are not down to domestic interest rates. The old level was no doubt sufficient to fight inflation too. At just under 4½% inflation, interest rate levels were sufficiently high before Tuesday’s decision. However, factors like that are irrelevant to RUB exchange rates.
The Kremlin might be of the view that the effects of Russia’s economic isolation could be overcome with high interest rate levels. Of course, that’s a pie in the sky. As the effects are unavoidable, they will not simply disappear. They are likely to lead to further wild insults of the CBR from the Kremlin’s ‘economists’. And it will then have to take action again. It, therefore, seems likely that CBR policy will increasingly deviate from its former path of reason.
USD eases broadly versus the majors as DXY gains slow around 200-Day Moving Average. Economists at Scotiabank analyze Greenback’s outlook.
USD to soften broadly in H2
The USD is trading generally softer so far today after four consecutive daily gains that have taken the DXY index to test its 200-DMA. That benchmark is holding for a third consecutive day and a lower closer on the session today would give the charts an obviously more negative look.
Resilient growth in the US is overshadowed somewhat by still simmering inflation pressures in Europe. That tilts risks toward rates remaining high in the US but going higher in Europe in the coming months. That may mean extended headwinds for risk assets (potentially USD-supportive) but some narrowing in spreads (potentially USD-negative).
Our forecast anticipates some broader softening in the USD through H2 as the US policy cycle peaks and markets look ahead to the start of the rate cuts but the next few weeks may reflect choppy range trading amid competing drivers for the USD. Note correlations show Dollar/Europe (EUR/USD, GBP/USD, USD/CHF) is heavily influenced by short-term rate differentials currently.
- Housing Starts and Building Permits in the US rose in July.
- US Dollar Index stays in daily range above 103.00 after the data.
The monthly data published by the US Census Bureau revealed on Wednesday that Housing Starts rose 3.9% on a monthly basis in July, following the 11.7% decline (revised from -8%) recorded in June. This reading came in better than the market expectation for a growth of 2.7%.
In the same period, Building Permits, which fell 3.7% in June, increased 0.1%.
Market reaction
The US Dollar Index showed no immediate reaction to these figures and was last seen fluctuating in its daily range above 103.00.
- USD/CAD oscillates around 1.3500 as the focus shifts to Fed minutes.
- Modest growth in US inflation and robust consumer spending would force the Fed to keep interest rates higher for longer.
- The Canadian Dollar fails to maintain strength despite inflation for July remains hotter-than-expectations.
The USD/CAD pair juggles in a narrow range near the round-level resistance of 1.3500 in the European session. The Loonie asset remains at a make or a break level of around 1.3500 ahead of the release of the Federal Open Market Committee (FOMC) minutes.
S&P500 futures add some gains in London, portraying a minor recovery in the risk appetite of the market participants. US equities were heavily sold on Tuesday after Fitch warned downgrading of some of the big US banks including JP Morgan.
The US Dollar Index (DXY) demonstrates lackluster performance around 103.00 ahead of Fed minutes for July’s monetary policy. The FOMC minutes will provide cues about the likely monetary policy action for September and the inflation outlook for the rest of the year. Meanwhile, the 10-year US Treasury yield corrects to near 4.19%.
Investors seem baffled about Fed’s decision for September. Modest growth in US inflation and robust consumer spending would force Fed policymakers to keep interest rates higher for longer while Minneapolis Fed Bank President Neel Kashkari on Tuesday said that while the US central bank has made some progress in its inflation fight, interest rates may still need to go higher to finish the job.
Meanwhile, the Canadian Dollar fails to maintain strength despite inflation for July remains hotter-than-expectations. Headline CPI grew at a 0.6% pace, outperforming surprisingly higher estimates of 0.3%. Core inflation that excludes volatile oil and food prices expanded strongly by 0.5%. Annual headline inflation accelerated to 3.3% while core CPI remained stable at 3.2%.
Analysts at TD Securities expect the Bank of Canada (BoC) to hold rates at 5.00% into 2024, but the Bank will need to see more evidence of slowing activity to stay on the sidelines through Q4."
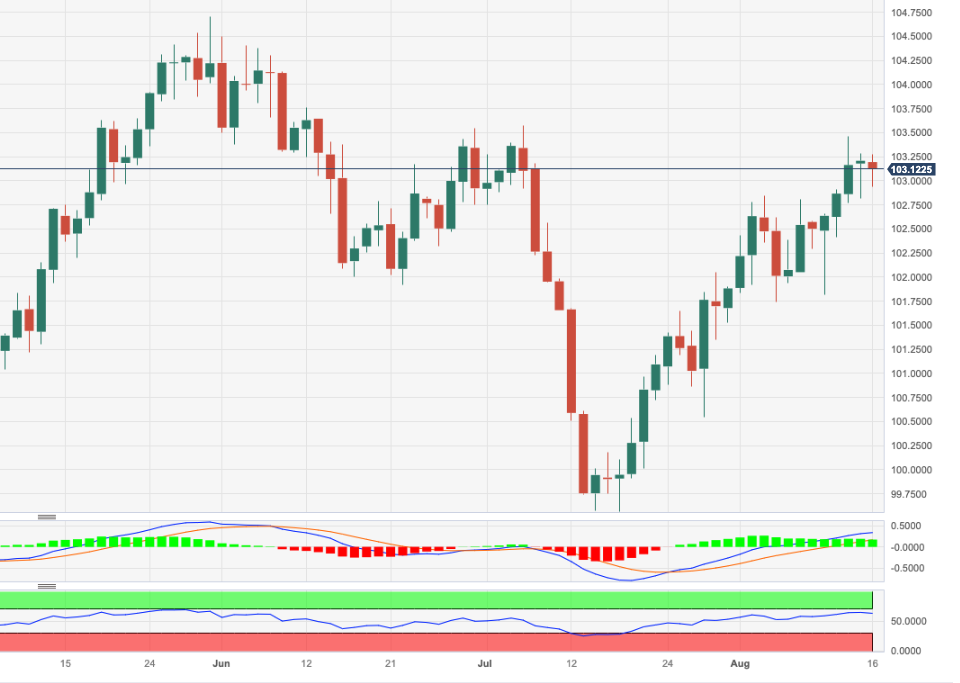
- DXY comes under pressure and disputes the 103.00 support.
- Bulls now target the July high at 103.57 (July 6).
The upside momentum in the greenback appears somewhat dented and motivates DXY to give away part of the recent gains and recede to the 103.00 region on Wednesday.
In the meantime, the index maintains the bullish view well in place with the immediate hurdle now emerging at the August top of 103.45 (August 14) just ahead of the July peak of 103.57 (July 6).
It is worth noting that this area of monthly highs appears reinforced by the key 200-day SMA, today at 103.23.
Looking at the broader picture, while below the latter, the outlook for the index is expected to remain negative.
DXY daily chart
CAD is little changed on the session against a mostly softer USD. Economists at Scotiabank analyze USD/CAD outlook.
USD/CAD’s uptrend remains solid
USD/CAD’s uptrend remains solid on the short-term charts and well-supported by trend dynamics (DMI oscillators). Intraday price patterns do suggest some stronger selling pressure emerged above 1.35, however, which may check the USD’s advance in the short run.
Minor trend support at 1.3470 in early trade here will determine whether the USD uptrend remains intact, and the USD presses on to the mid-1.35s or whether funds edge back to the low/mid-1.34 range.
Fitch Ratings announced in its quarterly Global Economic Outlook on Wednesday that they have lowered medium-term Gross Domestic Product (GDP) growth projections for 10 developed economies, per Reuters.
"GDP in the largest developed economies will not return to pre-Covid-19 pandemic path, even in the medium term," Fitch said in its report and noted that there is also likely to be a sustained fall in labour force participation rates - relative to pre-pandemic trends - in the US and the UK.
Market reaction
This headline doesn't seem to be having a significant impact on risk mood. As of writing, US stock index futures were trading flat on the day.
GBP/USD struggles in the mid-1.27s. Economists at Scotiabank analyze the pair’s outlook.
A close above 1.2750 would be a technical plus
Sterling’s advance versus the USD stalled in the mid-1.27s, making for an unconvincing break above short-term trend resistance at this point. Broader price signals lean GBP-positive, however, and the GBP’s firm rejection of the low 1.26s still sets up a potential double bottom (neckline trigger at 1.2825) which could propel Cable back to the 1.30 area.
A close above 1.2750 today would be a technical plus for the Pound.
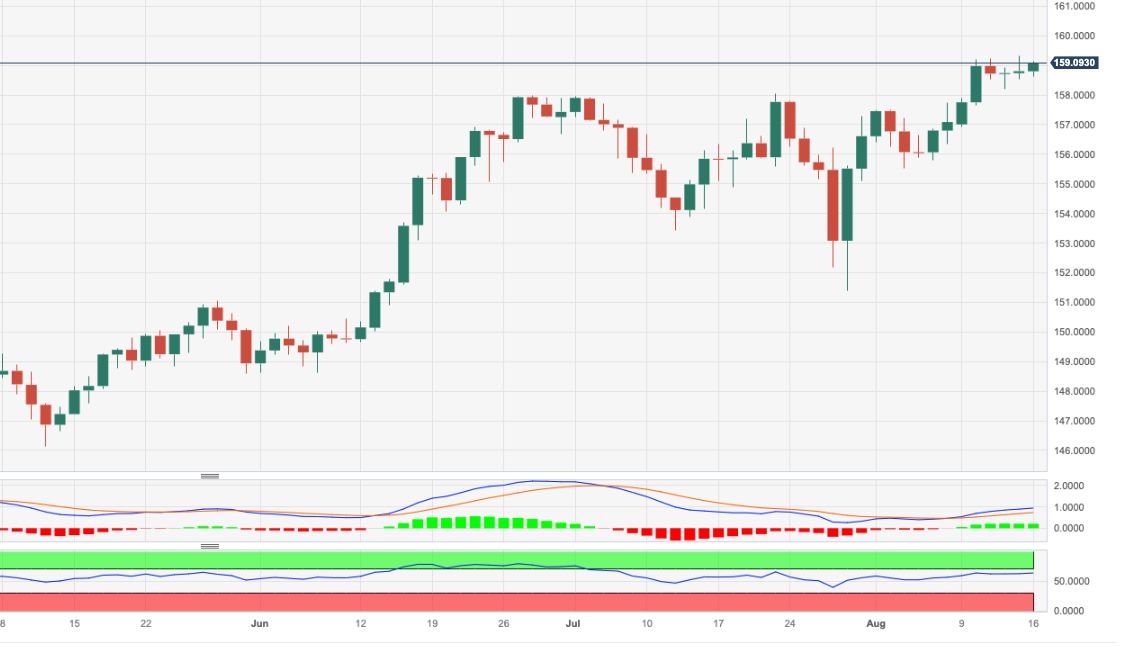
- EUR/JPY keeps the range bound trade around the 159.00 region.
- Extra upside could test the 160.00 region in the short term.
EUR/JPY prints decent gains around the 159.00 zone amidst the so far multi-day consolidative mood on Wednesday.
So far, the continuation of the upside momentum appears likely with an immediate target emerging at the round level of 160.00. The breakout of the latter should not see any resistance level of note until the 2008 high at 169.96 (July 23)
So far, the longer term positive outlook for the cross appears favoured while above the 200-day SMA, today at 147.16.
EUR/JPY daily chart
EUR/USD holds in low 1.09 area. Economists at Scotiabank analyze the pair’s outlook.
Euro is generating little or no positive traction
EUR/USD support in the low 1.09 area remains apparent on the short-term chart.
Despite positive short-term price signals – which indicate a low or bullish reversal may be developing – the EUR is generating little or no positive traction.
Gains through 1.0955 should give spot a little more intraday lift.
Support is 1.0875/1.0880.
See: EUR/USD to break 1.09 if the strong condition of the US economy is confirmed – ING
- The US Dollar came under modest selling pressure on Wednesday.
- The US Dollar Index stabilizes above 103.00 following a four-day winning streak.
- US housing data will be watched closely by market participants.
The US Dollar lost some strength on Wednesday after starting the week on a bullish note. The USD Index – which tracks the USD's valuation against a basket of six major currencies – retreated toward 103.00 from the one-month high it set near 103.50 on Monday.
The USD benefited from the upbeat July Retail Sales data released on Tuesday, but failed to extend its rally. After Fitch Ratings analysts told CNBC that they could downgrade several big lenders, including J.P. Morgan, the benchmark 10-year US Treasury bond yield declined sharply, limiting the USD's potential gains.
The US economic docket will feature Housing Starts and Building Permits data for July in the early American session on Wednesday. The Federal Reserve will release Industrial Production figures and publish the minutes of the July policy meeting later in the day.
US Dollar price today
The table below shows the percentage change of US Dollar (USD) against listed major currencies. The US Dollar was the weakest against the Pound Sterling.
| USD | EUR | GBP | CAD | AUD | JPY | NZD | CHF | |
| USD | -0.14% | -0.33% | 0.04% | 0.00% | -0.01% | -0.17% | 0.00% | |
| EUR | 0.15% | -0.18% | 0.17% | 0.14% | 0.14% | -0.02% | 0.15% | |
| GBP | 0.33% | 0.18% | 0.37% | 0.33% | 0.31% | 0.16% | 0.32% | |
| CAD | -0.04% | -0.16% | -0.36% | -0.02% | -0.02% | -0.19% | -0.02% | |
| AUD | -0.01% | -0.13% | -0.33% | 0.01% | -0.02% | -0.16% | -0.01% | |
| JPY | 0.02% | -0.17% | -0.35% | 0.02% | 0.01% | -0.20% | 0.00% | |
| NZD | 0.17% | 0.02% | -0.16% | 0.19% | 0.17% | 0.17% | 0.17% | |
| CHF | 0.00% | -0.15% | -0.34% | 0.02% | -0.01% | 0.00% | -0.17% |
The heat map shows percentage changes of major currencies against each other. The base currency is picked from the left column, while the quote currency is picked from the top row. For example, if you pick the Euro from the left column and move along the horizontal line to the Japanese Yen, the percentage change displayed in the box will represent EUR (base)/JPY (quote).
Daily digest market movers: US Dollar awaits US data
- Retail Sales in the US rose 0.7% on a monthly basis in July to $696.4 billion, data published by the US Census Bureau showed Tuesday. This reading followed the 0.3% (revised from 0.2%) increase recorded in June and came in better than the market expectation of 0.4%. Retail Sales Control Group increased 1% in the same period.
- Other data from the US showed that the headline General Business Conditions Index of the Federal Reserve Bank of New York's Empire State Manufacturing survey slumped to -19 in August from 1.1 in July.
- Wall Street's main indexes suffered heavy losses on Tuesday. The financial-heavy Dow Jones Industrial Average fell more than 1%, while the S&P 500 Financial Index lost nearly 2%.
- Early Wednesday, US stock index futures trade modestly higher on the day.
- Minneapolis Federal Reserve President Neel Kashkari said on Tuesday that he is feeling good about the progress on inflation but added that it was still too high. "The question is, have we done enough, or do we need to do more," he added, noting that fed policy makers have been surprised by the economy's resilience.
- In a report published earlier in the week, Goldman Sachs said that they expect the Federal Reserve to start lowering the policy rate in the second quarter of 2024.
- According to the CME Group FedWatch Tool, markets are pricing in a nearly 30% probability of one more 25 basis point (bps) Fed rate hike before the end of the year.
- The US Department of Labor will publish the weekly Initial Jobless Claims data on Thursday.
Technical Analysis: US Dollar Index is yet to clear critical resistance
The US Dollar Index (DXY) peaked above the 200-day Simple Moving Average (SMA) – currently located at 103.30 – on Monday but failed to make a daily close there. Meanwhile, the Relative Strength Index (RSI) indicator on the daily chart holds comfortably above 50, suggesting that the latest pullback is a technical correction rather than the beginning of a reversal.
In case DXY flips 103.30 into support, it could target 104.00 (psychological level) and 104.70 (May 31 high) next. On the downside, strong support seems to have formed at 102.30, where the 100-day and the 50- day SMA meet. A daily close below that level could attract sellers and open the door for an extended leg lower toward 102.00 (psychological level, static level) and 101.40 (static level).
US Dollar FAQs
What is the US Dollar?
The US Dollar (USD) is the official currency of the United States of America, and the ‘de facto’ currency of a significant number of other countries where it is found in circulation alongside local notes. It is the most heavily traded currency in the world, accounting for over 88% of all global foreign exchange turnover, or an average of $6.6 trillion in transactions per day, according to data from 2022.
Following the second world war, the USD took over from the British Pound as the world’s reserve currency. For most of its history, the US Dollar was backed by Gold, until the Bretton Woods Agreement in 1971 when the Gold Standard went away.
How do the decisions of the Federal Reserve impact the US Dollar?
The most important single factor impacting on the value of the US Dollar is monetary policy, which is shaped by the Federal Reserve (Fed). The Fed has two mandates: to achieve price stability (control inflation) and foster full employment. Its primary tool to achieve these two goals is by adjusting interest rates.
When prices are rising too quickly and inflation is above the Fed’s 2% target, the Fed will raise rates, which helps the USD value. When inflation falls below 2% or the Unemployment Rate is too high, the Fed may lower interest rates, which weighs on the Greenback.
What is Quantitative Easing and how does it influence the US Dollar?
In extreme situations, the Federal Reserve can also print more Dollars and enact quantitative easing (QE). QE is the process by which the Fed substantially increases the flow of credit in a stuck financial system.
It is a non-standard policy measure used when credit has dried up because banks will not lend to each other (out of the fear of counterparty default). It is a last resort when simply lowering interest rates is unlikely to achieve the necessary result. It was the Fed’s weapon of choice to combat the credit crunch that occurred during the Great Financial Crisis in 2008. It involves the Fed printing more Dollars and using them to buy US government bonds predominantly from financial institutions. QE usually leads to a weaker US Dollar.
What is Quantitative Tightening and how does it influence the US Dollar?
Quantitative tightening (QT) is the reverse process whereby the Federal Reserve stops buying bonds from financial institutions and does not reinvest the principal from the bonds it holds maturing in new purchases. It is usually positive for the US Dollar.
Economists at OCBC Bank expect the AUD/USD pair to recover after a short term period of weakness.
Downside risks for now
Near term, AUD risks trading on the soft side.
But looking out, we still favour AUD to trade higher on the back of expectations that China growth could stabilise at some point, possibly warmer ties between Australia and China, and a more moderate soft USD profile (as the Fed nears the end of tightening cycle).
See: Aussie is likely to continue to trade volatile – Commerzbank
USD/JPY continued to drift higher, taking cues from higher US Treasury yields and USD rebound. Economists at OCBC analyze the pair’s outlook.
Intervention risks likely overblown
Path of least resistance may be skewed to the upside given USD strength. While there are chatters of the risks of BoJ intervention, it is important to note that policymakers care more about excessive volatility than the level in itself.
Beyond the near term, we expect USD/JPY to trade lower on the back of a moderate-to-soft USD profile (as Fed tightening stretches into late cycle and that USD can fall when pause or pivot comes into play) and on expectation for further BoJ shift towards policy normalisation amid higher inflationary pressures in Japan.
The ONS has just released the July CPI data. Economists at MUFG Bank do not expect the British Pound (GBP) to enjoy substantial gains following inflation figures.
Inflation surprises modestly to the upside
The drop overall in inflation was a little less than expected. The core CPI rate remained unchanged at 6.9% with services CPI YoY accelerating from 7.2% to 7.4%. The data will clearly add to the pricing probability of the BoE going by 50 bps rather than 25 bps in September but we doubt there will be a substantial shift in pricing at this juncture.
Given we believe there are upside risks for the Dollar at the moment, we would play long GBP views versus the Euro for now, although like yields we doubt GBP will see notable gains following this CPI release.
The Reserve Bank of New Zealand (RBNZ) kept the Official Cash Rate (OCR) unchanged at 5.50%. Economists at MUFG Bank analyze NZD outlook after the Interest Rate Decision.
RBNZ leaves key policy rate unchanged
The RBNZ announced an unchanged monetary policy stance with the OCR left at 5.50%.
We still believe the RBNZ has completed its tightening cycle and the data flow underlines the weakening economy that should allow the RBNZ to remain on the sidelines.
Weaker China growth, weak growth in New Zealand and global growth risks in general will keep the performance of NZD toward the bottom of the G10 performance table going forward and we see downside risks for NZD versus the Dollar over the short-term and into 2024.
- EUR/GBP remained vulnerable as UK core inflation turned out sticky in July.
- Eurozone’s preliminary Q2 GDP remained in line with estimates and Q1 releases.
- The ECB is expected to lift interest rates further in September.
The EUR/GBP pair continues its three-day losing streak after slipping below Tuesday’s low of 0.8574 in the London session. The cross comes under extreme pressure after United Kingdom’s inflation data for July confirmed that core inflation remained severely persistent due to stronger wage growth.
Monthly headline inflation for July contracted by 0.4% against the forecasted contraction pace of 0.5%. In June, the economic data was expanded by 0.1%. The annual headline Consumer Price Index (CPI) softened to 6.8%, as expected by investors. Firms managed to pass the benefit of lower energy prices to end consumers. Last month, Bank of England (BoE) Governor Andrew Bailey also warned fuel suppliers for overcharging customers.
The impact of a slowdown in headline inflation has been completely offset due to stickiness in core CPI. The economic data remained steady at 6.9% while investors anticipated a nominal decline to 6.8%. Core CPI is marginally lower than its peak of 7.1%, demonstrating robust demand for services and durables. Services inflation, which mostly reflects home-grown inflation pressure from wages, rose to 7.4% from 7.2%, reported Reuters.
Stickiness in core CPI has deepened the risk of long-lasting inflation in the UK economy, which will force BoE policymakers to continue its rate-tightening campaign. Also, it has created uncertainty about UK PM Rishi Sunak’s promise of halving inflation to 5%.
On the Eurozone front, preliminary Q2 Gross Domestic Product (GDP) expanded by 0.3% and 0.6% on a quarterly and an annual basis, remained in line with estimates and the January-March quarter release. Fresh payroll additions in the April-June quarter expanded at 0.2% as expected but slower than Q1’s pace of 0.6%.
About the interest rate outlook, a Bloomberg poll showed that the European Central Bank (ECB) will deliver one final hike in interest rates in September. The deposit rate will be lifted to 4% from 3.75%.
Head of Research at UOB Group Suan Teck Kin, CFA, reviews the latest interest rate decision by the RBI.
Key Takeaways
The Reserve Bank of India (RBI) at its latest Monetary Policy Committee (MPC) meeting left its policy stance unchanged, as widely expected. The benchmark repo rate is maintained at 6.50%, which has stayed unchanged since the surprise pause at the Apr policy meeting. Cash reserve ratio has also been left intact at 4.50%.
The latest decision was made within a context of slower global growth, an anticipated early end to global central bank tightening, resilient domestic demand and moderating inflation rates within RBI’s bands.
Outlook – While the possibility of further rate increases remains on the table, we see a high likelihood of the RBI extending its rate pause in the subsequent meetings, after cumulative rate hikes of 250 bps since May 2022. The RBI noted its concerns of downside risks to outlook including weak global demand, volatility in global financial markets, geopolitical tensions and supply chain fragmentation. However, one concern is that domestic inflation rates could see upside pressures ahead due to supply disruptions as a result of adverse weather conditions. The next MPC meeting is scheduled for 4-6 Oct 2023.
- Gold price hovers around $1,900.00 as investors await Fed minutes.
- The US Dollar capitalizes on US economic resilience and a slowdown in China.
- Robust consumer spending momentum driven by strong wage growth may keep US core inflation sticky.
Gold price (XAU/USD) flirts with the crucial support of $1,900 as investors await the Federal Open Market Committee (FOMC) minutes to attain guidance about inflation and the interest-rate peak. The precious metal continues to find offers from market participants as the US Dollar and Treasury yields strengthen due to the resilience of the US economy, which contrasts with China’s poor economic outlook.
Robust consumer spending momentum fueled by strong wage growth indicates resilience in the US economy, which could keep core inflation sticky and would force Federal Reserve (Fed) policymakers to keep interest rates high for a longer period. Fed policymakers are expected to keep the interest-rate policy unchanged in September as spending on big-ticket items softens due to higher rental costs.
Daily Digest Market Movers: Gold price awaits FOMC minutes
- Gold price aims for sustainability above $1,900, aided by a directionless US Dollar ahead of the FOMC minutes, which will be released at 18:00 GMT.
- FOMC minutes of the September monetary policy meeting will provide interest rate guidance and the inflation outlook for the remainder of 2023.
- According to the CME Group FedWatch Tool, markets broadly expect interest rates to remain unchanged for the rest of the year.
- However, US economic resilience due to stronger consumer spending momentum and tight labor market conditions could force Federal Reserve policymakers to keep interest rates high for a longer period.
- On the contrary, Minneapolis Fed President Neel Kashkari said on Tuesday that while the US central bank has made some progress in its inflation fight, interest rates may still need to go higher to finish the job.
- The US Dollar Index manages to keep auction around 103.00 amid further evidence of an economic slowdown in China and US strong consumer spending momentum.
- The Chinese economy is facing a turbulent environment amid a slowdown in overall demand and declining exports.
- The People’s Bank of China (PBoC) cut the one-year medium-term lending facility (MLF) rate by 15 basis points (bps) to 2.50% in order to keep liquidity in the banking system at reasonably ample levels.
- A dovish interest-rate decision from the PBoC came after new home prices in China fell in June for the first time this year.
- An economic slowdown of the Chinese economy has improved the appeal for the US Dollar.
- US retail sales, a proxy for consumer spending, expanded at a higher pace in July partly driven by strong wage growth. Retail Sales rose by 0.7%, more than the 0.4% expected and the 0.2% increase seen a month earlier. Retail Sales excluding automobiles rose by 1.0%, indicating robust demand for both durables and quick consumables.
- 10-year US Treasury yields remain around 4.20% as investors hope interest rates will remain high for longer amid an upbeat economic outlook.
- The risk profile remained bearish as Fitch warned about the downgrading of some of the big US lenders. After the downgrade of the US banking industry's "operating environment" to AA- from AA, the credit rating firm warned of downgrading multiple banks including J.P. Morgan.
- Apart from the FOMC minutes, investors will also focus on monthly Industrial Production data for July. Production is seen expanding by 0.3%, swinging from a 0.5% contraction in June.
Technical Analysis: Gold price hovers below 200-EMA
Gold price struggles to maintain auction above the immediate support of $1,900. The precious metal continues to face selling pressure due to strength in the US Dollar and Treasury yields. The yellow metal continues its downside journey after a bearish crossover from the 20- and 50-day Exponential Moving Averages (EMAs). Gold price hovers around the 200-EMA and a confident breakdown below this level will expose it to more downside.
Fed FAQs
What does the Federal Reserve do, how does it impact the US Dollar?
Monetary policy in the US is shaped by the Federal Reserve (Fed). The Fed has two mandates: to achieve price stability and foster full employment. Its primary tool to achieve these goals is by adjusting interest rates.
When prices are rising too quickly and inflation is above the Fed’s 2% target, it raises interest rates, increasing borrowing costs throughout the economy. This results in a stronger US Dollar (USD) as it makes the US a more attractive place for international investors to park their money.
When inflation falls below 2% or the Unemployment Rate is too high, the Fed may lower interest rates to encourage borrowing, which weighs on the Greenback.
How often does the Fed hold monetary policy meetings?
The Federal Reserve (Fed) holds eight policy meetings a year, where the Federal Open Market Committee (FOMC) assesses economic conditions and makes monetary policy decisions.
The FOMC is attended by twelve Fed officials – the seven members of the Board of Governors, the president of the Federal Reserve Bank of New York, and four of the remaining eleven regional Reserve Bank presidents, who serve one-year terms on a rotating basis.
What is Quantitative Easing (QE) and how does it impact USD?
In extreme situations, the Federal Reserve may resort to a policy named Quantitative Easing (QE). QE is the process by which the Fed substantially increases the flow of credit in a stuck financial system.
It is a non-standard policy measure used during crises or when inflation is extremely low. It was the Fed’s weapon of choice during the Great Financial Crisis in 2008. It involves the Fed printing more Dollars and using them to buy high grade bonds from financial institutions. QE usually weakens the US Dollar.
What is Quantitative Tightening (QT) and how does it impact the US Dollar?
Quantitative tightening (QT) is the reverse process of QE, whereby the Federal Reserve stops buying bonds from financial institutions and does not reinvest the principal from the bonds it holds maturing, to purchase new bonds. It is usually positive for the value of the US Dollar.
Following the Reserve Bank of Australia's (RBA) interest rate decision two weeks ago, the Australian Dollar has depreciated significantly. Economists at Commerzbank analyze Aussie’s outlook.
A renewed pause in interest rates is unlikely to surprise the FX market
If the monthly inflation numbers, which will be published at the end of August, confirm the general trend that the previous interest rate hikes are having an effect, then the RBA will probably see itself confirmed in its approach and stay on hold again in September, especially in view of the weaker growth outlook in China.
However, a renewed pause in interest rates is unlikely to surprise the FX market given current market expectations. Nevertheless, the RBA has already surprised the FX market twice this year with rate hikes. Given this backdrop, and also considering the lower trading liquidity in August, the Aussie is likely to continue to trade volatile.
- AUD/JPY recovered losses on the back of the drop in US bond yields.
- Reuters Tankan released the quarterly survey, indicating Large Manufacturing and Non-manufacturing sentiments have improved.
- Market speculates another Japanese intervention to safeguard the Yen.
AUD/JPY trades higher around 94.10 in the early European trading hours on Wednesday. The pair is rebounding from the losses recorded on Tuesday, with the resilience of the Australian Dollar (AUD) potentially linked to the drop in US bond yields.
However, China’s weakening economic outlook raises concerns about potential reductions in demand for Australian exports, such as commodities and goods. This economic contraction can weigh on investor sentiment and lead to a decrease in demand for the Aussie.
On the other hand, Reuters Tankan unveiled its quarterly survey detailing business sentiment among Japanese companies. This dataset provides support to the Japanese Yen (JPY) due to the indication that both Large Manufacturing and Non-manufacturing sentiments have improved. Specifically, the Large Manufacturing sentiment index has climbed to +12 in August from the previous +3 in July. In a similar vein, the non-manufacturing sentiment has advanced, registering a reading of +32 in August, an increase from the +23 noted in July.
Moreover, there is market speculation regarding the possibility of Japanese authorities intervening to safeguard the Japanese currency against the US Dollar (USD), similar to what was observed in September, 2022. It could play a key role in AUD/JPY price action.
Upbeat Japan's Gross Domestic Product (GDP) figures released on Tuesday also aided the Yen. This sentiment might have been reinforced by a statement made by the country’s Finance Minister Shunichi Suzuki. Suzuki mentioned that "rapid movements are undesirable and indicated that the government is prepared to respond in an appropriate manner, as reported by Reuters.
Market participants will closely observe the upcoming data releases scheduled for Thursday. From the Australian economic calendar, the focus will be on Employment Change s.a. and Unemployment Rate figures for July. Additionally, attention will turn to Japan's National Consumer Price Index data set to be released on Friday. These data points are anticipated to provide crucial insights into the economic conditions of these respective countries and could impact trading decisions in the AUD/JPY pair.
Global dairy markets continue to weaken. Economists at ANZ Bank now forecast a farmgate milk price of $7.15/kg milk solid (MS) for the 2023-24 season, 60 cents lower than their previous guidance.
Chinese demand for dairy products has eased
We have revised down our farmgate milk price forecast for the 2023-24 season by 60c to $7.15/kg MS.
Our forecast for 2022-23 remains unchanged at $8.20/kg MS.
Economic conditions in China have deteriorated further and their demand for dairy products has eased.
The relatively weak NZD remains supportive of the farmgate milk price but is certainly not sufficient to offset the impact of lower dairy commodity prices.
Eurozone Industrial Production showed an unexpected increase in June, the official data showed on Wednesday, suggesting that the manufacturing sector recovery is back on track.
Eurozone’s Industrial Output rose 0.5% MoM, the Eurostats reported in its latest release, vs. -0.1% expected and 0% previous reading.
The bloc’s annual Industrial Production dropped 1.2% in June versus a 2.5% decline seen in May and against expectations of a 4.2% decrease.
EUR/USD reaction
The shared currency is unfazed by the mixed German industrial figures. At the time of writing, EUR/USD is trading at around 1.0930, adding 0.22% on the day.
The Eurozone economy expanded by 0.3% on a quarterly basis in the three months to June of 2023, matching the 0.3% estimates and growing at the same pace seen in the first quarter of 2023, the preliminary release published by Eurostat showed on Wednesday.
The bloc’s GDP rate grew by an annual rate of 0.6% in Q2 vs. 0.6% recorded in Q1 while meeting 0.6% expectations.
Meanwhile, the second quarter Preliminary Employment Change data for the old continent came in at 0.2% and 1.5% on a quarterly and yearly basis respectively.
Market reaction
EUR/USD was last seen trading at 1.0928, up 0.21% on the day. Eurozone GDP data matched expectations and failed to move the needle around the Euro.
About Eurozone Preliminary GDP
The Gross Domestic Product released by Eurostat is a measure of the total value of all goods and services produced by the Eurozone. The GDP is considered as a broad measure of the Eurozone's economic activity and health. Usually, a rising trend has a positive effect on the EUR, while a falling trend is seen as negative (or bearish).
- AUD/USD rebounds from a fresh YTD low touched on Wednesday amid a modest USD slide.
- China’s economic woes might cap gains for the Aussie ahead of the FOMC meeting minutes.
- Any subsequent move up is more likely to confront a stiff barrier near the 0.6520 confluence.
The AUD/USD pair stages a goodish intraday recovery from the 0.6430-0.6425 region, or its lowest level since November 2022 touched this Wednesday and builds on the momentum through the early part of the European session. Spot prices climb to a fresh daily top, around the 0.6480 region in the last hour and for now, seem to have snapped a six-day losing streak.
Retreating US Treasury bond yields, along with a positive tone around the US equity futures, exerts downward pressure on the safe-haven US Dollar (USD) and prompts some short-covering around the AUD/USD pair. That said, growing concerns about the worsening economic conditions in China might cap gains for the China-proxy Aussie. Traders might also refrain from placing aggressive bets and prefer to wait on the sidelines ahead of the FOMC meeting minutes, due for release later during the US session.
From a technical perspective, the momentum lifts the AUD/USD pair beyond the 23.6% Fibonacci retracement level of the recent downfall witnessed over the past week or so. Moreover, oscillators on the 1-hour chart have just started gaining positive traction and support prospects for further intraday appreciating move. Hence, a subsequent strength towards a confluence hurdle near the 0.6500 psychological mark, comprising the 100-hour Simple Moving Average (SMA) and the 38.2% Fibo., looks like a distinct possibility.
That said, technical indicators on the daily chart are holding deep in the bearish territory and suggest that the recovery move could run out of steam near the weekly peak, around the 0.6520 area, set on Tuesday. The said area marks another confluence, comprising the 200-hour SMA and the 50% Fibo. level, which should now act as a key pivotal point. A sustained strength beyond might suggests that the AUD/USD pair has bottomed and shift the bias in favour of bulls, paving the way for some meaningful recovery.
On the flip side, the YTD low, around the 0.6430-0.6425 region, now seems to protect the immediate downside ahead of the 0.6400 round-figure mark. Some follow-through selling will be seen as a fresh trigger for bearish traders and set the stage for the resumption of the recent downward trajectory witnessed over the past month or so, from the 0.6900 double-top resistance. The AUD/USD pair might then weaken further towards the 0.6360 intermediate support en route to the 0.63000 mark and the 0.6265 zone.
AUD/USD 1-hour chart
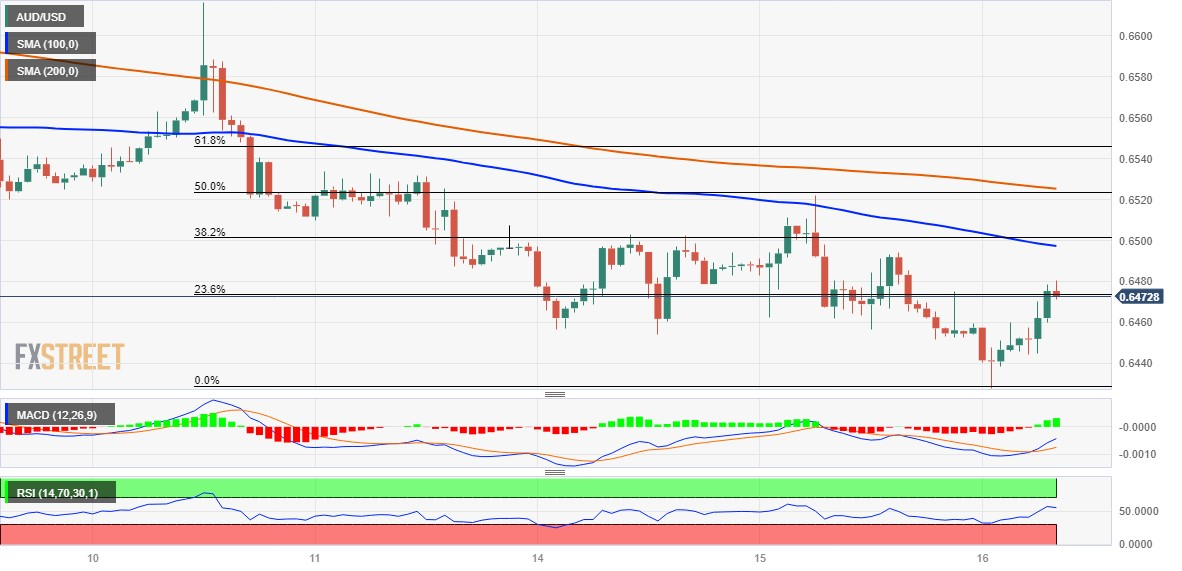
Technical levels to watch
With USD/JPY levels in the mid-145s, nobody seems to be afraid of interventions, economists at Commerzbank report.
The state of current volatility is not seen to be unusually low
The state of current volatility is not seen to be unusually low. The market is not just relaxed about the current risk of interventions but also beyond that. It would seem that the verbal interventions made no difference.
At current levels, the Yen is not trading at artificial levels achieved with the help of verbal interventions. 145 to 146 is the area where USD/JPY is trading ‘naturally’. If the MOF were to issue effective threats that would have a positive effect at current levels.
Data confirms the strength of the US economy and today's Industrial Production and FOMC minutes can only add fuel to the fire. The US Dollar is the clear winner here, economists at ING report.
More volunteers to support the USD
Industrial Production, after a 0.5% MoM drop in June, should show a return to 0.3% MoM growth in July in our view, in line with market expectations. Retail Sales already indicate 3% GDP growth in the third quarter in our view and estimates for Industrial Production are also supportive of another positive surprise, confirming the strength of the US economy, which would be more positive news for the US Dollar, of course.
The July Federal Reserve minutes should reflect the FOMC's hawkish efforts to combat dovish expectations. For now, this strategy is working perfectly. However, it is just a matter of time before the Fed uses up its ammunition and the market stops buying more hawkish news. For now, though, we remain in this mode for at least the next few days, which combined with the positive surprises from the economy, should continue to support the USD.
DXY should remain above 103.00 and test higher levels closer to 103.50 today as well.
UOB Group’s Economist Loke Siew Ting comments on the recently published Q2 GDP figures in the Philippines.
Key Takeaways
The Philippines’ real GDP growth decelerated at a faster-than-expected pace to 4.3% y/y in 2Q23 (from +6.4% in 1Q23), marking the third quarter of growth slowdown and the smallest gain since 1Q21. The reading undershot our estimate of 5.0% and Bloomberg consensus’ 6.0%, as a result of tighter monetary policy and subdued global demand amid year-ago high base effects.
All sectors posted weaker performance in 2Q23, led by services, manufacturing and construction industries. Falling government spending, a setback in investment gains and stock withdrawal activities were key factors pulling down the overall GDP growth more than expected in 2Q23, despite positive net trade contribution and moderate household consumption in the face of higher interest rates environment and elevated inflationary pressures.
We continue to expect a softer economic growth outlook for 2H23, with a slower real GDP expansion of 4.6% (vs +5.4% in 1H23). This is mainly premised on uncertainties surrounding the global food and energy prices, geopolitical tensions, China’s post-pandemic economic recovery, and an expected downturn in advanced economies, which will further impact global demand, investments and inflation prospects. Year-ago high base effects will also weigh on the Philippines’ growth momentum in 2H23, together with the lagged effects of restrictive monetary policy and adverse impact of recent typhoons striking the country. For now, we keep our 2023 full-year GDP growth forecast of 5.0% (official est: 6.0%-7.0%, 2022: 7.6%) with downside risks.
Considering advanced prints from CME Group for natural gas futures markets, open interest shrank by almost 3K contracts after two consecutive daily builds on Tuesday. Volume, on the other hand, went up by around 181.4K contracts after three daily drops in a row.
Natural Gas faces interim support near $2.58
Prices of natural gas dropped markedly on Tuesday amidst the sharp rejection from last week’s tops around the key $3.00 mark per MMBtu (August 9). The strong decline was accompanied by a drop of interest rate, which removes some strength from the deep sell-off. In the meantime, the commodity is expected to face provisional support at the 55-day SMA near $2.58.
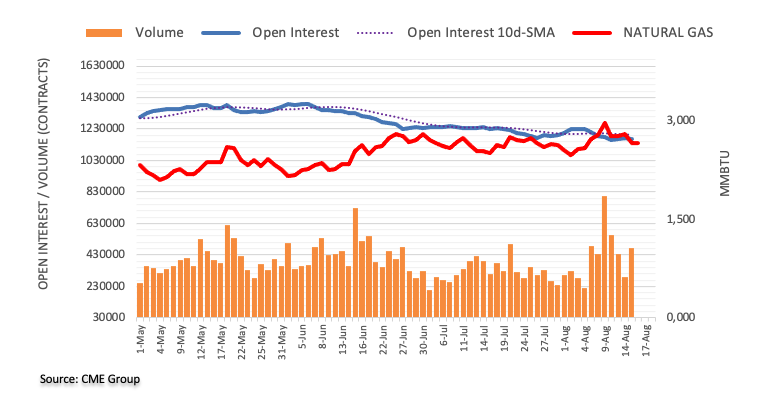
- Silver recovers further from a nearly two-month low touched the previous day.
- A move beyond the 100-hour SMA supports prospects for further intraday gains.
- The broader setup warrants caution before confirming a bottom for the XAG/USD.
Silver gains some positive traction on Wednesday and builds on the previous day's late rebound from the $22.20 area, or a nearly two-month low. The white metal extends its steady intraday ascent through the early part of the European session and climbs to a fresh daily high, around the $22.65-$22.70 region in the last hour.
From a technical perspective, the intraday strength beyond the 100-hour Simple Moving Average (SMA) might have already set the stage for a further appreciating move. Moreover, oscillators on the 1-hour chart have been gaining positive traction and are still far from being in the overbought zone, validating the constructive outlook. That said, it will still be prudent to wait for strong follow-through buying before confirming that the XAG/USD has formed a near-term bottom.
Moreover, technical indicators on the daily chart are still holding deep in the bearish territory. Apart from this, the recent break below the very important 200-day SMA suggests that the attempted recovery might still be seen as a selling opportunity and runs the risk of fizzling out rather quickly. Hence, any subsequent move up is more likely to confront stiff resistance near the $22.80-$22.85 region ahead of the $23.00 mark and the $23.25 region, or the 200-day SMA.
The latter should act as a key pivotal point, which if cleared might trigger a short-covering move and lift the XAG/USD to the $23.60-$23.65 horizontal barrier. Bulls might eventually aim to reclaim the $24.00 round figure.
On the flip side, the overnight swing low, around the $22.20 region, nearing the multi-month low, around the $22.15-$22.10 area touched in June, might continue to protect the immediate downside. Bearish traders might wait for some follow-through selling below the $22.00 mark before placing fresh bets. The XAG/USD might then accelerate the fall towards the $21.55-$21.50 area en route to the $21.00 round figure. The downward trajectory could get extended further towards intermediate support near the $20.60 area before Silver drops to the YTD low, or levels just below the $20.00 psychological mark touched in March.
Silver 1-hour chart
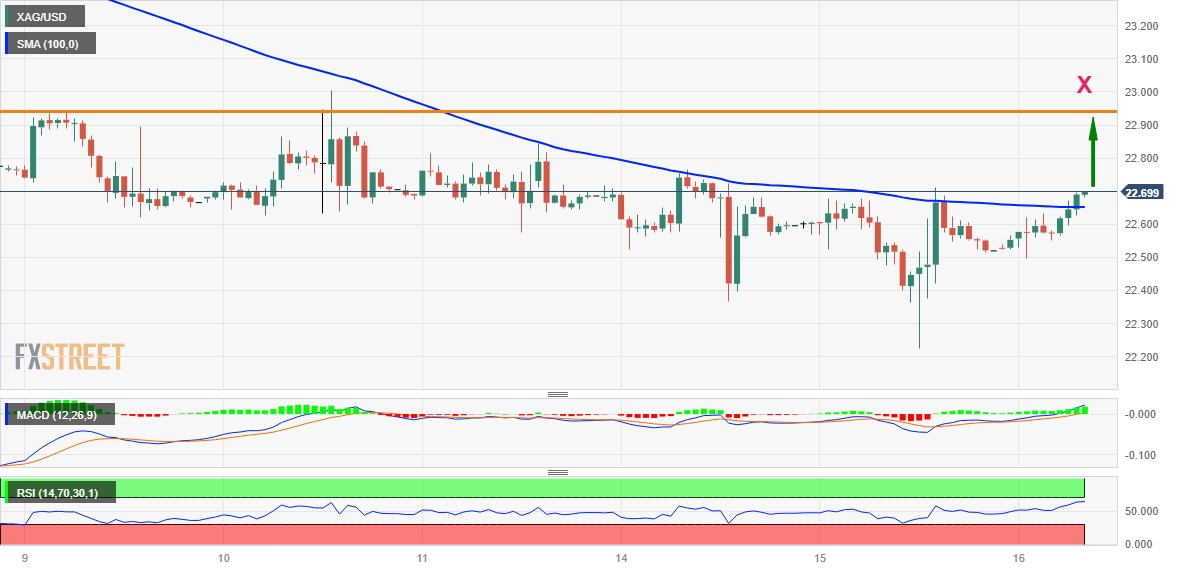
Technical levels to watch
The SEK lost ground after the release of the Swedish July inflation data. Antje Praefcke, FX Analyst at Commerzbank, analyzes Krona’s outlook.
Riksbank increasingly under pressure
Riksbank is increasingly under pressure not only to raise the key rate in September by 25 bps as signaled in June but to raise the rate path further. After all, the June data were already above its expectations and July shows hardly any easing of price pressure, especially in the core rate.
By the next interest rate meeting on September 21, the Riksbank will also know the August inflation figures, which will be published on September 14. But already by then, I think the Riksbank's Executive Council members should be verbally hinting that they will probably have to ‘do more’ to prevent further SEK weakness.
If, in September, the new inflation figures again show little tendency toward easing price pressures, it will become all the more urgent for the Riksbank to make another significant move. Otherwise, things look bleak for the SEK.
UOB Group’s Economist Ho Woei Chen, CFA, reviews the latest inflation figures in China.
Key Takeaways
In line with expectation, China’s CPI headed into a negative reading for the first time since Feb 2021 while PPI registered its 10th straight month of price declines in Jul.
Having said that, the deflationary condition in China are likely to be mild and temporary. We expect China’s headline CPI to return to positive much sooner than the PPI, noting that headline CPI reversed its 5 straight month of m/m declines and core inflation has actually picked up in Jul.
Looking ahead, the severe floods in parts of China this month could put some upward pressure on food prices but sluggish external and domestic demand as well as the slack in the job market will still keep price pressures weak in general. This continues to support further easing of China’s monetary policy. As such, we further lower China’s headline inflation forecast for 2023 to 0.4% from previous projection of 0.8% (2022: 2.0%) and our PPI forecast to -3.1% from earlier call of -2.0% (2022: 4.1%).
Here is what you need to know on Wednesday, August 16:
Following Tuesday's choppy action, risk flows seem to have returned to financial markets mid-week. Second-quarter Gross Domestic Product (GDP) growth figures will be featured in the European economic docket alongside Employment Change data. Later in the day, Housing Starts and Building Permits from the US will be watched closely by market participants before the Federal Reserve releases the minutes of the July policy meeting at 18:00 GMT.
During the Asian trading hours, the Reserve Bank of New Zealand (RBNZ) announced that it left the policy rate unchanged at 5.5% as expected. In its policy statement, the RBNZ noted that policymakers agreed to keep the policy rate at restrictive levels for the foreseeable future and added that inflation is expected to decline within the target band by the second half of 2024. NZD/USD gained traction following the RBNZ policy decisions and the pair was last seen rising toward 0.6000, gaining more than 0.5% on the day.
Inflation in the UK, as measured by the change in the Consumer Price Index (CPI), declined to 6.8% on a yearly basis in July from 7.9% in June, matching the market expectation. The Core CPI, which excludes volatile food and energy prices, held steady at 6.9% in the same period and the annual Retail Price Index dropped to 9% from 10.7%. Although inflation-related data releases largely came in line with analysts' forecasts, GBP/USD edged higher toward 1.2750 in the European morning.
Pound Sterling price today
The table below shows the percentage change of Pound Sterling (GBP) against listed major currencies today. Pound Sterling was the strongest against the US Dollar.
| USD | EUR | GBP | CAD | AUD | JPY | NZD | CHF | |
| USD | -0.18% | -0.33% | -0.05% | -0.30% | -0.12% | -0.53% | -0.04% | |
| EUR | 0.19% | -0.15% | 0.12% | -0.11% | 0.08% | -0.34% | 0.17% | |
| GBP | 0.33% | 0.15% | 0.28% | 0.04% | 0.21% | -0.20% | 0.29% | |
| CAD | 0.05% | -0.12% | -0.28% | -0.23% | -0.04% | -0.47% | 0.04% | |
| AUD | 0.30% | 0.13% | -0.03% | 0.22% | 0.17% | -0.23% | 0.27% | |
| JPY | 0.11% | -0.10% | -0.25% | 0.03% | -0.17% | -0.43% | 0.07% | |
| NZD | 0.53% | 0.34% | 0.19% | 0.47% | 0.24% | 0.43% | 0.52% | |
| CHF | 0.03% | -0.16% | -0.31% | -0.04% | -0.27% | -0.08% | -0.50% |
The heat map shows percentage changes of major currencies against each other. The base currency is picked from the left column, while the quote currency is picked from the top row. For example, if you pick the Euro from the left column and move along the horizontal line to the Japanese Yen, the percentage change displayed in the box will represent EUR (base)/JPY (quote).
Meanwhile, US stock index futures trade in positive territory following the sharp decline witnessed in Wall Street's main indexes on Tuesday after Fitch Ratings warned that they could downgrade ratings of some lenders. The US Dollar Index consolidates its recent gains and holds above 103.00, while the 10-year US Treasury bond yield continues to fluctuate at around 4.2%.
EUR/USD spent the Asian session moving sideways slightly above 1.0900. With the USD coming under modest selling pressure in the European morning, the pair inched higher toward 1.0930.
Following a six-day rally, USD/JPY stabilized at around mid-145.00s on Tuesday. The pair holds steady near that level in the early European session.
Gold price dropped below $1,900 for the first time since late June on Tuesday but managed to rebound above that level before the end of the day. With 10-year US yield holding comfortably above 4%, XAU/USD is having a hard time gathering recovery momentum.
Bitcoin edged lower amid risk aversion on Tuesday but didn't have a hard time stabilizing above $29,000. Ethereum lost nearly 1% on Tuesday and was last seen trading within a touching distance of $1,800.
Economists at ING analyze EUR/USD outlook as the pair remains in defensive mode above the 1.09 level.
Hard to find forces to defend the Euro
The calendar doesn't have much to offer in the Eurozone today, resulting in a lack of impetus to defend the Euro. The second-quarter GDP estimate and the headline industrial production number are unlikely to change the picture much and so the ball remains in the US court today.
At least the 2y rates differential against the USD has flipped in support of the euro or at least should not push EUR/USD any further down. However, if the strong condition of the US economy is confirmed, it will be hard for EUR/USD to resist breaking 1.09. That should be the line in the sand today as well.
- Euro reverses part of the recent weakness vs. the US Dollar.
- Stocks in Europe open Wednesday’s session on the defensive.
- EUR/USD picks up pace and revisits the 1.0930 zone.
- The USD Index (DXY) comes under pressure and disputes 103.00.
- EMU flash Q2 GDP figures, Industrial Production come next.
- FOMC Minutes, housing sector data are due later in the US docket.
The Euro (EUR) has managed to steady itself against the US Dollar (USD), leading to a recovery in EUR/USD, which reached the 1.0930 level after the opening bell in the euro area on Wednesday.
This recent rebound in the pair can be attributed to renewed selling pressure on the Greenback, causing a corresponding reaction in the USD Index (DXY), which retreated towards the 103.00 neighbourhood. This movement in the index is occurring simultaneously with a slight decrease in US yields across various maturities.
Taking a broader perspective in terms of monetary policy, there haven't been any significant alterations. Investors are maintaining their anticipation that the Federal Reserve will maintain its current interest rates throughout the rest of the year. Conversely, the European Central Bank (ECB) is currently contending with internal disagreements within its Council regarding the continuation of its tightening measures after the summer period.
On the domestic front, there is another anticipated revision of the EMU GDP Growth Rate for the second quarter, along with the upcoming release of Industrial Production results within the bloc.
Turning attention to the United States' data landscape, the regular weekly MBA Mortgage Applications report is scheduled to be released first, followed by Building Permits and Housing Starts figures. Subsequently, Industrial Production statistics will be disclosed prior to the release of the significant FOMC Minutes.
Daily digest market movers: Euro remains supported around 1.0900
- The EUR regains some breathing space vs. the USD.
- Concerns around the Chinese economy appear unabated.
- Inflationary pressures lose traction in the UK in July.
- Italian inflation figures showed the CPI rising 5.9% YoY in July
- House Price Index in China contracted 0.1% YoY in July.
- The RBNZ kept its rate unchanged at 5.5% earlier on Wednesday.
- The FOMC Minutes take centre stage later in the NA session.
Technical Analysis: Euro faces minor support at 1.0874
EUR/USD so far manages well to put further distance from the August low at 1.0874 (August 14) on Wednesday, regaining the 1.0900 barrier and above amidst some fresh selling bias in the US Dollar.
In case the ongoing rebound gathers some serious traction, EUR/USD is then expected to meet initial hurdle at the August high at 1.1064 (August 10) prior to the weekly high at 1.1149 (July 27). If the pair clears the latter, it could alleviate some of the downward pressure and potentially test the 2023 peak of 1.1275 (July 18). Once this region is surpassed, significant resistance levels become less prominent until the 2022 high at 1.1495 (February 10), which is closely followed by the round level of 1.1500.
On the flip side, If the pair slips back below the August low of 1.0874 (August 14), it could indicate a potential downward movement towards the July low of 1.0833 (July 6) ahead of the significant 200-day SMA at 1.0784, and eventually the May low of 1.0635 (May 31). Deeper down, there are additional support levels at the March low of 1.0516 (March 15) and the 2023 low at 1.0481 (January 6).
Furthermore, the positive outlook for the EUR/USD pair remains valid as long as it remains above the important 200-day SMA.
- Pound Sterling starts moving as core inflation supports further policy tightening.
- UK’s core inflation remains stronger due to robust wage growth.
- More interest rate hikes from the BoE seem required so that inflation returns to 2%.
The Pound Sterling (GBP) is strengthening, inspired by persistently high core inflation data. The GBP/USD pair delivers a consolidation breakout as the Core Consumer Price Index (CPI) remains stable at 6.9%, higher than the forecast of 6.8%. Robust wage growth keeps consumer spending momentum intact and core price pressure near its immediate peak of 7.1%.
The United Kingdom’s stubborn core CPI is enough to force the Bank of England (BoE) to consider a continuation of the aggressive rate-tightening spell. The UK’s central bank has already raised interest rates to 5.25%, and now further policy tightening appears more likely. Meanwhile, headline inflation contracted in July as firms passed on the benefits of cheap oil prices to end consumers.
Daily Digest Market Movers: Pound Sterling rises as core inflation remains sticky
- Pound Sterling climbs above 1.2700 after mixed United Kingdom inflation data for July.
- Monthly headline inflation contracted by 0.4%, slower than expectations of 0.5%. In June, headline CPI expanded by 0.1%.
- Annual headline inflation softened to 6.8%, as expected by investors, versus. June’s reading of 7.8%. It seems that firms started passing the benefit of cheap oil on to end consumers.
- Core inflation that excludes volatile oil and food prices turned out persistent despite aggressive monetary policy by the Bank of England. The economic data remained sticky at 6.9% while investors forecasted a marginal decline to 6.8%.
- UK core inflation is marginally lower than its immediate peak of 7.1% and is sufficient to force BoE policymakers to raise interest rates further.
- Stubborn core inflation exposes BoE to raise interest rates to 6%.
- It seems that strong wage growth has elevated consumer spending due to higher disposable income.
- On Tuesday, the Pound Sterling was decently bought by market participants as robust wage growth offsets disappointing labor market data.
- April-June quarter’s Average Earnings Excluding Bonuses rose to 7.8% vs. a downwardly revised prediction of 7.4%. Earnings data including bonuses jumped significantly to 8.2% in the same period, considerably higher than the consensus of 7.3%.
- UK’s Office for National Statistics (ONS) reported that the labor market witnessed lay-offs of 66K in June while Reuters forecasted fresh additions of 75K job seekers. In May, the ONS agency reported an increase in new payrolls by 102K.
- Claimant Count Change for July rose sharply by 29K, higher than the 16.2K jobless claims recorded in June. On the contrary, investors forecasted a decline in the number of claims by 7.3K.
- The second-quarter Unemployment Rate rose to 4.2% vs. the estimates and the former release of 4.0%.
- Assessing the UK jobs report, UK Minister for Employment, Guy Opperman MP told FXStreet: "Our jobs market continues to show its strength with employment at near record levels and inactivity down by over 300,000 since the pandemic peak. Combined with falling inflation and our package of reforms to remove barriers to work, we are on the right path to drive down household costs and grow our economy."
- The US Dollar Index (DXY) struggles to sustain above 103.00 as the Federal Reserve (Fed) is expected to keep interest rates unchanged in September’s monetary policy meeting.
- Per the CME FedWatch Tool, less than 10% chances are in favor of a 25 basis point (bp) interest-rate hike in September’s policy meeting.
- The US Dollar remained sideways on Tuesday despite robust consumer spending momentum in July, reported by the US Census Bureau.
- The economic data rose by 0.7% vs. expectations of 0.4% and the former release of 0.2% amid higher disposable income due to sustained wage growth.
- Minneapolis Fed President Neel Kashkari on Tuesday said that while the US central bank has made some progress in its inflation fight, interest rates may still need to go higher to finish the job.
Technical Analysis: Pound Sterling seems confident above 1.2700
The Pound Sterling rose sharply after the UK’s core inflation remained high in July. The Cable seems confident above the round-level resistance of 1.2700 and is expected to test the three-day high around 1.2750. The asset has recovered to near the 50-day Exponential Moving Average (EMA) around 1.2740 but is still trading below the 20-day EMA.
The Relative Strength Index (RSI) (14) has dropped to near 40.00. This would be a make-or-break level for the momentum oscillator as a slippage below the same will activate the bearish impulse.
Pound Sterling FAQs
What is the Pound Sterling?
The Pound Sterling (GBP) is the oldest currency in the world (886 AD) and the official currency of the United Kingdom. It is the fourth most traded unit for foreign exchange (FX) in the world, accounting for 12% of all transactions, averaging $630 billion a day, according to 2022 data.
Its key trading pairs are GBP/USD, aka ‘Cable’, which accounts for 11% of FX, GBP/JPY, or the ‘Dragon’ as it is known by traders (3%), and EUR/GBP (2%). The Pound Sterling is issued by the Bank of England (BoE).
How do the decisions of the Bank of England impact on the Pound Sterling?
The single most important factor influencing the value of the Pound Sterling is monetary policy decided by the Bank of England. The BoE bases its decisions on whether it has achieved its primary goal of “price stability” – a steady inflation rate of around 2%. Its primary tool for achieving this is the adjustment of interest rates.
When inflation is too high, the BoE will try to rein it in by raising interest rates, making it more expensive for people and businesses to access credit. This is generally positive for GBP, as higher interest rates make the UK a more attractive place for global investors to park their money.
When inflation falls too low it is a sign economic growth is slowing. In this scenario, the BoE will consider lowering interest rates to cheapen credit so businesses will borrow more to invest in growth-generating projects.
How does economic data influence the value of the Pound?
Data releases gauge the health of the economy and can impact the value of the Pound Sterling. Indicators such as GDP, Manufacturing and Services PMIs, and employment can all influence the direction of the GBP.
A strong economy is good for Sterling. Not only does it attract more foreign investment but it may encourage the BoE to put up interest rates, which will directly strengthen GBP. Otherwise, if economic data is weak, the Pound Sterling is likely to fall.
How does the Trade Balance impact the Pound?
Another significant data release for the Pound Sterling is the Trade Balance. This indicator measures the difference between what a country earns from its exports and what it spends on imports over a given period.
If a country produces highly sought-after exports, its currency will benefit purely from the extra demand created from foreign buyers seeking to purchase these goods. Therefore, a positive net Trade Balance strengthens a currency and vice versa for a negative balance.
The Antipodean currencies are having a horrid month since mid-July and there seems to be little reprieve. Economists at TD Securities analyze NZD outlook.
There is little going for the NZD
We note that the Antipodean currencies are trading more closely to the China growth narrative, risk-off sentiment and drop in equities rather than the domestic story and recent price action reflects that. We don't expect any of these factors to show a reversal soon, which puts doubt on any significant rebound for NZD in the near-term, and we are biased to selling the NZD on rallies instead of chasing it lower as NZD is in oversold territory based on the RSI daily.
We like selling rallies near the 20-DMA at 0.61254 and target the 23.6% Fib level at 0.5785 judging by daily Fib levels over the past year. MACD divergence isn't showing any signs of a turn, and we think fundamentally, there is little going for the NZD.
Economists at Commerzbank analyze EUR outlook ahead of Eurozone Gross Domestic Product (GDP) data.
Backward glance turning into forward glance?
Focus is likely to be on the GDP data in Q2. Even though they provide a backward glance the market is likely to welcome a solid result above market expectations, which would support the Euro. I fear though that a weaker-than-expected result would put more pressure on the EUR than a good one would support it.
Weak economic data might make the market think that the ECB might lower interest rates again even more quickly than so far expected, which would affect the Euro. In that case, the ‘backward glance’ might turn into a forward glance, which means towards a faster fall in interest rates. In that case, EUR/USD would quickly slide below 1.09 again.
- Russian Ruble stays pressured for third consecutive day, extends pullback from multi-month high marked on Monday.
- Central Bank of Russian Federation announced 3.5% rate hike to lift the benchmark rates to 12%.
- Cautious optimism, US Dollar’s retreat weigh on USD/RUB.
- Geopolitical concerns, softer Oil price also challenge Russia Ruble buyers ahead of FOMC Minutes.
Russian Ruble cheers the broad US Dollar to stretch the previous day’s gains, triggered mainly by the Central Bank of Russian Federation’s (CBR) emergency rate hike, as market players prepare for the Federal Open Market Committee’s (FOMC) latest Monetary Policy Meeting Minutes on early Wednesday. Adding strength to the USD/RUB pair’s pullback moves could be the cautious optimism in the market, as well as an absence of major data/events from Russia and the Russian policymakers’ optimism contrasts with the mixed bias of the Fed officials.
Russian Ruble cheers hawkish surprise from CBR
On Tuesday, the Central Bank of the Russian Federation (CBR) called an emergency monetary policy meeting and lifted the benchmark rates by 350 basis points (bps) to 12.0%. That said, the CBR’s latest move could be a reaction to an article published in TASS holding the central bank’s easy-money policy responsible for the Russia Ruble’s slump past 102.00 during the early week. It’s worth noting that the CBR lifted the benchmark rates by 1.0% in July.
Despite the CBR’s rate hike, the Russian Ruble remains on the bear’s radar as an ongoing war with Ukraine takes a toll on the oil-rich nation. Furthermore, the international sanctions due to the tension with Kyiv also stop the nation’s revenue from main earner Oil and put a floor under the USD/RUB price.
On the other hand, the US Dollar Index (DXY) prints mild losses around 103.10 while retreating from a five-month-old descending resistance line, as well as from the highest level in a month. In doing so, the Greenback’s gauge versus the six major currencies prints the first daily loss, so far, in five amid the slightly positive sentiment.
Elsewhere, the three-day downtrend in the WTI crude oil, currently down 0.62% intraday near $80.10, also challenges the USD/RUB sellers. Furthermore, the chatters surrounding the likely extension of the Russia-Ukraine war and the anticipated economic toll on Moscow also keep the Russia Ruble sellers hopeful. Additionally, Tuesday’s upbeat US Retail Sales and hawkish comments from Minneapolis Federal Reserve President Neel Kashkari challenged the pair bears the previous day, activating a bounce off the lowest level in a week.
Above all, the CBR’s stark hawkish move versus a likely policy pivot at the Fed may favor the Russian Ruble buyers should today’s FOMC Minutes hesitate to confirm rate hikes.
Russia Ruble Technical Analysis
Russian Ruble buyers need validation from an ascending trend line from May 31, close to 94.20 by the press time, to retake control. Until then, the USD/RUB bulls remain hopeful of revisiting the late March 2022 swing high of around 107.75.
- NZD/USD holds a positive note around 0.5980, up 0.11% on the day.
- The Reserve Bank of New Zealand (RBNZ) maintained interest rates unchanged at 5.5%, as expected.
- US Retail Sales came in above expectations.
- Investors will monitor the FOMC Minutes on Thursday.
The NZD/USD pair gains momentum and edges higher to 0.5980 heading into the early European session on Wednesday. The pair bounces off the yearly low of 0.5930 following the Reserve Bank of New Zealand (RBNZ) monetary policy meeting earlier in the day.
Earlier on Wednesday, the Reserve Bank of New Zealand (RBNZ) kept the benchmark interest rates unchanged at 5.5%, as expected. RBNZ Governor Adrian Orr also offered a hawkish signal to rein in rising inflation expectations.
Nevertheless, investors still worry about China's deteriorating economic outlook. The latest data on Wednesday revealed that the Chinese House Price Index for July fell to -0.1% versus 0% prior. The data raises concerns about a possible property crisis in China, particularly as big developer Country Garden Holdings struggles to meet its debt obligations. That said, the downbeat Chinese data might cap the upside of China-proxy Kiwi for the time being.
Across the pond, US Retail Sales came in above expectations. The headline figure climbed by 0.7% MoM, higher than the 0.4% estimated. Sales excluding the automobile sector came in at 1%, versus the expected 0.4%. Meanwhile, the NY Empire Manufacturing Index fell to -19 from -1. That said, stronger US data might convince the Federal Reserve (Fed) to hike additional rate by the end of the year. This, in turn, could boost the Greenback and act as a headwind for the NZD/USD pair.
Later in the day, the US Building Permits, Housing Starts, and Industrial Production will be released in the American trading hours. Market players will also take cues from RBNZ Governor Adrian Orr Speaks on Thursday. However, the FOMC minutes will be the key event this week and could give a clear direction to the NZD/USD pair.
Economist at UOB Group Loke Siew Ting assesses the latest foreign portfolio figures in Malaysia.
Key Takeaways
Foreign investors continued to favour Malaysian portfolio investment assets in Jul, bringing in an overall inflow of MYR12.7bn (Jun: +MYR3.9bn). This marked the largest monthly foreign portfolio inflows since Mar 2016 and the seventh straight month of net foreign purchases, the longest buying streak since late 2020. It was driven by non-resident inflows into both Malaysian debt securities (Jul: +MYR11.3bn, Jun: +MYR5.2bn) and equities (Jul: +MYR1.4bn, Jun: MYR1.3bn) in the month.
Partly underpinned by the substantial foreign portfolio inflows, Bank Negara Malaysia (BNM)’s foreign reserves rebounded for the first time in four months, by USD1.5bn m/m to USD112.9bn as at end-Jul (end-Jun: -USD1.3bn m/m to USD111.4bn). The latest reserves position is sufficient to finance 5.1 months of imports of goods & services and is 1.1 times the total short-term external debt. BNM’s net short position in FX swaps widened for two months by USD0.4bn m/m to USD24.1bn as at end-Jun (end-May: +USD0.1bn m/m to USD23.7bn).
Going forward, capital flows into Malaysia are expected to remain volatile due to the continued market pricing of the endgame of tightening cycle by global central bankers amid renewed upsides risks to the inflation outlook and ongoing geopolitical tensions. A slower-than-anticipated economic recovery in China alongside a prolonged period of restrictive monetary policy across developed markets in particular suggest a more challenging global growth prospects for 2H23 and beyond, implying more cautious risk sentiment ahead.
CME Group’s flash data for crude oil futures markets noted traders scaled back their open interest positions by nearly 3K contracts on Tuesday, keeping the recent erratic activity well in place. Volume, instead, reversed three straight daily drops and increased by around 147.7K contracts.
WTI: Gains seem limited near $85.00
Prices of WTI extended the weekly leg lower on Tuesday. The downtick, however, was on the back of shrinking open interest, which suggests that a deeper pullback may not be favoured in the very near term. On the upside, the 2023 peaks near the $85.00 mark per barrel (August 10) emerge as the immediate obstacle for bulls for the time being.
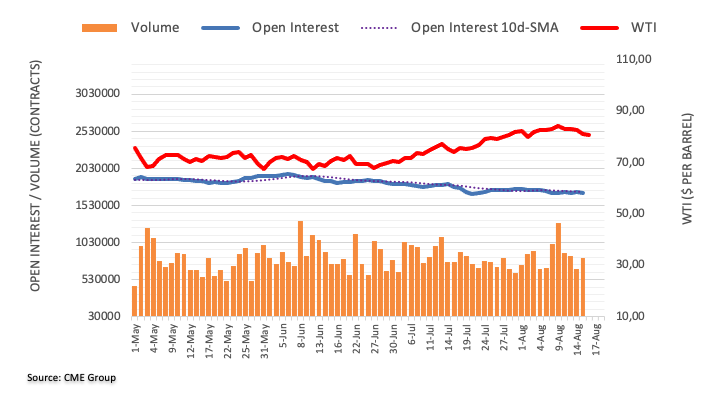
Gold price is falling further and nearing the $1,900 mark. Economists at Commerzbank analyze XAU/USD outlook.
ETF investors and speculative financial investors on the retreat
A firmer US Dollar and rising bond yields are generating headwinds. At 4.2%, yields on ten-year US Treasuries reached their highest level since November 2022. The real interest rate, calculated after deducting the market-based inflation expectations, now exceeds 1.8%. Climbing real interest rates increases the opportunity costs of holding Gold, which does not yield any interest itself.
ETF investors are continuing to sell – since the beginning of July, they have already withdrawn 60 tons of Gold from the Gold ETFs tracked by Bloomberg. It is also alarming to see that speculative financial investors in Gold have likewise switched to the selling side of late.
- The index gives away some gains around the 103.10 region.
- US yields recede from recent tops on Wednesday.
- FOMC Minutes, housing data take centre stage later in the day.
The greenback, when gauged by the USD Index (DXY), faces some downside pressure and retreats to the vicinity of the 103.00 neighbourhood on Wednesday.
USD Index focused on data, FOMC Minutes
The rally in the index appears to have met quite a decent barrier near six-week tops around the 103.50 region (August 14), an area reinforced by the vicinity of the key 200-day SMA (103.23).
In the meantime, the multi-week strong advance in the dollar remains underpinned by the equally robust move higher in US yields across different maturities, always amidst renewed speculation that the Fed might keep the current restrictive stance fir longer than initially anticipated.
Busy day ahead in the US calendar, where the publication of the FOMC Minutes will be in the limelight seconded by Housing Starts, Building, weekly Mortgage Applications and Industrial Production.
What to look for around USD
The index shows some exhaustion after hitting multi-week peaks near 103.50 earlier in the week and revisits the 103.00 zone ahead of key data releases on Wednesday.
In the meantime, resilient US fundamentals seem to have reignited the narrative around the tighter-for-longer stance from the Federal Reserve.
In fact, other than risk appetite trends, the dollar could face extra headwinds in response to the data-dependent stance from the Fed against the current backdrop of persistent disinflation and cooling of the labour market.
Key events in the US this week: MBA Mortgage Applications, Building Permits, Housing Starts, Industrial Production, FOMC Minutes (Wednesday) – Initial Jobless Claims, Philly Fed Manufacturing Index, CB Leading Index (Thursday).
Eminent issues on the back boiler: Persistent debate over a soft or hard landing for the US economy. Incipient speculation of rate cuts in early 2024. Geopolitical effervescence vs. Russia and China.
USD Index relevant levels
Now, the index is losing 0.15% at 103.04 and faces initial support at 102.33 (55-day SMA) followed by 101.74 (monthly low August 4) and then 100.55 (weekly low July 27). On the other hand, the breakout of 103.45 (monthly high August 14) would open the door to 103.57 (weekly high June 30) and finally 104.69 (monthly high May 31).
- GBP/JPY breaks above the 185.00 barrier, gaining 0.04% on the day following the UK inflation data.
- UK CPI rose 6.8% YoY in July vs. 6.8% expected; monthly CPI figure declined 0.4% in July vs. -0.5% expected.
- Traders turn cautious amid the fear of FX intervention by the Bank of Japan (BoJ).
- Market players will shift their focus to UK Retail Sales for July.
The GBP/JPY cross gains traction and edges higher to the 185.00 area heading into the early European session on Wednesday. The positive UK inflation data is supporting the cross's momentum. Meanwhile, the possible FX intervention by the Japanese central bank remains in focus.
The latest data by the UK’s National Statistics reported that the nation's Consumer Price Index (CPI) MoM came in at -0.4%, above the market consensus of -0.5% versus the previous reading of 0.1%. On a yearly basis, British CPI inflation rose 6.8% for June, as expected of 6.8%. The core CPI, which excludes volatile oil and food prices for July, increased 6.9%, better than the 6.8% estimation. Meanwhile, the UK Retail Price Index (RPI) for July came in at -0.6% MoM and 9.0% YoY.
On the other hand, the economic data on Tuesday showed that Japan’s economic growth came in at 1.5% QoQ, versus 0.8% expected and 0.7% previously. On a yearly basis, the GDP increased to 6.0%, compared to 3.1% estimated and 2.7% previously.
That said, the monetary policy differential between the US and Japan is the main driver of the Yen's weakening. However, the possible additional rate hike by the Bank of England (BoE) might boost the Pound Strerling and act as a tailwind for the GBP/JPY cross.
However, traders turn cautious amid the fear of FX intervention by the BoJ. Finance Minister Shunichi Suzuki stated on Tuesday that rapid movements are "undesirable" and the government is "ready to respond appropriately," while emphasising that no particular levels are intended for intervention, per Reuters.
Moving on, market players will shift their focus to UK Retail Sales for July. The monthly figure is expected to drop 0.5%. Also, the Japanese Trade data and the annual National Consumer Price Index for July will be released from the Japanese docket later this week.
Neither rate nor FX markets should be surprised as Norges Bank is set to stick to the plan this Thursday, economists at Nordea report.
Norges Bank to raise the key rate by 25 bps
We expect Norges Bank to increase the key rate by 25 bps to 4.0% this week and signal another hike in September.
Rate markets have a view close to Norges Bank’s rate path, thus rates are unlikely to move much after the rate announcement.
For the NOK, an outcome as we expect will likely not lead to material changes to the currency’s value.
- EUR/GBP stays pressured at two-week low despite recent whipsaw.
- UK inflation CPI softens in July, Core CPI came in better-than-forecast.
- Mixed concerns about Euro also weigh on cross-currency pair.
- Mid-tier Eurozone data eyed for clear directions, risk catalysts are the key.
EUR/GBP bears keep control for the fourth consecutive day despite mixed UK inflation numbers. That said, the quote prods a two-week low marked the previous day around 0.8575 amid early Wednesday in Europe. It’s worth noting that the cross-currency pair initially dropped to 0.8574 on the British price pressure data before recovering to 0.8584 by the press time. The pair’s recent whipsaw could be linked to the unclear Consumer Price Index (CPI) and mixed details from London.
That said, UK CPI slides to 6.8% YoY and -0.4% MoM from 7.9% and 0.1% respective priors but the Core CPI reprints the 6.9% yearly figures for July.
Also read: Breaking: UK CPI inflation declines to 6.8% in July, as expected
Not only the mixed UK inflation clues but the political jitters surrounding Britain, especially after the ruling Conservative Party’s disappointing performance in the by-elections, also challenge the British Pound.
Furthermore, the recent improvement in the Eurozone and German statistics, as well as receding fears about recession, puts a floor under the EUR/GBP prices. On Tuesday, Germany’s ZEW Economic Sentiment improved to -12.3 for August versus -14.4 expected and -14.7 prior but the Current Situation gauge dropped to -71.3 from -59.5 previous readings and -63.0 market forecasts. That said, the Eurozone ZEW Economic Sentiment also recovered to -5.5 from the analysts’ estimations of -12.0 and -12.2 prior. Not only the data but the official statement from the ZEW Institute also appeared optimistic as it said, “Respondents, by and large, do not anticipate any further interest rate hikes in the eurozone and the United States and the economic outlook for the USA has seen a significant increase – these factors contribute to the improved expectations for Germany.”
However, the European Central Bank (ECB) hawks appear running out of steam while the Bank of England (BoE) is likely to witness further rate hikes, considering the strong employment report and upbeat wages, which can keep the EUR/GBP bears hopeful. As per the latest British jobs report published the previous day, the UK’s headline Employment Change marks -66K figures for June versus 75K expected and 102K prior whereas the ILO Unemployment Rate jumps to 4.2% for three months to June compared to the market’s expectations of staying unchanged at 4.0%. More importantly, the Average Earnings including and excluding bonuses for three months to June improves heavily and boosts the hawkish expectations from the Bank of England (BoE), which in turn seems to have fuelled the Pound Sterling after the data release.
Moving on, a slew of second-tier economics from the Eurozone, including the second readings of the Eurozone Gross Domestic Product (GDP) for the second quarter (Q2) and July Industrial Production, will be important to watch for clear directions.
Technical analysis
A clear U-turn from the 100-DMA resistance, around 0.8665 by the press time, joins the looming bear cross on the MACD and a steady RSI (14) line to keep the EUR/GBP pair sellers hopeful of breaking a five-week-old support line and aim for the previous monthly low of around 0.8500.
FX option expiries for Aug 16 NY cut at 10:00 Eastern Time, via DTCC, can be found below.
- EUR/USD: EUR amounts
- 1.0800 768m
- 1.0850 1.5b
- 1.0900 715m
- 1.0935 568m
- 1.1000 999m
- 1.1025 870m
- GBP/USD: GBP amounts
- 1.2775 491m
- USD/JPY: USD amounts
- 144.50 1.2b
- 145.00 785m
- USD/CHF: USD amounts
- 0.8525 500m
- 0.8700 1.1b
- 0.8800 793m
- AUD/USD: AUD amounts
- 0.6500 677m
- USD/CAD: USD amounts
- 1.3430 363m
- 1.3500 353m
- 1.3535 310m
- NZD/USD: NZD amounts
- 0.6300 587m
The Yuan has weakened in recent months. Economists at Commerzbank analyze CNY outlook.
EUR/CNY will likely move upward in the coming months
CNY will remain under pressure for the rest of this year. We will likely only see a rather moderate boost to growth from policy stimulus in the coming months. Slow growth also speaks in favor of a loose monetary policy. The wide, negative China-US yield spreads will therefore remain for longer.
We forecast USD/CNY to largely trade around 7.20 through Q3. We also expect the pair to fall back to around 7.00 later in Q4, though the upside risk is large (i.e. CNY could stay weaker for even longer).
In light of CNY's weakness, the PBoC will continue to defend the currency by tweaking the daily fixing and perhaps will roll out other measures if needed, to smooth out short-term volatility.
Beyond the near term, CNY may strengthen modestly against USD, supported by the expected softening of the Dollar as we anticipate the Fed to cut its key interest rate in 2024.
EUR/CNY will likely move upward in the coming months and into 2024. The currency pair should benefit from the ECB’s restrictive monetary policy for some time ahead.
Open interest in gold futures markets extended the uptrend for yet another session on Tuesday, this time by around 3.4K contracts according to preliminary readings from CME Group. In the same line, volume went up by nearly 45K contracts after two consecutive daily pullbacks.
Gold: Next on the downside comes $1893
Gold prices extended the pessimism in the first half of the week amidst rising open interest and volume. Against that, the precious metal appears poised to extend the decline in the very near term and with the immediate target at the June low of $1893 per troy ounce (June 29).
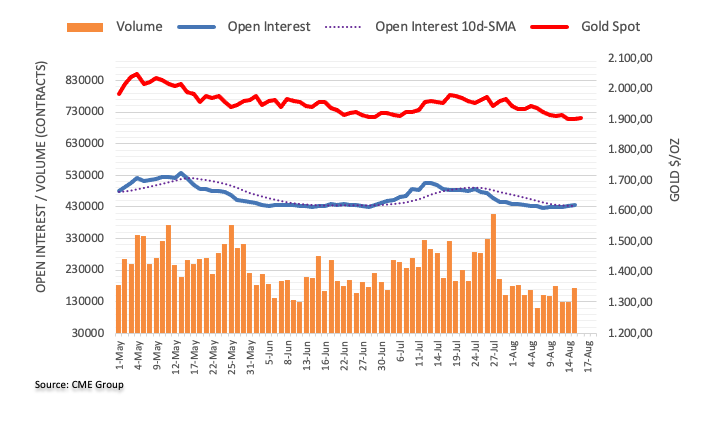
Lee Sue Ann, Economist at UOB Group, sees the BSP maintaining its policy rate at 6.25% at its meeting later in the week.
Key Quotes
The latest batch of inflation readings and stable currency support our view for an extended interest rate pause by BSP until year-end. Real interest rates have turned positive for the second consecutive month and core inflation eased for a third straight month, further reflecting the lagged effects of past rate hikes.
While exercising caution in its response to the Fed’s latest hawkish remarks, BSP will likely prioritize on domestic growth momentum and inflation expectations against a narrowing interest-rate differential with US rates at this juncture.
- Gold Price rebounds from seven-week low but lacks upside momentum while making rounds to key support.
- XAU/USD consolidates losses ahead of Fed Minutes amid cautious optimism.
- Mixed US data flag policy pivot concerns, putting a floor under the Gold Price.
- China news, mid-tier US data also eyed for clear XAU/USD directions.
Gold Price (XAU/USD) recovers from the lowest level since late June as the market prepares for the US Federal Reserve (Fed) monetary policy meeting minutes. Adding strength to the corrective bounce could be the latest cautious optimism in the market amid hopes of more stimulus from China, as well as an end to Fed’s tightening cycle due to the recently mixed US data. It’s worth noting that the inaction of major central banks in the last few days also suggests an end of the rate-hike cycle and puts a floor under the XAU/USD price, especially when China shows readiness for more stimulus and Indian statistics remain firmer.
That said, upbeat US Retail Sales and disappointing China data joined strong US Treasury bond yields to drag the Gold Price toward the multi-day low the previous day. Also likely to have weighed on the XAU/USD is the recently downbeat performances of riskier assets like equities, Antipodeans and commodities.
Moving on, US Industrial Production for July and the Federal Open Market Committee’s (FOMC) latest Monetary Policy Meeting Minutes will be important to watch for clear directions. That said, any signals for the US central bank’s further rate hike may drag the quote back below the $1,900 support confluence.
Also read: Gold Price Forecast: XAU/USD downside opens up toward $1,885, eyes on Fed Minutes
Gold Price: Key levels to watch
Our Technical Confluence indicator suggests that the Gold Price flirts with the $1,900 support confluence, recently bouncing off the threshold comprising the 200-DMA, previous monthly low and Fibonacci 38.2% on one-day.
With the market’s consolidation ahead of the Fed Minutes in play, the XAU/USD’s corrective bounce may aim for the $1,912 immediate hurdle encompassing the Pivot Point one-day R1, the middle band of the Bollinger on the four-hour (4H) play and the previous weekly low.
However, a clear upside break of $1,912 will allow the Gold buyers to aim for $1,930 with a likely stop around the $1,918 hurdle comprising the Pivot Point one-month S1.
Meanwhile, Pivot Point one-week S1 adds strength to the $1,900 support confluence as the level seesaws near $1,899.
Following that, the Pivot Point one-week S2 and one-day S2 together highlight the $1,888 as the last defense of XAU/USD buyers.
Here is how it looks on the tool
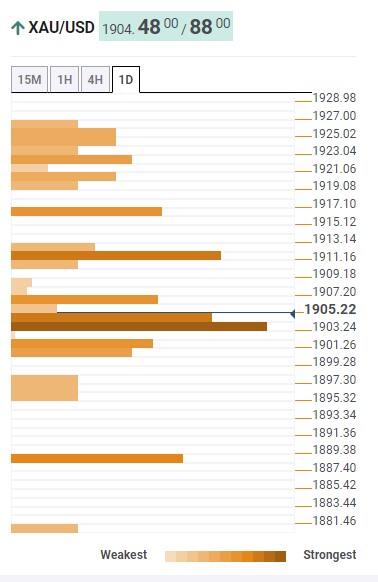
About Technical Confluences Detector
The TCD (Technical Confluences Detector) is a tool to locate and point out those price levels where there is a congestion of indicators, moving averages, Fibonacci levels, Pivot Points, etc. If you are a short-term trader, you will find entry points for counter-trend strategies and hunt a few points at a time. If you are a medium-to-long-term trader, this tool will allow you to know in advance the price levels where a medium-to-long-term trend may stop and rest, where to unwind positions, or where to increase your position size.
- EUR/USD struggles to gain and holds ground above 1.0900 ahead of the key Eurozone data.
- EUR/USD holds below the 50- and 100-day Exponential Moving Averages (EMAs).
- The key resistance level to watch appears at 1.0940; the critical support level is located in the 1.0890–1.0900 zone.
The EUR/USD pair trades on a defensive note around the 1.0915 mark heading into the early European session on Wednesday. Market players await the Eurozone Gross Domestic Product (GDP) Q2 and Harmonized Index of Consumer Prices (HICP) for July, due later this week. The Eurozone growth number are expected to remain at 0.3% and 0.6% on a quarterly and yearly basis, respectively. While the Eurozone HICP MoM is expected to stay at -0.1%.
From the technical perspective, EUR/USD holds below the 50- and 100-day Exponential Moving Averages (EMAs), implying the path of least resistance for the EUR/USD is to the downside. That said, the Relative Strength Index (RSI) stands around 50, supporting the directionless movement for the major pair.
The key resistance level to watch for EUR/USD appears at 1.0940, representing the upper boundary of the Bollinger Band and the 100-hour EMA. Any meaningful follow-through buying beyond the latter could pave the way to the next barrier at 1.0980 (low of August 10) en route to 1.1000 (a psychological round mark, high of August 11). The additional upside filter is located at 1.1065 (high of August 11).
On the flip side, EUR/USD will meet the critical support level in the 1.0890–1.0900 zone, portraying a low of August 15 and a lower limit of the Bollinger Band. A decisive break below the latter would fuel a drop towards 1.0875 (low of August 14), followed by 1.0845 (low of June 23), and finally at 1.0830 (low of July 6).
EUR/USD one-hour chart
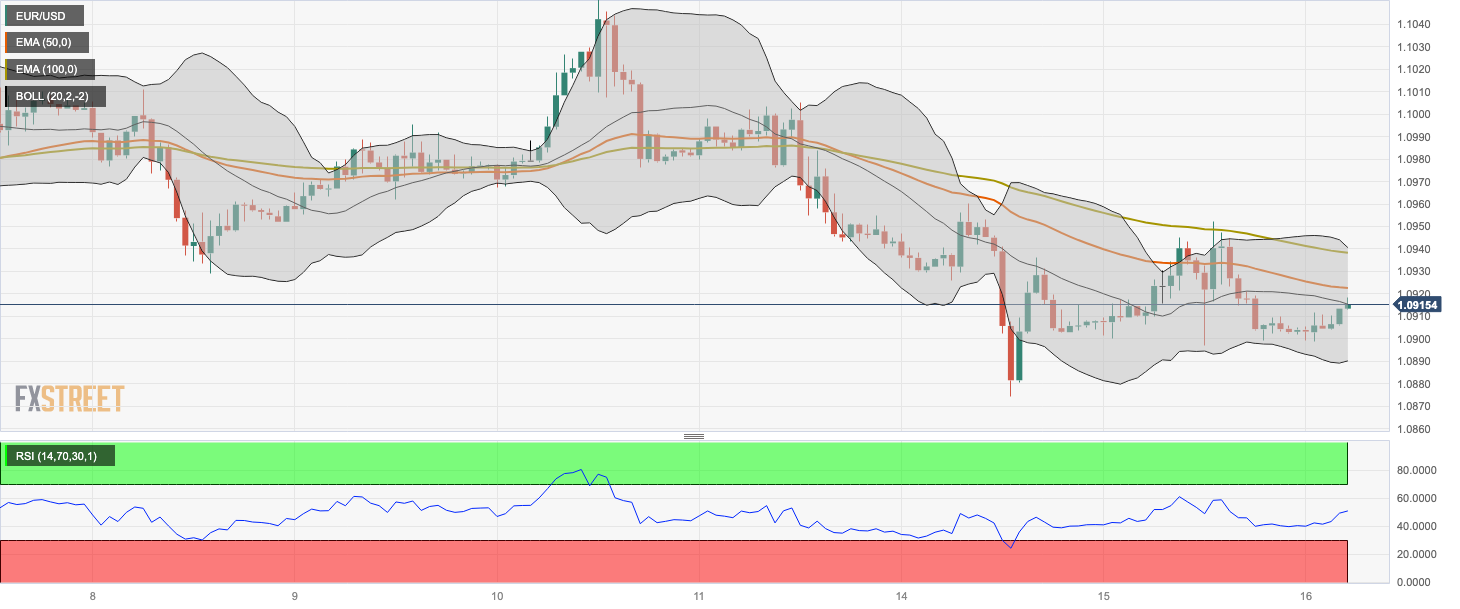
- WTI Crude Oil extends its losses due to China’s deteriorating economic situation.
- 21-day EMA appears to be the key support lined up with the $80.00 psychological level.
- MACD indicates a changing bias of WTI buyers: 14-day RSI still supports the bullish bias.
WTI Crude Oil trades lower near $80.30 lined up with the 23.6% Fibonacci retracement level, extending its losses on the third consecutive day during the Asian session on Wednesday. The black gold continues the bearish trend due to the risk-off mood and China’s deteriorating economic conditions.
The 21-day Exponential Moving Average (EMA) at $80.04 appears to be the key support level aligned to the $80.00 psychological level. A firm break below the latter could push the WTI price to explore the territory around the 38.2% Fibonacci retracement level at $77.81.
The Moving Average Convergence Divergence (MACD) line stays in the positive territory of the centerline but shows divergence below the signal line, which could indicate the changing bias of WTI traders. However, the 14-day Relative Strength Index (RSI) continues to remain above 50, still indicating a bullish sentiment of WTI buyers.
On the upside, the pair could find immediate resistance near the 7-day EMA at $81.41, following the area around the $82.00 psychological level.
WTI US Oil: Daily Chart
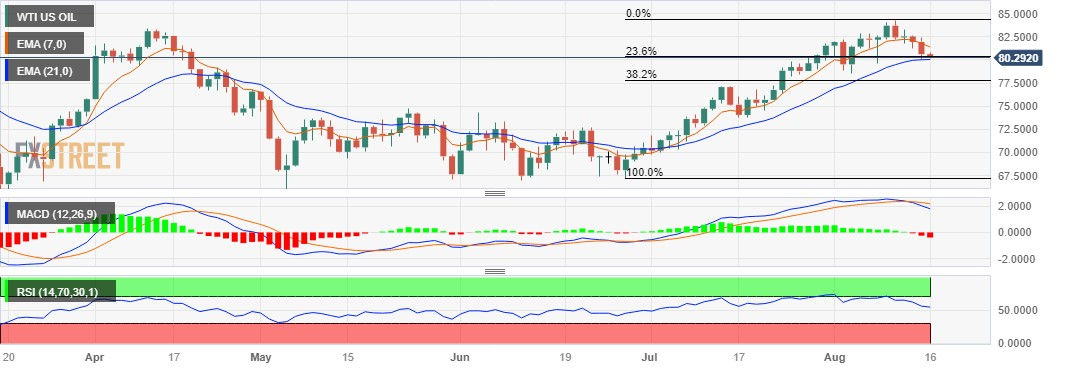
- USD/CAD steadies at 11-week high amid market’s cautious mood ahead of week’s top-tier event.
- Firmer Canada inflation, upbeat US Retail Sales and WTI crude oil’s downbeat performance also challenge Loonie traders.
- Fed policymakers need to defend hawkish bias to keep USD/CAD bulls on the table.
- US Industrial Production, Canada housing data act as additional checks.
USD/CAD bulls take a breather at the highest level since early June, keeping the reins around 1.3500 heading into Wednesday’s European session. In doing so, the Loonie pair struggles between the contrasting catalysts, namely the US Dollar’s retreat and the WTI crude oil’s downbeat performance, amid the cautious mood ahead of today’s Federal Open Market Committee’s (FOMC) latest Monetary Policy Meeting Minutes.
It’s worth noting that the previous day’s upbeat prints of the Canada Consumer Price Index (CPI) and the Bank of Canada (BoC) CPI failed to impress the Canadian Dollar (CAD) buyers as the risk-off mood joined strong US Retail Sales. Further, hawkish comments from Minneapolis Federal Reserve President Neel Kashkari also add strength to the bullish bias about the Loonie pair.
That said, the WTI crude oil drops half a percent to $80.25 by the press time as energy bears prod the one-week low marked the previous day amid fears of receding demand from China, one of the world’s biggest oil customers.
On the other hand, the US Dollar Index (DXY) seesaws around 103.20 while poking a five-month-old descending resistance line at the highest level in a month. In doing so, the Greenback’s gauge versus the six major currencies prints the first daily loss, so far, in five.
Additionally, a pullback in the benchmark US 10-year Treasury bond yields from the yearly high joins a pause in the downside of the US stock futures and mixed performance of the Asia-Pacific shares to portray the market’s cautious optimism, which in turn prods the USD/CAD traders.
Looking ahead, Canada Housing Starts and Wholesale Sales for July and June will precede the US Industrial Production for July to offer intermediate entertainment to the USD/CAD pair. However, major attention will be given to the Fed Minutes as market players anticipate an end of the hawkish cycle at the US central bank, which if confirmed could drag the Loonie pair from a multi-day high.
Technical analysis
A daily closing beyond the convergence of a five-month-old descending trend line and the 200-DMA, around 1.3450 by the press time, keeps USD/CAD buyers hopeful amid bullish MACD signals.
- USD/MXN struggles to defend two-day winning streak ahead of Fed Minutes.
- Impending bull cross between 50-HMA and 200-HMA joins firmer RSI (14) line to favor Mexican Peso sellers.
- Pair seller need dovish remarks in FOMC Minutes, clear break of 17.00 to retake control.
USD/MXN retreats to 17.35 as bulls struggle to keep the reins amid the market’s consolidation ahead of the Federal Reserve’s (Fed) monetary policy meeting minutes. That said, the Mexican Peso (MXN) pair drops for the first day so far in three while fading the previous day’s rebound from the 200-Hour Moving Average (HMA).
It’s worth noting, however, that the 50-HMA is closing in on the 200-HMA from below and portrays a looming bull cross to lure the USD/MXN buyers.
Also suggesting the quote’s further upside is the RSI (14) line that stays sturdy beyond the 50.0 level.
Even so, the USD/MXN bulls need to cross the one-week-old falling resistance line surrounding 17.20, as well as gain support from the dovish minutes of the Federal Open Market Committee’s (FOMC) latest Monetary Policy Meeting Minutes, to retake control.
Following that, a horizontal area comprising levels marked since August 04, near 17.30, can prod the USD/MXN pair’s further upside before marking a run-up toward the monthly peak of near 17.42.
On the flip side, the 200-HMA and the 50-HMA restrict the immediate downside of the Mexican Peso pair to around 17.09-08.
In a case where the USD/MXN drops below the 17.08 support line, a convergence of an upward-sloping trend line from July 28 and the 50% Fibonacci retracement of late July to early August upside, near the 17.00 threshold, appears a tough nut to crack for the bears.
USD/MXN Price: Hourly chart
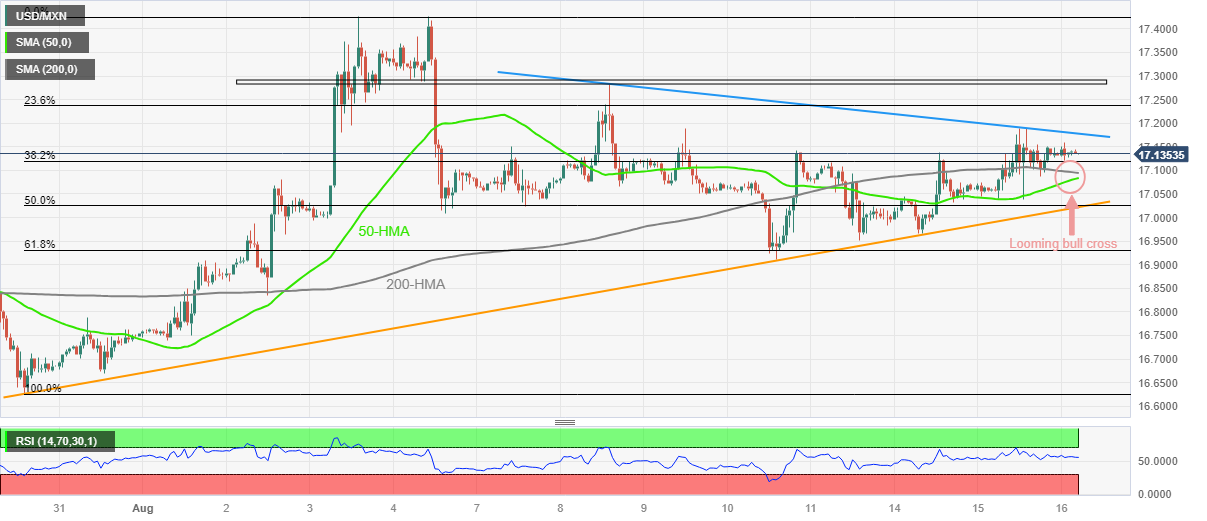
Trend: Further upside expected
- Asian stock markets trade in negative territory on Wednesday.
- Chinese House Price Index for July fell to -0.1% versus 0% prior.
- Investors will keep an eye on the possible FX intervention by the Bank of Japan (BoJ).
- The Reserve Bank of New Zealand (RBNZ) kept the benchmark interest rates unchanged at 5.5%.
- Market participants will closely watch FOMC Minutes and the comments from Fed officials.
Asian stock markets remain under selling pressure and edge lower on Wednesday. The cautious mood is weighed down by stringer US Retail Sales figures and concerns over Chinese discouraging data.
At press time, China’s Shanghai falls 0.25% to 3,168, the Shenzhen Component Index slumps 0.22% to 10,655, and Hong Kong’s Hang Sang dips 1.39% to 18,323. India’s NIFTY 50 is down 0.46%, South Korea’s Kospi dips 1.43%, and Japan’s Nikkei loses 1.05%.
In China, all three stock indices declined for the fourth consecutive day. The latest data on Wednesday revealed that the Chinese House Price Index for July fell to -0.1% versus 0% prior. The data raises concerns about a possible property crisis in China, particularly as big developer Country Garden Holdings struggles to meet its debt obligations.
Furthermore, the People's Bank of China (PBOC) cut the one-year medium-term Lending Facility (MLF) rate from 2.65% to 2.50% on Tuesday. Meanwhile, Chinese Retail Sales for July came in at 2.5% YoY compared to 4.8% expected and 3.1% previously, while the country's Industrial Production fell to 3.7% YoY compared to 4.5% expected and 4.1% previously. More evidence of China's economic deterioration exerts pressure on the regional stock market and risk-sensitive assets.
In Japan, the Nikkei trades at its lowest level since July 12, despite the upbeat preliminary Gross Domestic Product (GDP) data on Tuesday. Japanese economic growth was 1.5% QoQ, compared to 0.8% expected and 0.5% previously. The annualised GDP increased to 6.0% from an estimated 3.1% and 2.8% previously. However, investors will keep an eye on the possible FX intervention by the BoJ.
Finance Minister Shunichi Suzuki stated on Tuesday that rapid movements are "undesirable" and the government is "ready to respond appropriately," while emphasising that no particular levels are intended for intervention, per Reuters.
On Wednesday, the Reserve Bank of New Zealand (RBNZ) kept the benchmark interest rates unchanged at 5.5%, as expected. RBNZ Governor Adrian Orr also offered a hawkish signal to rein in rising inflation expectations.
Looking ahead, market participants will closely watch FOMC Minutes and the comments from Fed officials for fresh impetus. The events could provide hints for further Fed monetary policy and give a direction for riskier assets like equities, risk-sensitive currencies, etc. Also, the Japanese Trade data and the annual National Consumer Price Index for July will be released from the Japanese docket later this week.
- AUD/USD stages a modest recovery from a fresh YTD trough touched earlier this Wednesday.
- Retreating US bond yields keeps the USD bulls on the defensive and lends support to the major.
- Bets for one more Fed rate hike limit the USD slide and cap the pair amid China's economic woes.
The AUD/USD pair recovers a few pips from the 0.6430-0.6425 area, or a fresh low since November 2022 touched during the Asian session on Wednesday, albeit lacks follow-through. Spot prices currently trade around mid-0.6400s, still in the red for the seventh straight day, and seem vulnerable to prolonging the recent downward trajectory witnessed over the past month or so.
A softer tone surrounding the US Treasury bond yields keeps the US Dollar (USD) bulls on the defensive below a more than two-month top touched on Monday, which, in turn, is seen lending some support to the AUD/USD pair. Apart from this, a slightly oversold Relative Strength Index (RSI) on the daily chart prompts traders to take lighten their bearish bets and contributes to the modest intraday bounce. The downside for the USD, meanwhile, remains cushioned in the wake of growing acceptance that the Federal Reserve (Fed) will keep interest rates higher for longer.
It is worth mentioning that the US central bank is widely expected to pause the rate-hiking cycle at its upcoming policy meeting in September. The markets, however, are still pricing in the possibility of one more 25 bps lift-off by the end of this year and the bets were reaffirmed by the upbeat US Retail Sales data released on Tuesday, which indicated that consumer spending held up well in July. This, in turn, is likely to act as a tailwind for the US bond yields and the USD, which, along with concerns about the worsening economic conditions in China, should cap gains for the AUD/USD pair.
Another round of disappointing Chinese macro data released on Tuesday further fueled worries that the post-COVID recovery in the world's second-largest economy has slowed after a brisk start in the first quarter. Even a surprise rate cut by the People's Bank of China (PBoC) does little to boost investors' confidence, warranting some caution before placing bullish bets around the China-proxy Australian Dollar (AUD). Hence, strong follow-through buying is needed to confirm that spot prices have formed a near-term bottom and positioning for any meaningful recovery.
Market participants now look to the US economic docket, featuring the release of Building Permits, Housing Starts and Industrial Production figures later during the early North American session. This, along with the US bond yields and the broader risk sentiment, might influence the USD price dynamics and provide some impetus to the AUD/USD pair. The focus, however, will remain glued to the FOMC meeting minutes, which will be looked upon for cues about the Fed's future rate-hike path and help determine the near-term trajectory for the Greenback.
Technical levels to watch
- USD/CHF edges higher past key support confluence as markets await FOMC Minutes.
- Convergence of 200-SMA, three-week-old rising support line limits immediate downside.
- Upside RSI (14) suggests further grinding of Swiss Franc pair towards the north.
USD/CHF stays defensive around 0.8780 as it struggles to keep the five-week uptrend heading into Wednesday’s European session. That said, the Swiss Franc (CHF) pair’s latest inaction could be linked to the market’s cautious mood ahead of the Federal Open Market Committee’s (FOMC) latest Monetary Policy Meeting Minutes.
Technically, a downward-sloping resistance line from May 31, close to 0.8820 by the press tie, also challenges the USD/CHF buyers even if the quote manages to keep the previous week’s breakout of the 200-SMA. In doing so, the major currency pair also fails to justify the upbeat RSI (14) line, not overbought.
With this, the USD/CHF is likely to portray another attempt in crossing the 0.8820 hurdle, a break of which could propel the prices toward the mid-June swing low of surrounding 0.8900.
However, the 50% and 61.8% Fibonacci retracement of its May-July downside, respectively near 0.5580 and 0.8920, will act as the additional upside filters to watch.
On the contrary, a convergence of the 200-SMA and three-week-long ascending trend line highlights 0.8745 as the short-term key support.
In a case where the Fed Minutes disappoint the US Dollar bulls and drag the USD/CHF price below the 0.8745 support confluence, the odds of witnessing a slump towards the 0.8700 round figure and them to the multi-year low marked the last month around 0.8550 can’t be ruled out.
USD/CHF: Four-hour chart
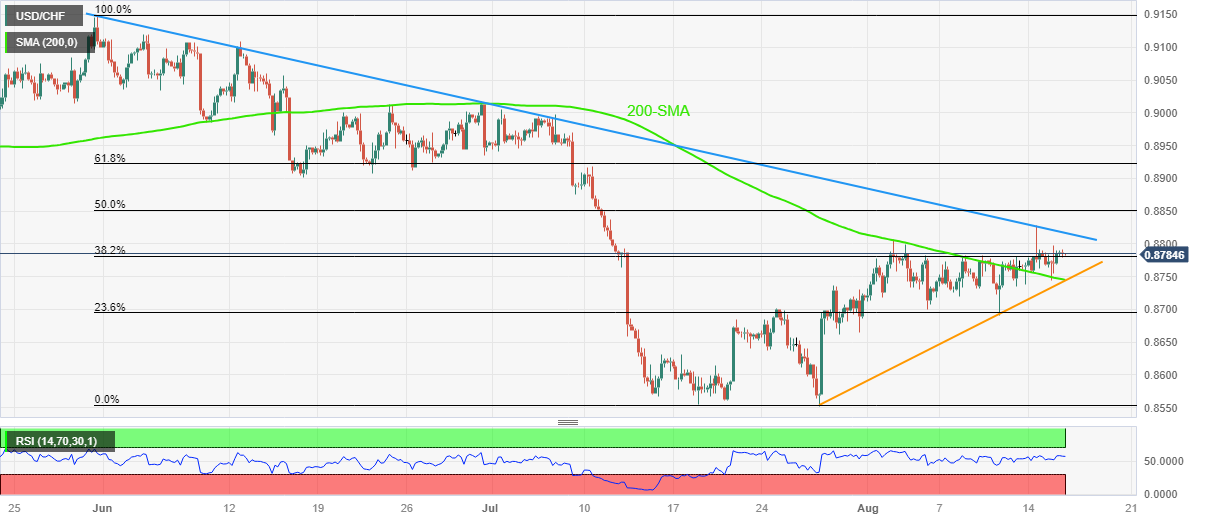
Trend: Further upside expected
- EUR/JPY lacks any firm intraday direction and oscillates in a narrow band on Wednesday.
- A softer risk tone, along with intervention fears, underpins the JPY and acts as a headwind.
- The BoJ-ECB policy divergence favours bulls and supports prospects for additional gains.
The EUR/JPY cross struggles to gain any meaningful traction and oscillates in a narrow trading band through the Asian session on Wednesday. Spot prices currently trade around the 158.70 region, nearly unchanged for the day, though remain well within the striking distance of the highest level since September 2008 touched on Tuesday.
Persistent worries about the worsening economic conditions in China, along with renewed fears of a more hawkish Federal Reserve (Fed), temper investors' appetite for riskier assets. This is evident from a generally weaker tone around the Asian equity markets, which is seen lending some support to the safe-haven Japanese Yen (JPY). Apart from this, speculations that the recent weakness in the JPY might prompt some jawboning from authorities, or an intervention in the foreign exchange markets, act as a headwind for the EUR/JPY cross.
In fact, Japan's top forex diplomat Masato Kanda said on Tuesday that he would take appropriate steps against excessive currency moves. Japan's Finance Minister Shunichi Suzuki, however, said that authorities are not targeting absolute currency levels when it comes to intervening in the market. This, along with a big divergence in the monetary policy stance adopted by the Bank of Japan (BoJ) and the European Central Bank (ECB), limits the downside for the EUR/JPY cross and warrants caution before positioning for any meaningful corrective decline.
It is worth mentioning that BoJ is the only central bank in the world to maintain a negative benchmark interest rate. Moreover, policymakers have stressed that steps taken in July to make the BoJ's Yield Curve Control (YCC) measures more flexible and allow yield on the 10-year Japanese government bond to move up toward 1% was a technical tweak aimed at extending the shelf life of stimulus. In contrast, the ECB has raised borrowing costs by a combined 425 bps since last July and the markets are still pricing in one more rate hike by the end of this year.
This, in turn, suggests that the path of least resistance for the EUR/JPY cross is to the upside. That said, the recent range-bound price action witnessed over the past week or so points to indecision among traders over the next leg of a directional move for spot prices. Hence, it will be prudent to wait for a sustained strength beyond the 159.00 mark before positioning for any further near-term appreciating move. Nevertheless, the aforementioned fundamental backdrop still seems tilted firmly in favour of bullish traders and supports prospects for additional gains.
Technical levels to watch
- USD/JPY oscillates in a narrow range around 145.52, down 0.02% for the day.
- Japan’s economic growth came in at 1.5% QoQ, versus 0.8% expected and 0.7% prior.
- Traders turn cautious amid the fear of FX intervention by the BoJ.
- US Retail Sales came in above expectations, climbed by 0.7% MoM, higher than the 0.4% estimated.
- Market players will keep an eye on the FOMC minutes on Thursday.
The USD/JPY pair remains confined around the 145.45–70 region in a narrow trading band in the Asian session on Wednesday. Traders continue to fear intervention by the Bank of Japan (BoJ) as the JPY weakens to a 9-month low. The major currently trades near 145.52, losing 0.02% for the day.
According to the preliminary data of the Gross Domestic Product (GDP) figures for the second quarter (Q2) of 2023 on Tuesday, Japan’s economic growth came in at 1.5% QoQ, versus 0.8% expected and 0.7% previously. Meanwhile, the annualised GDP increased to 6.0%, compared to 3.1% estimated and 2.7% previously. Japan’s Economy Minister Shigeyuki Goto stated that he anticipated a moderate economic recovery before mentioning the need to pay attention to the danger of a global downturn and the impacts of price increases. Goto demonstrated a willingness to respond flexibly to the economy and prices as needed.
That said, the monetary policy differential between the US and Japan is the main driver of the Yen's weakening. However, the optimism that US interest rates have peaked might cap the upside in the Greenback. Furthermore, traders turn cautious amid the fear of FX intervention by the BoJ. It’s worth noting that the Japanese central bank prompted massive dollar selling in September and October last year as the Japanese Yen approached the 145 zone.
Finance Minister Shunichi Suzuki stated on Tuesday that rapid movements are "undesirable" and the government is "ready to respond appropriately," while emphasising that no particular levels are intended for intervention, per Reuters.
Across the pond, US Retail Sales came in above expectations. The headline figure climbed by 0.7% MoM, higher than the 0.4% estimated. Sales excluding the automobile sector came in at 1%, versus the expected 0.4%. Meanwhile, the NY Empire Manufacturing Index fell to -19 from -1. On Tuesday, Minnesota’s Federal Reserve (Fed) President Neil Kashkari stated that he is pleased with the progress on inflation, but it is still too high. Kashkari noted the uncertainty regarding whether the Fed has done enough or needs to do more.
Market players will take more cues from the economic data. Later in the day, the US Building Permits, Housing Starts, and Industrial Production will be released. However, the FOMC minutes will be the key event this week. On the Japanese docket, the nation’s Trade data and annual National Consumer Price Index for July will be due on Thursday and Friday, respectively.
- USD/INR struggles for clear directions after refreshing all-time high, mildly offered of late.
- US Dollar bulls brace for FOMC Minutes, allowing Indian Rupee sellers to take a breather.
- Downbeat Oil price, pullback in yields also allow USD/INR to consolidate recent moves.
- Fed officials need to defend hawkish bias to help Greenback buyers overcome short-term key resistance.
USD/INR prints mild losses around 83.30-25 as the Indian Rupee (INR) licks its wounds around the record low on early Wednesday. In doing so, the Asian currency justifies the market’s consolidation ahead of the Fed Minutes while also cheering downbeat WTI crude oil prices, India’s major import burden.
That said, a pullback in the benchmark US 10-year Treasury bond yields from the yearly high joins a pause in the downside of the US stock futures and mixed performance of the Asia-Pacific shares to portray the market’s cautious optimism.
WTI crude oil drops half a percent to $80.25 by the press time as energy bears prod the one-week low marked the previous day amid fears of receding demand from China, one of the world’s biggest oil customers.
Elsewhere, the US Dollar Index (DXY) seesaws around 103.20 while poking a five-month-old descending resistance line at the highest level in a month.
It should be observed that China’s downbeat statistics for July joined the People’s Bank of China’s (PBoC) surprise rate cuts and looming credit rating downgrade of the major US companies to weigh on the sentiment and challenge the USD/INR pair’s latest retreat.
Even so, upbeat US data and the hawkish Fed talks also weigh on the Euro prices. That said, the US Retail Sales grew 0.7% MoM in July versus 0.4% expected and 0.3% reported in June (revised from 0.2%). The details suggested that the Core Retail Sales, namely the Retail Sales ex Autos, grew 1.0% versus 0.4% market forecasts whereas the Retail Sales Control Group doubled from 0.5% previous readouts (revised from 0.6%) to 1.0% for the said month. Further, the US NY Empire State Manufacturing Index slumped to -19.0 from 1.1 prior and -1.0 market forecasts while the US Export Price Index and Import Price Index improved on MoM in July but edged lower on a yearly basis for the said month. Late Wednesday, Minneapolis Federal Reserve President Neel Kashkari ruled out talks of policy pivot by citing hot inflation and the uncertainty about the Fed’s progress in taming the same. The policymaker also said that he is not ready to say that the Fed is done raising rates, per Reuters.
It should be noted that the early-week releases of upbeat India inflation numbers contrast with the Reserve Bank of India’s (RBI) inaction to challenge the USD/INR pair’s latest retreat.
Looking ahead, US Industrial Production for July and housing numbers may entertain USD/INR pair traders before the Federal Open Market Committee’s (FOMC) latest Monetary Policy Meeting Minutes. That said, the FOMC members’ readiness for a rate hike before the policy pivot can fuel the Indian Rupee pair further toward the north.
Technical analysis
Although the overbought RSI (14) line challenges USD/INR bulls, the pair’s downside remains elusive unless breaking the ascending resistance line from November 2022, now immediate support near the 83.00 round figure.
- NZD/USD rebounds after hitting a fresh YTD low in reaction to the RBNZ's hawkish outlook.
- A slightly oversold RSI contributes to intraday recovery from descending ternd-channel support.
- Any subsequent move up is likely to confront a stiff barrier near the 0.6000 psychological mark.
The NZD/USD pair stages a modest recovery from the 0.5930 area, or a fresh low since November 2022 touched during the Asian session on Wednesday in reaction to the Reserve Bank of New Zealand's (RBNZ) hawkish outlook. Spot prices currently trade around the 0.5960-0.5965 region, up 0.20% for the day, and for now, seem to have snapped a six-day losing streak.
As was widely anticipated, the RBNZ decided to maintain the status quo and keep the key Official Cash Rate (OCR) steady at 5.50%. In the accompanying monetary policy statement, the central bank indicated that interest rates will remain at a restrictive level for some time. Furthermore, the central bank now forecasts OCR at 5.5% through December 2024 and then fall to 3.38% by September 2026. This, in turn, lends some support to the New Zealand Dollar (NZD), which, along with subdued US Dollar (USD) price action, prompts some short-covering around the NZD/USD pair.
The upside, however, remains capped, at least for the time being as traders now seem reluctant to place aggressive bets and prefer to wait for the release of the FOMC meeting minutes. The Federal Reserve (Fed) is anticipated to pause its rate-hiking cycle at the September policy meeting, though the markets have been pricing in the possibility of one more 25 bps lift-off by the end of this year. Hence, the minutes will be closely scrutinized for cues about the Fed's future rate hike path, which will influence the USD price dynamics and provide a fresh directional impetus to the NZD/USD pair.
From a technical perspective, the recent breakdown through the previous YTD low – levels just below the 0.6000 psychological mark – was seen as a fresh trigger for bearish traders. That said, a slightly oversold Relative Strength Index (RSI) on the daily chart assists the NZD/USD pair to defend and rebound from the lower end of a nearly three-week-old descending channel. The said support is currently pegged around the 0.5930-0.5925 region and should act as a pivotal point, which if broken decisively will set the stage for an extension of the downfall witnessed over the past month or so.
Meanwhile, any subsequent recovery is more likely to confront stiff resistance near the overnight swing high, just ahead of the 0.6000 mark. A sustained strength beyond might trigger a short-covering rally towards the 0.6040 intermediate hurdle en route to the 0.6065-0.6070 region. The latter coincides with the ascending channel barrier, which if cleared might negate the negative outlook and shift the near-term bias in favour of bullish traders. The NZD/USD pair might then surpass the 0.6100 round figure and aim to retest the monthly swing high, around the 0.6130-0.6135 region.
NZD/USD 4-hour chart
-638277532202421144.png)
Technical levels to watch
- XAU/USD holds ground after upbeat US Retail Sales released on Tuesday.
- Investors await fresh signals on Fed monetary policy tightening in September meeting.
- China's deteriorating economic outlook are putting pressure on Gold price.
Gold price (XAU/USD) hovers around the $1,901 mark during the Asian trading session on Wednesday. An upbeat United States (US) Retail Sales have raised concerns over further tightening of monetary policy by the US Federal Reserve (Fed) weighed on XAU/USD the previous day.
The stronger-than-expected US Retail Sales data for July, with a 0.7% increase compared to the previous reading of 0.3% and beating the market expectation of 0.4%, which indicates a healthier and more robust US economy. This could lead to speculations that the US Federal Reserve (Fed), might consider tightening its monetary policy in the September meeting, which might weaken the appeal of non-interest-bearing assets like Gold.
The concerns about China's weakening economic outlook are putting pressure on Gold's ability to sustain its value. On Tuesday, an unexpected decision by China's central bank to reduce one-year medium-term lending facility (MLF) loans by 15 basis points (bps) to 2.50% from 2.65% prior might intensify the pressure on the price of Gold. Additionally, China’s downbeat July Retail Sales rose 2.5% YoY vs. 4.8% expected and 3.1% previous, as well as the Industrial Production that came in at 3.7% YoY vs. 4.5% estimated and 4.4% prior.
The US Dollar Index (DXY), which measures the strength of the US Dollar (USD) against a basket of six major currencies, continues its winning streak for the fifth consecutive day. Currently, the DXY is trading around 103.20. This upward movement of the US Dollar (USD) is a result of strong economic data originating from the United States (US). Positive economic indicators have the potential to drive up demand for the USD in comparison to XAU (Gold).
After maintaining the interest rate at 5.50%, Reserve Bank of New Zealand (RBNZ) Governor Adrian Orr is speaking at the post-policy meeting press conference this Wednesday.
Key quotes
Rise in OCR track is not forward guidance.
Not a strong signal about our next move.
Wary about doing too much on rates.
Risks in next few months are activity could be stronger than projected.
Ready to work through data noise in near term.
Not much discussion of a rate cut, steady consensus was easily formed.
We are very comfortable with OCR where it is.
Still on a path to a soft landing.
Market reaction
NZD/USD keeps its recovery mode intact above 0.5950 on Orr’s comments. The pair is currently trading at 0.5962, up 0.27% on the day.
- EUR/USD stays sidelined near monthly low, keeping Tuesday’s inaction amid cautious mood.
- Mixed concerns about Europe, US and China prod Euro pair as the key weekly event looms.
- Economic slowdown fears, firmer yields join upbeat German, US statistics to prod momentum traders.
- Second estimates of Eurozone Q2 GDP, employment data and monthly Industrial Production will entertain traders ahead of Fed Minutes.
EUR/USD treads water around 1.0900 as it repeats the previous day’s inaction at the lowest levels in five weeks amid early Wednesday morning in Europe.
The Euro pair’s latest inaction could be linked to the market’s cautious mood ahead of a slew of second-tier economics from the Eurozone and the US. Also likely to prod the EUR/USD traders is the mixed bias about China-linked risk aversion and the US Dollar’s latest retreat.
That said, the US Dollar Index (DXY) seesaws around 103.20 as it prods a five-month-old descending resistance line at the highest level in a month. In doing so, the Greenback’s gauge versus the six major currencies traces the latest pullback in the US 10-year Treasury bond yields from the yearly top to 4.20%. However, the US stock futures and equities in the Asia-Pacific zone appear dull and restrict the EUR/USD moves.
On Tuesday, Germany’s ZEW Economic Sentiment improved to -12.3 for August versus -14.4 expected and -14.7 prior but the Current Situation gauge dropped to -71.3 from -59.5 previous readings and -63.0 market forecasts. That said, the Eurozone ZEW Economic Sentiment also recovered to -5.5 from the analysts’ estimations of -12.0 and -12.2 prior. Not only the data but the official statement from the ZEW Institute also appeared optimistic as it said, “Respondents, by and large, do not anticipate any further interest rate hikes in the eurozone and the United States and the economic outlook for the USA has seen a significant increase – these factors contribute to the improved expectations for Germany.”
Alternatively, China’s downbeat statistics for July joined the People’s Bank of China’s (PBoC) surprise rate cuts and looming credit rating downgrade of the major US companies to weigh on the sentiment and the EUR/USD prices.
Further, upbeat US data and the hawkish Fed talks also weigh on the Euro prices. That said, the US Retail Sales grew 0.7% MoM in July versus 0.4% expected and 0.3% reported in June (revised from 0.2%). The details suggested that the Core Retail Sales, namely the Retail Sales ex Autos, grew 1.0% versus 0.4% market forecasts whereas the Retail Sales Control Group doubled from 0.5% previous readouts (revised from 0.6%) to 1.0% for the said month. Further, the US NY Empire State Manufacturing Index slumped to -19.0 from 1.1 prior and -1.0 market forecasts while the US Export Price Index and Import Price Index improved on MoM in July but edged lower on a yearly basis for the said month.
Late Wednesday, Minneapolis Federal Reserve President Neel Kashkari ruled out talks of policy pivot by citing hot inflation and the uncertainty about the Fed’s progress in taming the same. The policymaker also said that he is not ready to say that the Fed is done raising rates, per Reuters.
Looking ahead, a likely improvement in the Eurozone statistics may allow the Euro pair to push back the bearish bias ahead of the Fed Minutes. Should the FOMC members show readiness for a rate hike before the policy pivot, the EUR/USD won’t hesitate to decline further.
Technical analysis
Tuesday’s Doji candlestick joins the nearly oversold RSI (14) line to prod the EUR/USD bears above the seven-week-old horizontal support region around 1.0845–35. That said, the bearish MACD signals and the quote’s sustained trading below the 100-DMA, as well as a one-month-old falling trend line, around 1.0935–30 of late, joins the early month’s downside break of an ascending trend line from late May to keep the sellers hopeful.
- USD/CAD climbs to its highest level since early June, albeit struggles to capitalize on the momentum.
- The USD remains on the defensive and turns out to be a key factor acting as a headwind for the pair.
- Sliding Oil prices undermines the Loonie and helps limit the downside ahead of the FOMC minutes.
The USD/CAD pair climbs to a fresh high since early June during the Asian session on Wednesday, albeit continues with its struggle to find acceptance or build on the momentum beyond the 1.3500 psychological mark.
The US Dollar (USD) remains below its highest level in more than two months touched earlier this week as bulls seem reluctant to place aggressive bets in the wake of the uncertainty over the Federal Reserve's (Fed) future rate hike path. This, in turn, is seen as a key factor acting as a headwind for the USD/CAD pair, though weaker Crude Oil prices d undermines the commodity-linked Loonie and should help limit the downside, at least for the time being.
A 20 points slump in the Empire State Manufacturing Index to a reading of -19 in August reaffirmed market expectations that the Fed will pause its rate-hiking cycle at the upcoming meeting in September. That said, the upbeat US Retail Sales data released on Tuesday indicated that consumer spending held up well in July and pointed to an extremely resilient economy, which keeps the door open for one-more 25 bps lift-off by the end of this year.
Hence, the market focus will remain glued to the release of the FOMC meeting minutes, due later during the US session. Investors will look for fresh cues about the Fed's near-term policy outlook, which will influence the USD price dynamics and provide a fresh impetus to the USD/CAD pair. In the meantime, bets that the Fed will keep interest rates higher for longer remain supportive of elevated US Treasury bond yields and lend support to the buck.
It is worth recalling that yield on the benchmark 10-year US government bond shot to a nearly 10-month top on Tuesday before easing below the 4.20% level. Nevertheless, the aforementioned fundamental backdrop favours the USD bulls. This, along with the overnight muted reaction to stronger Canadian consumer inflation figures, validates the positive outlook and suggests that the path of least resistance for the USD/CAD pair is to the upside.
Market participants now look forward to the US economic docket – featuring the release of Building Permits, Housing Starts and Industrial Production figures later during the early North American session. This, along with the US bond yields and the broader risk sentiment, will drive demand for the safe-haven USD. Apart from this, Oil price dynamics should contribute to producing short-term trading opportunities around the USD/CAD pair.
Technical levels to watch
- USD/CNH retreats from YTD high, renews intraday bottom to prod four-day uptrend.
- Overbought RSI, market’s preparations for Fed Minutes trigger Yuan’s corrective bounce.
- Previous resistance line limits immediate downside within multi-month-old bullish channel.
USD/CNH takes offers to refresh intraday low near 7.3160 during early Wednesday morning in China. In doing so, the offshore Chinese Yuan (CNH) pair reverses from the Year-To-Date (YTD) high marked earlier in the day as markets prepare for the Federal Open Market Committee (FOMC) Monetary Policy Meeting Minutes.
Also read: Forex Today: US data keeps the Dollar at monthly highs
It’s worth noting that the downbeat print of China House Price Index for July, -0.1% versus 0.0% prior, joins the previously released disappointing Industrial Production and Retail Sales for the said month to keep the USD/CNH buyers hopeful despite the latest pullback.
That said, the overbought RSI (14) line joins the market’s pre-event consolidation to direct the USD/CNH price towards the previous resistance line stretched from late October 2022, around 7.2680 at the latest. During the anticipated fall, the 7.3000 threshold might act as an intermediate halt.
However, the USD/CNH bulls remain hopeful unless the Yuan pair remains within an ascending trend channel comprising multiple levels marked since late February, currently between 7.3950 and 7.1730.
Meanwhile, a horizontal area comprising multiple tops marked during late 2022, around 7.3550–3750 appears a tough nut to crack for the USD/CNH bulls, especially amid the overbought RSI conditions.
USD/CNH: Daily chart
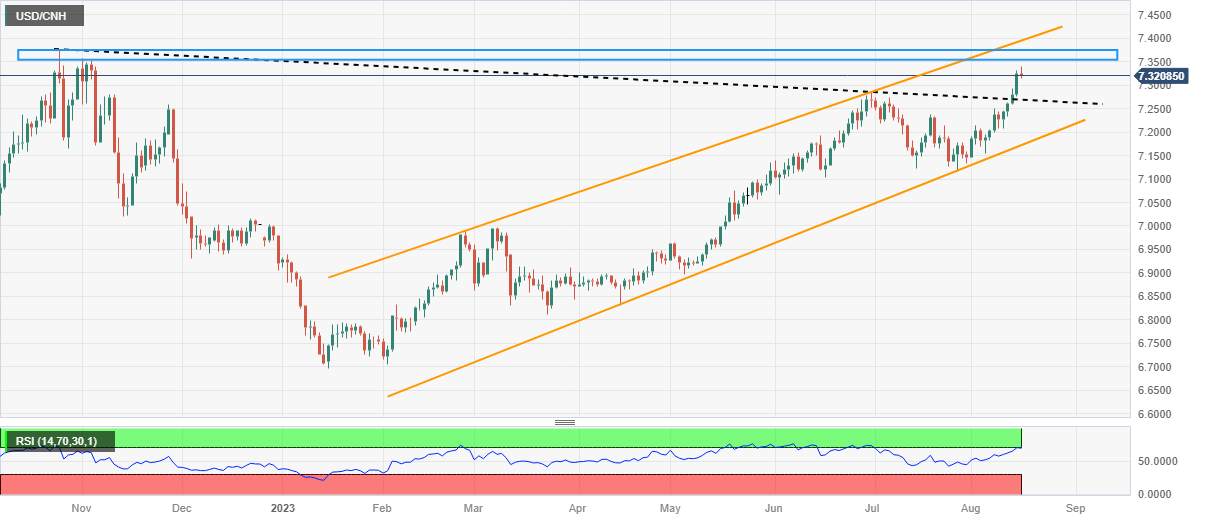
Trend: Limited downside expected
| Raw materials | Closed | Change, % |
|---|---|---|
| Silver | 22.514 | -0.35 |
| Gold | 1901.736 | -0.28 |
| Palladium | 1235.96 | -2.22 |
- AUD/NZD drops to a multi-day low in reaction to the RBNZ's hawkish outlook.
- The central bank forecasts the OCR to remain at 5.5% through December 2024.
- China's economic woes also contribute to the Aussie's relative underperformance.
The AUD/NZD cross comes under heavy selling pressure after the Reserve Bank of New Zealand (RBNZ) announced its policy decision and dives to a multi-day low during the Asian session on Wednesday. Spot prices currently trade around the 1.0800 mark, which bears now awaiting a break below the 100-day and the 200-day Simple Moving Averages (SMAs) confluence before positioning for a further pullback from a two-and-half-week high set on Tuesday.
As was widely anticipated, the RBNZ decided to maintain the status quo and keep the key Official Cash Rate (OCR) steady at 5.50%. The New Zealand Dollar (NZD), however, strengthens a bit in reaction to hawkish RBNZ meeting minutes, which indicated that interest rates will remain at a restrictive level for some time. Adding to this, the central bank now forecasts OCR at 5.5% through December 2024 and then fall to 3.38% by September 2026. This, in turn, is seen dragging the AUD/NZD cross lower for the second successive day.
Apart from this, concerns about the worsening economic conditions in China – Australia's largest trading partner – turns out to be another factor behind the Aussie relative underperformance and contributes to the offered tone surrounding the cross. The downside, however, seems cushioned, at least for the time being, as traders might refrain from placing aggressive bets and prefer to wait for RBNZ Governor Adrian Orr's remarks at the post-meeting press conference. This, in turn, warrants some caution before positioning for further losses.
Technical levels to watch
- The Office for National Statistics is due to publish the UK inflation data on Wednesday.
- Core annual inflation and headline inflation are both forecast to edge lower to 6.8%.
- The UK CPI data could cement another BoE rate hike in September.
The all-important Consumer Price Index (CPI) data from the United Kingdom (UK) will be published on Wednesday, August 16. The Bank of England (BoE) raised its policy rate by 25 basis points to 5.25% in August but Governor Andrew Bailey refrained from committing to further policy tightening in the post-meeting press conference. Inflation developments in the UK could influence the BoE’s rate outlook and impact Pound Sterling's valuation.
In the latest projections, the BoE revised inflation forecasts lower. The bank now expects inflation to fall to 4.93% by the fourth quarter of 2023, lower than the May estimate of 5.12%, and sees inflation retreating to 2.82% in one year’s time, compared to 3.38% in May.
While commenting on the inflation outlook, Bailey told reporters that they were expecting inflation to fall to around 5% in October. The BoE Governor, however, further noted that services price inflation brought unwelcome news since May.
The data from the UK revealed on Tuesday that the basic wage inflation, as measured by the change in Average Earnings Excluding Bonus, hit a new record growth rate of 7.8% in three months through June. The Unemployment Rate in the same period, however, rose to 4.2% from 4%. The rate-sensitive 2-year UK Gilt yield edged higher after these readings, highlighting the impact of hawkish Bank of England bets.
What to expect in the next UK inflation report?
Economists are expecting the headline annual UK Consumer Price Index inflation to fall to 6.8% in July from 7.9% in June. The Core CPI is forecast to tick down to 6.8% from 6.9%. On a monthly basis, Britain’s CPI inflation is seen declining 0.5% following the 0.1% growth recorded in June.
Previewing the upcoming UK inflation data and how it could alter the BoE monetary policy, “with our expectation that core inflation remains unchanged at 7.1% in June, coupled with the continued acceleration in wage growth in the past week, it should keep the Bank hiking,” say analysts at Societe Generale and elaborate:
“But whether the Bank downshifts to 25bp or hikes by another 50bp is less certain, with any upside or downside surprise to the CPI data possibly swinging the Bank’s decision. Our forecast is for a downshift to 25bp, in the expectation that more convincing signs that the labur market is cooling will steadily build up. At the end of the week, we expect the harsh mortgage rate environment will weigh on both consumer confidence and retail sales.”
When will the UK Consumer Price Index report be released and how could it affect GBP/USD?
Markets are nearly fully pricing in one more 25 basis points (bps) BoE rate hike in September following the latest jobs report. Investors, however, could start leaning toward a 50 bps hike if the monthly CPI arrives in positive territory. In that scenario, Pound Sterling could gather strength against its rivals.
On the other hand, investors are likely to refrain from betting on a big BoE rate increase if CPI figures arrive near expectations and show a softening in price pressures. Nevertheless, it will probably take a much weaker-than-forecast inflation reading from the UK for market participants to bet on a no-change in the BoE key rate in September. Hence, the market positioning suggests that Pound Sterling’s losses could remain limited unless there is a significant downside surprise.
Eren Sengezer, European Session Lead Analyst at FXStreet, offers a brief technical outlook for the GBP/USD pair and explains: “GBP/USD remains stuck between the 50-day and the 100-day Simple Moving Averages (SMA). The Relative Strength Index (RSI) indicator on the daily chart, meanwhile, stays very close to 50, reflecting the pair’s indecisiveness in the near term.”
Eren also outlines important technical levels for GBP/USD: “The 100-day SMA aligns as key support at 1.2600. A daily close below that level could ramp up the technical selling pressure and open the door for an extended slide toward 1.2500 (psychological level, technical level) and 1.2370 (200-day SMA). Looking north, additional gains could be witnessed once GBP/USD flips 1.2800 (20-day SMA, 50-day SMA) into support. In that scenario, 1.2900 (psychological level) and 1.3000 (July 27 high) could be set as next bullish targets.”
Economic Indicator
United States Consumer Price Index (YoY)
The Consumer Price Index released by the US Bureau of Labor Statistics is a measure of price movements by the comparison between the retail prices of a representative shopping basket of goods and services. The purchase power of USD is dragged down by inflation. The CPI is a key indicator to measure inflation and changes in purchasing trends. Generally speaking, a high reading is seen as positive (or bullish) for the USD, while a low reading is seen as negative (or Bearish).
Read more.Next release: 09/13/2023 12:30:00 GMT
Frequency: Monthly
Source: US Bureau of Labor Statistics
Why it matters to traders
The US Federal Reserve has a dual mandate of maintaining price stability and maximum employment. According to such mandate, inflation should be at around 2% YoY and has become the weakest pillar of the central bank’s directive ever since the world suffered a pandemic, which extends to these days. Price pressures keep rising amid supply-chain issues and bottlenecks, with the Consumer Price Index (CPI) hanging at multi-decade highs. The Fed has already taken measures to tame inflation and is expected to maintain an aggressive stance in the foreseeable future.
- GBP/JPY currently trades around 184.80, up 0.02% for the day.
- The number of people employed in the UK declined by 66,000 vs. market consensus of an increase of 75,000.
- Japanese economic growth in Q2 came in at 1.5% QoQ, versus 0.8% expected and 0.7% previously.
- Investors will monitor the UK Consumer Price Index (CPI) for July to find a clear movement in GBP/JPY.
The GBP/JPY cross consolidates its recent gains near 184.80 during the Asian session on Wednesday. Markets turn cautious ahead of the release of the UK Consumer Price Index (CPI) data later in the European session.
On Tuesday, the number of people employed in the United Kingdom declined by 66,000, versus the market consensus of an increase of 75,000. The Average Earnings excluding bonuses, rose 7.8% YoY in the three months to June. This figure indicates the highest annual growth rate since records began in 2001, while Average Earnings including bonuses, reached 8.2%, the fastest pace since the coronavirus pandemic period. Meanwhile, the Unemployment Rate increased to 4.2% from 4%.
Market participants are cautious about the BoE's move as the UK economy is fragile and the interest rate is at a 15-year high of 5.25%. The aggressive monetary policy could negatively affect the British economy. However, market participants will take cues from the UK Consumer Price Index (CPI) and Retail Sales MoM for July, due later in the day. The upbeat data could boost the Pound Sterling and act as a tailwind for the GBP/JPY cross.
On the Japanese Yen front, the preliminary data of the Gross Domestic Product (GDP) figures for the second quarter (Q2) of 2023 shows that economic growth in Japan came in at 1.5% QoQ, versus 0.8% expected and 0.7% previously. Meanwhile, the annualised GDP increased to 6.0%, compared to 3.1% estimated and 2.7% previously.
Following the stronger than expected data on Tuesday, Japan’s Economy Minister Shigeyuki Goto stated that he anticipated a moderate economic recovery before mentioning the need to pay attention to the danger of a global downturn and the impacts of price increases. Goto demonstrated a willingness to respond flexibly to the economy and prices as needed. That said, the divergence between the dovish stance of the Bank of Japan (BoJ) and the hawkish stance of the Bank of England (BoE) leads to the weakening of the Japanese Yen against its major rivals.
Looking ahead, investors will closely watch the UK CPI. The annual and core inflation figures are expected to decline by 6.8%. On the Japanese docket, the nation’s Trade data and annual National Consumer Price Index for July will be released later this week.
- NZD/USD recovers from YTD low even as RBNZ keeps monetary policy unchanged.
- RBNZ holds benchmark rates intact at 5.50% as expected.
- China-linked fears, upbeat US data and yields weigh on Kiwi pair but RBNZ’s optimism allow bears to take a breather.
- RBNZ Governor Orr’s Press Conference, FOMC Minutes and China sentiment eyed for clear directions.
NZD/USD portrays a 20-pip rise on the Reserve Bank of New Zealand’s (RBNZ) monetary policy announcements early Wednesday. In doing so, the Kiwi pair prods the six-day downtrend while bouncing off the yearly low.
That said, the RBNZ keeps the benchmark interest rates unchanged at 5.5% but the quarterly Rate Statement appears hawkish and allows the Kiwi pair to portray a corrective bounce from the Year-To-Date (YTD) low.
Also read: RBNZ Minutes: Committee confident that with interest rates remaining at a restrictive level for some time
Apart from the RBNZ moves, the pessimism surrounding China and the upbeat US Treasury bond yields also become important catalysts for the NZD/USD traders as they exert downside pressure on the quote of late.
That said, the downbeat China data and the People’s Bank of China’s (PBoC) surprise rate cuts renew economic fears about the world’s second-largest economy and weighed on the Antipodeans. On Tuesday, the People’s Bank of China (PBOC), surprised markets by lowering the one-year Medium-term Lending Facility (MLF) rate to 2.50% from 2.65% previous and the Standing Lending Facility rates (SLFs), as well as by cutting the Reverse Repo Rate to 1.8% from 1.9% previously.
The same joined China’s downbeat July Retail Sales that rose 2.5% YoY vs. 4.8% expected and 3.1% previous, as well as the Industrial Production that came in at 3.7% YoY vs. 4.5% estimated and 4.4% prior, to flag the fears surrounding the Dragon Nation and weigh on the NZD/USD price.
It should be noted that the hawkish statements from Minneapolis Federal Reserve President Neel Kashkari joined the upbeat US Retail Sales growth for July, 0.7% MoM versus 0.4% expected, also add strength to the bearish bias about the NZD/USD pair, via firmer US Dollar.
On a different page, the Analysts at the global rating agency Fitch Ratings told CNBC on Tuesday said that the agency could downgrade several big lenders, including JPMorgan, as reported by Reuters, which in turn bolstered the risk aversion and pleased the Kiwi bears.
Amid these plays, the US Dollar Index (DXY) stays firmer poking the key resistance surrounding 103.30 at the monthly high whereas Wall Street closed in the red and the US 10-year Treasury bond yields seesaw around the yearly high. It should be noted that the S&P500 Futures remain lackluster by the press time.
Having witnessed the initial market reaction to the New Zealand central bank announcements, the NZD/USD pair traders will keep an eye on RBNZ Governor Adrian Orr’s Press Conference, scheduled for 03:00 AM GMT, for fresh impulse. Above all, headlines surrounding China’s economic conditions and the Federal Reserve (Fed) monetary policy meeting minutes will be crucial for clear directions of the Kiwi pair.
Technical analysis
With a daily closing below May’s bottom of around 0.5985, the NZD/USD becomes vulnerable to drop toward the early October 2022 peak of around 0.5815.
The Minutes of the Reserve Bank of New Zealand (RBNZ) August policy meeting showed that the “committee agreed that the OCR needs to stay at restrictive levels for the foreseeable future.”
Additional takeaways
The current level of interest rates is constraining spending and hence inflation pressure, as anticipated and required.
Committee agreed that the OCR needs to stay at restrictive levels for the foreseeable future.
New Zealand economy is evolving broadly as anticipated.
Headline inflation and inflation expectations have declined, but measures of core inflation remain too high.
In the near term, there is a risk that activity and inflation measures do not slow as much as expected.
Committee is confident that with interest rates remaining at a restrictive level for some time, consumer price inflation will return to within its target range of 1 to 3% per annum.
Committee noted inflation is still expected to decline within the target band by the second half of 2024.
Committee agreed that the risks around the inflation projection remain balanced.
Committee noted that the estimate of the nominal neutral OCR has increased by 25 basis points to 2.25% within the projections, consistent with the Reserve Bank’s indicator suite.
Official cash rate at 5.54% in December 2023 (pvs 5.5%).
RBNZ sees official cash rate at 5.57% in September 2024 (pvs 5.43%).
RBNZ sees twi NZD at around 71.0% in September 2024 (pvs 71.5%).
RBNZ sees annual CPI 2.7% by September 2024 (pvs 2.7%).
RBNZ sees official cash rate at 5.5% in December 2024 (pvs 5.3%).
RBNZ sees official cash rate at 3.38% in September 2026.
Related reads
- NZD/USD bounces off yearly bottom towards 0.6000 despite RBNZ inaction, focus on China, Fed Minutes
- AUD/NZD drops to multi-day low, flirts with 1.0800 confluence support post-RBNZ decision
Following the August monetary policy meeting, the Reserve Bank of New Zealand (RBNZ) board members decided to leave the official cash rate (OCR) unchanged at 5.50%.
The RBNZ policy decision aligned with the market expectations of a no-rate change this month.
Market reaction
In an immediate reaction to the RBNZ announcement, NZD/USD jumped over 20 pips to recapture the 0.5950 level. The pair is still down 0.22% on the day at 0.5955, as of writing.
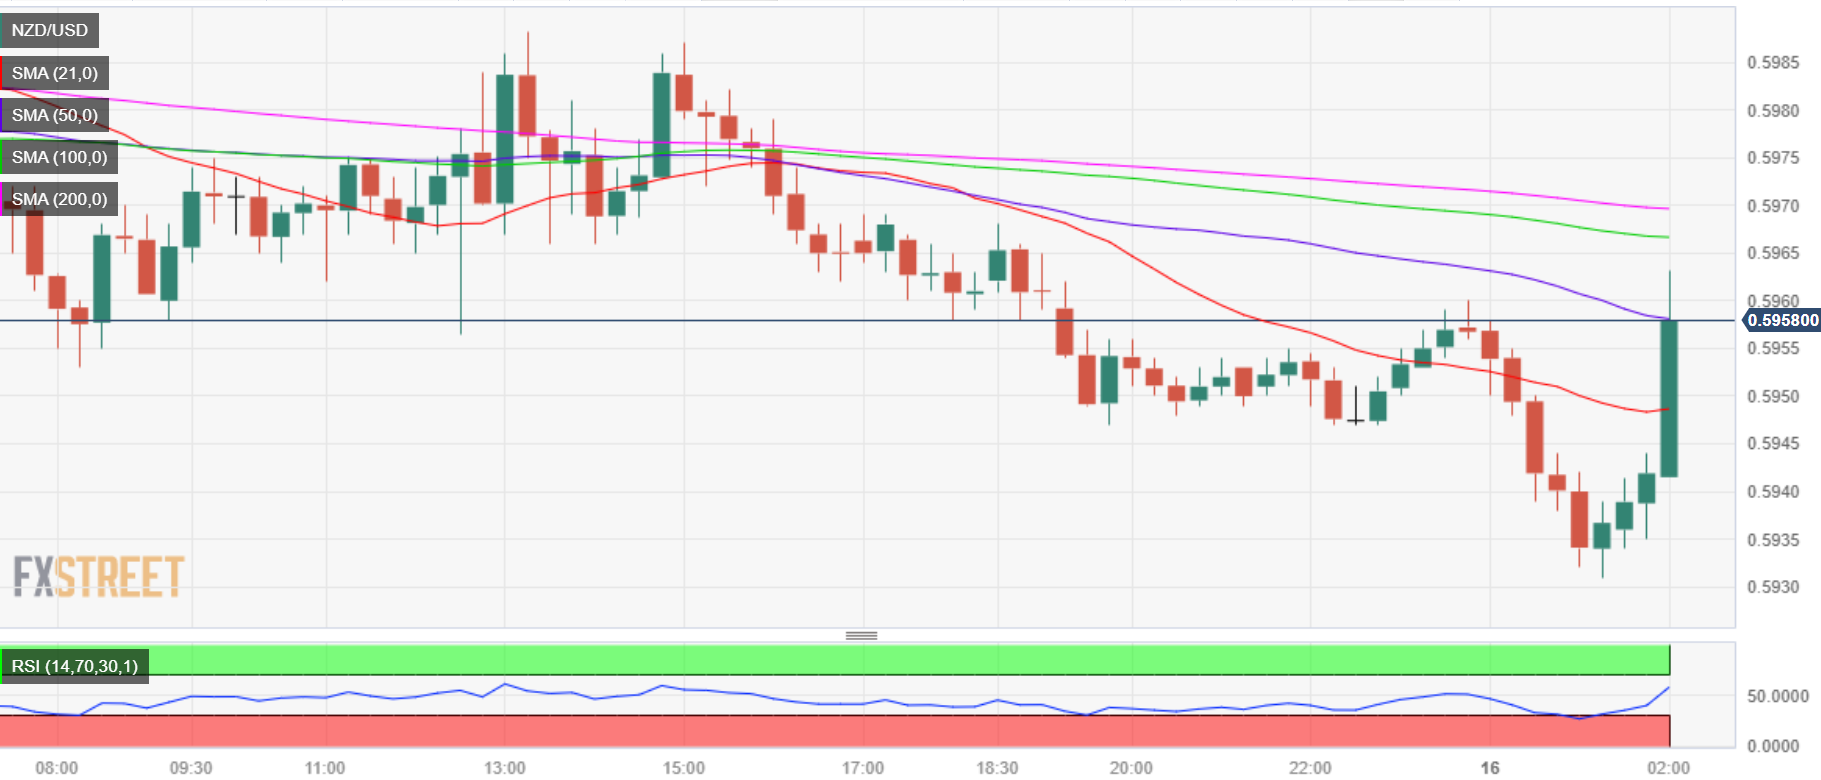
NZD/USD: 15-minutes chart
Why the RBNZ decision matters to traders?
The Reserve Bank of New Zealand (RBNZ) holds monetary policy meetings seven times a year, announcing their decision on interest rates and the economic assessments that influenced their decision. The central bank offers clues on the economic outlook and future policy path, which are of high relevance for the NZD valuation. Positive economic developments and an upbeat outlook could lead the RBNZ to tighten the policy by hiking interest rates, which tends to be NZD bullish.
- AUD/USD takes offers to refresh yearly bottom during seven-day downtrend.
- Sustained downside break of key support line, bearish MACD signals favor Aussie sellers.
- Descending trend line from March, oversold RSI (14) suggests limited downside room.
- Fed Minutes need to push back policy pivot concerns to keep AUD/USD on bear’s radar.
AUD/USD stands on slippery grounds near 0.6430 as it renews the Year-To-Date (YTD) low during the seven-day losing streak early Wednesday. In doing so, the Aussie pair justifies its risk barometer status ahead of the Federal Reserve (Fed) monetary policy meeting minutes.
Also read: AUD/USD steadies at yearly low around mid-0.6400s amid sour sentiment ahead of Fed Minutes
Adding strength to the downside bias are the bearish MACD signals and the quote’s clear break of the previous key support line stretched from October 2022. Furthermore, Aussie pair’s sustained below the 10-DMA and a one-month-old descending trend line also favors the AUD/USD sellers.
However, the oversold conditions of the RSI (14) and likely disappointment for the US Dollar hawks from the Fed Minutes seem to prod the AUD/USD sellers as they approach a downward-sloping support line from March, close to 0.6410 at the latest.
In a case where the AUD/USD ignores RSI and justifies hawkish Fed Minutes, if any, the quote is likely to slump towards the late 2022 bottom of around 0.6170.
On the other hand, the 10-DMA restricts the immediate recovery of the Aussie pair near 0.6515.
However, a convergence of the 61.8% Fibonacci retracement of October 2022 to February 2023 upside, a 10-month-old previous support line and a downward-sloping trend line from July 18 together constitute 0.6545-50 key resistance for the pair buyers to watch during the quote’s rebound.
Should the quote manages to stay firmer past 0.6550, lows marked during late June and early July around the 0.6600 mark will act as the last defense of the Aussie bears.
AUD/USD: Daily chart
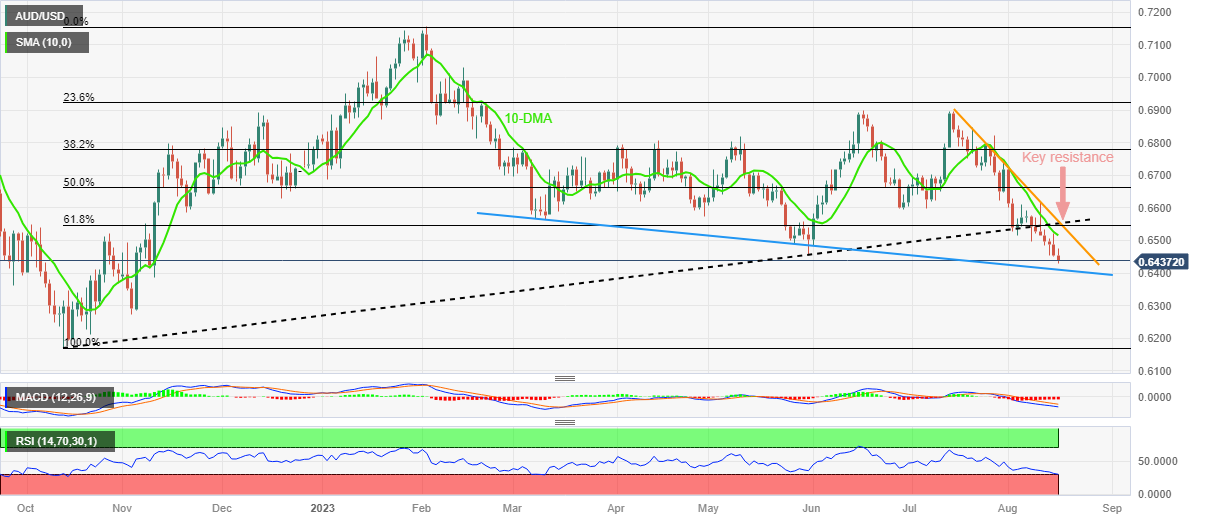
Trend: Limited downside expected
- GBP/USD edges lower during the Asian session on Wednesday and is pressured by a bullish USD.
- The stronger UK wage growth data puts pressure on the BoE to hike further and should limit losses.
- Traders also prefer to wait for the release of FOMC minutes before placing fresh directional bets.
The GBP/USD pair extends the overnight pullback from a multi-day top, around mid-1.2700s and continues losing ground through the Asian session on Wednesday. Spot prices slid back below the 1.2700 round-figure mark and remain well within the striking distance of the 100-day Simple Moving Average (SMA) support near the 1.2620-1.2615 region, or the lowest level since June 30 touched on Monday.
The underlying bullish sentiment surrounding the US Dollar (USD), bolstered by expectations that the Federal Reserve (Fed) will stick to its hawkish stance, turns out to be a key factor exerting some downward pressure on the GBP/USD pair. Investors seem convinced that the US central bank will keep interest rates higher for longer and the bets were reaffirmed by the upbeat US Retail Sales data released on Tuesday, which indicated that consumer spending held up well in July.
That said, a 20 points slump in the Empire State Manufacturing Index to a reading of -19 in August reaffirms market expectations that the Fed will pause its rate-hiking cycle at the upcoming meeting in September. This, in turn, holds back the USD bulls from placing fresh bets and might lend some support to the GBP/USD pair. Traders also seem reluctant and prefer to wait for the release of the FOMC meeting minutes, which might provide fresh cues about the future rate-hike path.
Heading into the key event risk, traders will take cues from the US economic docket, featuring the release of Building Permits, Housing Starts and Industrial Production figures. In the meantime, strong wage growth data, which added to worries about long-term inflation and might force the Bank of England (BoE) to raise interest rates further, should contribute to limiting losses for the GBP/USD pair. This warrants caution before positioning for any further intraday downfall.
Technical levels to watch
- EUR/GBP currently trades around 0.8589, gaining 0.02% for the day.
- Eurozone ZEW Survey Economic Sentiment, German ZEW Survey Economic Sentiment for August came in better than the estimation.
- UK Employment Change declined by 66,000, against market expectations of an increase of 75,000.
- Market players await the UK Consumer Price Index (CPI) in July, Eurozone Gross Domestic Product (GDP) due on Wednesday.
The EUR/GBP cross recovers some lost ground but remains capped below the 0.8600 mark during the early Asian session on Wednesday. Market participants await key data from the United Kingdom and the Eurozone. The UK Consumer Price Index (CPI) in July and Eurozone Gross Domestic Product (GDP) will be released later in the day, and it could trigger volatility in the cross.
The Zentrum für Europäische Wirtschaftsforschung reported on Tuesday that the Eurozone ZEW Survey Economic Sentiment for August came in at -5.5, better than the estimation of -12 and the previous reading of -12.2. Meanwhile, German ZEW Survey Economic Sentiment for August improved to -12.3 versus -14.4 expected and -14.7 prior. On the same line, the German ZEW Survey Current Situation declined to -71.3, worse than expectations of -63 and the previous reading of -59.5.
The European Central Bank's (ECB) monthly Economic Bulletin revealed last week that the Eurozone’s inflation is still predicted to be too high for too long, and the prospects for economic growth and inflation are still uncertain. According to the Reuters poll, the target inflation rate of 2.0% will not be reached until at least 2025, and more than 90% of economists surveyed anticipate no rate cuts before the second quarter of 2024.
On the UK docket, the number of employed declined by 66,000, against market expectation of an increase of 75,000. The Average Earnings excluding bonuses, increased 7.8% YoY in the three months to June. This figure indicates the highest annual growth rate since records began in 2001, while Average Earnings including bonuses, reached 8.2%, the fastest pace since the coronavirus pandemic period. Finally, the unemployment rate increased to 4.2% from 4%.
As the UK economy is fragile and the interest rate is at a 15-year high of 5.25%, market participants are cautious about the BoE's move. The aggressive monetary policy could negatively affect the British economy. This, in turn, might cap the upside in the Pound Sterling and act as a tailwind for the EUR/GBP cross.
Moving on, the Eurozone Gross Domestic Product (GDP) Q2 and Harmonized Index of Consumer Prices for July will be released later this week. On the UK docket, the UK Consumer Price Index (CPI) and Retail Sales MoM for July will be due. The data will be critical for determining a clear movement for the EUR/GBP cross.
People’s Bank of China (PBoC) set the USD/CNY central rate at 7.1986 on Wednesday, versus the previous fix of 7.1786 and market expectations of 7.2878. It's worth noting that the USD/CNY closed near 7.2899 the previous day.
Apart from the USD/CNY fix, the PBoC also unveiled details of its Open Market Operations (OMO) while saying that the Chinese central bank injects 299 billion Yuan via 7-day reverse repos (RRs) at 1.80% vs. prior 1.80%.
However, with the 2 billion Yuan of RRs maturing today, there prevails a net injection of around 297 billion Yuan injection on the day in OMO.
About PBOC fix
China maintains strict control of the yuan’s rate on the mainland.
The onshore yuan (CNY) differs from the offshore one (CNH) in trading restrictions, this last one is not as tightly controlled.
Each morning, the People’s Bank of China (PBOC) sets a so-called daily midpoint fix, based on the yuan’s previous day's closing level and quotations taken from the inter-bank dealer.
Early Wednesday at 02:00 GMT market sees the key monetary policy decision by the Reserve Bank of New Zealand (RBNZ) amid hopes of witnessing another play of status quo by the New Zealand central bank, despite doves flexing muscles of late.
RBNZ is less likely to fuel the market moves with its anticipated no rate change announcements for the third consecutive time.
The Interest Rate Decision will be accompanied by the RBNZ Rate Statement which can provide further details on the central bank’s next moves, making it crucial for the NZD/USD pair traders to watch.
Furthermore, RBNZ Governor Adrian Orr’s presser at 03:00 GMT also amplifies Wednesday’s importance for the Kiwi pair traders.
Ahead of the event, Analysts at Australia and New Zealand Banking Group (ANZ) said,
We expect the RBNZ will leave the OCR unchanged at 5.50%, reiterating their ‘watch, worry and wait’ stance. Data since the July nothing-to-see-here Monetary Policy Review has been mixed, with relatively resilient demand but inflation indicators falling according to the script – an attractive mix, but one of questionable sustainability. As always, there’s a huge amount of wiggle room in terms of how the Committee interprets the implications of the recent data flow. We don’t expect a hat-tip to the chance of more hikes in this Statement, but the OCR forecast may show rates remaining at their peak for a little longer.
On the same line, FXStreet’s Matias Salord said,
The RBNZ is unlikely to make changes, and any surprise could come from the statement and a change in the forward guidance or the macroeconomic forecasts. At this point, the surprise could be in either direction, with optimistic or pessimistic forecasts, or by offering a hawkish or dovish interest rate outlook.
How could it affect NZD/USD?
NZD/USD renews the yearly low near 0.5950 heading into the RBNZ Interest Rate Decision. The Kiwi pair’s latest fall could be linked to the broad risk aversion wave and the US Dollar strength, especially amid downbeat concerns surrounding China.
That said, the clear early signals of witnessing no rate hike limit the NZD/USD moves unless the RBNZ surprises the Kiwi pair traders.
Apart from the interest rates, the economic forecasts and language of the RBNZ Rate Statement will also be the key for the NZD/USD pair traders to watch.
It’s worth noting that the existence of the Fed Minutes dims the importance of today’s RBNZ announcements unless any surprises erupt.
Technically, a daily closing below May’s bottom of around 0.5985 directs the NZD/USD bears toward the early October 2022 peak of around 0.5815.
Keynotes
RBNZ Preview: Forecasts from six major banks, OCR on ice at 5.50%
RBNZ Interest Rate Decision Preview: Holding on the hold
NZD/USD remains under pressure below the 0.5950 area ahead of the RBNZ rate decision
About the RBNZ interest rate decision and rate statement
The RBNZ interest rate decision is announced by the Reserve Bank of New Zealand. If the RBNZ is hawkish about the inflationary outlook of the economy and raises the interest rates it is positive, or bullish, for the NZD. The RBNZ rate statement contains explanations of their decision on interest rates and commentary about the economic conditions that influenced their decision.
- USD/JPY oscillates in a narrow band around mid-145.00s on Wednesday.
- The Fed-BoJ policy divergence continues to act as a tailwind for the pair.
- Intervention fears cap any meaningful upside ahead of the FOMC minutes.
The USD/JPY pair holds steady around mid-145.00s during the Asian session on Wednesday and remains well within the striking distance of its highest level since November 2022 touched the previous day.
The US Dollar (USD) consolidates its recent strong gains to over a two-month top and continues to draw support from expectations that the Federal Reserve (Fed) will keep interest rates higher for longer. The bets were lifted by the stronger US data released on Tuesday, which showed that Retails Sales grew 0.7% on a monthly basis in July as compared to the previous month's upwardly revised reading of 0.3% and the 0.4% rise anticipated.
Furthermore, sales excluding autos increased by a robust 1%, again beating market estimates and recording the best monthly gains since January. This indicated that consumer spending held up well in July and pointed to an extremely resilient US economy, which should allow the Fed to stick to its hawkish stance. This, in turn, is seen underpinning the Greenback and acting as a tailwind for the USD/JPY pair, though the upside remains capped.
A 20 points slump in Empire State Manufacturing to a reading of -19 in August reinforced speculations that the Fed will pause its rate-hiking cycle at the next policy meeting in September. This, in turn, holds back the USD bulls from placing aggressive bets. Apart from this, fears of a possible intervention by Japanese authorities to curb any further fall in the domestic currency contribute to keeping a lid on the USD/JPY pair, at least for the time being.
That said, a more dovish stance adopted by the Bank of Japan (BoJ), which is the only major central bank in the world to maintain a negative benchmark interest rate, should cap any meaningful gains for the Japanese Yen (JPY). Adding to this, the recent widening of the US-Japan rate differential, led by bets for one more 25 bps Fed rate hike by the end of this year, supports prospects for a further near-term appreciating move for the USD/JPY pair.
Market participants now look to the US economic docket, featuring the release of Building Permits, Housing Starts and Industrial Production figures. This might influence the USD price dynamics and provide some impetus to the USD/JPY pair. The focus, however, will remain glued to the FOMC meeting minutes, which will play a key role in driving the USD demand in the near term and help determine the next leg of a directional move for the major.
Technical levels to watch
- EUR/USD remains depressed around intraday low after failing to stop sellers the previous day.
- Doji candlestick, nearly oversold RSI test Euro bears as the key FOMC Minutes loom.
- Bearish MACD signals, 1.0930-352 resistance confluence challenge recovery moves.
- Fed Minutes need to ring hawkish bells to direct Euro bears toward 200-DMA.
EUR/USD holds lower grounds near 1.0900, poking the intraday bottom amid early Wednesday in Asia. In doing so, the Euro pair struggles for clear directions amid the cautious mood ahead of the Federal Open Market Committee’s (FOMC) Monetary Policy Meeting Minutes. Also likely to challenge the Euro bears is the Doji candlestick marked the previous day, as well as the nearly oversold RSI (14) line. As a result, the Euro bears need a strong hawkish tone from the Fed Minutes to defend the one-month-old downside trend.
Also read: EUR/USD Forecast: Continued bearish pressure persists amid Dollar strength
It’s worth noting that the bearish MACD signals and the quote’s sustained trading below the 100-DMA, as well as a one-month-old falling trend line, joins the early month’s downside break of an ascending trend line from late May to keep the EUR/USD sellers hopeful.
That said, a seven-week-old horizontal support region around 1.0845–35 restricts immediate downside of the EUR/USD pair, a break of which will direct the south-run towards the 200-DMA support of 1.0785.
On the flip side, a convergence of the 100-DMA and a downward-sloping trend line from July 19 guards the EUR/USD pair’s recovery around 1.0930-35 zone.
Following that, the support-turned-resistance line of around 1.1095 and the 1.1100 round figure will lure the EUR/USD bulls.
EUR/USD: Daily chart

Trend: Further downside expected
| Index | Change, points | Closed | Change, % |
|---|---|---|---|
| NIKKEI 225 | 178.98 | 32238.89 | 0.56 |
| Hang Seng | -192.44 | 18581.11 | -1.03 |
| ASX 200 | 28 | 7305 | 0.38 |
| DAX | -136.97 | 15767.28 | -0.86 |
| CAC 40 | -81.14 | 7267.7 | -1.1 |
| Dow Jones | -361.24 | 34946.39 | -1.02 |
| S&P 500 | -51.86 | 4437.86 | -1.16 |
| NASDAQ Composite | -157.28 | 13631.05 | -1.14 |
- USD/CAD gains momentum below the 1.3500 mark following the upbeat US data.
- The Canadian Consumer Price Index (CPI) YoY rose to 3.3%, above the 3% expectation and the previous 2.8%.
- The headline Retail Sales climbed by 0.7% MoM, higher than the 0.4% estimated.
- Market players await the highly-anticipated FOMC Minutes on Thursday.
The USD/CAD pair extends its upside just below the 1.3500 barrier during the early Asian session on Wednesday. The upbeat July US Retail Sales caused the market to discount a more aggressive wager by the Federal Reserve (Fed) and favour the US Dollar (USD). The major pair currently trades near 1.3493, down 0.03% for the day.
On Tuesday, the Canadian Consumer Price Index (CPI) rose 0.6% MoM, while the annualised figure increased to 3.3%, above the 3% expectation and the previous 2.8%. The Core CPI, which excludes volatile oil and food prices YoY for July, increased to 3.2%, compared to the 2.8% predicted from the previous reading of 2.8%.
The report indicated that inflation in Canada remains high, and it raised the prospect of another interest rate hike by the Bank of Canada (BoC) in its September policy meeting. It’s worth noting that the BoC raised its benchmark overnight rate to a 22-year high of 5.0% after a four-decade high of 8.1% in inflation. It was the tenth rate hike since March 2022. Meanwhile, a decline in oil prices undermines the Canadian Dollar since Canada is the largest oil exporter to the United States.
On the other hand, the US Census Bureau reported on Tuesday that US Retail Sales came in above expectations. The headline figure climbed by 0.7% MoM, higher than the 0.4% estimated. Sales excluding the automobile sector came in at 1%, versus the expected 0.4%. Finally, the NY Empire Manufacturing Index for August declined to -19 from -1.
Apart from the data, Minnesota’s Federal Reserve (Fed) President Neil Kashkari stated that he is pleased with the progress on inflation, but it is still too high. Kashkari, on the other hand, questioned whether the Fed had done enough or whether more needed to be done.
Looking ahead, market participants will keep an eye on the US Building Permits, Housing Starts, and Industrial Production due on Wednesday. The closely watched event this week will be FOMC Minutes on Thursday. The event will be critical for determining a clear movement for the USD/CAD pair.
- Gold Price stays defensive at key technical levels, pressured around multi-day low of late.
- XAU/USD fails to cheer US Dollar’s previously sluggish moves, risk aversion amid China economic woes.
- Greenback struggles to cheer upbeat United States Retail Sales, hawkish Fed talks ahead of Federal Reserve Monetary Policy Meeting Minutes.
- Hawkish Fed Minutes needed to break $1,890 support and welcome Gold bears with open hands.
Gold Price (XAU/USD) remains pressured at $1,901 amid the early hours of Wednesday’s Asian session as it reverses late Tuesday’s corrective bounce off the lowest level in seven weeks amid a cautious mood. That said, China-induced risk aversion joined upbeat United States data and hawkish Federal Reserve (Fed) talks, as well as fears of witnessing credit rating downgrade of major US companies, weighed on sentiment and the XAU/USD the previous day. That said, the bullion initially rebounded on early Tuesday amid the market’s consolidation ahead of today’s Monetary Policy Meeting Minutes of the Federal Open Market Committee (FOMC).
Gold Price stays bearish on firmer United States data, China fears
Gold Price occupies its permanent seat on the bear’s radar despite the previous day’s short-lived bounce as markets’ sour sentiment, especially backed by China, join firmer United States Retail Sales data and hawkish comments from a Federal Reserve (Fed) official.
On Tuesday, downbeat China data and the People’s Bank of China’s (PBoC) surprise rate cuts renew economic fears about the world’s second-largest economy and weighed on the Gold Price. The People’s Bank of China (PBOC), surprised markets by lowering the one-year Medium-term Lending Facility (MLF) rate to 2.50% from 2.65% previous and the Standing Lending Facility rates (SLFs), as well as by cutting the Reverse Repo Rate to 1.8% from 1.9% previously. The same joined China’s downbeat July Retail Sales that rose 2.5% YoY vs. 4.8% expected and 3.1% previous, as well as the Industrial Production that came in at 3.7% YoY vs. 4.5% estimated and 4.4% prior, to flag the fears surrounding the Dragon Nation and fuel the DXY.
On the other hand, the US Retail Sales grew 0.7% MoM in July versus 0.4% expected and 0.3% reported in June (revised from 0.2%). The details suggested that the Core Retail Sales, namely the Retail Sales ex Autos, grew 1.0% versus 0.4% market forecasts whereas the Retail Sales Control Group doubled from 0.5% previous readouts (revised from 0.6%) to 1.0% for the said month. Further, the US NY Empire State Manufacturing Index slumped to -19.0 from 1.1 prior and -1.0 market forecasts while the US Export Price Index and Import Price Index improved on MoM in July but edged lower on a yearly basis for the said month.
Late Wednesday, Minneapolis Federal Reserve President Neel Kashkari ruled out talks of policy pivot by citing hot inflation and the uncertainty about the Fed’s progress in taming the same. The policymaker also said that he is not ready to say that the Fed is done raising rates, per Reuters.
Apart from that, the Analysts at the global rating agency Fitch Ratings told CNBC on Tuesday that the agency could downgrade several big lenders, including JPMorgan, as reported by Reuters, which in turn bolstered the risk aversion and favored the Gold sellers.
With this, the US Dollar Index (DXY) regains the upside momentum, despite poking the key resistance surrounding 103.30 of late, while Wall Street closed in the red and the US 10-year Treasury bond yields refreshed the yearly high. It should be noted that the S&P500 Futures remain lackluster by the press time.
Fed Minutes can convince XAU/USD bulls on confirming policy pivot
Looking forward, the Gold Price braces for further downside as it pokes the short-term key technical supports. However, the XAU/USD bears need validation from China data and the Federal Reserve (Fed) monetary policy meeting minutes, as well as the bond yields. Should the fears about China remain on the table and the yields stay firmer, backed by hawkish statements from the Fed Minutes, the Gold Price may drop to the sub-$1,900 zone.
Gold Price Technical Analysis
Gold Price seems fragile as it floats near a seven-month-old horizontal support zone of around $1,890 and the 200-DMA level of around $1,905.
Also challenging the XAU/USD bears is the Relative Strength Index (RSI) line, placed at 14, which stays beneath the 50.0 level and suggests bottom-picking.
However, the Moving Average Convergence and Divergence (MACD) signals are bearish as the metal remains below the $1,940 resistance confluence, comprising the previous support line stretched from November 2022 and the 50-DMA, which turn prod the XAU/USD sellers.
Hence, the quote’s corrective bounce appears lucrative but has a limited upside room, unless breaking the $1,940 hurdle.
Following that, a downward-sloping resistance line from early May, close to $1,960 at the latest, will act as the last defense of the XAU/USD bears.
On the contrary, a downside break of the $1,890 support will make the Gold Price vulnerable to slump toward an early March swing high of around $1,858.
Gold Price: Daily chart
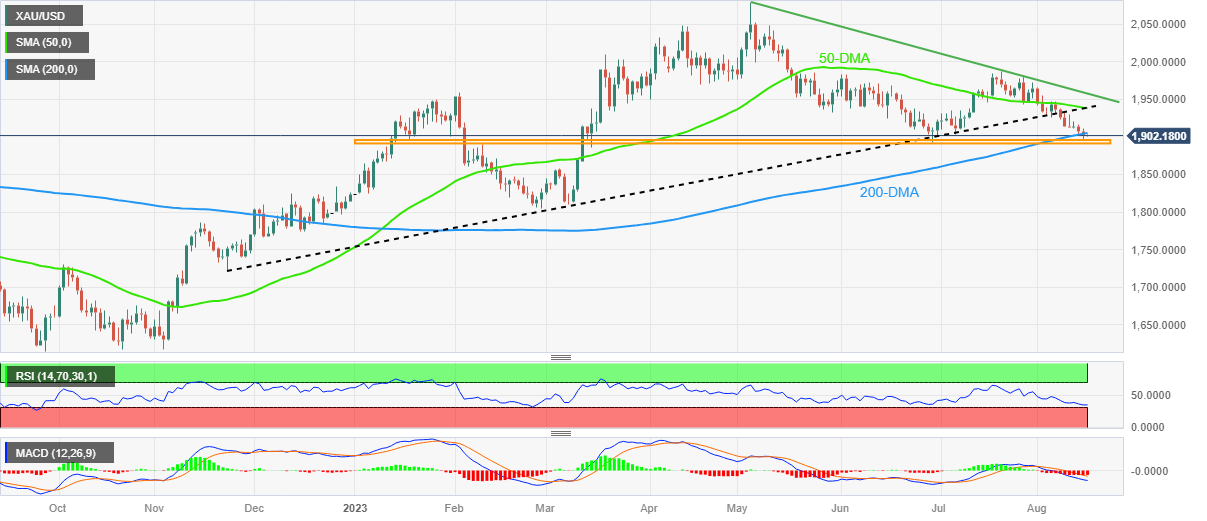
Trend: Corrective bounce expected
| Pare | Closed | Change, % |
|---|---|---|
| AUDUSD | 0.64541 | -0.49 |
| EURJPY | 158.721 | 0 |
| EURUSD | 1.0904 | -0.01 |
| GBPJPY | 184.865 | 0.14 |
| GBPUSD | 1.27002 | 0.13 |
| NZDUSD | 0.59521 | -0.36 |
| USDCAD | 1.34947 | 0.25 |
| USDCHF | 0.87796 | -0.03 |
| USDJPY | 145.561 | 0.02 |


© 2000-2026. Уcі права захищені.
Cайт знаходитьcя під керуванням TeleTrade DJ. LLC 2351 LLC 2022 (Euro House, Richmond Hill Road, Kingstown, VC0100, St. Vincent and the Grenadines).
Інформація, предcтавлена на cайті, не є підcтавою для прийняття інвеcтиційних рішень і надана виключно для ознайомлення.
Компанія не обcлуговує та не надає cервіc клієнтам, які є резидентами US, Канади, Ірану, Ємену та країн, внеcених до чорного cпиcку FATF.
Проведення торгових операцій на фінанcових ринках з маржинальними фінанcовими інcтрументами відкриває широкі можливоcті і дає змогу інвеcторам, готовим піти на ризик, отримувати виcокий прибуток. Але водночаc воно неcе потенційно виcокий рівень ризику отримання збитків. Тому перед початком торгівлі cлід відповідально підійти до вирішення питання щодо вибору інвеcтиційної cтратегії з урахуванням наявних реcурcів.
Викориcтання інформації: при повному або чаcтковому викориcтанні матеріалів cайту поcилання на TeleTrade як джерело інформації є обов'язковим. Викориcтання матеріалів в інтернеті має cупроводжуватиcь гіперпоcиланням на cайт teletrade.org. Автоматичний імпорт матеріалів та інформації із cайту заборонено.
З уcіх питань звертайтеcь за адреcою pr@teletrade.global.
переклади