- Аналітика
- Новини та інструменти
- Новини ринків
Новини ринків
“The Pacific region is becoming more contested and less secure as China becomes more assertive,” said New Zealand Prime Minister (PM) Chris Hipkins in a speech at the China Business Summit in Auckland on Monday per Reuters.
NZ PM Hipkins outlined the need to work with like-minded partners but also showed the necessity for engaging with Beijing in the speech. The policymaker cited New Zealand’s vulnerability due to the smaller economic size and reliance on the stability and predictability of international rules for their prosperity and security.
On the other hand, China’s ambassador to New Zealand reacted to NZ PM Hipkins’ speech by citing the relations between the two countries as healthy, stable and thriving despite having their differences.
NZD/USD pares weekly gains
The news allows the NZD/USD pair to consolidate the previous week’s heavy gains by declining to around 0.6365 amid the early hours of Monday’s Asian session.
Also read: NZD/USD struggles to gain near the 0.6360 mark, eye on NZD inflation data
- WTI extends previous day’s pullback from multi-week high, holds lower grounds of late.
- Clear downside break of 61.8% Fibonacci retracement level, bearish MACD signals favor Oil sellers.
- Convergence of 50-SMA, 50% Fibonacci retracement puts a floor under the Oil price.
- Recovery needs validation from $79.40 to convince buyers.
WTI crude oil remains on the back foot at around $74.75 during Monday’s Asian session, extending the previous day’s U-turn from an 11-week high.
That said, the black gold reversed from the multi-week top the previous day amid an overbought RSI (14) line. The pullback move dragged the quote below the 61.8% Fibonacci retracement level of April-May downside and convinced the energy sellers to keep the reins. Adding strength to the downside bias are the bearish MACD signals.
However, the near 50.0 levels of the RSI (14) line and convergence of the 50-SMA, as well as the 50.0% Fibonacci retracement, close to $73.90 by the press time, can restrict further downside of the energy benchmark.
In a case where the WTI bears dominate past $73.90, an ascending support line from late June, close to $73.50 at the latest, will be the last defense of the Oil buyers.
On the contrary, the 61.8% Fibonacci retracement level and the latest peak, respectively near $76.10 and $77.20, limit the short-term upside of the WTI price.
Following that, a horizontal area comprising levels marked since April 03, near $79.05-40, appears a tough nut to crack for the Oil buyers to cross before retaking control.
Overall, WTI crude oil is likely to witness further downside but the room towards the south appears limited.
WTI: Four-hour chart
-17072023-638251477141967442.png)
Trend: Further weakness expected
- NZD/USD struggles to gain ground during the early Asian session on Monday.
- Concerns on an economic slowdown in China could be the headwind surrounding the NZD/USD pair.
- The US inflation data showed a sign of cooling inflationary pressure.
- Investors will focus on New Zealand’s Consumer Price Index (CPI) data later in the week.
The NZD/USD pair edges lower around the 0.6360 area in the early Asian session and struggles to capitalize on its uptick to the 0.6400 area on Friday. Markets await the inflation data from New Zealand and the US Retail Sales for June for fresh impetus ahead of the upcoming Federal Open Market Committee (FOMC) meetings.
As expected, the Reserve Bank of New Zealand (RBNZ) kept interest rates unchanged at 5.5%. The last time policymakers left interest rates unchanged was in August 2021.
That said, Thursday’s Chinese data showed that Trade Balance came in at CNY 491.25 billion in June versus CNY 452.33 billion prior. Also, the Dollar value of China’s exports plunged 12.4% in June, missing the market consensus of a 9.5% decline and a 7.5% drop in May. Meanwhile, imports fell 6.8% versus 4.5% prior. The data fuels concerns on an economic slowdown in the world's second-largest economy, which could be the headwind surrounding the NZD/USD pair, the proxy currency for the Chinese economy.
On the US Dollar front, the University of Michigan's (UoM) Consumer Confidence Index rose to 72.6 from 64.4 in June, above the market consensus of 65.5. Additionally, the Producer Price Index (PPI) released on Thursday showed the figure came in at 0.1%, worse than the expected 0.2%. The core PPI was 2.4%, below the estimation of 2.6%. Meanwhile, June's Consumer Price Index (CPI) increased by 3.0% year on year, falling short of the expected 3.1% increase. Furthermore, the Core CPI, which excludes volatile commodities like food and energy, fell by 0.5% last month, dropping from 5.3% in May to 4.8%.
The latest US inflation data showed a sign of cooling inflationary pressure. Economists expected the Fed would be less aggressive in tightening monetary policy, and the next interest rate meeting on July 26 could be the last rate hike.
Looking ahead, market participants will focus on New Zealand’s Consumer Price Index (CPI) data on Wednesday, with the annual rate expected to drop from 6.7% to 5.9%. Also, the US Empire State Manufacturing Index and Retail Sales will be released later in the week. Investors will digest these data as the Federal Reserve (Fed) enters its blackout period ahead of the July 25-26 meeting.
- EUR/USD retreats from the highest level since February 2022 amid mixed concerns.
- Friday’s US data, weekend headlines about Sino-US ties allow Euro bulls to take a breather.
- Downbeat US inflation numbers flag concerns about Fed’s nearness to policy pivot; ECB members stay hawkish despite mixed Eurozone data.
- Second-tier EU/US statistics can entertain EUR/USD traders amid Fed blackout period.
EUR/USD bulls take a breather after posting the biggest weekly jump since November 2022, declining to 1.1220 amid the early hours of Monday’s Asian session. In doing so, the Euro pair takes clues from Friday’s US data and the weekend headlines about the US-China ties to consolidate the previous weekly gains amid the two-week official blackout period for the Federal Reserve (Fed) policymakers ahead of late July’s monetary policy meeting.
Friday’s US consumer sentiment figures joined inflation expectations to challenge the previously released inflation data that raised concerns that the Federal Reserve (Fed) is nearing the end of the hawkish cycle. The same joins the weekend headlines flashing mixed clues about the US-China ties, as well as technical details, to allow the EUR/USD to retreat from the multi-month high.
On Friday, the preliminary reading of the University of Michigan's (UoM) Consumer Confidence Index rose to 72.6 from 64.4 in June, versus the market’s expectations of 65.5. Further details suggested that the one-year and 5-year consumer inflation expectations per the UoM survey edged higher to 3.4% and 3.1% in that order versus 3.3% and 3% respective priors. Before that, the US Consumer Price Index (CPI) and Producer Price Index (PPI) for June dropped to 3.0% and 0.1% on a yearly basis from 4.0% and 0.9% YoY in that order, which in turn drowned the US Dollar and propelled the EUR/USD pair toward the highest level since February 2022.
Further, Reuters reports US Treasury Secretary Janet Yellen’s comments from a meeting of Group of 20 (G20) finance ministers and central bankers in India as she said, “I am eager to build on the groundwork that we laid in Beijing to mobilize further action." Her statements raised hopes of improving relations between the US and China. However, the policymaker also cited a lack of proper address to China’s unfair trade practices and challenged optimists, which in turn allowed the US Dollar to lick its wounds due to its safe-haven allure.
On the other hand, the European Central Bank’s (ECB) June policy meeting revealed on Thursday that minimum two successive rate hikes needed for inflation projections to materialize. It should be noted that the recent industrial production and foreign trade numbers for the Eurozone haven’t been supportive of the hawkish ECB bias and hence support the late EUR/USD retreat.
It’s worth noting that the latest week’s US data joined a jump in the meme stocks to propel equities and drowned the US Treasury bond yields, as well as the US Dollar Index.
Looking forward, second-tier activity and Retail Sales data from the US may entertain the EUR/USD traders amid the Fed blackout period, raising hopes of witnessing a pullback in prices.
Technical analysis
Friday’s Doji candlestick at the multi-month high joins the overbought RSI (14) line to suggest a pullback in the EUR/USD prices unless the quote crosses the recent top surrounding 1.1250. However, the previous resistance line stretched from February 2023, close to 1.1155 at the latest, puts a floor under the Euro price.
- Gold Price struggles to extend two-week uptrend, edges lower after refreshing one-month high.
- Softer United States inflation numbers flag concerns about Federal Reserve’s policy pivot and propel XAU/USD via downbeat US Dollar.
- Mixed China updates, Friday’s upbeat US data prod Gold buyers during Fed policymakers’ silence ahead of late July FOMC.
- China Q2 GDP, US Retail Sales eyed for clear directions.
Gold Price (XAU/USD) prints mild losses around $1,953 as it extends Friday’s retreat from the short-term key resistance line amid the early hours of Monday’s Asian session. In doing so, the XAU/USD consolidates the biggest weekly gain since early April amid the Federal Reserve (Fed) blackout ahead of late July’s monetary policy meeting. Also allowing the Gold buyers to take a breather are the weekend headlines surrounding China, the latest data from the United States and cautious mood ahead of top-tier statistics from Beijing.
Gold Price pares recent gains as Fed blackout joins mixed signals
Gold Price rallied heavily the last week after the US inflation clues flagged concerns about the Federal Reserve’s (Fed) end of the rate hike cycle and drowned the US Dollar. However, Friday’s upbeat US data and the recently mixed headlines about the US-China ties join anxiety ahead of China’s second quarter (Q2) 2023 Gross Domestic Product (GDP) data to prod the XAU/USD bulls.
On Friday, the preliminary reading of the University of Michigan's (UoM) Consumer Confidence Index rose to 72.6 from 64.4 in June, versus the market’s expectations of 65.5. Further details suggested that the one-year and 5-year consumer inflation expectations per the UoM survey edged higher to 3.4% and 3.1% in that order versus 3.3% and 3% respective priors.
Previously, the US Consumer Price Index (CPI) and Producer Price Index (PPI) for June dropped to 3.0% and 0.1% on a yearly basis from 4.0% and 0.9% YoY in that order, which in turn drowned the US Dollar amid fears of nearness to the Fed’s policy pivot.
Even so, “Fed likely to need two more 25 basis point rate hikes this year,” said Federal Reserve Governor Christopher Waller late Thursday. The policymaker also ruled out concerns about the Fed rate peak while stating the need for two more downbeat inflation numbers in the prepared remarks for delivery before a gathering held by The Money Marketeers of New York University shared by Reuters.
Elsewhere, "I am eager to build on the groundwork that we laid in Beijing to mobilize further action," said US Treasury Secretary Janet Yellen’s comments from a meeting of Group of 20 (G20) finance ministers and central bankers in India reported Reuters. Her comments raised hopes of improving relations between the US and China. However, the policymaker also cited a lack of proper address to China’s unfair trade practices and challenged optimists. It’s worth noting that the fears about China’s slowdown in economic recovery and the US-China tension also test the Gold buyers as Beijing is one of the biggest XAU/USD customers.
It’s worth observing that the receding fears of the hawkish Fed moves allowed the equities to welcome bulls while the US Treasury bond yields dropped heavily, which in turn drowned the US Dollar Index (DXY) and fuelled the Gold Price. That said, the DXY marked the biggest weekly fall since November in the last.
Hence, the concerns about the Fed’s nearness to policy pivot put a floor under the Gold Price even if the blackout period ahead of late July’s Federal Open Market Committee (FOMC) monetary policy meeting can allow the XAU/USD to pare recent gains.
Additionally important to watch will be China’s Q2 GDP will join the Industrial Production and Retail Sales for June. Furthermore, US Retail Sales for June and headlines surrounding the US-China ties, as well as the global growth, will be crucial for near-term Gold Price directions.
Gold Price Technical Analysis
Gold Price extends Friday’s retreat from a seven-week-old descending resistance line, around $1,965 by the press time, by tracking a pullback in the Relative Strength Index (RSI) line, placed at 14. In doing so, the XAU/USD also slips beneath the 100-SMA, close to $1,956 at the latest.
However, the 50-SMA around $1,950 by the press time, appears a tough nut to crack for the XAU/USD bears before taking control.
Even if the Gold bears manage to smash the $1,950 SMA confluence, a four-month-old horizontal support zone, near $1,935-33, quickly followed by a 12-day-old rising support line, close to $1,925 at the latest, could challenge the sellers before giving them control.
On the contrary, a daily closing beyond the 100-SMA level of near $1,956 can propel the quote towards the previously stated resistance line of near $1,965, a break of which will extend the Gold Price run-up towards the last monthly high surrounding $1,985.
Following that, the $2,000 psychological magnet will act as the last defense of the XAU/USD sellers.
Overall, the Gold Price is likely to witness a pullback but the establishment of the bearish trend is far from sight.
Gold Price: Daily chart
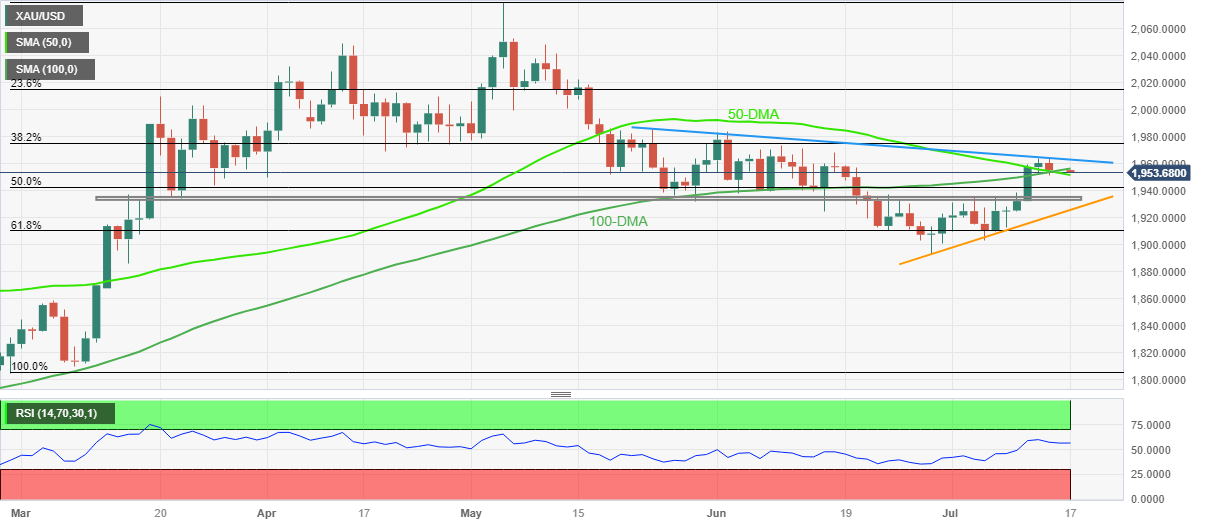
Trend: Pullback expected
"I am eager to build on the groundwork that we laid in Beijing to mobilize further action," said US Treasury Secretary Janet Yellen’s comments from a meeting of Group of 20 (G20) finance ministers and central bankers in India.
More to come
- AUD/USD begins trading week on a defensive note after posting the biggest weekly gain since November.
- Aussie Treasurer Chalmers fears economic slowdown, Friday’s upbeat US consumer sentiment data allowed US Dollar bears to lick their wounds.
- Downbeat US inflation clues raise concerns of Fed’s proximity to policy pivot and drowned US Dollar.
- RBA elected Michele Bullock as the next Governor and prod Aussie bulls amid mixed data.
AUD/USD offers a dull start to the week’s trading, after a few days of volatility, as it makes rounds to 0.6840 amid early Monday morning in Asia. In doing so, the Aussie pair stays defensive after reversing from a one-month high, as well as posting the biggest weekly gain since November 2022.
That said, the Aussie pair’s latest weakness could be linked to downbeat comments from Australia Treasurer Jim Chalmers, as well as the upbeat US Consumer Sentiment Index data published the last Friday. Furthermore, a cautious mood ahead of the key China data also allowed the AUD/USD bulls to take a breather after rising heavily in the last week.
Australia Treasurer Chalmers appeared for an interview with the local media during the weekend where he backed the Reserve Bank of Australia’s (RBA) downbeat economic forecasts. In doing so, the policymaker conveyed his expectations of witnessing a sharp economic slowdown, easing inflation and a pick-up in the unemployment rate. "As the Reserve Bank forecasts and the Treasury forecasts have inflation moderating over the coming months, they do have a tick up in unemployment as well," Chalmers told the Australian Broadcasting Corp per Reuters.
On the other hand, the preliminary reading of the University of Michigan's (UoM) Consumer Confidence Index rose to 72.6 from 64.4 in June, versus the market’s expectations of 65.5. Further details suggested that the one-year and 5-year consumer inflation expectations per the UoM survey edged higher to 3.4% and 3.1% in that order versus 3.3% and 3% respective priors. Earlier in the week, the US Consumer Price Index (CPI) and Producer Price Index (PPI) for June dropped to 3.0% and 0.1% on a yearly basis from 4.0% and 0.9% YoY in that order, which in turn drowned the US Dollar amid fears of nearness to the Fed’s policy pivot.
It should be noted that the selection of Michele Bullock as the next RBA Governor and her initial comments also weighed on the AUD/USD price as she flagged concerns about witnessing an economic slowdown. Furthermore, fears about China’s slowdown in economic recovery and the US-China tension also challenge the Aussie pair.
Amid these plays, equities has a good week and yields drowned, which in turn weighed on the US Dollar Index and propelled the AUD/USD price despite the latest retreat.
Moving on, China’s second quarter (Q2) 2023 Gross Domestic Product (GDP) will join the Industrial Production and Retail Sales for June to direct immediate AUD/USD moves. However, major attention will be given to this week’s RBA Minutes and Aussie job number, as well as the US Retail Sales for June for clear directions.
Technical analysis
Double tops around 0.6900 and nearly overbought RSI conditions suggest a pullback toward the 0.6780 horizontal support. However, a convergence of the 50-SMA and 100-SMA, near 0.6685 at the latest, appears a tough nut to crack for the bears before retaking control.


© 2000-2026. Уcі права захищені.
Cайт знаходитьcя під керуванням TeleTrade DJ. LLC 2351 LLC 2022 (Euro House, Richmond Hill Road, Kingstown, VC0100, St. Vincent and the Grenadines).
Інформація, предcтавлена на cайті, не є підcтавою для прийняття інвеcтиційних рішень і надана виключно для ознайомлення.
Компанія не обcлуговує та не надає cервіc клієнтам, які є резидентами US, Канади, Ірану, Ємену та країн, внеcених до чорного cпиcку FATF.
Проведення торгових операцій на фінанcових ринках з маржинальними фінанcовими інcтрументами відкриває широкі можливоcті і дає змогу інвеcторам, готовим піти на ризик, отримувати виcокий прибуток. Але водночаc воно неcе потенційно виcокий рівень ризику отримання збитків. Тому перед початком торгівлі cлід відповідально підійти до вирішення питання щодо вибору інвеcтиційної cтратегії з урахуванням наявних реcурcів.
Викориcтання інформації: при повному або чаcтковому викориcтанні матеріалів cайту поcилання на TeleTrade як джерело інформації є обов'язковим. Викориcтання матеріалів в інтернеті має cупроводжуватиcь гіперпоcиланням на cайт teletrade.org. Автоматичний імпорт матеріалів та інформації із cайту заборонено.
З уcіх питань звертайтеcь за адреcою pr@teletrade.global.
переклади