- Аналітика
- Новини та інструменти
- Новини ринків
Новини ринків
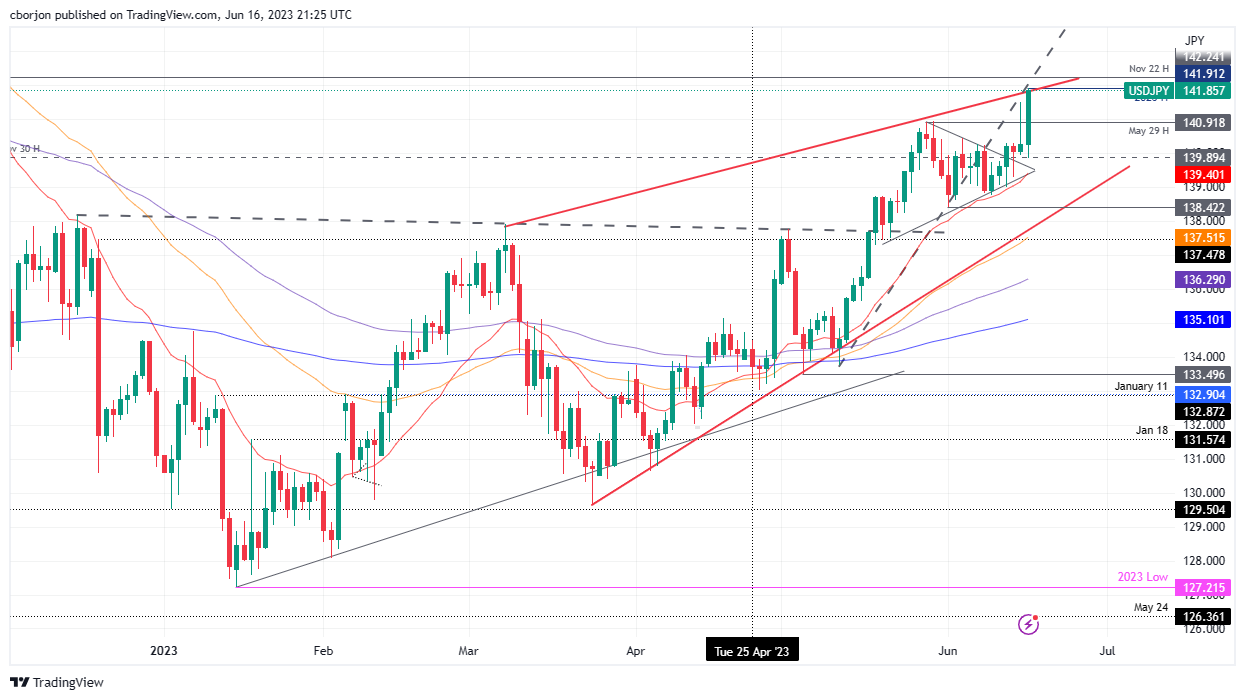
- USD/JPY surges to a YTD high of 141.91, though failure to surpass 142.00 could trigger a sell-off.
- The rising wedge pattern sparks uncertainty as USD/JPY nears key resistance.
- Japanese FX intervention may influence future USD/JPY direction.
USD/JPY soared more than 1% on Friday due to safe-haven flows and a jump in US Treasury bond yields. On its way north, the USD/JPY reached a new year-to-date (YTD) high of 141.91 after bouncing off daily lows of 139.85. At the time of writing, the USD/JPY is exchanging hands at 141.85.
USD/JPY Price Analysis: Technical outlook
USD/JPY finished the week with a higher tone but facing solid resistance, as the daily chart shows. The major has been trading within a rising wedge, and the USD/JPY closed nearby the top-trendline of the pattern at around 141.86. Failure to crack resistance and push prices above 142.00 would expose the USD/JPY to selling pressure. In addition, Japanese authorities’ language interventions in the FX markets could weigh on the pair and open the door for a correction.
With the USD/JPY’s path of least resistance being upwards, the pair’s first ceiling level would be 142.00. Break above will expose the November 22 high at 142.24, ahead of reaching 143.00. Conversely, the USD/JPY could dive to May’s 29 high turned support at 140.92 before dropping to the 20-day Exponential Moving Average (EMA) at 139.40.
USD/JPY Price Action – Daily chart
- NZD/USD traded neutral at the 0.6230 area on Friday but set a 1.70% weekly gain.,
- Hawkish Fed speakers and upbeat UoM data gave the USD traction.
- Rising US bond yields limited the Greenback's traction.
The NZD/USD traded stable at the 0.6210 - 0.6245 range at the end of the week, holding to a 170 pip weekly gain. In that sense, hawkish Federal Reserve (Fed) speakers lifted the US bond yields while upbeat consumer confidence data from the University of Michigan gave the Greenback an additional boost. On the NZD’s side, now relevant economic data was released, and the Kiwi’s gains seem to be capped by the confirmation of New Zealand's economy entering a recession following Gross Domestic Product (GDP) on Wednesday.
US bond yields made the US Dollar hold its ground
On Wednesday, Fed Chair Powell stated that a rate-hike pause was needed in order to assess additional information and its implications on monetary policy, while the dot plots showed that members foresee an additional 50 basis points tightening for the rest of 2023. In that sense, as stocks rallied through Thursday, investors seemed not to believe the Fed, so speakers were today on the wires supporting the hawkish case.
That being said, Fed’s Christopher Waller expressed his concerns regarding the limited advancement in core inflation and indicated the potential need for additional hikes. Later, Fed Thomas Barkin stated that he is open to taking further action if the data justifies it. As a reaction, shorter-term bond yields rose across the board on Friday. The 10-year bond yield rose to 3.76%, while the 2-year yield increased to 4.73% and the 5-year to 4.00%, respectively, with the 2-year rate leading the way showing a 2% increase and giving support to the USD.
In addition, the University of Michigan (UoM) released its Consumer Sentiment Index for June, which exceeded predictions, reaching 63.9. This indicates a rise in consumer confidence compared to the previous reading of 59.2. Furthermore, the five-year Consumer Inflation Expectation declined from the expected 3.1% to 3%, with these encouraging figures also contributing to the Greenback holding its ground.
NZD/USD Levels to watch
Both the weekly and daily chart suggest a bullish outlook for the NZD. On the weekly chart, the pair consolidates a third-consecutive advance.Out of the last seven days, the Kiwi tallied gains in six of them. In addition, both the Relative Strength Index (RSI) and Moving Average Convergence Divergence (MACD) suggest that the buyers have the upperhand.
In case of correcting to the downside, immediate support is seen at the 100-day Simple Moving Average (SMA) at 0.6218 followed by the 0.6200 psychological mark and the 200-day SMA at 0.6150. On the other hand, resistances line up at 0.6250 followed by 0.6300 (May 12 high) and the 0.62320 area.
NZD/USD Daily chart
-638225465891306460.png)
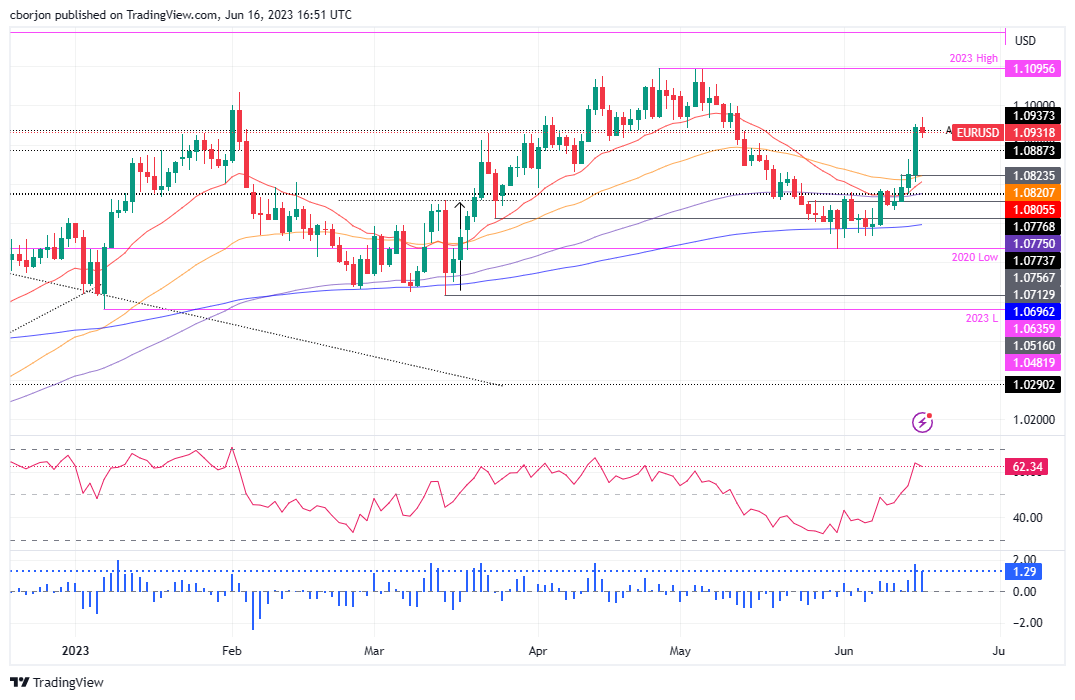
- EUR/USD bulls eye higher highs but a correction could be on the cards.
- Bears eye a correction to test trendline support.
The euro surged into the 1.0970 mark vs. the US Dollar on Friday, reaching its strongest level since May, following the European Central Bank's decision to raise interest rates for the eighth consecutive time earlier in the week. There was also a signal that future rate hikes were on the table, leaving scope for higher highs in the pair:
EUR/USD weekly chart
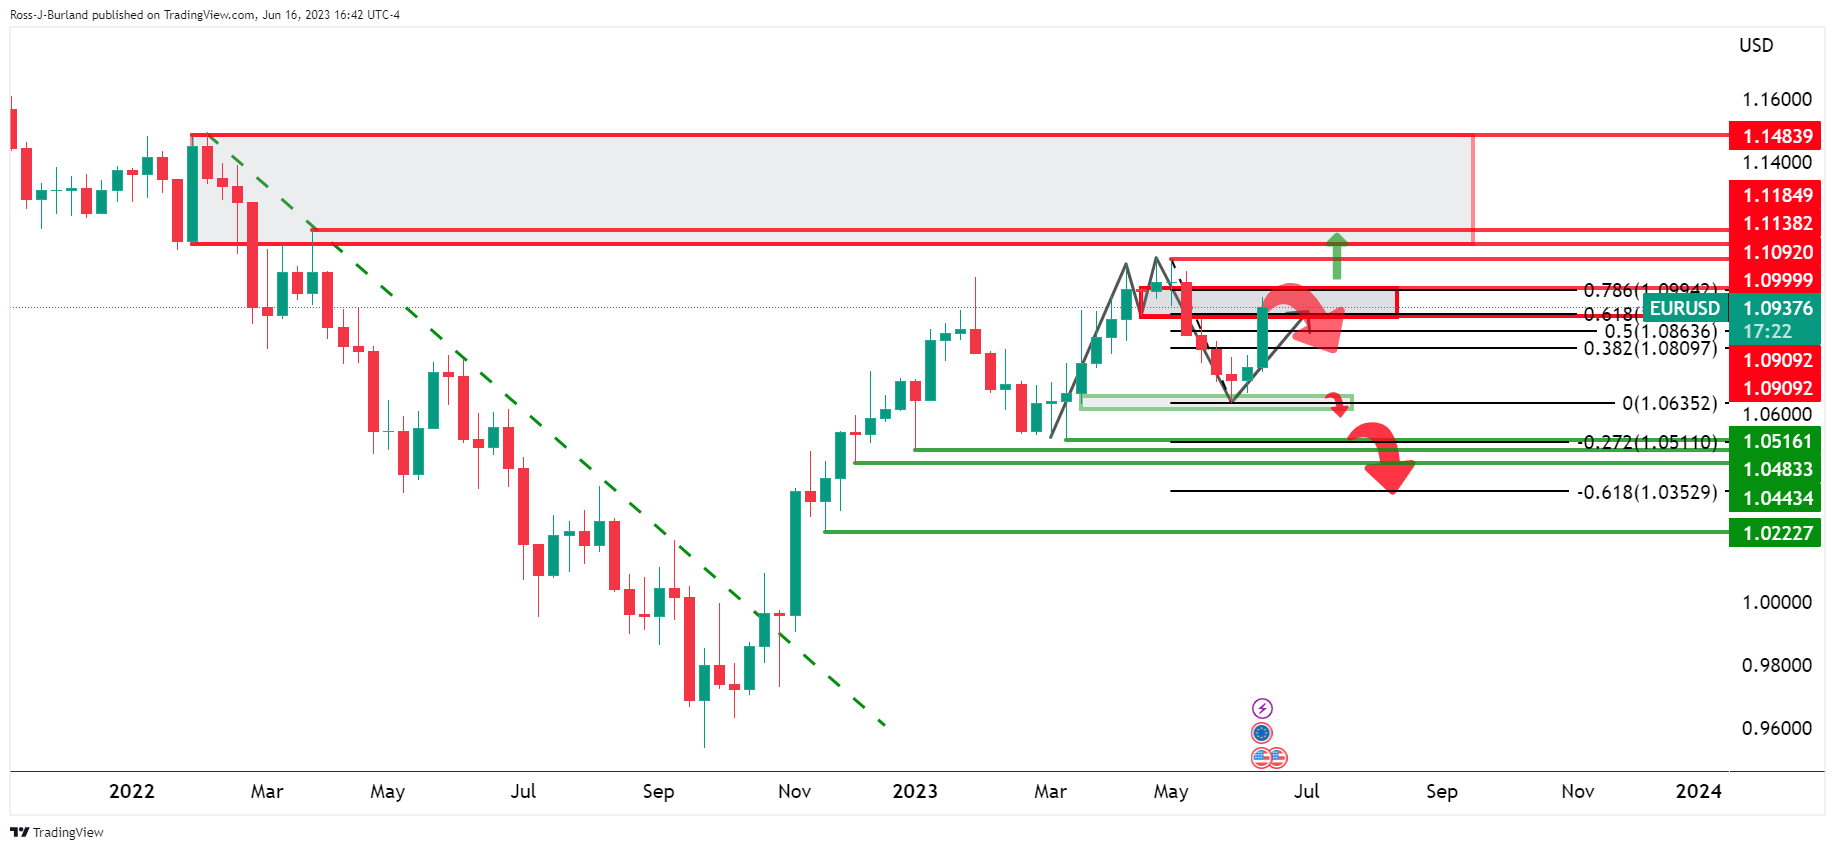
The market has run into the weekly neckline of the M-formation. This leaves prospects of a correction but it has been a solid drive higher, so there is momentum in this bullish impulse and we could be headed for higher highs still.
EUR/USD daily chart
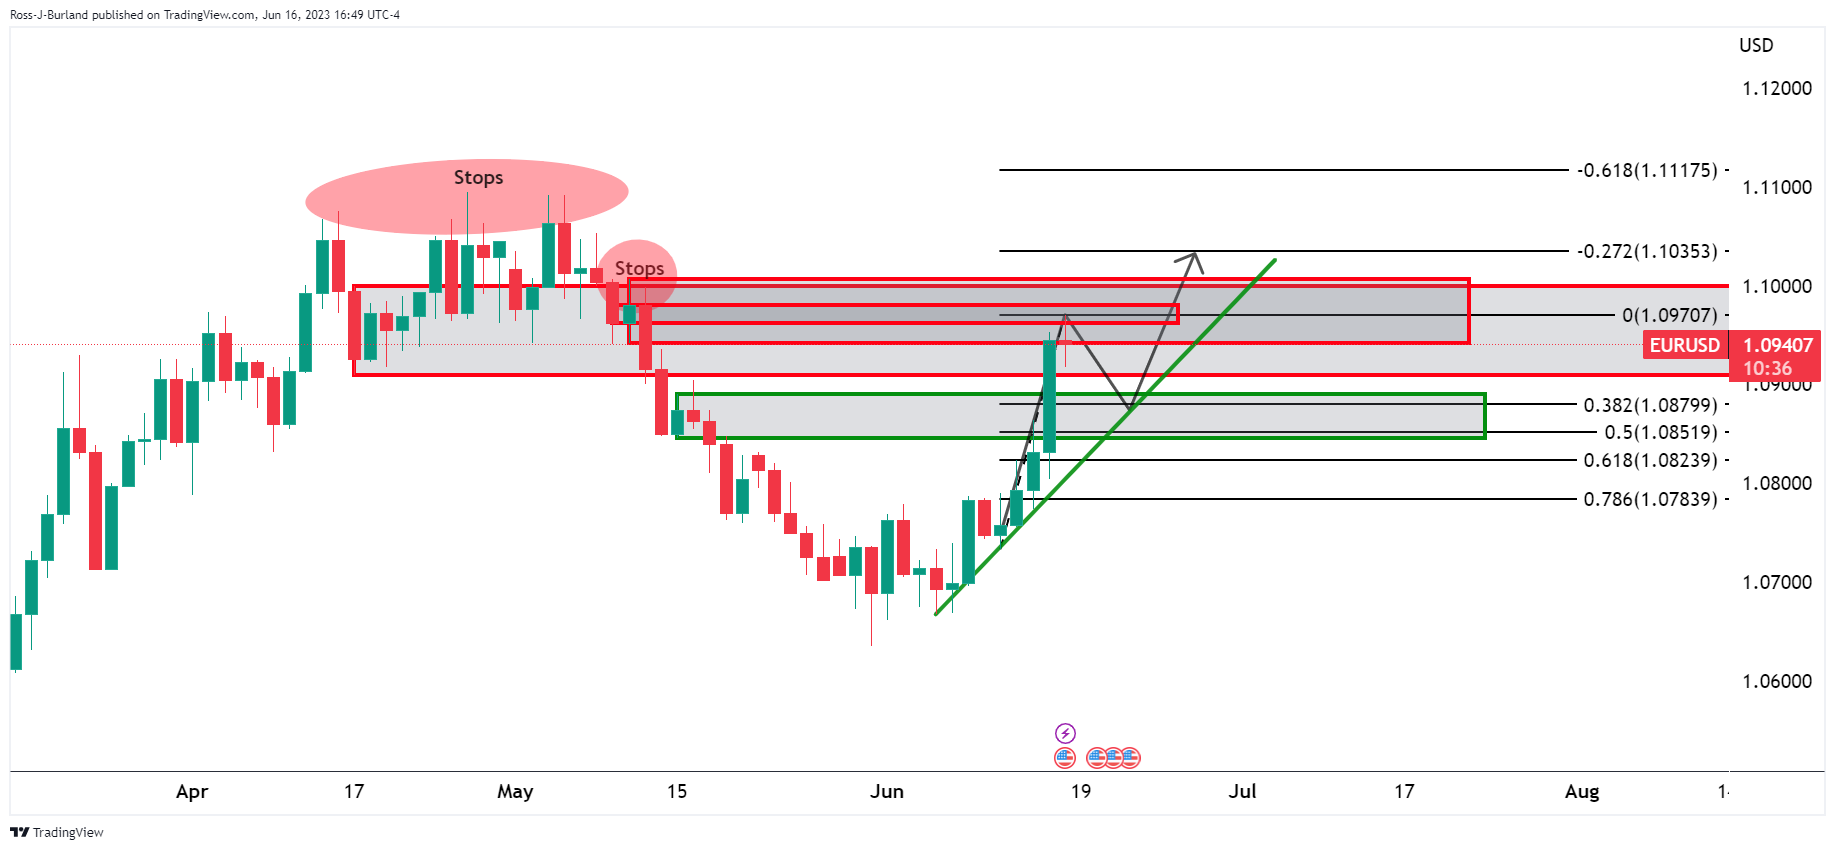
We have possible stops above the swing highs that have been left intact, so far. Before a move higher into them, a drive to the downside could be in order first. This brings the 38.2% Fibonacci of the bullish impulse on the daily chart into focus and trendline support.
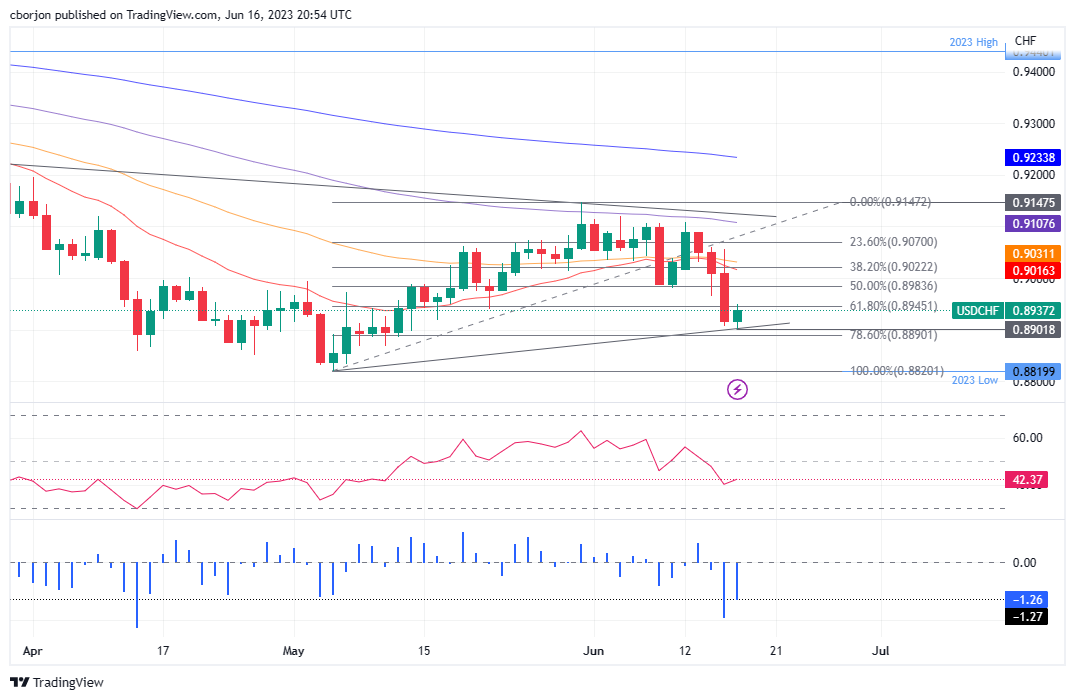
- USD/CHF rebounds, trading at 0.8941, showing consolidation around the 0.8900 level.
- The pair needs to surpass 0.8949 (61.8% Fibonacci Retracement) to reach the 0.9000 mark.
- A drop below 0.8900 could expose the year-to-date low at 0.8819.
USD/CHF rebounds at around weekly lows, though it remains below the 0.9000 figure, due to a risk-off impulse that bolstered the US Dollar (USD), which is set to finish the week with losses of 1.18%, per the US Dollar Index (DXY). The USD/CHF is trading at 0.8941 after hitting a daily low of 0.8901.
USD/CHF Price Analysis: Technical outlook
The USD/CHF depicts the pair as downward biased, though set to consolidate nearby the 0.8900 figure. During the session, the USD/CHF dropped from around 61.8% Fibonacci Retracement (FR) toward the 78.6% FR level but failed to surpass 0.8900, which would have exacerbated additional losses and a YTD low test of 0.8819.
With the USD/CHF rebounding toward the 61.8% FR at 0.8949, buyers must conquer the latter to lift rates toward the 0.9000 psychological level. In that outcome, the USD/CHF next resistance would be the 50% FR at 0.8983, followed by the 0.9000 mark.
Conversely, the path of least resistance, according to oscillators like the Relative Strength Index (RSI) and the Rate of Change (RoC), If the USD/CHF drops below 0.8900 and beneath the 78.6% FR, would expose the YTD low at 0.8819.
USD/CHF Price Action – Daily chart
- AUD/USD bears are in the market and eye the 38.2% Fibo.
- Daily trendline supports are a focus on the downside.
The Australian dollar has been running on its last gas into the close on Friday with the price at its highest in four months, after surging 1.3% overnight. It is set for a 2.2% weekly gain, the best since mid-November 2022, and way off its 2023 low of $0.6459 two weeks ago. Technically the price is now reaching a daily order block:
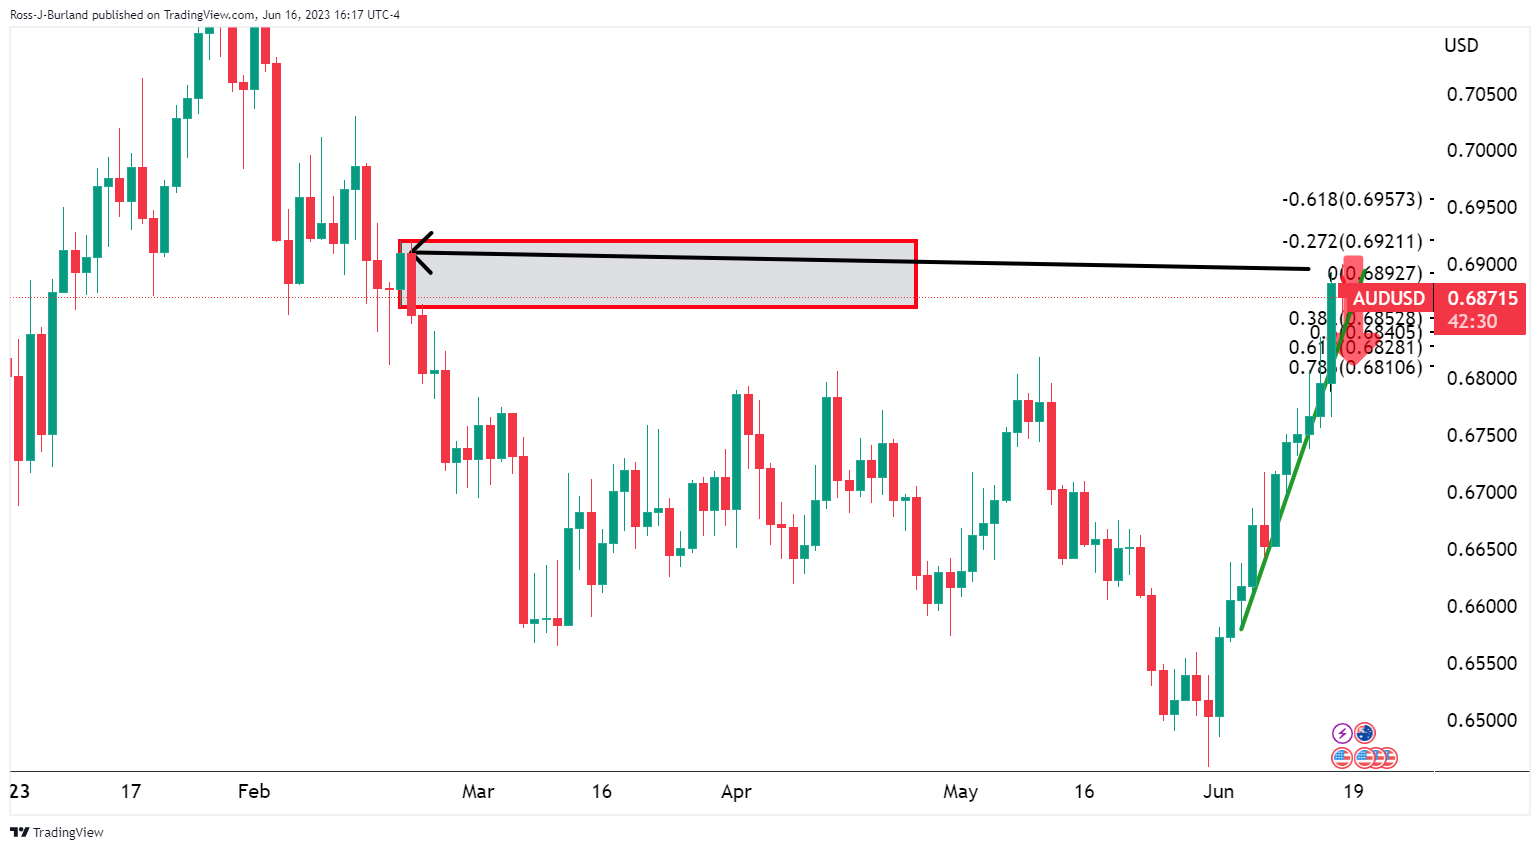
AUD/USD daily charts
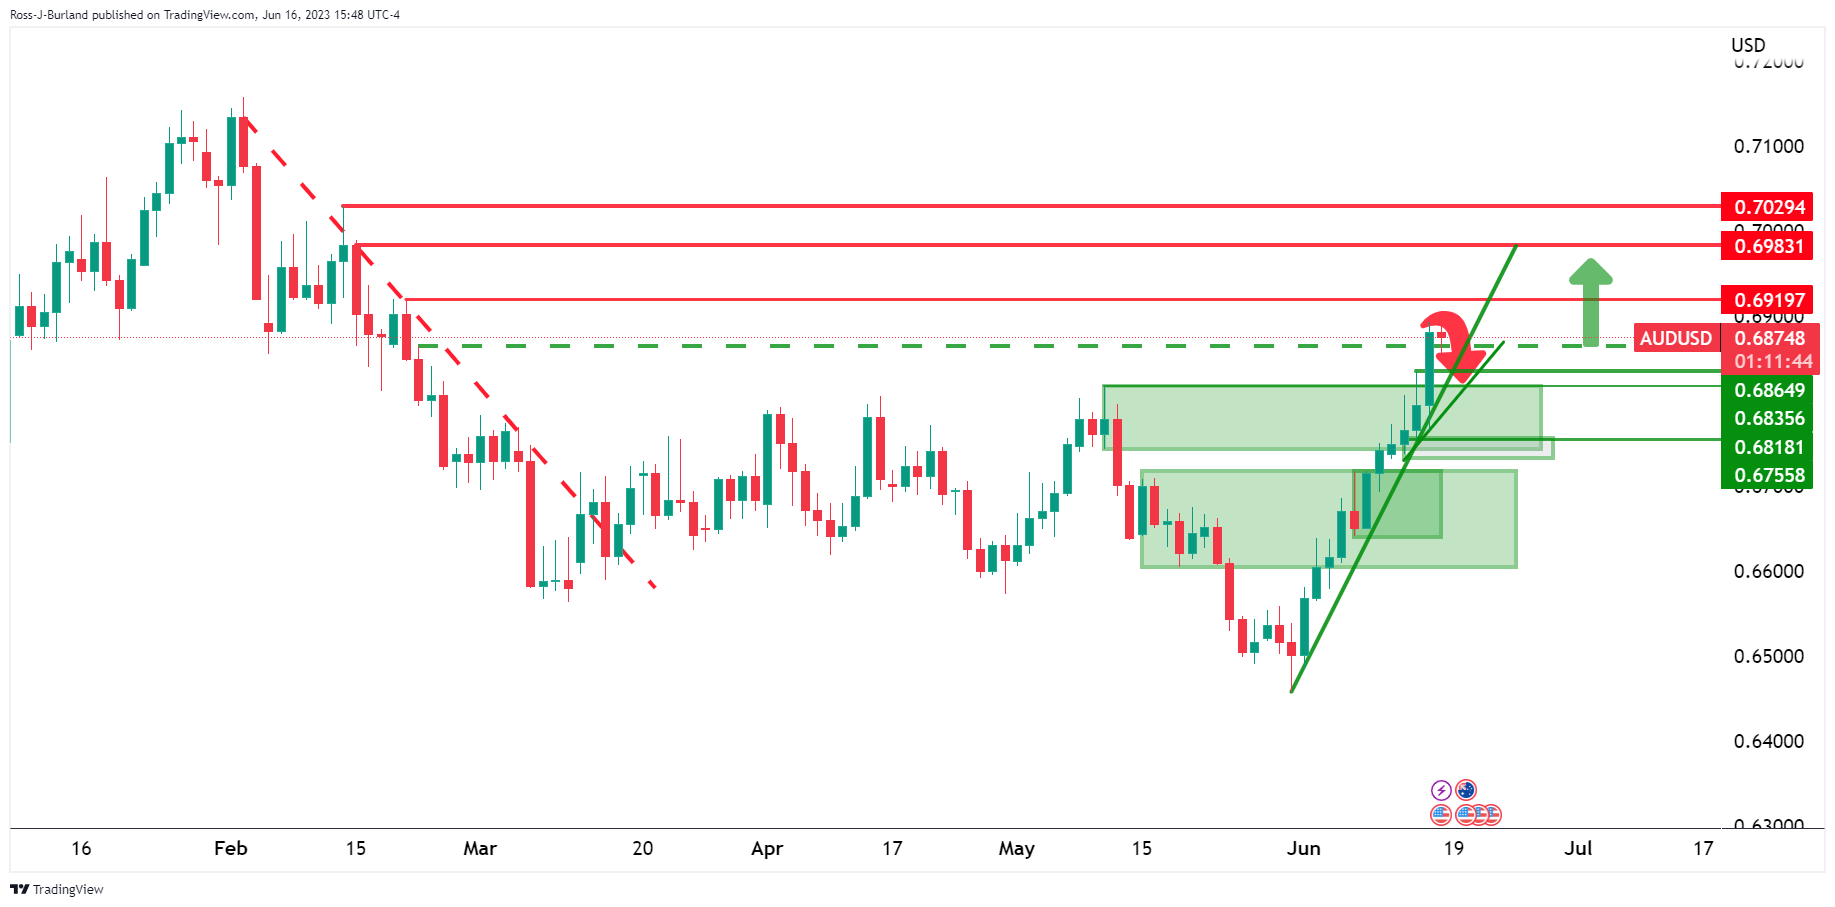
At this juncture, there could be a sell-off and to target the depths of the 0.68s:
We have trendline supports to target as well.
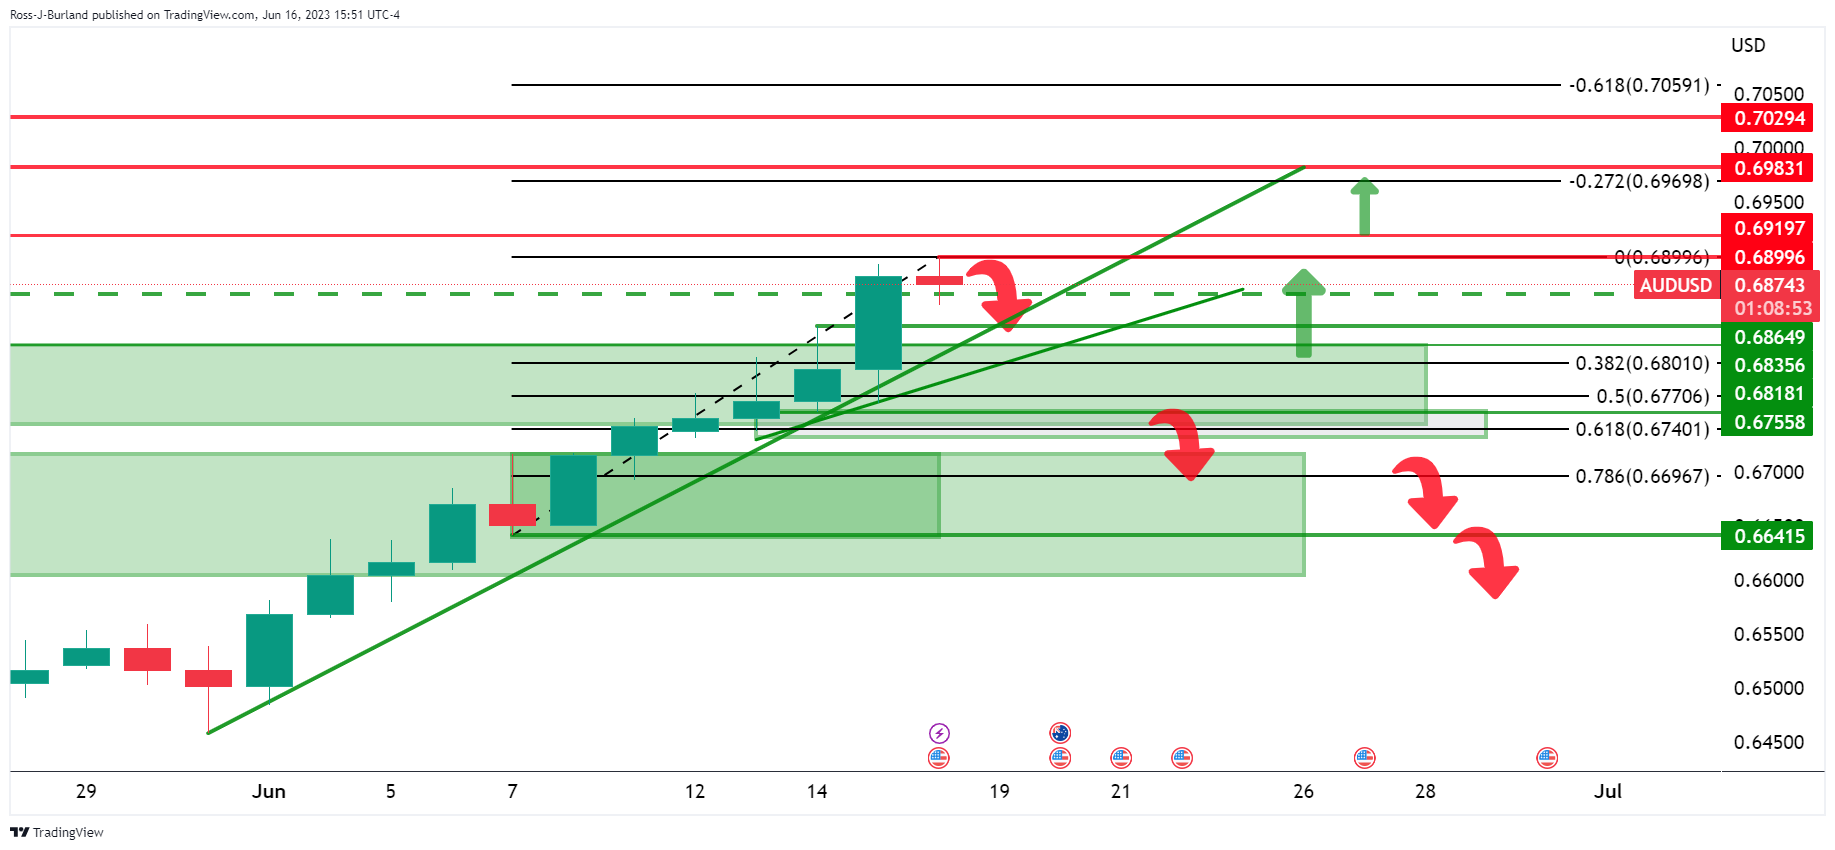
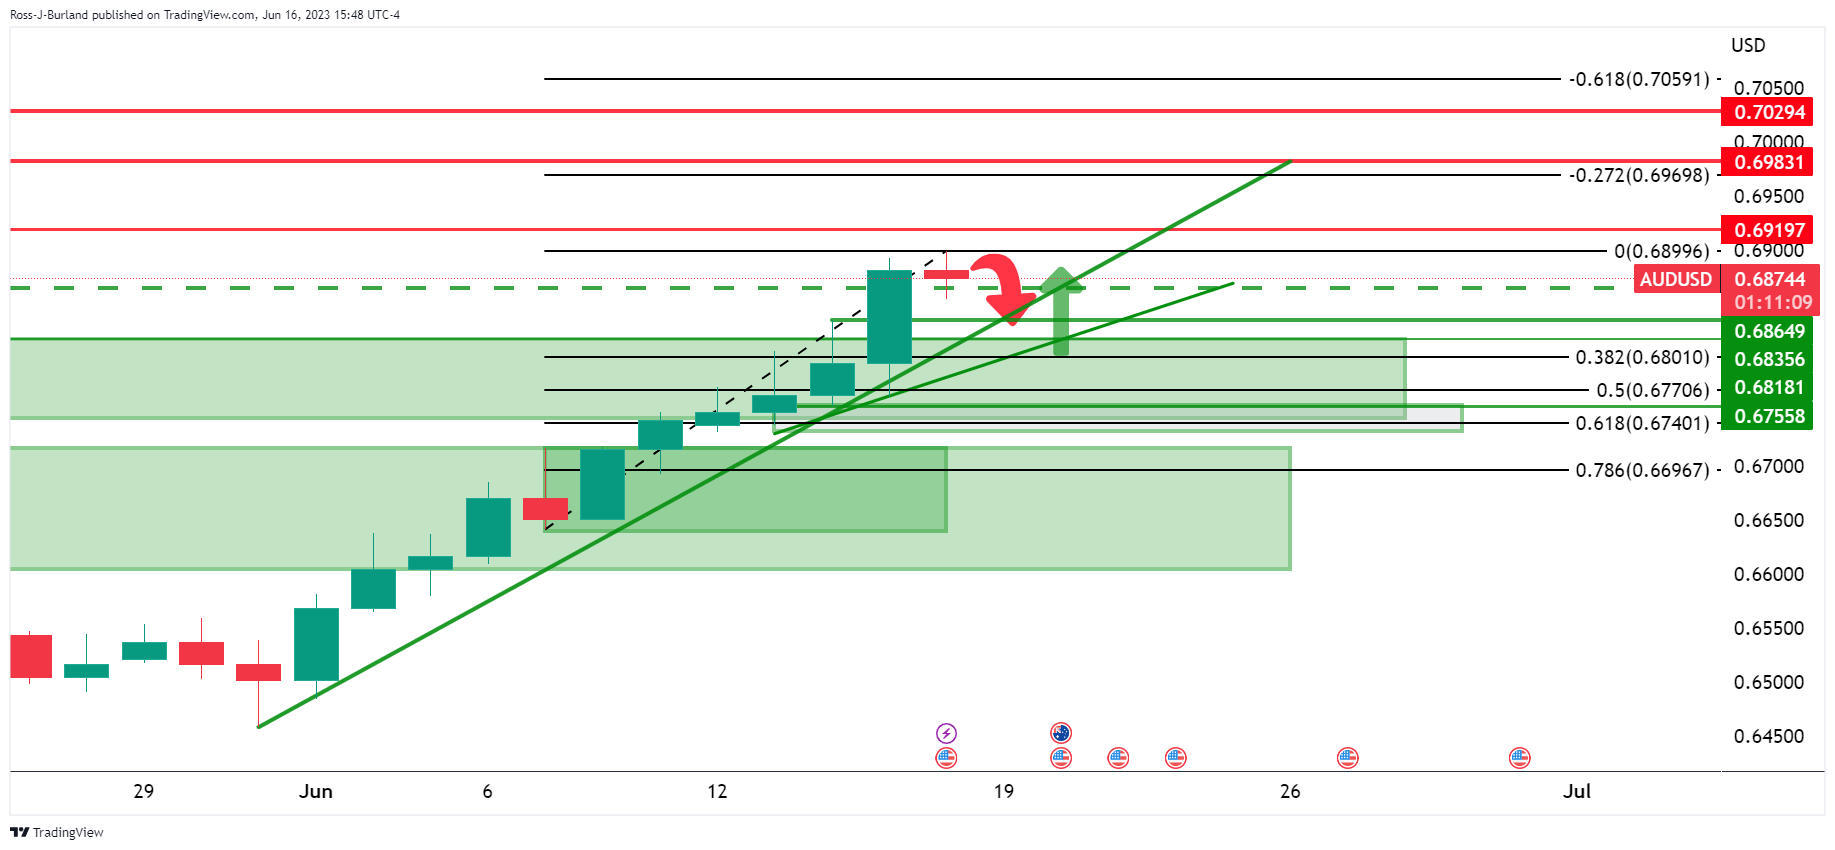
The Fibonacci scale is also a focus in this regard with the 61.8% eyed in confluence with key support on the 4-hour chart:
AUD/USD H4 chart
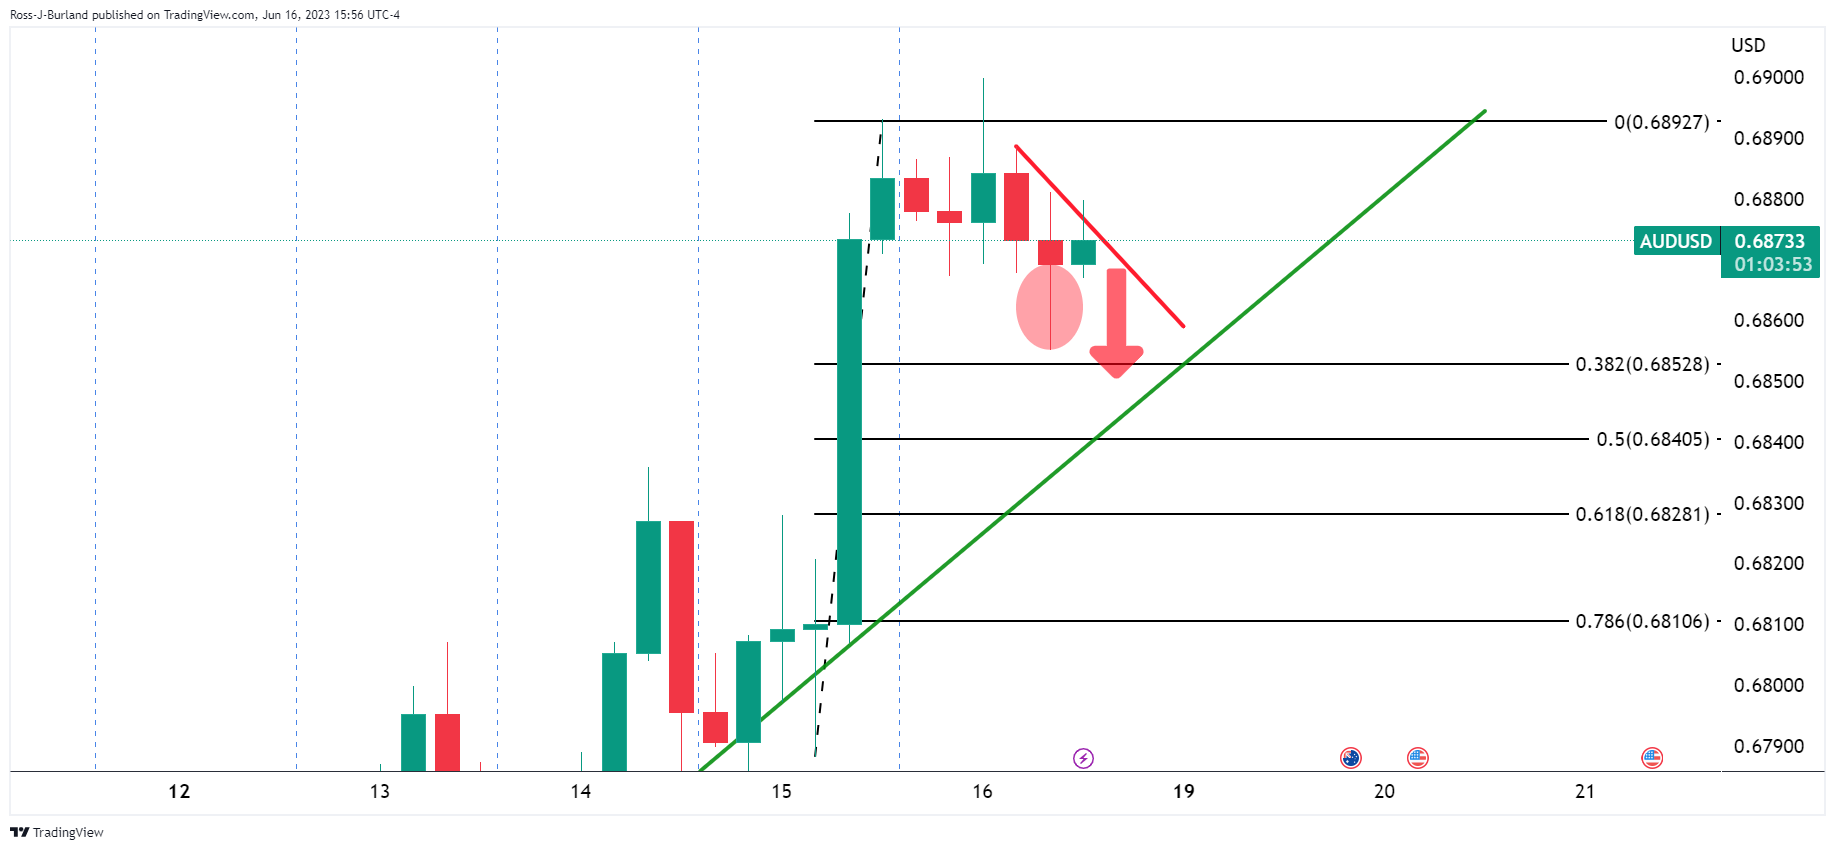
That wick is vulnerable to be filled to test the 38.2% Fibo thereafter.
- USD/MXN drops to a seven-year low, extending losses for the fourth consecutive week.
- Federal Reserve’s decision to keep rates unchanged weakens the US Dollar, propelling further USD/MXN losses.
- Hawkish remarks from Fed policymakers hint at further tightening if inflation doesn’t slow.
- Comments from Banxico officials suggest a possible rate cut in November, conflicting with Governor Victoria Rodriguez Ceja’s viewpoint.
The Mexican Peso (MXN) printed a new seven-year high against the US Dollar (USD), as the USD/MXN tumbled as low as 17.0360, extending its losses to four consecutive weeks. The Federal Reserve’s (Fed) decision to keep rates unchanged weakened the greenback, a headwind for the USD/MXN, which continued to fall amidst a risk-off impulse. At the time of writing, the USD/MXN is exchanging hands at 17.0449.
Banxico officials’ comments in focus, US Consumer Sentiment rises while inflation expectations ease
Wall Street turned negatively due to OpEx triple witching, with nearly 4.2 trillion options set to expire. Nevertheless, amidst Fed’s hawkish commentary, the risk-sensitive Mexican Peso held to its weekly and daily gains that followed the Fed’s decision.
Data from the United States (US) showed that inflation is cooling down, but not at the pace the US central bank would like. However, they failed to pull the trigger and would wait for the July meeting to deliver the first of two 25 bps rate hikes priced in by investors, which are expecting the first rate cut in early 2024.
That propelled the USD/MXN to new seven-year lows during the last two days, even though Fed policymakers revised upward peak rates upwards, above the 5.50% threshold.
On Friday, the US agenda revealed that consumer sentiment for May in the US rose by 68.0 above May’s 64.9 final reading. The same poll from the University of Michigan (UoM) depicted that inflation expectations for one year eased from 4.2% to 3.3% in June.
Meanwhile, US central bank officials crossed wires hawkishly, though they failed to underpin the USD/MXN. Richmond’s Fed President Thomas Barkin said he wants to do “more” if inflation doesn’t slow down. Fed Governor Christopher Waller added that slow progress on inflation “will probably require some more tightening.”
On the Mexican front, the lack of economic data was not an excuse for the MXN to continue to gain strength vs. the buck. Comments from the Bank of Mexico (Banxico) deputy Governor Jonathan Heath opened the door for the Mexican central bank’s first rate cut in November. Contrary to his point of view, Banxico’s Governor Victoria Rodriguez Ceja commented that rates would be unchanged at the current bank rate of 11.25% for at least two meetings. However, it did not open the door to easing policy.
Upcoming events
On the US front, Fed speakers would be grabbing most headlines, alongside the release of housing data and S&P Global PMIs. On the Mexican front, the agenda will reveal Retail Sales ahead of the Banxico monetary policy decision.
USD/MXN Price Analysis: Technical outlook
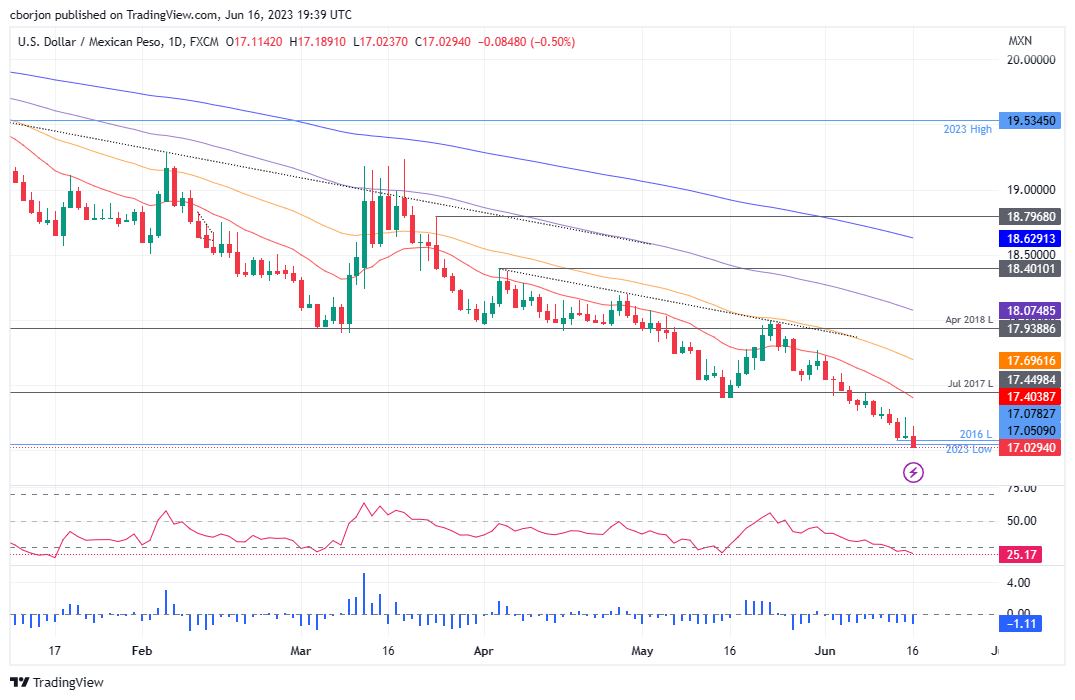
The USD/MXN extended its fall past the 2016 low of 17.0509, poised to challenge the 17.0000 figure. Even though oscillators remain in overbought conditions, with the Relative Strength Index (RSI) below 30, the three-day Rate of Change (RoC) suggests some selling pressure lies ahead. However, failure to crack the 17.0000 mark could expose sellers to a squeeze as Banxico’s monetary policy decision looms.
Nevertheless, the path of least resistance in the near term is downwards. The USD/MXN’s next stop would be 17.0000. if USD/MXN dives beneath that level, the psychological 16.50 would be next, ahead of testing the October 2015 low of 16.3267. Conversely, USD/MXN upside risks lie in the confluence of May’s 15 low and the 20-day Exponential Moving Average (EMA) at 17.4038/42, followed by the 50-day EMA at 17.6963.
- Gold bears are licking their lips as p[rice is technically coiled and biased lower.
- A break of resistance opens risk of higher highs.
Gold dropped from a high of $1,967 on Friday's US session and cleaned up the prior session's length, creating a fresh low of the day down at $1,953.32.
The focus has been on the Federal Reserve which issued a hawkish outlook for interest rates on Wednesday even as it ended its two-day meeting without hiking rates. The Fed forecast 50 basis points of additional increases prior to year-end.
''It’s likely the Fed will need to see softening in the labour market to be confident that inflation is sustainably on its way down. Little guidance was offered for upcoming meetings, with Fed Chair Powell noting decisions will be made meeting to meeting. We continue to expect a 25bp hike in July,'' analysts at ANZ Bank argued.
Meanwhile, the dollar rose early following three losing sessions. Bond yields were also higher, with the US two-year note last seen paying 4.733%, up 8.2 basis points and the 10-year note up 4.9 basis points to 3.772%. DXY traded 0.13% higher form a low of 102.006 to a high of 102.427.
'' As trend signals improve, CTA trend followers have already begun adding to their length in silver, where current prices could spark a buying program totaling +6% of this cohort's max size. In gold markets, the bar for algo buying activity is also razor-thin. Prices need only break the $1980/oz mark to spark the first marginal buying program, and the risk for subsequent buying flows is elevated above the $2000/oz range,'' analysts at TD Securities argued.
Gold technical analysis
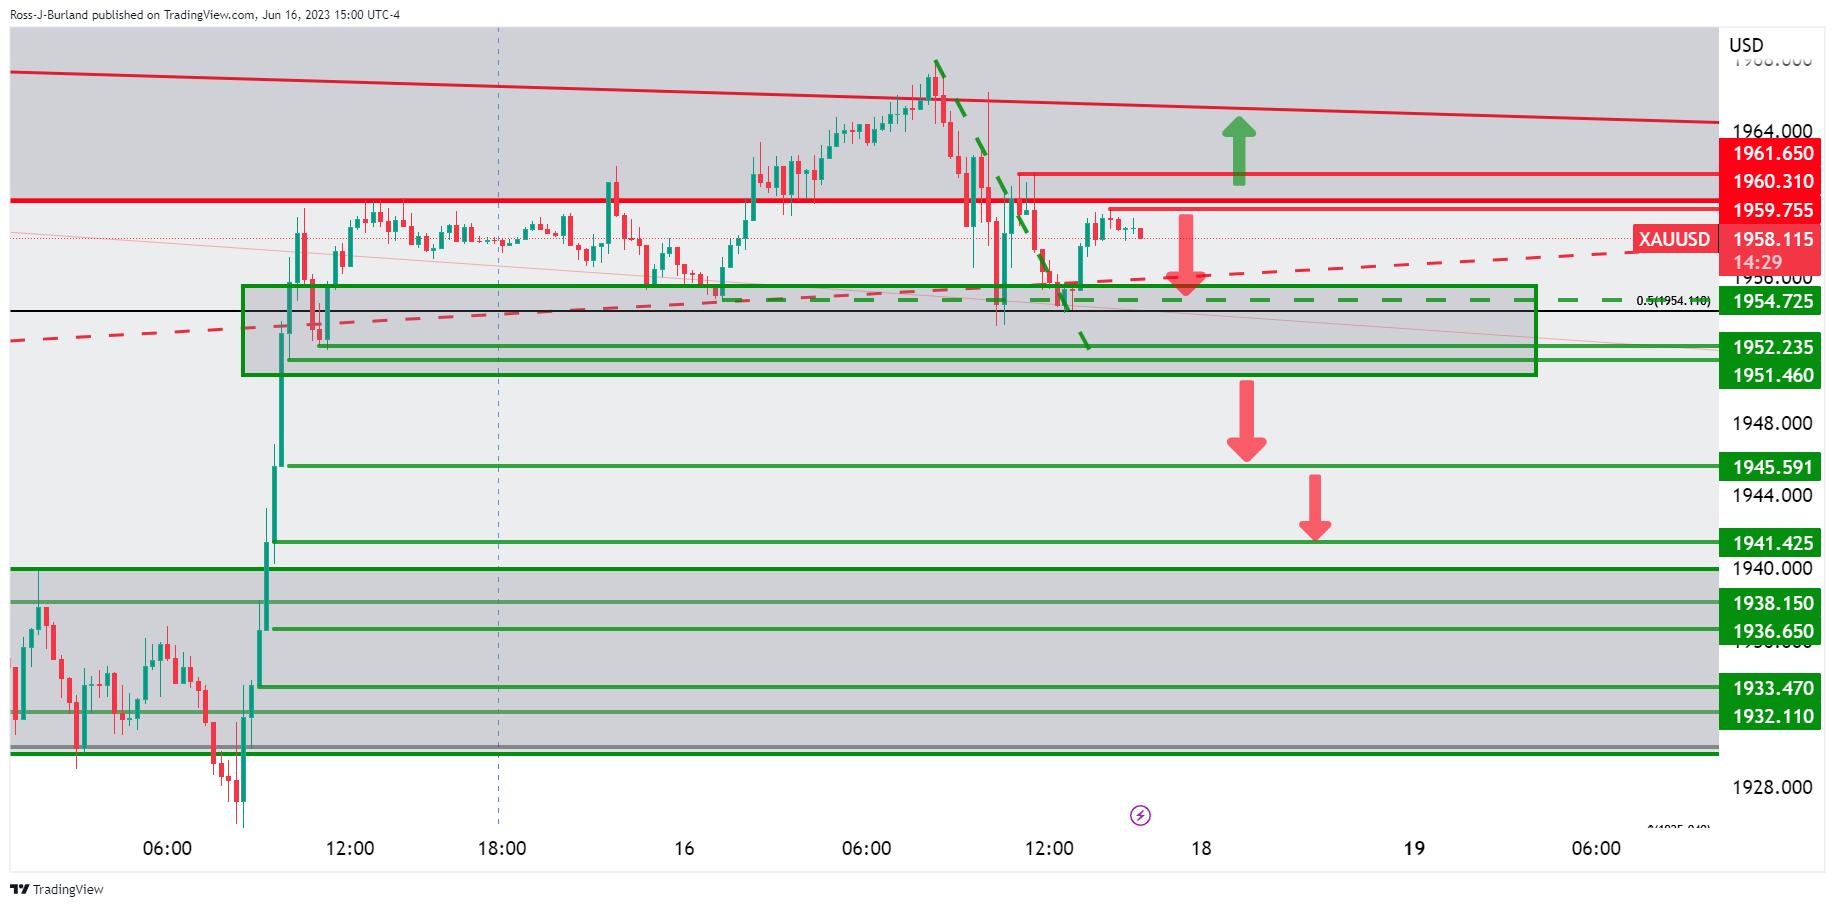
The 15min chart shows a number of levels to the downside to break while the daily offers a bearish bias while below trendline resistance and a break out of the channel:
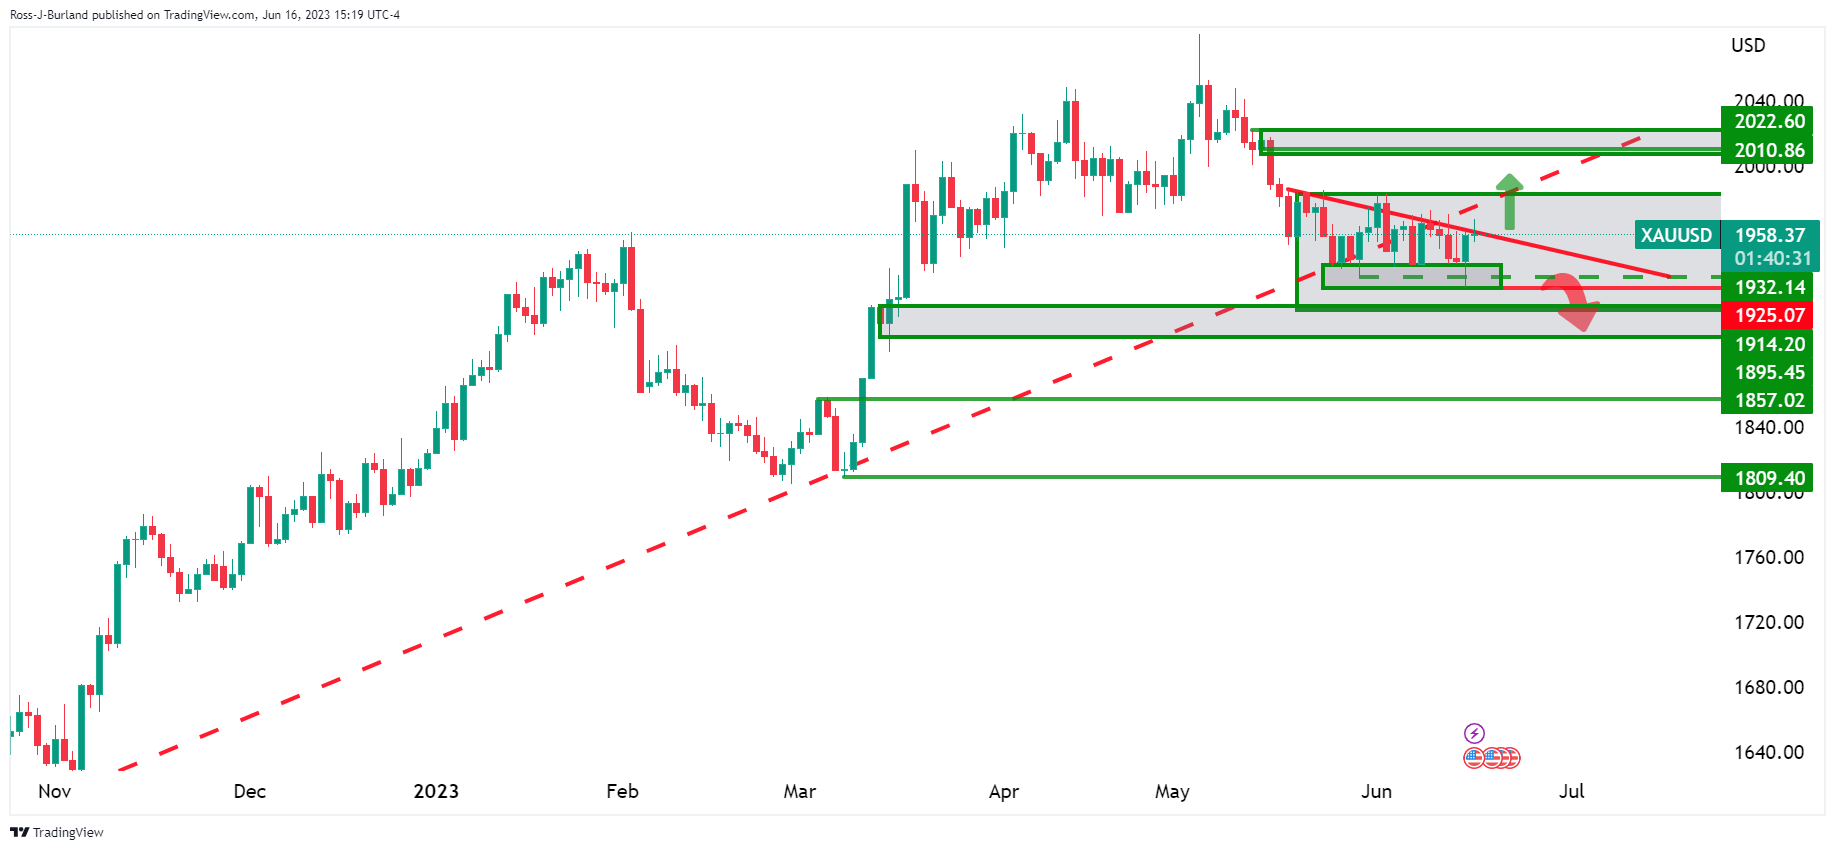
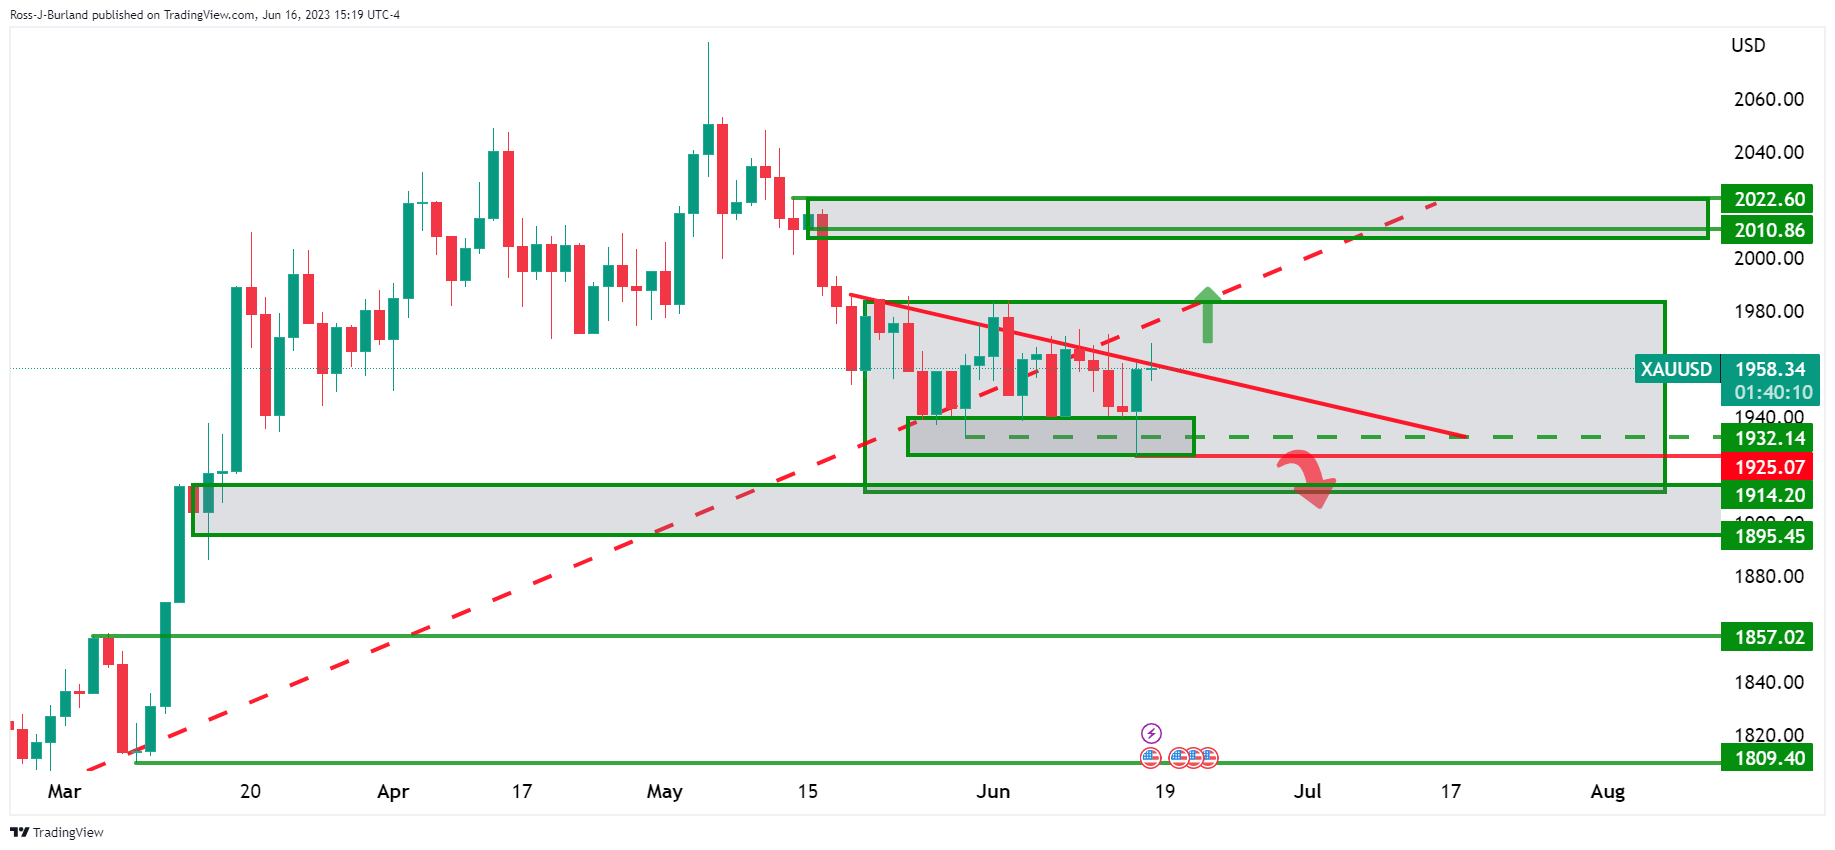
With that being said, there will be prospects of a move higher if bulls stay committed and break trendline resistance.
After a volatile week that included many top-tier events such as the US CPI, the Fed and the ECB meetings, next week will see interest rate decisions from the Bank of England and the Swiss National Bank. The UK will release inflation data, and the preliminary Global PMI will provide insight into the state of the global economy. Comments from officials at the Fed and ECB will be closely watched.
Here is what you need to know for next week:
The beginning of the week may be relatively quiet since the US stock and bond markets are closed on Monday in observance of Juneteenth.
The People's Bank of China has already cut interest rates and may continue to do so. The Wall Street Journal has reported that China is planning major steps to revive its economy, including new infrastructure spending.
Despite the gloomy outlook and recent rate hikes, global equity markets finished the week with gains. Expectations that the tightening cycle is nearing its end, evidence of inflation slowing down, and some upbeat labor data have helped to boost market sentiment.
The US Dollar Index had its worst week in months, as risk appetite weighed on the Greenback despite the hawkish tone from Federal Reserve Chair Jerome Powell. The DXY dropped to 102.00, the weakest level in four weeks. US data showed that inflation continues to slow down. With a live FOMC meeting in July, economic data from the US have become more relevant, as well as comments from Fed officials. Fed Chair Powell will present the semiannual monetary policy report to Congress on Wednesday and Thursday. He is expected to reiterate what he said after the FOMC meeting.
EUR/USD had its best week in months, rising above 1.0900. The bullish tone has put the 1.1000 area back on the radar. The European Central Bank (ECB) raised rates by 25 basis points, as expected, and signaled another hike in July. The surprise came from upward revisions to core inflation forecasts. The key report next week will be the flash PMIs on Friday.
USD/JPY posted its highest weekly close since October, above the 141.50 area. The Japanese Yen hit multi-year lows against many of its rivals, affected by the dovish stance from the Bank of Japan (BoJ), risk appetite, and higher government bond yields. As expected, the BoJ kept its monetary policy stance unchanged. The central bank will have the opportunity to signal changes in its policy at the July meeting with new macroeconomic projections. A key report to watch for will be the Japanese National Consumer Price Index, which is set to be released next Friday.
GBP/USD accelerated to the upside, climbing for the third consecutive week and reaching the highest levels since April 2022. On Friday, it rose above 1.2800. Despite the hawkish ECB, the EUR/GBP dropped again, falling towards 0.8500. The Pound outperformed during the week, boosted by upbeat economic data from the UK, particularly strong wage growth numbers. Next Thursday, the Bank of England will announce its monetary policy decision, with a 25 basis points rate hike expected. Prior to the decision, inflation data from the UK is due on Wednesday.
Analysts at Wells Fargo:
Next week's inflation data will be key in determining the path ahead for the Bank of England. While we forecast additional BoE tightening, another hot inflation print could result in a terminal rate that is much higher than we currently forecast. Right now, we believe BoE policymakers will reach a peak policy rate of 5.00%; however, should core inflation tick higher in May, we would likely revise that forecast higher to reflect a need for tighter monetary policy. In the event inflation comes in softer than expected, softer price pressures could take some pressure off of the U.K. economy, although a shift to interest rate cuts is likely a ways off.
USD/CHF retreated from the 20-week Simple Moving Average (SMA) at 0.9110, ending the week below 0.9000. Meanwhile, EUR/CHF gained 80 pips during the week, rebounding from monthly lows and posting the highest close in two months. The Swiss National Bank (SNB) will hold its monetary policy meeting next Thursday. A rate hike is priced in, and a 50 basis point increase is not ruled out, following hawkish comments from Chairman Thomas Jordan, and considering the SNB meets one time per quarter.
NZD/USD continued its recovery and climbed above 0.6200, gaining 1.60% during the week. New Zealand's Q1 GDP numbers came in below expectations. The Reserve Bank of New Zealand (RBNZ) has ended its tightening cycle, while its neighbor, the Reserve Bank of Australia (RBA), unexpectedly hiked rates last week and could do so again. The divergence has boosted the AUD/NZD, which surpassed 1.1000, reaching the highest level since February.
AUD/USD broke above the medium-term resistance at 0.6800 and approached 0.6900, posting the highest close since January. The pair was boosted by a weak US Dollar and strong Australian labor data, which triggered expectations of more rate hikes from the RBA in July and August. Next Tuesday, the RBA will release the minutes from its latest meeting.
USD/CAD broke below the 1.3300 area and tumbled, falling below 1.3200, the lowest level since August. The Bank of Canada's meeting minutes and retail sales data are both due next week.
USD/TRY stabilized around 23.60, rising almost 20% in the month following President Erdogan's victory. Next Thursday, the Central Bank of the Republic of Turkey (CBRT) is expected to raise the repo rate sharply, following the sharp depreciation of the Turkish Lira. If the CBRT delivers, it will signal a pivot from its previous policy and could help the TRY.
The South African Rand was the best-performing currency of the week, as the USD/ZAR retreated to 18.00. The Mexican Peso rose for the fifth consecutive week against the Dollar, with USD/MXN moving closer to 17.00, the lowest level since 2016. Next Wednesday, the Brazilian Central Bank and Bank Indonesia will have their monetary policy meeting.
Like this article? Help us with some feedback by answering this survey:
- EUR/JPY closes a 300-pips winning week, trading in the 155.20 area.
- As anticipated, the two-day BOJ meeting concluded without any adjustments made to monetary policy.
- Monetary policy divergence now favours the Euro.
At the end of the week, the EUR/JPY gained over 1%, soaring to a fresh cycle high of 155.20. In that sense, the ultra-dovish stance by the Bank of Japan (BoJ) vs. the hawkish messages from the European Central Bank (ECB) made on Thursday, where Christine Lagarde hinted at more hikes, seems to be giving the Euro traction.
BoJ held its monetary policy unchanged, as expected
The Bank of Japan (BoJ) recently concluded its two-day meeting without making any policy changes, just as the markets anticipated. The bank acknowledged that inflation expectations have remained relatively stable, but core inflation is slowing due to government measures aimed at reducing energy prices. The bank expects inflation to decelerate further by the middle of the fiscal year of 2023 and emphasized the need to monitor developments in financial and foreign exchange markets.
In the presser, Governor Ueda mentioned that different data between policy meetings could lead to varying outcomes, but any significant change in the inflation outlook could prompt a policy adjustment.
Looking forward, according to World Interest Rate Possibilities (WIRP), markets foresee a 15% probability of a policy shift in July, where an updated macro forecast will be released, then increasing to 25% in September, 45% in October, and 65% in December.
EUR/JPY Levels to watch
According to the daily chart, the EUR/JPY holds a bullish outlook for the short term as the Relative Strength Index (RSI) and Moving Average Convergence Divergence (MACD) suggest that the buyers are in control while the pair holds above its main moving averages. However, both indicators suggest intensely overbought conditions as the pair gained more than 2% in the last two days and over 3% in the week, suggesting that a healthy correction may be necessary to consolidate gains.
Upcoming resistance for EUR/JPY is seen at the next round level at 155.30, followed by the 155.55 zone and the 156.00 area. On the other hand, the psychological mark at 153.35 is the immediate support level for the cross which could act as a support in case of a correction. A break below this level could pave the way towards the 153.00 area and then to the 152.00 zone
EUR/JPY Daily chart
-638225385226912492.png)
- GBP/USD trades with significant gains as UK economic data supports expectations of further BoE tightening.
- US data moderation softens the USD tone, providing an additional boost to GBP/USD.
- Hawkish remarks from Fed policymakers suggest further tightening may be needed.
- Upcoming events include the UK’s May inflation data release, the BoE decision, US Fed speakers, housing data, and S&P Global PMIs.
GBP/USD trades with solid gains on Friday, set to finish its weekly rise in six months after UK economic data supported additional Bank of England (BoE) tightening. The US Federal Reserve (Fed) keeping rates unchanged was a headwind for the US Dollar (USD). Hence, the GBP/USD is trading at 1.2833, up 0.40%, after hitting a low of 1.2768.
US Fed decision and hawkish remarks from policymakers in focus, upcoming UK inflation data and BoE decision awaited
Several factors benefitted the Pound Sterling (GBP) during the. Firstly, market sentiment remains upbeat, with most global equities trading with gains. That, alongside robust employment data in the UK, spurred a reaction in the bond market, with most investors expecting at least 125 bps of additional tightening by the BoE, which current Bank Rate sits at 4.50%.
Additionally, data from the United States (US) warranting a moderation in the pace of tightening softened the US Dollar trading tone as CPI and PPI figures slowed. That, alongside Fed’s decision not to increase rates in June to further assess upcoming data so they do not overshoot in monetary policy, gave another leg-up to the GBP/USD pair.
In the meantime, after Wall Street opened, Consumer Sentiment for June in the US improved, as the University of Michigan (UoM) revealed. Figures came at 68.0 vs. May’s Final 64.9, while inflation expectations for one year were downward revised from May 4.2%, while June data came at 3.3%.
Consequently, the GBP/USD capped its uptrend as US Treasury bond yields resumed to the upside, underpinning the greenback. The US 10-year Treasury bond yield rises five basis points up to 3.773%, while the US Dollar Index (DXY) edges up 0.13%, at 102.277.
Recently, Federal Reserve policymakers crossed wires with a hawkish stance after the latest Fed decision. Richmond Fed President Thomas Barkin said that he’s “comfortable doing more” if inflation does note recedes. Later, Fed Governor Christopher Waller added that slow progress on inflation “will probably require some more tightening.”
Upcoming events
The UK economic docket will feature May’s inflation data release ahead of the Bank of England decision on Thursday. On the US front, Fed speakers would be grabbing most headlines, alongside the release of housing data and S&P Global PMIs.
GBP/USD Technical Levels
- The USD/CAD dipped to a multi-month low of 1.3188, last seen in September 2022.
- Rising Oil prices give traction to CAD.
- Hawkish Fed speakers limit the pair’s upside potential.
On Friday, the USD/CAD continued its downward momentum dropping to a low of 1.3188 and its set to confirm a 100 pips weekly decline. Expectations that the rate peak of the Federal Reserve (Fed) will weaken the US Dollar linger but an upbeat Consumer Confidence Index from the University of Michigan and hawkish Fed speakers limit the downside potential.
UoM Confidence data Surpassed expectations, hawkish speaker revives US Yields
The University of Michigan (UoM) reported that the Michigan Consumer Sentiment Index for June surpassed expectations at 63.9, indicating increased consumer confidence compared to the previous figure of 59.2. Additionally, the five-year Consumer Inflation Expectation dropped to 3% from the anticipated 3.1%. These positive data points helped strengthen the US Dollar.
Furthermore, after the Federal Open Market Committee (FOMC) released its monetary policy statement and updated dot plots on Wednesday – indicating a projected additional tightening of 50 basis points – various speakers from the Federal Reserve reiterated on Friday their concern with inflation, showing their willingness to continue hiking.
Christopher Waller of the Federal Reserve expressed concerns about the lack of progress in core inflation and suggested the possibility of further tightening if necessary, while Thomas Barkin argued that he is comfortable “doing more” if the data warrants it. As a response, the US bond yields are seeing gains across the curve. The 10-year bond yield rose to 3.78%, while the 2-year yield stands at 4.74% and the 5-year yielding 4.00%, respectively, with all three seeing more than 1% increases on the day.
USD/CAD Levels to watch
According to the daily chart, the USD/CAD holds a bearish outlook for the short term as the Relative Strength Index (RSI) and Moving Average Convergence Divergence (MACD) both suggest that the sellers have control while the pair trades well below its main moving averages. However, the RSI pierced through the oversold threshold, indicating that a healthy upwards correction may be needed in the upcoming sessions.
The 1.31500 level remains the key support level for USD/CAD. If broken, the 1.3100 zone and 1.3090 area could come into play in case of further downside. Furthermore, a move above the 1.3250 zone would favor the pair’s bullish momentum, with next resistances at the 1.3270 area and 1.3330 psychological mark.
USD/CAD Levels to watch
-638225341800013598.png)
- EUR/USD rally curtailed following the ECB rate hike and hawkish remarks from central bankers.
- US Consumer Sentiment improves, supporting a stronger USD; Eurozone inflation slows as expected.
- Hawkish stances by both ECB and Fed officials hint at potential further tightening.
- Upcoming key events include the German May PPI, the EU’s General Council meeting, and US housing market data.
EUR/USD rally stalled in the aftermath of the European Central Bank (ECB) rate hike, trimming some of its previous day’s gains amidst mixed market sentiment. Following the Federal Reserve (Fed) and the ECB’s decisions, central bank speakers are grabbing the most headlines, amidst the lack of news, besides Eurozone (EU) inflation. At the time of writing, the EUR/USD is trading at 1.0920, down 0.23%.
Mixed market sentiment following central bank decisions, Eurozone inflation slows down.
Market participants’ sentiment is mixed, as shown by US equities. The latest round of economic data from the United States (US showed an improvement in Consumer Sentiment, as revealed by the University of Michigan (UoM) at 68.0 vs. May’s Final 64.9. Regarding inflation expectations for a one-year period, they were downward revised from May 4.2%, while June data came at 3.3%.
The EUR/USD weakened amidst a raft of Federal Reserve and European Central Bank officials’ commentary, with postures leaning toward the hawkish side of monetary policy. It should be said the American Dollar (USD) is showing signs of strength, as the US Dollar Index (DXY) edges up 0.21%, at 102.364.
In the Eurozone (EU) front, inflation data slowed down as expected to 6.1% YoY in May, below April’s 7% reading. Meanwhile, two ECB central bankers, Mario Centeno and Pierre Wunsch, delivered hawkish remarks, suggesting that more rate hikes are needed. Mario Centeno added that “the risk of interest rates rising again” exists if prices do not slow. Meanwhile, Pierre Wunsch said, “ECB could hike rates again in September unless there is a substantial drop in core inflation.”
Across the pond, Federal Reserve officials, although moderated in June’s FOMC meeting, are struck with a hawkish stance after the decision. Richmond Fed President Thomas Barkin said that he’s “comfortable doing more” if inflation does note recedes. Later, Fed Governor Christopher Waller later added that slow progress on inflation “will probably require some more tightening.”
The EUR/USD retraced some of its weekly gains. The Fed and ECB stances are on the table, and with both central banks headed for 50 bps of further tightening, it could spur some consolidation in the EUR/USD.
Upcoming events
Eurozone docket: It would feature German May PPI, EU’s General Council meeting, June’s Consumer Confidence Flash, and GDP figures in Spain, alongside S&P Global PMIs for Spain, Germany, France, and the bloc.
US economic agenda: Fed speakers, housing market data, and S&P Global PMIs.
EUR/USD Price Analysis: Technical outlook
From a technical perspective, the EUR/USD remains upward biased, set to test the 1.1000 figure. The daily Exponential Moving Averages (EMAs) are well located below the exchange rate, suggesting further upside is expected. Still, the three-day Rate of Change (RoC) portrays buyers are losing momentum, and the Relative Strength Index (RSI) indicator, remains in bullish territory but shifted flat. Upside risks lie at 1.1000, followed by the YTD high at 1.1095. Contrarily, a drop below 1.0900 could expose the 50-day EMA at 11.0820, ahead of the confluence of the 20-day EMA and June’s 15 daily low of 1.0803/05
- AUD/USD corrects lower but is set to close a third consecutive weekly gain.
- US Michigan Consumer Sentiment Index came in at 63.9 in June vs 60 expected.
- Fedspeak makes the USD holds its ground but it is still vulnerable.
At the end of the week, the AUD/USD bulls seem to have taken a step back, after six consecutive days of gains and the pair retreated to the 0.6860 area. In that sense, the USD managed to hold its ground amid upbeat Michigan Consumer Sentiment Index and hawkish Fed speakers. On the Australian front, eyes are on next week’s Reserve Bank of Australia (RBA) minutes.
UoM data and the hawkish comments of Fed officials give the USD traction
The University of Michigan (UoM) reported on Friday that the Michigan Consumer Sentiment Index came in at 63.9 in June vs 60 expected and accelerated from its previous figure of 59.2. In addition, the five-year Consumer Inflation Expectation from June dropped to 3% vs the consensus of 3.1%. The data helped the US Dollar find its feet after the recent decline.
In addition, Christopher Waller from the Federal Reserve (Fed) stated that he is concerned with core inflation not seeing progress adding that it may require more tightening. Elsewhere, Thomas Barkin mentioned that he is comfortable “doing more” if the data warrants it. It's worth noting that on Wednesday, the revised dot plots from the Federal Open Market Committee (FOMC) showed that members are seeing two more 25 bps hikes this year, so the hawkish stance from the Fed gives the USD traction.
On the other hand, the focus now shifts to Tuesday’s RBA minutes where investors will look for clues as to why Governor Philip Lowe decided to unexpectedly hike rates by 25 basis points to 4.10% in the last monetary policy meeting.
AUD/USD Levels to watch
According to the daily chart, the AUD/USD holds a neutral to the bullish outlook for the short term as the bulls seemed to have taken a step back to consolidate gains, but indicators still favor the Aussie. However, as the pair remains in overbought conditions, more downside may be on the horizon.
If AUD/USD manages to move higher, the next resistances to watch are at the daily high at 0.6890, followed by the psychological mark at 0.6900 and the 0.6920 area. On the other hand, immediate support for the pair line up at 0.6800, 0.6730 and 0.6690.
AUD/USD Daily chart
-638225304397577209.png)
Inflation in the US is well above target and the labor market remains very tight, the US Federal Reserve's recently published monetary policy report to Congress read, ahead of Chairman Jerome Powell's Capitol Hill testimony next week, per Reuters.
Key takeaways
"Bringing inflation down likely to require a period of below-trend growh, some softening of labor market conditions."
"Financial conditions have tightened further since January."
"Some indicators of future business defaults are somewhat elevated."
"Several major foreign central banks continued tightening, but also emphasized need to be cautious given lags and uncertainty."
"Core services ex-housing inflation has not shown signs of easing."
"Slowing inflation may depend in part on further easing of tight labor market."
"Outlook for funds rate is subject to considerable uncertainty."
"Will adjust pace of balance sheet contraction if needed."
"Bank credit conditions have tightened further since March."
"March banking system turmoil reportedly left an imprint on bank lending conditions, especially for mid-sized and small banks."
Market reaction
The US Dollar Index clings to modest recovery gains near 102.40 after this report.
Gold price fluctuates noticeably following central bank meetings. Economists at Commerzbank analyze XAU/USD outlook.
Gold will only begin to recover once it becomes clear that US key rates have peaked
Participants in the Gold market are disappointed that the rate hike cycle may not be over after all: the Gold price meanwhile was trading more than $100 lower than it was in early May and found itself at a three-month low.
We had anticipated a correction but believe it should now be largely finished. Having said that, prices will probably only begin to recover once it becomes clear that US key rates have peaked.
The Bank of Japan (BoJ) left policy unchanged. Kit Juckes, Chief Global FX Strategist at Société Générale, analyzes JPY outlook.
No BoJ surprise, Yen bulls still suffering
Governor Ueda made veiled threats about intervention but otherwise, offered no sign that there was any rush to tighten monetary policy. The impression the Governor leaves, is that only further Yen weakness or distortions in the curve would cause any rush to act on YCC. The contrast with the ECB, which sent out clearer warnings that there is another hike following fast on the heels of yesterday’s, is clear and reflected in EUR/JPY.
I think USD/JPY should be below 135 now and heading to 130 later this year, but it may need to go higher first. As for EUR/JPY, shorting the pair has the same drawbacks but it does look out of line with rates.
- US UoM Consumer Confidence Index improves to 63.9 in June surpassing expectations.
- US yields are modestly higher supporting USD/JPY.
- The pair is testing the relevant 141.50 area.
The USD/JPY reached its highest level since November 2022, hitting 141.57 following the release of positive US economic data. However, the pair has been unable to consolidate above the 141.50 area.
Data released on Friday showed Consumer sentiment in the US improved in early June measured by the University of Michigan's (UoM) Consumer Confidence Index that rose to 63.9 from 59.2 in May, surpassing the market expectation of 60.
US Treasury yields spiked after the report with the 10-year reaching 3.80%. As yields pullback, the USD/JPY lost momentum. If the pair manages to stay above the 141.50 area, the Dollar could gain support. However, if it fails to do so, a correction seems likely.
Life after central bank meetings
On Wednesday, the Federal Reserve (Fed) kept interest rates unchanged but signaled that rates could be raised at the next meeting. A few hours ago, the Bank of Japan also kept its monetary policy stance unchanged. The BoJ's statement was seen as dovish, as it offered no guidance on an exit from ultra-accommodative policies.
Following a busy week, the economic calendar ahead is relatively light. The most significant events in the US will be Jobless Claims and the June preliminary S&P Global PMI. In Japan, inflation data is due on Friday.
Technical levels
Economists at ANZ Bank discuss Platinum and Palladium outlooks.
Platinum over Palladium
Among PGMs, we reiterate our preference for Platinum over Palladium. Platinum mines supply recovery looks constrained due to power challenges in South Africa. Meanwhile, substitution and higher penetration of electric vehicles are likely to weigh on auto catalyst demand for Palladium.
We expect the Platinum price to move towards $1,150 and Palladium to hover near $1,420 by the end of this year.
See – Silver Price Analysis: XAG/USD to reach $26 by year-end – ANZ
The S&P 500 is up 20% from October’s low. Economists at UBS say that investors will at least need to believe in the following three narratives to see a sustainable rally in equities.
Boosted market conviction that the Fed is close to the end of its hiking cycle
The Fed won’t increase interest rates any more than the two hikes implied by the latest ‘dot plot.” From here, this conviction could only go higher if disinflationary forces strengthen, or if investors believe that political considerations will lead the Fed to allow inflation to run above its target for an extended period.
The widely predicted US recession is canceled. Confidence that a recession can be avoided could increase if real income growth continues to improve, companies start restocking inventories, and the labor market remains robust.
The rally in artificial intelligence has been justified, and a combination of enthusiasm and FOMO (‘fear of missing out’) helps keep it going.
Economists at Commerzbank analyze EUR/USD outlook after adjusting their ECB projections.
ECB likely to hike one more time
We have adjusted out ECB projections and now expect a rate hike in July. We do not, however, expect a further rate step in September.
We assume that the ECB will keep its rates at the level of 3.75% reached at that point for a long time. Contrary to the market, as the first rate cuts are being priced in there for next year.
Against this background, we now feel even more comfortable with our projection of EUR/USD levels around 1.14 by year-end. Even if there is a certain potential for disappointment regarding the September meeting as the market prices in a rate hike at quite a high likelihood the market will have to abandon its expectation of a rate cut, which should support EUR in the end.
Growing conviction of a soft landing in the global economy and a more hawkish view across the G10 central banks outside of the US are weakening the Dollar, economists at ING note.
Increasing hawkishness shown by the rest of the central banks in the G10 space
Inflation forecasts and expected tightening cycles are being revised higher across the board and in some cases more aggressively than in the US. This includes recent surprise hikes from Australia and Canada, a very hawkish ECB meeting yesterday, and very aggressive expectations for Bank of England rate hikes.
Bullish global risk environment
Investors are cutting allocations to cash and look to be putting money to work in bonds, equities and emerging markets. Against all the odds the MSCI world equity index is up 14% year-to-date and fund managers are surprisingly suffering from a Fear Of Missing Out (FOMO) on a good rally in benchmark risk assets.
China as a location is suffering from rising costs and geopolitical risks. Economists at Commerzbank investigate whether India could be an alternative.
The two countries differ in many aspects
In the coming years, India will certainly attract a larger share of global foreign direct investment. The positive factors are the trend toward diversification of supply chains, the development of alternative production locations, and the political risk of concentrating on China. This is all the more true if the government continuously improves the country's infrastructure and makes it easier for foreign companies to do business in the coming years.
However, it will probably not catch up with China for a long time. After all, apart from the similar population size, the two countries differ in many aspects, including the homogeneity of the population, the political system, and the decision-making process. In addition, China benefited from the fact that its rise coincided with a period of increasing globalization, which made the country's development much easier. India, on the other hand, now faces increasing protectionism, which will at least make its rise more difficult.
- UK data and BoE rate hike expectations support the Pound.
- EUR/GBP breaks below 0.8540, to fresh multi-month lows.
The EUR/GBP is breaking below the support area of 0.8540 and is currently trading around 0.8530, its lowest level since August 2022. The cross resumed its downward trend after a brief pause and a short-lived rebound following the European Central Bank (ECB) meeting.
On Thursday, as expected, the ECB raised rates by 25 basis points. Despite the hawkish tone from President Lagarde, who mentioned that another hike in July was likely, the EUR/GBP only rose modestly approaching 0.8600 and then weakened again.
Next Thursday, the Bank of England (BoE) will announce its decision and a 25 basis points hike is expected. "Even though the BoE was among the first of the large central banks to engage in rate hikes, the UK's persistent inflation means it will be among the last to complete its hiking cycle," said analysts at Rabobank.
The expectation that the BoE will continue to raise rates after the ECB and the Fed end their tightening cycles has been supporting the Pound. This week, the Sterling has outperformed on those expectations and also following upbeat UK employment data.
Technical outlook
The EUR/GBP is currently exhibiting a clear bearish bias, and a consolidation below 0.8530 would likely pave the way for further losses. The next levels to watch are the 0.8500 area, followed by support at 0.8480. However, a recovery above 0.8550 would alleviate some of the bearish pressure.
To improve the short-term outlook, the Euro needs to climb above 0.8610, which is a horizontal resistance level and the 20-day Simple Moving Average. Breaking above this level would signal that the bulls are gaining strength and could potentially push the cross higher.
Technical levels
- UoM Consumer Confidence Index rose more than expected in early June.
- US Dollar Index stays in daily range slightly above 102.00.
Consumer sentiment in the US improved in early June, with the University of Michigan's (UoM) Consumer Confidence Index rising to 63.9 from 59.2 in May. This reading came in better than the market expectation of 60.
"Year-ahead inflation expectations receded for the second consecutive month, falling to 3.3% in June from 4.2% in May," the UoM further added in its publication. "The current reading is the lowest since March 2021. In contrast, long-run inflation expectations were little changed from May at 3.0%, again staying within the narrow 2.9-3.1% range for 22 of the last 23 months."
Market reaction
This report doesn't seem to be having a significant impact on the US Dollar's (USD) performance against its rivals. As of writing, the US Dollar Index was virtually unchanged on the day at 102.10.
Economists at BNP Paribas share their USD/JPY forecasts.
Downward trend in USD/JPY
While we have revised our USD/JPY forecasts higher to account for a higher Fed terminal rate and a later widening of the BoJ's YCC, we continue to project a downward trend in USD/JPY.
We now forecast USD/JPY to fall to 130 by the end of 2023 and further to 123 by the end of 2024, up from the previous projections of 127 and 121, respectively.
See – USD/JPY: A recipe for Yen weakness is boiling – MUFG
- WTI crude oil is up by 0.28%, supported by PBoC’s rate cut.
- ECB’s rate hike and Fed’s rate hold contrast, influencing WTI’s movement.
- Increasing Chinese oil demand, OPEC+ output cuts lend support to WTI prices.
Western Texas Intermediate (WTI), the US crude oil benchmark, remained steady on Friday, gaining 0.28% or $0.50, set for weekly gains of more than 1%. The rate cut provided by the People’s Bank of China (PBoC) aimed to stimulate economic growth and improve oil’s outlook. At the time of writing, WTI exchanged hands at $70.75, up 0.21%.
China’s rate cut and OPEC+ output cut to prop up oil amid economic headwinds
Major global central banks decided to hold rates unchanged amidst worldwide elevated prices and an ongoing economic slowdown. The European Central Bank (ECB) raised rates to a 22-year high, while the Federal Reserve (Fed) “skipped” June’s meeting, though upward revised its peak rates to finish above the 5.50% threshold. Even though bolstered the greenback, Jerome Powell’s neutral commentary erased those gains, which weighed on WTI-s price.
Contrarily to the ECB and the Fed, the PBoC slashed rates after the Chinese economy failed to recover faster than expected, as recent data points to a loss In momentum. That capped oil prices rise after Saudi Arabia announced a cut on its crude oil output to begin in July.
Oil prices were underpinned by increasing demand in China, as its refinery output grew to its second-highest reading on record. Kuwait Petroleum Corp CEO estimates Chinese oil demand will increase towards the second half.
It is worth mentioning that voluntary crude output cuts implemented by the Organization of the Petroleum Exporting Countries and its allies (OPEC+) will curb supply in the near term. That, alongside a weaker US Dollar (USD), after the Fed-s hold rates unchanged, are tailwinds for WTI prices.
WTI Price Analysis: Technical outlook
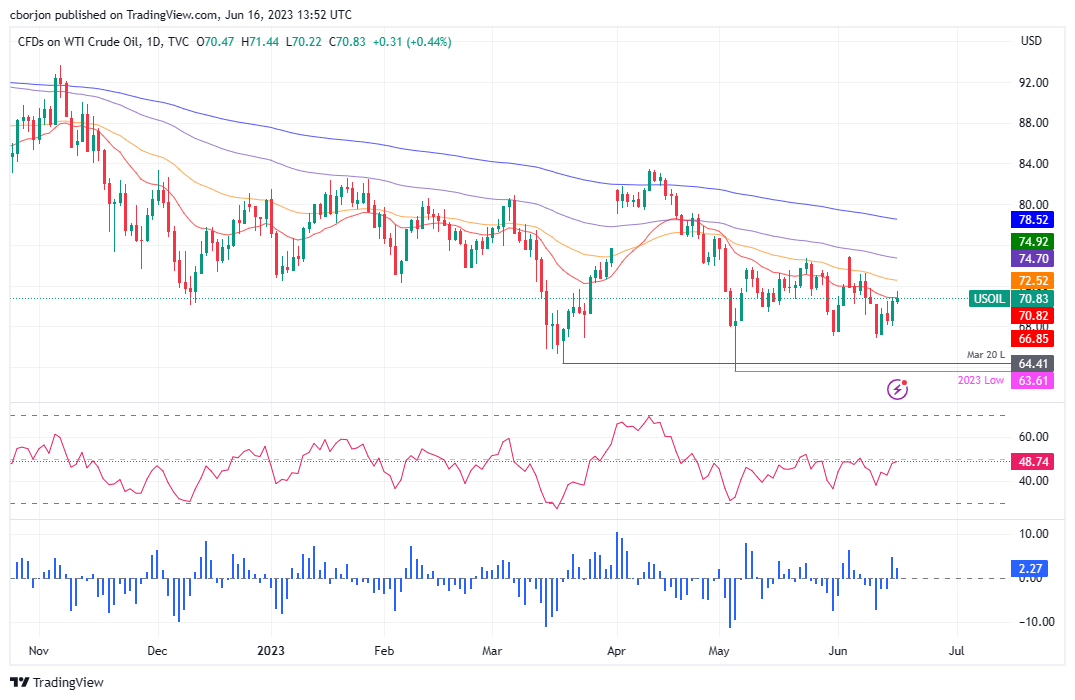
From a technical perspective, WTI remains sideways after bottoming at around the $63.50/$68.00 area in the year. Even though technical indicators and price action suggest further downside, WTI is forming a double bottom that could propel prices to test the 200-day Exponential Moving Average (EMA) at $78.52. On the upside, WTI’s first resistance would be the 50-day EMA at $72.51, followed by the 100-day EMA at $74.70m, and then the 200-day EMA. On the downside, a fall below $66.85 would pave the way to challenge the YTD low at $63.61.
- Silver price has comfortably shifted above $24.00 as the USD Index remains weak.
- The USD Index is facing pressure as investors are not agreeing that the Fed will hike rates two times more this year.
- Fed Barkin has commented that raising rates further could create the risk of a more significant slowdown in the economy.
Silver price (XAG/USD) has shifted its auction comfortably above the crucial resistance of $24.00 in the early New York session. The white metal has got strengthened as investors have found clarity about Federal Reserve’s (Fed) interest rate peak for now.
S&P500 is expected to open on a positive note considering bullish cues from overnight futures. Market mood is quite cheerful as uncertainty about the interest rate peak has receded after the display of the dot plot by Fed chair Jerome Powell.
The upside in the US Dollar Index (DXY) seems restricted around 102.30 amid the risk-appetite theme. In June’s monetary policy statement, Fed Powell confirmed that two more interest rate hikes are appropriate this year. However, investment banking firm Morgan Stanley sees no more hikes and expects the Fed to hold the rate at 5.1% till it undertakes a 25 bps cut in March 2024.
Meanwhile, Richmond Fed Bank President Thomas Barkin has commented that raising rates further could create the risk of a more significant slowdown in the economy, as reported by Reuters. He further added, "Comfortable doing more on interest rates if coming data doesn't confirm a story that slowing demand is returning inflation to the 2% target."
Silver technical analysis
Silver price is struggling to surpass the 23.6% Fibonacci retracement (plotted from May 26 low at $22.68 to June 09 high at $24.53) at $24.10 on a two-hour scale. The 50-period Exponential Moving Average (EMA) at $23.88 is providing support to the Silver bulls.
The Relative Strength Index (RSI) (14) is looking to shift into the bullish range from the bearish range of 20.00-60.00. An occurrence of the same will activate the upside momentum.
Silver two-hour chart
-638225196816029406.png)
This week’s key central bank meetings are out of the way. So where now for the USD? Economists at Scotiabank analyze the greenback outlook.
USD likely to retain a soft bias
USD is poised to remain soft and could retest the recent lows in the DXY index near 101 in the short run but a decisive move through the recent range lows may have to wait until we get a stronger sense of how far central banks will push on with policy tightening.
Broadly though, the short- and medium-term backdrop appears more negative for the USD which should curb the USD’s ability to recover and drive better selling interest on moderate rebounds.
Thomas Barkin, president of the Federal Reserve Bank of Richmond, acknowledged on Friday that raising rates further could create the risk of a more significant slowdown in the economy, per Reuters. "The ’70s provides a clear lesson: If you back off inflation too soon, inflation comes back stronger, requiring the Fed to do even more, with even more damage," Barkin further elaborated.
Key takeaways
"Comfortable doing more on interest rates if coming data doesn't confirm a story that slowing demand is returning inflation to the 2% target."
"2% target has served the Fed well for a generation."
"Inflation has proved stubbornly persistent, still looking to be convinced that weakening demand will control it."
"A question whether inflation can settle while higher-income consumers continue spending and the labor market remains robust."
Market reaction
The US Dollar Index clings to small recovery gains at 102.20 after these comments.
- GBP/USD has printed a fresh annual high at 1.2830 as BoE policymakers are gearing up for a fresh rate hike.
- Investors should understand that the Fed has skipped an interest rate hike for now and the policy-tightening spell is not concluded yet.
- The Pound Sterling is on the seventh cloud as discussions about a pause in the rate-hike regime by the BoE are far from over.
The GBP/USD pair has printed a fresh annual high at 1.2830 in the early American session. The Cable has shown resilience as the Bank of England (BoE) is expected to raise interest rates further to sharpen its quantitative tools in the battle against United Kingdom’s stubborn inflation.
S&P500 futures have extended their upside move despite fears of a recession in the United States but have not eased even after a neutral interest rate decision by the Federal Reserve (Fed). The overall upbeat market mood is the outcome of a subdued appeal for the US Dollar Index (DXY).
Investors are showing back to the USD Index due to a relief rally inspired by a pause in the rate-hiking spell by the Fed. The investing community should understand that the Fed has skipped an interest rate hike for now and the policy-tightening spell is not concluded yet. Headline US inflation is twice the required inflation rate and core inflation is showing enormous persistence, which would keep the requirement of more interest rate hikes steady.
Meanwhile, the USD Index has attempted a recovery move after dropping to near 102.00 ahead of the United States Michigan Consumer Sentiment Index data.
The Pound Sterling is on the seventh cloud as discussions about a pause in the rate-hike regime by the BoE are far from over. BoE Governor Andrew Bailey is confident that inflation will soften but required time is expected to remain high as inflationary pressures are near 9% due to labor shortages and 45-year high food inflation.
Meanwhile, Reuters reported that the BoE looks set to raise interest rates by a quarter point to a 15-year high of 4.75% on June 22, its 13th straight rate rise as it fights unexpectedly sticky inflation that risks making it a global outlier. It further added investors this week expect that the UK central bank might hike rates as high as 6% this year
- Natural Gas resumes rally after outsized gains on Thursday as a perfect storm of factors lead to a surge in prices.
- The latest driver is the news that the Groningen Gas plant in the Netherlands will probably close in October 2023, a year earlier than previously thought.
- A weaker US Dollar following the ECB’s hawkish hike on Thursday adds further fuel to XNG/USD’s rally.
Natural Gas price has shot up over 14% so far this week, propelled by lower-than-expected storage data, hotter weather conditions (Gas is used for cooling as well as heating), reports of high-profile outages in Europe, a substantially weaker US Dollar, and expectations of keener demand from Asia.
XNG/USD is trading marginally higher on Friday, exchanging hands at $2.617 MMBtu, at the time of writing.
Natural Gas news and market movers
- Natural Gas rises on rumors reported by Bloomberg that the Groningen Gas plant in the Netherlands could close a year earlier than expected – this October rather than next – due to mounting complaints because of political pressure from earthquakes caused by the plant damaging local residents’ homes.
- Weekly data from the US Energy Information Administration (EIA) showed an unexpected fall in Natural Gas Storage Change data to 84B cubic feet in the previous week when 95B had been forecast, suggesting demand outweighs supply.
- According to a report by Reuters, the Nyhamna Gas processing plant in Norway is experiencing technical problems that will put an end to production for a month. This is much longer than expected and rattles confidence in Norwegian supply.
- Commitment of Traders (COT) data tracking Gas futures positions from last week showed many traders were short Natural Gas futures. Many of these traders were caught in a ‘short squeeze’ this week, which led to panic covering, further adding fuel to the rally.
- XNG/USD experienced further upside from a substantial weakening of the US Dollar after the European Central Bank (ECB) executed a hawkish rate hike at its meeting on Thursday, strengthening the Euro and weighing on the US Dollar Index (DXY).
- The kicker came from the ECB revising up its forecasts for core inflation in 2023-4.
- ECB President Christine Lagarde made it clear the ECB would keep the door open to further rate hikes in the future during her press conference after the meeting.
- The ECB policy outlook contrasted with the US Federal Reserve’s relatively less hawkish delivery on Wednesday.
- Natural Gas price is further underpinned by expectations of higher Asian demand and Russian pipeline disruptions.
- A hotter-than-expected summer drives increased demand for Natural Gas used in cooling, bolstering prices.
Natural Gas Technical Analysis: Recovering within a longer-term downtrend
Natural Gas price remains in a long-term downtrend ever since turning lower from its peak of $9.960 MMBtu achieved in August 2022. That said, bearish momentum has tapered off considerably since February 2023, as evidenced by the bullish convergence of the Relative Strength Index (RSI) momentum indicator with price, beginning in May. Bullish convergence occurs when price makes new lows but RSI fails to copy. It can be indicative of a bullish reversal brewing.
Nevertheless, unless Natural Gas can break above the last lower high of the long-term downtrend at $3.079 MMBtu, the odds still favor an extension of the bear trend, and shorts over longs.
A break below the $2.110 MMBtu year-to-date lows would solidify the bearish outlook and suggest a continuation down to a target at $1.546 MMBtu, the 61.8% Fibonacci extension of the height of the roughly sideways consolidation range that has unfolded during 2023.
-638225177399817584.png)
Natural Gas: Weekly Chart
Scoping into the daily chart, it can be seen that price has now broken above both the 50 and not the 100-day Simple Moving Average (SMA), which is a short-term bullish sign.
-638225177811596463.png)
Natural Gas: Daily Chart
Looking at the 4-hour chart, the pair has been in a short-term uptrend since the start of June 2023, making successively higher highs and higher lows.
-638225178174675490.png)
Natural Gas: 4-hour Chart
This falls in line with the bullish RSI convergence observed on the weekly chart.
Yet on the 4-hour chart, RSI is now blinking ‘overbought’ (above 70), which is a signal for bulls not to add any new long positions. In the event of RSI exiting the overbought zone and returning to neutral territory, it would be a signal for short-term horizon bulls to close their long positions altogether, and is likely to be indicative of a pullback in price after the recent strong gains.
Natural Gas FAQs
What fundamental factors drive the price of Natural Gas?
Supply and demand dynamics are a key factor influencing Natural Gas prices, and are themselves influenced by global economic growth, industrial activity, population growth, production levels, and inventories. The weather impacts Natural Gas prices because more Gas is used during cold winters and hot summers for heating and cooling. Competition from other energy sources impacts prices as consumers may switch to cheaper sources. Geopolitical events are factors as exemplified by the war in Ukraine. Government policies relating to extraction, transportation, and environmental issues also impact prices.
What are the main macroeconomic releases that impact on Natural Gas Prices?
The main economic release influencing Natural Gas prices is the weekly inventory bulletin from the Energy Information Administration (EIA), a US government agency that produces US gas market data. The EIA Gas bulletin usually comes out on Thursday at 14:30 GMT, a day after the EIA publishes its weekly Oil bulletin. Economic data from large consumers of Natural Gas can impact supply and demand, the largest of which include China, Germany and Japan. Natural Gas is primarily priced and traded in US Dollars, thus economic releases impacting the US Dollar are also factors.
How does the US Dollar influence Natural Gas prices?
The US Dollar is the world’s reserve currency and most commodities, including Natural Gas are priced and traded on international markets in US Dollars. As such, the value of the US Dollar is a factor in the price of Natural Gas, because if the Dollar strengthens it means less Dollars are required to buy the same volume of Gas (the price falls), and vice versa if USD strengthens.
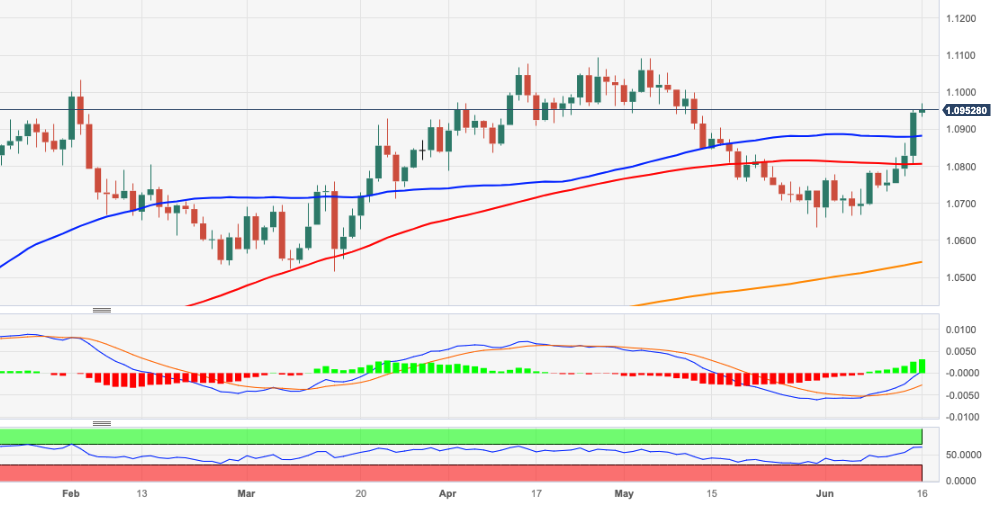
- EUR/USD advances to new highs around 1.0970 on Friday.
- The continuation of the upside retargets the 1.1000 hurdle.
EUR/USD maintains the bullish outlook well and sound for the fifth consecutive session on Friday, this time hitting new 5-week tops around 1.0970.
Further gains remain well on the table for the time being. Against that, the pair is expected to challenge the psychological barrier at 1.1000 once the June peak at 1.0970 (June 16) is cleared.
Looking at the longer run, the constructive view remains unchanged while above the 200-day SMA, today at 1.0540.
EUR/USD daily chart
Federal Reserve Governor Christopher Waller said on Friday that the US economy is still "ripping along" and noted that everything seems to be calm in the US banking system, as reported by Reuters.
Additional takeaways
"Global spillovers expected from coordinated central bank tightening have not really materialized."
"Could be short run price impacts of things like re-shoring production, but should not imply ongoing inflationary price increases."
"Banks deal with interest rate risk all the time and most have done fine with it."
"Reliance on forward guidance means policy lag is not the same as it used to be, makes conditions tighten faster."
Market reaction
The US Dollar Index showed no immediate reaction to these comments and was last seen moving sideways slightly above 102.00.
GBP/USD holds impressive gains. Economists at Scotiabank analyze the pair’s outlook.
Technical outlook remains constructive
The BoE meets next week and a 25 bps hike – with hawkish guidance is expected. Sterling should remain well-supported on moderate dips for now as a result.
With trend momentum oscillators aligned bullishly across short, medium-, and long-term studies, the firm trend should extend towards 1.30+ in the weeks ahead (76.4% retracement resistance at 1.3328).
See – GBP/USD: There is 'fresh air' between current levels and 1.3000 – ING
UOB Group’s Economist Ho Woei Chen, CFA, reviews the latest set of Chinese data releases.
Key Takeaways
The moderation in China’s industrial production came within expectation while retail sales and fixed asset investment slowed more than expected in May. New home prices also rose at its slowest pace in four months and the youth unemployment rate hit a fresh record high in May.
China’s post-Covid recovery is running out of steam with risks that the economy may weaken further without stronger fiscal and monetary policy support.
As expected, the PBOC cut the benchmark 1Y medium-term lending facility (MLF) rate by 10-bps to 2.65% today following a 10-bps reduction in the key 7-day reverse repo rate to 1.9% on Tue. The PBOC net increased liquidity as it conducted CNY237 bn of 1Y MLF to replace CNY200 bn that matured this month.
We expect another 25-bps reduction in banks’ reserve requirement ratio (RRR) in 2H23 as well as more measures to boost the property market recovery.
We maintain our 2Q23 GDP growth forecast for China at 7.8% y/y which is measured against the low base during Shanghai’s two-month Covid-19 lockdown in 2Q22. With stronger monetary and fiscal support, we think China’s full-year GDP growth is still on track to reach our forecast of 5.6% in 2023. Having said that, the downside risks have certainly increased.
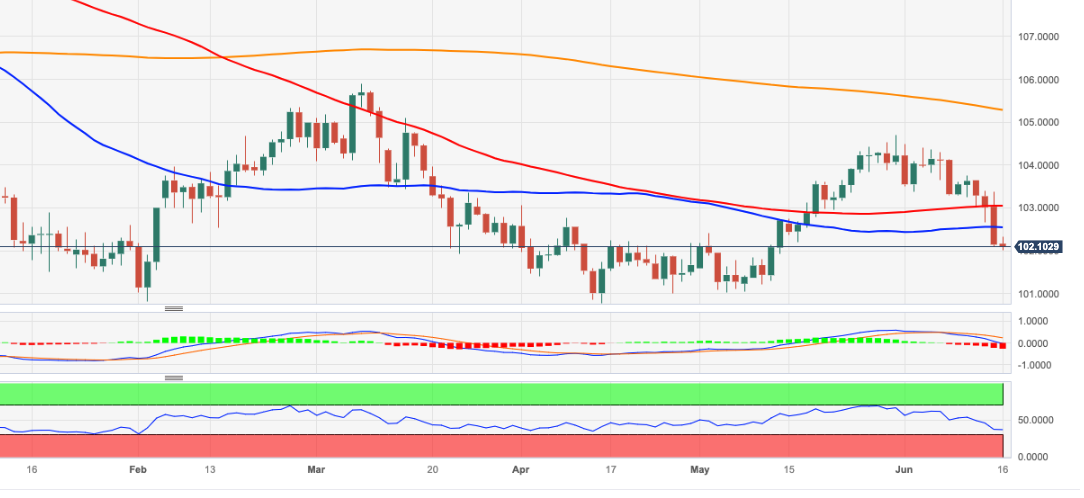
- DXY keeps the tight range amidst steady downside pressure.
- Extra losses are likely on a breach of the 102.00 mark.
There is no respite for the selling bias in the dollar, as the DXY remains close to multi-week lows near the 102.00 region on Friday.
In case the index breaches the monthly low near 102.00, it could then pave the way for another visit to the monthly low of 101.02 (May 4) ahead of the April low at 100.78 (April 14).
Looking at the broader picture, while below the 200-day SMA at 105.28 the outlook for the index is expected to remain negative.
DXY daily chart
- NZD/USD is in a sideways trend below 0.6250, upside seems favored as the USD Index has refreshed its annual low.
- The New Zealand Dollar would show action next week due to the release of the PBoC policy.
- NZD/USD is consolidating in a narrow range around the 61.8% Fibonacci retracement at 0.6233.
The NZD/USD pair is demonstrating a sideways auction below the immediate resistance of 0.6250 in the early New York session. The Kiwi asset is struggling to show a power-pack action amid an absence of economic indicators that could bring volatility.
S&P500 futures have added more gains as the risk appetite theme is in action. The US Dollar Index (DXY) has refreshed its monthly low at 102.01 as the Federal Reserve (Fed) might not stand with the promise of two more interest rate hikes this year.
US economic prospects are losing their resilience and the margin between desired inflation rate and current price pressures is effectively eroding. Also, tight credit conditions by the US regional banks to maintain their asset quality in the turbulent environment are doing their job efficiently.
The New Zealand Dollar would show action next week due to the release of the interest rate decision by the People’s Bank of China (PBoC).
NZD/USD is consolidating in a narrow range around the 61.8% Fibonacci retracement (plotted from May 11 high at 0.6385 to May 31 low at 0.5985) at 0.6233 on a two-hour scale. The Kiwi asset is in an inventory adjustment phase and a breakout is anticipated.
Upward-sloping 20-period Exponential Moving Average (EMA) at 0.6218 indicates that the short-term trend is bullish.
The Relative Strength Index (RSI) (14) is broadly oscillating in the bullish range, which indicated more upside ahead.
A confident break above May 17 high at 0.6261 will drive the Kiwi asset toward May 19 high at 0.6306 followed by May 08 high around 0.6360.
Alternatively, a downside move below the intraday low at 0.6015 will expose the asset for a fresh six-month low toward 11 November 2022 low at 0.5984. A slippage below the latter would expose the asset toward 02 November 2022 high at 0.5941.
NZD/USD four-hour chart

Yen sell-off continues as BoJ leaves monetary policy unchanged. Economists at MUFG Bank analyze the JPY outlook.
BoJ stands pat as policy divergence widens
The combination of improving global investor risk sentiment, falling FX volatility and the widening monetary policy divergence between the BoJ and other major central banks is a recipe for Yen weakness. The BoJ’s latest policy update did not disrupt the Yen weakening trend. The BoJ decided to leave their loose monetary policy conditions unchanged.
The widening yield spreads between Japan and overseas alongside lower FX and rates volatility is making Yen-funded carry trades more attractive, and contributing to the Yen becoming more deeply undervalued.
The USD is ending the week trading mixed versus the majors. Shaun Osborne, Chief FX Strategist at Scotiabank, analyzes the greenback outlook.
Dollar’s general outlook is poised to remain soft
USD’s undertone remains weak but the broader sell-off is, I think, looking a little stretched, at least in the short run.
While the DXY has stabilized, there is little sign from price action of a turnaround in losses and the Dollar’s general outlook is poised to remain soft and markets consider whether the Fed can or will fully deliver on the implied hikes in this week’s dot plot.
The peak of the Fed policy cycle is likely to be negative for the USD; risk assets should respond positively and investors will be more inclined to move capital away from the relative safety of the USD to riskier, higher-yielding assets in anticipation of some relaxation in monetary policy.
- USD/CHF is expected to resume its downside journey below 0.8900 amid an upbeat market mood.
- The USD Index is facing the heat as investors are expecting that the Fed might raise interest rates for once only.
- SNB Jordan believes that this is no better waiting for inflation to increase first.
The USD/CHF pair is demonstrating topsy-turvy moves above the round-level cushion of 0.8900 in the European session. The Swiss Franc asset looks delicate above the aforementioned support as the appeal for the US Dollar Index (DXY) has weakened due to the cheerful market mood.
S&P500 futures are trading in positive territory after recovering losses generated in the Asian session. The risk-sensitive assets have hogged the limelight as investors are hoping that the Federal Reserve (Fed) might not stand by its promise of two more rate hikes due to the worsening economic outlook.
US labor market conditions are easing at a decent pace as initial jobless claims are landing higher than expectations consistently from the past four weeks. Factory activity is in a contraction phase for the past seven months and the service sector is showing a mild expansion. Apart from them, factory gate prices have softened dramatically as the demand for durables is facing the heat of high inflation.
This would sharply impact the USD Index and its broader outlook. Economists at TD Securities cited we continue to think that inflation matters more than growth, showing that policymakers won’t actually push back on growth if it accompanies further disinflation. That keeps us biased to fade USD rallies ahead of the July meeting unless we start to see a clear string of upside US data surprises.
On the Swiss Franc front, investors are shifting their focus toward the interest rate decision by the Swiss National Bank (SNB), which will be announced next week. SNB Chairman Thomas J. Jordan believes that this is no better waiting for inflation to increase first. So a hawkish stance is widely anticipated from the SNB.
EUR/USD consolidates in the mid-1.09s. Economists at Scotiabank analyze the pair’s outlook.
Firm support on minor weakness
Consolidation is evident in EUR/USD price action, with the EUR essentially moving sideways in a tight range around the mid-1.09s.
Trend signals lean EUR bullish, suggesting firm support on minor weakness.
EUR gains through the 40-DMA (1.0859 today – and important support now) should cue up more gains in the near-term through 1.10 and perhaps towards the May peak at 1.1090.
See: EUR/USD can push on to the 1.1000/1030 region today – ING
Economist at UOB Group Lee Sue Ann comments on the recently published jobs report in Australia.
Key Takeaways
Australia’s seasonally adjusted unemployment rate fell to 3.6% in May from 3.7% in Apr. Seasonally adjusted employment increased by 75,900 people, from a revised fall of 4,000 people (4,300 fall previously). The increase in employment in May also saw the number of employed people in Australia reach 14mn for the first time.
We had previously held the view of the RBA pausing and maintaining its cash rate target at 4.10%. Given the latest jobs numbers, however, the extended period of inflation above target amidst a tight labour market poses the risk of stronger wage and price expectations becoming embedded. As such, there are risks that inflation may remain higher for longer.
We are now penciling in a 25bps hike at the next monetary policy meeting on 4 Jul. We are nonetheless, aware that the key risk to our cash rate target call is the reaction function of the RBA to inflation data. It may prefer to have the benefit of the full 2Q22 CPI data release on 26 Jul before moving the cash rate target again
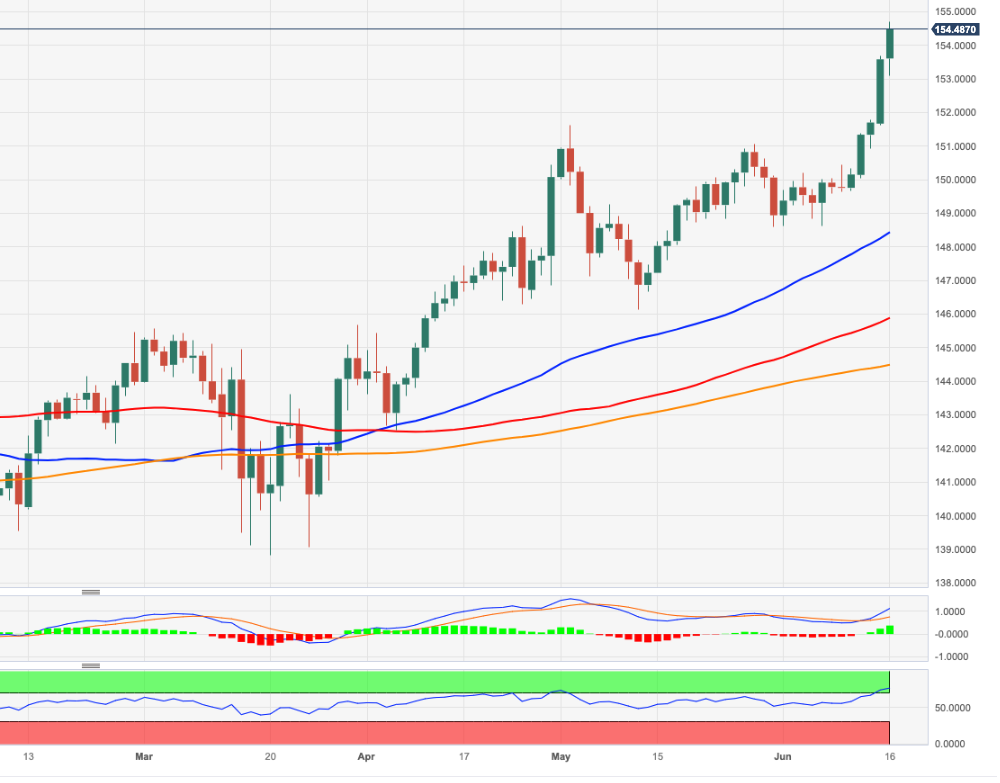
- EUR/JPY extends the rally beyond the 154.00 hurdle.
- There are no resistance levels of note before the 156.80 region.
EUR/JPY marches north at a firmer pace and surpasses the 154.00 yardstick for the first time since September 2008 o Friday.
The current scenario remains open to extra gains in the short-term horizon. Against that, the next up-barrier of certain significance is expected at the weekly top recorded in late September 2008 at 156.83, which precedes the key round level at 157.00.
So far, further upside looks favoured while the cross trades above the 200-day SMA, today at 144.45.
EUR/JPY daily chart
Economists at Commerzbank discuss the Bank of Japan's (BoJ) policy outlook and its implications for the Yen.
JPY depreciation will continue if the Fed continues to signal two further rate hikes
The BoJ expects that over the coming months the headline rate will continue to fall as price pressure in particular from import prices should ease. The weak JPY over the past weeks might counteract this though, in particular as there is a risk that the JPY depreciation will continue if the US central bank continues to signal two further rate hikes and if future data publication from the US were to support that.
However, speculation on the market that the BoJ might take a first step to end its ultra-expansionary monetary policy in the near future is likely to continue, which might reduce the downside pressure on JPY.
It is generally expected that the BoJ will raise its inflation projections as part of its new projections in July. It is possible that it will then implement at least an adjustment of the Yield Curve Control as part of this.
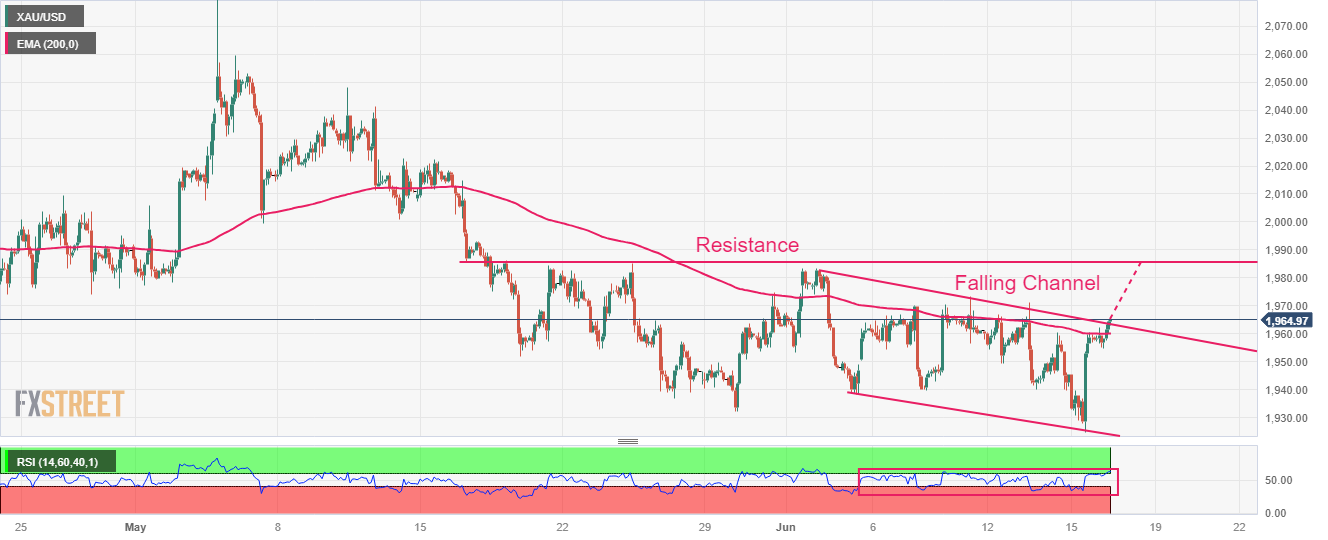
- Gold price has stretched its rally above $1,960.00 amid a risk-on mood.
- The interest rate decision of skipping interest rate hikes by the Fed has provided relief to the market participants.
- Gold price has delivered a breakout of the Falling Channel pattern, which supports a bullish reversal.
Gold price (XAU/USD) has stretched its rally to near $1,964.00 in the European session. The precious metal is expected to deliver more gains as the USD Index (DXY) looks vulnerable above the crucial support of 102.00.
S&P500 futures have recovered entire losses posted in Asia and has shifted into positive territory as the risk appetite theme is getting traction. The US Dollar Index (DXY) is consolidating in a narrow range above 102.00. US Treasury yields are also choppy amid a lack of potential triggers ahead.
The interest rate decision of skipping interest rate hikes by the Federal Reserve (Fed) has provided relief to the market participants. The neutral decision of Fed chair Jerome Powell was followed by a hawkish dot plot in which it is confirmed that two more interest rate hikes will be announced. However, investors are hoping that current United States economic prospects are turning vulnerable as labor market conditions are further easing now.
On Thursday, the US Department of Labor reported higher-than-expected jobless claims straight for four weeks. It seems that higher interest rates by the Fed and tight credit conditions by US regional banks have put a lid on the route of credit disbursals to firms, which has forced them to underutilize their total capacity.
Gold technical analysis
Gold price has delivered a breakout of the Falling Channel chart pattern formed on a two-hour scale. A breakout of the aforementioned chart pattern supports a bullish reversal. The precious metal is approaching the horizontal resistance plotted from May 16 low at $1,985.53.
Gold price has climbed above the 200-period Exponential Moving Average (EMA) at $1,960.00, which indicates that the long-term trend has turned bullish.
The Relative Strength Index (RSI) (14) is looking to shift into the bullish range of 60.00-80.00. An occurrence of the same will activate the upside momentum.
Gold two-hour chart
USD/CAD holds in a narrow range in the low 1.32s. Economists at Scotiabank analyze the pair’s outlook.
Trend lower to persist
USD/CAD’s decline has reached its near-term potential defined by the 38.2% retracement support from the 2021/22 rally in the USD at 1.3220. Some consolidation from here would not surprise but the general trend remains USD-negative, trend momentum oscillators are bearish for the USD across a range of timeframes and the short-term pattern of trade (bear flag) suggests it would not take too much the get the ball rolling on the downside again.
Minor support (and bear trigger) stands at 1.3205 today.
Resistance is 1.3240 and 1.3275/80.
The USD’s loss of support around 1.33 this week suggests the medium-term technical objective is 1.2980/90.
Alvin Liew, Senior Economist at UOB Group, assesses the latest FOMC event (June 14).
Key Takeaways
The Fed in its 13/14 Jun 2023 Federal Open Market Committee (FOMC) meeting, unanimously agreed to keep the target range of its Fed Funds Target Rate (FFTR) unchanged at 5.00%-5.25%. This was the first pause in the Fed’s current rate hike cycle after having raised rates for ten meetings in a row. The Fed also voted unanimously to keep the interest rate paid on reserve (IOER) balances unchanged at 5.15%.
In the monetary policy statement (MPS), the most important change was it noted “Holding the target range steady at this meeting allows the Committee to assess additional information and its implications for monetary policy.” (i.e. the pause in the rate hike cycle was specific to this meeting only.) And the most noteworthy commentary from FOMC Chair Powell during the press conference was the Fed has “covered a lot of ground and the full effects of our tightening have yet to be felt” and that the pause is only for this meeting and that the Jul FOMC meeting “is live”. As expected, Powell declined to comment on whether the Fed will resume its hiking cycle in Jul, only to suggest that the Fed is “stretching out to a more moderate pace of hiking”.
As for the Dotplot, the median terminal rate projection was pushed higher to 5.6% in the Jun FOMC (from 5.1% in Mar 2023 FOMC), implying two more 25-bps rate hikes or one more 50-bps hike this year. 12 of the 18 FOMC policymakers have their dots coalescing at or above 5.50-5.75%, indicating strong support among policy members for further hikes. In the Jun Summary of Economic Projections (SEP), the two key revisions were 2023 GDP growth (which was revised higher to 1.1% from 0.4% previously) and 2023 core PCE inflation (which was revised higher to 3.9% from 3.6% previously). Unemployment rate in 2023 was revised lower to 4.1% (from 4.5% previously).
FOMC Outlook – One More Hike In Jul FOMC: The latest FOMC statement and Dotplot revision together with Powell’s comments (“stretching out to a more moderate pace of hiking”) are making us reassess (again) on the terminal rate, especially against the still elevated core PCE in 2023. As such, it seems that the Fed will hike some more, but as Powell alluded to during his presser, the [hiking] cycle is near the end, so there is possibly more hikes to come but very limited. We now expect the Fed to hike one final time by 25-bps in the Jul 2023 FOMC and pause thereafter. This means, with the FFTR currently at 5.00-5.25%, we are adjusting our terminal FFTR level higher to 5.25-5.50%. We continue to expect no rate cuts in 2023, so this terminal rate of 5.50% is forecast to last through 2023, with rate cuts coming in from 1Q 2024 onwards.
Kit Juckes, Foreign Exchange Chief Global FX Strategist at Société Générale, analyzes EUR/USD outlook after yesterday’s ECB meeting.
EUR/USD looks set to edge back toward the April high just below 1.11
The ECB move yesterday has given the Euro a good lift, and we look set to edge back toward the April high, just below 1.11. But breaking higher than that may require more than a hawkish central bank in the face of mediocre growth.
The growth outlook needs to improve on this side of the Atlantic, outright and relative to the US, if we’re to see EUR/USD at 1.15.
- US Dollar mixed on Friday after a very volatile week where the Greenback lost substantial ground.
- Traders will look for comments from Fed speakers on Friday that might try to salvage the losses.
- US Dollar Index sinks to a new monthly low and flirts with a break below 102.
The US Dollar (USD) is on track for its worst monthly performance against the Euro after the European Central Bank (ECB) and its chairman Christine Lagarde out-hawkished the US Federal Reserve (Fed). The ECB delivered a 25 basis points rate hike and committed to a hike for July, while the Fed Chairman Jerome Powell reiterated that the US central bank remains data dependent and that it will hike when it deems necessary. This split in stance on monetary policy gave the Euro wings and saw the US Dollar losing ground against some of its peers.
On Friday, traders are assessing the Bank of Japan (BoJ) policy meeting which already took place early this morning in the ASIA PAC session and saw BoJ chairman Kazuo Ueda repeating an unchanged stance as long as price forecast is above 2%, maintaining its policy rate at -0.1% and its 10-year JGB yield target around 0%. On the speakers front, markets will hear from three Fed members with Jim Bullard, Chris Waller at 11:45 and Tom Barkin at 13:00 GMT. Look for clues or any change in statements in order to further clarify what Jerome Powell communicated in case the Fed is not happy with the current stance of the markets, as Michigan Consumer Sentiment and Inflation expectations are to close off this trading week at 14:00 GMT in terms of economic data.
Daily digest: US Dollar losing interest
- The US futures markets Chicago Mercantile Exchange (CME),Intercontinental Exchange (ICE), and the Chicago Board Options Exchange (CBOE) and several other institutions are facing exceptional large volumes today as 'Quadruple Witching' is set to take place today. 'Quadruple Witching' is the moment when a big bulk of options and futures contracts in several asset classes are set to expire at the same moment and will either be liquidated or rolled over. Traded volumes could be multiple times higher than normal.
- The US session will be key to see where the US Dollar closes against several of its peers. At the moment, mostly sideways price action is noted, which could result in either a recovery of more follow-through in recent moves. Seeing the fact that this is the last trading day of the week, some profit taking in certain positions could materialise.
- Speaker of Russia's Upper House of Parliament commented that an extension to the Black Sea Grain Deal is off the table.
- Belarus is officially taking delivery of Russian nuclear weapons. Meanwhile NATO Secretary-General Jens Stoltenberg said it's too early to decide on delivering F-16 to Ukraine.
- Bank of Japan held its rate decision early this Friday morning with BoJ chairman Ueda keeping the central bank's measures unchanged at -0.1% for the policy rate and the 10-year JGB yield target at 0%. Special remarks for the recent FX developments in Japanese Yen, which was a topic of concern for the central bank and requires additional attention.
- Three Fed members on the docket on Friday with Fed’s Jim Bullard to speak at the Norges Bank Conference. Fed’s Chris Waller at 11:45 will be speaking on Macroeconomic policy at the same Norges Bank event, and Fed’s Barkin at 13:00 GMT speaking out of Maryland on inflation. The speech from Jim Bullard did not hold any references towards this week's monetary policy or personal views as Fed member on the current monetary approach for the US.
- A rather quiet close of the week with only the University of Michigan numbers this Friday at 14:00 GMT, with the Sentiment expected at 60, coming from 59.2, Current Conditions expected to come in at 65.1, climbing higher from the 64.9 previous. A big focus on the inflation expectations as well with the 1-year inflation expectations sliding lower from 4.2% to 4.1%. The 5-year to 10-year expectations are 10 basis points lower from 3.1% to 3.0%.
- The China Hang Seng stock market added another 1% gain to its winning streak and nearly closed at a one month high, while Japans Topix index closed just below its 33-year high. Meanwhile the tailwind is picking up speed in Europe as well with the German DAX printing a new all-time high and US equity futures nearly flat for the day.
- The CME Group FedWatch Tool shows that markets are pricing in a 71.9% chance of a 25 basis point (bp) hike on July 26th. Overall, the point of view here seems to be just one more hike and done as all other futures for 2023 are pointing to an unchanged rate level. Nevertheless, with the data dependency of the Fed, there could be a dislocation between the Fed policy and market expectations, possibly undervaluing the Greenback currently, which could trigger US Dollar strength later this year.
- The benchmark 10-year US Treasury bond yield trades at 3.71%, back lower as bonds are in favor again. The 10-year yield was trading around 3.83% before dropping substantially toward 3.70% as the ECB outpaced the Fed with its forward guidance.
US Dollar Index technical analysis: A long way to go for recovery
The US Dollar has taken a firm step back against a few of its peers, while it tries to cling on to gains against some Asian currencies. This mixed bag of performances triggers a mild uptick in the US Dollar Index (DXY) this Friday morning. After the substantial slide lower on Thursday from 103 to nearly 102 it looks to try and hold above 102 before the weekly close.
On the upside, a whole other ball park now as the 55-day Simple Moving Average (SMA) at 102.55 has turned from support into resistance. Should the DXY recover further today, look for the 103 psychological level as the next big challenge to the upside. The high of May at 104.70 remains the ultimate target longer term.
On the downside, the psychological level near 102 is the only element upholding DXY for now. Once price action should start to reside below it, expect to see another nosedive move for the US Dollar Index toward 100.82. That means a challenge for the low of this year and means a substantial devaluation for the Greenback to come.
What is US Dollar Index (DXY)?
The US Dollar Index, also known as DXY or USDX, is a benchmark index that was established by the US Federal Reserve in 1973. DXY is widely used as a tool measuring the US Dollar (USD) value in global markets. The index is calculated by measuring the US Dollar’s performance against a basket of six foreign currencies, the Euro, the Japanese Yen (JPY), Swedish Krona (SEK), the British Pound (GBP), the Swiss Franc (CHF) and the Canadian Dollar (CAD).
With 57.6%, the Euro has the biggest weight in the index followed by the JPY (13.6%), GBP (11.9%), CAD (9.1%), SEK (4.2%), and CHF (3.6%). Hence, a sharp decline in the EUR/USD pair could help the US Dollar Index rise even if the US Dollar weakens against some of the other currencies in the basket.
USD took a battering against most of the G10 currencies yesterday. Economists at Commerzbank analyze the currency outlook.
USD positive arguments, at least short-term
The Retail Sales for May came in slightly above expectations yesterday. At the same time, the initial jobless claims remain at stable levels. That means the cooling of the labor market is progressing only slowly. Further data surprises over the coming weeks would increase the likelihood of a further rate hike over the coming weeks.
We see a high likelihood that the Fed will hike interest rates again in July. So there is still some potential for a surprise there, which might support USD on a temporary basis. However, as our economist project rate cuts for the US central bank next year, EUR/USD is likely to climb sooner or later.
The Bank of Japan (BoJ) maintained its current monetary policy at today’s policy board meeting. Economists at Société Générale discuss JPY outlook.
July YCC tweak will depend on US rates
As we expected, the BoJ maintained its current monetary policy at today’s policy board meeting.
In view of Ueda’s comments during the press conference, we still think that the BoJ could widen the range of fluctuation permitted on 10-year JGB yields from ±50bp to ±100 bps at its July meeting, if there is another US rate hike in July, 10-year JGB yields could once again stick at 0.5% and the USD/JPY rate could rise to 145.
Economist at UOB Group Lee Sue Ann reviews the latest release of GDP figures in New Zealand.
Key Takeaways
New Zealand has entered a technical recession, with the economy contracting by 0.1% q/q in 1Q23, in comparison to the revised 0.7% q/q fall in 4Q22 (-0.6% q/q previously). The reading was sharply below the Reserve Bank of New Zealand (RBNZ)’s projection for 0.3% growth.
Overall, there is a high degree of uncertainty surrounding the latest GDP figure, as the COVID-19 pandemic has significantly disrupted the usual seasonal patterns in the data. However, the downturn was exacerbated by the effects of extreme weather that hit the country through Feb and Mar. We have lowered our GDP growth forecast for 2023 to 0.7%, from 1.3% previously.
The Reserve Bank of New Zealand (RBNZ) has undertaken its most aggressive policy tightening since 1999, when the official cash rate (OCR) was introduced, lifting it by 525bps since Oct 2021 to 5.50%, a 14-year high. However, it has signaled that it has finished hiking. We maintain our view for the OCR to remain at 5.50% for now. The next RBNZ meeting is on 12 Jul.
- EUR/JPY has maintained its four-day winning spell and has climbed to 154.71.
- IMF has advised that the ECB needs the support of lower fiscal spending to scale down inflationary pressures.
- BoJ Ueda conveyed that inflationary pressures in Japan are driven by higher costs and external factors.
The EUR/JPY pair has continued its four-day winning streak after climbing above Thursday’s high at 153.69. The cross has extended its perpendicular north-side momentum to 154.71 as the Bank of Japan (BoJ) has continued its ultra-dovish policy stance and the European Central Bank (ECB) has raised interest rates by 25 basis points (bps) to 4% as expected by the market participants.
On Thursday, ECB President Christine Lagarde delivered hawkish guidance citing that one more interest rate hike is appropriate in July. Also, ECB Lagarde remained doors open for further rate hikes beyond July as core inflation in Eurozone is extremely persistent.
Meanwhile, "Monetary policy must continue to tighten to bring inflation to target in a timely manner, said a commentary by the International Monetary Fund (IMF). Also, IMF has urged nations to cut fiscal spending for increasing the efficiency of the monetary policy by the ECB.
A statement has come from German Finance Minister Christian Lindner "We need common rules that are the same for everyone. We need a reliable path to lower deficits and also to lower debt levels overall, as reported by Reuters.
On the Eurozone’s economic front, Q1 Labor Cost has jumped to 5.0% vs. the estimates of 3.3% but lower than the prior release of 5.6%. Higher payouts to individuals might keep demand pressures elevated.
The Japanese Yen is facing an immense sell-off as the Bank of Japan (BoJ) didn’t alter its interest rate policy to keep the momentum of monetary stimulus intact. BoJ Governor Kazuo Ueda conveyed that inflationary pressures in Japan are driven by higher cost and external factors and a steady 2% inflation demands support from higher wages and domestic demand.
In light of the recent price action, USD/CNH is now likely trade within the 7.0900-7.18000 range, comment UOB Group’s Economist Lee Sue Ann and Markets Strategist Quek Ser Leang.
Key Quotes
24-hour view: While we expected USD to advance yesterday, we were of the view that “a sustained rise above 7.2000 appears unlikely”. USD then rose to 7.1916 before staging a surprising sharp selloff to 7.1180. The sharp and swift drop is overdone and USD is unlikely to weaken further. Today, USD is more likely to trade in a range of 7.1200/7.1600.
Next 1-3 weeks: The USD strength that started late last week ended abruptly as after rising to a fresh high of 7.1916, it then plunged below our ‘strong support’ level of 7.1400 (low of 7.1180). The 7.1916 is likely an interim top and USD has likely moved into a consolidation phase. For the time being, USD is likely to trade between 7.0900 and 7.1800.
USD/JPY is now pushing through 141.00. Economists at ING analyze the pair’s outlook.
USD/JPY may well still bid and should remain in the lead should any US data surprise on the upside
We think there is a chance that the BoJ does tweak its policy set-up at the 28 July policy meeting, when new forecasts will be released. Until that point, however, USD/JPY may well still bid and should remain in the lead should any US data surprise on the upside.
Equally, the Yen will lag – and will continue to decline on the cross rates – if this current period of Dollar weakness does extend after all.
- USD/JPY has jumped above 141.00 confidently as the BoJ has continued its expansionary policy.
- BoJ Ueda stated that Japan's headline CPI around 3.5% is due to external, cost-push factors, and cannot be controlled by Japan's monetary policy.
- USD/JPY is approaching 61.8% Fibonacci retracement plotted at 142.63.
The USD/JPY pair showed a V-shape recovery from 140.00 after the Bank of Japan (BoJ) Governor Kazuo Ueda announced an unchanged interest rate decision. BoJ Ueda decided to continue monetary stimulus to spur wages and the overall demand as current inflationary pressures in Japan are majorly contributed by higher import prices.
BoJ Ueda has commented that Japan's headline CPI around 3.5% is due to external, cost-push factors, and cannot be controlled by Japan's monetary policy.
Meanwhile, the US Dollar Index (DXY) is consistently trading in a narrow range above 102.00 amid an absence of potential triggers ahead.
Economists at ING analyzed the USD Index outlook stating that in the short term, the Dollar may well stay soft against most currencies except the Japanese Yen, with the Bank of Japan remaining resolutely dovish. Here, Yen-funded carry trades will remain popular.
USD/JPY is approaching 61.8% Fibonacci retracement (plotted from 21 October 2022 high at 151.94 to 16 January 2023 low at 127.22) at 142.63 on a daily scale. The asset has refreshed its six-month high at 141.50.
Upward-sloping 20-period Exponential Moving Average (EMA) at 139.38 is providing a cushion to the US Dollar bulls.
The Relative Strength Index (RSI) (14) has shifted into the bullish range of 60.00-80.00, which indicates that the bullish momentum is active.
Going forward, an upside move above a six-month high at 141.50 will drive the asset toward a 61.8% Fibo retracement at 142.58 and 04 October 2022 low at 143.89.
On the flip side, a confident break below June 06 low at 139.09 will drag the asset toward March 08 high at 137.92 followed by March 02 high at 137.10.
USD/JPY daily chart
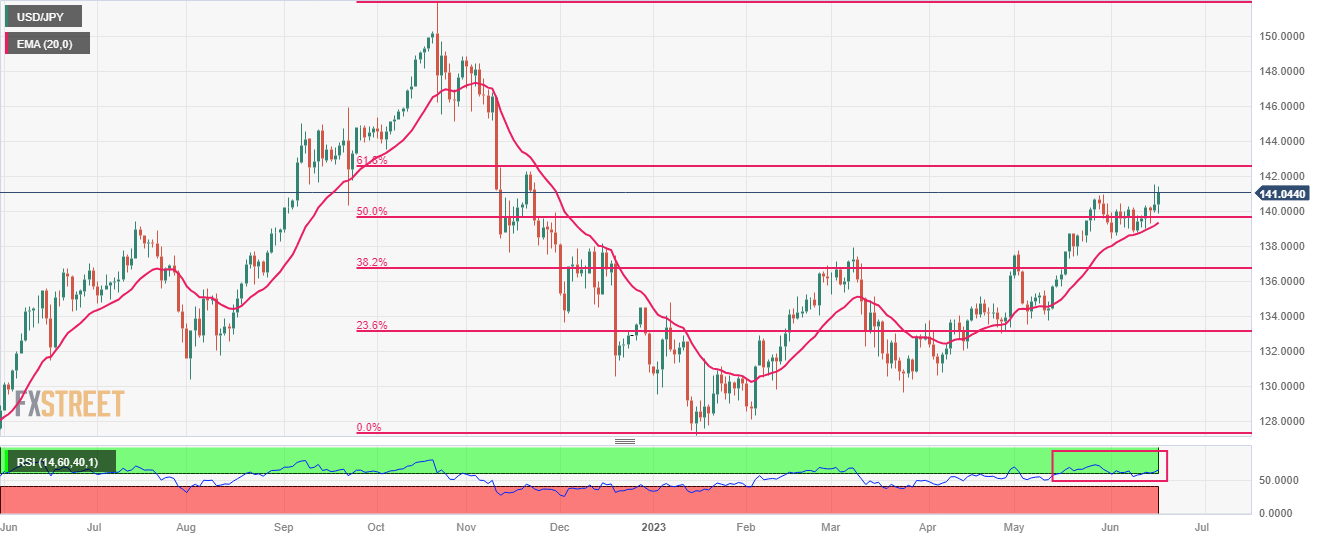
The Australian labour market data for May published yesterday was much better than expected. Economists at Commerzbank analyze AUD outlook after the report.
Surprise rise in employment in Australia fuels rate hike expectations
Employment rose by an impressive 75.9K MoM. The data is likely to add to the Australian central bank’s (RBA) concerns that inflation remains stubbornly at high levels.
The market expects the RBA to take countermeasures and to further hike the key rate compared with the current 4.1%.
Against this background, it would seem that the Aussie, which yesterday also benefitted from a weakening USD, will not continue to rise endlessly. Seeing that the Fed seems willing to implement further rate hikes despite the recent pause we consider AUD to be well supported though in view of an also hawkish RBA.
European Central Bank (ECB) policymaker Robert Holzmann said on Friday that he has no view on what should happen with rates beyond July.
Additional takeaways
“If things continue as they are, namely with stubbornly high inflation, then further action on rates will be needed.”
“Key question will be how persistent core inflation is.”
Market reaction
At the time of writing, EUR/USD is trading at 1.0953, up 0.07% on the day, little affected by the ECB commentary.
- Gold price gains positive traction for the second straight day, though lacks bullish conviction.
- An intraday pickup in the US bond yields revives the USD demand and could act as a headwind.
- Hawkish outlook by major central banks further contribute to capping gains for the XAU/USD.
Gold price builds on the overnight goodish recovery from the $1,925-$1,924 area, or a nearly three-month low and attracts some follow-through buying for the second successive day on Friday. The XAU/USD trades with a mild positive bias through the early part of the European session and is currently placed just above the $1,960 level, up over 0.20% for the day.
The uncertainty over the Federal Reserve’s (Fed) rate-hike path is seen as a key factor lending some support to the non-yielding Gold price, though any meaningful appreciating move still seems elusive. Thursday's rather unimpressive macro data from the United States (US) raised questions over how much headroom the Fed has to keep raising rates and fueled speculations that the end of the current policy tightening cycle is nearing.
The Fed, however, has signalled earlier this week that borrowing costs may still need to rise by as much as 50 bps by the end of this year. This, along with a modest uptick in the US Treasury bond yields, assists the US Dollar (USD) to stage a modest recovery from over a one-month low touched earlier this Friday. A modest USD strength might hold back traders from placing bullish bets around the US Dollar-denominated Gold price.
Furthermore, a more hawkish outlook by other major central banks might further contribute to capping the upside for the yellow metal. It is worth recalling that the Reserve Bank of Australia (RBA) and the Bank of Canada (BoC) delivered a surprise 25 basis point (bps) rate hike last week. The European Central Bank (ECB) also lifted rates by 25 bps, to the highest level in 22 years, and indicated further tightening to bring down inflation.
Moreover, the Bank of England (BoE) is expected to be far more aggressive in policy tightening to contain stubbornly high inflation and hike interest rates by 25 bps on June 22. Apart from this, a generally positive tone around the equity markets makes it prudent to wait for strong follow-through buying before confirming that the Gold price has formed a near-term bottom and positioning for any further gains.
Technical levels to watch
Sterling continues to hold gains. Economists at ING analyze the GBP outlook.
Sterling to hold gains into next week's CPI data
This year Sterling's correlation with risk assets had fallen, suggesting perhaps that it should not be at the forefront of a risk rally. However, we think the Dollar environment is softening and we do not want to stand in the way of a GBP/USD rally.
Looking at the charts it seems there is 'fresh air' between current levels (1.2750/1.2800) and 1.3000 – suggesting the latter beckons.
For EUR/GBP, the hawkish ECB helps strengthen the support at 0.8550, although next week's release of the UK June CPI will probably be the next big driver here, ahead of an expected 25 bps BoE rate hike next Thursday.
This month in the G10 space, the Dollar is only stronger against the Yen. Economists at ING analyze the USD outlook.
DXY can probably edge down to the 102.00 area
In the short term, the Dollar may well stay soft against most currencies except the Japanese Yen, with the Bank of Japan remaining resolutely dovish. Here, Yen-funded carry trades will remain popular.
For today's data, we have the University of Michigan's inflation expectations. This occasionally moves markets and any meaningful drop could nudge the Dollar lower. Equally, we have three Fed speakers, generally from the hawkish end of the spectrum.
We think the mood to put money to work probably dominates and barring any big upside surprise in US inflation expectations, DXY can probably edge down to the 102.00 area, if not below.
- AUD/USD has shown exhaustion in the north-side momentum after reaching to near 0.6900.
- The risk-taking ability of the market participants is cooling down as the Fed has confirmed two more interest rate hikes this year.
- The minutes from RBA will provide a detailed explanation behind the interest rate hike of 25 bps.
The AUD/USD pair has witnessed an exhaustion in the upside momentum after coming closer to near the round-level resistance of 0.6900 in the European session. The Aussie asset is expected to remain on the tenterhooks as the US Dollar Index (DXY) has shown a solid recovery after printing a fresh monthly low at 102.05.
S&P500 futures are holding some losses in the London session as investors are worried that recession fears in the United States have not receded yet despite a skip in the policy-tightening spell by the Federal Reserve (Fed). The risk-taking ability of the market participants is cooling down as Fed chair Jerome Powell has confirmed two more interest rate hikes this year.
The USD Index has extended its recovery to near 102.30 as the risk-on market mood is fading now. Investors should understand that the rate-hiking spell has skipped for a month is not concluded as inflationary pressures are twice the desired rate of 2%.
On the Australian Dollar front, investors are awaiting the release of the Reserve Bank of Australia (RBA) minutes, which will release on Tuesday. The minutes from RBA will provide a detailed explanation behind the interest rate hike of 25 basis points (bps). RBA Governor Philip Lowe raised interest rates to 4.10% as monthly inflation has rebounded to near 6.8% after softening to 6.3%.
Also, the RBA minutes will provide guidance about the interest rate policy for July. The guidance for interest rates should be hawkish as Australian Employment has turned out to be resilient.
- Euro advances to new multi-week tops near 1.0960.
- Stocks markets in Europe open with marginal changes.
- The appetite for the risk complex appears slightly favoured on Friday.
- ECB’s J. Nagel and B. Vasle advocated for an extra hike in the summer.
- EMU Final Inflation Rate is due later in the domestic docket.
- US Flash Consumer Sentiment and Fedspeak comes later in the session.
The European currency (EUR) seems to struggle to continue its weekly sharp rally and motivates EUR/USD to recede from earlier multi-week peaks near 1.0960 at the end of the week, and area last visited in mid-May.
In the meantime, risk appetite trends appears somewhat divided as investors continue to adjust to Thursday’s hawkish message from the ECB, after the central bank walked the talk and raised rates by 25 bps and signalled that more is coming at the July meeting.
On the latter, ECB Board members Joachim Nagel and Bostjan Vasle advocated earlier in the European morning for an extra 25 bps rate hike in the summer, a view that falls in line with President Christine Lagarde’s comments on Thursday.
Back at the ECB event, the bank's rate increases were underscored during the press conference, where President Lagarde dedicated a significant amount of time emphasizing factors that contribute to inflation growth, such as robust wage increases, improved profit margins, and high expectations of inflation. Although potential risks to economic growth and stricter financial conditions were acknowledged, the primary message conveyed by the ECB today was its commitment to maintain the upward trajectory of interest rates. As Lagarde mentioned, the ECB has no intention of considering a pause at the moment.
The domestic calendar will include the final inflation figures in the euro area for the month of May, whereas the preliminary Michigan Consumer Sentiment gauge will be the salient release across the pond along with speeches by St. Louis Fed James Bullard (2025 voter, hawk) and FOMC’s Christopher Waller (permanent voter, hawk).
Daily digest market movers: Euro seems to have met initial hurdle near 1.0960
- The US Dollar attempts a tepid bounce and encourages the USD Index (DXY) to put some distance from earlier multi-week lows near 102.00.
- US and German yields pick up pace, while their inversion keep signalling the likelihood of a recession in the next months.
- It seems that a continuous decrease in the Greenback is not certain after the FOMC event on Wednesday, as the Committee plans to resume increasing interest rates, potentially starting as early as July and Jerome Powell clarified that the decision not to increase rates at the current meeting was not a "skip".
- EMU Final inflation figures due later in the session are expected to confirm the gradual disinflation.
- Consensus expects a slight improvement in the US Consumer Sentiment in June, while the resumption of the hawkish narrative should not be ruled out when C. Waller speaks later in the session.
Technical Analysis: Euro faces a key hurdle at 1.1000
Euro (EUR) printed a new monthly high at 1.0962 on June 16. Further gains need to rapidly clear this level to allow for a potential move to the psychological 1.1000 hurdle. North from here, the pair could challenge the 2023 high at 1.1095 (April 26), which is closely followed by the round level of 1.1100 and comes ahead of the weekly top of 1.1184 (March 31, 2022). In addition, the latter appears propped up by the proximity of the 200-week SMA, today at 1.1182.
In case bears regain the initiative, there are no contention levels of significance until the May low of 1.0635 (May 31). The breach of this level could sponsor a deeper decline to the March low of 1.0516 (March 15) seconded by the 2023 low at 1.0481 (January 6).
Euro FAQs
What is the Euro?
The Euro is the currency for the 20 European Union countries that belong to the Eurozone. It is the second most heavily traded currency in the world behind the US Dollar. In 2022, it accounted for 31% of all foreign exchange transactions, with an average daily turnover of over $2.2 trillion a day.
EUR/USD is the most heavily traded currency pair in the world, accounting for an estimated 30% off all transactions, followed by EUR/JPY (4%), EUR/GBP (3%) and EUR/AUD (2%).
What is the ECB and how does it impact the Euro?
The European Central Bank (ECB) in Frankfurt, Germany, is the reserve bank for the Eurozone. The ECB sets interest rates and manages monetary policy.
The ECB’s primary mandate is to maintain price stability, which means either controlling inflation or stimulating growth. Its primary tool is the raising or lowering of interest rates. Relatively high interest rates – or the expectation of higher rates – will usually benefit the Euro and vice versa.
The ECB Governing Council makes monetary policy decisions at meetings held eight times a year. Decisions are made by heads of the Eurozone national banks and six permanent members, including the President of the ECB, Christine Lagarde.
How does inflation data impact the value of the Euro?
Eurozone inflation data, measured by the Harmonized Index of Consumer Prices (HICP), is an important econometric for the Euro. If inflation rises more than expected, especially if above the ECB’s 2% target, it obliges the ECB to raise interest rates to bring it back under control.
Relatively high interest rates compared to its counterparts will usually benefit the Euro, as it makes the region more attractive as a place for global investors to park their money.
How does economic data influence the value of the Euro?
Data releases gauge the health of the economy and can impact on the Euro. Indicators such as GDP, Manufacturing and Services PMIs, employment, and consumer sentiment surveys can all influence the direction of the single currency.
A strong economy is good for the Euro. Not only does it attract more foreign investment but it may encourage the ECB to put up interest rates, which will directly strengthen the Euro. Otherwise, if economic data is weak, the Euro is likely to fall.
Economic data for the four largest economies in the euro area (Germany, France, Italy and Spain) are especially significant, as they account for 75% of the Eurozone’s economy.
How does the Trade Balance impact the Euro?
Another significant data release for the Euro is the Trade Balance. This indicator measures the difference between what a country earns from its exports and what it spends on imports over a given period.
If a country produces highly sought after exports then its currency will gain in value purely from the extra demand created from foreign buyers seeking to purchase these goods. Therefore, a positive net Trade Balance strengthens a currency and vice versa for a negative balance.
- USD/CAD is seen consolidating its recent losses to the lowest level since September 2022.
- A modest USD recovery from a multi-week low is seen acting as a tailwind for the major.
- The uncertain Fed policy outlook might cap any further upside for the buck and the pair.
The USD/CAD pair enters a bearish consolidation phase on Friday and oscillates in a narrow trading band near its lowest level since September 2022 touched the previous day. Spot prices, however, manage to hold steady above the 1.3200 mark through the early part of the European session, though any meaningful recovery still seems elusive.
A modest intraday pickup in the US Treasury bond yields assists the US Dollar (USD) to bounce off a one-month low, which, in turn, is seen lending some support to the USD/CAD pair. The Federal Reserve's (Fed) hawkish outlook, signalling that borrowing costs may still need to rise by as much as 50 bps by the end of this year, acts as a tailwind for the US bond yields and the USD. That said, Thursday's rather unimpressive US macro data raised questions over how much headroom the US central bank has to keep raising rates.
This, along with expectations that the Fed is getting closer to the peak of its policy tightening cycle might hold back the USD bulls from placing aggressive bets. The Canadian Dollar (CAD), on the other hand, might continue to draw support from the Bank of Canada's (BoC) surprise 25 bps lift-off last week. This, along with this week's goodish recovery in Crude Oil prices, from the lowest level since early May, could underpin the commodity-linked Loonie and further contribute to capping the upside for the USD/CAD pair, at least for now.
Nevertheless, spot prices remain on track to register heavy losses for the third successive week. Market participants now look to Fed Governor Christopher Waller's public appearance later during the early North American session. Traders will further take cues from the Preliminary release of the Michigan US Consumer Sentiment Index. This, along with the US bond yields, will drive the USD demand. Apart from this, Oil price dynamics might further contribute to producing short-term trading opportunities around the USD/CAD pair.
Technical levels to watch
Yen is broadly offered. Economists at Société Générale analyze USD/JPY technical outlook.
An initial pullback is not ruled out
USD/JPY has faced interim resistance near the upper end of a multi-month channel at 141.50. An initial pullback is not ruled out however the 200-DMA and the upper band of the previous consolidation near 138/137.20 is expected to provide support. Defending this can lead to continuation in up move.
Beyond the 141.50 mark, next potential hurdles are at 142.50/142.80, the 61.8% retracement from last year.
Here is what you need to know on Friday, June 16:
The US Dollar (USD) suffered heavy losses against its major rivals on Thursday, with the US Dollar Index (DXY) touching its weakest level in over a month near 102.00. The DXY consolidates its weekly losses early Friday as investors await comments from Federal Reserve officials. The University of Michigan's preliminary Consumer Sentiment Survey for June will also be featured in the US economic docket. In the European session, Eurostat will release revisions to May inflation data.
The weekly Initial Jobless Claims in the US came in at 262,000 in the week ending June 10, surpassing the market expectation of 249,000. Other data from the US showed that Retail Sales rose 0.3% in May, while the Federal Reserve Bank of Philadelphia's Manufacturing Survey dropped to -13.7 in June from -10.4 in May. Mixed US data triggered another leg of USD selloff during the American trading hours on Thursday.
Meanwhile, the European Central Bank (ECB) announced on Thursday that it raised key rates by 25 basis points (bps) as expected. The ECB revised inflation projections for inflation excluding energy and food, especially for 2023 and 2024, citing past upward surprises and implications of robust labour market for speed of disinflation.
In the post-meeting news conference, "bearing a material change to our baseline, it is very likely the case that we will continue to raise rates in July," ECB President Christine Lagarde said. Revisions to inflation alongside Lagarde's hawkish tone provided a boost to the Euro and EUR/USD advanced to its highest level in over a month above 1.0950 before retreating below that level early Friday.
In the Asian session, the Bank of Japan (BoJ) left its monetary policy setting unchanged. Commenting on the policy outlook, "responding to an inflation undershoot after a premature rate hike is more difficult than responding to an overshoot," Bank of Japan Governor Kazuo Ueda said. USD/JPY gathered bullish momentum and was last seen gaining more than 0.5% on the day above 141.00.
GBP/USD capitalized on the broad USD weakness on Thursday and rose above 1.2800 for the first time since April 2022. In the European morning, the pair trades in a narrow range slightly above 1.2800.
Gold price rose sharply after falling to a three-month low below $1,930 on Thursday. Falling US Treasury bond yields provided a boost to XAU/USD and the pair snapped a four-day losing streak. Early Friday, Gold price continues to stretch higher and was last seen trading slightly above $1,960.
Following Wednesday's drop, Bitcoin gained nearly 2% on Thursday before settling at around $25,500 early Friday. Ethereum is struggling to gather recovery momentum and trading below $1,700 despite having registered small gains on Thursday.
Yesterday, the better global growth environment and softer Dollar generated a 1% rally in EUR/USD. Economists at ING analyze the pair’s technical outlook.
Bullish on EUR/USD in the second half
We are bullish on EUR/USD in the second half, but we are not sure which month exactly the bull trend would take off. Could it be June?
For EUR/USD today, let us see whether the US data and Fed speakers make much of an impression.
In addition, we have four ECB speakers from the more hawkish end of the spectrum. We prefer to back the bullish momentum here and can see EUR/USD pushing on to the 1.1000/1030 region today.
More comments are flowing in from new Bank of Japan Governor Kazuo Ueda on Friday, as he addresses his first press conference that follows the monetary policy meeting.
Key quotes
Japan's headline CPI around 3.5% is due to external, cost-push factors, cannot be controlled by Japan's monetary policy.
No comment on stock price moves, levels.
Coronavirus-caused supply shocks and strong global inflationary pressures have spread to Japan.
Responding to inflation undershoot after premature rate hike is more difficult than responding to overshoot.
Risk of excessive inflation overshoot with cautious policy response is 'not zero', but there's also risk of inflation undershoot with hasty monetary normalisation.
Rising stock and other asset prices could positively affect consumption, capex, but there's risk of negative impact from 'going too far'.
Will consider more detailed description of risks in policy documents.
Market reaction
USD/JPY is extending the upside to refresh multi-month highs at 141.40 on Ueda’s dovish remarks. The pair is trading at 141.20, up 0.63% on the day.
- USD/MXN has displayed a recovery move from 17.10 following positive cues from the USD Index.
- S&P500 futures have increased losses as investors are hoping that recession fears in the US have not receded.
- The US economy is operating in a better position beyond full-employment levels and will keep households demand at elevated levels.
The USD/MXN pair has shown a recovery move after defending its crucial support of 17.10 in the European session. The asset is following the footprints of the US Dollar Index (DXY) as the latter has also shown a recovery move from 102.00.
S&P500 futures have increased losses in the London session as investors are hoping that recession fears in the United States have not receded despite the Federal Reserve (Fed) has skipped hiking interest rates in June.
The USD Index has rebounded firmly to near 102.23 as two more interest rate hikes have been announced by Fed chair Jerome Powell. Also, Fed Powell confirmed that rate cuts are not appropriate by year-end. The Fed believes that headline inflation has softened due to the gasoline prices impact while the core inflation is still showing persistence.
Apart from that, US labor market conditions are well tight in spite of the Unemployment Rate having increased to 3.8%. The US economy is still operating in a better position beyond full-employment levels and will keep households’ demand at elevated levels.
On Thursday, US Census Bureau reported that monthly Retail Sales (May) surprisingly expanded by 0.3% while the street was anticipating a contraction of 0.1% but the pace of expansion was slow against the prior pace of 0.4%. Scrutiny of the Retail Sales report shows that demand for automobiles was extremely solid though inflationary pressures have squeezed the real income of households.
On the Mexican Peso front, Bank of Mexico (Banxico) Governor Victoria Rodriguez Ceja is expected to hold interest rates at a record-high for at least the next two meetings before considering neutrality.
- EUR/GBP struggles to register any meaningful recovery from the YTD low touched earlier this week.
- Bets for more rate hikes by the BoE underpin the British Pound and act as a headwind for the cross.
- The ECB’s hawkish outlook lends support to the Euro and helps limit the downside, at least for now.
The EUR/GBP cross trades with a mild negative bias, around mid-0.8500s heading into the European session on Friday and remains well within the striking distance of its lowest level since August 2022 touched earlier this week.
The British Pound (GBP) continues with its relative outperformance in the wake of expectations that the Bank of England (BoE) will be far more aggressive in policy tightening to contain stubbornly high inflation. In fact, the headling UK CPI, at 8.7% in April, is still running more than four times the central bank's target. This, in turn, cemented market bets for another 25 bps BoE rate hike on June 22, which is seen underpinning the Sterling and exerting some pressure on the EUR/GBP cross.
The shared currency, on the other hand, might draw support from the European Central Bank's (ECB) hawkish outlook, signalling further tightening to bring Eurozone inflation to its medium-term target of 2%. It is worth recalling that the ECB hiked interest rates for the eighth straight time on Wednesday, by 25 bps to 3.5% or the highest in 22 years. The inflation projection for this year was raised to 5.1% from 4.6%, suggesting that the central bank is still not done with the policy tightening.
This, in turn, is holding back traders from placing aggressive bearish bets around the EUR/GBP cross and helping limit any further losses, at least for the time being. Market participants now look forward to the release of the final Eurozone CPI report, which might do little to dent expectations about additional rate hikes by the ECB and provide any meaningful impetus. The lack of any buying interest, meanwhile, suggests that the path of least resistance for spot prices is to the downside.
Technical levels to watch
There still seems to be room for further upside in USD/JPY to the mid-141.00s, note UOB Group’s Economist Lee Sue Ann and Markets Strategist Quek Ser Leang.
Key Quotes
24-hour view: Yesterday, we expected USD to trade with an upward bias but we held the view that it “is unlikely to break 141.00”. We did not anticipate the elevated volatility as USD surged to 141.50 and then sold off sharply to a low 0f 139.93. The rapid loss in momentum suggests USD is unlikely to advance further. Today, USD is more likely to trade in a range of 139.50 and 140.70.
Next 1-3 weeks: We highlighted yesterday that “upward momentum appears to be building”. We added, “for USD to advance in a sustained manner, it must break clearly above 141.00”. While USD surged to a high of 141.50, it plummeted from the high. The price actions did not result in any increase in momentum. However, as long as 139.30 (no change in ‘strong support level) is not breached, there is a slim chance for USD to break above 141.50 (this level is a solid resistance now).
Considering advanced figures from CME Group for natural gas futures markets, open interest dropped for the second session in a row on Thursday, this time by around 2.5K contracts. Volume, instead, went up sharply by nearly 364K contracts, offsetting the previous daily pullback.
Natural Gas: Next resistance emerges near $2.70
Prices of natural gas rose markedly on Thursday and clinched multi-day highs near the $2.60 zone. The pronounced uptick, however, was amidst shrinking open interest and volume and could prompt some corrective move in the very near term. In the meantime, the May high near $2.70 per MMBtu (May 19) emerges as the immediate target for bulls.
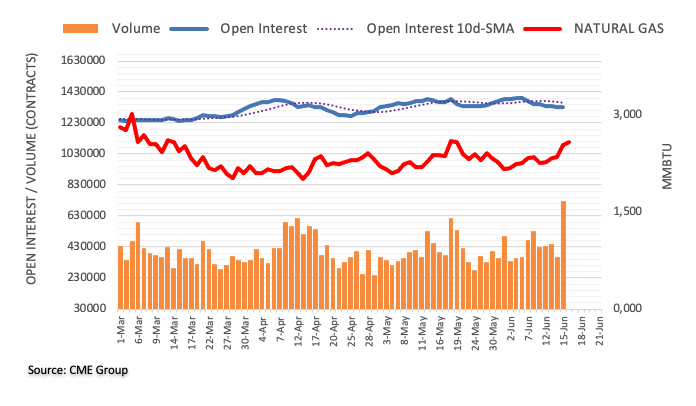
- The index extends the decline and flirts with 102.00.
- The US Dollar risks further weakness in the near term.
- Flash Consumer Sentiment, Bullard, Waller next on tap.
The greenback, when measured by the USD Index (DXY), maintains the offered stance and trades at shouting distance from the key support at 102.00 the figure at the end of the week.
USD Index weaker on firmer risk appetite
The index extends its negative streak for the fourth consecutive session on Friday, as the sentiment around the risk complex continues to improve and market participants keep adjusting to the hawkish message from the ECB event in the previous session.
Indeed, the index flirts with 6-week lows near 102.00 and risks a deeper pullback in the short-term horizon despite the so far small recovery in US yields across the curve and renewed speculation of a potential US recession.
In the US calendar, the only release of note will be the advanced print of the Consumer Sentiment for the month of June, along with speeches by St. Louis Fed J. Bullard (2025 voter, hawk) and FOMC’s C. Waller (permanent voter, hawk).
What to look for around USD
The index appears under heavy downside pressure, although it so far holds on just above the 102.00 region on Friday.
In the meantime, bets for another 25 bps rate hike at the Fed’s gathering in July remain well on the cards against the backdrop of the steady resilience of key US fundamentals (employment and prices, mainly).
The above-mentioned scenario was also reinforced by Chief Powell on Wednesday after he deemed the July meeting “live”, while the majority of the Committee seems ready to resume the tightening campaign as soon as next month.
Key events in the US this week: IFlash Michigan Consumer Sentiment (Friday).
Eminent issues on the back boiler: Persistent debate over a soft/hard landing of the US economy. Terminal Interest rate near the peak vs. speculation of rate cuts in late 2023/early 2024. Fed’s pivot. Geopolitical effervescence vs. Russia and China. US-China trade conflict.
USD Index relevant levels
Now, the index is gaining 0.05% at 102.19 and the breakout of 103.04 (100-day SMA) would open the door to 104.69 (monthly high May 31) and then 105.28 (200-day SMA). On the downside, the next support emerges at 102.04 (monthly low June 16) followed by 100.78 (2023 low April 14) and finally 100.00 (round level).
- GBP/JPY rises for the fourth consecutive day to refresh multi-month high after BoJ Governor Ueda’s speech.
- BoJ’s Ueda defends easy-money policy by citing hopes of easing inflation.
- RSI conditions, multiple upside hurdles around mid-180.00s prod buyers.
- Bears have a long and bumpy road to take entry into the bar.
GBP/JPY bulls cheer dovish comments from Bank of Japan (BoJ) Governor Kazuo Ueda by leaping to a fresh high since December 2015, up 0.55% intraday around 180.40 during early Friday morning in London.
That said, the BoJ kept the short-term interest rate target at -0.1% while directing 10-year Japanese Government Bond (JGB) yields with the band of +/-0.50% earlier in the day by expecting softer inflation pressure to arrive. To defend the view, BoJ’s Ueda recently said, “More time will be needed to meet the central bank’s 2% inflation target.”
Also read: BoJ’s Ueda: More time needed to meet BoJ’s 2% inflation target
Although the BoJ-inspired rally has fewer fundamental hurdles, the technical details suggest a pullback in the GBP/JPY price amid the overbought RSI (14) line, as well as the quote’s battle with the horizontal area comprising levels marked in September-October 2015, near 180.40-80.
Even if the quote rises past 180.80, the 181.00 round figure and 78.6% Fibonacci Expansion (FE) of its moves from September 2020 to December 2022, near 186.30 and the 190.00 round figure will challenge the GBP/JPY bulls.
Meanwhile, the GBP/JPY pair’s failure to provide a weekly closing beyond 180.80 can trigger a pullback toward the 180.00 round figure and then to the 61.8% Fibonacci retracement level of around 179.50.
Above all, the GBP/JPY buyers remain hopeful unless witnessing the weekly close below the previous resistance line from April 2022, near 176.20 by the press time.
GBP/JPY: Weekly chart
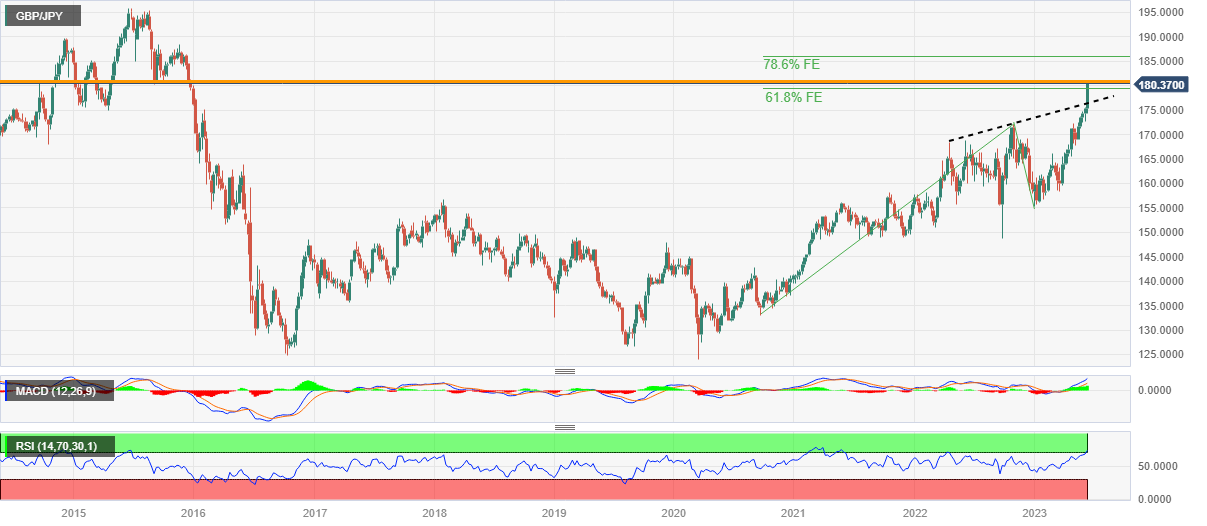
Trend: Pullback expected
FX option expiries for June 16 NY cut at 10:00 Eastern Time, via DTCC, can be found below.
- EUR/USD: EUR amounts
- 1.0600 2.1b
- 1.0625 910m
- 1.0650 3.5b
- 1.0700 2.4b
- 1.0750 2.9b
- 1.0800 4.1b
- 1.0840 3.4b
- 1.0900 3.6b
- 1.0915 659m
- 1.1000 1.3b
- USD/JPY: USD amounts
- 138.00 1.5b
- 139.75 490m
- 140.50 797m
- 141.00 1b
- 142.20 555m
- USD/CHF: USD amounts
- 0.8650 540m
- 0.8785 500m
- 0.8900 1.0b
- 0.9145 493m
- 0.9280 485m
- 0.9300 300m
- AUD/USD: AUD amounts
- 0.6650 301m
- 0.6670 388m
- 0.6680 1.3b
- 0.6750 667m
- 0.6800 615m
- USD/CAD: USD amounts
- 1.3200 744m
- 1.3250 824m
- 1.3300 415m
- 1.3350 1.2b
- 1.3630 330m
- NZD/USD: NZD amounts
- 0.6030 428m
- Silver price is hoping to shift its auction above $24.00 amid a sell-off in the USD Index.
- Further ease in US labor market conditions indicates that the Fed could continue skipping rate hikes in July too.
- The anatomy of the Retail Sales report showed that demand for automobiles and building materials was extremely solid.
Silver price (XAG/USD) is looking for breaking above the crucial resistance of $24.00 in the European session. The white metal is getting strength as the US Dollar Index (DXY) is expected to resume its downside journey below 102.00.
The USD index has retreated after a less-confident pullback to near 102.29 as further ease in United States labor market conditions indicates that the Federal Reserve (Fed) could continue skipping interest rate hikes in July’s monetary policy meeting too.
On Tuesday, the US Department of Labor conveyed that initial jobless claims have landed higher than expectations straight for four weeks. For the week ending June 09, jobless claims landed at 262K, similar to their prior release while the street was anticipating a decline to 249K.
While upbeat monthly Retail sales data failed to provide strength to the US Dollar bulls. The anatomy of the Retail Sales report showed that demand for automobiles and building materials was extremely solid. The economic data was surprisingly expanded by 0.3% while the street was anticipating a contraction of 0.1% but the pace of expansion has slowed against the prior pace of 0.4%.
Meanwhile, S&P500 futures have recovered their entire losses while entering into the London session as the overall market mood is quite upbeat.
Silver technical analysis
Silver price has climbed above the 38.2% Fibonacci retracement (plotted from May 26 low at $22.68 to June 09 high at $24.53) at $23.83 on an hourly scale. The 20-period Exponential Moving Average (EMA) at $23.83 is providing support to the Silver bulls.
The Relative Strength Index (RSI) (14) is looking to shift into the bullish range from the bearish range of 20.00-60.00. An occurrence of the same will activate the upside momentum.
Silver hourly chart
-638224947883518639.png)
Bank of Japan (BOJ) Governor Kazuo Ueda is speaking at the post-June policy meeting conference on Friday, noting that more time will be needed to meet the central bank’s 2% inflation target.”
Additional quotes
Effects, side-effects of unconventional monetary policy in past 25 years will be subject to our review of past policies.
Prices will be on uptrend but uncertainty high including outcome of annual wage negotiations.
Review of past policies will also address how globalisation, depopulation since 1990s affected businesses, households, monetary policy.
Will update progress of review of past policies on boj website starting next month.
There are signs of changes in corporate price-setting mechanism.
Pace of decline in prices has somewhat been slow.
We are weighing benefits and side-effects of yield curve control policy.
Will carefully explain our view on economy, financial markets and prices in communicating with markets.
No comment on forex rates.
There are both positive and negative impacts from weak Yen.
Important for currencies to move stably reflecting economic fundamentals.
Having 2% inflation target helps understanding of policy.
There is a gap between trend inflation and underlying inflation.
more to come ...
Market reaction
In reaction to the above comments, USD/JPY is resuming its rally, currently testing 141.00, up 0.45% on the day.
- NZD/USD continues scaling higher on Friday and climbs to a nearly four-week high.
- The USD remains depressed amid dovish Fed expectations and lends some support.
- A positive risk tone further undermines the buck and benefits the risk-sensitive Kiwi.
The NZD/USD pair prolongs its recent upward trajectory witnessed since the beginning of the current month and climbs to over a three-week high on Friday. The pair maintains its bid tone, just below mid-0.6200s heading into the European session and now seems to have found acceptance above a technically significant 200-day Simple Moving Average (SMA).
The US Dollar (USD) continues with its struggle to register any meaningful recovery and remains depressed near a five-week low, which, in turn, is seen acting as a tailwind for the NZD/USD pair. Despite the Federal Reserve's (Fed) hawkish signal that borrowing costs may still need to rise by as much as 50 bps by the end of this year, investors seem convinced that the US central bank is getting closer to the peak of its policy tightening cycle. Moreover, Thursday's rather unimpressive US macro data raised questions over how much headroom the US central bank has to keep raising rates., which continues to undermine the buck.
Apart from this, a generally positive tone around the equity markets is seen as another factor weighing on the safe-haven Greenback and benefitting the risk-sensitive Kiwi. That said, worries about a global economic downturn, particularly in China, might keep a lid on any optimism. Furthermore, a modest uptick in the US Treasury bond yields could limit the USD losses. This, along with the Reserve Bank of New Zealand's (RBNZ) explicit signal that it was done with its most aggressive hiking cycle since 1999 and a technical recession in New Zealand, might hold back bulls from placing fresh bets around the NZD/USD pair.
Nevertheless, spot prices remain on track to register strong weekly gains and end in the green for the third successive week. In the absence of any relevant market-moving economic releases from the US, traders on Friday will take cues from Governor Christopher Waller's public appearance later during the early North American session. This, along with the US bond yields, will influence the USD price dynamics and provide some impetus to the NZD/USD pair. Apart from this, the broader risk sentiment might further contribute to producing short-term trading opportunities on the last day of the week.
Technical levels to watch
European Central Bank (ECB) policymaker and Bundesbank Chief Joachim Nagel is speaking at a panel discussion titled "The Macroeconomic Outlook: Growth, Inflation and Risks" at an event hosted by the Group of Thirty, in Amsterdam.
Key quotes
“German economy to shrink by 0.3% in 2023, expand by 1.2% in 2024 and 1.3% in 2025.”
“German inflation seen at 6.0% in 2023, 3.1% in 2024 and 2.7% in 2025.”
“Decisive monetary policy action is key to counteracting risks of more persistent inflation.“
“Economy is set to recover only arduously but inflation at last is easing.”
“Inflation risks are tilted to the upside.”
Market reaction
EUR/USD was last seen trading at 1.0950, up 0.04% on the day.
In the opinion of UOB Group’s Economist Lee Sue Ann and Markets Strategist Quek Ser Leang, the ongoing strong upside momentum in AUD/USD is expected to meet solid resistance in the 0.6915/40 band.
Key Quotes
24-hour view: The strong surge in AUD to a high of 0.6893 came as a surprise (we were expecting it to consolidate). There is room for AUD to strengthen further but overbought conditions suggest a break of 0.6915 is unlikely today. There is another rather strong resistance at 0.6940. A breach of 0.6830 (minor support is at 0.6850) indicates the current upward pressure has eased.
Next 1-3 weeks: The pace of the advance in AUD continues to surprise us. Yesterday (15 Jun, spot at 0.6800), we indicated that AUD “is likely to strengthen further” but we were of the view that “the next target 0.6860 might not come into view so soon”. However, AUD surged to a high of 0.6893 in NY trade. Despite the rally in AUD that started last week is severely overbought, it is too early to expect a reversal. That said, the solid resistance zone between 0.6915 and 0.6940 might not be easy to break. All in all, only a breach of 0.6790 (‘strong support’ level was at 0.6735 yesterday) would indicate that AUD is not advancing further.
CME Group’s flash data for crude oil futures markets noted traders reduced their open interest positions for the third session in a row on Thursday, now by around 8.8K contracts. In the same line, volume shrank for the third straight session, this time by around 153.7K contracts.
WTI: Gains remain capped by the June top near $75.00
WTI prices extended the weekly bounce and reclaimed the area above the key $70.00 mark per barrel on Thursday. The move, however, was on the back of shrinking open interest and volume, removing strength for the continuation of the rebound in the very near term. So far, bullish attempts appear limited around the monthly highs near the $75.00 level.
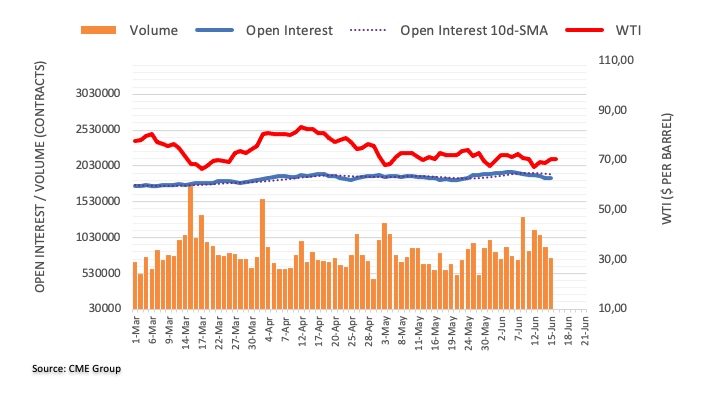
- USD/TRY trades in choppy weekly range after refreshing all-time high.
- Markets expect CBRT rate hike next week as newly appointed policymakers seem having permission from Turkish President Erdogan.
- Fed’s hawkish pause gains little acceptance amid mixed US data, Chairman Powell’s Testimony eyed.
- Mid-tier US data, risk catalysts can entertain Turkish Lira traders amid a likely dull Friday.
USD/TRY portrays indecision among the traders after refreshing the highest price ever recorded earlier in the week, making rounds to 23.65-70 heading into Friday’s European session.
Not only on the daily chart but the weekly performance of the Turkish Lira (TRY) also appears dicey as markets await the next week’s Central Bank of the Republic of Türkiye (CBRT) monetary policy meeting, as well as the Testimony of Fed Chair Jerome Powell, especially after the latest failure to convince hawks.
That said, the market’s anxiety about the CBRT move escalates after the recent appointment of Hafize Gaye Erkan as the new Governor of the CBRT and former economy chief M. Simsek’s posting as the new Finance Minister. On the same line is a Financial Times (FT) news piece suggesting that the Turkish policymakers have a free go from President Recep Tayyip Erdogan. “Erdoğan said this week that while he had not changed his mind on the unorthodox view that high interest rates caused rather than cured inflation, he would allow Erkan and Şimşek to take steps to bring inflation to single digits from the current level close 40%,” per the FT.
On the other hand, markets struggle to believe the Federal Reserve’s (Fed) hawkish signals for the July rate hike amid recently mixed US data. That said, US Retail Sales growth marked an increase of 0.3% for May versus -0.1% expected and 0.4% previous readings while the Core readings, mean Retail Sales ex Autos, match 0.1% market forecasts for the said month, compared to 0.4% prior. Meanwhile, NY Fed Empire State Manufacturing Index jumps to 6.6 in June versus -15.1 expected and -31.8 prior whereas Philadelphia Fed Manufacturing Index drops to -13.7 for the said month from -10.4 prior and compared to -14 market forecasts. On the same line, US Industrial Production for May cools down to -0.2% against 0.1% estimated and 0.5% prior while Initial Jobless Claims reprints the upwardly revised figures of 262K for the week ended on June 09 versus 249K expected.
Amid these plays, US Dollar Index (DXY) grinds near 102.20-30 while struggling to pare the biggest daily loss in three months whereas the US 10-year Treasury bond yields snap a two-day losing streak to regain 3.75% mark of late. Furthermore, S&P500 Futures remain dicey at a 14-month high whereas the stocks in the Asia-Pacific zone trace Wall Street benchmarks toward the north, despite the downbeat performance of Taiwan and Indonesia.
Technical analysis
Tuesday’s Doji candlestick joins the overbought RSI (14) line to challenge USD/TRY bulls unless the quote crosses the latest peak of around 24.10. The pullback moves, however, need to break the weekly support line of around 23.60-58 to convince sellers.
Extra gains could see GBP/USD revisiting the 1.2900 region in the next few weeks, according to UOB Group’s Economist Lee Sue Ann and Markets Strategist Quek Ser Leang.
Key Quotes
24-hour view: We highlighted yesterday that “while severely overbought, the advance in GBP has room to break above 1.2700 before the risk of a pullback increases”. We added, “The next major resistance at 1.2790 is highly unlikely to come into view”. We did not expect GBP to accelerate upwards to within one pip of 1.2790 (high of 1.2789). Today, GBP is likely to break 1.2790. In view of the severely overbought conditions, it is unlikely to challenge the next resistance at 1.2850. On the downside, a breach of 1.2710 (minor support is at 1.2750) indicates that GBP is not rising further,
Next 1-3 weeks: Yesterday (15 Jun, spot at 1.2665), we held the view that GBP “is likely to strengthen further” and “the next level to watch is 1.2790”. Our view was correct, but we did not quite expect GBP to rise towards 1.2790 so quickly (high has been 1.2789). Not surprisingly, conditions are severely overbought. However, only a breach of 1.2630 (‘strong support’ level was at 1.2560) indicates that the GBP strength that started one week ago has ended. On the upside, the next level to aim for is 1.2900.
Open interest in gold futures markets rose by around 2.6K contracts after four consecutive daily drops on Thursday, according to preliminary readings from CME Group. Volume followed suit and went up by around 67.5K contracts, reversing at the same time the previous daily pullback.
Gold: Extra gains need to surpass $1980
Thursday’s marked advanced in gold prices was on the back of increasing open interest and volume, suggesting that further upside appears on the table in the very near term. For bullion to break out the ongoing consolidative phase it must clear the monthly peaks around $1980 per troy ounce.
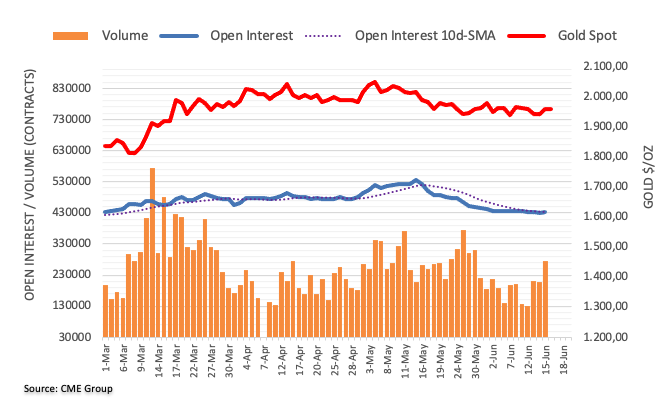
- GBP/USD is making efforts for shifting the auction above 1.2800 as the risk-appetite theme is in action.
- The Pound Sterling is in the limelight as the BoE is expected to raise interest rates further.
- GBP/USD has printed a fresh annual high of around 1.2790 after climbing above the horizontal resistance plotted at 1.2667.
The GBP/USD pair is gathering strength for climbing above the round-level resistance of 1.2800 in the early European session. The Cable has already shown a solid rally and is expected to extend gains further as the risk appetite of the market participants is extremely solid.
S&P500 futures have recovered some losses, portraying a recovery in the overall market mood. The US Dollar Index (DXY) is oscillating in a narrow range above 102.00 after a massive sell-off. More downside seems solid as United States Employment conditions have eased further following the fourth consecutive addition in weekly jobless claims than expectations.
The Pound Sterling is in the limelight as the Bank of England (BoE) is expected to raise interest rates further to keep building pressure on stubborn United Kingdom inflation.
GBP/USD has printed a fresh annual high around 1.2790 after climbing above the horizontal resistance plotted from 27 May 2022 high at 1.2667. Advancing 20-period Exponential Moving Average (EMA) at 1.2558 is providing support to the Pound Sterling bulls. Forward resistance is plotted from 14 March 2022 low around 1.3000
The Relative Strength Index (RSI) (14) has climbed above 60.00, showing no signs of divergence and any kind of overbought situation. This indicates an activation of the bullish momentum.
For further upside, a confident break above 1.2800 will drive the Cable toward the round-level resistance at 1.2900 followed by 14 March 2022 low around 1.3000.
On the flip side, a break below May 31 low at 1.2348 would drag the asset toward May 25 low at 1.2308. Slippage below the latter would expose the asset to April 03 low at 1.2275.
GBP/USD daily chart
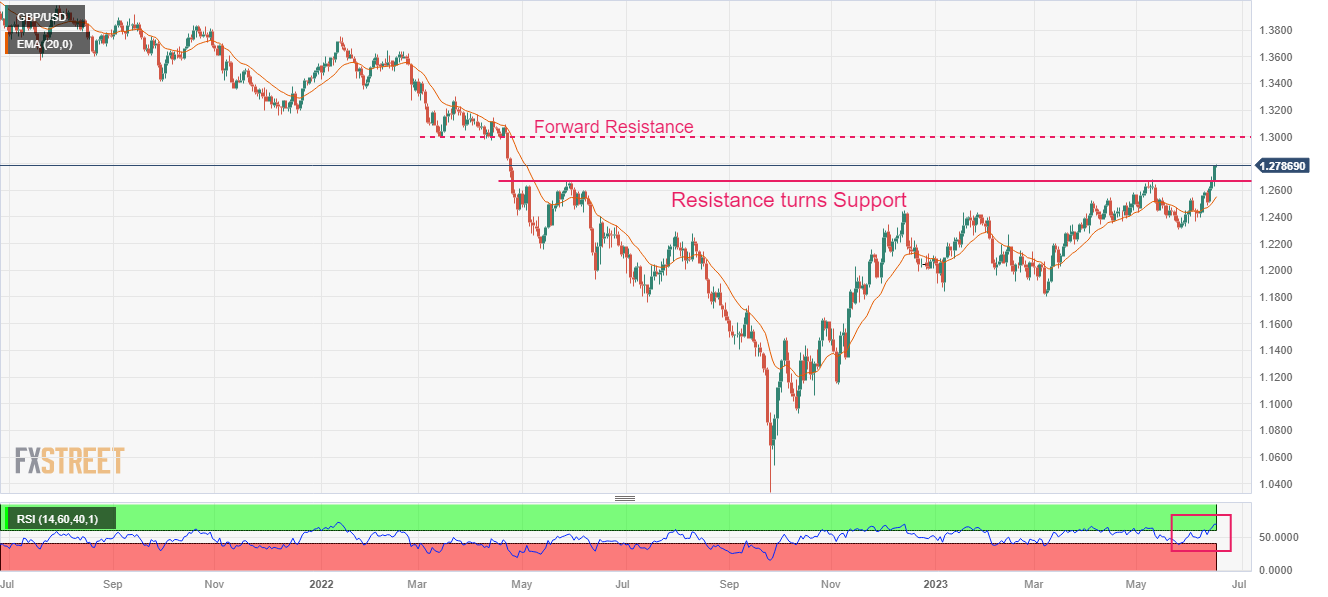
UOB Group’s Economist Lee Sue Ann and Markets Strategist Quek Ser Leang suggest EUR/USD could now attempt a move to 1.1000.
Key Quotes
24-hour view: While we expected EUR to advance further yesterday, we indicated that “overbought conditions suggest the next major resistance at 1.0900 is unlikely to come under threat today”. The anticipated EUR strength exceeded our expectation by a wide margin as it surged by 1.05% (NY close of 1.0945), its biggest 1-day gain in 4-1/2 months. Conditions remain overbought but EUR could rise above the major resistance at 1.0965. The next resistance at 1.1000 is unlikely to come under threat. Support is at 1.0915, followed by 1.0880.
Next 1-3 weeks: Yesterday (15 Jun, spot at 1.0835), we noted that “the outlook for EUR is still positive and the next level to aim for is 1.0900”. Our expectation for EUR to strengthen was correct, but we did not expect the sharp rally that sent EUR surging to a high of 1.0952. We continue to expect EUR to rise, in view of the severely overbought conditions, the pace of any advance is likely to be slower. The next level to watch is 1.1000. Overall, only a breach of 1.0825 (‘strong support’ level was at 1.0755 yesterday) would indicate the EUR strength that started last Friday has come to an end.
- USD/JPY catches fresh bids on Friday in reaction to the BoJ’s dovish stance.
- An uptick in the US bond yields revives the USD demand and lends support.
- The Fed-BoJ policy divergence supports prospects for further intraday gains.
The USD/'JPY pair attracts fresh buyers after the Bank of Japan (BoJ) announced its policy decision earlier this Friday and stalls the overnight retracement slide from the 141.50 region, or its highest level since November 2022. The pair maintains its bid tone heading into the European session and current trades near the top end of its daily range, around the 140.65-140.70 area.
The Japanese Yen (JPY) weakens across the board in reaction to the BoJ's decision to maintain its ultra-loose monetary policy stance to support fragile economic growth. The Japanese central bank held its short-term interest rate target at -0.1%, as expected, and made no changes to its yield curve control policy after a two-day meeting. The BoJ also kept intact its view that inflation will slow later this year, suggesting that it will remain a dovish outlier amid global uncertainty. This, along with a modest US Dollar (USD) strength, assists the USD/JPY pair to regain some positive traction on the last day of the week.
Having registered heavy losses over the past three days, the USD Index (DXY), which tracks the Greenback against a basket of currencies, stages a modest bounce from over a five-week low and draws support from an uptick in the US Treasury bond yields. That said, any meaningful USD rally seems limited in the wake of expectations that the Federal Reserve (Fed) is getting closer to the peak of its policy tightening cycle. Thursday's rather unimpressive US macro data - namely Industrial Production, Weekly Jobless Claims and Retail Sales - raised questions over the prospects for additional rate hikes by the Fed.
The US central bank, meanwhile, indicated earlier this week that borrowing costs may still need to rise by as much as 50 bps by the end of this year. This marks a big divergence in comparison to the BoJ's dovish outlook, which might continue to undermine the JPY. Apart from this, diminishing odds for an intervention by the Japanese government to stabilize the domestic currency suggests that the path of least resistance for the USD/JPY pair is to the upside. Hence, any intraday dip might still be seen as a buying opportunity and remain cushioned in the absence of any relevant market-moving data from the US.
Technical levels to watch
- USD/CHF licks its wounds at the lowest levels in five weeks.
- Clear break of bullish channel, 50-DMA favor Swiss Franc (CHF) pair sellers amid bearish MACD signals.
- Two-month-old horizontal support may prod further downside as RSI (14) drops below 50.0.
USD/CHF bears take a breather at the monthly low, defensive near 0.8920 heading into Friday’s European session, after posting a stellar fall to convince sellers the previous day.
The Swiss Franc (CHF) pair dropped the most in a week while breaking the key technical supports to convince bears in refreshing the multi-day bottom. Also keeping the USD/CHF sellers hopeful are the bearish MACD signals.
It’s worth noting that the below 50.0 levels of the RSI (14) line suggests bottom picking and hence challenging the USD/CHF bears of late.
Even so, there prevails no barrier for the quote before it tests a two-month-old horizontal support zone near 0.8865-60.
Following that, the yearly low of around 0.8820 can act as an extra filter toward the south while the 61.8% Fibonacci Expansion (FE) of its March-May moves, near 0.8765, can lure the pair sellers afterward.
Meanwhile, the USD/CHF buyers may initially aim for the 50-DMA support-turned-resistance of around 0.8985, a break of which could direct the price to the 0.9000 round figure.
However, the bottom line of the six-week-old rising trend channel, around 0.9015, can act as the final check for the USD/CHF bulls before allowing them to return home.
USD/CHF: Daily chart
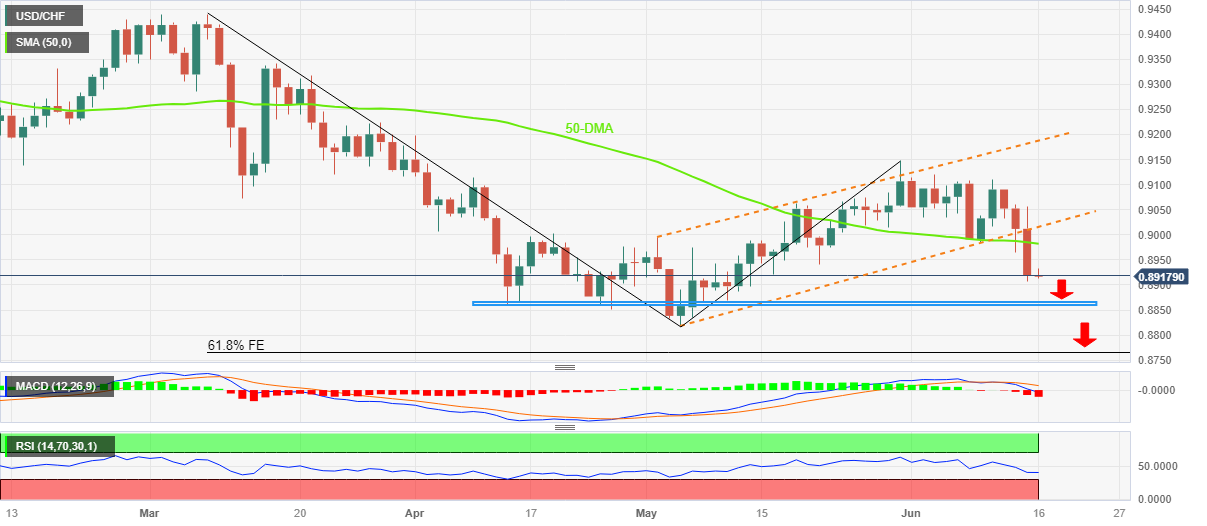
Trend: Further downside expected
- EUR/USD is showing a non-directional performance after climbing to near 1.0940, more upside seems favored.
- Fourth consecutive wider-than-expected US weekly jobless claims conveyed that labor market conditions are further easing.
- The ECB decided not to take the bullet and raise interest rates further despite a technical recession in the German economy.
The EUR/USD pair is demonstrating back-and-forth action around 1.0940 in the early European session. The major currency pair has turned sideways after a sharp upside propelled by narrowing Federal Reserve (Fed)-European Central Bank (ECB) policy divergence.
S&P500 futures are showing nominal losses in Asia after an extremely bullish settlement on Thursday. US equities remained the talk of the town as investors got clarity on where interest rates by the Federal Reserve (Fed) would peak. Also, wider-than-expected United States weekly jobless claims conveyed that labor market conditions are further easing.
The US Dollar Index (DXY) is consistently defending further downside below 102.00. Bearish bets for the USD Index are extremely solid as easing labor market conditions might force the Fed to skip policy further. On Thursday, the Department of Labor showed that initial jobless claims for the week ending June 09 have remained steady at 262K. The street was expecting a decline to 249K. This was the fourth consecutive higher-than-anticipated weekly jobless claims.
On the Eurozone front, the European Central Bank (ECB) hiked interest rates by 25 basis points (bps) to 4% to tame inflationary pressures, which are above 6.1%. ECB President Christine Lagarde decided not to take the bullet and raise interest rates further despite a technical recession in the German economy.
For further guidance, economists at Nordea cited July hike could end up being the last one of the cycle, but risks are clearly tilted toward the hiking cycle continuing after the summer.
- Gold Price fades the previous day’s corrective bounce off three-month low, sidelined of late.
- Multiple technical levels, mixed sentiment in the market challenge XAU/USD traders.
- More clues to confirm July Fed rate hike eyed to lure the Gold sellers.
Gold Price (XAU/USD) struggles to defend bounce off a three-month low as market players seek more clues to confirm the cautious optimism amid a looming July rate hike. Also challenging the XAU/USD bulls can be the recently mixed US data and the trader’s lack of conviction about the Fed’s July rate hike, even if the policymakers did utter the same on Wednesday.
Elsewhere, fears that China’s economic recovery will slow down, even if the dragon nation’s state planner eyes faster execution of the key projects, exert downside pressure on the Gold Price. Furthermore, the cautious mood ahead of mid-US data and the next week’s Testimony of Fed Chair Jerome Powell challenges the XAU/USD optimists, especially after this week’s central-bank moves.
Also read: Gold Price Forecast: XAU/USD needs weekly close above 21 DMA for a meaningful recovery
Gold Price: Key levels to watch
As per our Technical Confluence Indicator, the Gold Price retreats towards the $1,950 key support comprising Fibonacci 61.8% on the weekly play, Fibonacci 23.6% on the daily chart and the 5-DMA.
In a case where the XAU/USD prod the immediate support, like it did Thursday, the bears will jostle with another important downside level, also the last defense of the buyers, around $1,940 that encompasses 100-DMA and the Pivot Point one-week S1.
On the contrary, Fibonacci 38.2% on weekly chart joins previous daily high and the upper band of the Bollinger on the 15-minute chart to restrict immediate Gold Price upside near $1,961-62.
Following that, Fibonacci 38.2% on one-month, around $1,68, will check the XAU/USD bulls before giving them control.
Here is how it looks on the tool
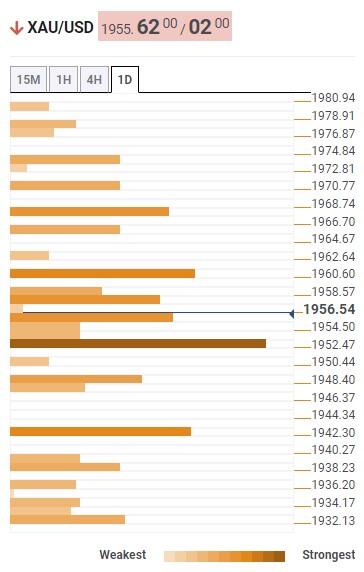
About Technical Confluences Detector
The TCD (Technical Confluences Detector) is a tool to locate and point out those price levels where there is a congestion of indicators, moving averages, Fibonacci levels, Pivot Points, etc. If you are a short-term trader, you will find entry points for counter-trend strategies and hunt a few points at a time. If you are a medium-to-long-term trader, this tool will allow you to know in advance the price levels where a medium-to-long-term trend may stop and rest, where to unwind positions, or where to increase your position size
- Asian stocks have shown an overall recovery after the BoJ continued its expansionary policy.
- Chinese big banks have announced rate cuts to stimulate capacity expansion.
- The oil price is consolidating above $70.00 after a V-shape recovery.
Markets in the Asian domain are demonstrating overall optimism as each economy has added significant gains. A continuation of the ultra-dovish interest rate decision by the Bank of Japan (BoJ) rate cuts by China’s big banks to accelerate overall demand in the economy has uplifted market sentiment. Apart from them, positive sentiment from the super bullish settlement by S&P500 on Thursday has also been carry-forwarded into Asian economies.
At the press time, Japan’s Nikkei225 added 0.21%, SZSE Component gained 0.56%, Hang Seng jumped 0.80%, and Nifty50 climbed 0.43%.
BoJ Governor Kazuo Ueda kept interest rates steady at -0.10% and 10-year Japan Government Bonds (JGBs) yield target at up and down 0.5% each. The central bank believes that domestic core consumer inflation is likely to slow the pace of increase towards the middle of the current fiscal year. Inflation expectations are moving sideways after heightening and uncertainty regarding Japan's economy is very high.
Meanwhile, rate cuts by China’s big banks to stimulate capacity expansion and overall demand is fueling hopes among market participants that the economy will be out of pessimism. Firms have been failing to lift prices due to weak domestic demand and lower exports to global customers.
On the oil front, the oil price has stabilized above the crucial resistance of $70.00 after a V-shape recovery from $68.00 as investors believe that monetary stimulus in China and a short-term pause in the policy-tightening spell by the Federal Reserve (Fed) would shore up its demand. Also, minutes from the latest oil market report published by the International Economic Agency (IEA) state that “global oil demand will grow by 2.4 million bpd this year, to a record 102.3 million bpd.” Global oil demand will rise by 6% between 2022 and 2028 to 105.7 mln bpd.
- USD/CAD bounces off the lowest levels in nine months but recovery moves lack upside momentum.
- Mixed sentiment, lack of conviction about Fed vs. BoC divergence trouble Loonie pair traders.
- Mid-tier statistics from US, Canada eyed for clear directions, next week’s Fed Chair Jerome Powell’s testimony is the key.
USD/CAD prints minor gains at the lowest level since September 2022, marked the previous day, amid sluggish markets on early Friday. In doing so, the Loonie pair licks its wounds near 1.3225 after falling the most in two weeks the previous day.
Apart from the dicey markets, the quote’s latest inaction could also be linked to the mixed concerns about the Bank of Canada (BoC) and the US Federal Reserve (Fed).
While the BoC surprised markets with a rate hike in the last week, the Canadian job numbers disappointed the policy hawks afterward.
On the other hand, the Fed’s hawkish halt couldn’t gain more accolades as the latest US data appear mixed. That said, US Retail Sales growth marked an increase of 0.3% for May versus -0.1% expected and 0.4% previous readings while the Core readings, mean Retail Sales ex Autos, match 0.1% market forecasts for the said month, compared to 0.4% prior. Meanwhile, NY Fed Empire State Manufacturing Index jumps to 6.6 in June versus -15.1 expected and -31.8 prior whereas Philadelphia Fed Manufacturing Index drops to -13.7 for the said month from -10.4 prior and compared to -14 market forecasts. On the same line, US Industrial Production for May cools down to -0.2% against 0.1% estimated and 0.5% prior while Initial Jobless Claims reprints the upwardly revised figures of 262K for the week ended on June 09 versus 249K expected.
Elsewhere, mixed concerns about China and a light calendar, after witnessing the Bank of Japan (BoJ) decision, prod the WTI crude oil price recovery.
Against this backdrop, US Dollar Index (DXY) grinds near 102.20-30 while struggling to pare the biggest daily loss in three months whereas the WTI crude oil grinds near a one-week high, mildly offered near $70.70 by the press time.
Looking ahead, Canada Wholesale Sales for April, the preliminary readings of the US Michigan Consumer Sentiment Index (CSI) and five-year inflation expectations for June will be important to watch for clear directions. However, major attention will be given to the next week’s Testimony of Fed Chair Jerome Powell, especially after the latest failure to convince haws.
Technical analysis
With the oversold RSI conditions, the USD/CAD may witness a corrective bounce toward February’s bottom of around 1.3265. However, the buyers are less likely to retake control unless witnessing a daily close beyond the previous monthly low surrounding 1.3315.
Meanwhile, tops marked in July and September 2022, around 1.3220-05 zone, appear a tough nut to crack for the Loonie pair sellers.
- USD/INR pares intraday gains to revisit multi-day low marked the previous day.
- US Dollar fails to cheer hawkish Fed bets amid mixed US data.
- Market’s cautious optimism, upbeat energy prices allow Indian Rupee to grind at the highest levels since May 09.
- Mid-tier US data eyed ahead of next week’s Fed Chair Powell’s Testimony.
USD/INR remains on the back foot at the lowest levels in five weeks, fading bounce off intraday low to 81.95 early Friday morning in Europe. In doing so, the Indian Rupee (INR) pair cheers the US Dollar’s inability to justify the hawkish Fed halt, as well as the latest retreat in the Oil price, amid doubt about the July rate hike from the US central bank. Also, the risk-on mood in the Asia-Pacific markets weighs on the prices.
US Dollar Index (DXY) grinds near 102.20-30 while struggling to pare the biggest daily loss in three months. In doing so, the greenback’s gauge versus the six major currencies justifies the previous day’s mixed US data that challenge the Fed’s indirect commitment to lift the benchmark rates in July.
Talking about the data, US Retail Sales growth marked an increase of 0.3% for May versus -0.1% expected and 0.4% previous readings while the Core readings, mean Retail Sales ex Autos, match 0.1% market forecasts for the said month, compared to 0.4% prior.
Meanwhile, NY Fed Empire State Manufacturing Index jumps to 6.6 in June versus -15.1 expected and -31.8 prior whereas Philadelphia Fed Manufacturing Index drops to -13.7 for the said month from -10.4 prior and compared to -14 market forecasts. On the same line, US Industrial Production for May cools down to -0.2% against 0.1% estimated and 0.5% prior while Initial Jobless Claims reprints the upwardly revised figures of 262K for the week ended on June 09 versus 249K expected.
It should be noted that the WTI crude oil grinds near a one-week high, mildly offered near $70.70 by the press time, as energy traders seek more clues to convince buyers amid mixed concerns about China's recovery. “UBS cuts China growth forecast to 5.2% after disappointing data,” said Bloomberg.
Looking ahead, the preliminary readings of the Michigan Consumer Sentiment Index (CSI) and five-year inflation expectations for June will be important for fresh impulse ahead of next week’s Fed Chair Jerome Powell’s testimony.
Technical analysis
A seven-month-old ascending support line, around 81.90 by the press time, restricts immediate USD/INR downside ahead of the double bottoms marked near 81.50. The pair’s recovery moves can take clues from the RSI but remain elusive unless crossing the month-start bottom of around 82.30.
- AUD/USD corrects from its highest level since February touched on Thursday.
- A modest USD recovery from a multi-week low prompt some profit-taking.
- The Fed rate hike uncertainty might cap the USD and limit losses for the pair.
The AUD/USD pair comes under some selling pressure during the Asian session on Friday and erodes a part of the previous day's blowout rally to 0.6900 neighbourhood, or its highest level since February 22. The pair currently trades around the 0.6870 region, down over 0.20% for the day, and for now, seems to have snapped a six-day winning streak.
Having registered heavy losses over the past three days, the US Dollar (USD) stages a modest bounce from over a five-week low. This, in turn, prompts traders to lighten their bullish bets around the AUD/USD pair, especially after the recent blowout rally of over 500 pips since the beginning of the current week. The USD upside, however, seems limited in the wake of expectations that the Federal Reserve (Fed) is getting closer to the peak of its policy tightening cycle, warranting caution before positioning for any meaningful corrective slide for the major.
It is worth recalling that the US central bank decided to leave interest rates unchanged at the end of a two-day policy meeting earlier this week, though indicated that borrowing costs may still need to rise by as much as 50 bps by the end of this year. That said, Thursday's rather unimpressive US macro data - namely Industrial Production, Weekly Jobless Claims and Retail Sales - raised questions over the prospects for additional rate hikes by the Fed to combat stubbornly high inflation. In fact, the US CPI, at 4.0% in May, is still twice the Fed's 2% target.
The uncertainty over the Fed's rate-hike path led to the overnight slump in the US Treasury bond yields, which might hold back the USD bulls from placing aggressive bets. Apart from this, the Reserve Bank of Australia's (RBA) surprise 25 bps lift-off last week and a hawkish policy statement might continue to underpin the Aussie. This might further contribute to limiting the downside for the AUD/USD pair in the absence of any relevant macro data from the US. Nevertheless, spot prices remain on track to record strong gains for the third successive week.
Technical levels to watch
- USD/MXN oscillates in a range just above the multi-year low touched earlier this week.
- The descending channel formation and the lack of buying interest favour bearish traders.
- A sustained strength beyond the 17.35 region is needed to negate the bearish outlook.
The USD/MXN pair continues with its struggle to register any meaningful recovery from the lowest level since May 2016, albeit manages to hold its neck above the 17.00 mark through the Asian session on Friday.
From a technical perspective, the USD/MXN pair has been drifting lower along a downward-sloping channel extending from the vicinity of the 18.00 mark touched on May 23. This points to a well-established short-term bearish trend and suggests that the path of least resistance for spot prices is to the downside. The lack of buying interest reaffirms the negative bias and indicates that the downward trajectory witnessed over the past four weeks or so is still far from being over.
That said, the Relative Strength Index (RSI) on the daily chart is flashing slightly oversold conditions and holding back traders from placing fresh bearish bets. This, in turn, assists the USD/MXN pair to defend
support marked by the lower end of the aforementioned trend channel. Hence, it will be prudent to wait for a sustained break and acceptance below the 17.00 mark, or the trend-channel support, before positioning for a further depreciating move.
On the flip side, any meaningful recovery attempt is likely to confront resistance near the overnight swing high, around the 17.25 area. This is closely followed by the trend-channel resistance, around the 17.35 region, which if cleared decisively might trigger a short-covering rally. The USD/MXN pair might then climb to the 17.70 intermediate resistance en route to the 18.00 mark. Some follow-through buying will suggest that spot prices have formed a near-term bottom.
USD/MXN 4-hour chart
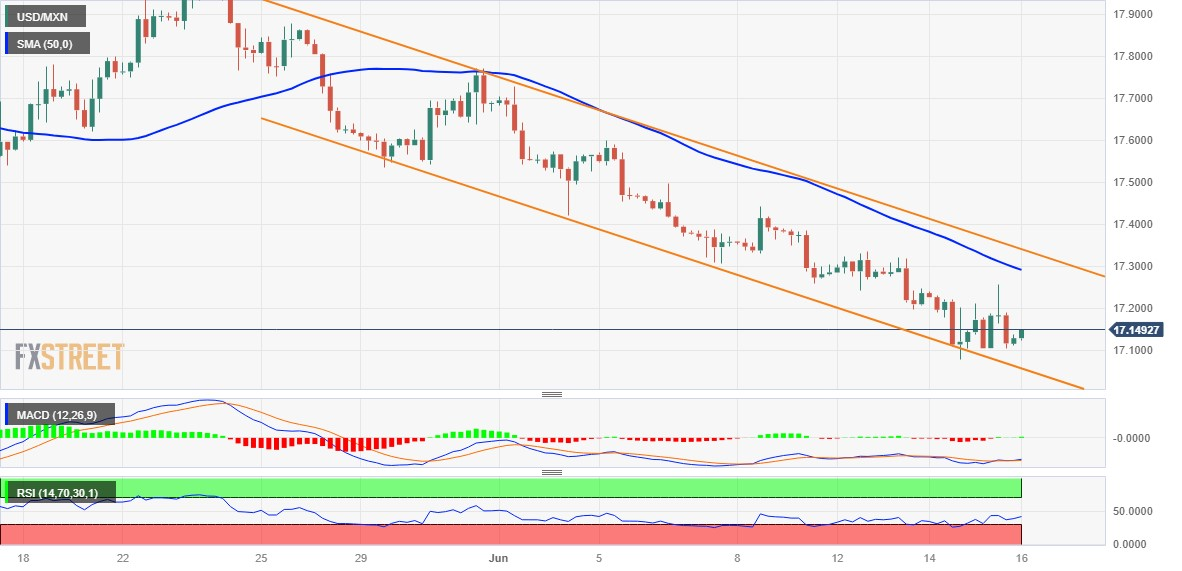
Key levels to watch
- EUR/JPY regains positive traction on Friday and jumps to a fresh 15-year peak.
- The BoJ’s decision to stand pat weigh on the JPY and provides a goodish boost.
- The ECB’s hawkish outlook remains supportive of the move and favours bulls.
The EUR/JPY cross attracts some dip-buying near the 153.00 mark during the Asian session on Friday and hits a fresh 15-year top in reaction to the Bank of Japan (BoJ) policy decision. The cross is currently placed just below the 154.00 round-figure mark and seems poised to build on its recent upward trajectory witnessed over the past month or so.
The Japanese Yen (JPY) weakens across the board after the BoJ, as was widely expected, stuck to its dovish stance and left its ultra-loose policy settings unchanged at the end of the June monetary policy meeting this Friday. This marks a big divergent in comparison to the European Central Bank's (ECB) hawkish 25 bps lift-off on Thursday, which continues to underpin the shared currency and remains supportive of the bid tone surrounding the EUR/JPY cross.
From a technical perspective, this week's sustained strength beyond the 151.00 horizontal barrier was seen as a key trigger for bullish traders. The subsequent move up validates the breakout, though the extremely overbought Relative Strength Index (RSI) on the daily chart makes it prudent to wait for some near-term consolidation or a modest pullback before positioning for any further move up. Nevertheless, the EUR/JPY cross remains on track to register strong weekly gains.
In the meantime, the 153.55 region now seems to protect the immediate downside ahead of the daily swing low, around the 153.00 mark. Some follow-through selling below the 152.80 zone might prompt some long-unwinding trade and accelerate the corrective decline towards the 152.00 round figure. Any further downfall, however, is likely to attract fresh buyers and remain cushioned near the previous YTD peak, around the 151.60 region touched in May.
EUR/JPY daily chart
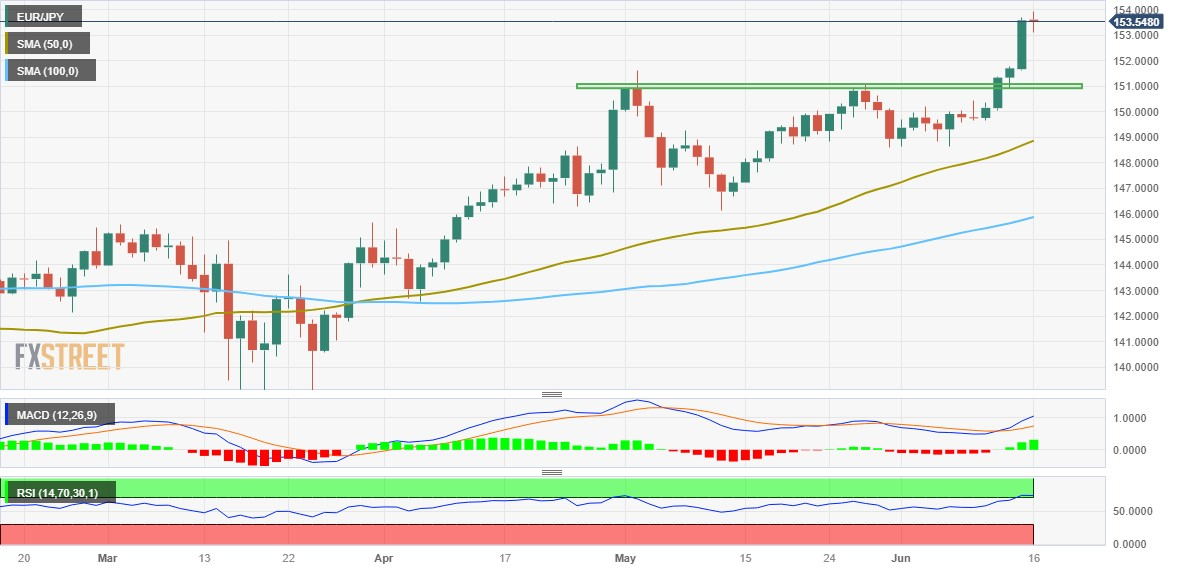
Key levels to watch
- GBP/USD struggles for clear directions at the highest levels since April 2022, snaps three-day uptrend.
- Downbeat US Dollar, hawkish hopes from BoE versus doubts about Fed’s July rate hike previously favored Cable bulls.
- Market’s consolidation of weekly performance, cautious mood ahead of UK/US data prod Pound Sterling traders.
GBP/USD steadies near the highest level in 14 months, making rounds to 1.2780-70 amid early Friday morning in London, as the Cable pair traders await more clues to defend the previous day’s heavy rally. That said, the Pound Sterling rose the most in a week while rising for the third consecutive day to refresh the multi-month high amid broad US Dollar weakness and hawkish concerns about the Bank of England (BoE).
Earlier in the week, a mixed batch of the UK details failed to tame the GBP/USD bulls amid hawkish BoE concerns, mainly due to the previously upbeat inflation numbers. the UK’s Gross Domestic Product (GDP) for April matches 0.2% growth versus -0.3% prior while the Industrial Production slumps during the stated month. That said, the Manufacturing Production also disappoints and so do the Index of Services for three months to April.
That said, US Dollar Index (DXY) picks up bids to pare the biggest daily loss in three months around 102.30, which in turn prods the Pound Sterling buyers. That said, the quote dropped heavily the previous day on mixed US data and the market’s lack of conviction about the Fed’s July rate hike, even if the policymakers did utter the same on Wednesday.
On Thursday, US Retail Sales growth marks an increase of 0.3% for May versus -0.1% expected and 0.4% previous readings while the Core readings, mean Retail Sales ex Autos, match 0.1% market forecasts for the said month, compared to 0.4% prior. Further, NY Fed Empire State Manufacturing Index jumps to 6.6 in June versus -15.1 expected and -31.8 prior whereas Philadelphia Fed Manufacturing Index drops to -13.7 for the said month from -10.4 prior and compared to -14 market forecasts. Additionally, US Industrial Production for May cools down to -0.2% against 0.1% estimated and 0.5% prior while Initial Jobless Claims reprints the upwardly revised figures of 262K for the week ended on June 09 versus 249K expected.
Against this backdrop, market players appear more hawkish on the BoE than the Fed and keep the Cable on the bull’s radar despite the latest pullback in the prices.
Looking ahead, UK’s Consumer Inflation Expectations for June will precede the preliminary readings of the Michigan Consumer Sentiment Index (CSI) and five-year inflation expectations for the said month to direct intraday GBP/USD moves.
Technical analysis
Although the overbought RSI suggests a pullback in the GBP/USD price, the pair buyers remain optimistic unless witnessing a daily closing below the previous resistance line stretched from late January, around 1.2730-25 at the latest.
- AUD/JPY reverses early-day fall but stays dicey near nine-month high.
- BoJ keeps monetary policy unchanged, defies inflation woes to drown Yen prices.
- Overbought RSI, one-year-old horizontal resistance zone challenge buyers.
- Bears need validation from previous resistance near 95.80.
AUD/JPY jumps 40 pips to 96.70 as the Bank of Japan (BoJ) refrains from any monetary policy change on early Friday. In doing so, the cross-currency pair reverses the initial pullback from the highest levels since September 2022, before retreating to 96.55 by the press time.
BoJ keeps the short-term interest rate target at -0.1% while directing 10-year Japanese Government Bond (JGB) yields with the band of +/-0.50%, per the latest monetary policy meeting update. The Japanese central bank also tames inflation fears by saying that the Consumer Price Index (CPI) around 3.5% recently owing to pass-through effects.
It’s worth noting that the overbought RSI (14) line challenges the AUD/JPY buyers even if the pair’s successful break of a previous horizontal resistance stretched from July 2022, now immediate support, suggests further advances of the quote.
As a result, a horizontal area comprising multiple levels marked since June 2022, around 96.90-97.05, gains the market’s attention ahead of the previously yearly peak of around 98.60.
On the flip side, a daily close below the resistance-turned-support of around 95.80 could trigger a short-term AUD/JPY fall.
The same highlights early October 2022 peak of around 94.70 and February’s top surrounding 93.00. Even so, the AUD/JPY bulls remain hopeful unless witnessing a clear break of the 200-DMA, at 91.75 by the press time.
AUD/JPY: Daily chart

Trend: Further upside expected
- GBP/JPY attracts some dip-buying on Friday and hits a fresh multi-year peak on Friday.
- The BoJ’s decision to stand pat weighs on the JPY and acts as a tailwind for the cross.
- Bets for more BoE rate hikes underpin the GBP and remain supportive of the move.
The GBP/JPY cross reverses an Asian session dip to the 178.80 region and spikes to a fresh high since December 2015 after the Bank of Japan (BoJ) announced its policy decision.
As was widely expected, the Japanese central bank stuck to its dovish stance and left its ultra-loose policy settings unchanged at the end of the June monetary policy meeting this Friday. Apart from this, reduced bets for an intervention by the Japanese government to stabilize the domestic currency, along with a generally positive tone around the equity markets, weigh on the Japanese Yen (JPY). This, in turn, assists the GBP/JPY cross to attract some dip-buying on the last day of the week.
The British Pound (GBP), on the other hand, continues to draw support from expectations that the Bank of England (BoE) is not yet done with rate increases as inflation in the UK, which, at 8.7% YoY in April, is still more than four times the 2% target. In fact, the markets have fully priced in another 25 bps lift-off, from 4.5% to 4.75% on June 22. Moreover, investors now see a greater chance that the rate will peak at 5.5% later this year. This is seen as another factor acting as a tailwind for the GBP/JPY cross.
That said, the Relative Strength Index (RSI) on the daily chart is flashing overbought conditions and might hold back traders from placing fresh bullish bets around the GBP/JPY cross. Investors might also prefer to move to the sidelines and now look to BoJ Governor Kazuo Ueda's comments for a fresh impetus. Nevertheless, spot prices remain on track to register strong weekly gains and seem poised to prolong its recent strong upward trajectory witnessed over the past five weeks or so.
Technical levels to watch
- USD/JPY picks up bids to refresh intraday high, reversing early day weakness on BoJ’s verdict.
- BoJ matches market forecasts of keeping benchmark rate, YCC unchanged.
- Traders will seem more details from Governor Ueda, US Michigan Consumer Sentiment Index for clear directions.
USD/JPY takes the bids to refresh intraday high near 140.70 as the Bank of Japan (BoJ) keeps monetary policy unchanged, as expected, during early Friday. Adding strength to the Yen pair’s upside momentum could be the US Dollar’s consolidation of the previous day’s heavy losses and a corrective bounce in the yields.
BoJ keeps the short-term interest rate target at -0.1% while directing 10-year Japanese Government Bond (JGB) yields with the band of +/-0.50%, per the latest monetary policy meeting update. The Japanese central bank also tames inflation fears by saying that the Consumer Price Index (CPI) around 3.5% recently owing to pass-through effects.
Also read: Breaking: BoJ leaves monetary policy settings unadjusted, USD/JPY advances
On the other hand, US Dollar Index (DXY) picks up bids to pare the biggest daily loss in three months around 102.30. That said, the quote dropped heavily the previous day on mixed US data and the market’s lack of conviction about the Fed’s July rate hike, even if the policymakers did utter the same on Wednesday.
That said, the latest US dollar rebound could be linked to the mildly bid Treasury bond yields and cautious mood ahead of the second-tier data, as well as nearly 70% market bets on the July Fed rate hike, per the CME’s FedWatch Tool.
Having witnessed the initial reaction to the BoJ, the Yen pair will pay attention to Governor Kazuo Ueda’s press conference, around 06:00 AM GMT, for fresh impulse. Although BoJ’s Ueda has previously ruled out the need for any change to the current monetary policy, hints of a future exit from the ultra-easy measures may allow the USD/JPY bulls to take a breather.
Following that, the preliminary readings of the Michigan Consumer Sentiment Index (CSI) for June and five-year inflation expectations will be crucial for clear directions, especially amid the recently easing hawkish Fed bets.
Technical analysis
Despite the latest run-up, the USD/JPY remains inside a 3.5-month-old rising wedge bearish chart formation, between 141.60 and 137.70 by the press time. That said, the overbought RSI conditions challenge the Yen pair buyers of late.
Following the conclusion of the June meeting, the Bank of Japan (BoJ) board members decided to leave their current monetary policy settings unchanged, maintaining rates and 10yr JGB yield target at -10bps and 0.00% respectively.
Summary of the statement
No change to the yield band.
BoJ maintains band around its 10-year JGB yield target at up and down 0.5% each.
BoJ made decision on YCC by unanimous vote.
Japan's economy picking up.
Japan's economy likely to continue recovering moderately.
Japan's core consumer inflation likely to slow pace of increase towards middle of current fiscal year.
Exports, output moving sideways.
Capex increasing moderately.
Consumption increasing moderately.
Inflation expectations moving sideways after heightening.
Uncertainty regarding japan's economy is very high.
Amendment to "principal terms and conditions of complementary deposit facility.
There is no change in the framework of the complementary deposit facility and the interest scheme to promote lending.
Market reaction
USD/JPY’s rebound received extra legs on the BoJ’s policy announcements. The pair is currently trading at 140.66, up 0.29% on the day.
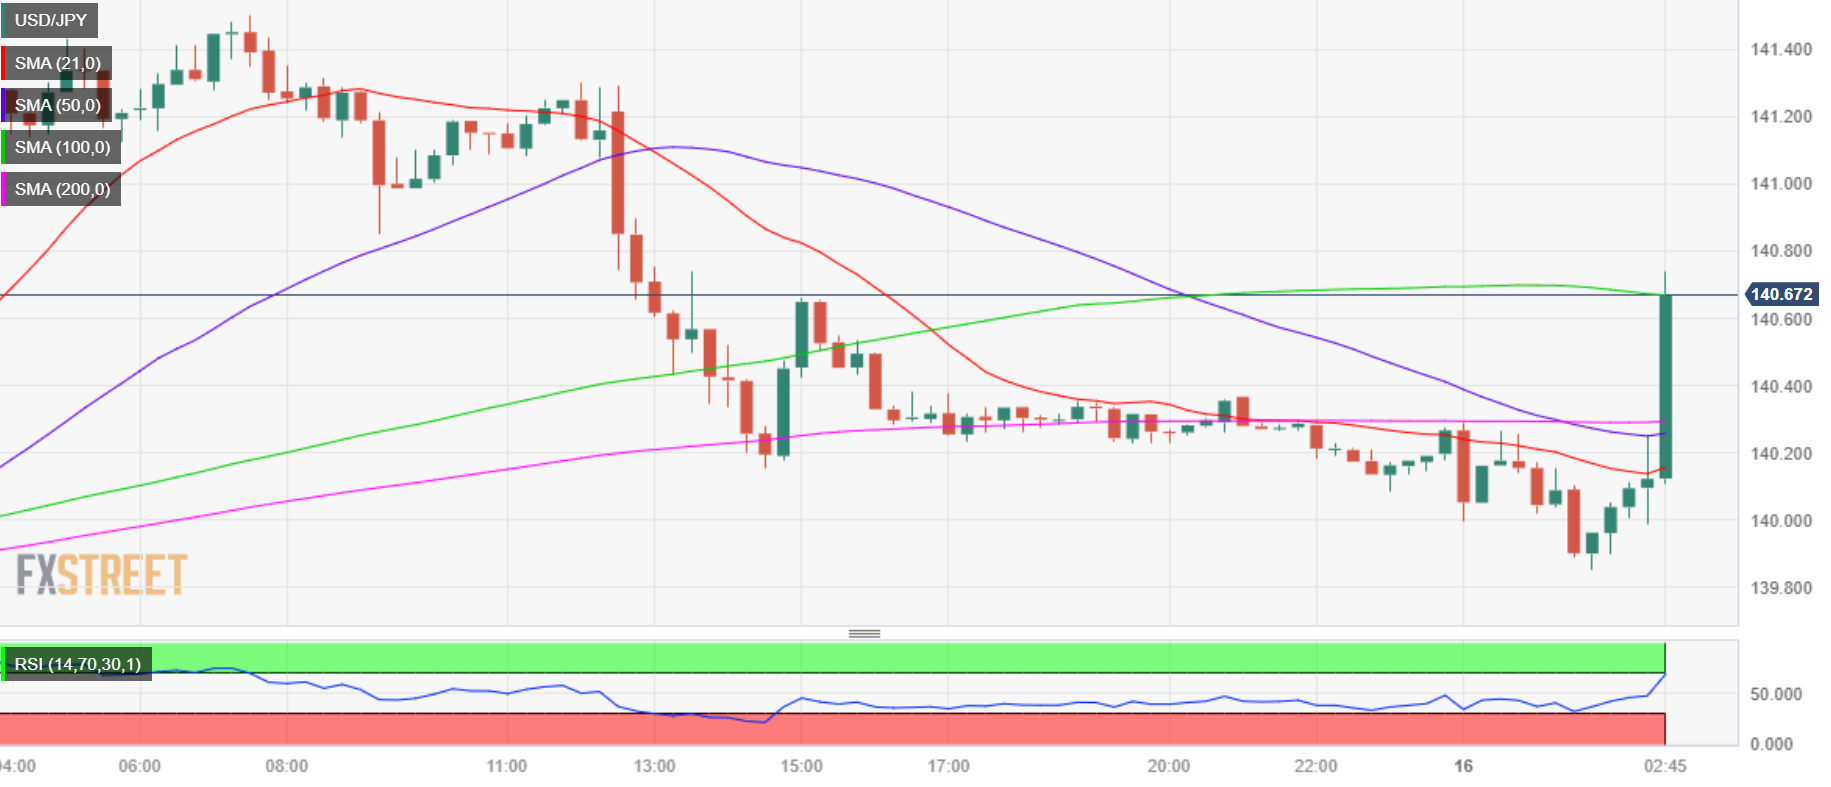
USD/JPY: 15-minutes chart
- EUR/USD bulls run out of steam inside seven-week-old horizontal resistance region.
- Overbought RSI, market’s consolidation after ECB, Fed moves challenge Euro pair’s further upside.
- 78.6% Fibonacci retracement acts as additional challenge for buyers; Euro bears remain off the table beyond 1.0820 support confluence.
- Final prints of Eurozone inflation, US Michigan Consumer Sentiment Index awaited for clear directions.
EUR/USD treads water around mid-1.0900s during a sluggish early Friday morning in Europe. In doing so, the Euro pair struggles to extend the previous day’s run-up, the biggest since early February, while making rounds to a five-week high.
That said, the pair rallied the previous day as the European Central Bank (ECB) marked a hawkish play to beat Wednesday’s Federal Reserve (Fed) announcements. The latest inaction, however, appears to lack clear catalysts amid a light calendar and cautious mood ahead of the final readings of Eurozone inflation data for May, as per the Harmonized Index of Consumer Prices (HICP) details. Additionally important will be the preliminary readings of the Michigan Consumer Sentiment Index (CSI) for June and five-year inflation expectations.
Also read: EUR/USD grinds at five-week top around 1.0950 as Euro bulls seek more clues of ECB vs. Fed play
Technically, a horizontal resistance zone comprising multiple levels marked since April 24, between 1.0965 and 1.0940, restricts immediate EUR/USD moves amid the overbought RSI.
Even if the quote manages to cross the 1.0965 hurdle, the 78.6% Fibonacci retracement level of its previous monthly fall, around the 1.1000 psychological magnet, can challenge the EUR/USD bulls ahead of directing them to the yearly high of near 1.1100 marked in April.
On the contrary, a downside break of the 1.0940 immediate support can drag the EUR/USD price to the 61.8% Fibonacci retracement surrounding the 1.0920 level. Following that, the 50% Fibonacci retracement level near 1.0865 may lure the Euro bears.
It should be noted, however, that the EUR/USD buyers should remain hopeful unless witnessing a clear downside break of the 1.0825-20 support confluence including the 200-SMA and an ascending trend line from June 07.
EUR/USD: Four-hour chart
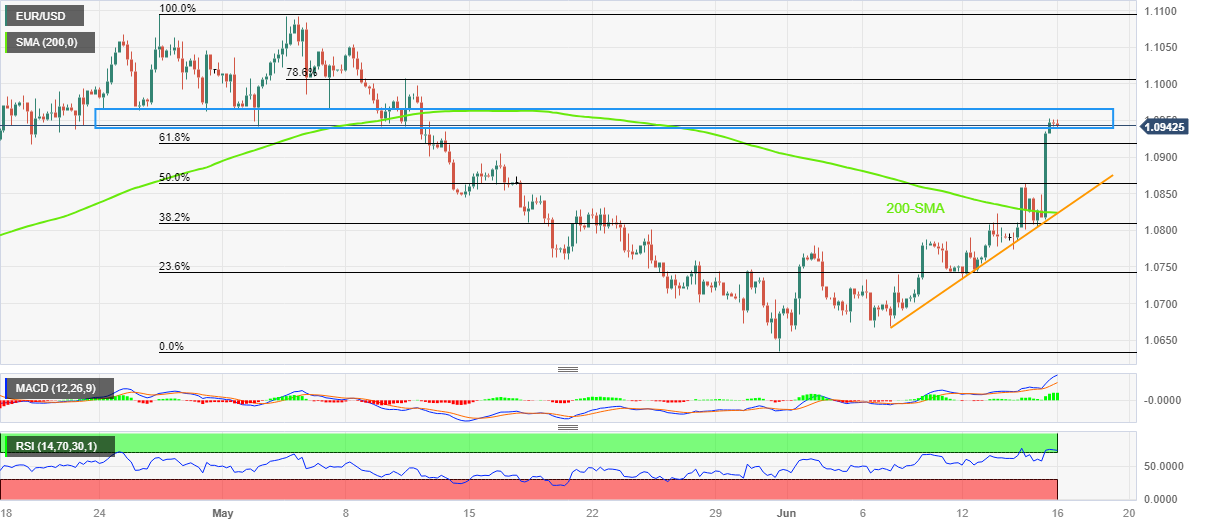
Trend: Pullback expected
| Raw materials | Closed | Change, % |
|---|---|---|
| Silver | 23.883 | -0.17 |
| Gold | 1957.98 | 0.74 |
| Palladium | 1394.5 | 0.27 |
- USD/CHF consolidates its recent slump to over a one-month low.
- The USD languishes near a five-week low and acts as a headwind.
- A positive risk tone undermines the CHF and lends some support.
The USD/CHF pair oscillates in a narrow trading band through the Asian session on Friday and consolidates its heavy losses recorded over the past three days. The pair, so far, has managed to defend and hold above the 0.8900 mark, or over a one-month low touched the previous day, though any meaningful recovery still seems elusive.
The US Dollar (USD) struggles to attract any buyers and languished near a five-week low, which, in turn, is seen as a key factor acting as a headwind for the USD/CHF pair. Despite the Federal Reserve's (Fed) hawkish outlook, investors seem convinced that the US central bank is nearing the end of its year-long rate-hiking cycle. This was reinforced by the overnight slump in the US treasury bond yields, which, along with the post-ECB surge in the shared currency, keep the USD depressed near a five-week low and acts as a headwind for the USD/CHF pair.
It is worth recalling that the US central bank decided to leave interest rates unchanged at the end of a two-day policy meeting on Wednesday, though signalled that borrowing costs may still need to rise by as much as 50 bps by the end of this year. In fact, the so-called "dot plot" indicated that officials now see rates peaking at 5.6% this year, higher than March's projection of 5.1%. Apart from this, the Fed expects slightly stronger growth and forecasts the economy to expand by 1% this year — up from the 0.4% rise projected in May — before rising 1.1% in 2024 and 1.8% in 2025.
This, in turn, is holding back traders from placing fresh bearish bets around the USD. Furthermore, a generally positive tone around the equity markets undermines the safe-haven Swiss Franc (CHF) and contributes to limiting the downside for the USD/CHF pair, at least for the time being. Any meaningful recovery, however, still seems elusive, warranting some caution for aggressive bullish traders in the absence of any relevant market moving economic releases from the US. Nevertheless, spot prices remain on track to end deep in the red for the second successive week.
Technical levels to watch
Early on Friday, around 03:00 AM GMT, the Bank of Japan (BoJ) will announce the ordinary monetary policy meeting decisions taken after a two-day brainstorming. Following the rate decision, BoJ Governor Kazuo Ueda will attend the press conference, around 06:00 AM GMT, to convey the logic behind the latest policy moves.
The Japanese central bank is widely expected to keep the short-term interest rate target at -0.1% while directing 10-year Japanese Government Bond (JGB) yields with the bank of +/-0.50%.
Given the latest increase in the Japanese inflation clues and the hawkish performance of major central banks, today’s BoJ monetary policy meeting announcements become important as market players place heavy bets on the end of ultra-easy measures during 2023.
Although the BoJ isn’t expected to offer any change in its monetary policy, traders will keep their eyes on details of the Yield Curve Control (YCC) policy and Governor Ueda’s speech as the Japanese central bank appears the last unturned stone as far as the monetary policy change is concerned.
Ahead of the event, FXStreet’s Matias Salord said,
Any signs of the Bank of Japan exiting its ultra-loose monetary policy will be positive for the Yen; actually, it would be very positive and could mark the beginning of a medium-term rally for the Yen. USD/JPY reached a seven-month high on Thursday near 141.50, the day after the FOMC meeting and the ECB decision. Later, the pair pulled back all the way to the range that has been prevailing since the beginning of the month.
How could it affect the USD/JPY?
USD/JPY extends the day-start retreat from the yearly high to around 139.90 by the press time as it braces for the BoJ monetary policy decision. In doing so, the Yen pair pays little attention to the recently firmer yields while cheering the US Dollar’s failure to rebound.
Japanese policymakers have already jostled with the expectations of a major move to alter the ultra-easy monetary policy, by suggesting no need for monetary policy change. However, the recent announcements of the US bond issuance due to the debt-ceiling deal are talks of the town supporting the official push for higher rates in late 2023. It should be noted, however, that the BoJ’s play of the Yield Curve Control (YCC) will be crucial to observe during today’s monetary policy releases.
In a case where Ueda manages to pave the way for future rate hikes, either via the alteration of the YCC band or dumping the YCC ultimately, the USD/JPY could extend its latest U-turn from towards the bottom line of a 3.5-month-old rising wedge, around 137.70 at the latest.
Alternatively, an absence of moves and the policymakers’ support the easy money could recall the USD/JPY buyers. However, the rebound will then wait for the US consumer-centric data for clear directions.
Key Notes
USD/JPY eases above 140.00 as traders await BoJ's YCC move, July expectations
Bank of Japan Preview: No surprises expected, looking at July
About BoJ Rate Decision
BoJ Interest Rate Decision is announced by the Bank of Japan. Generally, if the BoJ is hawkish about the inflationary outlook of the economy and rises the interest rates it is positive, or bullish, for the JPY. Likewise, if the BoJ has a dovish view of the Japanese economy and keeps the ongoing interest rate, or cuts the interest rate it is negative, or bearish.
- EUR/JPY pulls back from a nearly 15-year top touched on Thursday.
- Repositioning trade ahead of the BoJ prompts some profit-taking.
- The ECB’s hawkish rate hike should lend support and limit losses.
The EUR/JPY cross comes under some selling pressure during the Asian session on Friday and erodes a part of the previous day's strong move up to its highest level since September 2008. Spot prices currently trade just above the 153.00 mark, down nearly 0.30% for the day, though any meaningful corrective decline still seems elusive.
The intraday downtick, meanwhile, could be attributed to some repositioning trade ahead of the Bank of Japan (BoJ) monetary policy decision, scheduled to be announced at 03:00 GMT this Friday. The Japanese central bank is widely anticipated to stick to the ultra-loose policy settings, including the yield curve control policy. The expectations were reaffirmed by recent remarks by several BoJ officials, including Governor Kazuo Ueda, which might continue to undermine the Japanese Yen (JPY) and lend support to the EUR/JPY cross.
Adding to this, reduced bets for an intervention by the Japanese government, to stabilize the domestic currency, along with a generally positive tone around the equity markets, could further weigh on the JPY. The shared currency, on the other hand, might continue to draw support from the European Central Bank's (ECB) lift-off for the eighth straight time in June and hawkish outlook, signalling further tightening to bring Eurozone inflation to the 2% target. This might further contribute to limiting the downside for the EUR/JPY cross.
Even from a technical perspective, this week's sustained breakout through the 151.00 horizontal barrier was seen as a fresh trigger for bullish traders and supports prospects for additional gains. That said, the Relative Strength Index (RSI) on the daily chart is flashing overbought conditions and warrants some caution. Nevertheless, the EUR/JPY cross seems poised to register strong weekly gains and prolong its recent upward trajectory witnessed over the past three months or so.
Technical levels to watch
- NZD/USD bulls are in charge still in risk-on markets.
- Mixed fundamentals are in focus between the US Dollar and Kiwi.
NZD/USD is 0.2% higher in Tokyo after moving up from a low of 0.6228 to a high of 0.6245 in the session so far. The pair has tracked equities higher and has been supported by firmer commodities in the wake of a softer US dollar and risk-on sentiment.
Central bank divergence themes are in play and as analysts at ANZ Bank noted, ''a surging EUR in the wake of last night’s ECB hike (which was accompanied by a hawkish tone and plans to end QE in July) also helped.''
''If evidence is needed to show that the USD is doing all the grooving, one only needs to look at how in-step AUD and EUR were overnight,'' the analysts added.
''The fall in first quarter Gross Domestic Product now means New Zealand carries the recession label; we see that as a downside risk to NZD sentiment even though the recession is technical and can be partly explained by one-offs. We also worry about the current account, going the other way, the USD has some unwinding of its own to do. Tricky,'' the analysts concluded.
- Market sentiment remains dicey as traders reassess previous risk-on mood, central bank bias ahead of BoJ.
- S&P500 Futures print mild losses at the highest levels since April 2022, poked the previous day.
- US Treasury bond yields lick their wounds after a downbeat daily performance.
- Central bank talks, US data awaited for clear directions but risk-on mood is likely to fade.
Traders take a breather during early Friday, paring recent optimism after a volatile Thursday, amid a light calendar and wait for the key Bank of Japan (BoJ) monetary policy meeting, as well as the mid-tier US data. It’s worth noting that the easing hawkish bets on the Fed and mixed US data joined the downbeat yields to propel the market sentiment the previous day.
While portraying the mood, S&P500 Futures print mild losses at the highest levels since April 2022, down 0.23% intraday at 4,460 by the press time. That said, the US 10-year Treasury bond yields snap a two-day downtrend near 3.74% at the latest.
It’s worth noting that the S&P500 Futures and Nasdaq both jumped to the highest levels in 14 months the previous day while Dow Jones led the winning streak with 1.26% intraday gains to around 34,408 by the end of Thursday.
If we check the catalysts, the broad US Dollar slump amid mixed data and doubts about the July rate hike gained major attention. Also previously favoring the risk-on mood could be the headlines from China and Europe.
That said, the US Dollar Index (DXY) dropped the most in three months while poking the lowest levels since May 12, to 102.15 at the latest.
Talking about the US data, US Retail Sales growth marks an increase of 0.3% for May versus -0.1% expected and 0.4% previous readings while the Core readings, mean Retail Sales ex Autos, match 0.1% market forecasts for the said month, compared to 0.4% prior. Further, NY Fed Empire State Manufacturing Index jumps to 6.6 in June versus -15.1 expected and -31.8 prior whereas Philadelphia Fed Manufacturing Index drops to -13.7 for the said month from -10.4 prior and compared to -14 market forecasts. Additionally, US Industrial Production for May cools down to -0.2% against 0.1% estimated and 0.5% prior while Initial Jobless Claims reprints the upwardly revised figures of 262K for the week ended on June 09 versus 249K expected.
On the other hand, the hawkish performance of the European Central Bank (ECB), via 25 basis points (bps) interest rate hike and clues of more such moves ahead, joined the People’s Bank of China (PBoC) rate cut to also favor the market’s upbeat mood.
It’s worth noting that the CME FedWatch Tool’s 67% print for the July rate hike joins previously released downbeat China data and the market’s reassessments of the Fed’s hawkish halt to prod the optimists of late.
Moving on, the Bank of Japan (BoJ) monetary policy meeting announcements will be key to watch for immediate directions. Following that, the final readings of Eurozone inflation data for May, as per the Harmonized Index of Consumer Prices (HICP) details, will precede the preliminary readings of the Michigan Consumer Sentiment Index (CSI) for June and five-year inflation expectations to entertain traders.
Also read: Forex Today: Dollar tumbles, ECB hikes, and BoJ unlikely to tweak
- Gold price oscillates in a narrow trading band through the Asian session on Friday.
- Hawkish outlooks by major central banks act as a headwind for the precious metal.
- The US Dollar languishes near a multi-week low and lends support to the XAU/USD.
Gold price struggles to capitalize on the previous day's goodish rebound from the $1,925-$1,924 area, or its lowest level since March 17 and oscillates in a narrow trading band through the Asian session on Friday. The XAU/USD is currently placed just above the $1,955 level and remains well within a familiar trading range held over the month or so.
Bearish US Dollar lends support to Gold price
The US Dollar (USD) struggles to register any meaningful recovery and languishes near a five-week low amid expectations that the Federal Reserve (Fed) is nearing the end of its year-long rate-hiking cycle. This led to the overnight slump in the US Treasury bond yields, which keeps the USD bulls on the defensive and is seen acting as a tailwind for the US Dollar-denominated Gold price. Any meaningful upside, however, remains elusive in the wake of a more hawkish outlook by major central banks.
Hawkish central banks act as a headwind for XAU/USD
It is worth recalling that the Reserve Bank of Australia (RBA) and the Bank of Canada (BoC) delivered a surprise 25 basis point (bps) rate hike last week, suggesting that the fight against inflation is not over yet. Furthermore, the Fed signalled this week that borrowing costs may still need to rise by as much as 50 bps by the end of this year. The European Central Bank (ECB) also lifted rates by 25 bps, to the highest level in 22 years, and indicated further tightening to bring Eurozone inflation to its 2% target.
Positive risk tone contributes to capping Gold price
Adding to this, the Bank of England (BoE) is also expected to be far more aggressive in policy tightening to contain stubbornly high inflation, which, at an 8.7% YoY rate in April, is still running at more than four times the central bank's 2% target. This might hold back traders from placing aggressive bullish bets around the non-yielding Gold price. Apart from this, a generally positive tone around the equity markets might further contribute to capping gains for the safe-haven XAU/USD, at least for now.
The aforementioned fundamental backdrop makes it prudent to wait for strong follow-through buying before confirming that the Gold price has formed a near-term bottom. In the absence of any relevant market-moving economic releases from the United States (US), traders will take cues from Fed Governor Christopher Waller's public appearance. This, along with the US bond yields, might influence the USD. Apart from this, the broader risk sentiment could provide some impetus to the XAU/USD.
Gold price technical outlook
From a technical perspective, the recent repeated failures to find bearish acceptance below the 100-day Simple Moving Average (SMA) warrants some caution before positioning for further losses. That said, any subsequent move up is likely to confront resistance near the $1,962-$1,964 region ahead of the $1,970-$1,972 supply zone. This is followed by the $1,983-$1,985 hurdle, above which the Gold price could reclaim the $2,000 psychological mark and climb further to the next relevant resistance near the $2,010-$2,012 region.
On the flip side, the 100-day SMA, currently pegged near the $1,942-$1,940 area, now seems to protect the immediate downside ahead of the $1,932 region and the overnight swing low, around the $1,925-$1,924 zone. Some follow-through selling will be seen as a fresh trigger for bearish traders and make the Gold price vulnerable to accelerate the fall towards the $1,900 round figure. The downward trajectory could get extended further and drag the XAU/USD towards the $1,876-$1,875 horizontal support en route to the very important 200-day SMA, currently around the $1,839 region.
Key levels to watch
- AUD/USD bulls attack downward-sloping resistance line from April 2022.
- Overbought RSI, light calendar challenge further upside of Aussie pair.
- Clear break of 0.6900 could propel Aussie buyers toward Mid-February high, yearly peak.
- Fortnight-old support line, 200-EMA challenge AUD/USD bears before giving them control.
AUD/USD aptly portrays early Friday’s sluggish markets as it seesaws around 0.6880-90 while seeking fresh clues to challenge the four-month high marked the previous day. In doing so, the Aussie pair also justifies the overbought RSI (14) conditions as traders await more clues to confirm the US Federal Reserve’s (Fed) July rate hikes.
Also read: AUD/USD bulls take a breather at 16-week high below 0.6900 as Fed hawks retreat, more US data eyed
Elsewhere, failure to provide a daily closing beyond the key resistance line stretched from April 2022, close to the 0.6900 round figure by the press time, challenges the AUD/USD bulls, especially amid the overbought RSI.
However, the bullish MACD signals and the quote’s successful trading above the 200-day Exponential Moving Average (EMA), as well as an ascending support line stretched from early June, keeps the AUD/USD pair buyers hopeful.
That said, May’s high of 0.6820 appears the short-term important support to watch for the intraday sellers of the AUD/USD pair.
Following that, the aforementioned immediate support line and the 200-EMA, respectively near 0.6785 and 0.6760, will be in the spotlight.
On the flip side, a daily closing beyond the previously mentioned multi-month-old resistance line will need validation from the February 20 swing high of around 0.6920 and the 0.7000 psychological magnet to convince the bulls to aim for the mid-February 2023 peak of 0.7030.
Should the AUD/USD buyers manage to cross the 0.7030 hurdle, the odds of witnessing a run-up toward the yearly peak of 0.7157 can’t be ruled out.
AUD/USD: Daily chart
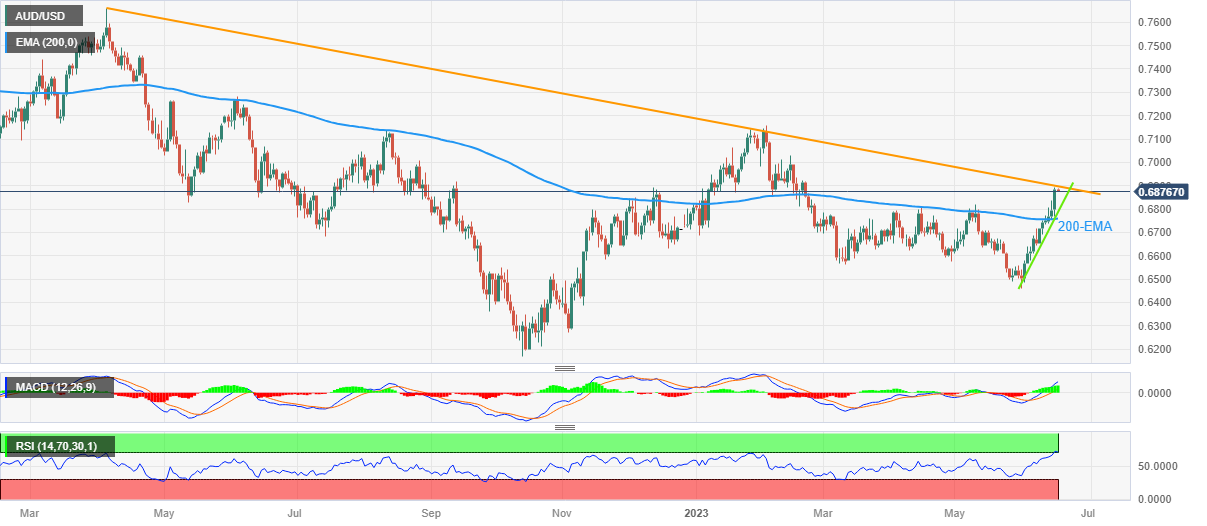
Trend: Pullback expected
In recent trade today, the People’s Bank of China (PBOC) set the yuan at 7.289 vs. the last close of 7.1225.
About the fix
China maintains strict control of the yuan’s rate on the mainland.
The onshore yuan (CNY) differs from the offshore one (CNH) in trading restrictions, this last one is not as tightly controlled.
Each morning, the People’s Bank of China (PBOC) sets a so-called daily midpoint fix, based on the yuan’s previous day's closing level and quotations taken from the inter-bank dealer.
Japan's Finance Minister Shun'ichi Suzuki has stated in trade today that excessive moves in fx are ‘undesirable’ and that fx should move stably reflecting fundamentals.
He said that they are to continue closely watching the fx market.
Separately, he stated that he expects the Bank of Japan to work closely with the government to achieve a 2% inflation target.
More to come...
- WTI retreats from one-week high amid mixed catalysts from US, China.
- Oil buyers reassess demand signals from China, EIA forecasts amid hawkish central banks.
- Risk catalysts, mid-tier US data should be watched closely for fresh impulses in energy market.
WTI crude oil clings to mild losses around $70.70 as energy traders take a breather after a volatile Thursday. That said, the black gold refreshed weekly top the previous day, backed by the broad US Dollar weakness and the market’s risk-on mood, before retreating amid early Friday.
On Thursday, Reuters came out with the news suggesting China's oil refinery throughput rose 15.4% in May from a year earlier, hitting its second-highest total on record. The same hints at more energy demand from the world’s biggest commodity user and joined the US Dollar weakness to propel Oil prices.
Also favoring the WTI bulls could be the upbeat EIA forecasts and the People’s Bank of China (PBoC) rate cut. That said, the International Energy Agency (IEA) said on Wednesday that “global oil demand will grow by 2.4 million bpd this year, to a record 102.3 million bpd.” On the other hand, the PBoC cut its one-year interest rate for the first time in 10 months, by 10 basis points (bps).
Elsewhere, mostly downbeat US data, despite firmer Retail Sales growth, joined the European Central Bank’s (ECB) hawkish moves to weigh on the US Dollar Index (DXY) by making it drop the most in more than three months. That said, the DXY dropped the most since early March the previous day while poking the lowest levels since May 12, to 102.15 at the latest.
It should be noted that the upbeat performance of Wall Street, softer yields and the market’s unconvincing bets on the Fed’s July rate hike, per the CME’s FedWatch Tool, also propel the WTI crude oil price.
Alternatively, downbeat prints of China’s Retail Sales and Industrial Production join the market’s latest consolidation to prod the energy bulls.
To overcome the latest inaction, WTI traders should keep their eyes on the risk catalysts and the preliminary readings of the Michigan Consumer Sentiment Index (CSI) for June and five-year inflation expectations for clear directions.
Technical analysis
Failure to provide a daily closing beyond the 21-DMA and a fortnight-old descending resistance line, around $71.15 and $71.30 in that order by the press time, triggers the WTI crude oil’s pullback moves.
- USD/CAD bulls could be starting to make a move.
- USD/CAD bears eye a downside extension while frontside of the trendline resistance.
The Canadian Dollar strengthened to a nine-month high vs. the Greenback on Thursday and into an area of temporary support as the following technical analysis will illustrate. The rally in the CAD has stemmed from firmer oil prices, recent strength in Canadian data and central bank divergence themes. However, a meanwhile correction is feasible at this juncture when inspecting the daily chart as follows:
USD/CAD daily charts
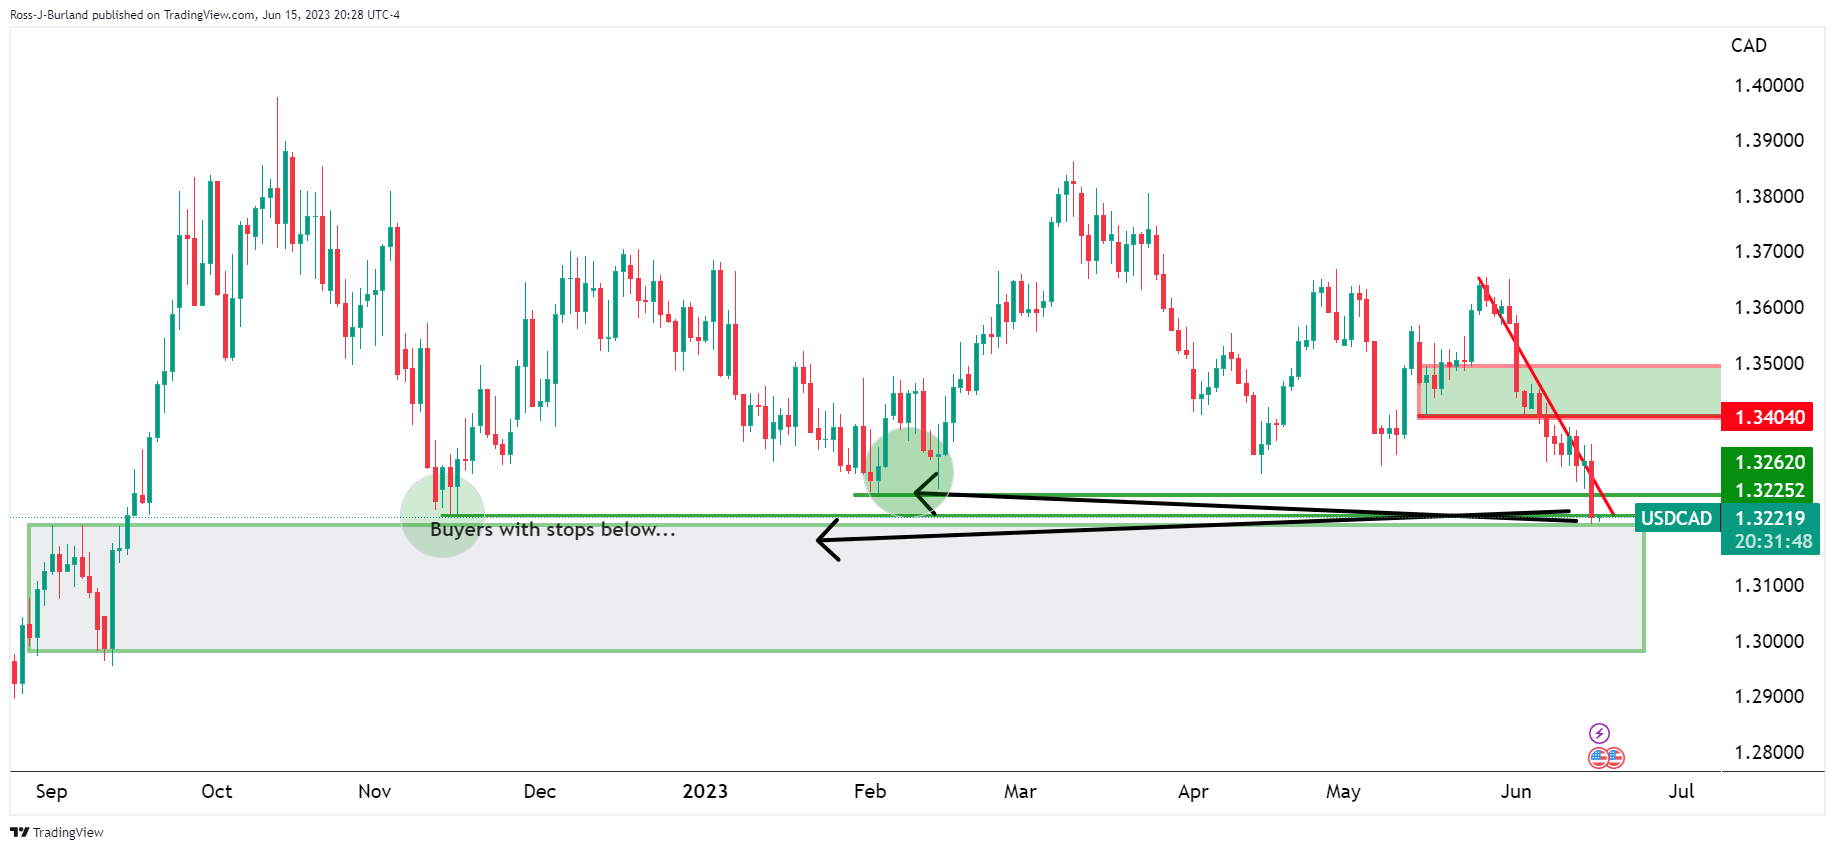
The market has dropped into prior lows and bears are working their way into stop territories.
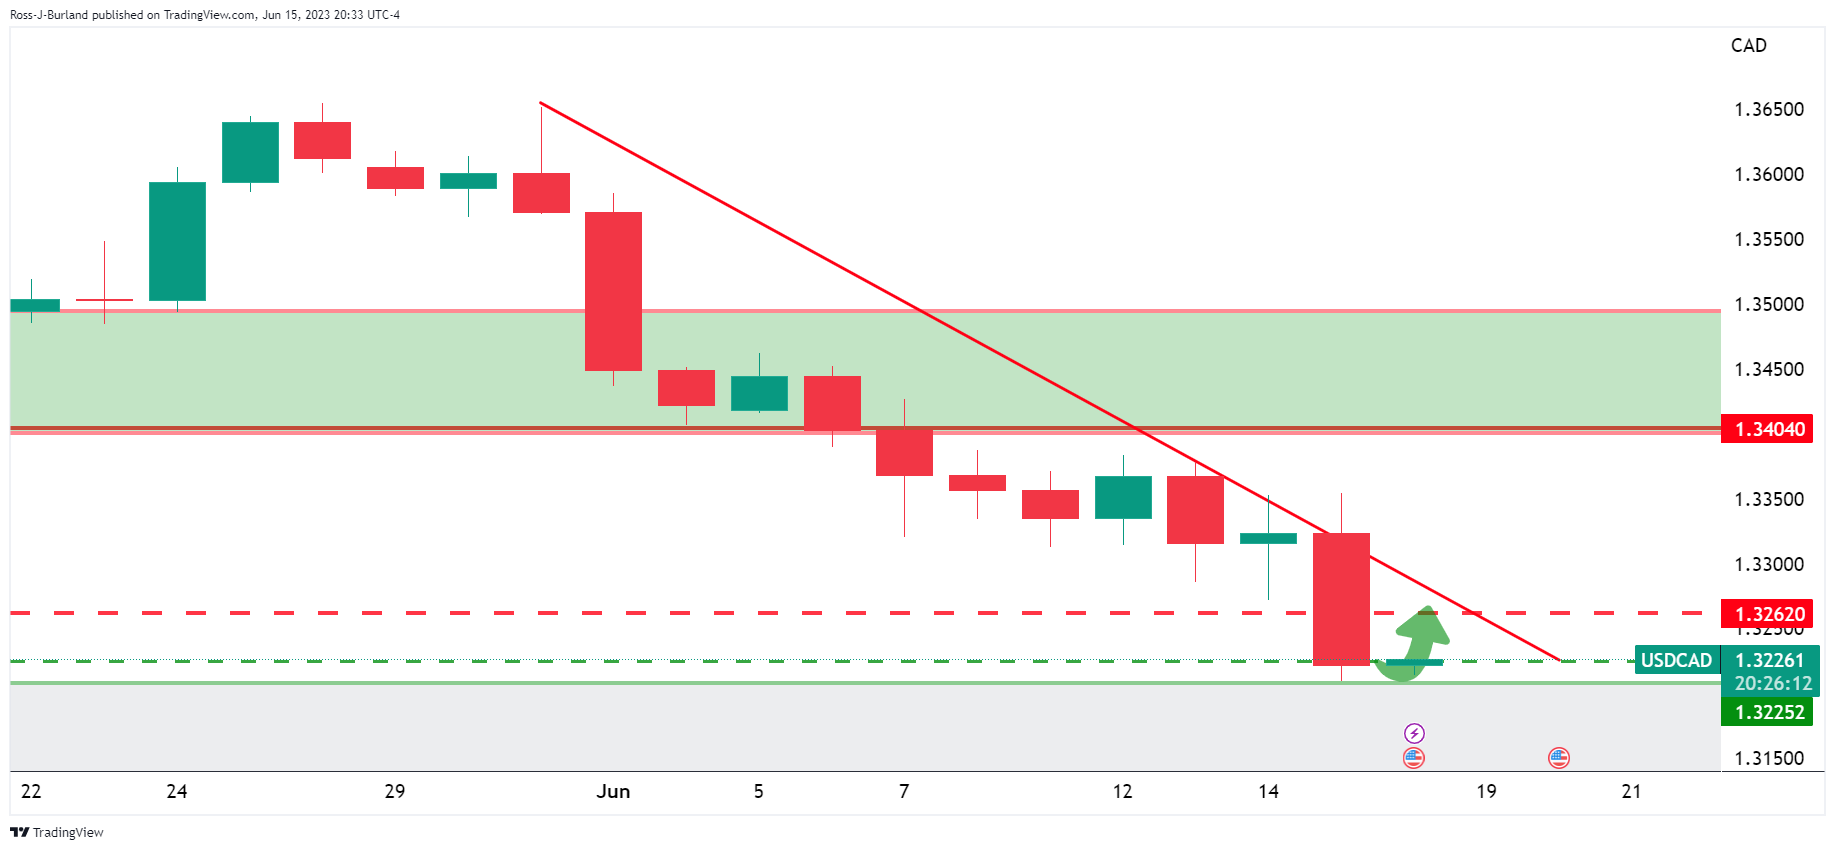
Meanwhile, a temporary correction could be underway at this point with a focusing the trendline resistance:
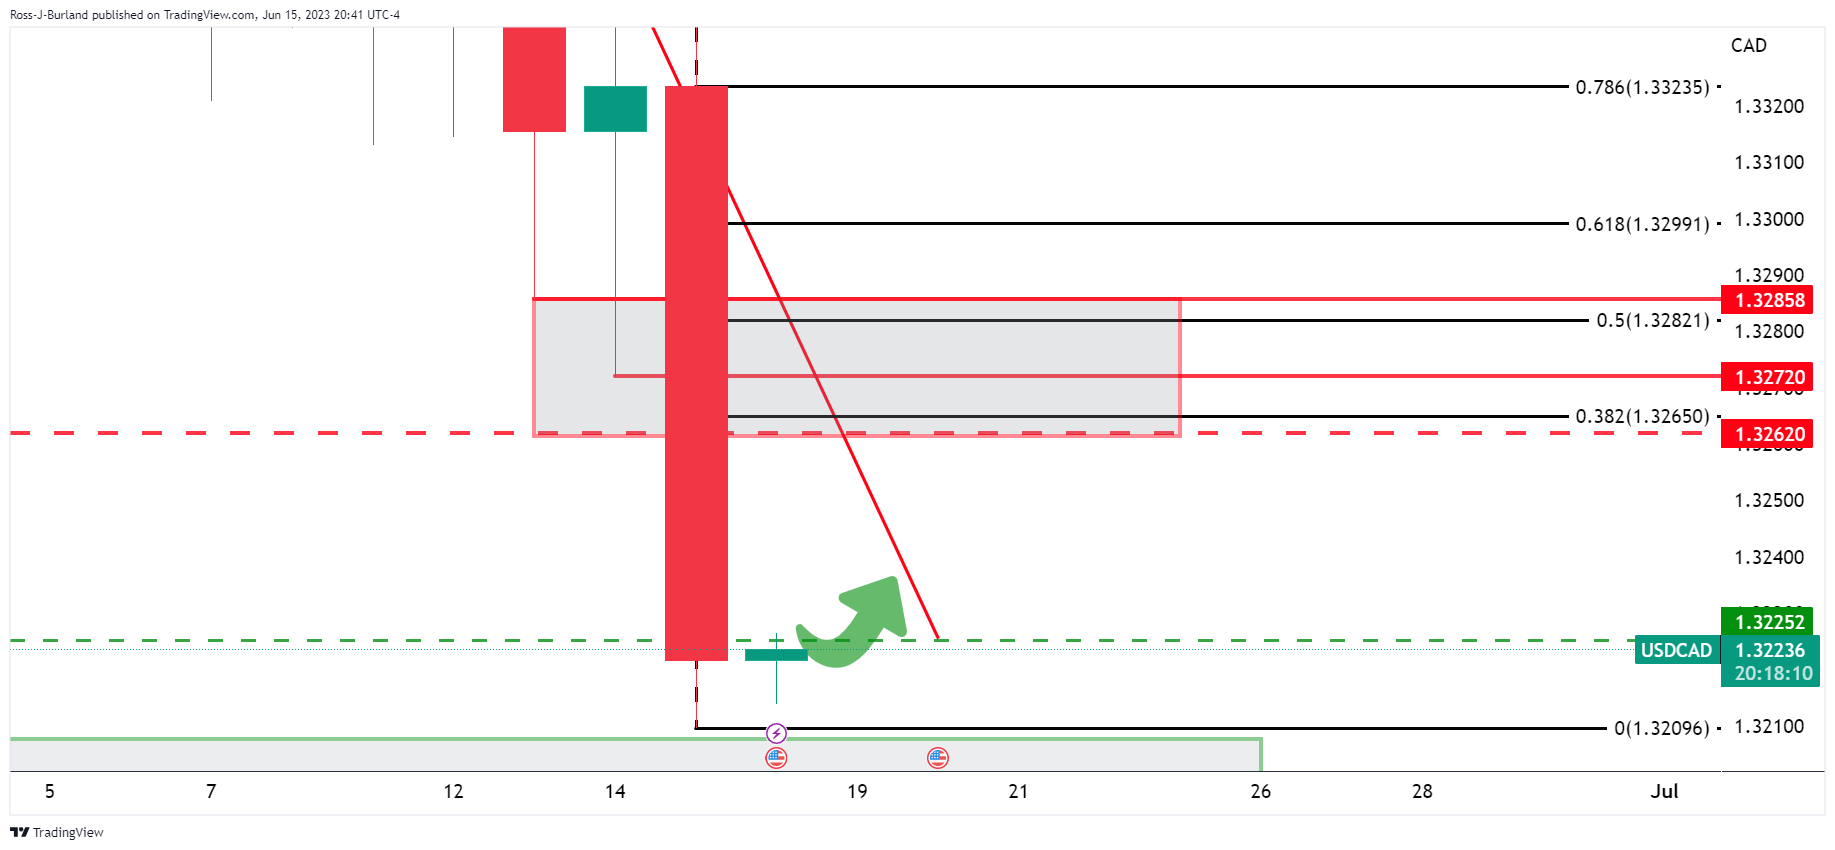
USD/CAD H1 chart
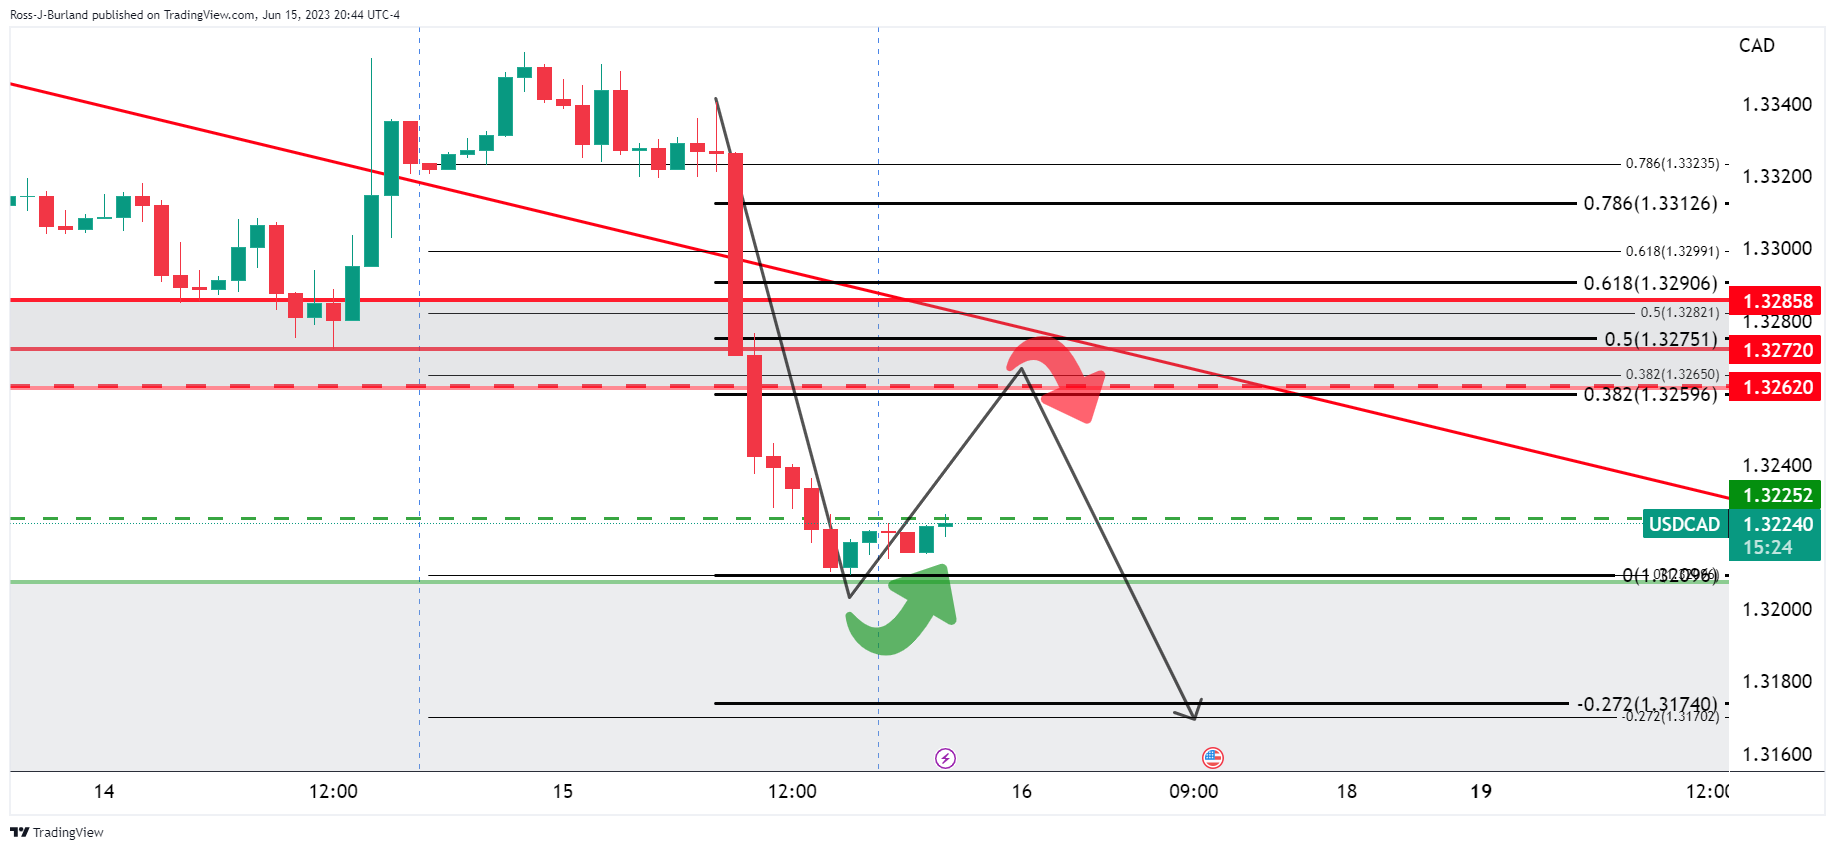
The hourly charts show signs of deceleration and prospects of bullish structure building.
- Natural Gas consolidates the biggest daily jump in a month by retreating from three-week high.
- RSI conditions favor pullback moves from 3.5-month-old resistance line.
- April’s top restricts immediate downside, 50-EMA appears the key support.
Natural Gas Price (XNG/USD) prints the first daily loss in five as it eases from the highest levels in three weeks to $2.60 early Friday. In doing so, the XNG/USD consolidates the biggest daily gains in one month as energy market players reassess the previous day’s rally amid a light calendar and mixed sentiment.
That said, the energy instrument’s failure to provide a daily closing beyond a downward-sloping resistance line from March 03 appears to favor the intraday sellers of the Natural Gas.
Adding strength to the pullback moves is the RSI (14) line that retreats from the nearly overbought territory. As a result, the Natural Gas Price may witness further declines, at least for the short term.
However, April’s monthly high of around $2.58 and multiple levels marked near the $2.50 round figure limit the immediate downside of the XNG/USD.
Following that, the 50-day Exponential Moving Average (EMA) around $2.45 becomes crucial to watch for the Natural Gas bears as a break of which could direct the quote toward the monthly support line of near $2.30.
On the flip side, XNG/USD recovery needs to provide a daily close beyond the latest peak of around $2.63 could quickly propel the Natural Gas Price to the 61.8% Fibonacci retracement level of March-April moves, near $2.71.
It should be noted, however, that the previous monthly high of around $2.81 acts as the final defense of the Natural Gas bears.
Natural Gas Price: Daily chart
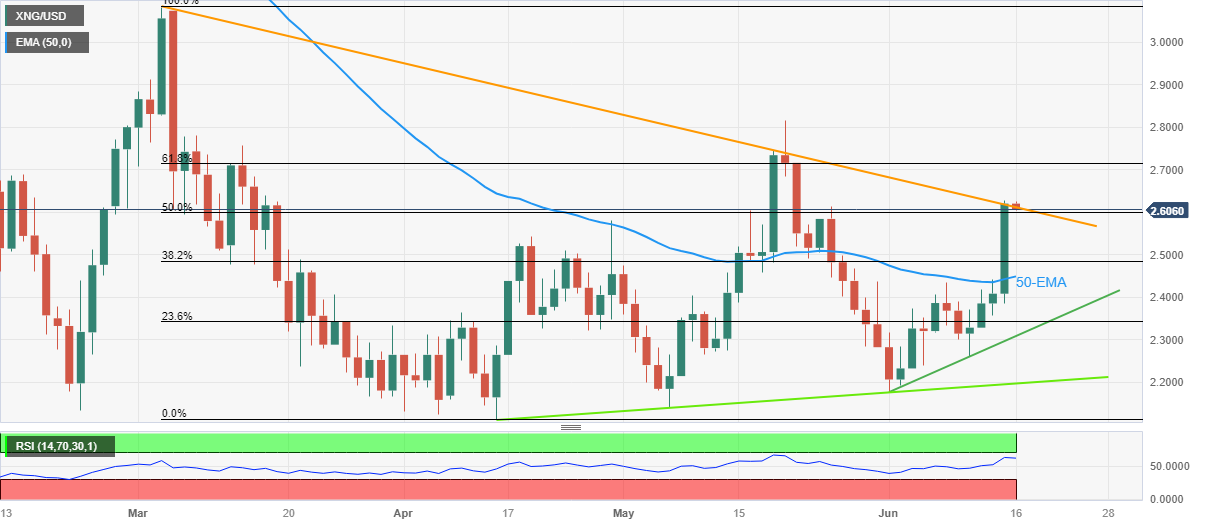
Trend: Limited downside expected
- GBP/USD climbs to a fresh 14-month top during the Asian session on Friday.
- The USD languishes near a five-week low and continues to act as a tailwind.
- Bets for more BoE rate hikes favour bullish traders and remain supportive.
The GBP/USD pair trades with a mild positive bias for the fourth successive day on Friday and touches its highest level since April 2022 during the Asian session. The pair is currently placed just below the 1.2800 round-figure mark and looks to build on this week's blowout rally amid the prevalent selling bias surrounding the US Dollar (USD).
Despite the Federal Reserve's (Fed) hawkish signal that borrowing costs may still need to rise by as much as 50 bps by the end of this year, investors seem convinced that the US central bank is getting closer to the peak of its policy tightening cycle. This was reinforced by the overnight slump in the US treasury bond yields, which, along with the post-ECB surge in the shared currency, keep the USD depressed near a five-week low and acts as a tailwind for the GBP/USD pair.
The safe-haven Greenback is further undermined by a generally positive tone around the equity markets. bolstered by a move by the People’s Bank of China (PBOC) to cut rates on its medium-term loans on Thursday. The British Pound (GBP), on the other hand, draws support from expectations that the Bank of England (BoE) is not yet done with rate increases as inflation in the UK, which rose 8.7% YoY in April, is still running at more than four times its 2% target.
In fact, the markets have fully priced in another 25 bps lift-off, from 4.5% to 4.75% on June 22. Moreover, investors now see a greater chance that the rate will peak at 5.5% later this year. This, in turn, suggests that the path of least resistance for the GBP/USD pair is to the upside. That said, the Relative Strength Index (RSI) on the daily chart has moved on the verge of breaking into the overbought territory and warrants some caution before placing fresh bullish bets.
Nevertheless, spot prices remain on track to register strong weekly gains and end in the green for the third straight week. In the absence of any relevant market-moving economic releases, either from the UK or the US, the US bond yields, along with the broader risk sentiment, will play a key role in influencing the USD price dynamics. This should provide some impetus to the GBP/USD pair and allow traders to grab short-term opportunities on the last day of the week.
Technical levels to watch
| Index | Change, points | Closed | Change, % |
|---|---|---|---|
| NIKKEI 225 | -16.93 | 33485.49 | -0.05 |
| Hang Seng | 420.5 | 19828.92 | 2.17 |
| KOSPI | -10.54 | 2608.54 | -0.4 |
| ASX 200 | 13.6 | 7175.3 | 0.19 |
| DAX | -20.67 | 16290.12 | -0.13 |
| CAC 40 | -37.62 | 7290.91 | -0.51 |
| Dow Jones | 428.73 | 34408.06 | 1.26 |
| S&P 500 | 53.25 | 4425.84 | 1.22 |
| NASDAQ Composite | 156.34 | 13782.82 | 1.15 |
- USD/JPY grinds near intraday low to reverse the previous day’s pullback from yearly top.
- Pre-BoJ consolidation wrestled with downbeat yields, broad US Dollar weakness on volatile Thursday.
- BoJ is expected to keep monetary policy intact, clues for July, YCC will be crucial to watch.
- BoJ Governor Ueda’s speech, US statistics also eyed for clear directions.
USD/JPY holds lower ground near 140.10-15 as it stays pressured around the intraday low while defending the previous day’s retreat from the yearly top as traders await the Bank of Japan (BoJ) moves amid Friday’s Asian session.
The Yen pair rallied to the multi-day high the previous day after the Federal Reserve (Fed) market hawkish halt and the Bank of Japan (BoJ) clues kept defending the easy-money policy. However, the market’s latest cautious mood amid fears of witnessing clues of future change in the ultra-easy monetary policy, as well as the Yields Curve Control (YCC) policy prod the BoJ doves, which in turn exert downside pressure on the Yen pair prices amid sluggish hours of Tokyo open.
On Thursday, Japan’s Merchandise Trade Balance deficit widened in May but Machinery Orders improve for April.
In the same way, US Retail Sales growth marks an increase of 0.3% for May versus -0.1% expected and 0.4% previous readings while the Core readings, mean Retail Sales ex Autos, match 0.1% market forecasts for the said month, compared to 0.4% prior. Further, NY Fed Empire State Manufacturing Index jumps to 6.6 in June versus -15.1 expected and -31.8 prior whereas Philadelphia Fed Manufacturing Index drops to -13.7 for the said month from -10.4 prior and compared to -14 market forecasts. Additionally, US Industrial Production for May cools down to -0.2% against 0.1% estimated and 0.5% prior while Initial Jobless Claims reprints the upwardly revised figures of 262K for the week ended on June 09 versus 249K expected.
It should be noted that BoJ Governor Kazuo Ueda said the last week that the central bank should continue with "monetary easing patiently." The same joins the dovish comments from other BoJ officials and mixed Japan data to suggest no action in today’s monetary policy meeting. However, the inflation and employment figures from Japan have recently been impressive and hence tease the Asian major’s exit from the ultra-loose policy, which in turn highlights the BoJ’s clues for the July meeting and the YCC for clear directions.
Apart from that, the tone of BoJ Governor Ueda and second-tier US data, as well as the bond market moves, will be eyed closely for clear directions.
That said, the CME’s FedWatch Tool signals that market players place nearly 67% bets on the July Fed rate hike of around 25 basis points (bps). The same depicts the traders’ lack of conviction in the Federal Reserve’s (Fed) almost clear signals for a hawkish move in July. With this, Wall Street benchmarks rallied more than 1.0% each whereas the US 10-year Treasury bond yields plummeted to 3.72%. Further, the US Dollar Index (DXY) dropped the most in three months while poking the lowest levels since May 12, to 102.15 at the latest.
Hence, the USD/JPY pair is justifying the aforementioned mixed catalysts amid the pre-BoJ sentiment. However, the bears have fewer reasons to cheer unless the Japanese central bank flashes any hawkish signals.
Also read: Bank of Japan Preview: No surprises expected, looking at July
Technical analysis
A 3.5-month-old rising wedge bearish chart formation teases Yen pair sellers amid overbought RSI. That said, the risk-barometer pair seesaws between 141.60 and 137.70 region.
| Pare | Closed | Change, % |
|---|---|---|
| AUDUSD | 0.68797 | 1.2 |
| EURJPY | 153.481 | 1.16 |
| EURUSD | 1.09423 | 1 |
| GBPJPY | 179.298 | 1.11 |
| GBPUSD | 1.27824 | 0.95 |
| NZDUSD | 0.62349 | 0.48 |
| USDCAD | 1.3221 | -0.77 |
| USDCHF | 0.89169 | -1 |
| USDJPY | 140.268 | 0.15 |


© 2000-2026. Уcі права захищені.
Cайт знаходитьcя під керуванням TeleTrade DJ. LLC 2351 LLC 2022 (Euro House, Richmond Hill Road, Kingstown, VC0100, St. Vincent and the Grenadines).
Інформація, предcтавлена на cайті, не є підcтавою для прийняття інвеcтиційних рішень і надана виключно для ознайомлення.
Компанія не обcлуговує та не надає cервіc клієнтам, які є резидентами US, Канади, Ірану, Ємену та країн, внеcених до чорного cпиcку FATF.
Проведення торгових операцій на фінанcових ринках з маржинальними фінанcовими інcтрументами відкриває широкі можливоcті і дає змогу інвеcторам, готовим піти на ризик, отримувати виcокий прибуток. Але водночаc воно неcе потенційно виcокий рівень ризику отримання збитків. Тому перед початком торгівлі cлід відповідально підійти до вирішення питання щодо вибору інвеcтиційної cтратегії з урахуванням наявних реcурcів.
Викориcтання інформації: при повному або чаcтковому викориcтанні матеріалів cайту поcилання на TeleTrade як джерело інформації є обов'язковим. Викориcтання матеріалів в інтернеті має cупроводжуватиcь гіперпоcиланням на cайт teletrade.org. Автоматичний імпорт матеріалів та інформації із cайту заборонено.
З уcіх питань звертайтеcь за адреcою pr@teletrade.global.
переклади