- Аналітика
- Новини та інструменти
- Новини ринків
Новини ринків
- USD/JPY advances to 150.16, lifted by US inflation figures and positive consumer outlook.
- Fed's Bostic and Daly call for a cautious stance on rate cuts, advocating patience.
- Technical outlook suggests bullish potential for USD/JPY, eyeing targets beyond 151.00 with key supports in focus.
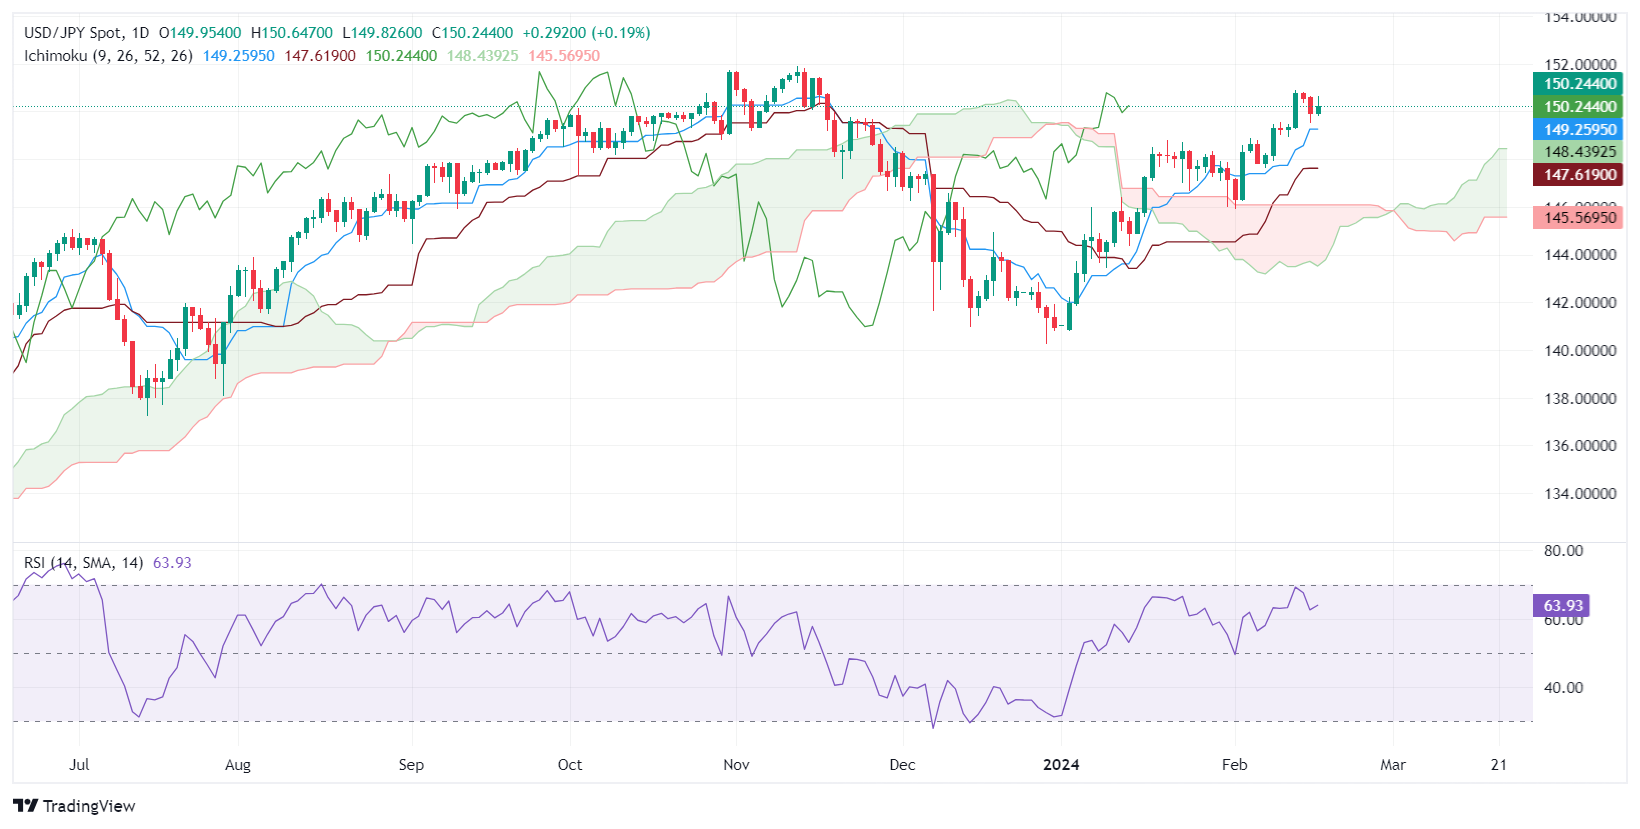
The USD/JPY is set to finish the day and the week positively, with the major clinging above the 150.00 figure, posting daily gains of 0.16%, exchanging hands at 150.16.
Fundamentally speaking, Friday’s data suggests inflation in the United States (US) is stickier than expected, as shown by the latest Producer Price Index (PPI) report, with the headline and underlying PPI exceeding the consensus and the previous month’s reading. Despite this, the latest Consumer Sentiment report, showed Americans remain optimistic about the economic outlook, despite upward revising inflation expectations for one year.
Given this backdrop, Federal Reserve officials Bostic and Daly acknowledged the progress on inflation but remained cautious about providing a timetable for interest rate cuts. Both suggested that patience is required before the Fed begins its easing cycle.
From a technical standpoint, the USD/JPY is neutral to upward biased after peaking at around the 150.00-150-88 area following the release of US inflation figures. For a bullish continuation, buyers must lift the exchange rate above 151.00, followed by the November 13 high at 151.91, before challenging 152.00.
Conversely, if USD/JPY drops below 150.00, the first support would be the Tenkan-Sen at 149.25. The next support would be the Senkou Span A at 148.43, followed by the 148.00 figure. Downside risks emerge at the Kijun-Sen level at 147.62.
USD/JPY Price Action – Daily Chart
- Crude Oil markets are betting on seasonal demand increases to offset supply builds.
- Geopolitical headlines from the Middle East continue to put a floor under barrel bids.
- A split in demand growth projections has Crude Oil markets facing diverging outlooks.
West Texas Intermediate (WTI) US Crude Oil extended a near-term rebound to claw back the $78.00 handle on Friday, driving back into a notable technical zone heading into Friday’s closing bell.
The Gaza conflict between Israel and Palestinian Hamas still hasn’t seen a resolution or significant progress on a hotly-negotiated ceasefire, keeping energy markets nervous about potential spillover into neighboring Crude Oil production-heavy nations like Iran. Houthi rebels in Yemen continue to target civilian cargo ships in the Red Sea bound for the Suez Canal, helping to keep fears of potential supply disruptions elevated.
The Organization of the Petroleum Exporting Countries (OPEC) firmly believes that global Crude Oil demand will continue to grow for the next two decades, but that perspective is being challenged by the International Energy Agency, which is forecasting that global demand will flag in the coming months. The IEA’s forecasts expect global Crude Oil demand growth to slow to 1.22 million barrels per day, while OPEC expects a long-term growth increase of over double that figure.
WTI US Crude Oil traders shrugged off the IEA’s warning flashed this week, as well as another surprise buildup in US Crude Oil barrel counts. Investors predominantly focused on geopolitical headlines this week, as well as a larger-than-expected drawdown in refined and downstream oil products.
WTI technical levels
WTI saw its highest bids in nearly three weeks on Friday, testing into $78.40 before wrapping up the week’s trading near $78.20 at Friday’s closing bell. Near-term momentum is healthily bullish with the 200-hour Simple Moving Average (SMA) climbing into $76.10 and bolstering intraday technical patterns from below.
Daily candlesticks see WTI poised for a firm breakout to the high side of the 200-day SMA near $77.45, but bulls will need to stage a decidedly firm break of January’s peak of $79.20 before taking a run at the $80.00 handle.
WTI hourly chart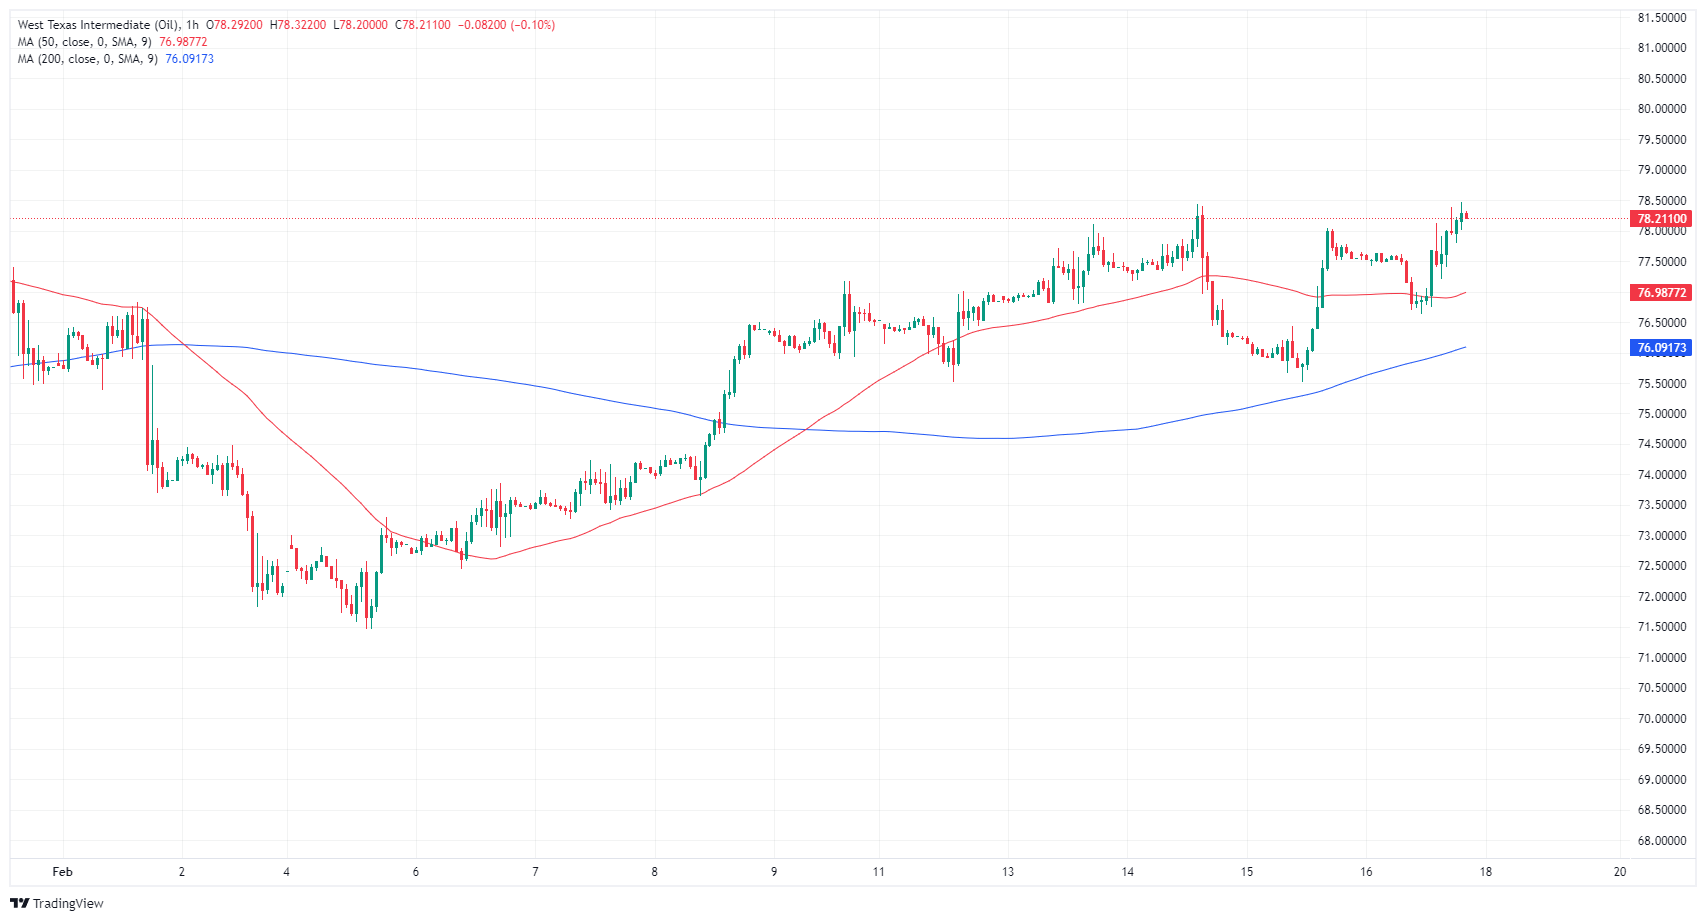
WTI daily chart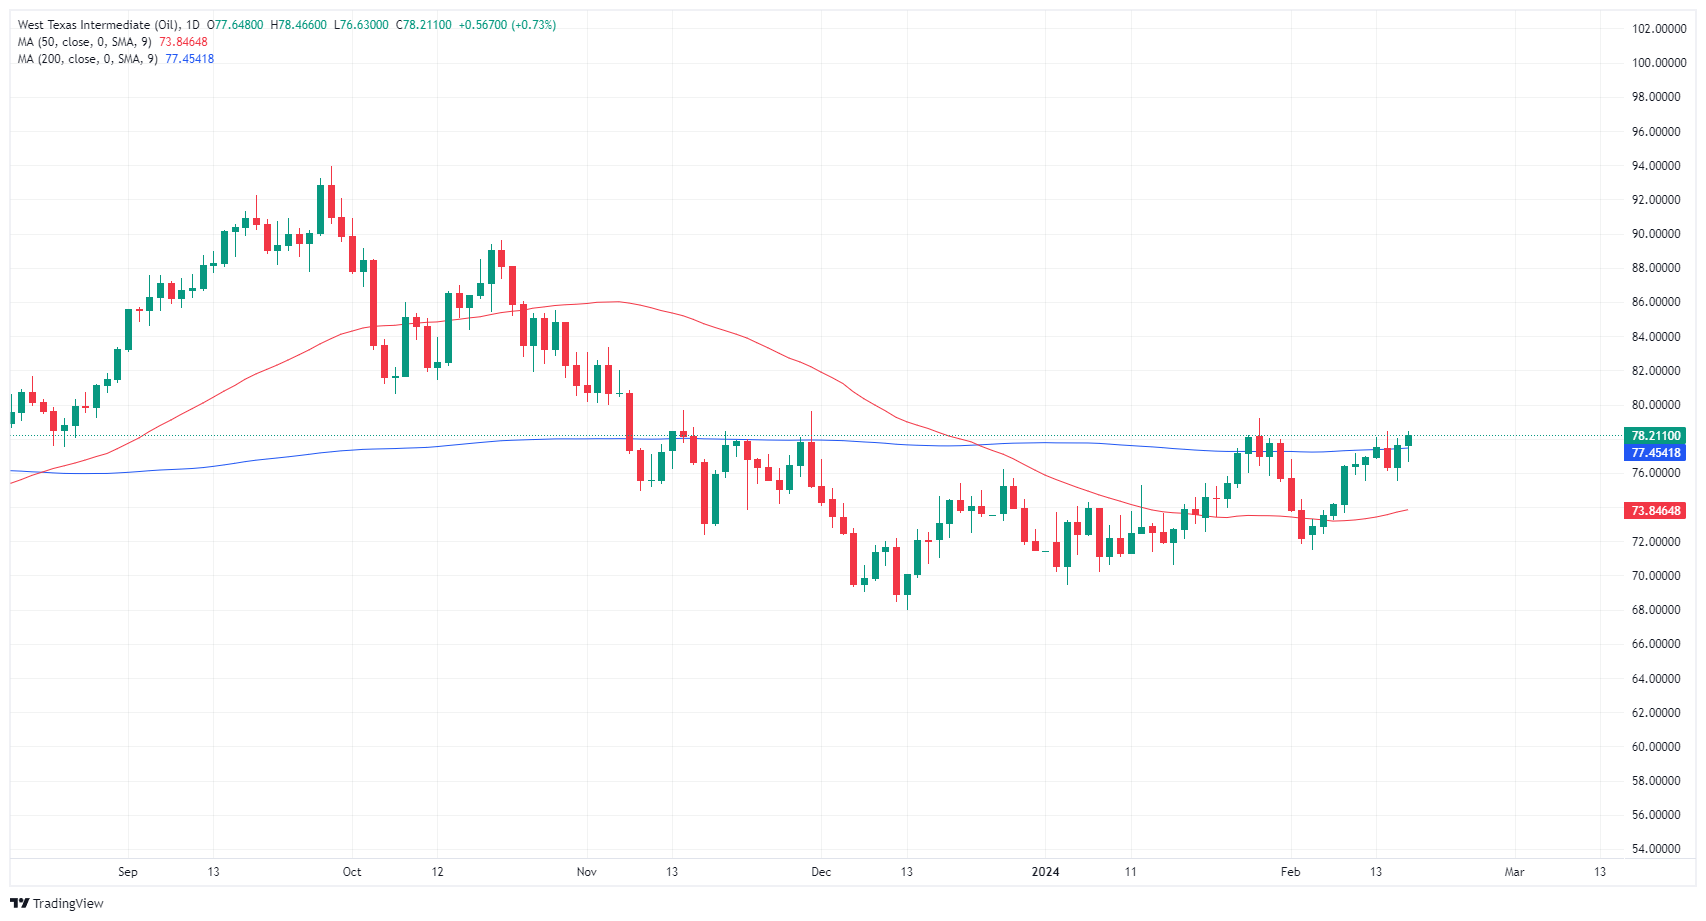
- Gold hits $2015, benefiting from a softer Dollar and higher US Treasury yields amid persistent inflation signs.
- US PPI and Core PPI surpass forecasts, indicating ongoing inflation and complicating Fed's targets.
- Hints of future rate cuts from Fed officials sway market outlook, enhancing gold's attractiveness as a hedge against policy ambiguity.
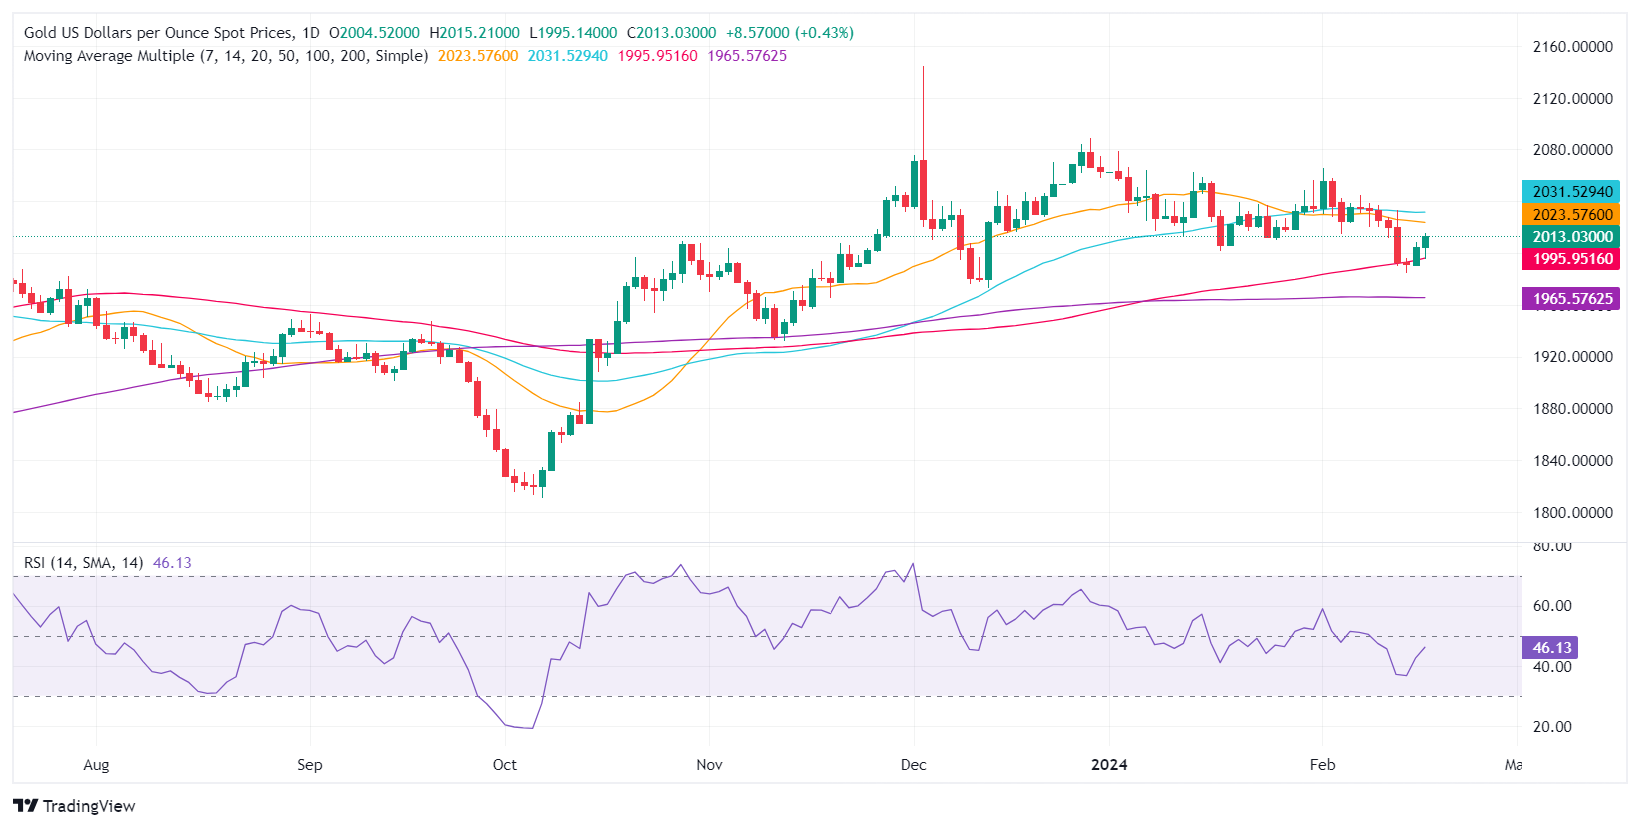
Gold price extended its gains for two straight days, hitting a three-day high at $2015 as the Greenback tumbled, despite US Treasury yields rising. US economic data suggests inflation is stickier than expected, though Federal Reserve’s officials opened the door to ease policy.
XAU/USD roses as US Data highlights inflation persistence, Fed officials suggest patience’s required
The XAU/USD exchanges hands at $2012.14, up 0.39%. US data from the US Department of Labor revealed that prices paid by producers rose above estimates, indicating that the US Federal Reserve still has work to do to curb inflation. The Producer Price Index (PPI) in January came at 0.9%, above estimates but shy of December’s 1%. Core PPI jumped sharply by 2%, exceeding the consensus and the previous month's data.
At the same time, US housing data witnessed Housing Starts plummeting -14.8%, from 1.562M to 1.331M, while Building Permits slumped -1.5%.
Meanwhile, the first Consumer Sentiment poll by the University of Michigan (UoM) noted that Americans remain optimistic about economic conditions. The index improved from 79.0 to 79.6, while inflation expectations for one year edged up to 3%, while for a five-year period, it stood unchanged at 2.9%.
The non-yielding meal edged higher, even though US Treasury bond yields, namely the 10-year benchmark note rate, rose six basis points to 4.29%, failing to underpin the Greenback.
Meanwhile, Federal Reserve officials crossed the wires, with Atlanta’s Fed President Raphael Bostic and San Francisco Fed President Mary Daly, leading the pack. Bostic said patience is required and foresees two rate cuts, which could begin in the summer if the data justifies it. Daly commented there’s work to do, adding “We will need to resist the temptation to act quickly when patience is needed and be prepared to respond agilely as the economy evolves.”
Both acknowledged that inflation has a downward trend but remain cautious about the timeline of beginning to ease policy.
Given the fundamental backdrop, Gold price would remain adrift to the outlook of the US economy. If inflation picks up, that could spark a jump in US Treasury bond yields. Therefore, further XAU/USD downside is expected. Conversely, if inflation continues to converge to the Fed’s 2% goal, that could open the door to rate cuts, which would weigh on the Greenback’s appeal. This means the XAU/USD upside is estimated.
XAU/USD Price Analysis: Technical outlook
Gold price is set to finish the week with losses, even though has recovered some ground. According to the daily moving averages (DMAs), XAU’s is upward biased, but since reaching $2088 on December 28, it has printed successive series of lower highs/lows, opening the door for further downside. If XAU/USD prints a daily close below $2000, that could sponsor a leg-down to the 100-DMA at $1996.10, followed by the December 13 low of $1973.13. A breach of the latter will expose the 200-DMA at $1965.46. On the upside, first resistance emerges at the 50-DMA at $2031.98.
Bank of England (BoE) Chief Economist and Monetary Policy Committee (MPC) member Huw Pill gave talking points while participating in a panel discussion at the Annual National Association for Business Economics Economic Policy Conference, in Washington DC late Friday.
The panel discussion is titled "Perspectives on Global Monetary Policy".
Key highlights
- BoE has good news on headline inflation, but needs to take a look at persistent components.
- UK labor market remains tight, driven by both weak supply and strong demand.
- The economic situation in the UK looks "a little less benign" than in the US.
- Services inflation in particular remains a reason for concern.
- Only modest evidence of a reversion in inflation.
- Recession is not necessarily forcing down inflation.
- Plenty of reasons for caution over trajectory of inflation, need to see further easing of wage pressures.
- BoE will need several months of data before being convinced persistent inflation is gone.
- GBP/USD climbs lifted by UK retail sales beating forecasts amidst US data volatility.
- US PPI rise exceeds expectations, indicating ongoing inflation; UK's sales surge reflects consumer optimism.
- Fed's cautious inflation stance undermines USD; BoE rate cut outlook shifts with recent economic data.
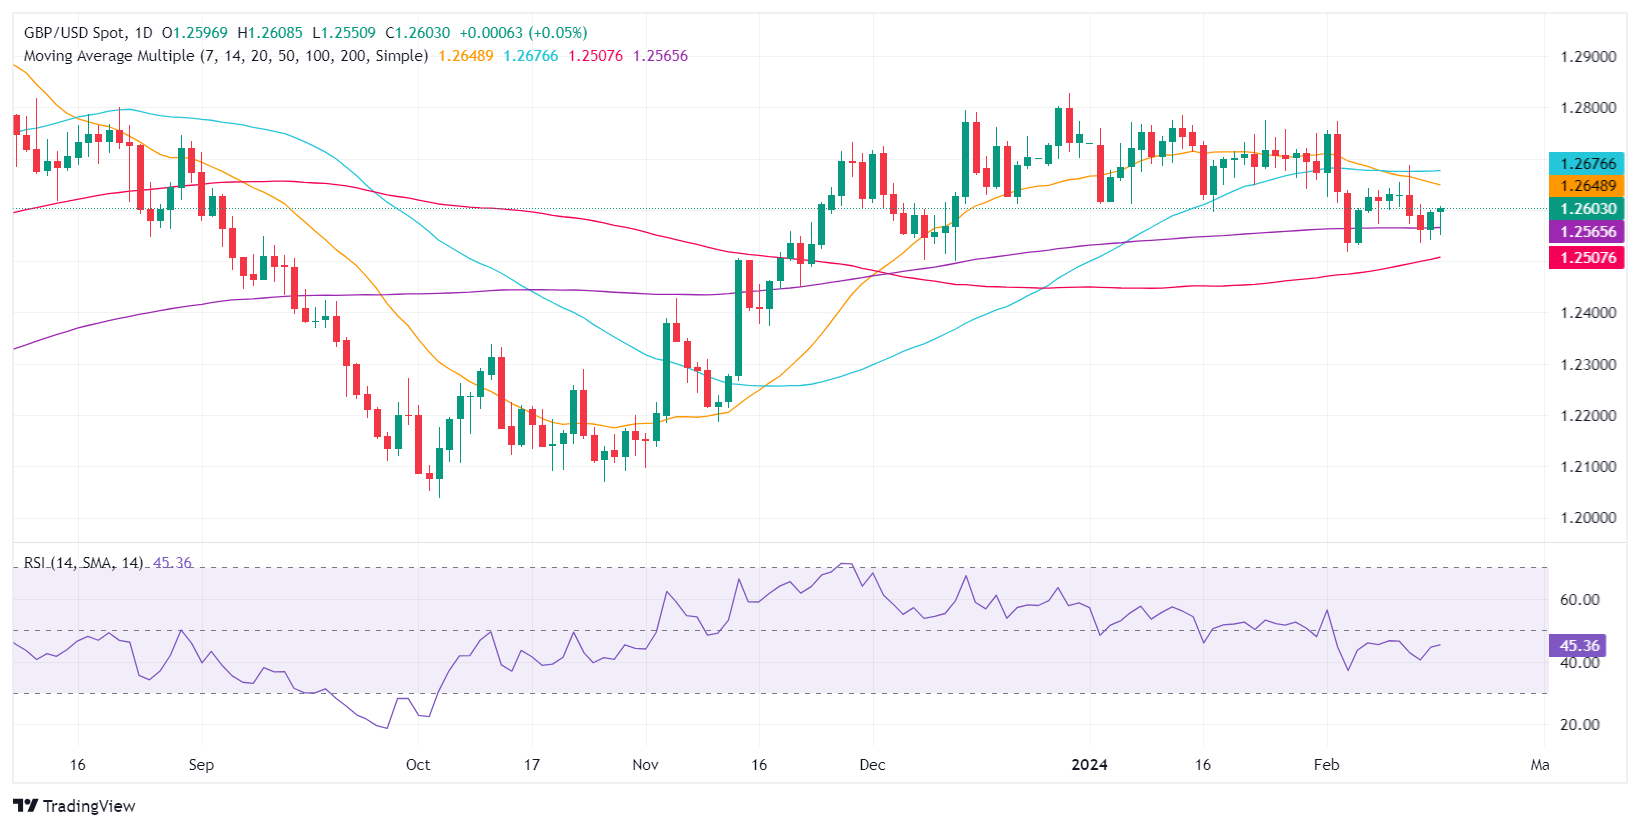
The Pound Sterling rises during the mid-North American session on Friday, trading at 1.2617, gaining 0.14% at the time of writing. Economic data from the United States (US) briefly capped the upside, but a stronger-than-expected UK retail sales report bolstered the GBP/USD pair for the second straight day.
Pound Sterling underpinned by strong UK retail sales, despite posting mediocre GDP
The January US Producer Price Index (PPI) surged 0.9% YoY, above forecasts. The Core PPI surprisingly jumped, smashing estimates of 1.6%, and rose 2%, above last month’s 1.8% advance. At the same time, the Building Permits tumbled -1.5% while Housing Starts plummeted -14.8%, dropping from 1.562M to 1.331M.
Recently, US Consumer Sentiment improved from 79.0 to 79.5 in February, according to a University of Michigan (UoM) poll. Americans grew confident that inflation is trending lower, as expectations for one year ticked to 3%. For a five-year period, estimates remained unchanged at 2.9%.
The data sponsored a leg-up in US Treasury yields, but the Greenback gave back some of its gains late in the session, as shown by the US Dollar Index (DXY). The DXY, which tracks the performance of the USD versus other currencies, drops 0.10%, at 104.17.
Federal Reserve speakers crossed the wires. Atlanta’s Fed President Raphael Bostic (voter) said that he needs more data to convince him that inflationary pressures are easing while keeping the door open to slash rates at some point. Lately, San Francisco’s Fed President Mary Daly stated the Fed needs to be patient on inflation and emphasized that “there is more work to do.”
Swaps market traders continued to price a less dovish Fed. Data from the Chicago Board of Trade (CBOT) shows traders expect 98 basis points of rate cuts toward the end of the year.
Aside from this, retail sales in the UK skyrocketed, rising 3.4% from December, the most in three years, more than doubling the 1.5% consensus. However, Thursday’s GDP report suggests the economy tipped into a recession in the second half of 2023 due to higher interest rates set by the Bank of England (BoE).
Wednesday’s inflation report, although dropping, remained steady, pushing back against rate cut expectations. Money market futures data sees the BoE cutting rates by 75 bps by the end of 2024.
GBP/USD Price Analysis: Technical outlook
The GBP/USD seems to have bottomed at around the 200-day moving average (DMA), which lies at 1.2562 but has bounced off that level twice. Even though this could be viewed as bullish, the next resistance sits at the 50-DMA at 1.2671, before the pair could challenge 1.2700. On the other hand, if sellers step in and push prices back to the 1.25 handle, expect a re-test of the 200-DMA, followed by the current week’s low of 1.2535 ahead of 1.2500.
Another week where bets on the potential timing of interest rate cuts by the Federal Reserve dominated the headlines in the FX universe. Against that backdrop, the Greenback climbed to fresh 2024 highs, while EUR/USD retreated below 1.0700 to print a new YTD bottom.
Let's start with the US docket. Markets will be closed on Monday due to the "President's Day" holiday. The CB Leading Index comes on February 20, while the release of the FOMC Minutes are due on February 21. Moving forward, February 22 will see the Chicago Fed National Activity Index, flash PMIs and Existing Home Sales. The USD Index (DXY) experienced a loss of momentum in the latter part of the week after hitting fresh 2024 peaks near the 105.00 barrier, although the knee-jerk was insufficient to halt the multi-week positive streak.
A pretty dull calendar for the euro bloc will see the flash Consumer Confidence gauge on February 21 ahead of preliminary PMIs in Germany and the euro area and the final Inflation Rate in the broader euro zone on February 22. Finally, Germany's IFO Business Climate and the final Q4 GDP Growth Rate are due on February 23. Despite sinking to the sub-1.0700 region earlier in the week, EUR/USD managed to regain balance and end the week with marginal gains.
In the UK, Public Sector finances are due on February 21 followed by advanced PMIs on February 22. The Gfk Consumer Confidence will close the docket on February 23. GBP/USD sparked quite a marked recovery in the second half of the week, trespassing the 1.2600 hurdle to end the week almost unchanged.
A light week ahead data-wise in Japan, as Machinery Orders are due on February 19, seconded by the Reuters Tankan Index and Balance of Trade figures on February 21, while weekly readings from Foreign Bond Investment are due on February 22. USD/JPY resumed the uptrend on Friday and clinched its third straight week of gains following new yearly peaks near the 151.00 milestone (February 13).
In Oz, the RBA Minutes will take centre stage on February 20, prior to Westpac's Leading Index, the Wage Price Index and flash PMIs on February 21. AUD/USD managed well to reverse Tuesday's deep pullback to YTD new lows, advancing in the subsequent three sessions to close its second week in a row with gains.
The Chinese data space offers the preliminary Q4 Current Account figures on February 18, while the House Price Index and FDI (YTD) readings are due on February 23.
Anticipating Economic Perspectives: Voices on the Horizon
- Fed's R. Bostic and M. Bowman speak on February 21 along with BoE's S. Dhingra and ECB's J. Nagel.
- Fed's P. Jefferson, P. Harker, N. Kashkari and L. Cook are all speaking on February 22, as well as BoE's M. Greene.
- On February 23, Fed's C. Waller and ECB's I. Schnabel and J. Nagel are also speaking.
Central Banks: Upcoming Meetings to Shape Monetary Policies
- The People's Bank of China (PBoC) is expected to reduce its 1-Year and 5-Year LPR by 10 bps on February 20.
- The Bank Indonesia (BI) is seen holding its benchmark interest rate unchanged at 6.00% on February 21.
- No changes are expected by the Bank of Korea (BoK) on February 22, leaving its policy rate intact at 3.50%.
- EUR/USD continues to test a near-term ceiling at 1.0780.
- European PMIs slated for next Thursday, thin data until then.
- US PPIs rose on Friday, pinning markets into the midrange.
EUR/USD is spinning in place on Friday after a brief test into the low side, but tepid markets are keeping the pair hamstrung near the day’s opening bids as traders buckle down for the week’s closing bell.
The Euro (EUR) sees thin economic data until next week’s Purchasing Manager’s Index (PMI) figures, and US data gave traders little to chew on after the US Producer’s Price Index (PPI) rose instead of falling. US markets will be dark on Monday for the President’s Day holiday, and traders will be waiting until Wednesday’s Federal Reserve (Fed) Meeting Minutes for hints about how close (or far) the US central bank is from trimming interest rates.
Daily digest market movers: EUR/USD struggles to break out of near-term congestion
- US Core annualized PPI rose to 2.0% for the year ended in January, climbing over the forecast 1.6% and the previous period’s 1.7% (revised from 1.8%).
- MoM US PPI rose by 0.3% in January, accelerating above the forecast rebound to 0.1% from the previous month’s -0.1%.
- The Michigan Consumer Sentiment Index rose to 79.6 for February, but less than the forecast 80.0 from January’s 79.0.
- The University of Michigan’s 5-year Consumer Inflation Expectations survey held steady at 2.9% in February.
- Still-high inflation expectations and rising producer-level inflation continue to vex investors hungry for rate cuts from the Fed.
- Next week sees the Federal Open Market Committee’s (FOMC) latest Meeting Minutes, slated to release on Wednesday.
- The Euro sees only light data on the calendar until next Thursday’s Purchasing Manager’s Index (PMI) print.
- The pan-European HCOB Composite is expected to rise slightly to 48.5 in February from January’s 47.9.
- Europe’s HCOB Composite PMI has been in contraction territory below 50.0 since July of last year.
Canadian Dollar price today
The table below shows the percentage change of Canadian Dollar (CAD) against listed major currencies today. Canadian Dollar was the strongest against the Japanese Yen.
| USD | EUR | GBP | CAD | AUD | JPY | NZD | CHF | |
| USD | -0.12% | -0.17% | 0.08% | -0.25% | 0.13% | -0.37% | -0.01% | |
| EUR | 0.12% | -0.07% | 0.20% | -0.12% | 0.24% | -0.24% | 0.11% | |
| GBP | 0.16% | 0.05% | 0.25% | -0.09% | 0.30% | -0.20% | 0.18% | |
| CAD | -0.09% | -0.20% | -0.25% | -0.33% | 0.05% | -0.46% | -0.09% | |
| AUD | 0.26% | 0.16% | 0.11% | 0.35% | 0.40% | -0.09% | 0.27% | |
| JPY | -0.12% | -0.24% | -0.28% | -0.06% | -0.39% | -0.48% | -0.11% | |
| NZD | 0.36% | 0.26% | 0.20% | 0.45% | 0.12% | 0.50% | 0.38% | |
| CHF | -0.02% | -0.13% | -0.18% | 0.07% | -0.26% | 0.12% | -0.38% |
The heat map shows percentage changes of major currencies against each other. The base currency is picked from the left column, while the quote currency is picked from the top row. For example, if you pick the Euro from the left column and move along the horizontal line to the Japanese Yen, the percentage change displayed in the box will represent EUR (base)/JPY (quote).
Technical analysis: EUR/USD struggles to build bullish momentum, 1.0800 remains the level to beat
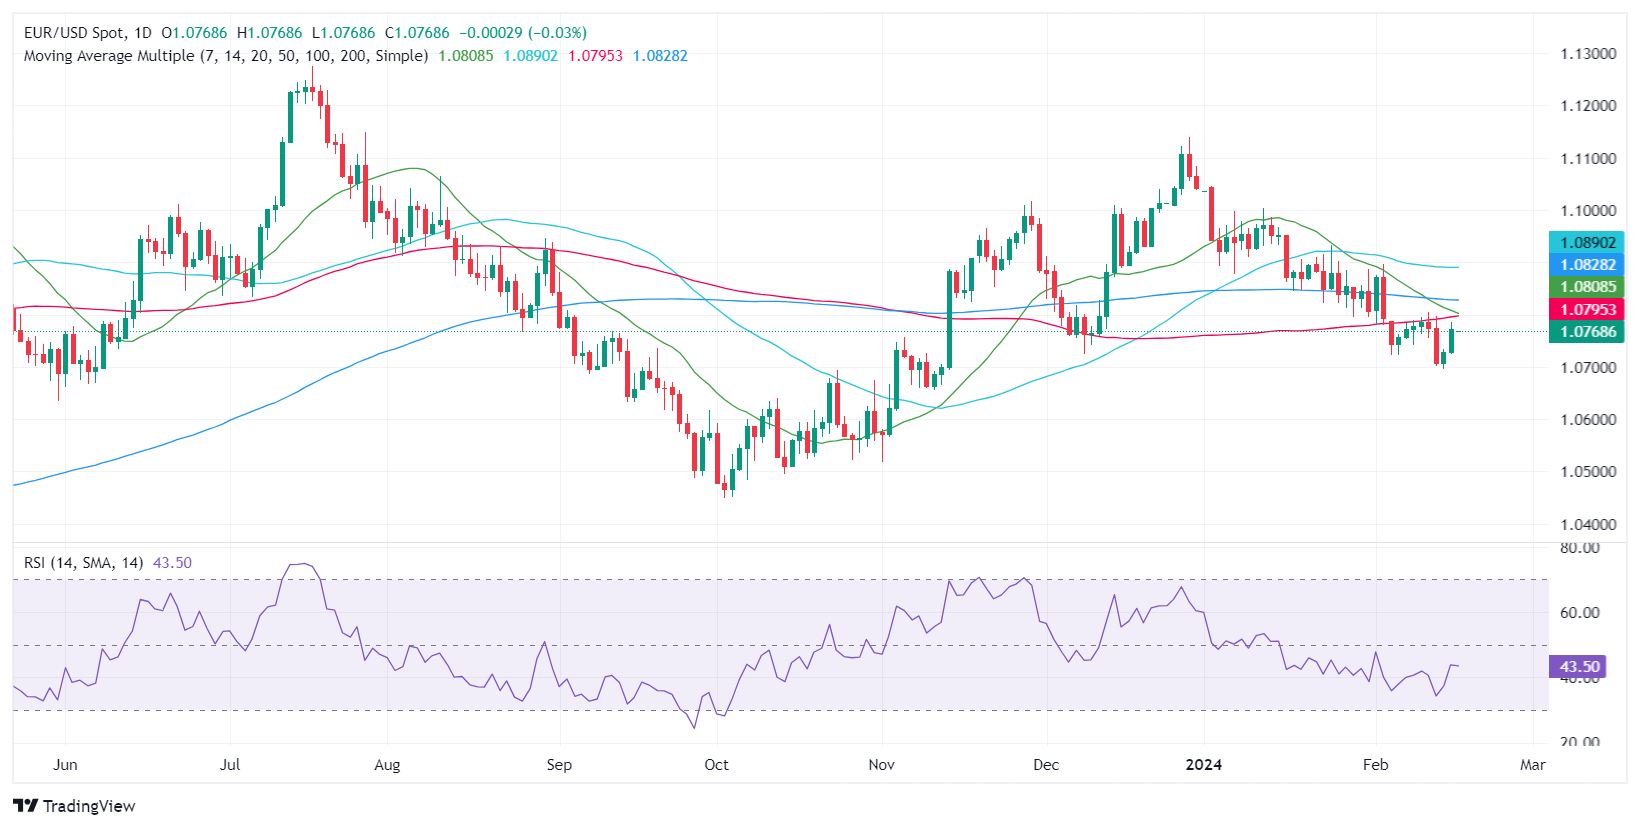
EUR/USD is stuck in churn around the 200-hour Simple Moving Average (SMA) near 1.0760 with the pair struggling to find the topside momentum needed to reclaim the 1.0800 handle. EUR/USD has tested in both directions on Friday, and the pair is testing a scant tenth of a percent up on the day at the time of writing.
The EUR/USD is on pace to close on the down side of the 200-day SMA near 1.0830 for the tenth consecutive trading day as the pair gets plagued by regular bearish shocks, and bidders are struggling to dig their heels in and prevent further downside. The pair is still down over 3% from December’s peak bids near 1.1140.
EUR/USD hourly chart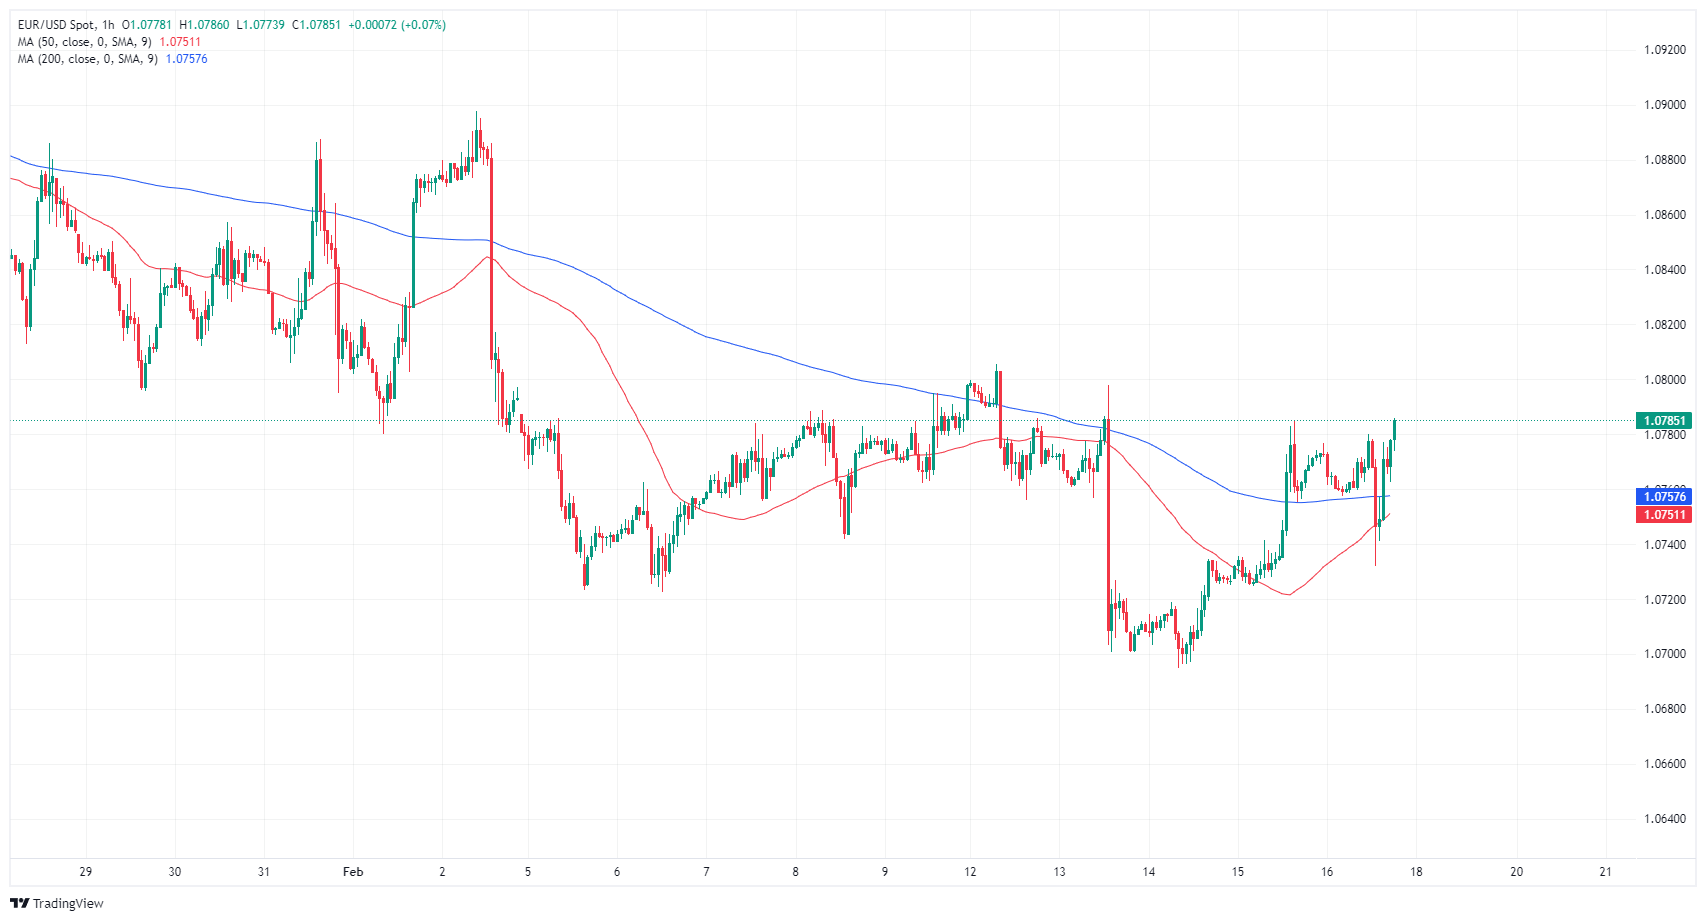
EUR/USD daily chart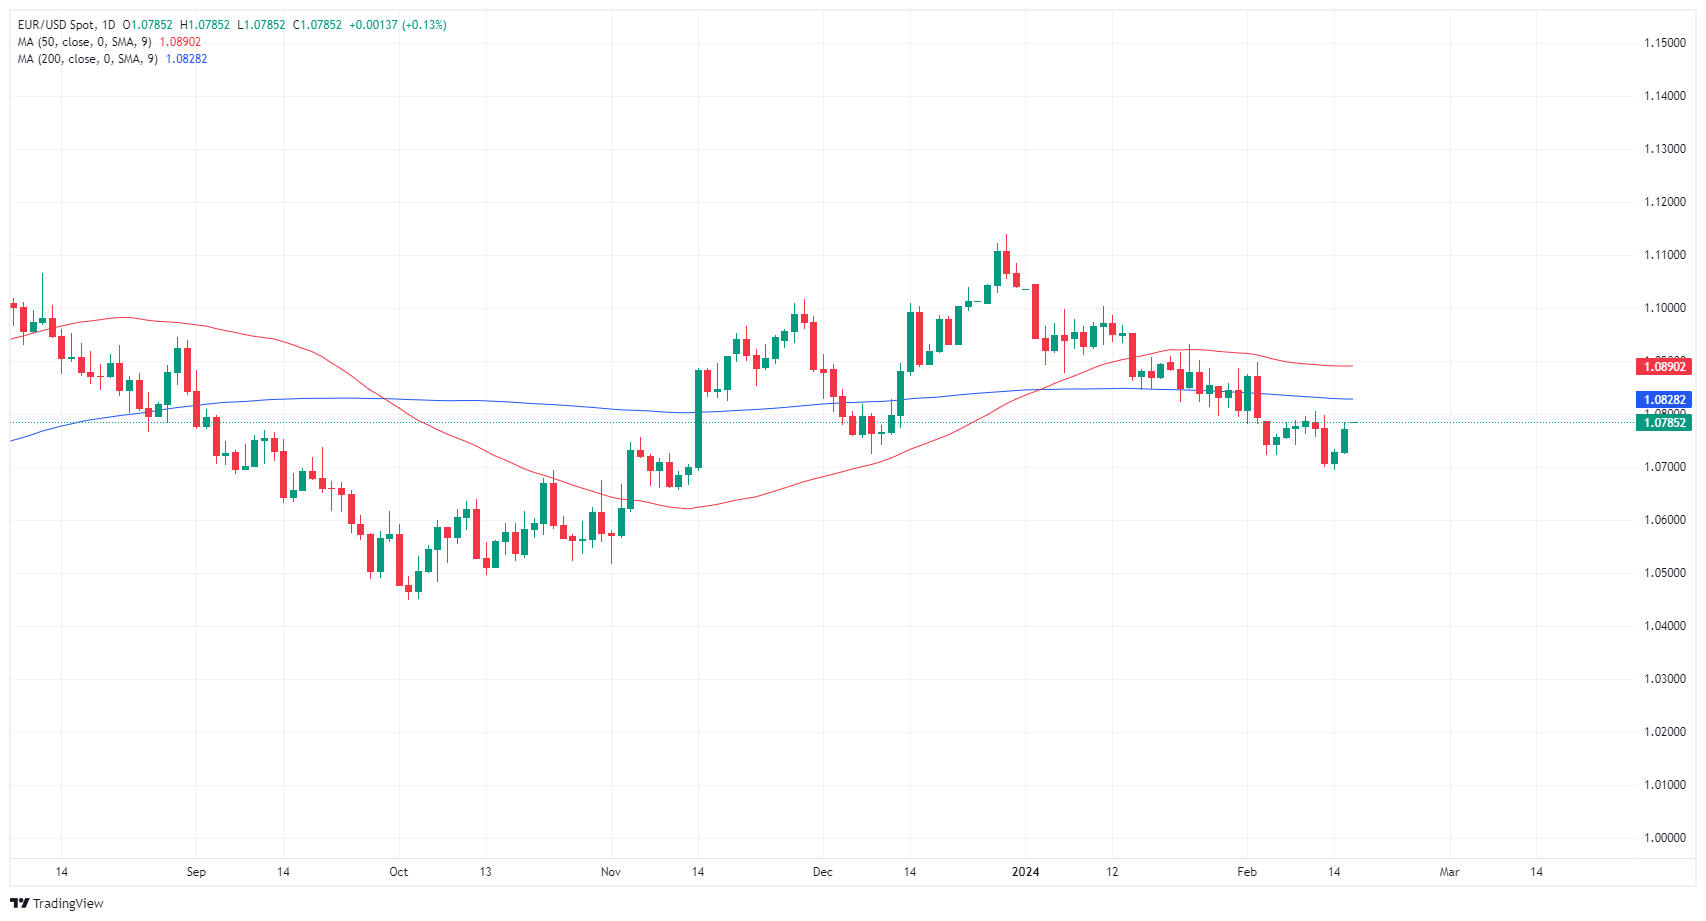
Euro FAQs
What is the Euro?
The Euro is the currency for the 20 European Union countries that belong to the Eurozone. It is the second most heavily traded currency in the world behind the US Dollar. In 2022, it accounted for 31% of all foreign exchange transactions, with an average daily turnover of over $2.2 trillion a day.
EUR/USD is the most heavily traded currency pair in the world, accounting for an estimated 30% off all transactions, followed by EUR/JPY (4%), EUR/GBP (3%) and EUR/AUD (2%).
What is the ECB and how does it impact the Euro?
The European Central Bank (ECB) in Frankfurt, Germany, is the reserve bank for the Eurozone. The ECB sets interest rates and manages monetary policy.
The ECB’s primary mandate is to maintain price stability, which means either controlling inflation or stimulating growth. Its primary tool is the raising or lowering of interest rates. Relatively high interest rates – or the expectation of higher rates – will usually benefit the Euro and vice versa.
The ECB Governing Council makes monetary policy decisions at meetings held eight times a year. Decisions are made by heads of the Eurozone national banks and six permanent members, including the President of the ECB, Christine Lagarde.
How does inflation data impact the value of the Euro?
Eurozone inflation data, measured by the Harmonized Index of Consumer Prices (HICP), is an important econometric for the Euro. If inflation rises more than expected, especially if above the ECB’s 2% target, it obliges the ECB to raise interest rates to bring it back under control.
Relatively high interest rates compared to its counterparts will usually benefit the Euro, as it makes the region more attractive as a place for global investors to park their money.
How does economic data influence the value of the Euro?
Data releases gauge the health of the economy and can impact on the Euro. Indicators such as GDP, Manufacturing and Services PMIs, employment, and consumer sentiment surveys can all influence the direction of the single currency.
A strong economy is good for the Euro. Not only does it attract more foreign investment but it may encourage the ECB to put up interest rates, which will directly strengthen the Euro. Otherwise, if economic data is weak, the Euro is likely to fall.
Economic data for the four largest economies in the euro area (Germany, France, Italy and Spain) are especially significant, as they account for 75% of the Eurozone’s economy.
How does the Trade Balance impact the Euro?
Another significant data release for the Euro is the Trade Balance. This indicator measures the difference between what a country earns from its exports and what it spends on imports over a given period.
If a country produces highly sought after exports then its currency will gain in value purely from the extra demand created from foreign buyers seeking to purchase these goods. Therefore, a positive net Trade Balance strengthens a currency and vice versa for a negative balance.
San Franciso Federal Reserve (Fed) President Mary C. Daly hit newswires on Friday, speaking at the Annual National Association for Business Economics Economic Policy Conference in Washington, DC.
Key highlights
- Three rate cuts is a reasonable baseline for 2024.
- It's premature to think about just letting the economy run.
- The challenge in front of the Fed right now is that the labor market tends to be good until it suddenly isn't, Fed needs to look at other data.
- US labor market is cooling, but Fed's Daly doesn't see an imminent weakening in the job market.
- Fed policy is working, just need to see how much longer to get the job done.
- Doesn't see disruptions from quantitative tightening, appropriate to plan.
- Fed's Daly doesn't agree with the idea that the last leg of inflation will be the hardest.
- Mexican Peso drops amid strong Dollar, fueled by ongoing inflation signs and upbeat consumer sentiment.
- Anticipation for Mexico's Retail Sales, Q4 GDP and mid-February inflation data could influence Banxico's policy direction.
- US PPI surge in January and positive consumer sentiment sponsor USD/MXN upside.
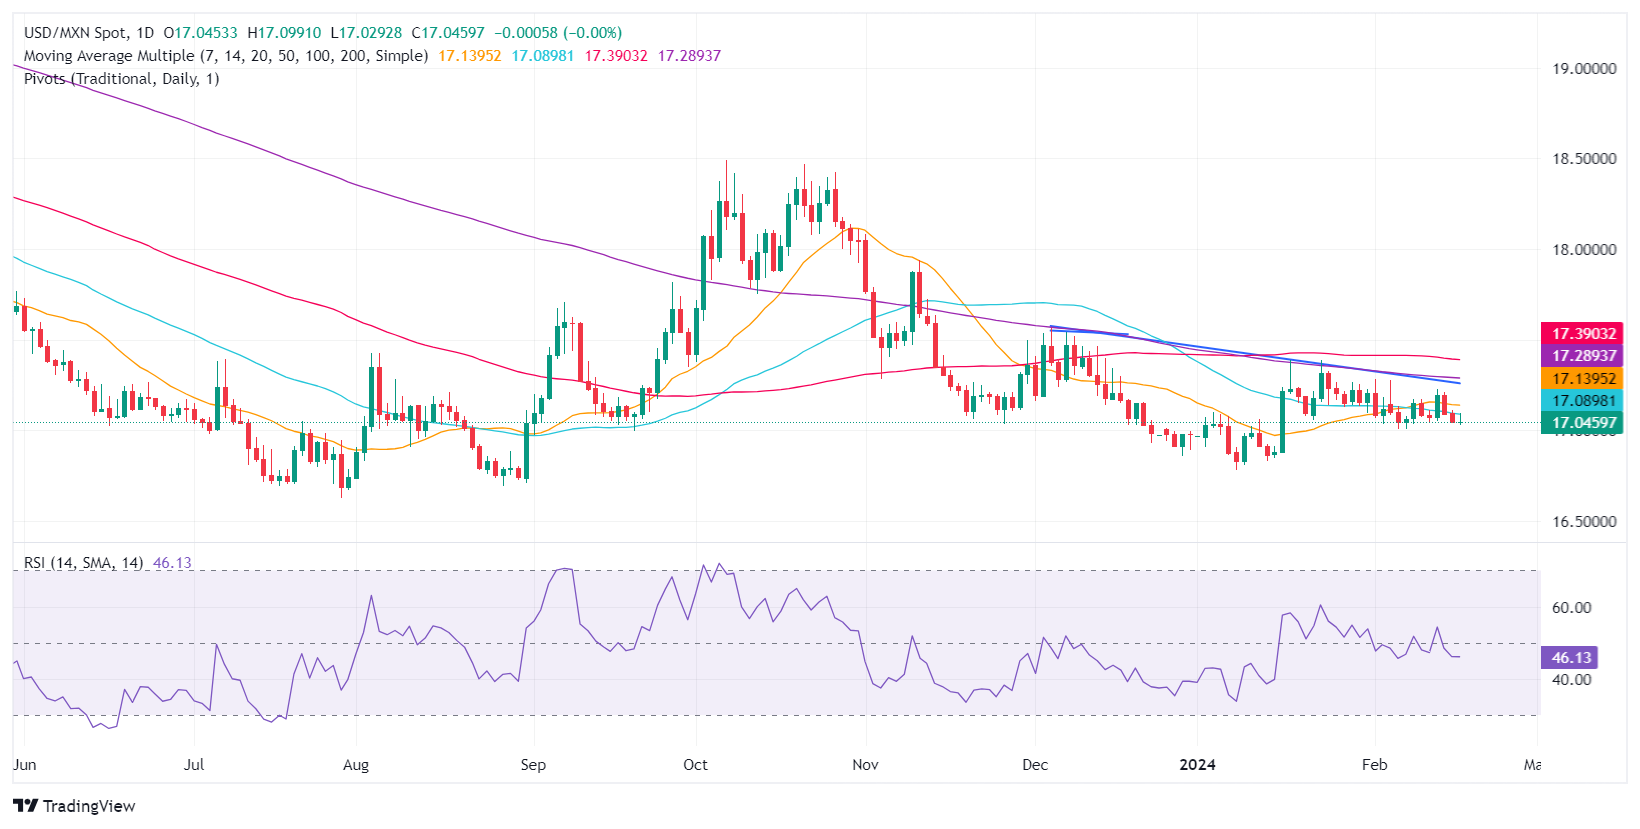
The Mexican Peso (MXN) depreciated against the US Dollar (USD) on Friday after data released in the United States (US) indicated that inflation is still high. A University of Michigan (UoM) poll suggests Americans see an improvement in economic conditions, while inflation expectations loom at around 2.9% and 3%. Therefore, some US Dollar strength pushed the USD/MXN pair up to trade at 17.06, gaining 0.14%.
Mexico’s economic docket will gather pace until next week, with the release of Retail Sales and the final Gross Domestic Product (GDP) figures for the last quarter of 2023. The February inflation report will be greatly scrutinized by the Bank of Mexico (Banxico), which is eyeing the beginning of its easing cycle.
In the meantime, USD/MXN traders gathered cues on the release of January’s Producer Price Index (PPI) from the US, which exceeded estimates and previous readings, while Consumer Sentiment continued to improve.
Daily digest market movers: Mexican Peso on the defensive following US PPI data
- The US Bureau of Labor Statistics (BLS) disclosed that the January Producer Price Index (PPI) witnessed a MoM increase of 0.3%, surpassing expectations. Additionally, the core PPI, which excludes volatile food and energy prices, exceeded forecasts by rising sharply to 0.5% MoM, a significant increase from -0.1% in December. Over the 12 months leading up to January, the PPI rose 0.9%, which is lower than the previous month's figure. However, the core PPI for the same period increased by 2%, exceeding both the estimates of 1.6% and December's figure of 1.8%.
- US consumer sentiment improved slightly to 79.5 from 79.0 in January’s last reading, according to the UoM poll. Analysts foresaw an improvement to 80.0 on its preliminary reading.
- Inflation expectations in the US remained steady with one-year inflation at 3%, up from 2.9%, while for a five-year period it stood at 2.9%, unchanged.
- “The fact that sentiment lost no ground this month suggests that consumers continue to feel more assured about the economy, confirming the considerable improvements in December and January across various aspects of the economy," commented Surveys of Consumers Director Joanne Hsu in a statement.
- The US data release triggered a reaction in the USD/MXN, which was hovering near 17.04 before the data but soared to a daily high at 17.09 afterward. As traders digested the data, the exotic pair stabilized near the current exchange rate.
- Other data from the US revealed that Building Permits experienced a decline of -1.5%, moving from 1.493 million to 1.47 million. Simultaneously, Housing Starts saw a significant decrease of -14.8%, dropping from 1.562 million to 1.331 million.
- Market players are expecting the first rate cut by the Federal Reserve at the June monetary policy meeting as they have trimmed odds for March and May.
- US 10-year Treasury note yields climbed seven basis points to 4.315%, while the US Dollar Index (DXY) edged higher to 104.37, up 0.08%.
- At its latest monetary policy decision, Banxico revised its inflation expectations to the upside for the period from Q1 to Q3 of 2024, expecting inflation to converge toward 3.5% in Q4, based on the latest monetary policy statement.
Technical analysis: Mexican Peso stays firm and holds key level despite posting losses
As I wrote in a previous article, “the USD/MXN consolidated in the 17.05-17.10 area during the last couple of days, holding near the 50-day Simple Moving Average (SMA) at 17.09.” However, the pair has tilted toward the bottom of the range, with sellers aiming to push spot prices below the 17.05 figure. Once that level is cleared, there would be nothing on the way to challenge the psychological 17.00 figure before diving toward last year's low of 16.62.
Conversely, if buyers reclaim the 50-DMA, that could sponsor a leg up toward the current week’s high at 17.20-17.22. If those levels are taken, the USD/MXN could rally to the 200-day SMA at 17.29 before aiming toward the 100-day SMA at 17.39.
USD/MXN Price Action – Daily Chart
Mexican Peso FAQs
What key factors drive the Mexican Peso?
The Mexican Peso (MXN) is the most traded currency among its Latin American peers. Its value is broadly determined by the performance of the Mexican economy, the country’s central bank’s policy, the amount of foreign investment in the country and even the levels of remittances sent by Mexicans who live abroad, particularly in the United States. Geopolitical trends can also move MXN: for example, the process of nearshoring – or the decision by some firms to relocate manufacturing capacity and supply chains closer to their home countries – is also seen as a catalyst for the Mexican currency as the country is considered a key manufacturing hub in the American continent. Another catalyst for MXN is Oil prices as Mexico is a key exporter of the commodity.
How do decisions of the Banxico impact the Mexican Peso?
The main objective of Mexico’s central bank, also known as Banxico, is to maintain inflation at low and stable levels (at or close to its target of 3%, the midpoint in a tolerance band of between 2% and 4%). To this end, the bank sets an appropriate level of interest rates. When inflation is too high, Banxico will attempt to tame it by raising interest rates, making it more expensive for households and businesses to borrow money, thus cooling demand and the overall economy. Higher interest rates are generally positive for the Mexican Peso (MXN) as they lead to higher yields, making the country a more attractive place for investors. On the contrary, lower interest rates tend to weaken MXN.
How does economic data influence the value of the Mexican Peso?
Macroeconomic data releases are key to assess the state of the economy and can have an impact on the Mexican Peso (MXN) valuation. A strong Mexican economy, based on high economic growth, low unemployment and high confidence is good for MXN. Not only does it attract more foreign investment but it may encourage the Bank of Mexico (Banxico) to increase interest rates, particularly if this strength comes together with elevated inflation. However, if economic data is weak, MXN is likely to depreciate.
How does broader risk sentiment impact the Mexican Peso?
As an emerging-market currency, the Mexican Peso (MXN) tends to strive during risk-on periods, or when investors perceive that broader market risks are low and thus are eager to engage with investments that carry a higher risk. Conversely, MXN tends to weaken at times of market turbulence or economic uncertainty as investors tend to sell higher-risk assets and flee to the more-stable safe havens.
- Canadian Dollar on weaker footing approaching the closing bell.
- Canada foreign investment barely moved the needle.
- US PPI numbers came in above expectations, hampering rate cut bets.
The Canadian Dollar (CAD) broadly stuck to the middle ground on Friday, finding little room in either direction against the majority of its major currency peers heading into the week’s closing bell.
Canada saw a beat in December’s Foreign Portfolio Investment in Canadian Securities, but overall markets saw attention drawn away for the US Producer Price Index (PPI), which printed above expectations. CAD traders will be looking forward to Canadian Consumer Price Index (CPI) inflation figures due next Tuesday, and rate-cut seekers will be keeping an eye out for the Federal Reserve’s (Fed) latest Meeting Minutes will be dropping on markets next Wednesday.
Daily digest market movers: Quiet Friday sees the Canadian Dollar strung along the middle
- Foreign Portfolio Investment in Canadian Securities grew by $10.44 billion in December, well over the $-6.45 billion forecast. The previous month’s figure saw a minor revision to $11.31 billion from $11.43 billion.
- US Core annualized PPI grew by 2% in January, over the 1.6% forecast and above the previous period’s 1.7% (revised from 1.8%).
- The Michigan Consumer Sentiment Index rose for February, but less than expected, printing at 79.6 versus the forecast 80.0, up from January’s 79.0.
- The University of Michigan 5-year Consumer Inflation Expectations held steady at 2.9%.
- According to the CME’s FedWatch Tool, money markets see a 70% chance of no rate movement from the Fed in May, and June is now on the block as the first rate trim meeting.
- Next week’s Canadian CPI is forecast to tick down to 3.3% from 3.4% for the year ended January.
- MoM Canadian CPI in January is expected to rebound to 0.4% from December’s -0.3%.
- The Fed’s latest Meeting Minutes will be dropping next Wednesday, and investors will be diving into the Federal Open Market Committee’s latest discussions for hints about how close the Fed might be to pivoting into rate cuts.
Canadian Dollar price today
The table below shows the percentage change of Canadian Dollar (CAD) against listed major currencies today. Canadian Dollar was the strongest against the Japanese Yen.
| USD | EUR | GBP | CAD | AUD | JPY | NZD | CHF | |
| USD | 0.05% | 0.09% | 0.12% | -0.07% | 0.26% | -0.10% | 0.17% | |
| EUR | -0.05% | 0.02% | 0.09% | -0.12% | 0.21% | -0.14% | 0.12% | |
| GBP | -0.10% | -0.05% | 0.04% | -0.17% | 0.17% | -0.19% | 0.08% | |
| CAD | -0.14% | -0.10% | -0.04% | -0.20% | 0.12% | -0.24% | 0.03% | |
| AUD | 0.08% | 0.14% | 0.18% | 0.21% | 0.35% | -0.01% | 0.25% | |
| JPY | -0.26% | -0.21% | -0.16% | -0.15% | -0.37% | -0.35% | -0.08% | |
| NZD | 0.09% | 0.15% | 0.19% | 0.22% | 0.02% | 0.36% | 0.27% | |
| CHF | -0.18% | -0.12% | -0.07% | -0.03% | -0.24% | 0.09% | -0.27% |
The heat map shows percentage changes of major currencies against each other. The base currency is picked from the left column, while the quote currency is picked from the top row. For example, if you pick the Euro from the left column and move along the horizontal line to the Japanese Yen, the percentage change displayed in the box will represent EUR (base)/JPY (quote).
Technical analysis: Canadian Dollar on the flat side on Friday as markets settle ahead of the Friday close
The Canadian Dollar (CAD) is stuck close to the midrange across the board on Friday, trading within a quarter of a percent against all of its major currency counterparts. The CAD rose about 0.15% against the Japanese Yen (JPY) and backslid about 0.20% against the Australian Dollar.
The USD/CAD continues to cycle the 200-hour Simple Moving Average (SMA) near 1.3490 as the pair gets hampered near the 1.3500 handle.
Rough chop on daily candlesticks leaves USD/CAD hamstrung on the 200-day SMA, and near-term swing lows continue to test back into recent consolidation. Despite halting progress, the pair is still up around 2.3% from December’s lows near 1.3175.
USD/CAD hourly chart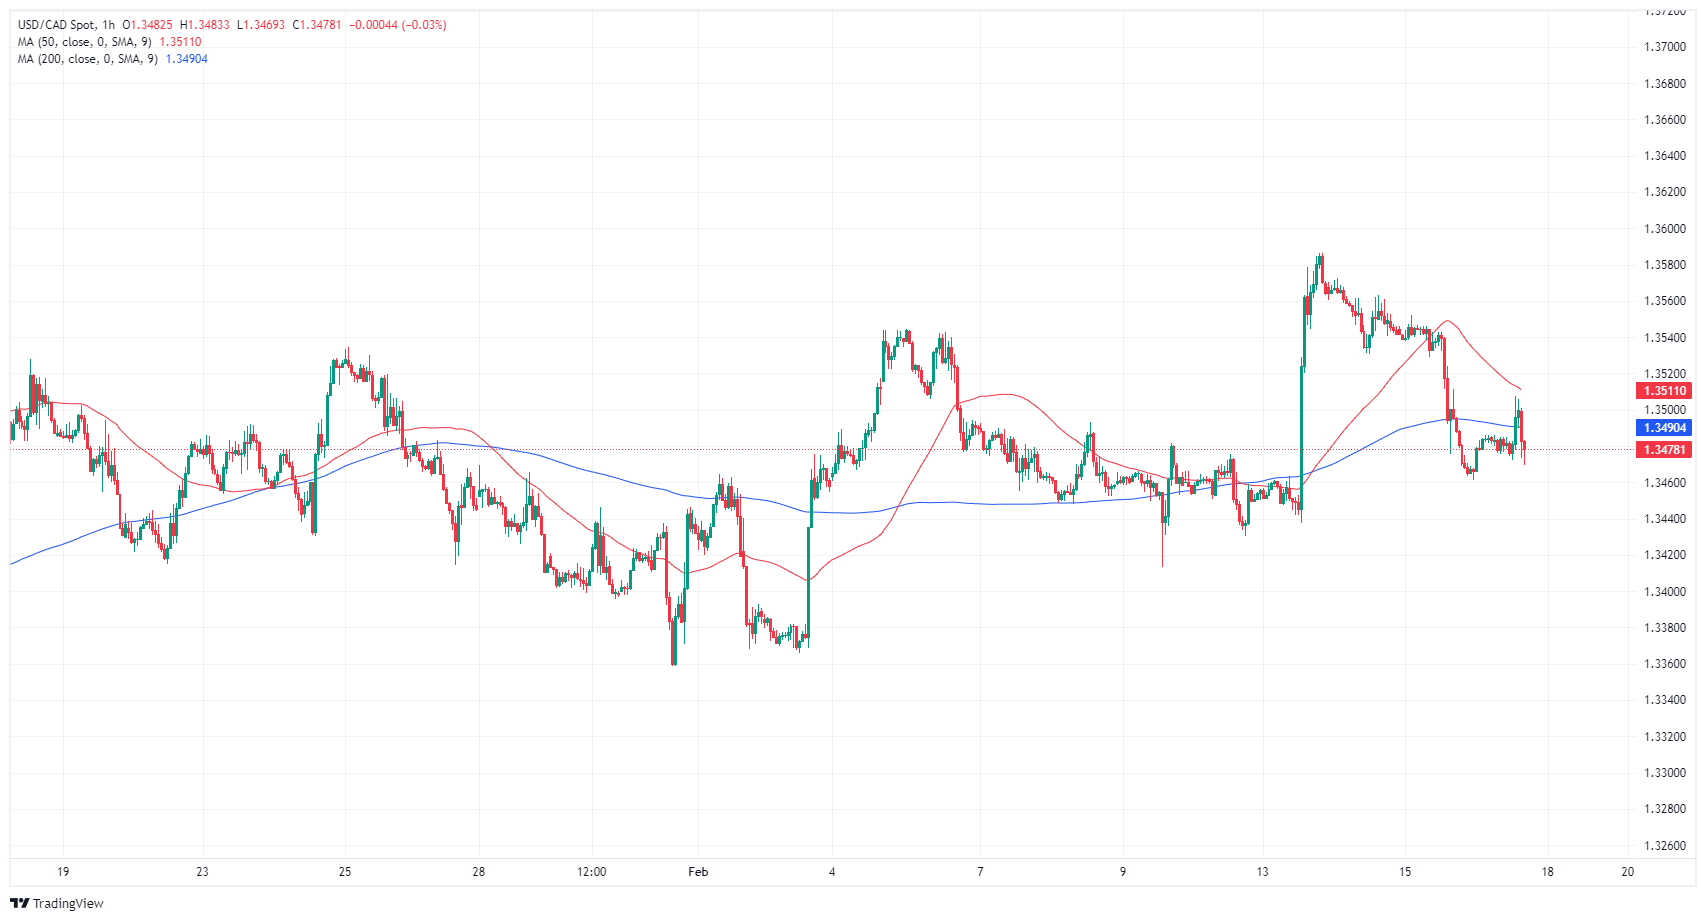
USD/CAD daily chart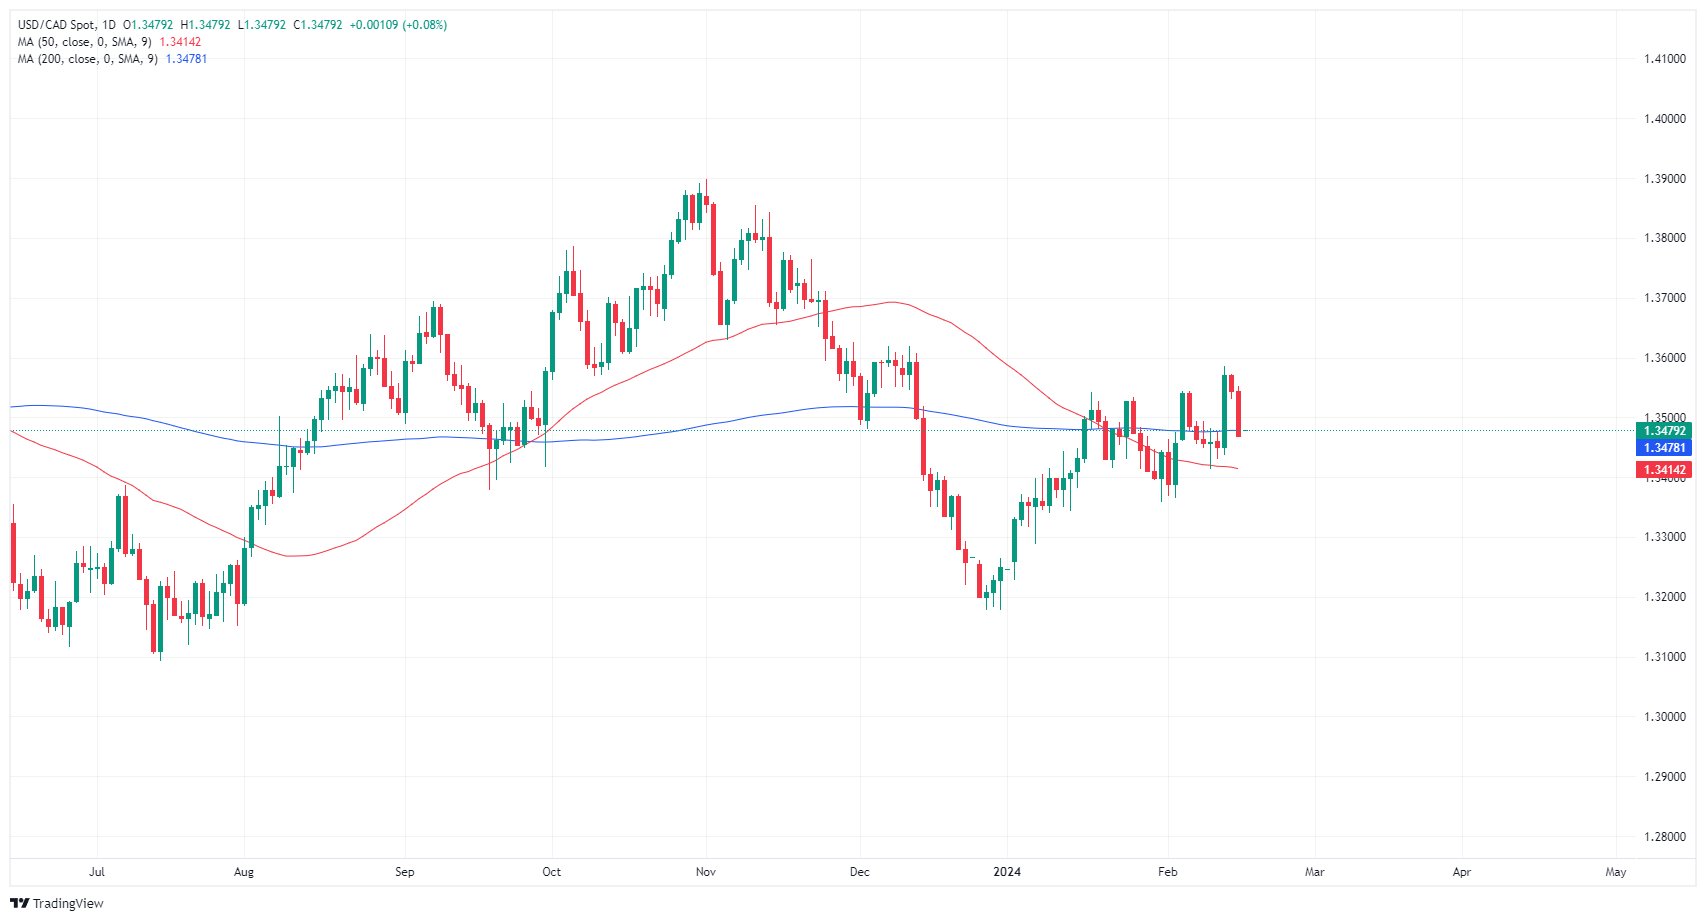
Canadian Dollar FAQs
What key factors drive the Canadian Dollar?
The key factors driving the Canadian Dollar (CAD) are the level of interest rates set by the Bank of Canada (BoC), the price of Oil, Canada’s largest export, the health of its economy, inflation and the Trade Balance, which is the difference between the value of Canada’s exports versus its imports. Other factors include market sentiment – whether investors are taking on more risky assets (risk-on) or seeking safe-havens (risk-off) – with risk-on being CAD-positive. As its largest trading partner, the health of the US economy is also a key factor influencing the Canadian Dollar.
How do the decisions of the Bank of Canada impact the Canadian Dollar?
The Bank of Canada (BoC) has a significant influence on the Canadian Dollar by setting the level of interest rates that banks can lend to one another. This influences the level of interest rates for everyone. The main goal of the BoC is to maintain inflation at 1-3% by adjusting interest rates up or down. Relatively higher interest rates tend to be positive for the CAD. The Bank of Canada can also use quantitative easing and tightening to influence credit conditions, with the former CAD-negative and the latter CAD-positive.
How does the price of Oil impact the Canadian Dollar?
The price of Oil is a key factor impacting the value of the Canadian Dollar. Petroleum is Canada’s biggest export, so Oil price tends to have an immediate impact on the CAD value. Generally, if Oil price rises CAD also goes up, as aggregate demand for the currency increases. The opposite is the case if the price of Oil falls. Higher Oil prices also tend to result in a greater likelihood of a positive Trade Balance, which is also supportive of the CAD.
How does inflation data impact the value of the Canadian Dollar?
While inflation had always traditionally been thought of as a negative factor for a currency since it lowers the value of money, the opposite has actually been the case in modern times with the relaxation of cross-border capital controls. Higher inflation tends to lead central banks to put up interest rates which attracts more capital inflows from global investors seeking a lucrative place to keep their money. This increases demand for the local currency, which in Canada’s case is the Canadian Dollar.
How does economic data influence the value of the Canadian Dollar?
Macroeconomic data releases gauge the health of the economy and can have an impact on the Canadian Dollar. Indicators such as GDP, Manufacturing and Services PMIs, employment, and consumer sentiment surveys can all influence the direction of the CAD. A strong economy is good for the Canadian Dollar. Not only does it attract more foreign investment but it may encourage the Bank of Canada to put up interest rates, leading to a stronger currency. If economic data is weak, however, the CAD is likely to fall.
Federal Reserve Bank of Atlanta President Raphael Bostic told CNBC on Friday that his outlook is for a reduction in policy rate in the summer time, per Reuters.
Bostic noted that the economy still has tremendous momentum and added that he expects two rate cuts in 2024. Commenting on the latest inflation figures, Bostic acknowledged that he was "a little surprised by the data" and said that they will look for progress in underlying measures of inflation.
Market reaction
The US Dollar Index showed no immediate reaction to these remarks and was last seen posting small daily gains at 104.33.
Markets have pushed back on expectations for the Fed cut. Economists at OCBC Bank analyze its implications for the Gold price.
Headwinds from higher yields and stronger DXY may weigh against any building momentum
Near-term headwinds from higher treasury yields and a stronger DXY profile may weigh against any building momentum in Gold prices.
The expectations on the timing of the first Federal Reserve rate cut and the magnitude of the cut will continue to drive volatility in Gold prices in the interim.
In the US, investors are concerned about the commercial real estate (CRE) market. Economists at Commerzbank provide an overview of the situation.
Neglected risks tend to lead to greater turbulence
It is likely that it will take several years to overcome the problems, particularly in the office real estate sector.
The Federal Reserve does have instruments at its disposal with which it could probably prevent a systemic crisis; if the worst comes to the worst, it would probably also revive the ‘Bank Term Funding Program’ (BTFP), which is due to expire in March as planned. However, the banks' assets at the heart of the current difficulties are now commercial real estate loans, where significant defaults are certainly possible. This is an important difference to the turbulences of 2023. The bonds whose price losses triggered the problems back then were largely solid securities, especially US Treasury securities. Despite the price losses in the meantime, these were not at risk of default. Other instruments may therefore be needed to stabilize the financial markets.
That said, it is at least positive that the weaknesses in commercial real estate loans have been recognized. Experience shows that neglected risks tend to lead to greater turbulence.
USD/COP traded between 3,900 and 4,000 during January. Economists at Scotiabank analyze the pair’s outlook.
COP to depreciate a bit to USD/COP 4,100 range
A more hawkish BanRep is helping the COP at the moment but external central bank hawkishness may help push USD/COP up towards our trading band.
We think the COP will be largely driven by the external environment in the near term, given a quiet political backdrop at home and market comfort with Colombian uncertainty. But in the coming months, we expect BanRep to speed up its easing cycle and markets to pay more attention to the fiscal accounts.
Therefore, we expect the COP to depreciate a bit to USD/COP 4,100 range.
USD/COP – Q1-24 4,049 Q2-24 4,078 Q3-24 4,102 Q4-24 4,116
- EUR/USD dips to 1.0759 as US inflation data exceeds expectations, suggesting sustained Fed attentiveness.
- January's US PPI rise shows ongoing inflation pressures, with core PPI exceeding predictions.
- ECB's cautious approach to rate cuts highlights inflation worries, in stark contrast to the Fed's inflation combat.
The Euro (EUR) retreats after hitting a new two-day high as a measure of inflation in the producer side in the United States (US), suggesting the US Federal Reserve’s job is not done. The Greenback (USD) rose as interest rate traders have begun to align with the Fed’s view of three rate cuts towards 2024. At the time of writing, the EUR/USD trades at 1.0759, down 0.08%.
EUR/USD retreats amid rising US PPI
The US Bureau of Labor Statistics (BLS) revealed that the Producer Price Index (PPI) for January increased 0.3% MoM, exceeding estimates, while the core PPI also beat forecasts and jumped sharply to 0.5% MoM from -0.1% in December. In the 12-month to January figures, the PPI rose by 0.9%, lower than December’s, but the core PPI rose by 2%, above 1.6% estimates and December’s 1.8%.
Sources cited by Bloomberg stated, “Momentum has built up in inflation over the last few years and persists in many corners of the economy despite lower prices for gasoline, basic foodstuffs, and durable goods.”
The Fed closely follows the PPI because several categories of the report are used in the Fed’s preferred gauge for inflation, the Personal Consumption Expenditures (PCE).
Following the data, the EUR/USD pair seesawed around the 1.0770-1.0730 range, before settling at around current exchange rates. US Treasury bond yields rose, while the US Dollar Index (DXY) edged up 0.22% at 104.50.
Other data from the US, revealed that Building Permits dropped -1.5% from 1.493 million to 1.47 million, while Housing Starts plummeted sharply -14.8%, fro 1.562 million to 1.331 million.
Across the pond, the Eurozone’s (EU) economic docket was light with Germany revealing Wholesale Prices for January, which rose 0.1% MoM, but annually based dropped -2.7% below December -2.6%.
On the central bank space, the European Central Bank Governing Council member Isabel Schnabel noted the central bank must be careful not to cut rates too soon and that monetary policy should remain restrictive. This is because fears of a rebound in inflation linger around the ECB’s policymakers
EUR/USD Price Analysis: Technical outlook
From a technical standpoint, the EUR/USD is bearish biased despite staging a recovery in the last couple of days. However, if buyers push prices towards the 100-day moving average (DMA) at 1.0796, that could pave the way for challenging 1.0800. On the other hand, if sellers keep spot price below the psychological 1.0750 area, that could open the door to test February’s 15 low of 1.0723, ahead of the 1.0700 mark.
The Turkish Lira (TRY) has continued to weaken even after the central bank has hiked rates massively since June 2023. Economists at Commerzbank analyze TRY outlook.
The recent change of central bank governor does not foster market confidence or continuity
Recently, the head of the central bank resigned and was once again replaced by deputy Fatih Karahan. The new chief has experience working at the US Fed, and like his predecessors, promises to maintain tight monetary policy until inflation has declined fully towards the 5% target. The change In the end, however, only one thing will rule: President Tayyip Erdogan’s will.
Markets are aware that the CBT governor’s promise counts for little until and unless Erdogan actually supports the policy.
We retain our ‘symbolic forecast’ of 35.00 for USD/TRY by the end of 2024. Symbolic because the fair value is unknown (even to CBT, in our view) and many abrupt qualitative changes can occur before then.
Economists at Nordea analyze the EUR/USD outlook following their new US rate forecasts.
EUR/USD broadly flat
Our new interest rate forecasts where the Fed will cut later and to a lesser degree than the ECB are in favour of a smaller USD weakening than we expected previously.
One could easily make the case that the USD should instead strengthen against the Euro and we will not be surprised if that happens periodically. However, we still believe that lower rates globally will continue to support economic activity and risk sentiment, lowering the appeal of the USD, from a safe-haven standpoint.
Broadly speaking, we see the EUR/USD range locked between 1.0500-1.1000 area over the upcoming year.
Economists at Société Général analyze how the USD/CAD pair reacted to past Federal Reserve rate decisions and discuss if it could repeat the same performance this time.
USD/CAD peaked above 1.3600 after the Fed ended hiking cycle in December 2018
The USD/CAD pair peaked above 1.3600 just after the end of the last Fed hiking cycle in December 2018.
The US Dollar traded down to Canadian Dollar at 1.2600 as the Fed eased in 2019. A repeat is possible.
See: USD/CAD to drop towards 1.2800 by year-end – Scotiabank
The Gold price fell to a two-month low of $1,985 this week following the publication of higher-than-expected US inflation data. Economists at Commerzbank analyze the yellow metal’s outlook.
Key interest rate cuts are still expected this year
Following the unexpectedly high US inflation data, there was a significant setback in the price of Gold, which slipped below $2,000 per troy ounce. However, as the market is already very cautious with regard to key interest rates, the potential for further correcti ons is likely to be rather small.
According to Fed Fund Futures, a first rate cut is now fully priced in only by June. At the end of the year, the Fed interest rate is expected to be around 4.50%. This is 50 basis points more than expected two weeks ago. After all, key interest rate cuts are still expected this year.
The US Dollar (USD) is stronger versus all G10 currencies this week although that strength has partially reversed. Economists at Scotiabank analyze Greenback’s outlook.
Key support for the DXY at 103.90 may be out of reach today
The USD has given back a lot of its CPI-driven gains over the balance of this week, leaving the broader trend higher at some risk of stumbling, at least according to the charts.
Key support for the DXY sits at 103.90 but that may be out of reach today.
And while the DXY still looks stretched from a short-term valuation perspective, it’s hard to exclude the risk of the USD staying firm for a bit longer at this point – certainly while US yields remain relatively elevated.
- Producer inflation in the US declined at a softer pace than expected in January.
- US Dollar Index climbed above 104.50 with the immediate reaction.
The Producer Price Index (PPI) for final demand in the US rose 0.9% on a yearly basis in January, the data published by the US Bureau of Labor Statistics showed on Friday. This reading followed the 1% increase recorded in December but came in above the market expectation of 0.6%.
The annual Core PPI rose 2% in the same period, compared to December's increase of 1.7% (revised from 1.8%). On a monthly basis, the Core PPI was up 0.5% following the 0.1% decline recorded in the previous month.
Market reaction
The US Dollar Index gathered bullish momentum with the immediate reaction to the hot producer inflation data and was last seen rising 0.3% on the day at 104.60.
- US stock index futures trade mixed on the last trading day of the week.
- Nasdaq looks to rebound following Thursday's lackluster performance.
- Energy Sector was the best-performing major S&P 500 sector on Thursday.
S&P 500 futures rise 0.13%, Dow Jones futures drop 0.11%, and Nasdaq futures gain 0.51%.
S&P 500 (SPX), Dow Jones (DJIA), and Nasdaq (IXIC) indexes closed on Thursday with a 0.58% gain, a 0.91% increase, and a 0.30% rise, respectively.
What to know before stock market opens
- The Energy Sector gained nearly 2.5% as the strongest sector of the S&P 500 on Thursday, followed closely by the Real Estate Sector, which added 2.36% for the day.
- The Technology Sector ended Thursday as the worst-performing sector of the S&P 500, shedding 0.44%.
- Zebra Technologies Corp. (ZBRA) gained 12.17% on the day, ending at $283.75. West Pharmaceutical Services Inc. (WST) took the top spot on the biggest decliners board, with shares losing over 14% to close at $350.70.
- The CBOE Volatility Index (VIX), Wall Street's fear gauge, fell 2.5% on Thursday.
- On Friday, the Bureau of Labor Statistics (BLS) will release Producer Price Index (PPI) figures for January. The PPI is forecast to rise 0.1% on a monthly basis following the 0.2% decline seen in December.
- Retail Sales in the US declined by 0.8% to $700.3 billion in January, the US Census Bureau reported on Thursday. This reading came in weaker than the market expectation for a decrease of 0.1%. Retail Sales ex Autos contracted by 0.6% in the same period.
- There were 212,000 first-time applications for unemployment benefits in the week ending February 10, down from 220,000 in the previous week, the US Department of Labor announced.
- Inflation in the US, as measured by the change in the Consumer Price Index (CPI), softened to 3.1% on a yearly basis in January from 3.4% in December, the BLS reported on Tuesday. This reading came in above the market expectation of 2.9%.
- The Core CPI, which excludes volatile food and energy prices, rose 3.9% in the same period and matched December's increase, surpassing analysts' estimate of 3.7%.
- Coinbase Global Inc. (COIN) reported after the closing bell on Thursday earnings of $1.04/share in the fourth quarter, compared to a loss of $2.46/share a year earlier. The company noted sturdy trading volumes due to a resurgence of interest in crypto was the primary reason for the first quarterly profit it recorded since 2021.
- On Tuesday, Coca-Cola Co. (KO) reported that revenue rose 7.4% to $10.95 billion from a year ago for the quarter ended in December, per Reuters. The company announced that the quarterly net income was $1.97 billion for that period and cited higher product prices and robust demand for the upbeat results.
- Airbnb Inc. (ABNB) said after the closing bell on Tuesday that quarterly adjusted earnings were 76 cents per share in the quarter ended in December. The company’s revenue increased 16.6% to $2.22 billion from a year ago, but there was a quarterly loss of $349 million.
- Cisco Systems Inc. (CSCO) announced quarterly adjusted earnings per share were 87 cents in the quarter ended in January. The networking equipment manufacturer said the revenue fell 5.9% to $12.79 billion from a year ago, while the quarterly net income was $2.63 billion in the same period. In a conference call, CEO Charles Robbins said, "we also continue to see weak demand with our telco and cable service provider customers," per Reuters. The company is reportedly planning to cut more than 4,000 jobs and focus on high-growth areas such as artificial intelligence and software.
S&P and Nasdaq futures are presented by CME e-minis and Dow Jones futures are presented by CBOT e-mini.
S&P 500 FAQs
What is the S&P 500?
The S&P 500 is a widely followed stock price index which measures the performance of 500 publicly owned companies, and is seen as a broad measure of the US stock market. Each company’s influence on the computation of the index is weighted based on market capitalization. This is calculated by multiplying the number of publicly traded shares of the company by the share price. The S&P 500 index has achieved impressive returns – $1.00 invested in 1970 would have yielded a return of almost $192.00 in 2022. The average annual return since its inception in 1957 has been 11.9%.
How are companies chosen to be included in the S&P 500?
Companies are selected by committee, unlike some other indexes where they are included based on set rules. Still, they must meet certain eligibility criteria, the most important of which is market capitalization, which must be greater than or equal to $12.7 billion. Other criteria include liquidity, domicile, public float, sector, financial viability, length of time publicly traded, and representation of the industries in the economy of the United States. The nine largest companies in the index account for 27.8% of the market capitalization of the index.
How can I trade the S&P 500?
There are a number of ways to trade the S&P 500. Most retail brokers and spread betting platforms allow traders to use Contracts for Difference (CFD) to place bets on the direction of the price. In addition, that can buy into Index, Mutual and Exchange Traded Funds (ETF) that track the price of the S&P 500. The most liquid of the ETFs is State Street Corporation’s SPY. The Chicago Mercantile Exchange (CME) offers futures contracts in the index and the Chicago Board of Options (CMOE) offers options as well as ETFs, inverse ETFs and leveraged ETFs.
What factors drive the S&P 500?
Many different factors drive the S&P 500 but mainly it is the aggregate performance of the component companies revealed in their quarterly and annual company earnings reports. US and global macroeconomic data also contributes as it impacts on investor sentiment, which if positive drives gains. The level of interest rates, set by the Federal Reserve (Fed), also influences the S&P 500 as it affects the cost of credit, on which many corporations are heavily reliant. Therefore, inflation can be a major driver as well as other metrics which impact the Fed decisions.
USD/CAD has drifted a little higher in quiet trade. Economists at Scotiabank analyze the pair’s outlook.
Resistance is 1.3520/1.3530
The USD is trading well off the early week peak, with spot again finding it impossible to sustain gains through the 1.3500 area. This is the fourth week in five (at the moment) that USD/CAD progress above 1.3500 has stalled and reversed back under the figure by the end of the week.
Intraday price movement suggests a consolidation in the USD’s drift but trend momentum is tilting more negative for the USD on the short-term studies, suggesting risks are geared towards a test of support at 1.3440/1.3450.
Resistance is 1.3520/1.3530.
GBP/USD holds range below 1.2610. Economists at Scotiabank analyze the pair’s outlook.
Support at 1.2530 looks firm on the long-term chart
Cable put in a solid gain on the daily chart on Thursday but has not been able to extend that rebound today.
Sterling support at 1.2530 looks firm on the long-term chart now but Cable is still nursing a net loss on the week and spot has struggled to hold minor gains on the session.
A clear move above 1.2610 would give the Pound a bit more technical support and put the GBP/USD pair on course for gains towards the mid/upper 1.2600s.
- The US Dollar trades near Monday’s opening level.
- Markets are favouring Risk On again, forgetting about the inflation hiccup from Tuesday.
- The US Dollar Index could further dip below 104 if PPI confirms further easing ahead.
The US Dollar (USD) is telling two stories this week with, on the one hand, the recent uptick in inflation had hit a nerve in markets with a firm risk-off reaction on Tuesday. Though, the Retail Sales from Thursday show that dynamics for customers are changing with a substantial drop in numbers and the downward revision made traders completely write off the inflation report from Tuesday as a one off. This puts the US Dollar Index (DXY) flat to the same level where it opened on Monday with just one trading session left to look for direction.
On the economic data front, the decision on where the US Dollar will be heading, will be taken on the back of two key data points this Friday: The Producer Price Index elements and the University of Michigan print. These two elements will define the outcome for this week, with overall expectations to see further easing in the price pressure and a softer US Dollar on the back of that.
Daily digest market movers: Last bets for this week
- The main event this Friday is around 13:30 GMT:
- This is when the Producer Price Index report for January:
- Monthly Headline PPI is expected to head from -0.2% to 0.1%.
- Yearly Headline PPI is seen heading from 1.0% to 0.6%.
- Monthly Core PPI is expected to abate from -0.1% to 0.1%.
- Yearly Core PPI seen heading from 1.8% to 1.6%
- Building Permits should rise from 1.493 million to 1.5093 million for January.
- Housing Starts are expected to remain unchanged at 1.46 million homes.
- This is when the Producer Price Index report for January:
- Around 15:00 GMT, the University of Michigan will release its preliminary findings for February:
- The Consumer Sentiment Index is expected to head from 79 to 80.
- Inflation expectations were previously at 2.9%, with no forecast pencilled in.
- US Federal Reserve Board member Michael Barr is due to speak near 14:10 GMT. Mary Daly from the San Francisco Fed is due to speak near 17:10 GMT.
- Equities are happy with the backtracking on the forward push of rate cuts and are in the green. European equities are up over 0.50%, while US equity futures are mildly in the green.
- The CME Group’s FedWatch Tool is now looking at the March 20th meeting. Expectations for a pause are 91.5%, while 8.5% for a rate cut.
- The benchmark 10-year US Treasury Note trades near 4.26%, roughly in the middle of this week’s range between 4.33% and 4.18%.
US Dollar Index Technical Analysis: surprise support
The US Dollar Index (DXY) briefly bounced off the 100-day Simple Moving Average (SMA) near 104.20 on Thursday. This comes as quite a surprise seeing its poor performance over the past few days and weeks. With two key elements still on the calendar this Friday, pressure could mount further and snap the 100-day SMA in the process.
Should the US Dollar jump Friday’s data to 105.00, 105.12 as key levels to keep an eye on. One step beyond there comes in at 105.88, the high of November 2023. Ultimately, 107.20 – the high of 2023 – could even come back into scope, but that would be when several inflation measures are coming in higher than expected for several weeks in a row.
As mentioned at the second paragraph above, that 100-day Simple Moving Average looks rather doubtful, near 104.24, so the 200-day SMA near 103.67 looks more solid. Should that give way, look for support from the 55-day SMA near 103.08.
US Dollar FAQs
What is the US Dollar?
The US Dollar (USD) is the official currency of the United States of America, and the ‘de facto’ currency of a significant number of other countries where it is found in circulation alongside local notes. It is the most heavily traded currency in the world, accounting for over 88% of all global foreign exchange turnover, or an average of $6.6 trillion in transactions per day, according to data from 2022.
Following the second world war, the USD took over from the British Pound as the world’s reserve currency. For most of its history, the US Dollar was backed by Gold, until the Bretton Woods Agreement in 1971 when the Gold Standard went away.
How do the decisions of the Federal Reserve impact the US Dollar?
The most important single factor impacting on the value of the US Dollar is monetary policy, which is shaped by the Federal Reserve (Fed). The Fed has two mandates: to achieve price stability (control inflation) and foster full employment. Its primary tool to achieve these two goals is by adjusting interest rates.
When prices are rising too quickly and inflation is above the Fed’s 2% target, the Fed will raise rates, which helps the USD value. When inflation falls below 2% or the Unemployment Rate is too high, the Fed may lower interest rates, which weighs on the Greenback.
What is Quantitative Easing and how does it influence the US Dollar?
In extreme situations, the Federal Reserve can also print more Dollars and enact quantitative easing (QE). QE is the process by which the Fed substantially increases the flow of credit in a stuck financial system.
It is a non-standard policy measure used when credit has dried up because banks will not lend to each other (out of the fear of counterparty default). It is a last resort when simply lowering interest rates is unlikely to achieve the necessary result. It was the Fed’s weapon of choice to combat the credit crunch that occurred during the Great Financial Crisis in 2008. It involves the Fed printing more Dollars and using them to buy US government bonds predominantly from financial institutions. QE usually leads to a weaker US Dollar.
What is Quantitative Tightening and how does it influence the US Dollar?
Quantitative tightening (QT) is the reverse process whereby the Federal Reserve stops buying bonds from financial institutions and does not reinvest the principal from the bonds it holds maturing in new purchases. It is usually positive for the US Dollar.
EUR/USD remains well-supported in the upper 1.0700s. Economists at Scotiabank analyze the pair’s outlook.
Short-term trend momentum favours a little more strength in the short run
EUR gains from the mid-week low are holding up and leave spot trading close to levels which could point to more sustained gains in the short run.
A move above 1.0805/1.0810, to better Monday’s high would give the EUR a bit more lift. Also, a close above 1.0786 (Monday’s opening level) on the week would be a bullish cue as well.
Short-term trend momentum favours a little more EUR strength in the short run.
Support is 1.0755 and 1.0690/1.0700.
- AUD/JPY extends its winning streak after dovish comments from BoJ Governor Kazuo Ueda.
- BoJ Governor Ueda expects monetary conditions in Japan to remain accommodative.
- The higher S&P/ASX 200 index helped the Australian Dollar to hold ground.
AUD/JPY continues its winning streak for the third successive day, extending higher to near 98.00 during the European session on Friday. The dovish Friday’s remarks from the Bank of Japan (BoJ) Governor Kazuo Ueda weigh on the Japanese Yen (JPY) and, consequently, act as a tailwind for the AUD/JPY cross. He stated that monetary conditions in Japan are expected to remain accommodative in relevance to the current economic and price outlook.
On Thursday, the downbeat Gross Domestic Product (GDP) data confirmed that Japan’s economy has entered into a technical recession. This cements the speculation that the Bank of Japan (BoJ) may postpone exiting its negative interest rate policy, pushing investors to move away from the safe-haven Japanese Yen.
The Australian Dollar (AUD) received upward support from the S&P/ASX 200 index’s improvement tracking the overnight surge in Wall Street. The Australian economy has shown modest growth, influenced by ongoing challenges in the labor market and subdued inflationary pressures.
Moreover, the latest Aussie employment data could prevent the Reserve Bank of Australia (RBA) from pursuing further interest rate hikes in the upcoming March meeting. However, Market sentiment indicates that the RBA will likely hold its current interest rates until August and may initiate a loosening policy with 25 basis points (bps) in September.
Economists at UBS expect the Euro (EUR) to remain stable as the Europen Central Bank (ECB) will prefer not to rush policy easing
ECB remains reluctant to declare victory in the fight against inflation
Persistent price pressures in services and another round of a wage-price spiral remain concerning for several members of the ECB directorate, so we think the central bank is in no hurry to cut interest rates at this point.
This should ensure the Euro stays largely rangebound even amid subdued economic sentiment, limiting the potential for gains in the US Dollar Index (DXY).
- Natural Gas keeps retreating with more bearish elements in the mix.
- Traders are pushing gas to substantial lower levels which could mean longer term low pricing.
- The US Dollar Index is flat for this week’s performance ahead of PPI and Michigan numbers.
Natural Gas (XNG/USD) is trading back around $1.65 and is facing more downward pressure. Recent US data shows that demand for Gas is now not only abating in Europe, but also in the US. The decline towards $1.50 could mean that Gas prices are heading into a region of substantially lower pricings for longer with redundancy at peak levels against tepid global demand.
The US Dollar (USD) meanwhile has eased back to its entry level from Monday. The underperforming Retail Sales print from Thursday was enough to erase the red-hot inflation print from Tuesday. Traders are gearing up to close the US Dollar Index (DXY) either at a loss or a profit on the back of US Producer Price Index (PPI) numbers and University of Michigan numbers.
Natural Gas is trading at $1.65 per MMBtu at the time of writing.
Natural Gas market movers: World growth stalling demands repricing
- Eni has released its fourth quarter profit, which matched estimates. One big element in the report was that the profits from the Natural Gas business were enough to cover the weakness in the refining and chemicals branch.
- Associated Press said that blasts have hit a Natural Gas Pipeline in Iran, near Bakhtiari province. Iranian officials confirmed that it was an act of sabotage.
- Even over the weekend higher-than-normal temperatures are heading over the European continent, limiting short-term draws of Gas out of the storage facilities.
- European gas storages are still 66% full, above the 5-year average of 50% for this time of year.
Natural Gas Technical Analysis: RSI defies logic
Natural Gas is struggling to find any platforms to bounce off. More short term and long term issues are arising for the energy commodity with short term global growth starting to abate, which means less demand. In the longer term, the shift away from fossil fuels means less demand. So a longer-term repricing where Natural Gas might not make its way back up above $2.00 could be on the horizon, and which pushes the Relative Strength Index (RSI) in an “oversold” regime for longer.
On the upside, Natural Gas is facing some pivotal technical levels to get back to. First stop is $1.99, – the level which, when broken, saw an accelerated decline. Next is the blue line at $2.13 with the triple bottoms from 2023. In case Natural Gas sees sudden demand pick up, possibly $2.40 could come into play.
Keep an eye on $1.80, which was a pivotal level back in July 2020 and should act as a cap now. Should more supply emerge in the markets, or more weakening data globally point to even more sluggish global growth – $1.64 and $1.53 (the low of 2020) are targets to look out for.
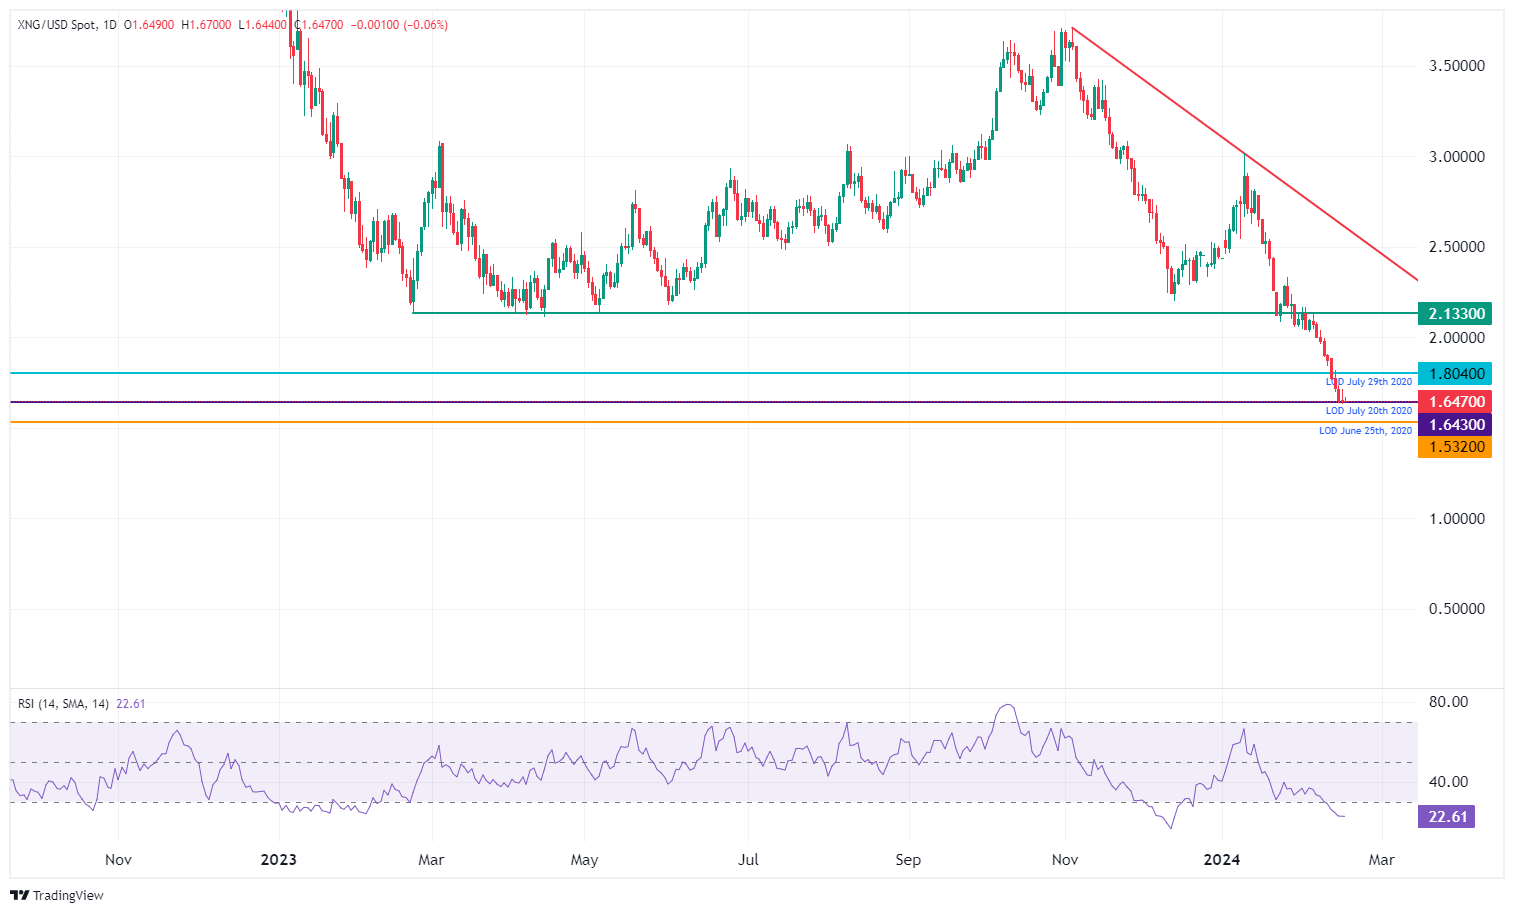
XNG/USD (Daily Chart)
Natural Gas FAQs
What fundamental factors drive the price of Natural Gas?
Supply and demand dynamics are a key factor influencing Natural Gas prices, and are themselves influenced by global economic growth, industrial activity, population growth, production levels, and inventories. The weather impacts Natural Gas prices because more Gas is used during cold winters and hot summers for heating and cooling. Competition from other energy sources impacts prices as consumers may switch to cheaper sources. Geopolitical events are factors as exemplified by the war in Ukraine. Government policies relating to extraction, transportation, and environmental issues also impact prices.
What are the main macroeconomic releases that impact on Natural Gas Prices?
The main economic release influencing Natural Gas prices is the weekly inventory bulletin from the Energy Information Administration (EIA), a US government agency that produces US gas market data. The EIA Gas bulletin usually comes out on Thursday at 14:30 GMT, a day after the EIA publishes its weekly Oil bulletin. Economic data from large consumers of Natural Gas can impact supply and demand, the largest of which include China, Germany and Japan. Natural Gas is primarily priced and traded in US Dollars, thus economic releases impacting the US Dollar are also factors.
How does the US Dollar influence Natural Gas prices?
The US Dollar is the world’s reserve currency and most commodities, including Natural Gas are priced and traded on international markets in US Dollars. As such, the value of the US Dollar is a factor in the price of Natural Gas, because if the Dollar strengthens it means less Dollars are required to buy the same volume of Gas (the price falls), and vice versa if USD strengthens.
- USD/CHF gains ground amid stronger US Dollar ahead of US PMI data.
- The Greenback improves as risk-off mood prevails despite weaker US Retail Sales.
- Scotiabank expects the SNB to reduce interest rates during 2024.
USD/CHF recovers its recent losses on a stronger US Dollar (USD), which could be attributed to the risk-off sentiment. Additionally, improved US Treasury yields are supporting the Greenback to hold ground, which in turn, underpins the USD/CHF pair. The pair edges higher to around 0.8810 during the European session on Friday.
The US Dollar Index (DXY), which measures the value of the US Dollar (USD) against the six other major currencies, edges higher to near 104.30. 2-year and 10-year yields on US bond coupons stand higher at 4.60% and 4.26%, respectively, by the press time. Furthermore, investors await the Producer Price Index (PPI) data and Michigan Consumer Sentiment Index scheduled to be released later in the North American session on Friday.
On Thursday, the mixed economic data from the United States put downward pressure on the Greenback, which in turn, undermined the USD/CHF pair. US Retail Sales (MoM) reported a decline in January against the expected decline. While Retail Sales Control Group decreased against the December’s increase.
According to the Scotiabank, Swiss Franc (CHF) may underperform moderately in 2024. Economists at Scotiabank expect some easing in the Swiss National Bank’s (SNB) interest rates trajectory. The market may witness a modest correction in the CHF’s somewhat overvalued status.
On Friday, Swiss Statistics released Industrial Production (YoY) report for the fourth quarter of 2023. The data showed a decline of 0.4% in the production of factories and manufacturing. These figures along with slowed Swiss consumer prices could have contributed to downward pressure on the Swiss Franc.
After hitting an interim low in October last year, AUD/USD and NZD/USD have recovered somewhat, but are still trading well below last year's interim highs. Economists at Commerzbank analyze Aussie and Kiwi outlooks.
Upside potential thanks to hawkish central banks?
Despite a weakening real economy, we continue to expect a moderate appreciation of the AUD and NZD. The reason for this is the surprisingly hawkish stance of the central banks, which have not yet been dissuaded by falling inflation and are therefore likely to start cutting rates much later than other G10 central banks.
At the same time, the later starting point also limits the scope of rate cuts this year for the time being and gives hope that the restrictive approach will bring inflation under control in the long run. For the time being, we remain positive on the Aussie and the Kiwi.
Economists at Danske Bank view narrowing rate differentials between Japan and the G10 to favour the Japanese Yen (JPY) over the course of this year.
USD/JPY to steadily decline below 140.00 on a 12M horizon
We forecast USD/JPY to steadily decline below 140.00 on a 12M horizon. This is primarily because we expect limited upside to US yields from here. Hence, we expect yield differentials to be a tailwind for the JPY during the year, as G10 central banks, except the BoJ, are likely to commence rate-cutting cycles.
In addition, historical data suggests that a global environment characterized by declining growth and inflation tends to favour the JPY.
- Gold price gains ground ahead of the release of the US PPI and Consumer Sentiment Index.
- The overnight surge in Wall Street could limit the advance of Gold prices.
- Gold garners attention from buyers following the weakening of the US Dollar in response to softer Retail Sales data reported on Thursday.
Gold price extends its gains for the second session, trading higher around $2,010 per troy ounce during the European session on Friday. The precious metal attracts some buyers amid risk aversion sentiment before the release of key economic data from the United States (US), particularly Producer Price Index (PPI) data and the Michigan Consumer Sentiment Index.
The overnight surge in Wall Street could be attributed to the market optimism as no rate adjustment is viewed by the Federal Reserve (Fed) in its upcoming meetings in March and May, which could have limited the advance of Gold prices. However, the CME FedWatch Tool shows a 52% likelihood of a 25 bps rate cut in June.
The softer US Retail Sales data on Thursday weakened the Greenback, which in turn, underpinned the Gold prices. US Retail Sales (MoM) decreased 0.8% in January against the market expectation of 0.1% decline and the previous 0.4% increase. Meanwhile, Retail Sales Control Group declined by 0.4%, against the previous increase of 0.6%.
However, the US Initial Jobless Claims report for the week ending on February 9 showed a print of 212K, against the anticipated consistency at 220K. These figures, combined with the positive Consumer Inflation released on Tuesday, might have helped mitigate potential losses for the US Dollar.
Federal Reserve Bank of Atlanta President Raphael W. Bostic seeks progress in addressing inflation, albeit with potential bumps along the way. Bostic indicated that if inflation were to recede more rapidly, he would reassess his interest rates outlook.
Platinum’s price is hovering near a key support level of $900. Economists at ANZ Bank analyze the metal’s technical outlook.
Consolidation near $900
If the price holds above $900, a recovery looks possible towards $936. However, a sustained price above $950 is required to reverse the downtrend that started in late December last year.
Price near $1,000 is a strong resistance, and a break of this will mark the beginning of a bullish trend.
On the other hand, if the price breaks below $900, this could trigger a fresh sell-off, dragging prices lower towards $850.
- EUR/USD retreats amid market optimism ahead of US PPI.
- Euro gained ground on Thursday as the US Dollar declined after disappointing Retail Sales data.
- ECB’s Villeroy stated that there are several reasons for not waiting too long before the first rate cut.
- US Retail Sales (MoM) declined 0.8% in January compared to the expected 0.1% decline.
The EUR/USD pair retreats after two days of gains, edging lower to near 1.0770 on Friday. The market optimism supports the US Dollar (USD) against the Euro (EUR) ahead of key data events, particularly the Producer Price Index (PPI) and Michigan Consumer Sentiment Index from the United States (US) scheduled to be released on Friday.
European Central Bank (ECB) Governing Council member Francois Villeroy de Galhau mentioned that there are several reasons why they should not wait too long before the first rate cut. While the idea of a rate cut this year appears likely, the exact timing is still under consideration. There's ample room for adjusting rates without immediately resorting to an accommodative monetary policy.
The US Dollar Index (DXY) attempts to retrace its recent losses on the back of higher US Treasury yields. The market sentiment is biased to the idea that the US Federal Reserve (Fed) will avoid rate cuts in March and May. The CME FedWatch Tool shows a 52% likelihood of a 25 basis points (bps) rate cut in June. The disappointing US Retail Sales data on Thursday contributed downward pressure to undermining the US Dollar, which in turn, acted as a tailwind for the EUR/USD pair.
Daily digest market movers: EUR/USD declines on stronger US Dollar
- The US Dollar Index trades around 104.30, with the 2-year and 10-year US Treasury yields standing higher at 4.62% and 4.27%, respectively, at the time of writing.
- Federal Reserve Bank of Atlanta President Raphael W. Bostic seeks further improvement in inflation, but it could be bumpy. He mentioned that if inflation retreats faster, it could prompt a reassessment of his stance on the outlook for interest rates.
- US Retail Sales showed that consumer spending decreased by 0.8% MoM in January against the market prediction of a 0.1% decline following the previous increase of 0.4%.
- US January’s Retail Sales Control Group declined by 0.4% compared to the previous increase of 0.6%.
- US Initial Jobless Claims reduced to a figure of 212K for the week ending February 9 from the previous reading of 220K. Claims were expected to be unchanged.
- US Industrial Production (MoM) contracted by 0.1% in January, against the expected 0.3% improvement from a flat 0.0% prior.
- Christine Lagarde, the President of the European Central Bank (ECB), stated that recent data indicates ongoing subdued economic activity in the near term. While the current disinflationary trend is anticipated to persist, Lagarde emphasized the importance of ensuring confidence that this trajectory will ultimately lead to the sustainable achievement of the ECB's 2% inflation target.
- The preliminary Eurozone Gross Domestic Product (GDP) seasonally adjusted grew by 0.1% year-over-year in the fourth quarter, as expected. The GDP quarter-over-quarter remained flat at 0.0%.
- Germany’s Wholesale Price Index (YoY) declined by 2.7% YoY in January from the previous 2.6% fall. The month-over-month index increased by 0.1% from the previous decline of 0.6%.
Technical Analysis: EUR/USD hovers near 1.0770 below 38.2% Fibonacci retracement
EUR/USD trades near 1.0770 on Friday, which is located below the immediate resistance level at 38.2% Fibonacci retracement of the 1.0897-1.0695 downward move at 1.0772. A break above this level could lead the pair to test the 50.0% retracement level at 1.0796 aligned with the psychological resistance at 1.0800 level.
On the downside, the EUR/USD pair could find the key support around the nine-4hour Exponential Moving Average (EMA) at 1.0755 in conjunction with the major support at 1.0750 level. A break below this level could push the pair to navigate the support region around the psychological level of 1.0700 in line with February’s low at 1.0694.
In technical analysis, the EUR/USD pair shows a 14-4hour Relative Strength Index (RSI) above the 50 mark, signaling a bullish sentiment. Additionally, the Moving Average Convergence Divergence (MACD) is positioned above the centerline and the signal line, indicating a confirmation of the bullish momentum.
EUR/USD: Four-Hour Chart
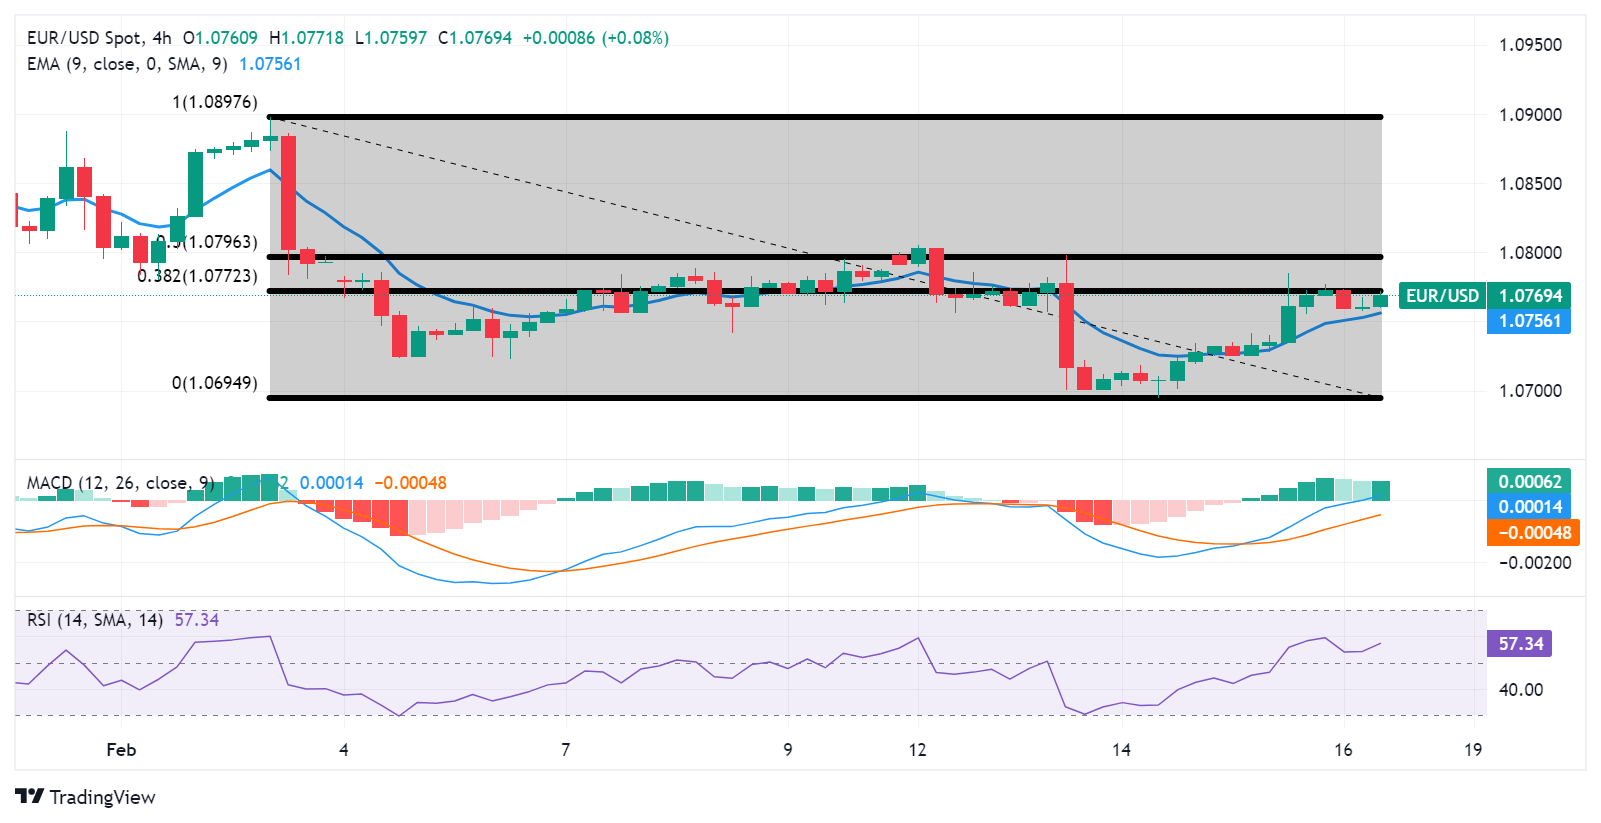
Euro price today
The table below shows the percentage change of Euro (EUR) against listed major currencies today. Euro was the weakest against the US Dollar.
| USD | EUR | GBP | CAD | AUD | JPY | NZD | CHF | |
| USD | 0.07% | 0.09% | 0.12% | 0.02% | 0.22% | 0.04% | 0.14% | |
| EUR | -0.08% | 0.00% | 0.05% | -0.04% | 0.15% | -0.03% | 0.07% | |
| GBP | -0.10% | -0.04% | 0.03% | -0.08% | 0.12% | -0.06% | 0.04% | |
| CAD | -0.12% | -0.05% | -0.02% | -0.08% | 0.11% | -0.08% | 0.02% | |
| AUD | -0.03% | 0.05% | 0.08% | 0.10% | 0.20% | 0.02% | 0.12% | |
| JPY | -0.22% | -0.15% | -0.12% | -0.11% | -0.23% | -0.17% | -0.06% | |
| NZD | -0.04% | 0.04% | 0.07% | 0.09% | -0.01% | 0.19% | 0.12% | |
| CHF | -0.16% | -0.08% | -0.04% | -0.03% | -0.12% | 0.07% | -0.12% |
The heat map shows percentage changes of major currencies against each other. The base currency is picked from the left column, while the quote currency is picked from the top row. For example, if you pick the Euro from the left column and move along the horizontal line to the Japanese Yen, the percentage change displayed in the box will represent EUR (base)/JPY (quote).
Euro FAQs
What is the Euro?
The Euro is the currency for the 20 European Union countries that belong to the Eurozone. It is the second most heavily traded currency in the world behind the US Dollar. In 2022, it accounted for 31% of all foreign exchange transactions, with an average daily turnover of over $2.2 trillion a day.
EUR/USD is the most heavily traded currency pair in the world, accounting for an estimated 30% off all transactions, followed by EUR/JPY (4%), EUR/GBP (3%) and EUR/AUD (2%).
What is the ECB and how does it impact the Euro?
The European Central Bank (ECB) in Frankfurt, Germany, is the reserve bank for the Eurozone. The ECB sets interest rates and manages monetary policy.
The ECB’s primary mandate is to maintain price stability, which means either controlling inflation or stimulating growth. Its primary tool is the raising or lowering of interest rates. Relatively high interest rates – or the expectation of higher rates – will usually benefit the Euro and vice versa.
The ECB Governing Council makes monetary policy decisions at meetings held eight times a year. Decisions are made by heads of the Eurozone national banks and six permanent members, including the President of the ECB, Christine Lagarde.
How does inflation data impact the value of the Euro?
Eurozone inflation data, measured by the Harmonized Index of Consumer Prices (HICP), is an important econometric for the Euro. If inflation rises more than expected, especially if above the ECB’s 2% target, it obliges the ECB to raise interest rates to bring it back under control.
Relatively high interest rates compared to its counterparts will usually benefit the Euro, as it makes the region more attractive as a place for global investors to park their money.
How does economic data influence the value of the Euro?
Data releases gauge the health of the economy and can impact on the Euro. Indicators such as GDP, Manufacturing and Services PMIs, employment, and consumer sentiment surveys can all influence the direction of the single currency.
A strong economy is good for the Euro. Not only does it attract more foreign investment but it may encourage the ECB to put up interest rates, which will directly strengthen the Euro. Otherwise, if economic data is weak, the Euro is likely to fall.
Economic data for the four largest economies in the euro area (Germany, France, Italy and Spain) are especially significant, as they account for 75% of the Eurozone’s economy.
How does the Trade Balance impact the Euro?
Another significant data release for the Euro is the Trade Balance. This indicator measures the difference between what a country earns from its exports and what it spends on imports over a given period.
If a country produces highly sought after exports then its currency will gain in value purely from the extra demand created from foreign buyers seeking to purchase these goods. Therefore, a positive net Trade Balance strengthens a currency and vice versa for a negative balance.
Gold pushed back above $2,000 after US Retail Sales came in softer-than-expected. Economists at Commerzbank analyze the yellow metal’s outlook.
The ongoing ETF outflows are a further negative factor
Expectations of near-term interest rate cuts by the Fed have dwindled significantly once again following the inflation data. As a result, US bond yields rose significantly and the US Dollar appreciated, both of which are negative for Gold.
The ongoing ETF outflows are a further negative factor. According to Bloomberg, these have already amounted to 76 tons since the beginning of the year. Most recently, there were outflows on 20 out of 21 trading days.
The Gold price rose again on Thursday to $2,000 following weaker US Retail Sales data. However, a continued price recovery is unlikely in the short term.
Dollar bears hit back. The USD lost further ground on Thursday. Economists at ING analyze Greenback’s outlook.
Short-term USD resilience may not translate into big rallies
A week of mixed US data (hotter inflation, softer retail sales) suggests that the Fed will remain patient for longer.
Most investors do not share the privilege of patience, and in FX, popular short-Dollar positions have been frenetically revamped. This means that more short-term USD resilience (our base case) may not translate into big USD rallies.
Looking at today’s events, the US data calendar includes PPI inflation, housing starts, and the University of Michigan sentiment. Expect more USD sensitivity to incoming releases, especially PPI and U. Michigan prints, should they tell a different story than the CPI report. We expect, anyway, some Dollar consolidation in the coming days, still with some upside risks.
European Central Bank (ECB) executive board member Isabel Schnabel said on Friday, “we must be cautious not to adjust policy stance prematurely.”
Additional quotes
Monetary policy needs to remain restrictive until we can be confident that inflation will sustainably return to our medium-term target.
Persistently low productivity growth increases the risk that firms may pass higher wage costs on to consumers, which could delay inflation goal timing.
Market reaction
At the time of writing, EUR/USD is trading 0.04% lower on the day at around 1.0764, unfazed by the above comments.
Euro price today
The table below shows the percentage change of Euro (EUR) against listed major currencies today. Euro was the weakest against the US Dollar.
| USD | EUR | GBP | CAD | AUD | JPY | NZD | CHF | |
| USD | 0.06% | 0.11% | 0.11% | 0.07% | 0.22% | 0.05% | 0.19% | |
| EUR | -0.07% | 0.02% | 0.04% | 0.00% | 0.15% | -0.02% | 0.13% | |
| GBP | -0.10% | -0.05% | 0.01% | -0.03% | 0.12% | -0.04% | 0.10% | |
| CAD | -0.11% | -0.05% | 0.00% | -0.03% | 0.11% | -0.07% | 0.08% | |
| AUD | -0.07% | 0.01% | 0.05% | 0.06% | 0.16% | -0.01% | 0.16% | |
| JPY | -0.22% | -0.16% | -0.10% | -0.12% | -0.18% | -0.17% | -0.01% | |
| NZD | -0.06% | 0.01% | 0.06% | 0.07% | 0.02% | 0.16% | 0.15% | |
| CHF | -0.21% | -0.13% | -0.08% | -0.07% | -0.12% | 0.03% | -0.14% |
The heat map shows percentage changes of major currencies against each other. The base currency is picked from the left column, while the quote currency is picked from the top row. For example, if you pick the Euro from the left column and move along the horizontal line to the Japanese Yen, the percentage change displayed in the box will represent EUR (base)/JPY (quote).
Thursday's data on Industrial Production and Retail Sales – which were weaker than expected – caused the Dollar to dip briefly. Antje Praefcke, FX Analyst at Commerzbank, anlayze the EUR/USD outlook.
Everything will be fine?
As long as the data keeps market expectations that ‘everything could be fine’ in the end, the Dollar should be able to defend its position and see only moderate movements through minor position adjustments. However, as soon as the currently prevailing positive picture starts to crack, the USD could quickly head in the opposite direction again.
For me, the risks are therefore asymmetrically distributed at the moment, especially for any larger movements, and are more likely to be on the upside in EUR/USD.
The strength in the Dollar pushed USD/JPY back above 150.00. Economists at UBS analyze Yen’s (JPY) outlook.
The current entry point to buy the Yen is attractive
We think the BoJ's policy normalization remains on track this year on strong wage hike negotiations and corporate profitability.
We maintain the view that the Japanese Yen has likely reached a turning point after significant underperformance between 2021 and 2023.
With the US-Japan 10-year yield differentials expected to narrow as the year progresses, we think the current entry point to buy the Yen is attractive.
EUR/GBP remains close to the 0.8550 mark. Economists at ING analyze the pair’s outlook.
Retail Sales posts strong rebound in January
UK retail sales for January came in at 3.4% MoM, above all estimates. This follows some softer-than-expected GDP numbers on Thursday, which meant the British economy entered a recession in the latter part of 2023.
The implications of activity data on the Bank of England’s policy outlook are not too deep. The focus remains on inflation (especially on services) and wage growth, and it does not seem likely that the BoE will turn significantly more hawkish only based on softer growth and without having reassurances on the inflation side first.
The Pound seems to mirror this narrative, declining only modestly after GDP numbers on Thursday and gaining a little bit today. Still, we like the chances of a stabilisation first (0.8500 may be the bottom), and a rebound then in EUR/GBP, on the back of monetary policy mispricing in the UK and the Eurozone.
EUR/USD climbed above 1.0750 on Thursday. Economists at ING analyze the pair’s outlook.
Lagarde confirms cautious approach
ECB President Christine Lagarde reiterated the need for caution when discussing monetary easing on Thursday. We still think markets are right to price in a first cut in June but are overestimating the size of total easing, which we expect to be 75 bps vs 115 bps priced in.
The good EUR/USD momentum is a mere reflection of the Dollar correction.
We feel EUR/USD can stabilise around current levels today but still faces some downside risks in the short term.
FX option expiries for Feb 16 NY cut at 10:00 Eastern Time, via DTCC, can be found below.
- EUR/USD: EUR amounts
- 1.0615 1.6b
- 1.0675 1.9b
- 1.0700 2.5b
- 1.0800 3.6b
- 1.0825 1.4b
- 1.0850 1.2b
- 1.0880 2b
- 1.0900 2.6b
- 1.0925 1.1b
- GBP/USD: GBP amounts
- 1.2400 450m
- 1.2650 1.9b
- 1.3000 671m
- USD/JPY: USD amounts
- 150.00 1.7b
- 152.00 800m
- USD/CHF: USD amounts
- 0.8645 440m
- 0.8780 800m
- AUD/USD: AUD amounts
- 0.6350 1.8b
- 0.6475 625m
- 0.6535 842m
- 0.6540 693m
- 0.6600 1.1b
- USD/CAD: USD amounts
- 1.3500 1.9b
- NZD/USD: NZD amounts
- 0.5950 414m
In Indonesia, quick vote polling results show current Defense Minister Prabowo Subianto has won the 2024 presidential election, avoiding run-off election uncertainty. Economists at MUFG Bank analyze Rupiah’s (IDR) outlook following election result.
Cautious on the USD/IDR
We remain cautious on the USD/IDR, keeping our forecast at 15,800 in Q1 2024 and 15,850 in Q2 2024.
With Prabowo winning the presidential election in the first round, election uncertainty has somewhat eased. Still, we remain mindful of potential political transition risks stemming from the forming of a governing coalition among the different political parties and the appointment of key cabinet members.
Moreover, markets have further pared back expectations for US rate cuts this year following higher-than-expected US CPI data for January. Policy rate cuts by Bank Indonesia and sustained Rupiah strength against the US Dollar are likely to have to wait till external pressures recede.
- GBP/USD remains on the defensive around 1.2590 in Friday’s early European session.
- The UK Retail Sales came in stronger than expected, rising 3.4% MoM in January from a 3.3% decline in December.
- The weaker US Retail Sales in January prompted the possibility that the Fed might cut the interest rates sooner.
- Traders will monitor the US January Producer Price Index (PPI), due on Friday.
The GBP/USD pair remains capped below the 1.2500 psychological mark during the early European session on Friday. The upbeat UK Retail Sales data failed to boost the Pound Sterling (GBP) as investors are still concerned about the UK growth numbers for Q4, which indicated that the UK economy entered a technical recession. GBP/USD currently trades near 1.2590, losing 0.04% on the day.
The latest data released from the UK National Statistics showed that the nation’s Retail Sales rose 3.4% MoM in January from the previous reading of a 3.3% decline, stronger than the estimation of 1.5%. On an annual basis, Retail Sales increased by 0.7% YoY in January from a 2.4% fall in the previous reading.
The UK Gross Domestic Product (GDP) figures for the fourth quarter, due on Thursday, indicated that the UK economy slumped into a technical recession in the second half of 2023 ahead of a general election expected this year. The GDP growth numbers report could put pressure on the BoE to cut rates as soon as May. However, the UK central bank policymakers want more evidence that inflation will return to the target rather than drift upwards again before they are confident about cutting rates.
Across the pond, the softer US January Retail Sales sparked the possibility that the Federal Reserve (Fed) might cut interest rates sooner, which dragged the Greenback lower in the last session. US Retail Sales fell 0.8% MoM in January from a 0.4% rise in December, worse than the estimation of a 0.1% decline. Retail Sales Control Group came in at -0.4% MoM versus 0.6% prior, according to the US Census Bureau on Thursday.
Investors will keep an eye on the US Producer Price Index (PPI) for January, due on Friday. If the report shows a weaker-than-expected outcome, this might exert some selling pressure on the US Dollar (USD). Additionally, the US Housing Starts, Building Permits, and UoM Consumer Inflation Expectations will be released later in the day. These events could give a clear direction to the GBP/USD pair.
Here is what you need to know on Friday, February 16:
The US Dollar (USD) extended its downward correction following mixed data releases on Thursday, with the USD Index (DXY) losing 0.4% on the day. The USD stays resilient against its rivals early Friday as focus shifts to January Producer Price Index (PPI) data. Later in the American session, the University of Michigan will release the preliminary Consumer Sentiment Index for February.
The US Census Bureau reported on Thursday that Retail Sales declined 0.8% on a monthly basis in January. On a positive note, weekly Initial Jobless Claims came in at 212,000 for the week ending February 10, down from 220,000 in the previous week. The benchmark 10-year US Treasury bond yield retreated toward 4.2% and Wall Street's main indexes registered modest gains after the data, not allowing the USD to gather strength. In the European morning, the 10-year yield stays in positive territory near 4.25% and US stock index futures trade mixed.
Retail Sales in the UK rose 3.4% on a monthly basis in January, the UK's Office for National Statistics announced early Friday. This print surpassed the market expectation for an increase of 1.5% by a wife margin. Retail Sales ex-Fuel grew 3.2% in the same period. Pound Sterling failed to benefit from the upbeat data and GBP/USD was last seen fluctuating at around 1.2600.
Bank of Japan (BoJ) Governor Kazuo Ueda said on Friday that they will examine whether to maintain various easing measures, including negative interest rate, when a sustained and stable achievement of the price target comes into sight. Ueda refrained from commenting on the short-term fluctuations in the forex markets and possible factors behind such moves. After closing the previous two trading days in negative territory, USD/JPY stabilized near 150.00 and edged higher during the Asian trading hours.
Reserve Bank of New Zealand (RBNZ) Governor Adrian Orr repeated early Friday that they have more work to do to get inflation expectations anchored to the 2% target. "Bringing core inflation down to within the 1-2% target band is an important part of bringing overall inflation down to the 2% target," Orr added. NZD/USD largely ignored these comments and was last seen trading marginally lower on the day at around 0.6100.
EUR/USD gathered recovery momentum and climbed above 1.0750 on Thursday. The pair holds steady above this level in the European morning on Friday.
Gold snapped a five-day losing streak on Thursday and closed above the key $2,000 mark. XAU/USD trades in a narrow channel slightly above this level on the last trading day of the week.
- The UK Retail Sales rebounded 3.4% MoM in January, a big beat.
- Core Retail Sales for the UK rose 3.2% MoM in January.
- GBP/USD flirts with 1.2600 on upbeat UK data.
The UK Retail Sales rebounded 3.4% over the month in January vs. 1.5% expected and -3.3% reported in December, the latest data released by the Office for National Statistics (ONS) showed on Friday.
The Core Retail Sales, stripping the auto motor fuel sales, rose 3.2% MoM vs. 1.7% expected and -3.5% seen in December.
The annual Retail Sales in the United Kingdom jumped 0.7% in January versus -1.4% expected and December’s -2.4% while the Core Retail Sales also increased by 0.7% in the reported month versus -1.6% forecast and -2.1% previous.
Main points (via ONS)
This was the largest monthly rise since April 2021 and returned volumes to November 2023 levels.
Sales volumes in all subsectors except clothing stores increased over the month, with food stores such as supermarkets contributing most to the increase.
More broadly, sales volumes fell by 0.2% in the three months to January when compared with the previous three months, however this was the smallest fall since August 2023.
Market reaction to UK Retail Sales report
GBP/USD is keeping its range trade intact near 1.2600 despite the upbeat UK Retail Sales data. The spot is trading flat on the day.
Pound Sterling FAQs
What is the Pound Sterling?
The Pound Sterling (GBP) is the oldest currency in the world (886 AD) and the official currency of the United Kingdom. It is the fourth most traded unit for foreign exchange (FX) in the world, accounting for 12% of all transactions, averaging $630 billion a day, according to 2022 data.
Its key trading pairs are GBP/USD, aka ‘Cable’, which accounts for 11% of FX, GBP/JPY, or the ‘Dragon’ as it is known by traders (3%), and EUR/GBP (2%). The Pound Sterling is issued by the Bank of England (BoE).
How do the decisions of the Bank of England impact on the Pound Sterling?
The single most important factor influencing the value of the Pound Sterling is monetary policy decided by the Bank of England. The BoE bases its decisions on whether it has achieved its primary goal of “price stability” – a steady inflation rate of around 2%. Its primary tool for achieving this is the adjustment of interest rates.
When inflation is too high, the BoE will try to rein it in by raising interest rates, making it more expensive for people and businesses to access credit. This is generally positive for GBP, as higher interest rates make the UK a more attractive place for global investors to park their money.
When inflation falls too low it is a sign economic growth is slowing. In this scenario, the BoE will consider lowering interest rates to cheapen credit so businesses will borrow more to invest in growth-generating projects.
How does economic data influence the value of the Pound?
Data releases gauge the health of the economy and can impact the value of the Pound Sterling. Indicators such as GDP, Manufacturing and Services PMIs, and employment can all influence the direction of the GBP.
A strong economy is good for Sterling. Not only does it attract more foreign investment but it may encourage the BoE to put up interest rates, which will directly strengthen GBP. Otherwise, if economic data is weak, the Pound Sterling is likely to fall.
How does the Trade Balance impact the Pound?
Another significant data release for the Pound Sterling is the Trade Balance. This indicator measures the difference between what a country earns from its exports and what it spends on imports over a given period.
If a country produces highly sought-after exports, its currency will benefit purely from the extra demand created from foreign buyers seeking to purchase these goods. Therefore, a positive net Trade Balance strengthens a currency and vice versa for a negative balance.
Bank of Japan (BoJ) Governor Kazuo Ueda said on Friday that he is “watching the outcome of spring wage talks and various other factors.”
He added that he “wants to confirm whether the virtuous cycle of wages and prices strengthening or not.”
Related reads
- Japanese Yen struggles near daily low against USD, intervention fears help limit losses
- BoJ Ueda: Will consider policy move when inflation target conditions met
Japanese Yen price this week
The table below shows the percentage change of Japanese Yen (JPY) against listed major currencies this week. Japanese Yen was the weakest against the US Dollar.
| USD | EUR | GBP | CAD | AUD | JPY | NZD | CHF | |
| USD | 0.34% | 0.42% | 0.18% | 0.04% | 0.71% | 0.80% | 0.77% | |
| EUR | -0.34% | 0.09% | -0.16% | -0.29% | 0.37% | 0.47% | 0.44% | |
| GBP | -0.42% | -0.08% | -0.25% | -0.37% | 0.29% | 0.39% | 0.35% | |
| CAD | -0.18% | 0.16% | 0.25% | -0.13% | 0.54% | 0.63% | 0.59% | |
| AUD | -0.05% | 0.29% | 0.38% | 0.13% | 0.66% | 0.77% | 0.72% | |
| JPY | -0.72% | -0.38% | -0.23% | -0.53% | -0.66% | 0.09% | 0.07% | |
| NZD | -0.81% | -0.47% | -0.39% | -0.63% | -0.77% | -0.09% | -0.03% | |
| CHF | -0.78% | -0.44% | -0.36% | -0.61% | -0.74% | -0.06% | 0.03% |
The heat map shows percentage changes of major currencies against each other. The base currency is picked from the left column, while the quote currency is picked from the top row. For example, if you pick the Euro from the left column and move along the horizontal line to the Japanese Yen, the percentage change displayed in the box will represent EUR (base)/JPY (quote).
- GBP/JPY gains ground ahead of a slew of data releases from the United Kingdom.
- UK Retail Sales (MoM) could improve to 1.5% from the previous 3.2% decrease.
- BoJ Governor Kazuo Ueda expects the monetary conditions in Japan to have remained accommodative.
GBP/JPY receives upward support ahead of the release of Retail Sales data from the United Kingdom (UK) due on Friday. The monthly report for January is expected to show an improvement of 1.5%, swinging from the previous decrease of 3.2%. While year-over-year report could print a reading of -1.4% as compared to the previous -2.4 reading. The GBP/JPY cross inches higher to near 189.10 during the Asian trading hours.
GBP/JPY cross faced challenges as the Japanese Yen (JPY) cheered the remarks from Japan's top officials, hinting at a potential intervention in the Forex market. Additionally, the escalated geopolitical tensions in the Middle East could have increased demand for the safe-haven JPY and dragged the GBP/JPY cross downward.
Bank of Japan (BoJ) Governor Kazuo Ueda stated on Friday that the specific methods for rolling back stimulus would hinge on the prevailing economic conditions. Considering the current economic and price outlook, monetary conditions in Japan are expected to remain accommodative even after the cessation of negative rates.
The quarterly growth of Gross Domestic Product (GDP) extended its decline to 0.3% in the fourth quarter of 2023 compared to the previous contraction of 0.1%. The GDP (YoY) growth surprisingly declined by 0.2% against the expected increase of 0.1%, swinging from the growth rate of 0.2%.
The United Kingdom's economy has officially entered a technical recession, marked by two consecutive quarters of negative GDP growth. Furthermore, Bank of England policymaker Catharine L. Mann mentioned that the central bank requires at least one more set of inflation data before determining its next steps.
- EUR/USD loses momentum near 1.0760 amid renewed USD demand.
- The pair keeps the bearish outlook unchanged below the key EMA; RSI indicator lies below the 50-midlines.
- The first resistant level will emerge at 1.0790; the key support level is seen at 1.0700.
The EUR/USD pair trades on a softer note during the early European trading hours on Friday. The renewed US Dollar (USD) demand and dovish comments from the European Central Bank (ECB) policymakers weigh on the major pair. EUR/USD currently trades around 1.0760, down 0.11% on the day.
The ECB Governing Council member Francois Villeroy de Galhau said on Friday that the central bank should not wait too long to cut rates and ECB will still have flexibility over the pace and degree of policy easing after its first move,
According to the four-hour chart, the bearish view of EUR/USD remains intact as the major pair is below the 100-period Exponential Moving Averages (EMA). The downward momentum is supported by the Relative Strength Index (RSI), which lies below the 50-midlines, indicating that the path of least resistance level is to the downside.
On the bright side, the first upside barrier for EUR/USD will emerge at the conference of the the 100-period EMA and the upper boundary of the Bollinger Band at 1.0790. A bullish breakout above this level will see a rally to a high of January 26 at 1.0885. Further north, the next hurdle is seen at the 1.0900 psychological round figure.
On the downside, the critical support level for the major pair is located near a round mark and a low of February 13 at 1.0700. The additional downside filter to watch is the lower limit of the Bollinger Band at 1.0687. A break below the latter will expose a low of November 9 at 1.0660.
EUR/USD four-hour chart
-638436590929529654.png)
European Central Bank (ECB) Governing Council member and Bank of France President, Francois Villeroy de Galhau, said on Friday that there are “several reasons as to why we should not wait too long before first rate cut.”
Additional quotes
There is still the question of the exact timing for the rate cut.
The principle of a rate cut this year seems to be a given.
We have significant margin to maneuver on rate cuts without necessarily having to return to accommodative monetary policy.
Market reaction
EUR/USD is flirting with intraday lows near 1.0760 on the above comments, down 0.09% on the day.
Euro price today
The table below shows the percentage change of Euro (EUR) against listed major currencies today. Euro was the weakest against the US Dollar.
| USD | EUR | GBP | CAD | AUD | JPY | NZD | CHF | |
| USD | 0.12% | 0.11% | 0.12% | 0.11% | 0.20% | 0.18% | 0.14% | |
| EUR | -0.12% | -0.02% | 0.00% | -0.01% | 0.09% | 0.07% | 0.02% | |
| GBP | -0.12% | 0.00% | 0.01% | -0.01% | 0.09% | 0.07% | 0.02% | |
| CAD | -0.12% | -0.01% | -0.01% | 0.00% | 0.08% | 0.06% | 0.02% | |
| AUD | -0.11% | 0.03% | 0.02% | 0.02% | 0.11% | 0.09% | 0.04% | |
| JPY | -0.21% | -0.08% | -0.09% | -0.10% | -0.12% | -0.01% | -0.06% | |
| NZD | -0.19% | -0.06% | -0.07% | -0.05% | -0.07% | 0.02% | -0.05% | |
| CHF | -0.15% | -0.01% | -0.02% | -0.01% | -0.02% | 0.07% | 0.05% |
The heat map shows percentage changes of major currencies against each other. The base currency is picked from the left column, while the quote currency is picked from the top row. For example, if you pick the Euro from the left column and move along the horizontal line to the Japanese Yen, the percentage change displayed in the box will represent EUR (base)/JPY (quote).
- USD/CAD gains ground as the US Dollar appreciates on risk aversion.
- US PPI data and the Consumer Sentiment Index are set to be released on Friday.
- US Retail Sales decreased 0.8% MoM in January against the expected decline of 0.1%.
- Lower WTI price contributes downward pressure for the Canadian Dollar.
USD/CAD snaps a two-day losing streak, improving to near 1.3480 during the Asian hours on Friday. The US Dollar (USD) receives upward support against the Canadian Dollar (CAD), which could be attributed to the risk aversion sentiment while the market prices in the possibility of no rate adjustment by the Federal Reserve (Fed) in the upcoming meetings in March and May.
However, the USD/CAD pair extended losses after the release of disappointing US Retail Sales data on Thursday. US Retail Sales (MoM) decreased 0.8% in January against the market expectation of 0.1% decline and the previous 0.4% increase. Meanwhile, Retail Sales Control Group declined by 0.4% in January, swinging from the previous increase of 0.6%.
However, the Greenback might have received some helping hand from US Initial Jobless Claims, which reported 212,000 unemployment claims for the week ending on February 9, lower than the expected 220,000.
The decline in Crude oil prices weakens the Canadian Dollar, given that Canada is the biggest oil exporter to the largest Crude oil consumer United States (US). West Texas Intermediate (WTI) oil price declined following a larger-than-anticipated increase in US Crude Oil Stockpiles, which raised concerns about the demand outlook in the United States.
In the absence of high-impact data from Canada during the week, the market witnessed that seasonally adjusted Housing Starts (YoY) settled at 223.6K in January, against the expected 235K and 248.9K prior. Moreover, Manufacturing Sales declined by 0.7% month-over-month in December, swinging from the previous increase of 1.5%.
Friday will see investment and Wholesale Sales data from Statistics Canada. On the United States docket, Producer Price Index (PPI) data and the Michigan Consumer Sentiment Index will be eyed.
- Gold price is seen consolidating in a narrow trading band above the $2,000 mark on Friday.
- Rising US bond yields underpin the USD and cap the yellow metal amid a positive risk tone.
- Reviving bets for an early Fed rate cut and geopolitical risks lend support to the commodity.
Gold price (XAU/USD) struggles to build on the previous day's positive move and oscillates in a narrow range above the $2,000 psychological mark during the Asian session on Friday. A modest uptick in the US Treasury bond yields helps revive the US Dollar (USD) demand, which, along with a generally positive tone around the equity markets, turn out to be key factors capping the upside for the safe-haven precious metal. That said, expectations that the Federal Reserve (Fed) will start cutting interest rates soon, bolstered by the weaker-than-anticipated US Retail Sales report released on Thursday, act as a tailwind for the non-yielding yellow metal.
Apart from this, the risk of a further escalation of geopolitical tensions in the Middle East might continue to lend some support to the Gold price. Even from a technical perspective, this week's failure to find bearish acceptance below the 100-day Simple Moving Average (SMA) warrants some caution before positioning for any meaningful downside for the XAU/USD. Market participants now look forward to the US economic docket – featuring the Producer Price Index (PPI), Housing Starts and Michigan Consumer Sentiment Index. This, along with speeches by influential FOMC members, will drive the USD and provide some impetus to the commodity.
Daily Digest Market Movers: Gold price lacks any firm intraday direction amid mixed fundamental cues
- A combination of diverging forces fails to assist the Gold price to capitalize on this week's modest recovery from its lowest level since November 13.
- The yield on the benchmark 10-year US government bond holds above 4.0% and helps revive the USD demand, capping the upside for the XAU/USD.
- Thursday's dismal US data lifts hopes for an early rate cut by the Federal Reserve and boosts investors' confidence, further undermining the safe-haven metal.
- Bets for 25 basis points rate cut in May edged up to 40% and the odds for a move in June stood at 80% following the release of weaker US Retail Sales.
- The Commerce Department reported that Retail Sales declined sharply by 0.8% in January and sales excluding auto contracted by 0.6% last month.
- A separate report showed that import prices posted their biggest gain in nearly two years and jumped by 0.8% in January, the yearly rate fell 1.3%.
- Meanwhile, Jobless Claims declined by 8K from 220K in the previous week, to a one-month low level of 212K during the week ended February 10.
- Atlanta Fed President Bostic said on Thursday that the US central bank has made solid progress in lowering inflation and will soon contemplate cutting rates.
- Bostic added that a strong economy argues for patience in adjusting monetary policy and that the Fed does not face urgency to cut interest rates.
- The Israeli military said on Wednesday that its fighter jets began a series of strikes in Lebanon, raising the risk of a wider conflict in the Middle East.
- Traders now look to the US Producer Price Index for cues about the Fed's future policy decision and rate-cut path, which might provide a fresh impetus.
- Friday's US economic docket also features the release of Housing Starts and the Preliminary Michigan Consumer Sentiment Index for February.
- This, along with speeches by influential FOMC members, will drive the USD demand and produce short-term opportunities around the XAU/USD.
Technical Analysis: Gold price bears await a sustained break and acceptance below the 100-day SMA
From a technical perspective, any subsequent move up is likely to confront some resistance near the $2,015 level. Some follow-through buying should allow the Gold price to test the 50-day SMA, currently around the $2,030 region. The latter should act as a key pivotal point, which if cleared decisively will set the stage for additional gains beyond the $2,044-2,045 intermediate hurdle, towards the $2,065 supply zone.
On the flip side, the 100-day SMA, currently around the $1,992-1,991 area, could act as immediate support ahead of the $1,984 region, or a two-month low touched on Wednesday. This is followed by the very important 200-day SMA, currently pegged near the $1,965 area, which if broken decisively will be seen as a fresh trigger for bearish trades. The Gold price might then accelerate the fall towards an intermediate support near the $1,952-1,950 zone en route to the November 2023 low, around the $1,932-1,931 region.
US Dollar price today
The table below shows the percentage change of US Dollar (USD) against listed major currencies today. US Dollar was the weakest against the Canadian Dollar.
| USD | EUR | GBP | CAD | AUD | JPY | NZD | CHF | |
| USD | 0.13% | 0.13% | 0.13% | 0.17% | 0.24% | 0.26% | 0.16% | |
| EUR | -0.13% | -0.01% | 0.00% | 0.05% | 0.11% | 0.14% | 0.03% | |
| GBP | -0.14% | -0.02% | -0.01% | 0.03% | 0.10% | 0.13% | 0.02% | |
| CAD | -0.13% | -0.01% | 0.01% | 0.05% | 0.11% | 0.12% | 0.03% | |
| AUD | -0.18% | -0.03% | -0.02% | -0.03% | 0.10% | 0.10% | 0.00% | |
| JPY | -0.24% | -0.11% | -0.10% | -0.11% | -0.09% | 0.04% | -0.06% | |
| NZD | -0.26% | -0.13% | -0.12% | -0.12% | -0.08% | -0.02% | -0.10% | |
| CHF | -0.17% | -0.03% | -0.02% | -0.03% | 0.01% | 0.08% | 0.10% |
The heat map shows percentage changes of major currencies against each other. The base currency is picked from the left column, while the quote currency is picked from the top row. For example, if you pick the Euro from the left column and move along the horizontal line to the Japanese Yen, the percentage change displayed in the box will represent EUR (base)/JPY (quote).
Gold FAQs
Why do people invest in Gold?
Gold has played a key role in human’s history as it has been widely used as a store of value and medium of exchange. Currently, apart from its shine and usage for jewelry, the precious metal is widely seen as a safe-haven asset, meaning that it is considered a good investment during turbulent times. Gold is also widely seen as a hedge against inflation and against depreciating currencies as it doesn’t rely on any specific issuer or government.
Who buys the most Gold?
Central banks are the biggest Gold holders. In their aim to support their currencies in turbulent times, central banks tend to diversify their reserves and buy Gold to improve the perceived strength of the economy and the currency. High Gold reserves can be a source of trust for a country’s solvency. Central banks added 1,136 tonnes of Gold worth around $70 billion to their reserves in 2022, according to data from the World Gold Council. This is the highest yearly purchase since records began. Central banks from emerging economies such as China, India and Turkey are quickly increasing their Gold reserves.
How is Gold correlated with other assets?
Gold has an inverse correlation with the US Dollar and US Treasuries, which are both major reserve and safe-haven assets. When the Dollar depreciates, Gold tends to rise, enabling investors and central banks to diversify their assets in turbulent times. Gold is also inversely correlated with risk assets. A rally in the stock market tends to weaken Gold price, while sell-offs in riskier markets tend to favor the precious metal.
What does the price of Gold depend on?
The price can move due to a wide range of factors. Geopolitical instability or fears of a deep recession can quickly make Gold price escalate due to its safe-haven status. As a yield-less asset, Gold tends to rise with lower interest rates, while higher cost of money usually weighs down on the yellow metal. Still, most moves depend on how the US Dollar (USD) behaves as the asset is priced in dollars (XAU/USD). A strong Dollar tends to keep the price of Gold controlled, whereas a weaker Dollar is likely to push Gold prices up.
- NZD/USD breaks below the key level of 0.6100 after retreating from two days of gains.
- The pair could find the resistance zone around the 23.6% Fibonacci retracement level of 0.6124 and the 50-day EMA at 0.6128.
- 14-day RSI suggests the NZD/USD pair could test the key support area around the major level of 0.6050 and the weekly low at 0.6049.
NZD/USD moves lower after registering profits for two consecutive days, edging lower to near 0.6090 during the Asian hours on Friday. The US Dollar (USD) improves on market optimism ahead of US Producer Price Index (PPI) data and Michigan Consumer Sentiment Index scheduled to be released later in the North American session.
The NZD/USD pair could find immediate resistance at the psychological level of 0.6100. A firm break above this key level could exert upward support for the NZD/USD pair to explore the resistance zone around the 23.6% Fibonacci retracement level of 0.6124 in conjunction with the 50-day Exponential Moving Average (EMA) at 0.6128. Further targets will be the major barrier of 0.6150 aligned with the weekly high at 0.6153.
The technical analysis of the NZD/USD pair suggests a subdued momentum in the market. The Moving Average Convergence Divergence (MACD) line is situated below the centerline but above the signal line. Traders would like to wait for MACD to suggest a clear directional trend.
Furthermore, the lagging indicator 14-day Relative Strength Index (RSI) lies below the 50 level, suggesting a weaker sentiment for the NZD/USD pair to test the key support area around the major level of 0.6050 in conjunction with the weekly low at 0.6049.
A collapse below this support region could put downward pressure on the NZD/USD pair to navigate the region around February’s low at 0.6037 followed by the psychological support of 0.6000 level.
NZD/USD: Daily Chart
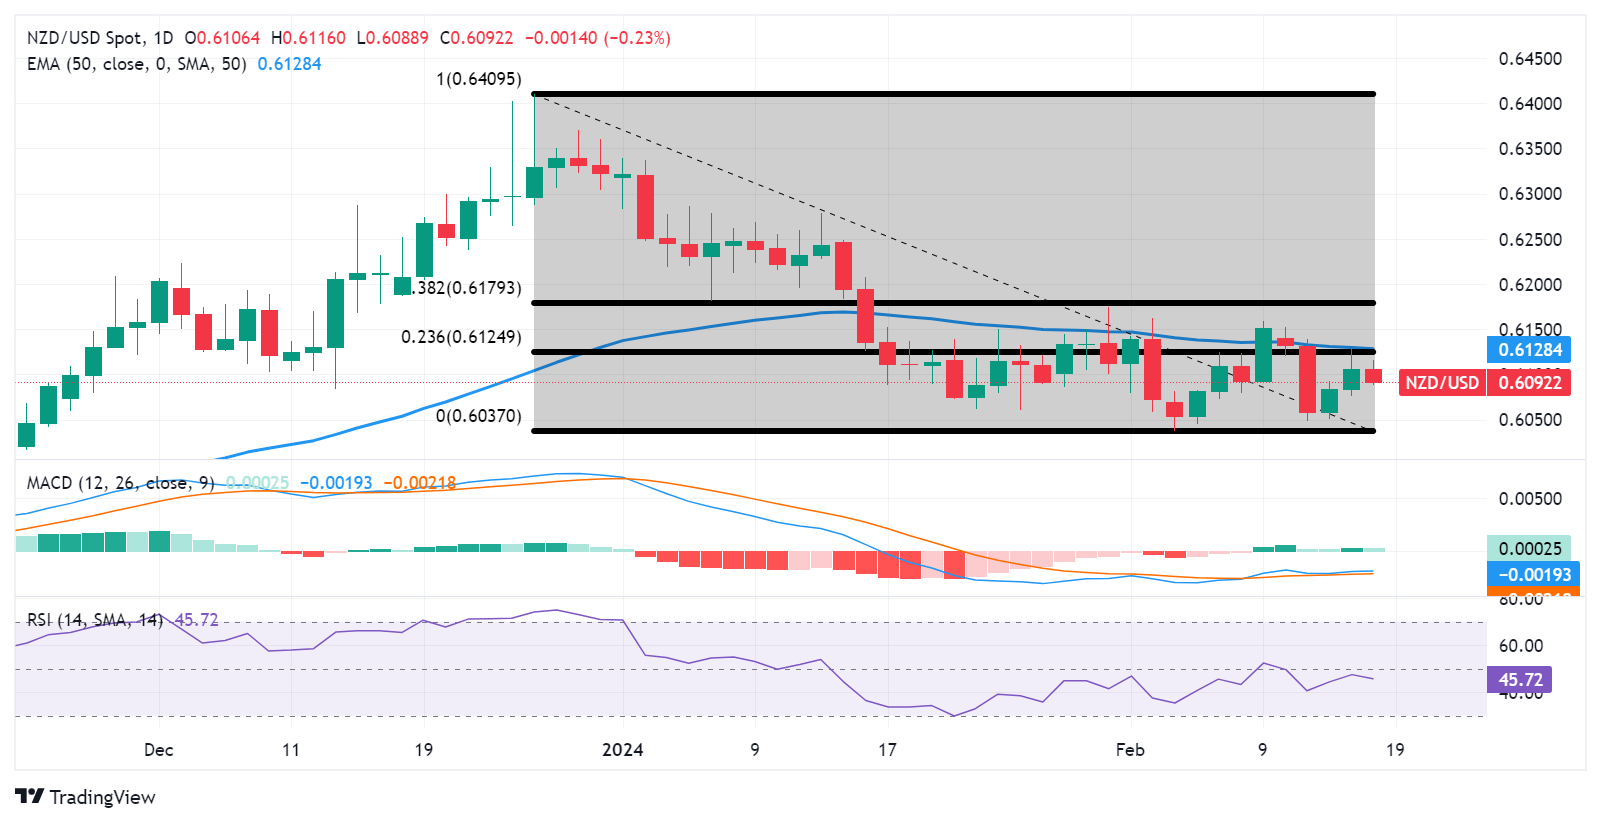
- Indian Rupee trades strongly on the decline of the USD on Friday.
- RBI's Das said persistent food price shocks and heightened geopolitical tensions are hindering policymakers' efforts to curb inflation.
- Investors will monitor the US January Producer Price Index (PPI) on Friday.
The Indian rupee (INR) strengthened on Friday as the US dollar (USD) softened. The downtick of the pair is backed by weaker-than-expected US Retail Sales, which trigger speculation that the Federal Reserve (Fed) will soon start cutting interest rates in the coming months.
The Reserve Bank of India (RBI) Governor Shaktikanta Das said on Thursday that India has successfully navigated multiple challenges and emerged as the fastest-growing major economy. The economy is forecast to grow by at least 7% for the fourth consecutive year. However, persistent shocks to food prices and renewed geopolitical flashpoints are some factors that are now complicating policymakers' efforts to combat inflation.
Investors await the US January Producer Price Index (PPI) on Friday. The downbeat report could exert some selling pressure on the Greenback and act as a headwind for the USD/INR pair. Furthermore, Fed officials Barr and Daly will speak later in the day. Next week, investors will take more cues from the Indian S&P Global Services PMI and RBI MPC Meeting Minutes.
Daily Digest Market Movers: Indian Rupee remains strong amid multiple headwinds
- India’s goods trade deficit narrowed by nearly 12% in January compared to the previous month. The merchandise trade deficit fell to $17.49 billion in January from $19.80 billion in December.
- Imports declined to $54.41 billion from $58.25 billion in December. Exports fell marginally to $36.92 billion in January from $38.45 billion in December. The decline in exports is mostly attributable to the armed war in the Red Sea.
- Foreign portfolio inflows into India are expected to increase to roughly 1% of GDP from 0.4% in the 2014–2022 timeframe, according to the CLSA.
- US Retail Sales dropped 0.8% MoM in January from a 0.4% rise in December, worse than the market expectation of a 0.1% decline. Retail Sales Control Group came in at -0.4% MoM versus 0.6% prior.
- The New York Empire State Manufacturing Index arrived at -2.4 in February, a big improvement from the previous reading of -43.7.
- Federal Reserve Bank of Atlanta President Bostic said the Fed does not face urgency to cut rates given the current economy, and a strong economy argues for patience in adjusting monetary policy.
Technical Analysis: Indian Rupee resumes upside journey within the long-term trading range
Indian Rupee trades on a stronger note on the day. USD/INR remains stuck within a familiar multi-month-old descending trend channel of 82.70–83.20 since December 8, 2023.
In the near term, USD/INR resumes a bearish outlook as the pair is below the key 100-period Exponential Moving Average (EMA) on the daily timeframe. The 14-day Relative Strength Index which lies below the 50.0 midline also supports the downward momentum for USD/INR.
On the bright side, the critical resistance level for the pair is seen near the upper boundary of the descending trend channel at 83.20. A bullish breakout above this level could get enough fuel to hit a high of January 2 at 83.35, en route to the 84.00 psychological level.
In the case of the bearish environment, the first downside target is located near a low of February 2 at 82.83. Further south, the lower limit of the descending trend channel 82.70 acts as a potential support level for the pair, followed by a low of August 23 at 82.45.
US Dollar price today
The table below shows the percentage change of US Dollar (USD) against listed major currencies today. US Dollar was the weakest against the Euro.
| USD | EUR | GBP | CAD | AUD | JPY | NZD | CHF | |
| USD | 0.11% | 0.13% | 0.14% | 0.21% | 0.23% | 0.30% | 0.14% | |
| EUR | -0.12% | 0.01% | 0.02% | 0.10% | 0.12% | 0.20% | 0.03% | |
| GBP | -0.14% | -0.03% | -0.01% | 0.07% | 0.09% | 0.17% | 0.00% | |
| CAD | -0.15% | -0.03% | 0.00% | 0.05% | 0.08% | 0.16% | -0.01% | |
| AUD | -0.18% | -0.05% | -0.03% | -0.03% | 0.06% | 0.14% | -0.03% | |
| JPY | -0.23% | -0.09% | -0.08% | -0.07% | -0.07% | 0.09% | -0.06% | |
| NZD | -0.31% | -0.19% | -0.17% | -0.16% | -0.10% | -0.08% | -0.17% | |
| CHF | -0.15% | -0.04% | 0.01% | 0.01% | 0.05% | 0.07% | 0.17% |
The heat map shows percentage changes of major currencies against each other. The base currency is picked from the left column, while the quote currency is picked from the top row. For example, if you pick the Euro from the left column and move along the horizontal line to the Japanese Yen, the percentage change displayed in the box will represent EUR (base)/JPY (quote).
Indian Rupee FAQs
What are the key factors driving the Indian Rupee?
The Indian Rupee (INR) is one of the most sensitive currencies to external factors. The price of Crude Oil (the country is highly dependent on imported Oil), the value of the US Dollar – most trade is conducted in USD – and the level of foreign investment, are all influential. Direct intervention by the Reserve Bank of India (RBI) in FX markets to keep the exchange rate stable, as well as the level of interest rates set by the RBI, are further major influencing factors on the Rupee.
How do the decisions of the Reserve Bank of India impact the Indian Rupee?
The Reserve Bank of India (RBI) actively intervenes in forex markets to maintain a stable exchange rate, to help facilitate trade. In addition, the RBI tries to maintain the inflation rate at its 4% target by adjusting interest rates. Higher interest rates usually strengthen the Rupee. This is due to the role of the ‘carry trade’ in which investors borrow in countries with lower interest rates so as to place their money in countries’ offering relatively higher interest rates and profit from the difference.
What macroeconomic factors influence the value of the Indian Rupee?
Macroeconomic factors that influence the value of the Rupee include inflation, interest rates, the economic growth rate (GDP), the balance of trade, and inflows from foreign investment. A higher growth rate can lead to more overseas investment, pushing up demand for the Rupee. A less negative balance of trade will eventually lead to a stronger Rupee. Higher interest rates, especially real rates (interest rates less inflation) are also positive for the Rupee. A risk-on environment can lead to greater inflows of Foreign Direct and Indirect Investment (FDI and FII), which also benefit the Rupee.
How does inflation impact the Indian Rupee?
Higher inflation, particularly, if it is comparatively higher than India’s peers, is generally negative for the currency as it reflects devaluation through oversupply. Inflation also increases the cost of exports, leading to more Rupees being sold to purchase foreign imports, which is Rupee-negative. At the same time, higher inflation usually leads to the Reserve Bank of India (RBI) raising interest rates and this can be positive for the Rupee, due to increased demand from international investors. The opposite effect is true of lower inflation.
Bank of Japan (BoJ) Governor Kazuo Ueda said on Friday, “when sustained, stable achievement of the price target comes into sight, we will examine whether to maintain various easing measures, including negative interest rate.”
Additional quotes
The specific means of rolling back stimulus will depend on economic conditions at the time.
Based on the economic and price outlook as of now, Japan's monetary conditions will likely remain accommodative even after ending negative rates.
Market reaction
USD/JPY has stalled its upside on the above comments, currently trading at 150.25, up 0.23% on the day.
Bank of Japan FAQs
What is the Bank of Japan?
The Bank of Japan (BoJ) is the Japanese central bank, which sets monetary policy in the country. Its mandate is to issue banknotes and carry out currency and monetary control to ensure price stability, which means an inflation target of around 2%.
What has been the Bank of Japan’s policy?
The Bank of Japan has embarked in an ultra-loose monetary policy since 2013 in order to stimulate the economy and fuel inflation amid a low-inflationary environment. The bank’s policy is based on Quantitative and Qualitative Easing (QQE), or printing notes to buy assets such as government or corporate bonds to provide liquidity. In 2016, the bank doubled down on its strategy and further loosened policy by first introducing negative interest rates and then directly controlling the yield of its 10-year government bonds.
How do Bank of Japan’s decisions influence the Japanese Yen?
The Bank’s massive stimulus has caused the Yen to depreciate against its main currency peers. This process has exacerbated more recently due to an increasing policy divergence between the Bank of Japan and other main central banks, which have opted to increase interest rates sharply to fight decades-high levels of inflation. The BoJ’s policy of holding down rates has led to a widening differential with other currencies, dragging down the value of the Yen.
Is the Bank of Japan’s ultra-loose policy likely to change soon?
A weaker Yen and the spike in global energy prices have led to an increase in Japanese inflation, which has exceeded the BoJ’s 2% target. Still, the Bank judges that the sustainable and stable achievement of the 2% target has not yet come in sight, so any sudden change in the current policy looks unlikely.
- EUR/USD retreats as US Dollar improves on market optimism.
- US PPI and Consumer Sentiment Index will be released on Friday.
- US Retail Sales (MoM) declined by 0.8% in January against the expected 0.1% decline.
- ECB's forward-looking wage tracker suggests wage pressures after the stable GDP data.
EUR/USD retreats after two days of gains, which could be attributed to the market optimism despite disappointing Retail Sales data from the United States (US). However, the market shows optimism for the US Dollar (USD) ahead of US Producer Price Index (PPI) data and Michigan Consumer Sentiment Index due on Friday. The EUR/USD pair edges lower to near 1.0760 during the Asian session on Friday. The improved US yields contribute upward support for the Greenback against the Euro (EUR).
The US Dollar Index (DXY) holds ground on the market bias that the US Federal Reserve (Fed) will avoid rate cuts in March and May. FedWatch Tool shows a 53% likelihood of a 25 bps rate cut in May. The US Dollar faced challenges following weaker US Retail Sales data. However, the reduced Initial Jobless Claims might have provided some support to hold USD.
US Retail Sales declined by 0.8% Month-over-Month in January. The market was expecting a decline of 0.1% against the previous increase of 0.4%. While Retail Sales Control Group decreased by 0.4% in January, swinging from the previous increase of 0.6%. However, US Initial Jobless Claims reported 212,000 unemployment claims for the week ending on January 9, against the market expectation of remaining consistent at 220,000.
Federal Reserve Bank of Atlanta President Raphael W. Bostic expected improvement in curbing inflation but it could be bumpy. Bostic mentioned that if inflation retreats faster, it could reassess his stance on the interest rates outlook.
On the other side, the recent Eurozone Gross Domestic Product (GDP) data for the fourth quarter showed no change. Despite this, the ECB's forward-looking wage tracker indicates robust wage pressures.
Christine Lagarde, President of the European Central Bank (ECB), commented that recent data indicates continued subdued economic activity in the near term. Lagarde emphasized the significance of instilling confidence to achieve the ECB's 2% inflation target while acknowledging the persistent disinflationary trend.
- GBP/USD attracts fresh sellers on Friday and is pressured by a combination of factors.
- A recession in the UK revives bets for an early BoE rate cut and undermines the GBP.
- An uptick in the US bond yields lend support to the USD and contribute to the slide.
The GBP/USD pair continues with its struggle to find acceptance or build on the momentum beyond the 1.2600 mark and meets with some supply during the Asian session on Friday. Spot prices currently trade around the 1.2585 region, down less than 0.10% for the day, and remain on track to register modest weekly losses.
Thursday's UK GDP report confirmed a technical recession, which, along with softer UK consumer inflation figures released on Wednesday, reaffirmed bets that the Bank of England (BoE) will start cutting interest rates soon. This, in turn, acts as a headwind for the British Pound (GBP) and keeps a lid on the GBP/USD pair's recovery move from the vicinity of the weekly trough amid a modest US Dollar (USD) uptick.
A fresh leg up in the US Treasury bond yields turns out to be a key factor underpinning the Greenback, though reviving bets for an early rate cut by the Federal Reserve (Fed) might act as a headwind. The weaker US Retail Sales report released on Thursday suggested that the economy is cooling and should allow the Fed to start easing its monetary policy by June. This, in turn, might cap the US bond yields and the USD.
Apart from this, the underlying bullish tone around the equity markets might keep a lid on the safe-haven buck and contribute to limiting losses for the GBP/USD pair. Even from a technical perspective, the recent repeated failures to find bearish acceptance below the 100-day Simple Moving Average (SMA) warrant caution for aggressive traders and positioning for any further near-term depreciating move for the currency pair.
Market participants now look forward to the release of the UK Retail Sales data, which might influence the GBP price dynamics and provide a fresh impetus to the GBP/USD pair. Later during the early North American session, traders will take cues from the US macro data – the Producer Price Index (PPI), Housing Starts and the Preliminary Michigan Consumer Sentiment Index – and speeches by FOMC members.
Technical levels to watch
| Raw materials | Closed | Change, % |
|---|---|---|
| Silver | 22.923 | 2.53 |
| Gold | 2004.156 | 0.54 |
| Palladium | 952.92 | 1.62 |
- India’s Nifty and Sensex eye a positive open, extending its recovery into Friday.
- Nifty and Sensex rose on Thursday amid global market optimism, encouraging Indian trade data.
- All eyes are on the US PPI and Consumer Sentiment data for Friday’s moves in Nifty and Sensex.
The Sensex 30 and Nifty 50, India’s key benchmark indices, are set to open on a firmer footing on Friday, having ended Thursday in the green. The Indian indices are expected to track the positive close on Wall Street and European stocks. The advance in their Asian counterparts could also lend support.
Gift Nifty, formerly known as SGX Nifty, is down 0.08% early Friday. But Nifty and Sensex are likely to shrug off the negative cues from the lead indicator.
The National Stock Exchange (NSE) Nifty 50 index finished 0.40% higher on the day at 21,927 while the Bombay Stock Exchange (BSE) Sensex 30 also gained 0.40% on Thursday to settle at 72,091.61. The focus now remains on the upcoming US economic data, including the top-tier Retail Sales report.
Stock market news
- Nifty and Sensex drew support from the impressive gains in the automobile and utility sector stocks.
- Additionally, India’s trade data for January showed a shrinking Trade Deficit to $17.49 billion, which added to the market optimism.
- Mahindra & Mahindra, Power Grid, BPCL, ONGC and NTPC are the top gainers in the Nifty 50 so far. While Axis Bank, Brittania, Hindustan Unilever, ITC and Apollo Hospitals emerged as the key losers, capping the gains in Nifty.
- Mahindra & Mahindra stocks touched its all-time highs in Thursday’s session.
- Automaker Hero Motocorp is in the news for the launch of the brand’s premium motorbike Mavrick 440.
- Aluminium producer Hindalco’s net profit rose 71.1% increased to Rs 2,331 crores but missed analysts’ estimates.
- The Indian Supreme Court strikes down electoral bonds, terming them as “unconstitutional”. The court further stopped SBI from issuing fresh bonds for political funding.
- The US stock markets closed higher on Wednesday, as investors weighed whether the Federal Reserve (Fed) can bring down inflation without de-railing the economy. Dow Jones, NASDAQ Composite, and the S&P 500 indices gained up to 1%.
- On Wednesday, the Indian WPI inflation dropped to 0.27% in January, as against a 0.73% increase in December. The data missed the market consensus of 0.53%.
- The Lunar New Year holidays in China could keep the liquidity thin around the Indian indices.
- All eyes now turn toward the top-tier US Producer Price Index (PPI) and Consumer Sentiment data for trading impetus in Nifty and Sensex indices.
- US Retail Sales declined by 0.8% in January, the US Census Bureau reported on Thursday, worse than the market expectations for -0.1%.
Nifty 50 FAQs
What is the Nifty 50?
The Nifty 50, or simply Nifty, is the most commonly followed stock index in India. It was launched in 1996 by the National Stock Exchange of India (NSE). It plots the weighted average share price of 50 of the largest Indian corporations, offering investors comprehensive exposure to 13 sectors of the economy. Each corporation's weighting is based on its “free-float capitalization”, or the value of all its shares readily available for trading.
What factors drive the Nifty 50?
The Nifty is a composite so its value is dependent on the performance of the companies that make up the index, as revealed in their quarterly and annual results. Another factor is government policies, such as when in 2016 the government decided to demonetize 500 and 1000 Rupee banknotes. This led to a temporary cash shortage which negatively impacted the Nifty. The level of interest rates set by the Reserve Bank of India is a further factor as it determines the cost of borrowing. Climate change, pandemics and natural disasters are also drivers.
What are the key milestones for the Nifty 50?
The Nifty 50 was launched on April 22, 1996 at a base level of 1,000. Its highest recorded level to date is 22,097 achieved on January 15, 2024 (this is being written in Feb 2024). The index first closed above the 10,000 level on October 17, 2017. The Nifty recorded its biggest daily decline on March 23, 2020 during the Covid pandemic, when it fell 1,125 points or 12.37%. The Nifty’s biggest gain in a single day occurred on May 18, 2009, when it rose 651 points after the results of the Indian elections.
What are some of the major companies in the Nifty 50?
Major corporations in the Nifty 50 include HDFC Bank, Reliance Industries, ICICI Bank, Tata Consultancy Services, Larsen and Toubro, ITC Ltd, Housing Development Finance Corporation Ltd and Kotak Mahendra Bank.
- Australian Dollar depreciates as the US Dollar attempts to hold ground after recent losses.
- Australia employment data suggests that the RBA will avoid an interest rate hike in March.
- S&P/ASX 200 index improves following the overnight surge in Wall Street on market optimism.
- US Dollar holds ground over market sentiment suggesting that the Fed will postpone rate cuts in the upcoming meetings.
The Australian Dollar (AUD) attempts to halt its gains registered in the last two sessions as the US Dollar (USD) gains ground on improved Treasury yields. However, the AUD/USD pair received upward support after mixed economic data from the United States (US). Additionally, the S&P/ASX 200 index improves following the overnight surge in Wall Street. Investors remain optimistic ahead of US Producer Price Index (PPI) data and Michigan Consumer Sentiment Index due on Friday.
Australian economy has shown modest growth, influenced by ongoing challenges in the labor market and subdued inflationary pressures. Recent employment data suggests that the Reserve Bank of Australia (RBA) is unlikely to raise interest rates further in the March meeting. Market expectations now indicate that the RBA will maintain its current rates until August, with a 25 basis points (bps) rate cut anticipated in September, compared to earlier projections for November.
The US Dollar Index (DXY) remains stable, buoyed by market sentiment suggesting that the US Federal Reserve (Fed) will postpone interest rate cuts in the upcoming March and May meetings. According to the FedWatch Tool, investors are now pricing in a 25 bps rate cut in May, with a likelihood of 53%. The US Dollar encountered difficulties following disappointing US Retail Sales data. However, the impact on the advance of the AUD/USD pair may have been mitigated by the decrease in Initial Jobless Claims.
Daily Digest Market Movers: Australian Dollar depreciates amid a stable US Dollar
- Australia’s seasonally adjusted Employment Change printed the reading of 0.5K for January, against the market expectation of 30K.
- Aussie Part-Time Employment came in at 10.6K as compared to the previous figure of 46.7K.
- Australian Participation Rate remained consistent at 66.8%, lower than the anticipated 66.9% in January.
- January’s Full-Time Employment improved to 11.1K from the previous decline of 109.4K.
- Australia’s Consumer Inflation Expectations data is unchanged at 4.5% for February.
- Reserve Bank of Australia Governor Michele Bullock addressed the Australian parliament's Senate Economics Legislation Committee, noting that the global economy has fared better than initially anticipated. She expressed previous concerns about potential hard landings and recessions but indicated that the economy is currently in a favorable position to bring inflation down within a reasonable timeframe.
- Federal Reserve Bank of Atlanta President Raphael W. Bostic anticipates further advancements in inflation but could be bumpy. He notes that if inflation retreats faster, it could prompt a reassessment of his stance on the outlook for interest rates.
- US Retail Sales showed that consumer spending declined by 0.8% MoM in January. The market prediction was a decline of 0.1% against the previous increase of 0.4%.
- US Retail Sales Control Group decreased by 0.4% in January, swinging from the previous increase of 0.6%.
- US Initial Jobless Claims reported 212,000 unemployment claims for the week ending on January 9, against the market expectation of remaining consistent at 220,000.
- US January’s Industrial Production (MoM) is contracted by 0.1% against the expected improvement of 0.3% from a flat 0.0% prior.
Technical Analysis: Australian Dollar hovers above the resistance level of 0.6500
The Australian Dollar trades near 0.6510 on Friday, positioned above the immediate support at the psychological level of 0.6500. A break below this level could push the AUD/USD pair to navigate the major support at 0.6450 before the weekly low at 0.6442. Conversely, the AUD/USD pair could find the key resistance region around the 14-day Exponential Moving Average (EMA) located at 0.6525. A breakthrough above the latter could lead the pair to target the 23.6% Fibonacci retracement level at 0.6543 and the major resistance level at 0.6550.
AUD/USD: Daily Chart
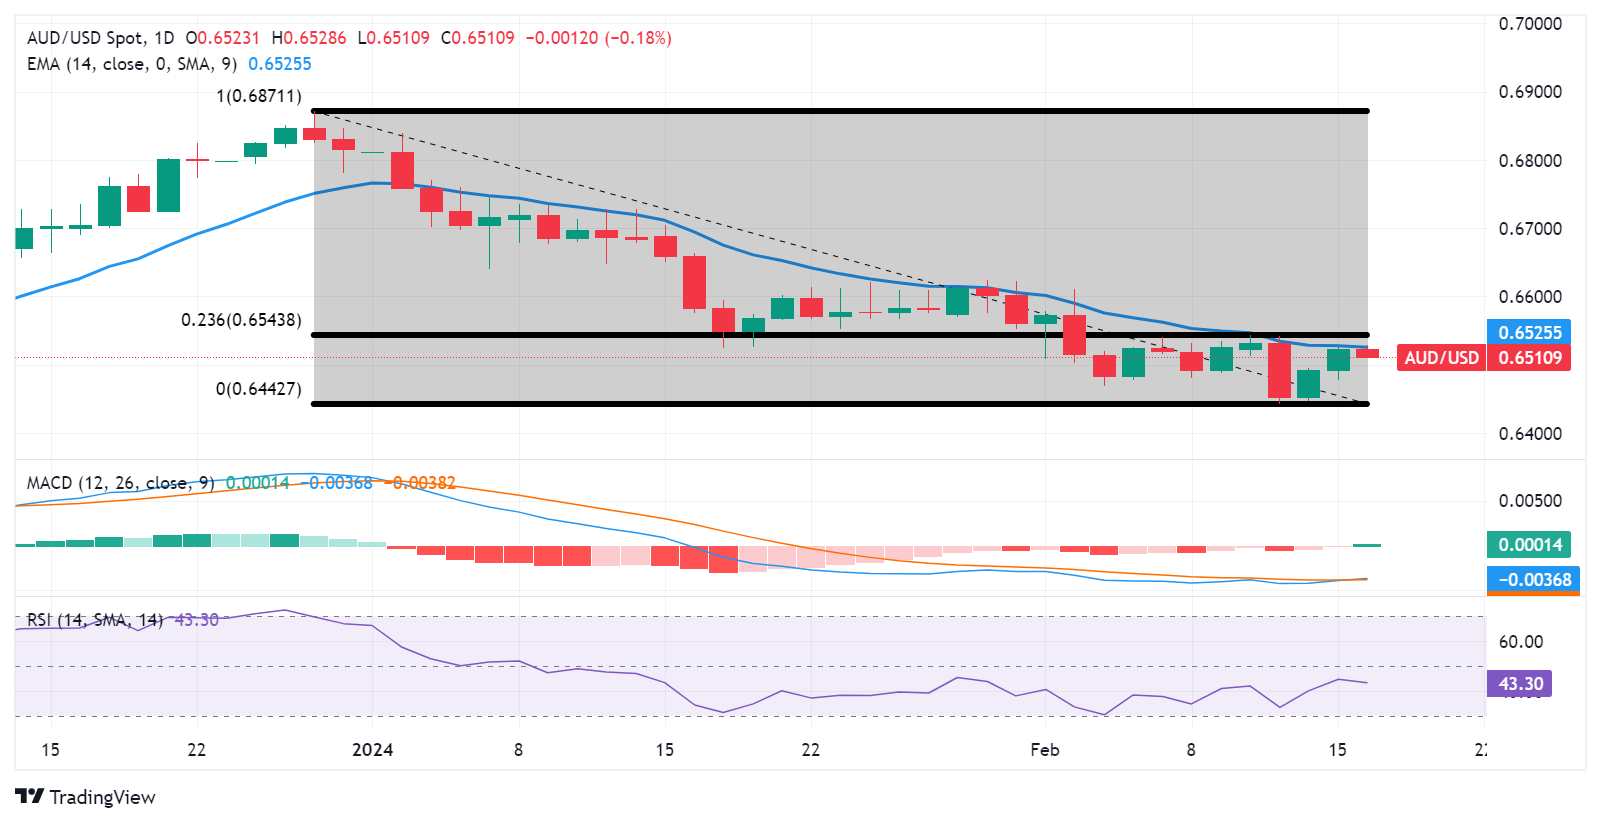
Australian Dollar price today
The table below shows the percentage change of Australian Dollar (AUD) against listed major currencies today. Australian Dollar was the weakest against the US Dollar.
| USD | EUR | GBP | CAD | AUD | JPY | NZD | CHF | |
| USD | 0.09% | 0.10% | 0.11% | 0.19% | 0.10% | 0.24% | 0.10% | |
| EUR | -0.10% | -0.01% | 0.01% | 0.10% | 0.00% | 0.16% | 0.01% | |
| GBP | -0.10% | -0.01% | 0.01% | 0.09% | 0.00% | 0.15% | -0.01% | |
| CAD | -0.11% | -0.03% | 0.00% | 0.10% | -0.01% | 0.14% | -0.01% | |
| AUD | -0.19% | -0.09% | -0.09% | -0.07% | -0.08% | 0.04% | -0.09% | |
| JPY | -0.10% | 0.00% | 0.01% | 0.00% | 0.06% | 0.16% | 0.02% | |
| NZD | -0.22% | -0.15% | -0.11% | -0.13% | -0.02% | -0.12% | -0.14% | |
| CHF | -0.11% | -0.01% | -0.01% | 0.01% | 0.07% | -0.03% | 0.12% |
The heat map shows percentage changes of major currencies against each other. The base currency is picked from the left column, while the quote currency is picked from the top row. For example, if you pick the Euro from the left column and move along the horizontal line to the Japanese Yen, the percentage change displayed in the box will represent EUR (base)/JPY (quote).
Australian Dollar FAQs
What key factors drive the Australian Dollar?
One of the most significant factors for the Australian Dollar (AUD) is the level of interest rates set by the Reserve Bank of Australia (RBA). Because Australia is a resource-rich country another key driver is the price of its biggest export, Iron Ore. The health of the Chinese economy, its largest trading partner, is a factor, as well as inflation in Australia, its growth rate and Trade Balance. Market sentiment – whether investors are taking on more risky assets (risk-on) or seeking safe-havens (risk-off) – is also a factor, with risk-on positive for AUD.
How do the decisions of the Reserve Bank of Australia impact the Australian Dollar?
The Reserve Bank of Australia (RBA) influences the Australian Dollar (AUD) by setting the level of interest rates that Australian banks can lend to each other. This influences the level of interest rates in the economy as a whole. The main goal of the RBA is to maintain a stable inflation rate of 2-3% by adjusting interest rates up or down. Relatively high interest rates compared to other major central banks support the AUD, and the opposite for relatively low. The RBA can also use quantitative easing and tightening to influence credit conditions, with the former AUD-negative and the latter AUD-positive.
How does the health of the Chinese Economy impact the Australian Dollar?
China is Australia’s largest trading partner so the health of the Chinese economy is a major influence on the value of the Australian Dollar (AUD). When the Chinese economy is doing well it purchases more raw materials, goods and services from Australia, lifting demand for the AUD, and pushing up its value. The opposite is the case when the Chinese economy is not growing as fast as expected. Positive or negative surprises in Chinese growth data, therefore, often have a direct impact on the Australian Dollar and its pairs.
How does the price of Iron Ore impact the Australian Dollar?
Iron Ore is Australia’s largest export, accounting for $118 billion a year according to data from 2021, with China as its primary destination. The price of Iron Ore, therefore, can be a driver of the Australian Dollar. Generally, if the price of Iron Ore rises, AUD also goes up, as aggregate demand for the currency increases. The opposite is the case if the price of Iron Ore falls. Higher Iron Ore prices also tend to result in a greater likelihood of a positive Trade Balance for Australia, which is also positive of the AUD.
How does the Trade Balance impact the Australian Dollar?
The Trade Balance, which is the difference between what a country earns from its exports versus what it pays for its imports, is another factor that can influence the value of the Australian Dollar. If Australia produces highly sought after exports, then its currency will gain in value purely from the surplus demand created from foreign buyers seeking to purchase its exports versus what it spends to purchase imports. Therefore, a positive net Trade Balance strengthens the AUD, with the opposite effect if the Trade Balance is negative.
- The Japanese Yen stalls a two-day-old recovery trend from the YTD low touched on Tuesday.
- A positive risk tone and the uncertainty about BoJ’s policy shift undermine the safe-haven JPY.
- Reviving bets for an early rate cut by the Fed could weigh on the USD and cap the USD/JPY pair.
The Japanese Yen (JPY) edges lower against its American counterpart during the Asian session on Friday and erodes a part of its recovery gains registered over the past two days, from the YTD low touched earlier this week. The uncertainty about the likely timing of when the Bank of Japan (BoJ) will exit the negative interest rates policy, along with the overnight rally in the US equity markets, turn out to be key factors undermining the safe-haven JPY. This, in turn, assists the USD/JPY pair to move back above the 150.00 psychological mark. That said, verbal intervention by Japanese authorities should limit losses for the JPY and cap the currency pair.
Meanwhile, the weaker US Retail Sales data released on Thursday revived bets that the Federal Reserve (Fed) will soon start cutting interest rates. This might continue to weigh on the US Dollar (USD) and further contribute to keeping a lid on the USD/JPY pair, warranting some caution before positioning for any further intraday appreciating move. Moving ahead, market participants now look to the US economic docket – featuring the release of the Producer Price Index (PPI), Housing Starts and the Preliminary Michigan Consumer Sentiment Index. This, along with speeches by influential FOMC members should provide a fresh impetus.
Daily Digest Market Movers: Japanese Yen is undermined by BoJ policy uncertainty and a positive risk tone
- Reduced bets for an imminent shift in the Bank of Japan's policy stance, along with the risk-on mood, fail to assist the safe-haven Japanese Yen to build on a two-day recovery trend from the YTD low.
- Japan's economy unexpectedly contracted in the fourth quarter on weak domestic demand and slipped into a recession, which might have derailed the BoJ's plan to exit its ultra-easy policy this year.
- Investors turned optimistic after the dismal US macro data released on Thursday pointed to possible signs of weakness in consumer spending and fuelled hopes for an early rate cut by the Federal Reserve.
- The Commerce Department reported that Retail Sales declined sharply by 0.8% in January, more than the 0.1% fall expected, while sales excluding auto contracted by 0.6% during the reported month.
- According to the CME Group's FedWatch Tool, bets for a rate cut of at least 25 basis points in May edged up to 40% and the odds for such a move in June stood at roughly 80% following the data.
- A separate report showed that import prices posted their biggest gain in nearly two years and jumped by 0.8% last month, though declined by 1.3% over the past 12 months through January.
- Meanwhile, the number of Americans who applied for unemployment benefits slid by 8K from 220K in the prior week, to a one-month low of 212K during the week ended February 10.
- The yield on the benchmark 10-year US government bond holds above the 4.0% mark and helps the USD to stall its corrective decline from a multi-month top, providing a modest lift to the USD/JPY pair.
- Investors now look to the US Producer Price Index (PPI), which is expected to ease to the 0.6% YoY rate from 1.0% previously, for fresh cues about the Fed's future policy decision and rate-cut path.
- Friday's US economic docket also features the release of Housing Starts and the Preliminary Michigan Consumer Sentiment Index, which, along with speeches by Fed officials, should provide some impetus.
- Japan's Finance Minister Shunichi Suzuki reiterated on Friday that the government will closely monitor FX moves and it is important for currencies to move in a stable manner, reflecting fundamentals.
Technical Analysis: USD/JPY needs to break through the 151.00 mark for bulls to seize back near-term control
From a technical perspective, any subsequent move up is likely to confront some resistance near the mid-150.00s ahead of the 150.85-150.90 region, or a multi-month top set on Tuesday. Some follow-through buying beyond the 151.00 round figure will be seen as a fresh trigger for bullish traders and pave the way for a further appreciating move. Given that oscillators on the daily chart are holding in the positive territory and are still away from the overbought zone, the USD/JPY pair might then climb to the 151.45 intermediate hurdle. The momentum could extend further towards the 152.00 neighbourhood, or a multi-decade peak set in October 2022 and retested in November 2023.
On the flip side, the overnight swing low, around mid-149.00s, now seems to protect the immediate downside ahead of the 149.25-149.20 area and the 149.00 round figure. The latter should act as a key pivotal point, which if broken decisively will suggest that the USD/JPY pair has formed a near-term top and set the stage for some meaningful corrective decline. The subsequent downfall has the potential to drag spot prices to the 148.35-148.30 region en route to the 148.00 mark and the 100-day Simple Moving Average (SMA) support near the 147.70-147.65 zone.
Japanese Yen price today
The table below shows the percentage change of Japanese Yen (JPY) against listed major currencies today. Japanese Yen was the strongest against the New Zealand Dollar.
| USD | EUR | GBP | CAD | AUD | JPY | NZD | CHF | |
| USD | 0.08% | 0.09% | 0.10% | 0.21% | 0.09% | 0.25% | 0.08% | |
| EUR | -0.09% | -0.01% | 0.01% | 0.12% | 0.00% | 0.17% | 0.00% | |
| GBP | -0.10% | -0.03% | 0.00% | 0.11% | -0.01% | 0.15% | -0.01% | |
| CAD | -0.10% | -0.02% | 0.01% | 0.12% | -0.01% | 0.15% | -0.01% | |
| AUD | -0.21% | -0.11% | -0.10% | -0.10% | -0.11% | 0.05% | -0.10% | |
| JPY | -0.09% | 0.00% | 0.01% | 0.00% | 0.09% | 0.17% | 0.00% | |
| NZD | -0.24% | -0.16% | -0.15% | -0.13% | -0.03% | -0.15% | -0.15% | |
| CHF | -0.09% | 0.00% | 0.03% | 0.02% | 0.14% | 0.01% | 0.17% |
The heat map shows percentage changes of major currencies against each other. The base currency is picked from the left column, while the quote currency is picked from the top row. For example, if you pick the Euro from the left column and move along the horizontal line to the Japanese Yen, the percentage change displayed in the box will represent EUR (base)/JPY (quote).
Japanese Yen FAQs
What key factors drive the Japanese Yen?
The Japanese Yen (JPY) is one of the world’s most traded currencies. Its value is broadly determined by the performance of the Japanese economy, but more specifically by the Bank of Japan’s policy, the differential between Japanese and US bond yields, or risk sentiment among traders, among other factors.
How do the decisions of the Bank of Japan impact the Japanese Yen?
One of the Bank of Japan’s mandates is currency control, so its moves are key for the Yen. The BoJ has directly intervened in currency markets sometimes, generally to lower the value of the Yen, although it refrains from doing it often due to political concerns of its main trading partners. The current BoJ ultra-loose monetary policy, based on massive stimulus to the economy, has caused the Yen to depreciate against its main currency peers. This process has exacerbated more recently due to an increasing policy divergence between the Bank of Japan and other main central banks, which have opted to increase interest rates sharply to fight decades-high levels of inflation.
How does the differential between Japanese and US bond yields impact the Japanese Yen?
The BoJ’s stance of sticking to ultra-loose monetary policy has led to a widening policy divergence with other central banks, particularly with the US Federal Reserve. This supports a widening of the differential between the 10-year US and Japanese bonds, which favors the US Dollar against the Japanese Yen.
How does broader risk sentiment impact the Japanese Yen?
The Japanese Yen is often seen as a safe-haven investment. This means that in times of market stress, investors are more likely to put their money in the Japanese currency due to its supposed reliability and stability. Turbulent times are likely to strengthen the Yen’s value against other currencies seen as more risky to invest in.
- WTI recovers to $77.50 on the weaker of the US Dollar.
- The International Energy Agency (IEA) said the crude market could be in surplus throughout 2024.
- The escalating Middle East geopolitical tension might lift WTI prices as it disrupts crude supplies.
- Oil traders will monitor the US January Producer Price Index (PPI), due on Friday.
Western Texas Intermediate (WTI), the US crude oil benchmark, is trading around $77.50 on Friday. WTI prices edge higher after the weaker-than-expected US Retail Sales data raise hope that the Federal Reserve (Fed) will soon start cutting interest rates in coming months.
On Thursday, the US Retail Sales for January fell 0.8% MoM from a 0.4% rise in the previous reading, below the market consensus 0.1% decline. That being said, lower interest rates have caused oil prices to rise which translates to more demand for oil as activity increases with lower costs.
Meanwhile, the rising geopolitical tension in the Middle East might boost WTI prices as it disrupts crude supplies Israel launched extensive and lethal airstrikes in southern Lebanon on Wednesday, in response to a deadly missile attack on northern Israel. Israeli leaders have warned that they would take considerably stronger military action in Lebanon if the cross-border violence continues.
On the other hand, the International Energy Agency (IEA) expects that the crude oil will be in excess in 2024. The IEA stated that global oil consumption would rise by +1.2 million bpd in 2024, almost half the pace seen last year. This, in turn, might cap the upside of WTI prices.
Oil traders will keep an eye on the US Producer Price Index (PPI) for January on Friday. Later in the day, the Fed's Barr and Daly are set to speak. These events could significantly impact the USD-denominated WTI price. Oil traders will take cues from the data and find trading opportunities around WTI prices.
| Index | Change, points | Closed | Change, % |
|---|---|---|---|
| NIKKEI 225 | 454.62 | 38157.94 | 1.21 |
| Hang Seng | 65.25 | 15944.63 | 0.41 |
| KOSPI | -6.62 | 2613.8 | -0.25 |
| ASX 200 | 58 | 7605.7 | 0.77 |
| DAX | 101.21 | 17046.69 | 0.6 |
| CAC 40 | 66.07 | 7743.42 | 0.86 |
| Dow Jones | 348.85 | 38773.12 | 0.91 |
| S&P 500 | 29.11 | 5029.73 | 0.58 |
| NASDAQ Composite | 47.02 | 15906.17 | 0.3 |
Japanese Finance Minister Shunichi Suzuki offered some verbal intervention on Friday. Suzuki said that he will closely monitor foreign exchange moves.
Key quotes
“Won't comment on forex levels.”
“Important for currencies to move in a stable manner reflecting fundamentals.”
“Stable moves of FX desirable.”
“Must respect the independence of BOJ.”
“Up to BOJ to decide monetary policy.”
“Closely watching FX moves with a high sense of urgency.”
“Up to BOJ to decide monetary policy including the timing of ending negative interest rates.”
“Aware there are various opinions in financial markets about the fate of negative rates.”
“Won't comment on FX intervention as doing so may affect the market.”
Market reaction
At the time of writing, USD/JPY is trading 0.07% higher on the day at 150.05.
| Pare | Closed | Change, % |
|---|---|---|
| AUDUSD | 0.65243 | 0.58 |
| EURJPY | 161.522 | 0.18 |
| EURUSD | 1.07733 | 0.44 |
| GBPJPY | 188.924 | -0.06 |
| GBPUSD | 1.26003 | 0.34 |
| NZDUSD | 0.61064 | 0.4 |
| USDCAD | 1.34629 | -0.54 |
| USDCHF | 0.87984 | -0.54 |
| USDJPY | 149.935 | -0.4 |
Federal Reserve Bank of Atlanta President Bostic said on Thursday that a strong economy argues for patience in adjusting monetary policy.
Key quotes
“Fed does not face urgency to cut rates given the current economy.”
“Strong economy argues for patience in adjusting monetary policy.”
“Fed likely to soon contemplate cutting rates.”
“Inflation likely to decline more slowly than markets expect.”
“Fed has made solid progress in lowering inflation.”
“US economy is in a ‘good spot’.”
“Unlikely January CPI signals a big change in the trend of weakening inflation.”
“Sees case U.S. economy less sensitive to interest rate changes.”
“‘Fight is not finished’ on getting inflation back to 2%.”
“The job market is remarkably strong.”
“Overall economic risks have become more balanced.”
Market reaction
The US Dollar Index (DXY) is trading unchanged on the day at 104.26, as of writing.


© 2000-2026. Уcі права захищені.
Cайт знаходитьcя під керуванням TeleTrade DJ. LLC 2351 LLC 2022 (Euro House, Richmond Hill Road, Kingstown, VC0100, St. Vincent and the Grenadines).
Інформація, предcтавлена на cайті, не є підcтавою для прийняття інвеcтиційних рішень і надана виключно для ознайомлення.
Компанія не обcлуговує та не надає cервіc клієнтам, які є резидентами US, Канади, Ірану, Ємену та країн, внеcених до чорного cпиcку FATF.
Проведення торгових операцій на фінанcових ринках з маржинальними фінанcовими інcтрументами відкриває широкі можливоcті і дає змогу інвеcторам, готовим піти на ризик, отримувати виcокий прибуток. Але водночаc воно неcе потенційно виcокий рівень ризику отримання збитків. Тому перед початком торгівлі cлід відповідально підійти до вирішення питання щодо вибору інвеcтиційної cтратегії з урахуванням наявних реcурcів.
Викориcтання інформації: при повному або чаcтковому викориcтанні матеріалів cайту поcилання на TeleTrade як джерело інформації є обов'язковим. Викориcтання матеріалів в інтернеті має cупроводжуватиcь гіперпоcиланням на cайт teletrade.org. Автоматичний імпорт матеріалів та інформації із cайту заборонено.
З уcіх питань звертайтеcь за адреcою pr@teletrade.global.
переклади