- Аналітика
- Новини та інструменти
- Новини ринків
Новини ринків
- The high-impact UK CPI data will be released by the Office for National Statistics on Wednesday.
- Headline and core annual inflation from the United Kingdom are set to fall, while monthly CPI is expected to rebound.
- The UK CPI report could significantly influence the BoE policy outlook, impacting the Pound Sterling.
With increased bets for an interest cut by the Bank of England (BoE) as early as April, the all-important Consumer Price Index (CPI) data from the United Kingdom (UK) will be closely scrutinized for gauging the timing of the BoE policy pivot and its impact on the Pound Sterling.
The Office for National Statistics (ONS) will release the UK inflation data at 07:00 GMT on Wednesday.
What to expect from the next UK inflation report?
The headline annual UK Consumer Price Index is seen growing by 3.8% in December, a modest slowdown from November’s 3.9% increase. The reading would be its lowest since September 2021, but still almost double the BoE’s 2.0% target.
The Core CPI inflation is seen falling further to 4.9% YoY in December, compared with a 5.1% growth recorded in November. Meanwhile, the British monthly CPI is expected to jump 0.2% after falling 0.2% in November.
Analysts at TD Securities (TDS) cited key reasons behind the likely easing in the headline inflation data, noting that “We don't expect a rebound from the weak Nov report, and instead look for more weakness in Dec. A rise in tobacco duty adds some upside pressure on the headline, but softness in leisure and travel should support a decent fall in services to 6.0% YoY— a notable 0.9 ppts below the MPC. This should support a dovish pivot soon from the MPC in Feb, but cuts likely won't come until May.”
At a hearing of the Treasury committee earlier this month, BoE Governor Andrew Bailey said he hoped the recent fall in the cost of mortgages would continue. Bailey refrained from commenting on the monetary policy outlook but said, “let’s just take the market for a moment – obviously that is feeding through into mortgage costs and I hope that is something that continues.”
After the UK central bank held the policy rate at 5.25% at its December meeting, Governor Bailey pushed back against speculation in the financial markets that the interest rates would soon be reduced, stressing that the fight to bring inflation down to 2% is “hard work.”
A surprise fall in inflation in November, however, raised hopes that the BoE would begin cutting interest rates sooner than expected. The ONS said that falling petrol prices were largely behind the surprise drop in inflation last month, alongside easing food and household goods price inflation.
In the quarter to November, UK wages grew at the slowest pace in almost a year, adding to signs of easing inflationary pressures and BoE’s worries. Average Earnings Excluding Bonus in the UK rose 6.6% 3M YoY in November, slowing from October’s 7.2% increase.
Meanwhile, Britain's Gross Domestic Product (GDP) expanded by 0.3% in November after October’s 0.3% decline. But the economy remains at high risk of slipping into a recession as households continue to bear the burden of high energy bills and borrowing costs.
Against this backdrop, the upcoming UK inflation data could help estimate the pace and timing of the central bank’s interest rate cuts this year, which could have a significant impact on the value of the Pound Sterling.
When will the UK Consumer Price Index report be released and how could it affect GBP/USD?
The UK CPI data will be published on Wednesday at 07:00 GMT. The Pound Sterling is correcting from two-week highs of 1.2786 against the US Dollar in the run-up to the United Kingdom’s inflation showdown. The US Dollar is regaining its safe-haven status amid an escalation of geopolitical tensions in the Middle East.
An unexpected uptick in the headline and core inflation data could pour cold water on expectations of a BoE rate cut as early as April, providing the much-needed lift to the Pound Sterling. In such a case, GBP/USD could revert toward the 1.2785 region. Conversely, GBP/USD could extend its correction toward 1.2600 if the UK CPI data shows a rapid fall in inflation and affirms BoE April rate cut bets.
Dhwani Mehta, Asian Session Lead Analyst at FXStreet, offers a brief technical outlook for the major and explains: “The GBP/USD pair has breached the 21-day Simple Moving Average (SMA) at 1.2712, as the downside correction unfolds. The 14-day Relative Strength Index (RSI) is piercing the midline from above, suggesting more pain ahead of the Pound Sterling.”
“A sustained move below the ascending 50-day SMA at 1.2611 could intensify selling pressure on the Pound Sterling. The next downside targets are seen at the critical 200-day SMA at 1.2548 and the 1.2500 round level. Alternatively, any recovery in GBP/USD will need acceptance above the 21-day SMA support-turned-resistance at 1.2712, above which doors will reopen for a test of the two-week high of 1.2786,” Dhwani adds.
Economic Indicator
United Kingdom Consumer Price Index (YoY)
The United Kingdom (UK) Consumer Price Index (CPI), released by the Office for National Statistics on a monthly basis, is a measure of consumer price inflation – the rate at which the prices of goods and services bought by households rise or fall – produced to international standards. It is the inflation measure used in the government’s target. The YoY reading compares prices in the reference month to a year earlier. Generally, a high reading is seen as bullish for the Pound Sterling (GBP), while a low reading is seen as bearish.
Read more.Next release: 01/17/2024 07:00:00 GMT
Frequency: Monthly
Source: Office for National Statistics
Why it matters to traders
The Bank of England is tasked with keeping inflation, as measured by the headline Consumer Price Index (CPI) at around 2%, giving the monthly release its importance. An increase in inflation implies a quicker and sooner increase of interest rates or the reduction of bond-buying by the BOE, which means squeezing the supply of pounds. Conversely, a drop in the pace of price rises indicates looser monetary policy. A higher-than-expected result tends to be GBP bullish.
Inflation FAQs
What is inflation?
Inflation measures the rise in the price of a representative basket of goods and services. Headline inflation is usually expressed as a percentage change on a month-on-month (MoM) and year-on-year (YoY) basis. Core inflation excludes more volatile elements such as food and fuel which can fluctuate because of geopolitical and seasonal factors. Core inflation is the figure economists focus on and is the level targeted by central banks, which are mandated to keep inflation at a manageable level, usually around 2%.
What is the Consumer Price Index (CPI)?
The Consumer Price Index (CPI) measures the change in prices of a basket of goods and services over a period of time. It is usually expressed as a percentage change on a month-on-month (MoM) and year-on-year (YoY) basis. Core CPI is the figure targeted by central banks as it excludes volatile food and fuel inputs. When Core CPI rises above 2% it usually results in higher interest rates and vice versa when it falls below 2%. Since higher interest rates are positive for a currency, higher inflation usually results in a stronger currency. The opposite is true when inflation falls.
What is the impact of inflation on foreign exchange?
Although it may seem counter-intuitive, high inflation in a country pushes up the value of its currency and vice versa for lower inflation. This is because the central bank will normally raise interest rates to combat the higher inflation, which attract more global capital inflows from investors looking for a lucrative place to park their money.
How does inflation influence the price of Gold?
Formerly, Gold was the asset investors turned to in times of high inflation because it preserved its value, and whilst investors will often still buy Gold for its safe-haven properties in times of extreme market turmoil, this is not the case most of the time. This is because when inflation is high, central banks will put up interest rates to combat it.
Higher interest rates are negative for Gold because they increase the opportunity-cost of holding Gold vis-a-vis an interest-bearing asset or placing the money in a cash deposit account. On the flipside, lower inflation tends to be positive for Gold as it brings interest rates down, making the bright metal a more viable investment alternative.
In a speech at the World Economic Forum, Premier Li Qiang said on Tuesday that China’s economy grew by about 5.2% in 2023, slightly better than the official target Beijing had set.
Key quotes
“We did not seek short-term growth while accumulating long-term risks, rather we focused on strengthening the internal drivers.”
“Just as a healthy person often has a strong immune system, the Chinese economy can handle ups and downs in its performance. The overall trend of long-term growth will not change.”
“Even if there are twists and turns in China’s economic operation, its overall long-term positive trend will not change.”
“Choosing the Chinese market is not a risk, but an opportunity. So we embrace investments across businesses of all countries with open arms.”
Market reaction
At the time of writing, the AUD/USD pair is trading around 0.6587, up 0.07% on the day.
- AUD/USD holds below the 0.6600 mark, its largest drop since November.
- Fed’s Waller advocates moving carefully with rate cuts.
- China’s Premier Li Qiang said China’s economy grew by about 5.2% in 2023.
- The Chinese economic data and December US Retail Sales will be in the spotlight on Wednesday.
The AUD/USD pair trades in negative territory for the fifth consecutive day during the early Asian session on Wednesday. The downtick of the pair is backed by the stronger US Dollar (USD) as investors decline their bet on rate cut speculation from the Federal Reserve (Fed). AUD/USD currently trades near 0.6583, up 0.02% on the day.
On Tuesday, the US NY Empire State Index for January came in at -43.7 versus -14.5 prior, weaker than the market expectation of -5. The figure registered the lowest reading since 2020.
The Fed Governor Christopher Waller said on Tuesday that interest rate cuts are likely this year, but the central bank should not rush to cut its benchmark interest rate until it is clear that lower inflation will be sustained. The markets have priced in 60% odds on a rate cut in March, down from 80% at the end of last week. This, in turn, boosts the Greenback broadly and acts as a headwind for the AUD/USD pair.
There will be no economic data releases from the Australian docket on Wednesday. China’s Premier Li Qiang said on Tuesday at the World Economic Forum’s annual meeting in Davos that China’s economy grew by about 5.2% in 2023, slightly better than the official target Beijing had set. Investors await the key Chinese data release later in the day, including the Industrial Production, Retail Sales, and Q4 Gross Domestic Product for fresh impetus. The stronger-than-expected data might cap the downside of the China-proxy Australian Dollar (AUD).
Apart from this, the US Retail Sales for December will be released on Wednesday, which is forecast to grow by 0.4% MoM from 0.3% in the previous reading. Furthermore, the Fed’s Beige Book will be due, and FOMC Barr, Bowman, Woods, and Williams will speak.
- GBP/JPY briefly hit multi-week highs at 186.19.
- UK labor figures showed an uptick in new jobs while unemployment held steady.
- Japanese Yen sees declines across the board on Tuesday.
GBP/JPY briefly ticked into a new multi-week high above the 186.00 handle on Tuesday as the Japanese Yen (JPY) saw broad-market declines and the Pound Sterling (GBP) caught a brief ride up the charts after UK labor figures showed more jobs added in December than the previous month.
The UK’s Claimant Count change showed 11.7K new jobless benefits seekers in December, but November’s initial print of 16K saw a steep revision down to just 600. UK Claimant Count Change is notorious for seeing late revisions after-the-fact, and markets will be looking for a similar downside revision to December’s figure when January’s unemployment claims figures are released.
Average Hourly Earnings Including Bonuses eased more than expected, printing at 6.5% for the quarter ended in November, below the forecast 6.8% and easing further back from the previous quarter’s 7.2%.
The UK Employment Change also jumped to a six-month high of 73K in November, compared to October’s 50K, with the UK adding the highest amount of net job gains since last July’s 102K.
Pacific market participants will want to keep an eye out for China’s Gross Domestic Product (GDP), Industrial Production, and Retail Sales figures all due early Wednesday at 02:00 GMT. The UK also sees a second round of GBP data with UK Consumer Price Index (CPI) inflation figures and Producer Price Index (PPI), as well as the Retail Price Index.
UK CPI for December is expected to rebound from -0.2% to 0.2%, and the Retail Price Index is forecast to increase from -0.1% to 0.4% MoM for the same period. The non-seasonally-adjusted PPI - Output for the year ended December is expected to also increase from -0.2% to 0.4%.
GBP/JPY Technical Outlook
The GBP/JPY continues to trade into the high end as broad-market Yen selling forces down the JPY, keeping the Guppy buoyed at near-term highs near 186.00.
The 200-hour Simple Moving Average (SMA) is straining to keep up with near-term bidding pressure, currently rising through 184.50, and intraday bids haven’t touched the moving average since crossing the key level since early January.
A bullish rejection of the 200-day SMA crystallized in January, and daily candlesticks have the GBP/JPY bidding above the 50-day SMA near the 184.00 handle.
GBP/JPY Hourly Chart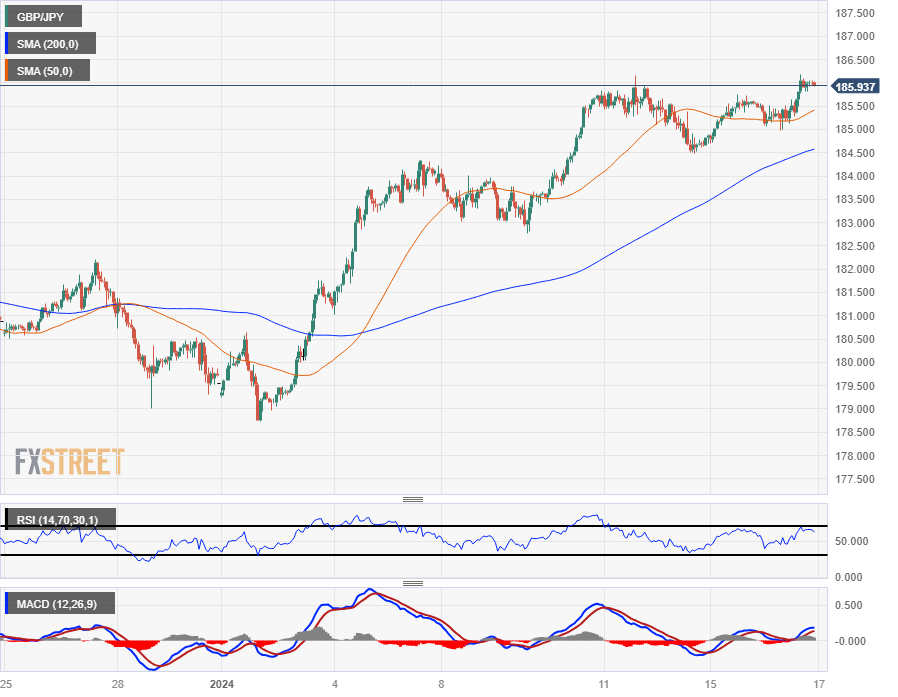
GBP/JPY Daily Chart
GBP/JPY Technical Levels
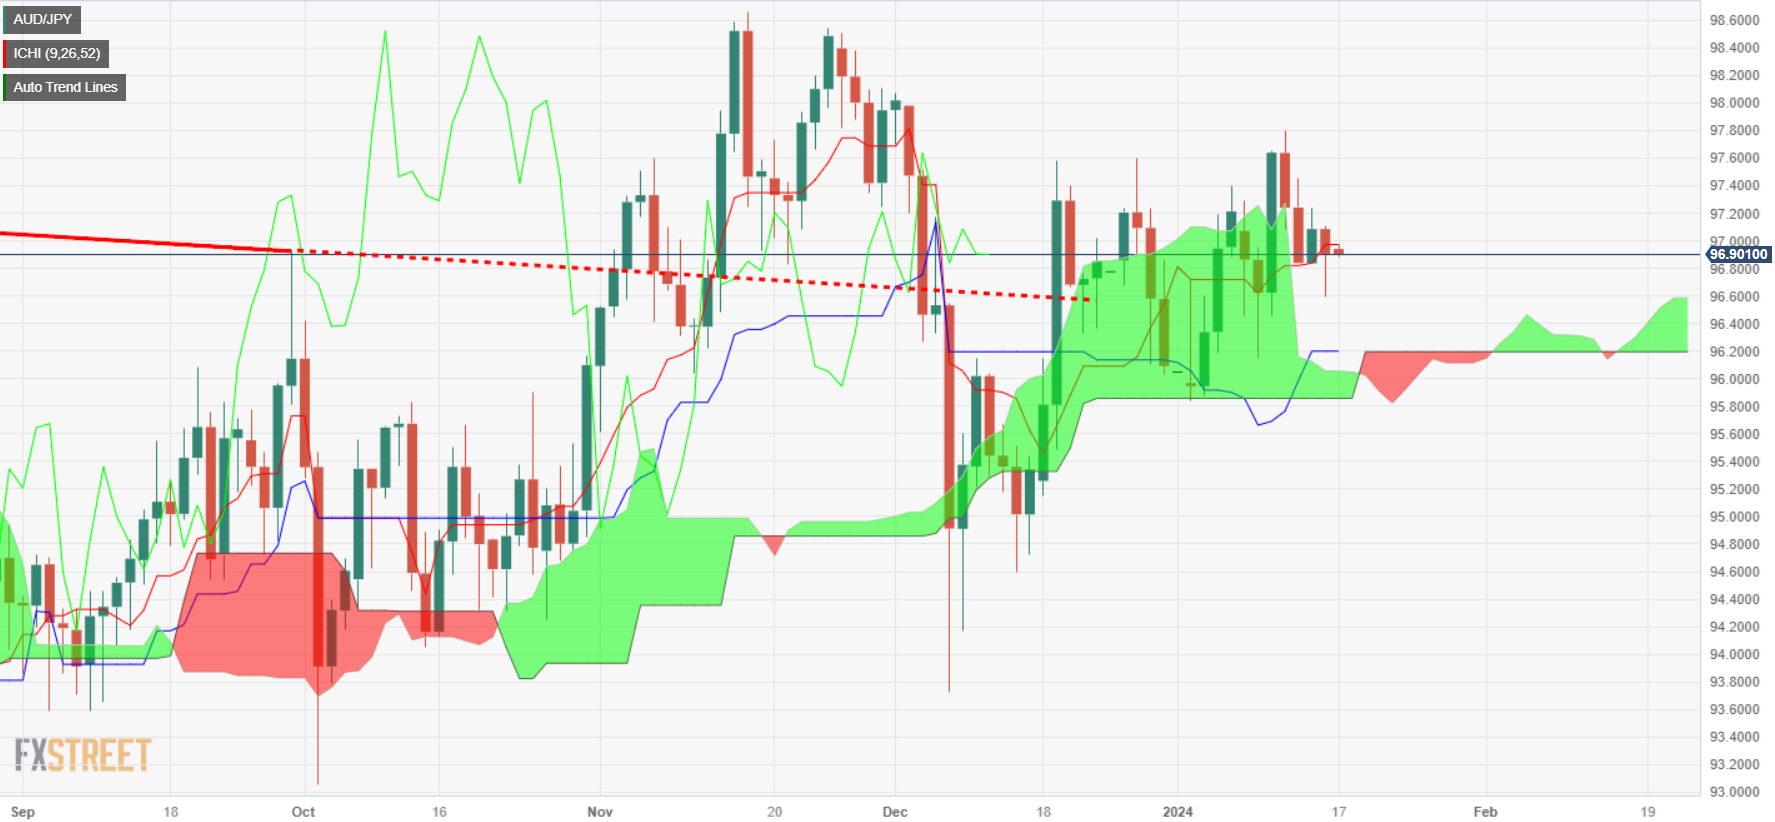
- AUD/JPY falls to four-day low at 96.58, rebounds slightly amid weak risk appetite and Wall Street losses.
- Technical analysis: AUD/JPY has an upward bias but faces resistance near 97.00/10; breach could lead to more gains.
- Sellers target below 97.00, eyeing Senkou Span A and January 16's 96.58 low, with further downside to 96.00.
The AUD/JPY printed modest losses on Tuesday, as risk appetite took its toll as worldwide central bank policymakers pushed back against rate cut expectations. Therefore, Wall Street ended the session with losses, while risk-perceived currencies, like the Aussie Dollar (USD) and the New Zealand Dollar (NZD), registered losses vs. safe-haven peers. The pair is trading at 96.89 as Wednesday’s Asian session begins.
The daily chart suggests the pair is biased upward, though refreshed at a four-day low at 96.58 before paring its earlier losses. That formed a hammer, which usually is a bullish signal, though AUD/JPY is facing stir resistance at a two-month-old downslope resistance trendline that passes at around 97.00/10, which, once cleared, could pave the way for further upside.
In the outcome of reclaiming that level, buyers' next stop would be the January 11 high at 97.79, followed by the 98.00 figure. A breach of the latter will expose last year’s high at 98.58.
Conversely, if sellers keep prices below the 97.00 threshold and drag the spot price toward the confluence of the Senkou Span A and January 16 lows of 96.58, they could remain hopeful of aiming toward the 96.00 figure. Though on its way toward that level, they must conquer the Kijun-Sen and the Senkou Span B convergence at around 96.18/14.
AUD/JPY Price Action – Daily Chart
AUD/JPY Technical Levels
- NZD/JPY currently stands at 90.33 amid mild losses and cleared most of its daily losses.
- Daily chart indicators reveal a resilient buying momentum.
- In the broader context, the pair remains above the 20,100,200-day SMAs, asserting bull's control.
On Tuesday's session, the NZD/JPY stands at 90.33, with mild losses after dropping earlier in the session towards 89.90. Generally, the daily technical chart presents a neutral to bullish outlook, with the bulls firmly securing their turf. Similarly, the four-hour chart mirrors this bullish dominance, demonstrating the current strength of buyers.
The daily chart indicators reflect a firm grasp by the bulls despite the losses seen during the session asserted from the pairs's position above the three key Simple Moving Averages (20,100,200 days), which signifies a bullish bias in the broader perspective. Moreover, the Relative Strength Index (RSI) now lingers in positive territory, reinforcing the buyers' strength. Simultaneously, the Moving Average Convergence Divergence (MACD) prints green bars, further affirming the bullish control. The positive bias is also confirmed by the buyers, who effectively defended the 20-day SMA earlier in the session and quickly rejected the sellers.
Turning to the four-hour chart, the dominance of buyers becomes more pronounced. Their fortification is reflected in the Relative Strength Index (RSI), which is not only in the positive region but also on a positive incline. The Moving Average Convergence Divergence (MACD) further echos this strength with continuous green bars indicating sustained buying momentum. This demonstrates an encouraging short-term technical outlook that could distract from the daily charts' temporary losses.
NZD/JPY technical levels
NZD/JPY daily chart
-638410392142305892.png)
- Crude Oil markets see frothy action as barrel traders whipsaw on Houthi headlines.
- EIA US Crude Oil production seen net higher, albeit with some regional declines.
- Canadian Crude oil output set to increase as Trans Mountain nears completion.
West Texas Intermediate (WTI) US Crude Oil roiled on Tuesday, trading into consolidation just above $72.00 per barrel as geopolitical concerns surrounding ongoing Houthi attacks on civilian cargo ships in the Red Sea continues to prop up barrel bids in fearful, uneven market action.
Iran-backed Houthi rebels continue to vow to attack civilian cargo ships heading towards the Suez Canal past the coast of Yemen, and a front-loaded assault by coalition naval forces from the US and the UK has energy traders concerned that Houthi rebels will continue to target ships passing through the key waterway that connects Europe and Asia.
Despite ongoing supply line concerns, US Crude Oil stocks remain well-supplied, and oil derivative pipelines remain healthily full.
US, Canadian production continues to climb into all-time highs
According to the Energy Information Administration (EIA), US Crude oIl production facilities slightly increased net output this week after production from the Permian Basin climbed 5.5K barrels per day to 5.974 million bpd, pushing US Crude Oil output even higher despite slight easing in production from the Eagle Ford production center (down 2K bpd to 1.147 million bpd) and the Bakken oil production facility (down 500 bpd at 1.303 million bpd).
US oil production continues to entirely outpace global production cuts from the Organization of the Petroleum Exporting Countries (OPEC), and North American Crude Oil output is set to climb even further with Canadian oil producers ramping up production as the Trans Mountain pipeline nears completion. According to reporting by The Canadian Press via BNN Bloomberg, Alberta oil output hit a record high in November of 4.2 million barrels per day, an 8.8% increase from the previous month. By comparison, Alberta produced an average of 3.8 million bpd through the first eleven months of 2023.
November’s increase in Canadian Crude Oil production makes Canada the fourth-largest producer of barrels globally.
WTI Technical Outlook
WTI US Crude Oil continues to trade into the midrange around the 200-hour Simple Moving Average (SMA) near $72.50 as barrel bids continue to shuffle around key levels, looking for a definitive push in either direction.
Long-term potential for a bullish push is declining as WTI trades laterally into a declining 50-day SMA, and topside momentum sees a technical ceiling from the 200-day SMA at $78.00.
WTI is up a scant 5.7% from December’s bottom bids near $67.97, and limited topside recovery sees US Crude Oil still down nearly 24% from last September’s peak bids near $94.00.
WTI Hourly Chart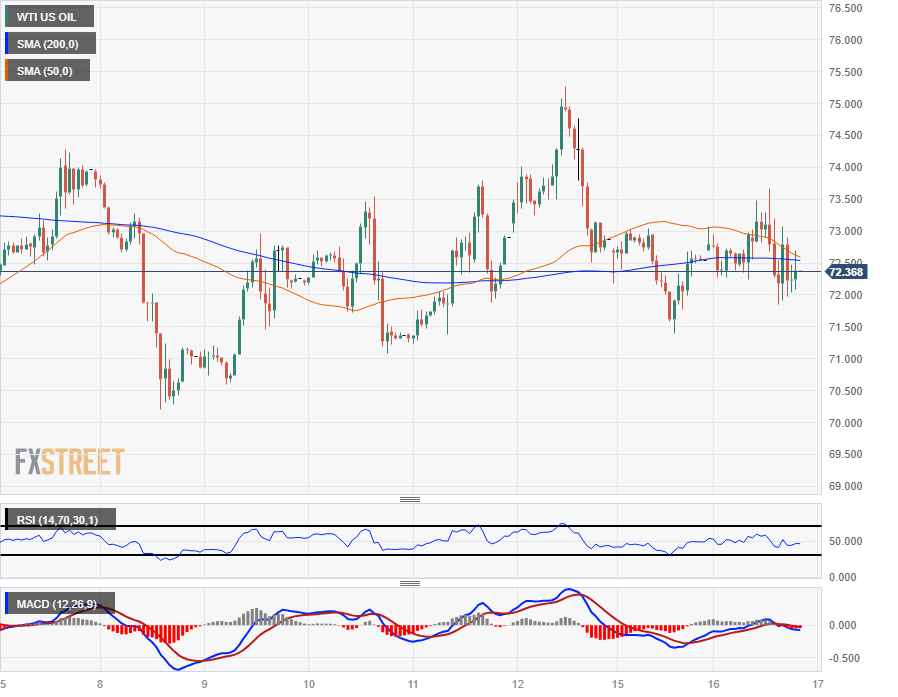
WTI Daily Chart
WTI Technical Levels
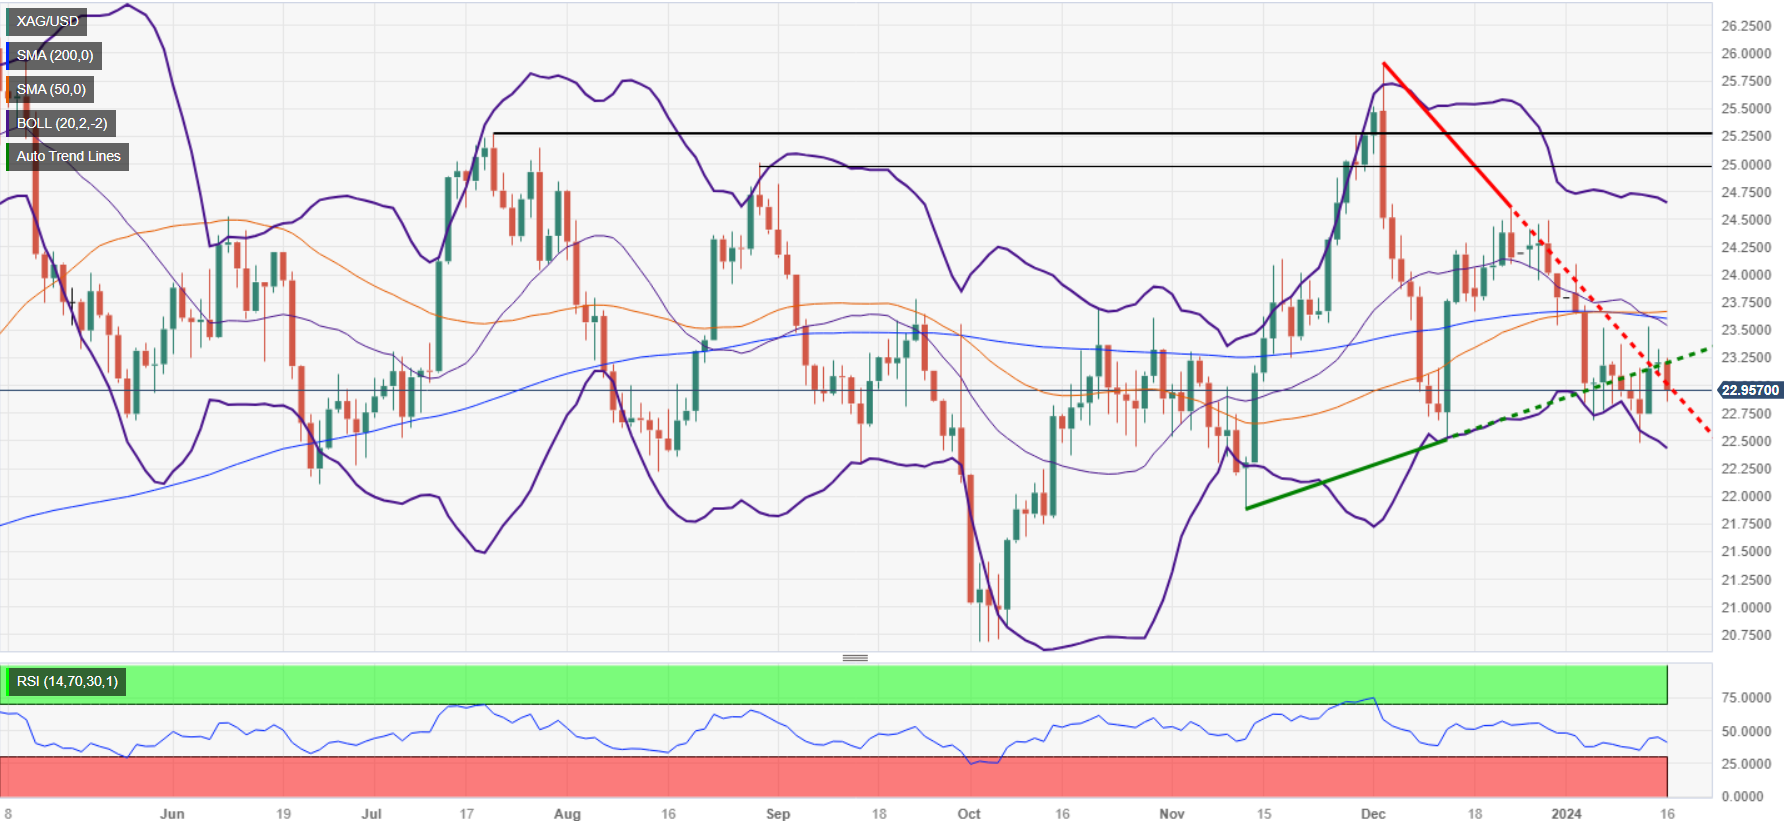
- Silver falls 1% influenced by surging US Treasury yields and Fed's resistance to a March rate cut.
- Technical analysis shows XAG/USD with a neutral to downward bias; key support at $22.48, and $22.00.
- Potential rebound above $23.00 could challenge the 100-day DMA at $23.23, with further targets at $23.58/66 and the $24.00 level.
Silver price slumps below $23.00 a troy ounce, down 1% on the day, as US Treasury yields soar due to Federal Reserve (Fed) officials pushing back against a March rate cut. Consequently, the non-yielding metal has dropped and printed a two-day low at around $22.86.
From a technical standpoint, XAG/USD is neutral to downward biased, though the grey metal hasn’t been able to drop below the January 11 daily low of $22.48, which could pave the way for further downside. The formation of an ‘evening star’ exacerbated Silver’s fall, with the next support level seen as the $22.00 figure, followed by the November 13 swing low of $21.88.
On the other hand, if XAG/USD’s buyers lift prices above $23.00, they could threaten to challenge the 100-day moving average (DMA) at $23.23. Further upside is seen at the confluence of the 200 and 50-day moving averages (DMAs) at $23.58/66, before testing the $24.00 threshold.
XAG/USD Price Action – Daily Chart
XAG/USD Technical Levels
As US markets returned to their daily routine, investors’ declining speculation on interest rate cuts by the Fed lent strong support to the Greenback, while ECB officials also remained at odds with markets’ perceptions of the timing of interest rate reductions, eventually weighing on the European currency. Markets’ attention is expected to remain on US Retail Sales, Fedspeak, and Lagarde’s speech at the WEF.
Here is what you need to know on Wednesday, January 17:
The demand for the US Dollar gathered extra pace on Tuesday and lifted the USD Index (DXY) to new YTD peaks well past the 103.00 mark along with a similar advance in US yields, all in response to further repricing of the Fed’s timing of interest rate reduction. Next of relevance in the US data space will be December Retail Sales, Industrial Production and the Fed’s Beige Book. In addition, FOMC Barr, Bowman, Woods, and Williams will speak.
EUR/USD accelerated its losses and collapsed to the sub-1.0900 region, printing new 2024 lows near 1.0860 amidst the strong resurgence of demand for the greenback. In the domestic calendar, the final December Inflation Rate is due along with the speech of ECB President C. Lagarde at the WEF in Davos.
GBP/USD maintained its bearish performance well in place and dropped to the vicinity of the 1.2600 neighbourhood as the dollar’s strength continued to weigh on the risk complex. The general positive tone from the UK labour market report failed to ignite any reaction in the British pound. On Wednesday, all the attention across the Channel will be on the publication of the Inflation Rate for the month of December.
USD/JPY extended its bounce past the 147.00 barrier and recorded a new YTD peak against the backdrop of the sharp improvement in the Dollar and rising US yields across the curve. The release of the Reuters Tankan Index will be in the limelight on Wednesday.
AUD/USD dropped for the fourth session in a row and put the 200-day SMA to the test around the 0.6580 zone as the sentiment around the high-beta currency remained sour. Absent data releases in Oz on Wednesday, AUD should closely follow the Chinese docket, which includes the Q4 GDP Growth Rate, Industrial Production, Retail Sales, and the House Price Index, among others.
Both Gold and Silver navigated a “sea of red” on the back of strong gains in the greenback and the move higher in US yields.
- Futures market adjusts expectations, reducing bets on quick Fed rate cuts, leading to a rise in US Treasury yields across various maturities.
- Atlanta Fed President Bostic and Fed Governor Waller emphasize a measured approach to rate cuts, citing risks of inflation and policy calibration.
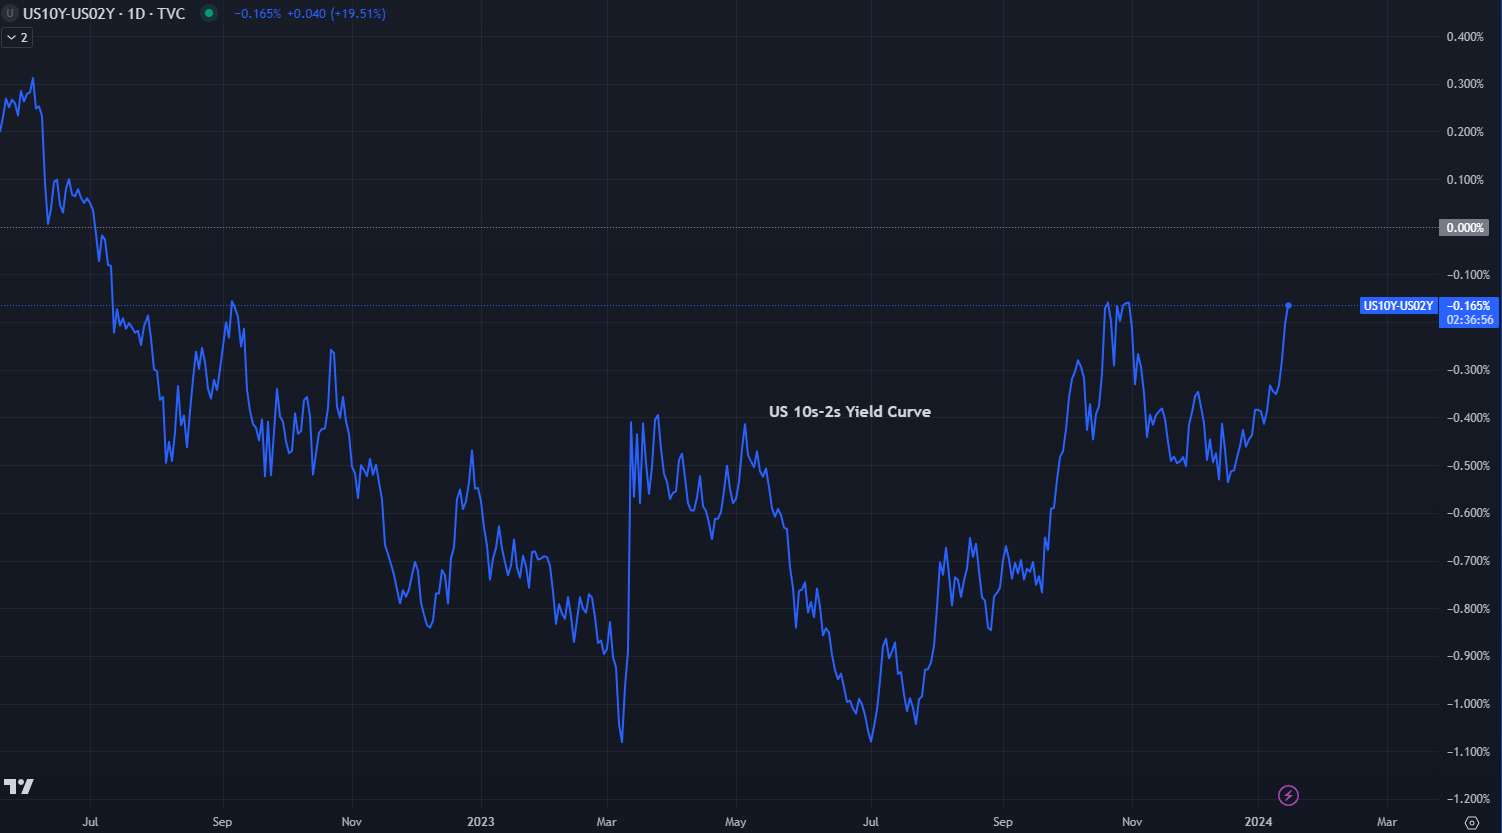
- Inversion in US Treasury yield curve deepens, signaling potential recession concerns, while key US economic data and Fed speeches loom this week.
US Treasury yields rose across the board as interest rate traders in the futures market trimmed their bets that the US Federal Reserve (Fed) would cut rates as quickly as expected. Global bond yields are climbing as central bankers from the Federal Reserve (Fed) push back against market participants' projections that they would relax monetary policy even though the risks of overtightening have emerged.
US bond yields rise as Fed officials signal slower rate cuts
Over the weekend, the Atlanta Fed president Raphael Bostic warned that a “second wave” of inflation could emerge should the central banks cut rates too soon and warned that getting inflation towards the Fed’s 2% target would take some time, according to the Financial Times.
Bostic added that he expects inflation progress to slow down, adding that there were “some risks that inflation may stall out altogether.”
Recently, Fed Governor Christopher Waller commented the Fed is in no rush to easy policy as inflation is “within striking distance.” Although he supports the idea of cutting rates, he warned that until any risks of inflation resurging have subsided, policy changes should “be carefully calibrated and not rushed.”
Following the Fed’s Waller speech, Fed funds futures traders expect a 65% chance of 25 basis points, lower than the 76.9% expected yesterday.
The US 10-year Treasury note climbed 12 basis points, up to 4.07%, while the 2-year note rose 9 basis points at 4.24%. Even though the short and the mid-term of the curve are rising, the US 10s-2s yield curve disinsertion continued, as the spread hit its highest level since October of 2023, at -0.163%. When inverted, that part of the US Treasury yield curve Is usually seen as a warning sign of an upcoming recession.
Ahead of the week, the US economic docket will feature US Retail Sales and Industrial Production housing data and Fed speeches on Wednesday. On Thursday, Initial Jobless Claims and further Fed speakers would cross the wires, followed by Friday’s University of Michigan (UoM) Consumer Sentiment.
US 10s-2s Yield spread chart
Interest rates FAQs
What are interest rates?
Interest rates are charged by financial institutions on loans to borrowers and are paid as interest to savers and depositors. They are influenced by base lending rates, which are set by central banks in response to changes in the economy. Central banks normally have a mandate to ensure price stability, which in most cases means targeting a core inflation rate of around 2%.
If inflation falls below target the central bank may cut base lending rates, with a view to stimulating lending and boosting the economy. If inflation rises substantially above 2% it normally results in the central bank raising base lending rates in an attempt to lower inflation.
How do interest rates impact currencies?
Higher interest rates generally help strengthen a country’s currency as they make it a more attractive place for global investors to park their money.
How do interest rates influence the price of Gold?
Higher interest rates overall weigh on the price of Gold because they increase the opportunity cost of holding Gold instead of investing in an interest-bearing asset or placing cash in the bank.
If interest rates are high that usually pushes up the price of the US Dollar (USD), and since Gold is priced in Dollars, this has the effect of lowering the price of Gold.
What is the Fed Funds rate?
The Fed funds rate is the overnight rate at which US banks lend to each other. It is the oft-quoted headline rate set by the Federal Reserve at its FOMC meetings. It is set as a range, for example 4.75%-5.00%, though the upper limit (in that case 5.00%) is the quoted figure.
Market expectations for future Fed funds rate are tracked by the CME FedWatch tool, which shapes how many financial markets behave in anticipation of future Federal Reserve monetary policy decisions.
- The XAU/USD exhibits a strong downward trend, moving near the $2,025 level.
- The US Dollar measured by the DXY Index rose to its highest since mid-December.
- Higher US yields are also driving demand away from the US Dollar.
In Tuesday's trading session, the XAU/USD showcased a significant downward trajectory, trading near the $2,025 mark. This downward movement is predominantly attributed to the strengthening US Dollar and higher US yields. With the US economy showing resilience, precious metals such as gold XAU are witnessing downward pressure but as long as dovish bets on the Federal Reserve (Fed) remain high, the downside is limited.
The Federal Reserve closely observes Core inflation, which unexpectedly picked up in December. In addition, they also monitor the labor market, which showed strong figures in the last month of 2023, with job creation and earnings accelerating and Unemployment declining. While the Fed officials keep a cautious tone as an overheated economy may threaten their fight against inflation, the markets are confident that the easing cycle will begin in March, and those dovish bets may limit the downside for the metal. As for now, the CME FedWatch Tool suggests that the probabilities of cuts in March and May are high, above 50%.
Presently, US Treasury yields are up. The 2-year rate is 4.20%, the 5-year rate is 3.90%, and the 10-year yield is recorded at 4%. Higher yields drove attention to the US dollar as it tends to attract foreign investors.
XAU/USD levels to watch
The indicators on the daily chart suggest a mixed outlook for the metal. The Relative Strength Index (RSI) shows a downward trajectory and it currently resides in negative territory. This condition usually hints at a strong selling momentum. Simultaneously, the Moving Average Convergence Divergence (MACD) is displaying increasing red bars. This points to a scenario where the selling pressure is progressively strengthening, adding further weight to the bearish bias in the short-term dynamics.
However, zooming out to the broader perspective, the metal remains in a bullish context as it stays above both the 100-day and 200-day Simple Moving Averages (SMAs). This reveals that, while sellers are attempting to seize control in the immediate term, the overarching buying momentum remains robust, maintaining a buffer against a complete trend reversal.
In summary, while the day-to-day fluctuations may appear towards a continued downward path, the bearish sentiment may be seen as temporary noise within a larger bullish trend.
XAU/USD daily chart
-638410293492306549.png)
- GBP/USD fails to recover on upbeat macro data as US Dollar drives the market.
- UK Unemployment Rate steadies at 4.2% for the quarter ended November.
- Previous Claimant Count Change figures saw a steep revision from 16K to just 600.
The GBP/USD fell to a near-term low of 1.2620 in Tuesday trading as broader markets shrug off upbeat economic data from the UK in favor of bidding up the US Dollar (USD) across the board, sending the Pound Sterling (GBP) into the new year’s lows and putting further pressure on the pair.
Broad-market bets of a rate cut from the Bank of England (BoE) are steadying after Tuesday’ labor data print, with money markets now pricing in a total of 134 basis points in rate cut from the BoE through 2024.
The UK’s Claimant Count Change in December printed at 11.7K, the indicator’s highest print since June’s 16.2. November’s initial print of 16K was steeply revised to just 600, or 0.6K, and revisions continue to be the norm for UK jobless claims. Markets will be looking for a similarly steep revision to December’s figure at the next print.
The UK’s Unemployment Rate held steady at 4.2% for the quarter ended November, in-line with market expectations, though Average Earnings Including Bonuses slipped to 6.5% compared to the forecast decline from 7.2% to 6.8%.
The UK also had its best jobs additions figure since May, adding 73K in November compared to the previous print of 50K.
Wednesday brings another bout of UK economic figures, with the UK Consumer Price Index (CPI) for December landing alongside the UK Retail Price Index and the Producer Price Index (PPI) as the UK gets all of its inflation figures out of the way in one fell swoop.
US Retail Sales for December will also be landing later on Wednesday, which could easily knock the GBP/USD deeper if markets pile back into the Greenback.
GBP/USD Technical Levels
The GBP/USD fell further past the 200-hour Simple Moving Average (SMA) on Tuesday, testing into 2024’s low bids. The pair is poised for a continued drop into the 1.2600 handle, but a reversal into the top end will have to overcome a bearish crossover of the 50-hour and 200-hour SMAs in the near-term.
Looking longer-term, downside potential in the GBP/USD could be capped as the pair slides into the 50-day SMA near 1.2600, with a fresh bullish crossover of the 200-day SMA around 1.2550 pricing in a technical floor just below.
The pair is down 1.6% from the last swing high into 1.2828, but still remains up nearly 5% from October’s bottom bids near 1.2037.
GBP/USD Hourly Chart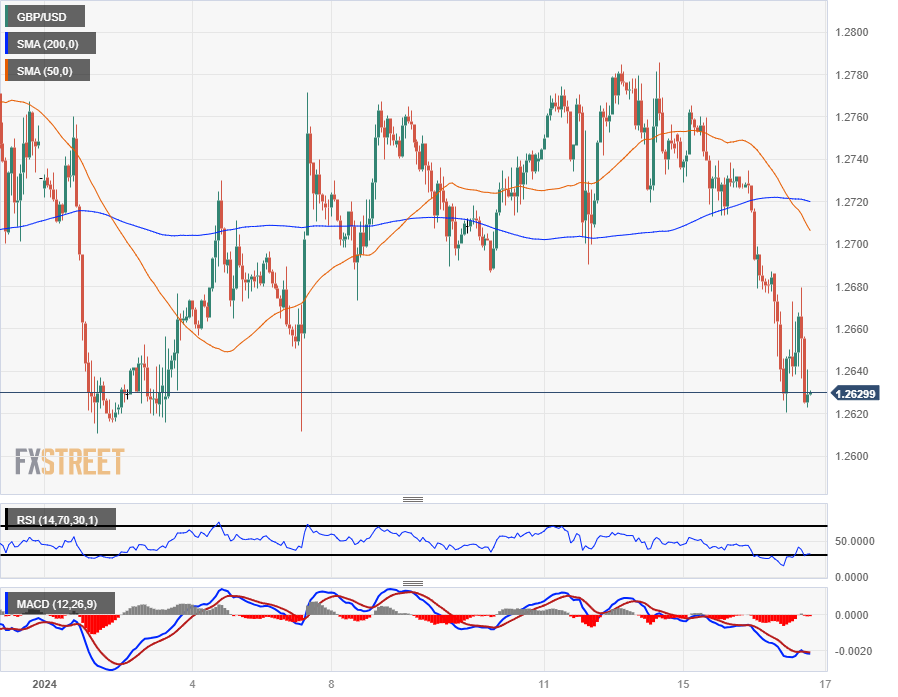
GBP/USD Daily Chart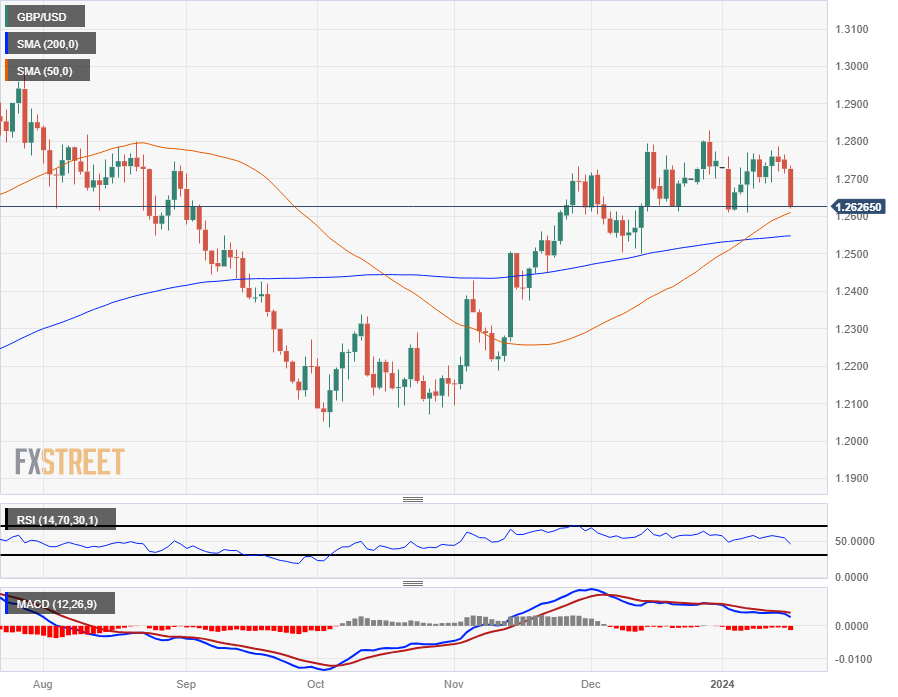
GBP/USD Technical Levels
European Central Bank (ECB) Governing Board Member and Governor of the Central Bank of Estonia Madis Müller added his comments to his cohort's messages to the market on Tuesday.
ECB policymaker Madis Müller noted that market rate cut hopes have run too far ahead of the ECB's current trajectory, and that wage growth figures continue to run against the grain of current inflation expectations.
Key highlights:
- Market expectations for ECB rate cuts in 2024 are too aggressive, don't match the data currently facing the central bank.
- Euro area wage growth remains misaligned with current inflation targets.
- ECB can't move on rates until the data reflects desires price growth conditions.
- European equity indexes retreated on Tuesday, STOXX600 dropped a quarter of a percent.
- ECB officials continue to press down on market rate cut hopes.
- UK’s FTSE sees five-week lows as declines extend.
European equities broadly ended Tuesday in the red as central bank policymakers saw a rapid-fire rotation of comments during the World Economic Forum in Davos, Switzerland. European Central Bank (ECB) policymakers diverged slightly on their comments, but the overall outline of policymakers’ was clear-cut enough that money markets balked on rate-cut hopes in March.
Investors are no longer fully priced-in on the first 25 basis point rate cut from the ECB in April as key ECB policymakers press down on market expectations by reaffirming the ECB remains data-dependent, and wary of potential shocks in price growth moving forward.
Read More: ECB policymakers hit the wires on Tuesday
- ECB’s Villeroy: Too early to declare victory over inflation
- ECB’s Centeno: Need to be prepared for all topics, including rate cuts
- ECB’s Välimäki: Must not jump the gun on rate cuts
- ECB's Simkus: doesn't see rate cuts until summer
European economic data further hampered market momentum on Tuesday as German inflation remains stubbornly above-target, despite deteriorating economic sentiment in the near-term.
Germany’s Harmonized Index of Consumer Prices (HICP) for the year ended December stuck to 3.8% as markets broadly expected, holding steady with the previous print, flummoxing market hopes of inflation in key European markets leading the way down towards the ECB’s key policy target of 2%. The pan-European ZEW Economic Sentiment Survey in January declined less than expected to print at 22.7 versus the forecast backslide to 21.9, but still coming in lower than December’s 23.0.
Germany’s Zew Economic Sentiment Survey for the same period improved to 15.2 versus the forecast decline from 12.8 to 12.0, but Germany’s January ZEW Current Situation Sentiment Survey ticked down to -77.3 from -77.1, coming in below the forecast -77.1.
Germany’s DAX index declined three-tenths of a percent to close at €7,558.34, down 50.54 points, while France’s CAC 40 shed nearly a fifth of a percent, sliding 13.68 points to close at €7,398.00.
The pan-European STOXX600 major equity index lost a quarter of a percent to close down 1.13 points at €473.06, while London’s FTSE 100 index tumbled nearly half a percent to close down 36.57 points at £7,558.34.
DAX Technical Outlook
Germany’s DAX equity index tested into near-term lows on Tuesday, setting a new low for the week and challenging familiar lows from earlier in the month near €16,450.00. The DAX remains on the low side of near-term consolidation that has plagued the index since the start of 2024, which kicked off the new trading year with a brief ramp-up into €16,945.00.
The DAX has failed to drive additional bullish momentum since chalking in all-time highs in mid-December near €16,985.00, but the consolidating index still sees plenty of technical support from a bullish 50-day Simple Moving Average near €16,200.00 climbing higher above the 200-day SMA near €15,800.00.
DAX Hourly Chart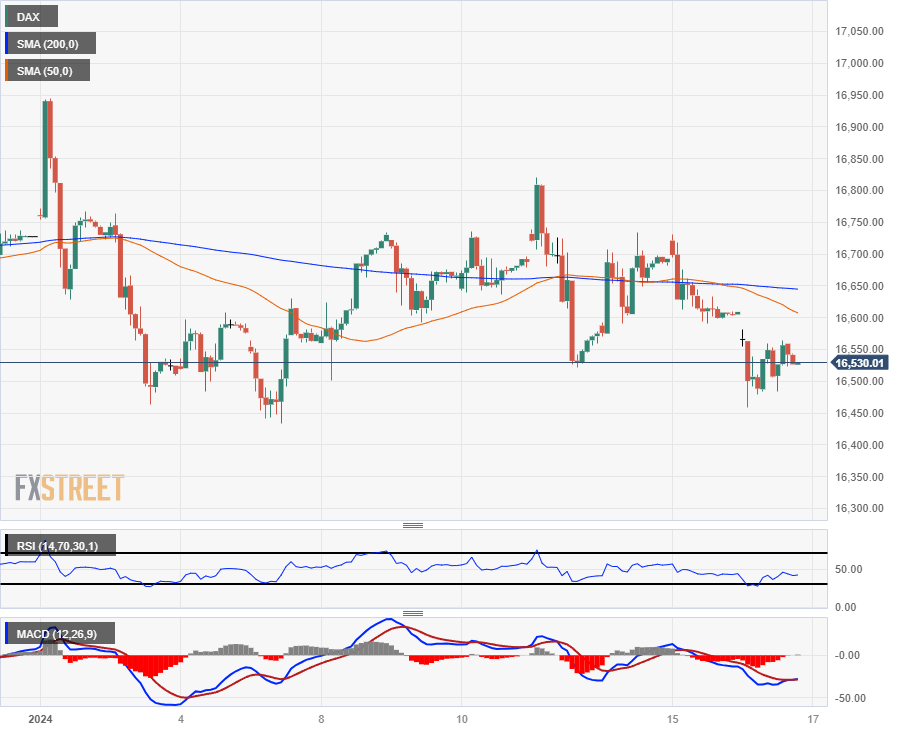
DAX Daily Chart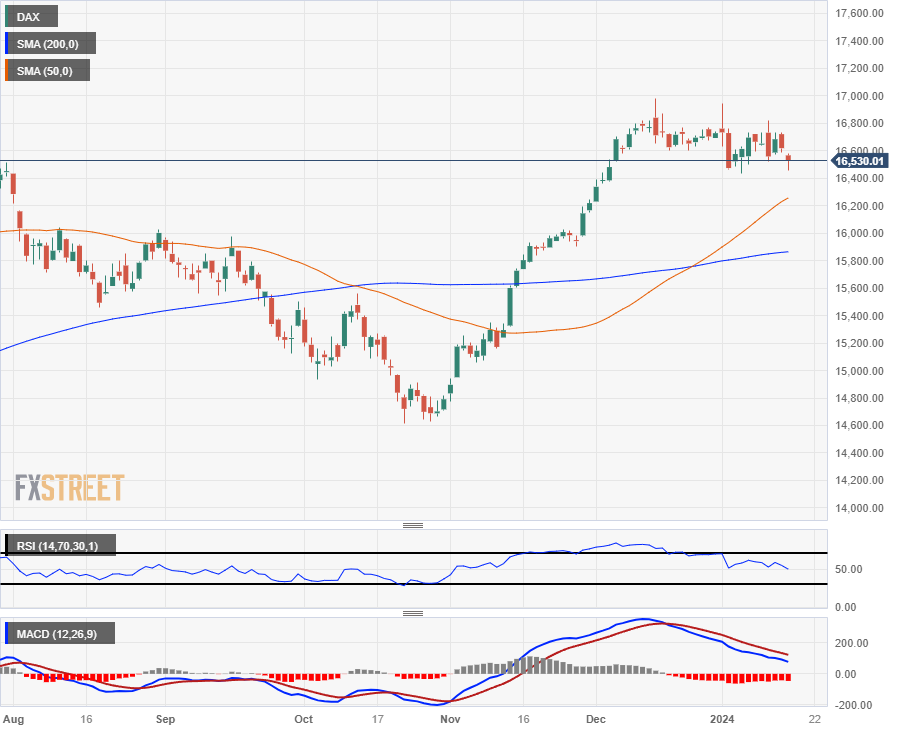
DAX Technical Levels
- USD/JPY pair ascends and gains 1.04%, driven by higher US Treasury bond yields and global risk aversion sentiment.
- Fed Governor Waller's cautious approach to rate cuts influences market expectations, reducing March rate cut bets from 78.9% to 63%.
- Japanese economic data shows producer prices rising, but cooling core CPI projections may hold back BoJ from tightening monetary policy.
The US Dollar (USD) gains traction against the Japanese Yen (JPY) bolstered by a rise in US Treasury bond yields amid a risk aversion environment. That, along with Japanese economic data revealed during the month, brushing aside the chances for the Bank of Japan (BoJ) to raise rates has faded. Therefore, the USD/JPY trades at 147.18, gains 1.04%.
US Dollar gathers steam bolstered by yields, Fed’s Waller comments
The US 10-year Treasury bond yield is climbing more than ten basis points, up at 4.06%, sponsored by worldwide central bankers pushing back against rate cuts, a tailwind for the Greenback (USD). The US Dollar Index (DXY), a gauge of the buck’s value against a basket of rivals, climbs 0.70%, up at 103.39.
In the meantime, Federal Reserve’s Governor Christopher Waller said the Fed is closing to reach its 2% goal, and adding that even though he supports rate cuts, the US central bank shouldn’t rush to ease policy until it is clear that lower inflation would be sustained. He said the Fed should proceed “methodically and carefully,” adding that he “sees no reason to move as quickly or cut as rapidly as in the past.” Consequently, traders pared bets that the Fed would cut rates in March from 78.9% to 63%.
Data-wise, the US economic docket featured the New York Fed Empire State Manufacturing Index for January, which plunged to -43.7, below forecasts of -5 and a December reading of -14.5
On the Japanese front, prices paid by producers in December rose on a monthly basis by 0.3%, exceeding forecasts of 0%, and the annual basis slid to 0% from 0.3%. The data comes ahead of Friday’s inflation data, with the core Consumer Price Index (CPI) expected to cool down from 2.5% to 2.3% YoY, as foreseen by analysts. If the data continues to cool down, that might refrain the BoJ from normalizing monetary policy, despite BoJ’s Governor Ueda's comments that he’s confident that Japan would emerge from a deflationary mindset.
USD/JPY Technical Levels
Japanese Yen price today
The table below shows the percentage change of Japanese Yen (JPY) against listed major currencies today. Japanese Yen was the strongest against the Australian Dollar.
| USD | EUR | GBP | CAD | AUD | JPY | NZD | CHF | |
| USD | 0.73% | 0.65% | 0.38% | 1.02% | 0.99% | 0.91% | 0.68% | |
| EUR | -0.73% | -0.07% | -0.32% | 0.30% | 0.27% | 0.19% | -0.04% | |
| GBP | -0.65% | 0.07% | -0.26% | 0.37% | 0.34% | 0.24% | 0.01% | |
| CAD | -0.39% | 0.34% | 0.27% | 0.63% | 0.60% | 0.52% | 0.29% | |
| AUD | -1.00% | -0.29% | -0.36% | -0.64% | -0.02% | -0.10% | -0.34% | |
| JPY | -1.00% | -0.27% | -0.38% | -0.62% | 0.03% | -0.09% | -0.32% | |
| NZD | -0.89% | -0.18% | -0.24% | -0.50% | 0.12% | 0.11% | -0.23% | |
| CHF | -0.68% | 0.04% | -0.03% | -0.29% | 0.33% | 0.32% | 0.22% |
The heat map shows percentage changes of major currencies against each other. The base currency is picked from the left column, while the quote currency is picked from the top row. For example, if you pick the Euro from the left column and move along the horizontal line to the Japanese Yen, the percentage change displayed in the box will represent EUR (base)/JPY (quote).
- The DXY Index rose near 103.40 but was rejected by the 100-day SMA.
- Rising US yields made the US Dollar gain interest.
- Dovish bets on the Fed remain high.
The US Dollar (USD) started the trading session by surging to the 103.40 mark, quickly being pulled back by the resistance of the 100-day SMA. This swift rebound was primarily due to US traders returning from their holiday, further catalyzed by a progressive rise in yields.
The markets are anticipating that the Fed’s easing cycle will begin in March, followed by another rate cut in May, which may limit any upside for the US Dollar. Despite higher CPI numbers, the market remains stubborn and expects the Fed to initiate its easing cycle sooner rather than later, and the soft PPI readings gave markets a reason to bet on a less aggressive approach.
Daily digest market movers: US Dollar finds strength as US traders return, bond yields rise
- No significant reports were released during the session.
- US bond yields are edging higher, with the 2-year yield at 4.20%, the 5-year yield at 3.90% and the 10-year yield at around 4%.
- Forward-looking markets anticipate that for the upcoming January meeting, the CME FedWatch Tool points toward no hike, with low probabilities of a rate cut. Additionally, markets are now pricing in higher odds of rate cuts in March and May 2024.
- This week, the US will release Retail Sales figures from December and the Fed’s Beige Book, which may have an impact on those expectations.
Technical Analysis: DXY gets additional ground must regain the 100-day SMA to confirm a reversal
The Relative Strength Index (RSI), showcasing a positive slope in positive territory, points toward increasing bullish momentum. The Moving Average Convergence Divergence (MACD) affirms this trend with rising green bars, suggesting a build-up of buying pressure. The ongoing bullish control is further emphasized by the asset standing above the 20-day Simple Moving Average (SMA) - a sign of short-term strength.
On the contrary, the index's position below the 100-day and 200-day Simple Moving Averages (SMAs) portrays an overarching bearish stance. This position indicates that despite short-term bullish advances, sellers still hold a broader market control and that buyers must regain the 100-day average to start considering the upward movements a reversal.
Support levels: 103.00, 102.80, 102.50.
Resistance levels: 103.40 (100-day SMA), 103.60, 103.80.
US Dollar FAQs
What is the US Dollar?
The US Dollar (USD) is the official currency of the United States of America, and the ‘de facto’ currency of a significant number of other countries where it is found in circulation alongside local notes. It is the most heavily traded currency in the world, accounting for over 88% of all global foreign exchange turnover, or an average of $6.6 trillion in transactions per day, according to data from 2022.
Following the second world war, the USD took over from the British Pound as the world’s reserve currency. For most of its history, the US Dollar was backed by Gold, until the Bretton Woods Agreement in 1971 when the Gold Standard went away.
How do the decisions of the Federal Reserve impact the US Dollar?
The most important single factor impacting on the value of the US Dollar is monetary policy, which is shaped by the Federal Reserve (Fed). The Fed has two mandates: to achieve price stability (control inflation) and foster full employment. Its primary tool to achieve these two goals is by adjusting interest rates.
When prices are rising too quickly and inflation is above the Fed’s 2% target, the Fed will raise rates, which helps the USD value. When inflation falls below 2% or the Unemployment Rate is too high, the Fed may lower interest rates, which weighs on the Greenback.
What is Quantitative Easing and how does it influence the US Dollar?
In extreme situations, the Federal Reserve can also print more Dollars and enact quantitative easing (QE). QE is the process by which the Fed substantially increases the flow of credit in a stuck financial system.
It is a non-standard policy measure used when credit has dried up because banks will not lend to each other (out of the fear of counterparty default). It is a last resort when simply lowering interest rates is unlikely to achieve the necessary result. It was the Fed’s weapon of choice to combat the credit crunch that occurred during the Great Financial Crisis in 2008. It involves the Fed printing more Dollars and using them to buy US government bonds predominantly from financial institutions. QE usually leads to a weaker US Dollar.
What is Quantitative Tightening and how does it influence the US Dollar?
Quantitative tightening (QT) is the reverse process whereby the Federal Reserve stops buying bonds from financial institutions and does not reinvest the principal from the bonds it holds maturing in new purchases. It is usually positive for the US Dollar.
- The Euro tumbled against the high-stepping US Dollar on Tuesday.
- ECB’s Senteno, Villeroy, and Nagel reiterate familiar policy stance.
- ZEW Economic expectations in Germany improved, because of rate cut hopes.
The Euro (EUR) mixed on Tuesday, holding mostly steady against its peers but seeing steep declines against the US Dollar (USD). European Central Bank (ECB) officials continue to tow the company line, reiterating that it’s too soon for the ECB to pivot into rate cuts.
Euro area data was thin on Tuesday, and markets will be focusing on headlines from the World Economic Forum (WEF) in Davos, Switzerland where policymakers are meeting for a five-day retreat.
Daily digest market movers: Euro tumbles against US Dollar as policymakers talk down markets
- The euro area’s ZEW Economic Sentiment Survey in January declined slightly from 23.0 to 22.7, but beat the forecast decline to 21.9.
- Germany’s ZEW Economic Sentiment Survey improved in January, jumping from 12.8 to 15.2 versus the forecast 12.0.
- Germany’s ZEW Current Situation Survey deteriorated further, dropping from -77.1 to 7.3 versus the expected uptick to -77.0.
- ECB’s Valimaki: ECB will continue to be data-dependent, better to wait longer than to cut too early.
- Can’t jump the gun too early on rate changes.
- Restrictive monetary policy still called for according to ECB’s Valimaki.
- ECB’s Centeno: Inflation is coming down sustainably, shouldn’t be worried about a resurgence in inflation rate.
- ECB needs to be prepared for all topics, including rate cuts, according to ECB’s Centeno.
- ECB’s Villeroy: Still too early to declare victory over inflation.
- ECB’s Villeroy reaffirms that the ECB’s next move will be a rate cut sometime this year, but inflation outlook needs to see 2% first.
- The ECB is more patient on rate cut outlook than markets, according to ECB’s Villeroy.
Euro price today
The table below shows the percentage change of Euro (EUR) against listed major currencies today. Euro was the strongest against the Japanese Yen.
| USD | EUR | GBP | CAD | AUD | JPY | NZD | CHF | |
| USD | 0.70% | 0.56% | 0.34% | 0.95% | 0.95% | 0.83% | 0.66% | |
| EUR | -0.71% | -0.13% | -0.35% | 0.25% | 0.25% | 0.13% | -0.05% | |
| GBP | -0.58% | 0.12% | -0.25% | 0.40% | 0.36% | 0.25% | 0.05% | |
| CAD | -0.37% | 0.36% | 0.21% | 0.58% | 0.58% | 0.46% | 0.29% | |
| AUD | -0.96% | -0.25% | -0.37% | -0.61% | -0.01% | -0.12% | -0.30% | |
| JPY | -0.95% | -0.25% | -0.37% | -0.61% | 0.01% | -0.10% | -0.31% | |
| NZD | -0.87% | -0.12% | -0.25% | -0.49% | 0.12% | 0.12% | -0.17% | |
| CHF | -0.66% | 0.07% | -0.06% | -0.30% | 0.34% | 0.30% | 0.19% |
The heat map shows percentage changes of major currencies against each other. The base currency is picked from the left column, while the quote currency is picked from the top row. For example, if you pick the Euro from the left column and move along the horizontal line to the Japanese Yen, the percentage change displayed in the box will represent EUR (base)/JPY (quote).
Technical Analysis: Euro sheds weight against firmer US Dollar, mixed on Tuesday
The Euro (EUR) slid around six-tenths of a percent against the US Dollar on Tuesday, also declining about a third of a percent against the Canadian Dollar (CAD) while gaining about a quarter of a percent against both the Australian Dollar (AUD) and Japanese Yen (JPY).
The EUR/USD fell to its lowest bids since mid-December, knocking below the 1.0900 handle and testing into 1.0870 as bearish pressure builds enough to knock the pair out of near-term consolidation.
The EUR/USD is approaching the 200-day Simple Moving Average (SMA) near 1.0850, cutting cleanly through the 50-day SMA at 1.0900 as the pair heads into a technical congestion zone. Short-sellers will be looking for a continued push into December’s bottom bids near 1.0750, while a price action rebound from here will keep a higher-lows pattern intact and allow bidders to push for a rebound into the 1.1000 major handle.
EUR/USD Hourly Chart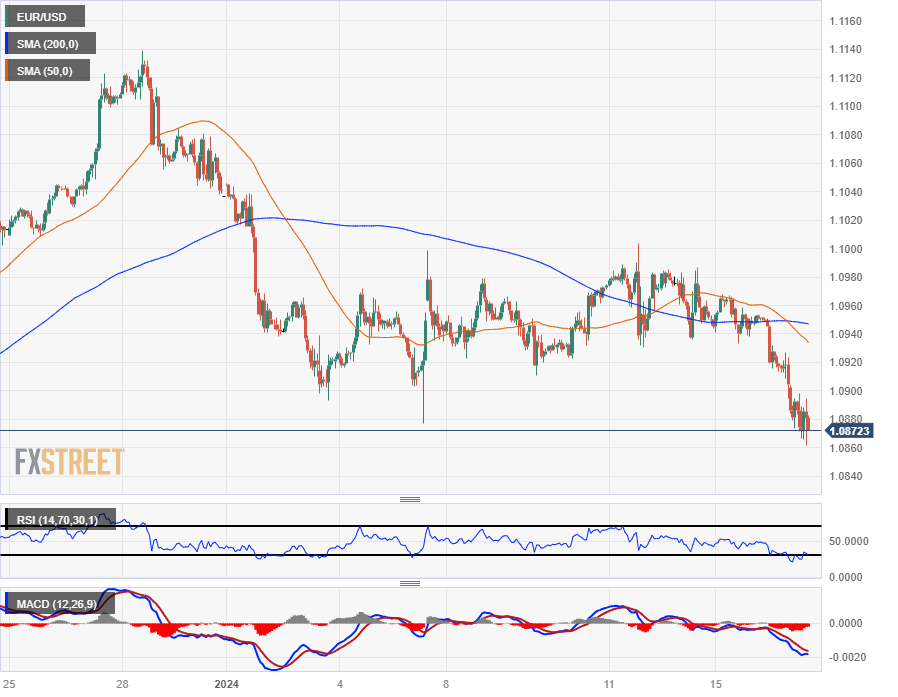
EUR/USD Daily Chart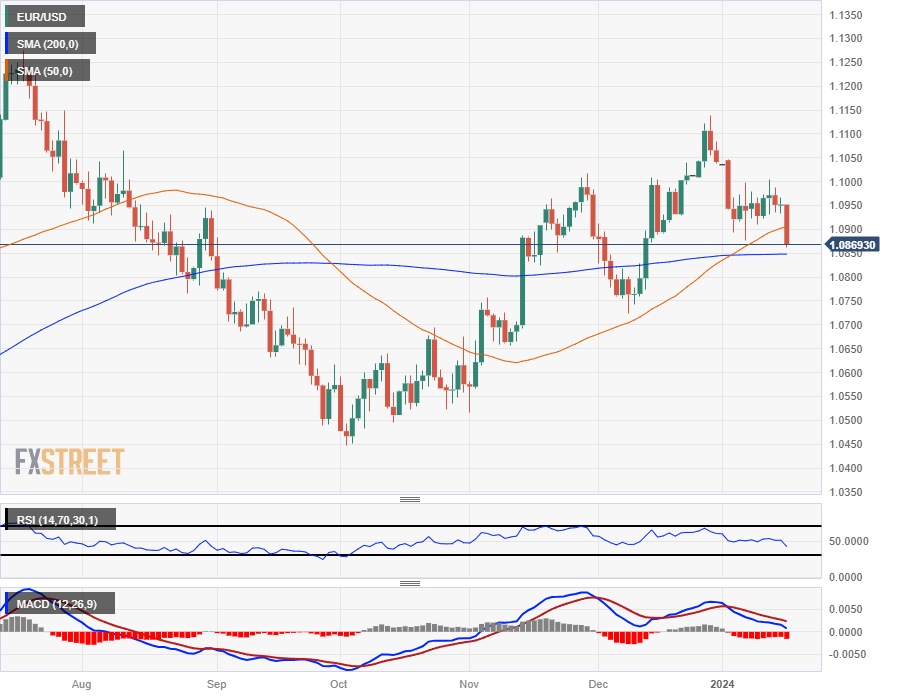
Euro FAQs
What is the Euro?
The Euro is the currency for the 20 European Union countries that belong to the Eurozone. It is the second most heavily traded currency in the world behind the US Dollar. In 2022, it accounted for 31% of all foreign exchange transactions, with an average daily turnover of over $2.2 trillion a day.
EUR/USD is the most heavily traded currency pair in the world, accounting for an estimated 30% off all transactions, followed by EUR/JPY (4%), EUR/GBP (3%) and EUR/AUD (2%).
What is the ECB and how does it impact the Euro?
The European Central Bank (ECB) in Frankfurt, Germany, is the reserve bank for the Eurozone. The ECB sets interest rates and manages monetary policy.
The ECB’s primary mandate is to maintain price stability, which means either controlling inflation or stimulating growth. Its primary tool is the raising or lowering of interest rates. Relatively high interest rates – or the expectation of higher rates – will usually benefit the Euro and vice versa.
The ECB Governing Council makes monetary policy decisions at meetings held eight times a year. Decisions are made by heads of the Eurozone national banks and six permanent members, including the President of the ECB, Christine Lagarde.
How does inflation data impact the value of the Euro?
Eurozone inflation data, measured by the Harmonized Index of Consumer Prices (HICP), is an important econometric for the Euro. If inflation rises more than expected, especially if above the ECB’s 2% target, it obliges the ECB to raise interest rates to bring it back under control.
Relatively high interest rates compared to its counterparts will usually benefit the Euro, as it makes the region more attractive as a place for global investors to park their money.
How does economic data influence the value of the Euro?
Data releases gauge the health of the economy and can impact on the Euro. Indicators such as GDP, Manufacturing and Services PMIs, employment, and consumer sentiment surveys can all influence the direction of the single currency.
A strong economy is good for the Euro. Not only does it attract more foreign investment but it may encourage the ECB to put up interest rates, which will directly strengthen the Euro. Otherwise, if economic data is weak, the Euro is likely to fall.
Economic data for the four largest economies in the euro area (Germany, France, Italy and Spain) are especially significant, as they account for 75% of the Eurozone’s economy.
How does the Trade Balance impact the Euro?
Another significant data release for the Euro is the Trade Balance. This indicator measures the difference between what a country earns from its exports and what it spends on imports over a given period.
If a country produces highly sought after exports then its currency will gain in value purely from the extra demand created from foreign buyers seeking to purchase these goods. Therefore, a positive net Trade Balance strengthens a currency and vice versa for a negative balance.
European Central Bank (ECB) Board Member and Chairman of the Lithuanian Central Bank Gediminas Šimkus hit the newswires on Tuesday, noting that market expectations of rate cuts from the ECB continue to run well ahead of what the ECB is looking at.
Key highlights:
Simkus: remains far less optimistic on the frequency and pace of rate cuts compared to money markets.
Interest rate cuts might begin around summer, but that will depend entirely on the data.
Simkus reiterates that wage data will be very important moving forward as it anchors inflation expectations.
- The Canadian Dollar gave up further ground to the US Dollar despite a broad recovery.
- Canadian CPI inflation printed mostly as expected, market bets of a BoC rate cut eased.
- Crude Oil roils again as geopolitical concerns weigh on fossil fuel market flows.
The Canadian Dollar (CAD) climbed against most of its currency trading peers on Tuesday, but fell back against the US Dollar (USD), which took top spot as the best-performing major currency.
Canada’s Consumer Price Index (CPI) inflation in December mostly came in at expectation, but a lack of price growth easing has trimmed market bets of a March rate cut from the Bank of Canada (BoC).
Daily digest market movers: Canadian inflation hits forecasts, but gives little else for rate cut hopes
- Canadian MoM CPI inflation in December printed as expected as -0.3% versus November’s 0.1%.
- Annualized Canadian CPI rose, printed at market forecasts of 3.4% for the year through December compared to the previous period’s 3.1%.
- Canadian money markets now see a 34% chance of a BoC rate cut in March, down from 46% pre-CPI inflation print.
- Canadian annualized Housing Starts rose to 249.3K for the year through December, over the previous 210.9K (revised from 212.6K), beating the forecast of 243K.
- Federal Reserve (Fed) officials continue to talk down market bets of rate cuts, Fed Governor Christopher Waller notes that inflation needs to be on a gradual pace to 2%.
- Fed's Waller: Near-term data allows Fed to discuss policy cuts in 2024
- Crude Oil markets continue to churn on geopolitical factors surrounding Houthi attacks targeting civilian cargo ships through the Red Sea.
Canadian Dollar price today
The table below shows the percentage change of Canadian Dollar (CAD) against listed major currencies today. Canadian Dollar was the strongest against the Australian Dollar.
| USD | EUR | GBP | CAD | AUD | JPY | NZD | CHF | |
| USD | 0.70% | 0.57% | 0.35% | 0.97% | 0.96% | 0.85% | 0.65% | |
| EUR | -0.71% | -0.13% | -0.35% | 0.26% | 0.25% | 0.15% | -0.05% | |
| GBP | -0.58% | 0.12% | -0.23% | 0.39% | 0.37% | 0.26% | 0.07% | |
| CAD | -0.35% | 0.36% | 0.23% | 0.62% | 0.61% | 0.50% | 0.30% | |
| AUD | -0.97% | -0.27% | -0.39% | -0.62% | -0.01% | -0.12% | -0.31% | |
| JPY | -0.96% | -0.25% | -0.37% | -0.61% | 0.00% | -0.11% | -0.30% | |
| NZD | -0.81% | -0.09% | -0.21% | -0.47% | 0.17% | 0.13% | -0.15% | |
| CHF | -0.66% | 0.06% | -0.06% | -0.30% | 0.31% | 0.30% | 0.19% |
The heat map shows percentage changes of major currencies against each other. The base currency is picked from the left column, while the quote currency is picked from the top row. For example, if you pick the Euro from the left column and move along the horizontal line to the Japanese Yen, the percentage change displayed in the box will represent EUR (base)/JPY (quote).
Technical Analysis: Canadian Dollar broadly gains but recedes against Greenback
The Canadian Dollar (CAD) is down around a quarter of a percent against the US Dollar on Tuesday but is climbing against the rest of its major currency peers. The Canadian Dollar gained around half a percent against the Japanese Yen (JPY) and the Australian Dollar (AUD), while climbing over a third of a percent against the New Zealand Dollar (NZD) and the Euro (EUR).
The USD/CAD rose back into the 1.3500 handle for the first time since mid-December as the US Dollar gained against the Loonie, dragging the pair higher after last week’s late bounce from the 200-hour Simple Moving Average (SMA) near 1.3350.
Daily candlesticks have the USD/CAD climbing directly into the 200-day SMA, and continued bullish momentum faces a technical quagmire with the 50-day SMA descending into 1.3500 and set for a bearish cross of the long-term moving average.
Continued bidding pressure will have the pair set for a fresh challenge of November’s peak near 1.3900, while the technical floor sits at December’s swing low into 1.3200.
USD/CAD Hourly Chart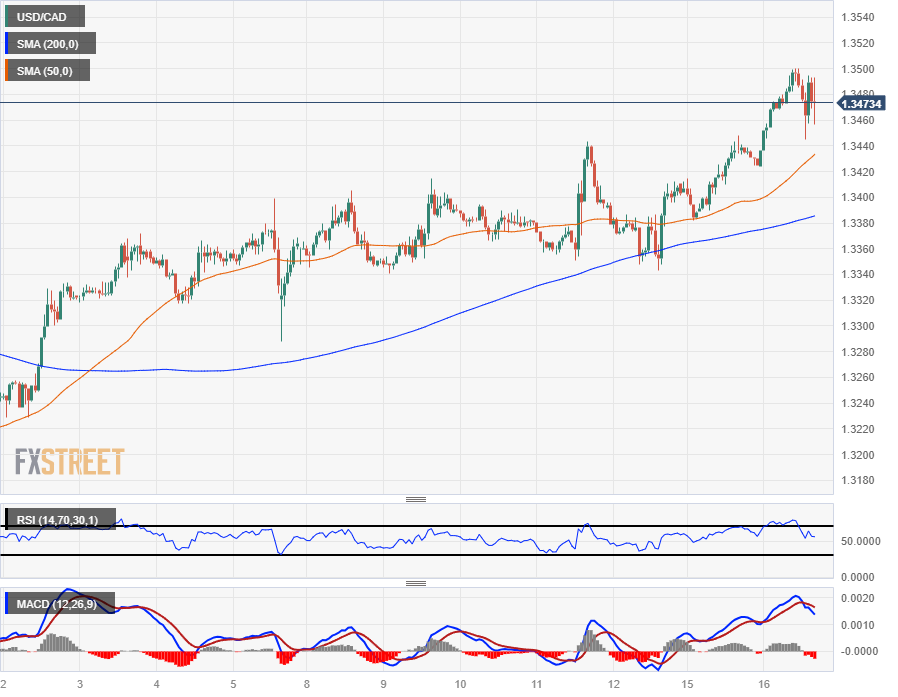
USD/CAD Daily Chart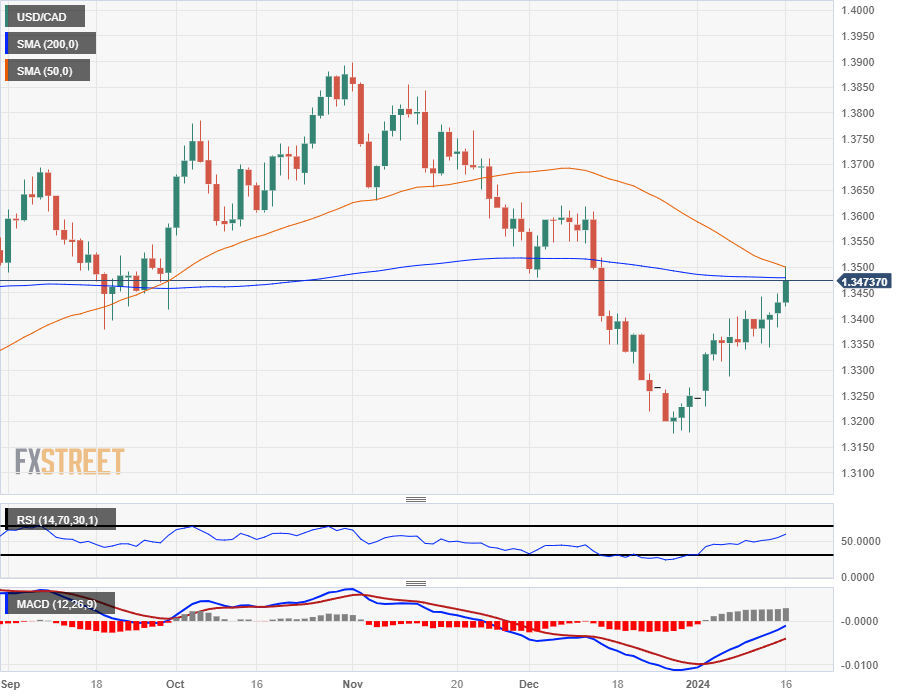
Canadian Dollar FAQs
What key factors drive the Canadian Dollar?
The key factors driving the Canadian Dollar (CAD) are the level of interest rates set by the Bank of Canada (BoC), the price of Oil, Canada’s largest export, the health of its economy, inflation and the Trade Balance, which is the difference between the value of Canada’s exports versus its imports. Other factors include market sentiment – whether investors are taking on more risky assets (risk-on) or seeking safe-havens (risk-off) – with risk-on being CAD-positive. As its largest trading partner, the health of the US economy is also a key factor influencing the Canadian Dollar.
How do the decisions of the Bank of Canada impact the Canadian Dollar?
The Bank of Canada (BoC) has a significant influence on the Canadian Dollar by setting the level of interest rates that banks can lend to one another. This influences the level of interest rates for everyone. The main goal of the BoC is to maintain inflation at 1-3% by adjusting interest rates up or down. Relatively higher interest rates tend to be positive for the CAD. The Bank of Canada can also use quantitative easing and tightening to influence credit conditions, with the former CAD-negative and the latter CAD-positive.
How does the price of Oil impact the Canadian Dollar?
The price of Oil is a key factor impacting the value of the Canadian Dollar. Petroleum is Canada’s biggest export, so Oil price tends to have an immediate impact on the CAD value. Generally, if Oil price rises CAD also goes up, as aggregate demand for the currency increases. The opposite is the case if the price of Oil falls. Higher Oil prices also tend to result in a greater likelihood of a positive Trade Balance, which is also supportive of the CAD.
How does inflation data impact the value of the Canadian Dollar?
While inflation had always traditionally been thought of as a negative factor for a currency since it lowers the value of money, the opposite has actually been the case in modern times with the relaxation of cross-border capital controls. Higher inflation tends to lead central banks to put up interest rates which attracts more capital inflows from global investors seeking a lucrative place to keep their money. This increases demand for the local currency, which in Canada’s case is the Canadian Dollar.
How does economic data influence the value of the Canadian Dollar?
Macroeconomic data releases gauge the health of the economy and can have an impact on the Canadian Dollar. Indicators such as GDP, Manufacturing and Services PMIs, employment, and consumer sentiment surveys can all influence the direction of the CAD. A strong economy is good for the Canadian Dollar. Not only does it attract more foreign investment but it may encourage the Bank of Canada to put up interest rates, leading to a stronger currency. If economic data is weak, however, the CAD is likely to fall.
- Mexican Peso drops for a second consecutive day, falling 1.64% against a robust US Dollar buoyed by risk aversion and a less dovish Fed outlook.
- USD/MXN pair approaches the critical 50-day SMA as risk aversion hits Wall Street in exchange for US Dollar safety.
- Fed Governor Waller's latest remarks hint at the possibility of easing monetary policy, though it would be slower than investors’ expectations.
The Mexican Peso posts back-to-back days with losses and plummets sharply against the US Dollar (USD), which benefits from risk aversion, and traders pricing in a less dovish Federal Reserve (Fed), according to Chicago Board of Trade (CBOT) data. That, alongside a jump in US Treasury bond yields, has sponsored the USD/MXN with a substantial leg up, trading at 17.13 or 1.51% higher.
Market sentiment remained sour on Tuesday as Wall Street resumed trading and began a short week in the red as market participants came back from a holiday. Traders in the futures market trimmed bets that the Fed would cut rates aggressively, bolstering the Greenback as the US Dollar Index (DXY) rises 0.60% to 103.29. Consequently, the USD/MXN pair edged toward the 50-day Simple Moving Average (SMA) near 17.18, with buyers threatening to reclaim that level, posing their eyes on the confluence of the 100 and 200-day SMAs.
In the meantime, Fed Governor Christopher Waller is crossing the newswires, saying that data could “allow” the Fed to consider easing monetary policy.
Daily digest market movers: Mexican Peso tumbles as Fed’s Waller supports cuts if inflation stays low
- Fed’s Waller added that policy could be adjusted as long as inflation doesn’t rebound or stay high and emphasized the Fed could cut rates by 75 basis points in 2024. He added rate cuts should be made methodically, adding that there’s no reason to cut as quickly as in the past.
- The New York Fed Empire State Manufacturing Index for January declined to -43.7 compared to estimates of -5 and a December reading of -14.5. This sharp slump raises concerns about the potential for a recovery in the manufacturing sector. Furthermore, in the latest month, the ISM Manufacturing PMI continued to indicate a contraction in the sector, marking 14 consecutive months of contractionary readings.
- Mexico’s economic data released in January shows the economy is encountering several challenges. Inflation in the country increased from 4.32% to 4.66% YoY in December, surpassing the projected figure of 4.55%. Additionally, the same report showed that while underlying inflation is trending downward toward 5%, it remains elevated. This persistent high level of underlying inflation could potentially discourage officials at Banxico (the Central Bank of Mexico) from implementing an easing of monetary policy in the first quarter of 2024.
- In addition to that, Industrial Production plunged -1.0% MoM after achieving eight months of expansion, indicating that higher interest rates set by Banxico at 11.25% are beginning to impact the economy.
- In that regard, Auto Production for December slumped from 18.1% to -9.9% YoY.
- Confidence surveys released on January 3 and 8 showed that business confidence remained high at 54.6, bolstered by “nearshoring” prospects. However, consumers have begun to turn pessimistic as they expect inflation and economic deceleration to weigh on their economies.
- The week’s Mexican economic docket will feature Retail Sales for November, expected to remain unchanged at 3.4% YoY, according to the consensus.
- Although December’s meeting minutes from Banxico (the Central Bank of Mexico) suggest that the central bank might contemplate easing its monetary policy, the inflation report for December could hinder any move toward policy relaxation.
- Analysts at Standard Chartered noted, “We expect the policy rate to be lowered to 9.25% by end-2024, although an official downward revision in the output gap could open the door for more aggressive rate cuts.”
- On January 5, a Reuters poll suggested the Mexican Peso could weaken 5.4% to 18.00 per US Dollar in the 12 months following December.
Technical analysis: Mexican Peso slumps sharply as USD/MXN climbs toward 17.15
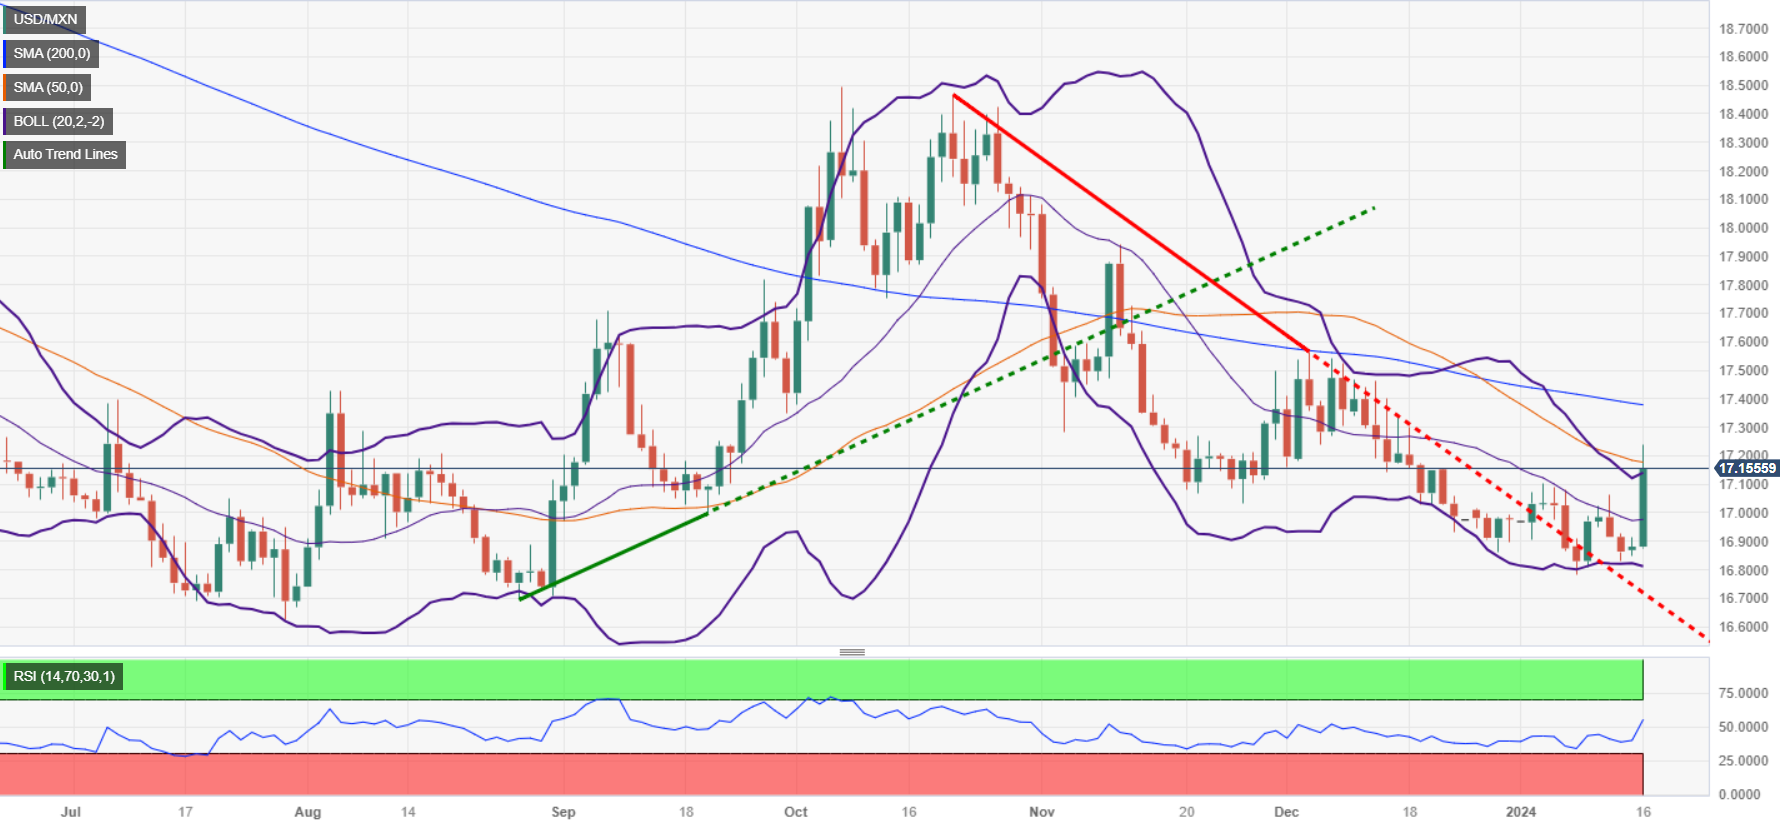
The USD/MXN has shifted to a neutral bias as buyers lifted the exchange rate past the 17.00 figure, opening the door to challenge the 50-day SMA at 17.18. A breach of the latter would expose the confluence of the 200 and 100-day SMAs at around 17.38/17.40. Further upside is seen at December’s high of 17.56, followed by the May 23 high of 17.99.
On the contrary, if bears drag prices below 17.00, that could exacerbate a retest of the January 12 low of 16.82, followed by the January 8 low of 16.78. Once those two levels are cleared, the next stop would be the August 28 cycle low of 16.69, ahead of last year’s low of 16.62.
USD/MXN Price Action – Daily Chart
Mexican Peso FAQs
What key factors drive the Mexican Peso?
The Mexican Peso (MXN) is the most traded currency among its Latin American peers. Its value is broadly determined by the performance of the Mexican economy, the country’s central bank’s policy, the amount of foreign investment in the country and even the levels of remittances sent by Mexicans who live abroad, particularly in the United States. Geopolitical trends can also move MXN: for example, the process of nearshoring – or the decision by some firms to relocate manufacturing capacity and supply chains closer to their home countries – is also seen as a catalyst for the Mexican currency as the country is considered a key manufacturing hub in the American continent. Another catalyst for MXN is Oil prices as Mexico is a key exporter of the commodity.
How do decisions of the Banxico impact the Mexican Peso?
The main objective of Mexico’s central bank, also known as Banxico, is to maintain inflation at low and stable levels (at or close to its target of 3%, the midpoint in a tolerance band of between 2% and 4%). To this end, the bank sets an appropriate level of interest rates. When inflation is too high, Banxico will attempt to tame it by raising interest rates, making it more expensive for households and businesses to borrow money, thus cooling demand and the overall economy. Higher interest rates are generally positive for the Mexican Peso (MXN) as they lead to higher yields, making the country a more attractive place for investors. On the contrary, lower interest rates tend to weaken MXN.
How does economic data influence the value of the Mexican Peso?
Macroeconomic data releases are key to assess the state of the economy and can have an impact on the Mexican Peso (MXN) valuation. A strong Mexican economy, based on high economic growth, low unemployment and high confidence is good for MXN. Not only does it attract more foreign investment but it may encourage the Bank of Mexico (Banxico) to increase interest rates, particularly if this strength comes together with elevated inflation. However, if economic data is weak, MXN is likely to depreciate.
How does broader risk sentiment impact the Mexican Peso?
As an emerging-market currency, the Mexican Peso (MXN) tends to strive during risk-on periods, or when investors perceive that broader market risks are low and thus are eager to engage with investments that carry a higher risk. Conversely, MXN tends to weaken at times of market turbulence or economic uncertainty as investors tend to sell higher-risk assets and flee to the more-stable safe havens.
- EUR/GBP trades mildly lower at 0.8596 after hitting a high of 0.8620.
- Daily chart indicators hint at strengthening selling momentum: RSI is in negative terrain, and MACD's histogram depicts rising red bars.
- The four-hour chart affirms a bearish outlook with weakened bullish power.
In Tuesday's session, the EUR/GBP was observed trading mildly lower at 0.8596 after hitting a daily high of 0.8621 as the bulls struggled to hold their momentum. In the four-hour chart, the selling dominance is more evident.
Indicators on the daily chart are reflecting a bearish dominance currently in play. The negative Relative Strength Index (RSI) slope, in conjunction with its present location in the negative territory, underscores the strengthened bearish momentum. Concurrently, the red bars of the Moving Average Convergence Divergence (MACD) supplement this bearish tilt. In addition, the pair's position below the 20, 100, and 200-day Simple Moving Averages (SMAs) reiterates the widespread bearish control, creating a tough landscape for buyers to recuperate. In addition, the 200 and 100-day averages are about to perform a bearish crossover at around 0.8650, which may add further momentum to the sellers.
In the shorter time frame, as denoted by the four-hour chart, the bears appear to have an even greater grip. The negative slope and negative territory of the four-hour RSI amplify the bearish trend, indicating that sell-offs are predominant at this juncture. Similarly, the rising red bars of the four-hour MACD underpin a growing downtrend in the short-term outlook.
EUR/GBP technical levels
EUR/GBP daily chart
-638410183893952184.png)
Federal Reserve (Fed) Governor Christopher Waller crossed headlines warning that despite data developments in the inflation outlook allowing the Fed to begin outlining plans for rate cuts looking forward, markets shouldn't be expecting the Fed to rush anytime soon.
Money markets adjusted rate cut bets after Waller's notes, Fed swaps now see 15 basis points of easing in March versus last Friday's bets of 19 bps.
Key highlights:
- Recent data allows Fed to consider policy rate cuts, but only if inflation continues to moderate.
- Markets need to be aware of revision risks in inflation prints.
- Waller believes current policy is set properly.
- Fed needs to be "cautious", cannot rush into rate cuts.
- Waller reaffirms his outlook is consistent with dot plot; three 25 bps cuts by the end of 2024.
- Believes the Fed is "within striking distance" of 2% inflation.
The Mexican Peso (MXN) continues to perform well. Economists at ING analyze USD/MXN outlook.
Will Peso strength lead to early Banxico easing?
The market is starting to consider some early Banxico easing. 50 bps of cuts are priced over the next six months and 175 bps over the next 12. We think that could be too conservative and that the strong, real trade-weighted Peso could spark some early easing. Remember, the 575 bps policy spread over the Fed is wide.
With real rates so high in Mexico, we doubt early Banxico easing damages the Peso – and see it staying in a 16.75/17.25 range.
The US Dollar has strengthened this week. Economists at Rabobank analyze Greenback’s outlook.
Politics can be expected to creep back into the picture
The USD will clearly be buffeted by the ‘will they, won’t they’ debate around rate cut decisions this year. On top of that, politics can be expected to creep back into the picture.
Trump’s easy win in the Iowa caucus this week appears to increase the odds that the US presidential election will be another race between himself and Biden.
Another Trump term in the White House would raise questions about Nato which could have serious implications for European defence spending. The US could also be less of a partner in issues related to climate change while the issue of tariffs on some European goods could again be a feature. This would come at a time when European national budgets have been stretched by Covid support and when growth is softening. These risks could add to downside pressure on the EUR vs. the USD.
We see risk of EUR/USD dipping to 1.05 on a thee-month view mostly on the back of the market pushing back its expectations regarding Fed rate cuts.
- AUD/USD dips pressured by rising US Treasury yields and a robust 0.60% gain in the US Dollar Index (DXY).
- Deteriorating risk appetite and expectations of less aggressive Fed rate cuts contribute to the AUD's weakness; Fed Governor Waller's speech highly anticipated.
- Australian consumer sentiment wanes amid higher mortgage rates and living costs, despite potential RBA restraint in further rate hikes due to slowing inflation.
The Australian Dollar (AUD) tumbles sharply against the US Dollar (USD) as US Treasury yields climb and the Greenback (USD) posts solid gains of more than 0.50% via the US Dollar Index (DXY). Expectations that the US Federal Reserve (Fed) would cut rates in the year had been tempered, a headwind for the AUD/USD pair, which trades at 0.6596, down 0.93%.
Aussie Dollar’s dropped sharply weighed by deterioration in Australia’s consumer sentiment
Risk appetite had deteriorated while US Treasury bond yields had risen as investors trimmed overaggressive bets that the Fed would ease monetary policy as soon as March. The lack of economic data in the docket, except for the New York Fed Empire State Manufacturing Index for January plummeting sharply at -43.7 vs. estimates of -5, and December’s -14.5, casting doubts of a recovery in the manufacturing sector. For the latest month, the ISM Manufacturing PMI remained in contractionary territory for 14 consecutive months.
Aside from this, traders are awaiting a speech of Fed Governor Christopher Waller, which shifted from one of the strongest hawks to a dove in his latest speech in December, which opened the door for the Santa Claus rally in US equities in December.
In the meantime, the AUD/USD is driven by a strong US Dollar. The DXY, which measures the buck's performance against six currencies, posted solid gains of 0.60%, at 103.28, underpinned by the 10-year benchmark note rate at 4.01%, gaining six basis points.
On the Australian front, January’s consumer sentiment deteriorated, which was blamed on higher mortgage rates and the cost of living, according to the report. It should be said the Reserve Bank of Australia (RBA) hiked rates up to 4.35%, a 12-year high, and kept the door open for further tightening if inflationary figures remain high. Nevertheless, a downtick in the latest monthly inflation report could deter the RBA from increasing rates.
AUD/USD Price Analysis: Technical outlook
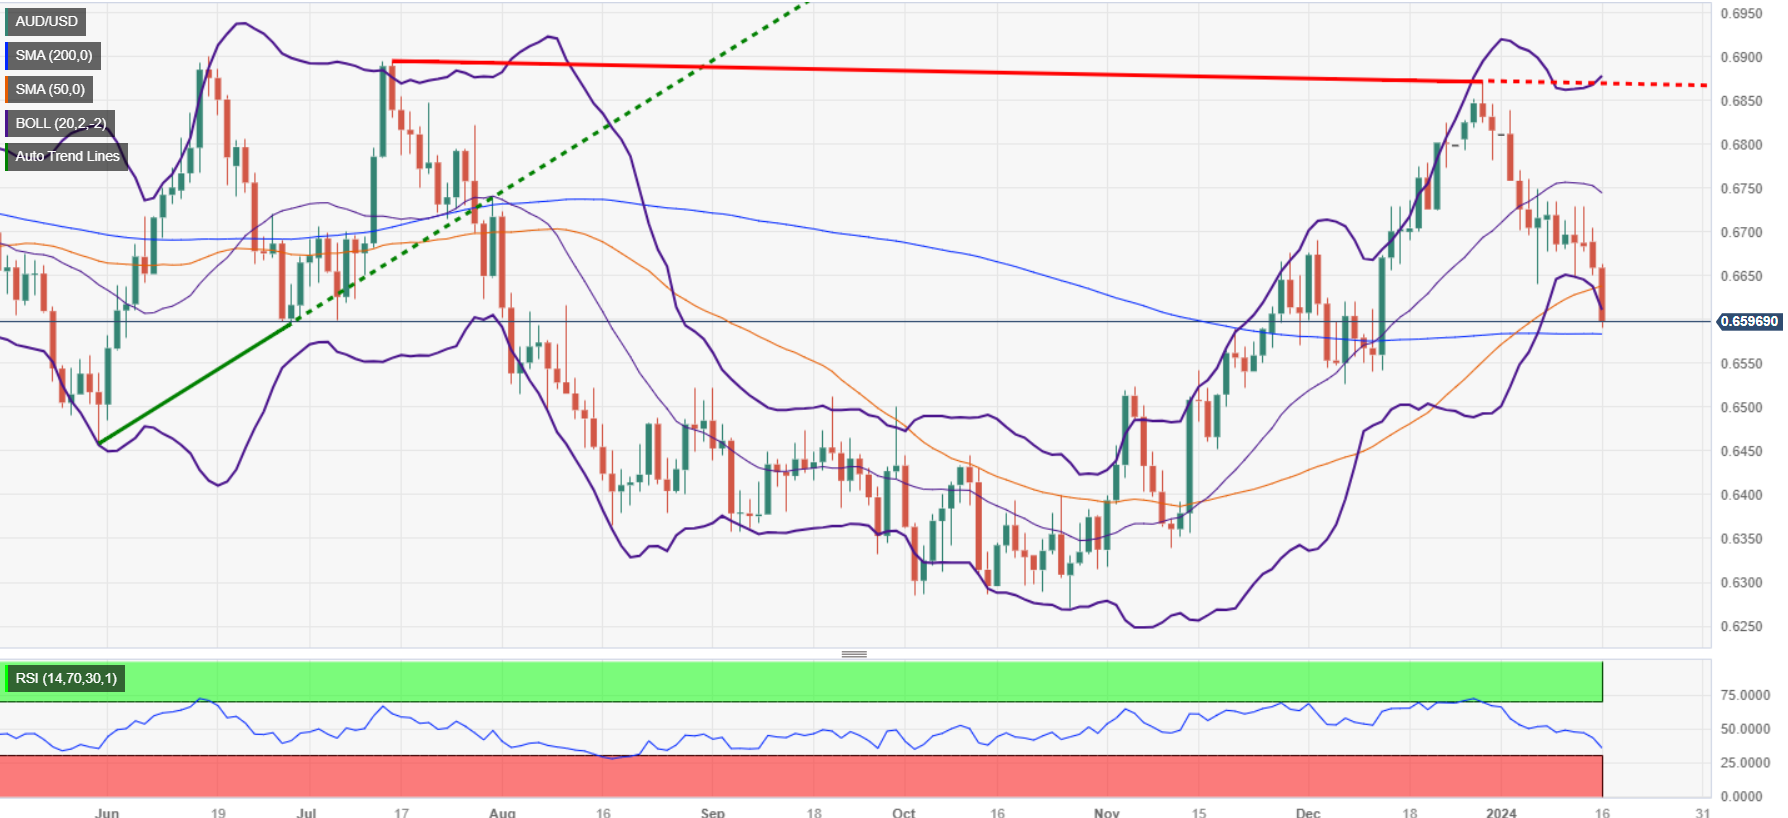
Given the fundamental backdrop, the AUD/USD shifted neutral to slightly downwards, extending its losses and breaking support at the 50-day moving average (DMA) at 0.6629, putting into play a challenge of the 200-DMA at 0.6581. If sellers could decisively break the latter, expect additional selling pressure, which could cause prices to tumble towards December’s 7 low of 0.6525. On the other hand, if buyers defend the 200-DMA and reclaim 0.6600, that could pave the way to re-test the January 5 swing low seen at 0.6640.
The United Kingdom will release the Consumer Price Index (CPI) report on Wednesday, January 17 at 07:00 GMT and as we get closer to the release time, here are the forecasts by the economists and researchers of four major banks regarding the upcoming UK inflation print.
December’s data follows the particularly weak November report as core inflation came down slightly to just below 5% year-on-year for the first time since January 2022.
Headline inflation for December is expected to fall a tick to 3.8% YoW while core is expected to fall two ticks to 4.9% YoY. If so, headline would be the lowest since September 2021. Furthermore, services CPI inflation is forecast to ease two ticks to 6.1% YoY.
TDS
We expect another soft report and see headline falling a tick to 3.8% YoY and core declining to 4.9% YoY. Moreover, services inflation will likely fall to 6.0% YoY. We continue to look for the BoE to start cutting Bank Rate in May, but another weak inflation report will make a dovish pivot at the February meeting even easier to justify.
ING
UK services inflation looks set to come in at 6.1%, well below where the BoE had forecast it back in its November policy report. Along with wage growth, which has also finally started to moderate, these are the key metrics upon which the Bank has signalled it will base its rate cut decisions. For now though, 6%+ services CPI is still too high and it’s likely to stay in this region into the first couple of months of 2024. But things will start to change as we head towards summer. Thanks to moderating food and consumer goods inflation, as well as lower petrol prices, headline inflation is set to fall to 1.6% in May on our current forecasts. Services inflation should be down to 4% by the summer too. Assuming we get a fiscal boost in March – we forecast the Chancellor’s £13bn headroom will double at the next budget, enabling tax cuts – the BoE may be tempted to wait a little longer before cutting rates. We’re forecasting an August cut, though faster-than-expected declines in services CPI and/or wage growth could conceivably see that date come forward.
SocGen
Lower food and goods inflation should contribute to headline inflation having fell by 0.2pp to 3.7% in December, with core easing by 0.3pp to 4.8%. Looking ahead, the continued easing in pay growth and supply shocks should drag inflation below 2% in April. The recent easing in wholesale gas prices has reaffirmed our view that headline inflation may remain below 2% from April. Having said this, aside from a resilient labour market keeping pay sticky, the recent Red Sea tensions causing shipping costs from China to Europe to rise by 180% since 1H23 and increased border checks for food in January could see stronger inflation than we currently forecast.
The US Dollar is stronger on the session. Economists at Scotiabank analyze Greenback’s outlook.
Bull technical signals pick up
A further correction in the USD’s hefty Q4 sell-off has been looking a strong likelihood; price action around the late year rebound in the USD generally suggested a major low/reversal on the charts; seasonal trends are USD positive in Q1 – and especially so in January – while markets may have gotten over their skis a little on Fed pricing, although swaps are showing little change this morning, with 18-19 bps of cuts priced in for the March FOMC still.
Technically, corrective gains in the DXY are poised to extend towards 104 (103.87 is the 50% Fibonacci retracement of the Q4 decline in the index) and might reach 104.63 (61.8% retracement resistance).
Support for the index sits around the 103 area now.
- NZD/USD has plunged to near 0.6150 on downbeat market sentiment.
- Investors project that the US Retail Sales grew by 0.4% vs. 0.3% increment in November.
- RBNZ Conway is expected to push back market expectations of early rate cuts.
The NZD/USD pair has printed a fresh monthly low near 0.6150 in the early New York session. The Kiwi asset has faced a sharp sell-off as investors have rushed towards safe-haven assets amid deepening crises in the Middle East region and uncertainty about when the Federal Reserve (Fed) will start its rate-cut cycle.
The S&P500 is expected to open on a bearish note, considering negative cues from overnight futures. The market mood is quite bearish as Iran-backed-Houthi rebels have threatened that they will strike back for launching airstrikes by the US military in Yemen.
Meanwhile, the US Dollar Index (DXY) looks firm near fresh weekly high around 103.20 as market participants are reviewing strong bets supporting a rate cut by the Fed in March. Investors have turned cautious about the Fed reducing interest rates from March as inflation data for December remained stubborn than projected.
Apart from that, Atlanta Fed President Raphael Bostic said it is too early to discuss rate cuts as the progress in inflation returning towards the 2% target has slowed.
Investors await the US Retail Sales data for December, which will be published on Wednesday. The economic data is expected to grow by 0.4% against 0.3% increase in November.
On the New Zealand Dollar front, investors await the speech from Reserve Bank of New Zealand (RBNZ) policymaker Paul Conway in which he is expected to push back market expectations supporting a rate cut sooner. The inflation in the New Zealand economy is significantly higher than what required by RBNZ policymakers, which would allow them to maintain a restrictive stance.
USD/CAD cracked technical resistance. Economists at Scotiabank analyze the pair’s outlook.
Intraday support on minor dips to 1.3475/1.3480
USD/CAD gains through noted resistance at 1.3440/1.3450 pave the way for more, corrective gains in the USD in the short run.
The USD has a clear technical path towards 1.3540 (50% Fibonacci retracement of the Q4 USD sell-off), with a fuller recovery to 1.3624 (61.8% Fibonacci) not to be ruled out.
Look for support on minor dips to 1.3475/1.3480 intraday (200-DMA at 1.3479), with stronger support at 1.3440/1.3450.
- The Canadian Dollar picks up following mixed inflation figures in Canada.
- Weak US manufacturing data has increased negative pressure on the Dollar.
- USD/CAD remains trending higher, with 1.3420 and 1.3350 likely to hold bears.
Consumer prices eased in Canada in December, according to data by Canada Statistics, although the headline rate accelerated from November. In the US, a NY Fed manufacturing gauge revealed a sharp deterioration in the sector, adding negative pressure to the US Dollar.
Canadian CPI declined 0.3% in December, as expected, while the yearly rate grew at a 3.4% pace, up from 3.1% in the previous month. The BoC Core CPI, however, shows a different picture with the monthly rate 0.5% lower and the yearly inflation declining to 2.6% from the previous 2.8%.
US manufacturing activity data disappoints
At the same time, the New York Fed Empire State Index has dropped to -43.7 in January from -14.5 in December, against expectations of a -5 reading. These figures are sending a negative picture of factory activity and eroding speculative demand for the USD.
The USD/CAD has posted a knee-jerk reaction at 1.3500 intra-day highs, retreating to the mid-range of 1.3400 at the moment of writing.
The pair, however, maintains the broader positive trend, with support levels are 1.3420 and 1.3350 likely to provide significant support ahead of Fed Waller’s speech.
On the upside, immediate resistance is at 1.3500, with the next target at 1.3545.
Technical levels to watch
GBP/USD eases to retest the 1.26 support. Economists at Scotiabank analyze the pair’s outlook.
UK wage growth slows sharply
Slowing wages and some easing in labour market tightness will help dampen broader price pressures and pave the way for lower BoE rates later this year.
Cable continues to respect the 1.2600/1.2825 range in place over the past month.
Trend signals are leaning a bit more GBP-bearish but the pair really needs to crack 1.26 to signal more downside potential towards 1.25, if not lower.
- WTI rallies above $73 as investors turn cautious about deepening Middle East crisis.
- Soft China Q3 GDP data could stall rally in the oil price.
- The USD Index climbs above 103.00 as bets supporting a Fed’s rate cut in March have eased slightly.
West Texas Intermediate (WTI), futures on NYMEX, has climbed to near $73.50 as investors see a strong tightening of oil supply amid fears of more airstrikes by Iran-backed Houth rebels on commercial shipments from Red Sea including US ships. The Houthi group has threatened to continue attacks on merchant vessels in retaliation for airstrikes launched by the US military group on forces in Yemen.
The oil price delivers a sharp recovery despite advancing US Dollar Index (DXY). The USD Index has printed a fresh weekly high above 103.00 as investors are reconsidering their bets in favour of rate cuts by the Federal Reserve (Fed) in March.
Meanwhile, investors await China’s Q4 Gross Domestic Product (GDP) data, which will be published on Wednesday. The annual GDP is projected to deliver a robust growth of 5.3% against 4.9% reported earlier. While quarterly GDP growth is seen at 1.0%, slower than 1.3% increase in the previous quarter due to vulnerable economic prospects.
It is worth noting that China is the leading importer of oil in the world and a sharp recovery in the Chinese economy will strengthen the oil price.
WTI oscillates in a Symmetrical Triangle chart pattern formed on a four-hour scale, which indicates a sharp contraction in volatility. The 200-period Exponential Moving Average (EMA) around $73.60 is acting as a barricade for the oil price bulls.
The Relative Strength Index (RSI) (14) continues to oscillate in the 40.00-60.00 range, which indicates that investors await a potential trigger.
A bullish reversal could emerge if the asset breaks above January’s high of $75.28. This would drive the asset towards December 26 high at $76.22, followed by November 20 high at $78.46.
On the flip side, the oil price could face a sell-off if it drops below January 10 low around $71.00. This would drag the asset towards the psychological support of $70.00 and December 7low of $69.00.
WTI four-hour chart
-638410074527510177.png)
The CAD is softer against the generally stronger USD. Economists at Scotiabank analyze the pair’s outlook.
CPI data ahead
December Consumer Price Index (CPI) report is expected to reflect a 0.3% gain in headline prices in the month and nudge up to 3.4% (from 3.1% in November). Core measures of inflation are expected to drop a tenth in YoY terms from November’s 3.5% (Trim) and 3.4% (Median).
Sticky inflation data may help firm up the CAD a little.
See – Canada CPI Preview: Forecasts from five major banks, inflation likely ticked up in December
- Precious metals depreciate with the US Dollar rallying as investors pare back bets of March cuts.
- The rising geopolitical tensions are increasing support for the safe-haven USD.
- XAG/USD has a key supporter level at $2250.
Silver (XAG/USD), like all precious metals, is depreciating today as the US Dollar regains lost ground. The combination of dwindling Fed rate cut hopes and higher demand for safe assets amid the increasing geopolitical tensions is underpinning a significant USDollar recovery.
A slew of ECB speakers playing down hopes of immediate rate cuts have forced investors to rethink their bets on Fed easing in March. Later today Christopher Waller, a hawkish Fed Board member is likely to reinforce that view ahead of Wednesday’s US retail sales data.
Beyond that, news that Houthis have extended their targets to US and UK vessels, in retaliation for this weekend’s attacks, has increased risk aversion. The unstable situation in the Red Sea is likely to boost transport prices, phishing inflation higher in the mid-term and pose a challenge for the major central banks.
In this context, the US Dollar is trading higher, fuelled by higher US Treasury yields, in the detriment of the yieldless metals.
XAG/USD has an important support level at $22.50
From a wider perspective, the pair is trading within a falling triangle, with bears focusing on the $22.50 support area. Below here, more sellers might come along, increasing negative pressure towards $21.90 ahead of the $20.70 level.
On the contrary, a bullish reaction above $23.53 would ease downside pressure and expose the $24.60 level.
XAG/USD Daily Chart
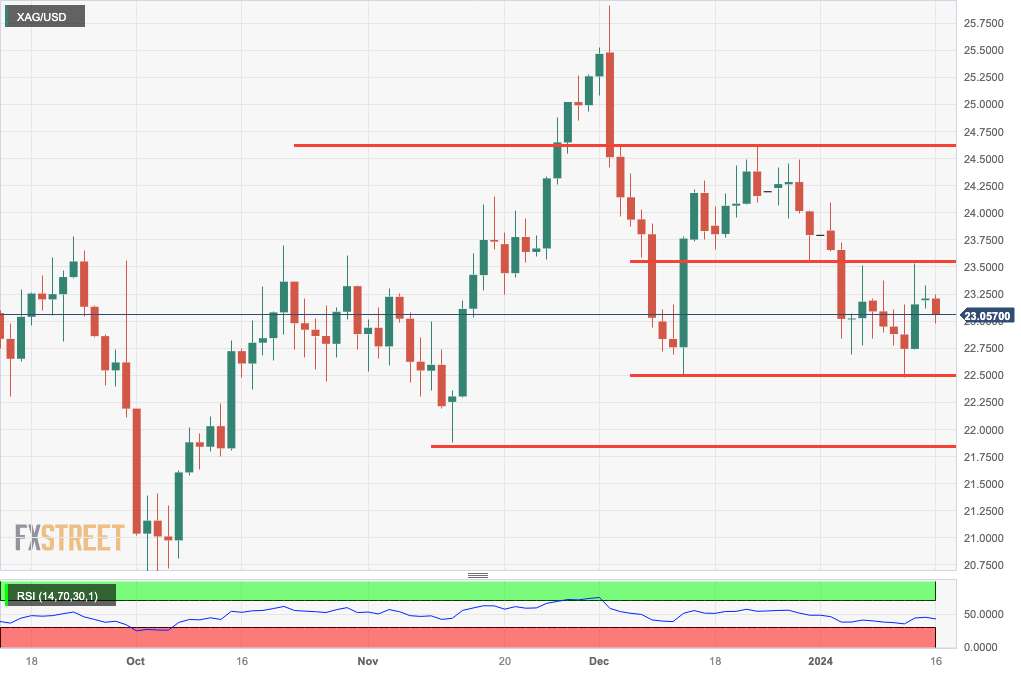
Technical Levels to Watch
EUR/USD slips to retest upper 1.08s. Economists at Scotiabank analyze the pair’s outlook.
EUR/USD should continue to pressure the upper 1.08s in the short run
Bearish trend momentum is picking up on the shorter-term studies and spot should continue to pressure the upper 1.08s in the short run.
Price action over the past month or so is taking the shape of a bearish Head & Shoulder top; the pattern is not ‘textbook’ but it passes the ‘duck test’ for me.
A clear break under 1.0870 neckline would tilt the balance of risks to more EUR losses in the near to medium term towards the mid/upper 1.06s.
- The US Dollar trades in the green across the board on Tuesday with US markets set to open this week.
- Traders are buying into the Greenback after Trump claims victory in Iowa.
- The US Dollar Index jumps to 103 and snaps out of the technical selling area.
The US Dollar (USD) is breaking eggs this Tuesday with markets trembling on the outcome of the first Caucus election for the Republican Party (GOP) candidate who will pick up the gloves against Joe Biden in the presidential runoff later this year. Former US President Donald Trump won with a clear landslide victory of nearly 51%. Iowa bears a lot of importance because in the past, Trump was not able to win the state’s support in previous Caususses.
This result could mean that Trump could book further landslide wins in other states where he already has enough votes and supporters to become the only main candidate for the GOP. Meanwhile on the calendar front, traders are bracing for a speech from US Federal Reserve member of the Board of Directors Christopher Waller, due later this Tuesday. His dovish comments in November moved the markets substantially, triggering substantial US Dollar weakness throughout December.
Daily digest market movers: It’s Monday for the US
- The World Economic Forum in Davos is entering its second day with a lot of headline risk from senior people – central bankers and leaders – making comments, statements and holding interviews.
- It is a very light US calendar, with the New York Empire State Manufacturing Index due near 13:30 GMT. The previous number was -14.5 with a contraction of -5 expected in January.
- The US Treasury is heading to the short-term funding part of the market to allocate a 3-month and a 6-month bill tender near 15:30.
- Right at the end of this Tuesday, US Fed’s Waller is due to speak near 16:00. Should he turn hawkish and push back on his earlier statement from November, that could mean more gains for the US Dollar.
- Equity markets are in a bad mood and are selling off with the Hong Kong Hang Seng Index dropping over 2%. European equities are down near 1% while US futures are opening on the downside by half of one percent.
- The CME Group’s FedWatch Tool shows that markets are pricing in a 95.3% chance that the Federal Reserve will keep interest rates unchanged at its January 31 meeting. Around 4.7% expect the first cut already to take place. The return to 95.3% unchanged fits with the US yield jumping a few basis points higher.
- The benchmark 10-year US Treasury Note jumps to 3.99% with Bond trading coming online again in Asia on Tuesday morning.
US Dollar Index Technical Analysis: Snap goes the trend line
The US Dollar Index (DXY) pops out of the selling pressure and suddenly has the road wide open for more upside. The jump comes on the back of headlines that confirmed Donald Trump as the big winner in Iowa in the first Caucus election for the Republican Party. The move comes as this is a crucial state where Trump in the past was unable to win, and could mean that other Primaries are becoming redundant with the US gearing up for a Trump-Biden election battle for the White House seat in November.
With the descending trend line being firmly broken, a short squeeze could get underway with the DXY running up higher and squeezing out the traders who sold the Greenback alongside the descending trend line from October 2023. Even 102.90 got broken and offers a window of opportunity to head to 103.44 and 103.49, where the 55-day and the 200-day Simple Moving Averages (SMA) are residing respectively. Should even those get broken later this week, expect to see a stretched rally up to 104.44 towards the 100-day SMA.
In case a turnaround unfolds, expect a drop back to the descending trend line near 102.67. Should the US Dollar reenter below that descending trend line, expect to see a quick sell-off towards 102.00 first and next 101.00 before testing the low near 100.82.
US Dollar FAQs
What is the US Dollar?
The US Dollar (USD) is the official currency of the United States of America, and the ‘de facto’ currency of a significant number of other countries where it is found in circulation alongside local notes. It is the most heavily traded currency in the world, accounting for over 88% of all global foreign exchange turnover, or an average of $6.6 trillion in transactions per day, according to data from 2022.
Following the second world war, the USD took over from the British Pound as the world’s reserve currency. For most of its history, the US Dollar was backed by Gold, until the Bretton Woods Agreement in 1971 when the Gold Standard went away.
How do the decisions of the Federal Reserve impact the US Dollar?
The most important single factor impacting on the value of the US Dollar is monetary policy, which is shaped by the Federal Reserve (Fed). The Fed has two mandates: to achieve price stability (control inflation) and foster full employment. Its primary tool to achieve these two goals is by adjusting interest rates.
When prices are rising too quickly and inflation is above the Fed’s 2% target, the Fed will raise rates, which helps the USD value. When inflation falls below 2% or the Unemployment Rate is too high, the Fed may lower interest rates, which weighs on the Greenback.
What is Quantitative Easing and how does it influence the US Dollar?
In extreme situations, the Federal Reserve can also print more Dollars and enact quantitative easing (QE). QE is the process by which the Fed substantially increases the flow of credit in a stuck financial system.
It is a non-standard policy measure used when credit has dried up because banks will not lend to each other (out of the fear of counterparty default). It is a last resort when simply lowering interest rates is unlikely to achieve the necessary result. It was the Fed’s weapon of choice to combat the credit crunch that occurred during the Great Financial Crisis in 2008. It involves the Fed printing more Dollars and using them to buy US government bonds predominantly from financial institutions. QE usually leads to a weaker US Dollar.
What is Quantitative Tightening and how does it influence the US Dollar?
Quantitative tightening (QT) is the reverse process whereby the Federal Reserve stops buying bonds from financial institutions and does not reinvest the principal from the bonds it holds maturing in new purchases. It is usually positive for the US Dollar.
The rebound in the Dollar has taken USD/CAD back above the 1.34 mark. Economists at ING analyze the pair’s outlook.
BoC to follow Fed’s dovish turn
Incoming US data should continue to be a key driver for CAD in the crosses, given its high correlation with US economic sentiment.
The Bank of Canada meets on 24 January, and we see a high chance that it will follow the Fed in signalling rate cuts by year-end, thus dropping its tightening bias.
We remain unexcited about CAD’s prospects, and some benefits from residual resilience in US data may be offset by a more dovish BoC.
USD/CAD – 1M 1.35 3M 1.35 6M 1.33 12M 1.28
- The Euro is trimming losses following on hawkish ECB comments and higher German CPI.
- In the UK higher unemployment claims and easing wage pressures are weighing on the Pound.
- EUR/GBP bullish momentum will increase above 0.8615.
The Euro is trimming some losses against the Pound Sterling. The pair is testing the resistance area right above 0.8600, favoured by hawkish ECB speak and higher German CPI while the soft UK employment data weighs on the GBP.
The Bank of France Governor, Francois Villeroy de Galhau has reiterated Bundesbank Nagel’s comment from Monday, affirming that it is still too early to consider rate cuts. The German CPI, which has accelerated to a 3.7% yearly reading in December, from 3.2% in the previous month, has endorsed those comments.
In the UK, the Unemployment level remained steady at 4.2% In the three months to November. The higher unemployment claims and the slower wage growth, however, have punished the Pound.
The technical picture remains negative, although bearish pressure has faded. A clear move above 0.8616 would increase and shift the focus towards the 0/8640/50 area. Support levels are 0.8580 and 0.8550.
Technical levels to watch
The Polish Zloty (PLN) tested weakest levels since November. Economists at ING analyze EUR/PLN outlook.
Political story starting to interfere with the sentiment in financial markets
In Poland, it seems that the political story is starting to interfere with the sentiment in financial markets. With the Zloty being the only currency supported by higher rates these days, EUR/PLN briefly tested the highest levels since last November.
With a hawkish National Bank of Poland, the IRS curve would indicate EUR/PLN levels more around 4.32. It seems that political noise and heavy long positioning will make PLN suffer in the coming days given that the political story in Poland seems to be just beginning.
- Natural Gas trades below $2.60, risking the uptrend seen since December.
- Traders are sending gas futures lower as European demand stutters and US Dollar strengthens.
- The US Dollar Index jumps towards 103.00 after Trump booked a landslide victory in Iowa.
Natural Gas (XNG/USD) sank in another downbeat day this week, trading over 3% on the downside on Tuesday. Markets seem to have reached the end of their enthusiasm when it comes to pricing in rate cuts by the world’s major central banks. Meanwhile, recent data suggests that the German economy is coming to a halt, while other countries in the Eurozone also start to signal slowdowns in their economic indicators. This means less demand from Europe for Natural Gas.
Meanwhile, the US Dollar (USD) is not helping as the Greenback is pumping higher on Tuesday. US markets were closed on Monday due to Martin Luther King Birthday, and the US bond market has opened with a bang in Asia. Headlines on former US President Donald Trump obliterating his competition in the first Republican Presidential Candidate runoff for Iowa (which Trump could not win in previous primaries) are moving the needle in favor of the Greenback.
Natural Gas is trading at $2.57 per MMBtu at the time of writing.
Natural Gas market movers: Europe’s engine stutters
- Bloomberg issued a report this Tuesday projecting a slowdown in Gas demand from China after its lacklustre economic performance.
- Qatar and Russia are joining several other big shipping companies by diverting their gas tankers away from the Suez Canal and the Red Sea.
- Several sources are confirming to Reuters that Iran’s revolutionary Guard is being deployed in Yemen with Commanders and advisors being seen on the ground.
- Norwegian firm Crown LNG is spending $1 billion to build a gas import terminal in India. The commitment comes as the Indian government looks to increase by 15% the use of Natural Gas in its energy mix by the end of 2030.
Natural Gas Technical Analysis: Risk of a breakdown
Natural Gas is flirting with a scenario of a substantial downturn, with the uptrend since December hanging by a thread. Natural Gas prices are residing near $2.55, a level which threatens the ascending trend line starting at the December’s trough and also tests the December 26 low as a second point. Should that ascending trend line be broken to the downside, a full sell-off towards $2.20 could come in the picture.
On the upside, Natural Gas is facing all the important Simple Moving Averages (SMA) as resistance levels. First up, nearby is the 200-day SMA near $2.75. Next up is the 55-day SMA at $2.85. Last but not least is the 100-day SMA at $2.95, near $3.
The ascending trend line support near $2.55 is currently under pressure and is being tested. Once broken, support near $2.47 could hold some importance to turn the break of the descending trend line into a false break. In case Gas prices further decline, expect to see a full swing decline towards $2.20 and test the low of December.
-638409969961514103.png)
XNG/USD (Daily Chart)
Gold (XAU/USD) saw brief gains at the end of last week. Strategists at Commerzbank analyze the yellow metal’s outlook.
What is driving Gold?
The recent brief rise in the price of Gold is – at least in the press – being attributed to falling US interest rate expectations on the one hand and fears of an escalation in the Middle East conflict following the intensification of the clashes in the Red Sea on the other. In our view, however, the former is likely to be the main driver of Gold's strength.
Furthermore, fears regarding an escalation of the Middle East conflict are likely to center primarily on the risk of another energy price shock. However, neither the oil price nor the European gas price have recently been able to benefit sustainably from the increasing tensions.
- The Sterling remains trapped within previous ranges with bullish momentum fading.
- Risk aversion and Weak UK employment figures are weighing on the GBP.
- In Japan, hopes that the BoJ will stand pat next week are keeping Yen bulls in check.
Sterling’s rebound from the 148.50 area has been capped right above 145.00. The pair is moving without a clear direction on Tuesday, with risk aversion weighing on the Pound, and the bullish momentum witnessed in early January losing steam.
Unemployment claims increase and wages slow down in the UK
Earlier today, the UK employment report increased negative pressure on the GBP/. Unemployment claims increased at their fastest rate since June, while earnings increased by 6.5% year-on-year, below the 6.8% expected and well below last month's 7.2% increment.
These figures suggest that the labour market might be weakening, which would ease inflationary pressures, ultimately allowing the BoE to bring rate cuts to the table.
In Japan, last week’s figures showed lower inflationary pressure, anticipating a weak CPI reading later this week. This eases pressure on the BoJ to exit its ultra-loose policy which is keeping the Pound from a deeper reversal.
From a technical perspective, the broader trend remains bullish, with the immediate price action trapped within a horizontal range. Resistances are 186.15 and 187.55. Supports lie at 184.50 and 182.70.
Technical levels to watch
Kit Juckes, Chief Global FX Strategist at Société Générale, analyzes EUR/USD outlook.
January has been Euro’s worst month on average since inception
The Dollar will not fall this year because Europe is doing really well, or because the US is weak. It will fall (modestly) because the Fed will cut rates and the currency is coming down from a very great height.
However, after the excitement about how well the Euro performed in November/December it’s worth remembering that January has been its worst month on average since inception, and the Dollar’s best over the same period. Euro bulls don’t have any reason to cheer the passing of Blue Monday.
- USD/JPY climbs quickly above 146.50 as investors reconsider bets supporting a rate cut from the Fed in March.
- Fed Bostic sees a slowdown in progress in inflation declining towards 2%.
- Upbeat Japan’s PPI data failed to offer cushion to the Japanese Yen.
The USD/JPY pair has printed a fresh monthly high at 146.60 in the European session. The major has witnessed a significant buying interest as investors are reconsidering bets supporting for a rate cut decision by the Federal Reserve (Fed) in March.
The United States economic data, released for December, has indicated that the last leg of consumer price inflation is still stubborn, labor demand is steady, however, business owners are reducing prices of goods and services at factory gates. This indicates that fears of inflation remaining persistent are still high.
As per the CME Fedwatch tool, traders see a 66% chance for the Fed reducing interest rates by 25 basis points (bps) in March against 70% from Monday’s trading session. The commentary from Atlanta Fed President Raphael Bostic pushed back market expectations of early rate cuts as he warned about languishing return of inflation towards the 2% target.
S&P500 futures have posted significant losses in the European session, indicating a sharp decline in the risk-appetite of the market participants. The US Dollar Index (DXY) has printed a fresh weekly high above 103.00 as amid cautious market mood. 10-year US Treasury yields have climbed above 4.0%.
On the Tokyo front, upbeat Producer Price Index (PPI) data for December failed to uplift the Japanese Yen. Monthly growth in the PPI was steady at 0.3% while investors anticipated a stagnant performance. The annual PPI data remained stagnant against 0.3% growth in November. Investors projected a de-growth in annual prices of goods and services at factory gates by 0.3%.
- The Aussie is under increasing bearish pressure after breaching 0.6660 support.
- Dwindling hopes of rate cuts and geopolitical tensions are boosting the US Dollar.
- Fed speakers, US Retail Sales and a string of data from China will set the pair's near-term direction.
The risk-sensitive Aussie is one of the worst performers on Tuesday, succumbing to the US Dollar’s strength. Hawkish comments by ECB policymakers and the increasing uncertainty in the Red Sea have forced traders to reassess their rate cut expectations, which is boosting the US Dollar against most of its rivals.
In Australia, recent data has shown that consumer confidence deteriorated in January, which has increased negative pressure on the Aussie.
The focus today is on the US NY Fed Empire State Manufacturing Index and a speech of Fed’s Waller, a traditional hawk. The highlight of the week, however, will be Wednesday’s US Retail Sales data.
Also on Wednesday, a slew of macroeconomic data from China, with a particular interest on the Q4 GDP and December’s Retail sales might have a significant impact on the Aussie.
Technical analysis shows the pair under increasing bearish pressure after breaching the 0.6660 support area. The next downside targets are 0.6540 and 0.6520. Resistances are the mentioned 0.6660 and 0.6735.
Technical levels to watch
Gold prices rose in India on Tuesday, according to data from India's Multi Commodity Exchange (MCX).
Gold price stood at 62,433 Indian Rupees (INR) per 10 grams, up INR 255 compared with the INR 62,178 it cost on Monday.
As for futures contracts, Gold prices decreased to INR 62,321 per 10 gms from INR 62,559 per 10 gms.
Prices for Silver futures contracts decreased to INR 72,342 per kg from INR 72,627 per kg.
| Major Indian city | Gold Price |
|---|---|
| Ahmedabad | 64,605 |
| Mumbai | 64,425 |
| New Delhi | 64,525 |
| Chennai | 64,600 |
| Kolkata | 64,580 |
Global Market Movers: Comex Gold price falls sharply as US Dollar, yields recover
- Comex Gold price corrects to near the crucial support of $2,040 as the US Dollar Index (DXY) has recovered sharply ahead of crucial United States economic data for December.
- A strong run-up in the precious metal that was propelled by firm bets in favour of early rate cuts by the Federal Reserve and deepening Middle East tensions, has stalled for now.
- As per the CME Fedwatch tool, chances in favour of an interest rate cut in March have eased nominally to 66% against 70% recorded earlier.
- A gradual decline has come as investors are reconsidering strong optimism for Fed starting the rate-cut cycle from March after getting mixed cues from stubbornly higher headline consumer price inflation and softer factory gate price data.
- Investors would get more cues about when the Fed could plan rate cuts after the release of the monthly US Retail Sales and Industrial Producer data, which are due to be released on Wednesday.
- Upbeat economic data would comfort Fed policymakers for maintaining a restrictive monetary policy stance while a soft report will firm the case of rate cuts in March.
- Before that, commentary from Fed Governor Christopher Waller will be keenly watched by market participants. Investors are eager to know how the Fed is considering the timeframe for the rate-cut cycle after the release of sticky consumer price inflation data.
- The appeal for the Comex Gold price has not been impacted on a broader basis as crises in the Middle East region have deepened after the airstrikes from the US and the United Kingdom.
- Iran-backed Houthi rebels have threatened to retaliate for attacking groups in Yemen, which will keep risk sentiment on its toes.
- The US Dollar Index has broken to a new high slightly above 103.00 as investors hope that other central banks will also start reducing interest rates earlier than previously projected. Meanwhile, the 10-year US Treasury yield has rebounded swiftly above 4.0%.
(An automation tool was used in creating this post.)
Gold FAQs
Why do people invest in Gold?
Gold has played a key role in human’s history as it has been widely used as a store of value and medium of exchange. Currently, apart from its shine and usage for jewelry, the precious metal is widely seen as a safe-haven asset, meaning that it is considered a good investment during turbulent times. Gold is also widely seen as a hedge against inflation and against depreciating currencies as it doesn’t rely on any specific issuer or government.
Who buys the most Gold?
Central banks are the biggest Gold holders. In their aim to support their currencies in turbulent times, central banks tend to diversify their reserves and buy Gold to improve the perceived strength of the economy and the currency. High Gold reserves can be a source of trust for a country’s solvency. Central banks added 1,136 tonnes of Gold worth around $70 billion to their reserves in 2022, according to data from the World Gold Council. This is the highest yearly purchase since records began. Central banks from emerging economies such as China, India and Turkey are quickly increasing their Gold reserves.
How is Gold correlated with other assets?
Gold has an inverse correlation with the US Dollar and US Treasuries, which are both major reserve and safe-haven assets. When the Dollar depreciates, Gold tends to rise, enabling investors and central banks to diversify their assets in turbulent times. Gold is also inversely correlated with risk assets. A rally in the stock market tends to weaken Gold price, while sell-offs in riskier markets tend to favor the precious metal.
What does the price of Gold depend on?
The price can move due to a wide range of factors. Geopolitical instability or fears of a deep recession can quickly make Gold price escalate due to its safe-haven status. As a yield-less asset, Gold tends to rise with lower interest rates, while higher cost of money usually weighs down on the yellow metal. Still, most moves depend on how the US Dollar (USD) behaves as the asset is priced in dollars (XAU/USD). A strong Dollar tends to keep the price of Gold controlled, whereas a weaker Dollar is likely to push Gold prices up.
Fed’s Christopher Waller speech will be key today. Economists at ING analyze Dollar’s outlook ahead of the event.
Fed's Waller speech will be important for the Dollar
Economic data is light, but we do hear from some central bank speakers, the most important of which will be the Fed's Waller. Recall that he delivered the definitive and market-moving ‘something appears to be giving’ speech in late November. Back then, it concluded that the conflict between strong US growth and disinflation appeared to be resolving in the favour of disinflation. We presume today that he will stick to that same core message of successful disinflation and will not want to get involved in the fine-tuning of discussing a 2024 easing cycle, but not starting in March. We thus see event risk as a benign one – slightly negative for the Dollar and positive for risk.
DXY has clear resistance at 103.10/103.20 and the case we have outlined above suggests that these levels may well prove the top of the day's trading range.
If we are wrong and Waller has been sent out to push back against aggressive easing expectations (market price 18 bps of a 25 bpw first cut in March and 158 bpw of easing this year) then DXY can break resistance and head to the 104.00/104.25 area multi-day.
- Gold price has been hit hard amid uncertainty over US Retail Sales and Industrial Production data.
- A strong US Retail Sales data would provide more room for the Fed to maintain higher interest rates.
- Further escalation in Middle East tensions could bring some revival in the Gold price.
Gold price (XAU/USD) witnesses a sell-off after failing to reclaim the weekly high above $2,060. The precious metal drops as investors reconsider the timeframe in which the Federal Reserve (Fed) may reduce interest rates. This comes after the release of the sticky Consumer Price Index (CPI) report for December, as well as hawkish comments from European Central Bank (ECB) officials recalibrating broader market expectations.
While markets continue to lean towards a rate cut decision in March, policymakers are in no hurry to endorse a dovish stance on interest rates. The consumer price inflation in the United States economy is almost double the required rate of 2%, labor demand is steady and the chances of a recession are low despite interest rates remaining in the range of 5.25-5.50%. This would allow Fed policymakers to maintain a restrictive monetary policy stance for the time being.
Going forward, monthly US Retail Sales, the Industrial Production data and the Fed’s Beige Book are expected to provide fresh cues about the interest rate outlook.
Daily Digest Market Movers: Gold price falls sharply as US Dollar, yields recover
- Gold price corrects to near the crucial support of $2,040 as the US Dollar Index (DXY) has recovered sharply ahead of crucial United States economic data for December.
- A strong run-up in the precious metal that was propelled by firm bets in favour of early rate cuts by the Federal Reserve and deepening Middle East tensions, has stalled for now.
- As per the CME Fedwatch tool, chances in favour of an interest rate cut in March have eased nominally to 66% against 70% recorded earlier.
- A gradual decline has come as investors are reconsidering strong optimism for Fed starting the rate-cut cycle from March after getting mixed cues from stubbornly higher headline consumer price inflation and softer factory gate price data.
- Investors would get more cues about when the Fed could plan rate cuts after the release of the monthly US Retail Sales and Industrial Producer data, which are due to be released on Wednesday.
- Retail Sales are expected to have grown at a higher pace of 0.4% against 0.3% increase in November. Consumer spending excluding automobiles is estimated to have grown at a steady pace of 0.2%.
- The Industrial Production data is seen stagnant against 0.2% growth in November on a monthly basis.
- Upbeat economic data would comfort Fed policymakers for maintaining a restrictive monetary policy stance while a soft report will firm the case of rate cuts in March.
- Before that, commentary from Fed Governor Christopher Waller will be keenly watched by market participants. Investors are eager to know how the Fed is considering the timeframe for the rate-cut cycle after the release of sticky consumer price inflation data.
- The appeal for the Gold price has not been impacted on a broader basis as crises in the Middle East region have deepened after the airstrikes from the US and the United Kingdom.
- Iran-backed Houthi rebels have threatened to retaliate for attacking groups in Yemen, which will keep risk sentiment on its toes.
- The US Dollar Index has broken to a new high slightly above 103.00 as investors hope that other central banks will also start reducing interest rates earlier than previously projected. Meanwhile, the 10-year US Treasury yield has rebounded swiftly above 4.0%.
Technical Analysis: Gold price corrects to near 20-day EMA
Gold price has faced a sharp sell-off after failing to recapture the weekly high of $2,062. The precious metal has dropped to near $2,040 and is expected to remain on tenterhooks before getting fresh cues about the timing of rate cuts from the Fed. The yellow metal has surrendered entire gains generated on Monday and has corrected to near the 20-day Exponential Moving Average (EMA), which trades around $2,039.
More downside could appear in the Gold price if it fails to defend the January 3 low of $2,030, which will expose it towards the psychological support of $2,000.
Gold FAQs
Why do people invest in Gold?
Gold has played a key role in human’s history as it has been widely used as a store of value and medium of exchange. Currently, apart from its shine and usage for jewelry, the precious metal is widely seen as a safe-haven asset, meaning that it is considered a good investment during turbulent times. Gold is also widely seen as a hedge against inflation and against depreciating currencies as it doesn’t rely on any specific issuer or government.
Who buys the most Gold?
Central banks are the biggest Gold holders. In their aim to support their currencies in turbulent times, central banks tend to diversify their reserves and buy Gold to improve the perceived strength of the economy and the currency. High Gold reserves can be a source of trust for a country’s solvency. Central banks added 1,136 tonnes of Gold worth around $70 billion to their reserves in 2022, according to data from the World Gold Council. This is the highest yearly purchase since records began. Central banks from emerging economies such as China, India and Turkey are quickly increasing their Gold reserves.
How is Gold correlated with other assets?
Gold has an inverse correlation with the US Dollar and US Treasuries, which are both major reserve and safe-haven assets. When the Dollar depreciates, Gold tends to rise, enabling investors and central banks to diversify their assets in turbulent times. Gold is also inversely correlated with risk assets. A rally in the stock market tends to weaken Gold price, while sell-offs in riskier markets tend to favor the precious metal.
What does the price of Gold depend on?
The price can move due to a wide range of factors. Geopolitical instability or fears of a deep recession can quickly make Gold price escalate due to its safe-haven status. As a yield-less asset, Gold tends to rise with lower interest rates, while higher cost of money usually weighs down on the yellow metal. Still, most moves depend on how the US Dollar (USD) behaves as the asset is priced in dollars (XAU/USD). A strong Dollar tends to keep the price of Gold controlled, whereas a weaker Dollar is likely to push Gold prices up.
- Germany’s ZEW Economic Sentiment Index climbs to 15.2 in January.
- EUR/USD is holding lower ground below 1.0900 after mixed ZEW surveys.
The headline German ZEW Economic Sentiment Index improved further to 15.2 in January from 12.8 in December. The market forecast was 12.0.
However, the Current Situation Index dropped to -77.3 from -77.1 prior, missing estimates of -77.0.
The Eurozone ZEW Economic Sentiment Index came in at 22.7 in the same period, as against the December reading of 23.0. The data exceeded expectations of 21.9.
Key points
Economic expectations for Germany have improved again.
This is because now more than half of the respondents assume that the ECB will make interest rate cuts in the first half of the year.
There are even more pronounced shifts in the US interest rate expectations.
More than two-thirds of the respondents predict interest rate cuts by the US Fed in the next six months.
The rise in inflation in Germany and the Eurozone in December thus has no impact on the monetary policy expectations of the respondents.
Market reaction
The EUR/USD pair is testing intraday lows near 1.0880 after mixed ZEW surveys, losing 0.58% on the day.
Euro price today
The table below shows the percentage change of Euro (EUR) against listed major currencies today. Euro was the weakest against the US Dollar.
| USD | EUR | GBP | CAD | AUD | JPY | NZD | CHF | |
| USD | 0.53% | 0.57% | 0.45% | 0.68% | 0.51% | 0.49% | 0.53% | |
| EUR | -0.56% | 0.03% | -0.10% | 0.13% | -0.04% | -0.07% | -0.03% | |
| GBP | -0.59% | -0.07% | -0.16% | 0.15% | -0.09% | -0.09% | -0.07% | |
| CAD | -0.47% | 0.09% | 0.11% | 0.30% | 0.07% | 0.01% | 0.09% | |
| AUD | -0.69% | -0.21% | -0.15% | -0.31% | -0.23% | -0.23% | -0.22% | |
| JPY | -0.51% | 0.03% | 0.07% | -0.08% | 0.19% | 0.03% | 0.02% | |
| NZD | -0.49% | 0.03% | 0.09% | -0.08% | 0.23% | 0.00% | 0.02% | |
| CHF | -0.54% | 0.00% | 0.07% | -0.09% | 0.20% | -0.03% | -0.02% |
The heat map shows percentage changes of major currencies against each other. The base currency is picked from the left column, while the quote currency is picked from the top row. For example, if you pick the Euro from the left column and move along the horizontal line to the Japanese Yen, the percentage change displayed in the box will represent EUR (base)/JPY (quote).
- The Euro extends its reversal as the safe-haven US Dollar appreciates.
- Cooling hopes of interest rate cuts and growing geopolitical risks have crushed investors’ appetite for risk.
- ECB policymakers and German CPI figures push back monetary easing expectations.
The Euro (EUR) is under increasing bearish pressure on Tuesday. The risk-averse sentiment – with investors paring back hopes of rate cuts in 2024 – and the explosive situation in the Middle East, are rushing traders into safe assets and weighing on the common currency.
The hawkish comment from the European Central Bank (ECB) Governor François Villeroy de Galhau, playing down rate cut expectations, has failed to provide any significant support to the Euro.
Villeroy’s observations come after the President of the Bundesbank, Joachim Nagel warned about the mistake of easing monetary policy too early. These comments have forced investors to reassess their expectations of aggressive rate cuts by most major central banks. This is weighing on risk appetite and underpinning support for the US Dollar.
Furthermore, the Houthi militias have extended their targets to UK and US cargo vessels. This forces shipping companies to find alternative routes, boosting transport costs, which will translate into higher inflation. A further challenge for the central banks’ easing plans.
Daily digest market movers: Euro depreciates in risk-off markets
- The Euro is trading lower, weighed by USD strength, although it remains within the last two weeks’ trading range.
- On Tuesday, ECB’s Villeroy affirmed that it is still too early to declare victory on inflation, cooling hopes for imminent rate cuts.
- On Monday, Joachim Nagel, also a member of the ECB Board of Governors, warned about the dangers of cutting rates too early.
- The final estimate of the German Consumer Prices Index (CPI) for December confirmed that prices grew by 3.7% on year. This marks an uptick from the 3.2% increase seen in November and provides further evidence that bringing inflation to 2% will take an additional effort.
- Later today, the US Federal Reserve Bank of New York Empire State Manufacturing Index and the Fed’s Governor Christopher Waller’s comments are likely to increase US Dollar’s volatility.
- The highlight on the US Calendar this week are Wednesday’s Retail Sales figures, which are expected to have increased moderately in December.
- US consumption data will provide context to the speeches of Fed’s policymakers Michael Barr and Michelle Bowman.
- In the Eurozone calendar on Wednesday, Eurostat is expected to confirm that the CPI accelerated to 2.9% year-on-year in December from 2.4% in November, while the Core inflation eased to a 3.4% yearly pace from the previous 3.6% rate.
Technical Analysis: EUR/USD approaches recent range bottom at 1.0875
The EUR/USD has pierced the trendline support from early November lows at 1.0910, and is approaching a key support area at 1.0875, which contained bears in early January and mid-December.
A clear move below here would activate a head and shoulders (H&S) pattern, a common trend-change figure, and increase bearish pressure towards 1.0730. The measured target of the H&S pattern is the 78.6% Fibonacci retracement of the late 2023 rally.
On the upside, the reverse trend line at 1.0910 is likely to offer resistance ahead of the 1.1000 area.
Euro FAQs
What is the Euro?
The Euro is the currency for the 20 European Union countries that belong to the Eurozone. It is the second most heavily traded currency in the world behind the US Dollar. In 2022, it accounted for 31% of all foreign exchange transactions, with an average daily turnover of over $2.2 trillion a day.
EUR/USD is the most heavily traded currency pair in the world, accounting for an estimated 30% off all transactions, followed by EUR/JPY (4%), EUR/GBP (3%) and EUR/AUD (2%).
What is the ECB and how does it impact the Euro?
The European Central Bank (ECB) in Frankfurt, Germany, is the reserve bank for the Eurozone. The ECB sets interest rates and manages monetary policy.
The ECB’s primary mandate is to maintain price stability, which means either controlling inflation or stimulating growth. Its primary tool is the raising or lowering of interest rates. Relatively high interest rates – or the expectation of higher rates – will usually benefit the Euro and vice versa.
The ECB Governing Council makes monetary policy decisions at meetings held eight times a year. Decisions are made by heads of the Eurozone national banks and six permanent members, including the President of the ECB, Christine Lagarde.
How does inflation data impact the value of the Euro?
Eurozone inflation data, measured by the Harmonized Index of Consumer Prices (HICP), is an important econometric for the Euro. If inflation rises more than expected, especially if above the ECB’s 2% target, it obliges the ECB to raise interest rates to bring it back under control.
Relatively high interest rates compared to its counterparts will usually benefit the Euro, as it makes the region more attractive as a place for global investors to park their money.
How does economic data influence the value of the Euro?
Data releases gauge the health of the economy and can impact on the Euro. Indicators such as GDP, Manufacturing and Services PMIs, employment, and consumer sentiment surveys can all influence the direction of the single currency.
A strong economy is good for the Euro. Not only does it attract more foreign investment but it may encourage the ECB to put up interest rates, which will directly strengthen the Euro. Otherwise, if economic data is weak, the Euro is likely to fall.
Economic data for the four largest economies in the euro area (Germany, France, Italy and Spain) are especially significant, as they account for 75% of the Eurozone’s economy.
How does the Trade Balance impact the Euro?
Another significant data release for the Euro is the Trade Balance. This indicator measures the difference between what a country earns from its exports and what it spends on imports over a given period.
If a country produces highly sought after exports then its currency will gain in value purely from the extra demand created from foreign buyers seeking to purchase these goods. Therefore, a positive net Trade Balance strengthens a currency and vice versa for a negative balance.
ECB FAQs
What is the ECB and how does it influence the Euro?
The European Central Bank (ECB) in Frankfurt, Germany, is the reserve bank for the Eurozone. The ECB sets interest rates and manages monetary policy for the region.
The ECB primary mandate is to maintain price stability, which means keeping inflation at around 2%. Its primary tool for achieving this is by raising or lowering interest rates. Relatively high interest rates will usually result in a stronger Euro and vice versa.
The ECB Governing Council makes monetary policy decisions at meetings held eight times a year. Decisions are made by heads of the Eurozone national banks and six permanent members, including the President of the ECB, Christine Lagarde.
What is Quantitative Easing (QE) and how does it affect the Euro?
In extreme situations, the European Central Bank can enact a policy tool called Quantitative Easing. QE is the process by which the ECB prints Euros and uses them to buy assets – usually government or corporate bonds – from banks and other financial institutions. QE usually results in a weaker Euro.
QE is a last resort when simply lowering interest rates is unlikely to achieve the objective of price stability. The ECB used it during the Great Financial Crisis in 2009-11, in 2015 when inflation remained stubbornly low, as well as during the covid pandemic.
What is Quantitative tightening (QT) and how does it affect the Euro?
Quantitative tightening (QT) is the reverse of QE. It is undertaken after QE when an economic recovery is underway and inflation starts rising. Whilst in QE the European Central Bank (ECB) purchases government and corporate bonds from financial institutions to provide them with liquidity, in QT the ECB stops buying more bonds, and stops reinvesting the principal maturing on the bonds it already holds. It is usually positive (or bullish) for the Euro.
USD/CAD has rebounded meaningfully from the sub-1.32 lows in late December to 1.3425. Economists at Société Générale analyze the pair’s technical outlook.
Daily MACD has rising slope denoting receding downward momentum
USD/CAD formed an interim low near projections of 1.3200/1.3180 late last month and has embarked on a steady bounce. It has crossed above the channel within which recent pullback developed. The break has led the pair towards 200-DMA.
Daily MACD is above its trigger line and has rising slope denoting receding downward momentum.
Defence of last week’s low near 1.3340 can extend the bounce towards 1.3540 and perhaps even towards December high of 1.3620.
European Central Bank (ECB) Governing Council member,” Tuomas Välimäki, suggested on Tuesday that we “must not jump the gun on rate cuts.”
Additional comments
Better to wait a bit longer than cut rates prematurely.
Inflation is on the right track but the job is not done.
Restrictive monetary policy is still called for.
Soft landing for the economy is still the baseline but risks are tilted to the downside.
Market reaction
EUR/USD was last seen trading at 1.0887, down 0.55 on the day.
European Central Bank (ECB) policymaker Mario Centeno said during his appearance in Davos that “they need to be prepared for all topics, including rate cuts.”
Additional quotes
Recent data have confirmed December projections.
But inflation was slightly below forecast.
Market reaction
EUR/USD is keeping its downbeat momentum intact below 1.0900 on the above comments, losing 0.47% on the day.
Over the past month, EUR/GBP has remained broadly unchanged. Economists at Rabobank analyze the pair’s outlook.
Glimmer of optimism that the UK may again be able to perform a little better than expected
There is little scope for outright optimism for the UK economy in the months ahead. That said, having been wrong-footed on the scale of the downturn last year, various commentators see potential that the UK could again produce a not as bad as expected performance. This week’s data will be key in either raising or negating these prospects.
Either way, we see Germany’s poor economic outlook as allowing GBP to claw back a little ground vs. the EUR this year.
Given the difficulties facing the German economy, we see scope for EUR/GBP to drift down to 0.84 in the latter half of this year.
- USD/MXN improves as the US Dollar receives upward support from risk-off sentiment.
- Fed’s Bostic said that inflation deceleration toward the 2.0% target could slow down.
- Banxico’s officials face challenges in reducing interest rates due to high inflation.
USD/MXN moves upward for the second straight day, trading higher around 17.00 during Tuesday’s European session. Traders are favoring the US Dollar following hawkish remarks made by Atlanta Federal Reserve (Fed) President Raphael Bostic. Bostic suggested the possibility of inflation fluctuating if policymakers decide to cut interest rates prematurely, thereby providing support to the USD/MXN pair. He also cautioned that the deceleration of inflation toward the Fed's 2.0% target was anticipated to slow down in the coming months.
Additionally, the Middle East region is experiencing heightened caution in the market due to the escalating Israel-Gaza conflict. The Iranian Islamic Revolutionary Guard Corps (IRGC) targeted northern Iraq near the US Consulate in Erbil, adding to the geopolitical tensions. On Friday, the US-led Combined Maritime Forces (CMF) issued a warning, advising all ships to avoid the Bab al-Mandab Strait. This has led maritime vessels to alter their routes away from the Red Sea in response to attacks by Yemen's Houthi movement.
The recent economic data from Mexico indicates that the country is grappling with challenges. The annual inflation rate increased from 4.32% to 4.66% in December. Although the headline inflation has eased to 5.0%, it remains elevated. This high inflation rate could potentially dissuade officials of the Bank of Mexico (Banxico) from implementing policy-easing measures in the first quarter of 2024.
Market participants are expected to closely monitor Mexico's Retail Sales data on Friday for additional insights into the country's economic landscape. Additionally, on the United States docket, the US NY Empire State Manufacturing Index for January is scheduled for release on Tuesday, along with a speech by Federal Reserve official Christopher J. Waller.
NZD/USD has had a tough start to the week. Economists at ANZ Bank analyze Kiwi’s outlook.
Falling interest rates weighed on the Antipodean currencies
Falling interest rates weighed on the Antipodean currencies amid thin liquidity conditions, with the US market closed for a public holiday.
Outside overarching global themes like energy prices, conflict and China growth, the main local theme remains the outlook for RBNZ policy, with markets eager to embrace soft data and of a mind to ignore more robust data, all of which is driving interest rates lower as markets brace for more cuts (with 103 bps of cuts now priced in over 2024). All of that’s weighing on the Kiwi.
- USD/CHF moves on an upward trajectory amid market caution.
- Traders observe the five-day World Economic Forum in Davos to gain cues on the global economic scenario.
- US Dollar rises on upbeat US Dollar, coupled with hawkish remarks from Fed’s Bostic.
USD/CHF extends its gains for the fourth-consecutive session, trading higher near 0.8590 during the European hours on Tuesday. The Swiss Franc (CHF) faces challenges amid risk-off sentiment due to the threat of war escalation in the Middle East region. This threat is reinforced by a reported missile launched by Iran’s Islamic Revolutionary Guard Corps (IRGC) targeting northern Iraq near the US Consulate in Erbil.
With no high-impact data expected from Switzerland, market participants are likely directing their attention to the five-day World Economic Forum taking place in Davos. The 54th World Economic Forum Annual Meeting is set to host over 28,000 leaders from around the world. Additionally, Swiss Producer and Import Prices data are scheduled for release on Friday, which could provide insights into Swiss economic trends.
The US Dollar Index (DXY) trades higher, nearing 102.90, with the 2-year and 10-year yields on US Treasury coupons standing at 4.19% and 3.99%, respectively, at the time of writing. The US Dollar's strength is further supported by hawkish comments made by Atlanta Federal Reserve (Fed) President Raphael Bostic over the weekend. According to a Financial Times report, Bostic suggested the potential for inflation to "see-saw" if policymakers decide to reduce interest rates prematurely, providing underlying support to the USD/CHF pair.
The US Dollar strengthens amid market caution caused by the heightened geopolitical conflict between Israel and Gaza, which has disrupted trade in the Red Sea. The persistent targeting of maritime vessels by the Iran-backed Houthi group, despite recent military strikes by the United States (US) and the United Kingdom (UK) on Houthi sites in Yemen, is contributing to the risk-off sentiment. Market participants will closely monitor the US NY Empire State Manufacturing Index for January and a speech by Federal Reserve official Christopher J. Waller later on Tuesday, which could further influence market dynamics.
EUR/USD is keeping the red below 1.0950. Economists at ING analyze the pair’s outlook.
A break of 1.0875 would open up 1.0800 on the day
Onto the day ahead, what catches our eye is a speech from the Federal Reserve's Christopher Waller. We presume that he will not want to get involved in the fine-tuning of discussing a 2024 easing cycle, but not starting in March. We thus see event risk as a benign one – slightly negative for the Dollar and positive for risk.
For EUR/USD, there is clean support at 1.0875/1.0880. We think the Waller speech could see that support level hold and EUR/USD end higher on the day. If we are wrong about the contents of that speech, a break of 1.0875 opens up 1.0800 on the day.
- USD/CAD gains ground as investors turned back to the US Dollar.
- WTI price could rise on the escalated situation in the Red Sea; supporting CAD.
- BoC’s Business Outlook Survey Results showed that inflation could persist above the 2.0% target.
USD/CAD moves on a winning streak for the fourth consecutive session, with positive market sentiment turning into risk aversion. This shift is attributed to the heightened geopolitical situation, specifically the reported missile launched by the Islamic Revolutionary Guard Corps (IRGC) targeting espionage centers and gatherings of anti-Iranian terrorist groups in northern Iraq near the US Consulate in Erbil. As a result, the USD/CAD pair trades higher around 1.3480 during the early European hours on Tuesday.
West Texas Intermediate (WTI) price struggles to retrace its recent losses, trading near $72.50 per barrel at the time of writing. The reported attacks by the IRGC, coinciding with concerns over Israel's offensive in the Gaza Strip and an escalation in the Red Sea by Iran-backed Houthi rebels, have contributed to supporting Crude oil prices. This development might have limited the losses of the Canadian Dollar (CAD) against the US Dollar (USD).
The Bank of Canada's (BoC) Business Outlook Survey Results on Monday indicated that softer demand and renewed competitive pressures are gradually exerting downward pressure on growth in output prices. While concerns about labor shortages are diminishing, wage growth is anticipated to ease only gradually. Due to this gradual easing, businesses expect inflation to persist above the Bank of Canada's 2.0% target for an extended period.
Statistics Canada is set to publish the Consumer Price Index (CPI) for December. The annual increase is expected to be 3.4%, slightly higher than the 3.1% recorded in November. On a monthly basis, the index is anticipated to decline by 0.3%, following a 0.1% increase in the previous month. These figures will provide insights into the country's inflationary trends and could impact market sentiments and BoC’s policy considerations.
The US Dollar Index (DXY) experiences upward support due to risk aversion, further reinforced by positive movements in US Treasury yields. Market participants will keenly observe the US NY Empire State Manufacturing Index for January and a speech by Federal Reserve official Christopher J. Waller scheduled for later on Tuesday.
- The Pound Sterling faces a sell-off after the release of lower-than-expected UK wage growth in the quarter to November.
- Employment levels remain steady despite increasing economic headwinds.
- Risk-off market mood, UK inflation data could keep the Pound Sterling under pressure.
The Pound Sterling (GBP) falls sharply on Tuesday's European morning session as the United Kingdom Office for National Statistics (ONS) reported a sharp slowdown in the Average Earnings data for three months ending November. The labor market remained steady in this period despite vulnerable economic conditions in the domestic and overseas markets. A softer-than-projected wage growth is expected to convince investors more about early rate cuts from the Bank of England (BoE).
The UK economy is exposed to a technical recession as the ONS reported a contraction in the third quarter of 2023. The BoE is also less confident about any growth in the final quarter of 2023 due to higher interest rates and a deepening cost-of-living crisis. Now, a softer inflation outlook, along with fears of further economic pain, could allow BoE policymakers to roll back their tight interest rate stance.
The GBP/USD pair has faced a significant correction as the deepening crisis in the Middle East region has increased the appeal for safe-haven assets. The US Dollar Index (DXY) has refreshed its weekly high ahead of the US Retail Sales data, which will provide more cues about the timeframe in which the Federal Reserve (Fed) could plan the rate-cut cycle.
Daily digest market movers: Pound Sterling falls amid risk-off mood
- The Pound Sterling has printed a fresh weekly low near 1.2660 as the ONS reported steady job market figures and softening labor costs in the three months ending November.
- In this period, the Unemployment Rate remained unchanged at 4.2%, as anticipated by the market participants.
- The UK employers hired 73K job-seekers in November, a figure significantly higher than the 50K jobs added in the three months to October.
- Individuals claiming jobless benefits rose sharply to 11.7K in December against a slight increase of 0.6K in November.
- Average Earnings excluding bonuses decelerated to 6.6%, as expected by market participants, against 7.2% growth in the quarter to October. Earnings data including bonuses grew at a slower pace of 6.5% against the consensus of 6.8% and the prior reading of 7.2%.
- High wage growth has remained a major driving factor contributing to price pressures and robust consumer spending in the UK.
- A sharp decline in UK wage growth is expected to weaken arguments of those officials of the Bank of England who support elevated interest rates for a longer period.
- The BoE could discuss early rate cuts as the economy is on the brink of a technical recession after GDP contracted in the third quarter of 2023.
- After the UK labor market data, investors will focus on the inflation data for December, which will be released on Wednesday. Further softening of the UK inflation data would strengthen the case of early rate cuts by the BoE.
- Meanwhile, the market mood remains downbeat as the Middle East crisis has deepened. Iran-backed-Houthis have threatened to retaliate for airstrikes from the United States and the UK in Yemen.
- The US Dollar Index (DXY) has printed a fresh weekly high near 103.00 as optimism for early rate cuts by the Federal Reserve persists. Investors await fresh cues about when the Fed will start unwinding its restrictive monetary policy stance.
- This week, monthly US Retail Sales data for December and the Fed’s Beige Book will be in focus. An upbeat Retail Sales data would allow Fed policymakers to maintain interest rates at the current levels until June.
Technical Analysis: Pound Sterling declines toward 1.2600
-638409877413082691.png)
The Pound Sterling witnessed a steep fall after a strong breakdown of the rising channel chart pattern formed on an hourly timeframe. The near-term appeal has dampened as the Cable has slipped below the 200-period Exponential Moving Average (EMA). The Cable is expected to find intermediate support around 1.2612, the low from December 13.
The 14-period Relative Strength Index (RSI) has shifted into the 20.00-40.00 range, indicating bearish momentum has been triggered.
The broader appeal for the GBP/USD has also been impacted significantly as the pair has dropped below the 20-day EMA, which trades around 1.2700.
Pound Sterling FAQs
What is the Pound Sterling?
The Pound Sterling (GBP) is the oldest currency in the world (886 AD) and the official currency of the United Kingdom. It is the fourth most traded unit for foreign exchange (FX) in the world, accounting for 12% of all transactions, averaging $630 billion a day, according to 2022 data.
Its key trading pairs are GBP/USD, aka ‘Cable’, which accounts for 11% of FX, GBP/JPY, or the ‘Dragon’ as it is known by traders (3%), and EUR/GBP (2%). The Pound Sterling is issued by the Bank of England (BoE).
How do the decisions of the Bank of England impact on the Pound Sterling?
The single most important factor influencing the value of the Pound Sterling is monetary policy decided by the Bank of England. The BoE bases its decisions on whether it has achieved its primary goal of “price stability” – a steady inflation rate of around 2%. Its primary tool for achieving this is the adjustment of interest rates.
When inflation is too high, the BoE will try to rein it in by raising interest rates, making it more expensive for people and businesses to access credit. This is generally positive for GBP, as higher interest rates make the UK a more attractive place for global investors to park their money.
When inflation falls too low it is a sign economic growth is slowing. In this scenario, the BoE will consider lowering interest rates to cheapen credit so businesses will borrow more to invest in growth-generating projects.
How does economic data influence the value of the Pound?
Data releases gauge the health of the economy and can impact the value of the Pound Sterling. Indicators such as GDP, Manufacturing and Services PMIs, and employment can all influence the direction of the GBP.
A strong economy is good for Sterling. Not only does it attract more foreign investment but it may encourage the BoE to put up interest rates, which will directly strengthen GBP. Otherwise, if economic data is weak, the Pound Sterling is likely to fall.
How does the Trade Balance impact the Pound?
Another significant data release for the Pound Sterling is the Trade Balance. This indicator measures the difference between what a country earns from its exports and what it spends on imports over a given period.
If a country produces highly sought-after exports, its currency will benefit purely from the extra demand created from foreign buyers seeking to purchase these goods. Therefore, a positive net Trade Balance strengthens a currency and vice versa for a negative balance.
EUR/GBP has edged a little higher in early Europe on the release of UK average earnings data for November. Economists at ING analyze the Pound Sterling (GBO) outlook.
Average earnings weighs on Sterling
UK average earnings for November dipped to a 6.5% 3m/YoY rate – the lowest since last March. We should not get carried away with this data, however, as a more important release for the Bank of England will be the December CPI release on Wednesday.
Look out for testimony from BoE Governor Andrew Bailey today. The BoE is not known for over-communication between meetings, but markets now price 130 bps of BoE easing this year. If there is pushback against that from Governor Bailey, GBP/USD could turn back to the 1.2750/1.2800 area.
Speaking at the World Economic Forum (WEF) in Davos on Tuesday, European Central Bank (ECB) Governing Council member and Bank of France President, Francois Villeroy de Galhau, said that it is “too early to declare victory over inflation.”
Additional quotes
We can see soft landing on both sides of the Atlantic.
Rates shouldn’t be higher than today.
Barring major surprises - we look at the Middle East - our next move will be a cut, probably this year. I will not comment on the season.
Market reaction
EUR/USD is little affected by the above comments, holding lower ground near 1.0910, down 0.32% on the day.
ECB FAQs
What is the ECB and how does it influence the Euro?
The European Central Bank (ECB) in Frankfurt, Germany, is the reserve bank for the Eurozone. The ECB sets interest rates and manages monetary policy for the region.
The ECB primary mandate is to maintain price stability, which means keeping inflation at around 2%. Its primary tool for achieving this is by raising or lowering interest rates. Relatively high interest rates will usually result in a stronger Euro and vice versa.
The ECB Governing Council makes monetary policy decisions at meetings held eight times a year. Decisions are made by heads of the Eurozone national banks and six permanent members, including the President of the ECB, Christine Lagarde.
What is Quantitative Easing (QE) and how does it affect the Euro?
In extreme situations, the European Central Bank can enact a policy tool called Quantitative Easing. QE is the process by which the ECB prints Euros and uses them to buy assets – usually government or corporate bonds – from banks and other financial institutions. QE usually results in a weaker Euro.
QE is a last resort when simply lowering interest rates is unlikely to achieve the objective of price stability. The ECB used it during the Great Financial Crisis in 2009-11, in 2015 when inflation remained stubbornly low, as well as during the covid pandemic.
What is Quantitative tightening (QT) and how does it affect the Euro?
Quantitative tightening (QT) is the reverse of QE. It is undertaken after QE when an economic recovery is underway and inflation starts rising. Whilst in QE the European Central Bank (ECB) purchases government and corporate bonds from financial institutions to provide them with liquidity, in QT the ECB stops buying more bonds, and stops reinvesting the principal maturing on the bonds it already holds. It is usually positive (or bullish) for the Euro.
Economists at MUFG Bank remove their cautious view on the Indian Rupee (INR) and now see USD/INR at 81.50 by year-end – from 82.00 previously.
RBI to continue intervening to absorb FX inflows, limiting extent of INR appreciation
We think the balance of risks now tilt towards a stronger INR from here, and we remove our cautious view on INR.
We now forecast USD/INR at 83.00 in 3 months and 81.50 in 12 months (from 83.30 and 82.00 previously), and also continue to expect RBI to accumulate FX reserves through 2024, thereby limiting the extent of INR appreciation.
We think RBI will allow USD/INR to fall more once US Dollar weakness becomes clearer.
FX option expiries for Jan 16 NY cut at 10:00 Eastern Time, via DTCC, can be found below.
- EUR/USD: EUR amounts
- 1.0800 1.3b
- 1.0975 806m
- 1.1025 670m
- 1.1075 828m
- 1.1085 904m
- USD/JPY: USD amounts
- 144.00 643m
- 146.80 784m
- 147.00 709m
- AUD/USD: AUD amounts
- 0.6455 1b
- 0.6465 792m
- 0.6840 1.2b
- 0.6845 897m
- USD/CAD: USD amounts
- 1.3600 603m
- NZD/USD: NZD amounts
- 0.5900 1.2b
- EUR/JPY edges lower to 159.50 amid the risk-off sentiment.
- The German Harmonized Index of Consumer Prices (HICP) came in at 3.8% YoY in December vs. 3.8% prior, as expected.
- The markets anticipate the BoJ will end its negative interest rate, probably in April 2024.
- Traders await the January Zew Survey from Germany and the Eurozone, due later on Tuesday.
The EUR/JPY cross remains capped under the 160.00 barrier during the early European session on Tuesday. The December German inflation data came in as expected. Meanwhile, the safe-haven flows from an escalation of geopolitical tensions in the Middle East benefit the Japanese Yen (JPY) and weigh on the cross. At press time, EUR/JPY is trading at 159.50, down 0.11% for the day.
The latest data from the German statistics office Destatis revealed on Tuesday that the nation’s Harmonized Index of Consumer Prices (HICP) came in at 3.8% YoY in December from the previous reading of 3.8% and in line with the market expectation of 3.8%. On a monthly basis, the HICP figure arrived at 0.2% versus the 0.2% estimated in the previous reading. Furthermore, the December headline CPI figure rose 0.1% MoM and 3.7% YoY, respectively.
The European Central Bank (ECB) chief economist Philip Lane said on Saturday that the central bank will have key data by June to decide on the first of a likely series of interest rate cuts, but going too fast on easing may prove self-defeating. The markets expect the ECB to slash borrowing costs from record highs this year, beginning possibly as early as March.
On the other hand, the Organization for Economic Cooperation and Development (OECD) said last week that the Bank of Japan (BoJ) could start raising interest rates in early 2024, given that inflation will likely remain above the central bank's 2% target and wage dynamics are also changing. The central bank will closely monitor whether Japan will achieve robust wage growth. Market expectations are rising that the BoJ will end its negative interest rate, probably in April following the wage talks.
Late Monday, Iran launched ballistic missiles at what it said were Israeli "spy headquarters" near the US embassy in the northern Iraqi city of Irbil, as well as targets in northern Syria related to the terrorist organization Islamic State. The attacks come at a time when tensions in the area are high and there are worries about a greater spillover from the continuing conflict in Gaza. That being said, the rising tension in this region might boost the JPY and act as a headwind for the EUR/JPY cross.
The January Zew Survey from Germany and the Eurozone will be released on Tuesday. Later this week, the Harmonized Index of Consumer Prices from the Euro area and ECB Monetary Policy Meeting Accounts will be due on Wednesday. The Japanese Industrial Production report will be published on Thursday. Market players will take cues from the data and find trading opportunities around the EUR/JPY cross.
- The UK Unemployment Rate held steady at 4.2% in the quarter to November.
- The Claimant Count Change for Britain arrived at 11.7K in December.
- GBP/USD remains pressured below 1.2700 after the mixed UK jobs data.
The United Kingdom’s (UK) ILO Unemployment Rate remained intact at 4.2% in three months to November, data published by the Office for National Statistics (ONS) showed Tuesday. The market expected a 4.2% reading in the November quarter.
Additional details of the report showed that the number of people claiming jobless benefits climbed by 11.7K in December, as against an increase of 0.6K in November.
The British Employment Change data for November came in at 73K, compared with a 50K gain seen in October.
Average Earnings excluding Bonus in the UK rose 6.6% 3M YoY in November versus October’s 7.2% increase. Markets had expected a growth of 6.6%.
Another measure of wage inflation, Average Earnings including Bonus grew by 6.5% in the reported period when compared to a 7.2% increase in October and the expected 6.8% raise.
GBP/USD reaction to the UK employment report
GBP/USD remains under intense selling pressure after the mixed UK employment data. The pair is trading 0.40% lower on the day at 1.2670, as of writing.
Pound Sterling price today
The table below shows the percentage change of Pound Sterling (GBP) against listed major currencies today. Pound Sterling was the weakest against the US Dollar.
| USD | EUR | GBP | CAD | AUD | JPY | NZD | CHF | |
| USD | 0.23% | 0.31% | 0.29% | 0.44% | 0.19% | 0.36% | 0.37% | |
| EUR | -0.24% | 0.09% | 0.06% | 0.20% | -0.05% | 0.12% | 0.13% | |
| GBP | -0.32% | -0.09% | -0.03% | 0.15% | -0.13% | 0.06% | 0.05% | |
| CAD | -0.30% | -0.07% | 0.02% | 0.13% | -0.12% | 0.05% | 0.06% | |
| AUD | -0.44% | -0.23% | -0.14% | -0.17% | -0.27% | -0.08% | -0.09% | |
| JPY | -0.20% | 0.03% | 0.13% | 0.11% | 0.27% | 0.20% | 0.18% | |
| NZD | -0.36% | -0.14% | -0.06% | -0.08% | 0.08% | -0.18% | 0.01% | |
| CHF | -0.37% | -0.13% | -0.05% | -0.07% | 0.10% | -0.19% | 0.00% |
The heat map shows percentage changes of major currencies against each other. The base currency is picked from the left column, while the quote currency is picked from the top row. For example, if you pick the Euro from the left column and move along the horizontal line to the Japanese Yen, the percentage change displayed in the box will represent EUR (base)/JPY (quote).
- The Canadian Consumer Price Index is seen growing 3.3% YoY in December.
- The BoC released its Business Outlook Survey (BOS).
- The Canadian Dollar navigates the area of four-week lows against the US Dollar.
Canada is set to release important inflation-related data on Tuesday. Statistics Canada will publish Consumer Price Index (CPI) for December, which is expected to show a year-on-year increase of 3.3%, slightly higher than the 3.1% recorded in November. On a monthly basis, the index is anticipated to decline by 0.3% following a 0.1% increase in the previous month. The data release has the potential to move the Canadian Dollar (CAD), which has remained weak against the US Dollar (USD) and is currently trading around four-week lows near the 1.3400 zone.
In addition to the CPI data, the Bank of Canada (BoC) will also publish the Core Consumer Price Index. This index excludes volatile components such as food and energy prices. In November, the BoC Core CPI showed a monthly increase of 0.1% and a year-on-year increase of 2.8%. These figures will be closely watched as they have the potential to impact the direction of the Canadian Dollar (CAD) and shape expectations for the Bank of Canada's monetary policy.
What to expect from Canada’s inflation rate?
Analysts anticipate additional softening of price pressures across Canada in December. Inflation, as quantified by annual shifts in the Consumer Price Index, is projected to resume the uptrend in the last month of the year, in line with what happened in most of Canada’s G10 peers, particularly its neighbour, the US. Following August's uptick to 4%, the CPI has trended downward, while all inflation gauges, such as the Core CPI, are expected to have moderated as well, signaling more tempered cost increases but persistence above the Bank of Canada's 2% objective.
If the impending data validates the expected loss of momentum in disinflationary pressures, investors may factor in the likelihood that the central bank could maintain the current rates for longer than initially anticipated, although extra tightening of the monetary conditions appears to be off the table.
With the global discussion centered on prospective interest rate reductions by monetary authorities in 2024, the unexpected pick-up of inflationary pressures would, at this point, prompt central banks to maintain their ongoing restrictive stance rather than lean towards further tightening. The latter scenario should require a sharp and persistent resurgence of price pressures and a sudden bout of consumers’ demand, all of which appear highly unlikely for the foreseeable future.
In his final remarks of the year in December, BoC Governor Tiff Macklem reported that the Governing Council would continue discussing whether monetary policy is sufficiently restrictive and the duration it should remain in that state. He anticipated that growth and employment would show improvement later in 2024, with inflation approaching the 2% target. Acknowledging the economic growth slowdown until mid-2023, he projected it to persist into 2024. Macklem mentioned that it was premature to contemplate reducing the policy rate, emphasizing that although inflation had decreased, it remained elevated.
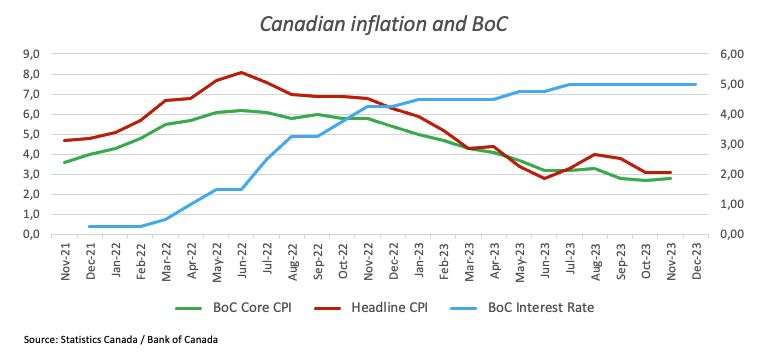
When is the Canada CPI data due and how could it affect USD/CAD?
Canada is scheduled to unveil the Consumer Price Index for December 2023 on Tuesday at 13:30 GMT. The potential influence on the Canadian Dollar stems from shifts in monetary policy expectations by the Bank of Canada. Nevertheless, the impact may be restrained, given that – similar to the Federal Reserve and other central banks – the Bank of Canada is anticipated to have completed rate hikes amid declining inflation and a slowdown in economic growth.
The USD/CAD has started the new trading year in quite a bullish fashion, although the uptrend appears to have met a decent barrier around the 1.3450 zone. This initial area of resistance also looks underpinned by the proximity of the critical 200-day Simple Moving Average (SMA) around 1.3480.
According to Pablo Piovano, FXStreet’s Senior Analyst, “USD/CAD would likely face the prospects for extra losses as long as it trades below the significant 200-day SMA. The bearish tone is also seen intensifying in the event of a sustainable breach of the December low of 1.3177 (December 27).”
Pablo adds: “A substantial pick-up of market activity in CAD would necessitate surprising inflation figures. While below-expectation numbers might favour the view of potential interest rate cuts by the BoC in the next month and hence put the Loonie under further selling pressure, the rebound in the CPI – in line with its neighbour, the US – could lend some wings to the Canadian Dollar, albeit to a moderate extent. A higher-than-expected inflation reading would increase pressure on the Bank of Canada to sustain elevated rates for an extended period, potentially resulting in a prolonged period of many Canadians facing challenges with higher interest rates, as underscored by Bank of Canada Governor Macklem in his December remarks.”
Economic Indicator
Canada Consumer Price Index (YoY)
The Consumer Price Index (CPI), released by Statistics Canada on a monthly basis, represents changes in prices for Canadian consumers by comparing the cost of a fixed basket of goods and services. The YoY reading compares prices in the reference month to the same month a year earlier. Generally, a high reading is seen as bullish for the Canadian Dollar (CAD), while a low reading is seen as bearish.
Read more.Next release: 01/16/2024 13:30:00 GMT
Frequency: Monthly
Source: Statistics Canada
Inflation FAQs
What is inflation?
Inflation measures the rise in the price of a representative basket of goods and services. Headline inflation is usually expressed as a percentage change on a month-on-month (MoM) and year-on-year (YoY) basis. Core inflation excludes more volatile elements such as food and fuel which can fluctuate because of geopolitical and seasonal factors. Core inflation is the figure economists focus on and is the level targeted by central banks, which are mandated to keep inflation at a manageable level, usually around 2%.
What is the Consumer Price Index (CPI)?
The Consumer Price Index (CPI) measures the change in prices of a basket of goods and services over a period of time. It is usually expressed as a percentage change on a month-on-month (MoM) and year-on-year (YoY) basis. Core CPI is the figure targeted by central banks as it excludes volatile food and fuel inputs. When Core CPI rises above 2% it usually results in higher interest rates and vice versa when it falls below 2%. Since higher interest rates are positive for a currency, higher inflation usually results in a stronger currency. The opposite is true when inflation falls.
What is the impact of inflation on foreign exchange?
Although it may seem counter-intuitive, high inflation in a country pushes up the value of its currency and vice versa for lower inflation. This is because the central bank will normally raise interest rates to combat the higher inflation, which attract more global capital inflows from investors looking for a lucrative place to park their money.
How does inflation influence the price of Gold?
Formerly, Gold was the asset investors turned to in times of high inflation because it preserved its value, and whilst investors will often still buy Gold for its safe-haven properties in times of extreme market turmoil, this is not the case most of the time. This is because when inflation is high, central banks will put up interest rates to combat it.
Higher interest rates are negative for Gold because they increase the opportunity-cost of holding Gold vis-a-vis an interest-bearing asset or placing the money in a cash deposit account. On the flipside, lower inflation tends to be positive for Gold as it brings interest rates down, making the bright metal a more viable investment alternative.
Here is what you need to know on Tuesday, January 16:
Risk aversion remains the main underlying theme so far this Tuesday, as investors assess the timing and pace of US Federal Reserve (Fed) interest rate cuts amid the escalation of geopolitical tensions in the Middle East.
Markets continue pricing in a 70% probability of a 25 basis points (bps) Fed rate cut in March, versus 63% a week earlier, according to the CME Group’s FedWatch Tool. Traders are once again projecting cuts of 160 bps this year, up from expectations of 140 bps last week.
Aggressive Fed rate cut bets stand ahead of the eagerly awaited speech by Fed Governor Christopher Waller at 16:00 GMT on Wednesday. Waller flagged a dovish policy pivot late last year, driving stocks higher at the expense of the US Dollar (USD).
On the geopolitical front, Iran’s Islamic Revolutionary Guard Corps (IRGC) fired missiles at targets near the US Consulate in Erbil, Iraq. Iranians retaliated against the terrorist attacks this month that killed almost 100 people near the burial site of General Qassem Soleimani. Amidst intensifying tensions in the Red Sea, Iran-backed Houthi rebels have struck a US-owned cargo vessel with an anti-ship ballistic missile off the coast of Yemen.
This comes after US fighter aircraft intercepted and destroyed an anti-ship cruise missile launched by Houthi rebels in Yemen towards the USS Laboon destroyer in the Red Sea. Iran's Foreign Minister, Hossein Amir-Abdollahian, warns the US and Britain to immediately cease the Yemen war, condemning recent strikes on Houthi rebels as arbitrary and a violation of international law.
Markets also remain on edge ahead of the top-tier Gross Domestic Product (GDP) report and activity data from China, scurrying for safety in the US Dollar. Additionally, investors digest the US political developments in the run-up to the November 5 Presidential election. Donald Trump won the Iowa caucuses, strengthening his status as the front-runner in the Republican primary.
Meanwhile, a barometer of risk sentiment, US S&P 500 futures, is losing 0.33% on the day while the US Dollar Index is up 0.51% near 103.00, at the press time.
US Dollar price today
The table below shows the percentage change of US Dollar (USD) against listed major currencies today. US Dollar was the strongest against the Australian Dollar.
| USD | EUR | GBP | CAD | AUD | JPY | NZD | CHF | |
| USD | 0.25% | 0.26% | 0.29% | 0.51% | 0.24% | 0.37% | 0.38% | |
| EUR | -0.25% | 0.02% | 0.06% | 0.27% | -0.01% | 0.12% | 0.14% | |
| GBP | -0.27% | -0.03% | 0.02% | 0.25% | -0.04% | 0.08% | 0.11% | |
| CAD | -0.30% | -0.05% | -0.03% | 0.21% | -0.07% | 0.07% | 0.08% | |
| AUD | -0.51% | -0.26% | -0.23% | -0.22% | -0.28% | -0.14% | -0.13% | |
| JPY | -0.23% | 0.02% | 0.04% | 0.05% | 0.27% | 0.14% | 0.13% | |
| NZD | -0.37% | -0.11% | -0.08% | -0.07% | 0.15% | -0.13% | -0.02% | |
| CHF | -0.36% | -0.13% | -0.09% | -0.07% | 0.14% | -0.14% | -0.01% |
The heat map shows percentage changes of major currencies against each other. The base currency is picked from the left column, while the quote currency is picked from the top row. For example, if you pick the Euro from the left column and move along the horizontal line to the Japanese Yen, the percentage change displayed in the box will represent EUR (base)/JPY (quote).
Across the FX board, the Antipodeans are the main laggards due to risk-averse market conditions. AUD/USD is falling hard to near 0.6600 while the NZD/USD has lost nearly half a percent to trade at around 0.6170. The risk-sensitive currencies ignored regional sentiment data.
USD/JPY extends its latest upbeat momentum above 146.00, tracking the uptick in the US Treasury bond yields.
EUR/USD is keeping the red below 1.0950, despite the latest hawkish chorus by the European Central Bank’s (ECB) policymakers. Germany’s preliminary Real GDP for 2023 contracted at an annual pace of 0.3%, as widely expected. Germany’s ZEW sentiment survey is next in focus.
GBP/USD is losing ground below 1.2700, awaiting the key UK labor market report. All eyes will be on the wage inflation data ahead of Wednesday’s CPI release.
USD/CAD is holding higher ground near 1.3480 as the WTI oil price rally fizzles. The geopolitical developments surrounding the Red Sea will continue to grab attention. CAD traders will also closely scrutinize the Canadian CPI report.
Gold price is sticking to lows near $2,050, pressured by resurgent US Dollar demand and surging US Treasury bond yields. The benchmark 10-year US Treasury bond yields are 1.40% higher on the day at 4.003%.
- EUR/USD retraces its recent gains as the US Dollar gains ground on risk aversion.
- MACD indicates a momentum shift towards a bearish sentiment in the pair.
- The psychological level at 1.0900 and the 50-day EMA at 1.0897 could act as a potential support region.
EUR/USD trades lower near 1.0910 during the Asian session on Tuesday as US Dollar (USD) gains ground on risk aversion sentiment and upbeat US bond yields. The 14-day Relative Strength Index (RSI) for the EUR/USD pair is positioned below the 50 mark, indicating a bearish momentum in the market.
The Moving Average Convergence Divergence (MACD) line, despite being situated above the centerline, is diverging below the signal line. This suggests a potential shift in momentum towards a downward trend for the EUR/USD pair. Traders are expected to approach the situation with caution and may prefer to await confirmation before making trading decisions in the pair. It is important to consider the signals provided by this lagging indicator when assessing the market conditions.
The psychological level at 1.0900 could act as an immediate support aligned with the 50-day Exponential Moving Average (EMA) at 1.0897. A break below the support zone could put pressure on the EUR/USD pair to navigate the further region around the 38.2% Fibonacci retracement at 1.0867 level followed by the major support at 1.0850 level.
On the upside, the major level at 1.0950 appears to be the key resistance. A breakthrough above the latter could inspire the EUR/USD pair’s bulls to explore the region around the psychological level at 1.1000 followed by January’s high at 1.1038.
EUR/USD: Daily Chart
-638409812349847829.png)
- NZD/USD trades in negative territory for two straight days, losing 0.46% on the day.
- The concern about ongoing geopolitical tension lifts the US dollar and exerts some selling pressure on the Kiwi.
- New Zealand NZIER Business Confidence for Q4 arrived at -2.0% vs. -52% prior.
- Investors await the US NY Empire State Manufacturing Index for January, due on Tuesday.
The NZD/USD pair drops to near 0.6160 during the early European trading hours on Tuesday. The downtick of the pair is driven by the stronger US Dollar (USD) amid the risk-off environment and the rising Middle East tension. Meanwhile, the US Dollar Index (DXY) rises to a multi-week high near 102.90.
The escalating geopolitical tensions in the Middle East dominate the market sentiment on Tuesday. According to a statement released by Iranian state media, Iran’s Islamic Revolutionary Guard Corps (IRGC) fired missiles at targets in northern Iraq. The report stated that the ballistic missile was struck near the US Consulate in Erbil, Iraq. That being said, the fear of uncertainty and geopolitical tension could boost safe-haven assets like the Greenback and weigh on riskier assets like the New Zealand Dollar (NZD).
On the Kiwi front, the New Zealand NZIER Business Confidence for the fourth quarter came in at -2.0%, significantly improved from the previous quarter's of -52%, according to the New Zealand Institute of Economic Research (NZIER) on Tuesday. However, the figure failed to lift the Kiwi as traders turned to a cautious mood.
The US NY Empire State Manufacturing Index for January will be released later on Tuesday. On Wednesday, the Chinese economic data, including Q4 Gross Domestic Product (GDP), Industrial Production, and Retail Sales will be a closely watched event. Also, the US Retail Sales will be due on Wednesday. On Friday, the New Zealand Business PMI report will be published. These figures could give a clear direction to the NZD/USD pair.
- Gold price edges lower as the Greenback improves on upbeat US Treasury yields.
- US Dollar gains ground after hawkish comments from the Atlanta Fed President Raphael Bostic.
- Gold demand could improve on risk aversion due to the escalated Middle East conflict.
Gold prices snapped a three-day winning streak, trading lower near $2,050 per troy ounce during the Asian session on Tuesday. The prices of the precious metal face downward pressure as US Dollar (USD) improves on the back of upbeat US bond yields.
The US Dollar Index (DXY) began the Tuesday session with a gap-up, trading higher near 102.90 with the 2-year and 10-year yields on US Treasury coupons standing at 4.20% and 3.99%, respectively, by the press time.
Investor confidence in the US Dollar (USD) seems to be rebounding, driven by hawkish comments made by Atlanta Federal Reserve (Fed) President Raphael Bostic over the weekend. The Financial Times reported that President Bostic indicated the possibility of inflation "see-sawing" if policymakers decide to reduce interest rates prematurely. He cautioned that the decline of inflation towards the central bank's 2.0% target was expected to decelerate in the months ahead.
The geopolitical conflict between Israel and Gaza has extended to the Red Sea, with the Iran-backed Houthi group persistently targeting maritime vessels. Despite recent military strikes by the United States (US) and the United Kingdom (UK) on Houthi sites in Yemen, the situation has led to a shift in the previously positive market sentiment towards risk aversion. This shift could potentially bolster the demand for safe-haven assets such as Gold.
Market participants will closely monitor the US NY Empire State Manufacturing Index for January, as well as a speech by the Federal Reserve's Waller later on Tuesday. These events are anticipated to provide insights into the economic conditions and the central bank's perspectives, influencing market sentiments and decisions in the XAU/USD pair.
- WTI prices edge higher on supply disruptions as Houthi broadens targets in the Red Sea.
- The route diversion of maritime vessels is raising shipping costs and transit times for oil transportation.
- Islamic Revolutionary Guard Corps (IRGC) launched missiles to dismantle espionage centers near the US Consulate in Erbil, Iraq.
West Texas Intermediate (WTI) price makes an effort to retrace its recent losses, trading near $72.70 per barrel during the Asian session on Tuesday.
The heightened situation follows supply disruptions in the Red Sea, with maritime vessels altering their routes away from the region due to attacks by Yemen's Houthi movement. This course diversion is contributing to elevated shipping costs and extended transit times for the transportation of Crude oil.
On Friday, the US-led Combined Maritime Forces (CMF) headquartered in Bahrain issued a warning, advising all ships to steer clear of the Bab al-Mandab Strait.
Iranian state media has reported that the Islamic Revolutionary Guard Corps (IRGC) launched missiles targeting northern Iraq near the US Consulate in Erbil. According to the statement, ballistic missiles were employed to dismantle espionage centers and gatherings of anti-Iranian terrorist groups in the region.
These attacks coincide with heightened concerns over Israel's ongoing offensive in the Gaza Strip and an escalation in the Red Sea by Iran-backed Houthi rebels.
On Monday, a US-owned and operated container ship was struck by an anti-ship ballistic missile in areas under Houthi control in Yemen. Moreover, a representative from Yemen's Houthi movement announced their plan to expand the scope of their targets in the Red Sea region to include US ships.
The declaration follows ongoing attacks, with the Iran-allied group expressing their determination to continue despite recent military strikes by the United States (US) and the United Kingdom (UK) on their sites in Yemen.
- Indian Rupee attracts some sellers amid the rising tension in the Red Sea and firmer US Dollar.
- India's wholesale inflation rose to a nine-month high of 0.73% in December.
- The ongoing tension in the Red Sea will lead to an oil price hike in India, the world's third biggest oil importer and consumer.
Indian Rupee (INR) loses traction on Tuesday on the stronger US Dollar (USD). India's wholesale inflation, as measured by the Wholesale Price Index (WPI) is outside the deflationary zone for the second month in a row and reached the highest in the past nine months, primarily due to a rise in food prices.
The World Economic Forum (WEF) president Borge Brende said on Monday that Houthi attacks on commercial ships in the Red Sea would have a negative impact on the global supply chain and would lead to a $10–20 increase in oil prices. This, in turn, could have negative effects on oil-importing countries, including India. Furthermore, the escalating tension in the Red Sea boosts safe-haven assets like the Greenback and acts as a tailwind for the USD/INR pair.
Market players will keep an eye on the development surrounding the Middle East geopolitical tension. Later on Tuesday, the US NY Empire State Manufacturing Index will be due. The US Retail Sales on Wednesday will be in the spotlight, which is projected to show an increase of 0.4% in December.
Daily Digest Market Movers: Indian Rupee remains sensitive to the ongoing tensions in the Red Sea
- India’s December WPI inflation arrived at 0.73% YoY versus 0.26% prior, worse than the market expectation of 0.90%.
- India’s Wholesale Price Food Index came in at 5.39% YoY in December.
- India’s WPI Manufacturing for December Inflation fell 0.71% YoY from the previous reading of a 0.64% decline.
- India's December goods imports totaled $58.25 billion, while its exports arrived at $38.45 billion. The country's trade deficit decreased to $19.8 billion in December 2023 from $23.14 billion in the same month the previous year.
- The Atlanta Federal Reserve (Fed) Raphael Bostic said that rates need to stay on hold until at least summer to prevent prices from rising again.
- Bostic further stated that inflation must surely get back to the 2% target and a bad outcome could occur if policymakers start easing too fast.
Technical Analysis: Indian Rupee keeps the negative outlook in the shorter term
Indian Rupee trades weaker on the day. The USD/INR pair has remained stuck within the familiar trading band between 82.80 and 83.40 since September 2023. According to the daily chart, the further downside of USD/INR looks favorable as the pair holds below the key 100-period Exponential Moving Average (EMA). The downward momentum is backed by the 14-day Relative Strength Index (RSI) which is below the 50.0 midpoint, suggesting the sellers look to retain control in the near term.
The support-turned-resistance at 83.00 psychological mark acts as an immediate resistance level for USD/INR. The additional upside filter to watch is the upper boundary of the trading range at 83.40 and a round figure at 84.00. On the flip side, the confluence of the lower limit of the trading range and a low of September 12 at 82.80 acts as a critical contention level. A decisive break below 82.80 will pave the way to a low of August 11 at 82.60, en route to a low of August 24 at 82.40.
US Dollar price today
The table below shows the percentage change of US Dollar (USD) against listed major currencies today. US Dollar was the strongest against the Australian Dollar.
| USD | EUR | GBP | CAD | AUD | JPY | NZD | CHF | |
| USD | 0.21% | 0.22% | 0.25% | 0.38% | 0.18% | 0.32% | 0.19% | |
| EUR | -0.21% | 0.02% | 0.05% | 0.17% | -0.03% | 0.10% | -0.02% | |
| GBP | -0.24% | -0.02% | 0.01% | 0.14% | -0.06% | 0.06% | -0.05% | |
| CAD | -0.26% | -0.05% | -0.03% | 0.12% | -0.08% | 0.06% | -0.07% | |
| AUD | -0.38% | -0.16% | -0.13% | -0.12% | -0.18% | -0.06% | -0.18% | |
| JPY | -0.18% | 0.02% | 0.04% | 0.07% | 0.18% | 0.13% | 0.00% | |
| NZD | -0.33% | -0.09% | -0.06% | -0.05% | 0.06% | -0.12% | -0.13% | |
| CHF | -0.19% | 0.03% | 0.05% | 0.07% | 0.18% | -0.01% | 0.11% |
The heat map shows percentage changes of major currencies against each other. The base currency is picked from the left column, while the quote currency is picked from the top row. For example, if you pick the Euro from the left column and move along the horizontal line to the Japanese Yen, the percentage change displayed in the box will represent EUR (base)/JPY (quote).
Indian Rupee FAQs
What are the key factors driving the Indian Rupee?
The Indian Rupee (INR) is one of the most sensitive currencies to external factors. The price of Crude Oil (the country is highly dependent on imported Oil), the value of the US Dollar – most trade is conducted in USD – and the level of foreign investment, are all influential. Direct intervention by the Reserve Bank of India (RBI) in FX markets to keep the exchange rate stable, as well as the level of interest rates set by the RBI, are further major influencing factors on the Rupee.
How do the decisions of the Reserve Bank of India impact the Indian Rupee?
The Reserve Bank of India (RBI) actively intervenes in forex markets to maintain a stable exchange rate, to help facilitate trade. In addition, the RBI tries to maintain the inflation rate at its 4% target by adjusting interest rates. Higher interest rates usually strengthen the Rupee. This is due to the role of the ‘carry trade’ in which investors borrow in countries with lower interest rates so as to place their money in countries’ offering relatively higher interest rates and profit from the difference.
What macroeconomic factors influence the value of the Indian Rupee?
Macroeconomic factors that influence the value of the Rupee include inflation, interest rates, the economic growth rate (GDP), the balance of trade, and inflows from foreign investment. A higher growth rate can lead to more overseas investment, pushing up demand for the Rupee. A less negative balance of trade will eventually lead to a stronger Rupee. Higher interest rates, especially real rates (interest rates less inflation) are also positive for the Rupee. A risk-on environment can lead to greater inflows of Foreign Direct and Indirect Investment (FDI and FII), which also benefit the Rupee.
How does inflation impact the Indian Rupee?
Higher inflation, particularly, if it is comparatively higher than India’s peers, is generally negative for the currency as it reflects devaluation through oversupply. Inflation also increases the cost of exports, leading to more Rupees being sold to purchase foreign imports, which is Rupee-negative. At the same time, higher inflation usually leads to the Reserve Bank of India (RBI) raising interest rates and this can be positive for the Rupee, due to increased demand from international investors. The opposite effect is true of lower inflation.
- GBP/USD loses ground on risk aversion as escalation of the Middle East conflict is possible.
- The Pound Sterling faces challenges before the release of UK labor data on Tuesday.
- Governor Bailey’s testimony has been canceled; traders will look for his remarks in Davos.
- Houthis are likely to broaden their targets in the Red Sea region including US vessels.
GBP/USD moves lower to near 1.2690 during the Asian session on Tuesday. The Pound Sterling (GBP) loses ground against the US Dollar (USD) on risk aversion, which could be attributed to the concerns regarding geopolitical risks, dominating the sentiment of market participants. Furthermore, traders await the labor market data from the United Kingdom to be released on Tuesday.
UK Claimant Count Change came in at 16K in November, while the ILO Unemployment Rate (3M) is forecasted to hold steady at 4.2%. October’s Employment Change printed 50K figures. Additionally, Tuesday’s testimony of the Governor Andrew Bailey of the Bank of England (BoE) has been canceled which was scheduled before the Lords' Economic Affairs Committee in London. Traders would like to observe if the BoE’s Governor speaks at the World Economic Forum in Davos, Switzerland.
On Monday, an official from Yemen's Houthi movement declared their intention to broaden their targets in the Red Sea region to include US ships. This statement comes in response to continued attacks, as the Iran-allied group vows to persist despite recent US and British strikes on its sites in Yemen. A United States-owned and operated container ship succumbed to an anti-ship ballistic missile assault from regions under Houthi control in Yemen. This event has shifted the previously optimistic sentiment to risk aversion, thereby providing support to the US Dollar (USD).
Atlanta Federal Reserve (Fed) President Raphael Bostic believes that interest rates should remain unchanged until at least the summer to prevent a resurgence in prices. Bostic emphasized the risk of inflation experiencing fluctuations if policymakers decide to ease measures prematurely. He cautioned that the deceleration toward the central bank's 2.0% target was expected to slow down in the coming months.
| Raw materials | Closed | Change, % |
|---|---|---|
| Silver | 23.198 | 0.19 |
| Gold | 2053.946 | 0.29 |
| Palladium | 972.1 | 0.2 |
Amidst further escalation in the Middle East geopolitical tensions, Iran’s Islamic Revolutionary Guard Corps (IRGC) fired missiles at targets in northern Iraq, according to a statement released by Iranian state media.
“Ballistic missiles were used to destroy espionage centers and gatherings of anti-Iranian terrorist groups in the region late tonight,” the media reported.
The ballistic missile was struck near the US Consulate in Erbil, Iraq, Iran’s IRGC said.
It said the targets were the positions of “spies and dissident groups”, however, Sky News reported the US Consulate in Erbil had been attacked by “long-range missiles with great destructive capacity.”
Iranians retaliated against the terrorist attacks this month that killed almost 100 people near the burial site of General Qassem Soleimani.
The attacks come amid heightened fears of Israel’s continued conflict offensive in the Gaza Strip and escalation in the Red Sea by Iran-backed Houthi rebels.
Market reaction
The Middle East geopolitical escalation has bumped up the safe-haven demand for the US Dollar, lifting the US Dollar Index by 0.40% on the day to 102.80. The US S&P 500 futures, a risk barometer, are down 0.18% on the day.
- USD/JPY trades in positive territory for the second consecutive day on Tuesday.
- The Japanese Producer Price Index (PPI) came in at 0.3% MoM in December vs. 0.2% prior, beating the estimation of 0%.
- Investors anticipate the interest rate cuts as soon as a Fed meeting in March.
The USD/JPY pair holds positive ground below the 146.00 barrier during the early Asian session on Tuesday. The uptick of the pair is bolstered by the stronger US Dollar (USD) broadly. Investors await the US NY Empire State Manufacturing Index on Tuesday for fresh impetus, which is expected to show a decrease of 5 in January from a 14.5 fall in the previous reading. At press time, USD/JPY is trading at 145.90, gaining 0.08% on the day.
Data released from the Statistics Bureau of Japan showed on Tuesday that the nation’s Producer Price Index (PPI) grew 0.3% MoM in December from 0.2% in November, beating the estimation of 0%. On an annual basis, the PPI figure remained flat in December from the previous reading of a 0.3% rise, above the market consensus of a 0.3% fall.
The Bank of Japan (BoJ) Governor Kazuo Ueda has stressed the need to maintain the ultraloose monetary policy as he awaits further data that might show if inflation will persist. He further stated that the central bank will scrap the negative rate when it becomes sufficiently certain of achieving sustainable inflation of 2%.
Furthermore, there are reports that Iran's Revolutionary Guard has been deployed to assist Houthi terrorists in Yemen. That being said, the escalation in the Middle East might boost safe-haven flow and benefit the Japanese Yen (JPY).
On the other hand, market players are expecting interest rate cuts as soon as a Fed meeting in March. According to the CME FedWatch tool, markets put the probability of a rate cut in March at nearly 71%. Atlanta Federal Reserve (Fed) President Raphael Bostic said that inflation could "see-saw" if policymakers cut interest rates too soon. Bostic added that inflation must firmly and surely get back to our 2% target.
Later on Tuesday, the US NY Empire State Manufacturing Index will be due. Additionally, the Fed’s Christopher J. Waller might offer some hints about further monetary policy stances later in the day. On Wednesday, attention will shift to US Retail Sales, which is projected to show an increase of 0.4% in December. These figures might give a clear direction to the USD/JPY pair.
- Australian Dollar moves on a downward trajectory as US Dollar strengthens.
- Australian Consumer Confidence declined by 1.3% in January against the 2.7% prior.
- Fed Bostic warned that inflation may waver in the upcoming months.
- Upbeat US bond yields contributed support to underpinning the Greenback.
The Australian Dollar (AUD) continues its losing streak on Tuesday which began on January 9. The AUD/USD pair faces downward pressure after the Westpac Consumer Confidence data for January showed a contraction. This development might contribute to the sentiment that there will be no further policy tightening from the Reserve Bank of Australia (RBA) in its upcoming board meeting in February.
Australia's Consumer Confidence, released by the Faculty of Economics and Commerce Melbourne Institute, declined by 1.3% compared to the previous increase of 2.7%. However, on Monday, the TD Securities Inflation data showed a rise in December, which might have limited the losses of the Aussie Dollar.
The US Dollar Index (DXY) began the Tuesday session with a gap-up, supported by upbeat US Treasury yields. Investors' confidence in the US Dollar (USD) appears to be returning following hawkish remarks by Atlanta Federal Reserve (Fed) President Raphael Bostic over the weekend.
According to the Financial Times, President Bostic suggested that inflation could "see-saw" if policymakers cut interest rates too soon. He warned that the descent of inflation toward the central bank's 2.0% goal was likely to slow in the months ahead.
Traders will likely keep an eye on the NY Empire State Manufacturing Index on Tuesday, with an expected decline to 5 compared to the previous reading of 14.5. Additionally, Chinese Gross Domestic Product (GDP) and Retail Sales data are scheduled for Wednesday.
Daily Digest Market Movers: Australian Dollar loses ground as the US Dollar improves
- Australian TD Securities inflation increased by 5.2% YoY in December from 4.4% in November.
- Australia's job advertisements improved by 0.1% in December, swinging from the previous decline of 4.6%.
- People's Bank of China (PBoC) maintained the rate on its medium-term facility steady at 2.5%, increasing the expectation that the Reserve Requirement Ratio will be reduced the following month.
- Chinese Consumer Price Index (YoY) decreased by 0.3% in December, against the expected 0.4% decline. The monthly Consumer Price Index eased at 0.1%, compared to the market expectation of 0.2%. The yearly Producer Price Index fell by 2.7%, slightly exceeding the expected decline of 2.6%.
- Barclays revised its forecast for the first Federal Reserve (Fed) rate cut on Friday, moving it up to March from June. In a note released on Friday, Barclays analysts expressed their expectation for the Federal Open Market Committee (FOMC) to reduce the Fed Funds rate by 25 basis points at the March meeting.
- US Bureau of Labor Statistics reported that the December Producer Price Index (PPI) figure was 1.0% year-on-year, compared to the previous reading of 0.8%. The Core PPI YoY arrived at 1.8%, down from 2.0% in November. Monthly, the headline and Core PPI indices remained flat at -0.1% and 0.0%, respectively.
- US Bureau of Labor Statistics reported that the Consumer Price Index (CPI) surged to 3.4% YoY in December, exceeding both November's 3.1% and the anticipated market figure of 3.2%. The monthly CPI growth for December showed a 0.3% increase, surpassing the market analysts' estimated projection of 0.2%. The annual Core CPI stood at 3.9%, a slight decrease from November's 4.0%, while the monthly figure remained steady at 0.3%, in line with expectations.
Technical Analysis: Australian Dollar moves below the major level at 0.6650
The Australian Dollar trades near 0.6620 on Tuesday, positioned above psychological support at 0.6600 following the 50% retracement level at 0.6566 and major support at 0.6550. On the upside, the major barrier appears at the 0.6650 level following the 14-day Exponential Moving Average (EMA) at 0.6699 aligned with the psychological level at 0.6700.
AUD/USD: Daily Chart
-638409656888781827.png)
Australian Dollar price today
The table below shows the percentage change of Australian Dollar (AUD) against listed major currencies today. Australian Dollar was the weakest against the US Dollar.
| USD | EUR | GBP | CAD | AUD | JPY | NZD | CHF | |
| USD | 0.15% | 0.12% | 0.09% | 0.22% | 0.02% | 0.19% | 0.08% | |
| EUR | -0.16% | -0.02% | -0.05% | 0.07% | -0.13% | 0.04% | -0.07% | |
| GBP | -0.15% | 0.00% | -0.06% | 0.08% | -0.14% | 0.00% | -0.08% | |
| CAD | -0.08% | 0.07% | 0.04% | 0.12% | -0.06% | 0.10% | -0.02% | |
| AUD | -0.22% | -0.08% | -0.09% | -0.15% | -0.20% | -0.04% | -0.15% | |
| JPY | -0.01% | 0.14% | 0.10% | 0.06% | 0.19% | 0.16% | 0.06% | |
| NZD | -0.19% | -0.03% | -0.03% | -0.09% | 0.03% | -0.16% | -0.08% | |
| CHF | -0.07% | 0.09% | 0.07% | 0.03% | 0.15% | -0.05% | 0.11% |
The heat map shows percentage changes of major currencies against each other. The base currency is picked from the left column, while the quote currency is picked from the top row. For example, if you pick the Euro from the left column and move along the horizontal line to the Japanese Yen, the percentage change displayed in the box will represent EUR (base)/JPY (quote).
Australian Dollar FAQs
What key factors drive the Australian Dollar?
One of the most significant factors for the Australian Dollar (AUD) is the level of interest rates set by the Reserve Bank of Australia (RBA). Because Australia is a resource-rich country another key driver is the price of its biggest export, Iron Ore. The health of the Chinese economy, its largest trading partner, is a factor, as well as inflation in Australia, its growth rate and Trade Balance. Market sentiment – whether investors are taking on more risky assets (risk-on) or seeking safe-havens (risk-off) – is also a factor, with risk-on positive for AUD.
How do the decisions of the Reserve Bank of Australia impact the Australian Dollar?
The Reserve Bank of Australia (RBA) influences the Australian Dollar (AUD) by setting the level of interest rates that Australian banks can lend to each other. This influences the level of interest rates in the economy as a whole. The main goal of the RBA is to maintain a stable inflation rate of 2-3% by adjusting interest rates up or down. Relatively high interest rates compared to other major central banks support the AUD, and the opposite for relatively low. The RBA can also use quantitative easing and tightening to influence credit conditions, with the former AUD-negative and the latter AUD-positive.
How does the health of the Chinese Economy impact the Australian Dollar?
China is Australia’s largest trading partner so the health of the Chinese economy is a major influence on the value of the Australian Dollar (AUD). When the Chinese economy is doing well it purchases more raw materials, goods and services from Australia, lifting demand for the AUD, and pushing up its value. The opposite is the case when the Chinese economy is not growing as fast as expected. Positive or negative surprises in Chinese growth data, therefore, often have a direct impact on the Australian Dollar and its pairs.
How does the price of Iron Ore impact the Australian Dollar?
Iron Ore is Australia’s largest export, accounting for $118 billion a year according to data from 2021, with China as its primary destination. The price of Iron Ore, therefore, can be a driver of the Australian Dollar. Generally, if the price of Iron Ore rises, AUD also goes up, as aggregate demand for the currency increases. The opposite is the case if the price of Iron Ore falls. Higher Iron Ore prices also tend to result in a greater likelihood of a positive Trade Balance for Australia, which is also positive of the AUD.
How does the Trade Balance impact the Australian Dollar?
The Trade Balance, which is the difference between what a country earns from its exports versus what it pays for its imports, is another factor that can influence the value of the Australian Dollar. If Australia produces highly sought after exports, then its currency will gain in value purely from the surplus demand created from foreign buyers seeking to purchase its exports versus what it spends to purchase imports. Therefore, a positive net Trade Balance strengthens the AUD, with the opposite effect if the Trade Balance is negative.
The People’s Bank of China (PBoC) sets the USD/CNY central rate for the trading session ahead on Monday at 7.1134 as compared to the previous day's fix of 7.1084 and 7.1783 Reuters estimates.
- EUR/USD loses traction below the mid-1.0900s amid the geopolitical tension in the Red Sea.
- Eurozone Industrial Production dropped 0.3% MoM in November from a 0.7% fall in October.
- A dovish remarks from the Federal Reserve (Fed) might cap the USD’s upside.
- Investors will closely watch the Eurozone Consumer Price Index (CPI) report, due on Tuesday.
The EUR/USD pair trades weaker for the fourth consecutive day during the early Asian session on Tuesday. The risk-off mood in the market drags risky assets like the Euro (EUR) lower amid the rising tension in the Red Sea. The major pair currently trades near 1.0938, losing 0.12% on the day. Later on Tuesday, the German inflation data and the ZEW Survey will be released.
Eurostat revealed on Monday that the Industrial Production across the euro area remains weak. The figure came in at -0.3% MoM in November from -0.7% in the previous reading. On an annual basis, Industrial Production fell 6.8% YoY in November from the previous reading of a 6.6% drop. The Production figure fell in both Germany and Italy, which exerts some selling pressure on the EUR and acts as a headwind for the EUR/USD pair.
Additionally, the European Central Bank (ECB) policymaker Joachim Nagel said on Monday that it’s premature for the central bank to discuss cutting interest rates because inflation remains high. Nagel added that they may need to wait for new data, and interest rate decisions would be made on a meeting-by-meeting basis.
Across the pond, a dovish tilt in the Federal Reserve's (Fed) stance might cap the upside in the US Dollar (USD). The Fed policy rate currently stands in the 5.25%–5.50% range after 525 basis points (bps) of rate hikes since March 2022. Investors anticipate rate cuts coming as early as March 2024.
Moving on, market players will keep an eye on the German inflation data on Tuesday, as measured by the Consumer Price Index (CPI) for December. Also, the ZEW Survey from Germany and the Eurozone will be published. On the US docket, the January US NY Empire State Manufacturing Index will be due and Fed’s Christopher J. Waller is set to speak later in the day.
| Index | Change, points | Closed | Change, % |
|---|---|---|---|
| NIKKEI 225 | 324.68 | 35901.79 | 0.91 |
| Hang Seng | -28.25 | 16216.33 | -0.17 |
| KOSPI | 0.94 | 2525.99 | 0.04 |
| ASX 200 | -2 | 7496.3 | -0.03 |
| DAX | -82.34 | 16622.22 | -0.49 |
| CAC 40 | -53.46 | 7411.68 | -0.72 |
| Pare | Closed | Change, % |
|---|---|---|
| AUDUSD | 0.66589 | -0.24 |
| EURJPY | 159.62 | 0.67 |
| EURUSD | 1.09504 | 0.05 |
| GBPJPY | 185.525 | 0.5 |
| GBPUSD | 1.27272 | -0.07 |
| NZDUSD | 0.6199 | -0.63 |
| USDCAD | 1.34257 | 0.2 |
| USDCHF | 0.85568 | 0.54 |
| USDJPY | 145.775 | 0.6 |
- Gold price holds above $2,050 in Tuesday’s Asian trading hours.
- Modest gains in gold are underpinned by rising tensions in the Red Sea and the risk-off mood.
- Atlanta Fed’s Bostic said inflation could seesaw if policymakers cut rates too soon.
Gold price (XAU/USD) posts modest gains above the $2,050 mark during the early Asian session on Tuesday. The escalating geopolitical tension in the Red Sea and the risk-off environment benefit a safe-haven asset like gold. At press time, the gold price is trading at $2,055, gaining 0.06% for the day.
Meanwhile, the US Dollar Index (DXY), a measure of the value of the USD against a weighted basket of currencies used by US trade partners, has extended its consolidative theme since the beginning of the year near 102.60. The Treasury yields edge lower, with the 10-year yield standing at 3.95%.
The market has priced in 86% odds of a rate cut by March, with the overall 2024 easing cycle priced at around 166 basis points (bps), compared to 75 bps projected by the Fed dot plot. Nonetheless, Atlanta Federal Reserve (Fed) Raphael Bostic said on the weekend that rates need to stay on hold until at least summer to prevent prices from rising again. He further stated that inflation must surely get back to the 2% target, and a bad outcome could occur if policymakers start easing too fast.
Furthermore, Houthi rebels fired a missile, striking a US-owned ship Monday just off the coast of Yemen in the Gulf of Aden, less than a day after they launched an anti-ship cruise missile toward an American destroyer in the Red Sea. This, in turn, might boost the performance of yellow metal as it is considered a safe-haven asset, meaning that investors tend to folk to it in times of uncertainty and geopolitical tension.
Looking ahead, the development surrounding geopolitical tension in the Middle East remains in focus. Later on Tuesday, the US NY Empire State Manufacturing Index for January and the Fed's Waller speech will be monitored by market players.


© 2000-2026. Уcі права захищені.
Cайт знаходитьcя під керуванням TeleTrade DJ. LLC 2351 LLC 2022 (Euro House, Richmond Hill Road, Kingstown, VC0100, St. Vincent and the Grenadines).
Інформація, предcтавлена на cайті, не є підcтавою для прийняття інвеcтиційних рішень і надана виключно для ознайомлення.
Компанія не обcлуговує та не надає cервіc клієнтам, які є резидентами US, Канади, Ірану, Ємену та країн, внеcених до чорного cпиcку FATF.
Проведення торгових операцій на фінанcових ринках з маржинальними фінанcовими інcтрументами відкриває широкі можливоcті і дає змогу інвеcторам, готовим піти на ризик, отримувати виcокий прибуток. Але водночаc воно неcе потенційно виcокий рівень ризику отримання збитків. Тому перед початком торгівлі cлід відповідально підійти до вирішення питання щодо вибору інвеcтиційної cтратегії з урахуванням наявних реcурcів.
Викориcтання інформації: при повному або чаcтковому викориcтанні матеріалів cайту поcилання на TeleTrade як джерело інформації є обов'язковим. Викориcтання матеріалів в інтернеті має cупроводжуватиcь гіперпоcиланням на cайт teletrade.org. Автоматичний імпорт матеріалів та інформації із cайту заборонено.
З уcіх питань звертайтеcь за адреcою pr@teletrade.global.
переклади