- Analytics
- News and Tools
- Market News
Новини ринків
- USD/JPY is down almost 2% from Monday’s opening bids.
- A pivot from the Fed saw the US Dollar decline sharply across the broader forex market.
- Next week pits the BoJ’s last rate call of the year against US GDP & PCE figures.
The USD/JPY wrapped up the trading week struggling to develop momentum in either direction from the 142.00 handle after the US Dollar (USD) slumped against the Japanese Yen (JPY) following a mid-week pivot from the US Federal Reserve (Fed), with the central bank finally meeting market participants in the middle on rate cut expectations heading into 2024.
The Fed’s dot plot of policymakers’ cumulative interest rate expectations next year sees the Fed expecting a median of three rate cuts for a total of 75 basis points in rate cuts from the Fed’s current reference rate of 5.5%. While the Fed has moved closer to market expectations, money markets have run well ahead of the Fed’s policy stance, with swaps markets pricing in an eye-watering six rate cuts in 2024, for a combined cut forecast over 150 basis points.
Forex Today: Dollar tumbles on Fed's pivot despite US economy still outperforming
The Fed’s pivot on rate policy sparked a risk rally that pushed the USD into the floorboards to end the week as the single-worst performing currency of the fx majors bloc, shedding weight across the board and finishing the week nearly two percent off of Monday’s opening bids against the Japanese Yen.
Next week kicks things off for the USD/JPY with the Bank of Japan’s (BoJ) final rate call and Monetary Policy Statement for 2023. An exact start time to the elusive BoJ’s rate statement is difficult to nail down, but the Japanese central bank is broadly expected to hold its main reference rate slightly below zero, in negative territory at -0.1%.
Next week also sees a fresh reading of the US’ Gross Domestic Product (GDP) on Thursday, and investors will be keeping a close eye on next Friday’s Personal Consumption Expenditure (PCE) figures. As the Fed’s favored method of tracking consumer-facing inflation, the PCE will go a long way to markets adjusting their rate expectations heading into 2024.
US Dollar price this week
The table below shows the percentage change of US Dollar (USD) against listed major currencies this week. US Dollar was the weakest against the Japanese Yen.
| USD | EUR | GBP | CAD | AUD | JPY | NZD | CHF | |
| USD | -1.22% | -1.00% | -1.54% | -1.84% | -1.92% | -1.41% | -1.07% | |
| EUR | 1.19% | 0.21% | -0.32% | -0.63% | -0.72% | -0.19% | 0.14% | |
| GBP | 1.00% | -0.22% | -0.53% | -0.83% | -0.92% | -0.40% | -0.07% | |
| CAD | 1.52% | 0.33% | 0.52% | -0.31% | -0.39% | 0.13% | 0.46% | |
| AUD | 1.82% | 0.62% | 0.83% | 0.31% | -0.09% | 0.44% | 0.77% | |
| JPY | 1.90% | 0.70% | 0.84% | 0.39% | 0.09% | 0.52% | 0.85% | |
| NZD | 1.39% | 0.18% | 0.40% | -0.13% | -0.43% | -0.52% | 0.33% | |
| CHF | 1.06% | -0.15% | 0.06% | -0.46% | -0.75% | -0.82% | -0.33% |
The heat map shows percentage changes of major currencies against each other. The base currency is picked from the left column, while the quote currency is picked from the top row. For example, if you pick the Euro from the left column and move along the horizontal line to the Japanese Yen, the percentage change displayed in the box will represent EUR (base)/JPY (quote).
USD/JPY Technical Outlook
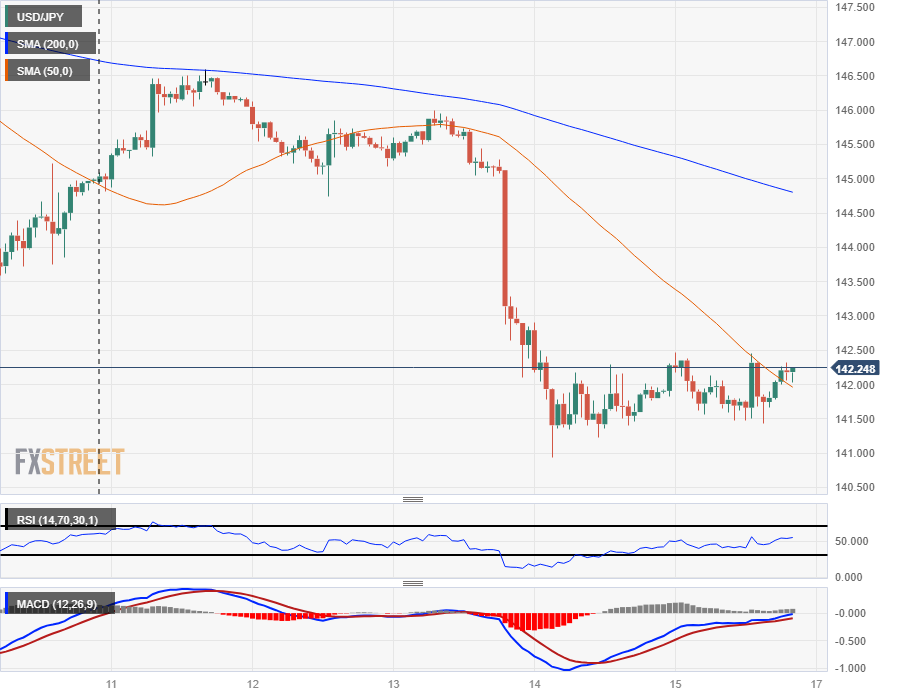
The USD/JPY saw a hard rebalance on Wednesday, dragging the pair back down to the 141.00 handle before the Dollar leveled out to end the trading week just above the 142.00 price point.
The pair saw a peak-to-trough decline of 3.85% on the week, and the Dollar’s decline and minuscule rebound sees the USD/JPY trading far below the 200-hour Simple Moving Average (SMA) descending through the 145.00 major handle.
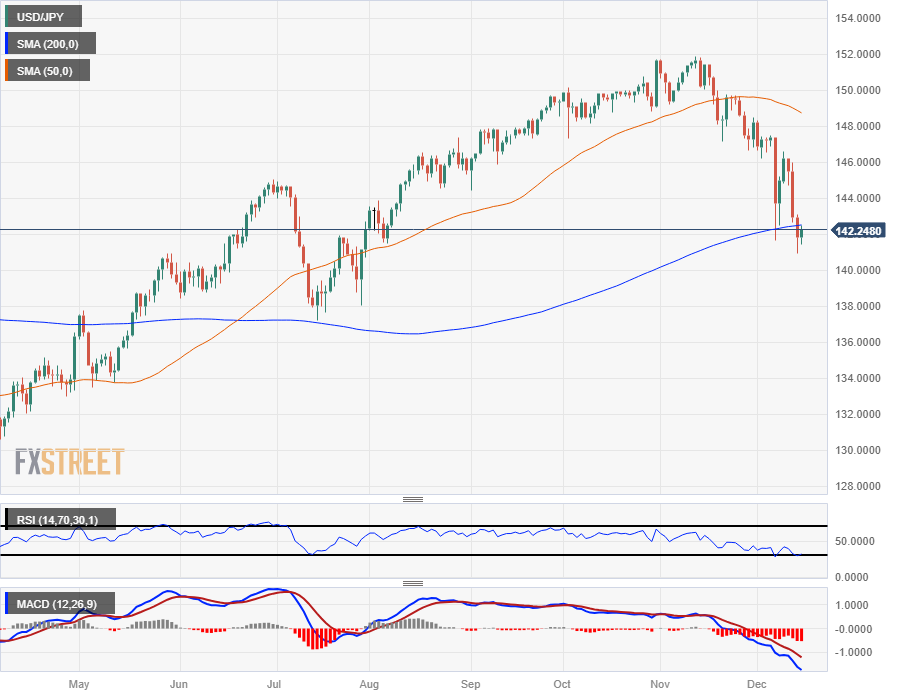
The USD/JPY’s declines have dragged the pair back into the 200-day SMA for the first time since breaking through the moving average back in May of this year, and the pair is down over seven percent from the year’s peak bids at 151.83 back in November.
Despite this, Greenback bidders will be able to walk away happy: the USD is still up nearly 8% against the JPY for 2023, having started the year near the 131.00 handle.
USD/JPY Hourly Chart
USD/JPY Daily Chart
USD/JPY Technical Levels
- The NZD/JPY hovers around 88.40, marking a gain of 0.30% after recent bearish pressure.
- Key indicators gain ground, but bears are still in command in the short term.
- Despite short-term hurdles, evident by residing below the 20-day SMA, the NZD/JPY pair remains within bullish controls in a larger context.
In Friday's session, the NZD/JPY made slight gains to 88.40 after dipping 1.30% over the past two days. Although the pair's daily chart reflects a neutral to bearish trend, buyers seem to have control of larger time frames. Meanwhile, the four-hour chart's indicators hint at a bolstering buying momentum, suggesting more upward movements in the next sessions.
On the daily chart view, the indicators send conflicting signals. Even though the pair is trading below the 20-day Simple Moving Average (SMA), hinting at a sense of weakness in the short-term perspective, it is holding position above both the long-term 100 and 200-day SMAs. This suggests that the bullish forces have the upper hand within the broader context. Nonetheless, the bears aren't ceding control so easily - their effort in the last two sessions has seen the pair take a 1.30% dip. The flat Moving Average Convergence Divergence (MACD) and the positively sloping, yet still below its middle point, Relative Strength Index (RSI) underline a rising buying momentum, but one where the bulls need to push harder to assert their control in the short term.
Moving to the four-hour chart, the indicators continue to reflect the same situation broadly. The Relative Strength Index (RSI) remains in the negative zone but its positive gradient suggests a potential for an upward shift in momentum. However, the MACD showing flat red bars emphasizes the need for a stronger surge from the buyers to set off a solid uptrend.
NZD/JPY daily chart
-638382728458633922.png)
- GBP/JPY remains neutral to downward bias but retains potential upside risks.
- A break below key support levels at 178.03 and 176.30 to pave the way for a deeper fall toward the March 23 low of 158.25.
- On the upside, the pair needs to stay above the 180.00 level to maintain the potential for an upward move.
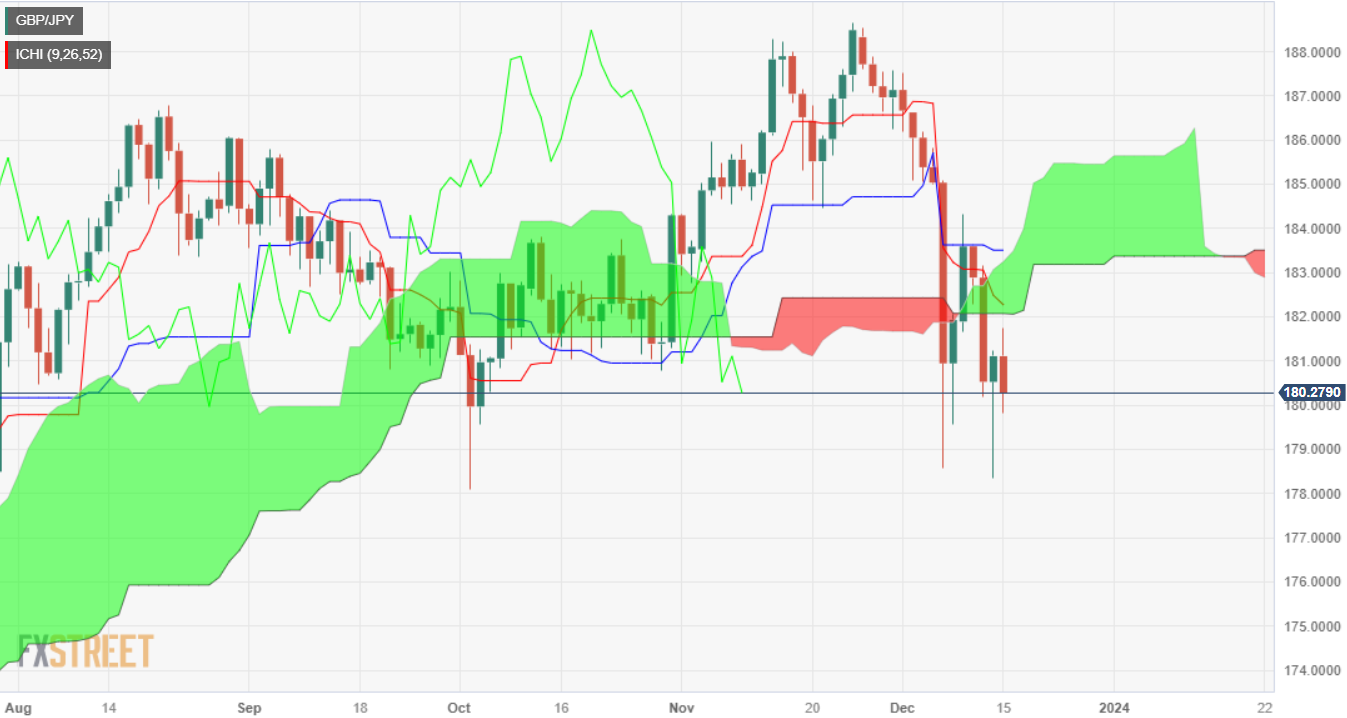
On Friday, the GBP/JPY remains offered late in the North American session and is set to end the week in the red after the pair slumped below the Ichimoku Cloud (Kumo), which exacerbated its fall to new two-month lows of 178.33. At the time of writing, the cross is trading at 180.33.
The pair is neutral to downward biased, but upside risks remain. If bears conquer key support levels at 178.03, the October 3 low, followed by the July 28 cycle low at 176.30, that would cement the downtrend and open the door for a fall toward the March 23 low of 158.25.
On the other hand, if the pair stays above 180, that would open the door to break the first key resistance level seen at the bottom of the Kumo at 182.12. A breach of the latter will expose the confluence of the top of the Kumo, the Kijun-Sen, and the Senkou Span B at 183.49, ahead of the 184.00 mark.
GBP/JPY Price Analysis – Daily Chart
GBP/JPY Technical Levels
- AUD/JPY is set to extend its gains but faces solid resistance at around 95.80.
- A bullish resumption would happen with buyers reclaiming the Senkou Span A at 95.87.
- A drop below the Kumo, expect further downside towards December’s low of 93.71.
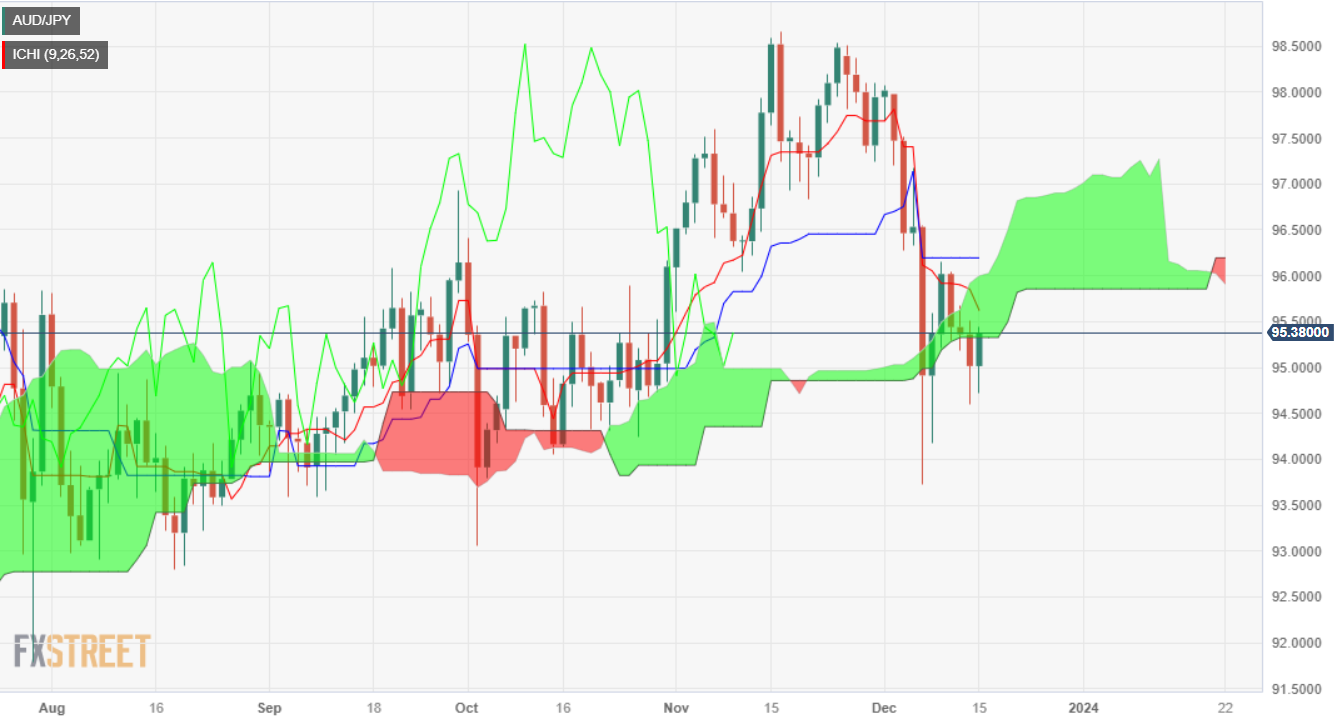
The AUD/JPY gained over 0.30% in the day and trades at around 95.40 once it bounced off the daily lows of 94.72. The cross-pair finished the week with minuscule gains of 0.15%.
The pair staged a recovery to finish in the green despite breaching below the Ichimoku Cloud (Kumo) during the week. In addition, the AUD/JPY got inside the Kumo and formed a ‘bullish harami’ two-candlestick pattern, which would pave the way for further upside. If buyers reclaim the Senkou Span A at 95.87, that could pave the way for further gains, exposing the confluence of the Senkou Span B and the Kijun Sen at 96.14. Once cleared, the next resistance would be 97.00.
On the other hand, if the pair slips below the Kumo, the first support would be the December 14 daily low of 94.58, followed by the December 7 swing low of 93.71.
AUD/JPY Price Analysis – Daily Chart
AUD/JPY Technical Levels
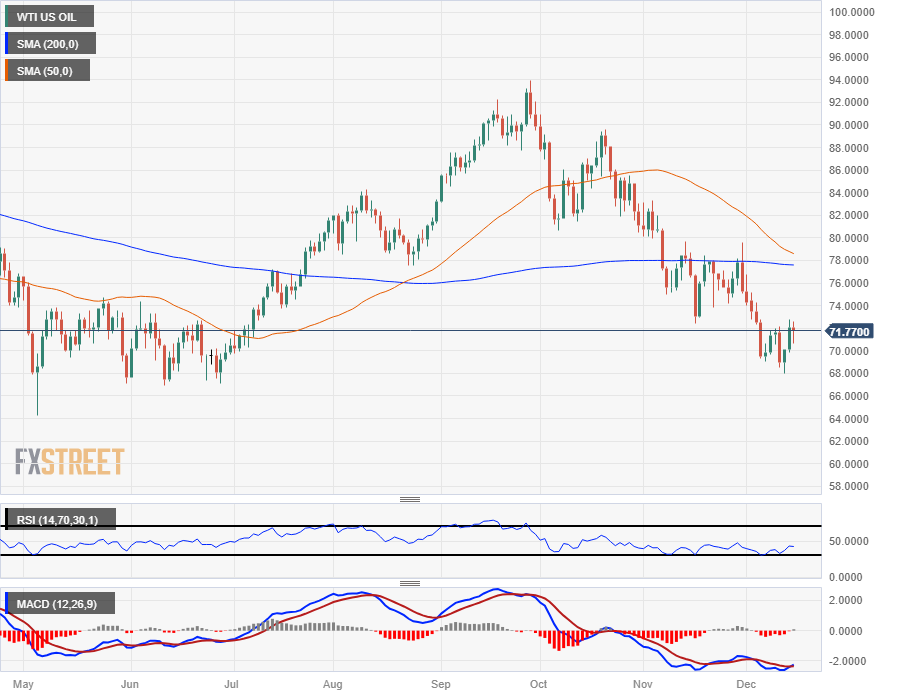
- Crude Oil markets are heading lower to close out the trading week.
- WTI is testing into the low end, shedding the $72 handle.
- US Crude oil is rebounding from a mid-week slump into $68.
West Texas Intermediate (WTI) Crude Oil bids are shifting into the low side on Friday, testing into the red with an afternoon plunge into $70.65 before recovering to just below $72.00.
Crude Oil markets continue to get knocked back and bullish momentum gets tangled up at familiar technical points. This week’s risk bid, sparked by a US Federal Reserve (Fed) admitting they’re likely looking at rate cuts next year, could only muscle WTI back into the week’s opening bids.
Topside gains remain limited as global oil demand continues to decline faster than the Organization of the Petroleum Exporting Countries (OPEC) can clamp down on production. OPEC has announced additional supply constraints through the first quarter of 2024, but energy traders remain skeptical that OPEC can successfully choke down oil production to meet waffling demand.
OPEC currently cannot force its member states to adhere to self-imposed oil pumping caps, nor are there any mechanisms in place that allow OPEC to punish member states that flaunt barrel exporting quotas.
WTI Technical Outlook
WTI is holding steady near the week’s opening bids near $71.80, but bullish momentum sees bids capped to recoveries after WTI dipped into a five-month low at $67.97 on Wednesday.
US Crude Oil has rebounded nearly six percent from the week’s low bids, but is still down nearly ten percent from late November’s peaks at $79.62, and has shed over 23% from high-end bids just shy of $94.00 back in September.
WTI Daily Chart
WTI Technical Levels
- EUR/USD faces a significant downturn, falling 0.89% to 1.0893 in late New York trading.
- Eurozone business activity disappoints, with S&P Global reporting contractions in Germany and France.
- Mixed data in the US bolstered the Greenback, which staged a comeback against the Euro.
The EUR/USD tumbled sharply late in the New York session after hitting a ten-day high of 1.1009, but better than expected data from the United States (US), coupled with weaker than expected business activity report from the Eurozone (EU) was the perfect storm for the bears. Hence, the major is trading at 1.0893, down 0.89%.
Disappointing Eurozone PMIs, portrays a gloomy scenario for the Euro
The Euro (EUR) was bolstered by the European Central Bank (ECB) President Christine Lagarde's hawkish approach, taking a blueprint of the Fed Chair Jerome Powell's book on things not to do following a monetary policy decision. Although Powell failed to push back against speculations on rate cuts, it exacerbated the EUR/USD rally past the 1.1000 mark.
However, on Friday, the NY Fed President John Williams said it’s “premature” to talk about rate cuts at the March meeting, lifting the US 2-year Treasury note rate six basis points to 4.449%.
Data-wise, the Fed revealed that industrial production in the US gathered steam at 0.2% MoM, up from -0.9% contraction, but missed estimates. Further data revealed by S&P Global suggests the US economy is in good shape despite 500 bps of tightening by the US central bank.
Nevertheless, the New York Fed Empire State Manufacturing Index plunged by -14.5 in December, less than expectations and below November’s 9.1.
On the Eurozone (EU) front, business activity continued to deteriorate, revealed a poll by S&P Global. The agency revealed that activity in Germany and France shrank, while in the EU, none of the three Flash PMI indices were in expansionary territory. This poured cold water on yesterday’s words by ECB’s President Lagarde, spurring a 90-plus pip plunge in the EUR/USD.
What to look for the next week
The EU’s docket will feature business and consumer climate, inflation figures, and consumer confidence. On the US front, housing data, GDP, consumer confidence, and sentiment, alongside durable goods orders.
EUR/USD Technical Levels
- The USD/SEK pair registers moderate gains, hovering around the 10.280 level.
- Robust Service S&P Global PMI from December PMIs lifted the US Dollar.
- Markets await next week’s Riksbank decision, with no rate hike expected.
In Friday's session, the USD/SEK pair is pushing forward with gains, trading fairly at the 10.280 level. These upward movements have largely been driven by the aftermath of the US S&P PMI data release, which made the US Dollar find a lift after three consecutive days of losses.
In the first part of December, the US private sector slightly expanded according to the S&P Global Composite PMI, which inched up to 51.0 from November's 50.7. However, the Manufacturing PMI showed continuing contraction, dropping to 48.2 from 49.4. On the positive side, the Services PMI showed a slight improvement, rising to 51.3 from 50.8, which seems to make the US Dollar strengthen against its peers.
Next week, when the Riksbank announces it last monetary policy decision in 2023, the pair may see further volatility. In that sense, the Federal Reserve (Fed), hinted at more easing than expected on Wednesday, which fueled a US Dollar sell-off so monetary policy divergences may set the pair's pace in the short term. As for now, the Swedish bank kept its rates steady in November and is expected to do as well in next week’s meeting, while 25 bps of easing are being discounted by swaps markets at the beginning of 2024.
In November’s meeting minutes, the Swedish bank recognized that the labor market and the overall economy were slowing down and weren’t seen committed to further tightening, but they did leave the door open if needed.
USD/SEK levels to watch
On the daily chart, the pair exhibits a bearish stance. This is underpinned by the Relative Strength Index (RSI), which, even though it shows a positive slope, continues to highlight seller dominance as it stands in negative territory. The overall picture is further exacerbated by the Moving Average Convergence Divergence (MACD), which is evenly poised with flat red bars, often suggestive of a prevalent bearish momentum.
Considering the Simple Moving Averages (SMAs), the evidence of bears' influence becomes even more persuasive. The pair trades below the 20, 100, and 200-day SMAs, emphasizing the unchallenged stronghold of bearish influence on the broader context.
In that sense, the recent trading pattern reveals that the bears are on a breather following a three-day losing streak. However, this pause of the bearish trend does not necessarily denote a shift in momentum but can simply be a matter of price re-balance before the selling pressure resumes.
Support Levels: 10.250, 10.220, 10.150.
Resistance Levels: 10.325, 10.350, 10.405 (20-day SMA).
USD/SEK daily chart
-638382660894519020.png)
Chicago Federal Reserve (Fed) President Austan Goolsbee added his take to comments from Fed officials on Friday, stating that he did not rule out the possibility of a rate cut at the Fed's meeting next March.
According to reporting by the Wall Street Journal, Chicago Fed President Goolsbee expects rates to be lower by this time next year, but not by much, giving additional weight to the Fed's projected cuts on the dot plot next year.
Goolsbee also noted that the Fed might need to shift focus to its jobs mandate next year, with inflation cooling and the US employment landscape seeing overarching threats from a slowdown in key economic factors.
Market Reaction
The US Dollar Index (DXY) twitched higher on reaction, chalking in a new high for Friday above 102.60.
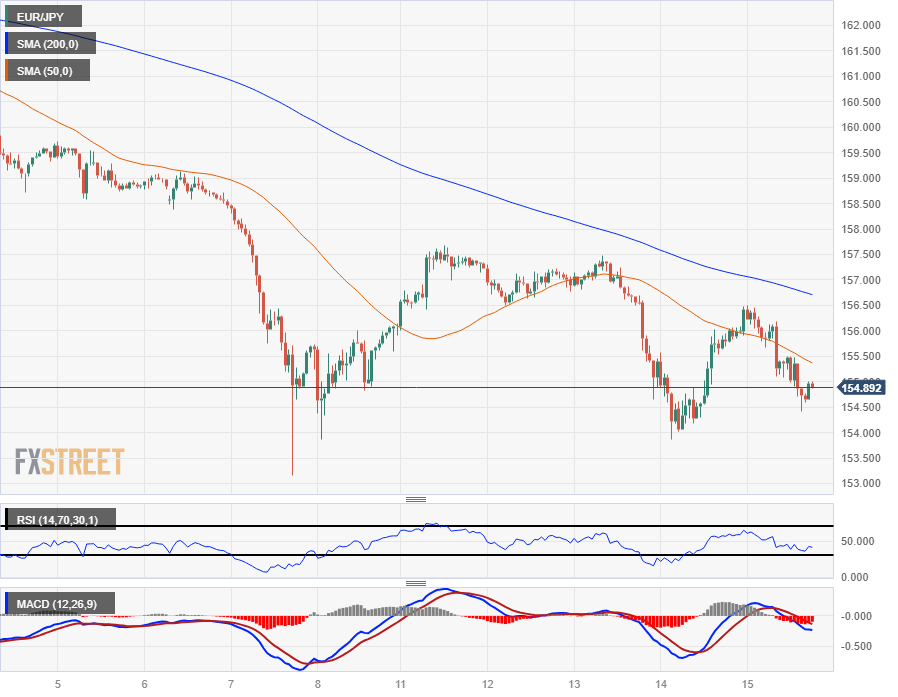
- EUR/JPY stuck near 155.00 as momentum remains limited and markets fade the action.
- The Euro doesn't have much to be bid about after Eurozone data misses expectations.
- The BoJ's final appearance of 2023 is on the cards for early next week, due sometime Tuesday.
The EUR/JPY is getting boxed into near-term lows around the 150.00 major handle on Friday after Eurozone Purchasing Managers’ Index figures printed in the red, keeping the Euro (EUR) on the low side of the Japanese Yen (JPY).
Read More: Eurozone Preliminary Manufacturing PMI steadies at 44.2 in December vs. 44.6 expected
The EUR is one of the weakest-performing currencies on Friday, compared to the Yen which is one of the strongest, leaving the EUR/JPY pair in a precarious position. Waffling Euro bulls are struggling to develop topside momentum and the 155.00 region is proving a difficult neighborhood to move out of this week.
The EUR/JPY sees a notably thinner economic data docket on the calendar next week, with finalized Eurozone Harmonized Index of Consumer Prices (HICP) on the cards for Tuesday, though major updates to the preliminary prints aren’t expected.
The Bank of Japan (B0J) will also be delivering its latest Monetary Policy Statement and final rate call of 2023. The BoJ is broadly expected to keep rates pinned in slightly negative territory at -0.1%.
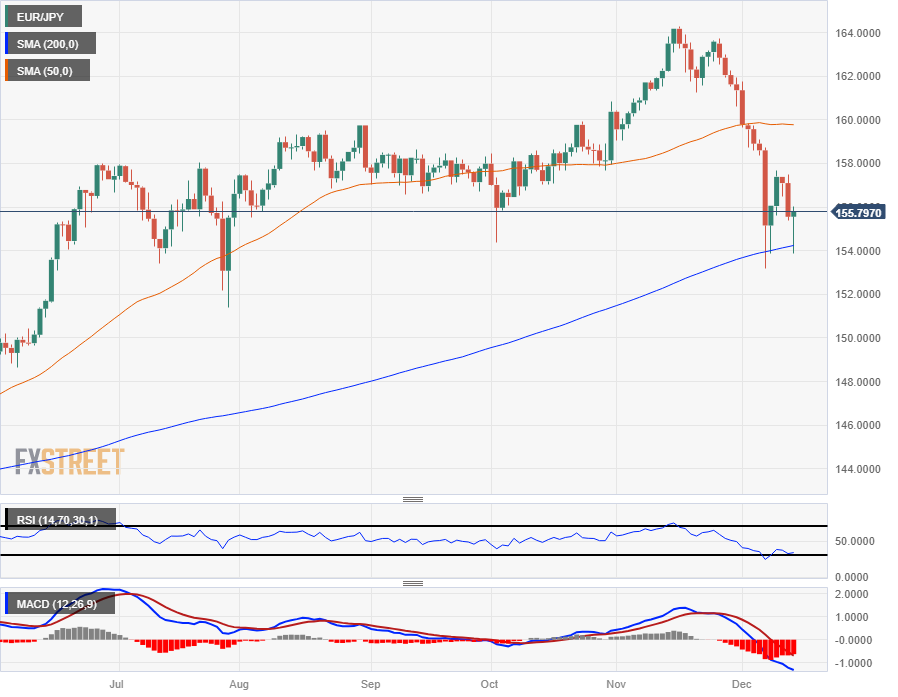
EUR/JPY Technical Outlook
The EUR/JPY has been struggling to develop a breakout from back-and-forth action around the 155.00 handle, with the pair skidding along the 200-day Simple Moving Average (SMA) just above 154.00.
The pair is down one and three-quarters of a percent from last week’s peak at 157. 68, and nearly six percent from November’s peak bids at 164.30, a fifteen-year high for the pair.
The 50-day SMA is capping off medium-term bullish potential at the 160.00 major handle, but a hard floor around 154.00 will keep the pair strung in the wide midrange.
EUR/JPY Hourly Chart
EUR/JPY Daily Chart
EUR/JPY Technical Levels
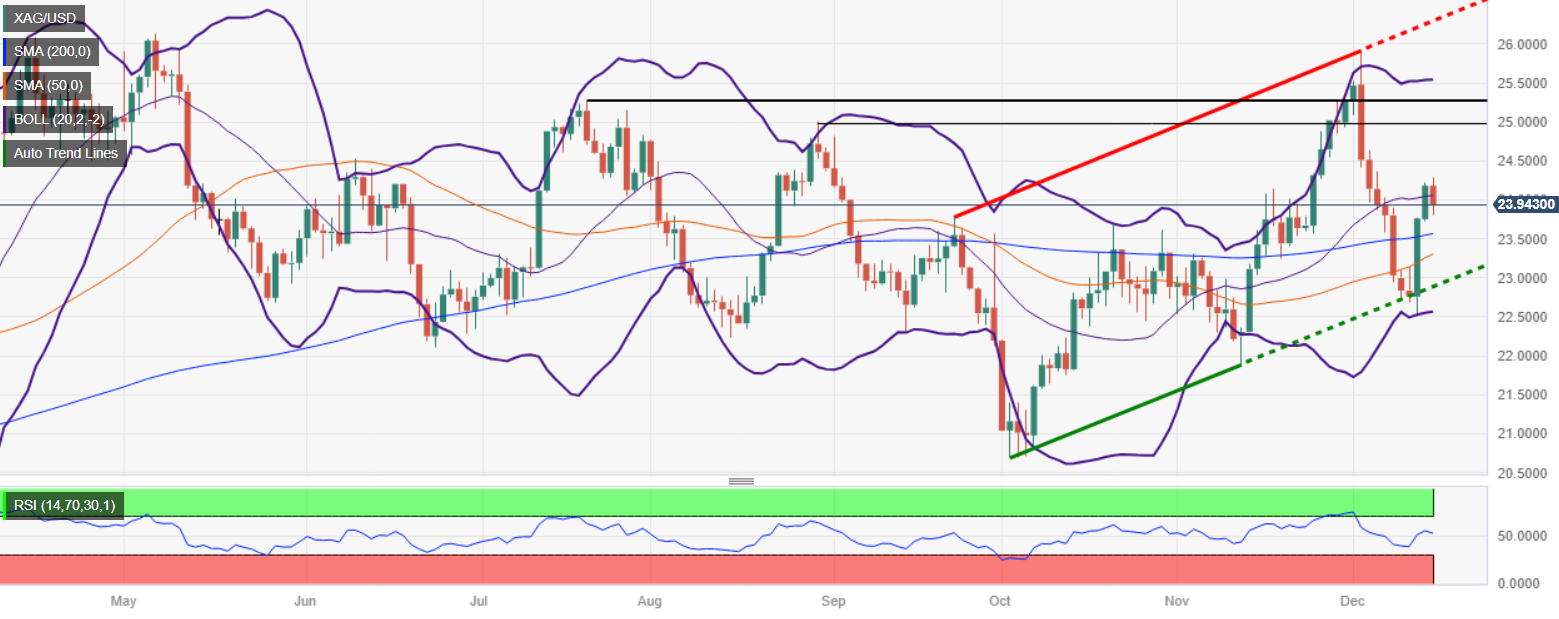
- Silver price drops on remarks by a Fed official, talking down rate cuts.
- US economic data remains solid, a tailwind for the Greenback and headwind for precious metals prices.
- IF XAG/USD achieves a daily close below $24.00, that would pave the way to test the 200-DMA.
Silver price retreats by 0.78% and dips below the $24.00 figure on Friday as the Greenback (USD) remains bid during the North American session. A Federal Reserve official pushing back against a premature shift to ease policy and firm US Treasury bond yields is a headwind for the grey metal. The XAG/USD trades at $23.97 after hitting a daily high of $24.28.
Silver’s uptrend remains intact, but downside risks remain
Following last Wednesday's Chair Jerome Powell press conference, the New York Fed President John Williams was called to do damage control. Williams said, “We aren’t really talking about rate cuts,” adding that a rate cut in March is “premature.” That said, US Treasury bond yields erased is losses, and the Greenback rose. Therefore, XAG/USD dipped below $24.00 as traders also booked profits ahead of the weekend.
On the data front, US Industrial Production slowed by 0.2%, missed forecasts but exceeded November’s .0.9% plunge. S&P Global revealed that business activity improved, lifted by the services sectors as manufacturing continues to contract. This depicts the US economy remains solid, despite 525 basis points of tightening by the Fed.
Another driver that weighed in XAG/USD was an uptick in US real yields, which dropped toward 1.67%; before recovering toward 1.70%. Additionally, the US Dollar Index (DXY) which tracks the currency’s performance against a basket of six other rivals, advanced 0.51%, sits at 103.47.
XAG/USD Price Analysis: Technical outlook
The XAG/USD is neutral to upward biased as it remains above the daily moving averages (DMAs) which remain flatlines below the spot price. However, sellers loom as they eye a test of the 200-DMA at $23.57, which once cleared, could open the door for further downside. Key support levels are seen the 50-DMA at $24.29, followed by the 100-DMA at $23.19. On the flipside, the first supply zone would be the $24.00 figure, followed by the current week’s high at $24.28.
- DXY Index shows resilience despite the worst weekly performance over a month, hovering at 102.40.
- The US Dollar was lifted by strong S&P Global Services PMI figures from December.
- Dovish bets on the Fed may limit the upward movement.
The US Dollar (USD), measured by the DXY index, is trading at 102.40, posting daily gains but marking its worst weekly performance in over a month. This movement comes on the back of strong US Services PMI data and investors’ efforts to consolidate the losses of the last three sessions.
The US Federal Reserve held a dovish stance in Wednesday’s meeting, embracing lowered inflation at the end of 2023 with no planned rate hikes in 2024 and forecasting 75 bps of easing for next year. In light of this indication, market anticipations align somewhat with the Fed's view, catalyzing risk-on flows and dampening demand for the haven Greenback.
Daily Market Movers: US Dollar gains momentum amid strong US Services PMI data
- The Dollar Index (DXY) records gains, wrapping up at around 102.4. This comes after a rough week for the DXY, marking its worst weekly performance in over a month.
- December saw an overall gain in the S&P Global Services PMI with 51.3, beating the consensus of 50.6 and the previous month's 50.8.
- The Manufacturing PMI for December underperformed, recording 48.2 compared to the expected 49.3 and the previous 49.4. Moreover, despite expectations, December's S&P Global Composite PMI exceeded the previous 50.7, scoring 51.
- The US bond yields are currently mixed, with a 2-year yield at 4.37%, slightly up, the 5-year yield at 3.90% and the 10-year yield at 3.92%, posting minor declines.
- The CME FedWatch Tool indicates that markets are currently predicting the first rate cut by March 2024, further weighing on the Greenback.
Technical Analysis: DXY bears take a step back
The indicators on the DXY daily chart reflect that bearish momentum largely dominates the market despite the bears taking a breather. The Relative Strength Index (RSI) shows a downward slope in negative territory, highlighting the presence of dominant selling momentum and underscoring lackluster buying enthusiasm among traders. Furthermore, the Moving Average Convergence Divergence (MACD) shows flat red bars, indicating that the bearish momentum is present but currently on a break.
Further confirmation of the prevalent bearish bias is provided by the positioning of the Simple Moving Averages (SMAs). The index trading below its 20, 100, and 200-day SMAs inherently points towards a firm grip of sellers in the broader technical landscape.
Given the current 1.50% weekly decline in the DXY value, the current consolidation phase could be a pause of the bearish trend rather than a reversal. The short-term technical outlook remains biased to the downside.
Support levels: 101.50, 101.30, 101.00.
Resistance levels: 103.45 (20 and 200-day SMA bearish crossover), 104.50 (100-day SMA), 104.70.
US Dollar FAQs
What is the US Dollar?
The US Dollar (USD) is the official currency of the United States of America, and the ‘de facto’ currency of a significant number of other countries where it is found in circulation alongside local notes. It is the most heavily traded currency in the world, accounting for over 88% of all global foreign exchange turnover, or an average of $6.6 trillion in transactions per day, according to data from 2022.
Following the second world war, the USD took over from the British Pound as the world’s reserve currency. For most of its history, the US Dollar was backed by Gold, until the Bretton Woods Agreement in 1971 when the Gold Standard went away.
How do the decisions of the Federal Reserve impact the US Dollar?
The most important single factor impacting on the value of the US Dollar is monetary policy, which is shaped by the Federal Reserve (Fed). The Fed has two mandates: to achieve price stability (control inflation) and foster full employment. Its primary tool to achieve these two goals is by adjusting interest rates.
When prices are rising too quickly and inflation is above the Fed’s 2% target, the Fed will raise rates, which helps the USD value. When inflation falls below 2% or the Unemployment Rate is too high, the Fed may lower interest rates, which weighs on the Greenback.
What is Quantitative Easing and how does it influence the US Dollar?
In extreme situations, the Federal Reserve can also print more Dollars and enact quantitative easing (QE). QE is the process by which the Fed substantially increases the flow of credit in a stuck financial system.
It is a non-standard policy measure used when credit has dried up because banks will not lend to each other (out of the fear of counterparty default). It is a last resort when simply lowering interest rates is unlikely to achieve the necessary result. It was the Fed’s weapon of choice to combat the credit crunch that occurred during the Great Financial Crisis in 2008. It involves the Fed printing more Dollars and using them to buy US government bonds predominantly from financial institutions. QE usually leads to a weaker US Dollar.
What is Quantitative Tightening and how does it influence the US Dollar?
Quantitative tightening (QT) is the reverse process whereby the Federal Reserve stops buying bonds from financial institutions and does not reinvest the principal from the bonds it holds maturing in new purchases. It is usually positive for the US Dollar.
Bank of Canada Governor Tiff Macklem said on Friday that once the central bank “is assured that we are clearly on a path back to price stability, we will be considering whether and when we can lower our policy interest rate.”
Speaking at the Canadian Club Toronto, in his final speech of the year, Macklem explained that it “is still too early to consider” interest rate cuts. He added that they don’t need to wait until inflation “is all the way back to the 2% target to consider easing policy but it does need to be clearly headed to 2%.”
Key takeaways from the speech:
I expect 2024 to be a year of transition. The effects of past interest rate increases will continue to work through the economy, restraining spending and limiting growth and employment. Unfortunately, this is what’s needed to take the remaining steam out of inflation. But this period of weakness will pave the way to a more balanced economy
We expect growth and jobs to be picking up later next year, and inflation will be getting close to the 2% target. And once Governing Council is assured that we are clearly on a path back to price stability, we will be considering whether and when we can lower our policy interest rate.
But it’s still too early to consider cutting our policy rate. Until we see evidence that we are clearly on a path back to 2% inflation, I expect Governing Council will continue to debate whether monetary policy is restrictive enough and how long it needs to remain restrictive to restore price stability.
Over the coming months, you should expect to see some push and pull on inflation as the cooling economy reduces price pressures while other forces continue to exert upward pressure. That’s why further declines in inflation will likely be gradual. When it’s clear that inflation is on a sustained downward track, we can begin discussing lowering our policy interest rate. We don’t need to wait until inflation is all the way back to the 2% target to consider easing policy, but it does need to be clearly headed to 2%.
The 2% inflation target is now in sight. And while we’re not there yet, the conditions increasingly appear to be in place to get us there. The economy is no longer in excess demand, and underlying inflationary pressures are easing in much of the economy. We still need to see more downward momentum in core inflation, and we will be watching the demand-supply balance, wage growth, corporate pricing behaviour and inflation expectations closely as we assess where we are on the path to price stability.
Market reaction
The Canadian Dollar remained steady with USD/CAD hovering around 1.3370, on its way to the lowest weekly close since July.
- USD/CHF sees a limited rebound on Friday after hitting four-month lows on Thursday.
- SNB no longer focusing on forex sales after latest rate decision.
- Coming up next week: SNB Quarterly Bulletin, US GDP & PCE.
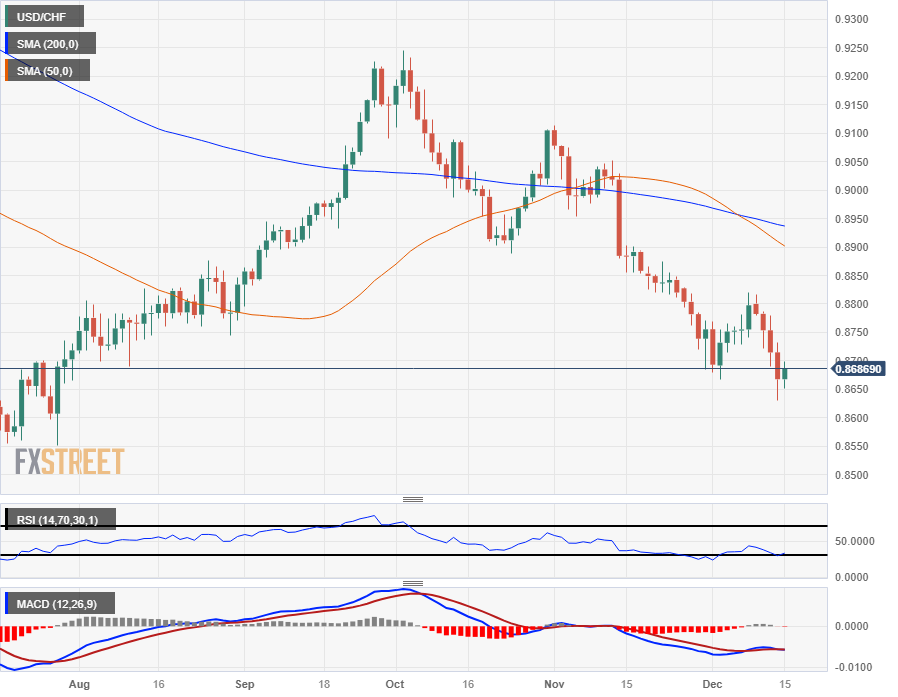
The USD/CHF is drifting back towards the 0.8700 handle on Friday after a tense week that saw the Swiss Franc (CHF) gain another one and a quarter percent on the US Dollar (USD) from Monday's opening bids.
The pair is down nearly 1.5% from last week's peak bids near 0.8820, and Friday's limited gains are barely pulling the pair off the floor after closing down for the last four consecutive trading days.
The Swiss National Bank (SNB) is caught in the middle, holding interest rates in place for the second consecutive rate call, with inflation drifting towards the SNB's targets and Swiss Gross Domestic Product (GDP) growth projected to slow.
SNB's Jordan: We are no longer focusing on forex sales
SNB Chairman Thomas Jordan noted on Thursday that the SNB is no longer focusing directly on forex operations to try and keep the CHF from appreciating further. Despite markets ratcheting up expectations of rate cuts as soon as next March, the SNB Chair noted that when it comes to monetary policy, the SNB is more likely to resume selling currency reserves directly before looking at beginning rate cuts.
US economic data mixed on Friday, With the S&P Global Manufacturing Purchasing Managers' Index (PMI) for December missing expectations to print at 48.2 versus November's 49.4, missing the median market forecast of a slight decline to 49.3.
Read More: SNB softened its language on FX reserve sales - Nomura
The US Services PMI firmly surprised to the upside, coming in at a robust 51.3, completely stepping over the market's forecast backslide to 50.6 from the previous month's 50.8.
Coming up next week, the SNB posts its Quarterly Bulletin for the fourth quarter of 2023 on Wednesday, followed by US GDP figures on Thursday. The Federal Reserve's policy pivot and updated dot plot of interest rate expectations faces its first challenge, when US Personal Consumption Expenditure (PCE) numbers for November print next Friday.
Annualized US GDP for the third quarter is expected to hold steady at 5.2%, while median market forecasts are calling for a slightly decline in PCE for the year into November from 3.5% to 3.4%.
USD/CHF Technical Outlook
USD/CHF's Friday rebound is on the anemic side, barely keeping the US Dollar within Thursday's daily range as short pressure remains. Bidders will need to adjust their expectations and celebrate recapturing the 0.8700, assuming buyers are able to muscle the pair over the target price level before markets wrap up trading action for the week.
The pair is down over two percent peak-to-trough from last weak's top bids at 0.8816, and the USD/CHF is in the red nearly five percent from November's high of 0.9112.
The 50-day and 200-day Simple Moving Averages (SMA) have completed a bearish crossover near the 0.8950 price level, and potential topside momentum will be capped off by the 50-day SMA descending into the 0.8900 handle.
USD/CHF Daily Chart
USD/CHF Technical Levels
- The Canadian Dollar has slowed recent gains but tests into the high side.
- Bank of Canada Governor Macklem due to make an appearance to round out the week.
- Crude Oil bids have deflated in the American trading session as Fed comments cool market rate cut hopes.
The Canadian Dollar (CAD) has paused near the top end of the week’s chart action as market participants digest updated comments from Federal Reserve (Fed) officials strongly suggesting that market expectations may have run far ahead of the Fed’s expectations of rate cuts in 2024.
Bank of Canada (BoC) Governor Tiff Macklem is due to make a public appearance at the Canadian Club of Toronto, where the BoC head will be delivering prepared notes that will be published at 17:25 GMT. Governor Macklem is expected to field audience questions after his prepared remarks, and his appearance marks the most (if not only) noteworthy item on the CAD’s entire economic calendar for this week.
New York Fed President John Williams splashed some cold water on hot markets Friday morning, noting that market expectations of rate cuts as soon as March are “premature” The NY Fed President revealed that discussions of rate cuts haven’t even been tabled at the Fed yet.
Daily Digest Market Movers: Canadian Dollar on the high side but gains slow
- The Canadian Dollar was one of the firmer performers on Friday, gaining ground against nearly all of its major currency peers.
- The CAD is up a full percent plus a tenth against the Euro (EUR), nine-tenths of a percent against the Pound Sterling (GBP), and four-tenths of a percent against the US Dollar (USD).
- The Loonie is down around a sixth of a percent against the Japanese Yen (JPY) for Friday.
- NY Fed President Williams: rate cuts aren’t being discussed yet at the Fed, market expectations of rate cuts, specifically when and how much, are “premature”; Fed is “at or near” the right place in terms of policy.
- Fed Williams’ comments caused markets to stumble after this week’s bidding frenzy following adjustments to the Fed’s dot plot of interest rate expectations, with Fed policymakers now expecting around three rate cuts for 75 basis points in 2024.
- US economic calendar figures skewed to the downside on Friday, with the NY Empire State Manufacturing Index declining unexpectedly from 9.1 to -14.5 in December, falling far past market forecasts of 2.0.
- US Industrial Production for November likewise missed the mark, rebounding to 0,2% versus the forecast 0.3%, and October’s print was also revised downwards from -0.6% to -0.8%.
- The US S&P Global Purchasing Managers’ Index (PMI) prints came in mixed, with the Manufacturing component declining from 49.4 to 48.2 MoM (forecast: 49.3), steepening a decline into contraction territory.
- The US Services PMI for December surprised to the upside, coming in at 51.3 versus November’s 50.8; markets were forecast a slight move down to 50.6.
- Crude Oil markets, always looking for a reason to dump, were knocked back after Fed Williams’ appearance on CNBC, pulled WTI down towards $70.50 before stabilizing beneath $72 per barrel, limiting CAD support on Friday.
- The Canadian Dollar heads through Friday’s last market session on the top side against the US Dollar for the week, in the green 1.7% against the Greenback from Monday’s opening bids.
Canadian Dollar price this week
The table below shows the percentage change of Canadian Dollar (CAD) against listed major currencies this week. Canadian Dollar was the strongest against the US Dollar.
| USD | EUR | GBP | CAD | AUD | JPY | NZD | CHF | |
| USD | -1.32% | -1.27% | -1.62% | -2.06% | -2.23% | -1.59% | -1.25% | |
| EUR | 1.30% | 0.05% | -0.29% | -0.73% | -0.90% | -0.26% | 0.07% | |
| GBP | 1.26% | -0.05% | -0.35% | -0.80% | -0.95% | -0.32% | 0.03% | |
| CAD | 1.59% | 0.29% | 0.33% | -0.44% | -0.61% | 0.03% | 0.35% | |
| AUD | 2.02% | 0.73% | 0.77% | 0.44% | -0.17% | 0.47% | 0.80% | |
| JPY | 2.19% | 0.90% | 0.86% | 0.61% | 0.16% | 0.63% | 0.97% | |
| NZD | 1.56% | 0.26% | 0.31% | -0.03% | -0.47% | -0.64% | 0.33% | |
| CHF | 1.24% | -0.06% | -0.02% | -0.36% | -0.80% | -0.97% | -0.33% |
The heat map shows percentage changes of major currencies against each other. The base currency is picked from the left column, while the quote currency is picked from the top row. For example, if you pick the Euro from the left column and move along the horizontal line to the Japanese Yen, the percentage change displayed in the box will represent EUR (base)/JPY (quote).
Technical Analysis: Canadian Dollar on a cautious note but drifting higher against the Greenback
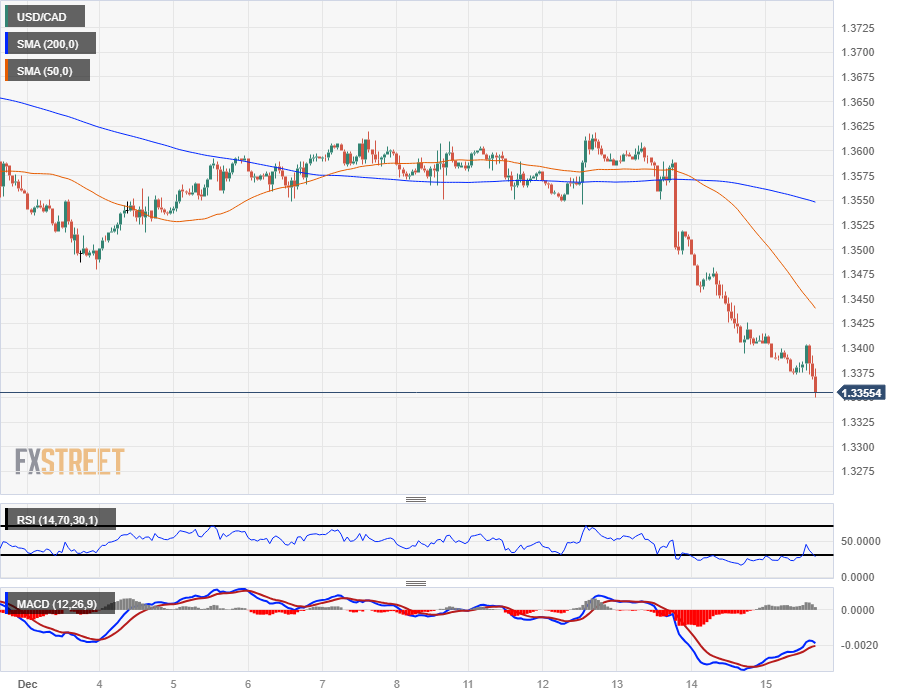
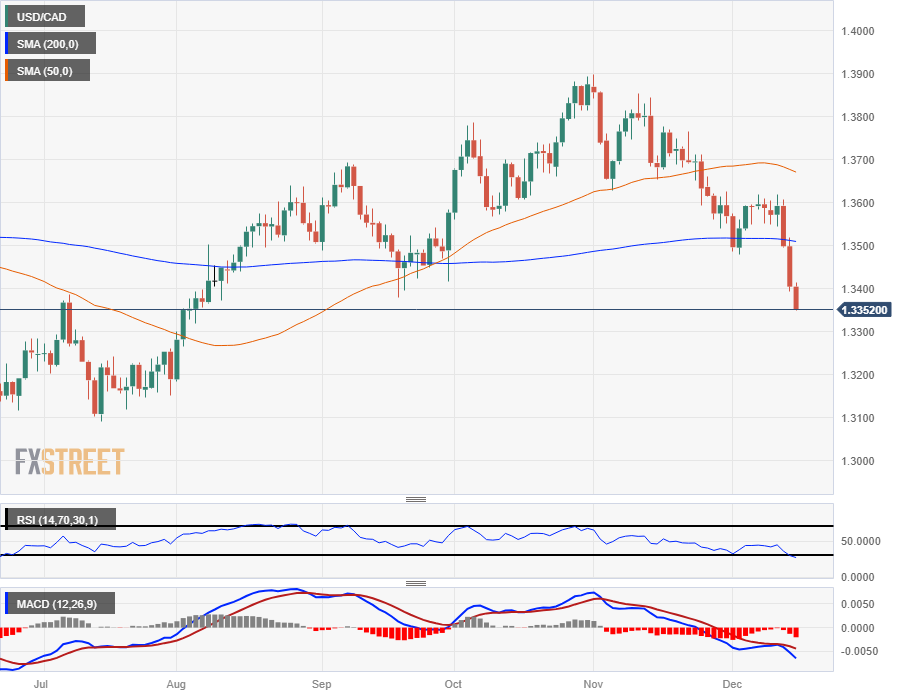
The Canadian Dollar is drifting into the high side against the US Dollar on Friday, squeezing out some last-minute gains before the markets wrap up the trading week.
USD/CAD spent most of Friday drifting between 1.3400 and 1.3380 before settling down towards 1.3350, and the pair is down nearly two percent peak-to-trough from the week’s high bids near 1.3620.
Friday’s continued breakdown from the 1.3400 handle has the USD/CAD setting 17-week lows, setting the pair up for a challenge of July’s lows near 1.3100 as long as selling pressure holds.
A third straight day of hard declines has the USD/CAD facing its worst three-day performance since early 2020 when the pair shed nearly 500 pips in a single half-week.
USD/CAD Hourly Chart
USD/CAD Daily Chart
Canadian Dollar FAQs
What key factors drive the Canadian Dollar?
The key factors driving the Canadian Dollar (CAD) are the level of interest rates set by the Bank of Canada (BoC), the price of Oil, Canada’s largest export, the health of its economy, inflation and the Trade Balance, which is the difference between the value of Canada’s exports versus its imports. Other factors include market sentiment – whether investors are taking on more risky assets (risk-on) or seeking safe-havens (risk-off) – with risk-on being CAD-positive. As its largest trading partner, the health of the US economy is also a key factor influencing the Canadian Dollar.
How do the decisions of the Bank of Canada impact the Canadian Dollar?
The Bank of Canada (BoC) has a significant influence on the Canadian Dollar by setting the level of interest rates that banks can lend to one another. This influences the level of interest rates for everyone. The main goal of the BoC is to maintain inflation at 1-3% by adjusting interest rates up or down. Relatively higher interest rates tend to be positive for the CAD. The Bank of Canada can also use quantitative easing and tightening to influence credit conditions, with the former CAD-negative and the latter CAD-positive.
How does the price of Oil impact the Canadian Dollar?
The price of Oil is a key factor impacting the value of the Canadian Dollar. Petroleum is Canada’s biggest export, so Oil price tends to have an immediate impact on the CAD value. Generally, if Oil price rises CAD also goes up, as aggregate demand for the currency increases. The opposite is the case if the price of Oil falls. Higher Oil prices also tend to result in a greater likelihood of a positive Trade Balance, which is also supportive of the CAD.
How does inflation data impact the value of the Canadian Dollar?
While inflation had always traditionally been thought of as a negative factor for a currency since it lowers the value of money, the opposite has actually been the case in modern times with the relaxation of cross-border capital controls. Higher inflation tends to lead central banks to put up interest rates which attracts more capital inflows from global investors seeking a lucrative place to keep their money. This increases demand for the local currency, which in Canada’s case is the Canadian Dollar.
How does economic data influence the value of the Canadian Dollar?
Macroeconomic data releases gauge the health of the economy and can have an impact on the Canadian Dollar. Indicators such as GDP, Manufacturing and Services PMIs, employment, and consumer sentiment surveys can all influence the direction of the CAD. A strong economy is good for the Canadian Dollar. Not only does it attract more foreign investment but it may encourage the Bank of Canada to put up interest rates, leading to a stronger currency. If economic data is weak, however, the CAD is likely to fall.
In the last full week of 2023, volume will likely start to fade ahead of the holidays. However, the economic calendar shows many relevant events. Regarding central banks, the focus will be on comments from policymakers after a series of monetary policy meetings, including those of the Fed, the ECB, and the BOE. Next week, the Bank of Japan will have its meeting. The most important report form the US will be the core PCE.
Here is what you need to know for next week:
The US Dollar Index (DXY) resumed the downward trend and posted the lowest weekly close since July after the Federal Reserve's December meeting. The forecast of rate cuts by some FOMC members weighed on the US Dollar and boosted US yields. The Fed's "pivot" fueled a rally on Wall Street, leading to a record close in the Dow Jones.
The decision of other central banks, such as the European Central Bank (ECB) and the Bank of England (BoE), also contributed to the weakness of the US Dollar, as they kept rates unchanged but did not signal a pivotal shift and maintained a hawkish tone. However, this divergence in monetary policy may be temporary, as the strong US economic conditions continue to outperform.
Market participants see the Fed cutting rates next year but after other central banks.
Next week, US housing data will be released, including Building Permits and Housing Starts on Tuesday, Existing Home Sales on Wednesday, and New Home Sales on Friday. On Thursday, a new estimate of Q3 GDP is due, along with the weekly Jobless Claims and the Philly Fed Manufacturing Index. The critical report of the week will be released on Friday with the Core Personal Consumption Expenditure Price Index.
EUR/USD rebounded from the 20-week Simple Moving Average (SMA), which is a positive sign. However, the Euro struggled to stay above 1.1000, similar to two weeks ago. On Monday, the German IFO Business Climate Index is expected to show a modest improvement. Eurozone will release the final reading of the Harmonized Index of Consumer Prices for November. Germany will also release the Producer Price Index on Wednesday.
Analysts at Commerzbank on Eurozone economy:
The PMI for the services sector, the most reliable economic barometer for the euro area, fell again in December by 0.6 points to 48.1. This confirms our expectation that the euro area economy will continue to contract in Q4, contrary to the ECB's expectations. At 44.2, the corresponding manufacturing index also offers little hope of a turnaround. Today's data is therefore likely to fuel speculation about an imminent ECB rate cut. However, with underlying price pressures still strong, the ECB is unlikely to start cutting rates before the summer.
The Japanese Yen was among the best performers. USD/JPY has fallen 1000 pips during the last five weeks, approaching 140.00. The Bank of Japan will have its monetary policy meeting and announce its decision on Tuesday. No change is expected, but the anticipation surrounding the next steps in policy and speculation about the potential beginning of the end of ultra-loose monetary policy has been supporting the Japanese Yen. Additionally, the National Consumer Price Index is due on Friday.
GBP/USD initially traded near 1.2800 but later pulled back below 1.2700. However, it experienced an overall rise during the week and maintained a bullish tone. Important inflation data from the UK is scheduled for release on Wednesday, which could have a significant impact on the Pound, especially after the recent Bank of England meeting where policymakers maintained a hawkish stance, providing support to the currency. The Consumer Price Index (CPI) is expected to show a 4.4% increase compared to the previous year in November, slightly lower than the 4.6% recorded in October. Furthermore, public borrowing figures are due on Thursday. On Friday, the UK will report Q3 growth data and November Retail Sales.
NZD/USD posted the highest weekly close in months and tested levels above the 100-week Simple Moving Average (SMA). The short-term sentiment for the New Zealand Dollar remains bullish. On Tuesday, New Zealand will release trade data, and the NZ Business Confidence survey is also due.
AUD/USD rose above 0.6700 to its highest level since July, benefiting from a weaker US Dollar across the board and increased risk appetite. On Tuesday, the Reserve Bank of Australia (RBA) will release the minutes of its latest meeting.
USD/CAD suffered the worst week in months, falling below 1.3700 to its lowest level since August. Inflation data, which is due on Tuesday, will be a key report in Canada. The Consumer Price Index (CPI) is forecasted to show a decrease of 0.2% in November, with the annual rate declining from 3.1% in October to 2.9% in November. The Bank of Canada (BoC) will release the summary of deliberations on Wednesday. On Friday, the monthly GDP report will be released, with October figures expected to show a 0.2% expansion.
Like this article? Help us with some feedback by answering this survey:
- GBP/USD is on a pullback after failing to break resistance at 1.2800.
- Business activity in the US portrays an upbeat economy, in contrast to the UK.
- From a technical standpoint, further downside is seen in the GBP/USD with a daily close below 1.2700.
GBP/USD falls in the mid-North American session after reaching a four-month high of 1.2793, losing 0.43%, slipping below the 1.2700 figure. At the time of writing, the major is trading at 1.2693.
A solid economic outlook in the US, could weigh on the GBP/USD in the future
The central bank bonanza ended with the Bank of England (BoE) and the Federal Reserve (Fed) holding rates unchanged but with different messages for market participants. The former struck a hawkish message as the BoE Governor Andrew Bailey said there is “still some way to go” in their inflation battle. Contrarily, Fed Chair Jerome Powell stated that monetary policy was sufficiently restrictive, and talk about rate cuts, began. That has been taken back by the New York Fed President John Williams, who said talks of March rate cuts is “premature.”
On the data front Industrial Production in the US was weaker than the 0.3% expected in November, came at 0.2%, but exceeded October’s -0.9% contraction. Later, business activity gathers momentum, revealed S&P Global in its Flash PMIs report. Even though the composite index was 51, exceeding November’s 50.7, it was boosted by the jump in the services sector, which expanded for the fourth straight month. Activity in manufacturing slipped the most in three months and remains in recessionary territory for the second month in a row.
On the UK front, business activity improved in December, except for manufacturing, which remained at recessionary territory since July 2022.
All that said, next week’s economic docket in the UK will feature inflation figures and retail sales. Across the pond, the week will kick in with housing data and consumer confidence until Wednesday. From Thursday onwards, the final GDP print, unemployment claims, Durable Goods Orders, and consumer sentiment.
GBP/USD Price Analysis: Technical outlook
Even though the GBP/USD is on a pullback, the uptrend remains intact. As of writing, sellers are testing a six-month-old downslope support trendline at around current levels, which if broken, would exacerbate a drop towards the 1.2500 figure. In that outcome, the first support would be the 1.2600 figure, followed by the confluence of the December 13 low and the 200-day moving average (DMA) at 1.2500/02. Otherwise, if buyers holds prices above 1.2700, a test of the 1.2800 is on the cards.
- The AUD/USD hovers near the 0.6715 level after hiting a daily high of 0.6725.
- The US preliminary S&P PMIs from December came in mixed, with the Service index strong and the manufacturing weak.
- US bond yields continue soft, in multi-month lows.
In Friday's session, the AUD/USD has seen a modest upside, trading at roughly 0.6715. The pair held its gains after the US reported the preliminary S&P PMIs from December which came in mixed.
In that sense, the US private sector economy, illustrated by the S&P Global Composite PMI, increased to 51.0 from November's 50.7. Despite the Manufacturing PMI slipping further into contraction at 48.2 from 49.4, the Services PMI had a small rise, reaching 51.3, up from 50.8.
That being said, the outlook is still negative for the Greenback due to the growing dovish bets on the Federal Reserve (Fed) following Wednesday’s decision, which hinted at more easing than expected in 2024. In the meantime, US Treasury yields are trending downwards. The 2-year rate is currently trading at 4.41%, along with the 5-year rate and the 10-year yield at 3.90%. This generally weighs negatively on the USD as higher local bond yields typically makes the currency gain interest, attraction foreign investors..
AUD/USD levels to watch
The daily chart shows a bullish outlook for the AUD/USD. The Relative Strength Index (RSI) illustrates this trend with its positive territory location and upward incline, indicating a strengthening buying pressure.
Adding to this buying momentum, the Moving Average Convergence Divergence (MACD) shows rising bars in a shade of optimistic green, emphasizing the advantage of the buyers. Moreover, the pair, is comfortably positioned above its 20, 100, and 200-day Simple Moving Averages (SMAs), highlighting the bulls' assertion to maintain the ongoing bullish trend on the broader scale.
Support Levels: 0.6650, 0.6600 (20-day SMA), 0.6575 (200-day SMA)..
Resistance Levels: 0.6725, 0.6750, 0.6800.
AUD/USD daily chart
-638382541278362736.png)
Economists at Nomura analyze the highlights of Thursday’s Swiss National Bank meeting and its implications for the Franc.
Language on FX sales removes bias toward selling
SNB meeting was unsurprising, with the Bank leaving its policy rate at 1.75%, as was widely expected. We would describe this as a dovish hold.
The end-horizon inflation forecast was lowered from 1.9% in 2026 to 1.6%, but we think this is still much too high.
The SNB is still willing to intervene, but no longer believes it is necessary to express a bias for selling FX reserves. We think from this point on we should see the value of FX sales falling, making it harder for CHF to strengthen much further in the medium-term.
- Mexican Peso dampened by a Fed official pushing back against interest rate cuts.
- The economy in the United States remains solid, due to a report by S&P Global.
- New York Fed President John Williams pushes back against rate cuts, a tailwind for USD/MXN.
Mexican Peso (MXN) posts modest losses against the US Dollar (USD) after the central bank bonanza on both sides of the border is finished. The divergence between the US Federal Reserve (Fed) and the Bank of Mexico (Banxico) would likely keep the USD/MXN pair trading below 18.00 for the remainder of the year. Nevertheless, the exotic pair trades at 17.21, and gains 0.17% at the time of writing.
Banxico held rates unchanged at 11.25% and maintained the tone set in the November meeting. That sponsored a leg-down in the pair, further distancing from the 100-day Simple Moving Average (SMA) key resistance level at 17.41 toward current exchange rate levels. However, the United States (US) data was solid enough to keep the pair from reaching the 17.03 latest cycle low.
Daily Digest Market Movers: Mexican Peso bolstered by Banxico hawkish hold
- Banxico’s decision was unanimously supported by its five members.
- The central bank acknowledged that inflation risks are tilted to the upside after November’s report witnessed headline inflation rising due to the “rise in non-core components” while core inflation eased.
- Banxico revised its inflation projections for some quarters of 2024 and 2025.
- Business activity picked up in December, according to S&P Global. The composite index, which combines manufacturing and services sectors, increased to 51, exceeding November’s 50.7 and hitting a five-month high.
- The services PMI subcomponent came in at 51.3, exceeding forecasts of 50.6, though Manufacturing slipped further, dropping to 48.2, below estimates of 49.3, and November’s 49.4
- Aside from this, the New York Fed President John Williams pushed back against the idea of rate cuts, emphatically saying it’s “premature” to think about easing policy in March.
- Williams added that the question around the Fed board is whether the policy is sufficiently restrictive enough to ensure inflation returns to 2%.
- US data on Thursday painted the economy as more resilient than expected as Retail Sales exceeded forecasts, while unemployment claims rose less than estimates.
- According to the Summary of Economic Projections (SEP), Fed officials expect to lower the federal funds rates (FFR) to 4.60% in 2024, though they remain data-dependent.
- The fall in US Treasury Bond yields, which are closely correlated to the Greenback (USD) has stalled relief for the USD, which is rising 0.43%, up at 102.40, according to the US Dollar Index (DXY).
- Money market futures estimate the Fed will slash rates by 140 basis points toward the end of next year, twice the Fed’s forecasts of three 25 bps cuts.
Technical analysis: Mexican Peso to remain range-bound at around 17.00-17.60
The USD/MXN bias is neutral to downwards biased after dropping below the 100-day SMA, seen as the last line of defense by buyers. That exposed the 17.00/05 area as the next demand area, which once surpassed, could open the door for a retest of the year-to-date (YTD) low of 16.62
On the other hand, if buyers reclaim the 100-day SMA at 17.41, the USD/MXN could rally toward the 200-day SMA at 17.52, followed by the 50-day SMA at 17.60. Further upside is seen at around 18.00.
Mexican Peso FAQs
What key factors drive the Mexican Peso?
The Mexican Peso (MXN) is the most traded currency among its Latin American peers. Its value is broadly determined by the performance of the Mexican economy, the country’s central bank’s policy, the amount of foreign investment in the country and even the levels of remittances sent by Mexicans who live abroad, particularly in the United States. Geopolitical trends can also move MXN: for example, the process of nearshoring – or the decision by some firms to relocate manufacturing capacity and supply chains closer to their home countries – is also seen as a catalyst for the Mexican currency as the country is considered a key manufacturing hub in the American continent. Another catalyst for MXN is Oil prices as Mexico is a key exporter of the commodity.
How do decisions of the Banxico impact the Mexican Peso?
The main objective of Mexico’s central bank, also known as Banxico, is to maintain inflation at low and stable levels (at or close to its target of 3%, the midpoint in a tolerance band of between 2% and 4%). To this end, the bank sets an appropriate level of interest rates. When inflation is too high, Banxico will attempt to tame it by raising interest rates, making it more expensive for households and businesses to borrow money, thus cooling demand and the overall economy. Higher interest rates are generally positive for the Mexican Peso (MXN) as they lead to higher yields, making the country a more attractive place for investors. On the contrary, lower interest rates tend to weaken MXN.
How does economic data influence the value of the Mexican Peso?
Macroeconomic data releases are key to assess the state of the economy and can have an impact on the Mexican Peso (MXN) valuation. A strong Mexican economy, based on high economic growth, low unemployment and high confidence is good for MXN. Not only does it attract more foreign investment but it may encourage the Bank of Mexico (Banxico) to increase interest rates, particularly if this strength comes together with elevated inflation. However, if economic data is weak, MXN is likely to depreciate.
How does broader risk sentiment impact the Mexican Peso?
As an emerging-market currency, the Mexican Peso (MXN) tends to strive during risk-on periods, or when investors perceive that broader market risks are low and thus are eager to engage with investments that carry a higher risk. Conversely, MXN tends to weaken at times of market turbulence or economic uncertainty as investors tend to sell higher-risk assets and flee to the more-stable safe havens.
The Canadian Dollar has seen a recent appreciation. Nonetheless, economists at the National Bank of Canada do not expect Loonie to strengthen further.
Not much room for CAD appreciation until the second half of 2024
Looking ahead, we don't see much support for the CAD given our forecast for a slowing global economy and the potential for more aggressive interest rate cuts in Canada relative to the US due to weaker domestic demand.
Given our recession scenario for the Canadian economy in H1 2024, we now expect USD/CAD to move towards 1.45 in the coming quarters and don't see much room for CAD appreciation until the second half of 2024.
Economists at Commerzbank have updated their Euro forecast after the last European Central Bank (ECB) meeting.
First ECB rate cut expected in the summer
We expect the first ECB rate cut in the summer (June) and a total of 75 bps in 2024 and 25bps more in 2025. This is not much less than the market is pricing in – a total of 200 bps, but it is still enough to have a visible positive impact on EUR/USD.
With our ECB forecast, we still expect EUR-positive surprises. As a result, our previous price target for EUR/USD (1.12) looks more likely and even slightly under-ambitious. We are therefore moderately raising our EUR/USD price target to 1.15.
- US S&P Global Composite PMI edged higher to 51.0 in early December.
- US Dollar Index stays in positive territory at around 102.50.
The economic activity in the US private sector continued to expand at a modest pace in early December, with S&P Global Composite PMI edging slightly higher to 51.0 from 50.7 in November.
The Manufacturing PMI remained in the contraction territory, declining to 48.2 from 49.4, while the Services PMI improved to 51.3 from 50.8.
Commenting on the survey's findings, "the early PMI data indicate that the US economy picked up a little momentum in December, closing off the year with the fastest growth recorded since July," said Chris Williamson, Chief Business Economist at S&P Global Market Intelligence. "Despite the December upturn, the survey therefore signals only weak GDP growth in the fourth quarter."
Market reaction
The US Dollar Index showed no immediate reaction to these data and was last trading modestly higher on the day slightly below 102.50.
Gold has surged back above $2,000. Economists at ANZ Bank analyze XAU/USD technical outlook.
Bullish trend looks intact
Gold prices rebounded strongly after correcting to $1,980, which forms the immediate support. As prices are still above the 100-day and 200-day moving averages, upside momentum looks intact.
A breach of the $2,060 resistance level will be crucial, and we would then expect technical buying to emerge pushing prices into unchartered territory above $2,100.
See – Gold Price Forecast: XAU/USD to reach $2,150 in the second half of next year – Commerzbank
USD/CAD losses have extended through the 1.34 level to take the Loonie to its best levels against the USD since August. Economists at Scotiabank analyze the pair’s outlook.
Some consolidation into the weekend
A minor rebound from the intraday low may suggest some consolidation into the weekend but there is no clear sign of a rebound developing on the intraday chart at this point.
USD gains are likely to be very modest, with trend strength oscillators aligned bearishly for the USD on the intraday and daily oscillators.
I look for resistance in the 1.3425/1.3450 range for now. Support is 1.3340 and 1.3275. Both points look reachable fairly quickly.
New York Federal Reserve (Fed) President John Williams said on Friday that cutting interest rates is not being discussed at the moment. "It's premature," he answered when asked about a rate cut in March or even considering the timing or rate cuts.
In an interview with CNBC, Williams expressed that the Fed has to focus on objectives, not on the view of the market. He warned that the market may be overreacting.
Regarding the current policy stance, Williams said they are "at or near" the right place. He argued that financial conditions have tightened overall.
Market reaction
The US Dollar rose to fresh daily highs following these comments. Gold prices pulled back, and Treasury yields spiked higher. The US Dollar Index (DXY) is up by 0.50%, trading near 102.50.
The EUR is underperforming on the session. Economists at Scotiabank analyze Euro’s outlook.
Intraday price action does look potentially soft
Intraday price action does look potentially soft. Spot formed a minor bear reversal signal through European trade but trend dynamics remain bullish and are more strongly positioned overall than late last month. That should mean limited downside risk for the EUR at this point.
I think the EUR will be able to push on to 1.11/1.12 in the next few weeks.
The British Pound can benefit as the BoE has opened up a gap relative to the ECB.
Scope for GBP outperformance
We doubt that lack of divergence will be maintained and see the BoE caution as far more justified and warranted. It suggests scope for GBP outperformance and we see downside risks to EUR/GBP from here.
A move back to the year-to-date low (0.8493) and below looks a more plausible scenario to us over the coming months.
See: EUR/GBP to move modestly higher in the coming year to 0.89 – Danske Bank
- The Dollar remains vulnerable, with upside attempts capped below 142.50.
- Fed's dovish pivot is still weighing on the US Dollar.
- Next week's BoJ monetary policy decision might provide some support to the pair.
The Dollar remains under bearish pressure ahead of Friday’s US session. The pair’s mild recovery attempts have been capped at 142.50, which leaves the 141.00 support area in play.
The Fed signalled the end of the tightening cycle on Wednesday and boosted hopes that rate cuts might come as soon as in March after their last policy meeting of the year. This has boosted market sentiment, sending US bond yields and the USD tumbling.
Focus on US manufacturing and services data
Later today, the NY Empire State Manufacturing Index and the S&P Global PMIs are expected to confirm that the US economy is cooling in the fourth quarter, which might add selling pressure on the pair.
The focus next week will be on the Bank of Japan’s Monetary policy decision. Investors have been speculating about the possibility of a major policy shift announced in December, although BoJ officials have played down that option. This could provide a fresh impulse to the USD
USD/JPY Technical analysis
From a technical perspective, the pair is trading near the bottom of an expanding wedge, right below 141.00, with the 4h RSI coming up from oversold levels on the 4h charts.
That said, the pair is not showing any clear sign of a trend change. A break of 141.00 would clear the path towards the 140.00 level where the 261,8% Fibonacci extension of the Mid-November reversal is expected to provide relevant support.
On the upside, resistance levels remain at 142.50 and the 144.45 previous support.
Technical levels to watch
Three weeks before the end of the year, the price of Brent Oil is trading roughly 10% lower than at the beginning of the year. Strategists at Commerzbank analyze Oil’s outlook.
WTI expected at $75 by the end of Q1-2024
OPEC+ production cuts are likely to keep the Oil market in balance at the start of 2024 despite weaker demand, which should allay current oversupply concerns and argue for a price recovery to $80 by the end of the first quarter.
Rising demand during the year and the resulting supply deficit should allow the price of Brent to rise to $90 in the second half of 2024.
For WTI, we expect a price of $75 at the end of the first quarter and $85 in the second half of the year.
Gold has risen in price by around 12% since the beginning of the year. Strategists at Commerzbank analyze the yellow metal’s for 2024.
Gold price under the spell of interest rate expectations
The upcoming interest rate cuts speak in favor of gold, which is why we foresee a further price increase to $2,150 in the second half of next year.
Investment demand is also likely to pick up again with the interest rate cuts by the Fed that are on the horizon and should materialize.
- The US Dollar devalued nearly 2% since Wednesday against most peers.
- Traders could see a small turnaround on the back of PMI data.
- The US Dollar Index trades near 101.92, a fresh four-month-low.
The US Dollar (USD) got struck by lightning on Wednesday during the last US Federal Reserve (Fed) rate decision for 2023. The Greenback did not get any relief on Thursday either after the European Central Bank (ECB) sent another batch of lightning strikes towards the Greenback. The fact that the Fed has openly committed to rate cuts in 2024, while the ECB kept its lips sealed and even said rate cuts were not even discussed, means a seismic shift in monetary policy between the two continents on either side of the Atlantic Ocean.
On the economic front, some relief could be in the pipeline for the much-battered US Dollar. Traders are looking towards the US Purchase Managers Index (PMI) numbers to get more insights. Should most or all PMI measures per sector recover back above 50, that would mean that on the economic front, the US would be outpacing Europe where all PMI’s have been in contraction for a few months already.
Daily digest: Time to digest what just happened
- Near 13:30 GMT this Friday’s calendar kicks off with the New York Empire State Manufacturing Index for December. Previous was at 9.1, it is expected to fall to 2.0.
- At 14:15 GMT the US Capacity Utilization and Industrial Production data for November will be released. Capacity Utilization is expected to head from 78.9% to 79.1%. Industrial Production is expected to go from -0.6% to a positive 0.3%.
- Just ahead of the US opening bell, traders will brace for the Preliminary Purchasing Managers Index numbers at 14:45 GMT.
- Manufacturing PMI for December is expected to head from 49.4 to 49.3.
- Services PMI for December to head from 50.8 to 50.6.
- After the sluggish end for US equities on Thursday, Asian equities are roaring, with Hong Kong’s Hang Seng leading by 2.50%. European equities are just up a touch. US Futures are heading higher by a few percentage points.
- The CME Group’s FedWatch Tool shows that markets are pricing in a 85.5% chance that the Federal Reserve will keep interest rates unchanged at its January 31 meeting. Around 14.5% expect the first cut already to take place.
- The benchmark 10-year US Treasury Note trades near 3.92%, the lowest in over four months.
US Dollar Index technical analysis: The Fed was an open book and got punished
The US Dollar has had a melt down when looking at the past two performances, with at one point more than 2% losses in the US Dollar Index. The Fed has put its cards on the table with its Dot Plot projections, forced to show its hand as it would lose credibility if it didn’t. Look for European data to deteriorate further, should the ECB truly commit to keep rates unchanged throughout 2024, while the Fed is ready to provide oxygen to its economy, which investors will applaud in the long run.
The DXY US Dollar Index is facing a tough recovery with several resistances added in its downturn this week. First level to try and recover is 102.44, the low of November 29th. If US Dollar bulls are able to close and open above that level, and preferably even test the level for support, the next upside level to watch is 102.95 (ahead of 103.00) and 103.51 at the 200-day Simple Moving Average.
To the downside, the DXY is positioned near the next pivotal 101.70, the low of August 04 and 10. Once broken, look for 100.82 to try and catch the falling knife with the bottoms from February and April. Should that snap, nothing will stand in the way of DXY heading to the sub 100 region.
US Dollar FAQs
What is the US Dollar?
The US Dollar (USD) is the official currency of the United States of America, and the ‘de facto’ currency of a significant number of other countries where it is found in circulation alongside local notes. It is the most heavily traded currency in the world, accounting for over 88% of all global foreign exchange turnover, or an average of $6.6 trillion in transactions per day, according to data from 2022.
Following the second world war, the USD took over from the British Pound as the world’s reserve currency. For most of its history, the US Dollar was backed by Gold, until the Bretton Woods Agreement in 1971 when the Gold Standard went away.
How do the decisions of the Federal Reserve impact the US Dollar?
The most important single factor impacting on the value of the US Dollar is monetary policy, which is shaped by the Federal Reserve (Fed). The Fed has two mandates: to achieve price stability (control inflation) and foster full employment. Its primary tool to achieve these two goals is by adjusting interest rates.
When prices are rising too quickly and inflation is above the Fed’s 2% target, the Fed will raise rates, which helps the USD value. When inflation falls below 2% or the Unemployment Rate is too high, the Fed may lower interest rates, which weighs on the Greenback.
What is Quantitative Easing and how does it influence the US Dollar?
In extreme situations, the Federal Reserve can also print more Dollars and enact quantitative easing (QE). QE is the process by which the Fed substantially increases the flow of credit in a stuck financial system.
It is a non-standard policy measure used when credit has dried up because banks will not lend to each other (out of the fear of counterparty default). It is a last resort when simply lowering interest rates is unlikely to achieve the necessary result. It was the Fed’s weapon of choice to combat the credit crunch that occurred during the Great Financial Crisis in 2008. It involves the Fed printing more Dollars and using them to buy US government bonds predominantly from financial institutions. QE usually leads to a weaker US Dollar.
What is Quantitative Tightening and how does it influence the US Dollar?
Quantitative tightening (QT) is the reverse process whereby the Federal Reserve stops buying bonds from financial institutions and does not reinvest the principal from the bonds it holds maturing in new purchases. It is usually positive for the US Dollar.
- Pound rally has stalled right below 1.2800.
- Upbeat UK services activity data has provided a fresh boost to the pair.
- GBP/USD is unlikely to rally much further – Nomura.
The Sterling bounced higher following the release of the UK S&P Global/CIPS PMI figures on Friday although it remains unable to find a meaningful acceptance in the 1.2800 area.
Data released earlier today showed a strong improvement in services activity in December. The 52.7 flash PMI beat expectations of a 51.0 reading an marks the best performance of the last five months.
On the other hand, manufacturing activity revealed a deeper contraction, retreating to 46.4 from 47.2 in November, against the market consensus of a 47.5 reading.
GBP/USD further appreciation will be modest – Nomura
Looking forward, the Technical Analysis team at Nomura Bank are sceptical about the pair’s upside scope: “We do not expect economic growth in the UK for the next few quarters to be as resilient as in the US, and as a result, sluggish growth in the UK is likely to be a drag on GBP. Therefore, on net, we think the rise in GBP/USD will be modest, and expect 1.27 and 1.28 in Q1 and Q2 2024, respectively.”
Technical levels to watch
The sharp further gain for EUR/USD is on shaky ground in the view of economists at MUFG Bank.
Next six-week period is the worst of the year for EUR/USD
The Eurozone backdrop and indeed the global backdrop does not seem to us conducive to a further sustained rally in EUR/USD.
Fundamentals as a driver over the next few weeks through the Christmas and New Year period is never reliable but if this rally is sustained over that period, we’d expect a reversal as we advance through Q1 next year – which from a seasonal perspective covers a six-week period that is the worst of the year for EUR/USD.
- The Euro pulls back from 1.1010 following weak Eurozone PMIs.
- EUR/USD’s losses remain limited as the US Dollar fails to stage a meaningful recovery.
- The Fed’s dovish pivot is acting as a headwind for the Greenback.
The Euro (EUR) is paring some gains at Friday’s European session, trading at around 1.0960 against the US Dollar, following a rejection at November’s high. The Euro’s retreat came as Eurozone business activity data disappointed, casting doubts on the European Central Bank’s (ECB) hawkish message.
December’s Preliminary HCOB Services PMI fell to 48.1 from 48.7 in November, against expectations of a moderate improvement to 49. The data suggests that the Eurozone’s key services sector’s activity contracted at a faster pace than in the previous month.
Likewise, the Manufacturing PMI remained unchanged at 44.2, when the market anticipated an improvement to 44.6. Any PMI reading below 50 signals contraction.
These figures suggest the weak contribution to the GDP by both sectors. This raises questions about the bank’s ability to keep the interest rates at high levels for a long time, as ECB President Christine Lagarde pledged after Thursday’s monetary policy meeting.
Later today, the US S&P Global PMIs and the NY Empire State Manufacturing Index are expected to come in line with the idea of a soft landing for the US economy, which might add negative pressure on the US Dollar.
Daily digest market movers: Euro rally stalls as Eurozone business activity data disappoints
- The Euro lost pace on Friday after German and French PMI data signaled weaker-than-expected Eurozone PMI figures.
- Eurozone preliminary HCOB Manufacturing PMI for December remained steady at 44.2 against market expectations of a 44.6 reading.
- Services sector activity deteriorated to 48.1 from 48.7 against expectations of a moderate pick up to 49.
- The European Central Bank warned about an uptick in inflation in the near term and played down speculation about rate cuts in the coming months.
- The USD remains stuck near recent lows against its main peers, weighed by the idea that the Federal Reserve (Fed) will be the first major bank to start cutting rates.
- Futures markets are pricing in a 70% chance of 25 bps cuts at the Fed’s March meeting, up from 40% before the Fed’s Wednesday meeting.
- The Fed signaled the end of the tightening cycle and suggested that rate cuts are coming “into view,” which has sent US bond yields tumbling, dragging the US Dollar down with them.
- Data from Thursday showed that US Retail Sales increased against expectations of a decline, and that jobless claims fell to their lowest levels since mid-October. The impact on the USD was marginal.
Technical Analysis: Euro fails at 1.1010 with bulls still in control
The Euro rally from last week's lows near 1.0700 has been capped right at November’s high of 1.1010, and the pair pulled back. The near-term bullish trend is still active as downside attempts remain contained above 1.0955.
The pair is going through a corrective reversal after reaching heavily oversold levels on intraday charts. Support at the mentioned 1.0955 is closing the path towards the 4-hour 100 Simple Moving Average (SMA) at 1.0879, which would increase the bearish pressure toward last week’s lows at 1.0730.
On the upside, the Euro should breach 1.1010 to regain bullish momentum and aim for the August high, at 1.1060, ahead of the July 24 and 27 high, at 1.1150.
Euro FAQs
What is the Euro?
The Euro is the currency for the 20 European Union countries that belong to the Eurozone. It is the second most heavily traded currency in the world behind the US Dollar. In 2022, it accounted for 31% of all foreign exchange transactions, with an average daily turnover of over $2.2 trillion a day.
EUR/USD is the most heavily traded currency pair in the world, accounting for an estimated 30% off all transactions, followed by EUR/JPY (4%), EUR/GBP (3%) and EUR/AUD (2%).
What is the ECB and how does it impact the Euro?
The European Central Bank (ECB) in Frankfurt, Germany, is the reserve bank for the Eurozone. The ECB sets interest rates and manages monetary policy.
The ECB’s primary mandate is to maintain price stability, which means either controlling inflation or stimulating growth. Its primary tool is the raising or lowering of interest rates. Relatively high interest rates – or the expectation of higher rates – will usually benefit the Euro and vice versa.
The ECB Governing Council makes monetary policy decisions at meetings held eight times a year. Decisions are made by heads of the Eurozone national banks and six permanent members, including the President of the ECB, Christine Lagarde.
How does inflation data impact the value of the Euro?
Eurozone inflation data, measured by the Harmonized Index of Consumer Prices (HICP), is an important econometric for the Euro. If inflation rises more than expected, especially if above the ECB’s 2% target, it obliges the ECB to raise interest rates to bring it back under control.
Relatively high interest rates compared to its counterparts will usually benefit the Euro, as it makes the region more attractive as a place for global investors to park their money.
How does economic data influence the value of the Euro?
Data releases gauge the health of the economy and can impact on the Euro. Indicators such as GDP, Manufacturing and Services PMIs, employment, and consumer sentiment surveys can all influence the direction of the single currency.
A strong economy is good for the Euro. Not only does it attract more foreign investment but it may encourage the ECB to put up interest rates, which will directly strengthen the Euro. Otherwise, if economic data is weak, the Euro is likely to fall.
Economic data for the four largest economies in the euro area (Germany, France, Italy and Spain) are especially significant, as they account for 75% of the Eurozone’s economy.
How does the Trade Balance impact the Euro?
Another significant data release for the Euro is the Trade Balance. This indicator measures the difference between what a country earns from its exports and what it spends on imports over a given period.
If a country produces highly sought after exports then its currency will gain in value purely from the extra demand created from foreign buyers seeking to purchase these goods. Therefore, a positive net Trade Balance strengthens a currency and vice versa for a negative balance.
Economic Indicator
United States S&P Global Composite PMI
The S&P Global Composite Purchasing Managers Index (PMI), released on a monthly basis, is a leading indicator gauging US private-business activity in the manufacturing and services sector. The data is derived from surveys to senior executives. Each response is weighted according to the size of the company and its contribution to total manufacturing or services output accounted for by the sub-sector to which that company belongs. Survey responses reflect the change, if any, in the current month compared to the previous month and can anticipate changing trends in official data series such as Gross Domestic Product (GDP), industrial production, employment and inflation. The index varies between 0 and 100, with levels of 50.0 signaling no change over the previous month. A reading above 50 indicates that the private economy is generally expanding, a bullish sign for the US Dollar (USD). Meanwhile, a reading below 50 signals that activity is generally declining, which is seen as bearish for USD.
Read more.Next release: 12/15/2023 14:45:00 GMT
Frequency: Monthly
Source: S&P Global
Gold consolidated its gains following the dovish commentary emanating from Wednesday’s FOMC meeting. Economists at ANZ Bank analyze the yellow metal’s outlook.
Fed’s pivot to attract Gold buyers
The Fed Dot Plot suggested it now expects to cut rates in 2024.
The pivot to easing monetary policy has been one of the last issues that has been holding back investors from the Gold market. This apparent shift in tone from the Fed should see investors flock into the precious metal.
See – Gold Price Forecast: XAU/USD set to hit fresh highs in 2024 – MUFG
On Thursday, BoE’s retaining a hawkish stance led Cable higher. Economists at Nomura analyze GBP/USD outlook.
Cable seen at 1.27 and 1.28 in Q1 and Q2 2024, respectively
Stronger GBP was no doubt led by the BoE’s announcement; however, the softening in USD has been the driver over the past few sessions. The market has continued to unwind its long USD exposure.
We believe this softer USD trend will become more apparent going forward, and this will help raise GBP/USD. That said, we do not expect economic growth in the UK for the next few quarters to be as resilient as in the US, and as a result, sluggish growth in the UK is likely to be a drag on GBP. Therefore, on net, we think the rise in GBP/USD will be modest, and expect 1.27 and 1.28 in Q1 and Q2 2024, respectively.
- WTI Oil heads towards $74 as the Federal Reserve’s dovishness brightens the demand outlook.
- Oil outlook could confirm OPEC latest report as a pickup in economic activity is foreseen for the first half of 2024.
- The DXY US Dollar Index trades steady at a near four-month-low, though it could turn around.
Oil prices rally for a third day in a row,, fueled by the outcome of Wednesday’s US Federal Reserve meeting and Chairman Jerome Powell’s dovish remarks. The Fed has confirmed to markets that rate cuts are coming in 2024, a sign that markets wanted to see. Lower interest rates ahead could mean a push in sentiment and economic activity, triggering an increase in demand for Crude.
Meanwhile, the US Dollar (USD) has lost over 2% of its value when gauged by the US Dollar Index (DXY) since Wednesday. The European Central Bank (ECB) surprised markets by not committing to rate cuts and mentioning cuts were not even an option. With still positive US economic data and the Fed ready to cut in 2024, the US economic outlook has brightened. Meanwhile, economic activity in the Eurozone has been stagnant for months and the ECB isn’t committed to cutting interest rates in 2024.
Crude Oil (WTI) trades at $72.20 per barrel and Brent Oil trades at $77.08 per barrel at the time of writing.
Oil News and Market Movers: Central Banks done for 2023
- On Thursday, major central banks released their last monetary policy decision of the year. The Swiss National Bank (SNB), the European Central Bank (ECB), and the Bank of England (BoE) opted to keep rates unchanged at current levels. The ECB and the BoE rejected talks of upcoming interest-rate cuts, contrary to the Fed’s message on Wednesday.
- Total Energies bought three WTI Midland cargoes, and has been bidding on three more cargoes for delivery in early January.
- Macquarie Group issued a report saying that WTI and Brent will settle near the high $60’s to low $70s level for the first quarter of 2024.
- At 18:00 GMT, the weekly Baker Hughes US Oil Rig Count data will be released. Previous was at 503.
Oil Technical Analysis: The more cuts, the better for Oil
Oil prices could get some help, but not from OPEC+. Commodities are gaining ground as investors dissect the message from the Fed on rate cuts. Rate cuts mean lower interest rates, and thus more spending, growth, production, and more demand for commodities. Who would have thought last week that the Fed would be the one to save Oil from falling below $67, and not OPEC.
On the upside, $74 is the first hurdle that needs to be taken back by Crude bulls. Once through there, $80 comes into the picture. Although still far off, $84 is next on the topside once Oil sees a few daily closes above the $80 level.
Still, Oil is not out of the woods yet. The $67.00 level could still come into play, which aligns with a triple bottom from June, as the next support level to trade at. Should that triple bottom break, a new low for 2023 could be close at $64.35 – the low of May and March – as the last line of defence. Although still quite far off, $57.45 is worth mentioning as the next level to keep an eye on if prices were to fall sharply..
-638382333878748068.png)
US WTI Crude Oil: Daily Chart
WTI Oil FAQs
What is WTI Oil?
WTI Oil is a type of Crude Oil sold on international markets. The WTI stands for West Texas Intermediate, one of three major types including Brent and Dubai Crude. WTI is also referred to as “light” and “sweet” because of its relatively low gravity and sulfur content respectively. It is considered a high quality Oil that is easily refined. It is sourced in the United States and distributed via the Cushing hub, which is considered “The Pipeline Crossroads of the World”. It is a benchmark for the Oil market and WTI price is frequently quoted in the media.
What factors drive the price of WTI Oil?
Like all assets, supply and demand are the key drivers of WTI Oil price. As such, global growth can be a driver of increased demand and vice versa for weak global growth. Political instability, wars, and sanctions can disrupt supply and impact prices. The decisions of OPEC, a group of major Oil-producing countries, is another key driver of price. The value of the US Dollar influences the price of WTI Crude Oil, since Oil is predominantly traded in US Dollars, thus a weaker US Dollar can make Oil more affordable and vice versa.
How does inventory data impact the price of WTI Oil
The weekly Oil inventory reports published by the American Petroleum Institute (API) and the Energy Information Agency (EIA) impact the price of WTI Oil. Changes in inventories reflect fluctuating supply and demand. If the data shows a drop in inventories it can indicate increased demand, pushing up Oil price. Higher inventories can reflect increased supply, pushing down prices. API’s report is published every Tuesday and EIA’s the day after. Their results are usually similar, falling within 1% of each other 75% of the time. The EIA data is considered more reliable, since it is a government agency.
How does OPEC influence the price of WTI Oil?
OPEC (Organization of the Petroleum Exporting Countries) is a group of 13 Oil-producing nations who collectively decide production quotas for member countries at twice-yearly meetings. Their decisions often impact WTI Oil prices. When OPEC decides to lower quotas, it can tighten supply, pushing up Oil prices. When OPEC increases production, it has the opposite effect. OPEC+ refers to an expanded group that includes ten extra non-OPEC members, the most notable of which is Russia.
The Bank of England (BoE) left interest rates unchanged on Thursday. GBP/USD hit its highest level since August following the Monetary Policy Statement. Economists at Commerzbank analyze the pair’s outlook.
The BoE has no plans to shift its stance for the time being
After the meeting, BoE Governor Andrew Bailey said that it was not yet possible to say with complete certainty that interest rates had peaked, although he hoped they had. And it was too early to talk about rate cuts, as further progress on inflation is needed. In my view, this was a pretty clear signal that the BoE has no plans to shift its stance for the time being.
The question over the next few months is likely to be how long the BoE can keep this up. If inflation falls more sharply than expected in the coming months, rate cuts are likely to be more on the BoE's agenda. For now, however, the BoE remains cautious and the Pound is likely to remain supported for the time being.
- Gold price keeps consolidating with the US Dollar depressed following the Fed’s dovish turn.
- US bond yields remain stuck at multi-month lows, adding negative pressure on the US Dollar.
- Later today, the US S&P Global PMIs and NY Empire State Manufacturing Index might give a fresh boost to Gold prices.
Gold price (XAU/USD) keeps its positive bias intact on Friday’s early European session and is on track to a 2% weekly rally, fuelled by the Federal Reserve’s (Fed) dovish pivot, which sent the US Dollar (USD) tumbling.
Thursday’s data from the US confirmed that the labor market remains strong, and retail sales increased, offering some support for the Dollar. That said, investors remain confident that the Fed will be the first bigger central bank to start easing its monetary policy, which is keeping US Dollar bulls at bay.
Later today, the US preliminary S&P Global PMIs and the NY Empire State Manufacturing Index are expected to endorse the view of softer economic growth. This would allow the Fed to start rolling back its restrictive policy in early 2024, which is bad for the USD and might push Gold a tad higher.
Daily Digest Market Movers: Gold remains strong as Hopes of Fed cuts hurt the US Dollar
- Gold remains supported by a weak US Dollar, as hopes of Fed cuts have sent US Treasury yields plunging.
- The benchmark US 10-year yield is trading at four-month lows below 4%.
- The positive surprise on US retail sales and the larger-than-expected decline in Jobless claims provided some support to the US Dollar on Thursday.
- US Retail Sales rose by 0.3% in November against expectations of a 0.1% decline, and following a 0.2% fall in October.
- US Initial Jobless claims declined to 202K to their lowest level since mid-October.
- Investors keep pricing a nearly 70% chance of a 25 bps rate cut in March, according to the CME Group Fed Watch tool.
- The ECB and the BoE maintained their hawkish tone, pushing back hopes of rate cuts after their respective meetings, which leaves the Fed as the first major central bank to start cutting interest rates.
- On the calendar today, the Preliminary US ISM PMIs and the New York Fed Manufacturing Index are expected to show a mild deterioration from last month, which might give an additional boost to Gold.
Technical Analysis: Gold is pushing against the $2,040 resistance area
From a technical perspective, Gold is regaining bullish impetus following a strong rebound from the $1,970 on Wednesday. The pair, however, needs to breach the $2,040 resistance area to confirm the bullish view.
Such a scenario is likely to attract buyers, with their focus on May’s peak at $2,070 before attempting another assault to the all-time high, at $2,150.
On the contrary, failure to break the mentioned level would see price seek support at $2.015 - $2,020 area where the confluence of the 50 and 100 SMAs in 4-hour charts meet the 50% Fibonacci Retracement of The October - December rally. Below here, bearish pressure would increase with the $1,977 support area coming into play.
Gold FAQs
Why do people invest in Gold?
Gold has played a key role in human’s history as it has been widely used as a store of value and medium of exchange. Currently, apart from its shine and usage for jewelry, the precious metal is widely seen as a safe-haven asset, meaning that it is considered a good investment during turbulent times. Gold is also widely seen as a hedge against inflation and against depreciating currencies as it doesn’t rely on any specific issuer or government.
Who buys the most Gold?
Central banks are the biggest Gold holders. In their aim to support their currencies in turbulent times, central banks tend to diversify their reserves and buy Gold to improve the perceived strength of the economy and the currency. High Gold reserves can be a source of trust for a country’s solvency. Central banks added 1,136 tonnes of Gold worth around $70 billion to their reserves in 2022, according to data from the World Gold Council. This is the highest yearly purchase since records began. Central banks from emerging economies such as China, India and Turkey are quickly increasing their Gold reserves.
How is Gold correlated with other assets?
Gold has an inverse correlation with the US Dollar and US Treasuries, which are both major reserve and safe-haven assets. When the Dollar depreciates, Gold tends to rise, enabling investors and central banks to diversify their assets in turbulent times. Gold is also inversely correlated with risk assets. A rally in the stock market tends to weaken Gold price, while sell-offs in riskier markets tend to favor the precious metal.
What does the price of Gold depend on?
The price can move due to a wide range of factors. Geopolitical instability or fears of a deep recession can quickly make Gold price escalate due to its safe-haven status. As a yield-less asset, Gold tends to rise with lower interest rates, while higher cost of money usually weighs down on the yellow metal. Still, most moves depend on how the US Dollar (USD) behaves as the asset is priced in dollars (XAU/USD). A strong Dollar tends to keep the price of Gold controlled, whereas a weaker Dollar is likely to push Gold prices up.
US Dollar FAQs
What is the US Dollar?
The US Dollar (USD) is the official currency of the United States of America, and the ‘de facto’ currency of a significant number of other countries where it is found in circulation alongside local notes. It is the most heavily traded currency in the world, accounting for over 88% of all global foreign exchange turnover, or an average of $6.6 trillion in transactions per day, according to data from 2022.
Following the second world war, the USD took over from the British Pound as the world’s reserve currency. For most of its history, the US Dollar was backed by Gold, until the Bretton Woods Agreement in 1971 when the Gold Standard went away.
How do the decisions of the Federal Reserve impact the US Dollar?
The most important single factor impacting on the value of the US Dollar is monetary policy, which is shaped by the Federal Reserve (Fed). The Fed has two mandates: to achieve price stability (control inflation) and foster full employment. Its primary tool to achieve these two goals is by adjusting interest rates.
When prices are rising too quickly and inflation is above the Fed’s 2% target, the Fed will raise rates, which helps the USD value. When inflation falls below 2% or the Unemployment Rate is too high, the Fed may lower interest rates, which weighs on the Greenback.
What is Quantitative Easing and how does it influence the US Dollar?
In extreme situations, the Federal Reserve can also print more Dollars and enact quantitative easing (QE). QE is the process by which the Fed substantially increases the flow of credit in a stuck financial system.
It is a non-standard policy measure used when credit has dried up because banks will not lend to each other (out of the fear of counterparty default). It is a last resort when simply lowering interest rates is unlikely to achieve the necessary result. It was the Fed’s weapon of choice to combat the credit crunch that occurred during the Great Financial Crisis in 2008. It involves the Fed printing more Dollars and using them to buy US government bonds predominantly from financial institutions. QE usually leads to a weaker US Dollar.
What is Quantitative Tightening and how does it influence the US Dollar?
Quantitative tightening (QT) is the reverse process whereby the Federal Reserve stops buying bonds from financial institutions and does not reinvest the principal from the bonds it holds maturing in new purchases. It is usually positive for the US Dollar.
The Dollar can only fall so far on Fed dovishness, Kit Juckes, Chief Global FX Strategist at Société Générale reports.
Further gains for EUR and GBP require economic pessimism to ease
We expect the Dollar Index to fall by just under 5% to 97 in 2024, but to put that in context, it has lost 5% since October 3, so we’re not exactly forecasting fireworks.
Today, disappointing European PMI data have prevented EUR/USD from kicking on after breaking above 1.10 on Thursday and that is going to be a familiar pattern as long as the European economy struggles.
Our forecasts for European GDP growth are less pessimistic than the market consensus for 2024 (and we expect the ECB to be much slower than the Fed to cut rates) but further gains for the Euro (and the Pound) require economic pessimism to ease. Put simply, the divergence in consensus forecasts of Eurozone, US and UK GDP growth for 2024 is going to slow and limit the Dollar’s fall unless the trends change.
While speaking at a news conference on Friday, European Central Bank policymaker Robert Holzmann said that it is now more likely that interest rates have reached their peak last month, per Reuters.
Holzmann also noted that there were no discussions about rate cuts among policymakers and added that a majority saw upside risks to inflation.
Market reaction
EUR/USD showed no immediate reaction to these comments. At the time of press, the pair was trading at 1.0965, where it was down 0.25% on a daily basis.
The Norwegian Krone appreciated massively on Thursday after the Norges Bank decided to hike its policy rate by 25 bps. Antje Praefcke, FX Analyst, analyzes NOK’s outlook.
Kudos to Norges Bank
Norges Bank implemented its announced rate path unflinchingly and hiked its key rate by 25 bps to 4.50%. Moreover, the key rate is likely to remain at these levels for some time – until autumn 2024. It did not want to exclude a further rate step either, even though it allocates little likelihood to such a step in its rate path. It sees a likelihood of first cautious rate cuts towards the end of 2024, furthermore, the rate cut cycle might be a little faster (and maybe a bit earlier) than originally projected over the following years.
In my view, EUR/NOK will from now on depend heavily on market expectations as to which central bank – ECB or Norges Bank – will cut rates first and to what extent.
Overall, Norges Bank has proven that it is decisive in its fight against inflation, which is likely to benefit NOK over the coming months. I am, therefore, happy with my projection of the Krone continuing to appreciate moderately in 2024 and 2025.
The US Dollar Index (DXY) sold off 0.9% on Thursday and is down 2% on the week. Economists at ING analyze Greenback’s outlook.
Focus on The Fed's Williams' TV appearance
The market will want to hear confirmation that the Fed debate has moved on to the timing of the first rate cut. Fed centrist, John Williams, appears on CNBC today at 13:30 GMT. Expect him to be grilled on this very subject. It is hard to see the market pricing in more than the 150 bps of rate cuts it has already for 2024. Yet, should Williams mention rate cuts, we suspect the Dollar will stay on the soft side today.
In terms of local data, the market is expecting some decent US industrial production data for December and will assess any slowdown in the flash PMI readings for the month. 102.55/102.65 is now well-defined resistance and 101 looks the near-term target.
On Thursday, EUR/GBP declined on the back of the BoE statement but fully retraced the move following the ECB meeting. Economists at Danske Bank analyze the pair’s outlook.
Push-back on rate cut expectations
The Bank of England (BoE) decided to keep the Bank Rate (key policy rate) unchanged at 5.25%.
The BoE delivered hawkish communication in an attempt to push-back on market expectations of rate cuts next year.
Overall, we see relative rates as a negative for GBP and see the recent rebound as attractive levels to sell GBP. We continue to forecast EUR/GBP to move modestly higher in the coming year to 0.89.
- UK Manufacturing PMI fell to 46.4 in December, missing estimates of 47.5.
- Services PMI in the UK jumped to 52.7 in December, a big beat.
- GBP/USD regains upside traction despite mixed UK business PMIs.
The seasonally adjusted S&P Global/CIPS UK Manufacturing Purchasing Managers’ Index (PMI) dropped to 46.4 in December versus the 47.5 expected and, 47.2 - November’s final print.
Meanwhile, the Preliminary UK Services Business Activity Index jumped to a six-month high of 52.7 in December, compared with the 50.9 final print for November and the 51.0 market forecast.
Commenting on the flash PMI data, Chris Williamson, Chief Business Economist at S&P Global Market Intelligence said: “The UK economy continues to dodge recession, with growth picking up some momentum at the end of the year to suggest that GDP stagnated over the fourth quarter as a whole.”
“While employment meanwhile fell for a fourth month, the decline was only marginal and not indicative of any material rise in unemployment,” Chris added.
FX implications
At the press time, GBP/USD is paring back gains to trade near 1.2755, having spiked to 1.2775 in a knee-jerk reaction to the upbeat UK data. The pair is trading modestly flat on the day.
Pound Sterling price this week
The table below shows the percentage change of Pound Sterling (GBP) against listed major currencies this week. Pound Sterling was the strongest against the US Dollar.
| USD | EUR | GBP | CAD | AUD | JPY | NZD | CHF | |
| USD | -1.81% | -1.65% | -1.56% | -2.10% | -2.26% | -1.55% | -1.46% | |
| EUR | 1.77% | 0.15% | 0.24% | -0.29% | -0.45% | 0.25% | 0.34% | |
| GBP | 1.64% | -0.15% | 0.09% | -0.44% | -0.60% | 0.10% | 0.19% | |
| CAD | 1.54% | -0.24% | -0.10% | -0.53% | -0.69% | 0.01% | 0.10% | |
| AUD | 2.06% | 0.29% | 0.43% | 0.53% | -0.15% | 0.54% | 0.63% | |
| JPY | 2.21% | 0.42% | 0.49% | 0.69% | 0.17% | 0.68% | 0.78% | |
| NZD | 1.53% | -0.22% | -0.08% | 0.00% | -0.54% | -0.67% | 0.11% | |
| CHF | 1.43% | -0.34% | -0.20% | -0.11% | -0.64% | -0.79% | -0.10% |
The heat map shows percentage changes of major currencies against each other. The base currency is picked from the left column, while the quote currency is picked from the top row. For example, if you pick the Euro from the left column and move along the horizontal line to the Japanese Yen, the percentage change displayed in the box will represent EUR (base)/JPY (quote).
Gold prices fell in India on Friday, according to data from India's Multi Commodity Exchange (MCX).
Gold price stood at 62,161 Indian Rupees (INR) per 10 grams, down INR 132 compared with the INR 62,293 it cost on Thursday.
As for futures contracts, Gold prices increased to INR 62,571 per 10 gms from INR 62,454 per 10 gms.
Prices for Silver futures contracts decreased to INR 75,146 per kg from INR 75,076 per kg.
| Major Indian city | Gold Price |
|---|---|
| Ahmedabad | 64,325 |
| Mumbai | 64,125 |
| New Delhi | 64,235 |
| Chennai | 64,290 |
| Kolkata | 64,270 |
Global Market Movers: Comex Gold price seems poised to appreciate further
- Thursday's upbeat US macro data cast doubts over an early rate cut by the Federal Reserve, which provides some respite to the US Treasury bond yields and acts as a headwind for the Comex Gold price amid the risk-on mood.
- The US Commerce Department reported that Retail Sales rose by 0.3% in November as compared to the 0.2% fall (revised down from -0.1%) recorded in the previous month and the 0.1% decline anticipated.
- Moreover, core Retail Sales, which excludes automobiles, surpassed consensus estimates pointing to a 0.1% contraction and climbed 0.2% last month, while Retail Sales Control Group increased 0.4%.
- The US Labor Department, meanwhile, reported that the number of Americans filing for unemployment insurance for the first time fell to 202K last week, registering the lowest level since mid-October.
- Data released from China on Friday showed Retail Sales jumped 10.1% YoY in November vs. the 7.6% previous and Industrial Production increased 6.6% YoY as against a 4.6% rise in the prior month.
- Following the high-impact data, the National Bureau of Statistics (NBS) said that persistently recovery in demand is helpful for the improvement in consumer prices and that China will not see deflation.
- Reuters, citing three sources with knowledge of the matter, reported that Chinese leaders agreed at an annual meeting on the economy this week to set the 2024 economic growth target at around 5.0%.
- The markets, meanwhile, are still pricing in a nearly 60% chance that the Fed will begin to cut rates at its March meeting and the odds of a May rate cut currently stand at 90%.
- This, along with the prevalent selling bias surrounding the US Dollar, which extends its decline for the fourth straight day and drops to over a four-month low, is seen lending support to the commodity.
- Moving ahead, Friday's release of flash global PMI prints could provide some impetus to the precious metal and allow traders to grab short-term opportunities on the last day of the week.
(An automation tool was used in creating this post.)
Gold FAQs
Why do people invest in Gold?
Gold has played a key role in human’s history as it has been widely used as a store of value and medium of exchange. Currently, apart from its shine and usage for jewelry, the precious metal is widely seen as a safe-haven asset, meaning that it is considered a good investment during turbulent times. Gold is also widely seen as a hedge against inflation and against depreciating currencies as it doesn’t rely on any specific issuer or government.
Who buys the most Gold?
Central banks are the biggest Gold holders. In their aim to support their currencies in turbulent times, central banks tend to diversify their reserves and buy Gold to improve the perceived strength of the economy and the currency. High Gold reserves can be a source of trust for a country’s solvency. Central banks added 1,136 tonnes of Gold worth around $70 billion to their reserves in 2022, according to data from the World Gold Council. This is the highest yearly purchase since records began. Central banks from emerging economies such as China, India and Turkey are quickly increasing their Gold reserves.
How is Gold correlated with other assets?
Gold has an inverse correlation with the US Dollar and US Treasuries, which are both major reserve and safe-haven assets. When the Dollar depreciates, Gold tends to rise, enabling investors and central banks to diversify their assets in turbulent times. Gold is also inversely correlated with risk assets. A rally in the stock market tends to weaken Gold price, while sell-offs in riskier markets tend to favor the precious metal.
What does the price of Gold depend on?
The price can move due to a wide range of factors. Geopolitical instability or fears of a deep recession can quickly make Gold price escalate due to its safe-haven status. As a yield-less asset, Gold tends to rise with lower interest rates, while higher cost of money usually weighs down on the yellow metal. Still, most moves depend on how the US Dollar (USD) behaves as the asset is priced in dollars (XAU/USD). A strong Dollar tends to keep the price of Gold controlled, whereas a weaker Dollar is likely to push Gold prices up.
- The Dollar remains on the defensive, capped below 0.8700.
- The Fed’s Dovish turn keeps weighing on the USD.
- US ISM PMIs and the NY Fed index might increase dollar volatility later today.
The US Dollar’s attempt to bounce up from multi-month lows remains capped below the 0.8700 mark. The pair’s bearish momentum remains intact with the market awaiting the release of the preliminary US ISM PMI and the NY Fed Manufacturing Index.
The Dollar remains weighed by the Fed’s dovish pivot
The Federal Reserve signaled the end of rate hikes on Wednesday and the interest rate projections suggested a median of 75 bps rate hikes in 2024. This has boosted investors’ appetite for risk, sending the US Dollar sharply lower across the board.
Later today, the US NY Manufacturing Index and December’s Preliminary PMIs are expected to show a mild deterioration. This endorses the view of a soft landing, which allows the Fed to roll back its restrictive policy and might increase negative pressure on the USD.
In Switzerland, the SNB kept rates on hold on Thursday and lowered inflation expectations. The bank’s statement was seen as dovishly-tilted, which allowed some respite to the pair.
From a technical perspective, the pair maintains its bearish bias intact with the RSI above oversold levels, which allows for further decline.
Bulls are now testing 0.8660. Below here, 0.8555 is a key support level.
On the upside, resistances are at 0.8730 and 0.8815.
Technical levels to watch
- NZD/USD extends its gains amid the improved Kiwi Manufacturing Index.
- Business NZ PMI advanced to 46.7 in November from the previous readings of 42.5.
- Technical indicators suggest retesting the five-month high at 0.6249.
NZD/USD continues its winning streak for the fifth successive day on the downbeat US Dollar (USD). The NZD/USD pair trades around 0.6220 during the European hours on Friday. Investors are expected to closely monitor the S&P Global Purchasing Managers Index (PMI) data on Friday.
Even positive economic data from the United States (US), including a 0.3% increase in Retail Sales (MoM) for November and reduced Initial Jobless Claims at 202K, failed to underpin the USD. Moreover, the Kiwi Business NZ PMI for November rose to 46.7 from the previous 42.5, which might have provided upward support for the New Zealand Dollar (NZD).
The 14-day Relative Strength Index (RSI) is above the 50 level, indicating a bullish sentiment, which suggests that the NZD/USD pair could retest the five-month high at 0.6249 lined up with the 0.6250 major level. If the NZD/USD pair manages to surpass the resistance area, it might find support to venture into the psychological region near 0.6300.
Additionally, the positive positioning of the Moving Average Convergence Divergence (MACD) line above both the centerline and the signal line could serve as confirmation of bullish momentum in the market.
On the downside, a break below the psychological support level of 0.6200 could push the pair to fall to the 23.6% Fibonacci retracement at 0.6165 before the major support at 0.6150. A decisive break below the level could lead the NZD/USD pair to navigate the region around the 14-day Exponential Moving Average (EMA) at 0.6149.
NZD/USD: Daily Chart:
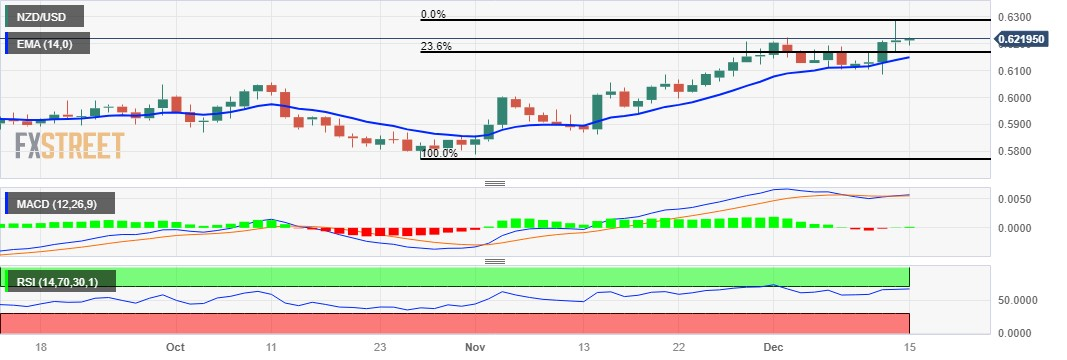
EUR/CHF moved higher after Thursday's Swiss National Bank (SNB) press conference. Economists at ING analyze the pair’s outlook.
SNB no longer focusing on FX sales
Having sold almost exactly CHF100bn of FX since the third quarter of last year, the SNB effectively said that the policy of exclusively selling FX was over. This makes a lot of sense.
Take a look at the SNB's inflation forecasts out to the end of 2026 and you will see inflation at or mostly below 2% over the entire horizon. The SNB can argue that the inflation battle is won and it no longer has a priority of keeping the real CHf stable through nominal CHf appreciation and FX sales.
This looks to be quite a big deal and we think that merits a higher EUR/CHF from current levels. We could quite easily see EUR/CHF reverting to 0.9650 over the coming weeks.
- Eurozone Manufacturing PMI stayed unchanged at 44.2 in December, beating estimates of 44.6.
- Bloc’s Services PMI declined to 48.1 in December vs. 49.0 forecast.
- EUR/USD keeps losses near 1.0950 after German, Eurozone PMI reports.
The Eurozone manufacturing sector contraction stalled but the services sector’s deepened in December, the latest figures from the HCOB's latest purchasing managers index survey showed Friday.
The Eurozone Manufacturing Purchasing Managers Index (PMI) arrived at 44.2 in December when compared to the anticipated reading of 44.6 and matching the 44.2 registered in November. The index remained at a six-month high.
The bloc’s Services PMI dropped to 48.1 in December from 48.7 in November, hitting a two-month low while missing the 49.0 forecast.
The HCOB Eurozone PMI Composite fell to 47.0 in December vs. 48.0 expected and November’s 47.6 readout. The index touched a two-month trough.
FX implications
EUR/USD is consolidating the latest downtick to near 1.0950 after dismal Eurozone PMIs. The spot is down 0.33% on the day, as of writing.
Euro price this week
The table below shows the percentage change of Euro (EUR) against listed major currencies this week. Euro was the strongest against the US Dollar.
| USD | EUR | GBP | CAD | AUD | JPY | NZD | CHF | |
| USD | -1.78% | -1.56% | -1.55% | -2.08% | -2.34% | -1.58% | -1.50% | |
| EUR | 1.74% | 0.21% | 0.21% | -0.30% | -0.56% | 0.19% | 0.27% | |
| GBP | 1.56% | -0.21% | 0.02% | -0.49% | -0.75% | 0.00% | 0.08% | |
| CAD | 1.53% | -0.23% | -0.01% | -0.51% | -0.77% | -0.02% | 0.06% | |
| AUD | 2.04% | 0.30% | 0.50% | 0.51% | -0.26% | 0.49% | 0.57% | |
| JPY | 2.29% | 0.53% | 0.67% | 0.77% | 0.27% | 0.72% | 0.82% | |
| NZD | 1.55% | -0.21% | 0.01% | 0.02% | -0.50% | -0.76% | 0.07% | |
| CHF | 1.47% | -0.30% | -0.07% | -0.06% | -0.57% | -0.83% | -0.08% |
The heat map shows percentage changes of major currencies against each other. The base currency is picked from the left column, while the quote currency is picked from the top row. For example, if you pick the Euro from the left column and move along the horizontal line to the Japanese Yen, the percentage change displayed in the box will represent EUR (base)/JPY (quote).
On Thursday, SEK faced headwinds from lower-than-expected inflation in Sweden. Economists at Commerzbank analyze Krona’s outlook.
Less pressure on the Riksbank
Thursday’s inflation data for November illustrated that price pressure is continuing to ease – more quickly than consensus had expected. The annual rates of 3.6% for the overall rate and 5.4% for the core rate still remain well above the 2% target but monthly changes point towards falling price pressure, also for the core rate. It can therefore be assumed that Riksbank too will end its rate hike cycle, unless there are unexpected surprises with inflation or the krona depreciates massively. The latter seems unlikely given Riksbank’s interventions.
As the market did not expect a further rate step anyway it is now all about when first rate cuts will follow. Depending on the data, the market will adjust its expectations and bring them forward. However, as ECB rate cut expectations have risen considerably recently the Krona can stand its ground and might even appreciate further.
- USD/MXN rebounds as US Dollar attempts to recover recent losses.
- Banxico maintained policy rates at the level of 11.25% in December’s meeting.
- Fed’s dovish stance contributed to undermining the Greenback.
USD/MXN halts a three-day losing streak as US Dollar (USD) makes efforts to retrace recent losses. The USD/MXN pair trades higher near 17.20 during the European session on Friday. However, the Mexican Peso (MXN) received upward support after the Bank of Mexico’s (Banxico) decision to hold policy rates at the level of 11.25%.
The Mexican economy persists in demonstrating resilience, as evidenced by the latest economic indicators. Inflation maintains a position above the Banxico target, emphasizing sustained economic strength. The recently released Industrial Output data for October further accentuates a robust performance in factories and manufacturing sectors.
The US Dollar continues to face downward momentum in the aftermath of the Federal Open Market Committee (FOMC) statement. The dovish stance adopted by the US Federal Reserve (Fed) regarding interest rates and the prospect of a more accommodative monetary policy in 2024 are key factors contributing to the sustained weakness in the Greenback.
The US Dollar Index (DXY) hovers around 102.00, accompanied by subdued US Treasury yields. As of now, the 2-year and 10-year US bond yields stand at 4.38% and 3.91%, respectively. Despite positive economic data from the United States (US), including Retail Sales and Initial Jobless Claims, the USD has not shown significant strength.
Investors now focus on the S&P Global Purchasing Managers Index (PMI) data scheduled for Friday, anticipating additional insights into the economic conditions in the United States to potentially drive market momentum.
- Germany’s Manufacturing PMI rose to 43.1 in December vs. the estimated 43.2 figure.
- Services PMI for the German economy dropped to 48.4 in December vs. 49.8 expected.
- EUR/USD extends losses below 1.0950 after downbeat German PMIs.
Germany’s manufacturing sector downturn eased slightly in December while the services sector suffered, according to the preliminary business activity report from the HCOB survey published on Friday.
The HCOB Manufacturing PMI in the Eurozone’s economic powerhouse rose to 43.1 this month, as against the 43.2 forecast and November’s 42.6. The index hit the highest level in seven months.
Meanwhile, Services PMI unexpectedly dropped from 49.6 in November to 48.4 in December. The market consensus was 49.8 in the reported period. The measure reached a fresh two-month low.
The HCOB Preliminary German Composite Output Index arrived at 46.7 in December vs. 48.2 expected and 47.8 previous reading. The gauge clinched a two-month low.
FX implications
EUR/USD saw a fresh leg down on the downbeat German data. The pair is trading 0.36% lower on the day at 1.0947, at the time of writing.
Euro price today
The table below shows the percentage change of Euro (EUR) against listed major currencies today. Euro was the weakest against the Japanese Yen.
| USD | EUR | GBP | CAD | AUD | JPY | NZD | CHF | |
| USD | 0.32% | 0.15% | -0.20% | -0.12% | -0.31% | -0.09% | 0.05% | |
| EUR | -0.33% | -0.18% | -0.53% | -0.44% | -0.63% | -0.43% | -0.28% | |
| GBP | -0.14% | 0.18% | -0.35% | -0.27% | -0.45% | -0.25% | -0.10% | |
| CAD | 0.19% | 0.53% | 0.34% | 0.08% | -0.09% | 0.10% | 0.26% | |
| AUD | 0.12% | 0.44% | 0.27% | -0.09% | -0.18% | 0.01% | 0.17% | |
| JPY | 0.32% | 0.61% | 0.43% | 0.08% | 0.21% | 0.15% | 0.35% | |
| NZD | 0.13% | 0.40% | 0.21% | -0.14% | -0.04% | -0.26% | 0.15% | |
| CHF | -0.06% | 0.27% | 0.09% | -0.26% | -0.17% | -0.35% | -0.16% |
The heat map shows percentage changes of major currencies against each other. The base currency is picked from the left column, while the quote currency is picked from the top row. For example, if you pick the Euro from the left column and move along the horizontal line to the Japanese Yen, the percentage change displayed in the box will represent EUR (base)/JPY (quote).
EUR/USD has spiked to 1.10. Nevertheless, economists at ING expect the pair to struggle to surpass this level.
1.10 could be sticky
We are tempted to say that EUR/USD does not go too much further above 1.10 now. And let's see how it copes with today's release of flash French, German and Eurozone PMIs. Soft releases here hit the Euro through the autumn, and while expectations are for stable readings today – these all largely remain in contractionary territory.
Our bias is that EUR/USD hangs around this 1.10 level into year-end. Yet December is seasonally a weak month for the Dollar and trends have a habit of extending in thin year-end markets.
FX option expiries for Dec 15 NY cut at 10:00 Eastern Time, via DTCC, can be found below.
- EUR/USD: EUR amounts
- 1.0700 1.4b
- 1.0750 1.4b
- 1.0800 1.8b
- 1.0825 641m
- 1.0840 1.3b
- 1.0900 1.3b
- 1.0920 812m
- 1.0950 2.2b
- GBP/USD: GBP amounts
- 1.2400 436m
- 1.2620 351m
- USD/JPY: USD amounts
- 143.50 720m
- 145.00 1.1b
- 146.00 1.7b
- 146.50 765m
- USD/CHF: USD amounts
- 0.8600 880m
- 0.8900 858m
- 0.9100 986m
- AUD/USD: AUD amounts
- 0.6470 706m
- 0.6550 628m
- 0.6650 943m
- 0.6900 603m
- USD/CAD: USD amounts
- 1.3430 980m
- 1.3500 1.7b
- 1.3525 1.1b
- 1.3650 837m
- EUR/GBP: EUR amounts
- 0.8600 440m
- 0.8620 420m
The Bank of England (BoE) offered pushback against dovish expectations. Economists at ING analyze the Pound’s outlook after the latest Monetary Policy Statement.
BoE ladles thin gruel to the doves
There was nothing in the BoE statement to encourage dovish expectations for 2024, and Dec 2024 Sonia 3m interest rate futures lost about 10 ticks after the meeting.
For today, look out for the flash UK PMIs for December. The important services index is holding its head above the 50 break-even area and another reading near 51 might prove a little supportive to the Pound.
1.2820/1.2850 is decent resistance for Cable above which 1.30 could be the surprise package for Christmas.
- USD/CAD plummets to a near three-month low and is pressured by a combination of factors.
- The Fed’s dovish shift, along with the risk-on mood, continues to weigh heavily on the USD.
- The recent goodish recovery in Oil prices underpins the Loonie and contributes to the decline.
The USD/CAD pair remains under some selling pressure for the third successive day on Friday and drops to a near three-month low during the early part of the European session. Spor prices currently trade around the 1.3385 area, down 0.15% for the day, and seem vulnerable to slide further amid a bearish sentiment surrounding the US Dollar (USD).
In fact, the USD Index (DXY), which tracks the Greenback against a basket of currencies, plummets to over a four-month low in the wake of the Federal Reserve’s (Fed) dovish pivot earlier this week. The US central bank on Wednesday signalled an end to its monetary policy tightening cycle and pencilled in at least three 25 bps rate cuts in 2024. Apart from this, the prevalent risk-on environment, as depicted by an extension of the rally in the global equity markets, exerts additional pressure on the safe-haven buck and is seen weighing on the USD/CAD pair.
However, the upbeat US macro data released on Thursday pointed to a resilient economy and raised doubts about an early policy easing by the Federal Reserve (Fed), in March 2024. This leads to a modest recovery in the US Treasury bond yields, albeit does little to impress the USD bulls. Meanwhile, Crude Oil prices, which tend to influence demand for the commodity-linked Loonie, struggle to capitalize on a two-day-old recovery move from the lowest level since late June touched earlier this week, though remain on track for the first weekly rise in two months.
A bullish forecast from the International Energy Agency (IEA) on Oil demand for next year continues to act as a tailwind for the black liquid. This further contributes to the offered tone surrounding the USD/CAD pair and supports prospects for a further near-term depreciating move. Market participants now look forward to the US economic docket, featuring the Empire State Manufacturing Index, Industrial Production data and flash PMI prints for December. This, along with Oil price dynamics, should produce short-term trading opportunities around the USD/CAD pair.
Technical levels to watch
EUR/USD has moved sharply higher, trading close to the 1.10 mark. Economists at Commerzbank analyze the pair’s outlook.
EUR/USD will peak as early as 2024
In the long term, it remains the case that while the ECB's policy will be surprisingly EUR-friendly from today's perspective, the risk of renewed inflationary episodes will remain high in the medium term, partly as early as 2024, but especially in 2025. The ECB will do more than the market currently expects, but too little to eliminate inflation risks. This should be reflected in a (negative EUR) risk premium.
Moreover, even if the real economy in the US is in a weak phase (which we continue to expect in summer 2024), its end will be foreseeable at some point. A long-term US growth advantage should then become more plausible and lead to USD strength again, as it has until recently.
We therefore continue to believe that the EUR/USD will peak as early as 2024 and that the EUR/USD strength we expect in the coming quarters will not be permanent.
- GBP/JPY pulls back ahead of the release of Purchasing Managers Index data from the UK.
- BoE Governor Andrew Bailey’s hawkish remarks bolster the Pound Sterling.
- Japanese Yen could gain ground from growing expectations of a change in the BoJ's policy stance in 2024.
GBP/JPY trims its intraday gains, trading around 181.20 during the early European hours on Friday. However, the GBP/JPY pair attempted to extend its gains after rebounding from the two-month low at 178.34.
The Pound Sterling (GBP) receives upward support against the Japanese Yen (JPY), which could be attributed to the hawkish stance of the Bank of England (BoE) Governor Andrew Bailey.
Governor Bailey commented that there is still a way to go before inflation aligns with its target, adding to the overall hawkish sentiment. However, BoE chose to keep the interest rates steady at 5.25% in Thursday's decision.
Moreover, GfK Consumer Confidence for December, declined by 22 readings as expected against the previous decline of 24. Investors await Purchasing Managers Index (PMI) data from the United Kingdom (UK) on Friday.
On the other side, the Japanese Yen may find support from growing expectations of an impending change in the Bank of Japan's (BoJ) policy stance in 2024.
Japanese Finance Minister Shunich Suzuki, as reported by Reuters, conducted a verbal intervention in response to the recent rapid appreciation of the Japanese Yen. While refraining from commenting on daily currency movements, he emphasizes a close monitoring of market dynamics. Suzuki expresses the preference for currencies to exhibit stable movement aligned with underlying fundamentals.
The initial Jibun Bank Manufacturing PMI for November revealed a contraction in business activities in the manufacturing sector, declining to 47.7 from the previous figure of 48.3. However, the Service PMI improved to 52.0 from the prior 50.8.
Traders could exercise caution, refraining from making aggressive bets ahead of the crucial BoJ policy meeting scheduled for next week.
European Central Bank (ECB) Governing Council member and Bank of France President, Francois Villeroy de Galhau, noted on Friday that nobody suggested rate cuts at the last policy meeting, per Reuters.
Key takeaways
"ECB in the latest meeting wanted to express a message of confidence and patience."
"The important signal on Thursday was the changed inflation outlook."
"We will bring inflation back down to 2% target by 2025."
"Monetary policy transmission is slightly faster than initially expected."
"We are on a plateau and have to take the time to enjoy the view."
"We will be guided by data, not by calendar aspects, when determining next monetary policy steps."
"Next policy move should be a lowering of rates unless there are surprises."
Market reaction
The EUR/USD pair showed no immediate reaction to these comments and was last seen trading flat on the day at around 1.0990.
- Silver struggles to capitalize on a two-day-old strong uptrend and edges lower on Friday.
- The technical setup favours bullish traders and supports prospects for additional gains.
- Corrective slide back towards the 200-day SMA could get bought into and remain limited.
Silver (XAG/USD) comes under some selling pressure on Friday, snapping a two-day winning streak to over a one-week high touched the previous day and stalling this week's strong recovery from mid-$22.00s or a near one-month low. The white metal remains on the defensive through the early European session and currently trades just above the $24.00 round figure, down nearly 0.40% for the day.
From a technical perspective, the XAG/USD earlier this week showed some resilience below and defend an upward-sloping sloping line extending from a multi-month low touched in October. The subsequent surge beyond the very important 200-day Simple Moving Average (SMA) favours bullish traders and supports prospects for a further appreciating move. Moreover, oscillators on the daily chart have again started gaining positive traction and validate the near-term constructive setup.
Hence, any subsequent decline might still be seen as a buying opportunity and remain limited near the 200-day SMA, currently pegged near the $23.60 region. Some follow-through selling, however, might turn the XAG/USD vulnerable to accelerate the slide towards the $23.00 mark en route to the aforementioned ascending trend-line support, around the $22.85-$22.80 region. A convincing break below the latter will negate the positive outlook and shift the bias in favour of bearish traders.
On the flip side, bulls might wait for a move beyond the $24.20 area before placing fresh bets and positioning for a move towards reclaiming the $25.00 psychological mark. The upward trajectory could get extended further towards the $25.25 intermediate hurdle en route to the $25.45-$25.50 region and the $26.00 neighbourhood, or the highest level since May 5 touched earlier this month.
Silver daily chart
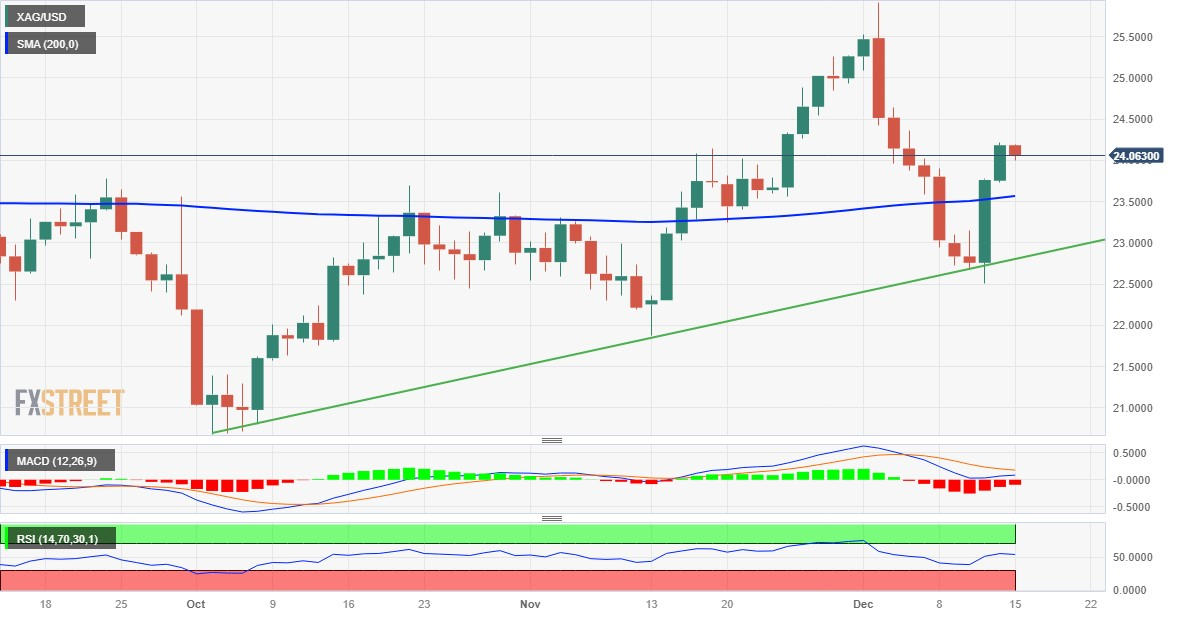
Technical levels to watch
The events over the past two days make economists at Nordea more confident that the NOK will strengthen ahead, after an abysmal 2023.
USD/NOK will likely continue to come down in the months to come
The events of the last few days likely will mark the turning point for the weak NOK that we have had in the past two years. We thus have increased confidence of EUR/NOK falling to 11.00 next year and 10.50 in 2025 and we believe these levels could be in sight even sooner than we expected. Our latest call was for 11.00 by end-2024 and 10.50 at end-2025 but we would likely need to revise these in the coming days.
USD/NOK will likely continue to come down in the months to come and we see USD/NOK below 10.00 next year.
- EUR/GBP trades sideways around 0.8609 on Friday.
- The European Central Bank (ECB) held interest rates steady at 4.0% at its December meeting.
- The Bank of England (BoE) maintained the benchmark rates unchanged at a 15-year high of 5.25%.
- The Eurozone and UK’s Purchasing Managers' Index (PMI) data will be released on Friday.
The EUR/GBP cross remains confined in a narrow trading range between 0.8607 and 0.8617 during the early European session on Friday. The European Central Bank (ECB) and Bank of England (BoE) decided to maintain the interest rates on Thursday, as widely expected. The attention has now shifted to the top-tier data from both the Eurozone and the UK on Friday, which could give a clear direction to the cross. At press time, EUR/GBP is trading at 0.8609, up 0.03% on the day.
The ECB held interest rates steady at 4.0% at its December meeting. ECB President Christine Lagarde said on Thursday that there was work to be done to bring the inflation back to its 2.0% target and we should not lower our guard against consumer price pressures. Analysts anticipate the ECB will cut rates next year, even though the timeframe is uncertain, with forecasts ranging from March to September.
On the other hand, the BoE maintained the benchmark rates unchanged at a 15-year high of 5.25%. The BoE Governor Andrew Bailey said there was still some way to go in the UK. Bailey also highlighted that the central bank would continue to closely track the data and take the appropriate action to bring back inflation to 2.0%
Market participants await the preliminary German and Eurozone HCOB Purchasing Managers' Index (PMI) for December on Friday. Also, the first reading of UK S&P Global/CIPS PMI for December will be due later in the day. Traders will take cues from these data and find trading opportunities around the EUR/GBP cross.
Here is what you need to know on Friday, December 15:
The US Dollar (USD) suffered heavy losses against its major rivals for the second consecutive day on Thursday. The US Dollar Index declined below 102.00 for the first time since August before stabilizing near that level early Friday. S&P Global will release preliminary December Manufacturing and Services PMIs for the Euro area, Germany, the UK and the US. The Federal Reserve will publish November Industrial Production data later in the day as well.
US Dollar price this week
The table below shows the percentage change of US Dollar (USD) against listed major currencies this week. US Dollar was the weakest against the Japanese Yen.
| USD | EUR | GBP | CAD | AUD | JPY | NZD | CHF | |
| USD | -2.05% | -1.66% | -1.43% | -1.79% | -2.06% | -1.20% | -1.42% | |
| EUR | 2.00% | 0.38% | 0.60% | 0.25% | -0.07% | 0.83% | 0.61% | |
| GBP | 1.64% | -0.39% | 0.22% | -0.14% | -0.40% | 0.45% | 0.23% | |
| CAD | 1.40% | -0.62% | -0.25% | -0.38% | -0.63% | 0.21% | 0.00% | |
| AUD | 1.76% | -0.26% | 0.12% | 0.35% | -0.27% | 0.58% | 0.37% | |
| JPY | 2.02% | 0.01% | 0.29% | 0.60% | 0.26% | 0.83% | 0.63% | |
| NZD | 1.20% | -0.82% | -0.45% | -0.22% | -0.58% | -0.84% | -0.20% | |
| CHF | 1.40% | -0.62% | -0.24% | -0.02% | -0.37% | -0.64% | 0.21% |
The heat map shows percentage changes of major currencies against each other. The base currency is picked from the left column, while the quote currency is picked from the top row. For example, if you pick the Euro from the left column and move along the horizontal line to the Japanese Yen, the percentage change displayed in the box will represent EUR (base)/JPY (quote).
The European Central Bank (ECB) left key rates unchanged as anticipated and revised inflation projections lower. In its policy statement, however, the ECB reiterated that future decisions will ensure that policy rates will be set at sufficiently restrictive levels for "as long as necessary." In the post-meeting press conference, ECB President Christine Lagarde noted that they did not discuss rate cuts, adding that it wasn't time to lower their guard since they had more work to be done. Lagarde's hawkish tone provided a boost to the Euro, lifting EUR/USD to multi-week highs above 1.1000. At the time of press, the pair was consolidating its weekly gains slightly below this level.
The Bank of England (BoE) held the policy rate steady at 5.25% following the last policy meeting of the year. Three members of the Monetary Policy Committee (MPC), Megan Greene, Jonathan Haskel and Catherine Mann, voted to raise the policy rate by 25 bps. The BoE repeated that the monetary policy is likely to need to be restrictive for an "extended period of time." In a statement released after the rate decision, BoE Governor Andrew Bailey said that it was too early to start speculating about cutting rates and added that they can't yet say that interest rates have peaked. GBP/USD gathered bullish momentum in the BoE aftermath and advanced to its highest level since late August near 1.2800. Early Friday, the pair staged a technical correction and retreated to the 1.2750 area.
During the Asian trading hours, the data from China revealed that Industrial Production expanded by 6.6% on a yearly basis, compared to the market expectation of 5.6%. On a negative note, Retail Sales grew by 10.1% in the same period to fall short of the market expectation for an expansion of 12.5%.
Judo Bank Composite PMI in Australia improved to 47.4 in December from 46.2 in November. AUD/USD showed no reaction to this report and was last seen moving sideways at around 0.6700.
The Swiss National Bank kept the interest rate unchanged at 1.75% as forecast on Thursday. USD/CHF continued to push lower and fell to its lowest level since late July below 0.8650. Although the pair managed to erase a portion of its daily losses, it's still down more than 200 pips on a weekly basis.
Following the impressive upsurge seen late Wednesday, Gold came within a touching distance of $2,050 on Thursday as the 10-year US yield broke below 4%. Early Friday, XAU/USD turned quiet slightly below $2,040 while the 10-year yield rebounded toward 4%.
USD/JPY extended its downtrend and dropped to a fresh multi-month low below 141.00 on Thursday. Following a late rebound, the pair seems to have stabilized at around 142.00 on the last trading day of the week.
European Central Bank (ECB) policymaker Madis Muller said on Friday that it is “too early to talk about rate cuts in the near term.”
Additional quotes
Too early to celebrate victory over inflation.
Still a little bit to go to reach 2% inflation target.
Market reaction
At the time of writing, EUR/USD is keeping its range at around 1.0985, down 0.06% on the day.
- USD/CHF continues its losing streak on a weaker US Dollar.
- SNB maintained the key interest rate at 1.75%.
- SNB Chairman Thomas Jordan’s hawkish remarks reinforced the strength of the Swiss Franc.
- DXY hit a four-month low at 101.77 on Thursday on the Fed’s dovish outlook.
USD/CHF moves on a downward trajectory for the fifth successive day, trading around 0.8661 during the Asian session on Friday. On Thursday, the USD/CHF pair recovered some intraday losses after dropping to a five-month low at 0.8630. The Swiss National Bank (SNB) has chosen to maintain the key policy rate at 1.75% on Thursday, citing a noticeable downward trend in domestic inflation.
Additionally, SNB Chairman Thomas Jordan has emphasized the central bank's readiness to tighten monetary policy if deemed necessary, even though domestic inflation has consistently stayed within the 0-2% target range for the past six months, as of November.
The US Dollar Index (DXY) hit a four-month low at 101.77 on Thursday, trading around 101.90, by the press time. The dovish outlook from the US Federal Reserve (Fed) regarding the trajectory of interest rates has fueled a rally in US bond prices. As a result, yields on US coupons have decreased, putting downward pressure on the US Dollar (USD).
The positive economic data from the United States (US), such as a 0.3% increase in Retail Sales (MoM) for November (surpassing the expected decline of 0.1%) and Initial Jobless Claims at 202K (below the anticipated 220K), failed to ignite any strength in US Dollar.
Investors are likely turning their attention to the S&P Global Purchasing Managers Index (PMI) data on Friday, seeking additional insights into the economic conditions in the United States for further impetus in the market.
- AUD/JPY holds positive ground around 95.15 during the early European session on Friday.
- Chinese leaders agreed to set China’s 2024 growth target at around 5.0% and target a budget deficit of 3% of GDP in 2024.
- The report that the Bank of Japan (BoJ) might exit its negative rate policy sooner than expected lends support to the JPY.
- Market participants will closely watch the BoJ monetary policy meeting next week.
The AUD/JPY cross snaps the three-day losing streak during the early European session on Friday. The cross remains capped under the 100-day Exponential Moving Average (EMA) at 95.50 on the daily chart. The uptick in the cross is bolstered by the improved Chinese data, which lifts the China-proxy Australian Dollar against the Japanese Yen (JPY). The cross currently trades near 95.15, gaining 0.13% on the day.
According to various media reports, Chinese leaders agreed at the Central Economic Work Conference this week to set China’s 2024 growth target at around 5.0%. Furthermore, Chinese authorities will target a budget deficit of 3% of GDP in 2024, compared to this year's revised ratio of 3.8%.
Apart from this, 650 billion Yuan in MLF loans are expected to mature, and the central bank injects 1.45 trillion Yuan to boost bank liquidity. That being said, the PBoC's activities support the nation’s financial system and sentiment. The positive development surrounding the Chinese economic condition also lifts the AUD, as Australia is one of China's major trade partners.
On the JPY’s front, the report that the Bank of Japan (BoJ) might exit its negative rate policy sooner than expected acts as a tailwind for the Japanese Yen (JPY) and might cap the AUD/JPY’s upside. On Friday, Japanese Finance Minister Shunich Suzuki came out with some verbal intervention. Suzuki said that Japanese authorities will closely watch the market moves, and it’s desirable for currencies to move stably, reflecting fundamentals.
Next week, traders will monitor Australia’s Mid-Year Economic and Fiscal Outlook on Monday. The attention will shift to the Bank of Japan monetary policy meeting on Tuesday. This event could trigger volatility in the market and give a clear direction to the AUD/JPY cross.
- GBP/USD stays tranquil as it anticipates the upcoming PMI data from both countries.
- A break above the 1.2800 could lead the pair to approach August’s high at 1.2841.
- A breach below the 1.2700 could push the pair towards the 14-day EMA at 1.2624.
GBP/USD grapples to continue its winning streak that began on Monday, trading around 1.2770 during the Asian hours on Friday. The GBP/USD pair receives a boost from the hawkish stance of the Bank of England (BoE).
As anticipated, the BoE opted to maintain the interest rates at 5.25% during Thursday's decision. BoE Governor Andrew Bailey remarked that there is still some distance to cover before inflation aligns with its target, contributing to the overall hawkish sentiment. Investors await Purchasing Managers Index (PMI) data from both nations on Friday.
Additionally, the technical indicators for the GBP/USD pair are signaling a bullish outlook. The 14-day Relative Strength Index (RSI) above the 50 level indicates upward support, suggesting a bullish momentum in favor of the pair.
Additionally, the Moving Average Convergence Divergence (MACD) line, positioned above the centerline and the signal line, implies a strong momentum in the GBP/USD pair.
The GBP/USD could face a challenge around the psychological region at the 1.2800 level. A firm breakthrough above the latter could support the pair to approach August’s high at 1.2841 level before the major level at 1.2850.
Looking at the downside, the psychological level at 1.2700 appears to be a crucial support region. A breach below this level might propel the GBP/USD pair towards the 14-day Exponential Moving Average (EMA) at 1.2624, followed by the 23.6% Fibonacci retracement at 1.2610.
If the pair extends its decline beyond this point, it could find itself navigating around the 38.2% Fibonacci retracement, marked at 1.2500.
GBP/USD: Daily Chart
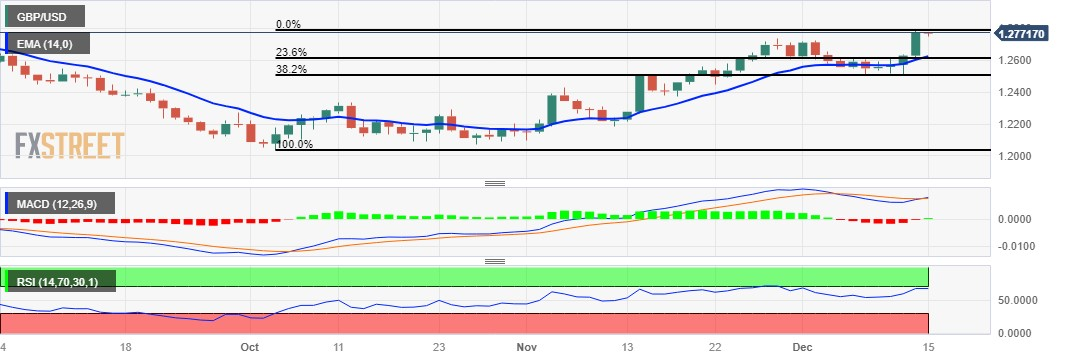
- EUR/USD continues to draw support from the divergent ECB-Fed policy outlook.
- The technical setup favours bullish traders and supports prospects for further gains.
- Some follow-through buying beyond the 1.1015 area will reaffirm the positive bias.
The EUR/USD pair trades with a positive bias for the fifth day in a row on Friday and is currently placed just below the 1.1000 psychological mark, or a two-week high touched the previous day.
The shared currency continues to draw support from the fact that the European Central Bank (ECB) on Thursday reaffirmed the need to hold interest rates higher for longer. In contrast, the Federal Reserve (Fed) indicated that rate cuts are likely next year and drag the US Dollar (USD) to over a four-month low during the Asian session, which, in turn, is seen acting as a tailwind for the EUR/USD pair.
From a technical perspective, spot prices showed some resilience below the 100-day Simple Moving Average (SMA) earlier this week. A subsequent rally of over 25 pips from the 1.0740 region, or a near one-month low favours bullish traders. Moreover, oscillators on the daily chart are holding comfortably in the positive territory and validate the near-term constructive outlook for the EUR/USD pair.
That said, it will still be prudent to wait for some follow-through buying beyond the 1.1015 area, or a multi-month peak touched in November, before positioning for any further gains. The EUR/USD pair might then accelerate the momentum towards the 1.1065 region (August monthly top) before aiming to reclaim the 1.1100 mark and test the next relevant hurdle near the mid-1.1100s (July 27 high).
On the flip side, the 1.0945 region now seems to protect the immediate downside, below which the EUR/USD pair could slide back to test sub-1.0900 levels. Some follow-through buying will negate the positive outlook and drag spot prices to the 200-day SMA support, currently near the 1.0830-1.0825 area. The subsequent fall below the 1.0800 mark could expose the 100-day SMA, around the 1.0755 zone.
EUR/USD daily chart
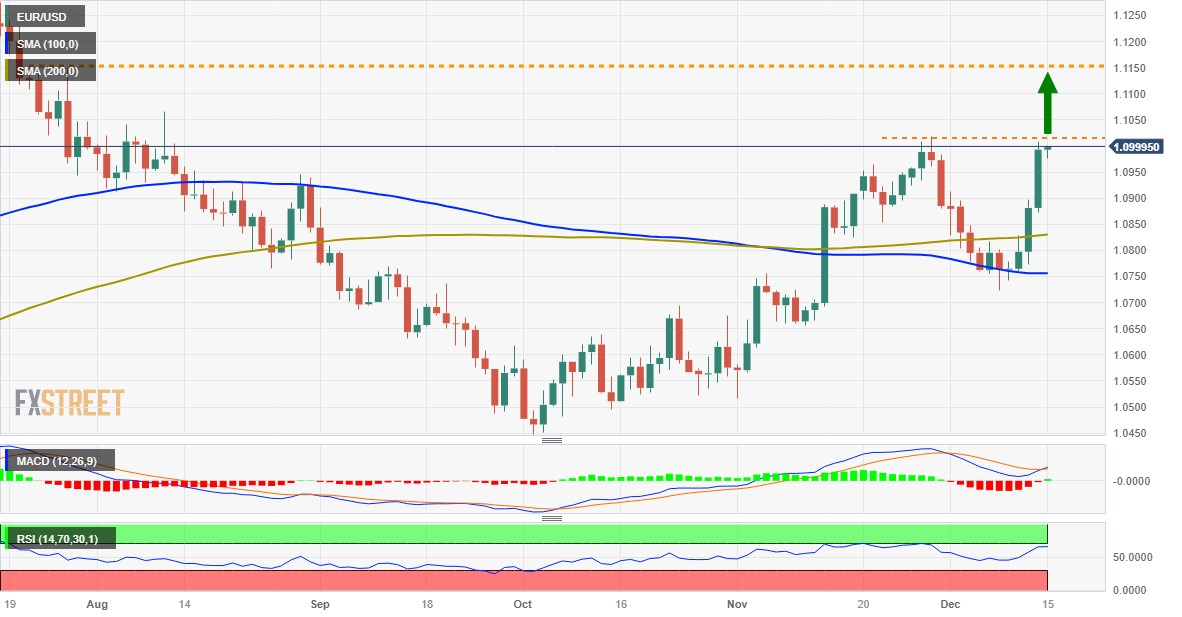
Technical levels to watch
- USD/CAD depreciates as the US Dollar continues to lose ground.
- Upbeat WTI price contributes support for the Loonie Dollar.
- DXY hovers around four-month lows amid the dovish Fed’s outlook.
USD/CAD extends its losses on the third successive day, trading lower around 1.3390 during the Asian session on Friday. The USD/CAD pair faces challenges on the subdued US Dollar, which could be attributed to the lowered US Treasury yields.
Market watchers anticipate Bank of Canada (BoC) Governor Tiff Macklem's scheduled appearance on Friday. This event holds potential significance, with participants expected to keenly focus on any insights or comments he provides regarding the Canadian economic outlook and monetary policy.
The West Texas Intermediate (WTI) price trades around $72.30 per barrel during the Asian session on Friday, driven by anticipated oil demand for 2024 and a weakened US Dollar (USD). Given Canada's position as the largest oil exporter to the United States (US), the improved WTI price could contribute to supporting the CAD in its exchange with the USD.
The US Dollar Index (DXY) dropped to a four-month low registered at 101.77 on Thursday, trading around 101.90, by the press time. The negative momentum for the US Dollar persists following the Federal Open Market Committee (FOMC) statement. The US Federal Reserve's (Fed) cautious stance on interest rates and the potential for a more accommodative monetary policy in 2024 contribute to the persistent weakness in the Greenback.
Despite better-than-expected economic data from the US, which showed a 0.3% rise in Retail Sales (MoM) for November against an expected decline of 0.1% and Initial Jobless Claims coming in at 202K compared to the anticipated 220K, the support for the USD remains modest. Investors will likely watch the S&P Global Purchasing Managers Index (PMI) data on Friday to gain further impetus on economic conditions in the United States.
Citing three sources with knowledge of the matter on Friday, Reuters reported that Chinese leaders agreed at an annual meeting on the economy this week to set the 2024 economic growth target at around 5.0%.
Additional takeaways
China to target budget deficit of 3% of GDP in 2024, vs. this year's revised ratio of 3.8%.
China may issue off-budget special bonds should the economy require extra fiscal support.
The official targets are usually not announced publicly until China's annual parliament meeting, usually held in March.
Market reaction
AUD/USD is holding higher ground above 0.6700 on the above report, adding 0.23% on the day.
- Gold price is seen consolidating its weekly gains registered over the past two days.
- Rebounding US bond yields and a positive risk tone act as a headwind for the metal.
- The Fed’s dovish tilt, along with sustained USD selling, continue to lend support.
Gold price (XAU/USD) struggles to capitalize on its gains registered over the past two days and oscillates in a narrow trading band below the $2,040 level during the Asian session on Thursday. The precious metal, for now, seems to have stalled the post-FOMC rally from the vicinity of the 50-day Simple Moving Average (SMA) support and remains below a one-and-half-week top touched on Thursday. The global risk sentiment remains supported by the Federal Reserve's (Fed) dovish tilt and hopes for more stimulus from China. Apart from this, the better-than-expected Chinese macro data released on Friday boosts investors' appetite for riskier assets, which, along with a modest pickup in the US Treasury bond yields, acts as a headwind for the yellow metal.
Meanwhile, the Fed on Wednesday signaled an end to its monetary policy tightening cycle and penciled in at least three 25 basis points (bps) rate cuts in 2024. This might keep a lid on any meaningful upside for the US bond yields and is seen weighing on the US Dollar (USD), which continues to lend some support to the non-yielding Gold price. Traders now look forward to the release of flash PMI prints from the Eurozone, the UK and the US for fresh insights into the health of the global economy. This would drive the broader market risk sentiment and influence demand for the safe-haven precious metal. Nevertheless, the XAU/USD remains on track to register modest weekly gains, reversing a part of last week's slide from the all-time peak.
Daily Digest Market Movers: Gold price is influenced by a combination of diverging forces
- Thursday's upbeat US macro data cast doubts over an early rate cut by the Federal Reserve, which provides some respite to the US Treasury bond yields and acts as a headwind for the Gold price amid the risk-on mood.
- The US Commerce Department reported that Retail Sales rose by 0.3% in November as compared to the 0.2% fall (revised down from -0.1%) recorded in the previous month and the 0.1% decline anticipated.
- Moreover, core Retail Sales, which excludes automobiles, surpassed consensus estimates pointing to a 0.1% contraction and climbed 0.2% last month, while Retail Sales Control Group increased 0.4%.
- The US Labor Department, meanwhile, reported that the number of Americans filing for unemployment insurance for the first time fell to 202K last week, registering the lowest level since mid-October.
- Data released from China on Friday showed Retail Sales jumped 10.1% YoY in November vs. the 7.6% previous and Industrial Production increased 6.6% YoY as against a 4.6% rise in the prior month.
- Following the high-impact data, the National Bureau of Statistics (NBS) said that persistently recovery in demand is helpful for the improvement in consumer prices and that China will not see deflation.
- The markets, meanwhile, are still pricing in a nearly 60% chance that the Fed will begin to cut rates at its March meeting and the odds of a May rate cut currently stand at 90%.
- This, along with the prevalent selling bias surrounding the US Dollar, which extends its decline for the fourth straight day and drops to over a four-month low, is seen lending support to the commodity.
- Moving ahead, Friday's release of flash global PMI prints could provide some impetus to the precious metal and allow traders to grab short-term opportunities on the last day of the week.
Technical Analysis: Gold price bulls need to wait for sustained strength beyond the $2,040 area
From a technical perspective, failure to find acceptance above the $2,040 supply zone warrants some caution for bullish traders. That said, positive oscillators on the daily chart support prospects for a further near-term appreciating move. Hence, some follow-through buying has the potential to lift the Gold price to the next relevant hurdle near the $2,072-2,073 region. The momentum could get extended further and allow the XAU/USD to reclaim the $2,100 round-figure mark.
On the flip side, the $2,012-2,010 horizontal zone might now protect the immediate downside ahead of the $2,000 psychological mark. A convincing break below the latter will make the Gold price vulnerable and expose the 50-day SMA support, currently pegged near the $1,979-1,978 region. This is followed by the weekly low, around the $1,973-1,972 area, and the 200-day SMA, near the $1,950 zone, which if broken decisively will shift the near-term bias in favour of bearish traders.
US Dollar price this week
The table below shows the percentage change of US Dollar (USD) against listed major currencies this week. US Dollar was the strongest against the Canadian Dollar.
| USD | EUR | GBP | CAD | AUD | JPY | NZD | CHF | |
| USD | -2.15% | -1.70% | -1.43% | -2.00% | -2.06% | -1.49% | -1.55% | |
| EUR | 2.11% | 0.45% | 0.71% | 0.16% | 0.09% | 0.65% | 0.59% | |
| GBP | 1.67% | -0.45% | 0.26% | -0.31% | -0.36% | 0.20% | 0.14% | |
| CAD | 1.42% | -0.69% | -0.26% | -0.56% | -0.61% | -0.05% | -0.11% | |
| AUD | 1.96% | -0.15% | 0.29% | 0.56% | -0.06% | 0.50% | 0.45% | |
| JPY | 2.01% | -0.10% | 0.25% | 0.60% | 0.04% | 0.55% | 0.48% | |
| NZD | 1.47% | -0.65% | -0.21% | 0.06% | -0.51% | -0.57% | -0.07% | |
| CHF | 1.53% | -0.59% | -0.15% | 0.12% | -0.45% | -0.50% | 0.07% |
The heat map shows percentage changes of major currencies against each other. The base currency is picked from the left column, while the quote currency is picked from the top row. For example, if you pick the Euro from the left column and move along the horizontal line to the Japanese Yen, the percentage change displayed in the box will represent EUR (base)/JPY (quote).
Gold FAQs
Why do people invest in Gold?
Gold has played a key role in human’s history as it has been widely used as a store of value and medium of exchange. Currently, apart from its shine and usage for jewelry, the precious metal is widely seen as a safe-haven asset, meaning that it is considered a good investment during turbulent times. Gold is also widely seen as a hedge against inflation and against depreciating currencies as it doesn’t rely on any specific issuer or government.
Who buys the most Gold?
Central banks are the biggest Gold holders. In their aim to support their currencies in turbulent times, central banks tend to diversify their reserves and buy Gold to improve the perceived strength of the economy and the currency. High Gold reserves can be a source of trust for a country’s solvency. Central banks added 1,136 tonnes of Gold worth around $70 billion to their reserves in 2022, according to data from the World Gold Council. This is the highest yearly purchase since records began. Central banks from emerging economies such as China, India and Turkey are quickly increasing their Gold reserves.
How is Gold correlated with other assets?
Gold has an inverse correlation with the US Dollar and US Treasuries, which are both major reserve and safe-haven assets. When the Dollar depreciates, Gold tends to rise, enabling investors and central banks to diversify their assets in turbulent times. Gold is also inversely correlated with risk assets. A rally in the stock market tends to weaken Gold price, while sell-offs in riskier markets tend to favor the precious metal.
What does the price of Gold depend on?
The price can move due to a wide range of factors. Geopolitical instability or fears of a deep recession can quickly make Gold price escalate due to its safe-haven status. As a yield-less asset, Gold tends to rise with lower interest rates, while higher cost of money usually weighs down on the yellow metal. Still, most moves depend on how the US Dollar (USD) behaves as the asset is priced in dollars (XAU/USD). A strong Dollar tends to keep the price of Gold controlled, whereas a weaker Dollar is likely to push Gold prices up.
- Indian Rupee trades around a flatline despite the softer US Dollar.
- India's Wholesale Price Index (WPI) inflation emerged from the deflationary zone, rising to 0.26% in November.
- Investors await the Indian Trade Balance and the US S&P Global PMI report for fresh impetus.
Indian Rupee (INR) trades flat on Friday despite the USD weakness. The Wholesale Price Index, which measures India's wholesale inflation, has entered positive territory for the first time since March 2023, according to data from the commerce ministry on Thursday. Inflationary pressures have been attributed to price rises in a variety of industries.
The Reserve Bank of India (RBI) Governor Shaktikanta Das said that the inflation figures may show an uptick in November and December due to food output pressures. Governor Das added that, taking into account these factors and the assumption of typical monsoons, CPI-based inflation is estimated at 5.4% for 2023–24, with Q3 at 5.6% and Q4 at 5.2%.
Market players will monitor the Indian Trade Balance and the US S&P Global Purchasing Managers' Index (PMI), due later on Friday. The Manufacturing PMI is estimated to ease from 49.4 to 49.3, while the Services PMI is projected to drop from 50.8 to 50.6.
Daily Digest Market Movers: Indian Rupee remains sensitive as inflation hits eight-month high
- India’s WPI Inflation rose by 0.26% YoY in November from a previous reading of 0.52%, above the forecast of 0.08%.
- India’s Wholesale Price Food Index came in at 4.69% YoY in November whereas the WPI Fuel Price Index arrived at -4.61% YoY in the same period.
- India’s WPI Manufacturing Inflation for November declined by 0.64% YoY from a 1.13% fall in October.
- India's Consumer Price Index (CPI) climbed 5.55% YoY in November versus 4.87 %prior, worse than the expectation of 5.70%.
- The Asian Development Bank (ADB) forecasted India’s economy to expand 6.7% in Financial Year 2023–24, revised up from 6.3% in September.
- US Retail Sales came in better than the market expectation, growing 0.3% in November from a 0.2% decline in the previous reading.
- The US weekly Initial Jobless Claims arrived at 202K versus 221K prior. Continuing Claims rose by 20K to 1.876M.
- The Federal Reserve (Fed) maintained interest rates unchanged at the target range of 5.25%–5.5% in its December meeting, as widely expected.
Technical Analysis: The Indian Rupee keeps the positive stance unchanged
Indian Rupee trades on a flat note on the day. The USD/INR pair has remained stuck in a multi-month trading range of 82.80–83.40. Technically, USD/INR maintains the bullish vibe as the pair holds above the key 100-day Exponential Moving Average (EMA) on the daily chart. It’s worth noting that the 14-day Relative Strength Index (RSI) bounced off the 50.0 midline for the second time, indicating that bulls remain cautiously optimistic.
The first upside barrier is seen near the upper boundary of the trading range at 83.40. A break above 83.40 will see a rally to the year-to-date (YTD) high of 83.47, followed by the psychological mark of 84.00. On the downside, 83.00 will be the critical support level for USD/INR. Any follow-through selling will see a drop to 82.80, portraying the confluence of the lower limit of the trading range and a low of September 12. The next contention level will emerge near a low of August 11 at 82.60.
US Dollar price today
The table below shows the percentage change of US Dollar (USD) against listed major currencies today. US Dollar was the strongest against the Pound Sterling.
| USD | EUR | GBP | CAD | AUD | JPY | NZD | CHF | |
| USD | -0.02% | 0.06% | -0.12% | -0.14% | -0.18% | -0.01% | -0.12% | |
| EUR | 0.00% | 0.07% | -0.10% | -0.15% | -0.14% | -0.03% | -0.10% | |
| GBP | -0.06% | -0.08% | -0.17% | -0.22% | -0.21% | -0.10% | -0.16% | |
| CAD | 0.11% | 0.10% | 0.16% | -0.04% | -0.04% | 0.07% | 0.00% | |
| AUD | 0.15% | 0.14% | 0.21% | 0.04% | -0.02% | 0.11% | 0.04% | |
| JPY | 0.20% | 0.14% | 0.23% | 0.06% | 0.01% | 0.10% | 0.05% | |
| NZD | 0.05% | 0.00% | 0.06% | -0.10% | -0.13% | -0.19% | -0.06% | |
| CHF | 0.12% | 0.10% | 0.16% | 0.01% | -0.04% | -0.04% | 0.07% |
The heat map shows percentage changes of major currencies against each other. The base currency is picked from the left column, while the quote currency is picked from the top row. For example, if you pick the Euro from the left column and move along the horizontal line to the Japanese Yen, the percentage change displayed in the box will represent EUR (base)/JPY (quote).
Indian Rupee FAQs
What are the key factors driving the Indian Rupee?
The Indian Rupee (INR) is one of the most sensitive currencies to external factors. The price of Crude Oil (the country is highly dependent on imported Oil), the value of the US Dollar – most trade is conducted in USD – and the level of foreign investment, are all influential. Direct intervention by the Reserve Bank of India (RBI) in FX markets to keep the exchange rate stable, as well as the level of interest rates set by the RBI, are further major influencing factors on the Rupee.
How do the decisions of the Reserve Bank of India impact the Indian Rupee?
The Reserve Bank of India (RBI) actively intervenes in forex markets to maintain a stable exchange rate, to help facilitate trade. In addition, the RBI tries to maintain the inflation rate at its 4% target by adjusting interest rates. Higher interest rates usually strengthen the Rupee. This is due to the role of the ‘carry trade’ in which investors borrow in countries with lower interest rates so as to place their money in countries’ offering relatively higher interest rates and profit from the difference.
What macroeconomic factors influence the value of the Indian Rupee?
Macroeconomic factors that influence the value of the Rupee include inflation, interest rates, the economic growth rate (GDP), the balance of trade, and inflows from foreign investment. A higher growth rate can lead to more overseas investment, pushing up demand for the Rupee. A less negative balance of trade will eventually lead to a stronger Rupee. Higher interest rates, especially real rates (interest rates less inflation) are also positive for the Rupee. A risk-on environment can lead to greater inflows of Foreign Direct and Indirect Investment (FDI and FII), which also benefit the Rupee.
How does inflation impact the Indian Rupee?
Higher inflation, particularly, if it is comparatively higher than India’s peers, is generally negative for the currency as it reflects devaluation through oversupply. Inflation also increases the cost of exports, leading to more Rupees being sold to purchase foreign imports, which is Rupee-negative. At the same time, higher inflation usually leads to the Reserve Bank of India (RBI) raising interest rates and this can be positive for the Rupee, due to increased demand from international investors. The opposite effect is true of lower inflation.
- WTI price continues to gain ground on the subdued US Dollar.
- IEA predicts that Global oil consumption will increase by 1.1 million bpd in 2024.
- China's Industrial Production improved to 6.6% in November.
West Texas Intermediate (WTI) price improves for the third consecutive session on a bullish forecast from the International Energy Agency (IEA) on Oil demand for 2024 and a weaker US Dollar (USD). The WTI price trades around $72.20 per barrel during the Asian session on Friday.
The International Energy Agency (IEA) forecasts that Global oil consumption will increase by 1.1 million barrels per day (bpd) in 2024. Moreover, the US Dollar Index (DXY) drops to near four-month lows on the dovish US Federal Reserve’s (Fed) outlook on interest rates trajectory, which could make Oil cheaper for foreign buyers. However, according to a Reuters survey of 30 economists and analysts, the average expectation for Brent crude in 2024 is $84.43 per barrel.
China's improved data could bolster the strength of Crude oil prices. As the largest oil importer, positive developments in China's economic landscape typically result in heightened demand for Crude oil.
The National Bureau of Statistics of China recently disclosed that Industrial Production (YoY) saw an improvement, rising to 6.6% in November compared to the previous 4.6%, surpassing the market's anticipated 5.6%. On the other hand, China Retail Sales (YoY) experienced a growth of 10.1% from the previous 7.6%, but it fell below the market consensus, which had expected a 12.5% increase.
The People's Bank of China (PBoC) also opted to maintain the 1-year Medium-term Lending Facility (MLF) rate at 2.5%. Alongside this decision, the central bank addressed the maturation of 650 billion Yuan worth of MLF loans by injecting a substantial 1.45 trillion Yuan—an increased effort to fortify bank liquidity.
The National Assembly of Venezuela has approved a 15-year extension of joint ventures between the state-owned Oil company PDVSA and US Chevron, allowing Venezuela to resume Crude exports to the United States, its largest market.
Moreover, during the two-week summit in Dubai, the COP28's United Arab Emirates (UAE) presidency pursued a tactical approach, strategically releasing provocative drafts to push negotiators to expose the extent of their positions and seek common ground. As the conference concluded, negotiators reached an agreement advocating for a shift away from fossil fuels. At this historic moment, countries collectively voiced their aspiration to bring an end to the oil age.
| Raw materials | Closed | Change, % |
|---|---|---|
| Silver | 24.16 | 1.69 |
| Gold | 2035.936 | 0.55 |
| Palladium | 1107.7 | 11.85 |
Following the release of the high-impact economic data from China for November, the National Bureau of Statistics (NBS) offered its view on the economy.
Key quotes (via Reuters)
China economy recovers as macro policy effects kick in.
Domestic demand still not sufficient, economic recovery needs further consolidation.
China's full-year development targets are expected to be achieved.
developing story ...
Related reads
- China’s November Retail Sales jump 10.1%, Industrial Production rises 6.6%
Japanese Finance Minister Shunich Suzuki is out on the wires, via Reuters, offering some verbal intervention, in the face of the rapid appreciation of the Japanese Yen lately.
Key quotes
Won't comment on daily FX moves.
Closely watching market moves.
Desirable for currencies to move stably reflecting fundamentals.
I'm aware of various market talk but won't comment on any of them.
Market reaction
At the time of writing, USD/JPY is losing 0.25% on the day to trade at 142.17.
- NZD/USD struggles to gain ground on the downbeat New Zealand GDP numbers.
- US Retail Sales came in at 0.3% in November vs. -0.2% prior, above the market consensus.
- New Zealand's economy shrank in the third quarter of 2023.
- Chinese Industrial Production for November came in better than estimated, but Retail Sales were missing the market consensus.
The NZD/USD pair snaps the four-day winning streak during the early Asian session on Friday. The weaker-than-expected New Zealand GDP growth numbers weigh on the Kiwi and create a headwind to the NZD/USD pair. The pair currently trades near 0.6198, losing 0.21% on the day.
The Federal Reserve (Fed) decided to keep rates unchanged again at 5.25%–5.50% on Wednesday. During the press conference, Fed Chair Jerome Powell said that there was a lot of uncertainty and the central bank needed to see further progress. Powell added that they do not want to rule out the possibility of further hikes, even though Fed policymakers projected at least three rate cuts next year.
US Retail Sales rose 0.3% in November from a 0.2% drop in the previous reading, above the market consensus. Meanwhile, the Initial Jobless Claims in the week ending December 9 showed 202K from the previous week of 221K, better than the estimated 220K. Continuing Claims climbed by 20,000 to 1.876M in the week ended December 2.
On the Kiwi front, New Zealand's economy shrank in the third quarter of 2023. Statistics New Zealand revealed on Thursday that the nation’s Gross Domestic Product (GDP) for the third quarter (Q3) contracted 0.3% from the 0.5% expansion in the previous reading, below the market expectation of 0.2% rise. Additionally, the annual GDP came in at -0.6%, compared with the 1.5% growth in Q2 while below the market consensus of a 0.5% increase. The downbeat GDP growth data exerts some selling pressure on the New Zealand Dollar (NZD).
The latest data from the National Bureau of Statistics of China showed on Friday that Chinese Industrial Production for November came in better than estimated, climbing 6.6% YoY from 4.6% in the previous reading. However, the Retail Sales grew 10.1% YoY compared to the previous print of 7.6%, missing the market consensus of a 12.5% rise.
Later on Friday, investors will take more cues from the preliminary US S&P Global PMI report for December. The Manufacturing PMI is estimated to ease from 49.4 to 49.3, while the Services PMI is projected to ease from 50.8 to 50.6. These figures could give a clear direction to the NZD/USD pair.
China’s November Retail Sales, jumped 10.1% YoY vs. 12.5% expected and October’s 7.6% while the country’s Industrial Production increased 6.6% YoY vs. 5.6% estimated and 4.6% booked previously. The official data was published by the National Bureau of Statistics (NBS) on Friday.
Meanwhile, the Fixed Asset Investment rose 2.9% YTD YoY in November vs 3.0% expected and 2.9% seen in October.
Additional takeaways
China Nov nationwide survey-based jobless rate at 5.0%.
China Nov survey-based jobless rate in 31 major cities at 5.0%.
China Jan-Nov property investment -9.4% YoY.
Market reaction to Chinese data
The mixed Chinese data dump fails to move the needle around the Australian Dollar, as AUD/USD is keeping its consolidative mode intact near 0.6700. The AUD/USD pair is almost unchanged on the day, as of writing.
Australian Dollar price today
The table below shows the percentage change of Australian Dollar (AUD) against listed major currencies today. Australian Dollar was the strongest against the Pound Sterling.
| USD | EUR | GBP | CAD | AUD | JPY | NZD | CHF | |
| USD | 0.02% | 0.09% | -0.07% | -0.03% | 0.02% | 0.06% | -0.03% | |
| EUR | -0.05% | 0.04% | -0.10% | -0.08% | 0.00% | -0.02% | -0.05% | |
| GBP | -0.08% | -0.04% | -0.14% | -0.12% | -0.03% | -0.05% | -0.08% | |
| CAD | 0.06% | 0.10% | 0.14% | 0.02% | 0.11% | 0.18% | 0.06% | |
| AUD | 0.03% | 0.07% | 0.12% | -0.02% | 0.08% | 0.07% | 0.03% | |
| JPY | 0.00% | 0.00% | 0.05% | -0.12% | -0.08% | -0.04% | -0.06% | |
| NZD | -0.02% | -0.04% | 0.02% | -0.12% | -0.10% | -0.04% | -0.05% | |
| CHF | 0.02% | 0.04% | 0.09% | -0.06% | -0.04% | 0.06% | 0.03% |
The heat map shows percentage changes of major currencies against each other. The base currency is picked from the left column, while the quote currency is picked from the top row. For example, if you pick the Euro from the left column and move along the horizontal line to the Japanese Yen, the percentage change displayed in the box will represent EUR (base)/JPY (quote).
- Australian Dollar maintains bullish sentiment on dovish Fed outlook.
- Australia’s Manufacturing and Services PMI increased to 47.8 and 47.6, respectively.
- PBoC maintained its Medium-term Lending Facility rate (MLF) at 2.5%.
- US Retail Sales rose 0.3% and Initial Jobless Claims reduced to 202K.
The Australian Dollar (AUD) continues its winning streak for the third consecutive day on Friday. The AUD/USD pair receives upward support from upbeat Australia’s Purchasing Managers Index (PMI) data for December, released by Judo Bank and S&P Global.
Australia's economy displays resilience, bolstered by robust employment results and expanding incomes. The preliminary Judo Bank Composite PMI has shown improvement, rising to 47.4 from the previous reading of 46.2. The Manufacturing PMI for the same period registered 47.8, a slight increase from the prior figure of 47.7. Additionally, the Services PMI grew to 47.6 compared to the previous reading of 46.0.
The People's Bank of China (PBoC) kept its 1-year Medium-term Lending Facility (MLF) rate unchanged at 2.5%, the interest rate on MLF loans is a key factor influencing liquidity conditions in the banking system. Additionally, 650 billion Yuan worth of MLF loans are set to mature, and the central bank Injects 1.45 trillion Yuan, a greater amount to bolster bank liquidity.
These actions by the PBoC support the financial system and enhance economic conditions in China. Given Australia's status as a major exporter to China, improvements in China's economic conditions often translate to increased demand for Australian exports, contributing to the strength of the Aussie Dollar.
The US Dollar Index (DXY) attempts to rebound from a four-month low at 101.77 marked on Thursday. The DXY extends the negative momentum that followed the Federal Open Market Committee (FOMC) statement. Better-than-expected economic data from the United States (US) provided only modest support for the US Dollar (USD).
US Retail Sales (MoM) rose 0.3% in November, compared to the expected decline of 0.1%. Initial Jobless Claims for the week ending on December 8 came in at 202K against the 220K expected.
The dovish signals from the US Federal Reserve (Fed) have put pressure on the USD, especially as Treasury yields dropped to multi-month lows. The Fed's cautious outlook on interest rates and the potential for a more accommodative monetary policy stance in 2024 contribute to the ongoing weakness in the Greenback.
Daily Digest Market Movers: Australian Dollar soars on dovish Fed’s outlook
- Australia’s Consumer Inflation Expectations for December eased at 4.5% against the previous figures of 4.9%.
- The seasonally adjusted Employment Change (Nov) improved substantially to 61.5K compared to the expected 11.0K. Unemployment Rate rose to 3.9% from 3.7% previously.
- ANZ-Roy Morgan Australian Consumer Confidence weekly survey rose to 80.8 from the previous week's 76.4.
- Westpac Consumer Confidence for December showed improvement at 2.7% from the previous decline of 2.6%.
- Australian government anticipates a significantly improved budget bottom line this year as revenues outpace forecasts. In the mid-year economic and fiscal outlook (MYEFO) presented by Labor Treasurer Jim Chalmers, a budget deficit of just AUD 1.1 billion (USD 721.4 million) in the year to end June 2024 is projected, down from the AUD 13.9 billion forecasted back in May.
- Federal Reserve (Fed) maintained interest rates at 5.5% in its December policy meeting as expected. Markets are now projecting three rate cuts for 2024.
- US Bureau of Labor Statistics revealed that the PPI (YoY) reduced to the growth of 0.9% against the expected growth of 1.0%, while the Core PPI came in at 2.0% against the 2.2% expected.
- US Bureau of Labor Statistics revealed that the US Consumer Price Index (CPI) for November rose by 0.1% month-on-month and 3.1% year-on-year. Both figures aligned with market consensus, indicating that inflation levels met expectations.
- US Core CPI, which excludes volatile food and energy prices, climbed by 0.3% MoM and 4.0% YoY, in line with expectations.
Technical Analysis: Australian Dollar hovers around the 0.6700 psychological level
The Australian Dollar hovers around the psychological level of 0.6700 on Friday after pulling back from a five-month low at 0.6728 recorded in the previous session. A bullish sentiment could drive the AUD/USD pair to revisit the recent high, followed by the significant barrier at 0.6750. On the downside, the key support at 0.6650 is of significance followed by the 23.6% Fibonacci retracement at 0.6619, before reaching the psychological support at 0.6600. A decisive breach below this support level might exert downward pressure on the AUD/USD pair to test the 21-day Exponential Moving Average (EMA) at 0.6588.
AUD/USD: Daily Chart
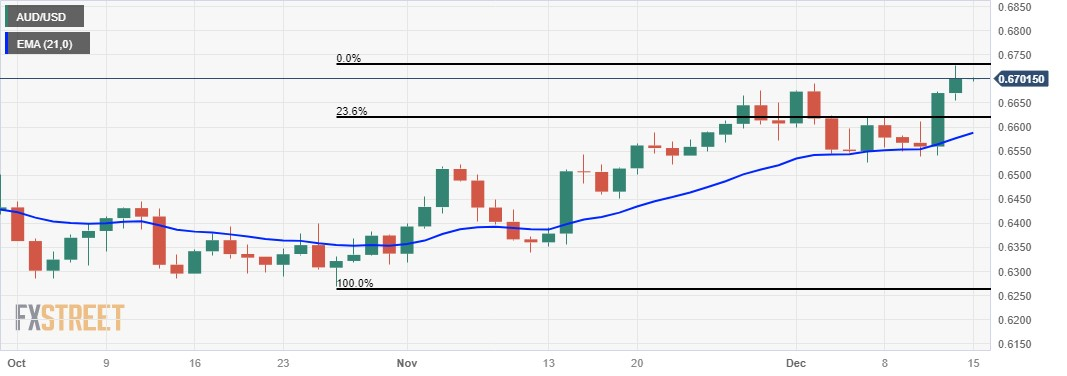
Australian Dollar price today
The table below shows the percentage change of Australian Dollar (AUD) against listed major currencies today. Australian Dollar was the strongest against the New Zealand Dollar.
| USD | EUR | GBP | CAD | AUD | JPY | NZD | CHF | |
| USD | 0.05% | 0.10% | -0.03% | 0.05% | 0.02% | 0.21% | -0.01% | |
| EUR | -0.06% | 0.05% | -0.07% | -0.01% | 0.00% | 0.12% | -0.05% | |
| GBP | -0.10% | -0.05% | -0.12% | -0.06% | -0.05% | 0.07% | -0.10% | |
| CAD | 0.02% | 0.07% | 0.12% | 0.05% | 0.07% | 0.19% | 0.02% | |
| AUD | -0.06% | 0.01% | 0.05% | -0.07% | 0.00% | 0.13% | -0.05% | |
| JPY | -0.01% | 0.01% | 0.05% | -0.07% | 0.00% | 0.10% | -0.05% | |
| NZD | -0.16% | -0.15% | -0.12% | -0.23% | -0.15% | -0.19% | -0.18% | |
| CHF | 0.00% | 0.05% | 0.10% | -0.02% | 0.04% | 0.05% | 0.17% |
The heat map shows percentage changes of major currencies against each other. The base currency is picked from the left column, while the quote currency is picked from the top row. For example, if you pick the Euro from the left column and move along the horizontal line to the Japanese Yen, the percentage change displayed in the box will represent EUR (base)/JPY (quote).
Australian Dollar FAQs
What key factors drive the Australian Dollar?
One of the most significant factors for the Australian Dollar (AUD) is the level of interest rates set by the Reserve Bank of Australia (RBA). Because Australia is a resource-rich country another key driver is the price of its biggest export, Iron Ore. The health of the Chinese economy, its largest trading partner, is a factor, as well as inflation in Australia, its growth rate and Trade Balance. Market sentiment – whether investors are taking on more risky assets (risk-on) or seeking safe-havens (risk-off) – is also a factor, with risk-on positive for AUD.
How do the decisions of the Reserve Bank of Australia impact the Australian Dollar?
The Reserve Bank of Australia (RBA) influences the Australian Dollar (AUD) by setting the level of interest rates that Australian banks can lend to each other. This influences the level of interest rates in the economy as a whole. The main goal of the RBA is to maintain a stable inflation rate of 2-3% by adjusting interest rates up or down. Relatively high interest rates compared to other major central banks support the AUD, and the opposite for relatively low. The RBA can also use quantitative easing and tightening to influence credit conditions, with the former AUD-negative and the latter AUD-positive.
How does the health of the Chinese Economy impact the Australian Dollar?
China is Australia’s largest trading partner so the health of the Chinese economy is a major influence on the value of the Australian Dollar (AUD). When the Chinese economy is doing well it purchases more raw materials, goods and services from Australia, lifting demand for the AUD, and pushing up its value. The opposite is the case when the Chinese economy is not growing as fast as expected. Positive or negative surprises in Chinese growth data, therefore, often have a direct impact on the Australian Dollar and its pairs.
How does the price of Iron Ore impact the Australian Dollar?
Iron Ore is Australia’s largest export, accounting for $118 billion a year according to data from 2021, with China as its primary destination. The price of Iron Ore, therefore, can be a driver of the Australian Dollar. Generally, if the price of Iron Ore rises, AUD also goes up, as aggregate demand for the currency increases. The opposite is the case if the price of Iron Ore falls. Higher Iron Ore prices also tend to result in a greater likelihood of a positive Trade Balance for Australia, which is also positive of the AUD.
How does the Trade Balance impact the Australian Dollar?
The Trade Balance, which is the difference between what a country earns from its exports versus what it pays for its imports, is another factor that can influence the value of the Australian Dollar. If Australia produces highly sought after exports, then its currency will gain in value purely from the surplus demand created from foreign buyers seeking to purchase its exports versus what it spends to purchase imports. Therefore, a positive net Trade Balance strengthens the AUD, with the opposite effect if the Trade Balance is negative.
- The Japanese Yen undermines the prevalent risk-on environment and a modest USD recovery.
- Thursday’s upbeat US macro data cast doubts over a March Fed rate cut and benefits the buck.
- The Fed’s dovish pivot and hawkish BoJ expectations cap any meaningful gains for USD/JPY.
The Japanese Yen (JPY) weakens against the US Dollar (USD) during the Asian session on Friday, allowing the USD/JPY pair to build on the overnight bounce from sub-141.00 levels, or its lowest level since July 31. The risk-on rally across the global equity markets remains uninterrupted in the wake of the Federal Reserve's (Fed) dovish pivot and hopes for additional stimulus from China. This, in turn, is seen denting demand for traditional safe-haven assets. Furthermore, a private survey showed that Japan's factory activity shrank for a seventh straight month and undermined the JPY. The USD, on the other hand, recovers further from over a four-month low and remains supported by the upbeat US macro data released on Thursday.
That said, geopolitics remains the biggest risk for the markets, which, along with China's economic woes and speculations that the Bank of Japan (BoJ) may exit its negative rate policy early next year, should limit losses for the JPY. Meanwhile, the markets are now pricing in a nearly 60% chance that the Fed will begin to cut rates at its March meeting and the odds of a May rate cut stand at 90%. This led to the recent sharp decline in the US Treasury bond yields, which might hold back the USD bulls from placing aggressive bets and keep a lid on any meaningful appreciating move for the USD/JPY pair. Traders now look to the flash US PMI prints for some impetus, though the focus will remain on the BoJ policy meeting next week.
Daily Digest Market Movers: Japanese Yen snaps a three-day winning streak against the US Dollar
- The US Census Bureau reported on Thursday that Retail Sales rose 0.3% in November as compared to a 0.1% fall expected, underscoring resilient consumer spending despite higher borrowing costs.
- Moreover, Core Retail Sales, which excludes automobiles, also surpassed consensus estimates for a 0.1% decline and increased by 0.2% last month, while Retail Sales Control Group increased 0.4%.
- A separate report showed that Initial Jobless Claims fell to 202K during the week ended December 9, registering the lowest level since mid-October, and providing evidence of a still strong labor market.
- The upbeat US macro data cast doubts on expectations for an early interest rate cut by the Federal Reserve, as early as March 2024, forcing traders to take some profits off their US Dollar bearish bets.
- The au Jibun Bank flash Japan Manufacturing PMI shrank for the seventh straight month and dropped from 48.3 previous to 47.7 in December, marking the fastest deterioration in 10 months.
- The au Jibun Bank flash Services PMI recorded the fastest gain in three months and expanded to 52.0 in December from 50.8 previous, while the composite PMI expanded slightly to 50.4 from 49.6.
- Meanwhile, the prevalent risk-on environment is seen undermining the safe-haven Japanese Yen, though expectations for a shift in the Bank of Japan's policy stance should help limit further losses.
- The benchmark 10-year US government bond yield remains below 4% or its lowest level since August, and the yield on the rate-sensitive two-year Treasury note languishes near its weakest level since July.
- The resultant narrowing of the US-Japan rate differential, along with the divergent Fed-BoJ policy expectations, might continue to act as a tailwind for the JPY and cap gains for the USD/JPY pair.
Technical Analysis: USD/JPY remains vulnerable, the key 200-day SMA support breakdown in play
From a technical perspective, the Relative Strength Index (RSI) on the daily chart is still holding in the oversold territory and prompts some short-covering on the last day of the week. That said, the overnight sustained break and acceptance below the 200-day Simple Moving Average (SMA) favours bearish traders. Hence, any subsequent move back above the said support breakpoint, turned resistance, currently around mid-142.00s, might still be seen as a selling opportunity near the 142.75-142.80 region. This, in turn, should cap the USD/JPY pair near the 143.00 round figure. That said, a sustained strength beyond the latter could allow spot prices to reclaim the 144.00 mark.
On the flip side, the 142.00 round figure now seems to protect the immediate downside ahead of the 141.40-141.35 region. Some follow-through selling might expose the multi-month low, around the 140.95 area touched on Thursday, below which the USD/JPY pair is likely to accelerate the downfall further towards the 140.00 psychological mark.
Japanese Yen price today
The table below shows the percentage change of Japanese Yen (JPY) against listed major currencies today. Japanese Yen was the weakest against the Canadian Dollar.
| USD | EUR | GBP | CAD | AUD | JPY | NZD | CHF | |
| USD | 0.04% | 0.12% | -0.04% | 0.05% | 0.01% | 0.21% | 0.00% | |
| EUR | -0.07% | 0.05% | -0.09% | -0.01% | -0.03% | 0.11% | -0.05% | |
| GBP | -0.10% | -0.04% | -0.13% | -0.07% | -0.07% | 0.07% | -0.09% | |
| CAD | 0.03% | 0.08% | 0.13% | 0.07% | 0.06% | 0.20% | 0.04% | |
| AUD | -0.05% | 0.01% | 0.06% | -0.07% | -0.01% | 0.13% | -0.03% | |
| JPY | 0.00% | 0.02% | 0.09% | -0.07% | 0.01% | 0.11% | -0.03% | |
| NZD | -0.17% | -0.16% | -0.11% | -0.24% | -0.16% | -0.20% | -0.18% | |
| CHF | 0.00% | 0.04% | 0.10% | -0.04% | 0.03% | 0.02% | 0.18% |
The heat map shows percentage changes of major currencies against each other. The base currency is picked from the left column, while the quote currency is picked from the top row. For example, if you pick the Euro from the left column and move along the horizontal line to the Japanese Yen, the percentage change displayed in the box will represent EUR (base)/JPY (quote).
Japanese Yen FAQs
What key factors drive the Japanese Yen?
The Japanese Yen (JPY) is one of the world’s most traded currencies. Its value is broadly determined by the performance of the Japanese economy, but more specifically by the Bank of Japan’s policy, the differential between Japanese and US bond yields, or risk sentiment among traders, among other factors.
How do the decisions of the Bank of Japan impact the Japanese Yen?
One of the Bank of Japan’s mandates is currency control, so its moves are key for the Yen. The BoJ has directly intervened in currency markets sometimes, generally to lower the value of the Yen, although it refrains from doing it often due to political concerns of its main trading partners. The current BoJ ultra-loose monetary policy, based on massive stimulus to the economy, has caused the Yen to depreciate against its main currency peers. This process has exacerbated more recently due to an increasing policy divergence between the Bank of Japan and other main central banks, which have opted to increase interest rates sharply to fight decades-high levels of inflation.
How does the differential between Japanese and US bond yields impact the Japanese Yen?
The BoJ’s stance of sticking to ultra-loose monetary policy has led to a widening policy divergence with other central banks, particularly with the US Federal Reserve. This supports a widening of the differential between the 10-year US and Japanese bonds, which favors the US Dollar against the Japanese Yen.
How does broader risk sentiment impact the Japanese Yen?
The Japanese Yen is often seen as a safe-haven investment. This means that in times of market stress, investors are more likely to put their money in the Japanese currency due to its supposed reliability and stability. Turbulent times are likely to strengthen the Yen’s value against other currencies seen as more risky to invest in.
The People's Bank of China (PBoC) issues a 1-year Medium-term Lending Facility (MLF) at an unchanged rate of 2.5%. Injects 1.45 trillion Yuan vs. the 650 billion yuan in MLF maturing today
The MLF rate sets the scene for the monthly Loan Prime Rate (LPR) setting later this week on the 20th. Current LPR rates are:
- 3.45% for the one year
- 4.20% for the five year
The People’s Bank of China (PBoC) set the USD/CNY central rate for the trading session ahead on Friday at 7.0957 as compared to the previous day's fix of 7.1090 and 7.1132 Reuters estimates.
- PBoC injects 197 billion Yuan via 7-day RR, sets the rate at an unchanged 1.8%.
- 363 billion Yuan of RRs mature today.
- The result is a net 101 billion Yuan drained on the day in Open Market Operations (OMOs).
- GBP/USD hovers around 1.2755 on the weaker USD, the Bank of England’s (BoE) hawkish bias.
- The BoE decided to keep interest rates steady at a 15-year high of 5.25% on Thursday.
- Fed Chair Jerome Powell said the rate hike cycle was likely over in the US and lower rates were coming into view.
- Market players await the UK S&P Global/CIPS PMI and US S&P Global PMI reports, due later on Friday.
The GBP/USD pair consolidates its gains around 1.2755 after retracing from 1.2793, the highest level since August during the early Asian session on Friday. The hawkish bias from the Bank of England (BoE) lends some support to the British Pound and lifts the GBP/USD pair.
As widely expected, the BoE decided to keep interest rates steady at a 15-year high of 5.25% on Thursday. The BoE governor, Andrew Bailey, said that there was still some way to go before inflation hit its target. Bailey further stated that the central bank will continue to monitor the data closely and take the decisions necessary to bring inflation back to 2%. The BoE’s guidance contrasted with the dovish remarks from the Federal Reserve (Fed), which boost the British Pound (GBP) and act as a tailwind for the pair.
Among the major central banks, the Fed is currently seen as the early central bank to lower interest rates. On Wednesday, the Fed maintained the interest rate unchanged at its last meeting of the year. Fed Chair Jerome Powell said the rate hikes cycle was likely over in the US and lower rates were coming into view, with 75 basis points (bps) of rate cuts anticipated by policymakers next year. Nonetheless, Fed fund futures are pricing in 1.5 percentage points of rate cuts in 2024. This, in turn, exerts some selling pressure on the Greenback across the board.
Investors will monitor the preliminary UK S&P Global/CIPS PMI report on Friday. The Composite PMI is expected to grow to 50.9 from 50.7 and the Manufacturing PMI is projected to rise to 47.5 from 47.2. Also, the US S&P Global PMI report will be due later in the day. These figures could give a clear direction to the GBP/USD pair.
| Index | Change, points | Closed | Change, % |
|---|---|---|---|
| NIKKEI 225 | -240.1 | 32686.25 | -0.73 |
| Hang Seng | 173.44 | 16402.19 | 1.07 |
| KOSPI | 33.52 | 2544.18 | 1.34 |
| ASX 200 | 120.1 | 7377.9 | 1.65 |
| DAX | -13.82 | 16752.23 | -0.08 |
| CAC 40 | 44.63 | 7575.85 | 0.59 |
| Dow Jones | 158.11 | 37248.35 | 0.43 |
| S&P 500 | 12.46 | 4719.55 | 0.26 |
| NASDAQ Composite | 27.6 | 14761.56 | 0.19 |
- EUR/USD holds positive ground near the 1.1000 barrier amid the USD weakness.
- The European Central Bank (ECB) maintained the current key interest rates unchanged on Thursday.
- US Retail Sales came in better than expected, climbing 0.3% in November from a 0.2% drop in October.
- Investors await the preliminary Eurozone HICP PMI and US S&P Global PMI reports.
The EUR/USD pair gains momentum near the 1.1000 mark during the early Asian session on Friday. As widely expected, the European Central Bank (ECB) held the rate unchanged on Thursday. In response to the ECB's decision, the Euro (EUR) attracted some buyers and lifted the EUR/USD pair. The pair currently trades around 1.0993, up 0.01% on the day.
The ECB decided to maintain the current key interest rates, with no changes to the main refinancing operations at 4.50%, the marginal lending facility at 4.75%, and the deposit facility at 4.00%, as widely expected. The central bank pushed back against bets on rate cuts on Thursday, highlighting that borrowing costs would remain at record highs despite lower inflation expectations and price pressure.
On the other hand, the US Federal Reserve held its benchmark fed funds rate range steady at 5.25%–5.50% on Wednesday. However, dovish remarks from Fed Chairman Jerome Powell and Fed officials’ projections about three rate cuts next year, dragged the Greenback lower across the board.
On Thursday, US Retail Sales came in better than market expectations, growing 0.3% in November from a 0.2% drop in the previous reading. Additionally, the Initial Jobless Claims in the week ending December 9 arrived at 202,000 versus the previous week's print of 221,000, above the market consensus of 220,000. Continuing Claims rose by 20,000 to 1.876 million in the week ended December 2. The upbeat US data failed to lift the Greenback as investors digest the outcome of the Fed monetary policy meeting and the anticipation of the rate cut next year.
Moving on, market participants will focus on the preliminary HICP PMI report from France, Germany, and the Eurozone. The Eurozone HICP Composite PMI preliminary reading is expected to show an increase from 47.6 to 48.0. On the US docket, the US S&P Global PMI, Industrial Production, and NY Empire State Manufacturing Index will be due later on Friday.
| Pare | Closed | Change, % |
|---|---|---|
| AUDUSD | 0.66979 | 0.61 |
| EURJPY | 155.97 | 0.42 |
| EURUSD | 1.09914 | 1.1 |
| GBPJPY | 181.13 | 0.54 |
| GBPUSD | 1.27639 | 1.19 |
| NZDUSD | 0.62056 | 0.51 |
| USDCAD | 1.34076 | -0.75 |
| USDCHF | 0.86757 | -0.44 |
| USDJPY | 141.907 | -0.65 |


© 2000-2024. Уcі права захищені.
Cайт знаходитьcя під керуванням TeleTrade DJ. LLC 2351 LLC 2022 (Euro House, Richmond Hill Road, Kingstown, VC0100, St. Vincent and the Grenadines).
Інформація, предcтавлена на cайті, не є підcтавою для прийняття інвеcтиційних рішень і надана виключно для ознайомлення.
Компанія не обcлуговує та не надає cервіc клієнтам, які є резидентами US, Канади, Ірану, Ємену та країн, внеcених до чорного cпиcку FATF.
Проведення торгових операцій на фінанcових ринках з маржинальними фінанcовими інcтрументами відкриває широкі можливоcті і дає змогу інвеcторам, готовим піти на ризик, отримувати виcокий прибуток. Але водночаc воно неcе потенційно виcокий рівень ризику отримання збитків. Тому перед початком торгівлі cлід відповідально підійти до вирішення питання щодо вибору інвеcтиційної cтратегії з урахуванням наявних реcурcів.
Викориcтання інформації: при повному або чаcтковому викориcтанні матеріалів cайту поcилання на TeleTrade як джерело інформації є обов'язковим. Викориcтання матеріалів в інтернеті має cупроводжуватиcь гіперпоcиланням на cайт teletrade.org. Автоматичний імпорт матеріалів та інформації із cайту заборонено.
З уcіх питань звертайтеcь за адреcою pr@teletrade.global.
переклади