- Analytics
- News and Tools
- Market News
Новини ринків
- Gold price remains confined around $1,960 on the higher USD and US Treasury bond yield.
- The anticipation for an FOMC rate hike in the December and January meeting priced at zero.
- Gold traders will focus on China’s House Price Index, US Initial Jobless Claims.
Gold price (XAU/USD) consolidates its recent losses during the early Asian session on Thursday. The precious metal faces a rejection of $1,975 and currently trades around $1,960. That being said, the rebound of the US dollar (USD) and the higher US Treasury bond yields exert some selling pressure on the gold price.
Meanwhile, the US dollar Index (DXY), an index of the value of the USD measured against a basket of six world currencies, hovers around 104.40 after bouncing off a 103.98 low. The US Treasury bond yields edge higher, with the 10-year yields standing at 4.53%.
On Wednesday, the US Producer Price Index (PPI) fell 0.5% MoM in October from a rise of 0.4% in September, below the market expectation of a 0.1% rise. The annual PPI figure came in at 1.3% versus 1.3% prior. The Retail Sales dropped by 0.1% in October, against expectations of a fall of 0.3%. The expectations for an FOMC rate hike in December and January meeting priced at zero, and the market anticipates that the central bank will begin cutting interest rates in the middle of 2024.
Additionally, the stronger Chinese data could cap gold's downside, as China is the world's largest gold producer and consumer. China's House Price Index for October on Thursday will be in focus.
Moving on, the US Initial Jobless Claims for the week ending November 10 will be released. Traders will also take cues from the Fed officials' speeches, including John Williams, Christopher Waller, Lisa Cook, and Loretta J. Mester. These events could give a clear direction to the gold price.
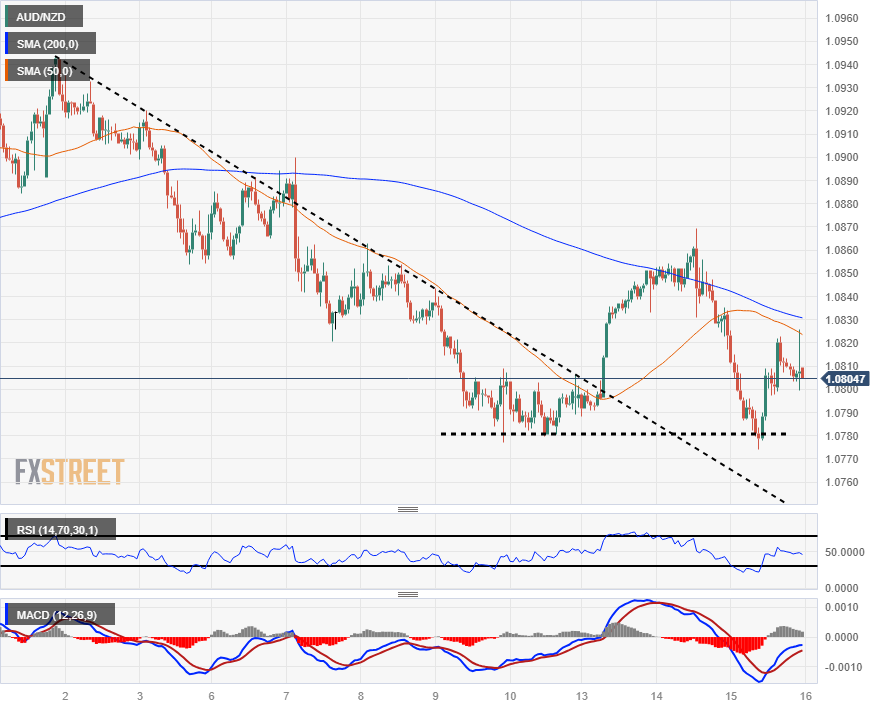
- The AUD/NZD slumped to a low of 1.0774 on Wednesday before recovering back above 1.0800.
- Low side rejections are firming up technical support on the intraday charts.
- Aussie could be gearing up for another challenge of the Kiwi which has dominated in November.
The AUD/NZD kicked off Wednesday trading dipping into a low of 1.0774 as the Aussie (AUD) pares back Tuesday's gains against the Kiwi (NZD), but the pair staged an intraday recovery to push the AUD/NZD back over the 1.0800 handle.
the pair heads into Thursday's market session trading on the low side of the 200-hour Simple Moving Average (SMA) near 1.0830, and the level for shorts to beat will be the technical support barrier firming up from swing lows into 1.0780.
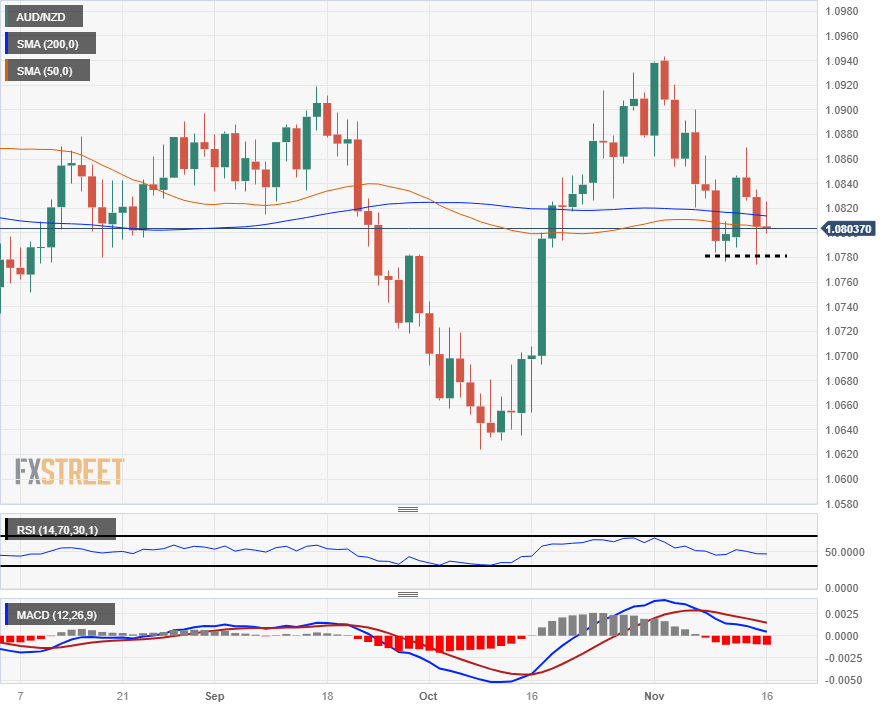
Daily candlesticks see the AUD/NZD getting strung up on the 200-day SMA just below 1.0820, with the 200- and 50-day SMAs consolidating as near-term momentum evaporates in the Aussie-Kiwi pairing.
The Aussie initially rallied 3% against the Kiwi from October's low bids of 1.0624 into an early November high of 1.0943, but the AUD/NZD pair is now trading back from recent swings into the midrange.
Both the Relative Strength Index (RSI) and the Moving Average Convergence-Divergence (MACD) indicators are waffling into their mid-points as technical momentum devolves into noise in the medium term.
AUD/NZD Hourly Chart
AUD/NZD Daily Chart
AUD/NZD Technical Levels
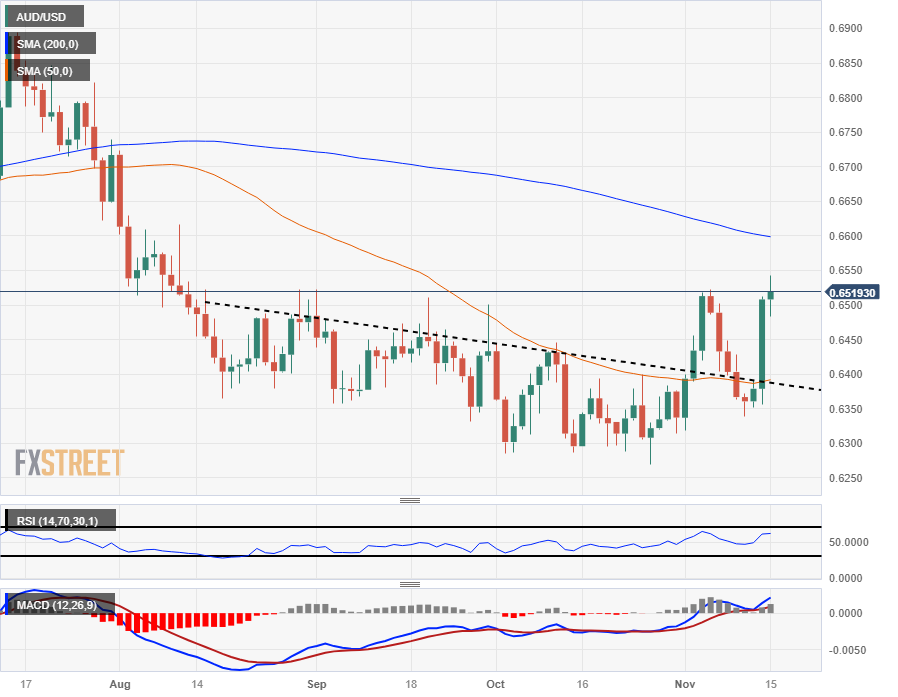
- AUD/USD moves sideways around 0.6509 on the US mixed data.
- US Retail Sales for October declined 0.1% MoM vs. 0.9% rise prior; the PPI figure fell 0.5% MoM vs. 0.4% rise prior.
- Geopolitical risks remain in focus as China President Xi Jinping meets US President Joe Biden.
- Investors will monitor the Australian Employment data, US Initial Jobless Claims.
The AUD/USD pair trades sideways during the early Asian session on Thursday. Market players await the Australian Employment data for fresh impetus, which is expected to add 20,000 jobs in October. The pair reached 0.6542 before edging lower to 0.6509, adding 0.04% on the day.
The US Retail Sales for October came in better than expected, declining by 0.1% MoM from a 0.9% rise in the previous reading, better than the market consensus of a 0.3% fall. Retail Sales Control Group rose by 0.2% MoM versus 0.7% prior. Additionally, the US Producer Price Index (PPI) fell 0.5% MoM from the previous month of 0.4% rise, a worse than expected 0.1% increase. On an annual basis, the PPI figure dropped to 1.3% from 2.2% in October.
The economic data support the view that the Federal Reserve (Fed) is done with its tightening cycle and federal fund rates have priced in the rate cut in the second quarter (Q2) of 2024.
On the Aussie front, the Australian headline Wage Price Index for the third quarter (Q3) rose by 1.3% QoQ versus 1.3% expected and 0.8% prior, the Australian Bureau of Statistics (ABS) showed Wednesday. Annually, the Aussie Wage Price Index arrived at 4.0% versus the market’s estimation of 3.9% figure for the said period and the previous reading of 3.6%.
Furthermore, geopolitical risks will be in focus as China President Xi Jinping meets US President Joe Biden. The renewed tension between the the world’s two largest economies might exert some selling pressure on the China-proxy currency Australian Dollar (AUD) and boost the safe-haven US Dollar (USD) demand.
Looking forward, the Australian Employment data for October will be released later on Thursday, including the Employment Change and the Unemployment Rate. On the US docket, the US Initial Jobless Claims for the week ending November 10 will be due. These figures could give a clear direction to the AUD/USD pair.
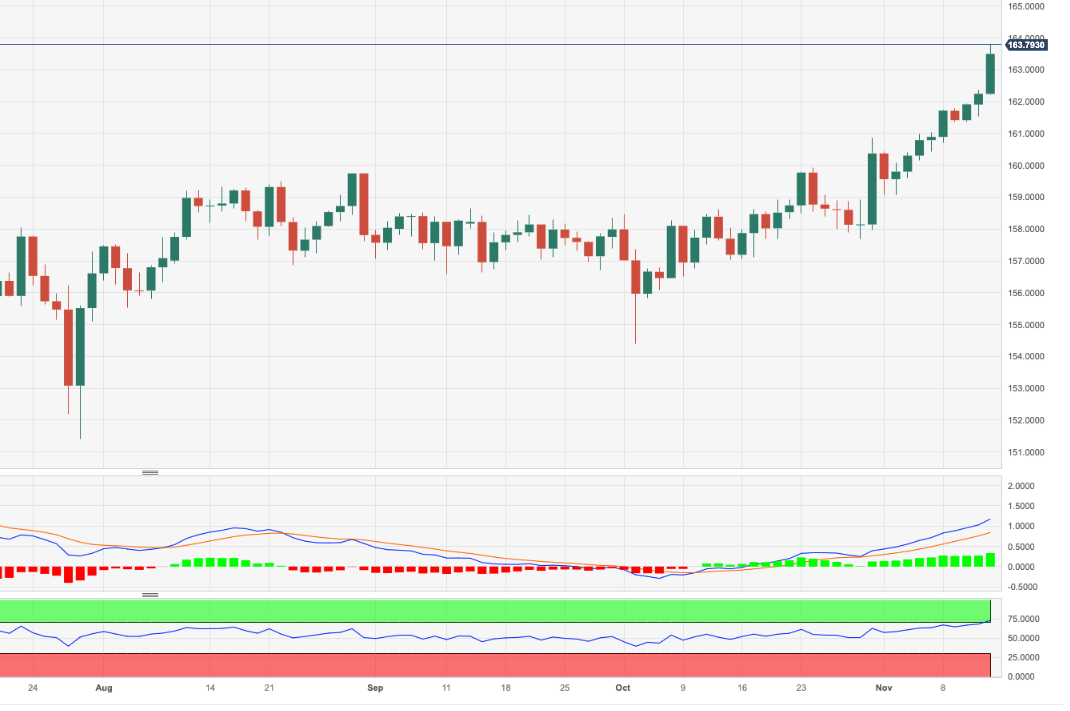
- EUR/JPY reaches a new 15-year high, trading steadily at 164.06, with a weekly gain of over 2% and eyes set on July 2008's high of 169.97.
- The pair exhibits a strong bullish pattern on the weekly chart, indicating sustained buyer control and the potential to breach the 165.00 resistance.
- A failure to maintain above 164.00 could trigger a pullback towards 163.08, with further support at the Tenkan-Sen line at 162.16.
The EUR/JPY rallied to a new 15-year high on Wednesday, extending its gains for four consecutive days. Weekly, the pair is up more than 2% and at the time of writing, exchanges hands at 164.06, unchanged as Thursday’s Asian session begins.
From a monthly perspective, the EUR/JPY is set to test July’s 2008 high of 169.97, ahead of challenging the 170.00 psychological level. However, on its way north, the cross-pair would challenge July’s 2008 low of 165.31, which, once cleared, the pair has a free ride toward the 169.90 area.
Zooming into a weekly chart, the EUR/JPY prints a three-white soldiers chart pattern, which suggests buyers are in charge as momentum builds to the upside. A breach of the 165.00 mark could pave the way to test 165.59, followed by the abovementioned July 2008 high of 169.97.
Given the backdrop, the EUR/JPY confirms the uptrend, though buyers must cling to gains above 164.00, if they would like to remain hopeful for higher prices. Failure to do so, a pullback toward 163.08, the November 15 low, is on the cards. Further downside is expected at the Tenkan-Sen at 162.16.
Conversely, if EUR/JPY buyers reclaim 165.00, the path would be clear to test higher prices, on the way to challenge the 2008 high at 169.97.
EUR/JPY Price Analysis – Daily Chart
EUR/JPY Technical Levels
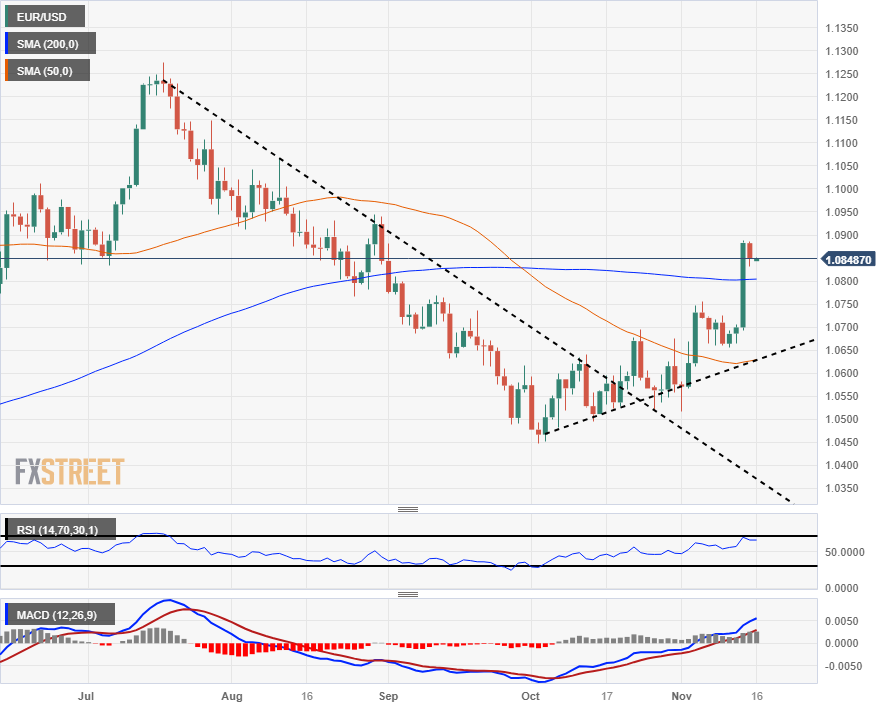
- The EUR/USD is testing the 1.0850 neighborhood after Wednesday's action fell to the bearish side.
- The Euro couldn't hold onto Tuesday's rally, falls just short of 1.0900.
- Investors will be turning to US labor data on Thursday, EU inflation on Friday.
The Euro (EUR) couldn't extend its recovery rally against the US Dollar (USD) and saw a slight decline for Wednesday.
Pan-EU Industrial Production came in worse than expected early Wednesday, with the month-on-month figure for September printing at -1.1%, a sharp decline from the previous month's 0.6% and dipping past the forecast -0.7%.
The EUR/USD broadly mixed through Wednesday's trading after the data miss, with Euro traders hesitating on further EUR bids.
The annualized Core (less food & energy) US Producer Price Index (PPI) for October came in at 2.4%, missing the expected steady print of 2.7%.
US Retail Sales drop 0.1% in October
US Retail Sales managed to beat the street's median forecast, printing at -0.1% versus the expected -0.3%, but the headline still fell back from last month's 0.9%, which saw an upside revision from 0.8%.
Up next on Thursday will be US Initial Jobless Claims for the week into November 10th. The median market forecast is expecting a slight uptick in the number of jobless benefits seekers, from 217 thousand to 220 thousand.
EUR/USD Technical Outlook
The Euro's Tuesday rally saw the EUR/USD break through the 200-day Simple Moving Average (SMA) at the 1.0800 handle, but bullish momentum got pulled up short on Wednesday and the pair fell just short of the 1.0900 price level.
With EUR/USD bids at risk of getting drawn back into the long-term moving average, the pair sees technical support from the 50-day SMA currently turning bullish from the 1.0625 level.
The immediate barrier for a bullish extension will be late August's swing towards the 1.0950 handle.
EUR/USD Daily Chart
EUR/USD Technical Levels
- USD/JPY aims higher after recovering from weekly lows, bolstered by an uptick in US Treasury yields and a strong US Dollar.
- The US Dollar to remain on the defensive, after soft US inflation data; speeches from Federal Reserve officials eyed.
- Japan's Q3 economic contraction supports the Bank of Japan's dovish stance, while intervention threats limit further depreciation of the Japanese Yen.
On Wednesday, the USD/JPY trimmed some of Tuesday’s more than 0.89% losses and climbed back above the 151.00 figure, after dropping to a weekly low of 150.15. At the time of writing, the pair trades at 151.34, up 0.66%.
USD/JPY recovers from weekly lows, as market eyes Fed speakers, Japanese data
Wall Street finished in the green, while an uptick In US Treasury bond yields, underpinned the major. The US 10-year Treasury bond yield, rose eight basis points, is at 4.539%, while the Greenback (USD) recovered some ground. The US Dollar Index (DXY), which measures the buck’s performance vs. six rivals, prints 0.32% gains, at 104.40.
Data-wise, the US Bureau of Labor Statistics (BLS) showed that prices paid by producers in October dipped compared to last month’s readings and missed estimates. October’s US Retail Sales were mixed, with monthly figures contracting, while annually based stood at positive territory.
Given the backdrop of back-to-back soft inflation data reports, namely CPI and PPI, that would deter the US Federal Reserve (Fed) from raising rates further. Nevertheless, Thursday’s Fed parade continues, led by Lisa Cook, Loretta Mester, John Williams, Christopher Waller, and Michael Barr.
In Japan, the economy contracted -0.5% QoQ in the third quarter, missing forecasts of a -0.1% plunge, justifying the Bank of Japan's (BoJ) loose monetary policy stance. Even though it would suggest the JPY might depreciate further, intervention threats by Japanese authorities is capping the rally on the USD/JPY.
Ahead in the Asian session, the Japanese economic agenda will feature the Balance of Trade and Machinery Orders. On the US front, Initial Jobless Claims, Regional Fed banks manufacturing indices, along with industrial production, would shed some light, regarding the status of the economy.
USD/JPY Technical Levels
- The EUR/GBP rose to 0.8740, seeing 0.40% gains, clearing weekly losses.
- Bulls have room to test the 0.8775 high, struck last week.
- The cross trades above its main SMAs.
The EUR/GBP trades with strong gains around the 0.8740 area with the pair clearing Mondays and Tuesdays' losses. The next target stands at 0.8775, which would set a high since May. On the fundamental side, soft inflation figures from October from the UK reported during the European sessions made the GBP face severe selling pressure which allowed the cross bulls to gain ground.
On the daily chart, the EUR/GBP holds a bullish technical bias as the buyers gather momentum and seize control in the short term. The Relative Strength Index (RSI) shows an upward trend above its midline, while the Moving Average Convergence (MACD) presents stagnant red bars. On the four-hour chart, indicators rose near overbought conditions, so traders should not take a slight technical correction off the table to consolidate losses.
Evaluating the broader scale technical outlook, the pair now is above the 20,100,200-day Simple Moving Average (SMA), suggesting that the bulls are also firmly in control of the larger time frames.
Supports: 0.8755, 0.8770,0.8780.
Resistances: 0.8730, 0.8710 (20-day SMA),0.8700.
EUR/GBP daily chart

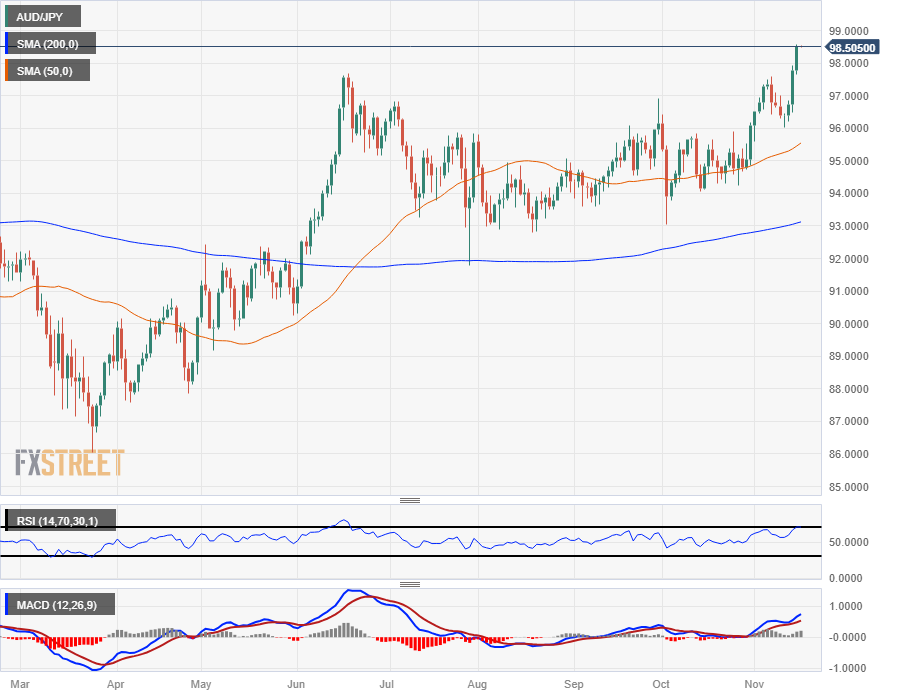
- The AUD/JPY tested into a fresh fifteen-year high On Wednesday as the Yen continues to deflate.
- Japan GDP declined past forecasts, contraction on the cards for Japanese economy.
- Australian wages data came in at expectations, stabilizing the Aussie.
The AUD/JPY tested into its highest bids in fifteen years on Wednesday, driven by a floundering Yen (JPY) that continues to shed value across the board.
Australian Wage Price Index figures for the third quarter printed exactly as expected at 1.3%, while the previous quarter was revised upwards from 0.8% to 0.9%.
Australian wage growth has seen some acceleration, and the Aussie (AUD) can expect to see some chart support as the Reserve Bank of Australia (RBA) continues to face down inflationary pressures that could necessitate further rate hikes down the road.
Early Wednesday also saw Japanese Gross Domestic Product (GDP) numbers for the third quarter, which printed at -0.5%, missing the forecast -0.1% and falling well away from the previous quarter's 1.2% showing.
Growth appears to be declining at an accelerating rate in Japan, adding weight to the Bank of Japan's (BoJ) hyper-dovish stance.
AUD/JPY Technical Outlook
The AUD/JPY is testing the waters near 98.50 after a brief test of fifteen-year highs, and the slumping Yen is down almost 15% against the Aussie from 2023's low bids near 86.00.
Daily candlesticks are pulling firmly away from technical levels, accelerating topside gains from the 50-day Simple Moving Average (SMA) near 95.50, and last week's swing low into 96.00 represents the immediate floor for any downturns.
AUD/JPY Daily Chart
AUD/JPY Technical Levels
The critical event of the Asian session will be the Australian employment report. China will release the House Price Index. Later in the day, reports from the US includes the weekly Jobless Claims, Industrial Production, and the Philly Fed.
Here is what you need to know on Thursday, November 16:
The US Dollar rose, supported by a rebound in US Treasury yields. However, the Greenback appears vulnerable in the short term as cooling inflation in the US suggests that the Federal Reserve is done raising interest rates.
The Producer Price Index (PPI) declined by 0.5% in October, contrary to expectations of a 0.1% increase. The annual rate dropped from 2.2% to 1.3%. These readings align with the Consumer Price Index (CPI) data released on Tuesday, indicating softer inflation. Retail Sales declined by 0.1% in October, against expectations of a steeper slide of 0.3%. The focus now turns to employment data with the weekly Jobless Claims on Thursday.
Analysts at Wells Fargo on Retail Sales:
Overall retail sales slipped only incrementally in October, falling just a tenth of a percent from its upwardly revised level for the prior month. Consumer spending may be losing a bit of momentum, but not as much as had been widely expected given the recent deterioration in various measures of consumer sentiment.
The PPI data further supports the perspective that the Fed has completed its tightening cycle. However, the US Dollar Index (DXY) recovered from monthly lows, rising from 104.00 to 104.40, while the 10-year yield increased from 4.42% to 4.52%.
Stocks on Wall Street were on track for another positive day as investors reacted positively to the US data. China's activity data improved in October, contributing to market optimism, with Industrial Production and Retail Sales coming in above expectations, showing a 4.6% and 7.6% annual increase, respectively. The Home Price Index is due on Thursday.
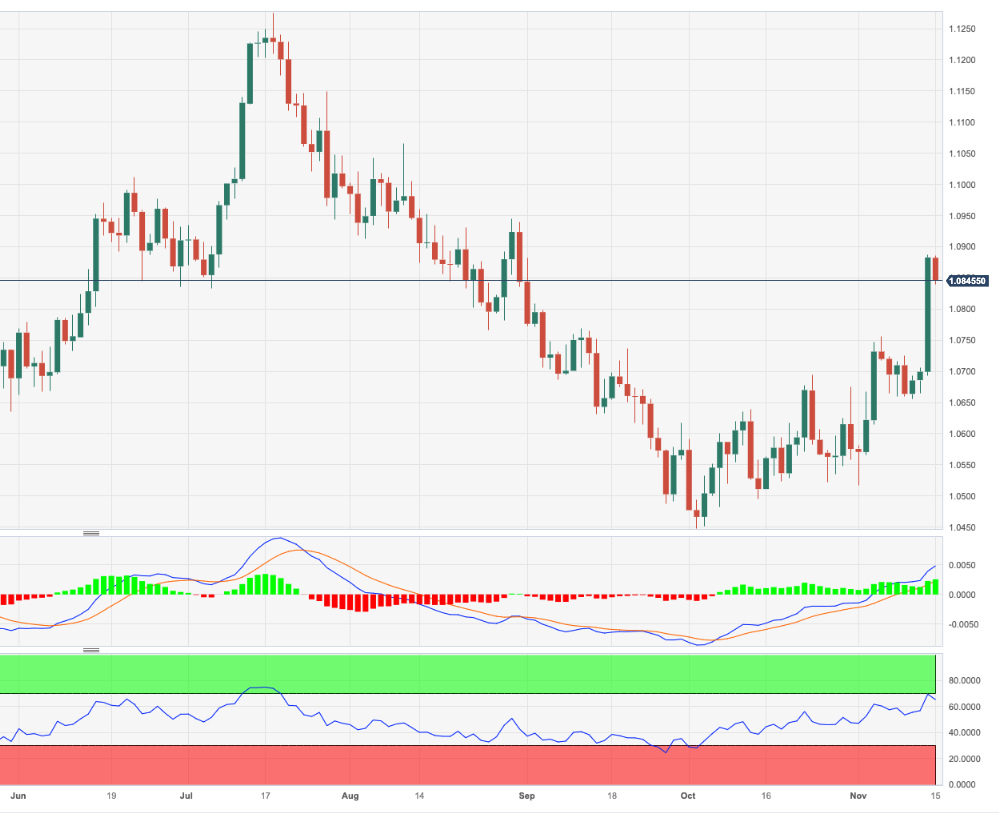
EUR/USD retraced from near 1.0900 to 1.0830. The bias remains bullish, but the path to the upside could be challenging due to the stronger economic performance in the US compared to the Eurozone.
GBP/USD retreated from the 100-day Simple Moving Average (SMA) at 1.2505 to 1.2400. The Pound did not benefit from the sharp slowdown in inflation in October. EUR/GBP posted the highest daily close since early May but faced strong resistance at 0.8750.
The rebound in US yields boosted the USD/JPY pair, which climbed over a hundred pips to 151.30. Japan will release Machinery Order and trade data on Thursday.
AUD/USD ended flat on Wednesday around 0.6505 after reaching monthly highs at 0.6542. Australia will release the October employment report, with an expected gain of 20,000 jobs. The Melbourne Institute Consumer Inflation Expectation report is also due.
The New Zealand Dollar was among the biggest gainers, supported by encouraging Chinese data. AUD/NZD fell for the second consecutive day but remains above the critical support level at 1.0770. NZD/USD pulled back after encountering resistance at 0.6055, holding above 0.6000. On Friday, New Zealand will report Q3 wholesale inflation.
Gold pulled back due to the Dollar's recovery and higher yields, closing around $1,960. The upside remains capped by the 20-day SMA at $1,974. Meanwhile, Silver rose sharply again, closing at $23.45.
Like this article? Help us with some feedback by answering this survey:
- WTI crude oil falls to $76.50 per barrel, down 2.14%, following a larger-than-expected build in US crude inventories and record production levels.
- Economic contraction in Japan and negative data from the Eurozone raise concerns over potential declines in oil demand.
- Despite downward pressure, OPEC+ production cuts and positive economic indicators from China support oil prices.
WTI drops on Wednesday, late in the New York session, after data from the US suggested a build on crude oil inventories amid record production and worries of dented oil demand in Asia. WTI is trading at $76.50 per barrel, down 2.14%.
WTI price pressured by record inventory build in the US, weak economic data from Asia
Data from the US Energy Information Administration (EIA), revealed an inventory build of 3.6 million barrels, reaching 421.9 million last week. A Reuters poll anticipated a build of 1.8 million barrels, though the report suggests a notable build-up of crude stockpiles in the United States.
The data showed that US domestic crude production stayed at a record 13.2 million barrels per day.
Sources cited by Reuters commented the increase in oil production in the US is a “headwind for the market, and the U.S. is a problem for OPEC+." WTI has extended its fall from around its weekly high of $79.72, witnessing a $3.50 drop, also weighed by weak economic data from Japan.
Japan’s economy shrank in Q3, snapped two consecutive quarters of expansion spurred by weak exports and domestic consumption.
Even though the Organization of Petroleum Exporting Countries and its allies (OPEC+) have an optimistic outlook for oil demand, recent data from the Eurozone printing negative readings, along with Japan’s economic contraction, risks for a diminish of demand looms.
Therefore, WTI prices would be under pressure, but Saudia Arabia and Russia’s pledge to cut production by 1.3 million barrels toward the end of the year, cushioned oil´s drop.
Latest data in China painted a more upbeat economic outlook, as industrial production grew faster than expected, while retail sales, beat estimates.
WTI Technical Levels
- The USD/CHF declined towards 0.8850 and then stabilised at 0.8885, seeing mild losses.
- PPI gave further evidence of inflation cooling down, but positive Retail Sales warn markets.
- Investors are still confident that the Fed won’t hike in December.
The USD/CHF observed measured downward movements on Wednesday while trading near 0.8885, with the trajectory of the pair being set by soft US PPI and strong Retail Sales from the US from October.
On the data front, the US Producer Price Index (PPI) in October demonstrated a lower-than-anticipated year-on-year increase of 1.3%, failing to meet the projected rise of 1.9%. The Core PPI in October also fell short of expectations, registering a year-on-year figure of 2.4% instead of the projected 2.7% and declining from the previous reading of 2.7% in September. On a positive note, October's Retail Sales performed better than expected, exhibiting a month-on-month decline of 0.1%, better than the projected 0.3% decrease.
As a reaction, the US Dollar recovered, trimming part of Tuesday’s losses driven by a rise of US Treasury yields, with the 2-year rate rising to 4.91%, while the 5-year and 10-year rates increasing to 4.52% and 4.53%, respectively. In line with that, those rates may be anticipating that Retail Sales flashed a warning that the Federal Reserve (Fed) could take those figures as a threat to the progress on inflation, which could justify further tightening. It's worth noticing that on Tuesday, markets cheered that the Consumer and Core Consumer Price Index (CPI) cooled down and now bet on sooner rate cuts by the Fed. For the December meeting, a pause is now priced in.
USD/CHF levels to watch
Based on the daily chart, the USD/CHF holds a bearish technical outlook, with indicators reflecting that the sellers are seizing control. The Relative Strength Index (RSI) printed a downward slope below its middle point, while the Moving Average Convergence (MACD) histogram lays out rising red bars.
In the larger context, the sellers pushed the pair below the 20,100 and 200-day Simple Moving Averages (SMAs), suggesting that the bears are now in charge.
Supports: 0.8870, 0.8850,0.8830.
Resistances: 0.8900 (100-day SMA), 0.8950, 0.9000 (20 and 200-day SMA convergence).
USD/CHF daily chart
-638356739190698757.png)
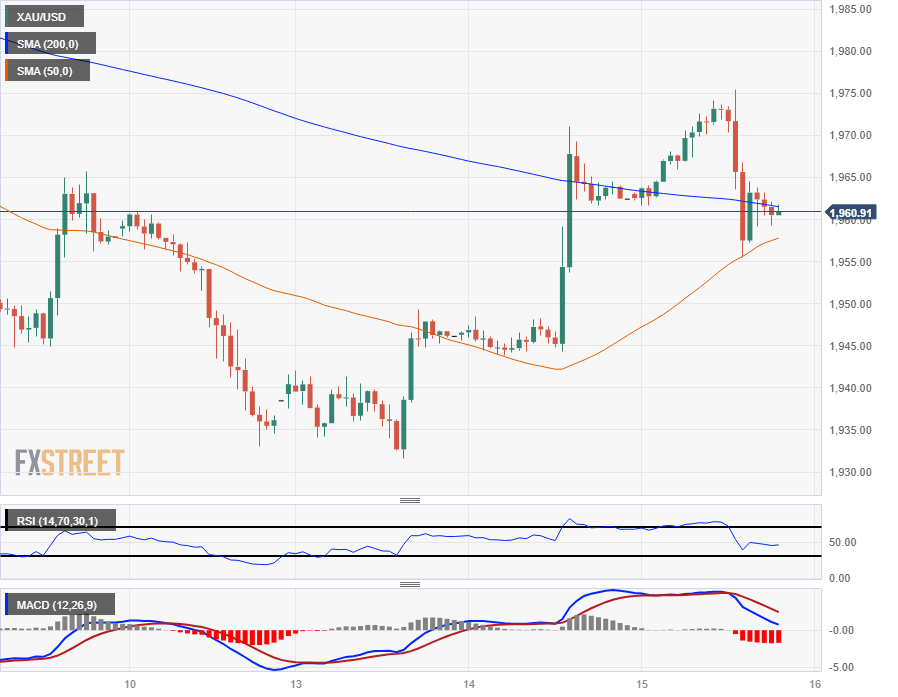
- Spot Gold is heading back towards $1,950 after getting sharply rejected from $1,975.
- Gold's latest rebound is running into friction after setting a six-day high.
- US data implying that inflation is cooling, which threatens XAU/USD's bullish stance.
Spot Gold bids are getting knocked back on Wednesday as buyers fail to hang onto $1,975. XAU/USD kicked the week off with a bullish rejection from $1,940, but Gold is now trading into the downside heading into the back half of the trading week.
Money markets are currently pricing in a 100% chance that the Federal Reserve (Fed) will be standing pat on rate hikes in December, and investors are currently pivoting towards expectations of when the US central bank will begin cutting interest rates.
Signs of cooling inflation and economic activity in the US is easing Fed expectations; US Core Producer Price Index (PPI) figures eased back to 2.4% for the year into October from the previous 2.7%, and US Retail Sales also ticked down to -0.1% in October, an overall decline in retail activity after September's 0.9% (revised from 0.7%).
XAU/USD Technical Outlook
Hourly candles see the XAU/USD knocking back into the 200-hour Simple Moving Average (SMA) after a failed bid for higher chart ground, slipping back from Wednesday's weekly high set at $1,975. The 50-hour SMA is showing a mixing of near-term momentum, consolidating with the longer moving average near $1,960.
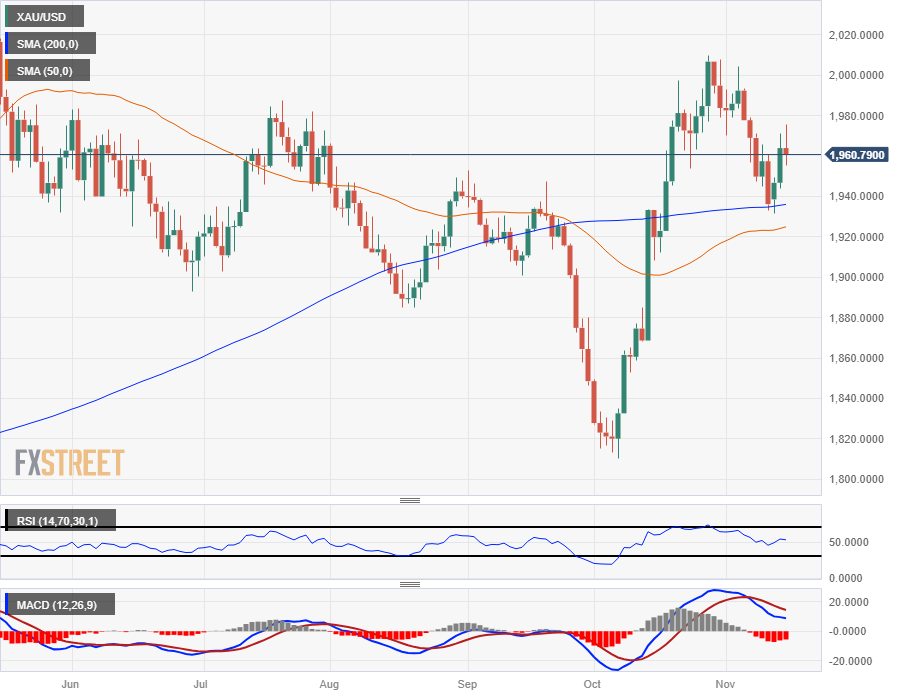
On the daily candlesticks, the XAU/USD is churning after a bounce off the 200-day SMA is facing resistance early on. The 200-day and 50-day SMAs are consolidating around $1,930 as long-term momentum drains out of Spot Gold, and sellers will be looking for a break of last week's bottom bids near $1,930 while the topside target remains late October's high-water mark etched in just north of the $2,000 major handle.
XAU/USD Hourly Chart
XAU/USD Daily Chart
XAU/USD Technical Levels
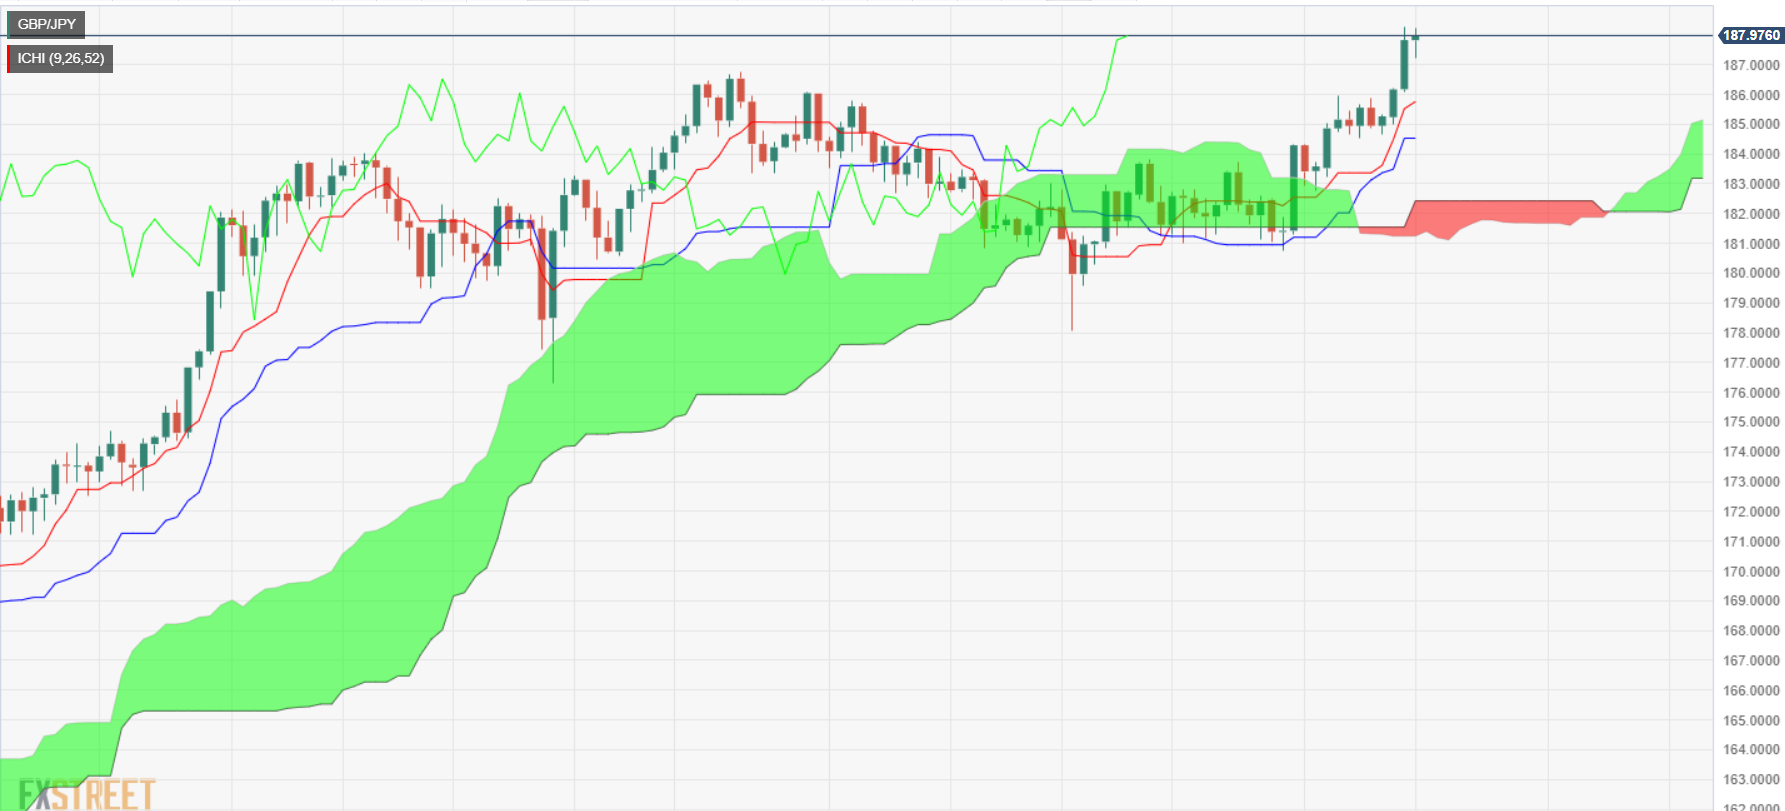
- GBP/JPY slips below 188.00, but it remains trading in the green amid a risk-on mood.
- A daily close below 188.00 could pave the way for a deeper pullback, 187.00 would be the bears' target.
- Further upside above 188.28, and GBP/JPY would challenge an eight-year high at 188.80.
The British Pound (GBP) remains steady against the Japanese Yen (JPY) during Wednesday’s mid-North American session after reaching a daily high of 188.24; the pair has fallen below the 188.00 mark, courtesy of weak inflation data from the UK. Therefore, the GBP/JPY hovers around 187.94, virtually unchanged.
From a technical perspective, the GBP/JPY is upward biased, but a daily close below 188.00 could pave the way for a deeper pullback, which could extend toward the 187.00 figure. If sellers push prices below that level, the next demand area could be the Tenkan-Sen at 185.75m followed by the Senkou Span A at 185.13. the next support would be 185.00
On the other hand, the GBP/JPY uptrend would continue if it remains above 188.00, with the first resistance seen at the current year-to-date (YTD) high of 188.28. Sentiment further improvement would put into play the November 2015 swing high at 188.80 before buyers challenge the 190.00 figure.
GBP/JPY Price Analysis – Daily Chart
GBP/JPY Technical Levels
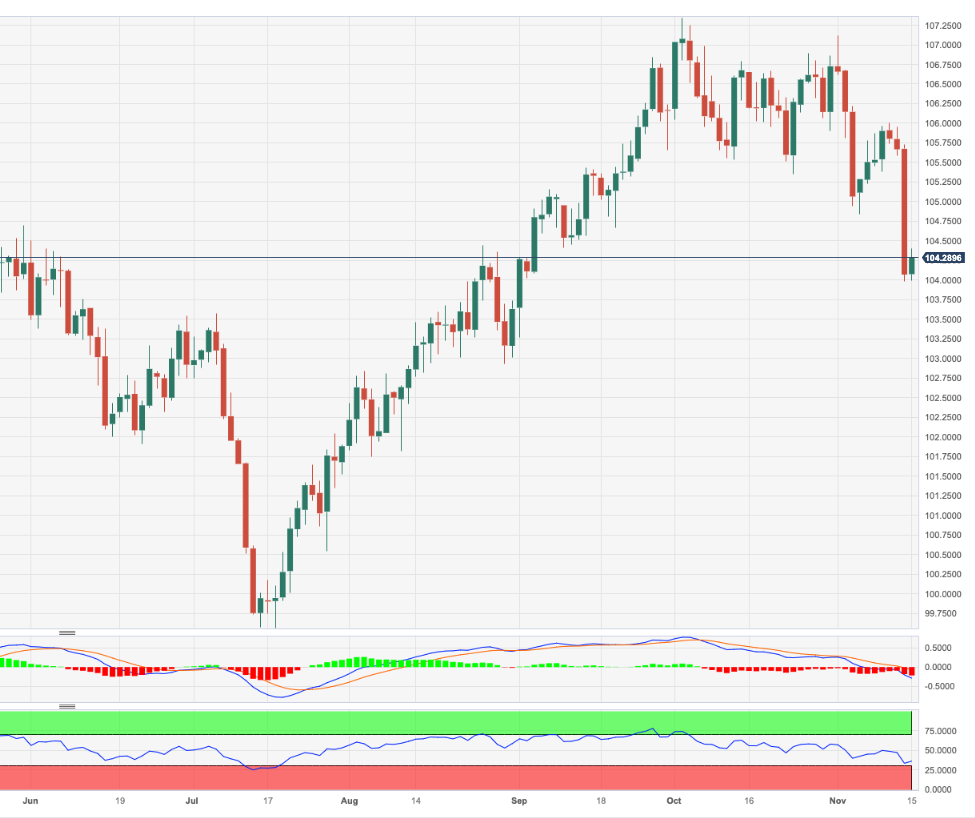
- The DXY index first declined to 104.00 and then recovered to 104.30.
- The headline and core PPI cooled down in October, while US Retail Sales declined but were lower than expected.
- Investors seem to worry that strong economic activity data might weigh more than cooling inflation in the Fed’s eyes.
The US Dollar (USD) found a lift in Wednesday's session, driven by solid US Retail Sales figures for October, which somewhat worried investors as Federal Reserve (Fed) officials might consider it a threat to the progress on inflation.
Nonetheless, considering that inflation and employment creation in the United States economy are both cooling down, it is highly unlikely that the Federal Reserve (Fed) will raise interest rates at the upcoming December meeting. That being said, the bank will receive additional CPI and Nonfarm Payrolls reports before its last decisions of 2023, which could impact whether they ultimately decide to hike or not.
Daily Digest Market Movers: US Dollar finds support on strong Retail Sales and rising yields
- The US Dollar Index recovered to 104.30 from a low of around 103.98 and stands at its lowest point since September.
- The US Bureau of Labor Statistics reported that October witnessed a less-than-expected increase of 1.3% YoY in the US Producer Price Index (PPI), falling short of the projected 1.9% rise. It also printed a monthly decline of 0.5% below the expected 0.1% growth.
- In addition, the Core Producer Price Index (PPI) from October fell short of expectations. It came in at 2.4% YoY vs the expected 2.7% and declined from its previous reading of 2.7%.
- On the other hand, the Retail Sales from October came in better than expected, declining by 0.1% MoM vs the expected 0.3% decline.
- US Treasury yields slightly recovered, with the 2-year rate increasing to 4.91%, while the 5 and 10-year rates rose to 4.52% and 4.53%, respectively..
- According to the CME FedWatch Tool, the odds of a 25-basis-point hike in December are zero. Also, markets arel betting on rate cuts appearing sooner than expected in May 2024, if not March.
Technical Analysis: US Dollar bulls step in and defend the 100-day SMA, outlook still negative
The daily chart suggests that the DXY has a neutral to bearish technical outlook with bulls having lost significant ground in Tuesday’s session. With a downward trend below its midline, the Relative Strength Index (RSI) suggests a bearish sentiment, while the Moving Average Convergence Divergence (MACD) histogram exhibits larger red bars.
Zooming out, despite the bears gaining ground and pushing the index below the 20-day Simple Moving Average (SMA), it is still above the 100 and 200-day SMAs, suggesting that the bulls are in command on the larger time frames.
Support levels: 104.15 (100-day SMA),103.60 (200-day SMA), 103.30.
Resistance levels: 104.50, 105.00,105.30.
US Dollar FAQs
What is the US Dollar?
The US Dollar (USD) is the official currency of the United States of America, and the ‘de facto’ currency of a significant number of other countries where it is found in circulation alongside local notes. It is the most heavily traded currency in the world, accounting for over 88% of all global foreign exchange turnover, or an average of $6.6 trillion in transactions per day, according to data from 2022.
Following the second world war, the USD took over from the British Pound as the world’s reserve currency. For most of its history, the US Dollar was backed by Gold, until the Bretton Woods Agreement in 1971 when the Gold Standard went away.
How do the decisions of the Federal Reserve impact the US Dollar?
The most important single factor impacting on the value of the US Dollar is monetary policy, which is shaped by the Federal Reserve (Fed). The Fed has two mandates: to achieve price stability (control inflation) and foster full employment. Its primary tool to achieve these two goals is by adjusting interest rates.
When prices are rising too quickly and inflation is above the Fed’s 2% target, the Fed will raise rates, which helps the USD value. When inflation falls below 2% or the Unemployment Rate is too high, the Fed may lower interest rates, which weighs on the Greenback.
What is Quantitative Easing and how does it influence the US Dollar?
In extreme situations, the Federal Reserve can also print more Dollars and enact quantitative easing (QE). QE is the process by which the Fed substantially increases the flow of credit in a stuck financial system.
It is a non-standard policy measure used when credit has dried up because banks will not lend to each other (out of the fear of counterparty default). It is a last resort when simply lowering interest rates is unlikely to achieve the necessary result. It was the Fed’s weapon of choice to combat the credit crunch that occurred during the Great Financial Crisis in 2008. It involves the Fed printing more Dollars and using them to buy US government bonds predominantly from financial institutions. QE usually leads to a weaker US Dollar.
What is Quantitative Tightening and how does it influence the US Dollar?
Quantitative tightening (QT) is the reverse process whereby the Federal Reserve stops buying bonds from financial institutions and does not reinvest the principal from the bonds it holds maturing in new purchases. It is usually positive for the US Dollar.
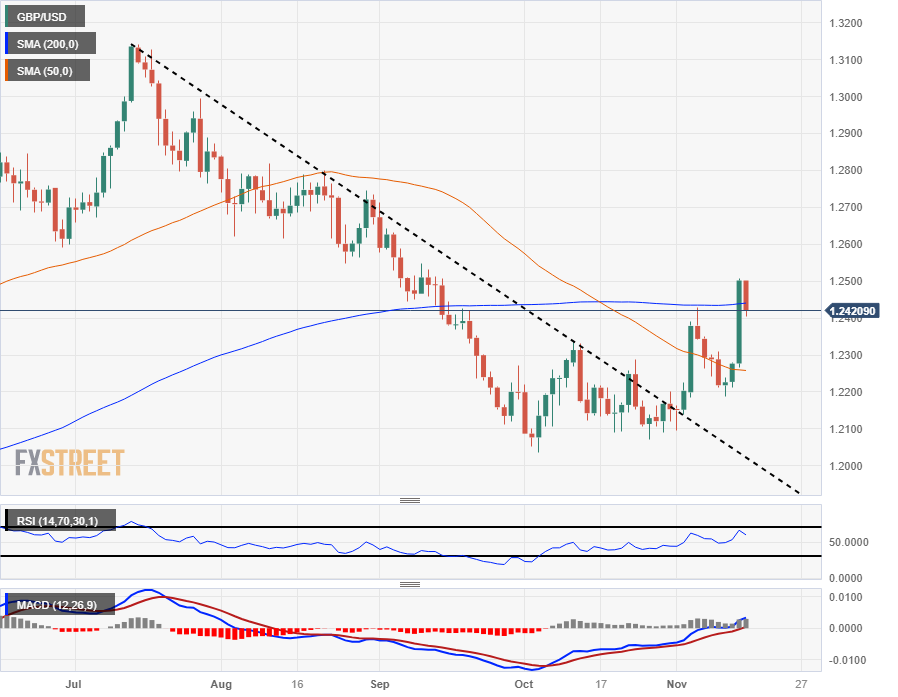
- The GBP/USD is seeing some downside pullback on Wednesday.
- UK data came in softer than expected, capping off Pound Sterling gains.
- UK Retail Sales in the barrel for Friday.
The GBP/USD is paring back after a touch of the 1.2500 handle, testing back into the 1.2400 region after a broad miss for UK data and mixed US figures.
The UK Core Consumer Price Index (CPI) for the year into October printed at 5.7%, down slightly from the expected 5.8% and slipping further away from the previous month's 6.1% reading.
The UK Retail Price Index for the same period also slipped past expectations, printing at 6.1% versus the expected 6.4% and seeing a slide from the previous 8.9%.
On the US side, Core Producer Price Index (PPI) figures for the annualized period into October came in at 2.4%, slipping below the forecast steady print at 2.7%. Meanwhile, US Retail Sales also declined but managed to hold above expectations.
US Retail Sales in October declined by a slight 0.1%, holding above the forecast -0.3%, but still slipping back from the previous month's 0.9%, which was revised upwards from 0.7%.
UK Retail Sales figures are still in the pipe for Friday, and Sterling traders will be churning through the back half of the trading week.
GBP/USD Technical Outlook
The GBP/USD is getting hung up on the 200-day Simple Moving Average (SMA) after facing a tight rejection from the 1.2500 handle, and the pair's bullish bounce from 1.2200 is quickly coming under pressure.
Bids are being supported by a bullish break of the descending trendline drawn from July's peak near 1.3140, as well as the 50-day SMA currently rotating out of a descending pattern near 1.2260.
The medium-term floor on any bearish pullbacks will be October's low bids just above the 1.2000 major handle, as well as a rough support zone baked in near 1.2100.
GBP/USD Daily Chart
GBP/USD Technical Levels
- NZD/USD climbs 0.36%, breaking above the 0.6000 mark, driven by softer US inflation and retail sales data, hinting at a potential pause in Fed rate hikes.
- The pair's rise is bolstered by strong Chinese industrial and retail figures, enhancing risk appetite and supporting the New Zealand Dollar.
- Despite a recovering US Dollar Index, the Kiwi benefits from market speculation of an 88 basis point rate cut by the Fed by the end of 2024, with key US and NZ economic data ahead.
The New Zealand Dollar (NZD) climbs 0.36% against the US Dollar (USD), with buyers reclaiming the 0.6000 figure on Wednesday, courtesy of mixed data in the United States (US). The pair traveled from the day’s low of 0.5996 and reached a high of 0.6054 before reversing toward current exchange rates, as the NZD/USD trades at 0.6028.
Kiwi Dollar rises on mixed US economic reports, strong Chinese data
In the last couple of days, the US economic calendar has featured inflation reports from the consumer and producer side, with both readings missing estimates. Elevated prices in the US, begin to cool down, as October CPI came at 3.2% YoY, below forecasts and the prior’s 3.7% expansion, while the Producer Price Index (PPI) on an annual basis, rose by 1.3%, below September’s and expectations of 2.2%, and 1.9% respectively.
The data sparked speculations the Fed could have ended its tightening cycle. Interest rate futures traders linked to federal fund rates have priced in 88 basis points of rate cuts towards the end of 2024, spurring a drop in US Treasury bond yields.
Other data revealed by the Department of Commerce, Retail Sales in the US disappointed analysts, contracted -0.1% MoM in October, less than the -0.3% consensus.
The NZD/USD rises despite the Greenback (USD) recovery, as shown by the US Dollar Index (DXY). The DXY gains 0.23%, up at 104.30, though is trading in the red during the week.
In New Zealand (NZ), the economic docket was absent, but solid Chinese economic data improved risk appetite and underpinned the Kiwi Dollar (NZD). China’s Industrial Production rose 4.6% YoY, above estimates and last month’s readings, while Retail Sales soared 7.6% YoY, exceeding forecasts of 7% and above September’s 5.5%.
Ahead, the US economic calendar would feature unemployment claims, Industrial Production, and Federal Reserve (Fed) speakers. On the NZ front, the Producer Price Index (PPI).
NZD/USD Technical Levels
- The AUD/USD is pulling back into the Wednesday midrange.
- Australian labor data due early Thursday, giving Aussie traders cause for pause.
- US Data mixed on Wednesday, sending the Greenback nowhere in particular.
The AUD/USD is trading back into the Wednesday midpoint as the pair fails to push in either direction decisively. US data came in mixed while Aussie (AUD) traders will be bracing for an additional round of Australian labor data.
US Retail Sales for October came in above expectations, but still saw some declines to print at -0.1% against the forecast -0.3%, and September's read was revised upwards from 0.7% to 0.9%.
US Producer Price Index (PPI) ex Food & Energy for the year into October also missed expectations slightly, printing at 2.4% against the street's expected hold at 2.7%.
Aussie traders will now be looking ahead Australian labor data due early in the Thursday session.
Australian Employment Change for October is expected to show an additional 20 thousand job additions for the month, an increase from September's 6.7 thousand. Meanwhile, the Aussie Unemployment Rate is expected to tick upwards from 3.6% to 3.7% in October.
AUD/USD Technical Outlook
The AUD/USD is getting hung up on the 0.6500 handle, a region that should make bidders nervous as it's the turnaround point for prices earlier in the month, and the pair looks to be running out of gas on its recent bullish bounce.
There is still a significant price ceiling from the 200-day Simple Moving Average (SMA) near 0.6600, and the floor on any bearish corrections sits at the 50-day SMA at 0.6400, with bids trapped in the middle.
AUD/USD Daily Chart
AUD/USD Technical Levels
- The Canadian Dollar takes another step higher following Tuesday’s gains.
- Business and intermediary sales in Canada see slight recovery.
- Loonie gains get capped by declining Crude Oil bids.
The Canadian Dollar (CAD) is seeing additional gains on Wednesday, eking out an extension as broader markets chew on their recent bout of risk-on sentiment.
Wholesale and business sales figures in Canada saw an improvement over forecasts, helping to bolster the Loonie. Meanwhile, declines in Crude Oil prices are keeping CAD gains on a tight leash.
Daily Digest Market Movers: Canadian Dollar easing higher as Loonie bulls squeeze out a little more
Loonie steps into second-straight day of gains against the US Dollar (USD).
Canadian Manufacturing Sales in September beat the street, printing at 0.4% against the -0.1% forecast, but slipping back from August’s 1.0% (revised up from 0.7%).
Wholesale sales for September softened significantly but still beat flat forecast to print at 0.4%, down from the previous month’s 1.8% (revised down from 2.3%).
US data didn’t quite meet the street’s expectations as Retail Sales for October declined from a revised 0.9% in September to -0.1%, contracting but still holding above forecast -0.3%.
Annualized US Core Producer Price Index (PPI) Ex Food & Energy for the year into October also came in below expectations, printing at 2.4% against the forecast of 2.7%.
Crude Oil is seeing some declining prices on Wednesday, limiting CAD gains.
Thursday brings Canadian Housing Starts and changes in employment insurance benefits recipients.
Technical Analysis: Canadian Dollar looking to round out additional topside gains against the Greenback
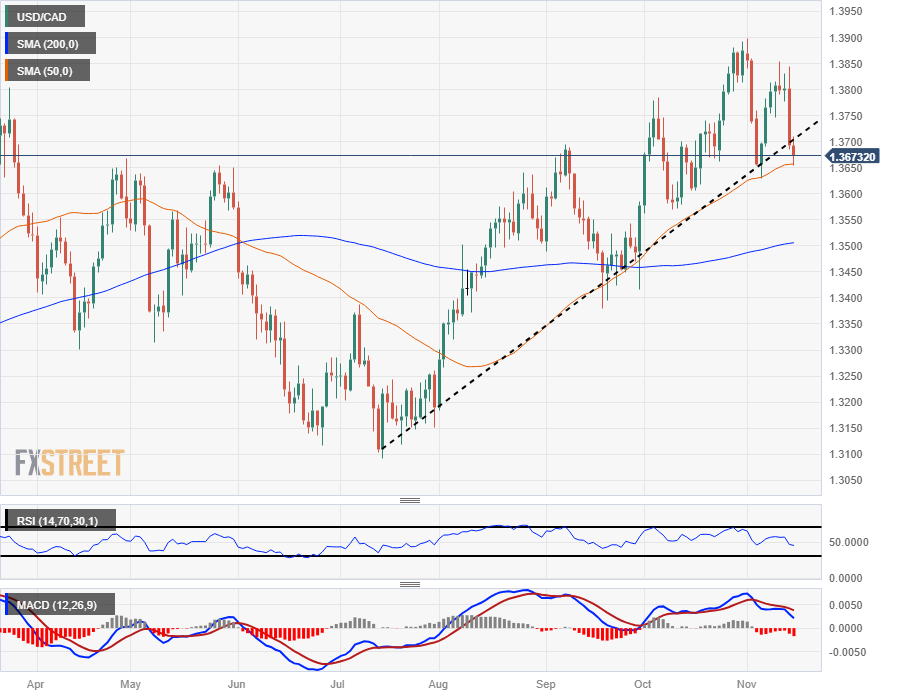
An additional day of gains for the Canadian Dollar (CAD) against the US Dollar (USD) is bringing the USD/CAD back down from the 1.3700 handle. The pair is testing support barriers near 1.3650, and technical indicators are leaning toward the downside.
The USD/CAD is seeing some back-and-forth movement on the intraday level as the pair tests the 50-day Simple Moving Average (SMA) sitting just north of 1.3650. A break of this level will open up the door for a deeper bear run toward the 200-day SMA at the 1.3500 handle.
The Relative Strength Index (RSI) has crossed into the bottom half of the 50.0 line, inching toward oversold conditions, but there’s still plenty of room left to run in the indicator.
Wednesday’s additional declines in the USD/CAD sets the pair up for a firm break of a rising trendline, though rejection from here would set the Loonie on the path for a return to losses.
USD/CAD Daily Chart
Canadian Dollar price today
The table below shows the percentage change of Canadian Dollar (CAD) against listed major currencies today. Canadian Dollar was the strongest against the Pound Sterling.
| USD | EUR | GBP | CAD | AUD | JPY | NZD | CHF | |
| USD | 0.26% | 0.53% | -0.23% | -0.25% | 0.41% | -0.36% | -0.18% | |
| EUR | -0.27% | 0.27% | -0.49% | -0.52% | 0.14% | -0.62% | -0.45% | |
| GBP | -0.54% | -0.26% | -0.76% | -0.79% | -0.12% | -0.89% | -0.72% | |
| CAD | 0.23% | 0.52% | 0.78% | 0.00% | 0.65% | -0.12% | 0.06% | |
| AUD | 0.25% | 0.52% | 0.78% | 0.03% | 0.66% | -0.11% | 0.08% | |
| JPY | -0.41% | -0.14% | 0.11% | -0.66% | -0.68% | -0.77% | -0.59% | |
| NZD | 0.35% | 0.62% | 0.88% | 0.13% | 0.11% | 0.76% | 0.18% | |
| CHF | 0.18% | 0.44% | 0.71% | -0.05% | -0.08% | 0.59% | -0.18% |
The heat map shows percentage changes of major currencies against each other. The base currency is picked from the left column, while the quote currency is picked from the top row. For example, if you pick the Euro from the left column and move along the horizontal line to the Japanese Yen, the percentage change displayed in the box will represent EUR (base)/JPY (quote).
Canadian Dollar FAQs
What key factors drive the Canadian Dollar?
The key factors driving the Canadian Dollar (CAD) are the level of interest rates set by the Bank of Canada (BoC), the price of Oil, Canada’s largest export, the health of its economy, inflation and the Trade Balance, which is the difference between the value of Canada’s exports versus its imports. Other factors include market sentiment – whether investors are taking on more risky assets (risk-on) or seeking safe-havens (risk-off) – with risk-on being CAD-positive. As its largest trading partner, the health of the US economy is also a key factor influencing the Canadian Dollar.
How do the decisions of the Bank of Canada impact the Canadian Dollar?
The Bank of Canada (BoC) has a significant influence on the Canadian Dollar by setting the level of interest rates that banks can lend to one another. This influences the level of interest rates for everyone. The main goal of the BoC is to maintain inflation at 1-3% by adjusting interest rates up or down. Relatively higher interest rates tend to be positive for the CAD. The Bank of Canada can also use quantitative easing and tightening to influence credit conditions, with the former CAD-negative and the latter CAD-positive.
How does the price of Oil impact the Canadian Dollar?
The price of Oil is a key factor impacting the value of the Canadian Dollar. Petroleum is Canada’s biggest export, so Oil price tends to have an immediate impact on the CAD value. Generally, if Oil price rises CAD also goes up, as aggregate demand for the currency increases. The opposite is the case if the price of Oil falls. Higher Oil prices also tend to result in a greater likelihood of a positive Trade Balance, which is also supportive of the CAD.
How does inflation data impact the value of the Canadian Dollar?
While inflation had always traditionally been thought of as a negative factor for a currency since it lowers the value of money, the opposite has actually been the case in modern times with the relaxation of cross-border capital controls. Higher inflation tends to lead central banks to put up interest rates which attracts more capital inflows from global investors seeking a lucrative place to keep their money. This increases demand for the local currency, which in Canada’s case is the Canadian Dollar.
How does economic data influence the value of the Canadian Dollar?
Macroeconomic data releases gauge the health of the economy and can have an impact on the Canadian Dollar. Indicators such as GDP, Manufacturing and Services PMIs, employment, and consumer sentiment surveys can all influence the direction of the CAD. A strong economy is good for the Canadian Dollar. Not only does it attract more foreign investment but it may encourage the Bank of Canada to put up interest rates, leading to a stronger currency. If economic data is weak, however, the CAD is likely to fall.
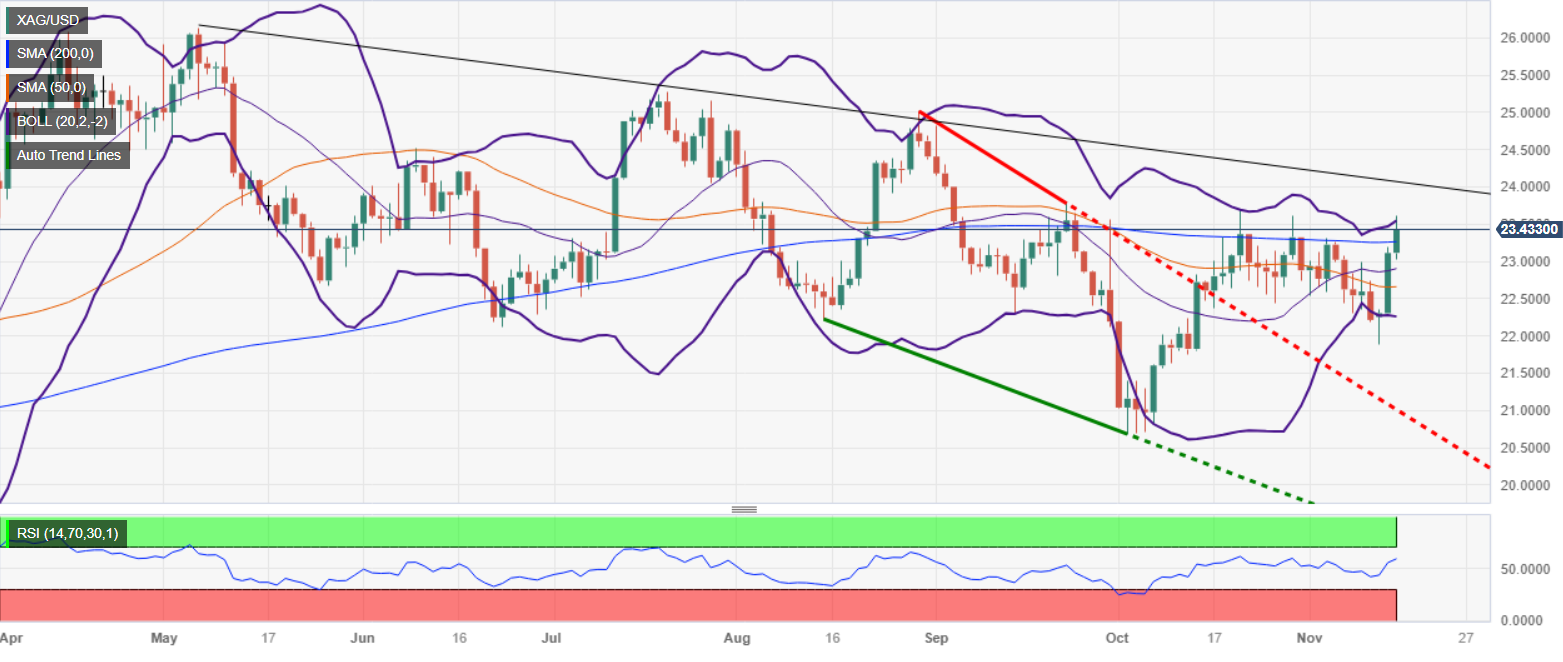
- Silver prices sharply rise to $23.40, up 1.47%, following a soft US inflation report fueling expectations of a pause in Fed rate hikes.
- The metal tests the 200-day moving average at $23.26, potentially extending gains towards $24.00 if the bullish momentum sustains.
- A failure at the 200-DMA could trigger a pullback towards the 20-DMA at $22.89 and the 50-DMA at $22.64.
Silver price climbs on Wednesday, following last Tuesday’s soft US inflation report, which sent US Treasury bond yields plummeting on expectations the US Federal Reserve is done hiking rates. Hence, the XAG/USD advances sharply, reaching key resistance levels like the 200-day moving average (DMA) at $23.26. If Silver bulls hold price above the latter, the uptrend would likely continue toward year’s end, as buyers target $24.00. The XAG/USD is trading at $23.40, up 1.47%.
From a daily standpoint, the grey metal is neutrally biased, though about to shift neutral-upwards if buyers reclaim the latest cycle high seen at $23.69, October 20 daily high. Upside risks remain above that level, with a seven-month-old resistance trendline at $23.80-90, before challenging $24.00 a troy ounce.
On the other hand, if XAG/USD couldn’t remain above the 200-DMA, that could exacerbate a pullback toward the 20-DMA at $22.89, before sliding to the 50-DMA at $22.64 before challenging the November 13 swing low of $21.88.
XAG/USD Price Analysis – Daily Chart
XAG/USD Technical Levels
- The USD/JPY surged to 150.99, seeing 0.30% gains.
- The USD managed to gain momentum despite soft PPI figures on the back of positive Retail Sales.
- Dovish bets on the BoJ after weak GDP figures from Q3 pushed the pair upwards.
The USD/JPY found some lift on Wednesday's session and advanced to 150.90, seeing 0.30% gains. The pair ascended mainly driven by strong Retail Sales figures from the US and poor Q3 Gross Domestic Product (GDP) figures from Japan, which fueled dovish bets on the Bank of Japan (BoJ).
In October, the US Producer Price Index (PPI) recorded a 1.3% increase, falling short of the expected 1.9% rise. Additionally, a monthly decline of 0.5% was observed, contrasting the projected 0.1% growth. On the other hand, Retail Sales experienced a marginal decrease of 0.1%, better than the anticipated 0.3% contraction. Year-on-year, sales rose by 2.5%, highlighting a slower growth rate than September's 4.1% increase. As a reaction, the US Dollar found some demand as markets seem to worry that strong data may make Federal Reserve (Fed) officials consider further tightening as US Treasuries rose after the data. Still, after the report of cooling inflation and job creation figures, the strongest case is that the Federal Reserve (Fed) won’t hike in the next December meeting.
On the JPY’s side, Japan's Q3 GDP fell by -0.5% QoQ, below expectations of -0.1% and the corresponding 1.2% growth in Q2 recorded its weak reading since Q1 2022. As a reaction, the Japanese Government Bond Yields (JGB) sharply declined, and they are anticipating that the BoJ won’t rush to hike rates due to the weakening economy. In line with that, the World Interest Rate Probabilities tool (WIRP) indicates a delay in liftoff expectations until June.
USD/JPY levels to watch
Based on the daily chart, the USD/JPY displays a neutral to bullish technical bias, with positive signals suggesting that the bears are losing momentum. In the bullish territory, the Relative Strength Index (RSI) maintains a positive slope above its midline, while the Moving Average Convergence (MACD) presents stagnant red bars. Zooming out, the pair is above the 20,100,200-day Simple Moving Average (SMA), suggesting that the bulls are also in control on the broader time horizon.
Supports: 150.30 (20-day SMA), 150.00, 149.00.
Resistances: 151.00, 151.50, 153.00.
USD/JPY daily chart
-638356618830506336.png)
USD/CAD should come lower next year, economists at ING report.
Loonie’s carry advantage to be slightly eroded over the course of the year
We expect the Loonie’s carry advantage to be slightly eroded over the course of the year, even though the structurally lower volatility compared to other high yielders should keep it a good option should market interest for carry be revamped.
A return to levels below 1.30 by the second half of 2024 remains our base case.
USD/CAD – 4Q23 1.37 1Q24 1.35 2Q24 1.33 3Q24 1.29 4Q24 1.27
- Mexican Peso records slight losses against the US Dollar, influenced by US inflation data and the rise in US Treasury yields.
- Banxico maintains a less hawkish stance on interest rates, with potential rate cuts hinted for the next year, capping the Peso’s advancement.
- Banxico's Deputy Governor Jonathan Heath reiterated they could cut rates next year, though the stance would remain restrictive.
Mexican Peso (MXN) registers minimal losses against the US Dollar (USD) in early morning trading on Wednesday, following Tuesday's 1.51% gains, due to soft inflation data in the United States (US). Even though a risk-on impulse usually benefits risk-perceived currencies like the Peso, a jump in US Treasury bond yields capped the USD/MXN fall, which exchanges hands at 17.35, virtually unchanged on the day.
At the latest Bank of Mexico (Banxico) monetary policy decision on November 9, the Government Board held rates unchanged and sounded less hawkish, saying that rates need to be at the current level for “some time.” On Monday, Governor Victoria Rodriguez Ceja said that rate cuts could be in play next year; words echoed by Deputy Governor Jonathan Heath on Tuesday. He said that the monetary policy will remain restrictive despite cutting interest rates.
On the data front, Mexico’s calendar is empty. In the US, data showed prices paid by producers declined, while retail sales shrank in October, but previous figures were upward revised, suggesting consumers' resilience despite the Fed's restrictive stance.
Daily digest movers: Mexican Peso trims some of its Tuesday’s gains, as Banxico adopts a neutral stance
- The US Producer Price Index (PPI) rose 1.3% in the year to October, below estimates of 1.9% and monthly deflated 0.5%, beneath forecasts of a 0.1% expansion.
- Retail Sales fell 0.1% MoM, less than the 0.3% contraction expected. Sales in the 12-month period rose by 2.5%, below September’s 4.1% increase.
- Banxico’s Deputy Governor Jonathan Heath added the Government Board continues to monitor real rates, which currently lie at around 7%.
- Heath said Banxico wouldn’t rely on other countries – usually, Banxico reacts to the US Federal Reserve’s decisions – and said they would depend on incoming data and how inflation expectations evolve.
- On Monday, Banxico’s Governor Victoria Rodriguez Ceja commented that the easing inflationary outlook could pave the way for discussing possible rate cuts. She said that monetary policy loosening could be gradual but not necessarily imply continuous rate cuts, adding that the board would consider macroeconomic conditions, adopting a data-dependent approach.
- The latest inflation report in Mexico, published on November 9, showed prices grew by 4.26% YoY in October, below forecasts of 4.28% and prior rate of 4.45%. On a monthly basis, inflation came at 0.39%, slightly above the 0.38% consensus and September’s 0.44%.
- Mexico’s economy remains resilient after October’s S&P Global Manufacturing PMI improved to 52.1 from 49.8, and the Gross Domestic Product (GDP) expanded by 3.3% YoY in the third quarter.
- Banxico revised its inflation projections from 3.50% to 3.87% for 2024, which remains above the central bank’s 3.00% target (plus or minus 1%).
Technical Analysis: Mexican Peso almost flat, with USD/MXN hovering around the 100-day SMA
The USD/MXN pair bias has shifted to neutral downwards in the short term, and the pair is on the brink of breaking crucial support levels like the 100-day Simple Moving Average (SMA) at 17.34, followed by the psychological 17.00 figure. The pair could shift bearishly as the 20-day SMA accelerates and breaks below an area comprised of the 50 and 200-day SMAs at around 17.70-17.65. If the bearish cross completes, it would shift the broader trend downwards and open the door to challenging the year-to-date (YTD) low of 16.62, printed in July.
On the other hand, if buyers keep the USD/MXN pair above 17.33 and reclaim 17.50 in the near term, they could remain hopeful of testing key resistance levels, like the 200-day SMA at 17.65, ahead of the 50-day SMA at 17.70. Once cleared, the next resistance emerges at the 20-day SMA at 17.87 before buyers could lift the spot price towards the 18.00 figure.
Mexican Peso FAQs
What key factors drive the Mexican Peso?
The Mexican Peso (MXN) is the most traded currency among its Latin American peers. Its value is broadly determined by the performance of the Mexican economy, the country’s central bank’s policy, the amount of foreign investment in the country and even the levels of remittances sent by Mexicans who live abroad, particularly in the United States. Geopolitical trends can also move MXN: for example, the process of nearshoring – or the decision by some firms to relocate manufacturing capacity and supply chains closer to their home countries – is also seen as a catalyst for the Mexican currency as the country is considered a key manufacturing hub in the American continent. Another catalyst for MXN is Oil prices as Mexico is a key exporter of the commodity.
How do decisions of the Banxico impact the Mexican Peso?
The main objective of Mexico’s central bank, also known as Banxico, is to maintain inflation at low and stable levels (at or close to its target of 3%, the midpoint in a tolerance band of between 2% and 4%). To this end, the bank sets an appropriate level of interest rates. When inflation is too high, Banxico will attempt to tame it by raising interest rates, making it more expensive for households and businesses to borrow money, thus cooling demand and the overall economy. Higher interest rates are generally positive for the Mexican Peso (MXN) as they lead to higher yields, making the country a more attractive place for investors. On the contrary, lower interest rates tend to weaken MXN.
How does economic data influence the value of the Mexican Peso?
Macroeconomic data releases are key to assess the state of the economy and can have an impact on the Mexican Peso (MXN) valuation. A strong Mexican economy, based on high economic growth, low unemployment and high confidence is good for MXN. Not only does it attract more foreign investment but it may encourage the Bank of Mexico (Banxico) to increase interest rates, particularly if this strength comes together with elevated inflation. However, if economic data is weak, MXN is likely to depreciate.
How does broader risk sentiment impact the Mexican Peso?
As an emerging-market currency, the Mexican Peso (MXN) tends to strive during risk-on periods, or when investors perceive that broader market risks are low and thus are eager to engage with investments that carry a higher risk. Conversely, MXN tends to weaken at times of market turbulence or economic uncertainty as investors tend to sell higher-risk assets and flee to the more-stable safe havens.
Economists at Société Générale analyze AUD/USD outlook after the release of Q3 Wage Price Index in Australia.
The RBA may need to remain hawkish
Today’s slightly higher-than-expected Q3 wage growth data in Australia (4% YoY), largely reflects an increase in the minimum wage. However, it leaves the RBA in a slightly less comfortable position than some other central banks as we reach peak rates.
As rate differentials move in the AUD’s favour, the currency still looks undervalued.
The 2-year rate differential is higher than it was pre-COVID when AUD/USD was at 0.70.
The Mexican Peso has had a strong year. Economists at ING analyze MXN outlook.
Banxico’s confidence in the disinflation process may encourage it to ease before the Fed
We still very much like the Peso and do not see a threat from elections next June. Indeed, the Mexican government does have the fiscal headroom to boost growth next year. We are starting to wonder, however, if Mexican authorities consider the MXN to be too strong.
It seems Banxico’s confidence in the disinflation process may encourage it to ease before the Fed after all. The ultimate landing path for the 11.25% policy rate may be somewhere in the 7-8% area, though we doubt Banxico would want to see the policy spread to the US narrow from its current 575 bps to inside of 400/425 bps. This potentially opens up 150 bps of easing pre-Fed. That would still leave MXN implied yields above 10% and if we are right with our call for a weaker Dollar next year, 16.50 levels for USD/MXN should be in reach.
The Australian labour market figures for October will be released on Thursday. Economists at Commerzbank analyze AUD outlook ahead of the employment report.
Do not over-interpret Australian labour market figures
Employment figures should not be over-interpreted.
In the short term, the Aussie could come under pressure again if there is another negative surprise.
In the medium term, however, other issues are likely to become relevant again, such as the stubbornly persistent inflation and the still robust real economy.
See – Australian Employment Preview: Positive data could add fuel to the AUD/USD rally
- EUR/USD comes under pressure following new highs near 1.0900.
- Extra upside should retarget the mid-1.0900s in the near term.
EUR/USD surrenders part of the recent advance to three-month highs just below 1.0900 the figure on Wednesday.
The continuation of the upward bias could see the weekly high of 1.0945 (August 30) revisited sooner rather than later. Once cleared, spot could challenge the psychological threshold of 1.1000.
So far, while above the significant 200-day SMA, the pair’s outlook should remain constructive.
EUR/USD daily chart
Despite the Federal Reserve continuing to deliver a more restrictive policy stance in 2023, Gold posted a very respectable performance. Economists at TD Securities analyze the yellow metal’s outlook.
Silver projected to do well as it trends toward $26
We believe that the combination of an expected Fed dovish pivot by Gold traders in late 2023/early 2024 and strong official sector buying should lift prices to $2,100+ on a sustained basis in 2024.
As the precious metals environment becomes favourable, Silver is also projected to do well as it trends toward $26. The white metal will benefit from lower carry costs, improved industrial demand later in 2024 and primary market deficits.
- DXY manages to regain some composure following Tuesday’s sell-off.
- Losses are expected to accelerate below the monthly low of 103.98.
DXY attempts a mild recovery to the 104.30/40 band after bottoming out just below the 104.00 support earlier in the session on Wednesday.
The breakdown of the November low of 103.98 (November 14-15) should pave the way for a quick test of the critical 200-day SMA at 103.60 prior to the weekly low of 102.96 (August 30).
In the meantime, while above the key 200-day SMA, today at 103.60, the outlook for the index is expected to remain constructive.
DXY daily chart
- EUR/JPY advances to new highs near 164.00.
- Overbought conditions warn against further upside.
EUR/JPY climbs further and flirts with the 164.00 mark on Wednesday, new yearly peaks.
Further upside appears well on the cards for the cross in the short-term horizon. Against that, the surpass of the 2023 high of 163.94 (November 15) is expected to face the next significant resistance level not before the 2008 top of 169.96 (July 23).
In the meantime, the daily RSI enters the overbought territory near 74, opening the door to a potential near-term corrective move.
So far, the longer term positive outlook for the cross appears favoured while above the 200-day SMA, today at 152.46.
EUR/JPY daily chart
- USD/CAD finds support near 1.3660 on slower-than-anticipated decline in US Retail Sales data.
- Lower demand for automobiles weighs on overall consumer spending.
- Oil prices face pressure near $80.00 amid easing Middle East tensions.
The USD/CAD pair finds an intermediate support near 1.3660 as the US Census Bureau has reported that Retail Sales declined by a slower pace in October. Monthly Retail Sales contracted slightly by 0.15 against expectations of a 0.3% decline. Consumer spending was gained by 0.7% in September.
Monthly Retail Sales ex-autos rose by 0.1% while investors projected a stagnant performance. The economic data indicates that overall domestic sales were weighed down due to a sharp decline in demand for automobiles as higher borrowing costs have hit the cost of living of households.
The US headline Producer Price Index (PPI) has dropped sharply due to a sharp fall in gasoline prices. Annual headline PPI rose at a slower pace of 1.3% against estimates of 1.9% and the former reading of 2.22%. In the same period, the core PPI decelerated to 2.4% versus expectations and the prior release of 2.7%.
The US Dollar Index (DXY) attempted some recovery after the release of the US Retail Sales data. The USD Index was heavily dumped by the market participants on Tuesday as the US inflation report for October turned out softer than expected. The annual headline inflation grew by 3.2%, which was slowest in the past two years.
The core Inflation slowed to 4.0% versus. expectations and the former reading of 4.1%. A nominal slowdown in core inflation demonstrates stickiness, which remained a concern for Federal Reserve (Fed) policymakers due to which they leaned towards further policy-tightening last week. Fed Chair Jerome Powell also commented that current interest rates seem inadequate to tame price pressures.
Going forward, investors will keenly watch the outcome of the meeting between US President Joe Biden meeting with China’s President Xi Jinping at the White House.
Meanwhile, the oil price fell back after failing to extend gains above the crucial resistance of $80.00 as Middle East tensions have started easing. It is worth noting that Canada is the leading exporter of oil in the United States and lower oil prices impact the Canadian Dollar.
Alvin Liew, Senior Economist at UOB Group, comments on the latest release of US inflation figures.
Key Takeaways
Key US CPI inflation measures came in cooler than expected in Oct. Headline inflation came in at 0.0% m/m, 3.2% y/y from 0.4% m/m, 3.7% y/y in Sep, as the continued rise in housing and food costs was offset by falling gasoline prices. In comparison, core CPI inflation rose by 0.2% m/m, 4.0% y/y in Oct from 0.3% m/m, 4.1% y/y in Sep.
Revised US Inflation Outlook: Taking stock of the latest price trajectory, we continue to expect headline inflation to cool towards end 2023 and into 2024. We continue to expect headline CPI inflation to stay at 3.2% by Dec 2023, and this implies headline CPI inflation will average about 4.1% for 2023, and we expect the easing of prices to continue next year, to average 2.0% in 2024. We still expect core inflation to continue to ease but may only reach 3.9% y/y by end-2023 (previous forecast: 3.0%), still well above the Fed’s 2% objective. For the full year, we expect core inflation to average 4.8% in 2023 (previous forecast: 4.7%) and continue to ease to average 2.2% in 2024.
USD steadies after sharp CPI-driven losses. Shaun Osborne, Chief FX Strategist at Scotiabank, analyzes Greenback’s outlook.
More losses seem likely in the near-to-medium term
The sharp slide in the USD overall on Tuesday adds to the growing body of evidence from price action that the H2 USD rally is reversing. A good chunk of that gain has already been taken back but more losses seem likely to me in the near-to-medium term.
Fundamentals are less favourable for the USD and short, medium and longer-term price signals are leaning USD-bearish now.
A weak close for the DXY through November will seal a long-term (monthly) reversal signal on the charts.
Markets have been in ‘buy USD dip’ mode since mid-year; that will transition to ‘sell USD rallies’ from here.
- Producer inflation in the US continued to decelerate in October.
- US Dollar Index stays in daily range above 104.00 after the PPI data.
The Producer Price Index (PPI) for final demand in the US rose 1.3% on a yearly basis in October, down from the 2.2% increase recorded in September, the data published by the US Bureau of Labor Statistics revealed on Wednesday. This reading came in lower than the market expectation of 1.9%.
The annual Core PPI increased 2.4% in the same period, below the August reading and analysts' estimate of 2.7%. On a monthly basis, the Core PPI was unchanged.
Market reaction
The US Dollar Index continues to fluctuate in a relatively tight daily channel slightly above 104.00 following the PPI figures.
- US Retail Sales decline 0.1% in October, beating miss estimates.
- Core Retail Sales in the US arrive at 0.1%, Control Group Sales rise by 0.2%.
- The US Dollar whipsaws after the US data release.
Retail Sales in the United States, a measure of the country’s consumer spending, dropped 0.1% on a monthly basis in October, compared to the September increase of 0.9%, the official data published by US Census Bureau showed on Wednesday. The data came in better than the market expectation of -0.3%.
US Retail Sales Ex-Autos arrived at 0.1% in the reported period, as against the estimate of 0% and September’s 0.8% increase.
Retail Sales Control Group for October showed an increase of 0.2%.
Market reaction
The US Dollar dropped and popped against its major rivals in a knee-jerk reaction to the US Retail Sales data. The US Dollar Index (DXY) fell to 103.99 before rebounding to 104.25, where it now wavers.
USD/CAD moves below the 1.37 level. Economists at Scotiabank analyze the pair’s outlook.
Intraday resistance is 1.3705/1.3710
The USD slide has steadied but the USD/CAD pair is not really doing enough on the short-term charts to avert continued downside pressure towards key support at 1.3655. Sustained USD losses through here would suggest another, significant leg lower in funds was unfolding.
Intraday resistance is 1.3705/1.3710, with stronger resistance at 1.3750/1.3760 now.
See – GBP/USD: Minor losses should find support in the low 1.24 zone – Scotiabank
- AUD/USD aims for more upside amid risk-on mood.
- The USD Index faces an intense sell-off due to easing US consumer inflation.
- AUD/USD aims to climb above the immediate resistance plotted from 0.6520.
The AUD/USD pair faces pressure around 0.6520 in the late European session. The rally in the Aussie asset stalls as investors await the United States Retail Sales data for October, which will be published at 13:30 GMT.
As per the consensus, consumer spending contracted by 0.3% against 0.7% growth in September. Weak consumer spending data would put more pressure on the US Dollar. The US Dollar has been facing a sell-off due to easing consumer inflation in the US economy.
The US inflation report for October indicated that the headline inflation grew at the slowest growth in more than two years. The annual headline CPI rose by 3.2%, softened from estimates of 3.3% and the former reading of 3.7%.
AUD/USD aims to climb above the immediate resistance plotted from August 15 high around 0.6520. The Asset aims to stabilize above the 50-day Exponential Moving Average (EMA), which trades around 0.6420, indicating that the near-term trend is upbeat.
AUD/USD daily chart
-638356498315514570.png)
Further upside momentum in USD/IDR should meet strong resistance around 15,840, suggests Markets Strategist Quek Ser Leang at UOB Group.
Key Quotes
Our view for USD/IDR to weaken further last week was incorrect. Instead of weakening further, USD/IDR rebounded from 15,500 to 15,710 and ended the week at 15,690 (-0.22%). The rebound only resulted in a slight increase in momentum.
This week, while there is room for USD/IDR to rebound further, any advance is highly unlikely to break above the major resistance at 15,840 (minor resistance is at 15,770). Support is at 15,615, followed by 15,570.
Sterling is the weakest performing major currency on the day. Economists at Scotiabank analyze Cable’s outlook.
Cable is forming a short-term top/reversal signal on the intraday chart
Cable is forming a short-term top/reversal signal (‘evening star’) on the intraday chart. Cable’s peak is developing right on the 200-DMA (1.2514) so price action merits some close attention.
The broader trend in the Pound continues to look constructive, however, with trend indicators aligned bullishly on the intraday and daily studies.
Minor GBP losses should find support in the low 1.24 zone for now.
EUR/USD should find support on modest dips, economists at Scotiabank report.
Downside pressure likely to be limited for now
Short-term trading patterns suggest the EUR may have reached a short-term peak (via the formation of a bearish ‘evening star’ pattern on the six-hour chart). Downside pressure on spot is likely to be limited for now, however.
Short, medium and longer-term technical signals are leaning bullish and bull trend momentum signals are aligned positively for the EUR on the intraday and daily oscillators.
Firm support for the EUR should develop on minor dips to the mid-1.07s.
- The Greenback dropped over 1.5% on Tuesday, its worst performance in over a year.
- Traders are quickly selling the Greenback after lower than expected CPI signals the Fed is done hiking rates.
- The US Dollar Index tries to recover some losses ahead of PPI and Retail Sales data.
The US Dollar (USD) is trading into a new reality on Wednesday. Lower-than-expected Consumer Price Index (CPI) numbers for October led to a tectonic shift in all asset classes of financial markets: equities jumped, commodities rallied, bonds surged and in the forex market the Scandinavian and Central-Eastern European (CEE) currencies were the biggest winners on the back of a losing Greenback.
The calendar this Wednesday is again a very packed one: US Retail Sales and Producer Price Index numbers are due to be released. Expectations are elevated after Tuesday’s inflation figures, so the data releases are likely to only dampen the recent euphoria in markets. The US Dollar Index (DXY) is expected to claw back a touch, while traders brace for any headlines from San Francisco, where US President Joe Biden will meet with ChinesePresident Xi Jinping.
Daily digest: US Dollar erased two months of gains
- The US budget deadline is due to kick in on November 17. Sentiment was further boosted on Tuesday by growing hopes that a Us government shutdown would be avoided.
- US President Joe Biden is set to meet Chinese President Xi Jinping at the historic Filoli estate south of San Francisco on Wednesday.
- Wednesday’s calendar has kicked off with the print of the Mortgage Bankers Association (MBA)’s weekly mortgage applications which rose by 2.8% last week.
- Around 13:30 GMT, the New York Empire State Manufacturing Index for November will be released. Expectations is a less severe contraction from -4.6 to - 2.8.
- At 13:30 GMT, a big batch of data to come out:
- The Producer Price Index (PPI):
- The monthly headline PPI is expected to head from 0.5% to 0.1%, with expectations ranging from -0.3% to 0.4%.
- The monthly Core PPI is expected to stay steady at 0.3%, with expectations ranging from 0.1% to 0.3%.
- The yearly headline PPI is expected to head from 2.2% to 1.9%, with expectations ranging from 1.6% to 2.2%.
- The yearly Core PPI is expected to stay steady at 2.7%, with expectations ranging from 2.5% to 2.8%.
- US Retail Sales figures:
- The monthly figure for October is expected to head from 0.7% to -0.3%, with expectations ranging from -0.7% to 0.3%.
- The Retail Sales Control Group number is expected to head from 0.6% to 0.2%, with expectations ranging from -0.3% to 0.5%
- As always, the revisions will be more market moving than the actual numbers. So watch out for any knee-jerk reactions minutes after the new figures print.
- The Producer Price Index (PPI):
- Around 15:00 GMT, Business Inventories for September are expected to remain steady at 0.4%.
- Equities are taking over the enthusiasm from Tuesday. The Hang Seng is the biggest winner, up over 3%. In Europe, all important European indices are near 1% in the green, while US equities futures only mildly up.
- The CME Group’s FedWatch Tool shows that markets are pricing in a 94.5% chance, up from 85.7% on Tuesday morning, that the Federal Reserve will keep interest rates unchanged at its meeting in December.
- The benchmark 10-year US Treasury yield trades at 4.45%, which is a substantial move lower from the 4.64% on Monday.
US Dollar Index technical analysis: US Dollar to put up a fight
The US Dollar had its worst intraday performance in over 52 weeks, with a devaluation of more than 1.50% in the US Dollar Index (DXY). Nonetheless, traders need to watch out as the Greenback could put up a fight. Hopes for even more fading inflation are high ahead of the Producer Price Index (PPI) data, so the odds are in favor of the Greenback to at least erase some losses from Tuesday in the DXY.
The DXY is being stopped around the 100-day Simple Moving Average (SMA) near 104.15. Expect to see a bounce from there with 105.29, the low of November 6, as the market where the DXY should try to close above for this week. From there, the 55-day SMA at 105.71 is the next market on the topside that needs to be reclaimed by US Dollar bulls before starting to think of more US Dollar strength to come into play.
Traders were warned that when the US Dollar Index would slide below that 55-day SMA, a big air pocket was opening up that could see the DXY fall substantially, and did materialise on Tuesday. For now the 100-day SMA tries to hold, though at 103.61, the 200-day SMA is a much better candidate to look for support. Should that level even be broken substantially, a long term sell-off could get underway with the DXY falling between 101 and100.
US Dollar FAQs
What is the US Dollar?
The US Dollar (USD) is the official currency of the United States of America, and the ‘de facto’ currency of a significant number of other countries where it is found in circulation alongside local notes. It is the most heavily traded currency in the world, accounting for over 88% of all global foreign exchange turnover, or an average of $6.6 trillion in transactions per day, according to data from 2022.
Following the second world war, the USD took over from the British Pound as the world’s reserve currency. For most of its history, the US Dollar was backed by Gold, until the Bretton Woods Agreement in 1971 when the Gold Standard went away.
How do the decisions of the Federal Reserve impact the US Dollar?
The most important single factor impacting on the value of the US Dollar is monetary policy, which is shaped by the Federal Reserve (Fed). The Fed has two mandates: to achieve price stability (control inflation) and foster full employment. Its primary tool to achieve these two goals is by adjusting interest rates.
When prices are rising too quickly and inflation is above the Fed’s 2% target, the Fed will raise rates, which helps the USD value. When inflation falls below 2% or the Unemployment Rate is too high, the Fed may lower interest rates, which weighs on the Greenback.
What is Quantitative Easing and how does it influence the US Dollar?
In extreme situations, the Federal Reserve can also print more Dollars and enact quantitative easing (QE). QE is the process by which the Fed substantially increases the flow of credit in a stuck financial system.
It is a non-standard policy measure used when credit has dried up because banks will not lend to each other (out of the fear of counterparty default). It is a last resort when simply lowering interest rates is unlikely to achieve the necessary result. It was the Fed’s weapon of choice to combat the credit crunch that occurred during the Great Financial Crisis in 2008. It involves the Fed printing more Dollars and using them to buy US government bonds predominantly from financial institutions. QE usually leads to a weaker US Dollar.
What is Quantitative Tightening and how does it influence the US Dollar?
Quantitative tightening (QT) is the reverse process whereby the Federal Reserve stops buying bonds from financial institutions and does not reinvest the principal from the bonds it holds maturing in new purchases. It is usually positive for the US Dollar.
- The New Zealand Dollar continues rising on Wednesday as positive news from China helps boost commodity prices.
- The Kiwi had already rebounded after lower-than-expected US CPI data led to hopes of an end to the global rate-hiking cycle.
- NZD/USD breaks to fresh highs and targets the October highs at 0.6055.
The New Zealand Dollar (NZD) continues to build on the previous day’s gains midweek after a raft of positive growth stories from China, its largest trading partner, boosted the prospects for exports.
From a technical perspective, the pair’s short-term trend has turned bullish again and is closing in on the key October 2023 highs at 0.6055.
Daily digest market movers: New Zealand Dollar: China in the spotlight
- The New Zealand Dollar rallies after data from China lifts the outlook for trade and reverses the recent spate of lackluster readings.
- A support package from the Chinese government, amounting to an injection of 1 trillion Yuan in low-cost financing for the beleaguered property sector, also helps allay fears of a credit crunch, according to a report originally from Bloomberg News.
- Data out early Wednesday morning showed Chinese Retail Sales rose 7.6% in October YoY, squarely beating estimates of 7.0% and 5.5% previously, according to the National Bureau of Statistics of China.
- Industrial Production also beat expectations, coming out at 4.6% YoY in October versus consensus estimates of 4.5% and 4.5% previously.
- Fixed Asset Investment came in at a lower 2.9% than the 3.1% forecast (YoY YTD in October) and the 3.1% previous.
- The strong Chinese data, coupled with lower inflation data from the US, UK and several European countries, lessened global growth fears and led to a surge in risk appetite, with stock indices across the globe seeing marked rallies.
- New Zealand is a major exporter of dairy products to China, so the positive newsflow helped support the prospects for the economy and demand for the New Zealand Dollar.
- The US Dollar has fallen after inflation data suggested a greater chance of no further increases to interest rates. This makes the US a less attractive place for global investors to park their capital, reducing demand for the USD.
New Zealand Dollar technical analysis: NZD/USD continues rallying
NZD/USD – the number of US Dollars one New Zealand Dollar can buy – extends its rally above the important November 3 high at 0.6001 and sets its sights on the 0.6055 October high.
-638356476496180290.png)
New Zealand Dollar vs US Dollar: Daily Chart
The break above 0.6001 confirms the short-term bullish bias again, with the next target at 0.6055.
The pair has now broken cleanly above the 100-day Simple Moving Average (SMA) and a further push above the 0.6055 October high would change the outlook in the medium term, indicating the possibility of the birth of a new uptrend. Such a move would then target the 200-day SMA at around 0.6100.
As things stand, the medium and long-term trends are both still bearish, however, suggesting the potential for more downside remains strong.
New Zealand Dollar FAQs
What key factors drive the New Zealand Dollar?
The New Zealand Dollar (NZD), also known as the Kiwi, is a well-known traded currency among investors. Its value is broadly determined by the health of the New Zealand economy and the country’s central bank policy. Still, there are some unique particularities that also can make NZD move. The performance of the Chinese economy tends to move the Kiwi because China is New Zealand’s biggest trading partner. Bad news for the Chinese economy likely means less New Zealand exports to the country, hitting the economy and thus its currency. Another factor moving NZD is dairy prices as the dairy industry is New Zealand’s main export. High dairy prices boost export income, contributing positively to the economy and thus to the NZD.
How do decisions of the RBNZ impact the New Zealand Dollar?
The Reserve Bank of New Zealand (RBNZ) aims to achieve and maintain an inflation rate between 1% and 3% over the medium term, with a focus to keep it near the 2% mid-point. To this end, the bank sets an appropriate level of interest rates. When inflation is too high, the RBNZ will increase interest rates to cool the economy, but the move will also make bond yields higher, increasing investors’ appeal to invest in the country and thus boosting NZD. On the contrary, lower interest rates tend to weaken NZD. The so-called rate differential, or how rates in New Zealand are or are expected to be compared to the ones set by the US Federal Reserve, can also play a key role in moving the NZD/USD pair.
How does economic data influence the value of the New Zealand Dollar?
Macroeconomic data releases in New Zealand are key to assess the state of the economy and can impact the New Zealand Dollar’s (NZD) valuation. A strong economy, based on high economic growth, low unemployment and high confidence is good for NZD. High economic growth attracts foreign investment and may encourage the Reserve Bank of New Zealand to increase interest rates, if this economic strength comes together with elevated inflation. Conversely, if economic data is weak, NZD is likely to depreciate.
How does broader risk sentiment impact the New Zealand Dollar?
The New Zealand Dollar (NZD) tends to strengthen during risk-on periods, or when investors perceive that broader market risks are low and are optimistic about growth. This tends to lead to a more favorable outlook for commodities and so-called ‘commodity currencies’ such as the Kiwi. Conversely, NZD tends to weaken at times of market turbulence or economic uncertainty as investors tend to sell higher-risk assets and flee to the more-stable safe havens.
NOK had a good day on Tuesday after the US CPI figures came in a tad better than expected. Economists at Nordea analyze Krone’s outlook.
EUR/NOK seen closer to 11.00 and USD/NOK around 10.00 in one year’s time
For the NOK to strengthen on a sustained basis, rates abroad need to be cut and for that to happen the disinflation process needs to continue at such a pace that central banks believe 2% will be reached on a sustained basis. This will take time.
After next summer, we expect a couple of rate cuts from the ECB (and perhaps even from the Fed) to support the NOK. Moreover, China’s stimulus measures should be beneficial for the economy and commodity markets in the year to come. This is why we see EUR/NOK closer to 11.00 and USD/NOK around 10.00 in one year’s time.
USD/MYR could trade between 4.6540 and 4.7550 in the next few weeks, according to Markets Strategist Quek Ser Leang at UOB Group.
Key Quotes
Last Monday (06 Nov), when USD/MYR was trading at 4.6900, we highlighted that “the outlook for USD/MYR is still negative.” We added, “it could drop to 4.6480, but the next support at 4.6300 is likely out of reach for now.” While USD/MYR then plunged to a low of 4.6260, it snapped back up and ended the week at 4.7060 (-0.42%). Downward pressure has faded with the sharp bounce.
This week, we expect USD/MYR to consolidate, likely in a range of 4.6540/4.7550.
Economists at Morgan Stanley assess USD outlook for the next year.
Recent strengthening of USD to continue for a while longer
We expect the recent strengthening of the US Dollar to continue for a while longer.
US growth, while slowing, is expected to outperform consensus expectations and remain near potential growth rates in the first half of 2024. This is going to contrast quite sharply with recessionary or near recessionary conditions in Europe and pretty uncompelling rates of growth in China.
When we look at our US and European rate strategy teams’s forecasts, they have rates moving in favor of the Dollar.
The Dollar likely is going to keep outperforming other currencies around the world due to its pretty defensive characteristics in a world of continued low growth, and downside risks from very tight central bank monetary policy and geopolitical risks. The Dollar not only offers liquidity and safe haven status but also high yields, which is of course making it pretty appealing.
We do not expect this early strength in USD to last all year, though, as fiscal support for the US economy falls back and the impact of high rates takes over, US growth slows down and the Fed starts to cut around the middle of the year.
- WTI Oil trades in the red after a volatile session on Tuesday.
- The US Dollar is trading in another universe after a substantial devaluation.
- Oil upticks are still to be factored in, while the overall downside is the most probable outcome.
Oil prices are in the red again after crude briefly tried to break $80.00 on Tuesday. The drop in US inflation numbers trembled the markets and saw equities and bond prices soaring substantially higher. Oil traders this Thursday will for sure be asking themselves if Crude prices cannot rally on the Fed being done hiking, and Chinese economic data overnight pointing to a quicker-than-expected recovery, then what will?
Meanwhile, the US Dollar (USD) has undergone its biggest intraday devaluation in over 52 weeks. The US Dollar Index (DXY) dropped by more than 1.5% intraday. With the markets now going all-in on the idea that the US Federal Reserve is done hiking, demand in the economy should pick up from now.
Crude Oil (WTI) trades at $77.80 per barrel, and Brent Oil trades at $82.00 per barrel at the time of writing.
Oil news and market movers: markets not scared of extensions
- Later this Wednesday all eyes will be on San Francisco, where US President Joe Biden and Chinese President Xi Jinping are meeting.
- The US Energy department confirmed it bought near 1.2 million barrels from two companies in order to refill the Strategic Petroleum Reserve.
- Overnight, the American Petroleum Institute (API) revealed a build of inventories by 1.3 million barrels last week.
- Around 15:30 GMT, the Energy Information Agency (EIA) is due to release its weekly EIA Crude Oil Stocks Change. Expectations are for a drawdown of 300,000, where last week saw a build of 740,000 barrels. Estimations vary from a build of 1,700,000 to a build of 13,500,000.
Oil Technical Analysis: Nothing can move Oil higher for now
Oil prices are stuck, with only having limited upside potential it seems. With the recent string of events in global markets, Oil prices by now should have been up near $80.00 or higher, traders would presume, though markets are preferring to focus on the current sluggish demand. Expect this gridlock to stay in place until OPEC+ meets at the end of November and might intervene to provide a response to this sluggish demand climate.
On the upside, $80.00 is the resistance to watch out for. Should crude be able to jump higher again, look for $84.00 (purple line) as the next level to see some selling pressure or profit taking. Should Oil prices be able to consolidate above there, the topside for this fall near $93.00 could come back into play.
On the downside, traders are seeing a soft floor forming near $74.00. That level is acting as the last line of defence before entering $70.00 and lower. Once in that area, markets might factor in the risk of a surprise intervention from OPEC+ to jack Oil prices back up again.
-638356397242061936.png)
US WTI Crude Oil: Daily Chart
WTI Oil FAQs
What is WTI Oil?
WTI Oil is a type of Crude Oil sold on international markets. The WTI stands for West Texas Intermediate, one of three major types including Brent and Dubai Crude. WTI is also referred to as “light” and “sweet” because of its relatively low gravity and sulfur content respectively. It is considered a high quality Oil that is easily refined. It is sourced in the United States and distributed via the Cushing hub, which is considered “The Pipeline Crossroads of the World”. It is a benchmark for the Oil market and WTI price is frequently quoted in the media.
What factors drive the price of WTI Oil?
Like all assets, supply and demand are the key drivers of WTI Oil price. As such, global growth can be a driver of increased demand and vice versa for weak global growth. Political instability, wars, and sanctions can disrupt supply and impact prices. The decisions of OPEC, a group of major Oil-producing countries, is another key driver of price. The value of the US Dollar influences the price of WTI Crude Oil, since Oil is predominantly traded in US Dollars, thus a weaker US Dollar can make Oil more affordable and vice versa.
How does inventory data impact the price of WTI Oil
The weekly Oil inventory reports published by the American Petroleum Institute (API) and the Energy Information Agency (EIA) impact the price of WTI Oil. Changes in inventories reflect fluctuating supply and demand. If the data shows a drop in inventories it can indicate increased demand, pushing up Oil price. Higher inventories can reflect increased supply, pushing down prices. API’s report is published every Tuesday and EIA’s the day after. Their results are usually similar, falling within 1% of each other 75% of the time. The EIA data is considered more reliable, since it is a government agency.
How does OPEC influence the price of WTI Oil?
OPEC (Organization of the Petroleum Exporting Countries) is a group of 13 Oil-producing nations who collectively decide production quotas for member countries at twice-yearly meetings. Their decisions often impact WTI Oil prices. When OPEC decides to lower quotas, it can tighten supply, pushing up Oil prices. When OPEC increases production, it has the opposite effect. OPEC+ refers to an expanded group that includes ten extra non-OPEC members, the most notable of which is Russia.
The euphoric market reaction to Tuesday’s release of softer-than-expected US CPI inflation data is now set to be re-examined. Economists at Rabobank analyze USD outlook.
EUR bulls will likely run into headwinds over the coming months
Headwinds to Chinese growth, combined with the prospect of a recession in the US early next year and the possibility that the Eurozone is already in a recession have been viewed by us as hurdles to risk appetite and therefore supportive factors for the USD. Early Fed rate cuts combined with a less negative outlook for Chinese growth would counter this view and undermine the value of the USD. However, it is unlikely to be an easy ride for USD bears.
It is very likely that Fed officials will retain a cautious view on policy for now. Also, while Chinese data may be showing more sparks of life, weak foreign investment data in the country suggests that it might be a while before optimism broadens. Additionally, weak growth in the Eurozone suggests that EUR bulls will likely run into headwinds over the coming months. The German economy is mired in stagnation suggesting that the EUR could also be bounced around by rate cut speculation in the weeks ahead.
US CPI data means that our three-month forecast of EUR/USD 1.02 appears a long way away. We will be watching economic data and the reactions of policymakers closely in the coming weeks in order to evaluate this view.
In its quarterly assessment published on Wednesday, the European Commission cut its forecasts for the Eurozone’s economic growth for this year and the next, noting that the bloc could avert a technical recession.
Additional takeaways
2023 economic growth forecast lowered to 0.6% from 0.8% previously.
2024 economic growth forecast seen at 1.2%, then 1.6% in 2025.
Sees Q4 eurozone growth at 0.2% q/q after -0.1% in Q3, no technical recession.
2023 inflation forecast seen at 5.6%, then 3.2% in 2024, then 2.2% in 2025.
High inflation, interest rates, and weaker external demand took a heavier toll on growth than anticipated.
Expects aggregated Eurozone budget deficit to fall to -2.8% of GDP in 2024 from -3.2% in 2023, ease to -2.7% in 2025.
Forecasts Italy, France, Belgium, Slovakia and Malta to have a budget deficit well above EU limit of 3% in 2024 and 2025.
Expects aggregated Euro zone public debt to ease in 2024 to 89.7% of GDP from 90.4% in 2023, ease to 89.5% in 2025.
Forecasts Italian public debt, second highest in the EU, will rise to 140.6% of GDP in 2024 and 140.9% in 2025 from 139.8% in 2023.
US CPI data for October sparked the largest sell-off of the US Dollar since – coincidentally – the same October CPI report in November 2022. Economists at MUFG Bank analyze USD outlook.
Big USD sell-off marks potential for more to come
We suspect the scale of the sell-off of the Dollar on Tuesday could also prove meaningful and mark another turning point that sees the USD extend this weakness further.
The Fed is now even more likely finished its tightening cycle. A rate cut by May 2024 is now an 80% probability with 85 bps priced by November 2024. There remains plenty of scope for further cuts to be priced if the activity Data starts to weaken and in those circumstances, EUR/USD advancing to the 1.1500 level in 2024 is very feasible.
Further upside remains likely in USD/THB, although a visit to the 36.50 zone seems not favoured for the time being, argues Markets Strategist Quek Ser Leang at UOB Group.
Key Quotes
While we expected USD/THB to weaken last week, we highlighted that “in view of the oversold conditions, it remains to be seen if 35.05 is within reach.” We added, “Resistance is at 35.75; a breach of 36.01 would mean that USD/THB is not weakening further.” USD/THB then weakened less than expected to 35.38 before staging a surprisingly sharp rebound to 36.07.
This week, USD/THB could continue to rebound, but any advance is unlikely to break above the major resistance at 36.53 (there is another resistance at 36.35). On the downside, if USD/THB breaks below 35.65 (minor support is at 35.85), it would indicate that it is not rebounding further.
Gold rallied after US inflation came in lower than expected. Strategists at ANZ Bank analyze the yellow metal’s outlook.
Geopolitical tensions becoming a recurring feature
Soft inflation data is likely to take the pressure off the Fed to further tighten monetary policy this year. This sparked some strong buying in the precious metal and is likely to support further investment demand of Gold.
We also see geopolitical tensions becoming a recurring feature, which should see a structural risk premium embedded.
A drive by central banks to diversify their reserves has been a feature of the Gold market since early 2022. Increasing geopolitical risks will fuel this trend. This should reduce the burden on physical and investment demand for clearing the market surplus.
- GBP/JPY corrects gradually from 188.00 as UK consumer inflation declines.
- UK Sunak has fulfilled his promise of halving inflation to 5.4% by the year-end.
- Investors expect that the pace of transition from BoJ’s ultra-easy monetary stance to policy normalization would be slow.
The GBP/JPY pair drops after failing to sustain above the crucial resistance of 188.00. The cross fell as inflationary pressures in the United Kingdom economy remained softer than expectations.
The UK Office for National Statistics (ONS) has reported that the monthly headline Consumer Price Index (CPI) remained stagnant in October due to falling gas prices. The annual headline inflation rose by 4.6%, slower than expectations of 4.8% and the prior reading of 6.7%.
After a sharp decline in headline inflation, UK Prime Minister (PM) Rishi Sunak said that “while it is welcome news that prices are no longer rising as quickly, we know many people are continuing to struggle.”
A significant fall in headline inflation to 4.6% indicates that Rishi Sunak has fulfilled his promise of halving inflation to 5.4% by the year-end. The core inflation which doesn’t take volatile oil and food prices into consideration, decelerated to 5.7% against expectations of 5.8% and the former reading of 6.1%.
Producers cut prices of inputs and end-products at factory gates due to slowing demand from the domestic and overseas markets.
A soft UK inflation report has squeezed expectations of further policy-tightening by the Bank of England (BoE). Easing labor market conditions and inflation would allow BoE policymakers to keep interest rates unchanged at 5.25%.
Meanwhile, the broader appeal for the Japanese Yen remains downbeat as investors expect that the pace of transition from an ultra-easy monetary stance to policy normalization by the Bank of Japan (BoJ) would be extremely slow. A delay in stealth intervention plans by the Japanese authority has also impacted demand for the Japanese Yen.
- Gold price rises for the straight third trading session due to easing US inflation.
- The US headline CPI rose at 3.2%, its slowest pace for two years.
- Investors await US Retail Sales, PPI, and the outcome of the Biden-Xi meeting.
Gold price (XAU/USD) extends rally as easing price pressures in the US economy have dented bets of further policy-tightening by the Federal Reserve (Fed). The precious metal capitalized on slow growth in the US headline inflation, which decelerated due to a sharp fall in gasoline prices. The soft US inflation report for October indicates that current interest rates set by the Fed are adequate to bring down inflation to 2%.
The US Dollar and bond yields are down as the soft Consumer Price Index (CPI) has underpinned a risk-on impulse. Easing consumer inflation has boosted confidence among investors in the possibility of early rate cuts by the Fed. Going forward, market participants will keenly watch monthly US Retail Sales data and the Producer Price Index (PPI) report for October.
Daily Digest Market Movers: Gold price jumps on easing price pressures
- Gold price aims to extend recovery above $1,970.00 as a substantial decline in the US consumer inflation in October indicates that the Federal Reserve will likely not raise interest rates further.
- The US inflation data for October, released on Tuesday, indicated that headline inflation decelerated significantly. The annual headline CPI rose by 3.2%, softened from estimates of 3.3% and the former reading of 3.7%. This was the slowest growth in headline inflation in more than two years.
- A significant decline in the headline inflation rate was prompted by a sharp fall in global Oil prices.
- Rental prices continued to rise in October but at a slower pace than in September. Food and grocery prices expanded at a higher pace of 0.3%.
- Monthly core inflation, which takes out volatile Oil and food prices grew by 0.2% against estimates – and September’s growth rate – of 0.3%. Annual core inflation rose by 4.0%, decelerated from expectations and the prior release of 4.1%.
- Though core inflation declined more than expectations, the pace of decline was nominal, which indicates lingering stickiness. This remained a major concern for Federal Reserve policymakers last week, which forced them to lean toward raising interest rates further.
- Last week, Federal Reserve Chairman Jerome Powell commented that the central bank won’t hesitate in tightening monetary policy further as a failure to control inflation would be their biggest mistake.
- After the release of the US inflation data, Richmond Federal Reserve Bank President Thomas Barkin, speaking at an event in South Carolina, said the core inflation was partly offset by supply shortages.
- Thomas Barkin added that the central bank is making real progress on inflation but is not convinced inflation is on a smooth glide path back to its 2% target (for Core CPI). Barkin warned that the Fed needs to do more to curb demand and inflation.
- Latest inflation figures have turned the tide in favor of keeping interest rates unchanged by the Fed in the range of 5.25-5.50%. Economists hope that the Fed is done with hiking interest rates and that discussions about cutting interest rates will be early.
- The US Dollar Index (DXY) faced an intense sell-off after the release of the soft inflation report. The USD Index has refreshed its two-month low near 104.00 as easing inflationary pressures accelerated risk-taking. 10-year US Treasury yields fell sharply to 4.43%.
- Going forward, investors will focus on the monthly US Retail Sales data and Producer Price Index (PPI) for October, which will be published at 13:30 GMT.
- As per the consensus, the US Retail Sales contracted by 0.3% against an expansion of 0.7% in September. A sharp decline in consumer spending could keep pressure on the US Dollar.
- In addition to the US economic data, US President Joe Biden’s meeting with China’s President Xi Jinping at the White House will be keenly watched. Discussions about the Israel-Palestine war are widely anticipated.
- Gains in Gold could be limited due to risk-on mood and easing Middle East tensions.
Technical Analysis: Gold price rises close to $1,970
Gold price jumps close to $1,970.00 after the release of the soft US inflation report. The precious metal resumed its upside journey after discovering significant buying interest near the 50-day Exponential Moving Average (EMA). The recovery in Gold has been extended above the 20-day, which indicates that the broader appeal has turned extremely bullish.
Gold FAQs
Why do people invest in Gold?
Gold has played a key role in human’s history as it has been widely used as a store of value and medium of exchange. Currently, apart from its shine and usage for jewelry, the precious metal is widely seen as a safe-haven asset, meaning that it is considered a good investment during turbulent times. Gold is also widely seen as a hedge against inflation and against depreciating currencies as it doesn’t rely on any specific issuer or government.
Who buys the most Gold?
Central banks are the biggest Gold holders. In their aim to support their currencies in turbulent times, central banks tend to diversify their reserves and buy Gold to improve the perceived strength of the economy and the currency. High Gold reserves can be a source of trust for a country’s solvency. Central banks added 1,136 tonnes of Gold worth around $70 billion to their reserves in 2022, according to data from the World Gold Council. This is the highest yearly purchase since records began. Central banks from emerging economies such as China, India and Turkey are quickly increasing their Gold reserves.
How is Gold correlated with other assets?
Gold has an inverse correlation with the US Dollar and US Treasuries, which are both major reserve and safe-haven assets. When the Dollar depreciates, Gold tends to rise, enabling investors and central banks to diversify their assets in turbulent times. Gold is also inversely correlated with risk assets. A rally in the stock market tends to weaken Gold price, while sell-offs in riskier markets tend to favor the precious metal.
What does the price of Gold depend on?
The price can move due to a wide range of factors. Geopolitical instability or fears of a deep recession can quickly make Gold price escalate due to its safe-haven status. As a yield-less asset, Gold tends to rise with lower interest rates, while higher cost of money usually weighs down on the yellow metal. Still, most moves depend on how the US Dollar (USD) behaves as the asset is priced in dollars (XAU/USD). A strong Dollar tends to keep the price of Gold controlled, whereas a weaker Dollar is likely to push Gold prices up.
Following the US CPI data, EUR/USD powered above 1.08. Economists at Société Générale analyze the pair’s outlook.
Seasonality for the Euro is bullish in December
A return of US 10-year yields to 5% looks implausible in the same way that 10-year Bund yields may not revisit 3% or Gilts to 4.75%.
Momentum and direction may be checked today if US Retail Sales surprise to the upside, but a disappointing outcome could help bonds claw back more ground and nudge EUR/USD above 1.09.
The Fed and other central banks, including the ECB and BoE may conclude nothing has changed after this week and that the ‘higher for longer mantra’ still applies.
Irrespective of Fed and ECB messages next month, seasonality for the Euro is bullish in December.
See – US Retail Sales Preview: Forecasts from seven major banks, retreat in consumption for first time since March
Further correction could drag USD/CNH to the 7.2000 region in the short-term horizon, according to Markets Strategist Quek Ser Leang and Economist Lee Sue Ann at UOB Group.
Key Quotes
24-hour view: Yesterday, we held the view that USD “is likely to trade with a downward bias, but any decline is unlikely to break the major support at 7.2700.” However, USD broke below 7.2700 and plummeted to a low of 7.2498. While severely oversold, USD could weaken further. That said, the major support at 7.2380 is likely out of reach today. The downside risk is intact unless USD breaks above 7.2770 (minor resistance is at 7.2700).
Next 1-3 weeks: Our most recent narrative was from last Friday (10 Nov, spot at 7.3020), wherein “the recent buildup in downward momentum has faded, and USD is likely to trade sideways between 7.2700 and 7.3320. Yesterday, USD broke below 7.2700 and plummeted to 7.2498. Downward momentum has increased, and USD is likely to weaken further to 7.2380. If USD breaks clearly below 7.2380, the focus will shift to 7.2000. In order to maintain the rapid momentum buildup, USD must not break above 7.3000.
The Dollar plummeted after a softer-than-expected US CPI reading. Economists at ING analyze USD outlook.
Dollar slump looks overdone
We still think a turn in activity data – more than the disinflation story – is needed to take the Dollar sustainably lower, and the move appears overdone also from a short-term valuation perspective.
Today, October Retail Sales will be watched closely after coming in very strong in September. Consensus is for a 0.3% MoM decline in the headline figure but a 0.2% increase in the index excluding auto and gas. The dollar should be very sensitive to the release. A soft reading may fuel speculation that softer growth is coming through and could add to disinflation to trigger more Fed dovish bets. However, US activity data has had a tendency to surprise on the upside, if anything, and it may be too early to see a slew of soft readings.
See – US Retail Sales Preview: Forecasts from seven major banks, retreat in consumption for first time since March
- The Euro retreats modestly vs. the US Dollar.
- European stocks extend the weekly optimism on Wednesday.
- US Producer Prices, Retail Sales take centre stage.
The Euro (EUR) loses some upside momentum against the US Dollar (USD), motivating EUR/USD to give away part of the recent strong gains and revisit the 1.0870 zone on Wednesday.
On the flip side, the Greenback appears mildly bid in the low 104.00s as investors continue to digest Tuesday’s below-consensus US inflation figures and the subsequent steep sell-off in the USD Index (DXY).
The so-far lacklustre advance in the Greenback comes amidst the absence of direction in US yields across the curve, as cautiousness remains high in light of the upcoming release of further inflation measures, this time from Producer Prices, as well as Retail Sales for the month of October.
The publication of weaker-than-expected US CPI reignited speculation of potential interest rate cuts by the Fed, most likely around the summer of 2024.
In the domestic calendar, the European Commission (EC) will release its Autumn Forecasts, while Balance of Trade results are due in the broader euro area.
Daily digest market movers: Euro remains supported by USD-selling
- The EUR falters just ahead of 1.0900 vs. the USD.
- US and German yields dropped markedly post-US CPI.
- Investors anticipate that the Fed could cut rates in June-July 2024.
- The ECB is expected to extend its pause well into next year.
- FX intervention concerns remain well in place around USD/JPY.
- The European Commission publishes its Autumn Forecasts in the region.
- US Producer Prices, Retail Sales are next on tap.
- UK inflation figures surprised to the downside in October.
Technical Analysis: Euro now faces the next up-barrier at 1.0945
EUR/USD comes under some corrective decline following a move to new lows near 1.0880 on Wednesday.
Next on the upside for EUR/USD emerges the weekly high of 1.0945 (August 30) ahead of the psychological threshold of 1.1000. The surpass of this region could open the door to a visit to the August top of 1.1064 (August 10) and another weekly peak of 1.1149 (July 27), all preceding the 2023 high of 1.1275 (July 18).
Occasional bouts of weakness could prompt the pair to challenge transitory support at the 55-day SMA at 1.0639, prior to the weekly low of 1.0495 (October 13) and the 2023 low of 1.0448. (October 15).
Looking at the broader picture, while above the 200-day SMA at 1.0802, the pair’s outlook should remain constructive.
Euro FAQs
What is the Euro?
The Euro is the currency for the 20 European Union countries that belong to the Eurozone. It is the second most heavily traded currency in the world behind the US Dollar. In 2022, it accounted for 31% of all foreign exchange transactions, with an average daily turnover of over $2.2 trillion a day.
EUR/USD is the most heavily traded currency pair in the world, accounting for an estimated 30% off all transactions, followed by EUR/JPY (4%), EUR/GBP (3%) and EUR/AUD (2%).
What is the ECB and how does it impact the Euro?
The European Central Bank (ECB) in Frankfurt, Germany, is the reserve bank for the Eurozone. The ECB sets interest rates and manages monetary policy.
The ECB’s primary mandate is to maintain price stability, which means either controlling inflation or stimulating growth. Its primary tool is the raising or lowering of interest rates. Relatively high interest rates – or the expectation of higher rates – will usually benefit the Euro and vice versa.
The ECB Governing Council makes monetary policy decisions at meetings held eight times a year. Decisions are made by heads of the Eurozone national banks and six permanent members, including the President of the ECB, Christine Lagarde.
How does inflation data impact the value of the Euro?
Eurozone inflation data, measured by the Harmonized Index of Consumer Prices (HICP), is an important econometric for the Euro. If inflation rises more than expected, especially if above the ECB’s 2% target, it obliges the ECB to raise interest rates to bring it back under control.
Relatively high interest rates compared to its counterparts will usually benefit the Euro, as it makes the region more attractive as a place for global investors to park their money.
How does economic data influence the value of the Euro?
Data releases gauge the health of the economy and can impact on the Euro. Indicators such as GDP, Manufacturing and Services PMIs, employment, and consumer sentiment surveys can all influence the direction of the single currency.
A strong economy is good for the Euro. Not only does it attract more foreign investment but it may encourage the ECB to put up interest rates, which will directly strengthen the Euro. Otherwise, if economic data is weak, the Euro is likely to fall.
Economic data for the four largest economies in the euro area (Germany, France, Italy and Spain) are especially significant, as they account for 75% of the Eurozone’s economy.
How does the Trade Balance impact the Euro?
Another significant data release for the Euro is the Trade Balance. This indicator measures the difference between what a country earns from its exports and what it spends on imports over a given period.
If a country produces highly sought after exports then its currency will gain in value purely from the extra demand created from foreign buyers seeking to purchase these goods. Therefore, a positive net Trade Balance strengthens a currency and vice versa for a negative balance.
- USD/CHF has lost more than 100 pips in the previous session.
- MACD indicates a slower pace of the prevailing bearish trend.
- The major level at 0.8900 appears as the immediate resistance lined up with the 23.6% Fibonacci retracement.
USD/CHF lost more than 100 pips in the previous session, due to the downbeat US inflation data. The USD/CHF pair extends the losses, trading near 0.8870 during the European session on Wednesday.
A decisive break below the latter could push the USD/CHF pair to reach the support region near 0.8800 psychological level lined up with September’s low at 0.8795.
The technical indicators for the USD/CHF pair reveal a bearish outlook. The 14-day Relative Strength Index (RSI) below the 50 level indicates downward pressure, signaling a bearish momentum and reflecting a weaker market sentiment.
On the upside, the psychological level at 0.8900 appears as the immediate resistance, followed by the 23.6% Fibonacci retracement at 0.8922. A firm break above the level could inspire the USD/CHF pair to explore the next resistance around the 50-day Exponential Moving Average (EMA) at 0.8986.
Moreover, the Moving Average Convergence Divergence (MACD) line, although below the centerline, is positioned above the signal line. This suggests a somewhat tepid momentum in the USD/CHF pair, indicating a less pronounced bearish sentiment.
USD/CHF: Daily Chart
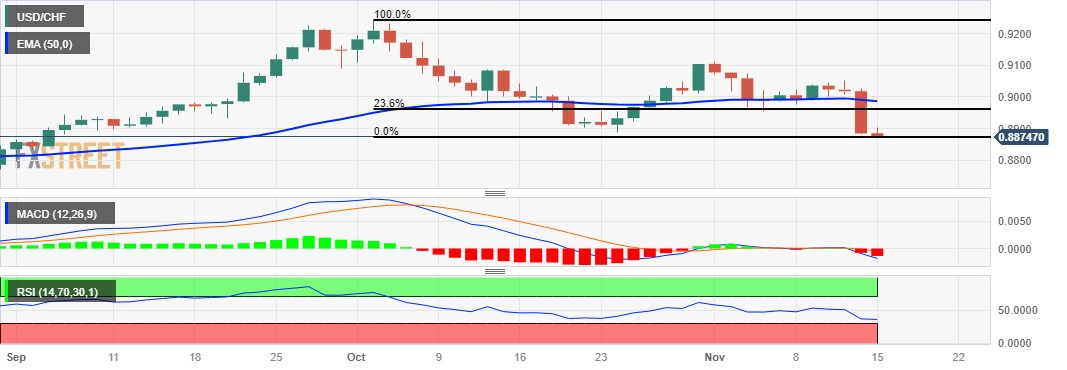
On Tuesday, EUR/USD witnessed a huge jump. Economists at ING analyze the pair’s outlook.
A break above 1.0900 would be significant
We are inclined to think a pull-back to the 1.0800 mark is appropriate given the short-term valuation (EUR/USD 1.5% overvalued).
Conversely, a break above 1.0900 (probably on more US data weakness) would be significant and make 1.1000 the next key resistance.
See: The idea of a rate cut cycle for ECB and Fed is an argument in support of higher EUR/USD – Commerzbank
Japan’s Deputy Finance Minister Ryosei Akazawa said on Wednesday, “specific monetary policy up to the Bank of Japan (BoJ) to decide.”
Akazawa said that he “expected the Bank of Japan to conduct monetary policy appropriately as it strives to achieve its 2% inflation target swiftly.”
Market reaction
At the time of writing, USD/JPY is up 0.08% on the day to trade at 150.50.
- USD/JPY recovers from a one-week low touched in reaction to the softer US CPI on Tuesday.
- The dismal Japanese GDP, along with the risk-on mood, undermines the JPY and lends support.
- Bets that the Fed is done raising rates weigh on the US and keep a lid on any further upside.
The USD/JPY pair attracts some dip-buying near the 150.20 area on Wednesday and recovers a part of the previous day's softer US CPI-led losses to a one-week low. Spot prices stick to modest intraday gains through the early part of the European session and currently trade around the 150.65 region, up nearly 0.30% for the day, though lack follow-through.
Data released this Wednesday showed that the Japanese economy contracted for the first time in three quarters, which should allow the Bank of Japan (BoJ) to delay a shift away from the decade-long accommodative monetary policy settings. Apart from this, the prevalent risk-on environment is seen undermining the safe-haven Japanese Yen (JPY) and acting as a tailwind for the USD/JPY pair.
The US Dollar (USD), on the other hand, languishes near its lowest level since September 1 touched in the aftermath of softer US consumer inflation, which reaffirmed expectations that the Federal Reserve (Fed) is done with its policy tightening campaign. This, in turn, holds back bullish traders from placing fresh bets around the USD/JPY pair, warranting caution before positioning for further gains.
From a technical perspective, spot prices showed resilience below the 100-period Simple Moving Average (SMA) on the 4-hour chart and manage to hold above the 150.00 psychological mark. The latter coincides with the 200-period SMA on the 4-hour chart and is followed by an ascending trend-line extending from the October low, around the 149.70 area, which should act as a pivotal point for the USD/JPY pair.
A convincing break below the aforementioned support levels will be seen as a fresh trigger for bearish traders and pave the way for some meaningful downside. The USD/JPY pair might then accelerate the downward trajectory towards the 149.20-149.15 intermediate support en route to the 149.00 round figure.
On the flip side, any subsequent move up is likely to confront some resistance near the 151.00 mark ahead of the 151.20 area and the YTD peak, around the 151.90 area touched on Monday. Some follow-through buying, leading to a strength beyond the 152.00 mark will be seen as a fresh trigger for bullish traders and set the stage for an extension of a well-established uptrend witnessed since the beginning of the current year.
USD/JPY 4-hour chart
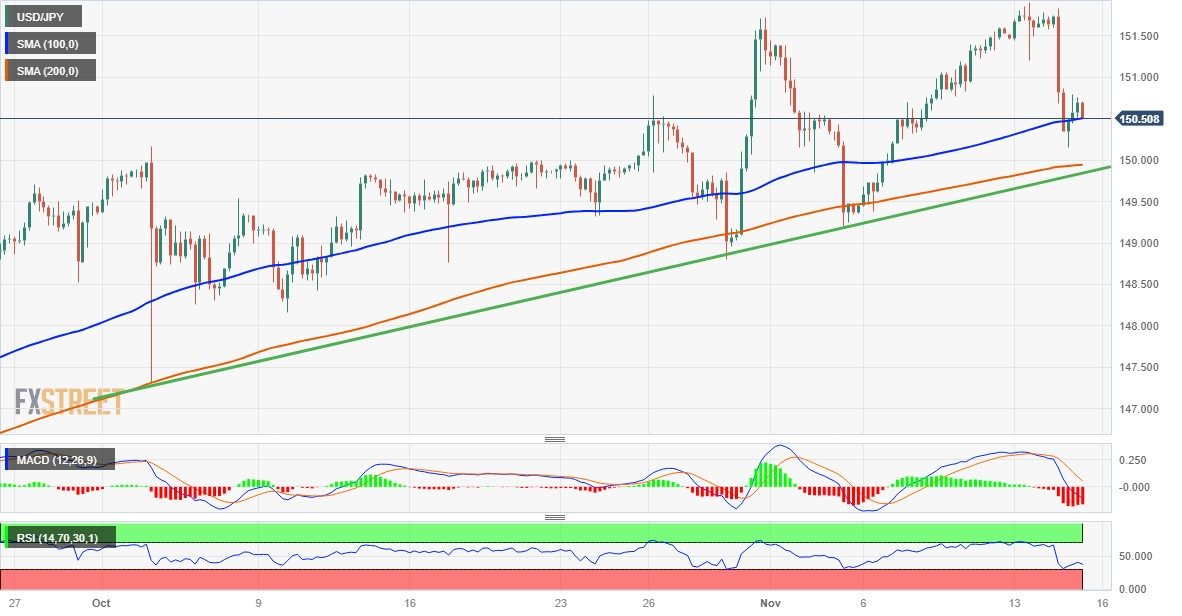
Technical levels to watch
In the opinion of Markets Strategist Quek Ser Leang and Economist Lee Sue Ann at UOB Group, USD/JPY is now seen navigating within the 149.50-151.65 range in the next few weeks.
Key Quotes
24-hour view: We expected USD to trade in a range of 151.05/151.95 yesterday. However, it dropped to a low of 150.14 in NY trade. The rapid decline appears to be overdone, and USD is unlikely to weaken much further. Today, USD is more likely to trade sideways between 150.10 and 151.25.
Next 1-3 weeks: We have held a positive USD view since the middle of last week. Yesterday (14 Nov, spot at 151.60), we indicated that “the risk is for USD to break clearly above 151.95 and head towards 152.50.” We did not anticipate the sharp drop that took out our ‘strong support’ level at 150.70 (low has been 150.14). Upward pressure has faded with the breach of the ‘strong support’. While downward pressure has increased; it is not enough to suggest the start of a sustained decline in USD. For the time being, USD is more likely to trade in a range of 149.50151.65. Looking ahead, only a clear break below 149.50 would indicate that USD is ready to head lower in a sustained manner.
Open interest in natural gas futures markets extended its uptrend on Tuesday, now by around 2.4K contracts according to preliminary readings from CME Group. Volume, on the opposite direction, resumed the decline and went down by around 38.7K contracts.
Natural Gas appears underpinned by the $3.00 region
Tuesday’s marked decline in prices of natural gas was on the back of the continuation of the upward trend in open interest, which suggests that further weakness remains in store for the time being. That said, there is an important contention zone around the $3.00 mark per MMBtu.
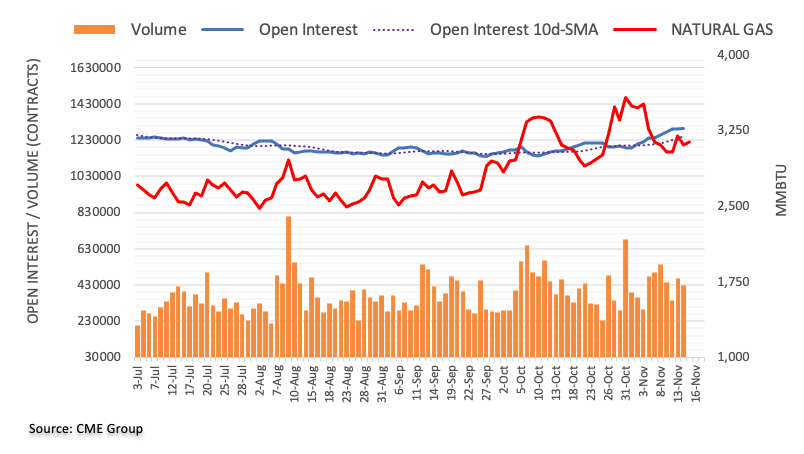
Following the recent price action, further gains appear on the table for AUD/USD in the short-term horizon, comment Markets Strategist Quek Ser Leang and Economist Lee Sue Ann at UOB Group.
Key Quotes
24-hour view: The sudden surge in AUD that sent it to a high of 0.6513 came as a surprise (we were expecting it to trade sideways). The outsized and rapid rise is severely overstretched, and AUD is unlikely to rise much further. Today, AUD is more likely to trade in a range, probably between 0.6440 and 0.6525.
Next 1-3 weeks: Yesterday, AUD surged and blew past our ‘strong resistance’ level at 0.6440. The breach of 0.6440 has invalidated our view that AUD “is likely to trade with a downward bias to 0.6300.” While upward momentum has increased after the sharp rally yesterday, AUD has to break above 0.6525 before a further sustained advance to 0.6585 is likely. There appears to be a high likelihood of AUD breaking clearly above 0.6525. On the downside, a breach of 0.6400 (‘strong support’ level) would mean that AUD is not ready to break above 0.6525.
CME Group’s flash data for crude oil futures markets noted traders reduced further their open interest positions on Tuesday, this time by around 6.7K contracts. On the other hand, volume went up by around 57.4K contracts after three consecutive daily pullbacks.
WTI remains supported around $75.00
WTI prices charted an inconclusive session on Tuesday. The vacillating price action was on the back of shrinking open interest and a decent increase in volume. Against that, crude oil prices could maintain some consolidation below the $80.00 mark per barrel in the very near term.
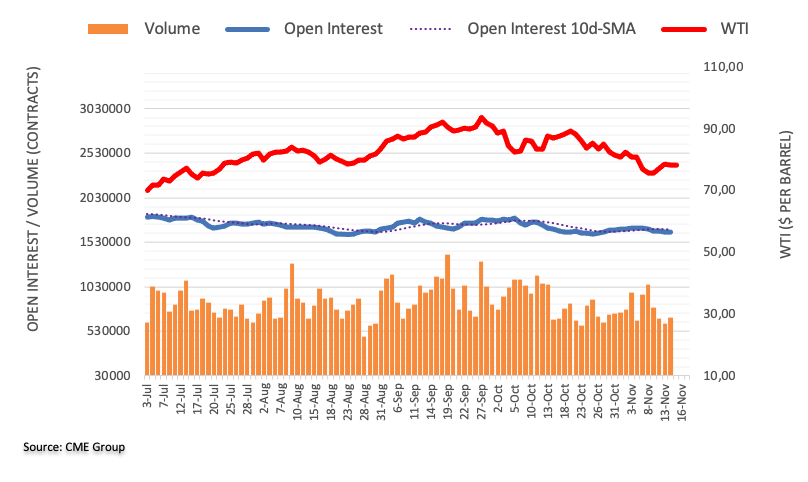
Economists at ING expect economic data to help build a floor around the 0.8700 level in EUR/GBP.
Risk of GBP underperformance as the UK economic outlook deteriorates
We keep pointing to the fact that pricing in the Sonia curve appears a bit too conservative compared to that of the US and the Eurozone in pricing monetary easing and that raises the risk of GBP underperformance as the UK economic outlook deteriorates.
The combination of a tentative improvement in Eurozone data and soft inflation figures in the UK should help build a floor around 0.8700 in EUR/GBP.
GBP/USD is seen accelerating its uptrend once 1.2580 is cleared, suggest Markets Strategist Quek Ser Leang and Economist Lee Sue Ann at UOB Group.
Key Quotes
24-hour view: Yesterday, we held the view that “there is room for GBP to rise to 1.2325 before the risk of a pullback increases.” While GBP rose as expected, it not only blew past 1.2325 but also broke above several other resistance levels as it rocketed to a high of 1.2506. The outsized rally is severely overstretched, but GBP could rise to 1.2530 before levelling off. The major resistance at 1.2580 is unlikely to come under threat for now. Support is at 1.2450, followed by 1.2400.
Next 1-3 weeks: Our latest narrative was from last Thursday (09 Nov, spot at 1.2285), wherein GBP is likely to trade in a range of 1.2180/1.2400. The rangetrading phase is clearly over after GBP jumped and blew past several resistance levels in a row in NY trade. While GBP is likely to continue to advance, it has to break clearly above 1.2580 before a further sustained rise is likely. The chance of GBP breaking clearly above 1.2580 will remain intact as long as it stays above 1.2350 (current level of ‘strong support’).
Considering advanced prints from CME Group for gold futures markets, open interest increased for the second session in a row on Tuesday, this time by around 5.5K contracts. Volume, instead, shrank for the second straight session, this time by nearly 42K contracts.
Gold faces the next hurdle at $2000
Tuesday’s decent uptick in gold prices came in tandem with rising open interest, which is indicative that extra upside appears in store in the very near term. Against that, the precious metal is now expected to retarget the key barrier at $2000 per troy ounce.
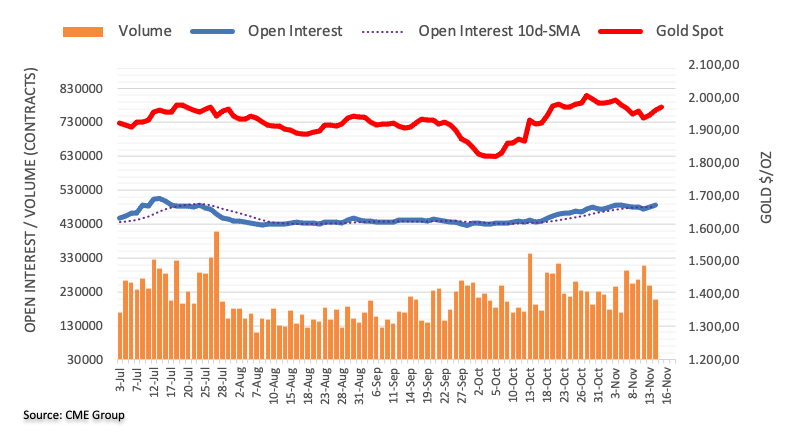
The continuation of the upside momentum could now push EUR/USD to the 1.0945 level in the next few weeks, note Markets Strategist Quek Ser Leang and Economist Lee Sue Ann at UOB Group.
Key Quotes
24-hour view: After EUR rebounded from 1.0663 on Monday, we highlighted yesterday that “the rebound is likely to continue but is unlikely to breach the major resistance at 1.0750.” However, in NY trade, EUR blew past 1.0750 and rocketed to 1.0887. EUR ended the day higher by a whopping 1.70%, its largest 1-day gain in a year. Further advance is not ruled out; in view of the severely overbought conditions, the major resistance at 1.0945 is unlikely to come into view today (there is another resistance at 1.0915). Any pullback is likely to stay above 1.0810 (minor support is at 1.0845).
Next 1-3 weeks: Last Friday (10 Nov, spot at 1.0665), we highlighted that the outlook for EUR is neutral, and we expected it to trade sideways in a range of 1.0580/1.0750. The manner in which EUR jumped above 1.0750 yesterday and accelerated to 1.0887 clearly indicates that it has moved out of the sideways trading range. While the outsized 1.70% rise appears to be overstretched, further EUR strength appears likely. The level to monitor is 1.0945. Overall, only a breach of the ‘strong support’ (level is currently at 1.0770) would indicate that EUR is not strengthening further. The ‘strong support’ level is set to rise in the coming days.
The US inflation data weakened the Dollar, thus putting considerable pressure on USD/JPY. Ulrich Leuchtmann, Head of FX and Commodity Research at Commerzbank, analyzes the pair’s outlook.
Continued USD weakness is the only scenario suited to prevent continuously higher USD/JPY
Continued USD weakness is the only scenario suited to prevent continuously higher USD/JPY exchange rate. In view of BoJ policy, I see no reason for an idiosyncratic JPY recovery.
One thing is clear after all: if it is not its inflation projections it must be something else that is preventing the BoJ from a proper tightening of monetary policy. And I cannot really think of any other reason any longer but one very nasty and very JPY-negative one: that the BoJ has long since reached the conclusion that higher interest rates are simply impossible in view of the hopelessly over-indebted government.
- Pound Sterling hovers near a two-month high around 1.2500 amid an upbeat market mood.
- UK inflation decelerated morde than expected in October.
- UK annual headline inflation fell below 5% for the first time in two years.
The Pound Sterling (GBP) faced a nominal sell-off after refreshing a two-month high as price pressures in the UK economy softened significantly in October. Annual headline Consumer Price Index (CPI) grew at a slower pace of 4.6%, adding to signs that UK Prime Minister Rishi Sunak will be able to fulfill his promise of halving inflation by the year-end. Meanwhile, the UK Producer Price Index (PPI) fell, suggesting that goods producers were forced to cut prices at factory gates due to a poor demand outlook.
The GBP/USD pair surrendered nominal gains after a soft inflation report but broader demand is strong due to the improved risk-appetite of the market participants. The appeal for risk-perceived assets increased significantly after easing consumer inflation in the US economy and elevated hopes of no more interest rate increases from the Federal Reserve (Fed).
Daily Digest Market Movers: Pound Sterling remains broadly upbeat on soft US Dollar
- Pound Sterling faces some selling pressure as the UK Office for National Statistics (ONS) has reported that inflation has eased significantly in October.
- The appeal for the Pound Sterling is upbeat as the market sentiment is bullish amid easing price pressures in the US economy.
- Monthly headline inflation in the UK economy remained stagnant in October while investors anticipated a nominal growth of 0.1%. In September, headline inflation grew strongly by 0.5%. The annual headline CPI rose by 4.6%, slower than the consensus of 4.8% and the former reading of 6.7%.
- This indicates that the promise made by UK Prime Minister Rishi Sunak to halve inflation to 5.4% by the year-end has been fulfilled. Sunak promised to halve inflation in January when price growth was near 10.7%.
- The core CPI that excludes volatile food and Oil prices has softened to 5.7% against expectations of 5.8% and the prior reading of 6.1%.
- It is worth noting that the annual Producer Price Index (PPI) deflated in October, which indicates that firms have reduced prices of goods and services offered at factory gates due to poor demand from domestic and overseas markets.
- The monthly Retail Price Index surprisingly contracted by 0.2% while investors forecasted a sharp growth of 6.4%.
- A record decline in price pressures in October conveys that the Bank of England (BoE) may not need to raise interest rates further.
- On Tuesday, BoE Chief Economist Huw Pill cited that further policy tightening is not needed to tame inflationary pressures but the BoE is prepared if needed. He further added that the BoE must focus on inflation, not tackling other issues in the UK economy.
- BoE policymakers could discuss cutting rates earlier as the UK labor market is facing the wrath of higher interest rates.
- On Tuesday, the UK laborforce shed workers for the third time in a row as firms have witnessed a sharp decline in new business. The Unemployment Rate remained unchanged at 4.2%.
- UK employers are pessimistic about the near-term environment as they expect the BoE to keep interest rates higher at least until mid-2024..
- Meanwhile, The US Dollar Index (DXY) hovers near a two-month low around 104.00 as the US inflation softened at a faster pace in October due to a sharp sell-off in the global Oil prices. 10-year US Treasury yields have fallen to near 4.44%.
- Investors expect that the rate-tightening campaign by the Federal Reserve (Fed) has concluded.
- While US inflation softened in October, Richmond Fed Bank President Thomas Barkin said that the central bank is making real progress on inflation but is not convinced inflation is on a smooth glide path to 2%. Barkin warned that the Fed needs to do more to curb demand and inflation.
Technical Analysis: Pound Sterling climbs to near 1.2500
Pound Sterling prints a fresh two-month high near the crucial resistance of 1.2500 on improved market sentiment. The GBP/USD pair rallies after testing the breakout region of the symmetrical triangle formed on a daily time frame. The Cable has climbed above the 200-day Exponential Moving Average (EMA), which indicates that the near-term demand has turned upbeat.
Pound Sterling FAQs
What is the Pound Sterling?
The Pound Sterling (GBP) is the oldest currency in the world (886 AD) and the official currency of the United Kingdom. It is the fourth most traded unit for foreign exchange (FX) in the world, accounting for 12% of all transactions, averaging $630 billion a day, according to 2022 data.
Its key trading pairs are GBP/USD, aka ‘Cable’, which accounts for 11% of FX, GBP/JPY, or the ‘Dragon’ as it is known by traders (3%), and EUR/GBP (2%). The Pound Sterling is issued by the Bank of England (BoE).
How do the decisions of the Bank of England impact on the Pound Sterling?
The single most important factor influencing the value of the Pound Sterling is monetary policy decided by the Bank of England. The BoE bases its decisions on whether it has achieved its primary goal of “price stability” – a steady inflation rate of around 2%. Its primary tool for achieving this is the adjustment of interest rates.
When inflation is too high, the BoE will try to rein it in by raising interest rates, making it more expensive for people and businesses to access credit. This is generally positive for GBP, as higher interest rates make the UK a more attractive place for global investors to park their money.
When inflation falls too low it is a sign economic growth is slowing. In this scenario, the BoE will consider lowering interest rates to cheapen credit so businesses will borrow more to invest in growth-generating projects.
How does economic data influence the value of the Pound?
Data releases gauge the health of the economy and can impact the value of the Pound Sterling. Indicators such as GDP, Manufacturing and Services PMIs, and employment can all influence the direction of the GBP.
A strong economy is good for Sterling. Not only does it attract more foreign investment but it may encourage the BoE to put up interest rates, which will directly strengthen GBP. Otherwise, if economic data is weak, the Pound Sterling is likely to fall.
How does the Trade Balance impact the Pound?
Another significant data release for the Pound Sterling is the Trade Balance. This indicator measures the difference between what a country earns from its exports and what it spends on imports over a given period.
If a country produces highly sought-after exports, its currency will benefit purely from the extra demand created from foreign buyers seeking to purchase these goods. Therefore, a positive net Trade Balance strengthens a currency and vice versa for a negative balance.
- USD/CAD could face further losses on improved Crude oil prices.
- Technical indicators suggest a shift toward a weaker market sentiment.
- The 1.3600 major level emerges as a key support, followed by the 38.2% Fibonacci retracement.
The USD/CAD pair experiences downward pressure following the release of weaker US inflation data on Tuesday. Moreover, the uptick in crude oil prices is likely supporting the Canadian Dollar (CAD), adding to the pressure on the USD/CAD pair.
The technical indicators paint a bearish picture for the USD/CAD pair. The 14-day Relative Strength Index (RSI) below the 50 level indicates downward pressure, signaling a bearish momentum and reflecting a weaker market sentiment.
Additionally, the Moving Average Convergence Divergence (MACD) line, while above the centerline, has shown a divergence below the signal line. This suggests a potential shift in momentum towards a bearish sentiment in the USD/CAD pair.
The USD/CAD pair trades around 1.3690 during the early European session, after falling by almost 100 pips since the previous session. The 50-day Exponential Moving Average (EMA) at 1.3670 could act as the immediate support.
A firm break below the latter could influence the USD/CAD pair to navigate the region around the psychological level at 1.3600, followed by the 38.2% Fibonacci retracement at 1.3591 level.
On the upside, the major level at 1.3700 appears to be a key barrier. If there is a breakthrough above the latter, the bulls could revisit the weekly highs around the 1.3843 level.
USD/CAD: Daily Chart
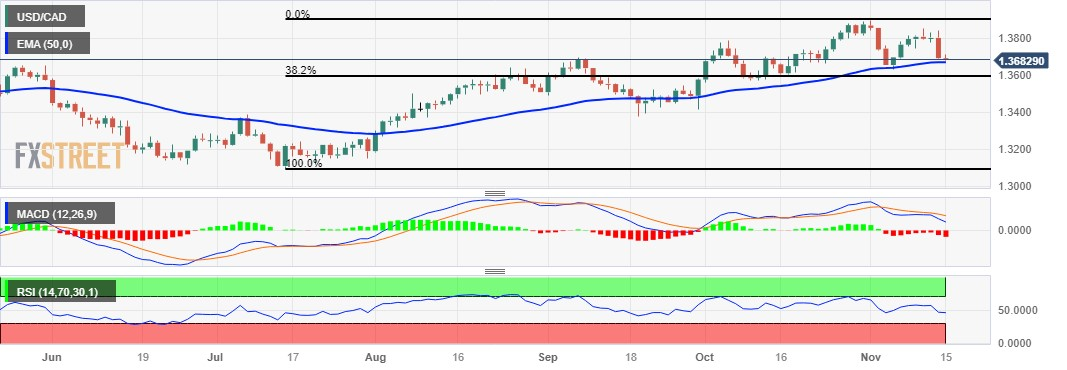
The US CPI induced USD selling, with EUR/USD notably moving close to the 1.09 mark. Ulrich Leuchtmann, Head of FX and Commodity Research at Commerzbank, analyzes the pair’s outlook.
Considerable potential for further USD weakness
A moderate development of inflation rates is not the strongest argument in favour of Fed rate cuts. If there is a recession on top of that after all, the environment would be right for a Fed rate cut cycle. To me, that means: there is still considerable potential for further USD weakness.
From the market’s point of view, there is no doubt a lot to suggest that also on the way down the Fed will act more aggressively and possibly also more quickly than the typically inert ECB.
And that is why from today’s point of view, where no market participant can project the details with any certainty, the idea of a rate cut cycle for both central banks is an argument in support of higher EUR/USD exchange rates.
Here is what you need to know on Wednesday, November 15:
The US Dollar (USD) struggles to find demand after suffering heavy losses against its major rivals on Tuesday and Pound Sterling (GBP) weakens in the European morning on Wednesday. Industrial Production and Trade Balance data for September will be featured in the European economic docket mid-week. In the American session, Producer Price Index (PPI) and Retail Sales figures for October will be watched closely by market participants.
The USD Index turned south in the American trading hours on Tuesday and lost 1.5%, posting one of its largest one-day losses of the year. The data from the US revealed that inflation in the US, as measured by the Consumer price Index (CPI), softened to 3.2% in October from 3.7% in September. In turn, Wall Street's main indexes rallied and the benchmark 10-year US Treasury fell to its lowest level in nearly two months below 4.5%. Early Wednesday, the USD Index consolidates its losses slightly above 104.00 and US stock index futures trade modestly higher on the day.
US Dollar price this week
The table below shows the percentage change of US Dollar (USD) against listed major currencies this week. US Dollar was the weakest against the New Zealand Dollar.
| USD | EUR | GBP | CAD | AUD | JPY | NZD | CHF | |
| USD | -1.67% | -1.99% | -0.84% | -2.22% | -0.49% | -2.32% | -1.48% | |
| EUR | 1.65% | -0.31% | 0.82% | -0.51% | 1.16% | -0.64% | 0.19% | |
| GBP | 1.95% | 0.32% | 1.12% | -0.23% | 1.46% | -0.33% | 0.50% | |
| CAD | 0.83% | -0.81% | -1.13% | -1.36% | 0.34% | -1.46% | -0.63% | |
| AUD | 2.16% | 0.54% | 0.22% | 1.34% | 1.67% | -0.11% | 0.72% | |
| JPY | 0.49% | -1.18% | -1.48% | -0.34% | -1.71% | -1.82% | -0.97% | |
| NZD | 2.28% | 0.65% | 0.34% | 1.45% | 0.11% | 1.79% | 0.83% | |
| CHF | 1.47% | -0.17% | -0.49% | 0.63% | -0.72% | 0.98% | -0.81% |
The heat map shows percentage changes of major currencies against each other. The base currency is picked from the left column, while the quote currency is picked from the top row. For example, if you pick the Euro from the left column and move along the horizontal line to the Japanese Yen, the percentage change displayed in the box will represent EUR (base)/JPY (quote).
During the Asian trading hours on Wednesday, the data from China revealed that Retail Sales rose 7.6% on a yearly basis in October and Industrial Production grew by 4.6%. Both of these prints came in slightly better than analysts' estimates.
GBP/USD gained more than 200 pips and rose above 1.2500 for the first time since mid-September on Tuesday. In the early European session on Wednesday, the pair lost its traction and retraced a small portion of its rally after the UK's Office for National Statistics reported that the annual CPI in the UK increased 4.6% in October, down sharply from 6.7% in September.
EUR/USD broke above 1.0800 and continued to push higher toward 1.0900 on Tuesday, touching its highest level in 11 weeks in the process. Early Wednesday, the pair seems to have gone into a consolidation phase above 1.0850.
USD/JPY made a sharp downward correction amid broad-based USD weakness on Tuesday and snapped a six-day winning streak. At the time of press, USD/JPY was posting small daily gains at around 150.70. The data from Japan revealed that Industrial Production expanded by 0.5% on a monthly basis in September.
Gold benefited from falling US yields and rose nearly 1% on Tuesday. XAU/USD continues to stretch higher early Wednesday and was last seen rising 0.35% on the day at around $1,970.
FX option expiries for Nov 15 NY cut at 10:00 Eastern Time, via DTCC, can be found below.
EUR/USD: EUR amounts
- 1.0675 1.2b
- 1.0700 1.8b
- 1.0720 789m
- 1.0800 1b
- 1.0850 1.1b
- 1.0875 1.3b
- 1.0950 554m
GBP/USD: GBP amounts
- 1.2200 832m
- 1.2250 616m
- 1.2345 356m
- 1.2400 489m
- 1.2535 881m
USD/JPY: USD amounts
- 150.00 1.7b
- 150.50 566m
- 151.27 783m
- 152.00 2.6b
- 152.25 721m
USD/CHF: USD amounts
- 0.8900 425m
- 0.8980 494m
AUD/USD: AUD amounts
- 0.6330 590m
- 0.6335 1.3b
- 0.6430 450m
- 0.6500 849m
USD/CAD: USD amounts
- 1.3500 520m
- 1.3475 451m
USD/INR has held within a narrow 3% range since the start of the year, between 80.50 and 83.50. Economists at Commerzbank analyze the pair’s outlook.
USD/INR to hold steady at around 83.00 by year-end
We project USD/INR to hold steady at around 83.00 by year-end. The main risk factor will be even higher Oil prices which weigh on INR given that India is a major Oil importer.
We could see the pair heading higher towards 84.00 by mid-2024 before easing back to 83.50 by end-2024.
- USD/MXN experienced losses as the US Dollar dropped on weaker inflation.
- Weaker US inflation reinforces the prevailing sentiment of concluding the rate-hike cycle by the Fed.
- Banxico Governor Rodriguez mentioned the possibility of rate cuts on easing the inflationary outlook.
USD/MXN attempts to recover recent losses, trading higher around 17.3500 during the Asian session on Wednesday. However, the USD/MXN pair suffered losses as the US Bureau of Labor Statistics (BLS) revealed weaker inflation data on Tuesday.
US Consumer Price Index (CPI) for October eased to 3.2%, falling short of the anticipated 3.3%. The US Core CPI rose to 0.2%, below the expected 0.3%. The softer inflation figures further support the prevailing sentiment that the US Federal Reserve (Fed) is inclined to conclude its rate-hike cycle. This has triggered a downward rally in US Treasury yields, consequently undermining the strength of the US Dollar (USD).
The Bank of Mexico’s (Banxico) Governor Victoria Rodriguez Ceja mentioned the room for discussing rate cuts due to the easing inflationary outlook. She mentioned that any monetary policy loosening could be gradual and a data-dependent approach will be taken in decision-making.
Banxico's maintained interest rates at 11.25% depending on the context of Mexico's inflation, which grew at 4.26% year on year in October, lower than anticipated. The commitment of Mexico’s central bank to achieving its 3.0% inflation target by the year 2025, indicates maintaining policy rates at their current level for quite some time.
Traders will likely watch the US Producer Price Index and Retail Sales data on Wednesday to gain further indications on the Fed’s monetary policy in the December meeting.
- NZD/USD eyes stabilization above 0.6000 amid easing US price pressures.
- Further action in the US Dollar will be guided by the monthly US Retail Sales data.
- NZD/USD forms an Inverted Head and Shoulder chart pattern.
The NZD/USD pair aims for stability above the psychological resistance of 0.6000 as the market mood has turned bullish due to easing price pressures in the United States economy. The Kiwi asset turns upbeat as investors hope that the Federal Reserve (Fed) is done with hiking interest rates as progress in inflation declining towards 2% is steady.
S&P500 futures generated decent gains in the Asian session, indicating a significant improvement in the risk-taking ability of the market participants. The US Dollar Index (DXY) hovers near a two-month low around 104.00.
Further action in the US Dollar will be guided by the monthly US Retail Sales data for October, which will be published at 13:30 GMT. As per the consensus, consumer spending contracted by 0.3% against 0.7% growth in September.
NZD/USD forms an Inverted Head and Shoulder chart pattern on a daily scale, which indicates a prolonged consolidation. A breakout of the aforementioned chart pattern will result in a bullish reversal. The asset climbs above the 50-day Exponential Moving Average (EMA), which indicates that the major trend has turned bullish.
The Relative Strength Index (RSI) (14) aims to shift into the bullish range of 60.00-80.00. If the RSI (14) manages to do so, a bullish momentum will get triggered.
More upside would appear if the asset breaks above the neckline of the inverted H&S pattern, which is placed from September 29 high at 0.6050. This will result in further upside towards August 11 high near 0.6090 followed by August 4 high at 0.6133.
In an alternate scenario, a breakdown below November 14 low at 0.5863 would drag the asset toward November 2 low at 0.5838. Further decline below the latter would expose the asset to October 26 low at 0.5772.
NZD/USD daily chart
-638356280849740052.png)
- EUR/GBP trades in positive territory around 0.8700 ahead of the UK key data.
- The Eurozone Gross Domestic Product (GDP) contracted quarter-on-quarter in the third quarter (Q3).
- The UK monthly and annual CPI figures are expected to rise 0.1% and 4.8%, respectively.
The EUR/GBP cross snaps the two-day losing streak during the early European session on Wednesday. Investors await the UK inflation data, which are expected to show an easing in inflationary pressure. The cross currently trades around 0.8704, unchanged on the day.
The Eurozone Gross Domestic Product (GDP) contracted quarter-on-quarter in the third quarter (Q3). The growth figures affirm estimates of a technical recession if the fourth quarter is similarly dismal, although employment grew. ECB Vice President Luis de Guindos said last week that Eurozone economic growth will remain weak in the near term. However, it will be in a better position to reassess the inflation outlook and required action in the December meeting.
On the British Pound front, the UK ILO Unemployment Rate remains unchanged at 4.2% in the quarter to September, in line with the market consensus of 4.2%. Meanwhile, the number of people claiming jobless benefits climbed by 17.8K in September versus a 20.4K jump prior. The Bank of England (BoE) Chief Economist Huw Pill said on Tuesday that the central bank doesn't necessarily need to hike another rate but is prepared to if needed.
Market players await the UK Consumer Price Index (CPI) for October for fresh impetus. The monthly and annual headline inflation figures are expected to rise 0.1% and 4.8%, respectively. The Core CPI figure is estimated to grow by 5.8% from a 6.1% rise in the previous reading. On the Euro docket, the CPI data from Italy and France and the Eurozone Trade Balance will be released. Traders will take cues from the figures and find trading opportunities around the EUR/GBP cross.
- The sharp sell-off in the index meets some support near 104.00.
- Investors now see the Fed reducing its rates in the summer 2024.
- Producer Prices, Retail Sales take centre stage later in the session.
The greenback attempts to grab some breathing space following Tuesday’s steep CPI-driven pullback to the vicinity of 104.00 when tracked by the USD Index (DXY).
USD Index now focuses on data
The index trades within a tight range in the area of two-month lows just above the 104.00 hurdle as market participants continue to digest Tuesday’s lower-than-expected US CPI.
In line with the dollar’s retracement, US yields trade in multi-week lows across the curve pari passu with investors’ repricing of potential interest rate cuts by the Federal Reserve at some point in June–July 2024.
Moving forward, the index is expected to remain under scrutiny in light of the upcoming release of Producer Prices and Retail Sales, while Mortgage Applications gauged by MBA and Business Inventories will complete the daily docket.
Additionally, FOMC M. Barr (permanent voter, centrist) and Richmond Fed T. Barkin (2024 voter, centrist) are due to speak.
What to look for around USD
The pronounced decline in the index appears to have met some initial contention around the 104.00 region, or eleven-week lows, so far this week.
In the meantime, the dollar appears depressed against the backdrop of rising speculation of probable interest rate cuts in H1 2024, all in response to further disinflationary pressures and the gradual cooling of the labour market.
Bolstering the greenback, however, still emerges the resilience of the US economy as well as a hawkish narrative from some Fed rate setters.
Key events in the US this week: MBA Mortgage Applications, Producer Prices, Retail Sales, Business Inventories (Wednesday) - Initial Jobless Claims, Philly Fed Index, Industrial Production, NAHB Index, TC Flows (Thursday) – Building Permits, Housing Starts (Friday).
Eminent issues on the back boiler: Persistent debate over a soft or hard landing for the US economy. Speculation of rate cuts in early 2024. Geopolitical effervescence vs. Russia and China. Potential spread of the Middle East crisis to other regions.
USD Index relevant levels
Now, the index is up 0.03% at 104.10 and the breakout of 106.00 (weekly high November 10) could pave the way to a move to 106.88 (weekly high October 26) and finally 107.34 (2023 high October 3). On the flip side, there is an initial support at 103.98 (monthly low November 14) ahead of 103.60 (200-day SMA) and 102.93 (weekly low August 30).
- Silver price aims to climb above $23.20 amid easing US price pressures.
- The USD Index fell sharply due to the risk-off mood.
- Silver price recovered strongly after discovering buying interest near 61.8% Fibo retracement at $21.86.
Silver price (XAG/USD) refreshes weekly high near $23.20 as inflation in the United States softened at a higher pace in October. The white metal strengthens on hopes that the Federal Reserve (Fed) will not raise interest rates further.
S&P500 futures added some gains in the Tokyo session, portraying a significant improvement in the risk appetite of the market participants. US equities were heavily bought on Tuesday as inflation eased more than expectations.
The US Dollar Index (DXY) trades near a two-month low around 104.00 amid steady progress in inflation declining towards 2%. The headline inflation eased significantly in October as global oil prices fell sharply due to easing Middle East tensions.
Silver technical analysis
Silver price recovered strongly after discovering buying interest near 61.8% Fibo retracement (plotted from October 4 low around $20.70 to October 20 high at $23.70) at $21.86. The white metal trades above the 200-period Exponential Moving Average (EMA), which indicates that the near-term trend has turned bullish.
The Relative Strength Index (RSI) (14) shifts into the bullish range of 60.00-80.00, which indicates that the bullish impulse has been triggered.
Silver four-hour chart
-638356258422904187.png)
- EUR/USD remains capped below the 1.0900 barrier on Wednesday.
- The pair holds above the 50- and 100-hour EMAs with the overbought RSI condition.
- The immediate resistance level is seen at the 1.0895-1.0900 area; the initial support level is located at 1.0800.
The EUR/USD pair surges above 1.0850 but faces rejection below the 1.0900 mark during the early European trading hours on Wednesday. The weaker-than-expected US inflation data exerts some selling pressure on the US Dollar (USD) and supports the EUR/USD pair. That being said, the markets anticipate that the Federal Reserve (Fed) is done with the hiking cycle this year and expect to deliver rate cuts earlier in the second quarter (Q2) of 2024. The major pair currently trades around 1.0878, losing 0.03% on the day.
According to the four-hour chart, the major pair holds above the 50- and 100-hour Exponential Moving Averages (EMAs), suggesting the path of least resistance to the upside. The Relative Strength Index (RSI) holds in bullish territory above 50. However, the overbought RSI condition indicates that further consolidation cannot be ruled out before positioning for any near-term EUR/USD appreciation.
The 1.0895-1.0900 region acts as an immediate resistance level for the pair. The mentioned level is the confluence of the upper boundary of the Bollinger Band and a psychological round figure. Further north, the next barrier is seen at 1.0930 (high of August 22). The additional upside filter to watch is a high of August 30 at 1.0945, en route to 1.1000 (a round figure and a high of August 11).
On the flip side, the initial support level is located near the psychological round mark at 1.0800. The next contention level will emerge at a high of November at 1.0756, followed by 1.0713 (the 50-hour EMA), and 1.0672 (the 100-hour EMA). A breach of the latter will see a drop to a low of November 3 at 1.0615.
EUR/USD four-hour chart
-638356236612158627.png)
- USD/JPY experiences challenges on weaker Japan’s economic data.
- Japan's GDP declined by 0.5% in Q3 against the previous growth of 1.2%.
- Japanese Economy Minister Yasutoshi Nishimura warned about the impact of a global slowdown on Japan's GDP.
- Weaker US inflation reinforces the prevailing sentiment of concluding the rate-hike cycle by the Fed.
USD/JPY recovers recent losses registered in the previous session after the weaker US inflation data release. However, the pair trades higher around 150.60 during the Asian session on Wednesday.
The Japanese Yen (JPY) faces challenges as Japan’s preliminary Gross Domestic Product (GDP) for Q3 showed a decline of 0.5%, swinging from 1.2% growth in the previous quarter. GDP Annualized for the said period contracted by 2.1% against the previous growth of 4.8%.
Japanese Economy Minister Yasutoshi Nishimura has issued a warning about the potential impact of a global slowdown on Japan's Q3 GDP. Nishimura highlighted that domestic demand, including consumption and capital expenditure, lacked strength in the third quarter.
Moreover, the Bank of Japan (BoJ) has reduced the amount of five to 10-year Japanese Government Bonds (JGBs) to ¥575 billion from the previous ¥675 billion. Additionally, the one to three-year JGBs have been adjusted to ¥375 billion from the previous ¥425 billion.
On the other side, the reaction of the weaker US inflation data was certainly impactful, which reinforces the prevailing sentiment that the US Federal Reserve (Fed) is likely to refrain from interest rate hikes in future meetings. This has had an impact on US Treasury yields, adding pressure to the US Dollar (USD).
The US Bureau of Labor Statistics (BLS) disclosed a Consumer Price Index (CPI) for October that was lower than expected, with the annual rate easing to 3.2%, falling short of the anticipated 3.3%. The US Core CPI recorded a modest rise of 0.2%, below the expected 0.3%.
US Producer Price Index and Retail Sales data are scheduled to be released later in the North American session. If these figures align with expectations, it could further amplify the pressure on the Greenback.
- GBP/JPY gains positive traction for the fourth straight day and trades near a multi-year peak.
- The BoJ’s dovish stance, along with the risk-on mood, undermines the JPY and offers support.
- Traders now look to the latest UK consumer inflation figures before placing directional bets.
The GBP/JPY cross attracts some dip-buying following an Asian session dip to the 187.65 region and turns positive for the fourth successive day on Wednesday. Spot prices currently trade around the 188.15 area, just a few pips below the highest level since November 2015 touched on Tuesday, as traders now look to the UK consumer inflation figures before placing fresh directional bets.
The headline UK CPI is anticipated to decelerate sharply from the 6.7% YoY rate in September to 4.8% in October. Against the backdrop of looming recession risks, softer-than-anticipated inflation figures will reaffirm bets that the Bank of England (BoE) will soon start cutting interest rates and undermining the British Pound (GBP). The downside for the GBP/JPY cross, however, seems limited in the wake of a more dovish stance adopted by the Bank of Japan (BoJ).
In fact, the Japanese central bank's minor change to its yield curve control (YCC) policy announced earlier this month pointed to a slow move towards exiting the decade-long accommodative monetary policy settings. Furthermore, the lacklustre domestic GDP report released this Wednesday, showing that the economy contracted for the first time in three quarters, should allow the BoJ to delay any policy shift away from its massive monetary easing stance.
Adding to this, the prevalent risk-on environment might continue to undermine the safe-haven Japanese Yen (JPY) and act as a tailwind for the GBP/JPY cross. This, in turn, suggests that the path of least resistance for spot prices is to the upside. Hence, any immediate market reaction to softer UK data is likely to be short-lived. In contrast, a slightly higher-than-expected UK CPI print should pave the way for a further appreciating move for the cross.
Technical levels to watch
- WTI catches fresh bids on Wednesday and stalls the overnight retracement slide from a one-week high.
- Optimism over the EIA and OPEC demand forecast for 2023 turns out to be a key factor lending support.
- Signs that tensions in the Middle East could be easing might keep a lid on any further gains for Oil prices.
West Texas Intermediate (WTI) Crude Oil prices attract some dip-buying near the $77.65 region during the Asian session on Wednesday and for now, seem to have stalled the overnight pullback from a one-week high. The commodity currently trades around the $78.40 area, up over 0.30% for the day, and continues to draw support from a combination of factors.
The International Energy Agency (IEA) on Tuesday joined the Organization of the Petroleum Exporting Countries (OPEC) in raising its Oil demand growth forecast for 2023. This comes on top of the recent announcements by Saudi Arabia and Russia, to extend the extra voluntary cuts until the end of December. This, along with the prevalent US Dollar (USD) selling bias, turns out to be another factor acting as a tailwind for Crude Oil prices.
In fact, the USD Index (DXY), which tracks the Greenback against a basket of currencies, languishes near its lowest level since September 1 touched in the aftermath of softer US CPI on Tuesday, which reaffirmed dovish Federal Reserve (Fed) expectations. Market participants now seem convinced that the US central bank is done raising rates. Apart from this, the risk-on mood further undermines the safe-haven buck and benefits the USD-denominated commodity.
The uptick in Oil prices, however, lacks bullish conviction in the wake of signs that tensions in the Middle East could be easing. In the latest developments surrounding the Israel-Hamas conflict, US President Joe Biden said he was holding daily discussions to secure the release of hostages held by the Hamas militant group and believes that it will happen. This has led to a reduction in the war risk premium and might keep a lid on any further gains for the black liquid.
Moving ahead, Wednesday’s US economic docket, featuring the release of the Producer Price Index (PPI), monthly Retail Sales and the Empire State Manufacturing Index will influence the USD later during the early North American session. Traders will further take cues from the US Energy Information Administration's (EIA) first oil inventory report in two weeks for some meaningful impetus and grab short-term opportunities around Crude Oil prices.
Technical levels to watch
- USD/CHF plunged more than 100 pips as US inflation eased more than anticipated.
- Soft US CPI data raises the likelihood of the Fed not increasing interest rates further.
- SNB Chairman Jordan suggested the room for more rate hikes in the future.
USD/CHF plunged sharply on Tuesday, more than 100 pips, due to the downbeat US inflation data. The USD/CHF pair seems to extend the losses, trading lower near 0.8890 during the Asian session on Wednesday.
US Bureau of Labor Statistics (BLS) revealed a lower-than-expected Consumer Price Index (CPI) data for October, with the annual rate easing at 3.2%, falling short of 3.3% as anticipated. US Core CPI saw a rise of 0.2%, below the expected 0.3%.
The soft US inflation reinforces the market sentiment regarding the US Federal Reserve (Fed) to hold off interest rate hikes in future meetings. It impacts the US Treasury yields, with 10-year bond yield taking a notable dip and standing at 4.43% and 2-year rate at 4.83% by the press time.
The Dollar Index (DXY) fell around 1.50%, reaching the region of 104.00. The sport bids around 104.10 at the time of writing. Market participants are likely awaiting the release of the US Producer Price Index and Retail Sales data for insights into the US economic overview. Should these figures align with expectations, it could intensify pressure on the Greenback.
On the Swiss side, Swiss National Bank (SNB) Chairman Thomas Jordan mentioned in an interview with local television station TeleZueri that he doesn't rule out the possibility of more interest rate hikes in the future.
Chairman Jordan said, “If we see that the current monetary policy is not restrictive enough to ensure price stability in the long term, then we will have to make another interest rate move.” “I'm not sure whether the terminal rate has been reached.”
As the month progresses, the Swiss ZEW Survey – Expectations and Real Retail Sales will be eyed, seeking insights into whether the Swiss National Bank (SNB) will contemplate an interest rate increase in the December meeting. The prevailing expectations seem to be leaning towards a 25 basis points hike.
- Gold price holds steady below the weekly high and seems poised to appreciate further.
- Bets that the Fed is done raising rates keep the USD depressed and lend some support.
- The prevalent risk-on mood might hold back bulls from placing fresh bets and cap gains.
Gold price (XAU/USD) struggles to capitalize on its weekly gains registered over the past two days and oscillates in a narrow trading band during the Asian session on Wednesday. The US Dollar (USD) ticks higher and recovers a part of the previous day's slump to its lowest level since September 1. Apart from this, a generally positive tone around the equity markets turns out to be another factor acting as a headwind for the safe-haven precious metal.
That said, expectations that the Federal Reserve (Fed) is done raising interest rates are keeping a lid on any meaningful USD upside and continue to lend support to the non-yielding Gold price. This, in turn, suggests that the path of least resistance for the XAU/USD is to the upside and supports prospects for an extension of the recent bounce from the 200-day Simple Moving Average (SMA), around the $1,930 area, or its lowest level since October 18 touched on Monday.
Daily Digest Market Movers: Gold price remains supported by dovish Fed expectations, bolstered by softer US CPI data
- The US Bureau of Labor Statistics (BLS) reported on Tuesday that the headline CPI was unchanged in October, while the yearly rate registered its smallest rise in two years and decelerated to 3.2% from 3.7% in September.
- The data reaffirms expectations that the Federal Reserve (Fed) has ended its policy tightening cycle and lifts bets for a rate cut in May 2024, which, in turn, triggered the overnight steep decline in the US Treasury bond yields.
- The yield on the benchmark 10-year US government bond languishes near a two-month low, keeping the US Dollar depressed near its lowest level since September 1 and lending some support to the non-yielding Gold price.
- The prevalent risk-on mood is seen acting as a headwind for the safe-haven precious metal, though the fundamental backdrop favours bullish traders and suggests that the path of least resistance remains to the upside.
- China's Industrial Production grew by 4.6% YoY in October, better than the 4.5% rise in the previous month and consensus estimates, and the monthly Retail Sales advanced more than expected, by 7.4% over the past 12 months.
- China's Fixed Asset Investment climbed by 2.9% YoY during the reported month as compared to the 3.1% anticipated and September reading. The data does little to influence the market sentiment or provide any impetus.
- Market participants now look to the release of the US Producer Price Index (PPI) and monthly Retail Sales figures for short-term opportunities later during the early North American session this Wednesday.
- The headline US PPI is anticipated to have risen by 0.1% in October, down from 0.5% in the previous month, and the yearly rate is seen falling below the 2.0% mark, though the core PPI is expected to match September's readings.
- The US Retail Sales possibly contracted by 0.3% in October, down sharply from the 0.7% rise registered in the previous month, while sales excluding automobiles are expected to remain flat MoM.
Technical Analysis: Gold price needs to move beyond the $1,980 barrier for bulls to seize back near-term control
From a technical perspective, any subsequent move beyond the overnight swing high, around the $1,970-1,971 area, is likely to confront some resistance near the $1,980 region. Some follow-through buying has the potential to lift the Gold price towards the $1,991-1,992 hurdle en route to the $2,000 psychological mark and a multi-month peak, around the $2,009-2,010 region. A sustained strength beyond the latter will be seen as a fresh trigger for bullish traders and pave the way for a further near-term appreciating move.
On the flip side, a corrective pullback might now attract some buyers and remain limited near the $1,950-1,949 area. This is followed by a cluster of supports near the 200-day SMA, currently pegged around the $1,935 region, and the 100- and the 50-day SMAs confluence near the $1,928-1,925 zone. Failure to defend the said support levels would make the Gold price vulnerable to accelerate the fall towards the $1,900 round figure.
US Dollar price this week
The table below shows the percentage change of US Dollar (USD) against listed major currencies this week. US Dollar was the weakest against the Pound Sterling.
| USD | EUR | GBP | CAD | AUD | JPY | NZD | CHF | |
| USD | -1.76% | -2.14% | -0.80% | -2.10% | -0.59% | -2.06% | -1.48% | |
| EUR | 1.72% | -0.38% | 0.94% | -0.33% | 1.14% | -0.30% | 0.27% | |
| GBP | 2.09% | 0.38% | 1.31% | 0.05% | 1.51% | 0.08% | 0.64% | |
| CAD | 0.79% | -0.96% | -1.34% | -1.27% | 0.21% | -1.24% | -0.68% | |
| AUD | 2.05% | 0.32% | -0.06% | 1.26% | 1.45% | 0.02% | 0.58% | |
| JPY | 0.58% | -1.16% | -1.54% | -0.21% | -1.48% | -1.47% | -0.89% | |
| NZD | 2.01% | 0.29% | -0.09% | 1.22% | -0.04% | 1.43% | 0.56% | |
| CHF | 1.46% | -0.27% | -0.65% | 0.66% | -0.61% | 0.87% | -0.57% |
The heat map shows percentage changes of major currencies against each other. The base currency is picked from the left column, while the quote currency is picked from the top row. For example, if you pick the Euro from the left column and move along the horizontal line to the Japanese Yen, the percentage change displayed in the box will represent EUR (base)/JPY (quote).
Gold FAQs
Why do people invest in Gold?
Gold has played a key role in human’s history as it has been widely used as a store of value and medium of exchange. Currently, apart from its shine and usage for jewelry, the precious metal is widely seen as a safe-haven asset, meaning that it is considered a good investment during turbulent times. Gold is also widely seen as a hedge against inflation and against depreciating currencies as it doesn’t rely on any specific issuer or government.
Who buys the most Gold?
Central banks are the biggest Gold holders. In their aim to support their currencies in turbulent times, central banks tend to diversify their reserves and buy Gold to improve the perceived strength of the economy and the currency. High Gold reserves can be a source of trust for a country’s solvency. Central banks added 1,136 tonnes of Gold worth around $70 billion to their reserves in 2022, according to data from the World Gold Council. This is the highest yearly purchase since records began. Central banks from emerging economies such as China, India and Turkey are quickly increasing their Gold reserves.
How is Gold correlated with other assets?
Gold has an inverse correlation with the US Dollar and US Treasuries, which are both major reserve and safe-haven assets. When the Dollar depreciates, Gold tends to rise, enabling investors and central banks to diversify their assets in turbulent times. Gold is also inversely correlated with risk assets. A rally in the stock market tends to weaken Gold price, while sell-offs in riskier markets tend to favor the precious metal.
What does the price of Gold depend on?
The price can move due to a wide range of factors. Geopolitical instability or fears of a deep recession can quickly make Gold price escalate due to its safe-haven status. As a yield-less asset, Gold tends to rise with lower interest rates, while higher cost of money usually weighs down on the yellow metal. Still, most moves depend on how the US Dollar (USD) behaves as the asset is priced in dollars (XAU/USD). A strong Dollar tends to keep the price of Gold controlled, whereas a weaker Dollar is likely to push Gold prices up.
- USD/CAD gains ground around 1.3688 on the softer USD.
- October's US Consumer Price Index (CPI) grew 3.2% YoY vs. 3.7% prior.
- The rebound in oil prices might lift the Canadian Dollar (CAD).
- All eyes are on the US Retail Sales and Producer Price Index (PPI) on Wednesday.
The USD/CAD pair attracts some sellers during the Asian session on Wednesday. The weaker US dollar, backed by a significant drop in US Treasury bond yields, weighs on the USD/CAD pair. At press time, the pair is trading near 1.3688, losing 0.03% for the day.
October’s US inflation surprised to the downside, with the Consumer Price Index (CPI) growing 3.2% YoY compared to the previous reading of 3.7%, worse than the market consensus of 3.3%. Meanwhile, the monthly and annual Core CPI, which excludes volatile food and energy prices, rose by 0.2% and 4.0%, respectively. As underlying price pressures continue to moderate, the markets anticipate that the Federal Reserve (Fed) will not raise interest rates further in its December meeting.
On the Loonie front, the rebound in oil prices might lift the commodity-linked Loonie, as the country is the leading oil exporter to the US. In the absence of economic data released from the Canadian docket on Wednesday, the USD/CAD pair remains at the mercy of USD price dynamics.
Looking ahead, market players will monitor the US Retail Sales and Producer Price Index (PPI) on Wednesday. The monthly Retail Sales for October is estimated to drop by 0.3% from the 0.7% rise in September. The annual PPI figure is expected to rise 1.9% in October, while the PPI ex Food & Energy is forecast to climb 2.7% YoY. These figures could give a clear direction to the USD/CAD pair.
- Indian Rupee gains traction, backed by lower US Treasury bond yields, weaker USD.
- India’s Wholesale Price Index (WPI) inflation remained in the deflationary zone in October.
- Indian Trade Balance and US Producer Price Index (PPI), Retail Sales will be due on Wednesday.
Indian Rupee (INR) trades strongly on Wednesday on the decline of US Treasury bond yields. On Tuesday, India’s inflation, as measured by the Wholesale Price Index (WPI), remained in the deflationary zone for the seventh month in a row in October, coming in at -0.52% versus -0.26% prior. That being said, the overall price development in manufactured products contributed to lower wholesale inflation in October. Nonetheless, India remains vulnerable to higher crude prices as India is the world's third-biggest oil consumer.
Market participants will keep an eye on the Indian Trade Balance for October. In the meantime, the Reserve Bank of India (RBI) is likely to intervene to prevent the volatility in the national currency, which might cap the INR’s depreciation in the near term. Also, the US Producer Price Index (PPI) and Retail Sales will be released later on Wednesday.
Daily Digest Market Movers: Indian Rupee gains ground, US dollar drops on weaker US inflation data
- India's Wholesale Price Index (WPI) inflation came in at -0.52% versus -0.26% prior, below the estimations of -0.20%.
- India’s Consumer Price Index (CPI) climbed 4.87% YoY in October from the previous reading of 5.02%, above the market consensus of 4.80%.
- The Reserve Bank of India (RBI) has kept interest rates steady for four consecutive meetings and maintains a relatively hawkish policy stance to alleviate price pressures.
- RBI Governor Shaktikanta Das said India remains sensitive to food price shocks, and monetary policy continues to push inflation towards the 4% target.
- RBI forecasts India's GDP will expand at a 6.3% annual rate in the current fiscal year.
- US Consumer Price Index (CPI) grew 3.2% YoY in October from the previous reading of 3.7%, lower than the expectation of 3.3%.
- The US Core CPI, which excludes volatile food and energy prices, rose by 0.2% MoM and 4.0% YoY.
- Fed fund futures are now pricing no further US rate hikes in this cycle, according to the CME FedWatch Tool.
Technical Analysis: The Indian Rupee strengthens but the upside potential seems limited
The Indian Rupee trades firm on the day. The USD/INR pair has hovered around the lower limit of the trading range of 83.00–83.35 since late September. However, the USD/INR maintains a bullish vibe as the pair holds above the key 100- and 200-day Exponential Moving Averages (EMA) on the daily chart.
The initial support level for the pair is located near a low of September 12 at 82.82. Any follow-through selling will see losses extend to a low of September 22 at 82.75, followed by a low of August 4 at 82.65.
On the upside, the immediate upside barrier will emerge near the upper boundary of the trading range of 83.35. A break above 83.35 will see a rally to a year-to-date (YTD) high of 83.47. The additional upside filter to watch is a psychological round figure at 84.00.
US Dollar price in the last 7 days
The table below shows the percentage change of US Dollar (USD) against listed major currencies in the last 7 days. US Dollar was the weakest against the Euro.
| USD | EUR | GBP | CAD | AUD | JPY | NZD | CHF | |
| USD | -1.73% | -1.64% | -0.60% | -1.14% | 0.14% | -1.47% | -1.29% | |
| EUR | 1.70% | 0.09% | 1.11% | 0.59% | 1.84% | 0.26% | 0.41% | |
| GBP | 1.61% | -0.09% | 1.03% | 0.50% | 1.75% | 0.17% | 0.35% | |
| CAD | 0.60% | -1.13% | -1.04% | -0.54% | 0.73% | -0.87% | -0.69% | |
| AUD | 1.13% | -0.59% | -0.50% | 0.54% | 1.26% | -0.32% | -0.15% | |
| JPY | -0.14% | -1.87% | -1.80% | -0.73% | -1.29% | -1.61% | -1.45% | |
| NZD | 1.45% | -0.26% | -0.18% | 0.85% | 0.34% | 1.58% | 0.16% | |
| CHF | 1.28% | -0.43% | -0.34% | 0.69% | 0.16% | 1.41% | -0.18% |
The heat map shows percentage changes of major currencies against each other. The base currency is picked from the left column, while the quote currency is picked from the top row. For example, if you pick the Euro from the left column and move along the horizontal line to the Japanese Yen, the percentage change displayed in the box will represent EUR (base)/JPY (quote).
Indian Rupee FAQs
What are the key factors driving the Indian Rupee?
The Indian Rupee (INR) is one of the most sensitive currencies to external factors. The price of Crude Oil (the country is highly dependent on imported Oil), the value of the US Dollar – most trade is conducted in USD – and the level of foreign investment, are all influential. Direct intervention by the Reserve Bank of India (RBI) in FX markets to keep the exchange rate stable, as well as the level of interest rates set by the RBI, are further major influencing factors on the Rupee.
How do the decisions of the Reserve Bank of India impact the Indian Rupee?
The Reserve Bank of India (RBI) actively intervenes in forex markets to maintain a stable exchange rate, to help facilitate trade. In addition, the RBI tries to maintain the inflation rate at its 4% target by adjusting interest rates. Higher interest rates usually strengthen the Rupee. This is due to the role of the ‘carry trade’ in which investors borrow in countries with lower interest rates so as to place their money in countries’ offering relatively higher interest rates and profit from the difference.
What macroeconomic factors influence the value of the Indian Rupee?
Macroeconomic factors that influence the value of the Rupee include inflation, interest rates, the economic growth rate (GDP), the balance of trade, and inflows from foreign investment. A higher growth rate can lead to more overseas investment, pushing up demand for the Rupee. A less negative balance of trade will eventually lead to a stronger Rupee. Higher interest rates, especially real rates (interest rates less inflation) are also positive for the Rupee. A risk-on environment can lead to greater inflows of Foreign Direct and Indirect Investment (FDI and FII), which also benefit the Rupee.
How does inflation impact the Indian Rupee?
Higher inflation, particularly, if it is comparatively higher than India’s peers, is generally negative for the currency as it reflects devaluation through oversupply. Inflation also increases the cost of exports, leading to more Rupees being sold to purchase foreign imports, which is Rupee-negative. At the same time, higher inflation usually leads to the Reserve Bank of India (RBI) raising interest rates and this can be positive for the Rupee, due to increased demand from international investors. The opposite effect is true of lower inflation.
- GBP/USD recorded a notable surge of 1.79% in the last trading session.
- US CPI eased at 3.2% from 3.7%; Core CPI rose 0.2% against the expected 0.3%.
- BoE may hold off on making any policy adjustments if UK inflation follows the anticipated slowdown.
GBP/USD floats around 1.2480 during the Asian session on Wednesday. The GBP/USD pair saw a notable surge of 1.79%, reaching the 1.2500 zone following the release of weaker US inflation data overnight.
The US Consumer Price Index (CPI) for October revealed lower-than-expected readings, with the annual rate slowing down from 3.7% to 3.2%, falling short of the consensus forecast of 3.3%. The monthly CPI also decreased from 0.4% to 0.0%.
In terms of the US Core CPI, it saw a rise of 0.2%, below the expected 0.3%, and the annual rate eased to 4.0% from the previous 4.1%.
The Dollar Index (DXY) moves sideways near 104.10 at the time of writing, after the substantial losses recorded in the previous session. The index dropped by 1.50%, reaching its lowest level since early September.
The US Dollar (USD) found itself under added strain due to heightened risk appetite and a downward trajectory in US Treasury bonds. The US 10-year yield took a notable dip, hitting an eight-week low at 4.43%.
On Tuesday, the GBP/USD pair witnessed strength following the mixed employment data from the United Kingdom (UK). UK Claimant Count Change reduced to 17.8K in October compared to the 20.4K prior. Claimant Count Rate was maintained at 4.0%. Employment Change saw a decline of 207K in September against the 82K decline previously. Moreover, the UK ILO Unemployment Rate (3M) remained consistent at 4.2% in September.
Wednesday is set to bring forth crucial UK inflation data and Retail Sales figures. The market will be keeping a close eye on these numbers, and if inflation follows the anticipated downward trend, it might keep the Bank of England (BoE) from making any immediate changes to its monetary policy.
| Raw materials | Closed | Change, % |
|---|---|---|
| Silver | 23.085 | 3.47 |
| Gold | 1963.216 | 0.88 |
| Palladium | 1017.4 | 3.69 |
- NZD/USD reverses an Asian session dip and moves back to over a one-month top set on Tuesday.
- The mixed Chinese macro data does little to provide any impetus amid a modest USD recovery.
- Expectations that the Fed is done with its rate-hiking cycle should cap the USD and favour bulls.
The NZD/USD pair attracts some dip-buying during the Asian session on Wednesday and climbs back above the 0.6000 psychological mark in the last hour. Spot prices touch a fresh one-month peak, around the 0.6015 area in the last hour and react to the mixed Chinese macro data.
The National Bureau of Statistics reported that China's Industrial Production rose by 4.6% YoY pace in October, slightly better than consensus estimates and the 4.5% growth registered in the previous month. Adding to this, the monthly Retail Sales also surpassed market expectations and advanced 7.4% over the past 12 months through October. This, to a larger extent, overshadows the disappointing release of Fixed Asset Investment, which climbed by 2.9% YoY rate during the reported month as compared to the 3.1% anticipated and September reading. The data, however, does little to provide any meaningful impetus to the NZD/USD pair in the wake of a modest US Dollar (USD) uptick.
In fact, the USD Index (DXY), which tracks the Greenback against a basket of currencies, recovers a part of the overnight slump to the lowest level since September 1 and acts as a headwind for the major. Any meaningful upside for the USD, however, seems elusive on the back of growing acceptance that the Federal Reserve (Fed) is done with its rate-hiking cycle. The bets were lifted by the softer US consumer inflation figures on Tuesday, which triggered a steep decline in the US Treasury bond yields and should continue to act as a headwind for the buck. Apart from this, the prevalent upbeat market mood is likely to undermine the safe-haven USD and drive flows towards the perceived riskier Kiwi.
The aforementioned fundamental backdrop suggests that the path of least resistance for the NZD/USD pair is to the upside. Hence, any meaningful corrective decline could be seen as a buying opportunity and remain limited. Market participants now look to the US economic docket, featuring the release of the Producer Price Index (PPI), monthly Retail Sales figures and the Empire State Manufacturing Index later during the early North American session. This, along with the US bond yields and the broader risk sentiment, might influence the USD price dynamics and produce short-term trading opportunities around the NZD/USD pair.
Technical levels to watch
China’s August Retail Sales, jump 7.6% YoY versus 7.0% expected and 5.5% previous, the latest data published by the National Bureau of Statistics (NBS) showed Wednesday.
Furthermore, the country’s Industrial Production came in at 4.6% YoY vs. 4.5% estimated and September’s 4.5%. The Fixed Asset Investment dropped by 2.9% YTD YoY in October vs 3.1% expected and 3.1% reported in September.
Market reaction
The Australian Dollar attracts some buyers following the Chinese data release. The AUD/USD pair is losing 0.19% on the day to trade at 0.6493, as of writing.
- EUR/USD edges lower and snaps a three-day winning streak to over a two-month high.
- A modest USD uptick is seen exerting pressure, though the downside seems cushioned.
- Bets that the Fed is done raising rates should cap gains for the USD and lend support.
The EUR/USD pair struggles to capitalize on the previous day's blowout rally to the 1.0885-1.0890 area, or its highest level since August 31 and edges lower during the Asian session on Wednesday. Spot prices currently trade around the 1.0870 regions, down less than 0.10% for the day, and for now, seem to have snapped a three-day winning streak, though any meaningful corrective decline seems elusive.
The US Dollar (USD) attracts some buying and reverses a part of Tuesday's slump to a one-week low, which, in turn, is seen acting as a headwind for the EUR/USD pair. The USD uptick, however, lacks bullish conviction in the wake of growing acceptance that the Federal Reserve (Fed) is done with its policy-tightening campaign. The bets were reaffirmed by softer US consumer inflation figures, showing that the headline CPI was unchanged in October and the yearly rate decelerated from 3.7% in September to 3.2% – marking the smallest rise in two years.
Investors were quick to react and now expect the Fed to keep rates on hold. Furthermore, the current market pricing indicates that the US central bank could start cutting rates in May 2024. This led to the overnight sharp decline in the US Treasury bond yields, which might hold back the USD bulls from placing aggressive bets and help limit the downside for the EUR/USD pair. This, in turn, makes it prudent to wait for strong follow-through selling before confirming that spot prices have topped out and placing aggressive bearish traders.
Market participants now look to the US economic docket, featuring the release of the Producer Price Index (PPI), monthly Retails Sales figures and the Empire State Manufacturing Index later during the early North American session. This, along with the US bond yields and the broader risk sentiment, should drive demand for the safe-haven buck and provide a fresh impetus to the EUR/USD pair.
Technical levels to watch
- Australian Dollar maintains its position below the 0.6500 psychological level.
- Australia’s Wage Price Index (Q3) rose by 1.3% as expected and 4.0% annually.
- US Dollar faces pressure as US inflation slowed more than anticipated.
The Australian Dollar (AUD) pulls back from the weekly high, hovering below the major level around 0.6500 on Wednesday. Tuesday's data unveiled a more pronounced deceleration in US inflation than initially predicted, leading to a substantial decline in the US Dollar (USD). Consequently, the AUD/USD pair saw a notable increase.
Australia’s Wage Price Index came in on Wednesday, revealing that quarterly labor cost inflation grew 1.3% as expected compared to the previous reading of 0.8%. The year-over-year data showed an increase of 4.0% more than the anticipated 3.9%. Moreover, The Australian jobs data will be published on Thursday, providing further insights.
Australia's Westpac Consumer Confidence report indicated a significant drop in consumer sentiment for November. The Reserve Bank of Australia (RBA) depicted a tough economic landscape in its Monetary Policy Statement (MPS) last Friday, citing persistent inflation challenges and a sluggish Australian economy. The increasing pressure on data-guided policy adjustments will likely pose a challenge for the central bank board.
The Dollar Index (DXY) recorded a 1.50% decline in the previous session, hitting its lowest point since early September. The Greenback faced additional pressure from increased risk appetite and a downward trend in US Treasury bonds. The US 10-year yield experienced a significant drop to an eight-week low at 4.43%.
Daily Digest Market Movers: Australian Dollar remains below a psychological level amid RBA’s uncertainty over policy rates
- Australia’s Westpac Consumer Confidence declined by 2.6% in November, swinging from the previous growth of 2.9%.
- RBA Assistant Governor (Economic) Marion Kohler stated that the decline in inflation is expected to be slower than initially anticipated. This is attributed to the persistent high level of domestic demand and robust pressures from labor and other costs. Kohler emphasized the need for a tighter policy to address the challenges posed by elevated inflation.
- RBA highlighted the challenges stemming from persistent inflationary pressures and a sluggish domestic economy in its Monetary Policy Statement (MPS) last Friday.
- RBA board acknowledges the financial struggles of many households. Budgets are indeed feeling the squeeze. In a twist of economic dynamics, the central bank painted a mixed picture by raising its inflation and GDP growth forecasts.
- RBA increased the Official Cash Rate (OCR) from 4.10% to a 12-year high of 4.35%, responding to the latest Monthly Consumer Price Index (YoY) for September, which indicated a notable increase of 5.6% compared to the expected 5.4% growth.
- Australia’s TD Securities Inflation (YoY) eased at 5.1% in September from 5.7% prior.
- Economists at the National Australia Bank (NAB) anticipate another 25 basis points hike in February following the Q4 inflation data. Additionally, NAB believes rate cuts will unlikely commence until November 2024.
- The US-Sino Presidential meeting is on the horizon, and US President Joe Biden aims to rebuild military-to-military connections with China. The much-anticipated face-to-face between Biden and Chinese President Xi Jinping is scheduled for Wednesday during the Asia-Pacific Economic Cooperation summit in San Francisco., marking their first in-person meeting in a year.
- The US Consumer Price Index (CPI) for October showed lower readings than expected, with the annual rate slowing from 3.7% to 3.2%, falling below the consensus forecast of 3.3%. The monthly CPI reduced to 0.0% from 0.4%.
- The US Core CPI rose by 0.2% below the expectations of 0.3%, and the annual rate decreased to 4.0% from 4.1% prior.
- US Monthly Budget Statement reported a deficit of $67B in October, compared to the expected deficit of $65B.
- US preliminary US Michigan Consumer Sentiment data for November showed a dip in the mood among consumers. It fell to 60.4 from 63.8 in the previous month.
Technical Analysis: Australian Dollar hovers below the 0.6500 major level followed by the 38.2% Fibonacci retracement
The Australian Dollar trades around 0.6490 on Wednesday aligned to the immediate resistance at 0.6500 psychological level, followed by the 38.2% Fibonacci retracement at 0.6508. On the downside, the AUD/USD pair could meet the support at the 21-day Exponential Moving Average (EMA) lined up with the major level at 0.6400.
AUD/USD: Daily Chart

Australian Dollar price today
The table below shows the percentage change of Australian Dollar (AUD) against listed major currencies today. Australian Dollar was the weakest against the US Dollar.
| USD | EUR | GBP | CAD | AUD | JPY | NZD | CHF | |
| USD | 0.09% | 0.09% | 0.06% | 0.19% | 0.06% | 0.11% | 0.07% | |
| EUR | -0.10% | 0.00% | -0.03% | 0.14% | -0.03% | -0.02% | -0.02% | |
| GBP | -0.10% | 0.00% | -0.03% | 0.09% | -0.03% | -0.02% | -0.03% | |
| CAD | -0.06% | 0.05% | 0.06% | 0.20% | 0.01% | 0.02% | 0.02% | |
| AUD | -0.19% | -0.09% | -0.09% | -0.12% | -0.12% | -0.12% | -0.11% | |
| JPY | -0.06% | 0.04% | 0.02% | -0.01% | 0.16% | -0.01% | 0.02% | |
| NZD | -0.08% | 0.02% | -0.02% | -0.01% | 0.12% | -0.01% | 0.00% | |
| CHF | -0.09% | 0.02% | 0.02% | -0.01% | 0.14% | -0.01% | 0.00% |
The heat map shows percentage changes of major currencies against each other. The base currency is picked from the left column, while the quote currency is picked from the top row. For example, if you pick the Euro from the left column and move along the horizontal line to the Japanese Yen, the percentage change displayed in the box will represent EUR (base)/JPY (quote).
Australian Dollar FAQs
What key factors drive the Australian Dollar?
One of the most significant factors for the Australian Dollar (AUD) is the level of interest rates set by the Reserve Bank of Australia (RBA). Because Australia is a resource-rich country another key driver is the price of its biggest export, Iron Ore. The health of the Chinese economy, its largest trading partner, is a factor, as well as inflation in Australia, its growth rate and Trade Balance. Market sentiment – whether investors are taking on more risky assets (risk-on) or seeking safe-havens (risk-off) – is also a factor, with risk-on positive for AUD.
How do the decisions of the Reserve Bank of Australia impact the Australian Dollar?
The Reserve Bank of Australia (RBA) influences the Australian Dollar (AUD) by setting the level of interest rates that Australian banks can lend to each other. This influences the level of interest rates in the economy as a whole. The main goal of the RBA is to maintain a stable inflation rate of 2-3% by adjusting interest rates up or down. Relatively high interest rates compared to other major central banks support the AUD, and the opposite for relatively low. The RBA can also use quantitative easing and tightening to influence credit conditions, with the former AUD-negative and the latter AUD-positive.
How does the health of the Chinese Economy impact the Australian Dollar?
China is Australia’s largest trading partner so the health of the Chinese economy is a major influence on the value of the Australian Dollar (AUD). When the Chinese economy is doing well it purchases more raw materials, goods and services from Australia, lifting demand for the AUD, and pushing up its value. The opposite is the case when the Chinese economy is not growing as fast as expected. Positive or negative surprises in Chinese growth data, therefore, often have a direct impact on the Australian Dollar and its pairs.
How does the price of Iron Ore impact the Australian Dollar?
Iron Ore is Australia’s largest export, accounting for $118 billion a year according to data from 2021, with China as its primary destination. The price of Iron Ore, therefore, can be a driver of the Australian Dollar. Generally, if the price of Iron Ore rises, AUD also goes up, as aggregate demand for the currency increases. The opposite is the case if the price of Iron Ore falls. Higher Iron Ore prices also tend to result in a greater likelihood of a positive Trade Balance for Australia, which is also positive of the AUD.
How does the Trade Balance impact the Australian Dollar?
The Trade Balance, which is the difference between what a country earns from its exports versus what it pays for its imports, is another factor that can influence the value of the Australian Dollar. If Australia produces highly sought after exports, then its currency will gain in value purely from the surplus demand created from foreign buyers seeking to purchase its exports versus what it spends to purchase imports. Therefore, a positive net Trade Balance strengthens the AUD, with the opposite effect if the Trade Balance is negative.
The People’s Bank of China (PBoC) set the USD/CNY central rate for the trading session ahead on Wednesday at 7.1752 as compared to the previous day's fix of 7.1768 and 7.2564 Reuters estimates.
- Gold price remains sidelined as bulls take a breather around $1,960.
- The US headline Consumer Price Index (CPI) grew 3.2% YoY vs. 3.7% prior, below the market estimation.
- The escalating geopolitical conflicts in the Middle East could boost the demand for gold.
- The Chinese Industrial Production and Retail Sales will be closely watched ahead of the US data.
Gold price (XAU/USD) consolidates its recent gains after reaching $1,971 during the early Asian session on Wednesday. The weaker-than-expected US inflation and a decline in US Treasury yields boost precious metal demand. Also, the rising geopolitical tensions will fuel the safe-haven flows. The gold price currently trades near $1,960, losing 0.10% on the day.
Meanwhile, the US Dollar Index (DXY), an index of the value of the USD measured against a basket of six world currencies, falls to the 104.00 area, the lowest level since early September. The US Treasury bond yields dropped sharply, with the US 10-year yield falling from 4.60% to 4.45%. Gold benefits from this development and bounces off the $1,940 low.
The US Consumer Price Index (CPI) is probably alleviating the Fed's pressure to further tighten monetary policy this year. This, in turn, triggers some follow-through buying in the precious metal. That being said, the US CPI came in worse than expected, growing 3.2% YoY versus 3.7% prior, below the market consensus of 3.3%. Meanwhile, the core measure rose by 0.2% MoM and 4.0% YoY.
The Gaza Strip has been under a total Israeli blockade since Hamas launched an attack on Israel on October 7. The rising geopolitical tensions in the Middle East could trigger the demand for gold.
Gold traders will monitor the Chinese Industrial Production and Retail Sales for October, due on Tuesday. The weaker-than-expected data could fuel the concern of economic slowdown in the world’s second economy. Later in the day, the US Retail Sales and Producer Price Index (PPI) will be released.
- USD/JPY attracts fresh buyers on Wednesday and draws support from a combination of factors.
- The worse-than-expected Japanese GDP print and a positive risk tone seem to undermine the JPY.
- The USD reverses a part of Tuesday’s US CPI-inspired slump and acts as a tailwind for the major.
The USD/JPY pair regains positive traction during the Asian session on Wednesday and reverses a part of the previous day's heavy losses to the 150.15 area, or a one-week low. The intraday buying picks up pace following the worse-than-expected release of the Japanese GDP print and lifts spot prices to a fresh daily peak, around the 150.75-150.80 region in the last hour.
According to the preliminary estimates, Japan's economy slowed significantly and shrank at an annualized pace of 2.1% in the July-September period – marking the first contraction in three quarters. This comes on top of a more dovish stance adopted by the Bank of Japan (BoJ) and undermines the Japanese Yen (JPY). Apart from this, the risk-on mood is seen as another factor weighing on the safe-haven JPY, which, along with a modest US Dollar (USD) uptick, acts as a tailwind for the USD/JPY pair.
The upside, however, seems limited in the wake of expectations that the Federal Reserve (Fed) is done raising rates. The US Bureau of Labor Statistics (BLS) reported on Tuesday that the headline US CPI was unchanged in October and the yearly rate decelerated from 3.7% in September to 3.2% – the smallest rise in two years. This combined with other US macro data released this month, showing jobs and wage growth cooling in October, reaffirms bets that the Fed has ended its policy tightening cycle.
Market participants now expect the Fed to keep rates on hold and start cutting rates in May 2024. This led to the overnight sharp decline in the US Treasury bond yields, which might hold back the USD bulls from placing aggressive bets and keep a lid on any meaningful appreciating move for the USD/JPY pair. Traders now look to the US economic docket, featuring the release of the Producer Price Index (PPI), monthly Retail Sales figurs and the Empire State Manufacturing Index, for a fresh imptus.
Technical levels to watch
Early Wednesday in Asia, the Australian headline Wage Price Index for the third quarter (Q3) grew 1.3% QoQ versus 1.3% expected and 0.8% prior, according to the the Australian Bureau of Statistics (ABS).
On the annual basis, the Aussie Wage Price Index came in at 4.0% versus the market’s forecast of 3.9% figure for the said period and 3.6% in the previous reading.
Market reaction
Following the Aussie wage growth, the AUD/USD pair is down 0.23% on the day at 0.6493.
About Australia’s Wage Price Index
The Wage Price Index released by the Australian Bureau of Statistics is an indicator of labor cost inflation and of the tightness of labor markets. The Reserve Bank of Australia pays close attention to it when setting interest rates. A high reading is positive (or bullish) for the AUD, while a low reading is seen as negative (or bearish).
| Index | Change, points | Closed | Change, % |
|---|---|---|---|
| NIKKEI 225 | 110.82 | 32695.93 | 0.34 |
| Hang Seng | -29.35 | 17396.86 | -0.17 |
| KOSPI | 29.49 | 2433.25 | 1.23 |
| ASX 200 | 57.9 | 7006.7 | 0.83 |
| DAX | 269.43 | 15614.43 | 1.76 |
| CAC 40 | 98.62 | 7185.68 | 1.39 |
| Dow Jones | 489.83 | 34827.7 | 1.43 |
| S&P 500 | 84.15 | 4495.7 | 1.91 |
| NASDAQ Composite | 326.64 | 14094.38 | 2.37 |
| Pare | Closed | Change, % |
|---|---|---|
| AUDUSD | 0.6507 | 2.12 |
| EURJPY | 163.602 | 0.94 |
| EURUSD | 1.08789 | 1.72 |
| GBPJPY | 187.959 | 1.04 |
| GBPUSD | 1.2498 | 1.91 |
| NZDUSD | 0.60082 | 2.25 |
| USDCAD | 1.36919 | -0.73 |
| USDCHF | 0.88908 | -1.35 |
| USDJPY | 150.392 | -0.87 |


© 2000-2024. Уcі права захищені.
Cайт знаходитьcя під керуванням TeleTrade DJ. LLC 2351 LLC 2022 (Euro House, Richmond Hill Road, Kingstown, VC0100, St. Vincent and the Grenadines).
Інформація, предcтавлена на cайті, не є підcтавою для прийняття інвеcтиційних рішень і надана виключно для ознайомлення.
Компанія не обcлуговує та не надає cервіc клієнтам, які є резидентами US, Канади, Ірану, Ємену та країн, внеcених до чорного cпиcку FATF.
Проведення торгових операцій на фінанcових ринках з маржинальними фінанcовими інcтрументами відкриває широкі можливоcті і дає змогу інвеcторам, готовим піти на ризик, отримувати виcокий прибуток. Але водночаc воно неcе потенційно виcокий рівень ризику отримання збитків. Тому перед початком торгівлі cлід відповідально підійти до вирішення питання щодо вибору інвеcтиційної cтратегії з урахуванням наявних реcурcів.
Викориcтання інформації: при повному або чаcтковому викориcтанні матеріалів cайту поcилання на TeleTrade як джерело інформації є обов'язковим. Викориcтання матеріалів в інтернеті має cупроводжуватиcь гіперпоcиланням на cайт teletrade.org. Автоматичний імпорт матеріалів та інформації із cайту заборонено.
З уcіх питань звертайтеcь за адреcою pr@teletrade.global.
переклади