- Аналітика
- Новини та інструменти
- Новини ринків
Новини ринків
- S&P 500 closes down at 4450.32, losing 1.22%, as Technology, Consumer Discretionary, and Energy sectors led the decline.
- Upbeat US economic data, including a rise in the Empire State Manufacturing Index, fuels optimism that the Fed may achieve a soft landing.
- US 10-year Treasury yields climb to 4.334%, adding to market jitters, while WTI oil prices rise by 0.56% due to tight supplies.
Wall Street finished the week on a lower note, as a pile of expiring options and an index rebalance sparked volatility in the US equity markets after printing weekly highs during the last two trading days. This, alongside upbeat US economic data and a jump in US Treasury bond yields, turned sentiment sour.
S&P 500 loses 1.22% as expiring options and index rebalance add volatility, despite optimism about a Fed’s soft landing
The S&P 500 registered solid losses of 1.22%, down at 4450.32, while the heavy-tech Nasdaq 100 erased 1.56% of its hard-earned gains, ending at 13,813.59. At the same time, the Dow Jones Industrial Average fell 0.83% and finished the session at 34,618.24
Sector-wise, the biggest losers were Technology, Consumer Discretionary, and Energy, each losing 1.95%, 1.88%, and 1.32%. The least damaged were Utilities, Real Estate, and Industrials, erasing from its value 0.49%, 0.51%, and 0.53%, respectively.
US economic data revealed on Friday echoed an upbeat tone amongst investors, who are optimistic the Federal Reserve would achieve a soft landing. The University of Michigan showed that despite consumer sentiment deteriorating, Americans see a ray of light regarding lower prices. According to the UoM survey, inflation expectations lowered to 3.1% in September for one year and 2.7% for a 5-year horizon.
The New York Fed released its Empire State Manufacturing Index, which rose sharply, crushing last month’s figures and the consensus. At the same time, the Federal Reserve announced that Industrial Production in August expanded by 0.4%, above forecasts but trailed July’s data.
Today’s data, summed up with the previous one revealed in the week, raised speculation the Fed might achieve a soft landing. In the meantime, money market futures remain certain the Fed would skip hiking rates next week when the US central bank meets in Washington, in the only meeting in Q3.
US Treasury bond yields finished the session with the 10-year benchmark note rate at 4.334%, gained 0. 98%. The Greenback, as shown by the US Dollar Index, ended positively, climbing 0.01%, at 105.33..
WTI rose by 0.56% daily in the commodity space underpinned by tight supplies after Saudi Arabia and Russia’s 1.3 million barrel crude oil cut.
S&P 500 Price Action – Daily Chart
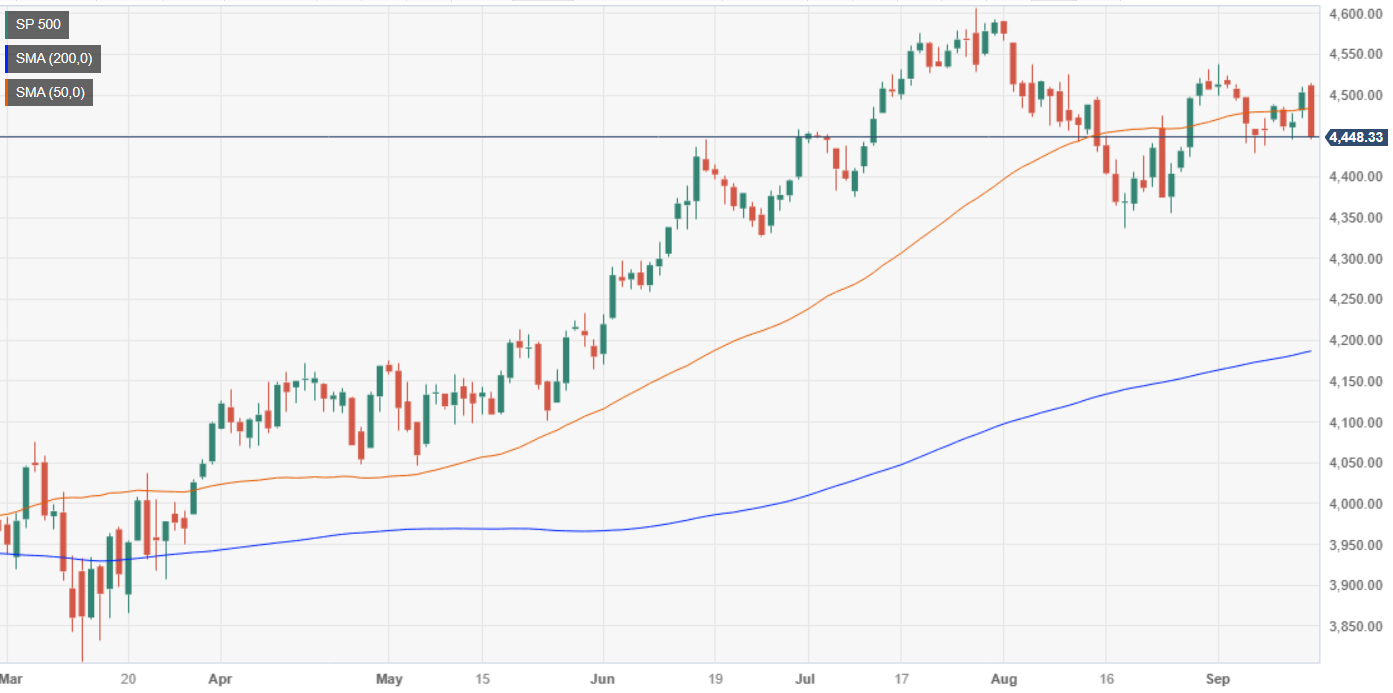
S&P 500 Technical Levels
- USD/NOK saw green on Friday, rising 0.50% above 10.788.
- Investors expect the NB to deliver a 25 basis point hike to 4.25% next week.
- The Fed decision will likely be a pause next Wednesday.
On the last day of the week, the USD/NOK gained additional traction, rising to multi-month highs above 10.788.
On the NOK’s side, Norges Bank (NB) is anticipated to announce a 25 basis point hike, bringing the key rate to 4.25% in the next week and will likely be the last increase of its tightening cycle. However, the bank is expected to maintain rates at restrictive levels to reassure, and incoming data will ultimately decide when the first rate cut will come or when the bank will maintain rates highs. In the meantime, recent economic data, including inflation numbers and the Norwegian Krone (NOK) stability, have generally aligned with the central bank's expectations.
For next week’s Federal Reserve (Fed) decision, markets have already warranted a pause, but attention is set on the monetary policy statement and Chair Powell’s tone. The last data sets have shown that the US economy is holding firm, seemingly achieving a soft landing while inflation figures accelerated in August, so one more hike will be justified. As for now, the CME FedWatch tool indicates that the odds of a 25 basis point hike in November or December have somewhat eased to 35%.
USD/NOK Levels to watch
Based on the daily chart, the USD/NOK exhibits a bullish outlook for the short term. Both the Relative Strength Index (RSI) and Moving Average Convergence Divergence (MACD) remain in positive territory, with the RSI above its midline and showing a northward slope. The MACD is also displaying green bars, indicating a strengthening bullish momentum. Furthermore, the pair is above the 20,100,200-day Simple Moving Average (SMA), suggesting that the bulls are firmly in control of the bigger picture.
Support levels: 10.703,10.671 (20-day SMA), 10.625.
Resistance levels: 10.779, 10.837, 10.850.
USD/NOK Daily Chart
-638304110076960613.png)
- GBP/JPY looking down a steep hill as the pair loses ground near 183.00.
- Data-packed economic calendar for the UK in the bottom half of next week.
- GBP struggles to find a floor on mixed UK data souring investor appetite.
The GBP/JPY has struggled to develop meaningful momentum in recent weeks, and the Guppy is drifting into the low end of recent consolidation, testing the 183.00 handle ahead of next week’s United Kingdom (UK) heavy economic calendar.
This week saw employment and GDP figures for the UK come in below expectations. Wages also ticked higher, keeping inflation concerns elevated.
UK employment change numbers printed at -207K, worse than the forecast figure of -185K and far below the previous read of -66K. Meanwhile, average earnings for the quarter ending July printed at 8.5%, above the previous figure which was revised upwards to 8.4%. The UK's economy is caught between a rock and a hard place with rising wages increasing concerns of inflation coupled with a flagging employment landscape.
Up next week: Japan and UK econ data on the docket
Next week's economic calendar sees Japanese trade balance figures on Tuesday, with both Japanese exports and imports expected to decline. Japan's merchandise trade balance total for August is expected to decline further, forecast to print at ¥-659.1B.
Next week will also see UK Consumer Price Index (CPI) figures, retail sales, and the next rate call from the Bank of England (BoE), which is expected to raise the main benchmark rate to 5.5%, up 25 basis points. The BoE makes its appearance on Thursday at 11 GMT.
UK CPI for the month of August is forecast to print at 0.7% on Wednesday, with retail sales slated for Friday, and expected to show a moderate recovery of 0.5% in August. The previous month saw retail sales decline 1.2%.
Also on Friday will be the Bank of Japan's (BoJ) monetary policy statement and interest rate decision. the BoJ is broadly expected to maintain a negative policy rate of -0.1% as the central bank struggles to keep inflation above the 2% target heading into the fourth quarter.
GBP/JPY technical outlook
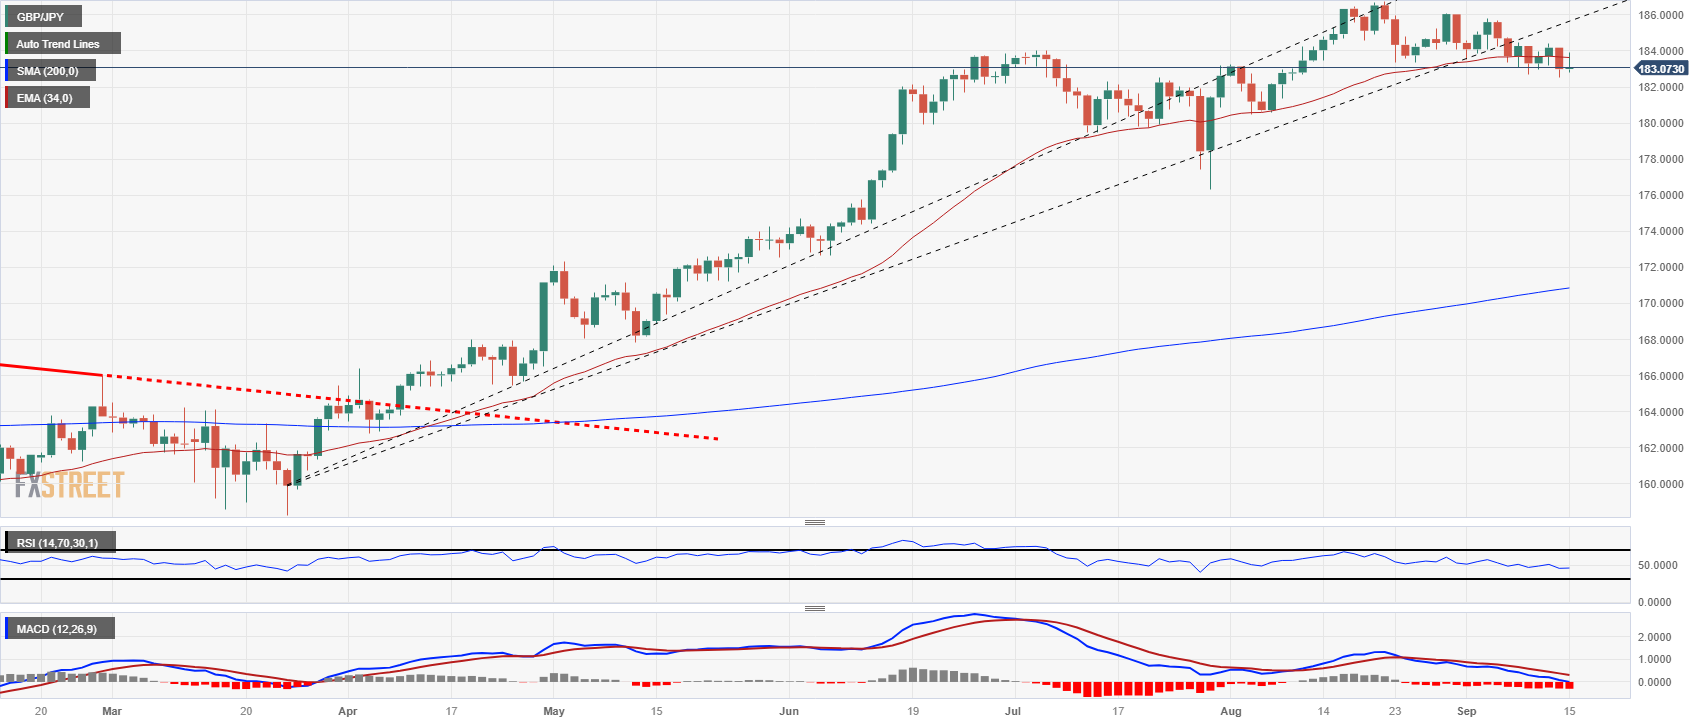
The Guppy is down to the 183.00 handle to close out the trading week, down 2% from the week’s high near 182.85.
The GBP/JPY Has struggled to develop momentum from the 34-day Exponential Moving Average (EMA) But is trading well above the 200-day Simple Moving Average (SMA) currently parked near 171.00.
The pair has traded sideways through a rising trendline from March's lows near the 160.00 major handle, and Yen bulls will be looking to develop bearish momentum from here.
GBP/JPY daily candlestick chart
GBP/JPY technical outlook
- XAU/USD tallied 0.60% daily gains and jumped to a daily high of $1,930, then settled at $1,923.
- Bulls quickly recovered the 20 and 200-day SMAs at the $1,920 area after losing them at the beginning of the week.
- Indicators point to a bullish resurgence.
At the end of the week, the Gold Spot price will close a weekly gain, recovering losses, which took the price to a weekly low of $1,900 and closing above $1,920.
Based on the daily chart, the XAU/USD exhibits a bullish outlook for the short term. Both the Relative Strength Index (RSI) and Moving Average Convergence Divergence (MACD) show signs of the buyers recovering and stan in positive territory, with the RSI jumping back above its midline and showing a northward slope. The MACD is also displaying green bars, indicating a strengthening bullish momentum. Additionally, on the four-hour chart, the price jumped above the 20,100 and 200 Simple Moving Averages (SMA) and their indicators also gained significant momentum.
However, on the larger time frame, the spot is well below the 100-day SMA, which suggests that the buyers still have some work to do to confirm a recovery.
Support levels: $1,923 - $1,920 (200 and 20-day SMA), $1,910, $1,900.
Resistance levels: $1,930,$1,940, $1,950 (100-day SMA).
XAU/USD Daily Chart
-638304076955950023.png)
- The EUR/USD couldn’t extend recovery motivation after getting knocked back by Lagarde.
- Friday rebound facing downside pressure as US Dollar maintains strength.
- Next week sees market movers on the cards with EU inflation figures, FOMC.
The EUR/USD is set to close out Friday’s trading on the back foot, testing the week’s lows near 1.0650 as the US Dollar (USD) catches a late-week bid, sending the broad dollar index higher.
ECB strips down the Euro at the top of the rate hike cycle
The European Central Bank (ECB) managed to swing a dovish rate call that saw the central bank raising their benchmark interest rates 25 basis points to bring the overnight deposit rate to 4%. Despite the rate hike, markets lurched and the Euro (EUR) slumped on the news as the ECB effectively announced the end of the current rate hike cycle without directly saying it.
While the ECB has left the door open for possible rate hikes in the future, ECB President Christine Lagarde poured cold water over the Euro, declaring that the ECB has shifted to determining how long rates should remain at current levels instead of how much they should change.
Expectations of further rate hikes from the ECB have entirely evaporated in markets and investors are now anticipating the first rate cut to come from the European Union’s central bank in March of next year.
On the US side, the economic calendar did not disappoint, sending the Greenback (USD) higher at regular intervals as US data continues to surprise to the upside.
US retail sales figures for August beat expectations, printing at 0.6% against the forecast 0.2%, and climbing over the revised-upwards previous figure of 0.5%. The US economy appears to be healthy, and is shrugging off concerns of an impending recession. The “soft landing” narrative that has undershot markets recently appears to be receding as the US consumer segment appears to be in a healthy position.
EU inflation, US FOMC on the docket for next week
Next week sees EU inflation figures due on Tuesday, with the Harmonized Index of Consumer Prices (CPI) for August forecast to print in-line with the previous period. Pan-European inflation last came in at 0.3%, and investors are expecting a repeat showing. Inflation still remains a stubborn concern, and an excessive beat on the headline could see investors scurrying for safety.
On the US side it’s another ‘all eyes on the Federal Reserve (Fed)’ week, with the Fed’s Federal Open Market Committee broadly expected to keep the US benchmark interest rate steady at 5.5%, though inflation concerns sees markets still bracing for further hikes into the end of the year.
Thursday will also see US jobless claims and Friday will deliver preliminary EU manufacturing and services Purchasing Manager Indexes (PMI), followed by the US iteration of the same data publication later in the day.
EUR/USD technical outlook
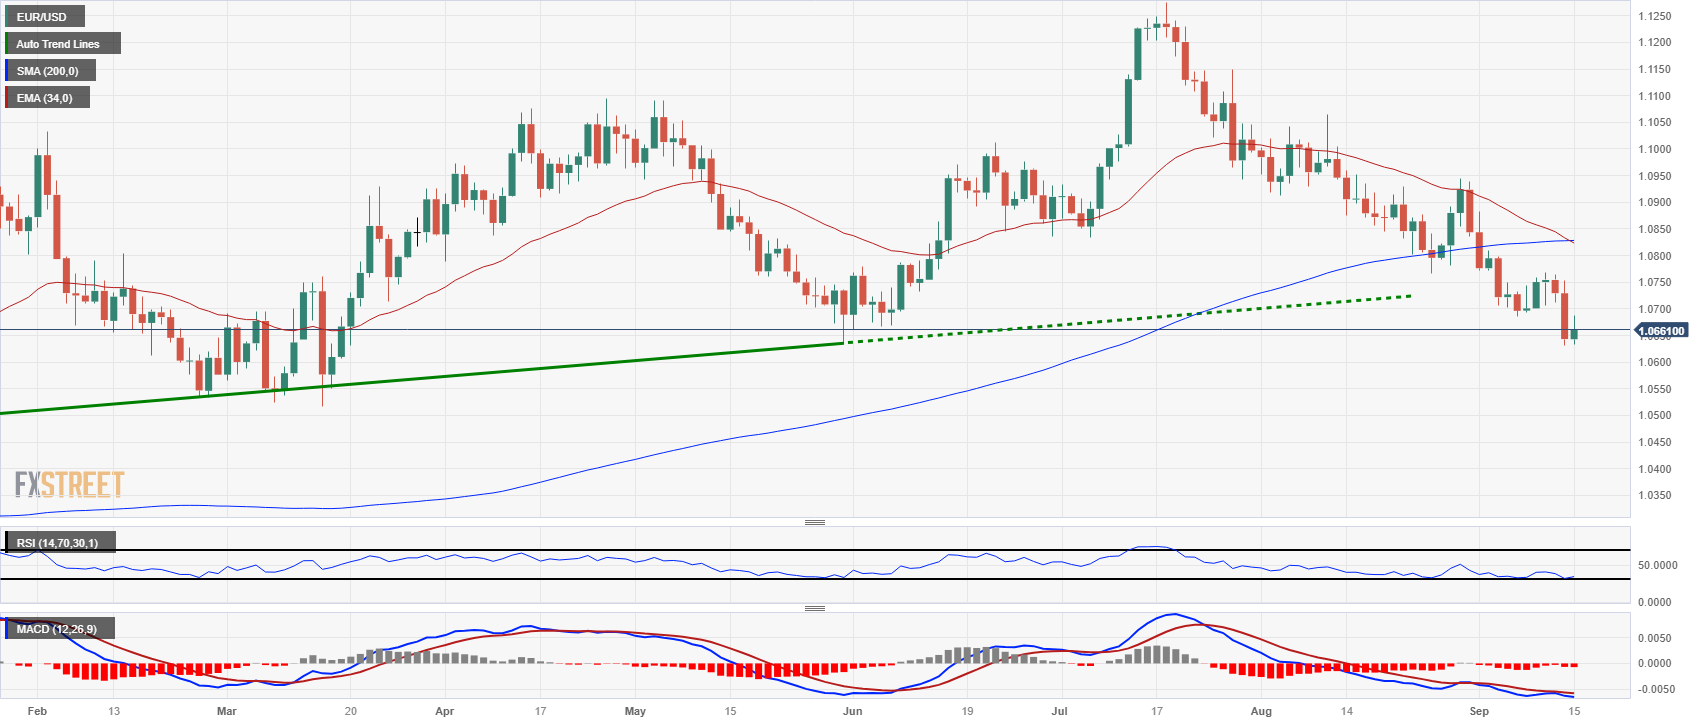
The Euro is set to close in the red for the ninth consecutive week, trading into four-month lows just north of the 1.0650 handle. Friday saw some bullish recovery for the Euro before broader US Dollar flows sent the pair back towards the day’s opening prices.
Daily candlesticks have drifted below the 200-day Simple Moving Average (SMA), and bidders will be keeping an eye on the 14-day Relative Strength Index (RSI) and the Moving Average Convergence Divergence (MACD) histogram indicators, both of which are flashing oversold conditions.
The 34-day Exponential Moving Average (EMA) is poised to confirm a bearish cross of the 200-day SMA just below 1.0850, and a series of lower highs sees the EUR/USD using the bearish-leaning 34-EMA as descending resistance further down the charts.
EUR/USD daily chart
EUR/USD technical levels
- USD/CAD stalls its downtrend, finding support at 1.3489, just above the 200-day Moving Average, and trades 0.14% higher.
- If the pair sustains above 1.3489, it could target resistance levels at 1.3550, 1.3580/90, and the psychological 1.3600 mark.
- A break below 1.3489 could signal a bearish resumption, exposing the 200-DMA at 1.3463 and the 50-DMA at 1.3413.
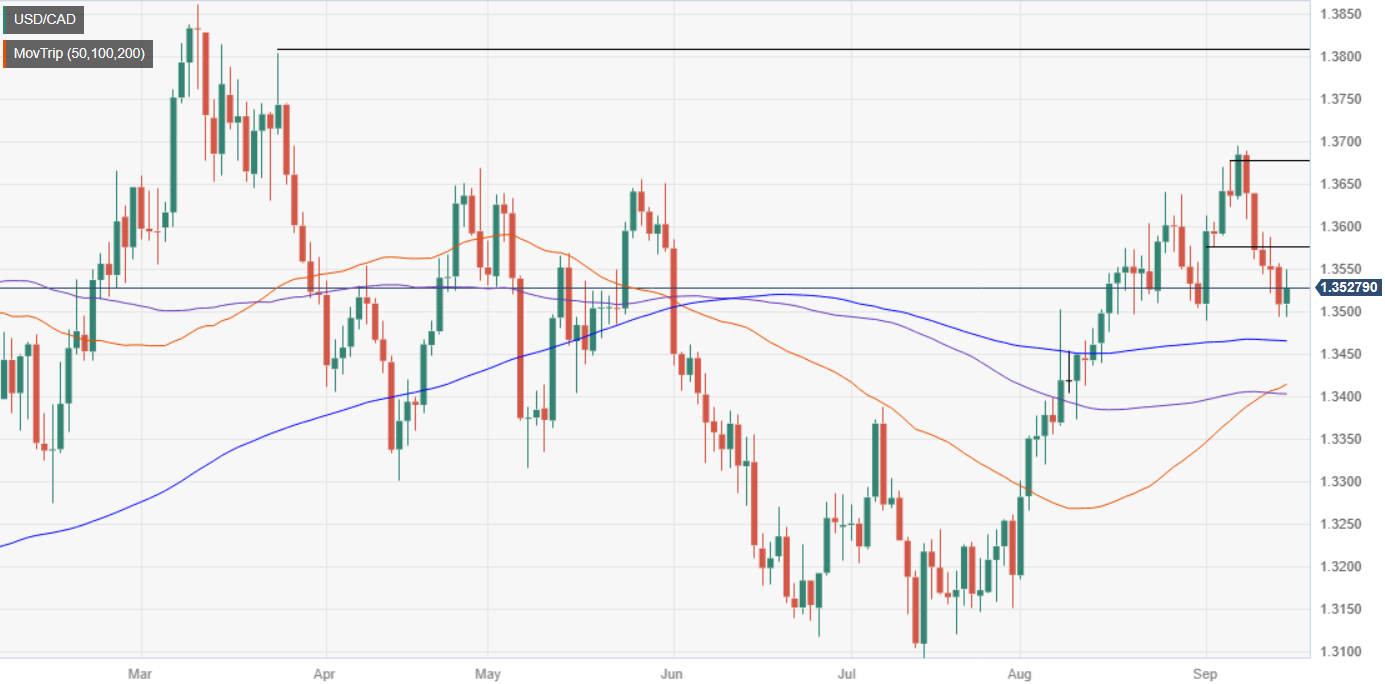
The USD/CAD downtrend stalls after the US Dollar found its footing, trimming some of its previous losses against the Loonie. Support emerged at around 1.3489, cushioning the pair’s fall and the 200-day Moving Average (DMA) sitting below that level. As of writing, the currency pair exchanges hands at 1.3527, up 0.14%.
From a daily chart perspective, the pair remains upward-biased despite the recent retracement. Sellers failed to drag prices below the September 1 swing low of 1.3489, which could exacerbate a leg up, and the USD/CAD could resume its uptrend in the short term. Hence, the first resistance would be the 1.3550 area, followed by the confluence of the September 12 and 13 highs at around 1.3580/90, immediately followed by the 1.3600 psychological level.
Contrarily, a bearish resumption would happen if the USD/CAD slumps below 1.3489, which could trigger a break in the market structure and expose the 200-DMA at 1.3463. A breach of the latter would expose the 50-DMA at 1.3413, followed by the July 7 daily high turned support at 1.3387.
USD/CAD Price Action – Daily chart
USD/CAD Technical Levels
- AUD/USD drops to 0.632, down 0.12%, reversing earlier gains spurred by positive economic data from China, Australia’s largest trade partner.
- US manufacturing and industrial data beat expectations, raising the odds for a soft landing by the Federal Reserve despite tightening.
- Market futures indicate a 32.45% chance of a Fed rate hike in November, while the September hike is largely ruled out.
The Australian Dollar reversed its course against the US Dollar after registering gains during the Asian session. Late in the North American session, the AUD/USD is trading at 0.632, losing 0.12% after reaching a daily high of 0.6473.
Australian Dollar loses steam against the US Dollar as strong US manufacturing and industrial data fuel optimism for a Fed soft landing
The economy in the United States (US) keeps surprising economists, as it remains more resilient than expected despite 525 basis points of tightening by the US Federal Reserve. Two indicators of manufacturing and industrial activity came better than expected, while Americans are optimistic that elevated prices would wane, as revealed by a University of Michigan poll.
The New York Fed revealed the Empire State Manufacturing Index, which improved after printing a mediocre -21 print in August, improved to 1.9, beating forecasts of a -10 plunge. At the same time, the Federal Reserve showed that Industrial Production expanded by 0.4% MoM, beneath July’s 1% but above the consensus forecasts.
The University of Michigan recently revealed that although inflation expectations remain not as close to the Fed’s 2% goal, they have subsided. Americans estimate inflation in one year at 3.1%, below August’s 3.5, while for ten years, they expected prices to drop to 2.7%. Regarding how they feel about the economy, known as Consumer Sentiment, the index deteriorated from 69.1 forecasts to 67.7.
Today’s data, summed up with the previous one revealed in the week, raised speculation the Fed might achieve a soft landing. In the meantime, money market futures remain certain the Fed would skip hiking rates in September, but odds for a 25 bps hike at the November meeting lie at a decent 32.45% chance.
Earlier, the additional stimulus provided by Chinese authorities is giving results on its economy, as revealed by the latest economic figures, which bolstered the Aussie, as China is Australia’s largest trade partner. Industrial Production in August rose above the prior’s reading and estimates, and retail sales jumped by 4.6% YoY, up from July 2.5% exceeding estimates.
AUD/USD Price Analysis: Technical outlook
The daily chart portrays the US Dollar might continue to appreciate against the Aussie, with next week’s Fed decision looming. The major remains downward biased, with the 200 and 50-day Moving Averages (DMAs) slopes aiming south while price action continues to dive lower, approaching the year-to-date (YTD) low of 0.6357. As of writing, the first support would be 0.6400, followed by the latter, and the next floor would be the November 22 swing low of 0.6272.

The key event next week will be the FOMC meeting. In addition, the Bank of Japan, the Swiss National Bank, and the Bank of England will also have their respective policy meetings. As for economic data, the most important release will be the preliminary September PMIs.
Here is what you need to know for next week:
The US Dollar Index (DXY) posted its ninth consecutive weekly gain, closing above 105.00. This continued streak is supported by the strong performance of the US economy. Economic data released this week provided evidence of a rebound in inflation, although core rates slowed.
The Federal Reserve will have its monetary policy meeting, and it is expected to keep interest rates unchanged on Wednesday. Fed Chair Powell will later hold a press conference. No major changes are anticipated from the Fed. A pause, with the recognition that they might raise interest rates further if inflation halts its slowdown, is a possibility. The current state of the economy indicates that it is capable of accommodating to another rate hike. A dovish tilt has the potential to trigger a sharp correction in the US dollar and a rally in commodity prices.
The Bank of England is set to announce its decision on Thursday, following the release of UK consumer inflation data on Wednesday. Market expectations point to a 25 basis point rate hike. However, earlier expectations of a larger hike have softened due to recent UK data and the economic outlook, causing GBP/USD to tumble below 1.2400 to its lowest level since early June.
The Euro also declined after the European Central Bank (ECB) signaled that its recent rate hike may be its last, leading financial markets to interpret the message as dovish. The key report next week will be the European preliminary September PMIs.
EUR/USD has experienced its ninth consecutive weekly decline, the longest losing streak since its creation. It reached a low of 1.0631 during the week, slightly above the 200-week Simple Moving Average, and remains under pressure.
The Canadian Dollar outperformed, supported by the rally in crude oil prices, resulting in its best week against the US dollar since March. USD/CAD lost over a hundred pips and is testing the 1.3500 support area. Canada will release the August Consumer Price Index next week.
The Bank of Japan is expected to maintain its current policy in its upcoming decision. USD/JPY ended the week near the 148.00 area, which acted as resistance last week and remains a level to break.
Antipodean currencies finished the week with modest gains against the US dollar, with AUD/USD and NZD/USD holding in recent ranges. The stronger US dollar was partially offset by improved risk sentiment and signs of stabilization from China.
Like this article? Help us with some feedback by answering this survey:
- The EUR/GBP saw upside for the week as inflation concerns weigh down the Pound Sterling.
- The ECB's dovish rate hike saw the Euro get sandbagged in the midweek before recovering on rising investor confidence.
- Next week will see EU and UK inflation figures going head-to-head.
The Euro (EU) clipped higher against the Pound Sterling (GBP) on Friday, heading into the end of the trading week in the green, setting a fresh four-week high and geared for further gains.
UK, EU economic calendar week-in-review
This week saw United Kingdom (UK) employment figures dip more than expected, and wage growth came in over forecast, increasing inflation concerns. On the EU side, it was all about the European Central Bank (ECB) this week as the ECB delivered its last rate hike for the foreseeable future.
UK wages printed at 8.5% for the quarter into July, above the forecast 8.2% and a tick higher than the previous reading which was revised higher to 8.4%. An increasing pace of wage growth in the UK will put upward pressure on inflation concerns as the UK battles a flagging economy that is also still exposed to runaway price spirals.
The ECB delivered what is widely expected to be their last rate hike in the current monetary tightening cycle, lifting their main rates 25 basis points to 4% for their overnight deposit facility and 4.5% on the main refinancing rate.
Despite the rate hike, the ECB managed to achieve a dovish rate increase, with the Euro slumping and European equities getting a boost on the rate headliner. Fears of a readjusted rate schedule spiked earlier this week following an ECB leak that suggested the central bank would be raising their inflation expectations looking forward, but the adjustment wasn’t enough to push the ECB closer to more rate hikes.
Markets are currently pricing in the first rate cut from the ECB in March of 2024.
The first half of next week sees the EU’s Harmonized Index of Consumer Prices (CPI) for August on Tuesday; monthly inflation is expected to hold steady at the previous reading of 0.6%.
On the UK side, Wednesday brings CPI figures for the UK, and August’s MoM inflation figures are forecast to reverse from the previous month’s 0.4% decline, with market analysts anticipating a print of 0.7%.
Producer Price Index (PPI) and Retail Price Index figures are also expected at the same time. Retail prices are expected to increase 0.9% compared to the previous 0.6% decline, but eyes will be focused on the headline CPI figures.
EUR/GBP technical outlook
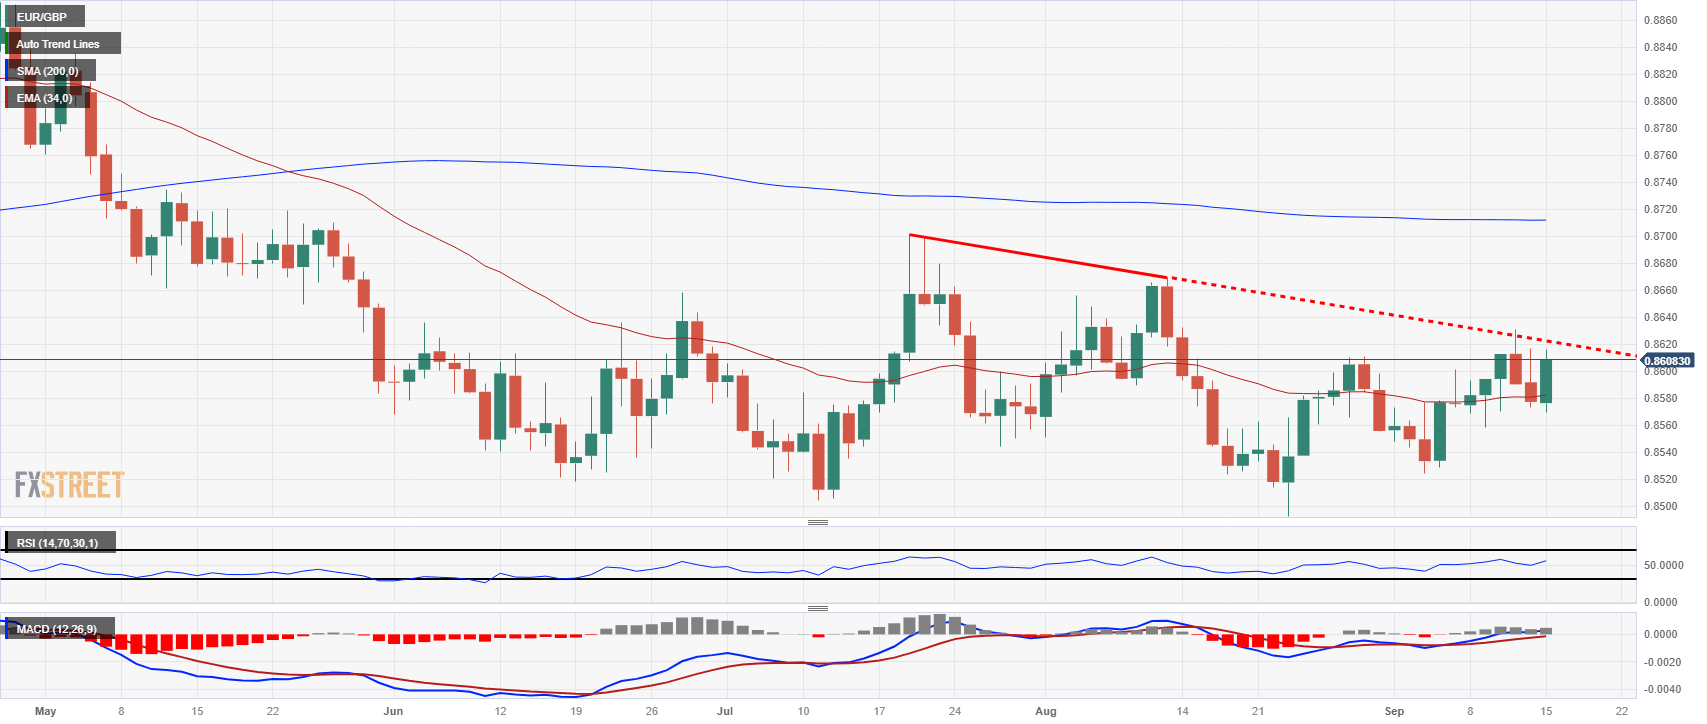
The EUR/GBP pair rebounded from the midweek’s swing low of 0.8570, set for a Friday close near the 0.8600 handle. Downside resistance is coming from a declining trendline off of July’s swing high int 0.8700.
On the downside, a price floor has firmed up as higher lows get marked in from August’s bottoms, building a support zone from 0.8530 to 0.8510.
The 34-day Exponential Moving Average (EMA) has gone sideways on the chart as price cycles familiar levels, baked in just above 0.8580, and the 200-day Simple Moving Average (SMA) currently sits just below 0.8720 in a softly bearish stance.
EUR/GBP daily chart
EUR/GBP technical levels
- USD/PEN increased 0.30% and got rejected by the 200-day SMA at 3.7220.
- The USD is consolidating on Friday while investors await next week’s Fed decisions.
- Fed bets and US yields remain steady.
At the end of the week, the USD/PEN increased to a high of 3.7248 and then settled at 3.7108, mainly driven by a broad-based PEN weakness, and the US Dollar is consolidating, seeing losses against its rivals. As the Banco Central de Reserva del Peru (BCRP) continues through its easing cycle, more upside for the pair may be on the horizon, as the Federal Reserve’s (Fed) tightening cycle is not done yet.
On Thursday, the BCRP cut rates 25 basis points to 7.5% as expected. Still, the bank emphasized entering an easing cycle doesn't automatically signal a series of consecutive interest rate reductions. However, Bloomberg shows that markets are expecting. However, Bloomberg consensus sees a nearly 2.25% easing until 2024 Q4.
On the US side, for next week’s Federal Reserve (Fed) decision, a pause is practically priced in, but investors will closely monitor Chai Powell’s tone and the policy statement to look for clues on forward guidance. In the meantime, the odds of one last hike in 2023 stand near 35% according to the CME FedWatch tool, and US yields on the 2,5 and 10-year bonds are holding firm at 5.03%, 4.40% and 4.30%.
USD/PEN Levels to watch
With the Relative Strength Index (RSI) and Moving Average Convergence Divergence (MACD) comfortably placed in positive territory on the daily chart, the USD/PEN buyers hold the upperhand. In addition, the pair is above the 20 and 100-day Simple Moving Averages (SMAs), but below the 200-day SMA, suggesting the bulls still have one more barrier to conquer to expand their bullish trajectory.
Support levels: 3.7065, 3.690, 3.6890 (20-day SMA).
Resistance levels: 3.7220 (200-day SMA), 3.7260, 3.7280.
- Europe sees green as stocks celebrate the end of ECB rate hikes.
- European rate hike cycle appears at the peak as central bank focuses on how long rather than how much for current rates.
- Consumer data beats from China supporting risk appetite to finish the week.
European equity indexes enter the weekend broadly in the green after a good week on the charts. London’s FTSE 100 index caught a late-week rally to end the trading week into the £7,700 region. Developers and home builders were the big bidders for the United Kingdom’s (UK) major index as investors bet that the housing market slowdown could face its end.
Investor sentiment caught some support from China figures this week that saw retail sales and industrial production figures broadly beat expectations, easing concerns of a global slowdown sparked by a declining Chinese economy.
EU equities chalk in gains for the week on the end of ECB rate hikes
Germany’s DAX closed the week in the green but has struggled to regain the €16,000 level, closing out Friday near €15,870. The German index is up over 0.5% for Friday, and gained a little over 2% from the week’s lows.
France’s CAC 40 was the big winner of the major European indexes on Friday, bouncing upwards just shy of 1% and gaining 1.6% for the trading week.
The UK’s FTSE 100 ended Friday up 0.5%, capping off a 3.15% rebound from the week’s bottom and the equity index tested into sixteen-week highs on Friday.
Headwinds still remain in the future, but recent risk appetite pangs have eased for the time being and investors are pushing higher-yielding assets higher. The pan-European EuroStoxx 50 blue chip index ended the week 1.15% higher at €4,327 but has yet to re-challenge 2023’s highs above €4,450.
Investors are increasingly hopeful for an end to the tightening cycle in monetary policy, bolstered by a dovish showing from the European Central Bank (ECB) this week.
ECB President Christine Lagarde delivered what is set to be the ECB’s last rate hike for the foreseeable future, talking down the potential for future rate hikes, and declaring the ECB's pivot to focusing on rate duration rather than adjustment. President Lagarde also reiterated that while economic growth is expected to be constrained looking forward, the ECB doesn't see contraction, and stubbornly sticky inflation isn't expected to increase from this point.
FTSE 100 technical outlook
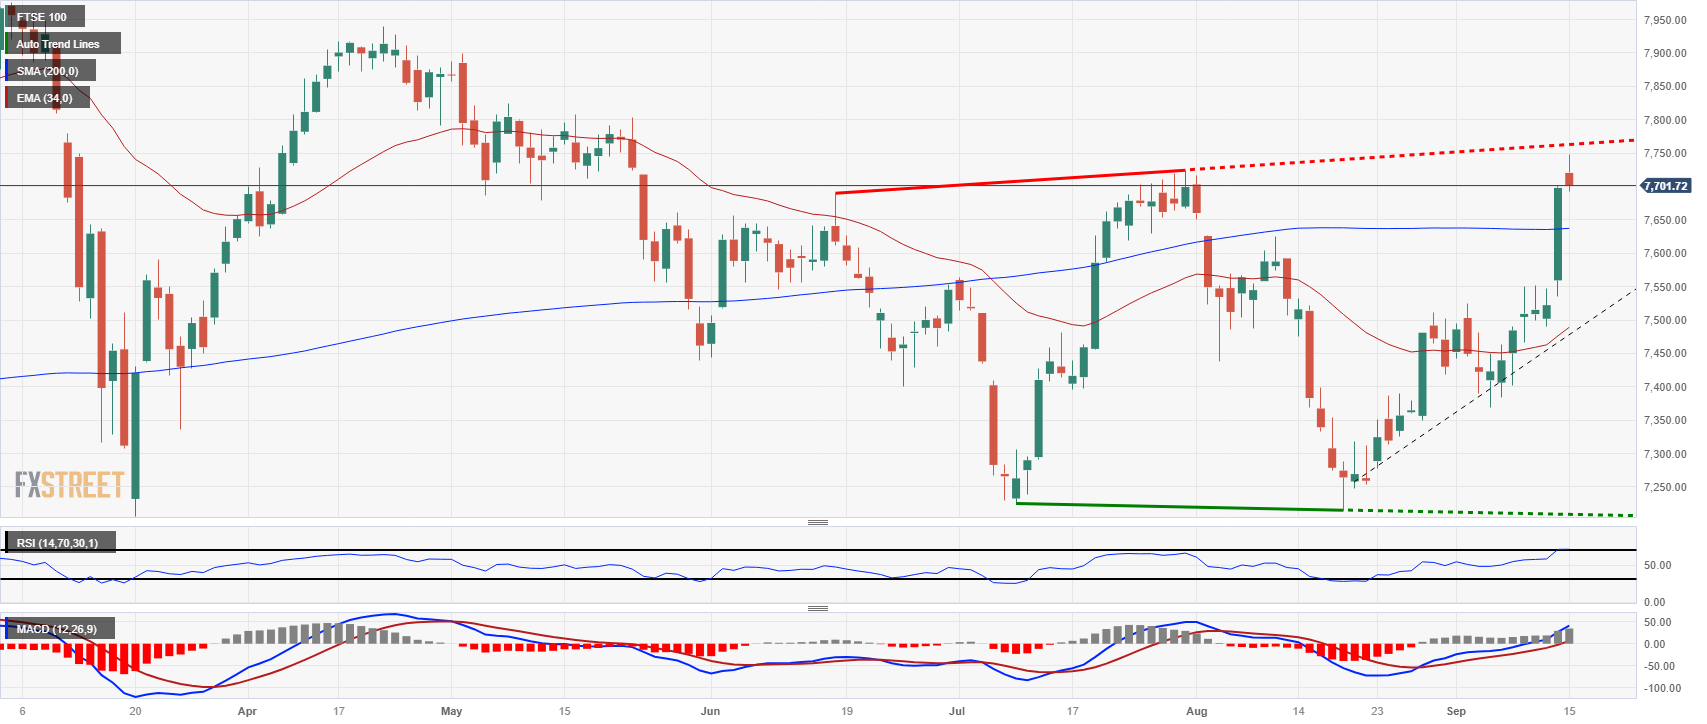
The UK major index is knocking into the high side on daily candlesticks, but profit-taking could see the FTSE slipping back to the 100-day Simple Moving Average (SMA) just below £7,650.
A pattern of higher highs could be developing, and a rising near-term trendline from August’s lows near £7,250 could provide dynamic support if an extended move lower begins to develop.
Bidders will note the Relative Strength Index (RSI) is moving into overbought territory, and another leg higher might need to wait for a pullback and the 34-day Exponential Moving Average (EMA) to gather further steam from the £7,500 handle.
FTSE 100 daily chart
FTSE 100 technical levels
- USD/CHF trades at 0.8963, just shy of the key 0.9000 level, after gaining 4.50% from its year-to-date low.
- Buyers aim to reclaim the 0.9000 psychological mark and the 200-day Moving Average at 0.9039 for further upside.
- Downside risks emerge if the pair falls below the September 14 daily low of 0.8914, targeting the 0.8900 mark and the 50-DMA at 0.8774.
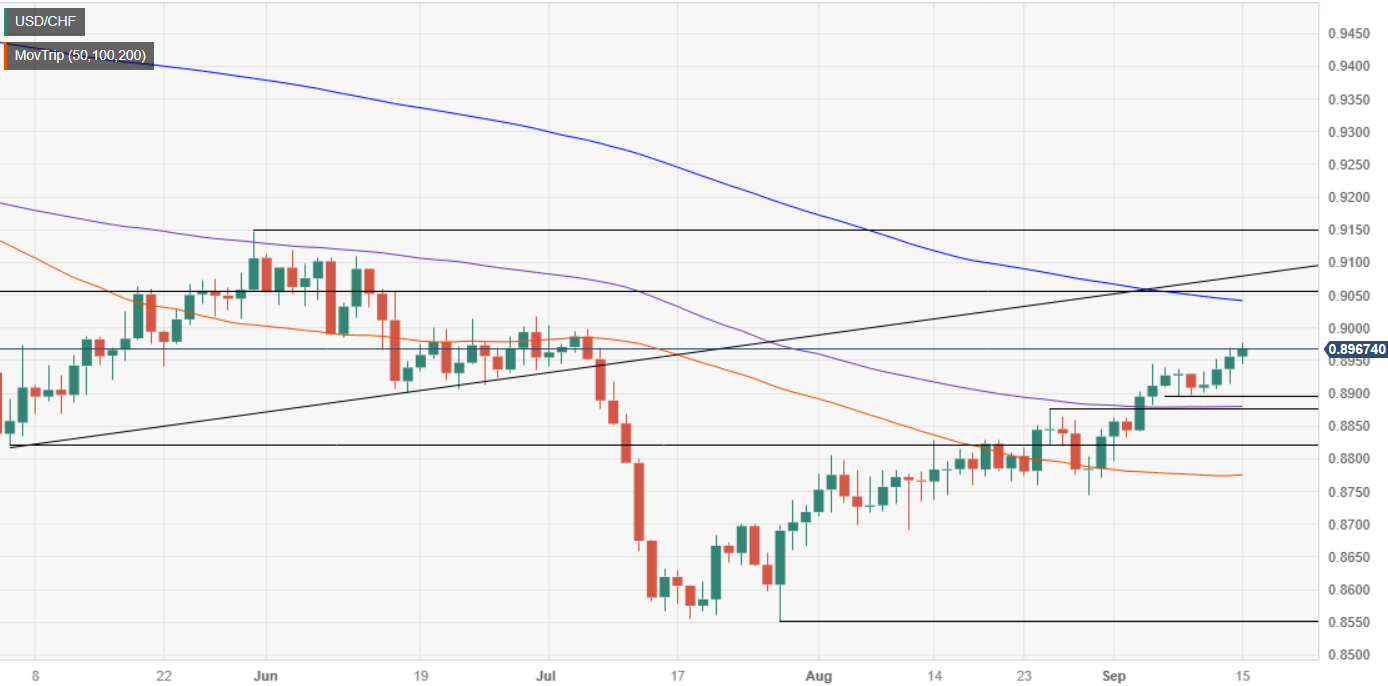
The USD/CHF extended its gains in the week to five consecutive days and printed a new two-month high at 0.8977, yet it remains shy of reclaiming the 0.9000 figure. Nevertheless, the pair is set to continue its uptrend and challenge the 200-day Moving Average (DMA() at 0.9039 once buyers reclaim 0.9000. At the time of writing, the major is trading at 0.8963 after hitting a daily low of 0.8944.
The daily chart portrays the pair’s recovery after printing a new year-to-date (YTD) low of 0.8552. Since then, the USD/CHF has achieved gains of 4.50% as buyers stepped in and lifted the exchange rate to current levels. Even though buyers reclaimed the 50-DMA at 0.8774, they remain shy of remaining in charge unless they reclaim the psychological 0.9000 figure, followed by the 200-DMA at 0.9039. Once those areas are cleared, the next test would be the May 31 high at 0.9147.
Conversely, if the USD/CHF drops below the September 14 daily low of 0.8914, that would exacerbate a challenge of the 0.8900 mark. A breach of the latter, and the pair could aim toward the current week’s low of 0.8893, followed by the 50-DMA at 0.8774.
USD/CHF Price Action – Daily chart
USD/CHF Technical Levels
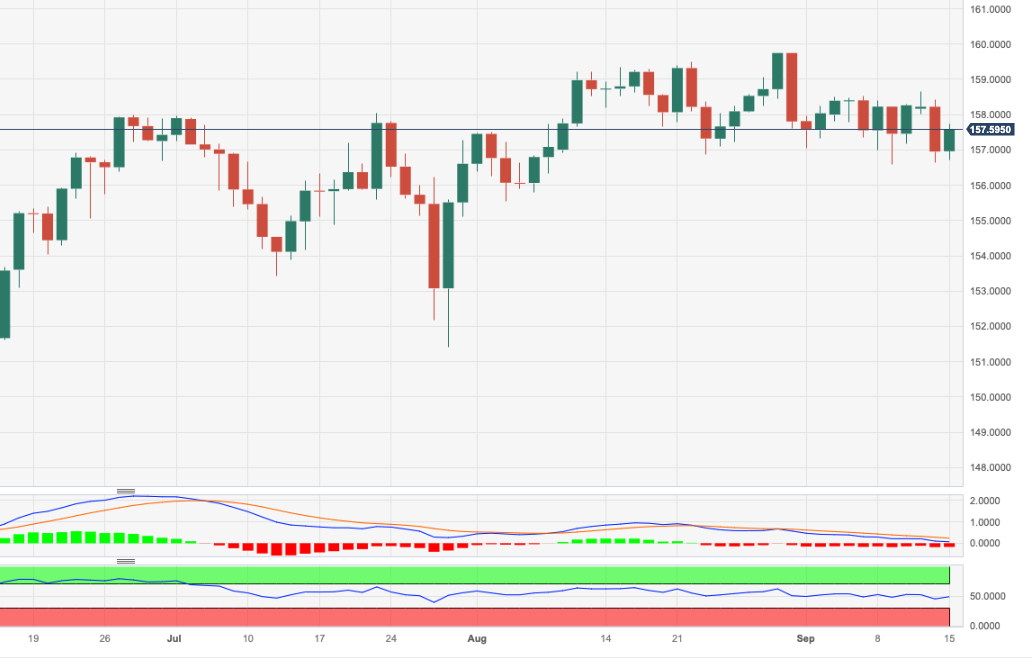
- USD/JPY advanced to fresh multi-month highs near 147.85
- US Michigan’s Consumer Sentiment came in lower than expected.
- The US DXY index reached its highest point since March 9 at 105.43 and then settled at 105.23.
- All eyes are now on the Fed’s decision next week.
Ahead of the weekend, the USD/JPY pair resumed its upward path, rising to 147.85 and will record a second consecutive weekly gain. On the USD side, the greenback traded soft and faced selling pressure after soft consumer sentiment figures from the US from September. However, the DXY index will close its eight-consecutive winning week, gaining more than 5% in July. On the other hand, the JPY gave up all gains seen by Ueda’s comments earlier this week and the Bank of Japan (BoJ) dovish stance, leaves the Yen vulnerable.
Investors gear up for next week’s Fed decision
During the week, key inflation data from the US from August measured by the Consumer Price Index (CPI) came in higher than expected. In addition, economic activity figures, including Retail Sales from the same month and Jobless Claims for the second week of September, also showed good news for the US economy.
Regarding expectations on the Federal Reserve (Fed), according to the CME FedWatch tool, the odds of one last hike slightly decline but remain relatively high, around 35%. That decline may be explained by the European Central Bank's (ECB) dovish tone on Thursday after it decided to hike by 25 bps and Christine Lagarde refrained from committing to another hike. Nevertheless, the US economy is not cooling down, and Fed officials have all the reasons to hike one last time.
On the JPY front, as highlighted by the BoJ, local wage and inflation trends are key drivers in the decision-making process around monetary policy shifts. On Monday, Governor Ueda commented that the bank may gather enough data by years-end to consider a pivot which lifted the Yen during the week, but that momentum slowly faded. For next week’s BoJ meeting, no changes in the ultra-loose policy are expected, but markets will monitor any changes in the economic forecast.
USD/JPY Levels to watch
As per the daily chart analysis, the USD/JPY has a bullish technical bias for the short term. The Relative Strength Index (RSI) also exhibits a northward slope above its midline, emphasising the presence of strong buying pressure, while the MACD, with its green bars, highlights the strengthening bullish momentum of the USD/JPY. On the other hand, the pair is above the 20,100,200-day Simple Moving Average (SMA), indicating that the buyers are commanding the broader perspective.
Support levels: 147.00, 146.60 (20-day SMA), 146.00.
Resistance levels: 148.00, 149.00, 150.00.
USD/JPY Daily Chart
-638303948233014416.png)
- As US economic data strengthens the dollar, GBP/USD trades at 1.2397, slipping below its 200-day Moving Average.
- Odds for a November rate hike by the Fed stand at 32.45%, while bets on a BoE rate hike toward 6% are scaled back.
- With U.S. 10-year Treasury yields at 4.326% and a solid US economy, the BoE may be the first to blink and cut rates, pressuring GBP/USD further.
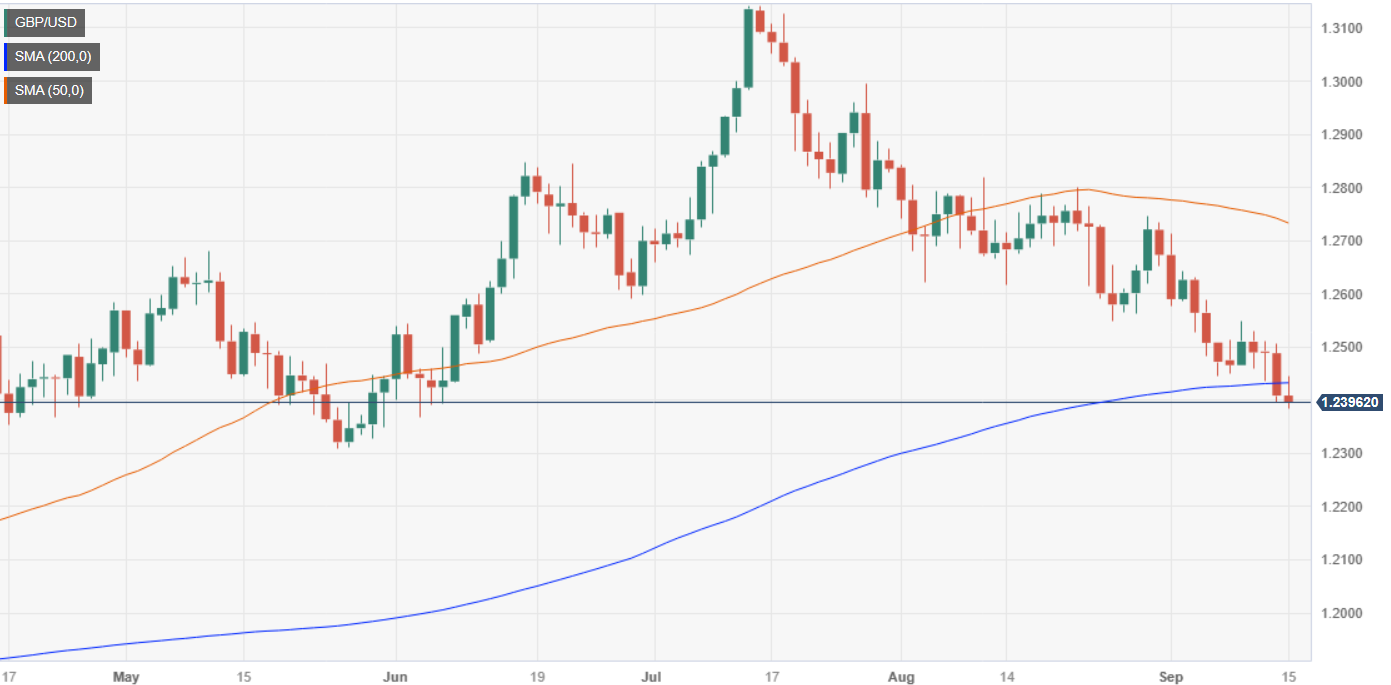
The Pound Sterling (GBP) continues to weaken against the US Dollar (USD) for the second consecutive day after a tranche of positive US economic data bolstered the Greenback. Hence, the GBP/USD is set to finish the week with losses, exchanging hands at 1.2397, below its 200-day Moving Average (DMA).
GBP/USD dips below its 200-day Moving Average as positive US data boosts the dollar, while the Bank of England faces a rate hike dilemma
Sentiment shifted sour, bolstering appetite for safe-haven assets, notably the US Dollar. Data revealed on Friday showed Americans’ inflation expectations were lowered, as demonstrated by the University of Michigan (UoM) poll. Inflation is expected to rise to 3.1% below August’s reading for one year, and it is projected at 2.7% for a ten-year period. Despite people’s high spirits, consumer sentiment dropped to 67.7, below forecasts of 69.1.
The US Federal Reserve earlier revealed that Industrial Production expanded 0.4% MoM, below July’s 1% but above the consensus forecasts. Further data released by the New York Fed showed its Empire State Manufacturing Index for September improved to 1.9 from a -21 figure in August, above forecasts of a -10 drop.
In the meantime, money market futures remain skeptical that the US Federal Reserve would hike rates once more before the year’s end, as shown by the CME FedWatch Tool. For the next week, the US central bank is projected to hold rates, and for November, odds for a 25 bps hike lie at a decent 32.45% chance.
Nevertheless, US Treasury bond yields advanced, as the latest inflation reports on the consumer and producer side revealed an uptick after decelerating sharply through the year. The US 10-year Treasury Note yields 4.326%, but the buck is losing some steam.
Across the pond, the Bank of England (BoE) is expected to raise rates by 25 bps, though it faces some challenges, like a slowdown in the economy. The Bank Rate would be lifted toward 5.50%, but traders scaled back previous bets the BoE would lift rates toward 6%, as odds for the November 2 meeting are around 15%.
The Fed would likely keep rates unchanged on the US front, but its economy remains solid, and investors are optimistic the US central bank would achieve a soft landing. Therefore, further downward action is expected in the GBP/USD, as monetary policy could suggest the BoE would be the first to blink and cut rates.
GBP/USD Price Analysis: Technical outlook
Since peaking at around 1.3140s, the major is in a downward trend, with the GBP/USD threatening to achieve a daily close below the 200-day Moving Average (DMA) at 1.2430, further reinforcing that sellers are in charge. Price action would put the May 25 swing low of 1.2308 into play before the pair nosedives toward the March 8 swing low of 1.1802. Contrarily, buyers must reclaim the 200-DMA and lift the exchange rate past the August 25 swing low of 1.2548 to remain hopeful of reaching higher prices.
- Kiwi holding near the middle, set to finish Friday near where it started.
- Market flows are firmly in the hands of the US Dollar.
- Risk sentiment getting limited knock-on positive support from upbeat China outlook.
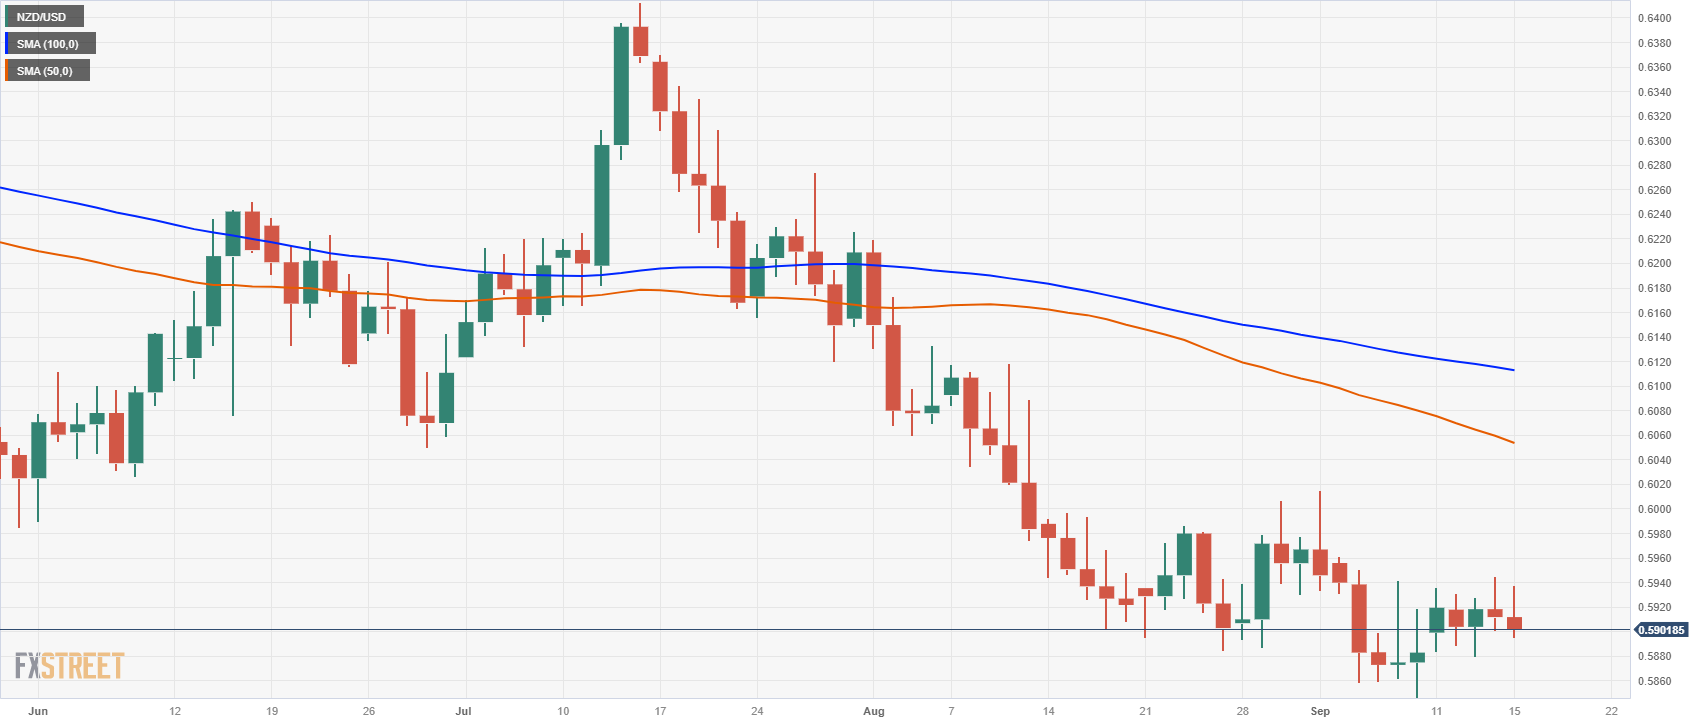
The NZD/USD is set to finish Friday on a slight downstep, trading into the 0.5900 level and unable to find some lift.
With little meaningful momentum coming from the Kiwi (NZD) side of things, the NZD is fully exposed to broader market flows, leaving the Greenback (USD) to dictate the direction of the pair.
China data beats bolstering beleaguered Kiwi
Risk appetite is being supported by additional stimulus from China, bolstering the Antipodeans and putting a floor beneath any major declines. Official Chinese data showed that industrial production and retail sales figures rose faster than expected, providing further support for market sentiment heading into the weekend.
Market flows for the NZD/USD are notably leaning into the US Dollar side, and the direction is following the broader Dollar Index. The USD saw some hesitation after the University of Michigan (UoM) Sentiment Index missed expectations, slipping more than expected to 67.7 from 69.5. Inflation expectations also slid from 3.0% to 2.7%.
The USD is now catching some bids across the board as markets ease into the week's market close.
NZD/USD technical outlook
The Kiwi is constrained near the middle of price congestion that has become familiar territory for this trading week, caught in a rough near-term range between 0.5930 and 0.5890.
Upside momentum will be constrained by the last swing high near 0.5980 on the daily candlesticks, which show the pair decidedly on the low end. Support is coming from September’s lows near 0.5860, and a further break to the downside sees little in the way of additional technical support.
The 50- and 100-day Simple Moving Averages (SMAs) are in a bearish decline, piled up at 0.6060 and 0.6120 respectively, and breaks above the 100-day SMA have struggled to sustain for some time in the NZD/USD pair.
NZD/USD daily chart
NZD/USD technical levels
- US oil took a small hit on Friday, but is rebounding firmly to hold $90/bbl.
- OPEC production cuts are squeezing crude prices into the ceiling.
- The next hurdle for buyers will be pushing crude into $100.
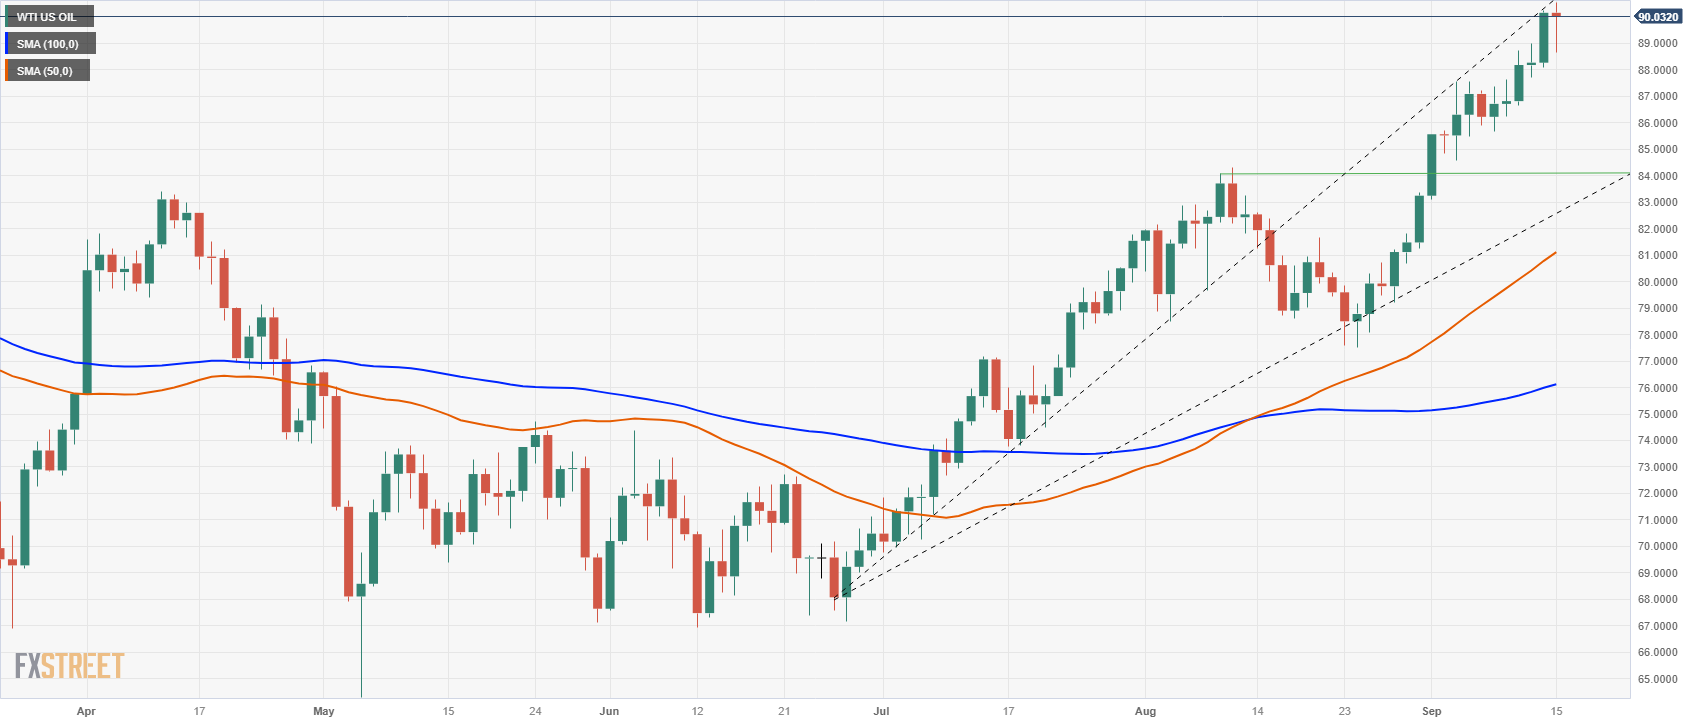
West Texas Intermediary (WTI) US crude oil hesitated in Friday trading, dipping to $88.60 per barrel before rebounding to the $90/bbl major handle. US crude oil is on pace to close in the green for the fourth straight month, rallying nearly 40% from the year’s lows near $64.50.
Extended production cuts from member states of the Organization of the Petroleum Exporting Countries (OPEC) crude oil cartel are putting a tight squeeze on crude markets., sending US crude to ten-month highs.
OPEC-led oil cuts sending oil barrels higher
Saudi Arabia and Russia both recently, announced an extension of their current oil production cuts, extending a combined 1.3 million barrel per day (bpd) decline in headline barrel production through the end of the year.
When announcing the cut extensions, Riyadh stated that the production cuts were to promote stability in global oil markets. It is generally accepted by oil analysts that Saudi Arabia needs oil to be above $85 per barrel to balance their budget.
WTI technical outlook
US crude oil barrels have closed either flat or in the green for fifteen of the last sixteen trading days and are currently poised to end the week on the high side, mounting the $90/bbl level. Bulls will be firmly targeting the $100.00 major psychological level despite Friday’s brief decline, which could be a sign of profit-taking rather than an actual reversal, given the market’s rapid rebound.
Technical support for any moves to the downside will be at August’s last swing high near $84.00, and the nearest challenge for buyers will be the strong swing points that were marked in at $92.00 in late 2022.
WTI daily chart
WTI technical levels
- XAG/USD advanced by 2.20% to $23.20.
- The USD is trading somewhat soft on Friday ahead of the weekend.
- US yields and tightening expectations remain steady.
- Michigan Consumer Sentiment from September declined to 67.7.
At the end of the week, the XAG/USD Silver Spot price gained significant demand and increased to $23.15. On the US Dollar side, it's consolidating, but its DXY index continues to trade at multi-month highs. Attention is now set on the Federal Reserve (Fed) decision next week, and markets remaining cautious seem to benefit the grey metal.
According to the CME FedWatch tool, a pause is practically priced in, but investors bets on the November and December meetings determine the Greenback’s price dynamics. Fundamentally, Fed officials have the green light to hike on more time as the economy hasn’t cooled down, and Chair Powell stated that ongoing decisions will be carefully decided according to the incoming data. So far, inflation accelerated in August, and economic activity is holding firm, so the Fed may have one more hike up their sleeves.
On the data front, the University of Michigan reported that September’s Consumer Sentiment Index declined to 67.7, lower than the expected and previous figures of 69.1 and 69.5, respectively. The initial reaction was a decline in the DXY index from 105.30 to 105.15. US Treasury yields on the 2,5 and 10-year bonds are holding firm at 5.03%, 4.40% and 4.30%, cushioning the Greenback’s losses and limiting the XAG/USD's potential.
XAG/USD Levels to watch
Analysing the daily chart, it is apparent that the XAG/USD has a neutral to bullish technical stance, with the bulls gradually recovering ground. The Relative Strength Index (RSI) displays an ascending slope in the bearish territory, hinting at a potential trend reversal, while the Moving Average Convergence (MACD) exhibits decreasing red bars. However, the price is below the 20,100 and 200-day Simple Moving Averages (SMAs), suggesting that the buyers are struggling to overcome the overall bearish trend and the bears are still in charge.
Support levels: $23.00, $22.90, $22.70.
Resistance levels: $23.30-70 (20,100,200-day SMA convergence)
XAG/USD Daily Chart
-638303907072369840.png)
- USD/MXN trades at 17.0741, down 0.19%, as the pair slides below the 20-day Moving Average, targeting the psychological 17.0000 level.
- Mixed US data, including a drop in inflation expectations, leaves investors uncertain about further Fed tightening beyond September.
- Technical outlook suggests downside risks below the 50-DMA at 17.0079 while reclaiming the 100-DMA at 17.2271 could spur a recovery.
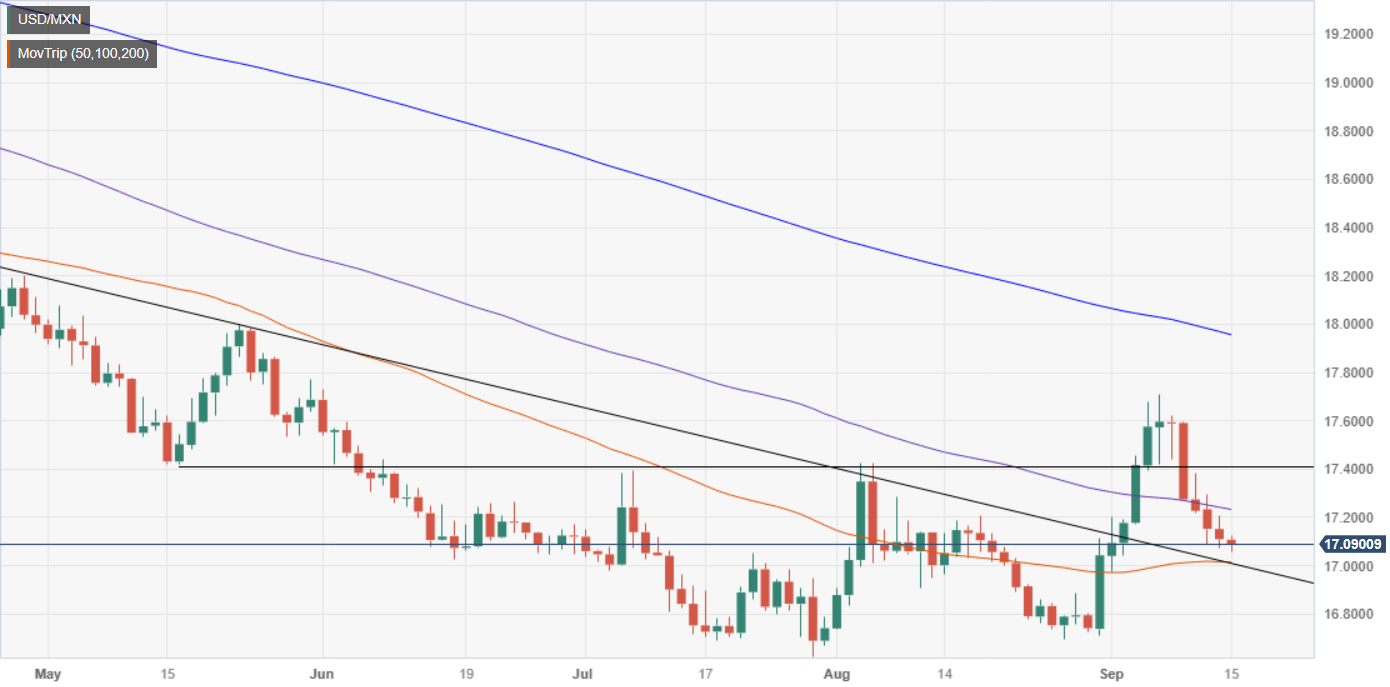
The Mexican Peso (MXN) extends its gains versus the US Dollar (USD), and prolongs its rally to five consecutive days, with USD/MXN bears setting their sight on the 17.0000 psychological level after sliding below the 20-day Moving Average (DMA) at 17.0921. The pair exchanges hands at 17.0741, down 0.19%.
USD/MXN slips further as mixed US data fails to lift the Greenback, while traders eye a packed economic calendar in Mexico next week
Data from the United States (US) so far failed to bolster the Greenback (USD) as inflation expectations dropped the most in two years, as revealed by the University of Michigan (UoM) Consumer Sentiment poll. Inflation is expected to climb at a 3.1% pace, down from August 3.5%, and estimate a 2.7% jump over a 10-year period. Despite America’s optimism on inflation, sentiment fell to 677 below estimates of 69.1, blamed on high food and energy prices.
Before Wall Street opened, Industrial Production in August rose by 0.4% MoM, below July’s 1% increase but above the 0.1% estimated by the consensus, as the US Federal Reserve revealed. That depicts consumers taking a breather as retailers posted limited orders on manufacturers, struggling with higher borrowing costs and uncertainty on demand.
At the same time, the New York Fed revealed its Manufacturing Index, which expanded this month from -21 to 1.9, exceeding forecasts of -10. Given the amount of data posting positive surprises about the US economy, investors remain hesitant that the US Federal Reserve would continue to tighten monetary policy past the September meeting.
Across the border, a scarce economic docket left USD/MXN traders adrift to market sentiment and US Dollar dynamics. Nevertheless, next week’s agenda will be busy, with the release of Private Spending, Aggregate Demand, Retail Sales, Economic Activity, and inflation for the first half of September.
USD/MXN Price Analysis: Technical outlook
The USD/MXN remains neutrally biased despite printing a new multi-month high. After reaching 17.7074, the pair’s pullback could offer buyers a better entry price than last week’s close. However, downside risks remain and emerge slightly below the 50-DMA at 17.0079. Once cleared, a test of the August 28 swing low of 16.6923 is on the cards. On the other hand, if buyers reclaim the 100-DMA at 17.2271, that would exacerbate a recovery towards September’s high of 17.7074.
The CHF is the best performing major currency so far this year, gaining 3.5% on the USD, the best among the core peers. Economists at Scotiabank analyze Franc’s outlook.
The trend decline in EUR/CHF may stabilize around the 0.95 point
While inflation has moderated somewhat and has clearly moved back below 2%, policymakers appear to be leaning towards some additional ‘insurance’ tightening to take the SNB’s key policy rate to 2%.
Easing inflation pressures may spill over into the currency’s broader trend. Policymakers have favoured a somewhat stronger exchange rate to help dampen price pressures.
The trend decline in EUR/CHF (more than 5.5% this year) may stabilize around the 0.95 point.
We anticipate a EUR rebound to 0.98 by year-end.
USD/CHF – Q3-23 0.88 Q4-23 0.88 Q1-24 0.87 Q2-24 0.87
Gold traded above $1,900 despite the recent rise in US bond yields and the USD. Economists at ANZ Bank analyze the yellow metal’s outlook.
Gold maintains its resilience
While the US Federal Reserve’s ‘higher rates for longer’ narrative gains momentum in response to strong economic data, we see these headwinds having limited impact on Gold over the coming months.
Central bank gold purchases, healthy demand for physical Gold and economic growth risks are cushioning the impact of rising rates. Our view of the USD’s long-term bearish trend is unchanged, and this could be an ongoing tailwind as it shares a negative relationship with Gold.
We believe investors will increase exchange traded funds (ETF) holdings for Gold as the Fed nears the end of its rate hiking cycle. A revival in investment demand will be crucial for Gold to trade above $2,000 in 2024.
The Pound has retreated from their mid-year highs against the USD. Economists at Scotiabank analyze GBP’s outlook.
Sentiment and technical signals tilt bearish
Technical signals are leaning bearish after GBP/USD broke below bull trend support in the 1.28 area at the start of August.
Investors are concerned that high BoE policy rates will crush growth but recent data revisions have shown the UK economy to be much stronger and more resilient than previously believed.
Markets are pricing in significantly less BoE rate easing ahead than the Fed or ECB which may cushion GBP losses.
- AUD/USD faces pressure in extending recovery as the US Dollar rebounds.
- US Michigan Consumer Sentiment Index drops to 67.7 as investors worry about the economic outlook.
- AUD/USD recovers after discovering buying interest while re-testing the horizontal support plotted from 0.6365.
The AUD/USD pair retreats after failing to extend recovery above the immediate resistance of 0.6470 as the US Dollar resumes its upside journey after a mild correction in the early New York session. The Aussie asset fails to stretch recovery further despite robust China’s economic data.
China’s annual Industrial Production remained robust in August, rose by 4.5%, and Retail Sales expanded by 4.6%. Investors feel that one-time robust economic data is insufficient to warrant decent growth prospects. The Australian Dollar, being a proxy to the Chinese economy, is facing tough barriers.
The US Dollar Index remains inside the woods but is expected to renew its six-month high despite expectations of a steady interest rate decision by the Federal Reserve (Fed) next week.
Meanwhile, the US Michigan Consumer Sentiment Index (CSI) drops to 67.7 as investors worry about the economic outlook knowing that the Fed is expected to keep interest rates high long enough’ till inflation comes down to 2%.
AUD/USD recovers after discovering buying interest while re-testing the horizontal support plotted from August 17 low at 0.6365. The Aussie asset climbs above the 50-period Exponential Moving Average (EMA), which trades around 0.6433. Potential resistance is plotted from August 30 high at 0.6522.
The Relative Strength Index (RSI) (14) aims to shift into the bullish range of 60.00-80.00. An occurrence of the same will activate the upside momentum.
A decisive break above August 15 high around 0.6522 will drive the asset to August 9 high at 0.6571. Breach of the latter will drive the asset towards August 10 high at 0.6616.
On the flip side, fresh downside would appear if the Aussie asset will drop below August 17 low around 0.6360. This would expose the asset to the round-level support of 0.6300 followed by 03 November 2022 low at 0.6272.
AUD/USD two-hour chart
-638303841053725128.png)
The US Dollar, which had been riding higher in recent weeks, has shown signs of vulnerability again. Economists at UBS analyze Greenback’s outlook.
USD/JPY to fall back to around 142 by year-end
The Euro, the largest component of the DXY, should benefit from a narrowing rate gap with the US. While both the Fed and the ECB face finely balanced decisions on whether to raise rates further, we believe tightening is more likely in the Eurozone, where core inflation has been slower to come down. That is despite more tepid data on economic activity in the Eurozone. In addition, we think negative economic surprises in the region are already priced into the currency’s valuation, and the Eurozone’s improving trade balance should be supportive.
Ultra-easy monetary policy could end in Japan sooner than expected. The wide rate differential between the US and Japan has been a key driver of Yen's weakness, so any move to close this gap would send a strong signal to investors positioning for more yen declines. We expect the Dollar to fall back to around 142 against the Yen by the end of the year.
- The UoM Consumer Confidence Index declined more than expected in September.
- US Dollar retreats across the board, DXY hits fresh daily lows under 105.20.
Consumer sentiment in the US weakened in August, with the University of Michigan’s (UoM) Consumer Confidence Index declining to 67.7 from 69.5. This reading came in worse than the market expectation of 69.5. The Current Condition Index fell from 75.7 to 69.8, and the Expectations Index rose from 65.5 to 66.3.
Further details of the publication revealed that “year-ahead inflation expectations moderated from 3.5% last month to 3.1% this month. The current reading is the lowest since March 2021 and is just above the 2.3-3.0% range seen in the two years prior to the pandemic. Long-run inflation expectations came in at 2.7%, falling below the narrow 2.9-3.1% range for only the second time in the last 26 months.”
Market reaction
The US Dollar Index edged lower after the report reaching fresh daily lows below 105.20. EUR/USD climbed to new highs, approaching 1.0700 and USD/JPY trimmed gains falling to 147.60.
The Canadian Dollar (CAD) has been unable to resist the broader USD advance since mid-year. Economists at Scotiabank analyze Loonie’s outlook.
Undervalued CAD looks for reasons to rise
The CAD is trading well below our forecast levels for Q3 but the currency looks undervalued from a fundamental point of view and the risk of more tightening from the BoC before year-end is perhaps higher than markets are pricing at present.
The CAD could still end the year close to 1.30.
USD/CAD – Q3-23 1.30 Q4-23 1.30 Q1-24 1.27 Q2-24 1.27
The Platinum price fell to $900 amid increased headwinds. Strategists at ANZ Bank analyze the precious metal’s outlook.
Platinum is the least expensive of the precious metals
Disappointing auto sales in China added to weak market sentiment, but we believe this price is inconsistent with underlying fundamentals.
A challenging supply backdrop, heavy platinum loadings, substitution away from Palladium and increasing use of hydrogen fuel are all long-term supports for Platinum. Further, prices have fallen to near cost-of-production, which could disincentivise already challenged producers. We therefore expect Platinum to find its floor near the current level.
The USD has been declining against all currencies since October 2022. Will the Dollar’s decline continue? Economists at Natixis analyze Greenback’s outlook.
No decline in the weight of the Dollar in foreign exchange reserves
The Dollar has depreciated against all currencies since October 2022. This depreciation is probably due to the outlook for monetary policy: the US is expected to cut rates before other OECD countries.
But we do not believe that we should anticipate a sharp and lasting depreciation of the USD. Indeed, the only component of Dollar demand that remains stable, but is not declining, is demand for Dollars from central banks. The weight of the Dollar in financial transactions has been increasing since 2010, and in trade transactions since 2021.
Moreover, the outlook for the US economy is more positive than for the Eurozone or Chinese economy, due to demographic trends, productivity and R&D spending.
The Mexican Peso weakened in August, posting its first monthly decline this year. Losses have extended in September so far. Economists at Scotiabank analyze MXN’s outlook.
Potential for rate cuts to start late this year may be encouraging profit-taking
Mexican yields remain attractive, but investors may be reducing exposure to the MXN after a solid run to multi-year highs against the USD (which is down more than 13% against the MXN over the past year).
Domestic yields have likely peaked and focus on the potential for rate cuts to start late this year as well as domestic issues (such as the looming election cycle) may be encouraging profit-taking.
We anticipate USD/MXN ending the year at 17.90.
USD/MXN – Q3-23 17.30 Q4-23 17.90 Q1-24 17.90 Q2-24 18.30
- USD/CAD finds significant bids near 1.3500 as the US Dollar resumes its upside journey.
- The US Dollar Index prepares for a fresh upside despite the Fed is expected to keep interest rates unchanged.
- One-time robust economic data is insufficient to warrant economic growth in the Chinese economy.
The USD/CAD pair recovers swiftly as the downside momentum exhausts near the psychological support of 1.3500 in the London session. The Loonie asset rebounds to near 1.3530 as the oil price corrects after printing a fresh 10-month high near $91.00 and the US Dollar Index (DXY) regains control after a nominal correction from a six-month high at 105.40.
S&P500 futures generated nominal losses in the European session, indicating that the risk-on impulse is fading away. The US Dollar Index (DXY) resumes upside as the impact of upbeat economic data from the Chinese economy starts losing its appeal.
China’s annual Industrial Production rose by 4.5% and Retail Sales expanded by 4.6%, outperformed expectations. However, one-time robust economic data is insufficient to warrant economic growth in an economy.
The US Dollar Index prepares for a fresh upside despite the Federal Reserve (Fed) being expected to keep interest rates unchanged at 5.25-5.50% in its monetary policy scheduled for September 20. However, Fed policymakers are expected to keep doors open for further policy tightening as inflation in excess of the desired rate of 2% would be the hardest nut to crack.
Meanwhile, oil prices dropped after failing to continue the three-day winning streak. However, the broader term is still bullish as OPEC sees demand for oil rising on expectations of global recovery. It is worth noting that Canada is the leading exporter of oil to the United States and lower oil prices impact the Canadian Dollar.
- Industrial Production in the US expanded 0.4%, surpassing expectations of a 0.1% gain.
- July numbers were revised lower from 1% to 0.7%.
- US Dollar retreats modestly after the data.
Industrial Production in the US expanded by 0.4% in August, surpassing the 0.1% of market consensus. July numbers were revised lower from a 1% increase to 0.7%.
Key takeaways from the report:
Industrial production increased 0.4 percent in August, and manufacturing output inched up 0.1 percent. The August reading for manufacturing was held back by a drop of 5 percent in the output of motor vehicles and parts; factory output elsewhere rose 0.6 percent.
At 103.5 percent of its 2017 average, total industrial production in August was 0.2 percent above its year-earlier level.
Capacity utilization moved up to 79.7 percent in August, in line with its long-run (1972–2022) average.
Manufacturing output rose 0.1 percent in August for its second consecutive monthly gain but was 0.6 percent below its year-earlier level.
Capacity utilization for manufacturing remained at 77.9 percent in August, a rate that is 0.3 percentage point below its long-run (1972–2022) average.
Market reaction
The US Dollar edged lower after the report, with the US Dollar Index (DXY) dropping below 105.30. Meanwhile, EUR/USD rebounded back above 1.0660. Later in the day, the University of Michigan will release its consumer confidence survey.
EUR/USD steadies after a 0.8% drop on Thursday. Economists at Société Générale analyze the pair’s outlook.
Toxic mix for the Euro: ECB lowers growth and raises inflation forecast
The staff forecast slashed the outlook for real GDP by 0.8ppt over the forecast period. Below trend growth in theory should augur well for a return of inflation to 2% but this is not how the ECB sees things pan out. The jump in Oil prices and sticky wage growth resulted in an upward revision of inflation by 0.5ppt over the forecast period. Next year’s estimate was raised to 3.2%.
For EUR/USD, the path looks clear for convergence toward 1.05 if the Fed maintains its hawkish policy stance next week.
- EUR/USD picks up some pace and revisits 1.0670.
- The next support of note emerges at the March low at 1.0516.
EUR/USD reclaims the 1.0660/70 band after bottoming out in the 1.0630 region.
The underlying bearish sentiment remains unchanged and leaves the door open to extra pullbacks in the short-term horizon. Against that backdrop, further losses could see the March low of 1.0516 (March 15) revisited in the short-term horizon.
In the meantime, further losses remain in the pipeline while below the key 200-day SMA, today at 1.0827.
EUR/USD daily chart

- DXY keeps the trade near recent multi-month tops.
- Bulls should meet the next hurdle at the 2023 top.
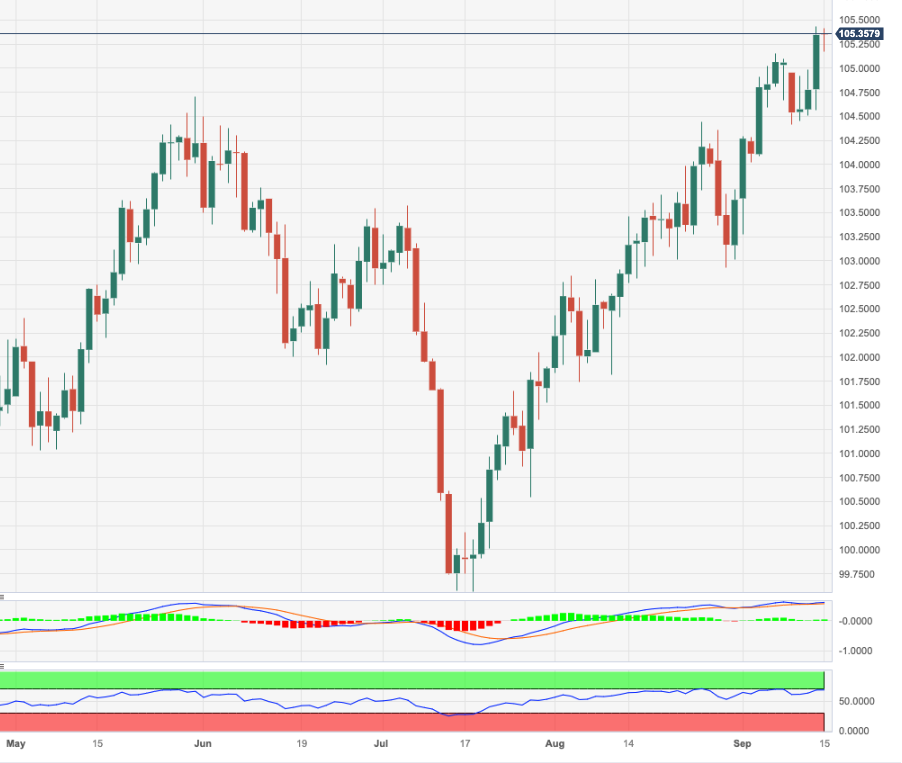
DXY extends further its rally and looks to revisit the area of recent six-month highs around 105.40 on Friday.
The continuation of the multi-month rally appears well and sound and a breakout of the monthly high of 105.43 (September 14) should encourages the index to retest the 2023 peak of 105.88 (March 8), just before the round level of 106.00.
While above the key 200-day SMA, today at 103.02, the outlook for the index is expected to remain constructive.
DXY daily chart
The AUD remains something of a laggard among G10 currencies so far this year. Economists at Scotiabank analyze Aussie’s outlook.
RBA tightening cycle may have peaked at 4.10%
The RBA tightening cycle may have peaked at 4.10%, with policymakers perhaps concerned that the passthrough of higher mortgage rates will slow the domestic economy.
Soft regional growth trends (China) and a weak Yuan have weighed on the AUD sentiment and speculative positioning has been persistently bearish in recent months.
Meaningful China stimulus would be a major plus for the AUD but, in the absence of more positive drivers, reaching our 0.69 year-end target will be a challenge.
- EUR/JPY manages to regain some buying interest above 157.00.
- Extra range bound trade seems probable for the time being.
EUR/JPY reverses two consecutive daily pullbacks and advances north of the 157.00 yardstick at the end of the week.
In the meantime, the cross continues to face some side-lined trading prior to a potential resumption of the uptrend. That said, a minor hurdle emerges at the so far monthly high of 158.65 (September 13) ahead of the 2023 top at 159.76 (August 30) and before the key round level at 160.00. The surpass of the latter should not see any resistance level of note until the 2008 high at 169.96 (July 23).
So far, the longer term positive outlook for the cross appears favoured while above the 200-day SMA, today at 148.70.
EUR/JPY daily chart
ECB rate hike weighs only moderately on Gold price. Strategists at Commerzbank analyze the yellow metal’s outlook.
Gold market participants are likely to remain cautious
Gold slid back towards the $1,900 mark this week. This is because the core rate of US consumer prices slowed less sharply than had been hoped. The ECB’s rate hike also weighed briefly on XAU/USD.
In the market’s opinion, another Fed rate hike this year cannot be ruled out yet either. We believe that the Federal Reserve will not make any announcement next week, but that Fed Chair Powell will leave the door open to further rate hikes. This will keep the Gold price in check in the short term.
However, with economic activity likely to slow in the coming weeks as a result of the monetary tightening that has already taken place, rate hike expectations should gradually fade. Against this background, Gold is likely to recover significantly by the end of the year.
The headline General Business Conditions Index of the Federal Reserve Bank of New York's Empire State Manufacturing survey rose to 1.9 in September from -19.0 in August. This reading came in better than the market expectation of -10.0.
Manufacturing activity held steady in New York State, according to the September survey. Labor market indicators softened to -2.7 “indicating a slight decline in employment levels” and “optimism continues to grow” as the Future Business Conditions index rose to 26.3, the highest level in more than a year.
Key takeaways from the report:
Business activity was little changed in New York State, according to firms responding to the September 2023 Empire State Manufacturing Survey.
The headline general business conditions index rose twentyone points to 1.9. New orders and shipments increased.
Delivery times remained steady, and inventories continued to contract. Labor market indicators pointed to a slight decline in employment levels and the average workweek. The pace of input price increases was similar to last month, while selling price increases picked up.
Looking ahead, firms continued to grow more optimistic about the sixmonth outlook
The prices paid index held steady at 25.8, pointing to little change in the pace of input price increases, while the prices received index rose seven points to 19.6, signaling a modest pickup in the pace of selling price increases.
Market reaction
The US Dollar gained momentum after the report and strengthened against a broad range of currencies, reversing earlier losses. The US Dollar Index (DXY) rebounded to the 105.40 area, reaching levels near multi-month highs.
Brent Crude bottomed out at $72/bbl in June and then rose more than 28% over the following three months to break above $90/bbl. Economists at ANZ Bank analyze Oil’s outlook.
Market tightening significantly over the next three months
With OPEC’s production cuts firmly in place for the remainder of the year, we see the market moving into a deficit of 2mb/d in Q4. This tightness is likely to continue into Q1 2024 as production constraints remain in place and will keep Oil prices on an upward trajectory in Q4. We maintain our end of year price target of $100/bbl.
However, market conditions are closer to ‘managed tightness’ than to the fundamental pressures that pushed prices above $100/bbl last year.
As it stands, spare capacity is ample. OPEC’s supply agreements have done their job and stabilised the market. However, the eventual unwinding of these over the next 6-12 months will ease the current supply tightness. As such, we don’t see much upside over our short-term target in 2024.
Boštjan Vasle, Governor of the Bank of Slovenia and member of the Governing Council of the European Central Bank (ECB), said on Friday that they cannot exclude future interest rate hikes, as the outcome depends on data. He added that they will have much more data available for the December meeting.
Regarding the purchase program, Vasle explained that reductions in the asset purchase program (APP) could be accelerated, as the current rate level "opens more space to discuss" quantitative tightening.
Market reaction
The EUR/USD is holding around 1.0650 after experiencing a sharp decline on Thursday following the ECB meeting. Despite keeping interest rates at record lows, the Euro tumbled as the ECB signaled the end of rate hikes.
- EUR/GBP finds buying interest near 0.8570 as the ECB keeps doors open for further policy tightening.
- ECB Lagarde made clear that interest rates will remain higher for long enough to tame inflationary pressures.
- The BoE has already raised interest rates to 5.25% and is expected to raise one more time amid rising upside risks to inflation.
The EUR/GBP pair recovered strongly after discovering firm buying interest near 0.8570 in the late European session. The cross rebounded as investors started digesting the fact that the European Central Bank (ECB) will not raise interest rates further but will keep interest rates higher for a lengthy time till the achievement of price stability.
ECB President Christine Lagarde announced a hawkish interest rate decision on Thursday, pushing interest rates by 25 basis points (bps) to 4.5% to sharpen monetary tools in the battle against persistent inflation. Christine Lagarde kept doors open for further policy tightening but promised to remain data-dependent. While ECB policymaker Gediminas Simkus said he hoped the ECB was done raising rates. Christine Lagarde made clear that there was no discussion about rate cuts.
Eurozone’s economic growth has remained vulnerable as the economy is struggling to absorb the repercussions of higher interest rates by the ECB. Mounting fears of a stagflation in the Eurozone have dented its economic outlook.
On the Pound Sterling, the United Kingdom economy is also facing the consequences of higher interest rates by the Bank of England (BoE). The UK central bank has already raised interest rates to 5.25% and is expected to raise one more time amid rising upside risks to inflation.
But before that, UK inflation data for August will be keenly watched. Inflationary pressures could remain persistent as the wage growth momentum is strong. The British economy shrank in July as the output from the service sector fell significantly.
Cable’s push higher stalled around the 1.2450 mark. Economists at Scotiabank analyze the GBP/USD outlook.
Strength through 1.2550 resistance is needed to cue up more gains
Short and medium-term trend dynamics are GBP-bearish and loss of support in the mid and upper 1.24s this week points to GBP losses extending towards 1.20/1.21 in the next few weeks.
Cable gains back through the 1.2475 resistance will stabilize trends in the short run. GBP strength through 1.2550 resistance is needed to cue up more gains.
USD drifts as risk mood improves. Shaun Osborne, Chief FX Strategist at Scotiabank, analyzes Greenback’s outlook.
USD uptrend is looking riper for consolidation or correction
Streaks of consecutive (daily/weekly) gains in the major currencies rarely stretch far into double digits so the broader USD uptrend is looking riper for a consolidation or correction.
The BBDXY is trading net down on the week and technically signaling a consolidation may develop while the DXY is stretching spread-based gains even more significantly relative to fair value, according to my simple model.
Bearish cues for the USD are not at all obvious at the moment but the USD could steady as markets eye next week’s FOMC decision.
- The US Dollar flattens on Friday as investors take profits after its rally on Thursday.
- Traders are letting the dust settle on the lacklustre performance of the Euro after ECB’s dovish hike.
- The US Dollar Index is above 105.00, though faces some profit taking ahead of the weekend.
The US Dollar (USD) got the wind in its sales after a very volatile afternoon on Thursday had faith falling in favor of the Greenback. A dovish hike from the European Central Bank prompted traders to sell the Euro in the conviction the Eurozone economy will crash. Meanwhile, Retail Sales data out of the US and Producer Price Index numbers signalled that the US economy looks to head for that soft landing.
The Greenback will need to perform on its own this Friday as already in early morning trading some profit taking is happening ahead of the weekend. The University of Michigan Consumer Sentiment print will determine whether the US Dollar Index (DXY), which tracks the value of the USD against a basket of currencies, will close below or above 105.00. Another weekly positive close for the US Dollar hangs in the balance, with chances that the DXY will close in green for a ninth straight week.
Daily digest: US Dollar faces profit taking ahead of Michigan Sentiment
- Plenty of datapoints to process on Friday. At 12:30 GMT, the Import and Export Price Indexes for August are due, both monthly and yearly prints. The Export Price Index is expected to increase 0.3% on month in August, less than the 0.7% rise seen in July. . The yearly index decreased by 7.9% in July and there is no no forecast for the upcoming August reading. The Import Price Index is expected to slow to 0.3% on month from 0.4%. The yearly reading decreased 4.4% in July and there’s no market forecast for August..
- Also at 12:30 GMT, the New York’s Fed Empire State Manufacturing Index for September is due to come out. Expectations are still for a negative print, though less negative, from -19 to -10.
- At 13:15 GMT, markets will digest Industrial Production data from August, which is expected to increase by a marginal 0.1%, slowing sharply from the 1% rise seen in July.
- Focal point for this Friday comes in at 14:00 GMT with the Michigan Consumer Sentiment Index and the 5-year Consumer Inflation Expectations. The preliminary Consumer Sentiment Index for September is expected to head from 69.5 to 69.1. No forecast on the five-year inflation expectations component, which were at 3% at the end of August..
- Equities are in the green across the board with both the most important Asian and European indices all up near 1%. US equity futures are lagging a touch, and are all up by 0.20%.
- The CME Group FedWatch Tool shows that markets are pricing in a 97% chance that the Federal Reserve will keep interest rates unchanged at its meeting in September after the recent PPI and Retail Sales numbers.
- The benchmark 10-year US Treasury bond yield trades at 4.30%, substantially higher to where it was at the beginning of the week.
US Dollar Index technical analysis: On its own
The Greenback had a double jetpack strapped on Thursday. One element that boosted the US Dollar was the macroeconomic front, with the solid US Retail Sales data, lower Jobless Claims both initial and continuing, and PPI numbers confirming the Fed is on the right track. The second jetpack came from the depreciating Euro, which got hammered after a European Central Bank meeting where Lagarde refrained to answer several simple questions, leaving traders behind with not much belief or elements to support the Euro.
The US Dollar Index (DXY) has edged up, reaching as high as 105.41. This is just a sigh away from the 2023 high near 105.88. Should the DXY be able to close above there for the week, expect King Dollar to go even stronger in the medium-turn.
On the downside, the 104.44 level seen on August 25 kept the Index supported on Monday, not allowing the DXY to sell off any further.. Should the uptick that started on Tuesday reverse and 104.44 gives way, a substantial downturn could take place to 103.04, where the 200-day SMA comes into play for support.
US Dollar FAQs
What is the US Dollar?
The US Dollar (USD) is the official currency of the United States of America, and the ‘de facto’ currency of a significant number of other countries where it is found in circulation alongside local notes. It is the most heavily traded currency in the world, accounting for over 88% of all global foreign exchange turnover, or an average of $6.6 trillion in transactions per day, according to data from 2022.
Following the second world war, the USD took over from the British Pound as the world’s reserve currency. For most of its history, the US Dollar was backed by Gold, until the Bretton Woods Agreement in 1971 when the Gold Standard went away.
How do the decisions of the Federal Reserve impact the US Dollar?
The most important single factor impacting on the value of the US Dollar is monetary policy, which is shaped by the Federal Reserve (Fed). The Fed has two mandates: to achieve price stability (control inflation) and foster full employment. Its primary tool to achieve these two goals is by adjusting interest rates.
When prices are rising too quickly and inflation is above the Fed’s 2% target, the Fed will raise rates, which helps the USD value. When inflation falls below 2% or the Unemployment Rate is too high, the Fed may lower interest rates, which weighs on the Greenback.
What is Quantitative Easing and how does it influence the US Dollar?
In extreme situations, the Federal Reserve can also print more Dollars and enact quantitative easing (QE). QE is the process by which the Fed substantially increases the flow of credit in a stuck financial system.
It is a non-standard policy measure used when credit has dried up because banks will not lend to each other (out of the fear of counterparty default). It is a last resort when simply lowering interest rates is unlikely to achieve the necessary result. It was the Fed’s weapon of choice to combat the credit crunch that occurred during the Great Financial Crisis in 2008. It involves the Fed printing more Dollars and using them to buy US government bonds predominantly from financial institutions. QE usually leads to a weaker US Dollar.
What is Quantitative Tightening and how does it influence the US Dollar?
Quantitative tightening (QT) is the reverse process whereby the Federal Reserve stops buying bonds from financial institutions and does not reinvest the principal from the bonds it holds maturing in new purchases. It is usually positive for the US Dollar.
EUR/USD stabilizes in the low 1.06 area. Economists at Scotiabank analyze the pair’s outlook.
Undertone remains soft
Minor spot gains from the low 1.06 area have not developed too far on the day but support emerging very, very close to the late May low warrants some attention, even if broader trend signals look quite negative for the EUR at the moment.
Intraday gains have stalled around 1.0670 and spot really needs to regain 1.07+ to show some signs of short-term technical strength.
Weakness below longer-run retracement support at 1.0610 would point to losses extending to 1.04.
CAD rebound stalls around 1.35. Economists at Scotiabank analyze Loonie’s outlook.
Risks tilted to the downside for USD/CAD
Grinding gains for the CAD this week are basing around the 1.35 high/low support point. But there has been a bit of a change in trend dynamics over the past few days which should, in the short run at least, keep risks tilted to the downside for USD/CAD.
Intraday DMI signals are bearish and the daily study is flipping to (marginally) negative. Weekly trend dynamics are slipping to nearer neutral. Combined, these signals suggest weak upside impulses at least for the USD.
Intraday resistance should emerge on USD gains to the 1.3540/1.3450 area. A push under 1.3495 should, however, point to USD losses towards the low/mid 1.34s.
Economists at Danske Bank forecast USD/JPY towards 130 on 6/12M horizon.
Global environment favours the Yen
For the rest of this year, the biggest driver of the JPY is likely the developments in global yields, especially US yields, and energy prices, to a lesser extent. We deem that US yields are at (or close to their peak), which is the main argument for our bearish USD/JPY stance.
Furthermore, in the current global economic environment where both growth and inflation are declining, history suggests that it is favourable conditions for the JPY. Hence, we forecast USD/JPY to be around 130 in a 6/12-month horizon.
If the US enters a recession within the next couple of quarters, prompting the Fed to start a rate-cutting cycle, we find it unlikely that the BoJ will start normalizing monetary policy as long as the Fed is cutting rates. In such a scenario, the BoJ will keep policy unchanged until at least H2 2024 when the Fed is done cutting rates. That scenario will likely add support to the JPY on the back of narrowing rate differentials.
Kit Juckes, Chief Global FX Strategist at Société Générale, notes that the growth outlook is dominating the FX market.
Growth matters more than central banks
The only positive I can think of for the Euro or Sterling, in a world where growth expectations are the biggest driver of exchange rates, is that expectations about UK and Eurozone growth are already dire relative to the US.
That ought to be enough to prevent a sharp collapse by EUR/USD or GBP/USD (parity for EUR/USD, or GBP/USD down to around 1.15 seems unlikely) but GBP/USD could get to 1.20, and EUR/USD can easily trade below 1.05 easily if we don’t get any positive surprises from the real economy data in Europe soon.
- Natural Gas dropped lower after a volatile Thursday.
- The US Dollar rallied to print a new six-month high.
- US Natural Gas prices might slide further lower after recent developments.
Natural Gas prices had a volatile day on Thursday and saw its price sinking below $3. The mix of headlines are pushing Natural Gas prices lower as the demand side looks to remain bleak. The latest European Central Bank meeting saw substantial downward revision in the growth projections for the eurozone, which means that the big gas-dependent block will need even less LNG than initially projected.
Add to that equation several comments out of Norway where the biggest LNG field, the Troll field, is set to fully reopen on Saturday, and already the supply is overtaking the demand. Even the United States sees its gas storage levels being filled up quite rapidly with Thursday's numbers from the Energy Information Administration(EIA) revealed a build in gas storage from 33 billion to 57 billion cubic feet. Meanwhile, Europe is ready for the winter season with still elevated temperatures in the coming weeks.
At the time of writing, Natural Gas is trading at $2.949per MMBtu.
Natural Gas news and market movers
- The European Central Bank (ECB) has slashed the growth forecast for the eurozone to the downside for the rest of 2023 and 2024. This together with the local German downgraded forecast for its growth means that the overall demand out of the block will be even lower as of 2022.
- The Norwegian Troll field is set to fully reopen on Saturday.
- The Freeport restart as well is helping to relieve any tightness in the LNG markets.
- Meteorologists are putting forward a model where temperatures will remain elevated throughout October for the eurozone.
- European gas storage is expected to survive the upcoming winter and end the season with 44% supply left. European storage is at 93%.
- A buildup in US rig counts could point to more LNG supply coming online in the coming weeks. More data on that later this Friday arrives at 17:00 GMT.
Natural Gas Technical Analysis: The quicker they rise, the harder they fall
Natural Gas took it on the chin in a direct backslash from the European Central Bank communication. The downgraded projections for economic growth in the eurozone are being translated as an even worse dampening of demand for gas. Meanwhile, European industries are seeing their order books getting thinner, and households are enjoying an Indian Summer in Europe, which means twice as less demand for LNG as normal around this period of time.
As already mentioned, $3 is the target and hard nut that needs to be cracked. Seeing the current equilibrium, a catalyst is needed to move the needle upwards. That could come with more supply disruptions from Australia or sudden changes in the current gas storage level in Europe due to a sudden peak in demand. In such events, Gas prices could rally to $3.20, testing the upper band of the ascending trend channel.
On the downside, the 200-day Simple Moving Average (SMA) at $2.89 has been turned into support. Should that give way on a downside move, some area will be crossed before the next support kicks in at $2.73. This level aligns with the 55-day SMA, which is likely to step in to avoid any nosedive moves in the commodity.
-638303674112498529.png)
XNG/USD (Daily Chart)
Natural Gas FAQs
What fundamental factors drive the price of Natural Gas?
Supply and demand dynamics are a key factor influencing Natural Gas prices, and are themselves influenced by global economic growth, industrial activity, population growth, production levels, and inventories. The weather impacts Natural Gas prices because more Gas is used during cold winters and hot summers for heating and cooling. Competition from other energy sources impacts prices as consumers may switch to cheaper sources. Geopolitical events are factors as exemplified by the war in Ukraine. Government policies relating to extraction, transportation, and environmental issues also impact prices.
What are the main macroeconomic releases that impact on Natural Gas Prices?
The main economic release influencing Natural Gas prices is the weekly inventory bulletin from the Energy Information Administration (EIA), a US government agency that produces US gas market data. The EIA Gas bulletin usually comes out on Thursday at 14:30 GMT, a day after the EIA publishes its weekly Oil bulletin. Economic data from large consumers of Natural Gas can impact supply and demand, the largest of which include China, Germany and Japan. Natural Gas is primarily priced and traded in US Dollars, thus economic releases impacting the US Dollar are also factors.
How does the US Dollar influence Natural Gas prices?
The US Dollar is the world’s reserve currency and most commodities, including Natural Gas are priced and traded on international markets in US Dollars. As such, the value of the US Dollar is a factor in the price of Natural Gas, because if the Dollar strengthens it means less Dollars are required to buy the same volume of Gas (the price falls), and vice versa if USD strengthens.
The Euro has continued to weaken after Thursday’s ECB policy meeting. Economists at MUFG Bank analyze the shared currency outlook.
Dovish ECB update weighs on EUR
The break below the low from the end of May at 1.0635 opens the door to a test of the bottom of the current year-to-date trading range between 1.0500 and 1.1000.
The dovish market reaction to the ECB’s policy update highlights that market participants have placed more importance on both: i) the stronger signal that rates may have peaked and are now more likely to remain on hold for a long period, and ii) the much weaker growth outlook for the euro-zone and lower inflation projections for 2025.
Economists at UBS share their USD/CNY forecast.
Yuan could come under further pressure into the end of this year
China’s central bank should continue to lean against the Dollar’s rise versus the Yuan. The Chinese currency could come under further pressure into the end of this year. We still think the exchange rate with the Dollar could trade in a wide range for a while. However, there are early signs that growth in China is stabilizing. The central bank has also indicated it is averse to an excessive depreciation of the currency, saying in a statement that foreign exchange market participants should ‘resolutely avoid behaviors that disturb market orders such as conducting speculative trades.’
We forecast the USD to end 2023 at 7.40 versus the Yuan, easing to 7.20 by March next year and to 7.00 by September 2024.
- USD/CHF trades sideways around 0.8950 as the US Dollar turns subdued after refreshing a six-month high.
- The US Dollar failed to capitalize on strong Retail Sales data for August as it was majorly driven by higher gasoline prices.
- The SNB is expected to maintain a hawkish tone as inflation in the Swiss economy has not come confidently below 2%.
The USD/CHF pair trades directionless around 0.8950 in the European session. The Swiss Franc asset struggles to find a decisive move as investors shift focus to the interest rate decision by the Federal Reserve (Fed) and the Swiss National Bank (SNB), which will be announced next week.
S&P500 futures added some gains in the London session, portraying ease in the risk-off profile after upbeat Chinese economic data receded worries about a global economic slowdown. China’s annual Industrial Production rose by 4.5% and Retail Sales expanded by 4.6%, outperformed expectations.
The US Dollar Index (DXY) corrected gradually to near 105.20 from its six-month high of 105.43 amid some improvement in the risk appetite of the market participants. The US Dollar failed to capitalize on strong Retail Sales data for August as it was majorly driven by higher gasoline prices. Meanwhile, US President Joe Biden vowed to bring down gasoline prices, which rose 106% in August.
After stickier headline consumer inflation and Producer Price Index (PPI), investors see the impact of rising gasoline prices limited on inflation, which would discourage Fed policymakers from discussing more interest rate hikes for the remainder of 2023.
On the Swiss Franc front, investors keenly focus on the SNB monetary policy, which will be announced on Thursday. The SNB is expected to maintain a hawkish tone as inflation in the Swiss economy has not come confidently below 2%. SNB Chairman Thomas J. Jordan already conveyed that the consequences of higher inflation are worse than the repercussions of a lower price index.
USD/JPY locked in a tight range as traders await fresh catalysts in the form of the Fed and the BoJ next week, economists at Société Générale report.
A break above 147.80/148.10 is essential to affirm continuation in up move
The BoJ meets next week, expectations for a change in policy are low but a move closer to 150 in USD/JPY is not ruled out after the FOMC decision.
A break above upper part of recent consolidation at 147.80/148.10 which is also the trend line connecting highs of June and August is essential to affirm continuation in up move.
In case the pair fails to defend recent pivot low at 145.90, there could be risk of a short-term pullback towards the 50-DMA near 144.50/143.90.
Senior Economist at UOB Group Alvin Liew assesses the latest release of US inflation figures.
Key Takeaways
The latest US Aug inflation report is overall seen as in line with market expectations but the slight uptick in m/m core inflation sparked concerns about future Fed hikes even though y/y core inflation continued to ease to 4.3% y/y, lowest level in 2 years.
The US Aug headline CPI rose by 0.6% m/m (exactly at the Bloomberg median estimate, up from 0.2% m/m in Jul) and it was also the fastest m/m pace recorded so far in 2023, largely due to higher energy prices. This translated to a faster headline CPI inflation at 3.7% y/y (versus Bloomberg est 3.6% y/y, UOB est 3.5% y/y, and up from 3.2% y/y in Jul).
Core CPI (which excludes food and energy) saw a sequential pickup in pace to 0.3% m/m (above Bloomberg est 0.2% m/m, and up from the 0.2% pace in Jun and Jul). Compared to one year ago, core inflation eased to 4.3% y/y in Aug, from 4.7% y/y in Jul. The 4.3% print was exactly at the Bloomberg median estimate and was also the lowest y/y core inflation print since Sep 2021 (4.0%).
US Inflation Outlook – Taking stock of the price trajectory to date, despite the slight Jul & Aug y/y upticks, we continue to expect headline inflation to head lower towards end 2023 (in part due to base effects) and to average about 3.2% for 2023. In comparison, core inflation continued to ease, and we still expect core inflation to ease to 3.0% y/y by end-2023, but still above the Fed’s 2% objective. For the full year, we expect core inflation to average 4.6% in 2023.
The dovish ECB hike and another round of strong US activity data sent the Dollar on another rally on Thursday. Economists at ING analyze Greenback’s outlook.
Risks remain skewed towards further strengthening in the near term
The next resistance for DXY is the 105.85 March high: beyond that, it would explore levels last seen in November 2022.
The Dollar may correct a bit lower today, but the risks remain skewed towards further strengthening in the near term, or at least until the US activity picture starts to show some cracks.
European Central Bank (ECB) Vice President, Luis de Guindos, said on Friday, interest rates will stay at this level for some time enough to tame the Consumer Price Index (CPI).
Additional comments
CPI and core CPI will continue to ease.
Any future rate cuts to depend on many factors.
Related reads
- ECB’s Muller: No further rate hikes expected in coming months
- Euro bounces off six-month lows near 1.0630 as Lagarde set to speak again
European Central Bank (ECB) policymaker Madis Muller said on Friday, “no further rate hikes are expected in the coming months.”
Additional quotes
Higher inflation could yet warrant another hike.
Rates high enough to bring inflation back to 2%.
Market reaction
EUR/USD is unpertubed by the dovish comments from the ECB official, keeping its recovery mode intact near 1.0665, up 0.25% on the day.
A move to the sub-7.2600 region in USD/CNH should not be ruled out, comment Group’s Economist Lee Sue Ann and Markets Strategist Quek Ser Leang.
Key Quotes
24-hour view: After USD fell sharply on Wednesday, we indicated yesterday that “despite the relatively large decline, downward momentum has not improved all that much.” We held the view that USD “is likely to grind below 7.2600.” We were also of the view that “the next major support at 7.2390 is unlikely to come into view.” Instead of ‘grinding below 7.2600’, USD dropped to 7.2609 before snapping back up to end the day at 7.2903 (+0.27%). Downward pressure has eased, and USD has likely entered a consolidation phase. Today, we expect USD to trade in a range of 7.2750/7.3080.
Next 1-3 weeks: Yesterday (14 Sep, spot at 7.2740), we highlighted that “downward momentum has increased, and USD could break below 7.2600.” We indicated, “the next support level is at 7.2390.” USD then dropped to 7.2608 before rebounding. We continue to hold the same view. That said, oversold short-term conditions suggest USD could consolidate for a couple of days before heading lower. On the upside, if USD breaks above 7.3200 (no change in ‘strong resistance’ level), it would indicate that the current downward pressure has faded.
The ECB hiked the key rate by 25 bps to 4.0%. Antje Praefcke, FX Analyst at Commerzbank expects the Euro to turn back higher.
Euro to appreciate again
I think there are no good reasons now to trade the Euro weaker based on the expectations of future monetary policy. On the contrary: if it turns out that, contrary to market expectations, the ECB will not cut rates next year, as our experts project, and the economy shows resilience as the ECB expects, the market would have to adjust its expectations, which would allow the EUR to appreciate again.
The price and economic data over the coming months will provide more of an insight. For now, the FX market will focus on the Fed though – the next major event in the diary.
- Gold recovers sharply as the Fed is expected to pause the policy-tightening spell.
- The US Dollar comes under pressure after refreshing a six-month high as fears of a global slowdown recede.
- US Retail Sales increased sharply in August as service stations received higher revenue due to rising gasoline prices.
Gold price (XAU/USD) recovers strongly as investors see no more interest rate increases from the Federal Reserve (Fed) for the remainder of 2023. The Fed seems to be done with its historically aggressive interest rate hiking cycle in the absence of economic indicators that support further upside risks to inflation. The recovery move in the precious metal is also backed by a correction in the US Dollar after China’s Retail Sales and Industrial Production were robust in August.
Meanwhile, US Retail Sales rose sharply in August as service stations received higher revenue due to rising gasoline prices. The impact of the higher energy prices is expected to remain limited on the overall Consumer Price Index (CPI), something that should encourage Fed policymakers to keep interest rates unchanged next week.
Daily Digest Market Movers: Gold price rebounds sharply as US Dollar corrects
- Gold price extends its recovery to near $1,920.00 from around $1,900.00 as investors hope that the Federal Reserve is done with hiking interest rates for 2023.
- The precious metal recovered strongly as soaring expectations of no more interest rate increases from the Fed triggered some profit-booking in the US Dollar.
- A big chunk of US economic data for August suggests that upside risks to inflation are receding, adding to the thesis that Fed policymakers could discuss more about keeping interest rates ‘’higher for longer” and less about additional increases.
- On Thursday, the US Census Bureau reported that monthly Retail Sales expanded at a higher pace of 0.6% in August compared with July’s reading of 0.5%. Investors anticipated a slower growth pace of 0.2%.
- A major contributor to higher consumer spending came from strong gasoline prices, which have increased due to the global rally in Oil prices.
- The headline Producer Price Index (PPI) in the US rose 0.7% on a monthly basis, higher than the 0.4% increase expected and also July’s print. Annual headline PPI accelerated to 1.6% against estimates of 1.2% and the former reading of 0.8%.
- Overall energy prices that include components like gasoline, electricity, and utility gas prices spiked 5.6% in August compared with the previous month due to the global oil rally that pushed headline PPI higher at a stronger pace.
- US President Joe Biden vowed to cut gasoline prices after the US Retail Sales report showed that higher prices boosted revenue at service stations. Gasoline prices jumped 10.6% in August after climbing 0.2% in July.
- Meanwhile, the annual Core PPI decelerated to 2.2% from July’s 2.4%, as expected by market participants.
- Investors see the Fed pausing the policy tightening spell in its September monetary policy as the impact of higher energy prices on overall headline inflation looks limited. Generally, Fed policymakers consider the core CPI for the monetary policy decision, which is expected to continue to fall.
- As per the CME Group Fedwatch Tool, traders see a 97% chance for interest rates to remain steady at 5.25%-5.50% after the September 20 Federal Open Market Committee (FOMC) meeting. For the rest of the year, traders anticipate almost a 60% chance for the Fed to keep monetary policy unchanged. This marks an increase from the 54% before the release of PPI and Retail Sales data release.
- On Thursday, the US Department of Labor reported that Initial Jobless Claims for the week ending September 8 were higher than in the prior week, breaking a streak of five straight weeks of declines. Individuals claiming jobless benefits for the first time rose by 220K, while investors anticipated claims at 225K. In the prior week, jobless claims were at 216K.
- The US Dollar faces some selling pressure as fears of a global economic downturn ease after the release of upbeat Industrial Production and Retail Sales data from China.
Technical Analysis: Gold price delivers a bearish wedge breakout
Gold price extends its sharp recovery to near $1,920.00 as the declining momentum appears to have exhausted after the selling pressure dried. The asset delivers a breakout of the Bearish Wedge chart pattern formed on a lower time frame, which triggered a bullish reversal. The precious metal found decent buying interest near the 200-day Exponential Moving Average (EMA) at $1,900.00 and has recovered to near the 20-day EMA, which trades near $1,920.00.
Fed FAQs
What does the Federal Reserve do, how does it impact the US Dollar?
Monetary policy in the US is shaped by the Federal Reserve (Fed). The Fed has two mandates: to achieve price stability and foster full employment. Its primary tool to achieve these goals is by adjusting interest rates.
When prices are rising too quickly and inflation is above the Fed’s 2% target, it raises interest rates, increasing borrowing costs throughout the economy. This results in a stronger US Dollar (USD) as it makes the US a more attractive place for international investors to park their money.
When inflation falls below 2% or the Unemployment Rate is too high, the Fed may lower interest rates to encourage borrowing, which weighs on the Greenback.
How often does the Fed hold monetary policy meetings?
The Federal Reserve (Fed) holds eight policy meetings a year, where the Federal Open Market Committee (FOMC) assesses economic conditions and makes monetary policy decisions.
The FOMC is attended by twelve Fed officials – the seven members of the Board of Governors, the president of the Federal Reserve Bank of New York, and four of the remaining eleven regional Reserve Bank presidents, who serve one-year terms on a rotating basis.
What is Quantitative Easing (QE) and how does it impact USD?
In extreme situations, the Federal Reserve may resort to a policy named Quantitative Easing (QE). QE is the process by which the Fed substantially increases the flow of credit in a stuck financial system.
It is a non-standard policy measure used during crises or when inflation is extremely low. It was the Fed’s weapon of choice during the Great Financial Crisis in 2008. It involves the Fed printing more Dollars and using them to buy high grade bonds from financial institutions. QE usually weakens the US Dollar.
What is Quantitative Tightening (QT) and how does it impact the US Dollar?
Quantitative tightening (QT) is the reverse process of QE, whereby the Federal Reserve stops buying bonds from financial institutions and does not reinvest the principal from the bonds it holds maturing, to purchase new bonds. It is usually positive for the value of the US Dollar.
According to the quarterly survey conducted by the Bank of England (BoE), UK public inflation expectations for the coming year are seen at 3.6% in August, compared with a 3.5% figure predicted in May.
Additional findings
UK public medium-term inflation expectations are 2.9% in August (May: 3.0%).
40% of UK public say best for economy if interest rates go down, the highest share since 2008.
33% of UK public say best for them personally if rates go down, the highest share since 2008.
UK public net satisfaction with BoE controlling inflation falls to a new record low of -21%.
Market reaction
At the time of writing, GBP/USD is holding the recovery gains around 1.2425, adding 0.22% on the day.
- NZD/USD struggles to preserve its modest intraday gains, though the downside remains limited.
- The risk-on impulse prompts some USD profit-taking and lends support to the risk-sensitive Kiwi.
- The lack of follow-through buying warrants some caution before positioning for any further gains.
The NZD/USD pair attracts some sellers following an intraday uptick to the 0.5935 area on Friday and has now surrendered its modest intraday gains. Spot prices, however, manage to hold above the daily trough, around the 59.00 mark, which represents the 200-hour Simple Moving Average (SMA) and should act as a pivotal point for intraday traders.
In the meantime, a generally positive tone around the equity markets, bolstered by more stimulus from China, undermines the safe-haven US Dollar (USD) and should lend some support to the risk-sensitive Kiwi. The People’s Bank of China (PBoC) lowered the Reserve Ratio Requirements for local lenders by 25 bps. This is the second such move this year and is expected to release more liquidity, which should potentially shore up growth in the world's second-largest economy. Adding to this, China reported better-than-expected Industrial Production and Retail Sales figures for August, which further investors' appetite for riskier assets.
Despite the aforementioned supporting factors, the NZD/USD pair, so far, has been struggling to gain any meaningful traction. Furthermore, firming expectations that the Federal Reserve (Fed) will stick to its hawkish stance favour the USD bulls. This, in turn, warrants some caution before placing aggressive bullish bets around the pair positioning for an extension of the recent recovery from the 0.5860-0.5855 region, or the YTD low touched last week. The incoming upbeat US macro data continue to point to a resilient economy. This, along with still-sticky inflation, supports prospects for one more 25 bps Fed rate hike move by the end of this year.
Hence, strong follow-through buying beyond the overnight swing high, around the 0.5945 region, is needed to confirm that the NZD/USD pair has formed a near-term bottom. Market participants now look to the US economic docket, featuring the release of the Empire State Manufacturing Index and Prelim Michigan Consumer Sentiment Index later during the early North American session. The data might influence the USD price dynamics, which, along with the broader risk sentiment, should contribute to producing short-term trading opportunities on the last day of the week. Nevertheless, spot prices remain on track to register modest weekly gains.
Technical levels to watch
EUR/GBP moved back below the 0.8600 level after the ECB dovish hike. Economists at ING analyze the pair’s outlook.
EUR/GBP may stay under some mild pressure into the BoE
EUR/GBP may stay under some mild pressure into the BoE but looks more likely to struggle finding much direction in the near term.
Both investors and policymakers will still get the chance to look at a CPI print (on Wednesday) before the BoE announcement (on Thursday), which has a good chance of tilting market pricing.
- Crude prices correct ahead of the release of the US economic data.
- WTI reached a YTD high of $90.56 due to a forecasted tighter supply of black gold.
- The pullback in the US Dollar (USD) could provide support in strengthening the Oil prices.
Western Texas Intermediate (WTI), the US crude oil benchmark, is hovering around $89.90 during the European session on Friday. WTI prices experienced a correction from the Year-To-Date (YTD) high at $90.56, which was marked earlier in the day.
The International Energy Agency (IEA) reported on Wednesday that the reduction in OPEC+ output would result in a significant supply deficit in the fourth quarter, starting in September. Consequently, WTI prices have been on the rise in recent weeks due to a tighter supply resulting from voluntary oil production cuts by Saudi Arabia and Russia.
These two major oil-exporting nations, Saudi Arabia and Russia, declared their commitment to extending oil output restrictions until the conclusion of 2023. As a result, Saudi Arabia's oil production will be reduced to approximately 1.3 million barrels per day (bpd) throughout the remainder of 2023.
Furthermore, OPEC expressed optimism in its monthly report released on Tuesday regarding Chinese demand for oil throughout 2023. OPEC has upheld its forecast for strong growth in global oil demand for 2023 and 2024, despite challenges like rising interest rates and higher inflation.
According to the report, the organization anticipates that global oil demand will increase by 2.25 million bpd in 2024, a slight decrease from the 2.44 million bpd growth expected in 2023. These forecasts remained unchanged from the previous month's projections.
Additionally, the positive data released by the National Bureau of Statistics (NBS) in China reveals encouraging economic trends. The upbeat figures could provide support in underpinning the Crude oil prices, coupled with the market optimism due to the recent move by the People's Bank of China (PBoC).
In August, China's year-over-year Retail Sales showed robust growth, expanding by 4.6%. This exceeded expectations, which had forecasted a 3.0% increase, and marked an improvement from the previous month's figure of 2.5%. Furthermore, Industrial Production exceeded estimates by recording a growth rate of 4.5% in August, compared to a 3.7% rise in July.
Furthermore, Chinese authorities have reduced the Reserve Requirement Ratio (RRR) by 25 basis points (bps) for a significant portion of the banking system. This action is aimed at releasing additional liquidity and potentially supporting economic growth in the world's second-largest economy.
US Dollar Index (DXY) has retreated from its recent six-month high, trading lower around 105.20. However, the likelihood of a substantial corrective decline in the Greenback seems restricted, largely due to market participants being cautious in response to the US Federal Reserve's (Fed) hawkish stance on monetary policy.
Furthermore, the US Treasury yields snapped the previous day’s gains, with the yield on the 10-year US bond corrects at 4.28% by the press time. The pullback in yields might exert minor pressure on the USD.
Traders are expected to closely watch the release of the US preliminary Michigan Consumer Sentiment Index during the North American session. The consensus expectation is for a minor decline from the previous reading of 69.5 to 69.1.
This economic indicator could provide insights into the economic situation, which can contribute support in deciding the trading bets on the US Dollar (USD).
Krona has suffered a strong depreciation since July. Antje Praefcke, FX Analyst, analyzes SEK’s outlook ahead of next week’s Riksbank meeting.
ECB coming across as much more determined compared with the Riksbank
Due to continued high inflation rates above its expectations and the risk posed by the weak currency, the Riksbank should hike the key rate next week and keep the door open for further rate steps. In my view, anything else would be a signal to the market that it is not determined enough to tackle the risks of inflation and that it is dropping behind the curve. That in turn would cause the SEK to depreciate further, thus causing inflation to become even more stubborn.
It is up to the Riksbank. I hope that it will be hawkish next week, as otherwise, I am not optimistic for the Krona, above all against the background of the ECB coming across as much more determined compared with the Riksbank.
- Silver gains strong positive traction and moves away from a one-month low touched on Thursday.
- Technical indicators on the daily chart warrant some caution before placing aggressive bullish bets.
- A sustained strength beyond the $23.20 area is needed to support prospects for additional gains.
Silver builds on the previous day's bounce from the $22.30 area – support marked by an ascending trend line extending from the June swing low – and gains strong positive traction on Friday. The momentum lifts the white metal to the top end of its weekly range during the early European session, though struggles to make it through the 200-hour Simple Moving Average (SMA) resistance near the $23.15-$23.20 region.
Technical indicators on the daily chart, meanwhile, are yet to confirm a bullish bias and make it prudent to wait for a sustained strength beyond the aforementioned barrier before placing fresh bullish bets. The XAG/USD might then aim to challenge the very important 200-day SMA, currently around the $23.45 region, en route to the 100-day SMA, near the $23.80 region. This is followed by the $24.00 mark, which if cleared will set the stage for additional gains.
The next relevant hurdle is pegged near the $24.30-$24.35 region, above which the XAG/USD could aim towards reclaiming the $25.00 psychological mark. The latter coincides with the August monthly swing high and should act as a pivotal point. Some follow-through buying, leading to subsequent gains beyond the July peak, around the $25.25 region, will shift the near-term bias in favour of bullish traders and should pave the way for a further appreciating move.
On the flip side, the $22.80 area now seems to protect the immediate downside ahead of the $23.30 region, or a nearly one-month low touched on Thursday. A convincing break below will be seen as a fresh trigger for bearish traders and make the XAG/USD vulnerable to resume its downfall witnessed since the beginning of this month. The subsequent slide has the potential to drag the white metal to the next relevant support near the $21.25 zone en route to the $21.00 mark.
Silver daily chart
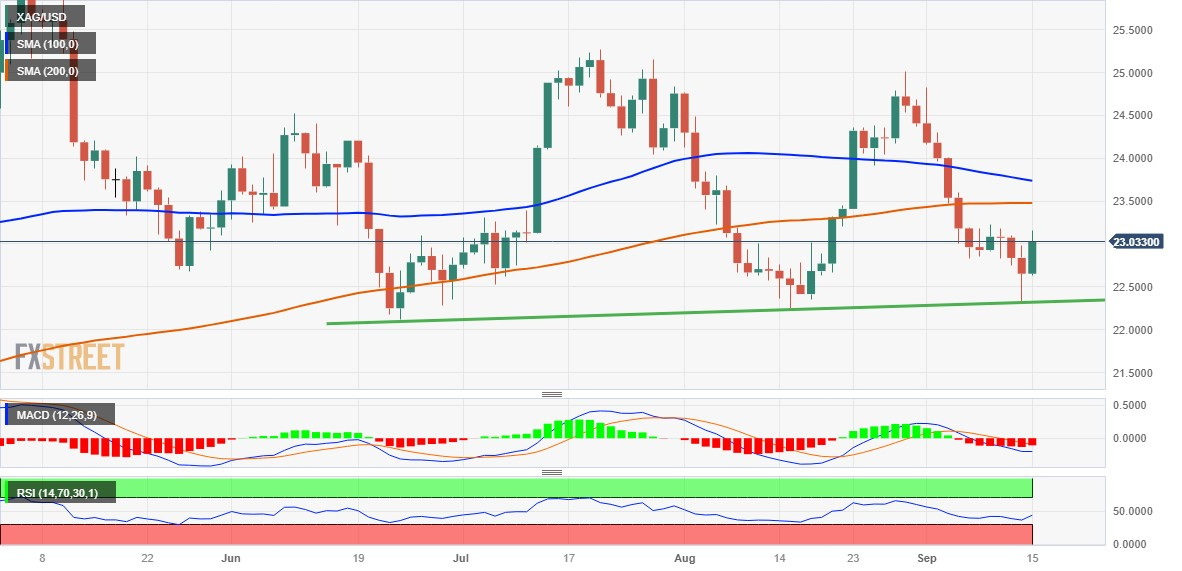
Technical levels to watch
- The Euro regains some balance vs. the US Dollar.
- Stocks in Europe opened with strong gains on Friday.
- EUR/USD appears to have met contention around 1.0630 so far.
- The USD Index (DXY) gives aways part of the recent strong advance.
- The ECB seems to have entered an impasse regarding rate hikes.
- Industrial Production and Consumer Sentiment will take centre stage in US.
Following Thursday’s drop to multi-month lows, the Euro (EUR) managed to pick up some upside traction against the US Dollar (USD), encouraging EUR/USD to retake the 1.0660 region in the wake of the opening bell in Europe at the end of the week.
The improvement in sentiment surrounding the pair comes pari passu with (finally) firmer results from the Chinese docket published during early trade, which helps the risky assets regain some poise.
On the flip side, the Greenback recedes from recent multi-month tops around 105.40 when tracked by the USD Index (DXY) against the backdrop of further gains in US yields across different time frames so far on Friday.
The monetary policy landscape remains unchanged, with investors steadfast in their anticipation of potential interest rate cuts by the Federal Reserve (Fed) taking place at some point in the second quarter of 2024.
Shifting our attention to the European Central Bank (ECB), following the dovish rate hike on Thursday, market participants have begun to factor in an extended pause. This shift in sentiment is driven by the ongoing deterioration of key economic indicators in Germany and the wider euro area. Furthermore, inflation in the region continues to exceed the bank's target. The concerns of excessive tightening, along with mounting worries of stagflation, further support this outlook.
Back on the domestic calendar, final inflation figures in Italy saw the CPI rise 0.3% MoM in August and 5.4% over the last twelve months. Later, Balance of Trade results for the broader euro zone are also due, while ECB President Christine Lagarde will speak at the ECOFIN meeting in Spain.
Across the Atlantic, all the attention will be on the release of Industrial Production readings prior to the preliminary gauge of the Michigan Consumer Sentiment.
Daily digest market movers: Euro grabs some breathing space
- The EUR manages to pick up some traction vs. the USD.
- US and German yields accelerate the upside so far on Friday.
- Markets now see the ECB pausing its tightening campaign.
- Chinese Retail Sales, Industrial Production improved in August.
- Investors keep assessing probable rate cuts by the Fed in Q2 2024.
- US docket will take centre stage later in the NA session.
- The ECB’s C. Lagarde should keep investors entertained later.
Technical Analysis: Euro still risks a drop to 1.0516
EUR/USD seems to have met initial contention around the 1.0630 region, or March lows, for the time being.
Should EUR/USD successfully break below its September low at 1.0631 (September 14), it may enter a phase of retesting the March low at 1.0516 (March 15). If the latter level is breached, it could initiate a possible examination of the 2023 low at 1.0481 (January 6).
On the other hand, the primary focus currently lies on targeting the crucial 200-day SMA at 1.0827. If the pair surpasses this level, a bullish momentum might ensue, leading to a challenge of the interim 55-day SMA at 1.0926 ahead of the weekly peak at 1.0945 (August 30). The surpass of the latter could pave the way for an advance towards the psychological level of 1.1000 and the August high at 1.1064 (August 10). If the spot clears this area, it could alleviate some of the bearish pressure and potentially aim for the weekly top at 1.1149 (July 27), followed by the 2023 high at 1.1275 (July 18).
It is crucial to note that as long as the EUR/USD remains below the 200-day SMA, there remains a possibility of a sustained decline in the pair.
Euro FAQs
What is the Euro?
The Euro is the currency for the 20 European Union countries that belong to the Eurozone. It is the second most heavily traded currency in the world behind the US Dollar. In 2022, it accounted for 31% of all foreign exchange transactions, with an average daily turnover of over $2.2 trillion a day.
EUR/USD is the most heavily traded currency pair in the world, accounting for an estimated 30% off all transactions, followed by EUR/JPY (4%), EUR/GBP (3%) and EUR/AUD (2%).
What is the ECB and how does it impact the Euro?
The European Central Bank (ECB) in Frankfurt, Germany, is the reserve bank for the Eurozone. The ECB sets interest rates and manages monetary policy.
The ECB’s primary mandate is to maintain price stability, which means either controlling inflation or stimulating growth. Its primary tool is the raising or lowering of interest rates. Relatively high interest rates – or the expectation of higher rates – will usually benefit the Euro and vice versa.
The ECB Governing Council makes monetary policy decisions at meetings held eight times a year. Decisions are made by heads of the Eurozone national banks and six permanent members, including the President of the ECB, Christine Lagarde.
How does inflation data impact the value of the Euro?
Eurozone inflation data, measured by the Harmonized Index of Consumer Prices (HICP), is an important econometric for the Euro. If inflation rises more than expected, especially if above the ECB’s 2% target, it obliges the ECB to raise interest rates to bring it back under control.
Relatively high interest rates compared to its counterparts will usually benefit the Euro, as it makes the region more attractive as a place for global investors to park their money.
How does economic data influence the value of the Euro?
Data releases gauge the health of the economy and can impact on the Euro. Indicators such as GDP, Manufacturing and Services PMIs, employment, and consumer sentiment surveys can all influence the direction of the single currency.
A strong economy is good for the Euro. Not only does it attract more foreign investment but it may encourage the ECB to put up interest rates, which will directly strengthen the Euro. Otherwise, if economic data is weak, the Euro is likely to fall.
Economic data for the four largest economies in the euro area (Germany, France, Italy and Spain) are especially significant, as they account for 75% of the Eurozone’s economy.
How does the Trade Balance impact the Euro?
Another significant data release for the Euro is the Trade Balance. This indicator measures the difference between what a country earns from its exports and what it spends on imports over a given period.
If a country produces highly sought after exports then its currency will gain in value purely from the extra demand created from foreign buyers seeking to purchase these goods. Therefore, a positive net Trade Balance strengthens a currency and vice versa for a negative balance.
EUR/CNY plummeted below 7.75 following the ECB meeting, meaning it has lost almost 5% from the high this summer. Economists at Société Générale analyze the pair’s technical outlook.
April high of 7.69/7.68 is a potential support
EUR/CNY failed to overcome the trend line since 2014 at 8.11 and evolved within a Head and Shoulders pattern. Confirmation of the formation has resulted in a sharp down move.
The pair is now in vicinity of April high of 7.69/7.68 which is a potential support.
A short-term bounce can’t be ruled out however it would be interesting to see if the pair can reclaim the neckline at 7.83. Failure could mean continuation in decline.
Below 7.68, next objectives are at the 200-DMA near 7.60 and target of the formation at 7.54.
- Pound Sterling attempts recovery as the risk-off profile eases, while broader bias is still weak.
- The UK economy shrank in July due to a sheer decline in service sector output.
- Investors await the inflation data for August, which will be released next week.
The Pound Sterling (GBP) attempts a recovery move as investors start digesting the upside risks of the global economic slowdown, while the absence of supportive fundamentals keeps the overall trend wobbly. The GBP/USD pair could resume the downside journey as the tight interest rate policy by the Bank of England (BoE) has dampened the labor demand outlook and has exposed the economy to a possible recession.
The UK economy shrank in July due to a sheer decline in service sector output as persistent inflation narrowed households’ pockets. Inflation risks are skewed to the upside as wage growth remains strong. The Pound Sterling is expected to deliver a bumpy ride as investors shift focus to the Consumer Price Index (CPI) data for August, which will be released next Wednesday. The inflation data will be followed by the interest rate decision from the BoE, which will be announced next Friday.
Daily Digest Market Movers: Pound Sterling capitalizes on mild correction in US Dollar
- Pound Sterling discovers interim support near the round-level cushion of 1.2400 as investors start digesting the consequences of higher interest rates by the Bank of England amid the battle against stubborn inflation.
- UK labor market slowed down and the economy contracts at a sharp pace in July as firms avoid banking on higher inventories and larger labor forces amid a deteriorating demand environment.
- UK firms focus on cutting input and labor costs to address bulky interest obligations due to rising mortgage costs.
- British job market witnessed a reduction in labor for the second straight month. In July, lay-offs were recorded at 207K, while investors anticipated a retrenchment of 185K.
- UK monthly Gross Domestic Product (GDP) for July shrank by half a percent, contributed to majorly by service output, which dropped by 0.5%.
- Monthly Industrial Production contracted by -0.7%, which was a higher pace than expectations of -0.6%. In June, the economic indicator expanded by 1.8%. In a similar period, Manufacturing Production contracted by -0.8%, a slower pace vs. expectations of a 1.0% contraction.
- In spite of a drawdown in the job market and deepening fears of an economic slowdown, higher inflationary pressures are going to force the BoE to raise interest rates further.
- Strong wage growth momentum is the major catalyst behind a persistent inflation outlook. Three months to July Average Earnings excluding bonuses remained in line with estimates and the former figure at 7.8%.
- A Reuters poll showed that the BoE is going to raise interest rates by 25 basis points (bps) to 5.50% in its upcoming monetary decision, which is scheduled for September 21. A minority of BoE policymakers would favor keeping doors open for further policy tightening.
- The uncertainty over the interest rate outlook remains higher as BoE Governor Andrew Bailey conveyed last week that the interest rate peak is near.
- Before September’s monetary policy, investors await the inflation data for August, which will be published on Wednesday.
- Any surprise rise in inflation would dampen the UK’s economic outlook further.
- Meanwhile, the risk appetite of market participants improved nominally as investors shrugged off risks associated with a global economic slowdown. The market mood turned cheerful as China’s Industrial Production and Retail Sales grew at a faster pace in August.
- The US Dollar Index (DXY) witnessed some profit-booking after a refreshing six-month high at 105.44. The upside bias is still upbeat as strong monthly Retail Sales data for August propelled consumer inflation expectations.
- Consumer spending expanded at a higher pace of 0.6% vs. estimates of 0.2% and July’s reading of 0.5%, driven by higher gasoline prices.
- Meanwhile, weekly Jobless Claims remained higher than the prior week's figures after declining straight for five weeks. Individuals claiming jobless benefits for the first time rose by 220K, while investors anticipated higher jobless claims at 225K. In the previous week, jobless benefits were recorded at 216K.
Technical Analysis: Pound Sterling attempts recovery from 1.2400
Pound Sterling rebounds after discovering a cushion near 1.2400 as the risk-aversion theme eases. The recovery move in the Cable is backed by a sell-off in the US Dollar. The absence of supportive fundamentals could fade and invite investors to use the pullback move as a selling opportunity. The asset seems settled below the 200-day Exponential Moving Average (EMA), which trades around 1.2480.
BoE FAQs
What does the Bank of England do and how does it impact the Pound?
The Bank of England (BoE) decides monetary policy for the United Kingdom. Its primary goal is to achieve ‘price stability’, or a steady inflation rate of 2%. Its tool for achieving this is via the adjustment of base lending rates. The BoE sets the rate at which it lends to commercial banks and banks lend to each other, determining the level of interest rates in the economy overall. This also impacts the value of the Pound Sterling (GBP).
How does the Bank of England’s monetary policy influence Sterling?
When inflation is above the Bank of England’s target it responds by raising interest rates, making it more expensive for people and businesses to access credit. This is positive for the Pound Sterling because higher interest rates make the UK a more attractive place for global investors to park their money. When inflation falls below target, it is a sign economic growth is slowing, and the BoE will consider lowering interest rates to cheapen credit in the hope businesses will borrow to invest in growth-generating projects – a negative for the Pound Sterling.
What is Quantitative Easing (QE) and how does it affect the Pound?
In extreme situations, the Bank of England can enact a policy called Quantitative Easing (QE). QE is the process by which the BoE substantially increases the flow of credit in a stuck financial system. QE is a last resort policy when lowering interest rates will not achieve the necessary result. The process of QE involves the BoE printing money to buy assets – usually government or AAA-rated corporate bonds – from banks and other financial institutions. QE usually results in a weaker Pound Sterling.
What is Quantitative tightening (QT) and how does it affect the Pound Sterling?
Quantitative tightening (QT) is the reverse of QE, enacted when the economy is strengthening and inflation starts rising. Whilst in QE the Bank of England (BoE) purchases government and corporate bonds from financial institutions to encourage them to lend; in QT, the BoE stops buying more bonds, and stops reinvesting the principal maturing on the bonds it already holds. It is usually positive for the Pound Sterling.
In the view of economists at ING, EUR/USD sensitivity to the Dollar leg and – by extension – US activity data should be even higher at this point.
Driven even more by the Dollar after dovish ECB hike
We think that at this stage EUR/USD will revert to being even more driven by the Dollar leg. Markets have taken on board the notion that the ECB has likely peaked, meaning that data releases in the Eurozone should lose some degree of market relevance.
Lagarde has probably switched from a near-term hawkish narrative to defending a higher-for-longer approach to combat inflation: expect some pushback against rate cut speculation if Eurozone data deteriorate further.
We could see EUR/USD inch back higher today, but a return to the 1.0600/1.0650 area around the Fed meeting seems appropriate.
- Gold price strengthens after China’s positive data and fresh fiscal stimulus.
- US Dollar (USD) has pulled back from its six-month high; contributing support for the yellow metal.
- Enhanced US bond yields could offer support in constraining the correction of the US Dollar (USD).
Gold price extends gains on the second day, trading higher near $1,920 per troy ounce during the early trading hours of the European session on Friday. The pair is receiving upward support, likely attributed to a slight correction in the US Dollar (USD).
Additionally, the positive data released by the National Bureau of Statistics (NBS) in China reveals encouraging economic trends. The market optimism could provide support in underpinning the prices of Gold, coupled with the recent move by the People's Bank of China (PBoC) to lower the Reserve Requirement Ratio (RRR) by 25 basis points (bps).
China’s Retail Sales (YoY) grew by 4.6%, surpassing expectations of a 3.0% increase in August and demonstrating an improvement from the previous month's 2.5% figure. Moreover, Industrial Production outperformed estimates by showing a growth rate of 4.5% in August, compared to a 3.7% rise in July.
US Dollar Index (DXY) has retreated from its recent six-month high, trading lower around 105.20. However, the likelihood of a substantial corrective decline in the Greenback seems restricted, largely due to market participants being cautious in response to the US Federal Reserve's (Fed) hawkish stance on monetary policy.
Furthermore, the US Treasury yields recovered the intraday losses, with the yield on 10-year US bond at 4.30% by the press time. The improved yields could provide support for the USD.
The anticipation of the Fed's dedication to a more stringent monetary policy, potentially involving additional interest rate hikes or tightening measures, is expected to discourage traders from placing bold positions on non-yield assets like yellow metal. Monetary policy decisions and the Fed's communications will remain focal points for buck movements in the near term.
Moreover, recent economic data from the United States has been generally positive. Initial Jobless Claims for the week ending September 8 were better than anticipated, with 220,000 new claimants. The report showed a slight improvement from the previous week's figure of 217,000.
Core Producer Price Index (PPI) for August matched expectations with a 2.2% increase, although it was slightly lower than the previous rate of a 2.4% hike. Retail Sales also exhibited improvement, rising to 0.6% compared to the previous month's 0.5%, surpassing market expectations that had predicted a slowdown to 0.2%.
These data figures collectively suggest a relatively healthy economic environment in the US, which can have an impact on market sentiment and influence trading decisions.
Market participants will closely monitor the release of the US preliminary Michigan Consumer Sentiment Index during the North American session. The consensus expectation is for a minor decline from a reading of 69.1 to 69.5.
Following the risk event “ECB meeting” attention will now focus on the Dollar again. Antje Praefcke, FX Analyst at Commerzbank, does not expect US data to have a significant impact on the USD.
There is no point in looking at the US data
Decisive for the Fed will be insights into inflation developments and the labour market. I can therefore imagine that the data published over the past weeks has already produced a ‘big picture’ for many FOMC members, which is not likely to be completely shaken by the data on the agenda for today, but will at best be adjusted slightly.
Today’s US data might be sufficient for a few pips, but it is unlikely to cause major adjustments in the Dollar – if any at all.
- The index comes under pressure following recent tops.
- The mild recovery in the risk complex weighs on the Dollar.
- Industrial Production, flash Consumer Sentiment next on tap in the US docket.
The USD Index (DXY), which tracks the greenback vs. a bundle of its main competitors, trades slightly on the defensive around the 105.30 region at the end of the week.
USD Index appears offered ahead of data
The index sheds some ground after three consecutive daily advances on Friday, all following Thursday’s multi-month peaks in the 105.40/45 band.
The tepid improvement in the appetite for the risk-associated galaxy weighs on the greenback in the wake of the opening bell in the old continent, as market participants continue to digest the latest ECB gathering and US yields look poised to extend Thursday’s advance for the time being.
In the meantime, bets for a 25 bps rate hike by the Federal Reserve at its November 1 event keep losing ground vs. increasing speculation of interest rate cuts to start in the second quarter of the next year.
In the domestic calendar, Export/Import Prices are due seconded by Industrial/Manufacturing Production, Capacity Utilization and the advanced prints for the Consumer Sentiment for the current month.
What to look for around USD
Despite the so far knee-jerk, the upside bias in the index appears intact and with rising chances of another visit to the 2023 peak near 105.90 (March 8).
In the meantime, support for the dollar keeps coming from the good health of the US economy, despite the narrative around the tighter-for-longer stance from the Federal Reserve now looks somewhat diminished amidst the current backdrop of persistent disinflation and cooling of the labour market.
Key events in the US this week: Industrial Production, Advanced Michigan Consumer Sentiment (Friday).
Eminent issues on the back boiler: Persevering debate over a soft or hard landing for the US economy. Incipient speculation of rate cuts in early 2024. Geopolitical effervescence vs. Russia and China.
USD Index relevant levels
Now, the index is down 0.09% at 105.25 and the breach of 104.42 (weekly low September 11) would open the door to 103.02 (200-day SMA) and then 102.93 (weekly low August 30). On the other hand, the next up barrier align at 105.43 (monthly high September 14) ahead of 105.88 (2023 high March 8) and finally 106.00 (round level).
Economists at Société Générale outline risk scenarios for the impact of higher Oil prices on the Indian Rupee (INR).
A combination of a higher Dollar and higher Oil prices is detrimental for INR
In the most bearish scenario, i.e. the Dollar strengthening by 5% and oil rallying to $110/bbl, USD/INR could breach the 84 level by the end of the year.
If the Dollar remains flat or if Oil prices remain flat, then USD/INR would probably remain at around 83.50, which has roughly been the resistance level since October last year.
The most probable outcome, based on SG forecasts, is for both the Oil price and the Dollar to remain roughly flat until the year-end. In this scenario, USD/INR would trade at around the 83 handle. We are sticking with this view but, owing to renewed upside risks to Oil prices, an outright short USD/INR doesn’t appear favourable.
The selling bias around USD/JPY appears to be losing momentum, according UOB Group’s Economist Lee Sue Ann and Markets Strategist Quek Ser Leang.
Key Quotes
24-hour view: We expected USD to consolidate in a range of 146.80/147.65 yesterday. In line with our view, USD consolidated, albeit in a narrower range than expected (147.00/147.56). USD closed little changed in NY (147.47, +0.01%), and further consolidation appears likely. Expected range for today, 146.95/147.65.
Next 1-3 weeks: Our update from yesterday (14 Sep, spot at 147.30) is still valid. As highlighted, the recent mild downward pressure is beginning to ease, and the odds of USD pulling back further have diminished. However, only a clear break of 147.80 (no change in ‘strong resistance’ level) would invalidate our view that USD could pullback further.
- EUR/JPY gains traction around 147.40 amid the Euro demand.
- The cross holds below the 50- and 100-hour EMAs; the Relative Strength Index (RSI) stands above 50, within bullish territory.
- The immediate resistance level is located at 157.50; the initial support level is seen at 156.63.
The EUR/JPY pair gains momentum near 157.40 during the early European session on Friday. Market players await the second-tier economic data release from the Eurozone ahead of the European Central Bank (ECB)’s President Christine Lagarde speech.
According to the one-hour chart, EUR/JPY holds below the 50- and 100-hour Exponential Moving Averages (EMAs), which means further downside looks favorable. However, the Relative Strength Index (RSI) stands above 50, within bullish territory, suggesting that buyers will likely retain control soon.
Therefore, the cross could meet the immediate resistance level near the 50-hour EMA at 157.50. The key barrier is located at 157.65, representing the 100-hour EMA and the upper boundary of the Bollinger Band. The additional upside filter to watch is 158.00 (a psychological round mark and a low of September 13), followed by 158.52 (a high of September 7).
On the downside, the cross will see an initial support level at 156.63 (a low of September 14). Any follow-through selling will see a drop to the lower limit of the Bollinger Band at 156.45. Further south, the cross will see the next contention level at 156.00, highlighting a psychological round figure and a low of August 7. Finally, the downside stop to watch at 155.85 (a low of August 3).
EUR/JPY one-hour chart
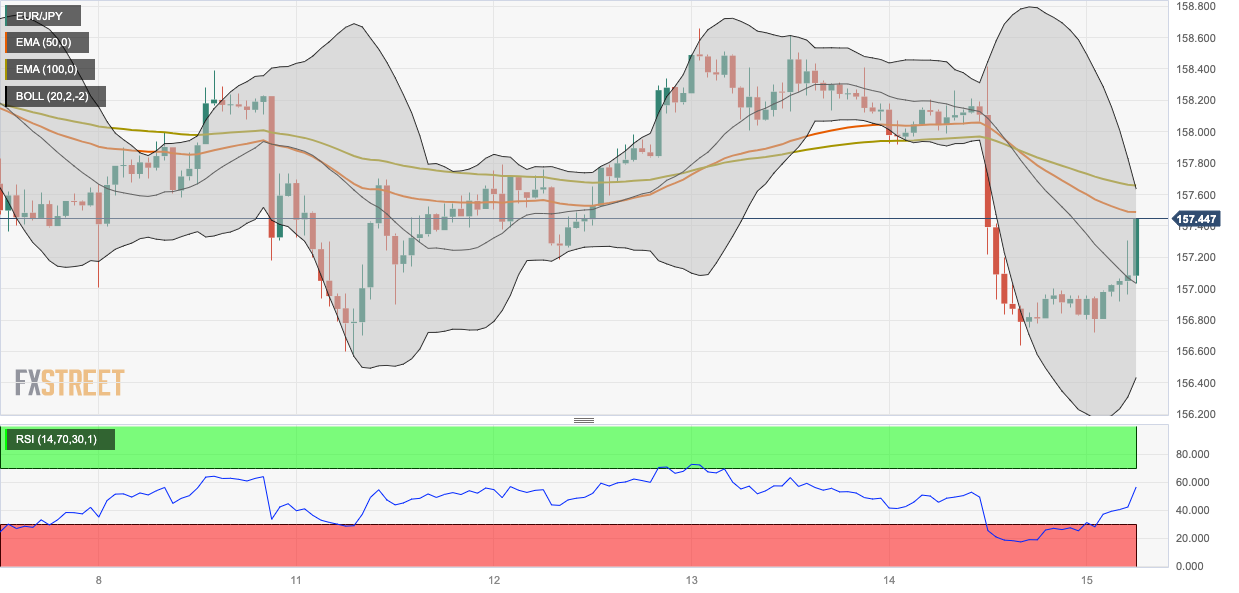
NZD/USD continues to range-trade either side of 0.59. Economists at ANZ Bank analyze the pair’s outlook.
USD continues to benefit from hope for a soft landing
FX markets were looking to US CPI data this week for direction, but it didn’t shift the dial, leaving markets focusing on next week’s Fed meeting, piling more pricing risk on that event.
EUR is struggling amid stagflation fears (it fell sharply following this week’s hike), but by contrast, the USD continues to benefit from hope for a soft landing.
Until a differentiated local theme comes along, a continued period of range trading seems likely for the Kiwi.
Considering advanced prints from CME Group for natural gas futures markets, open interest went up by more than 5K contracts after three daily drops in a row on Thursday. On the opposite side, volume added to the previous daily decline and shrank by nearly 92K contracts.
Natural Gas faces initial hurdle near $2.90
Prices of natural gas climbed to multi-session peaks past $2.80 before receding to the $2.70 region on Thursday. The marginal advance was amidst increasing open interest, which suggests that further gains could be in store in the very near term. Against that, the $2.90 region per MMBtu appears as the immediate resistance for the time being.
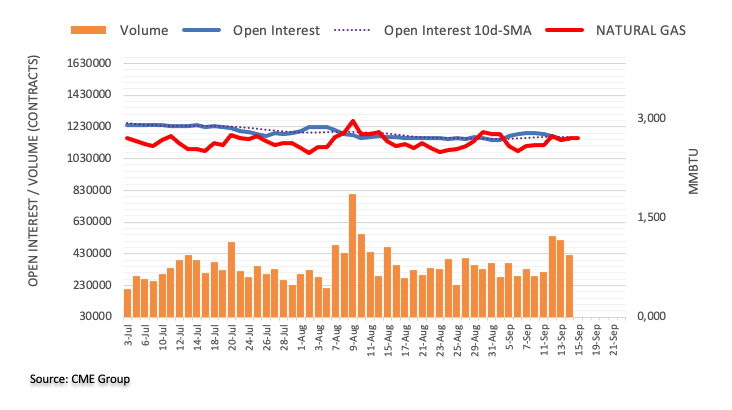
FX option expiries for Sept 15 NY cut at 10:00 Eastern Time, via DTCC, can be found below.
- EUR/USD: EUR amounts
- 1.0600 270m
- 1.0700 244m
- 1.0800 673m
- 1.0850 239m
- GBP/USD: GBP amounts
- 1.2620 900m
- USD/JPY: USD amounts
- 145.00 260m
- 146.75 2.03b
- 147.00 230m
- 148.00 210m
- AUD/USD: AUD amounts
- 0.6610 300m
- 0.6630 723m
- USD/CAD: USD amounts
- 1.3490 210m
- 1.3500 670m
- 1.3510-25 814m
The Russian Central Bank (CBR) will hold another rate meeting today. Economists at Commerzbank discuss RUB’s outlook ahead of the Interest Rate Decision.
Possibility of status quo on rates
There is no longer the sense of something being ‘out of control’ or ‘blowing up’ like it was a month ago. The calmer exchange rate is one argument in favour of a CBR pause.
Most pointers would be towards an unchanged rate today; except the broad argument that CBR tends to keep hiking rates until all developments in the direction of greater inflation risk have been eliminated. It remains a close call.
Here is what you need to know on Friday, September 15:
A risk-on market profile remains heading into the European session, as Asian markets tracked the rally in Wall Street overnight. The successful IPO of Arm instilled confidence in the US capital markets and lifted the market sentiment. Traders cheered China’s policy support measures and strong business activity data on the final trading day of the week, adding to the market’s optimism. The US S&P 500 futures are up nearly 0.20% on the day.
The People’s Bank of China (PBOC) cut the bank’s Reserve Requirement Ratio (RRR) and the 14-day Reverse Repo rate, in an effort to stimulate the faltering economic recovery. China’s Retail Sales and Industrial Production increased more than expected in August.
The US Dollar (USD) retreated from fresh six-month highs of 105.43 against its main rivals, as risk appetite reduces its safe-haven appeal. Meanwhile, the US Treasury bond yields are in a phase of upside consolidation, awaiting a fresh batch of US economic data for fresh impetus. The US docket will feature the mid-tier Industrial Production and the high-impact UoM preliminary Consumer Sentiment and Inflation Expectations.
US Dollar price today
The table below shows the percentage change of US Dollar (USD) against listed major currencies today. US Dollar was the weakest against the Australian Dollar.
| USD | EUR | GBP | CAD | AUD | JPY | NZD | CHF | |
| USD | -0.25% | -0.24% | -0.09% | -0.57% | 0.03% | -0.53% | -0.14% | |
| EUR | 0.26% | 0.01% | 0.16% | -0.34% | 0.28% | -0.30% | 0.15% | |
| GBP | 0.22% | -0.04% | 0.13% | -0.37% | 0.28% | -0.33% | 0.12% | |
| CAD | 0.08% | -0.18% | -0.15% | -0.50% | 0.11% | -0.46% | -0.01% | |
| AUD | 0.57% | 0.32% | 0.35% | 0.49% | 0.63% | 0.04% | 0.48% | |
| JPY | -0.04% | -0.30% | -0.28% | -0.15% | -0.61% | -0.60% | -0.17% | |
| NZD | 0.53% | 0.27% | 0.30% | 0.43% | -0.05% | 0.58% | 0.41% | |
| CHF | 0.12% | -0.15% | -0.12% | 0.01% | -0.45% | 0.17% | -0.42% |
The heat map shows percentage changes of major currencies against each other. The base currency is picked from the left column, while the quote currency is picked from the top row. For example, if you pick the Euro from the left column and move along the horizontal line to the Japanese Yen, the percentage change displayed in the box will represent EUR (base)/JPY (quote).
AUD/USD is extending the rebound toward 0.6500 on strong Chinese data and policy support measures. USD/CAD is struggling near 1.3500 amid a pause in the oil price rally and a broad US Dollar retreat. WTI is trading close to the multi-month high of $90.56, at the time of writing.
USD/JPY is holding steady at around 147.50, keeping the weekly range ahead of next week’s Fed and Bank of Japan’s (BoJ) monetary policy decisions.
EUR/USD is building on the rebound from six-month lows reached at 1.0633 on Thursday. The European Central Bank (ECB) hiked the key rates by 25 basis points (bps) but signaled that it could be the last hike amid downward revisions to the central bank’s growth and inflation forecasts.
GBP/USD is defending the 1.2400 level, as a better market mood underpins the higher-yielding Pound Sterling.
Gold price is moving further away from multi-week lows, looking to recapture the critical hurdle at $1,920.
- USD/JPY holds ground near 147.50, gaining 0.02% on the day.
- The upbeat US data on Thursday indicate that the US economy remains resilient and inflation rebounded in August.
- BoJ said a pivot would not be considered if wage and inflation data do not reach its forecast.
The USD/JPY pair hovers around 147.50 after retracing from 147.70 during the early European trading hours on Friday. Meanwhile, the US Dollar Index (DXY) trades near its highest daily close since March near 105.30, supported by the robust US economic data. Market players will take cues from the preliminary University of Michigan (UoM) Consumer Confidence survey ahead of the Federal Open Market Committee (FOMC) meeting next week.
On Thursday, the Bureau of Labor Statistics revealed that the August Producer Price Index (PPI) grew 1.5% YoY from 0.8% in the previous reading and above the expectation. The annual Core figure fell from 2.4% to 2.2%. Meanwhile, Retail Sales grew by 0.6% MoM in August, beating estimations of 0.2%. Furthermore, the US Department of Labor reported that weekly Initial Jobless Claims totaled 220,000 from 217,000, below the market consensus of 225,000. These figures indicated that the US economy remains resilient and inflation rebounded in August.
However, the Federal Reserve's (Fed) monetary policy expectations were not significantly altered by these figures. Markets anticipate that the Fed will maintain its interest rate at its meeting scheduled for next week. In the meantime, the hawkish stance from the Fed remains in favor of US bond yields and USD for the time being.
On the Japanese Yen front, the Bank of Japan (BoJ) policymaker stated that an exit from an ultra-easy policy will not be considered as long as wage and inflation data do not meet expectations, leaving the JPY vulnerable against its rivals.
On Thursday, Japan’s Machinery Orders fell 13% in July versus -5.8% prior On a monthly basis, the figure dropped 1.1% from a 2.7% rise in June. Both figures came in below the market consensus. Despite the dovish tone of BoJ officials, the disappointing data fails to lift the Japanese Yen (JPY).
Market participants will monitor the release of the US Empire State Manufacturing Index, Industrial Production, and the University of Michigan Consumer Confidence survey. These figures could offer hints about the peak interest rate by the Federal Reserve (Fed) for the rest of the year ahead of the Fed meeting next week.
In the view of UOB Group’s Economist Lee Sue Ann and Markets Strategist Quek Ser Leang, further upside in AUD/USD should meet a strong barrier around 0.6485.
Key Quotes
24-hour view: Yesterday, we expected AUD to trade in a range between 0.6390 and 0.6450. However, AUD traded in a range of 0.6419/0.6460 before closing at 0.6441 (+0.31%). Despite rising to a high of 0.6460, there is no increase in upward momentum. Today, we continue to expect AUD to trade in a range, likely between 0.6415 and 0.6460.
Next 1-3 weeks: There is no change in our view from Tuesday (12 Sep, spot at 0.6395), wherein AUD “could rebound further, but any advance is expected to face solid resistance at 0.6485”. The upward pressure is intact as long as AUD remains above 0.6385 (‘strong support’ level previously at 0.6370). Looking ahead, if AUD breaks below 0.6385, it would mean that AUD is likely to trade in a range instead of rebounding further.
Open interest in crude oil futures markets shrank for the second straight session on Thursday, this time by almost 5K contracts according to preliminary readings from CME Group. On the other hand, volume resumed the uptrend and rose by nearly 32K contracts, reversing the previous daily decline.
WTI: Next up-barrier sits near $93.70
The sharp uptrend in prices of WTI surpassed the key $90,00 mark per barrel on Thursday amidst diminishing open interest, leaving the door open to a corrective move in the not-so-distant future. In the meantime, bulls are expected to meet the next hurdle around the November 2022 peak at $93.73 (November 7).
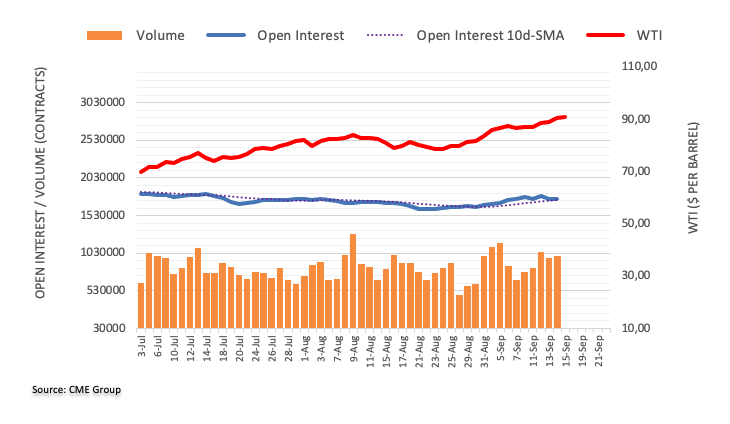
ECB delivered a 25 bps rate hike. Economists at Société Générale do not exclude further rate hikes.
A dovish ECB hike that may raise the need of further hikes
Despite attempts to highlight that further hikes are still possible, the formulation in the press release suggests strongly that the goal now is to keep rates at these levels for long enough. Unfortunately, in our view, stating this so clearly raises the risk that markets will now increasingly focus on the timing of the first cut, especially as inflation is likely to come down and growth remains sluggish.
The immediate impact on long-term yields and the Euro could imply a more delayed return to price stability, paradoxically raising the need of further rate hikes.
We do not expect any more hikes by the ECB this year, although we still see mainly upside risks to inflation, and instead look forward to the discussion on balance sheet normalisation by year-end.
With slightly accelerated QT, there should be room to push the yield curve steeper, thereby also supporting price stability. However, we also see a clear risk that high unit labour costs will result in sticky core inflation, which the ECB may need to react to with rate hikes next year.
- AUD/USD elevates due to China’s positive economic data, coupled with RRR cuts.
- US Dollar (USD) has pulled back from its six-month high, additional decline seems restricted.
- US data indicated slight moderation in the production costs but consumer spending remained resilient.
AUD/USD extends gains on the second day, trading higher around 0.6470 during the Asian session on Friday. China’s positive economic data is reinforcing the strengthening of the Aussie pair.
The data released by the National Bureau of Statistics (NBS) in China reveals encouraging economic trends. In August, year-over-year Retail Sales grew by 4.6%, surpassing expectations of a 3.0% increase and demonstrating an improvement from the previous month's 2.5% figure.
Moreover, Industrial Production outperformed estimates by showing a growth rate of 4.5% in August, compared to a 3.7% rise in July. These positive indicators suggest an uptick in economic activity in China, which can have both domestic and international implications.
China’s favorable economic figures point toward an enhancement in economic activity, and this could have meaningful implications for Australia as a significant trading partnership between the two countries.
Any upturn in China's economic performance often translates to increased exports and trade for Australia. Consequently, the Australian Dollar (AUD) may benefit from this improved economic situation in China, as it is likely to support Australia's export-driven economy.
The recent move by the People's Bank of China (PBoC) to lower the Reserve Requirement Ratio (RRR) by 25 basis points (bps) for a significant portion of the banking system is aimed at releasing additional liquidity and potentially supporting economic growth in the world's second-largest economy.
US Dollar Index (DXY) retreats from its six-month high, holding ground near 105.30. This reflects the relative strength of the US Dollar (USD) when compared to six major currencies, providing insights into market sentiment and the perceived strength of the Greenback.
The potential for a significant corrective decline in the US Dollar (USD) appears limited, primarily because market participants are exercising caution in response to the US Federal Reserve's (Fed) hawkish stance on monetary policy.
The expectation of the Fed's commitment to a more restrictive monetary policy, which could include further interest rate hikes or tightening measures, is likely to deter traders from making aggressive moves in the AUD/USD pair.
Furthermore, the recent data on US Initial Jobless Claims for the week ending September 8 were better than expected, with 220,000 new claimants, slightly improved from the previous week's 217,000.
Core Producer Price Index (PPI) for August met expectations with a 2.2% increase, albeit slightly lower than the previous rate of a 2.4% hike. Retail Sales demonstrated improvement, rising to 0.6% compared to the previous month's 0.5%, surpassing market expectations that had predicted a slowdown to 0.2%.
These economic indicators indicate that, while there was a slight moderation in the PPI, consumer spending remained resilient, reflecting the complex dynamics at play in the US economy.
Market participants will closely watch the release of the US preliminary Michigan Consumer Sentiment Index during the North American session. The consensus expectation is for a minor decline from a reading of 69.1 to 69.5.
If the actual reading aligns with or exceeds these expectations, it has the potential to provide the US Dollar (USD) with the momentum required to maintain its upward trajectory. This data is significant as it could offer insights into consumer sentiment, which can influence trading decisions related to the Greenback.
UOB Group’s Economist Lee Sue Ann and Markets Strategist Quek Ser Leang suggest there is still room for further weakness in GBP/USD in the next few weeks.
Key Quotes
24-hour view: Our view of range trading in GBP yesterday was incorrect. Instead of trading in a range, GBP fell sharply and dropped a couple of pips below the major support at 1.2400 (low of 1.2398). Today, GBP is likely to continue to weaken, even though severely oversold conditions suggest a sustained break below 1.2355 is unlikely. The next major support at 1.2305 is highly unlikely to come into view today. On the upside, a break of 1.2455 (minor resistance is at 1.2430) would indicate that the weakness in GBP has stabilised.
Next 1-3 weeks: Last Monday (04 Sep), when GBP was trading at a much higher level of 1.2590, we highlighted that “the risk for GBP appears to have shifted to the downside.” We maintain our negative GBP view, and yesterday (14 Sep, spot at 1.2490), we pointed out that “as long as 1.2555 is not breached, there is a chance for GBP to drop to 1.2400 before stabilisation can be expected.” While our view turned out to be correct, as GBP dropped to a low of 1.2398 in NY trade, we did not quite expect the rapid pace of decline as GBP closed sharply lower by 0.64% (NY close of 1.2411). There is no sign of stabilisation just yet. In other words, we continue to expect GBP to weaken. The next level to watch is May’s low near 1.2305. On the upside, the ‘strong resistance’ level has moved lower to 1.2485 from 1.2555.
CME Group’s flash data for gold futures markets noted investors trimmed their open interest positions by just 898 contracts after three consecutive daily drops on Thursday. Volume, instead, remained choppy and went up by around 46.6K contracts.
Gold: Next target emerges at the 200-day SMA
Prices of gold bounced off lows near the key $1900 region per troy ounce on Thursday. The move was in tandem with shrinking open interest, which hints at the idea that a more sustained rebound looks not favoured for the time being. On the upside, the next resistance area emerges at the key 200-day SMA, today around $1922.

Danmarks Nationalbank (DN) hiked its key policy rate 25 bps to 3.60% after the ECB increased its key policy rate 25 bps earlier. EUR/DKK trades close to the central rate. Economists at Danske Bank analyze the pair’s outlook.
End of the hiking cycle
DN hiked its key policy rate 25 bps to 3.60%. The rate increase follows the decision by the ECB earlier, which increased its policy rates 25 bps to 4.00%.
We expect the rate hikes to mark the end of the hiking cycle in the Euro area and in Denmark and next move to be a rate cut in the summer of 2024.
EUR/DKK trades close to the central rate. We expect it to stay here and thus for DN to follow future interest rate changes from the ECB 1-to-1. I.e. we do not expect DN to make any unilateral adjustments of the policy rate spread, which is currently -0.40pp. It means we expect DN to keep its key policy rate unchanged at 3.60% until next summer.
A deeper drop could drag EUR/USD to the 1.0515 zone in the next few weeks, note UOB Group’s Economist Lee Sue Ann and Markets Strategist Quek Ser Leang.
Key Quotes
24-hour view: The sharp selloff that sent EUR plunging to a 6-month low of 1.0629 came as a surprise (we were expecting EUR to trade in a range). While the decline appears to be overdone, the weakness in EUR has not stabilised. Today, EUR could decline further, but it is unlikely to break clearly below 1.0600. Resistance is at 1.0665, a break of 1.0690 would mean that EUR is not weakening further.
Next 1-3 weeks: On Tuesday (12 Sep, spot at 1.0750), we indicated that “the weakness in EUR has stabilised”, and we held the view that EUR “is likely to trade in a range between 1.0690 and 1.0820.” Yesterday (14 Sep, spot at 1.0730), we highlighted that “Looking ahead, if EUR breaks and stays below 1.0690, it will increase the risk of it dropping towards the major support at 1.0635.” In London trade, not only did EUR break below 1.0690, it also dropped slightly below May’s low of 1.0635 (low has been 1.0629). The sharp increase in momentum suggests EUR has resumed its weakness. However, it remains to be seen if there is enough momentum to carry EUR lower March’s low near 1.0515. In order to keep the momentum going, EUR must stay below 1.0730, the current ‘strong resistance’ level. This level will move lower in the coming days.
- USD/CAD attracts some sellers and trades in negative territory for the sixth consecutive day on Friday.
- The pair holds below the 50- and 100-hour EMAs; the Relative Strength Index (RSI) stands below 50.
- The immediate resistance level for the pair is seen at 1.3530; the 1.3490 acts as an initial support level.
The USD/CAD pair extends its downside around the 1.3500 mark during the early European session on Friday. A rally in crude oil prices near the highest level since November 2022 boosts the commodity-linked Loonie against the US Dollar (USD) and acts as a headwind for the USD/CAD pair.
According to the one-hour chart, USD/CAD holds below the 50- and 100-hour Exponential Moving Averages (EMAs) with a downward slope, which supports the sellers for the time being. Additionally, the Relative Strength Index (RSI) stands below 50, activating the bearish momentum for the USD/CAD pair for pair.
The immediate resistance level for the pair is seen at 1.3530, representing the 50-hour EMA and the upper boundary of the Bollinger Band. Any follow-through buying above the latter will pave the way to 1.3553 (the 100-hour EMA). The additional upside filter to watch is near a high of September 13 at 1.3586, followed by a psychological round figure at 1.3600.
Looking at the downside, the 1.3490 acts as an initial support level for USD/CAD. The mentioned level portrays the lower limit of the Bollinger Band. A breach below the latter will see a drop to 1.3475 (a low of August 16). Further south, the next downside stop is located at 1.3445 (a low of August 15) en route to a low of August 11 at 1.3412.
USD/CAD one-hour chart
-638303529916349041.png)
- Asian stocks trade in positive territory after encouraging Chinese data.
- Chinese Retail Sales and Industrial Production for August came in better than expected.
- Investors will monitor the preliminary US University of Michigan (UoM) Consumer Confidence survey on Friday.
Asian stocks trade in positive territory on Friday following the stronger-than-expected Chinese data and stimulus measures from the Chinese authorities to boost the economy.
At press time, China’s Shanghai is up 0.28% to 3,135, the Shenzhen Component Index rises 0.11% to 10,208, Hong Kong’s Hang Sang surges 1.66% to 18,347, South Korea’s Kospi climbs 1.27% and Japan’s Nikkei surges 1.28%.
Chinese equities edge higher as investors are more optimistic about economic growth in China, the world’s second-largest economy. The National Bureau of Statistics (NBS) revealed on Friday, that Chinese Retail Sales for August improved 4.6% YoY compared to the previous reading of 2.5%, exceeding market expectations. In the meantime, the nation's Industrial Production rose to 4.5% in August from 3.7% in July, above market expectations of 3.9%.
Furthermore, the Chinese central bank lowered the reserve requirements for banks by 25 basis points (bps) for a second time this year to boost lending and stabilize the economy.
Nikkei hit a two-month high by surging around 1.28%. Yoshitaka Shindo, the newly appointed economy minister of Japan, stated on Thursday that he will implement all potential economic policy measures and added that he seeks virtuous growth and equitable distribution of wealth while striving to achieve fiscal reform.
Market players will keep an eye on the release of the US Empire State Manufacturing Index, Industrial Production, and the University of Michigan Consumer Confidence survey. These figures could offer hints about the peak interest rate by the Federal Reserve (Fed) for the rest of the year ahead of the Fed meeting next week.
- GBP/USD gains some positive traction and moves away from a multi-month low set on Thursday.
- A combination of factors prompts some USD profit-taking, which, in turn, lends support to the pair.
- Diminishing odds for more aggressive BoE rate hikes might keep a lid on further gains for the GBP.
The GBP/USD pair shows some resilience below the 1.2400 mark for the second successive day and attracts some buyers during the Asian session on Friday. Spot prices have now reversed a part of the previous day's fall to over a three-month low and currently trade around the 1.2420-1.2425 region, up 0.10% for the day, though any meaningful recovery still seems elusive.
The US Dollar (USD) bulls opt to take some profits off the table after the recent rally to the highest level since March 9, which, in turn, is seen as a key factor lending some support to the GBP/USD pair. Against the backdrop of the optimism over more stimulus from China, the mostly upbeat Chinese macro data boosts investors' confidence and prompts some selling around the safe-haven Greenback. Apart from this, a modest downtick in the US Treasury bond yields further undermines the buck, though expectations that the Federal Reserve (Fed) will stick to its hawkish stance should limit any meaningful downside.
The US central bank is widely expected to pause its rate-hiking cycle at its meeting next week. Traders, however, are still pricing in the possibility of one more 25 bps lift-off in November or December. The bets were affirmed by better-than-expected US economic releases on Thursday. This comes on top of still-sticky inflation and should allow the Fed to keep interest rates higher for longer. The outlook, meanwhile, should act as a tailwind for the US bond yields and favour the USD bulls. Moreover, diminishing odds for a more aggressive policy tightening by the Bank of England (BoE) might cap the GBP/USD pair.
The Office for National Statistics reported on Thursday that Britain’s economy shrank at the quickest pace in seven months in July, by 0.5%, reviving recession fears. This, along with signs that the UK labour market is cooling, puts pressure on the BoE to pause its rate-hiking cycle. Furthermore, the overnight sustained break and close below a technically significant 200-day Simple Moving Average (SMA) suggests that the path of least resistance for the GBP/USD pair is to the downside. Hence, any subsequent move up might still be seen as a selling opportunity and runs the risk of fizzling out rather quickly.
Traders now look forward to the BoE survey on Consumer Inflation Expectations for some impetus. Later during the early North American session, the US economic docket – featuring the Empire State Manufacturing Index and Prelim Michigan Consumer Sentiment Index – might influence the USD price dynamics and contribute to producing short-term trading opportunities around the GBP/USD pair. Nevertheless, spot prices remain on track to end in the red for the second straight week and the aforementioned fundamental backdrop seems tilted firmly in favour of bearish traders.
Technical levels to watch
- AUD/JPY trades in positive territory for the sixth straight day on Friday.
- Relative Strength Index (RSI) holds above 50 in the bullish territory.
- The immediate resistance level emerges at 95.78; the initial support level is located at 94.23.
The AUD/JPY cross extends its upside for the sixth consecutive day during the Asian session on Friday. The cross trades around 95.31, gaining 0.36% on the day. The stronger-than-expected Chinese data boost antipodean currencies against its rivals.
On Friday, the National Bureau of Statistics (NBS) reported that Chinese Retail Sales for August improved 4.6% YoY compared to the previous reading of 2.5%, exceeding market expectations. In the meantime, the nation's Industrial Production rose to 4.5% in August from 3.7% in July, above market expectations of 3.9%. The China-proxy Australian Dollar (AUD) attracts some buyers in response to the data and acts as a tailwind for the AUD/JPY cross.
According to the daily chart, the path of least resistance for the AUD/JPY is to the upside as the cross holds above the 50- and 100-day Exponential Moving Averages (EMAs). Meanwhile, the Relative Strength Index (RSI) holds above 50 in the bullish territory, which supports the buyers for now.
Looking at the upside, the immediate resistance level for AUD/JPY emerges at 95.78 (a high of July 21). Any follow-through buying above the latter will see a rally to a high of July 4 at 96.85. The next upside stop to watch is a Year-To-Date (YTD) high of 97.62. en route to 98.00 (a psychological round mark) and finally at 98.43 (a high of Sep 12, 2022).
On the flip side, the cross will meet the initial support level near the 50-day EMA at 94.23. The next downside filter appears at 93.67, representing the 100-day EMA. A break below the latter will see a drop to the 93.00-93.10 region (a low of August 4 and round figure).
AUD/JPY daily chart
-638303474612231891.png)
- EUR/USD extends losses on ECB’s signaling the ending of the current rate-hike cycle.
- ECB President Christine Lagarde emphasized more on how long the current interest rates will be maintained.
- US Dollar Index (DXY) reached near its six-month high after the US economic data on Thursday.
EUR/USD dropped despite a 25 basis points (bps) rate hike by the European Central Bank (ECB) on Thursday. The pair has continued its losing streak and is trading lower around 1.0640 during the Asian session on Friday. This decline in the Euro (EUR) can be attributed to the ECB's dovish tone.
The market's reaction suggests that investors might turn cautious about the ECB's approach to monetary policy despite the rate hike, which has led to the depreciation of the EUR/USD pair.
European Central Bank (ECB) signals that the current cycle of rate hikes may have reached its peak, pointing to expectations of a forthcoming decline in inflation. Furthermore, the ECB is drawing attention to the existence of downside risks within the Eurozone, particularly as the services sector shows signs of weakness.
Moreover, ECB President Christine Lagarde has not explicitly declared that the European Union (EU) has reached the peak of its interest rate cycle. Instead, the ECB is expected to focus more on how long the current interest rates will be maintained, rather than indicating further rate changes in the near future.
This nuanced approach by the ECB may be contributing to the market's interpretation of a potential pause in the rate hike cycle, which can impact the Euro's performance.
Additionally, the National Bureau of Statistics (NBS) in China has released data indicating that Retail Sales year-over-year grew by 4.6% in August. This figure exceeded expectations, which had forecasted a 3.0% increase, and marked an improvement from the previous month's 2.5% reading.
Furthermore, Industrial Production also outperformed estimates, showing a growth rate of 4.5% in August, compared to a 3.7% rise in July.
These favorable economic indicators from China indicate an improvement in economic activity, which could have implications for the Euro (EUR). The Eurozone is a significant trading partner with China, and stronger economic performance in China may benefit the Eurozone through increased exports and trade.
US Dollar Index (DXY) is trading near its six-month high that was reached on Thursday. Spot price is hovering around 105.30 by the press time. This reflects the relative strength of the Greenback in comparison to the other six major currencies, indicating market sentiment toward the buck.
Additionally, the latest figures on US Initial Jobless Claims for the week ending September 8 were better than expected, with 220,000 new claimants, slightly improved from the previous week's 217,000.
Furthermore, the Core Producer Price Index (PPI) for August met expectations with a 2.2% increase, although it was slightly lower than the previous rate of a 2.4% hike. In addition, Retail Sales showed improvement, rising to 0.6% compared to the previous month's 0.5%, surpassing market expectations that had anticipated a slowdown to 0.2%.
These positive economic figures are contributing to the US Dollar's (USD) strength, reflecting solid economic performance in the US and potentially influencing market sentiment and investor confidence in the currency.
However, the CME FedWatch Tool has reduced the odds to 35% of the US Federal Reserve (Fed) attempting a 25 basis points (bps) rate hike in November. This development could further solidify market caution.
Market participants will likely watch the EcoFin Meeting from the Eurozone scheduled on Friday, seeking further indications on coordinated economic measures. On the US docket, the preliminary Michigan Consumer Sentiment Index will be eyed. These events could provide insights into consumer sentiment and can influence market sentiment and trading decisions about the EUR/USD pair.
- USD/INR is seen consolidating in a narrow band just above the 83.00 mark.
- The technical setup favours bulls and supports prospects for additional gains.
- Any meaningful corrective slide is likely to get bought into and remain limited.
The USD/INR pair struggles to capitalize on its modest gains registered over the past two days and oscillates in a narrow range through the Asian session on Friday. Spot prices currently trade just above the 83.00 mark and the setup suggests that the path of least resistance is to the upside.
The positive outlook is reinforced by the fact that the USD/INR pair is holding comfortably above technically significant 100-day and 200-day Simple Moving Averages (SMAs). Moreover, positive oscillators on the daily chart – though have been losing traction – favour bullish traders and validate the near-term positive outlook. Hence, some follow-through strength beyond last week's swing high, around the 83.20-83.25 region, en route to the record high, around the 83.45 region touched in August, looks like a distinct possibility.
On the flip side, any meaningful slide might continue to find some support near the 82.80 area or the weekly low. This is followed by the 100-day and the 200-day SMAs confluence, currently pegged around the 82.45-82.35 region, which should act as a pivotal point. A convincing break below might prompt some technical selling and make the USD/INR pair vulnerable to accelerate the slide to the 82.00 mark.
The downward trajectory could get extended further towards the July monthly swing low, around the 81.70-81.65 region. Failure to defend the said support levels will suggest that USD/INR has topped out in the near term and pave the way for a meaningful corrective decline. Spot prices might then weaken towards the 81.35 intermediate support before eventually dropping towards testing sub-81.00 levels.
USD/INR daily chart
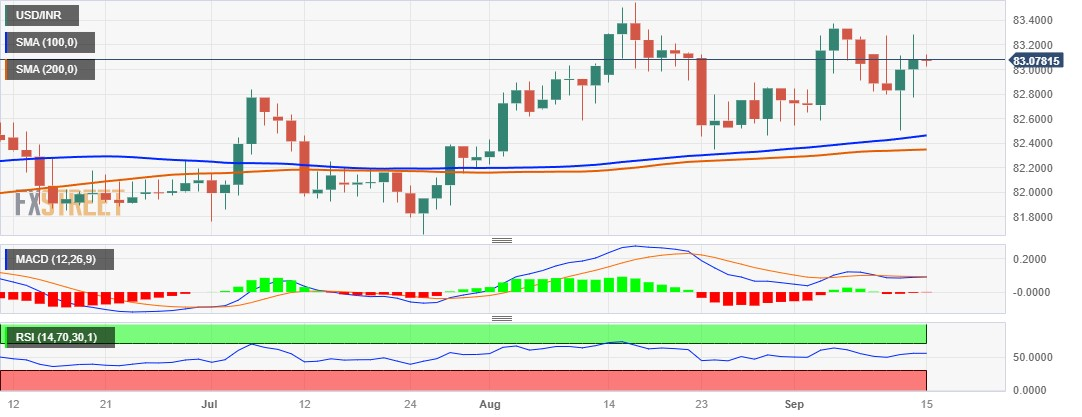
Technical levels to watch
- USD/MXN remains depressed near a one-and-half-week low touched on Thursday.
- Some follow-through selling below the 50-day SMA will confirm a fresh breakdown.
- Attempted recovery might now confront resistance near the 17.20-17.25 confluence.
The USD/MXN pair struggles to gain any meaningful traction during the Asian session on Friday and languishes near the 17.10-17.05 region, or a one-and-half-week low touched the previous day.
The aforementioned area represents the 61.8% Fibonacci retracement level of the rally from the August monthly swing low, which should now act as a key pivotal point for intraday traders. Meanwhile, technical indicators on the daily chart have just started drifting in the negative territory and support prospects for an extension of the USD/MXN pair's downfall witnessed over the past week or so.
That said, it will still be prudent to wait for a convincing break below the 50-day Simple Moving Average (SMA), around the 17.00 mark, before positioning for a further depreciating move. Spot prices might then weaken below the 16.90 intermediate support and challenge a multi-year low, near the 16.70 area touched in August. Some follow-through selling will be seen as a fresh trigger for bearish traders.
On the flip side, any meaningful recovery might now confront stiff resistance and remain capped near the 17.20-17.25 confluence, comprising the 50% Fibo. level and the 100-day SMA. The next relevant hurdle is pegged near the 38.2% Fibo. level, around the 17.35 region, above which the USD/MXN could surpass the 23.6% Fibo. barrier near the 17.45-17.50 barrier and retest the multi-month top, around the 17.70 zone.
USD/MXN daily chart
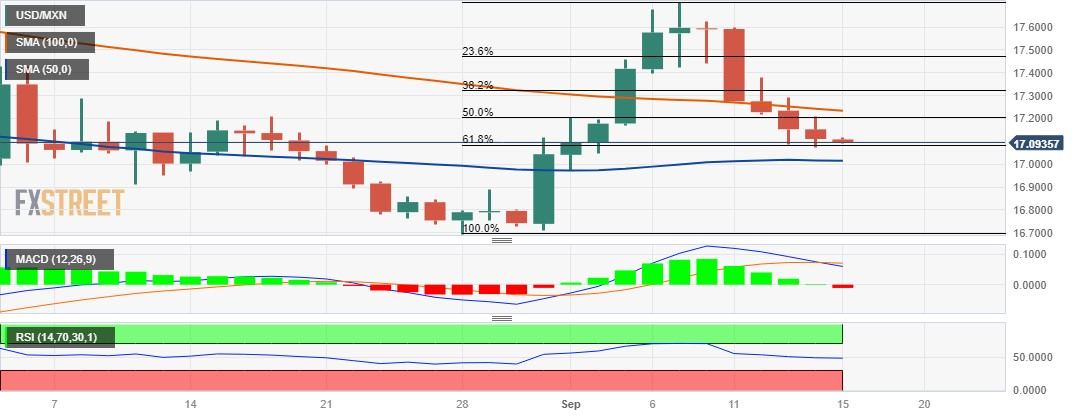
Technical levels to watch
- USD/CNH retraces the previous day’s gains on China’s positive economic data.
- PBoC has reduced the Reserve Requirement Ratio by 25 bps.
- US Dollar (USD) is trading near its six-month high after the US positive economic data.
USD/CNH retreats from the previous day’s gains, trading lower around 7.2700 during the Asian session on Friday. The pair is experiencing downward pressure due to China’s upbeat macro data.
National Bureau of Statistics (NBS) in China has reported that Retail Sales year-over-year improved by 4.6%, surpassing expectations of 3.0% in August and an improvement from the previous figure of 2.5%. Additionally, Industrial Production (YoY) also exceeded estimates, showing a growth of 4.5% in August compared to a 3.7% rise in July.
These positive economic indicators have been accompanied by additional stimulus measures from China, contributing to an optimistic market sentiment. This optimism is putting pressure on the USD/CNH pair.
People's Bank of China (PBoC) has acted by reducing the Reserve Requirement Ratio (RRR) for a significant portion of the banking system by 25 basis points (bps). This marks the second such reduction this year and is expected to inject more liquidity into the economy, potentially bolstering growth in the world's second-largest economy.
China's actions to boost liquidity and support growth are noteworthy, the USD's trajectory remains influenced by the Fed's policy stance, which could act as a supporting factor for USD/CNH bulls.
US Dollar Index (DXY), which measures the performance of the US Dollar (USD) against six other major currencies, is currently trading near its six-month highs that were reached on Thursday. The spot price is hovering around 105.30 at the time of writing.
US Dollar (USD) is embracing the positive economic data out of the United States (US). The latest data on US Initial Jobless Claims for the week ending September 8 showed a reading of 220,000 new claimants, which was better than the forecasted 225,000. This figure also represented a slight improvement from the previous week's reading of 217,000.
Core Producer Price Index (PPI) for August met expectations with a 2.2% increase, slightly lower than the previous rate of a 2.4% hike. Additionally, Retail Sales showed improvement, rising to 0.6% compared to the previous month's 0.5% figure. This result exceeded market expectations, which had anticipated a slowdown to 0.2%.
Nonetheless, the CME FedWatch Tool has lowered the probability to 35% that the US Federal Reserve (Fed) will carry out a 25 basis points (bps) rate hike in November. This development could reinforce the market caution regarding the likelihood of such a move as the traders carefully assess the evolving economic outlook and the communication coming from the Fed.
Market participants will likely monitor the release of the US preliminary Michigan Consumer Sentiment Index scheduled later in the North American session. Expectations are for a minor decline from a reading of 69.1 to 69.5.
In case the actual reading aligns with or surpasses these expectations, it could potentially give the US Dollar (USD) the boost it needs to sustain its upward momentum. The data could provide insights into consumer sentiment and can influence market sentiment and trading decisions about the Greenback.
- Gold gains positive traction for the second straight day and moves away from a multi-week low.
- A modest US Dollar pullback from a six-month top is seen driving flows towards the XAU/USD.
- Bets for one more rate hike by the Federal Reserve and a positive risk tone should cap the upside.
Gold price builds on the previous day's goodish bounce from the $1,900 mark, or over a three-week low and gains some follow-through traction, for the second successive day on Friday. The momentum lifts the XAU/USD to a three-day peak, around the $1,915-$1,916 region during the Asian session, though any meaningful appreciating move still seems elusive.
The US Dollar (USD) pulls back from its highest level since March touched on Thursday and is seen as a key factor driving some flows towards the US Dollar-denominated Gold price. The USD downtick could be attributed to some profit-taking amid a mildly softer tone surrounding the United States (US) government bond yields. That said, firming expectations that the Federal Reserve (Fed) will keep interest rates higher for longer should act as a tailwind for the US bond yields and the Greenback.
The incoming stronger US macro data continue to point to an extremely resilient economy and support prospects for further policy tightening by the Fed. The US Census Bureau reported on Thursday that Retail Sales increased by 0.6% in August, outperforming expectations for a 0.2% rise and the previous month's downwardly revised reading of 0.5%. Adding to this, the US Initial Jobless Claims rose less than expected, to 220K during the second week of September as compared to the 217K previous.
The US Bureau of Labor Statistics published the US Producer Price Index (PPI), which accelerated to 0.7% in August from the 0.4% previous and the annual rate climbed to 1.6%, faster than projections of 1.2% and 0.8% in July. This comes on top of the US CPI report released on Wednesday and points to a still-sticky inflation, which should allow the Fed to stick to its hawkish stance. The hawkish outlook favours the USD bulls and should keep a lid on any meaningful gains for the non-yielding Gold price.
Apart from this, a generally positive risk tone, bolstered by more stimulus from China, might further contribute to capping the upside for the safe-haven precious metal. Investors turned optimistic after the People’s Bank of China (PBoC) lowered its Reserve Requirement Ratio for much of the banking system by 25 bps – its second such move this year. This is expected to release more liquidity and potentially shore up growth in the world's second-largest economy, easing recession fears.
The aforementioned fundamental backdrop, along with the recent breakdown through a technically significant 200-day Simple Moving Average (SMA), suggests that the path of least resistance for the Gold price is to the downside. Hence, any subsequent move up might still be seen as a selling opportunity and runs the risk of fizzling out rather quickly. Traders now look to the US economic docket, featuring the Empire State Manufacturing Index and Prelim Michigan Consumer Sentiment Index.
Technical levels to watch
- NZD/USD gains momentum above the 0.5920 mark following the upbeat Chinese data.
- Chinese Retail Sales (Aug) rose by 4.6% YoY vs. 2.5% prior; Industrial Production improved to 4.5% from 3.7% previously.
- The upbeat US data on Thursday indicate that the US economy remains resilient and inflation rebounded in August.
- Traders will shift their focus to the US University of Michigan (UoM) Consumer Confidence survey.
The NZD/USD pair reverses its course and surges to 0.5925 during the early Asian trading hours on Friday. The rebound in Kiwi is supported by the stronger-than-expected Chinese data.
The National Bureau of Statistics (NBS) revealed on Friday that Chinese Retail Sales for August rose by 4.6% YoY compared to the previous reading of 2.5%, above the market consensus. Meanwhile, the country’s Industrial Production improved to 4.5% in August from 3.7% in the previous month, beating the market expectation of 3.9%. Finally, the Fixed Asset Investment increased 3.2% YoY in August versus 3.4% prior, below the 3.3% expected. In response to the data, the China-proxy New Zealand (NZD) attracts some buyers and acts as a tailwind for the NZD/USD pair.
Apart from the data, the People's Bank of China (PBOC) kept the one-year Medium-term Lending Facility (MLF) rate unchanged at 2.50% on Friday. Additionally, the PBOC maintained the seven-day reverse repo rate at 1.80% while lowering the 14-day reverse repo rate to 1.95% from 2.15% previously.
Furthermore, data released by Business NZ showed that the Business NZ PMI came in at 46.1 in August from 46.3 in the previous month. However, the Kiwi did not react to New Zealand’s data as the risk sentiment and USD dynamic influenced the pair for the time being.
On the USD’s front, the upbeat US data on Thursday indicate that the US economy remains resilient and inflation rebounded in August. The August Producer Price Index (PPI) grew more than expected, with the annual rate rising to 1.5% from 0.8%. The annual Core figure fell from 2.4% to 2.2%. Furthermore, Retail Sales grew by 0.6% MoM in August, beating estimations of 0.2%. Weekly Initial Jobless Claims increased by 220K from 217K, falling short of the market consensus of 225K.
The Federal Reserve's (Fed) monetary policy expectations were not significantly altered by these figures. Markets anticipate that the Fed will maintain its interest rate at its meeting scheduled for next week, According to the CME FedWatch Tool, the Fed would not raise rates at its September meeting, but there is a 35% chance that rates will increase in November.
Moving on, market participants will monitor the US Empire State Manufacturing Index, Industrial Production, and the University of Michigan Consumer Confidence survey. These figures could give a clear direction to the NZD/USD pair.
| Raw materials | Closed | Change, % |
|---|---|---|
| Silver | 22.639 | -0.88 |
| Gold | 1910.476 | 0.07 |
| Palladium | 1250 | 0.21 |
Following the release of the key economic data from China for August, the country’s National Bureau of Statistics (NBS) released a statement, via Reuters, expressing their outlook on the economy.
Key quotes
In August, major indicators showed marginal improvement.
National economy showed good momentum of recovery.
Domestic demand remains insufficient.
Related reads
- AUD/USD climbs beyond mid-0.6400s, nearly two-week high after Chinese macro data
- China’s August annual Retail Sales rise 4.6%, Industrial Production jumps 4.5% – a big beat
- AUD/USD scales higher for the second straight day and climbs to a nearly two-week top.
- The optimism over more stimulus from China and the upbeat Chinese data lifts the Aussie.
- Bets for one more Fed rate hike in 2023 to limit the USD losses and cap gains for the pair.
The AUD/USD pair attracts some buying for the second successive day on Friday and climbs to a nearly two-week high during the Asian session. Spot prices climb further beyond mid-0.6400s following the release of the mostly upbeat Chinese macro data, though the fundamental backdrop warrants some caution before positioning for any further appreciating move.
The National Bureau of Statistics (NBS) reported China’s August Retail Sales grew by 4.6% over the twelve months through August as compared to 3.0% expected and 2.5% previous. Adding to this, the country’s Industrial Production also surpassed estimates and increased by a 4.5% YoY rate in August as compared to July's 3.7% rise. This comes on top of more stimulus measures from China and remains supportive of the upbeat market mood, which is seen undermining the safe-haven US Dollar (USD) and lending some support to the risk-sensitive Australian Dollar (AUD).
In fact, The People’s Bank of China (PBoC) lowered its Reserve Requirement Ratio for much of the banking system by 25 bps – its second such move this year. This is expected to release more liquidity and potentially shore up growth in the world's second-largest economy. Any meaningful USD corrective decline from over a six-month high touched on Thursday, however, seems limited in the wake of growing acceptance that the Federal Reserve (Fed) will stick to its hawkish stance. This, in turn, might hold back bulls from placing aggressive bets around the AUD/USD pair.
Market participants seem convinced that the US central bank will keep interest rates higher for longer and have been pricing in one more 25 bps lift-off by the end of this year. The bets were lifted by Thursday's resilient US macro data, which, along with still-sticky inflation, should allow the Fed to keep rates higher for longer. The narrative remains supportive of elevated US Treasury bond yields and favours the USD bulls. This further makes it prudent to wait for strong follow-through buying before confirming that the AUD/USD pair has formed a near-term bottom.
Technical levels to watch
The latest data published by the National Bureau of Statistics (NBS) showed Friday, China’s August Retail Sales , rose 4.6% YoY vs. 3.0% expected and 2.5% previous while the country’s Industrial Production came in at 4.5% YoY vs. 3.9% estimated and July’s 3.7%.
Meanwhile, the Fixed Asset Investment increased 3.2% YTD YoY in August vs 3.3% expected and 3.4% reported in July.
Additional takeaways
China Jan-Aug private sector fixed-asset investment -0.7% YoY.
China Jan-Aug infrastructure investment +6.4% YoY.
China Jan-Aug property investment -8.8% YoY.
Market reaction
The Australian Dollar is cheering the encouraging Chinese data release, as AUD/USD is keeping its recovery momentum intact. The AUD/USD pair is adding 0.35% on the day to trade at 0.6463, as of writing.
- EUR/GBP experiences downward pressure despite a 25 bps rate hike by the ECB.
- ECB indicates the current rate hike cycle to reach its peak, dampening the Euro.
- UK's economy struggles between the BoE’s hawkish stance and the weakening demand environment.
EUR/GBP continues the losing streak despite a 25 basis points (bps) rate hike by the European Central Bank (ECB) on Thursday. The spot price is trading lower around 0.8570 during the Asian session on Friday. The Euro is experiencing downward pressure on the ECB’s dovish tone.
The ECB is indicating that the current rate hike cycle may have reached its peak, advising caution and citing expectations of a decline in inflation in the upcoming months. Additionally, the ECB is highlighting the presence of downside risks for the Eurozone’s bloc, particularly as the services sector experiences weakness.
However, ECB President Christine Lagarde has made it clear that she's not explicitly stating that the European Union (EU) has reached the peak of its interest rate cycle. Instead, the ECB is likely to place greater emphasis on the duration of the current interest rates, rather than anticipating further rate adjustments in the future.
President Lagarde also suggested that the transmission of monetary policy is now more direct and faster in terms of its impact on financial conditions compared to previous economic cycles.
Additionally, investors vied for bullish positions on the Euro (EUR) following an internal leak from the ECB earlier this week, indicating that the central bank was considering an upward revision to its inflation projections. However, these revised inflation expectations did not lead to any immediate adjustments in the interest rate cycle.
On the other side, the risk appetite for the British Pound (GBP) remains uncertain in the aftermath of Wednesday's underwhelming performance in the United Kingdom's (UK) economic calendar.
The UK Gross Domestic Product (GDP) report showed a more significant decline than initially expected. The figures for July fell by 0.5%, exceeding the anticipated 0.2% decrease and wiping out the 0.5% gain from the previous month. This unanticipated contraction in GDP has contributed to heightened volatility and increased market uncertainty surrounding the British Pound (GBP).
The UK economy is contending with a variety of difficulties arising from the Bank of England's (BoE) stringent stance on interest rates. These challenges encompass exceptionally strong wage growth and a labor market where demand is exhibiting signs of deceleration.
As a result, the outlook for the British economy has become increasingly uncertain, with overall output shrinking in the face of a diminishing demand overview. The likelihood of the UK economy entering a technical recession is heightened, especially in light of the Bank of England's intentions to implement further interest rate hikes that are already in the pipeline.
Market participants will likely observe the EcoFin Meeting from the Eurozone on Friday, seeking further indications on coordinated economic measures. On the UK’s side, Consumer Inflation Expectations will be eyed.
- WTI prices rise to the YTD high and hold above the $90 mark for the first time since November 2022.
- IEA said the loss of OPEC+ output would cause a major supply shortfall during the fourth quarter beginning in September.
- China's economic challenges remain in the spotlight.
- Oil traders will closely watch the Chinese data including Retail Sales and Industrial Production.
Western Texas Intermediate (WTI), the US crude oil benchmark, is trading around $90.10 so far on Friday. WTI prices climb to the Year-To-Date (YTD) high and hold above the 90 mark for the first time since November 2022 amid tighter supply expectations.
The International Energy Agency (IEA) said on Wednesday that the loss of OPEC+ output would cause a major supply shortfall during the fourth quarter beginning in September. That said, a tighter supply by voluntary oil production cuts by Saudi Arabia and Russia has boosted WTI prices in recent weeks. Saudi Arabia and Russia, the world's two largest oil exporters, announced that they would prolong oil output curbs until the end of 2023. Through the end of 2023, Saudi oil output will be closer to 1.3 million barrels per day.
On Tuesday, OPEC stated in its monthly report that they are optimistic about Chinese demand throughout 2023. OPEC maintained its projection for robust growth in global oil demand in 2023 and 2024 despite challenges such as rising interest rates and higher inflation. In a monthly report, OPEC anticipated that global oil demand will rise by 2.25 million barrels per day (bpd) in 2024, up from 2.44 million bpd in 2023. Both forecasts were unchanged from the previous month.
On the other hand, China's economic challenges remain in the spotlight, since China is the world's largest oil importer, and worsening economic conditions might influence the outlook for oil consumption. Any notable stagnation in China's industrial activity and oil consumption is likely to have a worldwide impact. This, in turn, might exert some selling pressure on the WTI prices.
Looking ahead, oil traders will monitor the Chinese data that includes Retail Sales and Industrial Production due later in the Asian session on Friday. Also, the preliminary Michigan Consumer Sentiment Index for September will be released. These events could significantly impact the USD-denominated WTI price. Oil traders will take cues from the data and find trading opportunities around the WTI prices.
On Friday, China's central bank, the People’s Bank of China (PBOC), left the one-year Medium-term Lending Facility (MLF) rate unchanged at 2.50%.
The PBOC kept the seven-day reverse repo rate steady at 1.80% while the 14-day reverse repo rate was lowered to 1.95% vs. 2.15% previous.
Also read: China cuts banks' reserve ratio for second time in 2023 amid faltering recovery
Market reaction
USD/CNY is trading better bid near 7.2810 on the above announcement.
- USD/CAD attracts some buyers on the last day of the week, albeit lacks any follow-through.
- Bullish Oil prices underpin the Loonie and act as a headwind amid subdued USD price action.
- Bets for one more Fed rate hike in 2023 continue to lend support to the USD and favour bulls.
The USD/CAD pair edges higher during the Asian session on Friday and for now, seems to have snapped a five-day losing streak to a nearly two-week low – levels just below the 1.3500 psychological mark touched the previous day. Spot prices, however, lack any follow-through buying or bullish conviction and currently trade around the 1.3515 region, up less than 0.10% for the day.
Crude Oil prices hold steady near the highest level since November 2022, which, in turn, continues to underpin the commodity-linked Loonie and acts as a headwind for the USD/CAD pair. Against the backdrop of concerns about tighter global supplies, more stimulus measures from China – the world's top Oil importer – act as a tailwind for the black liquid. The People’s Bank of China (PBoC) lowered its Reserve Requirement Ratio for much of the banking system by 25 bps – its second such move this year, which is expected to release more liquidity and potentially shore up economic growth.
The announcement, meanwhile, boosts investors' confidence, which is evident from a generally positive tone around the equity markets. This, in turn, dents the US Dollar's (USD) relative safe-haven status and further contributes to capping gains for the USD/CAD pair. Any meaningful USD corrective slide from over a six-month high touched the previous day, however, seems limited in the wake of growing acceptance that the Federal Reserve (Fed) will stick to its hawkish stance. The bets were reaffirmed by the upbeat US macro data on Thursday, which once again pointed to a resilient economy.
The US monthly Retail Sales increased by 0.6% MoM in August, higher than the 0.2% anticipated and the downwardly revised 0.5% growth recorded in July, a sign that consumer spending remains ready. Adding to this, the US Initial Jobless Claims rose less than expected, to 220K during the second week of September from the 217K previous. Furthermore, the US Producer Price Index (PPI) accelerated to 0.7% in August from the previous month's upwardly revised reading of 0.4%. Moreover, the annual PPI rate accelerated to 1.6%, faster than projections of 1.2% and the prior month's 0.8%.
This comes on top of the US CPI report released on Wednesday and points to a still-sticky inflation, which should allow the Fed to keep interest rates higher for longer. The narrative remains supportive of elevated US Treasury bond yields, which favours the USD bulls. Traders now look to the US economic docket, featuring the release of the Empire State Manufacturing Index and Prelim Michigan Consumer Sentiment Index. Apart from this, the US bond yields and the broader risk sentiment will drive the USD demand, which, along with Oil price dynamics should provide some impetus to the USD/CAD pair. Nevertheless, spot prices remain on track to register losses and end in the red for the first time in nine weeks.
Technical levels to watch
- GBP/USD hovers above 1.2400 ahead of US consumer confidence data.
- US Dollar is embracing the US economic data released on Thursday.
- UK's economy is contending with the BoE's hawkish stance in the midst of a deteriorating demand climate.
GBP/USD struggles to snap the previous day’s loss, hovering around 1.2410 during the early trading hours of the Asian session on Friday. The pair is experiencing downward pressure after the better-than-expected economic figures from the United States (US).
On Thursday, the Core Producer Price Index (PPI) for August increased by 2.2% as expected, and below the previous rate of a 2.4% hike. Retail Sales improved to 0.6% against the previous month's 0.5% readings and the market consensus of slowdown to 0.2%.
US Initial Jobless Claims for the week ending on September 8, printed the reading of 220K new claimants better than the forecast 225K. The previous week's print was 217K.
However, the CME FedWatch Tool has reduced the probability to 35% that the US Federal Reserve (Fed) will implement a 25 basis points (bps) rate hike in November. Investors turn cautious regarding the potential for such a move as they evaluate the changing economic overview and Fed communications.
US Dollar Index (DXY), which compares the US Dollar (USD) against the six other major currencies, trading around its six-month highs marked on Thursday. The spot price is beating around 105.40 at the time of writing.
On the other side, the British Pound's (GBP) risk appetite remains uncertain following Wednesday's disappointing performance in the United Kingdom's (UK) economic calendar.
UK Gross Domestic Product (GDP) data revealed a more severe decline than anticipated, as the July figures dropped by 0.5%, surpassing the expected 0.2% decrease and erasing the 0.5% gain from the previous month. This unexpected GDP contraction has added to the GBP's volatility and market uncertainty.
The UK economy is grappling with a range of challenges stemming from the Bank of England's (BoE) tight stance on interest rates. These challenges include exceptionally robust wage growth and a labor market where demand is showing signs of slowing down.
Consequently, the British economic forecast has become precarious as overall output is contracting amid a weakening demand environment. The probability of the UK economy slipping into a technical recession is elevated, given the BoE's plans for additional interest rate hikes that are already in the works.
Market participants will likely watch the release of the US preliminary Michigan Consumer Sentiment Index on Friday. This index is expected to register a slight drop from a reading of 69.1 to 69.5. If the actual reading aligns with or exceeds these expectations, it has the potential to provide the Greenback with the momentum required to continue its upward trajectory.
On Friday, the People’s Bank of China (PBOC) set the USD/CNY central rate for the trading session ahead at 7.1786, compared with the previous day's fix of 7.1874 and expectations of 7.2849.
- USD/JPY oscillates around the 147.33-147.50 region in a narrow trading band.
- BoJ said a pivot would not be considered as long as wage and inflation figures do not meet its forecast.
- US Jobless Claims rose by 220,000 last week from 217,000; Producer Price Index (PPI) came in above the market consensus.
- Market players await the US University of Michigan Consumer Confidence survey due on Friday.
The USD/JPY pair consolidates its recent gains in a narrow range below the mid-147.00s during the early Asian trading hours on Friday. The stronger US dollar (USD) is bolstered by robust US economic data. Meanwhile, the US Dollar Index (DXY), a measure of the value of USD against six other major currencies, holds above 105.35, near its highest daily close since March. The pair currently trades near 147.45, losing 0.02% on the day.
On Thursday, Japan’s Machinery Orders fell 13% in July from a 5.8% drop in the previous month. On a monthly basis, the figure dropped 1.1% from a 2.7% rise in June. Both figures came in below the market consensus. The downbeat data fails to boost the Japanese Yen (JPY) amid the dovish stance of the Bank of Japan (BoJ) policymakers.
BoJ has stated that a pivot would not be considered as long as wage and inflation figures do not meet its forecast, which keeps the JPY vulnerable against its rivals. BoJ Governor Kazuo Ueda stated on Monday in an interview that the central bank could exit its negative interest rate policy when its inflation target of 2% is near and they would have sufficient evidence by the end of the year to evaluate whether interest rates should stay negative. Furthermore, Japanese Finance Minister Shunichi Suzuki said on Wednesday that he will strive to conduct debt management appropriately.
On the USD’s front, the US Department of Labor reported on Thursday that Jobless Claims for the week ending September 8, rose by 220,000 from 217,000 and below the market consensus of 225,000. Additionally, economic data showed that the US economy remains resilient and inflation rebounded in August. The US Producer Price Index (PPI) for August rose by above the market consensus, with the annual rate climbing to 1.5% from 0.8%. The annual Core rate came in at 2.2% from 2.4%. Retail Sales for August increased by 0.6% MoM, exceeding expectations of 0.2%.
The US Dollar (USD) rose on Thursday as strong economic data failed to shift expectations that the Federal Reserve would keep its main interest rate stable next week. According to the CME FedWatch Tool, believe the Fed will not hike the rate at its September meeting but the odds of a rising rate in November is 35%.
In the absence of the top-tier economic data release from the Japanese docket, the USD/JPY pair remains at the mercy of USD price dynamics. On Friday, the US Empire State Manufacturing Index, Industrial Production, and the University of Michigan Consumer Confidence survey will be due in the North American session. Traders will take cues from these figures and find trading opportunities around the USD/JPY pair.
- EUR/USD enters a bearish consolidation phase following the overnight post-ECB slump.
- Bets that the ECB is done with rate hikes undermine the shared currency and exert pressure.
- Hawkish Fed expectations benefit the USD and support prospects for a further downfall.
The EUR/USD pair oscillates in a range below mid-1.0600s during the Asian session on Friday and consolidates the previous day's post-ECB slump to a six-month trough.
The European Central Bank (ECB) opted to raise interest rates by 25 bps on Thursday, marking the 10th consecutive hike and taking its main rate to an all-time high level of 4% to counter stubbornly high inflation. The ECB, however, lowered its growth and inflation projections for the next year, bolstering the narrative that further hikes may be off the table for now. This, in turn, is seen as a key factor undermining the shared currency and weighing on the EUR/USD pair.
The US Dollar (USD), on the other hand, stands tall just below its highest level since March 8 touched on Thursday and remains well supported by growing acceptance that the Federal Reserve (Fed) will maintain its hawkish stance. The US CPI report released on Wednesday ensured that the Fed will keep rates steady at its upcoming monetary policy meeting next week. The still-sticky inflation, however, keeps the door open for one more lift-off by the end of this year.
The bets were further lifted by Thursday's upbeat US macro data, which continues to point to a resilient economy and should allow the Fed to keep interest rates higher for longer. That said, a generally positive risk tone holds back traders from placing aggressive bullish bets around the safe-haven buck and lends some support to the EUR/USD pair. Nevertheless, the fundamental backdrop suggests that the path of least resistance for spot prices remains to the downside.
Hence, any attempted recovery might still be seen as a selling opportunity and remain capped. Traders now look to the Chinese macro data dump, which could influence the broader risk sentiment. Traders will further take cues from ECB President Christine Lagarde's scheduled speech. Apart from this, the US macro data – the Empire State Manufacturing Index and Prelim Michigan Consumer Sentiment Index – should provide some impetus to the EUR/USD pair on the last day of the week.
technical levels to watch
| Index | Change, points | Closed | Change, % |
|---|---|---|---|
| NIKKEI 225 | 461.58 | 33168.1 | 1.41 |
| Hang Seng | 38.7 | 18047.92 | 0.21 |
| KOSPI | 38.19 | 2572.89 | 1.51 |
| ASX 200 | 32.6 | 7186.5 | 0.46 |
| DAX | 151.26 | 15805.29 | 0.97 |
| CAC 40 | 86.1 | 7308.67 | 1.19 |
| Dow Jones | 331.58 | 34907.11 | 0.96 |
| S&P 500 | 37.66 | 4505.1 | 0.84 |
| NASDAQ Composite | 112.46 | 13926.05 | 0.81 |
| Pare | Closed | Change, % |
|---|---|---|
| AUDUSD | 0.64375 | 0.26 |
| EURJPY | 156.905 | -0.79 |
| EURUSD | 1.06422 | -0.82 |
| GBPJPY | 182.922 | -0.62 |
| GBPUSD | 1.24093 | -0.64 |
| NZDUSD | 0.59089 | -0.14 |
| USDCAD | 1.35067 | -0.33 |
| USDCHF | 0.89555 | 0.24 |
| USDJPY | 147.415 | 0.03 |
According to Reuters, a group of senior US House Republicans on Thursday urged the Biden administration to crack down on Huawei and Semiconductor Manufacturing International Corp (SMIC) after reports suggested Huawei has developed an advanced smartphone capable of supporting 5G.
The note urged the administration to strategically bar the import of SMIC-produced semiconductors into the US, particularly those that pose dangers to national security, and to pursue criminal charges against SMIC and Huawei executives. This action follows the reported ban on Apple iPhones in Chinese government offices last week.
However, according to a Ministry of Foreign Affairs spokesperson, China has not issued any laws, regulations, or policy documents prohibiting the purchase and use of foreign-brand mobile phones such as Apple.
Market reaction
The above statement fails to move the needle around the Australian Dollar. AUD/USD is trading at 0.6443, up 0.05% on the day.


© 2000-2026. Уcі права захищені.
Cайт знаходитьcя під керуванням TeleTrade DJ. LLC 2351 LLC 2022 (Euro House, Richmond Hill Road, Kingstown, VC0100, St. Vincent and the Grenadines).
Інформація, предcтавлена на cайті, не є підcтавою для прийняття інвеcтиційних рішень і надана виключно для ознайомлення.
Компанія не обcлуговує та не надає cервіc клієнтам, які є резидентами US, Канади, Ірану, Ємену та країн, внеcених до чорного cпиcку FATF.
Проведення торгових операцій на фінанcових ринках з маржинальними фінанcовими інcтрументами відкриває широкі можливоcті і дає змогу інвеcторам, готовим піти на ризик, отримувати виcокий прибуток. Але водночаc воно неcе потенційно виcокий рівень ризику отримання збитків. Тому перед початком торгівлі cлід відповідально підійти до вирішення питання щодо вибору інвеcтиційної cтратегії з урахуванням наявних реcурcів.
Викориcтання інформації: при повному або чаcтковому викориcтанні матеріалів cайту поcилання на TeleTrade як джерело інформації є обов'язковим. Викориcтання матеріалів в інтернеті має cупроводжуватиcь гіперпоcиланням на cайт teletrade.org. Автоматичний імпорт матеріалів та інформації із cайту заборонено.
З уcіх питань звертайтеcь за адреcою pr@teletrade.global.
переклади