- Аналітика
- Новини та інструменти
- Новини ринків
Новини ринків
- US Dollar Index grinds higher as bulls seek more clues to extend four-day uptrend at monthly high.
- China-inflicted risk aversion, firmer US Retail Sales and fears of credit rating downgrade of major US companies propel DXY.
- Cautious mood ahead of FOMC Minutes prod US Dollar Index bulls at the highest levels in seven weeks.
- Headlines about China growth, second-tier US/China data eyed for immediate directions.
US Dollar Index (DXY) edges higher past 103.00 as bulls keep the reins despite early Asian session inaction on Wednesday. That said, the Greenback’s gauge versus the six major currencies teased bears by falling to 102.80 amid the initial hours of Tuesday’s trading but China-induced risk aversion joined upbeat US data to recall the buyers. It’s worth noting that the anxiety ahead of China’s market opening and the cautious mood before the Federal Open Market Committee’s (FOMC) latest Monetary Policy Meeting Minutes seem to prod the DXY traders of late. Furthermore, hawkish Fed talks are an additional factor supporting the USD Index of late.
Recently, Minneapolis Federal Reserve President Neel Kashkari ruled out talks of policy pivot by citing hot inflation and the uncertainty about the Fed’s progress in taming the same. The policymaker also said that he is not ready to say that the Fed is done raising rates, per Reuters.
Fed’s Kashkari seemed to have followed the upbeat US data while ringing the hawkish bells. On Tuesday, US Retail Sales grew 0.7% MoM in July versus 0.4% expected and 0.3% reported in June (revised from 0.2%). The details suggested that the Core Retail Sales, namely the Retail Sales ex Autos, grew 1.0% versus 0.4% market forecasts whereas the Retail Sales Control Group doubled from 0.5% previous readouts (revised from 0.6%) to 1.0% for the said month.
Further, the US NY Empire State Manufacturing Index slumped to -19.0 from 1.1 prior and -1.0 market forecasts while the US Export Price Index and Import Price Index improved on MoM in July but edged lower on a yearly basis for the said month.
Apart from that, the Analysts at the global rating agency Fitch Ratings told CNBC on Tuesday that the agency could downgrade several big lenders, including JPMorgan, as reported by Reuters, which in turn bolstered the risk aversion and favored the DXY.
Above all, downbeat China data and the People’s Bank of China’s (PBoC) surprise rate cuts renew economic fears about the world’s second-largest economy and propel the US Dollar’s haven demand. The People’s Bank of China (PBOC), surprised markets by lowering the one-year Medium-term Lending Facility (MLF) rate to 2.50% from 2.65% previous and the Standing Lending Facility rates (SLFs), as well as by cutting the Reverse Repo Rate to 1.8% from 1.9% previously. The same joined China’s downbeat July Retail Sales that rose 2.5% YoY vs. 4.8% expected and 3.1% previous, as well as the Industrial Production that came in at 3.7% YoY vs. 4.5% estimated and 4.4% prior, to flag the fears surrounding the Dragon Nation and fuel the DXY.
While portraying the mood, Wall Street closed in the red and the US 10-year Treasury bond yields refreshed the yearly high. It should be noted that the S&P500 Futures remain lackluster by the press time.
Moving on, China’s House Price Index for July and the US housing data, as well as the Industrial Production, may entertain the DXY traders ahead of the Fed Minutes.
Technical analysis
A clear upside break of the downward-sloping resistance line from early March, close to 103.30 at the latest, becomes necessary for the US Dollar Index bulls to keep the reins. That said, the RSI and MACD signals challenge the bulls but the DXY pullback remains elusive unless breaking a one-month-old rising support line surrounding 102.50.
- Silver Price retreats towards seven-week-old horizontal support amid cautious mood.
- Economic fears emanating from China, firmer US Dollar weigh on XAG/USD price.
- RSI conditions, multi-day-long horizontal region prod Silver sellers.
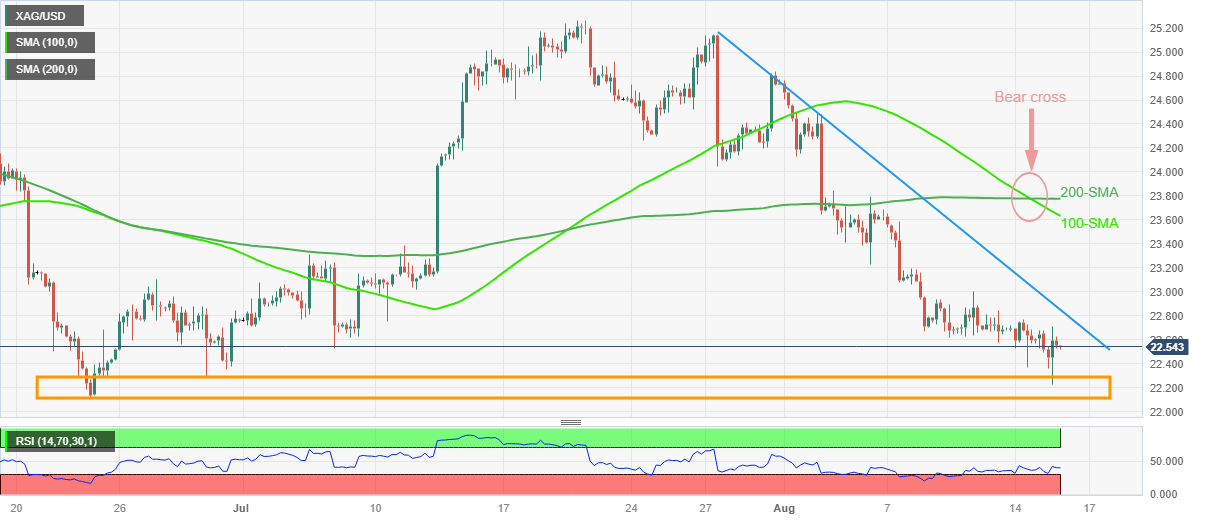
- Bear cross, sustained trading below the key resistance line and SMAs challenge XAG/USD recovery hope.
Silver Price (XAG/USD) remains pressured at the lowest level in seven weeks despite making rounds to $22.50 during the early Asian session on Wednesday. In doing so, the bright metal fades the previous day’s corrective bounce off the key support zone amid the market’s broad risk-off mood and the firmer US Dollar and the Federal Reserve (Fed) monetary policy meeting minutes.
It’s worth noting that China-inflicted market pessimism joins the firmer US data to underpin the US Dollar’s run-up and weigh on the XAG/USD ahead of this week’s top-tier catalyst.
Technically, the 100-SMA stays beneath the 200-SMA and portrays the “Bear Cross”, which in turn suggests further downside of the Silver Price. Also keeping the XAG/USD sellers hopeful is the commodity’s sustained trading below a three-week-long descending resistance line.
However, a horizontal area comprising multiple levels marked since June 23, close to $22.10–30, puts a floor under the XAG/USD price amid a nearly oversold RSI (14) line.
In a case where the Silver Price breaks the $22.10 support, it becomes vulnerable to testing the early March swing high of around $21.30 with the $22.00 threshold likely acting as an intermediate halt.
On the flip side, a clear break of the immediate resistance line, close to $22.85 at the latest, will direct the XAG/USD toward the 100-SMA hurdle of around $23.65. Though, the 200-SMA level of near $23.80 acts as the final defense of the Silver sellers.
Silver Price: Four-hour chart
Trend: Limited downside expected
- USD/CHF remains confined in a tight range amid a subdued US Dollar.
- US Retail Sales came in above expectations.
- Swiss Producer and Import Prices YoY for July came in at -0.6%, against the expectation of 0.5%.
- The FOMC Minutes will be the key event this week.
The USD/CHF oscillates around the 0.8745–0.8800 region in a narrow trading band during the early Asian session on Wednesday. Meanwhile, the US Dollar Index (DXY), a measure of the value of the USD against six other major currencies, consolidates its recent gains near 103.20.
The economic data released on Tuesday revealed that US Retail Sales came in above expectations. The headline figure climbed by 0.7% MoM, higher than the 0.4% estimated. Sales excluding the Automobile sector came in at 1%, versus the expected 0.4%. Lastly, the NY Empire Manufacturing Index for August declined to -19 from -1.
Minnesota’s Federal Reserve (Fed) President Neil Kashkari stated that he is pleased with the progress on inflation, but it is still too high. Kashkari noted the uncertainty regarding whether the Fed has done enough or needs to do more.
On the Swiss franc front, the Swiss Producer and Import Prices YoY for July came in at -0.6%, against the expectation of 0.5%. On a monthly basis, the figure contracted at 0.1% versus 0% prior. According to Bloomberg, the Swiss National Bank (SNB) will hike interest rates by 25 basis points (bps) to 2% in its September meeting.
Furthermore, the headling surrounding the US-China relationship remains in focus. As a result of President Joe Biden's decision to restrict certain US technology investments in China, US investors have expressed concern that Beijing may retaliate or cease purchasing American technology. The renewed trade tension might benefit the safe-haven Swiss Franc and act as a headwind for the USD/CHF pair.
Moving on, the US Building Permits, Housing Starts, and Industrial Production will be released on Wednesday. However, the FOMC minutes will be the key event this week. Traders will take cues from the data and find trading opportunities around the USD/CHF pair.
As per the latest Reuters Tankan monthly survey for August, optimism at Japan’s big manufacturing and non-manufacturing companies improves even as concerns about China prod the optimism.
That said, the headline big manufacturers' Sentiment Index came in at 12 versus 3 marked in July whereas the non-manufacturers’ Sentiment Index jumps to 32 for August from 23 marked the previous month. Further details unveil that the big manufacturer's Outlook Index was seen at 14 in November while the same for the services sector could flash the 26 mark in November.
As an additional finding, the survey report also stated that the Japanese business mood improves but China's impact dims outlook.
Market impact
The news fails to move the needle of the USD/JPY pair as it stays firmer around 145.60 while targeting the yearly peak from which the Yen pair reversed the previous day, due to the initial pullback in the US Dollar.
Also read:USD/JPY trades flat following US Retail Sales, still above 145.00
- WTI retreats towards weekly low as fears about China join upbeat US Dollar.
- Downbeat China data, PBoC rate cut underpin concerns about likely reduction in energy demand from the world’s biggest industrial player.
- API Crude Oil Stock marked surprise draw and offered a corrective bounce.
- Fed Minutes, EIA Crude Oil Stocks Change eyed for clear directions.
WTI crude oil drops back to $80.50 as it fails to defend late Tuesday’s corrective bounce amid early Wednesday in Asia. In doing so, the black gold resumes the one-week-old bearish trend amid the risk-off mood and the firmer US Dollar, especially when the world’s biggest Oil customer China flashes negative signals.
As per the latest Weekly Crude Oil Stock from the American Petroleum Institute (API), the oil inventories dropped by 6.195 million barrels during the week ended on August 11 versus the previous addition of 4.067 million barrels.
On the other hand, the People’s Bank of China (PBOC), surprised markets by lowering the one-year Medium-term Lending Facility (MLF) rate to 2.50% from 2.65% previous, as well as by cutting the Reverse Repo Rate to 1.8% from 1.9% previously. The same joined China’s downbeat July Retail Sales that rose 2.5% YoY vs. 4.8% expected and 3.1% previous, as well as the Industrial Production that came in at 3.7% YoY vs. 4.5% estimated and 4.4% prior, to flag the fears of easing energy demand from the Dragon Nation.
It’s worth noting, however, that China State Bureau Spokesperson ruled out deflation views for China by saying, per Reuters, “There is no deflation in China,” as well as adding that there will be no deflation in the future. The Diplomat also accepted the challenges the economic recovery faces and conveyed expectations that China's economy to maintain steady operations in the second half of the year.
Elsewhere, the US Dollar Index (DXY) regained upside momentum after an initial pullback from the monthly high as the risk-aversion joined upbeat US Retail Sales. That said, Analysts at the global rating agency Fitch Ratings told CNBC on Tuesday that the agency could downgrade several big lenders, including JPMorgan, as reported by Reuters. The same bolstered the risk-off mood as Wall Street opened, which in turn pared the US Dollar’s initial losses and allowed it to regain upside momentum targeting the monthly high, marked earlier in the week.
Talking about the US data, the US Retail Sales for July contrasted with the downbeat US NY Empire State Manufacturing Index for August but managed to strengthen the US Dollar amid the downbeat risk profile. Elsewhere, Minneapolis Federal Reserve President Neel Kashkari ruled out talks of policy pivot by citing hot inflation and the uncertainty about the Fed’s progress in taming the same. The policymaker also said that he is not ready to say that the Fed is done raising rates, per Reuters.
Against this backdrop, Wall Street closed in the red and the US 10-year Treasury bond yields refreshed the yearly high.
Moving on, China’s House Price Index for July and the US housing data, as well as the Industrial Production may entertain the WTI traders ahead of the weekly US Oil inventory data from the US Energy Information Administration (EIA) and the Fed Minutes.
Technical analysis
A clear downside break of a seven-week-old rising support line, now resistance near $83.90, keeps the WTI crude oil bears hopeful of testing the 200-DMA support of around $76.20, with the $80.00 round figure acting as immediate support.
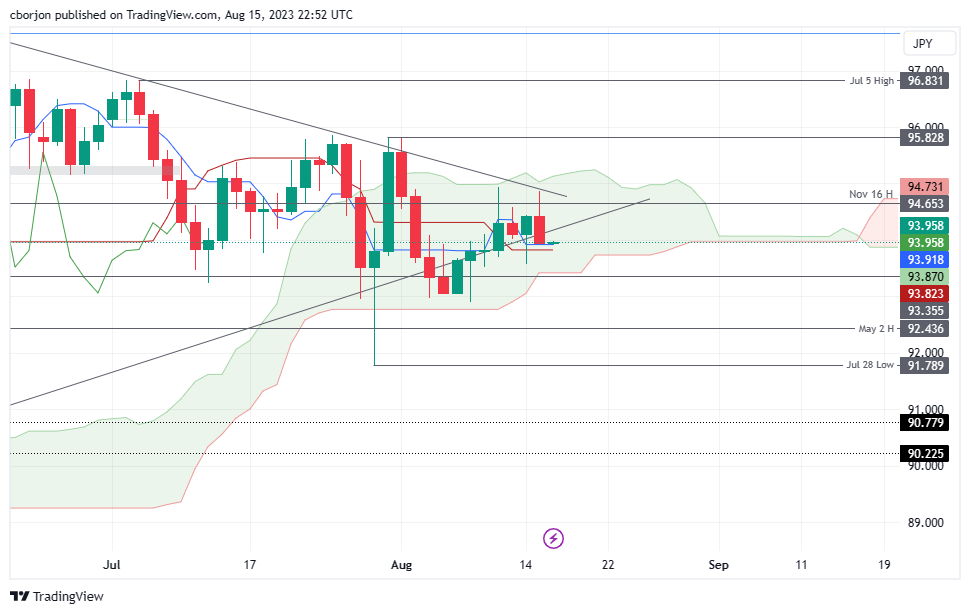
- AUD/JPY faces resistance from Tenkan and Kijun-Sen lines, currently trading just above at 93.93.
- Downside potential targets include the bottom of the Ichimoku Cloud at 93.45 and the 93.00 psychological level.
- On the upside, reclaiming 94.00 could see challenges at the August 15 high (94.86) and the Kumo top near 95.00/05.
The AUD/JPY retraces from weekly highs reached during Tuesday’s session at around 94.86, prolonging its losses after cracking a five-month-old upslope support trendline that intersects with the 94.00 mark. At the time of writing, the AUD/JPY is trading at 93.93, down by a minimal 0.01%.
AUD/JPY Price Analysis: Technical outlook
The daily chart portrays the AUD/JPY pair as subdued, capped on the downside by the Tenkan and Kijun-Sen lines at 93.92 and 93.82. If AUD/JPY slides past that area, the next support will emerge at the bottom of the Ichimoky Cloud (Kumo) at 93.45 before challenging 93.00.
Conversely, if AUD/JPY buyers reclaim the 94.00 figure, the first resistance would be the August 15 high of 94.86 ahead of testing the top of the Kumo at around 95.00/05. Once cleared, the next resistance would emerge at 95.83, the July 31 daily high.
AUD/JPY Price Action - Daily chart
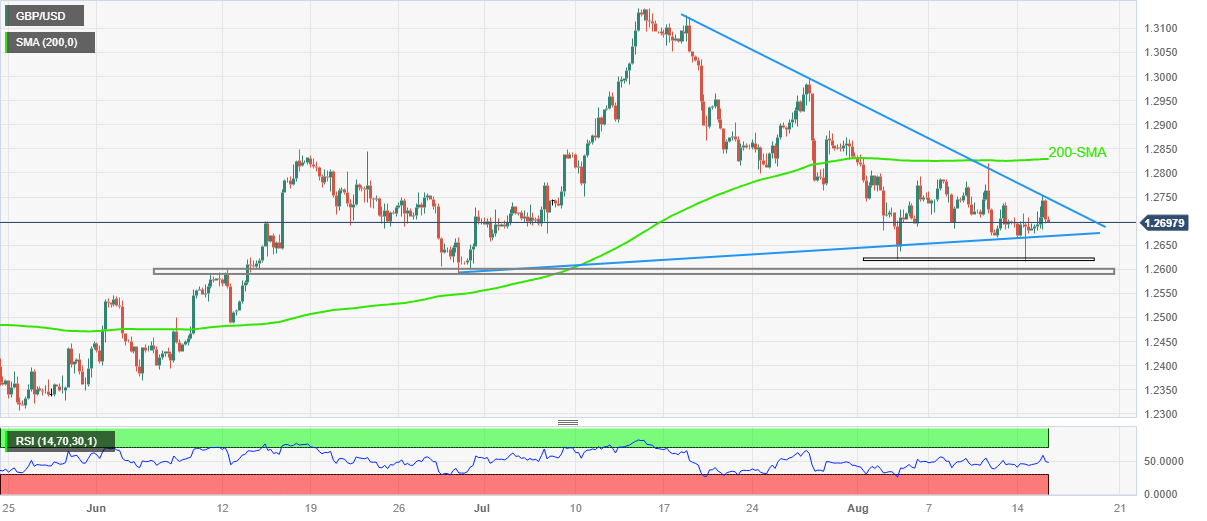
- GBP/USD fades corrective bounce off six-week low within short-term triangle.
- Sustained trading below 200-SMA, steady RSI keeps Cable hears hopeful.
- Multiple technical levels beyond 1.2600 stand tall to challenge Pound Sterling’s downside.
GBP/USD retreats to 1.2700 as bulls fail to keep the reins ahead of Wednesday’s top-tier US/UK catalysts, after a surprise entry the previous day.
That said, the Cable pair eases within a 1.5-month-old symmetrical triangle following a corrective bounce after the UK’s latest employment report. It’s worth noting that the Pound Sterling’s latest restoration of the original trend could also be linked to the market’s cautious mood ahead of British inflation data and Monetary Policy Meeting Minutes of the Federal Open Market Committee (FOMC).
Also read: GBP/USD upthrust spurred by UK’s wage growth, despite US retail sales surge
Technically, the GBP/USD pair’s sustained trading below the 200-SMA and failure to defy the stated triangle formation by an upside break of the 1.2750 immediate hurdle favor the sellers. Adding credence to the downside bias is the steady RSI (14) line.
However, the quote needs to provide a successful downside break of the triangle’s bottom line, close to 1.2670 at the latest to convince the sellers.
Even so, the double bottoms around 1.2620 and a two-month-old horizontal area surrounding 1.2600 can test the GBP/USD bears before giving them control.
On the flip side, a clear break of the 1.2750 isn’t enough for the GBP/USD bulls to retake the driver’s seat as the 200-SMA level of around 1.2830 could challenge the upside momentum.
Following that, the Cable pair’s run-up towards the late July peak surrounding the 1.3000 threshold can’t be ruled out.
GBP/USD: Four-hour chart
Trend: Further downside expected
- NZD/USD holds below the 0.5950 area in the early Asian session.
- US Retail Sales climbed by 0.7% MoM, higher than the 0.4% estimated.
- The Kiwi declines as investors worry about China's economy.
- Investors will monitor the Reserve Bank of New Zealand (RBNZ) interest rate decision.
The NZD/USD pair remains on the defensive below the 0.5950 mark during the early Asian session on Wednesday. Meanwhile, the US Dollar attracts some buyers following the US Retail Sales data. The pair currently trades around 0.5948, losing 0.04% for the day. Markets anticipate the Reserve Bank of New Zealand (RBNZ) to maintain 5.5% interest rates.
The US Retail Sales came in above expectations. The headline figure climbed by 0.7% MoM, higher than the 0.4% estimated. Sales excluding the Automobile sector came in at 1%, versus the expected 0.4%. Meanwhile, the NY Empire Manufacturing Index fell to -19 from -1. In response to the data, the Greenback edges higher across the board and trades above 103.20, reaching multi-week highs.
The New Zealand Dollar is losing ground as investors worry about China's deteriorating economic outlook. On Tuesday, Chinese Retail Sales for July came in at 2.5% YoY compared to 4.8% expected and 3.1% previously, while the country's Industrial Production fell to 3.7% YoY compared to 4.5% expected and 4.1% previously. The downbeat Chinese data capped the upside of China-proxy Kiwi.
The focus now shifts to the RBNZ interest rate decision. Markets expect the Reserve Bank of New Zealand (RBNZ) to maintain rates at 5.50%, a 14-year high, for the second consecutive meeting on Wednesday.
Looking ahead, the US Building Permits, Housing Starts, and Industrial Production will be released on Wednesday. However, the FOMC minutes will be the key event this week. The data will be critical for determining a clear movement for the NZD/USD pair.
- AUD/USD licks its wounds at the lowest level of the year after falling in the last six consecutive days.
- RBA Minutes, China updates join risk aversion to exert downside pressure on Aussie price.
- Mixed US data, higher yields defend US Dollar bulls despite initial retreat from monthly peak.
- Second-tier Australia/China data, RBNZ may entertain traders ahead of FOMC Minutes, bears seek hawkish tone of Fed officials.
AUD/USD holds lower grounds at the yearly bottom surrounding 0.6450 as it seeks fresh clues to extend the six-day downtrend amid Wednesday’s Asian session. In doing so, the Aussie pair justifies its risk-barometer catalysts, as well as bears the burden of the downbeat catalysts from home and the biggest customer China, to keep the bears hopeful. However, the market’s cautious mood ahead of the key Monetary Policy Meeting Minutes of the Federal Open Market Committee (FOMC) prod the quote’s further downside near the lowest level since November 2022.
Mixed statements from the Reserve Bank of Australia’s (RBA) Minutes of the August monetary policy meeting join downbeat statistics from Australia and China, as well as fears of another round of rating cut fears, to weigh on the AUD/USD prices. Further, hawkish comments from the Fed official also help the Aussie bears.
Late on Tuesday, Minneapolis Federal Reserve President Neel Kashkari ruled out talks of policy pivot by citing hot inflation and the uncertainty about the Fed’s progress in taming the same. The policymaker also said that he is not ready to say that the Fed is done raising rates, per Reuters.
That said, the market’s risk-off mood preceded the hawkish comments from Kashkari to favor the Aussie sellers. Analysts at the global rating agency Fitch Ratings told CNBC on Tuesday that the agency could downgrade several big lenders, including JPMorgan, as reported by Reuters. The same bolstered the risk-off mood as Wall Street opened, which in turn pared the US Dollar’s initial losses and allowed it to regain upside momentum targeting the monthly high, marked earlier in the week.
It should be observed that the firmer prints of the US Retail Sales for July contrasted with the downbeat US NY Empire State Manufacturing Index for August but managed to strengthen the US Dollar amid the downbeat risk profile. While portraying the mood, Wall Street closed in the red and the US 10-year Treasury bond yields refreshed the yearly high.
At home, the RBA highlighted the fact that a need for further hikes would depend on data and evolving assessment of risks. “Staff inflation forecast had assumed one more hike, rates notably lower than in other countries,” adds the RBA Minutes. Further, the Australian Bureau of Statistics (ABS) unveiled the second-quarter (Q2) Wage Price Index details while suggesting a reprint of 0.8% QoQ figures, versus 1.0% expected, whereas the yearly data eased to 3.6% YoY from 3.7% market forecasts and previous readings.
Talking about China, the People’s Bank of China (PBOC), surprised markets by lowering the one-year Medium-term Lending Facility (MLF) rate to 2.50% from 2.65% previous, as well as by cutting the Reverse Repo Rate to 1.8% from 1.9% previously. Further, China’s July Retail Sales rose 2.5% YoY vs. 4.8% expected and 3.1% previous while the Industrial Production came in at 3.7% YoY vs. 4.5% estimated and 4.4% prior.
Additionally, Reuters cited an anonymous source to state that China's major state-owned banks were seen selling US Dollars to defend the China Yuan (CNY) in the onshore spot foreign exchange (Forex) market.
At last, China State Bureau Spokesperson ruled out deflation views for China by saying, per Reuters, “There is no deflation in China,” as well as adding that there will be no deflation in the future. The Diplomat also accepted the challenges the economic recovery faces and conveyed expectations that China's economy to maintain steady operations in the second half of the year.
Looking ahead, Australia’s Westpac Leading Index for July and China’s House Price Index for the said month will precede the monetary policy announcements from the Reserve Bank of New Zealand (RBNZ) to direct AUD/USD moves in Asia. More importantly, the risk catalysts and the Fed Minutes will be crucial to watch for clear directions.
Technical analysis
A daily closing beneath May’s low of around 0.6460 and sustained trading below a one-month-old falling resistance line, around 0.6560 by the press time, keeps the AUD/USD bears hopeful of witnessing further downside towards the mid-November 2022 swing low of around 0.6385.
- US Retail Sales outpace expectations, with core sales jumping 1%, influencing the GDP consumer spending outlook.
- Wall Street banks, including Goldman Sachs, adjust Q3 GDP predictions in light of robust US economic indicators.
- Fed’s Kashkari highlights persistent inflation concerns and the resilience of the US economy, keeping rate hike speculations alive.
EUR/USD extended its losses on Tuesday for two straight days and clings above the 1.0900 figure after solid data from the United States (US) reignited worries of additional tightening by the Federal Reserve (Fed) amidst a resilient US economy. At the time of writing, the EUR/USD exchanges hands at 1.0903, gaining 0.02% as the Asian session begins.
Solid US economic data and Wall Street’s revised GDP forecasts put pressure on the Euro, as EUR/USD hovers above 1.0900
The EUR/USD seesawed during the session after the US Department of Commerce revealed that Retail Sales in the US exceeded forecasts of 0.4% MoM, with July sales growing by 0.7%, while excluding Autos, also called core retail sales, jumped 1%, smashing estimates of 0.4%. Core Retail Sales correspond closely with the Gross Domestic Product (GDP) consumer spending component.
Initially, the data sent the EUR/USD sliding but options expiring at 10:00 AM NY cut, at around 1.0930-3 topping 1.1 billion and at 1.0940 2.3 billion, triggered a rally in the pair. Past the cut, the EUR/USD reversed its course, finishing the session near the day’s lows.
Following the data, some banks on Wall Street, like Goldman Sachs, revised their Q3 Gross Domestic Product (GDP) forecasts to a 2.2% annualized rate. The Atlanta’s Fed GDPNow model, which estimates GDP expectations, updated its model after Retail sales data showed GDP jumping to 5% from 4.1% foreseen on August 8.
Meanwhile, bets for a pause on hikes by the Federal Reserve (Fed) in September remain intact at 89% after the data, while for November, it stood above 30% chance.
Other data from the US Department of Labor showed that Import and Export Prices rose above estimates. At the same time, the New York Federal Reserve revealed its Manufacturing Index plunged to -19, exceeding projections of -1, after business conditions improved in July.
Minnesota’s Fed President Neil Kashkari crossed the wires, expressing that inflation is still too high, even though he feels good about its progress while noting uncertainty about whether the Fed has done enough or needs to do more. He added US central bank officials are surprised by the economy’s resilience.
EUR/USD Price Analysis: Technical outlook
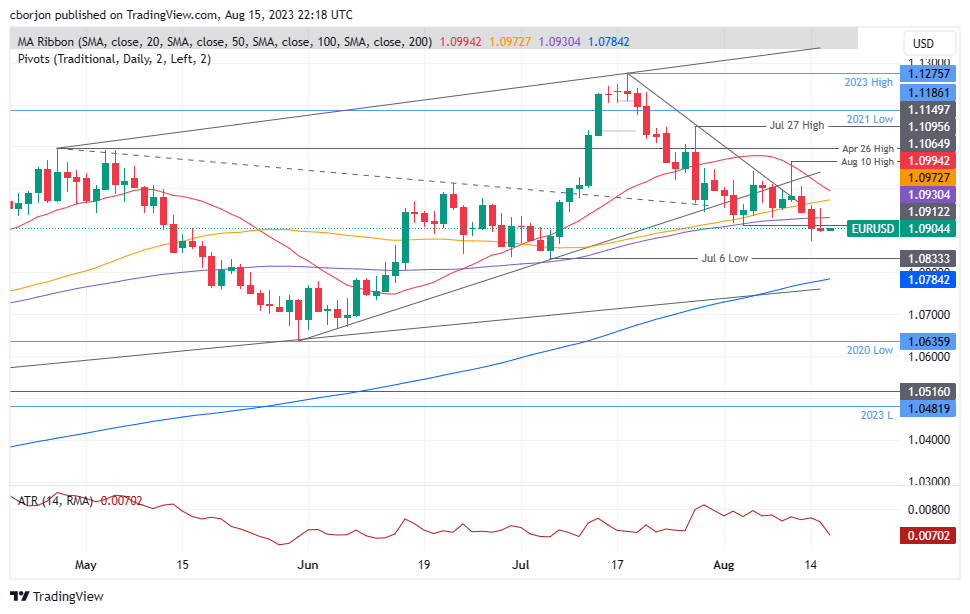
The EUR/USD remains neutral to downward bias, with the pair continuing to print lower highs and lower lows, seen as a pivotal reason for defining a downtrend. On Tuesday, sellers stepped in, dragging the exchange rate below the 100-day Exponential Moving Average (EMA), as they eye a break below the current week’s low of 1.0874. A breach of the latter will expose the July 6 daily low of 1.0833, followed by the 1.0800 mark and the 200-day EMA at 1.0784. Contrarily, EUR/USD buyers must keep prices above 1.0900 if they want to challenge the daily EMAs as first resistance levels, with the 100-day EMA at 1.0930, the 50-day EMA at 1.0972 and the 20-day EMA at 1.0994.
- XAU/USD fell near the $1,900 zone, below the 200-day SMA.
- Economic figures from the US point out that the Fed may still have room to hike.
- Investors await Wednesday’s FOMC minutes to look for further clues.
In Tuesday’s session, the XAU/USD faced selling pressure, lost the 200-day Simple Moving Average, and fell to $1,900 an ounce. In that sense, bearish pressure can be attributed to markets gearing up for another Federal Reserve (Fed), not in September but in November. The latest data revealed that the headline and core Consumer Price Index (CPI) decelerated in July, but the Producer Price Index (PPI) accelerated. In addition, July’s Retail Sales from the US were reported to have increased higher than expected.
As for now, according to the CME FedWatch tool, markets discount low odds of a hike in the upcoming September meeting, but the odds of a hike in November rise nearly 40%. In that sense, the July meeting's Federal Open Market Committee (FOMC) minutes will help investors model their expectations.
XAU/USD Levels to watch
The daily chart analysis indicated that the XAU/USD has a bearish technical bias for the short term, with Relative Strength Index (RSI) and Moving Average Convergence Divergence (MACD) residing in negative territory. The RSI also exhibits a southward slope below its midline, emphasising the presence of intense selling pressure, while the MACD, with its red bars, highlights the strengthening bearish momentum for the XAU/USD. Furthermore, the pair is below the 20,100 and 200-day Simple Moving Averages (SMAs), indicating that the sellers dominate the broader perspective.
Support levels: $1,890, $1,870, $1,850
Resistance levels: $1,905 (200-day SMA), $1,930, $1,950.
XAU/USD Daily chart
-638277323878765737.png)
The Reserve Bank of New Zealand will announce its decision on monetary policy. The UK inflation report is due. The Eurozone will release GDP, employment, and industrial production data. Later in the day, the Fed will release its meeting minutes.
Here is what you need to know on Wednesday, August 16:
The US Dollar Index remains strong. On Tuesday, it posted its fourth consecutive daily gain and reached the highest level in a month. The DXY managed to recover from losses, supported by a rebound in Treasury yields and increased risk aversion. Stocks on Wall Street, on average, lost more than 1%. The US 10-year Treasury yield initially dropped to 4.16% and then climbed back above 4.20%, while the 2-year yield rose from 4.90% to 4.95%.
The US Retail Sales exceeded expectations, rising by 0.7% in July, surpassing the market consensus of 0.2%. However, the NY Empire Manufacturing Index dropped to -19 from -1. On Wednesday, economic indicators such as Building Permits, Housing Starts, and Industrial Production will be released. Nevertheless, the key event to watch will be the release of the FOMC meeting minutes.
EUR/USD reached a peak at 1.0950 before retracing to 1.0900, driven by a rebound in the US Dollar. In the Eurozone, GDP, Employment, and Industrial Production data will be released on Wednesday.
The UK released stronger-than-expected wage data, boosting expectations of another rate hike from the Bank of England (BoE) and bolstering the Pound. The currency outperformed on Tuesday, with GBP/USD rising steadily and ending the day above 1.2700. On Wednesday, the UK will release the July Consumer Price Index (CPI) inflation report, which will be closely watched. The CPI is expected to decline from an annual rate of 7.9% in June to 6.7% in July.
USD/JPY remained flat, hovering around 145.50 after testing the downside near 146.00 and finding support above 145.00.
The Consumer Price Index rebounded in July in Canada to 3.3%, surpassing the expected 3%. The Canadian Dollar gained momentum briefly after the data. USD/CAD continued its upward trend and closed slightly below 1.3500, the highest level in more than two months.
Analysts at RBC:
We look for a softening economy to ease inflation pressures further going forward, and expect the odds are still tilted towards the Bank of Canada foregoing another increase in the overnight rate in September.
The Russian Ruble stabilized after the USD/RUB pulled back from above 100.00. The Central Bank of Russia (CBR) raised interest rates by 350 basis points to 12% after an extraordinary monetary policy meeting.
The Antipodean currencies remain under pressure as Chinese data continues to disappoint, and commodity prices remain weak. NZD/USD dropped for the sixth consecutive day, closing below 0.6000. The Reserve Bank of New Zealand will announce its monetary policy on Wednesday, and no change is expected. Similarly, AUD/USD also lost ground and was trading slightly above the key support area of 0.6450.
Like this article? Help us with some feedback by answering this survey:
- The pair is about to reach overbought conditions, trading around the 1.3500 zone, showing more than 0.30% of daily gains.
- Canadian’s CPI came in higher than expected, while US Retail Sales showed strong figures.
- Lower Oil prices limited the CAD’s potential.
The USD/CAD saw green on Tuesday and increased near highs since early June, trading around 1.3500. On the one hand, the optimistic US Retail Sales from July made the market discount a more aggressive bet by the Federal Reserve (Fed) and favoured the USD. On the other hand, the Consumer Price Index (CPI) from July came in higher than expected, favouring the Canadian dollar, while lower Oil prices limited the upside potential.
Canadian CPI from July came in higher than expected, as well as US Retail sales
Canadian inflation for July came in hot. The Consumer Price Index (CPI), advanced 0.3% Mom while the annualised measure accelerated to 3.2%, higher than the 3% expected and the previous 2.8%. The Core figure rose to 3.2% vs the 2.8% expected from the last 2.8%.
Regarding the next Bank of Canada (BoC), according to the World Interest Rate Possibilities (WIRP) tool, markets discount high odds of a 25% chance of a hike on September 6 and then increase to approximately 55% by October 25. Looking further ahead, it climbs to about 60% by December 6. In that sense, hawkish bets on the BoC may support the CAD in the following sessions.
On the other hand, July’s US Retail Sales exceeded expectations. The headline rose by 0.7% MoM, higher than the 0.4% expected. Sales Excluding the Automobile sector also met expectations and came in at 1% vs the 0.4% expected. The USD gained some momentum as a reaction, but the DXY traded relatively flat during the session. With that said, attention now turns to the Federal Open Market Committee (FOMC) meeting minutes released scheduled for Wednesday, where investors will look for clues regarding the Federal Reserve's (Fed) next steps. As for now, the stronger case, according to the CME FedWatch tool, is that the Fed will skip in September and then hike in November by 25 basis points (bps)
USD/CAD Levels to watch
According to the daily chart analysis, short-term prospects for USD/CAD look bullish. Both Relative Strength Index (RSI) and Moving Average Convergence Divergence (MACD) remain positive and are near overbought conditions. Moreover, the pair is above the 20,100,200-day Simple Moving Averages (SMA), indicating that the buyers command the broader perspective.
Support levels: 1.3450 (200-day SMA), 1.3400, 1.3380 (100-day SMA).
Resistance levels: 1.3510, 1.3550, 1.3570.
USD/CAD Daily chart
-638277298461411897.png)
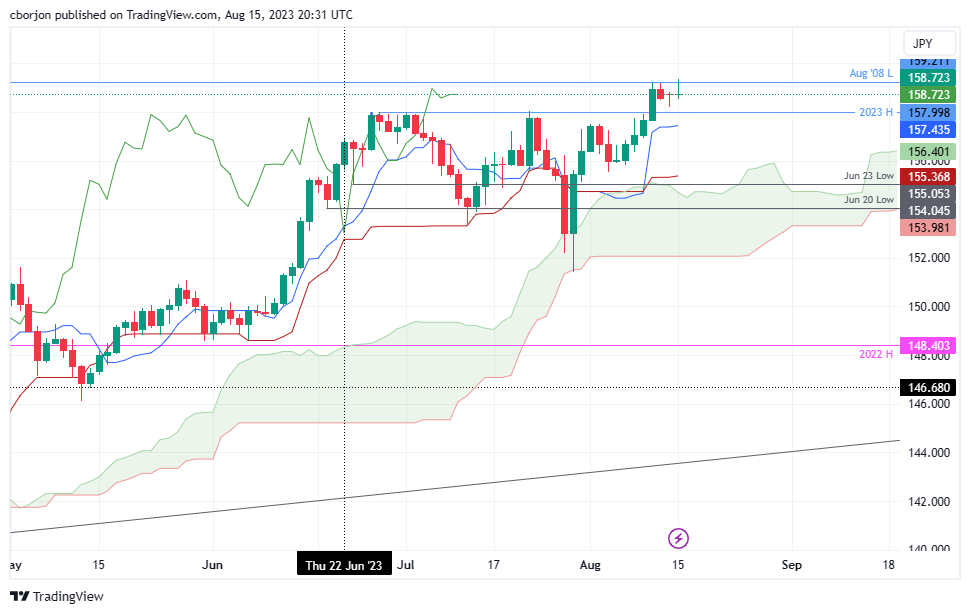
- EUR/JPY touches a new YTD peak but retracts swiftly as intervention fears loom with JPY’s softening stance.
- Consecutive ‘doji’ candlestick patterns signal uncertainty and potential price tug-of-war between buyers and sellers.
- Break above the recent high may challenge the 160.00 threshold, while a descent risks testing the Tenkan-Sen and Senkou-Span A lines in succession.
The EUR/JPY rallied to a new year-to-date (YTD) high of 159.33 but failed to hold above the 159.00 figure as sellers gained momentum due to fears that Japanese authorities might intervene in the Forex market as the Japanese Yen (JPY) weakens. The EUR/JPY is trading at 158.74, printing minuscule gains of 0.02% as the New York session winds down.
EUR/JPY Price Analysis: Technical outlook
The EUR/JPY cross-currency pair sits at around the 158.50/159.00 range for the second straight day in the week, failing to break above the 160.00 figure amidst a soft JPY. Technically speaking, in those days, back-to-back ‘doji’ suggests indecision lying ahead.
If EUR/JPY buyers lift the pair past the current YTD high, the next resistance would emerge at the 160.00 handle. Once cleared, the next resistance emerges at the August 2008 monthly high of 169.47.
Conversely, if EUR/JPY extends its losses below the current week’s low of 158.18, first support would emerge at the psychological 158.00 mark. If sellers push prices below that level, the Tenkan-Sen line surfaces as support at 157.43, followed by the Senkou-Span A line at 156.40 ahead of 156.00.
EUR/JPY Price Action – Daily chart
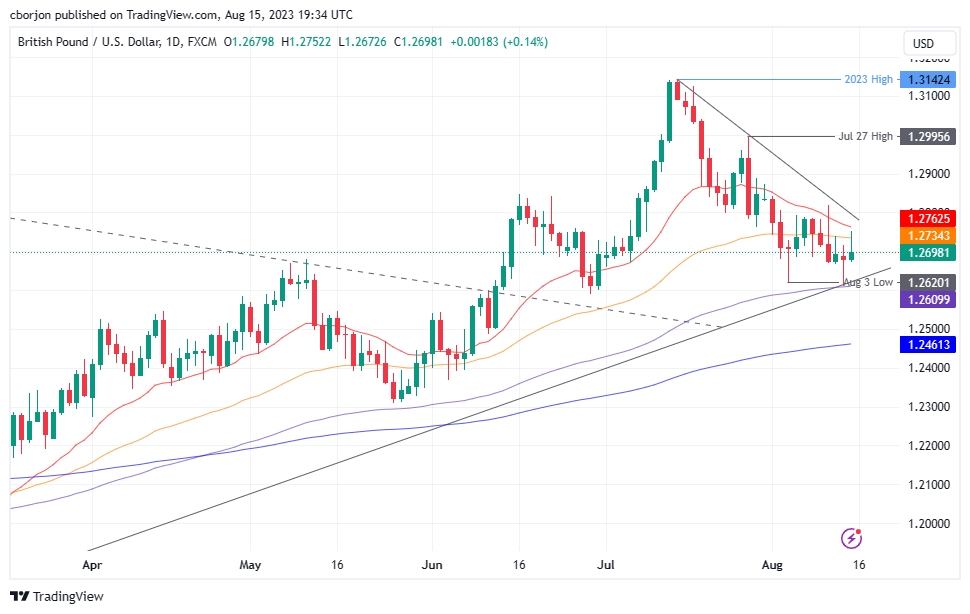
- UK wages excluding bonuses soar to the highest growth rate since 2001, pushing unemployment to 4.2%.
- US Retail Sales outperform expectations, prompting Goldman Sachs to uplift Q3 GDP projections.
- BoE’s potential rate hike in focus as traders anticipate Wednesday’s inflation report; GBP/USD eyes 1.2800 resistance.
GBP/USD rises following Monday’s session, which portrayed a ‘hammer’ formation, suggesting that further upside is expected. Jobs data in the UK overshadowed upbeat economic data from the United States (US), as wages grew above estimates, adding to the Bank of England’s (BoE) inflation pressures. Hence, the GBP/USD trades at 1.2705, above its opening price by 0.21%.
UK’s robust wage data adds to BoE’s inflation concerns, while US economic indicators paint a mixed picture
The Office for National Statistics (ONS) revealed that wages excluding bonuses rose 7.8% YoY in the three months to June, which according to Reuters, represents “the highest annual growth rate since comparable records began in 2001.” The same report highlighted the Unemployment Rate climbed to 4.2% from 4%.
In the meantime, traders brace for Wednesday’s inflation report. Any upside surprise could increase BoE’s chances of raising rates. Money market traders are fully pricing in a 25 basis point hike at its September meeting, with around a 12% chance they lift rates by a larger size of 50 basis points.
On the US front, US Retail Sales in the US exceeded estimates of 0.4% MoM, with July sales growing by 0.7%, while excluding Autos, also called core retail sales, jumped 1%, smashing forecasts of 0.4%. Core Retail Sales correspond most closely with the Gross Domestic Product (GDP) consumer spending component.
The report triggered a revision of US growth prospects, with Goldman Sachs raising Q3’s Gross Domestic Product (GDP) to a 2.2% annualized rate. Today’s data was computed by Atlanta’s Fed GDPNow model, which forecasts GDP expectations, jumping to 5% from 4.1% foreseen on August 8.
Meanwhile, bets for a pause on hikes by the Federal Reserve (Fed) in September remain intact at 89% after the data, while for November, it stood above 30% chance.
Other data from the US Department of Labor showed that Import and Export Prices rose above estimates. At the same time, the New York Federal Reserve revealed its Manufacturing Index plunged to -19, exceeding projections of -1, after business conditions improved in July.
Minnesota’s Fed President Neil Kashkari crossed the wires, expressing that inflation is still too high, even though he feels good about its progress while noting uncertainty about whether the Fed has done enough or needs to do more. He added US central bank officials are surprised by the economy’s resilience.
Given the backdrop, the GBP/USD could test the 1.2800 figure if UK’s inflation becomes higher than estimated. On the other hand, expect GBP/USD weakness if prices continue to cool down, as expected.
GBP/USD Price Analysis: Tech ical outlook
Although the GBP/USD remains in consolidation, it acquired a slight bullish bias, but its advancement is being capped by the 50 and 20-day Exponential Moving Average (EMA), each at 1.2734 and 1.2756, respectively. A daily close above those levels could impulse the GBP/USD exchange rate toward the 1.2800 figure, followed by 1.2900 and the July 27 pivot high at 1.2995. Conversely, if GBP/USD fails to print a daily close above 1.2700, expect the pair to dive towards the current week’s low of 1.2616 before challenging 1.2600.
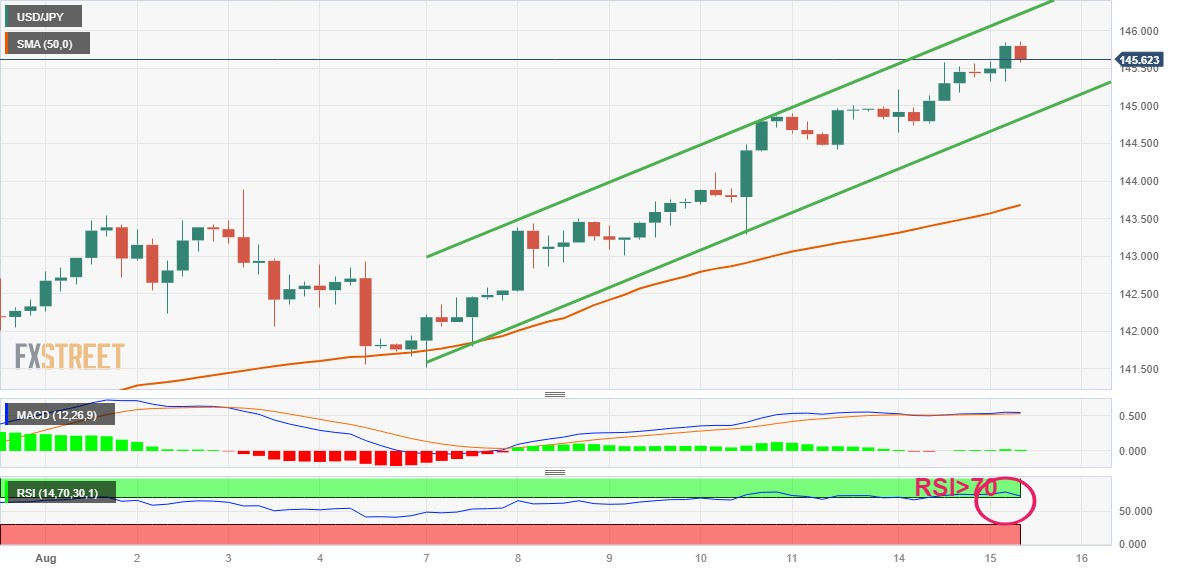
- USD/JPY trades neutral at the 145.55 area after hitting a low of 145.10.
- US Retail Sales came in strong, and the markets bet on a hike by the Fed in November.
- Monetary Policies divergences weight on the JPY which couldn’t benefit from robust GDP data.
On Tuesday, the USD/JPY traded flat while the USD seemed to consolidate. On the other hand, the JPY continues to trade vulnerable amid the extreme dovish stance of the Bank of Japan (BoJ) and monetary policy divergence between its peers.
US Retail Sales revealed that the US economy is holding strong. The headline Sales increased by 0.7% MoM, higher than the 0.4% expected, while the ones excluding the Automobile sector also came in strong and came in at 1% vs the 0.4% expected.
Regarding the next Federal Reserve (Fed) meeting, there's a prevailing market expectation of a no hike in September. However, the chances of a 25 basis point adjustment in November reach a peak of around 40%. That said, the focus now pivots to Wednesday's Federal Open Market Committee (FOMC) gathering, as investors seek hints in the forward guidance to attain a distinct perspective on the officials' position.
Despite reporting strong Gross Domestic Product (GDP) data, the JPY continues to trade weak. On Tuesday, it was reported that during the second quarter, the economy expanded by 1.5% QoQ at a 6% annualised pace in both figures. On the bright side, speculations of a potential Bank of Japan (BoJ) intervention to stop the currency's loss is the only hope for the Yen while the USD/JPY consolidated above the 145.00 level.
USD/JPY Levels to watch
The technical analysis of the daily chart supports a bullish view of USD/JPY in the short term. The relative Strength Index (RSI) maintains its favourable position above the midline, displaying an upward inclination. Moreover, Moving Average Convergence Divergence (MACD) showcases green bars, underlining the strengthening bullish momentum. Furthermore, the pair is above the 20,100,200-day SMAs, suggesting that the bulls are firmly in control of the bigger picture.
Support levels: 145.00, 144.70, 144.00.
Resistance levels: 145.70, 146.00, 146.50.
USD/JPY Daily chart
-638277218873176010.png)
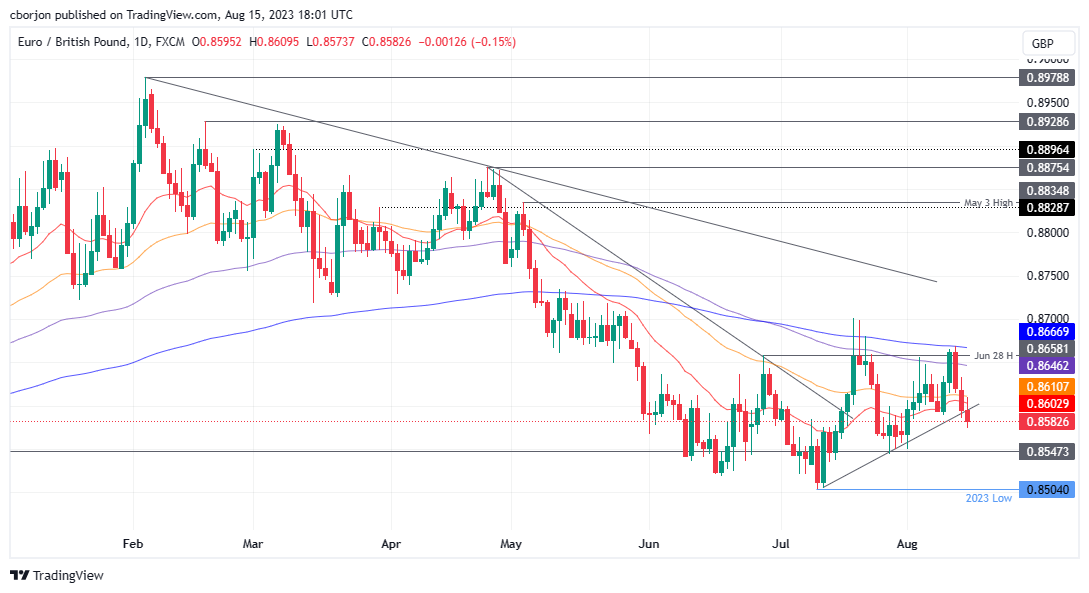
- EUR/GBP slips past 50 and 20-day EMAs, reflecting increased bearish sentiment, trading 0.14% below the opening.
- EUR/GBP’s breaking daily EMAs and one-month-old support trendline, deeper losses loom for the cross as sellers gain momentum.
- A close below 0.8600 could accelerate the slide toward July 27 swing low, with a focus on the year’s lowest point. Immediate resistance at 0.8600-0.8610 zone.
The EUR/GBP dropped for the third consecutive day, extending its losses past the 50 and 20-day Exponential Moving Averages (EMAs), the last time seen each at 0.8610 and 0.8603. At the time of writing, the EUR/GBP is trading at 0.8582, below its opening price by 0.14%.
EUR/GBP Price Analysis: Technical outlook
The EUR/GBP is trading sideways, slightly tilted to the downside, after prices fell below all the daily Exponential Moving Averages (EMAs), opening the door for further losses. Notably, the EUR/GBP fell to a new two-week low, and on its way down, it has broken a one-month-old support trendline drawn from the yearly lows, suggesting that sellers are gathering momentum.
If EUR/GBP achieves a daily close below 0.8600, the cross could extend its downtrend to the July 27 swing low of 0.8544 before challenging the year-to-date (YTD) low of 0.8504.
On the flip side, if EUR/GBP buyers reclaim 0.8600, the first resistance levels would be the 0.8601/10 area, followed by the 100-day EMA at 0.8646.
EUR/GBP Price Action – Daily chart
- XAG/USD found support at a daily low of $22.20, then recovered towards $22.55, trading flat.
- US retail sales came in higher than expected.
- Despite robust data, the USD consolidates and limits Silver’s losses.
On Tuesday, the XAG/USD cleared daily gains and its losses were limited by the USD consolidating its previous day’s gains. Focus now shifts to the July meeting's Federal Open Market Committee (FOMC) minutes.
US Retail Sales showed the US economy is holding firm. The headline Sales rose by 0.7% MoM, higher than the 0.4% expected, while the ones excluding the Automobile sector also came in strong and came in at 1% vs the 0.4% expected.
Regarding the next Federal Reserve (Fed) meeting, there's a prevailing market expectation of a no hike in September. However, the chances of a 25 basis point adjustment in November reach a peak of around 40%. That said, the focus now pivots to Wednesday's Federal Open Market Committee (FOMC) gathering, as investors seek hints in the forward guidance to attain a distinct perspective on the officials' position.
Considering this, the US bond yields, considered the opportunity cost of holding Silver, are edging lower. The 10-year bond yield trades at 4.18%, down by 0.62 % losses on the day. The 2-year yield stands at 4.95% with 0.81 % losses, and the 5-year yield is at 4.33% with 0.62 % losses.
XAG/USD Levels to watch
The technical analysis of the daily chart suggests a neutral to bearish stance for XAG/USD as the bears work on staging a recovery and exerting their influence. Having turned flat in negative territory, the Relative Strength Index (RSI) suggests a potential market equilibrium with balanced selling and buying pressure. At the same time, the Moving Average Convergence (MACD) shows flat red bars. In addition, the pair is below the 20,100 and 200-day Simple Moving Averages (SMAs), highlighting the continued dominance of bears on the broader scale, requiring the buyers to take action.
Support levels: $22.15, $22.00, $21.80.
Resistance levels: $23.30 (200-day SMA), $23.50, $24.00.
XAG/USD Daily chart
-638277176385847785.png)
- China’s central bank slashes key lending rates in response to slowing economic recovery, impacting global oil demand outlook.
- OPEC+ supply cuts by Saudi Arabia and Russia provide limited support as WTI retreats from YTD highs.
- Barclay’s revises China’s GDP forecast downwards, while WTI finds some relief in rising Chinese refinery throughput.
Western Texas Intermediate (WTI), the US crude oil benchmark, registers losses of more than 2%, as economic data from China portrays a slowing recovery, while the People’s Bank of China (PBoC) unexpectedly cut rates in key rates to stir the economy after the Covid-19 pandemic. WTI is trading at $80.49 per barrel, down 2.35%.
China’s disappointing Retail Sales and Industrial Production data weigh on crude; PBoC’s rate adjustments add to concerns
The latest round of economic data from China, with Retail Sales coming below estimates and Industrial Production disappointing market participants, spurred a reaction by the PBoC. China’s central bank cut its 7-day lending rates by ten basis points to 2.80% and applied the same measures to the overnight Standing Facility (SLF) rate from 2.75% to 2.65%.
That, alongside the supply cuts implemented by Saudi Arabia and Russia, which are part of the Organization of Petroleum Exporting Countries and its allies (OPEC+), have helped to lend a lifeline to oil’s rally, with prices reversing from year-to-date (YTD) highs.
The investment community’s concern about China’s meeting its 5% growth target in the year would likely pressure WTI’s prices. On Tuesday, Barclay’s cut China’s GDP forecast to 4.5%, citing the ongoing deterioration in the housing market.
Conversely, WTI’s fall was cushioned by the technical support level, and China’s refinery thought, climbing 17.4% in July from a year earlier. WTI traders’ focus shifts to US crude inventories.
WTI Price Analysis: Technical outlook
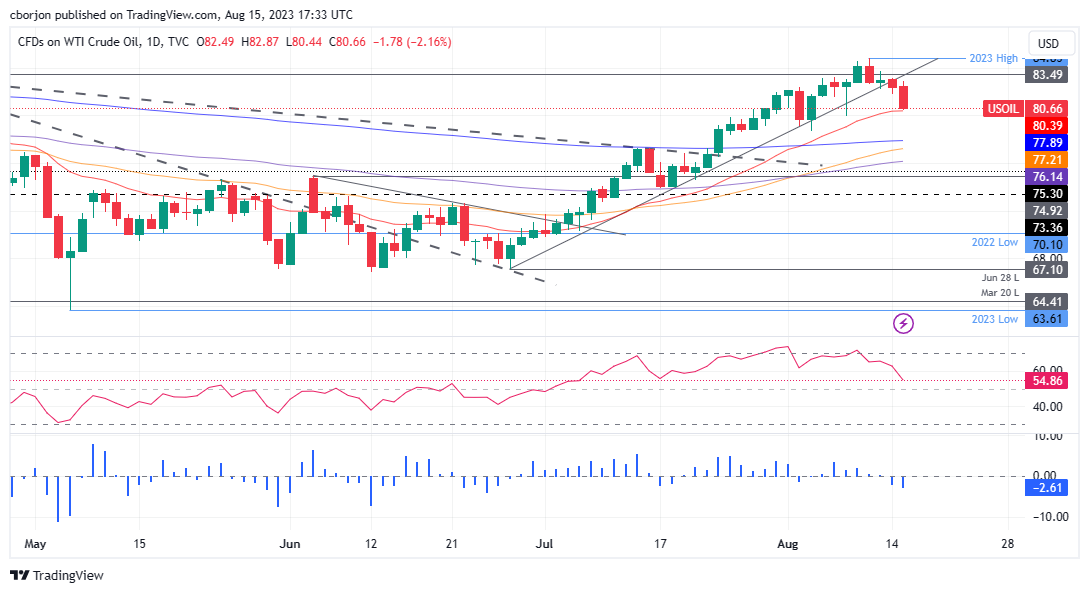
WTI reversed its course and dipped towards the 20-day Exponential Moving Average (EMA( at $80.47 per barrel, seen as first support, which, if broken, can pave the way for WTI to edge below $80.00. A breach of the latter will expose the August 3 daily low of $78.74, followed by the 200-day EMA at $77.89. Conversely, if WTI holds its ground above $80.00, that would be positive for buyers, which could re-test the year-to-date (YTD) high of $84.85, but firstly they need to break above the April 23 daily high of $83.49.
- NZD/USD trades with losses below 0.6000, its lowest in nine months.
- China reported weak Retail Sales and Industrial Production data from July.
- American Retail Sales from the US were higher than expected.
In Tuesday’s session, the NZD/USD traded lower, mainly driven by China’s fragile economic situation. On the other hand, the USD, despite solid Retail Sales data, the USD trades weakly and consolidates the previous session's gains. Eyes on the Reserve Bank of New Zealand’s (RBNZ) decision, expected to hold rates at 5.5%.
Investors digest Retail Sales figures from the US and China
US Retail Sales came in higher than expected. The headline rose by 0.7% MoM, higher than the 0.4% expected. Sales Excluding the Automobile sector also met expectations and came in at 1% vs the 0.4% expected. The USD gained some traction as a reaction, but the DXY remains in negative territory and is consolidating, as well as the US Treasury yields.
On the other hand, the Kiwi is losing traction amid the worrying economic situation. On Monday, real-state downturn figures applied selling pressure and was exacerbated on Tuesday following weak Retail Sales and Industrial Production from July. Focus now shift to the RBNZ decision on Wednesday, where markets expect the bank to hold rates steady at 5.5%.
NZD/USD Levels to watch
Observing the daily chart, NZD/USD suggests a bearish sentiment for the near term. The relative Strength Index (RSI) remains in the negative zone below its midline, near oversold conditions. Concurrently, Moving Average Convergence Divergence (MACD) reflects rising red bars, reinforcing the bearish momentum. Furthermore, the pair is below the 20,100 and 200-day Simple Moving Averages (SMAs), indicating a challenging position for the buyers in the bigger picture as the bears remain in command.
Support levels: 0.5950, 0.5930, 0.5920.
Resistance levels: 0.6000, 0.6020, 0.6050.
NZD/USD Daily chart
-638277148408650144.png)
Analysts at TD Securities note that the annual Consumer Price Index (CPI) in Canada rose 3.3% in July, at a much stronger pace than the market expectation of 3%.
BoC to hold rates at 5% into 2024
"Details were slightly less hawkish, with core measures matching the market consensus for 3.6%/3.7%, and core goods were much softer with a 0.2% m/m decline."
"The headline surprise is alarming given ongoing concerns around the persistence of inflation pressures, but we do not think it's enough to tip the scales towards another hike in September. Today's report follows a 0.2pp disappointment in June, and viewing the June/July CPI reports together paints a less alarming picture for the BoC. We continue to look for the Bank to hold rates at 5.00% into 2024, but the Bank will need to see more evidence of slowing activity to stay on the sidelines through Q4."
- US Retail Sales for July surpass expectations, buoyed by Amazon’s Prime Day, pushing core sales up by 1%.
- New York Fed’s Manufacturing Index sees a surprising dip, while Kashkari comments on inflation concerns and economic resilience.
- Despite the Greenback’s strength, interest rate differential may limit USD/MXN’s rally, with risk aversion playing a potential role.
USD/MXN climbs in the North American session by more than 0.40% as the Greenback stages a recovery, spurred by solid economic data from the United States (US) igniting rate jitters. Hence, the USD/MXN advanced to new weekly highs, exchanging hands at 17.1181.
Greenback’s rally spurred by robust Retail Sales and rate hike expectations; USD/MXN eyes stability above 17.0000
Market sentiment remains downbeat, as reflected by Wall Street printing losses. Retail Sales in the US exceeded estimates of 0.4% on a monthly basis, with July sales expanding by 0.7%, propelled by Amazon’s Prime Day. Excluding Autos, also called core retail sales, jumped 1%, crushing estimates of 0.4%. Core Retail Saeles correspond most closely with the Gross Domestic Product (GDP) consumer spending component.
Other data from the US Department of Labor showed that Import and Export Prices rose above estimates. At the same time, the New York Federal Reserve revealed its Manufacturing Index plunged to -19, exceeding projections of -1, after business conditions improved in July.
In the meantime, US Treasury bond yields paired their earlier gains, with the US 10-year Treasury note yield standing at 4.187% after touching a high of 4.274%, while the US Dollar reversed some of its earlier gains. The US Dollar Index (DXY), which tracks the buck’s performance against a basket of rivals,
In the meantime, Minnesota’s Fed President Neil Kashkari is crossing the wires, expressing he feels that inflation is still too high, despite feeling good about the progress while noting uncertainty about whether the Fed has done enough or needs to do more. He added US central bank officials are surprised by the economy’s resilience.
Even though market participants remain skeptical about another rate hike by the Fed, expectations stay at 32.2% for November’s monetary policy meeting, higher than a week ago’s 28% chances.
Given the backdrop, the USD/MXN might remain above the 17.0000 price level; even though the Mexican Peso (MXN) has been under pressure, the interest rate differential benefits the emerging market currency. That would put a lid on USD/MXN’s rally, and if the pair is to edge higher, it could do it steadily unless risk-aversion triggers outflows from riskier assets.
USD/MXN Price Analysis: Technical outlook
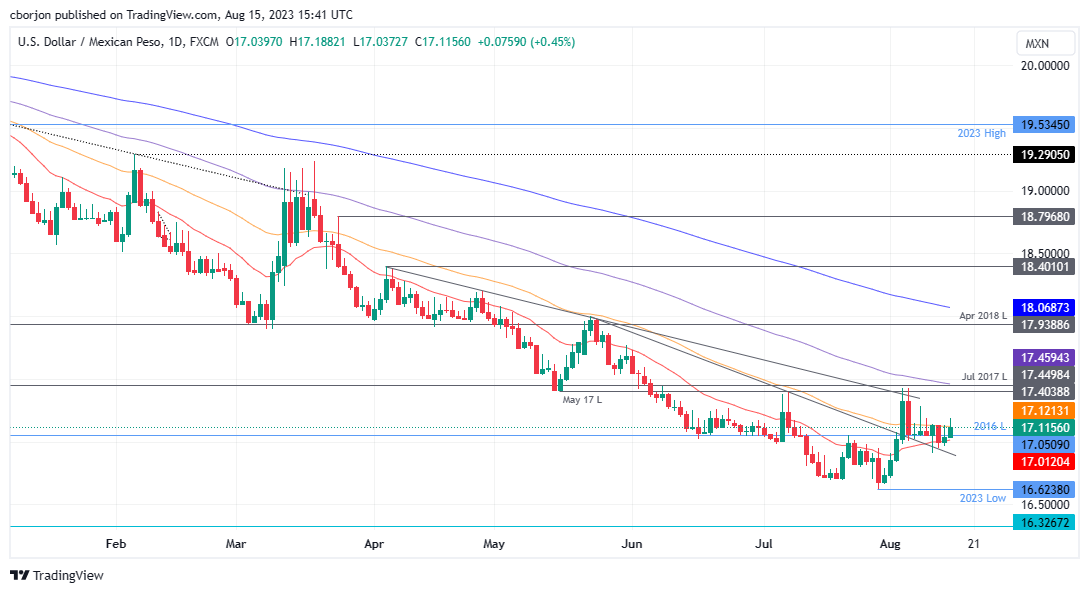
As of writing, the USD/MXN spot price is above the 20 and 50-day Exponential Moving Averages (EMAs), each at 17.0171 and 17.1234, which could pave the way for further upside. Even though it looks like the exotic currency pair achieved a bottom, USD/MXN buyers must reclaim the May 17 daily low-turned resistance at 17.4038, which could pave the way to test the 100-day EMA at 17.4605 before challenging 17.5000. Otherwise, further downside is expected below the psychological 17.0000 level, with the year-to-date (YTD) low lingering around 16.6238.
Minneapolis Federal Reserve President Neel Kashkari said noted on Tuesday that he is feeling good about the progress on inflation but added that it was still too high, per Reuters.
"The question is, have we done enough, or do we need to do more," Kashkari added said that they have been surprised by the economy's resilience.
Market reaction
These comments had little to no impact on the US Dollar's performance against its rivals. As of writing, the US Dollar Index was down 0.15% on the day at 103.00.
- The US Dollar weakens despite US Retail Sales beating expectations.
- The EUR/USD pair holds below the 1.0950 key short-term resistance area.
The EUR/USD is rising on Tuesday, recovering modestly from monthly lows. The pair hit a fresh daily high at 1.0953 and is hovering around 1.0940 as the upside remains limited after US data.
Mixed US data
Retail sales rose in July by 0.7% in the US, surpassing the expected increase of 0.4%. Additionally, June figures were revised higher from 0.2% to 0.3%. However, a different report indicated that the NY Empire State Manufacturing Index dropped to -19, against the market consensus of -1.
Following the release of retail sales figures, the US Dollar briefly rose, causing the EUR/USD pair to fall to 1.0896. However, it quickly rebounded and reached a fresh daily high at 1.0953.
The US Dollar is currently weakening after a strong performance over the past three days. The DXY is trading below 103.00, moving away from the one-month high it reached on Monday at 103.45.
The decline in the Greenback is happening alongside lower US yields. The 10-year Treasury yield spiked to 4.27% and as of writing, stands at 4.17%, while the 2-year yield briefly reached levels above 5.00% and is now moving toward 4.90%. Equity prices on Wall Street are falling, with the Dow Jones losing 0.85% after the first hour of trading.
Technical outlook
The EUR/USD pair is testing the 1.0950 area, which also coincides with the 20-period Simple Moving Average (SMA) on the 4-hour chart. A consolidation above 1.0950 would strengthen the short-term outlook for the Euro, favoring a potential extension.
On the contrary, if the pair fails to regain 1.0950, it could weaken, with a break below 1.0895 exposing the weekly low at 1.0874, and further below the 1.0830 support area.
Technical levels
Fitch Ratings analyst told CNBC on Tuesday that the agency could downgrade several big lenders, including JPMorgan, as reported by Reuters.
The financial-heavy Dow Jones Industrial Average opened in negative territory following this headline and was last seen losing 0.6% on a daily basis. Reflecting the poor performance of bank stocks, the S&P 500 Financials Index was down more than 1% at the time of press.
Meanwhile, the benchmark 10-year US Treasury bond yield turned negative on the day below 4.2%, causing the US Dollar Index to erase the gains it posted after the upbeat US Retail Sales data for July.
US Dollar price today
The table below shows the percentage change of US Dollar (USD) against listed major currencies today. US Dollar was the strongest against the Australian Dollar.
| USD | EUR | GBP | CAD | AUD | JPY | NZD | CHF | |
| USD | -0.28% | -0.36% | -0.01% | 0.10% | -0.05% | -0.02% | -0.18% | |
| EUR | 0.29% | -0.06% | 0.31% | 0.40% | 0.21% | 0.27% | 0.13% | |
| GBP | 0.35% | 0.08% | 0.35% | 0.45% | 0.31% | 0.33% | 0.16% | |
| CAD | 0.00% | -0.30% | -0.36% | 0.10% | -0.09% | -0.02% | -0.21% | |
| AUD | -0.16% | -0.45% | -0.52% | -0.14% | -0.25% | -0.18% | -0.33% | |
| JPY | 0.07% | -0.22% | -0.24% | 0.06% | 0.15% | 0.06% | -0.12% | |
| NZD | 0.02% | -0.28% | -0.35% | 0.01% | 0.12% | -0.04% | -0.16% | |
| CHF | 0.17% | -0.13% | -0.19% | 0.18% | 0.27% | 0.08% | 0.16% |
The heat map shows percentage changes of major currencies against each other. The base currency is picked from the left column, while the quote currency is picked from the top row. For example, if you pick the Euro from the left column and move along the horizontal line to the Japanese Yen, the percentage change displayed in the box will represent EUR (base)/JPY (quote).
- USD/CAD drops sharply to near 1.3450 as US Dollar loses resilience.
- US Retail Sales for July expanded at a stronger pace of 0.7% amid higher disposable income.
- Canadian inflation expanded at a robust pace, discomforting BoC policymakers.
The USD/CAD pair witnesses selling pressure after sensing immense selling interest near a two-month high of around 1.3500 in the early New York session. The Loonie asset dropped amid a sell-off in the US Dollar despite upbeat United States Retail Sales and higher-than-expected Canadian inflation data for July.
S&P500 opens on a negative note as robust consumer spending momentum elevates consumer inflation expectations. The US Dollar Index tests territory below the crucial support of 103.00.
US Census Bureau reported that consumer spending in July expanded at a higher momentum. The economic data rose by 0.7% vs. expectations of 0.4% and the former release of 0.2%. It seems that higher disposable income due to sustained wage growth allows individuals to spend heavily. Retail Sales excluding automobiles rose by 1.0%, indicating robust demand for durables and quick consumables.
A moderate increase in inflation and resilient consumer spending would force the Federal Reserve (Fed) to keep interest rates higher for a longer period. Going forward, investors will focus on the Federal Open Market Committee (FOMC) minutes for July’s monetary policy, which will be released on Wednesday.
Meanwhile, the Canadian Dollar strengthens as the Consumer Price Index (CPI) for July expanded strongly. Headline CPI grew at a 0.6% pace, outperforming surprisingly higher estimates of 0.3%. Core inflation that excludes volatile oil and food prices expanded strongly by 0.5%. Annual headline inflation accelerated to 3.3% while core CPI remained stable at 3.2%. Hotter-than-expected Canadian inflation would discomfort Bank of Canada (BoC) policymakers and force them to deliver hawkish commentary.
- Annual inflation in Canada rebounded to 3.3% in July from 2.8% in June.
- USD/CAD slides to 1.3470 after the CPI data and US Retail Sales.
Inflation in Canada, as measured by the change in the Consumer Price Index (CPI), rebounded to 3.3% on a yearly basis in July from 2.8% in June, which was the lowest since March 2021. This reading came in above the market expectation of 2.8%. On a monthly basis, the CPI rose 0.6%, compared to analysts' estimate for an increase of 0.3%.
Moreover, the Bank of Canada reported that the monthly Core CPI, which excludes volatile food and energy prices, rose 0.5%, while the annual Core CPI stayed at 3.2%, against expectations of a decline to 2.8%.
Market reaction
The USD/CAD edged lower following the Canadian CPI and also US Retail Sales data. The pair dropped from 1.3490 to 1.3470, as the positive impact on the Canadian Dollar was being offset by a larger-than-expected increase in US Retail Sales.
- The oil price is on the verge of delivering a breakdown ahead of the US Retail Sales data.
- US consumer spending momentum expanded at a higher pace of 0.4% vs. the former pace of 0.2%.
- A confident breakdown of the Rising Channel pattern will trigger a bearish reversal.
West Texas Intermediate (WTI), futures on NYMEX, skid below the $82.00 support and expose to further downside. The oil price faces significant selling pressure after printing a fresh eight-month high of around $84.85 as a moderate increase in the United States inflation would force the Federal Reserve (Fed) to keep interest rates higher for a longer period.
The oil price could resume its upside journey as Saudi Arabia considered an oil support cut to achieve price stability in the oil market.
Meanwhile, the US Dollar Index (DXY) struggles to maintain an auction around 103.00 ahead of the US Retail Sales data for July. As per the estimates, consumer spending momentum expanded at a higher pace of 0.4% vs. the former pace of 0.2%.
The oil price is on the verge of delivering a breakdown of the Rising Channel chart pattern formed on a two-hour scale. A confident breakdown of the aforementioned chart pattern will trigger a bearish reversal, which will strengthen bears. The 50-period Exponential Moving Average (EMA) at $82.23 is consistently acting as a barricade for the oil bulls.
The Relative Strength Index (RSI) (14) slips into the range of 20.00-40.00, which indicates an activation of a bearish impulse.
A downside move below August 1 low at $80.40 would drag the oil price toward August 3 low at $78.50, followed by July 24 low at $76.38.
In an alternate scenario, a recovery move above April 14 high near $82.50 would drive the asset toward April 10 high at $84.32. Breach of the latter would expose the oil price to a fresh nine-month high near $86.00.
WTI two-hour chart
-638276987601159378.png)
Economists at Rabobank expect GBP/USD to trade around 1.2600 on a 3-month view.
Cable to turn lower into autumn
"Before the BoE next meets on September 21, there will be plenty more economic data to digest. This will include another labour report and, including tomorrow’s release, two more sets of CPI inflation data. Although another rate hike in September looks all but certain, clearly policymakers will be hoping for further signs that inflation and wage growth have started to ease and that the peak in Bank rate is moving closer."
"We expect cable to turn lower into the autumn on the expectation that the peak in rates will then be close. We see cable edging back to GBP/USD 1.26 on a 3-month view and towards 1.22 in 6 months. We maintain the view that risks between GBP and the EUR are fairly evenly balanced and look for further range trading around the EUR/GBP 0.96 level on a 1-to-3-month view."
FX option expiries for August 15 NY cut at 10:00 Eastern Time, via DTCC, can be found below.
- EUR/USD: EUR amounts
- 1.0800-05 1.5b
- 1.0810 685m
- 1.0900 1.3b
- 1.0930-35 1.1b
- 1.0940 2.3b
- 1.0990 2.1b
- 1.1000 2.1b
- GBP/USD: GBP amounts
- 1.2650 570m
- 1.2700 585m
- USD/JPY: USD amounts
- 143.50 1.0b
- 145.00 1.3b
- 145.25 595m
- 146.00 900m
USD/CAD: USD amounts
- 1.3100 830m
- 1.3400 620m
Analysts at Standard Chartered Global Research expect the People’s Bank of China (PBoC) to lower the reserve requirement ratio (RRR) by 25 basis points both in Q3-2023 and Q1-2024.
China can still achieve growth target
"Fiscal spending fell behind the budget in H1. We expect the government to adopt a more expansionary fiscal policy in the remainder of 2023, fully utilising this year’s budgeted broad deficit of 7.5% of GDP."
"Despite a weak start to Q3, we still think China can achieve its GDP growth target of c.5% in 2023, thanks to favourable base effects, a reopening boost to the services sector, and increased policy stimulus. We maintain our full-year 2023 GDP growth forecast for China at 5.4%."
- Gold price continues its south-side move amid resilient US Dollar and Treasury yields.
- Investors await the US Retail Sales data for July, which is seen expanding with higher momentum.
- An economic slowdown in China improves the appeal of the US Dollar Index as a safe haven.
Gold price (XAU/USD) has remained in bearish territory for more than three weeks due to a resilient US Dollar. The precious metal faces the wrath despite elevated hopes of a steady interest rate decision to be taken by the Federal Reserve (Fed) in its September monetary policy. The context that the Fed will keep interest rates higher for a longer period as US economic resilience and a historically low jobless rate will appear as a difficulty in shredding the “last mile” of inflationary pressures.
As the Fed conveyed in July’s policy meeting that the central bank will be data-dependent from now on, investors will keenly watch the July US Retail Sales data. Consumer spending is seen expanding at a higher momentum as payroll bills expanded at a steady pace in July. After a modest inflationary recovery, higher consumer spending momentum would force Fed policymakers to keep interest rates higher for longer.
Daily Digest Market Movers: Gold price falls ahead of US Retail Sales data
- Gold price looks set to test the round-level support of $1,900.00 amid strength in the US Dollar and US Treasury yields.
- 10-year US Treasury yields jump to 4.22% as investors hope that Federal Reserve policymakers will face difficulties getting the economy to 2% core inflation.
- The US Dollar strengthens as investors lose confidence in China’s economic outlook due to persistent deflation risks.
- An economic slowdown in China improves the appeal of the US Dollar Index (DXY) as a safe haven.
- The US Dollar will remain in the spotlight on Tuesday as the US Census Bureau will report the monthly Retail Sales data for July, which will be published at 12:30 GMT.
- The significance of the US Retail Sales is high as Fed policymakers conveyed in their July monetary policy meeting that further policy action will be data dependent.
- Analysts at TD Securities expect Retail Sales to rise for a fourth consecutive month in July after 0.2%-0.5% MoM gains in Q2. Volatile auto sales will likely add to growth while sales in gas stations might be a minor obstacle. Importantly, the control group is expected to stay firm, with online sales benefiting from Amazon's Prime Day. Sales in bars/restaurants to expand at a brisk pace.”
- In spite of a slower-than-expected jump in US inflation and a decent increase in the Producer Price Index (PPI) for July, the Fed is expected to keep the interest rate policy unchanged in September.
- A moderate increase in US inflation is majorly contributed by higher rentals, which indicates that inflation is confidently returning to 2%.
- No doubt, the Fed is expected to keep policy rates unchanged in September, the context which is hurting the Gold price is the hope that the central bank will keep interest rates elevated for a longer period.
- Atlanta Fed Assistant Vice President and chief inflation watcher Brent Meyer suggests in a new analysis that the road to 2% inflation may in fact be smooth, rather than filled with the setbacks and difficult choices many Fed officials have said they expect.
- In the latest survey of consumer inflation expectations by the New York Fed, inflation one year from now will be at 3.5% vs. an expectation of 3.8% recorded in June.
- On Monday, US Treasury Secretary Janet Yellen said that President Joe Biden's policies are powering historic job growth and rebuilding competitiveness, Reuters reported.
- This week, investors will also focus on the Federal Open Market Committee (FOMC) minutes, which will be released on Wednesday at 18:00 GMT. Investors would look for cues about inflation and the interest rate guidance for the rest of 2023.
Technical Analysis: Gold price tests below the 200-day EMA
Gold price continues its declining spell after failing to sustain above the crucial support of $1,910.00. The precious metal is expected to extend its downside toward the $1,900.00 support amid sheer strength in the US Dollar. The yellow metal tests territory below the 200-day Exponential Moving Average (EMA), followed by a bearish crossover from the 20 and 50-day EMAs. Momentum oscillators indicate the activation of a bearish impulse.
Interest rates FAQs
What are interest rates?
Interest rates are charged by financial institutions on loans to borrowers and are paid as interest to savers and depositors. They are influenced by base lending rates, which are set by central banks in response to changes in the economy. Central banks normally have a mandate to ensure price stability, which in most cases means targeting a core inflation rate of around 2%.
If inflation falls below target the central bank may cut base lending rates, with a view to stimulating lending and boosting the economy. If inflation rises substantially above 2% it normally results in the central bank raising base lending rates in an attempt to lower inflation.
How do interest rates impact currencies?
Higher interest rates generally help strengthen a country’s currency as they make it a more attractive place for global investors to park their money.
How do interest rates influence the price of Gold?
Higher interest rates overall weigh on the price of Gold because they increase the opportunity cost of holding Gold instead of investing in an interest-bearing asset or placing cash in the bank.
If interest rates are high that usually pushes up the price of the US Dollar (USD), and since Gold is priced in Dollars, this has the effect of lowering the price of Gold.
What is the Fed Funds rate?
The Fed funds rate is the overnight rate at which US banks lend to each other. It is the oft-quoted headline rate set by the Federal Reserve at its FOMC meetings. It is set as a range, for example 4.75%-5.00%, though the upper limit (in that case 5.00%) is the quoted figure.
Market expectations for future Fed funds rate are tracked by the CME FedWatch tool, which shapes how many financial markets behave in anticipation of future Federal Reserve monetary policy decisions.
- USD/CHF drops to near 0.8750 amid subdued US Dollar ahead of Retail Sales data.
- Monthly consumer spending momentum is seen expanding at a higher pace of 0.4% vs. June’s pace of 0.2%.
- The SNB will raise interest rates by 25 bps in September to 2%.
The USD/CHF pair drops to near its immediate support of 0.8750 in the European session. The Swiss Franc asset faces pressure amid the directionless US Dollar Index (DXY) ahead of the United States Retail Sales data for July, which will be released at 12:30 GMT.
S&P500 futures posted some losses in London, portraying a cautious market mood amid an economic slowdown in the Chinese economy due to rising deflation risks. Economic risks in China have improved the appeal of the US Dollar as a safe haven significantly.
The USD Index oscillates in a narrow range of 103.00 as investors await the consumer spending data for further guidance. As per the estimates, monthly consumer spending momentum is seen expanding at a higher pace of 0.4% vs. June’s pace of 0.2%. A similar performance is expected in retail sales data excluding automobiles.
Resilience in consumer spending and tight labor market conditions could force the Federal Reserve (Fed) policymakers to keep interest rates elevated for a longer period. The sustainability of higher interest rates could also propel fears of a recession in the US economy.
In addition to the US consumer spending data, investors will also focus on the Federal Open Market Committee (FOMC) minutes, which will be released on Wednesday. Investors would look for cues about the interest rate guidance.
Meanwhile, the Swiss Franc remains subdued as July’s Producer and Import prices display deflation. Monthly economic data contracted at a 0.1% pace while annual figures remained deflated at 0.6%. This indicates that Swiss inflation is under control and the Swiss National Bank is well-handling the inflation situation. A survey from Bloomberg showed that the SNB will raise interest rates by 25 basis points (bps) in September to 2%.
- Germany’s ZEW Economic Sentiment Index improved in August, while Current Situation Index declined.
- EUR/USD stays in daily range above 1.0900 following the latest data.
The German ZEW headline number showed that the Economic Sentiment Index improved to -12.3 in August from -14.7 in July. This reading came in better than the market expectation of -14.4. Similarly, Economic Sentiment Index for the Eurozone rose to -5.5 from -12.2 in the same period.
On a negative note, the Current Situation Index for Germany declined to -71.3 from -59.5, missing analysts' estimate of -63.
Key takeaways
"Indicator of economic sentiment remains in negative territory, though it shows a slight improvement compared to the previous month."
"Financial market experts thus anticipate a slight uptick in the economic situation by yearend."
"However, these heightened expectations need to be viewed in the context of a significantly worsened assessment of the current economic situation in Germany."
"Respondents, by and large, do not anticipate any further interest rate hikes in the eurozone and the United States and the economic outlook for the USA has seen a significant increase – these factors contribute to the improved expectations for Germany."
Market reaction
EUR/USD showed no immediate reaction to mixed sentiment reading and the pair was last seen rising 0.2% on the day at 1.0925.
- USD/JPY scales higher for the seventh straight day and hits a fresh YTD peak on Tuesday.
- The recent move up along an ascending channel points to a well-established positive trend.
- Intervention fears hold back bulls from placing fresh bets and cap the upside for the major.
The USD/JPY pair gains some positive traction for the seventh successive day on Tuesday and climbs to its highest level since November 2022, around the 145.85 region during the early part of the European session.
The Japanese Yen (JPY) continues with its underperformance in the wake of a more dovish stance adopted by the Bank of Japan (BoJ), which is the only central bank in the world to maintain a negative benchmark interest rate. This, in turn, is seen as a key factor acting as a tailwind for the USD/JPY pair amid the underlying bullish tone around the US Dollar (USD), supported by expectations that the Federal Reserve (Fed) will keep rates higher for longer.
Even the upbeat Japanese GDP report, showing that the economy expanded by 1.5% during the second quarter and a 6% annualized pace, fails to provide any respite to the JPY. That said, speculations for a possible intervention by Japanese authorities to curb any further fall in the domestic currency hold back bulls from placing fresh bets. The fundamental backdrop, however, suggests that the path of least resistance for the USD/JPY pair is to the upside.
From a technical perspective, the recent strong move-up witnessed over the past one-and-half week or so has been along an upward sloping trend-channel. This, along with last week's breakout through the 145.00 psychological mark, adds credence to the positive outlook for the USD/JPY pair. That said, the Relative Strength Index (RSI) on the 1-hour chart is flashing slightly overbought conditions and warrants caution for bullish traders.
Hence, any subsequent move up is more likely to confront stiff resistance and remain capped near the 146.00 mark, representing the top boundary of the aforementioned trend channel. The said handle should act as a pivotal point, which if cleared will be seen as a fresh trigger for bullish traders and lift the USD/JPY pair beyond an intermediate hurdle near the 146.35 area, towards the 146.75-146.80 region en route to the 147.00 round figure.
On the flip side, any meaningful corrective decline might now find decent support near the 145.00 resistance breakpoint. This is followed by the lower end of the ascending channel, currently pegged around the 144.60 region. A convincing break below the latter might negate the constructive setup and shift the near-term bias in favour of bearish traders. The subsequent fall could then drag the USD/JPY pair to the 144.00 mark and then to the 143.30 horizontal support.
USD/JPY 4-hour chart
Technical levels to watch
- AUD/USD turns lower for the sixth straight day and slides back closer to the YTD low.
- China’s economic woes continue to exert pressure on the Aussie amid a bullish USD.
- Bets for one more Fed rate hike push US bond yields higher and underpin the buck.
The AUD/USD pair fades an intraday bullish spike to the 0.6520 region and retreats to the lower end of its daily range during the early part of the European session on Tuesday. Spot prices currently trade around the 0.6470 area, down for the sixth straight day and well within the striking distance of the YTD trough touched on Monday.
The initial market reaction to a surprise rate cut by the People's Bank of China (PBoC) fizzles out rather quickly on the back of concerns that China's post-pandemic recovery has slowed after a brisk start in the first quarter. The fears were further fueled by another round of disappointing macro data from China – including Retail Sales, Industrial Production, Fixed Asset Investment and the urban unemployment rate. This, in turn, undermines the China-proxy Australian Dollar (AUD), which, along with the underlying bullish sentiment surrounding the US Dollar (USD), continues to exert some downward pressure on the AUD/USD pair.
The USD Index (DXY), which tracks the Greenback against a basket of currencies, trades just below its highest level in more than two months and remains supported by expectations that the Federal Reserve (Fed) will stick to its hawkish stance. The outlook pushes the yield on the benchmark 10-year US government bond to a nine-month peak and supports prospects for a further near-term appreciating move for the buck. The Aussie bulls, meanwhile, seem unimpressed by the Reserve Bank of Australia's (RBA) August meeting minutes, which showed that policymakers saw a "credible path" back to the inflation target with the current cash rates at 4.1%.
The aforementioned fundamental backdrop, along with a confirmed bearish double-top breakdown, suggests that the path of least resistance for the AUD/USD pair is to the downside. Some follow-through selling below mid-0.6400s, or the lowest level since November 2022 set the previous day, will reaffirm the negative bias and pave the way for an extension of a one-month-old downtrend. Traders now look to the US economic docket, featuring monthly Retail Sales and the Empire State Manufacturing Index, later during the early North American session. Apart from this, the broader risk should provide a fresh impetus to the major.
Technical levels to watch
- Pound Sterling delivers a breakout of the consolidation after UK’s ONS reported weak labor market data.
- United Kingdom labor market witnessed lay-offs in June and a healthy jump in jobless claims in July.
- Britain’s Unemployment Rate rose to a fresh nine-month high at 4.2%.
The Pound Sterling (GBP) delivered a consolidation breakout after the United Kingdom’s Office for National Statistics reported a significant growth in jobless benefits and healthy lay-offs in the labor market. The GBP/USD pair extends its upside as a considerable jump in the labor cost index ensures more interest rate hikes from the Bank of England (BoE) cannot be ruled out. The Unemployment Rate rose to a fresh nine-month high at 4.2%.
United Kingdom’s vulnerable labor market report indicates the consequences of aggressively tight interest rate policy by the BoE. Labor shortages and high food inflation have remained major contributors to persistent inflation and lay-offs in June ensure easing inflationary pressures ahead. After a weak labor market report and healthy growth rate, investors will shift their focus toward the inflation data for July, which will be published on Wednesday at 06:00 GMT.
Daily Digest Market Movers: Pound Sterling moves north despite weak labor market data
- Pound Sterling jumps above 1.2700 as the United Kingdom labor market data demonstrates the consequences of the aggressive rate-tightening cycle by the Bank of England.
- Claimant Count Change for July rose sharply by 29K, higher than the 16.2K jobless claims recorded in June. On the contrary, investors forecasted a decline in the number of claims by 7.3K.
- The UK labor market witnessed a decline in payrolls by 66K in June while investors forecasted fresh additions of 75K job seekers. In May, the addition of 102K employees in the workforce was recorded.
- Three months to June Unemployment Rate rose to 4.2% vs. the estimates and the former release of 4.0%.
- The key catalyst that is going to discomfort BoE policymakers is the significant growth in labor cost data.
- April-June quarter Average Earnings excluding bonuses rose to 7.8% vs. a downwardly revised prediction of 7.4%. Earnings data including bonuses jumped significantly to 8.2% in the same period, considerably higher than the consensus of 7.3%.
- The BoE might continue tightening interest rates as significant growth in labor cost is sufficient to offset higher jobless claims and lay-offs.
- Last week, UK factory activities for June and Q2 Gross Domestic Product (GDP) grew significantly despite the continuation of aggressive policy-tightening by the Bank of England.
- Monthly GDP swung from a contraction and grew by 0.5% in June, more than the 0.2% expected. In the January-March quarter, the economy contracted by 0.1%.
- Quarterly GDP grew by 0.2% in 2Q, while analysts had forecasted a stagnant performance. The annual growth rate was 0.4%, doubling the consensus and the prior release of 0.2%.
- Monthly Industrial Production and Manufacturing Production for June expanded strongly by 1.8% and 2.4% respectively, outperforming expectations by a wide margin.
- After the hangover of factory activities and the labor market, investors will shift their focus toward the inflation and Retail Price Index data.
- UK inflation is expected to continue its softening spell as the BoE has raised interest rates to 5.25% and further policy tightening is widely anticipated.
- US Dollar appeal continues to shine as investors lose confidence in China’s economic growth, concerned about deflation risks due to weak demand and declining exports.
- Investors hope that the Federal Reserve (Fed) will keep the interest rate policy unchanged in September as modest growth in the United States inflation is in line with the Fed’s desired rate of 2%.
- On Tuesday, investors will keep an eye on the US Retail Sales, which will be released at 12:30 GMT. Retail sales are seen expanding by 0.4% in July, accelerating from the 0.2% increase recorded for June. A similar performance is expected for retail sales excluding autos.
Technical Analysis: Pound Sterling delivers a consolidation breakout
Pound Sterling comes out of the woods and tests the region above the round-level resistance of 1.2700. The Cable delivered a V-shape recovery after printing a fresh six-week low around 1.2600 as investors considered the Pound Sterling a value bet. Medium-term sentiment for the Pound Sterling is still bearish as the Cable is trading below the 20 and 50-day Exponential Moving Averages (EMAs). The asset could be exposed to fresh lows if it fails to sustain above the crucial support of 1.2600.
Pound Sterling FAQs
What is the Pound Sterling?
The Pound Sterling (GBP) is the oldest currency in the world (886 AD) and the official currency of the United Kingdom. It is the fourth most traded unit for foreign exchange (FX) in the world, accounting for 12% of all transactions, averaging $630 billion a day, according to 2022 data.
Its key trading pairs are GBP/USD, aka ‘Cable’, which accounts for 11% of FX, GBP/JPY, or the ‘Dragon’ as it is known by traders (3%), and EUR/GBP (2%). The Pound Sterling is issued by the Bank of England (BoE).
How do the decisions of the Bank of England impact on the Pound Sterling?
The single most important factor influencing the value of the Pound Sterling is monetary policy decided by the Bank of England. The BoE bases its decisions on whether it has achieved its primary goal of “price stability” – a steady inflation rate of around 2%. Its primary tool for achieving this is the adjustment of interest rates.
When inflation is too high, the BoE will try to rein it in by raising interest rates, making it more expensive for people and businesses to access credit. This is generally positive for GBP, as higher interest rates make the UK a more attractive place for global investors to park their money.
When inflation falls too low it is a sign economic growth is slowing. In this scenario, the BoE will consider lowering interest rates to cheapen credit so businesses will borrow more to invest in growth-generating projects.
How does economic data influence the value of the Pound?
Data releases gauge the health of the economy and can impact the value of the Pound Sterling. Indicators such as GDP, Manufacturing and Services PMIs, and employment can all influence the direction of the GBP.
A strong economy is good for Sterling. Not only does it attract more foreign investment but it may encourage the BoE to put up interest rates, which will directly strengthen GBP. Otherwise, if economic data is weak, the Pound Sterling is likely to fall.
How does the Trade Balance impact the Pound?
Another significant data release for the Pound Sterling is the Trade Balance. This indicator measures the difference between what a country earns from its exports and what it spends on imports over a given period.
If a country produces highly sought-after exports, its currency will benefit purely from the extra demand created from foreign buyers seeking to purchase these goods. Therefore, a positive net Trade Balance strengthens a currency and vice versa for a negative balance.
- Silver oscillates in a narrow band above its lowest level since June 30 set on Monday.
- The setup remains tilted in favour of bears and supports prospects for further losses.
- Attempted recovery towards the $23.00 mark could be seen as a selling opportunity.
Silver struggles to capitalize on the previous day's modest bounce from the $22.35 region, or its lowest level since June 30 and oscillates in a narrow band through the early part of the European session on Tuesday. The white metal currently trades just above the mid-$22.00s and remains vulnerable to prolong the recent downward trajectory witnessed over the past four weeks or so.
Last week's breakdown through a short-term ascending trend line support extending from the June swing low and a subsequent slide below the very important 200-day Simple Moving Average (SMA) was seen as a fresh trigger for bearish traders. Adding to this, technical indicators on the daily chart are holding deep in the negative territory and are still far from being in the oversold zone. This, along with the lack of any meaningful buying, suggests that the path of least resistance for the XAG/USD is to the downside.
Hence, some follow-through weakness back towards retesting the multi-month low, around the $22.15-$22.10 area touched in June, looks like a distinct possibility. This is closely followed by the $22.00 mark, below which the white metal could accelerate the fall towards the $21.55-$21.50 intermediate support en route to the $21.00 mark. The XAG/USD could extend the slide further towards the $21.00 round figure en route to the YTD low, or levels just below the $20.00 psychological mark touched in March.
On the flip side, attempted recovery is likely to confront some resistance near the overnight swing low, around the $22.75 region, ahead of the $23.00 round figure. Any subsequent move up might still be seen as a selling opportunity and remain capped near the $23.20-$23.30 confluence support breakpoint, now turned resistance. The latter should act as a pivotal point, which if cleared decisively might trigger a short-covering move and lift the XAG/USD to the $23.60-$23.65 horizontal barrier. Bulls might then aim to reclaim the $24.00 mark.
Silver daily chart
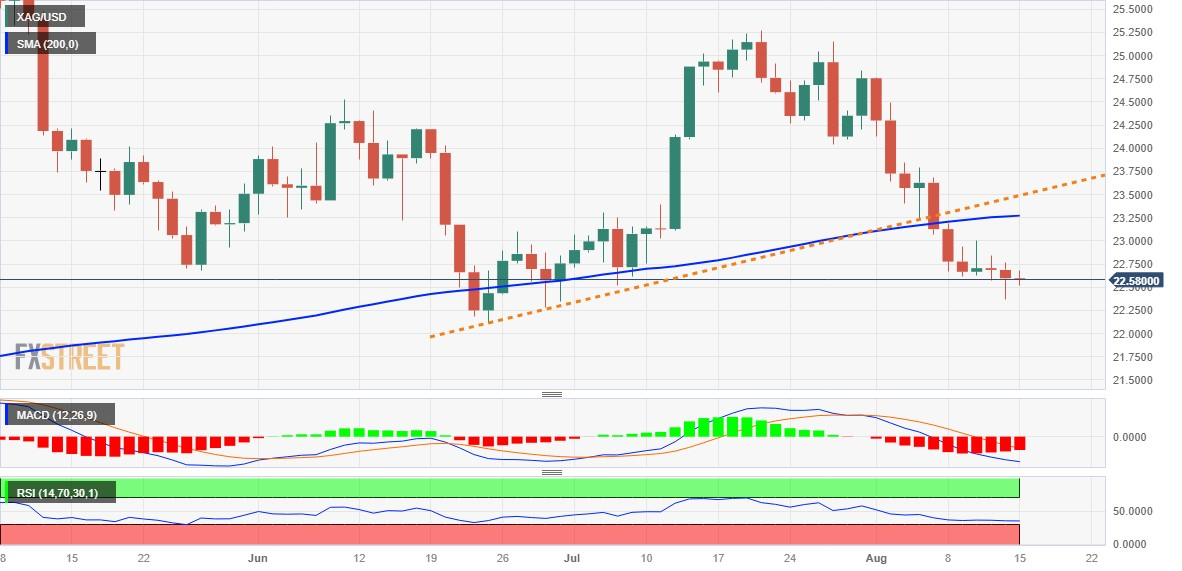
Technical levels to watch
- EUR/USD holds above the 1.0900 mark in the early European session.
- Germany’s Wholesale Price Index (WPI) for July increased to -2.8% YoY from -2.9% prior.
- Market players anticipate that the Federal Reserve (Fed) will keep the interest rate unchanged in its September meeting.
- The US Retail Sales data will be closely watched by traders.
The EUR/USD pair recovers some lost ground and bounces off the low of 1.0875 heading into the early European session on Tuesday. The major pair currently trades around 1.0925, up 0.17% for the day. Markets await US Retail Sales data, and it could trigger volatility in EUR/USD in the next sessions.
On Monday, Germany’s Wholesale Price Index (WPI) for July increased to -2.8% YoY from -2.9% prior. The figure came in lower than the -2.6% expected. The monthly Wholesale Price Index reprinted -0.2% versus the market consensus of -1.4%. However, the European Central Bank's (ECB) monthly Economic Bulletin revealed last week that the Eurozone’s inflation is still predicted to be too high for too long, and the prospects for economic growth and inflation are still uncertain.
On the US Dollar front, the Fed San Francisco President, Mary C. Daly, stated last week that there is a lot more information to evaluate and that it is premature to project whether additional rate increases or a prolonged period of holding rates are required. This, in turn, caps the upside for the Euro and acts as a headwind for the EUR/USD pair.
Investors will take cues from US Retail Sales due later in the American session. Market participants anticipate that the Federal Reserve (Fed) will keep the interest rate unchanged in its September meeting as US inflation remains moderate and in line with the central bank's target of 2%. However, the odds for an additional rate hike of 25 basis points (bps) increased to almost 40% in its November meeting.
Looking ahead, the highly-anticipated US Retail Sales will be released later in the day. The headline figure is likely to increase by 0.4% MoM in July. Later in the week, the annual Eurozone Gross Domestic Product (GDP) Q2 and Harmonized Index of Consumer Prices MoM for July will be due. Also, market players will keep an eye on the FOMC Minutes for fresh impetus.
- USD/CAD remains sidelined after poking monthly high the previous day, pares intraday losses of late.
- Downbeat US inflation expectations, cautious optimism joins consolidation ahead of key data/events to weigh on US Dollar.
- WTI crude oil cheers softer US Dollar, hopes of China stimulus and PBoC rate cut to recover.
- US Retail Sales, Canada inflation clues will join risk catalysts to entertain intraday traders of Loonie pair.
USD/CAD clings to mild losses near 1.3450 as it seesaws at the weekly top marked the previous day amid early Tuesday morning in Europe. In doing so, the Loonie pair aptly portrays the cautious mood ahead of the top-tier statistics from the US and Canada.
It’s worth noting that the recent retreat of the US Dollar Index (DXY) contrasts with a pick-up in the WTI crude oil price, Canada’s main export item, to challenge the pair’s upside amid mixed clues.
Having refreshed a five-week high the previous day, the DXY prints the first daily loss in four around 103.05 by the press time, after witnessing downbeat inflation clues. That said, the New York Fed’s one-year inflation expectations eased to 3.5% for July, down three points by falling to the lowest level since April 2021. New York Fed survey, however, also suggested confidence in positive labor market conditions and economic transition.
On the other hand, the WTI crude oil rises 0.40% intraday to $83.25 as it reverses the previous day’s fall to a one-week low. While the US Dollar’s pullback and the market’s cautious optimism can be cited as the key catalysts for the Oil Price rebound, the People’s Bank of China’s (PBoC) surprise rate cuts and readiness for further stimulus adds strength to the black gold’s corrective bounce as Beijing is one of the world’s biggest crude oil customer.
It should be noted that sluggish US Treasury bond yields, after refreshing the yearly top, also prods the USD/CAD buyers. That said, the US 10-year Treasury bond yields seesaw at the highest level since November 2022, marked the previous day, making rounds to 4.20% by the press time. While portraying the mood, stock futures of the US and Europe remain mildly positive and prod the DXY bulls.
Moving forward, the US Retail Sales for July, expected 0.4% MoM versus 0.2% prior, will be important to watch for immediate directions. Also important will be Canada’s Consumer Price Index (CPI) for July and the Bank of Canada (BoC) CPI Core for the said month, not to forget the risk catalysts and the energy market updates.
Technical analysis
A five-month-old descending resistance line joins the overbought RSI (14) to challenge the USD/CAD buyers around 1.3465-70.
Here is what you need to know on Tuesday, August 15:
Investors remain on edge on Tuesday as they assess the latest headlines and data releases from China. ZEW Sentiment survey for Germany and the Eurozone will be featured in the European economic docket. In the second half of the day, July Retail Sales data from the US and July Consumer Price Index data from Canada will be watched closely by market participants. NY Fed Empire State Manufacturing Survey and June Business Inventories will be the other US data releases of the day.
During the Asian trading hours, the data from China revealed that Retail Sales rose 2.5% on a yearly basis in July, down from 3.1% in June and much weaker than the market expectation of 4.8%. Other data showed that Industrial Production expanded by 3.7% in the same period, compared to analysts' estimate for a growth of 4.5%. In a surprising development, China's central bank, the People’s Bank of China (PBOC), unexpectedly lowered the one-year Medium-term Lending Facility (MLF) rate to 2.50% from 2.65%. Several experts think that this decision opens the door to a potential cut in China's lending benchmark loan prime rate (LPR) next week.
After falling more than 1% earlier in the session, Hong Kong's Hang Seng Index erased a portion of its daily losses and was last seen losing 0.7% on the day. Meanwhile, US stock index futures trade modestly higher on the day and the US Dollar Index consolidates Monday's gains near 103.00.
Following a bearish start to the day on disappointing Chinese data, AUD/USD and NZD/USD managed to rebound after PBoC announcements. AUD/USD was last seen posting small daily gains near 0.6500 and NZD/USD was holding steady at around 0.5980.
Earlier in the day, the UK's Office for National Statistics (ONS) reported that the ILO Unemployment Rate edged higher to 4.2% in three months through June from 4%. Employment Change arrived at -66,000 and missed the market expectation of +75,000 by a wide margin. Other details of the jobs report revealed that wage inflation, as measured by the change in Average Earnings Including Bonus, climbed from 7.2% to 8.2% in the same period. GBP/USD's reaction to these figures were relatively muted and the pair was last seen moving in positive territory slightly above 1.2700.
Pound Sterling price today
The table below shows the percentage change of Pound Sterling (GBP) against listed major currencies today. Pound Sterling was the strongest against the Japanese Yen.
| USD | EUR | GBP | CAD | AUD | JPY | NZD | CHF | |
| USD | -0.11% | -0.20% | -0.02% | -0.14% | 0.11% | -0.10% | -0.09% | |
| EUR | 0.12% | -0.07% | 0.10% | -0.02% | 0.23% | 0.02% | 0.03% | |
| GBP | 0.21% | 0.10% | 0.18% | 0.05% | 0.31% | 0.10% | 0.10% | |
| CAD | 0.03% | -0.08% | -0.16% | -0.11% | 0.14% | -0.07% | -0.09% | |
| AUD | 0.19% | 0.07% | -0.01% | 0.17% | 0.29% | 0.09% | 0.10% | |
| JPY | -0.11% | -0.22% | -0.30% | -0.14% | -0.27% | -0.20% | -0.20% | |
| NZD | 0.10% | -0.02% | -0.10% | 0.08% | -0.04% | 0.21% | 0.00% | |
| CHF | 0.09% | -0.03% | -0.11% | 0.07% | -0.05% | 0.20% | -0.01% |
The heat map shows percentage changes of major currencies against each other. The base currency is picked from the left column, while the quote currency is picked from the top row. For example, if you pick the Euro from the left column and move along the horizontal line to the Japanese Yen, the percentage change displayed in the box will represent EUR (base)/JPY (quote).
EUR/USD registered its lowest daily close since early July on Monday but managed to hold above 1.0900.
USD/JPY continues to inch higher early Monday and was last seen trading at its highest level since November above 145.70. The data from China showed that Industrial Production expanded 2.4% on a monthly basis in June but this print doesn't seem to be helping the Japanese Yen find demand.
Gold price stays on the back foot and closes in on $1,900 early Tuesday amid growing fears over a slowdown in China's economic activity. Meanwhile, the 10-year US Treasury bond yield holds near 4.2%, not allowing XAU/USD to stage a rebound.
Annual inflation in Canada is forecast to rise to 3% in July from 2.8% in June. USD/CAD was last seen moving sideways at around 1.3450.
Bitcoin stays directionless while moving in a tight channel below $29,500. Similarly, Ethereum continues to fluctuate slightly above $1,800.
- GBP/JPY prolongs its upward trajectory and climbs to a fresh multi-year peak on Tuesday.
- The stronger UK wage growth data lifts bets for more BoE rate hikes and boosts the GBP.
- The BoE-BoJ policy divergence favours bulls and supports prospects for additional gains.
The GBP/JPY cross jumps to a fresh high since December 2015 following the release of the UK employment details, with bulls now looking to build on the momentum further beyond the 185.00 psychological mark.
The UK Office for National Statistics (ONS) reported that the ILO Unemployment Rate unexpectedly rose to 4.2% in three months through June from 4% in the previous month. Moreover, the number of people claiming unemployment-related benefits increased by 29K in July as compared to the 7.3K decline anticipated, though the reading for June was revised down from 25.7K to 16.2 K. This, along with strong wage growth data, provides a goodish lift to the British Pound and the GBP/JPY cross.
In fact, British annual pay excluding bonuses was 7.8% higher than a year earlier in the three months to June, representing the highest annual rate since records began in 2001. Furthermore, wages including bonuses accelerated to 8.2% – also the fastest in the ONS data excluding the coronavirus pandemic period when government job subsidies distorted the data. This adds to worries about long-term inflation and might force the Bank of England (BoE) to continue raising interest rates, despite looming recession risks.
In contrast, the Bank of Japan (BoJ) the Bank of Japan (BoJ) has stuck to its ultra-loose monetary policy and is the only major central bank in the world to maintain a negative benchmark interest rate. This, along with a stable performance around the equity markets, is seen undermining the safe-haven Japanese Yen (JPY) and assisting the GBP/JPY cross to prolong its upward trajectory witnessed over the past one-and-half-week or so. Bulls, meanwhile, seem unaffected by the upbeat Japanese GDP report released earlier today.
The preliminary government data showed that the Japanese economy expanded by 1.5% during the April-June period and the annualized growth stood at 6.0% as compared to the 3.1% anticipated and 2.7% in the previous quarter. This marks the third straight quarter of expansion. Nevertheless, a big divergence in the monetary policy stance adopted by the BoE and the BoJ suggests that the path of least resistance for the GBP/JPY cross is to the upside. Hence, any meaningful corrective slide is likely to get bought into.
Technical levels to watch
- US Dollar Index takes offers to refresh intraday low, prints the first daily loss in four so far.
- Convergence of 200-DMA, descending trend line from March restricts immediate upside amid overbought RSI.
- DXY sellers remain cautious beyond 102.30 key support with eyes on US Retail Sales for July.
US Dollar Index (DXY) remains on the back foot at the intraday low of around 103.00 amid early Tuesday morning in Europe. In doing so, the Greenback’s gauge versus the six major currencies prints the first daily loss in four.
That said, a convergence of the 200-DMA and a 5.5-month-old descending trend line restrict immediate DXY upside amid the overbought RSI (14) line.
Adding strength to the pullback moves in the US Dollar Index is the market’s preparations for the US Retail Sales for July.
With this, the DXY is likely to extend the latest retreat towards the 50.0% Fibonacci retracement of the March-July downtrend, near 102.70.
However, the 100-DMA and a one-month-long rising trend line together puts a floor under the US Dollar Index Price near 102.30.
In a case where the DXY remains bearish past 102.30, April’s bottom of around 100.80 will be in the spotlight.
On the flip side, a daily closing beyond the aforementioned 103.30 resistance confluence isn’t an open invitation to the DXY bulls as the 61.8% Fibonacci retracement, also known as the Golden Fibonacci Ratio, will challenge the further upside near 103.50.
Also read: US Dollar Index: Firmer yields defend DXY bulls above 103.00 ahead of US Retail Sales
US Dollar Index: Daily chart
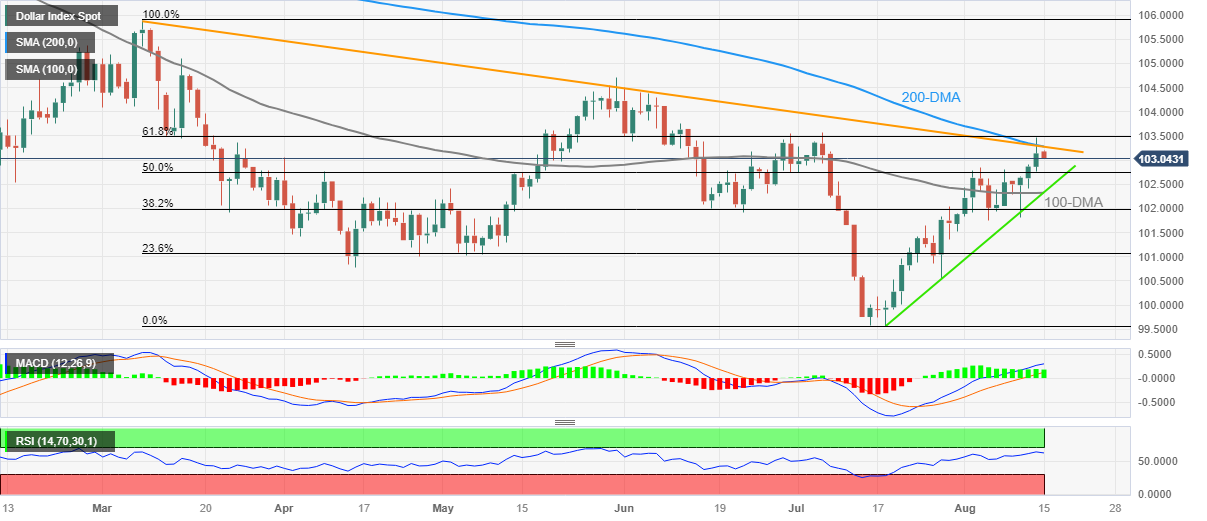
Trend: Limited downside expected
- Asian stock markets trade mixed on Tuesday.
- Chinese Retail Sales (July) came in at 2.5% YoY versus 4.8% expected; Industrial Production fell to 3.7% versus 4.5% expected.
- Japan's economic growth was 1.5% QoQ, compared to 0.8% expected and 0.5% previously.
- Indonesia's trade surplus declined more than expected in July to $1.31 billion.
- Investors await US Retail Sales, Japanese Trade data, FOMC Minutes.
Asian stock markets trade mixed on Tuesday following the release of downbeat Chinese data and the interest rate cut by the People's Bank of China (PBOC). During the early European session on Tuesday, EuroStoxx Futures gains 0.44% to 4,360 by press time.
At press time, China’s Shanghai falls 0.82% to 3,152, the Shenzhen Component Index slumps 1.42% to 10,604, and Hong Kong’s Hang Sang dips 1.24% to 18,540. India’s NIFTY 50 is up 0.03%, South Korea’s Kospi is down 0.79%, and Japan’s Nikkei gains 0.70%.
In China, the People's Bank of China (PBOC) cut the one-year medium-term Lending Facility (MLF) rate from 2.65% to 2.50% on Tuesday. The unexpected rate cuts by the People's Bank of China (PBOC) fuel fears about China's deteriorating economic outlook. Meanwhile, Chinese Retail Sales for July came in at 2.5% YoY compared to 4.8% expected and 3.1% previously, while the country's Industrial Production fell to 3.7% YoY compared to 4.5% expected and 4.1% previously.
In Japan, the preliminary data for Japan's Gross Domestic Product (GDP) for the second quarter (Q2) of 2023 showed that economic growth was 1.5% QoQ, compared to 0.8% expected and 0.5% previously. In the meantime, the annualised GDP increased to 6.0% from an estimated 3.1% and 2.8% previously. Japan's Economy Minister Shigeyuki Goto predicted a moderate economic recovery before mentioning the need to pay attention to the danger of a global downturn and the impacts of price increases. Goto demonstrated a willingness to respond flexibly to the economy and prices as needed.
On the Indonesian front, the statistics bureau revealed on Tuesday that Indonesia's trade surplus declined more than expected in July to $1.31 billion. Economists surveyed by Reuters estimated a surplus of $2.53 billion for July. In the previous month, a $3.46 billion trade surplus was recorded. Additionally, Imports fell 8.32% year on year to $19.57 billion, compared to the 15.50% a decrease projected by analysts in the survey.
Moving on, the Japanese Trade data and the annual National Consumer Price Index for July will be released from the Japanese docket later this week. Market participants will closely watch the US Retail Sales, FOMC Minutes and the comments from Fed officials for fresh impetus. The events could provide hints for further monetary policy and give a direction for riskier assets like equities, risk-sensitive currencies, etc.
The ILO Unemployment Rate in the UK climbed to 4.2% in three months through June, the Office For National Statistics (ONS) reported on Tuesday. This reading followed the 4% reported in May and came in worse than the market expectation of 4%.
Other details of the UK jobs report revealed that Employment Change was -66,000 in the same period, down sharply from +102,000. In the press release, the ONS noted that inactivity due to long-term sickness climbed to a new record high in the survey period.l
Wage inflation in the UK, as measured by the change in the Average Earnings Excluding Bonus, was 7.8% in June, compared to 7.5% in May. Average Earnings Including Bonus rose 8.2%, at a much stronger pace than analysts' estimate of 7.3%.
Market reaction
With the immediate market reaction, Pound Sterling managed to find demand with investors reacting to strong wage inflation readings. As of writing, GBP/USD was up 0.25% on the day at 1.2712.
Pound Sterling price today
The table below shows the percentage change of Pound Sterling (GBP) against listed major currencies today. Pound Sterling was the strongest against the Japanese Yen.
| USD | EUR | GBP | CAD | AUD | JPY | NZD | CHF | |
| USD | -0.07% | -0.19% | -0.08% | -0.35% | 0.06% | -0.26% | -0.04% | |
| EUR | 0.08% | -0.12% | -0.01% | -0.25% | 0.14% | -0.19% | 0.03% | |
| GBP | 0.20% | 0.15% | 0.12% | -0.13% | 0.27% | -0.06% | 0.15% | |
| CAD | 0.09% | 0.02% | -0.10% | -0.23% | 0.15% | -0.17% | 0.02% | |
| AUD | 0.33% | 0.25% | 0.14% | 0.24% | 0.38% | 0.07% | 0.28% | |
| JPY | -0.06% | -0.13% | -0.25% | -0.15% | -0.41% | -0.31% | -0.10% | |
| NZD | 0.26% | 0.18% | 0.07% | 0.17% | -0.07% | 0.32% | 0.21% | |
| CHF | 0.04% | -0.03% | -0.15% | -0.04% | -0.31% | 0.10% | -0.22% |
The heat map shows percentage changes of major currencies against each other. The base currency is picked from the left column, while the quote currency is picked from the top row. For example, if you pick the Euro from the left column and move along the horizontal line to the Japanese Yen, the percentage change displayed in the box will represent EUR (base)/JPY (quote).
- EUR/GBP takes offers to reverse early-day rebound from five-week-old rising support line.
- UK Employment Change drops, Unemployment Rate rises but Average Earnings improves.
- Market’s cautious optimism, holidays in multiple European markets prod cross-currency pair traders.
- German, Eurozone ZEW Survey for August will be important for intraday directions, Wednesday’s UK inflation will be the key.
EUR/GBP slides 25 pips to refresh intraday low near 0.8585 heading into Tuesday’s European session. In doing so, the cross-currency pair takes clues from the upbeat UK average earnings while paying a little heed to the downbeat employment change and unemployment rate figures per the latest release from the UK National Statistics.
Talking about the latest UK jobs report, the headline Employment Change marks -66K figures for June versus 50K expected and 102K prior whereas the ILO Unemployment Rate jumps to 4.2% for three months to June compared to the market’s expectations of staying unchanged at 4.0%.
More importantly, the Average Earnings including and excluding bonuses for three months to June improves heavily and boosts the hawkish expectations from the Bank of England (BoE), which in turn seems to have drowned the EUR/GBP price.
On Monday, the UK’s Chartered Institute of Personnel and Development (CIPD) released details of their latest survey while stating that the human resources executives expected to increase basic pay rates by a median of 5% – unchanged from the previous two quarters and the joint-highest readings since the survey started in 2012, per Reuters. The news increases the hawkish bias about the BoE after the upbeat UK growth numbers published the last week.
On the other hand, Germany’s Wholesale Price Index (WPI) for July edged higher to -2.8% YoY from -2.9% previous readings but came in softer than -2.6% expected. However, the monthly WPI figures reprinted the -0.2% MoM numbers versus -1.4% market forecasts.
Following the data, the German Economy Ministry noted that current early indicators do not yet point to a sustainable economic recovery in the coming months, per Reuters. The report, however, also added that the expected cautious recovery in private consumption, services and investment is showing the first signs of hope, which are likely to strengthen as the year progresses.
It’s worth noting that the Euro’s ability to cheer the US Dollar’s retreat from a five-week high, especially ahead of the mid-tier sentiment numbers from the ZEW Institute, puts a floor under the EUR/GBP price. Moving on, ZEW Economic Sentiment numbers for Germany and the Eurozone will be crucial for clear directions.
Technical Analysis
A clear U-turn from the 100-DMA resistance, around 0.8665 by the press time, joins the looming bear cross on the MACD and a steady RSI (14) line to keep the EUR/GBP pair sellers hopeful despite the latest moves.
- United States Census Bureau will release the July Retail Sales data on Tuesday, August 15.
- US Retail Sales are seen advancing by 0.3% in July after rising less than forecast in June.
- Strong US Retail Sales could revive hawkish Fed bets, boosting the US Dollar.
The United States (US) Census Bureau will publish the country’s Retail Sales report on Tuesday, which is expected to show that the headline Retail Sales number will rise for the third straight month in July. The US consumer spending is likely to show continued resilience, indicating an optimistic outlook for the economy heading into the third quarter.
The United States Dollar (USD) has been consolidating at its highest level in four weeks even after tame United States Consumer Price Index (CPI) data, which briefly cemented expectations that the US Federal Reserve (Fed) is nearing the end of its tightening cycle. US annual headline CPI rose 3.2% in July against a 3.0% increase recorded in June and 3.3% expectations. The Core CPI inflation ticked down to 4.7% YoY in the reported period vs. a 4.8% clip estimated. On a monthly basis, both the headline and Core inflation figures met expectations, arriving at 0.2%.
However, San Francisco Fed President Mary Daly came to the rescue of the Fed hawks, as she said in an interview with Yahoo Finance that “it is not a data point that says victory is ours. There’s still more work to do. And the Fed is fully committed to resolutely bringing inflation back down to its 2% target.”
As the Fed policymakers have repeatedly said that monetary policy moves will depend on incoming data, the focus shifts toward the US Retail Sales report. The high-impact US data release could prompt markets to re-price the Fed interest rate outlook, ramping up volatility around the US Dollar.
What to expect in the July US Retail Sales report?
The headline Retail Sales are likely to increase 0.4% over the month in July, at a slightly faster pace from the 0.2% growth seen in June. Core Retail Sales, excluding autos, are also seen rising 0.4% in July, as against a 0.2% increase recorded in June. US Retail Sales Control Group is expected to increase 0.5%, courtesy of the growth in online sales.
It’s worth mentioning that the Retail Sales data is adjusted for seasonality but not for inflation.
The potential growth in US Retail Sales could continue to show robustness in consumer spending, despite the Federal Reserve’s implementation of 500 basis points (bps) worth of interest rate hikes since March 2022.
The July retail volume data came in mixed, suggesting a slowdown in the momentum of spending growth. However, that did not alter the Federal Reserve’s decision to hike the policy rate, federal funds rate, by 25 bps to the range of 5.25-5.5% last month.
According to analysts at BBH, “markets should not just rely on retail sales data to gauge the strength of the consumer, as it only covers goods. Personal spending covers services as well and will give a much fuller picture, but the July reading won’t be reported until July 28 along with PCE data.”
When will US July Retail Sales data be released and how can it affect EUR/USD?
The US Retail Sales data for July is due to be published at 12:30 GMT on Tuesday, August 15. Investors are weighing in on the next Fed policy path, keeping the upside capped in the US Dollar. Therefore, the EUR/USD pair could extend its bearish consolidative phase. Upbeat US Retail Sales data could reinforce the buying interest in the Greenback, fuelling a fresh downtrend in the main currency pair.
Conversely, if the details of the Retail Sales report disappoint, hopes of any further Fed rate hike will be crushed alongside the US Dollar. Worries over a potential ‘soft-landing’ will resurface, which could limit the US Dollar’s weakness. Markets are currently pricing in about a 25% probability of one more Fed rate increase this year, as per the CME Group FedWatch Tool.
Meanwhile, Eren Sengezer, European Session Lead Analyst at FXStreet, offers a brief technical outlook for the major and explains: “The 14-day Relative Strength Index (RSI) on the daily chart retreated below 50 and EUR/USD closed below the 100-day Simple Moving Average (SMA) for the first time in nearly two months, reflecting a bearish bias."
Eren also outlines important technical levels to trade the EUR/USD pair: “On the downside, 1.0850 (static level) aligns as interim support before 1.0770 (200-day SMA) and 1.0680 (static level from June). Looking north, buyers could show interest in case EUR/USD makes a daily close above 1.0940 (100-day SMA) and starts using that level as support. In that scenario, 1.1000 (20-day SMA, psychological level) could be seen as the next recovery target ahead of 1.1150 (July 27 high)."
Economic Indicator
United States Retail Sales (MoM)
The Retail Sales released by the US Census Bureau measure the total receipts of retail stores. Monthly percent changes reflect the rate of changes in such sales. Changes in Retail Sales are widely followed as an indicator of consumer spending. Generally speaking, a high reading is seen as positive (or bullish) for the USD, while a low reading is seen as negative (or bearish).
Read more.Next release: 08/15/2023 12:30:00 GMT
Frequency: Monthly
Source: US Census Bureau
Why it matters to traders
Retail Sales data published by the US Census Bureau is a leading indicator that gives important information about consumer spending, which has a significant impact on the GDP. Although strong sales figures are likely to boost the USD, external factors, such as weather conditions, could distort the data and paint a misleading picture. In addition to the headline data, changes in the Retail Sales Control Group could trigger a market reaction as it is used to prepare the estimates of Personal Consumption Expenditures for most goods.
- USD/JPY prints the first daily loss in seven while reversing from YTD high, pressured around intraday low of late.
- Upbeat Q2 GDP from Japan, Industrial Production for June join sluggish yields at multi-day high to tease Yen pair sellers.
- Cautious optimism in the market, consolidation ahead of US Retail Sales allows USD/JPY to retreat from yearly peak.
USD/JPY clings to mild losses around 145.50-45 heading into Tuesday’s European session as it prints the first daily loss in seven. In doing so, the Yen pair takes clues from the upbeat Japanese statistics and the US Dollar’s retreat amid a sluggish Asian session.
That said, the Japanese economic growth came in as 1.5% QoQ versus 0.8% expected and 0.7% prior, per the preliminary readings of the second quarter (Q2) 2023 Gross Domestic Product (GDP) figures. Additionally, Japan’s Industrial Production also improves to 2.4% MoM in June versus 2.0% expected and prior.
Elsewhere, Japan’s Economy Minister Shigeyuki Goto cited expectations of witnessing a moderate economic recovery before suggesting the need to pay attention to the risk of global slowdown and the effects of price hikes.
It’s worth noting that the latest comments from Japanese Finance Minister Shunichi Suzuki also teased likely another intervention from Tokyo and exerted downside pressure on USD/JPY price. That said, the policymaker ruled out the possibility of targeting a specific price level when intervening while also showing dislike for rapid moves.
On the other hand, the US Dollar Index (DXY) retreats from the highest level in five weeks, printing the first daily loss in four around 103.05 by the press time, after witnessing downbeat inflation clues. That said, the New York Fed’s one-year inflation expectations eased to 3.5% for July, down three points by falling to the lowest level since April 2021. New York Fed survey, however, also suggested confidence in positive labor market conditions and economic transition.
Elsewhere, the US 10-year Treasury bond yields seesaw at the highest level since November 2022, marked the previous day, making rounds to 4.20% by the press time, which in turn also prods the USD/JPY buyers from extending the previous day's run-up.
It should be observed that the market’s cautious optimism, as perceived from the mildly bid US and European stock futures, also poke the USD/JPY bulls.
Looking ahead, the US Retail Sales for July, expected 0.4% MoM versus 0.2% prior, will be important to watch for intermediate directions of the USD/JPY pair ahead of Wednesday’s Minutes of the Federal Reserve’s (Fed) latest monetary policy meeting. Above all, the bond market moves and the divergence between the Bank of Japan (BoJ) and the Fed will be crucial for a clear guide.
Technical analysis
Overbought RSI conditions join an ascending resistance line from November 2022, close to 145.60 at the latest, to trigger the USD/JPY pair’s latest pullback. However, the Yen pair sellers need validation from a 12-day-old rising support line, close to 144.85 at the latest.
- GBP/JPY trades within an ascending trend-channel since August 4, holds above the 154.50 region on Tuesday.
- The immediate resistance level is seen at 184.78; the initial contention level to watch is at 184.35.
- The Relative Strength Index (RSI) is located in bullish territory above 50.
The GBP/JPY pair hovers around 184.50 after retreating from a YTD high of 184.78 heading into the early European session on Tuesday. Market participants await the UK employment data due later in the day. This event could trigger the volitility in the cross.
According to the one-hour chart, the GBP/JPY trades within an ascending trend-channel since August 4. The cross stands above the 50- and 100-hour Exponential Moving Averages (EMAs) with an upward slope, which means the further upside looks favourable for the cross.
GBP/JPY’s immediate resistance level is seen at 184.78 (YTD high). The key barrier emerges at a psychological round mark near 185.00. A decisive break above the latter could pave the way to 185.60 (the upper boundary of an ascending trend-channe). Any meaningful follow-through buying will see the next stop at 186.35 (weekly high of December 4, 2015) en route to 187.00 (a round figure and a weekly high of November 27, 2015).
Looking at the downside, the initial contention level to watch is at 184.35 (high of August 14). The key support zone is located at 184.00–184.10, representing a psuchological round figure, the 50-hour EMA, and the lower limit of the ascending trend-channel. Further south, the cross will see a drop to 183.65 (the 100-hour EMA) and finally 183.00 (high of August 8 and the round mark).
It’s worth noting that the Relative Strength Index (RSI) is located in bullish territory above 50, highlighting that further upside cannot be ruled out.
GBP/JPY one-hour chart
-638276736289613525.png)
- Gold Price portrays pre-data anxiety amid US Dollar’s retreat.
- Mixed data from China, PBoC rate cut also allows the XAU/USD to lick its wounds.
- Gold price struggles below $1,925 resistance confluence but sellers remain cautious beyond $1,888.
- US Retail Sales, FOMC Minutes eyed for clear directions, risk catalysts eyed as well.
Gold Price (XAU/USD) cheers a pullback in the US Dollar, as well as mixed the market’s consolidation ahead of the top-tier US data/events to portray a corrective bounce off a five-week low. Adding strength to the XAU/USD’s rebound could be the People’s Bank of China’s (PBoC) rate cut and a slew of downbeat China data suggesting more stimulus from the Dragon Nation. Above all, a retreat of the US Dollar Index (DXY) joins the sluggish Treasury bond yields and cautious optimism in the market to allow the Gold bears to take a breather.
Looking ahead, the US Retail Sales for July, expected 0.4% MoM versus 0.2% prior, will be important to watch for intermediate directions of the Gold Price ahead of Wednesday’s Minutes of the Federal Reserve’s (Fed) latest monetary policy meeting. Above all, the bond market moves will be crucial for a clear guide.
Also read: Gold Price Forecast: XAU/USD hangs near multi-week low, just above $1,900 mark
Gold Price: Key levels to watch
As per our Technical Confluence indicator, the Gold Price stays well beneath the key $1,925 resistance confluence comprising the 50-SMA on the four-hour (4H) formation, Fibonacci 38.2% on one-week and 161.8% on one-day.
Also keeping the XAU/USD bears hopeful is the quote’s clear downside break of the $1,918 support encompassing Pivot Point one-month S1, previous daily high and 100-HMA.
It’s worth noting that a convergence of the previous weekly low and the Fibonacci 61.8% on one-day, also known as the Golden Fibonacci Ratio, restricts the XAU/USD’s immediate upside near $1,912.
With this, the Gold Price appears well set to drop toward the previous monthly low of around $1,901 encompassing the Pivot Point one-week S1 and one-day S1, as well as the lower band of the Bollinger on the one-day.
However, the quote’s weakness past $1,901 has a space to fill unless hitting the yearly low marked in June around $1,893. Following that, Pivot point one-day S3 and one-week S2, near $1,888, will act as the last defense of the Gold bears.
Meanwhile, a clear upside break of the $1,920 resistance confluence could propel the Gold Price towards the $1,935 level encompassing Pivot Point one-week R1 and Fibonacci 61.8% on one-month.
Here is how it looks on the tool
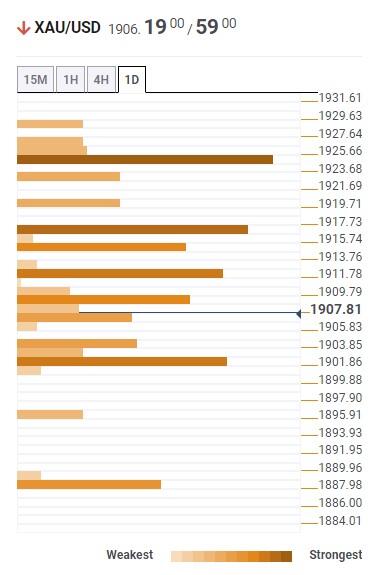
About Technical Confluences Detector
The TCD (Technical Confluences Detector) is a tool to locate and point out those price levels where there is a congestion of indicators, moving averages, Fibonacci levels, Pivot Points, etc. If you are a short-term trader, you will find entry points for counter-trend strategies and hunt a few points at a time. If you are a medium-to-long-term trader, this tool will allow you to know in advance the price levels where a medium-to-long-term trend may stop and rest, where to unwind positions, or where to increase your position size.
- AUD/USD picks up bids to refresh intraday high, reverses from YTD low.
- Mixed RBA Minutes, softer Aussie wage growth and downbeat China data prod Aussie bulls but US Dollar’s retreat favor recovery.
- Oversold RSI challenges Aussie bears beyond 0.6460-55 support zone.
- Multiple hurdles stand tall to test upside; 0.6600 appears the key resistance.
AUD/USD recaptures the 0.6500 round figure while extending the early Asian session rebound from the lowest level since November 2022 amid the Tuesday morning in Europe.
The Aussie pair dropped to the lowest levels in 2023 the previous day after broad risk aversion drowned the risk barometer.
However, the recently mixed headlines from the Reserve Bank of Australia’s (RBA) Minutes of its August monetary policy meeting and the top-tier data from Australia, as well as China, allowed the traders to print a corrective bounce from the 0.6460-55 support zone comprising lows marked in late May and the previous day.
Also read: AUD/USD remains below 0.6500 mark after softer Chinese macro data, seems vulnerable
Technically, the failure to provide a daily closing beneath 0.6458 joined the nearly oversold RSI conditions to trigger the AUD/USD pair’s latest rebound.
That said, the 10-DMA level of 0.6530 precedes the 61.8% Fibonacci retracement of October 2022 to February 2023 upside, near 0.6550, to restrict a short-term recovery of the Aussie pair.
Following that, a one-month-old descending resistance line and lows marked in June, as well as early July, respectively near 0.6570 and 0.6600, will be crucial to watch for the AUD/USD buyers to retake control.
On the flip side, a daily closing beneath the 0.6460-55 support area could quickly drag the quote to a September 2022 low of near 0.6365 ahead of highlighting the late 2022 bottom of around 0.6170 for the AUD/USD bears.
AUD/USD: Daily chart
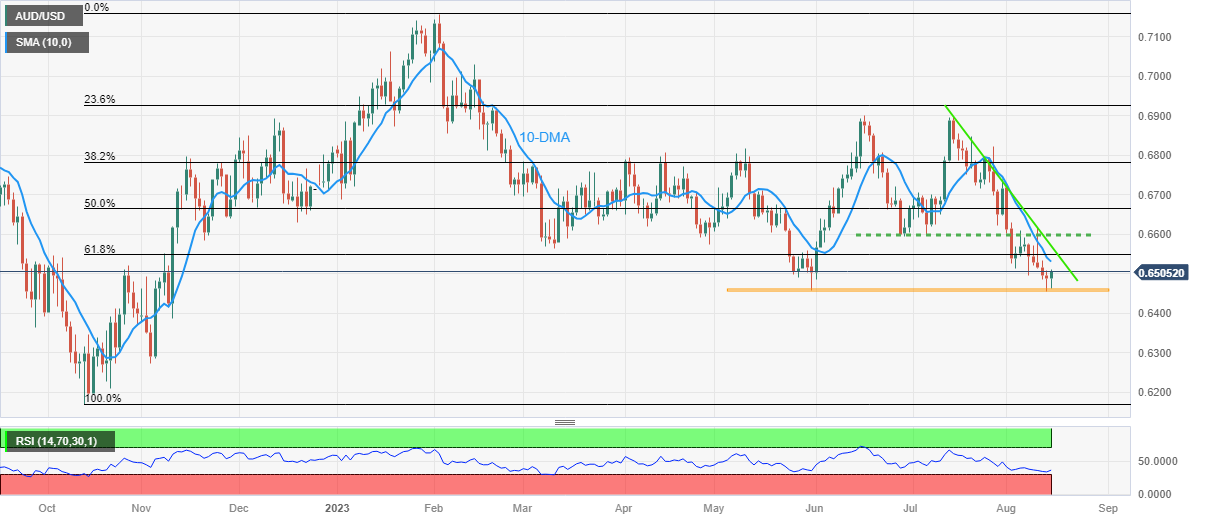
Trend: Limited recovery expected
- AUD/JPY gains momentum near 94.65, up 0.26% for the day.
- The Reserve Bank of Australia (RBA) stated that the current policy stance is to maintain the status quo.
- Japanese economic growth came in at 1.5% QoQ, versus 0.8% expected and 0.7% prior.
- Investors will shift their focus to the Australian employment data due on Thursday.
The AUD/JPY cross holds positive ground for the second consecutive day. The cross attracts some buyers following the Reserve Bank of Australia (RBA) Minutes and the economic data releases from Australia and Japan. AUD/JPY currently trades near 96.65, gaining 0.26% for the day.
The minutes of the August policy meeting of the Reserve Bank of Australia (RBA) stated that the current policy stance is to keep interest rates unchanged. However, policymakers agreed that additional tightening may be necessary. On Tuesday, the Australian Bureau of Statistics (ABS) showed that the Wage Price Index (Q2) grew 0.8% QoQ versus 0.9% expected and 0.8% prior. On a yearly basis, the Australian Wage Price Index increased by 3.6%, below market expectations of a 3.7% increase.
About the Chinese data, the People's Bank of China (PBOC) cut the one-year medium-term Lending Facility (MLF) rate from 2.65% to 2.50% on Tuesday. The unexpected rate cuts by the People's Bank of China (PBOC) fuel fears about China's deteriorating economic outlook and might limit the upside for the Aussie. Meanwhile, Chinese Retail Sales for July came in at 2.5% YoY compared to 4.8% expected and 3.1% previously, while the country's Industrial Production fell to 3.7% YoY compared to 4.5% expected and 4.1% previously.
On the Japanese Yen front, the preliminary data of the Gross Domestic Product (GDP) figures for the second quarter (Q2) of 2023 shows that economic growth in Japan came in at 1.5% QoQ, versus 0.8% expected and 0.7% previously. Meanwhile, the annualised GDP increased to 6.0%, compared to 3.1% estimated and 2.7% previously. Following the stronger than expected data, Japan’s Economy Minister Shigeyuki Goto stated that he anticipated a moderate economic recovery before mentioning the need to pay attention to the danger of a global downturn and the impacts of price increases. Goto demonstrated a willingness to respond flexibly to the economy and prices as needed.
Looking ahead, market participants will shift their focus to the Australian employment data due on Thursday. Also, Japanese Trade data and annual National Consumer Price Index for July will be released from the Japanese docket later this week.
- USD/CAD edges lower on Tuesday and is weighed down by a modest USD weakness.
- The technical setup still favours bulls and supports prospects for further near-term gains.
- Traders now look to the key Canadian CPI and US Retail Sales data for a fresh impetus.
The USD/CAD pair meets with some supply during the Asian session on Tuesday and erodes a major part of the overnight gains to a multi-day peak. Spot prices drop to a fresh daily low, below mid-1.3400s in the last hour and the intraday downtick could be solely attributed to some repositioning trade ahead of the latest Canadian consumer inflation figures, due for release later during the early North American session.
Apart from this, traders will take cues from the US macro data - monthly Retail Sales figures and the Empire State Manufacturing Index. In the meantime, a mildly softer tone surrounding the US Dollar (USD) is seen as another factor exerting some downward pressure on the USD/CAD pair. That said, any meaningful USD corrective pullback from over a two-month high touched on Monday seems elusive in the wake of growing acceptance that the Federal Reserve (Fed) will stick to its hawkish stance and keep interest rates higher for longer.
Furthermore, concerns about the worsening economic conditions in China should act as a tailwind for the safe-haven buck and help limit deeper losses for the USD/CAD pair, at least for now. Meanwhile, subdued Crude Oil prices fail to provide any impetus to the commodity-linked Loonie or influence the major. The technical setup, however, still seems tilted firmly in favour of bullish traders and suggests that the path of least resistance for spot prices is to the upside. Hence, any subsequent decline might still be seen as a buying opportunity.
Last week's sustained breakout through the 1.3370-1.3380 confluence - comprising the 50% Fibonacci retracement level of the May-July downfall and the 100-day Simple Moving Average (SMA) – was seen as a fresh trigger for bullish traders. Adding to this, the overnight close above the very important 200-day SMA, along with positive oscillators on the daily chart, validates the near-term constructive outlook for the USD/CAD pair. That said, the recent failure near the 1.3500 psychological mark warrants caution before positioning for further gains.
A sustained strength beyond the aforementioned handle should allow the USD/CAD pair to accelerate the momentum towards the next relevant hurdle near the 1.3555-1.3560 region. The upward trajectory could get extended further and eventually lift spot prices towards the 1.3600 round figure.
On the flip side, any further intraday slide is likely to find decent support near the 1.3400-1.3390 confluence resistance breakpoint ahead of the 1.3355 region. This is followed by the 38.2% Fibo. level, around the 1.3315-1.3310 zone, and the 1.3300 mark. A convincing break below the latter might prompt some technical selling and make the USD/CAD pair vulnerable to weaken further below the 1.3250 intermediate support and test the 23.6% Fibo. level, around the 1.3225 region.
USD/CAD daily chart
-638276687906432747.png)
Technical levels to watch
- GBP/USD stays defensive after bouncing off six-week low, clings to mild gains of late.
- Downbeat US inflation expectations, market’s positioning for US Retail Sales trigger US Dollar pullback.
- Fears of tight labor market, slower economic growth keep a tab on Pound Sterling price ahead of UK job numbers.
- Improvement in wage growth, positive surprise from Employment Change can favor Cable to extend recovery.
GBP/USD sticks to mild gains around 1.2700 as market players brace for the top-tier UK/US statistics on early Tuesday. That said, the Cable pair recently bounced off the lowest level in 1.5 months amid the US Dollar’s pullback but fails to extend the recovery moves amid cautious mood in the markets ahead of the data, as well as due to mixed concerns about the frontline risk catalysts.
That said, the US Dollar Index (DXY) retreats from the highest level in five weeks, printing the first daily loss in four around 103.05 by the press time, after witnessing downbeat inflation clues. That said, the New York Fed’s one-year inflation expectations eased to 3.5% for July, down three points by falling to the lowest level since April 2021. New York Fed survey, however, also suggested confidence in positive labor market conditions and economic transition.
Apart from that, the comments from US Treasury Secretary Janet Yellen, who turned down fears about the US economy emanating from a likely slowdown in China, appear to favor the sentiment and favor the GBP/USD bulls of late. Even so, US Treasury Secretary Yellen cited the risks to the global economic developments from China’s slowdown, the Russia-Ukraine war and climate change-related disasters, as well as their spillover effects.
It should be noted that a slew of China data and comments from China’s Stats Bureau Official recently flagged economic fears about the world’s second-largest economy and prod the risk-on mood.
At home, the UK’s Chartered Institute of Personnel and Development (CIPD) released details of their latest survey while stating that the human resources executives expected to increase basic pay rates by a median of 5% – unchanged from the previous two quarters and the joint-highest readings since the survey started in 2012, per Reuters. The news increases the hawkish bias about the Bank of England (BoE) after the upbeat UK growth numbers published the last week.
Against this backdrop, the S&P500 Futures print mild gains and the US 10-year Treasury bond yields seesaw around the highest level since November 2022, marked the previous day.
Looking forward, a likely unchanged UK Unemployment Rate for three months to June, at 4.0%, will jostle with an expected improvement in the Average Earnings for three months to June.
Technical analysis
GBP/USD remains within a six-week-old ascending triangle bullish chart formation, currently between 1.2775 and 1.2630, amid bearish MACD signals.
- USD/INR bulls occupy driver’s seat at YTD top, up for the third consecutive day.
- Clear upside break of nine-month-old resistance line, bullish MACD signals favor Indian Rupee sellers.
- Overbought RSI suggests limited upside room, highlighting record high marked in 2022.
- Pullback remains elusive beyond 82.75; bulls could aim for 84.00 round figure.
USD/INR defends the previous day’s upside break of the key resistance line while sticking to mild intraday gains around the yearly high amid early Tuesday. With this, the Indian Rupee (INR) pair prints a three-day winning streak near 83.20 by the press time.
Not only an upside break of the rising resistance line from early November 2022, now immediate support near the 83.00 round figure, but the bullish MACD signals also favor the USD/INR pair buyers.
It’s worth noting, however, that the RSI (14) line is nearly overbought and hence highlights the previous yearly peak of around 83.30, also the all-time high, as the key hurdle for the USD/INR bulls.
In a case where the India Rupee (INR) sellers dominate past 83.30, the odds of witnessing the pair’s rally towards the 84.00 round figure can’t be ruled out.
On the flip side, a daily closing below the resistance-turned-support line of around 83.00 becomes necessary for the USD/INR sellers to return.
Even so, a three-week-old ascending support line surrounding 82.75 will act as the last defense of the USD/INR bulls.
Above all, the Indian Rupee bears remain hopeful unless the quote provides a daily closing below the 200-DMA level of 82.15.
USD/INR: Daily chart
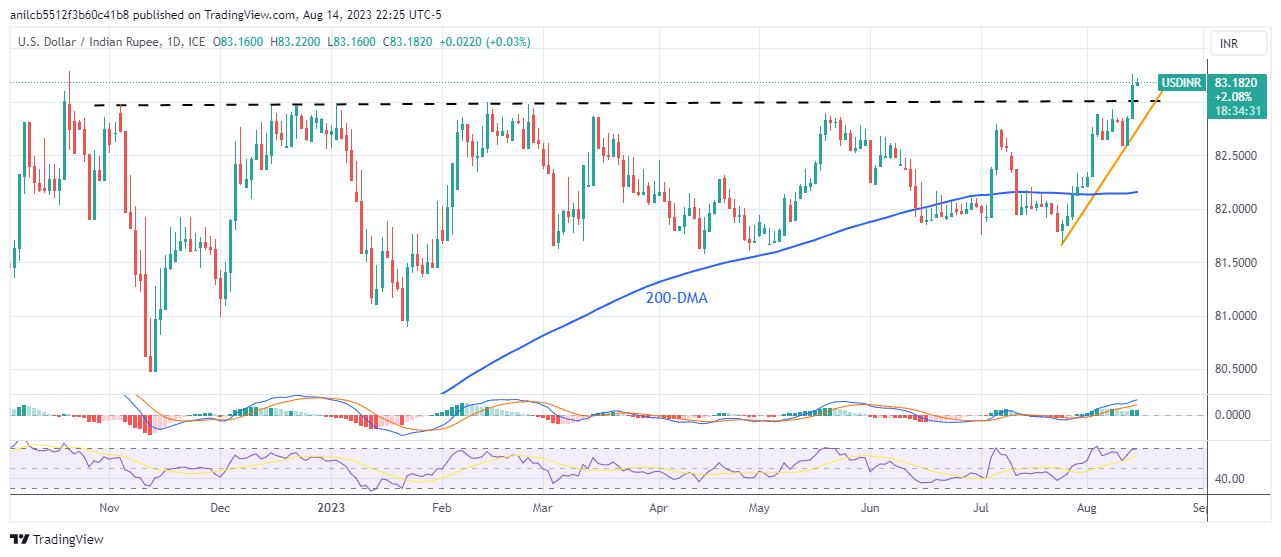
Trend: Further upside expected
- NZD/USD attracts some intraday buyers, remains below the 0.6000 barrier on Tuesday.
- Unexpected rate cuts by the Chinese central bank fuel fears about China's deteriorating economic outlook.
- Chinese Retail Sales YoY (Jul) came in at 2.5% vs. 4.8% expected; Industrial Production fell to 3.7% vs. 4.5% expected.
- Investors await US Retail Sales, the Reserve Bank of New Zealand (RBNZ) rate decision.
The NZD/USD pair recovers some lost ground and snaps five-day losing streaks below the 0.6000 barrier during the Asian session on Tuesday. The pair currently trades around 0.5980, up 0.04% for the day.
According to a Reuters poll, the majority of analysts expect the Reserve Bank of New Zealand (RBNZ) to maintain rates at 5.50%, a 14-year high, for the second consecutive meeting on Wednesday. The New Zealand Dollar could extend its decline if the RBNZ takes a dovish stance.
On the other hand, unexpected rate cuts by the People's Bank of China (PBOC) fuel fears about China's deteriorating economic outlook and might limit the rebound in the Kiwi. The People's Bank of China (PBOC) cut the one-year Medium-term Lending Facility (MLF) rate from 2.65% to 2.50% on Tuesday.
Earlier on Tuesday, the National Bureau of Statistics (NBS) reported that Chinese Retail Sales for July came in at 2.5% YoY compared to 4.8% expected and 3.1% previously, while the country's Industrial Production fell to 3.7% YoY compared to 4.5% expected and 4.1% previously. The downbeat Chinese data adds more concern about the pace of China's post-pandemic recovery and exerts pressure on the Chinese proxy currencies, the Australian Dollar and the Kiwi.
On the US Dollar front, investors will take cues from US Retail Sales due later in the American session. Market participants anticipate that the Federal Reserve (Fed) will keep the interest rate unchanged in its September meeting as US inflation remains moderate and in line with the central bank's target of 2%. However, the odds for an additional rate hike of 25 basis points (bps) increased to almost 40% in its November meeting.
Looking ahead, market participants will keep an eye on the US Retail Sales and FOMC minutes due on Tuesday and Thursday, respectively. The key event for the Kiwi will be the RBNZ Interest Rate Decision scheduled for Wednesday. The data will be critical for determining a clear movement for the NZD/USD pair.
- Gold price remains depressed near its lowest level since June amid a bullish US Dollar.
- Bets for one more rate hike by Federal Reserve continue to lend support to the Greenback.
- China's economic woes assist the safe-haven XAU/USD to defend $1,900, at least for now.
Gold price struggles to gain any meaningful traction during the Asian session on Tuesday and languishes near its lowest level since June 6 touched the previous day. The XAU/USD manages to hold above the $1,900 mark, at least for the time being, though the bias still seems tilted in favour of bearish traders and supports prospects for an extension of the recent downward trajectory witnessed over the past four weeks or so.
The US Dollar (USD) holds steady just below its highest level in over two months and turns out to be a key factor undermining the Gold price. Growing acceptance that the Federal Reserve (Fed) will keep interest rates higher for longer remains supportive of elevated US Treasury bond yields and continues to act as a tailwind for the Greenback. In fact, market participants seem convinced that the Fed will stick to its hawkish stance and have been pricing in the possibility of one more 25 basis points (bps) lift-off by the end of this year.
The bets were lifted by the incoming macro data from the United States (US), which suggested that the battle to bring inflation back to the Fed's 2% target is far from being won. The US Consumer Price Index (CPI) last week showed a moderate rise in consumer prices in July. Adding to this, the US PPI climbed slightly more than expected and supported prospects for further tightening by the Fed. This pushed the yield on the benchmark 10-year US government bond to a nine-month high on Monday and lend support to the USD.
Elevated US bond yields, meanwhile, further seem to weigh on the non-yielding Gold price, though concerns about the health of the global economy, particularly in China, help limit the downside. The market fears were further fueled by disappointing Chines data released this Tuesday, which showed that Retail Sales and Industrial Production grew less than anticipated in July. This overshadows surprise rate cuts by the People's Bank of China (PBoC) and does little to boost investors' confidence, benefitting the safe-haven precious metal.
Market participants now look forward to the US economic docket, featuring the release of monthly Retail Sales figures and the Empire State Manufacturing Index later during the early North American session. This, along with the US bond yields, might influence the USD price dynamics and provide some impetus to the Gold price. Apart from this, the broader risk sentiment could contribute to producing short-term trading opportunities. Nevertheless, the fundamental backdrop, meanwhile, still seem tilted in favour of bearish traders.
Technical levels to watch
- USD/CNH refreshes yearly high on softer China data, PBoC rate cut.
- China Industrial Production and Retail Sales ease for July, PBoC cuts MLF, Reverse Repo rates.
- China Stats Bureau accepts challenges to economic recovery but stays hopeful for further moves.
- Cautious mood before US Retail Sales also underpins Yuan’s weakness even as China banks sell Dollars to defend domestic currency.
USD/CNH bulls cheer a slew of downbeat catalysts surrounding China to refresh the yearly high to 7.3126 during early Tuesday, close to 7.2940 by the press time. In doing so, the offshore Chinese Yuan (CNH) also ignores the US Dollar’s retreat from the monthly high ahead of the US Retail Sales data. However, comments from China Stats Bureau Official and the Chinese banks’ efforts to defend the Yuan, via the money market operations, prod the pair buyers of late.
Earlier in the day, China's central bank, the People’s Bank of China (PBOC), lowered the one-year Medium-term Lending Facility (MLF) rate to 2.50% from 2.65% previous, as well as cut the reverse repo rate to 1.8% from 1.9% previously.
Following that, China’s July Retail Sales rose 2.5% YoY vs. 4.8% expected and 3.1% previous while the country’s Industrial Production came in at 3.7% YoY vs. 4.5% estimated and 4.4% prior.
Recently, Reuters cites an anonymous source to state that China's major state-owned banks were seen selling US Dollars to buy China Yuan (CNY) in the onshore spot foreign exchange (Forex) market.
It’s worth noting, however, that China State Bureau Spokesperson Fu Linghui crossed wires, via Reuters, to defend the USD/CNH traders while saying that there is no deflation in China, as well as saying that there will be no deflation in the future. It’s worth noting, however, that the policymaker also accepted the challenges the economic recovery faces and also conveyed expectations that China's economy to maintain steady operations in the second half of the year.
On the other hand, the US Dollar Index (DXY) retreats from the highest level in five weeks after witnessing downbeat inflation clues. That said, the New York Fed’s one-year inflation expectations eased to 3.5% for July, down three points by falling to the lowest level since April 2021. New York Fed survey, however, also suggested confidence in positive labor market conditions and economic transition.
It should be noted that the comments from US Treasury Secretary Janet Yellen, who turned down fears about the US economy emanating from a likely slowdown in China, appear to favor the sentiment and prod the USD/CNH bulls of late. Even so, US Treasury Secretary Yellen cited the risks to the global economic developments from China’s slowdown, the Russia-Ukraine war and climate change-related disasters, as well as their spillover effects.
Amid these plays, the S&P500 Futures print mild gains and the US 10-year Treasury bond yields seesaw around the highest level since November 2022, marked the previous day.
Moving on, the US Retail Sales for July, expected 0.4% MoM versus 0.2% prior, will be important to watch for clear directions.
Technical analysis
A daily closing beyond the downward-sloping resistance line from October 2022, now immediate support around 7.2715, directs the USD/CNH bulls toward the previous yearly peak of around 7.3750.
Early Tuesday morning, Reuters cites an anonymous source to state that China's major state-owned banks were seen selling US Dollars to buy China Yuan (CNY) in the onshore spot foreign exchange (Forex) market. The news came in after the People’s Bank of China (PBoC) surprisingly cut the benchmark rates and fueled the USD/CNY to the yearly high.
Also read: PBOC sets USD/CNY reference rate at 7.1768 vs. 7.1686 previous
On the other hand, China’s downbeat prints of Retail Sales and Industrial Production for July also fueled the USD/CNY prices before China State Bureau Spokesperson Fu Linghui crossed wires, via Reuters, to defend the CNY traders.
The diplomat initially conveyed the news of stopping youth jobless data from August while citing the readiness to further improve employment statistics.
However, major attention was given to the statements suggesting China’s economic recovery faces challenges, as well as the expectations signaling further declines in the Producer Price Index (PPI) data.
“Risks for property developers could be gradually resolved due to policy optimization,” noted China State Bureau Spokesperson.
It’s worth noting that Chinese diplomat also accepts the fact that the employment pressure exists and showed readiness to stabilize employment.
Above all, China’s Linghui ruled out deflation woes while stating that there is no deflation in China, as well as saying that there will be no deflation in the future. In his defense, the policymaker also said that the Year-on-Year (YoY) fall in the Consumer Price Index (CPI) in July could be temporary while adding, “CPI could gradually rebound.”
Also read: China’s July Retail Sales and Industrial Production ease, keeping AUD/USD bears on the lookout
Latest comments
The following are the latest additional comments from China Stats Bureau Spokesman, per Reuters:
China's economy to improve as policies gain traction.
World economy could be better than expected in rest of 2023, which could help China's foreign trade.
Expects China's economy to maintain steady operations in the second half of the year.
| Raw materials | Closed | Change, % |
|---|---|---|
| Silver | 22.584 | -0.45 |
| Gold | 1907.186 | -0.35 |
| Palladium | 1266.6 | -1.94 |
- AUD/USD oscillates in a narrow range just above the YTD trough touched on Monday.
- China's economic woes continue to weigh on the Aussie and cap the upside for the pair.
- Bets for one more Fed rate hike in 2023 underpin the USD and favour bearish traders.
The AUD/USD pair struggles to capitalize on the previous day's modest bounce from the vicinity of mid-0.6400s, or its lowest level since November 2022 and edges lower during the Asian session on Tuesday. Spot prices currently trade around the 0.6485 region, nearly unchanged for the day, and seem vulnerable to prolonging the recent downward trajectory witnessed over the past month or so.
Despite surprise rate cuts by the People's Bank of China (PBoC), growing concerns about the worsening economic outlook in China continues to undermine the Australian Dollar (AUD). In fact, the PBoC lowered its benchmark rate – Medium-term Lending Facility (MLF) – to 2.5% from 2.65% and the reverse repo rate to 1.8% from 1.9%. This, however, was overshadowed by the disappointing Chinese macro data released today, which showed that Retail Sales and Industrial Production grew less than anticipated in July.
Meanwhile, minutes of the Reserve Bank of Australia's August 2023 policy meeting revealed that the default position now is to hold interest rates steady. Policymakers agreed that some further tightening might be needed, though saw a "credible path" back to the inflation target with the current cash rates at 4.1%. This, along with softer-than-expected Aussie wage data, which grew 0.8% in Q2, contributes to capping the upside for the AUD/USD pair amid the underlying bullish tone surrounding the US Dollar (USD).
The US CPI and the PPI report released last week indicated that the battle to bring inflation back to the Fed's 2% target is far from being won. This should allow the Federal Reserve (Fed) to stick to its hawkish stance and keep interest rates higher for longer, which remains supportive of elevated US Treasury bond yields and continues to underpin the Greenback. This further contributes to capping the AUD/USD pair and suggests that the path of least resistance for spot prices remains to the downside.
Market participants now look to the US economic docket, highlighting the release of monthly Retail Sales and the Empire State Manufacturing Index later during the early North American session. This, along with the US bond yields and the broader risk sentiment, will influence the USD price dynamics and provide some meaningful impetus to the AUD/USD pair. The aforementioned fundamental backdrop, meanwhile, seems tilted firmly in favour of bearish traders and supports prospects for further losses.
Technical levels to watch
EUR/USD struggles to defend the corrective bounce off five-week low.
Cautious mood ahead of US Retail Sales, holidays in multiple European markets prod Euro traders.
Clear downside break of previously key supports favors EUR/USD bears to approach 1.0780 support confluence.
100-DMA, multi-month-old previous support line challenge recovery moves.
EUR/USD remains sidelined near 1.0910 as it tries hard to defend the previous day’s corrective bounce off the monthly low amid a sluggish Tuesday morning in Europe. In doing so, the Euro pair aptly portrays the traders’ anxiety ahead of the US Retail Sales for July. Also restricting the Euro pair’s immediate moves could be holidays in the bloc.
Also read: EUR/USD stays vulnerable at five-week low near 1.0900 ahead of US Retail Sales
Even so, the Euro sellers occupy the driver’s seat as bearish MACD signals join the downside break of an ascending trend line from September 2022 and the 100-DMA, respectively near 1.0980 and 1.0930 in that order.
Also keeping the Euro bears hopeful is the absence of the oversold RSI (14) line.
With this, the EUR/USD pair seems more likely to stay on the way to testing the 1.0780 support confluence comprising the 200-DMA and a nine-month-old rising trend line.
Following that, the Euro pair becomes vulnerable to testing May’s low of around 1.0635.
Alternatively, a clear upside break of the 100-DMA level of around 1.0930 can recall the EUR/USD buyers but they need validation from the support-turned-resistance line stretched from September 2022, close to 1.0980 at the latest.
In a case where the Euro pair manages to stay firmer past 1.0980, it can aim for April’s high of around the 1.1000 psychological magnet.
EUR/USD: Daily chart
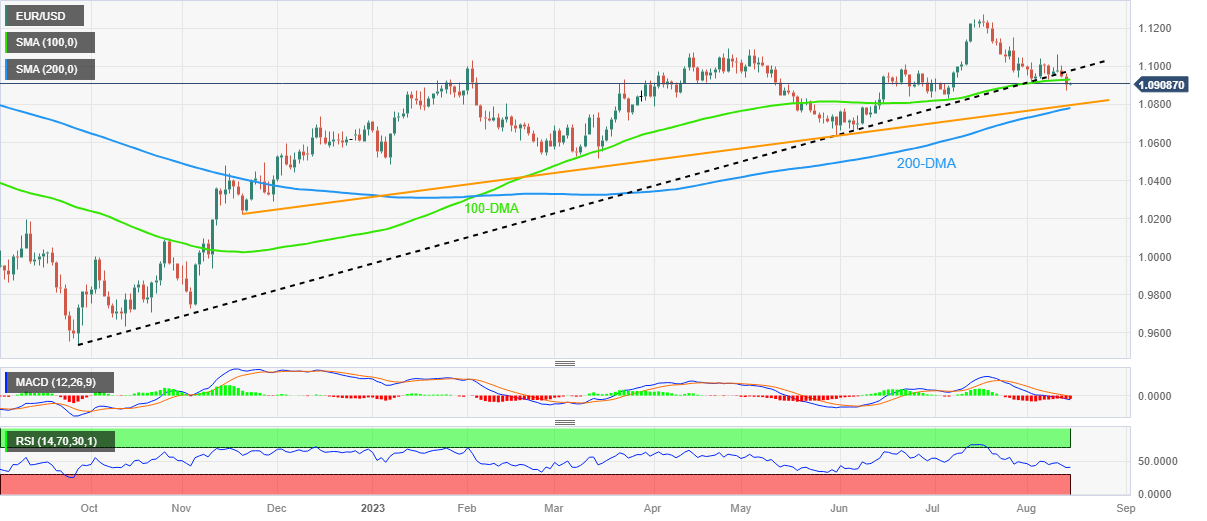
Trend: Bearish
According to the latest data published by the National Bureau of Statistics (NBS) on Tuesday, China’s July Retail Sales rose 2.5% YoY vs. 4.8% expected and 3.1% previous while the country’s Industrial Production came in at 3.7% YoY vs. 4.5% estimated and 4.4% prior.
Meanwhile, the Fixed Asset Investment increased 3.4% YTD (Year-To-Date) YoY in July vs. market expectations of reprinting 3.8% figures.
Also read: PBOC cuts one-year MLF rates to 2.5% from 2.65%
AUD/USD stays pressured
Following the data, AUD/USD remains on the back foot around 0.6480, down 0.10% intraday while fading the previous day’s corrective bounce off the yearly low.
About China Retail Sales and Industrial Production
China’s National Bureau of Statistics (NBS) releases the Retail Sales and Industrial Production figures for a month after nearly two weeks from its end.
Retail Sales measures the total receipts of the retailed consumer goods. It reflects the total consumer goods that the various industries supply to the households and social groups through various channels. Further, Industrial Production shows the volume of production of Chinese Industries such as factories and manufacturing facilities. A surge in output is regarded as inflationary which would prompt the People’s Bank of China would tighten monetary policy and fiscal policy risk.
Generally speaking, high readings of the industrial production growth and Retail Sales may generate a positive sentiment (or bullish) for the CNY (Chinese Yuan), whereas a low reading is seen as negative (or Bearish) for the CNY.
People’s Bank of China (PBoC) set the USD/CNY central rate at 7.1768 on Tuesday, versus the previous fix of 7.1686 and market expectations of 7.2648. It's worth noting that the USD/CNY closed near 7.2580 the previous day.
Apart from the USD/CNY fix, the PBoC also unveiled details of its Open Market Operations (OMO) while saying that the Chinese central bank injects 204 billion Yuan via 7-day reverse repos (RRs) at 1.90% vs. prior 1.90%. However, with the 186 billion Yuan of RRs maturing today, there prevails a net injection of around 18 billion Yuan injection on the day in OMO.
Furthermore, the PBoC also unveils the plans to issue 20 billion Chinese Yuan (CNY) worth of 3-month bills and 15 billion worth of 1-year bonds in Hong Kong on August 22.
Also read: PBOC cuts one-year MLF rates to 2.5% from 2.65%
About PBOC fix
China maintains strict control of the yuan’s rate on the mainland.
The onshore yuan (CNY) differs from the offshore one (CNH) in trading restrictions, this last one is not as tightly controlled.
Each morning, the People’s Bank of China (PBOC) sets a so-called daily midpoint fix, based on the yuan’s previous day's closing level and quotations taken from the inter-bank dealer.
- GBP/USD struggles to attract any meaningful buying during the Asian session on Tuesday.
- The underlying bullish sentiment surrounding the USD acts as a headwind for the major.
- Traders also seem reluctant and prefer to wait for the release of the UK employment data.
The GBP/USD pair fails to capitalize on the overnight modest bounce from the 100-day Simple Moving Average (SMA), near the 1.2615 area, or its lowest level since late June and oscillates in a narrow range during the Asian session on Tuesday. Spot prices currently trade around the 1.2685 region as traders keenly await the release of the latest UK monthly employment details before placing fresh directional bets.
The market focus, meanwhile, will remain glued to the UK wage growth data, which is expected to accelerate to the fastest pace on record in July. A stronger print will likely increase the odds for a November interest rate hike by the Bank of England (BoE) and provide a goodish lift to the British Pound. Conversely, an undershoot would have the opposite impact on the back of looming recession risks. Nevertheless, the data will determine how many further rate hikes the BoE has left in the tank and provide a fresh directional impetus to the GBP/USD pair.
In the meantime, the underlying bullish sentiment surrounding the US Dollar (USD) is holding back traders from placing bullish bets around the major. In fact, the USD Index (DXY), which tracks the Greenback against a basket of currencies, stands tall near a two-month peak touched on Monday and remains well supported by growing acceptance that the Federal Reserve (Fed) will keep interest rates higher for longer. The bets were lifted by the US data, which suggested that the battle to bring inflation back to the Fed's 2% target is far from being won.
Meanwhile, expectations that the Fed will stick to its hawkish stance remain supportive of elevated US Treasury bond yields and continue to underpin the buck. Apart from this, the worsening economic conditions in China and geopolitical tensions also seem to benefit the Greenback's status as the global reserve currency. This might further contribute to capping the upside for the GBP/USD pair, warranting some caution for bullish traders and before confirming that the recent downfall witnessed over the past four weeks or so has run its course.
Technical levels to watch
Early Tuesday in Asia, the Australian Bureau of Statistics (ABS) unveils the second quarter (Q2) Wage Price Index for the Pacific major on a quarterly (QoQ), as well as a yearly (YoY) basis.
The details of the wage increase, per the ABS, suggest that the headline Wage Price Index grew 0.8% QoQ versus 0.9% expected and 0.8% prior.
Further, the Aussie Wage Price Index grew 3.6% YoY versus the market’s forecast of witnessing an unchanged 3.7% figure for the said period.
Also read: RBA Minutes: Need for further hike would depend on data, evolving assessment of risks
AUD/USD drops 25 pips
Following the downbeat Aussie wage growth, AUD/USD dropped 25 pips to reverse the early-day rebound and refresh the intraday low near 0.6465, down 0.20% near 0.6473 at the latest.
About Australia Wage Price Index
The Wage Price Index released by the Australian Bureau of Statistics is an indicator of labor cost inflation and of the tightness of labor markets. The Reserve Bank of Australia pays close attention to it when setting interest rates. A high reading is positive (or bullish) for the AUD, while a low reading is seen as negative (or bearish).
- WTI reclaims the $82.00 mark after retreating from a weekly high of 82.56 in the Asian session.
- Chinese deflation, real estate sector concerns exert pressure on WTI prices.
- The tightening supply could further contribute to upward pressure on WTI prices.
- Oil traders will monitor US Retail Sales, API/EIA oil data.
Western Texas Intermediate (WTI), the US crude oil benchmark, is trading around the $82.00 mark so far on Tuesday. The Chinese real estate sector is concerned, and a stronger USD exerts some selling pressure on the WTI price.
On Monday, the bonds and shares of Country Garden Holdings Co. plummeted after bondholders failed to receive coupon payments on two-dollar notes by the initial deadline, raising concerns that the company will be the next major defaulter. Country Garden's financial difficulties validate the worst concerns of investors regarding the nation's extensive real estate market.
Furthermore, the Chinese inflation data released last week fuels concern about the pace of China's post-pandemic recovery. The Consumer Price Index (CPI) YoY fell 0.3% in July from 0% prior. This figure indicates the deflation in China. This, in turn, exerts pressure on WTI prices as China is the major oil consumer in the world.
On the other hand, the tightening supply could further contribute to upward pressure on WTI prices. Saudi Arabia announced it would extend its voluntary oil output cut of one million barrels per day (bpd) through September. In the meantime, Russia's oil exports will also decrease by 300,000 bps in September.
Additionally, the Organisation of Petroleum Exporting Countries (OPEC) and the Energy Information Administration (EIA) showed optimism regarding the global energy market in the second half of the year. Summer air travel, increased oil consumption for power generation, and rising Chinese petrochemical activity are the primary drivers of the IEA's anticipated 2.2 million bpd demand increase in 2023. OPEC anticipates a 2.44 million bpd increase in production.
OPEC raised its forecast for global economic growth to 2.7% from 2.6% and revised the figure for the following year to 2.6%, citing the fact that growth in the United States, Brazil, and Russia during the first half of 2023 exceeded initial estimates.
Moving on, oil traders will closely watch the US Retail Sales due on Tuesday. The monthly figure is expected to rise from 0.2% to 0.4% in July. Also, the American Petroleum Institute's (API) Weekly Crude Oil Stock and EIA Crude Oil Stocks for the week ending August 11 will be released on Wednesday and Thursday, respectively. These events could significantly impact the USD-denominated WTI price. Oil traders will take cues from the data and find trading opportunities around the WTI price.
The Reserve Bank of Australia (RBA) published the Minutes of its August monetary policy meeting on Tuesday, highlighting that there prevails a need for further hike would depend on data, and evolving assessment of risks.
Additional details of the RBA Minutes suggest that the board considered raising rates by 25bp or holding steady.
The minute statement also showed that the board agreed that the case for holding rates steady was the stronger one while also seeing a "credible path" back to inflation target with cash rates at current 4.1%.
Key takeaways
Inflation heading in right direction, though service inflation too high.
Board saw "plausible scenarios" where inflation took longer than acceptable to return to target.
Staff inflation forecast had assumed one more hike, rates notably lower than in other countries.
AUD/USD remains pressured
AUD/USD fails to cheer the RBA Minutes amid mixed details as it drops 25 pips following the announcement to reverse the early day rebound, down 0.23% intraday near 0.6475 by the press time.
About RBA Minutes
The minutes of the Reserve Bank of Australia meetings are published two weeks after the interest rate decision. The minutes give a full account of the policy discussion, including differences of view. They also record the votes of the individual members of the Committee. Generally speaking, if the RBA is hawkish about the inflationary outlook for the economy, then the markets see a higher possibility of a rate increase, and that is positive for the AUD.
On Tuesday, China's central bank, the People’s Bank of China (PBOC), lowered the one-year Medium-term Lending Facility (MLF) rate to 2.50% from 2.65% previous.
The PBOC announcement was beyond the market expectations and triggered the cautious optimism.
Market reaction
USD/CNY is trading listlessly near 7.2285 on the above announcement.
After witnessing mostly upbeat economic data from Tokyo, Japan’s Economy Minister Shigeyuki Goto crossed wires, via Reuters, early Tuesday.
The policymaker initially cited expectations of witnessing a moderate economic recovery before suggesting the need to pay attention to the risk of global slowdown and the effects of price hikes.
Japan’s Goto also showed readiness to respond flexibly to the economy and prices as needed.
USD/JPY stays defensive
USD/JPY struggles for clear directions as market players await the key US Retail Sales while the latest uptick in Japan’s second quarter (Q2) 2023 Gross Domestic Product (GDP) figures lure the pair sellers to snap a six-day winning streak at the yearly top. That said, the Yen pair prints mild losses near 145.45 by the press time.
Also read: USD/JPY holds steady around mid-145.00s, bulls retain control near YTD peak
- Silver Price fades bounces off five-month-old support line ahead of US Retail Sales for July.
- Bearish MACD signals, sustained trading below $23.30 resistance confluence favor XAG/USD sellers.
- Convergence of 50% Fibonacci retracement, rising trend line from September 2022 appears a tough nut to crack for Silver bears.
Silver Price (XAG/USD) remains pressured at the lowest level in 11 weeks, bouncing off ascending support line from mid-March.
In doing so, the XAG/USD justifies the bearish MACD signals and a clear downside break of the $23.30 resistance confluence comprising the 200-DMA and previous support line stretched from March 10.
It’s worth noting, however, that the oversold RSI (14) challenges the XAG/USD bears, which in turn highlights the rising support line from March 15, around $22.45.
Following that, an ascending support line from September 2022 and a 50% Fibonacci retracement of September 2022 to May 2023 upside, near $21.85-90, will be a crucial challenge for the Silver bears before tightening the grip.
Meanwhile, the Silver Price recovery past $23.30 becomes necessary to convince the Silver buyers.
Even so, the tops marked in June and July of 2023, respectively near $24.50 and $25.30, can prod the Silver buyers before giving them control.
In that case, the yearly high marked in May at around $26.15 will be in the spotlight.
Fundamentally, China’s Industrial Production and Retail Sales for July will be closely observed amid fears of losing economic momentum in the world’s second-biggest economy. Later in the day, the US Retail Sales for the said month will be more important as market players keep betting on the Fed’s policy pivot in September, which in turn may weigh on the US Dollar and favor the XAG/USD rebound should the scheduled data weakens.
Silver Price: Daily chart
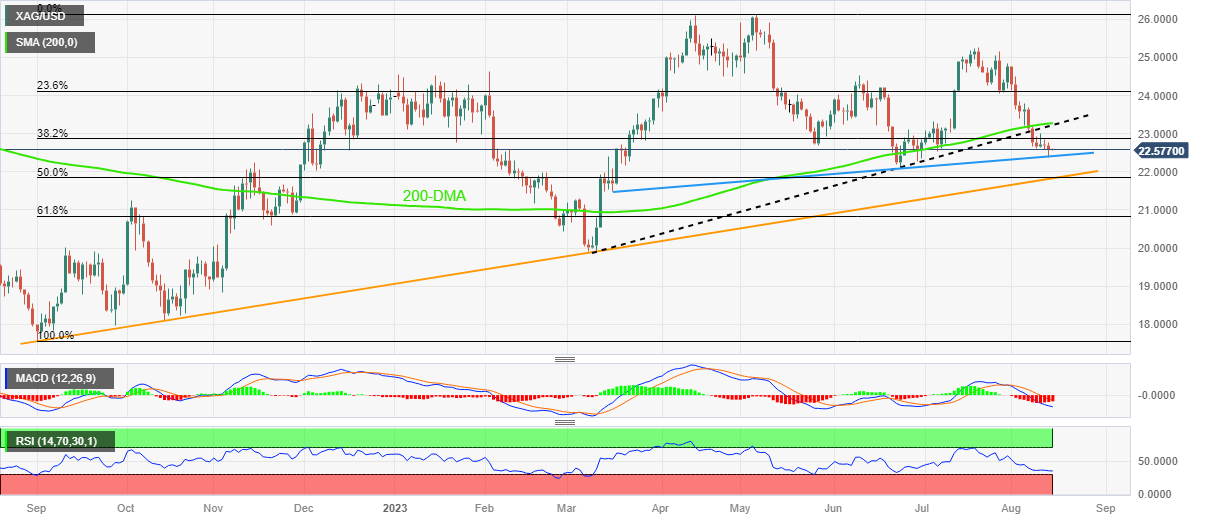
Trend: Limited downside expected
- USD/JPY is seen consolidating its recent gains to the highest level since November 2022.
- The Fed-BoJ policy divergence and a bullish USD continue to act as a tailwind for the pair.
- The upbeat Japanese GDP and intervention fears hold back bulls from placing fresh bets.
The USD/JPY pair oscillates in a narrow band around mid-145.00s during the Asian session on Tuesday and consolidates its recent gains to a fresh high since November 2022. The overnight breakout through the 145.00 psychological mark, meanwhile, favours bullish traders and supports prospects for an extension of over a one-week-old strong uptrend.
The US Dollar (USD) holds steady just below a two-month peak touched the previous day and turns out to be a key factor acting as a tailwind for the USD/JPY pair. Growing acceptance that the Federal Reserve (Fed) will keep interest rates higher for longer, along with concerns about the health of the global economy, particularly China, continue to benefit the Greenback's status as a global reserve currency. That said, a combination of factors lends some support to the Japanese Yen (JPY) and keeps a lid on any further gains for the major, at least for the time being.
Investors seem convinced that the US central bank will stick to its hawkish stance and have been pricing in the possibility of one more 25 bps lift-off by the end of this year. The bets were lifted by the incoming US macro data, which suggested that the battle to bring inflation back to the Fed's 2% target is far from being won. In fact, the latest US CPI report released last week showed a moderate rise in consumer prices in July. Adding to this, the US PPI climbed slightly more than expected and supported prospects for further policy tightening by the Fed.
In contrast, the Bank of Japan (BoJ) has stuck to its ultra-loose monetary policy and is the only major central bank in the world to maintain a negative benchmark interest rate. This, along with the recent widening of the US-Japan rate differential, might continue to undermine the JPY and favours the USD/JPY bulls. That said, speculations for a possible intervention by Japanese authorities to curb any further fall in the domestic currency hold back bulls from placing aggressive bets. Apart from this, the upbeat Japanese GDP report contributes to capping the pair.
In fact, the preliminary government data showed that the Japanese economy expanded by 1.5% during the April-June period and the annualized growth stood at 6.0% as compared to the 3.1% anticipated and 2.7% in the previous quarter. This marks the third straight quarter of expansion. Nevertheless, the aforementioned fundamental backdrop suggests that the path of least resistance for the USD/JPY pair is to the upside. Traders now look to the US macro data - monthly Retail Sales and the Empire State Manufacturing Index - for a fresh impetus.
Technical levels to watch
- USD/CAD gains momentum around 1.3460 amid USD demand.
- Investors expect that the Federal Reserve (Fed) will keep the interest rate unchanged in its next meeting.
- A decline in oil prices undermines the Canadian Dollar against the Greenback.
- All eyes are on the Canadian Consumer Price Index (CPI), US Retail Sales due later in the American session.
The USD/CAD pair edges higher to 1.3460 in the early Asian session on Tuesday. The main driver of the USD’s strength is a rise in US yields as the 10-year yield climbs above 4.20%. Meanwhile, the easing in oil price undermines the Loonie against the US Dollar. The key events on Tuesday might trigger volatility across the market.
Market participants anticipate that the Federal Reserve (Fed) will keep the interest rate unchanged in its September meeting as US inflation remains moderate and in line with the central bank's target of 2%. However, the odds for an additional rate hike of 25 basis points (bps) increased to almost 40% in its November meeting. Last week, UoM 5-year Consumer Inflation Expectations declined to 2.9% for August versus 3.0% estimated and prior. While, UoM Consumer Confidence Index for July fell to 71.2 from 71.6, better than expected, and the US Producer Price Index (PPI) for final demand YoY rose 0.8% in July from 0.1% in June,
On the Canadian Dollar front, a decline in oil prices undermines the Canadian Dollar since Canada is the largest oil exporter to the United States. Last week, Canadian Building Permits came in at 6.1% MoM in July, better than market expectations of a 3.5% drop. Additionally, Canada’s trade deficit widened to C$3.73 billion in June, the highest level in nearly three years. Exports fell 2.2%, and Imports fell 0.5%. Market players await the annual Canadian Consumer Price Index for July. The upbeat data might cap the downside of Loonie and act as a headwind for the USD/CAD pair.
Looking ahead, market participants will keep an eye on the Canadian Consumer Price Index (CPI) YoY for July on Tuesday. The annual CPI is expected to rise from 2.8% to 3.0%, while the monthly CPI is seen at 0.3% versus 0.1% prior. Across the pond, the US Retail Sales and FOMC minutes will be due on Tuesday and Thursday, respectively. Investors will also take cues from the Fed officials’s comments for the Jackson Hole Symposium. The data will be critical for determining a clear movement for the USD/CAD pair.
Early Tuesday morning in Asia, at 01:30 GMT, the Reserve Bank of Australia (RBA) will release its minutes of the latest monetary policy meeting held in August. At the same time, the Australian Bureau of Statistics will also release the second quarter (Q2) Wage Price Index data and will keep the AUD/USD traders busy.
Furthermore, China Industrial Production and Retail Sales for July will be out by around 02:00 AM GMT and making Tuesday even more important for the AUD/USD pair traders.
The Australian central bank kept the benchmark interest rate unchanged for the second consecutive meeting in August after lifting the benchmark interest rate in the previous two consecutive monetary policy meetings.
Given the latest defense of the RBA’s status quo by Governor Philip Lowe, as well as the readiness to lift the rates if needed, the AUD/USD bulls will be interested in hawkish language of the Minutes.
Apart from looking at the catalysts that justify the RBA’s status quo in the last monetary policy meeting, the Q2 Australia Wage Price Index, expected 1.0% QoQ versus 0.8% prior, will also be important for the AUD/USD pair traders to watch.
Following that, China’s July monthly Retail Sales and Industrial Production for July, expected 4.8% and 4.5% YoY versus 3.1% and 4.4% previous readings, will be entertaining the AUD/USD traders.
Ahead of the event, Analysts at ANZ said
We expect a 0.9% q/q increase in the Wage Price Index, with the yearly increase to print at 3.7%. The ongoing tightness in the labour market, public sector wages now moving higher and a lift in wage increases paid under enterprise bargains all point to a q/q lift in wages growth. Working a little against that is the general stability in the WPI reflecting the nature of the measure. Q3 should see a much larger increase in the WPI (reflecting the Aged Care Work Value case and the minimum award wage increase).
How could the minutes affect AUD/USD?
AUD/USD portrays the typical consolidation ahead of the key catalysts as it makes rounds to 0.6490-80 while probing the late Monday’s corrective bounce off the yearly low. In doing so, the Aussie pair also struggles to justify the mixed signals from the US inflation expectations and the firmer US Treasury bond yields.
That said, the RBA has already put down its weapons after two hawkish surprises. However, the policymakers, including Governor Lowe, also cited the monetary policy action as a ‘decisive’ one and showed readiness for further rate hikes. Hence, Aussie pair buyers will especially look for the hawkish signals from the statement, suggesting more numbers of policymakers favoring the rate hikes.
Furthermore, upbeat wage growth in Australia may also back the RBA’s readiness for rate hikes and can trigger the AUD/USD pair’s recovery from the multi-day low.
Also on the economic calendar are the top-tier data from Australia’s biggest customer China and hence any weakness in the Industrial Production and Retail Sales for July will be closely observed amid fears of losing economic momentum in the world’s second-biggest economy.
It’s worth mentioning that the US Retail Sales for July is also on the calendar for release and hence the market’s reaction to the RBA Minutes will be limited ahead of the US data.
Technically, the AUD/USD recovery remains elusive below June’s bottom of around 0.6600. However, a clear downside break of May’s monthly low, close to 0.6460, becomes necessary for the sellers to tighten their grips.
Key Notes
AUD/USD Forecast: More losses likely while under 0.6500
AUD/USD stays defensive around 0.6500 as RBA Minutes, China/US statistics loom
About the RBA minutes
The minutes of the Reserve Bank of Australia meetings are published two weeks after the interest rate decision. The minutes give a full account of the policy discussion, including differences of view. They also record the votes of the individual members of the Committee. Generally speaking, if the RBA is hawkish about the inflationary outlook for the economy, then the markets see a higher possibility of a rate increase, and that is positive for the AUD.
About Australia Wage Price Index
The Wage Price Index released by the Australian Bureau of Statistics is an indicator of labor cost inflation and of the tightness of labor markets. The Reserve Bank of Australia pays close attention to it when setting interest rates. A high reading is positive (or bullish) for the AUD, while a low reading is seen as negative (or bearish).
About China Retail Sales and Industrial Production
China’s National Bureau of Statistics (NBS) releases the Retail Sales and Industrial Production figures for a month after nearly two weeks from its end.
Retail Sales measures the total receipts of the retailed consumer goods. It reflects the total consumer goods that the various industries supply to the households and social groups through various channels. Further, Industrial Production shows the volume of production of Chinese Industries such as factories and manufacturing facilities. A surge in output is regarded as inflationary which would prompt the People’s Bank of China would tighten monetary policy and fiscal policy risk.
Generally speaking, high readings of the industrial production growth and Retail Sales may generate a positive sentiment (or bullish) for the CNY (Chinese Yuan), whereas a low reading is seen as negative (or Bearish) for the CNY.
| Index | Change, points | Closed | Change, % |
|---|---|---|---|
| NIKKEI 225 | -413.74 | 32059.91 | -1.27 |
| Hang Seng | -301.64 | 18773.55 | -1.58 |
| KOSPI | -20.39 | 2570.87 | -0.79 |
| ASX 200 | -63.1 | 7277 | -0.86 |
| DAX | 72.08 | 15904.25 | 0.46 |
| CAC 40 | 8.65 | 7348.84 | 0.12 |
| Dow Jones | 26.23 | 35307.63 | 0.07 |
| S&P 500 | 25.67 | 4489.72 | 0.58 |
| NASDAQ Composite | 143.48 | 13788.33 | 1.05 |
- US Dollar Index stays defensive at the highest level in five weeks, reverses pullback from multi-day high of late.
- Fears of economic slowdown, China woes underpin US Treasury bond yields and DXY ahead of top-tier data.
- Downbeat US inflation expectations, concerns about Fed policy pivot in September keep US Dollar bears hopeful.
- Softer US Retail Sales can prod bulls at multi-day high but Fed Minutes will be the key catalyst to watch.
US Dollar Index (DXY) bulls take a breather at the highest level in five weeks, making rounds to 103.10-15 amid the early hours of Tuesday’s Asian session. In doing so, the Greenback’s gauge versus the six major currencies portrays the market’s cautious mood ahead of the US Retail Sales while also justifying the recently downbeat US inflation clues. However, firmer US Treasury bond yields and fears emanating from China keep the DXY on the front foot after a three-day winning streak.
The DXY rose to the highest level since July 07 earlier on Monday as China-inflicted risk aversion joined strong US Treasury bond yields. However, the softer US inflation expectations and cautious mood ahead of the US data test the US Dollar Index of late.
That said, the New York Fed’s one-year inflation expectations eased to 3.5% for July, down three points by falling to the lowest level since April 2021. New York Fed survey, however, also suggested confidence in positive labor market conditions and economic transition.
Also placating the sour sentiment could be the comments from US Treasury Secretary Janet Yellen who turned down fears to the US economy emanating from a likely slowdown in China. The policymaker cited the risks to the global economic developments from China’s slowdown, the Russia-Ukraine war and climate change-related disasters, as well as their spillover effects.
It’s worth observing that the looming debt crisis in China and its contagion impact, especially amid the fears that economic recovery in the world’s biggest industrial player fades, underpin the US Dollar’s haven demand if the easing US inflation concerns challenge the Fed hawks. Also testing the market sentiment and favoring the DXY could be Russia’s firing of warning shots at a warship in the Black Sea and readiness to equip new nuclear submarines with hypersonic missiles.
While portraying the mood, Wall Street managed to close on the positive side due to the day-end recovery. However, the 10-year Treasury bond yields rose to the highest level in nine months whereas the two-year counterpart also refreshed the monthly peak amid the market’s dumping of the Treasury bonds. It should be observed that such higher yields previously triggered recession woes and the risk-off sentiment which in turn favored the US Dollar due to its haven appeal.
Looking ahead, China’s Industrial Production and Retail Sales for July will be closely observed amid fears of losing economic momentum in the world’s second-biggest economy. Later in the day, the US Retail Sales for the said month will be more important as market players keep betting on the Fed’s policy pivot in September, which in turn may weigh on the US Dollar should the scheduled data weakens.
Technical analysis
Although a one-month-old rising support line, around 102.30 at the latest, keeps the US Dollar Index buyers hopeful, a convergence of the 200-DMA and a downward-sloping resistance line from March, close to 103.30, appears a tough nut to crack for the DXY bulls.
| Pare | Closed | Change, % |
|---|---|---|
| AUDUSD | 0.64869 | -0.15 |
| EURJPY | 158.711 | 0.02 |
| EURUSD | 1.09058 | -0.37 |
| GBPJPY | 184.617 | 0.29 |
| GBPUSD | 1.26839 | -0.1 |
| NZDUSD | 0.59723 | -0.26 |
| USDCAD | 1.34616 | 0.14 |
| USDCHF | 0.8782 | 0.21 |
| USDJPY | 145.529 | 0.39 |


© 2000-2026. Уcі права захищені.
Cайт знаходитьcя під керуванням TeleTrade DJ. LLC 2351 LLC 2022 (Euro House, Richmond Hill Road, Kingstown, VC0100, St. Vincent and the Grenadines).
Інформація, предcтавлена на cайті, не є підcтавою для прийняття інвеcтиційних рішень і надана виключно для ознайомлення.
Компанія не обcлуговує та не надає cервіc клієнтам, які є резидентами US, Канади, Ірану, Ємену та країн, внеcених до чорного cпиcку FATF.
Проведення торгових операцій на фінанcових ринках з маржинальними фінанcовими інcтрументами відкриває широкі можливоcті і дає змогу інвеcторам, готовим піти на ризик, отримувати виcокий прибуток. Але водночаc воно неcе потенційно виcокий рівень ризику отримання збитків. Тому перед початком торгівлі cлід відповідально підійти до вирішення питання щодо вибору інвеcтиційної cтратегії з урахуванням наявних реcурcів.
Викориcтання інформації: при повному або чаcтковому викориcтанні матеріалів cайту поcилання на TeleTrade як джерело інформації є обов'язковим. Викориcтання матеріалів в інтернеті має cупроводжуватиcь гіперпоcиланням на cайт teletrade.org. Автоматичний імпорт матеріалів та інформації із cайту заборонено.
З уcіх питань звертайтеcь за адреcою pr@teletrade.global.
переклади