- Аналітика
- Новини та інструменти
- Новини ринків
Новини ринків
- EUR/USD seesaws near the highest levels since early May after rising the most in 4.5 months.
- ECB announced 25 bps rate hike and signals more to hawk-out Fed.
- Details of economic forecasts and President Lagarde’s comments, mixed US data raise needs for more clues for Euro traders.
EUR/USD makes rounds to 1.0950 as bulls catch a breather after a stellar run-up, the biggest since early February, amid sluggish hours of Friday’s Asian session. In doing so, the Euro pair also portrays the market’s need for more clues to defend the hawkish bias about the European Central Bank (ECB), as well as to confirm the doubts about the Federal Reserve’s (Fed) July rate hike.
That said, the European Central Bank (ECB) matched market forecasts by announcing a 25 basis points (bps) interest rate hike. More importantly, ECB President Christine Lagarde advocated for a July rate hike and ruled out rate cuts to allow the European Currency (Euro or EUR) to drum the victory over the previous day’s Federal Reserve’s (Fed) hawkish halt.
On the negative side, the ECB’s latest growth projections marked a softer economic run-up for 2023 and 2024 than previously estimated whereas ECB President Lagarde also stated that both growth and inflation are quite unpredictable.
On the other hand, the mixed US data and the Fed’s first status quo after fueling the rates in the last 10 consecutive meetings prod the US Dollar. With this, the US Dollar Index (DXY) bears take a breather at the lowest levels in over a month, flirting with 102.10 of late, after falling the most in three months by the press time.
Talking about the data, US Retail Sales growth marks an increase of 0.3% for May versus -0.1% expected and 0.4% previous readings while the Core readings, mean Retail Sales ex Autos, match 0.1% market forecasts for the said month, compared to 0.4% prior. Further, NY Fed Empire State Manufacturing Index jumps to 6.6 in June versus -15.1 expected and -31.8 prior whereas Philadelphia Fed Manufacturing Index drops to -13.7 for the said month from -10.4 prior and compared to -14 market forecasts. Additionally, US Industrial Production for May cools down to -0.2% against 0.1% estimated and 0.5% prior while Initial Jobless Claims reprints the upwardly revised figures of 262K for the week ended on June 09 versus 249K expected.
Following the data, the CME’s FedWatch Tool, market players place nearly 67% bets on the July Fed rate hike of around 25 basis points (bps). The same depicts the traders’ lack of conviction in the Federal Reserve’s (Fed) almost clear signals for a hawkish move in July.
Against this backdrop, Wall Street benchmarks rallied more than 1.0% each whereas the US 10-year Treasury bond yields plummeted to 3.72%. Further, the US Dollar Index (DXY) dropped the most in three months while poking the lowest levels since May 12, to 102.15 at the latest.
Looking ahead, the final readings of Eurozone inflation data for May, as per the Harmonized Index of Consumer Prices (HICP) details, will precede the preliminary readings of the Michigan Consumer Sentiment Index (CSI) for June and five-year inflation expectations to direct immediate EUR/USD moves. Above all, bond market moves and the central bank clues should be eyed closely for clear direction.
Technical analysis
The nearly overbought RSI (14) line suggests a pullback in the EUR/USD price towards the 50-DMA support of around 1.0880.
Silver Price (XAG/USD) grinds higher at around $23.90 amid the usual inactive hours of Friday’s Asian session.
The bright metal portrayed a stellar rebound from the monthly low the previous day amid broad US Dollar weakness. The same allows the options market players to convey their bullish bias and suggest further advances in the XAG/USD price.
It should be noted that the US Dollar Index (DXY) bears take a breather at the lowest levels in over a month, flirting with 102.10 of late, after falling the most in three months by the press time.
That said, the one-month risk reversal (RR) of the Silver price, a gauge of the spread between the call and put options, prints the strongest bullish level of 0.055 in three days by the end of Thursday’s North American session. With this, the weekly RR eyes the biggest jump in four weeks, around 0.105 by the press time.
Also read: Silver Price Analysis: XAG/USD recovery falters despite falling bond yields, sellers in charge
- US Dollar Index seesaws at monthly low after falling the most since early March.
- Unimpressive US Retail Sales growth, mixed activity data and downbeat Jobless Claims to push back hawkish Fed concerns.
- Firmer sentiment, ECB moves also weigh on US Treasury bond yields and DXY.
- US consumer sentiment numbers, inflation clues eyed for further directions as hawkish Fed bets ease.
US Dollar Index (DXY) bears take a breather at the lowest levels in over a month, flirting with the 102.00 round figure amid the early hours of Friday’s Asian session. In doing so, the greenback’s gauge versus six major currencies justifies the market’s easing hawkish concerns for the Federal Reserve’s July rate hike, as well as the risk-on mood, ahead of mid-tier US data.
As per the latest readings of the CME’s FedWatch Tool, market players place nearly 67% bets on the July Fed rate hike of around 25 basis points (bps). The same depicts the traders’ lack of conviction in the Federal Reserve’s (Fed) almost clear signals for a hawkish move in July amid mostly downbeat US data.
That said, US Retail Sales growth marks an increase of 0.3% for May versus -0.1% expected and 0.4% previous readings while the Core readings, mean Retail Sales ex Autos, match 0.1% market forecasts for the said month, compared to 0.4% prior. Further, NY Fed Empire State Manufacturing Index jumps to 6.6 in June versus -15.1 expected and -31.8 prior whereas Philadelphia Fed Manufacturing Index drops to -13.7 for the said month from -10.4 prior and compared to -14 market forecasts. Additionally, US Industrial Production for May cools down to -0.2% against 0.1% estimated and 0.5% prior while Initial Jobless Claims reprints the upwardly revised figures of 262K for the week ended on June 09 versus 249K expected.
It’s worth noting that the European Central Bank’s (ECB) victory over the Fed, by announcing 25 basis points (bps) interest rate hikes and suggesting more such moves ahead, also weighed on the US Dollar and the DXY. Furthermore, the PBoC cut its one-year interest rate for the first time in 10 months, by 10 basis points (bps), which in turn bolstered the market’s sentiment and exert downside pressure on the US Dollar Index.
US Dollar Index previously cheered the Fed’s hawkish halt but the aforementioned catalysts propelled the risk-on mood and drowned the US Treasury bond yields to recall the DXY bears. With this, Wall Street benchmarks rallied more than 1.0% each whereas the US 10-year Treasury bond yields plummeted to 3.72%.
Looking ahead, the preliminary readings of the Michigan Consumer Sentiment Index (CSI) for June and five-year inflation expectations will be in the spotlight as the Fed hawks find less acceptance. Additionally, the Bank of Japan (BoJ) Monetary Policy Meeting and Fed talks will also be crucial for clear directions
Technical analysis
A daily closing below the 50-DMA level of around 102.60 directs DXY bears toward an upward-sloping support line from mid-April, at 101.55 by the press time.
- NZD/USD eases from three-week high to print the first daily loss, so far, in four days.
- Business NZ PMI marks activity contraction for the third consecutive month in June.
- 100-DMA, previous resistance line join bullish MACD signals to favor Kiwi buyers.
NZD/USD takes offers to refresh intraday low around 0.6230 amid the early hours of Friday’s Asian session. In doing so, the Kiwi pair takes a U-turn from the highest levels since May 24, marked the previous day, while also snapping a three-day uptrend, amid downbeat New Zealand (NZ) data.
NZ Business PMI for June came in at 48.9 versus 50.2 expected and 49.1 prior. With this, the Pacific nation’s activity gauge marked the third consecutive monthly contraction in business performance.
Not only the downbeat NZ data but the above 50.0 levels of the RSI (14) line also allowed the NZD/USD bulls to take a breather at the multi-day high.
However, the 100-DMA support of around 0.6220 joins the bullish MACD signals to put a floor under the NZD/USD price for intraday traders, a break of which can quickly drag the quote to the 38.2% Fibonacci retracement of October 2022 to February 2023 upside, near 0.6150.
Following that, the resistance-turned-support line stretched from early May, around 0.6120 at the latest, will be in the spotlight.
In a case where the NZD/USD drops below 0.6120 support, the odds of witnessing a south-run towards the previous monthly low of around 0.5985 can’t be ruled out.
Meanwhile, the NZD/USD buyers can aim for the 23.6% Fibonacci retracement level of around 0.6300 on crossing the latest peak of 0.6250.
Though, a 4.5-month-old resistance line and a horizontal area comprising multiple levels marked since early February, respectively near 0.6330 and 0.6385-90, appear tough nuts to crack for the Kiwi pair buyers to keep the reins afterward.
NZD/USD: Daily chart
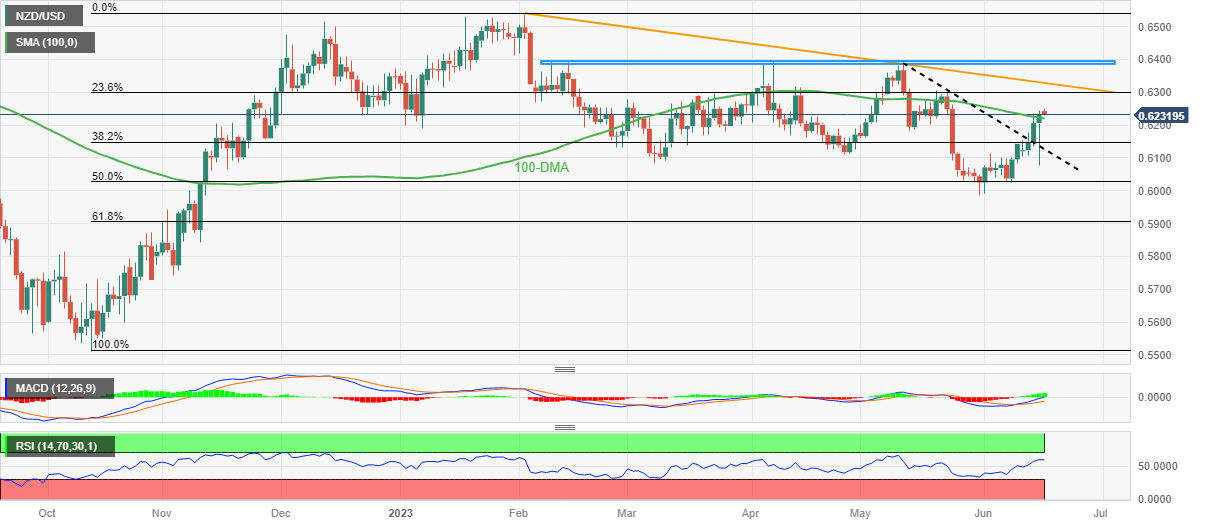
Trend: Limited downside expected
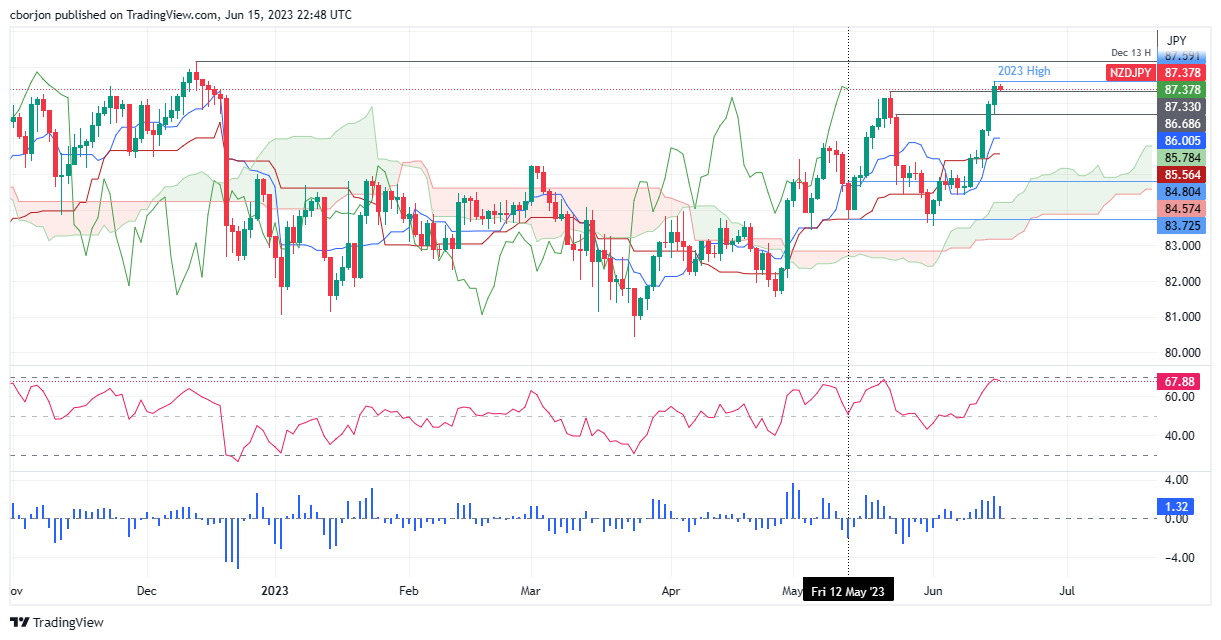
- NZD/JPY trades flat at 87.40, retracing slightly after reaching a new YTD high.
- Buyers remain in charge; however, a flat slope suggests potential near-term consolidation.
- Caution is warranted as RSI and Rate of Change indicate weakening buyer momentum.
NZD/JPY retraces slightly as the Asian session begins after posting solid gains on Thursday of 0.58% and reaches a new year-to-date (YTD) high of 87.59. At the time of writing, the NZD/JPY is almost flat, exchanging hands at 87.40.
NZD/JPY Price Analysis: Technical outlook
The NZD/JPY is still upward biased from a daily chart perspective, as the pair remains above the Ichimoku cloud. In addition, the cross-over of the Tenkan-Sen line above the Kijun-Sen, suggests that buyers remain in charge. But the slope of the latter for the last nine days shifted flat, suggesting some consolidation lies ahead before the NZD/JPY attacks the next resistance level at 88.17, the December 13 high.
If the NZD/JPY breaks the abovementioned price level, the next stop would be the 89.00 psychological level, as the pair gets on its way toward testing the 2015 high at 92.42. Conversely, the NZD/JPY first support would be the May 23 high at 87.31, which, once cleared, would expose the May 24 daily high turned support at 86.68. The following support levels would be the Tenkan-Sen line at 86.00 and the Kijun-Sen line at 85.56.
Given that the Ichimoku cloud suggests the NZD/JPY is upwards, oscillators like the Relative Strength Index (RSI) indicate that the pair is approaching overbought territory, but its slope aims down. The three-day Rate of Change (RoC) shows buyers are losing momentum.
Trend: Neutral-upward biased, but caution is warranted.
NZD/JPY Price Action – Daily chart
- AUD/USD retreats from the highest levels since late February, consolidating the biggest daily jump in two months.
- Upbeat sentiment, PBoC rate cut and fewer threats to the hawkish RBA concerns propel Aussie pair.
- Downbeat US data, ECB play drowned US Dollar and favored AUD/USD bulls.
- Mid-ties US statistics, yields eyed for clear directions on July Fed rate hike.
AUD/USD dribbles at the highest levels since February 21, making rounds to 0.6880-90, amid the early hours of Friday’s Asian session after rising the most since mid-April the previous day. In doing so, the Aussie pair traders portray the market’s consolidation move amid a lack of major data/events after a volatile day.
That said, the risk-barometer pair benefited from the strong Aussie jobs report versus downbeat US data, as well as the People’s Bank of China (PBoC) rate cut to post the stellar run-up.
On Thursday, Australia’s Consumer Inflation Expectations for June rose to 5.2% versus the 4.8% expected and 5.0% prior. Further, the Employment Change rallied by 75.9K in May compared to 15K market forecasts and -4.3K previous readings. Additionally, Australia's Unemployment Rate drops to 3.6% against expectations of witnessing a no-change figure of 3.7%.
On the other hand, US Retail Sales growth marks an increase of 0.3% for May versus -0.1% expected and 0.4% previous readings while the Core readings, mean Retail Sales ex Autos, match 0.1% market forecasts for the said month, compared to 0.4% prior. Further, NY Fed Empire State Manufacturing Index jumps to 6.6 in June versus -15.1 expected and -31.8 prior whereas Philadelphia Fed Manufacturing Index drops to -13.7 for the said month from -10.4 prior and compared to -14 market forecasts. Additionally, US Industrial Production for May cools down to -0.2% against 0.1% estimated and 0.5% prior while Initial Jobless Claims reprints the upwardly revised figures of 262K for the week ended on June 09 versus 249K expected.
It should be noted that the PBoC cut its one-year interest rate for the first time in 10 months, by 10 basis points (bps), which in turn unleashed hopes of more liquidity in Australia’s biggest customer and favored the AUD/USD price.
Elsewhere, the European Central Bank’s (ECB) 25 basis points (bps) interest rate hike and clues of more such moves ahead also weighed on the US Dollar and propelled the price.
In doing so, the AUD/USD pair pays little heed to the downbeat China Retail Sales and Industrial Production while also failing to justify a nearly 67% chance of the Fed’s July rate hike.
Amid these plays, Wall Street benchmarks rallied more than 1.0% each whereas the US 10-year Treasury bond yields plummeted to 3.72%. Further, the US Dollar Index (DXY) dropped the most in three months while poking the lowest levels since May 12, to 102.15 at the latest.
Moving on, preliminary readings of the Michigan Consumer Sentiment Index (CSI) for June and five-year inflation expectations will be in the spotlight as the Fed hawks find less acceptance.
Also read: AUD/USD Forecast: Aussie not getting tired, accelerates higher
Technical analysis
Although the overbought RSI conditions challenge the AUD/USD bulls at a multi-day high, a daily closing beyond a 3.5-month-old ascending resistance line, now support around 0.6835, keeps the Aussie pair buyers hopeful despite the latest pullback in the price.
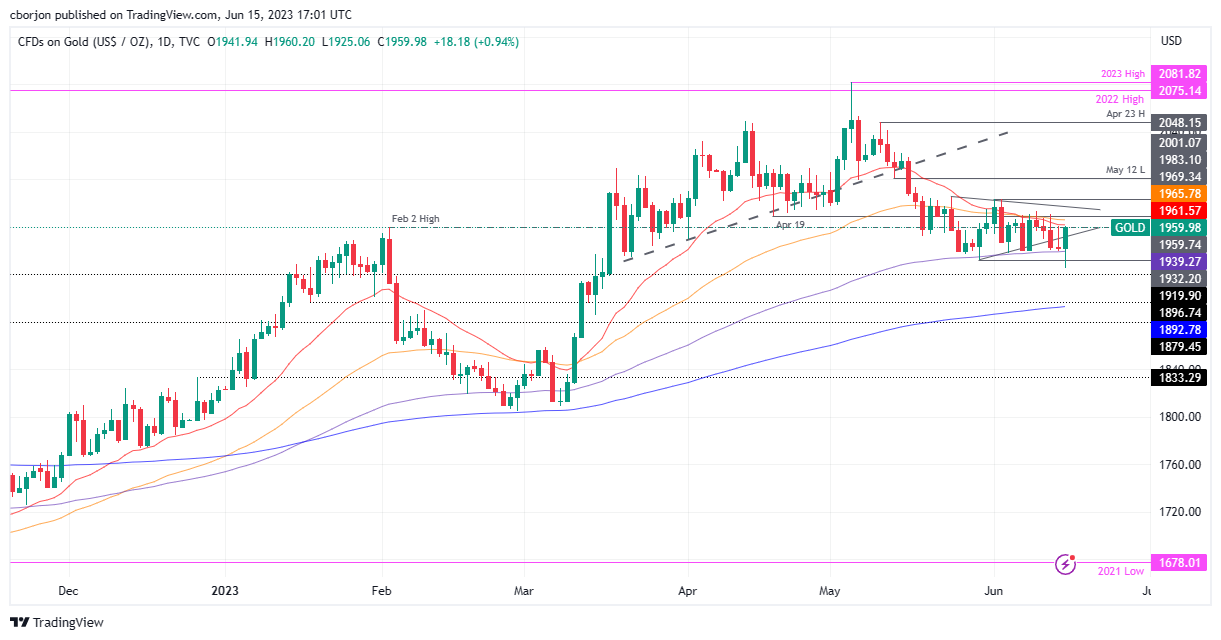
- Gold Price grinds higher after bouncing off the lowest level in three months.
- Pullback in United States Treasury bond yields, mixed US data weigh on US Dollar and propel XAU/USD.
- ECB rate hike versus hawkish Fed halt, China news also down US Dollar, favoring the Gold Price in turn.
- US Michigan Consumer Sentiment Index, Inflation expectations eyed for intraday XAU/USD directions.
Gold Price (XAU/USD) dribbles near $1,958-59 during early Friday after a volatile day that initially refreshed a multi-day low before bouncing off $1,924, as well as posted snapping the four-day losing streak. That said, the XAU/USD previously dropped to the three-month low as the US Dollar licked Federal Reserve (Fed) inflicted wounds amid hopes of a July rate hike before cheering the USD weakness on downbeat data and the market’s cautious optimism to recover from the lowest level since March.
Gold Price rebound relies on US Dollar weakness
Gold Price portrayed a perfect contrasting play with the US Dollar as the XAU/USD initially refreshed the monthly low on the greenback’s recovery amid hopes of a July rate hike from the Federal Reserve (Fed) before downbeat US data weighed on the yields and the USD.
That said, the US central bank kept the benchmark interest rate unchanged at 5.0-5.25%, matching market expectations of pausing the multi-month-old hawkish cycle after 10 consecutive rate increases. However, the upbeat FOMC Economic Projections and Federal Reserve (Fed) Chairman Jerome Powell’s speech backed the hawkish Fed bias surrounding the July meeting and weighed on the Gold Price on early Thursday, before bouncing off $1,924.
On the other hand, Thursday’s United States statistics haven’t been impressive and hence pushed back the July rate hike concerns, which in turn joined other risk-positive catalysts to weigh on the US Dollar and propel the Gold Price.
On Thursday, US Retail Sales growth marks an increase of 0.3% for May versus -0.1% expected and 0.4% previous readings while the Core readings, means Retail Sales ex Autos, match 0.1% market forecasts for the said month, compared to 0.4% prior.
Further, NY Fed Empire State Manufacturing Index jumps to 6.6 in June versus -15.1 expected and -31.8 prior whereas Philadelphia Fed Manufacturing Index drops to -13.7 for the said month from -10.4 prior and compared to -14 market forecasts.
Additionally, US Industrial Production for May cools down to -0.2% against 0.1% estimated and 0.5% prior while Initial Jobless Claims reprints the upwardly revised figures of 262K for the week ended on June 09 versus 249K expected.
Apart from the US data, the European Central Bank’s (ECB) 25 basis points (bps) interest rate hike and clues of more such moves ahead also weighed on the US Dollar.
Elsewhere, the People’s Bank of China (PBoC) cut its one-year interest rate for the first time in 10 months, by 10 basis points (bps), which in turn unleashed hopes of more liquidity in one of the world’s biggest Gold consumer and favor the metal price. It should be noted that downbeat prints of China Retail Sales and Industrial Production and fears of labor problems in Beijing-based factories prod the XAU/USD bulls.
Amid these plays, market players portrayed an optimistic day with upbeat Wall Street performance and a steep fall in the US Treasury bond yields, not to forget the US Dollar Index (DXY) drop to the three-week low. The same offered the Gold Price the much-needed rebound to pare weekly losses inside a bullish chart pattern.
More clues to defy July Fed hike needed for clear XAU/USD direction
Although the latest United States data have been helpful to push back the concerns about the Federal Reserve’s (Fed) July rate increase, the CME’s FedWatch Tool still shows around a 67% chance of the US central bank’s 0.25% rate hike in the next month. Hence, more data rejecting the hawkish bias needs to defend the latest Gold Price rebound.
As a result, today’s preliminary readings of the Michigan Consumer Sentiment Index (CSI) for June and five-year inflation expectations will be in the spotlight. Also important to watch will be the US Treasury bond yields and the US Dollar moves.
Also read: Gold Price Forecast: XAU/USD could well rally on any data showing inflation pressures are easing – TDS
Gold Price technical analysis
Gold Price fades upside momentum within a fortnight-old falling wedge bullish chart formation.
Adding strength to the XAU/USD recovery hopes is the looming bull cross on the Moving Average Convergence and Divergence (MACD) indicator, as well as a U-turn by the Relative Strength Index (RSI) line, placed at 14, from the oversold territory.
It’s worth noting, however, that the 200-bar Exponential Moving Average (EMA) adds strength to the wedge’s top line and makes it harder to cross the $1,968 hurdle.
Also challenging the Gold Price upside is a one-month-old horizontal resistance zone surrounding $1,983-87.
Meanwhile, the stated bullish chart pattern’s lower line, close to $1,923 at the latest, precedes the mid-March consolidation around $1,910-15 to challenge the short-term XAU/USD downside.
Following that, the Gold Price downside towards the $1,900 threshold, $1,890 dynamic support and the early March swing high of near $1,858 will be on the XAU/USD bear’s radar.
Gold Price: Four-hour chart
-16062023-638224642206860912.png)
Trend: Further downside expected
- EUR/GBP sees modest gains, trading at 0.8562, following ECB’s 25 bps rate hike.
- ECB pushes inflation prospects up, sparking expectations for further rate hikes.
- BoE’s hawkish expectations spark Sterling’s strength, capping the Euro’s rally.
EUR/GBP trades with modest gains after the European Central Bank (ECB) raised rates by 25 basis points (bps) and telegraphed additional increases. However, expectations of further tightening by the Bank of England (BoE) capped the Euro’s (EUR) rally at 0.8591, recovering ground after Wall Street closed. At the time of writing, the EUR/GBP is trading at 0.8562, up 0.13%.
Rate hike prospects for the BoE temper Euro’s rise despite ECB’s bold monetary tightening
On Thursday, the European Central Bank (ECB) raised rates by 25 bps as expected, leaving the deposit rates at 2.50%, its highest level in 22 years. Besides increasing rates, the ECB staff revised inflation prospected to the upside, from 4.6% to 5.1%.
In the meantime, ECB President Christine Lagarde cemented the case for a rate hike in July but pushed back against expectations for a September increase. Lagarde added, “Wage pressures, while partly reflecting one-off payments, are becoming an increasingly important source of inflation.”
Even though inflation cooled somewhat, it is still three times the ECB’s goal of 6.1%. It should be said that prices have come down at the expense of slow economic growth, as recent GDP reports from the bloc suggest the economy hit a recession. Back-to-back negative quarters revealed that growth was cut to -0.1% in Q4 2022 and Q1 2023.
Aside from this, expectations for a hawkish Bank of England (BoE) capped the Euro’s gains, which was set to challenge the 0.86 handle. Nevertheless, money market futures estimates for the BoE to raise rates at least 100 bps in the next twelve months spurred an appreciation in the Sterling (GBP), which posted solid gains against the US Dollar.
EUR/GBP Price Analysis: Technical outlook
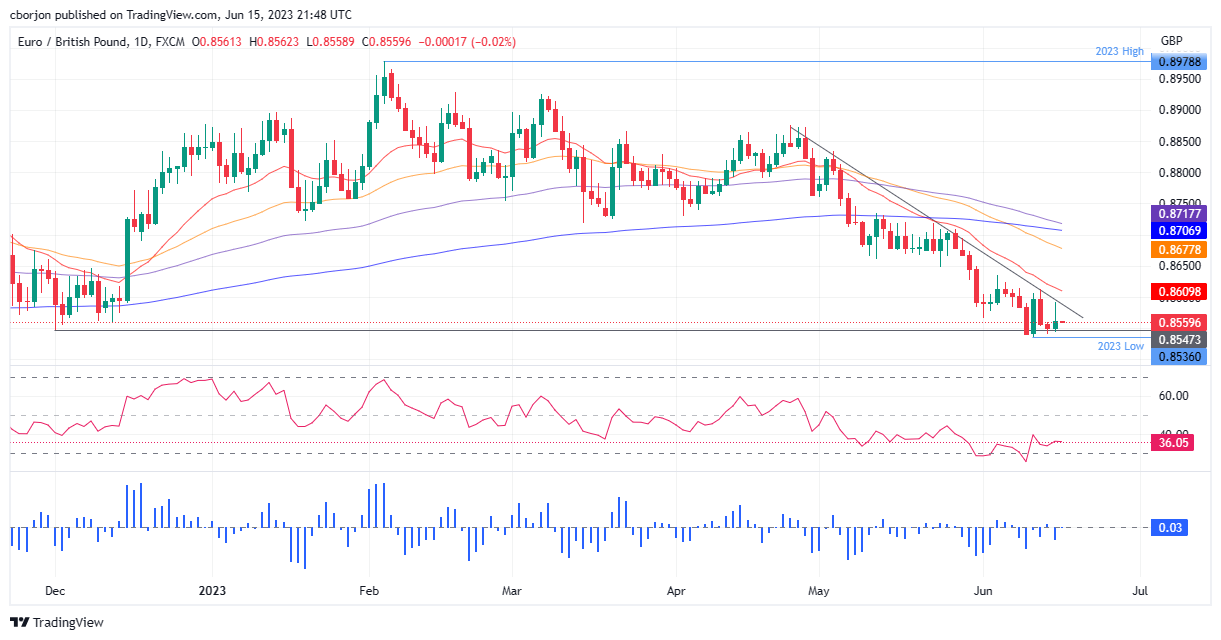
From a daily chart perspective, the EUR/GBP is tilted downwards, but since June 9, when it hit a low of 0.8540, the cross failed to extend its losses past the new year-to-date (YTD) low of 0.8536. since then, the EUR/GBP has been exchanging hands in a 70-pip range capped by the 20-day Exponential Moving Average (EMA) on the upside at 0.8610. Nevertheless, the ongoing downtrend started in February is still in place, and the path of least resistance is downwards.
The EUR/GBP first support would be the 0.8541, June 14 low. A breach of the latter will expose the YTD low of 0.8536 before dropping toward 0.8500. Upward risks lie above 0.8600, particularly at the 20-day EMA, followed by resistance at the 50-day EMA at 0.8677.
- EUR/USD bulls move into a key area of potential weekly resistance.
- Bears need to show up at this juncture for prospects of a move into the 1.0820s or face pressures to and above 1.1000.
EUR/USD moved to a five-week high on Thursday on the back of the European Central Bank increasing rates for the eighth straight time and signalled further tightening to bring eurozone inflation to its medium-term target of 2%.
At 3.5%, rates are the highest in 22 years and the ECB's inflation projection for this year was raised to 5.1% from 4.6%. Consequently, the price has moved into what could be regarded as a resistance area from trendline support. The following illustrates, however, prospects of a move through 1.1000 and into the tops of where the weekly M-formation shorts were established in the lows 1.1100s:
EUR/USD weekly charts
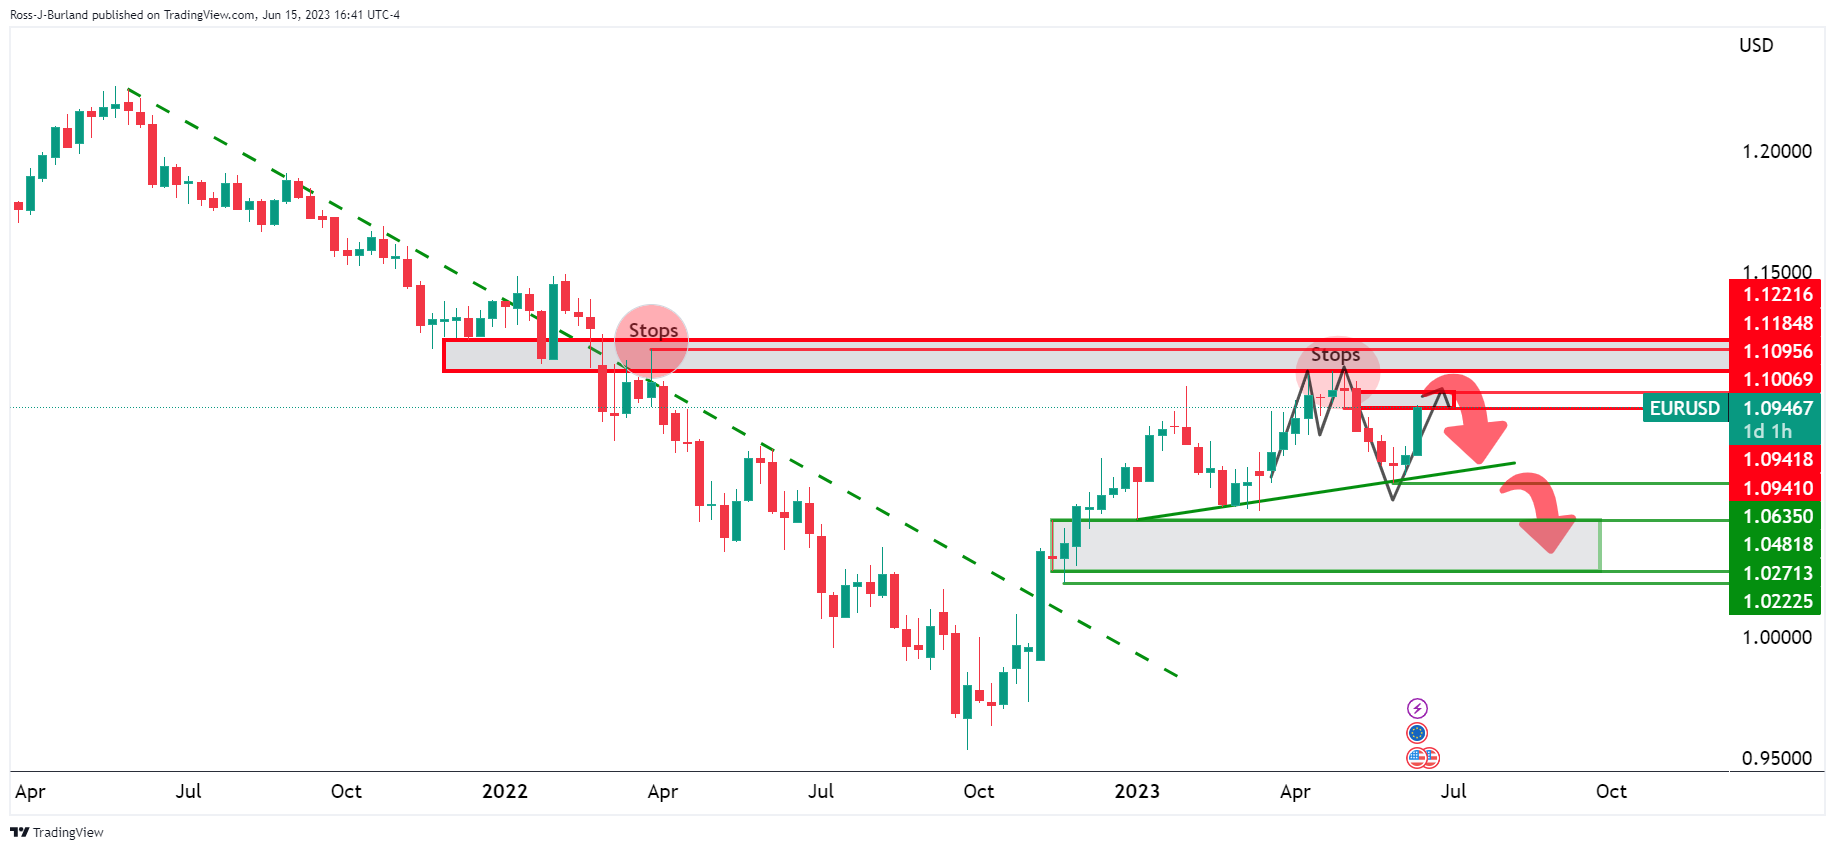
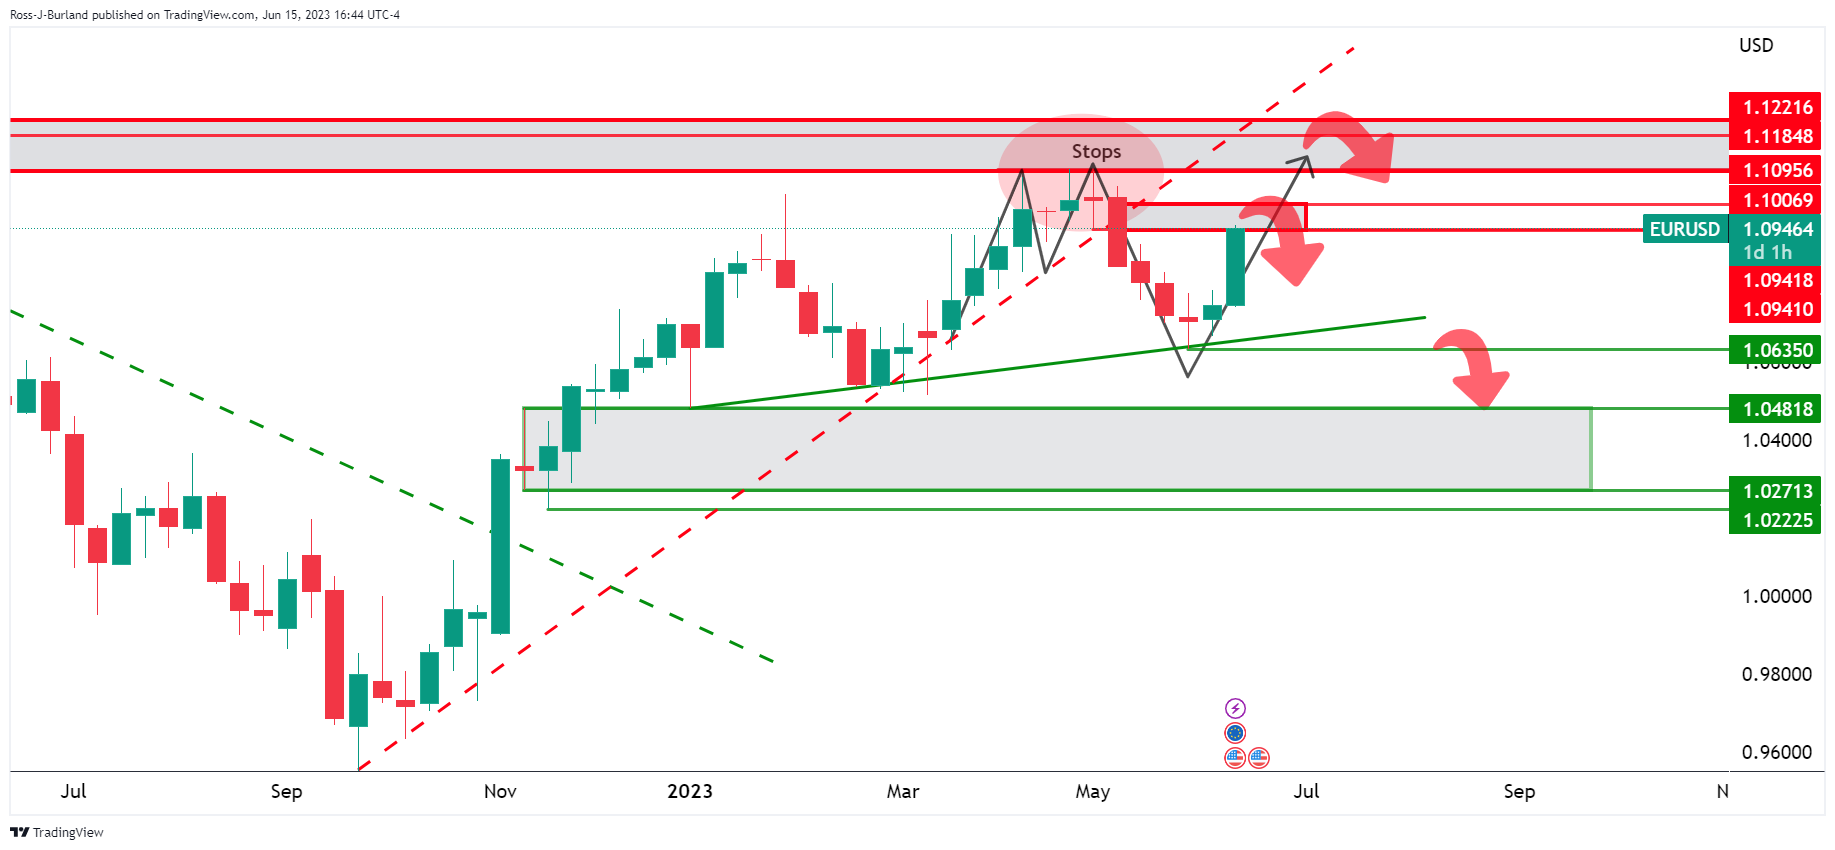
A move lower from here, however, opens risk to the 1.0820s as follows:
EUR/USD daily chart
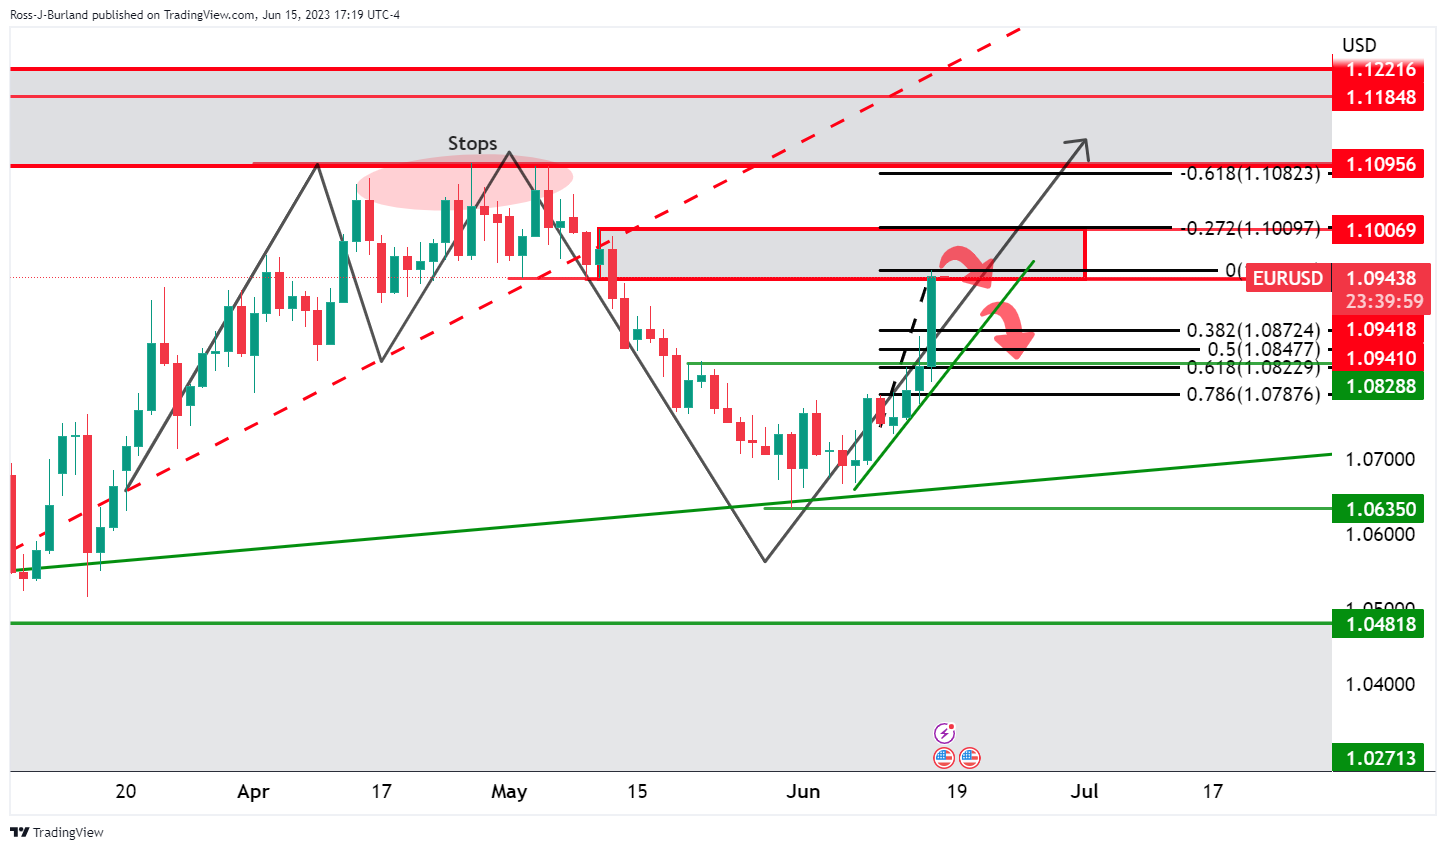
The 1.0820s align with the 61.8% Fibonacci and prior resistance structure as illustrated above.
- On Thursday, the GBP/JPY rocketed to a multi-year high of 179.40 for the first time since December 2015.
- Hot labour market and GDP data from the UK support a hawkish BoE.
- BoJ expected to keep its monetary policy unchanged.
The GBP/JPY gained more than 100 pips on Thursday, rallying to a high of 179.40 and then stabilizing at the 179.30 zone. In that sense, the GBP seems to be gaining ground on the back of hawkish bets on the Bank of England (BoE) after strong labour-market and Gross Domestic Product (GDP) data which supports more rate hikes. On the other hand, policy divergence seems to be weakening the Yen ahead of the Bank of Japan (BoJ) meeting on Friday.
British Yields hold the Pound afloat ahead of next week's BoE meetings
Along this week, labour-market data from the UK showed that unemployment decreased in the three months prior to April while average earnings, including and excluding bonuses, accelerated during the same period. In addition, monthly expanded by 0.2% in April after a decline in March while growing by 0.1% in the three months prior to April.
As the labour market remains robust and economic activity resilient, investors are expecting that the BoE will take a more aggressive path in its fight for inflation. In that sense, according to WIRP (World Interest Rate Probability), the market suggests that a 25 bps hike to 4.75% its already priced, which has small odds of a 15% of a larger 50 bps hike for next week meeting and that a 25 bps hike is already priced in for August, September and November.
Meanwhile, the British yields saw gains across the curve. The 10-year bond yield rose to 4.41%, while the 2-year yield stood at 4.93% and the 5-year yielded 4.56%, respectively.
GBP/JPY Levels to watch
According to the daily chart, the GBP/JPY holds a bullish outlook for the short term, but the pair trading in multi-year highs and at overbought conditions signalled by the Relative Strength Index (RSI) suggest that a healthy downward correction may be on the horizon.
In case the pair continues to gain traction, the following resistance line up at the 179.50 area, followed then by the psychological mark at 180.00 and the 180.50 zone. On the other hand, if the pair corrects to the downside, immediate support levels are seen at the 177.40 area, followed by the psychological mark at 175.00 and the 20-day Simple Moving Average (SMA) at 174.05.
GBP/JPY Daily chart
-638224610991030981.png)
The last top-tier event of the week will be the Bank of Japan's decision during the Asian session. Later in the day, the University of Michigan will release its Consumer Sentiment report in the US. On Friday, market participants will continue to biggest the latest central bank meetings.
Here is what you need to know on Friday, June 16:
The US Dollar tumbled on Thursday and it looks vulnerable to further losses. The improvement in risk sentiment and falling US yields triggered a sharp decline. Wall Street indexes ended with gains of more than 1%. Crude oil prices rose more than 3%, and Gold and Silver rebounded sharply, erasing heavy losses. Economic data from the US came in mixed.
- Retail Sales rise 0.3% in May vs. -0.1% expected
- Industrial Production drops 0.2% in May missing expectations of 0.1% increase
- NY Fed Empire State Manufacturing Index jumps to 6.6 in June vs. -15.1 expected
- Philadelphia Fed Manufacturing Index drops to -13.7 in June vs. -14 expected
- Weekly Initial Jobless Claims remain at 262K vs. 249K expected
Following the European Central Bank's (ECB) rate hike and Lagarde's hawkish tone, the Euro strengthened, boosting the EUR/USD pair. Later in the day, the rally was driven by the slide of the US Dollar. The pair hit monthly highs at 1.0950 and closed near the top, keeping the momentum intact. Inflation data from the Eurozone (EZ) is due on Friday, but is not expected to be relevant as it is the final reading. Also EZ Q1 labors costs are due
Analysts at Commerzbank:
ECB President Lagarde today surprisingly announced another rate hike for July. We are adjusting our forecast for July accordingly, but consider further rate hikes thereafter unlikely despite Lagarde's hawkish statements. This is because the economy is likely to disappoint the ECB's still optimistic expectations. Moreover, inflation will probably have fallen to around 4% by the meeting in mid-September. Moreover, a deposit rate of 3.75% in mid-September would be well above the neutral rate, which the ECB sees at only 2%.
The EUR/GBP peaked at 0.8595 but then pulled back to 0.8560. The GBP/USD posted its highest daily close in a year, slightly below 1.2800. Next week, the Bank of England will have its monetary policy meeting.
The USD/JPY peaked at 141.50, the highest level in seven months, and then pulled back to 140.25 amid falling US yields. The Bank of Japan will announce its decision on Friday and is expected to maintain its monetary policy stance. Any surprise will trigger sharp moves. The EUR/JPY jumped to the highest level since 2008 above 153.00, reflecting the divergence between the Bank of Japan and the ECB, alongside risk appetite.
The Australian Dollar outperformed on Thursday, boosted by the employment data from Australia and also by risk appetite and speculation about Chinese economic stimulus. AUD/USD rose for the sixth consecutive day, moving towards 0.6900.
The Kiwi lagged and was affected by the New Zealand GDP report. NZD/USD rose, reaching a fresh monthly high at 0.6241. AUD/NZD gained almost a hundred pips, posting the highest close since November at 1.1035.
Like this article? Help us with some feedback by answering this survey:
- EUR/JPY pierces through 153.50 for the first time since 2008.
- ECB hiked rates by 25 bps and hinted at more increases.
- BoJ is expected to take the dovish path on Friday.
The EUR/JPY sets four-day winning strike trading at 153.55 as the Euro rallied against most of its rivals on Thursday following the European Central Bank (ECB) meeting. In that sense, Christine Lagarde’s hawkish comments in the presser hinting at more hikes, fueled the Euro’s rally.
Rising German Bond yields favour the Euro
On Thursday, the ECB increased the main financing rate to 4.00%, the marginal lending to 4.25% and the deposit facility rate to 3.50%, all by 25 basis points as expected. Regarding the updated macroeconomic forecast, the central bank expects the Gross Domestic Product (GDP) to pick up later this year. They consider inflation will remain high, at least until 2025.
Looking forward, Christine Lagarde mentioned in the presser, that they are “not done yet”, and that there is still “more ground to cover”, stating that she is not satisfied with the progress being made. In relation to the recent deceleration of inflationary pressures in the Eurozone (EZ), she considered it as “broad-based” and that the central bank should focus on the long-term inflation expectations. All in all, she also confirmed that it is “very likely” that the ECB will hike again in July.
As a reaction, the German yields rose across the curve. The 10-year bond yield climbed to 2.46%, seeing a daily increase of 1.34%, while the 2-year yield stands at 3.13%, gaining 2.80%.
On the other hand, investors await the Bank of Japan (BoJ) decision on Friday. The central bank is expected to keep its monetary policy unchanged.
EUR/JPY Levels to watch
Based on the daily chart, the EUR/JPY holds a clear bullish bias in the short term, as the Relative Strength Index (RSI) and Moving Average Convergence Divergence (MACD) are both deep in positive territory, suggesting a strong upward momentum. However, the pair reached overbought conditions and uncharted territory, suggesting that a downward correction may be on the horizon.
If EUR/JPY manages to move higher, the next resistances to watch are at the 153.80 area, followed by the psychological mark at 154.00 and the 154.50 zone. On the other hand, in case the cross loses ground, support levels line up at the psychological mark at 152.00,the 150.50 area and the 20-day Simple Moving Average (SMA) at 150.05.
EUR/JPY Daily chart
-638224576885006391.png)
- WTI has rallied into a potential area of resistance on the daily chart.
- Bears need to commit at this juncture or face pressures towards $72.00 and then the $73.20s.
West Texas Intermediate WTI crude oil was headed for a higher close on Thursday marking the largest one-day percentage gain, so far, since the start of the month. The rise comes after the International Energy Agency on Wednesday hiked its 2023 demand forecast and Chinese refinery data showed rising demand from the world's No.1 importer.
At the time of writing, the black gold is trading 2.71% higher after rallying from a low of $68.03 to a high of $70.93 so far. This has seen the price move into the M-formation's neckline and a potential resistance zone. However, as the following analysis illustrates, the bulls could well commit at this juncture to complete the final leg of the W-formation:
WTI daily chart
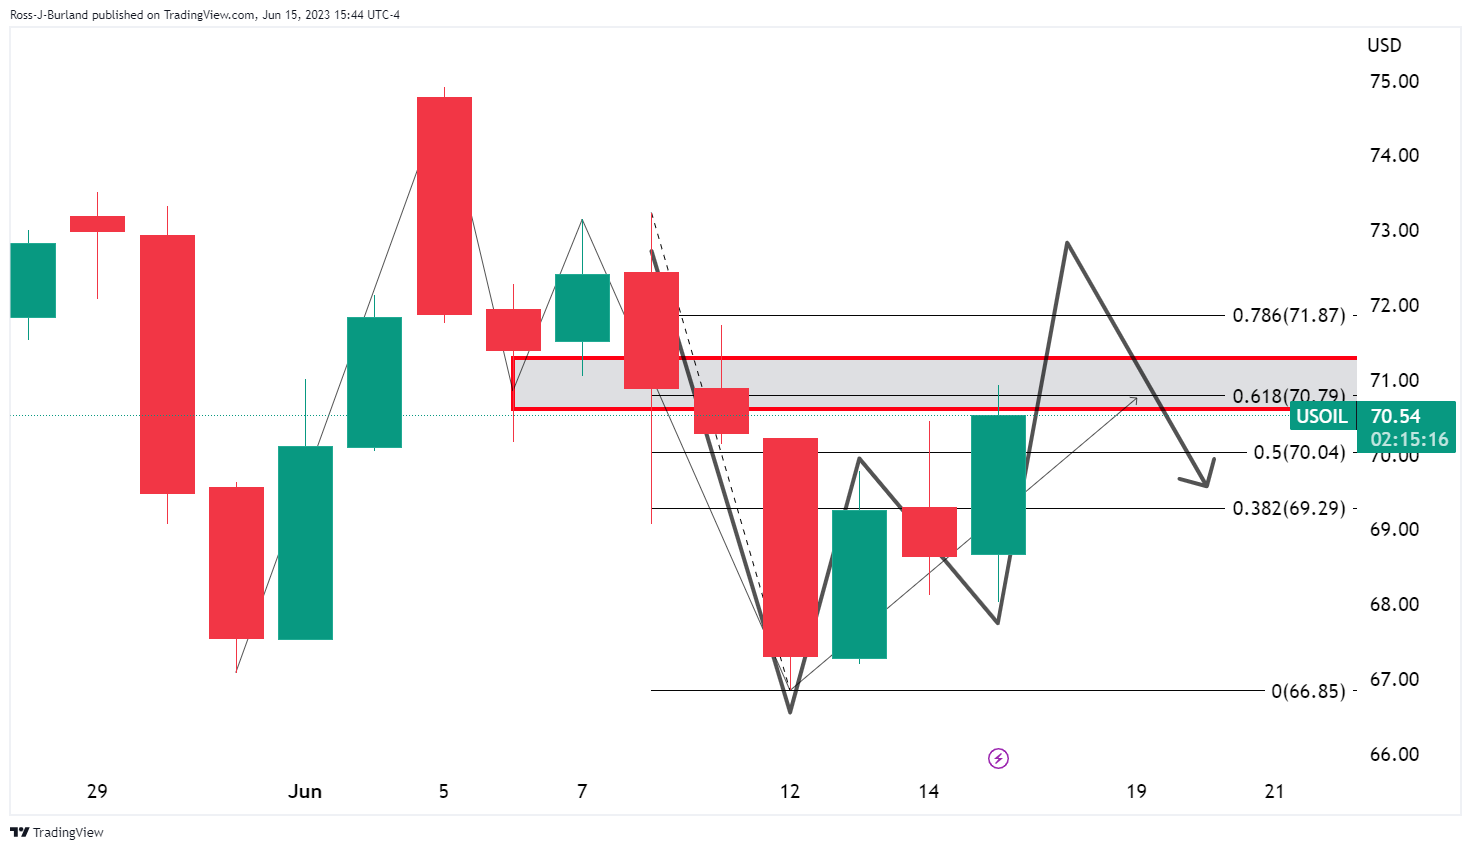
This will expose $72 the figure in the coming session and then $73.20s.
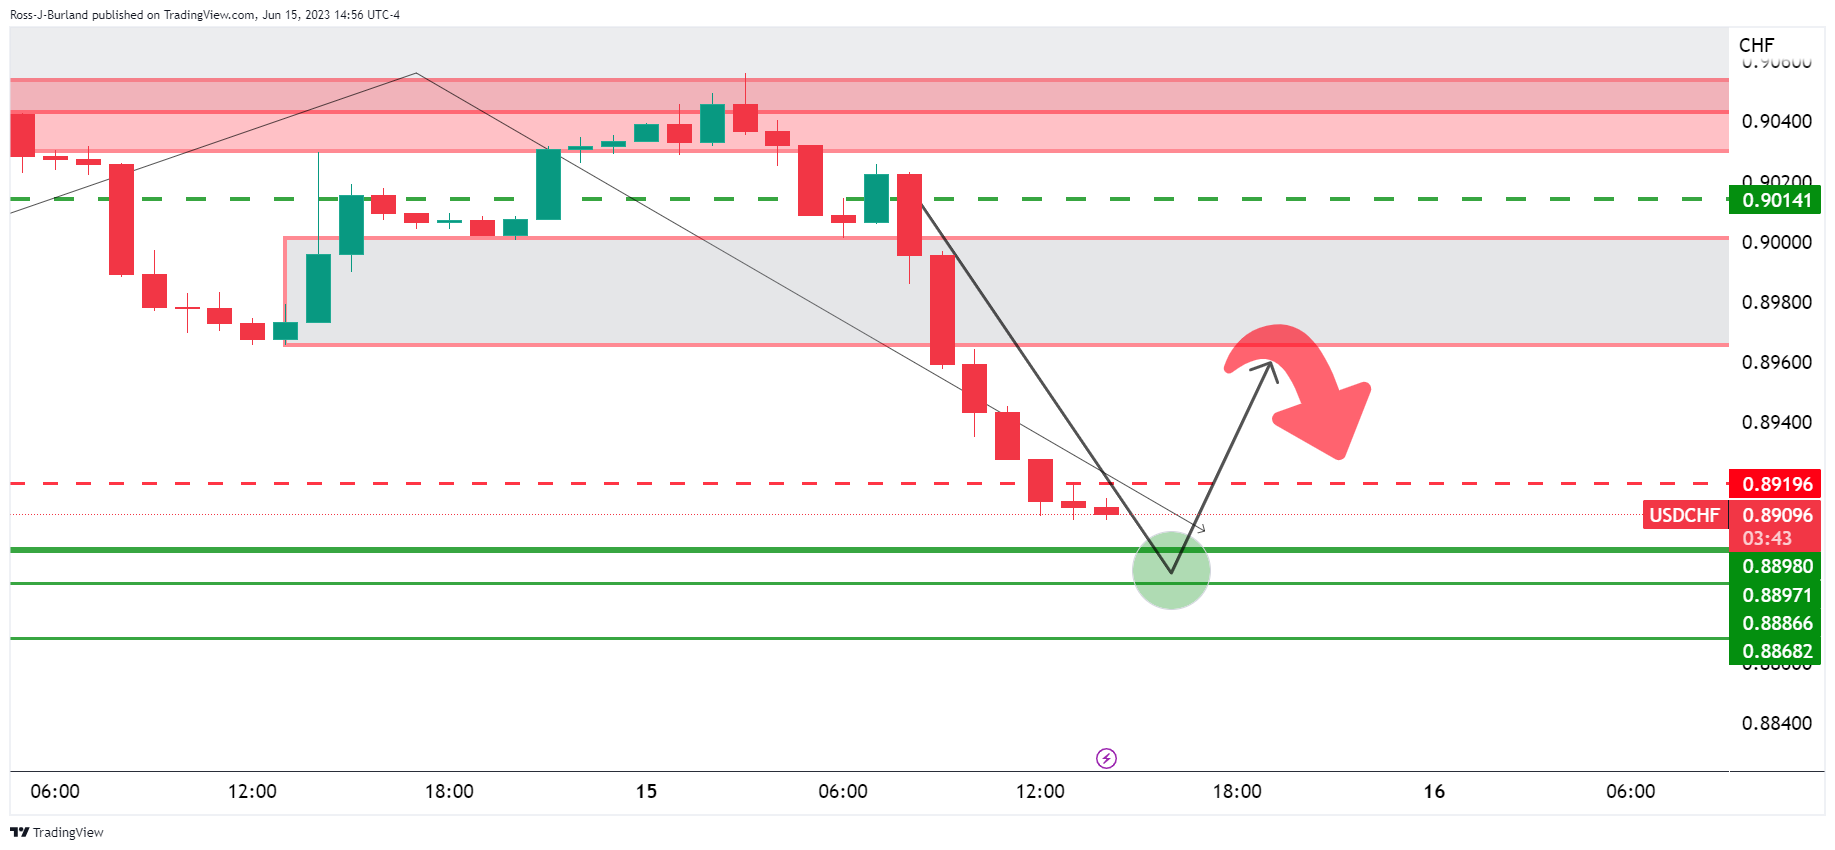
- The Swiss Franc is on the march but a correction is eyed for.
- USD/CHF bulls are lurking in what could be a support area for the coming sessions.
The Swiss Franc rallied in tandem with the Euro on Thursday which made a fresh four-week high against the US Dollar after the European Central Bank lifted interest rates to a two-decade high of 3.5% and guided towards more hikes ahead. This has seen USD/CHF subsequently plummet on the day towards a critical support area as the following technical analysis will illustrate:
USD/CHF H4 chart
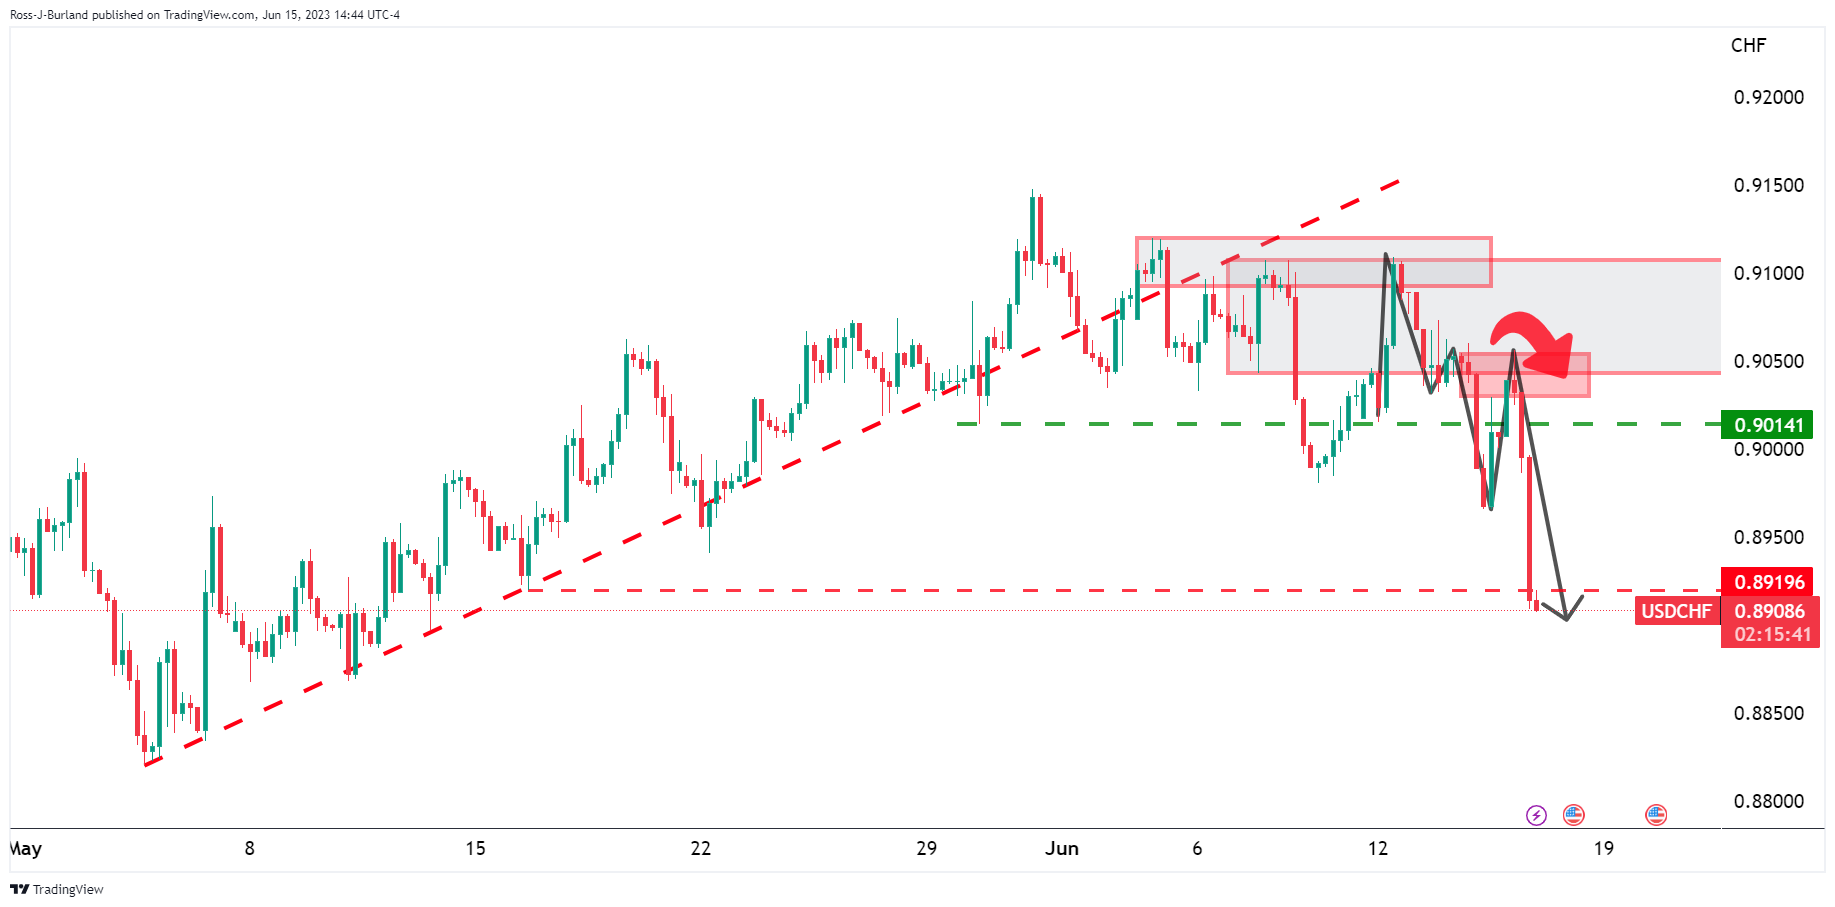
We have seen a breakdown in the market structure which has left behind the M-formation, a reversion pattern that leaves scope for a correction back towards prior support structures.
USD/CHF H1 charts

Zooming down to the hourly charts, we see the structure on the left where the price could be headed before a deceleration might come into play leading to a phase of accumulation.
Zooming into the present, bulls will be monitoring for that deceleration and a bullish structure within the accumulation schematic to lean against and targetting the imbalance to the upside.
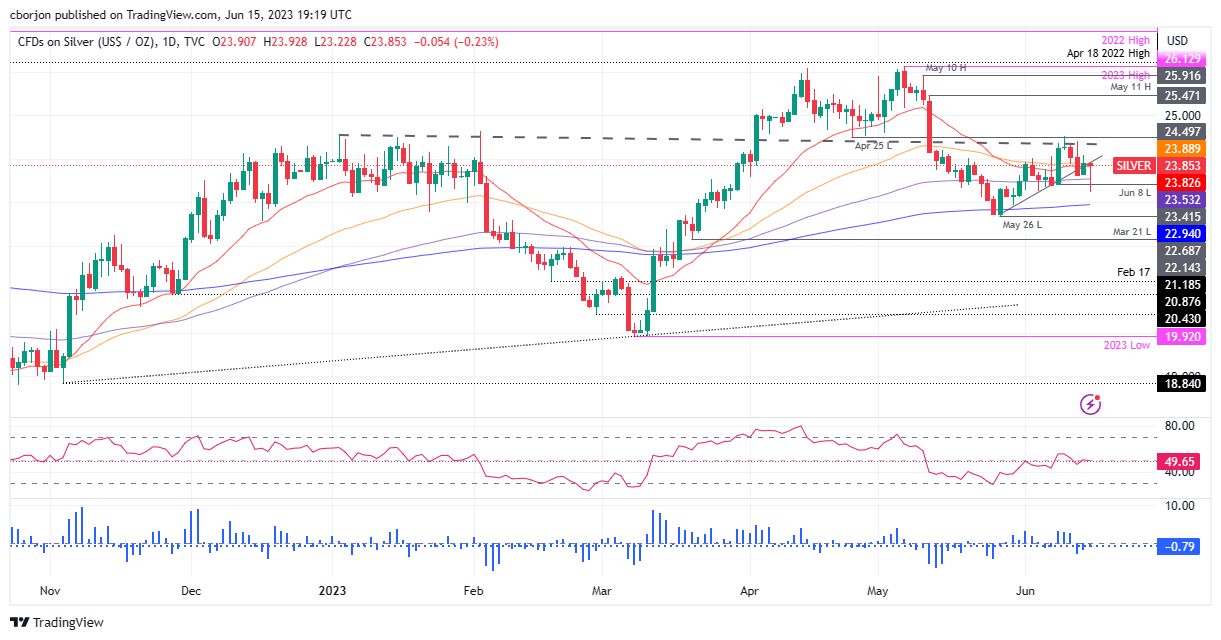
- XAG/USD sees resistance, trading at $23.82, down 0.36% amidst weakened US Treasury yields.
- Despite the downward tilt, breaking June 9 daily high could shift Silver’s bias to neutral upwards.
- Oscillators predict near-term downside, indicating sellers’ continued market control.
Silver price erases some of its earlier losses which witnesses XAG/USD’s printing a two-week low at $23.22 before reversing its direction. However, XAG/USD’s recovery stalled at a resistance area, with several technical indicators capping the uptrend. At the time of writing, the XAG/USD is trading at $23.82, down 0.36%.
XAG/USD Price Analysis: Technical outlook
The XAG/USD remains neutrally biased, tilted downwards as the white metal can’t reclaim the April 25 swing low of $24.49, an inflection point that can pave the way for further upside. Should be said Silver failed to rally, despite a drop in US Treasury bond yields. Therefore, XAG/USD’s momentum in the short term could be fading, warranting a bearish resumption.
To the downside, XAG/USD would find first support at the 100-day Exponential Moving Average (EMA) at $23.53, which, once cleared, would put at risk $23.00. Break below, and the 200-day EMA will be up for grabs at $22.94 before challenging May 26 low at $22.68, with further downside expected past the latter.
Conversely, the XAG/USD must crack the June 9 daily high for a bullish resumption at $24.52. The break above will put into play a higher trading range and shift Silver’s bias to neutral upwards. The next resistance would be $25.00, followed by May 11 high at $25.47.
However, oscillators suggest further downside expected in the near term, with the Relative Strength Index (RSI) at a bearish area and the three-day Rate of Change (RoC), portraying sellers remaining in control.
XAG/USD Price Action – Daily chart
- The NZD/USD jumped to 0.6235 and now trades above the 20,100, and 200-day SMAs.
- US Jobless Claims for the first week of June came in above expectations.
- New Zealand confirmed it entered into a technical recession.
In Thursday’s session, the Kiwi gained further traction to jump above the 100-day SMA as the US Dollar weakened post Jobless Claims and Retail Sales. In that sense, US bond yields are falling while US stocks are rising reflecting a positive market environment and applying further pressure on the USD. On the other hand, the NZD managed to clear losses after weak Gross Domestic Product (GDP) data from New Zealand.
Investors asses Fed decision after Jobless Claims data
The recent data from the US Census Bureau revealed that Retail Sales from May (MoM) experienced a growth of 0.3% compared to the previous reading vs the 0.1% decline expected. On the other hand, Jobless Claims for the week ending June 9 increased slightly to 262K, surpassing the predicted number of 249k but remaining at the same level as the previous week.
Despite the hawkish tone of Wednesday’s monetary policy statement from the Fed, US bond yields declined following the data as a weak labor market may reduce the pressure from Fed officials to continue to hike rates. Its worth noticing that Chair Powell stated that the labour market remains robust and that is the main engine of the US economy. That being said, the 2,5 and 10-year yields all saw declines, with the latter falling sharply to 3.72%, seeing a 1.60% contraction, and making the USD lose interest.
On the other hand, the NZD managed to shrug off weak-GDP-related losses. The report showed that the economy contracted by 0.1% QoQ in Q1, and as two consecutive contractions in quarterly figures is considered to be a technical recession.
NZD/USD Levels to watch
According to the daily chart, the bulls clearly have the upperhand in the short term. The Relative Strength Index (RSI) stands above its midline with a positive slope while the Moving Average Convergence Divergence (MACD) prints rising green bars suggesting a strong bullish momentum.
In case the pair continues to move upwards, resistance levels can be found at around 0.6250, followed by the 0.6280 area and the psychological mark at 0.6300. On the other hand, supports line up at the 100-day SMA at 0.6220 and below at the 20 and 200-day SMA at 0.6150 and 0.6111, respectively.
NZD/USD Daily Chart
-638224502470371043.png)
- USD/MXN registers minimal gains of 0.15%, trading around 17.1320, amidst a weakened USD.
- Surprise expansion in US Retail Sales countered by skepticism over projected Fed rate hikes.
- Upcoming US and Mexican data eyed by USD/MXN traders amid mixed signals on monetary policy.
USD/MXN found bids around the year-to-date (YTD) low area and climbed to fresh two-day highs before reversing its path as the US Dollar (USD) weakened. Nevertheless, the USD/MXN is still registering minimal gains of 0.15%, trading at around 17.1320, after reaching a YTD low of 17.0783.
Surprise expansion in US Retail Sales meets Skepticism over Fed’s rate hike expectations
The Mexican Peso (MXN) weakened amidst a risk-on impulse, as shown by Wall Street trading with gains. Market participants were surprised by the US Federal Reserve’s (Fed) hawkish dot plots, with 12 of 18 officials lifting their dots past the 5.50% threshold and revising Fed Funds peak rates upward. Although it briefly extended the US Dollar recovery, Jerome Powell’s press conference stabilized things sending the greenback lower.
Data-wise, the US economic docket revealed a surprising expansion in Retail Sales, topping expectations, increasing 0.3% MoM in May, above estimates of a 0.1% contraction. At the same time, the US Department of Labor updated unemployment claims data for the June 10 week, growing above estimates of 249K, at 262K, the same as the prior’s week upward revised figures.
Recently revealed data, Industrial Production contracted in May -0.2% MoM, missed the forecast of 0.1% growth, while the New York and Philadelphia Fed Manufacturing Indices came mixed, with the NY rebounding unexpectedly after May’s plunge, while the Philly further deteriorated but at a slower pace.
Reacting to the data, US Treasury bond yields tumbled, a headwind for the buck. The US Dollar Index (DXY), which tracks the greenback’s value against a basket of six rivals, drops 0.77%, down at 102.209 after hitting a one-month low.
Regarding upcoming monetary policy meetings, the CME FedWatch Tool shows odds for a 25 bps rate hike in July stand at 67%. Notably, traders contradict Fed Chair Powell’s words regarding two more rate hikes, as the swaps market expects no further increases. Investors speculate the Fed would slash rates as early as January 2024, expecting six rate cuts towards December 2024, with the Federal Funds Rate (FFR) seen at 3.50%-3.75%.
Upcoming events
The US agenda will feature Fed speakers, the US Consumer Sentiment from the University of Michigan (UoM), and American inflation expectations. On the Mexican front, next week’s Retail Sales and Bank of Mexico (Banxico) monetary policy decision are eyed by USD/MXN traders.
USD/MXN Price Analysis: Technical outlook
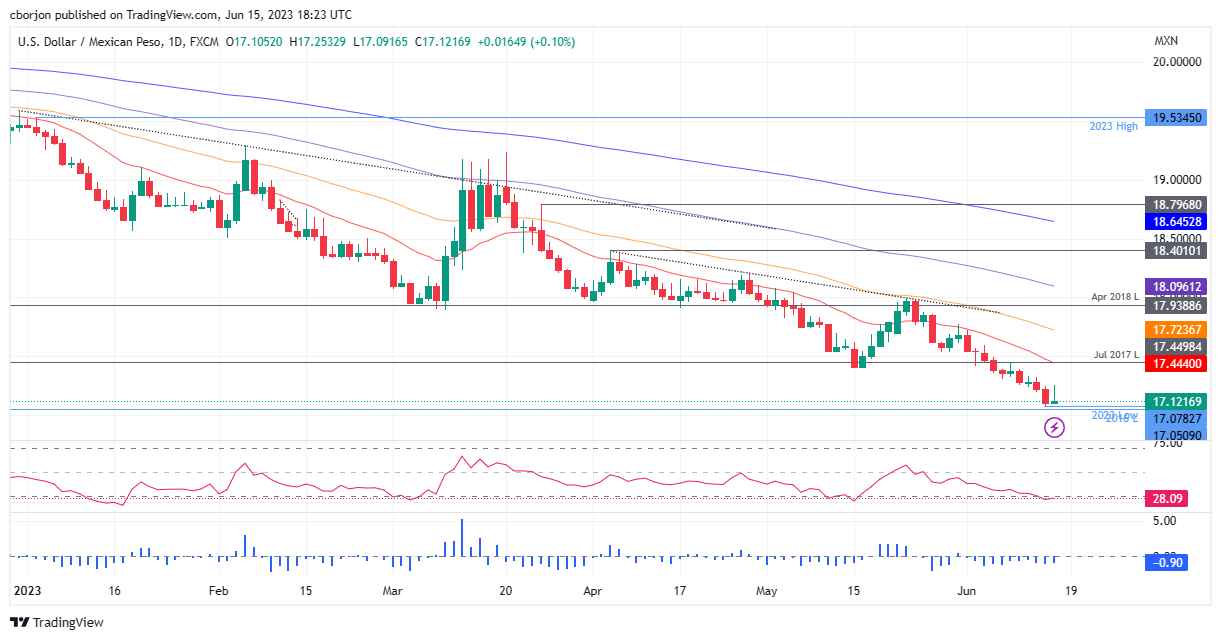
Despite slashing some of its losses, the USD/MXN remains downward biased as it remains below the May 16 low of 17.4038 turned resistance, seen as an inflection pivot that could shift the USD/MXN bias to neutral. That would put into play the 17.40-17.7720 area, surrounded by the 20 and 50-day Exponential Moving Averages (EMAs) at 17.4443 and 17.7238, respectively. Once those levels are cleared, USD/MXN buyers could remain hopeful the pair would challenge the 18.00 psychological level in the medium term. Otherwise, the path of least resistance is downwards, with the 17.0000 figure up next, followed by 16.50, before diving toward October 2015 low of 16.3257.
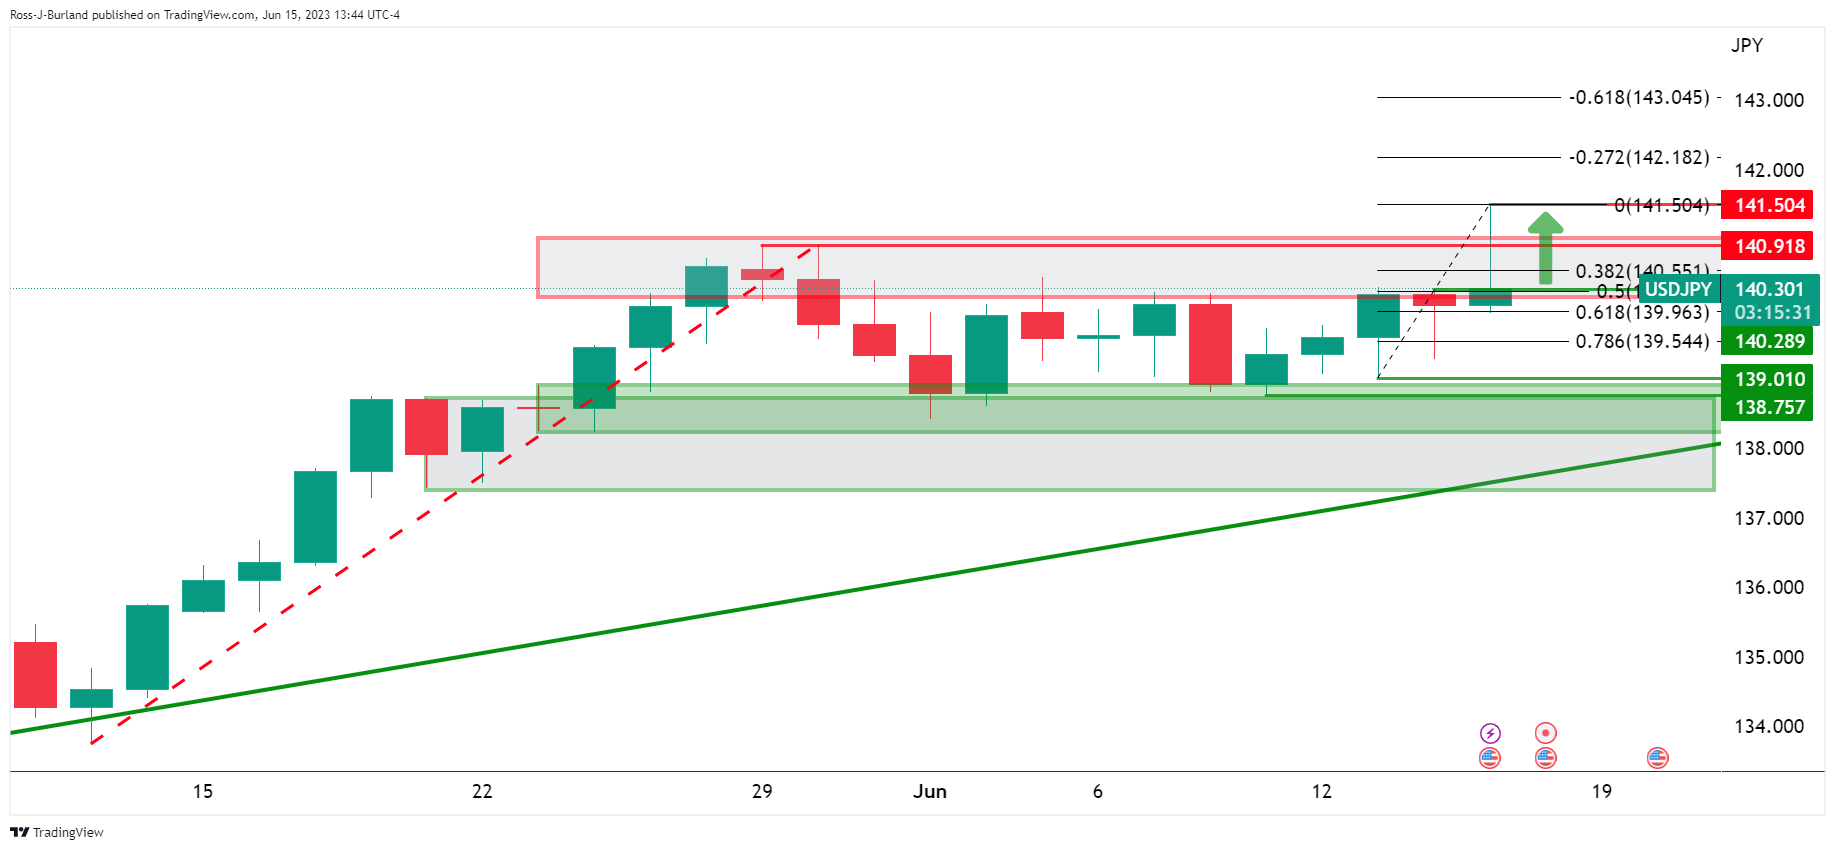
- USD/JPY bulls take a step back but eye higher highs.
- The price is meeting a prior area of resistance eyed as potential support.
USD/JPY has reached the highest levels since November 2022 as the US Federal Reserve maintained a hawkish stance in Wednesday's interest rate announcement with the dot plot hinting at two more quarter-point rate increases this year. However, a big wick is being left on the day's candle currently as the US Dollar and US Treasury yields pared gains. At the same time, investors digested the European Central Bank's interest rate hike and a flurry of economic data. Nevertheless, should support on the 4-hour charts hole, there will be prospects of a bullish extension in the coming sessions and days as the following analysis illustrates:
USD/JPY daily charts
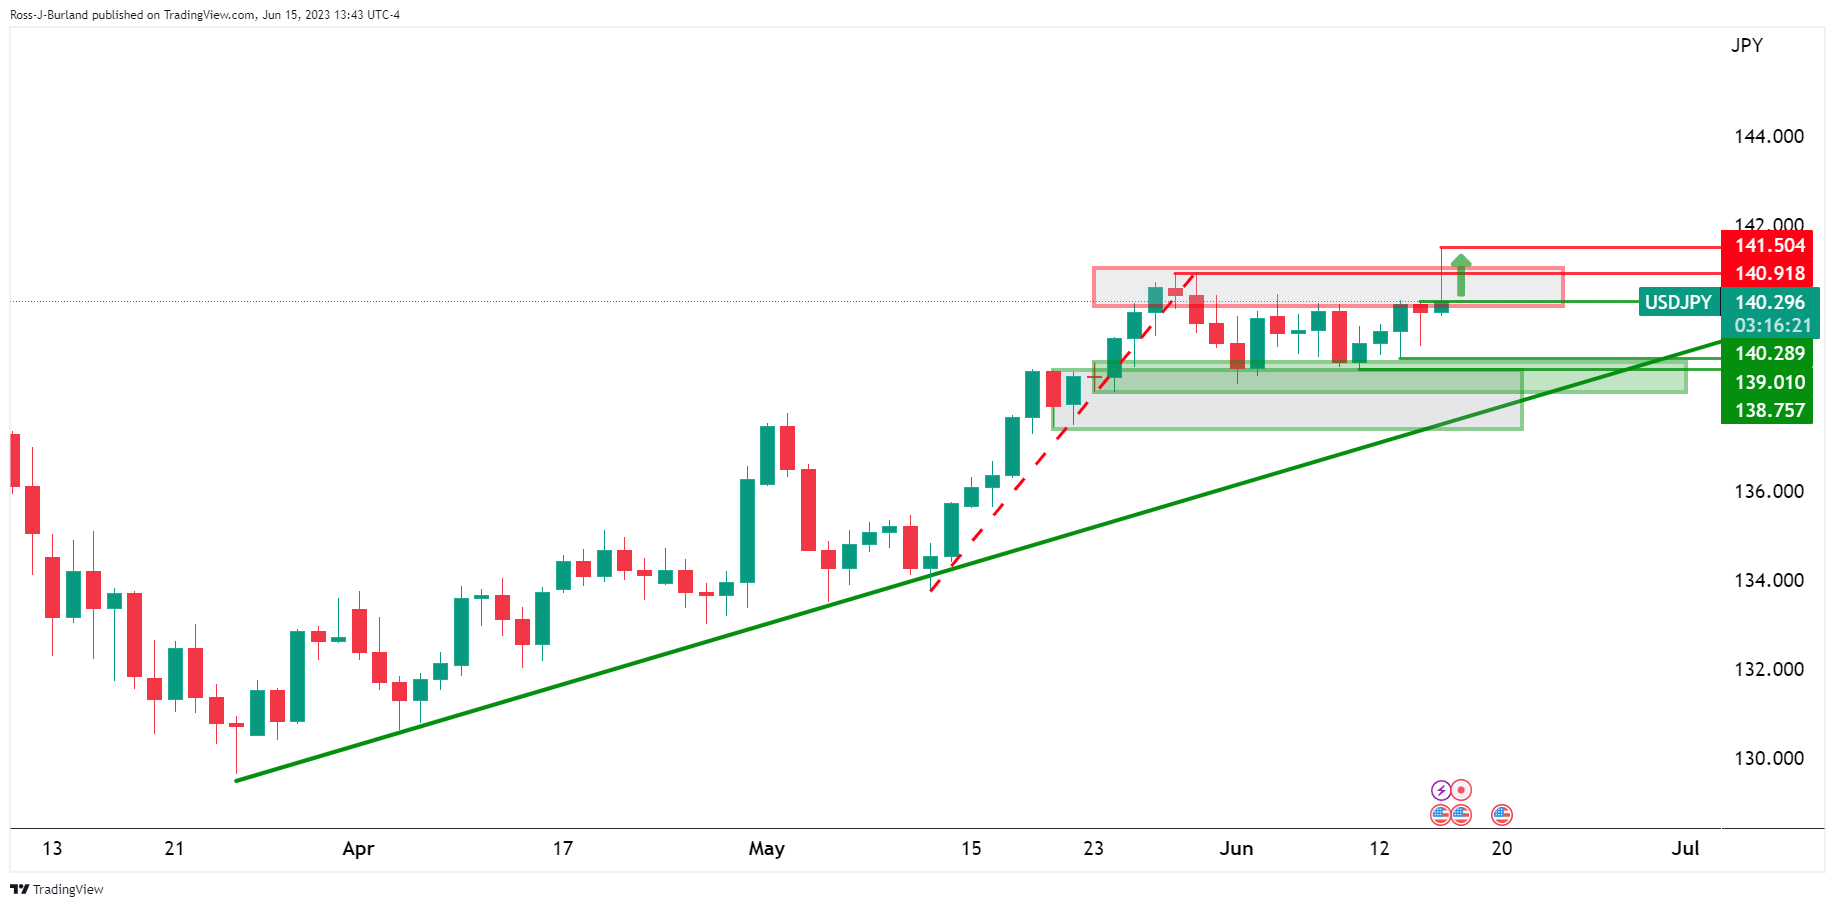
USD/JPY H4 chart
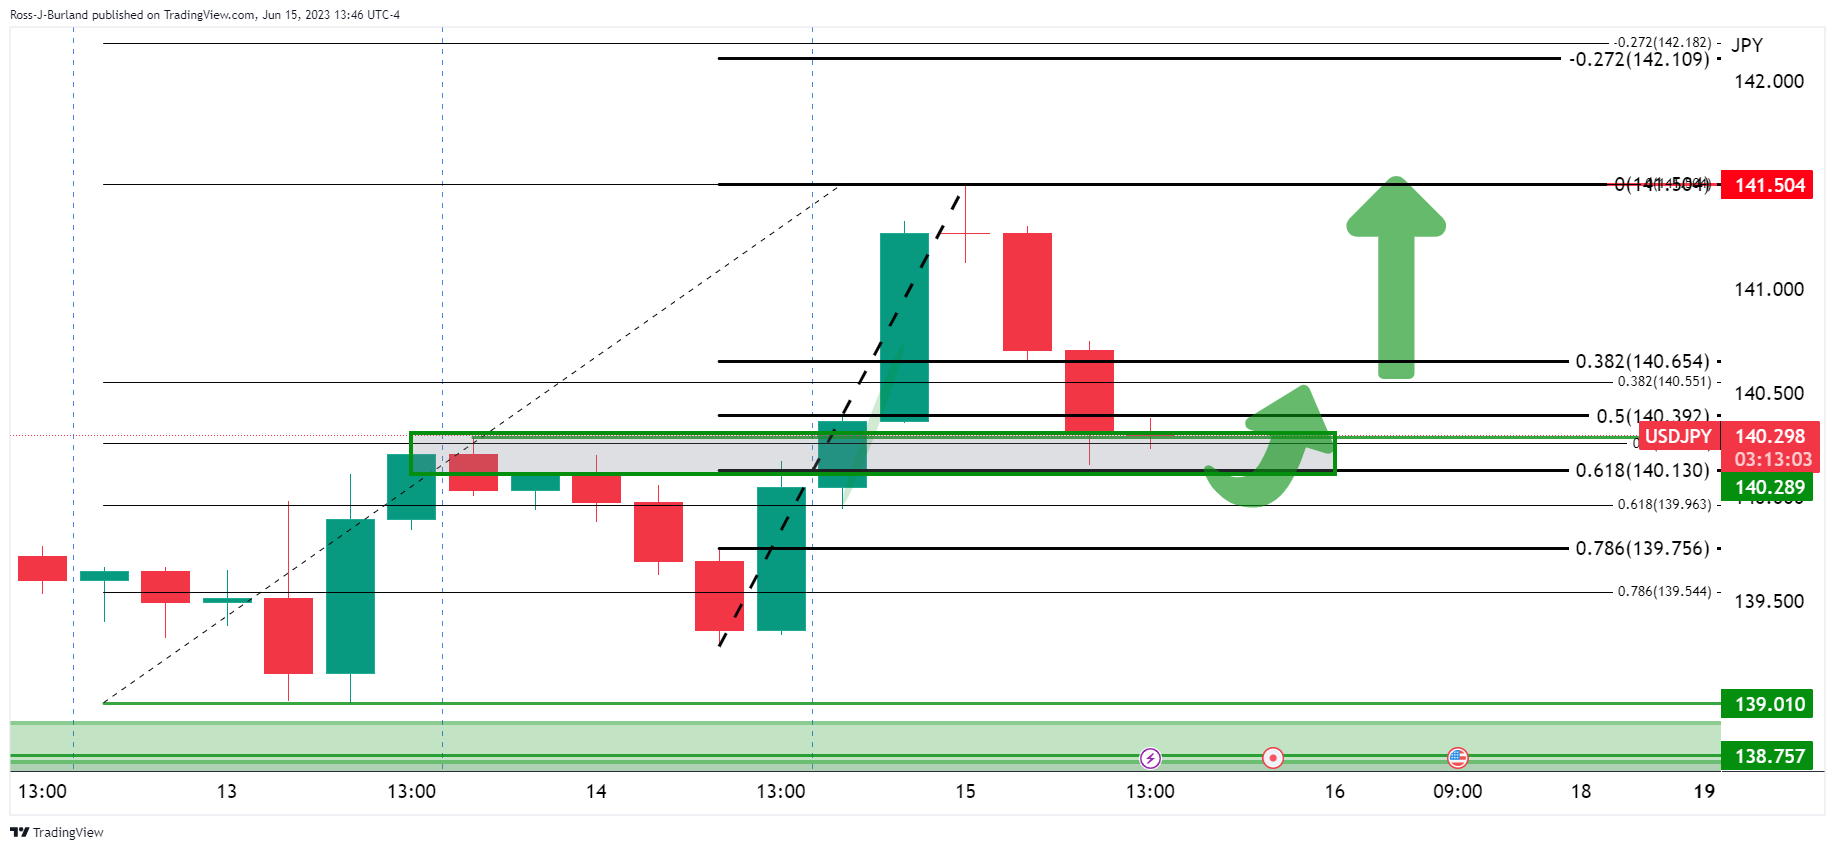
The support on the 4-hour chart could be where the price is meeting old resistance that is aligned with the 50% mean reversion of the 4-hour bullish impulse.
- AUD/USD sets a sixth consecutive day of gains, jumping to the 0.6870 area.
- Strong US Retails Sales and Jobless Claims data support a dovish Fed.
- Falling US yields and a positive market sentiment favour the AUD.
On Thursday, the AUD/USD pair surged to its highest level since February, gaining 90 pips. In that sense, post the release of US Retail Sales and Jobless Claims data, falling US bond yields and a positive market sentiment weakened the US Dollar and favoured the AUD.
US Economic activity data post-Fed decision weakened the USD Dollar
The latest data from the US Census Bureau revealed a surprising expansion in Retail Sales, surpassing expectations as they increased by 0.3% MoM in May, defying the anticipated contraction of 0.1%. Furthermore, Jobless Claims for the week ending June 9 rose to 262,000, slightly higher than the forecasted 249,000 and the same as the previous week's reading of 262,000.
In Wednesday’s session, the Fed decided to hold rates steady in order to assess additional information regarding its implication on monetary policy. In addition, Fed Chair Powell, in the press conference, stated that the labour market remains robust and drives the US economy, so weakness in this area makes investors think that the Fed may take a more dovish stance for its next meetings.
Reacting to the data, US bond yields are seeing losses across the curve. The 10-year bond yield slid to 3.75% while the 2-year yield stood at 4.68% and the 5-year yields at 3.95%, with all three seeing declines of between 0.30-1%, applying further pressure to the US Dollar. Stocks, on the other hand, continued to trade strong, with the S&P 500 (SPX) gaining over 0.40%, signalling a positive market environment.
AUD/USD Levels to watch
Technically speaking, the AUD/USD maintains a clear bullish outlook for the short term, as the pair managed to rally above the 20,100 and 200-day Simple Moving Averages (SMA) and the technical indicators suggest that the buyers have the upperhand. However, the pair approaches overbought conditions, suggesting that a downward correction may be on the horizon.
In case the AUD/USD continues to gain traction, the following resistance line up at the daily high at 0.6875, followed by the psychological mark at 0.6900 and the 0.6950 area. On the other hand, to the downside, the next support levels to watch are the 100-day Simple Moving Average (SMA) at 0.6730, followed by the 200-day and 20-day SMA at 0.6690 and 0.6630, respectively.
AUD/USD Daily chart
-638224472903316044.png)
- XAU/USD experiences an uptick of 0.86% in the trading, spurred on by a softer US Dollar and falling bond yields.
- Despite the Fed’s projected rate hikes, US Treasury yields are retreating, signaling broad market skepticism over monetary tightening.
- US Retail Sales see an unexpected rise in May, bucking predictions, but the labor market shows signs of easing amid higher jobless claims.
Gold price bounced off three-month lows of $1925.06, spurred on by a soft US Dollar (USD) and falling US bond yields as the main factors underpinning Gold. At the time of writing, the XAU/USD is trading at $1958.50 a troy ounce, up 0.86%.
Market skepticism over Fed’s rate hikes projections boosts Gold
Sentiment remains upbeat, even though the Fed’s announced additional hikes needed after holding rates unchanged. Even though the Fed’s decision weakened Gold prices, market participants remain skeptical about the Fed, as US Treasury bond yields retraced from Wednesday’s highs.
The US economic agenda revealed that Retail Sales surprisingly rose in May by 0.3% MoM surpassing estimates but trailing April’s figures. At the same time, the US Department of Labor released the Initial Jobless Claims for the last week, topping forecasts of 249K, it came at 262K, printing back-to-back negative jobs data, indicating the labor market is easing.
Industrial Production showed a further deterioration, contracting -0.2% MoM, missing estimates of 0.1% expansion. Recently, the New York and Philadelphia Fed Manufacturing Indices came mixed, with the NY rebounding unexpectedly after May’s plunge, while the Philly further deteriorated but at a slower pace.
The US Dollar Index (DXY), a gauge that measures the buck’s value vs. a basket of six currencies, tumbles 0.77%, down at 102.209 after hitting a one-month low, while the US 10-year benchmark note yields 3.729%, losses six basis points, from its opening price.
The CME FedWatch Tool shows odds for a 25 bps rate hike in July stand at 67%, but traders in the swaps market expect no additional hikes. Investors estimate the Fed would slash rates as early as January 2024, expecting six rate cuts towards December 2024, with the Federal Funds Rate (FFR) seen at 3.50%-3.75%.
Upcoming events
The Fed parade would begin once officials are officially released from the blackout period, ahead of the June meeting, led by the St. Louis Fed President James Bullard. On the data front, the US Consumer Sentiment from the University of Michigan (UoM) and American inflation expectations are expected.
XAU/USD Price Analysis Technical outlook
From a technical perspective, the XAU/USD will likely remain sideways after reclaiming the 100-day Exponential Moving Average (EMA) at $1939.26, as the yellow metal slipped to new three-month lows of $1925.06 earlier. On the upside, XAU/USD is capped by the 20 and 50-day EMAs, each at $1961.52 and $1965.76, respectively. Up next, a resistance trendline from the broken descending symmetrical triangle lies around the $1965-75 area before Gold’s test of June 2 high at $1983.44. On the downside, the XAU/USD first support would be the psychological $1950 level, followed by the 100-day EMA.
- USD/CAD targets November 2022 lows at 1.3260.
- US Retail Sales data came in strong, and Jobless Claims in the first week of June picked up.
- Rising Oil prices and positive market sentiment support the CAD.
In Thursday’s session, the USD/CAD dropped more than 60 pips towards the 1.3245 level amid US Dollar weakness. In that sense, US bond yields are declining while Wall Street indexes trade with gains. On the other hand, amid the positive market sentiment and rising Oil prices, the CAD gained traction
US Yields decline following Jobless Claims and Retail Sales data
The US Census Bureau confirmed that Retail Sales in the US expanded by 0.3% vs the 0.1% contraction expected, while Jobless Claims in the week that ended in June 9 came in at 262K vs the 249K expected – the same as the previous weekly reading of 262k. It's worth noticing that US Federal Reserve (Fed) Chairman Jerome Powell noted at Wednesday’s press conference that the labor market in the US remains robust, so signs of unemployment rising make a dovish stance by the Fed more likely.
As a reaction, the US bond yields have weakened across the curve. The 10-year bond yield fell to 3.73%, while the 2-year yield sits at 4.65% and the 5-year yields 3.93% with a 2.03% drop, respectively. In addition, as stocks and bond yields tend to be negatively correlated, the expectations of a less aggressive Fed made the major Wall Street indexes rise with the S&P 500 (SPX) rising more than 0.40% standing at highs since April 2022.
Moreover, the positive market sentiment made Oil prices rise. The Western Texas Intermediate (WTI) rose more than 1% to the $69.80 area benefiting the CAD as Canada is a world-leading oil exporter.
USD/CAD Levels to watch
According to the daily chart, the USD/CAD holds a bearish outlook for the short term as the Relative Strength Index (RSI) and Moving Average Convergence Divergence (MACD) both suggest that the sellers are in control while the pair trades below its main moving averages. However, both indicators are near oversold conditions suggesting an upwards correction could come into play.
If USD/CAD manages to move higher, the next resistances to watch are at the 1.3250 zone, followed by the 1.3300 area and the psychological mark at 1.3330. On the other hand, if the pair continues to lose ground, immediate support levels are seen at the November 2022 low at 1.3225, followed by the 1.3200 area.
USD/CAD Daily chart
-638224425732222225.png)
Economists at TD Securities discuss Gold (XAU/USD) outlook after the Fed meeting.
Gold to average $2,100 in the final three months of the year
The yellow metal could well move into the low $1,900 in the not-too-distant future if data remains strong enough to corroborate the Fed's interest rate forecast and technical supports are breached.
Given the world is looking like the Fed will not actually pull the trigger two more times, as suggested by the ‘meaningless’ median dots, our outlook for the yellow metal is positive.
Gold could well rally on any data showing inflation pressures are easing and the economy is reversing gears.
We see Gold averaging $2,100 in the final three months of the year, as we suspect the US central bank will cut rates aggressively thereafter, potentially before the two percent inflation target is reached.
- GBP/USD nears 1.2800 amid BoE hawkish signals, soft US Dollar.
- US Treasury yields lower despite forecasted hikes; a headwind for the greenback bolstered the GBP/USD.
- An unexpected jump in US Retail Sales; labor market cools.
GBP/USD rallies sharply in the North American session, propelled by an interest rate hike by the European Central Bank (ECB) and a hold of the US Federal Reserve (Fed). Expectations that the Bank of England (BoE) could be the more hawkish central bank amongst G10 FX countries keep the GBP/USD underpinned toward the 1.2800 mark. At the time of writing, the GBP/USD is trading at 1.2764 after hitting a low of 1.2628.
BoE hawkish expectations propel Sterling as US markets fight the Fed
Wall Street is trading with gains following the Fed’s decision to keep rates unchanged. Even though Jerome Powell and Co. telegraphed two more 25 bps rate hikes, the markets are not buying their narrative, as US Treasury bond yields drift lower, with the 10-year note yielding 3.753%, down four basis points (bps), while the greenback weakens across the board. In the meantime, the ECB lent a lifeline to the Pound Sterling (GBP) after lifting rates by 25 bps and suggesting more increases are coming.
Regarding economic data, US Retail Sales unexpectedly jumped in May by 0.3% MoM, against estimates for a 0.1% contraction, though it eased a tick compared to April’s data. Regarding the labor market, Initial Jobless Claims for the week ending June 10 rose 262K above the 249K analysts foresee, with back-to-back increases in claims, flashing that the labor market is cooling.
In other data, Industrial Production in the US, reported by the Fed, grew 0.2% YoY, though monthly figures showed a contraction of -0.2%. Aside from this, the Philadelphia Fed Manufacturing Index came better than expected but trailed May’s report; while the New York Empire State Manufacturing Index improved unexpectedly, exceeding estimates of -15.1, crushed last month’s reading of -31.8 at 6.6.
Across the pond, money market futures estimates the Bank of England (BoE) would continue to raise rates after solid employment data and April’s GDP figures. WIRP suggests a 25 bps hike in June is fully priced in, as well as August, September, and November, bringing the Bank Rate to 5.75%. Further data will be revealed the next week, with CPI for May expected at 8.5% YoY, compared to April’s 8.7%.
GBP/USD Price Analysis: Technical outlook
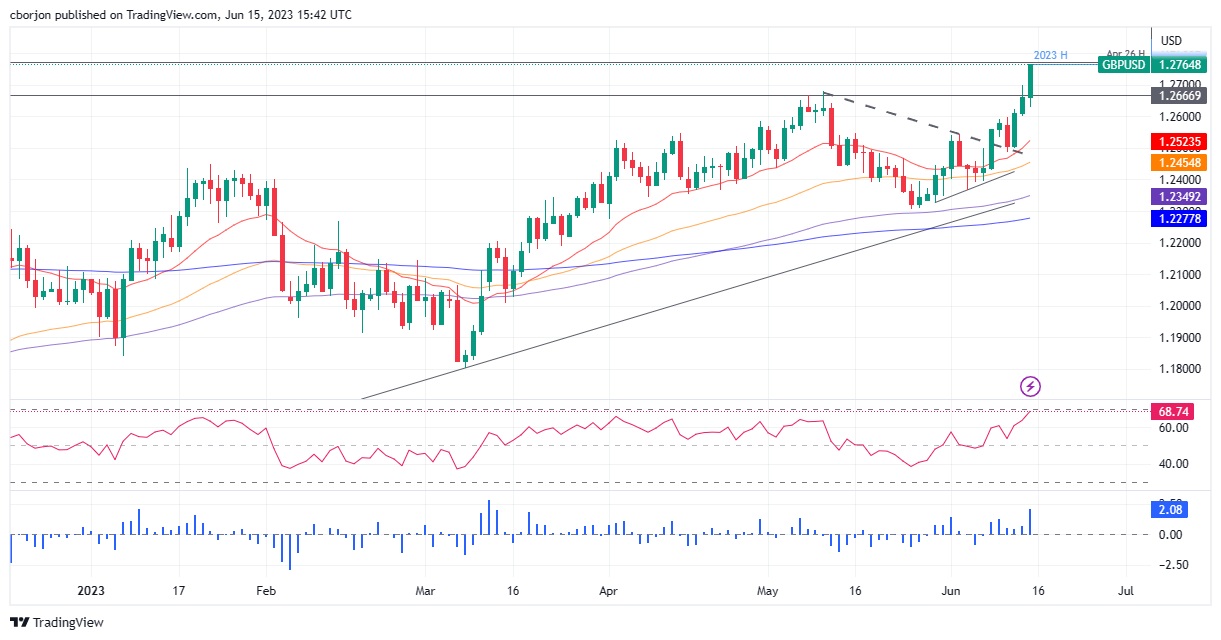
Once the GBP/USD conquered 1.2700, that exposed last year’s April 26 high at 1.2772 as the only resistance between the current exchange rate and the 1.28 handle. A breach of the latter will clear the path towards 1.3000, with resistance found at April 25 high at 1.2843 and April 13 low at 1.2972. Conversely, if GBP/USD drops below 1.2700, that would expose the May 10 high at 1.2679 before the major dips toward the 1.2600 figure. Downside risks lie at the 20-day Exponential Moving Average (EMA) at 1.2521, ahead of testing the June 12 low of 1.2487.
Economists at ING discuss USD/JPY outlook after the pair moved above 140, sparking the ire of Japanese officials again.
Market is under-pricing the risk of further normalisation in the BoJ’s YCC policy on 16 June
The question is whether policymakers in Tokyo are prepared to ride out another summer of strength in USD/JPY – or will be prepared to take action.
We think the market is under-pricing the risk of further normalisation in the Bank of Japan’s Yield Curve Control policy on 16 June. By the end of Q3, the Dollar decline should be underway.
USD/JPY – 1M 135.00 3M 130.00 6M 125.00 12M 120.00
The Bank of Japan (BoJ) will announce its monetary policy decision on Friday, June 16 and as we get closer to the release time, here are the expectations forecast by the economists and researchers of 10 major banks.
The BoJ is unlikely to tweak its Yield Curve Control (YCC), maintaining the current ultra-dovish stance.
Nordea
When it comes to the BoJ, after three decades of unconventionally loose monetary policy, it will take time for the BoJ to be convinced that sustainable 2% inflation is in sight. Thus, we expect no news from this week’s meeting. But we still believe that normalization is in the cards, however, the risk is that it might not come until next year.
Standard Chartered
We expect the BoJ to keep the policy rate unchanged. At his first policy meeting in April, BoJ Governor Kazuo Ueda sent a dovish signal and said major policy changes are unlikely in the near term. Still, we think there are reasons for the central bank to make changes to its policy; Japan’s core CPI inflation has stayed above 3% since September 2022 and wage growth for 2023 may exceed 3%. Also, with Japan posting strong Q1 GDP growth, the central bank may shift focus to CPI (rather than just growth). We do not rule out YCC band widening at this meeting, although this is not our baseline scenario.
Danske Bank
We expect the BoJ to tweak the YCC at one of the upcoming meetings. Widening of the yield curve control band to e.g. +/-100 bps can be explained as a move to improve market functioning, but will essentially be tightening. We still deem it most likely that the BoJ will stay put at the Friday meeting, though.
TDS
We expect BoJ to leave policy settings unchanged but think the prospects of a move in July to adjust the YCC band is much higher. BoJ also carries out its quarterly review in July, and it is likely that inflation forecasts are revised higher then. BoJ Governor Ueda has sounded cautious about a premature tightening of policy though this does not rule out a tweak in YCC.
SocGen
The BoJ will likely apply a -0.1% rate to the policy rate balance in the current account. It will also probably purchase the necessary amount of JGBs without setting an upper limit so that the 10y JGB yield remains at around 0%. On the other hand, it will allow 10y JGB yields to fluctuate in the range of around plus and minus 1 percentage point from the target level.
ING
We expect the BoJ to keep all its current policy settings unchanged. Likewise, a potential tweak in BoJ’s yield curve control policy is not likely to happen this month. However, should inflation remain at current levels in the second half of the year, we could still see a possible adjustment in the YCC policy over the next few months.
Deutsche Bank
We don't expect changes to the current policy. Given there won't be an Outlook Report, we see the central bank as likely continuing to focus on downside inflation risks but emphasises that inflation and currency are among key catalysts for a policy change.
Wells Fargo
While we do not anticipate the BoJ to change monetary policy settings at its June meeting, we do forecast a shift later this year in October, when the global monetary policy and bond yield backdrop may allow for a smoother adjustment. We expect the BoJ's policy adjustment to be a further step toward normalizing Japan's government bond market. Specifically, we expect the BoJ to lift the target for the 10-year Japanese government bond yield to 0.25% from 0% and widen the tolerance band around that target to +/- 75 bps. Should this adjustment proceed smoothly, we would view it as a probable precursor to the BoJ fully ending yield curve control, perhaps sometime in 2024.
ANZ
We expect the BoJ to leave its policy settings unchanged at its meeting this week. There is little incentive to change amid improved Japanese Government Bond (JGB) market functioning and soft wages growth. We maintain our view that the impetus to change the current policy stance of negative interest rates and yield curve control (YCC) will come from its negative side effects. We expect the BoJ to shorten the tenor of its target to 2y from 10y in coming meetings. The BoJ is likely to abandon YCC around the time it completes its comprehensive review of monetary policy.
Citi
We now expect the BoJ to keep all policy parameters, including YCC, unchanged and delay the decision to adjust YCC to July’s meeting.
The ECB hiked rates by 25 bps as expected. Economists at Nordea discuss the prospect of future hikes.
Hiking very likely to continue in July
The ECB raised rates by 25 bps, as expected, while Lagarde argued that the ECB still has more ground to cover and is very likely to hike rates again in July.
Staff forecasts put core inflation at 2.3% still in 2025, and Lagarde confirmed the ECB is not happy with the inflation outlook.
We think the July hike could end up being the last one of the cycle, but risks are clearly tilted toward the hiking cycle continuing after the summer.
The initial market reaction was hawkish, with rates rising, but rates started to fall soon after, and continued downwards, as Lagarde did not signal more than one more hike in July.
Despite the hawkish surprise contained in the Fed message – primarily in the dot plot – the Dollar failed to rebound. Economists at ING discuss the USD outlook.
Caution before jumping on a bearish Dollar trend just yet
The post-FOMC pricing is telling us that markets accord higher credibility to data than the Fed’s communication, so more evidence of US disinflation/economic slowdown can prompt more Dollar weakness moving ahead. However, with markets underpricing rate hikes compared to the dot plot, we’d be cautious before jumping on a bearish Dollar trend just yet, given the high risk of market pricing converging to the Fed’s projections and pushing short-term swap rates higher again.
So, Dollar bulls can probably cling on to the hawkish dot plot for now, or at least until (and if) data indicates more unequivocally that there is no longer a necessity to raise rates.
Economists at Standard Chartered now expect the Central Bank of the Republic of Türkiye (CBRT) to raise the weekly repo rate by 550 bps on 22 June.
CBRT likely to pivot with a 550 bps rate hike
We now expect the CBRT to raise the one-week repo rate by 550 bps to 14.0% on 22 June; we previously expected no change.
We now expect the CBRT to move gradually from a highly accommodative monetary policy stance towards a neutral or hawkish stance to address renewed TRY weakness, a widening current account deficit, and persistently high inflation (despite slowing economic activity).
- The USD Index has retreated from 103.28 despite Retail Sales have unexpectedly expanded.
- US Retail Sales report shows that demand for automobiles was extremely solid though inflation has squeezed real income of households.
- Fed Powell didn’t announce victory over inflation as core CPI is still persistent.
The US Dollar Index (DXY) has attracted plenty of offers that were capable of retreating bulls around 103.28 in the early New York session. The greenback basket has dropped vertically to near 102.80 despite households’ demand in the United States economy turning out to be resilient.
S&P500 futures are entering into the American session with significant losses generated in Europe as fears of a recession in the US are high despite a skip in the rate-hiking spell by the Federal Reserve (Fed). Fed chair Jerome Powell has paused its policy-tightening spell but has not ruled out more interest rates amid a battle against sticky inflation.
Retail Sales surprisingly expanded and Weekly jobless claims remain steady
US Census Bureau has reported that monthly Retail Sales (May) have surprisingly expanded by 0.3% while the street was anticipating a contraction of 0.1% but the pace of expansion has slowed against the prior pace of 0.4%. Scrutiny of the Retail Sales report shows that demand for automobiles was extremely solid though inflationary pressures have squeezed the real income of households.
Meanwhile, the Department of Labor has shown that initial jobless claims for the week ending June 09 have remained steady at 262K. The street was expecting a decline to 249K.
Fed announces a neutral policy with a hawkish dot plot
Fed Chair Jerome Powell didn’t announce victory over inflation as the core Consumer Price Index (CPI) is still persistent due to tight labor market conditions and resilience in consumer demand. While announcing the dot plot plan, Fed Powell confirmed two more interest rate hikes this year and cleared that rate cuts are not appropriate.
Investors should note that a skip in the interest rate regime by the Fed lacks optimism as the policy-tightening spell is not concluded now.
Christine Lagarde, President of the European Central Bank (ECB), is delivering her remarks on the policy outlook and responding to questions from the press following the Governing Council's decision to hike key rates by 25 basis points in June.
Key takeaways
"We had a harmonious discussion at the meeting."
"There was a very broad consensus behind the decision."
"There is some lag, but not that much, between 18 and 24 months."
"End of APP reinvestments should be well absorbed by markets."
"We see wages continuing to increase in the future."
"Services to continue to go strongly."
"We're not seeing 2nd round effects or a wage-price spiral."
About ECB's press conference
Following the ECB´s monetary policy decisions, the ECB President delivers a prepared statement and responds to questions from the press on the policy outlook. Her comments may influence the volatility of EUR and determine a short-term positive or negative trend. Her hawkish view is considered as positive, or bullish for the EUR, whereas her dovish view is considered as negative, or bearish.
- Industrial Production in the US contracted unexpectedly in May after a 0.5% increase in April.
- US Dollar Index stays in negative territory below 103.00.
Industrial Production in the US edged down 0.2% in May following April's increase of 0.5%, the Federal Reserve reported on Friday. This reading came in below the expectation for a growth of 0.1%.
Key takeaways:
“Industrial production edged down 0.2 percent in May following two consecutive months of increases.”
“In May, the index for manufacturing ticked up 0.1 percent, while the indexes for mining and utilities fell 0.4 and 1.8 percent, respectively.”
“At 103.0 percent of its 2017 average, total industrial production in May was 0.2 percent above its year-earlier level.”
“Capacity utilization moved down to 79.6 percent in May, a rate that is 0.1 percentage point below its long-run (1972–2022) average.”
Market reaction:
The US Dollar remains in negative territory across the board. The DXY is testing Wednesday’s low around the 102.65/70 area.
Economists at ING analyze the JPY outlook ahead of the Bank of Japan (BoJ) policy announcement.
It is a “skip” from the BoJ
We don’t expect real surprises from the BoJ policy announcement. Still, with little-to-nothing being priced in terms of a hawkish surprise, the downside risks for JPY also appear limited.
We continue to see good chances that the BoJ will make some changes to its YCC policy at the end of July – although the Fed decisions will admittedly play an important role.
Incidentally, further USD/JPY strength (possibly driven by carry trade strategies) may well lead Japanese authorities to restart FX intervention, which was deployed around the 145 area last September.
We may not be far from the peak in USD/JPY, even though a reversal of the bullish trend may take some time.
Christine Lagarde, President of the European Central Bank (ECB), is delivering her remarks on the policy outlook and responding to questions from the press following the Governing Council's decision to hike key rates by 25 basis points in June.
Key takeaways
"We still have ground to cover."
"Barring material change, very likely that we will continue to raise rates in July."
"We're not thinking about pausing."
"Inflation is projected to remain too high for too long."
"Future decisions will ensure that rates are sufficiently restrictive."
"Rates will be kept at those levels as long as necessary."
"We will continue to follow a data dependent approach."
"We need to be confident that core inflation is heading down. We're not satisfied with the inflation outlook."
About ECB's press conference
Following the ECB´s monetary policy decisions, the ECB President delivers a prepared statement and responds to questions from the press on the policy outlook. Her comments may influence the volatility of EUR and determine a short-term positive or negative trend. Her hawkish view is considered as positive, or bullish for the EUR, whereas her dovish view is considered as negative, or bearish.
The headline General Business Conditions Index of the Federal Reserve Bank of New York's Empire State Manufacturing survey recovered to 6.6 in June from -31.8 in May. This reading came in better than the market expectation of -15.1.
“New orders inched up, while shipments grew strongly. Delivery times held steady, and inventories moved lower. Both employment and hours worked continued to contract, and input and selling price increases slowed considerably. Planned increases in capital spending remained weak. Looking ahead, firms became more optimistic about the six-month outlook”, the NY Fed noted in its publication.
Key takeaways:
“At -3.6, the index for number of employees remained negative for a fifth consecutive month, and the average workweek index also held below zero at -5.8, pointing to another monthly decline in employment and hours worked.”
“Price increases moderated significantly: the prices paid index fell thirteen points to 22.0, and the prices received index fell fifteen points to 9.0.”
“The index for future business conditions increased nine points to 18.9, its second consecutive monthly increase, suggesting firms have become more optimistic that conditions will improve over the next six months.”
“New orders and shipments are expected to increase modestly, and employment is expected to expand. After falling close to zero last month, the capital spending index increased only seven points to 8.0, suggesting that capital spending plans remained soft.”
Market reaction:
The US Dollar pulled back after the release of US economic reports that also included Retail Sales, Jobless Claims and the Philly Fed. The DXY printed fresh daily lows under 103.00 as US Treasury Yields declined further.
Christine Lagarde, President of the European Central Bank (ECB), is delivering her remarks on the policy outlook and responding to questions from the press following the Governing Council's decision to hike key rates by 25 basis points in June.
Key takeaways
"Euro area growth is likely to stay weak, then strengthen."
"Manufacturing continues to weaken."
"Governments should roll back energy support measures."
"Past increases in energy are still pushing up prices, along with pent-up demand."
"Wage pressures are becoming an increasingly important source of inflation."
"Firms in some sectors able to keep profits high."
"Longer term inflation expectations warrant monitoring."
About ECB's press conference
Following the ECB´s monetary policy decisions, the ECB President delivers a prepared statement and responds to questions from the press on the policy outlook. Her comments may influence the volatility of EUR and determine a short-term positive or negative trend. Her hawkish view is considered as positive, or bullish for the EUR, whereas her dovish view is considered as negative, or bearish.
- Natural Gas surges, piercing through the 100-day SMA after ECB raises all three rates by 25 bps and revises up inflation forecasts.
- Gas market demand bubble and supply headwinds further underpin the commodity.
- Technically speaking, Natural Gas price is mounting a recovery despite remaining in a long-term downtrend.
Natural Gas price continues its run of recent gains on Thursday supported by a weaker US Dollar following the European Central Bank (ECB) interest rate decision, at which the ECB raised interest rates by 0.25%, as expected, and revised up its inflation forecasts, thus paving the way for hikes in the future. This strengthened the Euro and led to a steep decline in the US Dollar Index (DXY).
XNG/USD is further boosted by forecasts of hotter summer weather which is likely to stoke demand for Natural Gas in cooling systems. Increased demand from Asia, outages in Norwegian fields and disruptions to Russian pipeline gas flows are further factors cited for the recovery.
At the time of writing, Natural Gas is trading 2.75% higher on the day at $2.467 MMBtu.
Natural Gas news and market movers
- Natural Gas pops higher following the ECB meeting and decision to increase all three of its key interest rates by 0.25%, to 4.00%, 4.25% and 3.50% for the main refinancing, marginal lending and deposit facilities respectively.
- More importantly the ECB revised up its forecasts for core inflation in 2023-4.
- This will probably lead to higher interest rates in the future and contrasts with the US Federal Reserve’s relatively less hawkish outlook.
- A key phrase in the ECB’s monetary policy statement was, “The Governing Council’s future decisions will ensure that the key ECB interest rates will be brought to levels sufficiently restrictive to achieve a timely return of inflation to the 2% medium-term target and will be kept at those levels for as long as necessary."
- That said, the ECB also revised down growth estimates for 2023-4 – a dovish sign.
- Natural Gas price is further underpinned by a mixture of increased Asian demand, forecasts of hotter weather, Russian pipeline disruptions and Norwegian outages.
- Traders now await the press conference with ECB President Christine Lagarde for further clues about the ECB’s outlook and the key EIA Natural Gas inventory data out at 14:30 GMT.
Natural Gas Technical Analysis: Recovering within a longer-term downtrend
Natural Gas price is in a long-term downtrend after turning lower from its peak of $9.960 MMBtu achieved in August 2022. It continues to make lower lows, though bearish momentum has tapered off considerably since February 2023, as evidenced by the bullish convergence of the Relative Strength Index (RSI) momentum indicator since May. A bullish convergence occurs when price makes new lows but RSI fails to. It can indicate a propensity for price to rebound.
Nevertheless, unless Natural Gas can break above the last lower high of the long-term downtrend at $3.079 MMBtu, the odds continue to favor the bear trend, and shorts over longs.
A break below the $2.110 MMBtu year-to-date lows would solidify the bearish outlook and suggest a continuation down to a target at $1.546 MMBtu, the 61.8% Fibonacci extension of the height of the roughly sideways consolidation range that has unfolded during 2023.
-638224303782869931.png)
Natural Gas: Weekly Chart
Scoping into the daily chart, it can be seen that price has broken above the 50-day Simple Moving Average (SMA) but has been rebuffed by the 100-day SMA during the early session on Thursday. The 100-day SMA is likely to present a considerable hurdle for bulls and would require a decisive break to overcome.
Decisive bullish breaks are characterized by a break through a level by a longer-than-average green daily candle, which closes near to its high or three green daily candles in a row.
-638224304124113360.png)
Natural Gas: Daily Chart
Looking at the 4-hour chart, the current decisive break happening above the May 31 high of $2.433 MMBtu, is a bullish sign that suggests a continuation higher is likely in the short term, assuming the bullish break holds, and the current 4-hour period closes near to its high.
-638224304455467762.png)
Natural Gas: 4-hour Chart
This falls in line with the bullish RSI convergence observed on the weekly chart. On the 4-hour chart, meanwhile, the RSI is tracking price higher, peaking in the short term with price. This keeps the torch burning for bulls and indicates the possibility of higher prices to come, particularly in the near term.
Natural Gas FAQs
What fundamental factors drive the price of Natural Gas?
Supply and demand dynamics are a key factor influencing Natural Gas prices, and are themselves influenced by global economic growth, industrial activity, population growth, production levels, and inventories. The weather impacts Natural Gas prices because more Gas is used during cold winters and hot summers for heating and cooling. Competition from other energy sources impacts prices as consumers may switch to cheaper sources. Geopolitical events are factors as exemplified by the war in Ukraine. Government policies relating to extraction, transportation, and environmental issues also impact prices.
What are the main macroeconomic releases that impact on Natural Gas Prices?
The main economic release influencing Natural Gas prices is the weekly inventory bulletin from the Energy Information Administration (EIA), a US government agency that produces US gas market data. The EIA Gas bulletin usually comes out on Thursday at 14:30 GMT, a day after the EIA publishes its weekly Oil bulletin. Economic data from large consumers of Natural Gas can impact supply and demand, the largest of which include China, Germany and Japan. Natural Gas is primarily priced and traded in US Dollars, thus economic releases impacting the US Dollar are also factors.
How does the US Dollar influence Natural Gas prices?
The US Dollar is the world’s reserve currency and most commodities, including Natural Gas are priced and traded on international markets in US Dollars. As such, the value of the US Dollar is a factor in the price of Natural Gas, because if the Dollar strengthens it means less Dollars are required to buy the same volume of Gas (the price falls), and vice versa if USD strengthens.
- AUD/USD has attracted significant bets around 0.6800 despite US Retail Sales having expanded by 0.3% vs. a contraction of 0.1% as expected.
- The US Dollar Index has shown a sharp sell-off after a short-lived pullback to near 103.27.
- The synergic effect of a tight labor market and high inflationary pressures is going to force the RBA to remain hawkish ahead.
The AUD/USD pair has found strength near 0.6800 despite the United States Census Bureau having reported significantly upbeat monthly Retail Sales (May) data. The economic data has expanded by 0.3% while the street was anticipating a contraction of 0.1% but the pace of expansion has slowed against the prior pace of 0.4%.
This indicates resilience in US household demand and conveys why the Federal Reserve (Fed) delivered hawkish interest rate guidance.
The US Dollar Index (DXY) has shown a sharp sell-off after a short-lived pullback to near 103.27. More downside in the USD Index seems favored as the impact of the neutral policy stance by Fed chair Jerome Powell is yet to be discounted. Also, the 10-year US Treasury yields have dropped sharply to near 3.8%.
Meanwhile, S&P500 futures have extended their losses as fears of a recession in the US economy have accelerated as Fed chair Jerome Powell has promised that two more interest rate hikes will be announced by year-end.
The ultimate priority of Fed policymakers is to bring inflation down to 2% and the way forward is bumpy due to persistence in core Consumer Price Index (CPI) and tight labor market conditions.
The Australian Dollar is expected to pick more strength amid the release of upbeat Australian Employment data. As per the May labor market report, the Australian economy added fresh 75.9K payrolls against the consensus of 15K. The economy reported a lay-off of 4.3K employees last month. The Unemployment Rate declined to 3.6% vs. the estimates and the former release of 3.7%.
Investors should note that Australian inflation has rebounded to near 6.8% in May. The synergic effect of a tight labor market and high inflationary pressures is going to force the Reserve Bank of Australia (RBA) to remain hawkish ahead.
The diffusion index for current general activity of the Federal Reserve Bank of Philadelphia's Manufacturing Survey dropped to -13.7 in June from -10.4 in May. This mark was above the market expectation of -14. It was the 10th consecutive negative reading.
According to the report, data “suggest continued overall declines in the region’s manufacturing sector this month. The indicators for current activity and new orders remained negative, while the index for shipments turned positive”. Regarding the survey’s future indexes, the data shows an improvement “but continued to suggest subdued expectations for growth over the next six months.”
Key takeaways from the report:
“The index for new orders declined 2 points to -11.0, the index’s 13th consecutive negative reading. The current shipments index rose 15 points to 9.9, its highest reading since January.”
“On balance, the firms reported mostly steady levels of employment. The employment index rose 8 points to a near-zero reading.”
“The prices paid diffusion index was little changed at 10.5.”
“The current prices received index rose 7 points from a three-year low in May to 0.1 in June, marking the index’s first increase since January.”
Market reaction:
The US Dollar pulled back after the release of US economic reports that also included Retail Sales and Jobless Claims. The DXY dropped to fresh daily lows below 102.90 and US Treasury yields fell further.
USD/CAD pivots around 1.33 after failing to hold break under the figure. Economists at Scotiabank analyze the pair’s technical outlook.
Directional risks tilted to the downside
The snap higher in the USD back through the 1.3320/30 area from yesterday’s intraday low will undermine the USD/CAD bear trend. The technical jury is still out on that, however, with the USD rebound faltering in the mid-1.33 zone and running into steady selling pressure on minor gains.
Bearish trend momentum remains quite intense, preventing a stronger USD recovery at this point and keeping directional risks tilted to the downside.
The USD needs to regain (and hold) 1.3395/00 to stabilize.
Support is 1.3270 and 1.3225.
Initial Jobless claims totaled 262,000 in the week ending June 10, the weekly data published by the US Department of Labor (DOL) showed on Thursday. The print follows the previous week's 261,000 (revised to 262,000) and came in above market expectations of 249,000. It matches the highest reading since October 2021.
“The 4-week moving average was 246,750, an increase of 9,250 from the previous week's revised average. This is the highest level for this average since November 20, 2021 when it was 249,250.”
Continuing Claims advanced by 20,000 in the week ended June 3 to 1.775 million above market estimates of 1.765 million. It is the lowest reading since February. The 4-week moving average was 1.784 million a decrease of 12K from the previous week's average.
Market reaction:
The US Dollar pulled back after the release of US economic reports that also included Retail Sales and the Philly Fed. The DXY dropped to fresh daily lows below 102.90 and US Treasury yields fell further.
The data published by the US Census Bureau revealed on Thursday that Retail Sales in the United States rose 0.3% in May to $686.1 billion. This reading followed the 0.4% increase recorded in April. The market consensus was for a 0.1% decline.
In the same period, Retail Sales ex-Autos rose 0.1% above the 0% expected.
“Total sales for the March 2023 through May 2023 period were up 1.7 percent (±0.4 percent) from the same period a year ago. The March 2023 to April 2023 percent change was unrevised at 0.4 percent (±0.2 percent).”
“Retail trade sales were up 0.3 percent (±0.5 percent) from April 2023, and up 0.7 percent (±0.5 percent) above last year. Nonstore retailers were up 6.5 percent (±1.4 percent) from last year, while food services and drinking places were up 8.0 percent (±2.3 percent) from May 2022”.
Market reaction:
The US Dollar pulled back after the release of US economic reports that also included Jobless Claims and the Philly Fed. The DXY printed fresh daily lows under 102.90.
- European Central Bank raises rates as expected, attention turns to Lagarde.
- US data ahead: Retail Sales, Jobless Claims, Philly Fed.
- XAU/USD hits fresh monthly lows under $1,930.
Gold prices continue to remain under pressure, trading at their lowest level in three months below $1,930. Although XAU/USD rebounded marginally to $1,931 after the European Central Bank (ECB) decision, it dropped later to fresh monthly lows at $1,928.
The yellow metal is currently moving with a bearish bias, which has been the case since the Wednesday Federal Reserve meeting. If there is consolidation below $1,930, the next support area around $1,920 would be exposed. To alleviate the bearish pressure, XAU/USD needs to surpass $1,940.
The ECB announced on Thursday that it raised key rates by 25 basis points (bps) following the June policy meeting, as expected. They also projected that inflation would remain too high for too long. ECB President Lagarde will be holding a press conference at 12:45 GMT. German yields are rising.
Follow our live coverage of the market reaction to the ECB's policy announcements.
Before Lagarde's press conference, several economic reports will be released by the US, including Jobless Claims, Retail Sales, NY Empire State, Philly Fed, and later Industrial Production figures. These numbers could become critical, considering that the Fed left the door open to more rate hikes.
Technical levels
- EUR/GBP has climbed to near 0.8573 as the ECB has elevated its interest rates by 25 bps to 4% as expected by the market participants.
- The ECB decided not to take the bullet and raise interest rates further despite a technical recession in the German economy.
- UK inflation is turning out to be more persistent as the labor market conditions are resilient.
The EUR/GBP pair has shown a stellar move to near 0.8573 as the European Central Bank (ECB) has hiked its interest rates by 25 basis points (bps) to 4%, as expected by the market participants. ECB President Christine Lagarde has continued its policy-tightening spell as she believes that current financial conditions are not tight enough to threaten growth prospects.
In the last meeting, ECB Lagarde confirmed that more than one interest rate hike is appropriate. Inflationary pressures in Eurozone are at 6.1% and core inflation is showing severe persistence, therefore, a hawkish stance was widely expected.
The ECB decided not to take the bullet and raise interest rates further despite a technical recession in the German economy. Also, investors are forward looking for the economic outlook of the Eurozone as the shared continent reported a contraction in the final reading of Q1 Gross Domestic Product (GDP) by 0.1%. More interest rate hikes by the ECB might weigh heavily on Eurozone’s factory activity and would propel chances of a technical recession in the Eurozone too.
On the Pound Sterling front, United Kingdom’s inflation is turning out to be more persistent as the labor market conditions are resilient. Apart from the tight labor market, food price inflation is hovering near 45-year high levels and the street is confident about a recovery in their factory activity.
All inflation-associated indicators are strengthening the need for further policy-tightening by the Bank of England (BoE). On Tuesday, BoE Governor Andrew Bailey assured that inflation will come down, but it will take longer than expected while speaking before the House of Lords Economic Affairs Committee.
GBP/USD consolidates after test of 1.27. Economists at Scotiabank analyze the pair’s outlook.
Broader bull trend intact
The BoE/Ipsos 12m inflation survey is released early Friday and may sway markets to some extent (expectations have been trending lower) but may not change the prospect of still higher policy rates in the UK – a key support for the GBP – to any significant extent.
Spot is consolidating, rather than reversing bearishly, and a solid bull trend continues to play out here on the face of it.
Intraday gains through 1.2670 should put yesterday’s peak just under 1.27 within reach. Broader trends suggest a push on to major retracement resistance at 1.2760.
Support is 1.2630 and 1.2595/00.
- EUR/USD trades in a cautious tone in the low-1.0800s ahead of ECB.
- There is a temporary hurdle at the 55-day SMA near 1.0880.
EUR/USD keeps the volatile mood above the 1.0800 level ahead of the key ECB gathering on Thursday.
A more serious bullish attempt is expected to quickly surpass the so far monthly high at 1.0864 (June 14), to then refocus on the transitory 55-day SMA, today at 1.0876. North from here comes the weekly top at 1.0904 (May 16).
Looking at the longer run, the constructive view remains unchanged while above the 200-day SMA, today at 1.0535.
EUR/USD daily chart
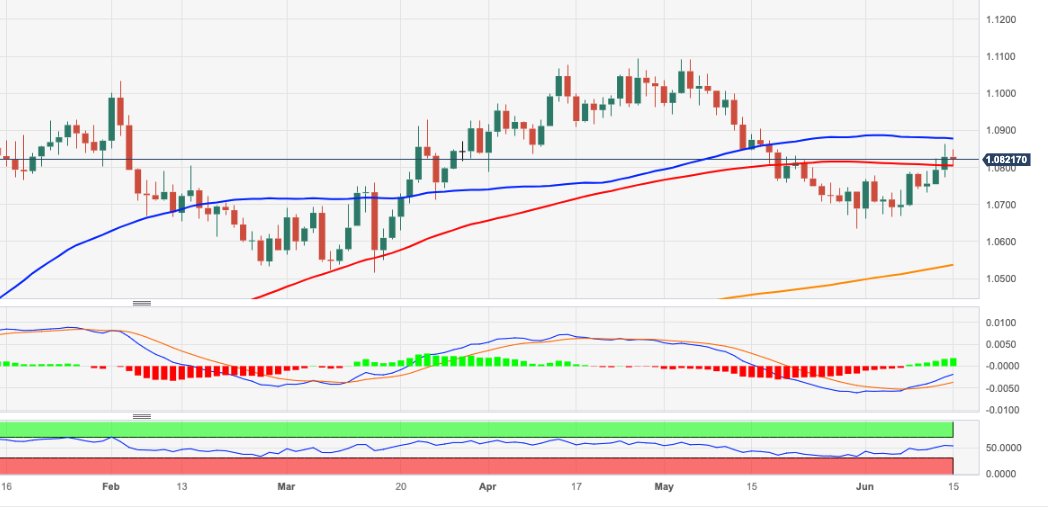
- DXY attempts a decent bounce and retakes 103.00 and beyond.
- Next on the downside appears the June low near 102.70.
Despite the ongoing rebound, DXY remains under pressure around the 103.00 region on Thursday.
In case the index breaches the monthly low near 103.00, it could then pave the way for another visit to the monthly low of 102.66 (June 14) prior to the interim 55-day SMA at 102.56.
Looking at the broader picture, while below the 200-day SMA at 105.32 the outlook for the index is expected to remain negative.
DXY daily chart
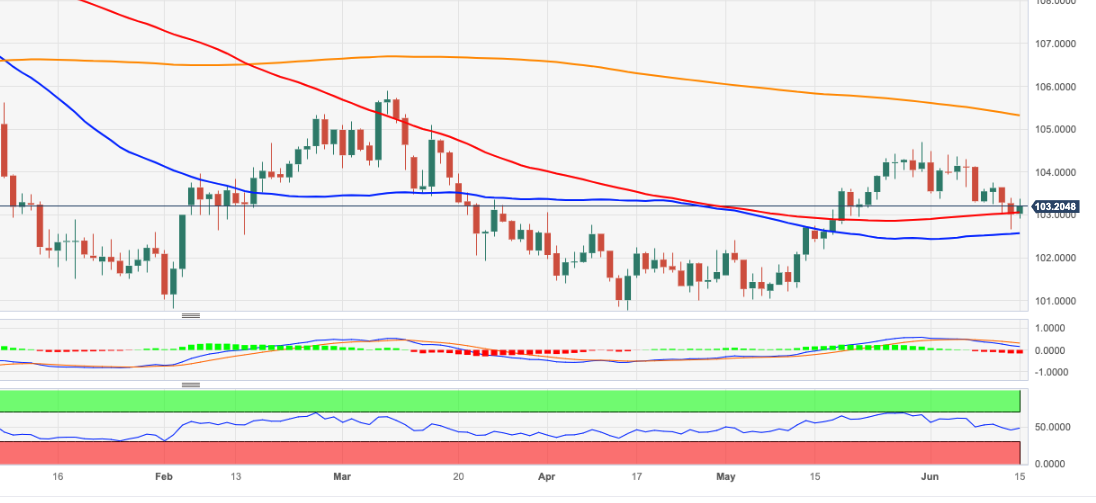
EUR/USD retains a firm undertone ahead of the ECB policy decision. Economists at Scotiabank analyze the pair’s outlook.
40-DMA emains an important bellwether for the EUR/USD rebound
The EUR/USD pair might be overshooting spreads to some extent in the short run but the trend higher in spot looks well-established and the EUR is likely to remain supported on dips.
Gains through the 40-DMA (1.0857 today) should see spot push on to the low 1.09 area and put a return to 1.10+ on the radar.
- EUR/JPY accelerates its upside and records new 2023 peaks.
- The next up-barrier is expected not before the 156.80 region.
EUR/JPY climbs markedly to new 2023 peaks just above the 153.00 hurdle on Thursday.
The current scenario remains open to extra gains in the short-term horizon. Against that, there are no resistance levels of note until the weekly low recorded in late September 2008 at 156.83, which precedes the key round level at 157.00.
So far, further upside looks favoured while the cross trades above the 200-day SMA, today at 144.39.
EUR/JPY daily chart
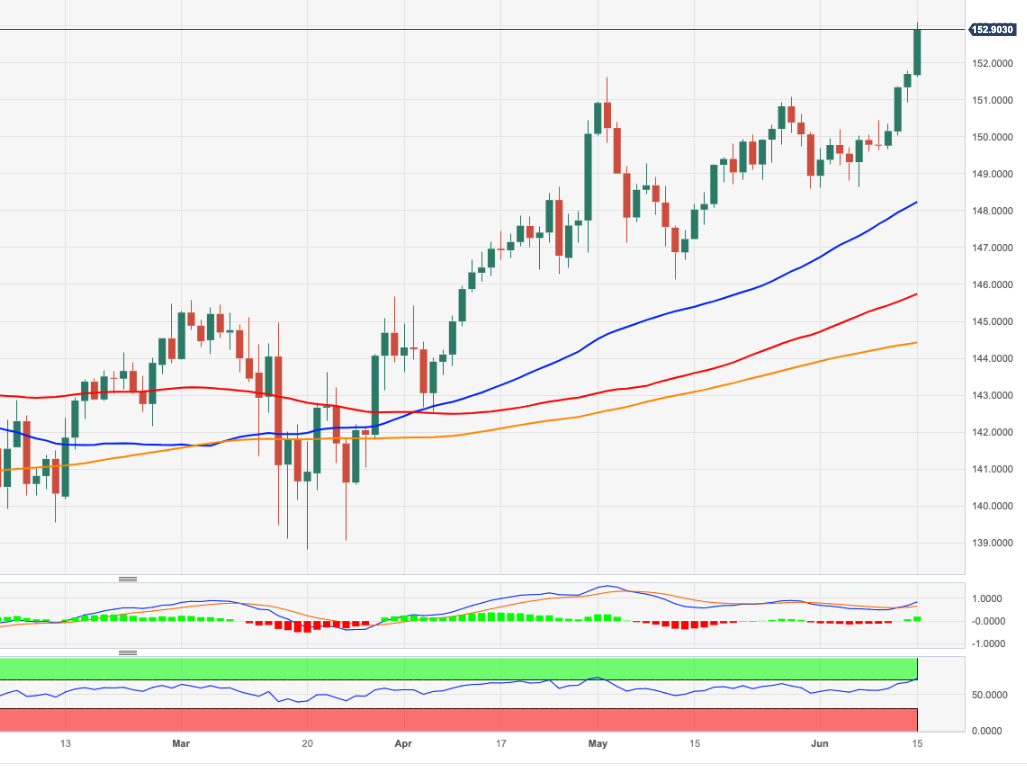
- EUR/JPY has printed a fresh 14-month high of 153.11 ahead of ECB policy.
- The ECB is expected to raise interest rates further as Eurozone’s growth could not be threatened by current financial conditions.
- A continuation of the ultra-dovish interest rate stance is expected from BoJ Ueda.
The EUR/JPY pair has continued its three-day winning streak after overstepping June 14 high at 151.78 in the European session. The cross has printed a fresh 14-month high of 153.11 as investors are hoping that the European Central Bank (ECB) will hike interest rates further to tighten its grip over stubborn Eurozone inflation.
In May’s monetary policy meeting, ECB President Christine Lagarde confirmed that more than one interest rate hikes are appropriate in the battle against sticky inflation. Economists at Credit Agricole expect a 25 bps rate hike along with indications from the ECB that it expects persisting inflation in the Eurozone and does not believe to financial conditions have tightened enough to threaten growth, which could spur further front-loading of rate hikes and support the Euro.
This week, the interest rate decision by the Bank of Japan (BoJ) will also be in focus. A continuation of the ultra-dovish interest rate stance is expected from BoJ Governor Kazuo Ueda.
EUR/JPY has fit above the 14-year high resistance of 149.68 plotted on a monthly scale, which has turned into support. Upward-sloping 10-period Exponential Moving Average (EMA) at 145.70 is consistently providing support to the Euro bulls.
The Relative Strength Index (RSI) (14) has shifted into the bullish range of 60.00-80.00, which conveys that the upside momentum is active.
A mild correction to near the psychological support of 150.00 will emerge as a buying opportunity, which will drive the asset toward a fresh 14-month high at 153.11 followed by the ultimate resistance at 155.00.
Alternatively, a breakdown below May 31 low at 148.59 will drag the asset toward April 27 high around 148.00. Slippage below the latter would drag the asset toward May 04 low at 147.13.
EUR/JPY monthly chart
-638224256670490456.png)
USD trades mixed as markets assess rate policy outlook. Economists at Scotiabank say that the US Dollar Index (DXY) is prone to more softness.
DXY prone to more softness in the short run
Markets seem to be confused by the Fed’s hawkish messaging and the failure to act yesterday and the USD continues to reflect that disconnect. The DXY is trading a little firmer on the session after closing lower yesterday but the index is well off the intraday high and prone to more softness in the short run as markets assess the policy outlook across the majors.
US data reports today include Retail Sales (expected –0.2% MoM), Import Prices and weekly claims data. Soft data will weigh on the USD.
Senior Economist at UOB Group Alvin Liew comments on the latest release of US inflation figures.
Key Takeaways
US headline consumer price index (CPI) increased by 0.1% m/m, 4.0% y/y in May (from 0.4% m/m, 4.9% y/y in Apr), the lowest headline inflation reading since Mar 2021 (2.6%) and the second below 5% print in a row. However, core CPI (which excludes food and energy) proved to be stickier, as it rose sequentially at 0.4% m/m, (same as Apr and Mar), and compared to one year ago, it eased slightly to 5.3% y/y in May (from 5.5% in Apr).
Goods inflation fell by -0.2% m/m in May (from 0.6% in Apr), due mainly to the fall in energy prices, and compared to a year ago, it also increased at a slower pace of 0.8% y/y (from 2.1% y/y in Apr). However, services inflation increased at a faster 0.3% m/m (from 0.2% in Apr), translating to a 6.3% y/y rise in May (lower from 6.8% in Apr), still elevated but is now matching that of Jul 2022 (6.3% y/y).
US Inflation Outlook – For 2023, we still expect both headline and core inflation to ease to an average of 3.0%, and above the Fed’s 2% objective. While the m/m decline in prices of energy (especially gasoline) and some discretionary items were welcomed developments, the modest but positive m/m reacceleration of shelter costs and food prices showed that it is premature to say that a clear disinflation trend has set in for US CPI, even though we still expect accommodation costs to ease more visibly in 2H 2023. Core and services inflation remain elevated (y/y) and rising (m/m), while the continued wage growth may still add to services cost pressure.
On we go to the ECB. Kit Juckes, Chief Global FX Strategist, analyzes the EUR outlook ahead of the Monetary Policy Decision.
The outlook is – even – more data-dependent
The market prices 50 bps in increases by September and is split on the idea of a third. That means 25 bps today and a lot of talk about inflation being too high/sticky.
The ECB needs to talk tough (and eventually, to act tough) to avoid the Euro rally fizzling out. But what we really need to see EUR/USD make a break towards our forecast of a peak between 1.15 and 1.20 in late 2023 or early 2024, is an improvement in the European growth outlook.
Signs of improvement in the European data could do more for the Euro’s outlook in the coming weeks than the ECB is likely to, just by sounding hawkish.
See – ECB Banks Preview: 25 bps, more remains in store
- USD/JPY has found support near 141.00 as the BoJ policy has come into the picture.
- The interest rate decision announced by the Fed was neutral but followed by a hawkish dot plot.
- Monthly US Retail Sales are expected to contract by 0.1% against an expansion of 0.4%.
The USD/JPY pair has resumed its north-side journey after a pullback move to near 141.00 in the London session. The major is aiming to reclaim its fresh six-month high of 141.60 as no tweak is expected in the monetary policy to be announced by the Bank of Japan (BoJ) on Friday.
S&P500 futures have added significant losses in London as investors believe that United States’ recession fears have a little postponed but not faded. The interest rate decision announced by the Federal Reserve (Fed) on Wednesday was neutral but followed with a hawkish dot plot in which Fed chair Jerome Powell confirmed that a neutral stance is merely a skip and the policy-tightening regime is not done yet.
It would be early calling a victory against stubborn US inflation as the core Consumer Price Index (CPI) is showing persistence due to resilient demand for durables and services. Apart from that labor market conditions are still tight as firms are rigorously continuing their hiring process.
The US Dollar Index (DXY) has found intermediates support after dropping to near 103.00. Some volatility is still left in the US Dollar ahead of the monthly Retail Sales data (May). Monthly retail demand is expected to contract by 0.1% against an expansion of 0.4%. This could be the impact of a lower Producer Price Index (PPI) due to weak gasoline prices. Meanwhile, the 10-year US Treasury yields are still solid around 3.83%.
On the Japanese Yen front, the need of keeping inflation steadily above 2% with the stipulation that inflationary pressures should be supported by in-house catalysts rather than higher import prices will force BoJ Governor Kazuo Ueda to keep monetary policy unchanged.
The Turkish Lira rallied noticeably yesterday. Economists at Commerzbank discuss TRY's outlook.
A symbolic interest rate hike on 22 June now looks very likely
We do not view the Lira's rally yesterday as a sign of greater market confidence: it was a typical pause, possibly a clearing of outstanding short positions because authorities are signalling that rate hikes or some combination of policy changes is now imminent.
Indeed, a symbolic interest rate hike on 22 June now looks very likely. The exact magnitude of it will make very little difference. Because its permanence will not be convincing. Other measures to dismantle the various distortive capital controls and FX restrictions may also be announced.
Beyond the immediate timeframe, we doubt that the market reaction will be too strong, especially if Erdogan keeps reminding markets that he is waiting in the shadows with a skeptical mindset.
Economists at TD Securities discuss the European Central Bank (ECB) interest rate decision and their implications for the EUR/USD pair.
Hawkish (10%)
The GC delivers another 25 bps hike but the statement strikes a more hawkish tone than in May. Lagarde removes any doubts about GC's hawkish shift and stresses a high likelihood that rates will be raised at least 2x more due to elevated inflation persistence. EUR/USD +0.65%.
Base Case (60%)
The GC hikes by 25 bps and keeps language around future hikes unchanged. Similar to in May, Lagarde remains noncommittal in language around future hikes but suggests that risks are skewed to further tightening. EUR/USD -0.15%.
Dovish (30%)
25 bps hike, but statement strikes a more dovish tone than in May. Lagarde more cautious than in May and signals at most one more hike in this tightening cycle. EUR/USD -0.50%.
The Krona has recovered somewhat from its lows at the beginning of June. Economists at Commerzbank discuss SEK's outlook.
If Riksbank does not deliver, the SEK is likely to ease again
In April the Riksbank had announced a further rate step for June or September. In my view it is clear: it will have to hike interest rates in June and definitely keep the door open for September and possibly beyond that. Anything else would not be sufficiently restrictive in my view and the market would react with SEK sales.
The Riksbank will have to sound determined at the end of June to raise its key rate path further and see the terminal rate above 3.65%. In that case, the Krona would have a chance to record further gains. If Riksbank does not deliver though, the SEK is likely to ease again.
- US Dollar books gain against most pairs with the dust settling over the Fed rate decision.
- Traders do not get much time to absorb the Fed’s message as PBOC cuts rates again and ECB is on the docket.
- US Dollar Index performs knee jerk reaction and is being priced back above 103.
The US Dollar (USD) Is clawing back after its lacklustre performance on Wednesday where traders tried to keep their powder dry for the US Federal Reserve (Fed) rate decision. The overall consensus is that, although there is a rate pause, the hawkish undertone was quite firm and will play a role in the coming months. Meanwhile China’s central bank People Bank of China (PBOC) has cut rates on 1-year loan rates from 2.75% to 2.65%.
With the Fed meeting out of the way, traders do not have much time to rethink their strategy as a big slew of data is just around the corner again this Thursday. Out of the US, Retail Sales are set to hit the wires at 12:30, joined by Initial Jobless Claims, NY Empire State Manufacturing and Philadelphia Fed Manufacturing Index. Big focus and importance as well at the other side of the Atlantic Ocean as the European Central Bank (ECB) is to announce another rate hike to 4%, with a press conference at 12:45 GMT where ECB Chairman Christine Lagarde will elaborate on the further rate path for the Eurozone.
Daily digest: US Dollar demand flairs up as focus shifts to Europe
- The Greenback advances near 1% against the Japanese Yen as traders prepare for the BoJ meeting on Friday.
- Traders across the Atlantic Ocean are gearing up for the European Central Bank (ECB) rate decision at 12:15 GMT with a speech from its chair Christine Lagarde at 12:45 GMT.
- In between these, at 12:30 GMT, the market gets a view on US Retail Sales, where a small drop is expected in both the core and overall numbers, and Jobless Claims.
- Some Manufacturing data will also come out of New York with the NY Empire State Manufacturing Index and from Philadelphia the Fed Manufacturing Index. These smaller economic numbers could ease the hawkish move from the Fed a bit if they all point to lower activity and less growth. or even contraction.
- Overnight the PBOC has cut its 1-year loan rate to 2.65% from 2.75%.
- On Wednesday, US Fed Chairman Jerome Powell mentioned during the press conference after their rate pause that inflation pressures remain to run high. Inflation still needs to get back to 2% and it will be a long way. The Fed will remain data dependent and will decide on a meeting-by-meeting basis. Powell reiterated again that core inflation is their main and biggest issue and still needs to be brought down further.
- Except for China, all other major indices are in the red in both Asia and Europe. The US equity futures are all three in the red as well as the dust settles over the hawkish stance of the Fed.
- The CME Group FedWatch Tool shows that markets are pricing in a 71.9% chance of a 25 basis point (bp) hike on July 26th. Overall, the point of view here seems to be just one more hike and done as all other futures for 2023 are pointing to an unchanged rate level.
- The benchmark 10-year US Treasury bond yield trades at 3.81%. During the Fed rate pause announcement, it briefly peaked to 3.85%. With the European trading session kicking into gear, yield is slightly heading lower.
US Dollar Index technical analysis: Sell the rumour, buy the fact
The US Dollar is a perfect example of sell the rumour and buy the fact, as the Greenback weakened in the wake of the US Fed rate pause decision, and rallied substantially afterwards. This made the Dollar Index (DXY) make a knee jerk reaction after it dipped below 103 and was on its way to 102.57. With the DXY back above 103 it will be key to see if the index can close above 103 in order to rally higher in the coming days.
On the upside, 105.37 (200-day Simple Moving Average) still acts as a long-term price target to hit. The next upside key level for the US Dollar Index is at 105.00 (psychological, static level), which acts as an intermediary element to cross the open space.
On the downside, 103.05 (100-day SMA) aligns as the first support level to confirm a change of trend. In case that breaks down, watch how the DXY reacts close to the 55-day SMA at 102.57 in order to assess any further downturn or upturn.
How does Fed’s policy impact US Dollar?
The US Federal Reserve (Fed) has two mandates: maximum employment and price stability. The Fed uses interest rates as the primary tool to reach its goals but has to find the right balance. If the Fed is concerned about inflation, it tightens its policy by raising the interest rate to increase the cost of borrowing and encourage saving. In that scenario, the US Dollar (USD) is likely to gain value due to decreasing money supply. On the other hand, the Fed could decide to loosen its policy via rate cuts if it’s concerned about a rising unemployment rate due to a slowdown in economic activity. Lower interest rates are likely to lead to a growth in investment and allow companies to hire more people. In that case, the USD is expected to lose value.
The Fed also uses quantitative tightening (QT) or quantitative easing (QE) to adjust the size of its balance sheet and steer the economy in the desired direction. QE refers to the Fed buying assets, such as government bonds, in the open market to spur growth and QT is exactly the opposite. QE is widely seen as a USD-negative central bank policy action and vice versa.
It is European Central Bank decision day. Economists at ING analyze how the policy announcement could impact the Euro.
EUR/USD faces some moderate downside risks
There is still interest for the ECB to sound hawkish today, but we suspect that might not be enough to send the Euro higher, and we see some moderate downside risks for EUR/USD today.
We could see EUR/USD drop back to the 1.0750 handle today, although developments on the US data side will continue to drive the large majority of trends in the pair moving ahead, with ECB policy playing second fiddle.
See – ECB Banks Preview: 25 bps, more remains in store
- GBP/USD is looking to reclaim 1.2700 as the Fed-BoE policy divergence looks set to squeeze after Fed’s neutral policy.
- Fed Powell has confirmed that two more interest rate hikes are appropriate this year.
- GBP/USD is gathering strength for printing a fresh annual high after climbing above the round-level resistance of 1.2700.
The GBP/USD pair has witnessed a halt after a recovery extension to near 1.2670 in the European session. The Cable is expected to resume its upside journey as the policy divergence between the Federal Reserve (Fed) and the Bank of England (BoE) is set to squeeze.
Due to the significant softening of inflation, the United States managed to skip one more interest rate hike by the Fed. However, the BoE will continue hiking interest rates as inflation in the United Kingdom is significantly higher in comparison with other developed economies.
Meanwhile, Fed chair Jerome Powell has confirmed that two more interest rate hikes are appropriate this year while borrowing rates from the BoE are expected to remain in unchartered territory for now.
GBP/USD is gathering strength for printing a fresh annual high after climbing above the round-level resistance of 1.2700. Advancing 20-period Exponential Moving Average (EMA) at 1.2518 is providing support to the Pound Sterling bulls.
The Relative Strength Index (RSI) (14) has climbed above 60.00, showing no signs of divergence and any kind of overbought situation. This indicates an activation of the bullish momentum.
For further upside, an acceptance above the round-level resistance of 1.2700 will drive the Cable asset toward 26 April 2022 high at 1.2773 and the critical resistance of 1.2800.
On the flip side, a break below May 31 low at 1.2348 would drag the asset toward May 25 low at 1.2308. Slippage below the latter would expose the asset to April 03 low at 1.2275.
GBP/USD daily chart
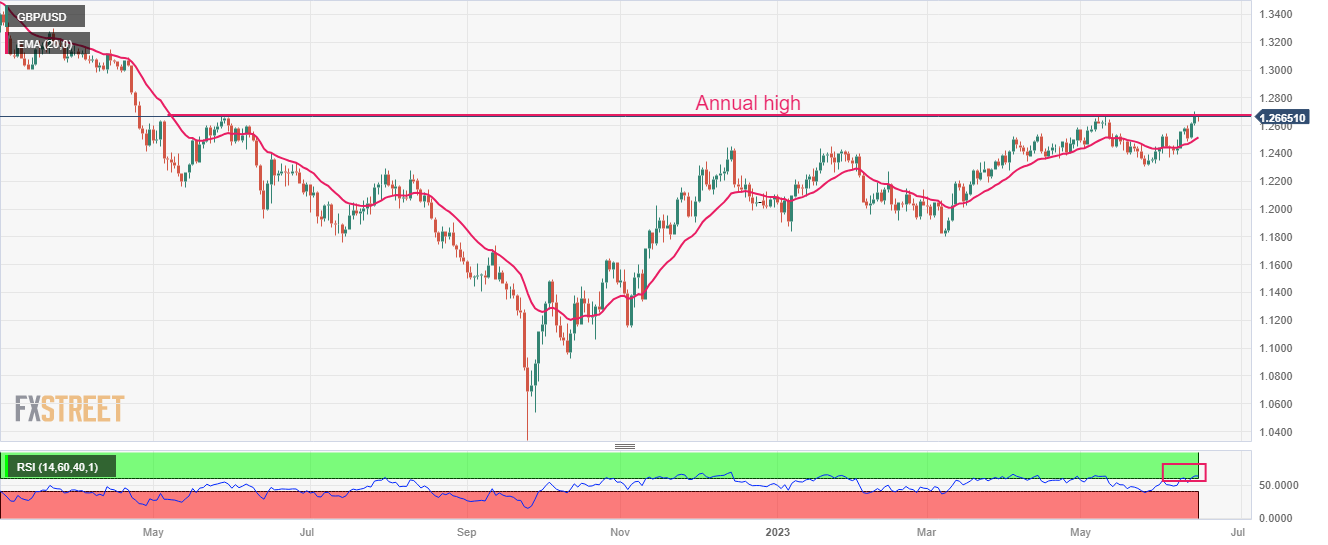
The US Dollar has continued to trade at modestly stronger levels following yesterday’s FOMC meeting. Economists at MUFG Bank discuss USD outlook.
Will the Fed will deliver two more hikes as planned?
The Fed’s policy update has not significantly altered our view that the Fed is close to the end of its hiking cycle.
While the Fed may now deliver one final hike in July, we remain unconvinced over the need for a second hike and believe that weaker activity and inflation data will encourage the Fed to signal that sufficient tightening has been delivered either at Jackson Hole over the summer and/or at the September FOMC meeting.
We don’t expect the US Dollar rally to extend much further unless backed up in the coming months by upside surprises for US activity and inflation data.
- USD/CHF gains some positive traction on Thursday, albeit lacks follow-through.
- The USD trims a part of its intraday gains and acts as a headwind for the major.
- The Fed’s hawkish outlook favours the USD and should lend support to the pair.
The USD/CHF pair builds on the previous day's late rebound from over a three-week low and gains some positive traction on Thursday, albeit struggles to capitalize on the move beyond mid-0.9000s. Spot prices retreat a few pips from the daily low and trade around the 0.9030 region, up over 0.20% during the first half of the European session.
The US Dollar (USD) trims a part of strong intraday gains and for now, seems to have stalled its recovery move from a one-month low touched on Wednesday, which, in turn, is seen acting as a headwind for the USD/CHF pair. Apart from this, a softer risk tone benefits the safe-haven Swiss Franc (CHF) and further contributes to capping the upside for the major. The market sentiment remains fragile in the wake of worries about a global economic slowdown, particularly in China. The fears were further fueled by disappointing Chinese macro data released earlier today, which tempers investors' appetite for riskier assets and largely overshadows a move by the People’s Bank of China (PBOC) to cut rates on its medium-term loans.
The downside for the USD, meanwhile, seems cushioned on the back of the Federal Reserve's (Fed) more hawkish outlook, signalling that borrowing costs may still need to rise by as much as 50 bps by the end of this year. In fact, the so-called "dot plot" indicated that officials now see rates peaking at 5.6% this year, higher than March's projection of 5.1%. Furthermore, the Fed now sees slightly stronger economic growth and forecasts the economy to expand by 1% this year — up from the 0.4% rise projected in May — before rising 1.1% in 2024 and 1.8% in 2025. This triggers a fresh leg up in the US Treasury bond yields, which might continue to lend some support to the Greenback and the USD/CHF pair, at least for the time being.
Market participants now look forward to the US economic docket, featuring the release of monthly Retail Sales, Weekly Initial Jobless Claims, the Empire State Manufacturing Index, Philly Fed Manufacturing Index and Industrial Production. This, along with the US bond yields, will influence the USD price dynamics and provide some meaningful impetus to the USD/CHF pair later during the early North American session. Traders will further take cues from the broader risk sentiment to grab short-term opportunities. The aforementioned fundamental backdrop, meanwhile, now seems tilted in favour of bullish traders.
Technical levels to watch
- The index reverses part of the recent bearish move.
- Investors continue to adjust to Wednesday’s FOMC event.
- The ECB is largely anticipated to raise rates by 25 bps.
The USD Index (DXY), which tracks the Greenback vs. a bundle of its main competitors, manages to pick up some traction and breaks above the key 103.00 hurdle on Thursday.
USD Index looks supported near 102.70
After two consecutive daily losses, the index regains some balance and reclaims the area above the 103.00 barrier following the post-FOMC decline to multi-week lows in the 102.70/65 band on Wednesday.
The daily uptick in the Buck appears propped up by the move higher in US yields across the curve after the FOMC event left the door open to extra rate hikes in H2 2023.
Indeed, and back at the Fed’s gathering, officials decided to maintain interest rates at their current level after a series of ten consecutive increases. However, they surprised observers by projecting an additional two quarter-point hikes for the remainder of the year in their economic forecasts. This is indicative that the majority of policymakers are in agreement that further tightening is necessary to address inflationary pressures.
Moving forward, the US Dollar will also pay close attention to the ECB meeting later in the European afternoon, as investors largely anticipate a 25 bps hike by the central bank.
An interesting session in the US docket will see usual weekly Claims seconded by the Philly Fed Manufacturing gauge, Industrial and Manufacturing Production, Business Inventories and TIC Flows to conclude the daily calendar.
What to look for around USD
The index gathers decent impulse after bottoming out in the vicinity of 102.70 in the wake of the FOMC gathering on Wednesday.
In the meantime, bets for another 25 bps rate hike at the Fed’s gathering in July remain well on the cards against the backdrop of the steady resilience of key US fundamentals (employment and prices, mainly).
The above-mentioned scenario was also reinforced by Chief Powell on Wednesday after he deemed the July meeting “live”, while the majority of the Committee seems ready to resume the tightening campaign as soon as next month.
Key events in the US this week: Initial Jobless Claims, Philly Fed Manufacturing Index, Retail Sales, NY Empire State Index, Industrial Production, Business Inventories, TIC Flows (Thursday) – Flash Michigan Consumer Sentiment (Friday).
Eminent issues on the back boiler: Persistent debate over a soft/hard landing of the US economy. Terminal Interest rate near the peak vs. speculation of rate cuts in late 2023/early 2024. Fed’s pivot. Geopolitical effervescence vs. Russia and China. US-China trade conflict.
USD Index relevant levels
Now, the index is gaining 0.14% at 103.14 and the breakout of 104.69 (monthly high May 31) would open the door to 105.32 (200-day SMA) and then 105.88 (2023 high March 8). On the downside, the next support emerges at 102.66 (monthly low June 14) seconded by 102.56 (55-day SMA) and finally 100.78 (2023 low April 14).
Economists at Commerzbank analyze EUR outlook ahead of the European Central Bank (ECB) Interest Rate Decision.
ECB rate hike already priced in
A rate hike has been announced, a rate hike is priced in, and so a rate hike alone is unlikely to move the Euro much.
If the ECB were to pave the way for an interest rate pause as early as today, this would likely weigh heavily on the Euro, especially after yesterday's Fed decision. However, the disappointment for the Euro should be limited by the fact that stubbornly high core inflation leaves no room for monetary easing for the time being, according to our experts.
See – ECB Banks Preview: 25 bps, more remains in store
- Gold price has displayed a decline after a short-lived pullback to near $1,934.00 as Fed delivered hawkish guidance.
- Some sort of consolidation is anticipated from the USD Index as investors are awaiting the release of the Retail Sales data.
- Gold price has displayed a breakdown of the crucial support plotted from March 22 low at $1,934.34.
Gold price (XAU/USD) has witnessed selling pressure after a less-confident recovery to near $1,934.74 in the London session. The precious metal has retreated as a neutral interest rate decision by the Federal Reserve (Fed) is merely a skip. Fed chair Jerome Powell has confirmed that more interest rate hikes will be announced as a victory against stubborn inflation is still far.
S&P500 futures have added more losses in Europe as fears of a recession in the United States are still healthy. The market sentiment is quite cautious as the Fed reiterated that core inflation is still persistent and labor market conditions are extremely tight. Also, Fed Powell confirmed that no rate cuts are appropriate by the year-end.
The US Dollar Index (DXY) has dropped to near 103.15 after facing stiff barricades around 103.40. Some sort of consolidation is anticipated from the USD Index as investors are awaiting the release of the monthly Retail Sales data.
As per the preliminary report, the economic data is seen contracting by 0.1% vs. an expansion of 0.4% registered in April. As food and gasoline prices have fallen significantly, a scrutiny of the Retail Sales report will be required to gauge whether the retail demand has contracted due to lower prices of necessities or the economy is losing resilience.
Gold technical analysis
Gold price has displayed a breakdown of the crucial support plotted from March 22 low at $1,934.34 on a four-hour scale. The precious metal has tested territory below $1,930.00 for the first time in the past three months.
The declining 200-period Exponential Moving Average (EMA) at $1,968.00 indicates that the long-term trend is bearish.
The Relative Strength Index (RSI) (14) has slipped into the bearish range of 20.00-40.00, which indicates that the downside momentum has been triggered.
Gold four-hour chart
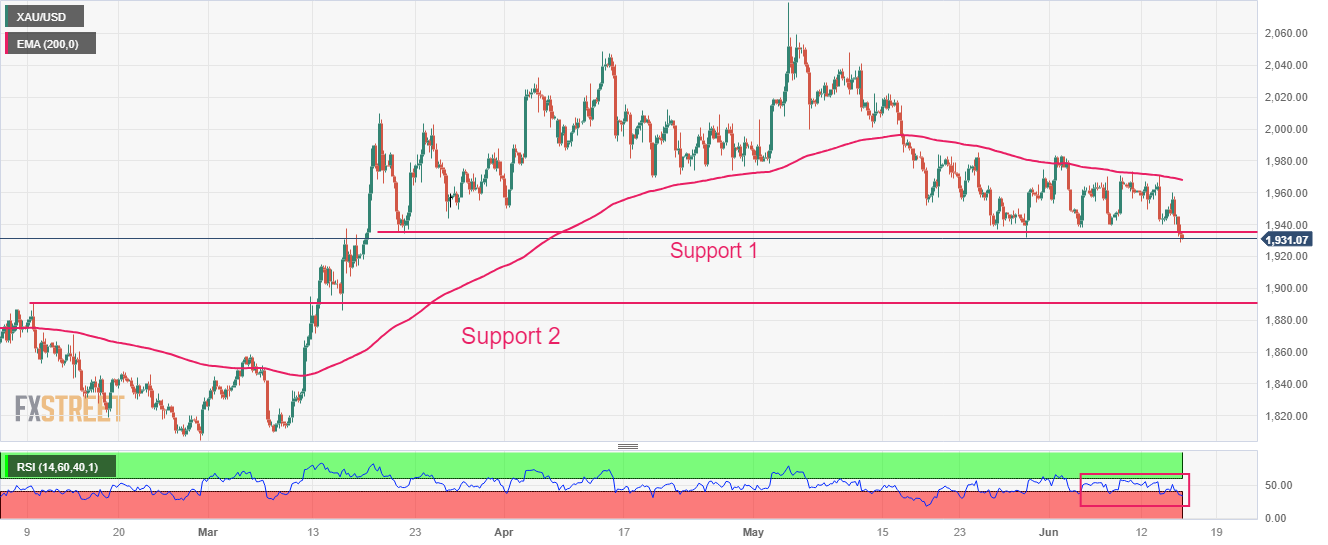
There are rising chances for USD/CNH to break above the 7.2000 level in the near term, comment Economist Lee Sue Ann and Markets Strategist Quek ser Leang at UOB Group.
Key Quotes
24-hour view: Our expectation for USD to break 7.1800 yesterday did not materialize as it traded in a range of 7.1512/7.1785. However, USD broke above 7.1800 in early Asian trade today. The price actions suggest USD is likely to advance, even though a sustained rise above 7.2000 appears unlikely. On the downside, a breach of 7.1550 (minor support is at 7.1660) indicates USD is not advancing further.
Next 1-3 weeks: We continue to hold the same view as yesterday (14 Jun, spot at 7.1740). As highlighted, upward momentum has increased and the chance of USD breaking above 7.2000 has improved. Looking ahead, the next level to watch above 7.2000 is 7.2200. On the downside, a break of 7.1400 (‘strong support’ level previously at 7.1330) would indicate that USD is not strengthening further.
- USD/TRY remains confined in a familiar trading range held over the past week or so.
- Overbought oscillators on short-term charts hold back bulls from placing fresh bets.
- A convincing break below the 23.00 mark could negate the near-term positive outlook.
The USD/TRY pair extends its sideways consolidative price move through the first half of the European session and remains confined in a familiar range held over the past week or so. The pair currently trades around the 23.65-23.70 region, up over 0.40% for the day and well within the striking distance of the all-time high touched on Tuesday.
Against the backdrop of the recent blowout rally, the range-bound price action could be categorized as a consolidation phase in the wake of extremely overbought technical indicators on short-term charts. Nevertheless, the setup still favours bullish traders and supports prospects for an extension of the move-up witnessed over the past month or so. That said, the recent failures near the 24.00 mark make it prudent to wait for a sustained strength beyond the said handle before placing fresh bets.
In the meantime, any meaningful slide below the 23.50 level is more likely to find decent support and remain cushioned near the 23.00 mark, or the low touched last Thursday. A convincing break below, however, might prompt aggressive long-unwinding trade and pave the way for deeper losses. The USD/TRY pair might then accelerate the fall towards the 22.80 horizontal zone en route to the 22.30-22.25 intermediate support before eventually dropping back to the 22.00 round-figure mark.
USD/TRY 4-hour chart
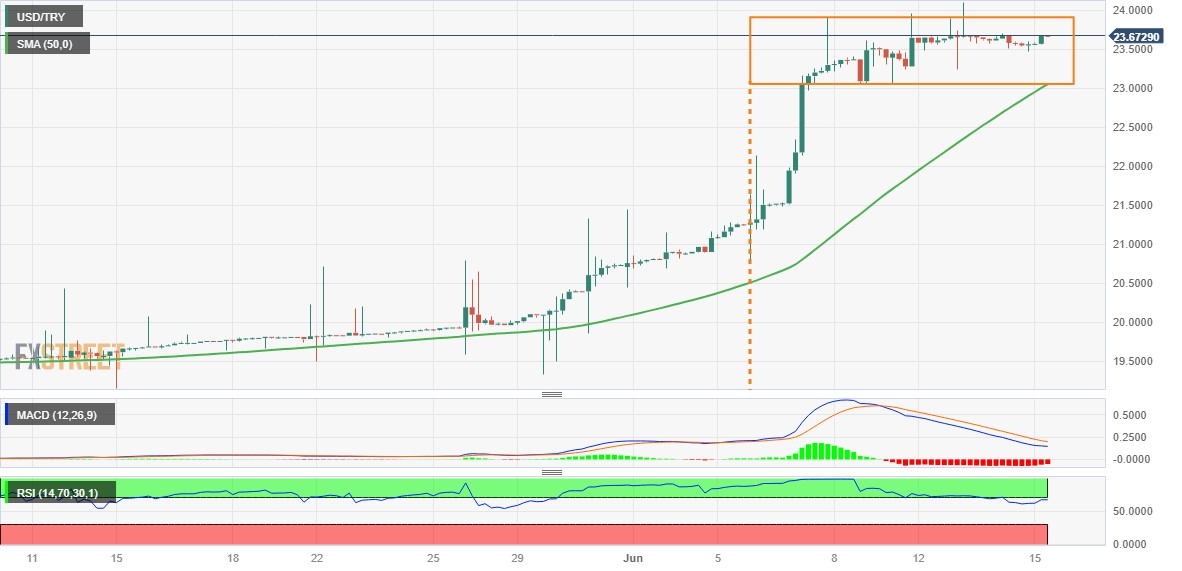
Economists at ING analyze GBP outlook ahead of the Bank of England (BoE) meeting next week.
Staying supported into the BoE meeting
It’s important to note how the higher gilt rates are by themselves starting to have their tightening effect on the economy. Mortgage market distress is the most direct example, with major lenders hiking rates and some pulling mortgage offers following the recent repricing of tightening expectations.
It is, still, too early to factor that – or any implications for the housing market – into Sterling, which will probably continue to find support into next week’s CPI and BoE meeting.
EUR/GBP could move closer to the 0.8500 key support after today’s ECB decision.
Economists at Société Générale discuss EUR/USD outlook ahead of the European Central Bank (ECB) Monetary Policy Decision.
ECB could tempt buyers on Euro dip after gains fizzled out following Fed pause
The ECB will have to out-hawk the Fed today to tempt buyers to reload EUR/USD longs.
The pair understandably wavered after the Fed decision but a 25 bps hike today by the ECB and prospect of another increase in July and possibly September means the policy rate and bond yield differentials will narrow, provided the Fed holds fire.
Downside risks to the currency outlook stem essentially from the rally in risk assets fizzling out and European economic growth languishing compared to the US.
The technical recession and stagflationary backdrop do not quite enhance the appeal of the single currency or European risk assets (making abstraction of relative valuations), but in a FX regime where rate differentials are governing the price action, there is a tactical case for EUR/USD to target higher levels.
See – ECB Banks Preview: 25 bps, more remains in store
- Euro gives away part of the recent 3-day advance.
- Markets in Europe will closely follow the European Central Bank event.
- Disheartening prints from the Chinese docket weigh on sentiment.
- Investors continue to digest the Fed’s hawk pause on Wednesday.
- The ECB is widely expected to hike rates by 25 bps on Thursday.
- Weekly Claims, Retail Sales, the Philly Fed Index take centre stage later.
The European currency (EUR) starts the ECB-day on the defensive vs. the US Dollar, although EUR/USD seem to hold pretty well just above the key 1.0800 the figure.
Meanwhile, the Euro, along with the rest of the risk complex, is being affected by the renewed strength of the Greenback after the Federal Open Market Committee (FOMC) meeting. The strength of the US Dollar also looks supported by the rebound in US yields across the curve.
A glimpse at Wednesday’s FOMC gathering shows that the Federal Reserve has decided to maintain its current policy settings without making any changes. However, they have indicated that they anticipate a higher peak rate in the future, implying that any pause in adjustments might be short-lived.
Other than the strength in the buck, results from the Chinese docket published during the Asian trading hours disappointed market expectations after Industrial Production and Retail Sales missed consensus in May. These results appear to eclipse the recent cut by the PboC of the 7-day reverse repo rate, which was intended to boost the so far uneven recovery in the country in the aftermath of the pandemic.
Closer to home, the European Central Bank (ECB) is forecast to raise its policy rate by a quarter-point at its gathering in the afternoon in the old continent and could signal a similar move in July. In her subsequent press conference, ECB President Christine Lagarde could strengthen this view, as the still elevated inflation in the region supports it.
Daily digest market movers: Euro looks at ECB for near-term direction
- The US Dollar recoups part of the ground lost and encourages the USD Index (DXY) to reverse two consecutive sessions with losses, including a drop to fresh multi-week lows in the 103.00 neighbourhood (June 14).
- German 10-year Bund yields extend the rebound in line with their US peers and navigate the area of monthly highs around the 2.50% zone.
- A sustained decline in the Greenback does not appear to be a done deal following the FOMC event on Wednesday and in light of the "live" meeting expected on July 26. Indeed, the Committee intends to resume raising interest rates, possibly as early as July. Furthermore, Jerome Powell indicated that a significant majority of the FOMC members are anticipating further tightening, and there were no objections. He clarified that the decision to refrain from hiking rates at the current meeting was not a "skip", while the July meeting may involve a discussion on increasing rates, and that the FOMC will evaluate each meeting independently before making any decisions.
- Anticipating a 25 bps rate hike by the European Central Bank, investors are expected to closely follow any hint regarding another potential raise at the July or September meetings.
- Final inflation figures in France are expected to confirm the persistence of disinflationary pressures, while the trade surplus in the broader euro zone is seen narrowing in April.
- Data releases across the Atlantic could see Retail Sales cooling further, a worsening of the key Philly Fed Manufacturing Index and further loss of momentum in the labour market as per weekly Initial Jobless Claims, all suggesting the existence of cracks in the so far resilient US economy.
Technical Analysis: Euro faces initial resistance near 1.0860
Euro (EUR) needs to quickly surpass the so-far June top at 1.0864 (June 14) to see gains accelerate and open the door to a rapid test of the temporary 55-day SMA at 1.0876. Once the latter is cleared, spot might target the weekly top of 1.0904 (May 16) prior to the psychological 1.1000 mark. North from here, the pair could challenge the 2023 high at 1.1095 (April 26), which is closely followed by the round level of 1.1100 and comes ahead of the weekly top of 1.1184 (March 31, 2022). In addition, the latter appears propped up by the proximity of the 200-week SMA, today at 1.1182.
In case bears regain the initiative, there are no contention levels of significance until the May low of 1.0635 (May 31). The breach of this level could sponsor a deeper decline to the March low of 1.0516 (March 15) seconded by the 2023 low at 1.0481 (January 6).
Euro FAQs
What is the Euro?
The Euro is the currency for the 20 European Union countries that belong to the Eurozone. It is the second most heavily traded currency in the world behind the US Dollar. In 2022, it accounted for 31% of all foreign exchange transactions, with an average daily turnover of over $2.2 trillion a day.
EUR/USD is the most heavily traded currency pair in the world, accounting for an estimated 30% off all transactions, followed by EUR/JPY (4%), EUR/GBP (3%) and EUR/AUD (2%).
What is the ECB and how does it impact the Euro?
The European Central Bank (ECB) in Frankfurt, Germany, is the reserve bank for the Eurozone. The ECB sets interest rates and manages monetary policy.
The ECB’s primary mandate is to maintain price stability, which means either controlling inflation or stimulating growth. Its primary tool is the raising or lowering of interest rates. Relatively high interest rates – or the expectation of higher rates – will usually benefit the Euro and vice versa.
The ECB Governing Council makes monetary policy decisions at meetings held eight times a year. Decisions are made by heads of the Eurozone national banks and six permanent members, including the President of the ECB, Christine Lagarde.
How does inflation data impact the value of the Euro?
Eurozone inflation data, measured by the Harmonized Index of Consumer Prices (HICP), is an important econometric for the Euro. If inflation rises more than expected, especially if above the ECB’s 2% target, it obliges the ECB to raise interest rates to bring it back under control.
Relatively high interest rates compared to its counterparts will usually benefit the Euro, as it makes the region more attractive as a place for global investors to park their money.
How does economic data influence the value of the Euro?
Data releases gauge the health of the economy and can impact on the Euro. Indicators such as GDP, Manufacturing and Services PMIs, employment, and consumer sentiment surveys can all influence the direction of the single currency.
A strong economy is good for the Euro. Not only does it attract more foreign investment but it may encourage the ECB to put up interest rates, which will directly strengthen the Euro. Otherwise, if economic data is weak, the Euro is likely to fall.
Economic data for the four largest economies in the euro area (Germany, France, Italy and Spain) are especially significant, as they account for 75% of the Eurozone’s economy.
How does the Trade Balance impact the Euro?
Another significant data release for the Euro is the Trade Balance. This indicator measures the difference between what a country earns from its exports and what it spends on imports over a given period.
If a country produces highly sought after exports then its currency will gain in value purely from the extra demand created from foreign buyers seeking to purchase these goods. Therefore, a positive net Trade Balance strengthens a currency and vice versa for a negative balance.
Economists at TD Securities do not think the Fed's ruse will fool the USD, leaving them sellers of rallies into the July meeting.
Inflation matters more than growth
While the Fed tried to execute a hawkish skip, the outcome should reinforce the dance data with the Dollar. With market pricing expecting a July hike, the burden is for good data to validate pricing. US data surprises, for their part, now sit in the 45th percentile of the past 6m range. The index has cooled off from the recent highs around the 80th percentile. In turn, that leaves the USD at a bigger risk of misses.
We continue to think that inflation matters more than growth, showing that policymakers won’t actually pushback on growth if it accompanies further disinflation. That keeps us biased to fade USD rallies ahead of the July meeting unless we start to see a clear string of upside US data surprises.
- AUD/USD found buying interest near 0.6800 as tight Australian labor market conditions support more rate hikes from the RBA.
- S&P500 futures have generated decent losses in Europe as a hawkish dot plot by the Fed has provoked caution.
- China’s commerce ministry commented that disputes with Australia are set out to resolve.
The AUD/USD pair has displayed a recovery move from the round-level support of 0.6800 in the European session. The Aussie asset is attracting significant bets as the US Dollar Index (DXY) has sensed selling pressure around 103.40.
S&P500 futures have generated decent losses in Europe as a hawkish dot plot by the Federal Reserve (Fed) has provoked caution. It seems that a skip in the policy-tightening regime by the Fed has failed to produce optimism as the spell has not concluded yet.
Fed Chair Jerome Powell didn’t announce victory over inflation as core inflation is still persistent due to tight labor market conditions and resilience in consumer demand. While announcing the dot plot plan, Fed Powell confirmed two more interest rate hikes this year and cleared that rate cuts are not appropriate.
The US Dollar Index (DXY) has dropped below 103.20 amid solid appeal for risk-sensitive currencies. Later the day, US monthly Retail Sales data (May) will be keenly watched. The economic data is seen contracting by 0.1% vs. an expansion of 0.4% registered in April.
On the Australian Dollar front, upbeat Employment data has strengthened the need for more interest rate hikes from the Reserve Bank of Australia (RBA). The Australian economy added fresh 75.9K payrolls in May against the consensus of 15K. The economy reported a lay-off of 4.3K employees last month. The Unemployment Rate declined to 3.6% vs. the estimates and the former release of 3.7%.
Meanwhile, the commentary from China’s commerce ministry on Australia is that disputes between nations are set out to resolve. Now, the economy will focus on the long-term development of Aussie-Sino relations, seeking common ground while reserving differences. It is worth noting that Australia is the leading trading partner of China and sound relations between them would strengthen the Australian Dollar.
Economists at Danske Bank analyze EUR/USD outlook ahead of the European Central Bank (ECB) meeting.
EUR/USD seen at 1.06/1.03 on 6M/12M
We stick to our strategic case for a lower EUR/USD in the second half, as we expect relative growth differentials to favour the USD despite lower carry.
We see the cross at 1.06/1.03 on 6M/12M.
Today, potentially hawkish ECB could drive the EUR/USD pair higher, which could give rise to selling opportunities.
See – ECB Banks Preview: 25 bps, more remains in store
The FOMC kept the Fed Funds Rate Target unchanged at 5-5.25%. But the Fed may not have reached the peak in rates yet, economists at Rabobank report.
Dot plot shows a majority for two more hikes before the end of the year
As expected, the FOMC kept the target range for the federal funds rate unchanged at 5.00-5.25%. The decision was unanimous. However, the dot plot shows a majority for two more hikes before the end of the year.
This confirms the upside risk to our forecast of one more hike in July. With the federal funds rate still in negative territory in real terms, there is certainly scope for several more rate hikes if the recession takes longer to materialize.
The Bank of Japan (BoJ) will announce the result of its monetary policy meeting tomorrow. Economists at Commerzbank analyze Yen outlook.
Non-event with residual risk
Tomorrow’s BoJ decision is likely to be a non-event for the Yen.
However, as long as inflation does not settle close to or below the inflation target larger JPY moves cannot be excluded in the future if the BoJ either tightens its monetary policy in view of a further rise in inflation or postpones such tightening measures despite escalating inflation which would sooner or later result in a loss of purchasing power and concerns about the long-term fiscal stability putting pressure on the JPY.
- GBP/USD retreats further from over a one-year top and is pressured by resurgent USD demand.
- The Fed’s hawkish outlook triggers a fresh leg up in the US bond yields and benefits the Greenback.
- Bets for more rate hikes by the BoE might continue to underpin the GBP and limit further losses.
The GBP/USD pair comes under some selling pressure on Thursday and extends the previous day's modest pullback from the 1.2700 neighbourhood, or its highest level since April 2022. The pair maintains its offered tone through the early European session and currently trades around the 1.2640 area, just a few pips above the daily low.
The US Dollar (USD) makes a solid comeback and snaps a two-day losing streak to a one-month low touched on Wednesday, which, in turn, is seen as a key factor exerting some downward pressure on the GBP/USD pair. The initial market reaction to the Federal Reserve's (Fed) decision to pause its rate-hiking cycle turns out to be short-lived in the wake of a more hawkish outlook, signalling that borrowing costs may still need to rise by as much as 50 bps by the end of this year.
In fact, the so-called "dot plot" indicated that officials now see rates peaking at 5.6% this year, higher than March's projection of 5.1%. The Fed also sees slightly stronger economic growth and forecasts the economy to grow by 1% this year — up from the 0.4% rise projected in May — before rising 1.1% in 2024 and 1.8% in 2025. This triggers a fresh leg up in the US Treasury bond yields. This, along with a softer risk tone, helps revive demand for the safe-haven buck.
The market sentiment remains fragile in the wake of worries about a global economic slowdown, particularly in China. The fears were further fueled by the disappointing Chinese macro data released earlier today, which tempers investors' appetite for riskier assets and largely overshadows a move by the People’s Bank of China (PBOC) to cut rates on its medium-term loans. The anti-risk flow boosts demand for traditional safe-haven assets and further benefits the Greenback.
The downside for the GBP/USD pair, however, remains cushioned on the back of expectations that the Bank of England (BoE) will be far more aggressive in policy tightening to contain stubbornly high inflation. In fact, the markets have been pricing in another 25 bps BoE rate hike on June 22 and the bets were reaffirmed by the upbeat UK jobs data released on Tuesday, which showed little signs of cooling off. This, in turn, warrants some caution for aggressive bearish traders.
Market participants now look forward to the US economic docket, featuring the release of monthly Retail Sales, Weekly Initial Jobless Claims, the Empire State Manufacturing Index, Philly Fed Manufacturing Index and Industrial Production. This, along with the US bond yields and the broader risk sentiment, will influence the USD price dynamics and provide a fresh impetus to the GBP/USD pair later during the early North American session.
Technical levels to watch
Economists at ING discuss European Central Bank (ECB) Monetary Policy Decision and its implications for the EUR/USD pair.
Running out of hawkish arguments
We expect the ECB to deliver a 25 bps rate hike this week and signal more to come.
Rates markets are already priced for this outcome, and softening economic data dents the ECB's ability to push rates above their 2023 top.
The impact on EUR/USD may be short-lived, with Dollar rates still likely to be the primary driver of any sustained trend in the pair.
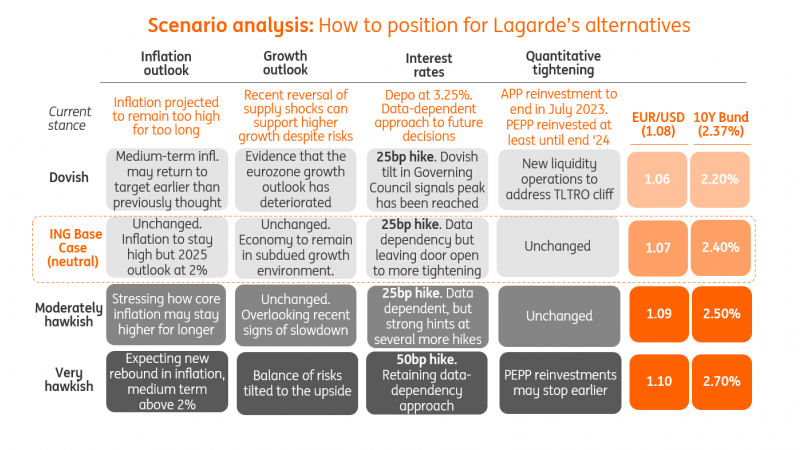
Source: ING
- GBP/JPY has continued its two-day winning streak due to solid hopes of further BoE-BoJ policy divergence.
- To maintain Japan’s inflation steadily above 2%, a tweak in the BoJ monetary policy is less likely.
- BoE Bailey assured that inflation will come down, but it will take longer than expected.
The GBP/JPY pair has stretched its rally to near 178.80 in the European session. The cross has extended its two-day winning streak as investors are hoping that the Bank of Japan (BoJ) will not alter its interest rate policy on Friday considering the fact that the Japanese economy needs monetary stimulus to elevate wages and the overall demand.
The asset is expected to continue its upside momentum as an unchanged interest rate decision by BoJ Governor Kazuo Ueda and a continuation of the rate-hiking regime by the Bank of England (BoE) would further widen the BoE-BoJ policy divergence.
BoJ Ueda is constantly reiterating the need for consistent monetary stimulus as historic high inflationary pressures in Japan are inspired by higher import prices. In order to maintain inflation steadily above 2% a tweak in the monetary policy is less likely.
Meanwhile, the odds of one more interest rate hike by the BoE have turned resilient further as United Kingdom’s labor market conditions have strengthened more and monthly Gross Domestic Product (GDP) is expanding and food prices are still near a 45-year high. Therefore, BoE Governor Andrew Bailey has no other option than to raise interest rates further.
Current UK inflation is at 8.7% on an annualized basis and can be tackled by the continuation of the interest rate hike spell. On Tuesday, BoE Governor Andrew Bailey assured that inflation will come down, but it will take longer than expected while speaking before the House of Lords Economic Affairs Committee.
- European Central Bank is widely expected to raise key rates by 25 bps on Thursday.
- Will the ECB hint at a potential September rate hike pause?
- Euro braces for wild action on the ECB decision and President Lagarde’s presser.
European Central Bank (ECB) is set to announce another rate hike on June 15, Wednesday, having slowed down its pace of tightening in the previous meeting. The policy statement will be accompanied by the staff economic projections, followed by the press conference.
ECB President Christine Lagarde will helm the presser and her words will be closely scrutinized for the central bank’s future interest rates path. In the lead-up to the ECB policy announcements, EUR/USD has been on a corrective decline from monthly highs while holding the 1.0800 level, undermined by the US Federal Reserve’s (Fed) hawkish pause on Wednesday.
European Central Bank interest rate decision: What to know in markets on Thursday, June 15
- EUR/USD has entered a downside consolidative phase just above 1.0800, as the US Dollar (USD) rally takes a breather following a jolt overnight from the hawkishness surrounding the Fed's pause.
- The Fed left the rates unchanged at 5.0%-5.25%, as widely expected at its June meeting but the Dot Plot chart projected two more 25 bps rate hikes ahead.
- Fed Chair Jerome Powell said: “We are not done yet. The Fed will continue to watch how the labor market moves for insights that can then help the central bank decide how to move interest rates going forward.”
- US S&P 500 futures trade modestly flat and the benchmark 10-year US Treasury bond yields cling to the previous gains near 3.85%.
- The People’s Bank of China (PBOC) cut one-year policy rate after lowering short-term rates. China’s economic recovery weakened in May as growth in industrial output and retail sales slowed, the latest data from the National Bureau of Statistics (NBS) showed early Thursday.
- On Tuesday, the Bureau of Labor Statistics (BLS) reported the United States Consumer Price Index (CPI), which increased just 0.1% for the month, bringing the annual inflation level down sharply to 4.0% from 4.9% in April. Meanwhile, the Core CPI rose 0.4% on the month and was still up 5.3% from a year ago, with both measures meeting the consensus forecasts.
- The ECB event will likely drive EUR/USD’s action while the US Jobless Claims and Retail Sales data could play second fiddle.
When will be the ECB meeting and how could it affect EUR/USD?
European Central Bank interest rates decision will be announced at 12:15 GMT, followed by Lagarde’s presser at 12:45 GMT. Money markets are pricing a 95% probability of the central bank raising the key interest rates by 25 basis points (bps) on Thursday, lifting the benchmark Deposit Rate from 3.25% to 3.50%.
At its May meeting, the ECB delivered a 25 bps rate hike, downsizing from the 50 bps rate hike announced in March. At the post-monetary policy meeting press conference, ECB President Christine Lagarde said, “based on the information we have today, we have more ground to cover, and we are not pausing. It’s extremely clear.” Lagarde later added, “This is a journey. We have not arrived yet.”
Since the May meeting, the Eurozone economic performance has been quite mixed but enough to hint at another ECB rate hike. Eurozone inflation declined sharply, with the annual Harmonised Index of Consumer Prices (HICP) rising 6.1% in May vs. April’s 7.0% increase, the latest data published by Eurostat revealed. The Core HICP inflation dropped to 5.3% YoY in May as against the expected 5.5% clip, down from the 5.6% figure booked in April.
Following the inflation data and while speaking at the Hearing before the Committee on Economic and Monetary Affairs (ECON) of the European Parliament in Brussels, ECB Chief Lagarde reiterated that “underlying inflationary pressures remain high,” adding that there is "no clear evidence that underlying inflation has peaked."
Meanwhile, the bloc entered a technical recession at the start of the year after Eurostat cut its earlier estimate of 0% growth in the final quarter of 2022 and 0.1% growth in the first quarter of 2023 to 0.1% contractions in both periods.
Against mounting economic concerns, economists expect one more 25 bps rate hike in July following June’s, adding that “the deposit rate is expected to remain at 3.75% for nearly a year to ensure inflation retreats sustainably,” the Bloomberg survey revealed.
Therefore, the Euro’s fate hinges on the European Central Bank’s (ECB) inflation and growth projections, with a 25 bps rate hike fully baked in. Further, President Lagarde’s outlook on the interest rates will be also critical to EUR/USD’s next directional move.
The Euro is likely to come under intense selling pressure should Lagarde hint at pausing rate hikes after July, which could knock down the EUR/USD pair toward 1.0700. On the other hand, the main currency pair could recapture 1.0850 and beyond if Lagarde sticks to the central bank’s commitment to bringing inflation back toward the 2.0% target. At the moment, inflation in the old continent is more than thrice the Bank’s target.
Meanwhile, Dhwani Mehta, Asian Session Lead Analyst at FXStreet, offers a brief technical outlook for the major and explains: “Despite the pullback from monthly highs, EUR/USD managed to settle Wednesday above the 100-Day Moving Average (DMA) support at 1.0805, where it now wavers. The 14-day Relative Strength Index (RSI) has turned lower but remains above the 50 level, keeping Euro buyers hopeful ahead of the ECB decision.”
Dhwani also outlines important technical levels to trade the EUR/USD pair: “On the upside, EUR/USD buyers need to take out the flattish 50 DMA barrier at 1.0875 on a sustained basis to confirm a bullish reversal from two-month troughs near 1.0635. The next relevant resistance is seen at the 1.0900 threshold.”
European Central Bank related content
- EUR/USD trades with modest intraday losses, holds above 1.0800 ahead of ECB
- Gold Price Forecast: Fed’s hawkish pause powers XAU/USD bears, $1,918 and ECB next in sight
- ECB Banks Preview: 25 bps, more remains in store
About the ECB interest rate decision
ECB Interest Rate Decision is announced by the European Central Bank. Usually, if the ECB is hawkish about the inflationary outlook of the economy and rises the interest rates it is positive, or bullish, for the EUR. Likewise, if the ECB has a dovish view on the European economy and keeps the ongoing interest rate, or cuts the interest rate it is seen as negative, or bearish.
- WTI bears stay hopeful after returning to the desk from one-week high.
- US Dollar strength joins IEA forecasts and downbeat EIA weekly Oil inventories to favor Oil sellers.
- US Retail Sales, more clues on energy market eyed for fresh impulse.
WTI crude oil clings to mild losses near $68.70 amid early Thursday in Europe. In doing so, the black gold suffers from downbeat weekly inventory data, firmer US Dollar and mixed headlines about the energy markets.
That said, a strong surprise build in the weekly Oil inventory data from the US Energy Information Administration (EIA), by 7.92 million barrels (M) versus hopes of witnessing a draw of 0.51M and -0.451M prior, weigh on the WTI at a first place.
Following that, the upbeat FOMC Economic Projections and Federal Reserve (Fed) Chairman Jerome Powell’s speech renewed the hawkish Fed bias and exert downside pressure on the energy benchmark.
Furthermore, the International Energy Agency (IEA) said on Wednesday that “global oil demand will grow by 2.4 million bpd this year, to a record 102.3 million bpd.” However, a lead US bank, namely JP Morgan, cuts its Oil price forecasts for 2023 and 2024 in the latest release. It should be noted that JP Morgan revised its average Brent price forecast for 2023 to $81 per barrel from $90 earlier, and for West Texas Intermediate (WTI) to $76 a barrel from $84 previously.
“JPMorgan cut its oil price forecasts for this year and 2024 as it sees global supply growth offsetting a record rise in demand, while inventory build-up lowers the risk of price spikes,” per Reuters.
Elsewhere, downbeat prints of China Retail Sales and Industrial Production joined upbeat US Dollar Index (DXY) prints to keep the Oil bears hopeful.
That said, energy traders should pay attention to the sentiment as the European Central Bank (ECB) and the US Retail Sales trade tall to shake the markets. Should the risk-off mood intensifies, the WTI may have more to lose.
Technical analysis
A bullish triangle formation restricts immediate moves of the WTI crude oil between $67.10 and $70.00. That said, energy bears seem running out of steam ahead of key data/events, per the dicey oscillators.
- Silver meets with a fresh supply on Thursday and drops to a one-week low.
- The setup favours bearish traders and supports prospects for further losses.
- A sustained move back above $24.00 is needed to negate the negative bias.
Silver struggles to capitalize on the previous day's positive move and comes under heavy selling pressure on Thursday, hitting a one-week low heading into the European session. The white metal currently trades just below mid-$23.00s, down around 2% for the day, and seems vulnerable to weaken further.
From a technical perspective, the recent failure near the $24.50-$24.55 area, representing the 50% Fibonacci retracement level of the downfall witnessed in May, and the subsequent break below the 200-hour Simple Moving Average (SMA) favours bearish traders. Moreover, the XAG/USD now seems to have found acceptance below the 23.6% Fibo. level, which, along with the fact that oscillators on the daily chart have just started drifting back into the negative territory, support prospects for additional losses.
That said, the Relative Strength Index (RSI) on the 1-hour chart is already flashing oversold conditions, making it prudent to wait for some intraday consolidation or a modest bounce before placing fresh bearish bets. Nevertheless, the XAG/USD remains on track to slide further below the $23.00 mark and test the $22.70-$22.65 region, or a two-month low touched in May. The downward trajectory could get extended further and drag the commodity further towards the $22.00 round figure.
On the flip side, an attempted recovery might now attract fresh sellers and remain limited near the $24.00 mark, coinciding with the 38.2% Fibo. level. That said, a sustained strength beyond might trigger a short-covering rally towards the $24.50-$24.55 supply zone, or the 50% Fibo. level. The XAG/USD might then climb back to reclaim the $25.00 psychological mark and then accelerate the momentum further towards the $25.35-$25.40 resistance zone. Bullish trders could eventually aim to conquer the $26.00 mark.
Silver 1-hour chart
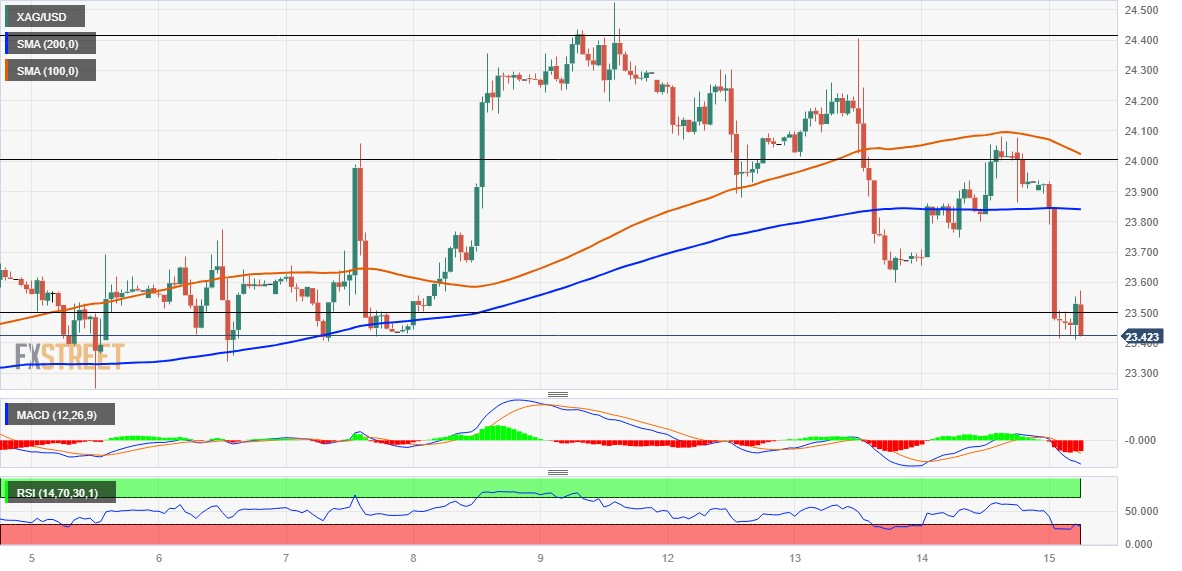
Key levels to watch
- NZD/USD has shown a recovery move to near 0.6200 despite the NZ economy reporting a technical recession.
- Fed Powell confirmed that rate cuts are not appropriate this year.
- NZD/USD faced sheer resistance near the 61.8% Fibonacci retracement at 0.6230.
The NZD/USD pair has rebounded after sensing buying interest near 0.6160 in the early London session. The Kiwi asset is struggling to find acceptance above the round-level resistance of 0.6200 despite multiple attempts.
S&P500 futures have generated more losses as the market sentiment is turning cautious. A skip in the interest rate regime by the Federal Reserve (Fed) lacks optimism as the policy-tightening spell is not concluded now. Also, Fed chair Jerome Powell confirmed that rate cuts are not appropriate this year.
Meanwhile, the New Zealand economy has reported a technical recession as quarterly Gross Domestic Product (GDP) has contracted by 0.1% as expected. Also, the Kiwi economy reported a contraction in its former GDP figures by 0.7%. Two consecutive time contraction in quarterly GDP figures of an economy is considered a technical recession.
NZD/USD faced sheer resistance near the 61.8% Fibonacci retracement (plotted from May 11 high at 0.6385 to May 31 low at 0.5985) at 0.6230 on a four-hour scale. The downward-sloping trendline placed from May 11 high at 0.6385 will continue to provide support to the New Zealand Dollar bulls. Also, the 20-period Exponential Moving Average (EMA) at 0.6161 is acting as a cushion for the Kiwi bulls.
The Relative Strength Index (RSI) (14) is making efforts in keeping its auction in the bullish range of 60.0-80.00.
A confident break above the round-level resistance at 0.6200 will drive the Kiwi asset toward May 17 high at 0.6261 followed by May 19 high at 0.6306.
Alternatively, a downside move below the intraday low at 0.6015 will expose the asset for a fresh six-month low toward 11 November 2022 low at 0.5984. A slippage below the latter would expose the asset toward 02 November 2022 high at 0.5941.
NZD/USD four-hour chart

Here is what you need to know on Thursday, June 15:
The US Dollar (USD) continues to gather strength against its rivals early Thursday, supported by the Federal Reserve's hawkish guidance. The European Central Bank (ECB) will announce monetary policy decisions later in the day. The US economic docket will feature May Retail Sales, Philadelphia Fed Manufacturing Survey for June and the weekly Initial Jobless Claims data.
As expected, the Fed left its policy rate unchanged at 5-5.25% range following the June policy meeting, explaining that holding the target range steady will give them time to assess additional information and implications for the monetary policy. More importantly, the Summary of Economic Projections showed that the terminal rate projection for end-2023 got revised higher to 5.6% from 5.1% in March, implying two more rate hikes in 2023. Moreover, end-2024 rate forecast rose to 4.6% from 4.3%.
Although FOMC Chairman Jerome Powell refrained from committing to rate increase in July, the hawkish dot plot helped the USD, with the US Dollar Index recovering back above 103.00.
The ECB is widely anticipated to raise key rates by 25 basis points. ECB President Christine Lagarde will comment on the policy outlook and respond to questions from the press in a news conference starting at 1245 GMT. After having climbed to its highest level in nearly a month above 1.0860 on Wednesday, EUR/USD stays on the back foot early Thursday and declines toward 1.0800.
GBP/USD edged lower in the late American session but registered its highest daily close in over a year at 1.2670. The pair edges lower amid renewed USD strength early Thursday and trades in negative territory below 1.2650.
USD/JPY gathered bullish momentum in the Fed aftermath and climbed to its highest level since November above 141.00. The Bank of Japan will announce monetary policy decisions in the Asian trading hours on Friday.
The data from Australia showed that the Unemployment Rate edged lower to 3.6% in May from 3.7% in April. The Employment Change came in at +75,900, surpassing the market expectation for an increase of 15,000 by a wide margin. Upbeat employment data helped the Australian Dollar (AUD) stay resilient against the USD. As of writing, AUD/USD was trading modestly higher on the day above 0.6800.
Gold price came under renewed bearish pressure and fell to its weakest level since mid-March at $1,930 before recovering modestly. The benchmark 10-year US Treasury bond yield rose above 3.8% and weighed heavily on XAU/USD.
Bitcoin turned south after the Fed event late Wednesday. BTC/USD continues to stretch lower and was last seen trading at a fresh two-month low below $25,000. Ethereum fell 5% on Wednesday and extended its slide early Thursday. At the time of press, ETH/USD was down nearly 1% on the day at $1,640.
- EUR/GBP stays pressured within seven-week-old falling wedge, approaches weekly support.
- RSI conditions suggest limited downside room, highlight 0.8520 as additional support.
- 100-SMA can prod bullish wedge confirmation before giving control to buyers.
- ECB is likely to announce 0.25% rate hike but Lagarde Speech will be crucial to watch.
EUR/GBP fades bounce off the yearly low, marked earlier in the week, as it drops to 0.8550 amid the initial hours of Thursday’s European session. In doing so, the cross-currency pair braces for the European Central Bank (ECB) Monetary Policy Meeting by approaching a short-term key support.
Also read: EUR/USD trades with modest intraday losses, holds above 1.0800 ahead of ECB
That said, the quote’s failure to keep the bounce off one-week-old rising support line, near 0.8540 by the press time, contrasts with the downbeat RSI (14) line.
The same suggests limited downside room for the quote, which in turn highlights the bottom line of a falling wedge bullish chart pattern comprising levels marked since late April.
As a result, the EUR/GBP pair’s latest weakness remains elusive beyond 0.8540 while a clear break of the said trend line support isn’t also an assurance to the bears as the stated wedge’s lower line, close to 0.8520 at the latest, offers an extra filter towards the south.
On the contrary, the month-start bottom of 0.8567 restricts immediate upside of the EUR/GBP pair ahead of the falling wedge’s top line, near to the 0.8600 round figure as we write.
It should be noted that the bullish chart pattern’s confirmation, via 0.8600 breakout, needs validation from the 100-SMA level surrounding 0.8620 to suggest further advances of the pair.
EUR/GBP: Four-hour chart

Trend: Limited downside expected
Further gains appear in store for USD/JPY on a surpass of the 141.00 hurdle, suggest Economist Lee Sue Ann and Markets Strategist Quek ser Leang at UOB Group.
Key Quotes
24-hour view: Yesterday, we stated that “the outlook appears to be mixed” and we expected USD to trade in a range of 139.20/140.40. USD then traded in a narrower range than expected (139.27/140.27) before closing little changed at 140.09 (-0.090%). Despite the quiet price actions, upward momentum appears to be building, and USD is likely to trade with an upward bias today. However, it is unlikely to break the major resistance at 141.00. On the downside, a breach of 139.60 (minor support is at 139.95) indicates that the buildup in momentum has faded.
Next 1-3 weeks: Our most recent narrative was from last Thursday (08 Jun, spot at 139.95) wherein USD “is likely to trade between 138.50 and 141.00”. After trading within the range for a week, short-term upward momentum appears to be building. However, for USD to advance in a sustained manner, it must break clearly above 141.00. The chance of USD breaking above 141.00 will remain intact as long as it stays above the ‘strong support’ (currently at 139.30) in the next few days.
Considering advanced figures from CME Group for natural gas futures markets, open interest remained choppy and shrank by more than 9K contracts on Wednesday. In the same line, volume reversed two consecutive daily builds and dropped by nearly 90K contracts.
Natural Gas: Further consolidation remains the name of the game
Prices of natural gas rose for the third session in a row on Wednesday. The daily uptick came in tandem with shrinking open interest and volume and exposes some corrective move in the very near term. Looking at the broader picture, the commodity is expected to keep the ongoing consolidation well in place for the time being.
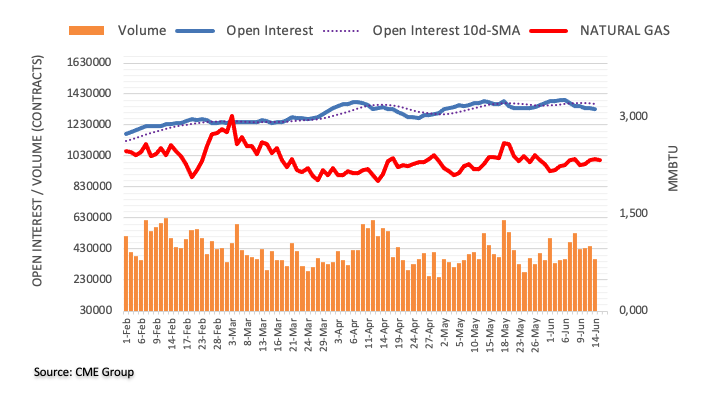
- EUR/JPY scales higher for the fourth straight day and spikes to a fresh multi-year high on Thursday.
- The BoJ’s dovish stance, along with reduced bets for Japan’s intervention, weigh heavily on the JPY.
- Investors now look to the key ECB decision for a fresh impetus ahead of the BoJ meeting on Friday.
The EUR/JPY cross prolongs its weekly uptrend for the fourth successive day on Thursday and rallies to its highest level since September 2008, around the 152.85 region heading into the European session.
The Japanese Yen (JPY) continues to be undermined by a big divergence in the monetary policy stance adopted by the Bank of Japan (BoJ) and other major central banks. In fact, several BoJ officials, particularly Governor Kazuo Ueda, have signalled to stick to the ultra-loose policy settings, including the yield curve control policy, to support the economy and ensure that the recent positive signs are sustained. Apart from this, reduced bets for an intervention by the Japanese government, to stabilize the domestic currency, exert additional downward pressure on the JPY and provide a goodish lift to the EUR/JPY cross.
Apart from this, the strong intraday move up could further be attributed to some repositioning trade ahead of the European Central Bank (ECB) event risk. The ECB is scheduled to announce its policy decision later this Thursday and is all but certain to hike interest rates by 25 bps, to their highest level in 22 years. The central bank is also expected to leave the door open for further tightening to combat high inflation, which, at 6.1% in May, is still more than three times the 2% target. This contributes to the shared currency's relative outperformance and remains supportive of the EUR/JPY pair's sharp rise to a multi-year peak.
The positive momentum could further be attributed to some follow-through technical buying following this week's breakout and acceptance above the 151.00 strong horizontal resistance. That said, the Relative Strength Index (RSI) on the daily chart is already flashing slightly overbought conditions, making it prudent to wait for some near-term consolidation or a modest pullback before placing fresh bullish bets around the EUR/JPY cross. Traders might also prefer to wait on the sidelines ahead of the key central bank event risks - the ECB decision and the BoJ meeting on Friday. Nevertheless, the aforementioned fundamental backdrop suggests that the path of least resistance for spot prices is to the upside.
Technical levels to watch
- Natural Gas price is hovering near the horizontal resistance of the Ascending Triangle pattern at $2.44.
- Investors are awaiting the natural gas inventory data by the US EIA for the week ending June 09.
- Soaring temperatures in US Texas would increase the usage of air-conditioning.
Natural Gas price (XNG/USD) has shown a recovery move after a minor correction to near $2.40. The energy component is expected to deliver more upside amid a solid demand outlook. The Electricity Reliability Council of Texas (ERCOT) said Tuesday that due to soaring temperatures this week, the usage of air-conditioning might climb in Texas to a record 80.3 gigawatts.
Investors are going to keep their entire focus on the natural gas inventory data by the United States Energy Information Administration (EIA) for the week ending June 09. Last week, the US EIA reported a jump in natural gas inventory by 109 billion cubic feet (bcf).
Natural Gas price is auctioning in the Ascending Triangle chart pattern on an hourly scale, which indicates a sheer contraction in volatility. Upward-sloping trendline of the aforementioned pattern is plotted from June 01 low at $2.18 while the horizontal resistance is placed from May 31 high at $2.44.
The 50-period Exponential Moving Average (EMA) at $2.38 is providing support to the Natural Gas bulls.
Meanwhile, the Relative Strength Index (RSI) (14) is oscillating in the 40.00-60.00 range, which indicates a non-directional performance.
Going forward, a decisive break above May 31 high at $2.44 by the Natural Gas price will result in a breakout of the volatility contraction and will open doors for May 23 low around $2.51 and May 24 high at $2.61.
In an alternate scenario, a decisive drop below June 06 low at $2.24 will drag the asset toward June 01 low at $2.18. A break below the latter will expose the asset to May 05 low around $2.10.
Natural Gas hourly chart
-638224063295051911.png)
Extra upside could motivate NZD/USD to retest the 0.6260 region in the short-term horizon, note Economist Lee Sue Ann and Markets Strategist Quek ser Leang at UOB Group.
Key Quotes
24-hour view: The strong surge in NZD that sent it to a high of 0.6236 in NY trade came as a surprise (we were expecting it to trade sideways). The sharp and swift rise appears to be overdone and NZD is unlikely to advance much further. Today, NZD is more likely to trade in a range of 0.6150/0.6230.
Next 1-3 weeks: Yesterday (14 Jun, spot at 0.6155), we highlighted that “there is room for NZD to strengthen further even though it must break clearly above 0.6180 before further sustained advance is likely”. We added, “Looking ahead, 0.6230 is a solid resistance and NZD might find this level difficult to break”. We did not anticipate the manner in which NZD lifted off and surged to a high of 0.6236 in NY trade. NZD is likely to advance further. The next level to watch is 0.6265. On the downside, a breach of 0.6125 (‘strong support’ level was at 0.6100 yesterday) would indicate that the NZD strength that started early this week has run its course.
- Gold Price prods crucial support confluence as US Dollar, yields cheer hawkish Fed bias.
- FOMC met expectations of holding rates unchanged but dot plot, Powell’s Speech weighs on XAU/USD price.
- Downbeat China data adds strength to bearish bias but $1,930, US data holds the key to further Gold Price weakness.
Gold Price (XAU/USD) drops to a three-month low as market players seek solace in the Fed’s hawkish hold, as well as downbeat China data, during the bumper week. That said, the US central bank kept the benchmark interest rate unchanged at 5.0-5.25%, matching market expectations of pausing the multi-month-old hawkish cycle after 10 consecutive rate increases. However, the upbeat FOMC Economic Projections and Federal Reserve (Fed) Chairman Jerome Powell’s speech renewed the hawkish Fed bias surrounding the July meeting and weighed on the XAU/USD afterward.
Elsewhere, downbeat prints of China Retail Sales and Industrial Production join firmer US Treasury bond yields to also keep the Gold bears hopeful. However, the People’s Bank of China’s (PBoC) rate cut and the Fed’s emphasis on incoming data for decision-making keeps the XAU/USD sellers skeptical.
Hence, today’s Retail Sales for May and other mid-tier activity data, as well as the weekly Jobless Claims, will be important to watch. Additionally, the European Central Bank’s (ECB) monetary policy meeting results will be eyed too as it can be directly linked to the US Dollar and the Gold Price.
Also read: Gold Price Forecast: Fed’s hawkish pause powers XAU/USD bears, $1,918 and ECB next in sight
Gold Price: Key levels to watch
Our Technical Confluence Indicator signals that the Gold Price knocks on the door of bears after a long run to defend itself from bulls. That said, the XAU/USD is near the $1,932 key support comprising lows marked on hourly, four-hour and one-month timeframes, as well as the lower band of the Bollinger on the 15-minute chart.
Following that, the Fibonacci 161.8% on the weekly play, close to $1,917, may offer a small hiccup to the Gold bears on their way toward the $1,900 round figure.
Meanwhile, the 100-DMA joins the Pivot Point one-week S1 to highlight $1,943 as the short-term key upside hurdle for the XAU/USD buyers to cross.
Even if the Gold Price rises past $1,943, the Fibonacci 38.2% on Daily chart may prod the bulls near $1,948 ahead of highlighting the $1,950 upside hurdle.
It’s worth noting that the Gold Price run-up beyond $1,950 is still not a free road for the bulls as the previous daily high and Fibonacci 38.2% on one-week, near $1,960, can also check the XAU/USD buyers.
Here is how it looks on the tool
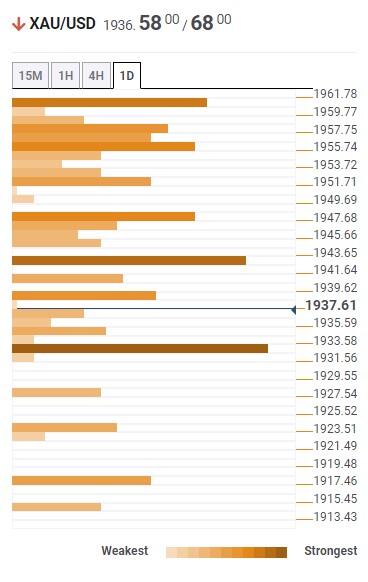
About Technical Confluences Detector
The TCD (Technical Confluences Detector) is a tool to locate and point out those price levels where there is a congestion of indicators, moving averages, Fibonacci levels, Pivot Points, etc. If you are a short-term trader, you will find entry points for counter-trend strategies and hunt a few points at a time. If you are a medium-to-long-term trader, this tool will allow you to know in advance the price levels where a medium-to-long-term trend may stop and rest, where to unwind positions, or where to increase your position size.
CME Group’s flash data for crude oil futures markets saw traders scale back their open interest positions by more than 21K contracts on Wednesday, adding to the previous daily drop. In the same line, volume went down for the second session in a row, this time by around 164.3K contracts.
WTI: Upside remains capped near $75.00
Wednesday’s daily retracement in prices of WTI was accompanied by diminishing open interest and volume, hinting at the idea that further weakness is not favoured and opening the door at the same time to a probable bounce in the short-term horizon. Against that, bullish moves are expected to meet a decent barrier around the monthly peak near the $75.00 mark per barrel (June 5).
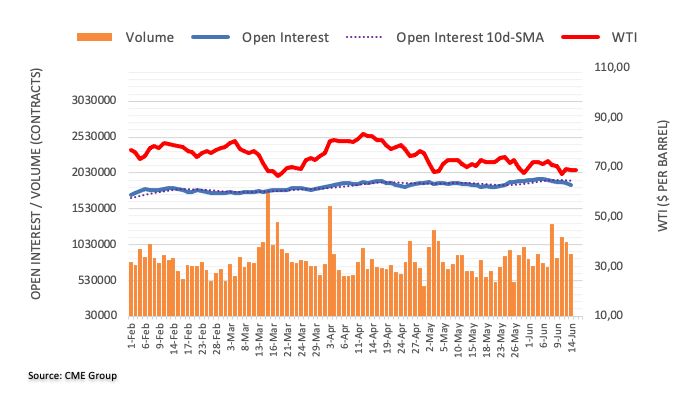
FX option expiries for June 15 NY cut at 10:00 Eastern Time, via DTCC, can be found below.
- EUR/USD: EUR amounts
- 1.0665 702m
- 1.0700 618m
- 1.0770 698m
- 1.0800 468m
- 1.0830 844m
- 1.0875 641m
- 1.0900 942m
- USD/JPY: USD amounts
- 139.00 572m
- 140.00 654m
- USD/CHF: USD amounts
- 0.8775 420m
- 0.9050 635m
- 0.9090 400m
- USD/CAD: USD amounts
- 1.2850 1.0b
- 1.3200 540m
- 1.3750 814m
In the view of Economist Lee Sue Ann and Markets Strategist Quek ser Leang at UOB Group, further upside could now lift GBP/USD to the 1.2790 region in the next few weeks.
Key Quotes
24-hour view: We highlighted yesterday that GBP “is likely to rise further”. We added, “barring a surge in momentum, the major resistance at 1.2680 is likely out of reach today”. GBP rose more than expected as it surged to a high of 1.2699 before easing off to close at 1.2661 (+0.38%). Conditions are severely overbought and the chance for a sustained break above 1.2700 is not high. Today, GBP is more likely to consolidate in a range of 1.2595/1.2700.
Next 1-3 weeks: We turned positive in GBP last Friday (09 Jun, spot at 1.2555) but we indicated that “it remains to be seen if it has enough momentum to revisit last month’s high near 1.2680”. Yesterday (14 Jun, spot at 1.2600), we stated that “the boost in momentum suggests that 1.2680 is likely to come into view”. While our view was correct, we did not quite expect GBP to surpass 1.2680 so soon (GBP soared to a high of 1.2699 in NY trade). Upward momentum remains robust, and we continue to expect GBP to strengthen. The next level to watch is 1.2790. On the downside, a breach of 1.2560 (‘strong support’ level previously at 1.2515) indicates GBP is not rising further.
- USD/CAD has sensed stiff barricades around 1.3350 as the USD Index has witnessed exhaustion in the upside momentum.
- Optimism inspired by a skip in the rate-hiking spree by the Fed was offset by caution generated due to hawkish interest rate guidance.
- The Canadian Dollar is going to show some action after the release of monthly Manufacturing Sales data.
The USD/CAD pair has sensed offers near the immediate resistance of 1.3350 in the early European session. The Loonie asset is losing strength despite more interest rate hikes by the Federal Reserve (Fed) will keep the policy divergence space of the US central bank with other global banks.
Nominal losses added in Asia by the S&P500 futures have been carry-forwarded in Europe as optimism inspired by a skip in the rate-hiking spree by the Fed has been offset by caution generated due to hawkish interest rate guidance.
Earlier, the US Dollar Index (DXY) pared its entire losses and climbed above 103.30 as Fed chair Jerome Powell confirmed that more interest rate hikes are in motion but is now struggling to maintain strength. Investors should note that United States headline inflation has critically softened, but core inflation is still showing persistence due to tight labor market conditions.
Fed Powell cited in his monetary policy statement that "Not seeing a lot of progress on core PCE inflation." And "Want to see core PCE moving down decisively."
The hawkish dot plot by the Fed has impacted the demand for US government bonds. This has led to a sharp jump in the 10-year US Treasury yields to near 3.83%.
The Canadian Dollar is going to show some action after the release of Canada’s monthly Manufacturing Sales data (April). A contraction of 0.2% is expected in the economic data vs. an expansion of 0.7%. It looks like higher interest rates by the Bank of Canada (BoC) have forced firms to underutilize their entire capacity, which has reduced the overall factory activity.
On the oil front, oil prices have shown a recovery move after a correction to near $68.00 as the USD Index has met offers. It is worth noting that Canada is the leading exporter of oil to the US and higher oil prices would strengthen the Canadian Dollar.
Open interest in gold futures dropped for the fourth session in a row on Wednesday, this time by around 2.1K contracts according to preliminary readings from CME Group. volume followed suit and shrank by around 3.5K contracts, partially reversing the previous build.
Gold remains supported by the $1930 region
Gold prices extended the downtrend on Wednesday and probed the $1940 area. The downtick, however, was on the back of shrinking open interest and volume, suggesting that a more sustained decline appears unlikely for the time being. So far, there seems to be decent support around $1930 per troy ounce.
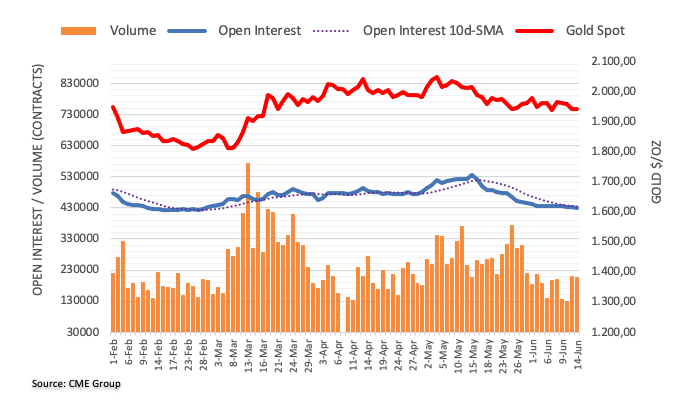
- USD/JPY jumps to the highest levels since November 2022, prints the biggest daily gains in a month.
- Upside break of previous yearly peak of around 141.00, looming bull cross on MACD favor Yen pair buyers.
- Overbought RSI, ascending resistance line from early March limit further upside.
USD/JPY bulls are high as the Yen pair renews the yearly peak near 141.45 amid early Thursday. In doing so, the risk-barometer pair prints the biggest daily gains, so far, in a month amid upbeat US Treasury bond yields.
That said, the US 10-year Treasury bond yields rise three basis points (bps) to 3.83% by the press time, versus the previous day’s lackluster move near a three-week top. While tracing the firmer bond coupons, the hawkish Fed bias and economic fears gain major attention.
Also read: USD/JPY looks to build on momentum beyond 141.00, highest since November 2022
On the other hand, sustained trading beyond the previous high of 2023, of around 141.00, enables the USD/JPY buyers to keep the reins, especially amid an impending bull cross on the MACD.
However, the nearly overbought RSI (14) line joins a three-month-old rising trend line, near 141.60 at the latest, to cap the pair’s immediate upside.
It should be noted that the late November 2022 high of near 142.25 and the 61.8% Fibonacci retracement level of the pair’s October 2022 to January 2023 fall, near 142.45, act as additional upside filters for the USD/JPY bulls to cross for conviction.
On the flip side, a one-month-old rising support line joins the 50% Fibonacci retracement level to limit the short-term downside of the USD/JPY pair near 139.55. Following that, the 200-DMA support of near 137.25 will be in the spotlight.
That said, the 141.00 mark and the 140.00 psychological magnet are extra supports to watch for the Yen pair traders.
USD/JPY: Daily chart
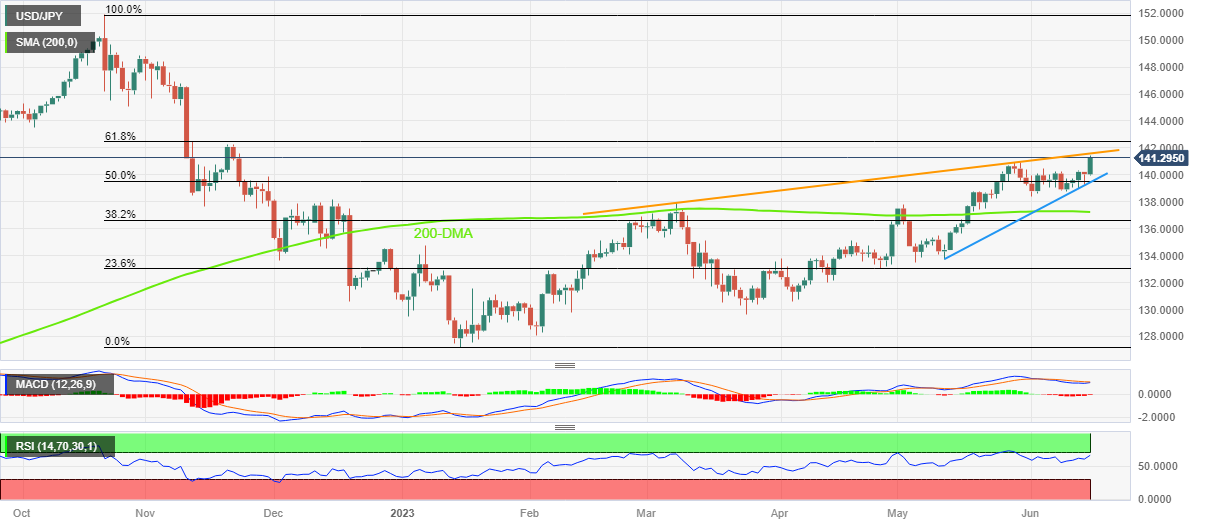
Trend: Limited upside expected
Economist Lee Sue Ann and Markets Strategist Quek ser Leang at UOB Group maintain the short-term positive outlook for EUR/USD.
Key Quotes
24-hour view: We highlighted yesterday that “there is a chance for EUR to retest the 1.0825 level”. We were also of the view that “the major resistance at 1.0850 is likely out of reach”. The anticipated EUR strength exceeded our expectations as it soared to 1.0863 before pulling back to end the day at 1.0831 (+0.37%). The pullback in overbought conditions suggest EUR is unlikely to rise further. Today, it is more likely to trade in a range of 1.0775/1.0866.
Next 1-3 weeks: Last Friday (09 Jun, spot at 1.0780), we noted that “upward momentum is building tentatively but it is not clear for now if EUR has enough momentum to rise to 1.0850”. After EUR rose, we highlighted yesterday (14 Jun, spot at 1.0790) that “the odds of EUR rising to 1.0850 have increased”. In NY trade, EUR soared to a high of 1.0863, and upward momentum has improved further. In other words, the outlook for EUR is still positive. The next level to aim for is 1.0900. In view of the overbought conditions, it may take a few days before this level comes into view. Overall, only a breach of 1.0755 (‘strong support’ level was at 1.0730) would suggest EUR is advancing further.
- USD/IDR picks up bids to renew intraday high, rises to the highest levels in eight days.
- Indonesia Imports, Exports improve but Trade Balance deteriorates in May.
- Fed matches market forecasts to halt the rate hike but details appear hawkish.
- US data will be closely observed as FOMC emphasizes incoming data for decision-making.
USD/IDR stays on the front foot for the second consecutive day as it refreshed the weekly top near 14,955 after witnessing mixed Indonesia trade numbers early Thursday. Also exerting downside pressure on the Indonesia Rupiah (IDR) is the US Dollar’s rebound amid hopes of a July Fed rate hike.
Indonesia’s headline Trade Balance drops to $0.44B in May versus $3.02B market forecasts and $3.94B previous readings. The details, however, appear impressive as Imports rose to 14.35%, from -22.32% previous fall and -11.0% prior, whereas the Exports improved to 0.96% versus the previous contraction of 29.4%. It should be noted that the cautious optimism in Asia, amid downbeat China data and hawkish Fed concerns, also propel the USD/IDR prices.
On the other hand, the US Federal Open Market Committee (FOMC) kept the benchmark interest rate unchanged at 5.0-5.25%, matching market expectations of pausing the multi-month-old hawkish cycle after 10 consecutive rate lifts. However, the upbeat FOMC Economic Projections and Federal Reserve (Fed) Chairman Jerome Powell’s speech renewed the hawkish Fed bias and propel the USD/IDR price.
Amid these plays, S&P500 Futures struggle at the yearly top whereas the US Treasury bond yields rebound after witnessing a pullback during the post-Fed move. That said, the US Dollar Index (DXY) prints the first daily gain in three while bouncing off the monthly low to around 103.30 at the latest.
Moving on, US Retail Sales for May and other mid-tier activity data, as well as the weekly Jobless Claims, will be important for the USD/IDR pair traders as the Fed has already highlighted the importance of each incoming data for decision-making.
Technical analysis
A convergence of the two-month-old descending trend line and the 100-DMA, around 15,025 at the latest, challenge USD/IDR bulls even if oscillators are favoring a gradual recovery.
- USD/CHF is eyeing a break above 0.9040 amid optimism inspired by a V-shape recovery in the USD Index.
- After having detailed guidance over interest rates, investors are shifting their focus toward US Retail Sales data.
- SNB Jordan has already cleared that the negative effects of a low inflation environment are lower than a highly-inflated scenario.
The USD/CHF pair is facing delicate barricades around the immediate resistance of 0.9040 in the Asian session. The Swiss Franc asset is aiming to extend its upside journey supported by a solid recovery in the US Dollar Index (DXY).
S&P500 futures are showing nominal losses in Tokyo as investors are cautious that more interest rate hikes by the Federal Reserve (Fed) would push the United States swiftly toward recession. US equities were extremely volatile on Wednesday as optimism inspired by a skip in the policy-tightening spell by the Fed receded after Fed chair Jerome Powell confirmed that two small interest rate hikes are in the pipeline and will be announced by year-end.
The USD Index showed a V-shape recovery after printing a fresh four-week low at 102.66. Hawkish guidance by the Fed infused fresh blood into the USD Index. The asset is expected to extend gains further amid cautious market sentiment.
After having detailed guidance over interest rates, investors are shifting their focus toward monthly US Retail Sales (May) data. The economic data is seen contracting by 0.1% vs. an expansion of 0.4% registered in April. As food and gasoline prices have fallen significantly, a scrutiny of the Retail Sales report will be required to gauge whether the retail demand has contracted due to lower prices of necessities or the economy is losing resilience.
Meanwhile, the Swiss Franc bulls are failing to offset strength in the US Dollar despite the Swiss National Bank (SNB) is expected to raise interest rates further. SNB Chairman Thomas J. Jordan has already cleared that the central bank won’t wait for an increase in inflation as the negative effects of a low inflation environment are extremely lower than a highly-inflated scenario.
- US Dollar Index grinds near intraday high as it recovers from the lowest level in a month.
- Oversold RSI, key Fibonacci retracement recall DXY buyers.
- Convergence of 100-SMA, fortnight-old descending trend line appears a tough nut to crack for greenback bulls.
US Dollar Index (DXY) seesaws around the daily top near 103.30 heading into Thursday’s European session. In doing so, the greenback’s gauge versus the six major currencies prints the first daily gain in three while bouncing off the monthly low.
It’s worth noting that the DXY dropped to the lowest levels in a month the previous day after the US Federal Open Market Committee (FOMC) kept the benchmark interest rate unchanged at 5.0-5.25%, matching market expectations. However, the upbeat FOMC Economic Projections and Federal Reserve (Fed) Chairman Jerome Powell’s speech renewed the hawkish Fed bias and triggered the US Dollar’s rebound afterward.
On a different page, failure on the part of the US Dollar Index to stay beneath the 50% Fibonacci retracement level of April-May upside, near 102.75 by the press time, joined the nearly oversold RSI (14) line to favor the DXY bulls of late. Adding strength to the recovery expectations is the quote’s sustained trading beyond the 200-SMA, following a brief fall post-Fed.
However, a downward-sloping resistance line from June 06, close to 103.40 at the latest, guards the immediate upside of the US Dollar Index.
Following that, a convergence of the 100-SMA and a fortnight-old resistance line, surrounding 103.85-90, appears a tough nut to crack for the US Dollar Index buyers.
Meanwhile, DXY sellers need validation from the 200-SMA and the aforementioned Fibonacci retracement level, respectively near 103.00 and 102.75, to retake control.
Even so, the 61.8% Fibonacci retracement, also known as the “Golden Fibonacci ratio”, can challenge the US Dollar Index bears around 102.30.
US Dollar Index: Four-hour chart
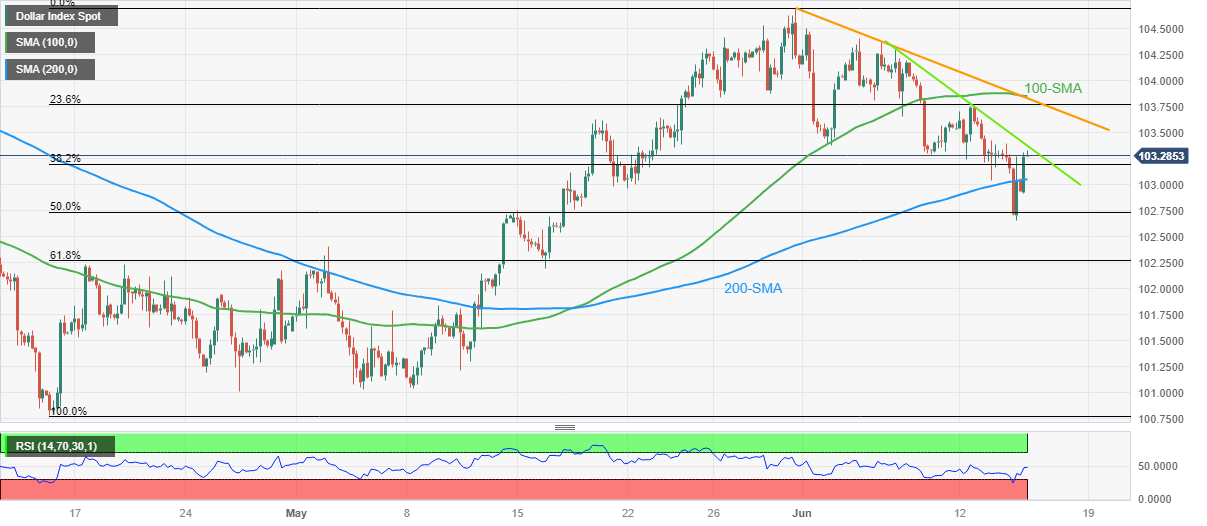
Trend: Limited recovery expected
- EUR/USD retreats further from a multi-week top and is pressured by a stronger USD.
- The Fed’s hawkish outlook lifts the US bond yields and helps revive the USD demand.
- The downside seems cushioned as traders seem reluctant ahead of the ECB meeting.
The EUR/USD pair attracts some selling following an early uptick to the 1.0845 region during the Asian session on Thursday and retreats further from a nearly one-month high touched the previous day. The pair currently trades near the lower end of its intraday trading range, just above the 1.0800 mark, and for now, seems to have snapped a three-day winning streak, though any meaningful downside seems elusive.
The US Dollar (USD) makes a solid comeback and reverses the previous day's slide to its lowest level since May 16, which, in turn, is seen as a key factor exerting some downward pressure on the EUR/USD pair. The strong USD bounce comes on the back of the Federal Reserve's (Fed) hawkish outlook and the intent to resume the rate-hiking cycle. It is worth recalling that the Fed, held interest rates steady at the end of a two-day policy meeting on Wednesday, as expected, but signalled that borrowing costs may still need to rise by as much as 50 bps by the end of this year.
In fact, the so-called "dot plot" indicated that officials now see rates peaking at 5.6% this year, higher than March's projection of 5.1%. The Fed also sees slightly stronger economic growth and forecasts the economy to grow by 1% this year — up from the 0.4% rise projected in May — before rising 1.1% in 2024 and 1.8% in 2025. This triggers a fresh leg up in the US Treasury bond yields and helps revive the USD demand. Apart from this, a softer tone around the equity markets underpins the safe-haven buck and contributes to the offered tone surrounding the EUR/USD pair.
Traders, however, might refrain from placing aggressive bearish bets ahead of the highly-anticipated European Central Bank (ECB) meeting later this Thursday. The ECB is all but certain to hike interest rates by 25 bps - to their highest level in 22 years - and leave the door open for further policy tightening to combat high inflation. It is worth mentioning that the headline CPI in the Eurozone decelerate to 6.1% in May, though is still more than three times the ECB's 2% target. Moreover, the core CPI, which excludes food and energy prices, has just started showing signs of slowing.
The aforementioned mixed fundamental backdrop, along with the overnight sustained break and acceptance above the 100-day Simple Moving Average (SMA), support prospects for the emergence of some dip-buying around the EUR/USD pair. Hence, it will be prudent to wait for strong follow-through selling before confirming that the recent positive move witnessed over the past week or so has run its course and positioning for any meaningful downside.
Technical levels to watch
- Asia-Pacific markets edge higher as Fed pauses multi-month-old rate hike cycle.
- Softer China data underpins hopes of more stimulus from Beijing and favor risk profile.
- Upbeat Aussie jobs, employment report joins market’s bets of July Fed rate hike to prod optimists.
Asian equities grind higher, making rounds to a two-month high early Thursday, as traders struggle to cheer the Federal Reserve (Fed) rate hike pause amid “higher for longer” fears. Also challenging the bulls could be hawkish concerns about the Reserve Bank of Australia (RBA) and downbeat China data.
While portraying the mood, the MSCI’s Index of Asia-Pacific shares outside Japan seesaw at the highest levels since April amid a five-day uptrend, up 0.30% intraday by the press time. That said, Japan’s Nikkei 225 adds 140 points to 33,655, rising 0.40% on a day at the latest.
It should be noted that Australia’s ASX 200 rises 0.20% whereas New Zealand’s NZX50 adds 0.35%. Further, Chinese shares also edge higher despite downbeat data.
That said, China’s Retail Sales for May rises 12.7% YoY versus 13.6% expected and 18.4% prior while the Industrial Production growth also eased to 3.5% in the stated month from 5.6% previous readings and 3.6% market forecasts. It should be noted that China cut its medium-term loan rates, by 10 bps, and drowned the Chinese Yuan (CNH) to a fresh six-month low.
On the other hand, Australia’s Consumer Inflation Expectations for June rose to 5.2% versus 4.8% expected and 5.0% prior. Further, the Employment Change rallied by 75.9K in May compared to 15K market forecasts and -4.3K previous readings. Additionally, Australia's Unemployment Rate drops to 3.6% against expectations of witnessing a no-change figure of 3.7%.
Earlier in the day, New Zealand’s first quarter (Q1) 2023 Gross Domestic Product (GDP) matches the -0.1% QoQ forecast, versus -0.7% (revised) prior. Further details reveal that the yearly figures ease to 2.2% YoY for the said period versus 2.6% market expectations and 2.3% previous readings. Given the second consecutive negative quarterly growth figure, the Pacific nation flags a ‘technical’ recession.
It should be noted that the US Federal Open Market Committee (FOMC) kept the benchmark interest rate unchanged at 5.0-5.25%, matching market expectations of pausing the multi-month-old hawkish cycle after 10 consecutive rate lifts. However, the upbeat FOMC Economic Projections and Federal Reserve (Fed) Chairman Jerome Powell’s speech renewed the hawkish Fed bias and might have prodded the sentiment.
Amid these plays, S&P500 Futures struggle at the yearly top whereas the US Treasury bond yields rebound after witnessing a pullback during the post-Fed move.
Also read: Forex Today: A hawkish hold from the Fed helps the Dollar
- GBP/USD fades bounce off intraday low during the first loss-making day in three.
- Hawkish Fed halt joins mixed UK data, post-FOMC consolidation to tease Cable bears.
- US Retail Sales, chatters about Fed vs. BoE divergence appear the key for fresh impulse.
GBP/USD remains depressed around 1.2650 as it prints the first daily loss in three heading into Thursday’s London open. In doing so, the Cable pair retreated from the highest levels since late April 2022.
The upbeat performance of the US Treasury bond yields joins recently increasing market chatters about the Federal Reserve’s (Fed) July rate hike to underpin the Pound Sterling’s latest pullback. Also weighing on the Cable prices could be the previous day’s mixed data.
That said, UK’s Gross Domestic Product (GDP) for April matches 0.2% growth versus -0.3% prior while the Industrial Production slumps during the stated month. That said, the Industrial Production also disappoints and so do the Index of Services for three months to April. Additionally, the UK’s NIESR GDP for three months to May eased to 0.0% versus 0.1% anticipated and prior.
On the other hand, the US Federal Open Market Committee (FOMC) kept the benchmark interest rate unchanged at 5.0-5.25%, matching market expectations of pausing the multi-month-old hawkish cycle after 10 consecutive rate lifts. However, the upbeat FOMC Economic Projections and Federal Reserve (Fed) Chairman Jerome Powell’s speech renewed the hawkish Fed bias and might have helped the US Treasury bond yields, as well as the US Dollar, to rebound of late.
That said, the Fed dot plot rose 30 bps from March for 2024 and 2025 to 4.6% and 3.4% respectively while the median rate forecasts suggest two more rate increases in 2023. Further, no rate cuts nor recession is expected in the current year whereas the median estimation for the US Gross Domestic Product (GDP) rose to 1.0% from 0.4% in March. Additionally, Powell’s speech unveils a “meeting by meeting” approach for decision-making but signals July as a ‘live’ meeting, suggesting a 0.25% rate hike.
Elsewhere, softer China data and fears of slower global economic recovery due to the hawkish mood of the Fed, despite the latest pause, seem to weigh on the S&P500 Futures and propel US Treasury bond yields, as well as the USD.
Looking ahead, US Retail Sales for May and other mid-tier activity data, as well as the weekly Jobless Claims, will be important for the USD/INR pair traders as the Fed has already highlighted the importance of each incoming data for decision-making.
Technical analysis
The overbought RSI (14) triggers GBP/USD retreat towards a one-week-old rising support line, around 1.2560 by the press time. On the contrary, the Pound Sterling’s recovery remains elusive unless it crosses an upward-sloping resistance line from August 2022, close to 1.2725 at the latest.
- Gold price drifts lower for the fifth successive day and drops closer to the May monthly swing low.
- The Federal Reserve’s hawkish outlook revives the US Dollar demand and weighs on the XAU/USD.
- Economic woes, especially in China, lend support to the safe-haven metal and limit the downside.
- Acceptance below the 100-day SMA favours bearish traders and supports prospects for further slide.
Gold price remains under some selling pressure for the fifth straight day on Thursday and drops back closer to the May swing low during the Asian session. The XAU/USD currently trades around the $1,935 region and for now, seems to have found acceptance below the 100-day Simple Moving Average (SMA) pivotal support defended since the beginning of this month.
Hawkish central banks weigh on Gold price
The prospects for further policy tightening by the Federal Reserve (Fed) keep traders wary of the non-yielding Gold price and contribute to an extension of the recent fall witnessed over the past week or so. It is worth recalling that the Fed, as was widely expected, held interest rates steady at the end of a two-day policy meeting on Wednesday, though showed the intent to resume its rate-hiking cycle. In fact, the so-called "dot plot" indicated that officials see rates peaking at 5.6% this year, higher than March's projection of 5.1%, suggesting two more 25 basis points (bps) rate hikes this year.
The Fed also sees slightly stronger economic growth and forecasts the economy to grow by 1% this year — up from the 0.4% rise projected in May — before rising 1.1% in 2024 and 1.8% in 2025. In the post-meeting press conference, Fed Chair Jerome Powell said that the pause was out of caution, to gather more information before determining if rates need to rise again. Powell further described US growth and the job market as holding up better than expected. This, along with rising bets for more rate hikes by the European Central Bank (ECB) and the Bank of England (BoE), weighs on the Gold price.
Modest US Dollar strength also undermines XAU/USD
The Fed's hawkish outlook, meanwhile, leads to a modest uptick in the US Treasury bond yields and assists the US Dollar (USD) to regain positive traction. In fact, the USD Index (DXY), which tracks the Greenback against a basket of currencies, recovers further from a one-month low touched on Wednesday and turns out to be another factor driving flows away from the US Dollar-denominated Gold price. That said, a softer tone around the US equity futures lends some support to the safe-haven XAU/USD and might hold back bearish traders from placing aggressive bets, at least for the time being.
Economic woes could help limit losses for Gold price
Investors remain worried about a global economic downturn and the fears were further fueled by the disappointing release of Chinese macro data on Thursday. The National Bureau of Statistics (NBS) reported that Retail Sales in China rose 12.7% YoY in May as compared to the 13.6% growth anticipated and 18.4% increase recorded in the previous month. Furthermore, China's Industrial Production also fell short of market expectations and came in at 3.5% YoY, down from 5.6% prior. Meanwhile, the Fixed Asset Investment increased 4.0% YTD YoY in May vs 4.4% expected and 4.7% last.
Traders now look to ECB and US macro data for fresh impetus
Traders also seem reluctant and prefer to wait on the sidelines ahead of the highly-anticipated ECB monetary policy decision, which is expected to infuse some volatility in the markets. Traders on Thursday will further take cues from the US economic docket, featuring the release of monthly Retail Sales, the usual Weekly Initial Jobless Claims, Empire State Manufacturing Index, Philly Fed Manufacturing Index and Industrial Production. This, in turn, will influence the USD price dynamics later during the early North American session and provide some meaningful impetus to the Gold price.
Gold price technical outlook
From a technical perspective, some follow-through selling below the $1,930 level will reaffirm a near-term bearish breakdown and make the Gold price vulnerable to accelerate the fall towards the $1,900 round figure. The downward trajectory could get extended further and drag the XAU/USD towards the $1,876-$1,875 horizontal support en route to the very important 200-day SMA, currently around the $1,845 region.
On the flip side, the 100-day SMA support breakpoint, near the $1,941-$1,942 zone, now seems to act as an immediate hurdle. A sustained strength beyond might trigger a short-covering move and lift the Gold price to the $1,962-$1,964 resistance zone. This is followed by the $1,973-$1,975 supply zone and the $1,983-$1,985 barrier, above which the XAU/USD could aim to reclaim the $2,000 psychological mark and climb further to the next relevant resistance near the $2,010-$2,012 region.
Key levels to watch
- AUD/USD retreats from the highest level since late February, pokes eight-day-old ascending support line.
- Overbought RSI, downbeat sentiment suggests further downside of the risk-barometer pair.
- Aussie bears also need softer US Retail Sales, mid-tier activity data for conviction.
AUD/USD fades a five-day-old bullish momentum at the highest levels in nearly 16 weeks as markets await more clues to confirm the Fed’s hawkish bias for the July rate hike.
In doing so, the Aussie pair struggles to cheer upbeat employment and inflation data from home, as well as downbeat China statistics during early Thursday. That said, the Aussie pair remains indecisive near 0.6795 as it prods a short-term support line at the latest.
Also read: AUD/USD bounces off daily low on upbeat Australian jobs report, up next Chinese macro data
Technically, an upward-sloping trend line from June 05, near 0.6785 at the latest, restricts immediate AUD/USD downside even as the overbought RSI (14) line signals the pair’s pullback moves.
However, a clear downside break of the stated support line will make the AUD/USD pair vulnerable to declining towards the mid-May swing high of around 0.6710 ahead of targeting the 200-SMA level surrounding 0.6655.
On the other hand, AUD/USD recovery should witness downbeat US data and easing odds of the Fed’s July rate hike to again aim for the key resistance line stretched from mid-April, close to 0.6835.
Following that, a run-up towards the December 2022 peak of around 0.6895 and then to the 0.6900 round figure can’t be ruled out.
AUD/USD: Four-hour chart
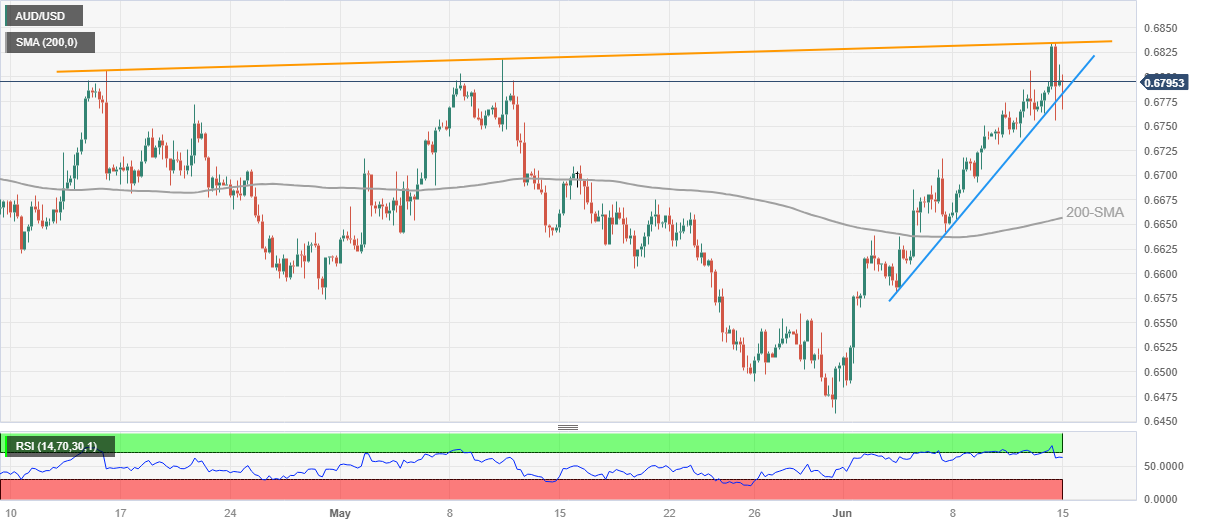
Trend: Limited downside expected
- USD/INR clings to mild gains after bouncing off one-month low, snaps five-day losing streak.
- Fed’s hawkish halt joins downbeat China data to weigh on Indian Rupee amid sluggish session.
- US Retail Sales, mid-tier activity, jobs data eyed as FOMC highlights data dependency for each upcoming meeting.
USD/INR picks up bids to print minor intraday gains around 82.15 during the first positive day in six amid early Thursday in Europe. In doing so, the Indian Rupee (INR) pair bounces off the lowest level in five weeks as the US Dollar portrays the market’s consolidation of the latest losses around the multi-day low.
That said, the US Dollar Index (DXY) rebounds from the lowest level in a month to snap a two-day downtrend near 103.30 by the press time.
The greenback’s gauge versus the six major currencies dropped to a fresh multi-day low after the US Federal Reserve (Fed) kept the benchmark Fed rate unchanged at 5.0-5.25%, matching market expectations of pausing the multi-month-old hawkish cycle that propelled rates for 10 consecutive times.
It’s worth noting, however, that the US Dollar’s latest gains could be linked to the increasing odds of witnessing a Fed rate hike in July. On the same line, the Fed’s dot plot rose 30 bps from March for 2024 and 2025 to 4.6% and 3.4% respectively while the median rate forecasts suggest two more rate increases in 2023. Further, no rate cuts nor recession is expected in the current year whereas the median estimation for the US Gross Domestic Product (GDP) rose to 1.0% from 0.4% in March. Additionally, Powell’s speech unveils a “meeting by meeting” approach for decision-making but signals July as a ‘live’ meeting, suggesting a 0.25% rate hike.
On the other hand, downbeat prints of China Retail Sales and Industrial Production weighed on the market sentiment in the Asia-Pacific zone.
Moving on, US Retail Sales for May and other mid-tier activity data, as well as the weekly Jobless Claims, will be important for the USD/INR pair traders as the Fed has already highlighted the importance of each incoming data for decision-making.
Technical analysis
A clear bounce off the 200-DMA support of 82.00 joins the below 50.0 levels of the RSI (14) line to underpin hopes of USD/INR bottom-picking, suggesting a further recovery towards the 100-DMA resistance of near 82.30.
It’s worth noting, however, that the USD/INR bulls need to cross a three-week-old resistance line, close to 82.50 by the press time, to retake control.
Meanwhile, a downside break of the 200-DMA should conquer an upward-sloping support line from November 2022, near 81.90 at the latest, to convince the USD/INR bears in challenging the April month’s bottom of around 81.50.
USD/INR: Daily chart
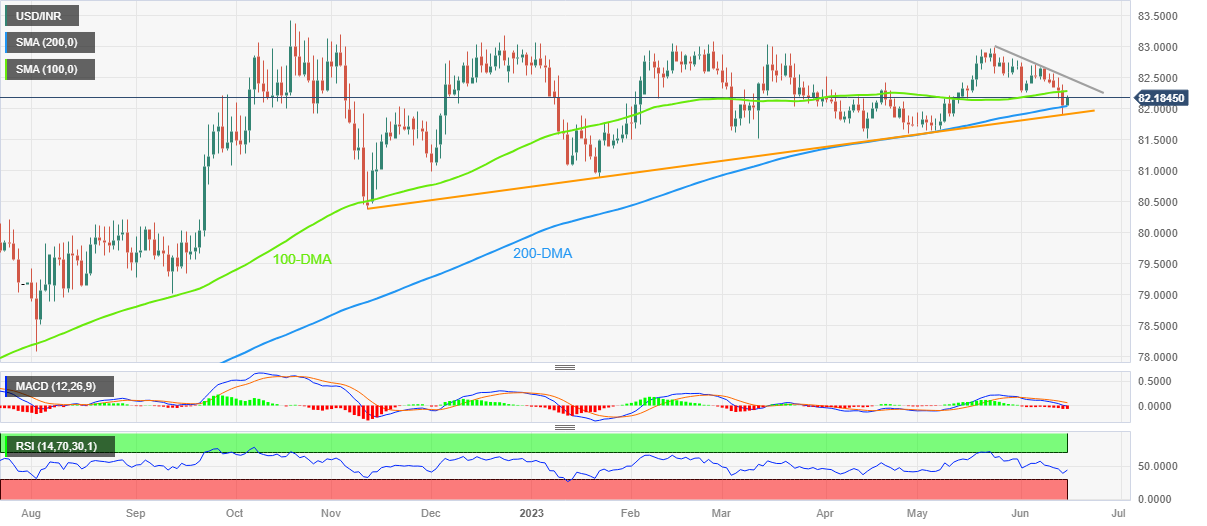
Trend: Limited recovery expected
- USD/JPY regains strong positive traction on Thursday and rallies to a fresh YTD top.
- The BoJ’s dovish outlook and weaker Japanese trade data weigh heavily on the JPY.
- The emergence of some USD buying remains supportive of the strong intraday rally.
- Traders now look to the US macro data for some impetus ahead of the BoJ on Friday.
The USD/JPY pair catches aggressive bids during the Asian session on Thursday and touches the 141.00 mark for the first time since November 2022, confirming a breakout through a two-week-old trading range.
The Japanese Yen (JPY) weakens in reaction to the weaker domestic data, showing that imports tumbled 9.9% in May and the trade deficit widened more than anticipated, to ¥1,372.5 billion in May. This validates expectations that the Bank of Japan (BoJ) will stick to its ultra-easy policy stance to support the economy and ensure that the recent positive signs are sustained. Apart from this, the emergence of some US Dollar (USD) buying provides an additional boost to the USD/JPY pair and remains supportive of the strong intraday move up.
The USD Index (DXY), which tracks the Greenback against a basket of currencies, is seen building on the overnight late rebound from a one-month low in the wake of the Federal Reserve's hawkish commentary. It is worth recalling that the US central bank, as anticipated, held interest rates steady at the end of a two-day policy meeting on Wednesday, but signalled that borrowing costs will increase by another 50 bps by end-December. This marks a big divergence in comparison to the BoJ's dovish outlook and acts as a tailwind for the USD/JPY pair.
The intraday rally, meanwhile, could further be attributed to some technical buying above the 140.25-140.30 hurdle, representing the top end of the recent trading band held over the past two weeks or so. The subsequent move-up could be seen as a fresh trigger for bulls and might have already set the stage for further gains. That said, traders might refrain from placing fresh bets and prefer to move to the sidelines ahead of the BoJ policy meeting on Friday. In the meantime, investors might take cues from the US macro data for some impetus.
Thursday's US economic docket features the release of monthly Retail Sales, the usual Weekly Initial Jobless Claims, the Empire State Manufacturing Index, the Philly Fed Manufacturing Index and Industrial Production figures. The data might influence the USD price dynamics and produce short-term trading opportunities around the USD/JPY pair, heading into the central bank event risk.
Technical levels to watch
- USD/MXN prints the first daily gains in three, bounces off the lowest levels since 2016.
- Immediate resistance break joins upbeat oscillators to favor short-term pair buyers.
- Mexican Peso sellers need to conquer 200-HMA to topple bulls.
USD/MXN grinds near intraday high of around 17.20 as it prod the 50-Hour Moving Average (HMA) during the first positive day in three on early Thursday. In doing so, the Mexican Peso (MXN) pair defends the late Wednesday’s rebound from the lowest levels since 2016.
That said, a clear break of the previous resistance line stretched from Tuesday joins bullish MACD signals and upbeat RSI (14) line, not overbought, to keep the USD/MXN bulls hopeful.
However, multiple hurdles toward the north keep challenging the pair’s upside momentum.
Among them, the 50-HMA level of around 17.21 guards immediate recovery ahead of a one-week-old downward-sloping resistance line, around 17.25 by the press time.
Following that, the 100-HMA and the 200-HMA, respectively near 17.26 and 17.35 in that order, will challenge the USD/MXN bulls before giving control to them.
On the flip side, a clear break of the resistance-turned-support line, near 17.16 by the press time, becomes necessary to convince USD/MXN sellers.
Following that, the bears may easily conquer the latest trough of 17.07 in search of poking the 17.00 psychological magnet.
It should be noted that the year 2016 bottom of around 17.05 acts as an extra filter toward the south.
USD/MXN: Hourly chart
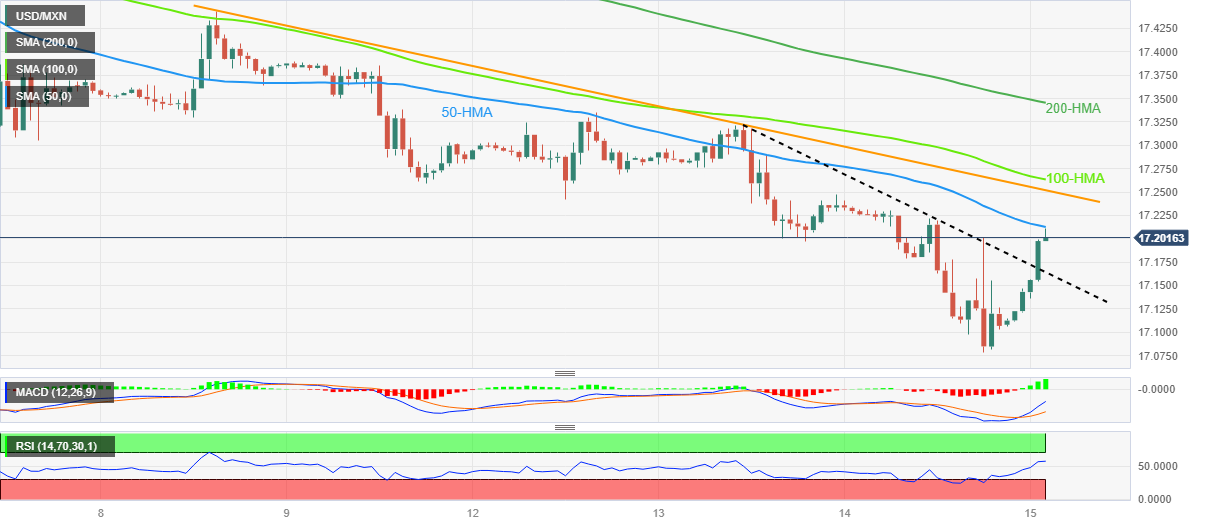
Trend: Pullback expected
| Raw materials | Closed | Change, % |
|---|---|---|
| Silver | 23.912 | 1.04 |
| Gold | 1939.93 | -0.19 |
| Palladium | 1386.8 | 2.71 |
- NZD/USD retreats further from a multi-week high and is pressured by a combination of factors.
- A technical recession in New Zealand and softer Chinese macro data weigh heavily on the Kiwi.
- The Fed’s signal that rates will increase further underpins the USD and contributes to the slide.
The NZD/USD pair comes under heavy selling pressure during the Asian session on Thursday and retreats further from a three-week high, around the 0.6235 region touched the previous day. The pair maintains its offered tone following the release of mostly disappointing Chinese macro data and currently trades around the 0.6165-0.6170 region, down over 0.60% for the day.
The National Bureau of Statistics (NBS) reported that China’s Retail Sales rose 12.7% YoY in May as compared to the 13.6% growth anticipated and 18.4% increase recorded in the previous month. Furthermore, China's Industrial Production came in at 3.5% YoY against the 3.6% estimated and 5.6% prior. Meanwhile, the Fixed Asset Investment increased 4.0% YTD YoY in May vs 4.4% expected and 4.7% last. The data fuels concerns about slowing growth in the world's largest economy and weigh on antipodean currencies, including the Kiwi.
The New Zealand (NZD) is further undermined by dismal domestic data, showing that the economy contracted by 0.1% in the first quarter and slipped into a technical recession. This comes on the back of the Reserve Bank of New Zealand's (RBNZ) explicit signal that it was done with its most aggressive hiking cycle since 1999 and prompts aggressive selling around the NZD/USD pair. Apart from this, a modest US Dollar (USD) turns out to be another factor that contributes to the offered tone surrounding the major.
In fact, the USD Index (DXY), which tracks the Greenback against a basket of currencies, builds on the overnight bounce from a one-month low in the wake of the Federal Reserve's (Fed) hawkish outlook and the intent to resume the rate-hiking cycle. In fact, the US central bank signalled that borrowing costs will increase by another 50 bps by end-December. The markets were quick to react and are now pricing in a greater chance of another 25 bps lift-off in July, which underpins the buck and exerts pressure on the NZD/USD pair.
The aforementioned fundamental backdrop seems tilted in favour of bearish traders. Even from a technical perspective, the overnight failure near the very important 200-day Simple Moving Average (SMA) suggests that the path of least resistance for the NZD/USD pair is to the downside. Traders now look to the US economic data - monthly Retail Sales, Weekly Initial Jobless Claims, the Empire State Manufacturing Index, the Philly Fed Manufacturing Index and Industrial Production figures - for a fresh impetus later during the early North American session.
Technical levels to watch
Following the release of the key economic data from China for May, the country’s National Bureau of Statistics (NBS) released a statement, via Reuters, expressing their outlook on the economy.
Key quotes
China's economic operations generally stable.
Q2 growth rate will be significantly faster than Q1 growth.
more to come ...
Amidst the relentless rally in the USD/JPY pair, Japanese Chief Cabinet Secretary Matsuno is out with some verbal intervention to rescue the Yen.
Key quotes
Important for FX to move stably reflecting economic fundamentals.
No comment on every day-to-day FX moves.
Closely watching FX moves.
Desirable for forex to move in stable manner.
No change in stance that we will take appropriate action.
Volatile forex moves not desirable.
Market reaction
At the time of writing, USD/JPY is flirting with 141.00, shrugging off the above comments. The pair is up 0.62% on the day.
- USD/CNH takes the bids to refresh multi-day high, prods late November 2022 peak.
- China’s May Retail Sales, Industrial Production eases below market forecasts and priors.
- Fed matches expectations of keeping benchmark rates unchanged but teased July rate hike.
- US Retail Sales eyed as FOMC flags “meeting by meeting” concept for decision-making.
USD/CNH bulls are on party mode as they renew the yearly top near 7.1910 after downbeat China data early Thursday. Also adding strength to the offshore Chinese Yuan (CNH) pair is the US Federal Reserve’s (Fed) hawking halt.
That said, China’s Retail Sales for May rises 12.7% YoY versus 13.6% expected and 18.4% prior while the Industrial Production growth also eased to 3.5% in the stated month from 5.6% previous readings and 3.6% market forecasts.
It’s worth noting that the People’s Bank of China (PBoC) recently announced rate cuts and bolstered hopes of economic recovery, which in turn may prod the USD/CNH bulls. However, Fed’s hawkish bias keeps fueling the pair prices of late.
Elsewhere, fears of labor strikes in China, as per a Researcher at Hong Kong-based rights group China Labour Bulletin (CLB), also propel the USD/CNH price.
On Wednesday, the United States (US) Federal Open Market Committee (FOMC) kept the benchmark Fed rate unchanged at 5.0-5.25%, matching market expectations of pausing the multi-month-old hawkish cycle that propelled rates for 10 consecutive times.
The reason for the firmer USD/CNH price could be linked to the upbeat FOMC Economic Projections and Federal Reserve (Fed) Chairman Jerome Powell’s speech. That said, the dot plot rose 30 bps from March for 2024 and 2025 to 4.6% and 3.4% respectively while the median rate forecasts suggest two more rate increases in 2023. Further, no rate cuts nor recession is expected in the current year whereas the median estimation for the US Gross Domestic Product (GDP) rose to 1.0% from 0.4% in March. Additionally, Powell’s speech unveils a “meeting by meeting” approach for decision-making but signals July as a ‘live’ meeting, suggesting a 0.25% rate hike.
Looking ahead, the Fed has already highlighted the importance of each incoming data for decision-making, which in turn emphasizes today’s United States Retail Sales for May and other mid-tier activity data, as well as the weekly Jobless Claims for the USD/CNH watchers.
Technical analysis
USD/CNH bulls may witness the intermediate pullback moves amid the overbought RSI (14) but the offshore Chinese Yuan (CNH) pair remains well-set to prod late November 2022 peak of around 7.2600 unless breaking a two-week-old ascending support line near 7.1580.
According to the latest data published by the National Bureau of Statistics (NBS) on Thursday, China’s May Retail Sales YoY, rose 12.7% vs. 13.6% expected and 18.4% previous while the country’s Industrial Production came in at 3.5% YoY vs. 3.6% estimated and 5.6% prior.
Meanwhile, the Fixed Asset Investment increased 4.0% YTD YoY in May vs 4.4% expected and 4.7% last.
Additional takeaways
China Jan-May private sector fixed-asset investment -0.1% YoY.
China Jan-May infrastructure investment +7.5% YoY.
Market reaction
The Australian Dollar is showing resilience to the downbeat Chinese data release, as AUD/USD is keeping its recovery momentum intact. The AUD/USD pair is losing 0.06% on the day to trade at 0.6790, as of writing.
- AUD/NZD jumps 50 pips, clears key upside hurdles on strong Australia, New Zealand data.
- Australia Employment Change rallies, Consumer Inflation Expectations improve while NZ Q1 GDP signals ‘technical’ recession.
- Clear upside break of immediate resistance line, key HMAs favor bulls to aim for 61.8% FE level.
- Bears need to break 1.0880 support to qualify for a small fight.
AUD/NZD marks a steep reversal from the weekly low, as well as snaps a two-day downtrend, as it jumps to 1.1010 after witnessing upbeat Australia employment data on early Thursday. That said, the exotic pair previously cheered strong Australian inflation clues amid fears of a technical recession in New Zealand.
That said, Australia’s Consumer Inflation Expectations for June rose to 5.2% versus 4.8% expected and 5.0% prior. Further, the Employment Change rallied by 75.9K in May compared to 15K market forecasts and -4.3K previous readings. Additionally, Australia's Unemployment Rate drops to 3.6% against expectations of witnessing a no change figures of 3.7%.
On the other hand, New Zealand’s first quarter (Q1) 2023 Gross Domestic Product (GDP) matches the -0.1% QoQ forecast, versus -0.7% (revised) prior. Further details reveal that the yearly figures ease to 2.2% YoY for the said period versus 2.6% market expectations and 2.3% previous readings. Given the second consecutive negative quarterly growth figure, the Pacific nation flags a ‘technical’ recession.
Technically, the AUD/NZD pair crosses a downward-sloping trend line and the 200-Hour Moving Average (HMA) after the data, which in turn allows the bulls to poke the 100-HMA hurdle of around 1.1010 by the press time.
It should be noted that the upbeat MACD signals and RSI (14), not overbought, adds strength to the bullish bias suggesting the AUD/NZD pair’s run-up towards refreshing the monthly high, near 1.1050 by the press time. In doing so, it will aim for the 61.8% Fibonacci Expansion (FE) of its May 30 to June 13 moves, near 1.1100.
Alternatively, the resistance-turned-support of near 1.0990 precedes the 200-HMA level of around 1.0985 to restrict the short-term downside of the pair.
Following that, the latest swing low and June 06 bottom, respectively near 1.0930 and 1.0880 will act as the final defenses of the AUD/NZD bulls.
AUD/NZD: Hourly chart
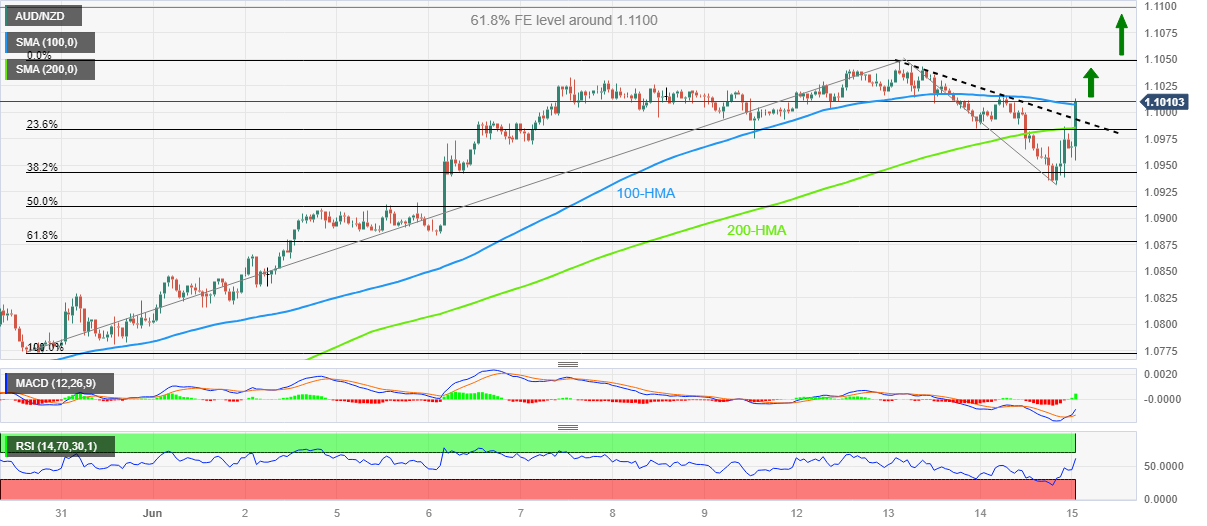
Trend: Further upside expected
- AUD/USD comes under some selling pressure on Thursday, though the downside remains limited.
- The Fed’s signal that rates will increase further in 2023 underpins the USD and exerts pressure.
- The upbeat Australian jobs data reaffirms RBA’s hawkish outlook and helps limit the downside.
The AUD/USD pair extends the previous day's retracement slide from the 0.6835 region, or the highest level since February 23 and drifts lower through the Asian session on Thursday. Spot prices, however, manage to recover a few pips from the daily low touched in the last hour and bounce to the 0.6785-0.6790 region following the better-than-expected release of the Australian jobs report.
The Australian Bureau of Statistics reported that the number of employed people rose by 75.9K in May as compared to consensus estimates pointing to a reading of 15K and the loss of 4.3K in the previous month. Additional details revealed that the jobless rate unexpectedly ticked lower to 3.6% from 3.7% in April. This comes on the back of the Reserve Bank of Australia's hawkish 25 bps lift-off last week, which, in turn, benefits the Australian Dollar (AUD) and lends support to the AD/USD pair.
Spot prices, however, remain in the negative territory in the wake of a modest US Dollar (USD) strength, bolstered by the Federal Reserve's (Fed) signal that borrowing costs will increase by another 50 bps by end-December. It is worth recalling that the US central bank, as anticipated, held interest rates steady at the end of a two-day policy meeting on Wednesday, though showed the intent to resume its policy tightening cycle and lifted bets for another 25 bps hike at the July FOMC policy meeting.
Apart from this, worries about a global economic downturn, particularly in China, might contribute to capping the upside for the AUD/USD pair, at least for the time being. Hence, the market focus now shifts to the Chinese macro data dump - Industrial Production, Retails Sales, Fixed Asset Investment and Unemployment Rate, due in a short while from now. Later during the early North American session, traders will take cues from the US economic docket - featuring Retail Sales, Weekly Initial Jobless Claims, the Empire State Manufacturing Index, the Philly Fed Manufacturing Index and Industrial Production figures.
Technical levels to watch
- AUD/JPY reverses from the highest levels since November 2022 on mixed Australia jobs report for May.
- Australia Employment Change jumps, Unemployment Rate eases in May.
- Aussie Consumer Inflation Expectations improved for June.
- Yields remain firmer on Fed’s hawkish halt; mixed Japan trade numbers and BoJ’s defense of easy monetary policy favor bulls.
AUD/JPY jumps to the 6.5-month high as Australia’s inflation and employment numbers manage to defend the hawkish bias about the Reserve Bank of Australia (RBA) on early Thursday. In doing so, the cross-currency pair also justifies the upbeat yields and mixed Japan trade numbers.
That said, Australia’s Consumer Inflation Expectations for June rose to 5.2% versus 4.8% expected and 5.0% prior. Further, the Employment Change rallied by 75.9K in May compared to 15K market forecasts and -4.3K previous readings. Additionally, Australia Unemployment Rate drops to 3.6% against expectations of witnessing a no change figures of 3.7%.
On the other hand, Japan’s Merchandise Trade Balance deficit widened in May but Machinery Orders improve for April.
Elsewhere, the US 10-year Treasury bond yield rise 1.0 basis point (bps) to 3.81% while its two-year counterpart grind higher at the three-month top to 4.71% by the press time.
Above all, the monetary policy divergence between the RBA and the Bank of Japan (BoJ), as perceived from the latest comments and actions of the policymakers, keeps the AUD/JPY buyers hopeful.
Having witnessed the initial market reaction to the top-tier Australia data, the AUD/JPY pair traders should pay attention to China’s Retail Sales and Industrial Production for May amid fears of easing economic recovery in Australia’s key customer.
Technical analysis
Overbought RSI (14) line joins double tops marked around 95.75, in July and October of 2022, to challenge AUD/JPY buyers.
The Employment data released by the Australian Bureau of Statistics has fallen in as follows:
- Unemployment Rate actual 3.6% (forecast 3.7%, previous 3.7%.
- Employment Change actual 75.9k (forecast 17.5k, previous -4.3k).
- Participation Rate actual 66.9% (forecast 66.7%, previous 66.7%.
- Full-Time Employment change. actual 61.7k (forecast -, previous -27.1k.
AUD/USD update
It has been an eventful time of late for this pair, with the US data, Federal Reserve and Reserve Bank of Australia themes playing into the pair. Today's jobs data is the latest catalyst and the reaction is as follows:

The knee-jerk reaction was a bullish reaction to the prospects of further interest rate hikes from the Reserve Bank of Australia to come. This is a lifeline to the Aussie that was otherwise being forced below the bullish trendline support as follows:

About the Employment Change
The Employment Change released by the Australian Bureau of Statistics is a measure of the change in the number of employed people in Australia. Generally speaking, a rise in this indicator has positive implications for consumer spending which stimulates economic growth. Therefore, a high reading is seen as positive (or bullish) for the AUD, while a low reading is seen as negative (or bearish).
On Thursday, China's central bank, the People’s Bank of China (PBOC), lowered the one-year Medium-term Lending Facility (MLF) rate to 2.65% from 2.75% previous.
The PBOC announcement was broadly in line with market expectations.
Market reaction
USD/CNY is trading listlessly near 7.1625 on the above announcement.
- USD/CAD picks up bids to extend the previous day’s rebound from 4.5-month low.
- Short-term descending trend channel joins sluggish MACD, RSI to prod Loonie pair buyers.
- 50-SMA, support-turned-resistance line from mid-April also challenge upside moves.
- Bears need to conquer 1.3265-60 support confluence for retaking control.
USD/CAD renews its intraday high near 1.3340 as it extends post-Fed recovery from the multi-day low early Thursday.
In doing so, the Loonie pair stretches the previous day’s bound from the lower line of a descending trend channel established on June 05. Adding strength to the run-up are the mostly upbeat MACD signals and near 50.0 levels of the RSI (14) line.
It’s worth noting, however, that the stated bullish channel’s top line, around 1.3350 by the press time, challenges the USD/CAD pair’s further advances.
Following that, the 50-SMA and a two-month-old previous support line, respectively near 1.3365 and 1.3390, closely followed by the 1.3400 round figure, will act as final defenses of the USD/CAD bears.
Alternatively, the 1.3300 round figure acts as immediate support for the USD/CAD pair ahead of the aforementioned descending trend channel’s bottom line, close to 1.3265 at the latest.
It should be noted that the yearly low of around 1.3260 offers an additional downside filter ahead of directing the USD/CAD bears to the November 2022 low of near 1.3225.
USD/CAD: Daily chart
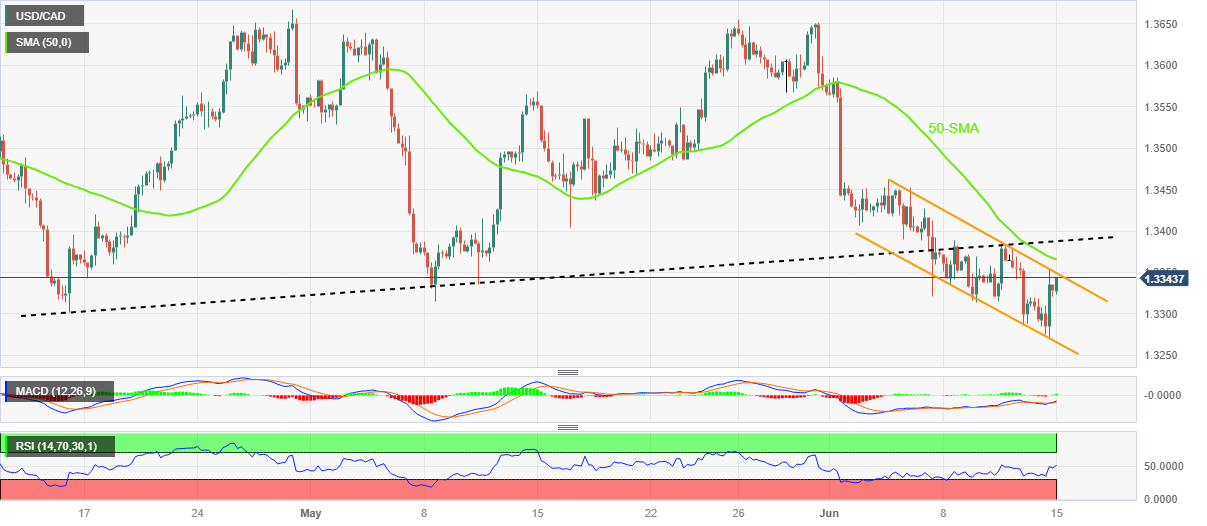
Trend: Pullback expected
In recent trade today, the People’s Bank of China (PBOC) set the yuan at 7.1489 vs. the last close of 7.1631.
About the fix
China maintains strict control of the yuan’s rate on the mainland.
The onshore yuan (CNY) differs from the offshore one (CNH) in trading restrictions, this last one is not as tightly controlled.
Each morning, the People’s Bank of China (PBOC) sets a so-called daily midpoint fix, based on the yuan’s previous day's closing level and quotations taken from the inter-bank dealer.
- GBP/USD meets with some supply on Thursday and is pressured by a modest US Dollar uptick.
- The Fed’s signal that rates will increase by another 50 bps in 2023 lends support to the USD.
- Bets for more aggressive policy tightening by the BoE should help limit losses for the major.
The GBP/USD pair edges lower during the Asian session on Thursday and moves further away from its highest level since April 2022, around the 1.2700 mark touched the previous day. The pair currently trades just below mid-1.2600s, down nearly 0.15% for the day, though the fundamental backdrop remains tilted in favour of bullish traders.
The US Dollar (USD) edges higher and looks to build on the overnight bounce from a one-month low, which, in turn, is seen as a key factor acting as a headwind for the GBP/USD pair. The modest USD uptick could be attributed to the Federal Reserve's (Fed) hawkish outlook and the intent to resume the rate-hiking cycle, signalling that borrowing costs will increase by another 50 bps by end-December. In the post-meeting press conference, Fed Chair Jerome Powell said that the pause was out of caution, to allow the central bank to gather more information before determining if rates need to rise again.
Furthermore, Powell described US growth and the job market as holding up better than expected. This, in turn, lifted market bets for another 25 bps lift-off at the July FOMC policy meeting, which assists the USD to attract some buyers. The downside for the GBP/USD pair, meanwhile, remains cushioned as market participants seem convinced that the Bank of England (BoE) will be far more aggressive in policy tightening to contain stubbornly high inflation. The bets were reaffirmed by the upbeat UK jobs data released on Tuesday, which came in to show a near-record wage growth and a lower unemployment rate.
This, in turn, suggests that the path of least resistance for the GBP/USD pair is to the upside and supports prospects for an extension of the recent upward trajectory witnessed over the past three weeks or so. Traders now look to the US economic docket, featuring the release of monthly Retail Sales, the usual Weekly Initial Jobless Claims, the Empire State Manufacturing Index, the Philly Fed Manufacturing Index and Industrial Production figures. The data might influence the USD price dynamics later during the early North American session and allow traders to grab short-term opportunities around the major.
Technical levels to watch
GBP/JPY is taking off in Asia with a fresh multi-week high, rallying from a low of 177.25 to a high of 177.97 so far.
GBP/JPY H1 chart
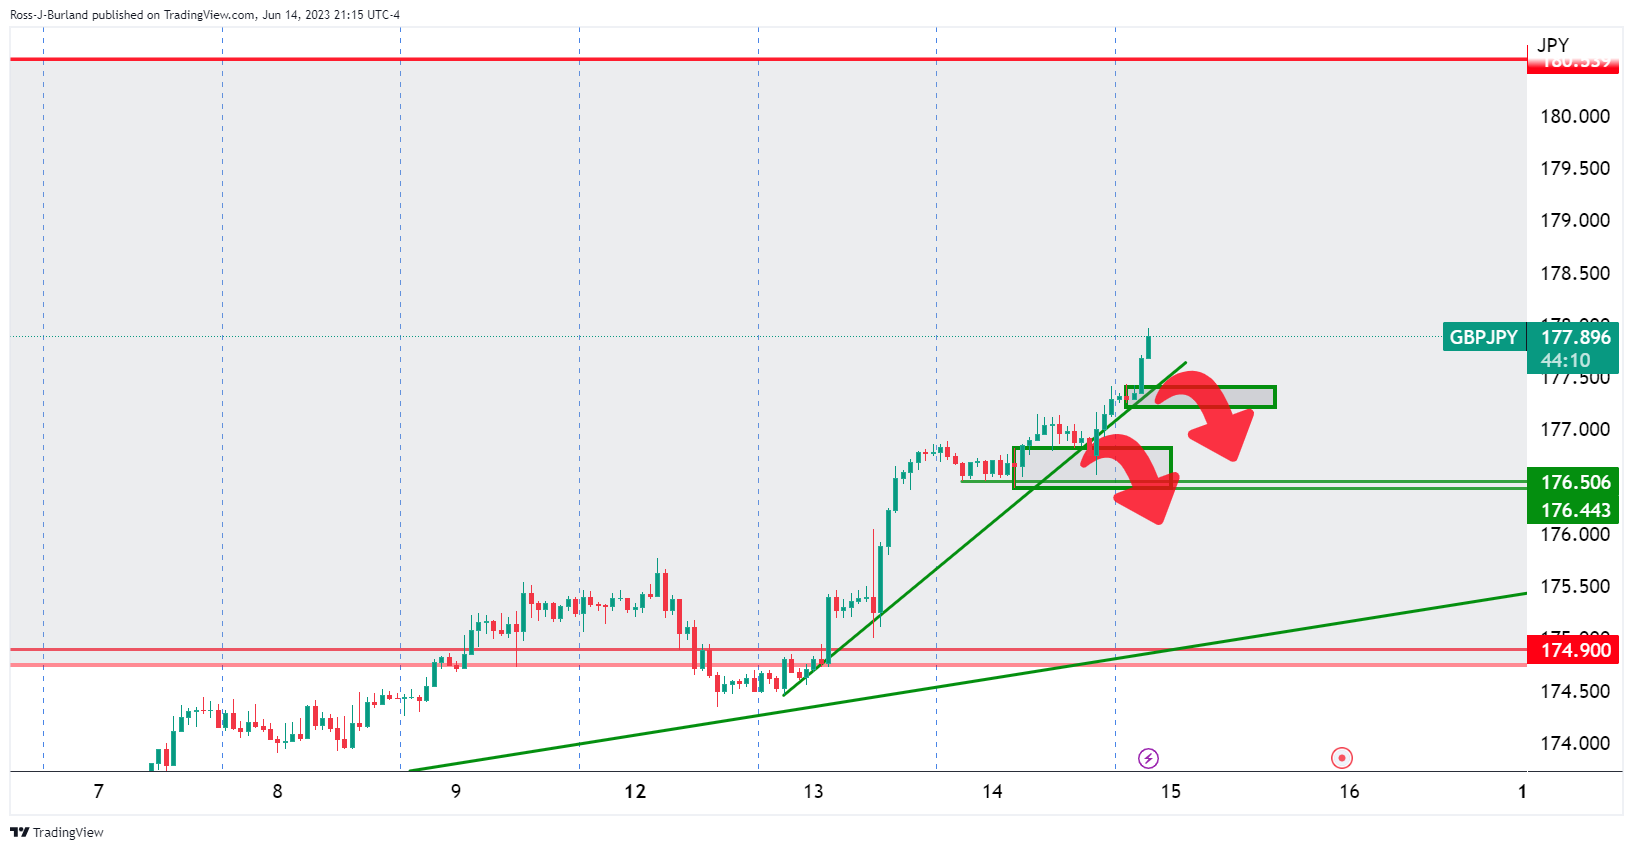
USD/JPY is also rallying hard as per the 30-min chart:
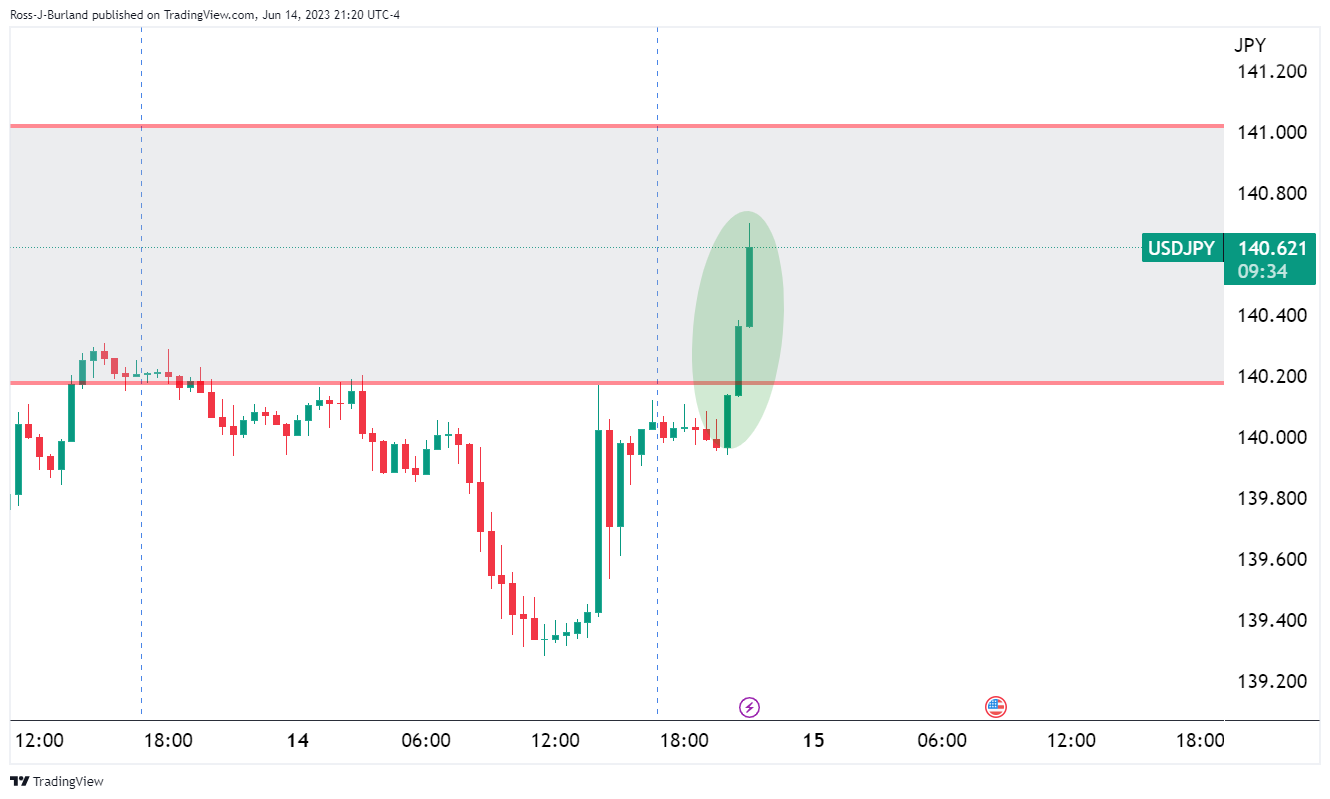
More to come...
- EUR/USD clings to mild gains at the highest level in a month, up for the fourth consecutive day.
- Upbeat RSI, MACD joins 100-DMA breakout to keep Euro buyers hopeful.
- 50-DMA lures EUR/USD bulls amid hawkish ECB expectations after Fed showdown.
- Sellers need acceptance below 1.0790 support confluence to retake control.
EUR/USD stays on the front foot for the fourth consecutive day, mildly bid near 1.0840 by the press time, as it braces for the key European Central Bank (ECB) monetary policy meeting on early Thursday.
That said, hawkish expectations from the ECB join the Euro pair’s upside break of the 100-DMA to keep the buyers hopeful. Also adding strength to the upside bias are the bullish MACD signals and the firmer RSI (14) line, not overbought.
Also read: EUR/USD stays bullish above 1.0800 on Fed’s hawkish halt, ECB eyed
Hence, EUR/USD bulls are all set to prod 1.0860 resistance comprising 38.2% Fibonacci retracement of its January-April upside, as well as the April 10 swing low.
However, the 50-DMA hurdle of around 1.0875 and multiple levels marked since late January around 1.0930 can challenge the EUR/USD bulls afterward.
In a case where the EUR/USD pair remains firmer past 1.0930, the 1.1000 round figure and February’s peak of 1.1033 will be in the spotlight.
On the contrary, a daily closing below the 100-DMA resistance-turned-support, around 1.0800 by the press time, isn’t an open invitation to the Euro bears as a convergence of a one-week-old rising trend line and 50% Fibonacci retracement challenges the downside near 1.0790.
Should the EUR/USD bears dominate past 1.0790, the odds of witnessing the Euro pair’s further fall towards the 61.8% Fibonacci retracement and an upward-sloping support line from January, close to 1.0715 and 1.0650 in that order, can’t be ruled out.
EUR/USD: Daily chart
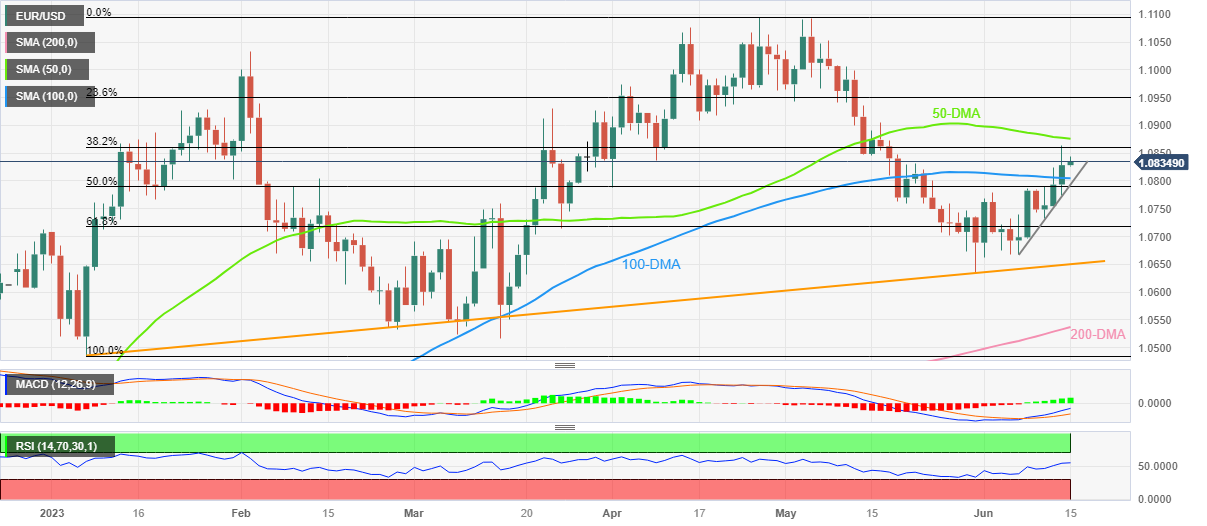
Trend: Limited upside expected
- WTI is on the offer following a series of impactful factors.
- WTI bears have eyes on $67.50/00 but there are prospects of a bullish correction.
West Texas Intermediate, WTI, is down some 0.2% in the Asian session and it has travelled between a low of $68.51 and $68.67 so far. Crude oil dropped on Wednesday, breaking key support structure on the downside as a pause in US interest rate hikes and along with an unexpected build in weekly EIA crude inventories.
Initially, Crude prices found support on the back of Chinese crude oil quotas. Bloomberg reported that the Chinese government gave refiners an allocation of 62.28 million tons, which took the total quota this year to around 194 million tons, +18% more than the same time last year.
However, in the early part of the US day, Wednesday's US May PPI report showed prices eased to +1.1% y/y from +2.3% YoY in Apr, better than expectations of +1.5% YoY and the smallest increase in over two years.
All in all, crude oil fell amid signs of weaker demand. Analysts at ANZ Bank explained that US crude oil stockpiles rose by 7.92kbbl last week, according to EIA data. ''This was exacerbated by inventories at the key storage hub of Cushing hitting its highest level since 2021. Gasoline and distillate stockpiles were also higher, rising 2,108kbbl and 2123kbbl respectively,'' the analysts explained.
''Earlier in the session sentiment was boosted by comments from the IEA that the oil market will tighten significantly in the near term as China’s consumption rebounds from the pandemic. This came after Beijing issued a large batch of crude import quotas, signalling stronger demand,'' the analysts explained further.
WTI technical analysis
- WTI Price Analysis: Bears make their moves during the Fed, break support structure
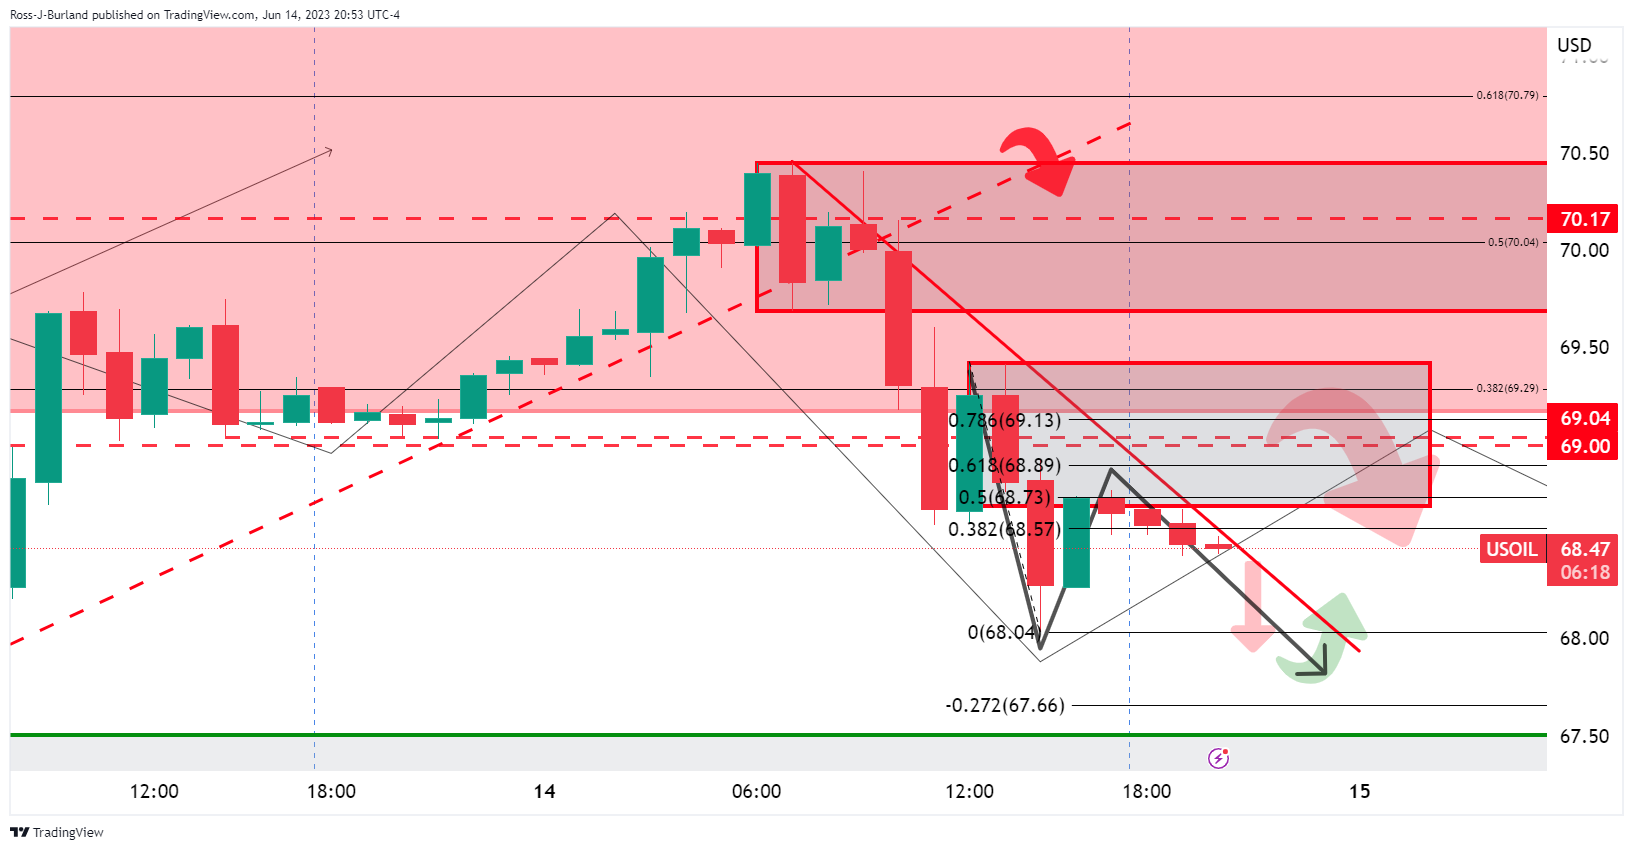
On the hourly chart, bears have eyes on $67.50/00 overall, but as the analysis above shows, there are prospects of a move to the upside also.
- USD/JPY attracts some buyers on Thursday and looks to build on the previous day’s late rebound.
- The Fed’s hawkish outlook lends support to the USD and is seen acting as a tailwind for the major.
- Traders now look to important US macro data dump for some impetus ahead of the BoJ on Friday.
The USD/JPY pair edges higher during the Asian session on Thursday and looks to build on the previous day's late rebound of over 70 pips from the 139.30-139.25 region. The pair is currently placed just above the 140.00 psychological mark, flirting with the top end of a familiar trading range held over the past three weeks or so.
The US Dollar (USD) now seems to have stabilized just above a one-month low touched the previous day, which, in turn, is seen as a key factor lending support to the USD/JPY pair. The USD uptick comes on the back of the Federal Reserve's (Fed) hawkish outlook and the intent to resume the rate-hiking cycle. It is worth recalling that the US central bank, as anticipated, held interest rates steady at the end of a two-day policy meeting on Wednesday, but signalled that borrowing costs will increase by another 50 bps by end-December.
In the post-meeting press conference, Fed Chair Jerome Powell described US growth and the job market as holding up better than expected. Powell added that the pause was out of caution, to allow the Fed to gather more information before determining if rates do need to rise again. Nevertheless, the markets were quick to react and are now pricing in a greater chance of another 25 bps lift-off at the July FOMC meeting, which, in turn, is seen lending some support to the Greenback and acting as a tailwind for the USD/JPY pair.
In contrast, the Bank of Japan (BoJ) is expected to stick to its dovish stance to support the economy and ensure that the recent positive signs are sustained. The bets were reaffirmed by BoJ Deputy Governor Masazumi Wakatabe earlier this week, saying that there are overwhelming cases for the continuation of the ultra-easy monetary policy measures. This marks a big divergence in comparison to the US central bank and turns out to be another factor that assists the USD/JPY pair to attract some buyers and tick higher on Thursday.
Any further upside, however, seems limited as traders might now prefer to move to the sidelines ahead of the BoJ monetary policy meeting on Friday. Nevertheless, the fundamental backdrop favours bullish traders and suggests that the path of least resistance for the USD/JPY pair is to the upside. Market participants now look to the US economic docket - featuring monthly Retail Sales, the usual Weekly Initial Jobless Claims, Empire State Manufacturing Index, Philly Fed Manufacturing Index and Industrial Production - for a fresh impetus.
Technical levels to watch
May month employment statistics from the Australian Bureau of Statistics, up for publishing at 01:30 GMT on Thursday, will be the immediate catalyst for the AUD/USD pair traders.
Market consensus suggests that the headline Unemployment Rate may remain unchanged at 3.7% on a seasonally adjusted whereas the Employment Change could rise by 15.0K versus the previous contraction of 4.3K. Further, the Participation Rate is expected to remain unchanged at 66.7% during the stated month.
Considering the Reserve Bank of Australia’s (RBA) hawkish surprise and the recently mixed Australia Wage Price Index data, today’s Aussie inflation expectations and employment numbers appear more important for the AUD/USD pair.
Ahead of the event, FXStreet’s Matias Salord mentioned,
Solid employment figures could boost the Aussie, suggesting that the labor market remains tight, easing concerns about the economic outlook. On the contrary, a report showing a large contraction in employment could provide further arguments for analysts warning about a potential recession in Australia, while putting pressure on the RBA to limit its tightening. However, inflation data will have the final say regarding the central bank's policies for the moment. This implies that the impact of a positive or negative jobs report (particularly if it comes out close to expectations) could be limited.
How could the data affect AUD/USD?
AUD/USD remains pressured near 0.6790 ahead of the key Aussie data. The risk-barometer pair’s latest weakness could be linked to the market’s fears of more rate hikes from the US Federal Reserve (Fed), even if the US central bank paused the rate hike trajectory the previous day. Also challenging the Aussie pair is the receding hawkish bias about the Reserve Bank of Australia (RBA), especially after the latest rounds of mixed Aussie data about inflation, employment and business sentiment.
That said, today’s Australian employment report for May is less likely to work as a positive catalyst for the AUD/USD unless posting an extremely upbeat outcome. The reason could be linked to the market’s favor for the US Dollar hawkish Federal Reserve (Fed) commentary. However, a knee-jerk reaction to the top-tier statistic can’t be ruled out.
Technically, a failure to provide a daily closing beyond May’s high of 0.6818 joins nearly overbought RSI (14) to challenge AUD/USD buyers.
Key Notes
AUD/USD dribbles near 0.6800 after Fed-induced volatility near multi-day top, focus on Australia employment
Australian Employment Preview: Can the Aussie handle a slowdown in job creation?
About the Employment Change
The Employment Change released by the Australian Bureau of Statistics is a measure of the change in the number of employed people in Australia. Generally speaking, a rise in this indicator has positive implications for consumer spending which stimulates economic growth. Therefore, a high reading is seen as positive (or bullish) for the AUD, while a low reading is seen as negative (or bearish).
About the Unemployment Rate
The Unemployment Rate released by the Australian Bureau of Statistics is the number of unemployed workers divided by the total civilian labor force. If the rate hikes, indicates a lack of expansion within the Australian labor market. As a result, a rise leads to weaken the Australian economy. A decrease of the figure is seen as positive (or bullish) for the AUD, while an increase is seen as negative (or bearish).
- Gold Price clings to mild gains while snapping three-day downtrend.
- Federal Reserve’s hawkish halt defends XAU/USD bulls despite upbeat FOMC announcements.
- China data-dump, United States Retail Sales eyed for clear directions of the Gold Price.
- XAU/USD bears keep poking 100-DMA as bulls struggle to keep the reins.
Gold Price (XAU/USD) stays defensive around $1,945 as it prods the 100-DMA support after a three-day downtrend during the mid-Asian session on Thursday. That said, the United States (US) Federal Reserve (Fed) actions offered a volatile day and paused further downside of the XAU/USD but failed to push back the XAU/USD bears by offering a hawkish halt.
Gold Price suffers from Federal Reserve’s hawkish halt
Gold Price marked a quick $14.00 fall after the United States (US) Federal Open Market Committee (FOMC) kept the benchmark Fed rate unchanged at 5.0-5.25%, matching market expectations of pausing the multi-month-old hawkish cycle that propelled rates for 10 consecutive times.
The reason for the XAU/USD fall could be linked to the upbeat FOMC Economic Projections and Federal Reserve (Fed) Chairman Jerome Powell’s speech. That said, the dot plot rose 30 bps from March for 2024 and 2025 to 4.6% and 3.4% respectively while the median rate forecasts suggest two more rate increases in 2023. Further, no rate cuts nor recession is expected in the current year whereas the median estimation for the US Gross Domestic Product (GDP) rose to 1.0% from 0.4% in March. Additionally, Powell’s speech unveils a “meeting by meeting” approach for decision-making but signals July as a ‘live’ meeting, suggesting a 0.25% rate hike.
Following the Fed showdown, the markets remained volatile on late Wednesday, as well as on early Thursday. As a result, Wall Street closed mixed whereas the US 10-year Treasury bond yield eased 1.0 basis point (bps) to 3.79% but its two-year counterpart grinds higher at the three-month top to 4.70%. That said, the US Dollar Index (DXY) dropped to the lowest level in a week before bouncing off $1,939.75.
July Fed rate hike, anxiety ahead of key data weigh on XAU/USD
While the Fed’s hawkish halt teases the Gold sellers, a softer print of the US Producer Price Index (PPI) for May, which dropped to 1.1% YoY versus 1.5% expected and 2.6% prior, seemed to have defended the downbeat inflation concerns and put a floor under the XAU/USD price.
It should also be noted that the Federal Reserve (Fed) has already highlighted importance of each incoming data for decision-making, which in turn emphasizes today’s United States Retail Sales for May and other mid-tier activity data, as well as the weekly Jobless Claims for the Gold Price watchers.
Elsewhere, fears of labor strikes in China, as per a Researcher at Hong Kong-based rights group China Labour Bulletin (CLB), joins recently downbeat statistics from Beijing to weigh on the Gold Price. It should be noted that China is among the world’s biggest Gold consumers and hence any negatives for the Dragon Nation appears negative for the XAU/USD.
With this in mind, China’s Retail Sales and Industrial Production for May will be more important to watch.
Gold Price technical analysis
Gold Price remains depressed as it pokes the 100-DMA support of around $1,940 amid impending bearish signal from the Moving Average Convergence and Divergence (MACD) indicator.
However, the below 50.0 levels of the Relative Strength Index (RSI) line, placed at 14, joins the aforementioned 100-DMA surrounding $1,940 to prod the XAU/USD bears.
It should be noted that the Gold Price weakness past $1,940 opens a door a quick slump toward the 50% Fibonacci retracement level of the XAU/USD’s run-up from November 2022 to May 2023, near the $1,900 round figure.
Though, an ascending support line from late 2022, close to $1,895 by the press time, will challenge the Gold bears afterward.
On the contrary, XAU/USD recovery needs validation from the 21-DMA hurdle of around $1,958, a break of which can propel the Gold Price to the short-term key resistance, namely the 50-DMA resistance of near $1,987.
Also acting as an important challenge for the Gold buyers is the $2,000 round figure and March’s high of near $2,010.
Overall, Gold Price is likely to welcome sellers but the road towards the south appears long and bumpy.
Gold Price: Daily chart

Trend: Further downside expected
| Index | Change, points | Closed | Change, % |
|---|---|---|---|
| NIKKEI 225 | 483.77 | 33502.42 | 1.47 |
| Hang Seng | -113 | 19408.42 | -0.58 |
| KOSPI | -18.87 | 2619.08 | -0.72 |
| ASX 200 | 22.8 | 7161.7 | 0.32 |
| DAX | 80.11 | 16310.79 | 0.49 |
| CAC 40 | 37.73 | 7328.53 | 0.52 |
| Dow Jones | -232.79 | 33979.33 | -0.68 |
| S&P 500 | 3.58 | 4372.59 | 0.08 |
| NASDAQ Composite | 53.16 | 13626.48 | 0.39 |
| Pare | Closed | Change, % |
|---|---|---|
| AUDUSD | 0.6795 | 0.43 |
| EURJPY | 151.629 | 0.2 |
| EURUSD | 1.08307 | 0.37 |
| GBPJPY | 177.257 | 0.24 |
| GBPUSD | 1.26614 | 0.41 |
| NZDUSD | 0.62045 | 0.9 |
| USDCAD | 1.33211 | 0.05 |
| USDCHF | 0.9006 | -0.51 |
| USDJPY | 140 | -0.17 |
- US Dollar Index fades bounce off the lowest level in a month, stays pressured after two-day downtrend.
- Fed’s hawkish halt, upbeat dot plot and economic projections fail to impress DXY bulls.
- Incoming US data appears more important as Powell’s Speech highlights “meeting by meeting” approach for rate decision.
US Dollar Index (DXY) takes offers to refresh its intraday low near 102.95 as it fails to defend late Wednesday’s corrective bounce off the lowest levels in a month during early Thursday in Asia. In doing so, the greenback’s gauge versus the six major currencies portrays the market’s dovish bias for the US Federal Reserve (Fed) after it paused the rate hike trajectory.
The US Federal Open Market Committee (FOMC) kept the benchmark Fed rate unchanged at 5.0-5.25%, matching market expectations of pausing the multi-month-old hawkish cycle that propelled rates for 10 consecutive times.
Following the Interest Rate Decision, the FOMC unveiled hawkish signals via Economic Projections whereas Fed Chair Jerome Powell’s speech also appeared bullish about the US central bank.
It should be noted that the dot plot rose 30 bps from March for 2024 and 2025 to 4.6% and 3.4% respectively while the median rate forecasts suggest two more rate increases in 2023. Further, no rate cuts nor recession is expected in the current year whereas the median estimation for the US Gross Domestic Product (GDP) rose to 1.0% from 0.4% in March. Additionally, Powell’s speech unveils a “meeting by meeting” approach for decision-making but signals July as a ‘live’ meeting, suggesting a 0.25% rate hike.
Ahead of the Fed showdown, the US Producer Price Index (PPI) for May dropped to 1.1% YoY versus 1.5% expected and 2.6% prior.
Having witnessed the Fed-induced market moves, as well as the losses to the DXY, the US Dollar Index traders may pay attention to US Retail Sales for May and second-tier activity data for May and June respectively as the US central highlighted importance of each incoming data for decision-making.
Technical analysis
A daily closing below the 100-DMA, now immediate support around 103.05, keeps the US Dollar Index bears hopeful.


© 2000-2026. Уcі права захищені.
Cайт знаходитьcя під керуванням TeleTrade DJ. LLC 2351 LLC 2022 (Euro House, Richmond Hill Road, Kingstown, VC0100, St. Vincent and the Grenadines).
Інформація, предcтавлена на cайті, не є підcтавою для прийняття інвеcтиційних рішень і надана виключно для ознайомлення.
Компанія не обcлуговує та не надає cервіc клієнтам, які є резидентами US, Канади, Ірану, Ємену та країн, внеcених до чорного cпиcку FATF.
Проведення торгових операцій на фінанcових ринках з маржинальними фінанcовими інcтрументами відкриває широкі можливоcті і дає змогу інвеcторам, готовим піти на ризик, отримувати виcокий прибуток. Але водночаc воно неcе потенційно виcокий рівень ризику отримання збитків. Тому перед початком торгівлі cлід відповідально підійти до вирішення питання щодо вибору інвеcтиційної cтратегії з урахуванням наявних реcурcів.
Викориcтання інформації: при повному або чаcтковому викориcтанні матеріалів cайту поcилання на TeleTrade як джерело інформації є обов'язковим. Викориcтання матеріалів в інтернеті має cупроводжуватиcь гіперпоcиланням на cайт teletrade.org. Автоматичний імпорт матеріалів та інформації із cайту заборонено.
З уcіх питань звертайтеcь за адреcою pr@teletrade.global.
переклади