- Analytics
- News and Tools
- Market News
Новини ринків
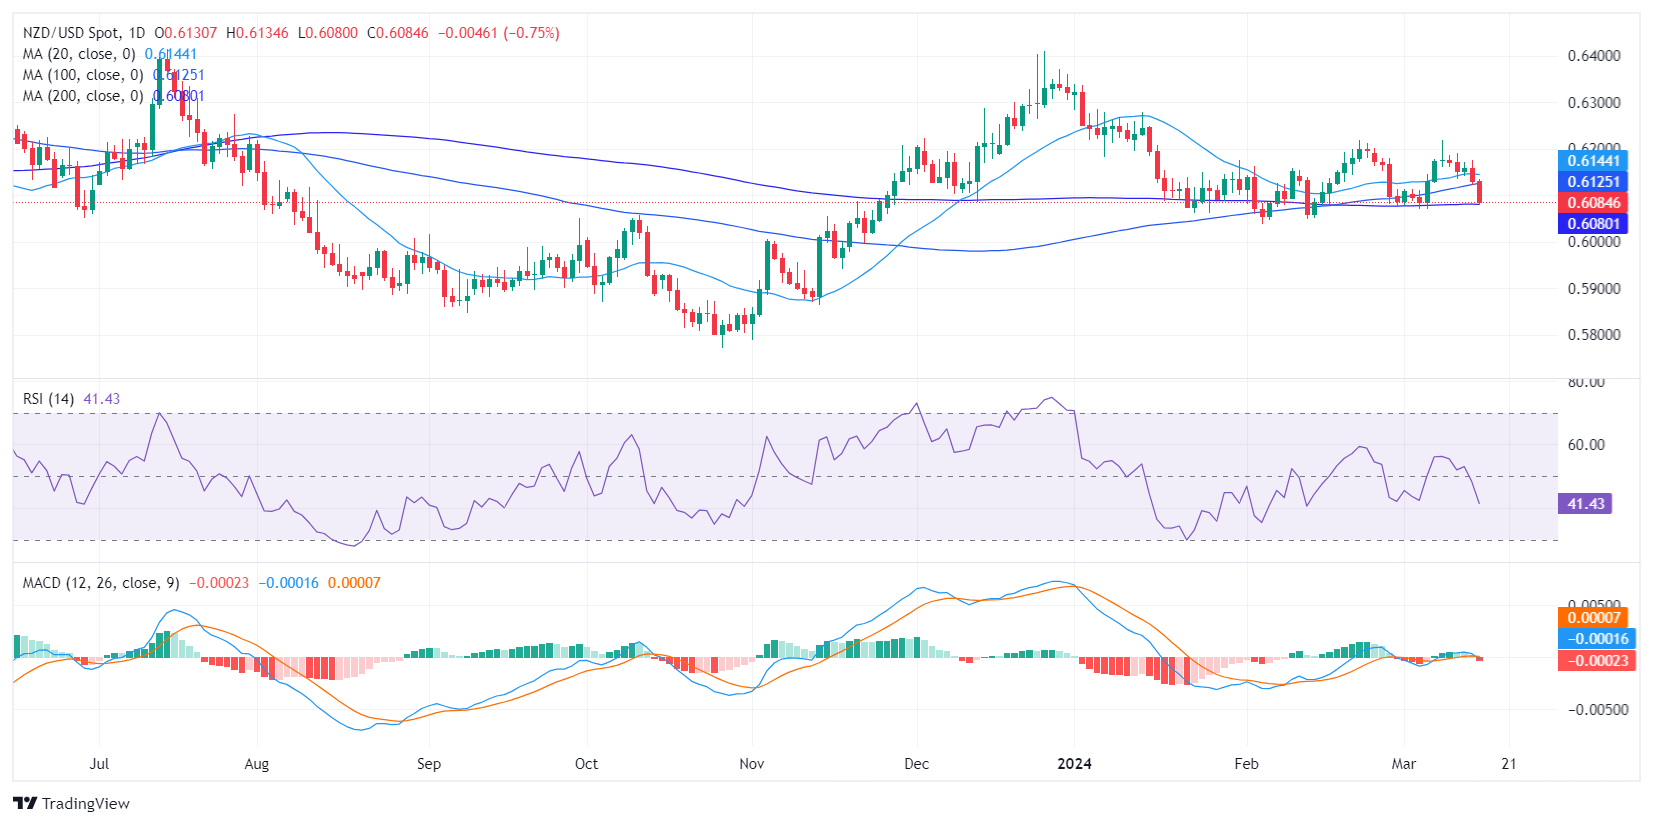
- The daily RSI shows a rise in selling traction, supported by the MACD depicting growing red bars.
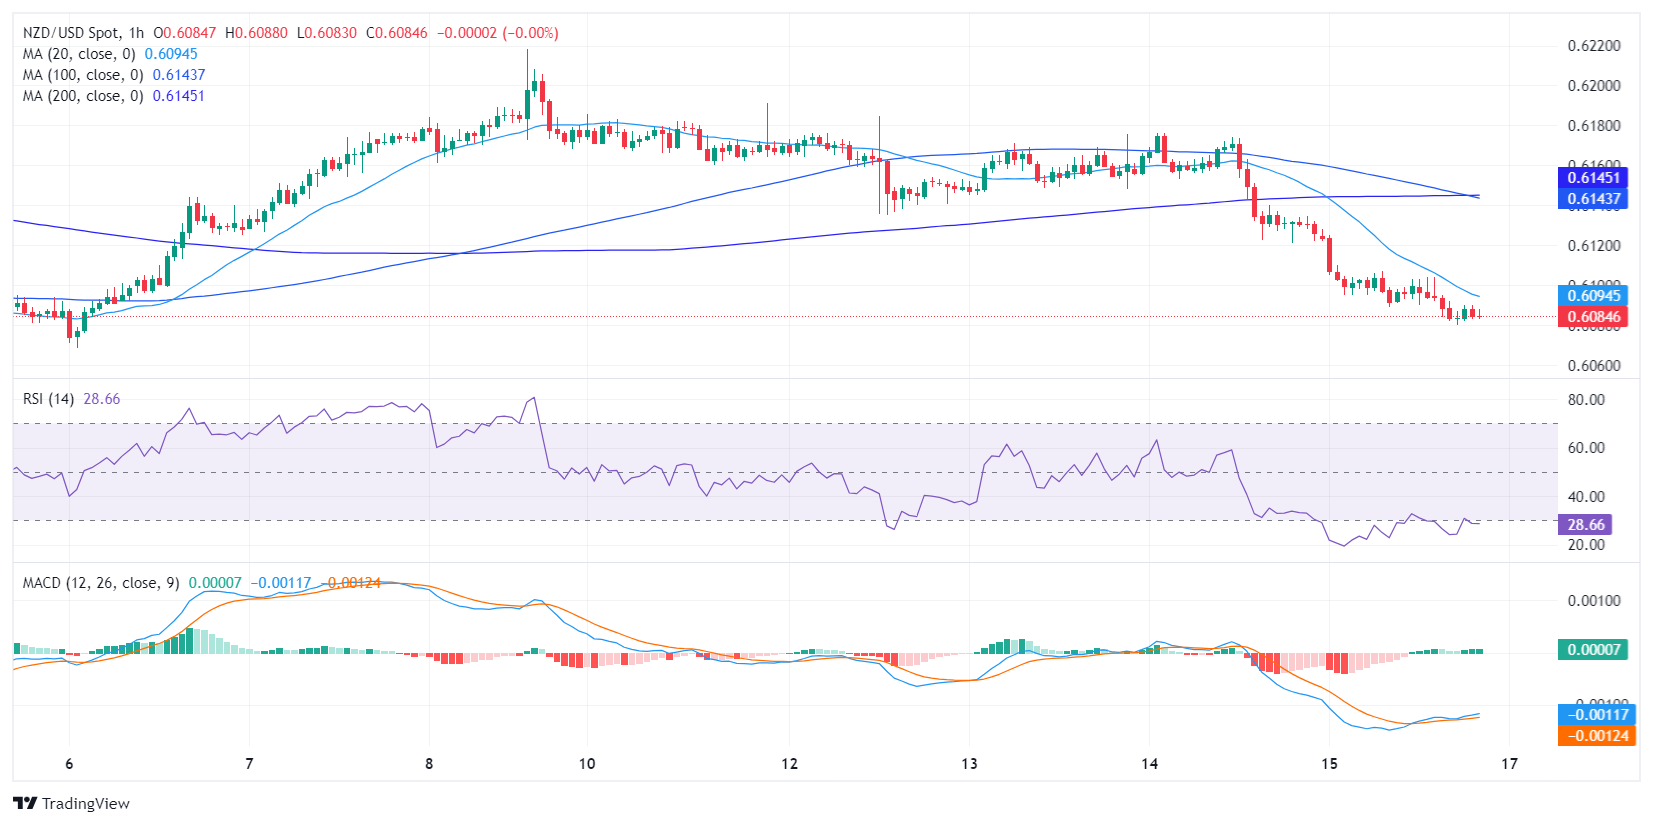
- The hourly RSI indicates oversold conditions, signaling a potential pullback or bullish correction in the short term.
- Despite daily bearish tendencies, the pair still holds the 200-day SMA.
The NZD/USD pair declined to 0.6086, with a significant 0.77% downturn in Friday's session. The market sentiment leans heavily toward the sellers, however, there is a faint glimmer of hope for the buyers, as they still hold on to the 200-day Simple Moving Average (SMA).
On the daily chart, the Relative Strength Index (RSI) has fallen into negative territory, after recovering above 50 last week, which suggests increasing selling pressure. Moreover, the Moving Average Convergence Divergence (MACD) histogram features rising red bars which further indicate growing bearish sentiment in the market.
NZD/USD daily chart
Moving to the hourly chart, there is a stark contrast. The RSI values are in deep, oversold territories, indicating the recent selling pressure may be overextended. This often foretells a possible price pullback or bullish correction in the near term. Regarding the MACD histogram, the green bars suggest neutral momentum, even though they are flat, indicating no significant change in the shorter term but may also hint that the bulls are gearing up.
NZD/USD hourly chart
Taking both into account, while the daily chart may hint at a generalized negative posture, the hourly chart suggests the possibility of a reprieve for the bulls very soon. The fact that the NZD/USD pair is holding above the 200-day SMA also lends some weight to this counter-trend, bullish outlook.
- Silver's bullish streak leads above $25.00, defying broader market trends with over 1.40% gains.
- A new year-to-date high at $25.44 highlights XAG/USD’s resilience, with $26.00 now in sight as next resistance.
- Should Silver retreat below $25.00, a move towards $24.50 and potentially $24.01 could unfold, testing buyer strength.
Silver's price shines on Friday and registers solid gains of more than 1.40%, shrugging off Gold’s two consecutive days of losses. It rises 1.52%, trading at $25.18 a troy ounce at the time of writing. XAG/USD advanced even though the Greenback remains strong, underpinned by high US Treasury bond yields.
XAG/USD Price Analysis: Technical outlook
During the session, Silver printed a new year-to-date (YTD) high of $25.44, but the advance toward $26.00 was capped by an upslope support trendline that turned resistance. That sent XAG/USD retreating toward the current price levels. Nevertheless, the Relative Strength Index (RSI) indicator is still bullish, indicating that bullish momentum remains in charge, and the $26.00 resistance level could be up for grabs.
On the other hand, if XAG/USD falls below $25.00, sellers could launch an assault towards the $24.50 area, followed by the March 12 daily low of $24.01.
XAG/USD Price Action – Daily Chart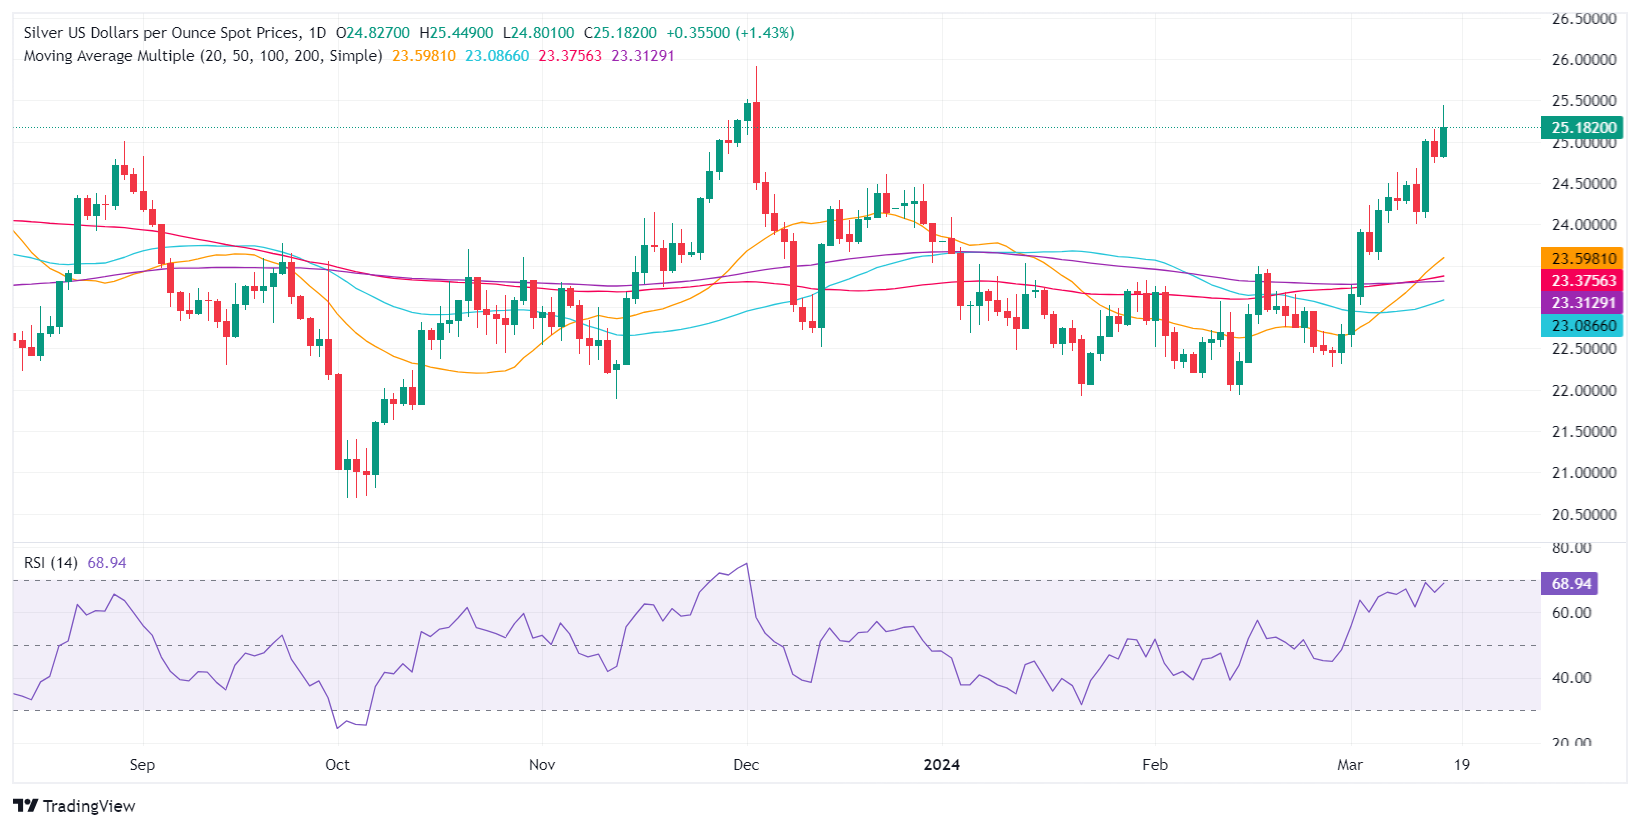
- Gold retreats from the $2,180 mark, reacting to hot US inflation data and Fed's cautious stance on policy easing.
- Rise in US Treasury yields post-PPI data release dampens XAU/USD’s appeal despite risk-off market sentiment.
- Gold remains subdued as Treasury yields inch higher and the US Dollar strengthens.
Gold spot retreated from around the $2,180 area on Friday, printing back-to-back negative sessions as market players' hope for the beginning of the US Federal Reserve's easing cycle has been delayed due to strong US economic data. Hotter-than-expected inflation figures justify Fed Chair Jerome Powell's remarks to be patient and stick to the current monetary policy stance until the disinflation process evolves. The XAU/USD trades at $2,157.66, down 0.20%.
Wall Street is set to finish Friday’s session on the back foot, reflecting a risk-off mood. Although the Gold price usually capitalizes on it, the rise of US Treasury yields after Thursday’s Producer Price Index (PPI) data kept XAU/USD offered in the European session and toward the end of the trading day.
The yellow metal remained under pressure even though US economic data failed to move the needle. The Fed revealed that Industrial Production improved in February. After that, University of Michigan Consumer Sentiment showed that Americans remain optimistic about the economic outlook.
The XAU/USD treads water as the US 10-year Treasury bond yield surges one basis point to 4.308%, while the US Dollar Index (DXY), a gauge of the buck’s performance versus other currencies, climbs 0.09% to 103.45.
Daily digest market movers: Gold retreats as US yields rise
- Friday’s economic data revealed that Industrial Production was 0.1% MoM, up from -0.5% contraction in January, and exceeded the consensus.
- Separately, the University of Michigan Consumer Sentiment on its preliminary reading was 76.5, below estimates and the previous reading of 76.9. Americans expect inflation to remain at 3% in the 12 months from March and for five years at 2.9%.
- The PPI was strong, at 1.6% YoY, up from 0.9%, while the core PPI stood at 2%, unchanged, with both figures exceeding the consensus.
- The US Department of Commerce revealed that Retail Sales missed estimates of 0.8% MoM and rose 0.6%, still an improvement compared to the prior month’s reading of -1.1%.
- The labor market remained tight as Initial Jobless Claims for the week ending March 9 dipped from 210K to 209K, below estimates of 218K.
- Given the backdrop of consumer and producer price indices in the US showcasing reaccelerating inflation, Fed officials should refrain from easing monetary policy.
- During last week's testimony at the US Congress, Fed Chairman Jerome Powell said that inflation is cooling while acknowledging that they could ease policy late in the year. However, he emphasized that it would depend on incoming data reassuring policymakers that inflation is sustainably moving toward the Fed’s 2% goal. The Fed’s next meeting is scheduled for March 19-20 next week.
- According to the CME FedWatch Tool, expectations for a May rate cut remain low, having dropped to 11% from 22%. However, the odds for June stand at 64%, down from 72%.
Technical analysis: Gold buyers take a breather below $2,170
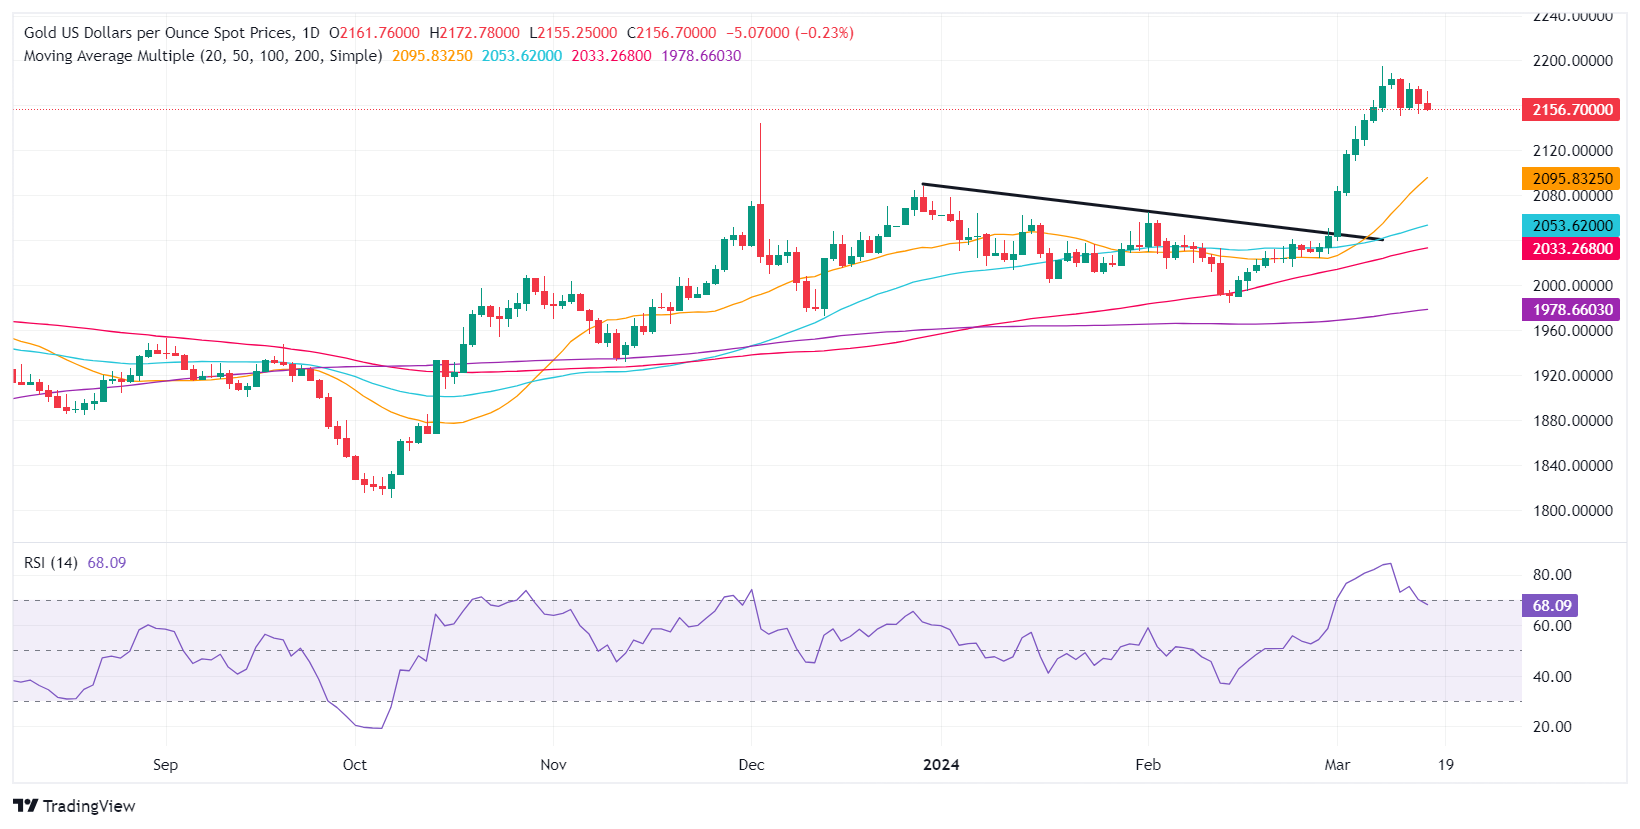
Gold’s uptrend remains intact with the pair consolidating near the $2,160-$2,180 area. As a symmetrical triangle forms, expectations for an upside break could lift the XAU/USD toward the $2,200 figure. However, the Relative Strength Index (RSI) indicator exiting from overbought conditions suggests that buyers are taking a breather.
If buyers break the top of the range, they would challenge the current year-to-date (YTD) high of $2,195.15. Once surpassed, the $2,200 is up next. Otherwise, a drop below $2,160 might pave the way for a pullback. The first key support level would be the March 6 low of $2,123.80, followed by $2,100, followed by the December 28 high at $2,088.48 and the February 1 high at $2,065.60.
Gold FAQs
Gold has played a key role in human’s history as it has been widely used as a store of value and medium of exchange. Currently, apart from its shine and usage for jewelry, the precious metal is widely seen as a safe-haven asset, meaning that it is considered a good investment during turbulent times. Gold is also widely seen as a hedge against inflation and against depreciating currencies as it doesn’t rely on any specific issuer or government.
Central banks are the biggest Gold holders. In their aim to support their currencies in turbulent times, central banks tend to diversify their reserves and buy Gold to improve the perceived strength of the economy and the currency. High Gold reserves can be a source of trust for a country’s solvency. Central banks added 1,136 tonnes of Gold worth around $70 billion to their reserves in 2022, according to data from the World Gold Council. This is the highest yearly purchase since records began. Central banks from emerging economies such as China, India and Turkey are quickly increasing their Gold reserves.
Gold has an inverse correlation with the US Dollar and US Treasuries, which are both major reserve and safe-haven assets. When the Dollar depreciates, Gold tends to rise, enabling investors and central banks to diversify their assets in turbulent times. Gold is also inversely correlated with risk assets. A rally in the stock market tends to weaken Gold price, while sell-offs in riskier markets tend to favor the precious metal.
The price can move due to a wide range of factors. Geopolitical instability or fears of a deep recession can quickly make Gold price escalate due to its safe-haven status. As a yield-less asset, Gold tends to rise with lower interest rates, while higher cost of money usually weighs down on the yellow metal. Still, most moves depend on how the US Dollar (USD) behaves as the asset is priced in dollars (XAU/USD). A strong Dollar tends to keep the price of Gold controlled, whereas a weaker Dollar is likely to push Gold prices up.
- AUD/USD cycles just north of 0.6550.
- Little Aussie data to chew on leaves AUD/USD in the lurch.
- Next week: double-header showings from RBA and Fed.
The AUD/USD is churning just above 0.6550 as markets prepare for next week’s double feature from the Reserve Bank of Australia (RBA) and the US Federal Reserve (Fed). Both central banks are broadly expected to hold interest rates steady as investors focus on when rate cuts will come. According to the CME’s FedWatch Tool, money markets were recently thrown a curve ball, and bets of a June rate cut from the Fed have eased to 60%, down from 70% at the start of the week.
Next week also brings Australia’s latest labor and employment figures on Thursday, and median market forecasts expect Australia’s Employment Change in February to add 30K new jobs, while the Unemployment Rate is forecast to tick down to 4.0% from 4.1%. Preliminary Judo Bank Australian Purchasing Managers Index (PMI) figures for February are also scheduled for early Thursday.
Broader markets will be focusing full-bore on next Wednesday’s Fed rate statement, where the US central bank is also expected to update the Fed Dot Plot summary of interest rate expectations. The near-term end of the Dot Plot curve is expected to tick up to 5.5% from the current 4.6%. With markets pinning hopes on at least three 25 basis point rate cuts from the Fed in 2024, investor sentiment has been at odds with the Fed’s own rate outlook for the entire year. The Fed projected three rate cuts through 2024, while money markets priced in an eye-watering six or seven rate cuts through the year totaling nearly 200 basis points in rate trims for the year.
As the US economy continues to churn at a healthy clip and inflation remains stubbornly sticky, markets have had little choice but to slash rate cut expectations, and rate futures traders are half-heartedly hoping for a June rate cut.
AUD/USD technical outlook
AUD/USD spent most of the trading week on the low side, backsliding into the 200-hour Simple Moving Average (SMA) near 0.6580 on Thursday. The 50-hour and 200-hour SMAs have begun a bearish crossover near 0.6585 as intraday price action tilts into the bearish side. The Aussie-Dollar pair flubbed a brief bullish push into the 0.6640 early in the week.
Friday’s third of a percent decline has the Aussie clattering into the 200-day SMA against the US Dollar near 0.6560, and momentum is tilted into bear country as the pair fails to find bullish momentum after a rebound from the last swing low into the 0.6450 handle.
AUD/USD hourly chart
AUD/USD daily chart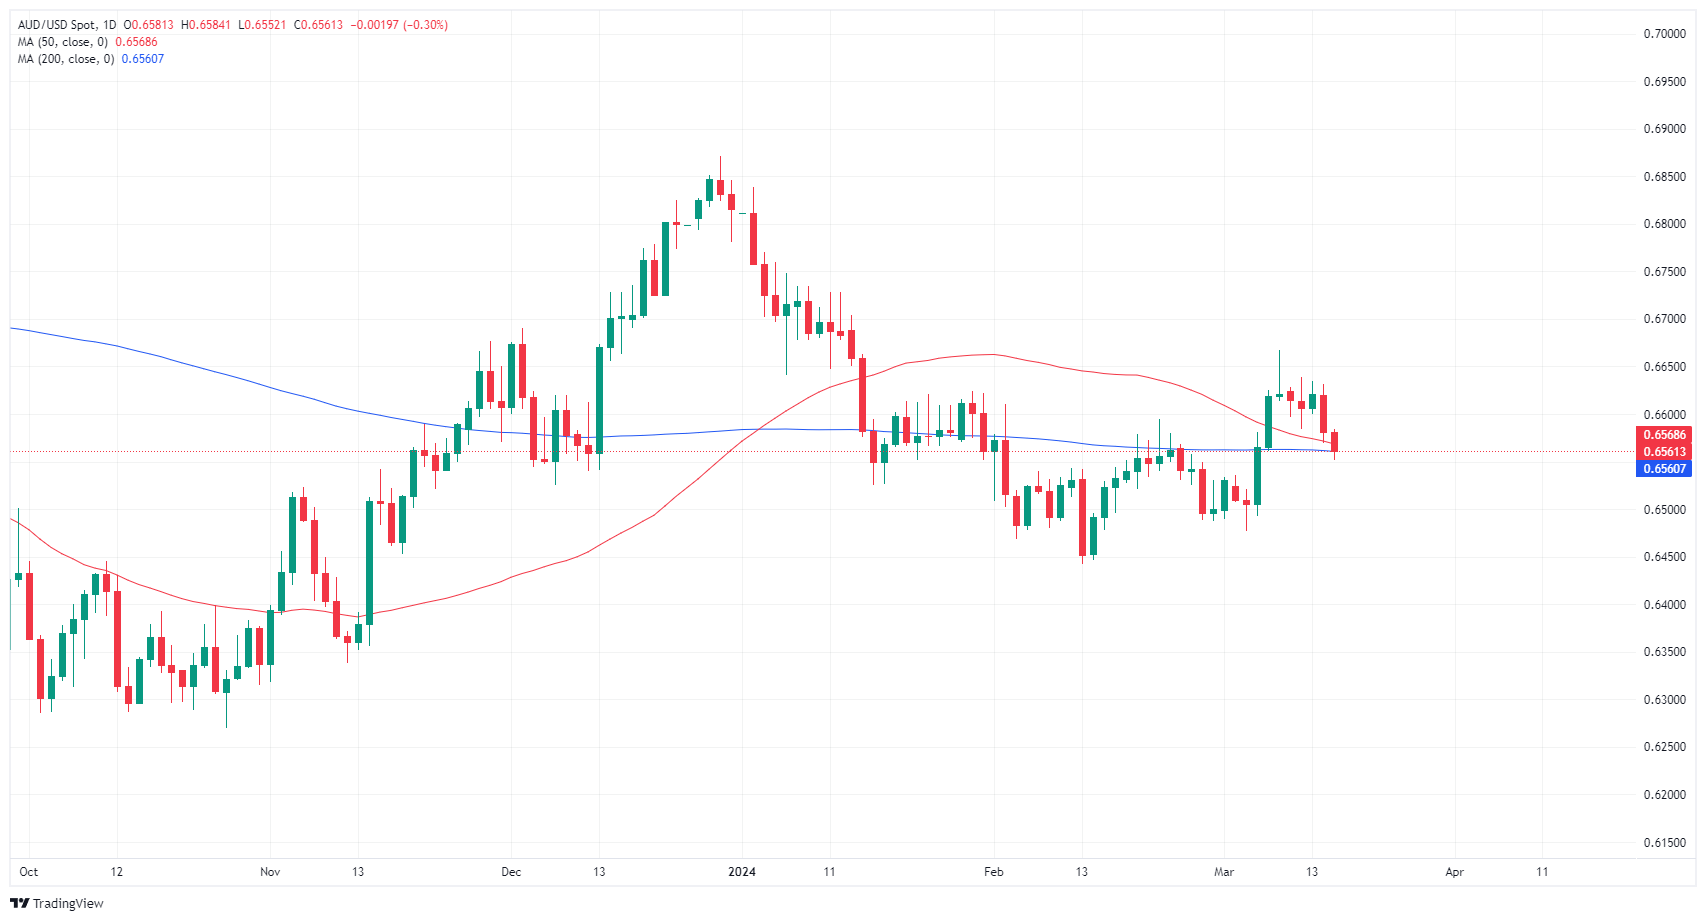
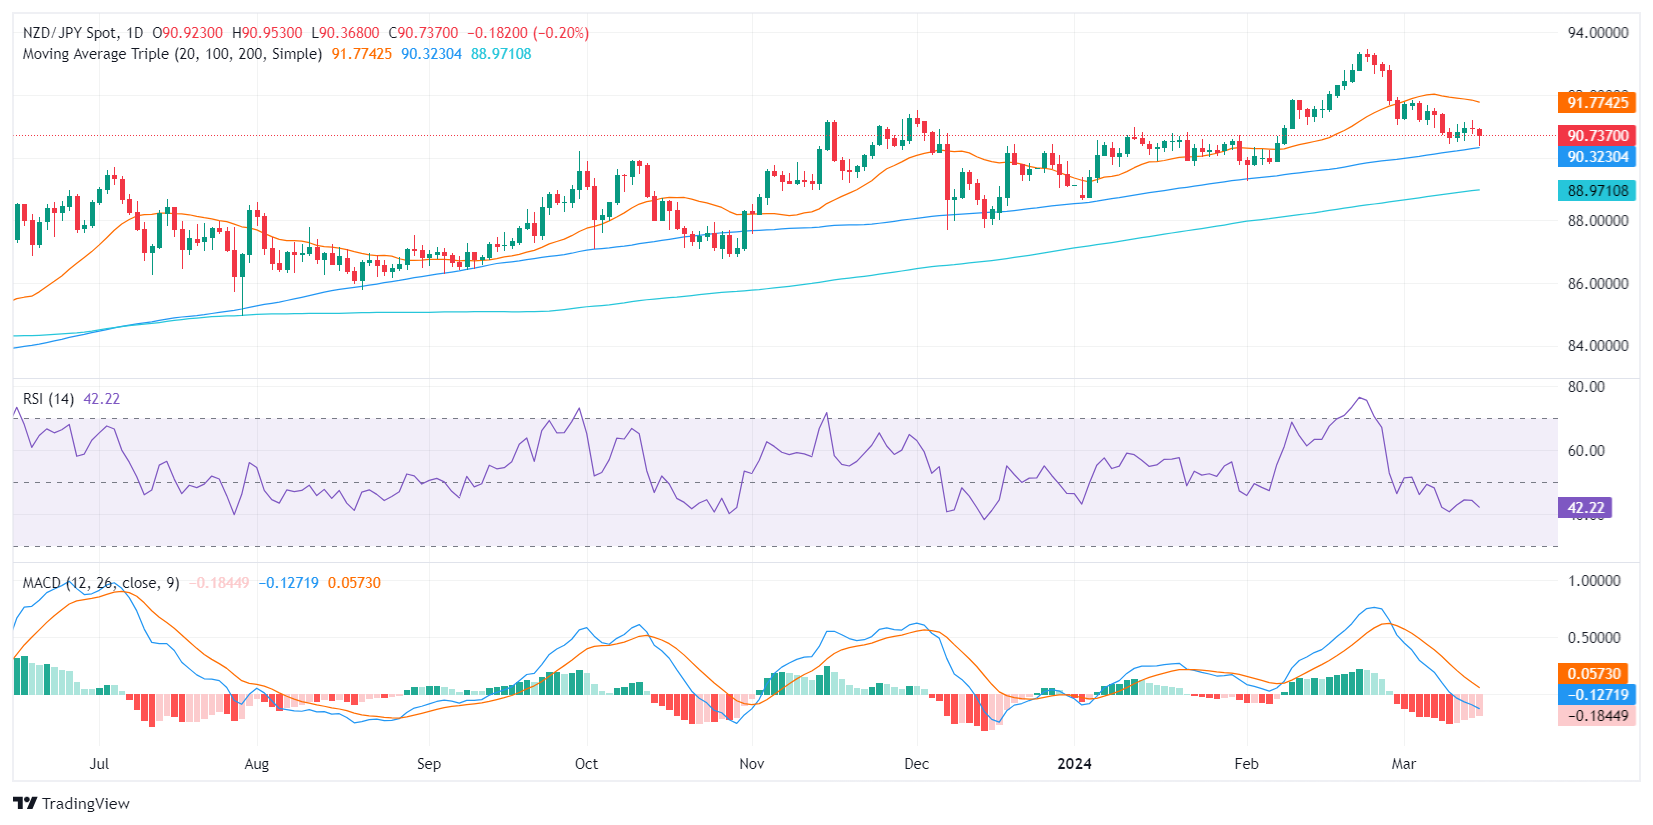
- On the daily chart, sellers remain in control despite the improvement of the RSI and MACD.
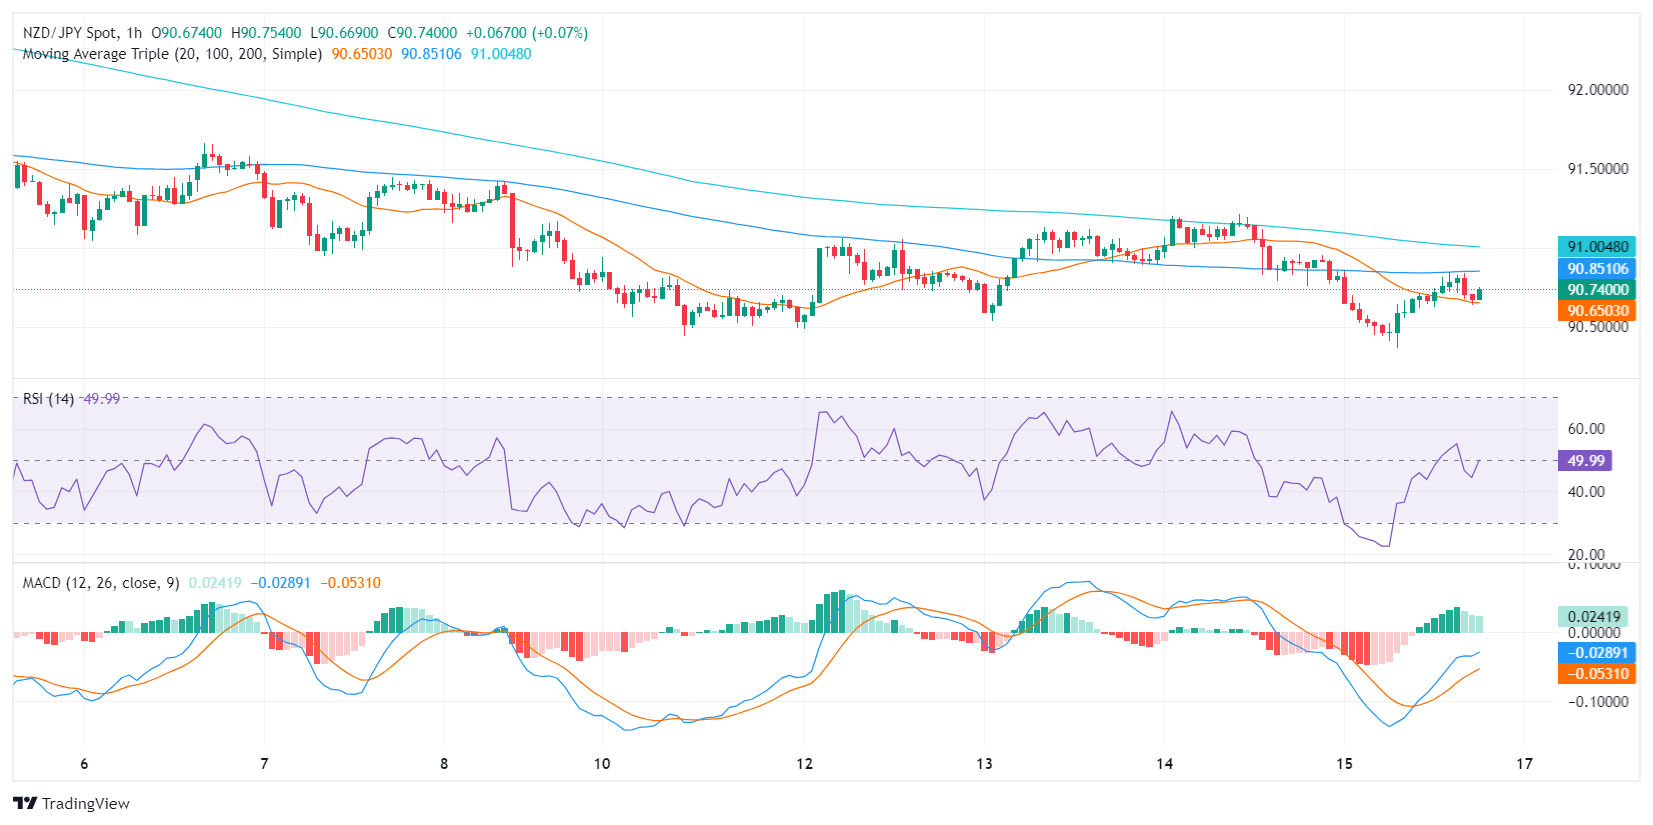
- While the daily chart emits bearish signals, the hourly indicators provide a more balanced picture, showcasing an equilibrium between buyers and sellers.
- The cross saw a recovery during the American session and managed to clear daily losses.
In Friday's session, the NZD/JPY is trading at 90.70, recording a slight loss of 0.22% after bottoming at a low of 90.35. The positioning of the pair above the key 100 and 200-day Simple Moving Averages (SMAs) might hint at bullish prospects in the overall trend, yet the shorter technical outlook tilts toward the bears as it trades below the 20-day average.
On the daily chart, the NZD/JPY's Relative Strength Index (RSI) has been in negative territory, signaling that sellers have been dominant. The Moving Average Convergence Divergence (MACD) doesn't present any brighter picture either. Its histogram has flat red bars, indicating negative momentum and a lack of buying strength.
NZD/JPY daily chart
Switching to the hourly chart, the RSI recovered towards 50, the neutral level, suggesting a balance between buyers and sellers. On the other hand, the MACD histogram displays flat green bars, indicating a steady positive momentum.
NZD/JPY hourly chart
To conclude, the broader daily analysis paints a reasonably bearish picture, with the RSI and MACD indicating seller dominance and the pair below the 20-day SMA. Yet, the hourly chart presents a somewhat mixed picture, showing a balance between buyers and sellers. Considering the pair's position above the 100 and 200-day SMAs, despite the immediate bearish sentiment, the bulls might still have a chance to regain control.
Firmer US inflation prints lent support to the Dollar and US yields, underpinning at the same time the view of a Fed’s rate cut at the June gathering. On another front, EUR/USD and GBP/USD abandoned the area of recent peaks, and the Japanese yen remained in the limelight ahead of the BoJ’s potential lift-off next week.
The USD Index (DXY) climbed past the 103.00 hurdle with certain conviction, aided by rising speculation over an interest rate cut in June and the increasing likelihood of only two rate cuts (instead of three) for the current year. In the upcoming week, the NAHB Housing Market Index is due on March 18, ahead of Building Permits and Housing Starts on March 19. The Fed meets on March 20 along with the always-relevant press conference by Chair J. Powell. Usual Initial Jobless Claims, the Philly Fed Manufacturing Index, Existing Home Sales, the CB Leading Index, and flash S&P Global Manufacturing and Services PMIs are due on March 21.
EUR/USD picked up some pace after bottoming out in fresh weekly lows near 1.0870, reversing at the same time three consecutive weeks of gains. On March 18, the final Inflation Rate in the broader Euroland is due seconded by the Balance of Trade figures. The ZEW’s Economic Sentiment is expected for both Germany and the euro bloc on March 19, prior to the flash Consumer Sentiment in the euro area on March 20. March 21 will see the release of advanced Manufacturing and Services PMIs in Germany and the broader euro region, while Germany’s Business Climate tracked by the IFO institute is due at the end of the week.
The persistent risk-off mood weighed on the British pound and dragged GBP/USD to new multi-day lows near 1.2520 on Friday, ending the week with marked losses. In the UK, the Inflation Rate is due on March 20 ahead of Public Sector Net Borrowing, flash Manufacturing and Services PMIs, and the BoE interest rate decision, all on March 21. Finally, Retail Sales and the Gfk Consumer Confidence are due on March 22.
USD/JPY advanced for the fourth straight session on Friday, extending the rebound past the 149.00 barrier following lows in the mid-146.00s recorded on Monday. Machinery Orders are due on March 18, while the BoJ meeting and Industrial Production come on March 19. In addition, the Reuters Tankan Index, Balance of Trade figures, and the advanced Jibun Bank Manufacturing and Services PMIs are due on March 21. Ending the week, emerge the Inflation Rate and Foreign Bond Investment readings.
AUD/USD put the key 200-day SMA around the 0.6560 to the test on Friday, adding to Thursday’s losses and extending further the weekly leg lower. On March 18, the RBA’s Consumer Inflation Expectations come on March 18, prior to the RBA meeting on March 19. Additionally, the Q4 GDP Growth Rate and the flash Judo Bank Manufacturing and Services PMIs are scheduled for March 20. The Australian labour market report is due on March 21, ahead of the Balance of Trade results.
In China, Fixed Asset Investment, Retail Sales, Industrial Production, and the Unemployment Rate are all due on March 18. USD/CNH ended the week in a positive tone and beyond the 7.2000 barrier.
Anticipating Economic Perspectives: Voices on the Horizon
- ECB C. Lagarde speaks on March 20 along with BuBa President J. Nagel.
- BoC T. Gravelle and FOMC M. Barr speak on March 21.
- BuBa President J. Nagel, FOMC M. Barr, and Atlanta Fed R. Bostic speak on March 22.
Central Banks: Upcoming Meetings to Shape Monetary Policies
- The RBA and the BoJ will meet on March 19.
- The PBoC, the BI, and the Fed will hold their events on March 20.
- The BoE and the Norges Bank meet on March 21.
- Crude Oil is pinned into the high end to wrap up the trading week.
- WTI holding above $80.00 per barrel.
- Barrel traders pinning hopes on supply constraints looking forward.
West Texas Intermediate (WTI) US Crude Oil was pinned north of $80.00 per barrel on Friday as energy markets continued to price in expectations of a widening gap between global Crude Oil output and a forecast uptick in global Crude Oil demand through the rest of 2024 and into 2025.
The International Energy Agency (IEA) recently adjusted its forecasts, calling for a global Crude Oil deficit assuming the Organization of the Petroleum Exporting Countries (OPEC) maintains its current voluntary production caps. OPEC will meet next on June 1 to discuss output levels for the second half of 2024, and investors are broadly anticipating the Crude Oil cartel to continue squeezing quotas as tight as possible as Saudi Arabia pushes to keep barrel prices bolstered.
Declines in US Crude Oil supplies sparked a bullish lean in energy markets this week after the American Petroleum Institute (API) and the Energy Information Administration (EIA) both printed deeper drawdowns in Crude Oil stocks than expected after capacity demand at US refineries ticked up.
US Crude Oil supplies drawdown sparks risk bid
The API reported on Tuesday that Weekly Crude Oil Stocks for the week ended March 8 declined 5.5 million barrels, well below the forecast uptick of 400K barrels, engulfing the previous week’s buildup of 4423K barrels. The EIA’s Crude Oil Stocks Change for the same period showed a 1.536 million barrel decline, missing the forecast buidup of 1.338 million barrels and wiping out the previous week’s 1.367 million barrel increase.
WTI technical outlook
WTI is trading into the high end of a supply zone near the $80.00 handle after vaulting over the 200-hour Simple Moving Average (SMA) just above $78.00 earlier this week, and the 200-hour SMA is now turning bullish, rising above $78.50.
A near-term demand zone sits nearby to catch any downside moves near the $77.00 handle, and Crude Oil is holding steady after tapping a multi-month high this week.
WTI hourly chart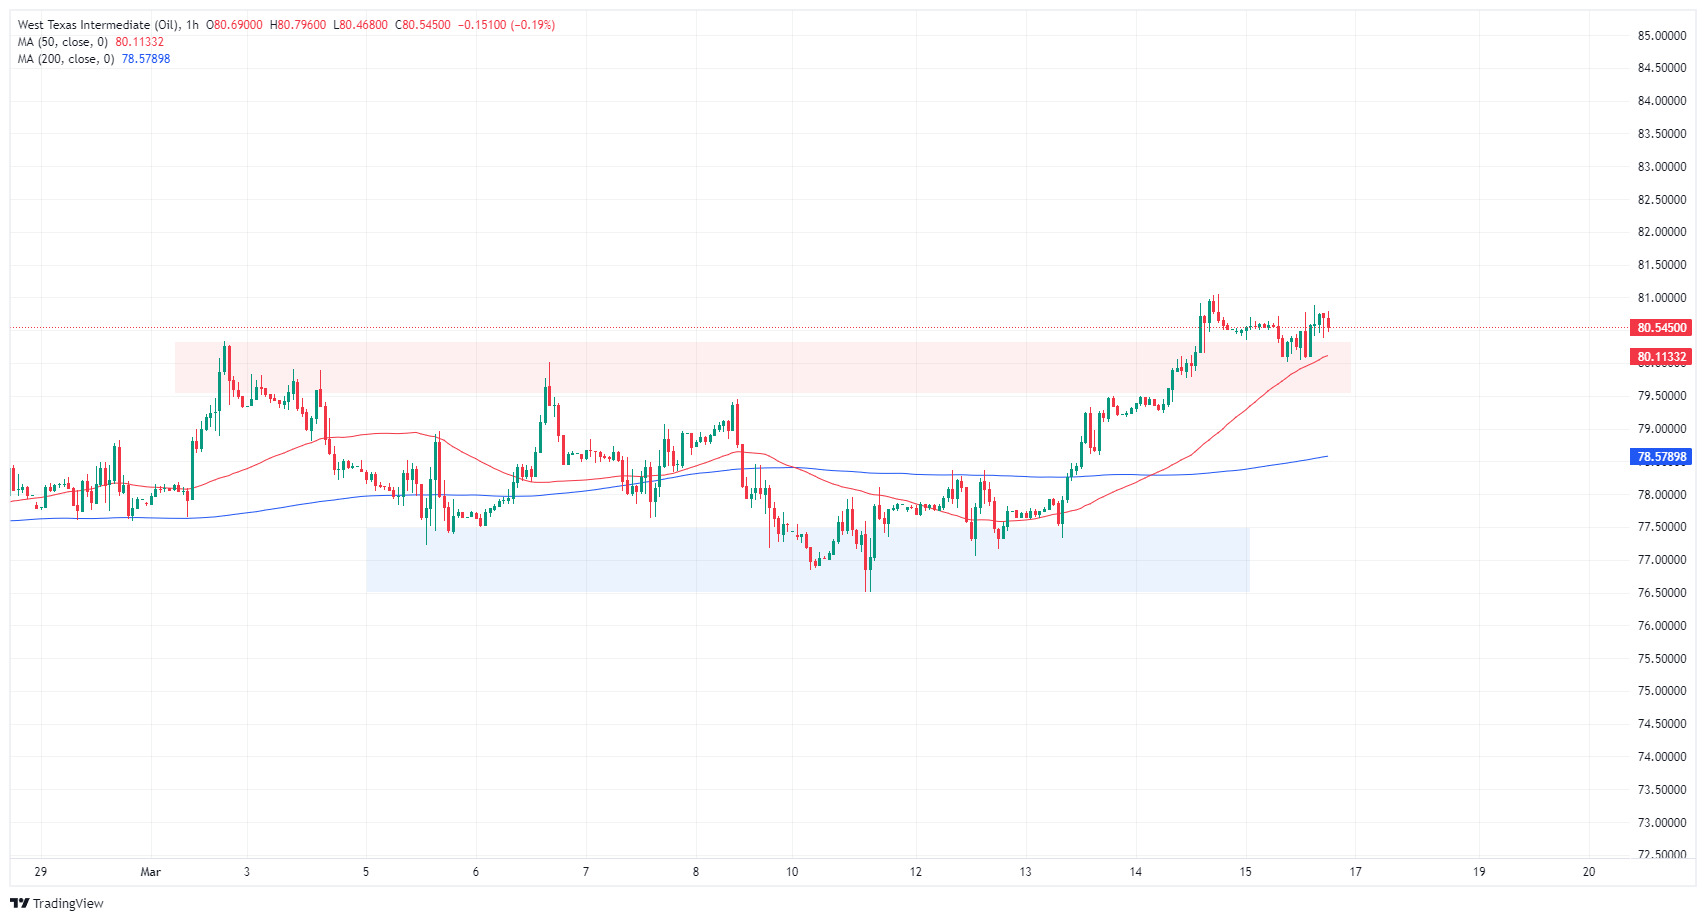
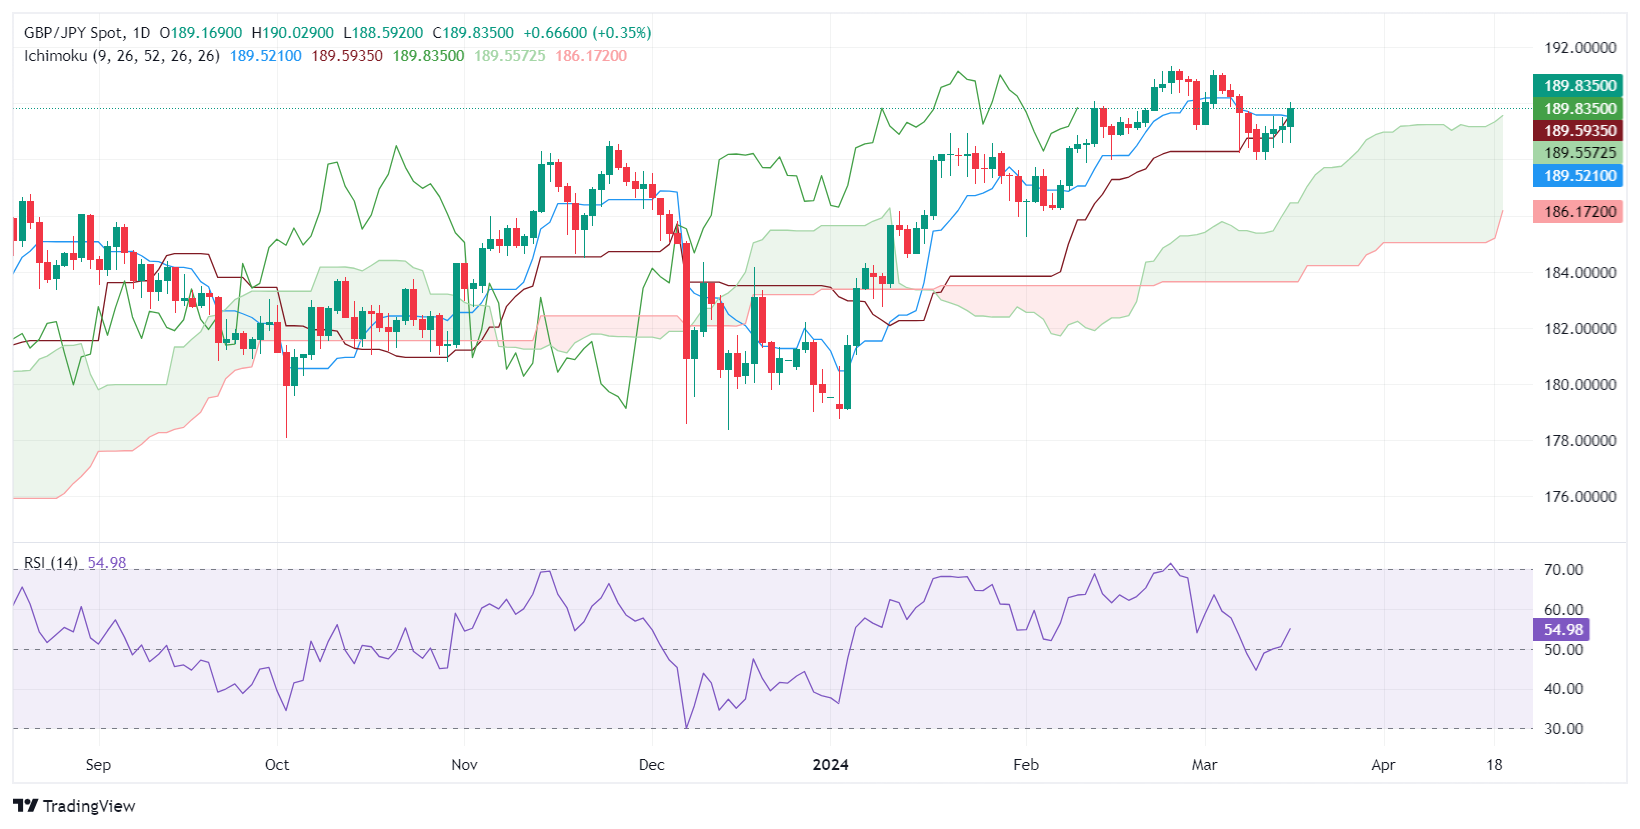
- GBP/JPY rises buoyed by uncertainty over BoJ's interest rate stance, marking a weekly gain.
- Recovery from near the 50-day DMA suggests bullish momentum, with eyes on the 190.00 resistance mark.
- A drop below the Kijun Sen could signal a correction phase, with significant support at the March 11 low.
The Pound Sterling extended its gains versus the Japanese Yen and is set to finish the week with gains, as the GBP/JPY trades at 189.72, gains 0.34%. Bank of Japan (BoJ) officials delivering mixed messages during the week prompted investors to sell the Yen as speculations grew the BoJ would not raise rates.
GBPJPY Price Analysis: Technical outlook
The cross-pair has recovered after dipping near the 50-day moving average (DMA) at 187.84, capping the GBP/JPY slide amid BoJ’s ending negative interest rates. Once those dissipated, a ‘bullish harami’ candle pattern emerged, pushing the spot prices higher. As of writing, the next resistance level would be 190.00. A breach of the latter would expose the March 4 high of 191.18, followed by the year-to-date high of 191.32.
For a bearish scenario, sellers must drag the price below the Kijun Sen o f58, ahead of the Senkou Span A at 189.64. Although this suggests that the pair is in an ongoing correction, a drop below the March 11 low of 187.96 could open the door for a deeper pullback.
GBPJPY Price Action – Daily Chart
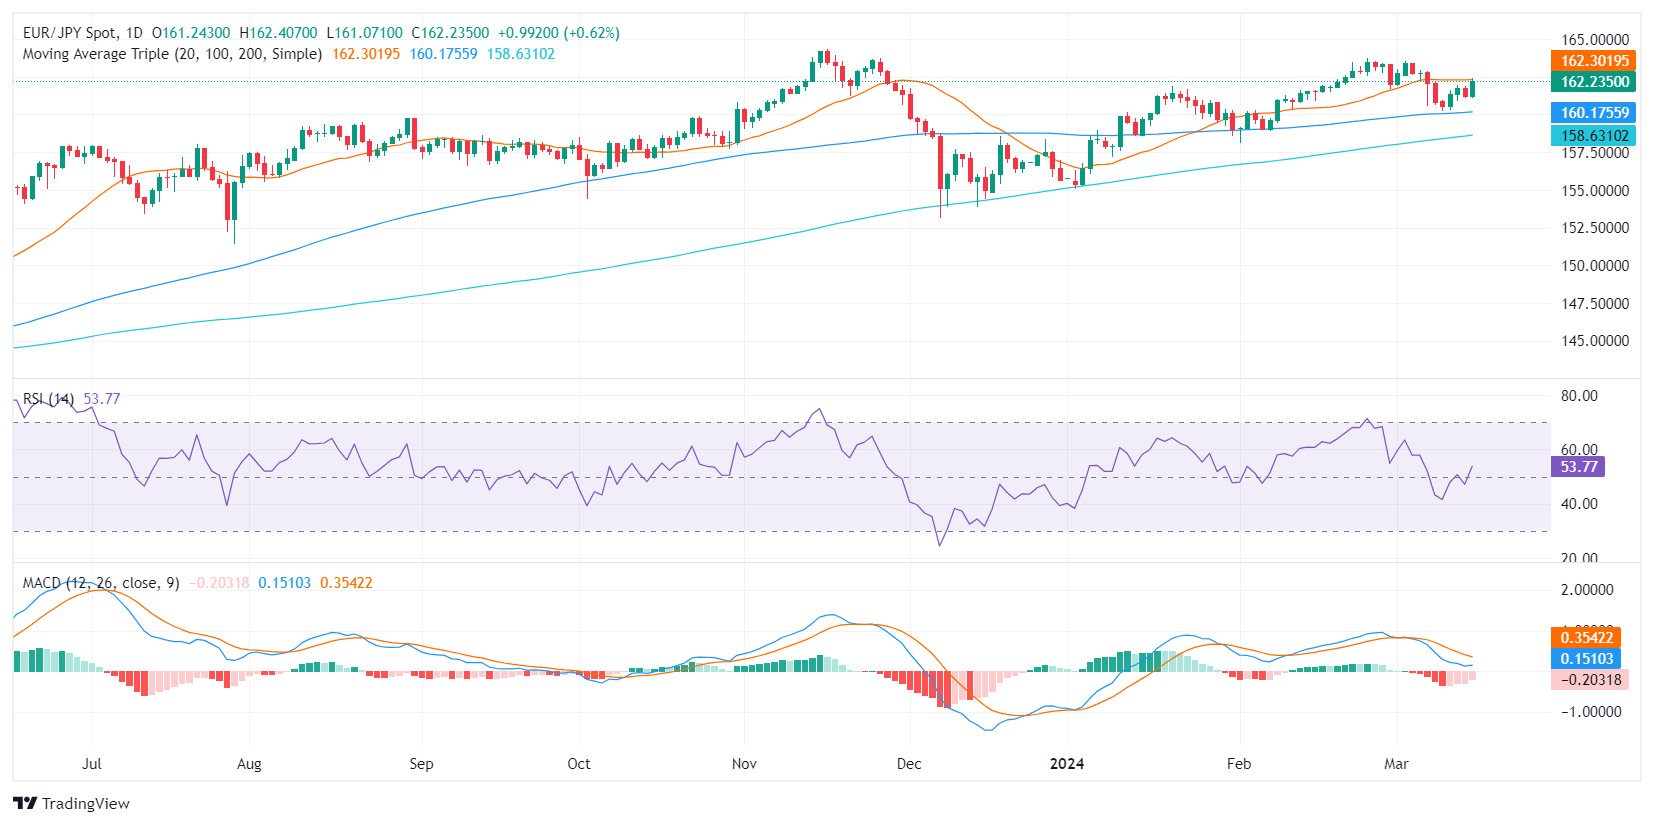
- The pair met strong resistance at the 20-day SMA, which in case of conquering it, will confirm a bullish bias.
- The daily chart indicators suggest a strengthening upward momentum with the RSI jumping above 50.
- The hourly RSI hovers in the overbought territory, a potential sign of short-term buyer exhaustion.
In Friday's session, EUR/JPY trades with gains at 162.27, marking a 0.54% rise in attempting to conquer the 20-day Simple Moving Average (SMA). The bulls seemingly hold a strong grip, as the buying momentum appears to intensify. Yet, the sellers might come into action as the indicators flash overbought signs on the hourly signs.
Based on the indicators of the daily chart for the EUR/JPY pair, the Relative Strength Index (RSI) has moved into positive territory, suggesting a stronger upward momentum. Meanwhile, the downturn of the Moving Average Convergence Divergence (MACD) histogram prints shortening red bars, arguing in favor of a stronger bullish grip.
EUR/JPY daily chart
Turning to the hourly chart, the RSI seems to be hovering in the overbought territory. Despite a strong upward trend, this indicates potential exhaustion from the buyers. Similarly, the MACD's decreasing green bars might be signaling a shift in the tide, turning favor towards sellers for the short-term period.
EUR/JPY hourly chart
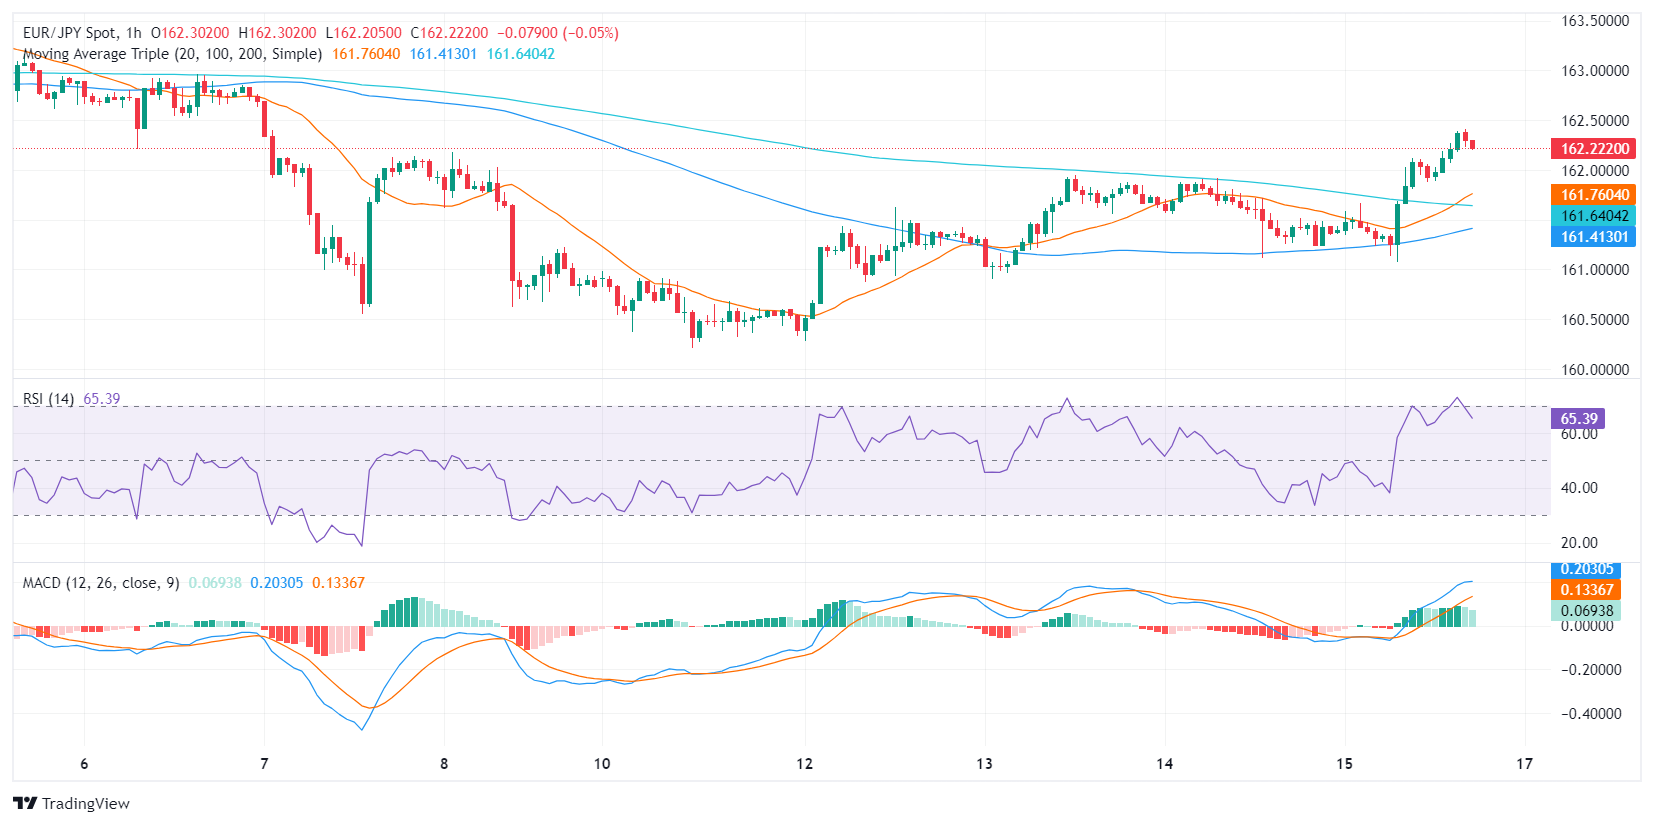
Given that the pair remains above the 100- and 200-day SMAs, yet below the 20-day SMA, it gives mixed signals regarding the broader market control. Thus, an interplay of daily and hourly charts suggests an uphill battle with the bulls maintaining control in a larger context, albeit facing potential near-term pressures.
- Dow Jones follows other indices lower on Friday.
- UoM Consumer Sentiment Index ticked lower.
- June rate cut bets have edged down to 60%.
The Dow Jones Industrial Average (DJIA) is down a little over half a percent as markets round the corner into the Friday closing bell with US equities broadly lower on the day. An extended pullback in the tech and telecoms sectors are dragging down the averages, with limited gains to keep the Dow Jones on-balance as markets buckle down for the weekend.
According to the CME’s FedWatch Tool, rate futures are pricing in nearly a 41% chance of no rate movement from the Federal Reserve (Fed) at the US central bank’s June rate call. Money markets see an over 90% chance of no rate cuts from the Fed at both the March and May rate statements. The Fed’s next rate call and update to the Fed’s in-houser Dot Plot summary of rate projections are due next week at 1800 GMT on Wednesday.
The Technology Sector has extended into a four-day pullback after peaking on Monday, shedding an additional 1.4% on Friday. A 1.2% decline in the Communications Services Sector follows closely behind the Tech Sector’s pullback.\
The Materials and Industrials Sectors are in the green on Friday but doing little to counterbalance headline losses, gaining a scant 0.22% and 0.11%, respectively.
Dow Jones news
Most of the equities listed on the Dow Jones Industrial Average (DJIA) were in the red on Friday, with Microsoft Corp. (MSFT) and Salesforce Inc. (CRM) leading the losers, both shedding around 2.5%. Amazon Inc. (AMZN) followed close behind, down around 2.3% on the day.
Boeing Co. (BA) is seeing a brief reprieve from recent hard selling, rebounding 1.3% on Friday as 3M Co. (MMM) climbs around 1%. Of the 30 securities listed on the Dow Jones, over two-thirds are printing on the down side as markets prepare to exit for the weekend.
The Dow Jones Industrial Average is following its peer indices lower on Friday but is drowning slower than the others, falling around 0.6% on the day as the NASDAQ Composite sheds a full percentage point and the S&P 500 slides 0.7%.
Dow Jones Industrial Average technical outlook
The Dow Jones Industrial Average (DJIA) declined after facing an intraday rejection from a supply zone near the 39,000.00 major handle, marking in the day's bottom at 38,606.59. The index is still trading above the week's early low set on Monday near 38,470.00, but is still down 1.4% from the week's peak bids near 39,225.00.
The Dow Jones continues to churn near all-time highs set in February at 39,281.86, and the index is still up over 19% from October's lows near 32,475.00.
Dow Jones Industrial Average, 5-minute chart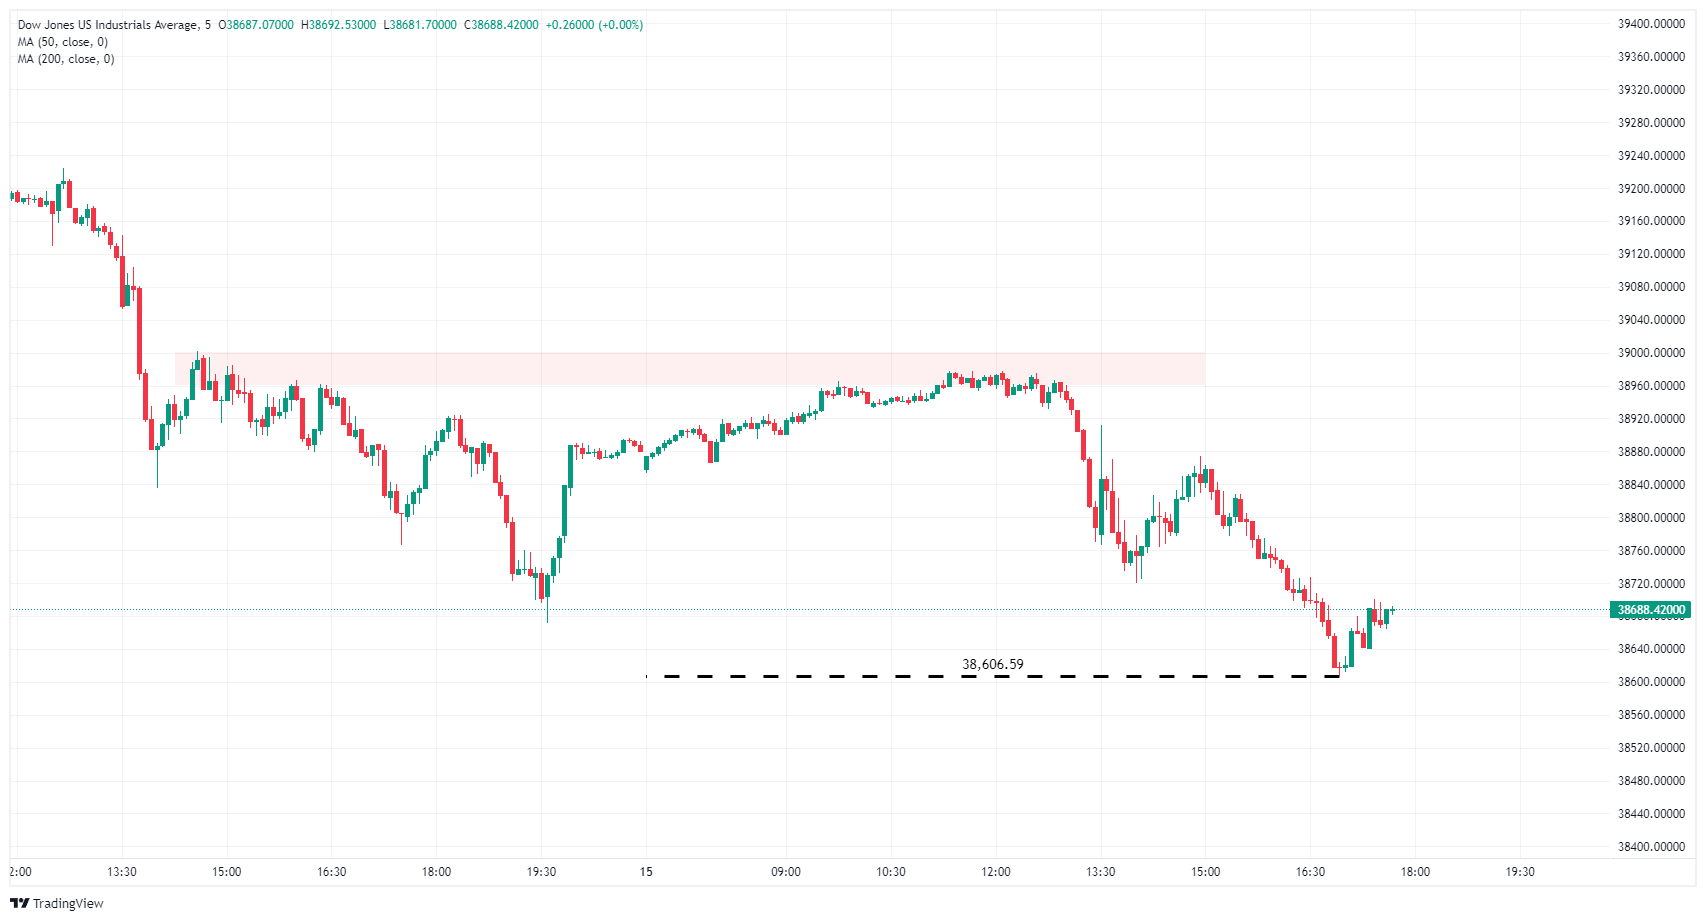
Dow Jones FAQs
The Dow Jones Industrial Average, one of the oldest stock market indices in the world, is compiled of the 30 most traded stocks in the US. The index is price-weighted rather than weighted by capitalization. It is calculated by summing the prices of the constituent stocks and dividing them by a factor, currently 0.152. The index was founded by Charles Dow, who also founded the Wall Street Journal. In later years it has been criticized for not being broadly representative enough because it only tracks 30 conglomerates, unlike broader indices such as the S&P 500.
Many different factors drive the Dow Jones Industrial Average (DJIA). The aggregate performance of the component companies revealed in quarterly company earnings reports is the main one. US and global macroeconomic data also contributes as it impacts on investor sentiment. The level of interest rates, set by the Federal Reserve (Fed), also influences the DJIA as it affects the cost of credit, on which many corporations are heavily reliant. Therefore, inflation can be a major driver as well as other metrics which impact the Fed decisions.
Dow Theory is a method for identifying the primary trend of the stock market developed by Charles Dow. A key step is to compare the direction of the Dow Jones Industrial Average (DJIA) and the Dow Jones Transportation Average (DJTA) and only follow trends where both are moving in the same direction. Volume is a confirmatory criteria. The theory uses elements of peak and trough analysis. Dow’s theory posits three trend phases: accumulation, when smart money starts buying or selling; public participation, when the wider public joins in; and distribution, when the smart money exits.
There are a number of ways to trade the DJIA. One is to use ETFs which allow investors to trade the DJIA as a single security, rather than having to buy shares in all 30 constituent companies. A leading example is the SPDR Dow Jones Industrial Average ETF (DIA). DJIA futures contracts enable traders to speculate on the future value of the index and Options provide the right, but not the obligation, to buy or sell the index at a predetermined price in the future. Mutual funds enable investors to buy a share of a diversified portfolio of DJIA stocks thus providing exposure to the overall index.
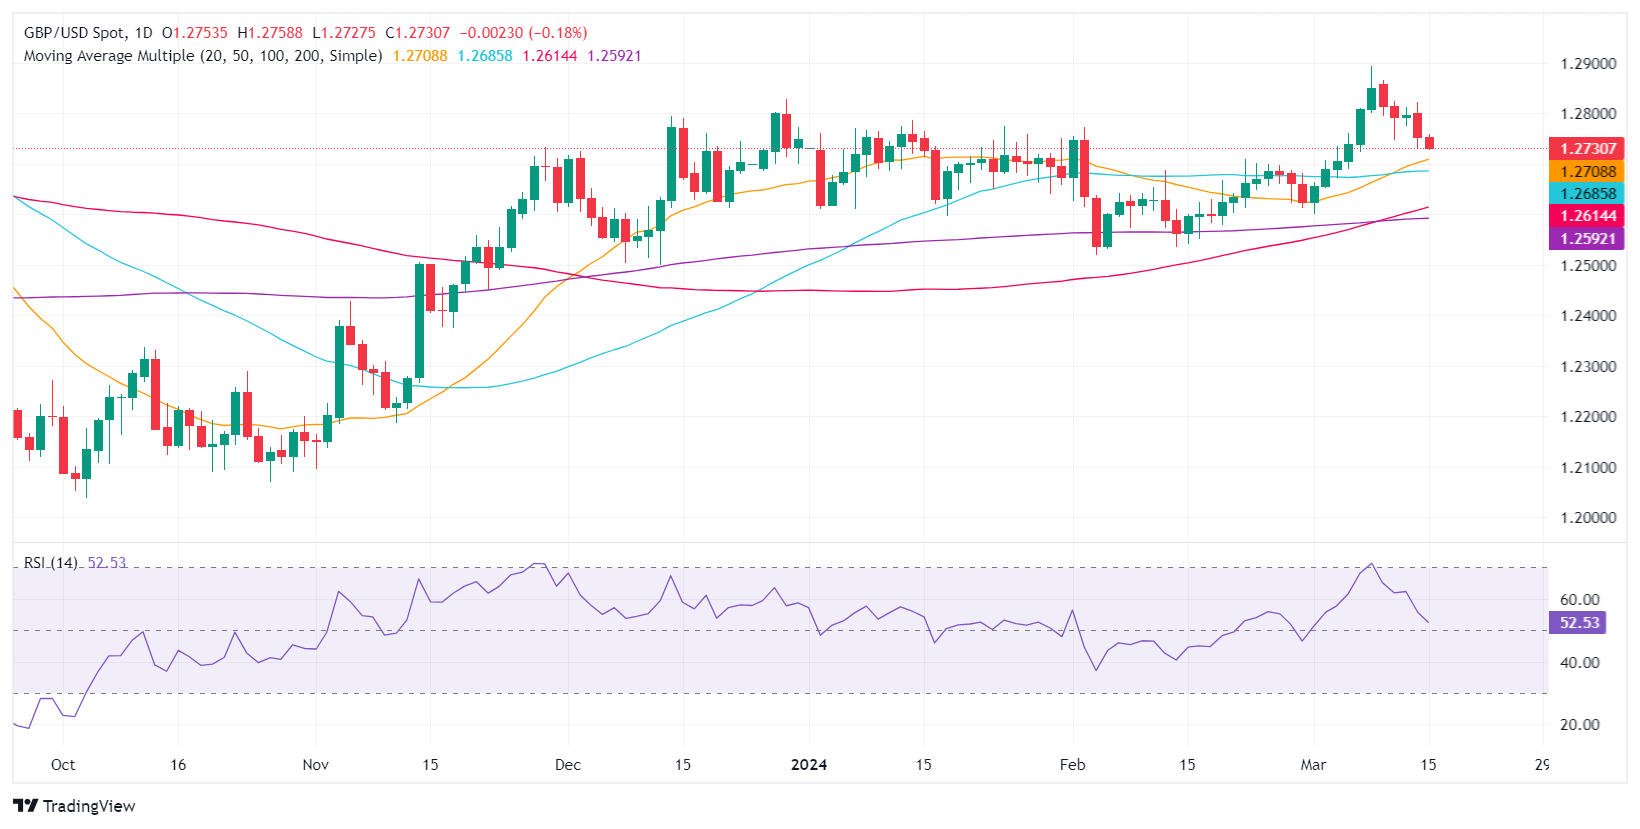
- GBP/USD falls as US inflation data and retail sales reinforce a less dovish Fed outlook.
- Industrial Production in the US shows signs of recovery, contributing to the US Dollar’s resilience.
- UK labor market report influences BoE rate cut speculations, with attention on June's monetary policy.
- Market anticipation builds for next week’s Fed and BoE meetings, with inflation data set to impact GBP/USD.
The Pound Sterling is set to finish the week with losses, yet extended its downtrend for two straight days after piercing the 1.2800 figure. The GBP/USD exchanges hands at 1.2731, post losses of 0.16%.
GBP/USD retreats below 1.2800, exposing critical support levels after hot US inflation
The Greenback remains bid as traders trimmed their bets of a dovish Federal Reserve. The US Department of Labor revealed February’s consumer and producer inflation data, with figures suggesting that prices remain elevated, unable to break below the 3% threshold. In the meantime, a solid Retail Sales report failed to exceed estimates but showed an improvement compared to the prior month’s reading.
Today, the US economic schedule showed that Industrial Production rebounded on February, snapping two months of consecutive deterioration. Manufacturing output came at 0.1% MoM, up from -0.5% contraction in January, and exceeded the consensus according to data revealed by the Fed. Recently, the University of Michigan Consumer Sentiment on its preliminary reading was 76.5, below estimates and the previous reading of 76.9. Americans expect inflation to remain at 3% in the 12 months from March and for five years at 2.9%.
Across the pond, a softish labor market report weakened the Cable. A rise in the unemployment rate and a dip in Average Earnings excluding Bonuses, a measure of wage inflation, dipped from 6.2% to 6.1%. The data sparked markets to ramp up bets on a Bank of England (BoE) rate cut in June.
In the meantime, traders brace for the next week’s monetary policy decisions by the Fed and the BoE. The consensus expect both institutions to hold rates unchanged, though any dovish hints, could trigger a reaction by the financial markets. Traders would also be looking at the release of inflation figures in the UK
GBP/USD Price Analysis: Technical outlook
GBP/USD buyers failed to cling to gains above 1.2800, exacerbating a drop below the latest cycle high of 1.2827, exacerbating a pullback below the 1.2800 handles. That said, key support levels were exposed, like the 50-day moving average (DMA) at 1.2685, followed by the next cycle low seen on March 1 low at 1.2599. once those levels are cleared, the confluence of the 100 and 200-DMAs around 1.2589/1.2601 would be up next.
Pound Sterling FAQs
The Pound Sterling (GBP) is the oldest currency in the world (886 AD) and the official currency of the United Kingdom. It is the fourth most traded unit for foreign exchange (FX) in the world, accounting for 12% of all transactions, averaging $630 billion a day, according to 2022 data. Its key trading pairs are GBP/USD, aka ‘Cable’, which accounts for 11% of FX, GBP/JPY, or the ‘Dragon’ as it is known by traders (3%), and EUR/GBP (2%). The Pound Sterling is issued by the Bank of England (BoE).
The single most important factor influencing the value of the Pound Sterling is monetary policy decided by the Bank of England. The BoE bases its decisions on whether it has achieved its primary goal of “price stability” – a steady inflation rate of around 2%. Its primary tool for achieving this is the adjustment of interest rates. When inflation is too high, the BoE will try to rein it in by raising interest rates, making it more expensive for people and businesses to access credit. This is generally positive for GBP, as higher interest rates make the UK a more attractive place for global investors to park their money. When inflation falls too low it is a sign economic growth is slowing. In this scenario, the BoE will consider lowering interest rates to cheapen credit so businesses will borrow more to invest in growth-generating projects.
Data releases gauge the health of the economy and can impact the value of the Pound Sterling. Indicators such as GDP, Manufacturing and Services PMIs, and employment can all influence the direction of the GBP. A strong economy is good for Sterling. Not only does it attract more foreign investment but it may encourage the BoE to put up interest rates, which will directly strengthen GBP. Otherwise, if economic data is weak, the Pound Sterling is likely to fall.
Another significant data release for the Pound Sterling is the Trade Balance. This indicator measures the difference between what a country earns from its exports and what it spends on imports over a given period. If a country produces highly sought-after exports, its currency will benefit purely from the extra demand created from foreign buyers seeking to purchase these goods. Therefore, a positive net Trade Balance strengthens a currency and vice versa for a negative balance.
- Canadian Dollar is mostly flat on Friday with limited momentum.
- Housing Starts in Canada since November ticked higher.
- Next week: Canadian CPI inflation, US Fed rate call.
The Canadian Dollar (CAD) was mostly higher on Friday but stuck close to the day’s opening range against the US Dollar (USD) as markets shuffled in place ahead of the weekend. The University of Michigan US Consumer Sentiment Index ticked slightly lower early in the American trading session, and the highest print of Canadian Housing Starts since November sailed by without much notice from investors.
Canada brings February’s Consumer Price Index (CPI) inflation figures next week, slated for Tuesday, and markets will be quickly pivoting to face the latest rate statement from the Federal Reserve (Fed) on Wednesday. The Fed will also be updating its Dot Plot projection of interest rate expectations for the next one to five years.
Next week, the latest US Manufacturing Purchasing Managers Index (PMI) will be released on Thursday, followed by Canadian Retail Sales and the US Services PMI component on Friday. Early median market forecasts expect the US Manufacturing PMI to tick slightly lower, and Canadian Retail Sales are expected to contract.
Daily digest market movers: Data drives little chart movement, investors buckle down for the wait to Fed
- Seasonally-adjusted Canadian Housing Starts for the year ending in February rose to 253.5K, easily clearing the forecast of 230K and the previous period’s 223.2K (revised down from 223.6K).
- Canadian Wholesale Sales in January also recovered to a slim 0.1%, bouncing from the forecast of -0.6%. The previous month’s Wholesale Sales were revised to -0.3% from 0.3%. Next-to-flat prints in the revision-prone indicator are unlikely to drive much investor confidence.
- The University of Michigan’s US Consumer Sentiment Index ticked slightly lower in March down to 76.5 versus the market’s forecast hold at the previous 76.9.
- UoM 5-year Consumer Inflation Expectations in March held steady at 2.9% as US consumers remain skeptical that the Fed will successfully drag inflation below 2%.
- US MoM Industrial Production recovered a slim 0.1% in February, snubbing the market’s forecast of 0.0%, but only slightly. The previous month’s Industrial Production was revised down to -0.5% from the initial print of -0.1%.
- Next Tuesday’s Canadian CPI for the year ended February is expected to increase to 3.1% from the previous 2.9%. The Bank of Canada’s (BoC) Core Consumer Price Index (CPI) last came in at 2.4%.
- Canadian Retail Sales are also forecast to contract, with markets expecting a -0.4% print versus the previous 0.9%.
Canadian Dollar price today
The table below shows the percentage change of Canadian Dollar (CAD) against listed major currencies today. Canadian Dollar was the strongest against the New Zealand Dollar.
| USD | EUR | GBP | CAD | AUD | JPY | NZD | CHF | |
| USD | -0.05% | 0.12% | 0.00% | 0.24% | 0.49% | 0.60% | -0.06% | |
| EUR | 0.04% | 0.15% | 0.03% | 0.27% | 0.52% | 0.63% | -0.03% | |
| GBP | -0.09% | -0.14% | -0.12% | 0.14% | 0.40% | 0.51% | -0.15% | |
| CAD | 0.01% | -0.05% | 0.11% | 0.24% | 0.48% | 0.60% | -0.06% | |
| AUD | -0.24% | -0.28% | -0.11% | -0.23% | 0.24% | 0.37% | -0.30% | |
| JPY | -0.50% | -0.53% | -0.35% | -0.48% | -0.27% | 0.09% | -0.52% | |
| NZD | -0.60% | -0.65% | -0.51% | -0.60% | -0.37% | -0.13% | -0.66% | |
| CHF | 0.04% | -0.01% | 0.15% | 0.04% | 0.27% | 0.53% | 0.64% |
The heat map shows percentage changes of major currencies against each other. The base currency is picked from the left column, while the quote currency is picked from the top row. For example, if you pick the Euro from the left column and move along the horizontal line to the Japanese Yen, the percentage change displayed in the box will represent EUR (base)/JPY (quote).
Technical analysis: Flat Friday trading as Canadian Dollar struggles to pare losses against Greenback
The Canadian Dollar (CAD) was mixed to flat on Friday, staying close to the day’s opening range against the US Dollar, Euro (EUR), and Swiss Franc (CHF). The CAD has climbed around a tenth of a percent against the Pound Sterling (GBP) and is up roughly half a percent against the Japanese Yen (JPY).
Intraday trading in the USD/CAD is stuck on the high side of 1.3500, with the day’s early high near 1.3550 and sellers failing to push the pair back below 1.3510. A near-term supply zone is pricing in a potential pullback floor near 1.3460, and intraday bids are struggling to pierce a support-turned-resistance level near 1.3550.
USD/CAD hourly chart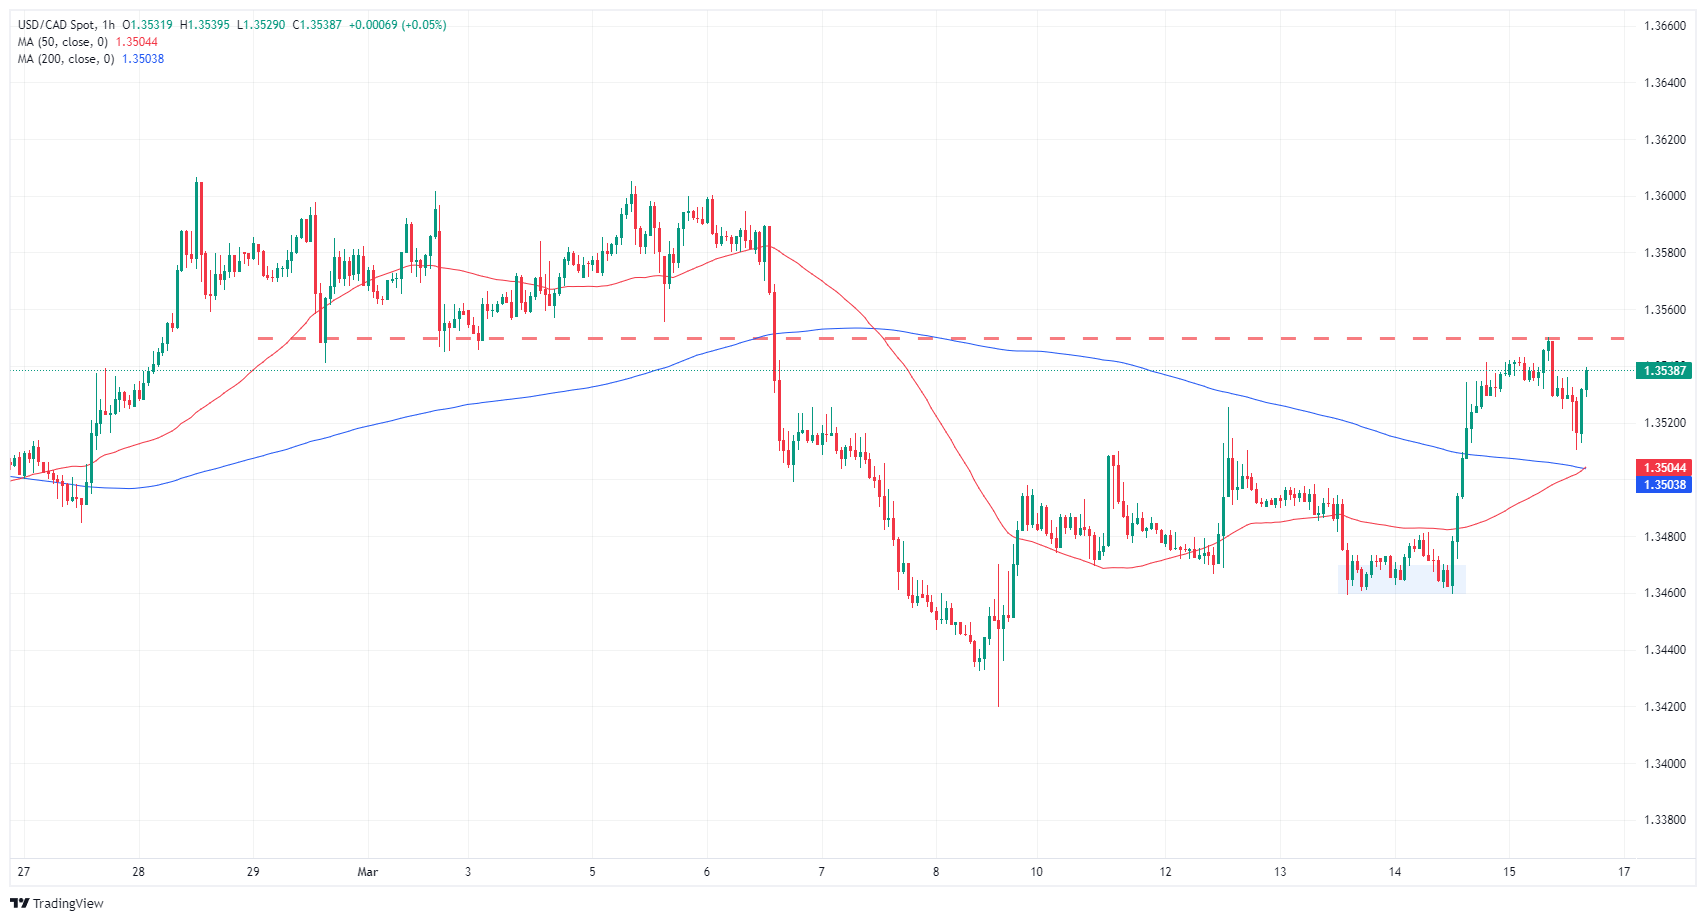
Canadian Dollar FAQs
The key factors driving the Canadian Dollar (CAD) are the level of interest rates set by the Bank of Canada (BoC), the price of Oil, Canada’s largest export, the health of its economy, inflation and the Trade Balance, which is the difference between the value of Canada’s exports versus its imports. Other factors include market sentiment – whether investors are taking on more risky assets (risk-on) or seeking safe-havens (risk-off) – with risk-on being CAD-positive. As its largest trading partner, the health of the US economy is also a key factor influencing the Canadian Dollar.
The Bank of Canada (BoC) has a significant influence on the Canadian Dollar by setting the level of interest rates that banks can lend to one another. This influences the level of interest rates for everyone. The main goal of the BoC is to maintain inflation at 1-3% by adjusting interest rates up or down. Relatively higher interest rates tend to be positive for the CAD. The Bank of Canada can also use quantitative easing and tightening to influence credit conditions, with the former CAD-negative and the latter CAD-positive.
The price of Oil is a key factor impacting the value of the Canadian Dollar. Petroleum is Canada’s biggest export, so Oil price tends to have an immediate impact on the CAD value. Generally, if Oil price rises CAD also goes up, as aggregate demand for the currency increases. The opposite is the case if the price of Oil falls. Higher Oil prices also tend to result in a greater likelihood of a positive Trade Balance, which is also supportive of the CAD.
While inflation had always traditionally been thought of as a negative factor for a currency since it lowers the value of money, the opposite has actually been the case in modern times with the relaxation of cross-border capital controls. Higher inflation tends to lead central banks to put up interest rates which attracts more capital inflows from global investors seeking a lucrative place to keep their money. This increases demand for the local currency, which in Canada’s case is the Canadian Dollar.
Macroeconomic data releases gauge the health of the economy and can have an impact on the Canadian Dollar. Indicators such as GDP, Manufacturing and Services PMIs, employment, and consumer sentiment surveys can all influence the direction of the CAD. A strong economy is good for the Canadian Dollar. Not only does it attract more foreign investment but it may encourage the Bank of Canada to put up interest rates, leading to a stronger currency. If economic data is weak, however, the CAD is likely to fall.
- The Greenback gears up to hold onto a 0.7% weekly gain.
- Sentiment data from the University of Michigan came in weak.
- On the bright side, Industrial Production data came in stronger than expected.
- The focus will now turn to next week’s FOMC meeting.
The US Dollar Index (DXY) is registering slight gains at the level of 103.40 on Friday, rebounding from December lows amid rising US Treasury yields. This follows the release of hot inflation data this week. The resilience of strong economic indicators and a cautious stance from the Federal Reserve (Fed) against hasty easing offer potential for US Dollar recovery. Next week, all eyes will be on the updated Federal Open Market Committee (FOMC) forecast, which could give additional traction to the USD.
Despite persistent inflation in the US, incoming data will continue to dictate the timing of the easing cycle, expected in June. Investors overlook hot inflation rates as mixed labor market data seems to have overshadowed it. Next week’s FOMC Dot Plot might also recalibrate the market’s expectations.
Daily digest market movers: US Dollar to close the week with mild gains after mid-tier data
- The University of Michigan reported the March Consumer Expectations index at 74.6, down from the previous figure of 75.2.
- The Consumer Sentiment index for March was reported at 76.5, slightly down from 76.9 in the previous period.
- The 5-Year Inflation Expectations remained steady at 2.9%.
- On the positive side, the Industrial Production (MoM) for February came in at 0.1%, which was an improvement from the previous report of -0.5%.
- US Treasury yields rise with the 2-year yield at 4.71%, the 5-year at 4.13%, and the 10-year at 4.29%.
- The market anticipates no rate cuts from the Federal Reserve in the coming week, with eyes on whether the Fed can ensure a smooth landing. Projections for a cut in May stand at 10%, while the likelihood of a June cut is around 65%.
- The market will focus on whether officials still envision three cuts in 2024.
DXY technical analysis: DXY sees a bearish undertone despite the recent bullish gains
The daily chart indicators reveal the dominance of selling momentum in DXY's technical landscape. The Relative Strength Index (RSI) prints a positive slope yet remains in negative terrain, suggesting that bears still hold the reins but with buyers building momentum. On the other hand, the Moving Average Convergence Divergence (MACD) histograms are showing decreasing red bars, highlighting decreasing selling pressure.
Adding to the bearish implications, DXY is trading below its 20, 100, and 200-day Simple Moving Averages (SMAs), pointing to a strong downtrend. This consolidation beneath the SMAs may suggest a short-term bearish outlook, offsetting any bullish attempt. Although bulls are gradually gaining ground, the prevailing selling momentum communicates strong downward pressure. Until the RSI climbs into bullish territory and MACD bars switch to the green zone, the bearish perspective will remain intact.
US Dollar FAQs
What is the US Dollar?
The US Dollar (USD) is the official currency of the United States of America, and the ‘de facto’ currency of a significant number of other countries where it is found in circulation alongside local notes. It is the most heavily traded currency in the world, accounting for over 88% of all global foreign exchange turnover, or an average of $6.6 trillion in transactions per day, according to data from 2022.
Following the second world war, the USD took over from the British Pound as the world’s reserve currency. For most of its history, the US Dollar was backed by Gold, until the Bretton Woods Agreement in 1971 when the Gold Standard went away.
How do the decisions of the Federal Reserve impact the US Dollar?
The most important single factor impacting on the value of the US Dollar is monetary policy, which is shaped by the Federal Reserve (Fed). The Fed has two mandates: to achieve price stability (control inflation) and foster full employment. Its primary tool to achieve these two goals is by adjusting interest rates.
When prices are rising too quickly and inflation is above the Fed’s 2% target, the Fed will raise rates, which helps the USD value. When inflation falls below 2% or the Unemployment Rate is too high, the Fed may lower interest rates, which weighs on the Greenback.
What is Quantitative Easing and how does it influence the US Dollar?
In extreme situations, the Federal Reserve can also print more Dollars and enact quantitative easing (QE). QE is the process by which the Fed substantially increases the flow of credit in a stuck financial system.
It is a non-standard policy measure used when credit has dried up because banks will not lend to each other (out of the fear of counterparty default). It is a last resort when simply lowering interest rates is unlikely to achieve the necessary result. It was the Fed’s weapon of choice to combat the credit crunch that occurred during the Great Financial Crisis in 2008. It involves the Fed printing more Dollars and using them to buy US government bonds predominantly from financial institutions. QE usually leads to a weaker US Dollar.
What is Quantitative Tightening and how does it influence the US Dollar?
Quantitative tightening (QT) is the reverse process whereby the Federal Reserve stops buying bonds from financial institutions and does not reinvest the principal from the bonds it holds maturing in new purchases. It is usually positive for the US Dollar.
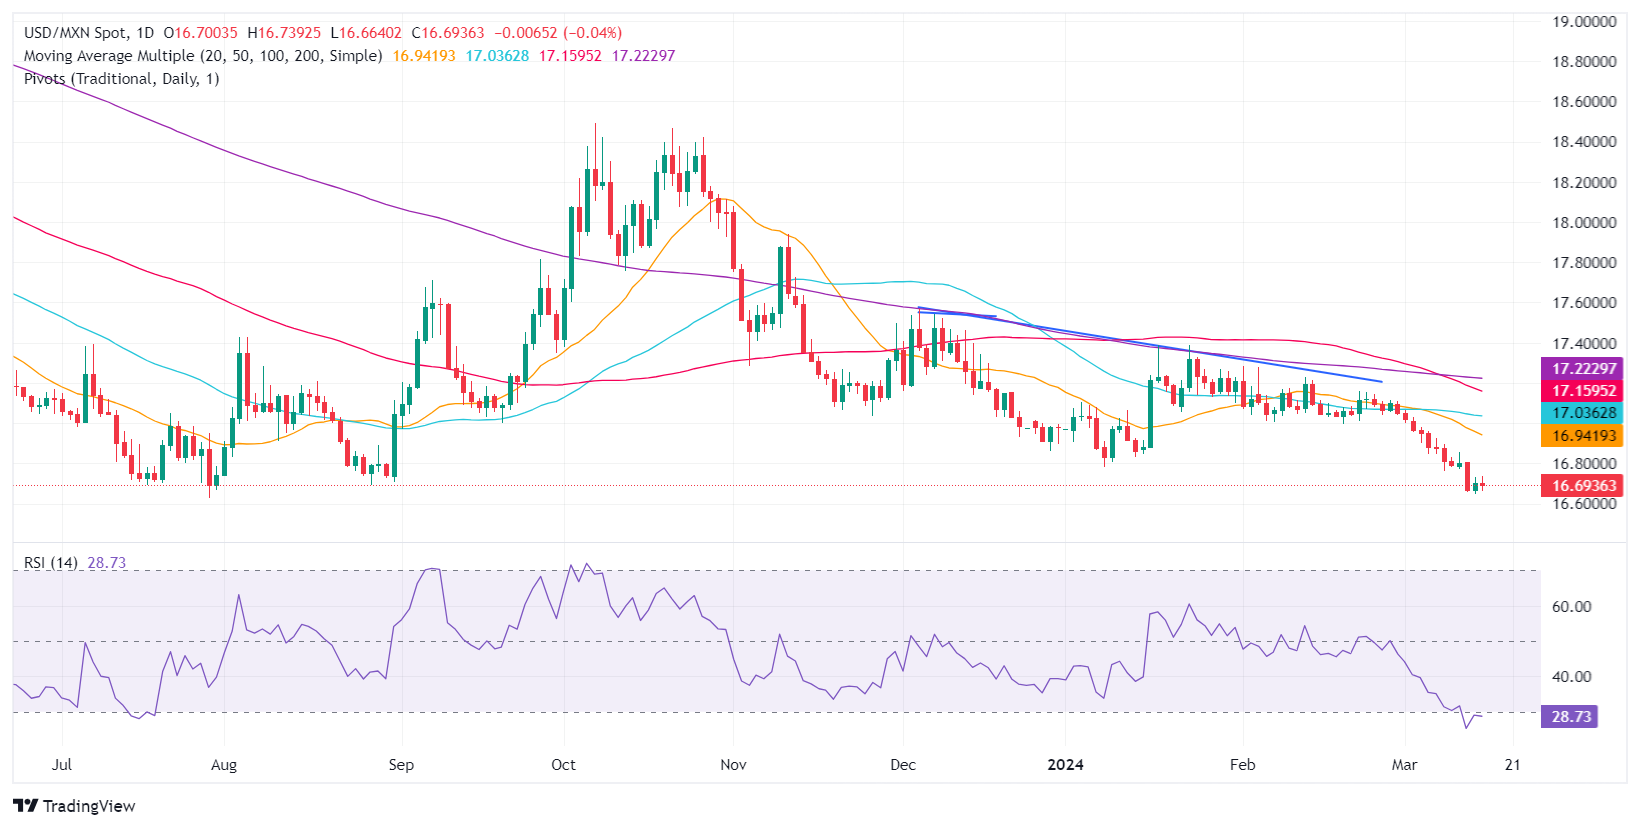
- Mexican Peso sees modest uplift as US inflation data tempers Fed easing expectations.
- Industrial Production in Mexico shows resilience, reinforcing views on potential Banxico rate adjustments.
- Deputy Governor Omar Mejia hints at upcoming rate cuts, with a focus on maintaining restrictive monetary policy.
- US Industrial Production recovery and shifts in consumer sentiment barely move the USD/MXN currency pair.
The Mexican Peso (MXN) begins Friday’s session printing minuscule gains against the US Dollar (USD) after hot inflation figures in the United States evaporated traders' hopes for a rate cut by the US Federal Reserve (Fed).
Mexico’s weekly economic docket witnessed the release of Industrial Production data, which showed a slight improvement despite dealing with high-interest rates of 11.25% set by the Bank of Mexico (Banxico). Two days ago, Banxico’s Deputy Governor, Omar Mejia, commented that a rate cut is possible, adding that it’s not premature and that despite decreasing interest rates, it doesn’t mean monetary policy is not restrictive. The Mexican Central Bank's next meeting will be on March 21, and market participants anticipate a 25-basis-point rate cut.
Across the border, the US economic docket is slightly busier. The Fed reported that Industrial Production recovered, snapping two consecutive months of decreases. The University of Michigan recently announced that consumer sentiment slightly deteriorated compared to last month’s figures and the consensus.
Daily digest market movers: Mexican Peso counterattacks ahead of Banxico and Fed decisions
- Banxico’s Mejia commented that they have a long way to go on the disinflationary path, though he acknowledged the stickiness of services inflation. He stresses that the balance of risks for inflation is less adverse.
- Mexico’s economic schedule for the next week will feature Aggregate Demand, Private Spending, Retail Sales, Economic Activity, and inflation figures for the first half of March. Besides all this data, the highlight would be Banxico’s interest rate policy decision.
- Banxico’s private analyst poll projections for February were updated. They expect inflation at 4.10%, core CPI at 4.06%, and the economy to grow by 2.40%, unchanged from January. Regarding monetary policy, they see Banxico lowering rates to 9.50% and the USD/MXN exchange rate at 18.31, down from 18.50.
- During Banxico’s quarterly report, policymakers acknowledged the progress on inflation and urged caution against premature interest rate cuts. Governor Victoria Rodriguez Ceja said adjustments would be gradual, while Deputy Governors Galia Borja and Jonathan Heath called for prudence. The latter specifically warned against the risks of an early rate cut.
- Banxico updated its economic growth projections for 2024 from 3.0% to 2.8% YoY and maintained 1.5% for 2025. The slowdown is blamed on high interest rates at 11.25%, which sparked a shift from three of Banxico’s five governors, who are eyeing the first rate cut at the March 21 meeting.
- A Reuters poll sees the Mexican Peso depreciating 7% to 18.24 in 12 months from 16.96 on Monday, according to the median of 20 FX strategists polled between March 1-4. The forecast ranged from 15.50 to 19.00.
- A Reuters poll shows 15 analysts estimate that inflation will slow down in February, corroborating bets that Banxico could cut rates as soon as the March 21 meeting.
- US Industrial Production was 0.1% MoM, up from -0.5% contraction in January, and exceeded the consensus.
- The University of Michigan Consumer Sentiment on its preliminary reading was 76.5, below estimates and the previous reading of 76.9. Americans expect inflation to remain at 3% in the 12 months from March and for five years at 2.9%.
- Thursday’s data added to the release of the latest Consumer Price Index (CPI) report in the United States, cementing the Federal Reserve’s case for being patient about cutting interest rates. Unless data proves the disinflationary process is sustainably trending toward the 2% goal, they will stick to the “higher for longer” mantra. The next Fed meeting is scheduled for March 19-20 next week.
- Meanwhile, 52 of 108 economists expect the Fed to cut rates by 75 basis points in 2024, with 26 saying 100 bps.
- The CME FedWatch Tool shows traders decreased their bets for a 25-basis-point rate cut in June, down from 72% at the beginning of the week to 58%.
- Next week, the US economic schedule will feature medium and high-impact data.
- March 19: Housing data, led by Building Permits, Housing Starts.
- March 20: The Federal Open Market Committee (FOMC) monetary policy decision and Fed Chair Jerome Powell press conference.
- March 21: Current Account, Initial Jobless Claims, S&P Global PMI and Existing Home Sales.
- March 22: Atlanta Fed President Raphael Bostic speech.
Technical analysis: Mexican Peso stays firm with USD/MXN spot below 16.70
The USD/MXN downtrend remains intact, but after refreshing year-to-date lows of 16.64, the exotic pair seems to be oversold. The Relative Strength Index (RSI) was below the 30.00 level and remains flat, which could open the door for further downside. In that case, the next support would be last year’s low of 16.62, which, once cleared, could exacerbate a fall to challenge October 2015’s low of 16.32, followed by the 16.00 psychological level.
On the other scenario, if buyers lift the USD/MXN exchange rate toward January’s low of 16.78, that could pave the way to challenge the 17.00 figure. Key resistance levels are seen at the 50-day Simple Moving Average (SMA) at 17.03, followed by the 100-day SMA at 17.17 and the 200-day SMA at 17.21.
USD/MXN Price Action – Daily Chart
Mexican Peso FAQs
The Mexican Peso (MXN) is the most traded currency among its Latin American peers. Its value is broadly determined by the performance of the Mexican economy, the country’s central bank’s policy, the amount of foreign investment in the country and even the levels of remittances sent by Mexicans who live abroad, particularly in the United States. Geopolitical trends can also move MXN: for example, the process of nearshoring – or the decision by some firms to relocate manufacturing capacity and supply chains closer to their home countries – is also seen as a catalyst for the Mexican currency as the country is considered a key manufacturing hub in the American continent. Another catalyst for MXN is Oil prices as Mexico is a key exporter of the commodity.
The main objective of Mexico’s central bank, also known as Banxico, is to maintain inflation at low and stable levels (at or close to its target of 3%, the midpoint in a tolerance band of between 2% and 4%). To this end, the bank sets an appropriate level of interest rates. When inflation is too high, Banxico will attempt to tame it by raising interest rates, making it more expensive for households and businesses to borrow money, thus cooling demand and the overall economy. Higher interest rates are generally positive for the Mexican Peso (MXN) as they lead to higher yields, making the country a more attractive place for investors. On the contrary, lower interest rates tend to weaken MXN.
Macroeconomic data releases are key to assess the state of the economy and can have an impact on the Mexican Peso (MXN) valuation. A strong Mexican economy, based on high economic growth, low unemployment and high confidence is good for MXN. Not only does it attract more foreign investment but it may encourage the Bank of Mexico (Banxico) to increase interest rates, particularly if this strength comes together with elevated inflation. However, if economic data is weak, MXN is likely to depreciate.
As an emerging-market currency, the Mexican Peso (MXN) tends to strive during risk-on periods, or when investors perceive that broader market risks are low and thus are eager to engage with investments that carry a higher risk. Conversely, MXN tends to weaken at times of market turbulence or economic uncertainty as investors tend to sell higher-risk assets and flee to the more-stable safe havens.
Gold’s rally has not been deterred by the pushing out of expectations around the timing of Federal Reserve rate cuts. Economists at ANZ Bank analyze the yellow metal’s outlook.
Macroeconomic and geopolitical backdrop remains supportive
The timing and pace of the Federal Reserve’s rate cuts is a long-term driver for Gold. Currently, the FOMC needs more confidence that inflation is returning to 2% before considering cuts. We believe the cuts will commence from July this year. Markets are pricing-in cuts starting from H2 2024. That said, the push back in market expectations from March to June may cap the price rally.
A change in the governing party in the US would present risks around the future of policies. Amid these economic and geopolitical tensions, equity markets are hitting record high. This could potentially make investors more wary about the downside risk than upside potential. Volatility is expected to pick up as we get closer to the US elections. A risk-off scenario in equity markets will lend support to Gold prices.
EUR/USD has seen some movement in the first two months of the year but remains relatively rangebound between the 1.0750 and 1.1000 levels. Economists at the National Bank of Canada analyze the pair’s outlook.
Some volatility for the Euro expected over the next quarters
We expect some volatility for the Euro over the next quarters, especially as both the Federal Reserve and the European Central Bank policy paths become clearer.
Nonetheless, we see the common currency depreciating towards the end of the year.
BoJ hiking could help the Japanese Yen (JPY) somewhat, but for a much stronger JPY the Fed needs to cut rates markedly, economists at Nordea say.
BoJ is at the onset of raising rates after high wage growth
While the USD sets the tone for most currencies, the JPY could finally be in for some slight relief now that the BoJ is at the beginning of its hiking cycle.
We believe that the BoJ will signal next Tuesday that rates will likely be raised at the April meeting after the announcement for wage growth above 5% for the largest workers union. With wage growth the highest in three decades and inflation above 2%, the negative interest rate era in Japa is about to end. However, we don’t expect a massive rate hiking cycle from the BoJ.
The BoJ will take baby steps when hiking rates to ensure that the inflation dynamic is around 2%. As such, no major JPY strengthening will come so long as the Fed and ECB keep rates unchanged.
The recent rise in the Gold price cannot be adequately explained in fundamental terms, which is why a price correction is likely in the short term, strategists at Commerzbank say.
Will XAU/USD rally continue?
In the absence of a convincing explanation for Gold's rally, we are sceptical that the precious metal will be able to sustain its gains in the short term.
In particular, if US interest rate cut expectations take a new blow, as they did on Tuesday following another strong reading on US inflation, many investors could be tempted to take profits and the recent moderate downward correction could continue.
However, it is unlikely that prices will fall back to the levels seen at the end of February as the Fed is expected to cut interest rates from June, which should support Gold. However, further upside potential is likely to be limited in the medium to long term. This is because a pronounced cycle of interest rate cuts in the US is unlikely, given the persistent risks of inflation.
We are therefore ‘only’ raising our Gold price forecast for the end of this year and the end of next year from $2,100 to $2,200.
- Silver nears the top of a range as the bulls push prices higher.
- Long-term fundamentals support, including positive global growth and robust demand.
- US Industrial Production data beats to the upside suggesting increased demand by industry.
Silver price (XAG/USD) pushes higher, trading up over one and a half percentage points in the $25.20s on Friday, on technical buying mainly – and long-term bullish fundamentals.
The precious metal, which is used in industrial processes as well as to store value, sees gains after the release of US Industrial Production data beat estimates with a 0.1% rise in February when economists had expected flat growth. The data, released by the US Federal Reserve (Fed), was also an improvement on the negative 0.5% of the previous month.
A positive outlook for global growth has led analysts such as Macquarie's Marcus Garvey to speculate Silver could be in for more gains as demand increases for its use in the manufacture of Solar Panels, a wide variety of electronic devices and jewelry.
Recent higher-than-expected inflation data from the US has failed to dissuade Silver bulls, despite the data pointing to further delays before the Federal Reserve pushes the button on cutting interest-rates. Usually a higher interest rate outlook would be bearish for Silver in its role as an investment since it is non-yielding so loses out in a high inflation environment, however, this has not been the case this time.
The Silver Institute, a not-for-profit organization based in the US, has forecast robust demand for Silver in 2024, predicting it will see its second best year on record with demand rising to 1.2 billion ounces.
From a technical perspective, XAG/USD remains stuck in a range between $19.00 and $26.00 (thick lines), which itself sits within a broader range between $17.50 and $30.00.
It is rallying in a short-term bullish uptrend within its ranges, and is now quite near the narrower range’s highs. A decisive break above $25.85 would probably indicate a breakout to the upside, further increasing bullish enthusiasm.
Such a breakout would probably see Silver rally to between around $29.50, if using the 0.618 Fibonacci ratio of the range, or just shy of $32.00 if extrapolating the full height of the range higher.
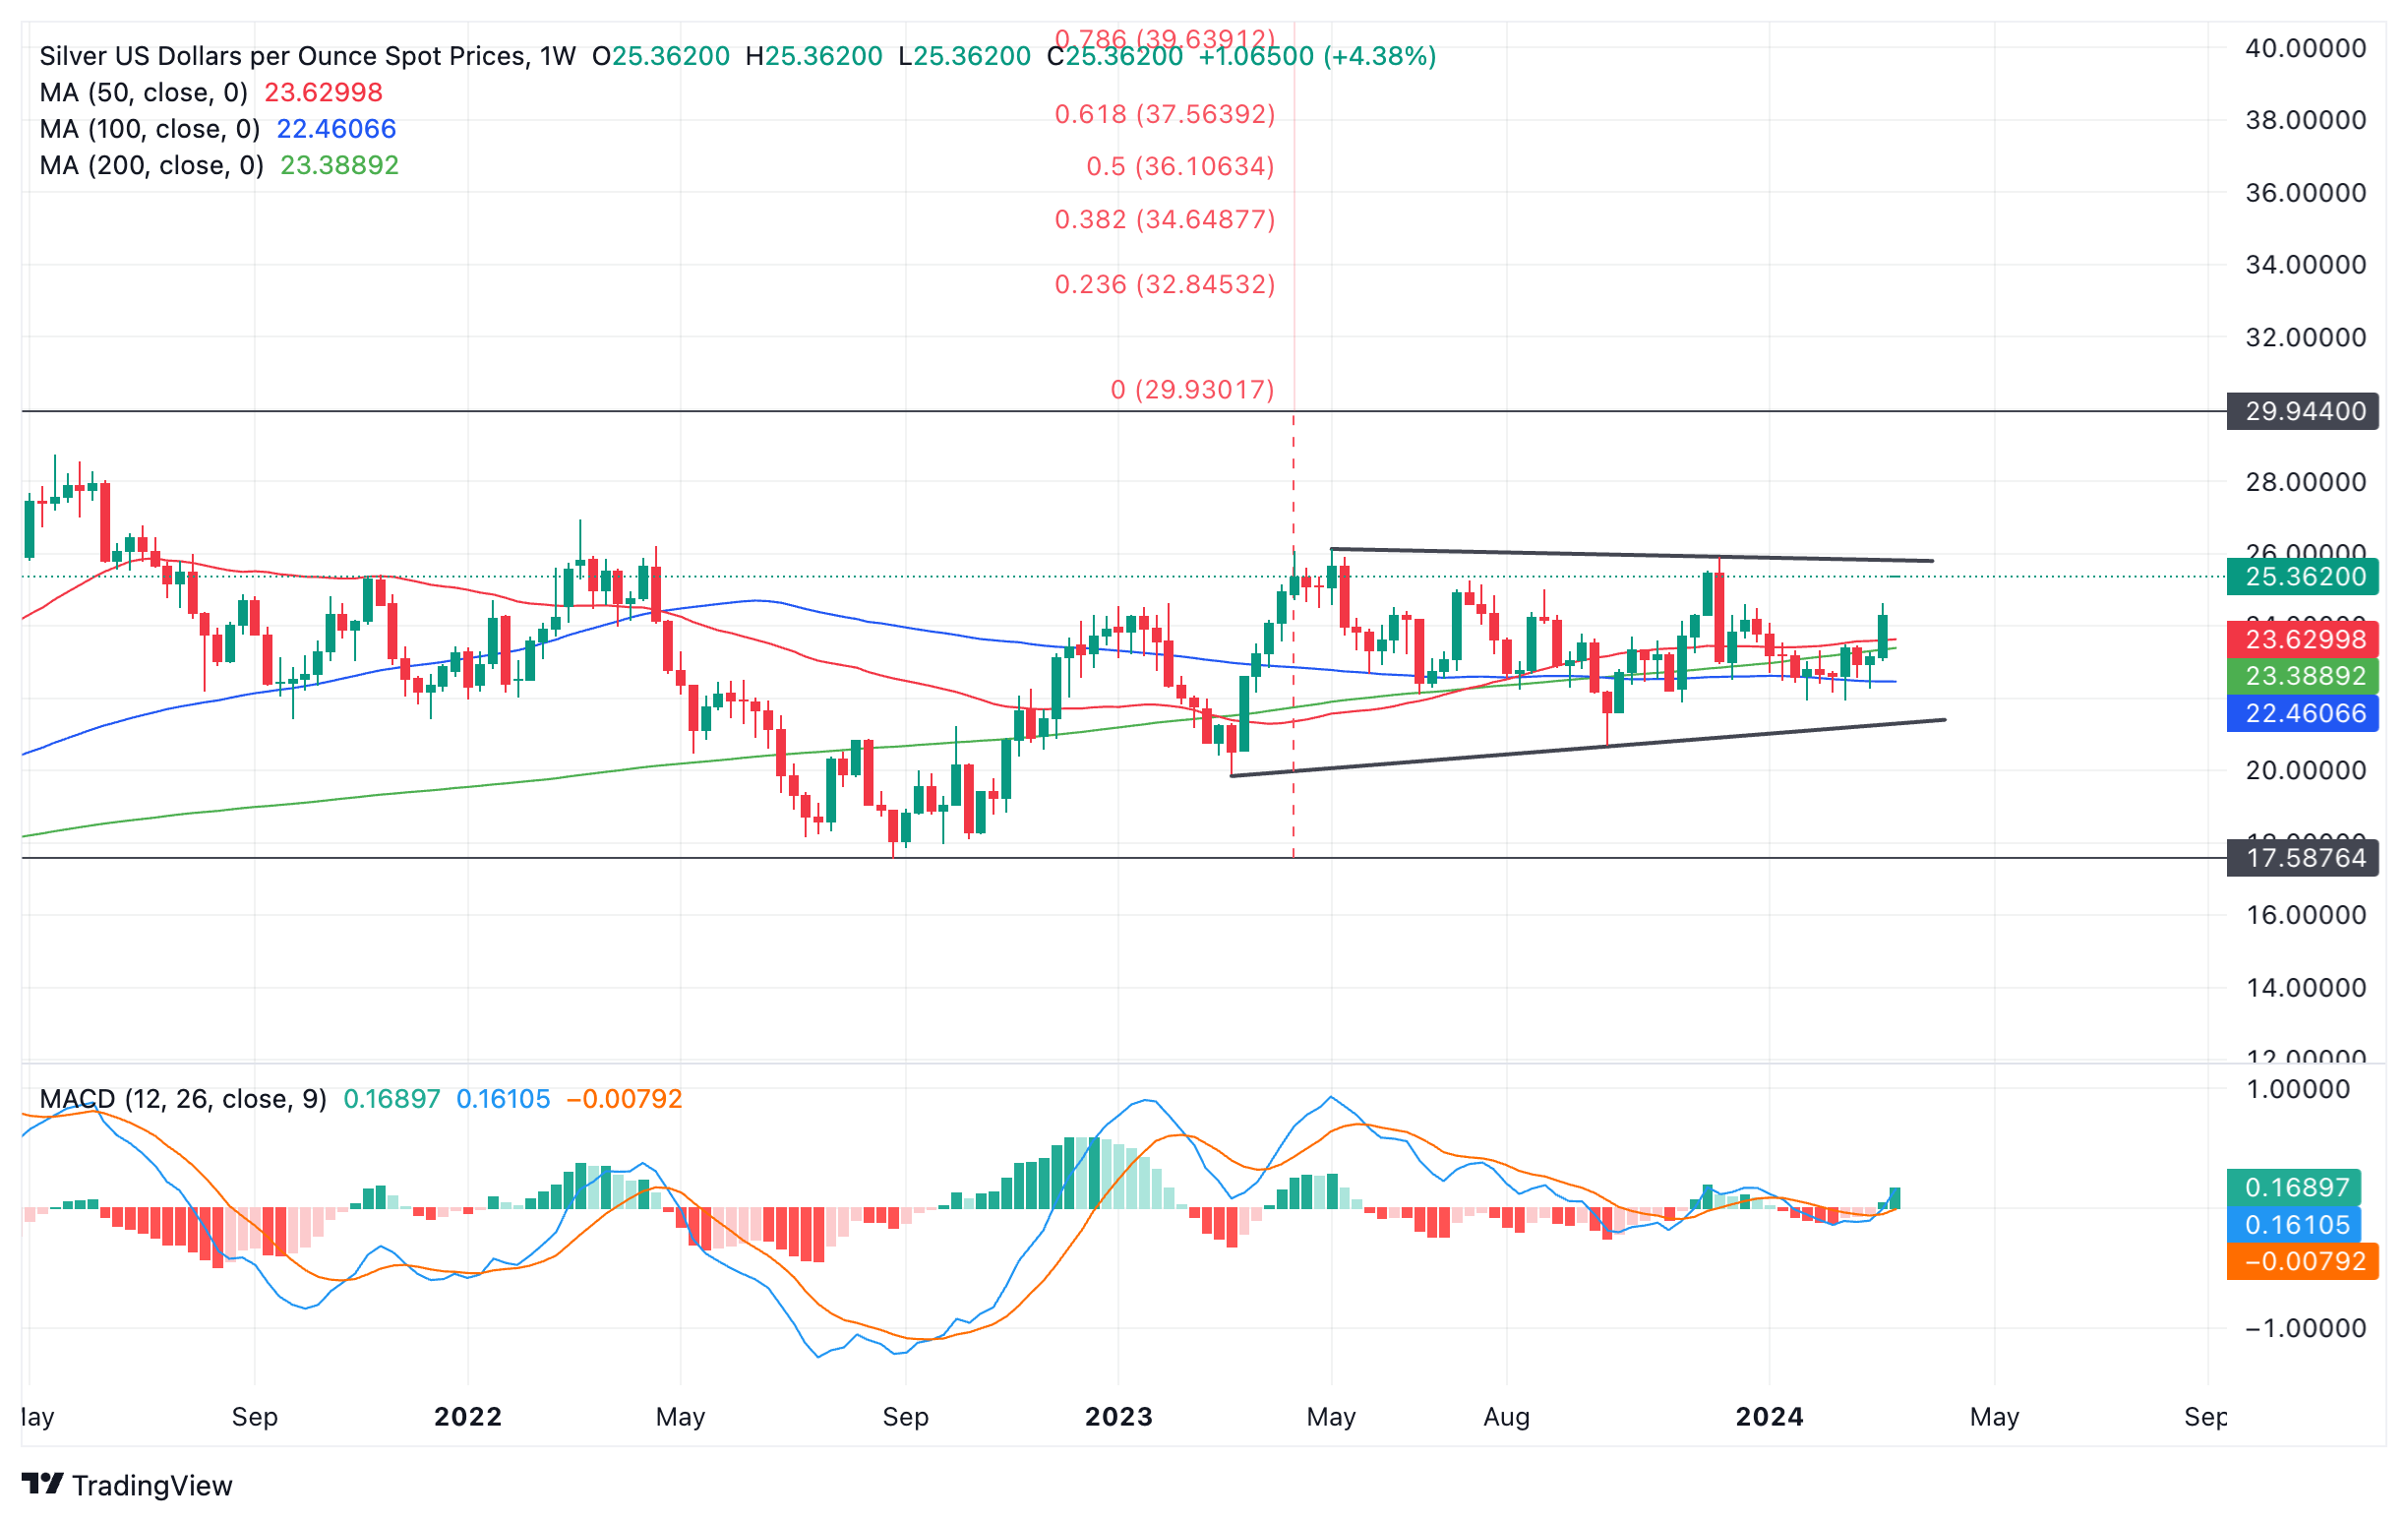
Silver versus US Dollars: Weekly chart
If the latter, then it will mean the pair has also broken out of the top of the broader range, indicating even greater upside, potentially to a target at $37.50.
Alternatively the precious metal could meet tough resistance at the range highs in the $25.80-90s and pullback down.
Traders should watch for a decisive break higher before jumping in. A “decisive” break is one characterized by a long green daily candle piercing clearly above the level and closing near its high, or three green candles in a row, breaching the level.
- NZD/USD tumbles to 0.6100 as market sentiment remains downbeat.
- Hot US CPI and PPI data for February has diminished Fed rate cut expectations for June.
- The NZ Dollar will dance to the tunes of the Q4 GDP data.
The NZD/USD pair falls vertically to the round-level support of 0.6100 in Friday’s early American session. The Kiwi asset weakens as market expectations for the Federal Reserve (Fed) reducing interest rates in the June policy meeting have diminished. This has led to a big dent in the demand for risk-sensitive assets.
The S&P 500 opens on a bearish note as investors rush for safe-haven assets amid uncertainty ahead of the Federal Reserve’s (Fed) monetary policy decision, which will be announced on Wednesday. The Fed is expected to keep interest rates unchanged in the range of 5.25%-5.50% while investors will majorly focus on the dot plot and economic projections. The US Dollar Index (DXY) consolidates in a tight range around 103.80. 10-year US Treasury yields rise to 4.31%.
Expectations for the Fed to cut interest rates are shifting to the July monetary policy meeting as consumer and producer prices remain hotter than expected in February. The situation is not favorable for the Fed to pivot to rate cuts. Fed policymakers have been reiterating that rate cuts would be appropriate only if they get confidence that inflation will sustainably return to the 2% target.
Meanwhile, the New Zealand Dollar will be guided by the Q4 Gross Domestic Product (GDP) data of 2023, which will be published later next week. The NZ economy is forecasted to have remained stagnant. The NZ economy would be considered in a technical recession if the economy contracts in the final quarter of 2023. The economy was contracted by 0.3% in the third quarter of 2023.
The US Dollar (USD) has run out of momentum due to more mixed economic data. Economists at Société Générale analyze the forex market outlook.
Sterling is clearly vulnerable
USD/JPY is likely to fall as the BoJ exits negative rates and yield curve control. A symbolic move still matters if it suggests that higher rates will be seen eventually. The Yen is too cheap.
EUR/USD may be stuck, but GBP/USD could fall as the UK continues to stagnate and the Bank of England finally cuts rates.
- UoM Consumer Sentiment Index edged lower in March's preliminary reading.
- The US Dollar Index stays in daily range above 103.00 after the data.
Consumer confidence in the US weakened slightly in early March, with the University of Michigan's Consumer Sentiment Index edging lower to 76.5 from 76.9 in February. This reading came in below the market expectation of 76.9.
The 5-year Inflation Expectation component of the survey remained unchanged at 2.9%.
Assessing the survey's findings, "small improvements in personal finances were offset by modest declines in expectations for business conditions," said Surveys of Consumers Director Joanne Hsu and continued:
"After strong gains between November 2023 and January 2024, consumer views have stabilized into a holding pattern; consumers perceived few signals that the economy is currently improving or deteriorating. Indeed, many are withholding judgment about the trajectory of the economy, particularly in the long term, pending the results of this November’s election."
Market reaction
This report failed to influence the US Dollar's valuation against its major rivals. At the time of press, the US Dollar Index was virtually unchanged on the day at 103.40.
Speculation around a BoJ monetary policy shift has been building. Economists at TD Securities bring forward their call for an April hike to March.
BoJ to hike next week
Following the positive round of wage increases announced this week and Rengo's announcement today delivering a 5% increase in first round wage negotiations, we believe the BoJ has the information it needs to hike at next week's meeting. Accordingly, we bring forward our call for an April hike to March.
We expect USD/JPY's reaction function to be asymmetric here with a bigger move on delivering a hike (USD/JPY towards 145.00) than on a disappointment (towards 150.00) as even in the latter the BoJ can try to sound hawkish and lay the grounds for an April pivot.
- USD/JPY jumps to 148.80 on hopes that the BoJ will maintain its ultra-loose monetary policy stance on Tuesday.
- The BoJ lacks a significant wage-price spiral to back an exit to negative interest rates.
- Diminished Fed rate cut expectations keep the US Dollar strong near its three-week highs around 103.50.
The USD/JPY climbs to 148.80 in the late European session on Friday as the Japanese Yen weakens on expectations that the Bank of Japan (BoJ) will not end the expansionary policy stance in the meeting on Tuesday.
Plenty of fundamentals favor the BoJ quitting negative interest rates. BoJ’s favourite inflation measure, the Consumer Price Index (CPI), excl. fresh food has remained above the 2% target for a longer period. Meanwhile, Japan's biggest companies agreed with labor unions to raise wages by the highest level in 33 years, reported Reuters.
In addition, Japan's Finance Minister Shunichi Suzuki said early Friday that the economy is no longer in deflation and that the government will mobilize all policy steps available to continue the strong trend of wage hikes this year. However, investors hope the BoJ will not go for exiting the prolonged expansionary policy stance as a full-proof plan for the wage-price spiral remains absent.
Market participants will keenly focus on the BoJ’s press conference about when the central bank will scrap its negative interest rates and Yield Curve Control (YCC). Earlier, BoJ Governor Kazuo Ueda said policymakers will debate whether the outlook is bright enough to phase out the massive monetary stimulus.
Meanwhile, market sentiment remains cautious as stubborn United States inflation has dented expectations for the Federal Reserve (Fed) to reduce interest rates from the June meeting. Surprisingly stubborn US Producer Price Index (PPI) data for February is expected to allow Fed policymakers to argue to keep interest rates higher for a longer period.
The US Dollar Index (DXY) is holding near its three-week high of around 103.50. Ten-year US Treasury yields are extending their upside to 4.31%.
The strength of the Gold price is a little puzzling. Economists at Commerzbank analyze the yellow metal’s outlook.
A Fed rate cut has hardly moved any closer for most market participants
Despite the recent weak US economic data, a Fed rate cut has hardly moved any closer for most market participants. According to Fed Funds Futures, the first rate cut is not expected until June at the earliest.
The Fed meets next week: a rate cut is not expected. But if the Fed's new projections and Fed Chairman Powell's words at the press conference can be interpreted as having increased the chances of faster interest rate cuts, the Gold market could even set new records, before the rally runs out of steam.
- The Australian Dollar is hit by negative Chinese House Price data on Friday.
- A fall in Chinese New Loans and M2 Money Supply add to the narrative of constraint.
- AUD/USD tumbled on Thursday after US data showed inflationary tendencies in the US economy.
AUD/USD is trading almost two tenths of a percent lower on Friday, extending Thursday’s sell-off into the weekend. The pair is feeling pressure from negative Chinese housing and lending data which indicates the property sector of the world’s second largest economy is still in the eye of the storm.
The weak Chinese data is a negative factor for the Australian Dollar which relies heavily on the Chinese market for its exports, particularly Iron Ore, which is Australia’s largest export commodity.
The Chinese House Price Index showed a decline in house prices of minus 1.4% in February from minus 0.7% in the previous month of January, according to data from the National Bureau of Statistics of China, released early Friday. This continues the down trend in Chinese house prices since 2019.
Chinese property market woes have had a direct impact on Iron Ore prices, because the country uses so much of the ore to make the steel girders it uses in its buildings. Iron Ore prices have registered a roughly 25% drop since the start of 2024 alone.
-638461042762640597.png)
Other data out on Friday showed an unexpected fall in New Loans in China, in February. New Loans shrank to ㍐1,450 billion, according to data from The People’s Bank of China (Pboc). This was a decline from the 4,920 billion Yuan in January and below estimates of 1,500 billion. The data indicates less lending, which could be growth limiting, especially for the borrowing intensive property sector.
Data showing lower-than-expected Money Supply M2, which increased by 8.7% YoY in February versus the 8.8% forecast, suggests a brake on liquidity.
US factory gate inflation rises
AUD/USD fell over half a percent on Thursday after the release of US macroeconomic data indicated the US economy was hotter-than-expected.
The US Producer Price Index, which measures factory-gate price inflation, rose to 1.6%, easily beating the 1.1% expected and 1.0% previous, suggesting continued inflationary tendencies.
Core PPI also rose by more than estimated. The data suggests the inflation will be passed on to consumers and turn up later to bug shoppers in the Consumer Price Index.
The higher inflation makes it less likely the Federal Reserve (Fed) will be in a hurry to cut interest rates. Whilst market expectations continue to see the probabilities favor a rate cut in June, the chance of a reduction in May has dwindled to virtually zero.
Higher interest rates for longer are positive for USD because they attract more foreign capital inflows. They are negative for the AUD/USD which measures the number of Australian Dollars purchasable with one US Dollar. As such the data was negative for the pair, which declined substantially after the release on Thursday.
- The US Dollar locks in gains for this week after hotter-than-expected US CPI and PPI figures.
- Traders brace for Import-Export prices and Michigan Consumer Sentiment numbers.
- The US Dollar Index trades at a crucial pivotal level that could unlock 104.00.
The US Dollar (USD) trades firmly in the green on Friday after markets got shaken on Thursday after a badge of US economic data suggested inflation pressures are far from over.. A textbook panic attack took place in markets, with risk assets such as equities and Bitcoin selling off, yields jumping higher with bonds being sold and the US Dollar strengthening against everything. The surprise uptick in the Produce Price Index (PPI) numbers spooked investors, who rushed to reprice the first interest-rate cut by the Federal Reserve (Fed) away from June and towards September.
On Friday’s economic calendar, there are some lighter data set to be released. Still, many investors will be set to square their positions for this week ahead of the US Federal Reserve rate decision next week and the risk event of the Bank of Japan, which could opt for hiking interest rates for the first time in decades. For this Friday, the Import and Export prices data and the preliminary data from the University of Michigan Consumer Sentiment and Inflation Expectations for March could eke out some more gains for the Greenback.
Daily digest market movers: Last data points opportunity
- At 12:30, Import and Export price data for February will be released:
- The monthly Import price Index headed from 0.8% to 0.3%, while the Yearly Import Index fell by 0.8% in January.
- The monthly Export price Index declined from 0.0% to 0.8%. The Yearly Export Index fell by 1.8% in January.
- The New York Empire State Manufacturing Index for March did a nosedive move from -2.4 to -20.9.
- At 13:15 GMT, both Industrial Production and Capacity Utilization data for February will be released. Production is expected to remain roughly stable, from -0.1% to 0.0%. Capacity Utilization is seen unchanged at 78.5%.
- The last data number for this Friday is the University of Michigan release, at 14:00 GMT:
- Consumer Sentiment for March is expected to remain stable at 76.9.
- Inflation expectations were at 2.9% in February, with no forecast available.
- Equities are carefully in the green after the bloodbath on both the European and US equity markets. European indices are though mildly in the green while US futures are flat ahead of the US opening.
- According to the CME Group’s FedWatch Tool, expectations for a Fed pause in the March 20 meeting are at 99%, while chances of a rate cut stand at 1%. The odds of a June rate cut are around 60%, below the above 70% priced in a week ago.
- The benchmark 10-year US Treasury Note trades around 4.28%, the highest level this week.
US Dollar Index Technical Analysis: Brief return of the King
The US Dollar Index (DXY) –not Elvis Presley of course – made its way back to the stage on Thursday after markets got shaken with the US Dollar as the sole winner. Although the PPI numbers might have sparked some worries on the June timing, it is again a mere repricing, by moving the probability for that initial rate cut from June to September. It is the same story we have seen year-to-date, which means that the probability of the DXY falling back to 103.00 is substantially bigger than rallying back up to 104.00.
On the upside, the 55-day Simple Moving Average (SMA) at 103.42 is facing some pressure. Not far above, a double barrier is set to hit with the 100-day SMA near 103.68 and the 200-day SMA near 103.70. Depending on the catalyst that pushes the DXY upwards, 104.96 remains the key level on the topside.
As mentioned in the opening paragraph on technical analysis, the move from Thursday already covers that pushback of a rate cut to September, and a move further down the line to December looks very unlikely. More downside thus, looks inevitable once markets move forward again to the June probability, with 103.00 and 102.00 up next, which bears some pivotal relevance. Once through there, the road is open for another leg lower to 100.61, the low of 2023.
US Dollar FAQs
The US Dollar (USD) is the official currency of the United States of America, and the ‘de facto’ currency of a significant number of other countries where it is found in circulation alongside local notes. It is the most heavily traded currency in the world, accounting for over 88% of all global foreign exchange turnover, or an average of $6.6 trillion in transactions per day, according to data from 2022. Following the second world war, the USD took over from the British Pound as the world’s reserve currency. For most of its history, the US Dollar was backed by Gold, until the Bretton Woods Agreement in 1971 when the Gold Standard went away.
The most important single factor impacting on the value of the US Dollar is monetary policy, which is shaped by the Federal Reserve (Fed). The Fed has two mandates: to achieve price stability (control inflation) and foster full employment. Its primary tool to achieve these two goals is by adjusting interest rates. When prices are rising too quickly and inflation is above the Fed’s 2% target, the Fed will raise rates, which helps the USD value. When inflation falls below 2% or the Unemployment Rate is too high, the Fed may lower interest rates, which weighs on the Greenback.
In extreme situations, the Federal Reserve can also print more Dollars and enact quantitative easing (QE). QE is the process by which the Fed substantially increases the flow of credit in a stuck financial system. It is a non-standard policy measure used when credit has dried up because banks will not lend to each other (out of the fear of counterparty default). It is a last resort when simply lowering interest rates is unlikely to achieve the necessary result. It was the Fed’s weapon of choice to combat the credit crunch that occurred during the Great Financial Crisis in 2008. It involves the Fed printing more Dollars and using them to buy US government bonds predominantly from financial institutions. QE usually leads to a weaker US Dollar.
Quantitative tightening (QT) is the reverse process whereby the Federal Reserve stops buying bonds from financial institutions and does not reinvest the principal from the bonds it holds maturing in new purchases. It is usually positive for the US Dollar.
Economists at ING analyze US Dollar’s outlook ahead of next week’s Fed meeting.
Dollar’s yield position is strong, even without a hawkish Fed
We recently stressed the upside risks for the Dollar given its still strong underlying yield position, and we are finally observing some USD buying across the board. The coming days will tell us where the FX market is positioning itself in the hawkish-dovish surprise spectrum for the Fed meeting.
We believe hawkish bets may be misplaced again this time as the Fed should reiterate a relatively optimistic narrative on disinflation and still hint at monetary easing ahead.
The main upside risk for the Dollar is a revision higher in the dot plots, but even then, we struggle to see this having a prolonged impact on FX if – as it appears likely – the Fed will continue to point to the crucial role of upcoming data releases, which are generally expected to start showing some signs of softening.
Economists at Rabobank analyze the Japanese Yen (JPY) outlook ahead of next week’s BoJ policy meeting.
Risk of a near-term pullback
If the BoJ does exit its negative interest rate policy on March 19, likely, rates will only be raised by 10 or 15 bps. Additionally, at best the tone of the BoJ’s guidance next week is likely to be one of cautious optimism. Importantly, even after the negative policy rate has been consigned to the economic history books, Japan’s monetary policy settings are likely to remain accommodative.
A very guarded tone from the BoJ on the outlook for further policy moves would raise the risk that the JPY could suffer a ‘sell on the fact’ reaction to a BoJ policy change on March 19. That said, despite the risk of a near-term pullback, we continue to see scope for USD/JPY to trend lower to 146.00 on a three-month view.
- Swiss Franc is vulnerable as inflation data continues to undershoot official forecasts.
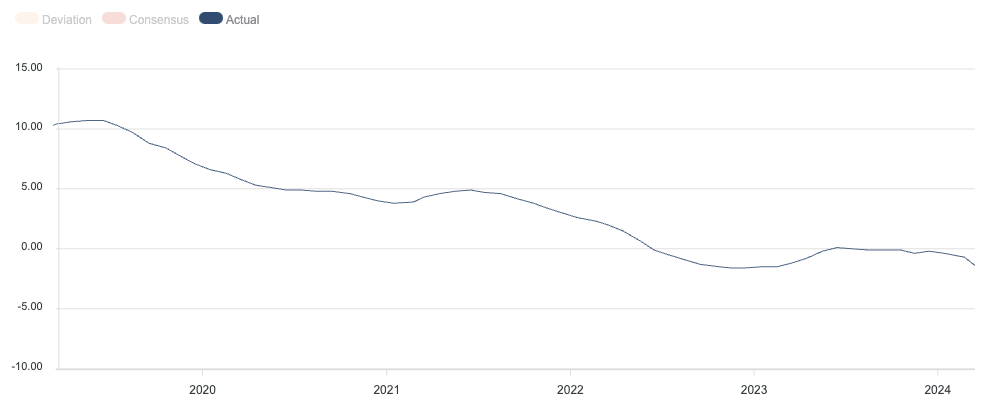
- The SNB expected inflation to average 1.9% in 2024 in its December forecast, but it currently sits at 1.2%.
- The latest Producer and Import Prices showed the tenth month of deflation in a row.
The Swiss Franc (CHF) is continuing its overall trend lower at the end of the trading week – down by a few hundredths of a percent in its European crosses but edging higher against the US Dollar (USD).
In its latest macroeconomic data release, Swiss Producer and Import Prices continued their deflationary trend in February, registering deflation for the tenth consecutive month at minus 2.0% (from negative 2.3% in January), according to data from the Federal Statistical Office.
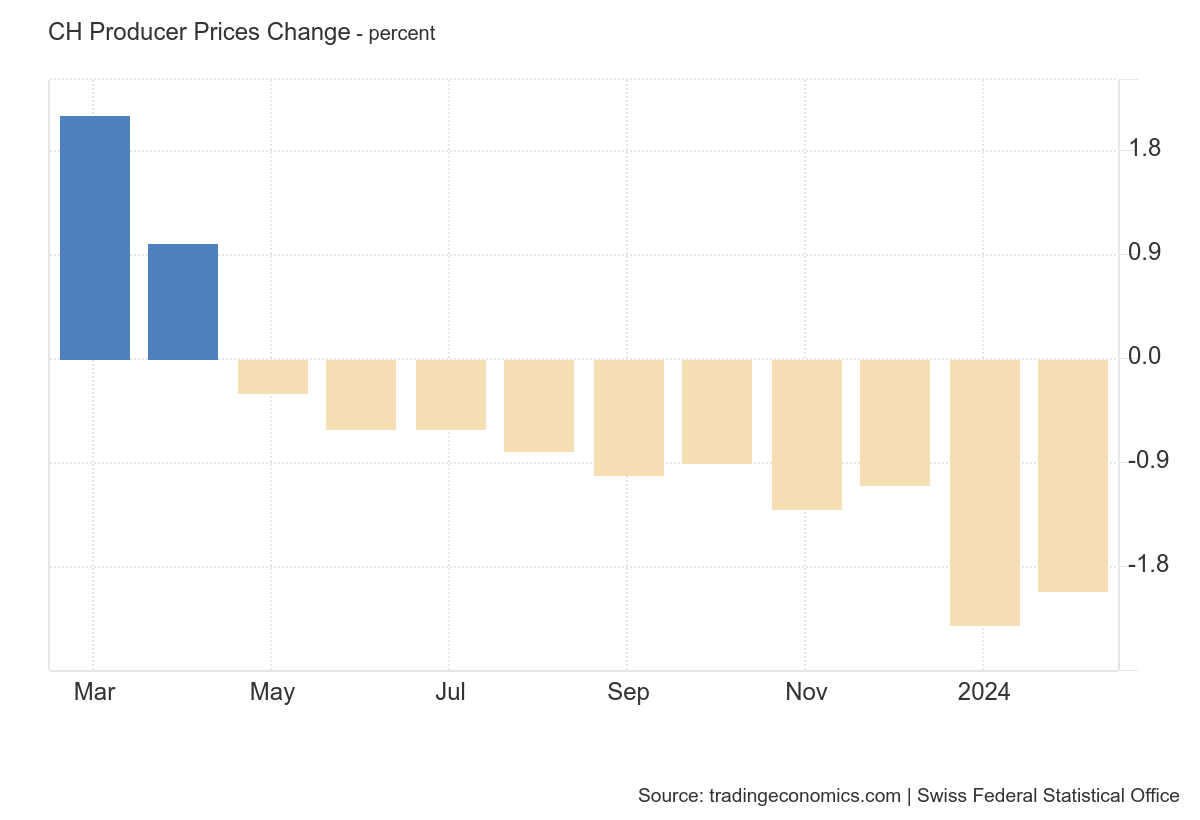
Swiss Franc at risk as inflation remains below SNB forecast
The Swiss Franc could be vulnerable to weakening further as inflation in Switzerland steadily declines and looks increasingly likely to undercut official forecasts.
In its latest batch of data, Swiss headline inflation rose 1.2% YoY in February, down from 1.3% in January, and increased 0.6%, up from 0.2% in January, on a month-on-month basis.
The data shows that inflation is undercutting the Swiss National Bank’s (SNB) own forecasts, which at its December policy meeting expressed the view that inflation would start rising from the 1.4% registered in November.
“However, inflation is likely to increase again somewhat in the coming months due to higher electricity prices and rents, as well as the rise in VAT.” The SNB said in its December policy statement.
The SNB implemented a rate hike of 0.25% in June 2023, raising rates from 1.50% to 1.75% to combat the threat of higher inflation. However, given the opposite has happened and inflation has actually come down quicker than expected, there is now a risk it could cut interest rates, which would be negative for the Swiss Franc, since lower rates attract less inflows of foreign capital.
The possibility of a change in policy is increased by the fact that inflation is running well below the SNB’s 1.9% forecast for 2024. Although there is only two months of data so far, it will have to rise substantially to meet the bank’s forecast before the end of the year. The SNB’s next policy meeting is on March 21.
SNB’s Jordan thinks Swiss Franc is too expensive
The Chairman of the SNB Thomas Jordan has expressed concerns about the Swiss Franc's excessive strength, particularly its impact on Swiss businesses, especially exporters. These concerns are reflected in data from Switzerland's Foreign Exchange Reserves (CHFER), which show a recovery in Forex reserves in 2024, indicating that the SNB may be selling Swiss Francs to bring the exchange rate down.
Technical Analysis: Swiss Franc oscillates in short-term range versus USD
The USD/CHF, which measures the number of Swiss Francs that one US Dollar can buy, has been oscillating within a relatively tight range between roughly 0.8900 and 0.8740 since the middle of February.
The pair is overall in short-term uptrend with the expectation that it will eventually breakout from the current range and start moving higher. However, resistance from a long-term trendline and the 50-week Simple Moving Average (SMA) present considerable obstacles to a prolongation of the trend.
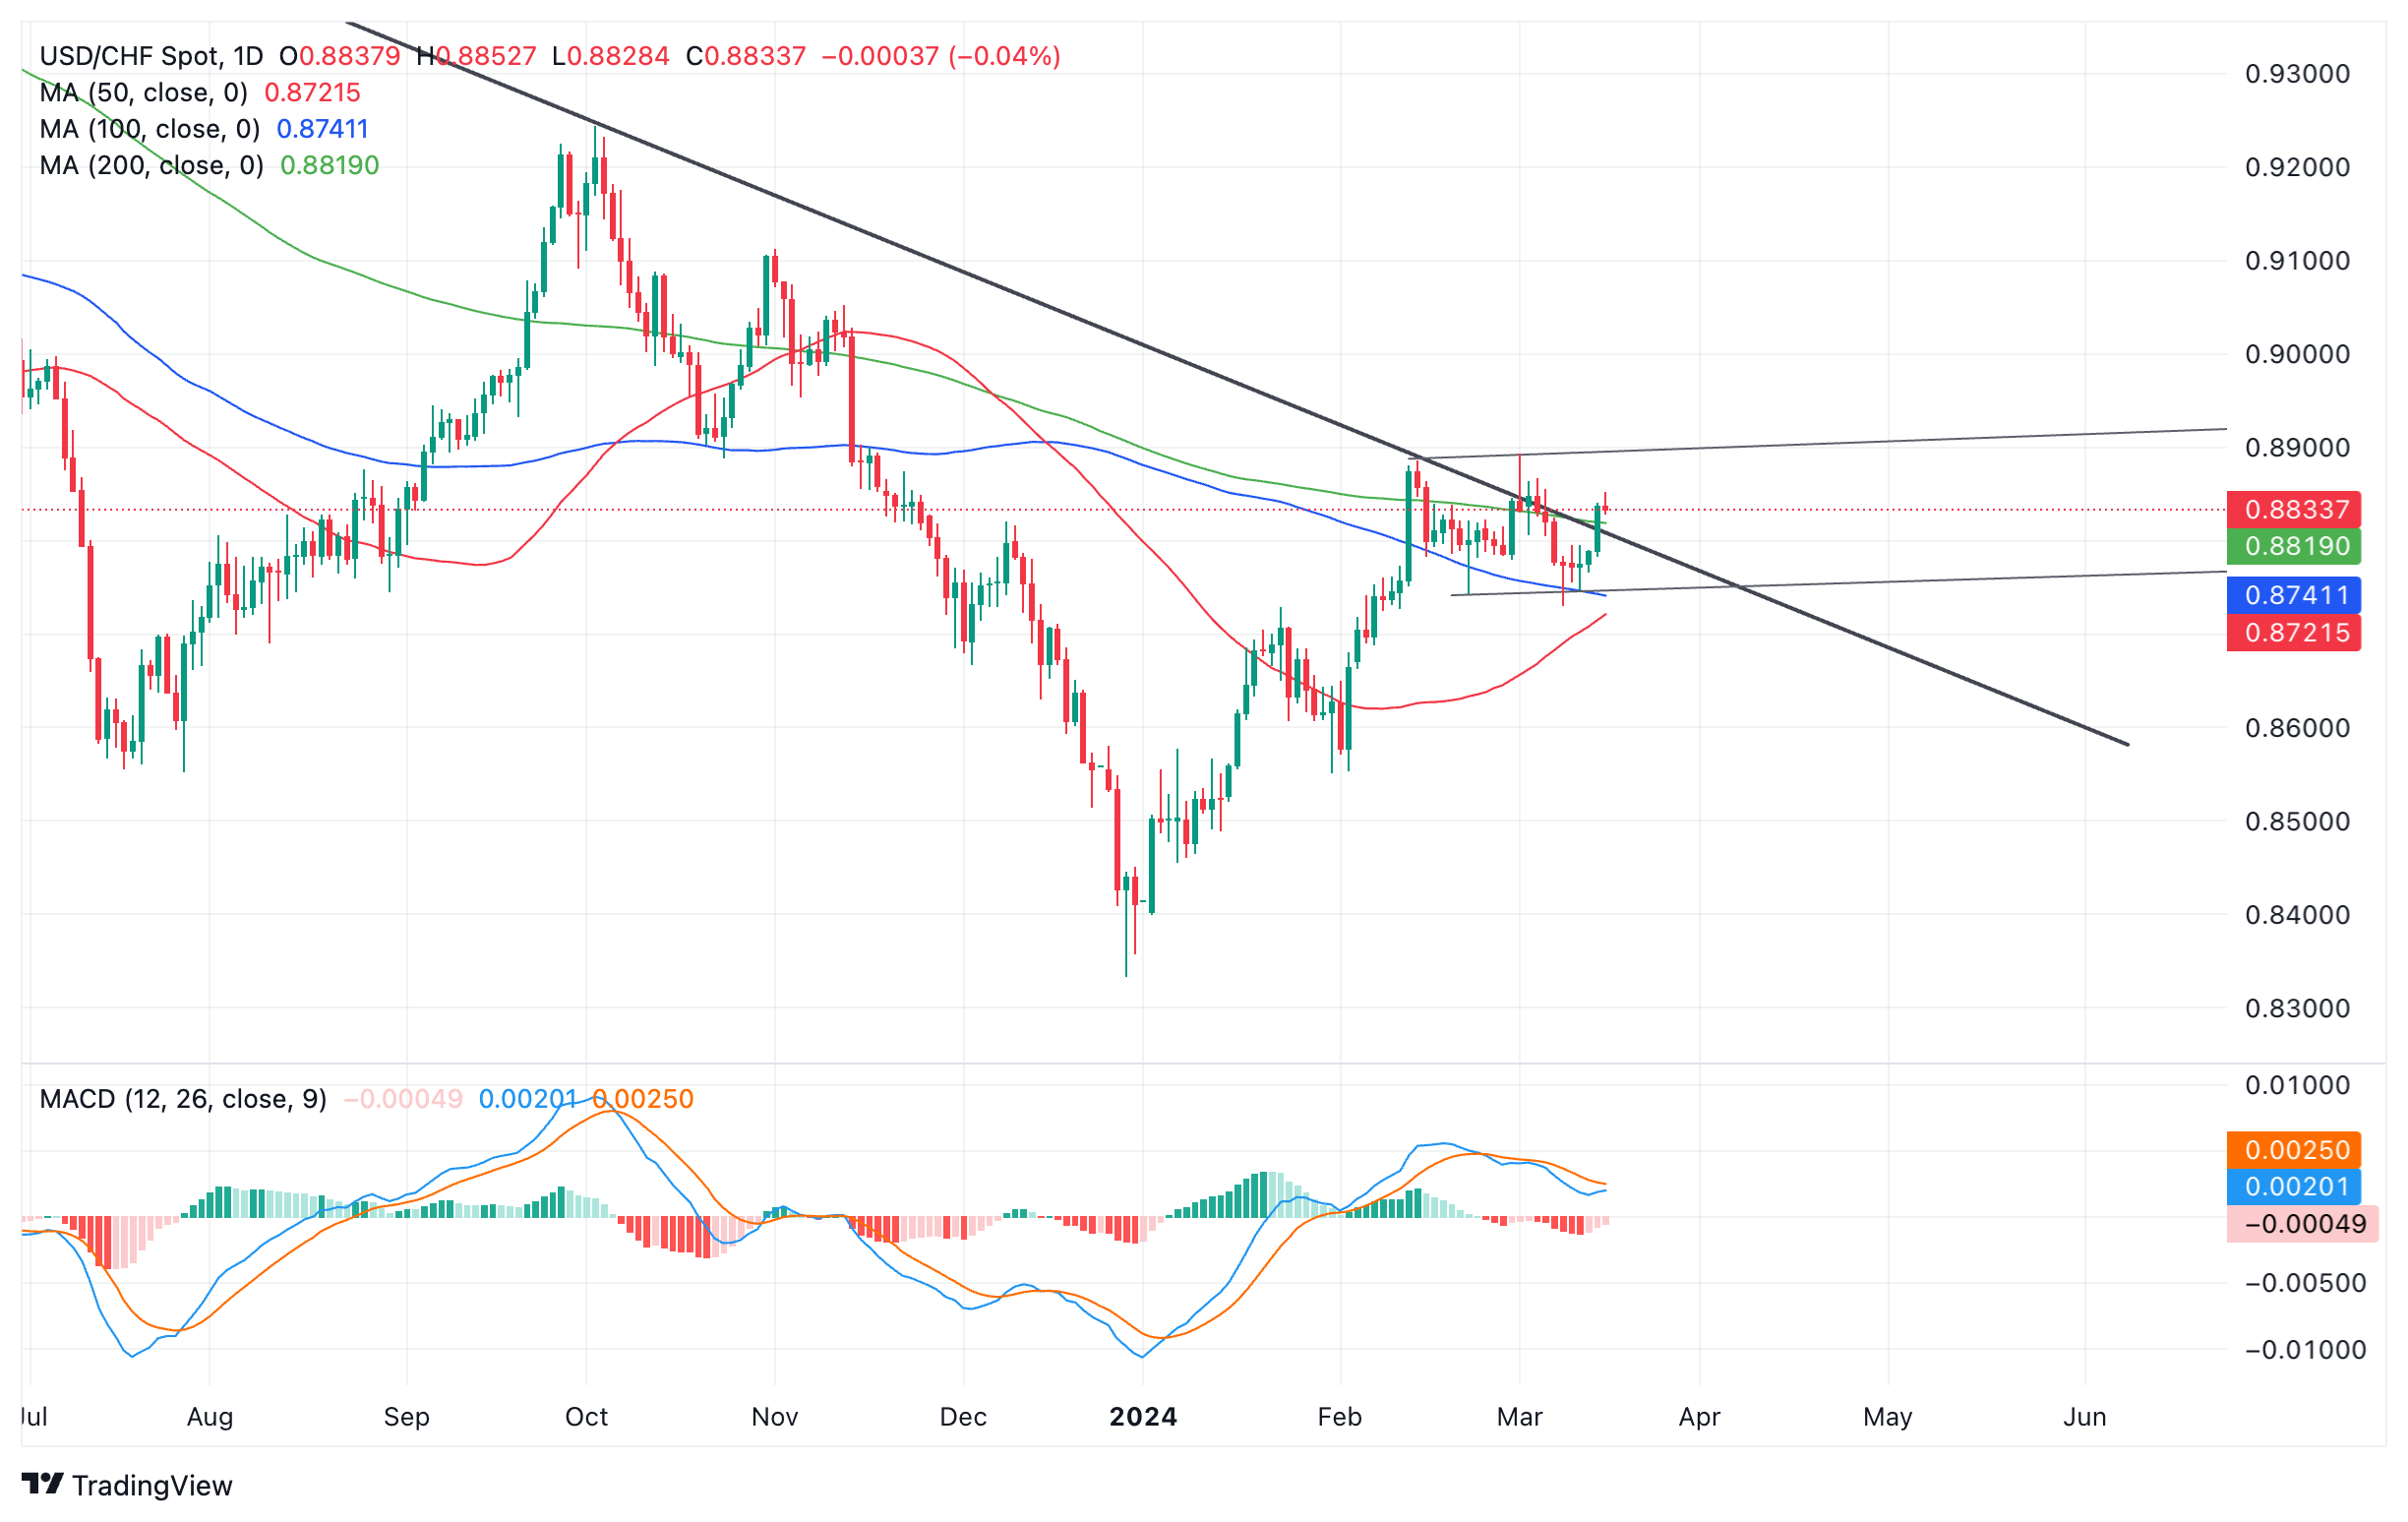
US Dollar versus Swiss Franc: 4-hour chart
For more upside to be confirmed, a decisive break above the range highs at 0.8900 would be required. Such a move would probably then extend to an initial target at 0.8992, the 0.618 Fibonacci ratio of the height of the range extrapolated higher, followed by 0.9052, the full height extrapolated higher.
A decisive break below the range low at 0.8729, however, could indicate a short-term trend reversal and the start of a deeper slide lower. The first target for the move lower would be the 0.618 extrapolation of the height of the range at 0.8632, followed by the full extrapolation at 0.8577, which is also close to the 0.8551 January 31 lows, another key support level to the downside.
Swiss Franc FAQs
The Swiss Franc (CHF) is Switzerland’s official currency. It is among the top ten most traded currencies globally, reaching volumes that well exceed the size of the Swiss economy. Its value is determined by the broad market sentiment, the country’s economic health or action taken by the Swiss National Bank (SNB), among other factors. Between 2011 and 2015, the Swiss Franc was pegged to the Euro (EUR). The peg was abruptly removed, resulting in a more than 20% increase in the Franc’s value, causing a turmoil in markets. Even though the peg isn’t in force anymore, CHF fortunes tend to be highly correlated with the Euro ones due to the high dependency of the Swiss economy on the neighboring Eurozone.
The Swiss Franc (CHF) is considered a safe-haven asset, or a currency that investors tend to buy in times of market stress. This is due to the perceived status of Switzerland in the world: a stable economy, a strong export sector, big central bank reserves or a longstanding political stance towards neutrality in global conflicts make the country’s currency a good choice for investors fleeing from risks. Turbulent times are likely to strengthen CHF value against other currencies that are seen as more risky to invest in.
The Swiss National Bank (SNB) meets four times a year – once every quarter, less than other major central banks – to decide on monetary policy. The bank aims for an annual inflation rate of less than 2%. When inflation is above target or forecasted to be above target in the foreseeable future, the bank will attempt to tame price growth by raising its policy rate. Higher interest rates are generally positive for the Swiss Franc (CHF) as they lead to higher yields, making the country a more attractive place for investors. On the contrary, lower interest rates tend to weaken CHF.
Macroeconomic data releases in Switzerland are key to assessing the state of the economy and can impact the Swiss Franc’s (CHF) valuation. The Swiss economy is broadly stable, but any sudden change in economic growth, inflation, current account or the central bank’s currency reserves have the potential to trigger moves in CHF. Generally, high economic growth, low unemployment and high confidence are good for CHF. Conversely, if economic data points to weakening momentum, CHF is likely to depreciate.
As a small and open economy, Switzerland is heavily dependent on the health of the neighboring Eurozone economies. The broader European Union is Switzerland’s main economic partner and a key political ally, so macroeconomic and monetary policy stability in the Eurozone is essential for Switzerland and, thus, for the Swiss Franc (CHF). With such dependency, some models suggest that the correlation between the fortunes of the Euro (EUR) and the CHF is more than 90%, or close to perfect.
Gold price has been scaling new highs in March. Economists at ANZ Bank analyze the yellow metal’s outlook.
Lifting the baseline of the Gold price range
While we continue to hold our long-term positive view, a retracement looks likely in the short term. A price pull-back is an opportunity to build long positions.
As the recent rise requires a lift of the price baseline, we upgrade our year-end forecast to $2,300 from $2,200.
See – Gold Price Forecast: XAU/USD well positioned to hit $2,250 Q2 target – TDS
- Natural Gas prices are popping back above $1.80.
- Gas traders saw prices swing higher even as the US Dollar strengthened.
- The US Dollar Index trades just below 104.00 after the inflation-data hiccup.
Natural Gas prices (XNG/USD) consolidate on Friday above $1.80 after shooting higher on Thursday with markets rattled in all asset classes. The flight to the US Dollar (USD) and commodities came on the back of a nosedive move in equities and bonds. Meanwhile, tensions in the Middle East are flaring up again after secretive talks between the US and Iran were held with Houthi Rebels, who were asked to back off in the Red Sea.
The US Dollar had a field day on Thursday and saw pure safe-haven inflows. These Came on the back of a domino effect that originated with a surprise uptick in US Producer Price Index (PPI) data. That triggered fear of possibly another delay in the initial rate cut timing from the US Federal Reserve (Fed), and forced a repricing in the markets from June towards September. This helped the DXY US Dollar Index jump on the charts, placing the USD in the green against nearly every major G20 peer.
Natural Gas is trading at $1.86 per MMBtu at the time of writing.
Oil news and market movers: IEA outlook spills over
- The International Energy Agency forecasted better demand for Oil, and that sentiment is spilling over as well for Natural Gas demand.
- TC Energy will sell a pipeline in British Columbia to Nisga’a Nation in Canada, as part of TC’s divestment plans which would be in total worth $2.2 billion.
- European gas storages are filled up over 60% with temperatures in Europe starting to rise above 10 degrees Celsius on average per day.
- Polish refiner Orlen signed an agreement to sell the country's gas storage operator to Gaz-System, which is the state run gas-pipeline operator.
Natural Gas Technical Analysis: Is more upside granted?
Natural Gas prices might have staged a very solid rally on Thursday, but it looks like this won’t be enough to avoid a weekly loss. Natural Gas prices are expected to remain very sensitive on any geopolitical headline on the Red Sea, Gaza, or Ukraine. Still, the downtrend looks intact for now and more downside is set to build on Gas prices.
On the upside, the key $2.00 level needs to be regained first. The next key level is the historic pivotal point at $2.12, which falls in line with the 55-day Simple Moving Average (SMA) at $2.13. Should Gas prices pop up in that region, a broad area opens up with the first cap at the red descending trend line near $2.40.
On the downside, multi-year lows are nearby with $1.65 as the first line in the sand. This year’s low at $1.60 needs to be kept an eye on as well. Once a new low for the year is printed, keep an eye on $1.53 as the next supportive area.
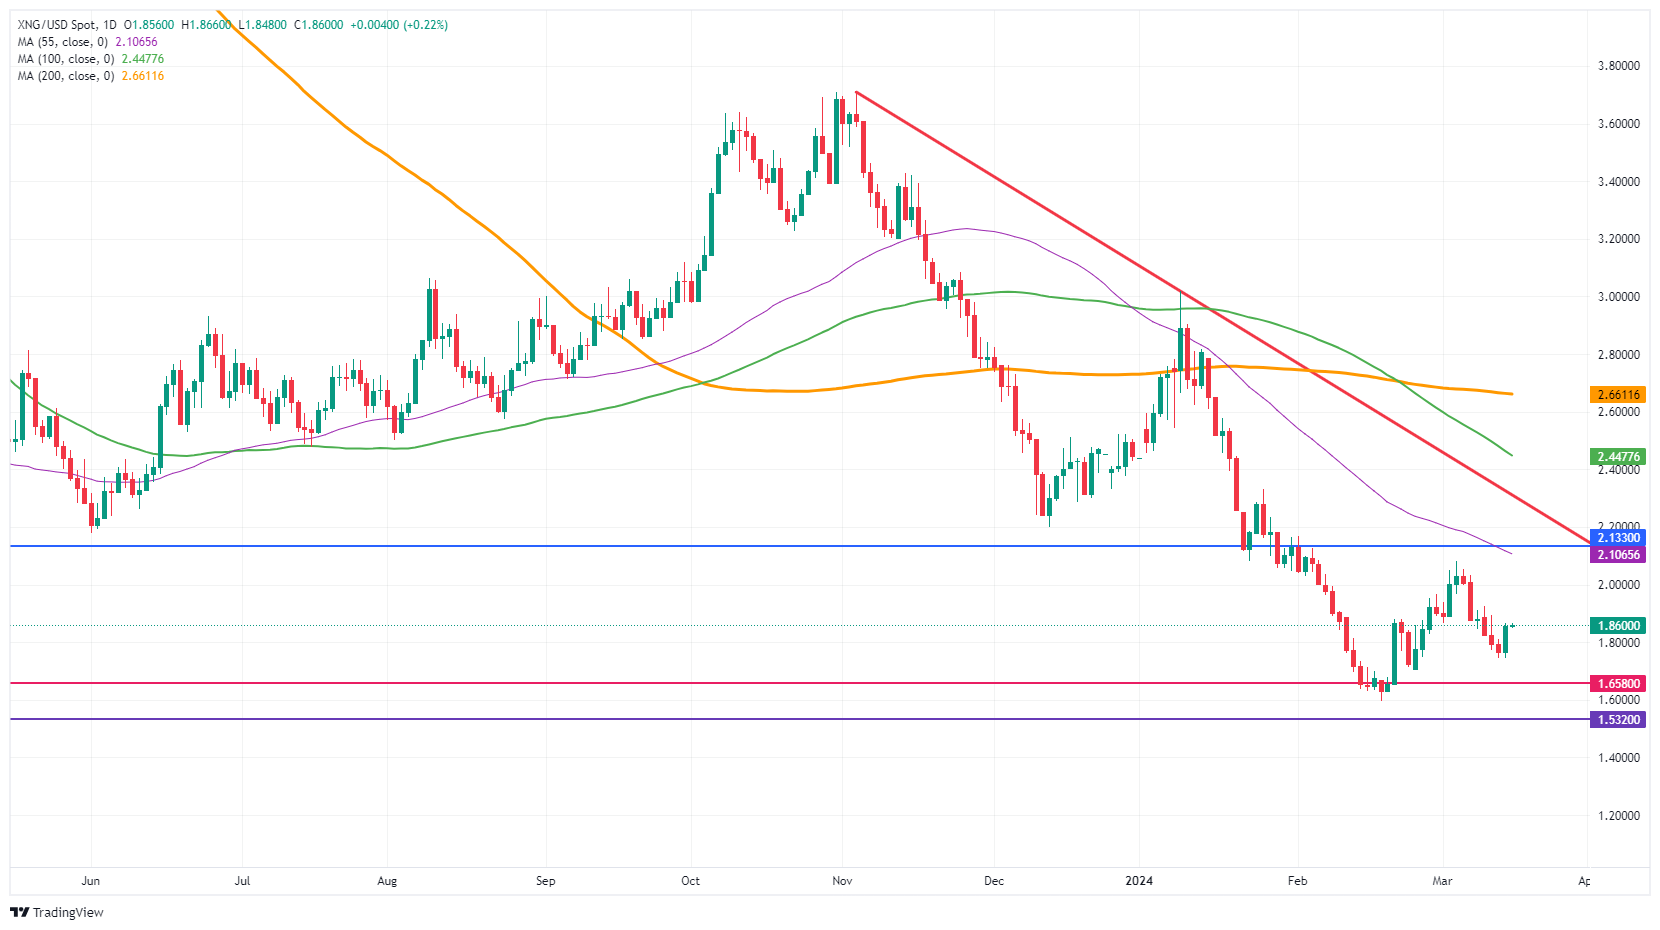
US WTI Crude Oil: Daily Chart
Natural Gas FAQs
Supply and demand dynamics are a key factor influencing Natural Gas prices, and are themselves influenced by global economic growth, industrial activity, population growth, production levels, and inventories. The weather impacts Natural Gas prices because more Gas is used during cold winters and hot summers for heating and cooling. Competition from other energy sources impacts prices as consumers may switch to cheaper sources. Geopolitical events are factors as exemplified by the war in Ukraine. Government policies relating to extraction, transportation, and environmental issues also impact prices.
The main economic release influencing Natural Gas prices is the weekly inventory bulletin from the Energy Information Administration (EIA), a US government agency that produces US gas market data. The EIA Gas bulletin usually comes out on Thursday at 14:30 GMT, a day after the EIA publishes its weekly Oil bulletin. Economic data from large consumers of Natural Gas can impact supply and demand, the largest of which include China, Germany and Japan. Natural Gas is primarily priced and traded in US Dollars, thus economic releases impacting the US Dollar are also factors.
The US Dollar is the world’s reserve currency and most commodities, including Natural Gas are priced and traded on international markets in US Dollars. As such, the value of the US Dollar is a factor in the price of Natural Gas, because if the Dollar strengthens it means less Dollars are required to buy the same volume of Gas (the price falls), and vice versa if USD strengthens.
- USD/CAD clings to gains above 1.3500 as Fed rate cut hopes for June wane.
- Investors shift focus to the Fed’s interest rate decision in which the central bank is expected to maintain a status quo.
- The IEA raises Oil demand forecasts by 110K bpd for 2024.
The USD/CAD pair holds strength above the psychological support of 1.3500 in Friday’s European session. The Loonie asset turns sideways after a sharp recovery, prompted by diminished market expectations for the Federal Reserve (Fed) reducing interest rates in the June policy meeting.
Fed policymakers want to see price pressures declining for months to gain confidence that inflation will return sustainably to the desired rate of 2%. However, the United States Producer Price Index (PPI) data for February, released on Thursday, remained stubborn than expected due to rising gasoline and food prices. Tuesday’s consumer price inflation data for February was also sticky from expectations.
The US Dollar Index (DXY) trades sideways after a sharp recovery to 103.50 as investors shift focus to the Fed’s policy decision, which will be announced on Wednesday. The Fed is widely anticipated to keep interest rates unchanged in the range of 5.25%-5.50% but the release of the dot plot and economic projections will be keenly watched.
Meanwhile, the Oil price turns sluggish after a two-day rally. The broader strength in the Oil price remains intact as the International Energy Agency (IEA) has raised its 2024 oil demand forecasts by 110K bpd (barrels per day). It is worth noting that Canada is the leading exporter of Oil to the US and higher oil prices support the Canadian Dollar.
USD/CAD rebounds from the upward-sloping border of the Ascending Triangle pattern, placed from the December 27 low at 1.3177. The horizontal resistance of the aforementioned pattern, formed on a daily timeframe, is plotted from the December 7 high at 1.3620. The near-term trend is bullish as the pair is trading above the 50-day Exponential Moving Average (EMA), which trades around 1.3500. However, investors would gain more conviction after a triangle breakout.
The triangle could break out in either direction. However, the odds marginally favor a move in the direction of the trend before forming the triangle – in this case, up. A decisive break above or below the triangle boundary lines would indicate a breakout is underway.
The 14-period Relative Strength Index (RSI) falls back into the 40.00-60.00 region, which indicates persistent indecisiveness among investors.
Fresh upside would appear if the asset breaks above December 7 high at 1.3620, which will drive the asset towards May 26 high at 1.3655, followed by the round-level resistance of 1.3700.
On the flip side, a downside move below February 22 low at 1.3441 would expose the asset to February 9 low at 1.3413. A breakdown below the latter would extend the downside towards January 15 low at 1.3382.
USD/CAD daily chart
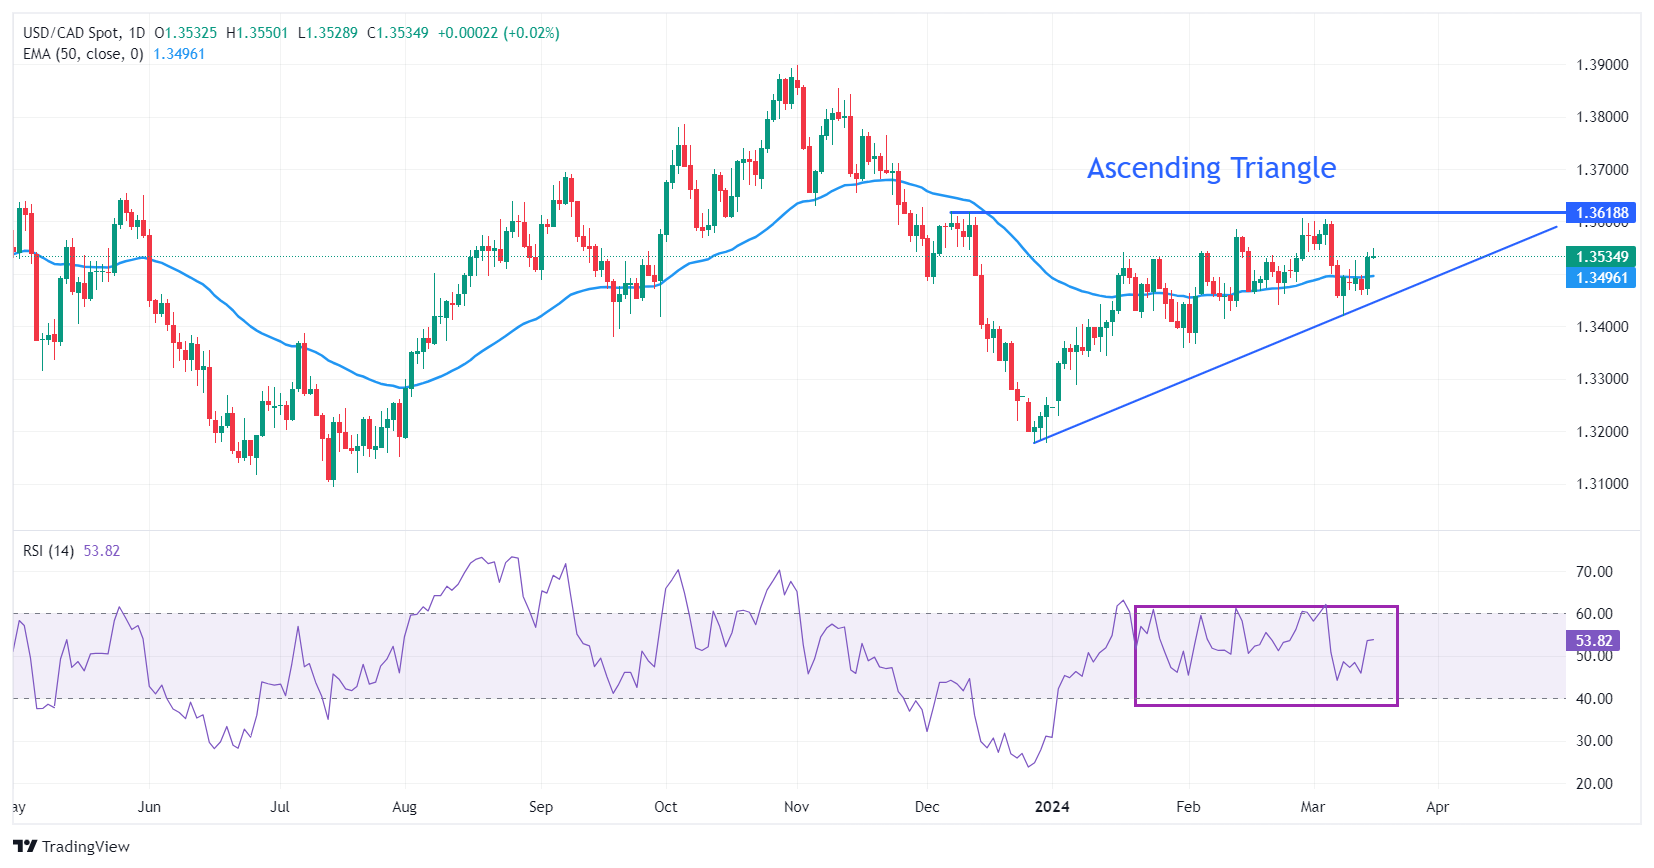
The Japanese Yen (JPY) got whipsawed following the significantly higher trade union wage hikes. Economists at BBH analyze Yen’s outlook.
Significant higher trade union wage hikes
Japan’s Rengo, the largest trade union, agreed on total pay increases averaging 5.28% in 2024. This is up from 3.8% in 2023 and higher than the 4.1% rise expected by a Bloomberg survey of economists.
The probability implied by interest rate futures (OIS) of a 10 bps Bank of Japan (BoJ) policy rate hike next week rose briefly to a high around 70% before settling back down around 60%.
In our view, Japan’s improving inflation backdrop and soft economic activity suggest the BoJ is unlikely to normalise the policy rate by more than is currently priced-in over 2024 (25 bps total rate hikes). As such, USD/JPY will likely remain well supported above its 200-DMA at 146.39.
- Gold price rebounds following a modest decline in US Treasury yields.
- The precious metal remains under pressure as Fed rate cut expectations for June wane.
- Stubborn US PPI data suggested inflation pressures persist.
Gold price (XAU/USD) moves higher in Friday’s European session as US bond yields cool slightly after a strong run-up on Thursday. Market expectations for the Federal Reserve (Fed) reducing interest rates in the June have diminished, suggesting that the slight recovery in the Gold price could merely be a pullback that could be used as a selling opportunity by investors.
The precious metal registered a sharp sell-off on Thursday on hotter-than-expected United States Producer Price Index (PPI) figures for February. Fed policymakers have brought down price pressures significantly but the last mile before the 2% target appears to be sticker than progress yet made. The prospect of high interest rates benefited the US Dollar (USD), weighing on the XAU/USD pair.
10-year US Treasury yields are slightly down to 4.28% on Friday, but easing expectations for the Fed announcing rate cuts in June have led them to a high of 4.30% this week from 4.03% previously. This has significantly increased the opportunity cost of holding investments in non-yielding assets such as Gold. Meanwhile, the US Dollar Index (DXY) refreshes a three-week high near 103.50.
Daily digest market movers: Gold price rebounds slightly ahead of US Michigan CSI data
- The Gold price rebounds to $2,170 as yields on US Treasury bonds decline slightly. The broader appeal of Gold remains uncertain as investors reassess expectations for Federal Reserve rate cuts in the June policy meeting after the February US PPI report indicated that producers hike prices of goods and services at a higher pace than anticipated.
- Market expectations for Fed rate cuts in June have dented as hot PPI data has indicated that Fed policymakers need not rush to reduce interest rates. According to the CME FedWatch tool, the chances for a rate cut have come down to 59% from 74% a week ago.
- This week, the consumer price index (CPI) data also showed inflation remains sticky. Stubborn price pressures have cast doubts over Fed Chair Jerome Powell’s commentary in his Congressional testimony that the central bank is not far from gaining confidence that inflation will return to the desired rate of 2%.
- Apart from the US PPI, the US Census Bureau reported that Retail Sales in February rebounded less than expected. The Retail Sales rose 0.6% while investors anticipated a 0.8% growth. In January, sales contracted by 1.1%, downwardly revised from the 0.8% decline previously estimated.
- Meanwhile, investors are shifting focus to the Fed’s interest rate decision, which will be announced on Wednesday. The Fed is widely anticipated to keep interest rates unchanged in the range of 5.25%-5.50%. The central bank will also release economic forecasts and the dot plot, which will indicate Fed officials’ expectations for interest rates over time.
- Before that, the preliminary Michigan Consumer Sentiment Index will be in focus, which will be published at 14.00 GMT. Sentiment is forecasted to have remained steady at 76.9. The data indicates individuals' perceptions of economic prospects. Upbeat figures tend to signal high consumer spending, faster economic growth, and a strong labor market while declining numbers generally indicate that individuals’ confidence in economic prospects is fading.
Technical Analysis: Gold price bounces back to $2,170
Gold price rebounds to $2,170 but trades inside Thursday’s trading range. The precious metal has been confined in a range between $2,153 and $2,180 in the last three trading sessions, indicating indecisiveness among market participants. The yellow metal exhibits a Symmetrical Triangle formation on an hourly timeframe, which indicates a sharp volatility contraction.
On a daily timeframe, an advancing 20-day Exponential Moving Average (EMA) near $2,115 indicates that the near-term demand is still strong. Still, any upside is expected to remain restricted.
The 14-Relative Strength Index (RSI) retraces from its peak near 84.50, although the upside momentum is still active.
Gold FAQs
Gold has played a key role in human’s history as it has been widely used as a store of value and medium of exchange. Currently, apart from its shine and usage for jewelry, the precious metal is widely seen as a safe-haven asset, meaning that it is considered a good investment during turbulent times. Gold is also widely seen as a hedge against inflation and against depreciating currencies as it doesn’t rely on any specific issuer or government.
Central banks are the biggest Gold holders. In their aim to support their currencies in turbulent times, central banks tend to diversify their reserves and buy Gold to improve the perceived strength of the economy and the currency. High Gold reserves can be a source of trust for a country’s solvency. Central banks added 1,136 tonnes of Gold worth around $70 billion to their reserves in 2022, according to data from the World Gold Council. This is the highest yearly purchase since records began. Central banks from emerging economies such as China, India and Turkey are quickly increasing their Gold reserves.
Gold has an inverse correlation with the US Dollar and US Treasuries, which are both major reserve and safe-haven assets. When the Dollar depreciates, Gold tends to rise, enabling investors and central banks to diversify their assets in turbulent times. Gold is also inversely correlated with risk assets. A rally in the stock market tends to weaken Gold price, while sell-offs in riskier markets tend to favor the precious metal.
The price can move due to a wide range of factors. Geopolitical instability or fears of a deep recession can quickly make Gold price escalate due to its safe-haven status. As a yield-less asset, Gold tends to rise with lower interest rates, while higher cost of money usually weighs down on the yellow metal. Still, most moves depend on how the US Dollar (USD) behaves as the asset is priced in dollars (XAU/USD). A strong Dollar tends to keep the price of Gold controlled, whereas a weaker Dollar is likely to push Gold prices up.
The rebound in the US Dollar on Thursday was not at all a surprise, economists at ING say. They analyze Greenback’s outlook.
Data dependency may well resonate louder than forward guidance
Data dependency may well resonate louder than forward guidance next week, and the recent strength in US data will hardly encourage aggressive Dollar selling, regardless of Powell's relative optimism.
DXY is now at 103.40 and we see no strong reasons why it should not go back to 104.00 before the Fed meeting. That is, again, purely on the back of pre-existing rate fundamentals, and does not require particularly hawkish expectations for the FOMC announcement.
The Japanese Yen (JPY) is struggling to trade higher. Economists at ING analyze Yen’s outlook.
The Yen needs a dovish Fed more than a hawkish BoJ
We have stressed multiple times how a sustainable rally in the Yen relied more on a decline in US rates than a BoJ rate hike. We may be observing the symptoms of this dynamic particularly well now, with the jump in Treasury yields on Thursday reasonably discouraging long-JPY positions. This is not just obvious in USD/JPY, but also in other crosses like EUR/JPY, which is still trading around 161.50.
We remain of the view that the Yen will struggle to trade on the strong side outside of volatility around a rate hike until USD rates move lower (which remains our base case for later this year).
UK public inflation expectations for the coming year are seen at 3.0% in February, declining from a 3.3% figure projected in November, the quarterly survey conducted by the Bank of England (BoE) showed on Friday.
Additional findings
UK public inflation expectations for 12 months after that unchanged at 2.8%.
UK public inflation expectations for five years' time 3.1% vs 3.2% in Nov.
Public confidence in BoE’s control of inflation -5.0% vs -14% in Nov.
Market reaction
At the time of writing, GBP/USD is holding steady at 1.2750, having recovered intraday losses.
Pound Sterling price today
The table below shows the percentage change of Pound Sterling (GBP) against listed major currencies today. Pound Sterling was the strongest against the New Zealand Dollar.
| USD | EUR | GBP | CAD | AUD | JPY | NZD | CHF | |
| USD | -0.14% | -0.06% | -0.06% | 0.21% | 0.28% | 0.45% | -0.16% | |
| EUR | 0.15% | 0.08% | 0.08% | 0.35% | 0.43% | 0.60% | -0.02% | |
| GBP | 0.07% | -0.08% | 0.00% | 0.28% | 0.36% | 0.51% | -0.09% | |
| CAD | 0.07% | -0.08% | 0.00% | 0.28% | 0.35% | 0.51% | -0.10% | |
| AUD | -0.22% | -0.36% | -0.28% | -0.28% | 0.09% | 0.24% | -0.37% | |
| JPY | -0.30% | -0.43% | -0.35% | -0.36% | -0.10% | 0.14% | -0.45% | |
| NZD | -0.45% | -0.60% | -0.52% | -0.52% | -0.24% | -0.16% | -0.61% | |
| CHF | 0.16% | 0.01% | 0.09% | 0.09% | 0.37% | 0.44% | 0.60% |
The heat map shows percentage changes of major currencies against each other. The base currency is picked from the left column, while the quote currency is picked from the top row. For example, if you pick the Euro from the left column and move along the horizontal line to the Japanese Yen, the percentage change displayed in the box will represent EUR (base)/JPY (quote).
Gold prices fell only briefly on the back of stronger-than-expected US inflation data. Economists at Commerzbank analyze the yellow metal’s outlook.
Gold stabilises just below record high
US economic data has been rather disappointing of late, which weighs against inflation risks in the medium term.
At the same time, Gold remains just below the record high it reached at the end of last week. However, given the recent rather asymmetric reaction to US data, i.e. strong rallies after weak economic data and only temporary setbacks after strong (inflation) data, a retest of the recent highs cannot be ruled out, for example following the US sentiment indicators due today.
European Central Bank (ECB) policymaker Olli Rehn spoke about the central bank’s interest rate outlook on Friday.
Key quotes
Started discussion about reducing the restrictive dimension of monetary policy.
Talk relates to when it is appropriate to start cutting interest rates.
If inflation continues to fall, can slowly start easing the foot off the brake pedal of monetary policy.
Market reaction
EUR/USD is keeping its gradual advance intact, despite the dovish comments, adding 0.13% on the day to currently trade at 1.0895.
Euro price this week
The table below shows the percentage change of Euro (EUR) against listed major currencies this week. Euro was the weakest against the US Dollar.
| USD | EUR | GBP | CAD | AUD | JPY | NZD | CHF | |
| USD | 0.45% | 0.82% | 0.35% | 0.91% | 1.32% | 1.36% | 0.64% | |
| EUR | -0.45% | 0.38% | -0.11% | 0.46% | 0.86% | 0.91% | 0.21% | |
| GBP | -0.83% | -0.38% | -0.48% | 0.09% | 0.50% | 0.54% | -0.18% | |
| CAD | -0.33% | 0.10% | 0.48% | 0.57% | 0.97% | 1.00% | 0.30% | |
| AUD | -0.91% | -0.46% | -0.09% | -0.56% | 0.42% | 0.46% | -0.27% | |
| JPY | -1.30% | -0.86% | -0.25% | -0.96% | -0.39% | 0.06% | -0.67% | |
| NZD | -1.36% | -0.90% | -0.54% | -1.03% | -0.45% | -0.04% | -0.71% | |
| CHF | -0.64% | -0.20% | 0.19% | -0.29% | 0.27% | 0.66% | 0.71% |
The heat map shows percentage changes of major currencies against each other. The base currency is picked from the left column, while the quote currency is picked from the top row. For example, if you pick the Euro from the left column and move along the horizontal line to the Japanese Yen, the percentage change displayed in the box will represent EUR (base)/JPY (quote).
- EUR/USD has fallen to the 1.0800s, close to a critical level for the short-term trend.
- Further weakness could tip the near-term outlook in favor of bears.
- Empire State Manufacturing, Michigan Sentiment, US Industrial Production and commentary from ECB’s Nagel round off the week.
EUR/USD is trading in the 1.0800s on the last day of the week after taking a step down from its previous range in the 1.0900s. The catalyst seems to have been Thursday’s US macro data, which dented optimism in the Federal Reserve (Fed) implementing early interest-rate cuts.
Thursday’s data showed the US Producer Price Index (PPI) unexpectedly rose 1.6% YoY in February after an upwardly-revised 1.0% increase in January, easily beating consensus estimates of 1.1%.
Along with lower-than-expected Initial Jobless Claims and a rise – albeit not as much as predicted – in Retail Sales to 0.6% from a negative, revised-down 1.1% previously, the data suggested the US economy remains hotter than expected.
It probably means the Fed will have to keep interest rates higher for longer. This is negative for EUR/USD but positive for the US Dollar (USD) since higher interest rates attract greater inflows of foreign capital.
EUR/USD: Talking heads at ECB cluster around summer
On Thursday, a long line-up of European Central Bank (ECB) policymakers appeared in public with some of them sharing their views about when the ECB should start cutting interest rates.
The official line, provided by Christine Lagarde at the press conference following the March ECB meeting, was that the Governing Council would review interest rates in June.
Following the meeting, however, Governor of the Bank of France Francois Villeroy de Galhau stirred up markets by hinting that an interest-rate cut might come as early as April.
His comments suggested that two camps might be forming at the ECB, favoring either a spring or summer rate cut.
On Wednesday, the Governor of the Bank of Austria and ECB Governing Council member Robert Holzmann joined the June camp.
Early Thursday ECB Governing Council member Yannis Stournaras seemed to back the case for a spring rate cut, adding that he didn’t buy the argument that the ECB could not cut rates before the Fed, and that four rate cuts in 2024 seemed reasonable.
Also on Thursday, ECB Governing Council member Klaas Knot said he believed the ECB would start cutting interest rates in June.
Vice-President of the ECB Luis de Guindos, speaking in Barcelona on Thursday, said “The ECB should have sufficient information in June to begin making decisions about monetary policy,” according to Bloomberg News.
On the horizon
Friday’s economic calendar shows no major economic data releases or events that could rock EUR/USD but the US Empire State Manufacturing Index, February Industrial Production figures out of the US and the preliminary Michigan Consumer Sentiment Index may offer traders short-term opportunities.
For the Euro, Bundesbank President Joachim Nagel is scheduled to give a press conference to present the research project "From the Reichsbank to the Bundesbank" in Frankfurt, Germany. It is possible he may comment on ECB policy at the event. Later on, ECB chief economist and board member Philip Lane will also speak.
Technical Analysis: EUR/USD reaches critical trend-determination level
EUR/USD continues correcting back, falling into the 1.0800s, after peaking at 1.0981 on March 8.
After Thursday’s sell-off, the correction is now so deep it brings into question the sustainability of the hitherto dominant short-term uptrend.
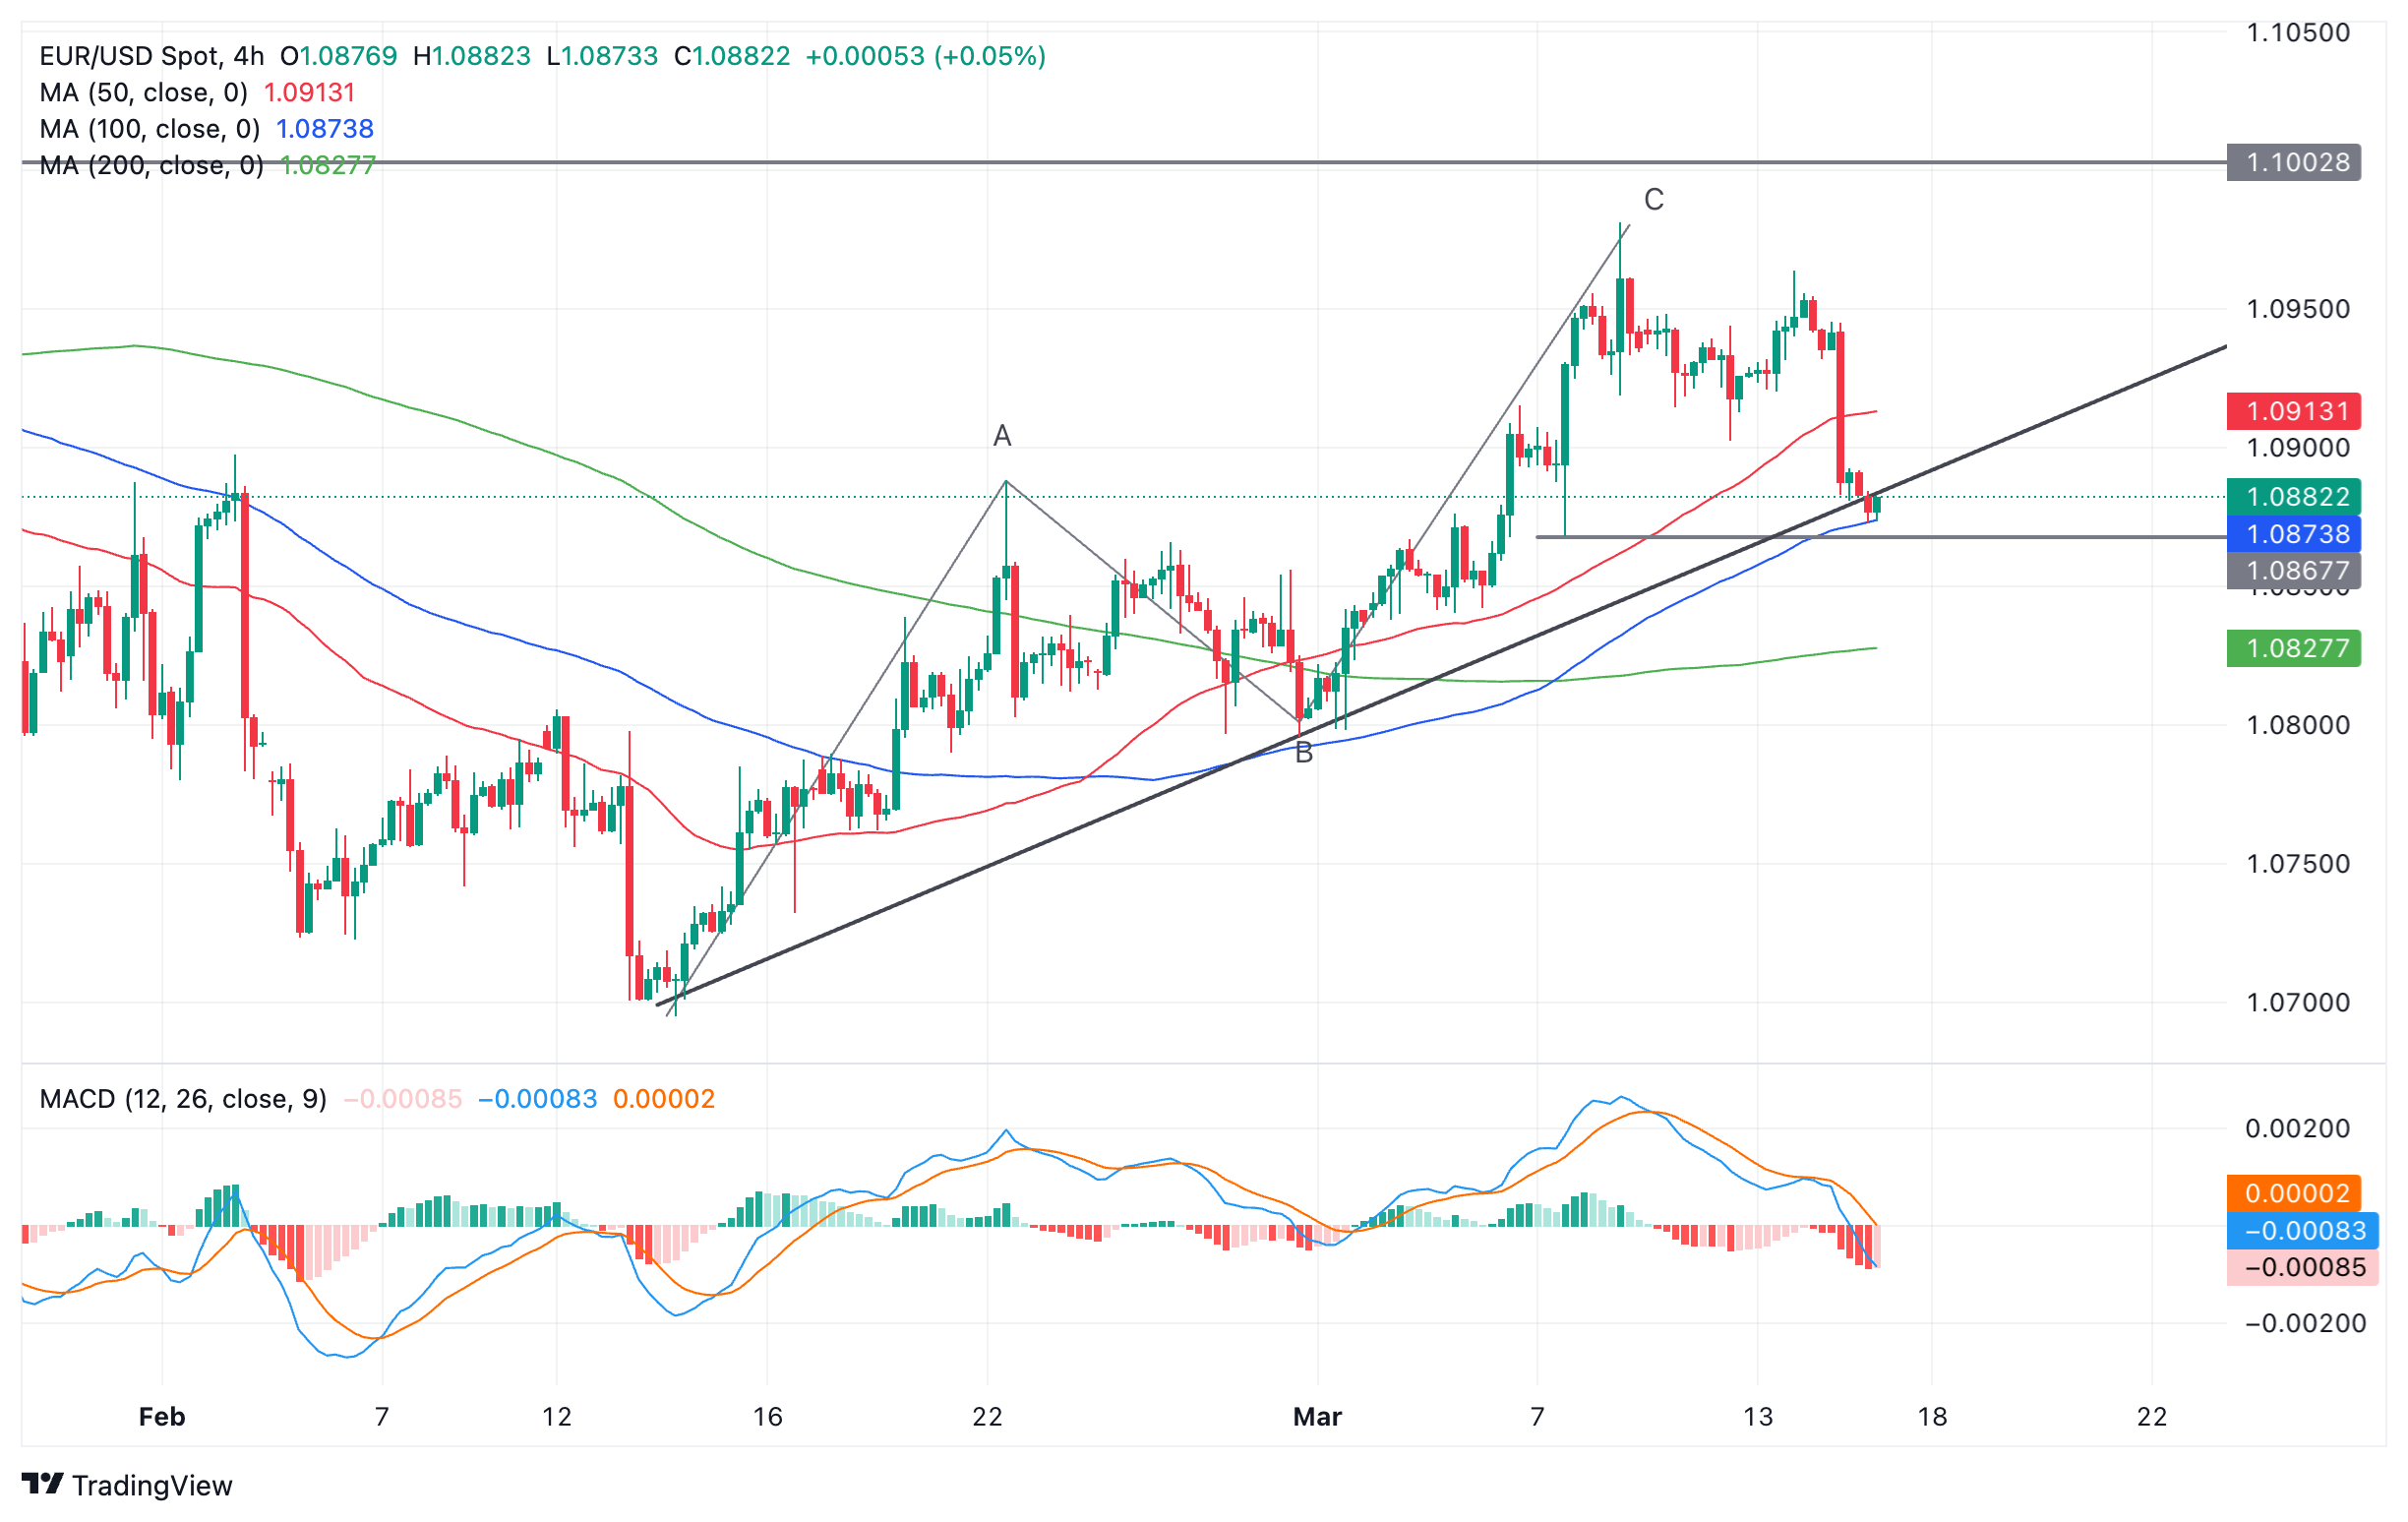
Euro vs US Dollar: 4-hour chart
Bears have now pushed price down to a few pips above the pivotal 1.0867 level of the previous key swing low, highlighted as the make-or-break level for the trend. Should they push price below this level it would start to shift the balance of probabilities in favor of a reversal of the uptrend.
Such a breakdown would then most probably see a continuation down to 1.0795, at the low of the B leg of the prior ABC Measured Move pattern that unfolded higher during February and early March.
Alternatively, if the level holds, the short-term uptrend could resume. Confirmation of a higher high and an extension of the uptrend would come from a break above the 1.0981 highs.
After that, tough resistance is expected at the 1.1000 psychological level, which is likely to be the scene of a fierce battle between bulls and bears.
A decisive break above 1.1000, however, would open the gates to further gains towards the key resistance level at 1.1139, the December 2023 high.
By “decisive” it is meant a break characterized by a long green candle piercing clearly above the level and closing near its high, or three green bars in a row, breaching the level.
Euro FAQs
The Euro is the currency for the 20 European Union countries that belong to the Eurozone. It is the second most heavily traded currency in the world behind the US Dollar. In 2022, it accounted for 31% of all foreign exchange transactions, with an average daily turnover of over $2.2 trillion a day. EUR/USD is the most heavily traded currency pair in the world, accounting for an estimated 30% off all transactions, followed by EUR/JPY (4%), EUR/GBP (3%) and EUR/AUD (2%).
The European Central Bank (ECB) in Frankfurt, Germany, is the reserve bank for the Eurozone. The ECB sets interest rates and manages monetary policy. The ECB’s primary mandate is to maintain price stability, which means either controlling inflation or stimulating growth. Its primary tool is the raising or lowering of interest rates. Relatively high interest rates – or the expectation of higher rates – will usually benefit the Euro and vice versa. The ECB Governing Council makes monetary policy decisions at meetings held eight times a year. Decisions are made by heads of the Eurozone national banks and six permanent members, including the President of the ECB, Christine Lagarde.
Eurozone inflation data, measured by the Harmonized Index of Consumer Prices (HICP), is an important econometric for the Euro. If inflation rises more than expected, especially if above the ECB’s 2% target, it obliges the ECB to raise interest rates to bring it back under control. Relatively high interest rates compared to its counterparts will usually benefit the Euro, as it makes the region more attractive as a place for global investors to park their money.
Data releases gauge the health of the economy and can impact on the Euro. Indicators such as GDP, Manufacturing and Services PMIs, employment, and consumer sentiment surveys can all influence the direction of the single currency. A strong economy is good for the Euro. Not only does it attract more foreign investment but it may encourage the ECB to put up interest rates, which will directly strengthen the Euro. Otherwise, if economic data is weak, the Euro is likely to fall. Economic data for the four largest economies in the euro area (Germany, France, Italy and Spain) are especially significant, as they account for 75% of the Eurozone’s economy.
Another significant data release for the Euro is the Trade Balance. This indicator measures the difference between what a country earns from its exports and what it spends on imports over a given period. If a country produces highly sought after exports then its currency will gain in value purely from the extra demand created from foreign buyers seeking to purchase these goods. Therefore, a positive net Trade Balance strengthens a currency and vice versa for a negative balance.
Higher US consumer inflation expectations can further curtail money market expectations of Fed funds rate cuts this year and turbocharge USD higher, economists at BBH say.
Will USD rally get turbocharged?
We see scope for Fed funds rate expectations to adjust higher in favour of a firmer USD because underlying US price pressures are still high, and the economic growth outlook is encouraging.
The risk to our bullish USD view is the Fed dismissing the latest high inflation readings as noise and power forward with a dovish stance. This would lead to lower US real interest rates and undermine USD against most major currencies.
- AUD/JPY faces headwinds on market anticipation of a shift in the BoJ's policy stance.
- Reuters cited news agency Jiji that the BoJ plans to end its negative interest rate policy.
- RBA maintains its potential stance for further rate hikes ahead of the policy decision on Tuesday.
AUD/JPY trims some of its daily losses and trades lower around 97.50 during the European hours on Friday. The AUD/JPY cross faces headwinds as the Japanese Yen strengthens, driven by market anticipation of a potential shift in the Bank of Japan's policy stance, following reports of major Japanese companies fully responding to union demands for wage hikes.
Additionally, Reuters reported on Thursday, citing Japanese news agency Jiji, that the Bank of Japan is planning to discontinue its negative interest rate policy during the March 18-19 meeting. The final decision will depend on the outcome of the preliminary survey regarding this year's spring wage negotiations by the labor organization Rengo, expected on Friday.
Meanwhile, the AUD/JPY cross gains some upward momentum as the Australian Dollar weakens amid a broad market sell-off, particularly evident in the lower S&P/ASX 200 Index. Australian equities mirror losses seen on Wall Street, with significant declines observed in banking and iron ore mining sectors.
Despite these challenges, the AUD/JPY cross may find support as the Reserve Bank of Australia (RBA) maintains its potential stance for further rate hikes. Analysts, according to a Reuters poll conducted before the RBA meeting, anticipate the central bank to keep its official cash rate unchanged at 4.35% for a third consecutive meeting, with no expected adjustments until at least the end of September.
Looking ahead, both the RBA and the Bank of Japan are scheduled to announce their policy decisions on Tuesday, adding further anticipation to the market regarding monetary policy directions.
EUR/USD is holding under 1.0900. Economists at ING analyze the pair’s outlook.
Dovish ECB commentary continues
The lack of market-moving data releases left EUR/USD to being driven by the dollar rebound, while some dovish comments by European Central Bank officials have hardly given markets a reason to hang on to the Euro.
EUR/USD is trading at more sustainable levels now, and we think it can remain under modest pressure into the FOMC meeting.
There are a few key moving average supports between 1.0840 and 1.0860: if broken, we could see the pair test 1.0800 in the coming days.
- Silver regains some positive traction on Friday and climbs to a fresh YTD top.
- The technical setup favours bulls and supports prospects for additional gains.
- Dips below the $24.50 resistance-turned-support are likely to get bought into.
Silver (XAG/USD) attracts fresh buyers following the previous day's modest slide and sticks to its gains near the YTD peak, above the $25.00 psychological mark through the early part of the European session on Friday.
From a technical perspective, the recent breakout through the very important 200-day Simple Moving (SMA) and a subsequent strength beyond the $24.50-$24.60 horizontal barrier was seen as a fresh trigger for bullish traders. This, in turn, suggests that the path of least resistance for the XAG/USD is to the upside. That said, the Relative Strength Index (RSI) on the daily chart is on the verge of breaking into overbought territory and warrants some caution.
Hence, it will be prudent to wait for some near-term consolidation or a modest pullback before positioning for the next leg of a move-up. Nevertheless, the XAG/USD seems poised to climb further beyond an intermediate hurdle near the mid-$25.00s, towards challenging the December 2023 swing high – levels just ahead of the $26.00 round figure. Some follow-through buying should pave the way for an extension of over a two-week-old bullish trend.
On the flip side, the $24.80-$24.75 region now seems to protect the immediate downside ahead of the $24.50 horizontal resistance breakpoint. Any subsequent decline is likely to attract fresh buyers and remain limited near the $24.15-$24.10 region. Some follow-through selling below the $24.00 mark, however, might shift the bias in favour of bearish traders and drag the XAG/USD back towards the 200-day SMA support, currently pegged near the $23.35-$23.30 region.
Silver daily chart
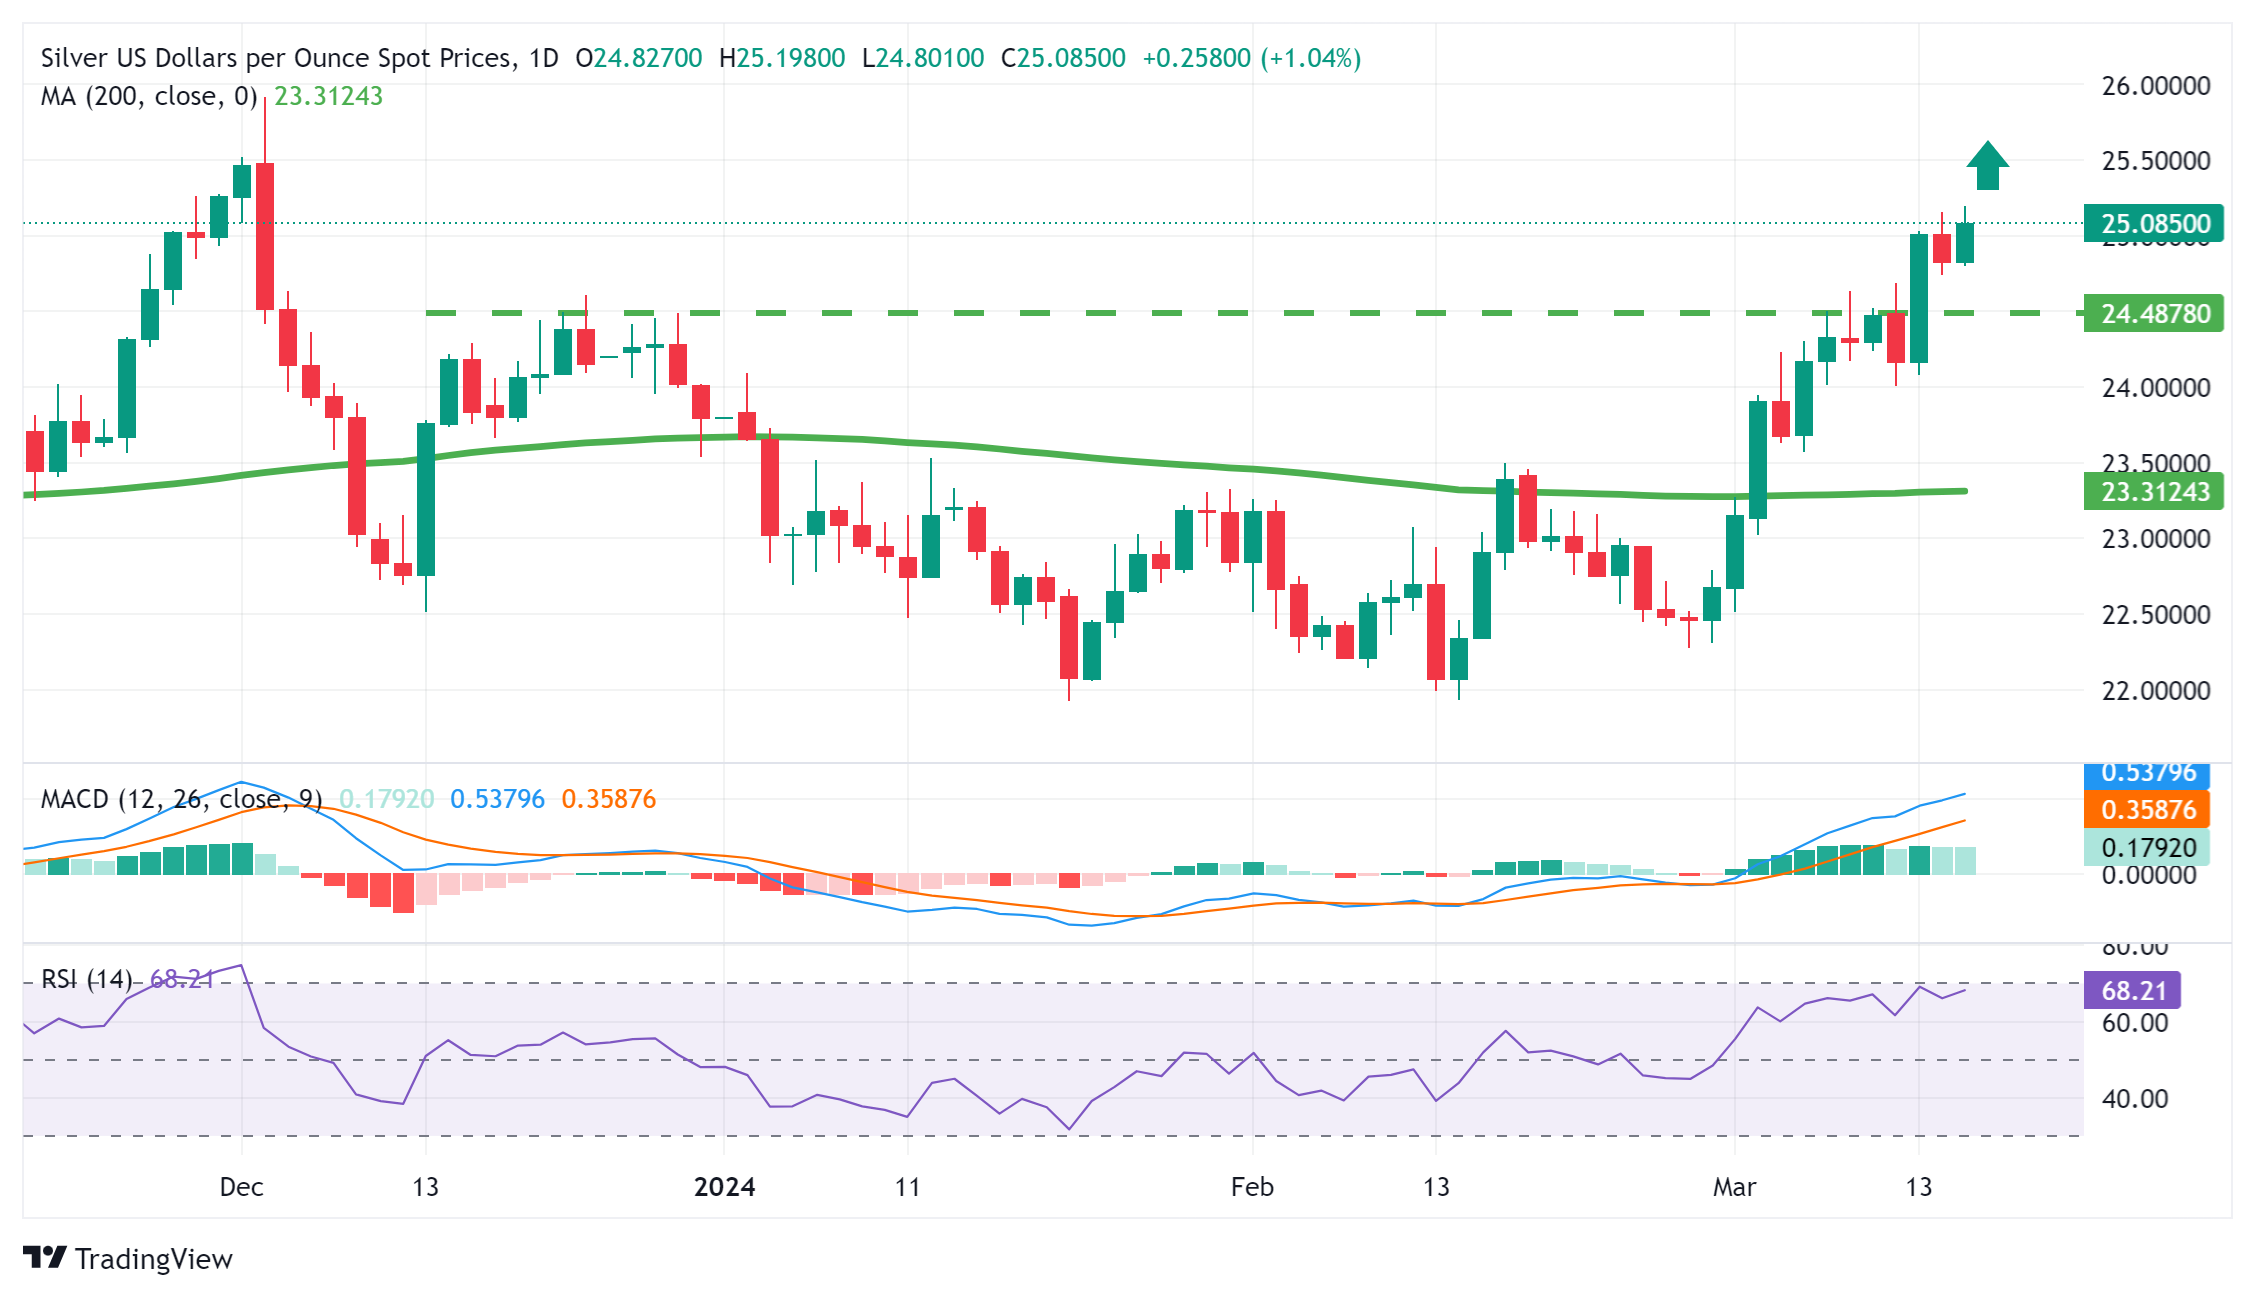
The Bank of England will release its Inflation Attitudes Survey on Friday. Economists at ING analyze Pound Sterling’s (GBP) outlook.
Recent price action showed that levels close to 0.8500 are stretched to the downside
Barring major surprises today, we think EUR/GBP will struggle to find direction into the CPI and BoE events next week.
Recent price action showed that levels close to 0.8500 are stretched to the downside, and the relatively unchanged short-term rate differential does not argue for any break lower.
When we look at the Sonia curve, however, 62 bps of easing by year-end still probably looks too conservative: our economist’s call is for 100 bps, leaving a considerable gap to be covered on the dovish side and giving us reasons to think we’ll see a higher EUR/GBP by year-end.
- EUR/GBP recovers from 0.8530 as investors shift focus to Thursday’s BoE policy decision.
- The ECB is expected to announce its first rate cut in June, while the BoE is expected to make a similar decision in August.
- The UK's inflation data, scheduled for Wednesday, will guide the Pound Sterling.
The EUR/GBP pair bounces back strongly from 0.8530 in the European session on Friday. The cross rebounds even though market participants anticipate that the Bank of England (BoE) will start reducing interest rates after the European Central Bank (ECB).
Market expectations for the ECB reducing interest rates are leaned towards the June policy meeting. Several ECB policymakers are also favoring a rate cut decision in June as the inflationary pressures in the Eurozone economy have come down significantly. The core inflation decelerated to 3.1% in February, and there are no signs of a significant improvement in the economic outlook, which will keep price pressures limited.
On Thursday, ECB Governing Council member Klaas Knot said he believes the central bank will start cutting interest rates in June. Separately, ECB Governing Council member Yannis Stournaras backed the case for an early rate cut. Stournaras added that he doesn't buy the argument that the ECB cannot cut rates before the Fed and that four rate cuts in 2024 seem reasonable.
Meanwhile, the Pound Sterling has come slightly under pressure as investors shift focus to the BoE’s interest rate decision, which will be announced on Thursday. The BoE is expected to keep interest rates unchanged at 5.25%. But before that, the United Kingdom’s inflation data for February will be keenly watched.
The inflation data will influence market expectations for BoE rate cuts, which are currently leaning toward August for the first rate cut.
- USD/MXN strengthens on risk-off sentiment after upbeat US inflation data.
- The US Dollar remains firmer despite the correction in the US Treasury yields.
- Banxico Deputy Governor Omar Mejia suggested the potential for an interest rate cut.
USD/MXN expands gains for the second consecutive day on Friday, bouncing back from the eight-month low at 16.64 reached on Thursday. At the time of writing, the USD/MXN pair attempts to extend its gains, trading around 16.70 during the European trading hours.
The upbeat US Core Producer Price Index (PPI) data for February, with a 2.0% year-over-year increase, exceeding expectations of 1.9%, has strengthened the US Dollar. This in turn supports the USD/MXN pair.
The recent economic indicators pose challenges for the Federal Reserve's decision-making process regarding interest rate cuts. Traders are eagerly awaiting the preliminary US Michigan Consumer Sentiment Index for March on Friday to gain insights into the Federal Reserve’s policy trajectory.
Officials from the Bank of Mexico (Banxico) have underscored the importance of avoiding premature interest rate cuts. Governor Victoria Rodriguez Ceja has advocated for a gradual approach to adjustments, while Deputy Governor Jonathan Heath has warned against the risks associated with premature rate cuts.
However, Banxico Deputy Governor Omar Mejia hinted at the possibility of an interest rate cut in a podcast on Wednesday, arguing that it wouldn't be premature given the high level of rates maintained by the bank. The market is pricing in expectations that Banxico could cut rates as soon as the March 21 meeting.
- The Pound Sterling faces selling pressure as the appeal for risk-sensitive assets fades.
- The UK economy grew as expected in January but fears of recession remain high.
- Going forward, investors will shift focus to the UK Inflation data for fresh guidance.
The Pound Sterling (GBP) declines in Friday’s European session as dismal market sentiment dampens the appeal of risk-sensitive assets. The GBP/USD pair refreshes a weekly low near 1.2730 as the US Dollar strengthens, driven by increasing expectations that the Federal Reserve (Fed) could keep interest rates unchanged in the range of 5.25%-5.50% in the June policy meeting.
The Cable is under pressure due to expectations that the Fed's first rate cut, a widely expected move for markets after high interest rates for more than two years, could be pushed back further down the summer. This would align the time frame of the Fed’s rate cut decision with that of the Bank of England (BoE), which is expected to start reducing interest rates from the August policy meeting.
Uncertainty over the United Kingdom's economic outlook may not allow BoE policymakers to keep interest rates higher for longer. The UK economy entered a technical recession in the second half of 2023, and despite January’s slight uptick, there is no solid indication that the worst is over for them.
Daily Digest Market Movers: Pound Sterling falls while USD Index looks set for positive weekly closing
- The Pound Sterling drops to 1.2730 as the market sentiment remains downbeat amid fears that the Federal Reserve would be reluctant to cut interest rates in the June policy meeting due to a string of stubborn inflation indicators.
- The US Dollar and bond yields soared after the United States Producer Price Index (PPI) data for February turned out more stubborn than expected. Producers tend to raise the prices of goods and services at their factory gates when they experience supply chain disruptions or anticipate higher consumer spending. In February, higher gasoline and food prices boosted producer prices. The US Dollar Index (DXY), which measures the US Dollar’s value against six major currencies, rose to 103.40 after the data release.
- This week, the Pound Sterling remains on the back foot. The 0.2% UK economic growth in January, which was expected by markets, fails to offset the impact of weak Employment data for the three months ending January, also released earlier this week. The UK economy has returned to growth after contracting in the second half of 2023. However, the economy needs to report an expansion as a whole in the first quarter to prove that the technical recession was shallow.
- Going forward, the major trigger for the Pound Sterling will be the UK’s inflation data for February, which will be published on Wednesday, a day before the Bank of England interest-rate decision. The impact of slowing wage growth, which has been feeding service inflation, could be visible in the Consumer Price Index (CPI) data. Stubborn service inflation has been a key driver of high inflationary pressures.
- The inflation data will influence market expectations for BoE rate cuts, which are currently pointing to the August policy meeting. According to a Reuters poll, the central bank will start cutting borrowing costs in the third quarter, although 40% of economists saw an earlier trim.
Technical Analysis: Pound Sterling declines towards 20-EMA
The Pound Sterling prints a fresh weekly low near 1.2730 against the US Dollar. The GBP/USD pair corrects significantly from its seven-month high near 1.2900. The pair is an inch higher than the 20-day Exponential Moving Average (EMA), which trades around 1.2725.
The 14-period Relative Strength Index (RSI) has dropped into the 40.00-60.00 range, indicating that the bullish momentum has faded.
Pound Sterling FAQs
The Pound Sterling (GBP) is the oldest currency in the world (886 AD) and the official currency of the United Kingdom. It is the fourth most traded unit for foreign exchange (FX) in the world, accounting for 12% of all transactions, averaging $630 billion a day, according to 2022 data. Its key trading pairs are GBP/USD, aka ‘Cable’, which accounts for 11% of FX, GBP/JPY, or the ‘Dragon’ as it is known by traders (3%), and EUR/GBP (2%). The Pound Sterling is issued by the Bank of England (BoE).
The single most important factor influencing the value of the Pound Sterling is monetary policy decided by the Bank of England. The BoE bases its decisions on whether it has achieved its primary goal of “price stability” – a steady inflation rate of around 2%. Its primary tool for achieving this is the adjustment of interest rates. When inflation is too high, the BoE will try to rein it in by raising interest rates, making it more expensive for people and businesses to access credit. This is generally positive for GBP, as higher interest rates make the UK a more attractive place for global investors to park their money. When inflation falls too low it is a sign economic growth is slowing. In this scenario, the BoE will consider lowering interest rates to cheapen credit so businesses will borrow more to invest in growth-generating projects.
Data releases gauge the health of the economy and can impact the value of the Pound Sterling. Indicators such as GDP, Manufacturing and Services PMIs, and employment can all influence the direction of the GBP. A strong economy is good for Sterling. Not only does it attract more foreign investment but it may encourage the BoE to put up interest rates, which will directly strengthen GBP. Otherwise, if economic data is weak, the Pound Sterling is likely to fall.
Another significant data release for the Pound Sterling is the Trade Balance. This indicator measures the difference between what a country earns from its exports and what it spends on imports over a given period. If a country produces highly sought-after exports, its currency will benefit purely from the extra demand created from foreign buyers seeking to purchase these goods. Therefore, a positive net Trade Balance strengthens a currency and vice versa for a negative balance.
Antje Praefcke, FX Analyst at Commerzbank, fears the worst: that the Riksbank's first interest rate cut could come as early as May.
The Riksbank will not be cautious
When I look at the statements made by Riksbank Executive Council members in recent weeks, I fear that the Council is inclined to cut the key rate as soon as possible, i.e. as early as May.
And this is against the backdrop that the disinflation process has stalled in many countries, which is making many central banks cautious about initial interest rate cuts.
I guess that the Riksbank will not be cautious. Even the majority of the market already sees an interest rate cut of 25 bps in May but is still far from being fully convinced. If I am ultimately right in my assumption, I would no longer attribute any upside potential to the Krona.
Gold prices pared Wednesday’s gains after the release of higher-than-expected US PPI. Economists at ANZ Bank analyze the yellow metal’s outlook.
Strategic investments in form of ETFs are yet to turn positive
Strong CPI and PPI numbers this week weighed on market expectations of a sooner rate cut this year.
Market pricing for a 25 bps rate cut in June is 75%, down from 95% at the start of the week. The FOMC is adopting a cautious stance and would like to see more evidence of inflation falling to the target of 2% before start cutting interest rates.
Investors will watch the Fed’s pivot to easing monetary policy before adding Gold.
Strategic investments in form of ETFs are yet to turn positive.
- NZD/USD extends losses to the psychological support of 0.6100 on Friday.
- Technical analysis suggests a bearish momentum to revisit March’s low at 0.6068.
- The key resistance zone appears around the 23.6% Fibonacci retracement level of 0.6124 and the nine-day EMA at 0.6137.
NZD/USD moves in the negative direction, extending its losses to near the psychological support of 0.6100 during the early European session on Friday. A decisive move below this level could exert downward pressure on the pair to navigate the area around March’s low at 0.6068 and a major support of 0.6050 level.
A break below the latter could lead the NZD/USD pair to revisit February’s low at 0.6037, followed by the psychological support at 0.6000. Traders will closely monitor these levels for potential shifts in market sentiment.
According to the Moving Average Convergence Divergence (MACD) analysis, a prevailing downward sentiment is indicated for the NZD/USD pair. The MACD line is positioned below both the centerline and the signal line, signaling a bearish trend. Additionally, the 14-day Relative Strength Index (RSI) is below the 50 level, providing further confirmation of the bearish sentiment.
On the upside, the NZD/USD pair could find a key barrier lies at the 23.6% Fibonacci retracement level at 0.6124, followed by the nine-day Exponential Moving Average (EMA) of 0.6137. The pair could face further resistance barriers if it climbs higher, with key levels anticipated at 0.6150, followed by the 38.2% Fibonacci retracement level of 0.6179.
NZD/USD: Daily Chart
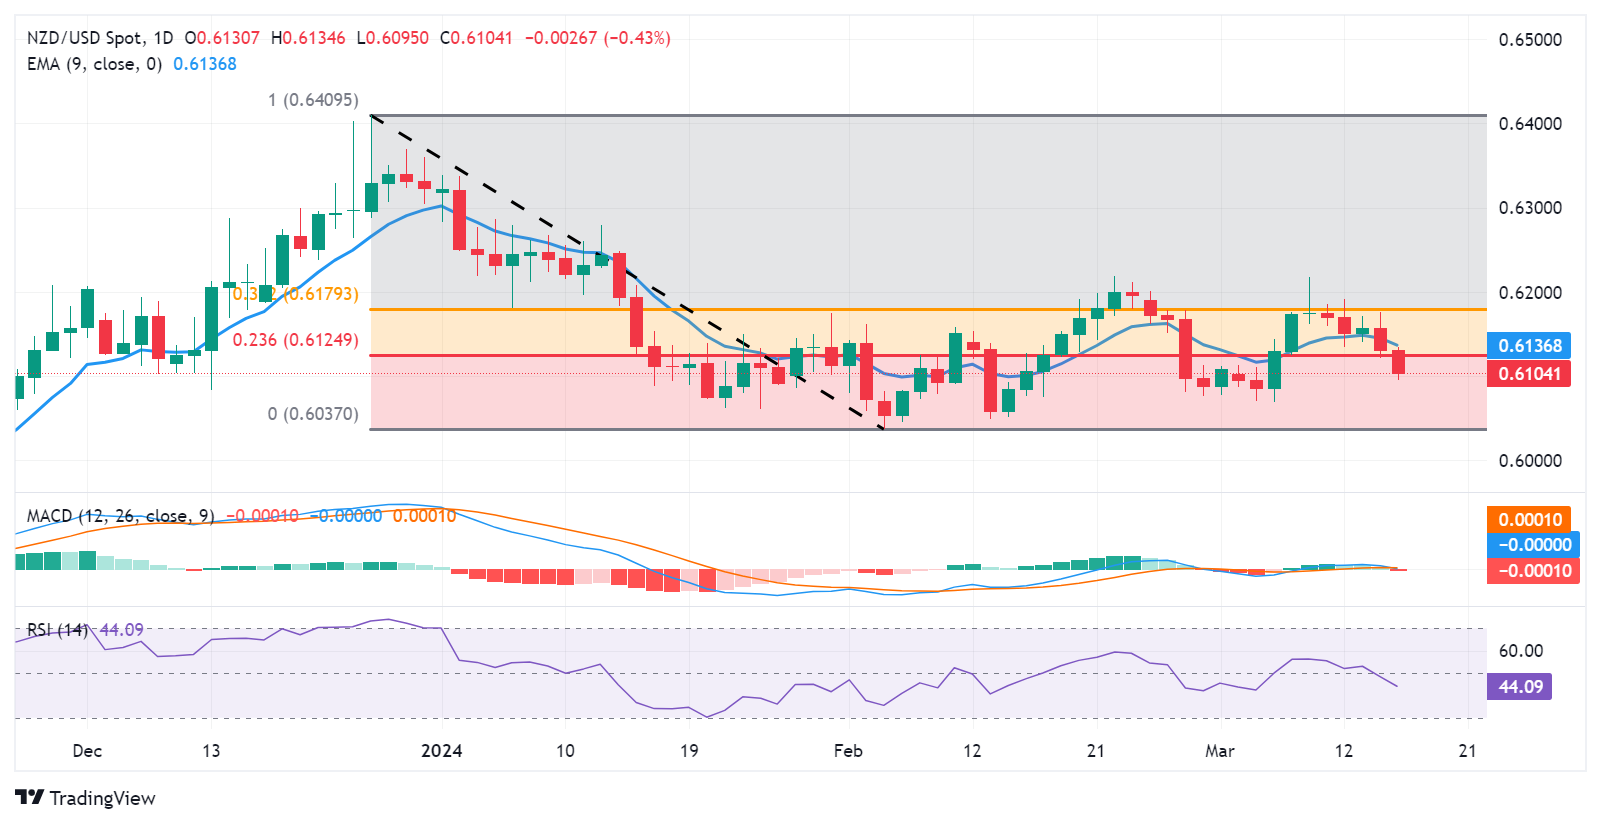
Economists at Standard Chartered expect the Bank of Japan (BoJ) to end its negative interest rate policy (NIRP) in March rather than April, alongside a de facto removal of yield curve control (YCC). They analyze the implications for the Japanese Yen (JPY).
Potential end to YCC accompanied by a greater tolerance for higher long-end yields should be JPY-positive
While the JPY has rallied and markets are already pricing in 6 bps of hikes by April, we think the BoJ could surprise with an earlier move in March. Even if the BoJ does not hike in March, the market would expect it to hike in April; market reaction should therefore be limited either way.
The removal of NIRP will not reverse negative yield differentials with other DMs, given that the anticipated policy adjustment in March is unlikely to signal the start of an aggressive rate hiking cycle by the BoJ. Nevertheless, a potential end to YCC accompanied by a greater tolerance by the BoJ for higher long-end yields should ultimately be JPY-positive, especially if our expectation for the Fed and ECB to start cutting rates from June pans out.
In that vein, risks are tilted to the downside for our USD/JPY forecast of 145.00 by the end of Q2-2024.
- EUR/JPY trades on a softer note around 161.15 in Friday’s early European session.
- BoJ’s Ueda said that policymakers will discuss whether the outlook is favorable enough to phase out the massive monetary stimulus.
- ECB’s Lane said March data showed progress on inflation, but ECB needs more time to decide when to ease policy.
The EUR/JPY cross attracts some sellers above the 161.00 support level during the early European trading hours on Friday. The cautious mood in the market provides some support to the Japanese Yen (JPY) against the Euro (EUR). However, the lower bets that the BoJ will abandon its negative rates soon might cap the upside of the cross. Market players await the Bank of Japan (BoJ) interest rate decision for fresh catalysts. The cross currently trades near 161.15, down 0.05% on the day.
The uncertainty around the Bank of Japan's next policy decision is likely to weaken the JPY and create a headwind for the EUR/JPY cross. The BoJ Governor Kazuo Ueda said that policymakers will discuss whether the outlook is favorable enough to phase out the massive monetary stimulus. Meanwhile, the rising geopolitical tension in Europe might boost safe-haven flows and benefit the JPY. Western officials reported on Friday that Russia has moved tactical nuclear weapons from its borders into neighboring Belarus, several hundred miles closer to NATO territory.
On the Euro front, the European Central Bank (ECB) chief economist Philip Lane stated that the central bank needs to take time to get a clearer picture of inflationary pressures in June. ECB President Christine Lagarde said during the press conference at its March meeting that the first-rate cuts are likely to take place in June rather than in April.
Later on Friday, the February Consumer Price Index (CPI) from France and Italy is due. These events are unlikely to move the market as traders await the BoJ monetary policy meeting next week. The outcome of the BoJ rate decision could give a clear direction to the EUR/JPY cross in the near term.
Here is what you need to know on Friday, March 15:
Following a quiet first half of the week, the US Dollar (USD) gathered strength against its rivals on Thursday. The USD Index stays in a consolidation phase near 103.50 early Friday after rising more than 0.5% in the previous day. February Export and Import Price Index and Industrial Production data will be featured in the US economic docket later in the day. The University of Michigan will release the preliminary Consumer Sentiment Index for March and the Federal Reserve Bank of New York will publish the findings of the Empire State Manufacturing Survey.
The data from the US showed that the Producer Price Index rose 1.6% on a yearly basis in February. This reading followed the 1% increase recorded in January and surpassed the market expectation of 1.1%. Meanwhile, the US Census Bureau reported that Retail Sales grew by 0.6% in February after contracting by 1.1% in January. The benchmark 10-year US Treasury bond yield climbed to 4.3% after these data releases and provided a boost to the USD. In the European morning, the 10-year yield fluctuates slightly below 4.3%. Meanwhile, US stock index futures trade marginally lower after Wall Street's main indexes closed in negative territory on Thursday.
US Dollar price this week
The table below shows the percentage change of US Dollar (USD) against listed major currencies this week. US Dollar was the strongest against the New Zealand Dollar.
| USD | EUR | GBP | CAD | AUD | JPY | NZD | CHF | |
| USD | 0.58% | 0.89% | 0.39% | 0.84% | 0.99% | 1.22% | 0.80% | |
| EUR | -0.58% | 0.31% | -0.19% | 0.26% | 0.41% | 0.64% | 0.23% | |
| GBP | -0.90% | -0.32% | -0.51% | -0.05% | 0.12% | 0.33% | -0.09% | |
| CAD | -0.40% | 0.18% | 0.50% | 0.44% | 0.57% | 0.82% | 0.40% | |
| AUD | -0.85% | -0.26% | 0.05% | -0.45% | 0.15% | 0.41% | -0.04% | |
| JPY | -1.00% | -0.45% | 0.13% | -0.61% | -0.16% | 0.22% | -0.21% | |
| NZD | -1.23% | -0.65% | -0.34% | -0.85% | -0.39% | -0.25% | -0.43% | |
| CHF | -0.81% | -0.22% | 0.09% | -0.41% | 0.04% | 0.18% | 0.42% |
The heat map shows percentage changes of major currencies against each other. The base currency is picked from the left column, while the quote currency is picked from the top row. For example, if you pick the Euro from the left column and move along the horizontal line to the Japanese Yen, the percentage change displayed in the box will represent EUR (base)/JPY (quote).
USD/JPY extended its rebound and closed above 148.00 on Thursday despite growing speculation about the Bank of Japan looking to end the negative interest rate policy at next week's policy meeting. After reaching a fresh weekly high above 148.50 in the Asian trading hours on Friday, USD/JPY retreated below this level into the European session.
Japanese Yen recovers early lost ground to over one-week low, lacks bullish conviction.
EUR/USD declined sharply in the second half of the day on Thursday and closed below 1.0900. The pair stays relatively calm in the European morning on Friday.
EUR/USD Price Analysis: The first downside target is located at 1.0840.
AUD/USD continued to push lower after losing 0.6% on Thursday and touched its lowest level since March 6 near 0.6550 in the Asian session on Friday. Although the pair managed to erase a portion of its losses, it remains well below 0.6600.
Australian Dollar drops as ASX 200 Index declines, awaits US Consumer Sentiment.
GBP/USD extended its slide after breaking below 1.2800 and closed deep in negative territory on Thursday. The pair stays on the back foot and trades below 1.2750 in the early European session.
Pressured by rising US Treasury bond yields, Gold turned south and fell below $2,160 in the American session on Thursday. XAU/USD stages a rebound early Friday and holds above $2,160 as the 10-year US yield struggles to build on Thursday's upside.
Gold price edges higher in a familiar trading range, manages to hold above $2,150 level.
Gold FAQs
Gold has played a key role in human’s history as it has been widely used as a store of value and medium of exchange. Currently, apart from its shine and usage for jewelry, the precious metal is widely seen as a safe-haven asset, meaning that it is considered a good investment during turbulent times. Gold is also widely seen as a hedge against inflation and against depreciating currencies as it doesn’t rely on any specific issuer or government.
Central banks are the biggest Gold holders. In their aim to support their currencies in turbulent times, central banks tend to diversify their reserves and buy Gold to improve the perceived strength of the economy and the currency. High Gold reserves can be a source of trust for a country’s solvency. Central banks added 1,136 tonnes of Gold worth around $70 billion to their reserves in 2022, according to data from the World Gold Council. This is the highest yearly purchase since records began. Central banks from emerging economies such as China, India and Turkey are quickly increasing their Gold reserves.
Gold has an inverse correlation with the US Dollar and US Treasuries, which are both major reserve and safe-haven assets. When the Dollar depreciates, Gold tends to rise, enabling investors and central banks to diversify their assets in turbulent times. Gold is also inversely correlated with risk assets. A rally in the stock market tends to weaken Gold price, while sell-offs in riskier markets tend to favor the precious metal.
The price can move due to a wide range of factors. Geopolitical instability or fears of a deep recession can quickly make Gold price escalate due to its safe-haven status. As a yield-less asset, Gold tends to rise with lower interest rates, while higher cost of money usually weighs down on the yellow metal. Still, most moves depend on how the US Dollar (USD) behaves as the asset is priced in dollars (XAU/USD). A strong Dollar tends to keep the price of Gold controlled, whereas a weaker Dollar is likely to push Gold prices up.
FX option expiries for Mar 14 NY cut at 10:00 Eastern Time, via DTCC, can be found below.
- EUR/USD: EUR amounts
- 1.0775 1.3b
- 1.0900 908m
- 1.0940 1.2b
- USD/JPY: USD amounts
- 147.00 3.0b
- 148.25 560m
- 149.00 1.1b
- USD/CAD: USD amounts
- 1.3490 2.4b
- 1.3535 1.5b
- EUR/USD trades in negative territory for the second consecutive day near 1.0875.
- The pair resumes a bearish outlook below the key EMA; RSI momentum indicator holds below the 50-midline.
- The initial support level is located at 1.0840; the first upside barrier will emerge at 1.0882.
The EUR/USD pair loses momentum below the 1.0900 mark during the early European session on Friday. The firmer US Dollar (USD) following the upbeat US February PPI data and Initial Jobless Claims have triggered the possibility that the Federal Reserve might delay the interest rate cuts next week, which exerts some selling pressure on the major pair. EUR/USD currently trades near 1.0875, losing 0.09% on the day.
According to the four-hour chart, EUR/USD resumes a bearish outlook as the major pair holds below the key 100-period Exponential Moving Averages (EMA). The downward momentum is also supported by the Relative Strength Index (RSI), which lies below the 50-midline, suggesting the path of least resistance is to the downside.
The initial support level for EUR/USD is located near a low of March 5 at 1.0840. The key contention level is seen at the confluence of a low of February 22 and a psychological mark at 1.0800. The additional downside filter to watch is a low of February 20 at 1.0761, followed by a low of February 15 at 1.0725.
On the bright side, the first upside barrier will emerge at the 100-period EMA at 1.0882. Any follow-through buying above the latter will attract some buyers to a high of March 14 at 1.0955, followed by the upper boundary of the Bollinger Band at 1.0971. A decisive break above this level will see a rally to 1.1000, representing a round mark and a high of January 11.
EUR/USD four-hour chart
-638460783785013360.png)
- GBP/USD drifts lower for the second straight day and drops to over a one-week trough.
- The USD sticks to the hotter US PPI-inspired gains and exerts some pressure on the pair.
- Traders now look to the US macro data for some impetus ahead of the FOMC next week.
The GBP/USD pair continues losing ground for the second straight day – also marking the fourth day of a negative move in the previous five – and drops to over a one-week low during the Asian session on Friday. Spot prices currently trade around the 1.2735 region and seem vulnerable to slide further amid some follow-through US Dollar (USD) buying.
The hotter-than-expected US Producer Price Index (PPI) pointed to still-sticky inflation and cooled market expectations for early interest rate cuts by the Federal Reserve (Fed). This, in turn, led to the overnight rise in the US Treasury bond yields, which, along with a generally weaker tone surrounding the equity markets, is seen underpinning the safe-haven Greenback and exerting some downward pressure on the GBP/USD pair.
Meanwhile, the current market pricing indicates a greater chance that the US central bank will begin cutting interest rates at the June policy meeting. This is reinforced by a fresh leg down in the US Treasury bond yields, which might hold back the USD bulls from placing aggressive bets. Apart from this, expectations that the Bank of England (BoE) will keep interest rates higher for longer should limit losses for the GBP/USD pair.
Traders might also prefer to wait for more cues about the Fed's rate-cut path before positioning for the next leg of a directional move for the USD. Hence, the focus will remain on the two-day FOMC meeting starting next Tuesday. In the meantime, Friday's release of the Empire State Manufacturing Index, Industrial Production and the Prelim Michigan Consumer Sentiment Index might provide some impetus to the GBP/USD pair.
- USD/CAD strengthens as market sentiment suggests the Fed could prolong higher interest rates.
- The uptrend in US Treasury yields has bolstered the US Dollar.
- SNB’s Jordan has voiced concerns that the CHF has an adverse impact on Swiss businesses.
USD/CHF appreciates for the third consecutive day on Friday, advancing to around 0.8850 during the Asian trading hours. The strong Producer Price Index (PPI) data from the United States (US), has contributed to the strength of the USD/CHF pair.
Furthermore, the US Dollar Index (DXY) benefits from the hawkish sentiment surrounding the US Federal Reserve, contemplating maintaining its higher interest rates in response to persistent inflationary pressures. Additionally, US Treasury yields have risen for the past four consecutive sessions, lending further support to the US Dollar (USD), consequently, underpinning the USD/CHF pair.
The US Core Producer Price Index (PPI) remained stable with a 2.0% year-over-year increase in February, surpassing the expected 1.9%. The US PPI (YoY) recorded a 1.6% increase, exceeding both the anticipated 1.1% and the previous 1.0%. Furthermore, the Retail Sales Control Group showed improvement, reaching a flat 0.0% compared to the previous decline of 0.3%.
These recent economic indicators complicate the Federal Reserve's decision-making process regarding interest rate cuts. According to the CME FedWatch Tool, the likelihood of a rate cut in March currently stands at only 1.0%, dropping to 7.7% for May. The probabilities for rate cuts in June and July are relatively lower, at 59.0% and 79.4%, respectively.
In Switzerland, Producer and Import Prices decreased by 2.0% year-on-year in February 2024, showing a slight improvement from the previous month's 2.3% decline, which marked the sharpest drop since December 2020. This decline marks the tenth consecutive period of decrease. Monthly, prices increased by 0.1%, rebounding from a 0.5% fall in the previous month.
The Swiss Franc (CHF) faces challenges as the Swiss National Bank (SNB) adjusts its policy stance, no longer prioritizing a strong domestic currency. SNB Chairman Thomas Jordan has expressed concerns about the Swiss Franc's excessive strength, particularly its impact on Swiss businesses, especially exporters. These concerns are reflected in data from Switzerland's Foreign Exchange Reserves (CHFER), which show a recovery in Forex reserves.
- AUD/JPY edges lower to 97.35 in Friday’s Asian session.
- Australian central bank is expected to maintain its key interest rate and policy stance in its March meeting.
- The financial market opinion is split on whether the BoJ will raise the rates in March or April.
The AUD/JPY cross trades on a weaker note below the mid-97.00s during the Asian trading hours on Friday. Investors will closely monitor the Reserve Bank of Australia (RBA) and the Bank of Japan (BoJ) interest rate decisions next week. These events might cause volatility in the market. At the press time, AUD/JPY is trading at 97.35, losing 0.27% on the day.
The RBA is anticipated to hold its key interest rate at 4.35% for a third consecutive meeting next week. Investors have priced in the first rate cuts in its June meeting. The RBA is likely to maintain its hawkish stance as inflation remains elevated. However, any hawkish warning from the Australian central bank might weigh on the Australian Dollar (AUD) against the Japanese Yen (JPY).
On the other hand, the financial market is split on whether the BoJ will raise rates in March or April. Investors believe that an April hike is slightly more likely than a March hike, but the possibility of a March hike cannot be ruled out since the large companies in Japan have offered their employees the highest wage increase in over three decades. The lower bets that the BoJ will end negative rates soon might drag the JPY lower and act as a tailwind for the AUD/JPY cross.
- USD/CAD extends its gains after stronger US Producer Price Index (PPI) data.
- US Core PPI remained at 2.0% YoY and rose by 0.3% MoM in February.
- Higher WTI price could provide support for the Canadian Dollar.
USD/CAD gains ground for the second successive session on Friday. Wednesday’s hotter-than-expected US Consumer Inflation data has reduced the likelihood of the Federal Reserve (Fed) cutting interest rates soon. This sentiment is further bolstered by Thursday’s Producer Inflation figures from the United States (US). As a result, the USD/CAD pair trades higher around 1.3540 at the time of this update.
The US Dollar Index (DXY) benefits from the hawkish sentiment surrounding the US Fed, which is considering prolonging its higher interest rates due to persistent inflationary pressures. US Treasury yields have increased in the previous four consecutive sessions, providing support to the US Dollar (USD). The DXY remains in the green zone around 103.40, with the 2-year and 10-year yields on US Treasury bonds correcting at 4.68% and 4.28%, respectively.
The US Core Producer Price Index (PPI) held steady with a 2.0% year-over-year increase in February, surpassing expectations which were set at 1.9%. The US PPI (YoY) experienced a 1.6% increase, exceeding both the expected 1.1% and the previous 1.0%.
US Retail Sales rose by 0.6% monthly, below the expected 0.8% in February, swinging from the previous decline of 1.1%. While Retail Sales Control Group improved to a flat 0.0%, compared to the previous decline of 0.3%. Traders will likely keep an eye on the preliminary US Michigan Consumer Sentiment Index for March, due to be released on Friday.
West Texas Intermediate (WTI) oil prices are on the rise for the third consecutive day, buoyed by signs of strong demand in the United States and an optimistic outlook for global consumption in 2024. This positive trend in Crude oil prices could offer support for the Canadian Dollar (CAD), as Canada is the largest oil exporter to the US. Consequently, this could limit the upside potential of the USD/CAD pair.
On Thursday, Canadian Manufacturing Sales showed a rebound to 0.2% in January, although it fell short of the forecasted 0.4%. Despite this, it marks a recovery from the previous month's decline of -1.1% (revised down from -0.7%). Investors will now turn their attention to Housing Starts and Wholesale Sales data scheduled for release on Friday.
- WTI pauses after the previous day’s strong move up to a fresh YTD peak.
- Hawkish Fed expectations and China’s economic woes act as a headwind.
- Improved demand outlook should limit any meaningful corrective decline.
West Texas Intermediate (WTI) US Crude Oil prices oscillate in a narrow range, just above mid-$80.00s during the Asian session on Friday and remain well within the striking distance of the highest level since November 6 touched the previous day.
The hotter-than-expected US Producer Price Index (PPI) suggested that the Federal Reserve (Fed) might stick to its higher-for-longer interest rates narrative to bring down inflation. This is expected to hamper economic activity and dent fuel demand, which, along with concerns about a slowdown in China, acts as a headwind for Crude Oil prices. The downside, however, remains cushioned in the wake of a sharp decline in US inventories, drone strikes on Russian refineries and a rise in energy demand forecasts.
The Energy Information Administration (EIA) reported on Wednesday that US crude stockpiles unexpectedly shrank by about 1.5 million barrels in the week to March 8. Meanwhile, Ukraine's one of the most serious drone attacks against Russia's energy sector in recent months caused a fire at Rosneft's biggest refinery on Wednesday. Moreover, the International Energy Agency raised its view on 2024 oil demand growth for a fourth time since November amid supply disruptions caused by Houthi attacks in the Red Sea.
This comes after OPEC+ members decided to extend the production cuts of 2.2 million barrels per day through the second quarter and support prospects for a further appreciating move for Crude Oil prices. Nevertheless, the black liquid remains on track to register strong week gains as the market focus now shifts to the highly-anticipated two-day FOMC monetary policy meeting starting next Tuesday.
- Gold price struggles for a firm direction amid the uncertainty over the Fed’s rate-cut path.
- Geopolitical risk, along with the risk-off impulse, lends support to the safe-haven XAU/USD.
- Traders look to the US macro data for some impetus ahead of next week’s FOMC meeting.
Gold price (XAU/USD) came under some renewed selling pressure on Thursday and dropped back closer to the weekly low in reaction to the hotter-than-expected US Producer Price Index (PPI). The data pointed to still-stick inflation and cooled market expectations for early interest rate cuts by the Federal Reserve (Fed). This, in turn, triggered a fresh leg up in the US Treasury bond yields and boosted the US Dollar (USD), which turned out to be a key factor driving flows away from the non-yielding yellow metal.
The markets, however, are still pricing in a greater chance that the US central bank will start cutting interest rates in June. This, along with the risk-off impulse, assisted the Gold price to attract some buyers ahead of the $2,150 level and trade with a mild positive bias during the Asian session on Friday. The XAU/USD, however, remains confined in a familiar range as traders seek more clarity about the Fed's rate-cut path before placing fresh directional bets. Hence, the focus remains on the FOMC meeting next week.
Daily Digest Market Movers: Gold price extends the range play amid mixed fundamental cues
- Data released on Thursday showed that the US producer prices increased more than expected in February, which might force the Federal Reserve to keep interest rates elevated and prompt some selling around the Gold price.
- The US Bureau of Labor Statistics reported that the Producer Price Index for final demand rose by a 1.6% YoY rate in February as compared to the previous month's upwardly revised print of 1% and the 1.1% market estimates.
- Separately, the US Department of Labor (DOL) published the usual Initial Jobless Claims data, which showed that the number of individuals filing for unemployment insurance for the first time unexpectedly fell to 209K last week.
- This, to a larger extent, overshadowed softer US Retail Sales figures, which rose by 0.6% in February and pointed to a slowdown in consumer spending during the first quarter amid rising inflation and high borrowing costs.
- Meanwhile, the CME Group's FedWatch Tool indicates that the markets are still pricing in about a 60% chance that the Fed will cut interest rates at the June policy meeting, helping limit losses for the non-yielding yellow metal.
- Investors turn more cautious over the possibility of more hawkish signals from the Fed, which is evident from a generally weaker tone around the equity markets and lends additional support to the safe-haven XAU/USD.
- Russia moved tactical nuclear weapons from its borders into neighbouring Belarus, closer to NATO territory, after President Vladimir Putin threatened a wider military showdown with NATO over the alliance's backing for Ukraine.
- Traders now look to Friday's US economic docket – featuring the release of the Empire State Manufacturing Index, Industrial Production figures and the Preliminary University of Michigan Consumer Sentiment Index.
- The focus, however, will remain glued to the upcoming FOMC monetary policy meetings, starting next Tuesday, which might provide fresh cues about the Fed's rate-cut path and determine the near-term trajectory for the metal.
Technical Analysis: Gold price bulls are not ready to give up, $2,150 support holds the key
From a technical perspective, the range-bounce price action since the beginning of the current week comes on the back of the recent blowout rally and might still be categorized as a bullish consolidation phase. The lower boundary of the said trading range near the $2,152-2,150 area might continue to protect the immediate downside. A convincing break below could drag the Gold price to the next relevant support near the $2,128-2,127 zone. The corrective slide could extend further towards the $2,100 round figure, which should act as a strong base for the XAU/USD.
On the flip side, the $2,178-2,180 region now seems to have emerged as an immediate strong barrier, which if cleared should allow the Gold price to challenge the record peak, around the $2,195 area touched last week. Some follow-through buying beyond the $2,200 mark will be seen as a fresh trigger for bullish traders and set the stage for the resumption of a well-established uptrend witnessed since the beginning of this month.
US Dollar price today
The table below shows the percentage change of US Dollar (USD) against listed major currencies today. US Dollar was the strongest against the New Zealand Dollar.
| USD | EUR | GBP | CAD | AUD | JPY | NZD | CHF | |
| USD | 0.08% | 0.12% | 0.03% | 0.31% | 0.12% | 0.43% | 0.08% | |
| EUR | -0.07% | 0.03% | -0.07% | 0.21% | 0.04% | 0.35% | -0.01% | |
| GBP | -0.12% | -0.03% | -0.10% | 0.18% | 0.00% | 0.32% | -0.04% | |
| CAD | -0.01% | 0.06% | 0.09% | 0.28% | 0.09% | 0.41% | 0.05% | |
| AUD | -0.31% | -0.21% | -0.18% | -0.27% | -0.18% | 0.14% | -0.23% | |
| JPY | -0.12% | -0.02% | 0.02% | -0.10% | 0.14% | 0.32% | -0.04% | |
| NZD | -0.43% | -0.35% | -0.33% | -0.42% | -0.14% | -0.32% | -0.36% | |
| CHF | -0.07% | 0.01% | 0.04% | -0.06% | 0.22% | 0.04% | 0.36% |
The heat map shows percentage changes of major currencies against each other. The base currency is picked from the left column, while the quote currency is picked from the top row. For example, if you pick the Euro from the left column and move along the horizontal line to the Japanese Yen, the percentage change displayed in the box will represent EUR (base)/JPY (quote).
Gold FAQs
Why do people invest in Gold?
Gold has played a key role in human’s history as it has been widely used as a store of value and medium of exchange. Currently, apart from its shine and usage for jewelry, the precious metal is widely seen as a safe-haven asset, meaning that it is considered a good investment during turbulent times. Gold is also widely seen as a hedge against inflation and against depreciating currencies as it doesn’t rely on any specific issuer or government.
Who buys the most Gold?
Central banks are the biggest Gold holders. In their aim to support their currencies in turbulent times, central banks tend to diversify their reserves and buy Gold to improve the perceived strength of the economy and the currency. High Gold reserves can be a source of trust for a country’s solvency. Central banks added 1,136 tonnes of Gold worth around $70 billion to their reserves in 2022, according to data from the World Gold Council. This is the highest yearly purchase since records began. Central banks from emerging economies such as China, India and Turkey are quickly increasing their Gold reserves.
How is Gold correlated with other assets?
Gold has an inverse correlation with the US Dollar and US Treasuries, which are both major reserve and safe-haven assets. When the Dollar depreciates, Gold tends to rise, enabling investors and central banks to diversify their assets in turbulent times. Gold is also inversely correlated with risk assets. A rally in the stock market tends to weaken Gold price, while sell-offs in riskier markets tend to favor the precious metal.
What does the price of Gold depend on?
The price can move due to a wide range of factors. Geopolitical instability or fears of a deep recession can quickly make Gold price escalate due to its safe-haven status. As a yield-less asset, Gold tends to rise with lower interest rates, while higher cost of money usually weighs down on the yellow metal. Still, most moves depend on how the US Dollar (USD) behaves as the asset is priced in dollars (XAU/USD). A strong Dollar tends to keep the price of Gold controlled, whereas a weaker Dollar is likely to push Gold prices up.
- EUR/USD hit a weekly low at 1.0872 amid a stronger Greenback.
- US Core PPI held steady with a 2.0% YoY and rose by 0.3% in February.
- US Dollar appreciates despite the correction in US Treasury yields.
The EUR/USD pair continues its downward trend for the second consecutive day, hitting weekly lows near 1.0870 in the Asian session on Friday. The depreciation of the EUR/USD is attributed to the US Dollar (USD) gaining strength, buoyed by the robust Producer Price Index (PPI) data from the United States (US), signaling ongoing inflationary pressures in the economy.
The US Core Producer Price Index (PPI) held steady with a 2.0% year-over-year increase in February, surpassing expectations which were set at 1.9%. Monthly, the report indicated a 0.3% uptick compared to the previous 0.5%, outperforming the anticipated 0.2% reading.
In February, the US PPI (YoY) experienced a 1.6% increase, exceeding both the expected 1.1% and the previous 1.0%. Meanwhile, the PPI (MoM) saw a 0.6% rise, surpassing market expectations and the previous 0.3% increase.
These figures add complexity to the Federal Reserve's interest rate cut timeline. According to the CME FedWatch Tool, the probability of a rate cut in March currently sits at 1.0%, decreasing to 7.7% for May. The likelihood of rate cuts in June and July are comparatively lower, standing at 59.0% and 79.4%, respectively.
The Euro confronts further hurdles due to the dovish stance emerging from European Central Bank (ECB) policymakers. François Villeroy de Galhau, an ECB policymaker, suggested on Wednesday that a rate cut in the spring remains probable. Additionally, on Thursday, ECB Governing Council member Yannis Stournaras advocated for an early rate reduction.
On Friday, ECB Board Member Philip Richard Lane is scheduled to deliver a guest lecture at the Imperial College Business School in London, United Kingdom. Investors are expected to closely monitor his remarks for insights into the ECB's policy direction.
- Indian Rupee trades on a negative note on Friday amid a stronger US Dollar.
- India's Wholesale Price Index-based inflation dropped to a four-month low, weaker than expected.
- Investors will focus on the Indian Trade Balance data and US preliminary Michigan Consumer Sentiment, due on Friday.
Indian Rupee (INR) loses momentum on Friday. The uptick in the pair is bolstered by the upbeat US February Producer Price Index (PPI) data. Furthermore, the weaker-than-expected Indian WPI inflation exerts some selling pressure on the INR and creates a tailwind for the USD/INR pair. India’s wholesale inflation for February cooled to a four-month low, according to the statistics ministry on Thursday. This report could form the basis for the Indian central bank’s monetary policy actions.
Nonetheless, the markets expect the Reserve Bank of India’s (RBI) Monetary Policy Committee (MPC) to hold the interest rate steady in the next meeting and might cut the repo rate in the second half of the calendar year 2024. The RBI is unlikely to precede the Fed in this rate cut cycle. This, in turn, might lift the Indian Rupee and cap the upside of the pair. Moving on, investors will keep an eye on the Indian Trade Balance data, due on Friday. Also, the US Industrial Production and the preliminary Michigan Consumer Sentiment will be released later in the day.
Daily Digest Market Movers: Indian Rupee remains vulnerable amid the multiple headwinds
- India's Wholesale Price Index-based inflation dropped to a four-month low, dropping to 0.20% YoY in February from 0.27% in January, worse than the market expectation of 0.25%.
- The Indian WPI Food climbed 6.95% YoY in February from the previous reading of 6.85%, while the WPI Fuel fell by 1.59% YoY from a 0.51% drop in January.
- The Indian WPI Manufacturing Inflation for February came in at -1.27% YoY versus -1.13% prior.
- US Retail Sales jumped 0.6% MoM in February from a downwardly revised -1.1% in the previous month, below the market consensus of a 0.8% m/m rise.
- The US PPI figure rose 0.6% MoM in February from 0.3% MoM in January, while the Core PPI figure climbed 0.3% MoM from a 0.5% gain in January.
- The US weekly Initial Jobless Claims for the week ending March 9 decreased by 1,000 to 209,000 from the previous week's print of 210,000, better than the market expectation of 218,000.
Technical Analysis: Indian Rupee continues its rangebound movement between 82.60 and 83.15 in the longer term
Indian Rupee trades softer on the day. USD/INR remains stuck within a multi-month-old descending trend channel around 82.60–83.15 since December 8, 2023.
From a technical perspective, USD/INR keeps the bearish vibe in the near term as the pair holds below the key 100-day Exponential Moving Average (EMA) on the daily chart. However, the 14-day Relative Strength Index (RSI) returns above the 50.0 midlines, indicating that further upside cannot be ruled out for the time being.
The first upside barrier for the pair will emerge near 83.00, portraying the confluence of the 100-day EMA and a psychological round figure. Any follow-through buying will pave the way to the upper boundary of the descending trend channel near 83.15. A bullish breakout of this level could signal that buyers are taking over and could allow USD/INR to reach the next upside target near a high of January 2 at 83.35, followed by the 84.00 round mark.
On the other hand, a low of March 14 at 82.80 acts as an initial support level for the pair. The critical support is located at the lower limit of the descending trend channel at 82.60. A break below 82.60 could drag the pair lower to a low of August 23 at 82.45, and finally a low of June 1 at 82.25.
US Dollar price today
The table below shows the percentage change of US Dollar (USD) against listed major currencies today. US Dollar was the strongest against the Australian Dollar.
| USD | EUR | GBP | CAD | AUD | JPY | NZD | CHF | |
| USD | 0.07% | 0.10% | 0.03% | 0.26% | 0.15% | 0.42% | 0.06% | |
| EUR | -0.06% | 0.02% | -0.06% | 0.18% | 0.07% | 0.35% | -0.01% | |
| GBP | -0.09% | -0.02% | -0.07% | 0.16% | 0.06% | 0.33% | -0.02% | |
| CAD | -0.02% | 0.05% | 0.08% | 0.25% | 0.12% | 0.40% | 0.04% | |
| AUD | -0.26% | -0.18% | -0.16% | -0.23% | -0.11% | 0.18% | -0.20% | |
| JPY | -0.15% | -0.05% | -0.02% | -0.12% | 0.12% | 0.29% | -0.08% | |
| NZD | -0.42% | -0.35% | -0.34% | -0.41% | -0.17% | -0.28% | -0.37% | |
| CHF | -0.06% | 0.01% | 0.04% | -0.05% | 0.19% | 0.08% | 0.36% |
The heat map shows percentage changes of major currencies against each other. The base currency is picked from the left column, while the quote currency is picked from the top row. For example, if you pick the Euro from the left column and move along the horizontal line to the Japanese Yen, the percentage change displayed in the box will represent EUR (base)/JPY (quote).
Indian Rupee FAQs
What are the key factors driving the Indian Rupee?
The Indian Rupee (INR) is one of the most sensitive currencies to external factors. The price of Crude Oil (the country is highly dependent on imported Oil), the value of the US Dollar – most trade is conducted in USD – and the level of foreign investment, are all influential. Direct intervention by the Reserve Bank of India (RBI) in FX markets to keep the exchange rate stable, as well as the level of interest rates set by the RBI, are further major influencing factors on the Rupee.
How do the decisions of the Reserve Bank of India impact the Indian Rupee?
The Reserve Bank of India (RBI) actively intervenes in forex markets to maintain a stable exchange rate, to help facilitate trade. In addition, the RBI tries to maintain the inflation rate at its 4% target by adjusting interest rates. Higher interest rates usually strengthen the Rupee. This is due to the role of the ‘carry trade’ in which investors borrow in countries with lower interest rates so as to place their money in countries’ offering relatively higher interest rates and profit from the difference.
What macroeconomic factors influence the value of the Indian Rupee?
Macroeconomic factors that influence the value of the Rupee include inflation, interest rates, the economic growth rate (GDP), the balance of trade, and inflows from foreign investment. A higher growth rate can lead to more overseas investment, pushing up demand for the Rupee. A less negative balance of trade will eventually lead to a stronger Rupee. Higher interest rates, especially real rates (interest rates less inflation) are also positive for the Rupee. A risk-on environment can lead to greater inflows of Foreign Direct and Indirect Investment (FDI and FII), which also benefit the Rupee.
How does inflation impact the Indian Rupee?
Higher inflation, particularly, if it is comparatively higher than India’s peers, is generally negative for the currency as it reflects devaluation through oversupply. Inflation also increases the cost of exports, leading to more Rupees being sold to purchase foreign imports, which is Rupee-negative. At the same time, higher inflation usually leads to the Reserve Bank of India (RBI) raising interest rates and this can be positive for the Rupee, due to increased demand from international investors. The opposite effect is true of lower inflation.
| Raw materials | Closed | Change, % |
|---|---|---|
| Silver | 24.803 | -0.76 |
| Gold | 2161.746 | -0.57 |
| Palladium | 1065.1 | 0.71 |
- The Japanese Yen continues losing ground on Friday amid the BoJ policy uncertainty.
- The hotter US PPI released on Thursday underpins the USD and further boosts USD/JPY.
- Traders look to the US data for some impetus ahead of central bank meetings next week.
The Japanese Yen (JPY) prolongs the descending trend against its American counterpart for the fourth straight day on Friday and drops to over a one-week low during the Asian session. Diminishing odds for an imminent shift in the Bank of Japan's (BoJ) policy stance turn out to be a key factor undermining the JPY. In fact, the BoJ Governor Kazuo Ueda offered a slightly bleaker assessment of the economy earlier this week and dashed hopes for a rate hike next week.
In contrast, the hotter-than-expected US Producer Price Index (PPI) fueled speculation that the Federal Reserve (Fed) will reiterate its higher-for-longer interest rates narrative to bring down still-sticky inflation. This, in turn, is seen acting as a tailwind for the US Dollar (USD) and lending additional support to the USD/JPY pair. This, to a larger extent, overshadows the risk-off impulse and does little to benefit the JPY's safe-haven status or cap gains for the currency pair.
Meanwhile, the outcome of Japan’s spring wage negotiations indicated that most firms have agreed to the trade unions' wage rise demands, which should allow the BoJ to exit negative interest rates in the coming months. Hence, it remains to be seen if bulls can capitalize on the move up or opt to wait on the sidelines ahead of next week's key central bank event risks – the BoJ policy decision on Tuesday, followed by the outcome of a two-day FOMC meeting on Wednesday.
Daily Digest Market Movers: Japanese Yen is undermined by reduced bets for a March BoJ rate hike
- The uncertainty over the Bank of Japan's next policy move continues to undermine the Japanese Yen and lifts the USD/JPY pair higher for the fourth successive day, to over a one-week high during the Asian session.
- BoJ Governor Kazuo Ueda offered few clues on how soon the central bank would end the negative rate and said that policymakers will debate whether the outlook is bright enough to phase out the massive monetary stimulus.
- Jiji news agency reported on Thursday that BoJ has started to make arrangements to end its negative interest rate policy at the March meeting as the bumper wage hikes give the central bank leeway to make the key policy shift.
- Japan's Finance Minister Shunichi Suzuki said on Friday that the economy is no longer in deflation and that the government will mobilize all policy steps available to continue the strong trend of wage hikes this year.
- Market participants, however, seem convinced that the BoJ won't tighten policy next week and wait until April when the amount of the wage rise pass-through to small and medium-sized firms becomes evident.
- Meanwhile, the hotter-than-expected US Producer Price Index released on Thursday forced investors to scale back their bets for an interest rate cut in June, pushing the US Treasury bond yields and the US Dollar higher.
- Data published by the US Bureau of Labor Statistics showed that the PPI for final demand rose by a 1.6% YoY rate in February as compared to the previous month's upwardly revised print of 1% and the 1.1% estimated.
- Separately, the US Department of Labor (DOL) reported that there were 209K initial jobless claims in the week ending March 9, down from the previous week's 210K and better than the market expectation of 218 K.
- This helps offset a slight disappointment from the US Retail Sales figures, which rose by 0.6% in February. Meanwhile, Sales Ex-Autos were up 0.3% and Retail Sales Control Group came in flat during the reported month.
- Traders now look to Friday's US economic docket – featuring the release of the Empire State Manufacturing Index, Industrial Production figures and the Preliminary University of Michigan Consumer Sentiment Index.
- The focus, however, remains glued to the BoJ and the FOMC monetary policy meetings next week, which should provide a fresh impetus and play a key role in determining the near-term trend for the USD/JPY pair.
Technical Analysis: USD/JPY might confront some resistance near 149.00, bulls have the upper hand
From a technical perspective, the overnight breakout through the 100-day Simple Moving Average (SMA) and a subsequent move beyond the 148.00 mark was seen as a key trigger for bullish traders. That said, oscillators on the daily chart – though have been recovering from lower levels – are yet to confirm a positive bias. Hence, any subsequent move up is more likely to confront stiff resistance near the 149.00 strong horizontal support breakpoint, now turned resistance. Some follow-through buying, however, might prompt an aggressive short-covering move and allow the USD/JPY pair to aim back to reclaim the 150.00 psychological mark.
On the flip side, the 148.00 round figure, followed by the 100-day SMA, currently around the 147.70-147.65 region, could offer immediate support. A convincing break below might turn the USD/JPY pair vulnerable to accelerate the fall back towards the 147.00 mark en route to the monthly swing low, around the 146.50-146.45 region. The latter nears the very important 200-day SMA, which if broken decisively will set the stage for the resumption of the recent sharp pullback from the vicinity of the 152.00 mark, or the YTD peak touched in February.
Japanese Yen price today
The table below shows the percentage change of Japanese Yen (JPY) against listed major currencies today. Japanese Yen was the weakest against the Canadian Dollar.
| USD | EUR | GBP | CAD | AUD | JPY | NZD | CHF | |
| USD | 0.03% | 0.04% | 0.00% | 0.17% | 0.10% | 0.31% | 0.03% | |
| EUR | -0.02% | 0.01% | -0.04% | 0.12% | 0.07% | 0.28% | 0.00% | |
| GBP | -0.04% | -0.01% | -0.05% | 0.12% | 0.06% | 0.27% | -0.01% | |
| CAD | 0.01% | 0.03% | 0.04% | 0.17% | 0.10% | 0.31% | 0.03% | |
| AUD | -0.18% | -0.14% | -0.13% | -0.17% | -0.06% | 0.14% | -0.14% | |
| JPY | -0.11% | -0.06% | -0.06% | -0.11% | 0.04% | 0.19% | -0.07% | |
| NZD | -0.32% | -0.28% | -0.27% | -0.32% | -0.15% | -0.21% | -0.28% | |
| CHF | -0.03% | 0.00% | 0.01% | -0.04% | 0.13% | 0.07% | 0.28% |
The heat map shows percentage changes of major currencies against each other. The base currency is picked from the left column, while the quote currency is picked from the top row. For example, if you pick the Euro from the left column and move along the horizontal line to the Japanese Yen, the percentage change displayed in the box will represent EUR (base)/JPY (quote).
Japanese Yen FAQs
What key factors drive the Japanese Yen?
The Japanese Yen (JPY) is one of the world’s most traded currencies. Its value is broadly determined by the performance of the Japanese economy, but more specifically by the Bank of Japan’s policy, the differential between Japanese and US bond yields, or risk sentiment among traders, among other factors.
How do the decisions of the Bank of Japan impact the Japanese Yen?
One of the Bank of Japan’s mandates is currency control, so its moves are key for the Yen. The BoJ has directly intervened in currency markets sometimes, generally to lower the value of the Yen, although it refrains from doing it often due to political concerns of its main trading partners. The current BoJ ultra-loose monetary policy, based on massive stimulus to the economy, has caused the Yen to depreciate against its main currency peers. This process has exacerbated more recently due to an increasing policy divergence between the Bank of Japan and other main central banks, which have opted to increase interest rates sharply to fight decades-high levels of inflation.
How does the differential between Japanese and US bond yields impact the Japanese Yen?
The BoJ’s stance of sticking to ultra-loose monetary policy has led to a widening policy divergence with other central banks, particularly with the US Federal Reserve. This supports a widening of the differential between the 10-year US and Japanese bonds, which favors the US Dollar against the Japanese Yen.
How does broader risk sentiment impact the Japanese Yen?
The Japanese Yen is often seen as a safe-haven investment. This means that in times of market stress, investors are more likely to put their money in the Japanese currency due to its supposed reliability and stability. Turbulent times are likely to strengthen the Yen’s value against other currencies seen as more risky to invest in.
- Australian Dollar extends losses as US Dollar cheers stronger producer inflation data.
- Australia's S&P/ASX 200 Index tracks losses on Wall Street overnight.
- Reuters poll forecasts that the RBA could maintain its cash rate at 4.35% until September.
The Australian Dollar (AUD) extends its losses for the second successive day on Friday, reaching weekly lows. The AUD/USD pair depreciates as the US Dollar (USD) gains fresh momentum, driven by stronger-than-expected Producer Price Index (PPI) data from the United States (US). This data further complicates the outlook for when the Federal Reserve will begin to cut interest rates.
Australia’s S&P/ASX 200 Index tumbles to its lowest levels in three weeks amidst a widespread market selloff. Australian shares follow losses on Wall Street overnight, with major banking and iron ore mining shares leading the decline.
The Reserve Bank of Australia (RBA) maintains its stance of potentially raising rates further, with the RBA’s policy decision scheduled for next week. In the meantime, traders will likely keep an eye on the preliminary US Michigan Consumer Sentiment Index for March, due to be released on Friday.
Daily Digest Market Movers: Australian Dollar depreciates after stronger US PPI data
- Australia's NAB Business Confidence Index decreased to 0 in February, from the previous reading of 1. Business Conditions Index improved to 10 from the previous reading of 7 (revised from 6).
- According to a Reuters poll conducted ahead of the RBA meeting, analysts forecast that the central bank could maintain its official cash rate at 4.35% for a third consecutive meeting, with no changes expected until at least the end of September.
- RBA Governor Michele Bullock recently stated that inflation in Australia is primarily "homegrown" and "demand-driven," attributable to the strength of the labor market and increasing wage inflation. The RBA does not anticipate this phenomenon occurring until 2026.
- Former RBA Governor Philip Lowe stated on Wednesday that there is a two-way risk on interest rates, supporting current RBA Governor Michelle Bullock's warning that interest rates might still need to increase.
- Chinese Foreign Minister Wang Yi is scheduled to meet with Australia's Foreign Affairs Minister Penny Wong in Canberra on March 20. The discussions are expected to cover various topics, including economic issues such as the removal of trade barriers, as well as more sensitive issues like human rights and regional security.
- US Treasury Secretary Janet Louise Yellen remarked that it appears unlikely for interest rates to revert to levels as low as those before the Covid-19 pandemic. She also noted that the interest rate assumptions outlined in Biden’s budget plan were deemed "reasonable" and aligned with a broad spectrum of forecasts.
- According to the CME FedWatch Tool, the probability of a rate cut in March currently stands at 1.0%, while it has decreased to 7.7% for May. The likelihood of a rate cut in June and July is lower, at 59.0% and 79.4%, respectively.
- The US Core Producer Price Index (PPI) remained consistent with the rise of 2.0% year-over-year in February, maintaining its position above the 1.9% expected. The monthly report showed an increase of 0.3% against 0.5% prior, exceeding the expected 0.2% reading.
- US PPI (YoY) increased by 1.6% in February, surpassing the expected 1.1% and 1.0% prior. PPI (MoM) rose by 0.6% above the market expectation and the previous increase of 0.3%.
- US Retail Sales rose by 0.6% monthly, below the expected 0.8% in February, swinging from the previous decline of 1.1%. While Retail Sales Control Group improved to a flat 0.0%, compared to the previous decline of 0.3%.
Technical Analysis: Australian Dollar drops to near 0.6570 followed by a 50.0% retracement
The Australian Dollar trades near 0.6570 on Friday. Immediate support is seen around the 50.0% retracement level of 0.6555, which aligns with the major support at 0.6550. A breach below this level could exert downward pressure on the AUD/USD pair, with potential support at the 61.8% Fibonacci retracement level of 0.6528, followed by the psychological level of 0.6500. On the upside, the AUD/USD pair may encounter a barrier around the nine-day Exponential Moving Average (EMA) at 0.6583, preceding the psychological barrier at 0.6600. A breakthrough above this level could lead the pair to revisit the weekly high of 0.6638, followed by the major level of 0.6650.
AUD/USD: Daily Chart
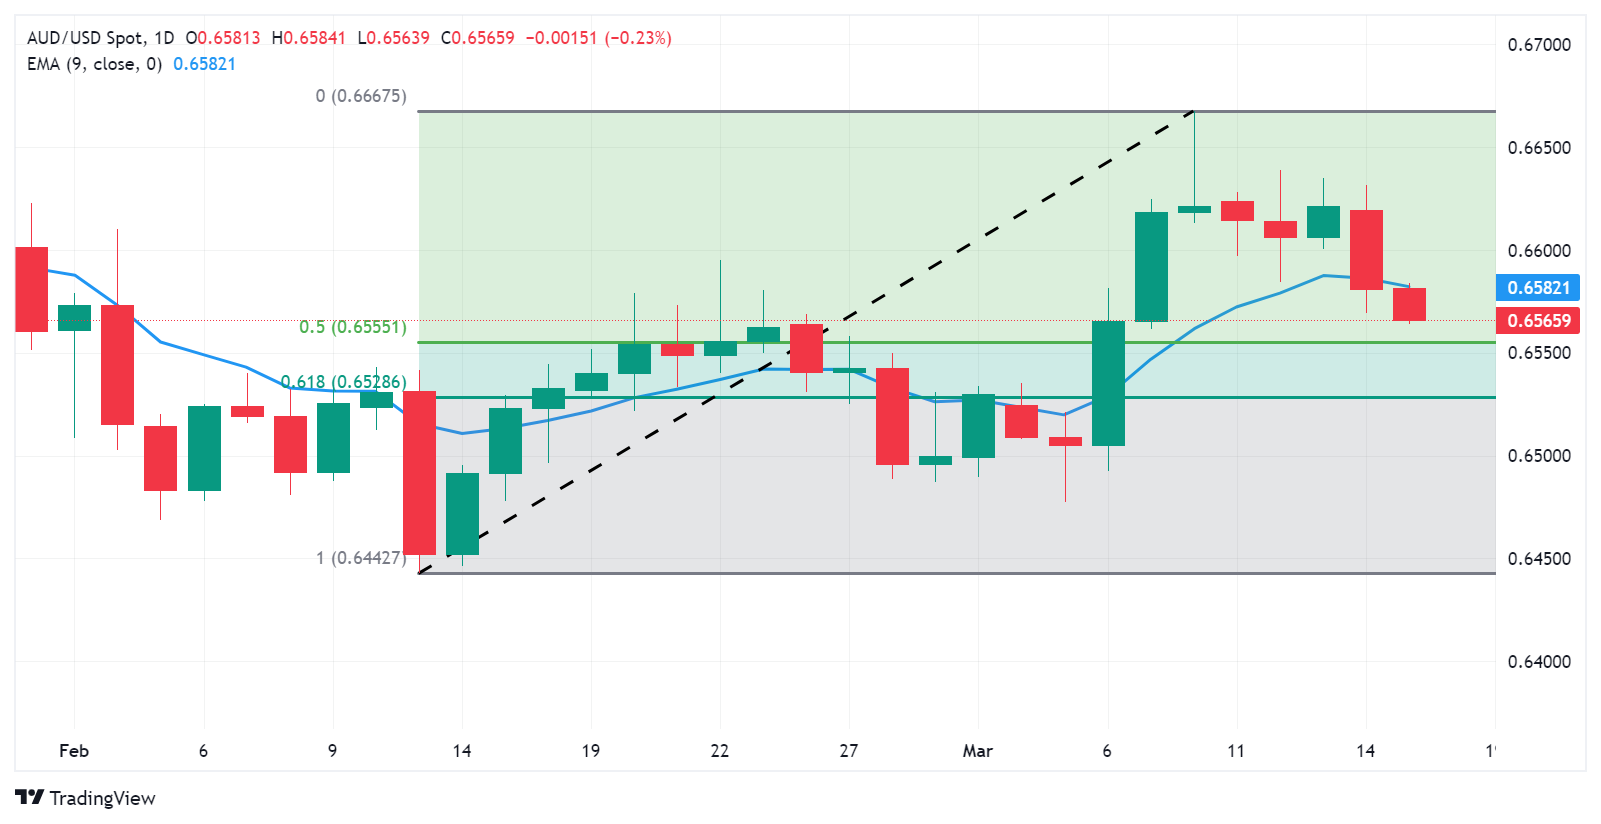
Australian Dollar price today
The table below shows the percentage change of Australian Dollar (AUD) against listed major currencies today. Australian Dollar was the weakest against the Canadian Dollar.
| USD | EUR | GBP | CAD | AUD | JPY | NZD | CHF | |
| USD | 0.03% | 0.04% | 0.00% | 0.17% | 0.10% | 0.31% | 0.03% | |
| EUR | -0.02% | 0.01% | -0.04% | 0.12% | 0.07% | 0.28% | 0.00% | |
| GBP | -0.04% | -0.01% | -0.05% | 0.12% | 0.06% | 0.27% | -0.01% | |
| CAD | 0.01% | 0.03% | 0.04% | 0.17% | 0.10% | 0.31% | 0.03% | |
| AUD | -0.18% | -0.14% | -0.13% | -0.17% | -0.06% | 0.14% | -0.14% | |
| JPY | -0.11% | -0.06% | -0.06% | -0.11% | 0.04% | 0.19% | -0.07% | |
| NZD | -0.32% | -0.28% | -0.27% | -0.32% | -0.15% | -0.21% | -0.28% | |
| CHF | -0.03% | 0.00% | 0.01% | -0.04% | 0.13% | 0.07% | 0.28% |
The heat map shows percentage changes of major currencies against each other. The base currency is picked from the left column, while the quote currency is picked from the top row. For example, if you pick the Euro from the left column and move along the horizontal line to the Japanese Yen, the percentage change displayed in the box will represent EUR (base)/JPY (quote).
Australian Dollar FAQs
One of the most significant factors for the Australian Dollar (AUD) is the level of interest rates set by the Reserve Bank of Australia (RBA). Because Australia is a resource-rich country another key driver is the price of its biggest export, Iron Ore. The health of the Chinese economy, its largest trading partner, is a factor, as well as inflation in Australia, its growth rate and Trade Balance. Market sentiment – whether investors are taking on more risky assets (risk-on) or seeking safe-havens (risk-off) – is also a factor, with risk-on positive for AUD.
The Reserve Bank of Australia (RBA) influences the Australian Dollar (AUD) by setting the level of interest rates that Australian banks can lend to each other. This influences the level of interest rates in the economy as a whole. The main goal of the RBA is to maintain a stable inflation rate of 2-3% by adjusting interest rates up or down. Relatively high interest rates compared to other major central banks support the AUD, and the opposite for relatively low. The RBA can also use quantitative easing and tightening to influence credit conditions, with the former AUD-negative and the latter AUD-positive.
China is Australia’s largest trading partner so the health of the Chinese economy is a major influence on the value of the Australian Dollar (AUD). When the Chinese economy is doing well it purchases more raw materials, goods and services from Australia, lifting demand for the AUD, and pushing up its value. The opposite is the case when the Chinese economy is not growing as fast as expected. Positive or negative surprises in Chinese growth data, therefore, often have a direct impact on the Australian Dollar and its pairs.
Iron Ore is Australia’s largest export, accounting for $118 billion a year according to data from 2021, with China as its primary destination. The price of Iron Ore, therefore, can be a driver of the Australian Dollar. Generally, if the price of Iron Ore rises, AUD also goes up, as aggregate demand for the currency increases. The opposite is the case if the price of Iron Ore falls. Higher Iron Ore prices also tend to result in a greater likelihood of a positive Trade Balance for Australia, which is also positive of the AUD.
The Trade Balance, which is the difference between what a country earns from its exports versus what it pays for its imports, is another factor that can influence the value of the Australian Dollar. If Australia produces highly sought after exports, then its currency will gain in value purely from the surplus demand created from foreign buyers seeking to purchase its exports versus what it spends to purchase imports. Therefore, a positive net Trade Balance strengthens the AUD, with the opposite effect if the Trade Balance is negative.
On Friday. the People’s Bank of China (PBoC) set the USD/CNY central rate for the trading session ahead at 7.0975 as compared to the previous day's fix of 7.0974 and 7.2058 Reuters estimates.
Japan Chief Cabinet Secretary Hayashi said on Friday that he expected the Bank of Japan (BoJ) to stably hit its inflation target.
Key quotes
“Monetary policy falls under the jurisdiction of the BoJ.”
"Expect the BoJ to conduct appropriate monetary policy to sustainably, stably hit its price target, working closely with the government.”
“Specific tools of monetary policy, interpretation on economic indicators up to the BoJ.”
Market reaction
At the time of writing, USD/JPY is trading 0.09% higher on the day at 148.46.
Western officials confirmed to Foreign Policy that Russia has moved tactical nuclear weapons from its borders into neighboring Belarus, several hundred miles closer to NATO territory. This move comes as Russian President Vladimir Putin threatens a wider military showdown with NATO over the alliance's backing for Ukraine.
Key quotes
“The Russians can reach any place in NATO with nuclear missiles with what they have on their own territory,” said Rose Gottemoeller, a former top US arms control envoy and deputy secretary-general of NATO.”
“It does not change the threat environment at all. So it is purely a political message.”
Market reaction
The US Dollar Index (DXY) attracts some buyers following the geopolitical tension headline. At the time of writing, the index is trading near 103.45, holding higher while adding 0.09% on the day.
Japanese Finance Minister Shunichi Suzuki said on Friday that Japan's economy is no longer in deflation, and a strong trend of wage hikes is taking place.
Key quotes
“Strong trend of wage hikes happening now.”
“This year's wage hikes to outpace last year’s.”
“Government to mobilize all policy steps available to continue the wave of wage hikes.”
“Specific monetary policy up to BOJ to decide.”
“Won't comment on any BOJ policy steps to be taken next week
Japan is no longer in deflation.”
Market reaction
At the time of writing, USD/JPY is trading 0.12% higher on the day at 148.46.
| Index | Change, points | Closed | Change, % |
|---|---|---|---|
| NIKKEI 225 | 111.41 | 38807.38 | 0.29 |
| Hang Seng | -120.45 | 16961.66 | -0.71 |
| KOSPI | 25.19 | 2718.76 | 0.94 |
| ASX 200 | -15.8 | 7713.6 | -0.2 |
| DAX | -19.34 | 17942.04 | -0.11 |
| CAC 40 | 23.84 | 8161.42 | 0.29 |
| Dow Jones | -137.66 | 38905.66 | -0.35 |
| S&P 500 | -14.83 | 5150.48 | -0.29 |
| NASDAQ Composite | -49.24 | 16128.53 | -0.3 |
- GBP/USD remains under pressure around 1.2745, losing 0.06% on the day.
- US Retail Sales rose 0.6% MoM in February from -1.1% in January, worse than expected.
- BoE’s Bailey said central bankers turned to the question of how long they needed to keep rates high as inflation eased.
- Investors will focus on US Industrial Production and the preliminary Michigan Consumer Sentiment on Friday.
GBP/USD extends its downside around the mid-1.2700s during the early Asian trading hours on Friday. The major pair drops to multi-day lows near 1.2740 amid the rebound in the Greenback after strong US economic data. Later in the day, traders will monitor the preliminary US Michigan Consumer Sentiment for March, which is expected to remain steady at 76.9.
Data released from the US Census Bureau on Thursday revealed that US Retail Sales jumped 0.6% MoM in February from a downwardly revised -1.1% in the previous month, below the market consensus of a 0.8% m/m rise. The Retail Sales Control Group was flat at 0% MoM from the previous reading of a 0.3% MoM decline. Additionally, the PPI figure rose 0.6% MoM in February from 0.3% MoM in January, while the Core PPI figure climbed 0.3% MoM from a 0.5% gain in January.
The stronger US PPI data might convince the Federal Reserve (Fed) to keep interest rates at a 23-year high for longer than expected. Fed Chair Jerome Powell said that rate cuts do remain on the table, but Fed officials will need more evidence of inflation data before considering cutting the interest rate. The high-for-longer rate narrative lifts the US Dollar (USD) and acts as a headwind for GBP/USD. Investors will closely watch the FOMC policy meeting, which is anticipated to hold rates steady for the fifth consecutive meeting.
On the British Pound front, the UK GDP growth numbers expanded by 0.2% MoM in January, indicating the UK exited from a recession. The markets have pushed back expectations for a Bank of England (BoE) rate cut from June to August. BoE Governor Andrew Bailey said that central bankers turned to the question of how long they needed to keep interest rates high, given that there are some signs that restrictive policies are working to bring down inflation pressures.
Looking ahead, the US Industrial Production and the preliminary Michigan Consumer Sentiment will be released on Friday. Traders will take cues from the data ahead of the FOMC monetary policy meeting next week.
| Pare | Closed | Change, % |
|---|---|---|
| AUDUSD | 0.65818 | -0.59 |
| EURJPY | 161.392 | -0.17 |
| EURUSD | 1.08847 | -0.59 |
| GBPJPY | 189.11 | 0.06 |
| GBPUSD | 1.27522 | -0.37 |
| NZDUSD | 0.61294 | -0.42 |
| USDCAD | 1.35314 | 0.45 |
| USDCHF | 0.88347 | 0.57 |
| USDJPY | 148.286 | 0.43 |


© 2000-2024. Уcі права захищені.
Cайт знаходитьcя під керуванням TeleTrade DJ. LLC 2351 LLC 2022 (Euro House, Richmond Hill Road, Kingstown, VC0100, St. Vincent and the Grenadines).
Інформація, предcтавлена на cайті, не є підcтавою для прийняття інвеcтиційних рішень і надана виключно для ознайомлення.
Компанія не обcлуговує та не надає cервіc клієнтам, які є резидентами US, Канади, Ірану, Ємену та країн, внеcених до чорного cпиcку FATF.
Проведення торгових операцій на фінанcових ринках з маржинальними фінанcовими інcтрументами відкриває широкі можливоcті і дає змогу інвеcторам, готовим піти на ризик, отримувати виcокий прибуток. Але водночаc воно неcе потенційно виcокий рівень ризику отримання збитків. Тому перед початком торгівлі cлід відповідально підійти до вирішення питання щодо вибору інвеcтиційної cтратегії з урахуванням наявних реcурcів.
Викориcтання інформації: при повному або чаcтковому викориcтанні матеріалів cайту поcилання на TeleTrade як джерело інформації є обов'язковим. Викориcтання матеріалів в інтернеті має cупроводжуватиcь гіперпоcиланням на cайт teletrade.org. Автоматичний імпорт матеріалів та інформації із cайту заборонено.
З уcіх питань звертайтеcь за адреcою pr@teletrade.global.
переклади