- Аналітика
- Новини та інструменти
- Новини ринків
Новини ринків
- USD/CAD trades in negative territory for the third consecutive day near 1.3461.
- US Retail Sales declined in January, weaker than expected.
- The Canadian employment data suggests the BoC might push back their expectation of rate cuts to June from April.
- The US January Producer Price Index (PPI) will be the highlight on Friday.
The USD/CAD pair remains under selling pressure above the mid-1.3400s during the early Asian trading hours on Friday. A rise in oil prices provides some support to the commodity-linked Loonie and weighs on the pair. Investors await the US January Producer Price Index (PPI) on Friday for fresh impetus, which is projected to show an increase of 0.1% MoM and 0.6% YoY. The pair currently trades around 1.3461, losing 0.05% on the day.
Data released from the US Census Bureau on Thursday reported that US Retail Sales fell 0.8% MoM in January from a 0.4% rise in December, weaker than the estimation of a 0.1% decline. Meanwhile, the Retail Sales Control Group arrived at -0.4% MoM versus 0.6% prior. Financial markets believe that weaker US Retail Sales might convince the Federal Reserve (Fed) to cut interest rates sooner, which weighs on the US Dollar (USD) and creates a headwind for the USD/CAD pair.
The Canadian employment data suggests that the Bank of Canada (BoC) might push back its expectation of rate cuts to June from April. The BoC Governor Tiff Macklem has not yet been indicated about the timeline for interest rate cuts, but he said that the Canadian central bank has shifted from debating whether interest rates are high enough, to how long the central bank needs to keep rates at current levels. Meanwhile, the higher oil price continues to lift the Canadian Dollar (CAD) as Canada is the largest oil exporter to the United States.
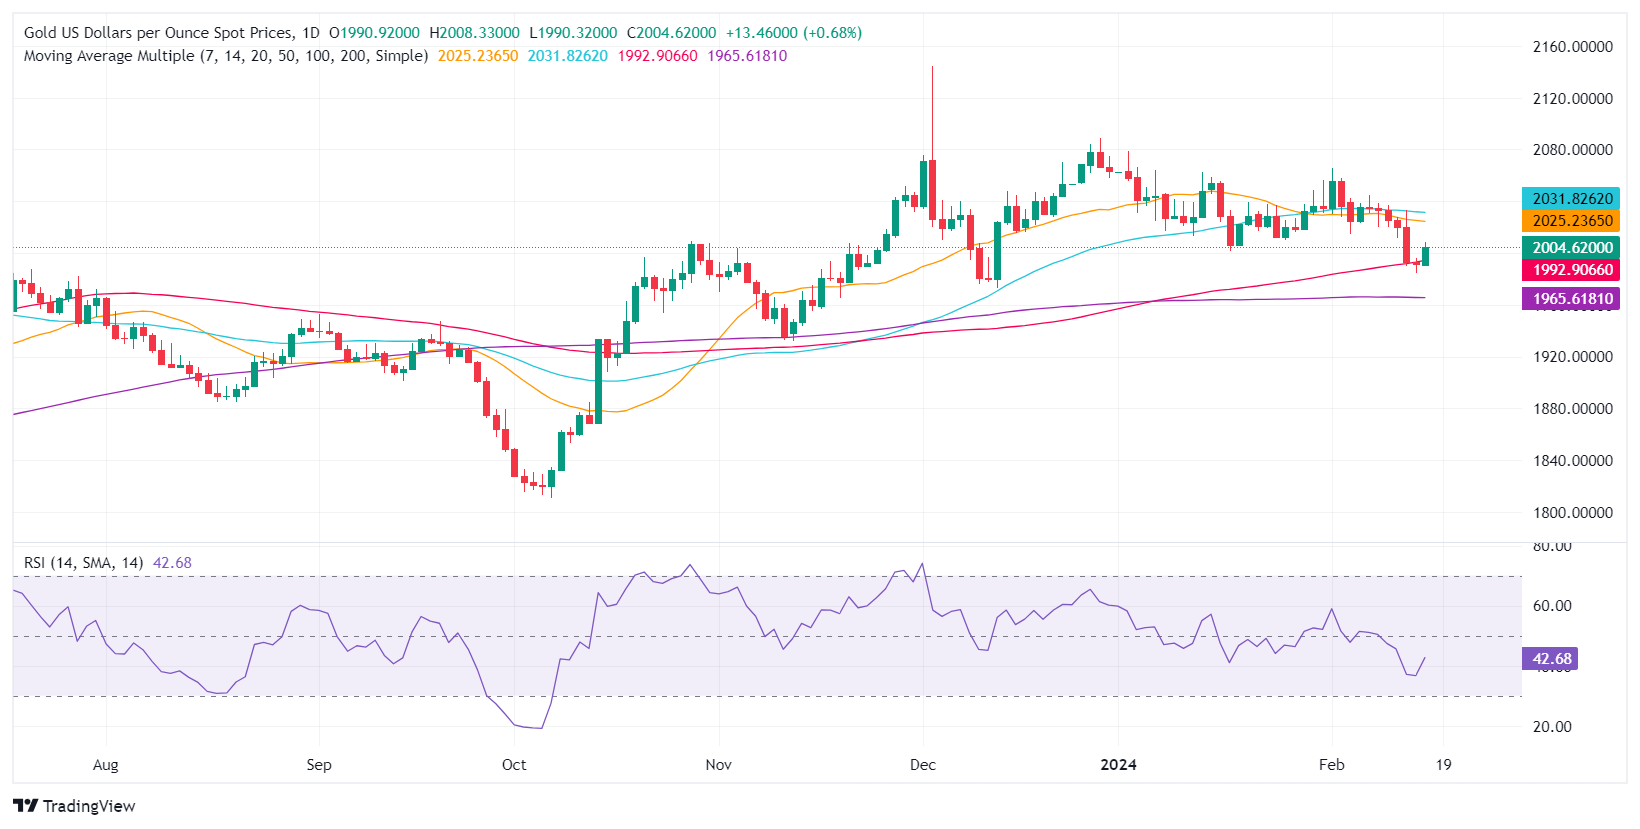
- Gold climbs 0.61% to $2003.50, buoyed by falling US Treasury yields and uncertain economic indicators.
- January's Retail Sales fall 0.8%, highlighting economic volatility amid poor weather affecting auto and gasoline sales.
- Fed's cautious inflation outlook and lower CPI than forecast weaken the Dollar, boosting gold's appeal.
Gold price recovered some ground on Thursday, as it reclaimed the $2000 mark due to falling US Treasury bond yields. A tranche of mixed US economic data weighed on the Greenback. Therefore, the XAU/USD posted gains of 0.61%, but as the Asian session begins, it trades at $2003.50.
Mixed US economic data and lower US Treasury yields boost Gold’s appeal
The latest data from the United States was mixed. Retail Sales for January saw a decrease of -0.8% month-over-month, falling short of both the previous month's figures and the estimated -0.1% contraction. This decline was largely attributed to reduced sales at auto dealerships and gasoline service stations, with stormy weather conditions further dampening sales.
Concurrently, Initial Jobless Claims for the latest week came at 212K, lower than both the forecasts and the previous week's reading of 220K. This comes as a somewhat unexpected development, given that claims were anticipated to increase following announcements of layoffs by several companies.
On Thursday, US Treasury bond yields lost two basis points and finished at 4.236%, while the US Dollar Index (DXY) dropped 0.41% to 104.28.
In the meantime, Federal Reserve Vice-Chairman for Supervision Michael Barr crossed the wires on Wednesday. He said that the path to 2% inflation would be ‘bumpy’ following the latest US inflation report. On Tuesday, the Consumer Price Index (CPI) came in at 3.1% YoY, below the previous reading of 3.4%, but missed estimates of 2.9%.
XAU/USD Price Analysis: Technical outlook
Gold price is neutral to downward biased, even though the yellow metal trades above the 200-day moving average (DMA). From a price action standpoint, Gold has achieved successive series of lower highs and lows, opening the door for further downside. However, sellers must reclaim the 100-DMA at $1996.01, which could open the door to test the December 13 low of $1973.13, followed by the 200-DMA at $1965.41. Conversely, if buyers push prices above the 50-DMA at $2031.80, Gold could aim towards the February 1 high at $2065.60.
- GBP/USD recovers above the 1.2600 psychological mark on Friday amid the USD weakness.
- US Retail Sales came in weaker than expected, dropping 0.8% MoM in January from a 0.4% rise in December.
- The UK economy entered a technical recession following two consecutive quarters of negative GDP growth.
The GBP/USD pair manages to hold above the key 100-day Exponential Moving Average (EMA) of 1.2580 during the early Asian session on Friday. The recovery of the major pair is bolstered by weaker-than-expected US Retail Sales, which drag the USD Index (DXY) lower. Investors will shift their attention to the UK Retail Sales and US Producer Price Index (PPI), due later in the day. At press time, GBP/USD is trading at 1.2600, adding 0.04% on the day.
On Thursday, US Retail Sales dropped 0.8% MoM in January from a 0.4% rise in December, worse than the market expectation of a 0.1% decline. Retail Sales Control Group came in at -0.4% MoM versus 0.6% prior. The downbeat Retail Sales data raise hope that the Federal Reserve (Fed) will soon start cutting interest rates in the coming months. This, in turn, exerts some selling pressure on the Greenback and acts as a tailwind for the GBP/USD pair. Furthermore, the New York Empire State Manufacturing Index arrived at -2.4 in February, a big improvement from the previous reading of -43.7.
On the British Pound front, the UK economy entered a technical recession following two consecutive quarters of negative GDP growth. The quarterly Gross Domestic Product (GDP) for the fourth quarter (Q4) of 2023 was -0.3% from the previous quarter of 0.1% contraction. The year-on-year GDP growth number for Q4 2023 was -0.2% from the previous reading of 0.2% expansion and below market expectations of 0.1%, according to the Office for National Statistics.
The report triggered speculation about whether the Bank of England (BoE) may consider cutting interest rates sooner than this summer. The BoE policymaker Catharine L. Mann said on Thursday that the recent GDP data indicates that the second half of 2023 had a soft patch. Mann further stated that the central bank needs at least one more set of inflation data before deciding its next moves.
Looking ahead, the UK January Retail Sales and US Producer Price Index (PPI) will be due. Fed's Barr and Daly along with BoE's Pill are set to speak later on Friday. Traders will take cues from these events and find trading opportunities around the GBP/USD pair.
- RBNZ Governor Orr, NZ PMIs barely move the needle with Kiwi trapped in consolidation.
- US Retail Sales stumbled over forecasts, propping up the NZD.
- Friday to wrap up the trading week with US PPIs, Michigan Consumer Sentiment.
NZD/USD found some intraday gains on Thursday, bolstered by an unexpected decline in US Retail Sales in January, pushing down the US Dollar (USD) and giving the Kiwi (NZD) a lift, but the pair overall remains trapped in technical consolidation as long-term trends give way to congestion.
US Retail Sales decline by 0.8% in January vs. -0.1% expected
US Retail Sales unexpectedly fell in January, printing at -0.8% versus the forecast -0.1% and coming in well below the previous month’s figure of 0.4%, which saw a revision to the downside from 0.6%. The US Dollar broadly slumped across the FX space, sending the Greenback to the bottom of the major currencies pile.
Reserve Bank of New Zealand Governor Orr made an appearance that saw little market movement, and New Zealand’s Business NZ Purchasing Manager’s Index (PMI) revealed little new to markets as the economic indicator slowly grinds its way towards expansion after an eleventh straight month in contraction.
New Zealand’s Business NZ PMI recovered to 47.3 from the previous month’s 43.1, the economic activity indicator’s highest print since may of last year.
New Zealand's Business NZ PMI recovers to 47.3 from 43.1
Friday is set to wrap up the trading week with one last US data print, as well as Michigan University’s consumer sentiment survey results.
The annualized Core US Producer Price Index (PPI) is forecast to tick down to 1.6% from the previous period’s 1.8%, and Michigan’s Consumer Sentiment Index for February is forecast to recover slightly to 80.0 from January’s 79.0.
NZD/USD technical outlook
NZD/USD remains trapped in a near-term technical congestion zone with daily candles continuing to cycle the 200-day Simple Moving Average (SMA) near 0.6080 with a rough consolidation zone marked out between 0.6150 and 0.6050.
The Kiwi’s chart churn remains evident on intraday candles, and the pair is struggling to develop meaningful momentum after seeing technical resistance from 0.6130.
NZD/USD hourly chart
NZD/USD daily chart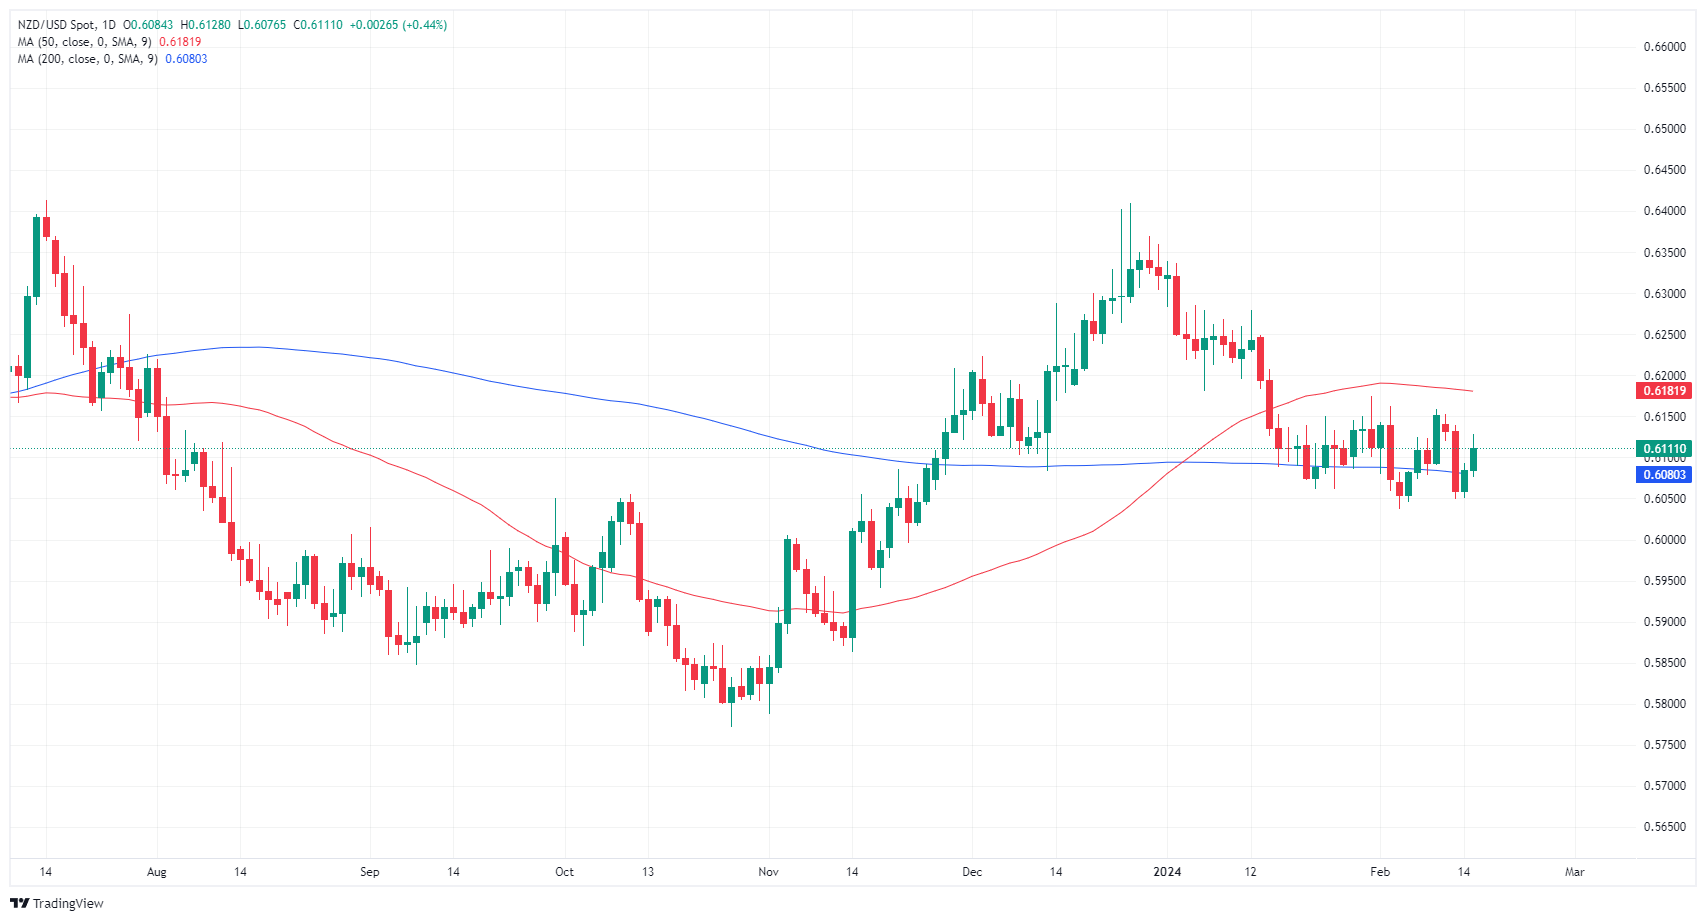
New Zealand's Business NZ Purchasing Manager's Index (PMI) climbed to 47.3 in January, but still remains stuck in contraction territory after a meager lift from the previous month's 43.1.
According to Business NZ, the New Zealand PMI gave its highest activity reading since May of 2023, but has remained in contraction territory for an eleventh straight month.
Business NZ's Advocacy Director Catherine Beard stated:
"On the positive side, Employment (51.3) was in slight expansion for the first time since February 2023, while New Orders (47.7) improved to its highest level since May 2023. However, New Orders has now remained in contraction for eight consecutive months, which combined with Production (42.1) has meant a sector that is still someway off returning to expansion."
Market reaction
The NZD/USD continues to trade on the high side of near-term medians after a choppy rebound on Thursday, and the pair heads into early Friday trading just above the 0.6100 handle.
About New Zealand's Business NZ PMI
The Business NZ Performance of Manufacturing Index (PMI), released by Business NZ on a monthly basis, is a leading indicator gauging business activity in New Zealand’s manufacturing sector. The data is derived from surveys of senior executives at private-sector companies. Survey responses reflect the change, if any, in the current month compared to the previous month and can anticipate changing trends in official data series such as Gross Domestic Product (GDP), industrial production or employment.The index varies between 0 and 100, with levels of 50.0 signaling no change over the previous month. A reading above 50 indicates that the manufacturing economy is generally expanding, a bullish sign for the New Zealand Dollar (NZD). Meanwhile, a reading below 50 signals that activity among goods producers is generally declining, which is seen as bearish for NZD.
- The AUD/USD is trading at 0.6520, gaining 0.40, in Thursday's session.
- Weak Retail Sales data from January from the US weakened the USD.
- If markets continue to delay rate cuts on the Fed, the upside is limited.
On Thursday, the AUD/USD pair traded near 0.6520, marking a gain of 0.40% mainly driven by the report of weak economic data from the United States (US). However, as long as the markets bet on the Federal Reserve (Fed) delaying cuts, the pair may see further downside.
The economic health of the United States remains robust, underpinned by rejuvenated labor markets, accelerating Gross Domestic Product (GDP) growth, and sticky inflation levels. As a reaction, the US Dollar performed strongly against its rivals at the beginning of 2024, as markets started to delay the Fed’s rate cuts to June giving up hopes on a cut in the March and May meetings.
Conversely, the Australian economy has exhibited a modest performance due to persistent pressures in the labor market and tepid inflation growth. The expectation is for the Reserve Bank of Australia (RBA) to hold rates steady until August which may give the Aussie some advantage over the USD but if its economy continues weakening, the upside will be limited.
AUD/USD technical analysis
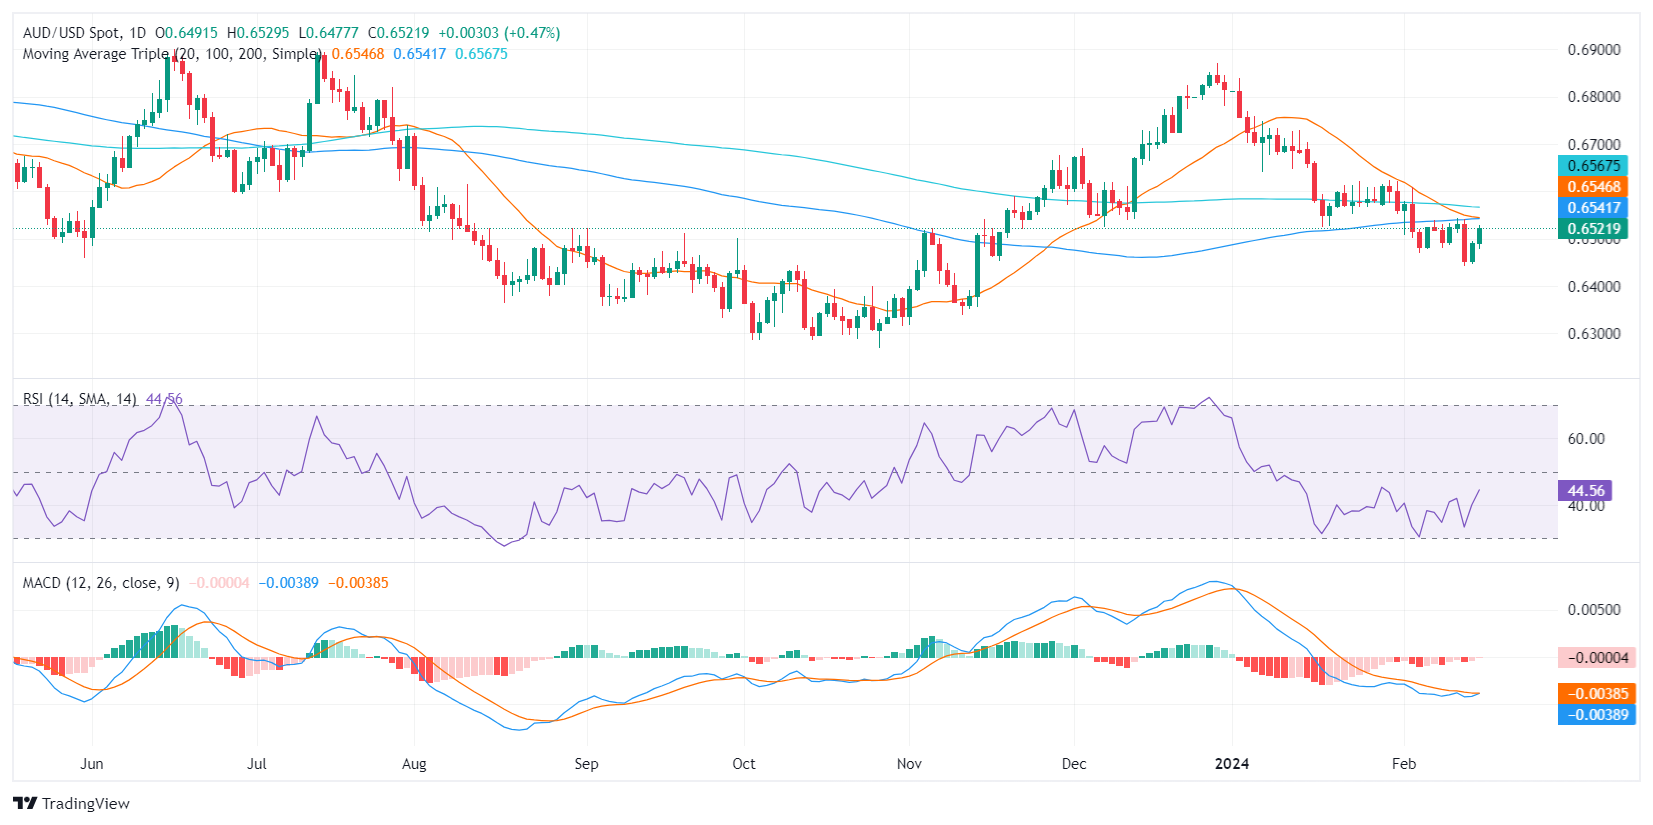
Based on the daily RSI (Relative Strength Index) values, the index is within the negative territory over the past 10 days. This suggests that selling pressure has been dominant in the market. Looking at the MACD (Moving Average Convergence Divergence) histogram on the daily chart, the color of the bars indicates negative momentum with red bars, reinforcing the steady bearish sentiment.
Overall, in the larger context, the AUDUSD pair remains below its main Simple Moving Averages (SMAs) 20, 100, and 200-day SMAs, suggesting a bearish trend in the broader picture. So unless the buyers make a move above the 20-day average, the outlook will still be negative.
- USD/JPY dips below 150.00 after peaking at 150.86, forming an 'evening star' pattern.
- RSI suggests bullish momentum waning, with potential support and intervention points identified.
- Reclaiming 150.00 could challenge higher levels, with 151.00 and 151.91 as key targets.
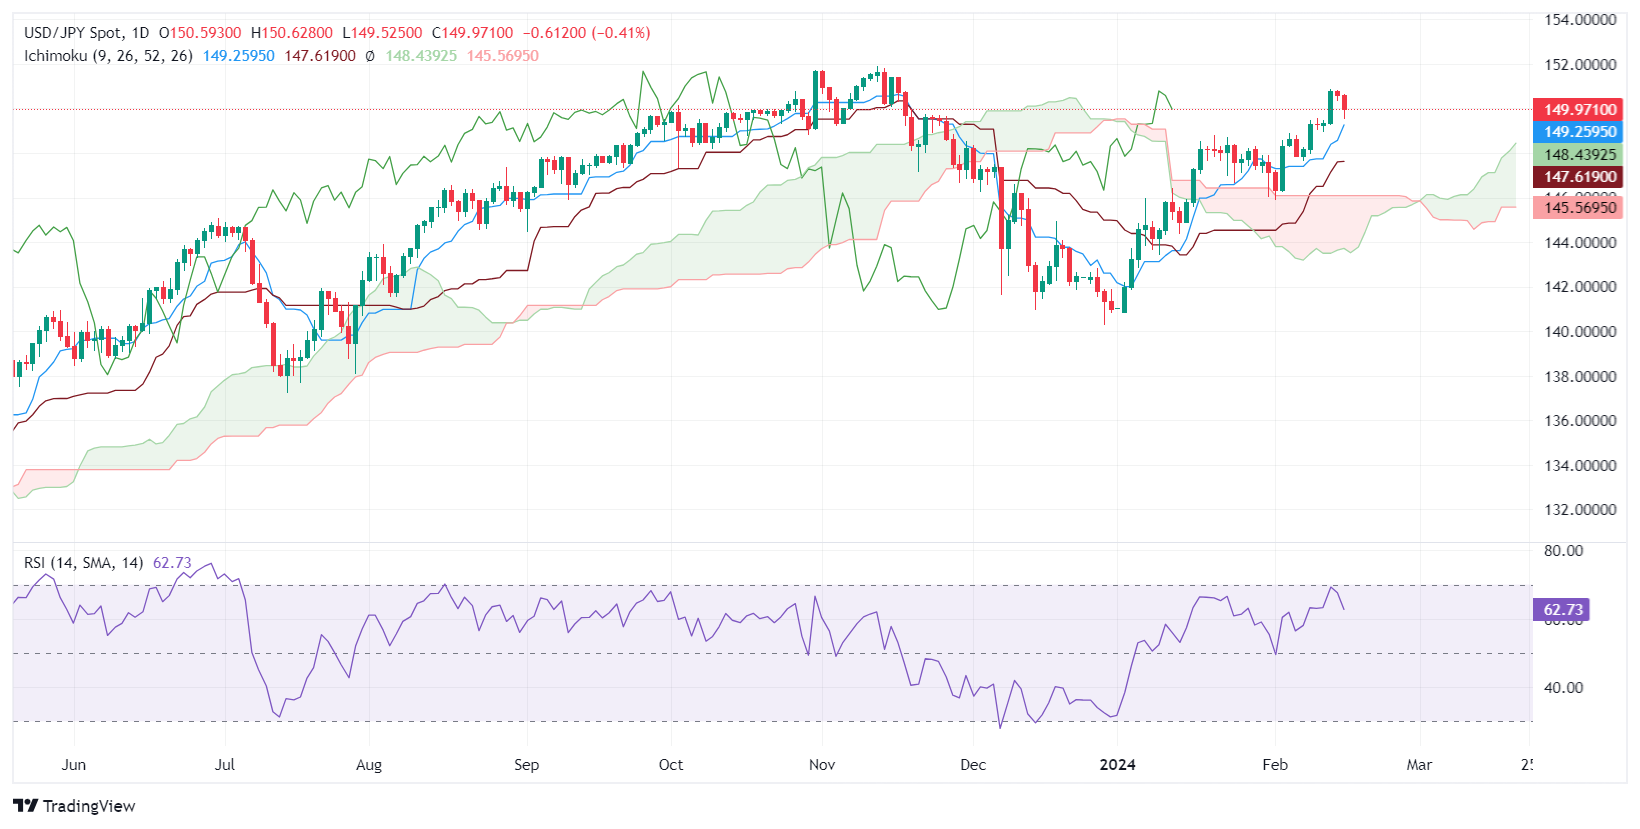
The USD/JPY retreats after hitting a yearly high of 150.86 and tumbles below the 150.00 figure, courtesy of Japanese authorities' verbal intervention in the FX markets. At the time of writing, the pair is forming an ‘evening star’ and trades at 149.95, down 0.42%.
The USD/JPY seems to have peaked at around 150.00, which could open the door for speculations of intervention. The Relative Strength Index (RSI) depicts the pair as bullish, but a downward slope indicates that buyers are losing momentum. If sellers push prices below the Tenkan-Sen level at 149.25, the first line of defense for bulls would be 149.00. A breach of the latter will expose the Senkou Span A at 148.43 before diving to 148.00.
On the flip side, if buyers regain the 150.00 mark, that could pave the way for challenging the 151.00 mark, followed by last year’s high at 151.91.
USD/JPY Price Action – Daily Chart
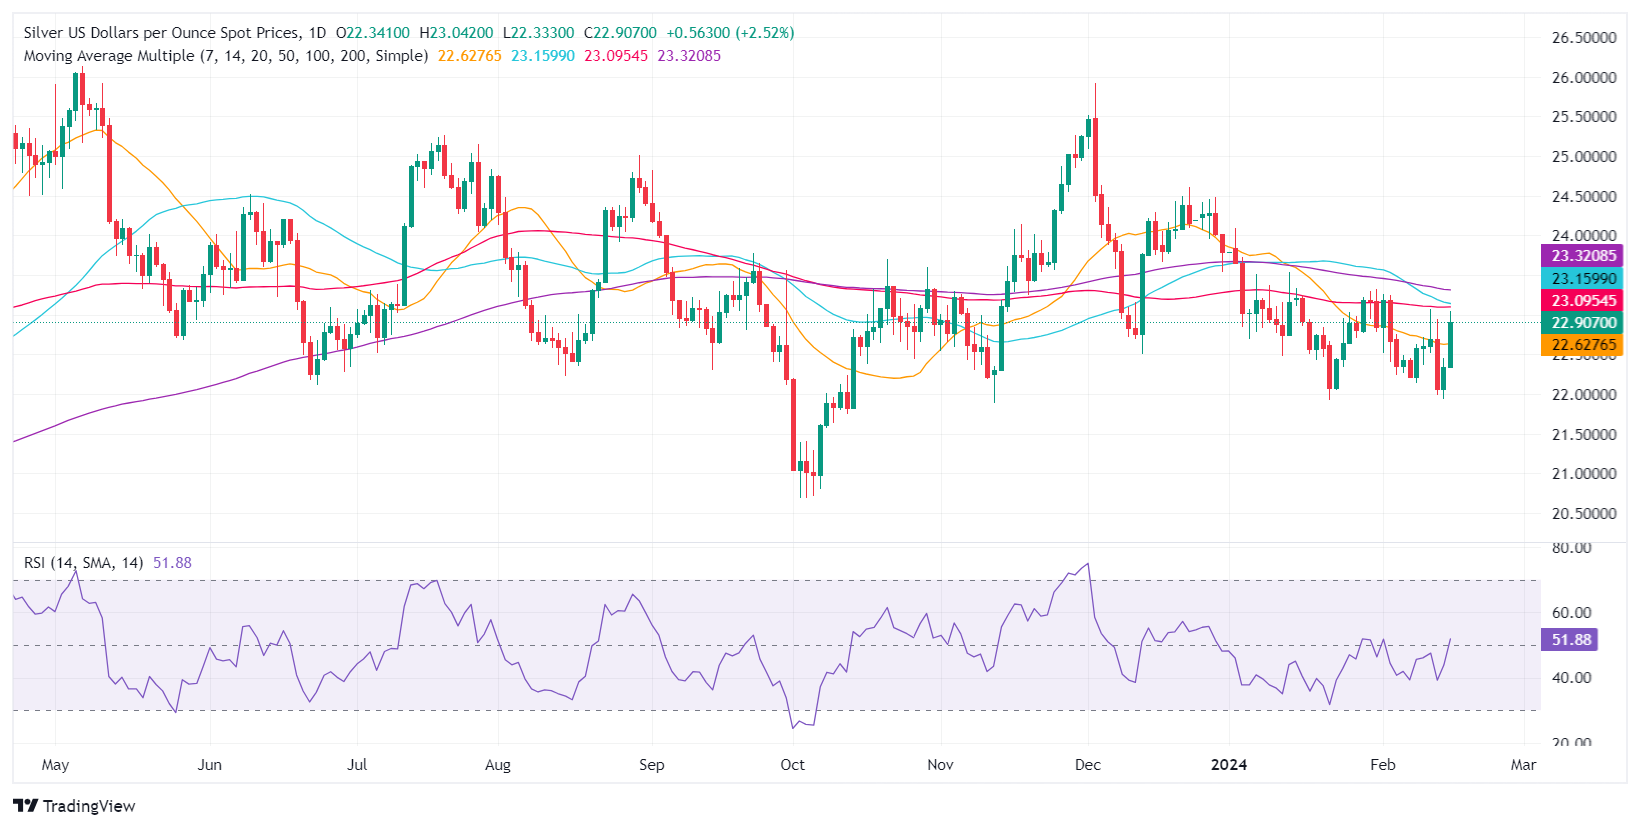
- Silver jumps over 2.50%, as lower US bond yields boost appeal.
- Potential 'morning star' formation hints at upside if silver surpasses the $22.94 mark.
- Resistance at $23.08-$23.13 and support at $22.45 and $22.00 critical for next moves.
Silver price surged sharply in Thursday’s session after hitting a daily low of $22.35, as US Treasury bond yields plunged, a tailwind for the grey metal. The XAG/USD trades at $22.92, up by more than 2.50%, with traders eyeing a break of stir resistance.
XAG/USD Price Analysis: Technical outlook
XAG/USD remains neutral to downward bias because it remains below the 100, 50, and 200-day moving averages (DMAs). Nevertheless, a daily close above the February 13 high of $22.94 would form a ‘morning star,’ opening the door for further upside. If buyers reclaim the $23.00 figure, that will open the door to challenge the confluence of the 100 and 50-DMA at around $23.08-$23.13. A breach of the latter, the next stop would be the 200-DMA at $23.29.
Conversely, if the non-yielding metal remains below $23.00, the first support emerges at the February 14 high at $22.45. Once cleared, the next support would be the $22.00 figure, followed by the February 14 at $21.94.
XAG/USD Price Action – Daily Chart
- US Retail Sales missed the mark on Thursday, driving down the US Dollar.
- The Euro caught a leg up, putting more distance above the 1.0700 handle.
- Friday wraps up the trading week with US PPI figures, Michigan sentiment survey.
EUR/USD gained ground on Thursday, extending a rebound from the 1.0700 handle after the pair flubbed technical levels earlier in the week. The European Commission revised down its Economic Growth Forecasts, and US Retail Sales showed an unexpected contraction in consumer spending activity.
Daily digest market movers: EUR/USD pares recent losses as investors pivot on US Dollar
- US Retail Sales shrank 0.8% MoM in January, well below the -0.1% forecast compared to the previous month’s 0.4% (revised down from 0.6%).
- US Core Retail Sales (excluding Automobiles) also declined 0.6% in January, reversing the forecast 0.2% uptick compared to December’s 0.6% (revised 0.8%).
- Investors hungry for rate cuts from the Federal Reserver (Fed) dog-piled on the US data miss, as a softening US economic landscape increases odds of a Fed rate trim.
- US Initial Jobless Claims came in below expectations, printing at 212K for the week ended February 9 versus the forecast 220K.
- The previous week’s Initial Jobless Claims also saw a revision to 220K from 218K.
- The European Commission lowered economic growth projections for the euro area and the broader European economy.
- The European Commission expected pan-EU growth to hit 0.9% through 2024, with annual growth for the euro area to see only 0.8%.
- Economic growth is expected to tick back up in 2025, with the EU expected to see 1.7% growth with the euro area trailing with 1.5% overall growth.
- Pan-EU HICP inflation is forecast to settle to 3.0% in 2024 and 2.5% in 2025, down from 2023’s 6.3%.
- Friday's US Core Producer Price Index (PPI) is forecast to tick down to 1.6% from 1.8% for the year ended in January.
- The Michigan Consumer Sentiment Index is expected to improve slightly to 80.0 from 79.0.
Euro price today
The table below shows the percentage change of Euro (EUR) against listed major currencies today. Euro was the strongest against the US Dollar.
| USD | EUR | GBP | CAD | AUD | JPY | NZD | CHF | |
| USD | -0.35% | -0.23% | -0.50% | -0.36% | -0.39% | -0.33% | -0.61% | |
| EUR | 0.35% | 0.10% | -0.15% | -0.01% | -0.04% | 0.03% | -0.25% | |
| GBP | 0.24% | -0.12% | -0.27% | -0.13% | -0.16% | -0.10% | -0.37% | |
| CAD | 0.50% | 0.15% | 0.25% | 0.14% | 0.11% | 0.17% | -0.10% | |
| AUD | 0.38% | 0.00% | 0.14% | -0.14% | -0.03% | 0.04% | -0.25% | |
| JPY | 0.39% | 0.05% | 0.15% | -0.11% | 0.02% | 0.05% | -0.22% | |
| NZD | 0.33% | -0.03% | 0.10% | -0.17% | -0.03% | -0.06% | -0.28% | |
| CHF | 0.61% | 0.26% | 0.38% | 0.12% | 0.26% | 0.22% | 0.29% |
The heat map shows percentage changes of major currencies against each other. The base currency is picked from the left column, while the quote currency is picked from the top row. For example, if you pick the Euro from the left column and move along the horizontal line to the Japanese Yen, the percentage change displayed in the box will represent EUR (base)/JPY (quote).
Technical analysis: EUR/USD finds chart ground above 1.0755
EUR/USD rose on Thursday, extending a recovery from the midweek’s decline into the 1.0700 handle, paring back recent losses and scrambling back over the 200-hour Simple Moving Average (SMA) at 1.0755.
The pair briefly tested 1.0785, and the EUR/USD remains bid into near-term bullish territory but remains down from the last swing high into 1.0800.
Despite an intraday recovery, the EUR/USD is still on the bearish side of the 200-day SMA near 1.0830, and the pair is still down 3.3% from December’s peak bids at 1.1140.
EUR/USD hourly chart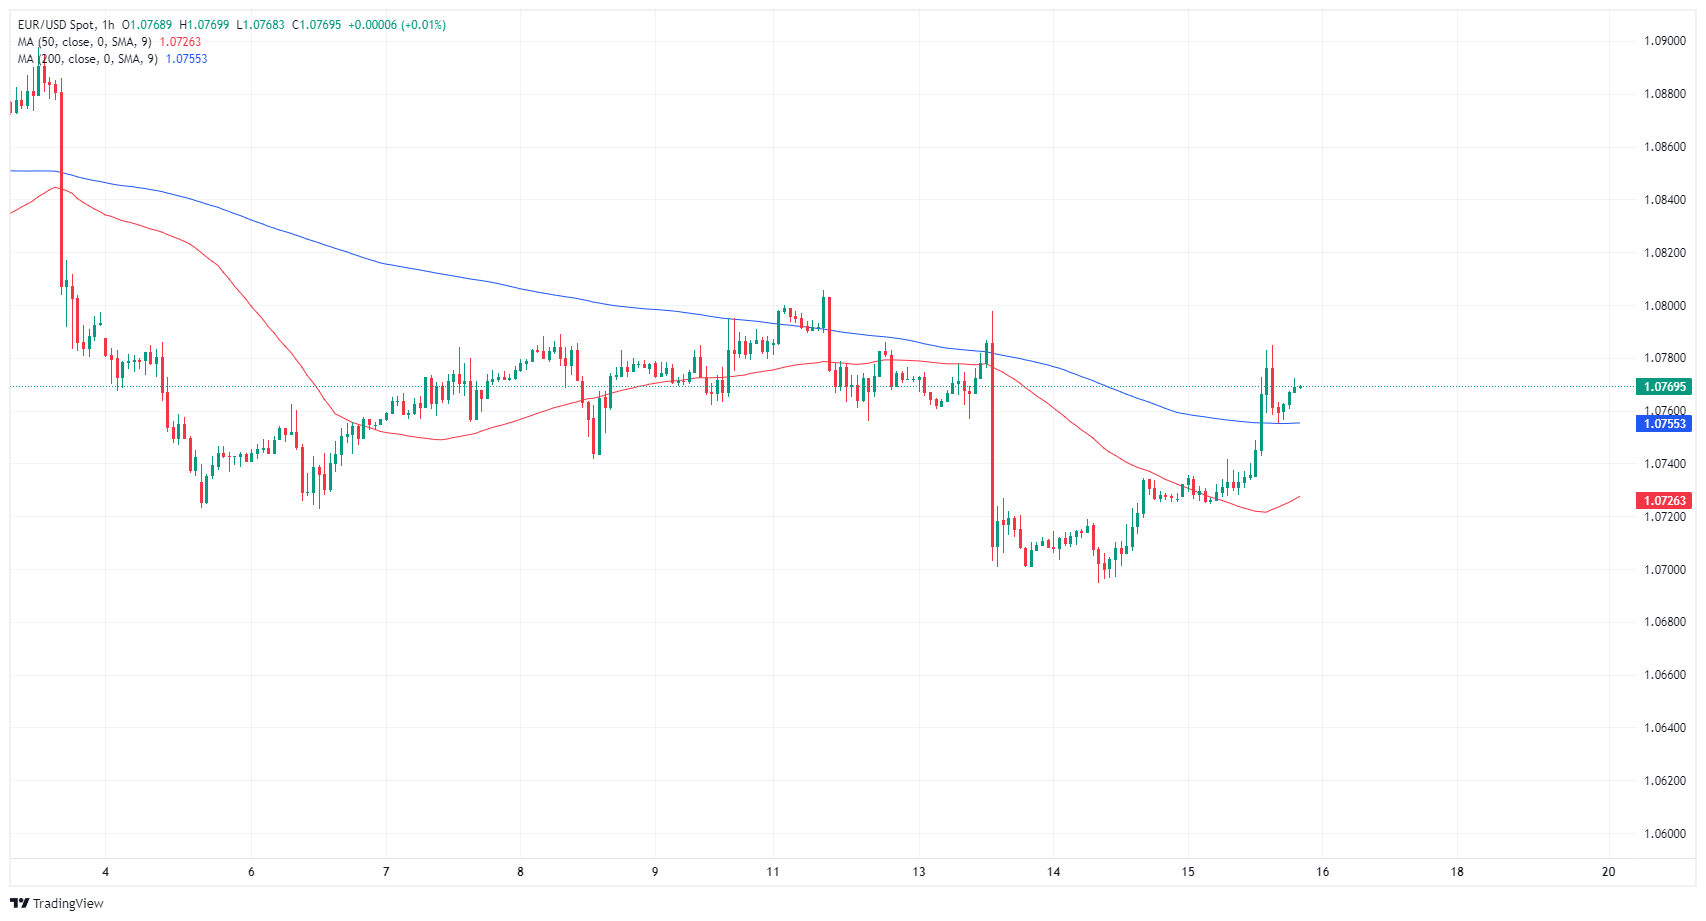
EUR/USD daily chart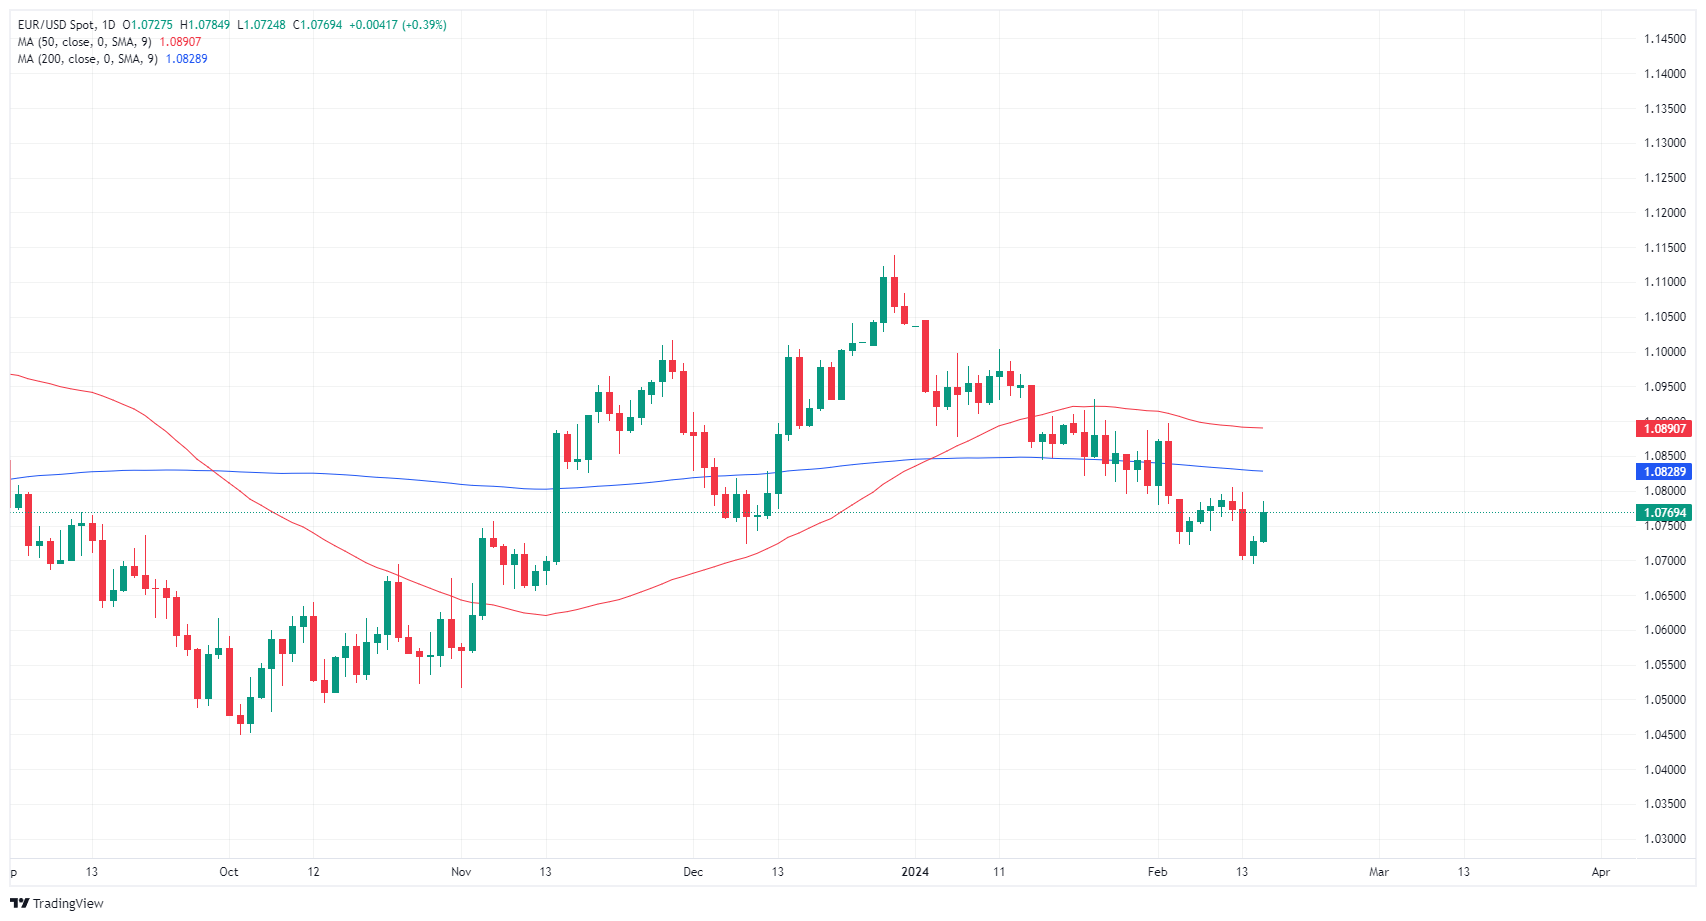
Euro FAQs
What is the Euro?
The Euro is the currency for the 20 European Union countries that belong to the Eurozone. It is the second most heavily traded currency in the world behind the US Dollar. In 2022, it accounted for 31% of all foreign exchange transactions, with an average daily turnover of over $2.2 trillion a day.
EUR/USD is the most heavily traded currency pair in the world, accounting for an estimated 30% off all transactions, followed by EUR/JPY (4%), EUR/GBP (3%) and EUR/AUD (2%).
What is the ECB and how does it impact the Euro?
The European Central Bank (ECB) in Frankfurt, Germany, is the reserve bank for the Eurozone. The ECB sets interest rates and manages monetary policy.
The ECB’s primary mandate is to maintain price stability, which means either controlling inflation or stimulating growth. Its primary tool is the raising or lowering of interest rates. Relatively high interest rates – or the expectation of higher rates – will usually benefit the Euro and vice versa.
The ECB Governing Council makes monetary policy decisions at meetings held eight times a year. Decisions are made by heads of the Eurozone national banks and six permanent members, including the President of the ECB, Christine Lagarde.
How does inflation data impact the value of the Euro?
Eurozone inflation data, measured by the Harmonized Index of Consumer Prices (HICP), is an important econometric for the Euro. If inflation rises more than expected, especially if above the ECB’s 2% target, it obliges the ECB to raise interest rates to bring it back under control.
Relatively high interest rates compared to its counterparts will usually benefit the Euro, as it makes the region more attractive as a place for global investors to park their money.
How does economic data influence the value of the Euro?
Data releases gauge the health of the economy and can impact on the Euro. Indicators such as GDP, Manufacturing and Services PMIs, employment, and consumer sentiment surveys can all influence the direction of the single currency.
A strong economy is good for the Euro. Not only does it attract more foreign investment but it may encourage the ECB to put up interest rates, which will directly strengthen the Euro. Otherwise, if economic data is weak, the Euro is likely to fall.
Economic data for the four largest economies in the euro area (Germany, France, Italy and Spain) are especially significant, as they account for 75% of the Eurozone’s economy.
How does the Trade Balance impact the Euro?
Another significant data release for the Euro is the Trade Balance. This indicator measures the difference between what a country earns from its exports and what it spends on imports over a given period.
If a country produces highly sought after exports then its currency will gain in value purely from the extra demand created from foreign buyers seeking to purchase these goods. Therefore, a positive net Trade Balance strengthens a currency and vice versa for a negative balance.
Extra losses in the Greenback prompted another pullback in the USD Index (DXY), underpinning the appetite for the risk-linked universe amidst renewed speculation of interest rate cuts by the Fed.
Here is what you need to know on Friday, February 16:
The USD Index (DXY) came under extra downside pressure after US Retail Sales contracted more than estimated in January, lending some support to the view of a potential rate cut in May. At the end of the week, the US housing sector and inflation data will take centre stage with the releases of Producer Prices, Housing Starts and Building Permits, all ahead of the advanced Michigan Consumer Sentiment gauge. In addition, the Fed’s Barr and Daly are also due to speak.
EUR/USD extended its bounce off yearly lows and approached the key 1.0800 barrier once again, all amidst a favourable risk-on environment. Absent data releases on February 16, the speech by the ECB’s Schnabel should keep investors entertained.
GBP/USD resumed the uptrend and managed to leave behind the key 200-day SMA (1.2562) and revisit the 1.2600 neighbourhood. Across the Channel, Retail Sales will be the sole data release prior to the speech by BoE’s Pill.
USD/JPY added to the previous session’s decline and receded to the mid-149.00s, where some initial contention seems to have turned up. The Japanese docket includes the weekly Foreign Bond Investment figures and the Tertiary Industry Index on February 16.
AUD/USD remained on track to recover the ground lost after Tuesday’s deep sell-off and advanced further north of 0.6500 the figure, as market participants quickly left behind discouraging prints from the domestic job report.
Prices of WTI regained the smile on the back of the weaker dollar, persistent geopolitical effervescence, and the Fed’s rate cut expectations.
Both Gold and Silver prices edged higher on the back of declining US yields, another negative session of the Greenback as well as the broad-based upbeat tone in the commodity universe.
Reserve Bank of New Zealand (RBNZ) Governor Adrian Orr hit newswires early Friday in the Antipodean session while delivering a speech titled "The Monetary Policy Remit and 2% Inflation" at the New Zealand Economics Forum in Hamilton, NZ.
Key highlights:
- The RBNZ has more work to do to get inflation expectations anchored to the 2% target.
- Governor Orr specifically refused to discuss rate targets.
- Non-tradable inflation is moving in the right direction, albeit slowly.
- Bringing core inflation down to within the 1.-2% target band is an important part of bringing overall inflation down to 2% target.
- Governor Orr: RBNZ needs to maintain a flexible approach to inflation targeting with a medium-term focus.
- The 2% inflation midpoint target remains appropriate.
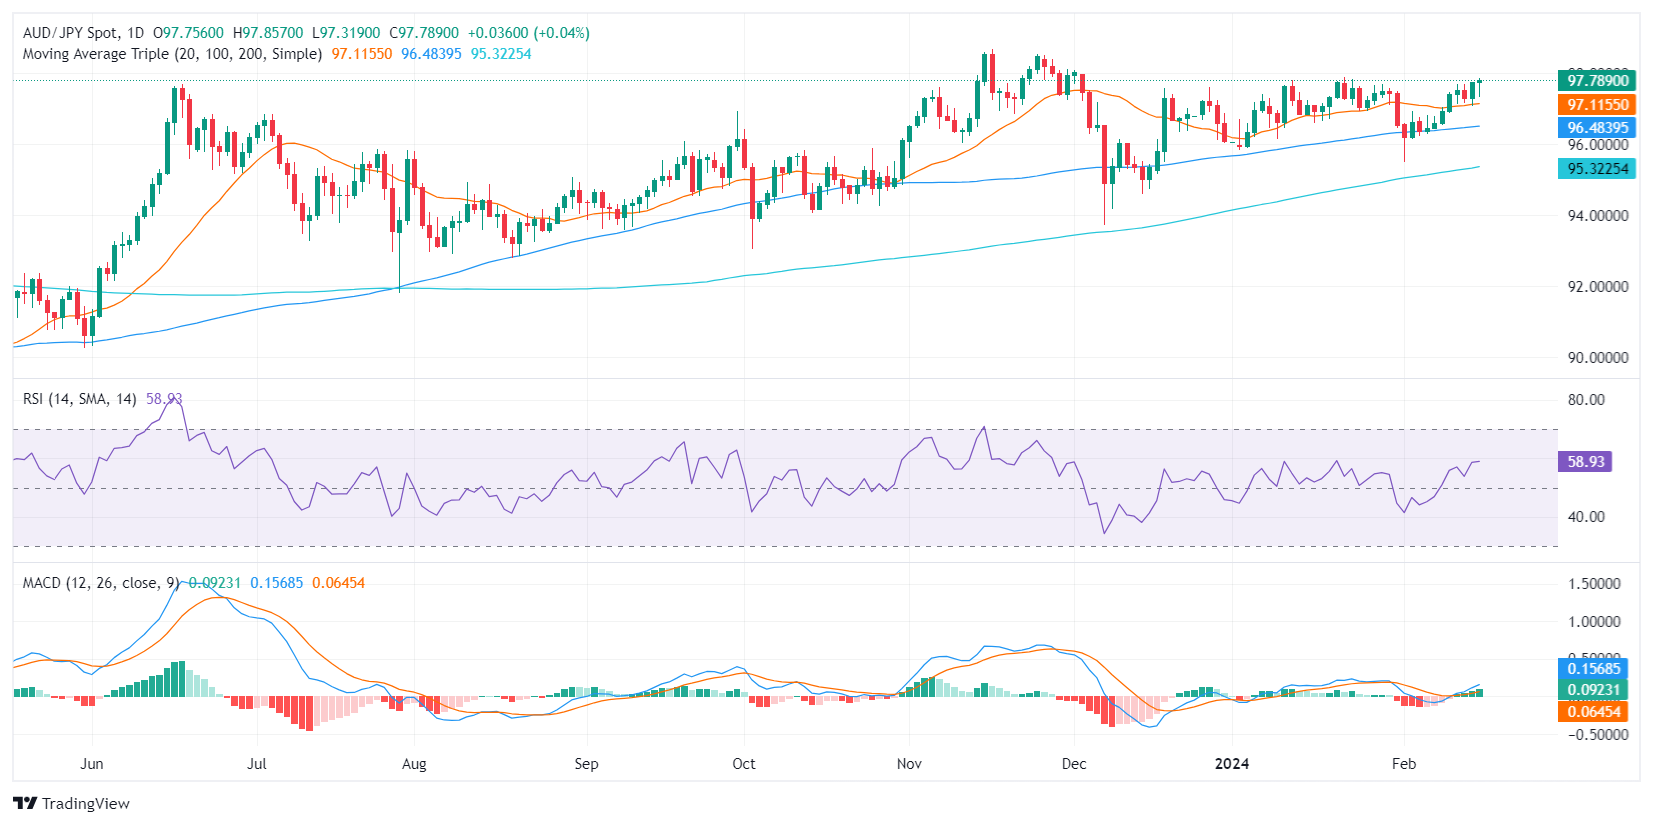
- The AUD/JPY is currently trading at 97.70 with mild gains in the Thursday session after bottoming at a low of 97.30.
- Daily chart indicators suggest that the buyers are in control of short-term price movement.
On Thursday, the AUD/JPY pair was rebounding from a daily low of 97.30 to 97.70 suggesting that the bulls are controlling the movement. The overall trend is also positive as the cross holds above the main Simple Moving Averages (SMAs).
On the daily chart, the Relative Strength Index (RSI) for the pair is currently in positive territory, indicating a positive momentum. The RSI has been trending slightly higher over the past few days, suggesting that buyers continue to dominate the market. In addition, the Moving Average Convergence Divergence (MACD) histogram is showing a rising trend, with green bars indicating positive momentum further supporting the positive outlook. Looking at the larger context, the AUDJPY pair remains above the 20, 100, and 200-day Simple Moving Averages (SMAs), indicating a bullish overall trend. This further supports the positive outlook for the pair.
AUD/JPY daily chart
- Crude Oil markets recovered after Wednesday’s decline as barrel bids rebound.
- WTI shrugs off warnings that global oil demand is set to peak according to the EIA.
- Crude Oil demand estimates have deviated wildly.
West Texas Intermediate (WTI) Crude Oil rebounded on Thursday, catching an upshot into $77.50 per barrel and slamming back into a technical congestion zone on the charts as energy market bid Crude Oil back up after a midweek pullback. Crude Oil supply lines saw an unexpected uptick in barrel counts this week, warning barrel traders that global supply continues to climb at a much faster pace than energy markets initially expected.
According to the International Energy Agency (IEA), global Crude Oil demand is going to settle into a much lower range than previously expected, with the IEA lowering its 2024 growth forecast. The IEA now expects global oil demand to grow by just 1.22 million barrels per day this year, down from the previous month’s estimate and coming in well below the forecast 2.25 million bpd growth forecast by the Organization for the Petroleum Exporting Countries (OPEC).
The IEA also expanded its projections for 2024’s production growth, forecasting global Crude Oil production to grow by 1.7 million bpd compared to the previous forecast of 1.5 million bpd. The IEA now expects global Crude Oil production will expand to a record 103.8 million barrels per day, fueled by production growth from non-OPEC entities, primarily the US.
Despite OPEC’s insinuation that they will be able to cut production enough to keep global crude markets constrained, the IEA expects demand for OPEC+ Crude Oil to continue to come in below current production targets.
WTI technical outlook
Thursday’s rebound in the WTI sees US Crude Oil climbing back into the 200-day Simple Moving Average (SMA) near $77.40 as WTI grinds its way back towards the $78.00 handle.
WTI is set to close once more in the green, offsetting Wednesday’s declines and putting US Crude Oil on pace to close higher for eight of the last nine consecutive trading days.
WTI hourly chart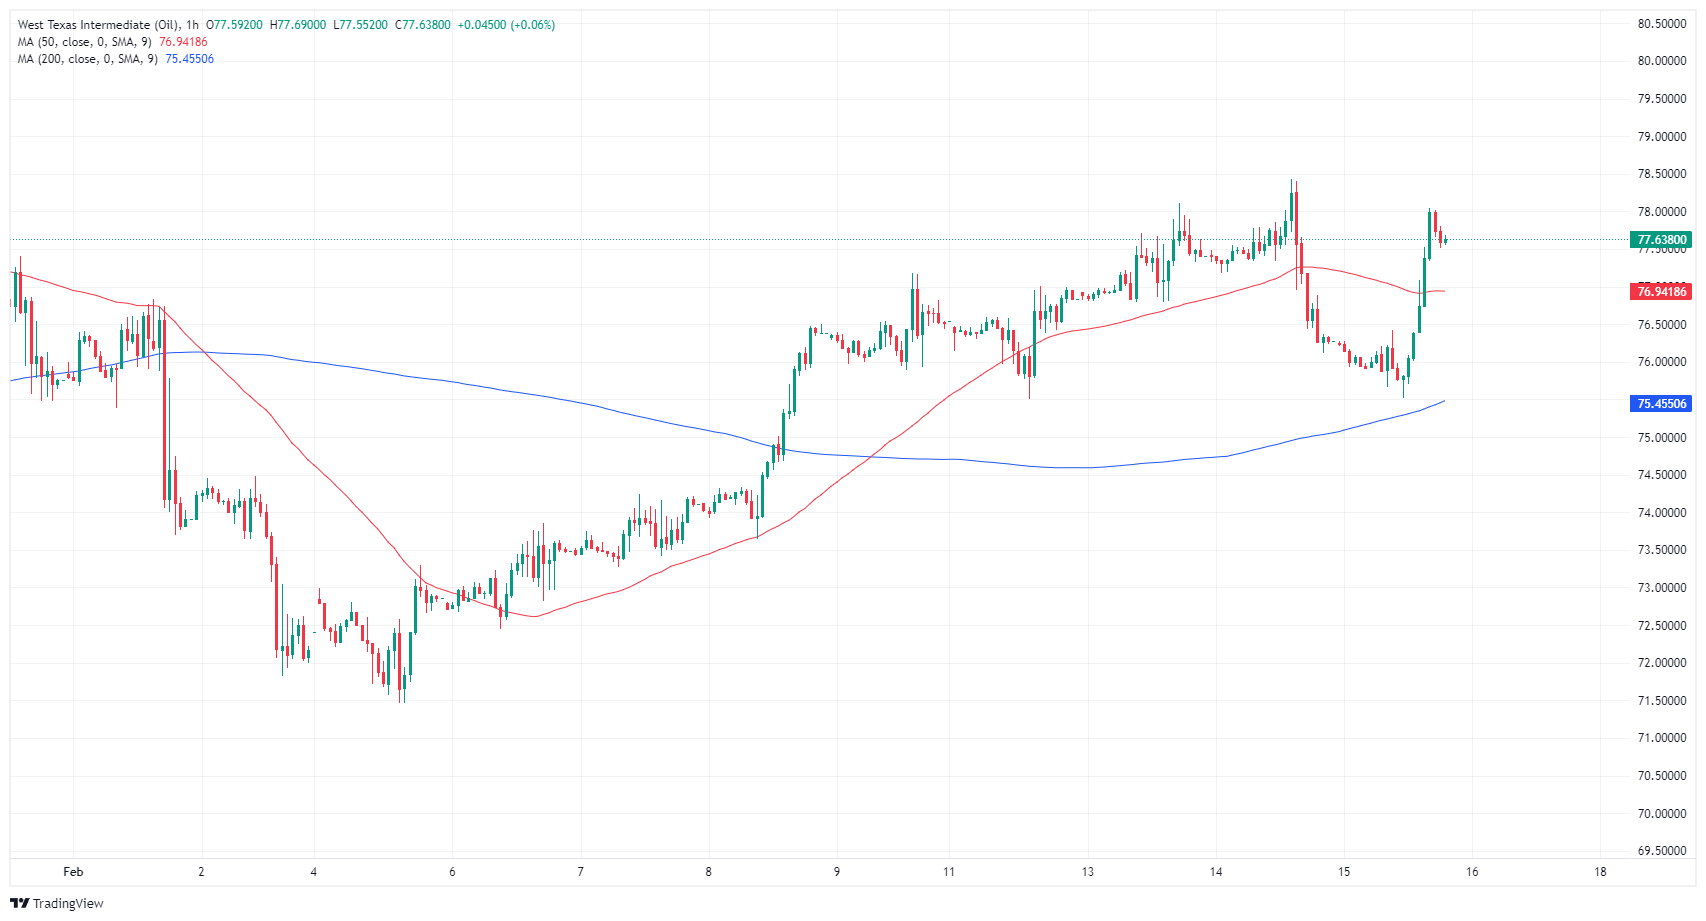
WTI daily chart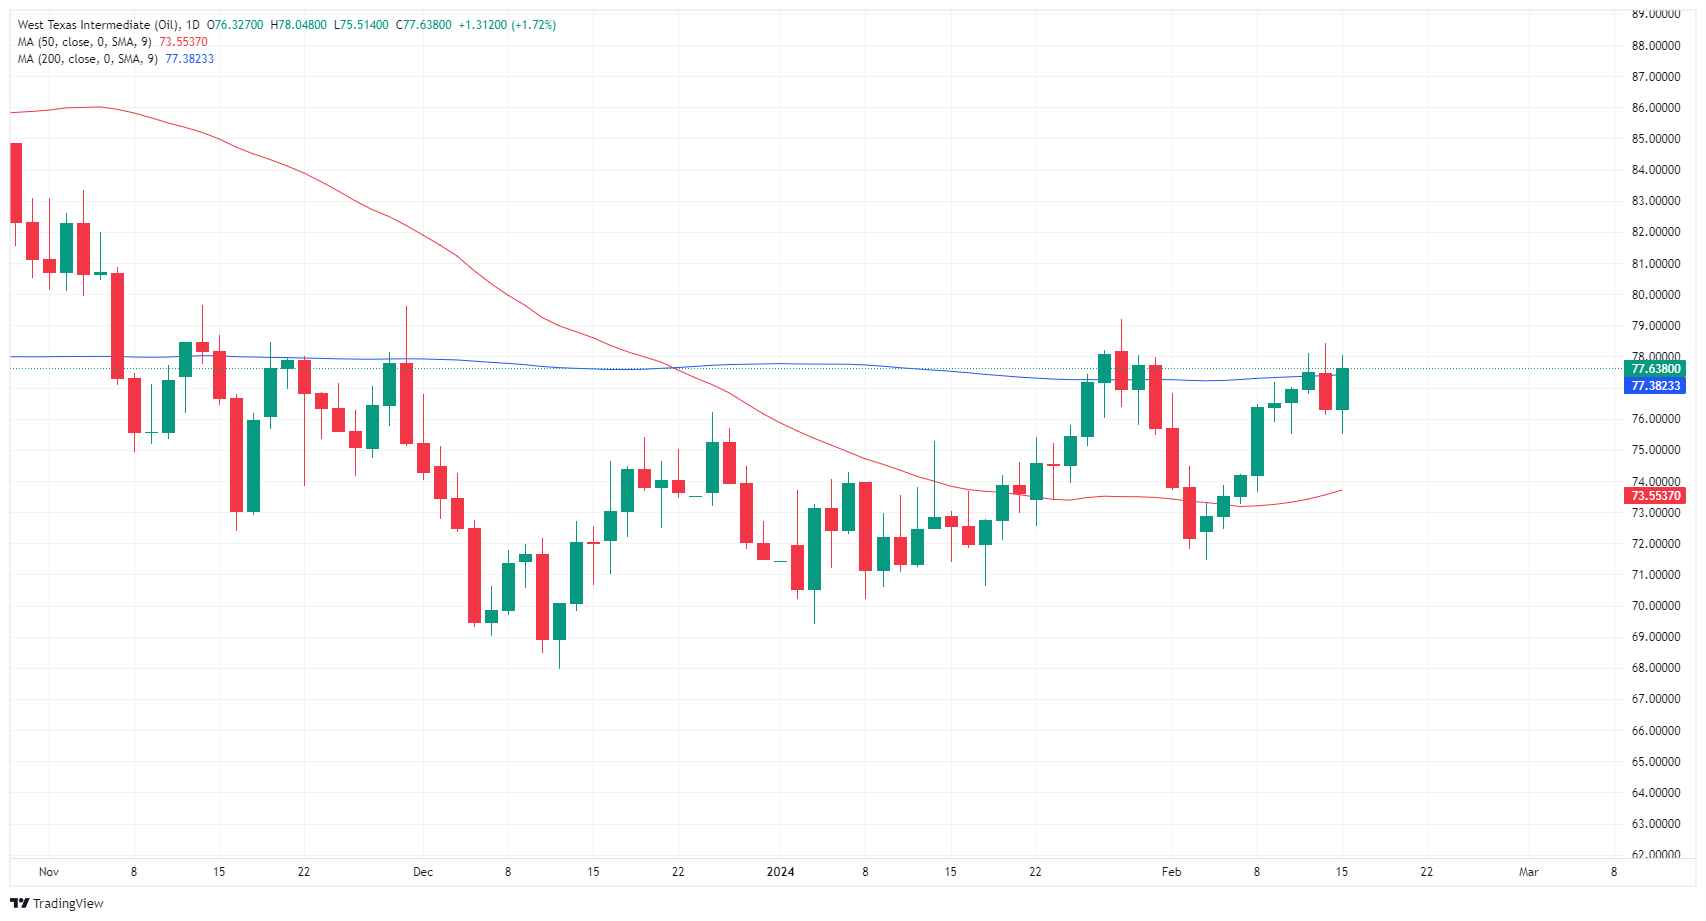
- GBP/USD recovers from daily lows, trading up 0.17% after a soft US retail sales report.
- UK officially enters recession, with GDP shrinking in the final quarter of 2023.
- BoE Governors signal potential for higher interest rates, depending on economic indicators.
The Pound Sterling (GBP) climbed during the North American session following a soft retail sales report that lifted the major from a crucial technical level. Consequently, the Greenback (USD) is on the defensive as the GBP/USD trades at 1.2586, up 0.17%, after jumping off a daily low of 1.2541.
Pund Sterling edges high amid mixed US economic reports, BoE’s rate cut estimates
Data from the United States (US) was mixed as Retail Sales in January plunged -0.8% MoM, below December’s and estimates of -0.1%, due to a drop in sales at auto dealerships and gasoline service stations. In addition to that, stormy weather also weighed down affected sales.
At the same time, unemployment claims for the week ending in February 10 rose by 212K, less than forecasts and the prior’s reading of 220K. Claims were expected to bounce back after companies announced layoffs.
Earlier, the GBP/USD dropped to a daily low of 1.2541 as the Office of National Statistics (ONS) in the UK reported that the economy fell into a recession at the end of 2023. The Gross Domestic Product (GDP) shrank -0.3% in the three months to December, which confirmed the country entered a recession in the second half of 2023.
Recently, the Bank of England (BoE) Governors Megan Greene and Catherine Mann crossed the wires. Greene, one of the hawks of the BoE, said she thinks rates are going to be higher than before and would consider changing my view if measures of wage growth ease. Mann commented that she’s not surprised by weak growth in 2023, that the outlook for 2024 could be brighter, and that she would look toward business surveys like the Purchasing Managers Index (PMI).
Fed and BoE Interest rate expectations
According to the FedWatch Tool, the Fed is expected to cut rates in June, with odds at 51%, but some traders estimate the Fed would slash rates by 50 bps. Meanwhile, the Bank of England (BoE) is seen cutting rates by 25 basis points in the August meeting.
GBP/USD Price Analysis: Technical outlook
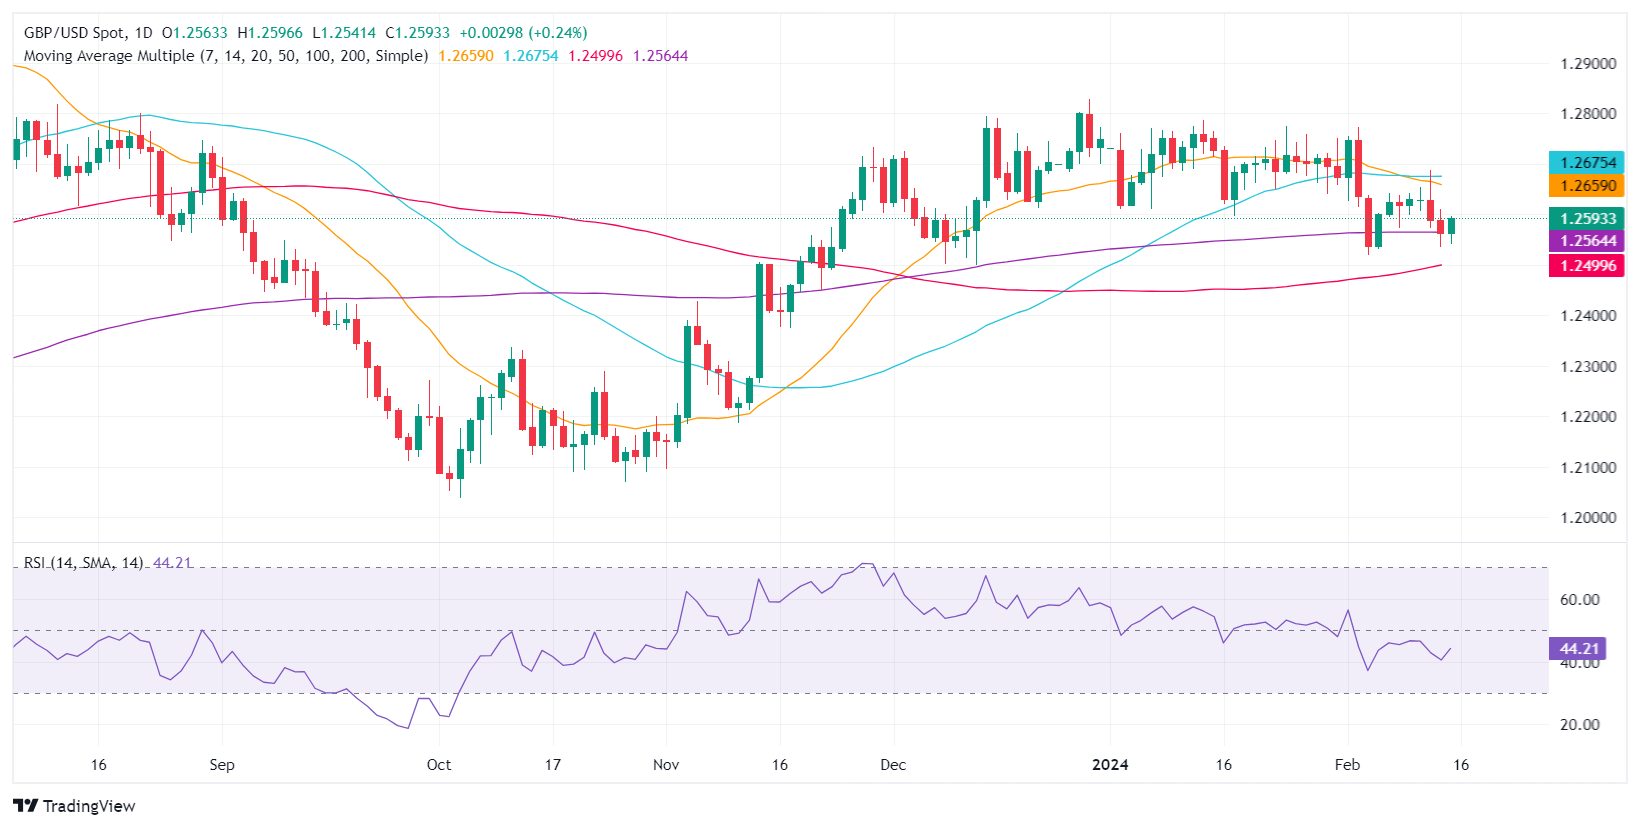
The daily chart shows the GBP/USD is neutral to downward biased, hovering around the 200-day moving (DMA) at 1.2562. Buyers will need a decisive break above 1.2600 if they want to remain hopeful of shiting the pair upwards, with eyes at the 50-DMA at 1.2669. On the other hand, a daily close below the 200-DMA could pave the way for further downside.
Federal Reserve (Fed) Governor Christopher Waller noted the US Dollar's (USD) importance in global markets while giving a speech titled "The Dollar's International Role" at the Global Interdependence Center and University of the Bahamas Conference in Nassau.
Key highlights
- US Dollar likely to remain the world's dominant reserve currency.
- Recent developments strengthen that status.
- Several factors weigh against the Chinese Yuan as an attractive asset.
- Fed's Waller sees no need for a central bank digital currency in the US.
- Waller does not want to see central banks holding large amounts of crypto-based ETFs.
- The DXY Index recorded losses in Thursday’s session, falling toward 104.40.
- Retail Sales from January declined higher than expected.
- Weekly Initial Jobless Claims came in strong.
The US Dollar (USD) measured by the Dollar Index (DXY) declined further on Thursday, this time fueled by weak Retail Sales figures from January.
Despite the weak Retail Sales figure, the US economy continues to show signs of being overheated, as seen in the higher-than-expected inflation figures from January that reinforce the case for the Fed delaying rate cuts. On Friday, Producer Price Index (PPI) figures will be closely watched as they may provide additional traction to the USD in case they come in higher than expected.
Daily digest market movers: US Dollar loses ground on weak economic data
- Retail Sales declined -0.8% MoM in January, beating the 0.1% decline expected.
- Industrial Production from the first month of 2024 declined by -0.1% MoM, while markets expected a 0.3% expansion.
- On the bright side, Initial Jobless Claims from the week ending February 9, came in lower than expected at 212K.
- Despite the weak data, markets are still confident about delaying rate cuts by the Federal Reserve (Fed), and as long as investors push the start of easing to June, the USD’s losses are limited.
Technical analysis: DXY will be good as long as buyers hold the 100-day SMA
The technical analysis on the daily chart reflects a negative slope in the Relative Strength Index (RSI), indicating selling momentum in the short term. The Moving Average Convergence Divergence (MACD) shows decreasing green bars, further supporting the concept of selling pressure.
However, despite these short-term negative indicators, the Dollar Index remains above the 20, 100, and 200-day Simple Moving Averages (SMAs), suggesting that the overall trend is still controlled by bulls.
US Dollar FAQs
What is the US Dollar?
The US Dollar (USD) is the official currency of the United States of America, and the ‘de facto’ currency of a significant number of other countries where it is found in circulation alongside local notes. It is the most heavily traded currency in the world, accounting for over 88% of all global foreign exchange turnover, or an average of $6.6 trillion in transactions per day, according to data from 2022.
Following the second world war, the USD took over from the British Pound as the world’s reserve currency. For most of its history, the US Dollar was backed by Gold, until the Bretton Woods Agreement in 1971 when the Gold Standard went away.
How do the decisions of the Federal Reserve impact the US Dollar?
The most important single factor impacting on the value of the US Dollar is monetary policy, which is shaped by the Federal Reserve (Fed). The Fed has two mandates: to achieve price stability (control inflation) and foster full employment. Its primary tool to achieve these two goals is by adjusting interest rates.
When prices are rising too quickly and inflation is above the Fed’s 2% target, the Fed will raise rates, which helps the USD value. When inflation falls below 2% or the Unemployment Rate is too high, the Fed may lower interest rates, which weighs on the Greenback.
What is Quantitative Easing and how does it influence the US Dollar?
In extreme situations, the Federal Reserve can also print more Dollars and enact quantitative easing (QE). QE is the process by which the Fed substantially increases the flow of credit in a stuck financial system.
It is a non-standard policy measure used when credit has dried up because banks will not lend to each other (out of the fear of counterparty default). It is a last resort when simply lowering interest rates is unlikely to achieve the necessary result. It was the Fed’s weapon of choice to combat the credit crunch that occurred during the Great Financial Crisis in 2008. It involves the Fed printing more Dollars and using them to buy US government bonds predominantly from financial institutions. QE usually leads to a weaker US Dollar.
What is Quantitative Tightening and how does it influence the US Dollar?
Quantitative tightening (QT) is the reverse process whereby the Federal Reserve stops buying bonds from financial institutions and does not reinvest the principal from the bonds it holds maturing in new purchases. It is usually positive for the US Dollar.
Governor of the Central Bank of Malta and European Central Bank (ECB) Governing Council policymaker Edward Scicluna noted on Thursday that he would be open to beginning rate cuts with euro area inflation receding and the European economy on pace for a soft landing scenario.
Key highlights
- Risks are "everywhere", but inflation is easing.
- Scicluna warns to be cautious when dismissing the market's views.
- ECB's Scicluna: I am open to a March rate cut, as long as inflation continues to fade.
- Europe's economy is facing a soft landing.
- Mexican Peso stable despite US Retail Sales affected by high interest rates.
- Bank of Mexico reports a modest 2.2% growth in Foreign Direct Investment for the year.
- US economic outlook positive, says White House Adviser, ahead of Fed Governor Waller's speech.
Mexican Peso is virtually unchanged against the US Dollar on Thursday following a softer retail sales report from the United States (US), an indication that higher interest rates impact consumer spending. Regarding the labor market, it remains solid after the US Bureau of Labor Statistics (BLS) announced that unemployment claims were below estimates. The USD/MXN trades at 17.07, almost flat.
Mexico’s economic docket remains scarce, though the Bank of Mexico revealed that Foreign Direct Investment (FDI) registered an expansion of 2.2% by the end of last year. Nevertheless, the data suggests the growth rate slowed, failing to reach the expectations of international organizations and economists.
Across the border, White House Economic Adviser Lael Brainard said the fundamentals of the US economy seem “quite good,” and consumer purchasing power remains strong. Later, her former colleague, Fed Governor Christopher Waller, will cross the wires.
Daily digest market movers: Mexican Peso stays firm as Foreign Direct Investment grows
- Mexico’s Foreign Direct Investment came at $36 billion dollars, according to the Ministry of Economy. Although last year’s data marked a historical level, it missed estimates of $43.9 billion by the United Nations Conference on Trade and Development.
- A survey of the Bank of Mexico (Banxico) announced that 25 polled economists expected a higher figure of $38 billion.
- The US Commerce Department announced that Retail Sales experienced a greater decline than the anticipated -0.1% contraction, recording a -0.8% MoM drop attributed to winter storms. Additionally, the sales data for December was revised downward from an initial estimate of 0.6% to 0.4% MoM.
- The US Bureau of Labor Statistics (BLS) reported that for the week ending February 10, unemployment claims fell to 212K, coming in below both the prior figure and the expected 220K.
- Market players are expecting the first rate cut by the Federal Reserve at the June monetary policy meeting as they trimmed odds for March and May.
- US 10-year Treasury note yield is almost flat at 4.253%, while the US Dollar Index (DXY) dropped toward 104.41, down -0.28%.
- At its latest monetary policy decision, Banxico revised its inflation expectations to the upside for the period from Q1 to Q3 of 2024, expecting inflation to converge toward 3.5% in Q4, based on the latest monetary policy statement.
Technical analysis: Mexican Peso tests key level as USD/MXN hovers around 17.10
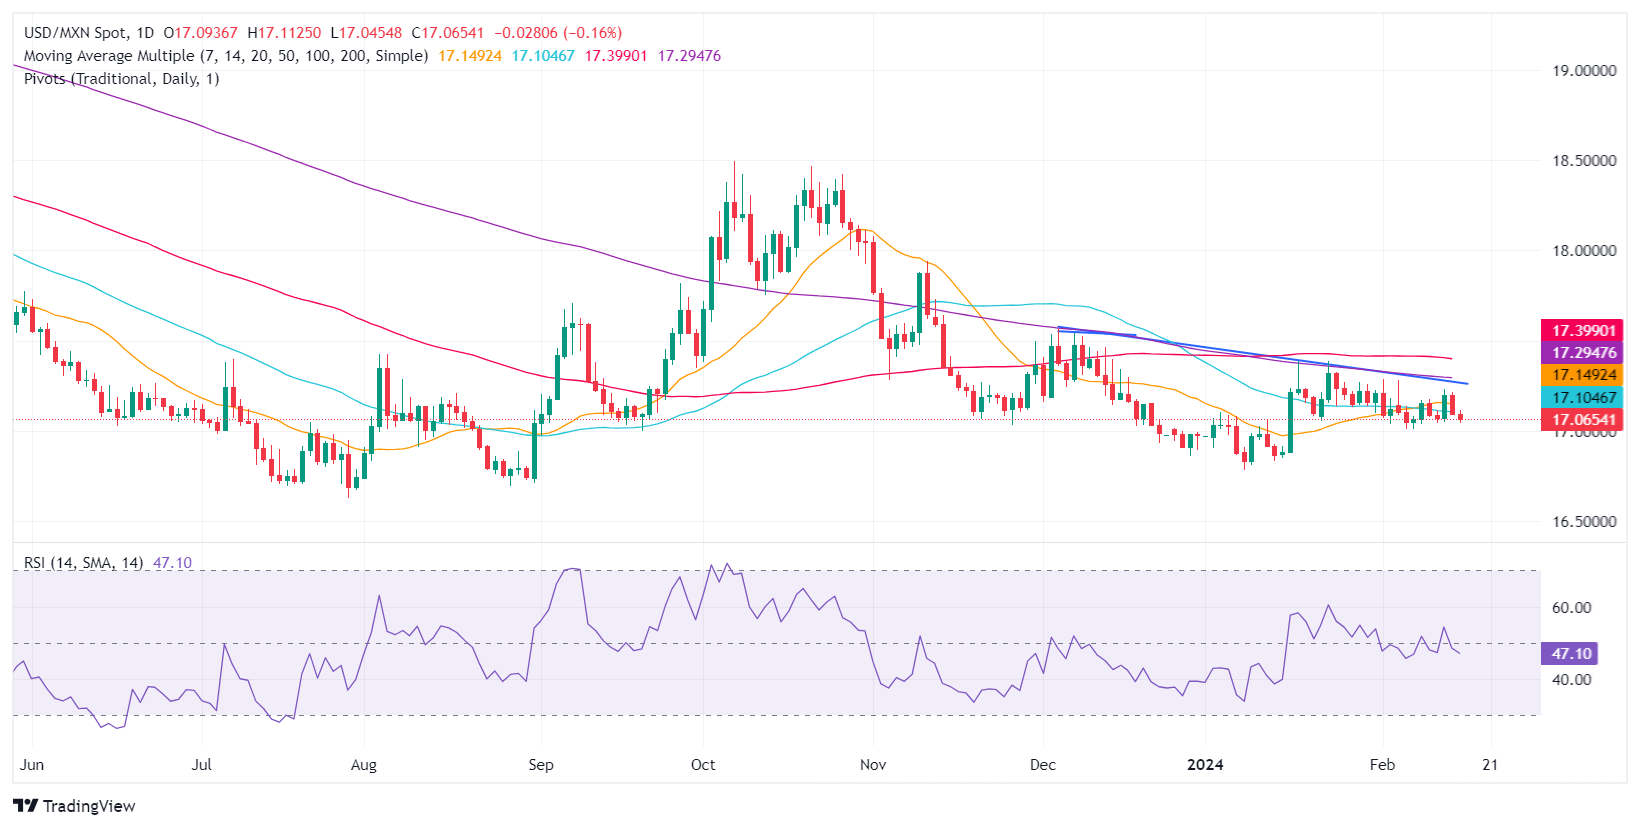
The USD/MXN consolidated in the 17.05-17.10 area during the last couple of days, holding near the 50-day Simple Moving Average (SMA) at 17.10. If buyers decisively break that level, the first resistance would be the psychological 17.20 area. A breach of the latter and the exotic pair could threaten the 200-day SMA at 17.29, before aiming toward the 100-day SMA at 17.39.
Conversely, if sellers step in and push prices below the 17.05 area, that would pave the way to test the 17.00 figure. Further downside is seen at last year’s low of 16.62.
USD/MXN Price Action – Daily Chart
Mexican Peso FAQs
What key factors drive the Mexican Peso?
The Mexican Peso (MXN) is the most traded currency among its Latin American peers. Its value is broadly determined by the performance of the Mexican economy, the country’s central bank’s policy, the amount of foreign investment in the country and even the levels of remittances sent by Mexicans who live abroad, particularly in the United States. Geopolitical trends can also move MXN: for example, the process of nearshoring – or the decision by some firms to relocate manufacturing capacity and supply chains closer to their home countries – is also seen as a catalyst for the Mexican currency as the country is considered a key manufacturing hub in the American continent. Another catalyst for MXN is Oil prices as Mexico is a key exporter of the commodity.
How do decisions of the Banxico impact the Mexican Peso?
The main objective of Mexico’s central bank, also known as Banxico, is to maintain inflation at low and stable levels (at or close to its target of 3%, the midpoint in a tolerance band of between 2% and 4%). To this end, the bank sets an appropriate level of interest rates. When inflation is too high, Banxico will attempt to tame it by raising interest rates, making it more expensive for households and businesses to borrow money, thus cooling demand and the overall economy. Higher interest rates are generally positive for the Mexican Peso (MXN) as they lead to higher yields, making the country a more attractive place for investors. On the contrary, lower interest rates tend to weaken MXN.
How does economic data influence the value of the Mexican Peso?
Macroeconomic data releases are key to assess the state of the economy and can have an impact on the Mexican Peso (MXN) valuation. A strong Mexican economy, based on high economic growth, low unemployment and high confidence is good for MXN. Not only does it attract more foreign investment but it may encourage the Bank of Mexico (Banxico) to increase interest rates, particularly if this strength comes together with elevated inflation. However, if economic data is weak, MXN is likely to depreciate.
How does broader risk sentiment impact the Mexican Peso?
As an emerging-market currency, the Mexican Peso (MXN) tends to strive during risk-on periods, or when investors perceive that broader market risks are low and thus are eager to engage with investments that carry a higher risk. Conversely, MXN tends to weaken at times of market turbulence or economic uncertainty as investors tend to sell higher-risk assets and flee to the more-stable safe havens.
Bank of England (BoE) policymaker and Monetary Policy Committee (MPC) member Catharine L Mann hit newswires on Thursday while discussing her policy outlook at an economic policy conference at the Annual National Association for Business Economics.
Key highlights
- Latest Gross Domestic Product (GDP) data confirms that the second half of 2023 was a soft patch.
- The BoE needs at least one more inflation data print before deciding next moves.
- UK unemployment rate remains "pretty low", labor market continues to be tight.
- Wage growth is slowing, but the pace remains "challenging" for the BoE's Consumer Price Index (CPI) target.
- GDP data is a rear-view mirror, Purchasing Managers' Index (PMI) and other forward-looking data all look good.
- Goods inflation has slowed across all advanced economies.
- Decomposition sources of inflation will be important in policy decisions.
- Goods prices may be deflationary at some point in the UK, but not on a durable basis.
- The UK has much stickier services inflation than the EU or the US.
- Canadian Dollar recovers ground on US data print.
- Canada sees low-impact data for the back half of the trading week.
- Crude Oil markets are in recovery mode, bolstering Canadian Dollar.
The Canadian Dollar (CAD) found itself on the high side of the US Dollar (USD) on Thursday after US Retail Sales missed expectations and shrank in January. The Greenback’s midweek surge on CPI-fueled risk aversion is getting pared back, and the CAD is finding additional support from recovering Crude Oil bids heading into the back end of the trading week.
Canadian Housing Starts came in below expectations, but the low-impact data saw little market movement as investors broadly focus on shifts in US data prints. A rebound in Crude Oil also bolsters the Canadian Dollar.
Daily digest market movers: US Retail Sales miss sparks Greenback weakness on Thursday
- US Retail Sales declined 0.8% in January, well below the -0.1% forecast.
- December’s US Retail Sales saw a downside revision to 0.4% from 0.6%.
- US Retail Sales excluding Autos also fell 0.6% MoM in January versus the 0.2% forecast.
- January’s US Industrial Production also fell 0.1% MoM versus the forecast of 0.3%, piling onto December’s 0.0% (revised from 0.1%).
- US Initial Jobless Claims printed at 212K versus the forecast of 220K for the week ended February 9, while the previous week saw a revision to 220K from 218K.
- Canadian Housing Starts settled to 223.6K for the year ending in January versus the 235K forecast, down even further from the previous period’s 248.9K (revised down from 249.3K).
- Crude Oil markets see a sharp recovery on Thursday after Wednesday’s stark decline.
- West Texas Intermediate (WTI) US Crude Oil barrels are back over $77.00, testing $77.50 during the US trading session.
- Friday is set to wrap up the trading week with US Producer Price Index (PPI) figures and the Michigan Consumer Sentiment Index.
- US PPI for the year ended January is forecast to tick down to 1.6% from 1.8%.
- The Michigan Consumer Sentiment Index for February is expected to improve slightly to 80.0 from 79.0.
Canadian Dollar price today
The table below shows the percentage change of Canadian Dollar (CAD) against listed major currencies today. Canadian Dollar was the strongest against the US Dollar.
| USD | EUR | GBP | CAD | AUD | JPY | NZD | CHF | |
| USD | -0.24% | -0.07% | -0.26% | -0.16% | -0.23% | -0.22% | -0.48% | |
| EUR | 0.23% | 0.15% | -0.04% | 0.07% | 0.00% | 0.01% | -0.24% | |
| GBP | 0.07% | -0.17% | -0.17% | -0.10% | -0.16% | -0.16% | -0.40% | |
| CAD | 0.26% | 0.02% | 0.20% | 0.09% | 0.03% | 0.02% | -0.21% | |
| AUD | 0.18% | -0.07% | 0.11% | -0.10% | -0.06% | -0.06% | -0.30% | |
| JPY | 0.23% | 0.00% | 0.15% | -0.04% | 0.05% | 0.00% | -0.24% | |
| NZD | 0.23% | -0.01% | 0.17% | -0.03% | 0.07% | 0.00% | -0.23% | |
| CHF | 0.47% | 0.24% | 0.40% | 0.21% | 0.31% | 0.24% | 0.24% |
The heat map shows percentage changes of major currencies against each other. The base currency is picked from the left column, while the quote currency is picked from the top row. For example, if you pick the Euro from the left column and move along the horizontal line to the Japanese Yen, the percentage change displayed in the box will represent EUR (base)/JPY (quote).
Technical analysis: Canadian Dollar claws back ground against the Greenback
The Canadian Dollar (CAD) recovered around a quarter of a percent against the US Dollar on Thursday, while shedding a quarter of a percent against the market’s strongest currency for the day in the Swiss Franc (CHF). The US Dollar is broadly softer in the back half of the trading week, giving the Canadian Dollar a leg up.
USD/CAD tumbled into an intraday low of 1.3475 on Thursday, and the pair is running into near-term technical support from the 200-hour Simple Moving Average (SMA) near 1.3494 as bids grapple with the 1.3500 handle.
Daily candlesticks continue to see friction from the 200-day SMA at 1.3478. Despite USD/CAD testing new highs consistently, progress has been thin as the pair threatens to tip into a consolidation pattern between 1.3400 and 13600.
USD/CAD hourly chart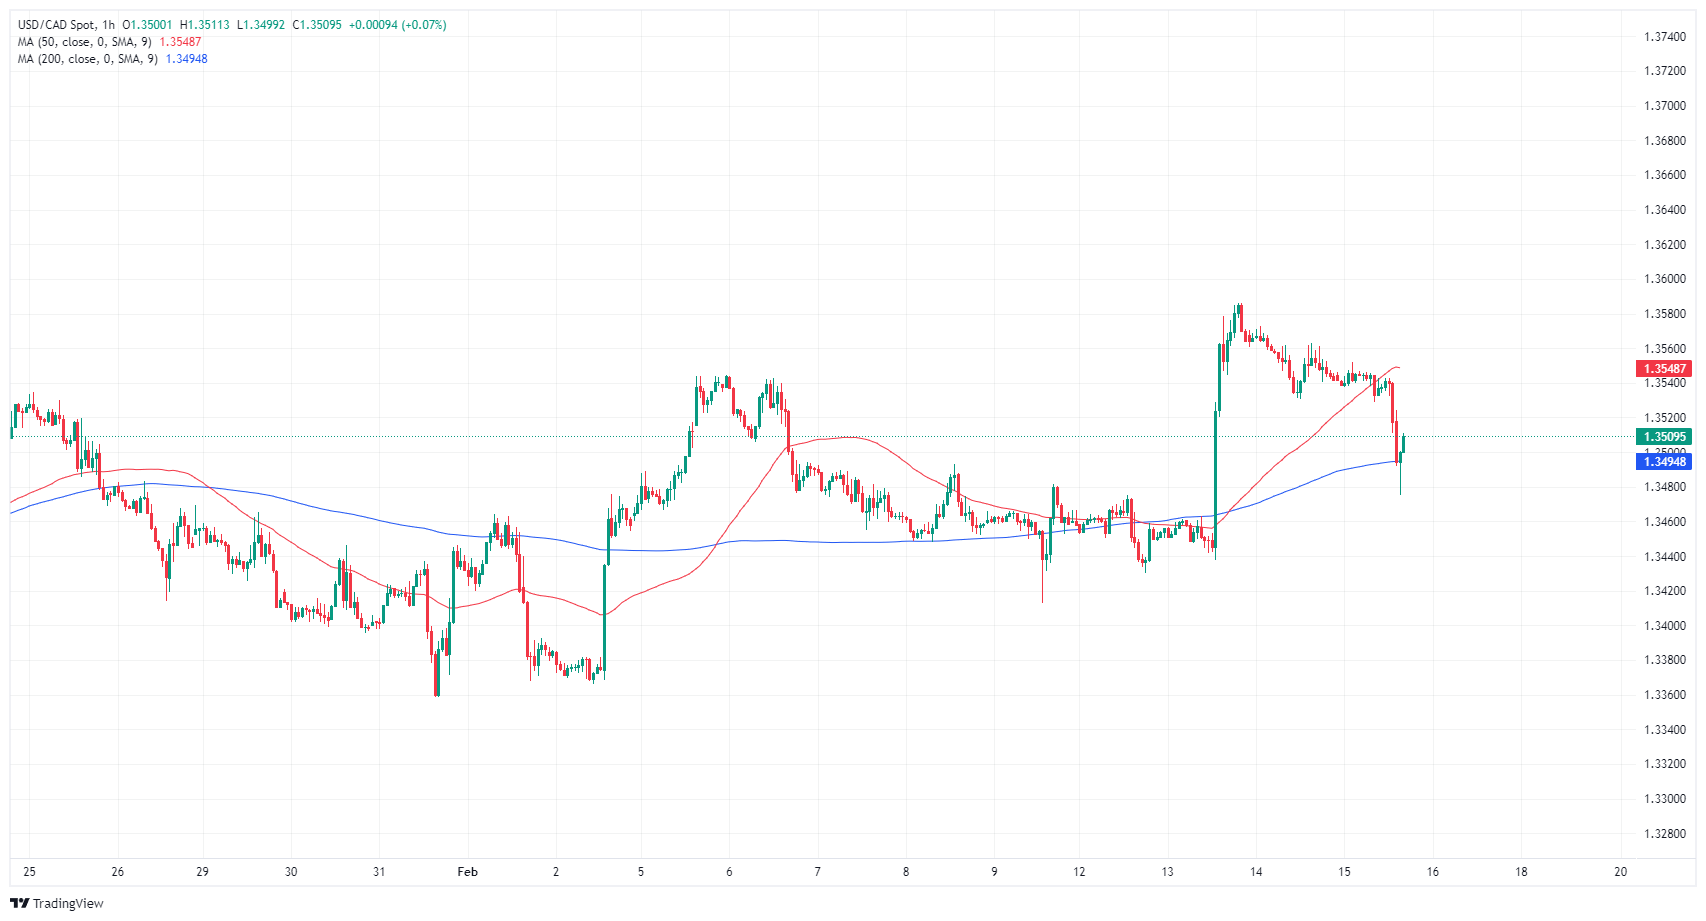
USD/CAD daily chart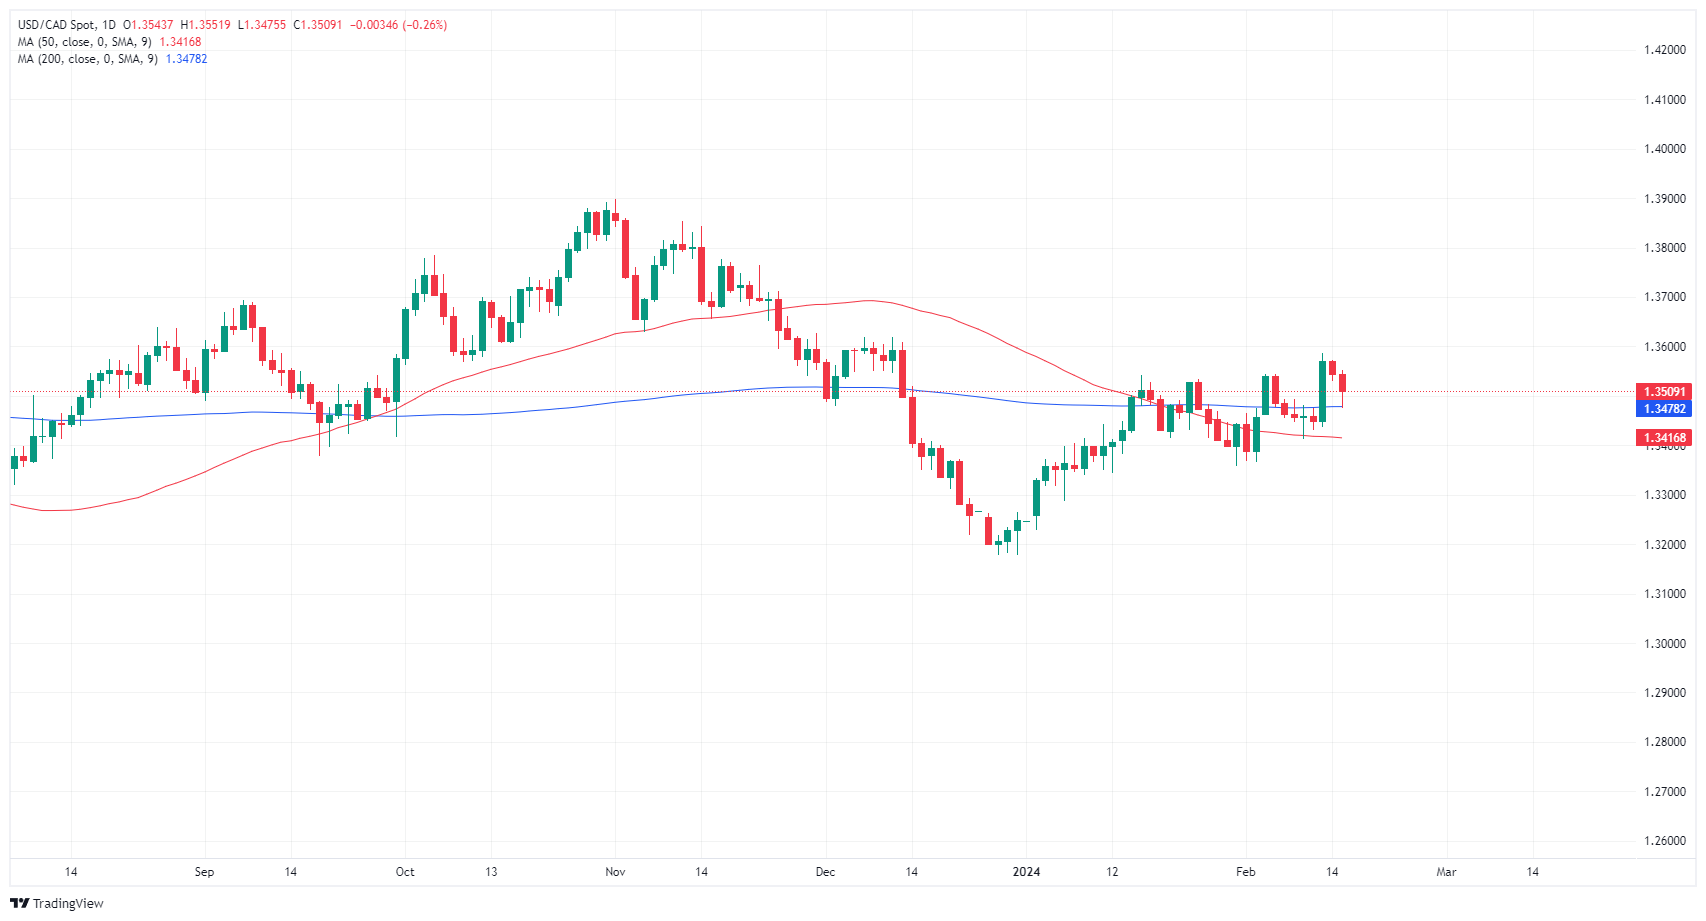
Canadian Dollar FAQs
What key factors drive the Canadian Dollar?
The key factors driving the Canadian Dollar (CAD) are the level of interest rates set by the Bank of Canada (BoC), the price of Oil, Canada’s largest export, the health of its economy, inflation and the Trade Balance, which is the difference between the value of Canada’s exports versus its imports. Other factors include market sentiment – whether investors are taking on more risky assets (risk-on) or seeking safe-havens (risk-off) – with risk-on being CAD-positive. As its largest trading partner, the health of the US economy is also a key factor influencing the Canadian Dollar.
How do the decisions of the Bank of Canada impact the Canadian Dollar?
The Bank of Canada (BoC) has a significant influence on the Canadian Dollar by setting the level of interest rates that banks can lend to one another. This influences the level of interest rates for everyone. The main goal of the BoC is to maintain inflation at 1-3% by adjusting interest rates up or down. Relatively higher interest rates tend to be positive for the CAD. The Bank of Canada can also use quantitative easing and tightening to influence credit conditions, with the former CAD-negative and the latter CAD-positive.
How does the price of Oil impact the Canadian Dollar?
The price of Oil is a key factor impacting the value of the Canadian Dollar. Petroleum is Canada’s biggest export, so Oil price tends to have an immediate impact on the CAD value. Generally, if Oil price rises CAD also goes up, as aggregate demand for the currency increases. The opposite is the case if the price of Oil falls. Higher Oil prices also tend to result in a greater likelihood of a positive Trade Balance, which is also supportive of the CAD.
How does inflation data impact the value of the Canadian Dollar?
While inflation had always traditionally been thought of as a negative factor for a currency since it lowers the value of money, the opposite has actually been the case in modern times with the relaxation of cross-border capital controls. Higher inflation tends to lead central banks to put up interest rates which attracts more capital inflows from global investors seeking a lucrative place to keep their money. This increases demand for the local currency, which in Canada’s case is the Canadian Dollar.
How does economic data influence the value of the Canadian Dollar?
Macroeconomic data releases gauge the health of the economy and can have an impact on the Canadian Dollar. Indicators such as GDP, Manufacturing and Services PMIs, employment, and consumer sentiment surveys can all influence the direction of the CAD. A strong economy is good for the Canadian Dollar. Not only does it attract more foreign investment but it may encourage the Bank of Canada to put up interest rates, leading to a stronger currency. If economic data is weak, however, the CAD is likely to fall.
- The EUR/GBP is trading at 0.8560, showing a gain of 0.25, in Thursday's American session.
- ECB President Lagarde was on the wires but didn’t offer any insights.
- The Sterling is weak due to lower-than-expected Q4 GDP data.
In Thursday's session, the EUR/GBP traded at 0.8560, showing a gain of 0.25% as the Sterling weakened due to softer-than-expected Q4 GDP data. However, the Bank of England (BoE) is expected to remain hawkish and the differing monetary policies with the European Central Bank (ECB) may eventually benefit the GBP.
In line with that, while markets expect the first rate cut in June by the ECB, economists foresee 125 bp of total easing within the next year, a decrease from the 150 bp predicted entered February and in case investors start to see less easing, the pair could continue rising.
Meanwhile, the UK saw its first consecutive quarters of contraction since early 2020, including a 0.3% QoQ decline in Q4, surpassing the 0.1% forecast. However, despite, the weak data, markets are expecting that the BoE won’t rush to cut rates, and as for now, the consensus is that the total easing will be between 75 bps and 100 bps in 2024. As long as the divergence between the BoE and ECB persists, the pound’s losses are limited.
EUR/GBP technical analysis
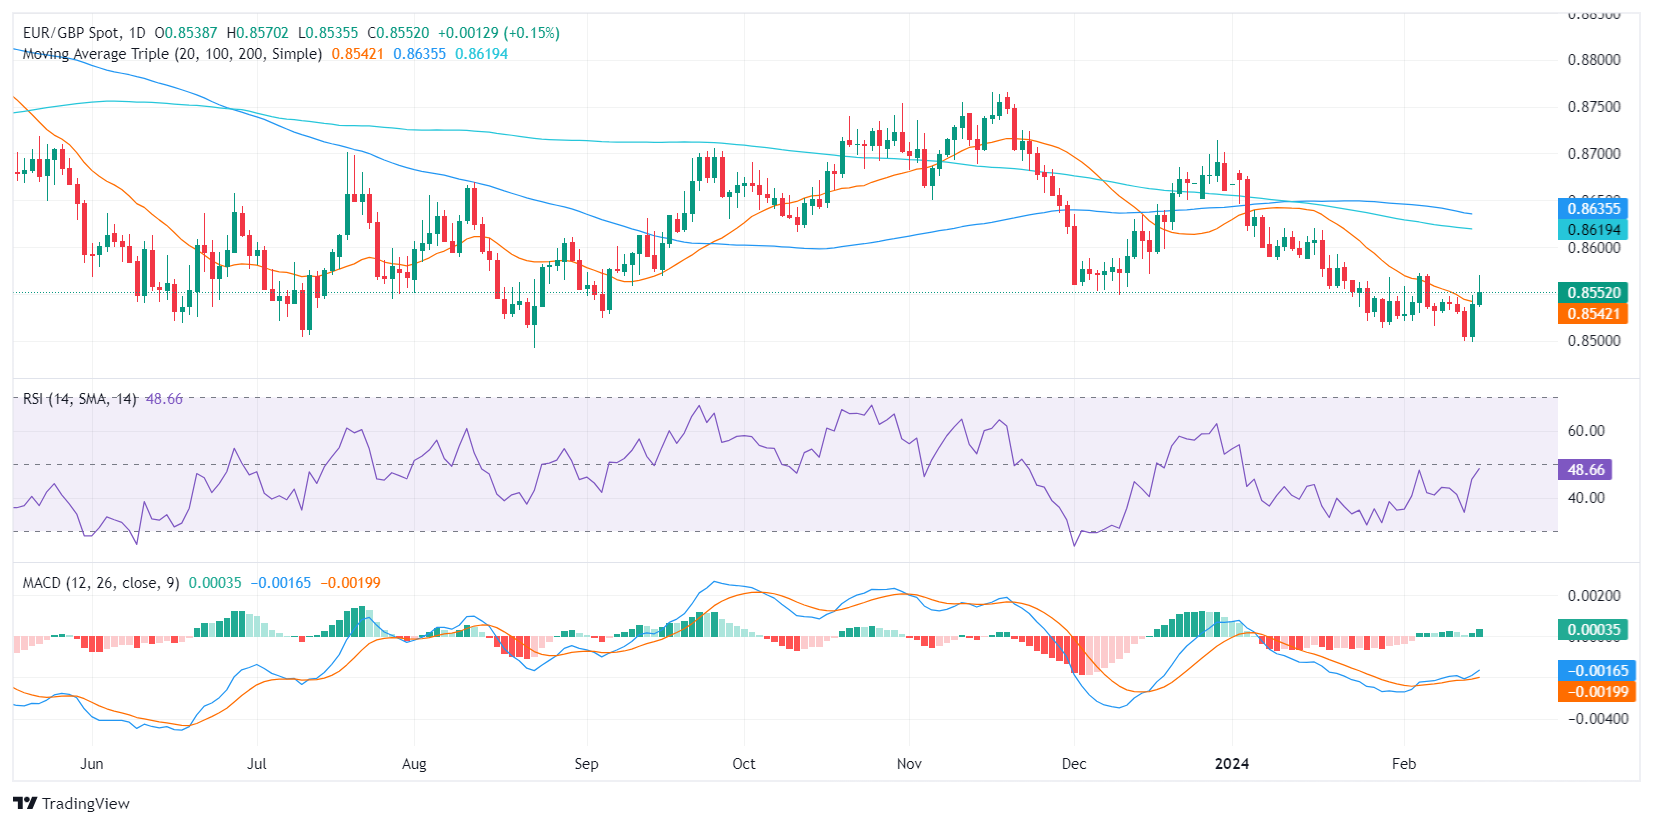
On the daily chart, the Relative Strength Index (RSI) for the EUR/GBP pair is currently near to jump to positive territory, indicating that buyers are gaining ground. In addition, the Moving Average Convergence Divergence (MACD) histogram has been consistently positive indicating that positive momentum is strong.
However, it is important to note that the broader perspective, represented by the Simple Moving Averages (SMAs), still favors sellers as the pair trades below the 100 and 200-day SMAs. That being said, the bulls managed to jump above the 20-day average so for the short term, the outlook might start to turn positive for them.
EUR/GBP daily chart
What will happen if Donald Trump is re-elected US President in November? Economists at Commerzbank analyze how the US Dollar (USD) could perform under a Trump presidency.
Making the Dollar great again?
The next ‘Trump Dollar’ is likely to be strong – at least in the short term. Sealing off foreign competition, deregulation, low taxes for companies and the rich: Trump's political agenda is likely to increase the profitability of capital invested in the US in many respects. And this should make the Dollar more desirable, i.e. more valuable.
In the long term, however, sealing off could lead to a loss of efficiency and thus to a weaker Dollar. The prospect of a strong Trump Dollar could also be disappointed if Trump does not content himself with publicly criticizing the Fed, as he did in his first term of office, but actually intervenes in Fed business. This would be very clearly USD-negative.
Gold (XAU/USD) dipped below $2,000 for the first time since December 2023. Economists at MUFG Bank analyze the yellow metal’s outlook.
Gold's resiliency intact despite hot US inflation dampening Fed rate cut expectations
Gold prices have remained in consolidation form as hotter-than-expected US inflation has dampened hopes for a rate cut in the first half of 2024. Beyond the sticky inflation reading, elevated yields have found further support following the recent FOMC meeting – removing the tightening bias with Fed Chair Powell signalling that a March cut ‘is probably not the most likely case’.
Whilst higher for longer rates is bearish for noninterest-bearing bullion, we hold conviction that the other two channels that are central to our bullish 2024 Gold view remain intact, namely, robust EM central bank purchases on reserve diversification and its role as the geopolitical hedge of last resort.
With Gold prices now flirting below the $2,00 handle, we acknowledge downside risks to our constructive $2,350 year-end forecasts. However, we continue to recommend leaning long Gold and view any sell-off as a buying opportunity in an environment with elevated risk dimensions (geopolitics, recession repricing) which play into Gold’s favourable hedging qualities.
- Euro rallies following a decline in US retail sales and Treasury yields.
- US Federal Reserve rate cut speculations grow amidst weaker-than-expected economic indicators.
- ECB President Lagarde highlights focus on Eurozone wage negotiations, with trade balance reporting a narrow surplus.
The Euro climbed in early trading during the North American session against the US Dollar after a softer-than-expected US retail sales report sparked a drop in US yields and, consequently, the Greenback. The EUR/USD exchanges hands at 1.0784 after hitting a daily low of 1.0723.
Softer EU’s data fules Euro’s rise with eyes on central bank moves
The US Commerce Department revealed retail sales fell more than the -0.1% contraction estimated, came at -0.8% blamed on winter storms. December’s data was revised lower, from 0.6% to 0.4%. At the same time, the US Bureau of Labor Statistics (BLS) revealed that unemployment claims for the week ending February 10, came at 212K, below the previous reading and forecasts of 220K.
The EUR/USD gathered cues and rose as the US 10-year Treasury bond yield dropped five basis points to 4.209%, while the US Dollar Index (DXY) plunged 0.50% at 104.20. Even though there are expectations that the US Federal Reserve will cut rates in 2024, traders speculate the Fed will slash the federal funds rates (FFR) to 4.40%.
In the European session, Christine Lagarde, the President of the European Central Bank (ECB), said the ECB would be watching closely the outcome of upcoming Eurozone wage negotiations. Aside from this, the Balance of Trade printed a surplus of EUR 16.8 billion, narrower than the 21.5 billion expected.
Additional data from the US was revealed, with Industrial Production for January plunging -0.1% below estimates of 0.3% and from last month’s 0% reading.
What to watch?
Ahead in the day, ECB Chief Economist Philip Lane will cross the wires. On the US front, Fed Governor Christopher Wall would be speaking.
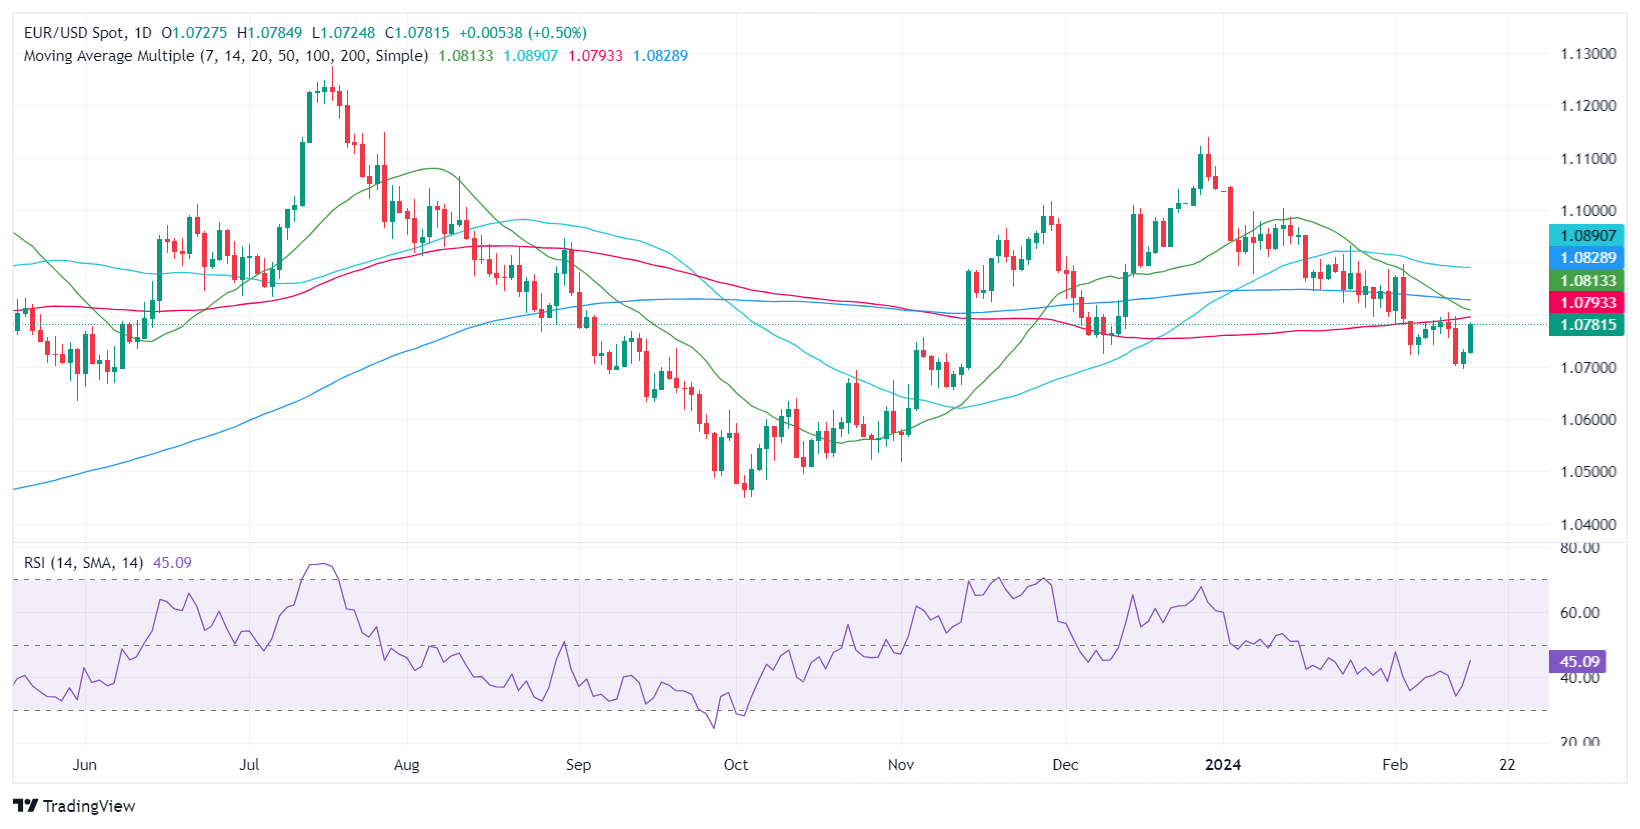
EUR/USD Price Analysis: Technical outlook
The EUR/USD daily chart remains neutral to a downward bias despite recovering from weekly lows below the 1.0700 figure. Unless buyers reclaim the 100-day moving average at 1.0795, that could open the door to testing the 1.0800 mark. Conversely, if bears regain control, pushing the exchange rate below 1.0750 would open the door to challenging 1.0700.
The Mexican Peso (MXN) is set to maintain its strength over an extended period, economists at Société Générale say.
High carry-to-vol is still supportive
The Fed nearing the start of its easing cycle in 2Q 2024 and the beginning of the end of QT, perhaps by June, coupled with Banxico’s sound monetary policy management, structural support (nearshoring) and high remittances, should keep the MXN relatively attractive. Low external imbalances and limited policy uncertainty should also help.
The US elections will probably generate a lot of noise but could be net positive for Mexico given its geopolitical position with respect to China.
Technically, high carry-to-vol, constructive positioning, and a neutral long-term valuation vs. an overvalued USD should lend additional support to the MXN.
The Canadian Dollar (CAD) has eased back somewhat in the early part of the new year after rallying significantly into the end of 2023. Economists at Scotiabank analyze Loonie’s outlook.
CAD expected to rebound in Q2/Q3
Headwinds for the CAD remain in the form of negative spreads versus the USD and soft commodity prices at present.
Near-term, CAD losses may extend a little further but the 1.3500/1.3600 zone may offer some (technical) value for the CAD.
Seasonality turns CAD-positive in Q2/ Q3, lower rates globally in the months ahead will be positive for risk appetite (and, by extension, for the CAD).
We expect the Fed to cut rates more aggressively than the BoC through 2025 which should result in a CAD-supportive compression in term yield spreads in the months ahead.
USD/CAD – Q1-24 1.3300 Q2-24 1.3300 Q3-24 1.2800 Q4-24 1.2800
The US Dollar Index (DXY) has inched higher as market pricing of Fed easing in 2024 has been downgraded. Economists at Société Générale analyze Greenback’s outlook.
The Fed is unlikely to ease dramatically
The US economy appears to have escaped a recession, and while that won’t stand in the way of monetary policy easing in 2024, it means that the Fed is unlikely to ease dramatically, reducing downward pressure on the USD.
Irrespective of the actual policies that might be adopted by Trump or Biden presidencies (not to mention the possibility that one or the other may not be on the ballot come November), increased uncertainty and increased tail risks will probably be USD supportive.
DXY looks set to trade in a 100.00-110.00 range.
EUR/USD grinds higher. Economists at Scotiabank analyze the pair’s outlook.
Little positive momentum on the short-term chart
Regaining 1.0725 lends the EUR a slightly better undertone in the near term and has some backing from a slight correction in EZ/US 2Y spreads.
EUR gains are generating a little positive momentum on the short-term chart – but longer-run studies remain resolutely bearish.
Short-term gains back above 1.0725 (former support) should boost near-term recovery potential but perhaps only towards 1.0755/1.0760.
Safer technical ground for the EUR remains relatively distant (above 1.0805/1.0810 at this point).
Bank of England's Monetary Policy Committee (MPC) member Megan Greene argued on Thursday that the Gross Domestic Product (GDP) surprise was "pretty minor" and added that she would not too much weight on the UK being in a technical recession, per Reuters.
Key takeaways
"Middle East risks are only on the upside for inflation and downside for output."
"If Middle East risks do not escalate, we expect the impact on inflation to be temporary and moderate."
"We are not seeing Middle East risk priced into energy markets."
"We don't feel any obligation to follow or front-run other central banks."
"Labour market data showed wage growth is still pretty strong."
Market reaction
GBP/USD edged slightly higher and was last seen posting small daily gains at 1.2570.
USD/CAD little changed in the low 1.3500s. Economists at Scotiabank analyze the pair’s outlook.
Holding above 1.3540 suggests scope for a push on to the low 1.3600s
Short-term drift in the USD is finding some support around 1.3530 intraday, limiting corrective losses in the USD. Still, the USD’s drop back under the 1.3540 Fibonacci resistance point does put a bit of a question mark over the sustainability of this week’s pop higher in spot that might only be resolved when we see where the market closes out the week.
Holding above 1.3540 suggests scope for a push on to the low 1.3600s; back below and we may see more USD losses to the mid-1.3400s.
- Initial Jobless Claims rose by 212K from a week earlier.
- Continuing Jobless Claims rose more than estimated..
US citizens that applied for unemployment insurance benefits increased by 212K in the week ending February 10 according to the US Department of Labor (DoL) on Thursday. Once again, the prints surpassed consensus and follow a 220K gain in the previous week.
Further details of the publication revealed that the advance seasonally adjusted insured unemployment rate was 1.3% (from 1.2%) and the 4-week moving average stood at 218.50K, an increase of 5.750K from the previous week's revised average.
In addition, Continuing Claims rose by 30K to 1.895M in the week ended February 3.
Market reaction
The US Dollar Index accelerated its losses and revisited the 104.40 region following the release, all amidst the broader bearish trend seen so far on Thursday.
GBP/USD slips but holds support in the low 1.2500 area. Economists at Scotiabank analyze the pair’s outlook.
Few positive things to note for the Pound on the intraday and daily charts
On the face of it, there are few positive things to note for the Pound on the intraday and daily charts.
Price action is soft and trend momentum signals are aligned bearishly across the shorter-term oscillators. But Cable continues to hold above last week’s low (1.2520) just about and the weekly candle pattern that developed last week was bullish.
While support in the low 1.2500 area holds, the risk of a rebound remains; gains through 1.2575 would be positive for Cable.
- Retail Sales in the US declined at a stronger pace than expected in January.
- US Dollar Index stays in negative territory below 104.50 after the data.
Retail Sales in the US declined by 0.8% to $700.3 billion in January, the US Census Bureau reported on Thursday. This reading came in weaker than the market expectation for a decrease of 0.1%. Retail Sales ex Autos contracted by 0.6% in the same period.
"Total sales for the November 2023 through January 2024 period were up 3.1% (±0.5 percent) from the same period a year ago," the publication read. "The November 2023 to December 2023 percent change was revised from up 0.6% (±0.5 percent) to up 0.4% (±0.3 percent)."
Market reaction
The US Dollar came under modest selling pressure following the disappointing data. At the time of press, the US Dollar Index was down 0.3% on the day at 104.40.
- EUR/GBP advances to 0.8550 as the UK economy remains in a recession in H1 of 2023.
- The UK economy contracted by 0.3% in Q42023, while investors anticipated a growth of 0.1%.
- The ECB continues to remain data-dependent for further monetary policy action.
The EUR/GBP pair climbs above 0.8550 as the latest preliminary Q4 Gross Domestic Product (GDP) data from the United Kingdom Office for National Statistics (ONS) showed that the economy witnessed a de-growth by 0.3%.
Surprisingly, the UK economy contracted by 0.3% in the last quarter of 2023, while investors forecasted a growth of 0.1%. In the July-September quarter, the UK economy was contracted by 0.1%. Two consecutive quarters of a slowdown in an economy confirms that it has fallen into a technical recession.
This has prompted hopes of an early rate cut by the Bank of England (BoE) as the maintenance of interest rates at their current level could worsen the economic outlook. Meanwhile, lower-than-anticipated inflation data for January has also flared up expectations for quick rate cuts.
Going forward, the BoE is expected to face a balancing act between a poor economic outlook and high persistent price pressures. On Wednesday, BoE Governor Andrew Baily said policymakers would discuss reducing interest rates after getting enough evidence about inflation declining towards the 2% target.
On the Eurozone front, the Euro strengthens despite European Central Bank (ECB) President Christine Lagarde's reiterated need to remain data-dependent for upcoming monetary policy meetings. ECB Lagarde said weakness in economic activities is broad-based. When asked about the inflation outlook, Lagarde said the disinflation process is ongoing and expected to come down considerably this year.
Bank of England's Monetary Policy Committee (MPC) member Megan Greene reiterated on Thursday that the monetary policy will need to remain restrictive for some time, per Reuters.
Key takeaways
"I need to see further evidence that inflation persistence is less embedded than previously feared before I would consider voting to loosen policy."
"Recent signs of persistence starting to ease are encouraging."
"Labour market has been slowly loosening."
"Brexit and the pandemic have left UK supply much weaker than in the US in recent years."
"All else equal, this would mean inflationary pressures are greater in the UK, but demand is weaker too."
"When it comes to pay growth, the UK stands out."
Market reaction
GBP/USD stays under modest bearish pressure following these comments. As of writing, the pair was down 0.15% on the day at 1.2545.
USD/CAD rose strongly on Tuesday, pushing through the 1.3540/1.3550 area. Economists at Scotiabank analyze the pair’s outlook.
Key support at 1.3340/1.3350
Given the resiliency of the 1.3540 area in the past few weeks, it may come down to where we close on the week to determine whether the break higher will hold and develop (into a push on to the low 1.3600s) or fade and dump the USD back into a 1.3350/1.3550 range.
Trend oscillators have perked up bullishly for the USD on the short-term DMI studies and the weekly DMI leans modestly USD-bullish as well.
The makings of a deeper USD rebound are there but there is a bit of a ‘show me’ aspect to price action at this point; bullish-leaning oscillators are still quite weak across all time frames.
USD support is 1.3520/1.3530 and 1.3400/1.3410 (40-DMA at 1.3402) ahead of key support at 1.3340/1.3350.
European Central Bank chief economist Philip Lane said on Thursday that the impact of monetary policy tightening is still unfolding and added that there is a continued transmission of interest rate hikes to broader financing conditions, per Reuters.
Earlier in the day, ECB policymaker Pablo Hernandez de Cos said that the next policy move will be a rate cut but noted that they still need some time to figure out the exact timing of the policy pivot
Market reaction
These comments failed to trigger a noticeable reaction in EUR/USD. At the time of press, the pair was up 0.15% on the day at 1.0744.
- The US Dollar trades near pivotal levels on Thursday.
- Markets are easing back earlier rate cuts and channel back to June or May.
- The US Dollar Index could dip to 104 before finding ample support.
The US Dollar (USD) is further trimming its weekly gains, which got booked on Tuesday in the aftermath of the red hot inflation report. Several analysts and economists were quick to write off the report as a one-off, with even US Federal Reserve member Austan Goolsbee saying that markets should not take into account only this Consumer Price Index (CPI) number. The disinflationary pathway to rate cuts is still very much intact and a cut is on the horizon.
On the economic data front,there is a chunky batch of data with all eyes on Retail Sales. Next to that some lighter data in the form of Industrial Production and Import/Export Prices that could give more support to this idea that disinflation is still there and the recent CPI was just a blip on the radar. To round it all off, Fed member Christopher Waller will speak at the end of this Thursday.
Daily digest market movers: Price Index components can confirm Goolsbee
- The first big batch of data is to be released at 13:30 GMT:
- Retail Sales for January:
- Monthly Retail Sales expected to contract by 0.1% after a 0.6% increase in the previous month.
- Monthly Retail Sales without cars are seen rising by 0.2% after a 0.4% expansion in December.
- As always with Retail Sales, the revisions will be more important than the actual numbers.
- NY Empire State Manufacturing Index for February is expected to head from -43.7 to -15.
- The Philadelphia Fed Manufacturing Survey for February is seen heading from -10.6 to -8.
- The Import/Export Price Index for January is due as well:
- The Monthly Import Price Index is seen unchanged at 0%.
- The Yearly Import Price Index contracted 1.6% in December with no forecast.
- The Monthly Export Price Index is expected to fall 0.1%.
- The Yearly Export Price Index dropped by 3.2% in the previous month, no forecast available.
- Weekly Jobless Claims are due as well:
- Initial Claims Previous was at 218,000 with 220,000 expected.
- Continuing Jobless Claims are seen heading from 1.871 million to 1.88 million.
- Industrial Production for January is expected to rise 0.3% after a 0.3% increase around 14:15 GMT.
- A mixed bag of data to be published at 15:00 GMT with the December Business Inventories seen heading from -0.1% to 0.4%.
- US Federal Reserve Board Member Christopher Waller will drop some comments around 18:15 GMT.
- The US Treasury Department will head to markets to allocate a 4-week bill around 16:30 GMT and a 30-year TIPS auction around 18:00 GMT.
- Equities are happy with the backtracking on the forward push of rate cuts and are in the green. European equities are up over 0.50%, while US equity futures are mildly in the green.
- The CME Group’s FedWatch Tool is now looking at the March 20th meeting. Expectations for a pause are 89.5%, while 10.5% for a rate cut.
- The benchmark 10-year US Treasury Note trades near 4.23%, roughly where it was trading ahead of the inflation report from Tuesday.
US Dollar Index Technical Analysis: Done yet
The US Dollar Index (DXY) is now fully stalling ahead of even a doubtful attempt to reach 105. Traders will need to learn to live with these kinds of small and short-lived moments of volatility until finally one of the big four central banks (Fed, ECB, BoE, BoJ) makes a move with either cutting or hiking. Expect to see a fading DXY, which could fall back to 104 or lower in search of support
Should the US Dollar jump on the back of this Thursday’s data to 105.00, 105.12 as key levels to keep an eye on. One step beyond there comes in at 105.88, the high of November 2023. Ultimately, 107.20 – the high of 2023 – could even come back into scope, but that would be when several inflation measures are coming in higher than expected for several weeks in a row.
Support should now be provided by the high of last week Monday near 104.59. Further down that 100-day Simple Moving Average looks rather doubtful, near 104.24, so the 200-day SMA near 103.67 looks more solid. Should that give way, look for support from the 55-day SMA near 103.08.
Risk sentiment FAQs
What do the terms"risk-on" and "risk-off" mean when referring to sentiment in financial markets?
In the world of financial jargon the two widely used terms “risk-on” and “risk off'' refer to the level of risk that investors are willing to stomach during the period referenced. In a “risk-on” market, investors are optimistic about the future and more willing to buy risky assets. In a “risk-off” market investors start to ‘play it safe’ because they are worried about the future, and therefore buy less risky assets that are more certain of bringing a return, even if it is relatively modest.
What are the key assets to track to understand risk sentiment dynamics?
Typically, during periods of “risk-on”, stock markets will rise, most commodities – except Gold – will also gain in value, since they benefit from a positive growth outlook. The currencies of nations that are heavy commodity exporters strengthen because of increased demand, and Cryptocurrencies rise. In a “risk-off” market, Bonds go up – especially major government Bonds – Gold shines, and safe-haven currencies such as the Japanese Yen, Swiss Franc and US Dollar all benefit.
Which currencies strengthen when sentiment is "risk-on"?
The Australian Dollar (AUD), the Canadian Dollar (CAD), the New Zealand Dollar (NZD) and minor FX like the Ruble (RUB) and the South African Rand (ZAR), all tend to rise in markets that are “risk-on”. This is because the economies of these currencies are heavily reliant on commodity exports for growth, and commodities tend to rise in price during risk-on periods. This is because investors foresee greater demand for raw materials in the future due to heightened economic activity.
Which currencies strengthen when sentiment is "risk-off"?
The major currencies that tend to rise during periods of “risk-off” are the US Dollar (USD), the Japanese Yen (JPY) and the Swiss Franc (CHF). The US Dollar, because it is the world’s reserve currency, and because in times of crisis investors buy US government debt, which is seen as safe because the largest economy in the world is unlikely to default. The Yen, from increased demand for Japanese government bonds, because a high proportion are held by domestic investors who are unlikely to dump them – even in a crisis. The Swiss Franc, because strict Swiss banking laws offer investors enhanced capital protection.
The Pound Sterling (GBP) has benefitted from a sharp repricing of the Bank of England. Economists at Danske Bank analyze EUR/GBP outlook.
Relative growth outlooks and broad central bank pricing to weigh on GBP
Over the past month, EUR/GBP has continued its move lower on the back of primarily a sharp BoE repricing. This could continue to lend support in the near term.
At present, we do not see the global investment environment to create meaningful divergence between EUR and GBP. However, we expect the UK economy to perform relatively worse than the Euro Area and expect relative growth outlooks and broad central bank pricing to weigh on GBP.
We target the cross at 0.8800 in 6-12M.
- US stock index futures trade marginally higher ahead of the opening bell.
- Investors await key macroeconomic data releases from the US.
- Uber was the best-performing S&P 500 stock on Wednesday.
S&P 500 futures rise 0.12%, Dow Jones futures climb 0.12%, and Nasdaq futures gain 0.13%.
S&P 500 (SPX), Dow Jones (DJIA), and Nasdaq (IXIC) indexes closed on Wednesday with a 0.96% gain, a 0.40% increase, and a 1.30% rise, respectively.
What to know before stock market opens
- The Industrials Sector gained 1.67% on Wednesday as the best-performing major S&P 500 sector, alongside the Communications Services Sector, which rose about 1.5%. The Energy Sector registered small losses.
- Uber Technologies Inc. (UBER) shares rose more than 14.7% to $79.15 and IQVIA Holdings Inc. (IQV) gained over 13% to end at $236.03 as the top performers in the S&P 500 on Wednesday.
- Akamai Technologies Inc (AKAM) was the biggest loser of the day, shedding 8.2% to hit $114.8 at the closing bell.
- The CBOE Volatility Index (VIX), Wall Street's fear gauge, fell 9.27% on Wednesday. Ahead of the opening bell on Thursday, VIX stays flat.
- January Retail Sales and Industrial Production data will be featured in the US economic docket. The US Department of Labor will publish weekly Initial Jobless Claims. On Friday, the BLS will release Producer Price Index (PPI) figures.
- Inflation in the US, as measured by the change in the Consumer Price Index (CPI), softened to 3.1% on a yearly basis in January from 3.4% in December, the US Bureau of Labor Statistics (BLS) reported on Tuesday. This reading came in above the market expectation of 2.9%.
- The Core CPI, which excludes volatile food and energy prices, rose 3.9% in the same period and matched December's increase, surpassing analysts' estimate of 3.7%.
- According to the CME FedWatch Tool, there is a nearly 40% probability of a Federal Reserve (Fed) rate cut in May, down from nearly 55% ahead of the January inflation data.
- On Tuesday, Coca-Cola Co. (KO) reported that revenue rose 7.4% to $10.95 billion from a year ago for the quarter ended in December, per Reuters. The company announced that the quarterly net income was $1.97 billion for that period and cited higher product prices and robust demand for the upbeat results.
- Airbnb Inc. (ABNB) said after the closing bell on Tuesday that quarterly adjusted earnings were 76 cents per share in the quarter ended in December. The company’s revenue increased 16.6% to $2.22 billion from a year ago, but there was a quarterly loss of $349 million.
- Cisco Systems Inc. (CSCO) announced quarterly adjusted earnings per share were 87 cents in the quarter ended in January. The networking equipment manufacturer said the revenue fell 5.9% to $12.79 billion from a year ago, while the quarterly net income was $2.63 billion in the same period. In a conference call, CEO Charles Robbins said, "we also continue to see weak demand with our telco and cable service provider customers," per Reuters. The company is reportedly planning to cut more than 4,000 jobs and focus on high-growth areas such as artificial intelligence and software.
- Applied Materials, Inc (AMAT), DoorDash Inc. (DASH) and Coinbase Global Inc. (COIN) are among top companies that will report quarterly earnings after the closing bell on Thursday.
S&P and Nasdaq futures are presented by CME e-minis and Dow Jones futures are presented by CBOT e-mini.
S&P 500 FAQs
What is the S&P 500?
The S&P 500 is a widely followed stock price index which measures the performance of 500 publicly owned companies, and is seen as a broad measure of the US stock market. Each company’s influence on the computation of the index is weighted based on market capitalization. This is calculated by multiplying the number of publicly traded shares of the company by the share price. The S&P 500 index has achieved impressive returns – $1.00 invested in 1970 would have yielded a return of almost $192.00 in 2022. The average annual return since its inception in 1957 has been 11.9%.
How are companies chosen to be included in the S&P 500?
Companies are selected by committee, unlike some other indexes where they are included based on set rules. Still, they must meet certain eligibility criteria, the most important of which is market capitalization, which must be greater than or equal to $12.7 billion. Other criteria include liquidity, domicile, public float, sector, financial viability, length of time publicly traded, and representation of the industries in the economy of the United States. The nine largest companies in the index account for 27.8% of the market capitalization of the index.
How can I trade the S&P 500?
There are a number of ways to trade the S&P 500. Most retail brokers and spread betting platforms allow traders to use Contracts for Difference (CFD) to place bets on the direction of the price. In addition, that can buy into Index, Mutual and Exchange Traded Funds (ETF) that track the price of the S&P 500. The most liquid of the ETFs is State Street Corporation’s SPY. The Chicago Mercantile Exchange (CME) offers futures contracts in the index and the Chicago Board of Options (CMOE) offers options as well as ETFs, inverse ETFs and leveraged ETFs.
What factors drive the S&P 500?
Many different factors drive the S&P 500 but mainly it is the aggregate performance of the component companies revealed in their quarterly and annual company earnings reports. US and global macroeconomic data also contributes as it impacts on investor sentiment, which if positive drives gains. The level of interest rates, set by the Federal Reserve (Fed), also influences the S&P 500 as it affects the cost of credit, on which many corporations are heavily reliant. Therefore, inflation can be a major driver as well as other metrics which impact the Fed decisions.
- EUR/JPY loses ground due to expected intervention in the Forex market.
- Japan's Shindo expects for close collaboration between the BoJ and the government to implement suitable monetary policies.
- Japan’s GDP Q4 eases to a 0.1% decline; indicating a technical recession.
- ECB's forward-looking wage tracker signals solid wage pressures.
EUR/JPY retreats from recent highs after Japan's top officials hinted at a potential intervention in the Forex market to curb further weakness in the Japanese Yen (JPY). Additionally, the escalated geopolitical tensions in the Middle East boost demand for the safe-haven JPY and drags the EUR/JPY cross to 161.10 during the European session on Thursday.
On Thursday, Japan's Economic Minister Yoshitaka Shindo commented that specific monetary policy measures are within the purview of the Bank of Japan (BoJ) to determine. He acknowledged that the BoJ considers a variety of data, including consumption patterns, economic projections, and associated risks when formulating monetary policy.
Economic Minister Shindo expressed expectations for close collaboration between the BoJ and the government to implement suitable monetary policies aimed at sustainably achieving the price stability target, alongside fostering wage growth.
The preliminary Japan’s Gross Domestic Product (GDP) eased to a 0.1% decline QoQ from the previous decline of 0.8%, against the expected increase of 0.3% in the fourth quarter. The weak fourth-quarter Gross Domestic Product (GDP) figures in Japan add complexity to the monetary policy outlook for the Bank of Japan (BoJ).
Rather than experiencing slight growth compared to the third quarter, the economy faced contraction once again. This development indicates that Japan has entered a technical recession in the latter half of 2023, as negative growth persisted in the third quarter, albeit at a more significant magnitude.
However, the Euro (EUR) encountered obstacles subsequent to the publication of the seasonally adjusted Eurozone Gross Domestic Product (GDP) data on Wednesday, which remained unchanged as anticipated for the fourth quarter. Despite this, the ECB's forward-looking wage tracker continues to signal robust wage pressures.
Christine Lagarde, President of the European Central Bank (ECB), remarked that recent data suggests continued subdued economic activity in the near term. While acknowledging the ongoing disinflationary trend, Lagarde stressed the importance of instilling confidence that this trajectory will ultimately lead to the sustainable attainment of the ECB's 2% inflation target.
The Swiss Franc (CHF) has been correcting lower at the start of the year. Economists at Scotiabank analyze CHF outlook.
CHF may underperform as inflation cools
The CHF may underperform moderately this year.
We expect some gains in EUR/CHF over the course of 2024, reflecting some easing in the Swiss National Bank’s already low 1.75% policy rate and a modest correction in the CHF’s somewhat overvalued status.
The central bank has also decided to stop leveraging a firm exchange rate as a tool to help battle domestic prices now that inflation is slowly converging with the central bank’s 2% target.
- Natural Gas jumps this Thursday in an attempt to snap the losing streak.
- Traders are sending Gas prices higher in a technical bounce.
- The US Dollar Index eased a touch and offers a window of opportunity for Gas to recover a touch.
Natural Gas (XNG/USD) has hit a fresh low overnight by hitting $1.64, which is the low of July 20th 2020. This further decline comes with a mix of sluggish demand, bleak outlooks and overall economic growth slowing down across the globe. Meanwhile the situation in the Middle East is not disrupting the Gas flow out of the region, which means a substantial oversupply in lower-than-normal demand.
The US Dollar (USD) is retreating a touch from its peak performance on Tuesday. Markets have digested the hot inflation report that came out with several analysts, economists and even US Federal Reserve member Austan Goolsbee commenting that this inflation report was a one off. The disinflationary path is still very much intact and cuts are set to come this year.
Natural Gas is trading at $1.68 per MMBtu at the time of writing.
Natural Gas market movers: EU reserves above average
- European Gas reserves are above 65%, which means the EU has less than half to restock before the next heating season kicks in.
- Turkish state energy grid-operated Botas is deepening its ties with Egyptian Natural Gas Holding Company. An agreement is on the table and will include sharing each other's infrastructure and underground storage.
- Recent numbers out of Europe show that wind energy is starting to take over energy production from Natural Gas.
Natural Gas Technical Analysis: Not the end of the line
Natural Gas is having a breather today, being up over 1.5% in a purely technical move higher. The reason for this uptick comes with the relentless selling pressure Gas prices have been facing, which now see some profit taking by short sellers. Add the inverse correlation with the US Dollar, which is a touch softer this Thursday, and a window of opportunity is offered for Gas prices to erase a little bit of thier overall loss in February.
On the upside, Natural Gas is facing some pivotal technical levels to get back to. First, $1.99, which saw an accelerated decline. Next is the blue line at $2.13 with the triple bottoms from 2023. In case Natural Gas sees sudden demand pick up, possibly $2.40 could come into play.
Keep an eye on $1.80, which was a pivotal level back in July 2020 and should act as a cap now. Should US President Biden’s moratorium be lifted, together with the additional supply from Canada – which is exporting more to fill the gap from the US – $1.64 and $1.53 (low of 2020) are targets to look out for.
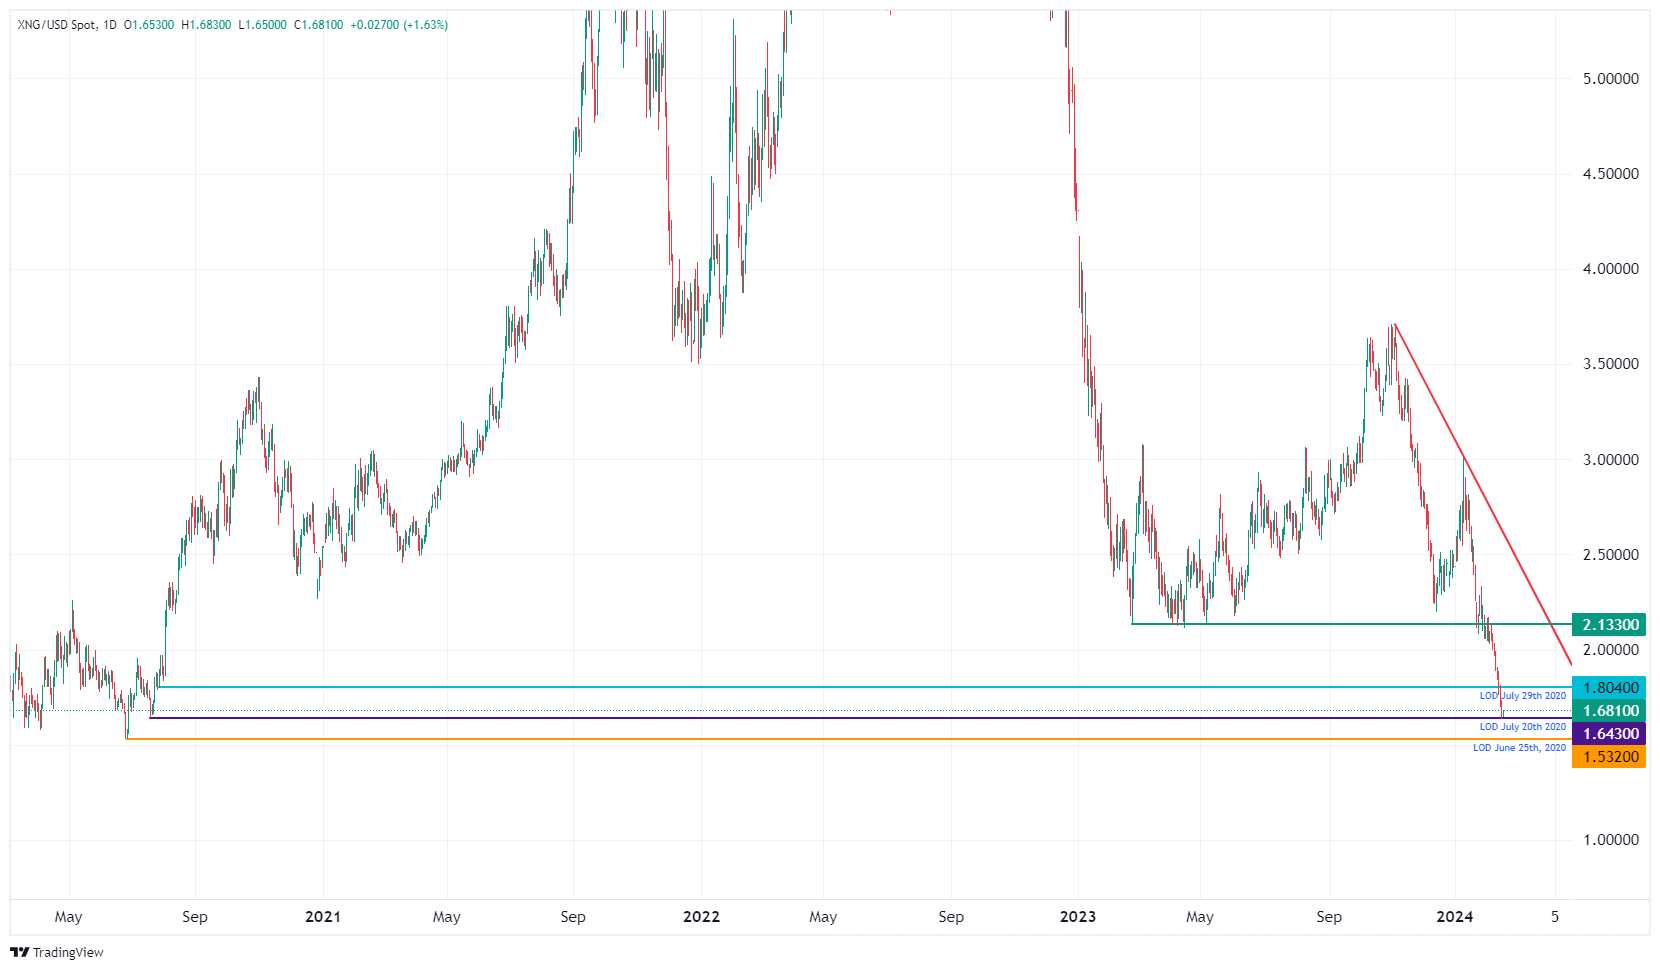
XNG/USD (Daily Chart)
Natural Gas FAQs
What fundamental factors drive the price of Natural Gas?
Supply and demand dynamics are a key factor influencing Natural Gas prices, and are themselves influenced by global economic growth, industrial activity, population growth, production levels, and inventories. The weather impacts Natural Gas prices because more Gas is used during cold winters and hot summers for heating and cooling. Competition from other energy sources impacts prices as consumers may switch to cheaper sources. Geopolitical events are factors as exemplified by the war in Ukraine. Government policies relating to extraction, transportation, and environmental issues also impact prices.
What are the main macroeconomic releases that impact on Natural Gas Prices?
The main economic release influencing Natural Gas prices is the weekly inventory bulletin from the Energy Information Administration (EIA), a US government agency that produces US gas market data. The EIA Gas bulletin usually comes out on Thursday at 14:30 GMT, a day after the EIA publishes its weekly Oil bulletin. Economic data from large consumers of Natural Gas can impact supply and demand, the largest of which include China, Germany and Japan. Natural Gas is primarily priced and traded in US Dollars, thus economic releases impacting the US Dollar are also factors.
How does the US Dollar influence Natural Gas prices?
The US Dollar is the world’s reserve currency and most commodities, including Natural Gas are priced and traded on international markets in US Dollars. As such, the value of the US Dollar is a factor in the price of Natural Gas, because if the Dollar strengthens it means less Dollars are required to buy the same volume of Gas (the price falls), and vice versa if USD strengthens.
Precious metals declined on the back of hotter-than-expected US inflation report. Economists at MUFG Bank analyze the market’s outlook.
Higher interest rates are typically negative for precious metals
Silver and PGMs (Platinum and Palladium) have hammered lower in line with Gold’s fall, but still stand to bounce on barging hunting.
Higher interest rates are typically negative for precious metals, as they are non-interest-bearing. The Gold price is likely to fall further short term as hopes of rate cuts in H1 2024 fade, but significant cuts could come later in the year so Gold weakness should only be temporary.
- USD/JPY corrects to near 150.00 as USD Index edges down.
- The US Retail Sales are forecasted to contract by 0.1% in January.
- The Japanese economy has entered a technical recession after contracting in the last two quarters of 2023.
The USD/JPY extends its correction to near the psychological support of 150.00 in Thursday’s European session. The asset has come under pressure as the US Dollar Index (DXY) and bond yields have dropped ahead of January's United States Retail Sales data.
S&P500 futures have posted decent gains in the London session, indicating a revival in the risk appetite of the market participants. The broader market outlook is still uncertain as investors pare bets in favor of rate cuts by the Federal Reserve (Fed) for the May monetary policy meeting.
The Fed's expectations for a rate-cut move have shifted for the June meeting as the consumer price inflation for January remained hotter than expected. Contrary, Chicago Fed Bank President Austan Goolsbee said on Wednesday that one bad inflation data is insufficient to impact the broader trend, which indicates that price pressures are coming down to the 2% target. Austan Goolsbee warned that a hawkish narrative for a more extended period could dampen the labor market conditions.
The US Dollar Index (DXY) has corrected to near 104.60 from a three-month high of 105.00. Going forward, investors will focus on the US Retail Sales data, which will be published at 13:30 GMT. According to the consensus, Retail Sales were contracted by 0.1%.
On the Tokyo front, the Japanese Yen strengthens despite investors' hope that the Bank of Japan (BoJ) will not exit the expansionary policy stance soon. The expectations of easy policy unwinding have waned as the Japanese economy has surprisingly entered into a technical recession. The Q4 GDP contracted by 0.1%, while investors forecasted an expansion of 0.3%.
- NZD/USD moves in an upward trajectory despite the tepid momentum.
- A break above the psychological barrier of 0.6100 level could lead the pair to revisit the weekly high at 0.6152.
- The key support region appears at the major level of 0.6050 aligned with the weekly low at 0.6049.
NZD/USD extends its winning streak for the second successive day as the US Dollar demonstrates weakness due to subdued US Treasury yields. The NZD/USD pair edges higher to near 0.6090 during the European hours on Thursday.
The immediate resistance appears at the psychological level of 0.6100. A breakthrough above this psychological level could inspire the NZD/USD pair to approach the resistance zone around the 23.6% Fibonacci retracement level of 0.6124 aligned with the 50-day Exponential Moving Average (EMA) at 0.6129.
If the NZD/USD pair surpasses this 50-day EMA, it could make it to the major barrier at 0.6150 in line with the weekly high at 0.6152.
The technical analysis for the NZD/USD pair indicates a tepid momentum in the market. The Moving Average Convergence Divergence (MACD) line is positioned below the centreline but lies above the signal line.
However, the lagging indicator 14-day Relative Strength Index (RSI) lies below the 50 level, suggesting a weaker sentiment for the NZD/USD pair.
On the downside, the NZD/USD pair could find key support at the major level of 0.6050 in conjunction with the weekly low at 0.6049. A break below the latter could put the downward pressure on the pair to navigate the region around February’s low at 0.6038 followed by the psychological support of 0.6000 level.
NZD/USD: Daily Chart

Weak fourth quarter Gross Domestic Product (GDP) figures in Japan complicate the monetary policy outlook for the BoJ. Economists at Commerzbank analyze the implications for the Yen.
Japanese growth figures disappoint
Instead of slightly positive growth compared to the third quarter, the economy contracted again. This means that Japan has slipped into a technical recession in the second half of 2023, as the third quarter also saw negative growth, albeit on a much larger scale. On top of that, the Q3 numbers were revised down a bit more.
As the global economy weakens, the Japanese economy seems to also suffer, except that the BoJ now has much less room to cut interest rates than other central banks. This is not a good outlook for the Yen.
And the Japanese figures underscore another fact: the US economy is out of competition at the moment, i.e. we are seeing a significant slowdown in economic growth in almost all other countries, with US growth being the main standout. That, in turn, is a much better outlook for the US Dollar.
- Gold price trades in a tight range below $2,000 as investors now see the Fed reducing key rate in June.
- The US Dollar remains subdued as the focus shifts to US Retail Sales data.
- Investors anticipate that Retail Sales contracted by 0.1% in January.
Gold price (XAU/USD) consolidates in a tight range ahead of the monthly United Sales Retail Sales data for January. The consensus shows a moderate decline in sales as households spent heavily in December amid the festive season, decline in gasoline prices, and lower auto sales.
The impact of lower Retail Sales data is expected to remain limited on the US Dollar as cooling expectations of aggressive rate cuts by the Federal Reserve (Fed) will continue to act as a cushion in the broader term. The US Dollar tends to attract high foreign inflows on expectations that the Fed will maintain a hawkish narrative for a longer period.
While investors are not expecting a rate-cut move by the Fed before June following stubborn inflation data, US Treasury Secretary Janet Yellen and Chicago Federal Reserve Bank President Austan Goolsbee see the one-time bump as incapable of impacting the longer-term trend in inflation declining towards the 2% target. Austan Goolsbee warned that higher interest rates for a longer period could result in a significant blow to employment, which is one of the Fed’s dual mandates.
Daily Digest Market Movers: Gold trades sideways ahead of US Retail Sales data
- Gold prices struggle to find buyers as expectations for a rate-cut move by the Federal Reserve in May have cooled down.
- Investors don’t see the Fed reducing the benchmark rate before June as price pressures in the United States economy were surprisingly stubborn in January.
- The US inflation turned out persistent despite the Fed holding interest rates unchanged in the range of 5.25-5.50% for a longer period.
- Market reaction to non-yielding assets and US equities was negative after higher-than-expected US CPI inflation was reported in January. However, US Treasury Secretary Janet Yellen advised to focus on a longer trend, which clearly indicates that inflation is moving decisively down.
- In her speech at the Detroit Economic Club on Wednesday, Janet Yellen said extensive consideration of a one-time blip in the inflation data is a tremendous mistake.
- Yellen added that our focus should be on the longer-term decline in inflation, resilient economy, and rising wages not on minor fluctuations.
- Similarly, Chicago Fed Bank President Austan Goolsbee said on Wednesday that inflation is on track to the central bank’s target of 2% despite remaining a bit higher for a few months.
- Austan Goolsbee added that the outlook of interest rates is tied to the Fed’s confidence in inflation declining to 2% but a longer stay with restrictive monetary policy stance could impact the employment side of the Fed’s mandate.
- On the contrary, Fed Vice Chair Michael Barr showed uncertainty over achieving a ‘soft landing’ as recent inflation data shows that the path towards price stability would be bumpy.
- Meanwhile, the US Dollar Index (DXY) remains subdued in the European session on Thursday ahead of the US monthly Retail Sales for January, which will be published at 13:30 GMT.
- Investors anticipate that Retail Sales were lower by 0.1% against a 0.6% increase in December. This could be the outcome of higher household spending in December due to the festive mood.
- The Retail Sales data represents trends in households’ spending, which provides cues over the inflation outlook. Therefore, a decline in Retail Sales could impact the US Dollar.
Technical Analysis: Gold price juggles above $1,990
Gold price trades in a tight range, slightly above the immediate support of $1,990. The broader outlook for the precious metal has turned negative after breaking below the psychological support of $2,000. Also, the 20 and 50-day Exponential Moving Averages (EMAs) are on the verge of delivering a bearish crossover. The 200-day EMA near $1,970 is expected to become a major support for the Gold price bulls.
The 14-period Relative Strength Index (RSI) has established below 40.00, indicating more downside amid an absence of divergence and oversold signals.
Gold FAQs
Why do people invest in Gold?
Gold has played a key role in human’s history as it has been widely used as a store of value and medium of exchange. Currently, apart from its shine and usage for jewelry, the precious metal is widely seen as a safe-haven asset, meaning that it is considered a good investment during turbulent times. Gold is also widely seen as a hedge against inflation and against depreciating currencies as it doesn’t rely on any specific issuer or government.
Who buys the most Gold?
Central banks are the biggest Gold holders. In their aim to support their currencies in turbulent times, central banks tend to diversify their reserves and buy Gold to improve the perceived strength of the economy and the currency. High Gold reserves can be a source of trust for a country’s solvency. Central banks added 1,136 tonnes of Gold worth around $70 billion to their reserves in 2022, according to data from the World Gold Council. This is the highest yearly purchase since records began. Central banks from emerging economies such as China, India and Turkey are quickly increasing their Gold reserves.
How is Gold correlated with other assets?
Gold has an inverse correlation with the US Dollar and US Treasuries, which are both major reserve and safe-haven assets. When the Dollar depreciates, Gold tends to rise, enabling investors and central banks to diversify their assets in turbulent times. Gold is also inversely correlated with risk assets. A rally in the stock market tends to weaken Gold price, while sell-offs in riskier markets tend to favor the precious metal.
What does the price of Gold depend on?
The price can move due to a wide range of factors. Geopolitical instability or fears of a deep recession can quickly make Gold price escalate due to its safe-haven status. As a yield-less asset, Gold tends to rise with lower interest rates, while higher cost of money usually weighs down on the yellow metal. Still, most moves depend on how the US Dollar (USD) behaves as the asset is priced in dollars (XAU/USD). A strong Dollar tends to keep the price of Gold controlled, whereas a weaker Dollar is likely to push Gold prices up.
- WTI price loses ground larger-than-expected US oil inventories.
- US EIA Crude Oil Stocks Change rose by 12.018 million barrels to 439.5 million barrels.
- Crude oil prices face challenges as IEA downward revised forecast of the global oil demand growth.
West Texas Intermediate (WTI) Crude oil price declined following a larger-than-anticipated increase in US Crude Oil Stockpiles, which raised concerns about the demand outlook in the United States (US), the world's largest consumer of Crude oil products. As a result, the WTI price extended its losses, reaching around $75.90 per barrel during the European trading session on Thursday.
US Energy Information Administration showed that Crude Oil Stocks Change rose by 12.018 million barrels to 439.5 million barrels for the week ending on February 9. The market was expecting an increase of 2.56 million barrels against the previous change of 5.521 million barrels.
Crude oil prices are under pressure following the International Energy Agency's (IEA) downward revision of the global oil demand growth forecast for 2024 in its latest monthly oil market report released on Thursday. The forecast for 2024 global oil demand growth has been reduced to 1.22 million barrels per day (bpd), down from the previous estimate of 1.24 million bpd.
The slowdown in global oil demand growth could be attributed in part to developments in China. The report highlights a tightening of oil market balances in January, primarily due to supply disruptions in the United States and Canada. Despite ongoing cuts by OPEC+ nations, the IEA expects a slight build in inventories in the first quarter of the year.
Kazakhstan and Iraq have committed to addressing their oil overproduction over the next four months, aligning with their, Organization of the Petroleum Exporting Countries and its allies (OPEC+), agreements for voluntary cuts. Analysts at ANZ noted on Thursday that attention is turning towards the upcoming March meeting of the OPEC+ will deliberate on whether to extend output curbs.
The Dollar direction today will be determined by the US consumer. Economists at ING analyze Greenback’s outlook ahead of January Retail Sales data.
DXY to stay bid in a 104.50-105.00 range
We and the market are looking for some softening in the January retail sales figures today, but the consensus of a 0.2% month-on-month increase in the retail sales control group (from +0.8% MoM in December) hardly signals cause for alarm.
Barring a huge downside surprise in retail sales or a surge in initial jobless claims (to support the anecdotal news of rising US layoffs) we do not think the Dollar has to come too much lower. Subdued cross-market volatility is keeping interest in the carry trade alive and also benefitting the high-yielding Dollar.
We favour DXY staying bid in a 104.50-105.00 range.
The Australian labor market disappointed again in January. Economists at Commerzbank analyze Aussie’s outlook after January employment data.
Labor market continues to slow down
Instead of the solid 25,000 job gains expected by the Bloomberg consensus, just under 500 jobs were added.
For the Reserve Bank of Australia, this is likely to mean that it will not raise interest rates any further, although it did not explicitly rule this out after its last decision. Instead, it is likely to keep rates higher for a longer period of time before inflation is brought under sustainable control.
Only if we see more months of a weaker labor market will it likely move up the timing of the first rate cut. Until then, the Aussie is likely to remain supported as the other Western central banks are one step ahead of the RBA and are already discussing rate cuts.
- USD/MXN extends losses as US Dollar depreciates on risk-on sentiment.
- The downbeat US Treasury yields contribute to downward pressure for the Greenback.
- MXN is expected to retain its strength for an extended duration as the Mexican elections are on the horizon.
USD/MXN moves into negative territory to extend losses to near 17.06 during the European session on Thursday. This decline in the US Dollar (USD) against the Mexican Peso (MXN) is attributed to decreasing US Treasury yields, which are influenced by improved risk appetite.
At present, the 2-year and 10-year US yields are at 4.56% and 4.23%, respectively, as market participants are analyzing the Federal Reserve's monetary policy outlook amidst robust inflation data and recent statements from Fed officials.
Chicago Fed President Austan Goolsbee's remarks on Wednesday aimed to ease market concerns by suggesting that higher-than-expected consumer prices do not necessarily rule out the possibility of the Federal Reserve considering interest rate cuts in 2024.
Federal Reserve Vice Chair for Supervision Michael Barr has also drawn attention by reaffirming the Federal Reserve's confidence, along with its core Federal Open Market Committee, in the trajectory of US inflation towards the Fed's 2% target.
Earlier this week, Bank of Mexico (Banxico) Governor Victoria Rodriguez Ceja stated in an interview that inflation is projected to resume its downward trajectory. She added that inflation is expected to reach Banxico's 3% target by 2025.
The Mexican Peso is poised to maintain its strength over an extended period, especially with Mexico's upcoming elections looming. Claudia Sheinbaum, the chosen representative of MORENA and favored candidate of Andrés Manuel López Obrador, is expected to secure the presidency in June.
These elections are likely to prioritize policy continuity, with Sheinbaum anticipated to pursue a technocratic approach to policymaking aimed at mitigating domestic political risks. Considering both monetary policy trends and the contained election risks, the Mexican peso is expected to remain robust in the long term.
In its monthly oil market report published on Thursday, the International Energy Agency (IEA) lowered the global oil demand growth forecast for 2024.
Additional takeaways
2024 global oil demand growth forecast seen at 1.22 mil bpd (previously 1.24 mil bpd).
Global oil demand growth is losing momentum, pace set to decelerate in part due to China.
Oil market balances tightened in January, driven by supply outages in US and Canada.
Expects slight inventories build in Q1 despite OPEC+ cuts.
The US Dollar (USD) raced higher after strong US inflation numbers on Tuesday. Economists at Commerzbank analyze Greenback’s outlook.
The Fed is likely to remain cautious for the time being
The Fed is likely to remain cautious for the time being, regardless of Tuesday’s surprise. Of course, this could change quickly if inflation were to fall more sharply or if the real economy were to get into trouble. But that would require hard data.
And today’s retail sales figures are unlikely to be enough to shake the Fed’s world view. As a result, the USD’s strength could last for a while.
European Central Bank (ECB) policymaker Pablo Hernandez de Cos said on Thursday that the next policy move will be a rate cut but added that they still need some time to figure out the exact timing of the policy pivot, per Reuters.
De Cos noted that ECB's projections foresee inflation and core inflation to continue falling.
Market reaction
These comments don't seem to be having a noticeable impact on the Euro's performance against its major rivals. As of writing, EUR/USD was trading modestly higher on the day at 1.0736.
A surprisingly soft fourth quarter GDP release from Japan is only adding to the bearish story for the Yen, economists at ING say.
Yen negatives build
Japan released some surprisingly weak fourth quarter GDP figures for 2023. Even though USD/JPY has not moved much, these would seem to be Yen negative in that i) it provides fewer reasons for the Bank of Japan to exit its super-loose policy settings in April, and ii) given that exports were the main engine of growth, Japanese authorities may not be averse to a weak/weaker Yen after all.
The 152.00 area is clearly a big resistance level for USD/JPY – a break that will have some dusting-off calls for 160.00.
We do not think USD/JPY is particularly stable in this 150.00-152.00 area and feel that implied volatility levels are too cheap.
- EUR/USD continues to gain ground due to risk-on market sentiment.
- The Euro avoided to react on remarks from the ECB President Christine Lagarde.
- ECB's forward-looking wage tracker maintains its indication of robust wage pressures.
- FedWatch Tool suggests around 90% and 59% probability of rate adjustment in March and May.
The EUR/USD pair continues its upward momentum for the second consecutive session on Thursday, finding support from a weakened US Dollar (USD) amid softer US yields. This reflects a notable shift in market sentiment, with expectations leaning towards no interest rate adjustment by the Federal Reserve (Fed) in March and May.
The Euro (EUR) faced challenges following the release of the seasonally adjusted Eurozone Gross Domestic Product (GDP) data, which stayed unchanged as expected for the fourth quarter. Christine Lagarde, the President of the European Central Bank (ECB), stated that recent data indicates ongoing subdued economic activity in the near term.
The US Dollar Index (DXY) faces challenges due to the improved risk appetite of investors. According to the FedWatch Tool, the probability of the Fed keeping interest rates steady in March and May has surged to nearly 90% and 59%, respectively. However, there is a 53% probability of a rate cut in June.
Daily digest market movers: EUR/USD appreciates on subdued US Dollar
- The US Dollar Index hovers around 104.70 with the 2-year and 10-year US Treasury yields standing lower at 4.57% and 4.23%, respectively, by the press time.
- Chicago Fed President Austan Goolsbee sought to alleviate market concerns by suggesting that higher-than-anticipated consumer prices don't necessarily preclude the Federal Reserve from considering interest rate cuts in 2024.
- Federal Reserve Vice Chair for Supervision Michael Barr attracted attention by reaffirming the Fed and its core Federal Open Market Committee's confidence in the trajectory of US inflation toward the Fed's 2% target.
- US headline Consumer Price Index (CPI) rose by 3.1% in January, surpassing the expected 2.9% but below the previous rate of 3.4%.
- US Inflation increased by 0.3% MoM, against the expectation of maintaining the previous reading of 0.2%. US Core CPI (YoY) remained consistent at 3.9% against the market expectation of a decline to 3.7% in January.
- Christine Lagarde, the President of the European Central Bank (ECB), stated that recent data indicates ongoing subdued economic activity in the near term. While the current disinflationary trend is anticipated to persist, Lagarde emphasized the importance of ensuring confidence that this trajectory will ultimately lead to the sustainable achievement of the ECB's 2% inflation target.
- ECB Vice President Luis de Guindos highlighted persistent wage pressures at elevated levels, suggesting that there is insufficient data available to confirm a reduction in these pressures.
- The preliminary Eurozone Gross Domestic Product (GDP) seasonally adjusted remained unchanged at 0.1% year-over-year in the fourth quarter, aligning with market expectations.
- The Eurozone GDP seasonally adjusted quarter-over-quarter remained flat at 0.0%, consistent with the reading in the previous quarter.
Technical Analysis: EUR/USD extends gains to near 1.0730
EUR/USD trades near 1.0730 on Thursday followed by the immediate resistance at the major level of 1.0750, followed by the 50-4hr Exponential Moving Average (EMA) at 1.0761. If the pair manages to breach these levels, it could target the area around the 23.6% Fibonacci retracement level at 1.0799, coinciding with the psychological barrier at 1.0800.
On the downside, the psychological level of 1.0700 is seen as a crucial support, coinciding with the three-month low reached at 1.0694 on Wednesday. A sustained break below this level might lead the EUR/USD pair towards testing the major support at the 1.0650 level.
In technical analysis, the EUR/USD pair exhibits a 14-day Relative Strength Index (RSI) below the 50 mark, signaling a bearish momentum. However, the Moving Average Convergence Divergence (MACD), a lagging indicator, is positioned below the centerline but has crossed over the signal line upwards, indicating a potential shift in momentum. Traders may opt to await confirmation from the MACD regarding the directional trend.
EUR/USD: Four-Hour Chart
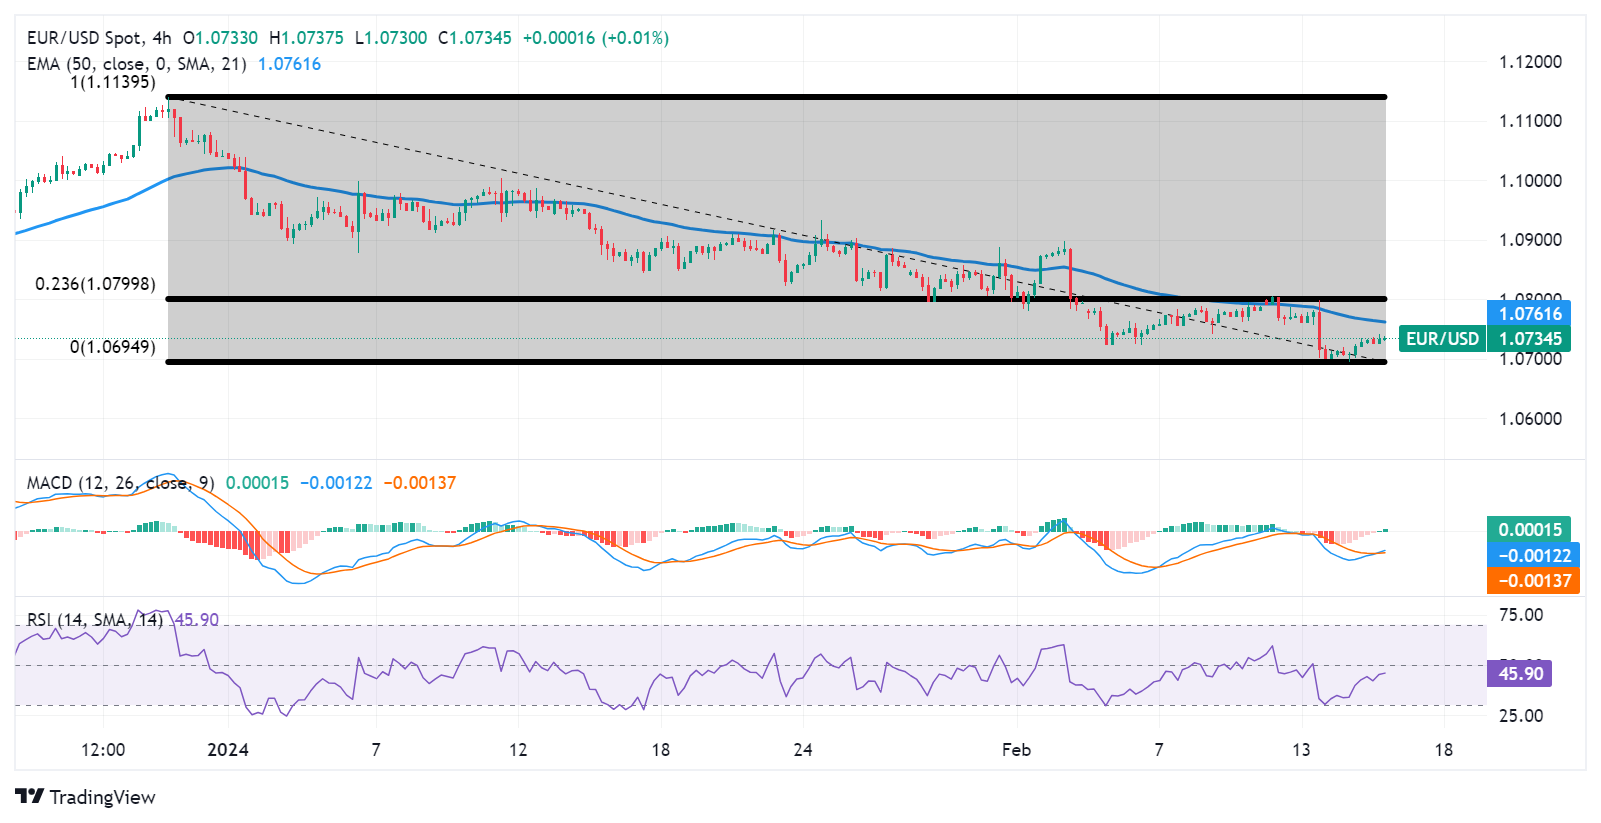
Euro price today
The table below shows the percentage change of Euro (EUR) against listed major currencies today. Euro was the strongest against the Pound Sterling.
| USD | EUR | GBP | CAD | AUD | JPY | NZD | CHF | |
| USD | 0.00% | 0.12% | -0.02% | 0.04% | -0.35% | 0.07% | -0.25% | |
| EUR | 0.00% | 0.10% | -0.03% | 0.04% | -0.35% | 0.08% | -0.25% | |
| GBP | -0.11% | -0.14% | -0.16% | -0.08% | -0.48% | -0.07% | -0.38% | |
| CAD | 0.03% | 0.03% | 0.16% | 0.07% | -0.32% | 0.10% | -0.22% | |
| AUD | -0.02% | -0.06% | 0.08% | -0.07% | -0.41% | 0.01% | -0.30% | |
| JPY | 0.35% | 0.36% | 0.46% | 0.33% | 0.38% | 0.42% | 0.11% | |
| NZD | -0.07% | -0.07% | 0.06% | -0.10% | -0.04% | -0.42% | -0.31% | |
| CHF | 0.26% | 0.26% | 0.38% | 0.23% | 0.30% | -0.10% | 0.33% |
The heat map shows percentage changes of major currencies against each other. The base currency is picked from the left column, while the quote currency is picked from the top row. For example, if you pick the Euro from the left column and move along the horizontal line to the Japanese Yen, the percentage change displayed in the box will represent EUR (base)/JPY (quote).
Euro FAQs
What is the Euro?
The Euro is the currency for the 20 European Union countries that belong to the Eurozone. It is the second most heavily traded currency in the world behind the US Dollar. In 2022, it accounted for 31% of all foreign exchange transactions, with an average daily turnover of over $2.2 trillion a day.
EUR/USD is the most heavily traded currency pair in the world, accounting for an estimated 30% off all transactions, followed by EUR/JPY (4%), EUR/GBP (3%) and EUR/AUD (2%).
What is the ECB and how does it impact the Euro?
The European Central Bank (ECB) in Frankfurt, Germany, is the reserve bank for the Eurozone. The ECB sets interest rates and manages monetary policy.
The ECB’s primary mandate is to maintain price stability, which means either controlling inflation or stimulating growth. Its primary tool is the raising or lowering of interest rates. Relatively high interest rates – or the expectation of higher rates – will usually benefit the Euro and vice versa.
The ECB Governing Council makes monetary policy decisions at meetings held eight times a year. Decisions are made by heads of the Eurozone national banks and six permanent members, including the President of the ECB, Christine Lagarde.
How does inflation data impact the value of the Euro?
Eurozone inflation data, measured by the Harmonized Index of Consumer Prices (HICP), is an important econometric for the Euro. If inflation rises more than expected, especially if above the ECB’s 2% target, it obliges the ECB to raise interest rates to bring it back under control.
Relatively high interest rates compared to its counterparts will usually benefit the Euro, as it makes the region more attractive as a place for global investors to park their money.
How does economic data influence the value of the Euro?
Data releases gauge the health of the economy and can impact on the Euro. Indicators such as GDP, Manufacturing and Services PMIs, employment, and consumer sentiment surveys can all influence the direction of the single currency.
A strong economy is good for the Euro. Not only does it attract more foreign investment but it may encourage the ECB to put up interest rates, which will directly strengthen the Euro. Otherwise, if economic data is weak, the Euro is likely to fall.
Economic data for the four largest economies in the euro area (Germany, France, Italy and Spain) are especially significant, as they account for 75% of the Eurozone’s economy.
How does the Trade Balance impact the Euro?
Another significant data release for the Euro is the Trade Balance. This indicator measures the difference between what a country earns from its exports and what it spends on imports over a given period.
If a country produces highly sought after exports then its currency will gain in value purely from the extra demand created from foreign buyers seeking to purchase these goods. Therefore, a positive net Trade Balance strengthens a currency and vice versa for a negative balance.
USD/IDR is stable at around the 15,600 level following Indonesian general elections. Economists at Commerzbank analyze the pair’s outlook.
Indonesia to post steady growth of around 5.1% this year
Prabowo Subianto, 72 and the current Defence Minister, claimed victory in the Presidential election in Indonesia. Investors have taken the result positively. The strong result for Prabowo is viewed as a vote for policy continuity of the outgoing administration led by the still popular President Joko Widodo (Jokowi).
The result is positive for stability and predictability for the rest of the ASEAN. This is because Indonesia is the largest economy in ASEAN, comprising around 35%. We project Indonesia to post steady growth of around 5.1% this year. However, it has the potential to grow even faster at around 6-7%.
For now, the FX market is taking the results positively and we continued sideways trading for USD/IDR around the 15,400-15,800 range.
While testifying before the Committee on Economic and Monetary Affairs (ECON) of the European Parliament on Thursday, European Central Bank (ECB) President Christine Lagarde said that the new policy framework will most likely comprise bond portfolio and lending operations, per Reuters.
Lagarde noted that they expect the framework review to be completed in a couple of months and added that the new balance sheet will most likely be lower than now.
Market reaction
These comments failed to trigger a noticeable reaction in the Euro. At the time of press, EUR/USD was virtually unchanged on the day at 1.0732.
- USD/CAD drifts lower for the second straight day amid a modest USD downtick.
- Sliding Oil prices undermine the Loonie and should help limit any further losses.
- The technical setup warrants caution before positioning for a meaningful decline.
The USD/CAD pair turns lower for the second successive day on Thursday and moves away from a fresh YTD peak, around the 1.3585 region touched earlier this week. Spot prices trade around the 1.3535-1.3530 area, down less than 0.10% during the first half of the European session as traders now look to the US macro data for a fresh impetus.
A further decline in the US Treasury bond yields keeps the US Dollar (USD) bulls on the defensive below its highest level since November 14 touched the previous day and is seen as a key factor weighing on the USD/CAD pair. That said, the prevalent selling bias around Crude Oil prices might undermine the commodity-linked Loonie and help limit any meaningful downside.
From a technical perspective, the USD/CAD pair once again struggled to find acceptance above the 100-day Simple Moving Average (SMA). The subsequent slide from the 1.3600 neighbourhood constitutes the formation of a double-top pattern on the daily chart. That said, oscillators on the daily chart are still holding in the positive territory and warrant caution for bears.
Hence, it will be prudent to wait for strong follow-through selling before confirming that the USD/CAD pair has topped out in the near term and positioning for any meaningful corrective decline. In the meantime, the 1.3500 psychological mark is likely to protect the immediate downside ahead of the very important 200-day SMA, currently pegged around the 1.3475 region.
Sustained weakness below the latter might prompt some technical selling and drag the USD/CAD pair below intermediate support near mid-1.3400s, towards last week's swing low, around the 1.3415-1.3410 region. This is closely followed by the 1.3400 mark, which if broken decisively will be seen as a fresh trigger for bearish traders and pave the way for additional losses.
On the flip side, the 100-day SMA, around the 1.3565 zone, followed by a two-month top near the 1.3585 region, might continue to act as an immediate hurdle. Some follow-through buying, leading to a move beyond the 1.3600 mark and the 1.3620 supply zone, could lift the USD/CAD pair to the 1.3700 mark en route to the next relevant barrier near the 1.3745-1.3750 region.
USD/CAD daily chart
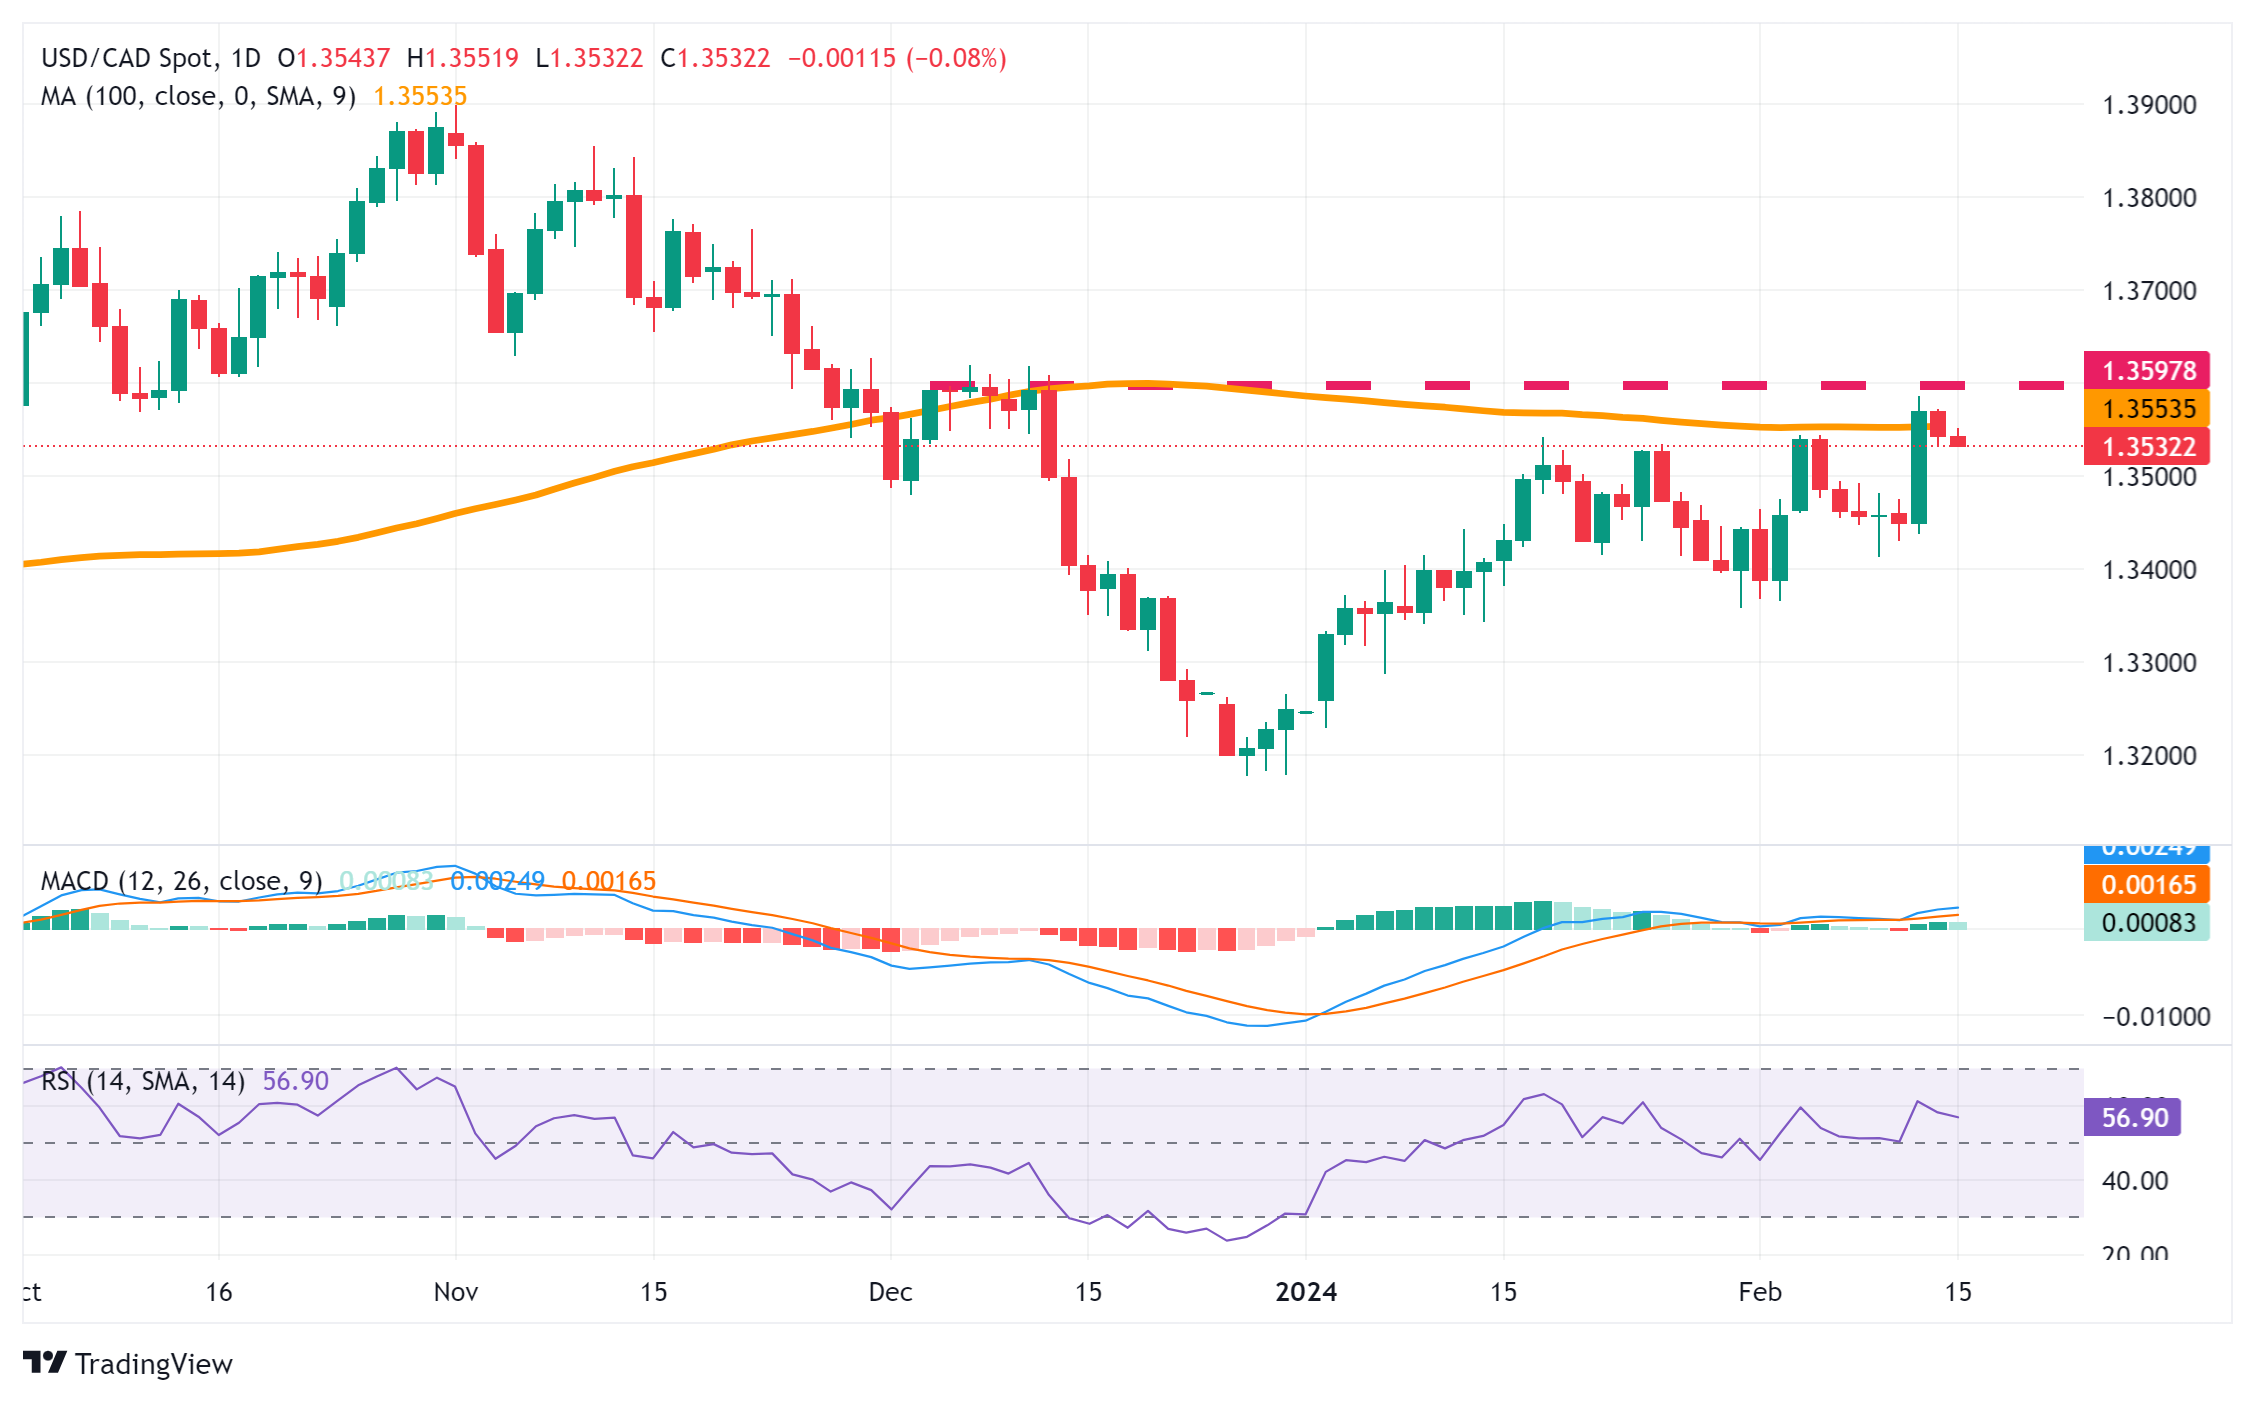
Technical levels to watch
The UK headlines today will centre on the UK entering a technical recession. Economists at ING analyze Pound Sterling’s (GBP) outlook following UK Gross Domestic Product (GDP) data.
GDP data not quite as bad as it looks
The data is not quite as bad as it looks and the low -0.3% quarter-on-quarter decline in the fourth quarter of last year is largely down to revisions in October and November, while December actually surprised on the upside. With the UK services PMI recently heading higher, first quarter GDP for this year should be better. Understandably there will be a lot of focus on the January retail sales data on Friday after the sharp 3.2% MoM drop in December.
However, it is fair to say that the Bank of England (and Sterling) are less driven by this activity data than they are by the price data. These should be on the turn lower now and we stick by our baseline view that this 0.8500 area in EUR/GBP will be major support and that a slightly more aggressive easing cycle from the BoE than the European Central Bank will take EUR/GBP a little higher later this year.
We should also keep an eye on the gilt market. There is a hint again that the UK government is committed to tax cuts but struggling to find funding. Any gilt underperformance could weigh on Sterling too.
- GBP/JPY extends this week’s corrective decline from the 190.00 mark or a multi-year top.
- A technical recession in the UK revives bets for an early BoE rate cut and weighs on the GBP.
- Verbal intervention from Japanese authorities benefits the JPY and contributes to the downfall.
The GBP/JPY cross remains under heavy selling pressure for the second successive day on Thursday and retreats further from its highest level since August 2015, around the 190.00 psychological mark touched earlier this week. The downward trajectory picks up pace in reaction to the disappointing UK GDP print and drags spot prices to the 188.30 area, or a multi-day low during the first half of the European session.
The UK Office for National Statistics reported that the economy unexpectedly contracted by 0.3% in the final three months of 2023. This follows a 0.1% drop in GDP during the July-September period, meaning that the economy entered a technical recession. Against the backdrop of Wednesday's softer UK consumer inflation figures, the latest data reaffirms market bets that the Bank of England (BoE) will start cutting interest rates soon and continues to undermine the British Pound (GBP).
The Japanese Yen (JPY), on the other hand, draws support from speculations about a potential intervention by authorities to stem the recent decline in the domestic currency. Apart from this, geopolitical tensions stemming from conflicts in the Middle East further benefit the safe-haven JPY and contribute to the offered tone surrounding the GBP/JPY cross. That said, reduced bets for an imminent shift in the Bank of Japan's (BoJ) policy stance might keep a lid on any meaningful downfall.
Provisional data released this Thursday showed that Japan's GDP contracted by 0.4% during the October-December period, missing market expectations for a 1.4% growth by a huge margin. This comes on top of the previous quarter's slump of 3.3%, confirming a technical recession and raising uncertainty about the likely timing of when the BoJ will exit the negative interest rates policy. This, in turn, warrants some caution before confirming that the GBP/JPY cross has formed a near-term top.
Technical levels to watch
- Pound Sterling faces a sharp sell-off as the UK Q4 GDP contracted by 0.3%.
- The BoE may consider aggressive rate cuts due to easing inflation, slowing wage growth and poor economic outlook.
- The US Dollar corrects as investors digest the Fed’s hawkish narrative.
The Pound Sterling (GBP) falls back in Thursday’s early European session as the United Kingdom economy enters into a technical recession. The preliminary Gross Domestic Product (GDP) data from the UK Office for National Statistics (ONS) shows that the economy contracted by 0.3% in the fourth quarter. This means the UK economy has contracted for the second straight quarter in a row – the definition of a technical recession. The data could also ignite expectations of early rate cuts by the Bank of England (BoE), who may be keen to introduce growth-stimulating policies.
The broader appeal for the Pound Sterling has weakened as majority of economic indicators apart from the economic contraction are pointing to aggressive rate cuts by the BoE to avoid further contraction. The Pound Sterling tends to face foreign outflows when expectations for the BoE turning dovish escalate.
The consumer price inflation remained steady in January while investors forecasted it to accelerate further. Also, BoE Governor Andrew Bailey sees price pressures taming to the required target by Spring.
While wage growth and service inflation are still skewed to the upside and therefore unlikely to bring inflation down to the 2% target, the moderate decline in wage growth momentum is clearly visible.
Meanwhile, the US Dollar has faced some backfilling after a sharp rally inspired by cooling expectations of early rate cuts by the Federal Reserve (Fed). Investors now expect the Fed to hold interest rates unchanged in the range of 5.25%-5.50% till June monetary policy meeting.
Daily Digest Market Movers: Pound Sterling off from day's high
- Pound Sterling faces a sharp sell-off as the United Kingdom ONS has reported that the economy contracted by 0.3% in the last quarter of 2023. Investors anticipated a deceleration of growth of 0.1%.
- The UK GDP also contracted in the third quarter of 2023, indicating the economy meets the criteria for a technical recession.
- This has escalated hopes of early rate cuts by the Bank of England as the economy desperately needs the stimulus provided by lower borrowing costs.
- This week, the expectations for an early unwinding of the restrictive policy stance by the Bank of England were already prompted by a steep slowdown in wage growth and steady annual inflation figures.
- Meanwhile, the inflation outlook softened on Wednesday after BoE Governor Andrew Bailey said inflation will come down to the target by spring.
- Andrew Bailey warned that wage growth and service inflation are still too high to be consistent with the central bank’s target of 2%.
- Bailey mentioned that policymakers would support rate cuts only after getting evidence that wage growth is receding.
- The monthly Manufacturing Production for December rose steadily by 0.8% MoM, while investors anticipated a stagnant performance. On an annual basis, the economic data grew at a higher pace of 2.3% against expectations of 0.6% and the prior reading of 1.9%.
- Monthly Industrial Production was up by 0.6% against 0.5% growth in November. Investors anticipated a decline of 0.1%. Surprisingly, the annual factory data rose by 0.6% while investors forecasted a contraction of 0.1%.
- On the United States front, the US Dollar Index (DXY) has gradually corrected from a three-month high of 105.00 as investors realize that the Federal Reserve will not cut interest rates sooner.
- The broader appeal for the US Dollar is upbeat as investors are now pricing in only three rate cuts this year, as guided by the Fed, after stubborn inflation data.
- Going forward, January's monthly Retail Sales data will guide the US Dollar, which will be published at 13:30 GMT. According to the estimates, the economic data contracted by 0.1% against a 0.6% increase in January.
Technical Analysis: Pound Sterling eyes downside toward 200-DEMA
Pound Sterling retreats from day’s high near 1.2570 as the UK economy has shifted into a technical recession. The GBP/USD pair is expected to resume its downside journey towards the 200-day Exponential Moving Average (EMA), which trades around 1.2520. More downside seem likely as the 20 and 50-day EMAs are on the verge of delivering a bearish crossover.
The 14-period Relative Strength Index (RSI) struggles to hold above 40.00. Failing to hold the same would trigger a bearish momentum.
Pound Sterling FAQs
What is the Pound Sterling?
The Pound Sterling (GBP) is the oldest currency in the world (886 AD) and the official currency of the United Kingdom. It is the fourth most traded unit for foreign exchange (FX) in the world, accounting for 12% of all transactions, averaging $630 billion a day, according to 2022 data.
Its key trading pairs are GBP/USD, aka ‘Cable’, which accounts for 11% of FX, GBP/JPY, or the ‘Dragon’ as it is known by traders (3%), and EUR/GBP (2%). The Pound Sterling is issued by the Bank of England (BoE).
How do the decisions of the Bank of England impact on the Pound Sterling?
The single most important factor influencing the value of the Pound Sterling is monetary policy decided by the Bank of England. The BoE bases its decisions on whether it has achieved its primary goal of “price stability” – a steady inflation rate of around 2%. Its primary tool for achieving this is the adjustment of interest rates.
When inflation is too high, the BoE will try to rein it in by raising interest rates, making it more expensive for people and businesses to access credit. This is generally positive for GBP, as higher interest rates make the UK a more attractive place for global investors to park their money.
When inflation falls too low it is a sign economic growth is slowing. In this scenario, the BoE will consider lowering interest rates to cheapen credit so businesses will borrow more to invest in growth-generating projects.
How does economic data influence the value of the Pound?
Data releases gauge the health of the economy and can impact the value of the Pound Sterling. Indicators such as GDP, Manufacturing and Services PMIs, and employment can all influence the direction of the GBP.
A strong economy is good for Sterling. Not only does it attract more foreign investment but it may encourage the BoE to put up interest rates, which will directly strengthen GBP. Otherwise, if economic data is weak, the Pound Sterling is likely to fall.
How does the Trade Balance impact the Pound?
Another significant data release for the Pound Sterling is the Trade Balance. This indicator measures the difference between what a country earns from its exports and what it spends on imports over a given period.
If a country produces highly sought-after exports, its currency will benefit purely from the extra demand created from foreign buyers seeking to purchase these goods. Therefore, a positive net Trade Balance strengthens a currency and vice versa for a negative balance.
European Central Bank (ECB) President Christine Lagarde is testifying before the Committee on Economic and Monetary Affairs (ECON) of the European Parliament on Thursday.
Key quotes
Weakness in activity is broad-based across sectors, extending from construction and manufacturing to services.
Incoming data continue to signal subdued activity in the near term.
The ECB’s forward-looking wage tracker continues to signal strong wage pressures.
Wage agreements indicate some levelling off in the last quarter of 2023.
The current disinflationary process is expected to continue, but the governing council needs to be confident that it will lead us sustainably to our 2% target.
We will continue to follow a data-dependent approach.
The latest data confirm the ongoing disinflation process and is expected to bring us gradually further down over 2024.
The latest data confirm the ongoing disinflation process and is expected to bring us gradually further down over 2024
We considered that the incoming information was broadly in line with our december assessment.
ECB's forward-looking wage tracker continues to signal strong wage pressures, but agreements indicate some levelling off.
The governing council needs to be confident that it will lead us sustainably to our 2% target.
Wage pressures for 2024 hinge particularly on the outcome of ongoing or upcoming negotiation rounds.
Market reaction to ECB Lagarde’s comments
Lagarde’s comments fail to move the needle around the Euro, as EUR/USD is keeping its range at around 1.0730, up 0.06% on the day.
Euro price today
The table below shows the percentage change of Euro (EUR) against listed major currencies today. Euro was the strongest against the Pound Sterling.
| USD | EUR | GBP | CAD | AUD | JPY | NZD | CHF | |
| USD | 0.01% | 0.18% | 0.02% | 0.04% | -0.29% | 0.05% | -0.11% | |
| EUR | -0.01% | 0.15% | 0.00% | 0.02% | -0.30% | 0.04% | -0.11% | |
| GBP | -0.18% | -0.19% | -0.18% | -0.16% | -0.48% | -0.14% | -0.29% | |
| CAD | -0.03% | -0.01% | 0.17% | 0.01% | -0.31% | 0.02% | -0.13% | |
| AUD | -0.02% | -0.02% | 0.17% | -0.01% | -0.33% | 0.03% | -0.12% | |
| JPY | 0.28% | 0.30% | 0.45% | 0.30% | 0.30% | 0.33% | 0.18% | |
| NZD | -0.06% | -0.04% | 0.14% | -0.03% | -0.02% | -0.33% | -0.15% | |
| CHF | 0.10% | 0.11% | 0.28% | 0.12% | 0.14% | -0.19% | 0.15% |
The heat map shows percentage changes of major currencies against each other. The base currency is picked from the left column, while the quote currency is picked from the top row. For example, if you pick the Euro from the left column and move along the horizontal line to the Japanese Yen, the percentage change displayed in the box will represent EUR (base)/JPY (quote).
EUR/USD registered small gains on Wednesday. Economists at ING analyze the pair’s outlook.
Market unlikely to price in anything less than three Fed cuts this year
We cannot see a strong case for an immediate reversal higher in EUR/USD but these relatively high levels of US rates and the Dollar should present opportunities this month for corporates and investors to better position for Fed easing this summer.
The market currently prices around 100 bps of Fed easing this year and we struggle to see the market pricing in anything less than three Fed cuts this year.
A narrow 1.0700-1.0760 range may again be on hand today.
FX option expiries for Feb 15 NY cut at 10:00 Eastern Time, via DTCC, can be found below.
- USD/JPY: USD amounts
- 148.00 350m
- 148.50 350m
Economists at Danske Bank expect relative rates to be positive for EUR/NOK in the coming quarters.
More topside in 2024
NOK has been off to a poor start this year and we expect this to continue in the months ahead.
We regard relative rates to be a positive for EUR/NOK in 2024 and given our call for below-trend-growth globally and that markets should price in tighter global monetary conditions that rarely pose an environment in which EUR/NOK declines.
In the near term, we will closely monitor developments in global manufacturing but in the absence of a sharp growth acceleration combined with further global disinflation we still think the balance of risk favours a higher EUR/NOK in the coming 3-12M.
We think NOK is fundamentally undervalued but we do not see the trigger for a sustainable turnaround in the next 12M.
Here is what you need to know on Thursday, February 15:
The US Dollar (USD) failed to build on Tuesday gains and the USD Index (DXY) closed in negative territory on Wednesday as the risk mood improved in the American session. Eurostat will release Trade Balance data for December in the European session. Later in the day, January Retail Sales and Industrial Production data will be featured in the US economic docket, alongside the weekly Initial Jobless Claims.
Wall Street's main indexes registered gains on Wednesday following Tuesday's sharp decline that was triggered by the hot US inflation numbers. Additionally, the benchmark 10-year US Treasury bond yield retreated from the multi-week high it set at 4.3% and lost more than 1% on the day. Early Thursday, US stock index futures trade modestly higher and the 10-year US yield continues to edge lower toward 4.2%, making it difficult for the USD to gather strength.
US Dollar price this week
The table below shows the percentage change of US Dollar (USD) against listed major currencies this week. US Dollar was the weakest against the Australian Dollar.
| USD | EUR | GBP | CAD | AUD | JPY | NZD | CHF | |
| USD | 0.60% | 0.60% | 0.63% | 0.51% | 0.64% | 1.00% | 1.11% | |
| EUR | -0.60% | 0.00% | 0.03% | -0.09% | 0.04% | 0.41% | 0.51% | |
| GBP | -0.61% | 0.00% | 0.03% | -0.08% | 0.04% | 0.39% | 0.51% | |
| CAD | -0.63% | -0.03% | -0.03% | -0.12% | 0.02% | 0.38% | 0.48% | |
| AUD | -0.51% | 0.09% | 0.09% | 0.12% | 0.13% | 0.49% | 0.60% | |
| JPY | -0.64% | -0.04% | 0.00% | 0.00% | -0.12% | 0.37% | 0.48% | |
| NZD | -1.01% | -0.41% | -0.41% | -0.38% | -0.50% | -0.36% | 0.11% | |
| CHF | -1.11% | -0.50% | -0.46% | -0.48% | -0.60% | -0.46% | -0.10% |
The heat map shows percentage changes of major currencies against each other. The base currency is picked from the left column, while the quote currency is picked from the top row. For example, if you pick the Euro from the left column and move along the horizontal line to the Japanese Yen, the percentage change displayed in the box will represent EUR (base)/JPY (quote).
The UK's Office for National Statistics reported on Thursday that the Gross Domestic Product (GDP) contracted at an annual rate of 0.2% in the fourth quarter. This reading followed the 0.3% expansion recorded in the previous quarter and came in weaker than the market expectation for a 0.1% growth. Other data from the UK showed that the Manufacturing Production and Industrial Production increased by 0.8% and 0.6%, respectively, on a monthly basis in December. GBP/USD came under modest bearish pressure following the mixed data and was last seen trading at around 1.2550.
After closing in negative territory for two consecutive days, EUR/USD staged a correction and registered small gains on Wednesday. Early Thursday, the pair fluctuates in a narrow channel below 1.0750. During the European trading hours, European Central Bank President Christine Lagarde will testify before the Committee on Economic and Monetary Affairs of the European Parliament.
During the Asian trading hours, the Australian Bureau of Statistics announced that the Unemployment Rate rose to 4.1% in January from 3.9%. Employment Change was +0.5K in that period, compared to the market expectation for an increase of 30K. AUD/USD showed no immediate reaction to these figures and was last seen moving sideways slightly below 0.6500.
USD/JPY posted small losses on Wednesday and continued to push lower toward 150.00 in the Asian session on Thursday. The data from Japan showed that the GDP contracted by 0.1% on a quarterly basis in Q4.
After breaking below $2,000 on Tuesday, Gold struggled to stage a rebound but retreating US yields helped the precious metal find a foothold on Wednesday. Early Thursday, XAU/USD stays in a consolidation phase slightly above $1,990.
- AUD/JPY faces some selling pressure near 97.43 following the downbeat Australian employment data.
- The Australian Unemployment Rate rose to 4.1%, the highest since January 2022.
- Japan's economy entered a technical recession after shrinking in the fourth quarter (Q4) of 2023.
The AUD/JPY cross loses momentum during the early European trading hours on Thursday. The downtick of the cross is supported by surprisingly weak Australian January employment data. AUD/JPY currently trades around 97.43, down 0.33% on the day.
The Australian Unemployment Rate rose to a two-year high, coming in at 4.1% in January from the previous reading of 3.9%, worse than the market expectation of 4.0%. The report suggested that the labor market was loosening in the face of a faltering economy and poor consumer demand, according to the Australian Bureau of Statistics (ABS) on Thursday. Meanwhile, the Australian Employment Change arrived at 0.5K in January versus -65.1K prior, below the market consensus of 30.0K.
This report has spurred speculation that the Australian central bank may adopt a dovish stance in response to the weakening economy, which exerts some selling pressure on the Aussie (AUD). The Reserve Bank of Australia (RBA) Governor Michele Bullock said on Thursday that RBA is in a good position to get inflation down in a reasonable amount of time.
On the other hand, Japan's economy entered a technical recession after shrinking again in the fourth quarter of 2023, according to preliminary data released from Japan’s Cabinet Office on Thursday. The GDP growth number contracted 0.1% QoQ in Q4 from a revised 0.8% contraction in the third quarter. This figure came in weaker than expectations of 0.3% expansion. Furthermore, the Annualized GDP contracted 0.4% YoY in Q4 versus the 1.4% expansion expected and 3.3% contraction prior.
Investors anticipate the Bank of Japan (BoJ) to abandon its negative interest rate regime at its April policy meeting, once the annual spring wage negotiations confirm a trend of considerable wage growth. However, the downbeat GDP report on Thursday implies that rising inflation threatens domestic demand and potentially supports the case for looser monetary policy for much longer.
In the absence of the top-tier economic data release from the Australian and Japanese docket later this week, the risk sentiment could drive the markets and influence the AUD/JPY cross.
- Silver price seems steady above $22 while US Dollar corrects.
- Fed Goolsbee said one-time persistent inflation is insufficient to temper long-term downtrend.
- The US Retail Sales data will guide the Silver price.
Silver price (XAG/USD) manages to shift its auction above the crucial resistance of $22 in the early European session on Thursday as investors digest that rate cuts by the won’t be announced Federal Reserve (Fed) atleast before June. The expectations of a rate cut by the Fed in the May monetary policy meeting have cooled down significantly on the persistent inflation outlook.
S&P500 futures has generated nominal gains in the late Asian session, portraying a marginal improvement in the risk appetite of the market participants. The US Dollar Index (DXY) has corrected gradually to 104.70 from three-month near 105.00. 10-year US Treasury yields have dropped to 4.24%.
On Wednesday, Chicago Fed Bank President Austan Goolsbee said one bad inflation data could not impact the broader trend, which is that price pressures are coming down to the 2% target. When asked about the timing of rate cuts, Goolsbee said the central doesn’t need to wait to reduce inflation to the 2% target to begin reducing the benchmark rates.
In today’s session, investors will focus on the United States Retail Sales data for January, which will be published at 13:30 GMT. The monthly Retail Sales are anticipated to have contracted by 0.1% after expanding 0.6% in December.
Silver technical analysis
Silver price trades in a Descending Triangle Chart pattern on a daily scale, which indicates a volatility contraction but with a negative bias. The 50-day Exponential Moving Average (EMA) near $23 continues to act as a barricade for the Silver price bulls.
The 14-period Relative Strength Index (RSI) consistently discovers support near 40.00. A slippage below the same would trigger a downside momentum.
Silver daily chart
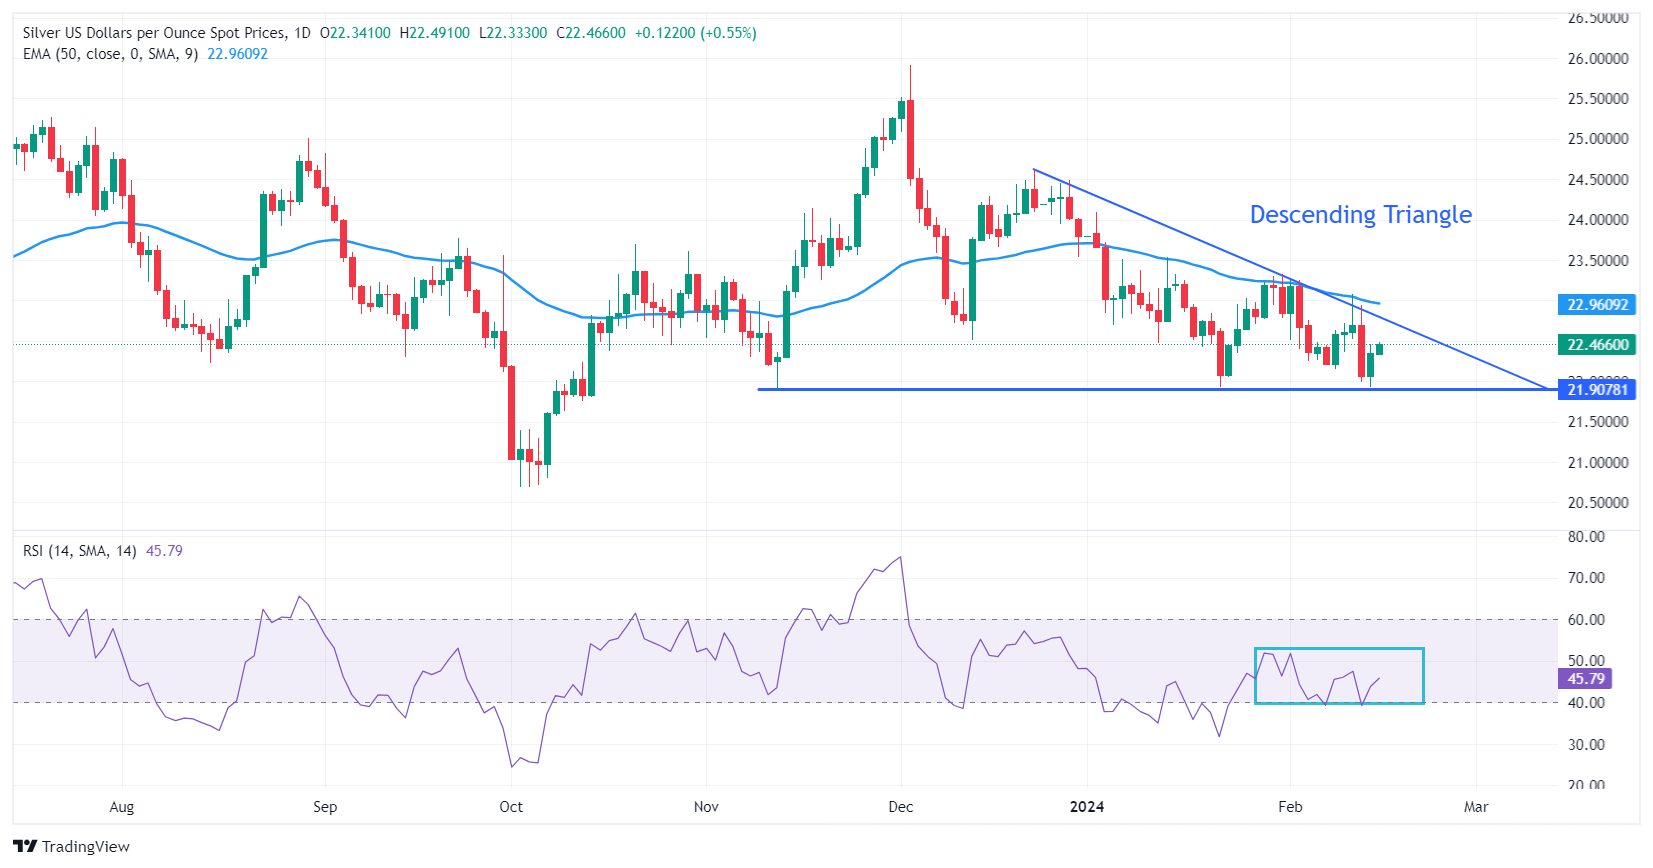
- USD/CHF loses ground as US Dollar declines on US yields.
- The risk appetite is improved on mild remarks from the Fed officials.
- The Swiss Franc faced pressure as Swiss inflation slowed in January.
USD/CHF maintains its downward trajectory, trading lower around 0.8850 during Thursday's Asian session. The US Dollar (USD) faces depreciation against the Swiss Franc (CHF) as US Treasury yields decline, driven by improved risk appetite. At the time of writing, the 2-year and 10-year US yields stand at 4.56% and 4.23%, respectively.
Traders assess the Federal Reserve's monetary policy outlook in light of robust inflation data and recent statements from Fed officials. Chicago Fed President Austan Goolsbee's remarks on Wednesday aimed to alleviate market concerns by suggesting that higher-than-expected consumer prices don't necessarily preclude the Federal Reserve from considering interest rate cuts in 2024.
Federal Reserve Vice Chair for Supervision Michael Barr attracted attention by reiterating the Federal Reserve's confidence, along with its core Federal Open Market Committee, in the trajectory of US inflation towards the Fed's 2% target.
On the other side, the Swiss Franc has faced downward pressure as consumer prices in the Swiss economy have notably slowed. In January, the monthly Consumer Price Index (CPI) increased by 0.2%, compared to expectations of a 0.6% growth, following a stagnant reading in December. Annual inflation significantly decelerated to 1.3%, below both expectations and the previous reading of 1.7%.
The Federal Statistical Office of Switzerland is scheduled to release Producer and Import Prices data on Thursday, with expectations leaning towards an improvement in January. Additionally, market attention will turn to Retail Sales data and Initial Jobless Claims from the United States.
- EUR/USD trades weaker on Thursday, despite the softer US Dollar.
- The major pair keeps the bearish vibe below the key EMA; RSI indicator lies below the 50-midlines.
- The immediate resistance level is seen at 1.0762; 1.0700 acts as a critical support level for the major pair.
The EUR/USD pair remains on the defensive above the 1.0700 mark during the early European trading hours on Thursday. The Eurozone Gross Domestic Product (GDP) for the fourth quarter remained flat in the final quarter of 2023, in line with the flash reading. However, incoming data continues to signal weakness in the near term, which drags the Euro (EUR) lower against the US Dollar (USD). At press time, EUR/USD is trading at 1.0727, losing 0.01% on the day.
Technically, EUR/USD maintains the bearish unchanged as the major pair is below the 50- and 100-period Exponential Moving Averages (EMA) on the four-hour chart. Additionally, the Relative Strength Index (RSI) lies below the 50-midlines, supporting the downward momentum and suggesting that further decline looks favorable.
The 50-period EMA at 1.0762 acts as an immediate resistance level for EUR/USD. The key upside barrier to watch is the 1.0795–1.0805 zone, portraying the 100-period EMA, the upper boundary of the Bollinger Band, a psychological round mark, and a high of February 12. A decisive break above this level will see a rally to a high of January 26 at 1.0885.
On the flip side, the potential support level for the major pair is seen at 1.0700, representing a psychological figure and a low of February 13, Further north, the next contention level is located near the lower limit of the Bollinger Band at 1.0680. A breach of the latter will see a drop to a low of November 9 at 1.0660.
EUR/USD four-hour chart
-638435705713920873.png)
- US Dollar Index faces challenges due to subdued US Treasury yields.
- The risk appetite is improved possibly on remarks from Fed officials.
- FedWatch Tool suggests a 90% chance of no rate adjustment by the Fed in March.
The US Dollar Index (DXY) grapples to recover recent losses, clinging around 104.70 during the Asian session on Thursday. The downward pressure on the US Dollar (USD) can be attributed to the decline in US Treasury yields, driven by improved risk appetite. At present, the 2-year and 10-year US yields stand at 4.55% and 4.23%, respectively. In terms of economic events, Retail Sales data and Initial Jobless Claims will be closely watched on Thursday.
Market sentiment indicates that the Federal Reserve (Fed) is likely to maintain interest rates unchanged in the upcoming meeting. According to the FedWatch Tool, the probability of the Fed keeping interest rates steady in the March meeting has surged to nearly 90%. Additionally, there is a modest 37% probability of a rate cut in May, with the likelihood of a 25 basis points (bps) rate cut increasing to around 53% in May.
Traders continue to evaluate the Federal Reserve's monetary policy outlook amid robust inflation data and recent statements from Fed officials. Chicago Fed President Austan Goolsbee's comments on Wednesday aimed to calm market worries by indicating that higher-than-expected consumer prices don't necessarily rule out the possibility of the Federal Reserve considering interest rate cuts in 2024.
Late on Wednesday, Federal Reserve Vice Chair for Supervision Michael Barr garnered attention by reaffirming the Fed and its core Federal Open Market Committee's confidence in the trajectory of US inflation towards the Fed's 2% target.
- Gold price remains confined in a range just above a two-month low touched on Wednesday.
- Delayed Fed rate cut bets underpin the USD and act as a headwind for the non-yielding metal.
- Geopolitical tensions in the Middle East help to limit the downside for the safe-haven XAU/USD.
Gold price (XAU/USD) extends its sideways consolidative price move during the Asian session on Thursday and is currently placed just above a two-month low touched the previous day. The hotter-than-expected US inflation data released on Tuesday pushed back expectations for the first interest rate cut by the Federal Reserve (Fed) to the middle of the year and continues to act as a headwind for the non-yielding yellow metal. Meanwhile, hawkish Fed expectations assist the US Dollar (USD) to stall the overnight pullback from its highest level since November 14 and is seen as another factor undermining the commodity.
That said, a further decline in the US Treasury bond yields holds back the USD bulls from placing fresh bets. This, along with the risk of a further escalation of geopolitical tensions, helps limit the downside for the safe-haven Gold price. Meanwhile, the lack of meaningful buying interest and the post-US CPI breakdown through a short-term trading range suggests that the path of least resistance for the XAU/USD remains to the downside. Hence, any attempted recovery might be seen as a selling opportunity and runs the risk of fizzling out rather quickly as traders now look to the US macroeconomic data for a fresh impetus.
Daily Digest Market Movers: Gold price lacks firm intraday direction amid mixed fundamental cues
- The stronger US consumer inflation figures prompted investors to lower bets for early rate cuts by the Federal Reserve and underpin the US Dollar, capping the upside for the non-yielding Gold price.
- Fed funds futures have priced out a rate cut in March and see a nearly 80% chance of easing at the June meeting, and about three 25 basis points rate cuts by the end of this year as against five two weeks ago.
- The US Treasury bond yields retreat further on the back of overnight comments by Chicago Fed President Austan Goolsbee, saying that the central bank should be wary of waiting too long before it cuts rates.
- Goolsbee indicated that the Fed's trajectory back towards achieving its 2% inflation target would still be on track even if price increases in the US run a bit hotter-than-expected over the next few months.
- This keeps a lid on the Greenback, which, along with the risk of a further escalation of geopolitical tensions in the Middle East, lends some support to the safe-haven XAU/USD and helps limit the downside.
- The Israeli military said on Wednesday its fighter jets began a series of strikes in Lebanon in retaliation to a rocket fired into Northern Israel, raising the risk of a war between the two countries.
- Meanwhile, negotiations for a ceasefire between Israel and Hamas in Gaza have resumed as the former faces international pressure to stop its bombardment of the southern Gaza city of Rafah.
- The US Retail Sales figures for January are due for release later during the North American session, with consensus estimates pointing to a 0.1% fall as compared to a flat reading last month.
- Thursday's US economic docket also features the Empire State Manufacturing Index, the Philly Fed Manufacturing Index, the usual Weekly Initial Jobless Claims and Industrial Production data.
Technical Analysis: Gold price bears await acceptance below 100-day SMA before placing fresh bets
From a technical perspective, bearish traders need to wait for acceptance below the 100-day Simple Moving Average (SMA) before positioning for any further losses. Given that oscillators on the daily chart are holding deep in the negative territory, the Gold price might then accelerate the fall towards the very important 200-day SMA support, currently pegged near the $1,965 area. A convincing break below the latter should pave the way for a further depreciating move towards an intermediate support near the $1,952-1,950 zone en route to the November 2023 low, around the $1,932-1,931 region.
On the flip side, any attempted recovery beyond the $2,000 mark now seems to confront stiff resistance near the $2,011-2,012 area. That said, some follow-through buying, leading to a subsequent strength beyond the $2,015 level, might trigger a short-covering rally and lift the Gold price to the 50-day SMA, currently around the $2,030 region. The latter should act as a key pivotal point, which if cleared decisively will set the stage for additional gains beyond the $2,044-2,045 intermediate hurdle, towards the $2,065 supply zone.
US Dollar price today
The table below shows the percentage change of US Dollar (USD) against listed major currencies today. US Dollar was the weakest against the Japanese Yen.
| USD | EUR | GBP | CAD | AUD | JPY | NZD | CHF | |
| USD | 0.06% | 0.03% | 0.04% | 0.20% | -0.19% | 0.10% | 0.02% | |
| EUR | -0.06% | -0.04% | -0.02% | 0.15% | -0.24% | 0.06% | -0.02% | |
| GBP | -0.02% | 0.02% | -0.01% | 0.17% | -0.23% | 0.07% | 0.00% | |
| CAD | -0.04% | 0.02% | 0.00% | 0.17% | -0.22% | 0.07% | 0.00% | |
| AUD | -0.18% | -0.17% | -0.16% | -0.16% | -0.40% | -0.09% | -0.16% | |
| JPY | 0.19% | 0.24% | 0.21% | 0.22% | 0.38% | 0.30% | 0.23% | |
| NZD | -0.12% | -0.06% | -0.08% | -0.08% | 0.07% | -0.31% | -0.08% | |
| CHF | -0.03% | 0.02% | 0.00% | 0.01% | 0.18% | -0.22% | 0.08% |
The heat map shows percentage changes of major currencies against each other. The base currency is picked from the left column, while the quote currency is picked from the top row. For example, if you pick the Euro from the left column and move along the horizontal line to the Japanese Yen, the percentage change displayed in the box will represent EUR (base)/JPY (quote).
Gold FAQs
Why do people invest in Gold?
Gold has played a key role in human’s history as it has been widely used as a store of value and medium of exchange. Currently, apart from its shine and usage for jewelry, the precious metal is widely seen as a safe-haven asset, meaning that it is considered a good investment during turbulent times. Gold is also widely seen as a hedge against inflation and against depreciating currencies as it doesn’t rely on any specific issuer or government.
Who buys the most Gold?
Central banks are the biggest Gold holders. In their aim to support their currencies in turbulent times, central banks tend to diversify their reserves and buy Gold to improve the perceived strength of the economy and the currency. High Gold reserves can be a source of trust for a country’s solvency. Central banks added 1,136 tonnes of Gold worth around $70 billion to their reserves in 2022, according to data from the World Gold Council. This is the highest yearly purchase since records began. Central banks from emerging economies such as China, India and Turkey are quickly increasing their Gold reserves.
How is Gold correlated with other assets?
Gold has an inverse correlation with the US Dollar and US Treasuries, which are both major reserve and safe-haven assets. When the Dollar depreciates, Gold tends to rise, enabling investors and central banks to diversify their assets in turbulent times. Gold is also inversely correlated with risk assets. A rally in the stock market tends to weaken Gold price, while sell-offs in riskier markets tend to favor the precious metal.
What does the price of Gold depend on?
The price can move due to a wide range of factors. Geopolitical instability or fears of a deep recession can quickly make Gold price escalate due to its safe-haven status. As a yield-less asset, Gold tends to rise with lower interest rates, while higher cost of money usually weighs down on the yellow metal. Still, most moves depend on how the US Dollar (USD) behaves as the asset is priced in dollars (XAU/USD). A strong Dollar tends to keep the price of Gold controlled, whereas a weaker Dollar is likely to push Gold prices up.
- USD/CAD treads water to hold ground post recent declines.
- The decline in the WTI price weighs on the Canadian Dollar.
- Fed’s Goolsbee suggested that the Fed may consider rate cuts despite upbeat consumer prices.
USD/CAD makes an effort to recover its recent declines observed in the previous session, spurred by a muted US Dollar (USD) possibly due to decreased US bond yields. The pair is hovering around 1.3540 during the Asian session on Thursday. Additionally, the drop in Crude oil prices might exert downward pressure on the Canadian Dollar (CAD), consequently providing support for the USD/CAD pair.
West Texas Intermediate (WTI) Crude oil price continues its downward trend for the second consecutive day, primarily driven by a larger-than-expected increase in US Crude oil inventories. This significant buildup in inventories outweighs concerns about potential supply disruptions stemming from geopolitical tensions in the Middle East. As a result, the WTI price declines to near $76.10 per barrel at the moment of writing.
The USD/CAD pair has encountered challenges amid prevailing market sentiment, which now strongly suggests that the Federal Reserve (Fed) will keep interest rates unchanged in the upcoming meeting. According to the FedWatch Tool, the probability of the Fed maintaining interest rates in the March meeting has surged to nearly 90%. Additionally, there is a modest 37% probability of a rate cut in May, with the likelihood of a 25 basis points (bps) rate cut increasing to approximately 53% in May.
Furthermore, improved risk appetite sentiment has led to a decline in US Treasury yields, with the 2-year and 10-year US yields standing at 4.55% and 4.23%, respectively, by the press time. Moreover, Chicago Fed President Austan Goolsbee's remarks on Wednesday sought to assuage market concerns by suggesting that a higher-than-anticipated reading on consumer prices does not necessarily mean that the Federal Reserve won't consider lowering interest rates in 2024.
- Indian Rupee loses traction despite the softer USD and lower bond yields.
- Indian CEA said the government is worried about headline retail inflation but is confident that India can manage it well.
- The Indian Trade Balance and US January Retail Sales will be due later on Thursday.
Indian Rupee (INR) attracts some sellers on Thursday despite the decline of the US Dollar (USD) and lower US Treasury bond yields. The Reserve Bank of India (RBI) held interest rates steady at its bi-monthly monetary policy earlier this month, with an effort to bring down headline retail inflation to 4%, while retail inflation continues to exceed 5%.
Chief economic advisor (CEA) V. Anantha Nageswaran said that since wholesale inflation has been eased, the Indian government is little worried about headline retail inflation, but is confident that India will be able to effectively manage it. Investors expect the RBI to maintain the hawkish stance in the near term and not to ease policy ahead of the US Federal Reserve (Fed), which might lift the INR and cap the upside of the USD/INR pair.
The Indian Trade Balance will be due at 10:00 GMT on Thursday. On the US docket, the January Retail Sales, Philly Fed Manufacturing Index, Industrial Production, and weekly Initial Jobless Claims will be released later in the day.
Daily Digest Market Movers: Indian Rupee remains vulnerable in the face of higher oil prices and inflation
- India's Wholesale Price Index-based inflation eased further to 0.27% YoY in January from 0.73% in December, below the market consensus of 0.53%, according to the Commerce Ministry.
- India’s Wholesale Price Index (WPI) Food arrived at 6.85% in January versus 9.38% prior.
- India's Retail inflation softened to 5.10% on an annual basis in January from 5.69% in December, better than the estimation of 5.09%.
- The hotter-than-expected US inflation data last week convinced Fed officials to maintain a cautious approach as they further evaluate the trajectory of inflation in the coming months.
- Fed Vice Chair for Supervision Michael Barr said that the Fed remains confident that US inflation is on the way to hitting the central bank's 2% target. However, Barr emphasized the necessity of further positive data before advocating interest rate cuts.
- Fed fund futures traders have priced in an 8% chance of a rate cut in the March policy meeting, from a 76.9% possibility a month ago, according to the CME FedWatch Tool.
Technical Analysis: Indian Rupee inches lower within the long-term trading range
Indian Rupee trades weaker on the day. USD/INR remains confined within a familiar multi-month-old descending trend channel of 82.70–83.20 since December 8, 2023.
In the near term, USD/INR keeps a neutral bias and continues its non-directional action as the pair hovers around the key 100-period Exponential Moving Average (EMA) on the daily timeframe. It’s worth noting that the 14-day Relative Strength Index lies below the 50.0 midline, suggesting that further decline cannot be ruled out.
A decisive break above the upper boundary of the descending trend channel at 83.20 could get enough fuel to hit a high of January 2 at 83.35, en route to the 84.00 psychological level.
On the downside, the 83.00 psychological round mark acts as an initial support level for USD/INR. The next downside target will emerge at a low of February 2 at 82.83. A potential support level is located at the lower limit of the descending trend channel at 82.70, followed by a low of August 23 at 82.45.
US Dollar price today
The table below shows the percentage change of US Dollar (USD) against listed major currencies today. US Dollar was the strongest against the Australian Dollar.
| USD | EUR | GBP | CAD | AUD | JPY | NZD | CHF | |
| USD | 0.02% | 0.01% | 0.02% | 0.17% | -0.18% | 0.05% | 0.02% | |
| EUR | -0.02% | -0.03% | -0.01% | 0.14% | -0.23% | 0.03% | 0.01% | |
| GBP | -0.01% | 0.00% | 0.00% | 0.14% | -0.22% | 0.03% | 0.01% | |
| CAD | -0.02% | 0.01% | 0.00% | 0.15% | -0.22% | 0.03% | 0.01% | |
| AUD | -0.15% | -0.15% | -0.15% | -0.16% | -0.37% | -0.12% | -0.14% | |
| JPY | 0.18% | 0.22% | 0.18% | 0.21% | 0.36% | 0.23% | 0.22% | |
| NZD | -0.05% | -0.03% | -0.03% | -0.03% | 0.12% | -0.25% | -0.01% | |
| CHF | -0.03% | 0.00% | -0.01% | 0.00% | 0.16% | -0.22% | 0.03% |
The heat map shows percentage changes of major currencies against each other. The base currency is picked from the left column, while the quote currency is picked from the top row. For example, if you pick the Euro from the left column and move along the horizontal line to the Japanese Yen, the percentage change displayed in the box will represent EUR (base)/JPY (quote).
Indian Rupee FAQs
What are the key factors driving the Indian Rupee?
The Indian Rupee (INR) is one of the most sensitive currencies to external factors. The price of Crude Oil (the country is highly dependent on imported Oil), the value of the US Dollar – most trade is conducted in USD – and the level of foreign investment, are all influential. Direct intervention by the Reserve Bank of India (RBI) in FX markets to keep the exchange rate stable, as well as the level of interest rates set by the RBI, are further major influencing factors on the Rupee.
How do the decisions of the Reserve Bank of India impact the Indian Rupee?
The Reserve Bank of India (RBI) actively intervenes in forex markets to maintain a stable exchange rate, to help facilitate trade. In addition, the RBI tries to maintain the inflation rate at its 4% target by adjusting interest rates. Higher interest rates usually strengthen the Rupee. This is due to the role of the ‘carry trade’ in which investors borrow in countries with lower interest rates so as to place their money in countries’ offering relatively higher interest rates and profit from the difference.
What macroeconomic factors influence the value of the Indian Rupee?
Macroeconomic factors that influence the value of the Rupee include inflation, interest rates, the economic growth rate (GDP), the balance of trade, and inflows from foreign investment. A higher growth rate can lead to more overseas investment, pushing up demand for the Rupee. A less negative balance of trade will eventually lead to a stronger Rupee. Higher interest rates, especially real rates (interest rates less inflation) are also positive for the Rupee. A risk-on environment can lead to greater inflows of Foreign Direct and Indirect Investment (FDI and FII), which also benefit the Rupee.
How does inflation impact the Indian Rupee?
Higher inflation, particularly, if it is comparatively higher than India’s peers, is generally negative for the currency as it reflects devaluation through oversupply. Inflation also increases the cost of exports, leading to more Rupees being sold to purchase foreign imports, which is Rupee-negative. At the same time, higher inflation usually leads to the Reserve Bank of India (RBI) raising interest rates and this can be positive for the Rupee, due to increased demand from international investors. The opposite effect is true of lower inflation.
- WTI remains under some selling pressure for the second straight day on Thursday.
- A spike in US inventories overshadows geopolitical risks and weighs on Oil prices.
- The OPEC sees a rise in global demand in 2024, 2025, albeit fails to lend support.
West Texas Intermediate (WTI) US Crude Oil prices extend the overnight pullback from the vicinity of mid-$78.00s, or a fresh monthly peak and drift lower for the second successive day on Thursday. The commodity hovers around the $76.00 mark during the Asian session and remains well within the striking distance of the weekly low touched on Monday.
The larger-than-expected build in US Crude Oil inventories, to a larger extent, overshadows a combination of factors and exerts some pressure on the black liquid. The Energy Information Administration (EIA) said on Tuesday that US inventories rose by roughly 12 million barrels in the week ended February 9, well above market expectations amid a drop in refinery utilization to its lowest levels since December 2022.
Meanwhile, a monthly report from the Organization of the Petroleum Exporting Countries (OPEC), indicating that global Oil demand will rise by 2.25 million bpd in 2024 and by 1.85 million bpd in 2025, does little to impress bullish traders. Moreover, a fresh escalation of tension in the Middle East, which could disrupt supply from the oil-rich region, also fails to lend support to Crude Oil prices, favouring bearish traders.
In the latest development, Israel launched airstrikes in Lebanon in retaliation to a rocket fired into Northern Israel. This comes after Israeli Prime Minister Benjamin Netanyahu defied ceasefire calls from the international community and called a powerful operation in Rafa, raising the risk of a further escalation of military action in the region. The lack of buying interest, however, supports prospects for additional losses for Oil prices.
Market participants now look to the US economic docket, featuring the release of the Empire State Manufacturing Index, monthly Retail Sales figures, the Philly Fed Manufacturing Index and the usual Weekly Initial Jobless Claims. The data might influence the US Dollar (USD) price dynamics later during the early North American session and allow traders to grab short-term opportunities around Crude Oil prices.
Technical levels to watch
| Raw materials | Closed | Change, % |
|---|---|---|
| Silver | 22.361 | 1.27 |
| Gold | 1992.206 | 0.01 |
| Palladium | 933.94 | 8.96 |
- EUR/USD received upward support on the subdued US Dollar.
- US Treasury yields put downward pressure on the Greenback.
- Traders seek further cues from the speech of ECB President Christine Lagarde.
EUR/USD hovers around 1.0730 during the Asian session on Thursday, attempting to extend its gains for the second successive day. The downward pressure on the EUR/USD pair could be attributed to the subdued US Dollar (USD). The US Dollar Index (DXY) trades near 104.70 after the previous day's losses with the lower US Treasury yields.
The 2-year and 10-year US Treasury yields are lower, with the 2-year yield at 4.56% and the 10-year yield at 4.23%. This signals a notable change in market sentiment, with expectations for no interest rate adjustment by the Federal Reserve (Fed) in the upcoming March meeting soaring to nearly 90%.
According to the FedWatch Tool, investors are now pricing in a modest 37% probability of a rate cut in May, with the likelihood of a 25 basis points (bps) rate cut increasing to approximately 53% in May.
On the other side, the Euro (EUR) encountered difficulties on Wednesday following the release of the seasonally adjusted Eurozone Gross Domestic Product (GDP) data, which met market expectations for the fourth quarter.
The preliminary Eurozone Gross Domestic Product (GDP) remained steady at 0.1% year-over-year, in line with market forecasts. Quarter-over-quarter, the figure remained unchanged at 0.0%, consistent with the previous quarter's reading.
Additionally, ECB Vice President Luis de Guindos highlighted persistent wage pressures at elevated levels, indicating that insufficient data is available yet to confirm a reduction in these pressures.
Market participants are likely awaiting a scheduled speech by Christine Lagarde, the President of the European Central Bank (ECB), on Thursday. Retail Sales data and Initial Jobless Claims will be closely monitored on the United States economic calendar.
- India’s Nifty and Sensex eye a subdued start on Thursday, following an upbeat close on Wednesday.
- Nifty and Sensex cheered positive European equities and softer Indian WPI inflation data.
- Nifty and Sensex traders gear up for India’s trade data and a fresh batch of US statistics.
The Sensex 30 and Nifty 50, India’s key benchmark indices, are set to open on a flat to lower side this Thursday, after a positive close on Wednesday. Gift Nifty, rebranded from SGX Nifty, is trading 0.05% lower on the day, suggesting a muted open for Nifty and Sensex.
The Indian indices defied the early bearish sentiment, tracking the advance in their European counterparts amid a recovery in risk sentiment while softer India’s Wholesale Price Index (WPI) inflation data also added to the renewed optimism.
The National Stock Exchange (NSE) Nifty 50 index finished Wednesday at 21,840 while the Bombay Stock Exchange (BSE) Sensex 30 settled at 71,833. Both indices gained roughly 0.40% on the day.
Stock market news
- Nifty and Sensex rebounded on Wednesday, courtesy of the solid recovery in the banking sector stocks.
- The top five gainers on the Nifty were BPCL, SBI Bank, ONGC, Coal India and Tata Steel. Meanwhile, the top losers were Tech Mahindra, Cipla, Dr Reddy's, Infosys and TCS.
- Yubi, a credit platform, has entered a co-lending partnership with Axis Bank and Muthoot Microfin.
- Indian automaker Mahindra & Mahindra’s standalone profit after tax rose 60.6%) in the three months to Dec. 31, missing analysts' estimate.
- Paytm shares fell to a fresh record low of Rs 342.15 after falling nearly 10% following the downgrade by the brokerage firm Macquarie. This came after the Reserve Bank of India's (RBI) recent regulatory action against Paytm Payments Bank.
- The Indian WPI inflation dropped to 0.27% in January, as against a 0.73% increase in December. The data missed the market consensus of 0.53%.
- The Lunar New Year holidays in China could keep the liquidity thin around the Indian indices.
- All eyes now turn toward the top-tier US Retail Sales report and India’s trade deficit data for trading impetus in Nifty and Senxex indices.
- Following Tuesday’s hot US Consumer Price Index (CPI) data, markets are pricing in a no Fed rate cut in March and a lower than 50% chance of easing in May.
Indian economy FAQs
How does the Indian economy impact the Indian Rupee?
The Indian economy has averaged a growth rate of 6.13% between 2006 and 2023, which makes it one of the fastest growing in the world. India’s high growth has attracted a lot of foreign investment. This includes Foreign Direct Investment (FDI) into physical projects and Foreign Indirect Investment (FII) by foreign funds into Indian financial markets. The greater the level of investment, the higher the demand for the Rupee (INR). Fluctuations in Dollar-demand from Indian importers also impact INR.
What is the impact of Oil prices on the Rupee?
India has to import a great deal of its Oil and gasoline so the price of Oil can have a direct impact on the Rupee. Oil is mostly traded in US Dollars (USD) on international markets so if the price of Oil rises, aggregate demand for USD increases and Indian importers have to sell more Rupees to meet that demand, which is depreciative for the Rupee.
How does inflation in India impact the Rupee?
Inflation has a complex effect on the Rupee. Ultimately it indicates an increase in money supply which reduces the Rupee’s overall value. Yet if it rises above the Reserve Bank of India’s (RBI) 4% target, the RBI will raise interest rates to bring it down by reducing credit. Higher interest rates, especially real rates (the difference between interest rates and inflation) strengthen the Rupee. They make India a more profitable place for international investors to park their money. A fall in inflation can be supportive of the Rupee. At the same time lower interest rates can have a depreciatory effect on the Rupee.
How does seasonal US Dollar demand from importers and banks impact the Rupee?
India has run a trade deficit for most of its recent history, indicating its imports outweigh its exports. Since the majority of international trade takes place in US Dollars, there are times – due to seasonal demand or order glut – where the high volume of imports leads to significant US Dollar- demand. During these periods the Rupee can weaken as it is heavily sold to meet the demand for Dollars. When markets experience increased volatility, the demand for US Dollars can also shoot up with a similarly negative effect on the Rupee.
Japan's Economic Minister Yoshitaka Shindo said on Thursday that “specific monetary policy means up to BoJ to decide.”
Additional quotes
Understand BoJ takes into account various data, including consumption, economic outlook and risks comprehensively in guiding policy.
Expect BoJ to work closely with govt, take appropriate monetary policy to sustainably, stably achieve its price target accompanied by wage rises.
Market reaction
At the time of writing, USD/JPY is trading 0.21% lower on the day at 150.20.
- The Japanese Yen attracts some follow-through buying amid intervention fears.
- Bulls seem unaffected by data showing that Japan’s economy contracted in Q4.
- Delayed Fed rate cut bets favour the USD bulls and could lend support to USD/JPY.
The Japanese Yen (JPY) ticks higher against its American counterpart for the second successive day on Thursday, albeit lacks follow-through and remains well within the striking distance of the YTD low touched earlier this week. Japanese officials warned against rapid and speculative moves in the FX market, fueling speculations about a possible intervention to defend the domestic currency. This, in turn, is seen as a key factor lending some support to the JPY. That said, provisional government data showed that Japan’s economy unexpectedly contracted again during the fourth quarter, confirming a technical recession and raising uncertainty about the likely timing of when the Bank of Japan (BoJ) will exit the negative interest rates policy.
This, along with signs of stability in the equity markets, keeps a lid on any meaningful appreciating move for the JPY. The US Dollar (USD), on the other hand, might continue to draw support from growing acceptance that the Federal Reserve (Fed) will keep interest rates higher for longer. The bets were further reaffirmed by hotter-than-expected US consumer inflation figures released on Tuesday, which comes on top of the upbeat data suggesting that the economy is in good shape. The hawkish outlook, meanwhile, favours the USD bulls and should further contribute to capping the upside for the USD/JPY pair. Traders now look to the US economic docket, highlighting monthly Retail Sales figures, for short-term opportunities.
Daily Digest Market Movers: Japanese Yen recovers further from YTD low amid intervention fears
- Japan's top currency diplomat Masato Kanda said on Wednesday that the nation would take appropriate actions on forex if needed, which is seen lending some support to the Japanese Yen.
- Provisional data released this Thursday showed that Japan's GDP contracted by 0.4% during the October-December period, missing market expectations for a 1.4% growth by a huge margin.
- This comes on top of the previous quarter's slump of 3.3%, confirming a technical recession and raising uncertainty about the Bank of Japan's plans to exit its ultra-easy policy sometime this year.
- Furthermore, the overnight rebound in the US equity markets might contribute to capping the safe-haven JPY, which, along with a bullish US Dollar, should limit losses for the USD/JPY pair.
- The US inflation data for January released on Tuesday pushed back expectations for the first interest rate cut by the Federal Reserve to the middle of the year and should underpin the USD.
- Fed funds futures have priced out a rate cut in March and see a nearly 80% chance of easing at the June meeting, and about three rate cuts of 25 basis points each by the end of this year.
- The US Retail Sales figures for January are due for release later during the North American session, with consensus estimates pointing to a 0.1% fall as compared to a flat reading last month.
- Thursday's US economic docket also features the Empire State Manufacturing Index, the Philly Fed Manufacturing Index, the usual Weekly Initial Jobless Claims and Industrial Production data.
Technical Analysis: USD/JPY drifts back closer to 150.00 mark, downside potential seems limited
From a technical perspective, the USD/JPY pair could find some support near the 150.00 psychological mark. Some follow-through selling has the potential to drag spot prices further towards the 149.65-149.60 region en route to the 149.25-149.20 area and the 149.00 round figure. The latter should act as a key pivotal point, which if broken decisively might prompt some technical selling and pave the way for some meaningful corrective decline.
On the flip side, the multi-month top, around the 150.85-150.90 region, touched on Tuesday, now seems to act as an immediate hurdle. A sustained strength beyond could lift the USD/JPY pair further towards the 151.45 intermediate hurdle en route to the 152.00 neighbourhood, or a multi-decade peak set in October 2022 and retested in November 2023.
Japanese Yen price today
The table below shows the percentage change of Japanese Yen (JPY) against listed major currencies today. Japanese Yen was the weakest against the US Dollar.
| USD | EUR | GBP | CAD | AUD | JPY | NZD | CHF | |
| USD | 0.04% | 0.03% | 0.05% | 0.31% | -0.21% | 0.15% | 0.05% | |
| EUR | -0.04% | -0.02% | 0.01% | 0.26% | -0.25% | 0.11% | 0.02% | |
| GBP | -0.03% | 0.00% | 0.01% | 0.26% | -0.25% | 0.11% | 0.02% | |
| CAD | -0.05% | 0.00% | -0.01% | 0.25% | -0.25% | 0.10% | 0.01% | |
| AUD | -0.29% | -0.26% | -0.26% | -0.26% | -0.52% | -0.16% | -0.24% | |
| JPY | 0.21% | 0.26% | 0.23% | 0.26% | 0.50% | 0.36% | 0.27% | |
| NZD | -0.15% | -0.10% | -0.11% | -0.10% | 0.15% | -0.35% | -0.09% | |
| CHF | -0.05% | -0.01% | -0.02% | 0.00% | 0.25% | -0.26% | 0.09% |
The heat map shows percentage changes of major currencies against each other. The base currency is picked from the left column, while the quote currency is picked from the top row. For example, if you pick the Euro from the left column and move along the horizontal line to the Japanese Yen, the percentage change displayed in the box will represent EUR (base)/JPY (quote).
Japanese Yen FAQs
What key factors drive the Japanese Yen?
The Japanese Yen (JPY) is one of the world’s most traded currencies. Its value is broadly determined by the performance of the Japanese economy, but more specifically by the Bank of Japan’s policy, the differential between Japanese and US bond yields, or risk sentiment among traders, among other factors.
How do the decisions of the Bank of Japan impact the Japanese Yen?
One of the Bank of Japan’s mandates is currency control, so its moves are key for the Yen. The BoJ has directly intervened in currency markets sometimes, generally to lower the value of the Yen, although it refrains from doing it often due to political concerns of its main trading partners. The current BoJ ultra-loose monetary policy, based on massive stimulus to the economy, has caused the Yen to depreciate against its main currency peers. This process has exacerbated more recently due to an increasing policy divergence between the Bank of Japan and other main central banks, which have opted to increase interest rates sharply to fight decades-high levels of inflation.
How does the differential between Japanese and US bond yields impact the Japanese Yen?
The BoJ’s stance of sticking to ultra-loose monetary policy has led to a widening policy divergence with other central banks, particularly with the US Federal Reserve. This supports a widening of the differential between the 10-year US and Japanese bonds, which favors the US Dollar against the Japanese Yen.
How does broader risk sentiment impact the Japanese Yen?
The Japanese Yen is often seen as a safe-haven investment. This means that in times of market stress, investors are more likely to put their money in the Japanese currency due to its supposed reliability and stability. Turbulent times are likely to strengthen the Yen’s value against other currencies seen as more risky to invest in.
- Australian Dollar lost its intraday gains after the release of weaker employment data.
- Australia Unemployment Rate rose by 4.1% from 3.9% prior, exceeding the expected 4.0% in January.
- AUD received support from the improved Australian ASX 200 Index.
- US Dollar depreciates due to the decline in the US Treasury yields.
The Australian Dollar (AUD) relinquished its intraday gains and slipped into negative territory following the release of downbeat Australian Employment data on Thursday. However, the AUD/USD pair managed to advance during early Asian hours on Thursday, supported by a weakening US Dollar (USD) and improved risk appetite in the market.
Australian Dollar found some upward momentum as the S&P/ASX 200 Index surged above 7,600 on Thursday, mirroring a rebound in Wall Street overnight. Strong corporate earnings and an optimistic corporate outlook overshadowed concerns about inflation and interest rates. Reserve Bank of Australia Governor Michele Bullock addressed Parliament, highlighting persistent inflation, particularly in services, but also noted a gradual decline in inflationary pressures.
The US Dollar Index (DXY) encountered difficulties amid subdued US Treasury yields, reflecting a significant shift in market sentiment. Expectations for no rate adjustment by the Federal Reserve (Fed) in the upcoming March meeting surged to nearly 90%. According to the FedWatch Tool, investors are now pricing in a modest 37% probability of a rate cut in May, with the likelihood of a 25 basis points (bps) rate cut increasing to approximately 53% in May.
Daily Digest Market Movers: Australian Dollar loses ground on weaker employment data
- Australia’s seasonally adjusted Employment Change printed the reading of 0.5K for January, against the market expectation of 30K.
- Aussie Part-Time Employment came in at 10.6K as compared to the previous figure of 46.7K.
- Australian Participation Rate remained consistent at 66.8%, lower than the anticipated 66.9% in January.
- January’s Full-Time Employment improved to 11.1K from the previous decline of 109.4K.
- Australia’s Consumer Inflation Expectations data is unchanged at 4.5% for February.
- Reserve Bank of Australia Governor Michele Bullock addressed the Australian parliament's Senate Economics Legislation Committee, noting that the global economy has fared better than initially anticipated. She expressed previous concerns about potential hard landings and recessions but indicated that the economy is currently in a favorable position to bring inflation down within a reasonable timeframe.
- Federal Reserve (Fed) Vice Chair for Supervision Michael Barr made headlines late Wednesday, affirming that both the Fed and its core Federal Open Market Committee (FOMC) maintain confidence in the trajectory of US inflation toward the Fed's 2% target.
- US headline Consumer Price Index (CPI) increased by 3.1% in January, exceeding the expected 2.9% but lower than the previous rate of 3.4%.
- US Inflation rose by 0.3% month-over-month, against the expectation of maintaining the previous reading of 0.2%.
- US Core CPI (YoY) remained consistent at 3.9% against the market expectation of a decline to 3.7% in January.
- US Core Inflation (MoM) increased by 0.4% against the 0.3% as expected to be unchanged in January.
Technical Analysis: Australian Dollar hovers below the psychological barrier of 0.6500
The Australian Dollar trades near 0.6490 on Thursday following the next major support at 0.6450 before the weekly low at 0.6442. A break below this level could push the AUD/USD pair to navigate the region around the psychological support of the 0.6400 level. On the upside, the AUD/USD pair faces a significant resistance level at the psychological threshold of 0.6500. If this level is breached, it could potentially propel the AUD/USD pair toward the 14-day Exponential Moving Average (EMA) located at 0.6522. Further upward movement may target the 23.6% Fibonacci retracement level at 0.6543, followed by the major resistance level at 0.6550.
AUD/USD: Daily Chart
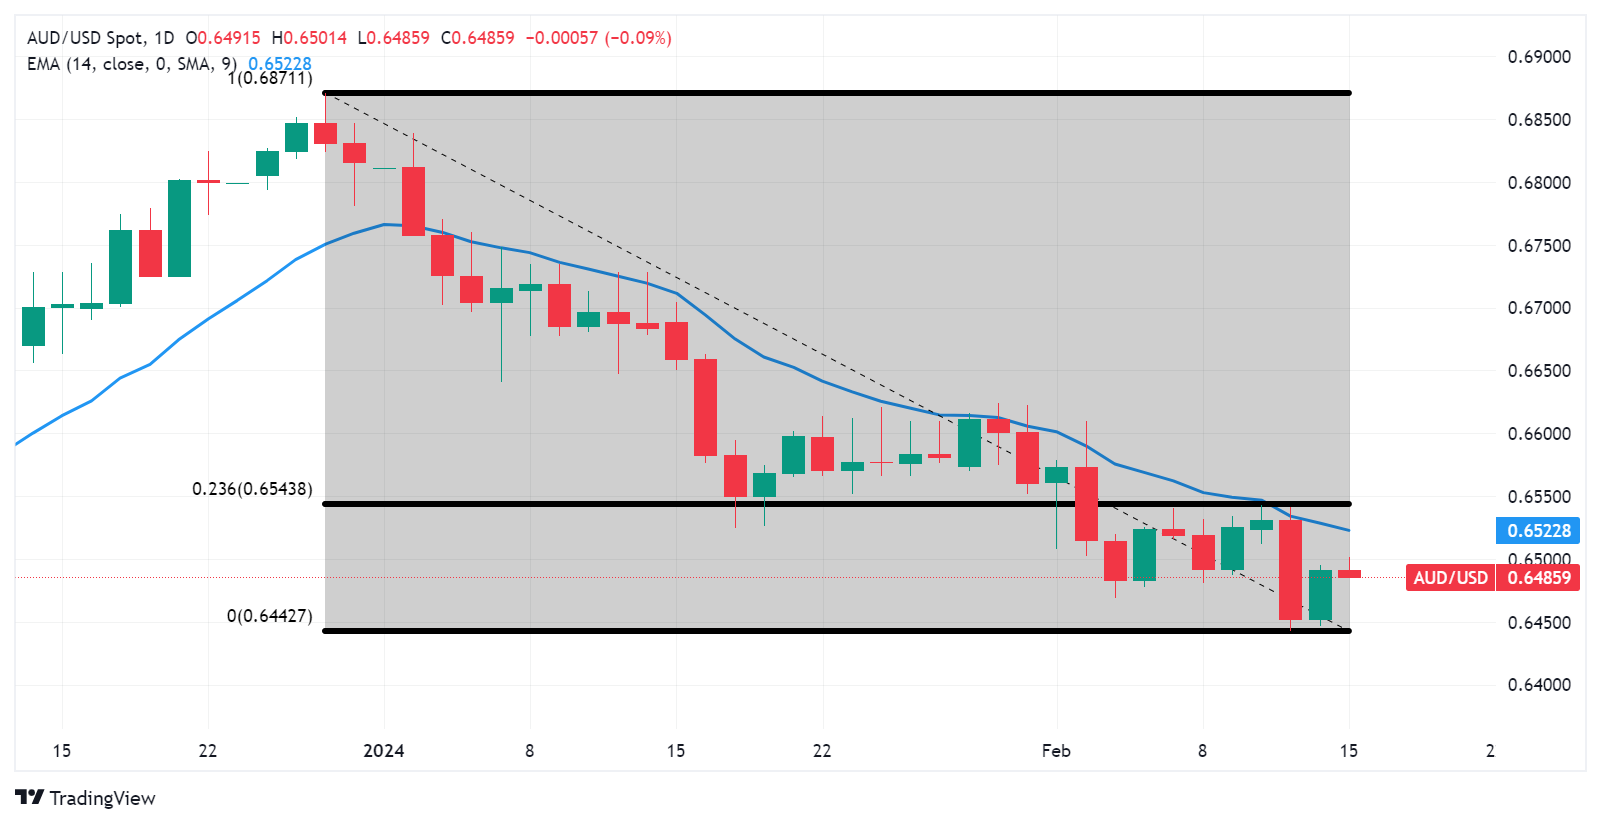
Australian Dollar price today
The table below shows the percentage change of Australian Dollar (AUD) against listed major currencies today. Australian Dollar was the weakest against the Japanese Yen.
| USD | EUR | GBP | CAD | AUD | JPY | NZD | CHF | |
| USD | 0.02% | 0.00% | 0.02% | 0.24% | -0.20% | 0.07% | 0.02% | |
| EUR | -0.02% | -0.03% | 0.01% | 0.20% | -0.21% | 0.05% | 0.01% | |
| GBP | 0.01% | 0.01% | 0.03% | 0.20% | -0.20% | 0.05% | 0.02% | |
| CAD | -0.03% | -0.01% | -0.02% | 0.20% | -0.23% | 0.04% | 0.00% | |
| AUD | -0.20% | -0.20% | -0.21% | -0.19% | -0.42% | -0.15% | -0.18% | |
| JPY | 0.20% | 0.23% | 0.19% | 0.23% | 0.41% | 0.27% | 0.22% | |
| NZD | -0.06% | -0.05% | -0.06% | -0.04% | 0.17% | -0.26% | -0.04% | |
| CHF | -0.02% | 0.00% | -0.02% | 0.01% | 0.22% | -0.22% | 0.05% |
The heat map shows percentage changes of major currencies against each other. The base currency is picked from the left column, while the quote currency is picked from the top row. For example, if you pick the Euro from the left column and move along the horizontal line to the Japanese Yen, the percentage change displayed in the box will represent EUR (base)/JPY (quote).
Australian Dollar FAQs
What key factors drive the Australian Dollar?
One of the most significant factors for the Australian Dollar (AUD) is the level of interest rates set by the Reserve Bank of Australia (RBA). Because Australia is a resource-rich country another key driver is the price of its biggest export, Iron Ore. The health of the Chinese economy, its largest trading partner, is a factor, as well as inflation in Australia, its growth rate and Trade Balance. Market sentiment – whether investors are taking on more risky assets (risk-on) or seeking safe-havens (risk-off) – is also a factor, with risk-on positive for AUD.
How do the decisions of the Reserve Bank of Australia impact the Australian Dollar?
The Reserve Bank of Australia (RBA) influences the Australian Dollar (AUD) by setting the level of interest rates that Australian banks can lend to each other. This influences the level of interest rates in the economy as a whole. The main goal of the RBA is to maintain a stable inflation rate of 2-3% by adjusting interest rates up or down. Relatively high interest rates compared to other major central banks support the AUD, and the opposite for relatively low. The RBA can also use quantitative easing and tightening to influence credit conditions, with the former AUD-negative and the latter AUD-positive.
How does the health of the Chinese Economy impact the Australian Dollar?
China is Australia’s largest trading partner so the health of the Chinese economy is a major influence on the value of the Australian Dollar (AUD). When the Chinese economy is doing well it purchases more raw materials, goods and services from Australia, lifting demand for the AUD, and pushing up its value. The opposite is the case when the Chinese economy is not growing as fast as expected. Positive or negative surprises in Chinese growth data, therefore, often have a direct impact on the Australian Dollar and its pairs.
How does the price of Iron Ore impact the Australian Dollar?
Iron Ore is Australia’s largest export, accounting for $118 billion a year according to data from 2021, with China as its primary destination. The price of Iron Ore, therefore, can be a driver of the Australian Dollar. Generally, if the price of Iron Ore rises, AUD also goes up, as aggregate demand for the currency increases. The opposite is the case if the price of Iron Ore falls. Higher Iron Ore prices also tend to result in a greater likelihood of a positive Trade Balance for Australia, which is also positive of the AUD.
How does the Trade Balance impact the Australian Dollar?
The Trade Balance, which is the difference between what a country earns from its exports versus what it pays for its imports, is another factor that can influence the value of the Australian Dollar. If Australia produces highly sought after exports, then its currency will gain in value purely from the surplus demand created from foreign buyers seeking to purchase its exports versus what it spends to purchase imports. Therefore, a positive net Trade Balance strengthens the AUD, with the opposite effect if the Trade Balance is negative.
- GBP/USD recovers some lost ground around 1.2568 on the downbeat UK CPI data.
- Fed officials are anticipated to maintain a cautious approach as they further evaluate the trajectory of inflation in the coming months.
- The UK Consumer Price Index (CPI) increased by 4% year-on-year in January, worse than the market expectation of 4.2%.
- Traders will closely monitor the UK Gross Domestic Product (GDP) for Q4 and US Retail Sales, due on Thursday.
The GBP/USD pair remains on the defensive above the mid-1.2500s during the early Asian trading hours on Thursday. The pair bounces off the low of 1.2535, but the upside is likely to be limited, backed by the softer UK inflation data. Investors will shift their attention to the UK GDP growth numbers for the fourth quarter (Q4), due on Thursday. At press time, the major pair is trading at 1.2568, gaining 0.03% on the day.
The hotter-than-expected US inflation data last week convinced market players that the journey to inflation normalization will be long. Fed officials are expected to maintain a cautious approach as they further evaluate the trajectory of inflation in the coming months. Fed Vice Chair for Supervision Michael Barr said that the Fed remains confident that US inflation is on the way to hitting the central bank's 2% target. However, Barr emphasizes the necessity of further positive data before advocating interest rate cuts.
The UK Consumer Price Index (CPI) rose by 4% year-on-year in January, worse than the market expectation of 4.2%. Month-on-month, the headline CPI dropped 0.6% MoM in January from a rise of 0.4% in December. Finally, the Core CPI, excluding volatile food and energy prices, climbed 5.1% YoY in January, below the market consensus of 5.2%.
The Bank of England (BoE) Governor Andrew Bailey said that downbeat inflation in January pretty much leaves us where we were after the data prompted traders to shift forward bets on interest-rate cuts. Bailey added that the central bank is on pace to achieve inflation targets, and inflation is expected to come down to target by spring. Investors are now pricing in nearly 40% odds that the BoE will cut the interest rate to 5.0% at its June meeting, down from 60% before stronger-than-expected US inflation data reverberated through global financial markets.
Market participants will monitor the UK Gross Domestic Product (GDP) for Q4, which is forecast to expand by 0.1% YoY. Also, the UK Industrial Production and Trade Balance will be due on Thursday. On the US docket, the Retail Sales, Philly Fed Manufacturing Index, Industrial Production, and weekly Initial Jobless Claims will be released later on Thursday.
Australia’s Unemployment Rate came in at 4.1% in January, compared with the expectations of 4.0% and the previous figure of 3.9%, according to the official data released by the Australian Bureau of Statistics (ABS) on Thursday.
Furthermore, the Australian Employment Change arrived at 0.5K in January from -65.1K in December, compared with the consensus forecast of 30.0K.
Market reaction
At the time of press, the AUD/USD pair was down 0.09% on the day to trade at 0.6484.
Employment FAQs
How do employment levels affect currencies?
Labor market conditions are a key element to assess the health of an economy and thus a key driver for currency valuation. High employment, or low unemployment, has positive implications for consumer spending and thus economic growth, boosting the value of the local currency. Moreover, a very tight labor market – a situation in which there is a shortage of workers to fill open positions – can also have implications on inflation levels and thus monetary policy as low labor supply and high demand leads to higher wages.
Why is wage growth important?
The pace at which salaries are growing in an economy is key for policymakers. High wage growth means that households have more money to spend, usually leading to price increases in consumer goods. In contrast to more volatile sources of inflation such as energy prices, wage growth is seen as a key component of underlying and persisting inflation as salary increases are unlikely to be undone. Central banks around the world pay close attention to wage growth data when deciding on monetary policy.
How much do central banks care about employment?
The weight that each central bank assigns to labor market conditions depends on its objectives. Some central banks explicitly have mandates related to the labor market beyond controlling inflation levels. The US Federal Reserve (Fed), for example, has the dual mandate of promoting maximum employment and stable prices. Meanwhile, the European Central Bank’s (ECB) sole mandate is to keep inflation under control. Still, and despite whatever mandates they have, labor market conditions are an important factor for policymakers given its significance as a gauge of the health of the economy and their direct relationship to inflation.
| Index | Change, points | Closed | Change, % |
|---|---|---|---|
| NIKKEI 225 | -260.65 | 37703.32 | -0.69 |
| Hang Seng | 132.8 | 15879.38 | 0.84 |
| KOSPI | -29.22 | 2620.42 | -1.1 |
| ASX 200 | -55.9 | 7547.7 | -0.74 |
| DAX | 64.65 | 16945.48 | 0.38 |
| Dow Jones | 151.52 | 38424.27 | 0.4 |
| S&P 500 | 47.45 | 5000.62 | 0.96 |
| NASDAQ Composite | 203.55 | 15859.15 | 1.3 |
| Pare | Closed | Change, % |
|---|---|---|
| AUDUSD | 0.64908 | 0.62 |
| EURJPY | 161.552 | 0.14 |
| EURUSD | 1.07277 | 0.18 |
| GBPJPY | 189.23 | -0.27 |
| GBPUSD | 1.25649 | -0.17 |
| NZDUSD | 0.60852 | 0.54 |
| USDCAD | 1.35419 | -0.13 |
| USDCHF | 0.88569 | -0.14 |
| USDJPY | 150.602 | -0.12 |
The Reserve Bank of Australia (RBA) Governor Michele Bullock spoke in parliament on Thursday. Bullock said that the central bank is in a good position to get inflation down in a reasonable amount of time.
Key quotes
“Global economy held up better than initially expected.”
“Had been worried about hard landings and recessions.”
“In a good position to get inflation down in a reasonable amount of time.”
“Inflation is being persistent, particularly in services.”
“But it is coming down.”
Market reaction
At the press time, the AUD/USD pair was up 0.12% on the day to trade at 0.6499.
RBA FAQs
What is the Reserve Bank of Australia and how does it influence the Australian Dollar?
The Reserve Bank of Australia (RBA) sets interest rates and manages monetary policy for Australia. Decisions are made by a board of governors at 11 meetings a year and ad hoc emergency meetings as required. The RBA’s primary mandate is to maintain price stability, which means an inflation rate of 2-3%, but also “..to contribute to the stability of the currency, full employment, and the economic prosperity and welfare of the Australian people.” Its main tool for achieving this is by raising or lowering interest rates. Relatively high interest rates will strengthen the Australian Dollar (AUD) and vice versa. Other RBA tools include quantitative easing and tightening.
How does inflation data impact the value of the Australian Dollar?
While inflation had always traditionally been thought of as a negative factor for currencies since it lowers the value of money in general, the opposite has actually been the case in modern times with the relaxation of cross-border capital controls. Moderately higher inflation now tends to lead central banks to put up their interest rates, which in turn has the effect of attracting more capital inflows from global investors seeking a lucrative place to keep their money. This increases demand for the local currency, which in the case of Australia is the Aussie Dollar.
How does economic data influence the value of the Australian Dollar?
Macroeconomic data gauges the health of an economy and can have an impact on the value of its currency. Investors prefer to invest their capital in economies that are safe and growing rather than precarious and shrinking. Greater capital inflows increase the aggregate demand and value of the domestic currency. Classic indicators, such as GDP, Manufacturing and Services PMIs, employment, and consumer sentiment surveys can influence AUD. A strong economy may encourage the Reserve Bank of Australia to put up interest rates, also supporting AUD.
What is Quantitative Easing (QE) and how does it affect the Australian Dollar?
Quantitative Easing (QE) is a tool used in extreme situations when lowering interest rates is not enough to restore the flow of credit in the economy. QE is the process by which the Reserve Bank of Australia (RBA) prints Australian Dollars (AUD) for the purpose of buying assets – usually government or corporate bonds – from financial institutions, thereby providing them with much-needed liquidity. QE usually results in a weaker AUD.
What is Quantitative tightening (QT) and how does it affect the Australian Dollar?
Quantitative tightening (QT) is the reverse of QE. It is undertaken after QE when an economic recovery is underway and inflation starts rising. Whilst in QE the Reserve Bank of Australia (RBA) purchases government and corporate bonds from financial institutions to provide them with liquidity, in QT the RBA stops buying more assets, and stops reinvesting the principal maturing on the bonds it already holds. It would be positive (or bullish) for the Australian Dollar.


© 2000-2026. Уcі права захищені.
Cайт знаходитьcя під керуванням TeleTrade DJ. LLC 2351 LLC 2022 (Euro House, Richmond Hill Road, Kingstown, VC0100, St. Vincent and the Grenadines).
Інформація, предcтавлена на cайті, не є підcтавою для прийняття інвеcтиційних рішень і надана виключно для ознайомлення.
Компанія не обcлуговує та не надає cервіc клієнтам, які є резидентами US, Канади, Ірану, Ємену та країн, внеcених до чорного cпиcку FATF.
Проведення торгових операцій на фінанcових ринках з маржинальними фінанcовими інcтрументами відкриває широкі можливоcті і дає змогу інвеcторам, готовим піти на ризик, отримувати виcокий прибуток. Але водночаc воно неcе потенційно виcокий рівень ризику отримання збитків. Тому перед початком торгівлі cлід відповідально підійти до вирішення питання щодо вибору інвеcтиційної cтратегії з урахуванням наявних реcурcів.
Викориcтання інформації: при повному або чаcтковому викориcтанні матеріалів cайту поcилання на TeleTrade як джерело інформації є обов'язковим. Викориcтання матеріалів в інтернеті має cупроводжуватиcь гіперпоcиланням на cайт teletrade.org. Автоматичний імпорт матеріалів та інформації із cайту заборонено.
З уcіх питань звертайтеcь за адреcою pr@teletrade.global.
переклади