- Analytics
- News and Tools
- Market News
Новини ринків
Japanese economic growth came in at -0.5% QoQ versus -0.1% expected and 1.2% prior, per the preliminary readings of the third quarter (Q3) 2023 Gross Domestic Product (GDP) figures.
Furthermore, the Annualized GDP contracted 2.1% versus 0.6% drop and 4.8% expansion prior.
Market reaction
Following the Japanese growth numbers, the USD/JPY pair is up 0.14% on the day at 150.44.
About Japan’s Gross Domestic Product (GDP)
The Gross Domestic Product (GDP), released by Japan’s Cabinet Office on a quarterly basis, is a measure of the total value of all goods and services produced in Japan during a given period. The GDP is considered as the main measure of Japan’s economic activity. The QoQ reading compares economic activity in the reference quarter to the previous quarter. Generally, a high reading is seen as bullish for the Japanese Yen (JPY), while a low reading is seen as bearish.
- GBP/USD surges to the 1.2500 barrier on the softer USD.
- The US headline Consumer Price Index (CPI) for October came in worse than the market consensus.
- UK ILO Unemployment Rate remains unchanged at 4.2% in the quarter to September.
- Traders will focus on the UK inflation data and the US Producer Price Index (PPI), Retail Sales.
The GBP/USD pair edges higher during the early Asian trading hours on Wednesday. The weakening of the US Dollar (USD), backed by a fall in US Treasury bond yields, lends some support to GBP/USD. At press time, the major pair is trading around 1.2497, down 0.04% on the day.
The US headline Consumer Price Index (CPI) for October surges 3.2% YoY versus 3.7% prior, worse than the market consensus of 3.3%. The core CPI, which excludes volatile food and energy prices, rose by 0.2% MoM and 4.0% YoY. The market anticipates the Federal Reserve (Fed) will not raise the interest rate further in this cycle. According to the CME FedWatch Tool, fed fund futures have priced in 0% odds of a rate hike in the December meeting. This, in turn, exerts some selling pressure on the Greenback and lifts the GBP/USD pair.
On the other hand, Bank of England (BoE) Chief Economist Huw Pill said on Tuesday that there is significant progress on inflation. Huw further stated that they don't necessarily need to hike another rate but are prepared to if needed.
On Tuesday, the UK ILO Unemployment Rate remained steady at 4.2% in the quarter to September, matching the market estimation of 4.2%. Meanwhile, the number of people claiming jobless benefits rose by 17.8K in September from the previous reading of 20.4K.
Looking ahead, the UK Consumer Price Index (CPI) for October will be released. The monthly and annual UK inflation figures are expected to rise by 0.1% and 4.8%, respectively. The core CPI number is estimated to climb 5.8% YoY in October. On the US docket, the Producer Price Index (PPI) and Retail Sales will be due.
- The NZD/USD has bounded back into the top end after broader markets went risk-on.
- Tuesday saw safe havens go broadly lower as investors stepped out post-US CPI.
- Up Next: US PPI, Retail Sales slated for Wednesday.
The NZD/USD has ripped higher after gaining almost 2.6% from Tuesday's lows. The Kiwi (NZD) saw its single best trading day against the US Dollar (USD) since July of this year as broad-market risk appetite roared back following a US Consumer Price Index (CPI) inflation reading that came in below expectations.
US inflation appears to be easing at a faster rate than market participants anticipated ahead of the US CPI print, and the decline in headline inflation sent the Greenback broadly lower across the board.
US CPI inflation softens to 3.2% vs. 3.3% forecast
Month-over-month headline US CPI in October printed at a flat 0.0%, coming in below the forecast 0.1% and dipping even further from the previous month's print of 0.4%.
With inflation measures falling past forecasts, investors are seeing hopes of the Federal Reserve (Fed) getting pushed off their "higher for longer" hawkish perch and will see an accelerated timeline for beginning the next rate cut cycle.
Forex Today: US inflation slows, Dollar tumbles
Next up on the economic calendar data docket will be US Producer Price Index (PPI) and Retail Sales numbers.
Core US PPI for the year into October is expected to print flat at 2.7%, in-line with September's annualized reading, while US MoM Retail Sales are forecast to see a sharp turnaround from September's 0.7% growth. Median market forecasts see October's monthly Retail Sales number printing at -0.3%.
NZD/USD Technical Outlook
Despite the Kiwi's firm bounce to reclaim the 0.6000 major handle on Tuesday, the NZD/USD remains under significant technical pressure. Price action continues to waffle below the 200-day Simple Moving Average (SMA) currently dropping into 0.6100, and the immediate ceiling on an bullish extension sits at early October's swing high into the 0.6050 level.
Swing lows on the daily candlesticks have begun to chalk out a technical support zone from 0.5800 to 0.5900, but the 50-day SMA continues to draw in bids, trapping prices into downside momentum near the 0.5900 handle.
NZD/USD Daily Chart
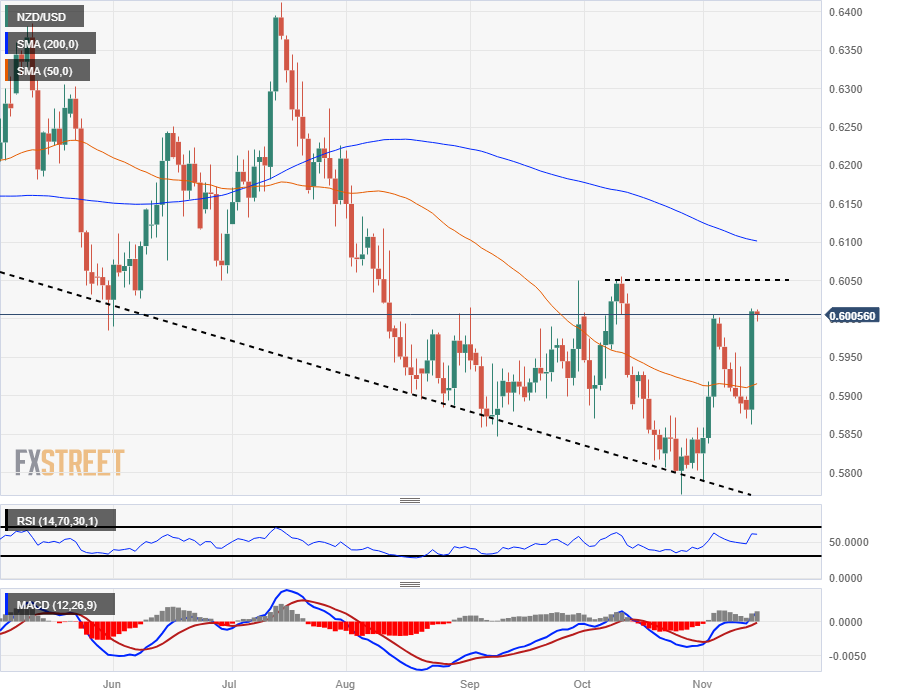 NZD/USD Technical Levels
- The Office for National Statistics will release the critical UK CPI report on Wednesday.
- Headline and Core annual inflation are set to fall in October, finally below the 6.0% level.
- The BoE’s interest rate outlook and the Pound Sterling’s fate hinges on the UK CPI data.
The Pound Sterling market keenly awaits the release of the high-impact United Kingdom’s (UK) Consumer Price Index (CPI) data for October, which will be released by the Office for National Statistics (ONS) on Wednesday.
Back in September, the UK CPI rose at an annual pace of 6.7% in September, at the same pace as seen in August. The data beat market expectations of a 6.5% rise. The Core CPI index (excluding volatile food and energy items) accelerated by 6.1% YoY in the reported month against an increase of 6.2% seen in August, surpassing the 6.0% forecast.
Despite the persistently high inflation level, the Bank of England (BoE) held the benchmark interest rate at a 15-year high of 5.25% at its November policy meeting, leaving the door open for another interest rate hike. The BoE tweaked the language in its policy statement by saying, “the Monetary Policy Committee’s (MPC) latest projections indicate that monetary policy is likely to need to be restrictive for an extended period of time.”
Last week, BoE Chief Economist Huw Pill reinforced the message that “maintaining a restrictive stance of monetary policy [is] key to meeting the inflation target.”
Meanwhile, the Bank’s updated forecasts showed that the British economy would be flatlining in the coming years. The BoE forecasts also showed that inflation was expected to fall to 4.8% in October, almost two full points lower than in September. The UK central bank said that the expected decline in inflation could be due to the slowdown in the economy and the fading impact of last year’s gas price surge, implying that inflation is set to resume its downward momentum soon.
Ahead of Wednesday’s inflation data, Pound Sterling traders digest the latest wage inflation data, which showed that Average Earnings excluding Bonus in the UK rose 7.7% 3M YoY in September, as against a 7.8% increase registered in August.
However, the UK pay growth data is unlikely to have any significant impact on the BoE’s policy outlook. The BoE acknowledged in its November policy statement that there were “increasing uncertainties” about official data on the labor market, which has been hampered by low survey response rates.
“But jobs growth was likely to have been weaker than it previously thought and the worryingly strong growth in wages was expected to cool off,” the statement said.
Meanwhile, “Bank of England tightening expectations have evaporated. World Interest Rate Probability (WIRP), a gauge by Bloomberg, now suggests 10% odds of a hike on December 14, rising modestly to top out near 20% for February 1. The first cut is largely priced in for August 1,” analysts at BBH noted.
What to expect in the next UK inflation report?
The headline annual UK Consumer Price Index is seen rising 4.8% in October as against a 6.7% increase in September. The figure would be the lowest since October 2021, still more than twice the BoE’s 2.0% target.
The Core CPI inflation is expected to drop to 5.8% YoY in October, compared to September’s 6.1% print. On a monthly basis, Britain’s CPI is seen rising by 0.1% after the 0.5% growth reported previously.
Analysts at TD Securities (TDS) offered a snippet on the UK CPI data, citing that the “UK headline inflation will drop sharply in October, likely matching the BoE's forecast of 4.8% y/y, largely on the back of base effects in the energy component. Services inflation likely remained below the BoE's forecast though (TDS: 6.7%, BoE: 6.9%), and should reinforce the view that the Bank is done hiking rates.”
When will the UK Consumer Price Index report be released and how could it affect GBP/USD?
The UK CPI data will be published at 07:00 GMT on Wednesday. The Pound Sterling is looking to build on its recovery above 1.2200 against the US Dollar in the lead-up to the high-impact United Kingdom’s inflation data. The reinforcement of the hawkish rhetoric from the US Federal Reserve (Fed) officials is helping keep the US Dollar afloat.
A hotter-than-expected headline and core inflation data could bring bets of one final BoE rate hike in December back on the table, providing extra legs to the upswing in the Pound Sterling. In this scenario, GBP/USD could head back toward the previous week’s high of 1.2429. GBP/USD is expected to challenge the 1.2100 static support should the UK CPI data disappoint the BoE hawks.
Meanwhile, Dhwani Mehta, Asian Session Lead Analyst at FXStreet, offers a brief technical outlook for the major and explains: “The GBP/USD pair needs to find acceptance above the critical 200-day Simple Moving Average (SMA) at 1.2438 on the renewed upside. The 14-day Relative Strength Index (RSI) is pointing north above the midline, justifying the extension of the upbeat momentum in the pair.”
“A sustained break above the 200-day SMA could fuel a fresh advance toward the 100-day SMA at 1.2515. The next topside barrier is seen at the 1.2600 round figure. Conversely, strong support is seen at the 50-day SMA at 1.2255, below which the 21-day SMA at 1.2205 could test bullish commitments. Further declines could challenge the 1.2100 demand area,” Dhwani adds.
Economic Indicator
United Kingdom Consumer Price Index (YoY)
The United Kingdom (UK) Consumer Price Index (CPI), released by the Office for National Statistics on a monthly basis, is a measure of consumer price inflation – the rate at which the prices of goods and services bought by households rise or fall – produced to international standards. It is the inflation measure used in the government’s target. The YoY reading compares prices in the reference month to a year earlier. Generally, a high reading is seen as bullish for the Pound Sterling (GBP), while a low reading is seen as bearish.
Read more.Next release: 11/15/2023 07:00:00 GMT
Frequency: Monthly
Source: Office for National Statistics
Why it matters to traders
The Bank of England is tasked with keeping inflation, as measured by the headline Consumer Price Index (CPI) at around 2%, giving the monthly release its importance. An increase in inflation implies a quicker and sooner increase of interest rates or the reduction of bond-buying by the BOE, which means squeezing the supply of pounds. Conversely, a drop in the pace of price rises indicates looser monetary policy. A higher-than-expected result tends to be GBP bullish.
Inflation FAQs
What is inflation?
Inflation measures the rise in the price of a representative basket of goods and services. Headline inflation is usually expressed as a percentage change on a month-on-month (MoM) and year-on-year (YoY) basis. Core inflation excludes more volatile elements such as food and fuel which can fluctuate because of geopolitical and seasonal factors. Core inflation is the figure economists focus on and is the level targeted by central banks, which are mandated to keep inflation at a manageable level, usually around 2%.
What is the Consumer Price Index (CPI)?
The Consumer Price Index (CPI) measures the change in prices of a basket of goods and services over a period of time. It is usually expressed as a percentage change on a month-on-month (MoM) and year-on-year (YoY) basis. Core CPI is the figure targeted by central banks as it excludes volatile food and fuel inputs. When Core CPI rises above 2% it usually results in higher interest rates and vice versa when it falls below 2%. Since higher interest rates are positive for a currency, higher inflation usually results in a stronger currency. The opposite is true when inflation falls.
What is the impact of inflation on foreign exchange?
Although it may seem counter-intuitive, high inflation in a country pushes up the value of its currency and vice versa for lower inflation. This is because the central bank will normally raise interest rates to combat the higher inflation, which attract more global capital inflows from investors looking for a lucrative place to park their money.
How does inflation influence the price of Gold?
Formerly, Gold was the asset investors turned to in times of high inflation because it preserved its value, and whilst investors will often still buy Gold for its safe-haven properties in times of extreme market turmoil, this is not the case most of the time. This is because when inflation is high, central banks will put up interest rates to combat it.
Higher interest rates are negative for Gold because they increase the opportunity-cost of holding Gold vis-a-vis an interest-bearing asset or placing the money in a cash deposit account. On the flipside, lower inflation tends to be positive for Gold as it brings interest rates down, making the bright metal a more viable investment alternative.
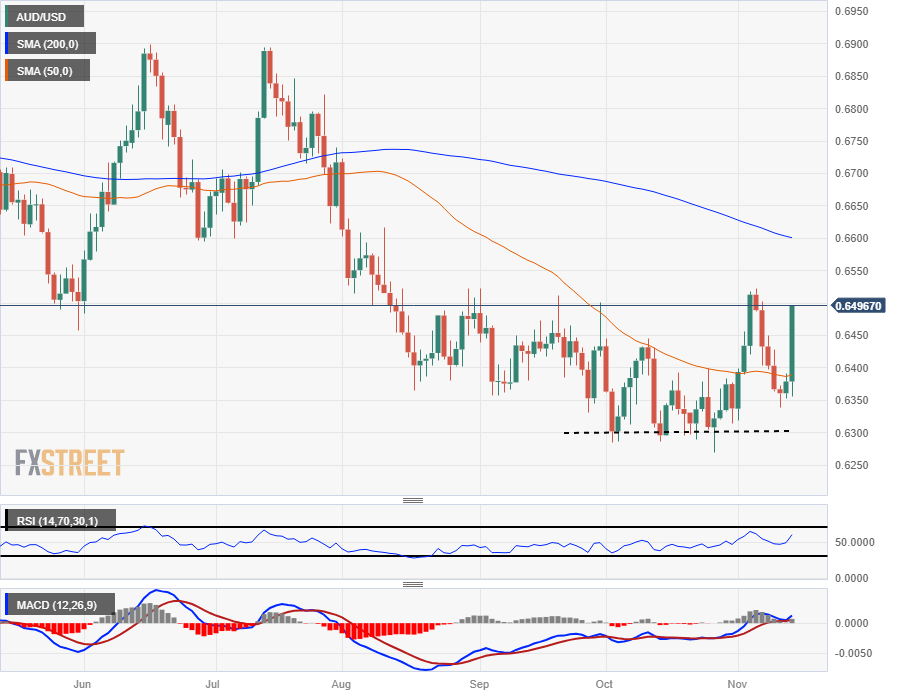
- AUD/USD edges higher to 0.6500 amid the weakness of USD.
- The US Consumer Price Index (CPI) fell 3.2% YoY in October vs. 3.7% prior.
- The Australian Wage Price Index will be released, which is expected to rise 1.3% QoQ in Q3.
- Traders will monitor US Retail Sales and Producer Price Index (PPI) on Wednesday.
The AUD/USD pair holds above 0.6500 during the early Asian session on Wednesday. The weaker US inflation data boosts the risk-on mood across markets, which increases investor appetite for riskier assets like the Australian dollar (AUD). The pair currently trades around 0.6503, down 0.05% on the day.
The US inflation, as measured by the Consumer Price Index (CPI) came in worse than market expectations by dropping 3.2% YoY in October from 3.7% in the previous reading. In response to the data, the US Dollar (USD) fell broadly, the lowest since early September. The 10-year US Treasury yield slid sharply from 4.60% to 4.48%, the lowest since September 26. These downbeat figures dampen expectations that the FOMC would increase interest rates further, and the odds of rate hikes in December and January are now zero. This, in turn, drags the USD lower and acts as a tailwind for the AUD/USD pair.
Chicago Federal Reserve (Fed) President Austan Goolsbee said on Tuesday that the path in lowering inflation continues and economic growth remains robust. While Richmond Fed President Thomas Barkin stated he is not convinced that inflation is on a "smooth glide path" to the 2% target.
Market participants will monitor Australia’s Wage Price Index for Q3 on Wednesday, which is expected to rise 1.3% QoQ in the third quarter. These data will have a considerable impact on the Reserve Bank of Australia's (RBA) expectations. Later in the day, the US Retail Sales and Producer Price Index (PPI) will be due. Traders will take cues from the data and find trading opportunities around the AUD/USD pair.
- USD/CHF drops more than 1.40% to a two-month low of 0.8879, influenced by soft US CPI.
- The pair's fall below the 200-day moving average strengthened the bearish bias, with potential targets at 0.8745 and the 0.8700 level.
- For a bullish reversal, the USD/CHF must breach the 0.8900 mark, aiming for the 200-DMA at 0.8993.
The USD/CHF plunged sharply on Tuesday, more than 1.40%, with the pair dropping to new two-month lows of 0.8879 after hitting a daily high of 0.9027, sponsored by soft US economic data. At the time of writing, the pair trades at 0.8883, down 0.07% as Wednesday’s Asian session begins.
The daily chart portrays the pair with a bearish bias. The USD/CHF drop below the 200-day moving average (DMA) at 0.8994 accelerated the downtrend, which witnessed a break of the latest cycle low seen on October 24 at 0.8887. Downside risks remain if USD/CHF tumbles toward the August 30 swing low of 0.8745, ahead of testing the 0.8700.
For a bullish resumption, USD/CHF buyers must reclaim 0.8900 to remain hopeful of lifting prices toward the 200-DMA at 0.8993, ahead of the 0.9000 figure. A breach of the latter, the next resistance will be the November 13 high at 0.9052.
USD/CHF Price Analysis – Daily Chart

USD/CHF Technical Levels
- The USD/SEK plunged towards 10.590, seeing 2.3% losses and hitting it lowest point since August.
- Swedish and US CPI readings from October came in lower than expected.
- Dovish bets on the Fed are pushing the pair downwards.
The USD/SEK dived vertically on Tuesday's session, falling to 10.590, tallying 2.3% daily losses. This was mainly driven by the USD weakening after the report of soft inflation figures for October, which was cheered by financial markets as their are now betting on the Federal Reserve (Fed) not hiking in December.
During October, the US Consumer Price Index (CPI) failed to meet expectations, exhibiting a decrease in the annual rate from 3.7% to 3.2%. This figure fell below the consensus forecast of 3.3%. Additionally, the Core CPI experienced a 0.2% increase in October, dropping the annual rate to 4%. These statistics further solidify the prevailing belief that the Federal Reserve is unlikely to proceed with further interest rate increases and cut rates sooner rather than later.
On Wednesday, the US will report Producer Price Index (PPI) and Retail Sales data from October, which could further reinforce the dovish narrative.
On the Swedish side, its CPI declined to 6.5% YoY but failed to trigger a reaction on the pair during the European session.
USD/SEK levels to watch
Based on the daily chart, the USD/SEK displays a bearish technical bias, with indicators reflecting that the sellers covered significant ground. The Relative Strength Index (RSI) reached oversold conditions, which could suggest that an upward correction could be possible in the next sessions, while the Moving Average Convergence (MACD) histogram prints rising red bars. In the larger context, the pair is now below the 20,100 and 200-day Simple Moving Averages (SMAs), confirming that the outlook has turned negative for the pair.
Supports: 10.650, 10.600, 10.550.
Resistances: 10.673 (200-day SMA), 10.692, 10.715.
USD/SEK daily chart
-638355980743992277.png)
Research from ABN Amro suggests that cooling US inflation will bring the Fed to the rate cut table sooner rather than later.
More good (inflation) news for the Fed
CPI inflation for October came in a touch weaker than consensus. In annual terms, disinflation therefore continued, with headline inflation falling back to 3.2% y/y.
As expected, the fall in gasoline prices (driven partly by lower refining margins) was the main driver of the flat m/m inflation reading. However, core inflation was also unexpectedly benign.
All in all, this is a very positive report for the Fed, with now five consecutive months of relatively benign inflation readings. This further strengthens our conviction that the Fed is done raising rates, and it raises the risk that the Fed could yet pivot to rate cuts earlier than our newly-revised June call.
Danske Bank has a quick note highlighting their inflation expectations both in the US and the EU.
The Big Picture
Inflation drivers continue to paint a mixed picture, but inflation is likely to head lower towards 2024 in the US and euro area. Underlying inflation and wage growth have begun to ease in the US, but remain sticky in the euro area.
(US) October CPI surprised to the downside in both headline and core terms. As underlying price pressures continue to moderate, we still expect the Fed to cut rates in March 2024.
(EU) Inflation fell significantly again in October due to base effects from energy and food prices but also waning inflationary momentum. Going forward, we expect the decline in core and food inflation to continue while energy inflation provides some upside risks to headline inflation.
- AUD/JPY pair surges over 1.90% to 97.87, driven by improved risk appetite and expectations of a less aggressive US Federal Reserve.
- The cross-pair approaches a new 13-month high, eyeing the critical 98.00 level, with the potential to test last year's peak of 98.60 and the 100.00 psychological mark.
- The pair shows the uptrend is overextended, with key supports at 97.59, 96.98, and 96.83, potentially halting further advances.
The AUD/JPY extended its gains on risk appetite improvement on Tuesday, as investors speculated the US Federal Reserve wouldn’t raise rates due to a soft October inflation report. Therefore, traders seeking risks bought high-beta currencies to the detriment of the Japanese Yen's (JPY's) safe-haven status. The pair is trading at 97.87, which is a gain of more than 1.90%.
The daily chart portrays the cross-pair as upward biased after hitting a new 13-month high, shy of reclaiming the 98.00 mark, which, once cleared, could pave the way to test last year´s high of 98.60, ahead of challenging the psychological 100.00 mark.
Nevertheless, the AUD/JPY uptrend seems overextended, and in the event of a pullback, the first support would be the November 7 high at 97.59, previous resistance levels, turned support. A decisive break would expose the Tenkan-Sen at 96.98 before sliding to the July 5 high at 96.83. Once this demand zone is cleared, the next stop would be the Senkou Span A at 96.49.
AUD/JPY Price Analysis – Daily Chart

AUD/JPY Technical Levels
- The EUR/USD has climbed almost 200 pips on Tuesday.
- Broader markets have flipped the risk appetite switch to 'on'.
- US CPI missed forecasts, increasing investor bets that rates could come back down sooner.
The EUR/USD is climbing on Tuesday, rising over 1.8% from bottom to top as the Euro (EUR) finds a firm bid against the US Dollar (USD).
US CPI inflation softens to 3.2% vs. 3.3% forecast
US Consumer Price Index (CPI) inflation broadly came in below expectations, giving investors hope that price growth is cooling enough in the US domestic economy to push the Federal Reserve (Fed) towards a rate cut cycle sooner rather than later.
Month-over-month headline US CPI in October printed at a flat 0.0%, declining from September's 0.4% and missing the median market forecast of 0.1%. Annualized inflation for the year into October also missed the mark, printing at 3.2% against the previous period's 3.7% and coming in below the forecast 3.3%.
Pan-EU Industrial Production for September is expected to come in on the downside early Wednesday, forecast to decline to -0.7% against the previous month's 0.6%.
US data is set to rule the charts heading into the mid-week with US Producer Price Index (PPI) and Retail Sales on the data docket for Wednesday.
The headline US PPI Core numbers for October are expected to hold steady for the year into October, forecast to print steady at 2.7%.
Meanwhile, Retail Sales for October are expected to pull back sharply, forecast to come in at -0.3% compared to September's 0.7%.
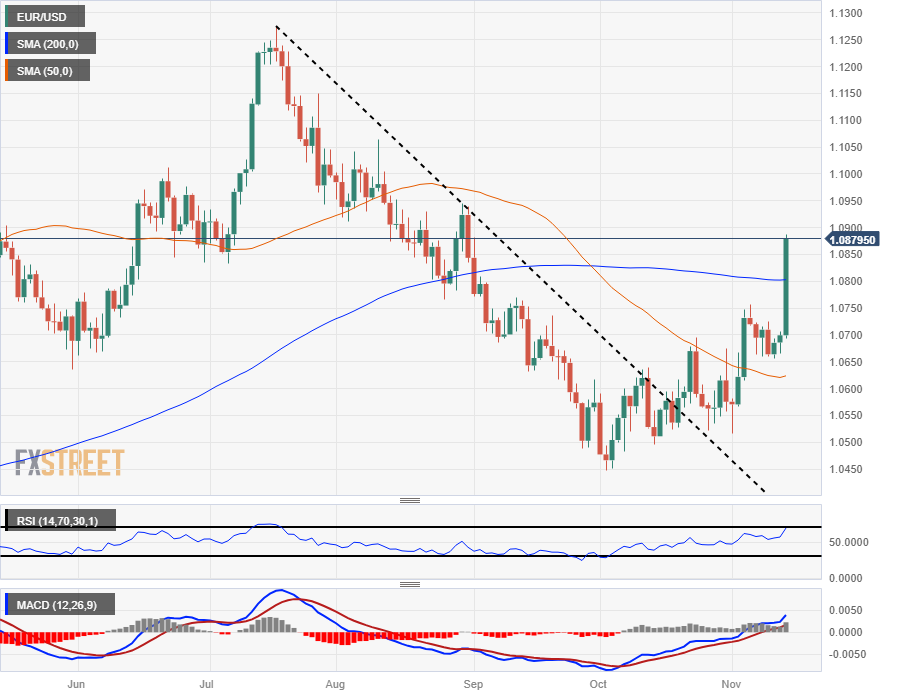
EUR/USD Technical Outlook
The Euro's Tuesday rally has sent the EUR/USD well above the 200-day Simple Moving Average (SMA), cracking the long-term moving average near the 1.0800 handle and easily clearing the technical barrier.
The pair is trading just south of the 1.0900 level after gaining over 1.8% from the day's lows near 1.0700.
The EUR/USD's recent lift from October's early low bids near 1.0450 has seen price action shear both the 200- and 50-day SMAs. The bearish-stacked moving averages are set for a bullish cross if markets can keep the risk bid on-balance.
EUR/USD Daily Chart
EUR/USD Technical Level
- The USD/JPY plunged towards, down by 0.95%.
- The pair is battling to hold the 20-day SMA, critical support since late July.
- After the CPI’s volatility, markets focus to the Japanese Q3 GDP figures, US PPI and Retail Sales data on Wednesday.
The USD/JPY suffered significant setbacks in Tuesday's session, falling towards the trajectory of the pair being set by soft CPI data from the US. Now, the focus shifts to high-tier data from both countries to be released on Wednesday.
In October, consumer price inflation in the United States was lower than expected, as indicated by the flat monthly headline Consumer Price Index (CPI). Additionally, prices in the core segment also demonstrated weaker growth than anticipated, registering a 0.2% increase MoM while the YoY measure decelerated to 4%. What weakened the USD was markets betting on a less aggressive Federal Reserve and the hopes on a sooner rate cuts, which fueled a wave of risk-on flows.
On the other hand, preliminary Gross Domestic Product (GDP) figures from Japan will likely impact the dynamics of the pair as it could fuel hawkish bets on the Bank of Japan (BoJ). It's worth noticing that former Bank of Japan BoJ official Hideo Hayakawa will likely raise rates by April 2024, so in case the economy shows strong figures, the JPY may strengthen. That being said, markets are forecasting a 0.6% annualised contraction from its previous 4.8% reading.
USD/JPY levels to watch
The USD/JPY displays a neutral to bearish technical bias on the daily chart, with signals suggesting that the bears are gaining ground. The Relative Strength Index (RSI) points south below its middle point, while the Moving Average Convergence (MACD) histogram exhibits flat green bars. Surveying the larger context, despite the bears gaining ground and pushing the pair just below the 20-day Simple Moving Average (SMA), it is still above the 100 and 200-day SMAs, suggesting that the bulls are common on the broader time horizon.
Supports: 150.30 (20-day SMA), 150.00, 149.00.
Resistances: 151.00, 151.50, 153.00
USD/JPY daily chart
-638355929282400319.png)
Another busy day lies ahead. During the Asian session, key reports will include Japan's Q3 GDP, Australia's Wage Price Index and Chinese Retail Sales and Industrial Production figures. Later in the day, data includes UK inflation data, followed by Euro zone Industrial Production. Traders will receive more US inflation figures with the Producer Price Index and information on consumption with Retail Sales.
Here is what you need to know on Wednesday, November 15:
In October, US inflation slowed more than anticipated, data released on Tuesday showed, resulting in a sharp decline of the US Dollar across the board. The Dollar Index (DXY) lost 1.50% and fell to the 104.00 area, reaching its lowest level since early September. Risk appetite and a rally in Treasury bonds weighed further on the Greenback that looked vulnerable to more losses ahead of the Asian session.
The US 10-year yield experienced a significant drop from 4.60% to 4.48%, marking its lowest level since September 26. Gold benefited from this development, witnessing a rally from $1,940 to $1,970. Silver joined the rally and surpassed the $23.00 mark.
The US Consumer Price Index (CPI) for October came in lower than expected, with the annual rate slowing from 3.7% to 3.2%, falling below the consensus forecast of 3.3%. The Core CPI rose by 0.2% in October, and the annual rate decreased to 4%. These figures further reinforced the prevailing narrative that the Federal Reserve is unlikely to raise interest rates further.
Analysts at TD Securities:
Today's CPI report should be a welcome relief for Fed officials: output has been advancing at a firm pace, but price pressures have continued to ebb. This should allow the Fed to be more patient in waiting for the economy to settle down at a lower pace of growth. Today's data also supports our long-held view that the Fed is likely done with rate increases, and we continue to look for a first rate cut in June 2024.
More inflation figures are scheduled to be released in the US on Wednesday, with the Producer Price Index (PPI). Additionally, the October Retail Sales report will be of relevance, with expectations indicating a contraction of 0.3%.
The EUR/USD surged towards the 1.0900 level, surpassing the key 100-day and 200-day Simple Moving Averages (SMA). Economic data from the Eurozone came in as expected, indicating a 0.1% contraction during the third quarter and a positive change in employment by 0.3%. The ZEW survey provided mixed numbers. Germany will report wholesale inflation on Wednesday, and Eurostat will release Industrial Production data.
GBP/USD experienced a significant gain of over 200 pips, reaching the 1.2500 zone and surpassing the 200-day Simple Moving Average (SMA). This shift in momentum has turned the outlook bullish for the pair. On Wednesday, UK inflation data and Retail Sales figures are due. These numbers will be closely monitored, and if inflation continues to decline as expected, it is likely to keep the Bank of England on hold in terms of monetary policy decisions.
UK CPI Preview: Forecasts from four major banks, inflation notably undershooting the BoE’s forecast
USD/CHF dropped to its lowest level since early September, falling below 0.8900. Surprisingly, the Swiss franc lagged behind despite comments from Swiss National Bank (SNB) Chairman Thomas Jordan not ruling out the possibility of more interest rate hikes in the future.
USD/JPY dropped significantly from 151.80 to 150.30 and appeared vulnerable to further losses. The Japanese Yen benefited from lower Treasury yields, but it lost strength against other G10 currencies due to risk appetite. Japan will release preliminary Q3 GDP data on Wednesday, with expectations of a 0.1% contraction. Later in the day, Industrial Production data will also be released.
AUD/USD broke above 0.6450 and surpassed 0.6500, approaching the key barrier at 0.6520. The Australian Bureau of Statistics is expected to release the Wage Price Index, which is anticipated to rise by 1.3%. These figures will be significant for expectations regarding the Reserve Bank of Australia (RBA). On Thursday, jobs data will be published, providing further insights.
NZD/USD rallied from 0.5880 to above 0.6000 and appeared poised to extended gains. Electronic Card Retail Sales figures for October are due.
Like this article? Help us with some feedback by answering this survey:
- Gold prices climbed nearly 0.90% to $1963.70, reacting to a drop in US Treasury yields after a softer-than-anticipated US inflation report.
- October's CPI in the US eases to 3.2%, below expectations, leading to a significant decrease in the US 10-year note yield and a 1.50% fall in the Dollar Index.
- Market focus shifts to upcoming US economic data, including PPI and Retail Sales, for further cues on the Federal Reserve's policy direction.
Gold price climbs close to 0.90% on Tuesday after hitting a daily low of $1938.84 due to a plunge in US Treasury bond yields courtesy of a softer inflation report in the United States (US). That weighed on the Greenback, which so far has lost more than 1.50% of its value against a basket of currencies, hence the jump in the price of yellow metal. The XAU/USD is trading at $1963.70.
XAU/USD Nears $1964 Mark Amid Declining Treasury Yields and Lower-than-Expected CPI Data
The US Bureau of Labor Statistics (BLS) reported that October's inflation cooled more than expected. The Consumer Price Index (CPI) for the 12 months came in at 3.2%, down from the previous reading of 3.7%. Additionally, the monthly CPI figure was 0%, below the 0.1% expected by most economists.
Furthermore, the report indicated that core CPI, which excludes volatile items and is often considered a more stable measure of inflation, decreased by a tenth of a percent. It fell from the prior month's reading of 4.1% to 4%, missing estimates that had predicted it would remain at 4.1%.
The release of this data has caused a significant decline in the US 10-year benchmark note yield, which decreased by more than 18 basis points and is currently at 4.45%, levels not seen since September 22, 2023. Consequently, the US Dollar Index (DXY) dropped by more than 1.50%, falling to 104.13. This decline follows a daily high of 105.73.
Consequently, XAU/USD jumped from below $1940 toward the $1970.92 daily high before trimming some of its gains and stabilizing at around the current spot price. Nevertheless, upside risks remain as the 20-day moving average (DMA) lies at $1972.81, which, once breached, could open the door for further upside.
The US economic docket would feature the Producer Price Index (PPI), Retail Sales, the New York Fed Empire States Manufacturing Index, and Federal Reserve speakers.
Gold Technical Levels
- The USD/NOK declined to 10.887, seeing 1.70% losses.
- Soft inflation figures from the US fueled risk on flows.
- Markets are betting on a more dovish Federal Reserve.
- The US will report Retail Sales and PPI figures on Wednesday.
The USD/NOK faced severe selling pressure on Tuesday, reaching 10.880 and seeing 1.70% losses. A weak US Dollar mainly drove the pair after the report of October inflation figures from the US, which came in softer than expected.
According to the official report of the US Bureau of Labor Statistics, the monthly Consumer Price Index (CPI) remained unchanged while experiencing a year-on-year increase of 3.2%. The Core measure was registered at 4% YoY, slightly lower than the prior 4.1%. After the report of soft Nonfarm Payrolls in early November, these figures reduced the likelihood of another interest rate increase by the Federal Reserve (Fed), immediately prompting a risk-on sentiment in financial markets.
The question is now how long the Fed will maintain rates at restrictive levels, and in the meantime, markets are betting on rate cuts in May 2024. On Wednesday, the US will report the Producer Price Index (PPI) and Retail Sales figures from October, which will likely give further clues on the Fed's plans.
USD/NOK levels to watch
Based on the daily chart, the USD/NOK has a bearish technical outlook as indicators are flashing signs of sellers gaining ground after pushing the pair down by more than 3% since last Friday. The Relative Strength Index (RSI) displays a negative slope in the bearish region, while the Moving Average Convergence (MACD) histogram shows rising red bars.
Evaluating the broader scale technical outlook, the pair is also below the 20 and 200-day Simple Moving Averages (SMAs), but above the 100-day SMA, indicating that the bulls are still holding some dominance over the bears on the broader time horizon despite the sellers being in command in the short term.
Supports: 10.881, 10.850, 10.775.
Resistances: 11.000, 11.030, 11.119 (20-day SMA).
USD/NOK daily chart
-638355868651946834.png)
- The EUR/JPY is trading into its highest bids since 2008, inches away from 164.00.
- A rebound in broad market sentiment is sending safe havens firmly lower on Tuesday.
- Up Next: Japan GDP in early Wednesday session.
The EUR/JPY has hit its highest prices since 2008, a fifteen-year high for the pair as the safe haven Japanese Yen (JPY) falls back against the Euro (EUR). A broad market recovery in risk appetite fueled by a worse-than-expected US Consumer Price Index (CPI) printing is giving investors renewed hopes that inflation could be receding faster than the Federal Reserve (Fed) expects, meaning the US central bank could be pushed towards rate cuts sooner than expected.
Pan-EU Gross Domestic Product (GDP) printed exactly as expected early Tuesday, with the quarter-on-quarter figure coming in at -0.1%. The annualized number printed steady at 0.1%.
The ZEW Economic Sentiment Survey for November improved appreciably, printing at 13.8 against October's 2.3.
The early Wednesday trading session sees Japanese GDP figures, and the QoQ figure is expected to decline from 1.2% to a -0.1% contraction.
Japanese Yen price today
The table below shows the percentage change of Japanese Yen (JPY) against listed major currencies today. Japanese Yen was the weakest against the New Zealand Dollar.
| USD | EUR | GBP | CAD | AUD | JPY | NZD | CHF | |
| USD | -1.57% | -1.68% | -0.68% | -1.86% | -0.74% | -1.96% | -1.32% | |
| EUR | 1.55% | -0.11% | 0.88% | -0.28% | 0.82% | -0.38% | 0.25% | |
| GBP | 1.65% | 0.10% | 0.98% | -0.18% | 0.92% | -0.29% | 0.36% | |
| CAD | 0.66% | -0.90% | -1.01% | -1.18% | -0.09% | -1.29% | -0.63% | |
| AUD | 1.83% | 0.27% | 0.17% | 1.16% | 1.09% | -0.11% | 0.53% | |
| JPY | 0.74% | -0.82% | -0.92% | 0.07% | -1.11% | -1.19% | -0.57% | |
| NZD | 1.93% | 0.38% | 0.28% | 1.29% | 0.12% | 1.18% | 0.62% | |
| CHF | 1.30% | -0.25% | -0.36% | 0.65% | -0.52% | 0.57% | -0.64% |
The heat map shows percentage changes of major currencies against each other. The base currency is picked from the left column, while the quote currency is picked from the top row. For example, if you pick the Euro from the left column and move along the horizontal line to the Japanese Yen, the percentage change displayed in the box will represent EUR (base)/JPY (quote).
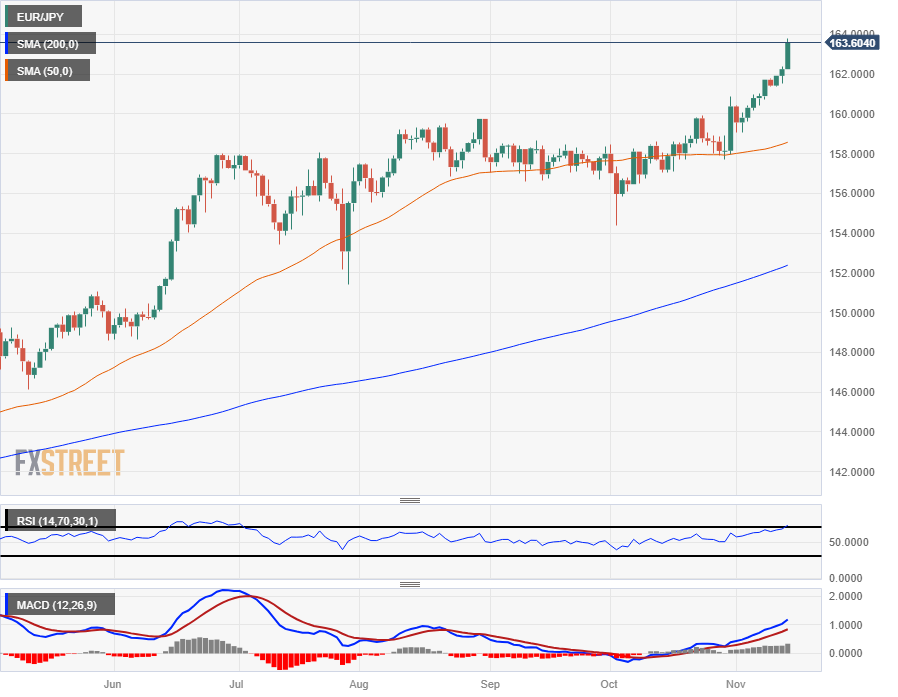
EUR/JPY Technical Outlook
The Euro has extended a rally against the Yen, closing in the green for nine of the past eleven consecutive trading days. The EUR/JPY is now set for a challenge of the 164.00 major handle.
The EUR's latest bull run has seen the pair climb further away from the 50-day Simple Moving Average (SMA) currently lifting from the 158.00 handle, while long-term support is coming from the 200-day SMA near 152.00, far below current price action.
EUR/JPY Daily Chart
 EUR/JPY Technical Level
- GBP/USD experiences a significant rally, climbing over 1.70% to trade around 1.2490, driven by the latest US inflation data
- October US inflation, based on an annual basis, dropped the most in the last three months to 3.2%.
- Lower than expected US CPI and core CPI numbers warrant a less hawkish approach by the US Federal Reserve.
GBP/USD rallies sharply on Tuesday after an inflation report from the United States (US) increased the chances the Federal Reserve (Fed) is done raising interest rates, while data from the UK was mixed. The major trades at around 1.2480s and climb more than 1.70%, with buyers eyeing the 1.2500 figure.
Pair approaches the key 1.2500 level as softer US CPI data leads to a sharp decline in the US Dollar
The US Bureau of Labor Statistics (BLS) informed that inflation in October cooled more than expected, with the Consumer Price Index (CPI) hitting 3.2% on a 12-month pace from 3.7%, with monthly figures cooling to 0% below the 0.1% expected by most economists. The same report revealed that core CPI, which excludes volatile items and is seen as a more stable inflation gauge, dipped a tenth and missed estimates and the prior month’s reading of 4.1% to 4%, missing estimates of 4.1%.
The data sent the Greenback on a tailspin, as the US Dollar Index (DXY) is plunging more than 1.40%, down at 104.13, after hitting a daily high of 105.73, undermined by US Treasury bond yields. The US 10-year benchmark note rate is sinking more than 18 basis points, down at 4.45%, a level last seen on September 22, 2023.
Consequently, the GBP/USD shrugged off a mixed employment report from the UK, which witnessed a slowdown in wages, while the economy added more jobs than the -198K contraction expected by analysts, with figures coming at 54K.
The GBP/USD is at the brisk of reclaiming the 1.2500 figure, despite the Bank of England{‘s (BoE) Chief Economist Huw Pill's comments, saying the BoE would need to raise rates further.
Focus shifts to Wednesday’s data, with UK’s inflation expected to dip below 5%, from September’s 6.7%. Excluding volatile items, is seen at 5.8% from 6.1%. On the US front, the agenda is expected to release the Producer Price Index (PPI), Retail Sales, the New York Fed Empire State Manufacturing Index, and Federal Reserve speakers.
GBP/USD Technical Levels
Chicago Federal Reserve President Austan Goolsbee stated on Tuesday that the progress in bring inflation down continues, while economic growth remains strong. According to him, the labor market remains vibrant, and he expressed more concern about potential external shocks rather than the economy overheating. He added that there is still a way to go before inflation reaches the Fed's 2% target.
Speaking at the Detroit Economic Club, Goolsbee explained that the US could witness the fastest non-war-related one-year decline in inflation in a century this year, while simultaneously keeping the unemployment rate below 4% without it rising.
Market reaction
The US Dollar is holding onto significant daily losses following the release of the US Consumer Price Index report, which, according to Goolsbee, appeared to be "pretty good." The US Dollar Index is down 1.40%, trading at 104.15, which is the lowest level seen since early September.
- The DXY index declined to 104.25, its lowest level since early September.
- The headline and core CPI from October came in lower than expected.
- Investors are expecting rate cuts sooner, betting on no more hikes by the Fed in 2023.
The US Dollar (USD) experienced a substantial downward movement in Tuesday's session, and the DXY index, which measures the value of the US Dollar versus a basket of global currencies, tanked to 104.25 driven by a lower-than-expected CPI and dovish bets on the Fed. Focus now shifts to the Producer Price Index (PPI) and Retail Sales figures from October on Wednesday.
As the United States economy recently printed lower than expected job creation and inflation figures, markets are taking off the table a rate hike at the next Federal Reserve (Fed) meeting in December. In addition, investors are seeing rate cuts sooner, in May 2024. This has made US Treasury yields decline, thus giving the market a reason to lose interest in the US Dollar.
Daily Digest Market Movers: US Dollar weakens as soft CPI fuels dovish bets on the Fed
- The US Dollar Index dived to 104.25, down more than 1% and standing near lows not seen since September, after the report of lower inflation figures.
- The US Bureau of Labor Statistics reported that the Core Consumer Price Index (CPI) from October missed the consensus. It came in at 4% YoY vs the expected 4.1% and decelerated from its previous figure of 4.1%.
- The headline figure came in at 3.2%YoY, below the consensus of 3.3% and in relation to its last reading of 3.7%.
- US Treasury yields fell vertically with the 2-year rate declining to 4.86%, while the 5 and 10-year rates declined to 4.45% and 4.46%, respectively..
- According to the CME FedWatch Tool, the odds of a 25-basis-point hike in December are extremely low, below 10%. In addition, markets are now pricing in rate cuts in May 2024.
- On Wednesday, the US will report Retail Sales from October, which are expected to have contracted by 0.3%, while the Producer Price Index (PPI) from the same month is expected to decelerate to 1.9% YoY.
Technical Analysis: US Dollar bears gain ground and threaten 100-day SMA
Based on the daily chart, the DXY Index has a bearish bias as indicators are flashing signs of bears seizing control. The Relative Strength Index (RSI) is trending below its midline, while the Moving Average Convergence Divergence (MACD) histogram displays rising red bars.
Despite bears gaining ground and pushing the pair below the 20-day Simple Moving Average (SMA) in the short term, the DXY is still above the 100 and 200-day SMAs. This suggests that bulls are in control in the broader context.
Support levels: 104.15 (100-day SMA),103.60 (200-day SMA), 103.30.
Resistance levels: 104.50, 105.00,105.30.
US Dollar FAQs
What is the US Dollar?
The US Dollar (USD) is the official currency of the United States of America, and the ‘de facto’ currency of a significant number of other countries where it is found in circulation alongside local notes. It is the most heavily traded currency in the world, accounting for over 88% of all global foreign exchange turnover, or an average of $6.6 trillion in transactions per day, according to data from 2022.
Following the second world war, the USD took over from the British Pound as the world’s reserve currency. For most of its history, the US Dollar was backed by Gold, until the Bretton Woods Agreement in 1971 when the Gold Standard went away.
How do the decisions of the Federal Reserve impact the US Dollar?
The most important single factor impacting on the value of the US Dollar is monetary policy, which is shaped by the Federal Reserve (Fed). The Fed has two mandates: to achieve price stability (control inflation) and foster full employment. Its primary tool to achieve these two goals is by adjusting interest rates.
When prices are rising too quickly and inflation is above the Fed’s 2% target, the Fed will raise rates, which helps the USD value. When inflation falls below 2% or the Unemployment Rate is too high, the Fed may lower interest rates, which weighs on the Greenback.
What is Quantitative Easing and how does it influence the US Dollar?
In extreme situations, the Federal Reserve can also print more Dollars and enact quantitative easing (QE). QE is the process by which the Fed substantially increases the flow of credit in a stuck financial system.
It is a non-standard policy measure used when credit has dried up because banks will not lend to each other (out of the fear of counterparty default). It is a last resort when simply lowering interest rates is unlikely to achieve the necessary result. It was the Fed’s weapon of choice to combat the credit crunch that occurred during the Great Financial Crisis in 2008. It involves the Fed printing more Dollars and using them to buy US government bonds predominantly from financial institutions. QE usually leads to a weaker US Dollar.
What is Quantitative Tightening and how does it influence the US Dollar?
Quantitative tightening (QT) is the reverse process whereby the Federal Reserve stops buying bonds from financial institutions and does not reinvest the principal from the bonds it holds maturing in new purchases. It is usually positive for the US Dollar.
- The AUD/USD is climbing into higher ground amidst risk-on markets.
- The Aussie is up over 2% from Tuesday's low bids against the Greenback.
- A miss for the US CPI data print is sending market sentiment soaring.
The AUD/USD is on the rise for Tuesday, rallying over 2% as market sentiment goes firmly risk-on following a US Consumer Price Index (CPI) print that suggests inflation in the US economy is receding faster than previously expected.
US CPI inflation softens to 3.2% vs. 3.3% forecast
US CPI inflation missed the mark on Tuesday, printing below forecast, and the miss is giving the market hope that US inflation is receding faster than policymakers have been anticipating. If inflation drops faster, for longer, than initially forecast, it would force open the door for a rate cut cycle from the Federal Reserve (Fed) sooner than expected.
Despite the Tuesday rally, the Aussie could see some difficulties holding onto higher chart ground heading through the rest of the week. Early Tuesday saw Australia's Westpac Consumer Confidence for November print at -2.6%, compared to October's 2.9% rise.
Early Wednesday will see Aussie Wage Price Index figures for the third quarter, which is forecast to increase from 0.8% to 1.3%. Later that same day, US Producer Price Index (PPI) and Retail Sales both land.
Producer inflation for the year into October is expected to hold steady at 2.7%, while month-on-month Retail Sales growth in October is expected to retreat from 0.7% to -0.3%.
Australian Dollar price today
The table below shows the percentage change of Australian Dollar (AUD) against listed major currencies today. Australian Dollar was the strongest against the US Dollar.
| USD | EUR | GBP | CAD | AUD | JPY | NZD | CHF | |
| USD | -1.61% | -1.71% | -0.66% | -1.84% | -0.70% | -1.83% | -1.25% | |
| EUR | 1.58% | -0.10% | 0.93% | -0.21% | 0.91% | -0.22% | 0.36% | |
| GBP | 1.68% | 0.10% | 1.05% | -0.11% | 1.00% | -0.12% | 0.47% | |
| CAD | 0.63% | -0.97% | -1.05% | -1.16% | -0.07% | -1.19% | -0.56% | |
| AUD | 1.80% | 0.21% | 0.12% | 1.17% | 1.11% | 0.00% | 0.58% | |
| JPY | 0.68% | -0.91% | -1.00% | 0.02% | -1.11% | -1.10% | -0.55% | |
| NZD | 1.80% | 0.21% | 0.12% | 1.16% | 0.00% | 1.11% | 0.58% | |
| CHF | 1.23% | -0.37% | -0.46% | 0.58% | -0.58% | 0.55% | -0.58% |
The heat map shows percentage changes of major currencies against each other. The base currency is picked from the left column, while the quote currency is picked from the top row. For example, if you pick the Euro from the left column and move along the horizontal line to the Japanese Yen, the percentage change displayed in the box will represent EUR (base)/JPY (quote).
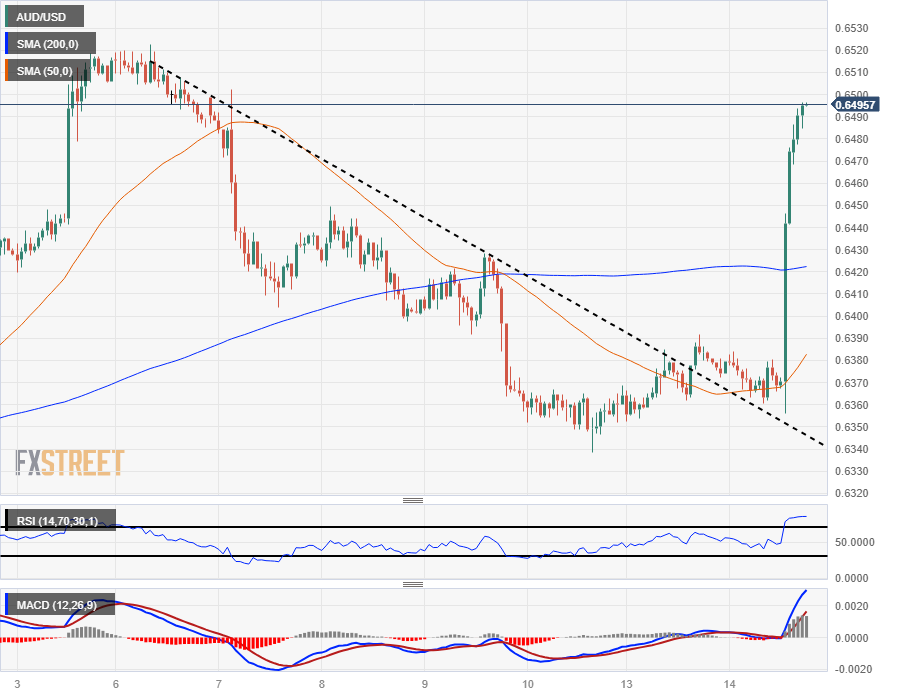
AUD/USD Technical Outlook
The AUD/USD's intraday rally sees the pair paring back last week's declines, spiking towards the 0.6500 handle following broad-market reaction to the US CPI data print.
The pair has risen over 2% from Tuesday's low bids near 0.6355, caching a firm ride up from the 50-hour Simple Moving Average (SMA) to sail clean through the 200-hour SMA, currently churning just north of 0.6420.
On the daily candlesticks, the Aussie is seeing one of its best trading days against the US Dollar since July, and has clawed back half of the range between the 50- and 200-day SMAs. The two moving averages have spread notably bearish, with the 50-day grinding it out from just below the 0.6400 handle while the 200-day SMA turns down into 0.660.
The AUD/USD, despite Tuesday's gains extending a lift from the consolidation zone near 0.6300, is still down for the year, and is trading at a nearly 6% discount against the Greenback from June's high bids near 0.6900.
AUD/USD Hourly Chart
AUD/USD Daily Chart
AUD/USD Technical Levels
- GBP/JPY uptrend appears to be overextended, with the next major target set at the 190.00 psychological level, a peak not seen since September 2008.
- A successful breach of 190.00 could open the path towards the September 2008 high of 198.34, potentially even the 200.00 mark.
- On the downside, initial support is today’s low of 186.04, followed by the Tenkan-Sen at 185.50, the Kijun-Sen at 184.52, and the Senkou-Span A at 185.01.
In the mid-North American session, GBP/JPY rallied and refreshed eight-year highs at around 188.28 on Tuesday, after economic data from the US sparked speculations the Federal Reserve wouldn’t tighten monetary policy any further. Investors see that as a green light to buy riskier assets, to the detriment of the safe-haven status of the Japanese Yen (JPY). The GBP/JPY trades at 188.08, up more than 2%
Given the abovementioned fundamental intro, from a technical perspective, the GBP/JPY uptrend seems overextended, with buyers targeting the 190.00 mark, a level that hasn’t been reached since September 2008. A breach of the latter will immediately expose the September 2008 high at 198.34 ahead of testing 200.00.
On the other hand, the GBP/JPY first support is seen at today’s low of 186.04, which, once cleared, te pair could dive to the Tenkan-Sen level at 185.50, followed by the Kijun-Sen at 184.52. Once cleared, the next support would be the Senkou-Span A at 185.01.
GBP/JPY Price Analysis – Daily Chart
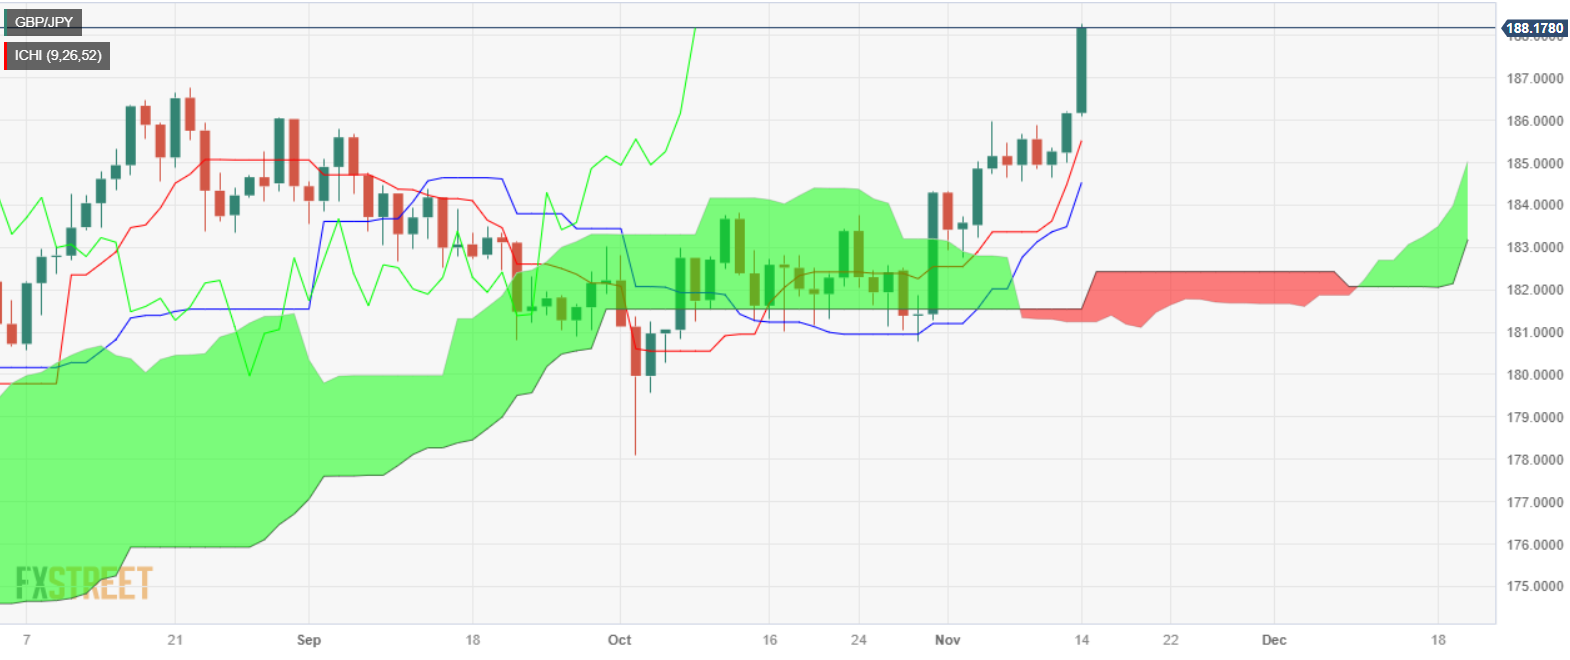
GBP/JPY Technical Levels
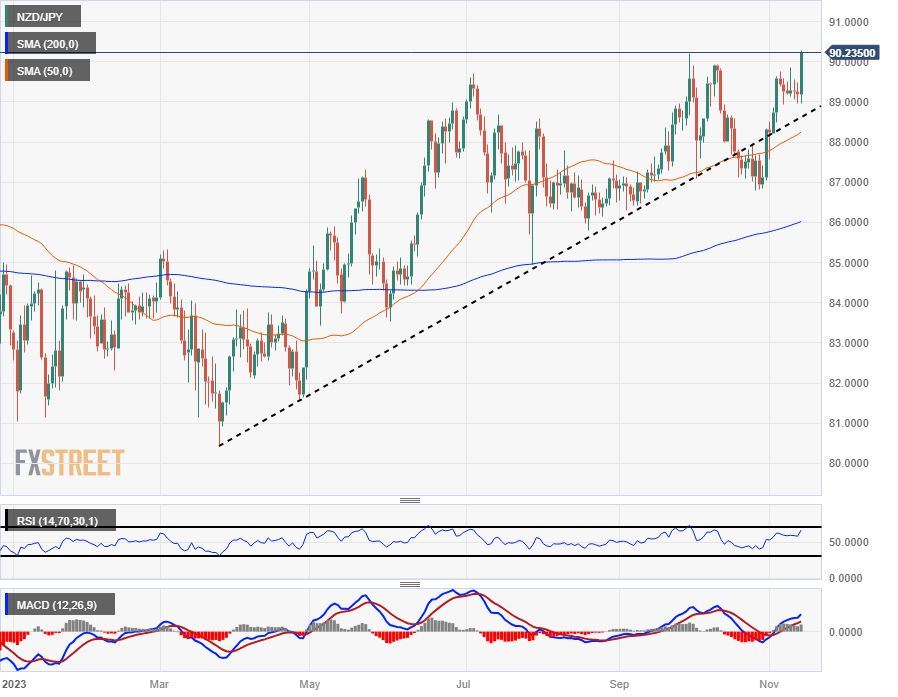
- The NZD/JPY is climbing into multi-year highs as broader markets flip on the risk switch.
- Light data on the calendar for both currencies in the early week sees market sentiment the primary driver.
- Up Next: Japan GDP figures due early Wednesday.
The NZD/JPY is chalking in multi-year highs as market sentiment surges and sends the safe haven Yen (JPY lower against the Kiwi (NZD). Tuesday's rally sees the Kiwi reaching its highest bids against the Yen in eight years.
New Zealand data remains limited on the economic calendar this week, though early Tuesday did see the NZ Food Price Index for October print at -0.9% compared to September's reading of -0.4%.
Wednesday's early market session will be seeing Japan Gross Domestic Product (GDP) figures for the 3rd quarter. Quarter-on-quarter GDP is forecast to decline from 1.2% to -0.1%, while the annualized reading is expected to steepen the decline from 4.8% to -0.6%.
NZD/JPY Technical Outlook
With the Kiwi's climb into 90.20, the NZD has rallied 1.5% against the Yen in a mere four hours, and the pair is set for a continued run towards 90.50 if bidders can keep the momentum going.
Intraday technical support sits at the top of the last swing high near 89.50, with dynamic support from the 200-hour Simple Moving Average (SMA) sitting just south of 89.30.
The NZD/JPY's previous long-term high was set at 90.20 back in September, and a second run at the high water mark is allowing the Kiwi to find some give in the Yen.
NZD/USD Daily Chart
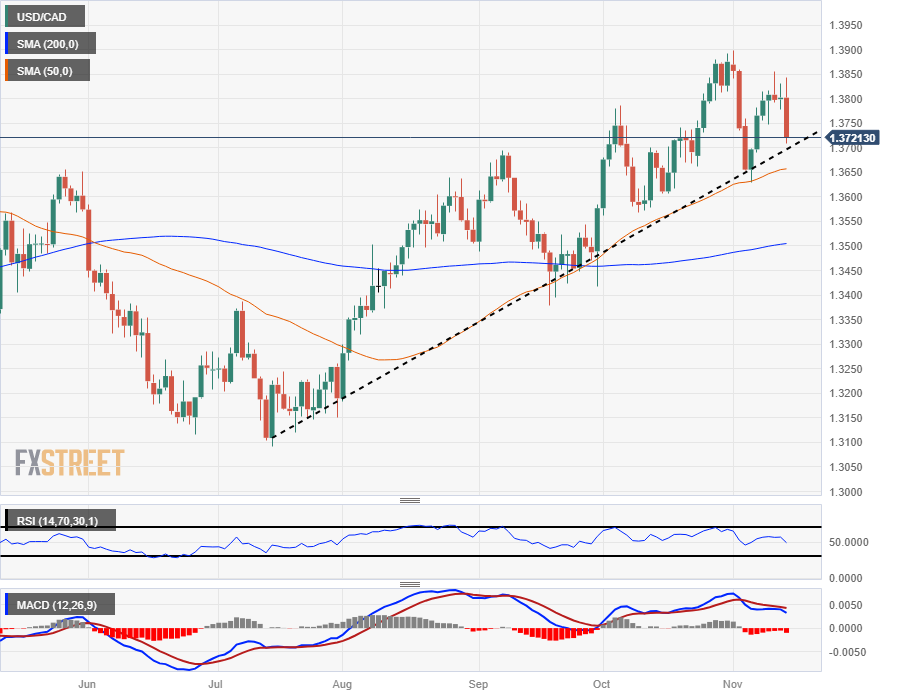
- The Canadian Dollar is getting a leg up as markets turn down the Greenback.
- Canada sees little of note on the data docket this week.
- Loonie traders aren’t out of the US data woods yet, US PPI and Retail Sales come tomorrow.
The Canadian Dollar (CAD) is catching a bid thanks to a forecast miss on US Consumer Price Index (CPI) inflation figures. The data miss is sending broader markets into risk-on mode as market sentiment improves.
US CPI for October came in lower than markets had initially forecast, and the easing inflation datapoint is giving markets reason to hope that the Federal Reserve’s (Fed) “higher for longer” narrative on interest rates may not prove to be as long as previously thought.
Daily Digest Market Movers: Canadian Dollar finds a CPI-fueled rebound
- The CAD is climbing into a five-day high and its highest bids in a week thanks to the US CPI miss.
- October’s headline month-on-month US CPI came in at a flat 0.0% against the forecast 0.1%, 0.4% previous.
- Annualized CPI printed at 3.2%, down from the previous 3.7% and missing the forecast of 3.3%.
- CPI expectations are one forecast markets are eager to have missed as risk appetite surges.
- Inflation cooling faster than expected is helping investors climb back into riskier assets, including the Loonie.
- This week still sees hefty US data on the calendar, with Producer Price Index (PPI) and Retail Sales for October arriving on Wednesday
Technical Analysis: Canadian Dollar pushing toward 1.37 against US Dollar as markets flip risk-on
The Canadian Dollar (CAD) is heading back into the 1.3700 handle against the US Dollar (USD), taking the USD/CAD pair down from the 1.3850 level for Friday.
Shorts on the USD/CAD will be looking to drag the pair back down towards the 50-day Simple Moving Average (SMA) near 1.3650. Longer-term support is coming from the 200-day SMA currently pushing into the high side of 1.3500.
Tuesday’s downturn on the USD/CAD chart is helping to solidify a potential lower high chart pattern, with a technical resistance zone building in from 1.3750 to 1.3800. Meanwhile, USD bulls will be hoping for a bounce from the rising trendline drawn from July’s swing low into 1.3100.
USD/CAD Daily Chart
Canadian Dollar price today
The table below shows the percentage change of Canadian Dollar (CAD) against listed major currencies today. Canadian Dollar was the strongest against the US Dollar.
| USD | EUR | GBP | CAD | AUD | JPY | NZD | CHF | |
| USD | -1.50% | -1.68% | -0.63% | -1.78% | -0.57% | -1.77% | -1.21% | |
| EUR | 1.48% | -0.17% | 0.86% | -0.27% | 0.93% | -0.26% | 0.30% | |
| GBP | 1.65% | 0.17% | 1.01% | -0.11% | 1.06% | -0.10% | 0.46% | |
| CAD | 0.63% | -0.85% | -1.00% | -1.13% | 0.05% | -1.12% | -0.54% | |
| AUD | 1.75% | 0.28% | 0.10% | 1.12% | 1.17% | 0.01% | 0.57% | |
| JPY | 0.59% | -0.91% | -1.07% | -0.05% | -1.19% | -1.16% | -0.62% | |
| NZD | 1.74% | 0.26% | 0.10% | 1.13% | 0.00% | 1.19% | 0.56% | |
| CHF | 1.19% | -0.29% | -0.45% | 0.56% | -0.57% | 0.62% | -0.56% |
The heat map shows percentage changes of major currencies against each other. The base currency is picked from the left column, while the quote currency is picked from the top row. For example, if you pick the Euro from the left column and move along the horizontal line to the Japanese Yen, the percentage change displayed in the box will represent EUR (base)/JPY (quote).
Canadian Dollar FAQs
What key factors drive the Canadian Dollar?
The key factors driving the Canadian Dollar (CAD) are the level of interest rates set by the Bank of Canada (BoC), the price of Oil, Canada’s largest export, the health of its economy, inflation and the Trade Balance, which is the difference between the value of Canada’s exports versus its imports. Other factors include market sentiment – whether investors are taking on more risky assets (risk-on) or seeking safe-havens (risk-off) – with risk-on being CAD-positive. As its largest trading partner, the health of the US economy is also a key factor influencing the Canadian Dollar.
How do the decisions of the Bank of Canada impact the Canadian Dollar?
The Bank of Canada (BoC) has a significant influence on the Canadian Dollar by setting the level of interest rates that banks can lend to one another. This influences the level of interest rates for everyone. The main goal of the BoC is to maintain inflation at 1-3% by adjusting interest rates up or down. Relatively higher interest rates tend to be positive for the CAD. The Bank of Canada can also use quantitative easing and tightening to influence credit conditions, with the former CAD-negative and the latter CAD-positive.
How does the price of Oil impact the Canadian Dollar?
The price of Oil is a key factor impacting the value of the Canadian Dollar. Petroleum is Canada’s biggest export, so Oil price tends to have an immediate impact on the CAD value. Generally, if Oil price rises CAD also goes up, as aggregate demand for the currency increases. The opposite is the case if the price of Oil falls. Higher Oil prices also tend to result in a greater likelihood of a positive Trade Balance, which is also supportive of the CAD.
How does inflation data impact the value of the Canadian Dollar?
While inflation had always traditionally been thought of as a negative factor for a currency since it lowers the value of money, the opposite has actually been the case in modern times with the relaxation of cross-border capital controls. Higher inflation tends to lead central banks to put up interest rates which attracts more capital inflows from global investors seeking a lucrative place to keep their money. This increases demand for the local currency, which in Canada’s case is the Canadian Dollar.
How does economic data influence the value of the Canadian Dollar?
Macroeconomic data releases gauge the health of the economy and can have an impact on the Canadian Dollar. Indicators such as GDP, Manufacturing and Services PMIs, employment, and consumer sentiment surveys can all influence the direction of the CAD. A strong economy is good for the Canadian Dollar. Not only does it attract more foreign investment but it may encourage the Bank of Canada to put up interest rates, leading to a stronger currency. If economic data is weak, however, the CAD is likely to fall.
- Eurozone's GDP contracted by 0.1% QoQ in Q3, indicating a slowing economy despite the ECB's aggressive tightening.
- In the UK, employment figures met expectations, but average earnings, including bonuses, rose more than forecast, signaling potential wage inflation.
- Rabo Bank analysts predict a potential drop in EUR/GBP below 0.8700, citing weak German economic data and a possible technical recession in the Eurozone.
EUR/GBP reversed its course after hitting a daily high of 0.8730, retreating toward the 0.8700 figure in the mid-North American session after economic data from the Eurozone (EU) and the United Kingdom (UK) favored the latter. At the time of writing, the cross is seen trading at around 0.8700s for a loss of 0.14%.
Cross pair nears 0.8700 amid EU GDP contraction, strong UK employment ahead of UK CPI
Gross Domestic Product (GDP) in the UE contracted by 0.1% QoQ as expected in Q3 on the second estimate, and in yearly figures came at 0.1% aligned with estimates, signaling the economy is slowing down amid more than 400 basis points of tightening by the European Central Bank (ECB). Nevertheless, employment data from the bloc suggested the labor market is tightening, which could warrant the ECB could keep the door open for additional tightening.
On the UK front, the Office for National Statistics (ONS) revealed employment figures, which came as expected, though Average Earnings, including bonuses, from three months to date on a yearly basis rose 7.9%, exceeding forecasts of 7.4%, but below August’s 8.2%. That could warrant further action by the Bank of England (BoE), though recent commentary from its Chief Economist Huw Pill suggested they would not need to raise rates further.
Analysts at Rabo Bank expect the EUR/GBP to tumble below 0.8700, based “on the back of weak German economic data and our house view that the Eurozone may already be in a technical recession.”
Meanwhile, traders' focus shifted to the UK’s inflation report on Wednesday, with CPI in October on an annual basis expected to dip to 4.8% from 6.7%, and core is seen at 5.8% from 6.1%. Monthly figures for CPI is seen at 0.1%, down from September’s 0.5% jump.
EUR/GBP Price Analysis: Technical outlook
The Euro is extending its losses against the Pound Sterling as economic growth faltered on the bloc. Hence, the pair is testing a three-month-old support trendline that was briefly broken on November 3, as the pair dropped to a three-week low of 0.8649 before buyers reclaimed the 0.8680 area, back above the aforementioned trendline. Nevertheless, at the time of writing the EUR/GBP is testing the latter, ann a sustained break could open the door to test the 200-day moving average (DMA) at 0.8684, followed by the 50-DMA at 0.8663.
- The USD/CHF fell by more than 1%, settling around 0.8915.
- The USD weakened as markets are confident that the Fed won’t hike in December.
- Markets focus shifts to PPI and Retail Sales figures on Wednesday.
The USD/CHF saw an impressive downward spiral on Tuesday, declining near 0.8915, seeing a loss of more than 1%, mainly driven by a broad US weakness following the report of October inflation figures from the US.
According to the US Bureau of Labor Statistics (BLS), the US October Consumer Price Index (CPI) increased by 3.2% YoY, below both previous forecasts and the rate of its prior month. Additionally, core CPI inflation, which excludes volatile food and energy prices, dropped to 4% YoY, below both September's rate and the estimated 4.1%. On a monthly basis, it decelerated to 0.2%, below both last month's reading and the predicted 0.3%.
The inflation figures had a direct impact on US government bond yields as the rate for the 2-year bond rate fell to 4.84%, and the 5 and 10-year yields were observed falling to 4.44% and 4.45%. As a result, these yield movements may signify that markets are cheering that a potential rate hike by the Federal Reserve (Fed) in December may no longer be on the table with inflation and the labor market cooling down. Now, attention turns to the next set of data, which will provide insight into how long the central bank will maintain restrictive interest rates to start shaping expectations on rate cuts.
On Wednesday, the Producer Price Index (PPI) is expected to have decelerated to 1.9% YoY, while Retail Sales are seen declining by 0.3% in October.
USD/CHF levels to watch
Analysing the daily chart, the USD/CHF has a bearish bias, with indicators reflecting that the sellers are strengthening. Exhibiting a downtrend below its midline, the Relative Strength Index (RSI) supports this view, as well as the Moving Average Convergence (MACD), as it lays larger red bars. In the larger context, the pair is also below the 20 and 200-day Simple Moving Averages (SMAs) but above the 100-day SMA$, indicating that the bulls continue to exhibit strength on the larger time frames despite the bearish sentiment seen in the short-term.
Supports: 0.8900 (100-day SMA), 0.8870, 0.8850.
Resistances: 0.8930, 0.8950, 0.9000 (20 and 200-day SMA convergence).
USD/CHF daily chart
-638355763078238363.png)
- Mexican Peso strengthens against the US Dollar, with USD/MXN falling below 17.40 after a peak of 17.62.
- The USD/MXN decline is supported by speculation the Federal Reserve might halt its monetary tightening.
- US Treasury bond yields plunged after the US CPI report; traders eye Fed rate cuts in June 2024.
- Banxico’s Governor Victoria Rodriguez Ceja hinted at the possibility of rate cuts in Mexico, noting that any easing of monetary policy would be gradual and data-dependent.
Mexican Peso (MXN) rallies against the US Dollar (USD) as investors speculate the Federal Reserve (Fed) has finished tightening monetary policy following a softer-than-expected inflation report in the United States (US). The USD/MXN pair dropped below 17.40 after hitting a daily high of 17.62, and it is on the brink of challenging the 100-day Simple Moving Average (SMA) at 17.33 at the time of writing.
A scarce Mexico’s economic docket kept traders adrift to the release of October’s Consumer Price Index (CPI) in the US, with figures coming below estimates and previous readings, both annually and monthly. Core CPI also slowed down, prompting investors to buy riskier assets to the detriment of the US Dollar’s safe-haven status. Consequently, US Treasury bond yields are plunging, while traders are expecting the federal funds rate to hit 5% in June 2024.
Daily digest movers: Mexican Peso climbs as US inflation slows down, despite Banxico’s Rodriguez dovish remarks
- US October CPI rose by 3.2% YoY, below forecasts and the previous month’s rate, respectively at 3.3% and 3.7%. On a monthly basis, CPI inflation was 0%, way beneath consensus expectations and September’s rate, each at 0.1% and 0.4%.
- Core CPI inflation stood above 4% YoY, easing below September’s and the estimated 4.1%. On month-over-month readings, inflation cooled to 0.2%, beneath last month's and the forecast of 0.3%.
- Richmond Fed President Thomas Barkin said he’s not convinced inflation is on a smooth glide path to 2%. He fears more needs to be done to curb inflation.
- On Monday, Banxico’s Governor Victoria Rodriguez Ceja commented that the easing inflationary outlook could pave the way for discussing possible rate cuts. She said that monetary policy loosening could be gradual but not necessarily imply continuous rate cuts, adding that the board would consider macroeconomic conditions, adopting a data-dependent approach.
- The latest inflation report in Mexico, published on November 9, showed prices grew by 4.26% YoY in October, below forecasts of 4.28% and prior rate of 4.45%. On a monthly basis, inflation came at 0.39%, slightly above the 0.38% consensus and September’s 0.44%.
- Last Thursday’s hawkish remarks by the US Federal Reserve Chairman Jerome Powell sponsored the USD/MXN a leg up, toward 17.93, before paring some losses.
- Mexico’s economy remains resilient after October’s S&P Global Manufacturing PMI improved to 52.1 from 49.8, and the Gross Domestic Product (GDP) expanded by 3.3% YoY in the third quarter.
- Banxico revised its inflation projections from 3.50% to 3.87% for 2024, which remains above the central bank’s 3.00% target (plus or minus 1%).
Technical Analysis: Mexican Peso surges with USD/MXN sellers eyeing a break below the 100-day SMA
The USD/MXN pair bias has shifted to neutral downwards in the short term, and the pair is on the brink of breaking crucial support levels like the 100-day Simple Moving Average (SMA) at 17.33, followed by the psychological 17.00 figure. A breach of those demand areas could open the door to testing the year-to-date (YTD) low of 16.62, printed in July.
On the other hand, if buyers keep the exotic pair above 17.33 and reclaim 17.50 in the near term, they could remain hopeful of testing key resistance levels, like the 200-day SMA at 17.65, ahead of the 50-day SMA at 17.70. Once cleared, the next resistance emerges at the 20-day SMA at 17.87 before buyers could lift the spot price towards the 18.00 figure.
Mexican Peso FAQs
What key factors drive the Mexican Peso?
The Mexican Peso (MXN) is the most traded currency among its Latin American peers. Its value is broadly determined by the performance of the Mexican economy, the country’s central bank’s policy, the amount of foreign investment in the country and even the levels of remittances sent by Mexicans who live abroad, particularly in the United States. Geopolitical trends can also move MXN: for example, the process of nearshoring – or the decision by some firms to relocate manufacturing capacity and supply chains closer to their home countries – is also seen as a catalyst for the Mexican currency as the country is considered a key manufacturing hub in the American continent. Another catalyst for MXN is Oil prices as Mexico is a key exporter of the commodity.
How do decisions of the Banxico impact the Mexican Peso?
The main objective of Mexico’s central bank, also known as Banxico, is to maintain inflation at low and stable levels (at or close to its target of 3%, the midpoint in a tolerance band of between 2% and 4%). To this end, the bank sets an appropriate level of interest rates. When inflation is too high, Banxico will attempt to tame it by raising interest rates, making it more expensive for households and businesses to borrow money, thus cooling demand and the overall economy. Higher interest rates are generally positive for the Mexican Peso (MXN) as they lead to higher yields, making the country a more attractive place for investors. On the contrary, lower interest rates tend to weaken MXN.
How does economic data influence the value of the Mexican Peso?
Macroeconomic data releases are key to assess the state of the economy and can have an impact on the Mexican Peso (MXN) valuation. A strong Mexican economy, based on high economic growth, low unemployment and high confidence is good for MXN. Not only does it attract more foreign investment but it may encourage the Bank of Mexico (Banxico) to increase interest rates, particularly if this strength comes together with elevated inflation. However, if economic data is weak, MXN is likely to depreciate.
How does broader risk sentiment impact the Mexican Peso?
As an emerging-market currency, the Mexican Peso (MXN) tends to strive during risk-on periods, or when investors perceive that broader market risks are low and thus are eager to engage with investments that carry a higher risk. Conversely, MXN tends to weaken at times of market turbulence or economic uncertainty as investors tend to sell higher-risk assets and flee to the more-stable safe havens.
The US Census Bureau will release the October Retail Sales report on Wednesday, November 15 at 13:30 GMT and as we get closer to the release time, here are the forecasts of economists and researchers of seven major banks regarding the upcoming data.
Economists expect US Retail Sales to have declined by 0.3% in October. In September, the volume of sales increased by 0.7%. Meanwhile, Sales ex Autos are expected at 0.0% month-on-month vs. the prior release of 0.6%.
Deutsche Bank
We expect weak unit motor vehicle sales to encourage a -0.4% print on the headline (from +0.7%), with the same forecast for Sales ex Auto (from +0.6%) due to lower gasoline prices. We expect Retail Control, which goes into GDP, to be only +0.1% (from +0.6%). This grew at an annualised +6.8% in Q3. So potentially a big step down.
TDS
We expect Retail Sales to retreat (-0.3%) for the first time since March, following much stronger gains over Q2/Q3. Volatile auto and gas station sales will likely be the main culprits behind weaker growth, while the key Control Group is expected to lose momentum. We also look for sales in bars/restaurants to decelerate, as services spending is likely to start Q4 on a weaker footing.
RBC Economics
We anticipate US Retail Sales to edge down 0.3% in October. Gasoline station sales likely fell on lower prices.
NBF
Judging from previously released data, motor vehicles and parts dealers as well as outlays at gasoline stations could have contributed negatively to the headline figure. All told, we expect total sales to have contracted 0.1%. Ex Auto outlays could have been a tad stronger, remaining unchanged month on month.
SocGen
We look for a 0.3% decline in October Retail Sales that captures a modest reversal in the 1% gain of September and a 4.0% drop in gasoline prices.
CIBC
High-frequency credit card spending data point to a further pick up in the Retail Control Group in October, which we think will be 0.3% MoM. Weak auto sales and gas prices in October, however, will likely cause the headline advanced reading to show a contraction of -0.2% MoM. A reading above our forecast and the steadying of the saving rate at a very low level would challenge’s the Fed’s theory that the supply side of the economy is partly responsible for surge in activity.
Wells Fargo
We forecast Retail Sales declined 0.2% in October. Consumers who pulled their holiday spending forward to take advantage of Amazon's Prime Big Deal Days and Target's Circle Week last month pose an upside risk to our call.
The US Consumer Price Index (CPI) was unchanged in October, the first time monthly inflation was flat since July 2022. Today's CPI report further reinforces Wells Fargo’s view that the last rate hike of this tightening cycle is behind us.
Focus to turn from future rate hikes to future rate cuts
October’s softer-than-expected CPI print is an encouraging development for the FOMC and reinforces our view that the FOMC has ended its hiking cycle. But, we do not see the latest data as a game-changer for inflation’s path ahead.
With inflation in October held down by volatile components like gasoline, travel services and autos, we expect inflation's return to 2% will continue to be a slow grind.
As 2023 draws to a close and 2024 comes into view, we suspect the debate next year will focus squarely on when rate cuts and the end of quantitative tightening will occur.
US Consumer price inflation surprised consensus expectations to the downside. Economists at TD Securities continue to expect the Fed to leave rates unchanged until pivoting to cuts in June 2024.
Inflationary pressures eased in October
Consumer price inflation surprised consensus expectations to the downside, with the headline CPI coming in flat MoM in October, down from 0.4% in September, as gasoline prices were a large drag on inflation this month. Prices in the core segment also came in much weaker than anticipated, printing 0.2% MoM. The CPI's ‘supercore’ decelerated to its lowest pace in three months at 0.2% MoM, as good prices came in broadly weaker in October.
Today's CPI report should be a welcome relief for Fed officials: output has been advancing at a firm pace, but price pressures have continued to ebb. This should allow the Fed to be more patient in waiting for the economy to settle down at a slower pace of growth.
Today's data also supports our long-held view that the Fed is likely done with rate increases, and we continue to look for a first rate cut in June 2024.
US October CPI was lower than expected and inflation could hit 2% by mid-2024, in the view of economists at ING.
Inflation pressures are subsiding
US consumer price inflation slowed more than expected in October.
Higher borrowing costs will increasingly weigh on activity and corporate pricing power while slowing housing rents will be the main driver of disinflation over the next two quarters.
With 2% inflation looking possible by next summer the pricing of rate cuts will intensify.
See – Fed: No further hikes – Commerzbank
The United Kingdom will release the Consumer Price Index (CPI) data on Wednesday, November 15 at 07:00 GMT and as we get closer to the release time, here are the forecasts by the economists and researchers of four major banks regarding the upcoming UK inflation print.
Headline is expected to fall to 4.8% year-on-year vs. 6.7% in September. Core is set to drop slightly at 5.8% YoY vs. the prior release of 6.1% in September. If so, headline would be the lowest since October 2021 but still above the 2% target.
TDS
UK headline inflation will drop sharply in October, likely matching the BoE's forecast of 4.8% YoY, largely on the back of base effects in the energy component. Services inflation likely remained below the BoE's forecast though (TDS: 6.7%, BoE: 6.9%), and should reinforce the widely-held view that the Bank is done hiking rates.
Deutsche Bank
We expect a further deceleration. This includes forecasts of a 4.74% YoY (6.7% in September) print for the headline CPI and a 5.81% YoY (6.1%) reading for core.
Nomura
We expect i) a fall in headline inflation from 6.7% to 4.7% (BoE: 4.8%), ii) a small fall in services inflation from 6.9% to 6.7% (BoE: unchanged at 6.9%), iii) an equivalently modest decline in core inflation from 6.1% to 5.9%, and iv) a fall in RPI inflation from 8.9% to 6.7% (index to 380.1).
SocGen
A massive decline in energy inflation should see CPI fall by 2.1pp to 4.6% YoY in October, meaning inflation has halved since the start of the year, which was one of the Prime Minister’s five pledges, while core inflation could prove to be stickier at 5.7%, down 0.4pp from September.
- The XAG/USD ascended to $23.00, seeing more than 3% gains.
- Headline and Core CPI from the US came in lower than expected in October, fuelling dovish bets on the Fed.
- The US bond yields dived, allowing the metal to gather momentum.
The XAG/USD rallied sharply on Tuesday to above $23.00, up by 3%, with soft CPI data from the US and falling US yields contributing to the upward movements.
The US Bureau of Labor Statistics (BLS) experienced a decrease in inflation to 3.2% (YoY) in October, while the Core CPI, which excludes the volatile prices of food and energy, recorded a 4% increase below the expected 4.1% rise. On a monthly basis, the headline CPI remained stable, while the Core CPI saw a growth of 0.2%.
As a reaction, the US government bond yields, often seen as the opportunity cost of holding non-yielding metals, sharply declined. The 2-year rate fell to 4.84%, and the 5 and 10-year yields are seen at 4.45%, with all three seen more than 2% declines. In that sense, they may suggest that markets are taking a rate hike by the Federal Reserve (Fed) off the table in December. Now, the focus shifts to the next set of data for markets on how long the bank will hold rates at restrictive levels.
On Wednesday, the US will release the Producer Price Index (PPI) and Retail Sales from October, which will likely have an impact on those expectations.
XAG/USD levels to watch
Analysing the daily chart, the XAG/USD displays a neutral to bullish technical outlook as bulls have gained significant momentum. The Relative Strength Index (RSI) displays a bullish bias with an ascending slope above its middle point, while the Moving Average Convergence (MACD) histogram exhibits increasing green bars. Considering the broader technical landscape, the pair is above the 20-day Simple Moving Average (SMA) but below the 100 and 200-day SMAs, indicating that the bears are still holding some dominance over the bears on the broader time horizon. However, the outlook will remain positive for the short term while the bulls gather further ground and hold above the 20-day SMA.
Supports: $22.86 (20-day SMA),$22.50, $22.30
Resistances: $ 23.15 -25 (100 and 200-day SMA convergence), $23.50, $23.70.
XAG/USD daily chart
-638355707391219026.png)
For a sustained Dollar decline, two apparently contradictory events must occur, in the opinion of economists at Citibank.
Euro could gain perhaps 10% against the USD within the coming two years
For a sustained Dollar decline, two apparently contradictory events must occur. The Fed will need to remain activist and vigilant in lowering rates. And the economy must slow, but not too much.
For the moment, a Fed pause with US bonds trading in a range of 4.5% to 5.0% may prevent the Dollar from rising further, but it may not necessarily cause it to decline substantially. Yet a significant slowing in US employment gains would change the picture for both bonds and currencies.
If the European Central Bank doesn’t ease monetary policy, real interest rate differentials suggest the Euro could gain perhaps 10% against the USD within the coming two years.
- EUR/USD shoots past the 1.0800 barrier, or multi-week highs.
- Extra gains appear on the cards above 1.0800.
EUR/USD picks up extra pace and surpasses the 1.0800 hurdle for the first time since early September.
A clear breakout of the 200-day SMA, today at 1.0801, should shift the pair’s outlook to a more constructive one and open the door to a potential challenge of the weekly high of 1.0945 (August 30).
EUR/USD daily chart
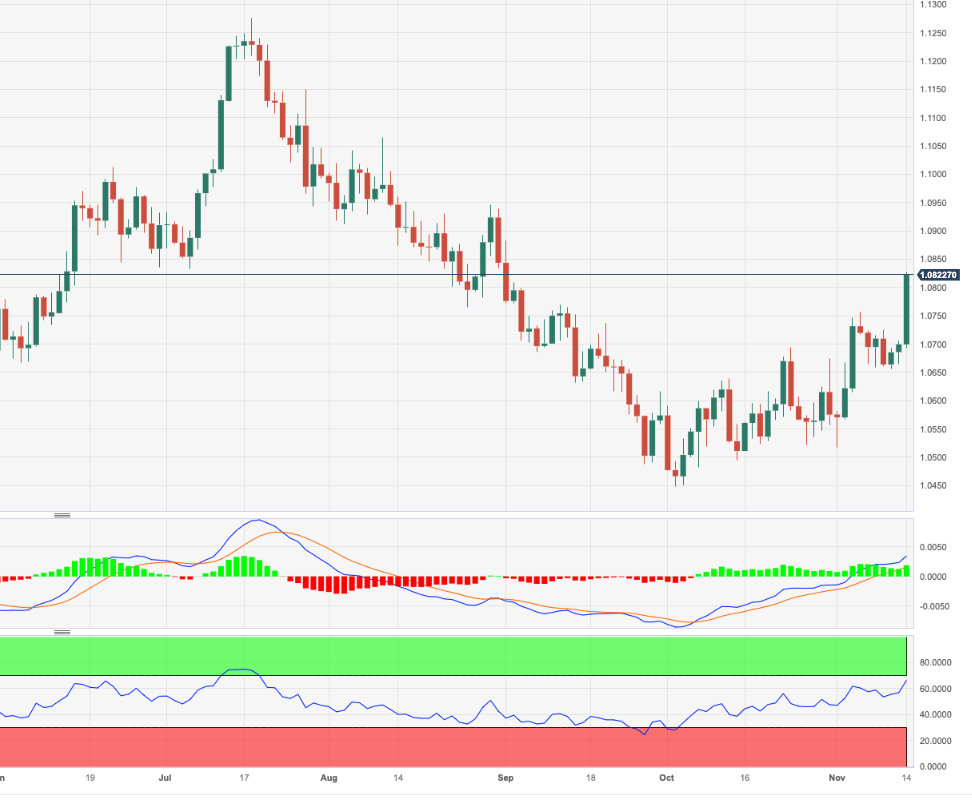
US consumer prices in October were unchanged from the previous month. In the view of economists at Commerzbank, a further interest rate hike is becoming increasingly unlikely.
US inflation surprisingly weak
US consumer prices surprisingly remained unchanged in October compared to the previous month. The year-on-year rate fell from 3.7% to 3.2%. The more important core rate, which excludes energy and food, amounted to 0.2% in month-on-month terms. In a year-on-year comparison, it fell from 4.1% to 4.0%.
Today's data should reinforce the market's view that the Fed will not raise its key interest rates any further (this has also been our forecast for some time).
- The New Zealand Dollar recovers on Tuesday after drifting lower for over 10 days straight.
- The Kiwi rebounds after US CPI data shows an unexpected slowdown in October, weighing on USD and lifting sentiment.
- NZD/USD reverses its bearish short-term trajectory and aims for the November highs.
The New Zealand Dollar (NZD) trades higher against most counterparts after the release of softer-than-expected US inflation data cheers Wall Street with the prospect of cheaper borrowing costs, lifting risk appetite and supporting commodity currencies like the Kiwi.
For NZD/USD, the short-term technical situation dramatically reverses after temporarily flirting with deeper losses. An earlier break below key support at 0.5874 had suggested a possible continuation lower but the pair reversed at a key Fibonacci level and now trades back above 0.5900 as the US session gets underway.
Daily digest market movers: New Zealand Dollar: US CPI brings uplift to Kiwi
- The New Zealand Dollar trades higher after the release of US Consumer Price Index (CPI) data shows a slowdown in inflation in October and triggers an improvement in risk appetite.
- As a commodity currency, the NZD tends to do well when market sentiment is risk-on.
- US Consumer Price Index (CPI) data showed no-change in broad headline inflation in October (0.0%) when economists had forecast a rise of 0.1% MoM. Year-on-year, a 3.2% increase was registered when 3.3% had been expected.
- For Core CPI, the data showed a 0.2% increase MoM versus 0.3% expected and 4.0% YoY against 4.1% forecast.
- The data suggests even less likelihood of the Federal Reserve (Fed) raising interest rates at their December meeting or at the start of 2024. Probabilities were already low at about 15%, but these have dropped even further following the release.
- The US Dollar has fallen after the data as the prospect of no further increases to interest rates makes the US a less attractive place for global investors to park their capital, reducing demand for the USD.
- Chinese Industrial Production and Retail Sales data out on Wednesday morning at 02:00 GMT could also impact the Kiwi since China is its largest trading neighbor.
- Recent downbeat Chinese inflation data has dampened the outlook for global growth, weighing on NZD last week.
- An inflation report from the RBNZ showed both one-year-out and two-years-out inflation expectations for New Zealand falling in Q3 compared to the previous quarter.
- The lower inflation expectations imply the RBNZ is less likely to raise interest rates.
- Tuesday’s lower-than-estimated CPI data will have overshadowed both the higher University of Michigan inflation expectations data out on November 10, and the recent hawkish tone of many Fed officials.
New Zealand Dollar technical analysis: NZD/USD surges higher at 61.8% Fib level
NZD/USD – the number of US Dollars one New Zealand Dollar can buy – finds a floor at around 0.5862, the key 61.8% Fibonacci retracement of the rally from the year-to-date lows, and lifts off! It surges higher at the start of the US Session on Tuesday after the release of US CPI data weakens the US Dollar.
-638355684277082061.png)
New Zealand Dollar vs US Dollar: Daily Chart
The pair is in a large part reversing the steady decline since November 3, however, it needs to make a higher high above 0.6001 to re-affirm belief in the short-term uptrend.
A break above 0.6001 would confirm the short-term bullish bias again. The likely target thereafter would be the 0.6055 October high.
In the event it is unable to break above 0.6001, there remains a risk of a capitulation. A break below the 0.5862 day’s lows would be required to signal a resumption of the short-term bear trend. The main targets to the downside would then be 0.5790, followed by 0.5773.
The medium and long-term trends are both still bearish, suggesting the potential for more downside remains strong.
Bulls would have to push above the 0.6055 October high to change the outlook in the medium term and indicate the possibility of the birth of a new uptrend. Such a move would then target the 200-day Simple Moving Average (SMA) at around 0.6100.
New Zealand Dollar FAQs
What key factors drive the New Zealand Dollar?
The New Zealand Dollar (NZD), also known as the Kiwi, is a well-known traded currency among investors. Its value is broadly determined by the health of the New Zealand economy and the country’s central bank policy. Still, there are some unique particularities that also can make NZD move. The performance of the Chinese economy tends to move the Kiwi because China is New Zealand’s biggest trading partner. Bad news for the Chinese economy likely means less New Zealand exports to the country, hitting the economy and thus its currency. Another factor moving NZD is dairy prices as the dairy industry is New Zealand’s main export. High dairy prices boost export income, contributing positively to the economy and thus to the NZD.
How do decisions of the RBNZ impact the New Zealand Dollar?
The Reserve Bank of New Zealand (RBNZ) aims to achieve and maintain an inflation rate between 1% and 3% over the medium term, with a focus to keep it near the 2% mid-point. To this end, the bank sets an appropriate level of interest rates. When inflation is too high, the RBNZ will increase interest rates to cool the economy, but the move will also make bond yields higher, increasing investors’ appeal to invest in the country and thus boosting NZD. On the contrary, lower interest rates tend to weaken NZD. The so-called rate differential, or how rates in New Zealand are or are expected to be compared to the ones set by the US Federal Reserve, can also play a key role in moving the NZD/USD pair.
How does economic data influence the value of the New Zealand Dollar?
Macroeconomic data releases in New Zealand are key to assess the state of the economy and can impact the New Zealand Dollar’s (NZD) valuation. A strong economy, based on high economic growth, low unemployment and high confidence is good for NZD. High economic growth attracts foreign investment and may encourage the Reserve Bank of New Zealand to increase interest rates, if this economic strength comes together with elevated inflation. Conversely, if economic data is weak, NZD is likely to depreciate.
How does broader risk sentiment impact the New Zealand Dollar?
The New Zealand Dollar (NZD) tends to strengthen during risk-on periods, or when investors perceive that broader market risks are low and are optimistic about growth. This tends to lead to a more favorable outlook for commodities and so-called ‘commodity currencies’ such as the Kiwi. Conversely, NZD tends to weaken at times of market turbulence or economic uncertainty as investors tend to sell higher-risk assets and flee to the more-stable safe havens.
While speaking at an event in South Carolina on Tuesday, Richmond Federal Reserve Bank President Thomas Barkin said that he is not convinced that inflation is on a "smooth glide path" to the 2% target.
"I fear more needs to happen curb demand and inflation," Barkin added and noted that the impact from higher interest rates may be lagged.
Market reaction
The US Dollar stays under strong selling pressure in the American session on Tuesday following the soft inflation reading. As of writing, the US Dollar Index was down nearly 1% on a daily basis at 104.65.
Gold’s macroeconomic backdrop looks supportive, in the view of strategists at ANZ Bank.
US rates have peaked
Recent US labour data showed hiring and wages are trending lower and approaching levels that are consistent with overall the Fed’s inflation target of 2%. These trends are likely to continue as the Fed’s restrictive policy flows through to the economy. Therefore, we believe that US rates have peaked.
US ISM Services PMI data confirm that underlying demand in the US is softening. This builds a case for declining UST yields and a moderating DXY, which is supportive for Gold investment demand.
- The US Dollar tumbled following the release of inflation data from the US.
- US inflation cooled to 3.2% in October, and core indicators also eased.
- The AUD/USD sharply rose, gaining over 70 pips in just a few minutes.
The AUD/USD surged from 0.6370 to 0.6445 within a few minutes after the release of the below-expectation US Consumer Price Index (CPI) figures for October. The US Dollar Index sharply declined, falling below 104.80, reaching its lowest level since September 20.
US inflation cools, so Fed rate hike expectations
The US CPI remained unchanged in October, defying expectations of a 0.1% increase, following a 0.4% rise in September. The annual inflation rate slightly declined from 3.7% in September to 3.2% in October, falling short of the market consensus of 3.3%. The Core CPI, excluding volatile food and energy prices, rose 0.2% on a monthly basis, below market expectations of 0.3%. The annual core inflation rate stood at 4.1%, slightly lower than the 4.2% recorded in the previous month.
Following the release of the data, the likelihood of a rate hike in December dropped to practically 0% from 14%, according to the CME FedWatch Tool. The swap market now predicts the possibility of the first rate cut again in June, compared to July.
US Treasury yields experienced a significant decline after the report, with yields dropping more than 3%. The 10-year yield fell from 4.62% to 4.50%. Meanwhile, stock markets on Wall Street surged to fresh weekly highs.
The combination of a weaker US Dollar, lower Treasury yields, higher commodity prices, and improved risk appetite boosted the AUD/USD pair, pushing it above 0.6400. The pair remains near its highs, slightly below 0.6450, with bullish momentum intact.
The next resistance level for AUD/USD is at 0.6450. If the pair breaks above that area, attention will turn to 0.6500, the last defense before the key resistance area of 0.6520. This resistance level capped the upside in late August, September, and last week. A break above that level would open the doors to further gains.
Technical levels
Bank of England (BoE) Chief Economist Huw Pill said on Tuesday, “there is significant progress on inflation.”
Further comments
5% inflation would be much too high still.
Today's pay data is down a but not consistent with 2% inflation on ongoing basis.
- The USD/JPY declined towards to 150.90, seeing 0.50% loses
- Headline and Core CPI in the US decelerated in October.
- The US Treasury yields are tanking, weakening the US Dollar.
On Tuesday, the USD/JPY fell sharply towards the 150.90 area, seeing nearly 0.50% losses. The pair declined amid soft Consumer Price Index (CPI) data from the US, which fueled a decline in US Treasury yields and hawkish bets on the Federal Reserve (Fed).
The US Bureau of Labor Statistics (BLS) revealed that inflation in the US decreased to 3.2% YoY in October, based on the changes in the Consumer Price Index (CPI). The Core CPI, which excludes the volatile prices of food and energy, witnessed a 4% increase during the same period, failing to meet the analysts' predicted 4.1% rise. On a monthly basis, the headline CPI remained stable, while the Core CPI encountered a 0.2% growth.
As a reaction, the US Treasury yields with the 2,5 and 10-year rates declined more than 2% to 4.86%, 4.46% and 4.48%, respectively, which seems to be pushing the pair upwards. Focus now shifts to Wednesday’s Producer Price Index (PPI) and Retail Sales figures from October to continue placing their bets on the next Fed meetings.
USD/JPY levels to watch
On the daily chart, the USD/JPY has a neutral to bearish bias with a consolidation phase underway, suggesting that the buyers are regrouping after a six-day winning streak. The Relative Strength Index (RSI) has a negative slope above its midline, indicating weakening buying pressure, while the Moving Average Convergence (MACD) presents shorter green bars. In the larger context, despite showing a negative outlook in the short-term, the pair is above the 20,100,200-day Simple Moving Average (SMA), suggesting that the bulls are firmly in control in the broader context.
Supports: 150.30 (20-day SMA), 150.00, 149.00.
Resistances: 151.00, 151.70, 152.00.
USD/JPY daily chart
In an interview with local television station TeleZueri, Swiss National Bank (SNB) Chairman Thomas Jordan said that he doesn’t rule out more interest rate hikes ahead.
Jordan said, “if we see that the current monetary policy is not restrictive enough to ensure price stability in the long term, then we will have to make another interest rate move.”
Related reads
- SNB’s Jordan: We will not hesitate to tighten monetary policy further if necessary
- USD Index Price Analysis: Further south comes 104.85
Bank of England (BoE) policymaker Swati Dhingra said on Tuesday, “food price inflation may rise again.”
“Geopolitical pressures may add to food costs,” Dhingra added.
Market reaction
GBP/USD is consolidating the latest uptick to near 1.2310, currently trading 0.13% higher on the day at 1.2291.
GBP/USD trades slightly higher. Economists at Scotiabank analyze the pair’s outlook.
Charts lean bullish
Technical signals are leaning bullish after a solid day for the Pound on Monday.
A clear net gain on the day formed the third leg of a bullish ‘morning star’ pattern on the daily candle chart, with the base developing around the 40-Day Moving Average support for Cable (1.2207).
Gains through 1.2310 target a renewed test of 1.2450.
See: GBP likely to remain in a narrow trading range – MUFG
- AUD/USD consolidates below 0.6400 ahead of US inflation.
- Economists see monthly and annual core CPI grow at a steady pace of 0.3% and 4.1%, respectively.
- Q3 Wage Cost Index is seen growing at a stronger pace of 1.3%.
The AUD/USD pair trades sideways in a narrow range below 0.6400 as investors await the United States inflation data for October. The Aussie asset struggles for a direction as the US inflation data will provide clarity on whether the Federal Reserve (Fed) will advocate for raising interest rates further.
S&P500 futures added some gains in the European session, portraying some improvement in the risk appetite of the market participants. The US Dollar Index (DXY) dropped straight for the third trading session to near 105.50 amid anxiety ahead of the inflation data.
Economists have forecasted that monthly headline inflation rose at a nominal pace of 0.1% against the higher growth rate of 0.4%. The annual headline Consumer Price Index (CPI) softened to 3.3% against a 3.7% reading from September. Monthly and annual core CPI grew at a steady pace of 0.3% and 4.1%, respectively.
The release of the US inflation data will provide guidance on the monetary policy action by the Fed. Last week, Fed Chair Jerome Powell said that he is not sure whether current monetary policy is sufficiently restrictive to tame price pressures.
On the Australian Dollar front, investors await the Q3 Wage Price Index, which will be released on Wednesday. As per the consensus, the labor cost index grew at a stronger pace of 1.3% against a 0.8% gain in the previous quarter.
Stronger growth in the labor cost index would prompt expectations of one more interest rate increase by the Reserve Bank of Australia (RBA) ahead. Last week, the RBA raised interest rates by 25 basis points (bps) to 4.35% as expected.
- DXY extends the corrective move to the 105.50 zone.
- The loss of 105.00 exposes a move to the 104.85 level.
DXY retreats for the third consecutive session and revisits the 105.50 zone on Tuesday.
Further decline appears on the cards in the very near term. Against that, the loss of the 105.00 support could put the so-far November low of 104.84 (November 6) to the test prior to the weekly low of 104.42 (September 11), which appears reinforced by the transitory 100-day SMA at 104.17.
In the meantime, while above the key 200-day SMA, today at 103.61, the outlook for the index is expected to remain constructive.
DXY daily chart
The US Dollar Index (DXY) shows signs of technical softness, economists at Scotiabank report.
Resistance looks firmer now around 105.95/106.00
The DXY is showing some signs of technical softness after gains last week stalled just below the 40-DMA.
DXY weakness below 105.30 on the day would be another negative for the index.
Resistance looks firmer now around 105.95/106.00 but there is still the open gap around 106.50 on the chart left by the sharp drop in the index at the start of the month. That may still have to be filled at some point.
USD/CAD trades slightly higher. Economists at Scotiabank analyze the pair’s outlook.
Finding firm support on dips through the upper 1.37s
CAD sentiment is poor, weighed by concerns over slowing growth and soft commodity prices which are weighing on Canada’s terms of trade. Market positioning suggests investors are already aggressively short the CAD, however, which may limit the USD’s ability to advance significantly and might also leave markets vulnerable to CAD-positive surprises.
The USD remains resilient and is finding firm support on dips through the upper 1.37s.
Price action is keeping the USD/CAD undertone constructive on the charts (bullish intraday and daily momentum signals) despite signs of USD softness elsewhere.
Resistance is 1.3855 and 1.3895/1.3900. Support is 1.3780/1.3790.
- The Greenback trades broadly flat ahead of US CPI numbers.
- Traders appear torn between the expected decline in inflation and against the Fed’s cautious comments.
- The US Dollar Index faces a string of volatile events this week.
The US Dollar (USD) is flat on Tuesday ahead of the crucial US inflation data for October. The Polish Zloty (USD/PLN) is the only pair making a substantial profit against the Greenback, which had a volatile ride overnight after rating agency Moody’s issued a negative outlook for the AAA rating of the US.
On the calendar front, all eyes are on the US Consumer Price Index (CPI). Expect traders to send the Greenback weaker if inflation continues its decline, while a surprise uptick might see US Dollar strength come into play. Strong inflation would make markets price in another rate hike, which will translate to a US Dollar advancing several big figures against most major G20 currency peers.
Daily digest: US Dollar set for pickup in volatility
- Fed Vice Chair Philip N. Jefferson is due to speak at 10:30 GMT.
- At 11:00 GMT, the National Federation of Independent Business (NFIB) is due to release its Business Optimism Index for October. Previous number was at 90.8.
- The US Consumer Price Index is due to be released at 13:30 GMT:
- Monthly Headline inflation is expected to head from 0.4% to 0.1%, with a range from 0% to 0.2% on estimations.
- Monthly Core Inflation is expected to stay stable at 0.3%, with a range from 0.2% to 0.4% on estimations.
- The yearly headline inflation rate is expected to slide from 3.7% to 3.3%, with a range of 3.2% to 3.4% on estimations.
- The yearly core inflation rate is expected to stay stable at 4.1%, with a range from 3.7% to 4.2% on estimations.
- Chicago Fed President Austan Goolsbee is due to speak at 17:45 GMT.
- Equities are in a holding pattern, with no real outliers to report across the globe. It looks that nothing substantially will be moving ahead of the US inflation print.
- The CME Group’s FedWatch Tool shows that markets are pricing in a 85.7% chance that the Federal Reserve will keep interest rates unchanged at its meeting in December. The possibility of a pause has diminished a bit ahead of the inflation numbers due to come out this Tuesday.
- The benchmark 10-year US Treasury yield trades at 4.62%, and is slowly making its way up again.
US Dollar Index technical analysis: US Dollar technically a sell
The US Dollar could be in a difficult moment from a pure technical point of view as the US Dollar Index (DXY) has breached the key 55-day Simple Moving Average (SMA). With a daily close and an opening on Tuesday below this 105.72 level, more downturn could be in the cards. In case the US CPI numbers are confirming the downtrend is not losing pace, expect a 1.4% devaluation in the DXY before finding the next support.
The DXY was looking for support near 105.00, and was able to bounce ahead of it earlier last week. Any shock events in global markets could spark a sudden turnaround and favour safe-haven flows into the US Dollar. A rebound first to 105.85 would make sense, a pivotal level from March 2023. A break above could mean a revisit to near 107.00 and recent peaks printed there.
On the downside, 105.10 is still acting as a line in the sand. Once the DXY slides back below that, a big air pocket is opening up with only 104.18 as the first big level, where the 100-day SMA can bring some support. Just beneath that, near 103.58, the 200-day SMA should provide similar underpinning.
US Dollar FAQs
What is the US Dollar?
The US Dollar (USD) is the official currency of the United States of America, and the ‘de facto’ currency of a significant number of other countries where it is found in circulation alongside local notes. It is the most heavily traded currency in the world, accounting for over 88% of all global foreign exchange turnover, or an average of $6.6 trillion in transactions per day, according to data from 2022.
Following the second world war, the USD took over from the British Pound as the world’s reserve currency. For most of its history, the US Dollar was backed by Gold, until the Bretton Woods Agreement in 1971 when the Gold Standard went away.
How do the decisions of the Federal Reserve impact the US Dollar?
The most important single factor impacting on the value of the US Dollar is monetary policy, which is shaped by the Federal Reserve (Fed). The Fed has two mandates: to achieve price stability (control inflation) and foster full employment. Its primary tool to achieve these two goals is by adjusting interest rates.
When prices are rising too quickly and inflation is above the Fed’s 2% target, the Fed will raise rates, which helps the USD value. When inflation falls below 2% or the Unemployment Rate is too high, the Fed may lower interest rates, which weighs on the Greenback.
What is Quantitative Easing and how does it influence the US Dollar?
In extreme situations, the Federal Reserve can also print more Dollars and enact quantitative easing (QE). QE is the process by which the Fed substantially increases the flow of credit in a stuck financial system.
It is a non-standard policy measure used when credit has dried up because banks will not lend to each other (out of the fear of counterparty default). It is a last resort when simply lowering interest rates is unlikely to achieve the necessary result. It was the Fed’s weapon of choice to combat the credit crunch that occurred during the Great Financial Crisis in 2008. It involves the Fed printing more Dollars and using them to buy US government bonds predominantly from financial institutions. QE usually leads to a weaker US Dollar.
What is Quantitative Tightening and how does it influence the US Dollar?
Quantitative tightening (QT) is the reverse process whereby the Federal Reserve stops buying bonds from financial institutions and does not reinvest the principal from the bonds it holds maturing in new purchases. It is usually positive for the US Dollar.
EUR/USD probes technical resistance at 1.0725 ahead of US CPI data. Economists at Scotiabank analyze the pair’s outlook.
Short-term price action looks constructive for the Euro
Short-term price action looks constructive for the EUR but spot will have to extend gains in the near term to solidify chances of the rally extending.
Firm support last week around 1.0660 has set up a minor double bottom on the intraday chart, with the EUR flirting with the bull trigger at 1.0725. From a non-technical point of view, the USD’s reaction to the CPI data will likely dictate whether this pattern has any traction or not.
A break higher should push EUR/USD on to new, short-term highs around 1.08. Failure, on the other hand, likely means a return to the upper 1.06s.
Bullish trend momentum signals lean in favour of more EUR gains.
- EUR/JPY extends the upside bias beyond 162.00.
- The continuation of the uptrend appears likely near term.
EUR/JPY advances further north of the 162.00 barrier and clocks a new 2023 peak at 162.75 on Tuesday.
Further upside appears well on the cards for the cross in the short-term horizon. Against that, the surpass of the 2023 high of 162.75 (November 14) is expected to face the next significant resistance level not before the 2008 top of 169.96 (July 23).
In the meantime, the daily RSI flirts with the overbought region near the 70 yardstick, which somehow opens the door to a potential corrective move in the not-so-far horizon.
So far, the longer term positive outlook for the cross appears favoured while above the 200-day SMA, today at 152.34.
EUR/JPY daily chart
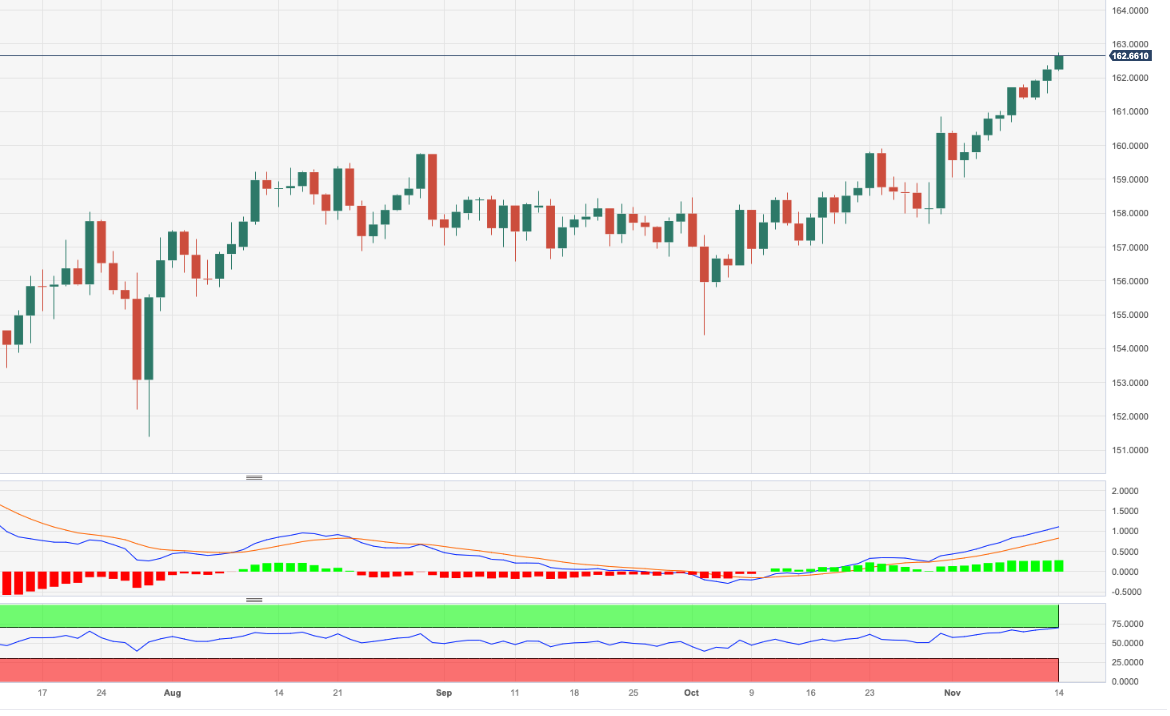
Gold was able to gain something of a foothold again at the start of the week. Economists at Commerzbank analyze the yellow metal’s outlook.
Gold likely to tread water ahead of US inflation data
Gold’s recovery potential is likely to remain limited ahead of the US inflation data due to be published today.
If the figures point to persistently high price pressure, the market is likely to ratchet up its interest rate expectations, which would exert renewed pressure on Gold.
We see the risk of a higher-than-expected figure for the core rate in particular. This could be as much as 0.4% (month-on-month).
At the same time, we believe that the obstacle to any further rate hike is high given that the first signs of weakness in the economy are apparent. We therefore remain optimistic about Gold in the medium term.
See – US CPI Preview: Forecasts from seven major banks, still to the high side of the Fed’s target
Inflation figures carry some downside risks to the Dollar, economists at ING report.
DXY could slip to the 105.20-105.40 area
The Dollar risks another correction event today as inflation may slow a bit more than expected, even though core stickiness should prevent a major repricing of rate expectations.
We see some downside risks to the Dollar given a potential downside surprise in CPI, and DXY could slip to the 105.20-105.40 area.
Expect some support mostly coming the way of procyclical currencies, while we remain unconvinced that the Yen can truly benefit from slight tweaks in the US/Fed narrative at this stage.
See – US CPI Preview: Forecasts from seven major banks, still to the high side of the Fed’s target
Economists at MUFG Bank analyze GBP outlook after the Office for National Statistics (ONS) released the UK employment data.
There is something in employment data for both the doves and the hawks on the MPC
The PAYE employment in October jumped 33K. The September data was also revised higher from -11K to +32K. The Average Weekly Earnings data showed stronger-than-expected overall wages which slowed from 7.9% to just 7.7%. The PAYE-related wage data also slowed with the median annual growth rate slowing from 6.0% to 5.9%.
We would argue that there is something in this data for both the doves and the hawks on the MPC. While labour demand is stronger, there remain signs of a trend of softening labour demand in the vacancy data and moderating wage growth. In the context of the sharp disinflation in CPI, the majority of the MPC will likely see enough here to justify the current stance of remaining on hold, especially with around half of the monetary tightening still to hit the real economy.
There is not enough in this jobs report to see big FX or rate moves and GBP is likely to remain in a narrow trading range, albeit to the firmer side, ahead of the US CPI today and the UK CPI data on Wednesday.
The continuation of the downward bias in USD/CNH appears to have run out of steam as of late, comment UOB Group’s Markets Strategist Quek Ser Leang and Economist Lee Sue Ann.
Key Quotes
24-hour view: Yesterday, we expected USD to trade in a range between 7.2770 and 7.2950. Instead of trading in a range, USD rose to a high of 7.3021. Upward momentum is beginning to improve, and the bias for USD is tilted to the upside. As upward momentum is only beginning to build, any advance is unlikely to reach the major resistance at 7.3320. Note that there is another resistance at 7.3200. On the downside, a breach of 7.2880 (minor support is at 7.2960) would indicate that the upward bias has faded.
Next 1-3 weeks: Our latest narrative was from Monday (06 Nov, spot at 7.2880), wherein, after the sharp drop last Friday, downward momentum is beginning to build, but USD must break clearly below 7.2700 before further decline is unlikely. Yesterday, USD rebounded to a high of 7.3021. While our ‘strong resistance’ level at 7.3200 has not been breached yet, downward momentum has more or less faded. The current price action is likely part of a sideways trading phase, likely between 7.2700 and 7.3320.
Considering advanced prints from CME Group for Natural Gas futures markets, open interest extended the uptrend and increased by just 946 contracts at the beginning of the week. In the same direction, volume rose by around 122.4K contracts after two consecutive daily pullbacks.
Natural Gas now retargets $3.60 and above
Monday’s strong rebound in prices of natural gas came in tandem with increasing open interest and volume, paving the way for extra gains in the very near term and with the immediate up-barrier at the so far October top near $3.65 per MMBtu (October 27).

USD/JPY traded at a new cycle high around 151.91 on Monday. Economists at MUFG Bank analyze the pair’s outlook ahead of CPI data for October.
Any Dollar strength will likely be most prevalent if option-related resistance at 152.00 gives way
The US CPI data will be crucial on whether USD/JPY breaks back higher and through the high from Monday and through the current cyclical high recorded in last year at 151.95, a 33-year high.
We think it would take a sharp upside surprise to get markets repricing Fed rate hikes and an upside surprise related to medical services inflation will likely be looked through (the same quirk does not happen in the PCE data).
Any Dollar strength will likely be most prevalent in USD/JPY if option-related resistance at 152.00 gives way.
See – US CPI Preview: Forecasts from seven major banks, still to the high side of the Fed’s target
Federal Reserve (Fed) Vice Chair Philip N. Jefferson said on Tuesday that some measures of economic uncertainty, particularly for inflation, are elevated, per Reuters.
"The uncertainty around inflation persistence may warrant stronger policy response than otherwise," Jefferson added and explained that policy decisions taken under uncertainty may look different from those optimal under certainty.
Market reaction
The US Dollar stays under modest bearish pressure following these comments. As of writing, the US Dollar Index was down 0.15% on a daily basis at 105.50.
- EUR/GBP discovers significant buying interest near 0.8700 on restricted GDP contraction in Q3.
- The Pound Sterling weakens against the Euro amid weak labor demand in the UK economy.
- UK’s upbeat wage growth has elevated consumer inflation expectations.
The EUR/GBP pair recovered sharply after defending the crucial support of 0.8700 as the preliminary Eurozone Q3 Gross Domestic Product (GDP) contracted by 0.1% as expected. The output by firms dropped as consumer spending remained vulnerable due to the entrenched cost of living crisis. The pace at which Eurozone firms hired job-seekers was higher at 0.3% against 0.2% recorded earlier.
The Euro seems recovering against the Pound Sterling on upbeat labor demand while employment levels in the United Kingdom economy fell further in the quarter-to-September period.
Earlier, the Pound Sterling discovered buying interest after mixed UK labor market data. The wage growth broadly outperformed while employment levels weakened further.
Average Earnings excluding bonuses for the quarter-to-September period rose by 7.7% as expected but softened from the former reading of 7.9%. The wage growth including bonuses grew at a stronger pace of 7.9% against expectations of 7.4%. Strong wage growth is expected to keep price pressures persistent ahead.
UK employers shed 207K jobs in three months to September, which were higher than expectations of 198K and the former reading of 82K. The UK laborforce squeezed for the third time in a row. UK firms slowed hiring due to poor demand outlook amid weak consumer spending in domestic and overseas markets.
A slowdown in job growth may not ease Bank of England (BoE) policymakers’ concerns about higher inflationary pressures as upbeat wage growth will prompt expectations for a higher price index.
Kit Juckes, Chief Global FX Strategist at Société Générale, analyzes what is needed for trades to get short USD.
The market wants more evidence to justify getting short USD
The market wants more evidence to justify getting short USD (today’s US CPI data are in focus but the omens aren’t good, a fall in headline inflation from 3.7% to 3.3% would be ignored and a steady 4.1% core rate would merely support the ‘high for long’ crowd and leave the markets waiting for confirmation that growth is slowing. This doesn’t really raise my hopes of a breakout by EUR/USD this week, ho hum!
The market overall is going to need more evidence of a US slowdown before it buys properly into the idea of a weaker Dollar.
Further upside momentum could lift USD/JPY to its next target of 152.50 in the next few weeks, according to UOB Group’s Markets Strategist Quek Ser Leang and Economist Lee Sue Ann.
Key Quotes
24-hour view: We highlighted yesterday that USD “could edge higher to 151.15 before the risk of a more sustained pullback increases.” We also highlighted that “151.30 is unlikely to come into view.” The anticipated USD strength exceeded our expectations as it rose to a high of 151.38. Further USD strength is not ruled out, but upward momentum is not exactly strong, and it remains to be seen if USD can break above last week’s high near 151.80. Support is at 151.10; a breach of 150.90 would indicate that the current upward pressure has eased.
Next 1-3 weeks: Yesterday (09 Nov, spot at 150.80), we indicated “upward momentum has increased just a tad.” We added, USD “has to break clearly above 151.30 before a sustained advance is likely.” USD then rose to a high of 151.38. While we prefer a more ‘impulsive’ break off 151.30, the price action suggests that the risk of USD breaking above last week’s high near 151.80 has increased. Note that this level is not far below last year’s peak near 151.95. If USD can break above this solid resistance zone, it is likely to rise further to 152.50. In order to keep the momentum going, USD must stay above 150.40 in the next few days.
- Germany’s ZEW Economic Sentiment Index improved to 9.8 in November.
- EUR/USD is holding higher near 1.0720 after the mixed ZEW surveys.
The German ZEW headline number showed that the Economic Sentiment Index improved further in November, arriving at 9.8 from -1.1 in October while beating the estimates of 5.0.
However, the Current Situation Index eased slightly to -79.8 from -79.9 prior, missing expectations of -76.7.
During the same period, the Eurozone ZEW Economic Sentiment Index rose to 13.8 from 2.3 recorded in October.
Key points
Economic expectations for Germany have again increased.
At the same time, assessment of the current situation remains unchanged at a low level.
These observations support impression that Germany's economic development has bottomed out.
Heightened economic expecations accompanied by significantly more optimistic outlooks for the German industrial sector.
Market reaction
The EUR/USD pair is testing daily highs above 1.0720 after ZEW surveys, up 0.24% on the day.
(The story was corrected on November 14 at 10:15 GMT to say that "the Current Situation Index eased slightly to -79.8 from -79.9 prior, not the Current Situation Index edged a tad higher to -79.9 from -79.4 prior.")
The Eurozone economy contracted by 0.1% on a quarterly basis in the three months to September of 2023, meeting the -0.1% estimates and confirming the -0.1% print registered in the preliminary release, the second estimate published by Eurostat showed on Tuesday.
The bloc’s GDP rate grew by an annual rate of 0.1% in Q3 vs. 0.1% recorded in Q2 while matching 0.1% expectations.
Separately, the third quarter Preliminary Employment Change data for the old continent came in at 0.3% and 1.4% on a quarterly and yearly basis respectively.
developing story ...
About Eurozone Preliminary GDP
The Gross Domestic Product released by Eurostat is a measure of the total value of all goods and services produced by the Eurozone. The GDP is considered as a broad measure of the Eurozone's economic activity and health. Usually, a rising trend has a positive effect on the EUR, while a falling trend is seen as negative (or bearish).
In its monthly oil market report published on Tuesday, the International Energy Agency (IEA) raised the global oil demand growth forecast for 2023 and 2024.
Key takeaways
Raises 2024 global oil demand growth forecast to 930,000 bpd (prev. 880,000 bpd).
Lifts 2023 global oil demand growth forecast to 2.4 mln bpd (prev. 2.3 mbpd).
Saudi-Russia cuts set to keep oil market in a significant deficit through year-end.
With oil demand growth set to slow, the market could shift into surplus at the start of 2024.
Chinese oil demand rose to record high of 17.1 mln bpd in Sept.
There has been no material impact on oil supply flows from the Israel-Hamas war.
Russian oil exports eased by 70,000 bpd in Oct to 7.5 mbpd.
Market reaction
WTI is off the daily highs but holds above $78 on the above findings, down 0.23% on the day.
- Gold price trades back-and-forth as the focus shifts to US inflation data.
- A persistent inflation report may prompt hawkish Fed bets.
- Various Fed policymakers are scheduled to speak today.
Gold price (XAU/USD) struggles to extend its recovery as investors remain anxious ahead of US inflation data for October, which will be published at 13:30 GMT. The precious metal consolidates with investors expected to wait until after the release before building fresh positions, as the inflation data will provide them with greater clarity about the monetary policy outlook.
Economists have projected a steady growth pace in the core Consumer Price Index (CPI) while the headline inflation is seen easing. A persistent US inflation report would prompt expectations of further policy-tightening by the Federal Reserve (Fed). The Fed is committed to bringing down inflation to 2% in a timely manner and it won’t hesitate to raise rates further if it thinks inflation has become entrenched.
Daily Digest Market Movers: Gold price trades directionless
- Gold price rebounds to near $1,945.00 but struggles to extend upside as investors remain cautious ahead of the US inflation data for October.
- The precious metal trades are in a tight range as investors are expected to build positions after the release of US consumer inflation figures, which will guide them about the Fed’s likely next interest rate action at its monetary policy meeting in December.
- The extent of persistence in US inflation would offer some clarity on whether Fed policymakers will advocate for raising interest rates further.
- Monthly headline CPI is expected to have slowed to a 0.1% rise in October, from a 0.4% in September. In the same timeframe, the core inflation is seen growing at a steady pace of 0.3%.
- On an annual basis, the headline inflation is forecast to have risen at a slower pace of 3.3% against a 3.7% reading in September. The core CPI is seen expanding at a steady pace of 4.1%.
- A stubborn US inflation report may reprice the expectations of one more interest rate increase from the Fed at its December monetary policy meeting or in the early start of 2024.
- Greater US inflation would indicate that progress has slowed in bringing inflation down to the Fed’s 2% target, prompting the need for increasing interest rates further.
- As per the CME Group Fedwatch tool, traders see a 15% chance of the Fed raising interest rates by 25 basis points (bps) at the December meeting and a 25% chance at the monetary policy meeting in January 2024.
- The odds for further rate-tightening edged higher as Federal Reserve Chair Jerome Powell along with his colleagues remain unsure about whether current interest rates are adequate to bring down inflation to 2%.
- Jerome Powell warned that a failure to control inflation by the Fed would be a big mistake. Therefore, the central bank won’t hesitate to tighten monetary policy further.
- Apart from the US inflation data, speeches from Fed policymakers: Philip Jefferson, Michael Barr and Austan Goolsbee will be of utmost importance.
- The US Dollar Index (DXY) has been consolidating in a range of 105.40-106.00 during the three trading sessions prior to the US inflation report. 10-year US Treasury yields hover near 4.63%.
- This week, investors will also focus on the monthly US Retail Sales data for October. As per the consensus, consumer spending is forecast to have contracted by 0.3% against 0.7% growth in September.
- Meanwhile, with no significant escalation in Middle East tensions appeal for bullion has diminished.
Technical Analysis: Gold price retraces 38.2%
-638355521950678755.png)
Gold price is struck in a tight range ahead of the release of the US inflation data. The corrective move in the precious metal has been extended to near 38.2% Fibonacci retracement (plotted from October 6 low at $1,810.50 to October 27 high at $2,009.50) around $1,933.80.
The near-term outlook for Gold has turned bearish as it is trading below the 20-day Exponential Moving Average (EMA) while the 50-EMA near $1,938.00 continues to offer support.
Gold FAQs
Why do people invest in Gold?
Gold has played a key role in human’s history as it has been widely used as a store of value and medium of exchange. Currently, apart from its shine and usage for jewelry, the precious metal is widely seen as a safe-haven asset, meaning that it is considered a good investment during turbulent times. Gold is also widely seen as a hedge against inflation and against depreciating currencies as it doesn’t rely on any specific issuer or government.
Who buys the most Gold?
Central banks are the biggest Gold holders. In their aim to support their currencies in turbulent times, central banks tend to diversify their reserves and buy Gold to improve the perceived strength of the economy and the currency. High Gold reserves can be a source of trust for a country’s solvency. Central banks added 1,136 tonnes of Gold worth around $70 billion to their reserves in 2022, according to data from the World Gold Council. This is the highest yearly purchase since records began. Central banks from emerging economies such as China, India and Turkey are quickly increasing their Gold reserves.
How is Gold correlated with other assets?
Gold has an inverse correlation with the US Dollar and US Treasuries, which are both major reserve and safe-haven assets. When the Dollar depreciates, Gold tends to rise, enabling investors and central banks to diversify their assets in turbulent times. Gold is also inversely correlated with risk assets. A rally in the stock market tends to weaken Gold price, while sell-offs in riskier markets tend to favor the precious metal.
What does the price of Gold depend on?
The price can move due to a wide range of factors. Geopolitical instability or fears of a deep recession can quickly make Gold price escalate due to its safe-haven status. As a yield-less asset, Gold tends to rise with lower interest rates, while higher cost of money usually weighs down on the yellow metal. Still, most moves depend on how the US Dollar (USD) behaves as the asset is priced in dollars (XAU/USD). A strong Dollar tends to keep the price of Gold controlled, whereas a weaker Dollar is likely to push Gold prices up.
Upcoming UK economic data will be significant in shaping the GBP's near-term direction, economists at Crédit Agricole report.
Many adverse factors seem to be priced into GBP
Given the market’s repositioning for potential BoE rate cuts and the bank’s economic forecasts, many negative factors seem to be already reflected in GBP’s current pricing. Therefore, GBP’s performance in the near term is likely to be heavily influenced by the upcoming data releases.
For GBP to extend its underperformance in the immediate future, the upcoming economic data would need to show more negative trends than currently anticipated by the market.
CME Group’s flash data for crude oil futures markets noted traders trimmed their open interest positions for yet another session on Monday, now by around 9.1K contracts. Volume followed suit and retreated for the third consecutive session, this time by around 47.8K contracts.
WTI: Another test of $75.00 appears likely
Prices of the barrel of WTI started the week on a positive foot. Monday’s gains, hovered, came on the back of shrinking open interest and volume, hinting at the view that further upside does not look favoured in the very near term. That said, there is scope for another drop to the November lows near $75.00 (November 8).
- The Euro advances modestly vs. the US Dollar.
- European stocks opened mostly with decent gains.
- US inflation figures, flash EMU Q3 GDP next of note in the docket.
The Euro (EUR) accelerates its gains against the US Dollar (USD), motivating EUR/USD to surpass the 1.0700 yardstick during Tuesday’s morning in the old continent.
On the other hand, the Greenback drifts lower and revisits the 105.60 area when measured by the USD Index (DXY) amidst the continuation of the gradual decline from last week’s top around 106.00.
The corrective knee-jerk in the Dollar comes amidst further weakness in US yields across different timeframes, always against the backdrop of a persistent discrepancy between recent hawkish statements from the Federal Reserve and investors' views suggesting a prolonged pause in the Fed's normalization program.
Around the European Central Bank (ECB), recent views from Council members keep pointing to a prolonged pause of the current restrictive stance as inflation continues to run hot and well above the target.
Daily digest market movers: Euro regains pace and trespasses 1.0700
- The EUR breaks above the key 1.0700 mark vs. the USD.
- Further decline looks favoured in both US and German yields.
- Investors anticipate that the Fed will not raise interest rates in December.
- The ECB appears to have reached a stalemate in its tightening drive.
- Fears of FX intervention keep hovering around USD/JPY.
- Next on tap in the euro area come the Economic Sentiment.
- US Inflation Rate will be the salient event later in the session.
- UK labour market report surprised to the upside.
Technical Analysis: Euro is expected to meet the next up-barrier near 1.0750
EUR/USD maintains the constructive stance and breaks above the key 1.0700 hurdle on Tuesday.
EUR/USD may return the November high of 1.0754 (November 6) before hitting the 200-day SMA at 1.0801 and the weekly top of 1.0945 (August 30) if the recovery continues. The psychological threshold of 1.1000 is followed by the August peak of 1.1064 (August 10) and another weekly high of 1.1149 (July 27), both of which precede the 2023 top of 1.1275 (July 18).
If sellers retake control, the pair may find temporary resistance at the 55-day SMA at 1.0637, ahead of the weekly low of 1.0495 (October 13) and the 2023 low of 1.0448. (October 15).
So far, additional decline in the pair is expected as long as it continues below the 200-day SMA.
Euro FAQs
What is the Euro?
The Euro is the currency for the 20 European Union countries that belong to the Eurozone. It is the second most heavily traded currency in the world behind the US Dollar. In 2022, it accounted for 31% of all foreign exchange transactions, with an average daily turnover of over $2.2 trillion a day.
EUR/USD is the most heavily traded currency pair in the world, accounting for an estimated 30% off all transactions, followed by EUR/JPY (4%), EUR/GBP (3%) and EUR/AUD (2%).
What is the ECB and how does it impact the Euro?
The European Central Bank (ECB) in Frankfurt, Germany, is the reserve bank for the Eurozone. The ECB sets interest rates and manages monetary policy.
The ECB’s primary mandate is to maintain price stability, which means either controlling inflation or stimulating growth. Its primary tool is the raising or lowering of interest rates. Relatively high interest rates – or the expectation of higher rates – will usually benefit the Euro and vice versa.
The ECB Governing Council makes monetary policy decisions at meetings held eight times a year. Decisions are made by heads of the Eurozone national banks and six permanent members, including the President of the ECB, Christine Lagarde.
How does inflation data impact the value of the Euro?
Eurozone inflation data, measured by the Harmonized Index of Consumer Prices (HICP), is an important econometric for the Euro. If inflation rises more than expected, especially if above the ECB’s 2% target, it obliges the ECB to raise interest rates to bring it back under control.
Relatively high interest rates compared to its counterparts will usually benefit the Euro, as it makes the region more attractive as a place for global investors to park their money.
How does economic data influence the value of the Euro?
Data releases gauge the health of the economy and can impact on the Euro. Indicators such as GDP, Manufacturing and Services PMIs, employment, and consumer sentiment surveys can all influence the direction of the single currency.
A strong economy is good for the Euro. Not only does it attract more foreign investment but it may encourage the ECB to put up interest rates, which will directly strengthen the Euro. Otherwise, if economic data is weak, the Euro is likely to fall.
Economic data for the four largest economies in the euro area (Germany, France, Italy and Spain) are especially significant, as they account for 75% of the Eurozone’s economy.
How does the Trade Balance impact the Euro?
Another significant data release for the Euro is the Trade Balance. This indicator measures the difference between what a country earns from its exports and what it spends on imports over a given period.
If a country produces highly sought after exports then its currency will gain in value purely from the extra demand created from foreign buyers seeking to purchase these goods. Therefore, a positive net Trade Balance strengthens a currency and vice versa for a negative balance.
EUR/USD might be helped by a marginal improvement in the ZEW survey out of Germany, economists at ING report.
Hoping for a glimmer of hope in the ZEW
Today, the ZEW survey out of Germany is expected to show a mild rebound. Consensus sees the ‘expectations’ index returning above zero for the first time since April, while the ‘current situation’ gauge is seen marginally improving. Any good surprises may build some support at 1.0700 for EUR/USD, even though the US CPI is set to be a much larger event for markets today.
The preliminary (i.e., second after the ‘advance’) release of third-quarter Euro area GDP figures is expected to confirm negative growth, but that should have a negligible market impact.
- USD/CAD could achieve the 1.3850 psychological level followed by the previous week’s high.
- Technical indicators suggest bullish momentum to revisit the yearly high at 1.3898 level.
- The psychological level at 1.3800 emerges as the immediate support followed by the 14-day EMA.
USD/CAD bids higher around 1.3820 during the early European session on Tuesday, followed by the immediate resistance region around 1.3850 lined up with the previous week’s high at 1.3854 level.
The 14-day Relative Strength Index (RSI) is positioned above the 50 level, indicating upward support. This signals a bullish momentum and reflects a robust market sentiment.
The Moving Average Convergence Divergence (MACD) line is situated above the centerline but shows convergence below the signal line, which suggests a potential momentum shift toward bearish sentiment in the USD/CAD pair.
Market participants adopt a cautious stance before US inflation data, higher than anticipated figures could boost the US Dollar (USD) and in return, the USD/CAD pair could revisit the yearly high at 1.3898 level.
On the downside, the USD/CAD could meet the key support around the psychological level at 1.3800, followed by the 14-day Exponential Moving Average (EMA) at 1.3778. A decisive break below the latter could force the USD/CAD pair to navigate the region around the 23.6% Fibonacci retracement level at 1.3706 aligned to the 1.3700 significant level.
USD/CAD: Daily Chart

Swedish core inflation slowed more than forecast in October. SEK seems limited after the release. Economists at ING analyze Krona’s outlook.
Faster inflation decline raises doubts about hike
While CPIF inflation accelerated – once again, less than expected – from 4.0% to 4.2%, the preferred core inflation measure by the Riksbank (CPIF excluding energy) slowed sharply from 6.9% to 6.1%.
Our stance on SEK is clear. FX hedging operations are offering an edge to the Krona over other pro-cyclicals in the short term and in an improving risk environment, but those operations should end by February anyway – meaning this is not a sustainable driver of currency appreciation. In other words, another hike remains an important step toward SEK strengthening.
We are still inclined to think the Riksbank will hike next week, although we admit this is closer to a 50/50 call at this stage. Wednesday’s Prospera inflation expectations survey results will help us make a final call.
For now, SEK weakness seems limited after the inflation release, probably given expectations of Riksbank FX selling later today.
- EUR/GBP remains volatile due to the slew of economic data from both economies.
- UK ILO Unemployment Rate remained consistent at 4.2% in September.
- UK fears over the stagflation scenario following the elevated inflation levels and a higher unemployment rate.
- Eurozone GDP is expected to contract by 0.1% in the quarter, while the annual growth is estimated to expand by 0.1%.
EUR/GBP trades lower around 0.8710, extending losses for the second consecutive day. The EUR/GBP pair continues to soften after the employment data from the United Kingdom (UK).
UK Claimant Count Change revealed that the claims for jobless benefits have reduced to 17.8K in October compared to the previous figures of 20.4K. Claimant Count Rate remained consistent at 4.0%. Employment Change declined by 207K in September against the 82K decline previously. Additionally, the UK ILO Unemployment Rate (3M) remained the same at 4.2% in September.
Pound Sterling (GBP) experienced a boost following the release of the UK preliminary Gross Domestic Product (GDP) data, which surpassed expectations last Friday. This positive development suggests that the UK may have avoided a recession in 2023.
However, it's worth noting that the situation remains precarious as the UK still teeters on the brink of a stagflation scenario following the elevated inflation levels alongside a higher unemployment rate, posing challenges for the overall economic landscape.
Traders are adopting a cautious approach, choosing to wait on the sidelines in anticipation of key data from the Eurozone. The upcoming Eurozone preliminary Gross Domestic Product (GDP) figures for the third quarter (Q3), set to be released in the European session on Tuesday, could trigger volatility in the market.
Projections suggest a contraction of 0.1% in the quarterly growth number, while the annual growth number is estimated to expand by 0.1%. Positive economic data from the Eurozone could potentially provide support to the Euro (EUR) against the British Pound (GBP).
Sterling is strengthening. Economists at ING analyze GBP outlook.
Wage data actually good news for BoE
Wage growth slowed less than expected in September from 8.1% to 7.9% (exp. 7.3%). The unemployment figures should discarded given the data quality issues, but in general, the report points to ongoing cooling in the jobs market. This appears to be good news for the Bank of England and we think private sector wage growth can slow down to around 4.5% by next summer.
EUR/GBP is heavily testing 0.8700 but will struggle to make a break lower if ZEW shows some improvement.
Ahead of the important US inflation data today, trading in EUR/USD was quite sluggish on Monday. Economists at Commerzbank analyze the pair’s outlook.
How stubborn is the US inflation?
Inflation would have to surprise quite notably to the upside to provide significant positive momentum for USD.
Stubborn inflation might not actually point towards a further rate hike, but at least towards ‘high for longer’. And that in turn might at least prevent USD from weakening further.
At present, the market expects a soft landing for the US economy, if this image is tainted USD might get under stronger depreciation pressure.
See – US CPI Preview: Forecasts from seven major banks, still to the high side of the Fed’s target
- Pound Sterling rose close to 1.2300 despite signs of a loosening UK labor market.
- UK employers shed jobs for straight three months, but earnings rose by more than expected.
- Investors await US,UK inflation data and commentaries from BoE policymakers.
The Pound Sterling (GBP) extended its upside on Tuesday after mixed UK labor market data, which pointed to wages rising faster than expected but also to lower employment levels. UK employers’ shed jobs in three months to September, posting a third straight decline in employment as firms reduce costs amid the decline in new business. The Unemployment Rate remained unchanged at 4.2%, while wage growth outperformed expectations.
The rally in the GBP/USD pair stretches despite weak UK labor market data, which indicates that soft employment conditions were already discounted by the market participants. Going forward, remarks from a few BoE policymakers are expected, followed by inflation data for October to be released on Wednesday. Inflation data is expected to provide fresh cues about the likely action by the BoE in its last monetary policy meeting of 2023.
Daily Digest Market Movers: Pound Sterling capitalizes on gradual fall in US Dollar
- Pound Sterling jumps to near the crucial resistance of 1.2300 despite loosening labor market conditions in the UK economy.
- Employment fell by 207K in the three months to September, a bigger decline than the 198K expected and the former decrease of 82K. The UK workforce has witnessed drawdown for the third time in a row.
- UK firms cut significantly on workforce as new demand has declined due to lower spending by households. Demand from overseas markets has also dropped due to geopolitical tensions.
- In the same period, the Unemployment Rate remained steady at 4.2%. Economists had projected the jobless rate rising to 4.3%.
- Individuals claiming jobless benefits for the first time rose to 17.8K in October, exceeding the 15K expected and 9K reading from September.
- Average Earnings excluding bonuses rose by 7.7% in the quarter-to-September period as expected, easing slightly from the former reading of 7.9%. However, wage growth including bonuses grew at a stronger pace of 7.9% against expectations of 7.4%. In the former period, earnings expanded by 8.2%.
- Strong wage growth in the UK economy has been a major contributor to stubborn price pressures. Stubborn UK wage growth is likely to lift consumer inflation expectations.
- In spite of persistent wage growth, a majority of Bank of England (BoE) policymakers are expected to support keeping interest rates unchanged or discuss early rate cuts due to weakening labor demand.
- The decrease in employment signals a slowdown in the UK economy.
- After UK labor market data, investors will shift focus on the commentaries from BoE policymakers: Swati Dhingra and Huw Pill, who are expected to advocate for a relief in tight monetary policy narrative to ease fears of a potential recession.
- Going forward, UK inflation data for October will be keenly watched on Wednesday. The annual headline and core inflation are expected to soften significantly to 4.8% and 5.8%, respectively.
- Soft consensus for UK inflation suggests that UK Prime Minister Rishi Sunak could fulfill his promise of halving inflation to 5.4% by the year-end. Sunak promised halving inflation in January, when price growth was near 10.7%.
- Meanwhile, the US Dollar Index (DXY) remains subdued ahead of the US inflation data for October.
- Investors see core inflation expanding at a steady pace of 0.3% on month and 4.1% on year, which could heat up discussions about further policy-tightening by the Federal Reserve (Fed).
- Failing to advance towards the 2% inflation target could lean Fed Chair Jerome Powell and colleagues toward tightening interest rates further.
Technical Analysis: Pound Sterling recovers to near 1.2300
Pound Sterling climbed to near 1.2300 after investors ignored weaker-than-anticipated UK labor market data. The GBP/USD pair recovered after testing support region near 1.200, where a breakout of the symmetrical triangle chart pattern took place.
The 20-day Exponential Moving Average (EMA), which trades around 1.2230, offered support to the Pound Sterling bulls, which later pushed it to near the 50-day EMA. The broader appeal for the Cable is still bearish as the 200-day EMA is sloping south.
Pound Sterling FAQs
What is the Pound Sterling?
The Pound Sterling (GBP) is the oldest currency in the world (886 AD) and the official currency of the United Kingdom. It is the fourth most traded unit for foreign exchange (FX) in the world, accounting for 12% of all transactions, averaging $630 billion a day, according to 2022 data.
Its key trading pairs are GBP/USD, aka ‘Cable’, which accounts for 11% of FX, GBP/JPY, or the ‘Dragon’ as it is known by traders (3%), and EUR/GBP (2%). The Pound Sterling is issued by the Bank of England (BoE).
How do the decisions of the Bank of England impact on the Pound Sterling?
The single most important factor influencing the value of the Pound Sterling is monetary policy decided by the Bank of England. The BoE bases its decisions on whether it has achieved its primary goal of “price stability” – a steady inflation rate of around 2%. Its primary tool for achieving this is the adjustment of interest rates.
When inflation is too high, the BoE will try to rein it in by raising interest rates, making it more expensive for people and businesses to access credit. This is generally positive for GBP, as higher interest rates make the UK a more attractive place for global investors to park their money.
When inflation falls too low it is a sign economic growth is slowing. In this scenario, the BoE will consider lowering interest rates to cheapen credit so businesses will borrow more to invest in growth-generating projects.
How does economic data influence the value of the Pound?
Data releases gauge the health of the economy and can impact the value of the Pound Sterling. Indicators such as GDP, Manufacturing and Services PMIs, and employment can all influence the direction of the GBP.
A strong economy is good for Sterling. Not only does it attract more foreign investment but it may encourage the BoE to put up interest rates, which will directly strengthen GBP. Otherwise, if economic data is weak, the Pound Sterling is likely to fall.
How does the Trade Balance impact the Pound?
Another significant data release for the Pound Sterling is the Trade Balance. This indicator measures the difference between what a country earns from its exports and what it spends on imports over a given period.
If a country produces highly sought-after exports, its currency will benefit purely from the extra demand created from foreign buyers seeking to purchase these goods. Therefore, a positive net Trade Balance strengthens a currency and vice versa for a negative balance.
NZD/USD is now expected to navigate between 0.5830 and 0.5965 in the short-term horizon, suggest UOB Group’s Markets Strategist Quek Ser Leang and Economist Lee Sue Ann.
Key Quotes
24-hour view: Yesterday, we expected NZD to trade in a range of 0.5900/0.5940. We did not anticipate the elevated volatility as NZD popped to a high of 0.5954 and then plummeted to a low of 0.5893. There is scope for NZD to weaken further, even though the major support at 0.5830 is highly unlikely to come under threat. Note that there is another support at 0.5860. Resistance is at 0.5915; a breach of 0.5935 would mean that NZD is not weakening further.
Next 1-3 weeks: Two days ago (08 Nov, spot at 0.5935), we highlighted, “while upward momentum has eased, there is still a chance, albeit not a high one, for NZD to rise to 0.6055.” We added, “only a clear break below 0.5900 would indicate the NZD that started late last week has ended.” In NY trade, NZD broke below 0.5900 (low of 0.5893). The price action suggests that NZD has entered a consolidation phase, and it is likely to trade in a range of 0.5830/0.5965 for the time being.
EUR/USD is enjoying a decent month of November. Economists at Société Générale analyze the pair’s outlook.
10-year UST/Bund spread pegged back below 200 bps
Near-term direction is likely to depend on the reaction of US bond yields this week to the outcomes of US Consumer Price Index (CPI) and Retail Sales data.
The narrowing of 10Y UST/Bund below 200 bps and 2y2y US/EU forward spreads are supporting the Euro.
Bullish seasonality in December is one reason not to rule out additional upside into year-end.
Chairman of the Governing Board of the Swiss National Bank (SNB), Thomas Jordan, is speaking at the SNB-FRB-BIS third Hight-Level Conference on Global Risk, Uncertainty, and Volatility.
Key quotes
We will not hesitate to tighten monetary policy further if necessary.
At next meeting, will review whether measures taken to date are sufficient to keep inflation within price stability range on a sustainable basis.
To this end, we will monitor the development of inflation closely in the coming weeks.
Market reaction
USD/CHF is little affected by the above comments, currently trading at 0.9015, flat on the day.
- USD/MXN could weaken as US inflation is expected to rise at a lower rate.
- Fed may consider a rate hike if US CPI data exceeds the expectation.
- Banxico Governor Rodriguez highlighted the possibility of rate cuts.
USD/MXN seems to extend losses on the third successive day, trading around 17.6000 during the Asian session on Tuesday. The pair faces downward pressure before the US CPI data as inflation is expected to rise but at a slower pace in October. Meanwhile, the forecast for the core annual rate remains stable.
However, if the upcoming inflation data exceeds expectations, it may prompt the Federal Reserve (Fed) to consider increasing interest rates by 25 basis points in subsequent meetings. The data-dependent approach highlighted by Fed officials indicates that robust inflation figures could play a pivotal role in shaping the central bank's decisions toward further tightening.
The Bank of Mexico’s (Banxico) Governor Victoria Rodriguez Ceja has highlighted the possibility of discussing rate cuts due to the easing inflationary outlook. She mentioned that any monetary policy loosening could be gradual and may not necessarily imply continuous rate cuts. The board, she noted, would consider macroeconomic conditions, signaling a data-dependent approach in their decision-making.
Banxico's decision to maintain interest rates at 11.25% aligns with the context of Mexico's inflation, which expanded by 4.26% year on year in October. This figure, slightly below the forecasted 4.28% and notably lower than the previous reading of 4.45%, likely played a role in the central bank's decision. Additionally, Banxico has committed to working towards achieving its 3.0% inflation target by the year 2025, signaling a commitment to maintaining policy rates at their current level for some time.
Here is what you need to know on Tuesday, November 14:
Financial markets remain relatively quiet on Tuesday as participants stay on the sidelines while waiting for the October Consumer Price Index (CPI) data from the US. In the European session, Eurostat will publish Gross Domestic Product (GDP) growth figures for the third quarter and ZEW will release economic sentiment survey outcomes for the Eurozone and Germany.
The US Dollar (USD) Index, which gauges the USD's performance against a basket of six major currencies, registered small losses on Monday and the benchmark 10-year US Treasury bond yield closed virtually unchanged slightly above 4.6%. Early Tuesday, the USD Index stays flat and the 10-year yield fluctuates in a tight channel at around 4.6%. Meanwhile, US stock index futures trade mixed. Annual inflation in the US, as measured by the change in the CPI, is forecast to decline to 3.3% in October from 3.7% in September.
US Dollar price this week
The table below shows the percentage change of US Dollar (USD) against listed major currencies this week. US Dollar was the strongest against the New Zealand Dollar.
| USD | EUR | GBP | CAD | AUD | JPY | NZD | CHF | |
| USD | -0.16% | -0.59% | 0.10% | -0.09% | 0.10% | 0.33% | -0.03% | |
| EUR | 0.16% | -0.43% | 0.25% | 0.07% | 0.25% | 0.49% | 0.13% | |
| GBP | 0.57% | 0.41% | 0.68% | 0.49% | 0.68% | 0.91% | 0.55% | |
| CAD | -0.10% | -0.25% | -0.68% | -0.18% | 0.00% | 0.24% | -0.12% | |
| AUD | 0.09% | -0.06% | -0.49% | 0.19% | 0.19% | 0.43% | 0.07% | |
| JPY | -0.11% | -0.27% | -0.70% | 0.00% | -0.20% | 0.23% | -0.13% | |
| NZD | -0.33% | -0.49% | -0.93% | -0.24% | -0.43% | -0.24% | -0.38% | |
| CHF | 0.04% | -0.12% | -0.54% | 0.14% | -0.05% | 0.13% | 0.38% |
The heat map shows percentage changes of major currencies against each other. The base currency is picked from the left column, while the quote currency is picked from the top row. For example, if you pick the Euro from the left column and move along the horizontal line to the Japanese Yen, the percentage change displayed in the box will represent EUR (base)/JPY (quote).
US CPI Data Forecast: Headline inflation expected to slow, core price pressures to remain high.
EUR/USD stabilized near 1.0700 early Tuesday after posting small gains on Monday. The European economy is expected to grow at an annual rate of 0.1% in the third quarter.
ILO Unemployment Rate in the UK stood unchanged at 4.2% in the three months to September, the UK's Office for National Statistics reported on Tuesday. Wage inflation, as presented by the change in Average Earnings Including Bonus, declined to 7.9% on a yearly basis from 8.2%. Pound Sterling showed no immediate reaction to these figures and GBP/USD was last seen trading slightly below 1.2300.
After coming within a touching distance of 152.00 during the early American session on Monday, USD/JPY declined sharply toward but managed to stabilize above 151.50. Early Tuesday, the pair struggles to make a decisive move in either direction.
Following a bearish start to the week, Gold gained traction and advanced toward $1,950, erasing a portion of previous Friday's losses. With the 10-year US yield holding steady, XAU/USD went into a consolidation phase at around mid-$1,940s.
National Australia Bank's Business Conditions Index improved slightly to 13 in October from 11 in September. The Business Confidence Index declined to -2 from 1 in the same period. AUD/USD came under modest bearish pressure during the Asian trading hours and was last seen losing 0.2% on the day at 0.6365.
The INR slipped to a fresh record low of 83.4775 against the USD on Friday. Economists at Société Générale analyze USD/INR outlook.
RBI likely to manage INR depreciation
The RBI is pursuing an explanation from Financial Technologies Group Ltd. and data provider LSEG about an outage in the spot FX market.
The RBI is likely to manage INR depreciation as Diwali festival leads to a decline in FX trading activity.
Investors brace for further selling towards 84.00 if the pre-Diwali bounce in equities unravels.
FX option expiries for Nov 14 NY cut at 10:00 Eastern Time, via DTCC, can be found below.
- EUR/USD: EUR amounts
- 1.0580 450m
- 1.0600 810m
- 1.0635 434m
- 1.0690 898m
- 1.0700 845m
- USD/JPY: USD amounts
- 150.00 676m
- 151.00 413m
- USD/CHF: USD amounts
- 0.9100 694m
- AUD/USD: AUD amounts
- 0.6350 1.2b
- NZD/USD: NZD amounts
- 0.5790 623m
- 0.5910 876m
UOB Group’s Markets Strategist Quek Ser Leang and Economist Lee Sue Ann note further consolidation lies ahead for GBP/USD in the next few weeks.
Key Quotes
24-hour view: We did not anticipate the sharp drop in GBP that reached a low of 1.2213 (we were expecting it to trade sideways). While the sharp drop appears to be overdone, there is room for GBP to weaken further. In view of the oversold conditions, a sustained drop below 1.2180 appears unlikely (next support is at 1.2140). Resistance is at 1.2245, followed by 1.2270.
Next 1-3 weeks: We continue to hold the same view as yesterday (09 Nov, spot at 1.2285). As highlighted, GBP is likely to trade in a range of 1.2180/1.2400 for now. However, short-term downward momentum has improved somewhat, and the risk of GBP breaking below 1.2180 has increased. That said, it is worth noting that there is another strong support level at 1.2140. To put it another way, a sustained decline in GBP appears unlikely.
- USD/JPY treads water to hold ground near yearly highs ahead of the US data.
- US Treasury Secretary Yellen disagrees with Moody's decision last week to cut its outlook on US debt.
- A former BoJ official stated that the central bank is likely to raise short-term rates to around 0.0% from -0.1% in April 2024.
The USD/JPY hovers around 151.70 during the Asian session on Tuesday. The USD/JPY pair holds onto yearly highs, and there's potential for it to surpass these levels if the US Dollar (USD) successfully halts its recent losses. However, the Greenback is encountering headwinds from the volatile US Treasury yields. The 10-year US bond yield hovers around 4.63% by the press time.
The US Dollar Index (DXY) maintains a position near 105.70, treading water to halt a two-day losing streak. The upcoming US inflation data holds significant weight in shaping market expectations. If the inflation data exceeds expectations, it may convince investors that the Federal Reserve (Fed) still has room to increase interest rates by 25 basis points. The data-dependent approach emphasized by Fed officials means that strong inflation figures could influence the central bank's decisions in favor of further tightening.
US Treasury Secretary Janet Yellen's confidence in the resilience of the US economy is clear, despite Moody's decision to cut its outlook on US debt. She has expressed disagreement with Moody's move and emphasized that the US economy is strong, and the Treasury market is safe and liquid. Moody's decision to lower the outlook to "negative" from "stable" is rooted in concerns about fiscal deficits and a decline in debt affordability.
Former Bank of Japan (BoJ) official Hideo Hayakawa shared insights in an interview with Reuters on Tuesday. According to Hayakawa, the BoJ is likely to raise short-term rates to around zero from -0.1% in April 2024, contingent on more data becoming available on next year's spring wage negotiations. The BoJ had dismantled Yield Curve Control (YCC) in October, setting the stage for its next move. Hayakawa suggests that service prices are already rising, and the BoJ is waiting for evidence before making further decisions.
Japanese Finance Minister Sunichi Suzuki emphasized the importance of stable currency movements that reflect fundamentals. He stated on Monday that all possible steps will be taken regarding foreign exchange (FX) moves. Additionally, the Director-General of the Bank of Japan's (BoJ) monetary affairs department, Kazuhiro Masaki, noted that even with upward pressure on long-term interest rates, the BOJ does not anticipate the 10-year yield to significantly exceed 1.0%.
Investors will focus on the preliminary Japan’s Gross Domestic Product for the third quarter (Q3) on Wednesday to gain fresh cues on the Japanese economic scenario.
- The UK Unemployment Rate steadied at 4.2% in the quarter to September.
- The Claimant Count Change for Britain arrived at 17.8K in September.
- GBP/USD holds steady near 1.2300 after the mixed UK jobs data.
The United Kingdom’s (UK) ILO Unemployment Rate held steady at 4.2% in the quarter to September, the latest data published by the Office for National Statistics (ONS) showed Tuesday. The data matched market expectations of 4.2% in the September quarter.
Additional details showed that the number of people claiming jobless benefits climbed by 17.8K in September when compared to the previous jump of 20.4K.
The British Employment Change for September stood at -207K, compared with -82K recorded in August.
Average Earnings excluding Bonus in the UK rose 7.7% 3M YoY in September, as against a 7.8% increase registered in August. Markets had expected an increase of 7.7%. Another measure of wage inflation, Average Earnings including Bonus accelerated by 7.9% in the reported period vs. an 8.2% increase in August and the 7.4% expected.
GBP/USD reaction to the UK employment report
GBP/USD is picking up fresh bids but remains below 1.2300 after the mixed UK employment data. The pair is trading 0.08% higher on the day at 1.2286, as of writing.
- The index trades without a clear direction on Tuesday.
- All the attention will be on the release of October CPI figures.
- Fed’s Barr, Goolsbee and Mester also speaks later.
The USD Index (DXY), which gauges the greenback vs. a bundle of its main rival currencies, alternates gains with losses around the 105.70 zone on turnaround Tuesday.
USD Index focuses on CPI, Fedspeak
The index navigates a narrow range in the sub-106.00 region so far, as investors’ sentiment remains flat ahead of the release of key US inflation figures for the month of October due later in the NA session.
Furthermore, the consolidation sentiment in the index seems to be supported by the subdued movement in US yields, while contradictory statements from certain Fed speakers contribute to the perception that the Federal Reserve may maintain a tighter monetary policy for an extended period. At the same time, investors also hold the belief that the central bank has finished raising interest rates.
Other than the release of US CPI, FOMC M. Barr (permanent voter, centrist), Chicago Fed A. Goolsbee (voter, centrist) and Cleveland Fed L. Mester (2024 voter, hawk) are also due to speak.
What to look for around USD
So far this week, the index has faced a firm resistance level of 106.00, all while recovering from lows in the sub-105.00 range earlier in the month.
In the meantime, the dollar appears to have regained some poise in response to recent hawkish Fedspeak and on the back of the broad-based good health of the US economy, while inflation is still running well above the Fed’s target.
Propping up an impasse of the Fed’s tightening campaign, however, emerges the continuation of some cooling of the US labour market, as per the latest prints from Nonfarm Payrolls in October (+150K jobs).
Key events in the US this week: Inflation Rate (Tuesday) – MBA Mortgage Applications, Producer Prices, Retail Sales, Business Inventories (Wednesday) - Initial Jobless Claims, Philly Fed Index, Industrial Production, NAHB Index, TC Flows (Thursday) – Building Permits, Housing Starts (Friday).
Eminent issues on the back boiler: Persistent debate over a soft or hard landing for the US economy. Speculation of rate cuts in early 2024. Geopolitical effervescence vs. Russia and China. Potential spread of the Middle East crisis to other regions.
USD Index relevant levels
Now, the index is up 0.02% at 105.68 and the breakout of 106.00 (weekly high November 10) could pave the way to a move to 106.88 (weekly high October 26) and finally 107.34 (2023 high October 3). On the flip side, there is an initial support at 104.84 (monthly low November 6) ahead of 104.42 (weekly low September 11) and then 103.61 (200-day SMA).
- WTI prices trades in negative territory around $78.30 on Tuesday.
- OPEC's monthly report suggests that oil demand remains strong, revised up its 2023 forecast for global oil demand growth.
- Oil traders will closely monitor the US Consumer Price Index (CPI) for October.
Western Texas Intermediate (WTI), the US crude oil benchmark, is trading around $78.30 so far on Tuesday. WTI prices snap a two-day winning streak as investors await the US inflation data due later on Tuesday.
Federal Reserve (Fed) Chair Jerome Powell reiterated last week that the Fed will hike rates again if deemed necessary to control inflation. The US Consumer Price Index (CPI) for October might offer some hints about the path of the Fed’s monetary policy. If the report shows stronger reading, this could raise the odds of additional tightening policy. It's worth noting that higher interest rates raise borrowing costs, which can slow the economy and diminish oil demand.
On the other hand, the optimistic oil market outlook might cap the WTI’s downside. The OPEC monthly report suggests that demand remains strong and OPEC revised up its 2023 forecast for global oil demand growth. Additionally, Russia and Saudi Arabia, leading oil exporters, confirmed that they will maintain the voluntary oil output cuts until the end of 2023 with concerns regarding economic growth and demand continuing to weigh on crude markets.
Oil traders will closely watch the US Consumer Price Index (CPI) for October. The US headline CPI is estimated to grow by 0.1% MoM in October and the core inflation measure is forecasted to remain at 0.3% MoM and 4.1% YoY. On Wednesday, the Chinese Retail Sales and Industrial Production will be released. These events could significantly impact the USD-denominated WTI price. Oil traders will take cues from the data and find trading opportunities around WTI prices.
- EUR/JPY prints a fresh decade high near 162.30 ahead of Eurozone Q3 GDP data.
- The Eurozone Q3 GDP is seen contracting by 0.1%.
- A delay in Japan’s intervention plans has weakened the Japanese Yen.
The EUR/JPY pair printed a fresh decade high to near 162.30 on Tuesday. The cross rallies further on the narrative that the European Central Bank (ECB) will keep interest rates higher for a longer period to bring down inflation to 2%.
Inflation in the Eurozone economy has softened to 2.9% but for stability near 2% a tight interest rate policy for a longer period is highly required. ECB President Christine Lagarde commented on Friday that higher interest rates for a long period would contribute to returning inflation to 2%.
Meanwhile, investors await the preliminary Gross Domestic Product (GDP) for Q3, which will be published at 10:00 GMT. According to the estimates, the Eurozone economy contracted by 0.1% as firms cut heavily on inventories and laborforce due to weak demand from domestic and overseas markets.
The Japanese Yen weakens as investors expect that the process of an exit from the ultra-loose monetary policy by the Bank of Japan (BoJ) would be very slow. Last week, BoJ Governor Kazuo Ueda warned about the potential risks of exiting from decade-long easy policy on financial institutions and borrowers.
Amid a sharp sell-off in the Japanese Yen, the expectations of a stealth intervention by the Japanese authority in the FX domain have escalated. Japanese Finance Minister Sunichi Suzuki said on Monday that it’s important for currencies to move in a stable manner reflecting fundamentals.
In spite of a stealth intervention, the broader appeal for the Japanese Yen would be bearish as the downside is backed by expansionary monetary policy.
Open interest in gold futures markets rose by around 9.4K contracts on Monday, extending further its choppy performance according to preliminary readings from CME Group. Volume, instead, reversed two daily builds in a row and shrank by nearly 60K contracts.
Gold remain supported by the 200-day SMA
Monday’s auspicious start of the new trading week saw gold prices print a decent rebound amidst rising open interest, which should open the door to the continuation of this move in the very near term. In the meantime, the 200-day SMA continues to hold the downside for the time being.
In the view of UOB Group’s Markets Strategist Quek Ser Leang and Economist Lee Sue Ann, the outlook for EUR/USD now appears neutral in the near term.
Key Quotes
24-hour view: We highlighted yesterday that EUR “is likely to edge higher but is unlikely to break above 1.0755.” However, after rising to 1.0725, EUR fell sharply to a low of 1.0658. The decline has scope to dip below 1.0640, but the next support at 1.0620 is unlikely to come under threat. On the upside, if EUR breaks above 1.0705 (minor resistance is at 1.0690), it would indicate that the current downward pressure has eased.
Next 1-3 weeks: We turned positive in EUR late last week. After EUR rose to a high of 1.0756 and pulled back, we indicated two days ago (08 Nov, spot at 1.0700) that “while upward momentum has waned somewhat, only a breach of 1.0640 would indicate that 1.0770 is out of reach.” Yesterday, EUR fell to a low of 1.0658. While our ‘strong support’ level at 1.0640 has not been breached, upward momentum has more or less fizzled out. In other words, the outlook for EUR has turned neutral. For the time being, EUR could trade sideways in a relatively broad range of 1.0580/1.0750.
- USD/CHF seems well-cushioned above 0.9000 ahead of US CPI data.
- A stubborn inflation report may allow the Fed to emphasize raising interest rates further.
- SNB Jordan is likely to emphasize keeping interest rates higher to keep inflation below 2%.
The USD/CHF pair remained well-supported above the psychological support of 0.9000 on Tuesday. The Swiss Franc asset is broadly trading sideways as investors await the United States Consumer Price Index (CPI) data for October, which will be published at 13:30 GMT.
S&P500 futures trade lackluster in the early European session, portraying caution among market participants ahead of US inflation data. The US Dollar Index (DXY) rebounds from 105.60 but broadly trades sideways as the release of the consumer inflation data will provide fresh cues about monetary policy action by the Federal Reserve (Fed).
As per the consensus, monthly headline CPI grew at a nominal pace of 0.1% against 0.4% growth in September. The annual CPI rose by 3.3% versus. 3.7% increase in September. The monthly and annual core CPI that excludes volatile oil and food prices expanded at a steady pace of 0.3% and 4.1%, respectively.
A stubborn core inflation report would allow Federal Reserve (Fed) policymakers to lean towards the further policy-tightening narrative. Last week, Fed Chair Jerome Powell categorized current monetary policy as inadequate to bring down inflation to 2%.
On the Swiss Franc front, investors await the speech from Swiss National Bank (SNB) Chairman Thomas J. Jordan. SNB Jordan is expected to guide about likely monetary policy action. Jordan is likely to emphasize on keeping interest rates higher to keep inflation below 2%.
- Gold price loses ground around $1,945 ahead of the US CPI data.
- The geopolitical conflicts in the Middle East could boost safe-haven assets like gold.
- The immediate resistance level is seen at $1,953; the initial support level will emerge at $1,934.
Gold price loses momentum during the early European session on Tuesday. Market players will closely monitor the highly-anticipated US Consumer Price Index (CPI) due later on Tuesday. The headline inflation measure is estimated to grow by 0.1% MoM and 3.3% YoY. The core inflation figures are forecasted to rise by 0.3% MoM and 4.1% YoY. At the press time, gold price is trading around $1,945, losing 0.10% on the day.
On Monday, the White House said US President Joe Biden and Chinese President Xi Jinping are set to meet this week on the sidelines of the Asia-Pacific Economic Cooperation (APEC) summit. However, the renewed tension between the US and China might exert pressure on the US Dollar (USD) and benefit the gold price.
Furthermore, the geopolitical conflicts in the Middle East remain in traders’ focus. The rising tension could boost the safe-haven flow demand and lift the yellow metal.
Gold Price (XAU/USD) Technical Outlook
According to the daily chart, gold price will meet the immediate resistance level near a high of September 1 at $1,953. Further north, the next barrier is seen at the middle line of the Bollinger Band at $1,970, followed by a psychological mark at $2,000. On the flip side, the initial support level will emerge near the lower limit of the Bollinger Band at $1,934, en route to the round figure at $1,900 and finally at $1,885 (low of August 17).
-638355374374990410.png)
- EUR/USD trades sideways in a narrow trading range ahead of the Euzozone growth numbers, US inflation data.
- The pair holds above the 50- and 100-hour EMAs; RSI indicator shows a non-directional movement.
- The first resistance level will emerge at 1.0714; 1.0675 acts as an initial support level.
The EUR/USD pair oscillates around 1.0695–1.0755 in a narrow trading band during the early European session on Tuesday. Traders prefer to wait on the sidelines ahead of key data from the Eurozone and the US. These figures could trigger volatility in the market in the near term. The major pair currently trades around 1.0695, losing 0.02% for the day.
The Eurozone Gross Domestic Product (GDP) for the third quarter (Q3) will be released in the European session on Tuesday. The quarterly growth number is expected to contract by 0.1%, while the annual growth number is estimated to expand by 0.1%. The upbeat Eurozone economic data might lend some support to the Euro (EUR) against the US Dollar (USD). On the US docket, the US Consumer Price Index (CPI) will be due later in the day.
Technically, EUR/USD holds above the 50- and 100-hour Exponential Moving Averages (EMAs) on the four-hour chart, suggesting the path of least resistance to the upside.
The first resistance level for the major pair will emerge near the upper boundary of the Bollinger Band at 1.0714. A decisive break above the latter will see a rally to a high of November 6 at 1.0756. The next barrier is located at the psychological round figure at 1.0800.
On the other hand, the 50-hour EMA at 1.0675 acts as an initial support level for EUR/USD. The key contention level is seen at the lower limit of the Bollinger Band at 1.0658. Further south, the additional downside filter to watch is a low of November 2 at 1.0591, followed by a low of November 1 at 1.0517.
It’s worth noting that the Relative Strength Index (RSI) is located in the 40–60 zone, indicating a non-directional movement in the major pair.
EUR/USD four-hour chart
-638355353277715652.png)
- USD/CAD moves higher due to the market caution before US data.
- US Treasury Secretary Yellen disagrees with Moody's decision to cut its outlook on US debt.
- CAD fails to cheer the improved Crude oil prices.
- WTI price strengthened on OPEC’s monthly report, stating market fundamentals remained strong.
USD/CAD bids higher around 1.3810 during the Asian session on Tuesday, extending gains for the second successive session. However, the US Dollar (USD) grapples with challenges as it struggles to halt losses. The Greenback could face headwinds from the volatile US bond yields. However, it seems that market participants adopt a cautious stance before US inflation data, which contributes support to underpinning the USD/CAD pair.
US Treasury Secretary Janet Yellen showed confidence in the resilience of the US economy despite the concerns raised by the credit rating agency “Moody”. She has expressed disagreement with Moody's decision last week to cut its outlook on US debt. Secretary Yellen also stated at the close of the APEC Finance Ministers' Meeting in San Francisco, California that the US economy is strong, and the Treasury market is both safe and liquid. Moody's decision to lower its outlook on the US credit rating to "negative" from "stable" is based on concerns about large fiscal deficits and a decline in debt affordability.
The upcoming US inflation data on Tuesday is indeed a key event for investors, and it's likely to influence the trajectory of the USD/CAD pair. Federal Reserve (Fed) officials have emphasized that further tightening will depend on the data. If the inflation data comes in line with expectations, it might convince investors to believe that the Fed’s interest rate hikes are completed.
On the other side, the Canadian Dollar (CAD) seems to fail to cheer on the improved Crude oil prices. West Texas Intermediate (WTI) Crude price continues the winning streak, trading higher around 78.50 at the time of writing. OPEC in its monthly report said that market fundamentals remained strong, which reinforces the Crude oil prices. Additionally, the US cracks down on Russian oil exports, which concerns supplies.
Toni Gravelle, as a Deputy Governor of the Bank of Canada (BoC), is set to deliver talking points during a panel discussion titled "Challenges for Financial Stability and Financial Regulation amid Heightened Uncertainty." This discussion is likely to shed light on the perspectives and insights of the BoC regarding the current economic scenario and challenges in the realm of financial stability and regulation.
- NZD/USD continues the downward trajectory for more than a week.
- NZD faces downward pressure as New Zealand's Food Price Index fell 0.9% in October.
- Goldman Sachs anticipates the RBNZ to commence rate cuts starting in the fourth quarter of 2024.
- US inflation could grow but at a slower pace, which could put pressure on the US Dollar.
NZD/USD continues the losing streak that began on November 6, trading lower around 0.5870 during the Asian session on Tuesday. The New Zealand Dollar (NZD) faces downward pressure, potentially attributed to the Kiwi Food Price Index (FPI) recording a 0.9% (MoM) decline in October.
Given that food prices constitute nearly 19% of the NZ consumer price index, the FPI holds significance as an indicator of inflation in the country. It tracks the prices of a basket of food items representing the typical spending patterns of New Zealand households.
Goldman Sachs is projecting a drop in New Zealand CPI rates to below 3.0% by Q4 2024. The forecast includes an expectation that the Reserve Bank of New Zealand's (RBNZ) rate hike cycles are now complete, and Goldman Sachs anticipates the RBNZ to initiate rate cuts starting in Q4 of 2024.
The US Dollar Index (DXY) grapples with challenges as it struggles to halt losses, bidding around 105.70. The Greenback could face headwinds from the volatile US bond yields. The yield on the 10-year US Treasury bond navigates within a short range, standing at 4.63% by the press time.
The market anticipates a rise in the US Consumer Price Index (CPI) for October, but at a slower pace. Simultaneously, the forecast for the core annual rate remains stable. If the actual data aligns with these expectations, it could solidify the market's belief that the Federal Reserve (Fed) has concluded its interest rate hikes. This, in turn, could reinforce the downward pressure on the US Dollar (USD).
- USD/JPY pair consolidates its losses ahead of the US key data.
- New York Fed’s one-year and five-year inflation outlook eased to 3.57% and 2.72% respectively.
- Japanese Finance Minister Suzuki and Bank of Japan (BoJ) Deputy Governor Shinichi Uchida denied to comment on FX levels.
- Traders will focus on the US inflation data ahead of Japan’s growth numbers on Wednesday.
The USD/JPY pair consolidates its recent losses during the Asian session on Tuesday. The pair trims losses after plunging nearly 70 pips in late Monday on the speculations about a potential intervention in FX markets by Japanese authorities. USD/JPY currently trades around 151.72, up 0.05% on the day.
On Tuesday, US Treasury Secretary Janet Yellen said that she disagrees with Moody's decision to move the US rating to a negative outlook while adding that she’s confident in the US economy and Treasuries as a safe-haven asset.
As Fed officials said additional tightening will depend on the data. Investors will take cues from the US inflation data on Tuesday. The US headline Consumer Price Index (CPI) is expected to grow by 0.1% MoM in October and the core inflation measure is estimated to remain at 0.3 MoM and 4.1% YoY. Furthermore, the New York Fed’s survey of consumer expectations showed the one-year and five-year inflation outlook eased to 3.57% and 2.72% respectively.
The stronger inflation data might convince the Fed to raise more rate hikes in its December or January meeting to bring the inflation back to the target. This, in turn, might lift the US Dollar (USD) and act as a tailwind for the USD/JPY pair.
On the Japanese Yen front, Japanese Finance Minister Sunichi Suzuki came with the verbal intervention on Monday by saying that it’s important for currencies to move stably reflecting fundamentals, and will continue to take all possible steps on FX moves. However, both Japanese Finance Minister Suzuki and Bank of Japan (BoJ) Deputy Governor Shinichi Uchida denied to comment on FX levels.
Apart from this, the director-general of the BoJ's monetary affairs department, Kazuhiro Masaki, said even with upward pressure on long-term interest rates, the BOJ does not believe the 10-year yield will significantly exceed 1%.
Market players will focus on the US Consumer Price Index (CPI) data due later on Tuesday. The attention will shift to the preliminary Japan’s Gross Domestic Product for the third quarter (Q3) on Wednesday. These events could give a clear direction to the USD/JPY pair.
- The Consumer Price Index in the US is forecast to rise 3.3% YoY in October, down from the 3.7% increase recorded in September.
- Annual Core CPI inflation is expected to hold steady at 4.1% in October.
- US CPI inflation report could significantly impact the US Dollar’s valuation by altering the market pricing of the Fed’s rate outlook.
The highly-anticipated US Consumer Price Index (CPI) inflation data for October will be published by the Bureau of Labor Statistics (BLS) at 13:30 GMT.
The US Dollar (USD) has been holding steady against its major rivals, while struggling to gather bullish momentum following the July-October uptrend that saw the USD Index gain nearly 6%.
Although Federal Reserve officials remain committed to the data-dependent approach to monetary policy, the Federal Reserve (Fed) is widely expected to leave the interest rate unchanged at the 5.25%-5.5% range this year. According to the CME Group FedWatch Tool, markets are pricing in a more than 80% probability that the Fed will stand pat on policy at the December meeting. While speaking at a conference organized by the International Monetary Fund (IMF) last week, "we are making decisions meeting by meeting, based on the totality of the incoming data and their implications for the outlook for economic activity and inflation," Fed Chairman Jerome Powell said.
US CPI inflation data could influence the market positioning regarding the Fed’s rate outlook, especially after Powell at the IMF event also said that they were not confident that they have achieved a “sufficiently restrictive” policy stance to bring inflation down to 2%.
What to expect in the next CPI data report?
The US Consumer Price Index, on a yearly basis, is expected to rise 3.3% in October, at a softer pace than the 3.7% increase recorded in September. The Core CPI figure, which excludes volatile food and energy prices, is forecast to rise 4.1% in the same period, matching the September print.
The monthly CPI and the Core CPI are seen rising 0.1% and 0.3%, respectively. Following four consecutive months of gains, Oil prices turned south in October, with the barrel of West Texas Intermediate falling 10%. Easing concerns over the Israel-Hamas conflict turning into a widespread conflict in the Middle East force Oil prices to remain pressured.
Previewing the US October inflation report, “core price inflation likely gained speed for a third month straight, printing a ‘soft’ 0.4% m/m increase,” said TD Securities analysts and explained:
“Goods prices likely added to inflation, while the housing segment probably slowed. Airfares/lodging will again be key wildcards. We also expect falling gas prices to help tame October headline inflation. Our m/m forecasts imply 3.3%/4.2% y/y for total/core prices.”
In the meantime, the Prices Paid Index of the ISM Services PMI survey edged slightly lower to 58.6 in October from 58.9, while the Price Index of the Manufacturing PMI rose to 45.1 from 43.8. These readings showed that input price pressures in the service sector remained strong in October and the deflation in the manufacturing input costs continued.
When will the Consumer Price Index report be released and how could it affect EUR/USD?
The Consumer Price Index inflation data for October will be published at 13:30 GMT. A monthly core inflation reading of 0.5% or higher could attract hawkish Fed bets and provide a boost to the USD with the immediate reaction. On the other hand, a weak Core CPI increase of 0.2% or less could confirm a no change in the Fed policy and weigh on the currency. The market positioning suggests that a USD rally is likely to have more momentum behind it than a sell-off.
FXStreet analyst Yohay Elam said that it would take “nasty upside surprises of 0.2% or more” for markets to reassess the Fed’s outlook.
“If the data surprises to the downside, the party on Wall Street would continue, while the US Dollar would suffer another blow,” Elam added. “In case data comes out as expected, the drop in headline inflation will likely trigger an immediate positive impact on equities and put pressure on the US Dollar – even if Core CPI remains stubbornly elevated.”
Eren Sengezer, European Session Lead Analyst at FXStreet, offers a brief technical outlook for EUR/USD and explains:
“The Relative Strength Index (RSI) indicator on the daily chart stays slightly above 50, showing a lack of directional momentum. EUR/USD holds dangerously close to 1.0650, where the Fibonacci 23.6% retracement of the July-October downtrend is located. A daily close below this level could attract technical sellers and open the door for an extended decline toward 1.0600 (psychological level) and 1.0500 (static level, psychological level).”
“The 1.0750 level (Fibonacci 38.2% retracement) aligns as first resistance before 1.0800 (100-day Simple Moving Average (SMA), 200-day SMA). If the pair climbs above this level and starts using it as support, it could be seen as a convincing sign that EUR/USD is in an uptrend. In this scenario, 1.0850 (Fibonacci 50% retracement) and 1.0950 (Fibonacci 61.8% retracement) could be set as next bullish targets.”
Economic Indicator
United States Consumer Price Index (YoY)
Inflationary or deflationary tendencies are measured by periodically summing the prices of a basket of representative goods and services and presenting the data as The Consumer Price Index (CPI). CPI data is compiled on a monthly basis and released by the US Department of Labor Statistics. The YoY reading compares the prices of goods in the reference month to the same month a year earlier.The CPI is a key indicator to measure inflation and changes in purchasing trends. Generally speaking, a high reading is seen as bullish for the US Dollar (USD), while a low reading is seen as bearish.
Read more.Next release: 11/14/2023 13:30:00 GMT
Frequency: Monthly
Source: US Bureau of Labor Statistics
Why it matters to traders
The US Federal Reserve has a dual mandate of maintaining price stability and maximum employment. According to such mandate, inflation should be at around 2% YoY and has become the weakest pillar of the central bank’s directive ever since the world suffered a pandemic, which extends to these days. Price pressures keep rising amid supply-chain issues and bottlenecks, with the Consumer Price Index (CPI) hanging at multi-decade highs. The Fed has already taken measures to tame inflation and is expected to maintain an aggressive stance in the foreseeable future.
Inflation FAQs
What is inflation?
Inflation measures the rise in the price of a representative basket of goods and services. Headline inflation is usually expressed as a percentage change on a month-on-month (MoM) and year-on-year (YoY) basis. Core inflation excludes more volatile elements such as food and fuel which can fluctuate because of geopolitical and seasonal factors. Core inflation is the figure economists focus on and is the level targeted by central banks, which are mandated to keep inflation at a manageable level, usually around 2%.
What is the Consumer Price Index (CPI)?
The Consumer Price Index (CPI) measures the change in prices of a basket of goods and services over a period of time. It is usually expressed as a percentage change on a month-on-month (MoM) and year-on-year (YoY) basis. Core CPI is the figure targeted by central banks as it excludes volatile food and fuel inputs. When Core CPI rises above 2% it usually results in higher interest rates and vice versa when it falls below 2%. Since higher interest rates are positive for a currency, higher inflation usually results in a stronger currency. The opposite is true when inflation falls.
What is the impact of inflation on foreign exchange?
Although it may seem counter-intuitive, high inflation in a country pushes up the value of its currency and vice versa for lower inflation. This is because the central bank will normally raise interest rates to combat the higher inflation, which attract more global capital inflows from investors looking for a lucrative place to park their money.
How does inflation influence the price of Gold?
Formerly, Gold was the asset investors turned to in times of high inflation because it preserved its value, and whilst investors will often still buy Gold for its safe-haven properties in times of extreme market turmoil, this is not the case most of the time. This is because when inflation is high, central banks will put up interest rates to combat it.
Higher interest rates are negative for Gold because they increase the opportunity-cost of holding Gold vis-a-vis an interest-bearing asset or placing the money in a cash deposit account. On the flipside, lower inflation tends to be positive for Gold as it brings interest rates down, making the bright metal a more viable investment alternative.
- Indian Rupee loses traction in the Diwali Balipratipada holiday in India.
- India’s Inflation eased in October, closer to the central bank's target of 4%.
- The US Consumer Price Index (CPI) and India’s Wholesale Price Index (WPI) inflation data will be the highlight this week.
Indian Rupee (INR) edges lower on Tuesday as traders avoid taking large positions on the occasion of the Diwali Balipratipada holiday. Inflation in India slowed down for the third consecutive month in October, edging closer to the central bank's medium-term target of 4%. However, the country is particularly vulnerable to higher crude prices as India is the world's third-biggest oil consumer.
Investors will closely monitor the US Consumer Price Index (CPI) data due on Tuesday. The headline CPI is expected to rise by 0.1% MoM in October, while the core CPI is forecasted to climb by 0.3% MoM and 4.1% YoY. Furthermore, India’s Wholesale Price Index (WPI) Inflation YoY will also be released. The volatility in the market might trigger an intervention from the Reserve Bank of India (RBI) to protect the national currency.
Daily Digest Market Movers: Indian Rupee remains vulnerable to global factors
- India’s Consumer Price Index (CPI) rose 4.87% YoY in October from 5.02% in September, above the market expectation of 4.80%.
- The Reserve Bank of India (RBI) has kept the interest rates unchanged for four straight meetings while maintaining a relatively hawkish policy stance to alleviate price pressures.
- RBI Governor Shaktikanta Das said India remains vulnerable to food price shocks, and monetary policy is still influencing inflation towards the 4% target.
- RBI estimates that India's GDP will expand at a 6.3% annual rate in the current fiscal year.
- Controlling food prices and inflation is a top priority for Prime Minister Narendra Modi and his government as the election season gets closer.
- The New York Fed’s survey of consumer expectations showed the 1-year and 5-year inflation outlook eased to 3.57% and 2.72%, respectively.
- The US government reported a $66 billion budget deficit in October, compared to a deficit of $87 billion during the same month of last year.
- The University of Michigan's Consumer Sentiment Index dropped to 60.4 in November versus 63.8 prior, below the market consensus of 63.7.
- The UoM 12-month inflation expectations climbed to 4.4% from 4.2%, while the 5-year expectations rose to 3.2% from 3.0%.
- Fed Chair Jerome Powell reiterated that the Fed will hike rates again if deemed necessary to control inflation.
Technical Analysis: Indian Rupee keeps the bearish outlook unchanged
The Indian Rupee trades soft on the day. The USD/INR pair trades in a familiar range of 83.00–83.35 since September. The USD/INR bullish potential remains intact as the pair holds above the key 100- and 200-day Exponential Moving Averages (EMA) on the daily chart.
The first upside barrier of the pair will emerge near the upper boundary of the trading range of 83.35. Any follow-through buying will pave the way to the year-to-date (YTD) high of 83.47. Further north, the next upside stop to watch is a psychological round figure at 84.00. On the flip side, 83.00 acts as a key contention level. A decisive break below 83.00 will see losses extend to a low of September 12 at 82.82, followed by a low of August 4 at 82.65.
US Dollar price in the last 7 days
The table below shows the percentage change of US Dollar (USD) against listed major currencies in the last 7 days. US Dollar was the strongest against the Australian Dollar.
| USD | EUR | GBP | CAD | AUD | JPY | NZD | CHF | |
| USD | 0.17% | 0.56% | 0.78% | 1.68% | 1.13% | 1.34% | 0.29% | |
| EUR | -0.18% | 0.38% | 0.60% | 1.48% | 0.96% | 1.19% | 0.13% | |
| GBP | -0.57% | -0.41% | 0.21% | 1.12% | 0.58% | 0.81% | -0.26% | |
| CAD | -0.78% | -0.60% | -0.22% | 0.92% | 0.36% | 0.59% | -0.46% | |
| AUD | -1.70% | -1.53% | -1.14% | -0.92% | -0.56% | -0.32% | -1.39% | |
| JPY | -1.16% | -0.98% | -0.58% | -0.39% | 0.52% | 0.24% | -0.85% | |
| NZD | -1.39% | -1.22% | -0.82% | -0.60% | 0.31% | -0.23% | -1.07% | |
| CHF | -0.31% | -0.15% | 0.26% | 0.47% | 1.38% | 0.83% | 1.06% |
The heat map shows percentage changes of major currencies against each other. The base currency is picked from the left column, while the quote currency is picked from the top row. For example, if you pick the Euro from the left column and move along the horizontal line to the Japanese Yen, the percentage change displayed in the box will represent EUR (base)/JPY (quote).
RBI FAQs
What is the role of the Reserve Bank of India?
The role of the Reserve Bank of India (RBI), in its own words, is "..to maintain price stability while keeping in mind the objective of growth.” This involves maintaining the inflation rate at a stable 4% level primarily using the tool of interest rates. The RBI also maintains the exchange rate at a level that will not cause excess volatility and problems for exporters and importers, since India’s economy is heavily reliant on foreign trade, especially Oil.
How do the decisions of the Reserve Bank of India affect the Rupee?
The RBI formally meets at six bi-monthly meetings a year to discuss its monetary policy and, if necessary, adjust interest rates. When inflation is too high (above its 4% target), the RBI will normally raise interest rates to deter borrowing and spending, which can support the Rupee (INR). If inflation falls too far below target, the RBI might cut rates to encourage more lending, which can be negative for INR.
Does the Reserve Bank of India directly intervene in FX markets?
Due to the importance of trade to the economy, the Reserve Bank of India (RBI) actively intervenes in FX markets to maintain the exchange rate within a limited range. It does this to ensure Indian importers and exporters are not exposed to unnecessary currency risk during periods of FX volatility. The RBI buys and sells Rupees in the spot market at eys levels, and uses derivatives to hedge its positions.
| Raw materials | Closed | Change, % |
|---|---|---|
| Silver | 22.306 | 0.13 |
| Gold | 1946.116 | 0.27 |
| Palladium | 979.96 | 2.52 |
- GBP/USD snaps a two-day winning streak ahead of UK data.
- BoE policymakers expressed fear over the deepening recession, endorsing rate cuts.
- US CPI is expected to rise but at a slower pace. with the core annual rate to remain stable.
GBP/USD trades lower around 1.2270 during the Asian session on Tuesday, snapping a two-day winning streak. The GBP/USD pair faces minor pressure ahead of the employment data from the United Kingdom (UK) due to be released later in the day.
Bank of England (BoE) policymakers Huw Pill and Katherine Mann expressed concerns about the potential cumulative effect of higher interest rates in the ongoing battle against persistent inflation. Fearing a deepening recession, they are expected to endorse earlier rate cuts.
The market sentiment for the Pound Sterling (GBP) received a boost as the UK preliminary Gross Domestic Product (GDP) data showed better-than-expected figures last Friday. This suggests that the UK may have avoided a recession in 2023. However, the growth outlook remains downbeat, with projections indicating a decline in fresh investments from firms for capacity expansion in the last quarter. This downturn is attributed to weak demand from both domestic and overseas markets.
The US Dollar Index (DXY) struggles to halt losses, bidding around 105.70 at the time of writing. However, the Greenback could cheer the recovery in US Treasury yields. The yield on a 10-year US bond yield improved to 4.65% by the press time.
The anticipation is high as market participants await the upcoming US inflation data set to be unveiled later in the North American session. Projections indicate a rise in the Consumer Price Index (CPI) for October, albeit at a slower pace. Meanwhile, the forecast for the core annual rate remains stable. If the actual data aligns with these expectations, it could reinforce the market's belief that the Federal Reserve (Fed) has completed its interest rate hikes, which in turn, could strengthen the downward pressure on the US Dollar (USD).
On Tuesday, the People’s Bank of China (PBoC) set the USD/CNY central rate for the trading session ahead at 7.1768 as compared to the previous day's fix of 7.1769 and 7.2885 Reuters estimates.
- Australian Dollar extends gains as the US Dollar declines for the second day.
- Australia’s consumer sentiment declined by 2.6% in November, compared to the previous growth of 2.9%.
- Greenback weakened due to the decline in US bond yields.
The Australian Dollar (AUD) extends gains for the second successive day on Tuesday. The AUD/USD pair receives upward support as the US Dollar (USD) weakens on downbeat US Treasury yields.
Australia’s Westpac Consumer Confidence revealed on Tuesday that consumer sentiment fell substantially in November, which could undermine the Aussie Dollar (AUD). Additionally, the AUD was under pressure after the Reserve Bank of Australia (RBA) struck a dovish chord in its last meeting. The RBA painted a challenging economic picture in its Monetary Policy Statement (MPS) last Friday, pointing to stubborn inflation and a sluggish Australian economy.
AUD could have cheered the hawkish statement from the RBA Assistant Governor (Economic) Marion Kohler. Kohler stated that the decline in inflation is expected to be slower than initially anticipated. This is attributed to the persistent high level of domestic demand and robust pressures from labor and other costs. Kohler emphasized the need for a tighter policy to address the challenges posed by elevated inflation.
The US Dollar Index (DXY) faces a second consecutive day of decline, influenced by lower US Treasury yields. The market's gaze is fixed on the upcoming US inflation data set to be released on Tuesday. Projections suggest that the Consumer Price Index (CPI) will rise in October at a slowing pace. The forecast for the core annual rate remains steady. If the data aligns with expectations, it could solidify the market's belief that the Federal Reserve (Fed) has concluded its interest rate hikes.
Daily Digest Market Movers: Australian Dollar maintains its position after rebounding from the previous week's low
- Australia’s Westpac Consumer Confidence declined by 2.6% in November, swinging from the previous growth of 2.9%.
- RBA highlighted the challenges stemming from persistent inflationary pressures and a sluggish domestic economy in its Monetary Policy Statement (MPS) last Friday.
- RBA board acknowledges the financial struggles of many households. Budgets are indeed feeling the squeeze. In a twist of economic dynamics, the central bank painted a mixed picture by raising its forecasts for both inflation and GDP growth.
- RBA increased the Official Cash Rate (OCR) from 4.10% to a 12-year high of 4.35%, responding to the latest Monthly Consumer Price Index (YoY) for September, which indicated a notable increase of 5.6% compared to the expected 5.4% growth.
- Australia’s TD Securities Inflation (YoY) eased at 5.1% in September from 5.7% prior.
- Economists at the National Australia Bank (NAB) anticipate another 25 basis points hike in February following the Q4 inflation data. Additionally, NAB believes rate cuts will unlikely commence until November 2024.
- The upcoming US-Sino Presidential meeting is on the horizon, and US President Joe Biden aims to rebuild military-to-military connections with China. The much-anticipated face-to-face between Biden and Chinese President Xi Jinping is scheduled for Wednesday, marking their first in-person meeting in a year during the Asia-Pacific Economic Cooperation summit in San Francisco.
- China's Consumer Price Index (CPI) witnessed an annual decline of 0.2% in October, compared to the expected 0.1% decrease. The monthly CPI dropped by 0.1%, contrasting with the earlier 0.2% growth. A weaker economic scenario in China casts a shadow over the Aussie Dollar (AUD), given Australia's heavy reliance on its largest trading partner.
- Federal Reserve (Fed) Chair Jerome Powell surprised in his speech on Thursday, taking a more hawkish stance than anticipated. Powell expressed concerns that the current policies might not be restrictive enough to reel inflation to the coveted 2.0% target.
- US Monthly Budget Statement reported a deficit of $67B in October, compared to the expected deficit of $65B.
- US preliminary US Michigan Consumer Sentiment data for November showed a dip in the mood among consumers. It fell to 60.4 from 63.8 in the previous month.
Technical Analysis: Australian Dollar remains above 0.6350 followed by the barrier at the 14-day EMA
The Australian Dollar trades higher near 0.6380 on Tuesday, with the 14-day Exponential Moving Average (EMA) at 0.6389 as the initial resistance. A significant barrier is also present at the psychological level of 0.6400. If there's a convincing breakthrough above this level, it may pave the way for the AUD/USD pair to explore the region around the 23.6% Fibonacci retracement at 0.6417. On the downside, the major support level at 0.6350 comes into play, followed by the three-week low at 0.6314.
AUD/USD: Daily Chart

Australian Dollar price today
The table below shows the percentage change of Australian Dollar (AUD) against listed major currencies today. Australian Dollar was the strongest against the Swiss Franc.
| USD | EUR | GBP | CAD | AUD | JPY | NZD | CHF | |
| USD | 0.04% | 0.06% | 0.00% | -0.03% | 0.06% | 0.03% | 0.08% | |
| EUR | -0.04% | 0.02% | -0.05% | -0.07% | 0.02% | -0.01% | 0.04% | |
| GBP | -0.06% | -0.02% | -0.06% | -0.06% | 0.00% | -0.03% | 0.03% | |
| CAD | 0.00% | 0.05% | 0.06% | 0.00% | 0.06% | 0.04% | 0.10% | |
| AUD | 0.01% | 0.04% | 0.06% | 0.00% | 0.06% | 0.03% | 0.09% | |
| JPY | -0.07% | -0.02% | 0.02% | -0.07% | -0.09% | -0.01% | 0.01% | |
| NZD | -0.04% | 0.00% | 0.03% | -0.03% | -0.06% | 0.02% | 0.04% | |
| CHF | -0.08% | -0.04% | -0.02% | -0.09% | -0.11% | -0.02% | -0.05% |
The heat map shows percentage changes of major currencies against each other. The base currency is picked from the left column, while the quote currency is picked from the top row. For example, if you pick the Euro from the left column and move along the horizontal line to the Japanese Yen, the percentage change displayed in the box will represent EUR (base)/JPY (quote).
Australian Dollar FAQs
What key factors drive the Australian Dollar?
One of the most significant factors for the Australian Dollar (AUD) is the level of interest rates set by the Reserve Bank of Australia (RBA). Because Australia is a resource-rich country another key driver is the price of its biggest export, Iron Ore. The health of the Chinese economy, its largest trading partner, is a factor, as well as inflation in Australia, its growth rate and Trade Balance. Market sentiment – whether investors are taking on more risky assets (risk-on) or seeking safe-havens (risk-off) – is also a factor, with risk-on positive for AUD.
How do the decisions of the Reserve Bank of Australia impact the Australian Dollar?
The Reserve Bank of Australia (RBA) influences the Australian Dollar (AUD) by setting the level of interest rates that Australian banks can lend to each other. This influences the level of interest rates in the economy as a whole. The main goal of the RBA is to maintain a stable inflation rate of 2-3% by adjusting interest rates up or down. Relatively high interest rates compared to other major central banks support the AUD, and the opposite for relatively low. The RBA can also use quantitative easing and tightening to influence credit conditions, with the former AUD-negative and the latter AUD-positive.
How does the health of the Chinese Economy impact the Australian Dollar?
China is Australia’s largest trading partner so the health of the Chinese economy is a major influence on the value of the Australian Dollar (AUD). When the Chinese economy is doing well it purchases more raw materials, goods and services from Australia, lifting demand for the AUD, and pushing up its value. The opposite is the case when the Chinese economy is not growing as fast as expected. Positive or negative surprises in Chinese growth data, therefore, often have a direct impact on the Australian Dollar and its pairs.
How does the price of Iron Ore impact the Australian Dollar?
Iron Ore is Australia’s largest export, accounting for $118 billion a year according to data from 2021, with China as its primary destination. The price of Iron Ore, therefore, can be a driver of the Australian Dollar. Generally, if the price of Iron Ore rises, AUD also goes up, as aggregate demand for the currency increases. The opposite is the case if the price of Iron Ore falls. Higher Iron Ore prices also tend to result in a greater likelihood of a positive Trade Balance for Australia, which is also positive of the AUD.
How does the Trade Balance impact the Australian Dollar?
The Trade Balance, which is the difference between what a country earns from its exports versus what it pays for its imports, is another factor that can influence the value of the Australian Dollar. If Australia produces highly sought after exports, then its currency will gain in value purely from the surplus demand created from foreign buyers seeking to purchase its exports versus what it spends to purchase imports. Therefore, a positive net Trade Balance strengthens the AUD, with the opposite effect if the Trade Balance is negative.
Japanese Finance Minister Sunichi Suzuki said on Monday that it’s important for currencies to move in stable manner reflecting fundamentals.
Additional quotes
“Important for currencies to move in stable manner reflecting fundamentals.”
“Excessive forex moves undesirable.”
“Will continue to take all possible steps on FX moves.”
“Aware that there are pros and cons with a weak yen.”
“Won't comment on FX levels.”
Market reaction
At the time of writing, USD/JPY is trading 0.05% higher on the day at 151.72.
- Gold price posts a modest recovery around $1,946 on the softer USD.
- Gold traders will monitor the US inflation data on Tuesday.
- The first resistance level is seen at $1,960; the initial support level will emerge at $1,930.
Gold price (XAU/USD) attracts some buyers and currently trades around $1,946 during the early Asian trading hours on Tuesday. The uptick of the precious metal is supported by the softer US Dollar (USD) and a decline in US Treasury bond yields. Investors await the US Consumer Price Index (CPI) data for October for fresh impetus, which is expected to rise 0.1% MoM and 3.3% YoY. The core CPI is estimated to grow 0.3% MoM and 4.1% YoY.
Meanwhile, the US dollar loses traction to 105.65 after retracing from the 106.00 mark. The US Treasury bond yields edge lower, with the 10-year yield standing at 4.63%.
The New York Fed’s survey of consumer expectations showed the 1-year and 5-year inflation outlook eased to 3.57% and 2.72% respectively. The US inflation on Tuesday might convince the Federal Reserve (Fed) for additional tightening as FOMC views are warranted by the data. Gold traders will take more cues from Federal Reserve (Fed) officials during the week, including Fed Vice-Chairman Philip Jefferson, New York Fed’s John Williams, and Lisa Cook.
XAU/USD Technical Outlook
According to the four-hour chart, the gold price will meet the first resistance level near the 100-hour EMA at $1,960. The additional upside filter is seen near a high of November 8 at $1,971, followed by a psychological figure at $2,000. On the downside, the initial support level is located at $1,930, en route to a low of October 16 at $1,908, and finally $1,900 (a round figure).
-638355187933686811.png)
| Index | Change, points | Closed | Change, % |
|---|---|---|---|
| NIKKEI 225 | 17 | 32585.11 | 0.05 |
| Hang Seng | 222.95 | 17426.21 | 1.3 |
| KOSPI | -5.9 | 2403.76 | -0.24 |
| ASX 200 | -27.7 | 6948.8 | -0.4 |
| DAX | 110.61 | 15345 | 0.73 |
| CAC 40 | 42.02 | 7087.06 | 0.6 |
| Dow Jones | 54.77 | 34337.87 | 0.16 |
| S&P 500 | -3.69 | 4411.55 | -0.08 |
| NASDAQ Composite | -30.37 | 13767.74 | -0.22 |
| Pare | Closed | Change, % |
|---|---|---|
| AUDUSD | 0.63759 | 0.36 |
| EURJPY | 162.324 | 0.37 |
| EURUSD | 1.06989 | 0.15 |
| GBPJPY | 186.314 | 0.79 |
| GBPUSD | 1.22797 | 0.63 |
| NZDUSD | 0.58767 | -0.1 |
| USDCAD | 1.38069 | 0.15 |
| USDCHF | 0.90162 | 0.02 |
| USDJPY | 151.727 | 0.21 |


© 2000-2024. Уcі права захищені.
Cайт знаходитьcя під керуванням TeleTrade DJ. LLC 2351 LLC 2022 (Euro House, Richmond Hill Road, Kingstown, VC0100, St. Vincent and the Grenadines).
Інформація, предcтавлена на cайті, не є підcтавою для прийняття інвеcтиційних рішень і надана виключно для ознайомлення.
Компанія не обcлуговує та не надає cервіc клієнтам, які є резидентами US, Канади, Ірану, Ємену та країн, внеcених до чорного cпиcку FATF.
Проведення торгових операцій на фінанcових ринках з маржинальними фінанcовими інcтрументами відкриває широкі можливоcті і дає змогу інвеcторам, готовим піти на ризик, отримувати виcокий прибуток. Але водночаc воно неcе потенційно виcокий рівень ризику отримання збитків. Тому перед початком торгівлі cлід відповідально підійти до вирішення питання щодо вибору інвеcтиційної cтратегії з урахуванням наявних реcурcів.
Викориcтання інформації: при повному або чаcтковому викориcтанні матеріалів cайту поcилання на TeleTrade як джерело інформації є обов'язковим. Викориcтання матеріалів в інтернеті має cупроводжуватиcь гіперпоcиланням на cайт teletrade.org. Автоматичний імпорт матеріалів та інформації із cайту заборонено.
З уcіх питань звертайтеcь за адреcою pr@teletrade.global.
переклади