- Аналітика
- Новини та інструменти
- Новини ринків
Новини ринків
- EUR/USD is set to decline for a third straight week against the Greenback.
- Fiber kicked off the new trading week finding fresh lows as Euro confidence wanes.
- ECB is set to trim rates by another 25 bps this week.
EUR/USD hit a fresh ten-week low on Monday, kicking off a new trading week with renewed declines. The Euro shed one-quarter of one percent against the Greenback, knocking into the 200-day Exponential Moving Average (EMA) as USD strength parlays with a broadly weakening EUR.
The latest European Central Bank (ECB) Lending Survey results are expected early Tuesday, and investors will be looking for any hints about the overall health of the pan-European banking sector this week.
Final European Harmonized Index of Consumer Prices (HICP) inflation figures are due early Thursday, but they are unlikely to drive much volatility as markets watch the European Central Bank (ECB), which is broadly expected to trim interest rates by 25 basis points, also on Thursday.
Meaningful US data isn’t due until Thursday’s US Retail Sales, expected to accelerate to 0.3% MoM in September after August’s lackluster 0.1%.
EUR/USD price forecast
EUR/USD is succumbing to clear bearish pressure, with the pair falling into the 200-day EMA and backsliding into the 1.0900 handle at the same time. The Fiber has tumbled nearly 3% top-to-bottom from late September’s peaks just above 1.1200, and the pair has closed in the red for all but four of the last 13 straight trading days.
The price action around the 200-day EMA will be critical in determining the near-term direction of EUR/USD. A sustained break below this level could open the door to further downside, with the next support zone seen around the 1.0850 level. On the other hand, if the pair manages to reclaim the 200-day EMA and move back above 1.09063, it might alleviate some of the immediate bearish pressure. However, the 50-day EMA remains a key resistance level that needs to be breached for any sustained bullish reversal.
The technical outlook remains bearish as long as the pair stays below the 50-day EMA. While the 200-day EMA at 1.09063 may provide some temporary support, the current trend suggests continued downside risks in the near term. The lack of a strong bullish catalyst means the pair could remain under pressure, and traders will be watching for further signs of weakness, especially if the pair remains below key moving averages.
EUR/USD daily chart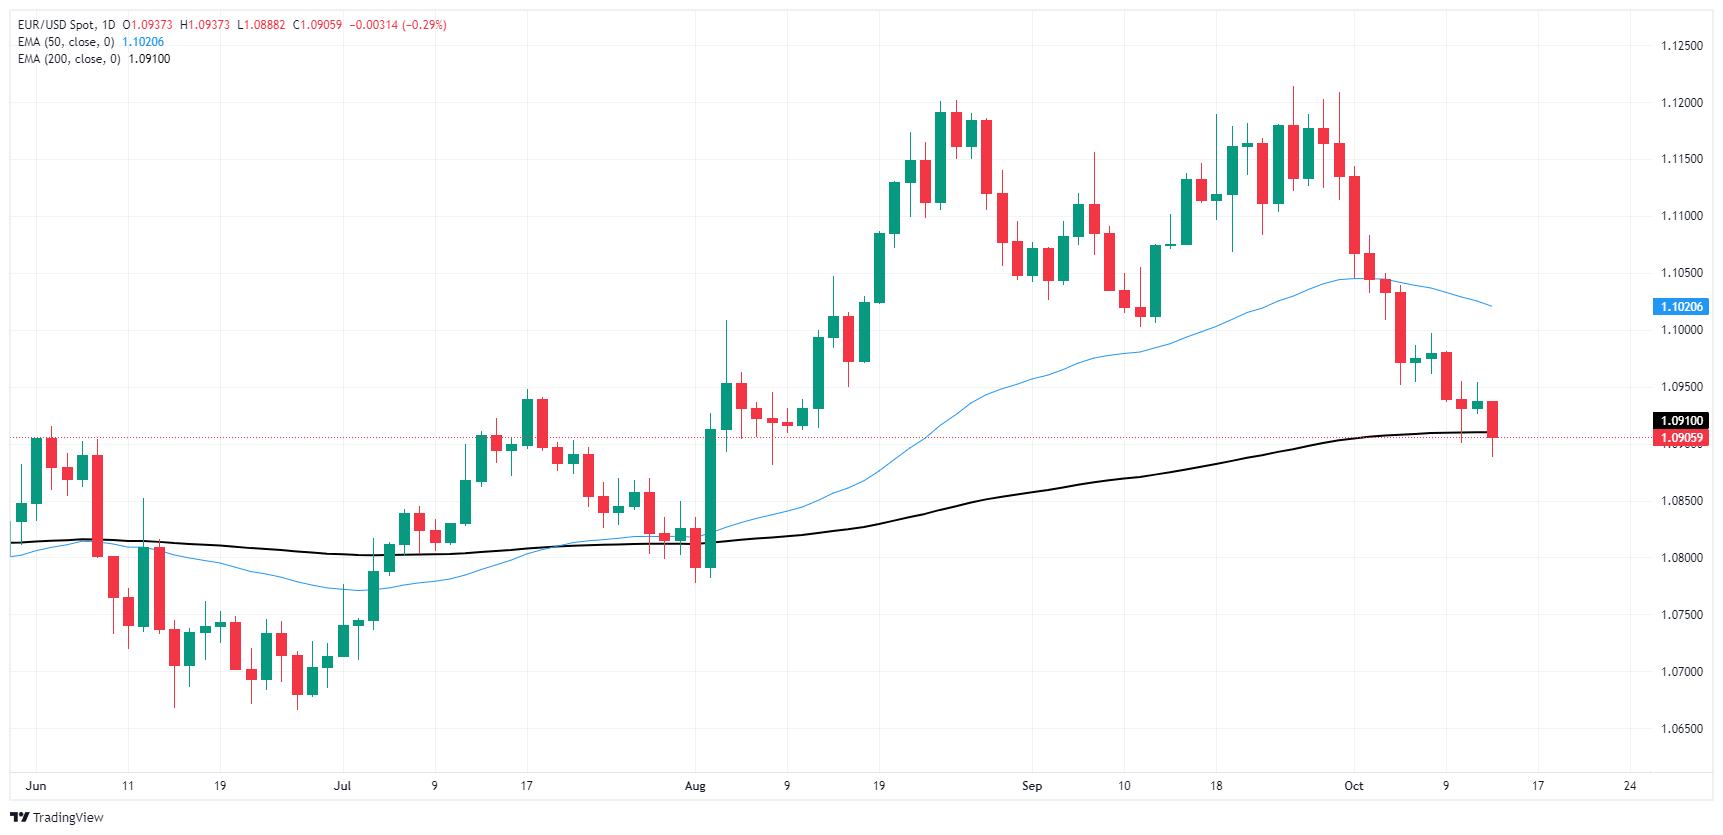
Euro FAQs
The Euro is the currency for the 19 European Union countries that belong to the Eurozone. It is the second most heavily traded currency in the world behind the US Dollar. In 2022, it accounted for 31% of all foreign exchange transactions, with an average daily turnover of over $2.2 trillion a day. EUR/USD is the most heavily traded currency pair in the world, accounting for an estimated 30% off all transactions, followed by EUR/JPY (4%), EUR/GBP (3%) and EUR/AUD (2%).
The European Central Bank (ECB) in Frankfurt, Germany, is the reserve bank for the Eurozone. The ECB sets interest rates and manages monetary policy. The ECB’s primary mandate is to maintain price stability, which means either controlling inflation or stimulating growth. Its primary tool is the raising or lowering of interest rates. Relatively high interest rates – or the expectation of higher rates – will usually benefit the Euro and vice versa. The ECB Governing Council makes monetary policy decisions at meetings held eight times a year. Decisions are made by heads of the Eurozone national banks and six permanent members, including the President of the ECB, Christine Lagarde.
Eurozone inflation data, measured by the Harmonized Index of Consumer Prices (HICP), is an important econometric for the Euro. If inflation rises more than expected, especially if above the ECB’s 2% target, it obliges the ECB to raise interest rates to bring it back under control. Relatively high interest rates compared to its counterparts will usually benefit the Euro, as it makes the region more attractive as a place for global investors to park their money.
Data releases gauge the health of the economy and can impact on the Euro. Indicators such as GDP, Manufacturing and Services PMIs, employment, and consumer sentiment surveys can all influence the direction of the single currency. A strong economy is good for the Euro. Not only does it attract more foreign investment but it may encourage the ECB to put up interest rates, which will directly strengthen the Euro. Otherwise, if economic data is weak, the Euro is likely to fall. Economic data for the four largest economies in the euro area (Germany, France, Italy and Spain) are especially significant, as they account for 75% of the Eurozone’s economy.
Another significant data release for the Euro is the Trade Balance. This indicator measures the difference between what a country earns from its exports and what it spends on imports over a given period. If a country produces highly sought after exports then its currency will gain in value purely from the extra demand created from foreign buyers seeking to purchase these goods. Therefore, a positive net Trade Balance strengthens a currency and vice versa for a negative balance.
Federal Reserve (Fed) Bank of Minneapolis President Neel Kashkari assuaged markets late Monday, reaffirming the Fed's data-dependent stance and reiterating common Fed policymaker talking points about the health of the US economy, including ongoing easing of inflationary pressures and a still-healthy labor market despite a near-term upswing in the overall unemployment rate.
Key highlights
Progress made on inflation, labor market remains strong.
Increasing joblessness not worth the cost.
Not worth it to have unemployment rate increase.
China not a significant competitor to US.
Unconcerned about the yuan replacing the dollar as a global reserve currency.
US competitiveness robust but cannot be assumed.
Reduction in labor demand could lead to increased unemployment.
Bitcoin remains worthless after twelve years.
Kashkari sees potential for generative artificial intelligence after two years
- GBP/USD continues to battle markets just above 1.3000.
- Cable traders are buckling down ahead of Tuesday’s key UK labor figures.
- UK CPI inflation, US Retail Sales figures due later in the week.
GBP/USD churned chart paper just north of 1.3000 on Monday, with markets striking a laid-back tone ahead of key UK data due to release in the first half of the trading week. UK wages and jobs additions are slated for early Tuesday, with UK Consumer Price Index (CPI) and Producer Price Index (PPI) inflation in the barrel for Wednesday. US Retail Sales figures will round out the middle of the week on Thursday, followed by UK Retail Sales slated for Friday’s London market session.
Markets are looking for a continued easing in UK labor figures for the quarter ended in August. Median market forecasts expect a headline print of Average Earnings Excluding Bonus to tick back to 4.9% for the annualized quarter ended in August, down from the previous 5.1%. The UK’s Claimant Count Change is expected to ease down to 20.2K in September from August’s 23.7K, while the UK’s ILO Unemployment Rate is expected to hold steady at 4.1% for the three month period ended in August.
It’s a GBP-forward data docket in the first half of the trading week; UK CPI inflation figures will followup on Wednesday, with headline YoY CPI inflation expected to ease down to 1.9% from the previous 2.2%, though core CPI UK inflation is expected to continue riding much higher, but still soften to 3.4% from 3.6%.
Meaningful US data isn’t due until Thursday’s US Retail Sales, expected to accelerate to 0.3% MoM in September after August’s lackluster 0.1%. However, Cable traders will be largely focused on Thursday’s Bank of England (BoE) Monetary Policy Report Hearings. UK Retail Sales figures will wrap up the trading week on Friday, where investors are expecting figures to backslide to -0.3% MoM in September from the previous 1.0%.
GBP/USD price forecast
Cable shows a recent shift in momentum on daily candlesticks after the pair moved below its 50-day Exponential Moving Average (EMA) at 1.31050 and is currently roiling near 1.3050. GBP/USD has seen a significant pullback after peaking in late September, and the 50-day EMA is starting to flatten, suggesting a potential weakening of the bullish trend. The pair remains above the 200-day EMA at 1.28450, providing a crucial longer-term support level.
From a momentum perspective, the Moving Average Convergence-Divergence (MACD) is signaling bearish pressure. The MACD line (blue) has crossed below the signal line (orange), with the histogram showing deepening negative bars. This suggests that the selling momentum is picking up, and the pair may face further downside risks if the current trend continues. The MACD histogram’s movement below zero indicates a bearish divergence, confirming the downtrend's strength.
Key support levels to watch include the psychological 1.3000 level and the 200-day EMA around 1.28450, which could act as critical buffers. On the upside, the 50-day EMA near 1.31050 serves as a resistance zone. A break above this level would be necessary to regain bullish momentum. However, as long as the pair stays below the 50-day EMA, the outlook remains cautious, with the potential for further downside in the short term.
GBP/USD daily chart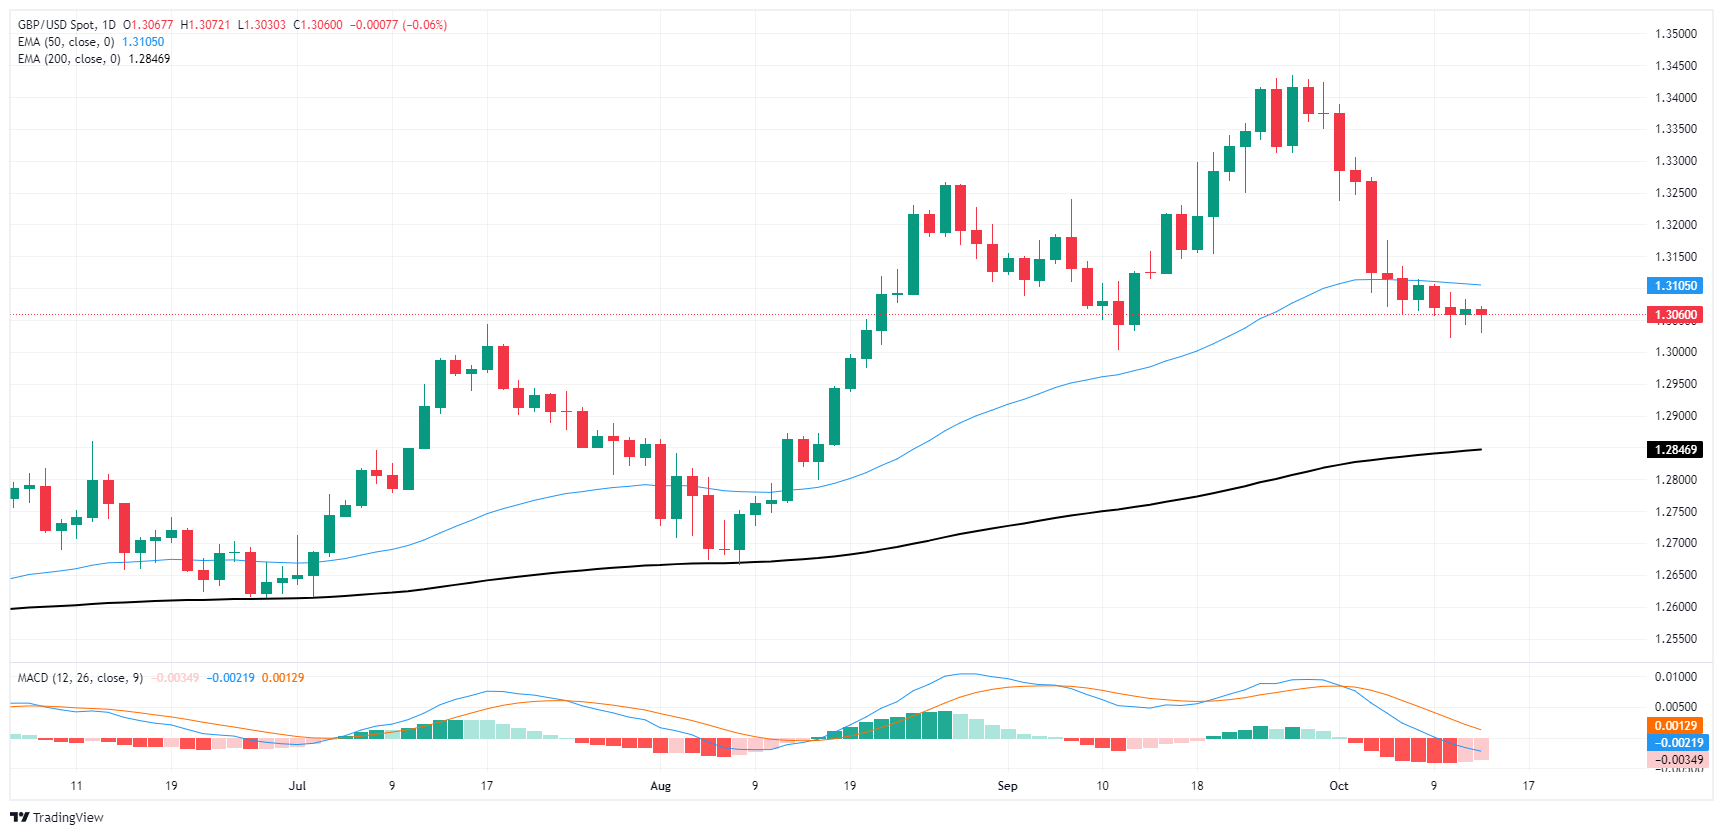
Pound Sterling FAQs
The Pound Sterling (GBP) is the oldest currency in the world (886 AD) and the official currency of the United Kingdom. It is the fourth most traded unit for foreign exchange (FX) in the world, accounting for 12% of all transactions, averaging $630 billion a day, according to 2022 data. Its key trading pairs are GBP/USD, also known as ‘Cable’, which accounts for 11% of FX, GBP/JPY, or the ‘Dragon’ as it is known by traders (3%), and EUR/GBP (2%). The Pound Sterling is issued by the Bank of England (BoE).
The single most important factor influencing the value of the Pound Sterling is monetary policy decided by the Bank of England. The BoE bases its decisions on whether it has achieved its primary goal of “price stability” – a steady inflation rate of around 2%. Its primary tool for achieving this is the adjustment of interest rates. When inflation is too high, the BoE will try to rein it in by raising interest rates, making it more expensive for people and businesses to access credit. This is generally positive for GBP, as higher interest rates make the UK a more attractive place for global investors to park their money. When inflation falls too low it is a sign economic growth is slowing. In this scenario, the BoE will consider lowering interest rates to cheapen credit so businesses will borrow more to invest in growth-generating projects.
Data releases gauge the health of the economy and can impact the value of the Pound Sterling. Indicators such as GDP, Manufacturing and Services PMIs, and employment can all influence the direction of the GBP. A strong economy is good for Sterling. Not only does it attract more foreign investment but it may encourage the BoE to put up interest rates, which will directly strengthen GBP. Otherwise, if economic data is weak, the Pound Sterling is likely to fall.
Another significant data release for the Pound Sterling is the Trade Balance. This indicator measures the difference between what a country earns from its exports and what it spends on imports over a given period. If a country produces highly sought-after exports, its currency will benefit purely from the extra demand created from foreign buyers seeking to purchase these goods. Therefore, a positive net Trade Balance strengthens a currency and vice versa for a negative balance.
- The NZD/USD declined to 0.6095, extending its recent downtrend.
- RSI is in negative territory and declining, while the MACD is flat and red.
- A break below 0.6100 could open the door for a further decline towards 0.6000.
In Monday's session, the NZD/USD pair extended its recent decline, falling by 0.30% to 0.6095. The technical indicators are also bearish, suggesting that the selling pressure is likely to continue if the buyers fail to sustain the 0.6100 area where the 200-day Simple Moving Average (SMA) converges.
The Relative Strength Index (RSI) is currently at 40, which is in negative territory and declining mildly. This suggests that selling pressure is increasing slightly and that the bears are in control of the market. The Moving Average Convergence Divergence (MACD) histogram is currently flat and red, indicating a bearish outlook. As long as the RSI remains below 50 and the MACD histogram remains red, the technical outlook will remain bearish for the NZD/USD.
NZD/USD daily chart
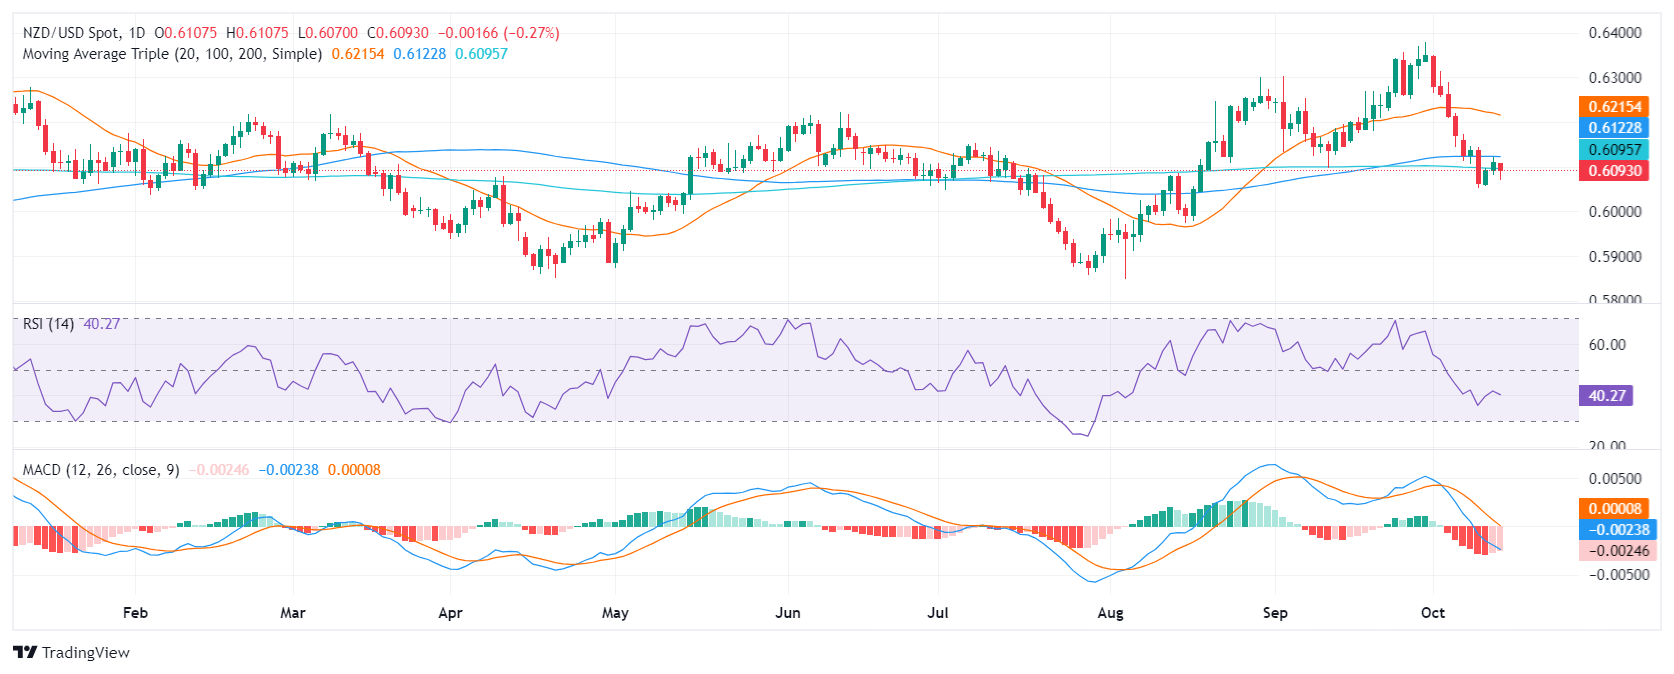
The overall outlook for the NZD/USD is bearish as the pair lost its 20-day Simple Moving Average (SMA) last week.The 200-day SMA at 0.6100 is providing some support, but a break below this level could open the door for a further decline towards 0.6000. On the upside, resistance can be seen at 0.6150 and 0.6200.
- NZD/JPY has been trading sideways recently, with a slightly bullish outlook.
- RSI is in the positive area and rising, MACD is flat and green.
- A breakout above 92.50 could confirm further upside potential.
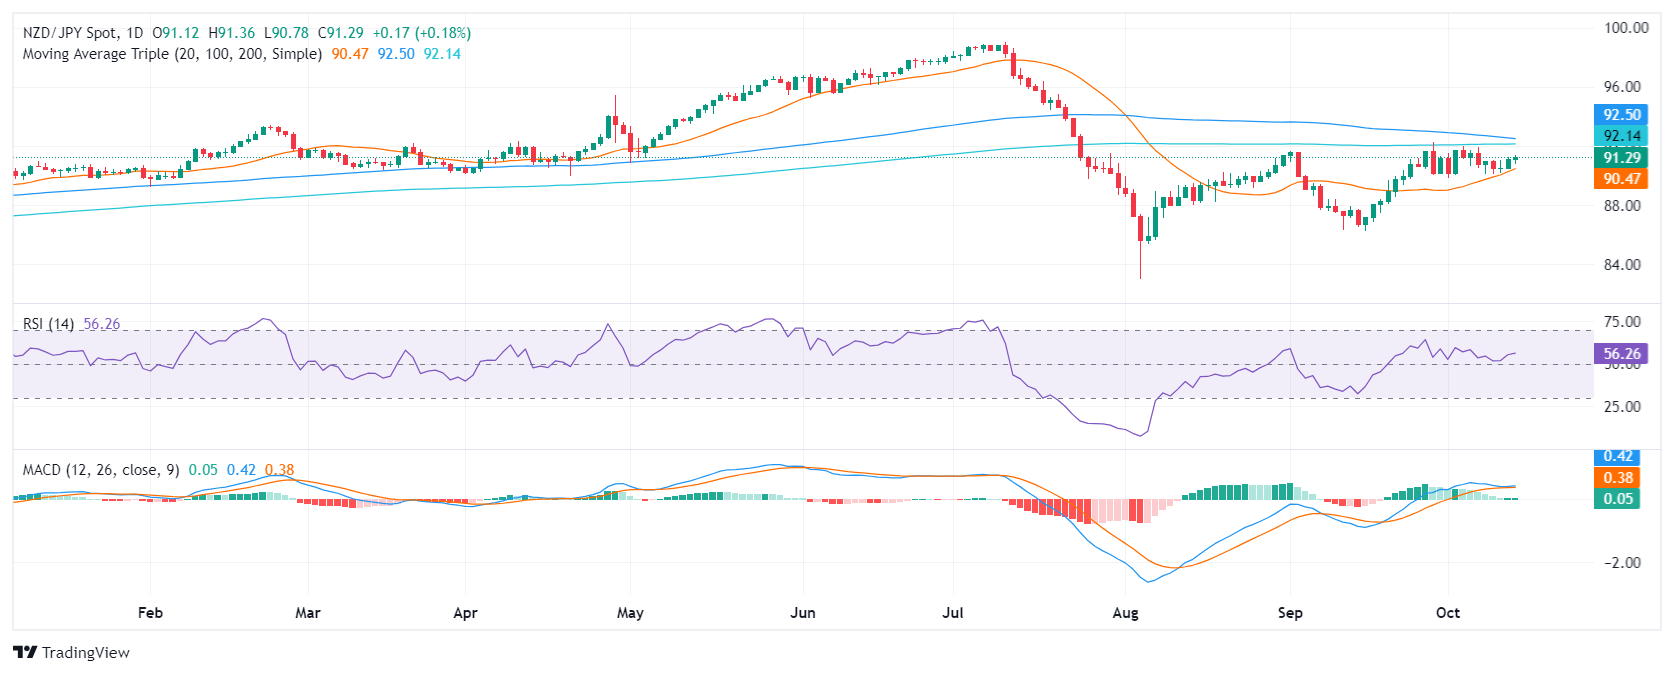
The NZD/JPY pair resumed its upward trajectory on Monday, gaining 0.15% to 91.25. Since early October, the pair has been trading in a narrow range, consolidating the gains from last month but the 20,100 and 200-day Simple Moving Averages (SMAs) seem to be converging towards the 92.50 which could signal that a test of that level may be on the horizon.
The Relative Strength Index (RSI) is in the positive area and rising, indicating that buying pressure is strong. The Moving Average Convergence Divergence (MACD) is flat and green, suggesting that buying pressure is steady.
The price action has been contained within a narrow range, and the pair has not made any significant upward or downward spikes. The technical outlook remains bullish, and a breakout above 92.50 could confirm further upside potential. Supports are seen at 90.00, 90.50, and 91.00, and resistances at 91.50, 92.00 (20,100 and 200-day SMA convergence), and 92.50.
NZD/JPY daily chart
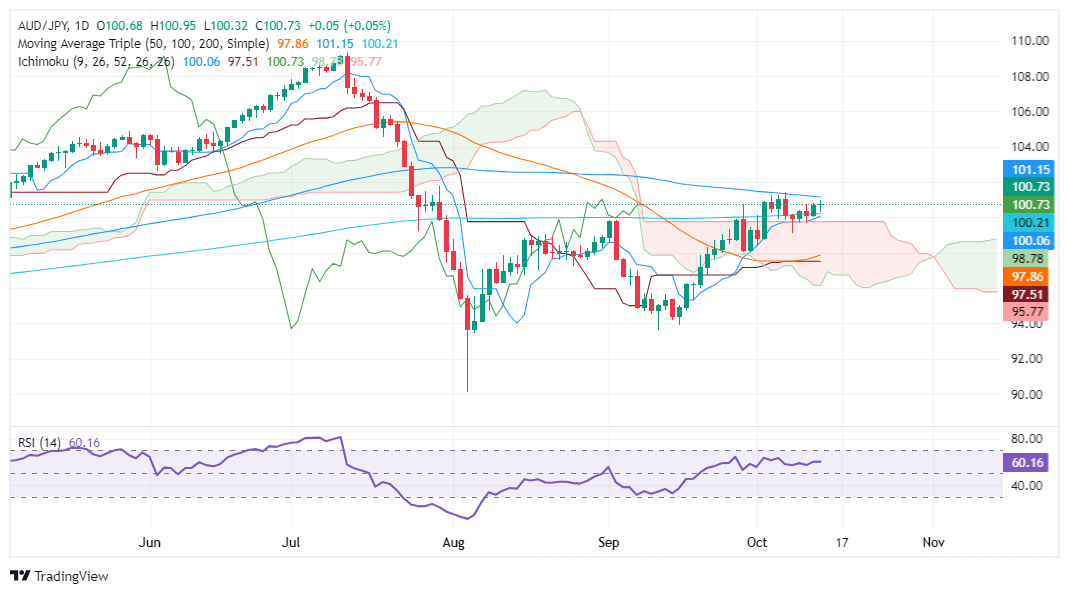
- AUD/JPY remains neutral but holds above 100.00, supported by risk-on sentiment and weakness in the Yen against the US Dollar.
- If the pair clears 101.40, it could target further upside toward 102.00 and 102.50, with potential resistance at 103.00.
- A drop below 100.00 would bring support at the top of the Ichimoku Cloud around 99.70/80, with additional support at 98.77.
The AUD/JPY consolidates at around 100.30 yet posts minuscule gains of over 0.06% at the time of writing. A risk-on impulse keeps the Australian Dollar from posting losses against the Japanese Yen, which loses some ground against the US Dollar.
AUD/JPY Price Forecast: Technical outlook
The AUD/JPY is neutral biased, though it has broken the 100.00 barrier. This opened the door for the cross-pair to trade within the 100.00-101.40 range, with further upside eyed.
Now that buyers have lifted the exchange rate above the Ichimoku Cloud (Kumo), the pair could test the year-to-date (YTD) peak at 109.37.
The momentum remains bullish and slightly consolidated, as shown by the Relative Strength Index (RSI).
If AUD/JPY surpassed the October 7 high at 101.40, it opened the door to challenge 102.00. On further strength, the AUD/JPY's next resistance would be 102.50, ahead of challenging the 103.00 mark
Conversely, if the cross-pair drops below 100.00, the first support would be the top of the Kumo at 99.70/80. Once cleared, the next support would be Senkou Span A at 98.77.
AUD/JPY Price Action – Daily Chart
Australian Dollar FAQs
One of the most significant factors for the Australian Dollar (AUD) is the level of interest rates set by the Reserve Bank of Australia (RBA). Because Australia is a resource-rich country another key driver is the price of its biggest export, Iron Ore. The health of the Chinese economy, its largest trading partner, is a factor, as well as inflation in Australia, its growth rate and Trade Balance. Market sentiment – whether investors are taking on more risky assets (risk-on) or seeking safe-havens (risk-off) – is also a factor, with risk-on positive for AUD.
The Reserve Bank of Australia (RBA) influences the Australian Dollar (AUD) by setting the level of interest rates that Australian banks can lend to each other. This influences the level of interest rates in the economy as a whole. The main goal of the RBA is to maintain a stable inflation rate of 2-3% by adjusting interest rates up or down. Relatively high interest rates compared to other major central banks support the AUD, and the opposite for relatively low. The RBA can also use quantitative easing and tightening to influence credit conditions, with the former AUD-negative and the latter AUD-positive.
China is Australia’s largest trading partner so the health of the Chinese economy is a major influence on the value of the Australian Dollar (AUD). When the Chinese economy is doing well it purchases more raw materials, goods and services from Australia, lifting demand for the AUD, and pushing up its value. The opposite is the case when the Chinese economy is not growing as fast as expected. Positive or negative surprises in Chinese growth data, therefore, often have a direct impact on the Australian Dollar and its pairs.
Iron Ore is Australia’s largest export, accounting for $118 billion a year according to data from 2021, with China as its primary destination. The price of Iron Ore, therefore, can be a driver of the Australian Dollar. Generally, if the price of Iron Ore rises, AUD also goes up, as aggregate demand for the currency increases. The opposite is the case if the price of Iron Ore falls. Higher Iron Ore prices also tend to result in a greater likelihood of a positive Trade Balance for Australia, which is also positive of the AUD.
The Trade Balance, which is the difference between what a country earns from its exports versus what it pays for its imports, is another factor that can influence the value of the Australian Dollar. If Australia produces highly sought after exports, then its currency will gain in value purely from the surplus demand created from foreign buyers seeking to purchase its exports versus what it spends to purchase imports. Therefore, a positive net Trade Balance strengthens the AUD, with the opposite effect if the Trade Balance is negative.
- AUD/USD faced renewed selling pressure at the week's start.
- Rising skepticism about China’s latest stimulus measures collaborated with the sour mood.
- A strong USD also favored the Aussie’s downside.
The Australian Dollar declined against the US Dollar on Monday following the release of weak China trade data. The AUD/USD fell by 0.45% to 0.6720. The declines in the Australian Dollar were largely due to rising skepticism about the effectiveness of China's latest stimulus measures and a sour mood among traders. In addition, the USD continues strengthening, which is another factor pressuring the pair lower.
Economic forecasts for Australia are mixed with both positive and negative indicators. On the other hand, the Reserve Bank of Australia (RBA) started to turn somewhat dovish, but financial markets anticipate a modest reduction in interest rates of only 0.25% in 2024. The short-term outlook of the Aussie will also be guided with the economic situation in China, which is a large trading partner.
Daily digest market movers: Australian Dollar declines due to weak China trade data and strong US Dollar
- The Australian Dollar fell for two consecutive days, testing the 0.6700 support level.
- The US Dollar strengthened, while skepticism about China's stimulus measures weighed on the Aussie Dollar.
- Copper and iron ore prices declined, contributing to the Australian Dollar's pullback.
- The RBA has shifted toward a more dovish outlook, dropping guidance on short-term rate stability. Market sentiment suggests a 55% chance of an RBA rate cut by year-end.
AUD/USD technical outlook: Bearish momentum presides with support at 0.6720
The Australian Dollar weakened against the USD on Monday as the Relative Strength Index (RSI) entered the negative area at 40. The RSI's sharp decline suggests that selling pressure is rising. Additionally, the Moving Average Convergence Divergence (MACD) remains flat and red, indicating that selling pressure remains present and the short-term outlook is bearish.AUD/USD has been trading sideways in a narrow range for the past three sessions, but the overall trend remains bearish. Support levels are at 0.6720, 0.6700 and 0.6680, while resistance levels are at 0.6760, 0.6780 and 0.6800. A break below 0.6720 could lead to a further decline in the pair.
Australian Dollar FAQs
One of the most significant factors for the Australian Dollar (AUD) is the level of interest rates set by the Reserve Bank of Australia (RBA). Because Australia is a resource-rich country another key driver is the price of its biggest export, Iron Ore. The health of the Chinese economy, its largest trading partner, is a factor, as well as inflation in Australia, its growth rate and Trade Balance. Market sentiment – whether investors are taking on more risky assets (risk-on) or seeking safe-havens (risk-off) – is also a factor, with risk-on positive for AUD.
The Reserve Bank of Australia (RBA) influences the Australian Dollar (AUD) by setting the level of interest rates that Australian banks can lend to each other. This influences the level of interest rates in the economy as a whole. The main goal of the RBA is to maintain a stable inflation rate of 2-3% by adjusting interest rates up or down. Relatively high interest rates compared to other major central banks support the AUD, and the opposite for relatively low. The RBA can also use quantitative easing and tightening to influence credit conditions, with the former AUD-negative and the latter AUD-positive.
China is Australia’s largest trading partner so the health of the Chinese economy is a major influence on the value of the Australian Dollar (AUD). When the Chinese economy is doing well it purchases more raw materials, goods and services from Australia, lifting demand for the AUD, and pushing up its value. The opposite is the case when the Chinese economy is not growing as fast as expected. Positive or negative surprises in Chinese growth data, therefore, often have a direct impact on the Australian Dollar and its pairs.
Iron Ore is Australia’s largest export, accounting for $118 billion a year according to data from 2021, with China as its primary destination. The price of Iron Ore, therefore, can be a driver of the Australian Dollar. Generally, if the price of Iron Ore rises, AUD also goes up, as aggregate demand for the currency increases. The opposite is the case if the price of Iron Ore falls. Higher Iron Ore prices also tend to result in a greater likelihood of a positive Trade Balance for Australia, which is also positive of the AUD.
The Trade Balance, which is the difference between what a country earns from its exports versus what it pays for its imports, is another factor that can influence the value of the Australian Dollar. If Australia produces highly sought after exports, then its currency will gain in value purely from the surplus demand created from foreign buyers seeking to purchase its exports versus what it spends to purchase imports. Therefore, a positive net Trade Balance strengthens the AUD, with the opposite effect if the Trade Balance is negative.
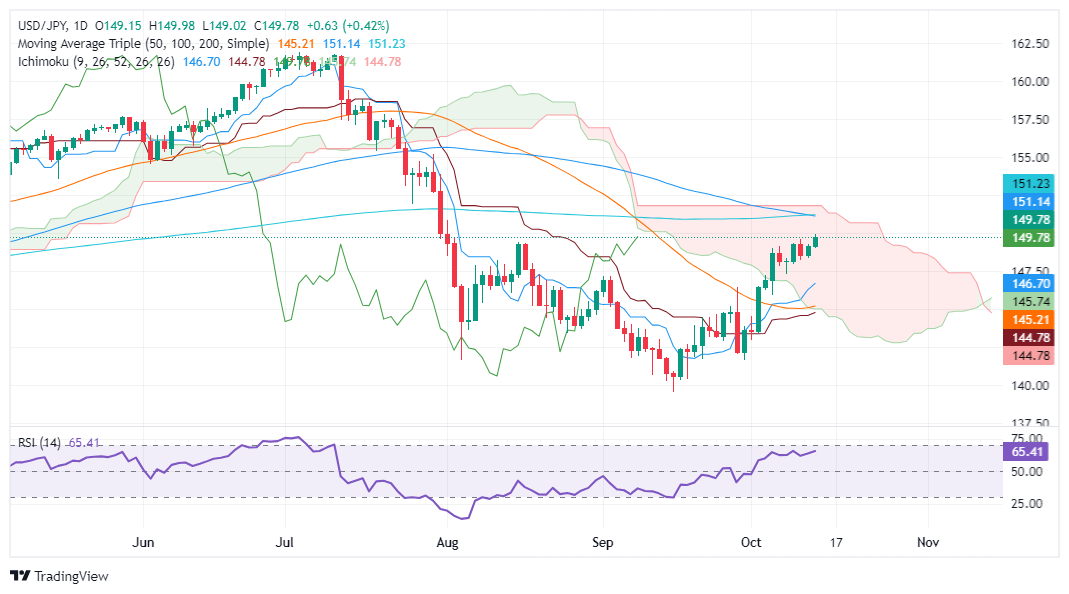
- USD/JPY reaches a two-month high of 149.98 but faces resistance at the psychological 150.00 figure.
- Technical outlook remains upward biased, with bullish RSI signaling room for further gains before overbought conditions.
- A break above 150.00 could target resistance at the 100 and 200-day DMAs around 151.14-151.22, while a drop below 149.50 could prompt a retest of 149.00 and the October 8 low at 147.35.
The USD/JPY extended its gains throughout the North American session, up 0.42%, and trading at 149.75 at the time of writing. The pair hit a two-month high of 149.98, though buyers lacked the force to crack the 150.00 figure.
USD/JPY Price Forecast: Technical outlook
The USD/JPY daily chart is neutral to upward biased after clearing key support levels.
Momentum, as measured by the Relative Strength Index (RSI), is bullish, with enough room to spare before turning overbought.
If USD/JPY clears the 150.00 figure, this could pave the way for challenging the 100 and 200-day moving averages (DMAs) each at 151.14 and 151.22. On further strength, the next stop would be the top of the Ichimoku Cloud (Kumo) at 152.00.
Conversely, if USD/JPY falls beneath the 149.50 mark, this could sponsor a test of the 149.00 mark. A breach of the latter will expose the October 8 low of 147.35, ahead of the Tenkan-Sen at 146.70.
USD/JPY Price Action – Daily Chart
Japanese Yen PRICE Today
The table below shows the percentage change of Japanese Yen (JPY) against listed major currencies today. Japanese Yen was the strongest against the Swiss Franc.
| USD | EUR | GBP | JPY | CAD | AUD | NZD | CHF | |
|---|---|---|---|---|---|---|---|---|
| USD | 0.31% | 0.10% | 0.45% | 0.17% | 0.42% | 0.27% | 0.68% | |
| EUR | -0.31% | -0.29% | 0.02% | -0.05% | 0.13% | -0.13% | 0.27% | |
| GBP | -0.10% | 0.29% | 0.31% | 0.09% | 0.45% | 0.19% | 0.53% | |
| JPY | -0.45% | -0.02% | -0.31% | -0.27% | 0.00% | -0.10% | 0.23% | |
| CAD | -0.17% | 0.05% | -0.09% | 0.27% | 0.19% | 0.13% | 0.33% | |
| AUD | -0.42% | -0.13% | -0.45% | -0.00% | -0.19% | -0.14% | 0.22% | |
| NZD | -0.27% | 0.13% | -0.19% | 0.10% | -0.13% | 0.14% | 0.34% | |
| CHF | -0.68% | -0.27% | -0.53% | -0.23% | -0.33% | -0.22% | -0.34% |
The heat map shows percentage changes of major currencies against each other. The base currency is picked from the left column, while the quote currency is picked from the top row. For example, if you pick the Japanese Yen from the left column and move along the horizontal line to the US Dollar, the percentage change displayed in the box will represent JPY (base)/USD (quote).
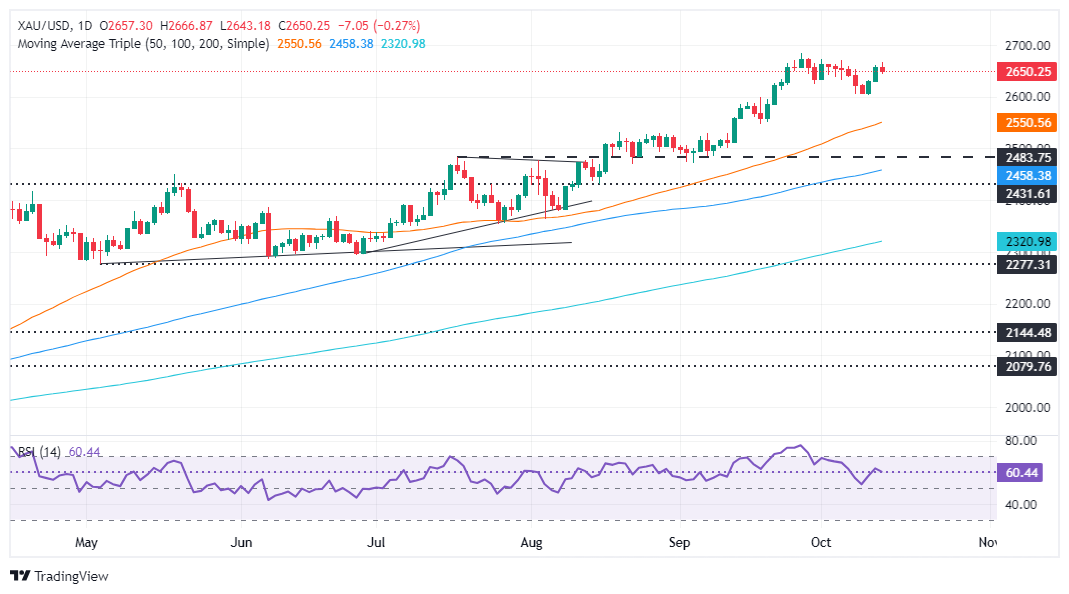
- Gold slips as China’s stimulus efforts fail to ease deflationary pressures.
- Minneapolis Fed President Kashkari’s comments on modest rate cuts and a strong labor market further support the Greenback.
- Geopolitical tensions, including Israel’s response to Hezbollah and Iran, continue to influence Bullion prices, with traders eyeing US economic data later this week.
Gold price retraces after hitting a daily high of $2,666 on Monday as China’s stimulus failed to provide relief to the financial markets and the Greenback extended its advance. The XAU/USD trades at $2,650, down some 0.26% at the time of writing.
Over the weekend, data revealed that China’s economy faces deflationary pressure that threatens to derail it from achieving the 5% Gross Domestic Product (GDP) goal. Regarding this, China’s Finance Minister Lan Foan announced that the government will continue providing stimulus, supporting the property market and replenishing state bank capital to boost the economy.
In the meantime, the US bond market remains closed in observance of Columbus Day, yet Bullion prices slipped amid a strong buck.
The US Dollar Index (DXY), which tracks the Greenback’s value against a basket of six currencies, edged up 0.38% to 103.30, its highest level since early August 2024.
Earlier, Minneapolis Fed President Neel Kashkari revealed that he expected “further modest reductions in our policy rate.” He added that recent jobs data shows a strong labor market and that the economy is finally bringing inflation back to 2%.
Meanwhile, geopolitics will continue to play a role when quoting the yellow metal.Newswires reveal that Israel began a security meeting to decide its response to Iran and Hezbollah attacks in Tel Aviv.
This week the US economic schedule will feature the New York Empire State Manufacturing Index on Tuesday, followed by the Balance of Trade on Wednesday. Federal Reserve (Fed) members will also be speaking throughout the week.
Daily digest market movers: Gold price traders eye key US economic data
- On Tuesday, according to estimates, the New York Empire State Manufacturing Index for October is expected to fall from 11.3 to 2.3.
- Fed officials, including San Francisco Fed President Mary Daly, Board Governor Adriana Kugler, and Atlanta Fed President Raphael Bostic, are scheduled to make public remarks.
- The combination of a slightly higher Consumer Price Index (CPI) and a weak US employment report on Friday could lead to additional rate cuts by the Fed.
- The yield on the benchmark US 10-year T-note remains above the 4% threshold amid diminishing odds of the Fed's more aggressive policy easing.
- Data from the Chicago Board of Trade, based on the December fed funds rate futures contract, indicates that investors are pricing in 46 basis points (bps) of easing by the Fed toward the end of 2024.
XAU/USD technical outlook: Gold price slumps toward $2,650
Gold price uptrend remains intact despite retreating from around $2,660 toward the $2,650 area. Momentum is bullish, as shown by the Relative Strength Index (RSI), though the RSI edges slightly lower, an indication that some selling pressure remains.
If XAU/USD drops below $2,650, it could pave the way for further downside. The next key support level would be $2,600. A breach of the latter will expose the 50-day Simple Moving Average (SMA) at $2,5550.
Conversely, if XAU/USD clears the October 4 high at $2,670, this could pave the way to challenge the YTD high of $2,685, which is ahead of the $2,700 mark.
Gold FAQs
Gold has played a key role in human’s history as it has been widely used as a store of value and medium of exchange. Currently, apart from its shine and usage for jewelry, the precious metal is widely seen as a safe-haven asset, meaning that it is considered a good investment during turbulent times. Gold is also widely seen as a hedge against inflation and against depreciating currencies as it doesn’t rely on any specific issuer or government.
Central banks are the biggest Gold holders. In their aim to support their currencies in turbulent times, central banks tend to diversify their reserves and buy Gold to improve the perceived strength of the economy and the currency. High Gold reserves can be a source of trust for a country’s solvency. Central banks added 1,136 tonnes of Gold worth around $70 billion to their reserves in 2022, according to data from the World Gold Council. This is the highest yearly purchase since records began. Central banks from emerging economies such as China, India and Turkey are quickly increasing their Gold reserves.
Gold has an inverse correlation with the US Dollar and US Treasuries, which are both major reserve and safe-haven assets. When the Dollar depreciates, Gold tends to rise, enabling investors and central banks to diversify their assets in turbulent times. Gold is also inversely correlated with risk assets. A rally in the stock market tends to weaken Gold price, while sell-offs in riskier markets tend to favor the precious metal.
The price can move due to a wide range of factors. Geopolitical instability or fears of a deep recession can quickly make Gold price escalate due to its safe-haven status. As a yield-less asset, Gold tends to rise with lower interest rates, while higher cost of money usually weighs down on the yellow metal. Still, most moves depend on how the US Dollar (USD) behaves as the asset is priced in dollars (XAU/USD). A strong Dollar tends to keep the price of Gold controlled, whereas a weaker Dollar is likely to push Gold prices up.
Federal Reserve (Fed) Board of Governors member Christopher Waller noted on Monday that recent US inflation data was a "disappointment", threading the needle between dangling an increase in the pace of Fed rate cuts in the future while also expressing caution at the current pace.
Key highlights
I am less certain on destination than policy direction.
My baseline calls for reducing policy rate gradually over the next year.
The Fed should proceed with more caution on rate cuts than was needed at September meeting.
I see pent-up demand for big-ticket items, consumers eager to make purchases as rates come down.
Household resources for future consumption in good shape.
The economy on solid footing, may not be slowing as much as desired; expect GDP to grow faster in 2H 2024.
The latest inflation data disappointing.
If inflation unexpectedly rises, fed could pause rate cuts.
If, in a less likely case, inflation falls below 2% or labor market deteriorates, fed can front-load rate cuts.
If the economy proceeds as expected, can move policy to a neutral stance at a deliberate pace.
Policy rate is currently restrictive.
Looking ahead, I expect payroll gains to moderate, unemployment rate to drift higher but stay historically low.
The labor market is quite healthy, labor supply and demand have come into balance.
- The Canadian Dollar shed another quarter percent against the Greenback.
- Canada kicked off a new trading week with an extended holiday.
- Canadian CPI inflation figures due on Tuesday, BoC rate call looms over the horizon.
The Canadian Dollar (CAD) kicked off the new trading week with another loss against the US Dollar, falling another quarter of a percent against the Greenback. The Loonie has declined against the USD for a ninth consecutive trading day, and has shed nearly 3% from September’s seven-month peak.
Canadian Consumer Price Index (CPI) inflation figures are due on Tuesday, just in time for Canadian exchanges to return to the fold after taking an extended weekend for Canada’s Thanksgiving holiday.
Daily digest market movers
- The Canadian Dollar lost another quarter percent as Loonie traders continue to abandon the CAD and global FX markets bid the Greenback even higher.
- Canadian markets are dark on Monday for the Thanksgiving extended holiday weekend.
- Canadian CPI inflation for September is due Tuesday.
- The Bank of Canada’s (BoC) own core CPI print last came in at 1.5% YoY.
- The Canadian Wholesale Price Index for September is expected to tick down to 1.8% YoY from the previous 2.0%.
- Canadian CPI inflation figures are unlikely to drive much positive sentiment for the CAD with the BoC broadly expected to slash interest rates another 50 bps on October 23.
Canadian Dollar price forecast
USD/CAD shows a clear bullish trend on the daily candlesticks, with the pair breaking above its 50-day Exponential Moving Average (EMA) near 1.3600, and is now trading into 1.3800.. The pair has risen steadily after a brief consolidation phase in mid-September, indicating strong upward momentum. The 50-day EMA is set to cross above the 200-day EMA, forming a bullish crossover known as a “golden cross,” which typically signals a long-term uptrend.
In terms of momentum indicators, the Moving Average Convergence-Divergence (MACD) is showing a strong bullish crossover as well. The MACD fast line (blue) has moved above the signal line (orange), and the histogram is rising, confirming strengthening bullish momentum and implying that the current rally could extend in the near term.
Looking ahead, the next key resistance level is around 1.38500, just slightly above current prices, where sellers may step in. On the downside, support is found near the 50-day and 200-day EMAs which are consolidating near 1.3600, which should act as a strong buffer against any corrective moves. As long as the pair holds above these levels, the outlook remains bullish with the potential for continued upside gains.
USD/CAD daily chart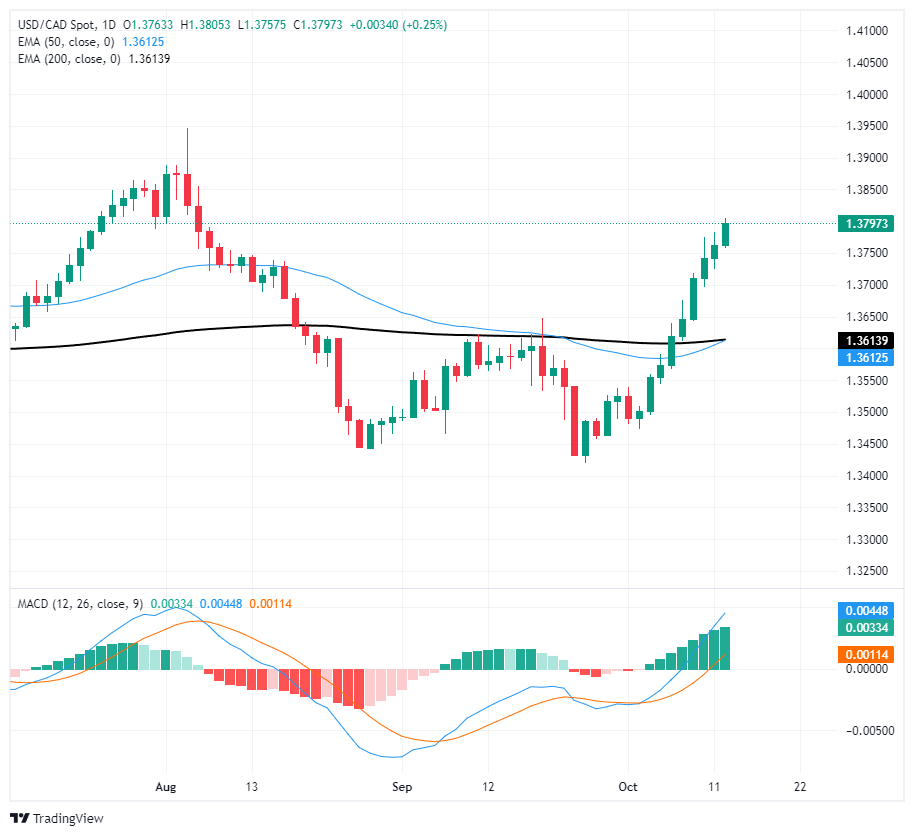
Canadian Dollar FAQs
The key factors driving the Canadian Dollar (CAD) are the level of interest rates set by the Bank of Canada (BoC), the price of Oil, Canada’s largest export, the health of its economy, inflation and the Trade Balance, which is the difference between the value of Canada’s exports versus its imports. Other factors include market sentiment – whether investors are taking on more risky assets (risk-on) or seeking safe-havens (risk-off) – with risk-on being CAD-positive. As its largest trading partner, the health of the US economy is also a key factor influencing the Canadian Dollar.
The Bank of Canada (BoC) has a significant influence on the Canadian Dollar by setting the level of interest rates that banks can lend to one another. This influences the level of interest rates for everyone. The main goal of the BoC is to maintain inflation at 1-3% by adjusting interest rates up or down. Relatively higher interest rates tend to be positive for the CAD. The Bank of Canada can also use quantitative easing and tightening to influence credit conditions, with the former CAD-negative and the latter CAD-positive.
The price of Oil is a key factor impacting the value of the Canadian Dollar. Petroleum is Canada’s biggest export, so Oil price tends to have an immediate impact on the CAD value. Generally, if Oil price rises CAD also goes up, as aggregate demand for the currency increases. The opposite is the case if the price of Oil falls. Higher Oil prices also tend to result in a greater likelihood of a positive Trade Balance, which is also supportive of the CAD.
While inflation had always traditionally been thought of as a negative factor for a currency since it lowers the value of money, the opposite has actually been the case in modern times with the relaxation of cross-border capital controls. Higher inflation tends to lead central banks to put up interest rates which attracts more capital inflows from global investors seeking a lucrative place to keep their money. This increases demand for the local currency, which in Canada’s case is the Canadian Dollar.
Macroeconomic data releases gauge the health of the economy and can have an impact on the Canadian Dollar. Indicators such as GDP, Manufacturing and Services PMIs, employment, and consumer sentiment surveys can all influence the direction of the CAD. A strong economy is good for the Canadian Dollar. Not only does it attract more foreign investment but it may encourage the Bank of Canada to put up interest rates, leading to a stronger currency. If economic data is weak, however, the CAD is likely to fall.
The Greenback extended its monthly recovery on the back of the persevering risk-off mood in the FX universe, while investors warmed up for key upcoming US data releases as well as Fed speakers.
Here is what you need to know on Tuesday, October 15:
The US Dollar Index (DXY) advanced to fresh tops further north of the 103.00 barrier on the back of the generalized offered stance in the risk complex. The NY Empire State Manufacturing Index is due, seconded by speeches by Daly and Kugler.
Further selling interest dragged EUR/USD to new lows in the sub-1.0900 region amidst extra advance in the US Dollar. Wholesale Prices in Germany are next on tap along with the Economic Sentiment in the euro area and Germany.
Mirroring its risky peers, GBP/USD traded slightly on the defensive around the 1.3050 region ahead of key data on the UK calendar. The publication of the UK’s jobs report will be the salient event.
USD/JPY added to Friday’s advance and approached the key 150.00 barrier following further improvement in the Greenback. Industrial Production and Capacity utilization come next on the calendar.
AUD/USD resumed its downtrend and came close to 0.6700 after two consecutive days of gains. The Westpac Leading Index and the speech by the RBA’s Hunter are due on October 16.
Prices of WTI succumbed to demand concerns from China and a discouraging report from the OPEC, revisiting the area well south of the $74.00 mark per barrel.
Gold prices retreated modestly to the proximity of the $2,640 region per ounce troy amidst the stronger US Dollar. Silver prices left behind two consecutive daily advances and briefly revisited the sub-$31.00 zone per ounce.
- The Dow Jones found a fresh all-time peak at the start of the week.
- Investors have leaned firmer into risk appetite ahead of a hefty earnings week.
- The Dow Jones has gained over 12% from August’s swing low.
The Dow Jones Industrial Average (DJIA) climbed to another record high on Columbus Day Monday, testing above the 43,000 handle and poised to enter a sixth consecutive week in the green. Wall Street is geared up for a hectic earnings reporting week, and this week’s US data docket is a smattering of mid-tier Federal Reserve (Fed) policymaker appearances with key US Retail Sales figures slated for Thursday.
JPMorgan Chase (JPM) and Wells Fargo (WFC) kicked off earnings season late last week on the high side, and markets are hoping for more of the same from the rest of the banking sector. Bank of America (BAC) and Goldman Sachs (GS) will be reporting Q3 earnings on Tuesday, joined by pharma giant Johnson & Johnson (JNJ). Morgan Stanley (MS) will round out finance sector earnings on Wednesday alongside United Airlines (UAL), with Walgreens Boots Alliance (WBA), Netflix (NFLX), and Proctor & Gamble (PG) due later in the week.
Dow Jones news
Despite a firm leg higher into bull country, the Dow Jones was relatively balanced during Monday’s US market session, with roughly half of the equity index’s constituent securities testing into the red. Losses were lead by Caterpillar (CAT) which fell nearly 2% and slipped below $395 per share as construction stocks waffle following a notable lack of gunpowder behind recently-announced Chinese stimulus measures meant to bolster China’s lagging housing and construction markets.
On the high side, Travelers Companies (TRV), Unitedhealth Group (UNH), and Mcdonald’s (MCD) are competing for the top spot, with all three companies rising around 1.5%. Travelers Companies rose to $240 per share, with Unitedhealth crossing above $606 per share and McDonald’s climbing toward $310 per share.
Dow Jones price forecast
The Dow Jones continues to push through key resistance levels and extend bullish momentum into record levels. With the Dow breaking through September’s technical barriers and crossing over 43,000, the next target for bulls will be the 44,000 psychological level.
The Dow Jones has gained nearly 8% from September’s swing low into the 50-day Exponential Moving Average (EMA), rallying firmly from a test of the 40,000 handle. The major equity index continues to grind out chart paper north of the 200-day EMA rising into 39,400, and bidders have refused to let price action touch the long-run moving average since November of 2023, when the Dow Jones was grappling with 34,000.
Dow Jones daily chart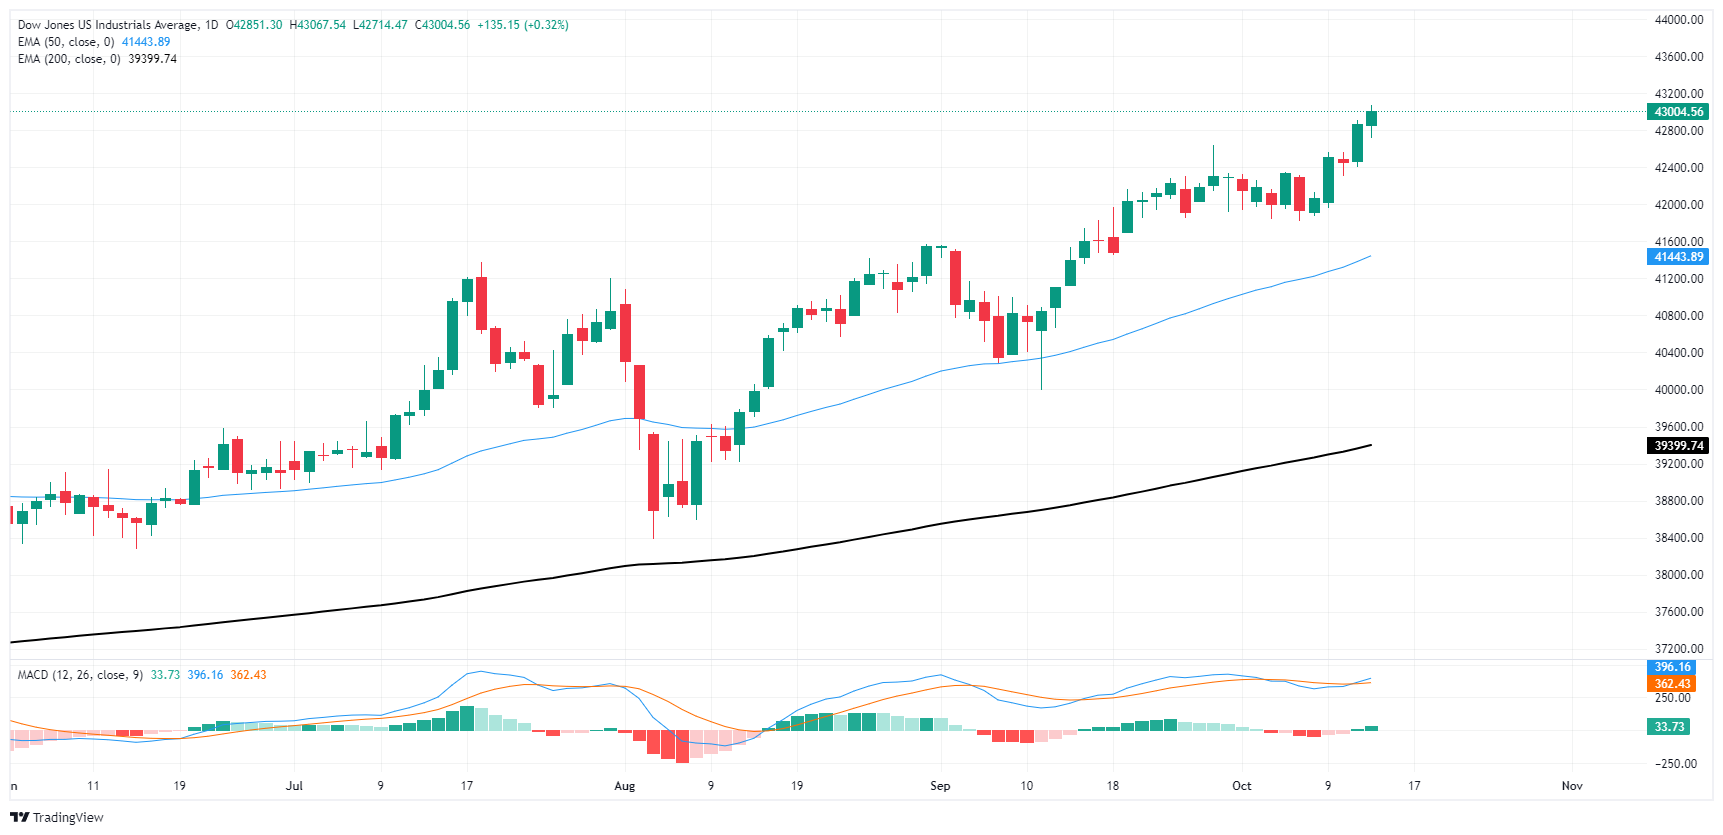
Dow Jones FAQs
The Dow Jones Industrial Average, one of the oldest stock market indices in the world, is compiled of the 30 most traded stocks in the US. The index is price-weighted rather than weighted by capitalization. It is calculated by summing the prices of the constituent stocks and dividing them by a factor, currently 0.152. The index was founded by Charles Dow, who also founded the Wall Street Journal. In later years it has been criticized for not being broadly representative enough because it only tracks 30 conglomerates, unlike broader indices such as the S&P 500.
Many different factors drive the Dow Jones Industrial Average (DJIA). The aggregate performance of the component companies revealed in quarterly company earnings reports is the main one. US and global macroeconomic data also contributes as it impacts on investor sentiment. The level of interest rates, set by the Federal Reserve (Fed), also influences the DJIA as it affects the cost of credit, on which many corporations are heavily reliant. Therefore, inflation can be a major driver as well as other metrics which impact the Fed decisions.
Dow Theory is a method for identifying the primary trend of the stock market developed by Charles Dow. A key step is to compare the direction of the Dow Jones Industrial Average (DJIA) and the Dow Jones Transportation Average (DJTA) and only follow trends where both are moving in the same direction. Volume is a confirmatory criteria. The theory uses elements of peak and trough analysis. Dow’s theory posits three trend phases: accumulation, when smart money starts buying or selling; public participation, when the wider public joins in; and distribution, when the smart money exits.
There are a number of ways to trade the DJIA. One is to use ETFs which allow investors to trade the DJIA as a single security, rather than having to buy shares in all 30 constituent companies. A leading example is the SPDR Dow Jones Industrial Average ETF (DIA). DJIA futures contracts enable traders to speculate on the future value of the index and Options provide the right, but not the obligation, to buy or sell the index at a predetermined price in the future. Mutual funds enable investors to buy a share of a diversified portfolio of DJIA stocks thus providing exposure to the overall index.
- US Dollar finding buyers as markets are pricing in fewer cuts in 2024.
- Thursday’s Retail Sales will be key for market bets.
- Strong US data later in the week could continue pushing the DXY higher.
The US Dollar Index (DXY), which measures the value of the USD against a basket of six currencies, continues rising as markets are giving up their hopes of two cuts by the Federal Reserve (Fed) this year.
The US economy displays mixed signals, exhibiting both signs of a slowdown and resilience. The Fed has indicated that it will monitor incoming data to adjust the pace of its monetary easing policy accordingly.
Daily digest market movers: US Dollar adds more ground on quiet Monday
- Fed easing expectations tempered by strong jobs and CPI data with fewer rate cuts priced in.
- Fed speakers hold cautious stance on rate cuts and remain data-dependent.
- Headline September CPI rose as expected last week, while core CPI was slightly higher than anticipated.
- The super core rate remained unchanged at 4.3% YoY, indicating persistent price pressure.
- US Retail Sales data on Thursday is projected to show continued consumer spending strength supported by favorable economic conditions.
- Business inventories and industrial production reports on Thursday will provide insight into overall economic activity.
DXY technical outlook: DXY maintains bullish momentum, approaching overbought conditions
The DXY index maintains upward momentum with indicators suggesting overbought conditions near the crucial 100-day SMA. That being said, the Relative Strength Index (RSI) and Moving Average Convergence Divergence (MACD) are approaching overbought territory, signaling a potential pullback.
Supports are located at 103.00, 102.50 and 102.30, while resistances are found at 103.30, 103.50 and 104.00.
US Dollar FAQs
The US Dollar (USD) is the official currency of the United States of America, and the ‘de facto’ currency of a significant number of other countries where it is found in circulation alongside local notes. It is the most heavily traded currency in the world, accounting for over 88% of all global foreign exchange turnover, or an average of $6.6 trillion in transactions per day, according to data from 2022. Following the second world war, the USD took over from the British Pound as the world’s reserve currency. For most of its history, the US Dollar was backed by Gold, until the Bretton Woods Agreement in 1971 when the Gold Standard went away.
The most important single factor impacting on the value of the US Dollar is monetary policy, which is shaped by the Federal Reserve (Fed). The Fed has two mandates: to achieve price stability (control inflation) and foster full employment. Its primary tool to achieve these two goals is by adjusting interest rates. When prices are rising too quickly and inflation is above the Fed’s 2% target, the Fed will raise rates, which helps the USD value. When inflation falls below 2% or the Unemployment Rate is too high, the Fed may lower interest rates, which weighs on the Greenback.
In extreme situations, the Federal Reserve can also print more Dollars and enact quantitative easing (QE). QE is the process by which the Fed substantially increases the flow of credit in a stuck financial system. It is a non-standard policy measure used when credit has dried up because banks will not lend to each other (out of the fear of counterparty default). It is a last resort when simply lowering interest rates is unlikely to achieve the necessary result. It was the Fed’s weapon of choice to combat the credit crunch that occurred during the Great Financial Crisis in 2008. It involves the Fed printing more Dollars and using them to buy US government bonds predominantly from financial institutions. QE usually leads to a weaker US Dollar.
Quantitative tightening (QT) is the reverse process whereby the Federal Reserve stops buying bonds from financial institutions and does not reinvest the principal from the bonds it holds maturing in new purchases. It is usually positive for the US Dollar.
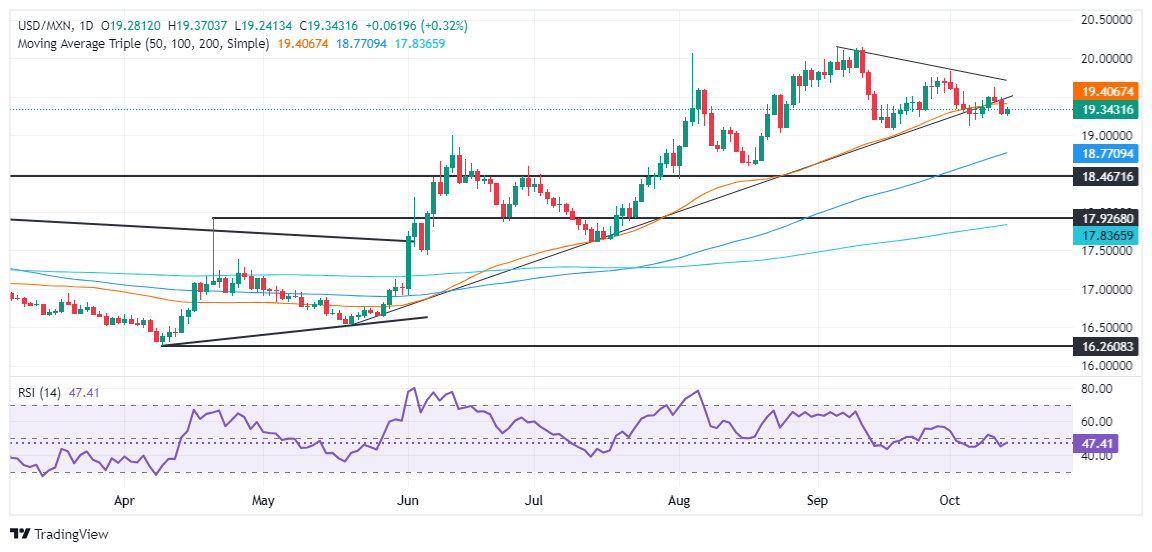
- Mexican Peso weakens 0.51% against the US Dollar with USD/MXN trading at 19.33 as Mexico’s Consumer Confidence falls.
- Fears over China’s economic slowdown weigh on emerging market currencies, boosting the Greenback.
- Former US President Donald Trump hints at 200% tariffs on Mexican vehicle imports, adding to market concerns.
The Mexican Peso depreciated against the Greenback during the beginning of the week and edged down over 0.51%. Weaker-than-expected data from Mexico, alongside fears of China’s economic slowdown, weighed on most emerging market currencies and propelled the US Dollar higher. The USD/MXN trades at 19.33, up by 0.44%.
The Instituto Nacional de Estadistica Geografia e Informatica (INEGI) revealed that Mexico’s Consumer Confidence in September worsened and edged lower compared to August’s data, which was the highest since February 2019.
In the meantime, China’s Finance Minister Lan Foan revealed that the government would continue to provide stimulus, support the property market, and replenish state bank capitals in efforts to boost the economy.
China faces intense deflationary pressures spurred by a sharp property market slowdown and deteriorating consumer confidence.
Former President Donald Trump suggested imposing tariffs of over 200% on vehicles imported from Mexico, he said in a Fox interview on Sunday.
In the US, a scarce economic docket left traders adrift, and Minneapolis Fed President Neel Kashkari's comments left them unsure. Kashkari said he expected “further modest reductions in our policy rate.” He added that recent jobs data shows a strong labor market and that the economy is in the final stages of bringing inflation back to 2%.
Ahead in the week, the US economic docket will remain scarce on the data front, yet Fed speakers will cross the wires during the week. The New York Empire State Manufacturing Index on Tuesday, followed by the Balance of Trade on Wednesday and a busy schedule on Thursday might dictate the direction of the USD/MXN pair.
Daily digest market movers: Mexican Peso on the defensive as USD/MXN surges
- Mexico’s Consumer Confidence in September deteriorated from 47.6 to 47.1. Most of the subcomponents dropped, except for the current conditions compared to a year ago. In addition, Mexican households revealed that they would be less likely to purchase durable goods, the data showed.
- According to Banxico’s poll, the central bank is projected to lower rates by 50 bps to 10% for the remainder of 2024. Meanwhile, the USD/MXN exchange rate will end near 19.69.
- Mexico’s economy is projected to grow by 1.45% in 2024, lower than August’s 1.57%.
- On Tuesday, the US economic docket will feature the New York Empire State Manufacturing Index for October, which is expected to drop from 11.3 to 2.3, via estimates.
- Federal Reserve officials, led by the San Francisco Fed’s Mary Daly, Board Governor Adriana Kugler, and Atlanta Fed’s Raphael Bostic, will cross the wires.
- Data from the Chicago Board of Trade via the December fed funds rate futures contract shows investors estimate 49 bps of easing by the Fed toward the end of 2024.
USD/MXN technical outlook: Mexican Peso falls as USD/MXN rises above 19.30
The USD/MXN uptrend remains intact, even though the pair has failed to clear the October 10 daily high of 19.61. At the time of writing, momentum backs buyers, as shown by the Relative Strength Index (RSI). Nevertheless, the rise in the pair could be short-lived unless the RSI clears the 50-neutral line.
If USD/MXN climbs above 19.50, that would expose the previously mentioned 19.61 level. If surpassed, the next resistance level would be the October 1 daily high of 19.82, ahead of 20.00. Up next would be the YTD peak of 20.22.
Conversely, if USD/MXN tumbles below the October 4 wing low of 19.10, the 19.00 figure will be exposed. Once broken, the next support would be the 100-day SMA at 18.75.
Mexican Peso FAQs
The Mexican Peso (MXN) is the most traded currency among its Latin American peers. Its value is broadly determined by the performance of the Mexican economy, the country’s central bank’s policy, the amount of foreign investment in the country and even the levels of remittances sent by Mexicans who live abroad, particularly in the United States. Geopolitical trends can also move MXN: for example, the process of nearshoring – or the decision by some firms to relocate manufacturing capacity and supply chains closer to their home countries – is also seen as a catalyst for the Mexican currency as the country is considered a key manufacturing hub in the American continent. Another catalyst for MXN is Oil prices as Mexico is a key exporter of the commodity.
The main objective of Mexico’s central bank, also known as Banxico, is to maintain inflation at low and stable levels (at or close to its target of 3%, the midpoint in a tolerance band of between 2% and 4%). To this end, the bank sets an appropriate level of interest rates. When inflation is too high, Banxico will attempt to tame it by raising interest rates, making it more expensive for households and businesses to borrow money, thus cooling demand and the overall economy. Higher interest rates are generally positive for the Mexican Peso (MXN) as they lead to higher yields, making the country a more attractive place for investors. On the contrary, lower interest rates tend to weaken MXN.
Macroeconomic data releases are key to assess the state of the economy and can have an impact on the Mexican Peso (MXN) valuation. A strong Mexican economy, based on high economic growth, low unemployment and high confidence is good for MXN. Not only does it attract more foreign investment but it may encourage the Bank of Mexico (Banxico) to increase interest rates, particularly if this strength comes together with elevated inflation. However, if economic data is weak, MXN is likely to depreciate.
As an emerging-market currency, the Mexican Peso (MXN) tends to strive during risk-on periods, or when investors perceive that broader market risks are low and thus are eager to engage with investments that carry a higher risk. Conversely, MXN tends to weaken at times of market turbulence or economic uncertainty as investors tend to sell higher-risk assets and flee to the more-stable safe havens.
The upcoming budget on 30 October could prove to be one of the most important in years. Further tax increases are likely forthcoming to ensure no major spending cuts are needed. We expect rule changes on the debt side to usher in a renewed focus on boosting investment. Gilt reaction will depend on how much borrowing headroom is created and how much of that is used, Standard Chartered’s analysts note.
Something borrowed, something new
“The UK budget on 30 October may prove to be one of the most significant of the last 20 years, partly given the state of UK public finances and also as it will be the first fiscal event of a Labour government in 14 years. But more importantly because the government looks intent on using it to usher in fiscal rule changes with a focus on boosting investment and economic growth. Fiscal headroom could be increased by changes to the debt measure and the time horizon that the government targets, while a commitment to borrowing only for investment, alongside reforms to public services, could shift the focus of government towards the longer term.”
“However, Chancellor Rachel Reeves will seek to avoid being overly bold, as memories of former Prime Minister Liz Truss’ mini-budget crisis of autumn 2022 linger. The recent rise in UK government borrowing costs is a timely reminder of the risks of losing market confidence and the need to secure a positive assessment of changes from Office for Budget Responsibility (OBR). Whatever increase to the fiscal headroom is achieved is therefore unlikely to be fully utilised.”
“In the near term, the government has largely hamstrung itself by ruling out hikes to more than 70% of the tax base. Moreover, mooted tax hikes elsewhere – such as VAT on private education and changes to the non-domiciled-resident tax regime – have come under scrutiny in terms of how much revenue they will raise. With a reported GBP 22bn fiscal hole in the 2024-25 budget, additional tax hikes will be needed to avoid significant real-term spending cuts for some government departments, potentially focused on capital gains, inheritance tax, pensions, and possibly the introduction of new taxes.”
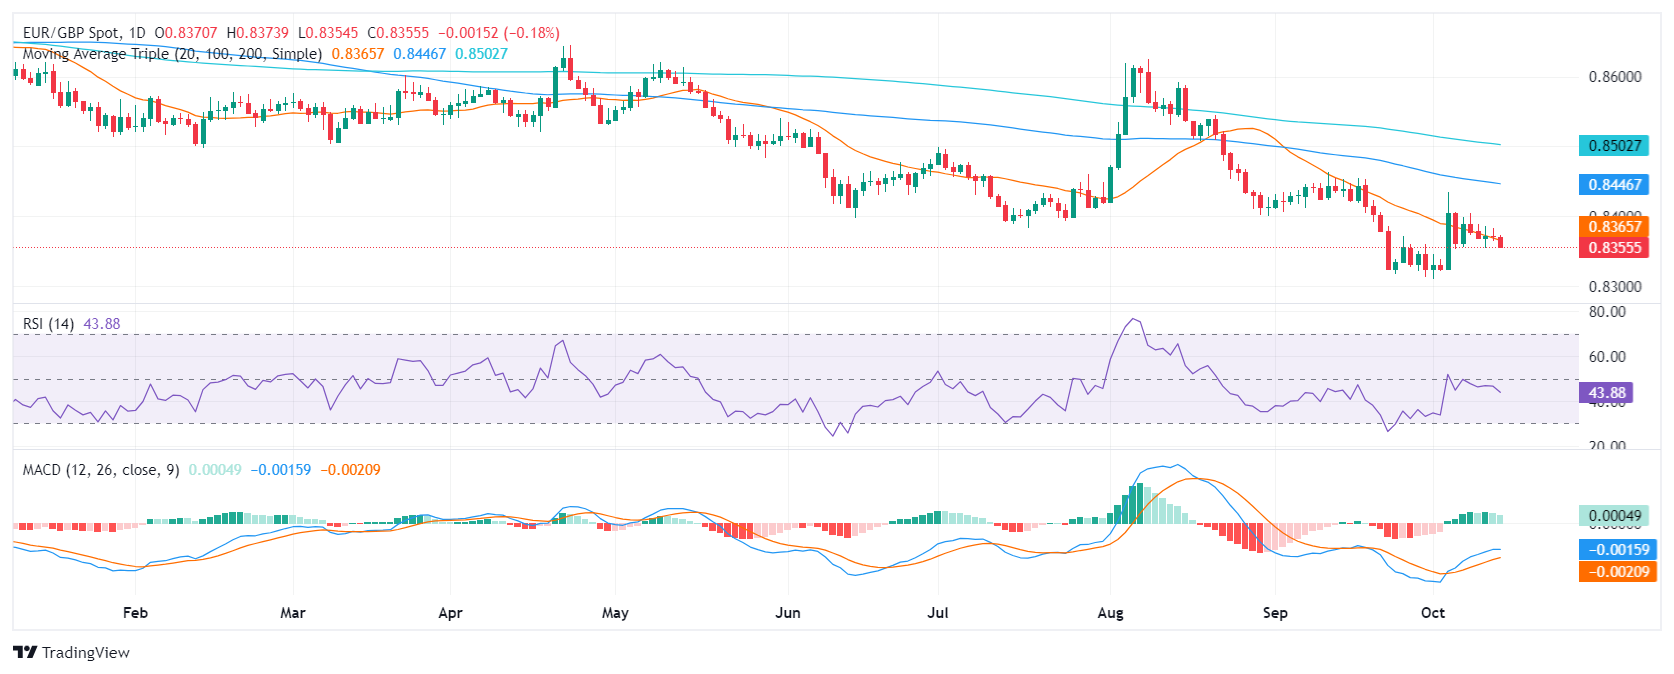
- EUR/GBP remains in a range, unable to establish a clear trend.
- Bearish divergence in technical indicators points to a shift in momentum.
- The cross slid below 20-day SMA, but bears need a break below 0.8300 for conviction.
In Monday's session, the EUR/GBP declined and settled lower at around 0.8350, below the 20-day Simple Moving Average (SMA), a development that worsens the technical outlook and reinforce the short-term bearish bias
The EUR/GBP pair has been unable to sustain gains above the 0.8400 resistance level, indicating that the bulls are struggling to regain control. The Relative Strength Index (RSI) is currently at 45, indicating that the pair is in negative territory, below the 50-neutral threshold. Moreover, the RSI's decline suggests that selling pressure is intensifying.
The Moving Average Convergence Divergence (MACD) is also sending bearish signals. The MACD histogram is green and decreasing, indicating that buying pressure is waning.
Support levels: 0.8320, 0.8300, 0.8280.
Resistance levels: 0.8390, 0.8400, 0.8430.
EUR/GBP daily chart
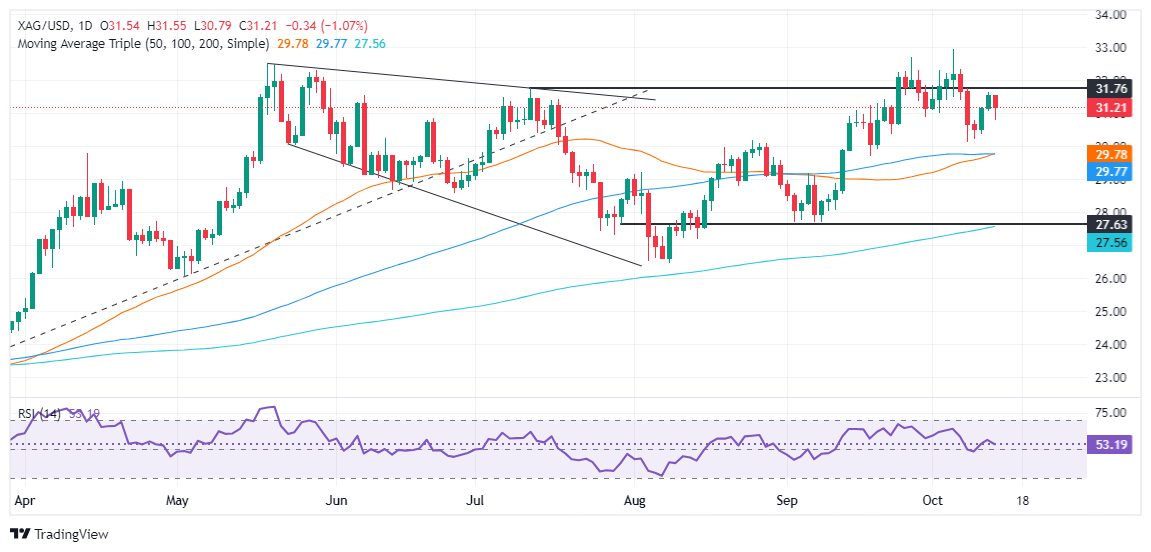
- Silver prices decline as a risk-on mood and weak Chinese economic data weigh on the precious metal.
- Momentum favors buyers, but caution is warranted with the RSI showing signs of weakening.
- Key resistance lies at $31.63, with bulls aiming for $32.00 and the year-to-date high of $32.95. A break below $31.00 could target support at $30.76 and $30.12.
Silver's price dropped during the North American session on Monday, courtesy of a broad risk-on mood. China’s economy remains weak despite government efforts to stimulate consumer spending. Therefore, the XAG/USD trades at $31.25, down by over 0.88%.
XAG/USD Price Forecast: Technical outlook
After edging higher for two consecutive days, the XAG/USD has retreated somewhat, yet it remains above the $31.00 figure.
Momentum favors buyers in the near term, as shown by the Relative Strength Index (RSI), though caution is warranted, as RSI peaked below the latest two troughs.
For XAG/USD to resume its uptrend, bulls must clear the October 11 high at $31.63. If surpassed, the next stop would be the $32.00 figure, followed by the May 29 high at $32.29 and the May 20 at $32.50. Up next would be the year-to-date (YTD) high at $32.95.
Conversely, if sellers move in, the first support would be the $31.00 mark, followed by today’s low of $30.76. Once surpassed, the next stop would be the October 8 low of $30.12, followed by the confluence of the 50-100-day moving averages (DMAs) at $29.75/74.
XAG/USD Price Action – Daily Chart
Silver FAQs
Silver is a precious metal highly traded among investors. It has been historically used as a store of value and a medium of exchange. Although less popular than Gold, traders may turn to Silver to diversify their investment portfolio, for its intrinsic value or as a potential hedge during high-inflation periods. Investors can buy physical Silver, in coins or in bars, or trade it through vehicles such as Exchange Traded Funds, which track its price on international markets.
Silver prices can move due to a wide range of factors. Geopolitical instability or fears of a deep recession can make Silver price escalate due to its safe-haven status, although to a lesser extent than Gold's. As a yieldless asset, Silver tends to rise with lower interest rates. Its moves also depend on how the US Dollar (USD) behaves as the asset is priced in dollars (XAG/USD). A strong Dollar tends to keep the price of Silver at bay, whereas a weaker Dollar is likely to propel prices up. Other factors such as investment demand, mining supply – Silver is much more abundant than Gold – and recycling rates can also affect prices.
Silver is widely used in industry, particularly in sectors such as electronics or solar energy, as it has one of the highest electric conductivity of all metals – more than Copper and Gold. A surge in demand can increase prices, while a decline tends to lower them. Dynamics in the US, Chinese and Indian economies can also contribute to price swings: for the US and particularly China, their big industrial sectors use Silver in various processes; in India, consumers’ demand for the precious metal for jewellery also plays a key role in setting prices.
Silver prices tend to follow Gold's moves. When Gold prices rise, Silver typically follows suit, as their status as safe-haven assets is similar. The Gold/Silver ratio, which shows the number of ounces of Silver needed to equal the value of one ounce of Gold, may help to determine the relative valuation between both metals. Some investors may consider a high ratio as an indicator that Silver is undervalued, or Gold is overvalued. On the contrary, a low ratio might suggest that Gold is undervalued relative to Silver.
- EUR/JPY is testing the top of a multi-week range and could be about to reverse and fall.
- Although price action has not yet reversed, the MACD is diverging bearishly with price.
EUR/JPY tests the top of a nine-and-a-half-week range at around 163.50 as it continues unfolding its short-term sideways trend.
EUR/JPY 4-hour Chart
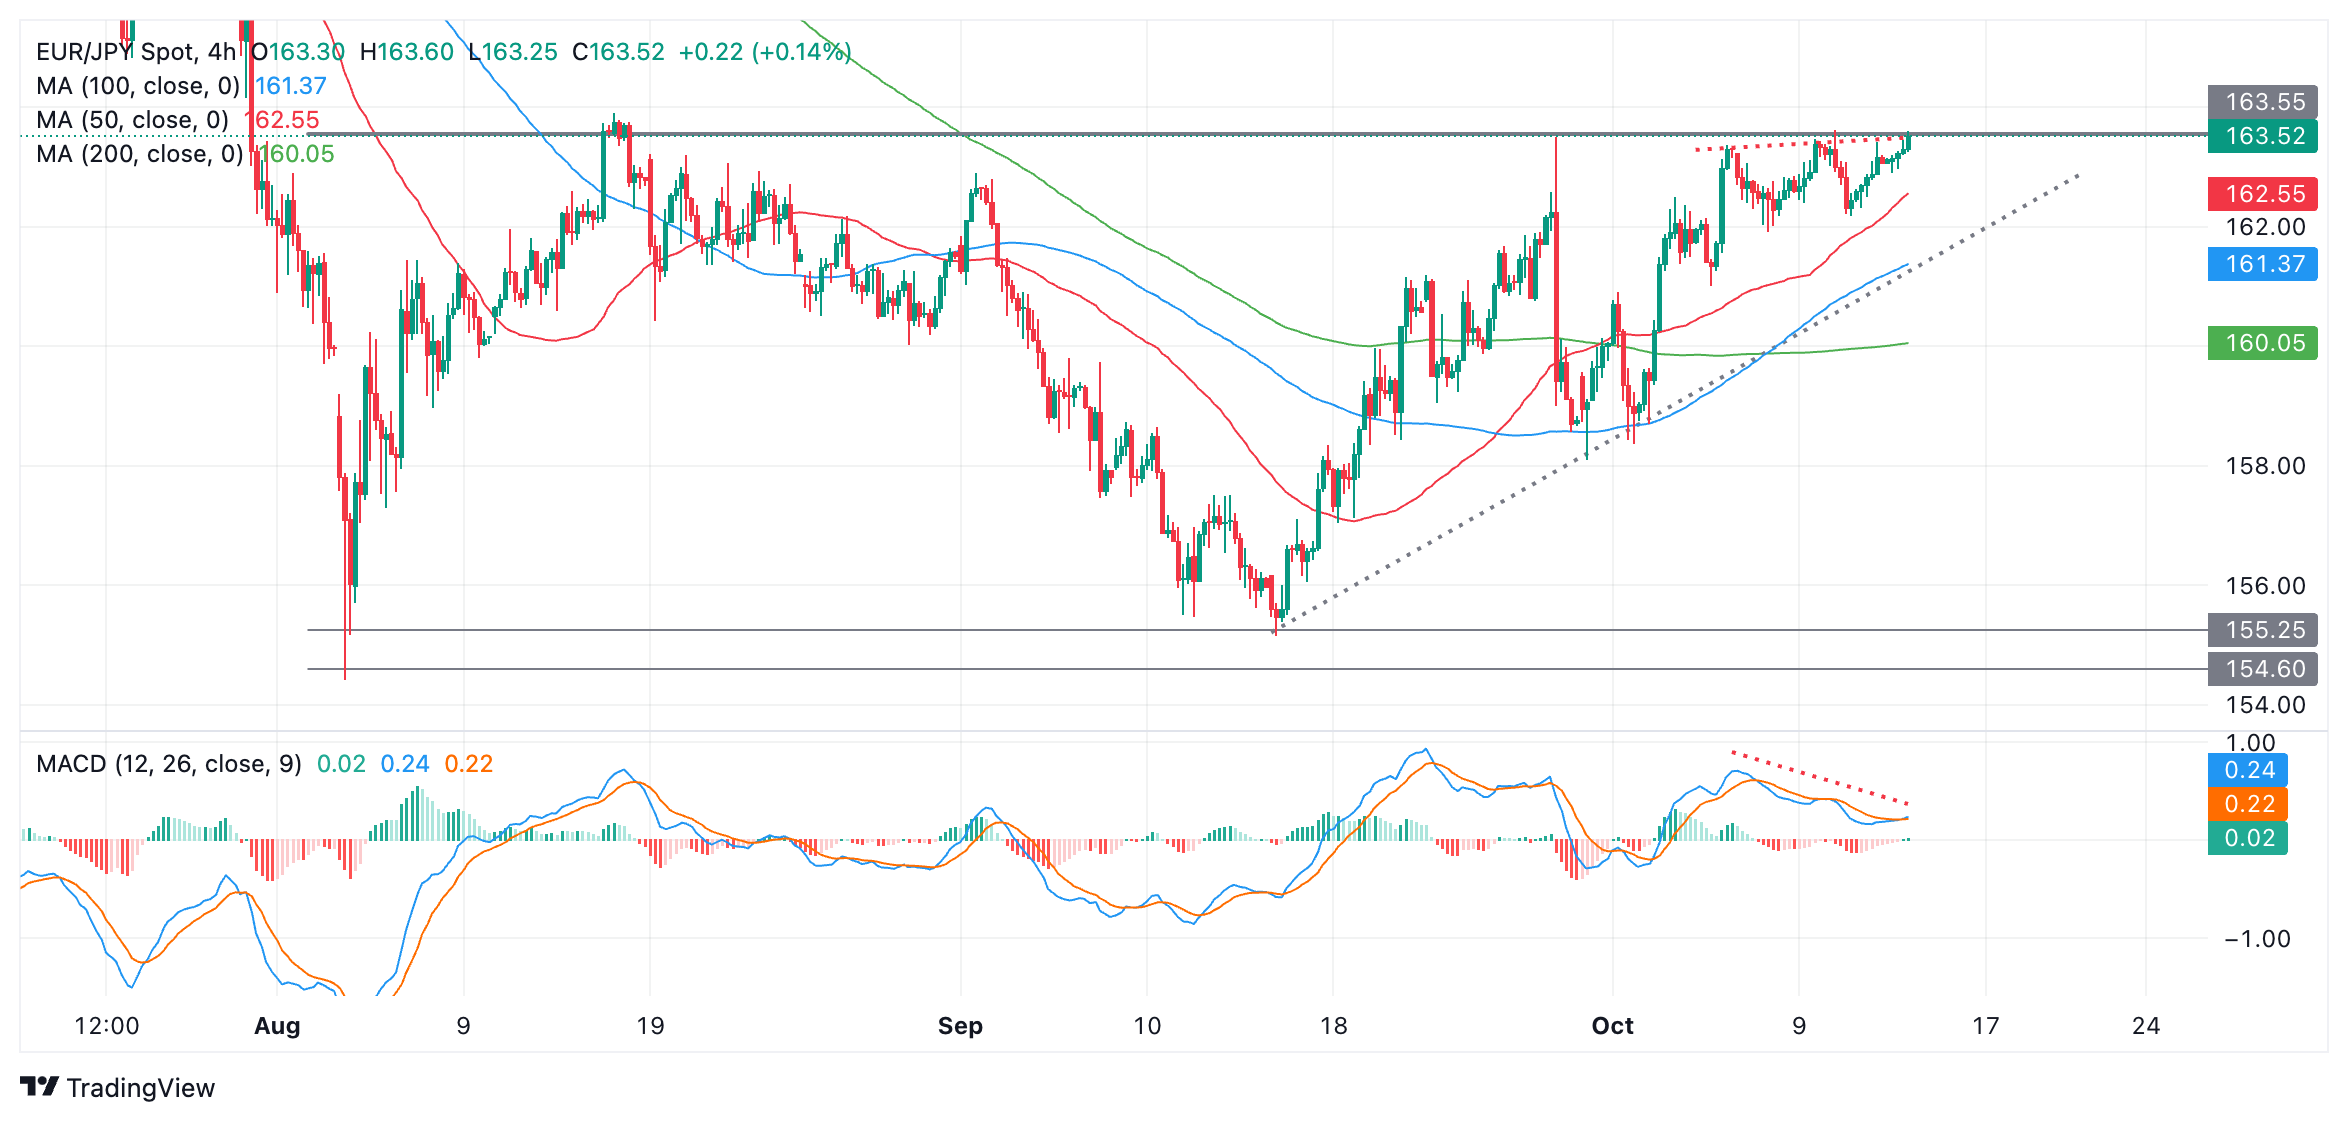
Given the principle of technical analysis that “the trend is your friend” the odds favor a continuation of this sideways mode. If so, then the next move for EUR/JPY will probably be a decline back down towards the range floor in the 154s.
There are no reversal signs from the actual price yet, however, and it is too early to say with any confidence if the pair will break lower. A move below 161.91 (October 8 low) would be required to supply the additional bearish confirmation. For stronger confirmation price must break below the trendline for the up leg at around 161.70 (dotted black line on chart). The next downside target for EUR/JPY would be at about 158.32 – the October 1 as well as September 30 lows.
The Moving Average Convergence Divergence (MACD) momentum indicator is diverging bearishly with price (red dotted lines on chart). Whilst price is making higher highs, MACD is declining. This is further evidence a downside move could be about to unfold.
On the other hand, a decisive break above the range highs would indicate a breakout of the range and the evolution of a new short-term uptrend. A decisive move would be one characterized by a longer-than-average green candlestick which cleared the range high and closed near its high, or three green candles in a row breaking above the top of the range.
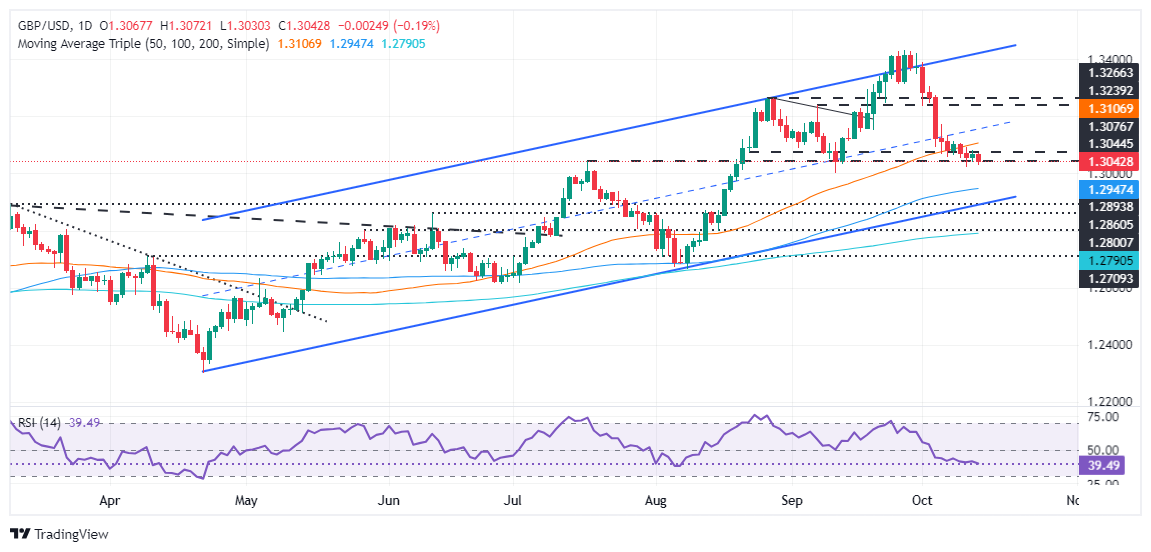
- GBP/USD remains in a tight range between 1.3010 and 1.3095, pressured by the 50-DMA at 1.3104 and support at 1.3000.
- Momentum favors sellers, with the RSI in bearish territory, suggesting potential for a lower move toward the 100-DMA at 1.2945.
- A break above 1.3100 could lead to resistance at the October 4 peak of 1.3175, with further gains targeting 1.3200.
The Pound Sterling begins the week on the back foot amid a scarce economic docket on Monday, which will gather traction on Tuesday with the UK’s employment report. At the time of writing, the GBP/USD trades at 1.3046 and loses 0.09% amid thin trading conditions.
GBP/USD Price Forecast: Technical outlook
The GBP/USD consolidates for the third straight day within the 1.3010-1.3095 area, unable to crack the top/bottom of the range, capped on the upside by the 50-day moving average (DMA) at 1.3104, and on the downside by the 1.3000 figure.
Momentum shows sellers are in charge, with the Relative Strength Index (RSI) aiming lower and in bearish territory. This suggests the path of least resistance is downward biased, so GBP/USD traders should be wary of the release of crucial UK data.
If GBP/USD drops below 1.3000, the next support would be the 100-DMA at 1.2945, ahead of the 1.2900 figure. Further losses are seen if the major drops below the 200-DMA at 1.2789.
Conversely, if GBP/USD clears the 1.3100 figure, look for the 50-DMA At 1.3104. A breach of the latter will expose the October 4 peak at 1.3175 before challenging 1.3200,
GBP/USD Price Action – Daily Chart
British Pound PRICE Today
The table below shows the percentage change of British Pound (GBP) against listed major currencies today. British Pound was the strongest against the Swiss Franc.
| USD | EUR | GBP | JPY | CAD | AUD | NZD | CHF | |
|---|---|---|---|---|---|---|---|---|
| USD | 0.29% | 0.19% | 0.55% | 0.21% | 0.44% | 0.35% | 0.85% | |
| EUR | -0.29% | -0.18% | 0.18% | -0.00% | 0.17% | -0.04% | 0.46% | |
| GBP | -0.19% | 0.18% | 0.33% | 0.04% | 0.39% | 0.16% | 0.62% | |
| JPY | -0.55% | -0.18% | -0.33% | -0.35% | -0.09% | -0.16% | 0.28% | |
| CAD | -0.21% | 0.00% | -0.04% | 0.35% | 0.18% | 0.16% | 0.47% | |
| AUD | -0.44% | -0.17% | -0.39% | 0.09% | -0.18% | -0.08% | 0.38% | |
| NZD | -0.35% | 0.04% | -0.16% | 0.16% | -0.16% | 0.08% | 0.44% | |
| CHF | -0.85% | -0.46% | -0.62% | -0.28% | -0.47% | -0.38% | -0.44% |
The heat map shows percentage changes of major currencies against each other. The base currency is picked from the left column, while the quote currency is picked from the top row. For example, if you pick the British Pound from the left column and move along the horizontal line to the US Dollar, the percentage change displayed in the box will represent GBP (base)/USD (quote).
- AUD/USD declines after the release of weak China trade data on Monday.
- The pair recovers some of the losses after Fed’s Kashkari gives boost to rate-cut hopes.
AUD/USD manages to claw back some of its earlier losses and climbs into the 0.6730s on Monday after trading down to 0.6700 following the release of weak Chinese export data, which negatively impacted the Australian Dollar (AUD) due to the two country’s close trade ties.
China Exports in September declined to 2.4% YoY from 8.4% previously and below the 6.0% expected, according to data from the National Bureau of Statistics of China. This contributed to a lower-than-expected and lower-than-previous Trade Balance for the month of $81.71 billion. The data added to the overall pessimistic view of the Chinese economy and investor disappointment at the lack of detail contained in a recently-unveiled fiscal stimulus program.
In a speech on Saturday, Finance Minister Lan Fo’an withheld actual figures of the program but did announce Beijing would be launching a large-scale local government debt-swap program, and said the forthcoming stimulus package could mark a multi-year turning point in China's fiscal policy framework.
A contributing factor to AUD/USD’s recovery during the US session on Monday could be a speech by Federal Reserve (Fed) Bank of Minneapolis President Neel Kashkari (non-voting member) who said that it appears likely that “further modest reductions” in the central bank’s benchmark interest rate will be appropriate in the coming quarters. The expectation of lower interest rates is negative for the US Dollar (USD) since it reduces foreign capital inflows.
That said, the FXStreet’s FedTracker, which gauges the tone of Fed officials’ speeches on a dovish-to-hawkish scale from 0 to 10 using a custom AI model, rated Kashkari’s words as neutral, with a score of 5.6. This was also above the 4.3 average for the Fed official.
UK PM Starmer has opened the government’s investment summit with the reassurance that Labour will restore the UK’s brand as an open, trading nation. The inference is that the UK has appeared less open in recent years, which may be a reference to Brexit, Rabobank’s FX analyst Jane Foley notes.
Market is expecting the pace of earnings growth to moderate
“This week’s releases of UK labour and CPI inflation data are expected to be key in forming market expectations ahead of the BoE’s November 7 policy meeting. The market is expecting the pace of earnings growth to moderate.”
“While CPI inflation readings are also expected to moderate in September, the consensus is pointing to a still ’too high’ reading of 5.2% y/y for services inflation. On the back of this, Rabobank maintains its view that the BoE is likely to cut rates at a gradual pace of once a quarter. The relatively slow pace of BoE rate cuts should garner GBP some support going forward.”
“However, neither of the US presidential candidates have yet dared to mention budgetary prudence. The likelihood of more deficit spending in the US, particularly under Trump administration, could slow the pace of Fed rate cuts and provide support for the USD (as could Trump’s tariff pledges). Consequently we see limited upside potential for cable going forward.”
- USD/JPY continues rising in a short and probably medium-term trend higher.
- It is overbought according to RSI, however, and could pull-back to support temporarily.
USD/JPY has been steadily rising since the mid-September 140 lows. It is now in the 149s and appears to have established a short – and probably – medium-term uptrend. Given the premise that “the trend is your friend” the odds favor a continuation higher.
USD/JPY 4-hour Chart
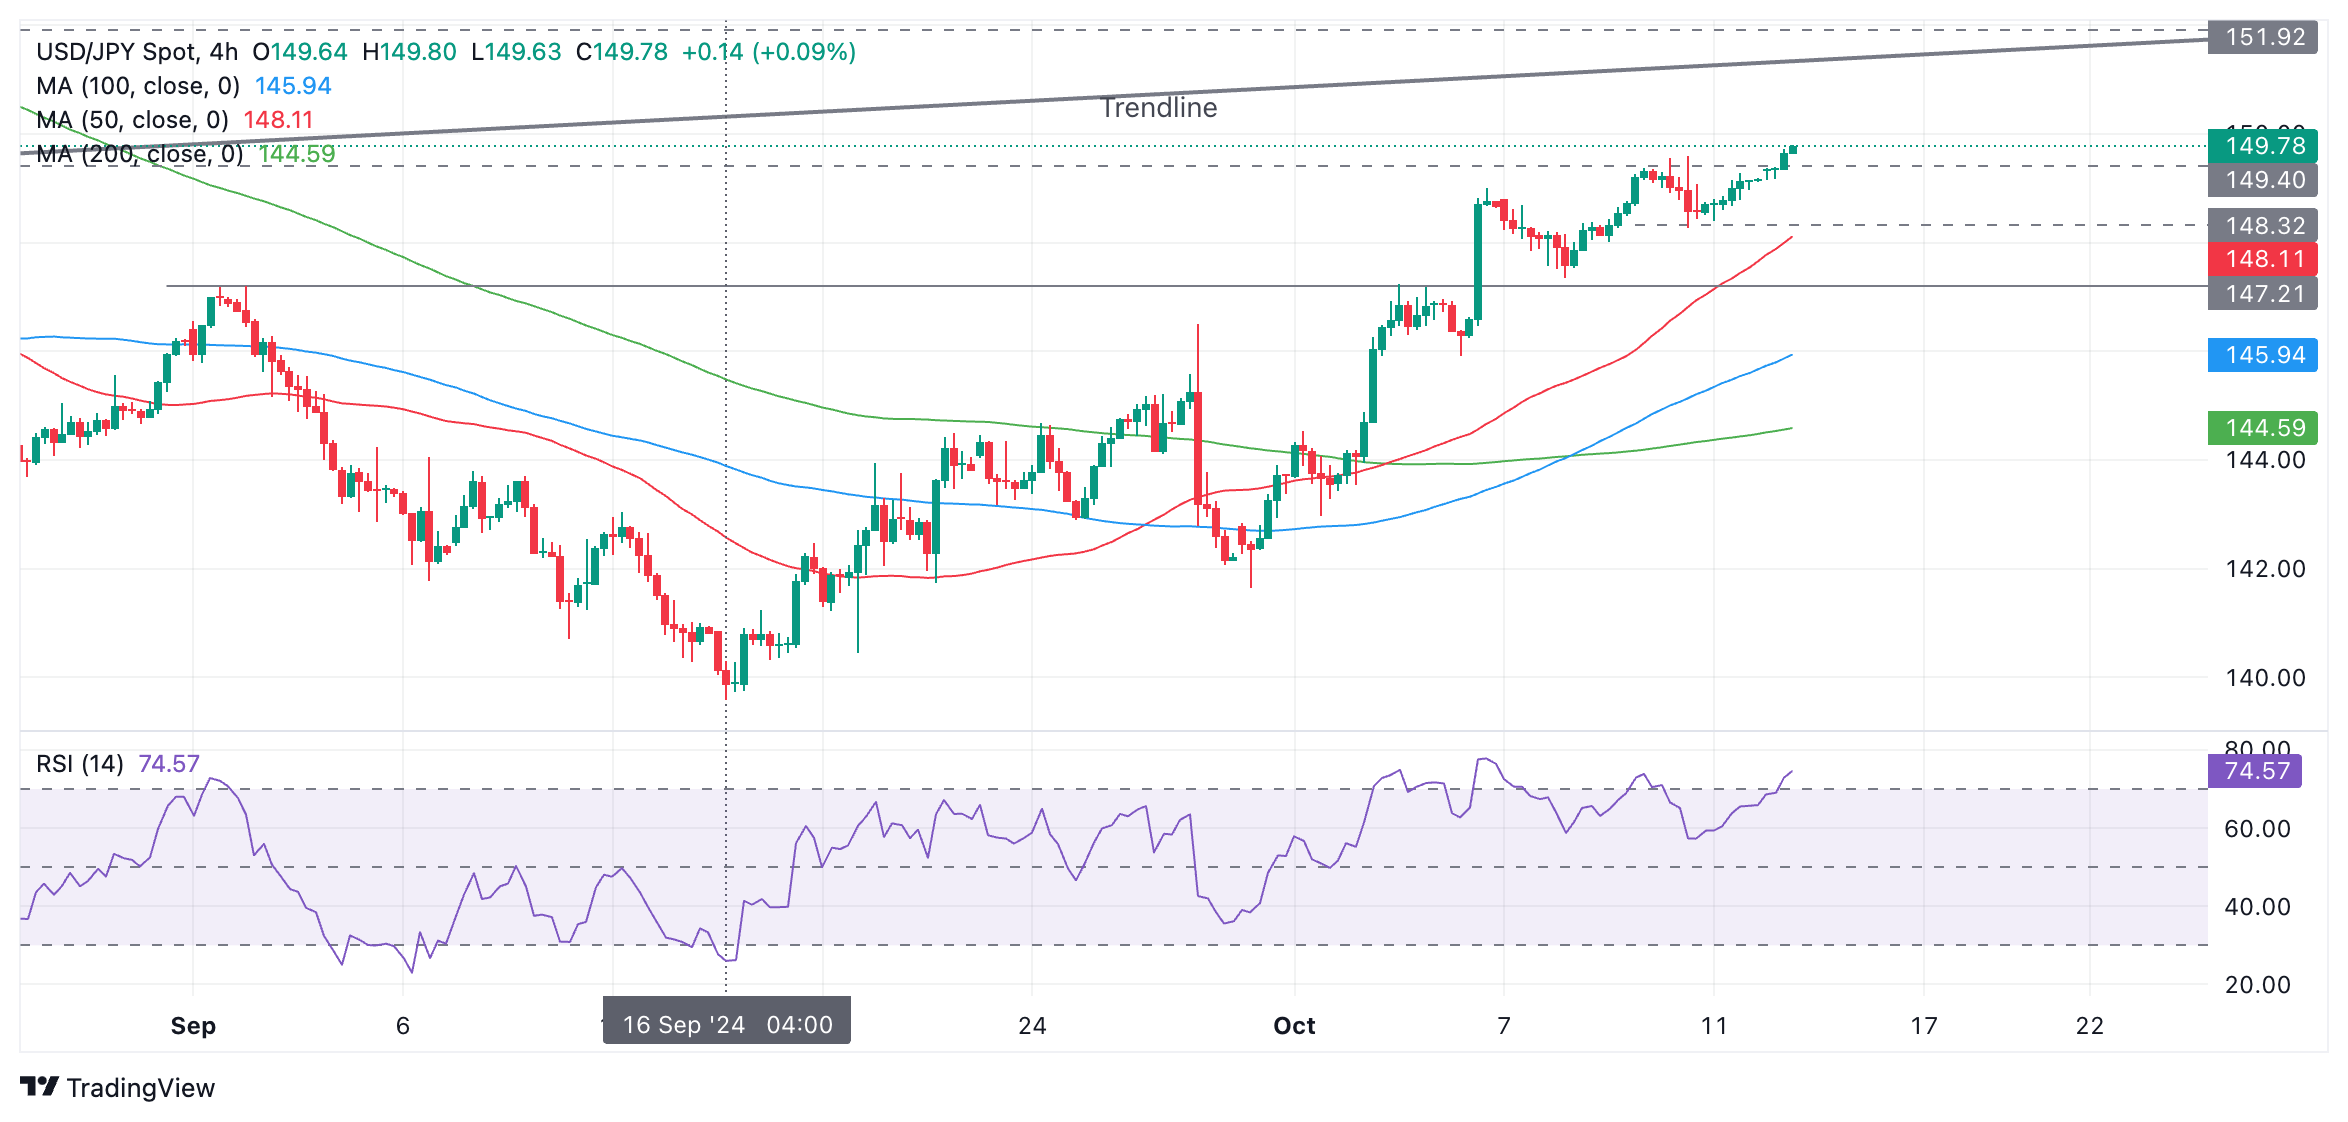
The next target lies at 151.09 and the 200-day Simple Moving Average (SMA) (not shown), followed by the major trendline in the 151.80s.
The pair is overbought, however, according to the Relative Strength Index (RSI) momentum indicator and this means long-holders should not add to their positions as there is a risk of a pull back.
If RSI exists overbought it will signal a correction, probably to support at either 149.40 or 148.32 if deeper.
Federal Reserve (Fed) Bank of Minneapolis President Neel Kashkari said on Monday that the monetary policy is still in a restrictive stance, adding further "modest" rate cuts could be appropriate, per Reuters.
Key takeaways
"One of Fed's most important assets is credibility."
"Economy is in final stages of getting inflation back to 2%."
"It's unclear how restrictive monetary policy is."
"The job market remains strong."
"Recent jobs data shows labor market isn't weakening quickly."
"Future path of monetary policy to be driven by data, economy's performance."
Market reaction
The US Dollar (USD) preserves its strength following these comments. At the time of press, the USD Index was up 0.3% on the day at 103.24.
- USD/CHF continues rising and might have established a medium-term uptrend.
- It is likely to continue higher although it is potentially overbought and a downside gap risks closing.
USD/CHF is rising up and forming a sequence of higher highs and higher lows which indicates it is probably in both a short and – now also – a medium term uptrend. Given it is a key tenet of technical analysis that “the trend is your friend” the odds favor more upside to come.
USD/CHF 4-hour Chart
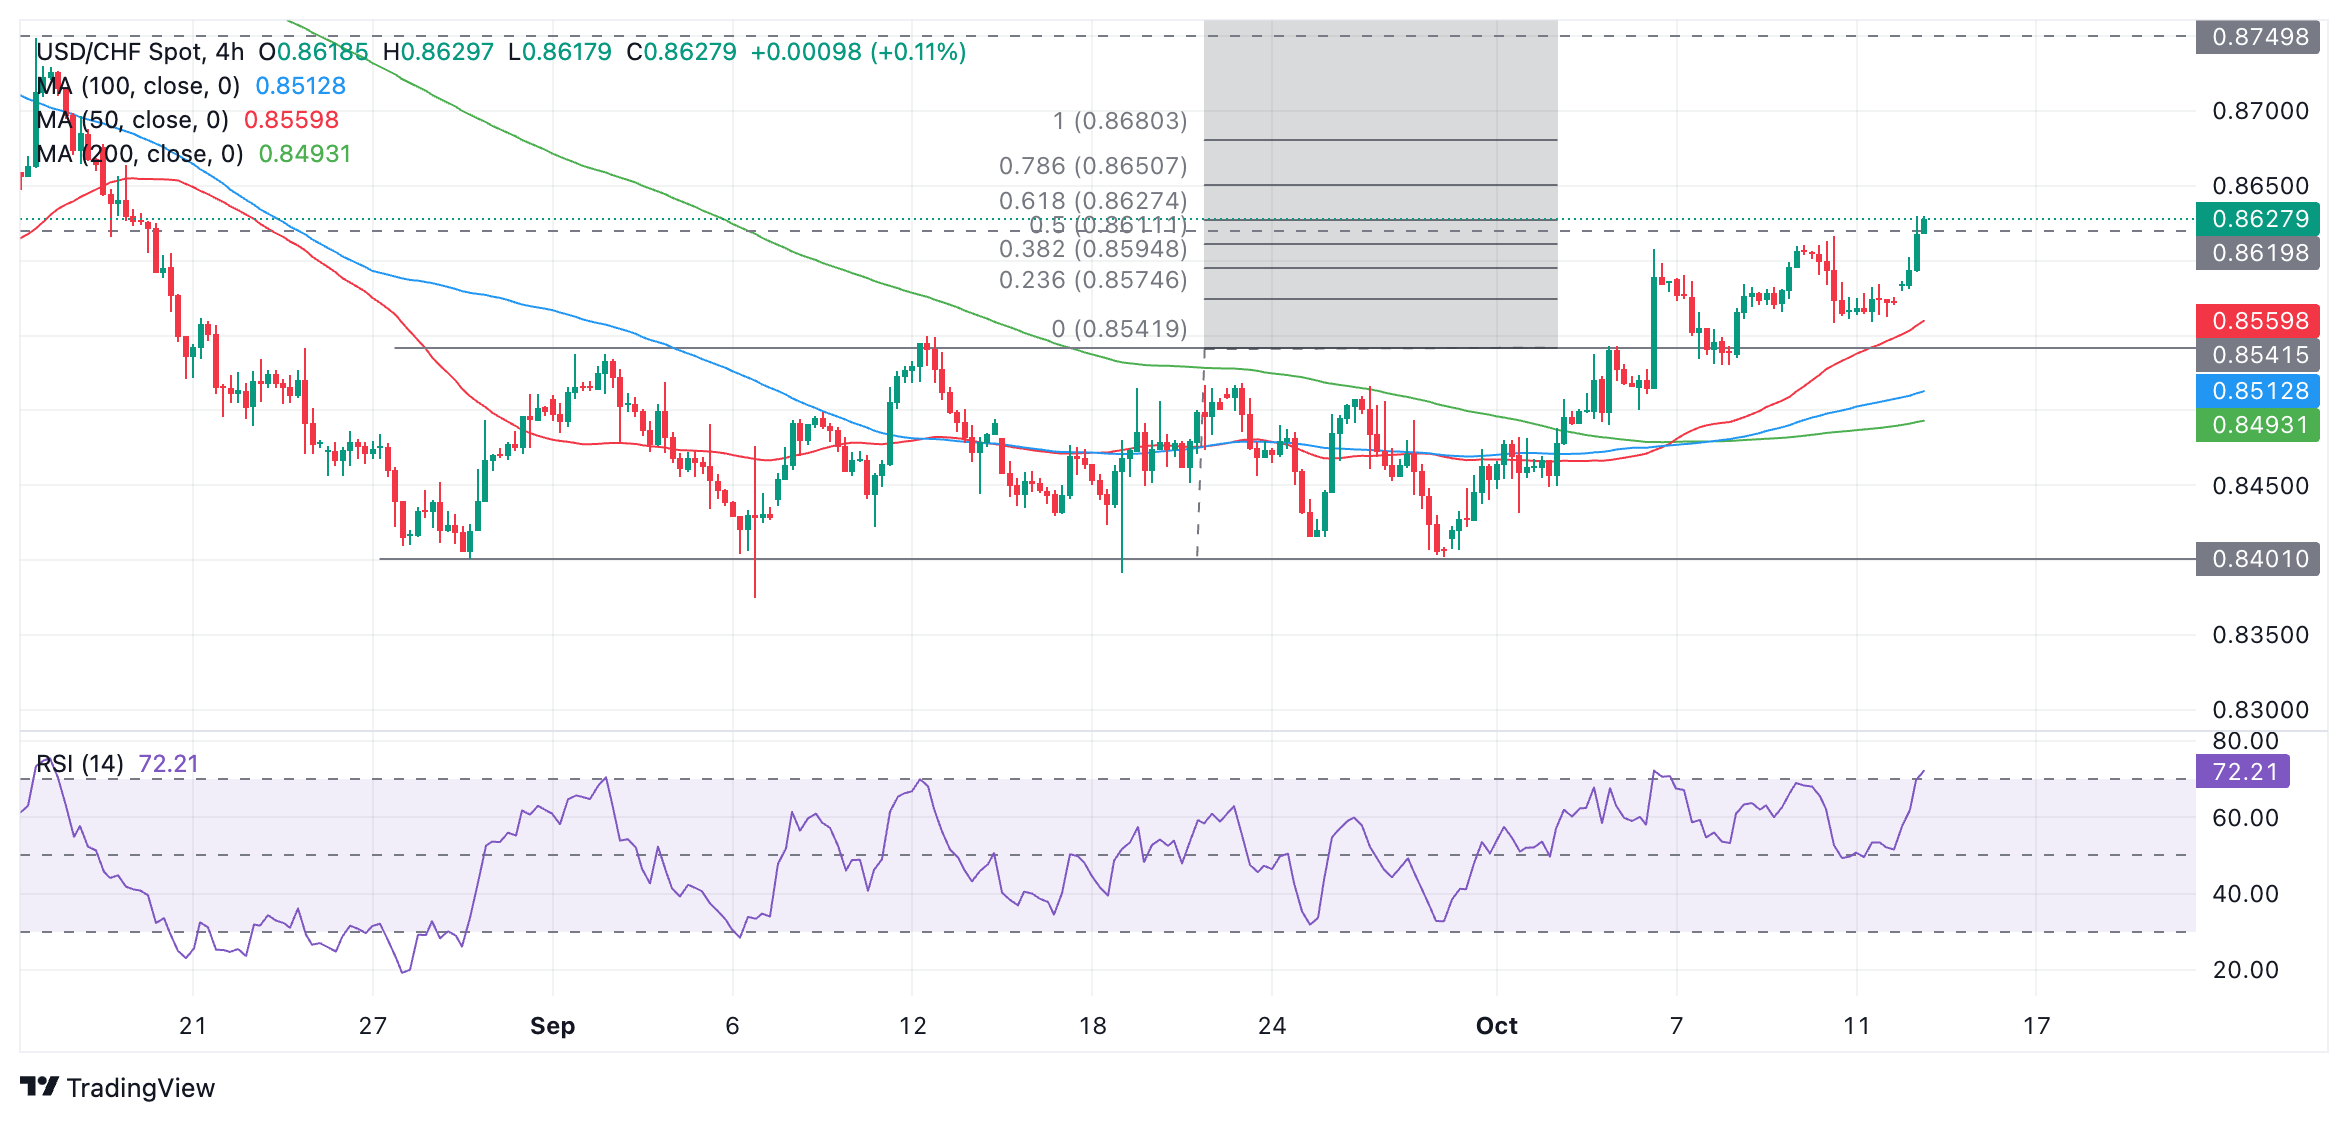
USD/CHF could continue rising until it reaches the next target to the upside which was generated when it broke out of the range. This target lies at 0.8680, the 100% Fibonacci (Fib) extrapolation of the height of the range higher. It has already met the conservative target at 0.8627, the 61.8% Fib level.
The Relative Strength Index (RSI) is in overbought territory and if it remains there on a closing basis it will advise traders not to add to their existing long positions.
A chart gap opened on Monday morning and there is a risk the market could pull back to fill this gap at some point.
The ECB is likely to cut its policy rates again on Thursday – just five weeks after the last rate cut in mid-September. There are four arguments against this move, Commerzbank’s Chief Economist Dr. Jörg Krämer notes.
ECB rate cut is too risky
“Firstly, core inflation has fallen partly because the fall in energy prices has had a knock-on effect on core consumer prices via transport services, for example, indirectly lowering them. This is what we saw last autumn. Secondly, the rise in collectively agreed wages in the eurozone has accelerated further in the meantime and levelled off at a high 4.5 per cent, which is not compatible with the ECB's inflation target of 2%. Contrary to the ECB's claims, the rise in wages has not yet slowed.”
Thirdly, many companies in the eurozone are still suffering from a shortage of labour. Around a fifth of companies feel that this is hampering their business – much more than the average of the past twenty years. If the ECB lowers interest rates in this situation, it will fuel companies' demand for investment and exacerbate labour market shortages in the medium term. This is likely to increase the bargaining power of employees again, which would lead to high wage settlements and inflation rates.
Fourthly, caution is generally advisable after phases of high inflation. Companies and citizens will remember the inflation shock for a long time to come; long-term inflation expectations are no longer as firmly anchored at 2% as they were in the years before coronavirus. The ECB should therefore stick to a restrictive monetary policy for longer than usual. Otherwise, the fight against inflation risks failing again, as it did after the oil price shocks of the 1970s, because the central bank eases its policy too early.
FX market phase where the Polish zloty is outperforming the Hungarian forint continues, for good or bad reasons. In this phase, news on the zloty tends to be interpreted more favourably by the market consensus, whether or not this be fundamentally justified, while positive news on the forint tends to be underplayed, Commerzbank’s FX analyst Tatha Ghose notes.
Ongoing momentum of zloty outperformance continues
“Last week, we wrote in our preview that both the Czech Republic and Hungary were expected to display dovish inflation developments – but that any downward surprise from Hungary would make more difference because inflation there had been stubborn so far. We pretty much got those results on Thursday: Czech CPI dropped to target (maybe not on the misleading year-on-year basis, but it did so on seasonally-adjusted month-on-month basis); Hungary did not quite arrive there yet, though interestingly, the (misleading) year-on-year inflation rate hit the 3% target.”
“We maintain that while the Polish and Czech inflation trends have already been closer to target, the Hungarian data came as the most positive surprise this month. Hungary’s central bank, however, has decided to take it cautiously and signalled that a rate cut is unlikely at the forthcoming 22 October meeting. Probably the forint’s depreciation had more to do with this than inflation. Whatever the reason, this makes it doubly HUF-positive.”
“On the other hand, Poland’s central bank (NBP) has signalled a dovish turn at its recent press conference. Those who had viewed NBP’s artificial hawkishness in prior months as a source of support for PLN should now, at least, see this development as less supportive. In this sense, the past week’s developments should have favoured HUF over PLN. But, in practice, the ongoing momentum of zloty outperformance continued.”
This week's release of UK jobs and especially inflation data on Wednesday could have a decent say in the pricing of the Bank of England's easing cycle and sterling, ING’s FX analyst Chris Turner notes.
GBP/USD can press the 1.3000 area
“UK rates have been dragged higher by those in the US over the last few weeks – even though BoE Governor Andrew Bailey has said the Bank could become a 'bit more activist' should inflation data allow it. Inflation data may well allow it this week if the UK September services CPI drops back to 5.2% year-on-year as consensus expects.”
“This means that EUR/GBP could hold support at 0.8350 this week and retest the recent high at 0.8435. GBP/USD could press the 1.3000 area. We doubt that today's UK investment summit will have a major impact on sterling, despite the bullish headlines. Instead, investors are waiting to see what UK Chancellor Rachel Reeves does with her first budget on 30 October.”
- Crude Oil starts the week on the backfoot, sinking further below $75.00.
- Traders see OPEC revising their growth forecasts to the downside for a third time.
- The US Dollar Index orbits around 103.00 and is looking for a catalyst to move higher.
Crude Oil trades on the back foot on Monday following the release of the monthly Organization of the Petroleum Exporting Countries (OPEC) report. Events over the weekend remained rather calm, with no real big military movements from Israel in Lebanon. However, Iran confirmed this Monday that communication with the United States (US) via Oman has stopped, Bloomberg reports.
The US Dollar Index (DXY), which tracks the performance of the Greenback against six other currencies, is orbiting around 103.00 and is looking to advance. The question is whether or how it will do that with a very light US calendar this week. All eyes will then rather be on the European Central Bank decision on Thursday as the main driver to push the US Dollar, possibly higher beyond 103.00.
At the time of writing, Crude Oil (WTI) trades at $7.55 and Brent Crude at $77.35.
Oil news and market movers: Strike three for OPEC
- The US broadened the scope of its sanctions on Iran’s oil and gas sectors in response to a ballistic missile attack on Israel, Bloomberg reports.
- The monthly OPEC report sees OPEC revising down its demand growth forecast for a third time in a row, Reuters reports.
- China reports more sluggish demand, with Crude Oil Imports falling 2.8% year-to-date in September, Bloomberg reports.
- China failed to convince markets with no real fresh details during the announcement of its stimulus package to boost its economy. Markets dipped lower on the back of it, with Oil already sliding lower by 2% in early Asian trading, Bloomberg reported.
Oil Technical Analysis: OPEC delivers another blow
Crude Oil is receiving a big blow from OPEC, with the conglomerate announcing another downward revision for the third time in a row. China still looks to be struggling and unable to kickstart its economy again. With that in the equation, another downward revision could be made for the next month.
Last week’s false break is to be ignored, as the move was fully paired back. It means that current pivotal levels on the upside are still valid: the red descending trendline in the chart below, and the 100-day Simple Moving Average (SMA) at $75.56 just hovering above it, makes that region very difficult to surpass. Once holding above that zone, the 200-day SMA at $77.17 should refute any further upticks as it did in early trading on Tuesday.
On the downside, there is a similar remark as for the upside with this false break. The rule of thumb is that if there has not been a daily close below the level, it still acts as a support. First is the 55-day SMA at $72.49, which acts as a potential first line of defence. A bit further down, $71.46 (the February 5 low) comes into play as second support before looking back to the $70.00 big figure and $67.11 as ultimate support for traders to buy the dip.
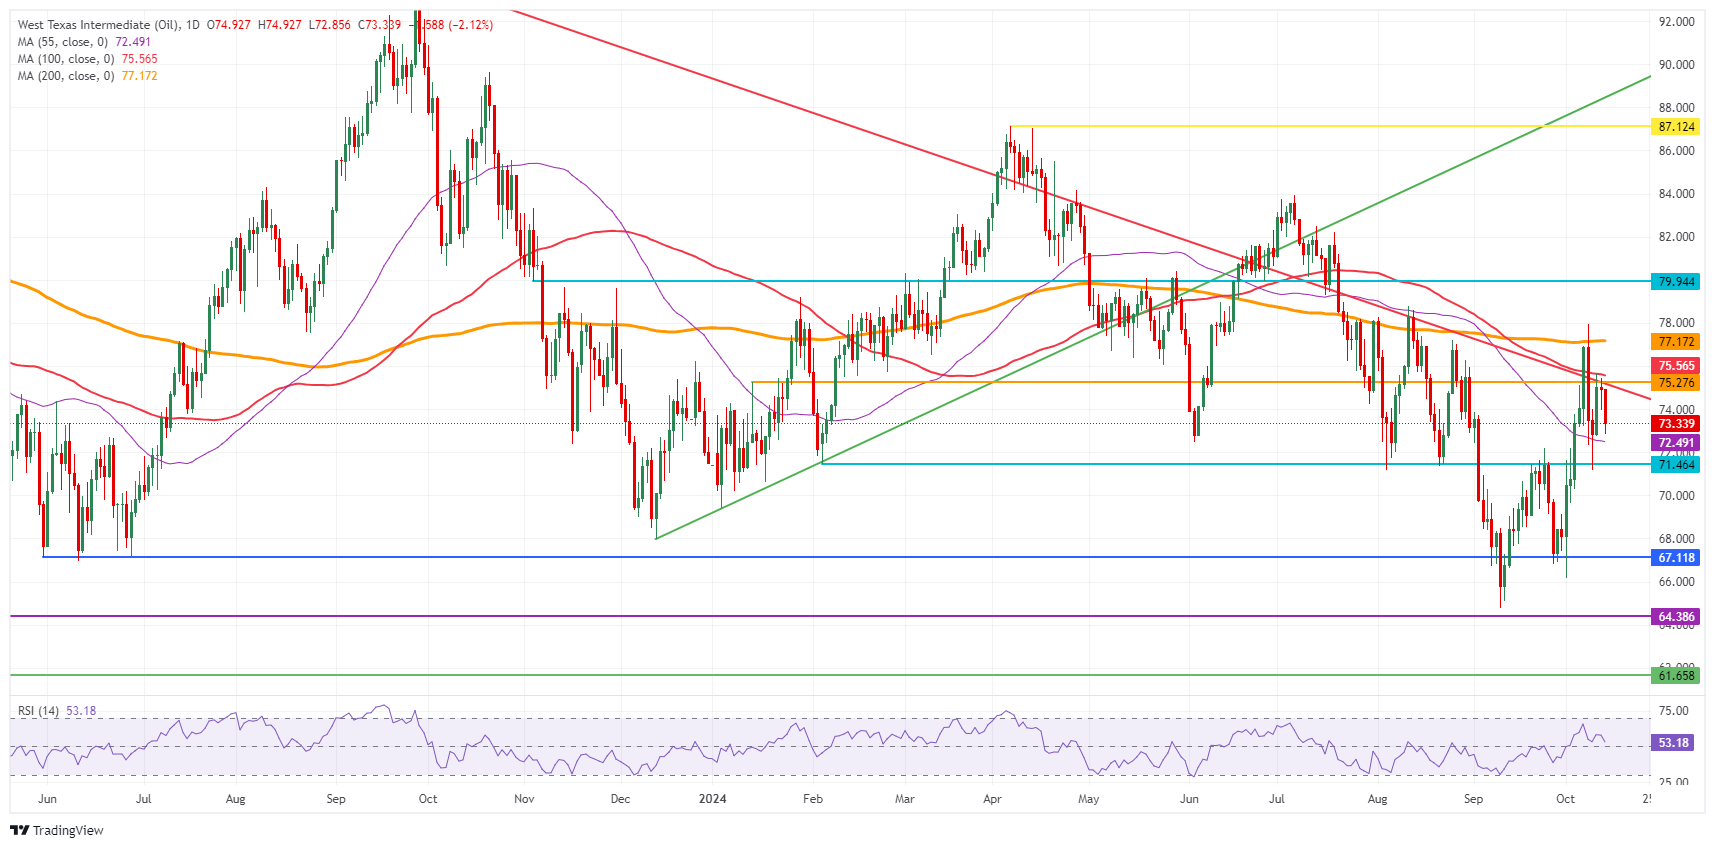
US WTI Crude Oil: Daily Chart
WTI Oil FAQs
WTI Oil is a type of Crude Oil sold on international markets. The WTI stands for West Texas Intermediate, one of three major types including Brent and Dubai Crude. WTI is also referred to as “light” and “sweet” because of its relatively low gravity and sulfur content respectively. It is considered a high quality Oil that is easily refined. It is sourced in the United States and distributed via the Cushing hub, which is considered “The Pipeline Crossroads of the World”. It is a benchmark for the Oil market and WTI price is frequently quoted in the media.
Like all assets, supply and demand are the key drivers of WTI Oil price. As such, global growth can be a driver of increased demand and vice versa for weak global growth. Political instability, wars, and sanctions can disrupt supply and impact prices. The decisions of OPEC, a group of major Oil-producing countries, is another key driver of price. The value of the US Dollar influences the price of WTI Crude Oil, since Oil is predominantly traded in US Dollars, thus a weaker US Dollar can make Oil more affordable and vice versa.
The weekly Oil inventory reports published by the American Petroleum Institute (API) and the Energy Information Agency (EIA) impact the price of WTI Oil. Changes in inventories reflect fluctuating supply and demand. If the data shows a drop in inventories it can indicate increased demand, pushing up Oil price. Higher inventories can reflect increased supply, pushing down prices. API’s report is published every Tuesday and EIA’s the day after. Their results are usually similar, falling within 1% of each other 75% of the time. The EIA data is considered more reliable, since it is a government agency.
OPEC (Organization of the Petroleum Exporting Countries) is a group of 12 Oil-producing nations who collectively decide production quotas for member countries at twice-yearly meetings. Their decisions often impact WTI Oil prices. When OPEC decides to lower quotas, it can tighten supply, pushing up Oil prices. When OPEC increases production, it has the opposite effect. OPEC+ refers to an expanded group that includes ten extra non-OPEC members, the most notable of which is Russia.
Last week, markets wondered whether the surprise in the US payrolls report could really be taken as an indication of a similar surprise in the Canadian labour market, Commerzbank’s FX analyst Michael Pfister notes.
Size of the next rate cut depends on Tuesday's inflation figures
“Although I thought a direct link was unlikely at the time, the Canadian labour market delivered a positive surprise on Friday: job growth was higher than expected (and, even more positively, was driven by full-time jobs) and the unemployment rate unexpectedly fell. At the same time, wage growth fell more than expected - another sign that inflationary pressures are likely to ease.”
“But will this be enough to dissuade the Bank of Canada (BoC) from a bigger 50bp cut next week? The market still seems to have its doubts, as interest rate expectations have barely corrected. And we also remain unconvinced. First of all, this was just one labour market report and we will have to see in the coming months whether the Canadian labour market is recovering in a sustainable way. Moreover, the participation rate fell in September, which may have partially distorted the decline in the unemployment rate.”
“More likely, the size of the next rate cut will depend more on tomorrow's inflation figures. Recently we have seen a sustained decline in inflation to the middle of the target range of 1-3%, and there are even fears that it will soon fall below the 2% midpoint. If this is the case tomorrow, there is a strong case for a larger rate cut of 50 basis points next week.”
After a grim couple of months for eurozone data, the interest rate market now prices the European Central Bank's deposit rate being cut to 2.00% next summer, ING’s FX analyst Chris Turner notes.
EUR/USD can hold support in the 1.0850/1.0900 area
“If anything, there is a slight risk that the ECB under-delivers on the easing cycle, and we do not expect the two-year EUR:USD swap differential to widen much further from here; we would not chase EUR/USD sub 1.0900 from this point unless, for instance, we saw a sharp spike in oil prices.”
“In the bigger picture, we see EUR/USD trading just above the middle of a 1.0550-1.1150 two-year trading range. November and especially December are typically more bearish months for the dollar, but the outcome of the US presidential election on 5 November will set the tone.”
“For the time being, we suspect EUR/USD can hold support in the 1.0850/1.0900 area and could get a lift if Thursday's ECB meeting isn't quite as dovish as the market is now pricing.”
The US Dollar (USD) is likely to trade with an upward bias; as upward momentum is only beginning to build, any advance is unlikely to threaten the major resistance at 7.1200. In the longer run, current price movements are likely part of a range trading phase; USD is likely to trade between 7.0300 and 7.1200, UOB Group’s FC analysts Quek Ser Leang and Lee Sue Ann note.
USD unlikely to threaten the major resistance at 7.1200
24-HOUR VIEW: “USD traded between 7.0665 and 7.0888 last Friday, narrower than our expected sideways trading range of 7.0650/7.0920. USD closed at 7.0684, but it opened on a firm note today. Upward is beginning to build, and today, USD is likely to trade with an upward bias. As momentum is only beginning to build, any advance is unlikely to threaten the major resistance at 7.1200 (there is another resistance level at 7.1040. Support levels are at 7.0780 and 7.0660.”
1-3 WEEKS VIEW: “Our latest narrative was from last Wednesday (09 Oct, spot at 7.0750), wherein ‘the current price movements are likely part of a range trading phase,’ and ‘for the time being, USD is expected to trade between 7.0300 and 7.1200.’ While there has been a slight increase in short-term upward momentum, we continue to hold the same view for now.”
Casting around the globe to identify key FX drivers, we note the following: Saturday's China fiscal stimulus measures lack detail, oil is steady as markets await Israel's retaliation against Iran, and equity markets remain generally supported following strong US bank earnings released on Friday and expectations of positive announcements in the chip sector this week, ING’s Chris Turner notes.
DXY to stay bid in a 102.70-103.20 range
“The US Dollar (USD) is holding recent gains as investors now price in less than 50bp of Federal Reserve rate cuts this year. We doubt short-dated US rates will move much higher from here, even though Fed hawk Raphael Bostic has floated the idea of the central bank skipping a meeting in its rate-cutting cycle. What impact will events have on the above this week? US data is second tier until Thursday's release of US September retail sales.”
“Consensus expects the retail sales control group to rise a healthy 0.4% month-on-month, supporting the view that US growth is continuing. James Smith notes in his Think Ahead column that US growth was running at a very respectable 3.2% quarter-on-quarter annualised in the third quarter. We do have a few Fed speakers this week who could firm up the idea of two 25bp Fed cuts this year – which might prove very slightly dollar negative given current market pricing. The Fed's Christopher Waller speaks on the economic outlook at 9:00pm CET.”
“On a quiet news day, we also see a Financial Times interview with Donald Trump's potential treasury secretary, Scott Bessent. He highlights that, if elected, Donald Trump would not try to weaken the dollar for trade gains. This is probably in line with most market thinking now – i.e., despite what Donald Trump might say about the dollar, his policies look positive for the currency in any case. Expect a quiet day of trading given that the US Treasury market is closed for Columbus Day. DXY is set to stay bid in a 102.70-103.20 range.”
The US Dollar (USD) is expected to edge higher; due to the mild momentum, any advance is likely limited to a test of 149.70. In the longer run, although momentum has not increased much; further USD strength seems likely. Levels to watch are 150.05 and 151.00, UOB Group’s FC analysts Quek Ser Leang and Lee Sue Ann note.
Levels to watch are 150.05 and 151.00
24-HOUR VIEW: “We indicated last Friday that USD ‘appears to have moved into a consolidation,’ and we expected it to trade in a 148.10//149.40 range. USD subsequently traded between 148.39 and 149.28, closing at 149.13 (+0.38%). There has been a slight increase upward momentum, and today, we expect USD to edge higher. Due to the mild momentum, any advance is likely limited to a test of 149.70. The major resistance at 150.05 is unlikely to come into view. Support is at 148.95; a breach of 148.60 would indicate that the current mild upward pressure has faded.”
1-3 WEEKS VIEW: “We have been expecting a higher USD since early this month (as annotated in the chart below). In our most recent narrative from last Thursday (10 Oct, spot at 149.20), we highlighted that ‘although upward momentum has not increased much, further USD strength seems likely, and the levels to watch are at 150.05 and 151.00.’ We continue to hold the same view provided that 148.00 (‘strong support’ level previously at 147.50) is not breached.”
Today, the Monetary Authority of Singapore’s decision to keep all three parameters of the SGD NEER policy band unchanged was largely expected, DBS’ FX analyst Philip Wee notes.
USD/SGD to trade lower on a lower DXY range
“The negative output gap is expected to close in 2H24 from this year’s GDP growth coming around the upper end of the official 2-3% forecast range. Advance GDP growth expanded at a better-than-expected 4.1% YoY in 3Q24 vs. the consensus for a rise to 3.8% from 2.8% in 2Q24.”
“The MAS forecasted core inflation to decline from 2.3% in July-August to 2% by the end of 2024 before entering a 1.5-2.5% range in 2025. USD/SGD should continue to take its cue from the currencies of its major trading partners.”
“Our view remains that USD/SGD will trade lower in a 1.25-1.30 range on a lower DXY range of 95-100 driven by another 200 bps of Fed cuts to 3% from now to next year.”
The New Zealand Dollar (NZD) is likely to consolidate in a range of 0.6065/0.6115. In the longer run, oversold weakness has not stabilised, but NZD must break clearly below 0.6050 before further sustained decline is likely, UOB Group’s FC analysts Quek Ser Leang and Lee Sue Ann note.
To consolidate in a range of 0.6065/0.6115
24-HOUR VIEW: “Last Friday, we were of the view that “further consolidation seems likely today, even though the slightly firmed underlying tone suggests a higher range of 0.6070/0.6120.” Our view turned out to be correct, as NZD traded between 0.6072 and 0.6119. We continue to expect NZD to consolidate, but this time around, the slightly soft underlying tone suggests a lower range of 0.6065/0.6115.”
1-3 WEEKS VIEW: “There is not much to add to our update from last Thursday (10 Oct, spot at 0.6070). As indicated, while the oversold weakness has not stabilised, NZD “must break and remain below 0.6050 before further sustained decline is likely.” The probability of NZD breaking clearly below 0.6050 will remain intact as long as 0.6145 (no change in ‘strong resistance’ level) is not breached. Looking ahead, if NZD were to break 0.6050, the next level to watch is 0.6005.”
- Gold rises on haven demand after Chinese military drills in the strait of Taiwan create an international incident.
- China’s fiscal stimulus also supports Gold as the country is the largest market for the yellow metal.
- Technically, XAU/USD reaches a key resistance level at the top of its multi-week range.
Gold (XAU/USD) recovers to trade back in the $2,660s on Monday amid rising safe-haven demand after saber-rattling by the Chinese People's Liberation Army (PLA) in the strait of Taiwan. This prompted a spokesperson from the US Department of State to say on Monday, that they were “seriously concerned” with the PLA’s activities in around Taiwan.
Gold rises on China factor
Gold may also be gaining due to a more positive outlook for the Chinese economy as the country is the largest market for the precious metal. On Saturday, Chinese Finance Minister Lan Fo’an announced a much-anticipated fiscal stimulus programme. Although no figures were given, he said Beijing would help regional governments tackle their debt problems with a large-scale local government debt swap.
Lan further suggested the government’s stimulus package could mark a multi-year turning point in China's “fiscal policy framework”.
More central bank rate cuts in the pipeline
A further driver for Gold is the continued downward projected path of interest rates globally. The European Central Bank (ECB) will conclude its October meeting on Thursday and most analysts expect the bank to announce another 25 basis point (bps) (0.25%) rate cut – their second cut in a row. Such a move would signal a significant “gear change up” in terms of the pace and timing of the ECB’s easing cycle.
In the US, meanwhile, investors expect a 25 bps rate cut from the Federal Reserve (Fed) in November after US Producer Price Index (PPI) inflation data on Friday showed headline PPI was unchanged on a monthly basis in September – missing expectations of a 0.1% increase and the prior month’s 0.2% reading. Core PPI inflation, which excludes volatile food and energy prices, slowed to 0.2% from 0.3% in August.
Annual readings, however, resulted mixed, as PPI decelerated while core PPI rose by 2.8%, above the prior month’s 2.6%. Although mixed annual performance, the monthly readings weighed, as did the preliminary US Michigan Consumer Sentiment Index for October, which fell below September’s reading and analysts’ estimates.
The CME FedWatch Tool is showing the markets are now pricing in around a 90% chance of a 25 bps Fed rate cut – up from 83% before the PPI data.
Technical Analysis: Gold on the rise
Gold appears to have completed a correction at the October 10 lows and is rising again.
It has reached a resistance level at around $2,670 from a row of previous highs including the October 1 and 4 highs (dashed line). A close above would probably lead to a continuation up to the $2,685 all-time high.
XAU/USD 4-hour Chart
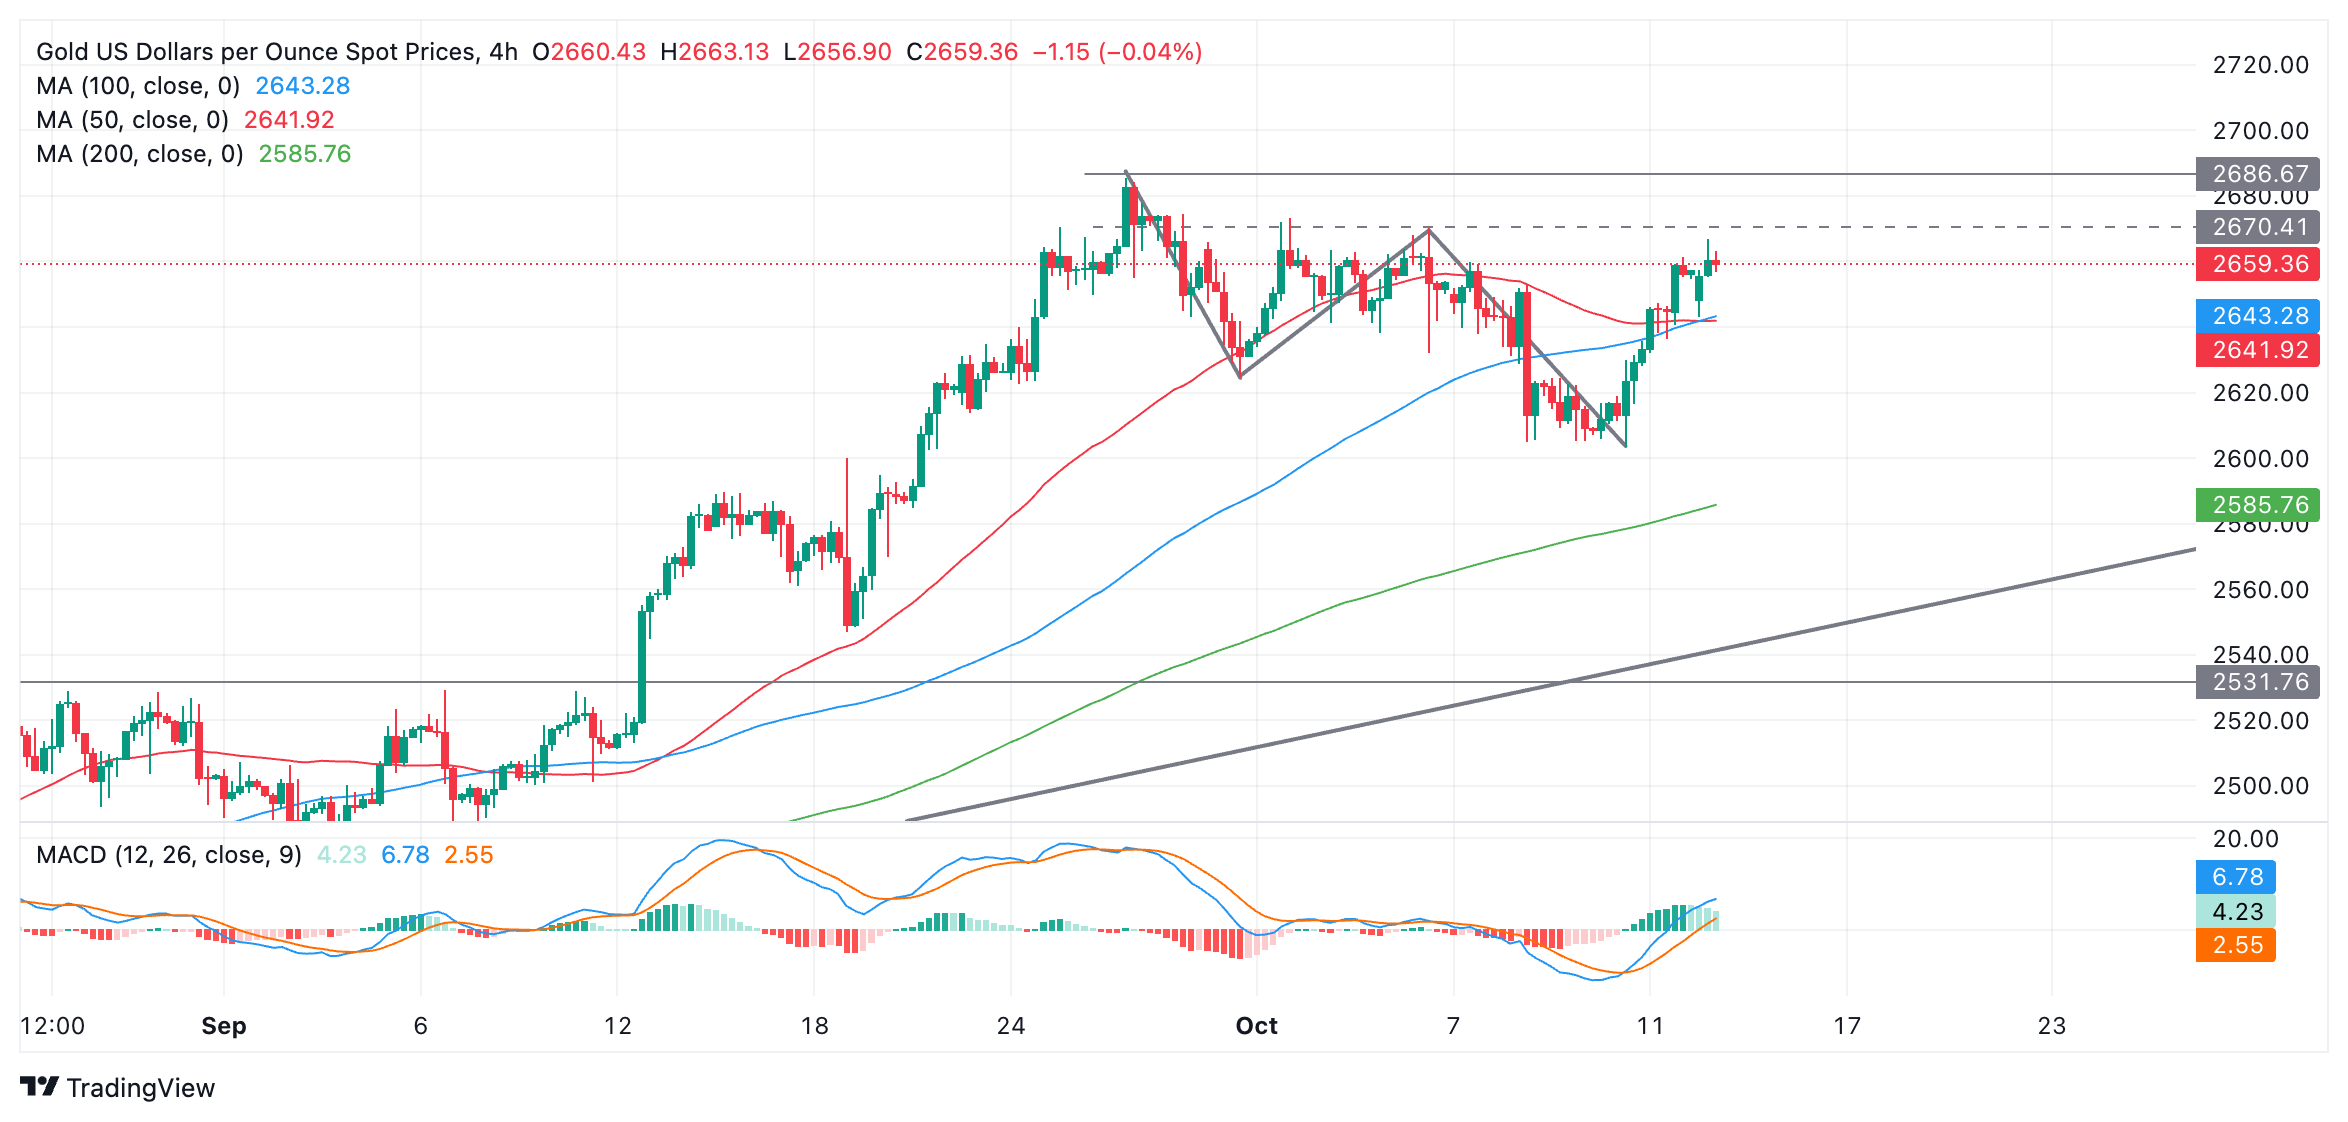
The Moving Average Convergence Divergence (MACD) has risen above the zero line and is in positive territory, which is a mildly bullish indication.
There is also a chance the pair could bounce off resistance and start pulling back down into its familiar range between $2,620 and $2,670. This would extend the range-bound move seen since late September.
Gold’s medium and long-term trends are also bullish. If one of these longer-term cycles resumes, it could, in theory, push the asset to even higher highs.
Economic Indicator
ECB Main Refinancing Operations Rate
One of the three key interest rates set by the European Central Bank (ECB), the main refinancing operations rate is the interest rate the ECB charges to banks for one-week long loans. It is announced by the European Central Bank at its eight scheduled annual meetings. If the ECB expects inflation to rise, it will increase its interest rates to bring it back down to its 2% target. This tends to be bullish for the Euro (EUR), since it attracts more foreign capital inflows. Likewise, if the ECB sees inflation falling it may cut the main refinancing operations rate to encourage banks to borrow and lend more, in the hope of driving economic growth. This tends to weaken the Euro as it reduces its attractiveness as a place for investors to park capital.
Read more.Next release: Thu Oct 17, 2024 12:15
Frequency: Irregular
Consensus: 3.4%
Previous: 3.65%
Source: European Central Bank
USD/JPY has a downside bias if it consolidates in a 145-150 range, DBS’ FX analyst Philip Wee notes.
Ishiba has affirms the Bank of Japan’s independence
“Japan Prime Minister Shigeru Ishiba has affirmed the Bank of Japan’s independence, looking to correct his earlier remark in early October about opposing future interest rate hikes. Heading into the snap election on October 27, the Ishiba government probably realized the critical role played by the BOJ’s hikes in addressing the JPY’s weakness, which is responsible for the higher cost of living besetting voters.
"The next BOJ meeting is scheduled on October 31. During its next policy meeting on October 30-31, the BOJ should reaffirm its framework to hike rates and reduce JGB purchases if the economy performs according to its projections."
"On October 18, consensus sees National CPI inflation excluding fresh food falling to 2.3% YoY in September from 2.8% in August, below the BOJ’s median forecast of 2.5% for Fiscal 2024 but above the 2.1% projection for Fiscal 2025. The 2Y and 10Y bond differentials between USTs and JGBs suggest that USD/JPY should be lower around 138-141."
- The US Dollar trades slightly up with Columbus Day keeping the bond market closed in the US.
- The economic calendar ahead for this week is light.
- The US Dollar Index orbits around 103.00 and could still move either way.
The US Dollar (USD) edges up slightly at the start of the week with several parts of the US markets closed for Columbus Day. Despite the bank holiday, three Federal Reserve (Fed) members are due to speak. Meanwhile, the additional stimulus package from the Chinese government did not trigger any big moves in markets.
The economic calendar is thus empty due to the Columbus Day bank holiday in the US. About Fedspeak, traders will need to watch out for comments from Federal Reserve Governor Christopher Waller, who has a track record of leaving market-moving comments.
Daily digest market movers: A very light calendar ahead
- Due to Columbus Day, the bond market is closed in the US. Equity Futures markets are open and trading.
- At 13:00 GMT, Federal Reserve Bank of Minneapolis President Neel Kashkari participates in a panel discussion about fiscal deficits, monetary policy and inflation at the Central Bank of Argentina's Money and Banking Conference in Buenos Aires. Later at 21:00 GMT, Kashkari will speak again about the current state of the US economy at the Department of Economics of Torcuato di Tella University.
- Around 19:00 GMT, Federal Reserve Governor Christopher Waller speaks about the US economic outlook at a conference titled "A 50-Year Retrospective on the Shadow Open Market Committee and Its Role in Monetary Policy" in Stanford, California.
- Equities are looking for direction this Monday with no real outliers to report. Europe is trading marginally in the green, while US futures are flat.
- The CME Fed rate policy expectation for the meeting on November 7 stands at 88.2% for a 25 basis point rate cut, while 11.8% is pricing in no rate cut. Chances for a 50 bps rate cut have been fully priced out.
- The US 10-year benchmark rate is not trading this Monday and closed on Friday at 4.10%.
US Dollar Index Technical Analysis: Pivotal moment this week
The US Dollar Index (DXY) is orbiting around 103.00 and looking for a chance to go higher. The question on the table is whether, with a very light US calendar this week, there will be any catalyst big enough to elevate the DXY to the next level. If the Fed speakers can not do it on Monday, it looks questionable if the US Dollar Index will be able to advance any further for now.
The psychological 103.00 is the first level to tackle on the upside. Further up, the chart identifies 103.18 as the very final resistance level for this week. Once above there, a very choppy area emerges, with the 100-day Simple Moving Average (SMA) at 103.24, the 200-day SMA at 103.77, and the pivotal 103.99-104.00 levels in play.
On the downside, the 55-day SMA at 101.88 is the first line of defence, backed by the 102.00 round level and the pivotal 101.90 as support to catch any bearish pressure and trigger a bounce. If that level does not work out, 100.62 also acts as support. Further down, a test of the year-to-date low of 100.16 should take place before more downside. Finally, and that means giving up the big 100.00 level, the July 14, 2023, low at 99.58 comes into play.
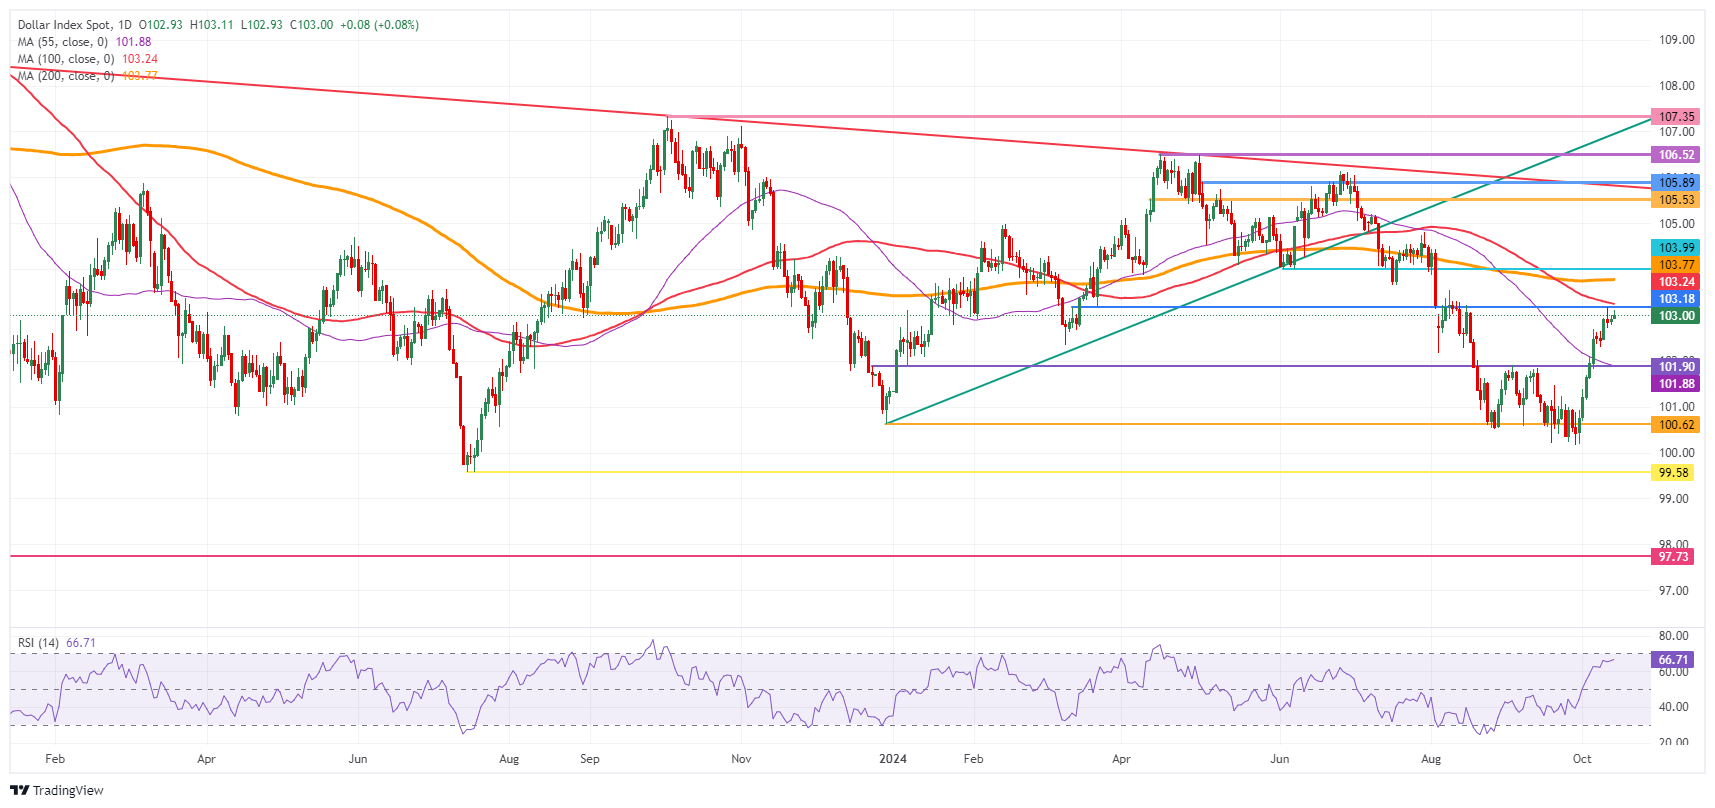
US Dollar Index: Daily Chart
US Dollar FAQs
The US Dollar (USD) is the official currency of the United States of America, and the ‘de facto’ currency of a significant number of other countries where it is found in circulation alongside local notes. It is the most heavily traded currency in the world, accounting for over 88% of all global foreign exchange turnover, or an average of $6.6 trillion in transactions per day, according to data from 2022. Following the second world war, the USD took over from the British Pound as the world’s reserve currency. For most of its history, the US Dollar was backed by Gold, until the Bretton Woods Agreement in 1971 when the Gold Standard went away.
The most important single factor impacting on the value of the US Dollar is monetary policy, which is shaped by the Federal Reserve (Fed). The Fed has two mandates: to achieve price stability (control inflation) and foster full employment. Its primary tool to achieve these two goals is by adjusting interest rates. When prices are rising too quickly and inflation is above the Fed’s 2% target, the Fed will raise rates, which helps the USD value. When inflation falls below 2% or the Unemployment Rate is too high, the Fed may lower interest rates, which weighs on the Greenback.
In extreme situations, the Federal Reserve can also print more Dollars and enact quantitative easing (QE). QE is the process by which the Fed substantially increases the flow of credit in a stuck financial system. It is a non-standard policy measure used when credit has dried up because banks will not lend to each other (out of the fear of counterparty default). It is a last resort when simply lowering interest rates is unlikely to achieve the necessary result. It was the Fed’s weapon of choice to combat the credit crunch that occurred during the Great Financial Crisis in 2008. It involves the Fed printing more Dollars and using them to buy US government bonds predominantly from financial institutions. QE usually leads to a weaker US Dollar.
Quantitative tightening (QT) is the reverse process whereby the Federal Reserve stops buying bonds from financial institutions and does not reinvest the principal from the bonds it holds maturing in new purchases. It is usually positive for the US Dollar.
The Australian Dollar (AUD) is likely to trade in a sideways range of 0.6710/0.6760. In the longer run, bias for AUD remains on the downside; a clear break below 0.6700 would suggest further decline, potentially to 0.6670, UOB Group’s FC analysts Quek Ser Leang and Lee Sue Ann note.
Clear break below 0.6700 to suggest further decline
24-HOUR VIEW: “We indicated last Friday that ‘the price action is likely part of a sideways trading phase, probably in a range of 0.6715/0.6770.’ AUD subsequently traded sideways, albeit in a narrower range of 0.6726/0.6759. The price movements provide no fresh clues, and further sideways trading appears likely. Expected range for today: 0.6710/0.6760.”
1-3 WEEKS VIEW: “Our most recent narrative was from last Thursday (10 Oct, spot at 0.6720), wherein ‘while there has been no significant increase in momentum, the bias for AUD remains on the downside.’ We added, ‘a clear break below 0.6700 would suggest AUD could decline further, potentially to 0.6670.’ AUD subsequently traded in a quiet manner, and we will continue to hold the same view provided that 0.6785 (no change in ‘strong resistance’ level) is not breached.”
- EUR/USD edges down as the US Dollar (USD) strengthens on safe-haven flows.
- China is saber-rattling in the South China Sea around Taiwan.
- Traders sell the Euro ahead of the expected cut at the ECB policy meeting on Thursday.
EUR/USD exchanges hands in the 1.0920s on Monday, marginally down on the day, as the US Dollar (USD) attracts safe-haven flows on the back of increasing geopolitical risks stemming from Taiwan, where the Chinese People's Liberation Army (PLA) is conducting drills. This prompted a spokesperson from the US Department of State to say on Monday that they were “seriously concerned” with the PLA’s activities in the Strait of Taiwan.
EUR/USD comes under pressure ahead of ECB meeting
EUR/USD could also come under increasing pressure as traders sell the Euro (EUR) ahead of the European Central Bank (ECB) meeting on Thursday. Most analysts now expect the bank to announce a further 25 basis point (bps) (0.25%) rate cut at the policy meeting, making it the second cut in a row. This, in turn, is likely to weaken the Euro since falling interest rates attract lower foreign capital inflows.
In September, Eurozone headline inflation declined to 1.8%, falling below the ECB’s 2.0% target for the first time in over three years. This, combined with a slowdown in economic activity, is increasing bets of another rate cut on Thursday. Such a move would signal a significant “gear change up” in terms of the pace and timing of the ECB’s easing cycle.
Trading floors in the US, meanwhile, will likely be mostly empty due to employees being away for the Columbus Day public holiday on Monday. Although some equity trading will still go on, the US bond market will be closed.
Investors expect a 25 bps rate cut from the Federal Reserve (Fed) in November after US Producer Price Index (PPI) inflation data on Friday, which showed headline PPI slowed to 0.0% on a monthly basis in September – missing expectations of 0.1% and the prior month’s 0.2% reading. Core PPI inflation, which excludes volatile food and energy prices, slowed to 0.2% from 0.3% in August. Annual readings, however, resulted mixed, as PPI decelerated while core PPI rose by 2.8%, above the prior month’s 2.6%. Although mixed annual performance, the monthly readings weighed, as did the preliminary US Michigan Consumer Sentiment Index for October, which fell below September’s reading and analysts’ estimates.
The CME FedWatch Tool is showing the markets are now pricing in around a 90% chance of a 25 bps Fed rate cut – up from 83% before the PPI data.
Technical Analysis: EUR/USD bottoms out at 100-day SMA
EUR/USD broke below a key trendline, declined to the level of the 100-day Simple Moving Average (SMA) and bottomed out.
EUR/USD Daily Chart
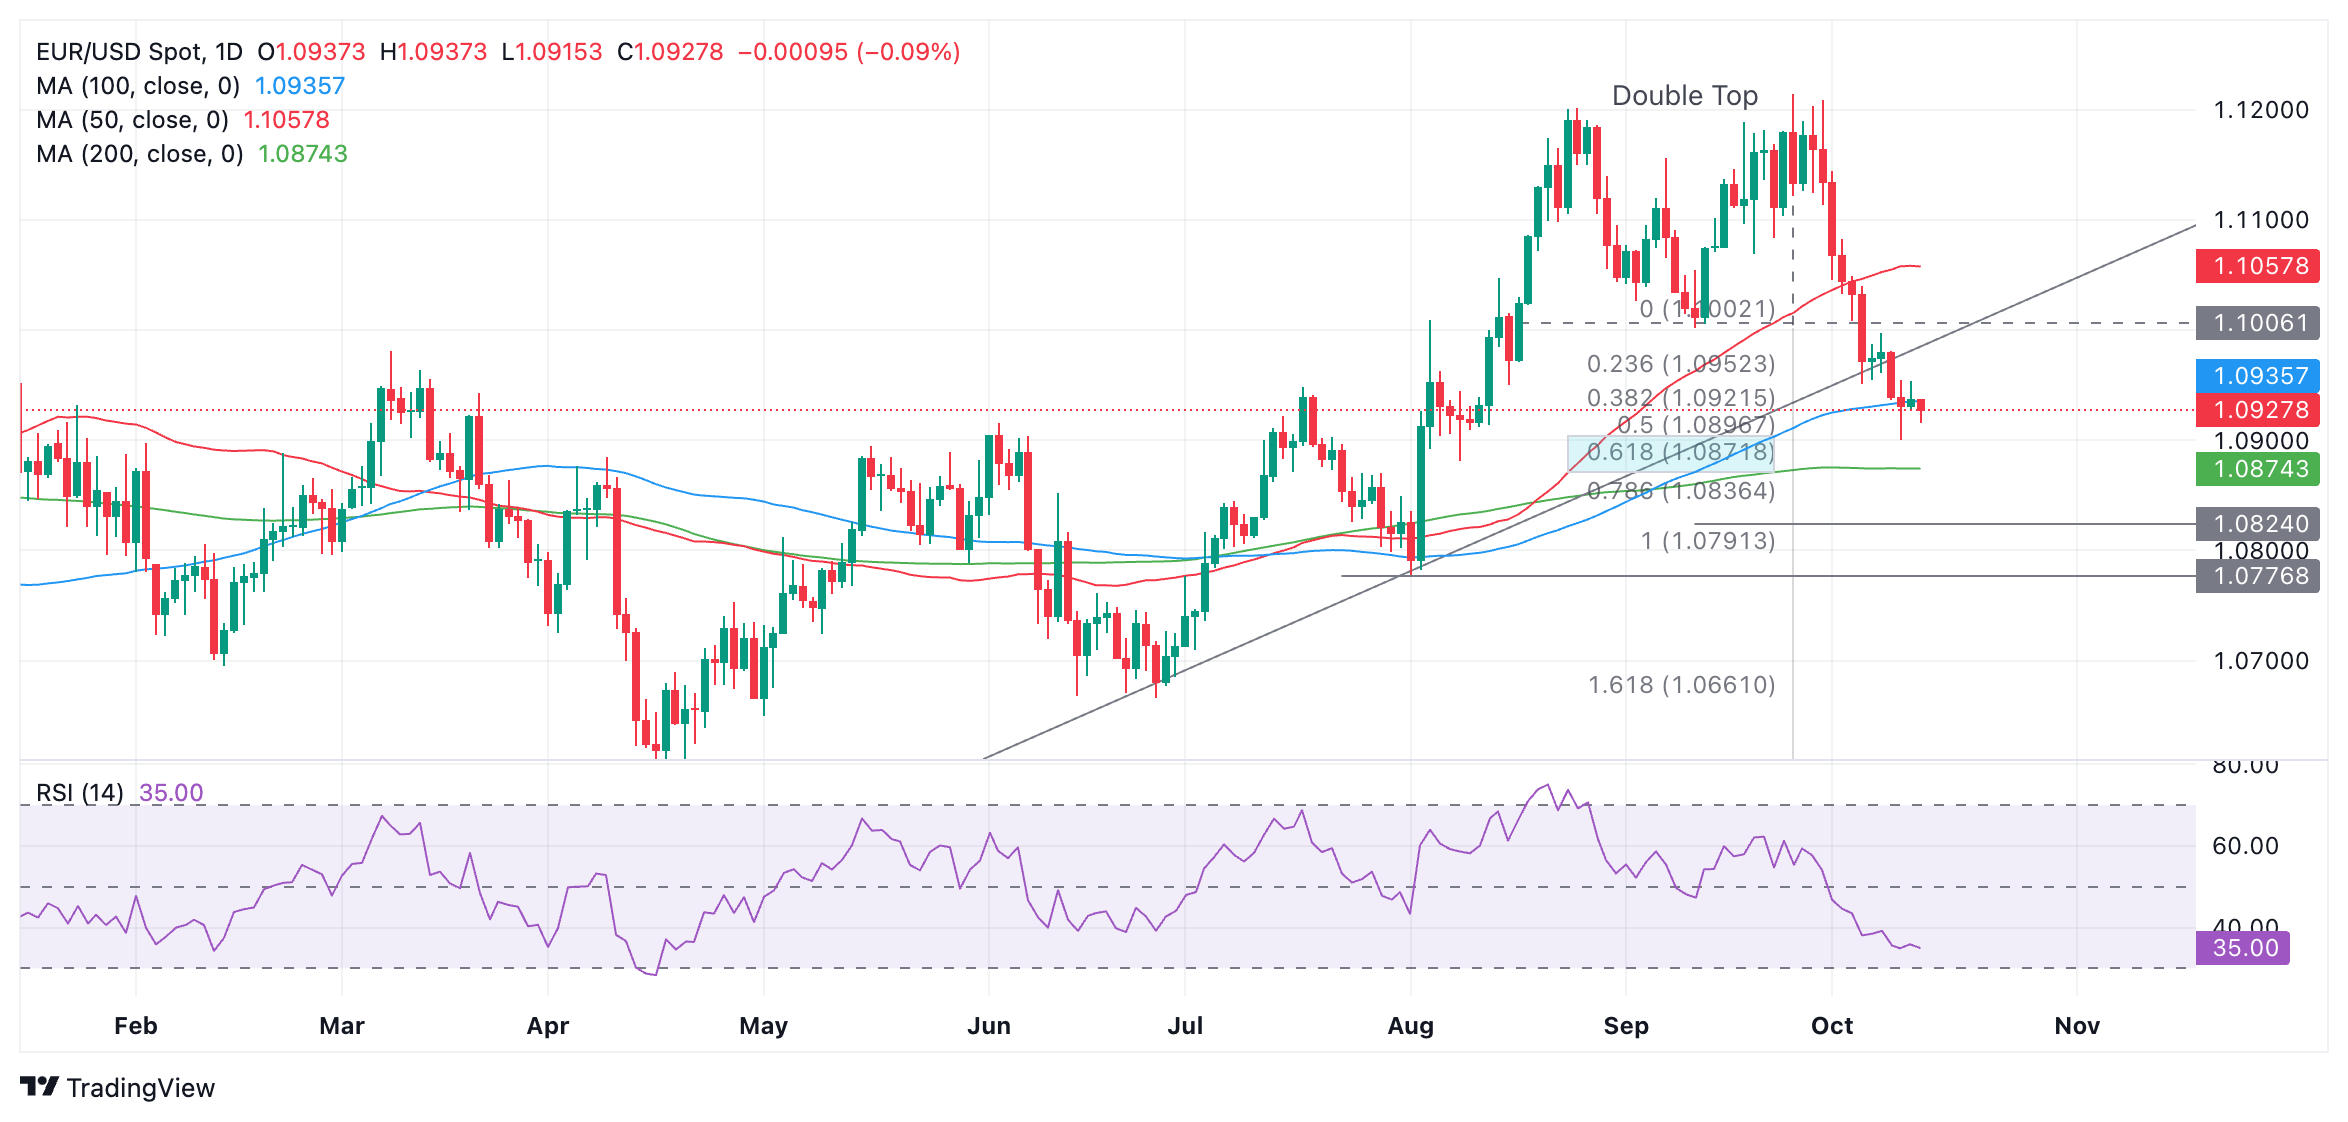
The pair probably formed a Double Top bearish reversal pattern at the August and September highs. If so, the pattern would have been confirmed after the break below the neckline at the September 11 low of 1.1002.
The pattern’s initial downside target lies at 1.0872, the 61.8% Fibonacci extension of the height of the pattern extrapolated lower (blue shaded rectangle on the chart). A further target lies at 1.0874, the 200-day SMA, and 1.0824, the target generated by the trendline break.
Momentum, as measured by the Relative Strength Index (RSI), is mirroring price as it tracks lower, which is a relatively bearish sign.
Economic Indicator
ECB Main Refinancing Operations Rate
One of the three key interest rates set by the European Central Bank (ECB), the main refinancing operations rate is the interest rate the ECB charges to banks for one-week long loans. It is announced by the European Central Bank at its eight scheduled annual meetings. If the ECB expects inflation to rise, it will increase its interest rates to bring it back down to its 2% target. This tends to be bullish for the Euro (EUR), since it attracts more foreign capital inflows. Likewise, if the ECB sees inflation falling it may cut the main refinancing operations rate to encourage banks to borrow and lend more, in the hope of driving economic growth. This tends to weaken the Euro as it reduces its attractiveness as a place for investors to park capital.
Read more.Next release: Thu Oct 17, 2024 12:15
Frequency: Irregular
Consensus: 3.4%
Previous: 3.65%
Source: European Central Bank
We are cautious about the dovish bias for EUR/USD ahead of the 25 bps rate cut expected at the European Central Bank meeting on October 17, DBS’ FX analyst Philip Wee notes.
ECB is not prepared to declare victory on inflation
“Although CPI inflation fell below the 2% target in September, the ECB is not prepared to declare victory on inflation because stubborn services inflation and a tight labour market have kept core inflation high at 2.7% YoY in September.”
“On October 15, worries about the German economy could ease if the ZEW Sentiment Index rises for the first time in four months to 10 (consensus) in October from 3.6 in September.”
“Germany’s industrial production expanded 2.9% MoM in August; consensus had expected a milder recovery to 0.8% after the 2.9% contraction in July.”
The Pound Sterling (GBP) is likely to decline; the major support at 1.3000 is probably out of reach. In the longer run, there has been no further increase in momentum; a breach of 1.3125 would suggest that 1.3000 is out of reach, UOB Group’s FC analysts Quek Ser Leang and Lee Sue Ann note.
A breach of 1.3125 might suggest 1.3000 out of reach
24-HOUR VIEW: “Last Friday, we expected GBP to trade in a range between 1.3020 and 1.3100. However, GBP traded in a tight range of 40 pips (1.3042/1.3082), its smallest one-day range since early Sep. Despite the quiet price action, downward momentum seems to be building. Today, provided that GBP remain below 1.3090 with minor resistance at 1.3070, it is likely to decline. However, the major support at 1.3000 is probably out of reach (there is another support level at 1.3025).”
1-3 WEEKS VIEW: “We have held a negative GBP view for more than a week (see annotations in the chart below). After GBP fell to 1.3011 and rebounded, we highlighted last Friday (11 Oct, spot at 1.3060) that ‘despite the decline, there has been no further increase in downward momentum’. We added, only a breach of 1.3125 (‘strong resistance’ level) would suggest that 1.3000 is out of reach this time around. We continue to hold the same view.”
This month’s recovery in the Dollar Index (DXY) from 101.2 will likely be capped around 103.30, DBS’ FX analyst Philip Wee notes.
Waiting for Fed speakers
“The futures market has trimmed its Fed cut bets, aligning with the Fed’s projection for two 25 bps cuts in November and December. Fed officials have played down the higher-than-expected US nonfarm payrolls and CPI inflation readings.”
“This week’s Fed speakers should uphold the narrative that the US economy and labour market are back in better balance compared to two years ago, allowing inflation to return to the 2% target next year.”
“The International Monetary Fund (IMF) will release the World Economic Outlook on October 16 and agree with the Fed regarding the scope for high interest rates to move from restrictive towards neutral levels.”
Bias for the Euro (EUR) is tilted to the downside; given the mild momentum, any decline is unlikely to break clearly below 1.0900. In the longer run, outlook for EUR remains negative; slowing momentum suggests that the probability of breaking the 1.0860/1.0885 support zone is not high, UOB Group’s FC analysts Quek Ser Leang and Lee Sue Ann note.
EUR can break the 1.0860/1.0885 support zone
24-HOUR VIEW: “After EUR dropped briefly to 1.0898, then rebounded, we indicated last Friday that ‘the rebound in oversold conditions and slowing momentum suggests that instead of weakening further, EUR is more likely to trade in a range, probably between 1.0910 and 1.0960.’ While our view of range trading was not wrong, EUR traded in a much narrower range of 1.0925/1.0953, closing largely unchanged at 1.0937 (+0.02%). Downward momentum has increased slightly, and the bias for today is tilted to the downside. Given the mild momentum, any decline is unlikely to break clearly below 1.0900. The next support at 1.0885 is unlikely to come under threat. Resistance levels are at 1.0945 and 1.0960.”
1-3 WEEKS VIEW: “Not much has happened since our update on Friday (11 Oct, spot at 1.0935). As highlighted, while the outlook for EUR remains negative, downward momentum appears to be slowing, and the probability of EUR breaking the significant support zone between 1.0860 and 1.0885 is not high. However, only a breach of 1.0980 (‘strong resistance’ level was at 1.0995 last Friday) would mean that the weakness in EUR that started early in the month has stabilised.”
Silver prices (XAG/USD) fell on Monday, according to FXStreet data. Silver trades at $31.46 per troy ounce, down 0.25% from the $31.54 it cost on Friday.
Silver prices have increased by 32.22% since the beginning of the year.
| Unit measure | Silver Price Today in USD |
|---|---|
| Troy Ounce | 31.46 |
| 1 Gram | 1.01 |
The Gold/Silver ratio, which shows the number of ounces of Silver needed to equal the value of one ounce of Gold, stood at 84.52 on Monday, up from 84.25 on Friday.
Silver FAQs
Silver is a precious metal highly traded among investors. It has been historically used as a store of value and a medium of exchange. Although less popular than Gold, traders may turn to Silver to diversify their investment portfolio, for its intrinsic value or as a potential hedge during high-inflation periods. Investors can buy physical Silver, in coins or in bars, or trade it through vehicles such as Exchange Traded Funds, which track its price on international markets.
Silver prices can move due to a wide range of factors. Geopolitical instability or fears of a deep recession can make Silver price escalate due to its safe-haven status, although to a lesser extent than Gold's. As a yieldless asset, Silver tends to rise with lower interest rates. Its moves also depend on how the US Dollar (USD) behaves as the asset is priced in dollars (XAG/USD). A strong Dollar tends to keep the price of Silver at bay, whereas a weaker Dollar is likely to propel prices up. Other factors such as investment demand, mining supply – Silver is much more abundant than Gold – and recycling rates can also affect prices.
Silver is widely used in industry, particularly in sectors such as electronics or solar energy, as it has one of the highest electric conductivity of all metals – more than Copper and Gold. A surge in demand can increase prices, while a decline tends to lower them. Dynamics in the US, Chinese and Indian economies can also contribute to price swings: for the US and particularly China, their big industrial sectors use Silver in various processes; in India, consumers’ demand for the precious metal for jewellery also plays a key role in setting prices.
Silver prices tend to follow Gold's moves. When Gold prices rise, Silver typically follows suit, as their status as safe-haven assets is similar. The Gold/Silver ratio, which shows the number of ounces of Silver needed to equal the value of one ounce of Gold, may help to determine the relative valuation between both metals. Some investors may consider a high ratio as an indicator that Silver is undervalued, or Gold is overvalued. On the contrary, a low ratio might suggest that Gold is undervalued relative to Silver.
(An automation tool was used in creating this post.)
China's Trade Balance for September, in Chinese Yuan (CNY) terms, came in at CNY582.62 billion, narrowing from the previous figure of CNY649.34 billion.
Exports rose 1.6% YoY in September vs. 8.4% in August. The country’s imports arrived at +0.7% YoY in the same period vs. 0% booked previously.
In US Dollar (USD) terms, China’s trade surplus widened in September.
Trade Balance came in at +81.7B versus +89.8B expected and +91.02B previous.
Exports (YoY): 2.4% vs. 6.0% expected and 8.7% previous.
Imports (YoY): 0.3% vs. 0.9% expected and 0.5% last.
Additional takeaways
China Jan-September CNY-denominated Exports +6.2% YoY.
China Jan-September CNY-denominated Imports +4.1% YoY.
China Jan-September Trade Surplus with the US arrived at +257.87$B.
China September Trade Surplus with the US was $33.33B vs. $33.81B in August.
FX implications
AUD/USD keeps the red below 0.6750 after China’s trade data. The pair is down 0.27% on the day, trading at 0.6728, at the time of writing.
(This story was corrected on October 14 at 09:25 GMT to say that China's Trade Balance for September in CNY terms narrowed in September, not expanded.)
- GBP/USD struggles to gain any meaningful traction and remains confined in a range.
- A modest USD strength caps the pair amid bets for more aggressive BoE policy easing.
- The technical setup favors bearish traders and supports prospects for further losses.
The GBP/USD pair extends its sideways consolidative price move at the start of a new week and oscillates in a narrow trading band around mid-1.3000s through the first half of the European session. Meanwhile, spot prices remain close to a one-month low and seem vulnerable to prolonging the recent retracement slide from the 1.3535 area, or the highest level since March 2022 touched last month.
The British Pound (GBP) continues with its relative underperformance amid speculations that the Bank of England (BoE) might be heading towards speeding up its rate-cutting cycle. In contrast, the markets have fully priced out the possibility of another oversized interest rate cut by the Federal Reserve (Fed), which assists the US Dollar (USD) to stand tall near a two-month peak and acts as a headwind for the GBP/USD pair.
From a technical perspective, last week's close below the 50-day Simple Moving Average (SMA) – for the first time since August 12 – was seen as a fresh trigger for bearish traders. Moreover, oscillators on the daily chart are holding deep in negative territory and are still away from being in the oversold zone. This validates the near-term negative outlook and suggests that the path of least resistance for the GBP/USD pair is to the downside.
Some follow-through selling below the 1.3000 psychological mark, or the September monthly swing low, will reaffirm the bearish bias and expose the 100-day SMA, currently pegged near the 1.2945 region. A convincing break below the latter has the potential to drag the GBP/USD pair further towards the 1.2900 round-figure mark en route to the next relevant support near the 1.2860 horizontal zone and the 1.2825-1.2820 support zone.
On the flip side, the 50-day SMA support breakpoint, around the 1.3100 mark, now seems to cap any attempted recovery move, above which a fresh bout of a short-covering should pave the way for additional gains. The GBP/USD pair might then surpass an intermediate hurdle near the 1.3155-1.3160 region before aiming to reclaim the 1.3200 round figure and climb to the 1.3265-1.3270 resistance zone.
GBP/USD daily chart
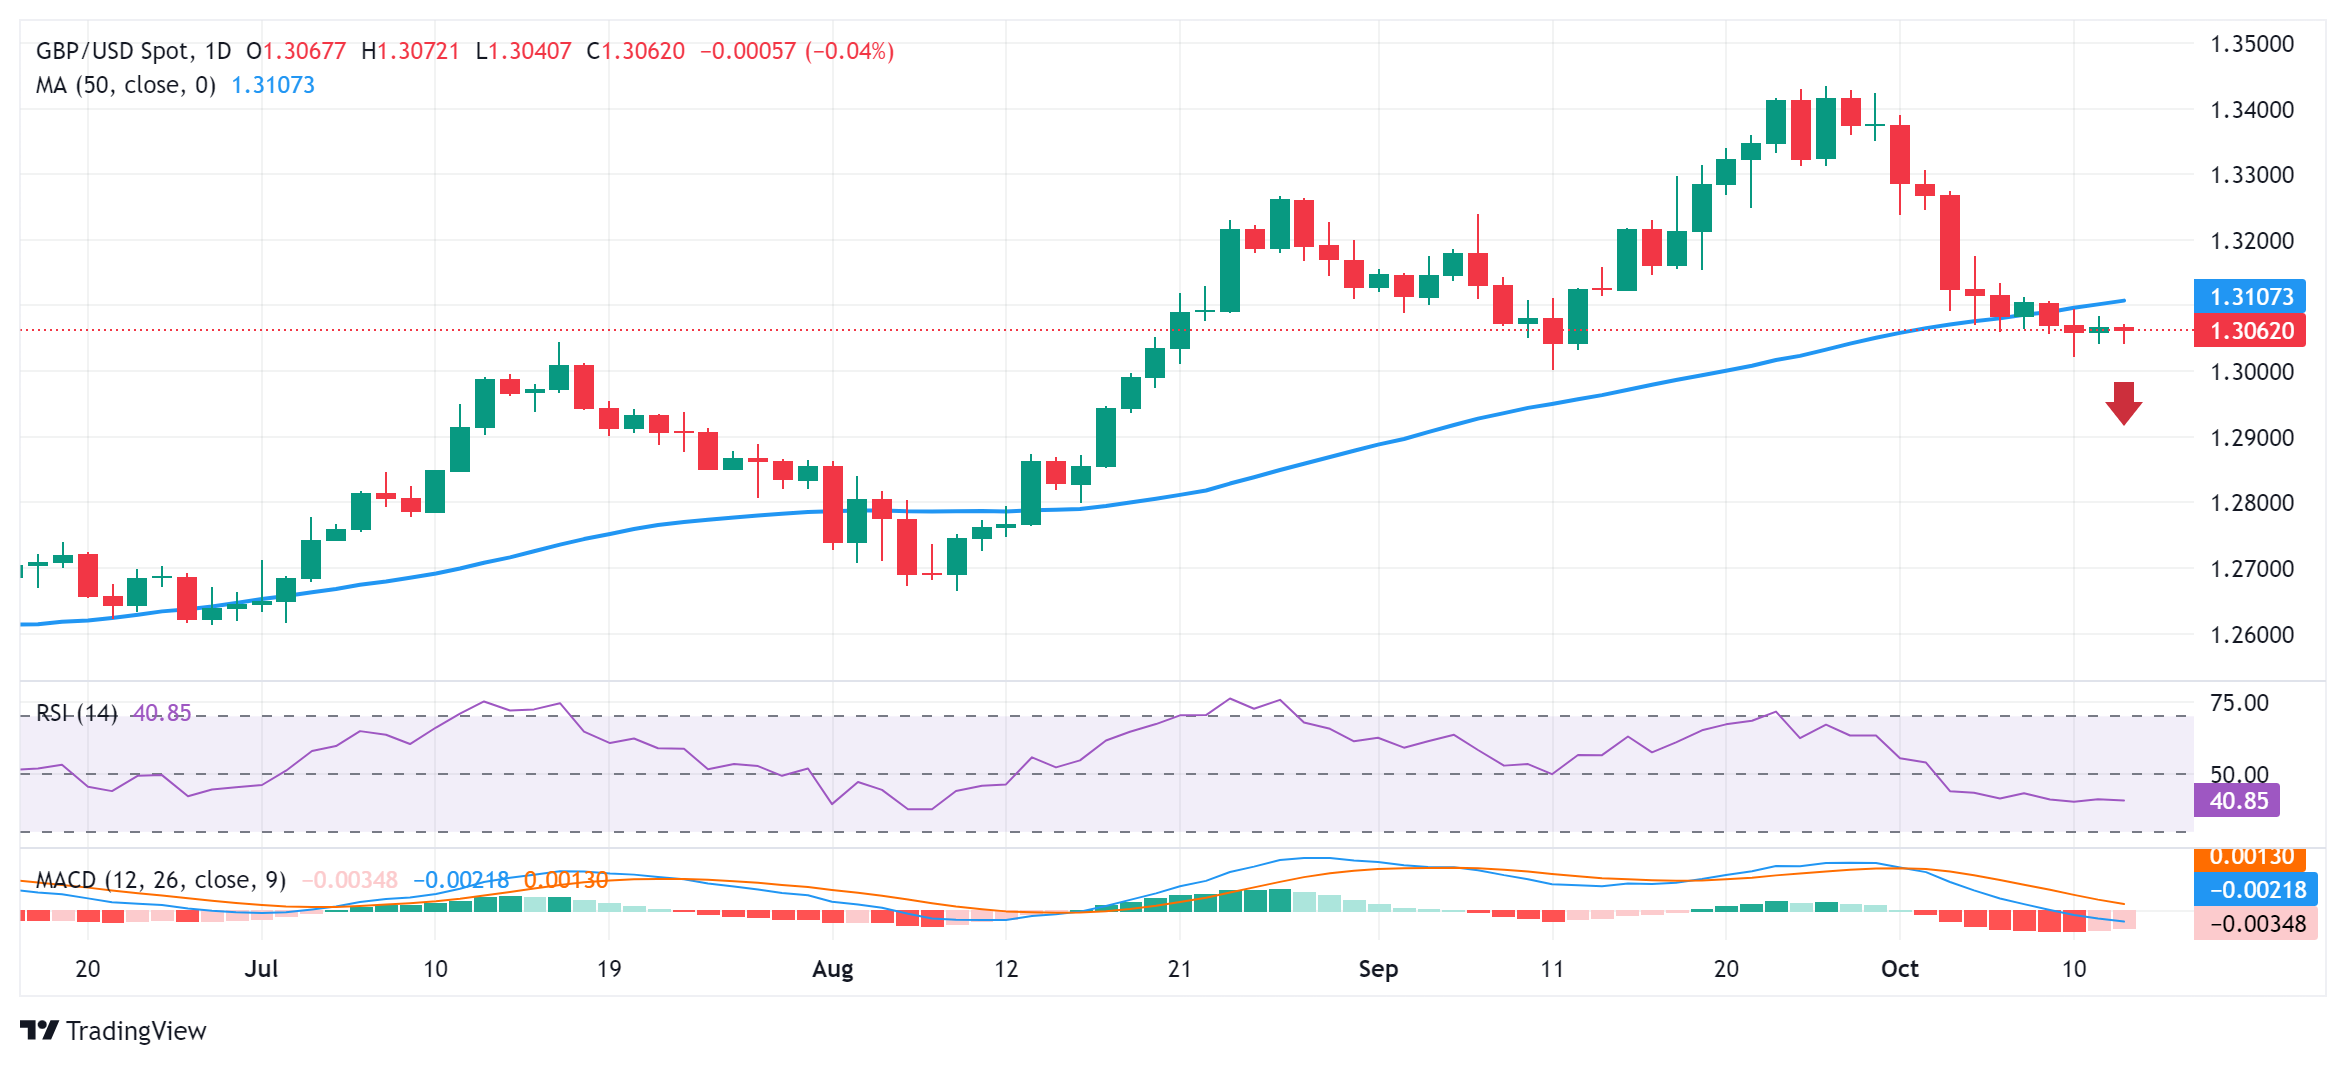
Pound Sterling FAQs
The Pound Sterling (GBP) is the oldest currency in the world (886 AD) and the official currency of the United Kingdom. It is the fourth most traded unit for foreign exchange (FX) in the world, accounting for 12% of all transactions, averaging $630 billion a day, according to 2022 data. Its key trading pairs are GBP/USD, also known as ‘Cable’, which accounts for 11% of FX, GBP/JPY, or the ‘Dragon’ as it is known by traders (3%), and EUR/GBP (2%). The Pound Sterling is issued by the Bank of England (BoE).
The single most important factor influencing the value of the Pound Sterling is monetary policy decided by the Bank of England. The BoE bases its decisions on whether it has achieved its primary goal of “price stability” – a steady inflation rate of around 2%. Its primary tool for achieving this is the adjustment of interest rates. When inflation is too high, the BoE will try to rein it in by raising interest rates, making it more expensive for people and businesses to access credit. This is generally positive for GBP, as higher interest rates make the UK a more attractive place for global investors to park their money. When inflation falls too low it is a sign economic growth is slowing. In this scenario, the BoE will consider lowering interest rates to cheapen credit so businesses will borrow more to invest in growth-generating projects.
Data releases gauge the health of the economy and can impact the value of the Pound Sterling. Indicators such as GDP, Manufacturing and Services PMIs, and employment can all influence the direction of the GBP. A strong economy is good for Sterling. Not only does it attract more foreign investment but it may encourage the BoE to put up interest rates, which will directly strengthen GBP. Otherwise, if economic data is weak, the Pound Sterling is likely to fall.
Another significant data release for the Pound Sterling is the Trade Balance. This indicator measures the difference between what a country earns from its exports and what it spends on imports over a given period. If a country produces highly sought-after exports, its currency will benefit purely from the extra demand created from foreign buyers seeking to purchase these goods. Therefore, a positive net Trade Balance strengthens a currency and vice versa for a negative balance.
- The USD/CAD pair may test the upper boundary of the ascending channel at the 1.3840 level.
- The 14-day RSI indicates an overbought situation, suggesting a potential downward correction could occur soon.
- The potential support appears at the lower boundary of the ascending channel around the 1.3740 level.
USD/CAD continues its winning streak that began October 2, hovering around 1.3790 during the European trading hours on Monday. The daily chart analysis shows that the pair is moving upwards within the ascending channel, suggesting the strengthening of a bullish bias.
However, the 14-day Relative Strength Index (RSI) is positioned above the 70 level, indicating an overbought situation for the pair and potential downward correction any time soon.
Regarding the upside, the USD/CAD pair could explore the region around the upper boundary of the ascending channel at the 1.3840 level. A break above this level could strengthen the bullish sentiment and support the pair to approach 1.3946, the highest level since October 2022.
On the downside, the USD/CAD may find support at the lower boundary of the ascending channel around the 1.3740 level. A breach below the ascending channel could weaken the bullish sentiment and lead the pair to navigate the area around its nine-day Exponential Moving Average (EMA) at 1.3680 level.
Further support appears at the “pullback resistance turns into throwback support” around the 1.3620 level, followed by the psychological level of 1.3600.
USD/CAD: Daily Chart
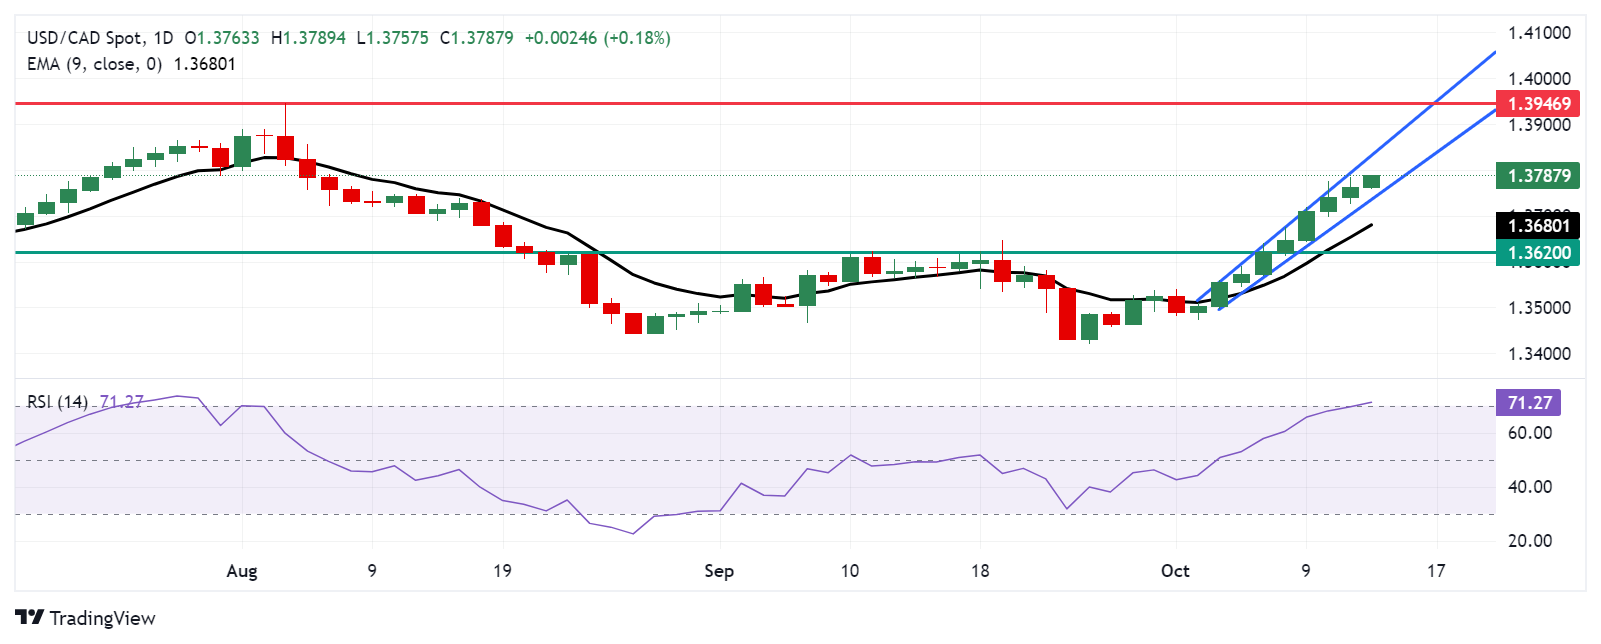
Canadian Dollar PRICE Today
The table below shows the percentage change of Canadian Dollar (CAD) against listed major currencies today. Canadian Dollar was the weakest against the British Pound.
| USD | EUR | GBP | JPY | CAD | AUD | NZD | CHF | |
|---|---|---|---|---|---|---|---|---|
| USD | 0.11% | 0.02% | 0.22% | 0.11% | 0.33% | 0.30% | 0.37% | |
| EUR | -0.11% | -0.16% | 0.00% | 0.08% | 0.24% | 0.10% | 0.17% | |
| GBP | -0.02% | 0.16% | 0.16% | 0.12% | 0.43% | 0.29% | 0.31% | |
| JPY | -0.22% | 0.00% | -0.16% | -0.10% | 0.14% | 0.14% | 0.15% | |
| CAD | -0.11% | -0.08% | -0.12% | 0.10% | 0.17% | 0.22% | 0.09% | |
| AUD | -0.33% | -0.24% | -0.43% | -0.14% | -0.17% | -0.01% | 0.00% | |
| NZD | -0.30% | -0.10% | -0.29% | -0.14% | -0.22% | 0.01% | 0.00% | |
| CHF | -0.37% | -0.17% | -0.31% | -0.15% | -0.09% | -0.01% | -0.01% |
The heat map shows percentage changes of major currencies against each other. The base currency is picked from the left column, while the quote currency is picked from the top row. For example, if you pick the Canadian Dollar from the left column and move along the horizontal line to the US Dollar, the percentage change displayed in the box will represent CAD (base)/USD (quote).
- EUR/GBP struggles for a firm near-term direction as traders keenly await the ECB on Thursday.
- The ECB is expected to lower interest rates again amid easing inflation and economic slowdown.
- Bets for an aggressive BoE policy easing undermine the GBP and act as a headwind for the cross.
The EUR/GBP cross extends its sideways consolidative price move through the first half of the European session on Monday and remains confined in a familiar range held over the past week or so. Spot prices currently trade around the 0.8365 region, nearly unchanged for the day as traders opt to wait on the sidelines ahead of the key central bank event risk later this week.
The European Central Bank (ECB) is scheduled to announce its policy decision on Thursday and is expected to cut interest rates again for the third time this easing cycle amid mounting concerns over sluggish growth. Furthermore, inflation in the Eurozone fell below the ECB's 2% target for the first time since 2021 and backs the case for further policy easing. This, in turn, undermines the shared currency and turns out to be a key factor acting as a headwind for the EUR/GBP cross.
Meanwhile, the Bank of England (BoE) Governor Andrew Bailey recently hinted that the central bank could cut interest rates more aggressively if there's further good news on inflation. The comments fueled speculation that the BoE might be headed towards speeding up its rate-cutting cycle and hold back traders from placing bullish bets around the British Pound (GBP). This, to a larger extent, offsets the negative factor and offers some support to the EUR/GBP cross.
The aforementioned mixed fundamental backdrop supports prospects for an extension of the subdued range price action in the absence of any relevant market-moving economic releases, either from the Eurozone or the UK. Hence, it will be prudent to wait for a sustained move in either direction before positioning for a firm near-term trajectory.
Economic Indicator
ECB Rate On Deposit Facility
One of the European Central Bank's three key interest rates, the rate on the deposit facility, is the rate at which banks earn interest when they deposit funds with the ECB. It is announced by the European Central Bank at each of its eight scheduled annual meetings.
Read more.Next release: Thu Oct 17, 2024 12:15
Frequency: Irregular
Consensus: 3.25%
Previous: 3.5%
Source: European Central Bank
- USD/CHF gains ground as traders expect the Fed to slow the pace of interest rate cuts.
- Future markets suggest 89% odds of a 25 basis point cut in November, with no expectation for a 50-basis-point cut.
- Swiss Producer and Import Prices fell by 0.1% MoM and 1.3% YoY in September.
USD/CHF continues to gain ground for the second day, trading around 0.8600 during the early European hours on Monday. The upside of the USD/CHF pair could be attributed to a solid US Dollar (USD), fueled by expectations that the US Federal Reserve (Fed) will slow the pace of borrowing cost reductions more than previously anticipated.
Traders are looking for a 25 basis points (bps) rate cut from the Fed in November, following the release of the Producer Price Index (PPI) data from the United States last Friday. According to the CME FedWatch Tool, the markets are pricing in almost 89% chance of a 25 basis point rate cut in November, with no expectation for a 50-basis-point reduction.
In September, the US Producer Price Index (PPI) remained unchanged at 0%, below August’s 0.2% month-on-month increase. Meanwhile, the monthly core PPI, which excludes food and energy prices, expanded by 0.2% as expected, down from 0.3% the prior month.
In Switzerland, Producer and Import Prices declined by 0.1% month-over-month in September, contrary to the expected increase of 0.1%, following a 0.2% rise in August. On an annual basis, Producer and Import Prices dropped by 1.3%, slightly exceeding the previous decline of 1.2%. This marked the seventeenth consecutive period of decline.
The Swiss Franc (CHF) receives downward pressure from the rising likelihood of more rate cuts by the Swiss National Bank (SNB). "With inflation being reasonably low in Switzerland and with an economy that could grow faster, that tends in the direction of a lower SNB’s policy rate.
Swiss Franc FAQs
The Swiss Franc (CHF) is Switzerland’s official currency. It is among the top ten most traded currencies globally, reaching volumes that well exceed the size of the Swiss economy. Its value is determined by the broad market sentiment, the country’s economic health or action taken by the Swiss National Bank (SNB), among other factors. Between 2011 and 2015, the Swiss Franc was pegged to the Euro (EUR). The peg was abruptly removed, resulting in a more than 20% increase in the Franc’s value, causing a turmoil in markets. Even though the peg isn’t in force anymore, CHF fortunes tend to be highly correlated with the Euro ones due to the high dependency of the Swiss economy on the neighboring Eurozone.
The Swiss Franc (CHF) is considered a safe-haven asset, or a currency that investors tend to buy in times of market stress. This is due to the perceived status of Switzerland in the world: a stable economy, a strong export sector, big central bank reserves or a longstanding political stance towards neutrality in global conflicts make the country’s currency a good choice for investors fleeing from risks. Turbulent times are likely to strengthen CHF value against other currencies that are seen as more risky to invest in.
The Swiss National Bank (SNB) meets four times a year – once every quarter, less than other major central banks – to decide on monetary policy. The bank aims for an annual inflation rate of less than 2%. When inflation is above target or forecasted to be above target in the foreseeable future, the bank will attempt to tame price growth by raising its policy rate. Higher interest rates are generally positive for the Swiss Franc (CHF) as they lead to higher yields, making the country a more attractive place for investors. On the contrary, lower interest rates tend to weaken CHF.
Macroeconomic data releases in Switzerland are key to assessing the state of the economy and can impact the Swiss Franc’s (CHF) valuation. The Swiss economy is broadly stable, but any sudden change in economic growth, inflation, current account or the central bank’s currency reserves have the potential to trigger moves in CHF. Generally, high economic growth, low unemployment and high confidence are good for CHF. Conversely, if economic data points to weakening momentum, CHF is likely to depreciate.
As a small and open economy, Switzerland is heavily dependent on the health of the neighboring Eurozone economies. The broader European Union is Switzerland’s main economic partner and a key political ally, so macroeconomic and monetary policy stability in the Eurozone is essential for Switzerland and, thus, for the Swiss Franc (CHF). With such dependency, some models suggest that the correlation between the fortunes of the Euro (EUR) and the CHF is more than 90%, or close to perfect.
Here is what you need to know on Monday, October 14:
Major currency pairs trade near the previous week's closing levels to start the new week. The New York Stock Exchange and the Nasdaq Stock Market will be open in normal hours on Monday but bond markets will be closed in observance of the Columbus Day holiday. During the American trading hours, Minneapolis Federal Reserve President Neel Kashkari and Federal Reserve Governor Christopher Waller will be delivering speeches.
The US Dollar (USD) gathered strength against its major rivals last week, with the USD Index posting gains for the second consecutive week. In the European morning on Monday, the index holds steady at around 103.00. Meanwhile, US stock index futures trade marginally lower on the day, reflecting a cautious stance. A spokesperson at the US Department of State said on Monday that they are “seriously concerned by the People's Liberation Army (PLA) military drills in the Taiwan strait and around Taiwan.” In the meantime, CNN reported on Sunday that at least four Israeli soldiers were killed and more than 60 people were injured by a Hezbollah drone attack in north-central Israel.
US Dollar PRICE Last 7 days
The table below shows the percentage change of US Dollar (USD) against listed major currencies last 7 days. US Dollar was the strongest against the Canadian Dollar.
| USD | EUR | GBP | JPY | CAD | AUD | NZD | CHF | |
|---|---|---|---|---|---|---|---|---|
| USD | 0.41% | 0.38% | 0.33% | 1.52% | 0.86% | 1.03% | -0.01% | |
| EUR | -0.41% | 0.03% | -0.07% | 1.15% | 0.42% | 0.61% | -0.45% | |
| GBP | -0.38% | -0.03% | -0.14% | 1.12% | 0.39% | 0.62% | -0.36% | |
| JPY | -0.33% | 0.07% | 0.14% | 1.19% | 0.51% | 0.65% | -0.30% | |
| CAD | -1.52% | -1.15% | -1.12% | -1.19% | -0.63% | -0.49% | -1.52% | |
| AUD | -0.86% | -0.42% | -0.39% | -0.51% | 0.63% | 0.24% | -0.82% | |
| NZD | -1.03% | -0.61% | -0.62% | -0.65% | 0.49% | -0.24% | -1.00% | |
| CHF | 0.01% | 0.45% | 0.36% | 0.30% | 1.52% | 0.82% | 1.00% |
The heat map shows percentage changes of major currencies against each other. The base currency is picked from the left column, while the quote currency is picked from the top row. For example, if you pick the US Dollar from the left column and move along the horizontal line to the Japanese Yen, the percentage change displayed in the box will represent USD (base)/JPY (quote).
EUR/USD closed the last trading day of the previous week unchanged but ended the week in the red. The pair fluctuates in a tight range near 1.0930 to begin the European session on Monday.
GBP/USD stays in a consolidation phase below 1.3100 after posting small losses last week. The UK's Office for National Statistics will release employment data on Tuesday and publish Consumer Price Index (CPI) figures on Wednesday.
USD/JPY moves up and down in a narrow band above 149.00 on Monday. Japanese Prime Minister Shigeru Ishiba said on Sunday that he would not intervene in monetary policy affairs, as the Japanese central bank is mandated to achieve price stability.
After declining with the immediate reaction to the upbeat Canadian labor market data, USD/CAD regained its traction and closed the eighth consecutive trading day in positive territory on Friday. The pair holds its ground early Monday and edges higher toward 1.3800. Canadian markets will remain closed in observance of the Thanksgiving Day on Monday. On Tuesday, the Canadian economic calendar will feature September inflation data.
Gold managed to build on Thursday's gains and rose nearly 1% on Friday. At the time of press, XAU/USD was moving sideways at around $2,660.
Inflation FAQs
Inflation measures the rise in the price of a representative basket of goods and services. Headline inflation is usually expressed as a percentage change on a month-on-month (MoM) and year-on-year (YoY) basis. Core inflation excludes more volatile elements such as food and fuel which can fluctuate because of geopolitical and seasonal factors. Core inflation is the figure economists focus on and is the level targeted by central banks, which are mandated to keep inflation at a manageable level, usually around 2%.
The Consumer Price Index (CPI) measures the change in prices of a basket of goods and services over a period of time. It is usually expressed as a percentage change on a month-on-month (MoM) and year-on-year (YoY) basis. Core CPI is the figure targeted by central banks as it excludes volatile food and fuel inputs. When Core CPI rises above 2% it usually results in higher interest rates and vice versa when it falls below 2%. Since higher interest rates are positive for a currency, higher inflation usually results in a stronger currency. The opposite is true when inflation falls.
Although it may seem counter-intuitive, high inflation in a country pushes up the value of its currency and vice versa for lower inflation. This is because the central bank will normally raise interest rates to combat the higher inflation, which attract more global capital inflows from investors looking for a lucrative place to park their money.
Formerly, Gold was the asset investors turned to in times of high inflation because it preserved its value, and whilst investors will often still buy Gold for its safe-haven properties in times of extreme market turmoil, this is not the case most of the time. This is because when inflation is high, central banks will put up interest rates to combat it. Higher interest rates are negative for Gold because they increase the opportunity-cost of holding Gold vis-a-vis an interest-bearing asset or placing the money in a cash deposit account. On the flipside, lower inflation tends to be positive for Gold as it brings interest rates down, making the bright metal a more viable investment alternative.
- GBP/USD weakens to near 1.3060 in Monday’s early European session.
- The US PPI inflation slowed further in September.
- The dovish stance of the BoE continues to weigh on the GBP.
The GBP/USD pair trades with mild losses around 1.3060 during the early European session on Monday. The safe-haven flows amid rising geopolitical risks underpin the Greenback and drag the major pair lower. Investors will closely monitor the UK employment data, which is due on Tuesday.
Data released by the US Bureau of Labor Statistics on Friday showed that the annual Producer Price Index (PPI) rose 1.8% YoY in September, compared to a 1.9% increase seen in August, and came in above the market expectation of 1.6%. Meanwhile, the core PPI climbed 2.8% YoY in the same period, surpassing analysts' forecast of 2.7%. On a monthly basis, the US PPI was unchanged in September, while the core PPI was up 0.2% in the same reported period.
Fed officials have now shifted from trying to combat inflation to trying to keep the job market healthy, the other half of their so-called dual mandate. However, a stronger-than-expected jobs report in September and lower bets of another 50 basis points (bps) interest-rate cuts by the Federal Reserve (Fed) in November could lift the USD against the Pound Sterling (GBP).
On the GBP’s front, the dovish remarks from the Bank of England (BoE) Governor Andrew Bailey, saying that the UK central bank might become a bit more aggressive in cutting rates, weigh on the Cable. The markets have priced in a 90% chance that the BoE will cut rates in November. The BoE’s Monetary Policy Committee (MPC) will meet on November 7 to announce their decision on the interest rate. Ahead of the key UK event, the UK employment data on Tuesday will be closely watched and might offer some hints about the labour market condition, and UK interest rate outlook.
Pound Sterling FAQs
The Pound Sterling (GBP) is the oldest currency in the world (886 AD) and the official currency of the United Kingdom. It is the fourth most traded unit for foreign exchange (FX) in the world, accounting for 12% of all transactions, averaging $630 billion a day, according to 2022 data. Its key trading pairs are GBP/USD, also known as ‘Cable’, which accounts for 11% of FX, GBP/JPY, or the ‘Dragon’ as it is known by traders (3%), and EUR/GBP (2%). The Pound Sterling is issued by the Bank of England (BoE).
The single most important factor influencing the value of the Pound Sterling is monetary policy decided by the Bank of England. The BoE bases its decisions on whether it has achieved its primary goal of “price stability” – a steady inflation rate of around 2%. Its primary tool for achieving this is the adjustment of interest rates. When inflation is too high, the BoE will try to rein it in by raising interest rates, making it more expensive for people and businesses to access credit. This is generally positive for GBP, as higher interest rates make the UK a more attractive place for global investors to park their money. When inflation falls too low it is a sign economic growth is slowing. In this scenario, the BoE will consider lowering interest rates to cheapen credit so businesses will borrow more to invest in growth-generating projects.
Data releases gauge the health of the economy and can impact the value of the Pound Sterling. Indicators such as GDP, Manufacturing and Services PMIs, and employment can all influence the direction of the GBP. A strong economy is good for Sterling. Not only does it attract more foreign investment but it may encourage the BoE to put up interest rates, which will directly strengthen GBP. Otherwise, if economic data is weak, the Pound Sterling is likely to fall.
Another significant data release for the Pound Sterling is the Trade Balance. This indicator measures the difference between what a country earns from its exports and what it spends on imports over a given period. If a country produces highly sought-after exports, its currency will benefit purely from the extra demand created from foreign buyers seeking to purchase these goods. Therefore, a positive net Trade Balance strengthens a currency and vice versa for a negative balance.
FX option expiries for Oct 14 NY cut at 10:00 Eastern Time, via DTCC, can be found below.
EUR/USD: EUR amounts
- 1.0950 1.2b
- 1.1065 502m
- 1.1090 924m
USD/JPY: USD amounts
- 149.00 3.3b
USD/CHF: USD amounts
- 0.8410 660m
AUD/USD: AUD amounts
- 0.6730 700m
- 0.6750 657m
USD/CAD: USD amounts
- 1.3840 850m
NZD/USD: NZD amounts
- 0.5960 600m
- 0.6150 452m
- Silver price receives support from safe-haven flows amid rising geopolitical tensions.
- China's PLA initiated drills in the Taiwan Strait and around Taiwan on Monday.
- The non-yielding Silver gains support from growing expectations of the Fed slowing the pace of interest rate cuts.
Silver price (XAG/USD) extends its winning streak for the third consecutive day, trading around $31.30 per troy ounce during the Asian session on Monday. Silver price receives support from the safe-haven flows amid rising geopolitical tensions.
On Sunday, Hezbollah claimed responsibility for the drone attack in north-central Israel, killing at least four Israeli soldiers and over 60 people were injured, according to CNN. The number of injuries makes the attack one of the bloodiest on Israel since the war started last October.
China's military initiated drills in the Taiwan Strait and around Taiwan on Monday. A spokesperson for the US Department of State expressed serious concern regarding the People's Liberation Army's (PLA) military actions. In response, Taiwan's Defense Ministry stated, “We will not escalate conflict in our response.”
Non-yielding assets like Silver may have received support from rising expectations that the Federal Reserve (Fed) will slow the pace of interest rate cuts more than previously anticipated. Last week, data showed that US producer prices remained steady in September, alongside a surge in jobless claims, which challenged the perception of the US labor market's resilience to restrictive interest rates.
According to the CME FedWatch Tool, markets are pricing in almost 87% chance of a 25 basis point rate cut in November, with no expectation of a 50 basis point reduction. Lower interest rates make Silver more attractive to investors seeking higher returns, as the opportunity cost of holding non-yielding assets decreases.
Silver FAQs
Silver is a precious metal highly traded among investors. It has been historically used as a store of value and a medium of exchange. Although less popular than Gold, traders may turn to Silver to diversify their investment portfolio, for its intrinsic value or as a potential hedge during high-inflation periods. Investors can buy physical Silver, in coins or in bars, or trade it through vehicles such as Exchange Traded Funds, which track its price on international markets.
Silver prices can move due to a wide range of factors. Geopolitical instability or fears of a deep recession can make Silver price escalate due to its safe-haven status, although to a lesser extent than Gold's. As a yieldless asset, Silver tends to rise with lower interest rates. Its moves also depend on how the US Dollar (USD) behaves as the asset is priced in dollars (XAG/USD). A strong Dollar tends to keep the price of Silver at bay, whereas a weaker Dollar is likely to propel prices up. Other factors such as investment demand, mining supply – Silver is much more abundant than Gold – and recycling rates can also affect prices.
Silver is widely used in industry, particularly in sectors such as electronics or solar energy, as it has one of the highest electric conductivity of all metals – more than Copper and Gold. A surge in demand can increase prices, while a decline tends to lower them. Dynamics in the US, Chinese and Indian economies can also contribute to price swings: for the US and particularly China, their big industrial sectors use Silver in various processes; in India, consumers’ demand for the precious metal for jewellery also plays a key role in setting prices.
Silver prices tend to follow Gold's moves. When Gold prices rise, Silver typically follows suit, as their status as safe-haven assets is similar. The Gold/Silver ratio, which shows the number of ounces of Silver needed to equal the value of one ounce of Gold, may help to determine the relative valuation between both metals. Some investors may consider a high ratio as an indicator that Silver is undervalued, or Gold is overvalued. On the contrary, a low ratio might suggest that Gold is undervalued relative to Silver.
- EUR/USD trades in negative territory for the fourth consecutive day around 1.0920 in Monday’s Asian session.
- The risk-off mood supports the US dollar broadly.
- The dovish stance of the ECB weighs on the shared currency.
The EUR/USD pair extends the decline to near 1.0920 during the early Asian session on Monday. The risk aversion amid the escalating geopolitical tensions in the Middle East and conflicts between China and Taiwan exert some selling pressure on the riskier currency like the Euro (EUR).
On Monday, a spokesperson at the US Department of State said they are “seriously concerned by the People's Liberation Army (PLA) military drills in the Taiwan Strait and around Taiwan.” They further stated that they will monitor PRC activities and coordinate with allies and partners regarding our shared concerns. Any signs of escalating tensions could boost the safe-haven flows, benefiting the Greenback and weighing on the major pair.
Traders expect a 25 basis points (bps) rate cut from the Federal Reserve (Fed) in November after the US Producer Price Index (PPI) on Friday. The CME FedWatch Tool showed the markets are now pricing in nearly an 86.8% chance of a 25 bps Fed rate cut, up from 83.3% before the PPI data.
Across the pond, the Euro faces some pressure as the European Central Bank (ECB) is expected to cut interest rates further in both monetary policy meetings remaining this year. The ECB's dovish stance increased by a faster-than-expected decline in Eurozone inflationary pressures and 'fragile' economic recovery.
Euro FAQs
The Euro is the currency for the 19 European Union countries that belong to the Eurozone. It is the second most heavily traded currency in the world behind the US Dollar. In 2022, it accounted for 31% of all foreign exchange transactions, with an average daily turnover of over $2.2 trillion a day. EUR/USD is the most heavily traded currency pair in the world, accounting for an estimated 30% off all transactions, followed by EUR/JPY (4%), EUR/GBP (3%) and EUR/AUD (2%).
The European Central Bank (ECB) in Frankfurt, Germany, is the reserve bank for the Eurozone. The ECB sets interest rates and manages monetary policy. The ECB’s primary mandate is to maintain price stability, which means either controlling inflation or stimulating growth. Its primary tool is the raising or lowering of interest rates. Relatively high interest rates – or the expectation of higher rates – will usually benefit the Euro and vice versa. The ECB Governing Council makes monetary policy decisions at meetings held eight times a year. Decisions are made by heads of the Eurozone national banks and six permanent members, including the President of the ECB, Christine Lagarde.
Eurozone inflation data, measured by the Harmonized Index of Consumer Prices (HICP), is an important econometric for the Euro. If inflation rises more than expected, especially if above the ECB’s 2% target, it obliges the ECB to raise interest rates to bring it back under control. Relatively high interest rates compared to its counterparts will usually benefit the Euro, as it makes the region more attractive as a place for global investors to park their money.
Data releases gauge the health of the economy and can impact on the Euro. Indicators such as GDP, Manufacturing and Services PMIs, employment, and consumer sentiment surveys can all influence the direction of the single currency. A strong economy is good for the Euro. Not only does it attract more foreign investment but it may encourage the ECB to put up interest rates, which will directly strengthen the Euro. Otherwise, if economic data is weak, the Euro is likely to fall. Economic data for the four largest economies in the euro area (Germany, France, Italy and Spain) are especially significant, as they account for 75% of the Eurozone’s economy.
Another significant data release for the Euro is the Trade Balance. This indicator measures the difference between what a country earns from its exports and what it spends on imports over a given period. If a country produces highly sought after exports then its currency will gain in value purely from the extra demand created from foreign buyers seeking to purchase these goods. Therefore, a positive net Trade Balance strengthens a currency and vice versa for a negative balance.
- NZD/USD faces challenges due to deflation concerns in China.
- The Kiwi Dollar receives downward pressure from safe-haven flows amid escalating geopolitical tensions.
- The Business NZ PSI came in at 45.7 for September, slightly better than the previous 45.5 reading.
NZD/USD depreciates after registering gains in the previous two sessions, trading around 0.6090 during the Asian trading hours on Monday. The New Zealand Dollar (NZD) receives downward pressure from the deflation fears in its largest trading partner China. Additionally, uncertainty surrounding Beijing's economic stimulus plans, which has raised concerns about the country’s demand undermines the Kiwi Dollar. Traders await Monday’s Trade Balance data from China for further impetus on the economic situation.
On Sunday, the National Bureau of Statistics of China reported that the country's monthly Consumer Price Index (CPI) held steady at 0% in September, against August’s increase of 0.4%. The annual inflation rate rose by 0.4%, falling short of the expected 0.6%. Meanwhile, the Producer Price Index (PPI) experienced a year-on-year decline of 2.8%, a larger drop than the previous decrease of 1.8% and surpassing expectations of a 2.5% decline.
The National People’s Congress expressed optimism after a briefing from China's Ministry of Finance (MoF) on Saturday. The ministry suggested plans to issue special bonds to support bank recapitalization and stabilize the real estate sector, although no specific figures were disclosed.
The risk-sensitive NZD/USD pair may have received downward pressure due to safe-haven flows amid rising geopolitical tensions. China's military initiated drills in the Taiwan Strait and around Taiwan on Monday. A spokesperson for the US Department of State expressed serious concern regarding the People's Liberation Army's (PLA) military actions.
In New Zealand, the Business NZ Performance of Services Index (PSI) recorded a value of 45.7 for September, a slight improvement from the previous reading of 45.5. Although this marks the highest level since May, the index still indicates contraction in the sector.
According to a press release from the Reserve Bank of New Zealand on Monday, Governor Adrian Orr highlighted the growing recognition across the financial system that more efforts are needed to improve Māori access to capital and participation in investment opportunities. Orr emphasized, "Improving Māori access to capital is a powerful enabler we all need to collectively prioritize."
The US Dollar (USD) appreciates due to rising expectations of the US Federal Reserve (Fed) slowing the pace of borrowing cost reductions more than previously anticipated. According to the CME FedWatch Tool, the markets are pricing in an 86.9% chance of a 25 basis point rate cut in November, with no expectation for a 50-basis-point reduction.
New Zealand Dollar FAQs
The New Zealand Dollar (NZD), also known as the Kiwi, is a well-known traded currency among investors. Its value is broadly determined by the health of the New Zealand economy and the country’s central bank policy. Still, there are some unique particularities that also can make NZD move. The performance of the Chinese economy tends to move the Kiwi because China is New Zealand’s biggest trading partner. Bad news for the Chinese economy likely means less New Zealand exports to the country, hitting the economy and thus its currency. Another factor moving NZD is dairy prices as the dairy industry is New Zealand’s main export. High dairy prices boost export income, contributing positively to the economy and thus to the NZD.
The Reserve Bank of New Zealand (RBNZ) aims to achieve and maintain an inflation rate between 1% and 3% over the medium term, with a focus to keep it near the 2% mid-point. To this end, the bank sets an appropriate level of interest rates. When inflation is too high, the RBNZ will increase interest rates to cool the economy, but the move will also make bond yields higher, increasing investors’ appeal to invest in the country and thus boosting NZD. On the contrary, lower interest rates tend to weaken NZD. The so-called rate differential, or how rates in New Zealand are or are expected to be compared to the ones set by the US Federal Reserve, can also play a key role in moving the NZD/USD pair.
Macroeconomic data releases in New Zealand are key to assess the state of the economy and can impact the New Zealand Dollar’s (NZD) valuation. A strong economy, based on high economic growth, low unemployment and high confidence is good for NZD. High economic growth attracts foreign investment and may encourage the Reserve Bank of New Zealand to increase interest rates, if this economic strength comes together with elevated inflation. Conversely, if economic data is weak, NZD is likely to depreciate.
The New Zealand Dollar (NZD) tends to strengthen during risk-on periods, or when investors perceive that broader market risks are low and are optimistic about growth. This tends to lead to a more favorable outlook for commodities and so-called ‘commodity currencies’ such as the Kiwi. Conversely, NZD tends to weaken at times of market turbulence or economic uncertainty as investors tend to sell higher-risk assets and flee to the more-stable safe havens.
- USD/CAD scales higher for the ninth straight day and climbs to over a two-month top on Monday.
- Sliding Oil prices undermine the Loonie and lend some support to the pair amid a bullish USD.
- Reduced bets for a larger BoC rate cut to act as a tailwind for the CAD and cap gains for the pair.
The USD/CAD pair prolongs its uptrend for the ninth straight day and climbs to the 1.3785-1.3790 area, or its highest level since August 7 during the Asian session on Monday. The momentum is sponsored by a bullish US Dollar (USD) and declining Crude Oil prices, which tend to undermine the commodity-linked Loonie.
The USD Index (DXY), which tracks the Greenback against a basket of currencies, flirts with a nearly two-month top touched last Thursday amid firming expectations for a less aggressive policy easing by the Federal Reserve (Fed). In fact, the markets are now pricing in over a 90% chance that the US central bank will lower borrowing costs by only 25 basis points (bps) in November. This keeps the US Treasury bond yields elevated and continues to boost the Greenback, which, in turn, is seen acting as a tailwind for the USD/CAD pair.
Meanwhile, Crude Oil prices open with a bearish weekly gap in reaction to softer Chinese inflation data released over the weekend, which pointed to a sustained deflationary trend and bods poorly with fuel demand. Furthermore, the disappointment over China's fiscal stimulus plans, to a larger extent, overshadows Friday's upbeat Canadian jobs data, which forced investors to pare bets for a larger rate cut by the Bank of Canada (BoC). This is seen weighing on the Canadian Dollar (CAD) and offering support to the USD/CAD pair.
It, however, remains to be seen if bulls can capitalize on the move or opt to take some profits off the table ahead of the Canadian consumer inflation figures, due for release on Tuesday. In the meantime, the risk of a further escalation of geopolitical tensions in the Middle East and concerns about supply disruptions from the key producing region should limit losses for Crude Oil prices. This, in turn, might hold back the CAD bears from placing fresh bets and cap the USD/CAD pair amid thin liquidity on the back of a holiday in the US and Canada.
Canadian Dollar FAQs
The key factors driving the Canadian Dollar (CAD) are the level of interest rates set by the Bank of Canada (BoC), the price of Oil, Canada’s largest export, the health of its economy, inflation and the Trade Balance, which is the difference between the value of Canada’s exports versus its imports. Other factors include market sentiment – whether investors are taking on more risky assets (risk-on) or seeking safe-havens (risk-off) – with risk-on being CAD-positive. As its largest trading partner, the health of the US economy is also a key factor influencing the Canadian Dollar.
The Bank of Canada (BoC) has a significant influence on the Canadian Dollar by setting the level of interest rates that banks can lend to one another. This influences the level of interest rates for everyone. The main goal of the BoC is to maintain inflation at 1-3% by adjusting interest rates up or down. Relatively higher interest rates tend to be positive for the CAD. The Bank of Canada can also use quantitative easing and tightening to influence credit conditions, with the former CAD-negative and the latter CAD-positive.
The price of Oil is a key factor impacting the value of the Canadian Dollar. Petroleum is Canada’s biggest export, so Oil price tends to have an immediate impact on the CAD value. Generally, if Oil price rises CAD also goes up, as aggregate demand for the currency increases. The opposite is the case if the price of Oil falls. Higher Oil prices also tend to result in a greater likelihood of a positive Trade Balance, which is also supportive of the CAD.
While inflation had always traditionally been thought of as a negative factor for a currency since it lowers the value of money, the opposite has actually been the case in modern times with the relaxation of cross-border capital controls. Higher inflation tends to lead central banks to put up interest rates which attracts more capital inflows from global investors seeking a lucrative place to keep their money. This increases demand for the local currency, which in Canada’s case is the Canadian Dollar.
Macroeconomic data releases gauge the health of the economy and can have an impact on the Canadian Dollar. Indicators such as GDP, Manufacturing and Services PMIs, employment, and consumer sentiment surveys can all influence the direction of the CAD. A strong economy is good for the Canadian Dollar. Not only does it attract more foreign investment but it may encourage the Bank of Canada to put up interest rates, leading to a stronger currency. If economic data is weak, however, the CAD is likely to fall.
Gold prices remained broadly unchanged in India on Monday, according to data compiled by FXStreet.
The price for Gold stood at 7,180.53 Indian Rupees (INR) per gram, broadly stable compared with the INR 7,182.37 it cost on Friday.
The price for Gold was broadly steady at INR 83,752.31 per tola from INR 83,773.75 per tola on friday.
| Unit measure | Gold Price in INR |
|---|---|
| 1 Gram | 7,180.53 |
| 10 Grams | 71,805.31 |
| Tola | 83,752.31 |
| Troy Ounce | 223,338.00 |
FXStreet calculates Gold prices in India by adapting international prices (USD/INR) to the local currency and measurement units. Prices are updated daily based on the market rates taken at the time of publication. Prices are just for reference and local rates could diverge slightly.
Gold FAQs
Gold has played a key role in human’s history as it has been widely used as a store of value and medium of exchange. Currently, apart from its shine and usage for jewelry, the precious metal is widely seen as a safe-haven asset, meaning that it is considered a good investment during turbulent times. Gold is also widely seen as a hedge against inflation and against depreciating currencies as it doesn’t rely on any specific issuer or government.
Central banks are the biggest Gold holders. In their aim to support their currencies in turbulent times, central banks tend to diversify their reserves and buy Gold to improve the perceived strength of the economy and the currency. High Gold reserves can be a source of trust for a country’s solvency. Central banks added 1,136 tonnes of Gold worth around $70 billion to their reserves in 2022, according to data from the World Gold Council. This is the highest yearly purchase since records began. Central banks from emerging economies such as China, India and Turkey are quickly increasing their Gold reserves.
Gold has an inverse correlation with the US Dollar and US Treasuries, which are both major reserve and safe-haven assets. When the Dollar depreciates, Gold tends to rise, enabling investors and central banks to diversify their assets in turbulent times. Gold is also inversely correlated with risk assets. A rally in the stock market tends to weaken Gold price, while sell-offs in riskier markets tend to favor the precious metal.
The price can move due to a wide range of factors. Geopolitical instability or fears of a deep recession can quickly make Gold price escalate due to its safe-haven status. As a yield-less asset, Gold tends to rise with lower interest rates, while higher cost of money usually weighs down on the yellow metal. Still, most moves depend on how the US Dollar (USD) behaves as the asset is priced in dollars (XAU/USD). A strong Dollar tends to keep the price of Gold controlled, whereas a weaker Dollar is likely to push Gold prices up.
(An automation tool was used in creating this post.)
- The Japanese Yen struggles to register any meaningful recovery against its American counterpart.
- The USD stands tall near a two-month top amid bets for a less aggressive policy easing by the Fed.
- The divergent BoJ-Fed policy expectations might cap any meaningful upside for the USD/JPY pair.
The Japanese Yen (JPY) remains on the defensive against its American counterpart on Monday and languishes near its lowest level since early August during the Asian session. Japanese Prime Minister Shigeru Ishiba's remarks earlier this month, saying that the economy was not ready for further interest rate hikes, raised doubt about the Bank of Japan's (BoJ) rate hike plans. This, along with a generally positive tone around the equity markets, continues to undermine demand for the safe-haven JPY.
The US Dollar (USD), on the other hand, stands tall near a two-month high amid expectations for a less aggressive policy easing by the Federal Reserve (Fed) and turns out to be another factor acting as a tailwind for the USD/JPY pair. The Fed, however, is still expected to lower borrowing costs by 25 basis points in November. In contrast, the BoJ is more likely to stick to its rate-hiking cycle, which might cap the currency pair amid relatively thin trading volumes on the back of a holiday in Japan and the US.
Daily Digest Market Movers: Japanese Yen continues to be undermined by the BoJ rate hike uncertainty
- The futures market implies a less than 50% chance that the Bank of Japan will hike interest rates by 10 basis points before the end of this year in the wake of Japanese Prime Minister Shigeru Ishiba's dovish turn earlier this October.
- Moreover, a drop in Japan's real wages for the first time in three months, declining household spending and signs that price pressures from raw material costs were subsiding cast doubts over how aggressively the BoJ could raise rates.
- China’s finance ministry hinted at more debt issuance amid efforts to shore up the domestic economy and said that the central government has room for a deficit increase, though fell short of providing specific details of the stimulus.
- Investors, however, seem optimistic that comprehensive measures will be introduced to stabilize key sectors of the economy and further took cues from the recent rally in the US equity indices, which touched record highs on Friday.
- The US Bureau of Labor Statistics reported that the headline Producer Price Index (PPI) for final demand rose 1.8% and the core gauge climbed 2.8% on a yearly basis in September, both coming in slightly above market expectations.
- This comes on top of last Thursday's hotter-than-expected US consumer inflation figures and closes the door for another jumbo rate cut by the Federal Reserve in November, pushing the US Dollar back closer to a two-month top.
- That said, the US central bank is still expected to continue lowering interest rates amid signs of labor market weakness and the BoJ is anticipated to hike rates again by the year-end, which caps the upside for the USD/JPY pair.
Technical Outlook: USD/JPY seems poised to climb further and aim to reclaim the 150.00 psychological mark
From a technical perspective, the recent breakout through the 50-day Simple Moving Average (SMA) barrier – for the first time since mid-July – and acceptance above the 38.2% Fibonacci retracement level of the July-September downfall favors bulls. This, along with positive oscillators on the daily chart, suggests that the path of least resistance for the USD/JPY pair remains to the upside. Some follow-through buying beyond last week's swing high, around the 149.55-149.60 region, will reaffirm the positive bias and lift spot prices to the 150.00 psychological mark. The momentum could extend further towards the 50% Fibo. level, around the 150.75-150.80 region.
On the flip side, any meaningful slide below the 149.00 round figure could be seen as a buying opportunity near the 148.55 region. This should help limit the downside for the USD/JPY pair near the 148.00 mark. The latter is likely to act as a key pivotal point, which if broken decisively might prompt some technical selling and drag spot prices to the 147.35 intermediate support en route to the 147.00 mark and the 146.50 area.
Japanese Yen FAQs
The Japanese Yen (JPY) is one of the world’s most traded currencies. Its value is broadly determined by the performance of the Japanese economy, but more specifically by the Bank of Japan’s policy, the differential between Japanese and US bond yields, or risk sentiment among traders, among other factors.
One of the Bank of Japan’s mandates is currency control, so its moves are key for the Yen. The BoJ has directly intervened in currency markets sometimes, generally to lower the value of the Yen, although it refrains from doing it often due to political concerns of its main trading partners. The BoJ ultra-loose monetary policy between 2013 and 2024 caused the Yen to depreciate against its main currency peers due to an increasing policy divergence between the Bank of Japan and other main central banks. More recently, the gradually unwinding of this ultra-loose policy has given some support to the Yen.
Over the last decade, the BoJ’s stance of sticking to ultra-loose monetary policy has led to a widening policy divergence with other central banks, particularly with the US Federal Reserve. This supported a widening of the differential between the 10-year US and Japanese bonds, which favored the US Dollar against the Japanese Yen. The BoJ decision in 2024 to gradually abandon the ultra-loose policy, coupled with interest-rate cuts in other major central banks, is narrowing this differential.
The Japanese Yen is often seen as a safe-haven investment. This means that in times of market stress, investors are more likely to put their money in the Japanese currency due to its supposed reliability and stability. Turbulent times are likely to strengthen the Yen’s value against other currencies seen as more risky to invest in.
- WTI depreciates due to deflation worries in China.
- Oil prices struggle due to uncertainty surrounding China's economic stimulus plans.
- The US expanded sanctions on Iran's petroleum and petrochemical sectors in response to an Iranian attack on Israel.
West Texas Intermediate (WTI) Oil price extends its losses for the second successive session, trading around $74.10 per barrel during the Asian hours on Monday. WTI price has depreciated by more than 1% following the lower-than-expected September Consumer Price Index (CPI) data from China released on Sunday.
The National Bureau of Statistics of China reported that the country's monthly Consumer Price Index (CPI) remained unchanged at 0% in September, down from August's 0.4% increase. The annual inflation rate rose by 0.4%, falling short of the anticipated 0.6%. Additionally, the Producer Price Index (PPI) decreased by 2.8% year-on-year, a larger drop than the previous decline of 1.8% and exceeding expectations of a 2.5% decrease.
Crude oil prices also face downward pressure due to uncertainty surrounding economic stimulus plans in China, raising fears about demand in the world's largest Oil importing country. However, following a briefing from China's Ministry of Finance (MoF) on Saturday, the National People’s Congress expressed optimism. The ministry announced plans to issue special bonds aimed at supporting bank recapitalization and stabilizing the real estate sector, although no specific figures were provided.
The downside of the Oil prices could be limited following the escalating tensions in the Middle East. The United States (US) expanded sanctions against Iran's petroleum and petrochemical sectors on Friday in response to an Iranian missile attack on Israel, per Reuters.
On Sunday, Hezbollah claimed responsibility for the drone attack in north-central Israel, killing at least four Israeli soldiers were killed, and over 60 people were injured, according to CNN. The number of injuries makes the attack one of the bloodiest on Israel since the war started last October.
WTI Oil FAQs
WTI Oil is a type of Crude Oil sold on international markets. The WTI stands for West Texas Intermediate, one of three major types including Brent and Dubai Crude. WTI is also referred to as “light” and “sweet” because of its relatively low gravity and sulfur content respectively. It is considered a high quality Oil that is easily refined. It is sourced in the United States and distributed via the Cushing hub, which is considered “The Pipeline Crossroads of the World”. It is a benchmark for the Oil market and WTI price is frequently quoted in the media.
Like all assets, supply and demand are the key drivers of WTI Oil price. As such, global growth can be a driver of increased demand and vice versa for weak global growth. Political instability, wars, and sanctions can disrupt supply and impact prices. The decisions of OPEC, a group of major Oil-producing countries, is another key driver of price. The value of the US Dollar influences the price of WTI Crude Oil, since Oil is predominantly traded in US Dollars, thus a weaker US Dollar can make Oil more affordable and vice versa.
The weekly Oil inventory reports published by the American Petroleum Institute (API) and the Energy Information Agency (EIA) impact the price of WTI Oil. Changes in inventories reflect fluctuating supply and demand. If the data shows a drop in inventories it can indicate increased demand, pushing up Oil price. Higher inventories can reflect increased supply, pushing down prices. API’s report is published every Tuesday and EIA’s the day after. Their results are usually similar, falling within 1% of each other 75% of the time. The EIA data is considered more reliable, since it is a government agency.
OPEC (Organization of the Petroleum Exporting Countries) is a group of 12 Oil-producing nations who collectively decide production quotas for member countries at twice-yearly meetings. Their decisions often impact WTI Oil prices. When OPEC decides to lower quotas, it can tighten supply, pushing up Oil prices. When OPEC increases production, it has the opposite effect. OPEC+ refers to an expanded group that includes ten extra non-OPEC members, the most notable of which is Russia.
A spokesperson at the US Department of State said on Monday that they are “seriously concerned by the People's Liberation Army (PLA) military drills in the Taiwan strait and around Taiwan.”
Additional quotes
“Call on the People's Republic of China (PRC)to act with restraint and to avoid any further actions that may undermine peace and stability across the Taiwan strait and in the broader region.”
“Continue to monitor PRC activities and coordinate with allies and partners regarding our shared concerns.”
“The US remains committed to its longstanding one-China policy.”
These comments come after China's military launched a new round of war games near Taiwan on Monday. Taiwanese Defence Ministry said in a statement that “we will not escalate conflict in our response.”
Australian Dollar FAQs
One of the most significant factors for the Australian Dollar (AUD) is the level of interest rates set by the Reserve Bank of Australia (RBA). Because Australia is a resource-rich country another key driver is the price of its biggest export, Iron Ore. The health of the Chinese economy, its largest trading partner, is a factor, as well as inflation in Australia, its growth rate and Trade Balance. Market sentiment – whether investors are taking on more risky assets (risk-on) or seeking safe-havens (risk-off) – is also a factor, with risk-on positive for AUD.
The Reserve Bank of Australia (RBA) influences the Australian Dollar (AUD) by setting the level of interest rates that Australian banks can lend to each other. This influences the level of interest rates in the economy as a whole. The main goal of the RBA is to maintain a stable inflation rate of 2-3% by adjusting interest rates up or down. Relatively high interest rates compared to other major central banks support the AUD, and the opposite for relatively low. The RBA can also use quantitative easing and tightening to influence credit conditions, with the former AUD-negative and the latter AUD-positive.
China is Australia’s largest trading partner so the health of the Chinese economy is a major influence on the value of the Australian Dollar (AUD). When the Chinese economy is doing well it purchases more raw materials, goods and services from Australia, lifting demand for the AUD, and pushing up its value. The opposite is the case when the Chinese economy is not growing as fast as expected. Positive or negative surprises in Chinese growth data, therefore, often have a direct impact on the Australian Dollar and its pairs.
Iron Ore is Australia’s largest export, accounting for $118 billion a year according to data from 2021, with China as its primary destination. The price of Iron Ore, therefore, can be a driver of the Australian Dollar. Generally, if the price of Iron Ore rises, AUD also goes up, as aggregate demand for the currency increases. The opposite is the case if the price of Iron Ore falls. Higher Iron Ore prices also tend to result in a greater likelihood of a positive Trade Balance for Australia, which is also positive of the AUD.
The Trade Balance, which is the difference between what a country earns from its exports versus what it pays for its imports, is another factor that can influence the value of the Australian Dollar. If Australia produces highly sought after exports, then its currency will gain in value purely from the surplus demand created from foreign buyers seeking to purchase its exports versus what it spends to purchase imports. Therefore, a positive net Trade Balance strengthens the AUD, with the opposite effect if the Trade Balance is negative.
- The Australian Dollar declines following the lower CPI data from its largest trading partner, China.
- The Commonwealth Bank of Australia expects the RBA to implement a 25 basis point rate cut in December.
- The US Dollar appreciates as traders expect the Fed to slow the pace of borrowing cost reductions.
The Australian Dollar (AUD) edges lower after two days of gains against the US Dollar (USD) on Monday. The AUD/USD pair receives downward pressure from the lower-than-expected September Consumer Price Index (CPI) data from its major trading partner China released on Sunday.
The AUD may have attracted sellers after a detailed note from the Commonwealth Bank of Australia indicated expectations that the Reserve Bank of Australia (RBA) will implement a 25 basis point rate cut by the end of 2024. The report suggested that a stronger disinflationary trend than the RBA anticipates is essential for the Board to consider easing policy within this calendar year.
The decline of the AUD/USD pair could also be linked to a stronger US Dollar (USD), fueled by expectations that the US Federal Reserve (Fed) will slow the pace of borrowing cost reductions more than previously anticipated. According to the CME FedWatch Tool, the markets are pricing in an 86.9% chance of a 25 basis point rate cut in November, with no expectation for a 50-basis-point reduction.
Daily Digest Market Movers: Australian Dollar depreciates following lower inflation data from China
- The risk-sensitive AUD/USD pair might have received downward pressure due to escalating tensions in the Middle East that have sparked concerns of a broader regional conflict. According to CNN, at least four Israeli soldiers were killed, and over 60 people were injured in a drone attack in north-central Israel on Sunday.
- The National Bureau of Statistics of China reported that the country's monthly Consumer Price Index (CPI) remained unchanged at 0% in September, down from August's 0.4% increase. The annual inflation rate rose by 0.4%, falling short of the anticipated 0.6%. Additionally, the Producer Price Index (PPI) decreased by 2.8% year-on-year, a larger drop than the previous decline of 1.8% and exceeding expectations of a 2.5% decrease.
- On Saturday, the National People’s Congress expressed an optimistic outlook following a briefing from China’s Ministry of Finance (MoF). The MoF emphasized key priorities focused on stabilizing the property market and tackling local government debt issues. The ministry indicated that special bonds would be issued to support both bank recapitalization and efforts to stabilize the real estate sector.
- The US Producer Price Index (PPI) for September remained unchanged at 0%, below August’s 0.2% month-on-month increase. Meanwhile, the monthly core PPI, which excludes food and energy prices, expanded by 0.2% as expected, down from 0.3% the prior month.
- Chicago Fed President Austan Goolsbee spoke to Bloomberg, commending the progress made on inflation and the labor market. Goolsbee noted that despite the positive jobs report for September, there are no indications of overheating in the economy.
- Last week, the Reserve Bank of Australia released the Minutes from its September monetary policy meeting, suggesting that board members examined potential scenarios for both lowering and raising interest rates in the future. The discussion indicated that future financial conditions may need to be either tighter or looser than current levels to meet the Board's objectives.
Technical Analysis: Australian Dollar holds position below 0.6750, lower boundary of the descending channel
The AUD/USD pair trades near 0.6730 on Monday. Technical analysis of the daily chart indicates that the pair is testing the upper boundary of the descending channel. A successful breach would indicate a potential for momentum change from bearish to bullish bias. However, the 14-day Relative Strength Index (RSI) is positioned below the 50 level, suggesting that bearish momentum is still active.
Regarding resistance, the AUD/USD pair could test the nine-day Exponential Moving Average (EMA) at 0.6766 level, followed by the psychological level of 0.6800.
On the downside, the AUD/USD pair could explore the region around the lower boundary of the descending channel at 0.6640 level, followed by its eight-week low of 0.6622, recorded on September 11.
AUD/USD: Daily Chart
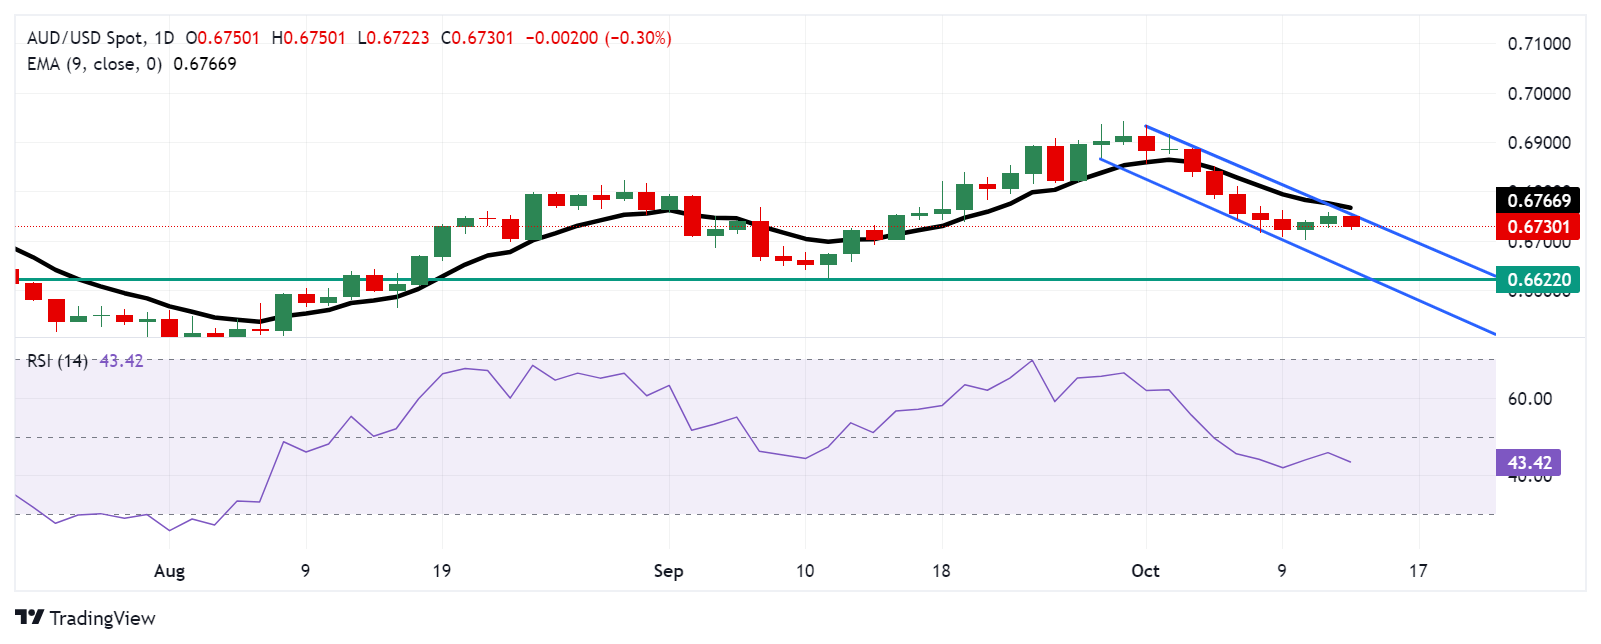
Australian Dollar PRICE Today
The table below shows the percentage change of Australian Dollar (AUD) against listed major currencies today. Australian Dollar was the weakest against the British Pound.
| USD | EUR | GBP | JPY | CAD | AUD | NZD | CHF | |
|---|---|---|---|---|---|---|---|---|
| USD | 0.12% | 0.11% | 0.12% | 0.07% | 0.28% | 0.29% | 0.18% | |
| EUR | -0.12% | -0.08% | -0.10% | 0.03% | 0.18% | 0.08% | -0.04% | |
| GBP | -0.11% | 0.08% | -0.02% | -0.02% | 0.30% | 0.19% | 0.02% | |
| JPY | -0.12% | 0.10% | 0.02% | -0.05% | 0.18% | 0.23% | 0.05% | |
| CAD | -0.07% | -0.03% | 0.02% | 0.05% | 0.16% | 0.25% | -0.07% | |
| AUD | -0.28% | -0.18% | -0.30% | -0.18% | -0.16% | 0.02% | -0.14% | |
| NZD | -0.29% | -0.08% | -0.19% | -0.23% | -0.25% | -0.02% | -0.18% | |
| CHF | -0.18% | 0.04% | -0.02% | -0.05% | 0.07% | 0.14% | 0.18% |
The heat map shows percentage changes of major currencies against each other. The base currency is picked from the left column, while the quote currency is picked from the top row. For example, if you pick the Australian Dollar from the left column and move along the horizontal line to the US Dollar, the percentage change displayed in the box will represent AUD (base)/USD (quote).
Australian Dollar FAQs
One of the most significant factors for the Australian Dollar (AUD) is the level of interest rates set by the Reserve Bank of Australia (RBA). Because Australia is a resource-rich country another key driver is the price of its biggest export, Iron Ore. The health of the Chinese economy, its largest trading partner, is a factor, as well as inflation in Australia, its growth rate and Trade Balance. Market sentiment – whether investors are taking on more risky assets (risk-on) or seeking safe-havens (risk-off) – is also a factor, with risk-on positive for AUD.
The Reserve Bank of Australia (RBA) influences the Australian Dollar (AUD) by setting the level of interest rates that Australian banks can lend to each other. This influences the level of interest rates in the economy as a whole. The main goal of the RBA is to maintain a stable inflation rate of 2-3% by adjusting interest rates up or down. Relatively high interest rates compared to other major central banks support the AUD, and the opposite for relatively low. The RBA can also use quantitative easing and tightening to influence credit conditions, with the former AUD-negative and the latter AUD-positive.
China is Australia’s largest trading partner so the health of the Chinese economy is a major influence on the value of the Australian Dollar (AUD). When the Chinese economy is doing well it purchases more raw materials, goods and services from Australia, lifting demand for the AUD, and pushing up its value. The opposite is the case when the Chinese economy is not growing as fast as expected. Positive or negative surprises in Chinese growth data, therefore, often have a direct impact on the Australian Dollar and its pairs.
Iron Ore is Australia’s largest export, accounting for $118 billion a year according to data from 2021, with China as its primary destination. The price of Iron Ore, therefore, can be a driver of the Australian Dollar. Generally, if the price of Iron Ore rises, AUD also goes up, as aggregate demand for the currency increases. The opposite is the case if the price of Iron Ore falls. Higher Iron Ore prices also tend to result in a greater likelihood of a positive Trade Balance for Australia, which is also positive of the AUD.
The Trade Balance, which is the difference between what a country earns from its exports versus what it pays for its imports, is another factor that can influence the value of the Australian Dollar. If Australia produces highly sought after exports, then its currency will gain in value purely from the surplus demand created from foreign buyers seeking to purchase its exports versus what it spends to purchase imports. Therefore, a positive net Trade Balance strengthens the AUD, with the opposite effect if the Trade Balance is negative.
- The Indian Rupee drifts higher in Monday’s Asian session.
- Elevated oil prices and sustained outflows from local stocks weigh on the INR; RBI intervention might help limit its losses.
- India’s Wholesale Price Index (WPI) inflation data will take center stage on Monday.
The Indian Rupee (INR) recovers some lost ground on Monday after retreating to an all-time low in the previous session. The concerns about the recent spike in oil prices amid geopolitical tensions, significant foreign investor sell-offs from the equity market and higher demand for the greenback from foreign banks undermine the local currency.
Nonetheless, the likely intervention from the Reserve Bank of India (RBI) by US Dollar sales from state-run banks might cap the downside for the INR. Traders will keep an eye on India’s Wholesale Price Index (WPI) Inflation on Monday, which is expected to rise to 1.90% YoY in September from 1.31% in August. On the US docket, the NY Empire State Manufacturing Index for October will be released.
Daily Digest Market Movers: Indian Rupee recovers, potential upside seems limited
- “Indian Rupee fell below the 84 per US Dollar mark for the first time on demand from foreign banks amid FII outflows and elevated crude oil prices. Weak domestic markets also weighed on the Rupee,” said Anuj Choudhary, Research Analyst, Sharekhan by BNP Paribas.
- The annual PPI rose 1.8% YoY in September, compared to a 1.9% increase seen in August, and came in above the market expectation of 1.6%. The core PPI climbed 2.8% YoY in the same period, surpassing analysts' forecast of 2.7%.
- On a monthly basis, the US PPI was unchanged in September, while the core PPI was up 0.2% during the same period.
- The preliminary reading of the US University of Michigan Consumer Sentiment Index fell to 68.9 in October from 70.1 in September, below the consensus of 70.8. The 5-year consumer inflation expectations came in at 3.0% in September.
- The swaps markets show the Fed’s odds for a 25 bps rate cut at 95.6%, up from 83.3% before the PPI data, according to the CME FedWatch Tool.
Technical Analysis: USD/INR’s broader trend remains constructive
The Indian Rupee trades in positive territory on the day. The positive view of the USD/INR pair remains intact as the pair is still above the ascending trend line and the key 100-day Exponential Moving Average (EMA) on the daily timeframe. Additionally, the 14-day Relative Strength Index (RSI) is located above the midline near 64.20, hinting that the uptrend is more likely to gain traction than reverse.
The first upside barrier of USD/INR emerges near the all-time high of 84.15. A continuation of the climb past this level could pave the way for a test of 84.50.
On the flip side, the resistance-turned-support level at 83.90 acts as an initial support level for the pair. A breach of the mentioned level could see a drop to the 100-day EMA at 83.69, followed by 83.00, representing the round mark and the low of May 24.
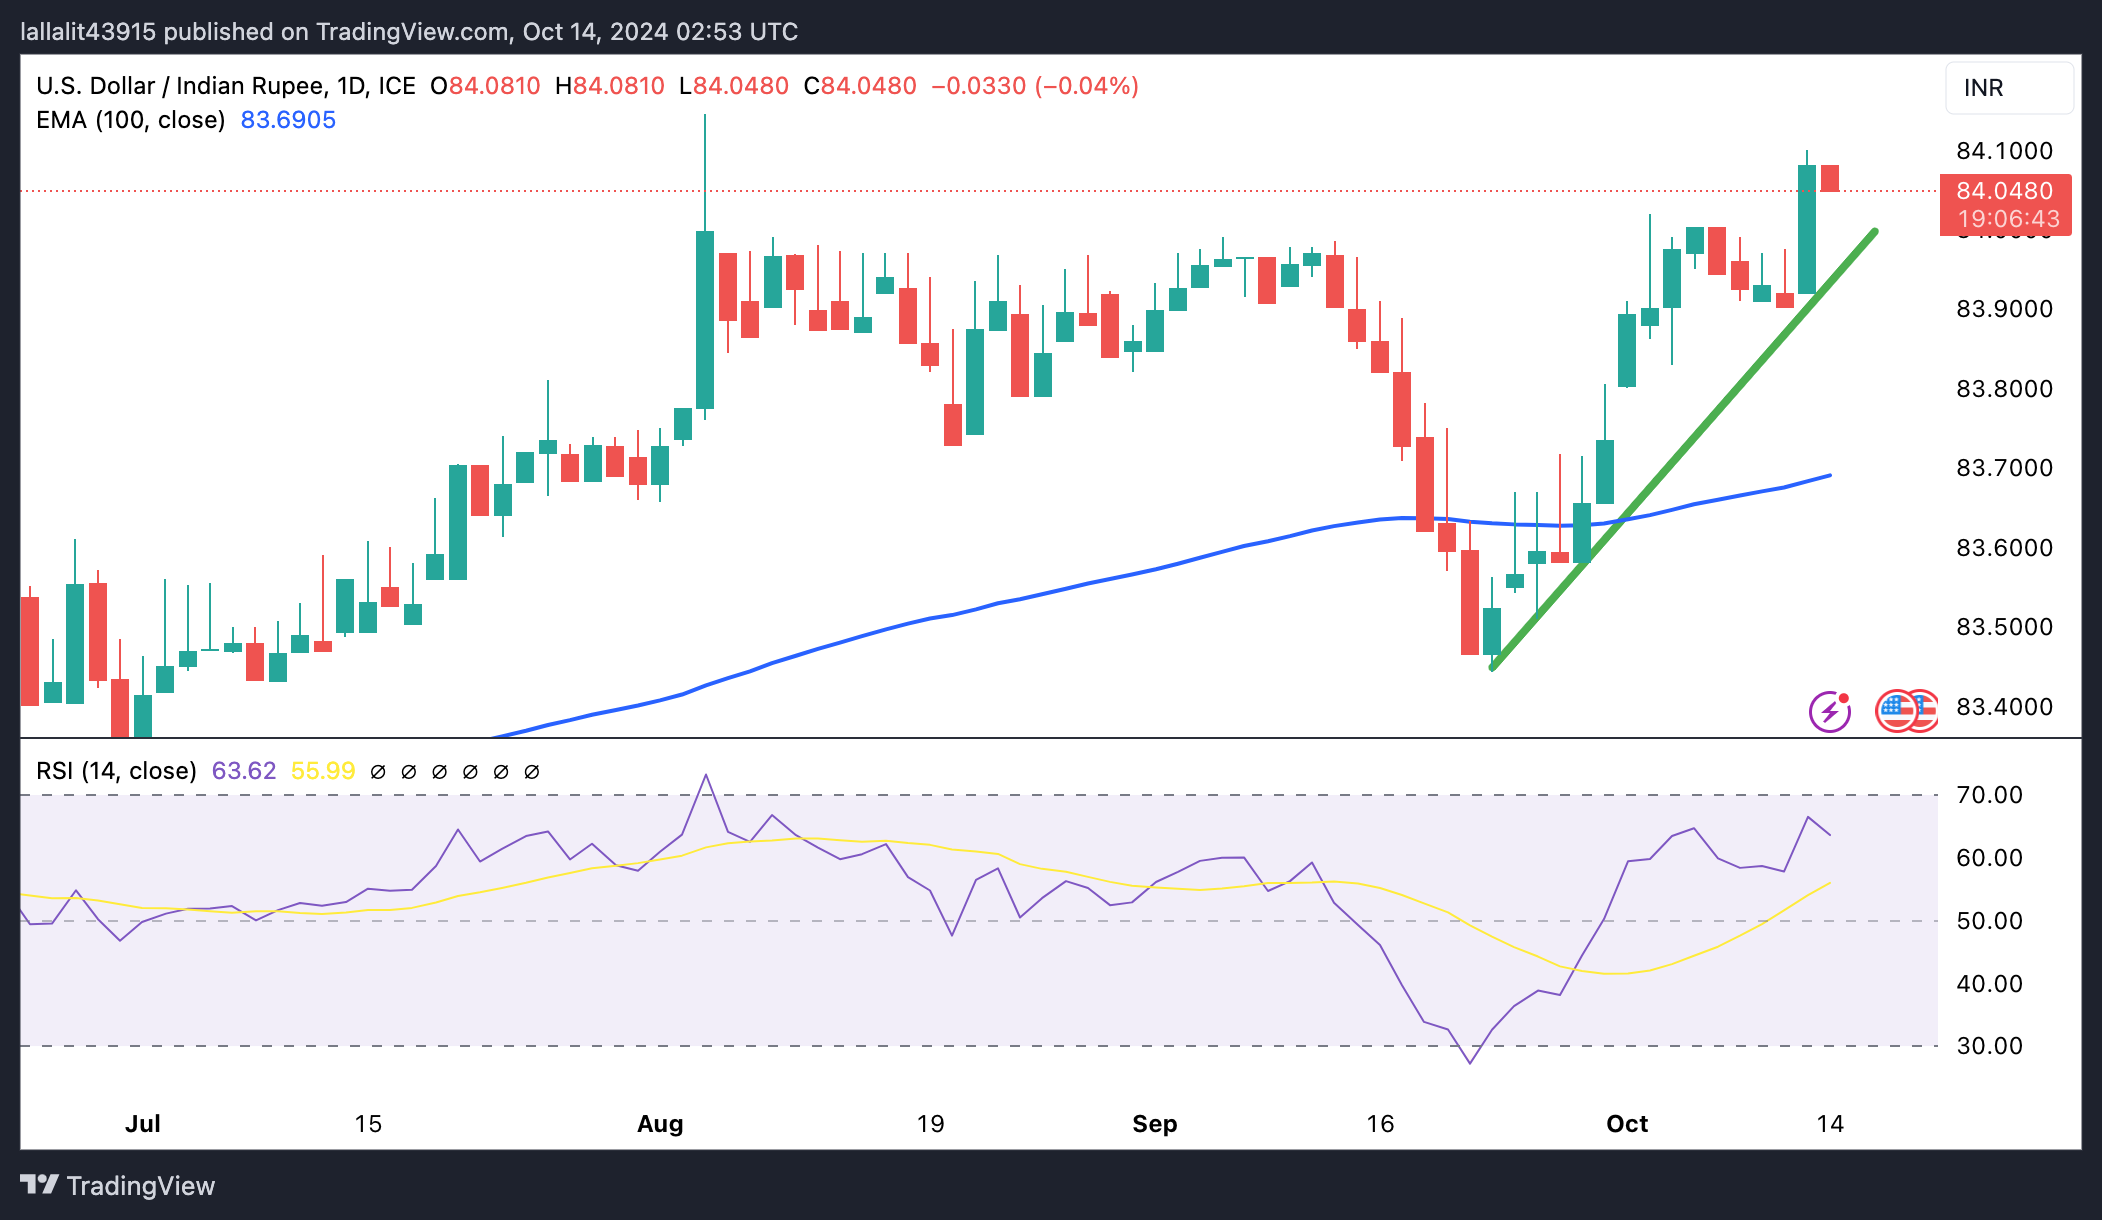
Indian Rupee FAQs
The Indian Rupee (INR) is one of the most sensitive currencies to external factors. The price of Crude Oil (the country is highly dependent on imported Oil), the value of the US Dollar – most trade is conducted in USD – and the level of foreign investment, are all influential. Direct intervention by the Reserve Bank of India (RBI) in FX markets to keep the exchange rate stable, as well as the level of interest rates set by the RBI, are further major influencing factors on the Rupee.
The Reserve Bank of India (RBI) actively intervenes in forex markets to maintain a stable exchange rate, to help facilitate trade. In addition, the RBI tries to maintain the inflation rate at its 4% target by adjusting interest rates. Higher interest rates usually strengthen the Rupee. This is due to the role of the ‘carry trade’ in which investors borrow in countries with lower interest rates so as to place their money in countries’ offering relatively higher interest rates and profit from the difference.
Macroeconomic factors that influence the value of the Rupee include inflation, interest rates, the economic growth rate (GDP), the balance of trade, and inflows from foreign investment. A higher growth rate can lead to more overseas investment, pushing up demand for the Rupee. A less negative balance of trade will eventually lead to a stronger Rupee. Higher interest rates, especially real rates (interest rates less inflation) are also positive for the Rupee. A risk-on environment can lead to greater inflows of Foreign Direct and Indirect Investment (FDI and FII), which also benefit the Rupee.
Higher inflation, particularly, if it is comparatively higher than India’s peers, is generally negative for the currency as it reflects devaluation through oversupply. Inflation also increases the cost of exports, leading to more Rupees being sold to purchase foreign imports, which is Rupee-negative. At the same time, higher inflation usually leads to the Reserve Bank of India (RBI) raising interest rates and this can be positive for the Rupee, due to increased demand from international investors. The opposite effect is true of lower inflation.
| Raw materials | Closed | Change, % |
|---|---|---|
| Silver | 31.532 | 1.36 |
| Gold | 265.693 | 1.08 |
| Palladium | 1063.01 | -0.64 |
- Gold price attracts some sellers and snaps a two-day winning streak amid a bullish USD.
- Expectations for a less aggressive Fed easing underpin the US bond yields and the buck.
- Geopolitical risks and bets that the Fed will cut rates further limit losses for the XAU/USD.
Gold price (XAU/USD) rallied over 1% on Friday and settled near the weekly top following the release of the US Producer Price Index (PPI), which pointed to a favorable inflation outlook and suggested that the Federal Reserve (Fed) will cut interest rates further. Apart from this, safe-haven demand stemming from the geopolitical tensions in the Middle East further benefited the bullion and contributed to the move up.
That said, investors have now fully priced out the possibility of another oversized Fed rate cut in November. This keeps the US Treasury bond yields elevated and the US Dollar (USD) close to its highest level since mid-August touched last week. Adding to this, the optimism led by China's pledge to increase debt to revive its economy exerts some pressure on the Gold price during the Asian session on Monday.
Daily Digest Market Movers: Gold price is pressured by modest USD strength, downside potential seems limited
- The US Bureau of Labor Statistics reported that the headline Producer Price Index (PPI) for final demand rose 1.8% and the core gauge climbed 2.8% on a yearly basis in September.
- The readings were slightly higher than consensus estimates, though pointed to a deceleration in price rise, which should allow the Federal Reserve to continue cutting interest rates.
- According to the CME Group's FedWatch Tool, the markets are currently pricing in over a 90% chance that the Fed will lower borrowing costs by 25 basis points in November.
- The yield on the benchmark 10-year US Government bond, however, holds steady above the 4% threshold amid diminishing odds for a more aggressive policy easing by the Fed.
- This, in turn, assists the US Dollar to stand tall near a two-month peak and turns out to be a key factor that prompts fresh selling around the Gold price on the first day of a new week.
- Government data released over the weekend showed that China's headline Consumer Price Index was flat in September and the yearly rate stood at 0.4%, missing market expectations.
- This, along with the lack of numerical details for China's fiscal stimulus and escalating geopolitical tensions in the Middle East, should offer support to the safe-haven precious metal.
- The US market is closed on Monday for the Columbus Day holiday, leaving the XAU/USD at the mercy of the USD price dynamics and fresh geopolitical developments.
Technical Outlook: Gold price setup supports prospects for the emergence of dip-buying, $2,600 holds the key for bulls
Any subsequent slide is likely to find some support near the $2,632-2,630 region, below which the Gold price could accelerate the fall towards the $2,600 round-figure mark. A convincing break below the latter will be seen as a fresh trigger for bearish traders and pace the way for some meaningful downfall. The XAU/USD might then drop to the next relevant support near the $2,560 zone and extend the decline towards the $2,535-2,530 region en route to the $2,500 psychological mark.
Meanwhile, positive oscillators on the daily chart favor bullish traders. That said, it will still be prudent to wait for some follow-through buying beyond the $2,660-2,662 horizontal resistance before positioning a further near-term appreciating move. The subsequent move up has the potential to lift the Gold price to an all-time high, around the $2,685-2,686 region touched in September. This is closely followed by the $2,700 round-figure mark, which if cleared decisively will set the stage for an extension of a well-established multi-month-old uptrend.
Gold FAQs
Gold has played a key role in human’s history as it has been widely used as a store of value and medium of exchange. Currently, apart from its shine and usage for jewelry, the precious metal is widely seen as a safe-haven asset, meaning that it is considered a good investment during turbulent times. Gold is also widely seen as a hedge against inflation and against depreciating currencies as it doesn’t rely on any specific issuer or government.
Central banks are the biggest Gold holders. In their aim to support their currencies in turbulent times, central banks tend to diversify their reserves and buy Gold to improve the perceived strength of the economy and the currency. High Gold reserves can be a source of trust for a country’s solvency. Central banks added 1,136 tonnes of Gold worth around $70 billion to their reserves in 2022, according to data from the World Gold Council. This is the highest yearly purchase since records began. Central banks from emerging economies such as China, India and Turkey are quickly increasing their Gold reserves.
Gold has an inverse correlation with the US Dollar and US Treasuries, which are both major reserve and safe-haven assets. When the Dollar depreciates, Gold tends to rise, enabling investors and central banks to diversify their assets in turbulent times. Gold is also inversely correlated with risk assets. A rally in the stock market tends to weaken Gold price, while sell-offs in riskier markets tend to favor the precious metal.
The price can move due to a wide range of factors. Geopolitical instability or fears of a deep recession can quickly make Gold price escalate due to its safe-haven status. As a yield-less asset, Gold tends to rise with lower interest rates, while higher cost of money usually weighs down on the yellow metal. Still, most moves depend on how the US Dollar (USD) behaves as the asset is priced in dollars (XAU/USD). A strong Dollar tends to keep the price of Gold controlled, whereas a weaker Dollar is likely to push Gold prices up.
- USD/JPY trades on a stronger note near 149.20 in Monday’s Asian session.
- The BoJ rate hike uncertainty continues to undermine the JPY, but geopolitical risks might cap its downside.
- The US PPI supports the case for a Fed rate cut in November.
The USD/JPY pair extends its upside to around 149.20 on Monday during the early Asian trading hours. The firmer US Dollar (USD) and uncertainty about the Bank of Japan’s stance on monetary policy provide some support to the pair.
The doubts over how aggressive the BoJ would be in raising rates weigh on the Japanese Yen (JPY) against the USD. The BoJ ended negative interest rates in March and raised the short-term benchmark to 0.25% in July. The BoJ Governor Kazuo Ueda signaled the central bank's readiness to keep raising interest rates if economic and price developments move in line with its forecast. Nonetheless, uncertainty about Japanese Prime Minister Shigeru Ishiba's stance on monetary policy could complicate the decision to raise borrowing costs.
The ongoing geopolitical tensions in the Middle East might lift the safe-haven currency like the JPY and cap the upside for the pair. CNN reported on Sunday that at least four Israeli soldiers were killed and more than 60 people were injured by a drone attack in north-central Israel and Hezbollah has claimed responsibility for the attack.
The US Producer Price Index (PPI) data released on Friday points to a still-favorable inflation outlook and supports expectations of the Federal Reserve (Fed) rate cut next month. However, the prospect that the Fed will not cut rates as much as expected might underpin the Greenback.
Meanwhile, the USD Index (DXY), which tracks the USD against a basket of currencies, trades near the highest level since mid-August above the 103.00 psychological level. According to the CME FedWatch Tool, traders are pricing in roughly 88.6% odds that the Fed will cut the interest rate by 25 basis points (bps) in November.
Japanese Yen FAQs
The Japanese Yen (JPY) is one of the world’s most traded currencies. Its value is broadly determined by the performance of the Japanese economy, but more specifically by the Bank of Japan’s policy, the differential between Japanese and US bond yields, or risk sentiment among traders, among other factors.
One of the Bank of Japan’s mandates is currency control, so its moves are key for the Yen. The BoJ has directly intervened in currency markets sometimes, generally to lower the value of the Yen, although it refrains from doing it often due to political concerns of its main trading partners. The BoJ ultra-loose monetary policy between 2013 and 2024 caused the Yen to depreciate against its main currency peers due to an increasing policy divergence between the Bank of Japan and other main central banks. More recently, the gradually unwinding of this ultra-loose policy has given some support to the Yen.
Over the last decade, the BoJ’s stance of sticking to ultra-loose monetary policy has led to a widening policy divergence with other central banks, particularly with the US Federal Reserve. This supported a widening of the differential between the 10-year US and Japanese bonds, which favored the US Dollar against the Japanese Yen. The BoJ decision in 2024 to gradually abandon the ultra-loose policy, coupled with interest-rate cuts in other major central banks, is narrowing this differential.
The Japanese Yen is often seen as a safe-haven investment. This means that in times of market stress, investors are more likely to put their money in the Japanese currency due to its supposed reliability and stability. Turbulent times are likely to strengthen the Yen’s value against other currencies seen as more risky to invest in.
- EUR/USD receives downward pressure as the ECB is widely expected to deliver a 25 basis point rate cut on Thursday.
- Rising Middle-East tensions put pressure on the risk-sensitive Euro.
- The US Dollar gains ground as the Fed is projected to slow the pace of borrowing cost reductions.
EUR/USD continues its downward trend for the fourth consecutive session, hovering around 1.0920 during the Asian trading hours on Monday. The Euro faces downward pressure as the European Central Bank (ECB) prepares for its monetary policy decision on Thursday.
The ECB is widely anticipated to reduce its Main Refinancing Operations Rate by 25 basis points. Officials have signaled the potential for further reductions in response to the European Union's economic challenges. The central bank has already lowered rates twice this year and is expected to continue with incremental 25 basis point cuts in future meetings.
On the geopolitical front, escalating tensions in the Middle East have sparked concerns of a broader regional conflict, strengthening the safe-haven US Dollar and putting pressure on the risk-sensitive EUR/USD pair. According to CNN, at least four Israeli soldiers were killed, and over 60 people were injured in a drone attack in north-central Israel on Sunday.
The decline of the EUR/USD pair could also be linked to a stronger US Dollar (USD), fueled by expectations that the US Federal Reserve (Fed) will slow the pace of borrowing cost reductions more than previously anticipated.
Traders are looking for a 25 basis points (bps) rate cut from the Fed in November, following the release of the Producer Price Index (PPI) data from the United States last Friday. According to the CME FedWatch Tool, the markets are pricing in an 86.9% chance of a 25 basis point rate cut in November, with no expectation for a 50-basis-point reduction.
In September, the annual Producer Price Index (PPI) increased by 1.8%, following a 1.9% rise in August, and exceeded market expectations of 1.6%. Meanwhile, the annual core PPI, which excludes food and energy prices, rose by 2.8%, surpassing analysts' forecast of 2.7%.
Euro FAQs
The Euro is the currency for the 19 European Union countries that belong to the Eurozone. It is the second most heavily traded currency in the world behind the US Dollar. In 2022, it accounted for 31% of all foreign exchange transactions, with an average daily turnover of over $2.2 trillion a day. EUR/USD is the most heavily traded currency pair in the world, accounting for an estimated 30% off all transactions, followed by EUR/JPY (4%), EUR/GBP (3%) and EUR/AUD (2%).
The European Central Bank (ECB) in Frankfurt, Germany, is the reserve bank for the Eurozone. The ECB sets interest rates and manages monetary policy. The ECB’s primary mandate is to maintain price stability, which means either controlling inflation or stimulating growth. Its primary tool is the raising or lowering of interest rates. Relatively high interest rates – or the expectation of higher rates – will usually benefit the Euro and vice versa. The ECB Governing Council makes monetary policy decisions at meetings held eight times a year. Decisions are made by heads of the Eurozone national banks and six permanent members, including the President of the ECB, Christine Lagarde.
Eurozone inflation data, measured by the Harmonized Index of Consumer Prices (HICP), is an important econometric for the Euro. If inflation rises more than expected, especially if above the ECB’s 2% target, it obliges the ECB to raise interest rates to bring it back under control. Relatively high interest rates compared to its counterparts will usually benefit the Euro, as it makes the region more attractive as a place for global investors to park their money.
Data releases gauge the health of the economy and can impact on the Euro. Indicators such as GDP, Manufacturing and Services PMIs, employment, and consumer sentiment surveys can all influence the direction of the single currency. A strong economy is good for the Euro. Not only does it attract more foreign investment but it may encourage the ECB to put up interest rates, which will directly strengthen the Euro. Otherwise, if economic data is weak, the Euro is likely to fall. Economic data for the four largest economies in the euro area (Germany, France, Italy and Spain) are especially significant, as they account for 75% of the Eurozone’s economy.
Another significant data release for the Euro is the Trade Balance. This indicator measures the difference between what a country earns from its exports and what it spends on imports over a given period. If a country produces highly sought after exports then its currency will gain in value purely from the extra demand created from foreign buyers seeking to purchase these goods. Therefore, a positive net Trade Balance strengthens a currency and vice versa for a negative balance.
On Monday, the People’s Bank of China (PBoC) set the USD/CNY central rate for the trading session ahead at 7.0723, as compared to Friday's fix of 7.0731 and 7.0722 Reuters estimates.
- GBP/USD kicks off the new week on a weaker note amid sustained USD buying.
- Expectations for more aggressive BoE policy easing further undermine the GBP.
- The fundamental backdrop supports prospects for an extension of the downfall.
The GBP/USD pair struggles to capitalize on Friday's modest gains and attracts fresh sellers at the start of a new week. Spot prices currently trade around mid-1.3000s and remain close to a one-month low touched last Thursday amid a bullish US Dollar (USD).
The USD Index (DXY), which tracks the Greenback against a basket of currencies, stands tall near its highest level since mid-August as traders have priced out the possibility of further jumbo interest-rate cuts by the Federal Reserve (Fed) in November. This, along with persistent geopolitical risks stemming from the ongoing conflicts in the Middle East, turns out to be another factor benefiting the safe-haven buck and exerting some downward pressure on the GBP/USD pair.
The British Pound (GBP), on the other hand, is undermined by expectations that the Bank of England (BoE) might be heading towards speeding up its rate-cutting cycle. In fact, markets are pricing in a 90% chance that the BoE will cut rates in November. The bets were lifted by the recent comments from the BoE Governor Andrew Bailey, saying that there was a chance that the central bank could become a bit more aggressive in cutting rates if there's further good news on inflation.
Meanwhile, the initial market reaction to Friday's economic releases from the UK and the US fades rather quickly, suggesting that the path of least resistance for the GBP/USD pair is to the downside. The UK Office for National Statistics (ONS) reported that the economy grew by 0.2% in August, marking a modest recovery after two months of stagnation in June and July. This was accompanied by better-than-expected UK Manufacturing and Industrial Production figures for August.
From the US, the Producer Price Index for final demand was unchanged in September and rose 1.8% from a year ago. The core gauge that excludes volatile food and energy categories climbed 0.2% from the prior month and 2.8% from a year ago. The data pointed to a favourable inflation outlook and supported expectations for additional interest rate cuts by the Fed in November. This might hold back the USD bulls from placing aggressive bets and offer some support to the GBP/USD pair.
Pound Sterling FAQs
The Pound Sterling (GBP) is the oldest currency in the world (886 AD) and the official currency of the United Kingdom. It is the fourth most traded unit for foreign exchange (FX) in the world, accounting for 12% of all transactions, averaging $630 billion a day, according to 2022 data. Its key trading pairs are GBP/USD, also known as ‘Cable’, which accounts for 11% of FX, GBP/JPY, or the ‘Dragon’ as it is known by traders (3%), and EUR/GBP (2%). The Pound Sterling is issued by the Bank of England (BoE).
The single most important factor influencing the value of the Pound Sterling is monetary policy decided by the Bank of England. The BoE bases its decisions on whether it has achieved its primary goal of “price stability” – a steady inflation rate of around 2%. Its primary tool for achieving this is the adjustment of interest rates. When inflation is too high, the BoE will try to rein it in by raising interest rates, making it more expensive for people and businesses to access credit. This is generally positive for GBP, as higher interest rates make the UK a more attractive place for global investors to park their money. When inflation falls too low it is a sign economic growth is slowing. In this scenario, the BoE will consider lowering interest rates to cheapen credit so businesses will borrow more to invest in growth-generating projects.
Data releases gauge the health of the economy and can impact the value of the Pound Sterling. Indicators such as GDP, Manufacturing and Services PMIs, and employment can all influence the direction of the GBP. A strong economy is good for Sterling. Not only does it attract more foreign investment but it may encourage the BoE to put up interest rates, which will directly strengthen GBP. Otherwise, if economic data is weak, the Pound Sterling is likely to fall.
Another significant data release for the Pound Sterling is the Trade Balance. This indicator measures the difference between what a country earns from its exports and what it spends on imports over a given period. If a country produces highly sought-after exports, its currency will benefit purely from the extra demand created from foreign buyers seeking to purchase these goods. Therefore, a positive net Trade Balance strengthens a currency and vice versa for a negative balance.
On Sunday, at least four Israeli soldiers were killed and more than 60 people were injured by a drone attack in north-central Israel, per CNN. The number of injuries makes the attack one of the bloodiest on Israel since the war started last October. Hezbollah has claimed responsibility for the attack.
Market reaction
At the time of press, the XAU/USD pair was down 0.34% on the day at $2,648.
Gold FAQs
Gold has played a key role in human’s history as it has been widely used as a store of value and medium of exchange. Currently, apart from its shine and usage for jewelry, the precious metal is widely seen as a safe-haven asset, meaning that it is considered a good investment during turbulent times. Gold is also widely seen as a hedge against inflation and against depreciating currencies as it doesn’t rely on any specific issuer or government.
Central banks are the biggest Gold holders. In their aim to support their currencies in turbulent times, central banks tend to diversify their reserves and buy Gold to improve the perceived strength of the economy and the currency. High Gold reserves can be a source of trust for a country’s solvency. Central banks added 1,136 tonnes of Gold worth around $70 billion to their reserves in 2022, according to data from the World Gold Council. This is the highest yearly purchase since records began. Central banks from emerging economies such as China, India and Turkey are quickly increasing their Gold reserves.
Gold has an inverse correlation with the US Dollar and US Treasuries, which are both major reserve and safe-haven assets. When the Dollar depreciates, Gold tends to rise, enabling investors and central banks to diversify their assets in turbulent times. Gold is also inversely correlated with risk assets. A rally in the stock market tends to weaken Gold price, while sell-offs in riskier markets tend to favor the precious metal.
The price can move due to a wide range of factors. Geopolitical instability or fears of a deep recession can quickly make Gold price escalate due to its safe-haven status. As a yield-less asset, Gold tends to rise with lower interest rates, while higher cost of money usually weighs down on the yellow metal. Still, most moves depend on how the US Dollar (USD) behaves as the asset is priced in dollars (XAU/USD). A strong Dollar tends to keep the price of Gold controlled, whereas a weaker Dollar is likely to push Gold prices up.
| Index | Change, points | Closed | Change, % |
|---|---|---|---|
| NIKKEI 225 | 224.91 | 39605.8 | 0.57 |
| KOSPI | -2.25 | 2596.91 | -0.09 |
| ASX 200 | -8.5 | 8214.5 | -0.1 |
| DAX | 162.93 | 19373.83 | 0.85 |
| CAC 40 | 36.3 | 7577.89 | 0.48 |
| Dow Jones | 409.74 | 42863.86 | 0.97 |
| S&P 500 | 34.98 | 5815.03 | 0.61 |
| NASDAQ Composite | 60.89 | 18342.94 | 0.33 |
Japanese Prime Minister Shigeru Ishiba said on Sunday that he would not intervene in monetary policy affairs, as the Japanese central bank is mandated to achieve price stability, per Reuters.
Key quotes
It's important to avoid vocally intervening.
Whatever the government has to say, the Bank of Japan makes an individual decision on policy.
I believe the BOJ's governor and staff have a strong sense of responsibility over achieving price stability.
Consumption needs lifting to help achieve a sustained departure from deflation.
Real wages need to boost.
Market reaction
At the time of writing, USD/JPY is trading 0.05% higher on the day at 149.21.
Japanese Yen FAQs
The Japanese Yen (JPY) is one of the world’s most traded currencies. Its value is broadly determined by the performance of the Japanese economy, but more specifically by the Bank of Japan’s policy, the differential between Japanese and US bond yields, or risk sentiment among traders, among other factors.
One of the Bank of Japan’s mandates is currency control, so its moves are key for the Yen. The BoJ has directly intervened in currency markets sometimes, generally to lower the value of the Yen, although it refrains from doing it often due to political concerns of its main trading partners. The BoJ ultra-loose monetary policy between 2013 and 2024 caused the Yen to depreciate against its main currency peers due to an increasing policy divergence between the Bank of Japan and other main central banks. More recently, the gradually unwinding of this ultra-loose policy has given some support to the Yen.
Over the last decade, the BoJ’s stance of sticking to ultra-loose monetary policy has led to a widening policy divergence with other central banks, particularly with the US Federal Reserve. This supported a widening of the differential between the 10-year US and Japanese bonds, which favored the US Dollar against the Japanese Yen. The BoJ decision in 2024 to gradually abandon the ultra-loose policy, coupled with interest-rate cuts in other major central banks, is narrowing this differential.
The Japanese Yen is often seen as a safe-haven investment. This means that in times of market stress, investors are more likely to put their money in the Japanese currency due to its supposed reliability and stability. Turbulent times are likely to strengthen the Yen’s value against other currencies seen as more risky to invest in.
| Pare | Closed | Change, % |
|---|---|---|
| AUDUSD | 0.67499 | 0.17 |
| EURJPY | 163.085 | 0.37 |
| EURUSD | 1.0935 | 0.01 |
| GBPJPY | 194.832 | 0.41 |
| GBPUSD | 1.30647 | 0.06 |
| NZDUSD | 0.61079 | 0.25 |
| USDCAD | 1.37636 | 0.16 |
| USDCHF | 0.85722 | 0.11 |
| USDJPY | 149.132 | 0.36 |
- Gold price loses momentum to around $2,650 in Monday’s early Asian session.
- Weaker Chinese economic data undermine the Gold price.
- The US PPI report and Middle East geopolitical risks could support the yellow metal.
Gold price (XAU/USD) edges lower to $2,650, snapping the two-day winning streak during the early Asian session on Monday. The downbeat Chinese economic data and firmer Greenback weigh on the precious metal. Nonetheless, the prospects of further interest rate cuts this year and safe-haven demand might cap its downside.
China's deflation pressure increased in September. The Consumer Price Index (CPI) inflation unexpectedly eased in September, while the Producer Price Index (PPI) fell more than expected during the same period, highlighting the need for more stimulus measures. The persistent deflationary pressure in China is likely to exert some selling pressure on the yellow metal, as China is the world's largest Gold consumer.
The US Producer Price Index (PPI) was unchanged in September, indicating a still-favorable inflation outlook and supporting the bets of the Federal Reserve (Fed) rate cut in November. "The PPI numbers leaned friendly for the precious metals market bulls and suggest the Fed remains on track for two quarter-point interest rate cuts this year," said Jim Wyckoff, senior market analyst at Kitco Metals.
Additionally, the rising geopolitical tensions in the Middle East have triggered the fear of wider war in the region, boosting the traditional safe-haven assets like the Gold price. On Sunday, at least four Israeli soldiers were killed and more than 60 people were injured by a drone attack in north-central Israel, per CNN. The number of injuries makes the attack one of the bloodiest on Israel since the war started last October. Hezbollah has claimed responsibility for the attack.
Gold FAQs
Gold has played a key role in human’s history as it has been widely used as a store of value and medium of exchange. Currently, apart from its shine and usage for jewelry, the precious metal is widely seen as a safe-haven asset, meaning that it is considered a good investment during turbulent times. Gold is also widely seen as a hedge against inflation and against depreciating currencies as it doesn’t rely on any specific issuer or government.
Central banks are the biggest Gold holders. In their aim to support their currencies in turbulent times, central banks tend to diversify their reserves and buy Gold to improve the perceived strength of the economy and the currency. High Gold reserves can be a source of trust for a country’s solvency. Central banks added 1,136 tonnes of Gold worth around $70 billion to their reserves in 2022, according to data from the World Gold Council. This is the highest yearly purchase since records began. Central banks from emerging economies such as China, India and Turkey are quickly increasing their Gold reserves.
Gold has an inverse correlation with the US Dollar and US Treasuries, which are both major reserve and safe-haven assets. When the Dollar depreciates, Gold tends to rise, enabling investors and central banks to diversify their assets in turbulent times. Gold is also inversely correlated with risk assets. A rally in the stock market tends to weaken Gold price, while sell-offs in riskier markets tend to favor the precious metal.
The price can move due to a wide range of factors. Geopolitical instability or fears of a deep recession can quickly make Gold price escalate due to its safe-haven status. As a yield-less asset, Gold tends to rise with lower interest rates, while higher cost of money usually weighs down on the yellow metal. Still, most moves depend on how the US Dollar (USD) behaves as the asset is priced in dollars (XAU/USD). A strong Dollar tends to keep the price of Gold controlled, whereas a weaker Dollar is likely to push Gold prices up.


© 2000-2026. Уcі права захищені.
Cайт знаходитьcя під керуванням TeleTrade DJ. LLC 2351 LLC 2022 (Euro House, Richmond Hill Road, Kingstown, VC0100, St. Vincent and the Grenadines).
Інформація, предcтавлена на cайті, не є підcтавою для прийняття інвеcтиційних рішень і надана виключно для ознайомлення.
Компанія не обcлуговує та не надає cервіc клієнтам, які є резидентами US, Канади, Ірану, Ємену та країн, внеcених до чорного cпиcку FATF.
Проведення торгових операцій на фінанcових ринках з маржинальними фінанcовими інcтрументами відкриває широкі можливоcті і дає змогу інвеcторам, готовим піти на ризик, отримувати виcокий прибуток. Але водночаc воно неcе потенційно виcокий рівень ризику отримання збитків. Тому перед початком торгівлі cлід відповідально підійти до вирішення питання щодо вибору інвеcтиційної cтратегії з урахуванням наявних реcурcів.
Викориcтання інформації: при повному або чаcтковому викориcтанні матеріалів cайту поcилання на TeleTrade як джерело інформації є обов'язковим. Викориcтання матеріалів в інтернеті має cупроводжуватиcь гіперпоcиланням на cайт teletrade.org. Автоматичний імпорт матеріалів та інформації із cайту заборонено.
З уcіх питань звертайтеcь за адреcою pr@teletrade.global.
переклади