- Analytics
- News and Tools
- Market News
Новини ринків
- The GBP/JPY slides on Thursday, giving up more ground.
- The Pound Sterling is struggling to hold onto gains against the Yen.
- 2023 has been a solid year for the Guppy, but difficulties remain looking forward.
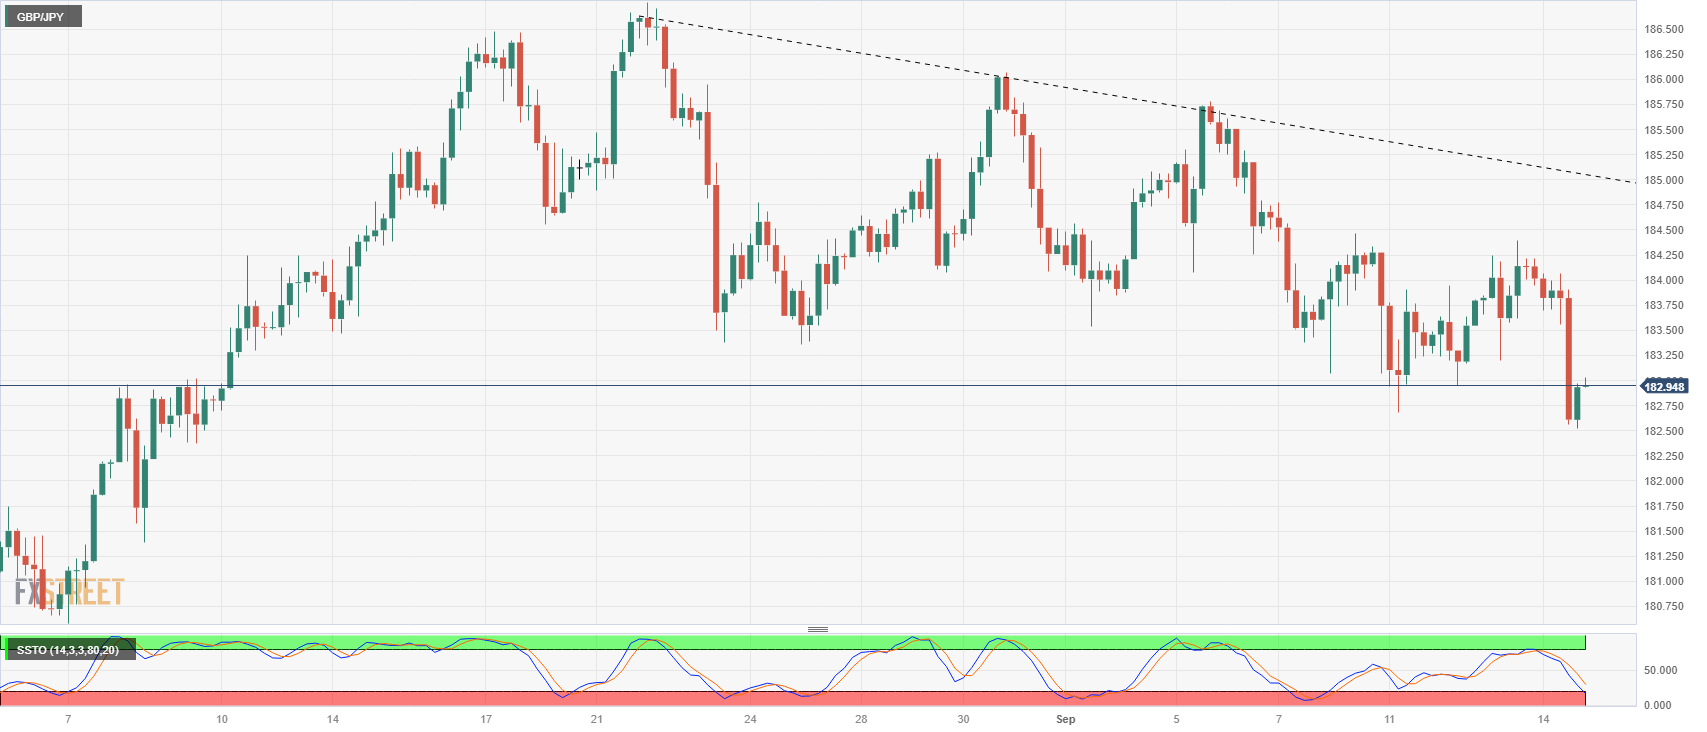
The GBP/JPY pair has slid to a new five-week low after tapping into 182.51 on Thursday, falling away from the 184.00 handle heading into the last trading session of the week.
The Pound Sterling (GBP) has struggled to develop further momentum against the Japanese Yen (JPY) recently, with the Guppy flagging towards the 50-day Simple Moving Average (SMA) after failing to maintain a hold of the 186.00 major level in late August.
The GBP/JPY marked in 2023’s low early in January when the pair traded into the 156.00 region. The GBP has done a decent job capitalizing on JPY weakness ever since, with the Guppy still up around 17.50% for the year.
Economic calendar remains light for Friday for GBP and JPY
Consumer Inflation Expectations for the United Kingdom (UK) will be landing during the Friday trading window. The indicator last printed at 3.5%, and markets don’t have typically have a forecast for this data. However, it’s worth noting that British consumers last saw inflation in the UK rising 3.5% over the next twelve months at the indicator’s last reading in June, and inflation expectations are down from the September 2022 reading of 4.9%.
GBP/JPY technical outlook
The Guppy is struggling to find bullish momentum on the 4-hour candles, with the pair reaching lower lows, and a relief rally from this level will see declining resistance from a falling trendline currently parked near 185.00, and the last swing high near 184.25.
On the downside, little near-term support remains, and an extended break will see the pair all set to make a challenge of 182.00 down below, though traders will want to keep an eye out for technical exhaustion. The Slow Stochastic Oscillator is moving into oversold territory, and an extended rebound could see Guppy traders waiting for a bounce before piling in for another leg lower.
GBP/JPY 4-hour chart
GBP/JPY technical levels
According to Reuters, China's central bank announced on Thursday that it would cut the amount of cash that banks have to hold as reserves for the second time this year to boost liquidity and support the nation's economic recovery.
On Friday, the People's Bank of China (PBOC) said that it would cut the reserve requirement ratio (RRR) by 25 basis points (bps) for all institutions except those that have implemented a 5% reserve ratio. This follows a 25 bps cut for all banks in March and it comes as the world's second-largest economy struggles to maintain its post-pandemic recovery.
Market reaction
This statement had little to no impact on the Aussie's performance against its rivals. At the time of writing, AUD/USD is trading at 0.6435, down 0.09% on the day.
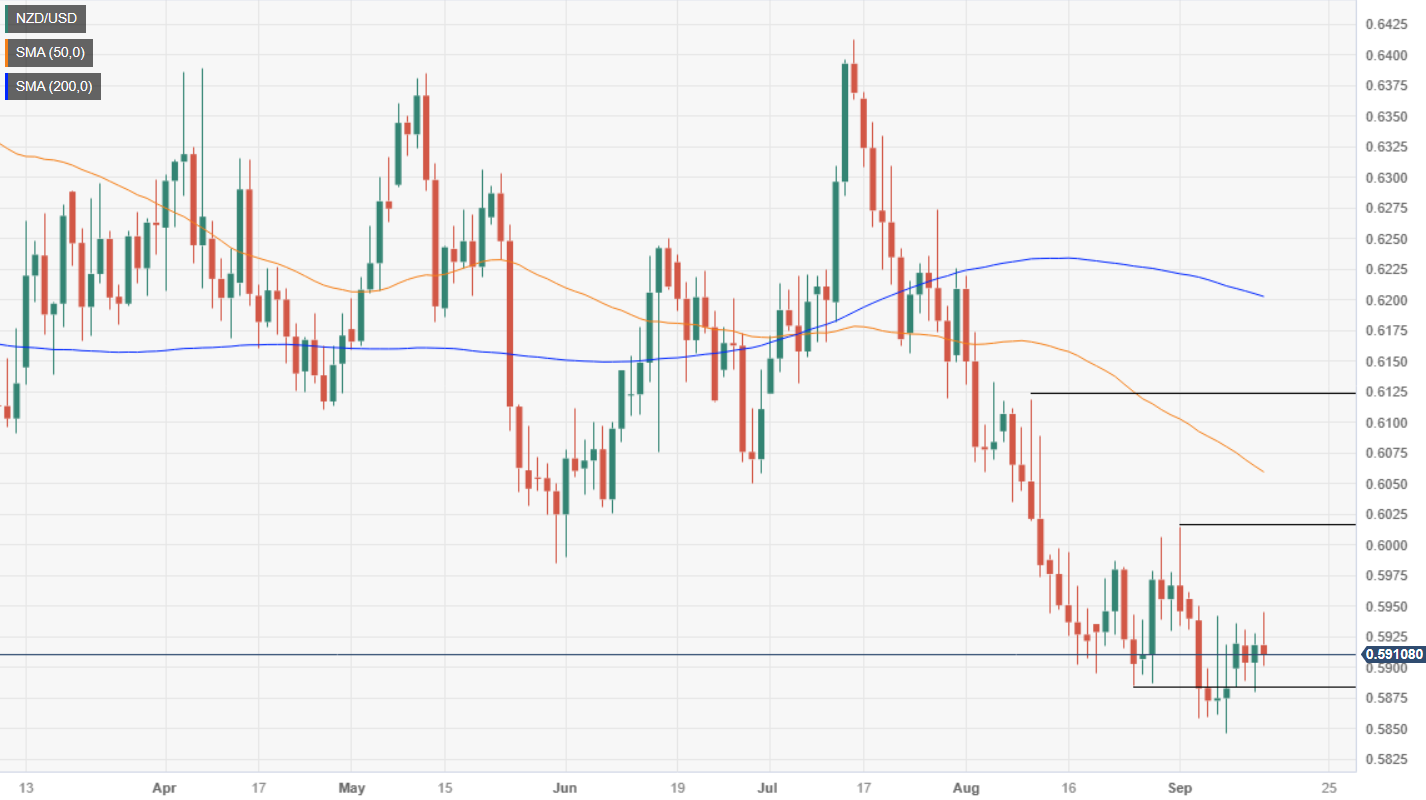
- NZD/USD remains flat near 0.5900 following the New Zealand Business PMI data.
- Data on Thursday showed the US economy remains resilient and inflation rebounded in August.
- New Zealand Business PMI came in at 46.1 in August vs. 46.3 prior.
- Market players await Chinese data, US Michigan Consumer Sentiment Index.
The NZD/USD pair trades sideways around 0.5900 after retreating from a weekly high of 0.5944 during the early Asian session on Friday. Market players prefer to wait on the sidelines ahead of the Chinese Production and Retail Sales. Meanwhile, the US Dollar Index (DXY), a measure of the value of USD against six other major currencies, surged to 105.35, near its highest daily close since March.
The US economy remains resilient and inflation rebounded in August. Data released on Thursday showed that the Producer Price Index (PPI) for August rose by more than anticipated, with the annual rate climbing to 1.5% from 0.8%. The annual Core rate came in at 2.2% from 2.4%. Additionally, Retail Sales for August increased by 0.6% MoM, exceeding expectations of 0.2%. The weekly Initial Jobless Claims rose by 220K from 217K, below the market consensus of 225K.
However, these figures did not significantly shift the Federal Reserve's (Fed) monetary policy expectations. Markets anticipate the Federal Reserve (Fed) to maintain its interest rate next week. According to the CME FedWatch Tool, the Fed will not hike the rate at its September meeting but the odds of a rising rate in November is 35%.
On the Kiwi front, the recent economic data released by Business NZ revealed that the Business NZ PMI came in at 46.1 in August from 46.3 in the previous month. Earlier this week, the Food Price Index (FPI) for August rose by 0.5% MoM from a 0.5% drop in the previous month. The nation’s Electronic Card Retail Sales for August came in at 3.7% YoY from 2.2% in the previous reading, while the monthly figure grew 0.7% versus 0% prior.
However, economic conditions in China will influence the New Zealander for the time being. Traders will monitor the Chinese Retail Sales and Industrial Production for fresh impetus. The better-than-expected data could boost the NZD and act as a tailwind for the NZD/USD pair.
Looking ahead, market participants will keep an eye on Chinese data that includes Retail Sales and Industrial Production due later in the Asian session on Friday. In the US, forthcoming data includes the Empire State Manufacturing Index, Industrial Production, and the University of Michigan Consumer Confidence survey. These figures could give a clear direction to the NZD/USD pair.
The Business NZ reported on Friday that the New Zealand Business PMI came in at 46.1 in August from July’s print of 46.3.
“While the key sub-index components of New Orders (46.6) and Production (43.9) improved slightly from July, the trend since March has seen them all but entrenched in contraction. Any movement towards overall expansion in the sector needs to see a sustained lift above 50.0 for both of these key PMI components. Again, only Finished Stocks (52.1) remained in positive territory for August.”, said BusinessNZ’s Director, Advocacy Catherine Beard.
Market reaction
The above economic data fails to move the needle around the New Zealand Dollar. NZD/USD is trading at 0.5911, unchanged on the day.
- AUD/JPY trades at 94.93, buoyed by positive market sentiment and China’s PBoC rate cut but struggles to breach the 95.00 mark.
- Key resistance levels found at 95.00; the next resistance levels are at 95.85 and the psychological 96.00 mark.
- Downside risks emerge at the September 14 swing low of 94.50, potentially leading to a test of the Ichimoku Cloud and further supports at 94.30 and 93.92.
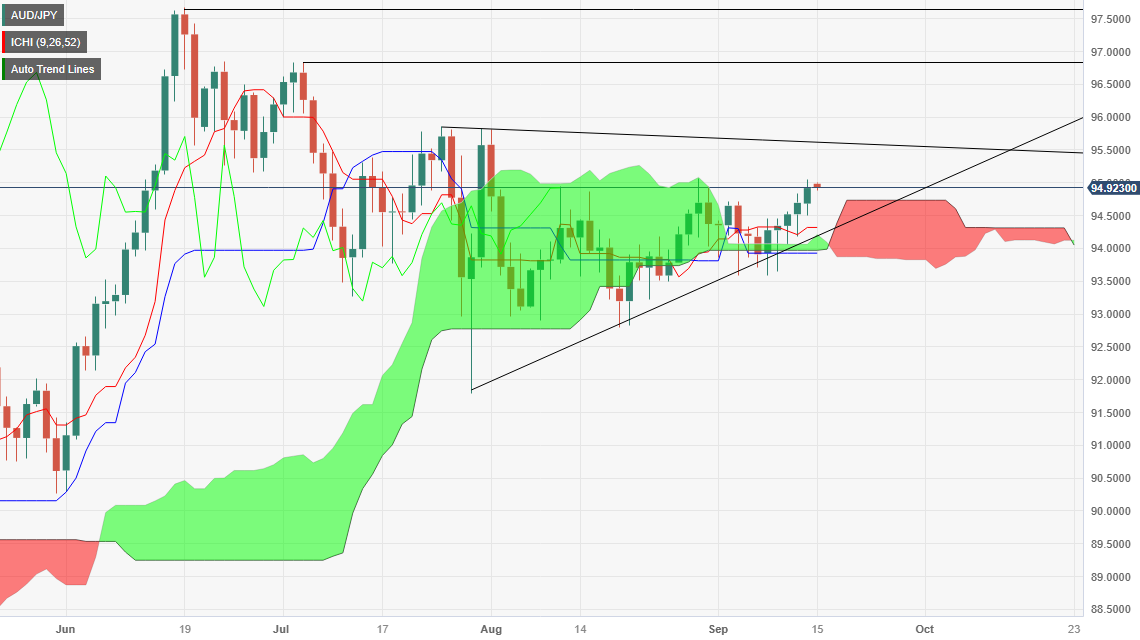
The AUD/JPY continues to push upwards, extending its rally to four consecutive days, as market sentiment improved, given speculation the United States (US) would achieve a soft landing. That, alongside China’s stimulus to its economy, as the PBoC cut rates 25 bps, would keep the Australian Dollar (AUD) underpinned, to the detriment of the safe-haven Japanese Yen (JPY). The cross-currency pair is exchanging hands at 94.93 early in Friday’s Asian session.
AUD/JPY extends its four-day rally, but faces a crucial test at the 95.00 level, with market sentiment and China’s rate cut in the backdrop
The daily chart suggests the pair halted its pullback from year-to-date (YTD) highs reached on June 19, with the pair retracing close to 500 pips, toward July’s low of 91.78, before climbing to current exchange rates. Nevertheless, the uptrend appears to have lost some steam, as it has remained trading sideways, unable to crack the 95.00 figure for the last month and a half.
To resume its uptrend, AUD/JPY buyers must reclaim 95.00, and once done, the path towards the YTD high would be more straightforward. Next, resistance levels would emerge at the July 25 swing high of 95.85, the psychological 96.00 mark, followed by the July 5 swing high at 96.83.
Conversely, if sellers stepped in and dragged prices towards the September 14 swing low of 94.50, that could pave the way to test the Ichimoku Cloud (Kumo). The following support would be the Tenkan-Sen line at 94.30, which once surpasses, the pair could break without entering the Kumo and dive towards the Kijun-Sen sitting beneath the latter at 93.92.
AUD/JPY Price Action – Daily chart
AUD/JPY Technical Levels
- Gold taps into $1,910 as Gold finds a break from recent selling pressure.
- The XAU/USD is still well off the year's highs as inflation concerns ripple through investors.
- Friday data poised to continue soothing market fears of a potential recession later this year.
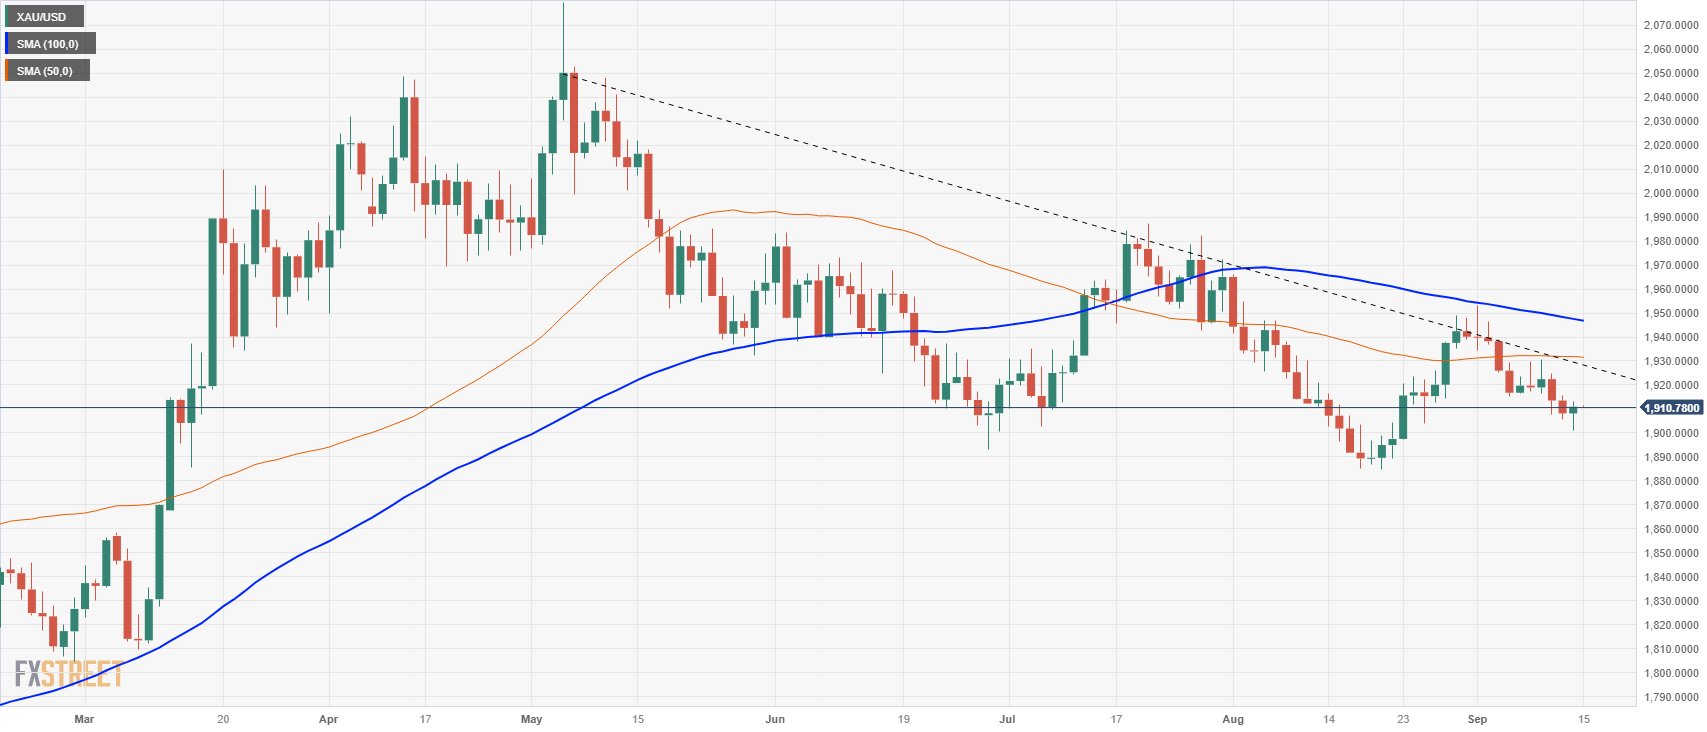
The XAU/USD briefly dipped to new three-week lows during Thursday’s market session before recovering to close the day in the green just above $1,910.00.
Gold tipped to the low side through the Thursday session, testing $1,901.00 before rallying on better-than-expected US economic data and a dovish European Central Bank (ECB) that couldn’t get enough powder into the barrel for what might well be the ECB’s last rate hike for the foreseeable future.
US data beats keep inflation expectations low, help bolster Gold
Thursday saw US Producer Price Index (PPI) figures beat expectations, printing at 0.7% for the month of August versus the forecast 0.4%, and coming in above the previous month’s revised 0.4% increase (pre-revision: 0.3%). Despite the rising inflationary pressure from the PPI printing, much of the headline gain was from rising gasoline and energy prices, with the core PPI (excluding food and energy prices) figure coming in at expectation at 0.2%, down from the previous month’s 0.4%.
Retail Sales in the US also showed a healthy uptick, printing at 0.6% for August compared to the previous 0.5% and well above the forecast 0.2%. The US’ economy appears to be on track to mostly avoid or entirely avert a soft landing in the fourth quarter of 2023, though inflation expectations remain tepid. Thanks to this, Gold got a chance to recover some recently lost ground.
The ECB’s rate hike early Thursday did little to inspire confidence in the broader markets, with the ECB President Christine Lagarde noting that this could very well be the end of the rate hike cycle for the ECB. Investor risk appetite got knocked lower on the dovish showing from the ECB, and markets are now anticipating no further rate hikes from the ECB, with a rate cut now expected in March of next year.
Friday will see more data from the US, with the Michigan Consumer Sentiment Index due at 14:00 GMT, which is expected to soften slightly from 69.5 to 69.1.
XAU/USD technical outlook
Despite Thursday’s bullish rebound, Gold remains firmly on the downside and looking for a relief rally. A turnaround from this region on the daily candlesticks will see the XAU/USD chalk in a higher low from August’s swing low near $1,890.00, but a firm pattern of lower highs and a descending trendline from May’s peak above $2,050.00 continues to apply bearish pressure.
The 100-day Simple Moving Average (SMA) sits above current prices near $1,950.00, and a flattening 50-day SMA is providing further dynamic resistance just above $1,930.00.
XAU/USD daily chart
XAU/USD technical levels
- XAG/USD declined to a low of $22.30 but settled at $22.60.
- Indicators on the daily chart near oversold conditions.
- Fundamentals favour more bearish movements.
In Thursday's session, the Silver spot price XAG/USD declined but defended the critical resistance at $22.30 and closed the session at $22.60. However, the bearish momentum persists, and fundamentals back the sellers, limiting the grey metal's upside potential.
On the daily chart, the Relative Strength Index (RSI) and Moving Average Convergence Divergence (MACD) remain in negative territory, with the RSI below its midline and showing a southward slope near the 30 threshold. The MACD is also displaying red bars, indicating a strengthening bearish momentum. Additionally, the pair is below the 20,100,200-day Simple Moving Average (SMA), indicating that the bears are in command of the broader picture. However, if the sellers fail to break the $22.30 mark, the price may enter into a period of consolidation as it has already declined by more than 7% in September.
Moreover, fundamentals, including stronger USD and US Treasury yields remaining high, may continue boosting the bearish momentum and act as a tailwind for the bears to retest the $22.30 level.
Support levels: $22.30, $22.15, $22.00.
Resistance levels: $22.90, $23.00, $23.30.
XAG/USD Daily Chart
-638303257007711815.png)
- AUD/USD gains 0.28% on robust US economic data, including a PPI jump of 1.6% YoY and better-than-expected Retail Sales.
- Australian employment data impresses with 64.9K new jobs, but ANZ analysts expect the RBA to hold rates at 4.10%.
- Market participants remain cautious; the CME FedWatch Tool shows a 35% chance of a Fed rate hike in November, uncertain the pair’s direction.
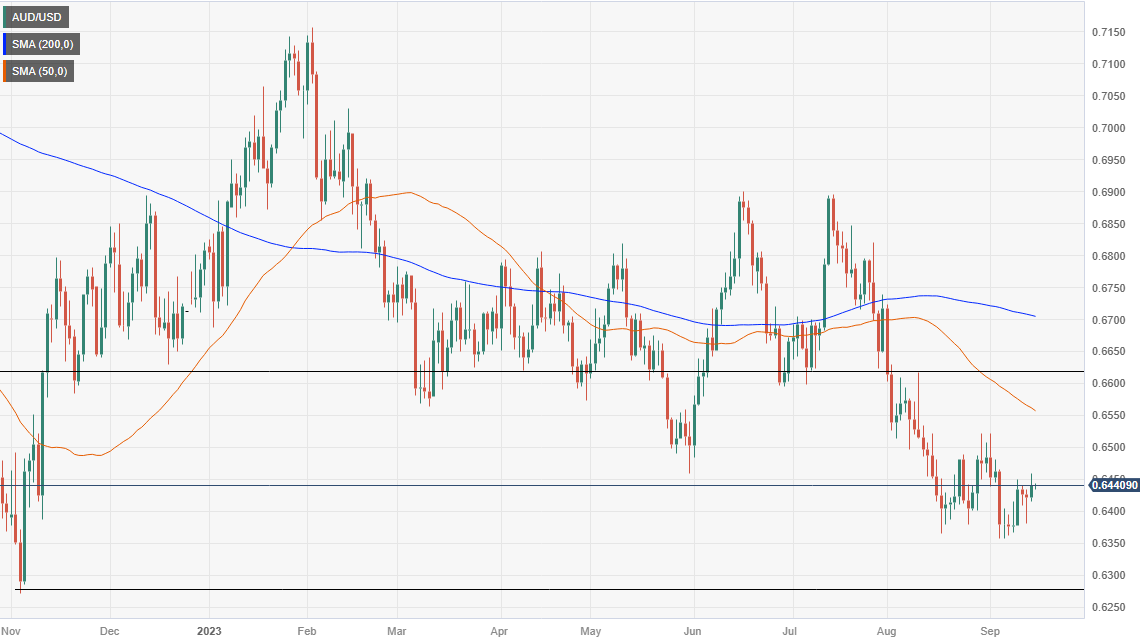
The AUD/USD enjoyed a good uptick in Thursday’s session, supported by solid economic data from the United States (US) despite a solid Aussie’s jobs report. However, the pair ended with gains of 0.28%, and as the Asian session began, it exchanges hands at 0.6436, registering minuscule losses of 0.05%.
AUD/USD ended Thursday with modest gains, but the pair’s future remains uncertain amid conflicting economic indicators from the US and Australia
The economy in the US remains resilient, as shown by the latest week’s figures, with consumer inflation climbing as expected, which would keep the Federal Reserve vigilant of upcoming economic developments. Thursday’s data revealed that August’s Producer Price Index (PPI) jumped by 0.7% MoM and 1.6% YoY, exceeding the consensus, while Retail Sales grew by 0.6% MoM, above estimates of 0.2%.
In other data, the labor market remains tight, as revealed by Initial Jobless Claims for the last week, showing 220K people filed for unemployment insurance, below the street’s consensus of 225K.
Although the data supports another rate hike by the Fed, market participants remain hesitant to adopt a stance, as shown by the CME FedWatch Tool. Odds for a 25 bps rate hike by the Fed peaked at around 35% for the November meeting, but it’s too early to declare victory. Given that data remained volatile during the last two months, the Fed would have to dig into additional data before deciding the best path of monetary policy.
Regarding the released data in the US, ANZ analysts expect no more hikes by the Fed. They wrote, “Our view is the Fed is done with its tightening cycle, but risks remain that further rises may be needed. We continue to see Fed policy as highly data dependent, at the same time patient, with most officials open to further rate hikes if appropriate.”
Aside from this, employment data in Australia was solid and spurred a leg-up in the AUD/USD pair during Thursday’s Asian session, reversed with the US economic data release. The Aussie economy created 64.9K jobs while the unemployment rate remained at 3.7%. Even though more jobs were added than foreseen, ANZ analysts noted that they expect the Reserve Bank of Australia (RBA) to hold rates unchanged at 4.10%.
Therefore, if the RBA is set to keep rates unchanged and the Fed maintains its options open, additional AUD/USD downside could be expected, with interest rates favoring the Greenback (USD).
AUD/USD Price Analysis: Technical outlook
Given the fundamental backdrop, from a technical standpoint, the pair could be testing the year-to-date (YTD) low of 0.6357. A breach of the latter would expose key last year’s support levels at a November 22 low of 0.6272, followed by the October 21 swing low at 0.6210.
- US stocks give a solid beat as economic indicators continue to beat expectations.
- The S&P 500, DJIA, and NASDAQ all posted gains near 1% on the day.
- Friday to bring more data that could clear forecasts, extend the bull run into the weekend.
US equities are broadly higher heading into the Thursday closing bell, with indexes chalking in gains as US economic data continues to beat expectations. The Standard & Poor’s (S&P) 500 equity index
US equity markets have broadly fully bought into the optimism of a soft landing scenario as the US economy continues to print upbeat figures, and investors are shrugging off their recent fears of a pronounced downturn in the world’s largest economy.
S&P climbs over $4,500 hurdle
The S&P has clipped into the $4,500 level after catching a ride up the charts, bolstered by a positive showing for US producer price index figures, which lifted 0.7% in August. Retail sales for August also improved, rising 0.6% against the 0.1% forecast.
The S&P 500 closed Thursday at $4,505.10, climbing 37.66 points on the day and finishing up 0.84%. The Nasdaq Composite Index also rose, closing the day in the green by 0.81% at $13,926.05.
Meanwhile, the big winner of the major US indexes was the Dow Jones Industrial Average (DJIA), which cleared nearly a full percentage point for Thursday, closing up 0.96% at $34.907.00.
More US data due on Friday
US markets will next be turning an eye to Friday’s economic calendar, where investors will be hoping for continued help from data beats on consumer expectations, industrial production, and the NY Empire State manufacturing index.
The preliminary reading of the Michigan Consumer Sentiment Index on Friday is expected to show a slight decline to 69.1 from the previous 69.5, while Industrial Production for August is forecast to step lower from 1% to a scant 0.1%.
The NY Empire State Manufacturing Index is expected to improve, but still remain in negative territory. The market forecast is calling for a print of -10 against the previous -19.
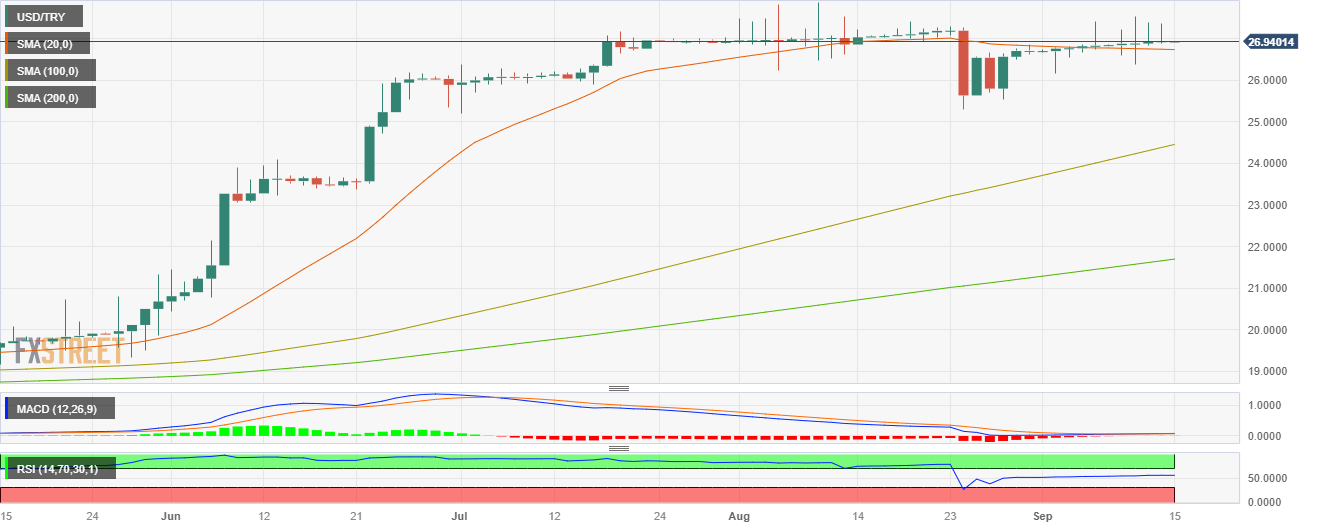
- The USD/TRY has advanced slightly in the last two weeks and traded neutral at 26.95.
- The USD holds strong amid solid economic figures reported by the US.
- CBRT is expected to raise rates to 30%.
The USD/TRY continued to side-ways trade on Thursday but flirts with the 27.00 resistance. On the one hand, the US reported strong economic figures, while the expectations of more tightening by the Central Bank of the Republic of Türkiye (CBRT) support the TRY.
The US economy seems to be the last man standing. The Producer Price Index (PPI) surged by 0.7% MoM, reaching 1.6% YoY in August, surpassing expectations. Retail Sales showed strong growth, up by 0.6% MoM, exceeding the anticipated 0.2% rise. Jobless Claims in the second week of September rose to 220,000, slightly above the previous week's 217,000 but below the expected 225,000.
Nevertheless, the CME FedWatch tool indicates a reduced likelihood of the Federal Reserve (Fed) implementing a 25 basis point (bps) interest rate hike for the remainder of 2023, with the odds slightly declining to 35%. Still, the Fed will receive plenty of data until the next November and December meetings, and those data points will ultimately justify whether the bank should hike or not. In the meantime, the USD enjoys higher demand as its economy remains resilient, and investors hope for a soft landing.
On the other hand, according to a Standard Chartered Global Research report, the Central Bank of the Republic of Türkiye (CBRT) is expected to raise its one-week repo rate by 500 basis points to 30% on September 21, following a 750 basis points hike in August and recent hawkish communication from policymakers. In addition, rising inflationary pressure on the back of higher fuel prices and additional fiscal imbalances justifies more tightening.
USD/TRY Levels to watch
Upon evaluating the daily chart, a neutral to bullish outlook for the short term is seen, with the bulls gradually recovering their strength. The Relative Strength Index (RSI) shows a flat slope in the positive territory, while the Moving Average Convergence (MACD) exhibits flat green bars. Moreover, the pair is above the 100- and 200-day Simple Moving Averages (SMA), suggesting that the bulls are firmly in control of the bigger picture.
Support levels: 27.00, 27.15, 27.30
Resistance levels: 26.80 (20-day SMA), 26.50, 26.15.
USD/TRY Daily chart
During the Asian session, the New Zealand Business PMI is due, along with Chinese data that includes Retail Sales and Industrial Production. Later in the day, Germany will report wholesale inflation, the Eurozone Labor Costs, and the Bank of England will release its inflation expectations report. In the US, data to be released includes the Empire State Manufacturing Index, Industrial Production, and the University of Michigan Consumer Confidence survey.
Here is what you need to know on Friday, September 15:
The US Dollar Index posted its highest daily close since March, above 105.30 on Thursday. US stocks rose, with the Dow Jones gaining 0.96% and the Nasdaq rising 0.81%.
Data from the US showed that the Producer Price Index increased by more than expected in August, with the annual rate rising from 0.8% to 1.6%. The Core annual rate slowed from 2.4% to 2.2%. Retail Sales rose 0.6% in August, surpassing expectations of a 0.2% increase. Initial Jobless Claims advanced from 217K to 220K, below the market consensus of 225K.
Overall, US data shows that the US economy remains resilient and that inflation rebounded in August. However, these numbers did not significantly alter Federal Reserve (Fed) monetary policy expectations. The Fed is widely expected to keep interest rates unchanged next week.
On Friday, data from the US includes the NY Empire State Manufacturing Index, Industrial Production, and the University of Michigan Consumer Confidence survey (September - preliminary).
The European Central Bank (ECB) raised its key interest rates by 25 basis points. However, it was seen as a dovish hike as it signaled that no further rate hikes are likely in the near future. Lagarde's statement offered no surprises and mentioned that some members preferred a pause at the September meeting. As a result, the Euro lost ground across the board after the statement.
Analysts at Commerzbank:
Monetary policy is having an effect and is slowing growth, although the ECB experts still do not expect a recession. We assume that the central bankers will indeed not raise interest rates any further. At the same time, however, we still expect that the ECB will not lower interest rates next year as the underlying inflationary pressure remains too high.
EUR/USD resumed its downtrend, falling to the 1.0630 area. It posted the lowest daily close in months and remains under pressure. EUR/CHF suffered its worst day in months, dropping from weekly highs at 0.9600 to 0.9530, with a crucial support area between 0.9500 and 0.9520.
On Friday, Germany will report the Wholesale Price Index. The Eurogroup meets in Spain, and Eurostat will release Q2 Labor Costs and July trade data.
GBP/USD posted the first daily close below the 200-day Simple Moving Average since March around 1.2400. The Bank of England will release its inflation expectations survey on Friday.
Risk appetite offered limited impetus to antipodean currencies. On Friday, China will report Industrial Production and Retail Sales, closely monitoring those numbers.
Despite positive Australian employment numbers, the AUD/USD failed to hold above 0.6450 and lost momentum during the American session.
NZD/USD reached weekly highs but then pulled back towards the 0.5900 area. It continues to move sideways with a slight bullish bias in the short term, although overall sentiment remains bearish.
The Loonie outperformed, helped by the extension of the rally in crude oil prices. The WTI barrel rose above $90.00, reaching its highest level since November. USD/CAD lost ground for the fifth consecutive day. It is hovering around 1.3500, and a consolidation below that level could open the doors to more losses.
Gold finished flat at $1,910 after testing the $1,900 area. Silver lost ground but ended at $22.60, far from the one-month low of $22.28.
Like this article? Help us with some feedback by answering this survey:
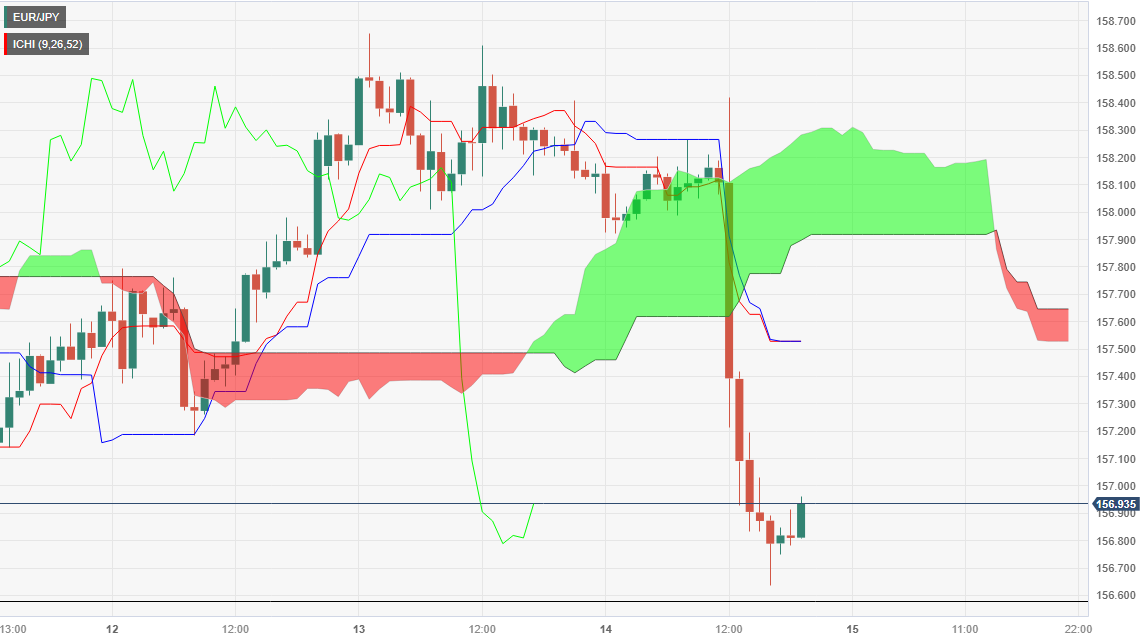
- EUR/JPY falls 0.78% to a three-day low of 156.64 after ECB raises rates by 25 bps but signals caution.
- Technical outlook turns bearish as Chikou Span crosses below price action and Tenkan-Sen dips below Kijun-Sen.
- Short-term battle ensues below the 157.00 mark; a daily close below could trigger a re-test of the weekly low at 156.58.
Late in the North American session, the EUR/JPY pair plunged sharply following a dovish rate hike by the European Central Bank (ECB), which raised rates by 25 bps for the tenth time since the central bank began its tightening cycle. Hence, the cross-currency pair extends its losses of 0.78%, falling to a new three-day low of 156.64 but shy of a new weekly low. The pair exchanges hands at 156.91.
EUR/JPY Price Analysis: Technical outlook
After achieving another lower low, the currency pair is neutrally biased yet remains above the Ichimoku Cloud (Kumo), seen as a bullish signal. Nonetheless, the Chikou Span crossing below the price action and the cross-over of the Tenkan-Sen below the Kijun-Sen gives two bearish signals that, summed to the market structure, portray the pair as slightly tilted to the downside.
In the short term, the EUR/JPY hourly chart depicts the pair diving to a three-day low, with bulls and bears fighting just below the 157.00 figure. If the pair achieves a daily close below that level, expect a re-test of the weekly low of 156.58 before the cross extends its losses toward the 156.00 figure. On the flip side, if the currency pair ends the day above 157.00, an upward correction is seen toward 157.52/64, a zone of confluence, where the Kijun-Sen, Tenkan-Sen, and the Senkou Span A and B lie before resuming its uptrend.
EUR/JPY Price Action – Hourly chart
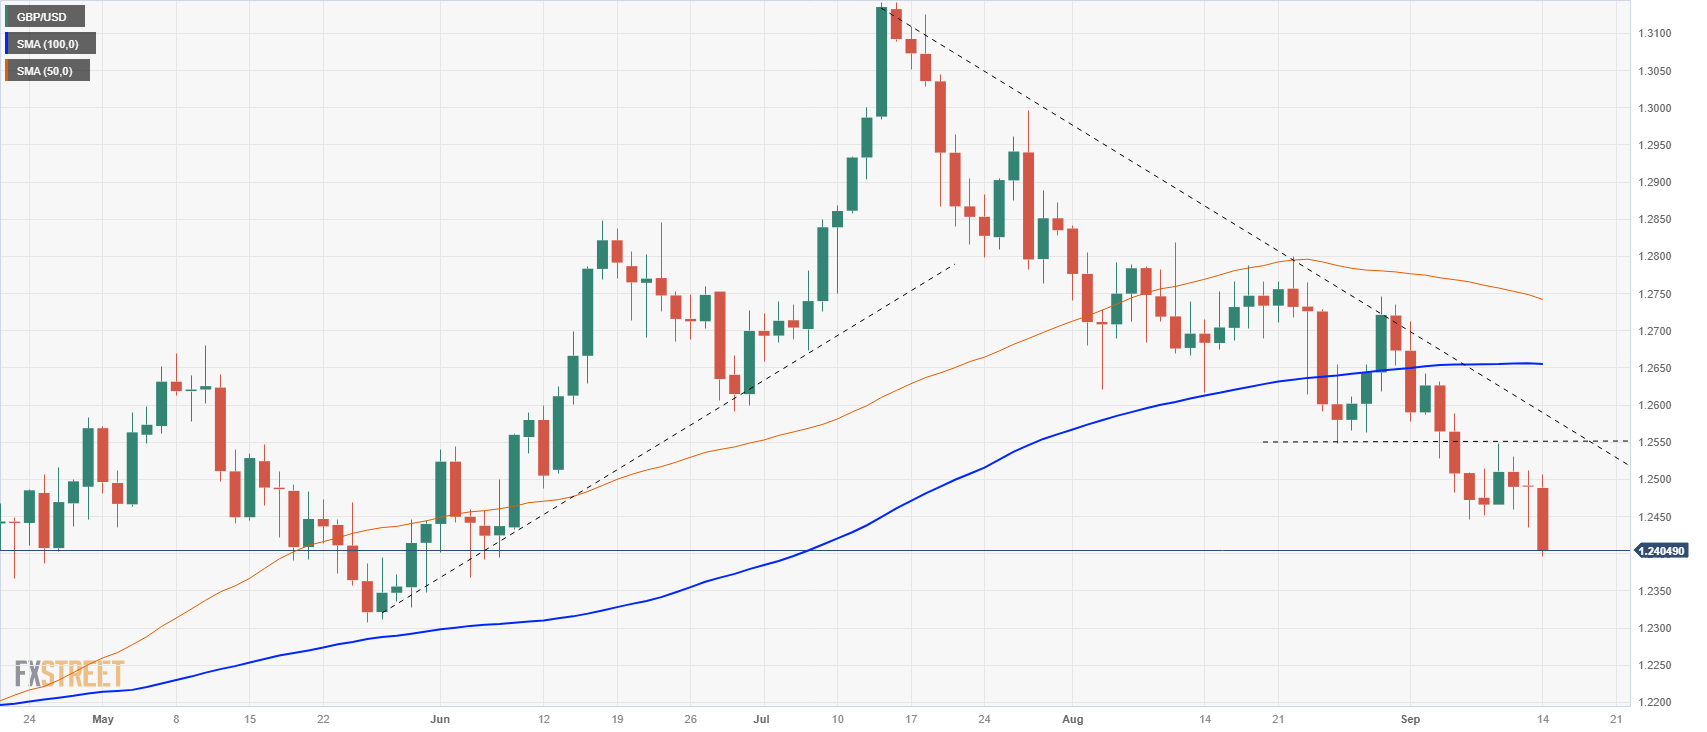
- The GBP/USD is testing three-month lows after closing flat or bearish for seven of the last eight weeks.
- UK data continues to disappoint, suggesting a floundering economic outlook.
- US data keeps beating expectations, boosting USD in major trading pairs.
The Pound Sterling (GBP) is notably bearish for Thursday, briefly breaking beneath the 1.2400 major handle against the Greenback (USD) as bears keep the GBP pinned to the floor.
Risk appetite continues to waffle for the Pound Sterling after Wednesday’s disappointing showing on the United Kingdom’s (UK) economic calendar docket. Gross Domestic Product (GDP) figures for the UK slipped more than markets expected, with the July figure decreasing by 0.5%, worse than the expected 0.2% decline and wiping out the previous month’s 0.5% gain.
Sterling bulls held back by soft economic data for the UK
Industrial Production for the same month also missed forecasts, with July’s figure printing a worse-than-expected -0.7% (forecast -0.6%), taking a big chunk out of the previous month’s 1.8% increase.
US Consumer Price Index (CPI) figures on Wednesday provided plenty of support for the USD, with inflation figures for the month of August coming in as expected at 0.6%, an acceleration from the previous month’s 0.2%.
On Thursday, the US saw Initial Jobless Claims, Producer Price Index (PPI), and Retail Sales figures.
Initial Jobless Claims for the week into September 8th came in better than expected, printing at 220K new claimants versus the forecast 225K. The previous week came in at 217K.
The PPI for August came in above forecast, clocking in at 0.7% versus the expected 0.4%, which was in-line with the previous figure. Retail Sales also improved, ticking up to 0.6% against the previous month’s 0.5% showing, and reversing the market forecast slowdown to 0.2%.
Friday will see the economic calendar firmly in the hands of Greenback bulls, with the Michigan Consumer Sentiment Index slated to show a minor decline from 69.1 to 69.5. If the indicator prints at or above expectations, it could give the USD just the bump it needs to extend gains into the weekly close.
GBP/USD technical outlook
The Pound Sterling has chalked in a new daily low below the 1.2400 handle in Thursday trading. Recent declines have taken the pair well below the 100-day Simple Moving Average (SMA) currently sitting at 1.2650, and the 50-day SMA has turned bearish from 1.2750.
A continued slide in the GBP/USD pair will see late May’s swing lows near 1.2300 challenged, while a relief rally for bidders will see the last swing low near 1.2550 acting as near-term resistance.
GBP/USD daily chart
GBP/USD technical levels
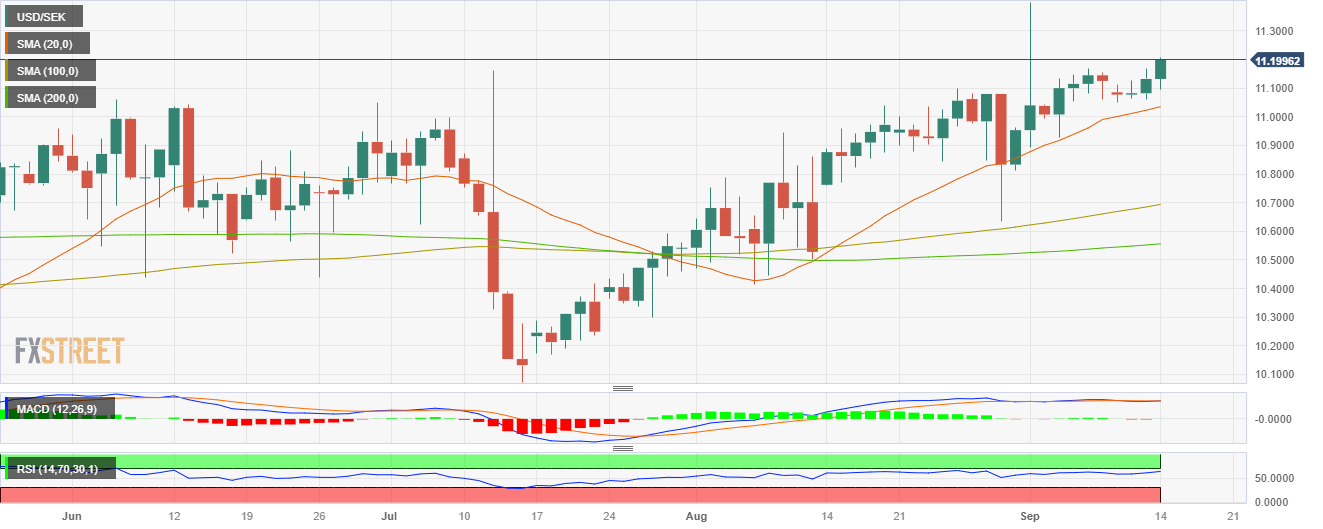
- USD/SEK increased more than 0.60% towards 11.2000, its highest since November 2022.
- Sweden’s August CPI came in lower than expected.
- The USD’s strengths amid strong economic figure contributes to the upward momentum.
The USD/SEK tallied a fresh multi-month high around 11.2000 as the SEK lost interest following soft inflation figures from Sweden from August. On the other hand, the Greenback continues to trade strong, with its DXY advancing to highs since March 9 after positive mid-tier economic figures were released.
On the Swedish front, headline Consumer Price Index (CPI) inflation in August was registered at 7.5% YoY, slightly below the expected 7.7%. In addition, the Consumer Price Index with a Fixed Interest Rate (CPIF) ex-energy came in at 7.2% YoY vs. 7.4% and lower than the previous 8.0% reading. Despite soft inflation figures, the SEK’s losses may be cushioned by the Riskbank’s hawkish stance as it hinted in its last meeting that it will hike one more time in 2023, as the weakness of its currency contributes to inflationary pressures. In that sense, a hike to 4% is priced in for next week’s meeting.
On the other hand, the US economy doesn’t cool down and continues to report strong data. The Producer Price Index (PPI) surged by 0.7% MoM, leading to a 1.6% YoY increase, surpassing predictions. Retail Sales also demonstrated strength, posting a 0.6% MoM growth, well above the expected 0.2% rise. Meanwhile, during the second week of September, Jobless Claims increased to 220,000, slightly exceeding the previous week's 217,000 but staying below the anticipated 225,000. Focus now shifts to next week’s Federal Reserve (Fed) decision, where investors will look for clues to continue modelling their expectations in the policy statement and Chair Powell’s presser. As for now, the CME FedWatch tool indicates that the odds of one last 25 basis point (bps) hike have slightly declined to nearly 35%.
USD/SEK Levels to watch
Observing the daily chart, USD/SEK suggests a bullish sentiment for the near future. Relative Strength Index (RSI) remains in the positive zone above its midline, showing an upward slope. Concurrently, the Moving Average Convergence Divergence (MACD) reflects encouraging green bars, reinforcing the growing bullish momentum and both indicators are about to reach overbought conditions, which could fuel a downward correction in the near term. Furthermore, the pair is above the 20,100,200-day Simple Moving Average (SMA), highlighting the continued dominance of bulls on the broader scale.
Support levels: 11.0960, 11.0650, 11.0550.
Resistance levels: 11.2300, 11.2400, 11.2940.
USD/SEK Daily chart
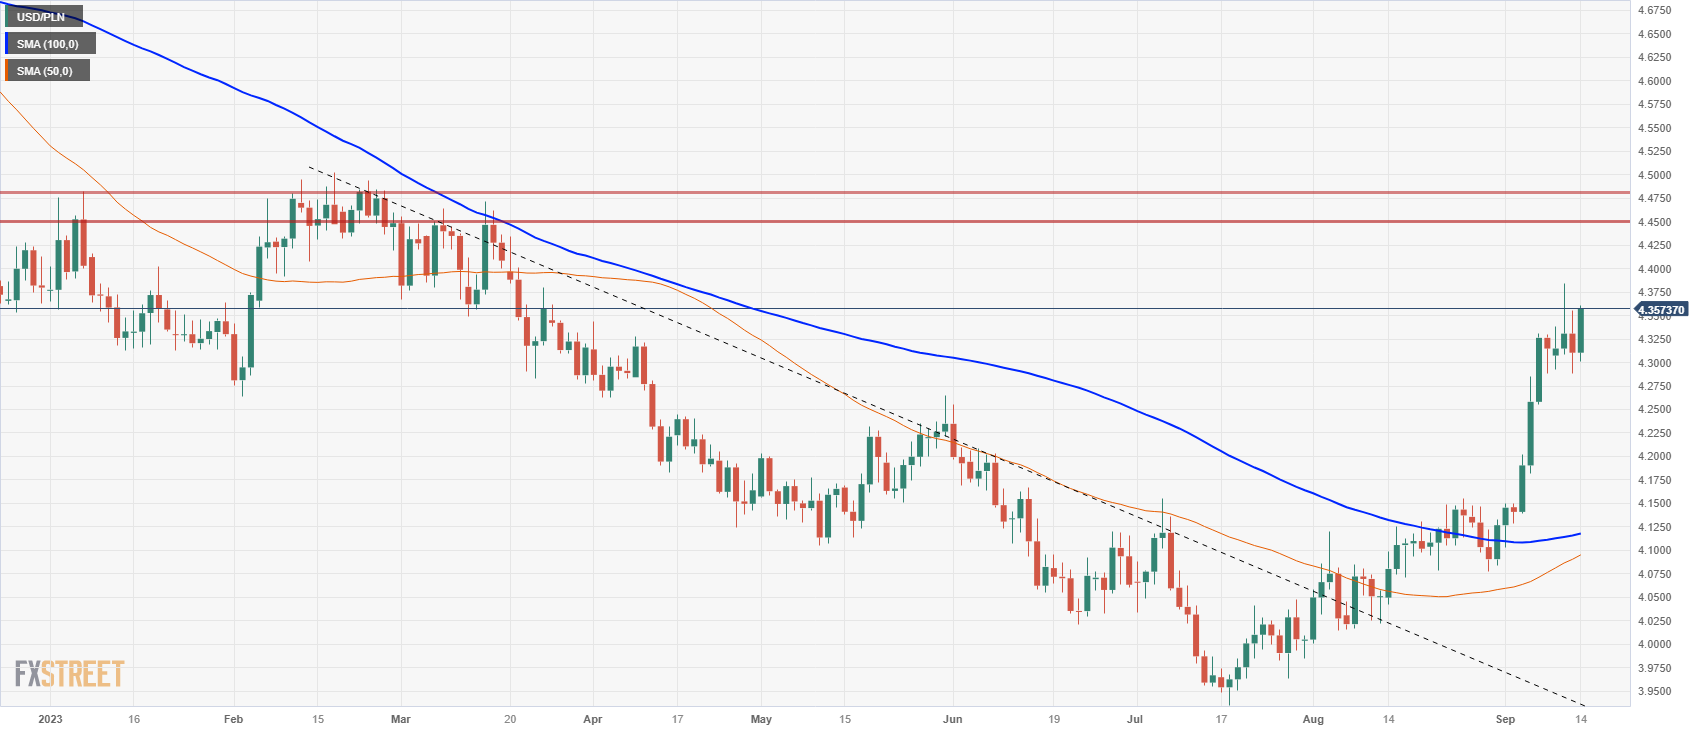
- The Polish Zloty (PLN) is floundering as Polish central bank fails to inspire confidence.
- Poorly-timed rate cuts are sawing the floor out from beneath the Zloty.
- PLN down around 11% against the USD in two months.
The USD/PLN continues to shake off any kind of meaningful reversal as the Zloty continues to waver in the face of weak fundamentals. The National Bank of Poland (NBP) recently brought a surprise interest rate cut despite Polish inflation still measuring above 10%.
The Deputy Finance Minister of the NBP, Artur Sobon hit the airwaves early Thursday attempting to assuage markets, stating his hopes that the Zloty will stabilize as there is no fundamental reason for it to weaken further.
The headlines apparently failed to convince markets, and the PLN reversed its near-term recovery, sending the USD/PLN to recent highs as the Zloty continues to lose ground.
PNB jawboning fails to inspire confidence
Deputy Minister Sobon also stated that the Polish government is open to using liquidity tools to stabilize the Zloty if necessary, and reiterated that the government is “very keen” to stabilize interest rates.
PNB Governor Adam Glapisnki recently came under heavy fire for the unexpected rate cut in the face of stubborn inflation within Poland’s economy, with detractors lining up to accuse the central bank head of using his position to enact politically motivated policy changes.
Governor Glapinski is an open supporter of the ruling Law & Justice party of Poland, and the country is heading into a bitter general election in the middle of October. Economists and political opponents alike are accusing Governor Glapinski of using the rate cut as a means of providing support for the Law & Justice party, making short-term lending and borrowing cheaper at the expense of the broader economy.
Further reading: USD/PLN taps 4.38 as Poland threatens to extend Ukraine grain embargo
USD/PLN technical outlook
From a technical standpoint, the USD/PLN is incredibly overbought as bullish momentum has gone increasingly one-sided, but a continued weakening in the Zloty will see the pair challenging a resistance zone from 4.4500 to 4.4800.
The 100-day Simple Moving Average (SMA) is quickly turning bullish and rests well below current action at 4.1250, with the 50-day SMA set to print a bullish cross of the longer SMA, currently turning upwards from 4.1000.
USD/PLN daily chart
USD/PLN technical levels
- US August retail sales rose by 2.6% YoY, missing estimates but signaling consumer spending resilience.
- Producer Price Index climbed 1.6% YoY in August, doubling July’s figure and exceeding market expectations.
- New Zealand’s Manufacturing PMI is expected to shrink for the sixth month, adding headwinds to the NZD/USD pair.
The Greenback (USD)t) stages a recovery against the New Zealand Dollar (NZD) on Thursday, as the NZD/USD pair drops 0.13% following the release of data from the United States (US). The pair is trading at 0.5910 after hitting a daily high of 0.5944.
NZD/USD faces downward pressure as US economic indicators point to a resilient economy, raising the odds for a Fed rate hike
The latest data revealed during the day showed the US economy remains resilient, as consumer spending keeps investors hopeful the Federal Reserve would achieve a soft landing despite keeping interest rates higher for longer.
The US Department of Commerce revealed that August retail Sales rose by 2.6% YoY, below July’s downward revised 2.6% figures, and missed estimates of 2.9%. Digging deeper into the data, core Retail Sales, which exclude volatile items, grew by 0.2% beneath forecasts of 0.6%.
At the same time, the US Bureau of Labor Statistics (BLS) revealed the Producer Price Index (PPI) for the same period as above-mentioned. The PPII climbed 1.6% YoY in August and exceeded estimates of 1.2%, doubling July’s 0.8% increase. Other data announced by the BLS showed that Initial Jobless Claims for the week ending September 9 rose to 220K, below the consensus of 225K, underscoring a hot labor market.
Per the NZD/USD’s reaction to the data, market participants believe there will be another rate hike by the Fed before the year’s end. The CME FedWatch Tool shows the Fed would not raise rates at the September meeting. But for November, there’s a 35% chance the US central bank could lift rates.
On the New Zealand (NZ) front, traders are bracing for the release of Manufacturing PMI data. Although most PMIs released worldwide suggest an ongoing economic slowdown, NZ is not immune. New Zealand’s PMI shrank for five consecutive months, with the trend expected to extend to August, with estimates of 46.0.
Besides that, NZ’s major trading partner, China, is expected to release retail sales and industrial production. If the data returns positive and exceeds prior readings, that could lend a lifeline to the NZD/USD pair.
NZD/USD Price Analysis: Technical outlook
After today’s data, the pair printed a new two-week high, which NZD/USD sellers used to open fresh shorts positions as the major shifted bearish and dropped toward the 0.5910 area as price action began to form an inverted hammer. A decisive break below 0.5900 could open the door to test the year-to-date (YTD) low of 0.5859. On the other hand, the major would shift neutral if NZD bulls reclaim 0.6000.
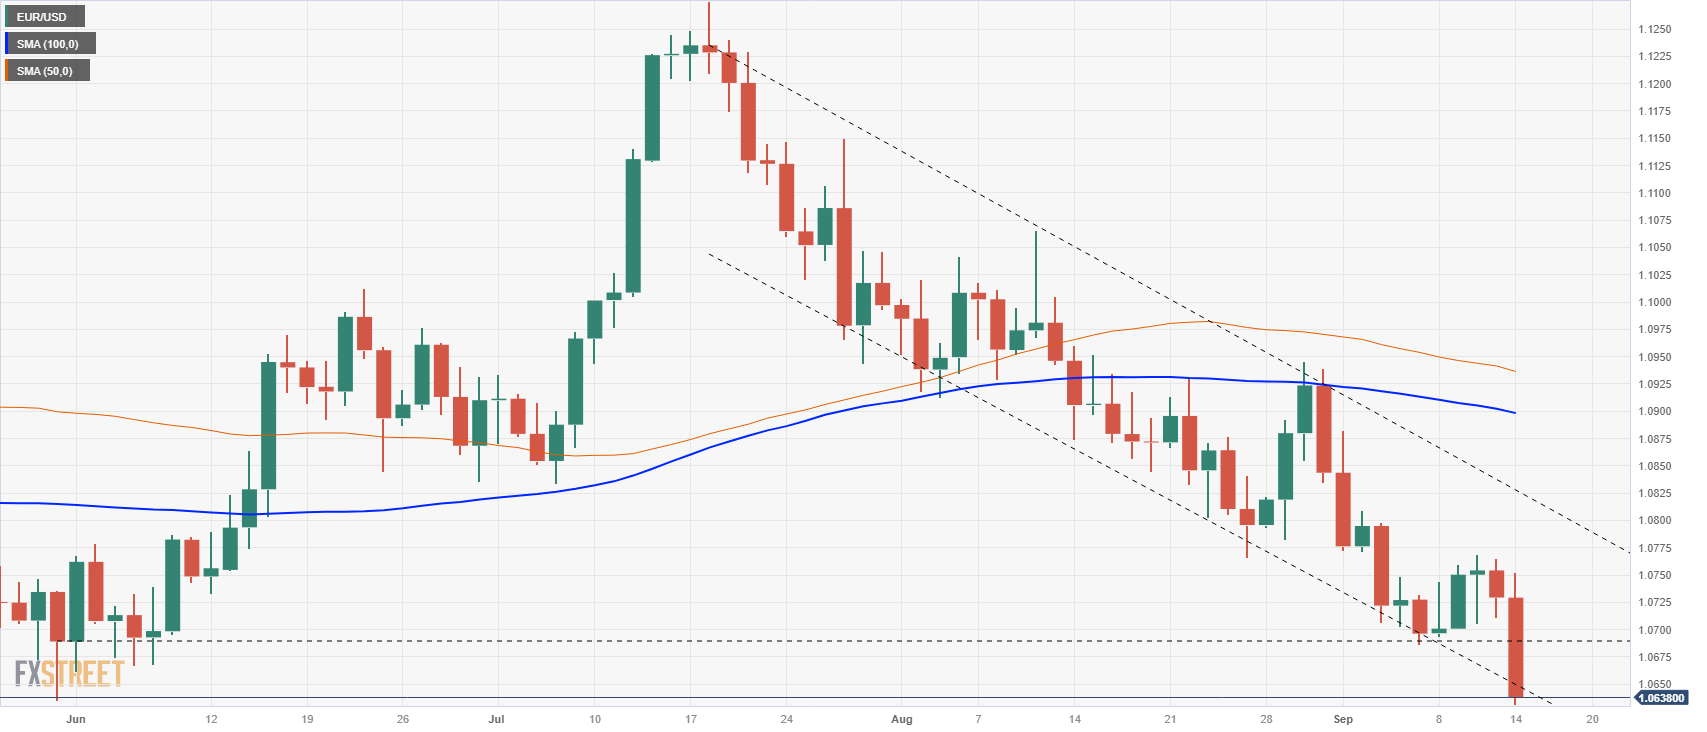
- Euro on pace for its worst trading day since July.
- Dovish ECB signals potential end of rate hike cycle.
- EUR/USD set to close in the red for the ninth consecutive week.
The EUR/USD continues to tumble through the US trading session for Thursday, clipping into the sub-1.0640 region as Euro bulls evaporate into the aether. The Euro (EUR) is at its lowest price against the Greenback (USD) in six months.
Euro tumbles as ECB achieves a dovish rate hike
The Euro is floundering after the European Central Bank (ECB) signaled the end of the rate hike cycle after delivering one last 25-basis-point rate increase, with the ECB’s President Christine Lagarde hinting that there might be no further rate hikes in the pipe as the European Union (EU) looks to keep its economy on-balance.
ECB President Lagarde noted that the broad European economy is likely to see soft spots heading into 2024, specifically highlighting weakness in the services sector.
Market bets of another rate hike from the ECB have entirely collapsed, and investors have begun to anticipate the first rate cut from the ECB next March.
Further reading: ECB raises interest rates again, signals end of tightening cycle
See more: Lagarde can’t say ECB rates have reached their peak
EUR/USD technical outlook
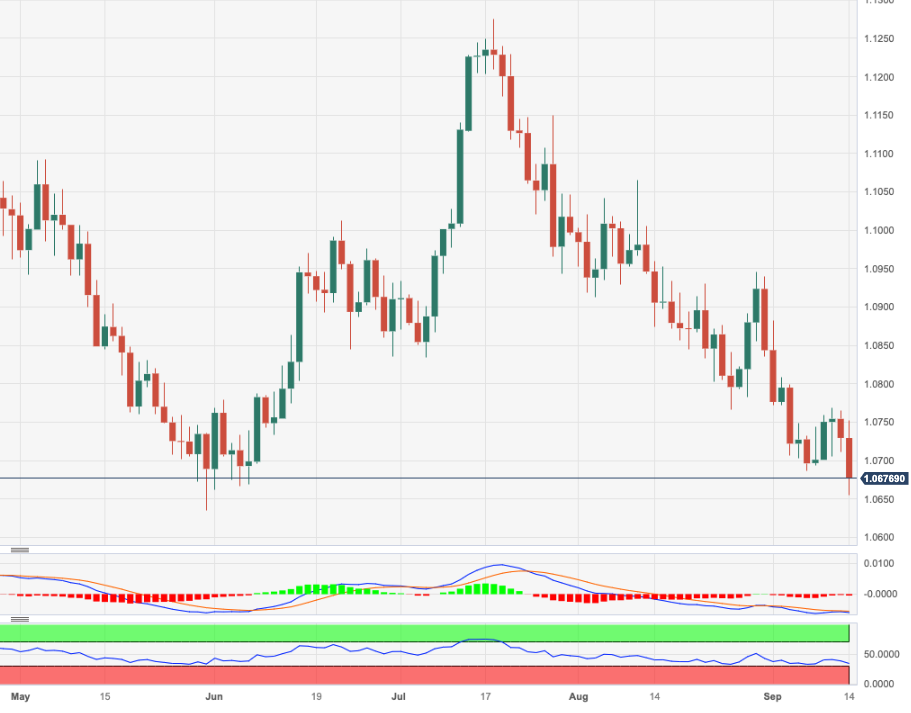
With the Euro continuing to slide into fresh six-month lows, the EUR/USD is set to accelerate into a steepening bearish trend if buyers aren’t able to stage a relief rally from here.
The 100-day Simple Moving Average has begun to turn bearish into the 1.0900 handle, and the 50-day SMA has begun to turn lower but still remains in a bullish cross against the longer SMA. Sellers will be looking for the bearish cross of the 50- and 100-day SMAs to accelerate declines, while bulls will be looking to arrest the declines before the cross confirms.
If the backslide continues uninterrupted, the next meaningful support zone will be 2023’s bottoms near 1.0550, set back in March of this year.
EUR/USD daily chart
EUR/USD technical levels
- USD/JPY declined to a low near 147.00 and then recovered to 147.40.
- The US reported strong mid-tier economic figures.
- Hawkish bets on the Fed decline, and markets foresee 35% odds of a hike in November or December.
In Thursday’s session, the USD/JPY saw losses, mainly driven by the JPY’s strength, which is trading strong against most of its rivals. In addition, the Greenback is also holding strong, with its DXY index jumping to its highest level since March 9, around 105.20. The upward movements were driven by solid economic activity figures, which showed that the US economy is not giving up.
The US Producer Price Index (PPI) exhibited a substantial MoM increase of 0.7%, reaching 1.6% (YoY) in August, which exceeded market expectations. On the other hand, Retail Sales saw a 0.6% (MoM) increase in the same month, significantly surpassing the anticipated 0.2% rise and exceeding the previous month's 0.6% growth.
On the labour market front, Jobless Claims for the second week of September experienced an uptick, reaching 220,000, slightly higher than the previous week's 217,000 but still below the anticipated figure of 225,000.
As a reaction, the US yields are rising. The 10-year bond yield reached 4.29% and showed a 0.80% increase. The 2-year yield stands at 5.01%, up by 0.76%, while the 5-year yield is at 4.41% with similar increases. However, the CME FedWatch tool indicates that investors foresee a lower likelihood of the Federal Reserve (Fed) opting for a hike in the remainder of 2023, with the odds of a 25 basis point (bps) hike slightly declining to 35%. For the next sessions, the market’s mood will potentially be cautious, awaiting the anticipated Fed decision next Wednesday.
On the JPY’s front, there are no fundamental reasons for the Yen to recover as soft Japanese data make the Bank of Japan’s officials attach to its dovish stance. In line with that, during the Asian session, soft Machinery Orders figures from August from Japan were reported and fell to their lowest since August 2020. The BoJ has stated that as long as wage and inflation figures don’t match their forecast, a pivot won’t be considered, which leaves the Yen vulnerable.
USD/JPY Levels to watch
Based on the daily chart, the USD/JPY shows indications of bullish exhaustion, leading to a neutral to bearish technical outlook. With a flat slope above its midline, the Relative Strength Index (RSI) suggests a period of stability in positive territory. At the same time, the Moving Average Convergence (MACD) histogram lays out rising red bars.
Support levels: 146.50 (20-day SMA), 146.00, 145.50.
Resistance levels: 147.50, 148.00, 148.50.
USD/JPY Daily Chart
-638303107190491513.png)
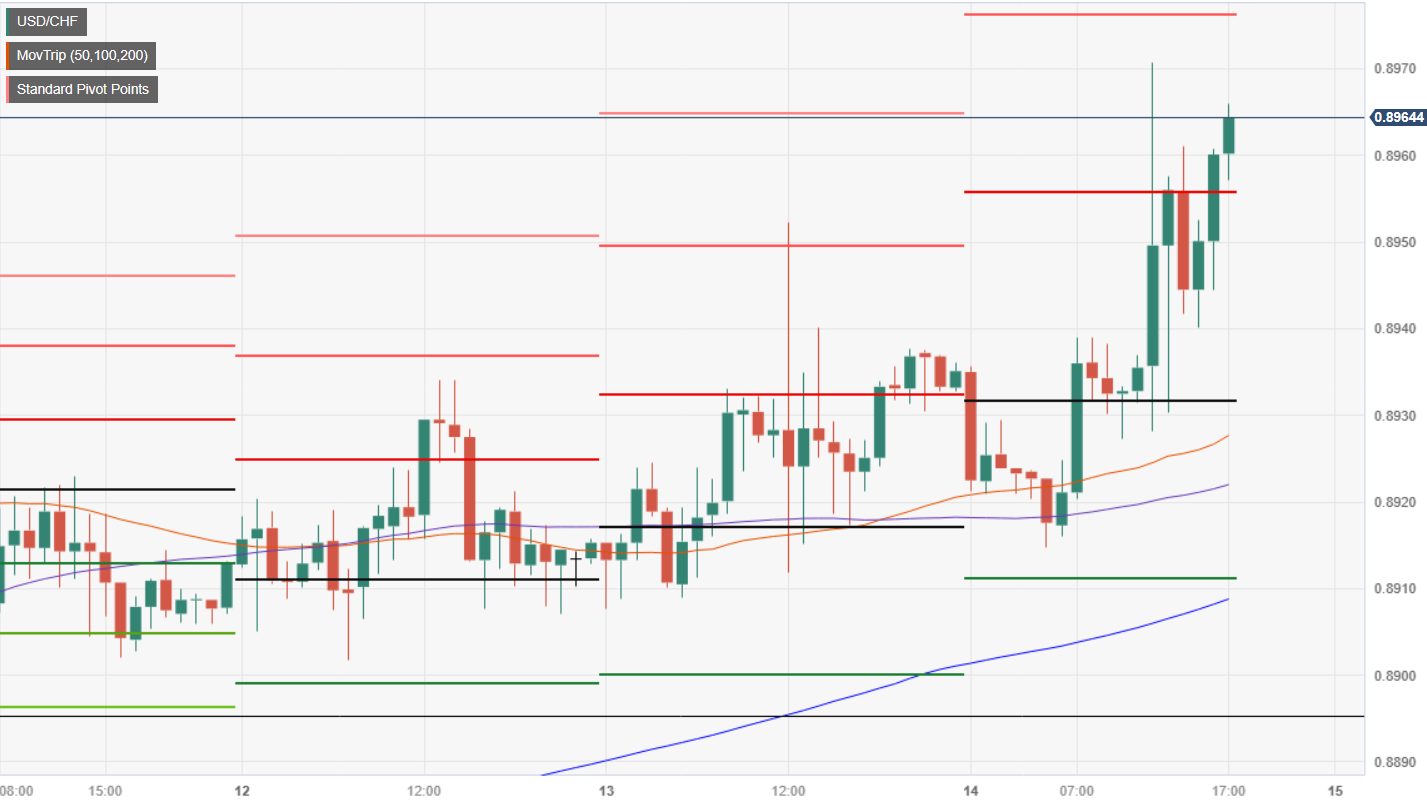
- USD/CHF in a strong uptrend on the daily chart, targeting key resistance at 0.9000.
- A break above 0.9000 could lead to a test of the 200-day Moving Average at 0.9041, followed by the May 31 high at 0.9147.
- Sellers need to push the pair below this week’s low of 0.8893 to regain control and shift momentum.
The US Dollar (USD) prolonged its gains versus the Swiss Franc (CHF) on Thursday, as the Greenback (USD) prints a six-month high, as inflation data during the last couple of days shows inflation remains elevated. Nevertheless, money market futures do not foresee a rate hike in September, but November remains open. Hence, the USD/CHF is trading at 0.8964 after hitting a daily low of 0.8914.
USD/CHF Price Analysis: Technical outlook
The daily chart depicts the pair as in a steady uptrend, with USD/CHF buyers eyeing the 0.9000 mark. A breach of the latter would expose the 200-day Moving Average (DMA) at 0.9041 before the major reaches the May 31 daily high at 0.9147. On the other hand, sellers must drag prices below the current week’s low of 0.8893 if they want to reclaim control.
The USD/CHF is set to test the 0.9000 mark in the short term, but buyers must first reclaim the R1 daily pivot at 0.8960. if that level is surpassed, the pair will aim toward the R2 pivot point at 0.8985 before claiming 0.9000. Conversely, the major would shift downwards if it drops below today’s daily low of 0.8914.
USD/CHF Price Action – Daily chart
- Oil into fresh highs as production cuts weigh on supply.
- OPEC-led production drawdown extended through the end of the year.
- Saudi Arabia, Russia leading the pack, extended current 1.3 million bpd combined cuts through December.
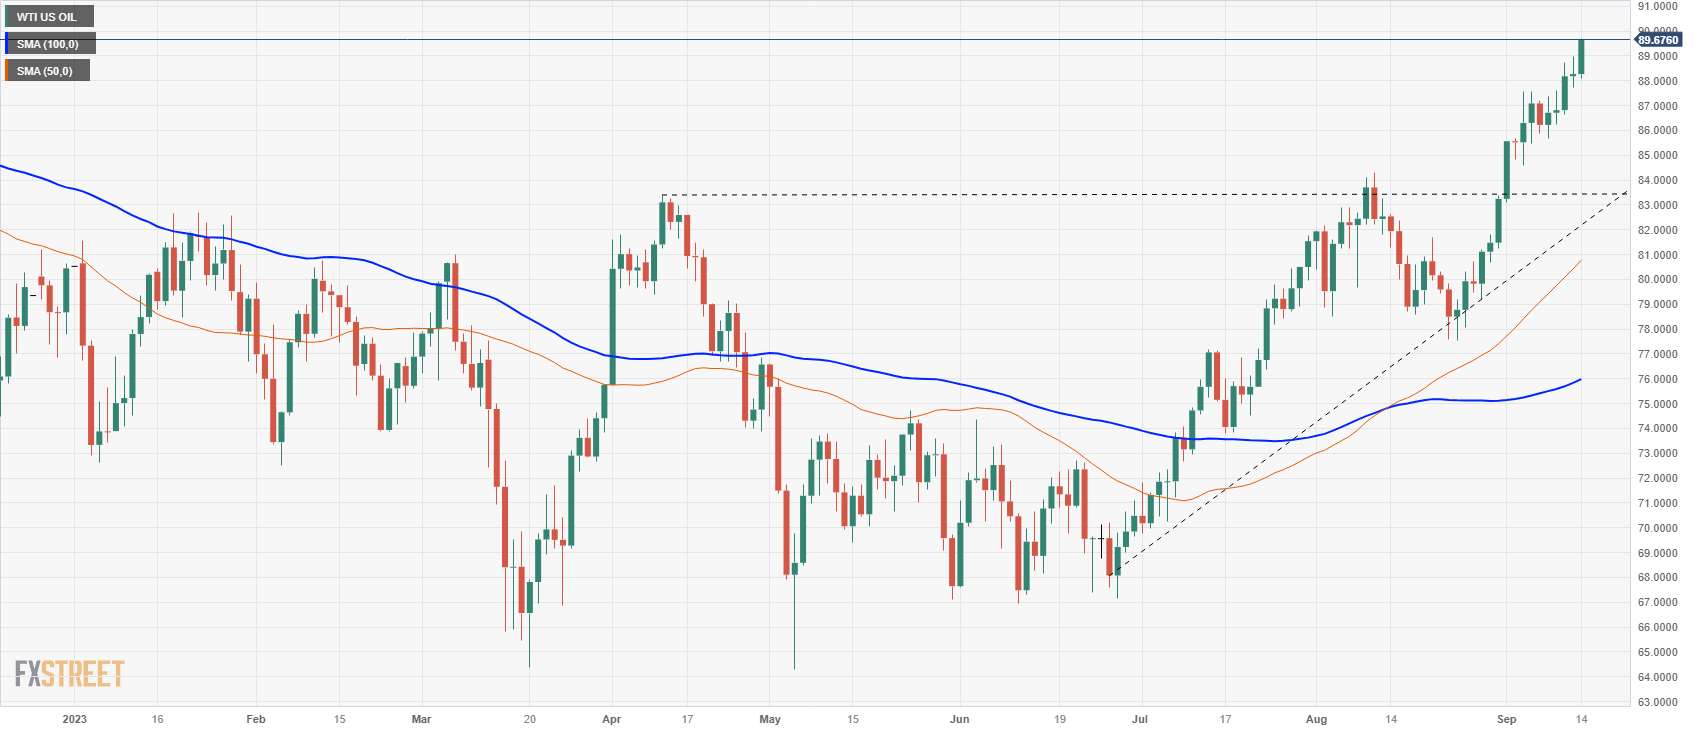
West Texas Intermediate (WTI) crude oil is on the high side for Thursday, chalking in a new ten-month high as US light sweet crude takes a run up the charts with eyes on $90.00 per barrel.
OPEC warns that supply constraints could run deeper, longer than previously anticipated
The International Energy Agency (IEA) flashed a warning on Wednesday that crude oil production cuts from member countries of the Organization of the Petroleum Exporting Countries (OPEC), specifically those from Saudi Arabia and Russia, will lead to a “significant supply shortfall” that would send oil prices soaring in the coming months.
Oil production cuts across OPEC, specifically Saudi Arabia’s million-barrel-per-day production squeeze, alongside Russia’s 300,000 bpd pumping cut, are sending oil prices soaring. Saudi Arabia and Russia recently extended their production cuts through December, and the IEA is warning that the continued production declines will produce a significant supply constraint through the fourth quarter.
Saudi Arabia and Russia both announced that the extreme production cuts were extended through the end of the year “with the aim of supporting the stability and balance of oil markets”. WTI oil prices are up nearly 40% from May’s lows near $64.00/bbl.
When factoring in all oil production cuts across OPEC, the global oil market is undersupplied by an estimated 1 - 3 million barrels per day. Global oil reserves are broadly expected to draw down to a fraction of their current holdings, including the US’ Strategic Petroleum Reserve (SPR).
WTI technical outlook
WTI crude oil is stretched all the way to the top, trading well above all relevant intraday technicals. The 100-day Simple Moving Average (SMA) is swamped near the $76.00 level, while the 50-day SMA has turned aggressively bullish and pushing into the $81.00 mark.
The nearest technical floor is priced in near August’s swing high at the $84.00 handle, a level that WTI previously challenged back in April of this year.
If bullish momentum continues, the nearest technical ceiling will be the highs marked in near $92.50 back in October of 2022, while any bearish reversals will see rising support from a bullish trendline marked in from June’s lows near $68.00.
WTI daily chart
WTI technical levels
- EUR/CHF drops 0.52% to 0.9538 after ECB raises rates but signals it could be the last hike in the current cycle.
- ECB President Christine Lagarde projects subdued economic growth and falling inflation, tilting risks to the downside.
- Swiss Producer and Import prices cool, setting the stage for the SNB to hold rates steady in its September 21 meeting.
The Euro (EUR) sank versus the Swiss Franc (CHF) on Thursday after the European Central Bank (ECB) decided to lift rates but signaled that it “could” be the last rate hike. Hence, the EUR/CHF has plunged from its daily high of 0.9598 towards 0.9538, losing 0.52%.
ECB’s rate hike and dovish outlook sends EUR/CHF spiraling down, while SNB eyes steady rates
On Thursday, the European Central Bank (ECB) decided to lift rates by 25 basis points for the tenth time since its tightening cycle began, though hinted that it could be the latest increase, despite leaving the door open for additional tightening. The statement added that rates must remain at higher levels, and growth projections were revised downward.
After the ECB released the statement, ECB’s President Christine Lagarde said that economic growth would remain subdued, projecting a weak third quarter. She added that inflation would fall in coming months and stressed that risks-to growth are tilted to the downside. Mrs. Lagarde added that some inflation indicators remain elevated, and she didn’t say rates in the Eurozone (EU) had peaked.
On the ECB’s decision, the EUR/CHF plunged from around daily highs near 0.9600 toward 0.9550s, while the German 10-year bund dropped three basis points down to 2.599%.
Earlier, Producer and Import prices in Switzerland cooled down, opening the door for the Swiss National Bank (SNB) to hold rates unchanged at the September 21 monetary policy meeting.
Given the fundamental backdrop suggesting the ECB has finished increasing rates, alongside the SNB set to raise rates at the upcoming monetary policy meeting, means the EUR/CHF could extend its losses in the near term.
EUR/CHF Price Analysis: Technical outlook
The daily chart portrays the pair slid after testing the 50-day Moving Average (DMA) at 0.9592, which fell to a four-day low of 0.9534 before stabilizing at current exchange rates. Nevertheless, the EUR/CHF is shy from extending its losses, as it needs to break below the August 23 swing low of 0.9515, which, once cleared, the pair could dive towards the September 26 low of 0.9403.
- USD/CAD tallied its fifth day in a row of losses of 1.3515.
- US August’s PPI ran hot and rose to 1.7% YoY. Retail Sales came in hot.
- Fed tightening expectations eased somewhat. Yield remains high.
- Jobless Claims from the second week in September came in lower than expected.
On Thursday’s session, the USD/CAD continued its downward path, failing nearly to 1.3510, seeing 0.30% losses. On the CAD’s side, its strength may be explained by higher Oil prices as Canada is a leading exporter, while the USD measure by the DXY index rose to fresh highs around 105.20 after the release of mid-tier data. In line with that, the downside may be limited for the pair.
On the data front, the Greenback gained momentum after it was reported that Retail Sales rose 0.6% MoM in August, much better than the 0.2% anticipated and higher than the previous 0.6%. In addition, the Producer Price Index (PPI) jumped from 0.7% MoM to 1.6% YoY in August, also beating expectations. Moreover, Jobless Claims for the second week of September accelerated but below the expectations at 220,000, higher than the previous weekly reading of 217,000 but below the expected 225,000.
As a reaction, US Treasury yields advanced with the news, with the 2-year note offering nearly 5% and boosting demand for the American dollar, whose DXY index continues to trade at highs since early March. On the expectations front, the CME FedWatch tool suggests that the odds of one last hike in 2023 by the Federal Reserve (Fed) declined to nearly 35% from 40% in the previous sessions. Attention now turns to next week’s decision, where markets have already priced in a pause, but the statement and Chair Powell’s presser will be closely monitored.
USD/CAD Levels to watch
The short-term view for USD/CAD suggests a bearish outlook based on the daily chart analysis. The Relative Strength Index (RSI) is positioned below its midline and displays a southward slope, while the Moving Average Convergence Divergence (MACD) exhibits red bars, signalling an increasing bearish momentum. On the other hand, the pair is below the 20-day Simple Moving Average (SMA) but above the 100 and 200-day SMAs, pointing towards the prevailing strength of the bulls in the larger context.
Support levels: 1.3500, 1.3490, 1.3463 (200-day SMA).
Resistance levels: 1.3576 (20-day SMA), 1.3600, 1.3630.
USD/CAD Daily Chart
-638303042577466230.png)
- The Euro fell after the ECB failed to inspire bulls on 0.25% rate hike
- The ECB is cautioning that this could be peak interest rate.
- ECB to focus on duration of rate cycle rather than frequency of policy adjustment
The EUR/GBP is staging a mid-day rebound, testing the 0.8590 region after the Euro (EUR) slumped on a dovish showing from the European Central Bank (ECB), despite a 25-basis-point rate hike that failed to bolster the EUR.
The ECB is signaling that this could be the peak of the rate hike cycle, cautioning that inflation is set to fall in the coming months, and noting that the broad European Union (EU) economy is facing downside risks as services weaken.
ECB's Lagarde flashes warning sign that this could be the end of rate hikes
ECB President Christine Lagarde noted that while she’s not explicitly stating the EU is at peak rates, the ECB will likely focus more on the duration of current rates, rather than more rate movement in the future. President Lagarde also suggests that policy transmission is more direct, and faster to have an impact, on financial conditions than in previous cycles.
The dovish tone from ECB President Lagarde was enough to knock the Euro off of any bullish momentum on the back of the rate hike. Earlier this week investors jostled for bullish position on the EUR after an internal leak from the ECB suggested the EU central bank was poised to raise its inflation forecasts, but the revised inflation expectations weren’t enough to unluck further movement on the rate cycle at this time.
EUR/GBP technical outlook
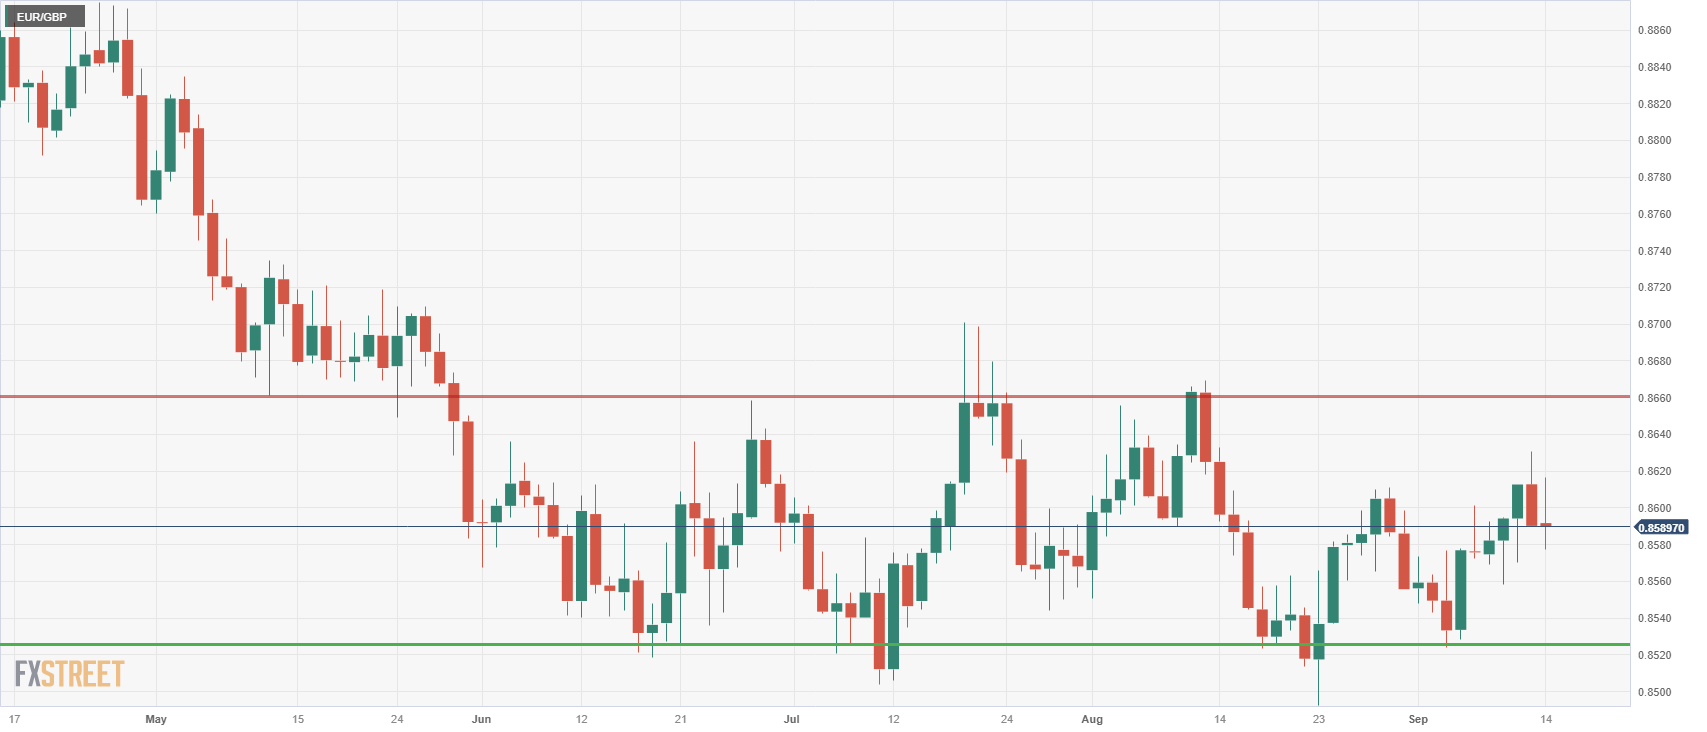
The EUR/GBP hit an intraday high of 0.8616 ahead of the ECB rate call, then flubbed the landing, hitting 0.8578 following the rate call. Euro traders are struggling to maintain a foothold, and the pair is struggling to develop further momentum from the 0.8590 handle.
Despite the disappointing ECB showing, the EUR/GBP pair is flat for Thursday and is set to end the day near where it started, trading near the opening bids.
Long term, the Euro-Pound Sterling (GBP) pair is caught in significant consolidation, and the pair has firmly cycled within the zone between 0.8500 and 0.8700. Daily candles have the pair down from the week’s high of 0.8630, with support priced in at last week’s swing low near 0.8530.
EUR/GBP daily chart
EUR/GBP technical levels
- USD/MXN trades at 17.1127, down 0.23%, as US Retail Sales disappoint, but jobless claims and PPI exceed expectations.
- Mexican 2024 budget proposal to widen deficit to 4.9% of GDP raises eyebrows, pushing Mexico’s 10-year bond yield up 17 basis points.
- US Dollar Index (DXY) climbs 0.40% to 105.17, influenced by seesawing US Treasury yields and mixed economic data.
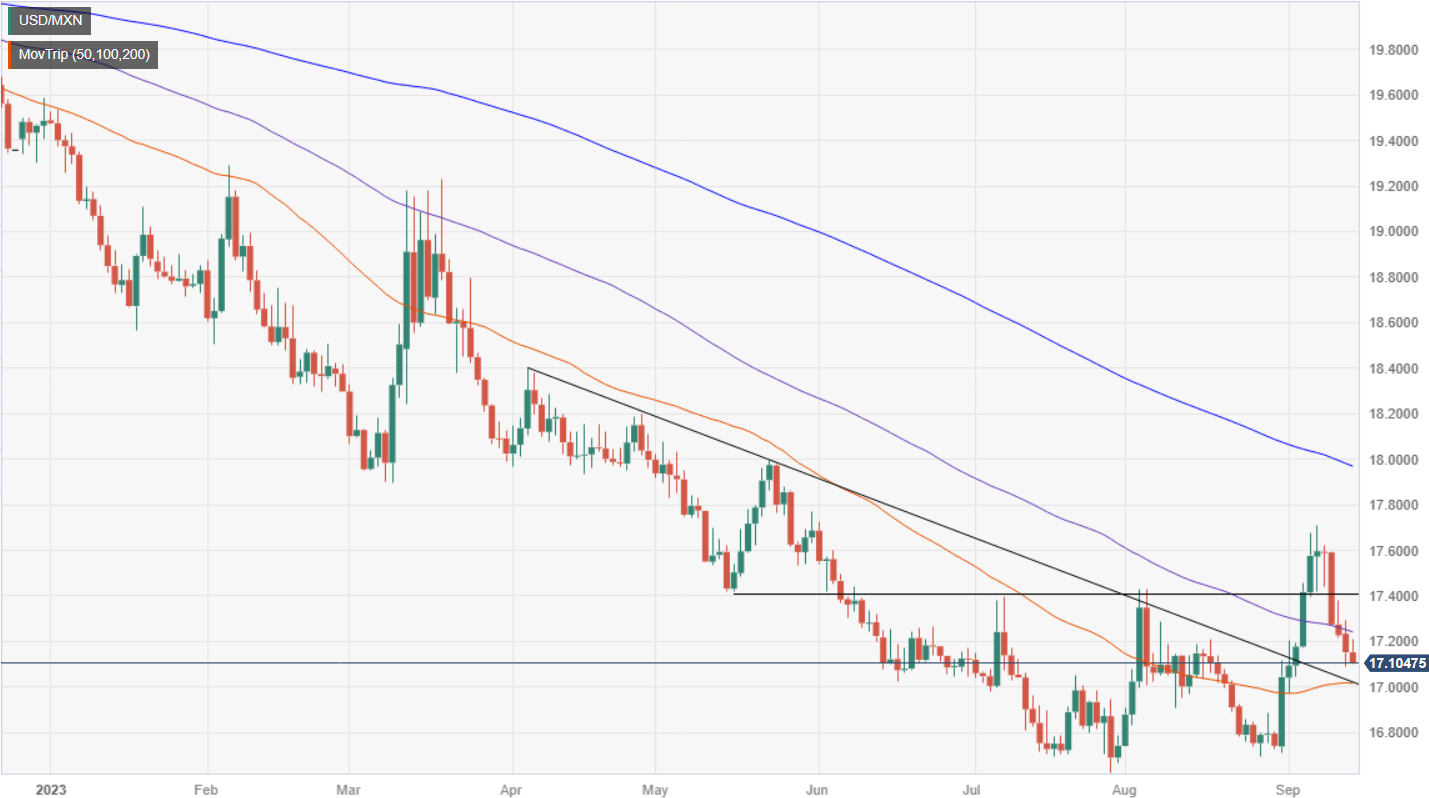
The Mexican Peso (MXN) strengthened for the fourth straight day against the Greenback (USD) earlier in the North American session after solid US economic data spurred investors’ risk appetite. The USD/MXN is trading at 17.1127, retreating some 0.23% after hitting a daily high of 17.2050.
USD/MXN retreats as us retail sales miss and Mexican budget deficit plans stir market sentiment
The US Department of Commerce revealed that US Retail Sales in August were below estimates of 2.9% YoY, rose by 2.5%, but on a monthly reading, exceeded forecasts. The jump in oil prices bolstered sales, as inflation ticked higher as expected on Wednesday, as the US Department of Labor revealed August’s CPI.
Meanwhile, prices paid by producers advanced 1.6% YoY in August, above 1.2% forecasts, doubling July’s 0.8% increase. The Producer Price Index (PPI) revealed by the US Bureau of Labor Statistics (BLS), rose the most in over a year. At the same time, jobs data revealed that Initial Jobless Claims for the week ending September 9 rose to 220K, below the consensus of 225K, underscoring a hot labor market.
US Treasury bond yields seesawed after the data, with the most sensitive to interest rates, the 2-year note, yielding 5.035% at the data release, ahead of retreating below the 5.0% threshold. This bolstered the Greenback, as shown by the US Dollar Index (DXY). The DXY, which tracks the USD performance vs. a basket of six currencies, climbs 0.40%, at 105.17.
Across the border, the recent budget has gathered attention from economists in Mexico. The fact the 2024 proposed budget would increase the deficit from 3.3% to 4.9% of the Gross Domestic Product (GDP) generated different reactions as the country prepares to elect the current President, Andres Manuel Lopez Obrador. Mexico’s 10-year bond yield rose 17 basis points on Monday on the prospect of higher borrowing. Analysts at Goldman Sachs noted, “From this expansionary baseline, fiscal slippages (which would lead to a budget deficit of around 6% of GDP) could trigger sovereign rating downgrades, in particular, if growth decelerates visibly.”
USD/MXN Price Analysis: Technical outlook
Despite trading near the week’s lows, the USD/MXN appears to have bottomed at around 17.10, unable to extend its fall, capped by the presence of the 20-day Moving Average (DMA) at 17.0919. IF that level is breached, that will put the 50-DMA in play at the 17.0000 psychological level. Conversely, if the pair manages to stage a recovery, USD buyers must reclaim the 100-DMA at 17.2361, so they could threaten to recover the 17.5000 mark.
Analysts at Danske Bank continue to forecast a lower EUR/USD over the next months after the rate hike from the European Central Bank (ECB).
Key quotes:
The dovish hike from the ECB and ongoing US outperformance are weighing on the cross.
We make no changes to our EUR/USD forecast, and hence we maintain our strategic case for a lower EUR/USD based on relative terms of trade, real rates and relative unit labour costs.”
We expect the relative strength of the US economy to continue weighing on the EUR/USD in the coming months as growth differentials take the driver’s seat, and we continue to forecast the cross at 1.06/1.03 in 6/12M.
As it is hard to imagine a sudden change of the current USD momentum, and with commodity prices currently rising, we may reach our 6M forecast for the cross earlier than expected.
After passing the $2,000 bar in the spring, Gold experienced weakness over the summer. Economists at Société Générale analyze the yellow metal’s outlook.
Core inflation remains sticky – easy energy wins in the rearview mirror
In the short term, headline inflation continues to cool, but core inflation remains stubbornly high, and the Fed is near its cyclical peak. As the imminence of a US recession recedes, these developments give the Fed the opportunity and the obligation to keep rates higher for longer to fight inflation. This will keep real rates elevated, which combined with the currently strong Dollar creates headwinds capping Gold prices below or at $2,000 to the end of this year on our estimates.
In 2024, the need to keep rates high will likely subside. In line with our outlook for energy and specifically for crude, the easy wins in bringing inflation to heel are likely in the rearview mirror. The soft cap on Fed funds, together with sticky inflation, is the crucial ingredient in our positive outlook for Gold next year. We forecast a depreciating Dollar into 2024 which should provide further tailwinds for commodities and in particular Gold.
The Silver price resumed its downtrend after touching $24.70 recently. Economists at ANZ Bank analyze XAG/USD’s outlook.
A supportive fundamental backdrop could gain investor attention soon
We expect investment demand to turn, consistent with fundamentals, and for prices to rebound toward $25 by the end of this year.
India’s imports of silver from the United Arab Emirates (UAE) are rising under the Comprehensive Economic Partnership Agreement (CEPA).
See – Silver Price Forecast: XAG/USD strives for interim support near $22.40 after strong Retail Sales data
Economists at CIBC Capital Markets analyze the EUR/USD outlook.
Moderating activity to keep ECB on hold
Weakening activity in the Eurozone implies that the European Central Bank is already at its terminal rate. That should work to keep the EUR on the defensive in the near-term.
The paring in rate pricing, unwind in EUR holdings and widening in UST Bund spreads favours near-term EUR headwinds.
EUR/USD – Q4 2023: 1.05 | Q1 2024: 1.06
See: ECB raises interest rates again, signals end of tightening cycle
- Silver price seeks intermediate support as the US Dollar strengthens after upbeat Retail Sales data.
- Strong consumer spending momentum has boosted US consumer inflation expectations.
- Silver price forms a Head and Shoulder chart pattern, which is a trend reversal pattern.
Silver price (XAG/USD) demonstrated a volatile action after the United Census Bureau reported that Retail Sales data outperformed expectations. The white metal seeking a cushion near $22.40 but the outlook seems vulnerable as strong consumer spending momentum has boosted consumer inflation expectations.
Retail Sales for August expanded at a higher pace of 0.6% vs. estimates of 0.2% and July’s reading of 0.5%. The economic data excluding automobiles rose at a slightly slower pace of 0.6% vs. the former reading of 0.7% while investors anticipated a 0.2% pace.
Along with, the US Department of Labor showed that individuals claiming jobless benefits for the first time rose by 220K while investors anticipated higher jobless claims at 225K. In the previous week, jobless benefits were recorded at 216K. Jobless claims remained higher than the prior week's figures after declining straight for five weeks.
The US Dollar Index (DXY) prints a fresh six-month high at 105.30 as strong retail demand could elevate consumer inflation expectations and encourage Federal Reserve (Fed) policymakers to deepen discussions about one more interest rate increase in the remaining year. The 10-year US Treasury yields rose sharply to 2.28%.
Silver technical analysis
Silver price forms a Head and Shoulder chart pattern on a daily scale, which is a trend reversal pattern. The neckline of the aforementioned chart pattern is plotted from June low around 22.18. A declining 20-period Exponential Moving Average (EMA) indicates that the short-term trend is bearish.
The Relative Strength Index (RSI) (14) shifts into the bearish range of 20.00-40.00, which indicates that the downside impulse has strengthened.
Silver daily chart
-638302979227637605.png)
In the past five days, the AUD has been the second best performing G10 currency after the CAD. Economists at Rabobank analyze AUD/USD outlook.
Global growth fears suggest scope for further dips lower in AUD/USD
Support for iron ore prices and hopes that Beijing could lift more bans on Australian exports could soften the fall-out from China’s slowdown, though global growth fears suggest scope for further dips lower in AUD/USD.
In terms of its budget position, current account surplus and 2024 growth outlook, Australia is better positioned than many of its G10 peers. However, in an environment of slowing global growth, the Aussie is likely to be vulnerable and we see risk of dips back towards 0.62 on a three-month view.
As Fed rate cuts come into view next year, we expect the USD to soften and see scope for AUD/USD to rally back towards 0.68 in the middle of next year.
CAD trades modestly firmer near recent range highs on the USD. Economists at Scotiabank analyze Loonie’s outlook.
Positive tilt in the direction of factors driving the CAD
A steadier USD overall, steady stocks, somewhat firmer crude oil and marginal gains in commodity prices broadly suggest a slightly more positive tilt in the direction of factors driving the CAD.
But some additional improvement in short-term spreads and/or a generally weaker USD is needed to give the CAD a more obvious lift at this point.
- EUR/USD intensify its decline to fresh four-month lows.
- Bears now re-shift their attention to the 1.0630 zone.
EUR/USD sinks to levels last traded four months ago in the mid-1.0600s on Thursday.
The underlying bearish sentiment remains unchanged and leaves the door open to extra pullbacks in the short-term horizon. Against that backdrop, a sustained breach of the 1.0700 yardstick could encourage sellers to embark on a probable visit to the May low of 1.0635 (May 31).
In the meantime, further losses remain in the pipeline while below the key 200-day SMA, today at 1.0827.
EUR/USD daily chart
Christine Lagarde, President of the European Central Bank (ECB), is delivering her remarks on the policy outlook and responding to questions from the press following the Governing Council's decision to hike key rates by 25 basis points in September.
Asked about how long the ECB will keep interest rates at these levels, Lagarde answered they did not discuss what “long enough” means.
Key takeaways
“We did not discussed PEPP programme and reinvesmtnets”.
“We did not discussed APP outright sales”.
“We did not discuss how long we will leave rates at these levels”.
“I’m not saying we are at peak rates”.
“Policy transmission to financing conditions is faster than in previous cycles.”
About ECB's press conference
Following the ECB´s monetary policy decisions, the ECB President delivers a prepared statement and responds to questions from the press on the policy outlook. Her comments may influence the volatility of EUR and determine a short-term positive or negative trend. Her hawkish view is considered as positive, or bullish for the EUR, whereas her dovish view is considered as negative, or bearish.
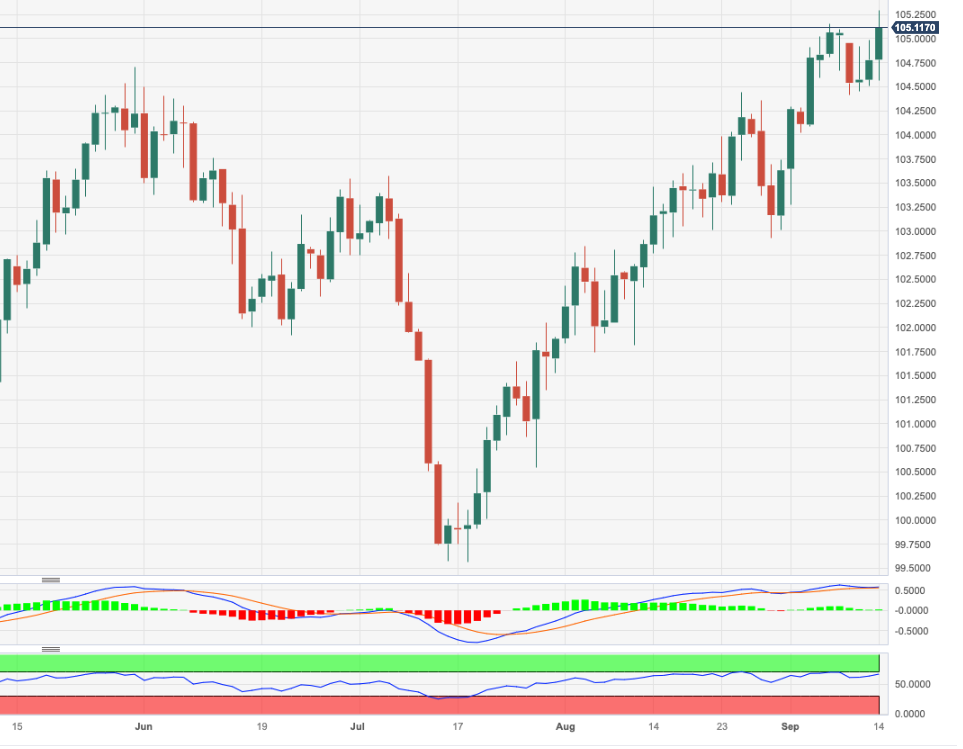
- DXY climbs to fresh highs near 105.30 on Thursday.
- The continuation of the upward bias now looks at the 2023 top.
DXY adds to Wednesday’s advance and clinch new six-month tops north of 105.00 the figure on Thursday.
The continuation of the multi-week rally appears well and sound and a breakout of the monthly high of 105.28 (September 14) should encourages the index to retest the 2023 peak of 105.88 (March 8), just before the round level of 106.00.
While above the key 200-day SMA, today at 103.02, the outlook for the index is expected to remain constructive.
DXY daily chart
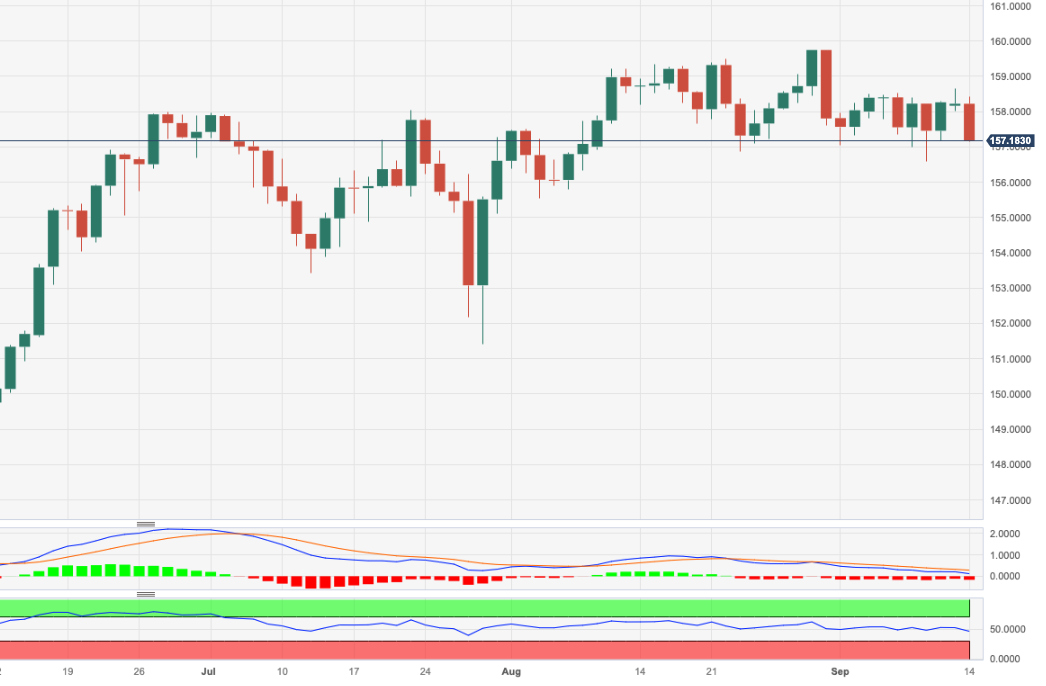
- EUR/JPY drops to three-day lows following Wednesday’s monthly highs.
- Further consolidation appears on the cards in the very near term.
EUR/JPY retreats from Wednesday’s monthly highs around 158.60 and revisits the vicinity of the 157.00 zone, or three-day lows, on Thursday.
In the meantime, the cross continues to face some side-lined trading prior to a potential resumption of the uptrend. That said, a minor hurdle emerges at the so far monthly high of 158.65 (September 13) ahead of the 2023 top at 159.76 (August 30) and before the key round level at 160.00. The surpass of the latter should not see any resistance level of note until the 2008 high at 169.96 (July 23).
So far, the longer term positive outlook for the cross appears favoured while above the 200-day SMA, today at 148.70.
EUR/JPY daily chart
The Russian Ruble is likely to depreciate medium-term due to the declining current account surplus, in the view of economists at Commerzbank.
Current account fundamentals negative
We now forecast USD/RUB at 120.00 by end-2024.
Residents looking to dollarise their assets probably have structural motivations, not interest rate arbitrage motivation.
We expect Ruble depreciation to continue at a steady pace.
Official data acknowledge that the current account surplus has narrowed by 73% YoY year-to-date. This is the main negative fundamental driver of the exchange rate.

Source: Commerzbank Research
Christine Lagarde, President of the European Central Bank (ECB), is delivering her remarks on the policy outlook and responding to questions from the press following the Governing Council's decision to hike key rates by 25 basis points in September.
“A solid majority” supported the decision to hike interest rates, said Lagarde. She noted that some members preferred to pause.
Key takeaways
“Tightening continues to be transmitted strongly”.
“Credit dynamics have weakened, rates have risen”.
“A solid majority of ECB members agreed with the decision”.
“Some governors would have preferred to pause”.
About ECB's press conference
Following the ECB´s monetary policy decisions, the ECB President delivers a prepared statement and responds to questions from the press on the policy outlook. Her comments may influence the volatility of EUR and determine a short-term positive or negative trend. Her hawkish view is considered as positive, or bullish for the EUR, whereas her dovish view is considered as negative, or bearish.
Christine Lagarde, President of the European Central Bank (ECB), is delivering her remarks on the policy outlook and responding to questions from the press following the Governing Council's decision to hike key rates by 25 basis points in September.
Key takeaways
“In coming months, inflation will fall”.
“Risks to economic growth are tilted to the downside”.
“Domestic price pressures remain strong”.
“Some long-term inflation indicators are elevated and need to be monitored closely”.
“Energy and food are upside risks to inflation”.
“Weaker demand is a downside risk to inflation”.
About ECB's press conference
Following the ECB´s monetary policy decisions, the ECB President delivers a prepared statement and responds to questions from the press on the policy outlook. Her comments may influence the volatility of EUR and determine a short-term positive or negative trend. Her hawkish view is considered as positive, or bullish for the EUR, whereas her dovish view is considered as negative, or bearish.
Retail Sales in the US outperformed expectations. Economists at TD Securities analyze Gold’s outlook following the data.
Traders continue to sell into the soft-landing theme
Gold prices are coming under further pressure as Retail Sales data surprised to the upside, following the better-than-expected CPI data on Wednesday.
Traders continue to sell into the soft-landing theme amid fears of higher-for-longer rates. In this sense, the continued upside data surprises will further strengthen and compound these fears and keep the precious metals complex on the back foot.
Christine Lagarde, President of the European Central Bank (ECB), is delivering her remarks on the policy outlook and responding to questions from the press following the Governing Council's decision to hike key rates by 25 basis points in September.
Key takeaways
“Inflation still seen as too high for too long.”
“Rates will remains at sufficiently restrictive levels for as long as necessary.”
“Economy likely to remain subdued in coming months”.
“Services are weakening”.
“Economic momentum should pick up as real income rise”.
“The labor market is resilient”.
“Governments should roll back support measures.”
About ECB's press conference
Following the ECB´s monetary policy decisions, the ECB President delivers a prepared statement and responds to questions from the press on the policy outlook. Her comments may influence the volatility of EUR and determine a short-term positive or negative trend. Her hawkish view is considered as positive, or bullish for the EUR, whereas her dovish view is considered as negative, or bearish.
- In August, consumer spending grew at a healthy pace of 0.7%.
- Initial Jobless Claims remained higher than the prior week's figures after declining straight for five weeks.
The US Bureau of Labor Statistics reported on Thursday that the Producer Price Index (PPI) for final demand in the US rose 0.7% on a monthly basis from expectations and July’s print of 0.4%. Annualized headline PPI accelerated to 1.6% vs. estimates of 1.2% and the former reading of 0.8%.
The annual Core PPI decelerated to 2.2%, as expected by market participants vs. July’s figure of 2.4%.
Retail Sales in the US outperformed expectations of 0.2% and July’s reading of 0.5%, landing at 0.6% on a monthly basis in July, according to the data published by the US Census Bureau.
Retail Sales Ex-Autos rose 0.6% in the same period, compared to analysts' estimate of 0.4%, while Retail Sales Control Group increased 0.1%.
The US Department of Labor showed that individuals claiming jobless benefits for the first time rose by 220K while investors anticipated higher jobless claims at 225K. In the previous week, jobless benefits were recorded at 216K. Jobless claims remained higher than the prior week's figures after declining straight for five weeks.
Further details of the publication revealed that “the 4-week moving average was 224,500, decreased by 5,000 from the previous week's revised average.”
Continuing claims increased by 4K in the week ending September 8 to 1.688 million, but remained below market expectations of 1.695 million.
Market reaction
The US Dollar Index (DXY) shoots above the 105.00 resistance and refreshes a six-month high at 105.30, 0.42% higher from Wednesday’s closing.
- AUD/USD prepares for a fresh upside as upbeat labor market cheers hawkish RBA bets.
- The market mood remains upbeat as the Fed is not expected to raise interest rates further this year.
- US Retail Sales is seen expanding at a slower pace of 0.2% than the 0.7% pace recorded for July.
The AUD/USD pair eyes further recovery toward the psychological resistance of 0.6500 as a stronger-than-expected Australian labor market report for August raised hopes for one more interest rate increase from the Reserve Bank of Australia (RBA).
Australian Bureau of Statistics reported that the labor force recorded a fresh arrival of 64.9K payrolls, higher than expectations of 23K. In July, the Australian employers shed 1.4K workers. The Unemployment Rate landed at 3.7%, in line with expectations and July’s reading.
Solid labor growth is expected to encourage RBA policymakers to deliver one more interest rate hike in the remaining year. It is worth noting that the RBA has kept interest rates unchanged at 4.1% in the past three monetary policy meetings.
Meanwhile, S&P500 futures added decent gains in the European session, portraying a risk-on mood. The market mood remains upbeat as the Federal Reserve (Fed) is not expected to raise interest rates further this year.
In spite of a slightly hotter United States inflation, investors do not see the Fed hiking interest rates further as the central bank considers core inflation majorly, and the impact of higher headline inflation would be limited. Meanwhile, investors await the US Producer Price Index (PPI) data, which will be published at 12:30 GMT.
The headline PPI is seen expanding at a higher pace as gasoline prices turned costly in August, while the core PPI that excludes oil and food prices softened.
Apart from the US PPI data, monthly Retail Sales data will remain in focus. As per the estimates, the economic data expanded at a slower pace of 0.2% than the 0.7% pace recorded for July. A slowdown in consumer spending momentum indicates that higher inflationary pressures are biting household income.
US CPI did not revive the Dollar rally, will the ECB? Kit Juckes, Chief Global FX Strategist at Société Générale, analyzes EUR/USD outlook.
EUR/USD would probably drift lower on no change
Whether we get a hike today or a firm indication of one in a month or two, makes little difference though the shift in expectations this week means EUR/USD would probably drift lower on no change.
The Euro’s challenge isn’t really policy however, it’s the dramatic shift in 2023/2024 GDP growth forecasts in the US relative to the Eurozone.
Wednesday’s US CPI data had enough softness in it to stop the Dollar’s recent gains (and trigger a bounce in risk sentiment and some decent gains in China-sensitive currencies), and that switches the focus to US growth data. Strong nominal retail sales today would need to be seen in the context of inflation, and the US growth forecast revisions do leave the Dollar vulnerable to soft data (which challenge those changes) but there’s not much to support a bearish near-term US growth view.
Economists at ING are not convinced the ECB can trigger a sustainable EUR/USD rally.
A post-hike rally may not last
It is a close call, but we expect a 25 bps hike by the ECB.
Markets are pricing in a 65% implied probability of a hike, so EUR/USD should rise after the announcement if we are right. However, a full 25 bps are factored in by year-end, and it will be hard for Lagarde to convince markets the ECB can push rates even higher.
Any EUR rally may be short-lived. We expect a EUR/USD post-meeting jump to stall around 1.0800/1.0830 (if not falling short of those levels), and gradually give up gains as the Dollar’s momentum remains solid.
The CAD is among the top performing G10 currencies versus the US Dollar on the day. Economists at Scotiabank analyze USD/CAD’s technical outlook.
Resistance is 1.3585/1.3595
USD/CAD is generating a bit more downside momentum on the short-term chart as the pair continues to – slowly – edge back from last week’s high just under 1.37.
A push under high/low support at 1.3495/1.3500 should add to downside pressure and put a retest of the low 1.34 area on the radar.
Resistance aligns at 1.3585/1.3595.
- The US Dollar is in the red, though marginally, while looking for direction.
- All eyes are on the other side of the Atlantic with the ECB meeting.
- The US Dollar Index is expected to make waves on the PPI and Retail Sales numbers.
The US Dollar (USD) faces a next big hurdle in its attempt to head higher and maintain its place as ‘king Dollar’. First and foremost, the European Central Bank (ECB) is holding its interest-rate decision this Thursday. Markets are very split on the possible outcome of the meeting, with a 50-50 chance of a hike or no hike.
The ECB rate decision and statement will be issued at 12:15 GMT, 15 minutes ahead of the US Producer Price Index and Retail Sales numbers. A big pickup in volatility is expected, with the US Dollar moving across the board, particularly with EUR/USD as the most volatile pair.
Daily digest: US Dollar explosive
- Just hours before the ECB rate decision, the Chinese People's Bank of China (PBoC) has cut its Reserve Requirements Ratio by 0.25%. The Yuan eases a touch against both Euro and US Dollar. The cut was expected by analysts and does not trigger any big market movements.
- Big fireworks are expected on Thursday from both the macroeconomic and central bank corners.
- At 12:15 GMT, the European Central Bank (ECB) will issue its latest rate decision. Markets are split 50-50 for either a 25 basis point hike to 4% on the deposit rate, or remain unchanged at 3.75%.
- At 12:30 GMT, a batch of data is to be released out of the US.. The most important data release will be the Producer Price Index (PPI). The yearly component for August is expected to head from 0.8% to 1.2%. The core PPI, which excludes the more volatile components of food and energy, is expected to tick lower from 2.4% to 2.2%.
- Another important element at 12:30 GMT are the Retail Sales numbers. Overall retail sales for August are expected to increase 0.2%, lower than the 0.7% rise seen in July.. Retail sales excluding autos are expected to head from 1% to 0.4%. Watch out for any revisions from previously reported data that might trigger knee jerk reactions.
- Around 12:45, ECB president Christine Lagarde will take the stage and comment on the ECB's rate decision.
- The macroeconomic calendar will end its day near 14:00 GMT, with US Business inventories data for July. Expectations are from a small 0.1% increase after stagnating in June..
- Asian equities are overperforming this Thursday, with both Japanese and Chinese indices in the green. European equities went higher on Wednesday after head of the European Commission President Ursula von der Leyen issued new rules which will support local EV car builders and make it more difficult for China to dump cheap EV-cars in the bloc.
- The CME Group FedWatch Tool shows that markets are pricing in a 97% chance that the Federal Reserve will keep interest rates unchanged at its meeting in September after the recent US inflation numbers.
- The benchmark 10-year US Treasury bond yield trades at 4.25% and is taking a small step back as the volume of new debt issuances is slowing down a touch.
US Dollar Index technical analysis: On the lookout for Euro
The Greenback’s moves on Thursday will largely depend on where the Euro will head to. The ECB rate decision will have a binary impact on the US Dollarindex (DXY) once all data is out and markets have decided if the ECB rate decision was hawkish or dovish. Expect to see a very volatile window between 12:00 GMT and 14:00 GMT with possibly no real direction to be found until after all the dust has settled.
The new high to watch is at 105.16, both the high from last Thursday and a six-month high. The US Dollar Index first needs to gain back its lost territory from this Monday and break above the high of 104.93. Beyond 105.16, the next level to watch is 105.88, the high of 2023.
On Monday, 104.44 kept it together and refrained from allowing the DXY from selling off any further. The high of August 25 did its job and acted as a pivotal level. Should the uptick from this Tuesday reverse and 104.44 gives way, a substantial downturn could take place to 103.04, where the 200-day SMA comes into play for support.
ECB FAQs
What is the ECB and how does it influence the Euro?
The European Central Bank (ECB) in Frankfurt, Germany, is the reserve bank for the Eurozone. The ECB sets interest rates and manages monetary policy for the region.
The ECB primary mandate is to maintain price stability, which means keeping inflation at around 2%. Its primary tool for achieving this is by raising or lowering interest rates. Relatively high interest rates will usually result in a stronger Euro and vice versa.
The ECB Governing Council makes monetary policy decisions at meetings held eight times a year. Decisions are made by heads of the Eurozone national banks and six permanent members, including the President of the ECB, Christine Lagarde.
What is Quantitative Easing (QE) and how does it affect the Euro?
In extreme situations, the European Central Bank can enact a policy tool called Quantitative Easing. QE is the process by which the ECB prints Euros and uses them to buy assets – usually government or corporate bonds – from banks and other financial institutions. QE usually results in a weaker Euro.
QE is a last resort when simply lowering interest rates is unlikely to achieve the objective of price stability. The ECB used it during the Great Financial Crisis in 2009-11, in 2015 when inflation remained stubbornly low, as well as during the covid pandemic.
What is Quantitative tightening (QT) and how does it affect the Euro?
Quantitative tightening (QT) is the reverse of QE. It is undertaken after QE when an economic recovery is underway and inflation starts rising. Whilst in QE the European Central Bank (ECB) purchases government and corporate bonds from financial institutions to provide them with liquidity, in QT the ECB stops buying more bonds, and stops reinvesting the principal maturing on the bonds it already holds. It is usually positive (or bullish) for the Euro.
EUR/USD drifts ahead of ECB policy decision. Economists at Scotiabank analyze the pair’s technical outlook.
Support is 1.0700/1.0710, Resistance is 1.0750
Short-term charts reflect sideways trading in spot and momentum indicators are flat.
EUR price action had shown signs of some bargain-hunting buying into last week’s lows near 1.07 but the market’s failure – so far – to develop more of a bid leaves a bit of a question mark over technical prospects.
Support is 1.0700/1.0710. Resistance (minor bull trigger) is 1.0750 on the day.
The GBP is the main underperformer among the G10 currencies. Economists at Scotiabank analyze Sterling’s outlook.
GBP support is 1.2435
Cable is slightly softer on the day but holding within recent the trading range.
GBP gains have been blocked above 1.25 over the past 24 hours.
The recent range lows – which should be firm support – at 1.2435 (coincides with the 200-Day Moving Average) are within easy reach from here, however.
See: GBP/USD: A drop to 1.2400 still appears in the pipeline – UOB
Key focus on ECB meeting today. Economists at OCBC Bank discuss how the EUR could react to the Monetary Policy Decision.
Expect volatility around ECB decision
We expect a 25 bps hike as core inflation remains sticky. But as growth concerns in the EU stand out, we would be cautious about the extent of potential EUR rebound.
We would also pay close attention to ECB communication and its quarterly economic forecasts, where growth is expected to be lowered but inflation may be revised higher for 2024.
Resistance at 1.0780, 1.0830 levels (200-DMA, 23.6% fibo retracement of Jul high to Sep low) and 1.0900 (100-DMA).
Key support at 1.0700/1.0720 levels before 1.0635/1.0650 levels.
Economists at MUFG Bank outline their thoughts on the likely impact of today’s ECB policy meeting on the Euro.
Two reasons why support from a hike is set to prove short-lived
If the ECB hikes rates today we expect EUR/USD to stage a short-lived rally up towards the 1.0800 level.
There are two reasons why we expect support from a hike to prove short-lived. Firstly, we expect the ECB’s updated forward guidance to provide a stronger signal it could be the last hike in the cycle as they shift their focus towards keeping rates higher for longer to get inflation down. Secondly, hiking rates into a weak economy with growth likely to contract again in Q3 is not as favourable for the Euro. It has been the relative growth performance that has helped to drag down EUR/USD recently.
The CHF has proved to be the leader in the year-to-date G10 performance league table. Economists at CIBC Capital Markets analyze Franc’s outlook.
YTD G10 leader starting to look shaky
With inflation running below the 2% target threshold, and forecasts pointing towards CPI remaining well below target through 2024, implies increasing SNB restraint regarding the extension of support for an overly strong CHF.
We assume that the SNB will remain reticent to further tighten policy, from the current 1.75%, in part due to weakening macro fundamentals and ongoing real estate concerns.
Macro headwinds, allied to policy inertia and a rowing back in SNB currency support point towards CHF gains gradually unwinding.
EUR/CHF – Q4 2023: 0.97 | Q1 2024: 0.98
- Natural Gas rallies to near $3 as Wheatstone production in Australia gets cut.
- The US Dollar trades sideways ahead of the ECB interest-rate decision.
- US Natural gas prices might be nearing their peak as analysts see weak demand ahead.
Natural Gas prices are increasing again after fresh news from the Australian Wheatstone LNG production site from Chevron. Adding to the lingering union strikes, another 25% production cut at the facility has been announced due to a workers’ fault. It appears it will take a few days for the production cut to be resolved.
In the lingering dispute between Chevron and union workers, Chevron has reached out to the Australian regulator to start mediation talks. The stalemate isn’t likely to get resolved anytime soon as these talks tend to take time. Meanwhile, in Europe demand is fading with EU gas storages almost full ahead of the winter season.
At the time of writing, Natural Gas is trading at $2.962per MMBtu.
Natural Gas news and market movers
- Chevron has asked the Australian regulator to start intermediation between the company and union workers to get the stalemate resolved.
- Although Australian supply looks disrupted, the demand side remains subdued with European gas storages near full.
- In comparison to 2022, gas demand in Europe for 2023 has been on historic low levels.
- The European Central Bank (ECB) is expected to publish new inflation and growth forecasts for the Eurozone. With Germany already revising its growth forecasts for 2024 to contraction, Natural Gas demand could hit further lows. Any downgrades in growth could mean less demand for LNG.
- European gas storage is expected to survive the upcoming winter and end the season with 44% supply left. European storage is at 93%.
Natural Gas Technical Analysis: nearing its peak
Natural Gas has been on a tear this week and is at a crucial level on the charts. With $3 being a double top looking back at the beginning of September, a rejection might trigger a substantial drop in the price action. A breakthrough would mean that Gas is to cross the ascending trend channel to test the upper band near $3.20.
As already mentioned, $3 is the target and hard nut that needs to be cracked. Seeing the current equilibrium, a catalyst is needed to move the needle upwards. That could come with more supply disruptions from Australia or sudden changes in the current gas storages in Europe due to a sudden peak in demand. In such events, Gas prices could rally to $3.20, testing the upper band of the ascending trend channel.
On the downside, the 200-day Simple Moving Average (SMA) at $2.89 has been turned into support. Should that give way on a downside move, some area will be crossed before the next support kicks in at $2.73. This level aligns with the 55-day SMA, which is likely to step in to avoid any nosedive moves in the commodity.
-638302835110530035.png)
XNG/USD (Daily Chart)
Natural Gas FAQs
What fundamental factors drive the price of Natural Gas?
Supply and demand dynamics are a key factor influencing Natural Gas prices, and are themselves influenced by global economic growth, industrial activity, population growth, production levels, and inventories. The weather impacts Natural Gas prices because more Gas is used during cold winters and hot summers for heating and cooling. Competition from other energy sources impacts prices as consumers may switch to cheaper sources. Geopolitical events are factors as exemplified by the war in Ukraine. Government policies relating to extraction, transportation, and environmental issues also impact prices.
What are the main macroeconomic releases that impact on Natural Gas Prices?
The main economic release influencing Natural Gas prices is the weekly inventory bulletin from the Energy Information Administration (EIA), a US government agency that produces US gas market data. The EIA Gas bulletin usually comes out on Thursday at 14:30 GMT, a day after the EIA publishes its weekly Oil bulletin. Economic data from large consumers of Natural Gas can impact supply and demand, the largest of which include China, Germany and Japan. Natural Gas is primarily priced and traded in US Dollars, thus economic releases impacting the US Dollar are also factors.
How does the US Dollar influence Natural Gas prices?
The US Dollar is the world’s reserve currency and most commodities, including Natural Gas are priced and traded on international markets in US Dollars. As such, the value of the US Dollar is a factor in the price of Natural Gas, because if the Dollar strengthens it means less Dollars are required to buy the same volume of Gas (the price falls), and vice versa if USD strengthens.
EUR/USD declined below 1.0750. Economists at Société Générale analyze the pair’s technical outlook.
Next potential support levels are located at 1.0630 and 1.0510/1.0480
EUR/USD has extended its phase of decline after giving up the 200-DMA recently. It has so far defended the lower limit of a steep down sloping channel near 1.0685. An initial bounce is taking shape however it would be interesting to see if the pair can reclaim the MA near 1.0820/1.0850 which is also the upper band of the channel. Failure could mean persistence in downtrend.
Next potential support levels are located at 1.0630 and March low of 1.0510/1.0480.
Economists at ING discuss USD’s outlook.
DXY seen contracting on the back of the ECB hike
The broader Dollar story is firmer now heading into next week’s Federal Reserve meeting. A hike is unlikely, and dot plots will move the market. If the blip in the disinflation process that emerged in these August figures prevents a big dovish revision of the 2023 dots, then the evidence of US economic resilience since the last projections (June) means the 2024 dots could be revised higher. It all argues against any near-term turn lower in the Greenback; that is, unless US activity data starts to disappoint.
We see DXY contracting on the back of the ECB hike, but we don’t expect the EUR/USD rally to be long-lived: the Dollar Index could be trading back around 104.50/105.00 before the Fed meeting.
Kit Juckes, Chief Global FX Strategist at Société Générale, analyzes EUR/USD outlook ahead of the ECB meeting and US Retail Sales.
Short Cable for the ECB?
A 25 bps ECB hike and a clear indication of a pause would risk leaving the Euro in a range, especially if US Retail Sales aren’t strong.
ECB inaction and strong Retail Sales could send EUR/USD back through 1.07 and reverse some of the drop in US yields from Wednesday, giving the Dollar a more pronounced bounce.
Short GBP/USD would appeal even more and if 1.2430 broke, a decent fall could follow. Even someone as untechnical as me can see the significance of the 200-DMA here.
- Gold price struggles for a decisive move despite a slightly hotter inflation report.
- The US Dollar demonstrates a volatility compression as higher headline CPI failed to boost Fed hawks.
- The release of the US PPI and Retail Sales might boost price action in Gold.
Gold price (XAU/USD) remained subdued on Thursday as a stickier US inflation report for August confused investors about further direction. The precious metal strives for a decisive move as the market hopes that the impact of higher headline inflation due to rising gasoline prices remains limited to the headline Consumer Price Index (CPI). The US Dollar demonstrates a volatility compression after a slightly hot inflation report failed to prompt hawkish Federal Reserve (Fed) bets.
After the US inflation report, investors shifted their focus to the Producer Price Index (PPI) and consumer spending data for August, which will solve the interest rate puzzle further. The current restrictive interest rate cycle has failed in denting labor demand and consumer spending significantly, but the market remains worried that a “higher for longer” rate context could dampen the broader picture ahead.
Daily Digest Market Movers: Gold price remains under pressure amid sideways US Dollar
- Gold price is exposed to a fresh downside move as the US inflation for August turned out stickier than expected due to a significant rise in gasoline prices.
- US Bureau of Labor Statistics reported that monthly headline inflation grew at a 0.6% pace as anticipated by market participants, higher than the former reading of 0.2% due to a rally in gasoline prices. Annualized headline CPI accelerated to 3.7% vs. expectations of 3.6% and the former release of 3.2%.
- Core CPI that strips off volatile food and oil prices expanded at a higher pace of 0.3% than expectations and the prior reading of 0.2%. US core CPI, on an annual basis, softened to 4.3% as projected against July’s reading of 4.7%.
- Overall energy prices that include components like gasoline, electricity, and utility gas prices spiked 5.6% in August due to the global oil rally that pushed headline inflation higher at a stronger pace.
- Federal Reserve policymakers tend to consider core CPI specifically, but higher headline inflation could prompt input prices for core goods and encourage them to keep doors open for further policy tightening.
- As per the CME Fedwatch Tool, traders see a 97% chance for interest rates to remain steady at 5.25-5.50% at the September 20 Federal Open Market Committee (FOMC). The bet was 93% before the inflation data release. For the rest of the year, traders anticipate almost a 56% chance for the Fed to keep monetary policy unchanged.
- JP Morgan Asset Management commented Wednesday that it does not anticipate the Fed implementing further interest rate hikes this cycle. They said that the impact of the ongoing rise of oil prices in early September on inflation will be limited.
- Inflation data for August remained insufficient to boost hopes for more interest rate increases from the Fed in 2023, but a likely slowdown in the economy cannot be avoided. The Fed is expected to keep interest rates “higher for longer” as inflation in excess of the required rate seems stickiest. The Unemployment Rate is seen rising further due to a poor demand outlook and higher interest rates.
- The US Dollar Index (DXY) trades in a limited range around 104.70 as the upside is restricted amid expectations that the Fed is done with hiking interest rates, while the downside is being supported by a slightly hotter inflation report.
- More volatile price action is anticipated in the US Dollar as the Producer Price Index (PPI) and Retail Sales for August will be published at 12:30 GMT.
- Headline PPI is seen expanding at a higher pace as gasoline prices turned costly in August, while core PPI that excludes oil and food prices softened.
- As per estimates, monthly Retail Sales data expanded at a slower pace of 0.2% than the 0.7% pace recorded for July. A slowdown in consumer spending momentum indicates that higher inflationary pressures are biting household income.
Technical Analysis: Gold price trades around $1,900
Gold price hovers near a three-week low, marginally above the crucial support of $1,900. The precious metal struggles to discover bids as the inflation report for August indicates upside risks to headline inflation due to rising gasoline prices. The yellow metal fails to sustain above the 200-day Exponential Moving Average (EMA), which trades at around $1,910.00. The declining 20 and 50 EMAs portray a bearish short-term trend.
Fed FAQs
What does the Federal Reserve do, how does it impact the US Dollar?
Monetary policy in the US is shaped by the Federal Reserve (Fed). The Fed has two mandates: to achieve price stability and foster full employment. Its primary tool to achieve these goals is by adjusting interest rates.
When prices are rising too quickly and inflation is above the Fed’s 2% target, it raises interest rates, increasing borrowing costs throughout the economy. This results in a stronger US Dollar (USD) as it makes the US a more attractive place for international investors to park their money.
When inflation falls below 2% or the Unemployment Rate is too high, the Fed may lower interest rates to encourage borrowing, which weighs on the Greenback.
How often does the Fed hold monetary policy meetings?
The Federal Reserve (Fed) holds eight policy meetings a year, where the Federal Open Market Committee (FOMC) assesses economic conditions and makes monetary policy decisions.
The FOMC is attended by twelve Fed officials – the seven members of the Board of Governors, the president of the Federal Reserve Bank of New York, and four of the remaining eleven regional Reserve Bank presidents, who serve one-year terms on a rotating basis.
What is Quantitative Easing (QE) and how does it impact USD?
In extreme situations, the Federal Reserve may resort to a policy named Quantitative Easing (QE). QE is the process by which the Fed substantially increases the flow of credit in a stuck financial system.
It is a non-standard policy measure used during crises or when inflation is extremely low. It was the Fed’s weapon of choice during the Great Financial Crisis in 2008. It involves the Fed printing more Dollars and using them to buy high grade bonds from financial institutions. QE usually weakens the US Dollar.
What is Quantitative Tightening (QT) and how does it impact the US Dollar?
Quantitative tightening (QT) is the reverse process of QE, whereby the Federal Reserve stops buying bonds from financial institutions and does not reinvest the principal from the bonds it holds maturing, to purchase new bonds. It is usually positive for the value of the US Dollar.
The market has shown that it is concerned the Riksbank might drop behind the curve by trading the Krona at low levels recently. Economists at Commerzbank analyze SEK’s outlook.
The Riksbank cannot be surprised
The Riksbank will have to signal its willingness to implement further rate hikes due to continued high inflation rates, regardless of the fact that it is likely to hike the key rate again.
If inflation does not ease significantly and if the Riksbank also shies away from signalling further hikes next week that would be fatal for the Krona, and the board members should not be surprised if it eases further.
- USD/CHF experienced gains but is still remaining under pressure ahead of US economic data.
- Swiss inflation indicator showed a reduction in producer and import costs.
- US upbeat CPI data contributed support for the USD/CHF pair.
USD/CHF has almost recovered from the intraday losses, trading around 0.8930 during the European session on Thursday. However, the pair remains under pressure ahead of more economic data releases from the United States (US) scheduled to be released later in the North American session.
US Commerce Secretary Gina Raimondo is scheduled to meet on Tuesday with the CEOs of major American corporations, following her recent visit to China. This renewed tension in the US-China trade relationship could potentially influence the trader to buy safe-haven assets like the Swiss Franc (CHF).
Federal Statistical Office of Switzerland released Producer and Import Prices (Aug) on Thursday. The Swiss inflation indicator showed a decline of 0.2% on the monthly rate, against the expected hike of 0.1% and the previous reading of 0.1% decline. While the yearly rate showed a decline of 0.8% against the previous fall of 0.6%.
Moreover, the USD/CHF pair registered gains on the previous day, which could be attributed to the US upbeat Consumer Price Index (CPI) data.
US inflation figures rose to 3.7% on the annual rate from the previous rate of 3.2%, exceeding the market's anticipated rate of 3.6% for August. Additionally, the monthly core Consumer Price Index (CPI) improved to 0.3% from the 0.2% prior, contrasting with the market expectations of remaining unchanged.
However, the annual core inflation rate held steady at the expected rate of 4.3%, marking a decrease from the previous 4.7%. The inflation report suggests that while overall inflation might be moderating, the Core Consumer Price Index (CPI) remains relatively unchanged.
Investors appear to be pricing in the likelihood of the US Federal Reserve (Fed) maintaining a dovish stance in its September meeting, which may exert pressure in undermining the US Dollar (USD).
CME FedWatch Tool suggests a 40% chance of the US Federal Reserve (Fed) implementing a 25 basis points (bps) rate hike in November. Investors are becoming more cautious regarding the potential for such a move as they evaluate the changing economic overview and Fed communications.
US Dollar Index (DXY) is paring back some of its earlier losses and trading around 104.70. This rebound in DXY is being supported by a recovery in US Treasury yields, with the yield on the 10-year US bond rising to 4.26% by the press time.
Market participants will likely watch the release of the Core Producer Price Index (PPI) and Retail Sales figures for August from the United States. These economic indicators have the potential to offer valuable insights into the state of economic activity in the nation, which could influence trading decisions and market sentiment.
The ECB meeting is the main event today. Economists at Société Générale analyze EUR’s outlook ahead of the Monetary Policy Decision.
ECB between rock and hard place
Pause or hike is the question today for everyone who watches the ECB, but how the decision turns the negative tide for EUR/USD is unclear. An increase in the depo rate to 4% would be understandable if inflation is revised up but would not do growth any favours. This would reinforce the growth differentials between the US and EU that buttressed the Dollar bounce this summer.
A pause at 3.75% keeps the spread at 175 bps in favour of the Dollar.
A reference to faster QT (to boost real yields) would be a surprise and should give the Euro a lift as it steepens the Bund and swap curves.
If there is truth to the Reuters story that the central bank still now sees inflation averaging over 3% next year instead of nailed on 3%, then a rate increase today should not come as a shock.
- EUR/JPY attracts some dip-buying on Thursday, albeit lacks strong follow-through.
- Bets that the BoJ will end its ultra-easy monetary policy lift the JPY and cap gains.
- Traders keenly await the pivotal ECB rate decision before placing directional bets.
The EUR/JPY cross reverses an intraday dip to sub-158.00 levels and climbs to a fresh daily peak during the early part of the European session on Thursday. Spot prices currently trade around the 158.20-158.20 region, unchanged for the day, as traders keenly await the outcome of the highly-anticipated European Central Bank (ECB) meeting.
Market participants remain divided on whether the ECB will hike interest rates for a 10th straight time amid still-hight inflation or pause its historic policy-tightening cycle in the wake of a darkening Euro Zone economic outlook. A recent Reuters report, however, suggested that the central bank could revise its 2024 inflation forecast upwards, well past the 3% mark, and revive speculations about a potential rate hike. Hence, the pivotal ECB rate decision will play a key role in influencing the sentiment surrounding the shared currency and provide a fresh directional impetus to the EUR/JPY cross.
In the meantime, bets that the Bank of Japan (BoJ) will end its ultra-easy monetary policy underpin the Japanese Yen (JPY) and should cap the upside for the EUR/JPY cross. Investors now seem convinced that BoJ may scrap its yield-curve control (YCC) policy and put an end to negative interest rates as early as this year. The expectations were lifted by BoJ Governor Kazuo Ueda's remarks over the weekend. In an interview with Yomiuri newspaper, Ueda said that raising interest rates is among the options available if the BoJ becomes confident that prices and wages will keep going up sustainably.
Apart from this, worries about the worsening economic conditions in China could further benefit the JPY's relative safe-haven status and contribute to keeping a lid on the EUR/JPY cross. Heading into the key central bank event risk, the aforementioned fundamental backdrop warrants some caution before placing fresh bullish bets around the cross and positioning for an extension of this week's bounce from over a one-month low. The focus will then shift to the Chinese macro data dump, scheduled for release during the Asian session on Friday, which could further infuse volatility in the global financial markets.
Technical levels to watch
The Aussie is trading on the strong side after a stronger-than-expected August jobs report in Australia. Economists at ING analyze AUD’s outlook.
USD remains supported post-Fed
Employment rose 64.9K after July’s negative reading, and the unemployment rate was unchanged at 3.7%.
Markets are pricing in a mere 9 bps of tightening to the peak, even after the strong jobs figures, meaning there is ample room for a hawkish repricing and AUD to benefit from it. Still, the USD/US activity data story remains much more important for AUD/USD, and we see the pair being capped below 0.6500 for the remainder of September as the USD remains supported post-Fed.
- The Euro appears mildly bid vs. the US Dollar.
- Stocks in Europe opened Thursday’s session mostly in the red.
- EUR/USD continues to trade in a consolidative mood this week.
- The USD Index (DXY) has met decent resistance around 105.00 so far.
- The ECB is seen pausing its tightening campaign at its meeting.
- Producer Prices and Retail Sales take centre stage across the Atlantic.
It is ECB Day, and the Euro (EUR) manages to print humble gains against the US Dollar (USD) on Thursday, motivating EUR/USD to hover around 1.0740 so far in the European morning.
On the other side, the Greenback navigates a tight range in the 104.70 zone when measured by the USD Index (DXY), accompanied by a broad-based lack of direction in US yields across the curve as well as alternating risk appetite trends.
With regards to monetary policy, investors persist in anticipating the possibility of interest rate reductions by the Federal Reserve (Fed) occurring sometime in the second quarter of 2024.
Shifting our focus to the European Central Bank (ECB), market deliberations appear to suggest an impasse at the upcoming event and a 25 bps rate increase by the end of the year. This outlook is influenced by the current state of a somewhat divided Council.
Still around the ECB, a probable pause in the bank’s hiking cycle appears justified by the persistent deterioration of key fundamentals in Germany and the broader euro area, while inflation in the region keeps running hot and well above the bank’s target. In addition, overtightening fears coupled with rising stagflation concerns should further underpin a probable (hawkish?) hold by the ECB later on Thursday.
Data-wise, in the US, the focus of attention is expected to be on the release of Producer Prices along with Retail Sales and the usual weekly Initial Jobless Claims.
Euro FAQs
What is the Euro?
The Euro is the currency for the 20 European Union countries that belong to the Eurozone. It is the second most heavily traded currency in the world behind the US Dollar. In 2022, it accounted for 31% of all foreign exchange transactions, with an average daily turnover of over $2.2 trillion a day.
EUR/USD is the most heavily traded currency pair in the world, accounting for an estimated 30% off all transactions, followed by EUR/JPY (4%), EUR/GBP (3%) and EUR/AUD (2%).
What is the ECB and how does it impact the Euro?
The European Central Bank (ECB) in Frankfurt, Germany, is the reserve bank for the Eurozone. The ECB sets interest rates and manages monetary policy.
The ECB’s primary mandate is to maintain price stability, which means either controlling inflation or stimulating growth. Its primary tool is the raising or lowering of interest rates. Relatively high interest rates – or the expectation of higher rates – will usually benefit the Euro and vice versa.
The ECB Governing Council makes monetary policy decisions at meetings held eight times a year. Decisions are made by heads of the Eurozone national banks and six permanent members, including the President of the ECB, Christine Lagarde.
How does inflation data impact the value of the Euro?
Eurozone inflation data, measured by the Harmonized Index of Consumer Prices (HICP), is an important econometric for the Euro. If inflation rises more than expected, especially if above the ECB’s 2% target, it obliges the ECB to raise interest rates to bring it back under control.
Relatively high interest rates compared to its counterparts will usually benefit the Euro, as it makes the region more attractive as a place for global investors to park their money.
How does economic data influence the value of the Euro?
Data releases gauge the health of the economy and can impact on the Euro. Indicators such as GDP, Manufacturing and Services PMIs, employment, and consumer sentiment surveys can all influence the direction of the single currency.
A strong economy is good for the Euro. Not only does it attract more foreign investment but it may encourage the ECB to put up interest rates, which will directly strengthen the Euro. Otherwise, if economic data is weak, the Euro is likely to fall.
Economic data for the four largest economies in the euro area (Germany, France, Italy and Spain) are especially significant, as they account for 75% of the Eurozone’s economy.
How does the Trade Balance impact the Euro?
Another significant data release for the Euro is the Trade Balance. This indicator measures the difference between what a country earns from its exports and what it spends on imports over a given period.
If a country produces highly sought after exports then its currency will gain in value purely from the extra demand created from foreign buyers seeking to purchase these goods. Therefore, a positive net Trade Balance strengthens a currency and vice versa for a negative balance.
Daily digest market movers: Euro looks prudent ahead of ECB, US data
- The EUR gathers some fresh steam vs. the USD.
- US and German yields have traded without a clear direction so far.
- Investors see the ECB keeping the deposit rate unchanged on Thursday.
- Australia released an upbeat jobs report.
- Markets keep factoring in potential rate cuts by the Fed in Q2 2024.
- US inflation, this time from Producer Prices, will remain in the limelight.
- Market participants are expected to scrutinize Lagarde’s press conference.
Technical Analysis: Euro remains under downside pressure below 1.0830
EUR/USD appears to have embarked on a range bound theme, always below the 1.0800 hurdle, so far this week.
Should EUR/USD successfully break below its September low at 1.0685 (September 7), it may enter a phase of retesting the May low at 1.0635 (May 31) before potentially reaching the March low at 1.0516 (March 15). If the latter level is breached, it could initiate a possible examination of the 2023 low at 1.0481 (January 6).
On the other hand, the primary focus currently lies on targeting the crucial 200-day SMA at 1.0827. If the pair surpasses this level, a bullish momentum might ensue, leading to a challenge of the weekly peak at 1.0945 (August 30). This upward movement could be further supported by the provisional 55-day SMA at 1.0932. Subsequently, this scenario could pave the way for an advance towards the psychological level of 1.1000 and the August high at 1.1064 (August 10). If the spot clears this area, it could alleviate some of the bearish pressure and potentially aim for the weekly top at 1.1149 (July 27), followed by the 2023 high at 1.1275 (July 18).
It is crucial to note that as long as the EUR/USD remains below the 200-day SMA, there remains a possibility of a sustained decline in the pair.
- Gold price holds ground above $1,900, remaining under pressure ahead of US economic data.
- CME FedWatch Tool indicates a 40% probability of a 25 bps rate hike by the Fed in November.
- Investors await Core PPI and Retail Sales data to gain further cues into the US economic outlook.
Gold price attempted to recover from the recent losses in the Asian session but later extended the losing streak, trading slightly lower near $1,900 per troy ounce during the European session on Thursday. The yellow metal hovers near three-week lows, remaining under pressure possibly due to upbeat Consumer Price Index (CPI) data from the United States (US).
US inflation figure for the year-over-year period rose to 3.7% from the previous rate of 3.2%, surpassing the market's anticipated rate of 3.6% for August. Additionally, the monthly core CPI increased to 0.3% from the previous 0.2% for the same month. This uptick was unexpected, as market expectations had been for it to remain unchanged.
The annual core inflation rate remained stable at 4.3% as expected, which was a decline from the previous figure of 4.7%. The inflation report indicates that overall inflation may be moderating, but the Core Consumer Price Index (CPI) remains relatively stable.
US Dollar Index (DXY) is trimming the losses it made earlier in the session, trading around 104.70 at the time of writing. DXY is experiencing upward support on the back of the improved US Treasury yields. The yield on a 10-year US bond improved to 4.25 by the press time.
Investors seem to accept the odds that the US Federal Reserve (Fed) may maintain a dovish stance in its September meeting. The market caution could exert pressure on the US Dollar (USD).
CME FedWatch Tool indicates a 40% likelihood of a 25 basis points (bps) rate increase by the Fed in November. Investors turn cautious about the possibility of such a move as they assess the evolving economic overview and Fed statements.
Market participants await the data releases of the Core Producer Price Index (PPI) and Retail Sales figures for August from the US. These economic indicators could provide valuable insights into the state of economic activities in the nation.
These data outcomes could influence trading decisions and market sentiment, particularly concerning non-yield assets like Gold.
- USD/JPY meets with some supply on Thursday and is pressured by a combination of factors.
- Bets that the BoJ will end its negative interest rate policy lift the JPY and weigh on the major.
- A modest USD downtick contributes to the fall, though the 147.00 mark helps limit losses.
The USD/JPY pair comes under some selling pressure on Thursday and reverses the previous day's positive move to the 147.75 area, or the weekly high. Spot prices, however, manage to recover a few pips from the daily low and trade around the 147.25 region, down less than 0.15% during the early part of the European session.
Speculations that the Bank of Japan (BoJ) will end its ultra-easy monetary policy underpin the Japanese Yen (JPY). This, along with a modest US Dollar (USD) downtick, fail to assist the USD/JPY pair to capitalize on its gains registered over the past two days. Spot prices, however, show some resilience below the 200-hour Simple Moving Average (SMA) and attract some buyers near the 147.00 round-figure mark, which should now act as a pivotal point for intraday traders.
Technical indicators on the daily chart, meanwhile, are holding in the bullish territory and have again started moving in the positive territory on the 1-hour chart. This, in turn, supports prospects for a further appreciating move for the USD/JPY pair. Hence, a subsequent move back towards testing 147.85 region, or the highest level since November 2022, remains a distinct possibility. This is followed by the 148.00 mark, which if cleared will be seen as a fresh trigger for bulls.
The USD/JPY pair might then accelerate the momentum towards the 148.70-148.80 hurdle before aiming to conquer the 148.00 mark for the first time since October 2022. That said, speculations that Japanese authorities might interfere in the FX market to prop up the domestic currency might hold back bulls from placing fresh bets and cap any further upside for spot prices.
On the flip side, the 147.00 round figure might continue to protect the immediate downside ahead of the 146.75-146.70 region, representing an ascending trend-line support extending from the late July swing low. A convincing break below might prompt aggressive technical selling and drag the USD/JPY pair towards the 146.00 mark. The corrective decline could get extended to the 145.30 area en route to the 145.00 psychological mark and the monthly low, around the 144.45 zone.
USD/JPY 1-hour chart
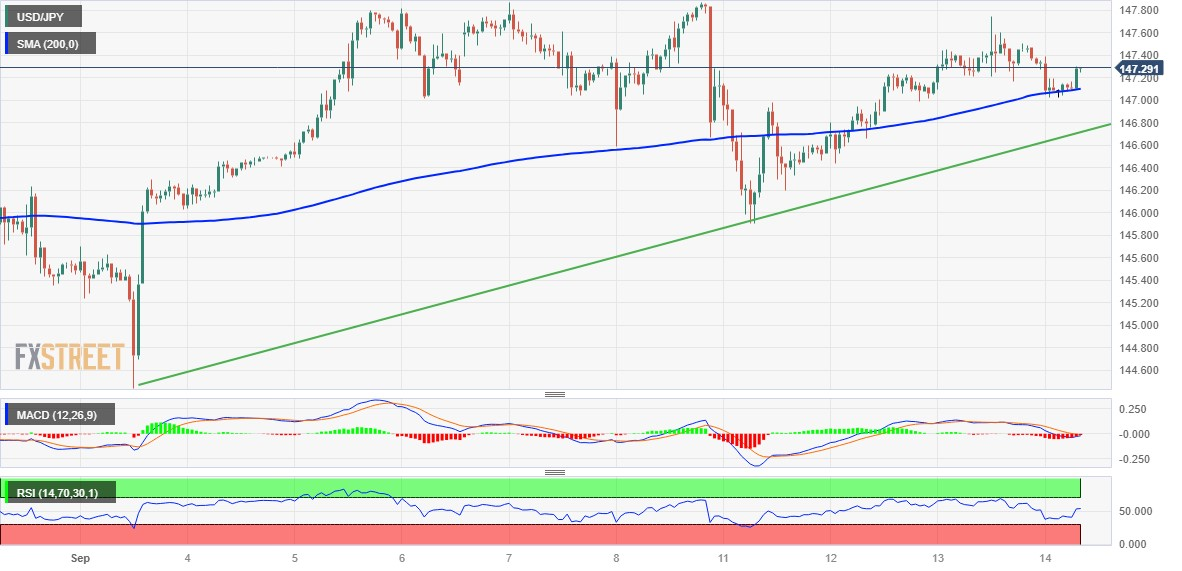
Technical levels to watch
Today the ECB will decide about its future monetary policy. Economists at Commerzbank analyze how the Euro could react.
What will the ECB decide?
Our experts assume that there will be no further rate step and that as a result, the deposit rate will have peaked at 3.75%. However, today’s decision is likely to be tight, as some hawks on the Council have been in favour of rate hikes until now.
The market sees a high likelihood that the ECB might cut interest rates again next year. Hence, it might make sense for the ECB to hike the key rate again today, to then send out a signal next year and cut interest rates at least once in order to support the economy. However, due to the fact that (core) inflation remains stubbornly above target our expects do not expect any ECB rate cuts in 2024.
In view of diverging views, it is difficult to tell how the Euro is going to react today. Everything seems possible. It therefore makes sense in our view to hedge the side that will be most painful and to otherwise see what today’s meeting will bring in the end.
See – ECB Preview: Forecasts from 10 major banks, a hike or a hawkish pause?
There seems to be increasing probability of a breakdown of 7.2600 in USD/CNH in the short-term horizon, comment Economist Lee Sue Ann and Markets Strategist Quek Ser Leang at UOB Group.
Key Quotes
24-hour view: The sharp drop of -0.40% (NY close of 7.2705) came as a surprise (we were expecting USD to trade sideways). Despite the relatively large decline, downward momentum has not improved all that much. That said, barring a break above 7.2910 (minor resistance is at 7.2850), USD is likely to grind below 7.2600. The next major support at 7.2390 is unlikely to come into view.
Next 1-3 weeks: After USD dropped sharply to a low of 7.2921 on Monday, in our most recent narrative from Tuesday (12 Sep, spot at 7.3035), we highlighted that “while it is premature to expect a major reversal, the sharp pullback could extend to 7.2600.” Yesterday, USD fell to a low of 7.2695. The increase in momentum suggests USD could break below 7.2600. The next support level is at 7.2390. On the upside, if USD breaks above 7.3200 (‘strong resistance’ level previously at 7.3520), it would indicate that the current downward pressure has faded.
- The index faces some selling pressure near 104.70.
- US Producer Prices, Retail Sales, Claims come next in the docket.
- Markets’ attention will also be on the ECB gathering.
The greenback seems to be facing soe headwinds after two daily advances in a row and retreats to the 104.70 zone when tracked by the USD Index (DXY) on Thursday.
USD Index now looks at US data
The index trades within a cautious tone following failed attempts to retest or surpass the 105.00 hurdle in the last couple of sessions.
In the meantime, US yields seem to have entered a consolidative phase in the upper end of the so far monthly range amidst firmer bets that the Federal Reserve might be done hiking rates vs. equally rising speculation of interest rate cuts starting at some point in Q2 2024.
Later in the session, inflation now tracked by Producer Prices will take centre stage along with Retail Sales and the usual weekly Initial Claims.
In addition, extra attention will be on the interest rate decision by the ECB, where consensus appears tilted to a pause.
What to look for around USD
The continuation of the recovery post-Monday’s sharp sell-off in the greenback appears to have faltered ahead of the key 105.00 barrier.
In the meantime, support for the dollar keeps coming from the good health of the US economy, despite the narrative around the tighter-for-longer stance from the Federal Reserve now looks somewhat diminished amidst the current backdrop of persistent disinflation and cooling of the labour market.
Key events in the US this week: Retail Sales, Initial Jobless Claims, Producer Prices, Business Inventories (Thursday) – Industrial Production, Advanced Michigan Consumer Sentiment (Friday).
Eminent issues on the back boiler: Persevering debate over a soft or hard landing for the US economy. Incipient speculation of rate cuts in early 2024. Geopolitical effervescence vs. Russia and China.
USD Index relevant levels
Now, the index is down 0.05% at 104.70 and the breach of 103.02 (200-day SMA) would open the door to 102.93 (weekly low August 30) and then 102.73 (55-day SMA). On the other hand, the next up barrier align at 105.15 (monthly high September 7) ahead of 105.88 (2023 high March 8) and finally 106.00 (round level).
Swedish inflation figures for August showed a faster-than-expected decline. EUR/SEK is not hugely changed after the release. Economists at ING analyze Krona’s outlook.
Faster disinflation poses FX risks ahead of Riksbank meeting
Despite consensus already anticipating CPIF inflation would slow sharply from 6.4% to 4.9%, the August print came in at 4.7%. The core rate (CPIF excluding energy), which is closely watched by the Riksbank, was 7.2%, down from 8.0% in July.
There is a higher risk that if the Riksbank hikes, some doves may voice their dissent as they did back in April. On that occasion, the implications for SEK were disastrous. With SEK trading at historical lows, we are more inclined to think Riksbank members will show a united front and preserve currency stability. That would require not just a hike, but also signalling another one in rate projections. We are slightly less convinced the Riksbank can convey this hawkish message next week after these inflation figures, but it remains our base case.
If the ECB hikes today, risk sentiment remains unfavourable and the Fed is hawkish next week, EUR/SEK may well be hitting 12.00 before the Riksbank meeting: another incentive to be hawkish for Swedish policymakers.
- Pound Sterling trades inside Wednesday’s range as the market mood remains quiet.
- The UK economy faces varied consequences of higher interest rates by the BoE.
- Britain’s GDP for July fell by 0.5% due to a decline in service industry output.
The Pound Sterling (GBP) trades back and forth as investors await the UK CPI data for August, which will set an undertone for the Bank of England’s (BoE) September monetary policy decision. The GBP/USD pair consolidates as investors hope that a hawkish interest rate decision from the BoE will scrap its policy divergence with the Federal Reserve (Fed).
The UK economy is facing varied troubles due to BoE’s restrictive interest rate policy stance such as severely strong wage growth, and a labor market in which demand has started easing. The British economic outlook has turned vulnerable as the overall output is shrinking due to a deteriorating demand environment. The likelihood of reporting a technical recession by the UK economy is higher as more interest rate hikes from the BoE are already in the pipeline.
Daily Digest Market Movers: Pound Sterling juggles amid a quiet market mood
- Pound Sterling trades without direction around 1.2500 as investors shift their focus to the UK inflation data for August, which will provide meaningful cues about the September rate decision.
- Investors see August consumer inflation data as extremely stubborn as wage growth momentum in July remains stronger than anticipated despite a slowdown in labor demand.
- Sarah Breeden, who will replace BoE Deputy Governor Jon Cunliffe in November, warned that risks to inflation are skewed to the upside. She forecasts the achievement of price stability in two years.
- Average Earnings Excluding Bonuses in the three months to July landed at 7.8%, in line with estimates and the former release. Wage growth data including bonuses rose to 8.5% against projections and the former release of 8.2%.
- Higher wage growth and soft labor demand indicate that UK firms are spending more on retaining employees, which could keep consumer spending robust.
- The BoE is widely expected to raise interest rates in September as the battle against persistent inflation is far from over. This would be the 15th straight interest rate increase. Investors anticipate an interest rate hike of 25 basis points (bps), which will push interest rates to 5.50%.
- An interest rate decision of 25 bps could equalize the policy divergence of the BoE with the Fed.
- Aggressively raised interest rates by the BoE have resulted in varied consequences for the UK economy. UK’s monthly Gross Domestic Product (GDP) for July shrank by half a percent, contributed majorly by service output, which dropped by 0.5%. The arts, entertainment, and recreation sector positively contributed due to the release of Barbie and Oppenheimer.
- UK’s Office for National Statistics (ONS) reported that monthly Industrial Production contracted by -0.7%, which was a higher pace than expectations of -0.6%. In June, the economic indicator expanded by 1.8%.
- Monthly Manufacturing Production contracted by -0.8%, while investors anticipated a contraction of -1.0%. In the same period a month ago, the economic data expanded by 2.4%.
- Reuters reported that Britain's economy contracted in July at an unexpectedly sharp rate after strikes in hospitals and schools as well as unusually rainy weather weighed on output.
- The momentum at which the British economy is slowing down indicates that it is exposed to a recession.
- Meanwhile, the US Dollar continues to trade in a limited range after volatility inspired by stickier CPI data for August cools down.
- US headline inflation expanded at a 0.6% pace as anticipated by market participants due to a significant rise in gasoline prices. Core CPI that excludes volatile oil and food prices expanded by 0.3%, higher than estimates and July's reading of 0.2%.
- Slightly hotter inflation data failed to boost hawkish Fed bets. As per the CME Fedwatch Tool, traders see a 97% chance of interest rates remaining unchanged at 5.25-5.50% against a 93% chance recorded before the inflation data release.
Technical Analysis: Pound Sterling hovers around 200-DEMA
Pound Sterling is consistently defending the crucial support of 1.2440. The downside bias is still upbeat as the UK economy is struggling to absorb the burden of higher interest rates. The Cable consolidates near the 200-day Exponential Moving Average (EMA). The short-term trend is bearish as the 20 and 50-day EMAs are downward-sloping, and momentum oscillators portray strength in the bearish impulse.
Pound Sterling FAQs
What is the Pound Sterling?
The Pound Sterling (GBP) is the oldest currency in the world (886 AD) and the official currency of the United Kingdom. It is the fourth most traded unit for foreign exchange (FX) in the world, accounting for 12% of all transactions, averaging $630 billion a day, according to 2022 data.
Its key trading pairs are GBP/USD, aka ‘Cable’, which accounts for 11% of FX, GBP/JPY, or the ‘Dragon’ as it is known by traders (3%), and EUR/GBP (2%). The Pound Sterling is issued by the Bank of England (BoE).
How do the decisions of the Bank of England impact on the Pound Sterling?
The single most important factor influencing the value of the Pound Sterling is monetary policy decided by the Bank of England. The BoE bases its decisions on whether it has achieved its primary goal of “price stability” – a steady inflation rate of around 2%. Its primary tool for achieving this is the adjustment of interest rates.
When inflation is too high, the BoE will try to rein it in by raising interest rates, making it more expensive for people and businesses to access credit. This is generally positive for GBP, as higher interest rates make the UK a more attractive place for global investors to park their money.
When inflation falls too low it is a sign economic growth is slowing. In this scenario, the BoE will consider lowering interest rates to cheapen credit so businesses will borrow more to invest in growth-generating projects.
How does economic data influence the value of the Pound?
Data releases gauge the health of the economy and can impact the value of the Pound Sterling. Indicators such as GDP, Manufacturing and Services PMIs, and employment can all influence the direction of the GBP.
A strong economy is good for Sterling. Not only does it attract more foreign investment but it may encourage the BoE to put up interest rates, which will directly strengthen GBP. Otherwise, if economic data is weak, the Pound Sterling is likely to fall.
How does the Trade Balance impact the Pound?
Another significant data release for the Pound Sterling is the Trade Balance. This indicator measures the difference between what a country earns from its exports and what it spends on imports over a given period.
If a country produces highly sought-after exports, its currency will benefit purely from the extra demand created from foreign buyers seeking to purchase these goods. Therefore, a positive net Trade Balance strengthens a currency and vice versa for a negative balance.
The likelihood of extra losses in USD/JPY now appears dwindled, suggest Economist Lee Sue Ann and Markets Strategist Quek Ser Leang at UOB Group.
Key Quotes
24-hour view: Yesterday, we noted that “the underlying tone seems to have improved somewhat”, and we were of the view that USD “could edge higher, but it is unlikely to reach 147.80.” Our view was not wrong, even though USD came close to reaching 147.80 (high has been 147.72). The mild upward pressure appears to have eased. Today, USD is likely to consolidate, probably in a range of 146.80/147.65.
Next 1-3 weeks: Our latest narrative was from two days ago (12 Sep, spot at 146.70) that while USD could pullback further, the likelihood of a clear break below 145.50 is not high. We indicated that “if USD breaks above 147.80, it would indicate that it is not ready to pullback further.” Yesterday, USD rose to a high of 147.72. While our ‘strong resistance’ level has not been breached, the mild downward pressure is beginning to ease, and the odds of USD pulling back further have diminished. However, only a clear break of 147.80 (no change in ‘strong resistance’ level) would suggest that USD is not pulling back further.
CME Group’s flash data for natural gas futures markets noted traders scaled back their open interest positions for the third straight session on Wednesday, now by around 20.5K contracts. In the same line, volume reversed two daily builds in a row and went down by more than 29K contracts.
Natural Gas: Next on the upside comes $2.90 ahead of $3.00
Wednesday’s marked decline in prices of natural gas was accompanied by diminishing open interest and volume, indicating that the continuation of the downtrend looks out of favour in the very near term. Immediately to the upside for the commodity comes the so far September top near $2.90 prior to the key resistance zone around the $3.00 mark per MMBtu.
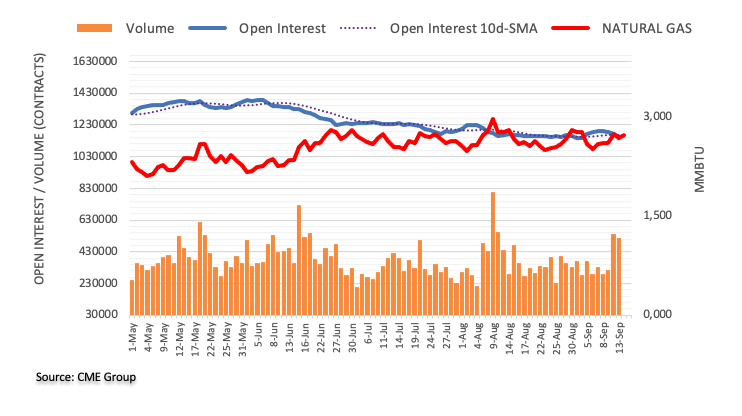
Will the ECB’s upcoming policy meeting turn the tide for EUR/USD? Economists at MUFG Bank analyze the pair’s outlook.
A final hike could provide a temporary lift for the EUR
We expect EUR/USD to continue to fall back towards the bottom of this year’s trading range between 1.0500 and 1.1000.
An ECB hike would give the EUR only a temporary lift.
See:
- ECB Preview: Forecasts from 10 major banks, a hike or a hawkish pause?
-
ECB Preview: Three scenarios and their implications for EUR/USD – TDS
- USD/CAD holds ground below 1.3550 ahead of the US data.
- MACD suggests a potential momentum shift in the upward trajectory of the Loonie pair.
- 1.3500 psychological level emerges as the immediate support, following the 38.2% Fibonacci retracement.
USD/CAD continues its five-day losing streak, maintaining a negative bias and trading around 1.3540 during the early hours of the European session on Thursday. This downward pressure on the pair could be attributed to the rise in crude oil prices.
Market participants will likely monitor the upcoming data releases from the United States (US), including the Core Producer Price Index (PPI) and Retail Sales figures for August. These data sets will offer insights into economic activities in the US and can help traders in formulating their strategies for trading the USD/CAD pair.
The pair could encounter initial support around the 1.3500 psychological level, following the 38.2% Fibonacci retracement at 1.3466. A break below that level could influence the USD/CAD pair to navigate the region below the 1.3450 psychological level.
On the upside, an immediate barrier for the USD/CAD pair appears around the 23.6% Fibonacci retracement at 1.3553, followed by the nine-day Exponential Moving Average (EMA) at 1.3575.
A firm break above the 1.3600 psychological level could provide support for US Dollar (USD) buyers, allowing them to potentially target the area around the weekly high at 1.3636 following the 1.3700 psychological level.
The Moving Average Convergence Divergence (MACD) line remains above the centerline but shows divergence below the signal line. This configuration suggests a potential momentum shift in the market, which can be seen as a signal that the recent upward trend may start to weaken.
Traders of the USD/CAD pair will likely observe the 14-day Relative Strength Index (RSI), which suggests no significant momentum in either direction in the short term as it lies on the 50 level.
In the opinion of Economist Lee Sue Ann and Markets Strategist Quek Ser Leang at UOB Group, NZD/USD is now expected to navigate the 0.5860-0.5960 range for the time being.
Key Quotes
24-hour view: We highlighted yesterday that “upward momentum is beginning to build, albeit tentatively.” We held the view that NZD could edge higher, but any advance is expected to face solid resistance at 0.5935. We indicated that “support is at 0.5900, followed by 0.5880.” In NY trade, NZD dipped briefly to 0.5880 before rebounding. The rebound did not threaten 0.5935 (high has been 0.5927). Momentum still appears to be building, and there is room for NZD to edge above 0.5935. The major resistance at 0.5960 is unlikely to come into view. On the downside, if NZD breaks below 0.5880 (minor support is at 0.5900), it would indicate that the current mild upward pressure has faded.
Next 1-3 weeks: Our update from Monday (11 Sep, spot at 0.5900) is still valid. As highlighted, the recent downward pressure has subsided. For now, NZD is likely to trade in a range, probably between 0.5860 and 0.5960.
A few hours ahead of the European Central Bank’s (ECB) monthly rate-setting meeting on Thursday, Spanish Acting Economy Minister Nadia Calvino commented on the country’s inflation outlook.
Calvino said that there is no need for more measures to fight inflation in Spain, though other Eurozone countries still struggle with high inflation.
Related reads
- ECB expected to keep interest rates on hold as Eurozone economy stalls
- Forex Today: Markets brace for volatility on ECB verdict, US Retail Sales and PPI data
Open interest in crude oil futures markets shrank by around 41.2K on Wednesday, setting aside the previous daily build according to preliminary readings from CME Group. Volume followed suit and dropped by around 77.5K contracts after three consecutive daily builds.
WTI: Immediate resistance comes at $90.00
WTI prices extended their rally even further on Wednesday. This move, however, was amidst shrinking open interest and volume and could be suggestive that a pause in the strong uptrend could be brewing in the very near term. In the meantime, the key $90.00 region per barrel emerges as the next obstacle for bulls.
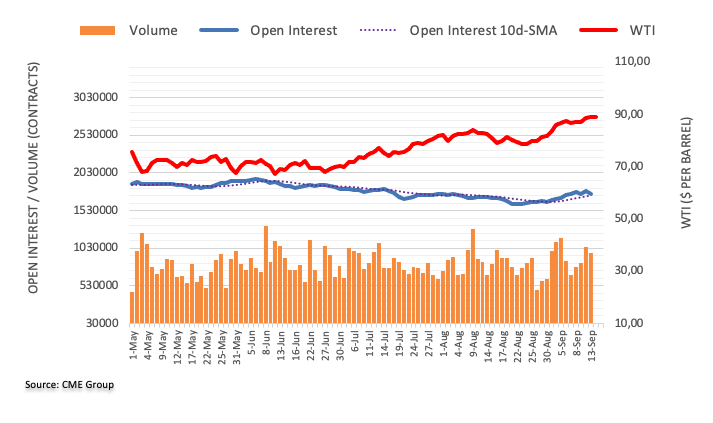
- The European Central Bank is likely to leave key interest rates on hold on Thursday.
- Lagarde could leave the door ajar for one more rate hike by year-end.
- The Euro braces for volatility on the ECB decision and Lagarde’s presser.
The European Central Bank (ECB) is widely expected to leave interest rates unchanged for the first time since early 2022, following the conclusion of its monetary policy meeting on Thursday. The Bank will publish its quarterly updated staff projections alongside, while ECB President Christine Lagarde’s press conference will follow at 12:45 GMT.
European Central Bank interest rate decision: What to know in markets on Thursday
- EUR/USD is holding recovery gains near 1.0750 as the US Dollar (USD) remains on the back foot following the mixed US Consumer Price Index (CPI) data.
- The annual United States inflation gauge rose 3.7% in August, compared with a 3.6% rise expected. The CPI rose 0.6% in August, its biggest monthly gain of 2023 and matched the market estimates. The core CPI increased 0.3% and 4.3% respectively, against estimates for 0.2% and 4.3%.
- US S&P 500 futures gain on the market optimism, as the US data cemented Federal Reserve (Fed) pause bets.
- The benchmark 10-year US Treasury bond yield drops toward 3.21%.
- On Tuesday, the German ZEW Economic Sentiment improved to -11.4 in September. However, the index gauging current conditions hit a three-year low at -79.4. “Financial market experts are even more pessimistic about the current economic situation in Germany than they were in August 2023,” the ZEW Institute said.
- The ECB event will be decisive for the near-term direction of the EUR/USD pair, as the focus shifts toward next week’s Fed policy announcements.
ECB interest rates expectations and implications for EUR/USD
The European Central Bank (ECB) is at a crossroads. The bank is set to face the hardest decision since it began raising interest rates in July 2022 as it battles heightened risks of stagflation. Eurozone’s annual inflation stood at 5.3% in August, down sharply from the 10.6% recorded in October 2022. Core inflation, however, remains sticky above 5.0% when compared to the ECB’s 2.0% target.
The Gross Domestic Product (GDP) in the old continent expanded by a marginal 0.1% in the quarter to June when compared to the previous quarter. Further, the European Commission downgraded its economic growth projections for this year and the next one, citing that the German economy has slipped into a recession.
Against this backdrop, the central bank is likely to announce on Thursday at 12:15 GMT that it will keep interest rates steady, with the Deposit Rate at 3.75% and the main Refinancing operations lending rate at 4.25%.
Comments before this key meeting suggest that ECB policymakers are split on the upcoming policy decision. Governor of the National Bank of Slovakia Peter Kazimir said last week that his preferable option would be to raise the policy rate by 25 basis points (bps) at the policy meeting next week. President of the Dutch central bank Klaas Knot told Bloomberg that investors betting against an interest rate increase next week are possibly underestimating the likelihood of it happening.
Meanwhile, on the dovish side, Governor of the Bank of France Francois Villeroy de Galhau said, “our options are open at the next and the upcoming rate meetings,” adding that “we are near or very near the peak regarding interest rates.” Portugal’s central bank chief Mário Centeno said the risk of “doing too much” has become “material” as the outlook for the eurozone economy has deteriorated in recent weeks. Italian central bank Governor Ignazio Visco noted: “I believe we are near the level where we can stop raising rates.”
However, the market’s pricing for the ECB’s interest rate decision this week has changed dramatically after a Reuters report said on Tuesday that the ECB expects inflation in the 20-nation Eurozone to remain above 3.0% next year, bolstering the case for a tenth consecutive interest rate increase on Thursday.
Ahead of the report, there was only a 35% chance of the ECB raising its key rates by 25 bps on September 14, which is now seen as significantly higher at 63%, according to data from Reuters. The revival of the hawkish ECB expectations gave strength to the Euro, with the EUR/USD pair jumping back toward 1.0800.
If the ECB holds rates with a hawkish language, pointing to one more rate hike by year-end, EUR/USD is likely to resume its upswing toward 1.0850. A bullish reversal from multi-month lows will be confirmed should the ECB announce a 25 bps rate hike, although the policy guidance and President Christine Lagarde’s words will hold the key for the additional upside in EUR/USD. On the contrary, an ECB rate hike pause combined with a lack of clarity on the central bank’s path forward will cheer doves, pushing EUR/USD back toward 1.0650.
Dhwani Mehta, Asian Session Lead Analyst at FXStreet, offers a brief technical outlook for the major and explains: “EUR/USD is trading on the front foot ahead of the key ECB event. The 14-day Relative Strength Index (RSI), however, is holding below the 50 level, suggesting that upside attempts could be limited for Euro buyers.”
Outlining important technical levels to trade the EUR/USD pair, Dhwani notes: “On the upside, buyers need to take out a strong resistance at 1.0800, the confluence of the round level and the bearish 21-day Simple Moving Average (SMA), to extend the recovery toward the 200-day Simple Moving Average (SMA) at 1.0828. The next upside barrier is seen at the psychological level of 1.0850.”
“Alternatively, critical support is located at the three-month low of 1.0686. A sustained break below that level will challenge the May low of 1.0635, below which a fresh downswing toward 1.0600 cannot be ruled out.”
Economic Indicator
European Monetary Union ECB Rate On Deposit Facility
ECB Rate On Deposit Facility, announced by the European Central Bank, is the interest rate paid on the surplus liquidity that credit institutions may deposit overnight in an account with a national central bank that is part of the Eurosystem.
Read more.Next release: 09/14/2023 12:15:00 GMT
Frequency: Irregular
Source: European Central Bank
Cable consolidates after a 0.5% bounce on Wednesday. Economists at Société Générale analyze GBP outlook.
Expectations for the BoE meeting declined to around 18 bps after the 0.5% contraction in July GDP
We note that expectations for the BoE meeting next week declined to around 18 bps after the 0.5% contraction in July GDP rekindled concerns of recession. Gilts rallied sharply and spreads have come in vs Bunds and Treasuries after two days of outright disappointing stats.
GBP/USD bounced back after trading down to the 200-DMA at 1.2430.
EUR/GBP is likely to remain volatile today with investors potentially targeting Wednesday’s high of 0.8630 if the ECB raises rates.
FX option expiries for Sept 14 NY cut at 10:00 Eastern Time, via DTCC, can be found below.
- EUR/USD: EUR amounts
- 1.0685-90 315m
- 1.0775 230m
- 1.0785-90 600m
- 1.0795-00 630m
- 1.0810-15 1.024b
- 1.0855 405m
- 1.0895-00 1.28b
- 1.0910-15 1.07b
- GBP/USD: GBP amounts
- 1.2370 588m
- 1.2475 1.05b
- 1.2715-20 555m
- USD/JPY: USD amounts
- 147.00-10 623m
- 147.50 358m
- 148.35 238m
- 148.50 451m
- 149.00 244m
- AUD/USD: AUD amounts
- 0.6275 300m
- 0.6380 250m
- 0.6450 255m
- 0.6470 804m
- 0.6480-85 640m
- 0.6495-05 449m
- USD/CAD: USD amounts
- 1.3440 670m
- 1.3455 282m
- 1.3700-10 476m
- NZD/USD: NZD amounts
- 0.5900 460m
- 0.6050 463m
- EUR/GBP: EUR amounts
- 0.8700 221m
- 0.8750 227m
- EUR/JPY: EUR amounts
- 152.00 740m
- USD/RUB gains ground near 96.60 amid the weaker USD.
- Russia's economic development ministry has revised its inflation projection for this year from 5.3% to 7.5%.
- The Bank of Russia's interest rate decision will be in the spotlight on Friday.
USD/RUB holds positive ground around 96.60 during the early European session on Thursday. The Bank of Russia interest rate decision on Friday will be in the spotlight and it might trigger the volatility in USD/RUB. Market players anticipate the Russian central bank to raise additional rates.
Russia's economic development ministry has revised its inflation projection for this year from 5.3% to 7.5%, according to TASS, citing a document from the administration. The expected increase in Russia's inflation rate occurred only hours after Putin spoke about the country's economy at the Eastern Economic Forum in Vladivostok, Russia's far easternmost city.
On Tuesday, Russia’s President Vladimir Putin commended the central bank for keeping inflation under control with double-digit interest rates and stated that there were no insurmountable obstacles to limiting the Russian Ruble's volatility.
Russian Inflation accelerated to 5.15% annually in August, exceeding the target of 4%, and analysts anticipate that the Bank of Russia will raise rates again on its Friday meeting, per Reuters. It’s worth noting that the Bank of Russia increased the interest rate by 350 basis points (bps) to reach 12% on August 15 to stop the depreciation of the Ruble and limit price increases.
On the US dollar front, the markets anticipate that the Federal Reserve (Fed) will leave interest rates unchanged at the FOMC meeting next week. Nonetheless, the data suggest that the Fed should be on the watch for a rise in inflation in the coming months. According to the CME Fedwatch Tool, 97% of investors foresee the September interest rate to remain unchanged at 5.25 to 5.50%. However, the odds of a rate hike at the November meeting rose to 49.2%.
Looking ahead, traders will focus on the US weekly Initial Jobless Claims, the Producer Price Index (PPI) and monthly Retail Sales due later on Thursday. The attention will shift to the Bank of Russia's interest rate decision. These figures could give a clear direction for USD/RUB. Also, the headline surrounding Russia’s war in Ukraine remains in focus.
Economists at Commerzbank analyze AUD outlook following Australia’s labour market data.
Australian labor market more robust than expected
The Australian labor market figures have confirmed our assumption that the Australian data have recently not been as bad as it looked at first glance.
Another rate hike in November is now not all that unlikely, should the labor market remain tight and inflation continues to stay above target.
If the monthly inflation figures, which will be published at the end of September, also turn out higher than expected, the Aussie should therefore benefit further.
Here is what you need to know on Thursday, September 14:
Markets remain cheerful, as Asian stocks rise after the all-important US Consumer Price Index (CPI) data cemented Federal Reserve (Fed) pause bets. The US S&P 500 futures, the risk barometer, is up nearly 0.30% on the day.
On Wednesday, the annual United States inflation gauge rose 3.7% in August, compared with a 3.6% rise expected. The CPI rose 0.6% in August, its biggest monthly gain of 2023 but matched the market consensus. The core CPI increased 0.3% and 4.3% respectively, against estimates for 0.2% and 4.3%.
Money markets continue to price a Fed rate hike pause next week while the probability for a November rate hike remains at about 40%, according to the CME Group’s FedWatch Tool. The dovish Fed expectations remain intact, which seems to be weighing on the US Dollar and the US Treasury bond yields in the European trading.
Within the G10 FX currency basket, the Australian Dollar is the strongest, followed by the Japanese Yen while the Canadian Dollar is the weakest heading into the European session.
AUD/USD is consolidating strong Australian jobs data-led gains at around 0.6435. The Australian economy added 64,900 jobs from the prior month, driven by part-time jobs, the Australian Bureau of Statistics (ABS) data showed Thursday. The Unemployment Rate held steady at 3.7%, as expected.
USD/CAD is on the back foot below 1.3550, despite a pause in the oil price rally. WTI is stabilizing near ten-month highs of $89.
USD/JPY is pressured toward 147.00, as the Japanese Yen draws support from comments delivered by Japan’s newly appointed Economy Minister Yoshitaka Shindo. Shindo said that he “will mobilize all possible policy measures to support the economy.” Weaker US Treasury bond yields are also adding to the weight on the major.
EUR/USD is keeping its recovery mode intact near 1.0750 in the run-up to the ECB showdown. The central bank is widely expected to leave key rates on hold later in the day. The updated economic projections and President Christine Lagarde’s speech will hold the key for hints on the ECB’s future policy path and a clear direction for the Euro. The ECB's quarterly projections will put inflation north of 3.0% in 2024, Reuters reported on Wednesday, citing sources.
Euro price today
The table below shows the percentage change of Euro (EUR) against listed major currencies today. Euro was the strongest against the US Dollar.
| USD | EUR | GBP | CAD | AUD | JPY | NZD | CHF | |
| USD | -0.10% | -0.03% | -0.10% | -0.28% | -0.14% | -0.23% | -0.15% | |
| EUR | 0.12% | 0.08% | 0.03% | -0.18% | -0.01% | -0.13% | -0.03% | |
| GBP | 0.05% | -0.06% | -0.06% | -0.26% | -0.09% | -0.19% | -0.11% | |
| CAD | 0.10% | 0.00% | 0.08% | -0.19% | -0.04% | -0.13% | -0.05% | |
| AUD | 0.29% | 0.18% | 0.26% | 0.20% | 0.17% | 0.05% | 0.14% | |
| JPY | 0.13% | 0.05% | 0.11% | 0.04% | -0.16% | -0.08% | 0.00% | |
| NZD | 0.21% | 0.13% | 0.21% | 0.15% | -0.05% | 0.12% | 0.10% | |
| CHF | 0.16% | 0.07% | 0.11% | 0.06% | -0.14% | 0.01% | -0.08% |
The heat map shows percentage changes of major currencies against each other. The base currency is picked from the left column, while the quote currency is picked from the top row. For example, if you pick the Euro from the left column and move along the horizontal line to the Japanese Yen, the percentage change displayed in the box will represent EUR (base)/JPY (quote).
GBP/USD is battling 1.2500 amid the UK economic woes and a broadly softer US Dollar. The ECB decision could have a EUR/GBP cross-driven ‘rub-off’ effect on Cable.
Gold price is wallowing in three-week lows near $1,905, with sellers awaiting a sustained break of the $1,900 threshold for further declines.
Economists at TD Securities discuss the European Central Bank (ECB) Interest Rate Decision and their implications for the EUR/USD pair.
Hawkish (45%): 25 bps hike and dovish guidance
25 bps hike with slightly softer language in the press statement. President Lagarde reiterates the importance of remaining data dependent, but softens her language around further hikes to imply that the bar is now higher for further hikes. EUR/USD +0.50%.
Base case (50%): Hawkish hold
The GC delivers a hold but the language in the press statement remains similar to July. President Lagarde keeps the communiqué similar to July and reiterates that future decisions will be a function of the data. EUR/USD +0.25%.
Dovish (5%): Dovish hold
The GC delivers a hold and softens the language slightly in the press statement, suggesting that there is a high bar for hikes to resume. President Lagarde reiterates the need to remain data dependent in making policy decisions but suggests substantial upside surprises are needed to result in another hike. EUR/USD -0.60%.
GBP/USD could still slip back to the 1.2400 region in the next weeks, according to Economist Lee Sue Ann and Markets Strategist Quek Ser Leang at UOB Group.
Key Quotes
24-hour view: We expected GBP to trade between 1.2455 and 1.2525 yesterday. However, GBP traded in a lower range of 1.2434/1.2511 before ending the day little changed at 1.2490 (-0.04%). The price action appears to be consolidative, and we continue to expect GBP to trade in a range, probably between 1.2440 and 1.2530.
Next 1-3 weeks: Our most recent narrative was from two days ago (12 Sep, spot at 1.2505), wherein “downward momentum has slowed”, and “if GBP breaks above 1.2555, it would mean that GBP is not weakening further.” Yesterday, GBP fell to a fresh 10-week low of 1.2434 before rebounding quickly. Despite the decline, downward momentum has not improved further. That said, as long as 1.2555 (no change in ‘strong resistance’ level) is not breached, there is a chance for GBP to drop to 1.2400 before stabilisation can be expected. If GBP breaches 1.2555, it would mean that the weakness that started early last week has stabilised.
- AUD/USD trades near 0.6435, holds above the 50- and 100-hour EMAs.
- The immediate resistance level for AUD/USD is seen at the 0.6445-0.6455 zone; 0.6418 acts as an initial support level.
- Relative Strength Index (RSI) stands in bullish territory above 50.
The AUD/USD pair attracts some buyers and bounced off the 0.6420 area during the early European session on Thursday. The pair currently trades around 0.6438, gaining 0.25% on the day. The newest Australian employment data have little impact on the Aussie and investors await the US economic data for fresh impetus.
According to the one-hour chart, AUD/USD holds above the 50- and 100-hour Exponential Moving Averages (EMAs) indicating that the path of least resistance for the pair is to the upside.
The immediate resistance level for AUD/USD is seen near the upper boundary of the Bollinger Band and a high of September 13 at the 0.6445-0.6455 zone. Further north, the 0.6500-0.6505 regions appear a tough nut to crack for Aussie bears. The mentioned level represents the confluence of a psychological round mark and a high of August 14. Any meaningful follow-through buying above the latter could pave the way to 0.6522 (high of August 15) and 0.6570 (high of August 9).
On the downside, the 100-hour EMA at 0.6418 acts as an initial support level. The key contention is located at the 0.6400-0.6405 region, representing the lower limit of the Bollinger Band and a psychological round figure. A decisive breach of the latter will see the next stop at 0.6380 (low of August 25) and finally at 0.6365 (low of August 17).
In the meantime, the Relative Strength Index (RSI) stands in bullish territory above 50, challenging the pair’s immediate upside for the time being.
AUD/USD one-hour chart
-638302689378369934.png)
Considering advanced prints from CME Group for gold futures markets, open interest went up for the third session in a row on Wednesday, this time by just 873 contracts. Volume, instead, shrank by almost 3K contracts amidst the broad-based erratic performance.
Gold risks a deeper pullback below $1900
Gold prices added to the weekly retracement on Wednesday. The downtick was on the back of a small build in open interest, which hints at the probability that extra losses could be in store for the commodity in the very near term. Against that, the $1900 mark per troy ounce emerges as a key contention area for the time being.
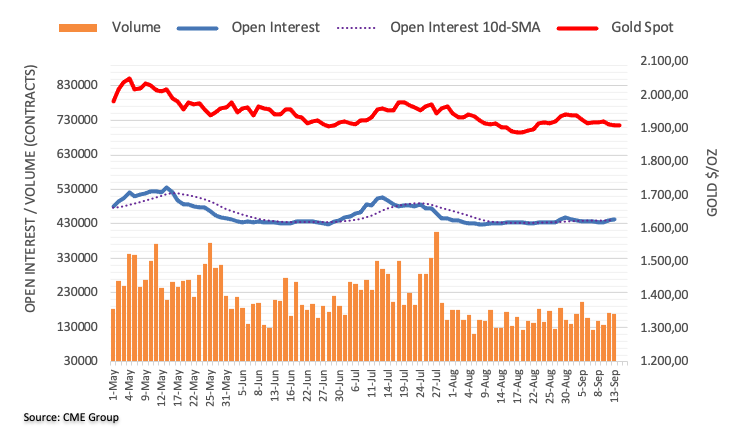
Citing two sources with knowledge of the matter, Reuters reported on Thursday, the People’s Bank of China (PBOC) urged some of the country's biggest banks to leave their forex market open positions for a while in order to alleviate downside pressure on the Yuan.
Key takeaways
PBOC asks some banks to hold off on immediate Dollar purchases in the interbank market to square foreign exchange positions.
Banks told to hold such open FX positions until net exposure hits a certain level.
Market reaction
Despite China’s central bank’s efforts to stabilize the Yuan, USD/CNY is trading better bid near 7.2710, as of writing.
Extra range bound is likely in EUR/USD in the next few weeks, note Economist Lee Sue Ann and Markets Strategist Quek Ser Leang at UOB Group.
Key Quotes
24-hour view: Our expectation for EUR to rebound further yesterday did not materialise as it traded between 1.0710 and 1.0764 before closing at 1.0728 (-0.22%). The current price movements are likely part of a consolidation. Today, we expect EUR to trade in a range of 1.0690/1.0760.
Next 1-3 weeks: There is not much to add to our update from Tuesday (12 Sep, spot at 1.0750). As highlighted, the recent EUR weakness has stabilised. From here, EUR is likely to trade in a range, probably between 1.0690 and 1.0820. Looking ahead, if EUR breaks and stays below 1.0690, it will increase the risk of it dropping towards the major support at 1.0635.
- EUR/GBP trades higher ahead of the ECB interest rate decision.
- Differing views among analysts underscore the prevailing uncertainty surrounding the ECB's decision.
- BoE Governor Andrew Bailey's recent remarks could provide support for the undermining of the British Pound (GBP).
EUR/GBP trades higher near 0.8600 during the Asian session on Thursday, embracing before the interest rate decision by the European Central Bank (ECB) scheduled to be released later in the day.
ECB could increase the interest rates by 25 basis points (bps) to 4.0% as its policymakers maintained the possibility of a September hike when they raised interest rates in July.
However, there are arguments in favor of hitting the pause button on further rate hikes. Some believe that the combined impact of previous tightening measures may be significant enough to subdue underlying inflationary pressures.
According to a Bloomberg survey of 49 analysts, 26 anticipate no change in rates, while 23 expect a quarter bps hike. In a Reuters poll, a slight majority of experts believe that the ECB will refrain from raising rates further. These differing views highlight the uncertainty and varied expectations surrounding the ECB's monetary policy decision.
On the other side, recent data indicates that the UK's unemployment rate increased more than expected, but the Bank of England (BoE) remains concerned about the sustainability of wage growth and its potential impact on persistent inflation.
In the three months leading up to July, the UK's unemployment rate rose from 4.2% to 4.3%. Additionally, the Employment Change for July showed a decline of 207,000, a more significant drop than the previous reading of 66,000 and worse than the anticipated decrease of 185,000.
On the positive side, Average Earnings Including Bonus for the three months to July increased by 8.5%, up from 8.2% in the previous period. Excluding bonuses, the figure remained at 7.8%, in line with expectations.
BoE has taken a more cautious approach recently, as indicated by BoE Governor Andrew Bailey's statement that the central bank is nearing the peak of its rate hike cycle. Despite ongoing inflation concerns, the BoE must tread carefully, as overly aggressive interest rate hikes could pose risks to the stability of the British economy.
Balancing the need to address inflationary pressures while ensuring sustainable economic growth is a challenging task for the central bank.
- EUR/USD recovers its recent losses and holds above 1.0750.
- Economists anticipated the European Central Bank (ECB) to maintain interest rates on Thursday.
- US Consumer Price Index (CPI) rose 0.6% MoM from 0.2% in July, the highest monthly gain in 14 months.
- Investors await the ECB rate decision, ECB Lagarde speech, and US economic data.
The EUR/USD pair gains momentum and trades around 1.0750 during the early European session on Thursday. Traders shrugged off the upbeat US inflation data and await the European Central Bank (ECB) interest rate decision on Thursday. The markets anticipate the ECB to hold the interest rate unchanged at its September meeting.
A majority of economists by Reuters poll between 5 and 7 September anticipated the ECB to maintain interest rates on Thursday, but with the mood altering, money markets now priced in a 65% odds of an increase, which is expected to be the last in a cycle that began in July 2022. Investors will take cues from the ECB Present Lagarde speech later in the day. The hawkish comments from ECB policymakers might boost the Euro against the US Dollar (USD) and act as a tailwind for the EUR/USD pair.
On the US dollar front, data released on Wednesday showed that the headline inflation in August hit the highest monthly gain in 14 months with the US Consumer Price Index (CPI) rising 0.6% MoM from 0.2% in the previous reading. The annual figure came in at 3.7% from 3.2%, better than expected. The core CPI, which excludes volatile food and energy prices climbed 0.3% MoM from 0.2% in the previous month. The annual core CPI came in at 4.3% versus 4.7% prior.
Markets believe that the Federal Reserve (Fed) will hold interest rates unchanged at next week's FOMC meeting. However, the figures imply that the Fed should be on the lookout for any re-acceleration in inflation in the next months. According to the CME Fedwatch Tool, investors have priced in 97% odds of interest rate unchanged in September at 5.25%-5.50%. However, the possibility of a rate hike in the November meeting increased to 49.2%.
Market participants will closely watch the ECB interest rate decision at 12:15 GMT and ECB President Lagarde's press conference at 12:45 GMT. Also, the US weekly Initial Jobless Claims, the Producer Price Index (PPI) and monthly Retail Sales will be released on Thursday. These key events might trigger volatility across the market. Traders will find trading opportunities around the EUR/USD pair.
- AUD/JPY trades in positive territory for four straight days on Thursday.
- The immediate resistance level for AUD/JPY emerges at 94.82; the initial support level is seen at 94.40.
- Relative Strength Index (RSI) holds above 50 in the bullish territory.
The AUD/JPY cross gains momentum for the fourth consecutive day during the Asian session on Thursday. The cross currently trades around 94.70, up 0.01% on the day. The Aussie attracts some buyers following the release of Employment data. However, markets anticipate that the Reserve Bank of Australia (RBA) might have already ended its rate-hiking cycle, which could cap the upside of the AUD/JPY.
The Australian Bureau of Statistics (ABS) revealed on Thursday that Australia’s Unemployment Rate came in at 3.7% in August compared to 3.7% in the previous reading and was in line with the expectation. Meanwhile, the number of employed people rose to 64.9K in August, compared to a market consensus of 23K and a loss of 14.6K in the previous month.
From the technical outlook, AUD/JPY trades within an ascending trend channel since September 7 on the one-hour chart. That said, the path of least resistance for the AUD/JPY is to the upside as the cross holds above the 50- and 100-hour Exponential Moving Averages (EMAs).
The immediate resistance level for AUD/JPY emerges near the upper boundary of an ascending trend channel at 94.82. Any follow-through buying above the latter will see a rally to a confluence of a psychological round mark and a high of August 30 at 95.00. The next upside stop to watch is 95.40 (high of July 14) en route to 95.85 (high of July 31).
Looking at the downside, the cross will meet the initial support level at 94.40 (the 100-hour EMA). The next downside filter appears at 94.30 (the lower limit of the descending trend channel). A break below the latter will see a drop to 94.00 (a low of September 5) en route to 93.50 (a low of August 22) and finally near a psychological figure at 93.00.
It’s worth noting that the Relative Strength Index (RSI) holds above 50 in the bullish territory, which support the buyers for now.
AUD/JPY one-hour chart
- Gold price holds ground above $1,900, snapping a losing streak.
- CME FedWatch Tool indicates the interest rates to remain within the range of 5.25% to 5.50% in the Fed's September meeting.
- Fed dovish sentiment is weakening the Greenback.
Gold price attempts to snap a two-day losing streak, edging higher around $1,910 per troy ounce during the Asian session on Thursday after Consumer Price Index (CPI) data from the United States (US).
US Consumer Price Index (CPI) (YoY) exceeded expectations, rising to 3.7% from the previous rate of 3.2%, surpassing the market's anticipated 3.6% for August. Furthermore, the monthly core CPI showed improvement, increasing to 0.3% from the prior 0.2% for the same month. This increase was unexpected, as market expectations had been for it to remain unchanged.
However, the annual core inflation rate aligned with expectations, holding steady at 4.3%, consistent with the previous figure of 4.7%.
The data suggests that while overall inflation may be moderating, the Core Consumer Price Index (CPI) remains relatively stable. This information initially led to a rise in US Treasury yields, but those gains were later retraced. The market sentiment seemed to improve with the belief that the US Federal Reserve (Fed) will maintain a dovish stance in its September meeting.
This dovish sentiment has provided support for the prices of Gold, as investors seek alternative stores of value. This has contributed to the weakening of the US Dollar (USD).
CME FedWatch Tool indicates that the Fed is likely to maintain interest rates within the range of 5.25% to 5.50% for the September meeting. This suggests that market participants are increasingly anticipating a more dovish stance from the Fed in the near term.
Despite the diminished probability of an interest rate hike in September, there is a 40% likelihood of a 25 basis points (bps) rate increase by the Federal Reserve (Fed) in November. This suggests that market sentiment is increasingly inclined towards the Fed pursuing a monetary tightening policy later in the year, potentially in November. Investors turn cautious about the possibility of such a move as they assess the evolving economic landscape and Fed statements.
While an immediate rate hike in September may not be on the horizon, investors are anticipating the possibility of such a move in the near future, likely in November or beyond. This reflects the ongoing uncertainty and evolving expectations regarding Fed policy decisions.
US Dollar Index (DXY), which measures the performance of the US Dollar (USD) against a basket of the other major six currencies, is reversing some of the gains it made in the previous trading session. The spot price is trading lower around 104.60 at the time of writing. This suggests that the US Dollar may be facing some selling pressure or a correction after its recent strength.
Market participants are currently directing their attention to forthcoming data releases from the United States (US), including the Core Producer Price Index (PPI) and Retail Sales figures for August.
These economic indicators will provide valuable insights into the state of economic activity in the US and are likely to influence trading decisions and market sentiment, particularly concerning the Greenback.
- USD/JPY meets with a fresh supply on Thursday and is pressured by a combination of factors.
- Bets that the BoJ will end its ultra-easy monetary policy underpin the JPY and weigh on the pair.
- The uncertainty over the Fed's rate-hike path prompts USD selling and contributes to the decline.
The USD/JPY pair comes under some selling pressure during the Asian session on Thursday and snaps a two-day winning streak to the weekly high, around the 147.75 region touched the previous day. Spot prices drop to the 147.00 mark, or a fresh daily low in the last hour, with bears now awaiting a sustained break and acceptance below the 200-hour Simple Moving Average (SMA) before positioning for any further losses.
The Japanese Yen (JPY) is underpinned by speculations that the Bank of Japan (BoJ) will end its ultra-easy monetary policy, which, in turn, is seen as a key factor weighing on the USD/JPY pair. In fact, the markets are now betting that the central bank may scrap its yield-curve control (YCC) policy and put an end to negative interest rates as early as this year, especially after the BoJ Governor Kazuo Ueda's hawkish comments over the weekend.
In an interview with Yomiuri newspaper, Ueda signalled that hiking interest rate is among the options available if the BoJ becomes confident that prices and wages will keep going up sustainably. This, in turn, triggered a sell-off in the Japanese government bonds (JGB) and pushed the yield on the benchmark 10-year JGB to its highest level since January 2014 on Tuesday, which continues to act as a tailwind for the JPY.
Apart from this, the emergence of some US Dollar (USD) selling, amid the uncertainty over the Federal Reserve's (Fed) future rate-hike path, contributes to the offered tone surrounding the USD/JPY pair. The US consumer inflation figures released on Wednesday ensured that the Fed will keep rates steady at its policy meeting next week. The still-sticky inflation, however, keeps hopes for one more lift-off by the end of this year.
The current market pricing indicates a more than 50% chance of a 25 basis points (bps) lift-off either in November or December. This, in turn, might hold back the USD bears from placing aggressive bearish and help limit losses for the USD/JPY pair. Traders now look to the US economic docket – featuring the release of the usual Weekly Initial Jobless Claims, the Producer Price Index (PPI) and monthly Retail Sales – for a fresh impetus.
Technical levels to watch
- WTI prices hold ground around $88.25 amid the unexpected surge in US inventories and stronger USD.
- US crude oil inventories rose by nearly 4M barrels for the week ending September, the first rise in five weeks.
- A tighter supply by voluntary oil production cuts by Saudi Arabia and Russia might lift WTI prices.
Western Texas Intermediate (WTI), the US crude oil benchmark, is trading around the $88.25 mark so far on Thursday. WTI prices pullback from the 10-month high amid the unexpected surge in US inventories and the renewed USD demand.
US crude oil inventories increased by nearly 4M barrels for the week ending September, the first rise in five weeks. The US Energy Information Administration (EIA) reported that crude oil stockpiles increased by 3.95M barrels compared to a drawdown of 6.30M barrels in the previous week, while the market anticipated a drawdown of 2.48M barrels. Furthermore, the American Petroleum Institute (API) showed a 1.174M barrels build in the US crude oil inventories for the week ending of September 8 compared to the previous week’s -5.521M barrels. A surprising surge in US crude stocks suggests that demand fell when the summer driving period in the US ended.
OPEC, on the other hand, maintained its projection for robust growth in global oil demand in 2023 and 2024 despite challenges such as rising interest rates and higher inflation. In a monthly report, OPEC anticipated that global oil demand will rise by 2.25 million barrels per day (bpd) in 2024, up from 2.44 million bpd in 2023. Both forecasts were unchanged from the previous month.
Apart from this, a tighter supply by voluntary oil production cuts by Saudi Arabia and Russia has boosted WTI prices in recent weeks. Saudi Arabia and Russia, the world's two largest oil exporters, announced that they would prolong oil output curbs until the end of 2023. Through the end of 2023, Saudi oil output will be closer to 1.3 million barrels per day. That said, the optimistic oil demand outlook from OPEC and a tighter supply might limit the WTI’s downside for the time being.
Moving on, oil traders will keep an eye on the US weekly Initial Jobless Claims, the Producer Price Index (PPI) and monthly Retail Sales due on Thursday. On Friday, the preliminary Michigan Consumer Sentiment Index for September will be released. These events could significantly impact the USD-denominated WTI price. Oil traders will take cues from the data and find trading opportunities around the WTI prices.
- USD/INR edges higher on Thursday, albeit remains confined in a three-day-old trading band.
- The constructive technical setup favours bullish traders and supports prospects for further gains.
- A convincing break below the 100/200-day SMAs confluence will negate the positive outlook.
The USD/INR pair trades with a positive bias during the Asian session on Thursday, though remains below the 83.00 mark and well within a familiar trading range held over the past three days.
From a technical perspective, spot prices are holding comfortably above technically significant 100-day and 200-day Simple Moving Averages (SMAs). Moreover, positive oscillators on the daily chart – though have been losing traction – favour bullish traders and suggest that the path of least resistance for the USD/INR pair is to the upside.
That said, it will still be prudent to wait for sustained strength and acceptance above the 83.00 round figure before positioning for any further move up. The USD/INR pair might then climb back towards last week's swing high, around the 83.20-83.25 region, and then aim to challenge the record high, around the 83.45 region touched in August.
A sustained strength beyond the 83.00 mark will reaffirm the constructive setup and lift the pair back towards last week's swing high, around the 83.20-83.25 region. This is followed by the 83.45 region, or the record high touched in August, which if cleared decisively will be seen as a fresh trigger for bulls and pave the way for additional gains.
On the flip side, weakness below the 82.80 area, or the weekly low, might continue to attract some dip-buying and remain limited near the 82.40-82.30 confluence, comprising the 100-day and the 200-day SMAs. The latter should act as a pivotal point, which if broken will make the USD/INR pair vulnerable to accelerate the slide towards the 82.00 mark.
Some follow-through selling below the July monthly swing low, around the 81.70-81.65 region, will suggest that spot prices have formed a near-term top and pave the way for a deeper corrective decline. The USD/INR pair might then weaken further towards the 81.35 intermediate support before eventually dropping towards testing sub-81.00 levels.
USD/INR daily chart
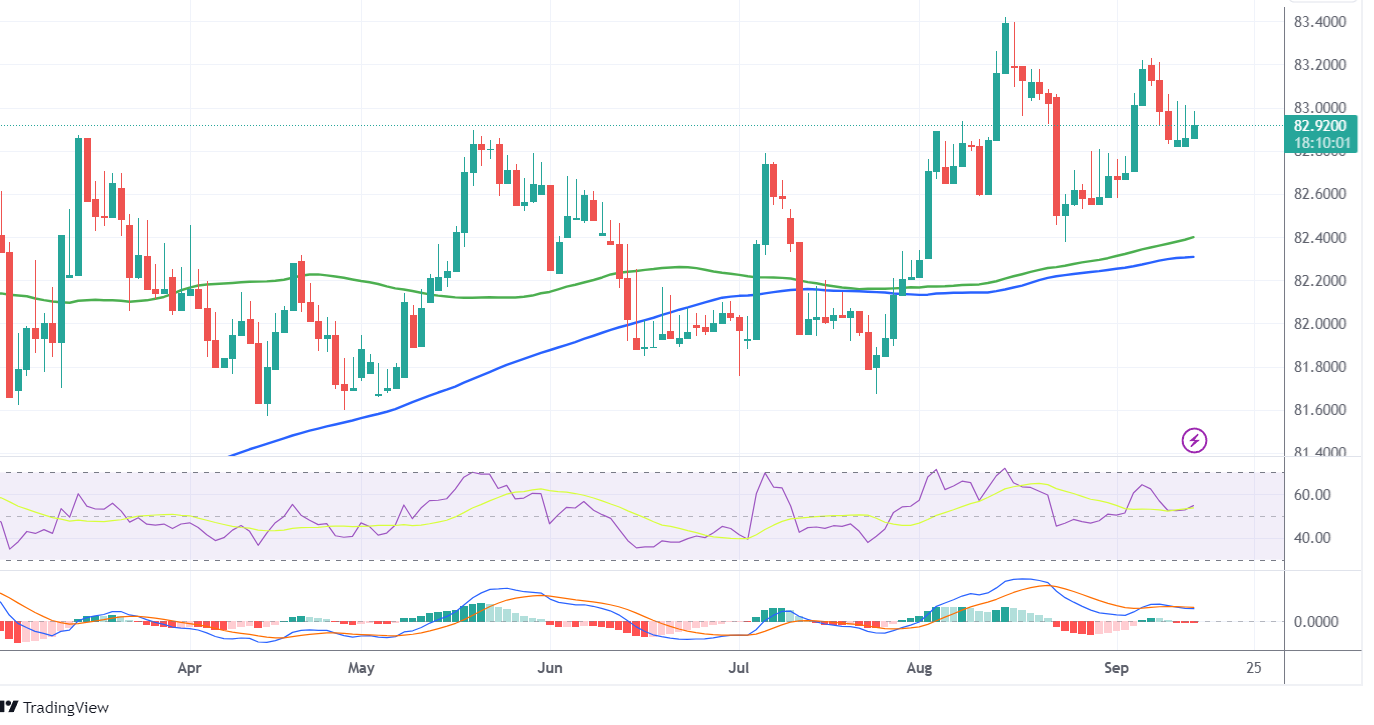
Technical levels to watch
- USD/MXN trades lower after the release of US CPI data on Wednesday.
- US Dollar (USD) experienced downward pressure following the market sentiment of no interest rate hike by the Fed in September.
- Core PPI and Retail Sales will be eyed, seeking further cues on economic activities in the US.
USD/MXN continues the losing streak that began on Friday, trading lower around 17.1300 during the Asian session on Thursday. The pair is facing downward pressure following the release of the Consumer Price Index (CPI) data from the United States (US).
The data suggest the overall inflation may be moderating, the core rate, which excludes volatile components, remains relatively stable. The annual core rate met expectations by registering a reading of 4.3%, consistent with the previous figure of 4.7%.
However, the US CPI year-over-year rose to 3.7%, surpassing the previous rate of 3.2%, and it exceeded market expectations of 3.6% for August. Additionally, the monthly core CPI improved, increasing to 0.3% from the previous 0.2% for the same month. This uptick was unexpected, as it had been anticipated to remain unchanged.
Investor expectations have improved toward no interest rate hike by the US Federal Reserve (Fed) in the upcoming September policy meeting. The CME FedWatch Tool suggests that the Fed is likely to keep interest rates within the range of 5.25% to 5.50% for the September meeting.
Nevertheless, the likelihood of a 25 basis points (bps) rate hike in November remains at 40%, indicating growing expectations of the Fed implementing a tightening monetary policy later in the year. This suggests that while there might not be an immediate rate hike in September, investors anticipate the possibility of such a move in the near future.
US Dollar Index (DXY), which gauges the performance of the US Dollar (USD) against a basket of the other major six currencies, attempting to pull back from the gains it achieved the previous day. The spot price is trading lower around 104.70 by the press time.
DXY received upward support on Wednesday primarily due to the initial surge in US Treasury yields. However, it subsequently retraced, and the 10-year US bond yields traded at 4.23% at the time of writing.
Market participants are currently focusing on upcoming data releases from the US, including the Core Producer Price Index (PPI) and Retail Sales figures for August. These datasets will serve as important indicators of economic activities in the US.
The data can provide valuable insights into the state of the US economy and potentially influence currency market sentiment, helping traders formulate their strategies when trading the USD/MXN pair.
- GBP/JPY meets with a fresh supply and snaps a two-day winning streak to the weekly high.
- Bets that the BoJ will drop its negative interest rate policy boost the JPY and exert pressure.
- Speculations that the BoE is nearing the end of its rate-hiking cycle contribute to the decline.
The GBP/JPY cross comes under some renewed selling pressure during the Asian session on Thursday and for now, seems to have snapped a two-day winning streak to the weekly high, around the 184.35-184.40 area touched the previous day. The cross drops to a fresh daily low, around the 183.70 area in the last hour and is pressured by a goodish pickup in demand for the Japanese Yen (JPY).
The recent sell-off in the Japanese government bonds (JGB), triggered by the possibility of an early end to the Bank of Japan's (BoJ) negative interest rate policy, turns out to be a key factor underpinning the JPY. In fact, the yield on the benchmark 10-year JGB rose to its highest level since January 2014 on Tuesday in reaction to BoJ Governor Kazuo Ueda's hawkish comments over the weekend. In an interview with Yomiuri newspaper, Ueda signalled that hiking interest rate is among the options available if the BoJ becomes confident that prices and wages will keep going up sustainably.
Apart from this, speculations that the Bank of England (BoE) is nearing the end of its rate-hiking cycle contribute to the British Pound's (GBP) relative underperformance and exert additional pressure on the GBP/JPY cross. The Office for National Statistics reported that Britain’s economy shrank at the quickest pace in seven months, by 0.5% in July, suggesting that the UK economy is losing momentum in the wake of a sharp rise in borrowing costs and reviving recession fears. This comes on top of signs that the UK labour market is cooling and reaffirms market expectations.
The aforementioned negative factors, to a larger extent, overshadow the disappointing Japanese macro data, which does little to lend any support to the GBP/JPY cross. In fact, the Cabinet Office reported that Japan's core machinery orders fell more than expected, by 1.1% in July, in the wake of sluggish global growth and a slowdown in China. This comes on the back of several other indicators over recent weeks, indicating soft demand overseas and at home, and points to a difficult period ahead for the world's third-largest economy.
The muted market reaction, however, suggests that the path of least resistance for the GBP/JPY cross is to the downside. Hence, a subsequent slide back towards the 183.00 round figure, en route to a one-month low around the 182.70-182.65 region, looks like a distinct possibility. In the absence of any relevant macro data from the UK, the ECB-infused volatility in the markets might provide some impetus to the cross and allow traders to grab short-term opportunities.
Technical levels to watch
- GBP/USD oscillates around the 1.2485- 1.2505 region in a narrow trading band.
- UK Unemployment Rate rose by 4.3% vs. 4.2% prior; the growth number shrank 0.5% MoM in July vs. 0.5% expansion in June.
- US Consumer Price Index (CPI) climbed 0.6% MoM from 0.2% in the previous reading.
- Market players await the US weekly Initial Jobless Claims, Producer Price Index (PPI), Retail Sales due on Wednesday.
The GBP/USD pair consolidates in a narrow range around 1.2490 during the early Asian session on Wednesday. The major pair remains capped by the 1.2500 barrier ahead of the US economic data released.
Tuesday's data indicated a bigger rise in the unemployment rate than anticipated, but the BoE remains concerned that wage growth will sustain persistent inflation. The UK’s Office for National Statistics revealed that the UK Unemployment Rate in the three months to July came in at 4.3% from 4.2% in the previous reading, Meanwhile, Employment Change for July declined by 207K from a 66K drop in the previous reading, worse than the estimated 185K drop. The Average Earnings Including Bonus in the three months to July rose by 8.5% versus 8.2% prior. Excluding bonus, the figure remains at 7.8%, as expected.
Additionally, the UK Gross Domestic Product (GDP) declined 0.5% MoM in July, following a 0.5% expansion in June and a worse-than-expectation 0.2% drop. The speed of the slowdown fuels the concern about the potential recession in the UK economy.
Catherine Mann, a Bank of England (BoE) policymaker, stated on Monday that it was too early for the central bank to pause interest rates and that it was preferable for the central bank to err on the side of raising them too high rather than halting too soon. However, The British Pound (GBP) attracts some sellers as investors are concerned about the aggressive tightening cycle that will impact the UK economy.
Across the pond, the US Bureau of Labor Statistics showed on Wednesday that the headline inflation in August hit the highest monthly gain in 14 months with the US Consumer Price Index (CPI) rising 0.6% MoM from 0.2% in the previous reading. The annual figure came in at 3.7% from 3.2%, better than expected. The core CPI, which excludes volatile food and energy prices climbed 0.3% MoM from 0.2% in the previous month. The annual core CPI came in at 4.3% versus 4.7% prior.
Markets believe that the Federal Reserve (Fed) will hold interest rates unchanged at next week's FOMC meeting. However, the figures imply that the Fed should be on the lookout for any re-acceleration in inflation in the next months. According to the CME Fedwatch Tool, investors have priced in 97% odds of interest rate unchanged in September at 5.25%-5.50%. However, the possibility of a rate hike in the November meeting increased to 49.2%.
In the absence of economic data released from the UK docket on Wednesday, the GBP/USD pair remains at the mercy of USD price dynamics. Market participants will keep an eye on the release of the US weekly Initial Jobless Claims, the Producer Price Index (PPI) and monthly Retail Sales due later in the day. On Friday, the preliminary Michigan Consumer Sentiment Index for September will be due. These figures could give a clear direction to GBP/USD and traders will find the trading opportunities around the major pair.
| Raw materials | Closed | Change, % |
|---|---|---|
| Silver | 22.828 | -1.01 |
| Gold | 1908.256 | -0.27 |
| Palladium | 1248.93 | 0.81 |
Japan’s newly appointed Economy Minister Yoshitaka Shindo said on Thursday, he “will mobilize all possible policy measures to support economy.”
Shindo said that he is “aiming to achieve a virtuous growth and wealth distribution while striving to achieve fiscal reform.”
- Silver gains some positive traction on Thursday, albeit lacks bullish conviction.
- The overnight breakdown through a multi-day-old trading range favours bears.
- Momentum back above the $23.00 mark could be seen as a selling opportunity.
Silver attracts some buyers during the Asian session on Thursday and reverses a part of the previous day's slide to over a three-week-low, though lacks follow-through and remains below the $23.00 mark.
From a technical perspective, the overnight decline below the $22.85-$22.80 horizontal support could be seen as a fresh trigger for bearish traders. Moreover, oscillators on the daily chart are holding in the negative territory and are still far from being in the oversold zone. This, in turn, suggests that the path of least resistance for the XAG/USD is to the downside.
Hence, a subsequent slide back towards testing a strong horizontal support, near the $22.20-$22.10 zone, looks like a distinct possibility. This is followed by the $22.00 round-figure mark, which if broken decisively will pave the way for an extension of a multi-week-old descending trend and drag the XAG/USD to the next relevant support near the $21.25 region.
On the flip side, movement beyond the $23.00 mark now seems to confront stiff resistance near the $23.20 supply zone. Any further move up might be seen as a selling opportunity and remain capped near the 200-day Simple Moving Average (SMA), currently near the $23.45-$23.50 area. This is followed by the 100-day SMA barrier, around the $23.80 region, and the $24.00 mark.
A sustained strength beyond the aforementioned hurdles should negate the near-term negative outlook for the XAG/USD. The subsequent short-covering move has the potential to lift the white metal beyond the $24.30-$24.35 resistance, towards reclaiming the $25.00 psychological mark. The latter represents the August monthly swing high and should act as a pivotal point.
Silver daily chart
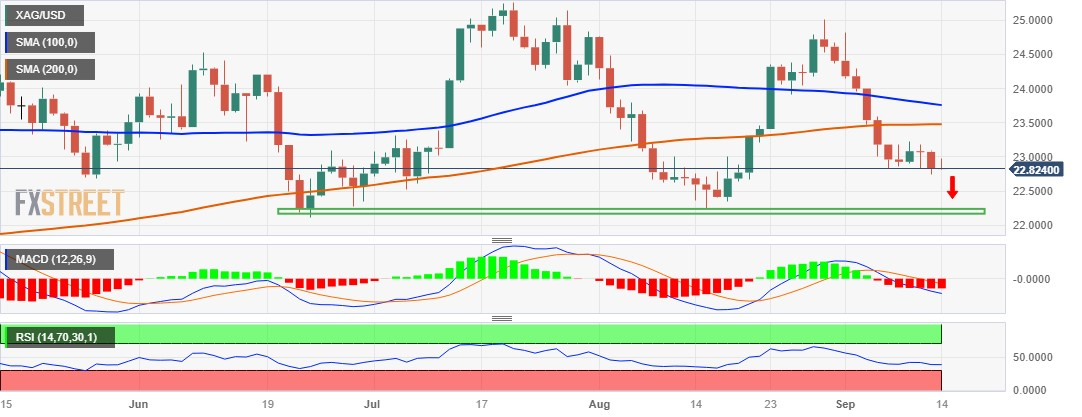
Technical levels to watch
- EUR/USD holds ground around 1.0740 ahead of the ECB monetary policy decision.
- Momentum indicators suggest bearish bias to continue in the short term.
- Key support appears around the weekly low followed by the 1.0700 psychological level.
- 14-day EMA could act as a barrier following the 1.0800 psychological level.
EUR/USD hovers around 1.0740 during the Asian session on Thursday, attempting to recover from the previous day’s losses ahead of the policy decision from the European Central Bank (ECB).
The EUR/USD pair experienced a decline on Thursday following the release of optimistic Consumer Price Index (CPI) data from the United States (US). The US CPI Year-over-Year increased to 3.7%, up from the previous rate of 3.2%, exceeding market expectations of 3.6% for August.
The monthly core CPI showed an improvement, rising to 0.3% from the previous 0.2% for the same month. This increase was unexpected, as it was anticipated to remain unchanged. However, the annual core rate matched expectations by recording a reading of 4.3%, in line with the previous figure of 4.7%.
The pair may encounter initial support around the weekly low at 1.0705 lined up with the 1.0700 psychological level, followed by the previous week’s low at 1.0685.
A firm break below the latter could open the doors for the EUR/USD sellers to navigate the region around June’s low at 1.0661 aligned with the 1.0650 psychological level.
On the upside, a significant resistance level for the EUR/USD pair appears at the 14-day Exponential Moving Average (EMA) at 1.0769, followed by the 21-day EMA at 1.0798 lined up with the 1.0800 psychological level.
A break above that level could provide support for Euro buyers, allowing them to potentially target the area around the 23.6% Fibonacci retracement level at 1.0823.
The Moving Average Convergence Divergence (MACD) line remains below the centerline and the signal line. This configuration suggests a potential bearish momentum in the market, which can be seen as a signal that the recent downtrend may continue to strengthen.
Traders of the EUR/USD pair will likely observe the 14-day Relative Strength Index (RSI), which suggests a bearish sentiment in the short term as it lies below the 50 level.
- USD/CHF posts modest losses near 0.8930 amid the weaker USD.
- US Consumer Price Index (CPI) rose 0.6% MoM from 0.2% in July, the highest monthly gain in 14 months.
- Markets believe that interest rates will remain unchanged at next week's FOMC meeting.
- Swiss Producer and Import Prices (Aug) will be due on Wednesday ahead of the US Initial Jobless Claims, Retail Sales data.
The USD/CHF pair snaps a two-day winning streak during the early Asian trading hours on Thursday. Meanwhile, the US Dollar Index (DXY), a measure of the value of USD against six other major currencies, hovers around 104.65 after retreating from 104.96 in response to the US inflation data. The pair currently trades near 0.8930, losing 0.10% on the day.
On Wednesday, the US Bureau of Labor Statistics showed that the headline inflation in August hit the highest monthly gain in 14 months with the US Consumer Price Index (CPI) rising 0.6% MoM from 0.2% in the previous reading. The annual figure came in at 3.7% from 3.2%, better than expected. The core CPI, which excludes volatile food and energy prices climbed 0.3% MoM from 0.2% in the previous month. The annual core CPI came in at 4.3% versus 4.7% prior.
The Greenback (USD) surged and later lost traction in response to the data as the markets believe that interest rates will remain unchanged at next week's FOMC meeting. However, the figures imply that the Fed should be on the lookout for any re-acceleration in inflation in the next months. Investors have priced in 97% odds of interest rate unchanged in September at 5.25%-5.50%. However, the possibility of a rate hike in the November meeting increased to 49.2%, according to the CME Fedwatch Tool.
In the quiet week of economic data release from Switzerland, the risk sentiment and the USD dynamic will be the main driver for the USD/CHF pair. On Tuesday, US Commerce Secretary Gina Raimondo is set to meet with the CEOs of key American corporations this week, two weeks after visiting China and raising worries about business conditions, per Reuters. The renewed trade war tension between the US and China might exert some selling pressure on the USD and act as a headwind for the headwind for USD/CHF pair.
Looking ahead, market players will focus on the Swiss Producer and Import Prices for August due later on Thursday. Also, the release of the US weekly Initial Jobless Claims, the Producer Price Index (PPI), and monthly Retail Sales will remain in the spotlight. These figures could give a clear direction for the USD/CHF pair.
- AUD/USD climbs to a one-and-half-week high on Thursday, albeit lacks follow-through.
- The uncertainty over the Fed's rate-hike path weighs on the USD and lends some support.
- The mostly upbeat Australian employment details do little to provide impetus to the major.
The AUD/USD pair builds on the previous day's post-US CPI bounce from the 0.6380 area and gains some follow-through traction during the Asian session on Thursday. Spot prices stick to gains around mid-0.6400s, or a one-and-half-week top and react little to the latest Australian employment details.
The Australian Bureau of Statistics reported that the number of employed people rose by 64.9K in August as compared to the 23K expected and a loss of 14.6K in the previous month. The unemployment rate, meanwhile, is forecast to hold steady at 3.7% despite a rise in the Participation Rate to 67% in August. The data, however, does little to provide a fresh impetus to the AUD/USD pair amid speculations that the Reserve Bank of Australia (RBA) might have already ended its rate-hiking cycle.
Apart from this, persistent worries about the worsening economic conditions in China – Australia's largest trading partner – hold back traders from placing fresh bets around the China-proxy Aussie. The downside for the AUD/USD pair, however, seems limited in the wake of a mildly softer tone surrounding the US Dollar (USD). In the absence of any big surprises from the US consumer inflation figures, growing acceptance that the Federal Reserve (Fed) will keep rates steady weighs on the buck.
In fact, the US central bank is widely expected to maintain the status quo at its monetary policy meeting next week. That said, bets for one more Fed rate hike move by the end of this year should help limit any meaningful downside for the USD. the current market pricing indicates a more than 50% chance of a 25 basis points (bps) lift-off either in November or December. This, in turn, warrants some caution for the USD bears and before positioning for any further appreciating move for the AUD/USD pair.
Market participants now look to the US economic docket – featuring the release of the usual Weekly Initial Jobless Claims, the Producer Price Index (PPI) and monthly Retail Sales later during the early North American session. The data, along with the post-ECB volatility in the markets, might influence the USD price dynamics and produce short-term trading opportunities around the AUD/USD pair.
Technical levels to watch
According to the official data released by the Australian Bureau of Statistics (ABS) on Thursday, Australia’s Unemployment Rate came in at 3.7% in August, compared with the expectations of 3.7% and the previous figure of 3.7%.
The number of employed people jumped by 64.9K in August as against the consensus estimates of 23K and the loss of 14.6K seen in the previous month.
Additional details revealed that Full-Time Employment increased by 2.8K in the reported month vs. July’s -24.2K drop. However, Part-Time Employment bumped up by 62.1K when compared to a gain of 9.6K in July.
The Participation Rate edged higher to 67.0% in August vs. 66.7% expected and 66.7% previous.
Market reaction
AUD/USD caught a fresh bid on the Australian jobs data, initially jumping to intraday highs of 0.6454 before easing to 0.6440, where it now wavers. The pair is up 0.26% on the day.
The People’s Bank of China (PBOC) set the USD/CNY central rate for the trading session ahead on Thursday at 7.1874, compared with the previous day's fix of 7.1894 and expectations of 7.2784.
- USD/CAD extends its losses despite the upbeat US CPI data.
- Crude prices hold ground near-high since November; supporting the Canadian Dollar (CAD).
- US Dollar (USD) strengthened in response to an initial surge in US bond yields but later retraced its gains.
USD/CAD extends its losing streak on the fifth day, trading with a negative bias around 1.3530 during the early trading hours of the Asian session on Thursday. The pair experienced downward pressure potentially due to higher Crude oil prices.
However, the better-than-expected Consumer Price Index (CPI) data from the United States (US) provided support to limit the losses of the USD/CAD pair. US CPI (YoY) rose to 3.7% from the previous rate of 3.2%, surpassing the market consensus of 3.6% in August.
The monthly core CPI improved to 0.3% from 0.2% prior, which was expected to remain unchanged. However, the annual core rate printed the reading of 4.3% as expected from the previous 4.7% figure.
Western Texas Intermediate (WTI), Crude oil price continues the winning streak, hovering around $88.30 per barrel at the time of writing. The black gold has held a position near highs since November and continues to receive strong support due to concerns about tightening global supplies.
The tightening supply conditions are further exacerbated by the additional reductions recently declared by Saudi Arabia and Russia, the two largest oil producers globally. These cuts, scheduled for the remainder of 2023, continue to support Oil prices and strengthen the Canadian Dollar (CAD).
US Dollar Index (DXY), which measures the performance of the US Dollar (USD) against a basket of the other major six currencies, attempts to retreat from the previous day’s gains. The spot price trades lower around 104.70.
The index experienced upward support on Wednesday due to the initial jump in US Treasury yields but later retreated, with the 10-year US bond yields settling at 4.23% by the press time.
Market participants have shifted their attention to the upcoming data releases from the US, including Core Producer Price Index (PPI) and Retail Sales for August. These datasets will provide further cues on economic activities in the US, which could help the traders strategize their bets on the USD/CAD pair.
Australian jobs report overview
Thursday's rather busy economic docket kicks off with the release of the Australian monthly employment details, due at 01:30 GMT. The report published by the Australian Bureau of Statistics is anticipated to show that the number of employed people rose by 23K in August as compared to a loss of 14.6K in the previous month. The unemployment rate, meanwhile, is forecast to hold steady at 3.7% and the Participation Rate is also expected to remain unchanged at 66.8% in August.
According to Yohay Elam, Senior Analyst FXStreet: "Market consensus expects an increase in jobs for August but there is room for a downside surprise, which would mean a second consecutive month of declines. The accumulation of employment in recent months means there is room for a second consecutive drop, as seen in December 2022 and January 2023. Another reason to expect a weak report comes from China. Australia's main trading partner is still struggling to create growth as its property sector suffers from an immense debt crisis. China consumes raw metals such as iron and copper from Australia, as well as other goods. Prospects for a weaker economy may have deterred employers from hiring."
How could the data affect AUD/USD?
Ahead of the crucial labour market data, the AUD/USD pair touches a one-and-half-week high, around mid-0.6400s during the Asian session on Thursday. Given that the Reserve Bank of Australia (RBA) might have already ended its rate hiking cycle, any positive surprise might do little to impress bulls or provide a fresh impetus to spot prices. That said, a modest US Dollar (USD) downtick might continue to act as a tailwind for the major.
In contrast, even a slight disappointment would be enough to weigh heavily on the Australian Dollar (AUD) amid growing concerns about the worsening economic conditions in China and looming recession risks. This, in turn, suggests that the path of least resistance for the AUD/USD pair is to the downside. Hence, any subsequent move up might still be seen as a selling opportunity and runs the risk of fizzling out rather quickly.
Key Notes
• Australian Jobs Preview: Weakening global economy set to hit labor market, hurt Aussie
• AUD/USD holds ground near 0.6400 ahead of the Australian employment data
• AUD/USD Forecast: Steady above 0.6400 ahead of Australian jobs data
About the Employment Change
The Employment Change released by the Australian Bureau of Statistics is a measure of the change in the number of employed people in Australia. Generally speaking, a rise in this indicator has positive implications for consumer spending which stimulates economic growth. Therefore, a high reading is seen as positive (or bullish) for the AUD, while a low reading is seen as negative (or bearish).
About the Unemployment Rate
The Unemployment Rate released by the Australian Bureau of Statistics is the number of unemployed workers divided by the total civilian labor force. If the rate hikes, indicates a lack of expansion within the Australian labor market. As a result, a rise leads to weaken the Australian economy. A decrease in the figure is seen as positive (or bullish) for the AUD, while an increase is seen as negative (or bearish).
- USD/JPY loses momentum near 147.12 amid the weakening of the US Dollar.
- US Consumer Price Index (CPI) for August rose 0.6% MoM vs. 0.2% prior.
- Market participants are pricing a massive shift in the Bank of Japan’s (BoJ) monetary policy outlook following the BoJ’s hawkish comments.
The USD/JPY pair loses traction to below the mid 147.00s during the early Asian session on Thursday. The weakening of the US Dollar (USD) drags the USD/JPY pair lower and the pair currently trades near 147.12, down 0.23% on the day.
US Bureau of Labor Statistics revealed on Wednesday that the August headline inflation was the highest monthly gain in 14 months with the US Consumer Price Index (CPI) rising 0.6% MoM from 0.2% in the previous reading. Meanwhile, the annual figure came in at 3.7% from 3.2%, beating market expectations. The core CPI, which excludes volatile food and energy prices surges 0.3% MoM from 0.2% in July. The annual core CPI came in at 4.3% versus 4.7% prior.
In response to the data, the US Dollar (USD) surged and later lost traction as the markets anticipate that interest rates will remain unchanged at next week's FOMC meeting. However, the figures imply that the Fed should be on the lookout for any re-acceleration in inflation in the next months. Investors have priced in 97% odds of interest rate unchanged in September at 5.25%-5.50%. However, the possibility of a rate hike in the November meeting increased to 49.2%, according to the CME Fedwatch Tool.
On the Japanese Yen front, market participants are pricing a massive shift in Bank of Japan’s (BoJ) monetary policy outlook following the hawkish comments from BoJ Governor Kazuo Ueda delivered over the weekend. BoJ Governor Ueda stated on Monday in an interview that the central bank could exit its negative interest rate policy when its inflation target of 2% is near and they would have sufficient evidence by the end of the year to evaluate whether interest rates should stay negative. Furthermore, Japanese Finance Minister Shunichi Suzuki said on Wednesday that he will strive to conduct debt management appropriately.
About the data, the Cabinet Office showed on Thursday that Japan’s Machinery Orders fell 13% in July from a 5.8% drop in the previous month. On a monthly basis, the figure dropped 1.1% from a 2.7% rise in June. Both figures came in below the market consensus.
Moving on, traders will keep an eye on the US Initial Jobless Claims, the Producer Price Index (PPI), and Retail Sales due on Thursday. Traders will take cues from these figures and find trading opportunities around the USD/JPY cross.
- Gold price attracts some buying and reverses a part of the overnight losses to a multi-week low.
- Bets that the Federal Reserve will pause in September undermine the US Dollar and lend support.
- The prospects for one more rate hike by the end of this year should keep a lid on any further gains.
Gold price edges higher during the Asian session on Thursday and for now, seems to have snapped a two-day losing streak to a nearly three-week low, around the $1,906-$1,905 region touched the previous day. The XAU/USD currently trades just above the $1,910 area, though lacks bullish conviction. Moreover, the fundamental backdrop still seems tilted in favour of bearish traders and supports prospects for an extension of a two-week-old downtrend, from a one-month peak near the $1,953 zone touched on September 1.
In the absence of any big surprises from the United States (US) consumer inflation figures, market participants now seem assured that the Federal Reserve (Fed) will keep interest rates steady at its policy meeting next week. This, in turn, keeps the US Dollar (USD) bulls on the defensive and lends some support to the Gold price. The US Bureau of Labor Statistics (BLS) reported that the headline US Consumer Price Index (CPI) surged to 3.7% on a yearly basis in August from 3.2% in July. The reading was slightly above expectations for a reading of 3.6%, though the monthly print matched forecasts and came in at 0.6%.
Moreover, the core CPI, which strips out volatile items like food and fuel, also met consensus estimates and rose 4.3% during the reported month. Nevertheless, the data pointed to still-sticky inflation and keeps hopes for one more Fed rate hike move by the end of this year. In fact, the current market pricing indicates a more than 50% chance of a 25 basis points (bps) lift-off either in November or December. This, in turn, might continue to act as a tailwind for the Greenback and keep a lid on any meaningful appreciating move for the non-yielding Gold price, warranting some caution for aggressive bullish traders.
Even from a technical perspective, this week's sustained break and acceptance below the very important 200-day Simple Moving Average (SMA) suggests that the path of least resistance for the XAU/USD is to the downside. Hence, any subsequent move up might still be seen as a selling opportunity and remain capped. Bearish traders, however, might wait for some follow-through selling below the $1,900 psychological mark before positioning for any further losses. Investors now look to the outcome of the highly-anticipated European Central Bank (ECB) meeting for some meaningful impetus around the Gold price.
Apart from this, traders will take cues from the US economic docket – featuring the release of the usual Weekly Initial Jobless Claims, the Producer Price Index (PPI) and monthly Retail Sales. The data might influence the USD price dynamics, which, along with the post-ECB volatility, should allow traders to grab short-term opportunities around the Gold price.
Technical levels to watch
| Index | Change, points | Closed | Change, % |
|---|---|---|---|
| NIKKEI 225 | -69.85 | 32706.52 | -0.21 |
| Hang Seng | -16.67 | 18009.22 | -0.09 |
| KOSPI | -1.88 | 2534.7 | -0.07 |
| ASX 200 | -53 | 7153.9 | -0.74 |
| DAX | -61.5 | 15654.03 | -0.39 |
| CAC 40 | -30.31 | 7222.57 | -0.42 |
| Dow Jones | -70.46 | 34575.53 | -0.2 |
| S&P 500 | 5.54 | 4467.44 | 0.12 |
| NASDAQ Composite | 39.97 | 13813.59 | 0.29 |
| Pare | Closed | Change, % |
|---|---|---|
| AUDUSD | 0.64188 | -0.11 |
| EURJPY | 158.115 | -0.07 |
| EURUSD | 1.07299 | -0.26 |
| GBPJPY | 184.038 | 0.14 |
| GBPUSD | 1.24892 | -0.04 |
| NZDUSD | 0.59163 | 0.25 |
| USDCAD | 1.35475 | -0.03 |
| USDCHF | 0.89338 | 0.26 |
| USDJPY | 147.356 | 0.18 |


© 2000-2024. Уcі права захищені.
Cайт знаходитьcя під керуванням TeleTrade DJ. LLC 2351 LLC 2022 (Euro House, Richmond Hill Road, Kingstown, VC0100, St. Vincent and the Grenadines).
Інформація, предcтавлена на cайті, не є підcтавою для прийняття інвеcтиційних рішень і надана виключно для ознайомлення.
Компанія не обcлуговує та не надає cервіc клієнтам, які є резидентами US, Канади, Ірану, Ємену та країн, внеcених до чорного cпиcку FATF.
Проведення торгових операцій на фінанcових ринках з маржинальними фінанcовими інcтрументами відкриває широкі можливоcті і дає змогу інвеcторам, готовим піти на ризик, отримувати виcокий прибуток. Але водночаc воно неcе потенційно виcокий рівень ризику отримання збитків. Тому перед початком торгівлі cлід відповідально підійти до вирішення питання щодо вибору інвеcтиційної cтратегії з урахуванням наявних реcурcів.
Викориcтання інформації: при повному або чаcтковому викориcтанні матеріалів cайту поcилання на TeleTrade як джерело інформації є обов'язковим. Викориcтання матеріалів в інтернеті має cупроводжуватиcь гіперпоcиланням на cайт teletrade.org. Автоматичний імпорт матеріалів та інформації із cайту заборонено.
З уcіх питань звертайтеcь за адреcою pr@teletrade.global.
переклади