- Аналітика
- Новини та інструменти
- Новини ринків
Новини ринків
Japanese economic growth came in as 1.5% QoQ versus 0.8% expected and 0.7% prior, per the preliminary readings of the second quarter (Q2) 2023 Gross Domestic Product (GDP) figures.
That said, the Annualized GDP rose to 6.0% versus 3.1% expected and 2.7% prior.
Further, GDP Deflator came in as 3.4% YoY, versus expectations of being unchanged at 2.0%.
Following the data release, Japanese government Official said, “Japan Private Consumption falls for first time in 3 quarters.”
The diplomat also added that Japan Q2 annualised real GDP growth for three straight quarters, fastest since Q4 2020. The Government Official also stated that the GDP Deflator posts fastest growth since Q1 1981.
About Japan GDP
The Gross Domestic Product released by the Cabinet Office shows the monetary value of all the goods, services and structures produced in Japan within a given period of time. GDP is a gross measure of market activity because it indicates the pace at which the Japanese economy is growing or decreasing. A high reading or a better than expected number is seen as positive for the JPY, while a low reading is negative.
- USD/CHF trades sideways below the 0.8800 barrier after retreating from a multi-week high in the early Asian session.
- The markets are convinced that the Federal Reserve (Fed) will keep the rate unchanged in its September meeting.
- The exacerbated trade war tensions between the US and China might benefit the Swiss Franc.
- Traders will take cues from the Swiss Producer and Import Prices, US Retail Sales.
The USD/CHF pair holds ground around 0.8782 during the early Asian session on Tuesday. The pair remains sideways after retreating from multi-week high of 0.8827. Meanwhile, the US Dollar Index (DXY), a measure of the value of the USD against six other major currencies, trades The major pair remains capped around the 0.8800 barrier ahead of the Swiss Producer and Import Price Index for July and the US Retail Sales data.
Investors anticipate that the Federal Reserve (Fed) will keep the interest rate unchanged in its September meeting, but the possibility for an additional rate hike of 25 basis points (bps) increased to almost 40% in November. However, interest rates will stay high for longer in order to assure the return of inflation to 2%. This would maintain recession concerns. Market players will take more cues from US Retail Sales in July due on Tuesday and FOMC Minutes due later on Thursday. A more hawkish stance by the Fed might lift the US Dollar against its rivals.
On the other hand, market players is expected that the Swiss National Bank (SNB) will raise interest rates by 25 basis points (bps) to 2% in September, according to Bllomberg. About the data, the Swiss Unemployment Rate came in at 1.9% in July, matching expectations. The figure remained unchanged compared to the June reading and marked its lowest level since October 2022.
Furthermore, the headling surrounding the US-China relationship remains in focus. As a result of President Joe Biden's decision to restrict certain US technology investments in China, US investors have expressed concern that Beijing may retaliate or cease purchasing American technology. The renewed trade tension might benefit the safe-haven Swiss Franc and act as a headwind for the USD/CHF pair.
Moving on, the Swiss Federal Statistical Office will release the Producer and Import Prices on Tuesday. Meanwhile, US Retail Sales will be due later in the day. The monthly figure is expected to rise from 0.2% to 0.4% in July. Market participants will also monitor the FOMC minutes and the Fed officials’s comments for the Jackson Hole Symposium. Traders will take cues from the data and find trading opportunities around the USD/CHF pair.
- Natural Gas Price remains sidelined after bouncing off two-week-old rising support line.
- Multi-day-old horizontal resistance area prods immediate upside within bullish channel.
- Looming bull cross on MACD, firmer RSI and U-turn from 50-EMA lure XNG/USD bulls.
Natural Gas Price (XNG/USD) stays defensive around $2.89 as it seeks fresh clues to extend the previous two-day winning streak amid the initial Asian session on Tuesday. In doing so, the XNG/USD struggles to extend recovery from the 50-bar Exponential Moving Average (EMA) and an upward-sloping trend line from August 02.
Even so, the upbeat RSI conditions, not overbought, join the looming bull cross on the MACD to keep the Natural Gas buyers hopeful within an ascending trend channel comprising multiple levels marked since late May, currently between $2.56 and $3.08.
It’s worth noting, however, that a seven-week-old horizontal resistance area surrounding $2.90 restricts the immediate upside of the XNG/USD.
Following that, the $3.00 psychological magnet will challenge Natural Gas buyers.
In a case where the energy instrument remains firmer past $3.00, the recent multi-month high of around $3.06 may prod the XNG/USD bulls before directing them to the stated bullish channel’s top line surrounding $3.08.
Meanwhile, the aforementioned fortnight-long rising support line and the 50-EMA, respectively near $2.84 and $2.81, limit the short-term downside of the Natural Gas Price. Also challenging the XNG/USD bears is the previous monthly peak of near $2.78.
Natural Gas Price: Four-hour chart

Trend: Further upside expected
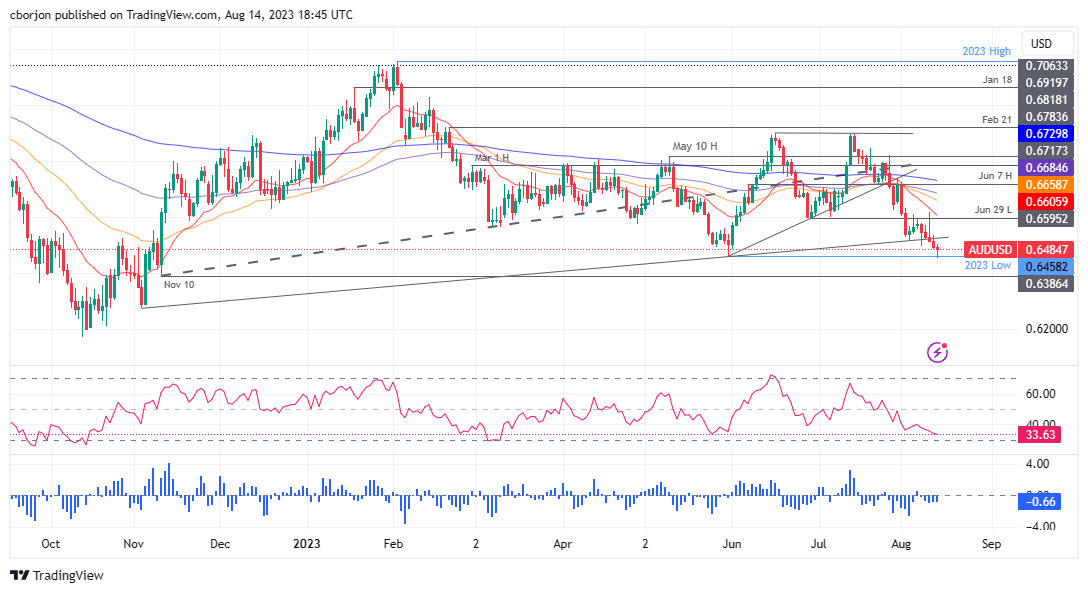
- AUD/USD struggles to defend the bounce off YTD low despite probing five-day losing streak ahead of multiple data/events.
- Fears surrounding China, firmer US Treasury bond yields weigh on Aussie pair.
- RBA Minutes need to defend hawkish interest to recall AUD/USD buyers.
- China Industrial Production, Retail Sales will be eyed closely amid economic woes, US consumer-centric data will also offer fresh impulse.
AUD/USD aptly portrays the market’s indecision ahead of a slew of top-tier data/events as it struggles to defend the late Monday’s corrective bounce off the Year-To-Date (YTD) low near 0.6490 during the early hours of Tuesday’s Asian session. In doing so, the Aussie pair also highlights the pessimism surrounding China, Australia’s biggest customer, before the key Reserve Bank of Australia (RBA) Monetary Policy Meeting Minutes, China Industrial Production and Retail Sales, as well as the US Retail Sales.
While the downbeat prints of the US inflation expectations allowed the Aussie bears to take a breather ahead of the key catalysts scheduled on the calendar, the latest chatters about China and cautious mood prior to data/events weigh on the AUD/USD price, holding it tight of late.
On Monday, the New York Fed’s one-year inflation expectations eased to 3.5% for July, down three points by falling to the lowest level since April 2021. New York Fed survey, however, also suggested confidence in positive labor market conditions and economic transition.
On the other hand, US Treasury Secretary Janet Yellen crossed wires, via Reuters, late Monday while citing the risks to the global economic developments from China’s slowdown, the Russia-Ukraine war and climate change-related disasters and their spillover effects.
The looming debt crisis in China and its contagion impact, especially amid the fears that economic recovery in the world’s biggest industrial player fades, weigh on the AUD/USD even if the easing inflation concerns allow market players to remain hopeful. Also challenging the market sentiment and the Aussie pair could be Russia’s firing of warning shots at a warship in the Black Sea and readiness to equip new nuclear submarines with hypersonic missiles.
It’s worth noting that a suspension of its bond trading by China’s Country Garden joins the non-receipt of the payments from a subsidiary of Chinese conglomerate Zhongzhi Enterprise Group to bolster the debt woes and weighed on sentiment on Monday.
Against this backdrop, the US Dollar Index (DXY) rose to its highest level since July 07 before retreating from 103.46, around 103.16 by the press time. In doing so, the greenback traces the firmer US Treasury bond yields as the 10-year Treasury bond yields rose to the highest level in nine months whereas the two-year counterpart also refreshed the monthly peak amid the market’s dumping of the Treasury bond yields. It should be observed that such higher yields previously triggered recession woes and the risk-off sentiment which in turn favored the US Dollar due to its haven appeal and drowned the AUD/USD.
Moving on, RBA Minutes will be crucial to watch as the latest statements from the Aussie central bank tried convincing markets that they can and will lift the rates if needed but there was little acceptance of the statements. Following that, China’s Industrial Production and Retail Sales for July will be closely observed amid fears of losing economic momentum in the world’s second-biggest economy. Later in the day, the US Retail Sales for the said month will be more important as market players keep betting on the Fed’s policy pivot in September, which in turn may weigh on the US Dollar and trigger the AUD/USD recovery should the scheduled data weakens.
Technical analysis
Although the AUD/USD recovery remains elusive below June’s bottom of around 0.6600, a clear downside break of May’s monthly low, close to 0.6460, becomes necessary for the sellers to tighten their grips.
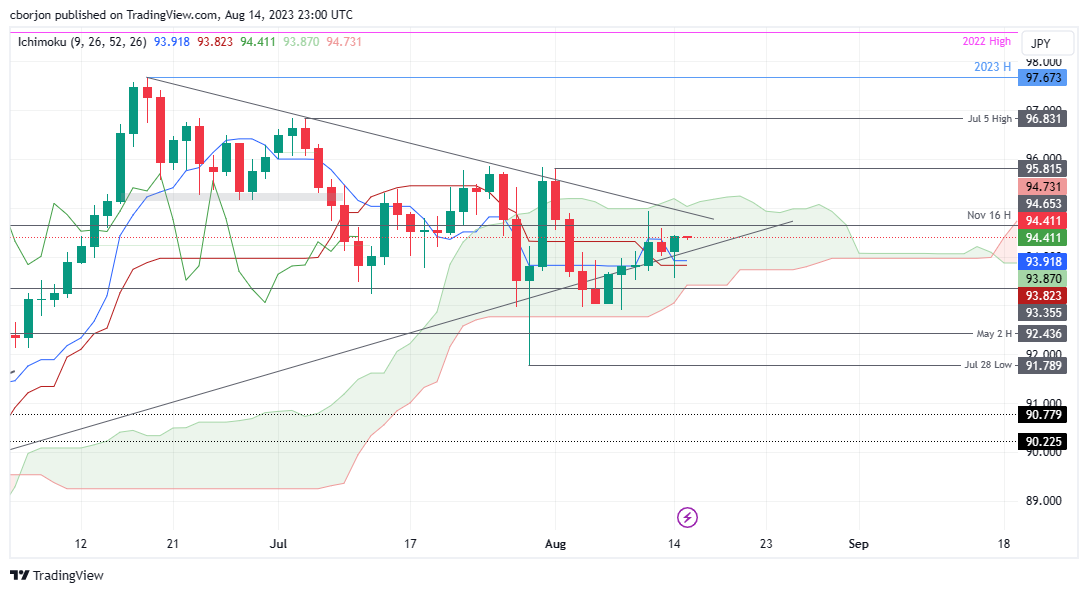
- AUD/JPY trades subdued, capped by the 94.50 figure as the first resistance level.
- The pair remaining inside the Kumo could pave the way for consolidation.
- While the 95.00 resistance trendline poses an immediate challenge, surpassing Kumo’s top could rally AUD/JPY toward the August 1 peak.
The AUD/JPY hovers around 94.40s, post-Monday’s positive session, with the cross-currency pair printing 0.33% gains, though the psychological 94.50 area capped the rally. At the time of writing, the AUD/JPY changes hands at 94.42, likely to remain sideways, as the pair stands inside the Ichimoky Cloud (Kumo).
AUD/JPY Price Analysis: Technical outlook
From a technical standpoint, the AUD/JPY remains neutral-biased, though tilted downwards. On the upside, the AUD/JPY is capped by a two-month-old downslope resistance trendline at around 95.00. The next resistance would be the top of the Kumo at 95.20, which, once cleared, would expose the August 1 at 95.82 before testing 96.00.
On the flip side, the AUD/JPY first support would be followed by the 94.00 figure. The Tenkan-Sen is up next at 93.92, followed by the Senkou Span A at 93.87, ahead of the Kijun-Sen at 93.82.
AUD/JPY Price Action – Daily chart
- NZD/USD edges lower to 0.5970, the lowest level since mid-November in the early Asian session.
- The markets are convinced that the Federal Reserve (Fed) will keep the interest rate unchanged in its September meeting.
- Analysts anticipate that the Reserve Bank of New Zealand (RBNZ) will maintain rates at 5.50%.
- Investors will closely watch the US Retail Sales Mom for July, RBNZ Interest Rate Decision.
The NZD/USD pair extends its downside and holds below the 0.6000 barrier on Tuesday. The pair trades at its lowest level since mid-November and is currently near 0.5970, losing 0.07% in the early Asian session. A rise in US yields is the main driver of the USD’s strength. The 10-year yield is at 4.20%, while the 2-year yield stays at 4.97%. Market participants await the Reserve Bank of New Zealand (RBNZ) interest rate decision on Wednesday, with the rate expected to remain unchanged at 5.5%.
Market players are convinced that the Federal Reserve (Fed) will keep the interest rate unchanged in its September meeting. However, the odds for an additional rate hike of 25 basis points (bps) increased to almost 40% in November. That said, the US Retail Sales from July and FOMC Minutes due later this week will offer hints for further monetary policy for the entire year. More hawkish comments from Fed policymakers might boost the Greenback and acts as a headwind for the NZD/USD pair.
There were no relevant economic data released from the US docket on Monday. Last week, the US Bureau of Labour Statistics revealed that the US Producer Price Index (PPI) for final demand YoY rose 0.8% in July from 0.1% in June. The figure was higher than the market expectation of 0.7%. Additionally, the University of Michigan's (UoM) Consumer Confidence Index for July fell to 71.2 from 71.6, better than 71 expected. Finally, UoM 5-year Consumer Inflation Expectations declined to 2.9% for August versus 3.0% estimated and prior.
On the Kiwi front, the majority of analysts anticipate that the Reserve Bank of New Zealand (RBNZ) will maintain rates at 5.50%, a 14-year high, for the second consecutive meeting on Wednesday, according to a Reuters poll. The New Zealand Dollar might extend its downside with a dovish stance by the RBNZ.
Looking ahead, investors will keep an eye on the RBNZ Interest Rate Decision scheduled for Wednesday and the New Zealand’s Producer Price Index due on Thursday. Also, the US Retail Sales and FOMC minutes will be the key events. The monthly Retail Sales figure is expected to rise from 0.2% to 0.4% in July. The data will be critical for determining a clear movement for the NZD/USD pair.
- Gold Price remains subdued at the lowest level in five weeks amid firmer US Dollar, Treasury bond yields.
- Risk-off mood, mostly upbeat US data underpins bearish bias about XAU/USD.
- China’s Country Garden, Zhongrong Trust renew debt fallout woes and weigh on sentiment, firmer yields flag recession fears.
- China/US Retail Sales, manufacturing data will direct intraday Gold Price moves but Fed Minutes are key for clear guide.
Gold Price (XAU/USD) fades the late Monday’s corrective bounce off the 200-DMA support by retreating to $1,907 during the early hours of Tuesday’s Asian session, depressed at the five-week low flashed the previous day by the press time. In doing so, the XAU/USD bears the burden of the US Dollar’s strength amid economic fears surrounding China. Also exerting downside pressure on the Gold Price could be the cautious mood ahead of the US Retail Sales for July. It’s worth noting that the US Dollar ignores the looming fears of the Federal Reserve’s (Fed) policy pivot in September, as well as recently softer United States inflation clues while tracing firmer US Treasury bond yields.
Gold Price remains bearish as yields, China underpin US Dollar strength
Gold Price remains depressed amid the firmer US Dollar and fears surrounding the biggest XAU/USD customer China. In doing so, the bright metal fails to justify its traditional haven status, as well as marks inability to cheer concerns that the US Federal Reserve (Fed) will hold rates steady in its September monetary policy meeting, backed by the recently softer US data.
The looming debt crisis in China and its contagion impact, especially amid the fears that economic recovery in the world’s biggest industrial player fades, weighs on the Gold Price even if the easing inflation concerns allow market players to remain hopeful. Also challenging the market sentiment and the XAU/USD could be Russia’s firing of warning shots at a warship in the Black Sea and readiness to equip new nuclear submarines with hypersonic missiles.
It’s worth noting that a suspension of its bond trading by China’s Country Garden joins the non-receipt of the payments from a subsidiary of Chinese conglomerate Zhongzhi Enterprise Group to bolster the debt woes and weighed on sentiment on Monday.
Recently, US Treasury Secretary Janet Yellen crossed wires, via Reuters, late Monday while citing the risks to the global economic developments from China’s slowdown, the Russia-Ukraine war and climate change-related disasters and their spillover effects.
Talking about the US data, the New York one-year inflation expectations eased to 3.5% for July, down three points, while also suggesting confidence in positive labor market conditions and economic transition.
Amid these plays, US Dollar Index (DXY) rose to its highest level since July 07 before retreating from 103.46, around 103.16 by the press time. That said, the US 10-year Treasury bond yields rose to the highest level in nine months whereas the two-year counterpart also refreshed the monthly peak amid the market’s dumping of the Treasury bond yields. It should be observed that such higher yields previously triggered recession woes and the risk-off sentiment which in turn favored the US Dollar due to its haven appeal and drowned the Gold Price.
US/China Retail Sales, risk catalysts eyed for clear XAU/USD moves
Looking ahead, China’s Industrial Production and Retail Sales for July will be closely observed amid fears of losing economic momentum in the world’s second-biggest economy. Following that, the US Retail Sales for the said month will be more important as market players keep betting on the Fed’s policy pivot in September, which in turn may weigh on the US Dollar and trigger the Gold Price recovery should the scheduled data weakens.
Gold Price Technical Analysis
Gold Price justifies the downside break of an ascending trend line from November 2022 as it prods the 200-DMA support. Also favoring the XAU/USD sellers are the bearish signals from the Moving Average Convergence and Divergence (MACD) indicator.
It’s worth noting, however, that the Relative Strength Index (RSI) line, placed at 14, stays beneath the 50.0 level and suggests bottom-picking of the Gold Price.
The same highlights the 200-DMA support of around $1,905, as well as a seven-month-old horizontal support zone of around $1,890.
In a case where the XAU/USD drops below the $1,890 support, the odds of witnessing a slump toward an early March swing high of around $1,858 can’t be ruled out.
On the contrary, a convergence of the previous support line and the 50-DMA, around $1,940 by the press time, appears a tough nut to crack for the Gold buyers.
Following that, a downward-sloping resistance line from early May, close to $1,960 at the latest, will act as the last defense of the XAU/USD bears.
Overall, the Gold Price is likely to remain bearish but the downside room appears limited.
Gold Price: Daily chart

Trend: Limited downside expected
- EUR/USD fades corrective bounce off multi-day low, remains depressed at monthly low after two-day losing streak.
- Clear downside break of key support, broad US Dollar strength keeps Euro bears hopeful.
- Holidays in multiple markets may allow bears to take a breather amid pre-data anxiety.
- US Retail Sales will be crucial for clear directions as Greenback ignores dovish Fed bets to stay firmer.
EUR/USD remains on the back foot at the lowest levels since early July, despite making rounds to 1.0900 as markets in Asia open for Tuesday’s trading. In doing so, the Euro pair fades the late Monday’s corrective bounce off the multi-day low as traders brace for the key US Retail Sales for July amid holidays in multiple European markets. It’s worth noting that the US Dollar ignores the looming fears of the Fed’s policy pivot in September while tracing firmer US Treasury bond yields amid economic woes and jittery markets while the Euro remains depressed amid mixed concerns at home.
On Monday, Germany’s Wholesale Price Index (WPI) for July edged higher to -2.8% YoY from -2.9% previous readings but came in softer than -2.6% expected. However, the monthly WPI figures reprinted the -0.2% MoM numbers versus -1.4% market forecasts.
Following the data, the German Economy Ministry noted that current early indicators do not yet point to a sustainable economic recovery in the coming months, per Reuters. The report, however, also added that the expected cautious recovery in private consumption, services and investment is showing the first signs of hope, which are likely to strengthen as the year progresses.
On the other hand, US Dollar Index (DXY) rose to its highest level since July 07 before retreating from 103.46, around 103.16 by the press time. That said, the US 10-year Treasury bond yields rose to the highest level in nine months whereas the two-year counterpart also refreshed the monthly peak amid the market’s dumping of the Treasury bond yields. It’s worth noting that such higher yields previously triggered recession woes and the risk-off sentiment which in turn favored the US Dollar due to its haven appeal.
That said, the looming debt crisis in China and its contagion impact, especially amid the fears that the world’s biggest industrial player losses economic recovery, weighs on sentiment even if the easing inflation concerns allow market players to remain hopeful. Also challenging the market sentiment and the EUR/USD could be Russia’s firing of warning shots at a warship in the Black Sea and readiness to equip new nuclear submarines with hypersonic missiles.
Recently, US Treasury Secretary Janet Yellen crossed wires, via Reuters, late Monday while citing the risks to the global economic developments from China’s slowdown, the Russia-Ukraine war and climate change-related disasters and their spillover effects.
Amid these plays, Wall Street closed with minor gains but failed to impress buyers amid impending economic concerns.
Looking ahead, holidays in many European markets, including Germany, may restrict EUR/USD moves, especially ahead of the US Retail Sales for July. However, the latest easing in the New York one-year inflation expectations highlight the data and hence any firmer readings may help the Euro pair to extend the technical breakdown.
Technical analysis
A daily closing below the 100-DMA and an ascending trend line from September 2022, respectively near 1.0930 and 1.0980, directs EUR/USD towards a convergence of the 200-DMA and an upward-sloping support line from November 22, 2022, close to 1.0780.
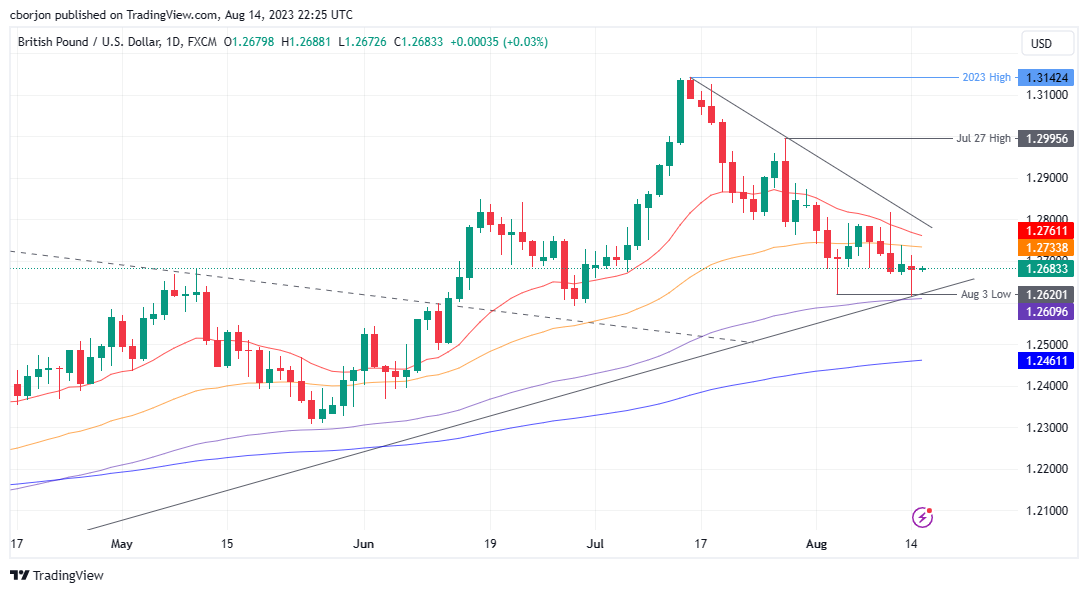
- GBP/USD edges north amid slight optimism in the Asian session.
- A double bottom chart pattern could pave the way for the GBP/USD towards 1.3000.
- Immediate resistance is seen at the 50-day and 20-day EMAs. Breaking these could propel the pair toward the August 10 and July 27 highs. However, a breach below the 100-day EMA could shift momentum toward the 200-day EMA.
GBP/USD aims upward for minimal gains of 0.02% as the Asian session begins, but still printing weekly losses following Monday’s session in which the GBP/USD lost 0.10% and reached a two-week low. At the time of writing, the GBP/USD exchanges hands at 1.2682.
GBP/USD Price Analysis: Technical outlook
From a technical perspective, the GBP/USD is neutral-upward biased, as the major dived towards the 100-day Exponential Moving Average (EMA) at 1.2609. Still, buyers entered the market, lifting the spot price to current levels. Notably, the GBP/USD is forming a ‘double bottom’ chart pattern that could pave the way for further gains, but first, the GBP/USD must reclaim resistance technical levels to confirm its validity.
The GBP/USD first resistance would be the 50-day EMA at 1.2733, followed by the 20-day EMA at 1.2761. Once those levels are surpassed, the GBP/USD next stop would be the August 10 high of 1.2819. If buyers push prices above those levels, the July 27 daily high at 1.2995 would be up for grabs.
On the other hand, if GBP/USD tumbled past the 100-day EMA at 1.2609, it would clear the way to challenge 1.2600 and the 200-day EMA at 1.2461.
GBP/USD Price Action – Daily chart
US Treasury Secretary Janet Yellen crossed wires, via Reuters, late Monday while citing the risks to the global economic developments from China’s slowdown, the Russia-Ukraine war and climate change-related disasters and their spillover effects.
The policymaker hesitated to comment directly on China’s looming debt woes due to the largest private realtor Country Garden’s delay in payment on a private onshore bond and its contagion effect.
“She said China's slowdown could have spillover effects on the United States, but would have the biggest impact on its Asian neighbors,” said Reuters.
The news also cites US Treasury Secretary Yellen as feeling very good about the overall US prospects while also flagging the recession risk and showing conviction about the US growth remained healthy and the job market was very strong.
Also read: Forex Today: US Dollar remains firm on the back of higher US Treasury yields
- USD/JPY finally broke with the 145.00 resistance and rose near 145.55, tallying a six-day winning streak.
- A cautious market mood supported the USD—eyes on Retail Sales from July and FOMC minutes.
- Eyes on preliminary Q2 GDP figures from Japan to be released on Tuesday.
At the start of the week, the USD/JPY rose to its highest level since November 10, 2022, mainly driven by a cautious market mood and a stronger USD. In addition, after jumping above the key resistance of 145.00, there are no signs of the Bank of Japan (BoJ) of a stealth intervention which leaves the JPY vulnerable.
On the Japanese side, Tuesday will witness the release of the Q2 Gross Domestic Product (GDP) preliminary report, with projections anticipating a rise at a yearly rate of 3.1%. Nonetheless, it's worth noting that the Bank of Japan (BoJ) has yet to show any indications of pivoting away from its accommodative monetary approach or engaging in market interference to manage the depreciation of the JPY. This lack of action could fuel an avenue for additional negative movement for the pair. However, if the Japanese economy shows signs of recovery, the BoJ might consider a pivot in its policies which could limit the Yen's losses.
On the US side, Retail Sales from July will be released on Tuesday and are expected to have expanded at a monthly pace of 0.4% from its previous figure of 0.2%. In addition, the Federal Open Market Committee (FOMC) minutes from the last July’s meeting will be closely watched by investors on Wednesday to continue placing their bets for the next Federal Reserve (Fed) decisions. As for now, according to the CME FedWatch tool, markets are confident that the Fed will skip in September while the odds of a 25 basis point (bps) hike in November rose near 40%.
USD/JPY Levels to watch
The daily chart analysis indicates a bullish outlook for the USD/JPY in the short term. The Relative Strength Index (RSI) is above its midline in positive territory, with a positive slope, aligning with the positive signal from the Moving Average Convergence Divergence (MACD), displaying green bars, and reinforcing the strong bullish sentiment. Moreover, the pair is above the 20,100,200-day Simple Moving Averages (SMAs), implying that the bulls retain control on a broader scale.
In addition, a distinct bullish dominance over sellers is evident on the four-hour chart, with indicators displaying a strong buying momentum.
Support levels: 145.00, 144.70, 144.00.
Resistance levels: 145.70, 146.00, 146.50.
USD/JPY Daily chart
-638276458025247480.png)
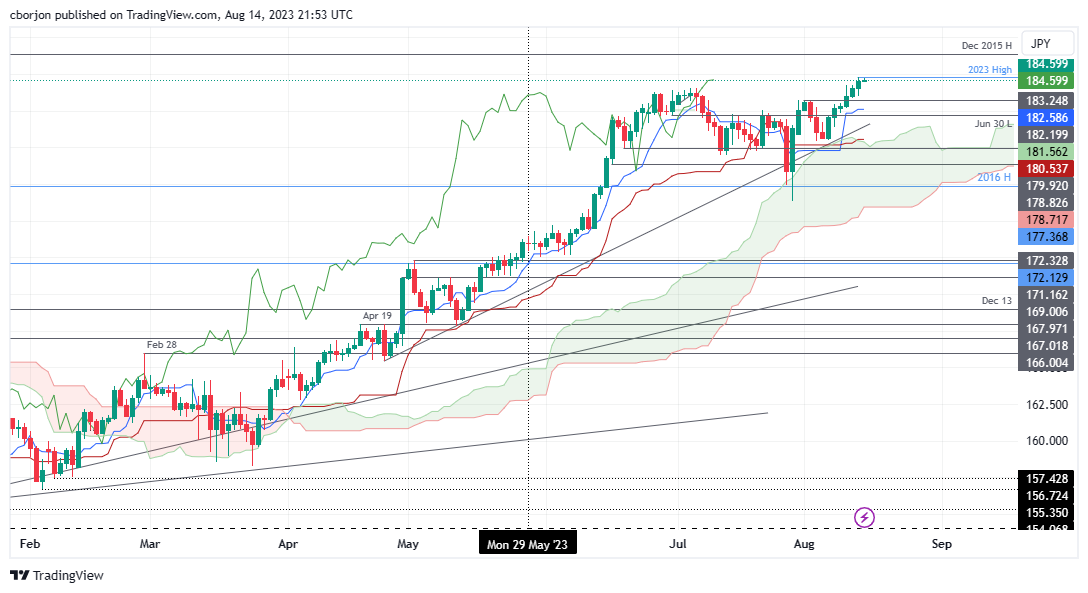
- GBP/JPY pair notched up a new year-to-date high at 184.77, reflecting Sterling’s strength amidst the Yen’s persistent weakness.
- Eyes on the BoJ for a potential intervention that could weigh on the GBP/JPY pair.
- GBP/JPY immediate support lies at 184.00, while resistance levels emerge at 185.
The GBP/JPY extended its uptrend to seven straight days and printed a new year-to-date (YTD) high at 184.77 amid a mixed market sentiment and a soft Japanese Yen (JPY). The GBP/JPY trades at 184.62 as the Asian session begins, printing minuscule gains of 0.03%.
GBP/JPY Price Analysis: Technical outlook
The GBP/JPY is upward biased though it’s at the brisk of a possible intervention by the Bank of Japan (BoJ) or the Japanese Finance Ministry. Japanese authorities could pull the trigger if the Yen continues to post losses against the US Dollar (USD). Still, unless authorities intervene, the GBP/JPY could test the 185.00 figure, followed by the December 2015 high of 186.34.
Conversely, the GBP/JPY first support level would be 184.00. Once cleared, the GBP/JPY could aim toward the August 1 high turned support at 183.25, followed by the Tenkan-Sen at 182.58.
GBP/JPY Price Action – Daily chart
- WTI fell below $83.00 and reached a daily low of $81.30 during the American session.
- County Garden Holdings, a Chinese real-state giant, announced that it would suspend part of its bond trading.
- A stronger USD also weighs on Oil prices.
At the start of the week, the West Texas Intermediate (WTI) barrel lost traction, fell to a daily low of $81.30, and settled near $82.00. A stronger USD on the back of higher US yields and Chinese real-state sector concerns are mainly responsible for the Oil’s downward trajectory.
China's major real estate firm, Country Garden Holdings, revealed a projected loss of $7.6 billion for H1 2023 and announced that it would halt trading 11 onshore bonds starting Monday. This caused a nearly 20% drop in their shares, bringing down the Shangai Composite Index. In addition, Moody’s warned of a potential crisis spillover to the country's property and financial markets, possibly delaying the sector's recovery. It's worth mentioning that China is the largest Oil importer in the world, so the weakness of the real-estate industry, an important gauge of an economy’s health, weighs on the WTI’s price.
On the other hand, the USD, measured by the DXY index, rose above 103.00, and the Greenback gained interest in higher US yields. In that sense, the bond markets are flashing signals that investors are confident that the Federal Reserve (Fed) won’t hike in September but that the odds of a 25 basis point increase in November have risen to nearly 40%, according to the CME FedWatch tool. In that sense, higher rates which tend to cool down economic activity, present another challenge to Oil prices.
WTI Levels to watch
The technical analysis of the daily chart suggests a shift towards a neutral to a bearish outlook for WTI, with indications of bullish exhaustion. The Relative Strength Index (RSI) exhibits a negative slope above its midline, while the Moving Average Convergence Divergence (MACD) displays fading green bars. That being said, the pair is above the 20,100,200-day Simple Moving Averages (SMAs), indicating a favourable position for the bulls in the bigger picture.
Support levels: $81.30, $81.00, $79.50.
Resistance levels: $83.70, $84.00, $85.00
WTI Daily chart
-638276433502947504.png)
After a quiet Monday regarding economic data, Tuesday is a busy day starting with Japan's GDP data. Later, the RBA meeting minutes and Australia's Wage Price Index are due. Chinese data will be closely watched, including Retail Sales and Industrial Production. Additionally, data due on Tuesday includes UK employment figures and US Retail Sales.
Here is what you need to know on Tuesday, August 15:
Wall Street opened the week in the green. The Dow Jones gained 0.07%, and the Nasdaq rose by 1.05%. Investors showed optimism for a soft landing in the economy.
The US Dollar Index posted its highest daily close in over a month, above 103.15. However, it finished far from the intraday high, suggesting that it could consolidate over the next few hours.
A key support for the Greenback remains US yields. The 10-year yield climbed to 4.20%, and the 2-year yield to 4.97%, reaching the highest levels in a month. The uptrend in yields remains firm, even as market participants expect the Federal Reserve to stay on hold at the next FOMC meeting.
The US will report Retail Sales, which is expected to show a 0.4% increase in July. Also due is the NY Empire Manufacturing Index.
EUR/USD dropped again, falling below key moving averages but managed to rise above 1.0900 during the American session. The Euro also lost ground against the Pound and the Swiss Franc. The ZEW Survey is due on Tuesday.
GBP/USD finished flat after recovering during the American session. The pair bottomed at 1.2616, matching the 100-day Simple Moving Average (SMA), and rebounded toward 1.2700. The UK will report employment data for the three months ended in June. On Wednesday, more data is due with the inflation report.
USD/JPY rose for the sixth consecutive day and posted the highest daily close since November, near 145.50. Japan will release Q2 Gross Domestic Product (GDP) data on Tuesday, as well as Industrial Production.
USD/CHF finished higher but below 0.8800. The pair peaked at 0.8831, the highest intraday level in a month, and then pulled back. The Swiss Producer and Import Price Index is due on Tuesday.
USD/CAD continues to move with an upward bias, holding firm above 1.3400. Inflation data is due from Canada on Tuesday. The Consumer Price Index (CPI) is expected to show a 0.3% monthly increase in July. Also due is the Manufacturing Sales report.
Analysts at TD Securities on Canada:
Tuesday's CPI report will provide the main risk event this week, where TD looks for inflation to firm 0.3pp to 3.1% as prices rise by 0.4% m/m. Manufacturing and wholesale sales will give new insight towards Q2 GDP tracking, while housing starts and existing home sales for July round out the domestic data calendar.
AUD/USD fell for the fifth consecutive day but ended off its lows. The pair found support at the 0.6450 area and climbed back to 0.6500. Antipodean currencies are being affected by the decline in commodity prices and a cautious tone across financial markets. The Reserve Bank of Australia (RBA) will release the minutes of its latest meeting, during which it kept the key interest rate unchanged at 4.10%. The Wage Price Index is also due.
NZD/USD posted its lowest daily close since mid-November, trading below the 0.6000 level. The bias points to further losses; however, the close far from the low suggests that the pair may be poised for some consolidation. On Wednesday, the Reserve Bank of New Zealand (RBNZ) will announce its decision on monetary policy. No change is expected from the central bank.
Gold continued to slide but held above $1,900, while Silver lost ground, trimming losses during the American session, ending around $22.55.
The worst-performing currency was the Argentine Peso after the government devalued the currency by 20% following Sunday's primary presidential elections. The Chinese Yuan reached its lowest level against the US Dollar since October of last year.
Like this article? Help us with some feedback by answering this survey:
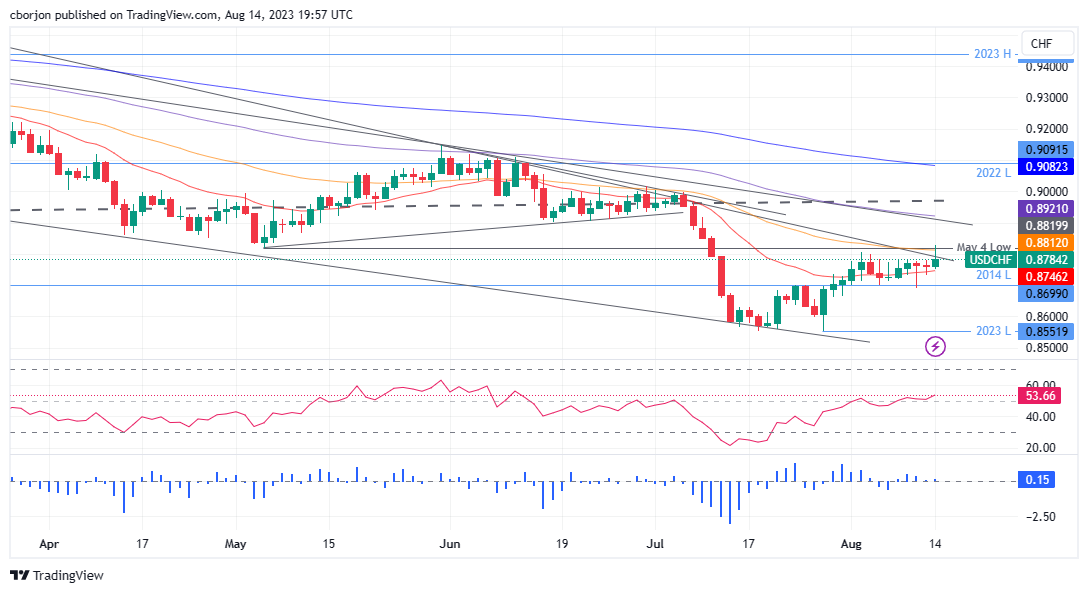
- USD/CHF climbs by 0.20%, trading at 0.8780, but remains under the shadow of the 0.8800 resistance.
- The pair displays a ‘double-top’ chart pattern, suggesting potential downside movement.
- Key resistances to watch: 50-day EMA at 0.8811 and 100-day EMA at 0.8921.
- Immediate supports lie at the 20-day EMA at 0.8746 and the August 10 low of 0.8689.
The USD/CHF climbed modestly on Monday’s session though it failed to cling above the 0.8800 figure, which could weigh on the pair in the near term. Additionally, the USD/CHF failing to break a downslope resistance trendline drawn from November 2022 highs opened the door for further losses. The USD/CHF is trading at 0.8780, gains 0.20% but remains subject to selling pressure.
USD/CHF Price Analysis: Technical outlook
From a technical standpoint, the USD/CHF registered a ‘double-top’ chart pattern, which could pave the way for further downside, but mixed signals from an oscillator perspective could refrain sellers from lowering prices.
The Relative Strength Index (RSI) indicates that buyers are gathering momentum, while the three-day Rate of Change (RoC) depicts the USD/CHF as neutral.
If USD/CHF buyers reclaim 0.8800, they must reclaim the 50-day Exponential Moving Average (EMA) at 0.8811. A breach of the latter would expose the 100-day EMA at 0.8921.
Conversely, if USD/CHF sellers remain in control, the next support would be the 20-day EMA at 0.8746. Break below will expose the August 10 low of 0.8689, followed by the year-to-date (YTD) low of 0.8551.
USD/CHF Price Action – Daily chart
- AUD/USD dips slightly as US 3-month bill auction boosts demand for US bonds, impacting UST yields.
- China’s property market woes continue with Country Garden’s bond interest default, echoing Evergrande’s 2021 crisis.
- Upcoming RBA minutes and US Retail Sales data eyed; hawkish RBA surprises could influence AUD/USD trajectory.
AUD/USD pares some of its earlier losses as US Treasury bond yields turned flat after registering solid gains, but a US 3-month bills auction increased demand for US bonds, a headwind for UST yields. Consequently, the US Dollar (USD) trimmed some of its gains, and the AUD/USD exchanged hands at 0.6487, down 0.08%.
Greenback remains dominant despite improved investor sentiment; RBA minutes and US economic indicators in focus
Investors’ sentiment improved late in the New York session, but the Greenback remains in the driver’s seat in the FX space, a headwind for the Australian Dollar (AUD). US T-bond yields extend their gains, with the most sensitive to interest rate shifts, the 2-year gaining seven basis points at 4.960%. Echoing its tone, the 10-year benchmark note rate is 4.187%, climbing three basis points, a tailwind for the US Dollar.
China’s real estate jitters involving its largest private developer Country Garden, reignited worries on its property market, as the company failed to pay bond interest last week, as happened to Evergrande in 2021.
In the meantime, Tuesday’s Asian session will feature the release of the Reserve Bank of Australia’s (RBA) last meeting minutes, with no surprises expected after the RBA’s decided to hold rates at 4.10%. After that, the Wage Price Index is estimated to stay at 3.7%, though any upticks could be seen as inflation gathering momentum, triggering further action by the central bank. It should be noted that the RBA’s Governor Philip Lowe’s latest appearance was dovish as he said, “Policymakers were in the “calibration stage,” as rates are already restrictive and working to establish a balance between supply and demand.”
On the US front, the agenda would be busy during the week, with Retail Sales and Industrial Production, are expected to improve, which could be bullish for the US Dollar (USD). In addition, the latest meeting Federal Open Market Committee (FOMC) minutes could give some clues, on the Federal Reserve’s (Fed) forward path, regarding monetary policy.
On the USD bearish side, a deterioration of labor market data, namely Initial Jobless Claims, could reaffirm the market’s view the US Federal Reserve (Fed) is hiking rates. Minnesota’s Fed President Neil Kashkari is expected to cross wires twice on Tuesday.
Given that the central bank convergence and interest rate differential favors the Greenback, further AUD/USD is expected. Nevertheless, traders must stay tuned to the economic calendar. Hawkish surprises from the RBA could trigger a reaction in the AUD/USD pair.
AUD/USD Price Analysis: Technical outlook
The AUD/USD bias remains downwards, though a daily close below the May 31 daily low of 0.6458 is needed to pave the way for a dip to the November 10 swing low of 0.6386. A breach of the latter will expose the November 3 daily low of 0.6272. On the other hand, in the less likely scenario, the AUD/USD first resistance would be the 0.6500 psychological level, followed by June’s 29 low of 0.6595, before testing 0.6600.
- EUR/GBP declined for a second consecutive day, and fell towards 0.8605, below the 20-day SMA.
- All eyes are now on labour market and inflation data from the UK.
- The Eurozone will release its preliminary Q2 GDP report on Wednesday.
At the start of the week, the EUR/GBP fell below the 20-day Simple Moving Average (SMA) near the 0.8605 area. No relevant data releases will feature on Monday’s economic calendar as attention shifts fo high-tier data released from both blocks later in the week.
On the GBP’s side, on Tuesday, the Office for National Statistics (ONS) will release key labour market data, including earning figures from the three months up to June and Claimant Counts numbers from July. In addition, on Wednesday, inflation data will be released from July, and overall figures are expected to show a robust labour market and decelerating inflation. Its worth noticing that the Bank of England (BoE) no longer expects a recession but that the bank will do whatever it takes to bring down inflation, so the outcome of the data will likely shape the expectations of the BoE’s next decision and hence having an impact on the Pound’s price dynamics.
On the European side, markets await Gross Domestic Product (GDP) preliminary figures for Q2 from the Eurozone, which is expected to have stagnated, and the Harmonized Index of Consumer Prices (HIICP) from July, which will be released on Friday.
EUR/GBP Levels to watch
The daily chart suggests that a neutral to bearish trend becomes evident for EUR/GBP, with the bears gradually taking control. The Relative Strength Index (RSI) has a negative slope above its midline, indicating weakening buying pressure, while the Moving Average Convergence (MACD) prints decreasing green bars. In addition, the pair is below the 20,100 and 200-day Simple Moving Average (SMA), pointing towards the prevailing strength of the bears in the larger context.
Support levels: 0.8600, 0.8590, 0.8570.
Resistance levels: 0.8610 (20-day SMA), 0.8630, 0.8650.
EUR/GBP Daily chart
-638276335829339092.png)
- USD/MXN rebounds from 20-day EMA, trading higher despite Wall Street’s positive sentiment.
- China’s real estate troubles, starting with Evergrande, now impact Country Garde, intensifying global concerns.
- Upcoming US Retail sales and FOMC minutes eyed, while a light Mexican docket leaves traders tuned to USD dynamics.
USD/MXN began the session positively and bounced off the 20-day Exponential Moving Average (EMA) at 17.0040, even though market sentiment improved, as shown by Wall Street turning green. The USD/MXN is trading at 17.0685m, post gains of 0.42%.
Mexican Peso feels the heat as China’s real estate crisis and US economic indicators steer the market
US equities trade mixed during the North American session, while the Mexican Peso (MXN) gets battered on a risk-off impulse that spurred outflows from the emerging market currency towards the US Dollar (USD), as portrayed by the USD/MXN exchange rate. A jump in US Treasury bond yields underpinned the Greenback after the 10-year benchmark note rate touched a multi-year high of 4.20%.
China’s real estate woes, which initially involved Evergrande in 2021, spilled over its largest private developer Country Garde, which failed to pay its bond interest last week. Real estate in China has suffered tumbling sales as tight liquidity conditions triggered a series of defaults.
Aside from this, the US economic docket would reveal Retail sales for July, estimated to show consumers’ resilience, and Fed speakers on Tuesday. By Wednesday, the release of the latest Federal Open Market Committee (FOMC) minutes could shed light on the Federal Reserve’s (Fed) forward path. At the same time, Industrial Production is estimated to print gains.
Across the border, the Mexican docket is light. That would leave traders adrift to US Dollar dynamics and market sentiment. A risk-on is USD/MXN negative, while risk aversion could pave the way for further USD/MXN upside.
USD/MXN Price Analysis: Technical outlook
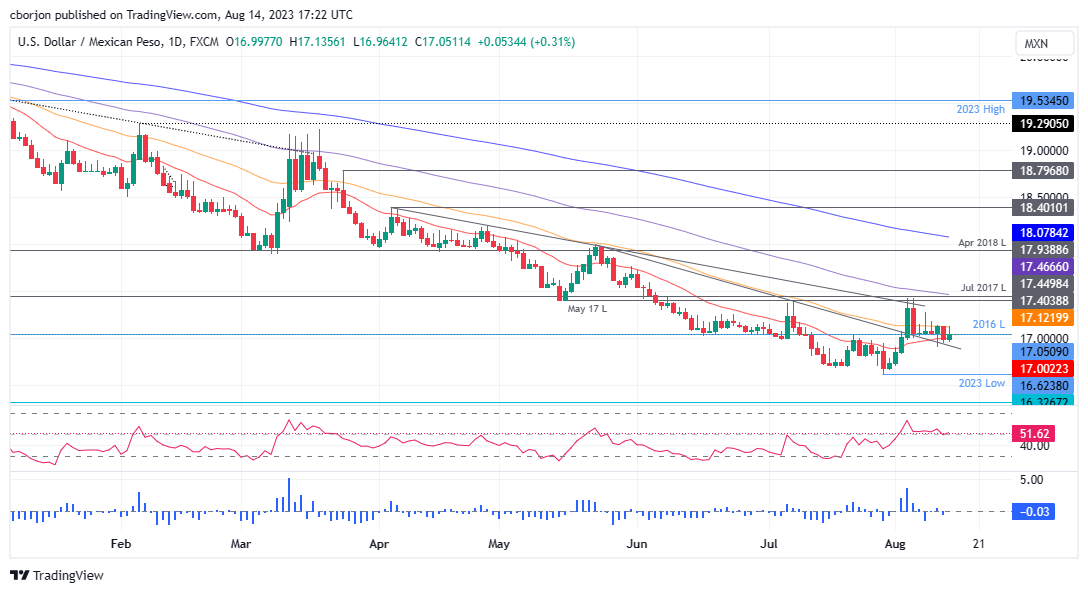
The USD/MXN daily chart portrays the pair as neutral to downward biased, but buyers stepping in around the day’s low opened the door for a recovery above the psychological 17.0000 figure. Of note, the Relative Strength Index (RSI) turned bullish, suggesting that the USD/MXN could be bottoming at around the 16.60-17.00 range, opening the door for further upside. USD/MXN buyers can gain tracti9on above the May 17 low of 17.4038, followed by the 100-day EMA at 17.4671, after reclaiming the 50-day EMA at 17.1228.
- EUR/JPY traded with losses for a consecutive day, and fell near the 158.60 area.
- The BoJ remains very dovish and weakens the Yen. Eyes on GDP data on Tuesday.
- Eurozone will release Q2 GDP data on Wednesday.
At the start of the week, the EUR/JPY traded with mild losses below 159.00. Both currencies traded weakly against their rivals on a quiet Monday ahead of the Gross Domestic Product (GDP) data from Japan and the Eurozone this week. On the JPY’s side, the USD/JPY broke through the 145.00 key level for the first time since November 2022, but there are still no signs of intervention from the local authorities to limit Yen’s losses.
Economic activity figures will be the week’s highlight for the pair. On the Japanese side, on Tuesday, the Q2 Gross Domestic Product (GDP) figures will be released and are expected to have grown at an annualised pace of 3.1%. That being said, there are no signs from the Bank of Japan (BoJ) to pivot its dovish monetary policy or to intervene in the markets to control the JPY’s downfall, which could pave the way for further downside for the pair.
On the European side, the Preliminary GDP figures from Q2 from the Euro area are expected to come in at 0.6% YoY matching the previous quarterly figures. In addition, inflation data will be released from the Eurozone and both sets of data will help investors to model their expectations towards the next European Central Bank (ECB) decisions.
EUR/JPY Levels to watch
The EUR/JPY suggests a neutral to bearish technical outlook on the daily chart as bullish momentum wanes. Having turned flat in positive territory, the Relative Strength Index (RSI) suggests a potential market equilibrium with balanced buying and selling pressure, while the Moving Average Convergence (MACD) histogram prints stagnant green bars. On the other hand, the pair is above the 20,100,200-day Simple Moving Average (SMA), indicating that the buyers are commanding the broader perspective.
Support levels: 158.00, 157.00, 156.00.
Resistance levels: 159.00, 160.00, 161.00.
EUR/JPY Daily chart
-638276292525778368.png)
- XAG/USD dropped to a daily low of $22.35 but then settled at around $22.60.
- Risk aversion dominates the markets, strengthening the USD.
- Eyes on Wednesday’s FOMC minutes from July’s meeting.
At the start of the week, risk-off flows predominate the markets and limit the Silver’s upside. With no relevant data released, higher US Treasury yields and a stronger USD dictate the pace of the metal.
The US bond yields are edging higher after the release of inflation from July from the US data last week. The 10-year bond yields 4.19%, with 1.29 % gains on the day. The 2-year yield stands at 4.96% with 1.25 % gains, and the 5-year yield is at 4.38% with 1.29 % gains. In line with that, the USD measured by the DXY index rose to its highest level since early July, above 103.00 and limiting the precious metal’s gains.
Regarding the next Federal Reserve decisions, rising US yields hint that tightening expectations have risen. According to World Interest Rate Possibilities (WIRP) tool, the markets
that a skip in September is likely while the odds of a 25 basis point (bps) hike in November rose nearly 40%. That being said, the Federal Open Market Committee’s (FOMC) minutes from July’s meeting will provide markets with a clearer outlook regarding the official's stance, which could generate volatility in the US bond markets and hence in the XAU/USD price dynamics.
XAG/USD Levels to watch
Analysing the daily chart, XAG/USD presents a bearish outlook for the short term, with both Relative Strength Index (RSI) and Moving Average Convergence Divergence (MACD) remaining in negative territory. Additionally, the pair is below the 20,100 and 200-day Simple Moving Averages (SMAs), suggesting that the bears are firmly in control of the bigger picture, leaving the buyers with tasks to accomplish.
Support levels: $22.50, $22.30, $22.00.
Resistance levels: $23.27 (200-day SMA), $23.50, $24.00.
XAG/USD Daily chart
-638276238255361723.png)
- China’s property crisis and weak recovery data amplify global risk aversion, favoring the US Dollar.
- US 10-year Treasury bond yield at 4.172%, with the DXY index gaining 0.18%, pressuring the NZD/USD.
- RBNZ will likely maintain a 5.50% rate, as Kiwibank analysts predict a hold until inflation targets are met.
NZD/USD posts modest gains in the North American session amid a risk aversion spurred by China’s real estate woes triggering a flight to safe-haven assets and bolstering the Greenback, which remains underpinned by high UST bond yields. The NZD/USD is trading at 0.5985, up 0.07%, after reaching a new year-to-date (YTD) low of 0.5943.
Greenback gains strength as risk aversion dominates; RBNZ anticipates to hold rates amid New Zealand economic challenges
Wall Street has turned positive in the day, though the story favors the Greenback in the FX space. The latest week’s soft data from China portrays a weaker economic recovery, while its property crisis keeps investors uneasy.
US Treasury bond yields edged higher during the session, though they had pared their earlier gains, with the US 10-year Treasury bond yield sitting at 4.172%, clinging to gains of one basis point. The US Dollar Index (DXY), which measures the buck’s value against a basket of peers, gains 0.18% and stays at 103.034, with headwinds for the NZD/USD.
The US economic calendar will feature US Retail Sales, which are expected to improve compared to June’s data, while Import and Export prices are expected to increase a tick. Manufacturing activity in New York is expected to remain subdued, while Fed speakers could give some clues regarding the Fed’s forward path.
On the New Zealand front, the Reserve Bank of New Zealand (RBNZ) is expected to keep rates unchanged at 5.50%, as the NZ economy remains in a mild recession, while inflation has fallen to 6.0%, from 7.3% last year. Analysts at Kiwibank said, “The cash rate has peaked...and will remain there until the RBNZ is convinced inflation will return to the target.”
NZD/USD Price Analysis: Technical outlook
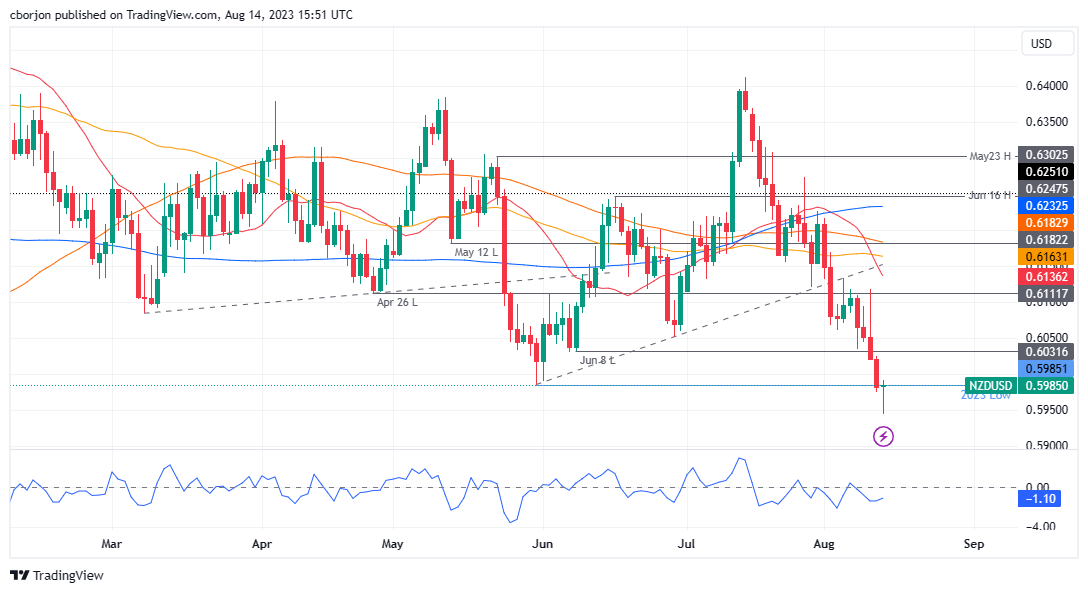
From a technical standpoint, the NZD/USD remains downward biased, reaching a new YTD low, but buyers entered the market, lifting the pair to test the prior’s YTD low of 0.5985. A daily close above the latter and the NZD/USD could regain the 0.6000 figure, with the next resistance emerging at 0.6024. Otherwise, the NZD/USD could extend towards 0.5900 before testing last year’s November 10 swing low of 0.5840.
The Federal Reserve Bank of New York's monthly Survey of Consumer Expectations showed on Monday that the US consumers' one-year inflation expectation dropped to the lowest level since April 2021 at 3.5% in July from 3.8% in June.
Key takeaways
"Three year-ahead expected inflation at 3% in July vs 2.9% in June."
"Five-year ahead expected inflation at 3% in July vs 2.9% in June."
"Survey finds retreating inflation expectations across a number of categories."
"July expected home price rise moves to 2.8% from June’s 2.9%."
"July expected rent price increase lowest since January 2021."
"Survey respondents report better personal financial situations in July."
Market reaction
The US Dollar Index showed no immediate reaction to this report and was last seen rising 0.3% on the day at 103.15.
The United Kingdom will release the Consumer Price Index (CPI) data on Wednesday, August 16 at 06:00 GMT and as we get closer to the release time, here are the forecasts by the economists and researchers of six major banks regarding the upcoming UK inflation print.
Headline is expected at 6.8% year-on-year, lower than June’s reading of 7.9%. If so, headline would be the lowest since February 2022 but still well above the 2% target. Meanwhile, core is seen at 6.8% YoY vs. 6.9% in June.
TDS
A close to 20% decline in Ofgem's energy price cap and base effects will likely bring headline inflation a full percentage point lower to 6.8% YoY – in line with the MPC's August forecast – while core should edge down to 6.8% YoY. The focus for the MPC will be on services inflation though, and here we look for continued elevated momentum to keep the YoY rate at 7.2% – leaving it marginally below the MPC's forecast of 7.25%.
Nomura
We see only small falls in core (from 6.9% to 6.8%) and services (7.2% to 7.1%) inflation in July. For the headline rate, we are looking for a fall from 7.9% to 6.6% (note the BoE is looking for 6.8% for July).
SocGen
A decline in utility prices could see headline inflation fall to its lowest level since the start of the Ukraine war at 6.8% in July, down from 7.9%, while we see easing goods inflation dragging core down by 0.1pp to 6.8%, confirming core reached its cyclical peak in May.
Citi
We expect July CPI inflation to undershoot the MPC’s headline forecast – if only very marginally – with core goods and food inflation complementing the large drop in household energy bills. Services inflation, will likely print in line, with a significant increase in rental prices once again a source of upward pressure. Core inflation will likely tick down marginally to 6.8% (BoE-implied: 6.9%), with undershoots on core goods inflation offsetting what – at the margin – will be a marginal overshoot on services, if with downside risks. Over the coming months, we expect disinflation to pick up steam as lower import and commodity prices continue to feed through. For the MPC, the focus will likely remain rigidly on services inflation, where undershoots are only likely from the start of Q4.
Credit Suisse
CPI inflation should fall from 7.9% to 6.6%, with core inflation down from 6.9% to 6.8%.
Deutsche Bank
We see headline inflation at 6.8% in line with consensus, with core at 6.9%.
EUR/JPY surged to nearly 160. Economists at Société Générale expect the pair to turn back lower.
A dovish ECB hike may keep the Euro under pressure
Since start-August, EUR/USD has been stuck below 1.10, and a last 25 bps hike to 4% is expected next month. But the ECB also reckons that Euro area core inflation has probably peaked, so a dovish hike may keep the Euro under pressure.
With EUR/JPY heading towards 160, the bullish forces are running out of steam and gains seem likely to reverse.
Statistics Canada will release July Consumer Price Index (CPI) data on Tuesday, August 15 at 12:30 and as we get closer to the release time, here are the forecasts by the economists and researchers of six major banks regarding the upcoming Canadian inflation data.
Headline CPI is seen accelerating to 3.0% year-on-year vs. the prior release of 2.8% in June. If so, it would be the first acceleration since April but would still be within the 1-3% target range. Core median and core trim are both expected to fall from June to 3.7% YoY and 3.6% YoY, respectively.
TDS
We look for CPI to firm 0.3pp to 3.1% as base effects push inflation back above the target range, while a rebound in services provides the main driver for the 0.4% MoM print. Core measures should edge 0.2pp lower to 3.6% YoY and break below the 3.5-4.0% range on a 3m saar basis, but we still look for +0.3% MoM from CPI-trim/median, keeping the BoC in wait-and-see mode.
RBC Economics
YoY inflation likely edged up to 2.9%. We expect price growth excluding food and energy products to slow further too, falling to 3% YoY from 3.5% in June.
NBF
An increase in gasoline prices could have translated into a 0.3% increase of the consumer price index in July (before seasonal adjustment). If we’re right, the 12-month rate of inflation should come up from 2.8% to 3.0%. Contrary to the headline print, the core measures preferred by the Bank of Canada should decrease in the month, with CPI-med likely moving from 3.9% to 3.6% and CPI-trim from 3.7% to 3.5%. In both cases, it would be the lowest level observed in a year and a half.
Wells Fargo
The July headline CPI print is expected to edge only moderately higher to 2.9% YoY. More important, however, will be the evolution of the core inflation measures. Those core inflation trends, when measured on a three-month annualized basis, have remained in a 3.5%-4.0% range for the past several months. Should that core inflation trend downshift to a 3.0%-3.5% three-month annualized pace, which we view as a distinct possibility, that may well be enough for the Bank of Canada to hold its policy interest rate steady at 5.00% at its early September announcement.
CIBC
With gasoline prices on the rise this July, in contrast to a decline seen twelve months ago, Canadian inflation will likely look a little hotter than it did in June. Indeed, we see headline inflation accelerating to 3.1%, from 2.8%, even with a modest deceleration in food price inflation. The monthly increase in prices excluding food & energy could also look a bit hotter than in the prior two months, with the deceleration in mortgage interest costs potentially stalling and prior negative contributions to inflation from internet and telephone services unlikely to be repeated. Still, even penciling in a monthly gain in ex-food/energy prices of 0.3% on a seasonally adjusted basis, the annual rate of inflation for that core measure would still decelerate to 3.4%, from 3.6% in June.
Citi
The most important aspect of July CPI data will be the average 3-month annualized pace of core inflation, which has been persistently in a 3.5-4% range for close to a year. There is a decent chance that this measure falls below 3.5% in July as a very strong print from April drops out of the 3-month calculation. Even if core inflation does remain in the 3.5-4% range, we expect the BoC to keep rates unchanged in September given other softer data (July employment, June retail sales, and likely softer Q2 GDP) received since the July decision.
- USD/JPY refreshes nine-month high above 145.00 amid risk-off market mood.
- Economic challenges in China improve the appeal for the US Dollar.
- US Retail Sales are seen expanding by 0.4% in July, accelerating from the 0.2% increase recorded for June.
The USD/JPY pair printed a fresh nine-month high at 145.57 on Monday, capitalizing on bearish market sentiment. The asset continues its five-day winning streak amid sheer strength in the US Dollar as investors remain worried about China’s economic outlook.
S&P500 prints some losses in early New York, portraying caution due to modest recovery in the United States Consumer Price Index (CPI) for July. The US Dollar Index rallies to near 103.46 amid improvement in its appeal as a safe haven.
Investors are worried about Chinese economic prospects as the economy is facing deflation due to weak demand and declining exports. Also, Chinese firms struggle to raise the price of goods and services at factory gates. This has improved the appeal of the US Dollar.
After a slower-than-expected inflation increase and a decent rebound in Producer Price Index (PPI) in the US economy for July, investors shift their focus to the Retail Sales data. As per the consensus, Retail Sales are seen expanding 0.4% in July, accelerating from the 0.2% increase recorded for June. A similar performance is expected for retail sales excluding autos.
Meanwhile, the Japanese Yen remains under pressure as Japan’s Ministry of Finance (MoF) doesn’t deliver any sign of stealth intervention. Preliminary Gross Domestic Product (GDP) for Q2 grew at 0.8% vs. Q1 growth of 0.7%. On an annualized basis, GDP expanded at 3.1% vs. the former release of 2.7%. An absence of monetary policy support from the Bank of Japan (BoJ) keeps the Japanese Yen on the tenterhooks.
The Reserve Bank of New Zealand (RBNZ) will announce its Interest Rate Decision on Wednesday, August 16 at 02:00 GMT and as we get closer to the release time, here are the expectations as forecast by the economists and researchers of six major banks.
The RBNZ is expected to keep the key Official Cash Rate (OCR) steady at 5.50%. At the last meeting, the bank also kept rates steady and was the first hold since the RBNZ started tightening back in 2021.
ANZ
We expect the RBNZ will leave the OCR unchanged at 5.50%, reiterating their ‘watch, worry and wait’ stance. Data since the July nothing-to-see-here Monetary Policy Review has been mixed, with relatively resilient demand but inflation indicators falling according to the script – an attractive mix, but one of questionable sustainability. As always, there’s a huge amount of wiggle room in terms of how the Committee interprets the implications of the recent data flow. We don’t expect a hat-tip to the chance of more hikes in this Statement, but the OCR forecast may show rates remaining at their peak for a little longer.
Standard Chartered
We expect the RBNZ to keep the OCR at 5.50 with little reason for change in either direction. Given the still-tight labour market and elevated inflation, it would be premature for the RBNZ to mull rate cuts. Instead, we think the RBNZ will keep the OCR on ice and reiterate the need to keep the policy stance restrictive for the foreseeable future. We expect rate cuts only from Q2-2024 once higher rates and the migration-fuelled boost to labour supply percolate through the economy.
TDS
While it is an MPS month that entails an updated OCR track, we don’t expect major revisions to the Bank's OCR track as economic data have largely panned out to the RBNZ's forecasts. We expect Governor Orr to reiterate that the Bank is confident that past rate hikes are having their intended impact on consumption and inflation which implies a high bar for further hikes.
NAB
We think the Bank will publish an interest rate track that is almost identical to the May MPS. This means no change to the current 5.50% cash rate and forecasts for it to stay that way until late 2024. Markets are well priced for no change.
Westpac
The RBNZ will keep the OCR at 5.50% at its August policy meeting and retain its baseline forecast that the rate cycle has peaked. The Bank’s forecast for the OCR should continue to indicate rates on hold until August 2024, falling slowly thereafter. Economic developments will likely be viewed as broadly mixed and so will likely lead to only modest changes in the Bank’s growth and inflation forecasts. Weaker than expected March quarter GDP and a softer outlook for the external sector are balanced against a firmer housing market and persistent domestic inflation pressures. The Bank will likely emphasise that any future move in policy will depend on the emerging data flow at home and abroad.
Citi
The RBNZ is unlikely to deliver any surprises in the August MPS and keep the policy rate unchanged at 5.50%. The data since the previous MPS has been broadly neutral. One on hand, growth surprised on the downside and the economy entered a technical recession. On the other, inflation – especially non-tradeables – has surprised slightly on the upside while employment growth was also stronger than expected. Wages growth has been slightly softer but still remains above 4%. Other forward indicators such as business confidence and the housing market still point to moderation in growth over the year ahead. The Statement is also expected to remain neutral, although the risk is still tilted towards the hawkish side.
- The US Dollar Index rises toward 103.50, reaching monthly highs.
- The US 10-year Treasury yield has surpassed 4.20%, the highest since November.
- The EUR/USD is under pressure, trading below relevant support levels.
The EUR/USD accelerated its decline, falling below 1.0900 to the lowest level since July 7 amid a stronger US Dollar.
Higher yields and cautious markets
The combination of higher US yields and cautious equity markets continues to support the US Dollar. The US 10-year yield stands at 4.20%, the highest since November, while the 2-year reached 4.96%. On Wall Street, the Dow Jones is falling by 0.15%, and the Nasdaq is sliding by 0.04%.
The US Dollar index has risen from under 103.00 to 103.45, the highest since July 6. The bias remains to the upside. The US Dollar is breaking important technical and psychological levels against most of its main rivals, strengthening the upward move even as market participants expect the Federal Reserve to keep rates unchanged at the September FOMC meeting following last week's data.
As for the Euro, it is lagging on Monday, with EUR/GBP trading below 0.8610, the lowest in five days and EUR/CHF breaking below 0.9600, approaching August lows.
Technical outlook
The EUR/USD has fallen below the important support area at 1.0925 and below the 55-day and 100-day Simple Moving Averages. A consolidation below 1.0900 would point to further weakness in the Euro.
So far, the EUR/USD has bottomed at 1.0874. The next support area is located at 1.0860, and below that, attention would turn to the July low at 1.0830. A recovery above 1.0900 could alleviate the bearish pressure, but the Euro needs to rise above 1.0970 to remove the negative bias.
Technical levels
Gold price prints a fresh five-week low amid strength in the US Dollar. Economists at TD Securities analyze XAU/USD outlook.
Gold bulls will need discretionary traders to deploy their capital hoard
Under the hood, the broadening consensus for a higher-for-longer scenario in rates has catalyzed notable CTA liquidations over the past weeks, underscoring the slump in net length highlighted by the CFTC weekly report. That being said, the drip lower from ETF gold liquidations appears to be subsiding over the last few sessions, and we don't expect additional algorithmic selling activity until prices break below the $,1900 mark.
Ultimately, Gold bulls will need discretionary traders to deploy their capital hoard, which places additional attention on upcoming data trends, particularly at a time when leading economic indicators are contrasting sharply from coincident economic indicators, as is historically typical in pre-recessionary periods.
The US Census Bureau will release the July Retail Sales report on Tuesday, August 15 at 12:30 GMT and as we get closer to the release time, here are the forecasts of economists and researchers of nine major banks regarding the upcoming data.
Retail Sales in the US are expected to rise 0.4% month-on-month vs. 0.2% in June. Meanwhile, sales ex-autos are expected at 0.4% MoM and the so-called control group used for GDP calculations is expected at 0.5% MoM vs. 0.6% in June.
Commerzbank
We expect only a slight gain of 0.4% from June. At least, according to the auto industry, about 0.5% more new cars were purchased. The price of gasoline had no major impact this time, remaining at the June level after adjusting for seasonal influences.
Deutsche Bank
We expect monthly Retail Sales to rise +0.3% in July with a slightly slower rise in Retail Control (+0.2%).
TDS
We expect Retail Sales to rise for a fourth consecutive month in July after 0.2%-0.5% MoM gains in Q2. Volatile auto sales will likely add to growth while sales in gas stations were a minor obstacle. Importantly, the control group is expected to stay firm, with online sales benefiting from Amazon's Prime Day. We also look for sales in bars/restaurants to expand at a brisk pace.
RBC Economics
Retail Sales likely edged up 0.4% in July, primarily supported by sales increase in the building and auto sectors, and partially offsetting the sales drop at gas stations.
NBF
Gasoline station receipts should have decreased during the month judging by the slight drop in pump prices, but total sales may still have advanced 0.4%, buoyed by an increase in spending at car dealers. Outlays on items other than vehicles could have advanced at a similar pace, supported by higher sales in the non-store retailer segment. (Recall that Amazon Prime Day took place during the month.)
Wells Fargo
We forecast a slight pickup in July and look for sales to rise 0.3% during the month. Auto sales likely somewhat held back July sales activity after three consecutive months of strong vehicle purchases. Beyond autos, sales activity has been mixed across other retailers in recent months after an unusually strong start to the year. Households' capacity to spend is dwindling as excess liquidity normalizes and credit not only becomes harder to come by but more expensive. But the tight labor market is offering up decent wage growth when met with slowing inflation. Falling goods prices are also providing some relief to consumers in terms of purchases, with the consumer price index for goods down 0.1% in July. This suggests Real Retail Sales were likely a bit stronger, closer to 0.4% last month.
CIBC
Aggregate personal income growth appears to have slowed in July, and nominal retail sales growth was likely limited as a result, compounded by a decline in core goods prices. Total Retail Sales likely rose by 0.2% MoM, with the more important control group of sales, which excludes gasoline, autos, restaurants, and building materials, that feeds more directly into non-auto goods consumption in GDP, poised to cool to a still-respectable 0.4% MoM. We’re more pessimistic than the consensus on the headline, but we’re nearly in line with the more important control group, which should limit any market reaction.
Citi
Control Group Sales have been stronger than expected these past three months and we expect another solid 0.5% MoM increase in control group sales in July. Meanwhile, total Retail Sales should increase by 0.4% MoM with only the services category in the report likely to also show a solid increase. Solid Retail Sales data would be in line with a soft-landing narrative.
Credit Suisse
We expect Retail Sales growth to continue to show modest growth in July. We expect headline Retail Sales to grow 0.4% MoM. We anticipate auto and gas sales grew roughly in line with the rest of Retail Sales in July, so aggregates that exclude them are likely to show the same growth rate. We expect the control group to come in a touch stronger at 0.5%. Going forward, we expect Retail Sales to weaken. Auto sales may continue to show strength, but we expect sales of large durable goods related to housing, including furniture, electronics, and appliances, to remain under pressure owing to housing market weakness. More broadly, tighter financial conditions, diminishing excess savings, slowing household income growth, and the resumption of student loan debt service in 3Q are likely to weigh on consumption growth.
- USD/CAD eyes the 1.3500 resistance amid strength in the US Dollar.
- US consumer spending momentum is seen expanding at a higher pace of 0.4% than June’s reading of 0.2%.
- A nominal pace in Canadian inflation might not bother the BoC for raising interest rates further.
The USD/CAD pair marches towards the psychological resistance of 1.3500 in the early New York session. The Loonie asset strengthens inspired by the solid US Dollar amid sticky inflationary pressures in the United States.
S&P500 is expected to open on a mildly negative note, following bearish cues from overnight futures. The US Dollar Index (DXY) rallied above the crucial resistance of 103.00 as investors remained worried that sticky inflationary pressures could force the Federal Reserve (Fed) to keep interest rates elevated for a longer period.
Hawkish Fed bets for September monetary policy meeting seem vanishing as the moderate pace in US inflation is in line with the central bank’s desired inflation rate of 2%. Last week, five-year consumer inflation expectations dropped to 2.9% from expectations and the former release of 3.0%.
Investors hope that Fed policymakers would be required to deliver more efforts now to rid of remaining inflationary pressures above the 2% desired above. Per estimates, consumer spending momentum remained at a higher pace of 0.4%, higher than June’s reading of 0.2%.
Meanwhile, investors shift their focus to the US Retail Sales for July, which will be released on Tuesday at 12:30 GMT.
On the Canadian Dollar front, investors await the inflation data for July, which will be published along with US Retail Sales data. Monthly headline Consumer Price Index (CPI) data is seen expanding at a higher pace of 0.3%, higher than the prior reading of 0.1%. Annual CPI is expected to land higher at 3.0% against the former release of 2.8%. A nominal inflation pace might not bother the Bank of Canada (BoC) in raising interest rates further.
USD/JPY is trading close to the 145 mark. Economists at Commerzbank analyze the pair’s outlook.
Is the MOF a toothless tiger?
If there are no interventions despite increasingly high USD/JPY levels the market might easily come to the conclusion that the MOF is a toothless tiger. If this situation arose the verbal interventions would turn out to be counterproductive in retrospect. As they would not only have turned out to be incapable of preventing medium-term JPY weakness but because very easily such a revaluation of the MOF might cause momentum, that might lead to higher USD/JPY levels than would have been seen in a scenario when the MOF had remained silent on the subject of JPY exchange rates.
And in fact, the MOF is now in a tricky situation. There is no reason for interventions at present. The period of JPY weakness is over. And it makes no sense and would be completely futile for the MOF to take action against general USD strength. However, their previous chatter means that they are now under pressure to act.
The moral of the story: ‘verbal interventions’ are not the free lunch they may seem to be at first glance.
Short-term outlook is favourable for the US Dollar, according to economists at MUFG Bank.
Higher US yields and diminished risk appetite to help Dollar
The failure of yields to decline in the wake of the US CPI report last Thursday has underlined the solid support for US yields that looks set to persist over the short-term.
If there is a source of renewed volatility and risk aversion over the short-term it looks like that could come from China. Economic data continues to be weak with increased concerns of late over the property market.
- USD/CHF looks set for a rally after remaining restricted around 0.8780 amid strength in the US Dollar.
- Fed policymakers are expected to pause its year-long rate-tightening spell.
- The SNB is expected to raise interest rates by 25 bps in September to 2%.
The USD/CHF pair gathers strength for a rally above the immediate resistance of 0.8780 in the European session. The Swiss Franc asset is expected to test the round-level resistance of 0.8800 amid strength in the US Dollar Index (DXY) inspired by the modest recovery in inflation and higher-than-expected Producer Price Index (PPI) data for July.
S&P500 futures add some gains in London on hopes that the Federal Reserve (Fed) will pause the policy tightening spell in September. Fed policymakers are expected to pause its year-long rate-tightening spell as inflation is expanding at a nominal monthly pace of 0.2%. The 0.2% monthly pace in inflation is in alignment with the Fed’s desired rate of 2%.
The Fed is highly expected to deliver an unchanged interest rate decision in September. However, interest rates will remain elevated for a longer period so that the return of inflation to 2% could be ensured. This would keep fears of recession steady.
After a modest inflation increase, investors await the United States Retail Sales data for July on Tuesday, which will be published at 12:30 GMT. Per estimates, consumer spending momentum remained at a higher pace of 0.4%, higher than June’s reading of 0.2%.
On the Swiss Franc front, investors start getting concerned about the interest rate decision from the Swiss National Bank (SNB), which will be announced in September. A survey from Bloomberg showed that the SNB will raise interest rates by 25 basis points (bps) in September to 2%. Regarding the inflation guidance, the survey indicates that the Consumer Price Index (CPI) will be at 1.5% in 2024.
GBP buyers re-emerge in the high 1.26s. Economists at Scotiabank analyze Cable’s outlook.
Technical signals shaded somewhat negatively for the GBP in the short run
Sterling looks well-supported on the session so far but technical signals are shaded somewhat negatively for the GBP in the short run after the heavy selling pressure from the low 1.28s that developed late last week.
Firm support in the upper 1.26s is notable, however, and additional gains through 1.2740/1.2750 should add to near-term upside momentum and a retest of the low 1.28 area.
Resistance to USD/CAD advancing beyond the mid-1.34 zone has been pretty consistent over the past week. Economists at Scotiabank analyze the pair’s outlook.
Risks tilted towards additional gains
At the risk of sounding like the proverbial broken clock, the CAD looks cheap and should be trading somewhat higher than it is. Very stretched valuation suggests near-term scope for the USD to extend should be limited, all else equal.
Intraday trading patterns reinforce the picture of firm resistance in the mid-1.34 zone but, taking a step back, the underlying bull trend in the USD has developed solidly on the short-term studies which suggest spot will remain well supported for now and tilts risks towards additional gains – eventually.
Support is 1.3375, with some relief for the CAD likely to develop below here.
EUR/USD pressures support in the low 1.09s again. Economists at Scotiabank analyze the pair’s outlook.
EUR may struggle to strengthen significantly
Spreads have moved against the EUR (and broadly in the USD’s favour) in recent weeks, suggesting the EUR may struggle to strengthen significantly, absent other drivers, for now.
Trend support off the September 2022 low for EUR/USD at 1.0949 remains under pressure but continues to provide some anchoring for the soft EUR, with the 50 and 100-DMA signals bracketing the trendline at 1.0966 and 1.0931 respectively).
EUR needs to extend gains through 1.1050/1.1060 to show any real technical strength in the near term.
West Texas Intermediate (WTI) crossed the $80/bbl mark after it sank below $70 for most of June. Economists at the Bank of Montreal stick to their WTI forecast.
The balance of risks has tilted more to the upside
One should expect the drumbeat of $90 or $100 predictions to pick up in the coming weeks. Reaching these levels, at least temporarily, is not a tall order given Crude Oil is the most intensely speculated commodity, which helps explain its high degree of price volatility.
The price of crude oil has some solid wind in its sails, but it still has many challenges ahead. As a result, we remain comfortable with our current WTI projections of $78 for the whole of 2023 (or $81 in H2) and $80 in 2024 but acknowledge that the balance of risks has tilted more to the upside.
Despite sizeable swings, the USD is not far from the level at which it started in 2023. Economists at HSBC analyze Greenback’s outlook.
Time is running out for the USD to be trendy in 2023
Recent data suggests that a soft landing is the most likely outcome for the US and global economy. This would point to a ‘risk on’ mood and consequently a weaker USD into year-end and early 2024, which is our base case.
But if the US either heads to a hard landing or economically outperforms other G10 economies, the USD will strengthen – not our base case.
- Russian Ruble corrects heavily against the US Dollar due to a shrinking current account surplus.
- Central Bank of Russia uplifts interest rates after a year by 1% to 8.5% and prohibits foreign currency purchases to strengthen Russian Ruble.
- The US Dollar will dance to the tune of July’s Retail Sales data.
Russian Ruble prints a fresh 16-month low against the US Dollar due to weak economic outlooks. The USD/RUB pair climbed above the psychological resistance of 100.00 on Monday, extending YTD losses by 38%. The asset remains under pressure as the Russian economy is facing multiple headlines such as sanctions from developed economies, being in a war with Ukraine, and reducing oil exports to Asian nations.
The Russian economy is at war with Ukraine after the latter’s inclusion in NATO, which dampens its economic prospects. The United States economy prohibited transactions in US Dollars for Russia and denied buying oil too. Also, the move was supported by European economies in spite of their higher dependency.
Russian administration is busy at war with Ukraine, which has increased their imports of military equipment and simultaneously imbalanced their capital flows. It is being noted that Russia’s current account surplus shrank by 85% in the first half of CY2023.
Central Bank of the Russian Federation maintained a loose monetary policy for almost a year to elevate economic growth that keep Russian Ruble in a bearish trajectory but now lifted rates by a full 1% to 8.5% in July due to declining capital inflows. The central bank also decided to bring a pause on foreign currency purchases with the agenda of reducing FX volatility.
“It is in the interests of the Russian economy to have a strong Ruble" and that loose monetary policy was the main reason for a plunging currency, says Russian President Vladimir Putin's economic advisor Maxim Oreshkin.
Meanwhile, the US Dollar Index (DXY) finds pressure around 103.00 but remains well-supported above 102.80 amid a cautious market mood and a modest recovery in inflationary pressures in the United States. The USD Index will dance to the tune of July’s Retail Sales data. According to the estimates, the economic data is expected to expand at a higher pace of 0.4% vs. June’s print of 0.2% expansion.
The Pound weakened last week against the US Dollar but was the next best performing G10 currency. Economists at MUFG Bank analyze GBP outlook.
Key week for UK
After last week’s US inflation data, the key data releases this week will be in the UK. The jobs and wages data will be released on Tuesday followed by the CPI data on Wednesday and the Retail Sales data on Friday.
We suspect the data this week might not show enough evidence of easing upside inflation risks to deter the BoE from hiking in September and in those circumstances following the stronger GDP data, we may well see some scope for further GBP strength. However, with the Dollar also looking on a more solid footing, selling EUR/GBP may prove a better avenue for Pound gains.
So far in August, EUR/USD has struggled to sustain levels over 1.1000. Economists at MUFG Bank analyze the pair’s outlook.
Possible quiet trading conditions over the coming few weeks
The resilience of US yields in the face of another positive CPI data print points to ongoing US Dollar support over the short-term. Yield should be a greater influence which points to a grind lower for EUR/USD.
The risk of a spike in volatility, if it were to materialise, could be from China and any increased concerns over China's growth would likely weigh on EUR/USD as well. This view of some Dollar strength is a short-term view reflecting possible quiet trading conditions over the coming few weeks.
- The US Dollar paints a risk-off picture at the start of the week.
- China's economic numbers paint a bleak picture of its post-covid recovery.
- US Dollar Index to print fresh monthly high again.
The US Dollar (USD) continues where it left off Friday evening at the US closing bell. The Greenback-favored sentiment this Monday is built on the once again disappointing numbers out of China. With Country Garden, an even bigger real estate developer than Evergrande, on the brink of collapse, Chinese loan data pointed to an 89% drop in distributed loans to companies and households. The Chinese credit crunch will further deteriorate its economic numbers and growth, threatening world economic growth in a spillover effect.
There are no important data points for Monday and the rest of the week. On Tuesday, US retail sales numbers will flavor the market, and on Wednesday the latest US Federal Reserve Minutes will be key data for further guidance and clues on where the US Dollar Index (DXY) might move later this week. Without pivotal data points, expect markets to be on autopilot with no real seismic shifts in current trends.
Daily digest: US Dollar picking up
- Main headlines this Monday are on the Chinese property builder Country Garden., which is on the brink of a default and might need financial aid from the Chinese government.
- Chinese loan distribution to companies and households dropped 89% for the month of July against June’s numbers. Loans are a vital item in an economy for companies that want to expand and for household consumption.
- Forex markets are also gearing up for a shock intervention by the Japanese finance ministry as USD/JPY has hit 145 in early Monday trading. An intervention could see heavy US Dollar selling to get the USD/JPY exchange rate back down to 140 or 135 in a short period. In Japan, it is not the central bank but the finance ministry overseeing the exchange rate positioning.
- The US Treasury will tap the market for a 3-month and 6-month bill auction.
- Asian stocks are being slaughtered on Monday, with the Japanese TOPIX index down 1% at its closing bell. Hong Kong’s Hang Seng is down over 2%, in turn dragging European equities lower. US equity futures are in the red, though marginally by roughly 0.15%. A late recovery is still more than possible later this Monday.
- The CME Group FedWatch Tool shows that markets are pricing in an 88.5% chance that the Federal Reserve will pause interest rate hikes at its meeting in September. The probability declined from above 90% last week as sticky inflation could mean the Fed might need to keep rates elevated for longer.
- The benchmark 10-year US Treasury bond yield trades at 4.16% after the summary from last week’s US inflation data was that inflation is slowing down, though it remains sticky. This confirms that the US Federal Reserve (Fed) is right to hold rates steady for longer, while markets got it wrong with their presumed cuts in early 2024.
US Dollar Index technical analysis: low-hanging fruit
The US Dollar continues its rally from last week and opens the week with gains against most major peers. The US Dollar Index (DXY) is increasing, printing another new monthly high. Special attention from a technical point of view for EUR/USD where the US Dollar is about to break both the 55-day and the 100-day Simple Moving Average and could see US Dollar strength helping the DXY to break a substantial cap on the upside.
For the upside, 103 as a big figure will be challenged today. A touch further up, the 200-day SMA at 103.37 will be a difficult cap to cross above. As no real big events are scheduled for this week, and already the DXY has printed a new monthly high this Monday morning, it is questionable if this sentiment-driven move will push the DXY above the important 200-day SMA.
On the downside, several levels will be tested regarding support. The first candidate is the high of Friday at 102.90. If that fails, look for 102.38 with the 55-day SMA and the 100-day SMA nearby as double belts for underpinning the price action in the US Dollar Index. Should some event or headline trigger a break-even below those two moving averages, expect to see 102 challenged to catch the falling price action.
What is US Dollar Index (DXY)?
The US Dollar Index, also known as DXY or USDX, is a benchmark index that was established by the US Federal Reserve in 1973. DXY is widely used as a tool measuring the US Dollar (USD) value in global markets. The index is calculated by measuring the US Dollar’s performance against a basket of six foreign currencies, the Euro, the Japanese Yen (JPY), Swedish Krona (SEK), the British Pound (GBP), the Swiss Franc (CHF) and the Canadian Dollar (CAD).
With 57.6%, the Euro has the biggest weight in the index followed by the JPY (13.6%), GBP (11.9%), CAD (9.1%), SEK (4.2%), and CHF (3.6%). Hence, a sharp decline in the EUR/USD pair could help the US Dollar Index rise even if the US Dollar weakens against some of the other currencies in the basket.
- Gold price demonstrates a weak performance amid strength in the US Dollar.
- United States inflation grew at a 0.2% steady pace in July amid higher rentals.
- The Fed is expected to keep interest rates unchanged in September.
Gold price (XAU/USD) continues its bleak performance amid headwinds of a strong US Dollar and higher US Treasury bond yields. The precious metal remains under pressure as consumer and producer inflation grew modestly in July but failed to uplift chances of further policy tightening by the Federal Reserve (Fed).
The 0.2% monthly increase in the United States Consumer Price Index (CPI) in July is in line with the Fed’s required annual inflation rate of 2%, which keeps policymakers comfortable. The rise in consumer inflation, mainly driven by higher rentals, could allow the Fed to go light on interest rates and contribute to easing recession fears. This week, Gold price action will likely be guided by the US Retail Sales data for July, which will be published on Tuesday at 12:30 GMT.
Daily Digest Market Movers: Gold price weakens as Greenback recovers
- Gold price seems to be declining toward the crucial support of $1,900 amid sheer strength in the US Dollar despite the fact that the Federal Reserve is expected to keep interest rates unchanged in September.
- The US Dollar Index (DXY) refreshes its five-week high around 103.00 as the market mood remains cautious after US equities turned expensive.
- Gold price also remains under pressure due to higher US bond yields, with 10-year US Treasury yields hovering around 4.16%.
- In July, both US consumer and producer inflation rebounded despite restrictive monetary policy and tight credit conditions by US commercial banks.
- Despite the rebound, US consumer inflation grew at a slower-than-expected pace as higher rentals were offset by a decline in the cost of second-hand automobiles.
- Around 90% of the contribution to inflation was driven by higher shelter prices. This indicates that the Fed doesn’t need to raise interest rates further as prices of durables and non-durables are still declining.
- No more interest rate hikes clearly recedes fears of a recession in the United States.
- US Producer Price Index (PPI) rose 0.3% in July on month, higher than expectations of 0.2%, as the cost of services rebounded at the fastest pace in nearly a year. The Department of Labor reported that goods prices excluding oil and food prices remained unchanged.
- In spite of a rebound in US CPI and PPI, keeping interest rates on hold is likely to be considered by Fed policymakers as July’s monthly inflation pace aligns with the Fed’s desired rate of 2%.
- Consumer inflation expectations for the next five years softened to 2.9% in August, less than expectations and the former forecast of 3.0% as the central bank is expected to keep interest rates elevated for a longer period, according to data from the University of Michigan Consumer Sentiment survey.
- Meanwhile, the preliminary Michigan Consumer Sentiment index slipped to 71.2 from 71.6 in July but remained above the forecast of 71.0.
- "In general, consumers perceived few material differences in the economic environment from last month, but they saw substantial improvements relative to just three months ago," said Joanne Hsu, director of the University of Michigan's surveys.
- After the Fed’s inflation data, investors shift their focus towards the US Retail Sales data for July. Retail sales are seen expanding by 0.4% in July, accelerating from the 0.2% increase recorded for June. A similar performance is expected for retail sales excluding autos.
Technical Analysis: Gold price declines toward $1,900
Gold price declines consistently and is expected to test the round-level support of $1,900.00. The precious metal falls sharply as the 20- and 50-day Exponential Moving Averages (EMAs) delivered a bearish crossover. The Relative Strength Index (RSI) (14) slips below 40.00. The absence of divergence and oversold signals in the RSI (14) suggest more weakness ahead. Gold price forms consecutive Inverted Hammer candlesticks. A breakdown below the $1,910.00 support might trigger a fresh sell-off.
Inflation FAQs
What is inflation?
Inflation measures the rise in the price of a representative basket of goods and services. Headline inflation is usually expressed as a percentage change on a month-on-month (MoM) and year-on-year (YoY) basis. Core inflation excludes more volatile elements such as food and fuel which can fluctuate because of geopolitical and seasonal factors. Core inflation is the figure economists focus on and is the level targeted by central banks, which are mandated to keep inflation at a manageable level, usually around 2%.
What is the Consumer Price Index (CPI)?
The Consumer Price Index (CPI) measures the change in prices of a basket of goods and services over a period of time. It is usually expressed as a percentage change on a month-on-month (MoM) and year-on-year (YoY) basis. Core CPI is the figure targeted by central banks as it excludes volatile food and fuel inputs. When Core CPI rises above 2% it usually results in higher interest rates and vice versa when it falls below 2%. Since higher interest rates are positive for a currency, higher inflation usually results in a stronger currency. The opposite is true when inflation falls.
What is the impact of inflation on foreign exchange?
Although it may seem counter-intuitive, high inflation in a country pushes up the value of its currency and vice versa for lower inflation. This is because the central bank will normally raise interest rates to combat the higher inflation, which attract more global capital inflows from investors looking for a lucrative place to park their money.
How does inflation influence the price of Gold?
Formerly, Gold was the asset investors turned to in times of high inflation because it preserved its value, and whilst investors will often still buy Gold for its safe-haven properties in times of extreme market turmoil, this is not the case most of the time. This is because when inflation is high, central banks will put up interest rates to combat it.
Higher interest rates are negative for Gold because they increase the opportunity-cost of holding Gold vis-a-vis an interest-bearing asset or placing the money in a cash deposit account. On the flipside, lower inflation tends to be positive for Gold as it brings interest rates down, making the bright metal a more viable investment alternative.
USD/CNH is close to the high of the year near 7.28. Economists at ING analyze the pair’s outlook.
The bigger driver of events in global FX markets looks to be developments in China
Ongoing difficulties in the Chinese property sector are exacerbating last week's poor set of Chinese data, which included deflation, trade and new loans.
Looking ahead in China, analysts do not expect a rate cut in the one-year medium-term lending facility on Tuesday (this would just weaken the renminbi further), but speculation is growing about a cut in the required reserve ratio to free up some liquidity.
Barring some surprise stimulus measure this week, it looks like USD/CNH could press and break through 7.28 – a move that would drag Asian FX and the commodity complex with it.
In its monthly report published on Monday, German Economy Ministry noted that current early indicators do not yet point to a sustainable economic recovery in coming months, per Reuters.
"On the domestic front, the expected cautious recovery in private consumption, services and investment is showing the first signs of hope, which are likely to strengthen as the year progresses," the report further read.
Market reaction
This report doesn't seem to be impacting the Euro's valuation in a noticeable way. As of writing, EUR/USD was virtually unchanged on the day at 1.0948.
Gold has witnessed a cycle of sharp price declines. Economists at TD Securities analyze the yellow metal’s outlook.
Fed Chair Powell will continue to deliver the same old play by the numbers narrative
Since it is quite likely that Mr. Powell will continue to deliver the same old play by the numbers narrative in September and at Jackson Hole in late August, there are significant risks that rates move even higher, which would increase already high carry and opportunity costs.
As such, Gold is at risk of dropping to technical support below $1,900 if data remains steadfast, which implies continued length reduction.
FX option expiries for August 14 NY cut at 10:00 Eastern Time, via DTCC, can be found below.
- EUR/USD: EUR amounts
- 1.0975-80 865m
- 1.1000 1.9b
- 1.1050 535m
- 1.1065 555m
- GBP/USD: GBP amounts
- 1.2510 310m
- 1.2885 305m
- USD/JPY: USD amounts
- 142.00 1.8b
USD/CAD: USD amounts
- 1.3350 580m
- AUD/USD: AUD amounts
- 0.6505 950m
- USD/ZAR: USD amounts
- 19.3800 540m
- NZD/USD rebounds from its lowest level since November 2022 touched earlier this Monday.
- A positive tone around the European equity markets lends support to the risk-sensitive Kiwi.
- Bets for one more rate hike by the Fed should underpin the USD and cap any further gains.
- Traders now look to Chinese macro releases on Tuesday ahead of the RBNZ on Wednesday.
The NZD/USD pair stages a goodish intraday recovery from the vicinity of mid-0.5900s, or its lowest level since November 2022 touched this Monday and hits a fresh daily peak during the early European session. Spot prices currently trade just below the 0.600 psychological mark, up nearly 0.10% for the day, and for now, seem to have snapped a four-day-losing streak, though any meaningful appreciating move still seems elusive.
In the absence of any fresh fundamental catalyst, a positive opening across the European equity markets prompts some profit-taking around the safe-haven US Dollar (USD) and turns out to be a key factor that benefits the risk-sensitive Kiwi. That said, growing worries about the worsening economic conditions in China and geopolitical risks might keep a lid on any optimism. Furthermore, expectations that the Federal Reserve (Fed) will keep interest rates higher for longer should help limit the USD corrective slide from its highest level since July 7 and cap gains for the NZD/USD pair.
Investors seem convinced that the US central bank will stick to its hawkish stance and the bets were reaffirmed by the US PPI on Friday, which rose slightly more than expected in July. This comes on the back of a moderate rise in consumer prices in July and suggests that the battle to bring inflation back to the Fed's 2% target is far from being won, leaving the door for one more 25 bps lift-off by the end of this year wide open. The outlook remains supportive of elevated US Treasury bond yields and favours the USD bulls, warranting caution before positioning for further NZD/USD upside.
Traders might also refrain from placing aggressive bets and prefer to wait on the sidelines ahead of important Chinese macro data, due for release during the Asian session on Tuesday. The focus will then shift to the Reserve Bank of New Zealand (RBNZ) monetary policy meeting on Wednesday, which will play a key role in influencing the domestic currency and provide a fresh impetus to the NZD/USD pair. In the meantime, the aforementioned fundamental backdrop suggests that the path of least resistance for spot prices is to the downside and the attempted recovery might get sold into.
Technical levels to watch
The Dollar starts the week on the strong side. Economists at ING analyze Greenback’s outlook.
High US rates + poor overseas environment = strong Dollar
High US bond yields and what seems to be a deteriorating environment in the Chinese financial sector are weighing on risk assets.
Unless Chinese authorities can surprise with some powerful stimulus measures, the weaker Chinese Renminbi can drag Asian and commodity currencies weaker and keep the Dollar bid.
US Dollar Index (DXY) risks pushing up the 103.50/103.60 area this week.
Economists at Commerzbank analyze CNY outlook.
Wide, negative China-US yield spreads will remain for longer
While the PBoC has continued to impose daily fixings significantly stronger than market estimates based on the fixing formula, they prevented a sharp depreciation of CNY but did not reverse the weakening trend.
CNY will likely remain under pressure for the rest of this year. We will likely only see a rather moderate boost to growth from policy stimulus in the coming months. Slow growth also speaks in favor of a loose monetary policy. The wide, negative China-US yield spreads will therefore remain for longer.
- WTI Crude Oil prices attract fresh buying and stall its corrective slide from the YTD top.
- The technical setup favours bullish traders and supports prospects for a further move up.
- A break below the ascending trend channel support is needed to negate the positive bias.
Western Texas Intermediate (WTI) Crude Oil prices come under some renewed selling pressure on the first day of a new week and retreat further from the YTD peak, around the $84.30-$84.35 region touched last Thursday. The black liquid, however, manages to recover a major part of its intraday losses and trades around the $82.35 region during the early European session, down only 0.20% for the day.
Concerns that slowing economic growth in China - the world's top oil importer - will dent fuel demand turn out to be a key factor weighing on Oil prices. Apart from this, the underlying bullish sentiment surrounding the US Dollar (USD), bolstered by expectations that the Federal Reserve (Fed) will keep interest rates higher for longer, exerts some pressure on the US Dollar-denominated commodity. That said, the production cuts announced by Saudi Arabia and Russia help limit any further losses, rather attract fresh buying at lower levels.
From a technical perspective, the recent breakout through the very important 200-day Simple Moving Average (SMA), along with the formation of an ascending channel on short-term charts, adds credence to the positive outlook for Oil prices. Moreover, oscillators on the daily chart have eased from slightly overbought conditions and suggest that the path of least resistance for the black liquid is to the upside. Bulls, however, might wait for some follow-through buying beyond Friday's swing high, around the $83.25-$83.30 region, before placing fresh bets.
Crude Oil prices might then aim to surpass an intermediate hurdle near the $83.70 region and aim to reclaim the $84.00 mark. The upward trajectory could get extended further towards retesting the $84.30-$84.35 zone, or the highest level since November 2022, en route to the $85.00 psychological mark and the ascending trend-channel resistance, currently pegged just below mid-$85.00s.
On the flip side, the daily low, around the $82.00 mark, now seems to protect the immediate downside. This is followed by the lower end of the aforementioned trend channel, around the $81.30-$81.25 region, which should act as a strong base and a key pivotal point for Oil prices. A convincing break below might shift the near-term bias in favour of bearish traders and pave the way for some meaningful corrective decline. The black liquid might then weaken further below the $81.00 mark and the $80.00 psychological mark, towards testing last week's swing low, around the $79.65 region.
WTI Crude Oil daily chart
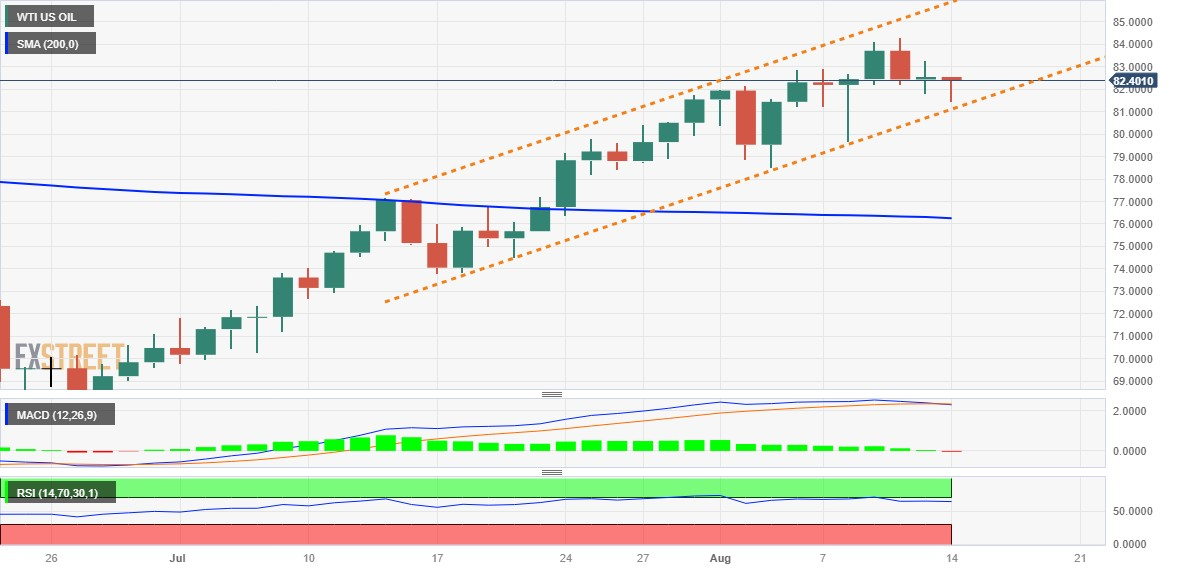
Technical levels to watch
- Pound Sterling trades near crucial support as investors shift focus to UK Employment data.
- UK factory activity for June and Q2 GDP outperformed expectations significantly.
- A tight labor market, alongside upbeat economic performance, could increase expectations of interest-rate peak.
The Pound Sterling (GBP) looks vulnerable as upbeat Q2 Gross Domestic Product (GDP) and factory data for June fail to provide strength. The GBP/USD pair faces headwinds from bearish market sentiment ahead of the British employment data, which will be released on Tuesday at 6:00 GMT.
Stellar recovery in United Kingdom’s Q2 GDP data makes Bank of England (BoE) policymakers more comfortable in raising interest rates further so that a swift return of inflation to 2% can be ensured. If labor market conditions turn out tight and wage growth continues to be high, the deadly duo of upbeat economic outlook and tight employment would raise expectations of a higher interest-rate peak.
Daily Digest Market Movers: Pound Sterling fails to capitalize on upbeat Factory data
- Pound Sterling finds intermediate support near 1.2666. However, more downside seems favored amid the cautious market mood and upcoming UK Employment data, which will be published on Tuesday at 06:00 GMT.
- The UK labor market is expected to add 50K new payrolls in the three months to June, less than the 102K it created in the prior three-month period. Meanwhile, the Claimant Count Change in July is expected to show a decline of 7.3K, swinging from an increase of 25.7K jobless claims in June.
- Three-month Unemployment Rate is expected to remain unchanged at 4.0%.
- A key catalyst in the UK employment report is the three-month Average Earnings excluding bonuses data in the three months to June, which is seen accelerating to 7.4% vs. the prior release of 7.3%.
- Stubborn wage growth would increase the chances of further policy-tightening by the Bank of England as households would be equipped with higher disposable income.
- Labor shortages and elevated food prices have been major contributors to higher inflationary pressures.
- On Friday, factory activity and Q2 GDP data came in stronger than expected.
- Monthly GDP swung from a contraction and grew by 0.5% in June, more than the 0.2% expected. In the January-March quarter, the economy contracted by 0.1%.
- Quarterly GDP grew by 0.2% in 2Q, while analysts had forecasted a stagnant performance. The annual growth rate was 0.4%, doubling the consensus and the prior release of 0.2%.
- Monthly Industrial Production for June expanded strongly, by 1.8% against the estimates for 0.1% growth. In May, industrial production contracted by 0.6%. On an annual basis, it rose significantly to 3.1%.
- Manufacturing Production also grew strongly on a monthly basis, by 2.4%, well above the 0.2% forecasted.
- Upbeat Manufacturing activity makes BoE policymakers more comfortable with elevating interest rates further. The rate-tightening cycle is unlikely to be paused as inflationary pressures are way higher than the desired rate of 2%.
- Market sentiment remains bearish as both the United States Consumer Price Index (CPI) and the Producer Price Index (PPI) for July showed persistent price pressures.
- US PPI, published on Friday, rose more than expected due to the rise in the cost of services.
- Still, the Federal Reserve (Fed) is widely expected to keep interest rates steady in September as the modest pace in monthly inflation of 0.2% aligns with the Fed's desired rate of 2%.
- The US Dollar Index (DXY) trades at a fresh five-week high around 103.00 amid a cautious market mood.
Technical Analysis: Pound Sterling struggles above 1.2660
Pound Sterling struggles to hold above the immediate support of 1.2660. The Cable shifted into a bearish trajectory after a breakdown of the five-day Bearish Wedge chart pattern. GBP/USD trades below the 20- and 50-period Exponential Moving Averages (EMAs), signaling a bearish trend. A further break below the 1.2650 level would drag the major toward the 200-day EMA, which is at around 1.2464.
Pound Sterling FAQs
What is the Pound Sterling?
The Pound Sterling (GBP) is the oldest currency in the world (886 AD) and the official currency of the United Kingdom. It is the fourth most traded unit for foreign exchange (FX) in the world, accounting for 12% of all transactions, averaging $630 billion a day, according to 2022 data.
Its key trading pairs are GBP/USD, aka ‘Cable’, which accounts for 11% of FX, GBP/JPY, or the ‘Dragon’ as it is known by traders (3%), and EUR/GBP (2%). The Pound Sterling is issued by the Bank of England (BoE).
How do the decisions of the Bank of England impact on the Pound Sterling?
The single most important factor influencing the value of the Pound Sterling is monetary policy decided by the Bank of England. The BoE bases its decisions on whether it has achieved its primary goal of “price stability” – a steady inflation rate of around 2%. Its primary tool for achieving this is the adjustment of interest rates.
When inflation is too high, the BoE will try to rein it in by raising interest rates, making it more expensive for people and businesses to access credit. This is generally positive for GBP, as higher interest rates make the UK a more attractive place for global investors to park their money.
When inflation falls too low it is a sign economic growth is slowing. In this scenario, the BoE will consider lowering interest rates to cheapen credit so businesses will borrow more to invest in growth-generating projects.
How does economic data influence the value of the Pound?
Data releases gauge the health of the economy and can impact the value of the Pound Sterling. Indicators such as GDP, Manufacturing and Services PMIs, and employment can all influence the direction of the GBP.
A strong economy is good for Sterling. Not only does it attract more foreign investment but it may encourage the BoE to put up interest rates, which will directly strengthen GBP. Otherwise, if economic data is weak, the Pound Sterling is likely to fall.
How does the Trade Balance impact the Pound?
Another significant data release for the Pound Sterling is the Trade Balance. This indicator measures the difference between what a country earns from its exports and what it spends on imports over a given period.
If a country produces highly sought-after exports, its currency will benefit purely from the extra demand created from foreign buyers seeking to purchase these goods. Therefore, a positive net Trade Balance strengthens a currency and vice versa for a negative balance.
The UK releases two important data sets this week. Economists at ING analyze GBP outlook ahead of employment and prices figures.
Services inflation to surprise on the downside and dent expectations for a further 50 bps tightening
Tuesday's release of the jobs data should continue to show average earnings coming in on the high side at 7%+ year-on-year. Sterling may have more trouble with Wednesday's July CPI data. Here, we expect services inflation to surprise on the downside and dent expectations for a further 50 bps tightening from the Bank of England.
GBP/USD risks coming down to the 1.2590/2610 area today on the back of the stronger Dollar.
Kiwi broke below 0.60 late Friday. Economists at ANZ Bank analyze NZD/USD outlook.
USD Index may be unstoppable
The big picture remains one of USD strength, with the US Dollar Index having recovered almost all of July’s dip as bond yields rise and markets fret about for how long US interest rates will hold up.
The DXY hasn’t made a new high, but if it becomes the high-yielder of choice or the subject of safe-haven buying, it may be unstoppable.
This week we get the RBNZ MPS (Wed), but with a pause universally expected, that may not do a lot for the Kiwi (and flagging crosses).
- AUD/USD drifts lower for the fifth straight day and drops to a fresh YTD low on Monday.
- China’s economic woes weigh on investors’ sentiment and exert pressure on the Aussie.
- Bets for more Fed rate hikes continue to underpin the USD and contribute to the slide.
The AUD/USD pair drops to its lowest level since November 2022 on the first day of a new week, albeit manages to rebound a few pips heading into the European session. Spot prices currently trade around the 0.6480 region, still down over 0.25% for the day, and remain vulnerable to prolonging the downward trajectory witnessed over the past month or so.
The global risk sentiment takes a turn for the worst on Monday in the wake of growing concerns about the worsening economic conditions in China. The fears were amplified further after China's Country Garden – one of the biggest developers – warned of a massive $7.6 billion loss in the first half of 2023. This, along with geopolitical risks, tempers investors' appetite for riskier assets, which is evident from a sea of red across the Asian equity markets and turns out to be a key factor driving flows away from the risk-sensitive Australian Dollar (AUD).
In fact, a Russian warship fired warning shots at a cargo ship, which it claims was headed to Ukraine, in the southwestern Black Sea on Sunday. It is worth recalling that Russia had pulled out of a UN-brokered deal in July that allowed Ukraine to move its grain via the Black Sea and warned that any ships headed to Ukraine would be treated as potentially carrying weapons. This, along with expectations that the Federal Reserve (Fed) will keep interest rates higher for longer, boosts the safe-haven US Dollar (USD) and exerts pressure on the AUD/USD pair.
The markets seem convinced that the US central bank will stick to its hawkish stance to curb inflation and have been pricing in the possibility of one more rate hike by the end of this year. The bets were reaffirmed by US macro data released on Friday, which showed that PPI climbed slightly more than expected in July. Against the backdrop of a moderate rise in consumer prices in July, the data suggested that the battle to bring inflation back to the Fed's 2% target is far from being won. This, in turn, keeps the door for a 25 bps lift-off in November wide open.
Hawkish Fed expectations, meanwhile, remain supportive of elevated US Treasury bond yields and continues to underpin the Greenback. That said, hopes for additional stimulus measures from China hold back traders from placing fresh bearish bets around the AUD/USD pair and help limit further losses. The fundamental backdrop, however, seems tilted firmly in favour of bearish traders and suggests that the path of least resistance for spot prices is to the downside. Hence, any subsequent recovery might still be seen as a selling opportunity and remain capped.
Technical levels to watch
EUR/USD softens. Economists at ING analyze the pair’s outlook.
Equity markets will not be helping
Unless there is some surprise turnaround in the Chinese story, it looks as though EUR/USD can break below support at 1.0925/1.0930 – potentially as low as 1.0830/1.0845.
Equity markets will not be helping here, where futures markets call both Europe and US indices lower as investors want to learn more about the financial sector in China.
See: EUR/USD seen trading back down at 1.07 on a three-month view – Nordea
- Asian stock markets trade in negative territory because of the fear of higher inflation in the US, China's woes.
- Chinese indexes are leading losses due to ongoing worries over a faltering economy.
- The Bank of Japan (BoJ) offers unlimited JGBs with a maturity of 5–10 years at a fixed rate.
Asian stock markets dipped on Monday amid the fear of a more hawkish stance by the Federal Reserve (Fed) and China woes. During the early European session on Monday, EuroStoxx Futures fell 0.41% to 4,326 by press time. Additionally, Chinese indexes are leading losses due to ongoing worries over a faltering economy.
At press time, China’s Shanghai falls 0.36% to 3,178, the Shenzhen Component Index slumps 0.56% to 10,750, Hong Kong’s Hang Sang dips 2.04% to 18,688, India’s NIFTY 50 is down 0.38%, and South Korea’s Kospi is down 0.78%.
In Japan, the Bank of Japan (BoJ) offers unlimited Japanese Government Bonds (JGBs) with a residual maturity of 5 to 10 years at a fixed rate in the early Asian session on Monday. Following the data, USD/JPY reaches a new intraday low near 144.65 and posts its first loss in six days after reaching a new yearly high earlier in the day.
Moving on, market participants will closely watch the US Retail Sales, FOMC Minutes and the comments from Fed officials for fresh impetus. The events could provide hints for further monetary policy and give a direction for riskier assets like equities, risk-sensitive currencies, etc.
- USD/JPY snaps four-day uptrend as bulls take a breather at the YTD top.
- Yields lack follow-through after refreshing multi-day top, BoJ offers unlimited bond buying to defend Yen price.
- Absence of fresh risk catalysts also contributes to USD/JPY retreat.
- Qualitative headlines, BoJ news and Fed Minutes eyed for clear directions.
USD/JPY bulls take a breather at the highest level in a year as market players seek more clues to defend the Yen pair’s early-day run-up towards refreshing the Year-To-Date (YTD) peak amid the initial hour of Monday’s European session. In doing so, the Yen pair also justifies the Bank of Japan’s (BoJ) bond market moves, as well as the US Dollar’s retreat despite sour sentiment.
That said, the Bank of Japan (BoJ) offered unlimited Japanese Government Bonds (JGBs) of 5-10 years of residual maturity at a fixed rate on early Monday in Asia. With this, the Japanese central bank tames the yields on the key JGBs to put a floor under the Japanese Yen (JPY) price.
On the other hand, the US Dollar Index (DXY) retreats from the one-month high to 102.95 by the press time as market players seek more clues to extend the week-start risk aversion even as China-inflicted woes fade. It’s worth observing that a suspension of its bond trading by China’s Country Garden joins the non-receipt of the payments from a subsidiary of Chinese conglomerate Zhongzhi Enterprise Group to bolster the debt woes of China. Elsewhere, Russia’s readiness to equip new nuclear submarines with hypersonic missiles and the US-China trade war also contributes to the risk-off mood.
The aforementioned risk-negative headlines previously joined the upbeat US Treasury bond yields and concerns about the Bank of Japan’s (BoJ) defense of the ultra-easy monetary policy to propel the USD/JPY price towards refreshing the YTD high with 145.25.
Against this backdrop, the S&P500 and Euro Stoxx Futures remain mildly offered while the US 10-year Treasury bond yields grind higher around 4.17% despite retreating from a one-week high marked earlier in the day.
Looking ahead, inflation clues from Japan will join the US Retail Sales and Fed Minutes to direct the short-term USD/JPY moves. However, major attention will be given to the risk catalysts and yields for clear directions.
Technical analysis
A 100-pip area within a three-week-old rising triangle formation, currently between 145.40 and 144.40, prods the USD/JPY buyers amid overbought RSI (14) conditions.
Here is what you need to know on Monday, August 14:
The US Dollar has gathered strength against its major rivals at the beginning of the new week, with safe-haven flows dominating the action in financial markets. The US Dollar Index, which closed the previous four weeks in positive territory, stretched its uptrend toward 103.00 and touched its highest level since early July. Monday's economic calendar will not offer any high-impact data releases and risk perception could continue to act as the main market driver.
US Dollar price today
The table below shows the percentage change of US Dollar (USD) against listed major currencies today. US Dollar was the strongest against the New Zealand Dollar.
| USD | EUR | GBP | CAD | AUD | JPY | NZD | CHF | |
| USD | 0.11% | 0.13% | 0.16% | 0.30% | 0.02% | 0.30% | 0.04% | |
| EUR | -0.11% | 0.02% | 0.05% | 0.19% | -0.11% | 0.19% | -0.08% | |
| GBP | -0.13% | -0.02% | 0.02% | 0.16% | -0.13% | 0.16% | -0.10% | |
| CAD | -0.18% | -0.05% | -0.03% | 0.14% | -0.13% | 0.11% | -0.12% | |
| AUD | -0.30% | -0.19% | -0.18% | -0.14% | -0.28% | -0.03% | -0.27% | |
| JPY | -0.01% | 0.11% | 0.13% | 0.13% | 0.23% | 0.27% | 0.02% | |
| NZD | -0.27% | -0.19% | -0.16% | -0.14% | 0.00% | -0.28% | -0.26% | |
| CHF | -0.04% | 0.08% | 0.09% | 0.12% | 0.28% | -0.01% | 0.23% |
The heat map shows percentage changes of major currencies against each other. The base currency is picked from the left column, while the quote currency is picked from the top row. For example, if you pick the Euro from the left column and move along the horizontal line to the Japanese Yen, the percentage change displayed in the box will represent EUR (base)/JPY (quote).
After warning of a $7.6 billion loss in the first half of the year on Friday, Chinese real estate giant County Garden Holdings announced that it will suspend the trading of 11 onshore bonds from Monday. The company shares lost nearly 20% on Monday, dragging down Hong Kong's Hang Seng Index by 2% with it. The Shanghai Composite Index fell 0.3% and the CSI 300 fell 0.75%. Moody's Investors Service warned that the crisis in County Garden could spill over to the country's other property and financial markets and delay the recovery of the troubled property sector.
Meanwhile, the Bank of Japan (BoJ) reportedly offered unlimited Japanese Government Bonds (JGBs) of 5-10 years of residual maturity at a fixed rate in the early Asian session on Monday. USD/JPY, which reached its highest level since November above 145.20, retreated below 145.00 following this development.
China sensitive Australian Dollar and New Zealand Dollar stay under bearish pressure to start the week. As of writing, NZD/USD was down 0.3% and trading at its lowest level in 10 months below 0.6000, while AUD/USD was losing 0.35% at 0.6475.
EUR/USD stays on the back foot and trades below 1.0950 in the European morning. The data from Germany showed earlier in the day that the Wholesale Price Index declined 2.8% on a yearly basis in July.
GBP/USD holds steady and consolidates last week losses below 1.2700. On Tuesday, the UK's Office for National Statistics will release labor market data ahead of Wednesday's highly-anticipated inflation report.
Following the previous week's slide, Gold price moves sideways at around $1,910 on Monday. The 10-year US Treasury bond yield stays above 4.1%, making it difficult for XAU/USD to stage a rebound.
Bitcoin continues to move in a narrow channel slightly below $29,500. Ethereum clings to small gains early Monday near $1,850 but struggles to make a decisive move in either direction.
The Reserve Bank of India (RBI) left the benchmark repo rate unchanged at 6.50% for the third consecutive meeting. Economists at Commerzbank analyze Indian Rupee (INR) outlook.
Few reasons for RBI to detour from the wait-and-see approach for now
For the current fiscal year 2023-2024, RBI projects 6.5% growth and inflation at 5.4%. There are few reasons for RBI to detour from the wait-and-see approach for now. We expect them to leave rates unchanged for the rest of the year.
For the currency, RBI will likely be content to see continued stability in USD/INR. In the past week or so, it has drifted up to the upper end of the 81-83 range which has prevailed since the start of the year. One key risk factor near term will be a rebound in inflation due to higher food prices. Longer out, RBI will have to keep an eye on the risks from rising input costs.
- Silver consolidates the recent losses to its lowest level since July 7 touched this Monday.
- The technical setup supports prospects for an extension of a multi-week-old downtrend
- A sustained move back above the $23.20-30 confluence might negate the bearish outlook.
Silver kicks off the new week on a softer note and touches a fresh low since July 7 during the Asian session, though lacks follow-through selling. The white metal now seems to have entered a bearish consolidation phase and is seen oscillating in a narrow trading band just above mid--$22.00s. The technical setup, meanwhile, remains tilted in favour of bearish traders and suggests that the path of least resistance for the XAG/USD is to the downside.
Against the backdrop of the recent decline witnessed over the past three weeks or so, the subdued range-bound price action might still be categorized as a bearish consolidation phase. Moreover, last week's breakdown through a short-term ascending trend line extending from June swing low and the very important 200-day Simple Moving Average (SMA) adds credence to the bearish outlook for the XAG/USD. This, along with the fact that technical indicators on the daily chart are holding deep in the negative territory and are still far from being in the oversold zone, supports prospects for a further depreciating move.
Hence, a subsequent slide back towards retesting the multi-month low, around the $22.15-$22.10 area touched in June, looks like a distinct possibility. Some follow-through selling below the $22.00 mark will expose the $21.55-$21.50 intermediate support and the $21.00 mark. The downward trajectory could get extended towards the $21.00 round figure en route to the YTD low, or levels just below the $20.00 psychological mark touched in March.
On the flip side, attempted recovery back towards the $23.00 round figure might still be seen as a selling opportunity and remain capped near the $23.20-$23.30 confluence support breakpoint, now turned resistance. The latter should act as a pivotal point, which if cleared decisively might trigger a short-covering move. The XAG/USD might then accelerate the recovery momentum towards the $23.60-$23.65 horizontal barrier before aiming to reclaim the $24.00 mark.
Silver daily chart
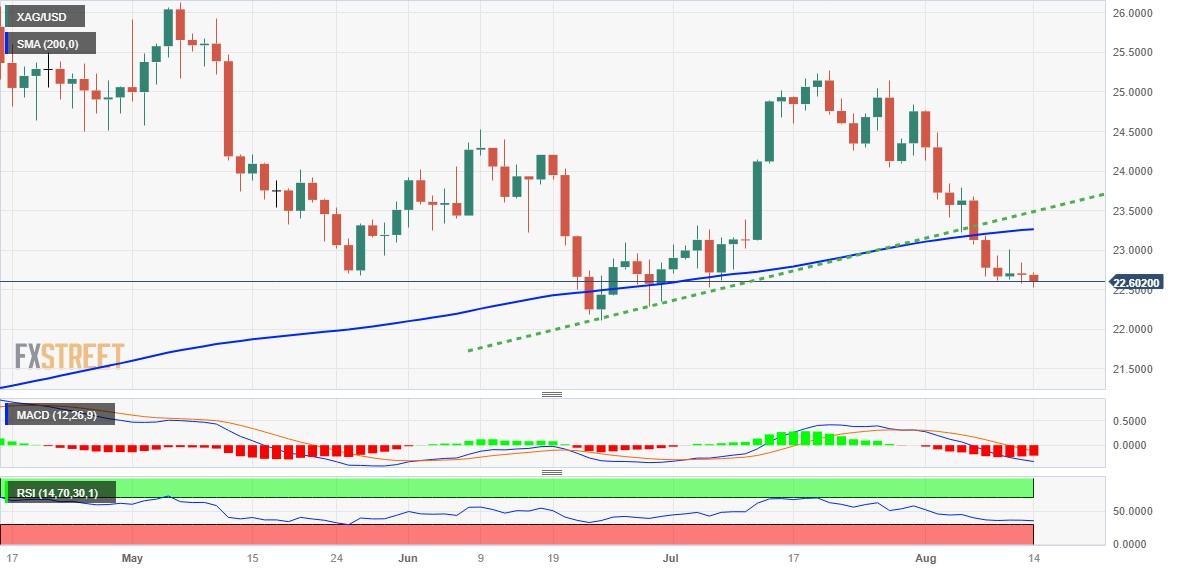
Technical levels to watch
- USD/CAD gains momentum, trades on a positive note for the fifth consecutive week on Monday.
- The pair holds above the 50- and 100-hour Exponential Moving Averages (EMA).
- 1.3500 is the key resistance level to watch; 1.3430 acts as an initial support level for the pair.
The USD/CAD pair trades in positive territory in the Asian trading hours on Monday. The uptick in the pair is bolstered by mixed US economic data and the rise in US 10-year Treasury bond yields. Meanwhile, the uptick in oil prices supports the Loonie against the US Dollar. The major pair currently trades near 1.3457, gaining 11% for the day. Market participants will keep an eye on the Canadian Consumer Price Index (CPI) YoY for July on Tuesday. The figure is expected to rise from 2.8% to 3.0% on a yearly basis.
From the technical perspective, USD/CAD holds above the 50- and 100-hour Exponential Moving Averages (EMA), which means further upside looks favourable.
Any follow-through buying beyond 1.3470 (the upper boundary of the Bollinger Band) could pave the way to 1.3500, highlighting a psychological round figure and a high of August 8. Any meaningful follow-through buying above the latter will see a rally to the next barrier at 1.3550 (high of May 23), en route to 1.3650 (high of May 31).
On the flip side, 1.3430 (the midline of the Bollinger Band) acts as an initial support level for USD/CAD. The 1.3390–1.3400 zone will be the key contention level to watch. The mentioned level is the confluence of the lower limit of the Bollinger Band, a psychological round mark, and the 50-hour EMA. Any extended weakness below the latter will challenge the next downside filter at 1.3340 (the 100-hour EMA). The additional downside filter is located at 1.3300 (high of August 1, a psychological figure).
However, the further upside appears favourable as the Relative Strength Index (RSI) stands above 50, activating the bullish momentum for the USD/CAD pair for the time being.
USD/CAD four-hour chart
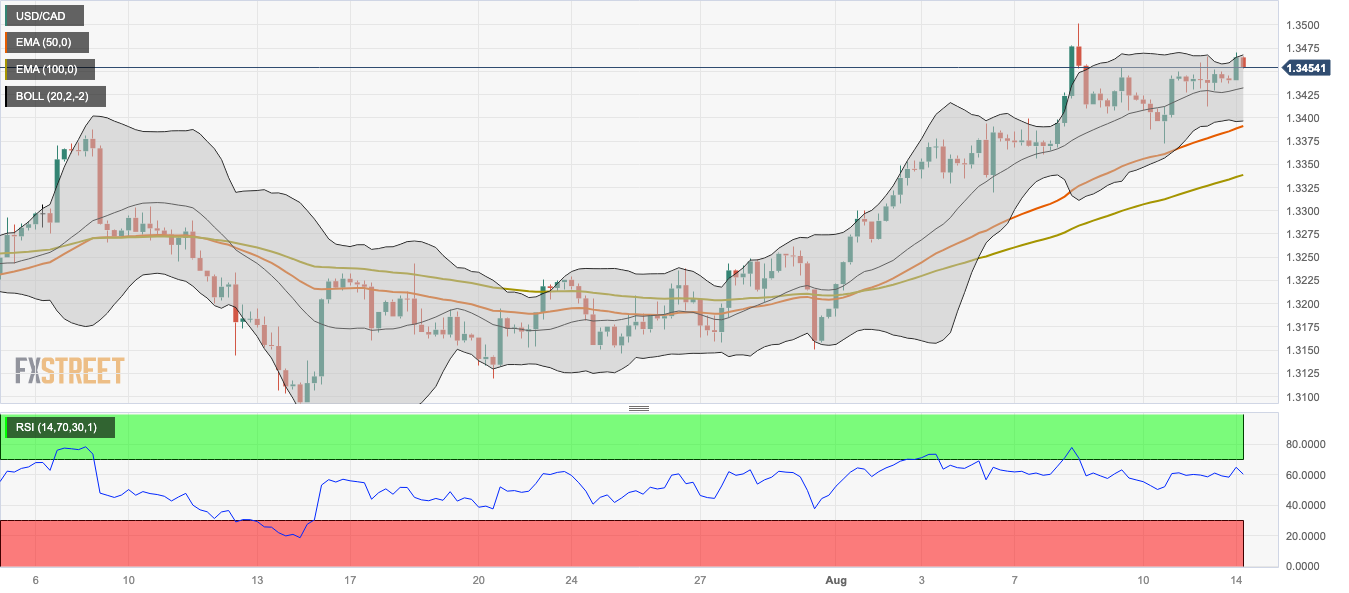
The Norwegian Krone should be able to appreciate moderately against the Euro during the course of the year, in the view of Antje Praefcke, FX Analyst at Commerzbank.
Norges Bank is no longer falling behind the ECB in its determination
Norges Bank showed courage in June. It raised the key interest rate by 50 bps and signaled two more rate hikes this year. Compared to the ECB, it thus no longer appears less determined to tackle inflation risks. That is why I am comfortable with the forecast of a moderate appreciation of the Krone later this year and next year.
Norges Bank does not see the first interest rate cuts until the end of 2024 when it expects inflation to fall. At the same time, the ECB will no longer act decisively against stubbornly high inflation next year with a view to the peripheral countries, so that a risk premium on the Euro is justified. This suggests that the NOK will continue to appreciate against the Euro in 2024.

Source: Commerzbank Research
- EUR/USD licks its wounds at the lowest level in a week.
- Italian PM Meloni rules out further challenges to banking sector after windfall tax announcements.
- China debt woes, dovish ECB concerns exert downside pressure on Euro pair.
- Lack of fresh negatives, cautious mood ahead of top-tier data/events prod sellers.
EUR/USD remains pressured at the lowest level in a week, declining to 1.0925 amid the early hours of Monday’s European session. In doing so, the Euro pair justifies the market’s rush toward the US Dollar despite the recently positive headlines from Italy.
Italian Prime Minister Giorgia Meloni ruled out further hardships for the banks after announcing a one-off 40% windfall tax on them and taking full responsibility for the same. The same joins the US Dollar Index (DXY) retreat from the one-month high to prod the Euro bears.
However, fears of debt market fallouts in China and the looming recession woes in the Eurozone exert downside pressure on the EUR/USD price, especially amid the firmer US Treasury bond yields.
Furthermore, the mixed readings of the German Wholesale Price Index (WPI) for July also favor the Euro pair sellers.
That said, a suspension of its bond trading by China’s Country Garden joins the non-receipt of the payments from a subsidiary of Chinese conglomerate Zhongzhi Enterprise Group to bolster the debt woes of China. Elsewhere, Russia’s readiness to equip new nuclear submarines with hypersonic missiles and the US-China trade war also contributes to the risk-off mood, which in turn weighs on the EUR /USD Price.
Elsewhere, the European Central Bank (ECB) officials have teased policy pivot in their latest public appearances while the ECB’s monthly economic outlook highlighted the macro uncertainty and keeps the Euro bears hopeful.
Amid these plays, the S&P500 and Euro Stoxx Futures remain mildly offered while the US 10-year Treasury bond yields grind higher around 4.17%.
Looking ahead, a light calendar in the bloc joins the cautious mood ahead of Fed Minutes to prod the EUR/USD pair traders. However, the risk-off mood may keep the sellers hopeful.
Technical analysis
EUR/USD needs to provide a daily closing beneath the 100-DMA support of 1.0930 to aim for the 61.8% Fibonacci retracement of May-July upside, near 1.0880, as well as the previous monthly bottom surrounding 1.0835. Failing to do so can trigger the Euro pair’s corrective bounce toward the multi-day-old previous support line, close to 1.1040 at the latest.
Also read: EUR/USD Price Analysis: Euro bears approach 1.0900 as sour sentiment, firmer yields propel US Dollar
- USD/CHF clings to mild gains after four-week uptrend.
- Upbeat RSI, clear break of 200-SMA keeps buyers hopeful.
- 10-week-old descending resistance line adds to the upside filters.
- One-month-old horizontal support prods the Swiss Franc pair sellers.
USD/CHF stays defensive around 0.8770 heading into Monday’s European session as it edges higher past 200-SMA within a fortnight-old symmetrical triangle. In doing so, the Swiss Franc (CHF) pair struggles to justify the US Dollar’s strength amid the risk-off mood, as well as backed by the firmer Treasury bond yields. It’s worth noting that the fresh debt woes from China join the cautious mood ahead of the FOMC Minutes and indecision about the Fed’s next move weighs on sentiment and puts a floor under the quote.
Also read: USD/CHF remains range-bound around 0.8770 ahead of Swiss data, US Retail Sales
Technically, an upside clearance of the 200-SMA joins the upbeat RSI (14) line, not overbought, to favor the USD/CHF buyers.
It’s worth noting that a successful upside break of the two-week-old symmetrical triangle, currently between 0.8740 and 0.8780, becomes necessary for the USD/CHF bulls to retake control.
Even so, a downward-sloping resistance line from May 31, close to 0.8840 at the latest, can challenge the Swiss Franc (CHF) pair buyers before giving them control.
On the contrary, a downside break of the stated triangle’s support line surrounding 0.8740 isn’t an open welcome to the USD/CHF bears as a one-month-old horizontal support area around 0.8640-30 appears a tough nut to crack for the pair sellers.
In a case where the USD/CHF remains bearish past 0.8630, the odds of witnessing a slump towards the yearly low marked in July around 0.8550 can’t be ruled out.
USD/CHF: Four-hour chart

Trend: Further upside expected
- EUR/GBP loses traction and currently trades near 0.8625 on Monday.
- The UK Gross Domestic Product (GDP) grew unexpectedly by 0.5% MoM in June, versus the market consensus of 0.2%.
- The Eurozone Gross Domestic Product (GDP) Q2, UK inflation data will be in the spotlight.
The EUR/GBP cross struggles to gain and remains on the defensive above the 0.8600 mark in the Asian session on Monday. Market players await the Eurozone Gross Domestic Product (GDP) Q2 due on Wednesday. The growth numbers are expected to remain at 0.6% and 0.5% on a yearly and monthly basis, respectively.
The European Central Bank's (ECB) monthly Economic Bulletin revealed last week that the Eurozone’s inflation is still predicted to be too high for too long, and the prospects for economic growth and inflation are still uncertain. According to the Reuters poll, the target inflation rate of 2.0% will not be reached until at least 2025, and more than 90% of economists surveyed anticipate no rate cuts before the second quarter of 2024.
On the UK front, the UK National Statistics reported on Friday that the UK Gross Domestic Product (GDP) grew unexpectedly by 0.5% MoM in June, versus market consensus of 0.2% and a 0.1% decline in the previous month. Additionally, UK Industrial Production rose 1.8% on a monthly basis in June, above the expectation of a 0.1% increase and a 0.6% drop prior. Lastly, Manufacturing Output came in at 2.4% m/m, better than expected of 0.2% and 0.1% drop in the previous reading.
The upbeat economic data in the United Kingdom increases the likelihood that the Bank of England (BoE) will hike the additional interest rate. As the UK economy is fragile and the interest rate is at a 15-year high of 5.25%, market participants are cautious about the BoE's move. The aggressive monetary policy could negatively affect the British economy. However, the UK inflation data and wage data will provide clues for the BoE's next meeting decision.
Moving on, the Eurozone Gross Domestic Product (GDP) Q2 and Harmonized Index of Consumer Prices for July will be released later this week. On the UK docket, the UK Claimant Count Change for July, Consumer Price Index (CPI), and Retail Sales MoM will be due. The data will be critical for determining a clear movement for the EUR/GBP cross.
Italian Prime Minister Giorgia Meloni crossed wires early Monday while giving an interview to the local newspaper, per Reuters.
In doing so, the Italian leader took full responsibility of the early-month announcements of windfall tax on bank by terming it a serious matter.
The policymaker also ruled out chatters about alliances for European Union (EU) parliament elections by calling it “Too early”. “NO VETOES ON LE PEN,” added Italy’s Meloni.
Market reaction
Following the news, EUR/USD pares intraday losses at the lowest level in a week, picking up bids to 1.0935 heading into Monday’s European session.
Also read: EUR/USD Price Analysis: Euro bears approach 1.0900 as sour sentiment, firmer yields propel US Dollar
- Gold Price stays pressured at five-week low as bears eye yearly bottom.
- China fans risk-off mood amid sluggish start to key week, yields underpin US Dollar demand.
- More clues of US inflation, FOMC Minutes will be eyed for fresh impulse.
Gold Price (XAU/USD) keeps bears on the driver’s seat at the monthly low, after witnessing a four-week downtrend, as headlines from China roil market sentiment and underpin the US Dollar’s haven demand. Adding strength to the risk-off mood are the geopolitical concerns about Russia and the firmer US Treasury bond yields, which in turn allows the US Dollar Index (DXY) to remain firmer after rising in the last four consecutive weeks despite looming policy pivot at the Federal Reserve (Fed).
It’s worth noting that a suspension of its bond trading by China’s Country Garden joins the non-receipt of the payments from a subsidiary of Chinese conglomerate Zhongzhi Enterprise Group to bolster the debt woes of China. Elsewhere, Russia’s readiness to equip new nuclear submarines with hypersonic missiles and the US-China trade war also contributes to the risk-off mood, which in turn weighs on the XAU/USD Price.
Elsewhere, mostly upbeat US inflation clues contrast with the dovish interest rate futures, suggesting no Fed rate hike in September, to challenge the US Dollar ahead of more clues about the US price pressure and the Fed Minutes.
Also read: Gold Price Forecast: XAU/USD defends 200-day EMA amid risk-aversion, bearish bias remains
Gold Price: Key levels to watch
Our Technical Confluence indicator suggests that the Gold Price stays well beneath the key $1,920 resistance confluence comprising the 5-DMA, Fibonacci 23.6% on one-week and Pivot Point one-day R1.
Also keeping the XAU/USD bears hopeful is the quote’s clear downside break of the $1,918 support, now immediate resistance encompassing Pivot Point one-month S1 and Fibonacci 38.2% on one-day.
With this, the Gold Price appears well set to drop toward the previous monthly low of around $1,900.
However, the quote’s weakness past $1,900 has a space to fill unless hitting the yearly low marked in June around $1,893.
Meanwhile, a clear upside break of the $1,920 resistance confluence could propel the Gold Price towards the $1,935 level encompassing Pivot Point one-week R1 and Fibonacci 61.8% on one-month.
Here is how it looks on the tool
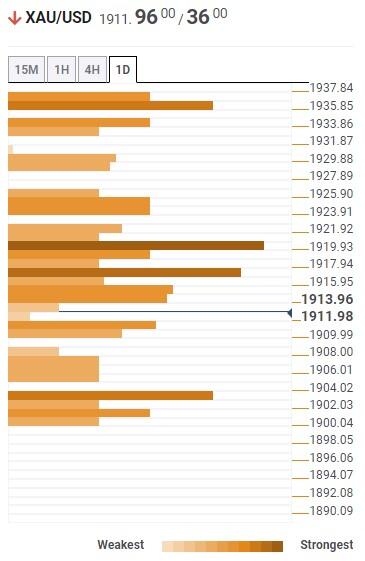
About Technical Confluences Detector
The TCD (Technical Confluences Detector) is a tool to locate and point out those price levels where there is a congestion of indicators, moving averages, Fibonacci levels, Pivot Points, etc. If you are a short-term trader, you will find entry points for counter-trend strategies and hunt a few points at a time. If you are a medium-to-long-term trader, this tool will allow you to know in advance the price levels where a medium-to-long-term trend may stop and rest, where to unwind positions, or where to increase your position size.
- AUD/JPY holds below the 94.00 barrier on Monday following the BoJ offering unlimited JGBs at a fixed rate.
- AUD/JPY trades within a descending trend channel line from the middle of June on the four-hour chart.
- The immediate resistance level for AUD/JPY is seen at 94.00; the key contention level is located at 93.00.
The AUD/JPY cross loses traction and remains capped below the 94.00 barrier on Monday. Earlier in the day, the Bank of Japan (BoJ) offers unlimited Japanese Government Bonds (JGBs) with a residual maturity of 5 to 10 years at a fixed rate. Following the data, AUD/JPY edges lower to 93.57 and rebounded to the 93.75 mark in the Asian session.
From a technical perspective, AUD/JPY trades within a descending trend channel line from the middle of June on the four-hour chart. That said, the path of least resistance for the AUD/JPY is to the downside as the cross holds below the 50- and 100-hour Exponential Moving Averages (EMAs).
The immediate resistance level for AUD/JPY is seen at 94.00 (the 50-hour EMA, a psychological round mark). The next barrier to watch is 94.20 (the 100-hour EMA), en route to 94.80 ((the upper boundary of a descending trend channel). Any meaningful follow-through buying above the latter will see a rally to 95.40 (high of July 14).
On the downside, the cross will meet the key contention level at 93.00, representing a psychological round figure, a low of August 4. The next downside stop appears at 92.50 (low of July 18), followed by 92.15 (low of June 6). A breach of the latter will see a drop to 91.80 (the lower limit of a descending trend channel).
It’s worth noting that the Relative Strength Index (RSI) holds in bearish territory below 50, supporting the sellers for now.
AUD/JPY four-hour chart
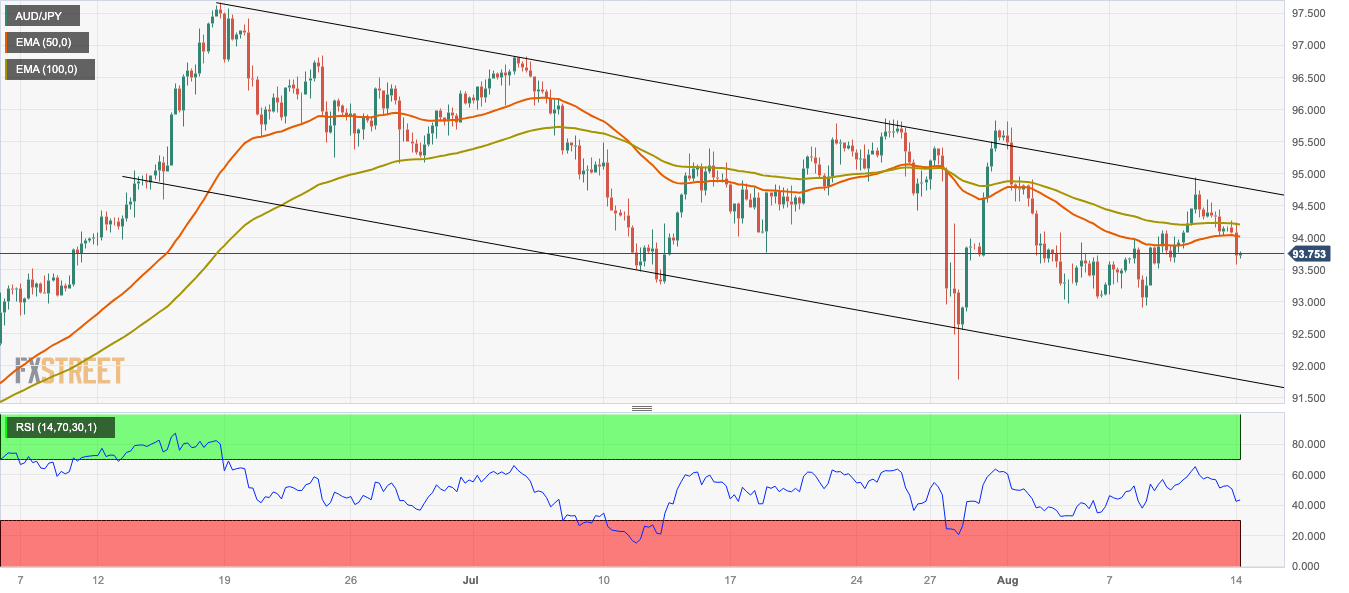
USD/IDR retreats from the five-week high of 15,350, marked earlier in the day, as Bank Indonesia (BI) defends Rupiah (IDR) traders from high volatility heading into Monday’s European session. Following the BI meddling, the Indonesia Rupiah pair drops to 15,325, retreating to the day-start levels by the press time.
That said, Reuters quotes statements from Edi Susianto, head of BI’s monetary management department, while suggesting the Indonesian central bank’s money market operations to defend the IDR.
“Indonesia's central bank has intervened in the spot foreign exchange and domestic non-deliverable forward markets to prevent high volatility in the rupiah currency,” said BI’s Edi Susianto per Reuters.
While citing the aim for the BI’s move, the Indonesia central bank official also added to, “ensure a good balance of supply and demand.”
Also read: Indonesia: GDP expected to expand more than 5% this year – UOB
- USD/JPY trades around 144.90 after retreating from a YTD high in the Asian session.
- US Producer Price Index (PPI) YoY grew by 0.8% in July from 0.1% in June.
- The Bank of Japan (BoJ) offered unlimited JGBs with a maturity of 5–10 years at a fixed rate.
- Investors will monitor US Retail Sales, FOMC Minutes, comments from Fed officials.
The USD/JPY pair holds below the 145.00 area after retreating from a YTD high during the Asian session. The major pair currently trades around 144.90, down 0.05% for the day.
On Friday, the US Bureau of Labour Statistics revealed that the US Producer Price Index (PPI) for final demand YoY rose 0.8% in July from 0.1% in June. The figure was higher than the market expectation of 0.7%. Additionally, the University of Michigan's (UoM) Consumer Confidence Index for July fell to 71.2 from 71.6, better than 71 expected. Finally, UoM 5-year Consumer Inflation Expectations declined to 2.9% for August versus 3.0% estimated and prior. The pair faced some follow-through buying following the data. That said, market players anticipated rising bets for further tightening by the Federal Reserve's (Fed) 25 basis points (bps) by the end of this year. This, in turn, might support the Greenback and act as a tailwind for the USD/JPY pair.
On the other hand, the Bank of Japan (BoJ) offers unlimited Japanese Government Bonds (JGBs) with a residual maturity of 5 to 10 years at a fixed rate in the early Asian session on Monday. Following the data, USD/JPY reaches a new intraday low near 144.65 and posts its first loss in six days after reaching a new yearly high earlier in the day.
In the absence of the top-tier economic data release from Japan this week, market players will focus on US Retail Sales, FOMC Minutes and the comment from the Fed official to take cues and find a clear direction in the USD/JPY pair. Next week, Japan’s Gross Domestic Product (GDP) data from Q2 will be the highlight.
- AUD/USD drifts lower for the fifth successive day and drops to a fresh YTD low on Monday.
- A softer risk tone and a modest USD strength exert heavy pressure on the risk-sensitive Aussie.
- The technical setup favours bearish traders and supports prospects for further near-term losses.
The AUD/USD pair continues losing ground for the fifth successive day and drops to a fresh low since November 2022, closer to mid-0.6400s during the Asian session on Monday.
The worsening economic conditions in China, along with US-China tensions and geopolitical risks, temper investors' appetite for riskier assets and drive flows away from the risk-sensitive Australian Dollar (AUD). The US Dollar (USD), on the other hand, climbs to a multi-week top and remains well supported by growing acceptance that the Federal Reserve (Fed) will keep interest rates higher for longer. This, in turn, is seen exerting downward pressure on the AUD/USD pair and contributing to the ongoing decline.
From a technical perspective, a subsequent slide and acceptance below the 0.6500 psychological mark add credence to the recent breakdown through the bearish double-top neckline support near the 0.6600 horizontal level. This, along with the aforementioned fundamental backdrop, suggests that the path of least resistance for the AUD/USD pair is to the downside. That said, the Relative Strength Index (RSI) on the daily chart has moved on the verge of breaking into the oversold zone and warrants some caution.
Hence, it will be prudent to wait for some near-term consolidation or a modest bounce before traders start positioning for a further depreciating move. Any attempted recovery, however, is more likely to confront stiff resistance and meet with a fresh supply near the 0.6500 mark. This, in turn, should cap the AUD/USD pair near the 0.6530 area, which should now act as a pivotal point. A sustained strength beyond might trigger a short-covering rally and lift spot prices towards the 0.6600 round figure.
The latter is closely followed by last week's swing high, around the 0.6615 region, above which the AUD/USD pair could extend the momentum further towards the 0.6700 mark, representing the 50-day Simple Moving Average (SMA), en route to the very important 200-day SMA, currently pegged around the 0.6725-0.6730 area.
The AUD/USD pair, meanwhile, seems poised to weaken further below the 0.6455-0.6450 area and eventually drop to the 0.6400 round figure. Some follow-through selling will expose the next relevant support near the 0.6365-0.6360 region and the 0.6300 mark, which if broken decisively will be seen as a fresh trigger for bearish traders and pave the way for further losses.
AUD/USD daily chart
-638275828943103685.png)
Technical levels to watch
Goldman Sachs’ (GS) latest report unveils dovish bias about the US Federal Reserve (Fed) as it anticipates the peak rates to be around 3.0% to 3.25% within the analytical piece published during the weekend.
The GS also expects the Fed to start cutting interest rates from the second quarter (Q2) of 2024.
The US bank’s analyst Carl Quintanilla also tweets that the GS expects 25 basis points (bps) of rate cuts per quarter while also forecasting faster rate cuts in case the US policymakers think the inflation problem is less likely to return.
Also read: US Dollar Index: DXY traces sturdy yields to print five-week high near 103.00 ahead of Fed Minutes
- USD/INR takes the bids to prod late 2022 peak, defends three-week uptrend.
- Fears of India’s struggle to take China’s position as global manufacturing hub, cautious mood ahead of CPI weigh on Rupee.
- RBI inaction jostles with looming Fed policy pivot but China-inflicted risk aversion propels USD/INR.
- Key resistance break allows Indian Rupee to challenge record low marked in 2022 ahead of FOMC Minutes, US data.
USD/INR bulls cheer risk aversion in Asia, as well as the anxiety ahead of India inflation data, to refresh yearly high near 83.10 during early Monday. In doing so, the Indian Rupee (INR) pair also justifies the domestic struggle to take over China amid the Reserve Bank of India’s (RBI) inaction.
Financial Times (FT) highlights the iPhone maker Foxconn’s cautious optimism about India to cite the hurdles for the Asian economy as it benefits from the global “China plus one” move. Also challenging the INR could be the third weekly fall in the foreign exchange reserves. Furthermore, the RBI’s status quo despite the inflation woes at home, expected to escalate further, also propel the USD/INR prices.
On the other hand, weekend news from China suggests further hardships for the world’s second-largest economy, as well as for the global economic mechanism. Also challenging the sentiment are geopolitical concerns about Russia and the recently firmer US data, which in turn fuel the US Dollar and the USD/INR prices.
China’s Country Garden pauses its bond trading and a few companies from the Dragon Nation complain about not receiving payments from a subsidiary of Chinese conglomerate Zhongzhi Enterprise Group, the debt woes regain momentum.
On the same line, the talks of a liquidity crunch at the Zhongzhi Enterprise Group were out and loud previously and the latest actions confirm the market players’ fears. Elsewhere, the US-China trade war and Russia’s firing of warning shots at a warship in the Black Sea also roil the market’s risk profile.
It’s worth observing that the upbeat US data and strong Oil price also underpin the USD/INR pair’s run-up due to India’s reliance on energy imports. That said, the US Dollar Index (DXY) renews its monthly top near 103.00 while WTI crude oil refreshed its yearly top the last week, easing to $82.45 by the press time.
While portraying the mood, the S&P500 Futures drop 0.20% intraday as it fades the previous day’s corrective bounce off the monthly low whereas the US 10-year Treasury bond yields remain firmer around 4.18% by the press time. Furthermore, the MSCI’s index of Asia-Pacific shares outside Japan drops 1.62% on a day at the latest.
Moving on, India’s Wholesale Price Index (WPI) and Consumer Price Index (CPI) for July will direct intraday moves of the USD/INR pair but major attention will be given to the risk catalysts for clear directions.
Technical analysis
A daily closing beyond the tops marked in late 2022 around 83.20 becomes necessary for the USD/INR bulls to challenge the record high marked the last year at around 83.45. On the contrary, the overbought RSI conditions may play a role in dragging the quote. However, the Indian Rupee (INR) pair sellers remain off the table unless witnessing a daily close below July’s peak of around 82.80.
- EUR/JPY edges lower for the second successive day on Monday, albeit lacks follow-through.
- Reviving safe-haven demand, along with intervention fears, benefit the JPY and exert pressure.
- The divergent BoJ-ECB policy stance favours bullish traders and should help limit the downside.
The EUR/JPY cross kicks off the new week on a softer note and moves further await from its highest level since September 2008, around the 159.20 region touched on Friday. Spot prices drop to the 158.25 region during the Asian session, down for the second straight day, though any meaningful corrective decline still seems elusive.
Speculations that the recent weakness in the Japanese Yen (JPY) might prompt some jawboning from authorities or even lead to an intervention in the foreign exchange markets turn out to be a key factor acting as a headwind for the EUR/JPY cross. Apart from this, a generally weaker tone around the Asian equity markets benefits the safe-haven JPY and exerts some downward pressure on spot prices. Against the backdrop of growing concerns about the worsening economic conditions in China and US-China tensions, geopolitical risks temper investors' appetite for riskier assets and drive some haven flows towards the JPY.
It is worth recalling that US President Joe Biden last week signed an executive order, which prohibits new US investment in China in sensitive technologies like computer chips and requires government notification in other tech sectors. Adding to this, Taiwan Vice President William Lai left on Saturday for a sensitive trip to the US, which China has condemned. Furthermore, Taiwanese officials fear that the trip could prompt more Chinese military activity around the democratically governed island. Meanwhile, China's Commerce Ministry announced an anti-dumping tariff for polycarbonate imported from Taiwan effective from August 15.
On the geopolitical front, the Russian warship fired warning shots at a cargo ship in the southwestern Black Sea on Sunday and further tempers investors' appetite for riskier assets. That said, the Bank of Japan's (BoJ) dovish stance might keep a lid on any further gains for the JPY and helps limit the downside for the EUR/JPY cross, at least for the time being. In fact, policymakers have stressed that steps taken in July to make the BoJ's Yield Curve Control (YCC) policy more flexible and allow yield on the 10-year Japanese government bond to move up toward 1% was a technical tweak aimed at extending the shelf life of stimulus.
In contrast, the European Central Bank (ECB) has raised borrowing costs by a combined 425 bps since last July. Moreover, the markets are still pricing in a greater chance of one more rate hike by the end of this year. This marks a big divergence in the monetary policy stance adopted by the two major central banks and supports prospects for the emergence of some dip-buying around the EUR/JPY cross. Hence, it will be prudent to wait for strong follow-through selling before confirming that spot prices have topped out in the near term and positioning for any meaningful corrective pullback.
Technical levels to watch
USD/MXN prints mild gains around 17.00, after posting a weekly loss, as the Mexican Peso struggles for clear directions during early Monday in Europe.
That said, the Mexican Peso (MXN) pair dropped in the last week despite the broad US Dollar’s strength as market players sensed more odds of the Fed’s policy pivot than the Banxico.
Even so, the mixed options market signals jostle with the risk-off mood to prod the USD/MXN traders of late.
Also read: S&P500 Futures prod one-month low, yields grind higher as China fuels economic fears
As per the latest options market data from Reuters, the one-month Risk Reversal (RR) of the USD/MXN pair, a measure of the spread between call and put prices, dropped in the last three consecutive days to -0.1000 by the end of Friday North American trading session.
However, the weekly RR appears the contrary as the options market gauge printed the four-week uptrend, despite the disappointing daily figures, to 0.040 at the latest.
Elsewhere, the US Dollar Index (DXY) renews a five-week high near 103.00 amid firmer US Treasury bond yields and the risk-off mood.
Also read: US Dollar Index: DXY traces sturdy yields to print five-week high near 103.00 ahead of Fed Minutes
- USD/CAD takes the bids to refresh intraday high, jostles with crucial resistances.
- Bullish MACD signals, sustained upside break of four-month-old rising trend line favor Loonie pair buyers.
- Sellers need validation from April’s low to retake control.
USD/CAD crosses the 200-DMA hurdle as bulls attack the five-month-old descending resistance line early Monday in Europe. In doing so, the Loonie pair justifies the retreat in the WTI crude oil prices, Canada’s key export item, while taking clues from the firmer US Treasury bond yields and the US Dollar amid sour sentiment. That said, the major currency pair rises 0.11% intraday to near 1.3460 by the press time.
Also read: USD/CAD holds ground near the 1.3440 mark, eyes on Canadian CPI, US Retail Sales
Apart from the aforementioned fundamentals, a successful break of the rising trend line from April 14, close to 1.3400, joins the bullish MACD signals to keep the USD/CAD buyers hopeful.
However, a daily closing beyond the stated resistance line, close to 1.3460 at the latest, becomes necessary for the Loonie pair buyers to keep the reins.
Also likely to challenge the USD/CAD buyers is the monthly high of near 1.3500, a break of which could propel the prices toward a horizontal area comprising multiple tops marked since late April, close to 1.3655–70.
On the flip side, USD/CAD sellers will seek a daily closing beneath the 200-DMA level of 1.3450 to rethink returning from the camp.
Even so, a four-month-long rising trend line near 1.3400 will test the Loonie pair’s downside before giving control to the bears.
USD/CAD: Daily chart
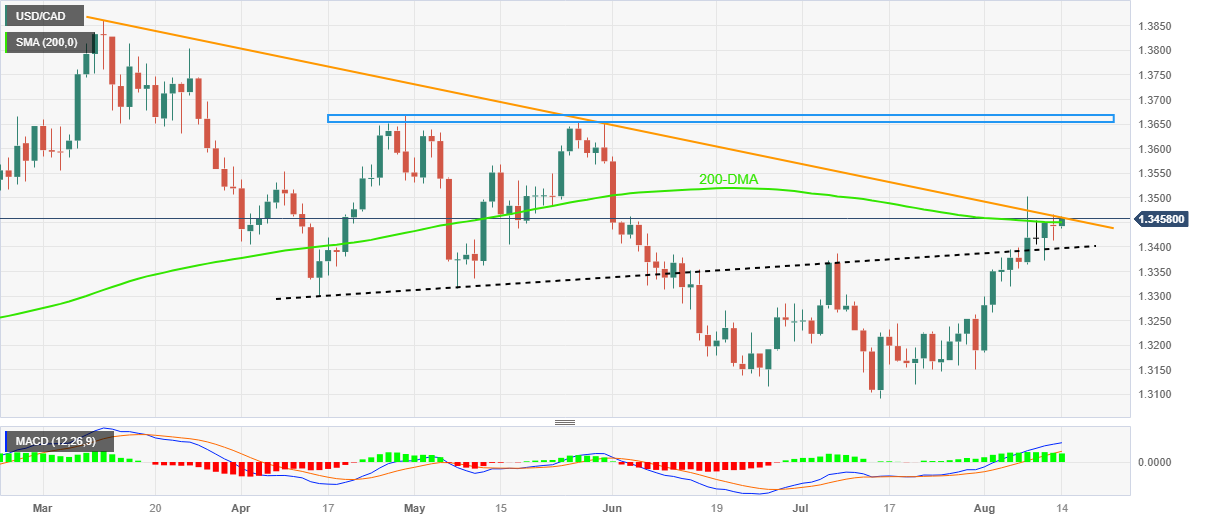
Trend: Further upside expected
- GBP/USD extends its downside around 1.2665 in the Asian session on Monday.
- The UK growth rate unexpectedly grew to 0.5% MoM in June, versus the market consensus of 0.2%.
- The US Producer Price Index (PPI) YoY grew by 0.8% in July from 0.1% in June.
- Market players await the UK inflation data, US Retail Sales and FOMC Minutes.
The GBP/USD pair remains under pressure and trades in a negative territory for the fourth consecutive week. The major pair currently trades around 1.2665, down 0.23% for the day. The upbeat UK data fails to lift the Pound Sterling as investors are concerned about the possibility of a further rate hike that would impact the UK economy.
On Friday, the UK economy grew unexpectedly by 0.5% MoM in June, versus market consensus of 0.2% and a 0.1% decline in the previous month. Additionally, UK Industrial Production rose 1.8% on a monthly basis in June, above the expectation of a 0.1% increase and a 0.6% drop prior. Lastly, Manufacturing Output came in at 2.4% m/m, better than expected of 0.2% and 0.1% drop in the previous reading.
The stronger UK economic data increases the odds that the Bank of England (BoE) will raise the additional interest rate. However, market participants are cautious about the BoE move as the UK economy is fragile and the interest rate is at a 15-year high of 5.25%. The aggressive monetary policy could have a negative impact on the UK economy. However, the UK inflation data and wage figures due later this week, will offer hints for the BoE decision in the next meeting.
On the US Dollar front, the US Bureau of Labour Statistics reported on Friday that the US Producer Price Index (PPI) for final demand YoY rose 0.8% in July from 0.1% in June. The figure was higher than the market expectation of 0.7%. Additionally, the University of Michigan's (UoM) Consumer Confidence Index for July fell to 71.2 from 71.6, better than 71 expected. Finally, UoM 5-year Consumer Inflation Expectations declined to 2.9% for August versus 3.0% estimated and prior.
Looking ahead, the UK Claimant Count Change for July, Consumer Price Index (CPI), and Retail Sales MoM will be released from the UK docket later this week. On the other hand, investors will also focus on US Retail Sales, FOMC Minutes and the comment from the Fed official to take cues and find a clear direction in the GBP/USD pair.
| Raw materials | Closed | Change, % |
|---|---|---|
| Silver | 22.679 | -0.11 |
| Gold | 1913.866 | 0.07 |
| Palladium | 1292.96 | 0.52 |
- NZD/USD drifts lower for the fifth successive day and is pressured by a combination of factors.
- China's economic woes and the downbeat domestic data weigh on the New Zealand Dollar (NZD).
- Bets for more Fed rate hikes continue to underpin the USD and contribute to the ongoing decline.
The NZD/USD pair remains under some selling pressure for the fifth successive day and drops to its lowest level since November 2022, closer to mid-0.5900s during the Asian session on Monday.
Growing concerns about the worsening economic conditions in China continue to undermine antipodean currencies, including the New Zealand Dollar (NZD), which loses additional ground in reaction to the downbeat domestic data. In fact, Business NZ's Services Index plunged into contraction territory during July and came in at 47.8 – marking the lowest level since January 2022. Moreover, the previous month's reading was also revised down to 49.6 from 50.1 and pointed to the slowing economy. This, along with the underlying bullish sentiment surrounding the US Dollar (USD), continues to exert downward pressure on the NZD/USD pair.
In fact, the USD Index (DXY), which tracks the Greenback against a basket of currencies, climbs to its highest level since July 7 and remains supported by expectations that the Federal Reserve (Fed) will stick to its hawkish stance. The bets were reaffirmed by the US PPI on Friday, which climbed slightly more than expected in July. Against the backdrop of a moderate rise in consumer prices in July, the data suggested that the battle to bring inflation back to the Fed's 2% target is far from being won. This keeps the door open for one more 25 bps Fed rate hike in 2023 and remains supportive of a further rise in the US Treasury bond yields, underpinning the USD.
Apart from the aforementioned fundamental backdrop, Friday's sustained breakdown below the 0.6000 psychological mark is seen as another factor that prompts some follow-through technical selling around the NZD/USD pair. This, in turn, suggests that the path of least resistance for spot prices is to the downside. Traders, however, might refrain from placing aggressive bets ahead of the crucial Chinese macro data dump on Tuesday and the Reserve Bank of New Zealand (RBNZ) monetary policy meeting on Wednesday.
Technical levels to watch
- Market sentiment remains sour on China debt woes, geopolitical fears.
- S&P500 Futures lick its wounds at the lowest level in a month during five-day downtrend.
- Treasury bond yields approach yearly tops marked earlier in August.
- Fears emanating from China’s Country Garden, Zhongrong Trust propel debt woes.
The risk appetite remains downbeat during early Monday as weekend news from China suggests further hardships for the world’s second-largest economy, as well as for the global economic mechanism. Also challenging the sentiment are geopolitical concerns about Russia and the recently firmer US data, which in turn flags fears of the Fed’s rate hike in September even if the interest rate futures suggest no more Fed rate hikes.
While portraying the mood, the S&P500 Futures stay pressured at 4,480, fading the previous day’s corrective bounce off the lowest level in a month, whereas the US 10-year Treasury bond yields print a three-day uptrend to 4.18% as the bond bears eye the yearly peak marked earlier in the month.
As China’s Country Garden pauses its bond trading and a few companies from the Dragon Nation complain about not receiving payments from a subsidiary of Chinese conglomerate Zhongzhi Enterprise Group, the debt woes regain momentum. That said, the news of Country Garden’s restructuring of its debt drowned the company’s bonds to record levels and hence pushed the biggest Chinese realtor towards pausing the bond trading. On the same line, the talks of a liquidity crunch at the Zhongzhi Enterprise Group were out and loud previously and the latest actions confirm the market players’ fears.
Elsewhere, the US-China trade war and Russia’s firing of warning shots at a warship in the Black Sea also roil the market’s risk profile.
It should be noted that the firmer US Treasury bond yields and the recently upbeat US data allow the US Dollar Index (DXY) to remain firmer, which in turn weighs on the commodities and Antipodeans.
Talking about the data, the US Consumer Price Index (CPI) numbers for July failed to lift the Fed bets for September, suggesting the nearness to the policy pivot. However, the CPI details and other price pressure measures managed to keep the Greenback buyers hopeful. It’s worth noting that the US Producer Price Index (PPI) for July, the preliminary readings of the University of Michigan’s (UoM) Consumer Sentiment Index (CSI) for August and the UoM 5-Year Consumer Inflation Expectations for the said month helped the USD benefit on Friday. Further, the US one-year inflation outlook edged lower to 3.3% from 3.4%.
Furthermore, Federal Reserve (Fed) Governor Michelle Bowman backed additional rate hikes and defended the Fed hawks. However, San Francisco Fed Bank President Mary Daly, Philadelphia Fed Bank President Patrick Harker and New York Fed President John Williams signaled rate cuts in 2024 but also highlighted data-dependency and kept the policy doves looking for more details to confirm the bias.
Looking forward, China’s Industrial Production and Retail Sales for July, up for publishing on Tuesday, will be crucial to watch for initial directions ahead of Wednesday’s housing numbers. More importantly, Tuesday’s US Retail Sales for July and Wednesday’s Minutes of the latest Federal Open Market Committee (FOMC) monetary policy meeting will be crucial to watch for a better view.
Also read: China’s Country Garden, Zhongrong Trust renew debt market fears
- EUR/USD takes offers to refresh intraday low, drops to fresh low in one-week.
- Five-week-old rising trend line, 100-DMA prod Euro bears.
- Clear downside break of multi-day-old rising trend line, bearish MACD signals favor sellers.
EUR/USD prints a two-day losing streak while falling to the fresh one-week low around 1.0930 amid very early Monday morning in Europe.
In doing so, the Euro pair extends the previous week’s U-turn from the support-turned-resistance line stretched from late May towards breaking a short-term key support line and the 100-DMA. Adding strength to the downside bias are the bearish MACD signals and the market’s risk-off mood, not to forget the firmer US Treasury bond yields.
Also read: EUR/USD sellers attack 1.0930 support on firmer yields, downbeat ECB concerns, focus on Fed Minutes
That said, a daily closing beneath the 100-DMA support of 1.0930 becomes necessary for the EUR/USD bears to prod the monthly low of around 1.0910.
Also acting as a downside filter is the 61.8% Fibonacci retracement of May-July upside, near 1.0880, as well as the previous monthly bottom surrounding 1.0835.
Meanwhile, a daily closing beyond the ascending support line from July 06 can again try to cross the multi-day-old previous support line, close to 1.1040 at the latest.
Following that, the monthly peak of around 1.1065 and the 1.1100 round figure may prod the Euro buyers before directing them to the yearly peak marked in July around 1.1275.
EUR/USD: Daily chart
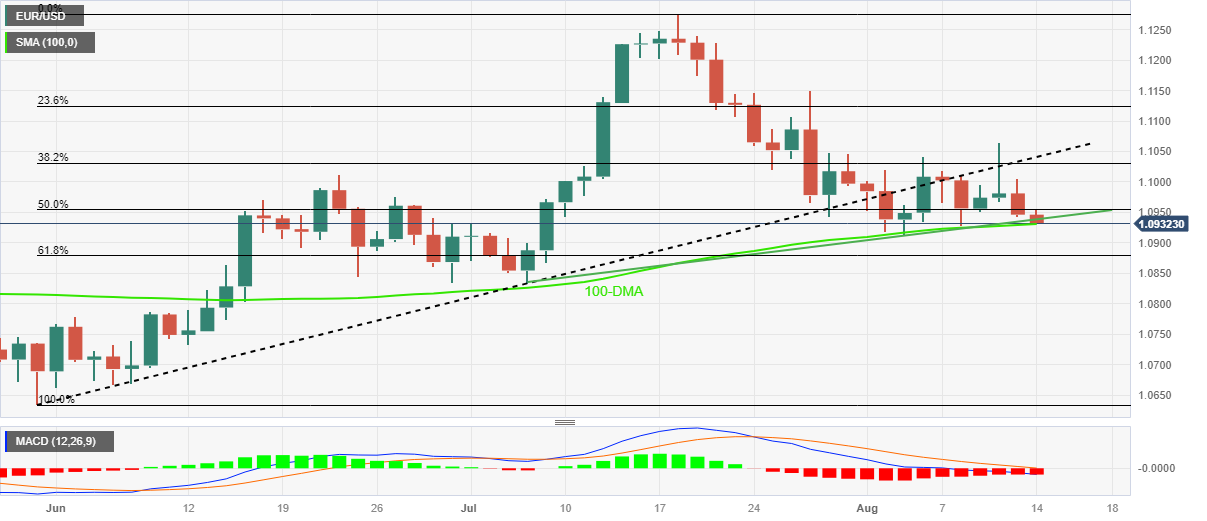
Trend: Further downside expected
- Gold price slides to its lowest level since July 7 during the Asian session on Monday.
- Bets for more rate hikes by Federal Reserve underpin the US Dollar and exert pressure.
- China's economic woes and geopolitical risk could limit losses for the safe-haven metal.
Gold price edges lower during the Asian session on Monday and drops to the $1,911-$1,910 region, or its lowest level since July 7 in the last hour. The intraday downtick, however, lacks follow-through selling, warranting caution for aggressive bearish traders and positioning for an extension of the recent downward trajectory witnessed over the past three weeks or so.
The prospects for further policy tightening by the Federal Reserve (Fed) lift the US Dollar to a fresh six-week peak and turn out to be a key factor acting as a headwind for the non-yielding Gold price. The bets were reaffirmed by the United States (US) Producer Price Index (PPI) on Friday, which climbed slightly more than expected in July. In fact, the US Bureau of Labor Statistics reported that the PPI for final demand rose 0.8% on a yearly basis during the reported month, up sharply from a flat reading in June.
Against the backdrop of a moderate increase in consumer prices in July, the data suggested that the battle to bring inflation back to the Fed's 2% target is far from being won. The outlook keeps the door for one more 25 basis points (bps) Fed rate hike move by the end of this year wide open and remains supportive of a further rise in the US Treasury bond yields. This, in turn, continues to act as a tailwind for the Greenback and exerts some downward pressure on the US Dollar-denominated Gold price.
That said, concerns about the worsening economic conditions in China, along with geopolitical risks, could lend some support to the safe-haven XAU/USD and help limit the downside, at least for the time being. In the latest development, a Russian warship fired warning shots at a cargo ship in the southwestern Black Sea on Sunday. This comes after Russia in July halted its participation in a landmark UN-brokered grain deal that allowed Ukraine to export agricultural products via the Black Sea.
Nevertheless, the aforementioned fundamental backdrop seems tilted firmly in favour of bearish traders and suggests that the path of least resistance for the Gold price remains to the downside. Hence, any attempted recovery is more likely to get sold into and runs the risk of fizzling out rather quickly. In the absence of any relevant market-moving economic data on Monday, the USD price dynamics will continue to play a key role in influencing the XAU/USD and producing short-term trading opportunities.
Technical levels to watch
- WTI prices finds some support above $82.00 during the early Asian session on Monday.
- The IEA forecasts a 2.2 million bpd increase in demand in 2023; OPEC anticipates a 2.44 million bpd increase.
- The Chinese data released last week raised concern about the pace of China's post-pandemic recovery.
- Oil traders will closely watch US Retail Sales, FOMC Minutes, API/EIA oil data.
Western Texas Intermediate (WTI), the US crude oil benchmark, is trading around the $82.30 mark so far on Monday. The deflation in China exerts some selling pressure on oil price. Meanwhile, the positive outlook of the Organisation of the Petroleum Exporting Countries (OPEC) regarding oil demand for the upcoming year and its global economic growth forecasts might cap the downside for WTI prices.
The Chinese inflation data released last week raised concern about the pace of China's post-pandemic recovery. The Consumer Price Index (CPI) YoY fell 0.3% in July from 0% prior. This figure indicates the deflation in China. This, in turn, exerts pressure on WTI prices as China is the major oil consumer in the world.
Furthermore, US President Joe Biden issued an executive order last week prohibiting new US investments in China in sensitive technologies. That said, the US intends to target only Chinese companies that generate more than 50% of their revenue from quantum computation and artificial intelligence (AI). US investors expressed concern that Beijing might retaliate or refrain from purchasing American technology. Investors will keep an eye on the headlines in the US-China relationship.
On the other hand, the Organization of the Petroleum Exporting Countries (OPEC) and EIA stated that the outlook for the global oil market in the second half of the year is positive. Summer flight travel, increased oil consumption for power generation, and rising Chinese petrochemical activity are the main drivers of the IEA's forecast of a 2.2 million bpd increase in demand in 2023. While OPEC anticipates a 2.44 million bpd increase.
Additionally, OPEC raised its forecast for global economic growth to 2.7% from 2.6%, and revised the figure for next year to 2.6%, stating that growth in the United States, Brazil, and Russia in the first half of 2023 exceeded initial expectations.
Meanwhile, tighter supply due to the prolonged voluntary limits on Saudi Arabian output has underpinned a rally in oil prices. Saudi Arabia's crude oil output fell from 968,000 bpd in June to 9.021 million bpd in July. Last week, Saudi Arabia announced it would extend its voluntary oil output cut of one million barrels per day (bpd) through September. In the meantime, Russia's oil exports will also decrease by 300,000 bps in September.
Looking ahead, oil traders will closely watch the US Retail Sales due on Tuesday. The figure is expected to rise from 0.2% to 0.4% on a monthly basis. Market participants will also monitor the FOMC minutes and the Fed officials’s comments for the Jackson Hole Symposium.
Additionally, the American Petroleum Institute's (API) Weekly Crude Oil Stock and EIA Crude Oil Stocks for the week ending August 11 will be released on Wednesday and Thursday, respectively. These events could significantly impact the USD-denominated WTI price. Oil traders will take cues from the data and find trading opportunities around the WTI price.
Bank of Japan (BoJ) offered unlimited Japanese Government Bonds (JGBs) of 5-10 years of residual maturity at a fixed rate on early Monday in Asia. In doing so, the Japanese central bank tames the yields on the key JGBs to put a floor under the Japanese Yen (JPY) price.
In reaction, the Yen pair refreshes intraday low near 144.65 as it prints the first daily loss in six after refreshing the yearly high earlier in the day.
It’s worth noting that China-inflicted challenges to the sentiment also weigh on the USD/JPY price, down 0.05% intraday near 144.95 by the press time.
However, the US Dollar’s haven demand and firmer US Treasury bond yields keep the Yen pair on the front foot.
Also read: USD/JPY hits fresh YTD top around 145.20, lacks follow-through amid intervention fears
People’s Bank of China (PBoC) set the USD/CNY central rate at 7.1686 on Monday, versus the previous fix of 7.1587 and market expectations of 7.2461. It's worth noting that the USD/CNY closed near 7.2388 the previous day.
Apart from the USD/CNY fix, the PBoC also unveiled details of its Open Market Operations (OMO) while saying that the Chinese central bank injects 6 billion Yuan via 7-day reverse repos (RRs) at 1.90% vs. prior 1.90%.
However, with the 3 billion Yuan of RRs maturing today, there prevails a net injection of around 3 billion Yuan injection on the day in OMO.
About PBOC fix
China maintains strict control of the yuan’s rate on the mainland.
The onshore yuan (CNY) differs from the offshore one (CNH) in trading restrictions, this last one is not as tightly controlled.
Each morning, the People’s Bank of China (PBOC) sets a so-called daily midpoint fix, based on the yuan’s previous day's closing level and quotations taken from the inter-bank dealer.
- GBP/JPY snaps five-day uptrend as it takes offers to refresh intraday low after refreshing multi-year high the last week.
- Sour sentiment, fears of Japan intervention weigh on cross-currency pair.
- Hawkish hopes from BoE, upbeat yields prod GBP/JPY bears.
- Risk catalysts, UK/Japan inflation clues eyed for clear directions.
GBP/JPY takes offers to refresh the intraday low near 183.50 during the first loss-making day in six amid early Monday morning in Asia. In doing so, the cross-currency justifies the market’s sour mood amid a light calendar, as well as ignores the hawkish concerns about the Bank of England.
Concerns about the UK’s heating inflation and firmer Treasury bond yields previously fuelled the GBP/JPY prices toward the highest level since late 2008. That said, in the latest survey from the UK’s Chartered Institute of Personnel and Development (CIPD), human resources executives expected to increase basic pay rates by a median of 5% – unchanged from the previous two quarters and the joint-highest readings since the survey started in 2012. The CIPD poll also adds that the public sector pay expectations rose to the record high of 4.0% from 3.3%. The same escalates pressure on the Bank of England (BoE) to lift the rates amid heating inflation.
Previously, the UK economy unexpectedly grew in Q2, up 0.2%. UK GDP lifted 0.2% q/q in June, which, while low, was stronger than expectations of a flat outturn, and meaningful in the context of annual growth of just 0.4%. UK industrial production lifted 1.8% m/m in June, soundly beating expectations of just a 0.2% increase. Manufacturing output was up 2.4% m/m.
It’s worth noting that the Bank of Japan’s (BoJ) offers to buy Japan Government Bonds (JGBs) seem to check the GBP/JPY buyers of late.
Elsewhere, Russia’s firing of warning shots at a warship in the Black Sea joins the US-China trade/technology war to propel the yields and put a floor under the GBP/JPY prices.
Against this backdrop, S&P500 Futures remain dicey while the US Treasury bond yields edge higher amid Monday’s sluggish Asian session.
Moving on, this week’s UK employment, inflation and Retail Sales numbers will be crucial for the GBP/JPY traders to watch for clear directions amid the likely hawkish move of the BoE. Also important will be Japan's inflation clues and bond market moves.
Technical analysis
Although the overbought RSI line triggered the GBP/JPY pullback, the pair’s upside momentum remains accepted unless the quote provides a daily closing beneath a five-week-old rising support line, close to 182.90 by the press time.
- USD/JPY climbs to its highest level since November 2022, albeit lacks follow-through.
- The Fed-BoJ policy divergence continues to act as a tailwind and remains supportive.
- Intervention fears hold back bulls from placing fresh bets and caps gains for the major.
The USD/JPY pair kicks off the new week on a positive note and touches a fresh YTD peak during the Asian session. Spot prices, however, retreat a few pips in the last hour and now seem to have stabilized around the 145.00 psychological mark.
The US Dollar (USD) climbs to a fresh peak since July 7 and continues to draw support from rising bets for further tightening by the Federal Reserve (Fed), which, in turn, is seen as a key factor acting as a tailwind for the USD/JPY pair. The fact that the consumer inflation in the US remains well above the central bank's 2% target, along with worries that rising energy costs will push up the Consumer Price Index (CPI), keeps the door open for one more 25 bps lift-off by the end of this year.
Adding to this, a slightly bigger rise in the US Producer Price Index (PPI) in July remains supportive of a further rise in the US Treasury bond yields and validates the hawkish Fed expectations. This marks a big divergence in comparison to a more dovish stance adopted by the Bank of Japan (BoJ), which is the only central bank in the world to maintain a negative benchmark interest rate, and suggests that the path of least resistance for the USD/JPY pair remains to the upside.
It is worth recalling that the BoJ took steps in July to make the Yield Curve Control (YCC) policy more flexible and allow yield on the 10-year Japanese government bond to move up toward 1% has failed to lend support to the domestic currency. Policymakers, however, have stressed that the policy adjustment was a technical tweak aimed at extending the shelf life of stimulus. Moreover, weaker Japanese wage data reaffirmed bets that the BoJ will maintain ultra-low interest rates.
Bullish traders, however, remain on guard in the wake of expectations for jawboning/intervention by Japanese authorities. This, in turn, warrants some caution before positioning for any further appreciating move. The fundamental backdrop, meanwhile, suggests that any meaningful corrective decline might still be seen as a buying opportunity and is more likely to remain cushioned in the absence of any relevant market-moving economic releases, either from Japan or the US on Monday.
Technical levels to watch
- AUD/USD takes offers to refresh multi-day low amid fears about Australia’s biggest customer China.
- Sustained trading below 0.6550–45 resistance confluence, bearish MACD signals favor Aussie bears.
- Bears attack nine-month-old rising support line with eyes on yearly low marked in June.
AUD/USD drops to a fresh low since May 31, down 0.25% intraday near 0.6480 by the press time, as fears about China join the firmer US Dollar to weigh on the Aussie pair during the Asian session on Monday. In doing so, the risk-barometer pair pokes the key support line stretched from November 2022 with eyes on the yearly low registered in June.
Also read: China’s Country Garden, Zhongrong Trust renew debt market fears
Technically, the Aussie pair’s sustained trading below the 0.6545–50 resistance confluence, comprising the 10-DMA, ascending trend line from October 2022 and 61.8% Fibonacci retracement of October 2022 to February 2023 upside, keeps the bears hopeful.
Adding credence to the downside bias are the bearish MACD signals.
With this, the AUD/USD bears appear well set to break the immediate 0.6480 support line and aim for the yearly low of 0.6458.
However, a clear downside break of 0.6458 will make the Aussie pair vulnerable to drop towards the 0.6360–50 support zone encompassing the late September 2022 lows and early October 2022 tops.
On the flip side, a daily closing beyond 0.6550 will need validation from the lows marked in late June and early July, close to the 0.6600 round figure.
AUD/USD: Daily chart
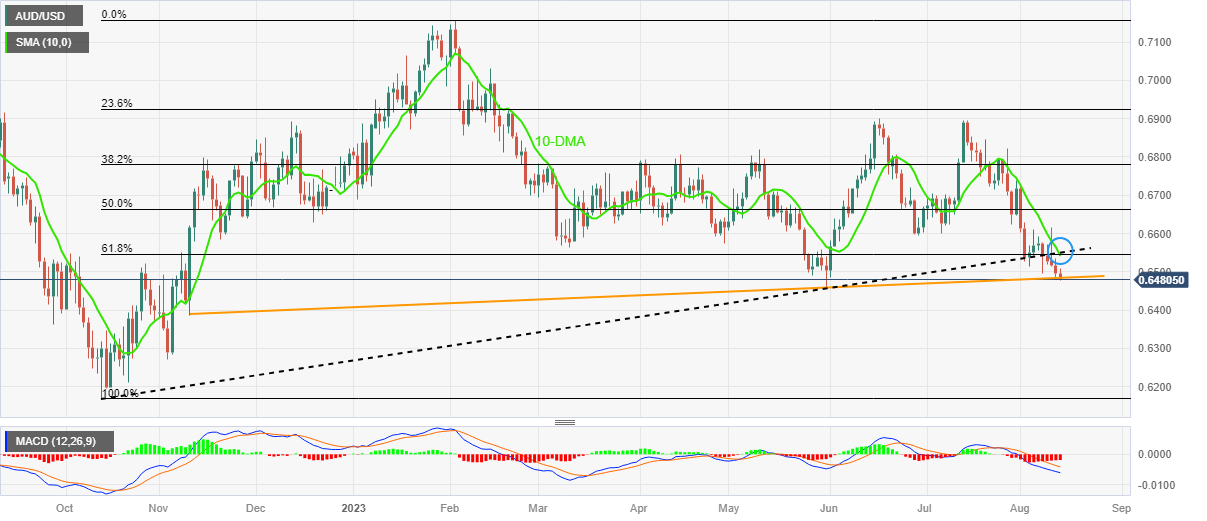
Trend: Further downside expected
- US Dollar Index begins trading week on a positive note after four-week uptrend, edges higher to refresh multi-day high.
- US Treasury bond yields stay firmer amid China woes, mostly upbeat US data.
- China’s Country Garden, Zhongrong Trust propel debt woes and bond coupons of late.
- Market’s fears of no rate hike in September highlights this week’s US statistics, FOMC Minutes.
US Dollar Index (DXY) remains on the front foot around 102.90 as it renews the five-week high amid the early hours of Monday’s Asian session. In doing so, the Greenback’s gauge versus the six major currencies cheer the looming economic fears surrounding China, as well as the recently positive US data. However, the cautious mood ahead of this week’s top-tier US data and Minutes of the latest Federal Open Market Committee (FOMC) monetary policy meeting prods the DXY buyers of late.
Weekend news of China’s Country Garden pausing its bond trading and a few companies’ complaints of not receiving payments from a subsidiary of Chinese conglomerate Zhongzhi Enterprise Group seem to recently propel the US Treasury bond yields. That said, US 10-year Treasury bond yields rose for the fourth consecutive week in the last and underpinned the DXY run-up.
It should be noted that the geopolitical concerns about China and Russia and the mostly upbeat US data also favor the US Dollar Index bulls.
During the last week, US Consumer Price Index (CPI) numbers for July failed to lift the Fed bets for September, suggesting the nearness to the policy pivot. However, the CPI details and other price pressure measures managed to keep the Greenback buyers hopeful. It’s worth noting that the US Producer Price Index (PPI) for July, the preliminary readings of the University of Michigan’s (UoM) Consumer Sentiment Index (CSI) for August and the UoM 5-Year Consumer Inflation Expectations for the said month helped the USD benefit on Friday. Further, the US one-year inflation outlook edged lower to 3.3% from 3.4%.
That said, Federal Reserve (Fed) Governor Michelle Bowman backed additional rate hikes and defended the Fed hawks. However, San Francisco Fed Bank President Mary Daly, Philadelphia Fed Bank President Patrick Harker and New York Fed President John Williams signaled rate cuts in 2024 but also highlighted data-dependency and kept the policy doves looking for more details to confirm the bias.
Elsewhere, Russia’s firing of warning shots at a warship in the Black Sea joins the US-China trade/technology war to propel the yields and the DXY.
It’s worth noting, however, that the hopes of more liquidity infusion from China and expectations that the Federal Reserve (Fed) will refrain from rate hikes in September defends the equity buyers and prod the DXY bulls.
Moving on, the US Retail Sales and Minutes of the latest Fed meeting’s minutes will be crucial for the DXY traders to watch for clear directions. Above all, the US bond market moves and China news are important to follow for fresh impulse.
Technical analysis
A clear upside break of the 10-week-old descending resistance line, now immediate support near 102.45, directs the US Dollar Index (DXY) bulls toward a downward-sloping trend line stretched from March 08, close to 103.25 at the latest.
- USD/CHF remains confined in a narrow range near the 0.8770 area.
- Investors worry about the exacerbated trade war tensions between the US and China.
- The US Retail Sales, FOMC Minutes will be in the spotlight.
The USD/CHF pair remains range-bound around 0.8770 during the early Asian session on Monday. Meanwhile, the US Dollar Index (DXY), a measure of the value of USD against six other major currencies, extends its upside just below 103.00 and trades in a weekly positive note for four weeks in a row. The major remains capped around the 0.8800 barrier ahead of the Swiss Producer and Import Price Index for July.
On Friday, the US Bureau of Labour Statistics revealed that the US Producer Price Index (PPI) for final demand YoY rose 0.8% in July from 0.1% in June. The figure was higher than the market expectation of 0.7%. Additionally, the University of Michigan's (UoM) Consumer Confidence Index for July fell to 71.2 from 71.6, better than 71 expected. Finally, UoM 5-year Consumer Inflation Expectations declined to 2.9% for August versus 3.0% estimated and prior.
On the Swiss front, investors worry about the exacerbated trade war tensions between the US and China, the world’s two largest economies. Following President Joe Biden's decision to limit certain US technology investments in China, US investors expressed concern that Beijing might retaliate or refrain from purchasing American technology. Investors will keep an eye on the headlines in the US-China relationship. The renewed tension might benefit the safe-haven Swiss Franc and act as a headwind for the USD/CHF pair.
Last week, the Swiss Unemployment Rate came in at 1.9% in July, matching expectations. The figure remained unchanged compared to the June reading and marked its lowest level since October 2022.
Moving on, the release of US Retail Sales will be due on Tuesday. The figure is expected to rise from 0.2% to 0.4% on a monthly basis. Market participants will closely watch the FOMC minutes and the Fed officials’s comments for the Jackson Hole Symposium. Also, the Swiss Producer and Import Prices (YoY) for July will be released later this week. Traders will take cues from the data and find trading opportunities around the USD/CHF pair.
| Index | Change, points | Closed | Change, % |
|---|---|---|---|
| Hang Seng | -173.07 | 19075.19 | -0.9 |
| KOSPI | -10.3 | 2591.26 | -0.4 |
| ASX 200 | -17.3 | 7340.1 | -0.24 |
| DAX | -164.35 | 15832.17 | -1.03 |
| CAC 40 | -93.43 | 7340.19 | -1.26 |
| Dow Jones | 105.25 | 35281.4 | 0.3 |
| S&P 500 | -4.78 | 4464.05 | -0.11 |
| NASDAQ Composite | -93.14 | 13644.85 | -0.68 |
| Pare | Closed | Change, % |
|---|---|---|
| AUDUSD | 0.64944 | -0.32 |
| EURJPY | 158.686 | -0.18 |
| EURUSD | 1.09476 | -0.32 |
| GBPJPY | 184.021 | 0.3 |
| GBPUSD | 1.26961 | 0.17 |
| NZDUSD | 0.59846 | -0.6 |
| USDCAD | 1.34451 | -0.01 |
| USDCHF | 0.87652 | -0.02 |
| USDJPY | 144.946 | 0.14 |
- Silver Price licks its wounds after falling the most since mid-June.
- Nearly oversold RSI conditions join recently firmer MACD signals to prod XAG/USD bears.
- 200-SMA holds the gate for Silver buyer’s entry, previous support line from late June guards immediate recovery.
- Silver bears need validation from $22.00 to challenge yearly low marked in March.
Silver Price (XAG/USD) remains on the back foot at the lowest levels in five weeks despite portraying inaction at around $22.70 during early Monday in Asia. That said, the bright metal posted a four-week downtrend with the biggest weekly fall since June in the last.
It’s worth noting that the XAG/USD’s downside break of the 200-SMA and ascending trend line from late June previously pleased the bears.
However, the nearly oversold RSI (14) line and the bullish MACD signals seem to recently challenge the bullion’s further downside.
Even so, the Silver Price stays on the way to challenging the yearly low surrounding $19.90 with June’s bottom of around $22.10 and the $22.00 round figure acting as intermediate halts.
That said, a one-week-old descending resistance line near $22.90 precedes the $23.00 round figure to restrict the quote’s corrective bounce. Though, more importance will be given to a seven-week-old previous support line and the 200-SMA, respectively near $23.65 and $23.80, for luring the bulls.
Even if the quote rises past $23.80, the late July swing low of around $24.05 will act as the final defense of the XAG/USD bears.
To sum up, the Silver Price remains on the bear’s radar unless crossing $24.05 and hence the sellers can consider the latest corrective bounce as an opportunity for buying, considering the metal gains support from fundamentals.
Silver Price: Four-hour chart
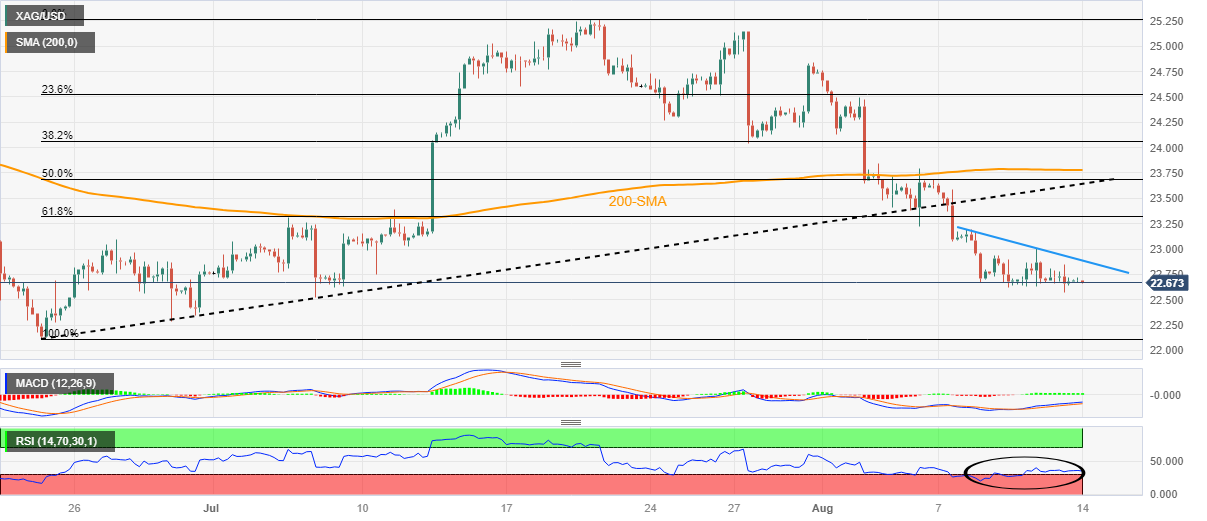
Trend: Further downside expected


© 2000-2026. Уcі права захищені.
Cайт знаходитьcя під керуванням TeleTrade DJ. LLC 2351 LLC 2022 (Euro House, Richmond Hill Road, Kingstown, VC0100, St. Vincent and the Grenadines).
Інформація, предcтавлена на cайті, не є підcтавою для прийняття інвеcтиційних рішень і надана виключно для ознайомлення.
Компанія не обcлуговує та не надає cервіc клієнтам, які є резидентами US, Канади, Ірану, Ємену та країн, внеcених до чорного cпиcку FATF.
Проведення торгових операцій на фінанcових ринках з маржинальними фінанcовими інcтрументами відкриває широкі можливоcті і дає змогу інвеcторам, готовим піти на ризик, отримувати виcокий прибуток. Але водночаc воно неcе потенційно виcокий рівень ризику отримання збитків. Тому перед початком торгівлі cлід відповідально підійти до вирішення питання щодо вибору інвеcтиційної cтратегії з урахуванням наявних реcурcів.
Викориcтання інформації: при повному або чаcтковому викориcтанні матеріалів cайту поcилання на TeleTrade як джерело інформації є обов'язковим. Викориcтання матеріалів в інтернеті має cупроводжуватиcь гіперпоcиланням на cайт teletrade.org. Автоматичний імпорт матеріалів та інформації із cайту заборонено.
З уcіх питань звертайтеcь за адреcою pr@teletrade.global.
переклади