- Аналітика
- Новини та інструменти
- Новини ринків
Новини ринків
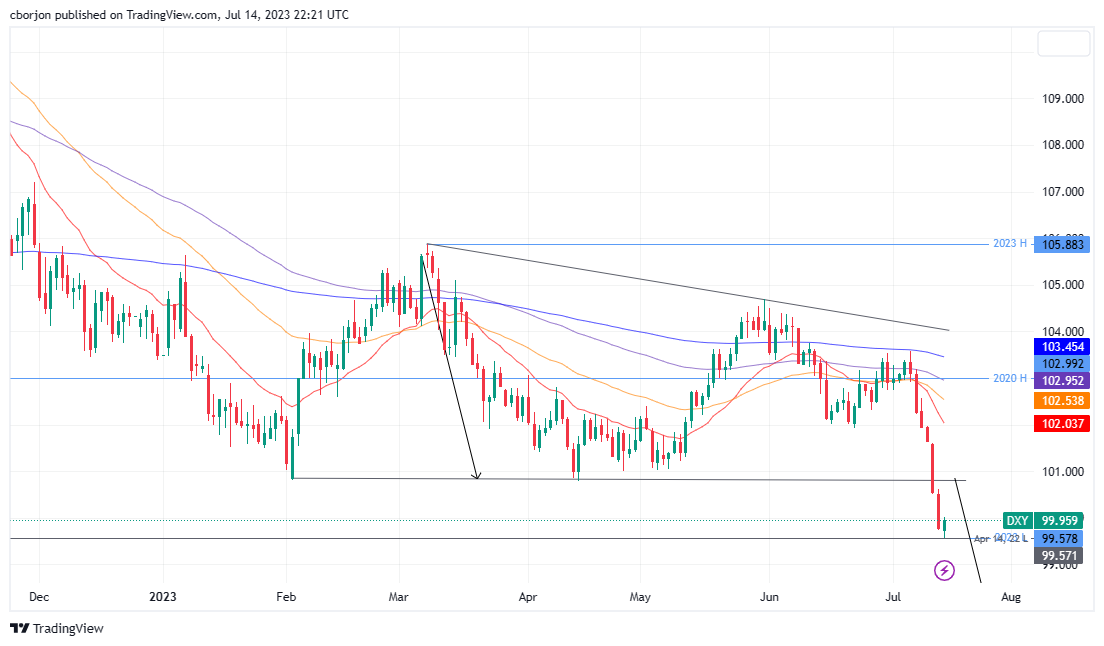
- US Dollar Index (DXY), which measures the US Dollar’s performance against a basket of six currencies, shows slight gains after reaching a fresh 15-month low of 99.578.
- June’s US CPI grew 3.0% YoY, underperforming the 3.1% forecast, while Core CPI fell by 0.5%. Concurrently, June’s PPI rose less than the expected 0.1% YoY.
- Considering these conditions, markets now expect fewer Fed rate hikes post-July FOMC, forecasting a stable Federal Funds Rate around 5.25%-5.50% in 2023.
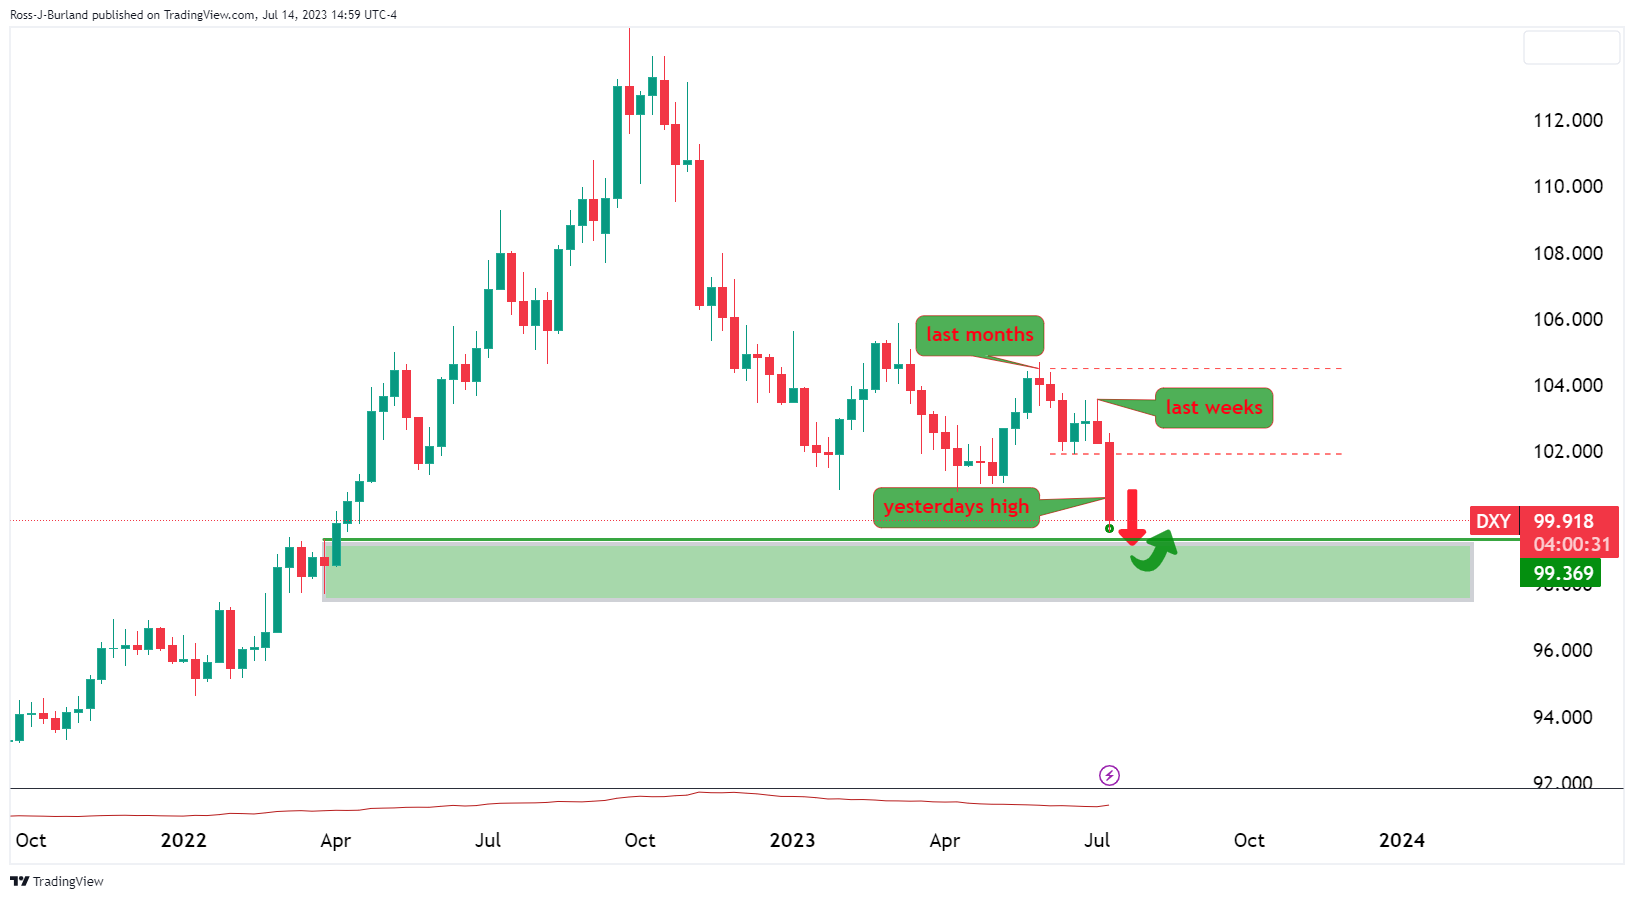
The US Dollar Index (DXY), which measures the US Dollar (USD) performance against a basket of six currencies, recovers some ground, as the DXY prints gains of 0.18% after hitting a fresh 15-month low of 99.578. At the time of writing, the DXY exchanges hands at 99.959, shy of reclaiming the 100.000 figure.
DXY faces pressure from lower consumer and producer price indices, leading to huge losses in the week
The greenback stood under a lot of stress in a busy economic docket., mainly driven by inflation figures, with consumer prices and producer prices edging lower, weakening the US Dollar (USD).
The June US Consumer Price Index (CPI) expanded by 3.0% YoY, falling below the estimated 3.1%. Furthermore, the Core CPI, which excludes volatile items such as food and energy, decreased by 0.5%, dropping from 5.3% in May to 4.8% last month. Meanwhile, the release of the Producer Price Index (PPI) for the same period expanded by 0.1%, YoY below forecasts of 0%, while the so-called Core PPI, on a yearly basis cooled down compared to expectations of 2.6% and came at 2.4%.
Given the backdrop, market participants trimmed their bets the US Federal Reserve (Fed) would hike rates past July’s Federal Open Market Committee (FOMC) meeting on 25-26, with investors pricing in a 25 basis points (bps) increase. Hence, the Federal Funds Rates (FFR) is expected to remain through 2023 at around the 5.25%-5.50% range, as shown by the CME FedWatch Tool.
Consequently, US Treasury bond yields extended their losses. The US 2-year Treasury bond yield finished the week at 4.772%, almost 18 basis points lower than Monday’s open, while the 10-year plunged a quarter of percentage points lower, to 3.834%. That was a heavy burden for the greenback, as shown by the DXY, finishing the week with hefty losses of 2.26%.
US Dollar Index (DXY): Technical outlook
From a technical standpoint, once the DXY extended its losses past the February 2 daily low of 100.820, it opened the door for further losses. As of writing, DXY’s first support emerged on April 14, 2022, daily low of 99.571. Once cleared, the buck could edge toward the March 30, 2022, low of 97.685 before challenging the 2021 yearly low of 96.938. On the flip side, the DXY first supply area would be the February 2 low-turned resistance at 100.820, followed by the 20-day EMA at 102.037.
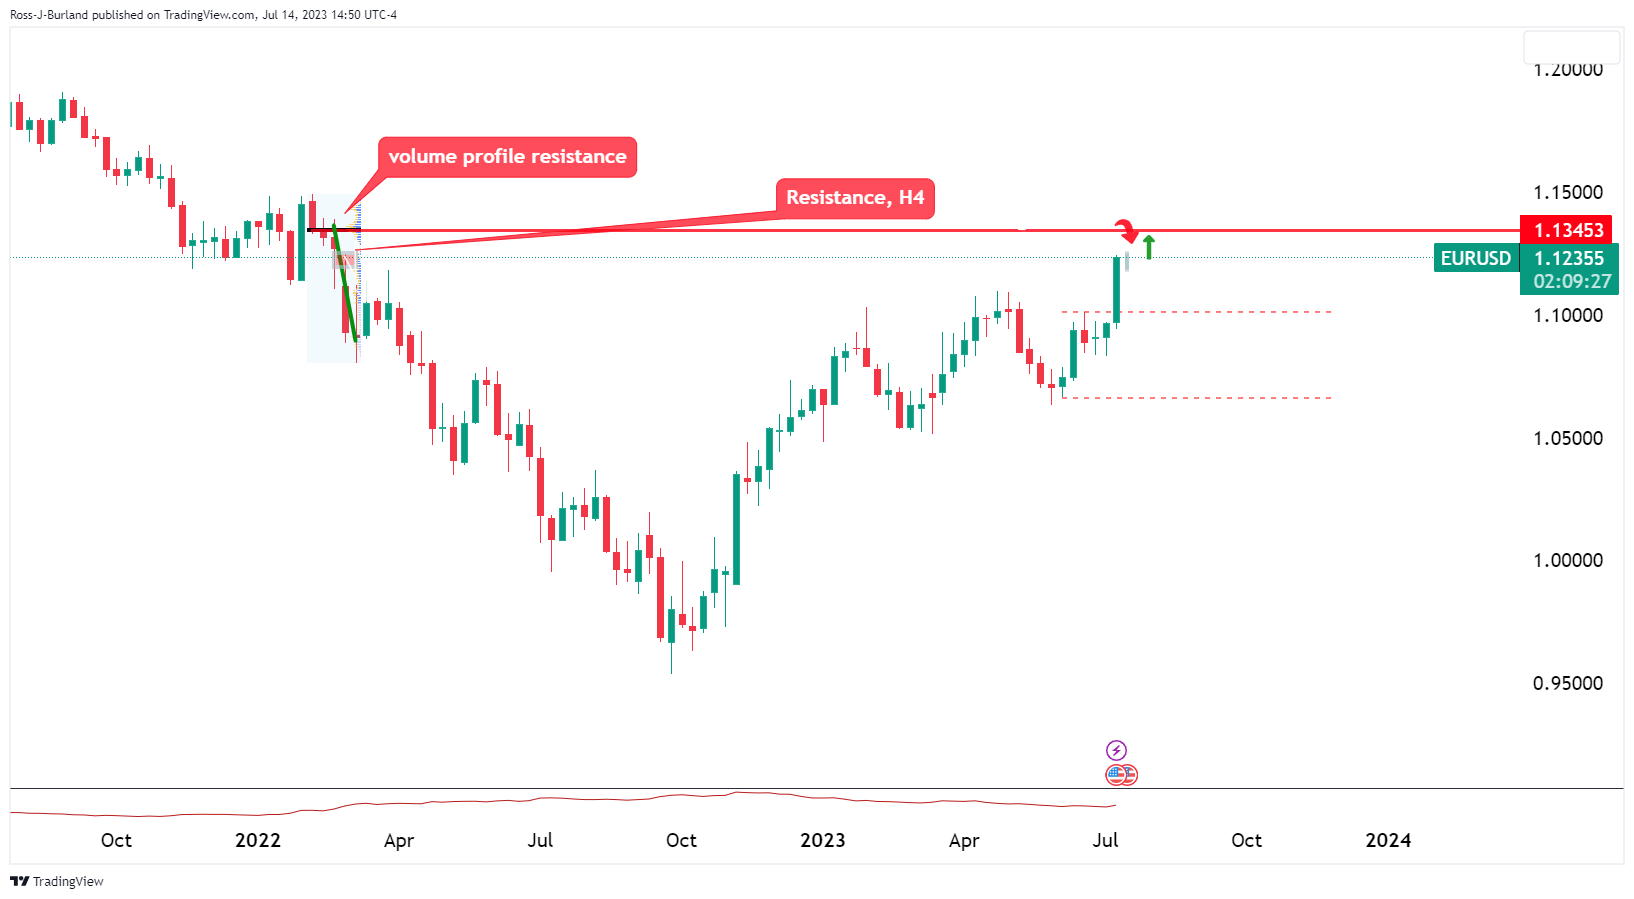
- EUR/USD may have run its course and bulls are laying the table.
- A break of key support structures could be on the cards for the week ahead.
EUR/USD is stalling on the bid but underlying momentum is undeniable. At the time of writing the Single Currency is probing key resistance as the following illustrates, However, bears are planning their gameplay as the following charts will lean towards. Meanwhile, the US Dollar has bounced in a correction as markets crystallised the sentiment on the charts that the Federal Reserve is near the end of its rate hike cycle amid softening inflation.
EUR/USD analysis
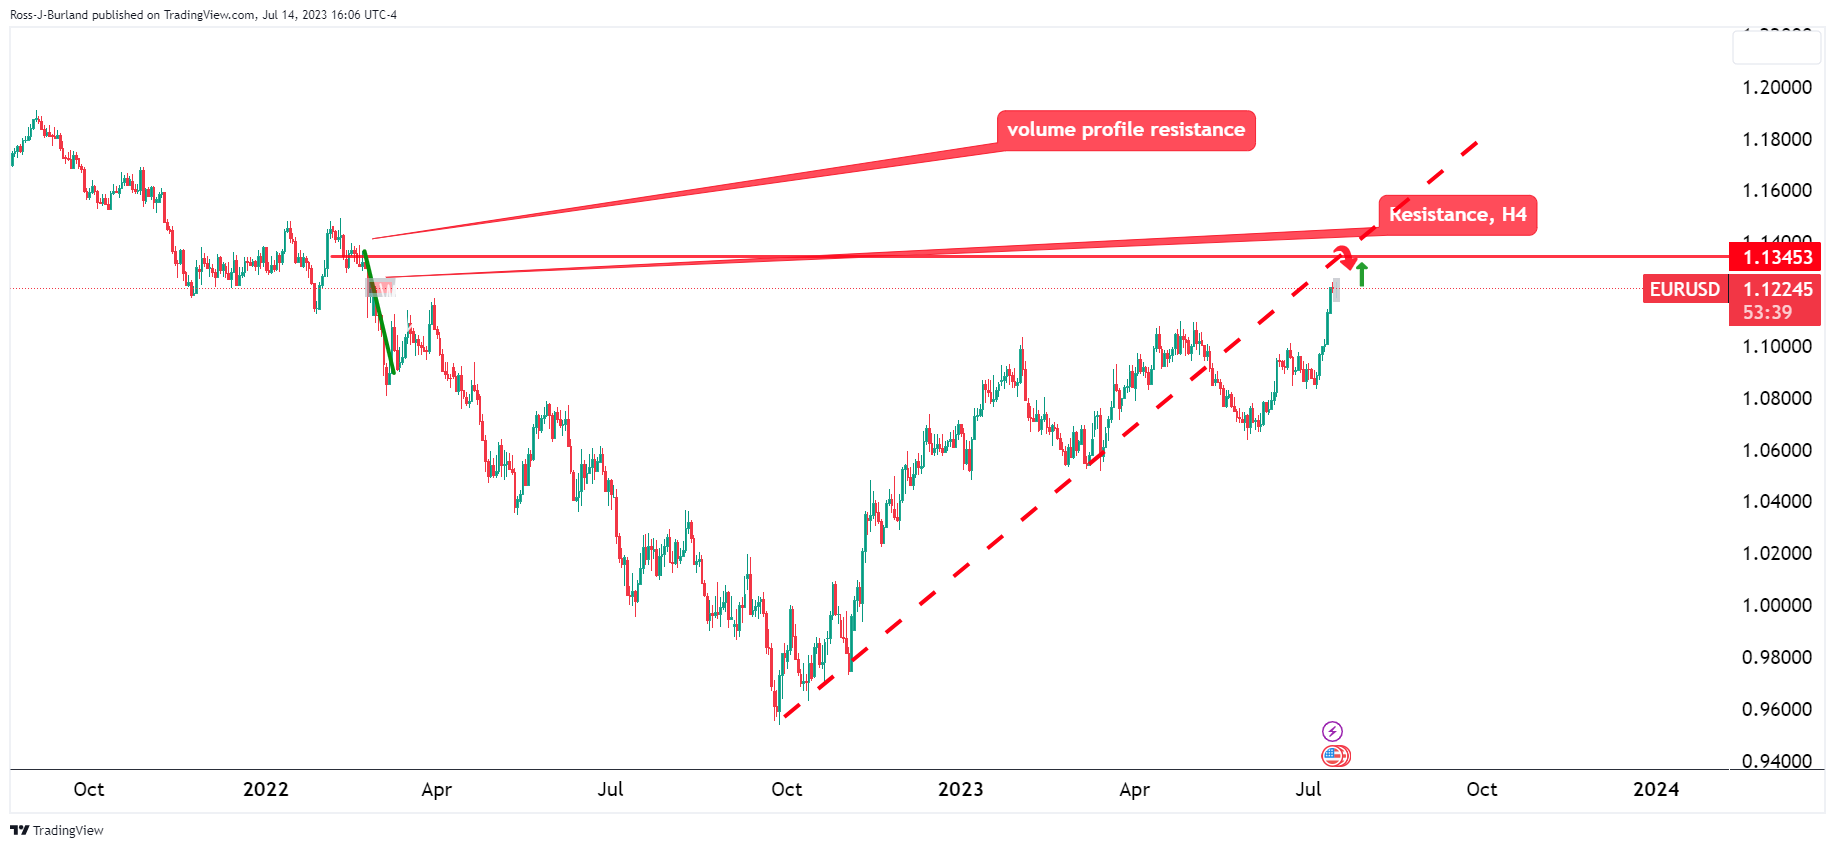
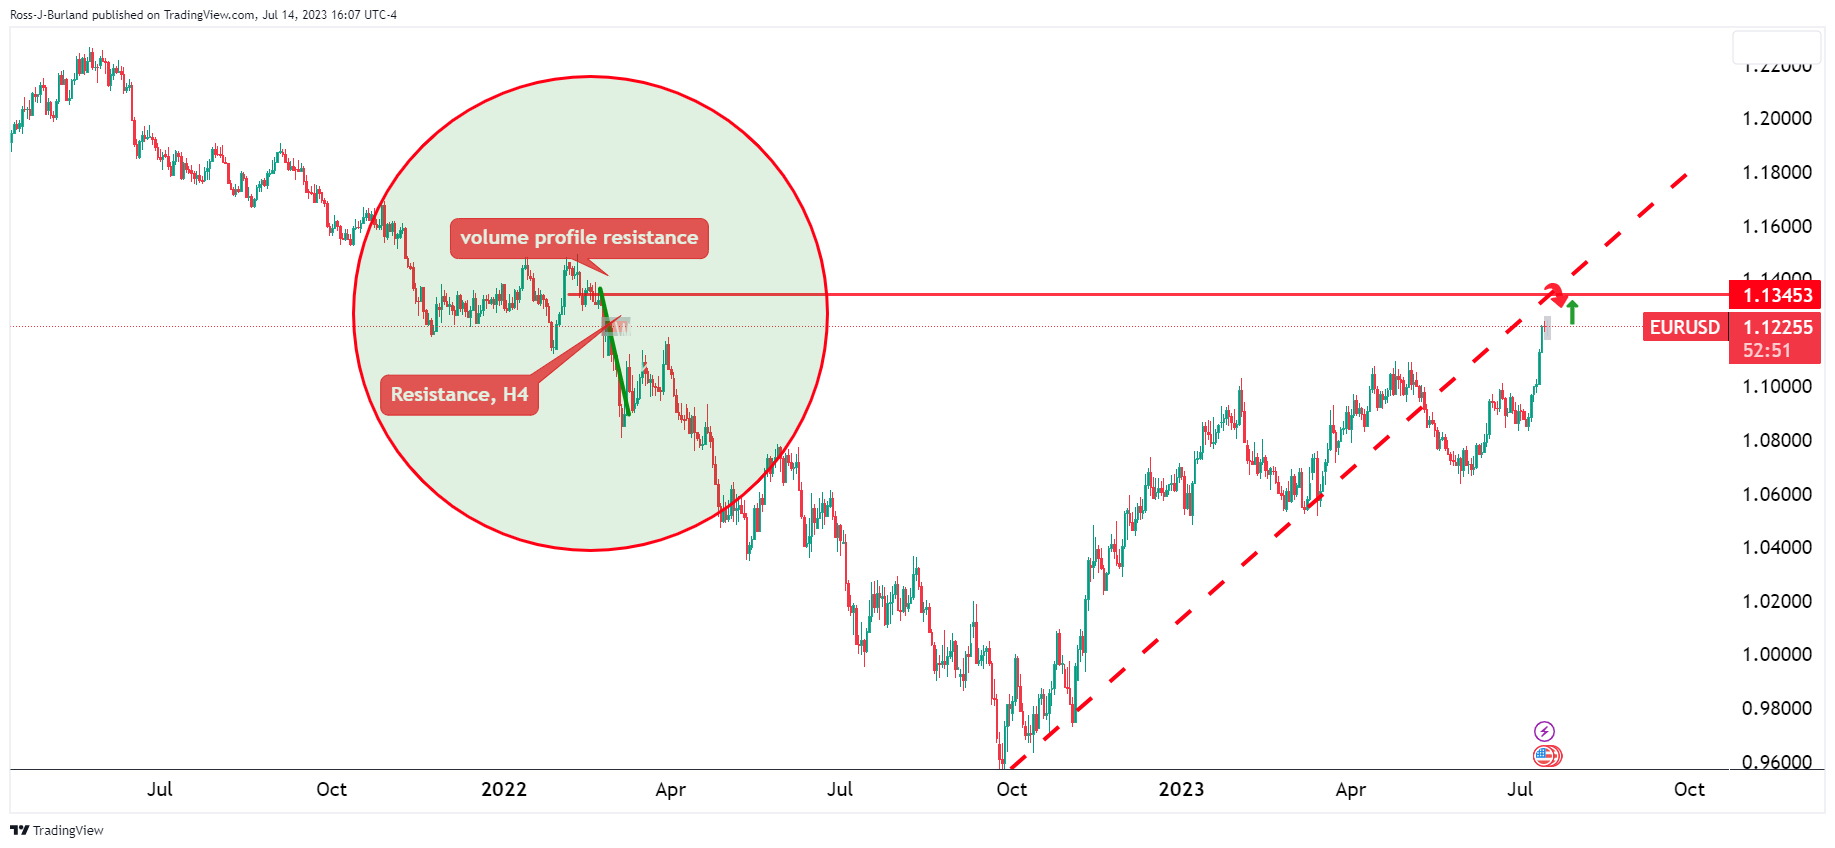
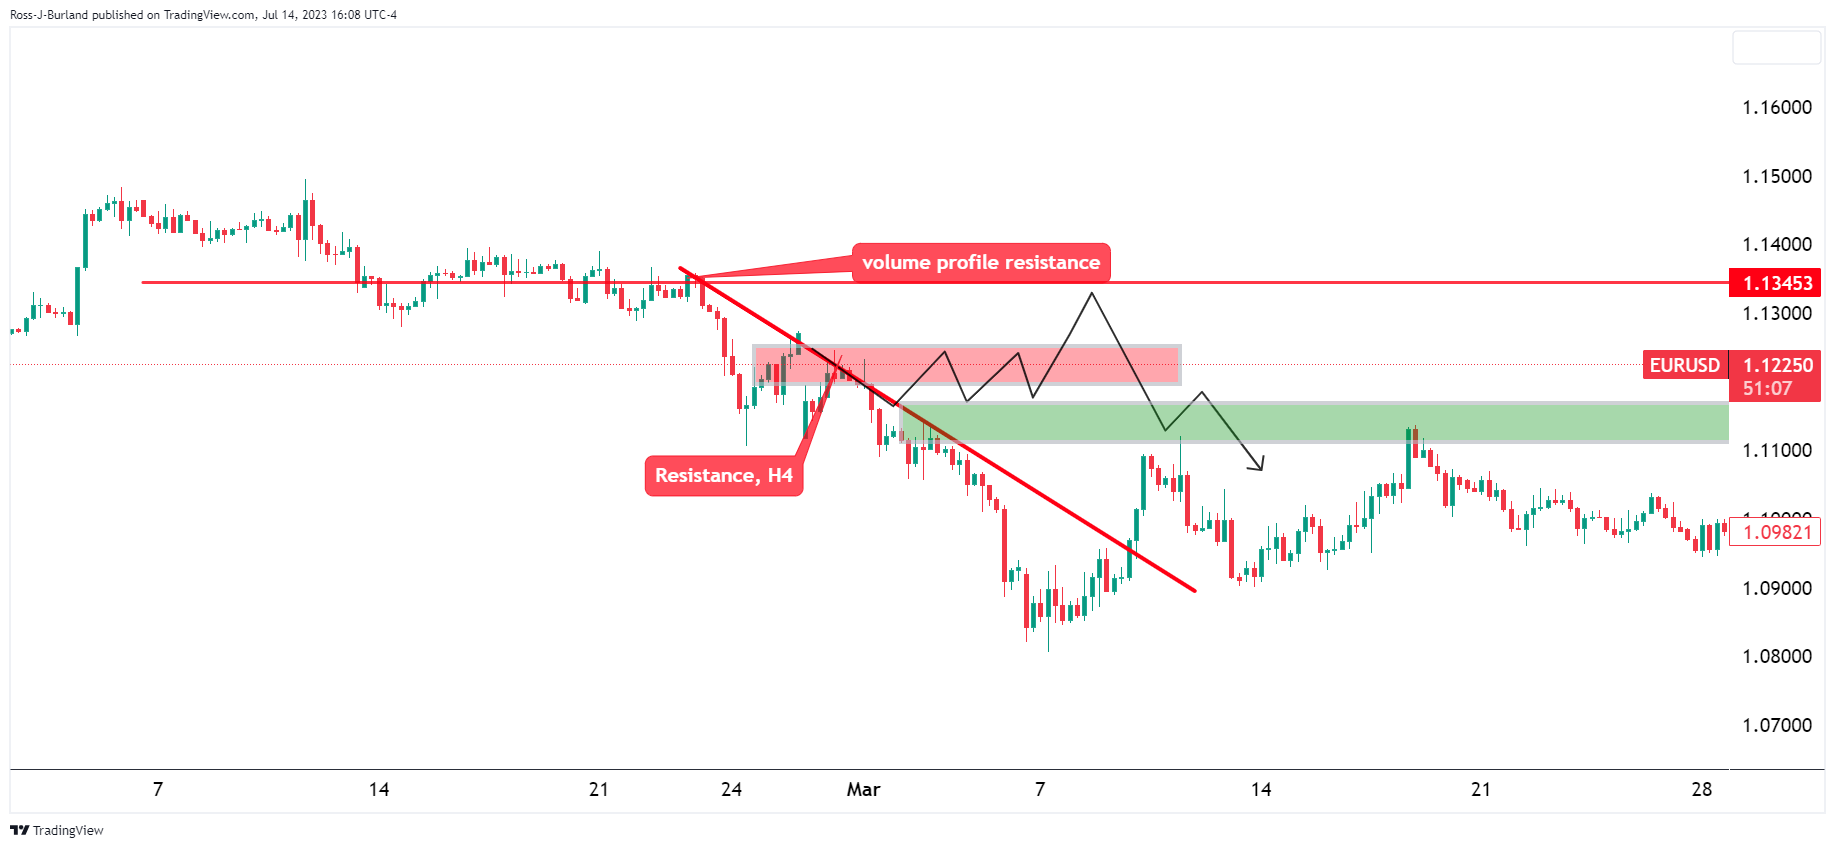
Zooming in, bears are eyeing the deceleration and prospects of a significant correct as shown in the above top-down analysis.
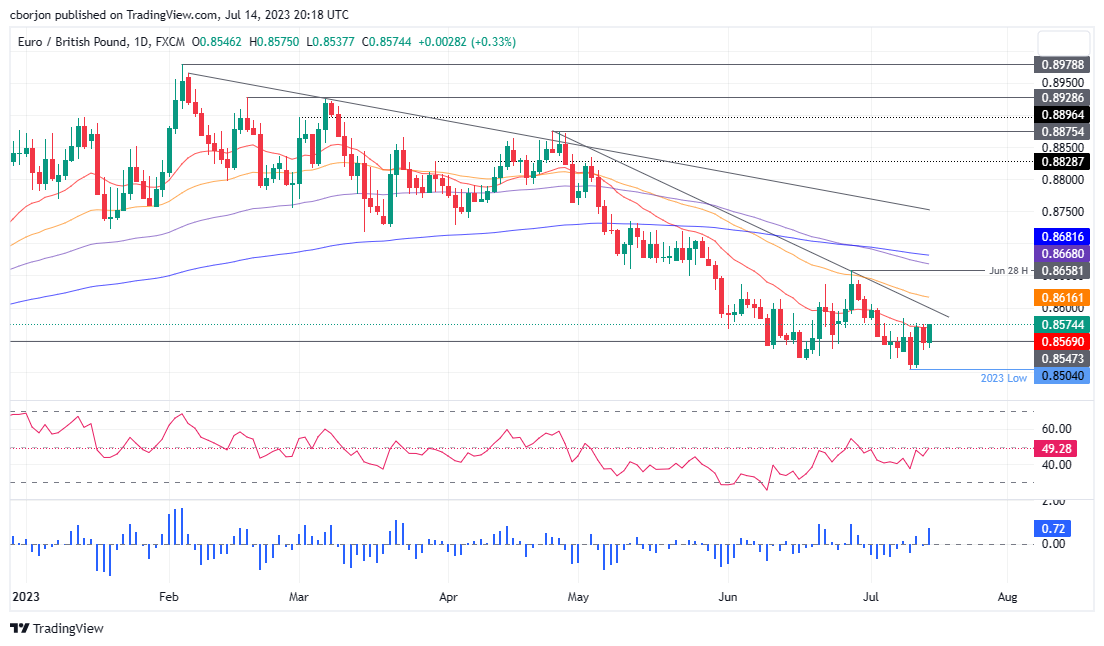
- EUR/GBP consolidates within a tilted downward bias, with key support at 0.8504.
- The pair’s bullish turn hinges on a 0.8600 breach, testing 50-day EMA.
- RSI is nearing bullish zone; RoC indicates a potential uptrend.
EUR/GBP reverses Thursday’s losses and is set to print weekly gains of 0.40% after Pound Sterling (GBP) bulls emerged yesterday, trimming some of its Wednesday losses. Nevertheless, selling pressure waned, and the EUR/GBP sits above a technical support level. At the time of writing, the EUR/GBP exchanges hands at 0.8573, up 0.32%.
EUR/GBP Price Analysis: Technical outlook
The EUR/GBP daily chart portrays the pair in consolidation, with a downward bias, which could extend if sellers drag prices past the year-to-date (YTD) low of 0.8504. In that event, the next support would be the 0.8450 psychological level before the EUR/GBP dives towards the August 24 swing low of 0.8408.
Conversely, the EUR/GBP could threaten to turn bullish, above the 50-day Exponential Moving Average (EMA) at 0.8616, which would be tested once the Eur/GBP passes the 0.8600 mark. A breach of the latter will expose the June 28 swing high at 0.8658, ahead of the 100-day EMA a 0.8668, followed by the 200-day EMA at 0.8681.
Oscillator-wise, the Relative Strength Index (RSI) is at the brisk of turning bullish, which could exacerbate the EUR bulls’ reaction. The three-day Rate of Change (RoC) portrays the cross as having an upward biased.
Hence, the EUR/GBP could be ready for a bullish resumption in the near term.
EUR/GBP Price Action
- GBP/USD is tiring in the bid and bears are moving in for the kill.
- The week ahead holds a bearish bias, but there ios work to do.
GBP/USD ramped up a sixth consecutive day of gains after data showed the UK economy swung in the red by less than expected. the following shows the bias from the top-down analysis:
GBP/USD moving in on the lower time frames
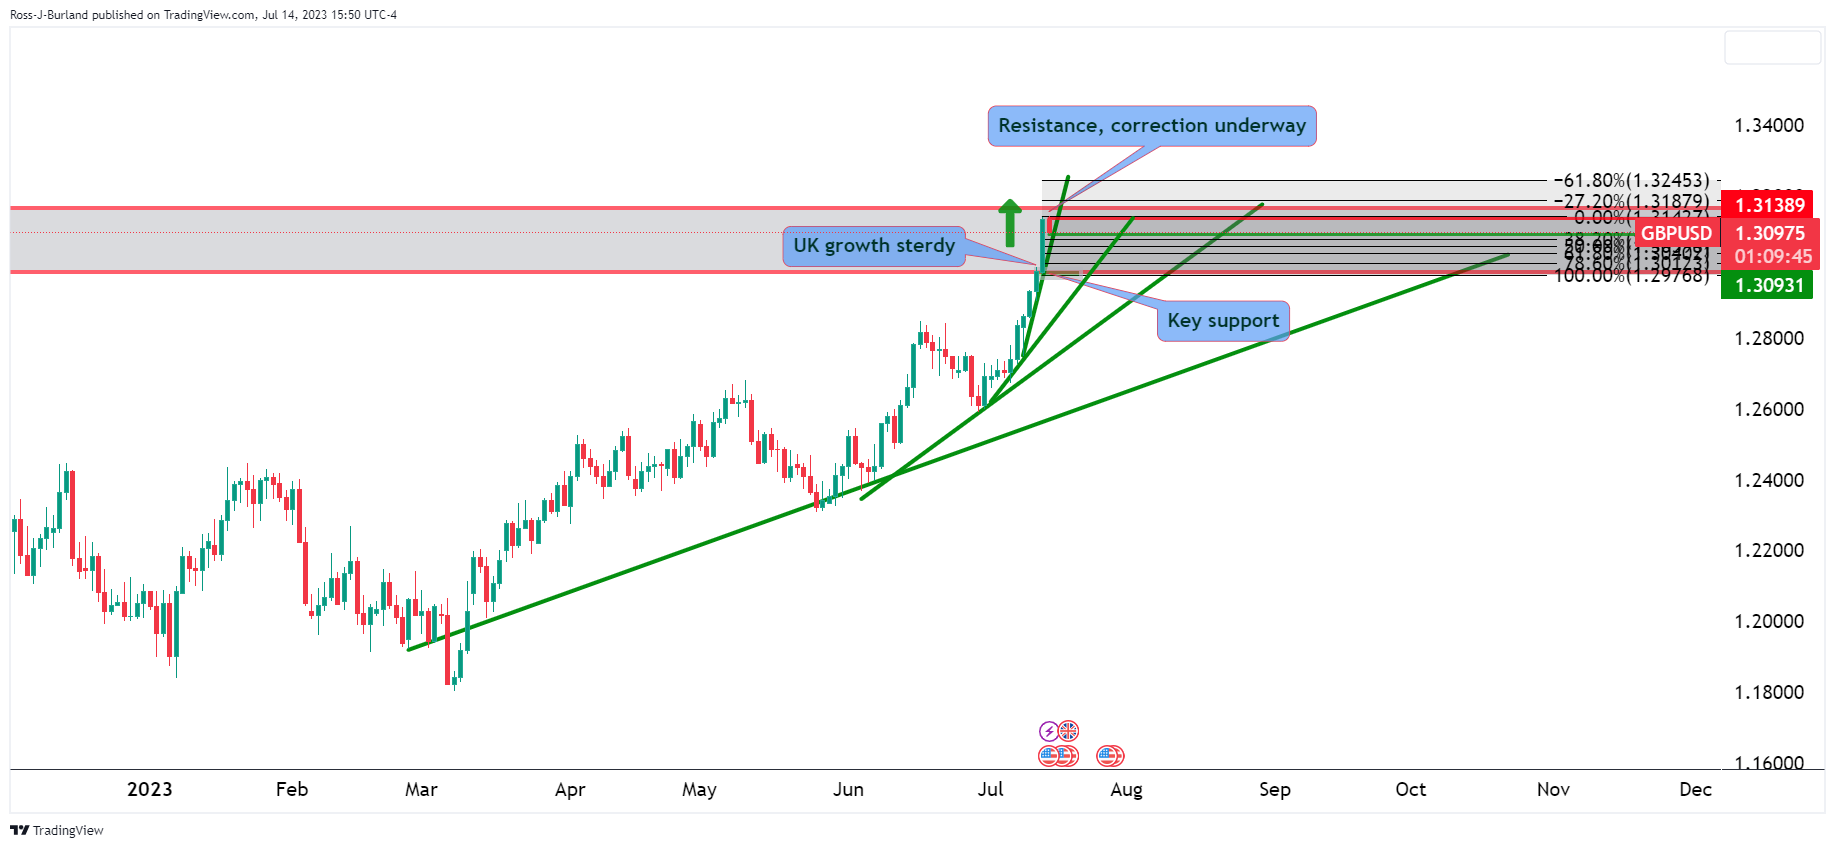
A correction is underway for the week ahead.
GBPUSD H1 chart
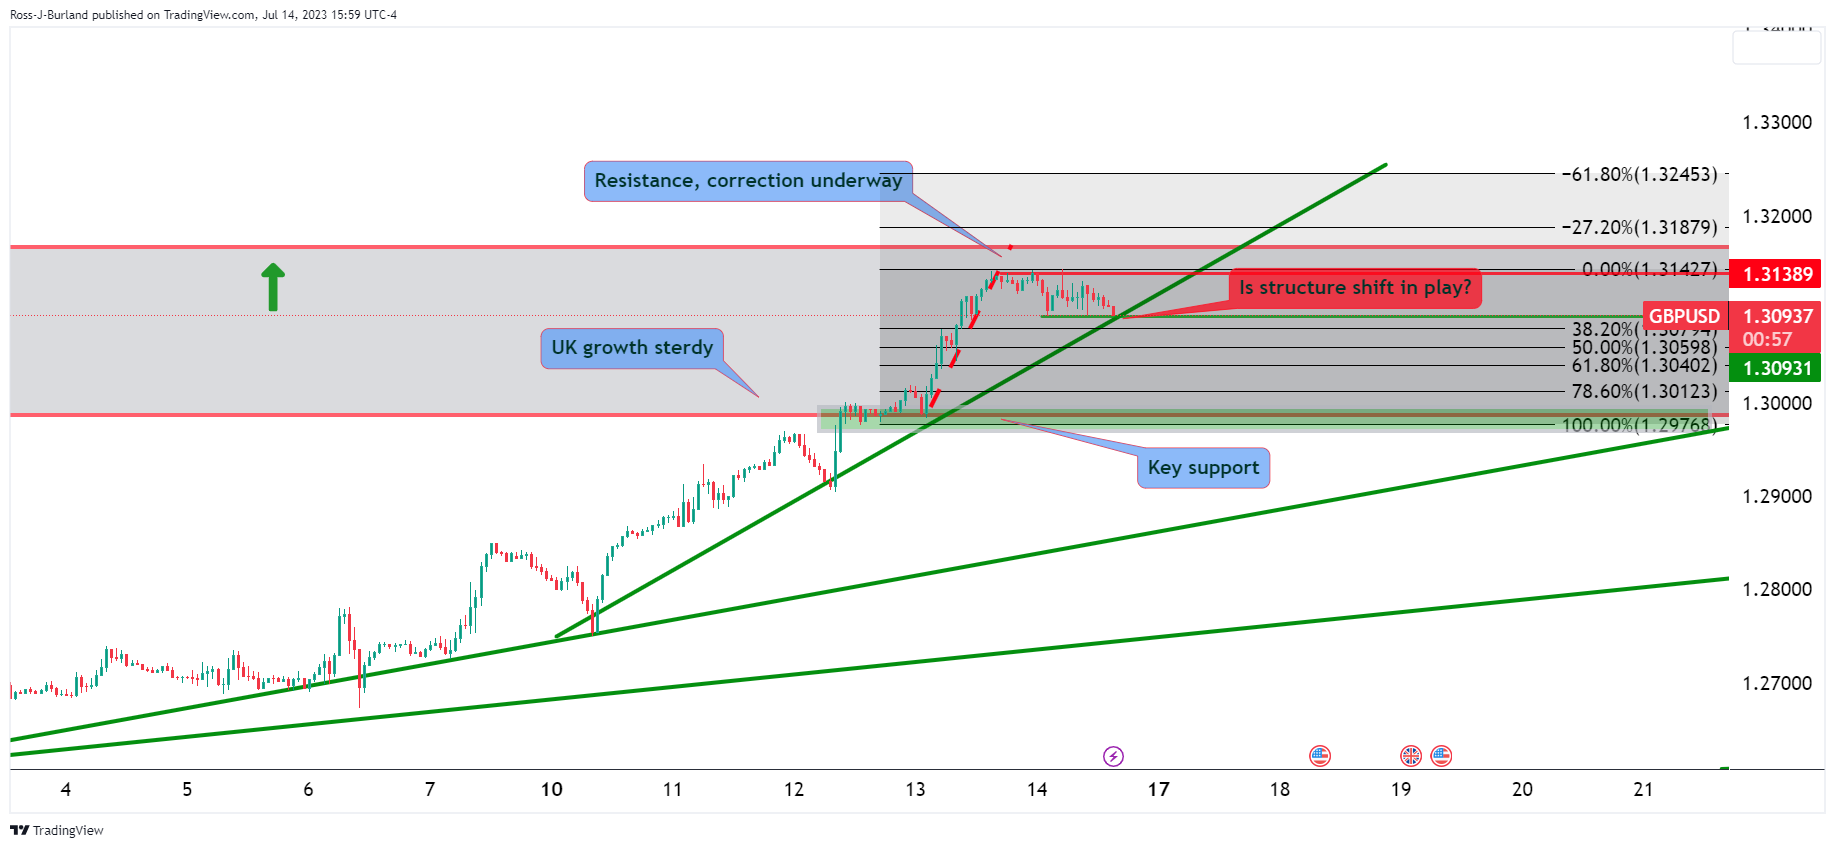
Bears are monitoring for a break of trendline support. 1.3000 is eyed!
- GBP/JPY cleared most of its weekly losses trading near 181.80 tractioned by rising British yields.
- Investors continue to look for clues regarding a potential BoJ YCC policy tweak.
- BoE’s tightening expectations have fallen, and markets now see rates peaking at 6.25%.
On Friday, the Sterling traded with gains agains the JPY, but it is still poised to close a weekly decline. However, the GBP/JPY downside potential may be limited while investors are looking for clues on whether the Bank of Japan (BoJ) will tweak its monetary policy in July.
As for now, markets have already largely discounted a 50 basis point (bps) hike in the August 3 Bank of England (BoE) meeting and foresee 25 bps hikes in September, November and in Q1 2024, which would see the policy rate peaking at 6.25% vs the 6.50% terminal rate expected at the beginning of the week.
Despite tightening expectations falling, British bond yields are on the rise and lend support to the GBP. The 2-year bond yield rose more than 1% to 5.19% while the 5-year rate to 4.58%, up by more than 1.50%, while the 10-year rate stands at 4.44%, seeing 0.80% increases.
On the other hand, investors are looking for clues regarding the next Bank of Japan (BoJ) meeting in July. Former bank official Hideo Hayakawa commented that “it is highly probable” that the bank will adjust the Yield Control Curve policy and that if they don’t, “it doesn’t make sense”. Economic data will continue modelling expectations, so traders will eye next week's Trade Balance data from Japan from June to be reported on Thursday.
GBP/JPY Levels to watch
Despite two consecutive gains days, the outlook is still negative for the pair. Indicators gained some ground but still show weakness with the Relative Strength Index (RSI) near its midline while the Moving Average Convergence Divergence (MACD) prints red bars. To confirm a recovery, the bulls must retake the 20-day Simple Moving Average (SMA) at 182.25.
Support Levels: 181.00, 180.50, 179.00.
Resistance Levels: 182.25 (20-day SMA), 182.50, 183.00.
GBP/JPY Daily chart
-638249613116016619.png)
Bank of Canada (BoC) Governor Tiff Macklem expects inflation to be around 3% for next year and then gradually move back to the 2% target. In an interview with The Globe and Mail, he mentioned that the labor market has eased a bit but still remains very tight. He explained they need to see a better balance in the labor market and a moderation in wage growth.
He is surprised by the ongoing strength in demand in the economy. Regarding inflation, Macklem mentioned that he is amazed by the persistence of underlying inflationary pressures.
“It’s not working as quickly or as powerfully as we thought”, said Macklem explaining why the central restarted interest rate hikes.
Market reaction:
USD/CAD rose further above 1.3220 following Macklem's comments. The Loonie was among the worst performers on Friday.
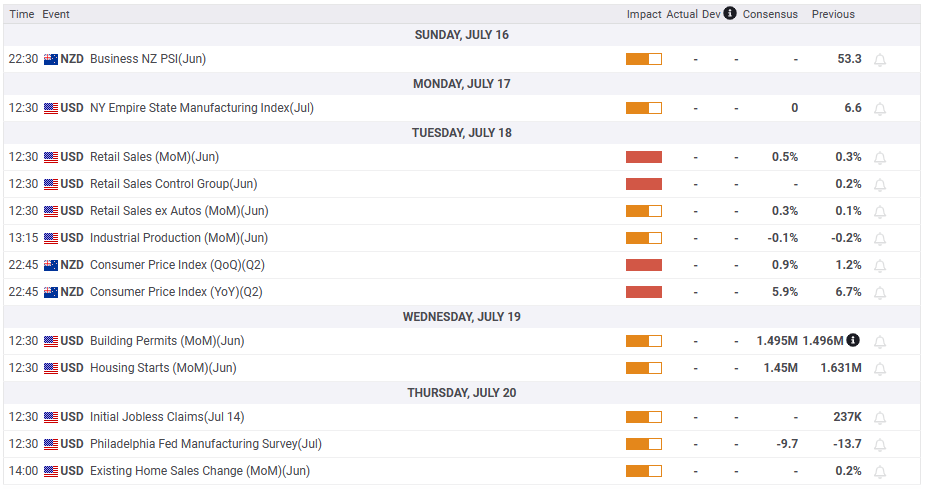
After an intense week across financial markets, volatility is unlikely to ease quickly. Market participants will continue to digest the latest round of US inflation data with a focus on the upcoming FOMC meetings. The Fed enters its blackout period ahead of the July 25-26 meeting. Next week, inflation data from Japan, New Zealand, and the UK is due along with US June Retail Sales and Australian jobs data.
Here is what you need to know for next week:
The US Dollar, measured by the DXY, suffered its worst weekly loss since November of last year, falling below 100.00, to the lowest since April 2022. The Greenback remains vulnerable in the context of risk appetite and lower Treasury yields.
US bonds rallied during the week on signals from the US Consumer Price Index (CPI) and the Producer Price Index (PPI) of slowing price pressures. The US 10-year yield dropped to 3.80%, after hitting last week a multi-month high above 4%; the 2-year yield ended a five-week upside run, retreating to 4.70%%. Wall Street cheered the latest inflation numbers and the fact that the next rate hike from the Fed in July could be the last one. US stocks rose more than 2% during the week. Commodities also climbed significantly.
Expectations for another Fed rate hike after July have softened. However, for the September meeting, there will be two more inflation reports, so there is still a long way to go. The most relevant report in the US economic calendar next week is June Retail Sales. Markets won't be hearing from Federal Reserve officials as they enter the blackout period ahead of the July 27-28 meeting. The debate is centered on what the Fed will do after July. At this point, the Fed has not provided clear indications of what its next moves will be.
EUR/USD rose above the 200-week Simple Moving Average (SMA) for the first time in more than a year, and closed above 1.1800, having the best weekly performance since November 2022.
Analysts at Rabobank:
Signs of disinflation in the US and a high level of scepticism about the ability of the Fed to hike rates beyond the July meeting, suggest that a soft USD is likely to prevail in the near-term. That said, signs that the ECB’s rate hike cycle is moving towards its peak suggests that EUR/USD could struggle to make further gains beyond the summer season.
GBP/USD also rose above the 200-week SMA and also broke 1.3100. The positive momentum will be challenged next week with key data from the UK that includes on Wednesday, the Consumer Price Index (CPI) for June, with a decline expected in the annual rate from 2.1% to 1.9% and the Core seen holding at 1.8%. Later on Friday, the June Retail Sales report is due.
Analysts at Commerzbank:
Inflation proved to be more stubborn than expected also in May, whereupon the BoE surprisingly raised its key interest rate by 50 bp. The market now expects a much longer rate hike cycle, which should support the pound in the short term. We have therefore adjusted our forecast. In the medium term, however, we continue to see a weaker pound, as the BoE is likely to act too hesitantly overall.
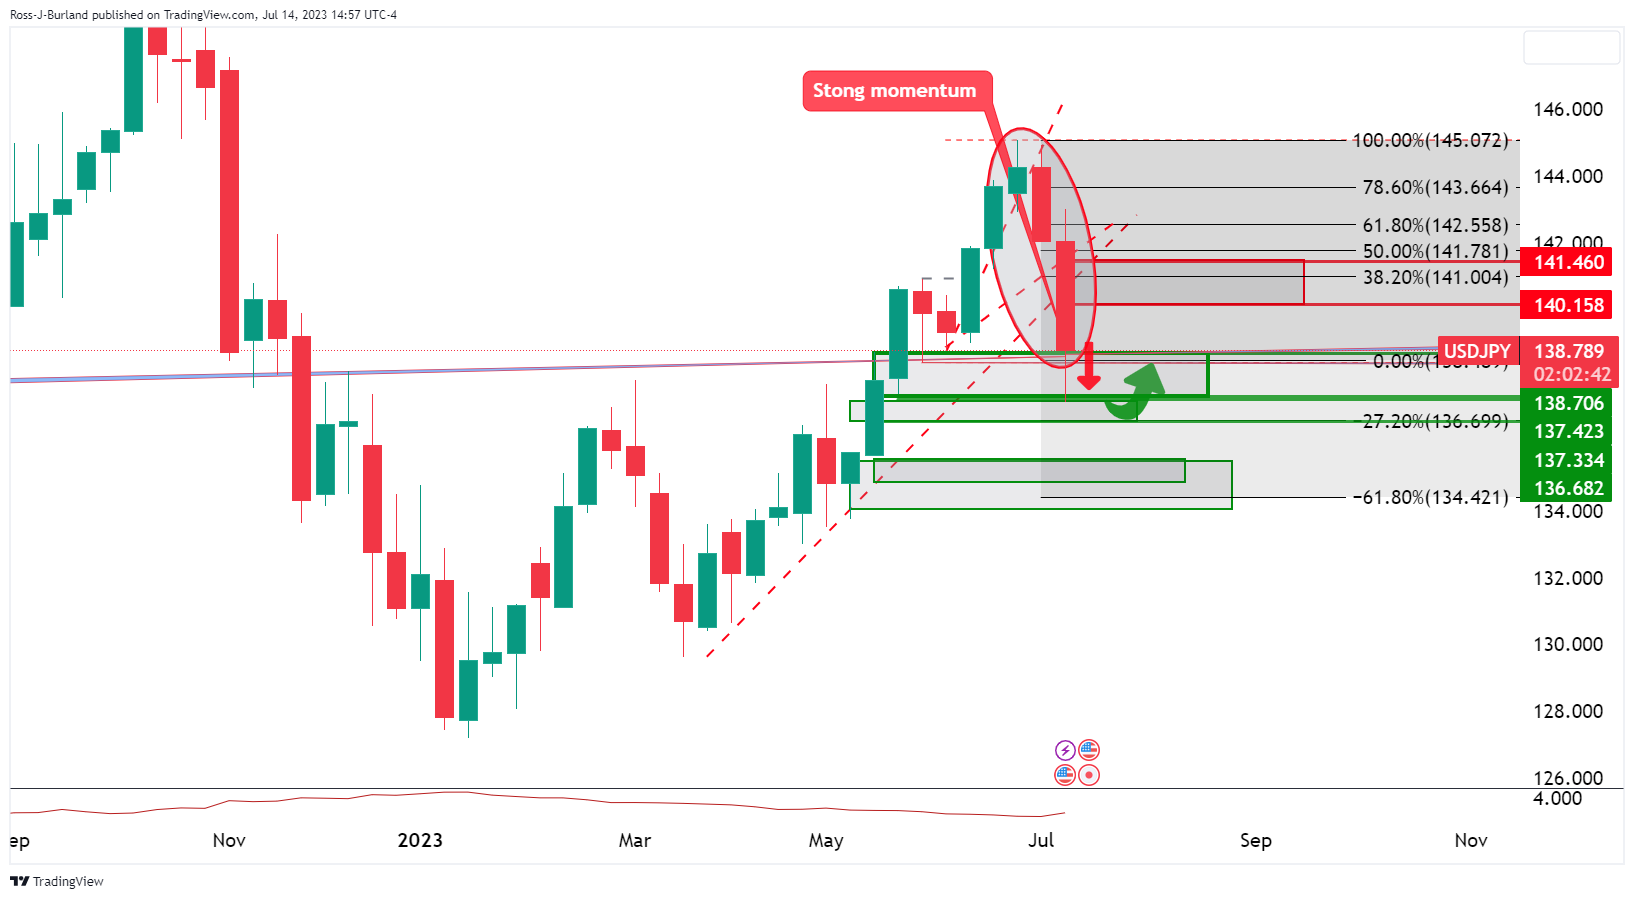
USD/JPY dropped for the second week in a row and found support above 137.00, on the 20 and 55-week SMA. The yen rose sharply versus the dollar but posted mixed results versus its other rivals as the positive impact from lower yields was offset by risk appetite. The divergence between the Bank of Japan and other central banks remains present, even as the tightening cycle becomes closer. Japan will release the Consumer Price Index on Friday, with the annual rate expected to remain at 0.2% from a year earlier.
USD/CAD rebounded sharply on Friday, trimming weekly losses and retaking 1.3200. The Bank of Canada hiked interest rates to 5.0%, its highest level in 11 years. Canada will report inflation data next Tuesday and Retail Sales on Friday.
AUD/USD broke its range, surpassing 0.6700 and jumped to test the 0.6900 area and June highs. It holds a bullish tone. The Reserve Bank of Australia (RBA) will release the minutes of its latest meeting on Tuesday. Australia will release employment data on Thursday.
NZD/USD broke the resistance area at 0.6300 and briefly reached levels above 0.6400, and then pulled back modestly. As expected, the Reserve Bank of New Zealand (RBNZ) kept interest rates unchanged at 5.5%. On Wednesday, New Zealand will release inflation data, with a slowdown in the annual rate expected from 6.7% to 5.9%.
The Chinese Yuan recovered with USD/CNH falling from 7.22 to 7.11. Data continues to point to weak domestic demand. China will report Q2 GDP on Monday.
Optimism that the Federal Reserve will soon end the tightening cycle boosted emerging market and higher beta currencies. USD/MXN posted its first weekly close under 17.00 since November 2015. The Mexican peso continues to be among the top performers so far during 2023.
The Swedish Krona and the South African Rand were the top performers during the week. USD/ZAR bottomed at 17.90, the lowest since April, while USD/SEK tumbled from 10.800 to 10.180, slightly above YTD lows. The Chilean Peso lagged and failed to rise versus the US Dollar.
Buying Silver was the best trade of the week with XAG/USD gaining more than 8% during the week. Gold rose from $1,925 to $1,960.
Like this article? Help us with some feedback by answering this survey:
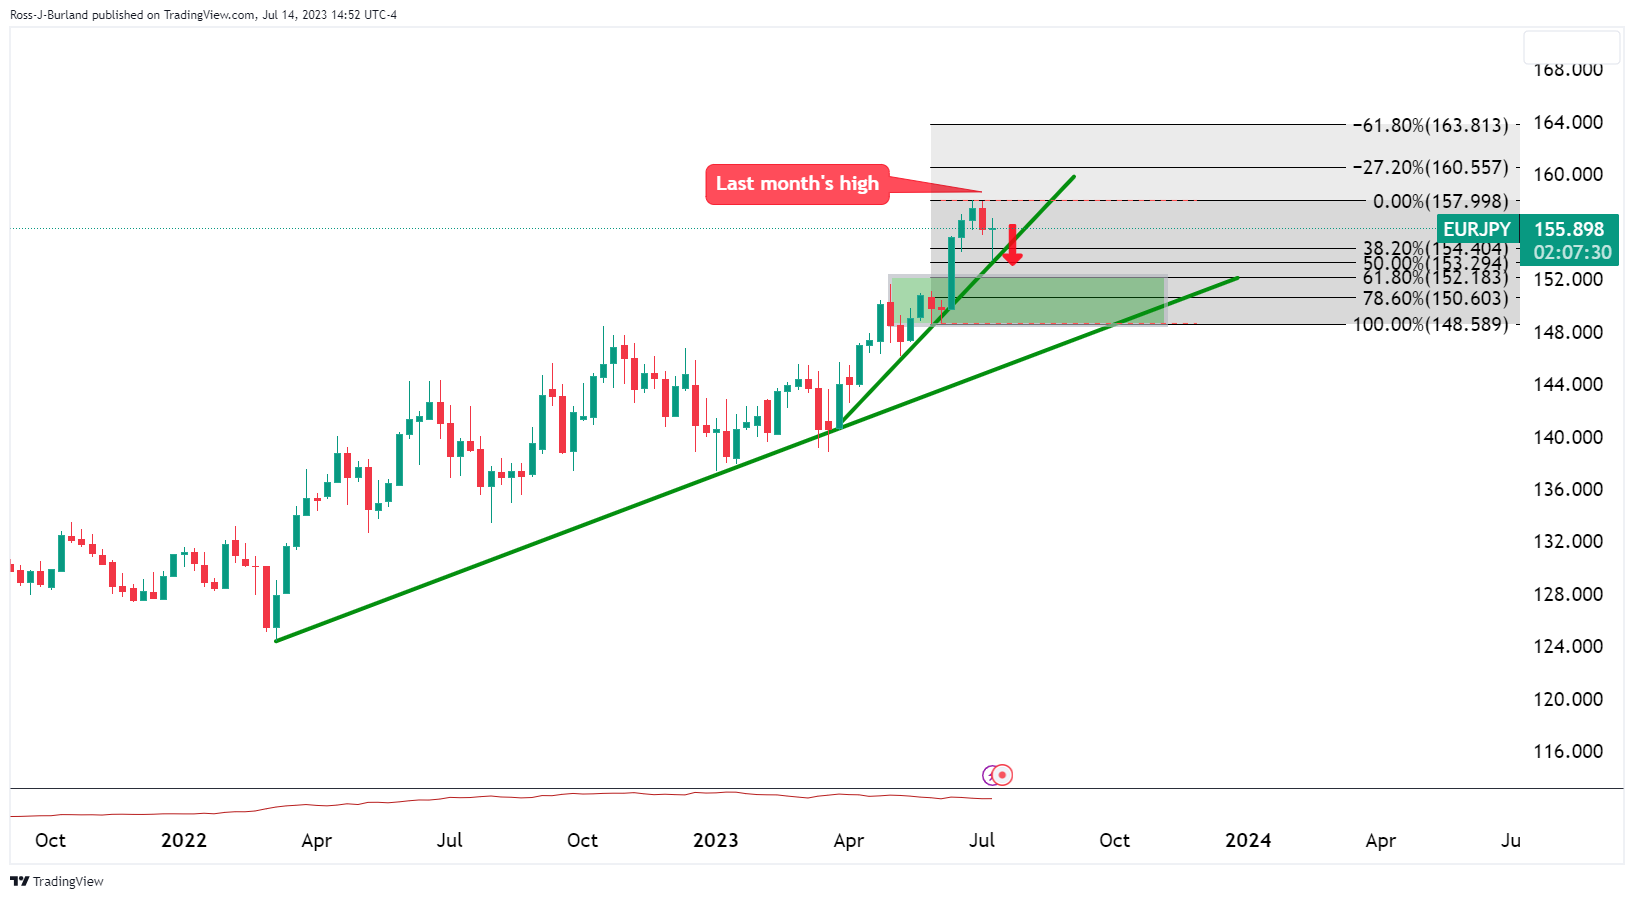
- EUR/JPY bears lurking for the open next week.
- EUR has remained firm and bulls stay in control, but the focus is on the Yen.
EUR/JPY is higher on Friday but that not tells the entire story as the following technical analysis illustrates. It has traded between a low of 155.92 and a high of 156.13 but there is a bearish bias:
EUR/USD technical analysis
While the Euro has upside potential, the EUR/JPY chart is bearish as the Yen is flying:
USD/JPY analysis
DXY analysis
EUR/JPY, possibility
If the Yen continues and US Dollar bears remain reluctant to commit, we could see the above scenario play out.
- The XAG/USD closes the week with slight gains near the $25.00 area, tallying a six-day winning streak.
- The metal is set to close an 8% winning week.
- USD sell-off stalled amid positive UoM data and a slight US yield recovery.
In Friday’s session, the XAG/USD stands with gains near the $25.00 psychological resistance. Despite US Treasury yields recovering, the precious metal stays resilient while the USD managed to stop the bleeding, still closing its worst week in 2023.
The XAG/USD gained interest due to falling yields during the week. As the US reported that the Core Consumer Price Index (CPI) from the US from June, dropped to 4.8% YoY in June, while the Core Producer Price Index (PPI) slid to 2.6% YoY in the same period, investors started to bet on a less-aggressive Federal Reserve.
As for now, according to the CME FedWatch tool, markets have priced in a 25 basis point (bps) hike in the next Fed meeting in July, but the odds of another hike in 2023 lowered to around 20% vs 40% at the start of the week. In that sense, US yields sharply declined, and as they could be seen as the opportunity cost of holding the non-yielding grey metal, the price rallied.
To close the week, the US yields recovered with more than 1% increases, but the 2, 5 and 10-year yields are set to close a week of more than 3% declines.
XAG/USD Levels to watch
The daily chart suggests a positive outlook for the XAG/USD, but after six consecutive days of losses, the price will eventually correct downwards. As for now, the Relative Strength Index (RSI) stands flat near overbought levels, while the Moving Average Convergence Divergence (MACD) seem to be running out of steam.
Resistance Levels: $25.10, $25.40, $26.00.
Support Levels: $23.95, $23.55 (100-day Simple Moving Average), $23.15 (20-day Simple Moving Average).
XAG/USD Daily chart
-638249565235285059.png)
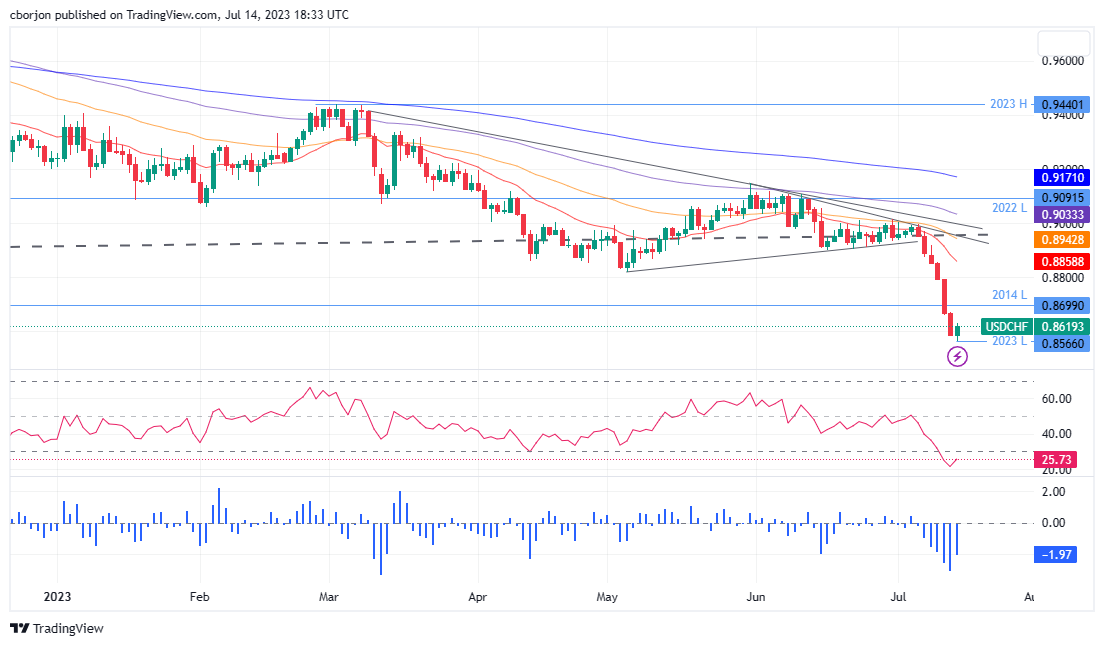
- USD/CHF drops 3%, RSI suggests potential recovery, past 0.8700, as a bullish-engulfing pattern could form.
- USD/CHF’s bearish extension hinges on breaking 0.8566 support.
USDH/CHF regains some composture after plummeting more than 3% in the week, breaking technical support levels due to overall US Dollar (USD) weakness across the Forex (FX) board. Slow inflation in the United States (US) triggered market players to pare bets the US Federal Reserve (Fed) will tighten monetary conditions past the Fed July meeting. Hence, the greenback weakened and, against the Swiss Franc (CHF), lost more than 250 pips. The USD/CHF is trading at 0.8622 after reaching a new eight-year low of 0.8566.
USD/CHF Price Analysis: Technical outlook
From a technical standpoint, the USD/CHF is suggested to continue downwards. Still, the Relative Strength Index (RSI) indicator, hitting an extreme 21.47 reading, jumped and is about to cross above the 30 line. That, along with the three-day Rate of Change (RoC) portraying sellers are beginning to lose momentum, could pave the way for the USD/CHF to recover some ground.
If USD/CHF buyers reclaim the 0.8700 figure, that could form a bullish-engulfing candlestick pattern, opening the door for an upward correction. Still, the USD/CHF will remain downward biased unless traders push prices past the 200-day EMA at 0.9179.
A bearish continuation will resume once USD/CHF sellers drag prices below 0.8566, exposing the 0.8500 mark, followed by the 0.8400 figure, ahead of diving towards the 2015 yearly low of 0.8300.
USD/CHF Price Action – Daily chart
- NZD/USD retreats from five-month highs amid profit-taking ahead of the weekend and the backdrop of easing US inflation.
- US economic data for the week revealed a disinflation process in progress, impacting investor anticipation of further rate hikes beyond the expected July FOMC decision.
- Reserve Bank of New Zealand’s decision to hold rates steady has not weakened the Kiwi, which is set to finish the week with gains of over 2.70%.
NZD/USD retreats from five-month highs reached at 0.6411 earlier, drops 0.31%, as traders square off their positions ahead of the weekend. US economic data revealed on Friday portrays inflation is easing, while a University of Michigan (UoM) poll showed consumer sentiment improved. The NZD/USD is trading at 0.6372.
NZD set to end the week with solid gains vs. the USD despite pullback
During the week, the US economic agenda showcased the Consumer Price Index (CPI) and the Producer Price Index (PPI) June figures, showed the disinflation process is gathering momentum. Hence, investors trimmed a possible rate hike past the July FOMC’s decision, in which the Federal Reserve is expected to lift rates by 25 bps to leave rates at 5.25%-5.50%.
Consequently, US Treasury bond yields plunged, while the greenback holds one of its most significant weekly losses since November 2022, as shown by the US Dollar Index (DXY). As of writing, the DXY, which portrays the US Dollar’s performance against a basket of six currencies, gains 0.17%, up at 99.943.
Data-wise, Friday’s US agenda witnessed Import and Export prices slowing down for the second consecutive month, with figures coming below May’s and analysts’ forecasts. That reinforced US CPI, and PPI data revealed during the week a headwind for the US Dollar.
The University of Michigan (UoM) revealed an improvement in US Consumer Sentiment, which was expected to print 65.5 but came at 72.6m at a two-year high. Further data showed that inflation expectations for one year were upward revised to 3.4% from 3.3% in June, while for five years, it edged high to 3.1%, up from 3%.
Joanne Jsu, the UoM Surveys of Consumers Director, said, “The sharp rise in sentiment was largely attributable to the continued slowdown in inflation along with stability in labor markets.”
On the New Zealand front, the latest Reserve Bank of New Zealand (RBNZ) monetary policy decision to hold rates unchanged didn’t weaken the Kiwi (NZD), which is set to finish the week with solid gains of more than 2.70% against the US Dollar (USD).
Upcoming events
NZD/USD Price Analysis: Technical outlook
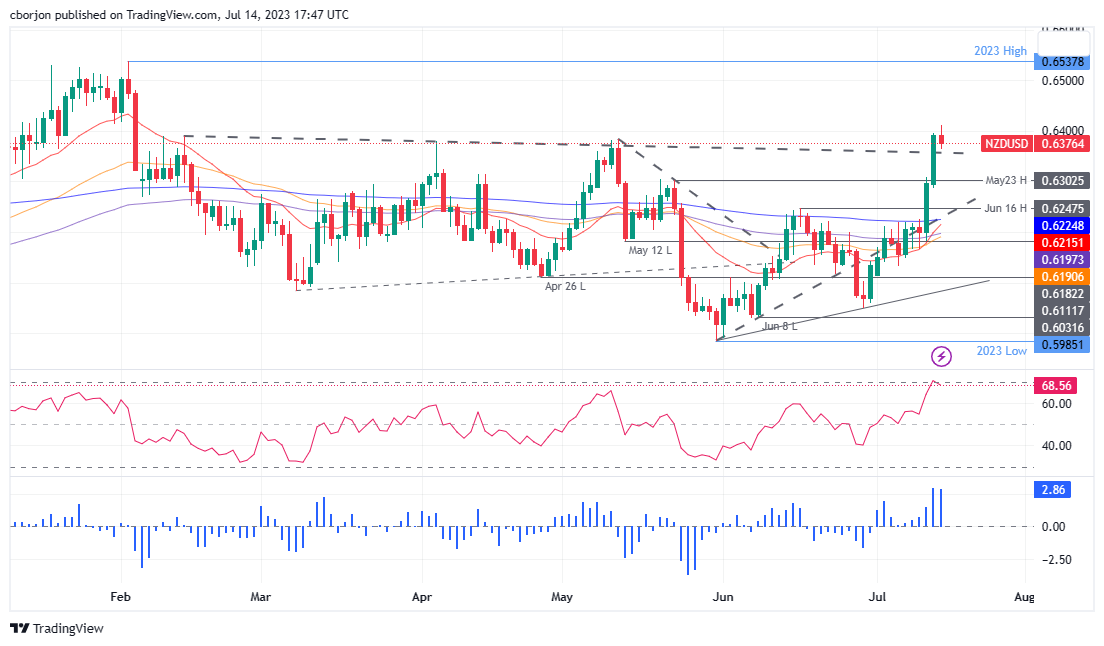
The NZD/USD daily chart portrays the pair as upward biased, though it should be said that it is trading below the May 23 daily high of 0.6385, opening the door for further losses. Traders should note the Relative Strength Index (RSI) indicator is exiting overbought territory, which could pave the way for deeper correction while keeping the bias intact.
NZD/USD’s support emerges at a five-month-old broken resistance trendline turned support at around 0.6350/60. A breach of that area, the NZD/USD could dive toward the May 23 high-turned support at 0.6302 before extending its losses to June’s 16 swing high-turned support at 0.6247
- WTI bulls are taking profits ahead of the weekend and the price retreated near $75.50.
- The price was rejected twice this week by the 200-day SMA at $77.17, and indicators show some weakness.
- USD weakness and dovish bets to limit the WTI losses.
On Friday, the West Texas Intermediate (WTI) barrel lost some ground as investors did some profit-taking ahead of the weekend after a three-day winning streak. Still, the black gold is set to close a 2.90% winning week amid USD weakness.
That said, the USD somewhat recovered on Friday but is still vulnerable. The Greenback gained some ground following positive University of Michigan (UoM) Consumer Confidence figures. Still, the soft inflation figures reported on Wednesday and Thursday, adding dovish bets on the Federal Reserve (Fed), should limit the USD upside potential.
As for now, investors continue to discount a 25 basis point (bps) hike for the next July Fed meeting but refrain from betting on an additional hike in the rest of 2023. Its worth noticing that higher rates cool down the economy and hence lower the Oil’s demand adding selling pressure to its price.
On the other hand, traders should monitor China’s economic situation, the world’s biggest Oil importer. As economic activity and trade balance data should recently some weakness, it is expected the Chinese government to announce more stimulus measures to support the weakening domestic economy. In that sense, a stronger Chinese economy could boost Oil prices.
WTI Levels to watch
According to the daily chart, the WTI showed a bullish outlook, but indicators show signs of exhaustion. The Relative Strength Index (RSI) got rejected at the overbought threshold and prints a negative slope, while the Moving Average Convergence Divergence (MACD) printed a decreasing green bar.
Resistance Levels: $77.17 (200-day SMA), $78.00,$81.00.
Support Levels: $74.70, 73.55 (100-day SMA), $71.76 (20-day SMA).
WTI Daily chart
-638249514529207101.png)
- USD/MXN extends its losses, falling past the 16.80 mark, as the Mexican Peso benefits from easing US inflation.
- US Bureau of Labor Statistics shows import and export prices trending down, reinforcing previous reports of easing consumer and producer prices.
- Despite this, the US Federal Reserve is expected to lift rates 25 bps at July’s meeting.
USD/MXN extended its losses past the 16.80 mark, with the Mexican Peso (MXN) eyeing additional gains as inflation in the United States (US) subsides, as revealed during the week. The USD/MXN is exchanging hands at 16.8000, down 0.23%, and set to finish the week with losses of almost 1.90%.
US Inflation downtrend favors Mexican Peso; pair loses 1.90% over the week
The last week witnessed inflation figures easing in the US. The US Bureau of Labor Statistics (BLS) revealed that Import and Export prices continued their downtrend, falling below May’s and estimate numbers, aligning recent consumer prices and producer prices reports previously showcased on Wednesday and Thursday, respectively. Although the data could be used by the US Federal Reserve (Fed) to pause its tightening cycle, officials remain focused on bringing inflation towards its 2% goal.
Traders expect the US central bank to hike rates 25 bps at the upcoming July Federal Open Market Committee (FOMC) on 25-26, with odds at 96.1%. However, contrary to Fed policymakers saying that an additional increase is needed past the July meeting, the swaps market shows US rates peaking at 5.25%-5.50%.
The University of Michigan (UoM) revealed an improvement in US Consumer Sentiment, which was expected to print 65.5 but came at 72.6m at a two-year high. Further data showed that inflation expectations for one year were upward revised to 3.4% from 3.3% in June, while for five years, it edged high to 3.1%, up from 3%.
Joanne Jsu, the UoM Surveys of Consumers Director, said, “The sharp rise in sentiment was largely attributable to the continued slowdown in inflation along with stability in labor markets.”
US Treasury bond yields are recovering some ground, as the 10-year Treasury note rate sits at 3.816%, gaining four and a half basis points, while the US Dollar Index, a measure of the dollar’s performance against a basket of peers, stopped its drop at 99.887, gaining 0.10%.
Across the border, a light economic calendar in Mexico left USD/MXN traders leaning into the interest rate differential between both countries and recent US inflation data, which could warrant the Fed could finish its tightening cycle.
USD/MXN Price Analysis: Technical outlook
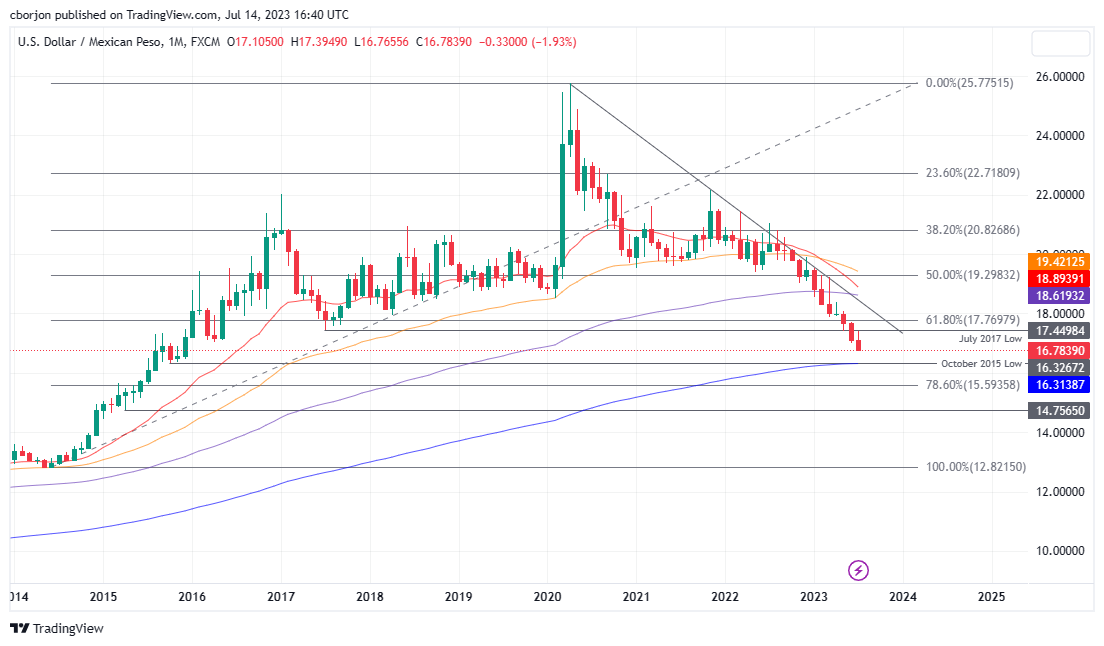
The USD/MXN monthly chart depicts that the pair might continue to trend lower as the next support emerges at the October 2015 swing low of 16.3267 and the 200-month Exponential Moving Average (EMA) at 16.3138. But firstly, a psychological 16.50 barrier must be taken out by sellers, which should be said, they had no issues taking psychological support levels out of the way, to the downside. Conversely, USD/MXN buyers must claim the July 2017 swing low of 17.4498, so they can have a chance, to lift exchange rates, to the 61.8% Fibonacci retracement at 17.7697, before rallyings toward the 18.0000 figure.
- AUD/USD retreats below 0.6850, still poised to make a 2.40% weekly gain, its highest in 2023.
- UoM US Confidence data provided some support to the USD.
- DXY Index stabilised below 100.00 but remains vulnerable.
At the end of the week, the Aussie lost some ground agains the Greenback as US Treasury yields somewhat recovered, lending the USD support. However, the pair is set to see further upside as it is expected the Federal Reserve (Fed) will tilt more dovish following soft inflation data from June.
In a tough week for the USD it was reported that the Core Consumer Price Index (CPI) from the US from June, dropped to 4.8% YoY in June, while the Core Producer Price Index (PPI) slid to 2.6% YoY in the same period. As markets seem to be taking off the table another rate hike past the July meeting, US Treasury yields declined, making the USD face severe selling pressure.
On the data front, the University of Michigan (UoM) reported that its Consumer Confidence Index increased to 72.6 in July from it previous 65.5 and provided some support for the USD.
On the Aussie’s side, investors await labor market data next week, including the Employment Change and Unemployment rate figures from June to be released next Thursday. In addition, investors should keep an eye on China’s situation as it is expected that the Chinese government will announce stimulus measures to bolster the economy. Regarding the Reserve Bank of Australia (RBA), Deputy Governor Bullock was appointed as the new Governor to replace Governor Lowe and her term is set to begin in September 18.
AUD/USD Levels to watch
Despite Friday’s downside movements, the AUD/USD’s outlook is bullish for the short term. The Relative Strength Index (RSI) and Moving Average Convergence Divergence (MACD) stand strong in positive territory while the pair trades above the 20, 100 and 200-day Simple Moving Averages.
Resistance Levels: 0.6900 (June high), 0.6950,0.6980.
Support Levels: 0.6785, 0.6750, 0.6715 (20-day Simple Moving Average).
AUD/USD Daily chart
-638249468263994885.png)
- USD/JPY recovered some ground but remained in danger of losing its early gains due to the slowing pace of inflation in the United States.
- The pair saw a brief uplift as a report from the University of Michigan indicated improved Consumer Sentiment, posting a two-year high.
- Rising household inflation expectations and speculation on adjustments to Yield Curve Control put pressure on the Bank of Japan.
USD/JPY recovers some ground but remains at the brisk of erasing most of its earlier gains after data from the United States (US) continued to show inflation is decelerating. At the same time, an improvement in US consumer sentiment lifted the pair towards its daily high of 139.15 before reversing its curse. The USD/JPY is trading at 138.47 after hitting a daily low of 137.21, up 0.31%.
USD/JPY trims losses on upbeat US data but inflation data on the US warrants less Fed tightening needed
The USD/JPY jumped during the latest hour after a report from the University of Michigan (UoM) saw an improvement in Consumer Sentiment, which was expected to print 65.5 but came at 72.6m at a two-year high. Joanne Jsu, the UoM Surveys of Consumers Director, said, “The sharp rise in sentiment was largely attributable to the continued slowdown in inflation along with stability in labor markets.” Additional data showed that inflation expectations for one year were upward revised to 3.4% from 3.3% in June, while for a five-year period, they were 3.1%, up from 3%.
Other data the US Department of Labor revealed showed US Import and Export prices slowed down, falling below the estimates in annual and yearly figures for June. The report aligned with the recent inflation data on the consumer and producer side, with numbers justifying the case for the US Federal Reserve (Fed) to keep rates unchanged if they want to, as prices are accelerating towards the Fed’s 2% goal. Nevertheless, Fed policymakers stressed that the battle against inflation has not been won, suggesting further tightening is needed.
US Treasury bond yields are recovering some ground, as the 10-year Treasury note rate sits at 3.793%, up two basis points, a tailwind for the greenback. The US Dollar Index, a measure of the dollar’s performance against a basket of peers, stopped its drop at 99.809, gaining 0.03%.
On the Japanese front, a Bank of Japan (BoJ) survey showed that households’ inflation expectations had risen, keeping the BoJ pressured. Also, expectations of the BoJ tweaking its Yield Curve Control (YCC) have been the main driver behind the Japanese Yen (JPY) strong week against most G8 FX currencies.
USD/JPY Price Analysis: Technical outlook
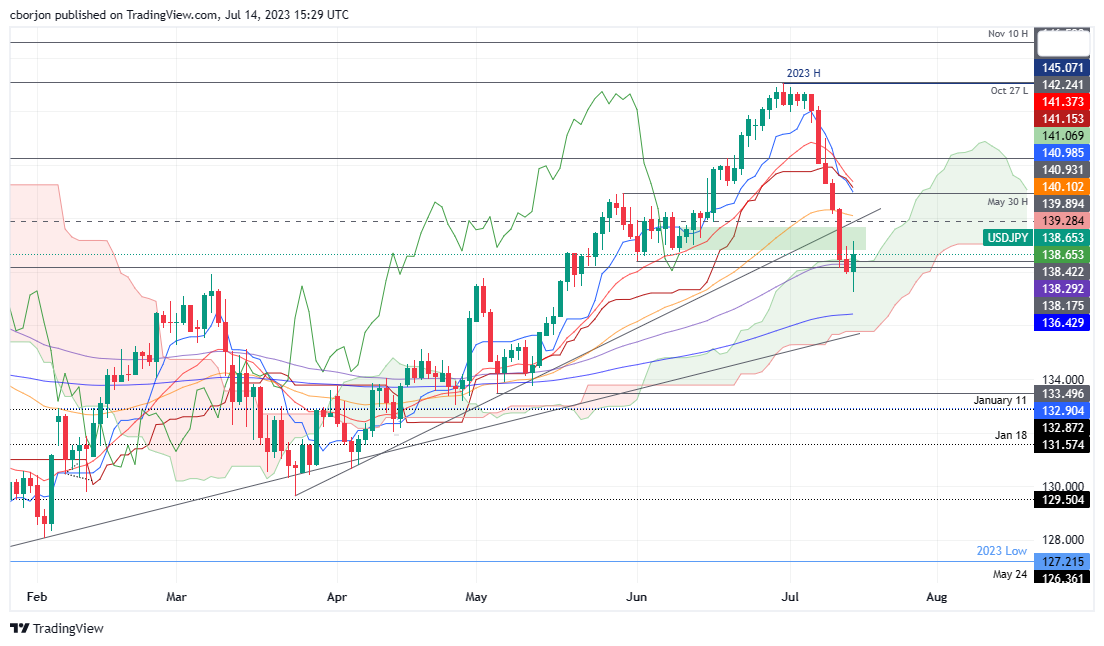
As of writing, the USD/JPY is struggling to decisively break the top of the Ichimoku Cloud (Kumo), which could pave the way for consolidation. USD/JPY’s sellers are eyeing the bottom of the Kumo at around 135.80/90, but the 200-day Exponential Moving Average (EMA) at 136.43 is expected to cushion the USD/JPY fall. On the upside, if USD/JPY buyers lift the pair past the top of the Kumo at around 138.50/60, it would exacerbate a challenge of the 139.00 psychological level.
The Gold price gained significantly following the publication of US inflation data on Wednesday. Economists at Commerzbank analyze XAU/USD outlook.
The market now only expects one more rate hike by the Fed
The Gold price has gained considerably, primarily thanks to the declining US inflation figures. After all, this makes it appear likely that the (US) rate hike cycle will soon come to an end: the market now envisages only one last rate increase at the end of July.
We agree and therefore expect prices to trend sideways in the coming weeks. They are likely to continue rising if the market begins discussing the subject of rate cuts.
The emergence of an El Niño weather event threatens to disrupt the already uncertain outlook for commodity markets, economists at ANZ Bank report.
El Niño is expected to increase demand for electricity
An El Niño typically brings drought to the western Pacific, rains to the equatorial coast of South America, and storms and hurricanes to the central Pacific. As such, we are likely to see warmer and drier weather in Europe and Asia. This will put further pressure on energy markets in the short term. Coal and Gas consumption is expected to rise.
We expect an increased level of disruptions to supply in the metals markets. Copper from South America is the most exposed. Aluminium supply in China is also at increased risk of disruption. On the flip side, demand for Gold could be impacted as lower revenue from reduced crops keeps India’s farmers hands in their pockets.
We could also see increase levels of carbon emissions brought about by increased fires and higher power consumption. Any potential pick-up in demand for carbon credits from industrial users and consumers could be offset by stronger renewable energy generation.
EUR/USD has had very little difficulty pushing through its spring high – just below 1.11. Economists at Rabobank analyze the pair’s outlook.
A soft USD is likely to prevail in the near-term
Signs of disinflation in the US and a high level of scepticism about the ability of the Fed to hike rates beyond the July meeting suggest that a soft USD is likely to prevail in the near-term. That said, signs that the ECB’s rate hike cycle is moving towards its peak suggest that EUR/USD could struggle to make further gains beyond the summer season. Additionally, if US recession fears strengthen into the end of the year, the USD could benefit from broad-based support.
We have revised down our USD forecasts across the board on a one-month view in response to the disinflationary signals in the US. However, in view of our house forecasts surrounding US recession risks, and in consideration of the economic headwinds facing the Eurozone, we see EUR/USD trading lower into year-end and through the early part of 2024.
Misery – defined as the unemployment rate plus inflation – is falling sharply in the US and more slowly in Europe. Kit Juckes, Chief Global FX Strategist at Société Générale, analyzes the implications for financial markets.
Can beating inflation be painless?
Risky assets would clearly benefit from a recession-free escape from inflation. The Dollar wouldn’t. Nor would the Dollar benefit from a mild recession that allowed European misery to melt away without too much pain (and the ECB to go on hiking after the Fed was finished).
But the tail risk that the Fed is encouraged to pause then pivot and stop raising rates, only to see tight labour markets drive a fresh upturn in underlying inflation next year, is now a real risk. That outcome, scuppering European recoveries and forcing the Fed to drive the economy in a late 2024 recession, may be a tail risk but it’s a big enough one to underpin FX volatility going forwards.
We think the volatility downtrend is over and bumpier markets are likely.
- UoM Consumer Confidence Index rose more than expected in July.
- US Dollar Index clings to modest recovery gains at around 100.00.
Consumer sentiment in the US continued to improve in early July, with the University of Michigan's (UoM) Consumer Confidence Index rising to 72.6 from 64.4 in June. This reading came in better than the market expectation of 65.5.
Further details of the publication revealed that the Current Conditions Index rose to 77.5 from 69.0 and the Expectations Index climbed to 69.4 from 61.5.
The one-year inflation outlook edged higher to 3.4% from 3.3% while the 5-year inflation outlook ticked up to 3.1% from 3%.
Market reaction
The US Dollar Index extended its daily recovery after the data and was last seen rising 0.23% on the day at 100.00.
With inflation receding faster in the US than Europe, economists at UBS expect the Dollar to weaken.
More investors to seek yield in Europe rather than the US
One key consequence of the steady retreat in global inflation will be a weaker US Dollar as price pressures ease faster in the US than in Europe.
Consumer energy subsidies in Europe meant inflation was slower to rise but will also be slower to fall. In turn, this should mean that interest rate differentials with the US will narrow – leading more investors to seek yield in Europe rather than the US.
We forecast EUR/USD to rise to 1.18 by June 2024.
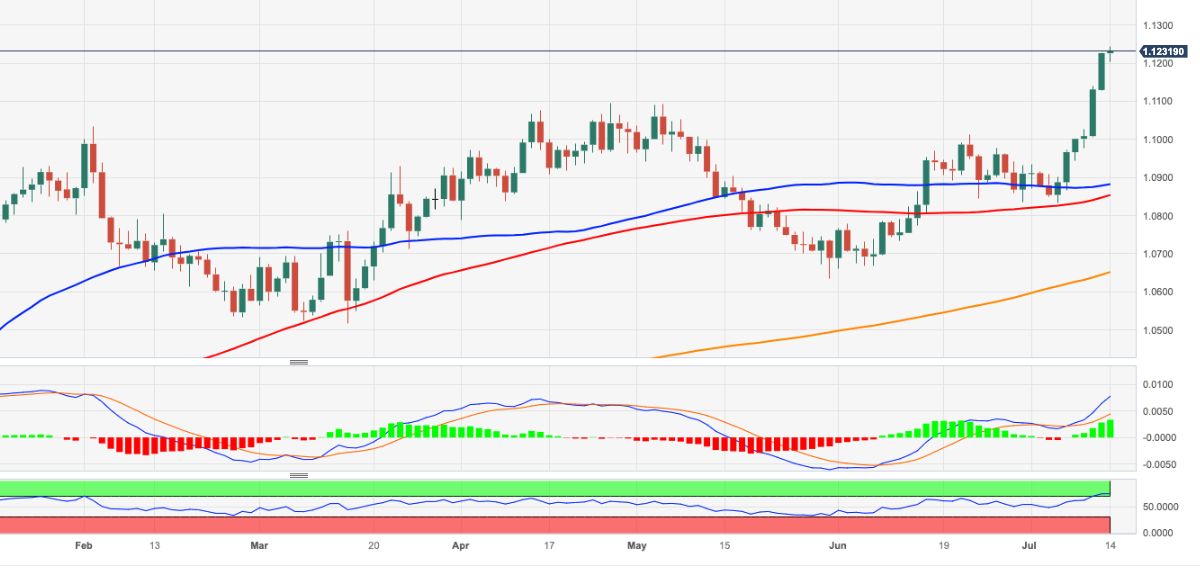
- EUR/USD advances to new highs in the 1.1240/45 band.
- The next up-barrier emerges not before 1.1495.
EUR/USD’s intense upside seems to have met an initial barrier around 1.1240, or 2023 peaks, so far on Friday.
While the continuation of the upside momentum appears favoured in the very near term, the pair’s current overbought conditions might spark a corrective knee-jerk. Further upside is then expected to meet the next resistance level of note at the 2022 high of 1.1495 recorded on February 10.
Looking at the longer run, the positive view remains unchanged while above the 200-day SMA, today at 1.0651.
EUR/USD daily chart
The CAD has participated in the broader rally against the USD this week but gains have come grudgingly. Economists at Scotiabank analyze Loonie's outlook.
CAD set to gain a little at least relative to the USD coming months
The CAD is perhaps catching some of the spillover from the USD, with investors believing that the Fed and BoC will follow similar policy cycles. That may be true in a broad sense but there are other factors that should help the CAD gain a little at least relative to the USD coming months.
If the Fed rate cycle is peaking, which looks very likely, risk assets should improve somewhat, providing the CAD with some additional support. A softer USD should also be supportive for commodity prices. An array of factors already suggests the CAD should be somewhat stronger.
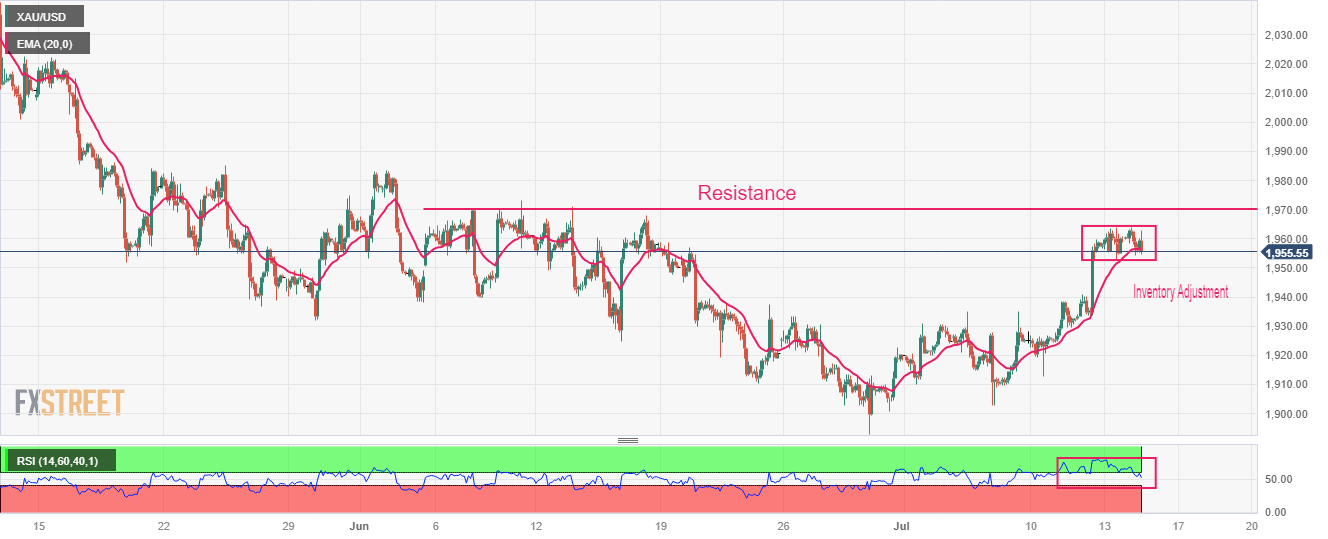
- Gold price has remained subdued around $1,960.00 as the US Dollar Index has attempted a recovery.
- In spite of a decline in price pressures, Fed Waller delivered a hawkish commentary.
- Gold price is gathering strength for further upside after a stalwart rally.
Gold price (XAU/USD) is demonstrating a subdued performance around $1,960.00 in the early New York session. The precious metal is struggling to deliver a decisive move as investors are hoping that the Federal Reserve (Fed) might skip the policy-tightening regime one more time this month.
After recognizing a consistent decline in inflationary pressures, Fed chair Jerome Powell skipped its policy-tightening spell in May but remained doors open for more rate hikes. June’s inflation report conveyed that price pressures have softened more than expected as prices of second-hand automobiles have dropped sharply.
Meanwhile, S&P500 is expected to open on a mildly bullish note amid a risk-on mood. The US Dollar Index (DXY) has delivered a short-lived pullback to near 100.00, however, the downside bias is still favored as fundamentals are still not supporting. The yields offered on 10-year US Treasury bonds have rebounded to near 3.79%.
In spite of the decline in price pressures, Fed Governor Christopher Waller delivered a hawkish commentary. Fed Waller is confident that two more interest rate hikes are appropriate this year to bring down inflation to 2%.
Gold technical analysis
Gold price is gathering strength for further upside after a stalwart rally on a two-hour scale. An inventory adjustment is under process as inventory is exchanged between institutional investors and retail participants. Potential resistance is plotted from June 07 high around $1,966.70.
Upward-sloping 20-period Exponential Moving Average (EMA) at $1,956.33 is providing support to the Gold bulls.
The Relative Strength Index (RSI) (14) has slipped below 60.00, which indicates exhaustion in the upside momentum.
Gold two-hour chart
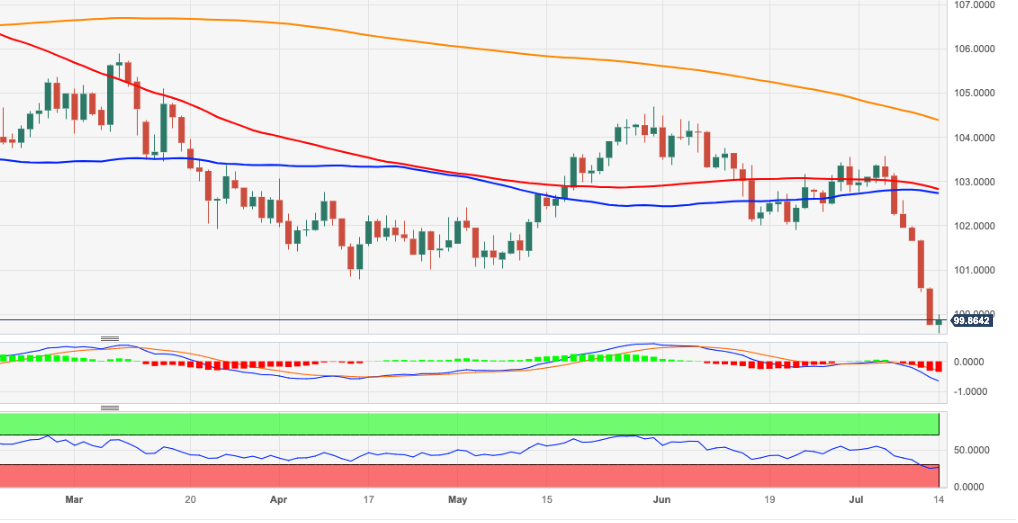
- DXY bounces off 15-month lows in the 99.60/55 band.
- Extra downside appears favoured for the time being.
DXY manages to regain some composure and leaves behind recent lows in the vicinity of 99.60 on Friday.
The continuation of the decline of the dollar looks the most likely scenario for the time being. Against that, the breach of the current 2023 low at 99.57 (July 14) could spark a deeper pullback to the weekly low of 97.68 (March 30 2022).
Looking at the broader picture, while below the 200-day SMA at 104.37, the outlook for the index is expected to remain negative.
DXY daily chart
The price of a barrel of Brent Oil has been trading below $80 since the beginning of May but has recently approached this level again after an interim drop in June to $72. Economists at Commerzbank analyze Oil outlook.
Oil price set to rise due to tighter market
Demand concerns still stand in the way of a stronger price increase. For example, the economic recovery in China has noticeably lost momentum. Rising interest rates in the USA and Europe are likely to curb Oil demand there.
We have lowered our price forecast for a barrel of Brent Oil at the end of the year to $85. However, we are sticking to the expected price recovery.
Gold climbed by some 1.3 percent on Wednesday and Thursday as inflation eases, but a sustained rally is unlikely for now, Bart Melek, Head of Commodity Strategy at TD Securities, reports.
Rallies may soon run out of steam
For Gold, rising real rates as inflation eases and policy rates stay at the terminal level for a prolonged period may again drive specs away. In addition, the high rate environment, weak Chinese economic performance and a pending recession in the US will no doubt weaken the demand for more industrial metals like Copper and Silver for many months to come. While industrial demand is on the wane into 2023, the unplugging of COVID inspired bottlenecks in the supply chain will likely see mine and smelter production make more metal available.
This may well mean that the Gold, Silver and Copper rallies, which to a large degree have been short covering driven, may soon run out of steam as high opportunity and carry costs prevent any additional meaningful increase in long exposure. New longs are needed to move these markets past resistance, into bull territory.
This rally is vulnerable to reversals, should the Fed's policy rhetoric remain hawkish and if US data surprises to the upside.
Momentum will continue into the third quarter. The max analysts at Société Générale would expect is an S&P 500 of 4,750.
Momentum mania to build further before it breaks
Our tactical indicators also suggest a risk to the upside in Q3 before the lag effect of the rate-hiking cycle appears in early 2024 in the S&P 500.
Momentum mania in Q3 with the S&P 500 reaching 4,750 but likely ending the year at 4,300.
We believe the profit margin reversal, credit weakness and sharply rising recession risk will most likely be visible in 1H24, bringing the S&P 500 back to 3,800.
- USD/CAD has turned sideways above 1.3100 as investors await key triggers for further guidance.
- In June, US inflation grew at a nominal pace as a decline in prices of second-hand automobiles offset a marginal rise in gasoline prices.
- BoC Macklem cited that higher interest rates are needed to slow the growth of demand in the economy and relieve price pressures.
The USD/CAD pair is demonstrating signs of a squeeze in volatility above the immediate support of 1.3100 in the European session. The Loonie asset has turned choppy as the US Dollar Index (DXY) has found an intermediate support around 99.60.
S&P500 futures have recovered their entire losses and have turned positive in London, portraying a recovery in the risk appetite of the market participants.
The US Dollar Index (DXY) has gauged temporary support, however, the downside bias is still solid as investors are hoping that the Federal Reserve (Fed) will pause the policy-tightening spell after hiking interest rates by 25 basis points (bps) to 5.25-5.50% this month. Contrary to the USD Index, the 10-year US Treasury yields have rebounded to near 3.77%.
This week, June’s inflation report conveyed that price pressures grew at a nominal pace as a decline in prices of second-hand automobiles offset the marginal rise in gasoline prices. Core Consumer Price Index (CPI) also posted a nominal pace as demand for big-ticket items remained extremely weak. No doubt, at least one more interest rate hike by the Fed this year is in the pipeline, July’s interest rate hike can be skipped.
Going forward, preliminary Michigan’s Consumer Sentiment Index data (June) will be keenly watched. As per the consensus, the economic data is seen improved to 65.5 vs. the former release of 64.4.
On the Canadian Dollar front, the Bank of Canada (BoC) raised interest rates by 25 basis points (bps) to 5% this week. BoC Governor Tiff Macklem cited "Higher interest rates are needed to slow growth of demand in the economy and relieve price pressures."
Meanwhile, oil prices are expected to extend losses to near $76.00 as global central banks are preparing for a fresh interest rate hike cycle. It is worth noting that Canada is the leading exporter of oil to the United States and a decline in oil prices would impact the Canadian Dollar.
- EUR/JPY reclaims the area above 155.00 on Friday.
- Next on the upside comes the YTD high near 158.00.
EUR/JPY climbs to 4-day highs north of the 155.00 hurdle at the end of the week.
In the meantime, the cross keeps the recovery mode in place and the continuation of the uptrend carries the potential to challenge the so far 2023 peak in the boundaries of 158.00 the figure (June 29).
So far, the longer term positive outlook for the cross appears favoured while above the 200-day SMA, today at 145.88.
EUR/JPY daily chart

USD consolidates in light trade but hefty loss on the week takes a toll, economists at Scotiabank report.
BBDXY breakdown suggests losses of around 4%
While marginally higher on the day overall, the USD is heading for a soft close on the week, a signal that momentum traders are likely to try and exploit further in the coming days and weeks.
Both the DXY and the broader BBDXY have broken below the lows seen earlier this year. After a period of slack, low conviction range trading, a more dynamic phase of market movement might be about to unfold.
The DXY breakdown suggests USD losses may extend 2-3% or perhaps as much as 5% in the next few months. The BBDXY suggests losses of around 4% potentially from a technical point of view.
Considering the ongoing price action, Markets Strategist at UOB Group Quek Ser Leang assesses the outlook for GBP/USD.
Key Quotes
In our 3Q23 Quarterly Global Outlook published on 16 June 2023, when GBP/USD was trading at 1.2785, we highlighted that the crossover of the 21- and 55-week exponential moving averages in GBP/USD. We noted, “This could lead to GBP/USD rising to 1.3100 before the risk of a pullback increases”.
After trading below the short-term resistance level of 1.2850 for a few weeks, GBP/USD lifted off earlier this week, and yesterday (13 July 2023), it surged past our objective of 1.3100 (high of 1.3144). The strong boost in momentum suggests GBP/USD is unlikely to pullback. Instead, it is likely to continue to head higher towards the top of the weekly exponential moving average envelope. This major resistance level is currently at 1.3335.
In order to maintain the strong buildup in momentum, GBP/USD should not break below the ‘breakout’ level of 1.2850 in the next month or so. However, the key support level is at the rising trendline, now at 1.2730. From the perspective of several months, the 55week exponential moving average (now at 1.2400) is unlikely to come under threat.
USD/CAD is trading marginally higher on the day. Shaun Osborne, Chief FX Strategist at Scotiabank, analyzes the pair’s outlook.
There is some support in the 1.3075 area
Intraday gains suggest some mild upside risk for the USD in the short run but gains are liable to remain limited to the upper 1.31/1.3200 area.
Trend signals are tilting a little more bearishly for the USD now, with the daily DMI more aligned with negative intraday and weekly signals.
There is some support for the USD in the 1.3075 area (200-week MA) but a push to test 1.30 (50% Fibonacci retracement of the 2021/22 move up at 1.2992) remains my target.
Shaun Osborne, Chief FX Strategist at Scotiabank, analyzes GBP/USD technical outlook.
Pullbacks to the 1.29/1.30 range likely to be well-supported
The Pound’s powerful rally has stalled against resistance at 1.3145 (tested four times in the past 24 hours). This does not appear to be a major technical point for Cable, according to my read of the charts, however. In fact, there is little – obvious – resistance to GBP gains extending until the 1.33 area at this point.
Some consolidation in this week’s strong GBP gains should perhaps be expected in the short run.
Pullbacks to the 1.29/1.30 range are likely to be well-supported.
EUR/SD holds above 1.12. Economists at Scotiabank analyze the pair’s technical outlook.
Some consolidation would not surprise
Price action looks mildly negative on the day and short-term gains are stretched. Some consolidation in spot gains would not surprise.
The broader trend higher remains strong and bullish momentum suggests limited losses in the short run and more gains ahead.
EUR/USD closing out the week above 1.1183 (200-Week Moving Average) will be an added plus.
See: EUR/USD could correct lower back to the 1.1170-80 area – ING
Economist at UOB Group Ho Woei Chen, CFA, comments on the recently published trade balance figures in the Chinese economy.
Key Takeaways
China’s exports and imports (both USD and CNY terms) contracted by a sharper pace in Jun in further signs of fading recovery momentum in its economy. Declining export and import prices could also have contributed to the weak data which are reported in nominal values.
Only a handful of products recorded y/y increase in exports including motor vehicles, LCD panels and refined petroleum products. Meanwhile, shipments of high-tech products continued to contract, by -16.8% y/y in Jun compared to 13.9% y/y in May.
In volume terms, China’s imports of commodities including crude oil and coal strengthened in Jun. Copper and iron ore imports also held up well above the same period in 2022 despite slowing economic activities.
In 1H23, China’s exports and imports contracted by -3.2% y/y and -6.7% y/y respectively. The weaker than expected June trade data suggests downside risk for our forecast for China’s export and import which are currently at -3.0% and -2.0% for 2023 respectively.
Recent data had turned out to be weaker than expected, suggesting downside risk to our 2Q23 GDP forecast of 7.8% y/y, 0.9% q/q. The 2Q23 GDP report is due next Mon (17 Jul). We expect more measures to stimulate growth in 2H23 to be announced soon after.
The US Dollar Index (DXY) is returning to the 90-100 range, economists at MUFG Bank report.
DXY close to fully reversing the surge fuelled by the Fed’s dramatic hawkish shift last year
DXY fell back below the 100 level on Thursday for the first time since April 2022 and we are now close to fully reversing the USD surge fuelled by the Fed’s dramatic hawkish shift last year when central bank officials and investors realised the scale of the inflation shock at hand.
Over the last 10 years, DXY has tended to remain within a 90-100 range and we suspect we are returning back into that more normal trading range as the global inflation shock recedes.
- GBP/JPY is aiming to recapture 182.00 as investors are shifting their focus on the UK inflation data.
- Catalysts that have been propelling severe inflation in the UK economy are labor shortages and significantly higher food inflation.
- The BoJ might continue its decade-long ultra-dovish interest rate policy this month to elevate wage pressures further.
The GBP/JPY pair is marching towards the crucial resistance of 182.00 in the European session. The cross has picked strength after overstepping the previous day’s high of 181.45 as expectations of a tweak in the Bank of Japan’s (BoJ) ultra-dovish monetary policy by BoJ Governor Kazuo Ueda have lost their impact.
The contribution of higher domestic demand to inflationary pressures in Japan is increasing but is still far from the impact of higher prices of imported products. Wages have shown little promising signs of recovery but the journey towards a 2% stable inflation target is still far. The BoJ might continue its decade-long ultra-dovish interest rate policy this month to elevate wage pressures further.
Meanwhile, the Pound Sterling has hogged the limelight as investors are assured that more interest rate hikes by the Bank of England are in the pipeline so that inflation could return to 2%. After bleak employment reports, stable wage pressures, and weak factory activities, investors are shifting their focus toward inflation data, which will release on Wednesday at 06.00 GMT.
In May, annual headline inflation rebounded to 8.7% and core CPI that excludes volatile oil and food prices printed a fresh high of 7.1%. Catalysts that have been propelling severe inflation in the UK economy are labor shortages and significantly higher food inflation. For labor shortages, the entire blame goes to the Brexit event and early retirements by UK individuals. While food price inflation in the Britain economy dropped to 18.3% in May from its 45-year high of 19.1 and has not peaked yet.
Investors are questioning the relevance of the current level of share prices. Economists at Natixis highlight the two conditions which, if met, imply that – US and Eurozone – equity markets are not overvalued.
There are two conditions that, if met, imply that current share prices are not overvalued
The first condition is that real long-term interest rates (currently 1% in the US and 0.5% in the Eurozone) do not rise significantly. This condition is difficult to meet: the increase in public and private investment linked to the energy transition, water management and industrial reshoring is likely to lead to a shortage of savings and therefore a rise in real long-term interest rates.
The second condition, particularly in the US, is that artificial intelligence generates additional productivity gains. Opinions differ on this question, but it can only be said that the internet has been associated with a marked decline in productivity gains, whereas the opposite was initially believed (in the late 1990s).
UOB Group’s Economist Ho Woei Chen, CFA, assesses the recent interest rate decision by the Bank of Korea (BoK).
Key Takeaways
In line with consensus and our expectation, Bank of Korea (BOK) extended its interest rate pause to the fourth straight meeting today with the benchmark 7day repo rate staying at 3.50%.
It also continued to maintain a tightening stance with all the board members open to a further 25-bps hike to bring the terminal rate to 3.75%. Although inflation is on a downtrend, the risk factors on prices and household debt still exist.
The central bank maintained its GDP growth and headline inflation forecasts for 2023 at 1.4% and 3.5% respectively. Core inflation is projected to continue its slowing trend but may turn out to be slightly higher than the May forecast of 3.3%.
Considering the soft economic outlook and the general slowdown in inflation, we continue to expect the BOK to stay on hold for the rest of 2023. We think a rate cut could come into view in 1Q24. The next monetary policy meeting will be held on 24 Aug.
- US Dollar tries to snap losing streak as Greenback trades in the green.
- All eyes on Michigan Consumer Sentiment to see if the US Dollar can close this week off the lows.
- The US Dollar Index consolidates below 100.00, a weekly close above there would offer relief.
The US Dollar (USD) is trying to claw back a bit after a hectic week where the Greenback did not get any relief at all. At one point it appeared that everything was against the USD, with several inverse correlations kicking into gear. Most notable element is that the stock market has rallied throughout the week which puts a goldilocks scenario on the table where US rates will keep abating, stocks keep rallying and the Greenback will be left behind paying the bill for it all by devaluing even more.
On the economic front, just one really important element to look for which could make or break the small recovery seen in the US Dollar in the European trading session. The University of Michigan Consumer Sentiment could either offer some relief or trigger another round of US Dollar selling and could push the US Dollar Index further below 100.00, making it the worst week since November 2022. The inflation expectations component in the Michigan survey will be crucial as a possible catalyst.
Daily digest: US Dollar pays the bill for the equity rally
- Early on Friday, Christopher Waller from the Federal Reserve Board of Governors reiterated that the Fed needs to keep on fighting inflation and needs to keep policy restrictive for some time.
- The Japanese Yen deserves a moment in the spotlight as the Japanese tiger roars back by hitting an eight-week high against the Greenback.
- At 14:00 GMT, the only important datapoint for this Friday to keep an eye on as the Michigan Consumer Sentiment Index for July will be published. The index itself is expected to rise from 64.4 to 65.5. As such, that number should not have that much market-moving effect. Traders will rather look for the inflation expectations on both short and long term to be more impactful for the US Dollar Index to move higher or to make a new low for this week.
- Equities across the globe are taking it easy this Friday with some very mild losses at -0.17% for the Japanese Topix and the Chinese Hang Seng closed at +0.33%. For the latter, some negative news came as China vows to only provide support packages for specific segments and in the global economy, but no real large support package or quantitative easing is to be in place.
- European and US equity futures are flat for this Friday halfway through the European session. Although the goldilocks scenario might be the talk of the town, the earnings season could throw a spanner in the works for that straight line up to a new all time high.
- The CME Group FedWatch Tool shows that markets are pricing in a 94.9% chance of a 25 basis points (bps) interest-rate hike on July 26. A second rate hike looks to be out of the question judged on the very low percentages that scenario receives for the last Fed meetings later this year.
- The benchmark 10-year US Treasury bond yield trades at 3.97% and is continuing its relentless slide lower from 4.09% last week. Traders are going all-in on the goldilocks scenario where the Fed is done hiking and might even cut rates earlier as foreseen, which would see a massive boom in the economy and stock market.
US Dollar Index technical analysis: 100.00 still in reach
The US Dollar is having its worst week since its sharp correction in November last year. With substantial losses against the Japanese Yen (USD/JPY), Euro (EUR/USD) and Swiss Franc (USD/CHF), the US Dollar Index has lost nearly 2.5% of its value this week. As the DXY has retreated below 100.00, a weekly close above the big figure could spark hopes for the Greenback to still be able to pair back some of the losses.
In such an upside case, look for 102.73 to provide resistance at the 55-day Simple Moving Average (SMA) that will partially re-gain its importance after having been chopped up that much a few weeks ago. Only a few inches above the 55-day SMA, the 100-day SMA comes in at 102.82 and could create a firm area of resistance in between both moving averages. In case the DXY makes its way through that region, the high of July at 103.57 will be the level to watch for a further breakout.
On the downside, the US Dollar bears will look to take price action toward 99.42 as the next important technical support and once tested, that would mean a new 18-month low for the DXY. Just below there, on the weekly chart, we can find the 200-day SMA at 98.25, which is the next vital level to halt any selloffs. Although the price action resides below 100.00, a small turnaround could still be in the cards.
US Dollar FAQs
What is the US Dollar?
The US Dollar (USD) is the official currency of the United States of America, and the ‘de facto’ currency of a significant number of other countries where it is found in circulation alongside local notes. It is the most heavily traded currency in the world, accounting for over 88% of all global foreign exchange turnover, or an average of $6.6 trillion in transactions per day, according to data from 2022.
Following the second world war, the USD took over from the British Pound as the world’s reserve currency. For most of its history, the US Dollar was backed by Gold, until the Bretton Woods Agreement in 1971 when the Gold Standard went away.
How do the decisions of the Federal Reserve impact the US Dollar?
The most important single factor impacting on the value of the US Dollar is monetary policy, which is shaped by the Federal Reserve (Fed). The Fed has two mandates: to achieve price stability (control inflation) and foster full employment. Its primary tool to achieve these two goals is by adjusting interest rates.
When prices are rising too quickly and inflation is above the Fed’s 2% target, the Fed will raise rates, which helps the USD value. When inflation falls below 2% or the Unemployment Rate is too high, the Fed may lower interest rates, which weighs on the Greenback.
What is Quantitative Easing and how does it influence the US Dollar?
In extreme situations, the Federal Reserve can also print more Dollars and enact quantitative easing (QE). QE is the process by which the Fed substantially increases the flow of credit in a stuck financial system.
It is a non-standard policy measure used when credit has dried up because banks will not lend to each other (out of the fear of counterparty default). It is a last resort when simply lowering interest rates is unlikely to achieve the necessary result. It was the Fed’s weapon of choice to combat the credit crunch that occurred during the Great Financial Crisis in 2008. It involves the Fed printing more Dollars and using them to buy US government bonds predominantly from financial institutions. QE usually leads to a weaker US Dollar.
What is Quantitative Tightening and how does it influence the US Dollar?
Quantitative tightening (QT) is the reverse process whereby the Federal Reserve stops buying bonds from financial institutions and does not reinvest the principal from the bonds it holds maturing in new purchases. It is usually positive for the US Dollar.
After the US inflation data surprised so much on Wednesday the market is likely to pay even closer attention to the price and economic data. Antje Praefcke, FX Analyst at Commerzbank, analyzes USD outlook.
Only the precursor?
The inflation data on Wednesday might only have been a precursor for further Dollar weakness. Just imagine what would happen if the next price data surprises to the downside while the economic data also illustrates increasingly clearly that the past rate hikes are having a dampening effect on the US economy – albeit with the expected delay.
In case of an increasingly rapid fall in inflation and weakening economic data the market might increasingly rely on key rates not remaining at high levels for a long time whereas rate cuts before the end of the year are becoming increasingly likely. That would cause the USD to ease further.
It makes sense in my view to also pay attention to second-tier data now, such as US import prices and the US Michigan Index today. Simply in an effort not to miss the trigger for the next downward push in the Dollar.
- USD/CHF is building a base after a sheer correction to near 0.8570.
- It would be early calling the recovery move in the USD Index a reversal amid an absence of supportive economic indicators.
- Michigan Consumer Sentiment Index (June) data is expected to improve to 65.5 vs. the former release of 64.4.
The USD/CHF has found temporary support after a perpendicular sell-off to near 0.8570 in the London session. The Swiss Franc asset is still prone to more losses as fundamentals are still unfavorable and fresh shorts could be built ahead.
S&P500 futures have generated nominal losses in Europe. The US-500 stock basket has remained in the bullish trajectory in the past four-trading sessions but caution among market participants has appeared ahead of quarterly result season.
The US Dollar Index (DXY) is gatherings strength to extend its recovery move made after dropping to near 99.50. It would be early calling the recovery move a reversal amid an absence of supportive economic indicators. This week, the consumer and producer prices report for June month confirmed that the United States is set on track to achieving the 2% inflation target.
Demand for big-ticket items has dropped and gasoline prices have been squeezed, which has released some heat from red-hot inflation. However, labor market conditions are still tight and the core Consumer Price Index (CPI) which doesn’t include volatile oil and food prices is still at 4.8%. Therefore, fears of high inflation are still persistent and the Federal Reserve (Fed) has no chance than to raise interest rates further.
On Friday, investors will focus on preliminary Michigan Consumer Sentiment Index (CSI) (June) data. As per the consensus, the sentiment data is expected to improve to 65.5 vs. the former release of 64.4. Improvement in the market sentiment could be the outcome of a significant decline in inflationary pressures.
Meanwhile, the Swiss Franc is expected to remain solid as the Swiss National Bank (SNB) is expected to raise interest rates further despite inflation data has shown figures below 2% for once. For keeping inflation below 2% steadily, more interest rate hikes are warranted.
The Canadian Dollar may see further gains, economists at Société Générale report.
USD/CAD could repeat a move down to 1.26
The USD/CAD pair should continue to fall (very slowly).
USD/CAD peaked above 1.36 just after the end of the last Federal Reserve hiking cycle in December 2018.
The US Dollar traded down to CAD 1.26 as the Fed eased in 2019. A repeat is possible.
See – USD/CAD: A downside overshoot to 1.28 through Q3 looks to be a growing risk – Scotiabank
Senior Economist at UOB Group Alvin Liew reviews the latest release of US inflation figures (July 12).
Key Takeaways
US headline consumer price index (CPI) increased by 0.2% m/m, 3.0% y/y in Jun (from 0.1% m/m, 4.0% y/y in May), below Bloomberg estimates (0.3% m/m, 3.1% y/y) and the lowest headline inflation reading since Mar 2021 (2.6%) and the third below 5% print in a row. Core CPI (which excludes food and energy) also rose at a slower than expected pace, coming in at 0.2% m/m, 4.8% y/y in Jun (versus Bloomberg estimate of 0.3% m/m, 5.0% y/y), compared to 0.4% m/m, 5.3% y/y in May. This was the smallest m/m increase for core CPI since Aug 2021, while the y/y print of 4.8% was the first sub-5% print since Nov 2021.
US Inflation Outlook – Taking stock of the price trajectory to date, we now expect headline inflation to potentially head to sub-1% by end 2023 (in part due to base effects) and to average about 3.2% for 2023. In comparison, while core inflation continues to ease, the pace is clearly slower than the headline, so we now expect core inflation ease to 3.0% y/y by end-2023, still above the Fed’s 2% objective. For the full year, we expect core inflation to average 4.6%. That said, we think that a clear disinflation trend has set in for US CPI, and we expect accommodation costs to ease more visibly in 2H 2023. We also note that core and services inflation remain elevated (y/y) and still rising (m/m), while the continued wage growth may still add to services cost pressure.
- Silver price has shown signs of a loss in the upside momentum while rallying towards $29.00.
- June’s Retail Sales data is seen expanding at a pace of 0.5% vs. the former pace of 0.3%.
- Silver price has delivered a break above the horizontal resistance plotted from $24.59, which has turned into support now.
Silver price (XAG/USD) has sensed selling pressure while attempting to capture the crucial resistance of $29.00 in the London session. The upside momentum in the white metal is losing strength as the US Dollar Index (DXY) has attempted a recovery, however, the upside bias is still intact.
S&P500 futures are showing choppy moves portraying caution among market participants as companies are ready to report second-quarter earnings. Mixed earnings are expected from corporate as the Federal Reserve (Fed) remained aggressive while hiking interest rates from last year’s winter. Also, United States commercial banks deployed more filters on the credit distribution process to maintain asset quality.
The US Dollar Index has rebounded after a straight six-day decline to near 99.50. Price pressures in the United States economy have dropped as gasoline prices have softened sharply and individuals have surrendered spending on big-ticket items to cater to necessities. Households’ real income has slimmed due to higher inflationary pressures.
Going forward, investors will focus on the monthly US Retail Sales data (June), which will release on Tuesday at 12:30 GMT. As per the consensus, the economic data is seen expanding at a pace of 0.5% vs. the former pace of 0.3%.
Silver technical analysis
Silver price has delivered a break above the horizontal resistance plotted from June 09 high at $24.59 on a daily scale, which has turned into support now. The asset is approaching its next stoppage, which is placed from 10 March 2022 high at $26.07.
Upward-sloping 10-period Exponential Moving Average (EMA) at $23.74 is providing support to the Silver bulls.
The Relative Strength Index (RSI) (14) has jumped above 60.00, showing no signs of divergence and any signal of overbought.
Silver daily chart
-638249238846447123.png)
Strategists at UBS are neutral on broad commodities but continue to like both Oil and Gold.
Brent Crude Oil to rise to $90/bbl by year-end
We see balanced risk and reward in broad commodity indexes. Weaker-than-expected growth in China means that concerns about industrial metal demand remain elevated. That said, secular demand drivers (such as the net-zero carbon transition) should provide longer-term support, and in energy, supply discipline means that inventories remain at structurally low levels.
The Oil market is likely to tighten further in the second half, and we forecast Brent Crude prices rising to $90/bbl by year-end.
Gold prices should be supported by a resumption of the US Dollar's downtrend and we like the yellow metal as a diversifier and a hedge within portfolios.
FX option expiries for July 14 NY cut at 10:00 Eastern Time, via DTCC, can be found below.
- EUR/USD: EUR amounts
- 1.0900 1.3b
- 1.0925 486m
- 1.0960 1.8b
- 1.1000 2.4b
- 1.1075 460m
- 1.1120 818m
- 1.1165 545m
- 1.1200 971m
- USD/JPY: USD amounts
- 140.00 780m
- 141.00 570m
- 141.25 550m
- 141.50 439m
- 144.00 450m
- USD/CHF: USD amounts
- 0.9750 1.3b
- AUD/USD: AUD amounts
- 0.6700 990m
- 0.6900 804m
- USD/CAD: USD amounts
- 1.3040795m
- 1.3100 700m
- 1.3225 502m
- 1.3265 368m
- 1.3440 316m
Economists at ING analyze US Dollar Index (DXY) outlook.
A pause or upside correction in the Dollar could come at any time
DXY broke below the 100.00 barrier on Thursday, and the next logical support would likely be at 99.00.
A pause or upside correction in the Dollar could come at any time given the large swings of the past couple of days.
Friday’s moves suggest we could see some re-adjustment/stabilisation happen today with a quiet calendar. However, downside risks will keep prevailing for the Dollar in the near term.
- AUD/USD edges lower on Friday and snaps a three-day winning streak to a nearly one-month high.
- Rebounding US bond yields helps ease the USD bearish pressure and acts as a headwind for the pair.
- Bets that the Fed will soon end its rate-hiking cycle to cap the upside for the USD and lend support.
The AUD/USD pair pulls back from the vicinity of the 0.6900 mark on Friday and eroded a part of the previous day's strong rally to a nearly one-month peak. Spot prices drop to a fresh daily low, around the 0.6860 region during the early part of the European session and for now, seem to have snapped a three-day winning streak, though the near-term bias still seems tilted in favour of bullish traders.
A modest pickup in the US Treasury bond yields assists the US Dollar (USD) to stall its recent sharp downfall to the lowest level since April 2022, which, in turn, is seen as a key factor acting as a headwind for the AUD/USD pair. Apart from this, a slightly negative tone around the US equity futures further contributes to capping the upside for the risk-sensitive Aussie. That said, growing acceptance that the Federal Reserve (Fed) is nearing the end of its policy tightening cycle should limit any meaningful USD recovery and validate the near-term positive outlook for the major.
The US economic data released this week pointed to a further moderation in inflationary pressures and should allow the Fed to soften its hawkish stance. In fact, the headline US CPI slowed to the 3% yearly rate - marking the smallest rise since March 2021, while the monthly rise in core prices was the smallest since August 2021. Moreover, the US PPI for June registered the smallest year-on-year rise since August 2020. This, in turn, reaffirmed market bets that the US central bank will keep interest rates steady after the widely anticipated 25 bps lift-off at its July monetary policy meeting.
Apart from this, hopes that China will announce more stimulus measures to support the fragile domestic economy might also lend some support to the China-proxy Australian Dollar (AUD). Adding to this, optimistic remarks by China's Foreign Minister Wang Yi, saying that China-Australia relations have stabilised, improved and developed, supports prospects for the emergence of some dip-buying around the AUD/USD pair. Bulls, however, might wait for a sustained breakout through the 0.6900 round-figure mark before placing fresh bets and positioning for any further gains.
Market participants now look forward to the release of the Preliminary Michigan US Consumer Sentiment Index. This, along with the US bond yields and the broader risk sentiment, might influence the USD and provide some impetus to the AUD/USD pair on the last trading day of the week. Nevertheless, spot prices remain on track to register strong weekly gains as the focus now shifts to important Chinese macro data due during the Asian session on Monday.
Technical levels to watch
Economists at Commerzbank analyze EUR outlook as the stubborn inflation continues to cause grave concerns for the ECB.
ECB rate cuts are being priced in only very cautiously, but quite convincingly for the US
The market is still pricing in a few more rate hikes for the ECB and what is probably more decisive: ECB rate cuts are being priced in only very cautiously, but quite convincingly for the US.
No doubt we could argue whether the market’s view on the Fed is exaggerated, but the most recent inflation data illustrated that the ECB will have to do more or will have to maintain a restrictive monetary policy for longer. Even if a few doves amongst the ECB board members have recently commented the data is pointing in another direction (for now). And as the ECB will certainly not want to give cause to doubts that it is doing its job properly that is positive for EUR.
- Pound Sterling has slipped modestly as investors are awaiting key inflation data for a fresh trigger.
- United Kingdom’s inflation is set to remain sticky as labor shortages are still a major issue.
- Food price inflation is expected to decelerate to 9% by December.
Pound Sterling has sensed light profit booking after printing a fresh annual high at 1.3140. The GBP/USD pair will likely resume its north-side rally amid an absence of evidence that the United Kingdom’s inflation will cool down. To return inflation to 2%, the Bank of England (BoE) has already raised interest rates to 5% and further policy-tightening is in the pipeline.
United Kingdom’s labor market data missed estimates this week but wage pressures remained elevated as firms are offering higher salaries to bring fresh talent in-house considering labor shortages. No doubt, higher disposable income equipped with households would propel inflationary pressures, which would threaten the economic outlook. Investors will keep an eye on next week’s inflation data as a stubborn report could trigger fears of recession.
Daily Digest Market Movers: Pound Sterling senses pressure as risk appetite eases
- Pound Sterling has dropped to near 1.3100 as the US Dollar Index (DXY) has attempted a recovery move after a five-day losing streak.
- After United Kingdom’s weak labor market report, rising wage pressures, and bleak factory activities, investors need guidance on interest rates peak from the Bank of England.
- UK’s employment data has demonstrated the burden of higher interest rates by the BoE this week despite the labor cost index maintaining strength.
- After the labor market and factory activity report, investors are shifting their focus toward the Consumer Price Index (CPI) data, which will release next week on Wednesday at 06:00 GMT.
- Investors should note that in May annual headline inflation rebounded to 8.7% and core CPI that excludes volatile oil and food prices printed a fresh high of 7.1%.
- Price pressures in the UK economy have not shown any evidence of softening despite BoE Governor Andrew Bailey having raised interest rates to 5%.
- Catalysts that have propelled severe inflation in the UK economy are labor shortages and significantly higher food inflation.
- Brexit event and early retirements by UK individuals are responsible for extreme labor shortages.
- Food price inflation in the Britain economy dropped to 18.3% in May from its 45-year high of 19.1 and has not peaked yet.
- UK’s Institute of Grocery Distribution has forecasted that food inflation will decelerate in the second half of the year and could drop to 9% by December.
- Re-hot inflation is threatening UK’s economic outlook and May’s Gross Domestic Product (GDP) contracted at a slower pace of 0.1% against the consensus of -0.3%.
- The burden on the UK economy could elevate as the BOE is set to raise interest rates further. Money markets are expecting that interest rates would peak around 6.5%.
- Overall market mood is upbeat as inflation in the United States has softened significantly, however, short-term uncertainty ahead of corporate earnings cannot be ruled out.
- America’s soft CPI and Producer Price Index (PPI) report for June month has elevated hopes of only one more interest rate hike from the Federal Reserve (Fed).
- The US economy is clearly in a disinflation process but has failed to turn Fed policymakers dovish.
- Fed Governor Christopher Waller is still confident that two more interest rate hikes are appropriate this year to bring down inflation to 2%.
Technical Analysis: Pound Sterling delivers a Rising Channel breakout
Pound Sterling looks set to register the biggest weekly gains in the past eight months amid a cheerful market mood and expectations of more interest rate hikes by the Bank of England. The Cable has delivered a breakout of the Rising Channel chart pattern formed on a daily scale. A breakout of the aforementioned chart pattern indicates that the upside bias for the Pound Sterling is full of strength. Momentum oscillators are in a bullish trajectory, supporting more gains ahead.
Pound Sterling FAQs
What is the Pound Sterling?
The Pound Sterling (GBP) is the oldest currency in the world (886 AD) and the official currency of the United Kingdom. It is the fourth most traded unit for foreign exchange (FX) in the world, accounting for 12% of all transactions, averaging $630 billion a day, according to 2022 data.
Its key trading pairs are GBP/USD, aka ‘Cable’, which accounts for 11% of FX, GBP/JPY, or the ‘Dragon’ as it is known by traders (3%), and EUR/GBP (2%). The Pound Sterling is issued by the Bank of England (BoE).
How do the decisions of the Bank of England impact on the Pound Sterling?
The single most important factor influencing the value of the Pound Sterling is monetary policy decided by the Bank of England. The BoE bases its decisions on whether it has achieved its primary goal of “price stability” – a steady inflation rate of around 2%. Its primary tool for achieving this is the adjustment of interest rates.
When inflation is too high, the BoE will try to rein it in by raising interest rates, making it more expensive for people and businesses to access credit. This is generally positive for GBP, as higher interest rates make the UK a more attractive place for global investors to park their money.
When inflation falls too low it is a sign economic growth is slowing. In this scenario, the BoE will consider lowering interest rates to cheapen credit so businesses will borrow more to invest in growth-generating projects.
How does economic data influence the value of the Pound?
Data releases gauge the health of the economy and can impact the value of the Pound Sterling. Indicators such as GDP, Manufacturing and Services PMIs, and employment can all influence the direction of the GBP.
A strong economy is good for Sterling. Not only does it attract more foreign investment but it may encourage the BoE to put up interest rates, which will directly strengthen GBP. Otherwise, if economic data is weak, the Pound Sterling is likely to fall.
How does the Trade Balance impact the Pound?
Another significant data release for the Pound Sterling is the Trade Balance. This indicator measures the difference between what a country earns from its exports and what it spends on imports over a given period.
If a country produces highly sought-after exports, its currency will benefit purely from the extra demand created from foreign buyers seeking to purchase these goods. Therefore, a positive net Trade Balance strengthens a currency and vice versa for a negative balance.
- Euro comes under pressure following new highs vs. the US Dollar.
- Stocks in Europe open mixed at the end of the week.
- EUR/USD advances to the 1.1240/45 band earlier on Friday.
- EMU Balance of Trade will be the only release in the domestic docket.
- Flash US Consumer Sentiment takes centre stage across the pond.
The Euro (EUR) seems to have met some initial resistance around the 1.1240 region vs. the US Dollar (USD) so far on Friday.
In fact, after reaching new highs in the 1.1240/45 band earlier in the Asian trading hours, EUR/USD now seems to have taken a breather amidst a marginal recovery attempt in the Greenback.
Despite the so-far lacklustre bounce, the US Dollar remains under heavy pressure as investors continue to anticipate the likelihood that the Federal Reserve might be nearing the end of its tightening campaign. This view has been reinforced as of late on the back of further signs of cooling US consumer prices as well as the persistent downtrend in producer prices.
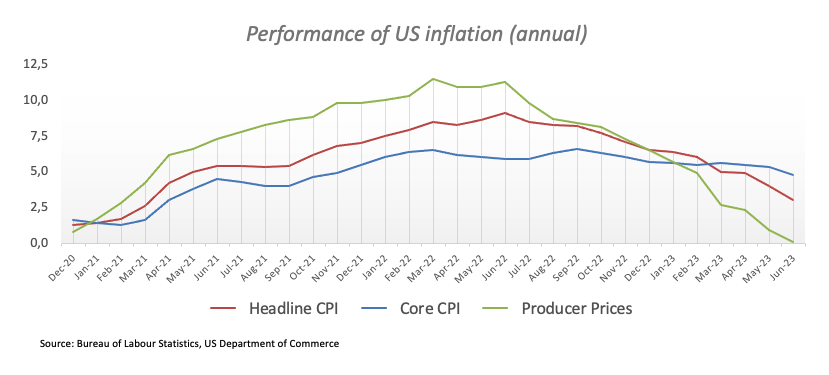
In the meantime, comments by the FOMC’s Governor Christopher Waller late on Thursday fell in line with the persevering hawkish narrative from his colleagues at the Committee after he suggested that the Fed might need two more rate hikes this year.
The strong upside impulse in the pair has been reinvigorated in response to lower-than-expected US inflation figures for the month of June, which, firstly, confirm that disinflationary forces remain well in place in the US economy and, secondly, underpin expectations that the Federal Reserve might end its ongoing hiking campaign sooner rather than later.
So far, market participants have already largely priced in a quarter-point rate hike by both the European Central Bank (ECB) and the Fed at their meetings later in the month, in a context where the potential future actions of the Fed and the ECB in normalizing their monetary policies continue to be a topic of discussion, especially with increasing concerns about an economic slowdown on both sides of the Atlantic.
In the domestic calendar, EMU’s Balance of Trade will be the sole release, whereas the advanced Michigan Consumer Sentiment will be in the limelight later in the NA session.
Daily digest market movers: Euro looks to consolidate the break above 1.1200
- The EUR treads water around 1.1230 vs. USD on Friday.
- Fed’s Waller favoured two more rate hikes by the Fed this year.
- The USD Index drops to new 15-month lows near 99.60.
- The Fed and the ECB are seen hiking rates by 25 bps this month.
- Oil, Gold retreats marginally during the European morning.
Technical Analysis: Euro sees the next up-barrier near 1.1500
The ongoing price action in EUR/USD hints at the idea that further gains might be in store in the short-term horizon. However, the current pair’s overbought condition (as per the daily RSI well above 70) opens the door to a potential near-term corrective move.
The pair printed a new 2023 high at 1.1243 on July 14. Once this level is cleared, there are no resistance levels of significance until the 2022 peak of 1.1495 recorded on February 10.
On the downside, the 1.1000 region emerges as a psychological support seconded by interim contention at the 55-day and 100-day SMAs at 1.0881 and 1.0852, respectively, ahead of the July low of 1.0833 (July 6) . The breakdown of this region should meet the next contention area not before the May low of 1.0635 (May 31), which also looks underpinned by the crucial 200-day SMA (1.0651). South from here emerges the March low of 1.0516 (March 15) prior to the 2023 low of 1.0481 (January 6).
Furthermore, the constructive view of EUR/USD appears unchanged as long as the pair trades above the key 200-day SMA.
Euro FAQs
What is the Euro?
The Euro is the currency for the 20 European Union countries that belong to the Eurozone. It is the second most heavily traded currency in the world behind the US Dollar. In 2022, it accounted for 31% of all foreign exchange transactions, with an average daily turnover of over $2.2 trillion a day.
EUR/USD is the most heavily traded currency pair in the world, accounting for an estimated 30% off all transactions, followed by EUR/JPY (4%), EUR/GBP (3%) and EUR/AUD (2%).
What is the ECB and how does it impact the Euro?
The European Central Bank (ECB) in Frankfurt, Germany, is the reserve bank for the Eurozone. The ECB sets interest rates and manages monetary policy.
The ECB’s primary mandate is to maintain price stability, which means either controlling inflation or stimulating growth. Its primary tool is the raising or lowering of interest rates. Relatively high interest rates – or the expectation of higher rates – will usually benefit the Euro and vice versa.
The ECB Governing Council makes monetary policy decisions at meetings held eight times a year. Decisions are made by heads of the Eurozone national banks and six permanent members, including the President of the ECB, Christine Lagarde.
How does inflation data impact the value of the Euro?
Eurozone inflation data, measured by the Harmonized Index of Consumer Prices (HICP), is an important econometric for the Euro. If inflation rises more than expected, especially if above the ECB’s 2% target, it obliges the ECB to raise interest rates to bring it back under control.
Relatively high interest rates compared to its counterparts will usually benefit the Euro, as it makes the region more attractive as a place for global investors to park their money.
How does economic data influence the value of the Euro?
Data releases gauge the health of the economy and can impact on the Euro. Indicators such as GDP, Manufacturing and Services PMIs, employment, and consumer sentiment surveys can all influence the direction of the single currency.
A strong economy is good for the Euro. Not only does it attract more foreign investment but it may encourage the ECB to put up interest rates, which will directly strengthen the Euro. Otherwise, if economic data is weak, the Euro is likely to fall.
Economic data for the four largest economies in the euro area (Germany, France, Italy and Spain) are especially significant, as they account for 75% of the Eurozone’s economy.
How does the Trade Balance impact the Euro?
Another significant data release for the Euro is the Trade Balance. This indicator measures the difference between what a country earns from its exports and what it spends on imports over a given period.
If a country produces highly sought after exports then its currency will gain in value purely from the extra demand created from foreign buyers seeking to purchase these goods. Therefore, a positive net Trade Balance strengthens a currency and vice versa for a negative balance.
- USD/JPY has extended its recovery to near 138.50, tracing action in the USD Index.
- Despite soft price pressures, Fed Waller believes that two more interest rate hikes are appropriate.
- Japanese officials are still observing FX moves despite the recent depreciation in the US Dollar against the Japanese Yen.
The USD/JPY pair has stretched its recovery to near 138.50 in the London session. The asset has traced the recovery move by the US Dollar Index (DXY). The USD Index rebounded after a six-day losing spell to near 99.50 as investors have got anxious after hawkish commentary from Federal Reserve (Fed) policymakers.
S&P500 futures are demonstrating a subdued performance in Europe, portraying caution among market participants amid an overall upbeat market mood. US equities were heavily bought on Thursday, supported by a rally in technology stocks. Investors are hoping that tech-savvy stocks could deliver decent figures in the second-quarterly earnings season despite weak performance in Bank and Financial Services Industry (BFSI).
The USD Index has found intermediate support near 99.50 and is gathering strength to recapture the psychological resistance of 100.00. Despite soft price pressures, Fed Governor Christopher Waller believes that two more interest rate hikes are appropriate this year to bring down inflation to 2%. Although inflation is consistently decelerating, the core Consumer Price Index (CPI) at 4.8% is far from the desired rate of 2%.
Meanwhile, data released from the Fed showed that borrowings by commercial banks from the Fed’s emergency lending programs declined slightly straight for the second week. US firms are avoiding credit to dodge high-interest payment obligations.
On the Japanese Yen front, investors are looking for cues on whether the Bank of Japan (BoJ) will continue its ultra-dovish policy stance or tweak its Yield Curve Control (YCC). Apart from that Japanese officials are still observing FX moves despite the recent depreciation in the US Dollar against the Japanese Yen.
The disinflation narrative has landed heavily on the Dollar. Economists at ING analyze Greenback’s outlook.
Army of bears growing stronger
A look at the next couple of weeks – in the lead-up to the July FOMC meeting – shows that there aren't many other data releases that can drastically turn the tide for the USD.
Dollar long positions are evaporating rapidly, with PPI numbers all but confirming the disinflationary narrative in the US.
It's hard to find a clear counterargument against the bearish Dollar momentum, but the move is looking stretched, so watch for potential temporary corrections.
EUR/USD has taken off on the back of US disinflationary bets and a large unwinding of Dollar positions. Economists at ING analyze the pair’s outlook.
Rally looking a bit stretched
It seems difficult to build a strong counterargument to the bearish USD narrative at this stage and while some correction after a large and possibly overstretched move is possible, the near-term outlook may stay broadly bullish on EUR/USD.
EUR/USD may stabilise around 1.1200 today, or even correct lower back to the 1.1170-80 area in the currently highly volatile environment.
- EUR/GBP edges higher on the last day of the week, albeit lacks follow-through buying.
- Hawkish ECB minutes on Thursday underpins the Euro and lends support to the cross.
- Expectations for a mor aggressive BoE rate hikes should cap any meaningful upside.
The EUR/GBP cross attracts some buying near the 0.8535 region on Friday, albeit struggles to capitalize on the modest intraday uptick and remains confined in the previous day's broader range. Spot prices, however, manage to hold above the lowest level since August 2022 touched on Thursday and currently trade around the 0.8550-0.8555 zone, up less than 0.10% for the day.
The minutes of the European Central Bank (ECB) June meeting, released on Thursday, showed that the Governing Council is determined to continue the current hiking cycle beyond July to bring inflation back to target. It is worth recalling that the ECB had forecasted that inflation would stay above its 2% target through the end of 2025. This hawkish outlook, to a larger extent, offsets emerging signs of a cooling economy and continues to underpin the shared currency, which, in turn, is seen lending some support to the EUR/GBP cross.
The upside, however, remains capped in the wake of expectations that the Bank of England (BoE) will tighten its monetary policy more aggressively to combat stubbornly high inflation. In fact, the current market pricing indicates that the BoE could raise interest rates from the current 5% to a cycle peak of 6.5% to dampen demand and force inflation lower. The speculations were fueled by stronger UK wage growth data, which, according to BoE Governor Andrew Bailey and UK Finance Minister Jeremy Hunt, is harming the efforts to contain inflation.
This overshadows the possibility of a recession in the UK later this year and is seen acting as a tailwind for the British Pound (GBP), capping the upside for the EUR/GBP cross. Data released on Thursday that the British economy contracted by 0.1% in May compared to April. The reading, however, was less worse than market expectations and should allow the BoE to keep raising interest rats in coming months. Hence, it will be prudent to wait for strong follow-through buying before confirming that the cross has bottomed out and placing fresh bullish bets.
Technical levels o watch
Technically, the recent break above $1,950 area is strengthening the prospect of the Gold price resuming its uptrend, economists at ANZ Bank report.
Break below $1,900 could trigger a fresh sell-off
The recent break-out above $1,950 has strengthened market sentiment. However, the price needs to break the resistance level of $1,970 to be seen as resuming the uptrend. Once this resistance breaks, Gold is set to move towards this year’s high.
On the downside, a fresh sell-off could be triggered if prices break below $1,900, as this would turn market sentiment negative. This could see prices falling back to $1,800.
USD/CNH could slip back to the 7.1000 region once 7.1250 is cleared, comment Economist Lee Sue Ann and Markets Strategist Quek Ser Leang at UOB Group.
Key Quotes
24-hour view: We highlighted yesterday that “there is a chance for USD to test 7.1500 before the risk of a rebound increases.” We added, “7.1250 is unlikely to come into view today.” Our view turned out to be correct as USD dropped to a low of 7.1479 and then closed at 7.1505 (0.22%). Downward momentum has increased and USD is unlikely to rebound just yet. Today, USD could drop below 7.1250. The round number support at 7.1000 is unlikely come under threat. In order to maintain the momentum, USD must stay below 7.1700 (minor resistance is at 7.1600).
Next 1-3 weeks: Yesterday (13 Jul, spot at 7.1670), we pointed out that “the focus is at 7.1500, and the next support below this level is at 7.1250.” USD fell to a low of 7.1479 before extending its decline in early Asian trade. We continue to expect USD to weaken. A break of 7.1250 will shift the focus to 7.1000. On the upside, a break of 7.1930 (‘strong resistance’ level was at 7.2150 yesterday) would suggest the USD weakness that started on Monday has stabilized.
- The index bounces off lows around 99.60 on Friday.
- US yields give signs of life following the recent strong pullback.
- Advanced Consumer Sentiment will take centre stage later in the session.
The greenback, when measured by the USD Index (DXY), now manages to regain some upside traction and trade closer to the psychological barrier at 100.00.
USD Index meets support near 99.60
After bottoming out in the vicinity of 99.60 during early trade, the index now picks up pace and appears to have embarked on a potential challenge of the critical 100.00 region on Friday.
While the recent fierce sell-off dragged the greenback to levels last seen in early April 2022, expectations of another 25 bps rate hike by the Federal Reserve at its July 26 meeting remain firm.
However, the likelihood of extra rate raises beyond July now appear dwindled, particularly in response to the persistent disinflationary pressures as well as the downtrend in producer prices.

Later in the NA session, the salient event is expected to be the release of the advanced prints of the Michigan Consumer Sentiment for the month of July, along with Export/Import Prices.
What to look for around USD
The index remains under heavy pressure and attempts a tepid recovery with immediate target at the 100.00 region.
Meanwhile, the likelihood of another 25 bps hike at the Fed's upcoming meeting in July remains high and supported by the still tight US labour market and despite the persevering disinflationary pressures.
This view was further bolstered by comments from Fed Chief Powell at the June FOMC event, who referred to the July meeting as "live" and indicated that most of the Committee is prepared to resume the tightening campaign as early as next month.
Key events in the US this week:) Advanced Michigan Consumer Sentiment (Friday).
Eminent issues on the back boiler: Persistent debate over a soft/hard landing of the US economy. Terminal Interest rate near the peak vs. speculation of rate cuts in late 2023/early 2024. Geopolitical effervescence vs. Russia and China. US-China trade conflict.
USD Index relevant levels
Now, the index is up 0.13% at 99.91 and the breakout of 100.00 (round level) could open the door to 102.72 (55-dat SMA) and then 103.54 (weekly high June 30). On the downside, the next support emerges at 99.57 (2023 low July 13) followed by 97.68 (weekly low March 30 2022) and 95.17 (monthly low February 10 2022).
Eventually, the Japanese Yen will rally, according to economists at Société Générale.
US 10-year yields are above 4% and have less room to rise further
Patience will eventually reward JPY buyers when US yields peak and the Bank of Japan (BoJ) tweaks its Yield Curve Control (YCC) policy.
YCC distorts the bond market so much that it makes no sense to delay a widening of the bands in which yields are allowed to move.
USD/JPY shorts have a better risk/reward balance now that US 10-year yields are above 4% and have less room to rise further.
See: USD/JPY seen falling to around 124 by next June – UBS
Economists at the Bank of America expect moderate USD softness with strong productivity growth not factored into the USD outlook.
Moderate USD softness expected
The current rapid technological progress, especially the advent of AI applications and chatbots, parallels the tech boom of the mid-90s. This previous era of technological advancement led to significant productivity growth and considerable USD strength.
Our base case scenario envisages moderate USD softness through the end of next year, with no strong productivity growth incorporated in the USD outlook. Despite optimism that technological progress will result in higher productivity, we foresee the US remaining in a softer growth mode for the medium term. This implies a EUR/USD that is around the 1.15 level by the end of next year, eventually moving towards fair value in the 1.20's.
Economist Lee Sue Ann and Markets Strategist Quek Ser Leang at UOB Group see USD/JPY breaking below the 137.15 level in the short term.
Key Quotes
24-hour view: While we expected further USD weakness yesterday, we held the view that “a clear break of 137.15 today will come as a surprise.” We noted, “there is another support at 138.00.” USD fell to a low of 137.91 and then closed at 138.03. In early Asian trade today, USD continues to fall. Today, 137.15 is likely within reach. At this stage, it is premature to expect USD to drop to the next major support at 135.80. Resistance is at 138.20, followed by 138.70.
Next 1-3 weeks: We have expected USD to weaken since Monday (10 Jul) when it was trading at 142.50. Yesterday (13 Jul, spot at 138.60), we indicated that USD “is still weak and the next level to watch is 137.15.” From here, USD appears likely to break below 137.15. The next level to aim for is the rather formidable support at 135.80. We will continue to expect USD to weaken as long as it stays below 139.50 (‘strong resistance’ level was at 140.50 yesterday).
Here is what you need to know on Friday, July 14:
The US Dollar (USD) continued to weaken against its rivals throughout Thursday and in the Asian on Friday. After having touched its weakest level in 15 months at 99.57, however, the US Dollar Index (DXY) started to recover toward 100.00. Import/Export Price Index data will be featured in the US economic docket alongside the University of Michigan's (UoM) Consumer Sentiment Index. During the European trading hours, Eurostat will release Trade Balance data for May.
Following Wednesday soft consumer inflation data, the US Bureau of Labor Statistics reported on Thursday that the Producer Price Index (PPI) rose only 0.1% on a yearly basis in June. Wall Street's main indexes opened higher after this data and the 10-year US Treasury bond yield extended its slide, losing over 2% for the second straight day. In turn, the DXY turned south and broke below 100.00. Although Federal Reserve (Fed) policymakers delivered hawkish comments, the USD failed to show resilience. The DXY is down more than 2% this week and remains on track to register its largest one-week loss since November.
Earlier in the day, Australian Prime Minister Anthony Albanese and Treasurer Jim Chalmers called an emergency press conference to announce that Michele Bullock will be appointed as the Governor of the Reserve Bank of Australia (RBA) when Philip Lowe's term expires in September. This development had little to no impact on AUD/USD and the pair was last seen trading in negative territory below 0.6900.
EUR/USD climbed to its highest level in 16 months near 1.1250 in the Asian session on Friday before retreating to the 1.1200 area. The pair is up more than 200 pips this week.
GBP/USD touched its strongest level since April 2022 at 1.3146 but lost its bullish momentum heading into the European session. At the time of press, the pair was down 0.3% on the day, trading a few pips below 1.3100.
The data from Japan showed early Friday that Industrial Production contracted by 2.2% on a monthly basis in May. Capacity Utilization also declined 6.3% in the same period. After having slumped to its weakest level in a month below 137.50, USD/JPY reversed its direction and was last seen trading in postive territory at around 138.50.
Gold price struggled to capitalize on the broad USD weakness and registered small gains on Thursday. XAU/USD stays on the back foot early Friday and retreats toward $1,950. Following this week's sharp decline, the 10-year US Treasury bond yield is up nearly 1% on the day near 3.8% in the European morning, making it difficult for the pair to hold its ground.
Following a consolidation phase earlier in the week, Bitcoin rose above $31,000 on Thursday. BTC/USD stays relatively quiet at around $31,300 early Friday. Ethereum gathered bullish momentum and gained more than 7% on Thursday. ETH/USD was last seen moving sideways at around $2,000.
- WTI takes offers to refresh intraday low during the first loss-making day in four.
- 200-DMA challenges Oil bulls amid overbought RSI conditions.
- 12-day-old rising support line holds the key to Oil seller’s entry.
- Descending trend line from November 2022 acts as an extra filter toward the north.
WTI crude oil remains on the back foot at the intraday low surrounding $76.50 as it prints the first daily loss in four, so far, heading into Friday’s European session. In doing so, the black gold reverses from the 200-DMA hurdle while justifying the overbought RSI (14) line.
With this, the energy benchmark is likely to witness further consolidation of the weekly gains while declining toward May’s monthly high of $74.70.
However, the 100-DMA and an upward-sloping support line from June 28, respectively near $73.60 and $73.10, will challenge the Oil bears before giving them control.
Should the WTI sellers keep the reins past $73.10, and also break the $73.00 round figure, the odds of witnessing a south run toward the $70.00 round figure and then to the previous monthly low of around $67.00 can’t be ruled out.
Alternatively, a daily closing beyond the 200-DMA level of $77.00 becomes necessary to convince the Oil buyers.
Even so, an eight-month-old falling resistance line, close to $77.70, acts as the last defense of the WTI bears and may prod further upside.
In a case where the energy benchmark rises past $77.70, the $80.00 psychological magnet and the yearly high marked in April near $83.40 will lure the Oil buyers.
WTI crude oil: Daily chart
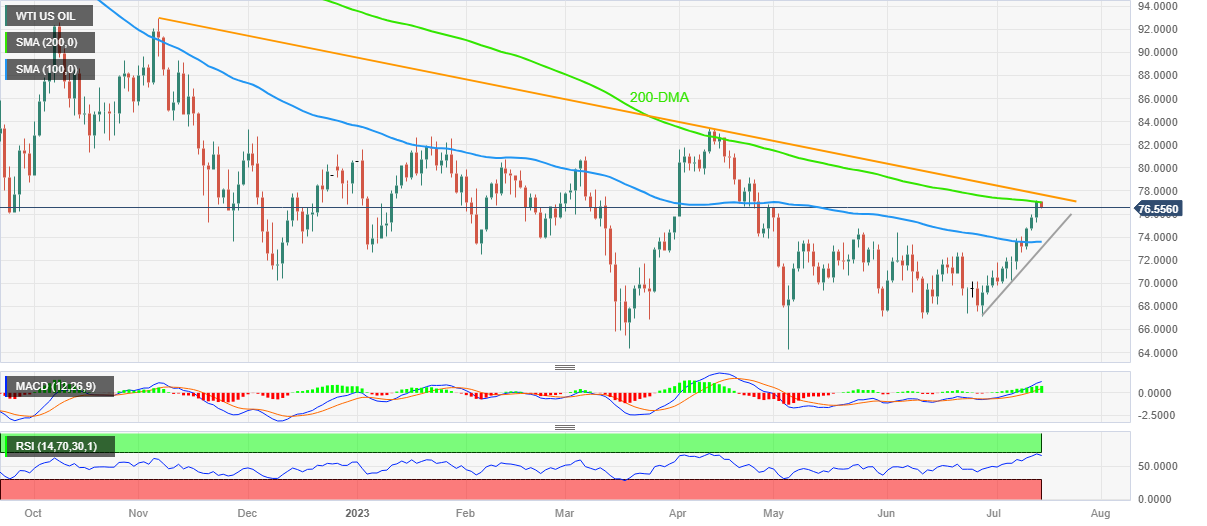
Trend: Pullback expected
Considering advanced prints from CME Group for natural gas futures markets, open interest rose for the second straight day on Thursday, now by just 187 contracts. In the same line, volume advanced for the fourth consecutive day, this time by around 31.1K contracts.
Natural Gas: Initial support remains at $2.50
Prices of natural gas extended the weekly corrective decline on Thursday. The negative price action was on the back of increasing open interest and volume and this is indicative that further losses appear in the pipeline in the very near term. So far, the $2.50 region per MMBtu still emerges as an initial decent contention for the commodity.
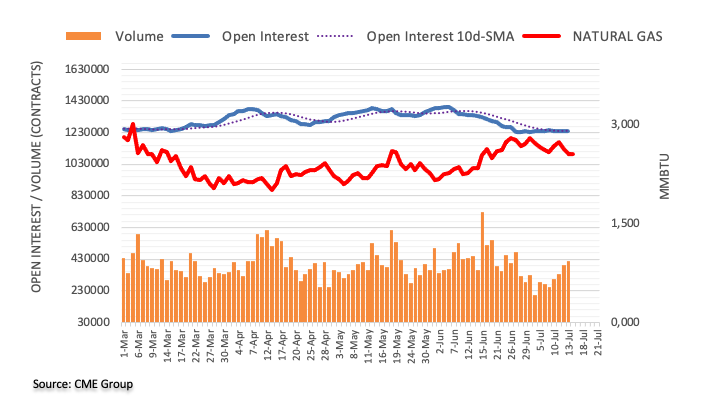
UR/PLN has reached and fallen below Commerzbank’s end-2023 target of 4.45. The bank updates its EUR/PLN forecasts.
Euro to remain strong through 2023, but weaken once again during 2024
We forecast the Euro to remain strong through 2023, but weaken once again during 2024. Given Zloty’s high-beta relationship to the Euro, we see EUR/PLN rising again towards 4.75 as inflation disappoints once again in 2024.
Our base case remains that inflation will moderate noticeably over the coming quarters, but not converge fully to target, hence we see 2024 as a potential Zloty-negative period.

Source: Commerzbank Research
- AUD/NZD struggles for a firm intraday direction, stuck in a narrow range.
- The critical resistance level stays at 1.0800, with an initial support level of 1.0750.
- The Relative Strength Index (RSI) hovers between 40-60.
The AUD/NZD pair consolidates in a narrow range between the 1.0750-1.0790 area on the four-hour chart. The path of least resistance for the AUD/NZD is to the downside, as the cross stands below the 200-hour Exponential Moving Average (EMA).
1.0800 acts as a critical barrier for the AUD/NZD bulls, representing a confluence of the upper boundary of the Bollinger Band, a psychological figure and a high of July 12. A break above the latter, AUD/NZD could still have legs to test 1.0835, the 200-hour EMA, followed by minor resistance at 1.0860 (High of July 3). The additional upside filter to watch is at 1.0920 (High of June 29).
On the downside, the cross will meet an initial support level at 1.0750, the lower limit of the Bollinger Bands. The next contention is seen at 1.0730 (Low of July 10), followed by 1.0690 (Low of April 28).
It’s worth noting that the Relative Strength Index (RSI) hovers between 40-60, indicating the non-directional movement for the AUD/NZD pair.
AUD/NZD four-hour chart

The current upside momentum could motivate AUD/USD to surpass the key barrier at 0.6900 in the short-term horizon, note Economist Lee Sue Ann and Markets Strategist Quek Ser Leang at UOB Group.
Key Quotes
24-hour view: We stated yesterday that “strong boost in momentum is likely to lead to further AUD strength and the levels to watch are 0.6820 and 0.6870.” We held the view that “the 0.6870 is likely out of reach today.” The anticipated AUD strength exceeded our expectations as it surged to a high of 0.6895. While clearly overbought, the AUD’s strength could extend above June’s peak of 0.6900. Today, 0.6950 is likely out of reach. Support is at 0.6850, followed by 0.6830.
Next 1-3 weeks: We turned positive in AUD yesterday (14 Jul, spot at 0.6790).” We highlighted that AUD “could rise to 0.6820, as high as 0.6870.” The pace of the advance exceeded our expectations as AUD rocketed to a high of 0.6895 before closing higher by a whopping 1.50% (NY close of 0.6890). The price actions suggest AUD is likely to break June’s peak of 0.6900. A break of this solid resistance level will shift the focus to 0.6950 and 0.7030. The upward pressure is intact as long as AUD stays above 0.6760 (‘strong support’ level was at 0.6680 yesterday).
Open interest in crude oil futures markets increased for the third session in a row on Thursday, now by nearly 4K contracts according to preliminary readings from CME Group. Volume followed suit and went up for the third consecutive session, this time by around 116.5K contracts.
WTI now targets the $80.00 mark
Prices of WTI extended their monthly rally and flirted with the key 200-day SMA above the $77.00 mark on Thursday. The strong uptick came amidst increasing open interest and volume and leaves the door open to the continuation of the uptrend to, initially, the key $80.00 mark per barrel in the very near term.
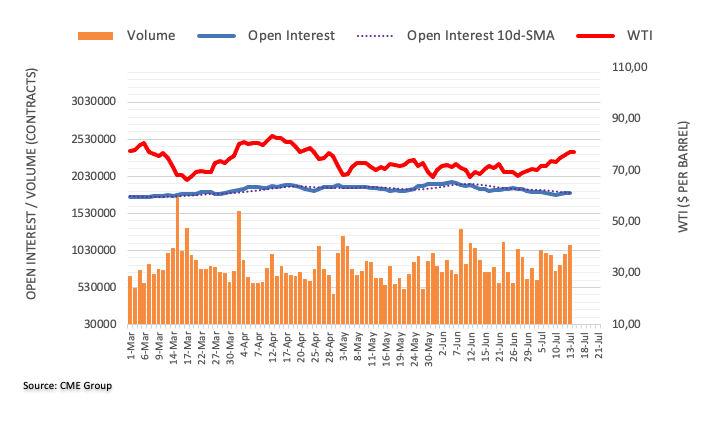
- USD/TRY picks up bids to reverse early-week retreat from all-time high, stays sidelined.
- Fears of CBRT rate hike jostle with receding concerns about hawkish Fed moves to restrict immediate Turkish Lira moves.
- Risk catalysts, US consumer-centric data eyed for clear directions
USD/TRY reverses the previous day’s losses while rising to 26.13 heading into Friday’s European session. In doing so, the Turkish Lira (TRY) pair justifies the US Dollar’s corrective bounce from the multi-day low amid sluggish trading hours ahead of mid-tier US consumer-centric data.
That said, the USD/TRY pair previously prod the bulls amid a reduction in the Turkish Unemployment Rate, to 9.5% in May from 10.2% prior, as well as due to the upbeat Industrial Production for May which improved to -0.2% YoY versus -1.2% previous readings.
Apart from that, the growing concerns about the US Federal Reserve’s (Fed) nearness to the policy pivot, backed by downbeat US inflation clues, also allowed the USD/TRY pair to retreat from an all-time high.
Even so, the market’s latest consolidation ahead of the preliminary readings of July’s US Michigan Consumer Sentiment Index, as well as the Five-Year Consumer Inflation Expectations, allows the US Dollar to pare the biggest weekly loss in eight months and favor the USD/TRY bulls. It should be noted that the US Dollar Index (DXY) rebounds from the April 2022 lows to 99.80 by the press time, snapping the six-day downtrend of late.
It should be noted that the hawkish comments from Federal Reserve Governor Christopher Waller joined mixed mood to underpin the USD/TRY rebound of late, via the US Dollar’s bounce.
That said, S&P500 Futures retreated from the yearly top whereas the US Treasury bond yields print mild gains around 3.78% and 4.65% by the press time, after refreshing a two-week low the previous day.
Above all, concerns that the monetary policy divergence between the Fed and the Central Bank of the Republic of Türkiye (CBRT) will last longer than expected, as well as downbeat Turkish statistics on a longer framework, keeps the USD/TRY bulls hopeful of witnessing a fresh record high.
Technical analysis
Despite the recent pick-up in the USD/TRY prices, the pair remains within a two-week-old trading range, between 25.82 and 26.16, which in turn suggests further inaction by the Turkish Lira (TRY) pair. However, the RSI (14) line remains firmer while the MACD indicator seems fading bearish bias of late, suggesting further upside of the quote.
- USD/MXN has found a temporary cushion near 16.82 after coping action in the USD Index.
- US equities are in the grip of bulls but uncertainty could emerge as firms will start reporting second-quarter results.
- The US Dollar Index remained under pressure as inflationary pressures have softened beyond expectations.
The USD/MXN has found intermediate supported after correcting to near 16.82 in the early European session. The downside bias in the asset has not faded yet and for a sustained bullish reversal, the pair has to pass through various filters. The major has followed the footprints of the US Dollar Index (DXY), which has also made a recovery attempt around 99.55.
S&P500 futures are showing choppy moves in early London, portraying quiet market sentiment for now. The overall market mood is quite upbeat as investors are hoping for a skip in the rate-hiking regime by the Federal Reserve (Fed) consecutively.
US equities are in the grip of bulls but uncertainty could emerge as firms will start reporting second-quarter results starting with big banks. Earnings and guidance could be subdued due to aggressive policy-tightening by the Fed and tight credit conditions by commercial and regional banks.
The US Dollar Index remained under pressure as inflationary pressures have softened beyond expectations and are sufficient to support expectations of only one more interest rate hike this year. Meanwhile, United States labor market conditions are still tight as weekly initial jobless claims have dropped for the week ending July 07. The US Department of Labor reported that individuals claiming for the first time were 237K vs. expectations of 250K and the former release of 249K.
On the Mexican Peso front, INEGI reported that monthly Industrial Output (May) reported an expansion of 1.0% vs. expectations of a stagnant performance. On an annualized basis, economic data expanded by 3.9% against the consensus of 1.9% and the former release of 0.7%.
In July, the USD/INR pair is forecast not to fall further, leading the Indian Rupee to depreciate slowly, economists at Mizuho Bank report.
EM currencies expected to start appreciating against the USD in the medium-to-long term
In July, USD/INR is expected to stabilize slowly, not falling much further, based on the foreign exchange market intervention by the central bank of India when the pair falls below the 82 level, as well as on occasional Indian Rupee-selling based on actual demand.
In the medium-to-long term, the currencies of emerging countries, including the INR, are expected to start appreciating against the USD, as the Fed is soon likely to end policy interest rate hikes to start policy interest rate cuts, which is likely to be next year or beyond. However, the RBI continues to intervene in the foreign exchange market in order to keep USD/INR from falling rapidly, and the Rupee is expected to depreciate slowly without seeing a significant shift in the market trend.
Further gains are likely in GBP/USD while above the 1.3000 level, suggest Economist Lee Sue Ann and Markets Strategist Quek Ser Leang at UOB Group.
Key Quotes
24-hour view: We highlighted yesterday that “as long as 1.2930 is not breached, GBP could grind higher to 1.3035.” We held the view that “1.3100 is highly unlikely to come into view.” Instead of ‘grinding higher’, GBP jumped to a high of 1.3144 before closing higher by 1.11% (NY close of 1.3134), its biggest 1-day gain in four months. Conditions are severely overstretched, but today, as long as 1.3055 (minor support is at 1.3080) is not breached, GBP could rise to 1.3160. We do not expect the next major resistance at 1.3330 to come into view today.
Next 1-3 weeks: We have expected GBP to strengthen since Monday (10 Jul), when it was trading at 1.2830 (see annotations in the chart below). After GBP rose above 1.3000, we indicated yesterday (13 Jul, spot at 1.2990) that “the focus is at 1.3100 now.” However, we were of the view that “it might take a few days before this level comes into view.” We did not anticipate GBP to jump by 1.11%, as it surged to a high of 1.3144 in late NY trade. From here, the next significant resistance is at 1.3335. We will continue to hold a positive GBP view as long as it stays above 1.3000 (‘strong support’ level was at 1.2885 yesterday).
CME Group’s flash data for gold futures markets noted traders increased their open interest positions for the second session in a row on Thursday, this time by around 1.5K contracts. Volume, instead, maintained the choppy activity and shrank by more than 26K contracts following the previous daily build.
Gold: Initial up-barrier emerges around $1980
Thursday’s uptick in gold prices was in tandem with a small increase in open interest, which is suggestive that further gains could still be in store in the very near term. Against that, the next resistance level is expected at the June peaks just above the $1980 mark per troy ounce.
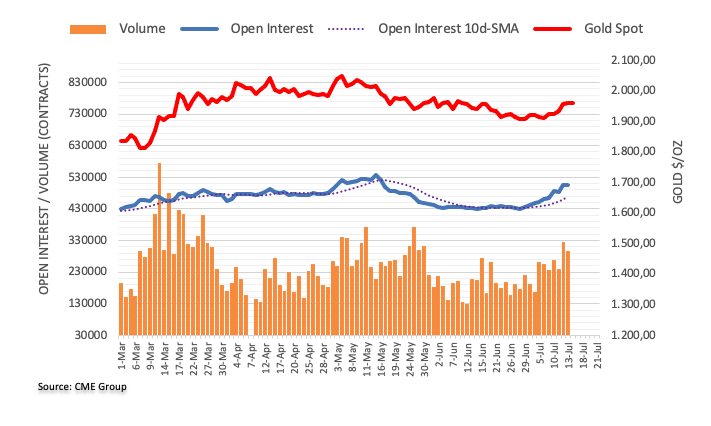
- EUR/JPY picks up bids from intraday low, consolidates losses on D1.
- Treasury bond yields pause further downside as markets await more clues to defy hawkish central bank concerns.
- Downbeat Japan data, hawkish ECB talks also underpin recovery moves.
- Risk catalysts, mid-tier EU data/events eyed for clear directions.
EUR/JPY recovers from the intraday low but stays mildly offered near 154.80 heading into Friday’s European session. In doing so, the cross-currency pair traces the latest corrective bounce in the Treasury bond yields, as well as justifies the downbeat Japan data, amid sluggish trading hours.
That said, the US 10-year and two-year Treasury bond yields print mild gains around 3.78% and 4.65% by the press time, after refreshing a two-week low the previous day. It should be noted that Japan Government Bond (JGB) yields for 10-year retreat from 11-week high while those from Europe and Germany await the opening bell.
Elsewhere, Japan’s Industrial Production for May dropped to -2.2% MoM and 4.2% YoY versus -1.6% and 4.7% respectively priors. Additionally, Capacity Utilization slumps to -6.3% compared to -2.5% market forecasts and 3.0% previous readings.
On the flip side, Eurozone Industrial Production eased to 0.2% MoM for May on a seasonally adjusted basis versus 0.3% market forecasts and 1.0% previous readings. It should be noted, however, that the European Central Bank’s (ECB) June policy meeting revealed on Thursday that minimum of two successive rate hikes needed for inflation projections to materialize. Alternatively, ECB Governing Council member Ignazio Visco said during an interview with Italy's Sky TG24 news channel, “We are not very far' from peak in interest rates.”
Amid these plays, markets in the Asia-Pacific region remain firmer but the S&P500 Futures print mild losses while making rounds to yearly top.
It’s worth noting that the recent easing chatters about Japan’s intervention to defend the Yen also allow the EUR/JPY pair to portray the corrective bounce.
Looking ahead, European Commission (EC) Economic Forecasts and trade numbers may direct the traders.
Technical analysis
Unless crossing a downward-sloping resistance line from July 04, close to 155.40 by the press time, the EUR/JPY pair remains on the bear’s radar.
- Gold price is demonstrating back-and-forth moves around $1,960.00 despite a steep fall in the USD Index.
- Soft US inflation and PPI June report indicate that households’ demand has turned subdued.
- Fed Waller is confident that two more interest rate hikes are appropriate this year to bring down inflation to 2%.
Gold price (XAU/USD) is demonstrating a non-directional performance from Thursday after a stalwart rally to near $1,960.00. The precious metal has failed to capitalize on soft inflation and Producer Price Index (PPI) June report, which cleared that households’ demand has turned subdued and the path towards the 2% inflation target is intact.
In spite of a heavy decline in the US Dollar Index (DXY), Gold price is struggling to come out of the woods. The US Dollar Index has surrendered the psychological cushion of 100.00 and has dropped to o near 99.65. Rising hopes of only one interest rate hike announcement from the Federal Reserve (Fed) by the year-end have sent the USD Index extremely lower.
Contrary to investors’ expectations, Fed Governor Christopher Waller is confident that two more interest rate hikes are appropriate this year to bring down inflation to 2%. Hawkish commentary from Fed Waller has infused some strength in the US Treasury yields. The yields offered on 10-year US Treasury bonds have jumped to near 3.77%.
Gold Price: Key levels to watch
FXStreet’s Technical Confluence Indicator is displaying that the Gold price is consolidating around $1,960.00 and the upside bias could strengthen if it manages to deliver a decisive break above the previous day high (PDH) at $1,964.00.
A strong break above PDH would expose the precious metal to $1,972.25, which is the first pivot resistance on a monthly basis and the third pivot cap on a weekly basis. More upside will open post a solid breakout of monthly R1 and the asset will find its next stoppage at $1,984.48, which is the previous month’s high.
The downside bias could unlock if the Gold price fails to sustain above $1,953.89 which is a daily 23.6% Fibonacci retracement. A slippage below the aforementioned support would drag the asset toward the daily 38.2% Fibo retracement plotted at $1,949.81, followed by a four-hour middle Bollinger Band at $1,939.62.
Here is how it looks on the tool
-638249107135375238.png)
About Technical Confluences Detector
The TCD (Technical Confluences Detector) is a tool to locate and point out those price levels where there is a congestion of indicators, moving averages, Fibonacci levels, Pivot Points, etc. If you are a short-term trader, you will find entry points for counter-trend strategies and hunt a few points at a time. If you are a medium-to-long-term trader, this tool will allow you to know in advance the price levels where a medium-to-long-term trend may stop and rest, where to unwind positions, or where to increase your position size.
In the view of Economist Lee Sue Ann and Markets Strategist Quek Ser Leang at UOB Group, further upside in EUR/USD to the 1.1495 level appears not favoured for the time being.
Key Quotes
24-hour view: We expected EUR to strengthen yesterday. However, we were of the view that “1.1200 is likely out of reach.” We did not expect EUR to continue to soar as it reached a high of 1.1227. Today, EUR could strengthen further, but it might not be able to maintain a foothold above 1.1250 (next resistance is at 1.1300). Support is at 1.1180, followed by 1.1150.
Next 1-3 weeks: Yesterday (13 Jul, spot at 1.1140), we stated that EUR “is still strong and could rise further to 1.1200, as high as 1.1250.” However, we did not quite expect EUR to break above 1.1200 so quickly (EUR rose to a high of 1.1227 in late NY trade). From here, a break of 1.1250 will not be surprising. That said, it remains to be seen if EUR can maintain the frenetic pace of advance seen over the past few days. We see short-term resistance levels at 1.1300 and 1.1400. At this stage, it is premature to expect EUR to rise to the 2022 high of 1.1495 (see updated 1-3 months view below). If EUR breaks below 1.1120 (‘strong support’ level was at 1.1035 yesterday), it would indicate that the EUR strength that started on Monday has come to an end.
- USD/CHF remains on the back foot at the lowest levels since January 2015.
- Oversold RSI prods Swiss Franc pair sellers within seven-month-old falling trend channel.
- 100-DMA holds the key to USD/CHF bull’s entry; sellers can aim for 2015 bottom past 0.8570.
USD/CHF bears keep the reins at the lowest levels since January 2015, down 0.12% intraday near 0.8575 heading into Friday’s European session.
In doing so, the Swiss Franc pair drops for the seventh consecutive day while refreshing the multi-year low. However, the oversold RSI conditions join the bottom line of a downward-sloping trend channel established in December 2022, around 0.8570, to challenge the USD/CHF bears.
In a case where the pair sellers ignore the oversold RSI conditions and defy the bearish chart pattern by breaking the 0.8570 support, the late January 2015 swing low of around 0.8500 may act as the last defense before directing the quote to the year 2015 bottom of 0.8300.
Meanwhile, USD/CHF recovery may aim for the 0.8600 and 0.8700 round figure but the bulls remain off the table unless witnessing a daily closing beyond May’s low of 0.8820.
Even so, the aforementioned multi-month-old bearish channel’s top line, close to 0.8990 at the latest, prods the pair buyers before giving them control.
It should be observed that the 0.9000 psychological magnet and the 100-DMA are extra filters toward the north.
Overall, USD/CHF remains bearish but the sellers appear running out of steam of late, which in turn suggests a corrective bounce in prices.
USD/CHF: Daily chart
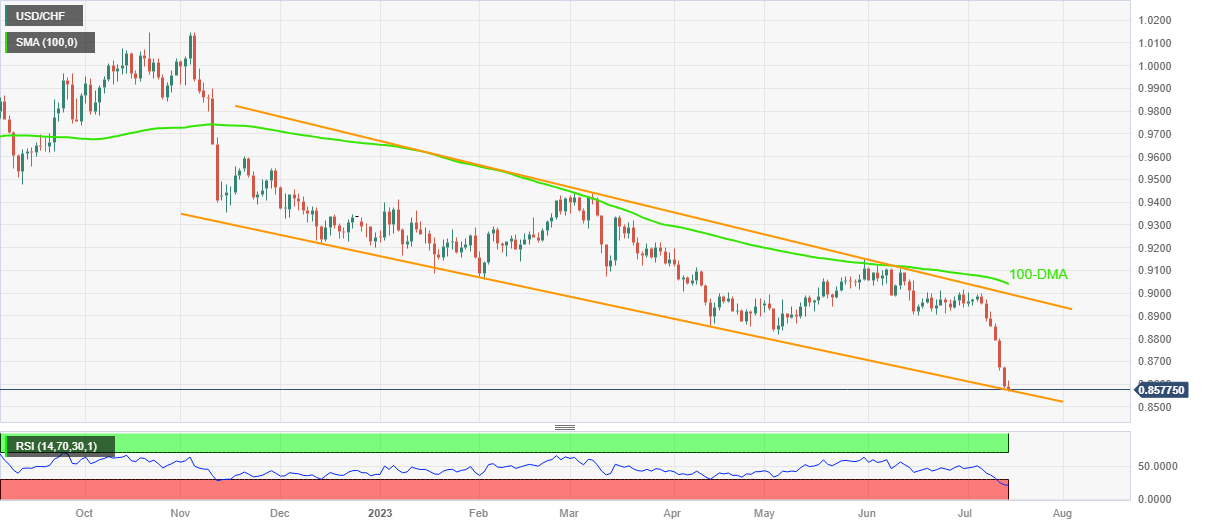
Trend: Limited downside expected
- USD/CAD remains on the defensive near the 1.3100 region.
- The US Dollar came under renewed selling pressure, hitting its lowest since April 2022.
- The hawkish stance from the Bank of Canada (BoC), the rise in crude oil prices underpin the Loonie.
The USD/CAD pair licks its wounds around the 1.3100 area, the lowest level in 10 months. The pair remains under pressure following weaker US inflation data earlier in the week.
The Bank of Canada (BoC) raised the benchmark interest rates by 25 basis points (bps) to 5.0% in its July policy meeting on Wednesday. BoC Governor Tiff Macklem stated on the policy outlook that additional interest rate hikes are necessary to slow demand growth in the economy and alleviate price pressures. This, combined with the recent rise in crude oil prices to fresh three-month highs, continues to support the commodity-linked Loonie on Friday.
On the other hand, the US Dollar came under renewed selling pressure, following the softer US inflation data earlier in the week. The US Dollar Index (DXY), a gauge of the performance of the Greenback against a basket of six major currencies, hit its lowest since April 2022, below 100.00.
That said, the US Consumer Price Index (CPI) dropped to 3.0% YoY in June from 4.0% in May, below the market anticipation of 3.1%, while the Producer Price Index (PPI) rose 0.1%, the lowest figure since August 2020. The inflation report suggested that inflationary pressures in the US economy are cooling and that the Federal Reserve (Fed) will be less aggressive with tightening monetary policy after an expected interest rates hike in the upcoming meeting on July 26. This, in turn, leds to a further decline in the US Treasury bond yields and weighed on the US Dollar as well as the USD/CAD pair.
Moving on, the US University of Michigan Preliminary Consumer Sentiment data is due later on Friday. The market participants will shift their focus to the Canadian Consumer Price Index (CPI) next week. Traders will take cues from the data and find a direction for the USD/CAD pair.
- NZD/USD is looking for comfortable stability above 0.6400 amid the declining US Dollar Index.
- A significant decline in the US PPI indicates that the overall demand has turned subdued now.
- The RBNZ has paused its rate-hiking spree for now to restrict the burden on the economy.
The NZD/USD pair is aiming to shift auction above the round-level resistance of 0.6400 in the Asian session. The Kiwi asset has got enormous strength as the US Dollar Index (DXY) has slipped below the psychological support of 100.00. The USD Index has dropped to near 99.60 as the United States economy is swiftly approaching towards 2% inflation scenario due to aggressive policy-tightening from the Federal Reserve (Fed).
S&P500 futures have posted nominal losses in Tokyo. However, the overall market mood is quite upbeat as a significant decline in the US Producer Price Index (PPI) indicates that the overall demand has turned subdued now. Contrary to the USD Index, the yields offered on 10-year US Treasury bonds have rebounded to 3.77%.
June’s PPI report conveyed that monthly headline and core figures were expanded at a nominal pace of 0.1%. Annual PPI has severely softened to 0.1%, which indicates that the impact of lower gasoline prices has entirely offset higher prices for core inputs. After the soft inflation report, a follow-up of more-than-expected deceleration in price pressures at factory gates has meaningfully propelled chances of only one more interest rate hike from the Federal Reserve (Fed) by the year-end.
As per the CME Fedwatch tool, the chances of a 25 basis point (bp) interest rate hike in July are above 92%. Still, there is hope that Fed chair Jerome Powell could skip policy-tightening for the second time.
Meanwhile, the New Zealand Dollar is on the buying list of investors as the Reserve Bank of New Zealand (RBNZ) has paused its rate-hiking spree for now to restrict the burden on the economy. The outlook of New Zealand has completely dampened and further policy-tightening could have done more worse. Investors should note that interest rates by the RBNZ are at 5.5%.
- Asia-Pacific equity markets brace for the longest weekly jump since November 2022.
- Hopes of China stimulus, chatters about Fed policy pivot keep sentiment positive in Asia.
- Cautious mood ahead of mid-tier US data prod S&P500 Futures at yearly top, yields dribble at fortnight low.
Market sentiment in the Asia-Pacific region remains bullish during early Friday amid receding fears of hawkish central bank moves, as well as amid hopes of getting more stimulus from the bloc leader China. Adding strength to the optimism were downbeat US data and a light calendar at home. However, the cautious mood ahead of the US consumer-centric data prods the optimists.
While portraying the mood, the MSCI’s index of Asia-Pacific shares outside Japan rises 0.90% intraday and around 5.5% on a week as it prepares for the biggest weekly gain since November 2022. It’s worth noting that strong Japan Government Bond (JGB) yields and fears of Tokyo’s market intervention prod the Nikkei 225, up 0.20% intraday by the press time.
Australia’s ASX 200 jumps around 0.80% amid news that Michele Bullock will be the next Reserve Bank of Australia (RBA) Governor, starting from September 18, 2023. It’s worth noting that Bullock’s initial comments after the selection were slightly cautious, which in turn suggested challenges for the RBA’s rate hike and favored equity bulls in Canberra.
It’s worth noting that People’s Bank of China (PBoC) Deputy Governor Guoqiang Liu, China’s top diplomat Wang Yi and statements from Beijing’s think tank Chinese Academy of Social Sciences (CASS) flagged concerns about more stimulus from the dragon nation and favored shares in China and surrounding nations.
With this in mind, hawkish comments from the Bank of Korea Governor fail to tame South Korea’s benchmark equity index KOSPI. On the same line, equity indices in India, Indonesia and Hong Kong were also firmer while tracking China amid broad optimism.
In doing so, the optimists ignore S&P500 Futures’ retreat from the yearly top, as well as a pause in the US Treasury bond yields. That said, the US 10-year and two-year Treasury bond yields print mild gains around 3.78% and 4.65% by the press time, after refreshing a two-week low the previous day.
It should be observed that the US Dollar Index remains pressured at the lowest level since April 2022 whereas Gold prices struggle near a one-month high. That said, WTI crude oil eases from the 11-week high as the 200-DMA challenges the Oil bulls.
Looking forward, China headlines and second-tier Japan data will entertain the traders ahead of the preliminary readings of July’s Michigan Consumer Sentiment Index, as well as the Five-Year Consumer Inflation Expectations. In a case where the US data keeps printing downbeat figures, the hopes of witnessing a sooner end to the rate hike cycle will strengthen, which in turn underpin the riskier assets like Gold, equities, AUDUSD, etc.
Also read: Forex Today: Dollar's downward spiral continues
- EUR/USD climbs to its highest level since February 2022 as the USD selling remains unabated.
- Expectations that the Fed will soon end its rate-hiking cycle continue to weigh on the Greenback.
- The ECB's hawkish outlook further underpins the Euro and remains supportive of the momentum.
The EUR/USD pair builds on this week's breakout momentum through the previous YTD peak and climbs to its highest level since February 2022, around the 1.1240-1.1245 region during the Asian session on Friday.
The US Dollar (USD) downward trajectory remains uninterrupted for the seventh straight day in the wake of expectations that the Federal Reserve (Fed) will soon end its policy-tightening cycle. In fact, investors now seem convinced that the US central bank will keep rates steady for the rest of the year after the widely anticipated 25 lift-off in July. This led to the recent sharp decline in the US Treasury bond yields and drags the USD to a fresh 15-month low, which, in turn, is seen as a key factor acting as a tailwind for the EUR/USD pair.
In contrast, the minutes of the European Central Bank (ECB) meeting held in June revealed that policymakers remain determined to continue the current hiking cycle beyond July to bring inflation back to target. It is worth recalling that the ECB, in its June economic projections, forecasted that inflation would stay above its 2% target through the end of 2025. This hawkish outlook, to a larger extent, offsets emerging signs of a cooling economy and continues to underpin the shared currency, further lending support to the EUR/USD pair.
That said, the Relative Strength Index (RSI) on the daily chart is already flashing overbought conditions and might hold back bulls from placing fresh bets around the major. Hence, it will be prudent to wait for some near-term consolidation or a modest pullback before positioning for any further appreciating move. Nevertheless, the aforementioned fundamental backdrop suggests that the path of least resistance for the EUR/USD pair is to the downside and any meaningful corrective decline might still be seen as a buying opportunity.
Technical levels to watch
- USD/JPY portrays corrective bounce after refreshing two-month low.
- Oversold RSI conditions trigger rebound ahead of 100-DMA, 200-DMA convergence.
- Bearish MACD signals, clear break of previously important support line keep Yen pair sellers hopeful.
- Six-month-old rising support line will act as the last defense of bears past 137.00.
USD/JPY rebounds from the lowest levels in two months while paring intraday loss near 137.70 heading into Friday’s European session. In doing so, the Yen pair justifies oversold RSI conditions despite being in the red for the seventh consecutive day.
Apart from the oversold RSI (14) line, a convergence of the 100-DMA and 200-DMA, around 137.00 by the press time, also challenges the USD/JPY bears in keeping the reins.
However, Wednesday’s downside break of the previously key support line stretched from April, now immediate resistance near 139.50, joins the bearish MACD signals to keep the USD/JPY sellers hopeful.
Hence, the quote’s corrective bounce remains elusive below 139.50, a break of which will recall the 140.00 round figure to the chart.
However, the 61.8% Fibonacci retracement of its October 2022 to January 2023 downturn and a 10-month-old horizontal resistance area, respectively near 142.50 and 144.85-145.00, appear tough nuts to crack for the USD/JPY bulls past 140.00.
On the flip side, a daily closing beneath the aforementioned DMA confluence surrounding 137.00 will make the Yen pair vulnerable to testing an upward-sloping support line from mid-January 2023, close to 135.40 by the press time.
In a case where the USD/JPY remains bearish past 135.40, the odds of witnessing a gradual south-run toward the 130.00 psychological magnet can’t be ruled out.
USD/JPY: Daily chart

Trend: Limited downside expected
- AUD/USD bulls take a brief pause after the recent rise to a nearly one-month peak.
- The technical setup supports prospects for an extension of the appreciating move.
- Any meaningful corrective decline could attract fresh buyers and remain limited.
The AUD/USD pair is seen consolidating its recent strong gains to a nearly one-month top and oscillating in a narrow trading band through the Asian session on Friday. Bulls now await a sustained strength above the 0.6900 round figure before placing fresh bets and positioning for an extension of the recent rally witnessed over the past week or so, from sub-0.6600 levels or the monthly low.
The US Dollar (USD) remains under some selling pressure for the seventh successive day and hits a fresh low since April 2022 as traders now seem convinced that the Federal Reserve (Fed) is nearing the end of its rate-hiking cycle. This, along with hopes that China will announce more stimulus measures to support the fragile domestic economy, benefits the China-proxy Australian Dollar (AUD) and acts as a tailwind for the AUD./USD pair.
From a technical perspective, the recent breakout through the 0.6800 static barrier and the subsequent move up favour bullish traders. Moreover, oscillators on the daily chart are holding comfortably in the positive territory and are still far from being in the overbought zone. This, in turn, supports prospects for a further near-term appreciating move and an eventual move beyond the 0.6900 mark, or the multi-month top touched in June.
The AUD/USD pair might then accelerate the momentum towards testing the 0.6955-0.6960 intermediate hurdle before aiming to reclaim the 0.7000 psychological mark for the first time since February 14. The next relevant hurdle is pegged near the 0.7025-0.7030 area, above which spot prices could climb further towards the 0.7100 round figure en route to the YTD peak, around the 0.7155-0.7160 region touched in February.
On the flip side, any meaningful corrective fall might now be seen as a buying opportunity near the 0.6835 region. This should help limit the downside near the 0.6800 resistance breakpoint, now turned support. The said handle should act as a pivotal point, which if broken decisively might prompt some technical selling and drag the AUID/USD pair back toward the very important 200-day Simple Moving Average (SMA), around the 0.6700 mark.
AUD/USD daily chart
-638249048772727360.png)
Key levels to watch
- Gold price touches a fresh one-month high on Friday, albeit lacks strong follow-through.
- The US Dollar selling bias remains unabated and continues to lend support to the metal.
- The overnight hawkish remarks by Fed's Waller act as a headwind for the XAU/USD.
Gold price trades with a positive bias for the fourth successive day on Friday and hits a fresh one-month high, around the $1,964 area during the Asian session. The intraday uptick, however, lacks bullish conviction, though acceptance above the 100-day Simple Moving Average (SMA) supports prospects for an extension of the recent bounce from the $1,893 region, or a three-and-half-month low touched in June.
Bearish US Dollar continues to underpin Gold price
The US Dollar (USD) languishes near its lowest level since April 2022 in the wake of firming expectations that the Federal Reserve (fed) could end its policy-tightening cycle soon and continues to act as a tailwind for the Gold price. Investors now seem convinced that the Fed will keep interest rates steady after the widely anticipated 25 basis points (bps) lift-off at its July policy meeting. The bets were reaffirmed by data released earlier this week, which showed that consumer prices in the United States (US) moderated further in June. In fact, the US Bureau of Labor Statistics reported that the headline Consumer Price Index (CPI) climbed 0.2% in June and the yearly rate slowed from 4% to 3% - marking the smallest rise since March 2021. Furthermore, the monthly increase in core prices was the smallest since August 2021.
Bets for only one Fed rate hike this year further benefit XAU/USD
Adding to this, the US Producer Price Index (PPI) for final demand rose barely, by a modest 0.1% in June and the previous month's reading was also revised down to show that the gauge fell 0.4% instead of the previously reported 0.3%. In the 12 months through June, the PPI fell from a 0.9% rise in May to 0.1% during the reported month - marking the smallest year-on-year rise since August 2020. This comes on the back of the unimpressive US monthly employment data last Friday, showing that the economy added the fewest jobs in two-and-half-years, which should allow the Fed to soften its hawkish stance. This led to the recent sharp decline in the US Treasury bond yields, which continues to drag the USD lower and remains supportive of the recent rise in the US Dollar-denominated Gold price.
Hawkish comments by Fed's Waller act as headwind for Gold price
That said, an unexpected fall in the US Weekly Initial Jobless Claims last week indicated that the labor market remains tight. Apart from this, the overnight hawkish remarks by Fed Governor Christopher Waller help the US bond yields to stall the downfall, which, in turn, is holding back traders from placing fresh bullish bets around the non-yielding Gold price. Waller said that he supports the Fed hiking by two more quarter percentage point increases this year and sees no reason why the first of those two hikes should not occur at the next meeting later this month. Nevertheless, the aforementioned fundamental backdrop validates the near-term positive outlook for the XAU/USD and remains tilted firmly in favour of bullish traders, suggesting that the path of least resistance is to the upside.
Market participants now look to the release of the Preliminary Michigan US Consumer Sentiment Index, due later during the early North American session. This, along with the US bond yields, will influence the USD price dynamics on the last day of the week and allow traders to grab short-term opportunities around the Gold price. The XAU/USD, meanwhile, seems poised to end in the green for the second successive week and possibly register its highest weekly close since May.
Gold price technical outlook
From a technical perspective, any subsequent move up is more likely to confront resistance near the $1.970-$1,972 region ahead of the $1,983-$1,984 zone. A sustained strength beyond has the potential to lift the Gold price beyond the $2,000 psychological mark, towards testing the next relevant hurdle near the $2,010-$2,012 area.
On the flip side, the 100-day SMA, currently around the $1,954-$1,953 zone, now seems to protect the immediate downside. This is followed by support near the $1,942 level, below which a bout of technical selling could drag the Gold price further towards the $1,925 region. Some follow-through selling will expose the $1,900 mark before the XAU/USD eventually drops to the multi-month low, around the $1,893 region.
Key levels to watch
- GBP/JPY holds the ground near 180.60 area, down 0.33% on the day.
- The Relative Strength Index (RSI) stands in the 40-60 zone, indicating the non-directional movement.
- The key resistance emerges at 180.80, the critical support level to watch is located at 180.00.
The GBP/JPY pair hovers around the 180.60 mark in the Asian session on Friday. The cross struggles to gain traction after retreating from the 181.40 region.
It’s worth noting that the Relative Strength Index (RSI) is located in the 40-60 zone, indicating the non-directional movement of the pair. However, the 25-hour Exponential Moving Average (EMA) is on the verge of crossing the 50-hour EMA. If a decisive crossover occurs on the one-hour chart. It would validate a Bull Cross highlighting the path of least resistance for the cross is to the upside.
GBP/JPY’s key resistance emerges at 180.80, representing a confluence of the 25- and 50-hour EMA. Any meaningful follow-through buying could pave the way to the next hurdle at 181.40 (High of July 13) en route to 182.00 (psychological level, High of July 11). A convincing break above the latter will trigger a rally to 182.65 (Low of July 6).
On the flip side, the critical support level to watch is at 180.00, the confluence of psychological round mark and a low of July 13. A breach of the mentioned level, further downside is expected. The next contention is seen at 179.55 (low of July 12), followed by 178.80 (low of June 16), and finally at 178.20 (low of June 15).
GBP/JPY one-hour chart

- USD/INR takes offers to reverse the previous day’s corrective bounce off one-week low.
- Clear downside break of multi-month-old support line, bearish MACD signals favor Indian Rupee buyers.
- Monthly low, 200-EMA lures pair sellers; corrective bounce needs validation from 82.20.
USD/INR renews intraday low near 81.96 during Friday morning in India as markets braces for the mid-ties US data to confirm the recently dovish concerns about the Federal Reserve (Fed).
In doing so, the Indian Rupee (INR) pair reverses the previous day’s rebound from the lowest levels since July 05 while extending the early week’s downside break of an ascending trend line from November 2022, around 82.05 by the press time.
Not only the failure to defend the previous day’s corrective bounce but the bearish MACD signals also weigh on the USD/INR price as it keeps the prior trend line breakdown.
With this, the Indian Rupee buyers are likely approaching the monthly low of 81.75 ahead of poking the 200-Exponential Moving Average (EMA) surrounding the 81.70 level.
Following that, a horizontal area around 81.50 comprising the lows marked in April and March appears the last defense of the USD/INR bulls.
On the contrary, the Indian Rupee’s weakness past the 82.05 level encompassing the support-turned-resistance line isn’t an open invitation to the pair buyers.
The reason could be linked to the presence of convergence of the 100-EMA and 23.6% Fibonacci retracement of August-October 2022 upside, near 82.20.
USD/INR: Daily chart

Trend: Further downside expected
- Natural Gas Price remains sidelined after refreshing three-week low the previous day.
- IEA conveyed economic woes to cut down Oil demand forecasts, XNG/USD trails the move.
- Chatters about China fading economic recovery jostle with downbeat USD on Fed policy pivot concerns to test Natural Gas Price.
- Risk catalysts, US data eyed for clear XNG/USD directions.
Natural Gas Price (XNG/USD) seesaws around $2.55 after refreshing a three-week low amid mixed concerns about economic recovery and Oil market updates. That said, the downbeat energy forecasts from the US International Energy Agency (IEA) weigh on the XNG/USD price even as the US Dollar stays pressured.
On Thursday, the US IEA flagged fears of softer energy demand from China, one of the world’s biggest energy customers, while stating, “China's economic recovery losing steam after bounce earlier in the year.” The IEA also revised up 2024 demand forecasts by saying that a more robust global economic outlook next year and an expected increase in gasoil use in China accounted for the raised forecast.”
On the other hand, the downbeat US Dollar should have also put a floor under the XNG/USD price. That said, the US Dollar Index (DXY) licks its wounds near 99.65 after dropping to the lowest level since April 2022 the previous day, down 2.45% in a week so far.
In doing so, the US Dollar struggles to justify hawkish comments from Federal Reserve Governor Christopher Waller as the US inflation clues flag the nearness of the Fed’s policy pivot even if the July rate hike is almost given.
It’s worth noting that the cautious mood, as per the S&P500 Futures’ retreat from the yearly top, also prods the Natural Gas traders.
Furthermore, headlines from China suggest more stimulus from the dragon nation and challenge the intraday sellers of the Natural Gas of late.
Moving on, China headlines will entertain the XNG/USD traders ahead of the preliminary readings of July’s Michigan Consumer Sentiment Index, as well as the Five-Year Consumer Inflation Expectations.
Technical analysis
Despite the latest corrective bounce off the 50-DMA, around $2.53 by the press time, the Natural Gas Price remains on the sellers' radar as it confirmed the bearish Head-and-Shoulders (H&S) chart formation by breaking the $2.56 support the previous day.
- Silver Price seesaws at the highest levels in nine weeks, prints the first daily loss in three.
- Key Fibonacci retracement hurdle, overbought RSI conditions challenge XAG/USD bulls amid cautious markets ahead of US data.
- Silver bears remain off the table unless the quote stays beyond 50-DMA, $24.55 can lure intraday sellers.
Silver Price (XAG/USD) retreats from the highest levels since early May, down 0.11% intraday near $24.85 amid the mid-Asian session on Friday. In doing so, the XAG/USD portrays the market’s anxiety ahead of the US consumer-centric data for July while printing the first daily loss in three.
That said, the overbought RSI (14) line joins the 78.6% Fibonacci retracement level of the XAG/USD’s March-September 2022 downturn to challenge the Silver buyers around $24.95.
Even if the bright metal crosses the $24.95 hurdle, the $25.00 round figure can act as an extra check for the bulls before directing them to the 15-month-old horizontal resistance area surrounding $26.10-20.
Following that, the previous yearly high of near $26.95 and the $27.00 threshold will be in the spotlight.
On the contrary, a horizontal area comprising multiple levels marked since January 2023, around $24.65-55, restricts the short-term downside of the Silver Price.
That said, the XAG/USD bears will need validation from the 50-DMA level of around $23.60 to retake control.
Overall, the Silver Price remains on the bull’s radar even if a short-term pullback is expected.
Silver Price: Daily chart
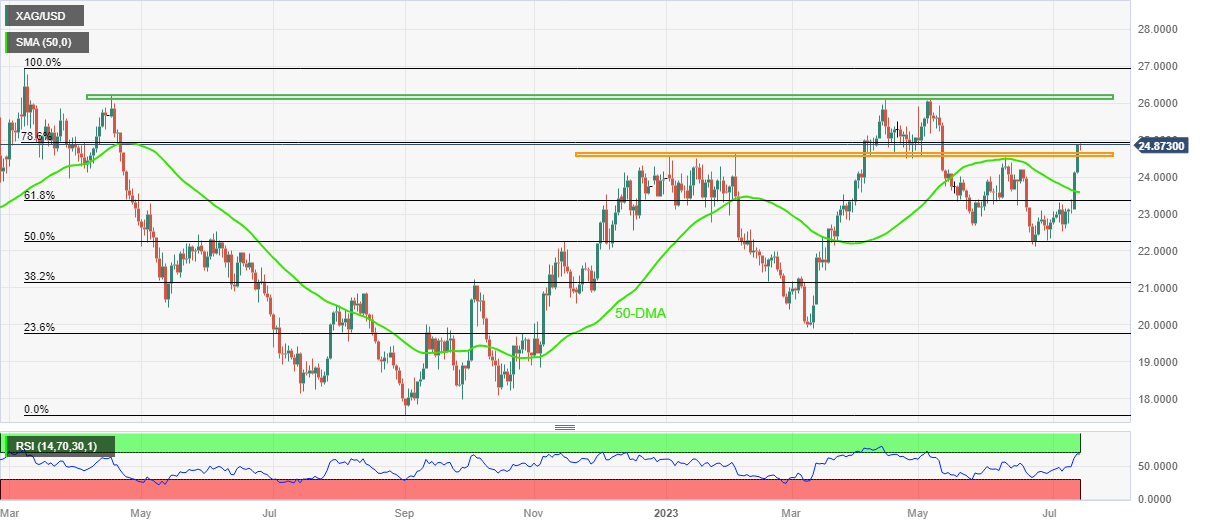
Trend: Pullback expected
- AUD/JPY meets with some supply on Friday and snaps a two-day winning streak.
- Speculations that BoJ will tweak its YCC policy boost the JPY and exert pressure.
- The downside seems limited as the focus shifts to Chinese macro data on Monday.
The AUD/JPY cross comes under some selling pressure during the Asian session on Friday and stalls its recovery from the monthly low, around the 93.25-93.20 region touched earlier this week. Spot prices drop to a fresh daily low, around the 94.55 area in the last hour and for now, seem to have snapped a two-day winning streak.
The Japanese Yen (JPY) continues to draw support from growing speculations that the Bank of Japan (BoJ) could adjust its Yield Curve Control (YCC) policy as soon as this month, which, in turn, exerts some pressure on the AUD/JPY cross. In fact, former BoJ Executive Director Hideo Hayakawa said that widening the band around zero for the 10-year Japanese Government Bond to 1% (from currently 0.5%) is the policy 'tweak' being considered.
Furthermore, Japanese media report the BoJ is likely to raise its FY2023 inflation forecast, which has exceeded the 2% goal for more than a year, and should put pressure on the central bank to start unwinding its ultra-loose monetary policy settings. Apart from this, a modest pullback in the US equity futures further benefits the safe-haven JPY and weighs on the risk-sensitive Aussie, contributing to the offered tone surrounding the AUD/JPY cross.
The downside, however, seems limited, at least for now, in the wake of hopes that China will announce more stimulus measures to support the fragile domestic economy. Adding to this, China's Foreign Minister Wang Yi sounded optimistic and said that China-Australia relations have stabilised, improved and developed. This, in turn, should lend some support to the China-proxy Australian Dollar (AUD) and act as a tailwind for the AUD/JPY cross.
Traders might also prefer to move to the sidelines and wait for the release of the key Chinese macro data, scheduled during the Asian session on Monday. This further makes it prudent to wait for strong follow-through selling before positioning for the resumption of the recent slide from the YTD peak touched in June.
Technical levels to watch
| Raw materials | Closed | Change, % |
|---|---|---|
| Silver | 24.855 | 3.07 |
| Gold | 1960.38 | 0.13 |
| Palladium | 1293.6 | 0.78 |
- USD/CNH seesaws at the lowest levels in a month, bounces off intraday low of late.
- Chatters about China’s need for more stimulus jostle with downbeat IMF remarks to prod Yuan buyers.
- Comments from Fed’s Waller also prod USD/CNH bears amid fears of Fed policy pivot.
- US consumer-centric data, risk catalysts eyed for clear directions.
USD/CNH bears lick their wounds at the lowest level in a month as the offshore Chinese Yuan pair rebounds from the monthly low to 1.1470 early Friday, after initially refreshing the multi-day bottom. In doing so, the pair justifies the market’s mixed concerns about Beijing even as the dovish Federal Reserve (Fed) bias weighs on the quote.
Earlier in the day, Nikkei Asia quoted China think tank Chinese Academy of Social Sciences (CASS) while citing the need for heavy stimulus, of around $182 billion, to regain the economic transition.
On the same line were statements from the International Monetary Fund (IMF) as it said late Thursday that China's economy is slowing due to weaker private investment, slowing exports and reduced domestic demand after a strong performance in the first quarter as the economy reopened from COVID-19 lockdowns.
Elsewhere, China’s top diplomat Wang Yi, also the Foreign Minister, cited improved relations with Australia and showed economic optimism.
Furthermore, People’s Bank of China (PBoC) Deputy Governor Guoqiang Liu said that China has not seen deflation and no deflationary risks in the second half of 2023 (H2 2023).
Apart from the mixed macros surrounding China, hawkish comments from Federal Reserve Governor Christopher Waller also prod the USD/CNH bears, especially amid downbeat sentiment.
“Fed likely to need two more 25 basis point rate hikes this year,” said Fed’s Waller. The policymaker also ruled out concerns about the Fed rate peak while stating the need for two more downbeat inflation numbers in the prepared remarks for delivery before a gathering held by The Money Marketeers of New York University shared by Reuters.
However, downbeat US inflation clues keep flagging fears of the Fed’s policy pivot after July’s already priced-in rate hike and exert downside pressure on the US Dollar Index. That said, US Producer Price Index (PPI) came in as 0.1% YoY for June, versus 0.4% expected and 0.9% prior while the PPI ex Food & Energy, also known as the Core PPI, eased to 2.4% YoY from 2.8% previous reading and 2.6% market forecasts. Earlier in the week, the US Consumer Price Index (CPI) registered a 3.0% YoY figure for June versus 3.1% market forecasts and 4.0% reported for May. Further details suggest that the CPI ex Food & Energy, also known as the Core CPI, softened to 4.8% yearly for the said month compared to analysts’ estimations of 5.0% and 5.3% previous readings.
Against this backdrop, the S&P500 Futures retreat from the yearly high, down 0.16% intraday at the latest, whereas the US 10-year and two-year Treasury bond yields print mild gains around 3.78% and 4.65% by the press time.
Looking ahead, China headlines will entertain the USD/CNH traders ahead of the preliminary readings of July’s Michigan Consumer Sentiment Index, as well as the Five-Year Consumer Inflation Expectations.
Technical analysis
Despite the latest inaction, a daily closing beneath the three-month-old rising support line, now immediate resistance near 7.1530, keeps the USD/CNH sellers hopeful.
“China has not seen deflation, no deflationary risks in the second half of 2023 (H2 2023),” per the latest comments from People’s Bank of China (PBoC) Deputy Governor Guoqiang Liu.
The PBoC official also mentioned that the Consumer Price Index (CPI) could decline further in July before improving in August.
“Central Bank has ample tools,” said PBoC Deputy Governor while adding that they will step up counter cyclical adjustments.
The policymaker also showed readings to increase support measures for key sectors while keeping credit growth appropriate.
USD/CNH stays pressured
Despite the mostly upbeat comments, USD/CNH remains pressured at the lowest levels in a month, down 0.07% intraday near 7.1460 by the press time.
- GBP/USD enters a bullish consolidation phase and trades just below the 15-month peak.
- Bets that the Fed will soon end its rate-hiking cycle undermine the USD and lend support.
- Expectations for further policy tightening by the BoE also contribute to limiting the slide.
The GBP/USD pair oscillates in a narrow trading band during the Asian session on Friday and consolidates its recent strong gains registered over the past two weeks or so, to its highest level since April 2022. Spot prices currently trade around the 1.3130-1.3125 region and the fundamental backdrop still seems tilted firmly in favour of bullish traders.
The US Dollar (USD) remains under some selling pressure for the seventh straight day and hits a fresh 15-month low in the wake of firming expectations that the Federal Reserve (Fed) is nearly done with its policy tightening cycle. The British Pound (GBP), on the other hand, continues to draw support from rising bets that the Bank of England (BoE) may need to raise interest rates further to combat high inflation. This should act as a tailwind for the GBP/USD pair and support prospects for an extension of the near-term well-established uptrend.
Investors seem convinced that the US central bank will hold interest rates steady for the rest of the year after the widely expected 25 bps lift-off in July. The bets were lifted by the US CPI report on Wednesday, which showed a further moderation in consumer prices. Adding to this, the US Producer Prices Index (PPI) recorded the smallest annual rise in nearly three years in June. This comes on the back of signs that the US labor market is cooling and should allow the Fed to soften its hawkish stance, which keeps the USD bulls on the defensive.
In contrast, the current market pricing indicates that the BoE could raise interest rates from the current 5% to a cycle peak of 6.5% to dampen demand and force inflation lower. The speculations were fueled by stronger UK wage growth data, which, according to BoE Governor Andrew Bailey and UK Finance Minister Jeremy Hunt, is harming the efforts to contain inflation. This, to a larger extent, helps offset the possibility of a recession in the UK later this year and suggests that the path of least resistance for the GBP/USD pair remains to the upside.
There isn't any relevant market-moving economic data due from the UK on Friday, leaving the major at the mercy of the USD price dynamics. Later during the early North American session, traders will take cues from the release of the Preliminary Michigan US Consumer Sentiment Index. This, along with the broader risk sentiment, might influence the USD and provide some impetus to the GBP/USD pair on the last trading day of the week. Nevertheless, spot prices remain on track to register strong gains and end in the green for the second straight week.
Technical levels to watch
- EUR/USD remains firmer at the highest levels in 16 months, picks up bids to renew multi-month peak of late.
- Hawkish comments from Fed’s Waller fail to prod Euro bulls as inflation concerns flag Fed policy pivot.
- Key Fibonacci retracement level challenge EUR/USD bulls amid overbought RSI.
- Euro sellers need validation from 1.1180 and mid-tier US/EU data for return.
EUR/USD picks up bids to refresh a 16-month high near 1.1235 during early Friday, rising for the seventh consecutive day to brace for the biggest weekly gain since November 2022. In doing so, the Euro pair fails to justify hawkish comments from Federal Reserve Governor Christopher Waller, as well as the cautious mood ahead of the mid-tier data from the US and Eurozone.
Also read: EUR/USD prods 16-month high past 1.1200 on broad US Dollar weakness, EU/US data eyed
Apart from the Fed concerns and slightly offbeat sentiment, the overbought RSI conditions also challenge the EUR/USD bulls as they approach the key 1.1280 hurdle comprising the 61.8% Fibonacci retracement of the pair’s January 2021 to September 2022 downturn.
It’s worth noting, however, that a clear upside break of 1.1280 enables the EUR/USD buyers to aim for the previous yearly high of near 1.1500.
Following that, the October 2021 low and the 78.6% Fibonacci retracement level, respectively near 1.1530 and 1.1760, will be in the spotlight.
On the contrary, a convergence of the 200-week SMA and previous resistance line stretched from May 2023, close to 1.1180 at the latest, put a floor under the EUR/USD price amid bullish MACD signals.
In a case where the EUR/USD remains bearish past 1.1180, tops marked in April and February, close to 1.1095 and 1.1030, will act as the final defense of the bulls.
EUR/USD: Weekly chart
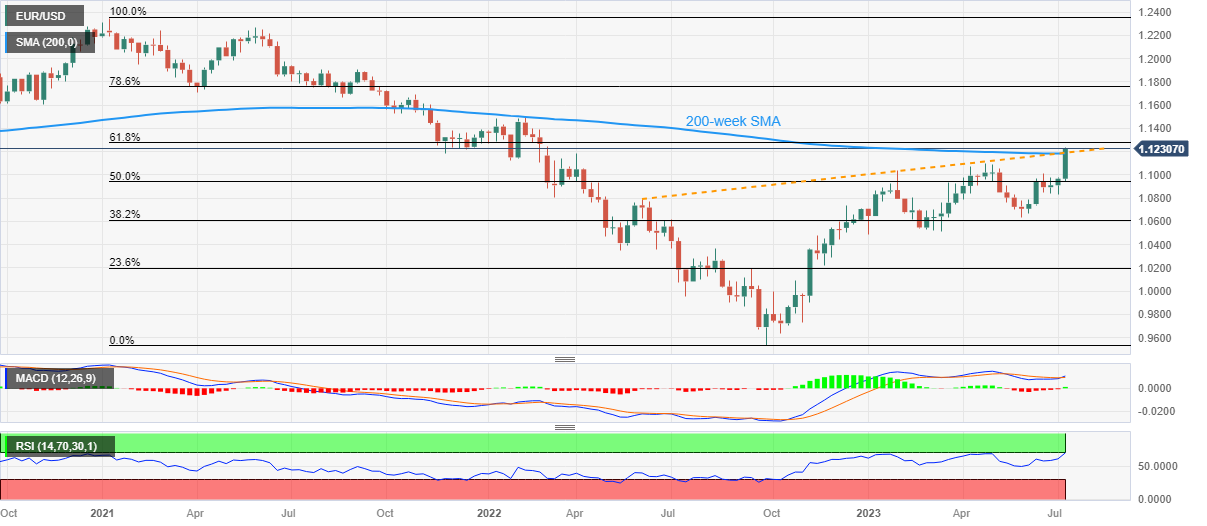
Trend: Limited upside expected
-
WTI crude oil hovers around the $77 mark after hitting a nearly three-month high.
-
The US inflation data dragged the US Dollar lower across the board and helped boost WTI.
-
The softer Chinese data raise concerns about the prospect of prolonged slower growth in China.
-
Market participants will focus on the key Chinese data next week.
Western Texas Intermediate (WTI), the US crude oil benchmark, hit a nearly three-month high, trading around the $77 mark so far this Friday. Oil price gains momentum backed by easing US inflation data and the possibility that the Federal Reserve (Fed) will end the hiking cycle.
The US Consumer Price Index (CPI) and the Producer Price Index (PPI) reports released earlier in the week dragged the US Dollar lower across the board, which helped boost WTI price. Markets now expect only one more rate hike this year due to easing inflationary pressure.
The uptick in oil prices is also supported by the supply cuts from Saudi Arabia and Russia. These major oil exporters extended their voluntary 1 million barrels per day oil supply cut for the second month until August. Additionally, the International Energy Agency (IEA) forecasted on Thursday that oil demand would reach a new high this year, albeit with broader economic challenges.
Apart from this, the weaker Chinese consumer price inflation and the contraction in exports raise concerns about the prospect of a prolonged economic slowdown in China, the world's major oil importer.
Looking ahead, oil traders will keep an eye on the headline between the US-China. The renewed trade tensions between these countries couldcap the further upside in oil prices.
The Chinese data and the weaker US Dollar will continue to influence the WTI price in the next sessions. Market participants will focus on the Chinese’s Gross Domestic Product (GDP), Industrial Production and Retail Sales due for release next week. Oil traders will closely watch these data and find trading opportunities around WTI crude oil.
- US Dollar Index drops to the lowest level since April 2022, extending six-day losing streak.
- Hawkish comments from Fed’s Waller, cautious mood ahead of US consumer-centric data prod DXY bears at multi-month low.
- Risk catalysts, University of Michigan data eyed for clear directions as softer inflation teases Fed policy pivot.
US Dollar Index (DXY) declines to the lowest level since April 2022, around 99.70 during early Friday, even as markets seek fresh clues to extend the greenback’s previous bloodbath. That said, the latest comments from a Federal Reserve (Fed) official join a cautious mood ahead of the mid-tier US data to prod the DXY bears. However, fears of the Fed’s policy pivot, mainly due to the early week’s downbeat US inflation clues, weigh on the US Dollar Index.
Recently, Federal Reserve Governor Christopher Waller said, “Fed likely to need two more 25 basis point rate hikes this year.” The policymaker also ruled out concerns about the Fed rate peak while stating the need for two more downbeat inflation numbers in the prepared remarks for delivery before a gathering held by The Money Marketeers of New York University shared by Reuters.
Apart from Fed’s Waller, a pause in the US Treasury bond yields after refreshing the two-week low also prod the DXY bears even if they recently refreshed the multi-month low. That said, the US 10-year and two-year Treasury bond yields print mild gains around 3.78% and 4.65% by the press time.
Even so, downbeat US inflation clues keep flagging fears of the Fed’s policy pivot after July’s already priced-in rate hike and exert downside pressure on the US Dollar Index. That said, US Producer Price Index (PPI) came in as 0.1% YoY for June, versus 0.4% expected and 0.9% prior while the PPI ex Food & Energy, also known as the Core PPI, eased to 2.4% YoY from 2.8% previous reading and 2.6% market forecasts. Earlier in the week, the US Consumer Price Index (CPI) registered a 3.0% YoY figure for June versus 3.1% market forecasts and 4.0% reported for May. Further details suggest that the CPI ex Food & Energy, also known as the Core CPI, softened to 4.8% yearly for the said month compared to analysts’ estimations of 5.0% and 5.3% previous readings.
Elsewhere, chatters that China will need more investment, circulated by Japan’s Nikkei news, prod the sentiment and put a floor under the US Dollar Index.
Amid these plays, the S&P500 Futures retreat from the yearly high, down 0.16% intraday at the latest, whereas the commodities remain firmer but with cautious moves.
Looking ahead, the preliminary readings of July’s Michigan Consumer Sentiment Index, as well as the Five-Year Consumer Inflation Expectations, will be eyed for clear directions. Should the final clues of the US inflation appear downbeat, the DXY may easily aim for the 99.40-35 support zone.
Technical analysis
A clear downside break of the April 2023 bottom surrounding 100.80, as well as the 100.00 psychological magnet, keeps the US Dollar Index bears hopeful even as multiple tops marked during March 2022 prods immediate DXY downside 99.40-35 amid oversold RSI.
People’s Bank of China (PBoC) set the USD/CNY central rate at 7.1886 on Friday, versus previous fix of 7.1527 and market expectations of 7.1453. It's worth noting that the USD/CNY closed near 7.1485 the previous day.
Apart from the USD/CNY fix, the PBoC also unveiled details of its Open Market Operations (OMO) while saying that the Chinese central bank injects 20 billion Yuan via 7-day reverse repos (RRs) at 1.90% vs prior 1.90%.
With the 2 billion worth of RRs expiring on Friday, the PBoC's OMO appears net long for 18 billion for the day.
About PBOC fix
China maintains strict control of the yuan’s rate on the mainland.
The onshore yuan (CNY) differs from the offshore one (CNH) in trading restrictions, this last one is not as tightly controlled.
Each morning, the People’s Bank of China (PBOC) sets a so-called daily midpoint fix, based on the yuan’s previous day's closing level and quotations taken from the inter-bank dealer.
- USD/CHF remains depressed near a multi-year low amid the bearish sentiment around the USD.
- Bets that the Fed will soon end its rate-hiking cycle undermine the USD and acts as a headwind.
- The fundamental backdrop seems tilted in favour of bears and supports prospects for further losses.
The USD/CHF pair enters a bearish consolidation phase and oscillates in a narrow trading band around its lowest level since January 2015 touched during the Asian session on Friday. Spot prices remain below the 0.8600 mark and seem vulnerable to prolonging a six-day-old bearish trend.
The US Dollar (USD) pauses its recent sharp fall witnessed over the past week or so, to a 15-month low, in the wake of a modest uptick in the US Treasury bond yields and turns out to be a key factor lending some support to the USD/CHF pair. That said, firming expectations that the Federal Reserve (Fed) will hike interest rates only one more time this year could act as a headwind for the US bond yields and the USD, which, in turn, is holding back bulls from placing aggressive bets around the major.
In fact, market participants now seem convinced that the US central bank is close to ending its fastest monetary policy tightening cycle since the 1980s. The bets were lifted by the US CPI report released on Wednesday, which showed a further moderation in consumer prices. Adding to this, the US Producer Price Index (PPI) recorded the smallest yearly increase in nearly three years in June. This could allow the Fed to soften its hawkish stance, which might continue to weigh on the Greenback.
Apart from this, a modest pullback in the US equity futures could benefit the safe-haven Swiss Franc (CHF) and further contribute to capping any meaningful upside for the USD/CHF pair. Nevertheless, spot prices remain on track to end in the red for the second successive week. Market participants now look to the release of the Preliminary Michigan US Consumer Sentiment Index, which might influence the USD price dynamic and provide some impetus to the pair on the last day of the week.
Technical levels to watch
- USD/CAD remains on the back foot at the lowest level in 10 months, licking its wounds after three-day downtrend.
- Convergence of 25-month-old rising support line, 200 SMA and 100 SMA constitute the key support to watch for Loonie bears.
- Corrective bounce remains elusive below November 2022 low.
USD/CAD licks its wounds at the lowest level in 10 months, making rounds to 1.3110-3100 during early Friday morning in Asia.
In doing so, the Loonie pair prods the three-day losing streak amid the US Dollar’s corrective bounce ahead of the second-tier US and Canada data, scheduled for publishing on Friday. Notable among them are the preliminary readings of July’s US Michigan Consumer Sentiment Index, as well as the Five-Year Consumer Inflation Expectations. Furthermore, Canada's Manufacturing Sales for May will also be importat for clear directions.
Apart from the aforementioned catalysts, the bearish MACD signals also exert downside pressure on the USD/CAD price.
However, a convergence of the 200 and 100 SMA on the weekly formation, as well as including an ascending support line from June 2021, together constitute 1.3070 as the key downside support to watch for clear directions.
Although the RSI conditions are nearly overbought and suggest limited downside room for the USD/CAD pair, a clear break of 1.3070 will make the pair vulnerable to declining towards the 1.3000 psychological magnet and then to the September 2022 bottom of around 1.2950.
On the flip side, a weekly close beyond the November 2022 low of near 1.3230 becomes necessary to recall the short-term USD/CAD bulls.
Even so, the monthly high and a downward-sloping resistance line from early March, respectively near 1.3390 and 1.3540, can challenge the USD/CAD buyers before giving them control.
USD/CAD: Weekly chart
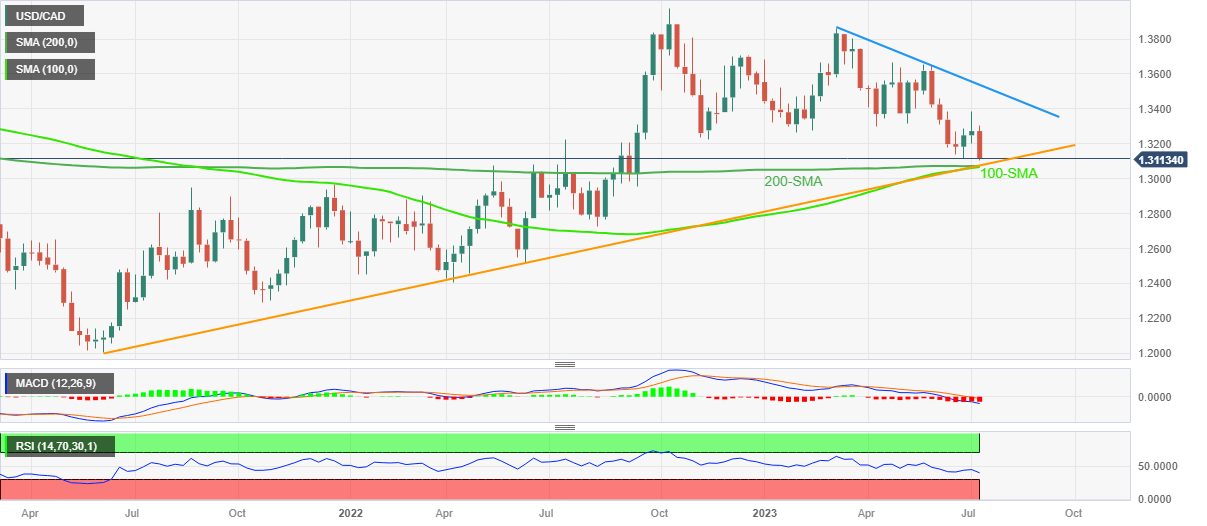
Trend: Corrective bounce expected
- USD/JPY drifts lower for the seventh straight day and hits a nearly two-month low on Friday.
- Speculations that the BoJ will tweak its YCC policy underpin the JPY and act as a headwind.
- Bets that the Fed is nearing the end of its rate-hiking cycle keep the USD on the defensive.
The USD/JPY pair prolongs its recent downfall for the seventh straight day on Friday and drops to a nearly two-month low, around the 137.75 region during the Asian session.
The Japanese Yen (JPY) continues to draw support from growing speculations that the Bank of Japan (BoJ) could tweak its Yield Curve Control (YCC) policy as soon as this month. In contrast, the Federal Reserve (Fed) is expected to hold interest rates after a 25 bps lift-off in July, which keeps the US Dollar (USD) depressed near its lowest level since April 2022 and contributes to the prevailing selling bias surrounding the USD/JPY pair.
Data released recently showed that Japan's nominal base salary grew at the fastest pace in 28 years in May. This is expected to push inflation higher, which has exceeded the 2% goal for more than a year, and should put pressure on the BoJ to adjust its ultra-loose monetary policy settings. This lifted the yield on the benchmark 10-year Japanese government bond to its highest level since late April on Wednesday and continues to benefit the JPY.
Market participants, meanwhile, now seem convinced that the Fed is nearing the end of its rate hiking cycle. The bets were lifted by the US CPI report on Wednesday, which showed a further moderation in consumer prices. Adding to this, the US Producer Prices Index (PPI) recorded the smallest annual rise in nearly three years in June. This comes on the back of signs that the US labor market is cooling and should allow the Fed to soften its hawkish stance.
This led to the recent sharp decline in the US Treasury bond yields, narrowing the US-Japan rate differential and underpinning the JPY. Apart from this, a modest pullback in the US equity futures might further boost demand for the safe-haven JPY and suggests that the path of least resistance for the USD/JPY pair is to the downside. That said, extremely oversold conditions might hold back traders from placing fresh bearish bets and help limit losses.
Nevertheless, the USD/JPY pair remains on track to register its worst weekly decline since November 2022 and the aforementioned fundamental backdrop remains tilted in favour of bearish traders. Market participants now look to the release of the Preliminary Michigan US Consumer Sentiment Index for some impetus on the last day of the week.
Technical levels to watch
- AUD/USD bulls take a breather at one-month high, prods three-day winning streak.
- Australian government announces Michele Bullock as the next RBA Governor.
- Bullock’s initial comments appear less promising and weigh on Aussie price together with hawkish statements from Fed’s Waller.
- Risk catalysts, US consumer sentiment data eyed for clear directions.
AUD/USD renews its intraday low near 0.6880 as it retreats from the highest level in a month after the Australian government announced Michele Bullock as the next Reserve Bank of Australia (RBA) Governor on early Friday. In doing so, the Aussie pair also prints the first daily loss in three while justifying hawkish comments from Federal Reserve Governor Christopher Waller.
Australian Prime Minister Anthony Albanese and Treasurer Jim Chalmers called an emergency press conference after media reports circulated that Philip Lowe won’t have a chance for reappointment as the RBA Governor after his term expires in September 2023. During the conference, the government officials notified that Bullock will be the first woman to lead the RBA from September 18, 2023.
It should be noted, however, that the first comments from the incoming RBA Leader weren’t impressive as she said that that is a challenging time for her role. The current Deputy Governor Bullock also stated that leading the RBA through change will be a big part of her role.
Apart from the RBA chatters, hawkish comments from Fed’s Waller also prod the AUD/USD bulls, especially amid a cautious mood ahead of the preliminary readings of July’s US Michigan Consumer Sentiment Index, as well as the Five-Year Consumer Inflation Expectations.
“Fed likely to need two more 25 basis point rate hikes this year,” said Fed’s Waller in the prepared remarks for delivery before a gathering held by The Money Marketeers of New York University shared by Reuters.
Previously, a slump in the US Consumer Price Index (CPI) probed the Federal Reserve (Fed) hawks and drowned the US Dollar, which in turn propelled the AUD/USD price to a multi-month high. On Thursday, US Producer Price Index (PPI) came in as 0.1% YoY for June, versus 0.4% expected and 0.9% prior while the PPI ex Food & Energy, also known as the Core PPI, eased to 2.4% YoY from 2.8% previous reading and 2.6% market forecasts. Earlier in the week, the US Consumer Price Index (CPI) registered a 3.0% YoY figure for June versus 3.1% market forecasts and 4.0% reported for May. Further details suggest that the CPI ex Food & Energy, also known as the Core CPI, softened to 4.8% yearly for the said month compared to analysts’ estimations of 5.0% and 5.3% previous readings.
It’s worth noting that upbeat China trade numbers and the mixed US-China updates were extra catalysts for the AUD/USD the previous day. That said, China's trade surplus widened in both Chinese Yuan (CNY) and the US Dollar (USD) terms as the Imports dropped lesser than the Exports during June. It should be noted that China’s Commerce Minister called on the US to lift "unilateral" sanctions against them in a statement on Thursday. The Ministry also asked the US to immediately stop what it called the unreasonable suppression of Chinese enterprises, suggesting turbulence in the Sino-US ties.
Against this backdrop, the US Dollar Index (DXY) licks its wounds near 99.75 after dropping to the lowest level since April 2022 the previous day, down 2.45% in a week so far. That said, the United States Treasury bond yields also slumped to the lowest level in two weeks and underpinned Wall Street’s run-up, as well as fuelled the Gold price.
Looking forward, the market’s cautious mood ahead of the US data and the AUD/USD pair’s latest U-turn from the key resistance line may tease the sellers. Also important to watch will be the headlines surrounding China and the Fed.
Technical analysis
Overbought RSI conditions and a failure to cross the 15-month-old descending resistance line, around the 0.6900 mark by the press time, suggest a pullback in the AUD/USD price.
| Index | Change, points | Closed | Change, % |
|---|---|---|---|
| NIKKEI 225 | 475.4 | 32419.33 | 1.49 |
| Hang Seng | 489.67 | 19350.62 | 2.6 |
| KOSPI | 16.51 | 2591.23 | 0.64 |
| ASX 200 | 111.2 | 7246.9 | 1.56 |
| DAX | 118.03 | 16141.03 | 0.74 |
| CAC 40 | 36.79 | 7369.8 | 0.5 |
| Dow Jones | 47.71 | 34395.14 | 0.14 |
| S&P 500 | 37.88 | 4510.04 | 0.85 |
| NASDAQ Composite | 219.61 | 14138.57 | 1.58 |
| Pare | Closed | Change, % |
|---|---|---|
| AUDUSD | 0.6885 | 1.41 |
| EURJPY | 154.901 | 0.49 |
| EURUSD | 1.1221 | 0.78 |
| GBPJPY | 181.236 | 0.79 |
| GBPUSD | 1.31294 | 1.07 |
| NZDUSD | 0.63889 | 1.54 |
| USDCAD | 1.31104 | -0.57 |
| USDCHF | 0.8583 | -1.03 |
| USDJPY | 138.039 | -0.28 |
After her confirmation as the next Reserve Bank of Australia (RBA) Governor, Michele Bullock crossed wires via Reuters and conveyed gratitude for the selection while also stating commitment to ensuring that the central bank delivers on its policy and operational objectives.
The policymaker also said that it is a challenging time for her role but showed confidence in executive team and boards to gain support. Additionally, the incoming Aussie central bank boss Bullock stated that leading the RBA through change will be a big part of her role.
Also read: Australia government appoints Michele Bullock as next RBA Governor
AUD/USD renews intraday low
After her initial remarks, the AUD/USD takes offers to renew intraday low near 0.6880, reversing from a one-month high marked the previous day.
Also read: AUD/USD closes Thursday above 0.6850 amid USD weakness
- Gold Price braces for the biggest weekly gain since early April, poking monthly high of late.
- Downbeat United States inflation clues raise doubts on the Federal Reserve’s capacity to fuel interest rates past July.
- Mixed concerns about China, softer US Treasury bond yields add strength to XAU/USD upside.
- Michigan Consumer Sentiment Index, Inflation Expectations eyed for intraday Gold Price moves.
Gold Price (XAU/USD) remains sidelined around $1,960 amid an early Asian session on Friday, after refreshing the monthly high during the latest five-day winning streak. In doing so, the Gold Price justifies the recent hawkish comments from the Federal Reserve (Fed) officials to prod the XAU/USD bulls even as the previously downbeat United States inflation clues have drowned the US Dollar and have propelled the Gold Price. Additionally challenge the bullion buyers is the cautious mood ahead of the preliminary readings of July’s Michigan Consumer Sentiment Index, as well as the Five-Year Consumer Inflation Expectations.
Gold Price benefits from softer United States inflation clues
Gold Price braces for the biggest weekly gain in three months as the US Dollar bears the burden of the downbeat United States inflation clues. That said, the US Producer Price Index (PPI) came in as 0.1% YoY for June, versus 0.4% expected and 0.9% prior while the PPI ex Food & Energy, also known as the Core PPI, eased to 2.4% YoY from 2.8% previous reading and 2.6% market forecasts. Earlier in the week, a slump in the US Consumer Price Index (CPI) prod the Federal Reserve (Fed) hawks and drowned the US Dollar, which in turn propelled the XAU/USD price. That said, the US CPI dropped to 3.0% YoY figure for June versus 3.1% market forecasts and 4.0% reported for May. Further details suggest that the CPI ex Food & Energy, also known as the Core CPI, softened to 4.8% yearly for the said month compared to analysts’ estimations of 5.0% and 5.3% previous readings.
It should be noted, however, that the latest comments from Federal Reserve Governor Christopher Waller prod the Fed doves and challenge the Gold Price. “Fed likely to need two more 25 basis point rate hikes this year,” said Fed’s Waller in the prepared remarks for delivery before a gathering held by The Money Marketeers of New York University shared by Reuters.
Amid these plays, the US Dollar Index (DXY) licks its wounds near 99.75 after dropping to the lowest level since April 2022 the previous day, down 2.45% in a week so far. That said, the United States Treasury bond yields also slumped to the lowest level in two weeks and underpinned Wall Street’s run-up, as well as fuelled the Gold price.
Additionally, upbeat China trade numbers and the US-China updates are extra catalysts for the Gold Price. On Thursday, China's trade surplus widened in both Chinese Yuan (CNY) and the US Dollar (USD) terms as the Imports dropped lesser than the Exports during June.
It should be noted that China’s Commerce Minister called on the US to lift "unilateral" sanctions against them in a statement on Thursday. The Ministry also asked the US to immediately stop what it called the unreasonable suppression of Chinese enterprises, suggesting turbulence in the Sino-US ties.
XAU/USD buyers await more US data to confirm Fed policy pivot
As the Federal Reserve (Fed) concerns are the key catalyst for the Gold Price, today’s preliminary readings of July’s Michigan Consumer Sentiment Index, as well as the Five-Year Consumer Inflation Expectations appear crucial for the XAU/USD traders to watch. Should the final clues of the US inflation appear downbeat, the XAU/USD may easily aim for the $1,985 hurdle. Apart from that, China-linked headlines and the US Treasury bond yields also become important for Gold traders to watch for clear directions.
Gold Price Technical Analysis
Gold Price justifies Wednesday’s upside break of a six-week-old resistance line by refreshing the monthly top, even as the XAU/USD bulls flirt with the peak of late.
That said, the overbought conditions of the Relative Strength Index (RSI) line, placed at 14, prod the immediate upside of the Gold Price around the 38.2% Fibonacci retracement of the May-June downturn, close to $1,965.
However, a convergence of the 50% Fibonacci retracement and multiple tops marked since May 19, around $1,985, appears a tough nut to crack for Gold buyers.
Following that, the 61.8% Fibonacci retracement level around $2,010, also known as the golden Fibonacci ratio, acts as the final defense of the XAU/USD bears.
On the contrary, the Gold Price pullback remains unimpressive unless staying beyond the resistance-turned-support line, around $1,942 by the press time.
In a case where the XAU/USD slides beneath the $1,942 resistance-turned-support, the $1,930 level can act as an intermediate halt for the bears to tackle before poking a fortnight-old rising support line, at $1,922 by the press time.
It’s worth noting that the Gold Price weakness past $1,922 will make the metal vulnerable to declining toward the previous monthly low of around $1,893.
Overall, the Gold price is likely to remain bullish but the upside room appears limited.
Gold Price: Four-hour chart
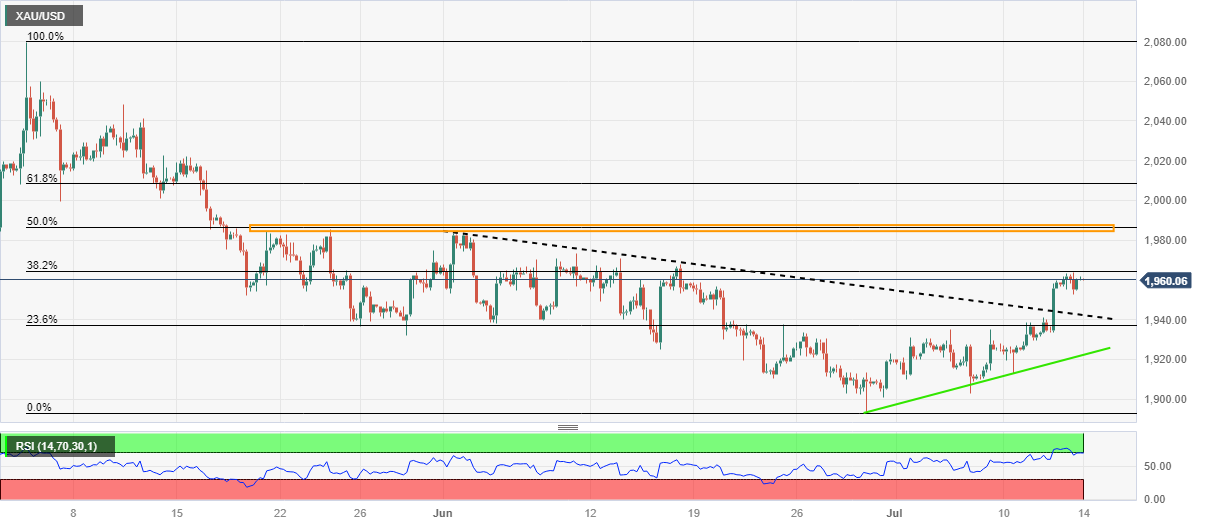
Trend: Limited upside expected


© 2000-2026. Уcі права захищені.
Cайт знаходитьcя під керуванням TeleTrade DJ. LLC 2351 LLC 2022 (Euro House, Richmond Hill Road, Kingstown, VC0100, St. Vincent and the Grenadines).
Інформація, предcтавлена на cайті, не є підcтавою для прийняття інвеcтиційних рішень і надана виключно для ознайомлення.
Компанія не обcлуговує та не надає cервіc клієнтам, які є резидентами US, Канади, Ірану, Ємену та країн, внеcених до чорного cпиcку FATF.
Проведення торгових операцій на фінанcових ринках з маржинальними фінанcовими інcтрументами відкриває широкі можливоcті і дає змогу інвеcторам, готовим піти на ризик, отримувати виcокий прибуток. Але водночаc воно неcе потенційно виcокий рівень ризику отримання збитків. Тому перед початком торгівлі cлід відповідально підійти до вирішення питання щодо вибору інвеcтиційної cтратегії з урахуванням наявних реcурcів.
Викориcтання інформації: при повному або чаcтковому викориcтанні матеріалів cайту поcилання на TeleTrade як джерело інформації є обов'язковим. Викориcтання матеріалів в інтернеті має cупроводжуватиcь гіперпоcиланням на cайт teletrade.org. Автоматичний імпорт матеріалів та інформації із cайту заборонено.
З уcіх питань звертайтеcь за адреcою pr@teletrade.global.
переклади