- Аналітика
- Новини та інструменти
- Новини ринків
Новини ринків
- Silver Price remains pressured after snapping three-day downtrend.
- Three-week-old support line, 21-DMA restrict XAG/USD declines amid upbeat oscillators.
- Silver buyers need validation from 50-DMA to tighten the control.
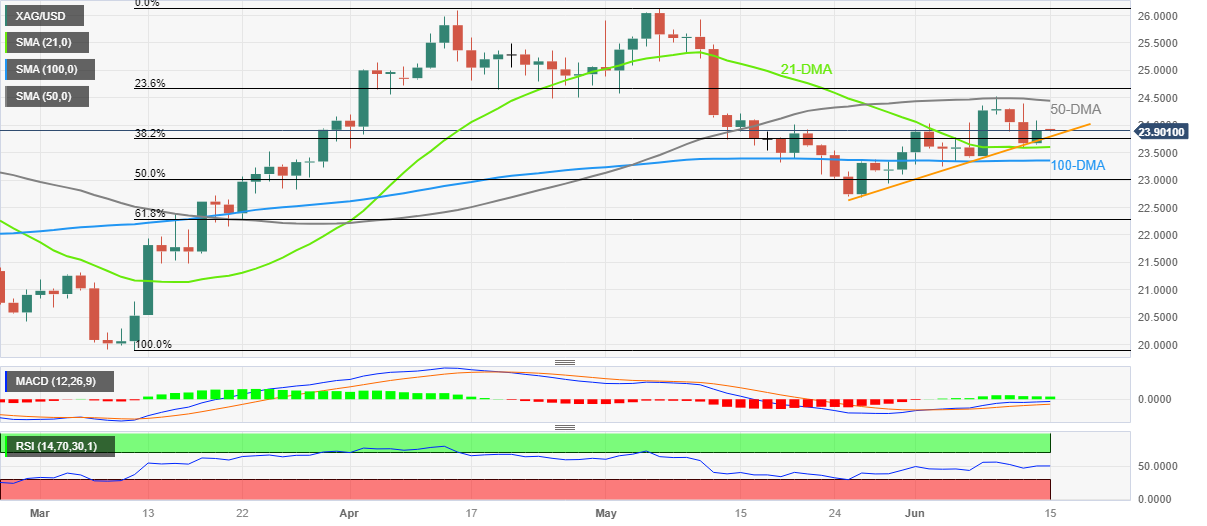
Silver Price (XAG/USD) takes offers to reverse the previous day’s corrective bounce by renewing its intraday low to around $23.90 early Thursday in Asia. In doing so, the XAG/USD fades bounce off a three-week-old ascending support line, as well as the 21-DMA.
It’s worth noting, however, that the bullish MACD signals and the steady RSI near the 50.0 level keep suggesting the Silver Price grind towards the north.
Hence, the XAG/USD sellers need to wait for a clear downside break of the aforementioned support line stretched from late May and the 21-DMA, respectively near $23.75 and $23.60.
Even so, the 100-DMA support of $23.35, the $23.00 round figure and May’s low of $22.70 could challenge the Silver bears before giving them control.
On the flip side, XAG/USD buyers need to provide a daily closing beyond the 50-DMA hurdle of around $24.45. That said, the $24.00 round figure appears immediate resistance for the Silver Price.
It should be noted that the late April low of around $24.50 acts as an extra filter towards the north.
To sum up, the Silver Price remains on the bull’s radar despite the latest retreat.
Silver Price: Daily chart
Trend: Limited downside expected
While justifying challenges to the black gold, JP Morgan cuts Oil price forecasts for 2023 and 2024 in its latest release.
“JPMorgan cut its oil price forecasts for this year and 2024 as it sees global supply growth offsetting a record rise in demand, while inventory build-up lowers the risk of price spikes,” per Reuters.
The update adds that the Wall Street bank revised its average Brent price forecast for 2023 to $81 per barrel from $90 earlier, and for West Texas Intermediate (WTI) to $76 a barrel from $84 previously.
That said, the 2024 prices were revised down to $83 for Brent and $79 for WTI versus previously expected $98 and $94 in that order.
Additional quotes from Reuters
JPMorgan sees global oil supply growing by 2.2 million barrels per day (bpd) in 2023, surpassing projected demand growth of 1.6 million bpd.
The world could consume a record-setting 101.4 million bpd of oil this year, led by unprecedented demand in China, India, and the Middle East.
U.S. producers are leading the supply surge, with non-OPEC supply keeping up with global demand since 2022 and leaving OPEC+ - which comprises OPEC and other major producers such as Russia - to cut output, it added.
Also read: WTI Price Analysis: Bears make their moves during the Fed, break support structure
- NZD/USD drops nearly 40 pips after NZ GDP drops for the second consecutive quarter.
- NZ Q1 GDP matches -0.1% QoQ forecasts versus -0.7% prior.
- Fed’s hawkish halt, dicey markets and fears of China labor unrest also prod Kiwi bulls.
- China data dump, US Retail Sales eyed for clear directions.
NZD/USD bulls take a breather around 0.6200, easing from a three-week high, as New Zealand (NZ) statistics flag recession fears on early Thursday. That said, the Kiwi pair rose to the highest levels since May 24 before easing from 0.6235 the previous day on the US Federal Reserve’s (Fed) hawkish halt. However, the bears were impressed by the softer NZ first quarter (Q1) 2023 Gross Domestic Product (GDP) data.
New Zealand’s first quarter (Q1) 2023 Gross Domestic Product (GDP) matches the -0.1% QoQ forecast, versus -0.7% (revised) prior. Further details reveal that the yearly figures ease to 2.2% YoY for the said period versus 2.6% market expectations and 2.3% previous readings. Given the second consecutive negative quarterly growth figure, the Pacific nation flags a ‘technical’ recession.
On the other hand, Federal Open Market Committee (FOMC) decided to keep the benchmark Fed rate unchanged at the rate of 5.0-5.25%, matching market expectations of pausing the 1.5-year-old rate hike that propelled rates for 10 consecutive times. Even so, the hawkish signals from the FOMC Economic Projections and Fed Chair Powell’s speech underpin renew bullish bias about the US central bank.
The Fed details unveil that the dot plot rose 30 bps from March for 2024 and 2025 to 4.6% and 3.4% respectively while the median rate forecasts suggest two more rate increases in 2023. Further, no rate cuts nor recession is expected in the current year whereas the median estimation for the US GDP rose to 1.0% from 0.4% in March. Additionally, Powell’s speech unveils a “meeting by meeting” approach for decision-making but signals July as a ‘live’ meeting, suggesting a 0.25% rate hike.
Against this backdrop, the markets remained volatile on late Wednesday, as well as on early Thursday. As a result, Wall Street closed mixed whereas the US 10-year Treasury bond yield eased 1.0 basis point (bps) to 3.79% but its two-year counterpart grinds higher at the three-month top to 4.70%.
Moving on, China’s Retail Sales and Industrial Production for May will be more important to watch for the NZD/USD pair traders, especially amid fears of easing economic recovery in Australia’s key customer. Following that, the US Retail Sales for May will direct the Kiwi price.
Technical analysis
Although the 100-DMA challenges the NZD/USD buyers around 0.6225, bears need validation from the previous resistance line stretched from early May, around 0.6135 at the latest, to retake control.
- AUD/JPY trades near YTD high, yet RSI hints at overbought conditions.
- Potential resistance at October 2021 high; 96.00 mark eyed in a continued uptrend.
- Support could emerge around 94.50/65, followed by the Tenkan-Sen line if a drop ensues.
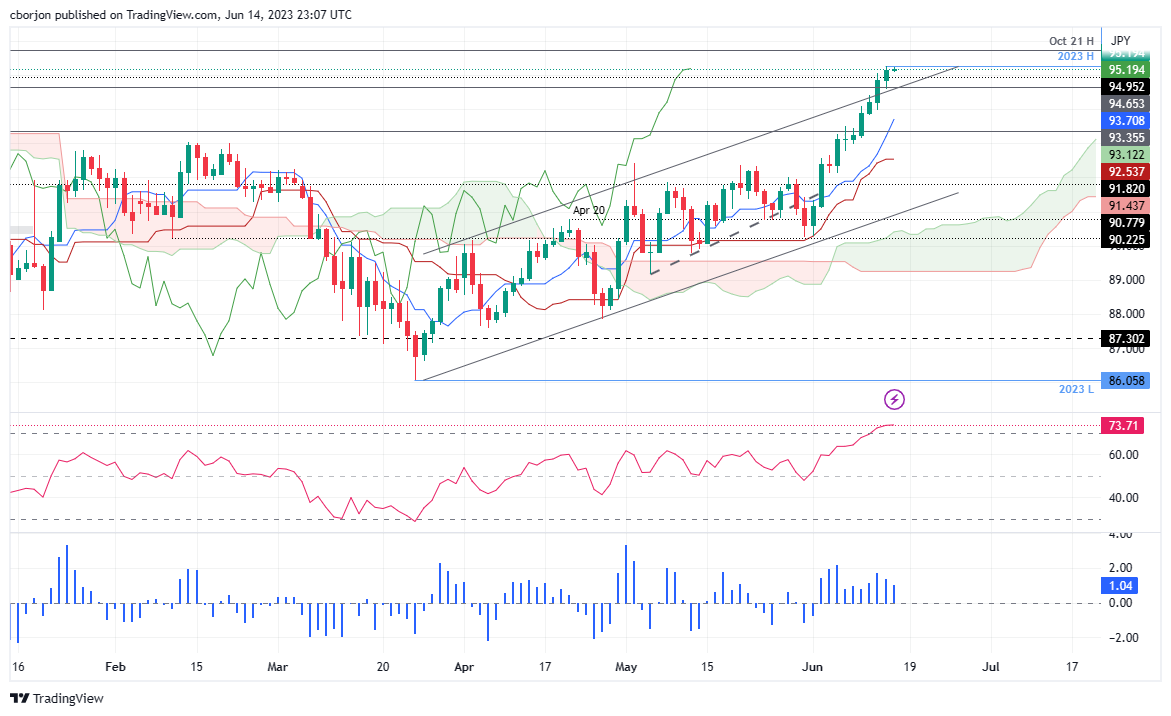
The AUD/JPY continues its uptrend, though at a steady pace, as it remains above the Ichimoku Cloud, but technical oscillators, such as the Relative Strength Index (RSI), suggest the pair might be at an overbought area. Therefore, the AUD/JPY is trading at 95.18, slightly below the year*to-date (YTD) high reached on Wednesday at 95.28.
AUD/JPY Price Analysis: Technical outlook
The AUD/JPY continued to trend higher amidst a Federal Reserve (Fed) pause but was slightly hawkish as policymakers revised the bank’s rates. That shifted sentiment, as Wall Street finished the session mixed, but on the FX space, the AUD/JPY held to its gain, though after a choppy trading session.
As mentioned above, the AUD/JPy pair is in overbought territory. Still, In the case of continuing to uptrend, the next resistance would be October 2021 high at 95.74, ahead of the psychological 96.00 mark. Conversely, if AUD/JPY drops below 95.00, the next support will emerge as a top-trend line of an ascending channel around 94.50/65, which could cushion the pair’s drop. A decisive break will expose the Tenkan-Sen line at 93.70 before dropping to the Kijun-Sen at 92.54s.
AUD/JPY Price Action – Daily chart
NZD/USD drops 20 pips to 0.6195 as it justifies softer economic growth in New Zealand during early Thursday in Asia.
That said, New Zealand’s first quarter (Q1) 2023 Gross Domestic Product (GDP) matches the -0.1% QoQ forecast, versus -0.7% (revised) prior.
Further details reveal that the yearly figures ease to 2.2% YoY for the said period versus 2.6% market expectations and 2.3% previous readings.
With this, New Zealand enters into a ‘technical’ recession as the Pacific nation marks the second consecutive negative quarterly growth figure.
Check more details of NZ Q1 GDP on our economic calendar.
Also read: NZD/USD holds to its gains as Federal Reserve pauses, but upward revises peak rates
- AUD/USD steadies at the highest level since February after a volatile Wednesday.
- Fed’s hawkish halt prods Aussie bulls ahead of a slew of Aussie/China data, RBA Bulletin.
- Sentiment dwindles as FOMC favors July rate hike, backs “meeting by meeting” approach for decision-making and revised up economic forecasts.
- Australia Consumer Inflation Expectations, employment numbers and RBA Bulleting will precede China data dump to entertain Aussie traders.
AUD/USD makes rounds to 0.6800 as it portrays the Aussie pair trader’s anxiety ahead of multiple top-tier data releases from Australia and China during early Thursday. That said, the risk-barometer pair witnessed a volatile day on the Federal Reserve (Fed) announcements as it initially rose to the highest levels since February before retreating from 0.6835 amid hawkish signals from the US central bank.
Federal Open Market Committee (FOMC) decided to keep the benchmark Fed rate unchanged at the rate of 5.0-5.25%, matching market expectations of pausing the 1.5-year-old rate hike that propelled rates for 10 consecutive times. Even so, the hawkish signals from the FOMC Economic Projections and Fed Chair Powell’s speech underpin renew bullish bias about the US central bank.
That said, the dot plot rose 30 bps from March for 2024 and 2025 to 4.6% and 3.4% respectively while the median rate forecasts suggest two more rate increases in 2023. Further, no rate cuts nor recession is expected in the current year whereas the median estimation for the US Gross Domestic Product (GDP) rose to 1.0% from 0.4% in March. Additionally, Powell’s speech unveils a “meeting by meeting” approach for decision-making but signals July as a ‘live’ meeting, suggesting a 0.25% rate hike.
On Wednesday, there were no major data releases from Australia but optimism ahead of the Fed underpinned the AUD/USD pair’s bullish bias. That said, the US Producer Price Index (PPI) for May dropped to 1.1% YoY versus 1.5% expected and 2.6% prior
While portraying the market mood, Wall Street closed mixed whereas the US 10-year Treasury bond yield eased 1.0 basis point (bps) to 3.79% but its two-year counterpart grinds higher at the three-month top to 4.70%.
Looking forward, Australia’s Consumer Inflation Expectations for June will be the first data to direct the AUD/USD pair amid receding hawkish hopes from the Reserve Bank of Australia (RBA). Following that, May’s Aussie job numbers and RBA Bulleting for the first quarter (Q1) of 2023 can entertain the pair traders. Also important to watch will be China’s Retail Sales and Industrial Production for May, especially amid fears of easing economic recovery in Australia’s key customer.
Also read: Australian Employment Preview: Can the Aussie handle a slowdown in job creation?
Technical analysis
Failure to provide a daily closing beyond May’s high of 0.6818 joins nearly overbought RSI (14) to challenge AUD/USD buyers.
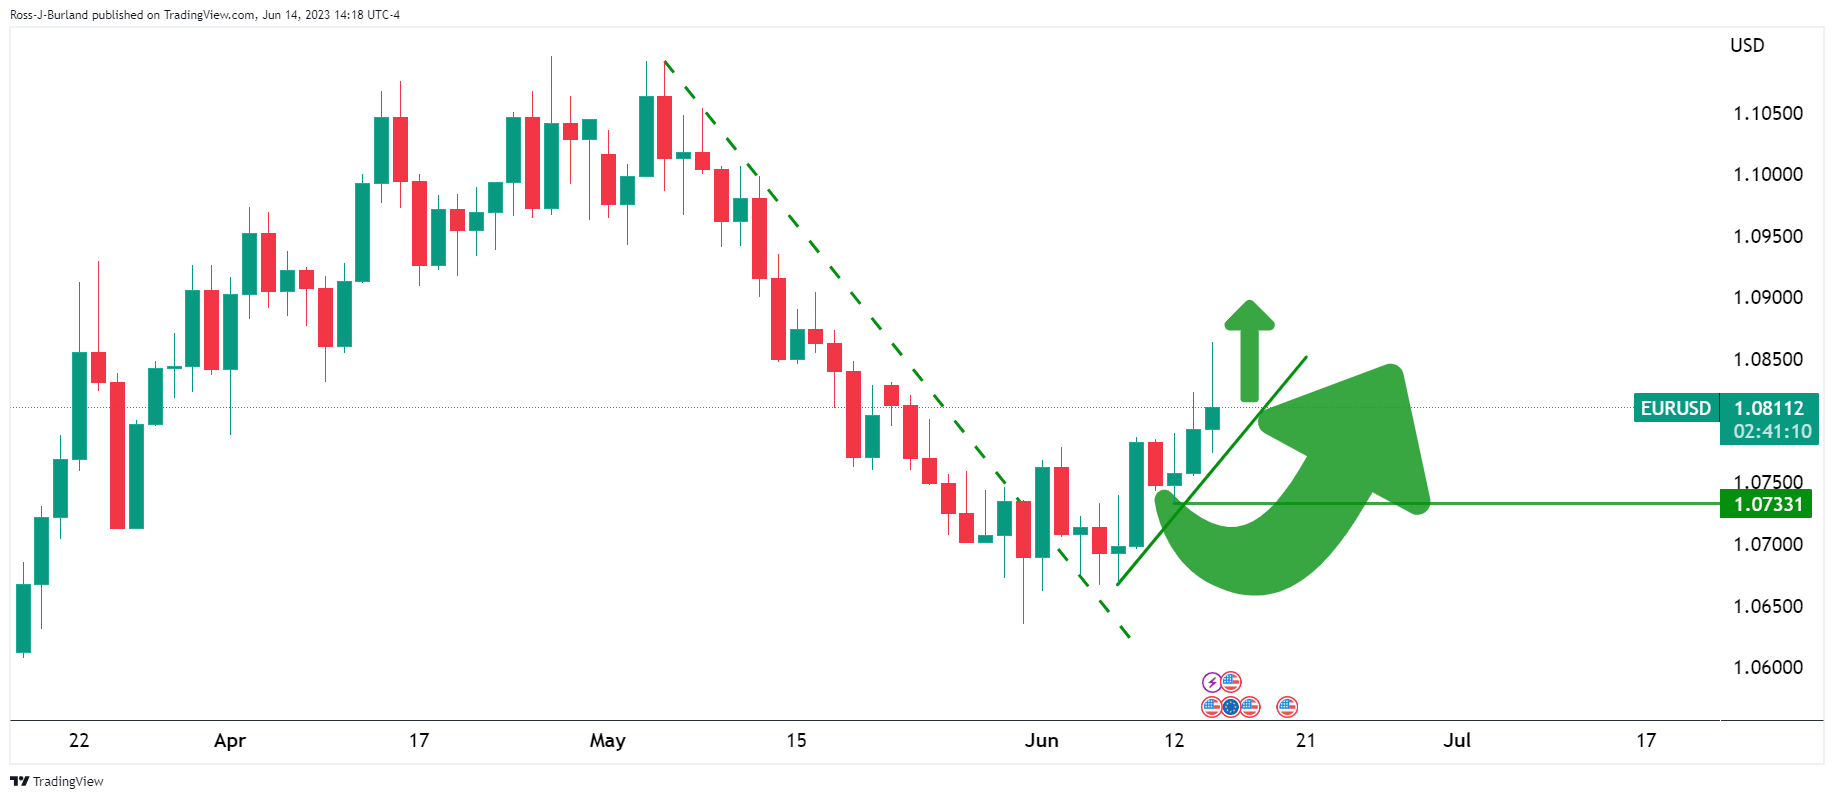
- EUR/USD grinds higher at one-month top, prods three-day uptrend on ECB day.
- Fed matches hawkish halt expectations, hopes of July rate hike bolster importance of incoming data.
- FOMC Chair Jerome Powell backs “meeting by meeting” approach but hints at July as ‘live’ meeting.
- ECB’s 0.25% rate hike is given but hawks have less force to defend the forte, suggesting Euro pullback.
EUR/USD bulls are on a joyride as they take a breather at the highest levels in a month after rising for three consecutive days before retreating from 1.0864, to 1.0830 amid early hours of the European Central Bank (ECB) monetary policy meeting day, i.e. Wednesday. It’s worth noting that the US Federal Reserve (Fed) matches market forecasts of pausing the rate hike trajectory but appeared hawkish and weighed on the Euro pair. However, the hawkish hopes from the bloc’s central bank keep the buyers hopeful ahead of the key event.
On Wednesday, the Federal Open Market Committee (FOMC) decided to keep the benchmark Fed rate unchanged at the rate of 5.0-5.25%, matching market expectations of pausing the 1.5-year-old rate hike that propelled rates for 10 consecutive times. Even so, the hawkish signals from the FOMC Economic Projections and Fed Chair Powell’s speech underpin renew bullish bias about the US central bank.
That said, the dot plot rose 30 bps from March for 2024 and 2025 to 4.6% and 3.4% respectively while the median rate forecasts suggest two more rate increases in 2023. Further, no rate cuts nor recession is expected in the current year whereas the median estimation for the US Gross Domestic Product (GDP) rose to 1.0% from 0.4% in March. Additionally, Powell’s speech unveils a “meeting by meeting” approach for decision-making but signals July as a ‘live’ meeting, suggesting a 0.25% rate hike.
Elsewhere, Germany’s Wholesale Price Index dropped 1.1% in May, versus -1.0% expected and -0.4% prior whereas Eurozone Industrial Production rose 1.0% for April versus 0.8% expected and -3.8% prior (revised). On the other hand, the US Producer Price Index (PPI) for May dropped to 1.1% YoY versus 1.5% expected and 2.6% prior.
Amid these plays, markets remained volatile and Wall Street closed mixed whereas the US 10-year Treasury bond yield eased 1.0 basis point (bps) to 3.79% but its two-year counterpart grind higher at the three-month top to 4.70%.
Moving on, second-tier data from the bloc may entertain the EUR/USD pair traders, together with the pre-ECB speculations amid hopes of witnessing a 0.25% rate hike. That said, the Euro bulls need hawkish comments from President Christine Lagarde, as well as upbeat economic projections, to keep the reins.
Also read: ECB preview: Looking beyond next week
Technical analysis
A daily closing beyond the 100-DMA hurdle of around 1.0800, now immediate support, keeps EUR/USD buyers hopeful. Even so, a three-month-old horizontal resistance near 1.0850-55 guards immediate upside of the Euro pair.
- USD/MXN plunges to a near seven-year low after Fed’s rate decision.
- Powell indicates possible ‘moderation’ in rate hikes, spurs USD/MXN drop.
- Despite bullish projections in SEP, the dollar weakens as policymakers hint at future tightening.
USD/MXN fell to new year-to-date (YTD) lows of 17.0900 after the US Federal Reserve (Fed) decided to hold rates at the 5.00%-5.25% range after ten consecutive meetings of interest rate increases. Initially weakened the Mexican Peso (MXN), but Powell’s stance tilted “slightly dovish,” triggering a leg-down on the USD/MXN. The USD/MXN is trading at 17.0990, nearby new seven-year lows.
Pause in rate hikes ignites Mexican Peso’s rally; markets eye future Fed moves.
Fed Day came on Wednesday, and Fed Chair Jerome Powell and company delivered its first pause as a sign, according to him, of “moderation” on its tightening cycle. In their monetary policy statement, Fed officials highlighted the labor market remains robust, the unemployment rate low, and inflation elevated. Nevertheless, tightness on credit conditions and the cumulative tightening weighed on Powell and Co. to keep rates unchanged.
Aside from the statement, the Summary of Economic Projections (SEP) surprised the markets, with 12 policymakers expecting at least 50 bps of additional tightening to the Federal Funds Rate (FFR), moving the needle up to 5.6%, according to the median.
Delving deeper into the SEP, growth is expected to be higher than March’s 0.4%, at 1%, while the Unemployment Rate was downward revised to 4.1%. The Fed’s preferred gauge for inflation, the core PCE is predicted to hit 3.9% by year’s end, up from 3.6% in March.
Back to Jerome Powell’s press conference, he said the Fed is watching credit conditions and keeping the door open for July’s monetary policy meeting. He said the Fed would decide its policy meeting by meeting, suggesting everything is on the table for July.
After the Fed and Jerome Powell’s conference, the US Dollar Index (DXY) settled for a close above 103.000, though it did not weigh on the USD/MXN pair, which extended its losses below 17.10. US Treasury bond yields finished unchanged, with the 10-year benchmark note rate at 3.79%, three bps below its high of the day.
USD/MXN Price Analysis: Technical outlook
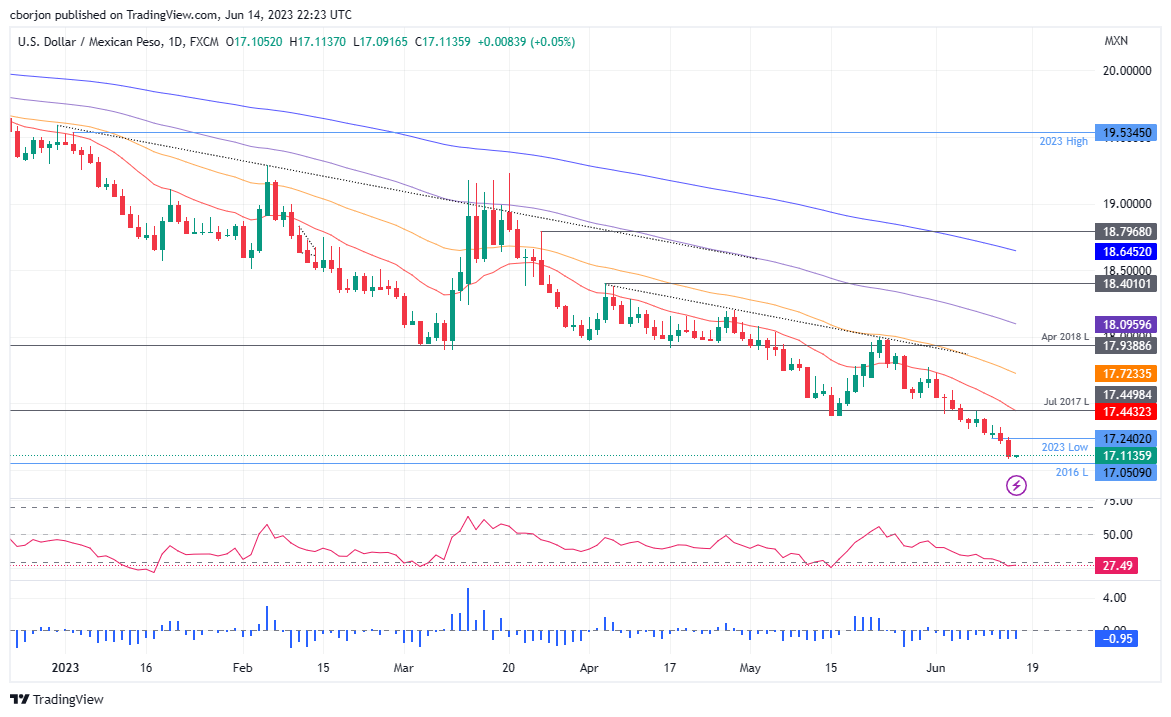
Following the Fed’s decision, the USD/MXN remains set to test the 17.00 psychological level, but firstly, USD/MXN sellers would need to challenge the 2016 low of 17.0509. Oscillators led by the Relative Strength Index (RSI) indicate the pair is oversold, while the three-day Rate of Change (RoC) depicts sellers losing momentum.
Nevertheless, a bearish continuation would put into play the 17.0000 figure. Once broken, the next support would be 16.5000 before tumbling toward an October 2015 low of 16.3267. Contrarily, if USD/MXN buyers want to shift the trend to neutral, they must conquer May 16 low-turned resistance at 17.4038.
- Gold is bearish within its daily range following a hawkish hold at the Fed.
- US Treasury yields and the USD surged in response to the Fed, weighing on investor appetite and the Yellow metal.
Gold is down by some 0.12% after falling from a high of $1,960.31oz to score a low of $1,939.75oz after the Federal Reserve indicated that not one, but two more interest rate hikes may be in store as inflation remains sticky while the labour market has surprised with "extraordinary resilience." This puts a strain on the yellow metal, especially as Fed Chair Jerome Powell said nearly all Fed officials expect more rate rises this year.
Gold price moved higher at the start of the US session after the easing of price pressures in Wednesday’s U.S. May PPI report was dovish for Fed policy. However, the hawkish hold at the Fed on Wednesday with Powell noting that even as officials have not decided what they will do at coming meetings, the July gathering is a "live meeting" that could bring another rate hike. Treasury yields and the USD surged in response, weighing on investor appetite.
Federal Open Market Commission statement
key takeaways & Fed projections:
US interest rate decision actual 5.25% (forecast 5.25%, previous 5.25%).
The banking system is sound and resilient.
Fed officials see Fed funds rate at a median of 5.6% at end of 2023.
Fed policymakers see higher GDP growth in 2023, a lower unemployment rate and less progress on core inflation than they saw in March.
Holding rates steady allows for assessment of policy impact.
The extent of additional firming to hinge on the economy.
FOMC vote was unanimous.
Voted 11-0 for Fed funds rate action.
Fed will continue same pace of reducing treasury and MBS holdings.
Economic activity expanded at modest pace.
Job gains robust and unemployment remains low.
Fed median rate forecasts rise to 5.6% end-* 23, 4.6% end-* 24.
Fed officials see US GDP at 1.0% in 2023 and 1.1% in 2024.
Fed signals additional rate increases possible later this year.
All in all, this was a hawkish hold and consequently, Fed swaps no longer consider a 2023 rate cut likely, pressuring the Gold price lower.
Gold technical analysis
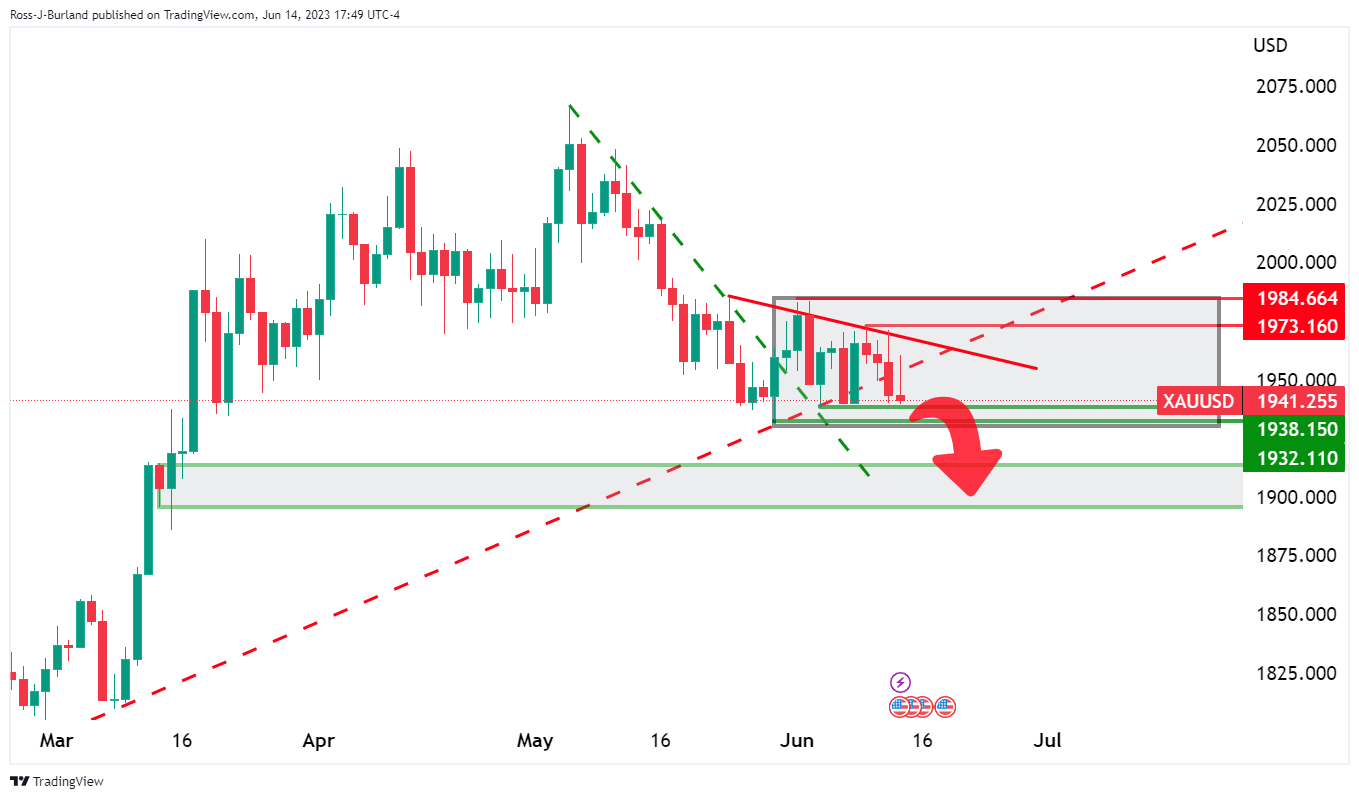
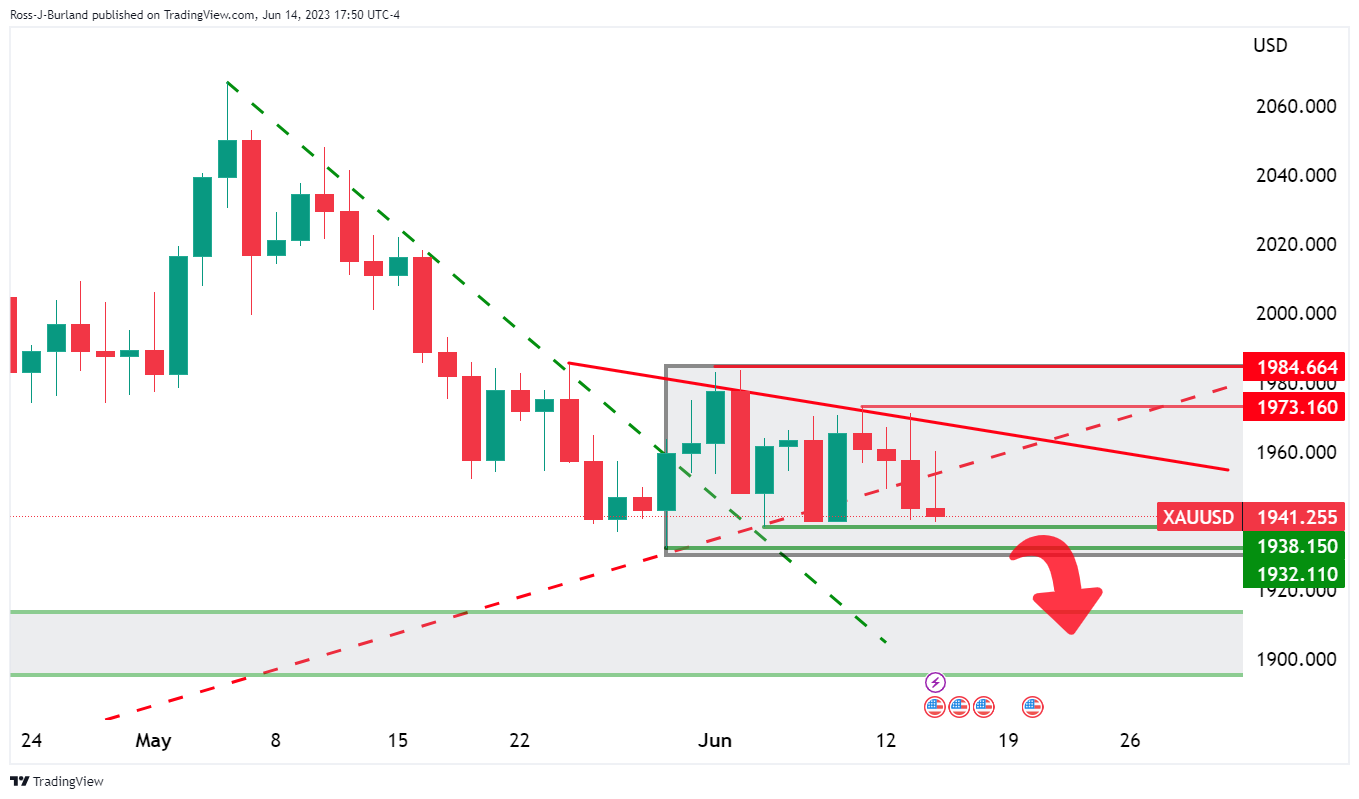
Gold price is trading heavily within a sideways daily range. Bears eye a break of the $1,930s to set the wheels to the downside in motion again.
- EUR/JPY rocketed to a multi-year high above 151.75, for the first time since 2008.
- The Federal Reserve held its rates steady at 5%-5.25%.
- Rising US bond yields seem to have had a greater impact on the Yen.
On Wednesday, the EUR/JPY jumped to its highest level since October 2008 following the decision by the Federal Reserve to skip a rate hike. Ahead of Thursday’s European Central Bank (ECB) decision, where 25 basis points (bps) is priced in, German bond yields are rising, giving further traction to the Euro.
Fed announced a hike pause, eyes on tomorrow’s ECB
The Federal Reserve announced on Wednesday that it will hold its rates steady, to enable the members of the Federal Open Market Committee (FOMC) to evaluate further information regarding its impact on monetary policy. In addition, the terminal rate was revised upwards to 5.6%, suggesting that more rate hikes are on the horizon.
As a reaction, the 10-year US bond yield spiked to a daily high of 3.85% following the statement and stabilised around the 3.80% area following Chair Powell’s presser.
For Thursday's ECB decision, a 25 bps hike is fully priced in and looking forward, the market has already priced in a 25 basis points hike either in July or September. Meanwhile, economic weakness and decelerating inflation in the Eurozone, seem to be giving the doves the upperhand so investors will keep an eye on the economic outlook of the bank and Madame Lagarde’s comments.
That being said, the German yields saw gains across the curve on Wednesday. The 10-year bond yield rose to 2.46%, while the 2-year yield stood at 3.09% and the 5-year yielded 2.54%.
EUR/JPY Levels to watch
According to the daily chart, the EUR/JPY holds a bullish outlook for the short term as the Relative Strength Index (RSI) and Moving Average Convergence Divergence (MACD) both suggest that the buyers are in control while the pair trades above its main moving averages. However, the pair leaps forward into overbought conditions with the RSI near the 70 threshold, suggesting that a downward technical correction could come into play.
Upcoming resistance for EUR/JPY is seen at the zone of around 152.00, followed by the area at 152.50 and the psychological mark at 153.00. On the other hand, in case the EUR/JPY loses more ground, support levels line up at 150.80 and below around the 20-day Simple Moving Average (SMA) at 149.90 and the 149.00 area.
EUR/JPY Daily chart
-638223747275343363.png)
- An M-formation has formed on GBP/USD H1 chart and it might pull the price in towards 1.2700.
- Bears look to test the1.2620s as a key support structure.
GBP/USD was higher on the day as it approached 1.27 the figure ahead of the Federal Reserve on Wednesday. It reached its strongest level since April 2022 as the central bank divergence between the Bank of England and the Fed ignited the bulls. However, the highs were shortlived and the price sank into the Fed meeting and throughout on a hawkish hold from the Fed. This leaves the technical outlook mixed in the shorter-term time frame as the following will illustrate:
GBP/USD hourly chart
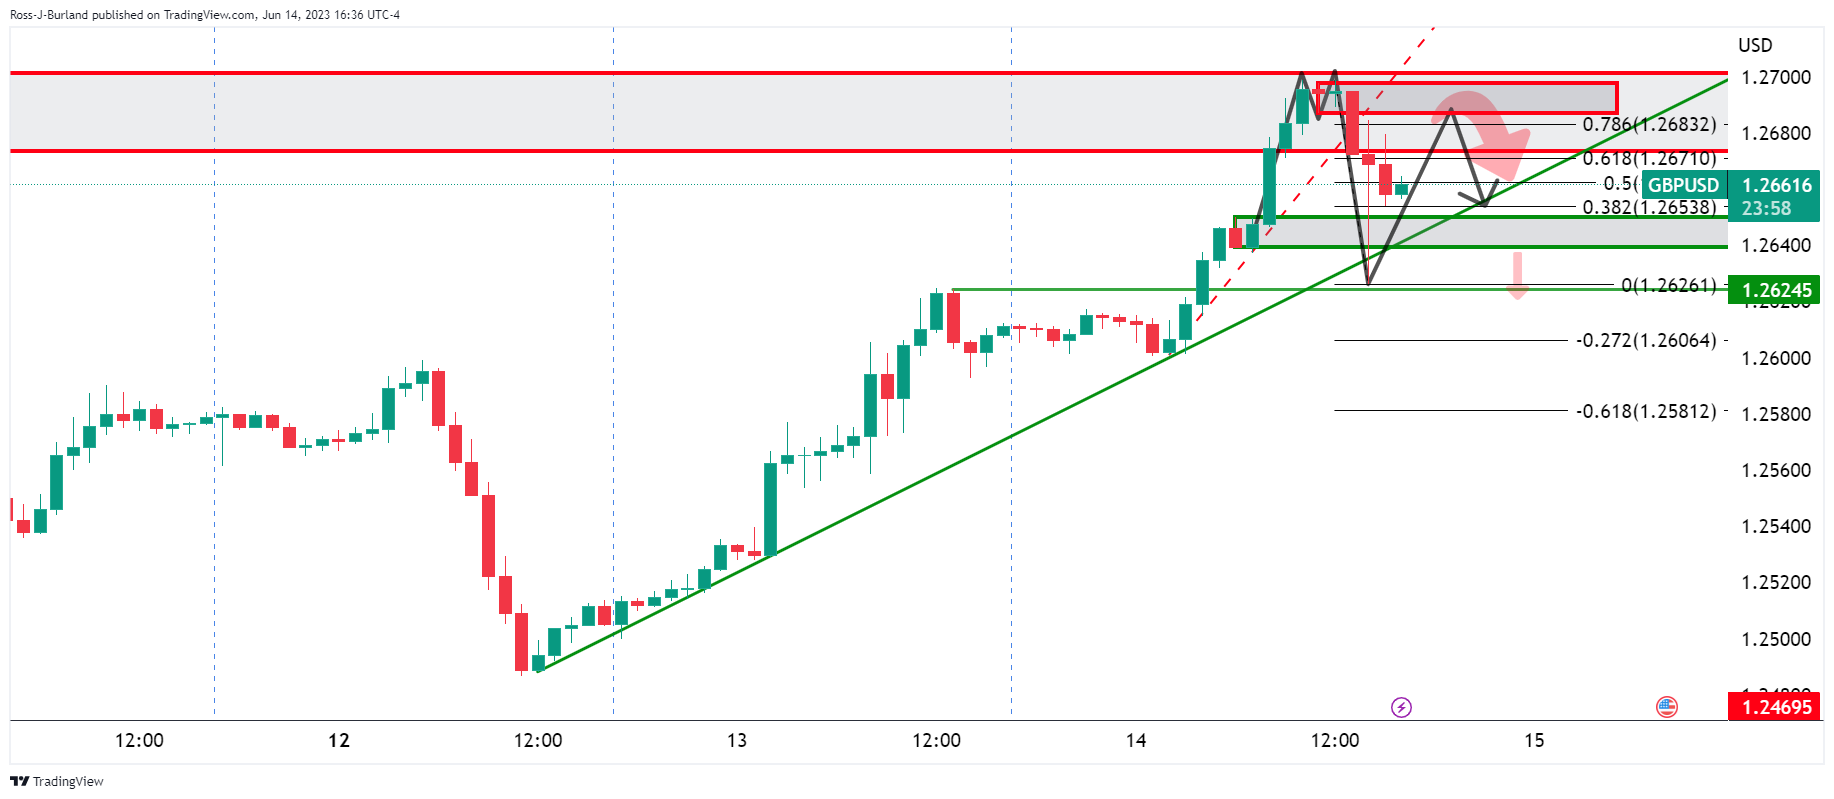
The M-formation has formed and it might pull the price in towards 1.2700 again but resistance could see the price fall. The trendline support is another factor, however, but if that goes, then the Bears will be back in the driving seat. 1.2620s are eyed as a key support structure in this regard.
After a busy day with the FOMC meeting, another busy day lies ahead. During the Asian session, New Zealand will report Q1 GDP, Japan will release Machinery Orders data, Australia will release Consumer Inflation Expectations and Employment data, and China will release Industrial Production and Retail Sales. All these numbers should contribute to keeping volatility elevated. Later on in the day, the European Central Bank will announce its decision and the US will report Retail Sales and Industrial Production.
Here is what you need to know on Thursday, June 15:
The Federal Reserve, as mostly expected, kept its interest rate unchanged. However, it delivered a hawkish message, signaling that rate hikes are not yet done. During the press conference, Chair Powell made it clear by saying that the July meeting will be a 'live meeting'. In the projections, none of the members considered that a rate cut by the end of 2023 would be appropriate.
Analysts at Wells Fargo:
The next FOMC meeting is scheduled for July 26. We expect that the continued resilience of the economy and the elevated rate of inflation will lead the Committee to hike by another 25 bps at that meeting.
We then look for the Committee to remain on hold for the remainder of the year. However, given today's dot plot, we readily acknowledge that the risks to our fed funds forecast are skewed to the upside. We think it will take a modest recession early next year, which will help to bring inflation lower, to induce the FOMC to ease policy.
US yields spiked after the statement and then pulled back. The US Dollar gained momentum after the decision and trimmed losses. The DXY finished the day with a 0.30% loss, posting its lowest close in a month, but off its lows.
Prior to the Fed meeting, more inflation data from the US came in below expectations. The Producer Price Index (PPI) dropped 0.3% in May, and the year-on-year rate slowed from 2.3% to 1.1%, below the consensus of 1.5%. On Thursday, the US will report Retail Sales, the Philly Fed, Jobless Claims, and Industrial Production. Economic data may have a greater influence after the June FOMC meeting.
Data released on Wednesday shows that the Wholesale Price Index in Germany dropped 1.1% in May, and the annual rate stood at -1.1%. A different report showed that Industrial Production expanded 1% in April in the Eurozone, above the 0.8% expected.
EUR/USD broke above 1.0800 and climbed to 1.0863, the highest level in almost a month, before pulling back. The short-term trend is up. The European Central Bank (ECB) will announce its monetary policy decision at 12:15 GMT. A 25 basis point hike is priced in. The focus will be on the language and the forward guidance. Lagarde (12:45 GMT) will probably reiterate that they are not done raising rates.
ECB Banks Preview: 25 bps, more remains in store
USD/CHF reached the lowest level in four weeks at 0.8963, but then rose back above 0.9000. The pair is moving with a bearish bias, but losses are limited while above 0.9000. Switzerland will report wholesale inflation, and the State Secretariat for Economic Affairs will release its economic forecasts.
More data from the UK was released on Wednesday, adding to the upbeat labor market report on Tuesday. GDP expanded 0.2% in April. However, Manufacturing Production contracted 0.3% in April, against expectations of a 0.2% slide. Next week is the Bank of England meeting, and a rate hike is expected as inflation remains above 9%. GBP/USD posted its highest daily close in a year as the pound continues to outperform. After approaching 1.2700, the pair pulled back to 1.2650.
USD/JPY continues to trade in the familiar range between 140.40 and 138.80. Late during the American session, the Dollar regained 140.00. Japan will report trade data, machinery orders, and the Tertiary Industry Index. The Bank of Japan (BoJ) will announce its decision on Friday.
China will release House Price data, Industrial Production, and Retail Sales. A slowdown is expected across the board. Market participants are expecting more stimulus from Chinese policymakers.
AUD/USD rose for the fifth consecutive day. However, it still struggles to hold above 0.6800. The bias is to the upside. The Melbourne Institute will release its inflation expectations for the next 12 months, which are expected to decline from 5.0% to 4.8%. Australia will report May jobs data on Thursday. Employment is expected to rise by 15,000, and the unemployment rate is expected to remain at 3.7%. The Reserve Bank of Australia (RBA) will present its Q1 Bulletin.
NZD/USD accelerated to the upside as the Kiwi outperformed on Wednesday. The pair climbed above 0.6200 and surpassed the 200-day Simple Moving Average (SMA). New Zealand reported a Q1 current account deficit of 8.5% of GDP. Gross Domestic Product (GDP) data is due on Thursday, expected to show a 0.1% contraction during the first quarter and a 2.6% expansion compared to a year ago.
USD/CAD rose marginally, rebounding after hitting fresh monthly lows. The rebound above 1.3300 could point to a bullish correction ahead. The Loonie lagged on Wednesday as crude oil prices retreated.
Gold finished flat around $1,940, looking weak. Earlier, the yellow metal peaked at $1,960 but tumbled following the FOMC meeting. Silver rose 1% and finished slightly below $24.00. Cryptocurrencies tumbled late on Wednesday, with BTC/USD falling more than 3% toward $25,000.
Like this article? Help us with some feedback by answering this survey:
- Fed’s rate hold and outlook shift spark NZD/USD volatility.
- Powell’s remarks indicate measured rate hikes to tackle inflation.
- Revised Fed predictions: 5.6% FFR peak, 1% growth in 2023, and 4.1% unemployment.
NZD/USD trades volatile on Wednesday after the US Federal Reserve (Fed) decided to keep the Federal Funds Rates (FFR) unchanged but upward revises its peak, which spurred a drop in the NZD/USD from around 0.6230 to 0.6170. Nevertheless, as Fed Chair Powell took the stance, it gave the green light to NZD buyers to re-enter fresh longs. The NZD/USD trades around the 0.6200-0.6220 range amidst a volatile session.
Federal Reserve’s hawkish hold rocks the NZD/USD
During his press conference, Fed Chair Jerome Pöwell commented that reducing inflation would require growth below trend and that decisions would be taken meeting by meeting. He said Fed’s July decision would be live and added the upward revision of the dot plot is consistent with where it was before the banking turmoil In March.
When asked why not hiking instead of pausing, Powell said the “question of speed on rate hikes is separate from the question of the level of rates.” He added the Fed is not that far from reaching peak rates, adding the need to adjust the pace slower.
Powell stressed the FOMC is “completely unified” to curb inflation to its 2% target and discounted rate cuts in 2023, adding that “it will be appropriate to cut rates when inflation comes down.”
The Fed’s statement highlights the labor market’s robustness, pointing out that the unemployment rate remains low but stresses that inflation is elevated and warning that tight market conditions could negatively impact economic activity. Given those conditions, the Fed kept rates unchanged, pausing its tightening cycle, but upward revised the FFR peak, as showcased by the dot plot in the Summary of Economic Projections (SEP).
The dot plot showed that most officials expect the Federal Funds Rates (FFR) to peak at 5.6% by the year-s end, up from March’s 5.1%. Additionally, policymakers have adjusted their forecast for growth in 2023, now predicting it to be 1%, a notable increase from their March prediction of 0.4%. They also reviewed the unemployment rate, lowering it from 4.5% to 4.1%. As for inflation, the Core PCE, the Fed’s favored measurement, is now predicted to hit 3.9%, up from the 3.6% estimated in March. However, the overall PCE has been slightly revised to 3.2% from 3.3%.
NZD/USD Technical Levels
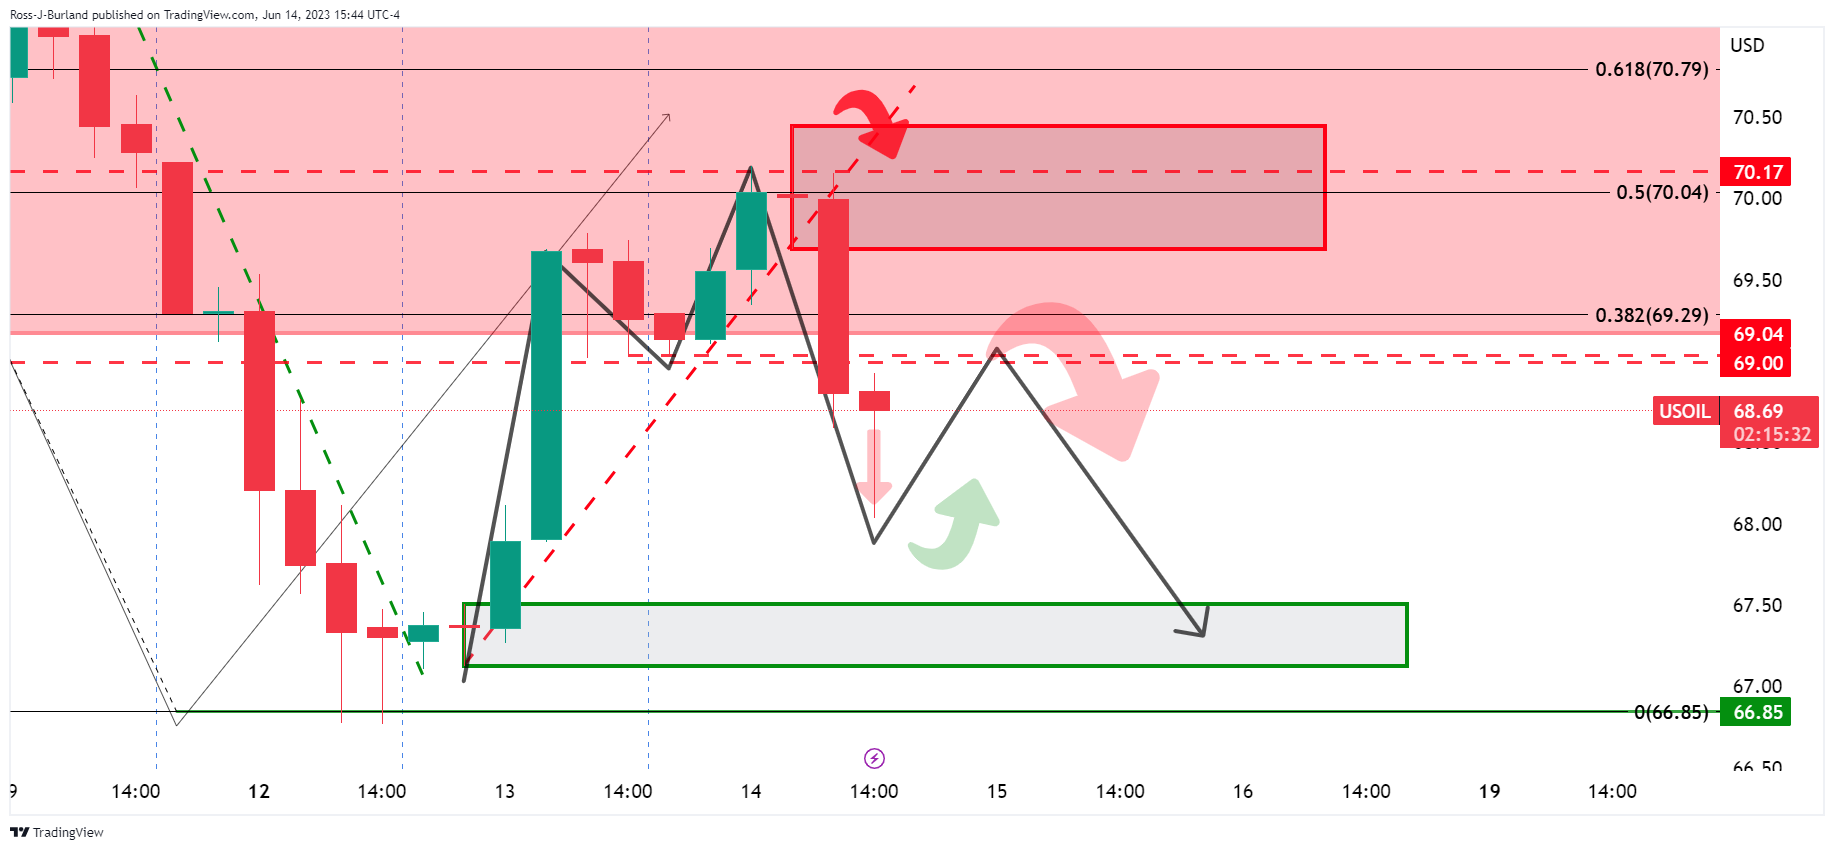
- WTI fell out of the hands of the bulls and is now moving into a bearish scenario.
- WTI bulls will target $69.00 and bears have eyes on $67.50/00 overall.
West Texas Intermediate, WTI, crude oil dropped on Wednesday, breaking key support structure on the downside as a pause in US interest rate hikes accompanied a bearish forecast for more hikes on the way. This has rocked risk sentiment and weighed on the commodity sector. Also, an outsized rise in US oil inventories squashed any bullish prospects for the oil price that might have otherwise derived from the demand forecast from the International Energy Agency leaving the price below key resistance as the following technical analysis illustrates:
WTI daily M-formation
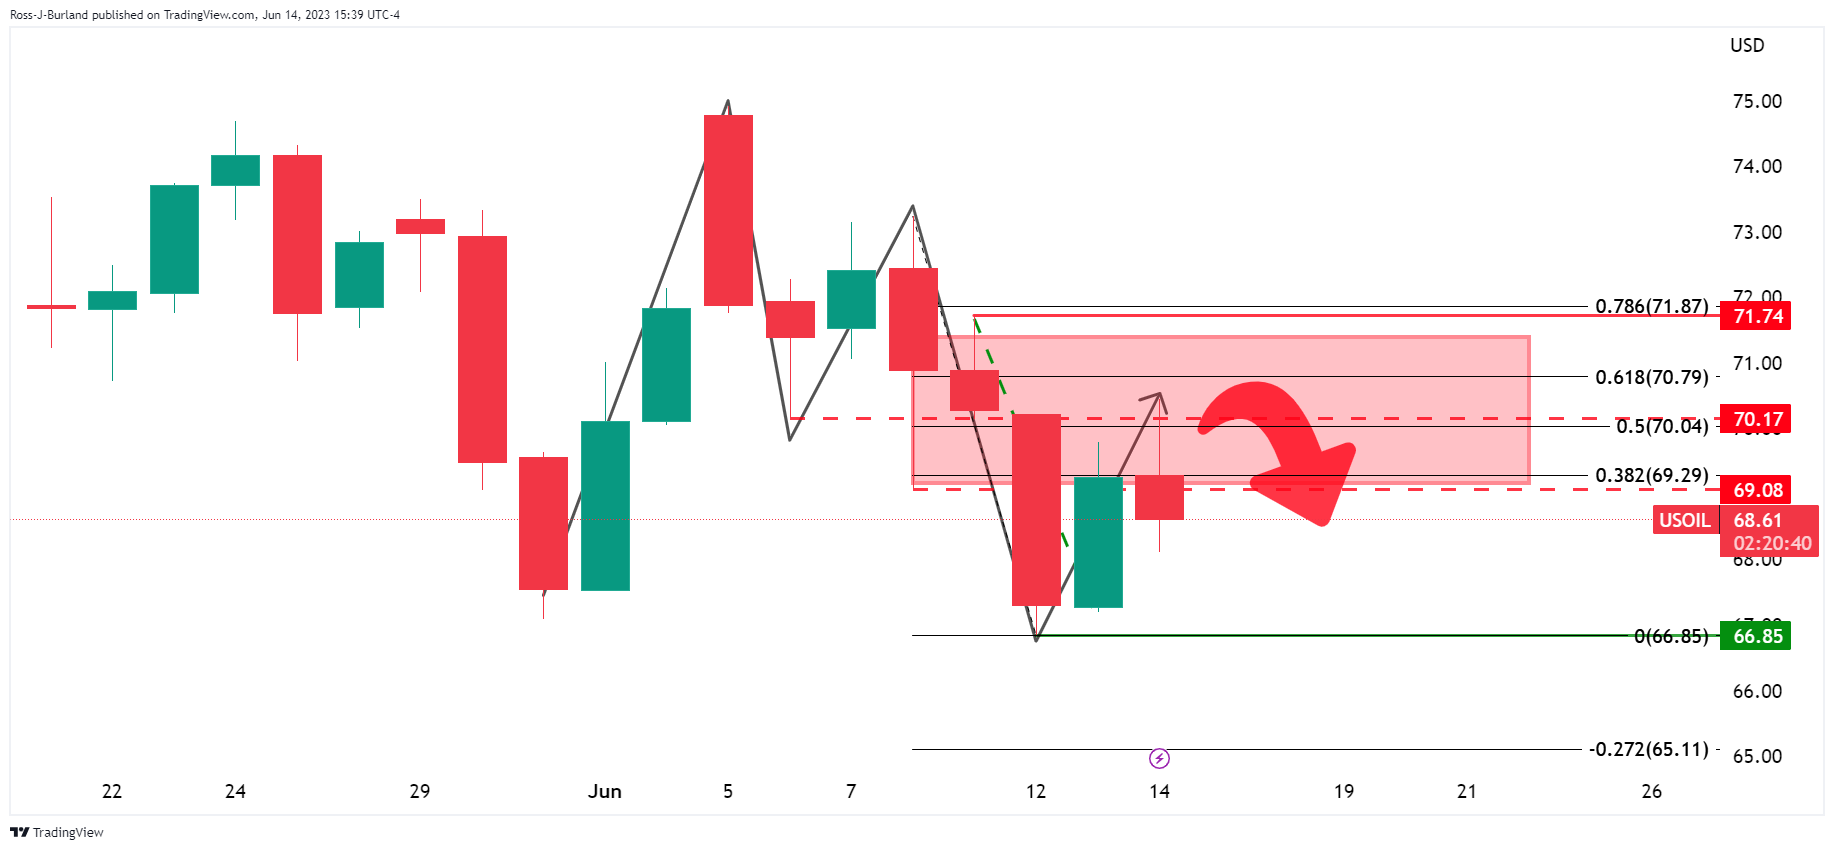
The daily M-formation is a reversion pattern and we have seen the price head into the neckline and meet resistance there.
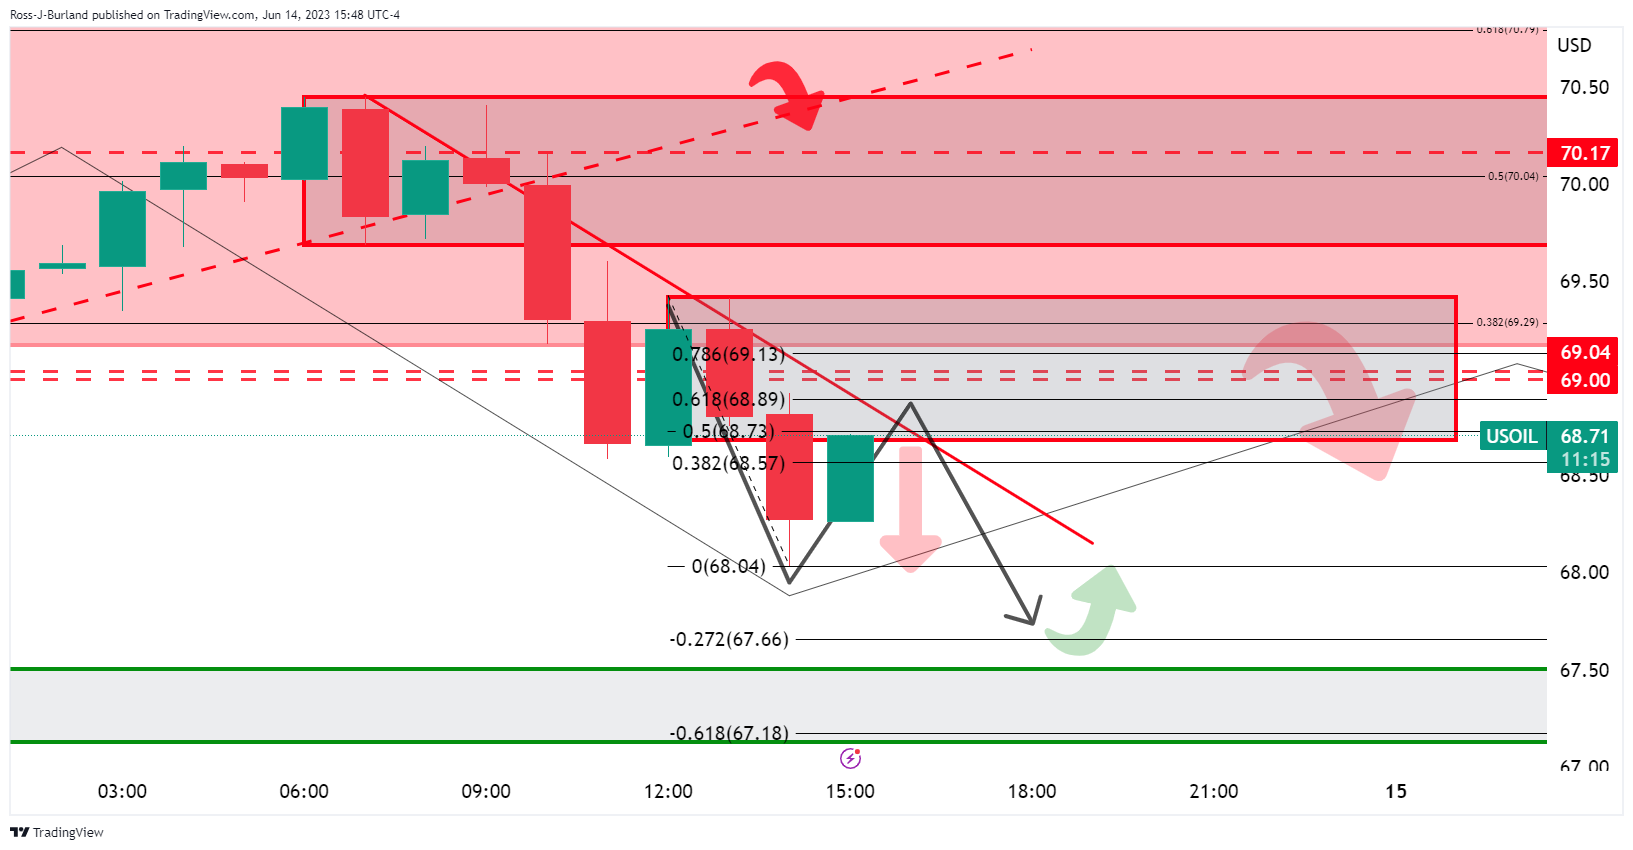
WTI 4HR M-formation
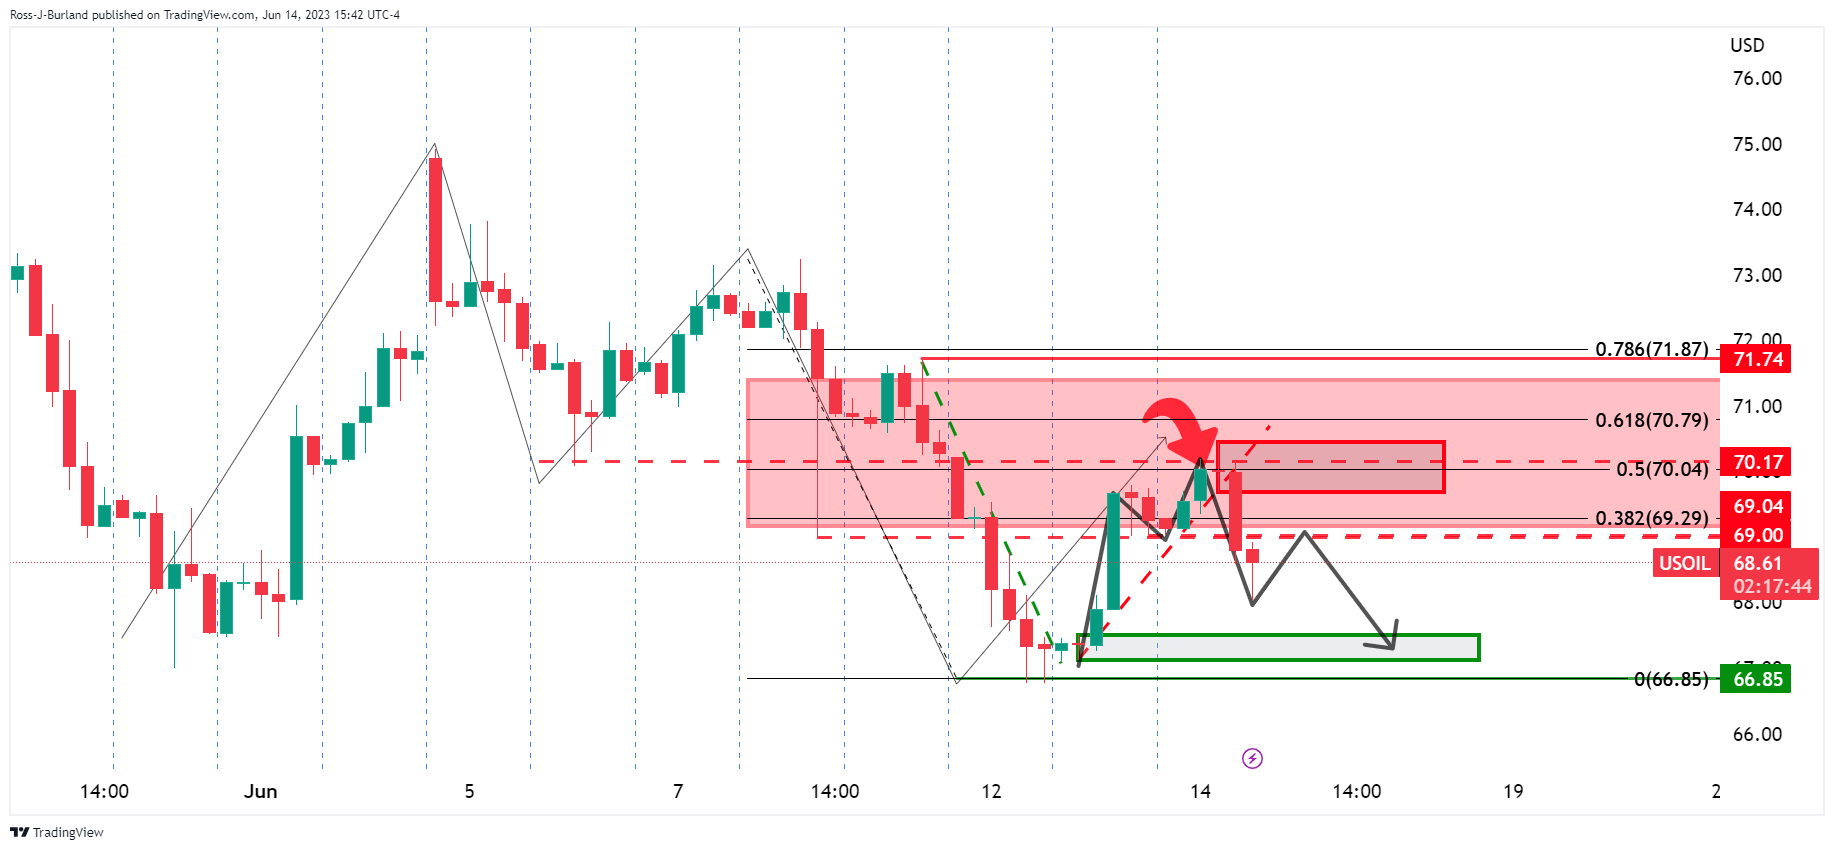
We now have an M-formation in development on the 4-hour chart. However, it might be premature to expect a 4-hour bullish candle to form and head into the neckline just yet as we might need to see some more downside from this bearish impulse. After all, it has only just broken out of the bullish trend on Wednesday. If the bears are committed we could see lower lows still to come.
In that sense, the current four-hour candle that still has two hours until the close could fill in the wick before $69.00 is retested. There may even be lower lows to follow before any significant correction on the 4-hour chart unfolds.
WTI H1 chart
On the hourly chart, the price is headed into resistance as per the dynamic trendline resistance. This could lead to the 4-hour wick being filled and lower lows before a break out of the bearish trend occurs and a bullish corrective thesis starts to take shape that will target $69.00.Bears have eyes on $67.50/00 overall.
- Fed left rates unchanged at 5.00%-5.25% as expected.
- An upwards revision of the median terminal rates hints at more hikes in 2023.
- The AUD/USD faced volatility, initially retreating from 0.6835 to 0.6755, and then stabilized around 0.6800.
The AUD/USD cleared part of its daily gains, retreating to 0.6800 after the Federal Reserve (Fed) decision to hold rates steady. Additionally, an upward revision of the terminal rate to 5.6% was confirmed, indicating the likelihood of two additional 25 basis points (bps) increases. In their statement, the Fed clarified that keeping rates unchanged during this meeting would enable the members of the Federal Open Market Committee to evaluate further information regarding its impact on monetary policy.
US yields recovered some ground as the Fed hinted at more hikes
Following the statement, the 10-year US bond yield recovered to 3.80%. On the other hand, the US stock market weakened, as all three major indices are in negative territory. The S&P 500 index (SPX) is seeing a 0.6% slide, the Dow Jones Industrial Average (DJI) a 1.19% loss, and the Nasdaq Composite (NDX) a 0.58% decrease.
For the following sessions, investors' assessment of the monetary policy statement, macro forecasts and Chair Powell’s comment will dictate the pace of the markets. That being said, the economic projections indicate a slower growth pace, a robust labour market and slower progress on inflation. Regarding the press conference, Powell focused on the need to pause following a consecutive 500 bps hike since last year to asses further information.
AUD/USD Levels to watch
According to the daily chart, the AUD/USD holds a neutral to bearish outlook for the short term as the bulls seemed to have taken a step back. However, technical indicators remain positive, indicating that the market may be preparing for another leg up.
If AUD/USD manages to move higher, the next resistances to watch are at the daily high at 0.6838, followed by the 0.6850 area and the psychological mark at 0.6900. On the other hand, the 100-day Simple Moving Average (SMA) at 0.6730 level is key for AUD/USD to maintain its upside bias. If breached, the pair could see a steeper decline towards the 200-day SMA at 0.6690 and the 20-day SMA at 0.6630.
AUD/USD Daily Chart
FOMC Chairman Jerome Powell comments on the policy outlook after the Federal Reserve's decision to leave the policy rate unchanged at 5-5.25% following the June policy meeting.
Key quotes
"I continue to think there is a path to 2% inflation without large losses of employment."
"A strong labor market that gradually cools could aid a soft landing."
"FOMC is completely unified on need to get to 2% inflation, will do whatever it takes to do that."
"Getting price stability back and restored will benefit generations."
"To maintain real rates as inflation comes down, will need to lower nominal rate in future."
"It will be appropriate to cut rates when inflation comes down."
"Not a single person wrote down a rate cut this year."
"Rate cuts this year will not be appropriate."
About Jerome Powell (via Federalreserve.gov)
"Jerome H. Powell first took office as Chair of the Board of Governors of the Federal Reserve System on February 5, 2018, for a four-year term. He was reappointed to the office and sworn in for a second four-year term on May 23, 2022. Mr. Powell also serves as Chairman of the Federal Open Market Committee, the System's principal monetary policymaking body. Mr. Powell has served as a member of the Board of Governors since taking office on May 25, 2012, to fill an unexpired term. He was reappointed to the Board and sworn in on June 16, 2014, for a term ending January 31, 2028."
FOMC Chairman Jerome Powell comments on the policy outlook after the Federal Reserve's decision to leave the policy rate unchanged at 5-5.25% following the June policy meeting.
Key quotes
"We are stretching out to a more moderate pace of hiking."
"When we see inflation flattening, and softening, we'll know that tightening is working."
"By taking a little more time on tightening, we reduce the chance of going too far."
"Too early to know full extent of banking turmoil-related credit tightening."
"If we see more of an effect from credit tightening, we will factor that into rate decisions."
"Not seeing a lot of progress on core PCE inflation."
"Want to see core PCE moving down decisively."
"We want to get inflation down to 2% with minimum damage to economy."
"In 2021, inflation was coming from strong demand for goods."
"In 2022 and now in 2023, many analysts believe getting wage growth down is important for getting inflation down."
"Our focus is on getting the policy right."
"The July meeting will be live."
"We do try to be transparent in our reaction function."
"We see housing putting in a bottom, maybe moving up a bit."
"We will see rents filtering into housing services inflation."
"I don't know that housing itself will drive rates picture, but it's part of it."
About Jerome Powell (via Federalreserve.gov)
"Jerome H. Powell first took office as Chair of the Board of Governors of the Federal Reserve System on February 5, 2018, for a four-year term. He was reappointed to the office and sworn in for a second four-year term on May 23, 2022. Mr. Powell also serves as Chairman of the Federal Open Market Committee, the System's principal monetary policymaking body. Mr. Powell has served as a member of the Board of Governors since taking office on May 25, 2012, to fill an unexpired term. He was reappointed to the Board and sworn in on June 16, 2014, for a term ending January 31, 2028."
FOMC Chairman Jerome Powell comments on the policy outlook after the Federal Reserve's decision to leave the policy rate unchanged at 5-5.25% following the June policy meeting.
Key quotes
"Question of speed on rate hikes is separate from question of level of rates."
"We are not so far away from destination on fed funds rates."
"It is reasonable to go slower as we approach rates destination."
"We don't know full extent of banking turmoil consequences."
"We are trying to get this right."
"By July, rates decision will have three months worth of data."
"We will look at all the data, the evolving outlook, and will make the decision in July."
"Labor market has surprised with extraordinary resilience."
"I can't tell you I ever have a lot of confidence where fed funds rate will be far in advance."
"We have moved much closer to sufficiently restrictive."
"The risks of overdoing and underdoing are closer to be in balance."
"The risks to inflation are to the upside
About Jerome Powell (via Federalreserve.gov)
"Jerome H. Powell first took office as Chair of the Board of Governors of the Federal Reserve System on February 5, 2018, for a four-year term. He was reappointed to the office and sworn in for a second four-year term on May 23, 2022. Mr. Powell also serves as Chairman of the Federal Open Market Committee, the System's principal monetary policymaking body. Mr. Powell has served as a member of the Board of Governors since taking office on May 25, 2012, to fill an unexpired term. He was reappointed to the Board and sworn in on June 16, 2014, for a term ending January 31, 2028."
- USD/JPY is volatile over the Fed and various mixed messages.
- Bears are trying to take control during Fed Powell's presser.
USD/JPY is volatile following the Federal Reserve's interest rate decision and projections. The pair jolted to the upside on the knee-jerk as the market prices in more rate hikes ahead although the pair is now turning lower during Chairman Jerome Powell's presser.
The markets are now digesting Powell's comments as well as the forecasts, projections and statement of the board.
Federal Open Market Commission statement
key takeaways & Fed projections:
US interest rate decision actual 5.25% (forecast 5.25%, previous 5.25%).
The banking system is sound and resilient.
Fed officials see Fed funds rate at a median of 5.6% at end of 2023.
Fed policymakers see higher GDP growth in 2023, a lower unemployment rate and less progress on core inflation than they saw in March.
Holding rates steady allows for assessment of policy impact.
The extent of additional firming to hinge on the economy.
FOMC vote was unanimous.
Voted 11-0 for Fed funds rate action.
Fed will continue same pace of reducing treasury and MBS holdings.
Economic activity expanded at modest pace.
Job gains robust and unemployment remains low.
Fed median rate forecasts rise to 5.6% end-* 23, 4.6% end-* 24.
Fed officials see US GDP at 1.0% in 2023 and 1.1% in 2024.
Fed signals additional rate increases possible later this year.
All in all, this was a hawkish hold and consequently, Fed swaps no longer consider a 2023 rate cut likely.
Markets are now digesting Fed's Powell, currently taking questions from the press:
Watch Federal Reserve's chairman Jerome Powell live
Powell speech: Need to see loosening of labor market conditions continue
Powell speech: Fed projections are not a plan or decision
Powell speech: Nearly all policymakers view some further rate hikes this year appropriate
Jerome Powell comments on policy outlook as Fed keeps interest rate steady in June
FOMC Chairman Jerome Powell comments on the policy outlook after the Federal Reserve's decision to leave the policy rate unchanged at 5-5.25% following the June policy meeting.
Key quotes
"Main issue is determining extent of additional tightening."
"It may make sense for rates to move higher, but at a more moderate pace."
"We did not discuss whether to go to an every-other-meeting approach."
"We didn't make a decision about July."
"Data since last meeting came in on high side of expectations."
"Any forecast about inflation coming down this year will contain a big dose of housing disinflation."
"Housing services disinflation will be a little slower than we would have expected."
"Key to non-housing services disinflation is to get loosening in labor market conditions."
"Need to see loosening of labor market conditions continue."
"The things we need for disinflation are coming into play, process will take some time."
About Jerome Powell (via Federalreserve.gov)
"Jerome H. Powell first took office as Chair of the Board of Governors of the Federal Reserve System on February 5, 2018, for a four-year term. He was reappointed to the office and sworn in for a second four-year term on May 23, 2022. Mr. Powell also serves as Chairman of the Federal Open Market Committee, the System's principal monetary policymaking body. Mr. Powell has served as a member of the Board of Governors since taking office on May 25, 2012, to fill an unexpired term. He was reappointed to the Board and sworn in on June 16, 2014, for a term ending January 31, 2028."
- Fed holds rates amid solid labor market and high inflation.
- Fed’s dot-plot predicts Federal Funds Rate at 5.6% by year-end.
- Fed anticipates 1% growth in 2023, with a high Core PCE at 3.9%.
The US Dollar Index (DXY), a gauge that tracks the American Dollar (USD) value against a basket of its rivals, trims some of its earlier losses, regaining the 103.000 mark, as investors brace for the Federal Reserve Chair Jerome Powell press conference. The greenback recovered even though the Fed held rates unchanged but revised its forecasts regarding the Federal Funds Rate (FFR) upward.
Summary of the Federal Reserve’s monetary policy statement
The Federal Reserve, in its recent monetary policy statement, highlighted the strength of the labor market, characterizing it as robust. The unemployment rate remains low, although inflation continues to be significantly high. The Fed warned that such tight market conditions could negatively affect economic activity.
Given those facts, Federal Reserve policymakers opted to maintain the current interest rates at the 5.00%-5.25% range. They believe this will provide them with the opportunity to assess further data and its implications for monetary policy. Policymakers emphasized the need to ensure inflation is steered back to the 2% mark over time, and to achieve this; they will consider the comprehensive effects of the monetary policy’s tightening, the delays inherent in how these policies impact economic activity and inflation, as well as the state of the economy and financial markets.
The Summary of Economic Projections (SEP), released alongside the statement, revealed a revised dot-plot where most officials now anticipate the Federal Funds Rate (FFR) to reach 5.6%
Officials from the Federal Reserve have adjusted their forecast for growth in 2023, now predicting it to be 1%, a notable increase from their March prediction of 0.4%. They also reviewed the unemployment rate, lowering it from 4.5% to 4.1%. As for inflation, the Core PCE, the Fed’s favored measurement, is now predicted to hit 3.9%, up from the 3.6% estimated in March. However, the overall PCE has been slightly revised to 3.2% from 3.3%.
US Dollar Index (DXY) reaction to the Fed’s decision
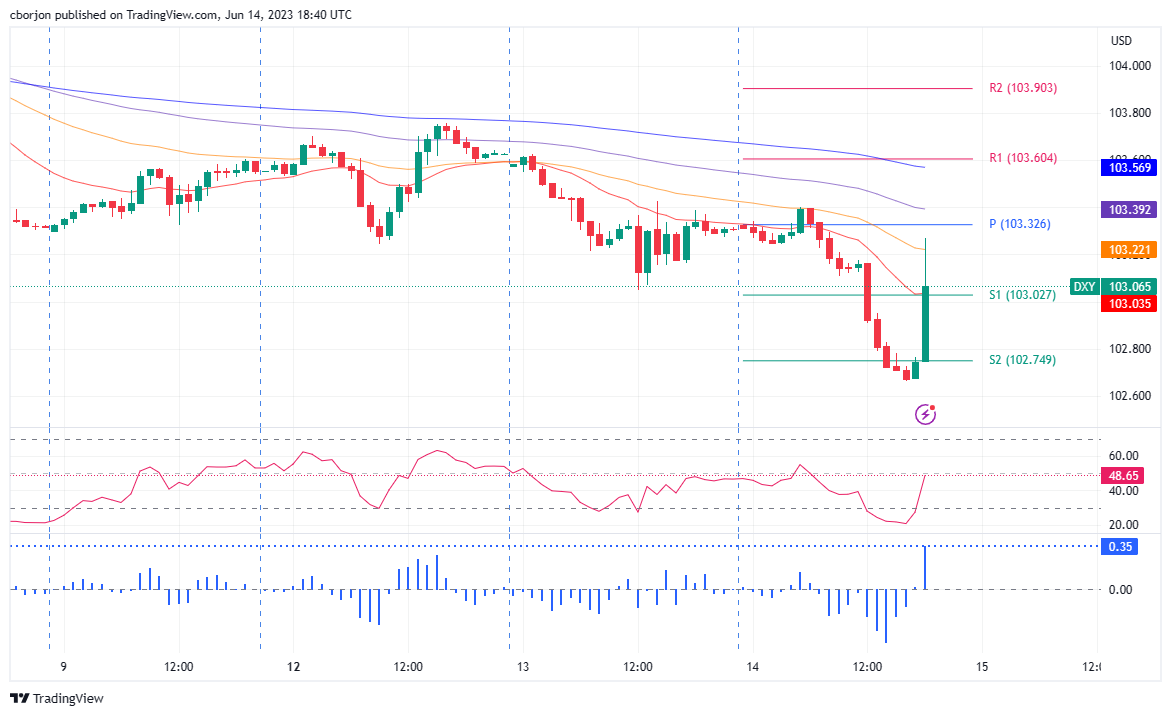
The DXY reacted from around the 102.600 area and jumped straight toward the 103.268 area, shy of cracking the 50-EMA at the 1-hour chart at 103.222, and fell short of erasing its earlier losses. Nevertheless, oscillators turned upwards, with the Relative Strength Index (RSI) about to cross the 50-midline, which would suggest further upside expected, putting into play the daily pivot at 103.326 and the 100-EMA at 103.392. Conversely, the DXY could extend its losses past the S1 pivot at 103.027, followed by the S2 daily pivot at 102.749, before breaking to new weekly lows.
FOMC Chairman Jerome Powell comments on the policy outlook after the Federal Reserve's decision to leave the policy rate unchanged at 5-5.25% following the June policy meeting.
Key quotes
"At this meeting, considering how far and fast we have moved, judged it prudent to hold rates steady."
"Fed projections are not a plan or decision."
"Will continue to make decisions meeting by meeting."
"Reducing inflation is likely to require below trend growth, some softening of labor conditions."
About Jerome Powell (via Federalreserve.gov)
"Jerome H. Powell first took office as Chair of the Board of Governors of the Federal Reserve System on February 5, 2018, for a four-year term. He was reappointed to the office and sworn in for a second four-year term on May 23, 2022. Mr. Powell also serves as Chairman of the Federal Open Market Committee, the System's principal monetary policymaking body. Mr. Powell has served as a member of the Board of Governors since taking office on May 25, 2012, to fill an unexpired term. He was reappointed to the Board and sworn in on June 16, 2014, for a term ending January 31, 2028."
FOMC Chairman Jerome Powell comments on the policy outlook after the Federal Reserve's decision to leave the policy rate unchanged at 5-5.25% following the June policy meeting.
Key quotes
"Strongly committed to 2% inflation."
"Without price stability, will not achieve sustained strong labor market."
"We have covered a lot of ground."
"Full effects of tightening yet to be felt."
"Nearly all policymakers view some further rate hikes this year appropriate."
"Activity in housing sector remains weak."
"Most policymakers expects subdued growth to continue."
"Labor market remains very tight."
"Some signs supply and demand in labor market coming into better balance."
"Getting inflation back to 2% has a long way to go."
"Inflation expectations appear well anchored."
"Acutely aware that high inflation imposes hardship."
"We are highly attentive to risks high inflation poses to both sides of mandate."
"Have been seeing effects of our policy tightening in housing, investment."
"Will take time for full effects of monetary restraint to be realized, especially on inflation."
About Jerome Powell (via Federalreserve.gov)
"Jerome H. Powell first took office as Chair of the Board of Governors of the Federal Reserve System on February 5, 2018, for a four-year term. He was reappointed to the office and sworn in for a second four-year term on May 23, 2022. Mr. Powell also serves as Chairman of the Federal Open Market Committee, the System's principal monetary policymaking body. Mr. Powell has served as a member of the Board of Governors since taking office on May 25, 2012, to fill an unexpired term. He was reappointed to the Board and sworn in on June 16, 2014, for a term ending January 31, 2028."
- EUR/USD sinks on the hawkish hold from the Fed.
- Bears eye the trendline support although bulls still in the market and eye the 1.0900s longer term.
EUR/USD is volatile following the Federal Reserve's interest rate decision and projections. The pair jolted to the downside on the knee-jerk as the market prices in more rate hikes ahead even as the Fed holds for now.
The markets are now digesting the forecasts, projections and statements while waiting to hear from the Federal Reserve's chairman, Jerome Powell, who will take questions from the press at the top of the hour.
Federal Open Market Commission statement
key takeaways & Fed projections:
US interest rate decision actual 5.25% (forecast 5.25%, previous 5.25%).
The banking system is sound and resilient.
Fed officials see Fed funds rate at a median of 5.6% at end of 2023.
Fed policymakers see higher GDP growth in 2023, a lower unemployment rate and less progress on core inflation than they saw in March.
Holding rates steady allows for assessment of policy impact.
The extent of additional firming to hinge on the economy.
FOMC vote was unanimous.
Voted 11-0 for Fed funds rate action.
Fed will continue same pace of reducing treasury and MBS holdings.
Economic activity expanded at modest pace.
Job gains robust and unemployment remains low.
Fed median rate forecasts rise to 5.6% end-* 23, 4.6% end-* 24.
Fed officials see US GDP at 1.0% in 2023 and 1.1% in 2024.
Fed signals additional rate increases possible later this year.
All in all, this was a hawkish hold and consequently, Fed swaps no longer consider a 2023 rate cut likely.
Traders now await Fed's Powell:
Watch Federal Reserve's chairman Jerome Powell live
EUR/USD technical analysis

The market is volatile around the Fed, but once the dust settles, the bulls will still be in control if they manage to stay on the front side of the bullish trend:

(Hourly chart)
The neckline of the M-formation on the weekly charts remains compelling:

- USD/CAD bottomed at a daily low of 1.3270 and jumped to the 1.3350 area after Fed's decision.
- The Fed skipped as expected, leaving the benchmark rate unchanged at the 5.00%-5.25% rate.
- The dot plots showed a median rate peak of 5.6%.
The USD/CAD recovered after the Federal Reserve (Fed) kept rates unchanged and revealed an upwards revision of the terminal rate to 5.6% suggesting that two more 25 basis points (bps) are likely. In the statement, they clarified that holding the rates in this meeting will allow the members of the Federal Open Market Committee to asses aditional information regarding its implication on monetary policy.
Follow our live coverage of the Fed's policy announcements and the market reaction.
US bond yields surge and stocks plunge after Fed’s decision
Reacting to the revised terminal rate, bond yields in the US recovered, which helped the US Dollar re-gain traction, fueling a spike of the DXY index to the 103.25 area, clearing daily losses. The 10-year bond yield jumped to 3.85% seeing a 0.64% increase. Simultaneously, the S&P 500 index (SPX) despite continuing to trade at its highest level since April 2022 reversed its course and cleared daily gains.
That being said, the focus now shifts to Fed Chair Jerome Powell’s conference, where investors will look for clues regarding forward guidance.
USD/CAD Levels to watch
Based on the daily chart, despite the daily reversal, the USD/CAD appears to be bearish in the short term, as the Relative Strength Index (RSI) and Moving Average Convergence Divergence (MACD) are both suggesting that the sellers have control while the pair trades below its main moving averages. In addition, the 20-day Simple Moving Average performed a bearish cross with the 100 and 200-day averages suggesting that more downside may be on the horizon.
The multi-month low at 1.3260 level is key support for the USD/CAD. If breached, the price could see a steeper decline towards November 2022 lows at 1.3230 and towards the 1.3200 area. Furthermore, upcoming resistance for USD/CAD is seen at the zone at 1.3350 level, followed by the 1.3380 area and the psychological mark at 1.3400.
USD/CAD Daily chart
-638223635913413624.png)
- Federal Reserve maintains rates, citing robust labor market and elevated inflation levels.
- Dot-plot reveals officials’ expectations for the Federal Funds Rate to reach 5.6% by the year’s end, hinting at further tightening.”
- Fed forecasts bolstered growth at 1% in 2023 and a lower unemployment rate but anticipates elevated inflation with Core PCE estimated at 3.9%.
GBP/USD dropped after the US Federal Reserve (Fed) held rates unchanged, in a buy-the-rumor, sell-the-fact reaction, as the GBP/USD is set to erase some of its earlier gains, which saw the GBP/USD reaching a new year-to-date (YTD) high at 1.2698. At the time of writing, the GBP/USD is trading volatile at around the 1.2690/1.2640 area as traders brace for Jerome Powell’s press conference.
Summary of the Federal Reserve’s monetary policy statement
In its monetary policy statement, the Federal Reserve said the labor market remains robust, with the unemployment rate low and inflation remains elevated. Furthermore, tighter conditions are likely to weigh on economic activity; therefore, according to the statement, policymakers decided to keep rates unchanged, which will “allow the Committee to assess additional information and its implications for monetary policy. In determining the extent of additional policy firming that may be appropriate to return inflation to 2 percent over time, the Committee will take into account the cumulative tightening of monetary policy, the lags with which monetary policy affects economic activity and inflation, and economic and financial developments.”
Regarding the dot-plot, revealed in the Summary of Economic Projections (SEP), officials revised upwardly, with most expecting the Federal Funds Rate (FFR) to hit 5.6% this year. Hence, Jerome Powell and Co. are evaluating 50 bps of additional rate hikes, up from the 5.10% projections in March.
Federal Reserve officials projected growth at 1% in 2023, up from 0.4% in March, and the Unemployment rate was downward revised from 4.5% to 4.1%. The Fed’s preferred gauge for inflation, the Core PCE, is estimated at 3.9% compared to March 3.6%, while general PCE is estimated at 3.2% from 3.3%.
GBP/USD reaction to the news headline

The GBP/USD edged from 1.2680 and cracked the R1 daily pivot, as it hit 1.2626, before stabilizing around the current exchange rate at around 1.2640. Should be said that it fell shy of breaking below Tuesday’s high, at 1.2624, seen as the next support before tumbling to 1.2600.
- Federal Reserve keeps rates unchanged at 5.00-5.25%.
- Dot plot shows a higher peak policy rate.
- US Dollar rises across the board, Gold tumbles as US yields soar.
Gold Price tumbled after the Federal Reserve kept interest rates unchanged for the first time after raising rates for ten consecutive meetings. XAU/USD dropped from $1,952 to the $1,940 area.
As mostly expected, the Fed kept the Fed funds target range at 5.00-5.25. The "skip" is seen as hawkish considering that the economic projections from the FOMC staff show the peak rate a bit higher.
With the Fed signaling that more rate hikes are likely, US Treasury bonds tumbled. The 10-year yield jumped from 3.78% to 3.85% and the 2-year from 4.64% to 4.80%. The US Dollar Index recovered from daily losses, rising back to the 103.25 area.
XAU/USD lost more than $10 in a few seconds, hitting a fresh daily low at $1,939. Gold is under pressure, looking at the $1,940 support area. A break lower could trigger more losses.
Market participants now await Chair Powell's press conference. Volatility is expected to remain elevated. If Gold recovers, resistance is seen at $1,955, followed by the daily high at $1,960.
Technical levels
May 03June 14, 2023
EconomicRecent indicators suggest that economic activity expanded has continued to expand at a modest pace in the first quarter. Job gains have been robust in recent months, and the unemployment rate has remained low. Inflation remains elevated.
The U.S. banking system is sound and resilient. Tighter credit conditions for households and businesses are likely to weigh on economic activity, hiring, and inflation. The extent of these effects remains uncertain. The Committee remains highly attentive to inflation risks.
The Committee seeks to achieve maximum employment and inflation at the rate of 2 percent over the longer run. In support of these goals, the Committee decided to raise maintain the target range for the federal funds rate to at 5 to 5-1/4 percent. The Holding the target range steady at this meeting allows the Committee will closely monitor incoming to assess additional information and assess the ts implications for monetary policy. In determining the extent to which of additional policy firming that may be appropriate to return inflation to 2 percent over time, the Committee will take into account the cumulative tightening of monetary policy, the lags with which monetary policy affects economic activity and inflation, and economic and financial developments. In addition, the Committee will continue reducing its holdings of Treasury securities and agency debt and agency mortgage-backed securities, as described in its previously announced plans. The Committee is strongly committed to returning inflation to its 2 percent objective.
In assessing the appropriate stance of monetary policy, the Committee will continue to monitor the implications of incoming information for the economic outlook. The Committee would be prepared to adjust the stance of monetary policy as appropriate if risks emerge that could impede the attainment of the Committee's goals. The Committee's assessments will take into account a wide range of information, including readings on labor market conditions, inflation pressures and inflation expectations, and financial and international developments.
Voting for the monetary policy action were Jerome H. Powell, Chair; John C. Williams, Vice Chair; Michael S. Barr; Michelle W. Bowman; Lisa D. Cook; Austan D. Goolsbee; Patrick Harker; Philip N. Jefferson; Neel Kashkari; Lorie K. Logan; and Christopher J. Waller.
Follow Fed meeting – Live coverage
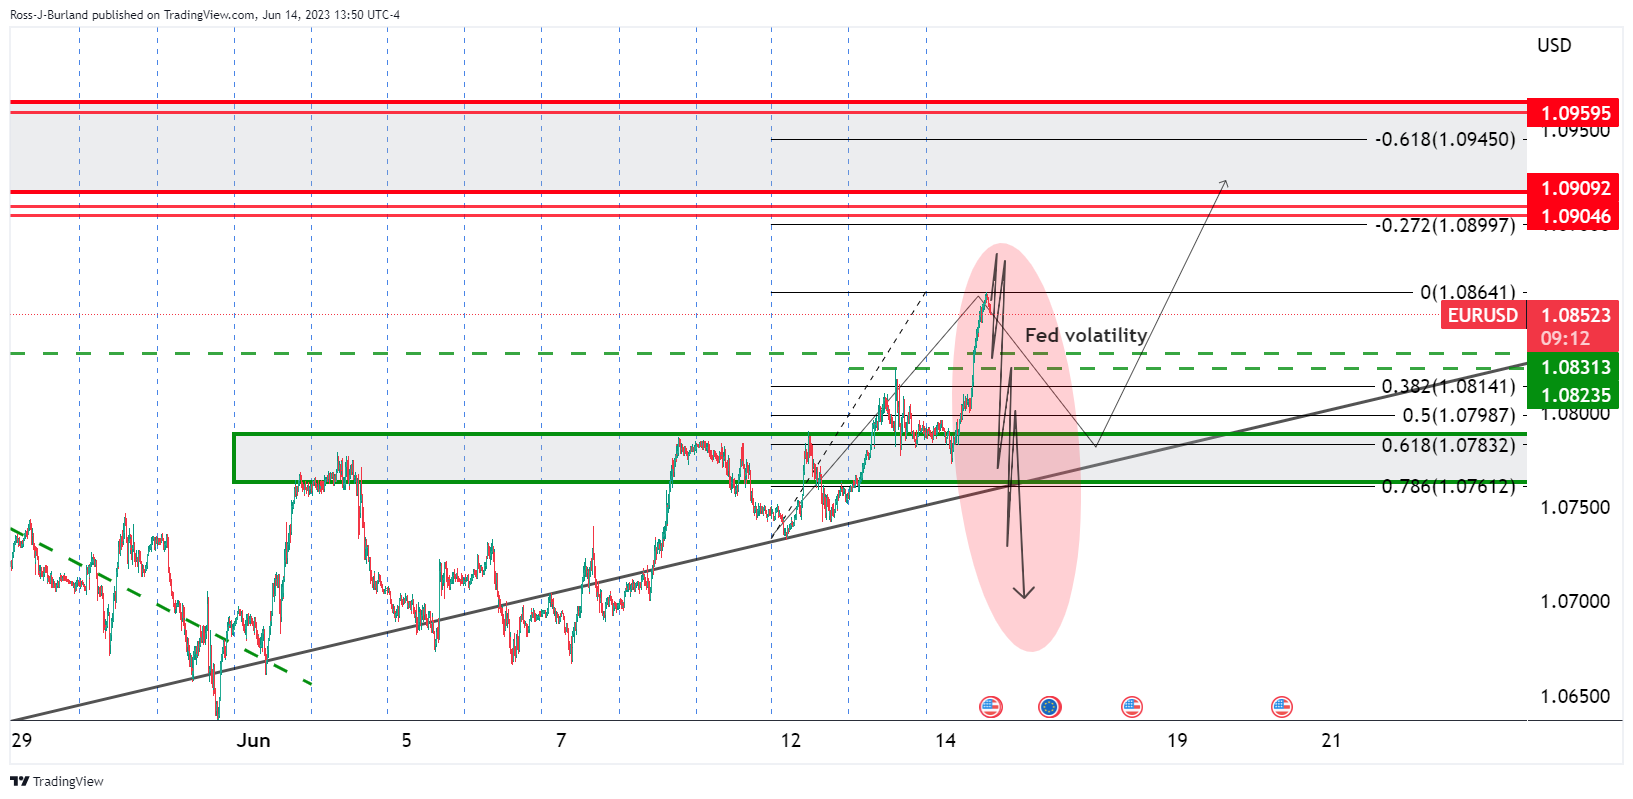
- EUR/USD bears and bulls go head to head into the Fed.
- Upside bias on weekly could be diminished by Fed.
EUR/USD has been decisively bid on the day in the build-up to the Federal Reserve which leaves the long squeeze a viable scenario for the sessions ahead if not as a consequence of the outcome of the Fed itself. On the flip side, there is a key area on the charts up ahead that could come under pressure in and around the event as the following charts will illustrate:
EUR/USD weekly and daily charts
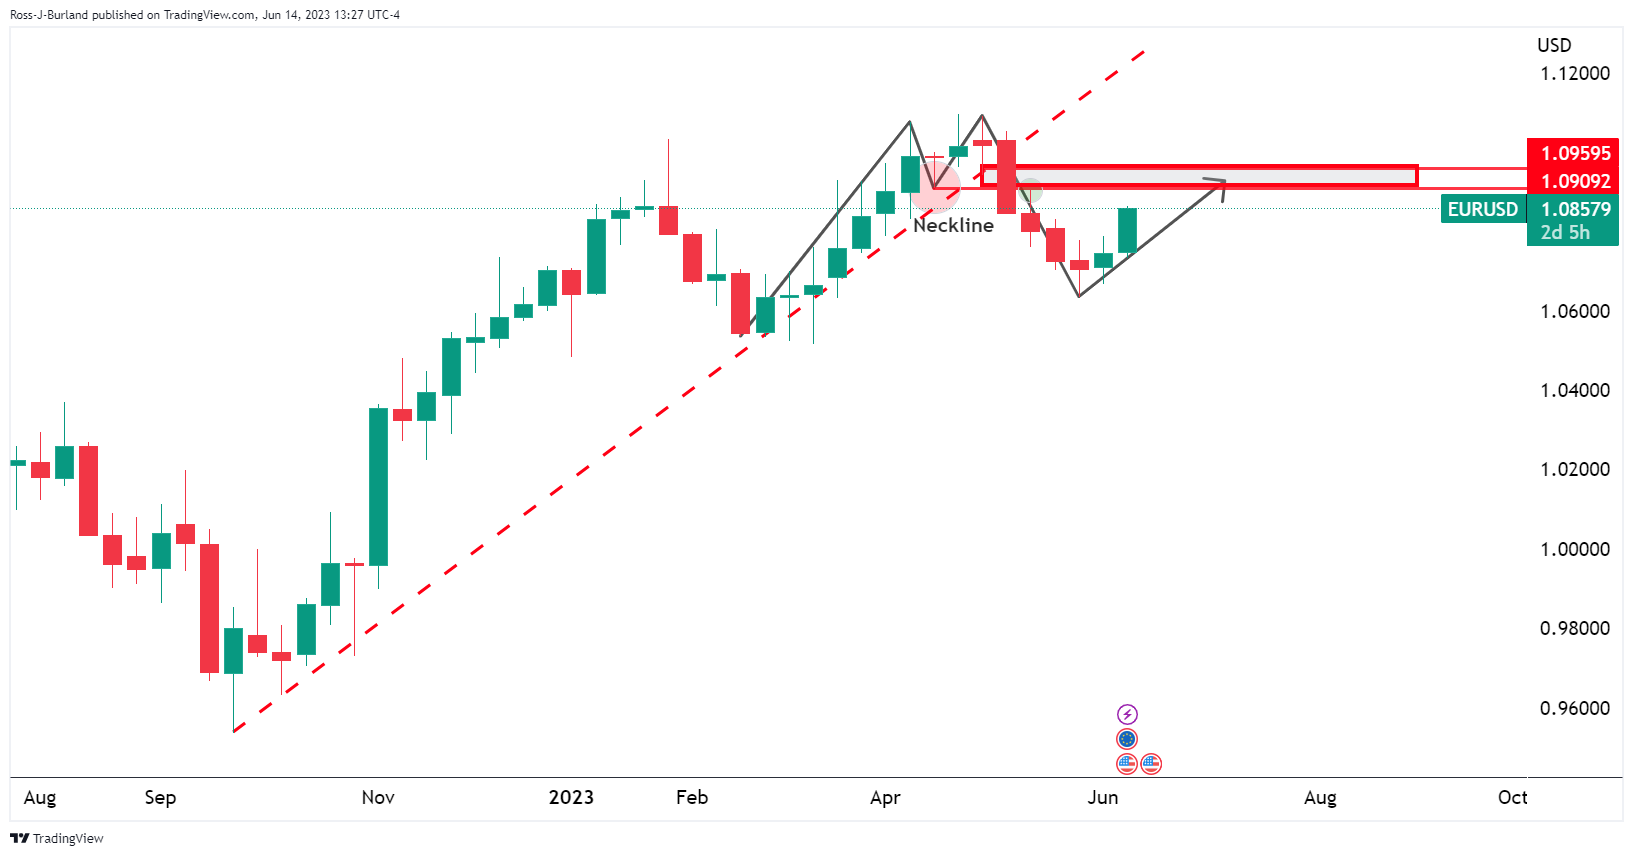
The weekly M-formation offers the neckline as a target through 1.09 the figure. This could easily be reached over the Fed event. On the other hand, the in-the-money longs could be put under heat beforehand and that would equate to a downside correction prior to the next bullish impulse.
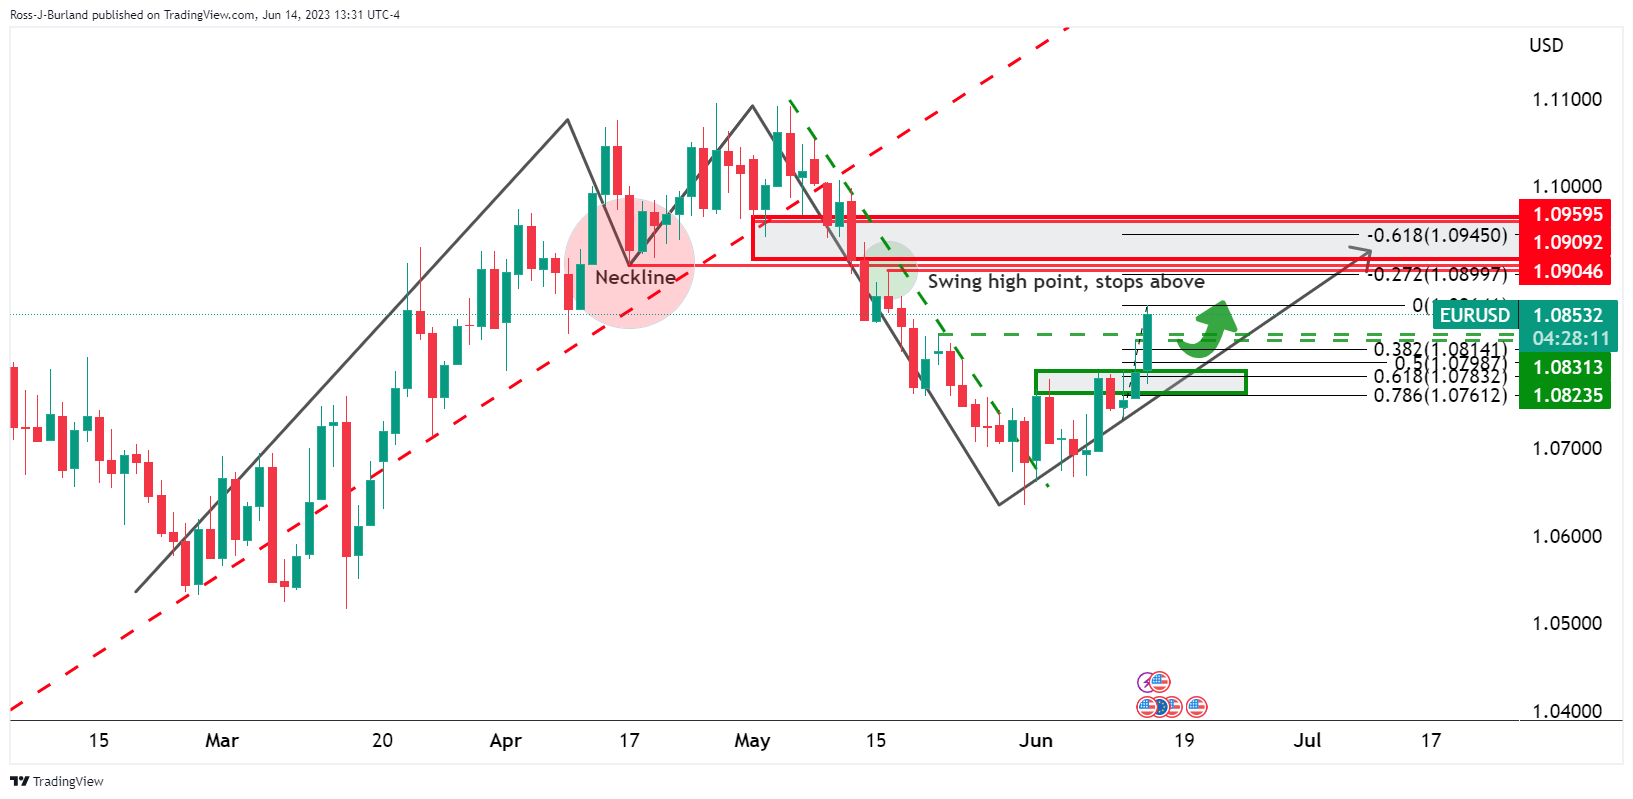
Moving down to the daily chart, this would bring in the Fibonacci scale as follows:
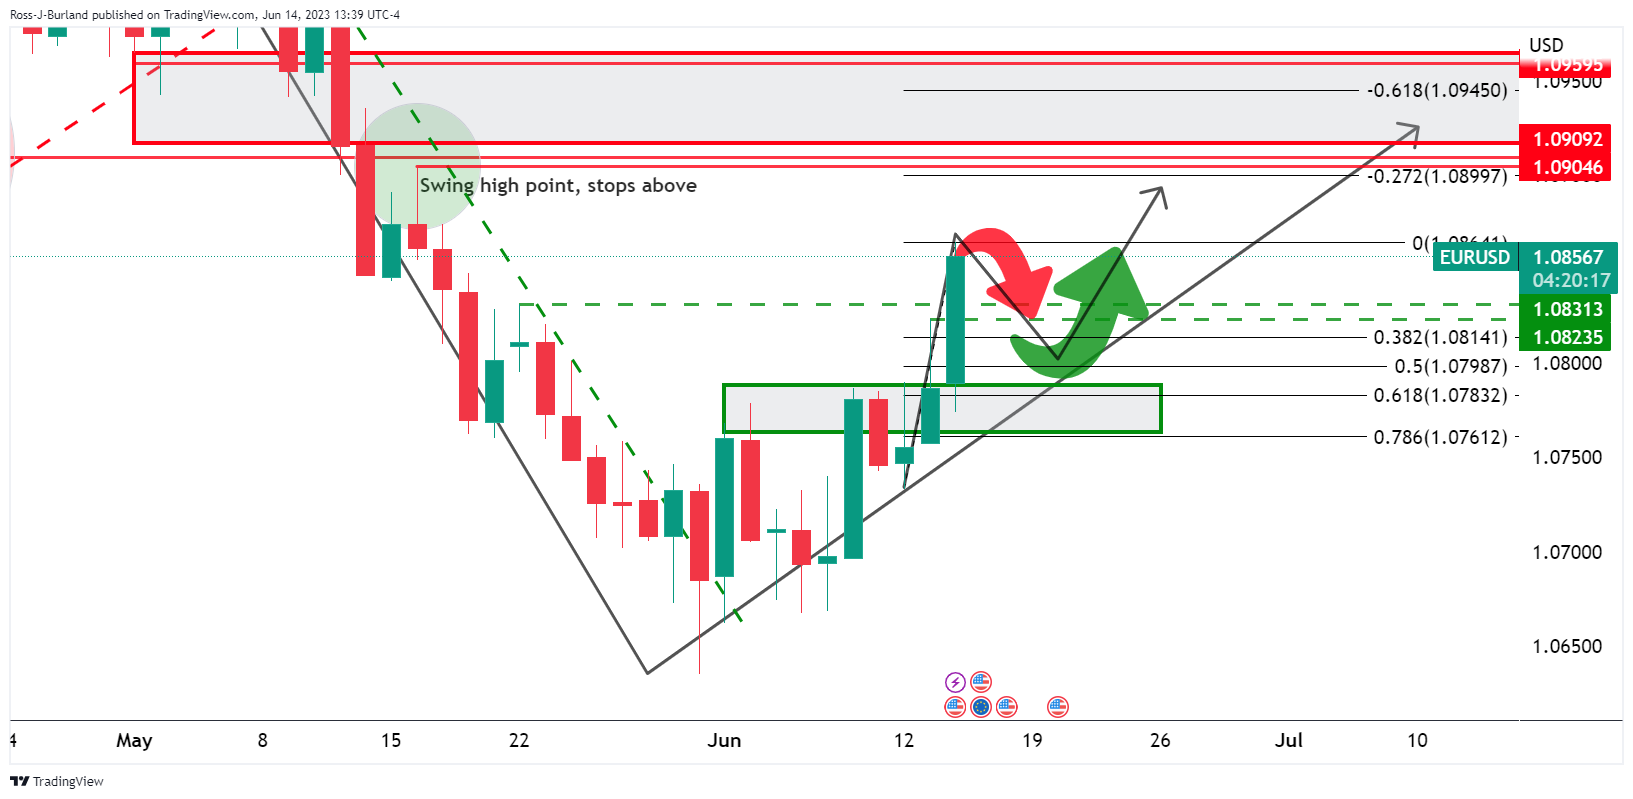
It is likely that the price action over the course of the Fed will be volatile and both sides of the range could easily be traded over the various stages of the event:
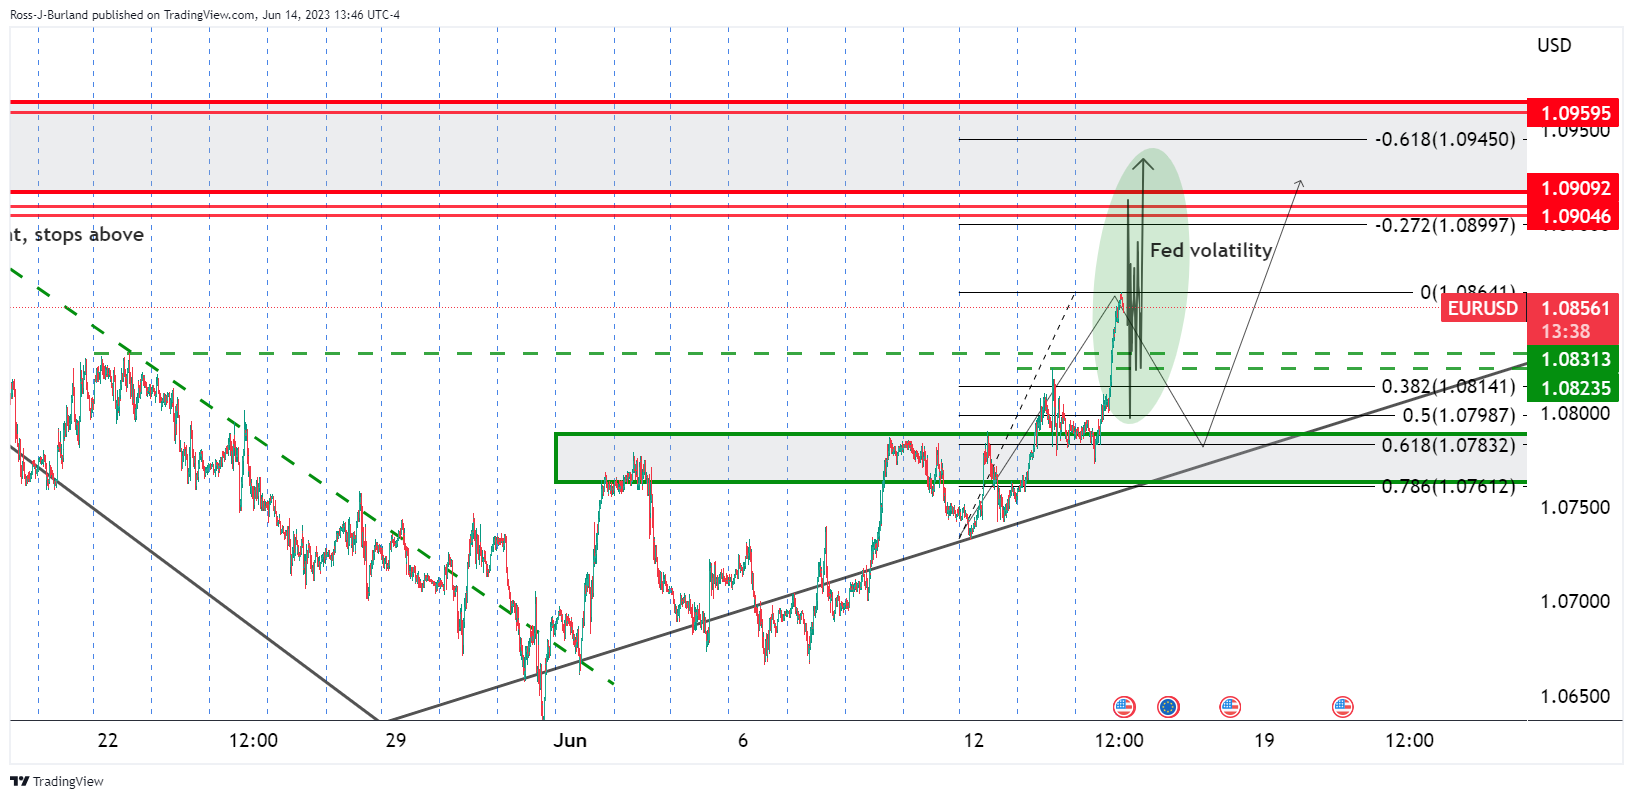
On the other hand, we may see capitulation of the bulls if the US dollar finds a bid:
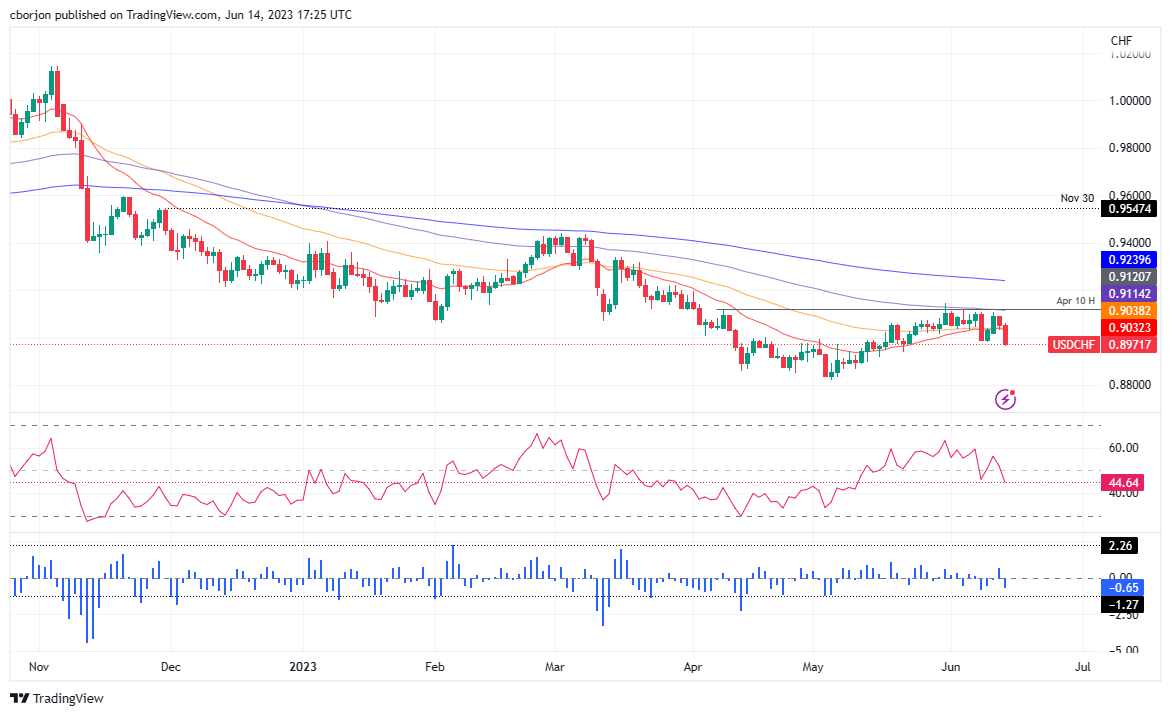
- USD/CHF slides below key technical support levels: 50 and 20-day EMAs.
- Bears target a May 22 swing low of 0.8940, with eyes on the psychological 0.8900 level.
- Oscillators RSI and RoC signal continued downward momentum.
USD/CHF nosedives ahead of the Federal Reserve’s (Fed) decision after falling below technical support levels, trading below the 0.9000 handle after reaching a daily high of 0.9060. At the time of writing, the USD/CHF is trading at 0.8969, down 0.90%.
USD/CHF Price Analysis: Technical outlook
The USD/CHF resumed its downward biased once it slid below the 50 and 20-day Exponential Moving Averages (EMAs), each at 0.9038 and 0.9033. After that, the USD/CHF extended its losses, surpassing the 0.9000 figure and falling to fresh three-week lows of 0.8965 before aiming for 0.8970. For a bearish continuation, the USD/CHF needs to clear the May 22 swing low of 0.8940, which would expose the 0.8900 psychological price level as the next support.
Conversely, USD/CHF buyers must reclaim the 0.9000 figure if they would like to see prices higher. That would open the door toward 0.9033/38, the confluence of the 20 and 50-day EMA, ahead of testing the intersection of the 100-day EMA and April 10 daily high at 0.9114/20.
Therefore, the USD/CHF trend remains downwards, supported by oscillators. The Relative Strength Index (RSI) and the three-day Rate of Change (RoC) remained in bearish territory.
USD/CHF Price Action – Daily chart
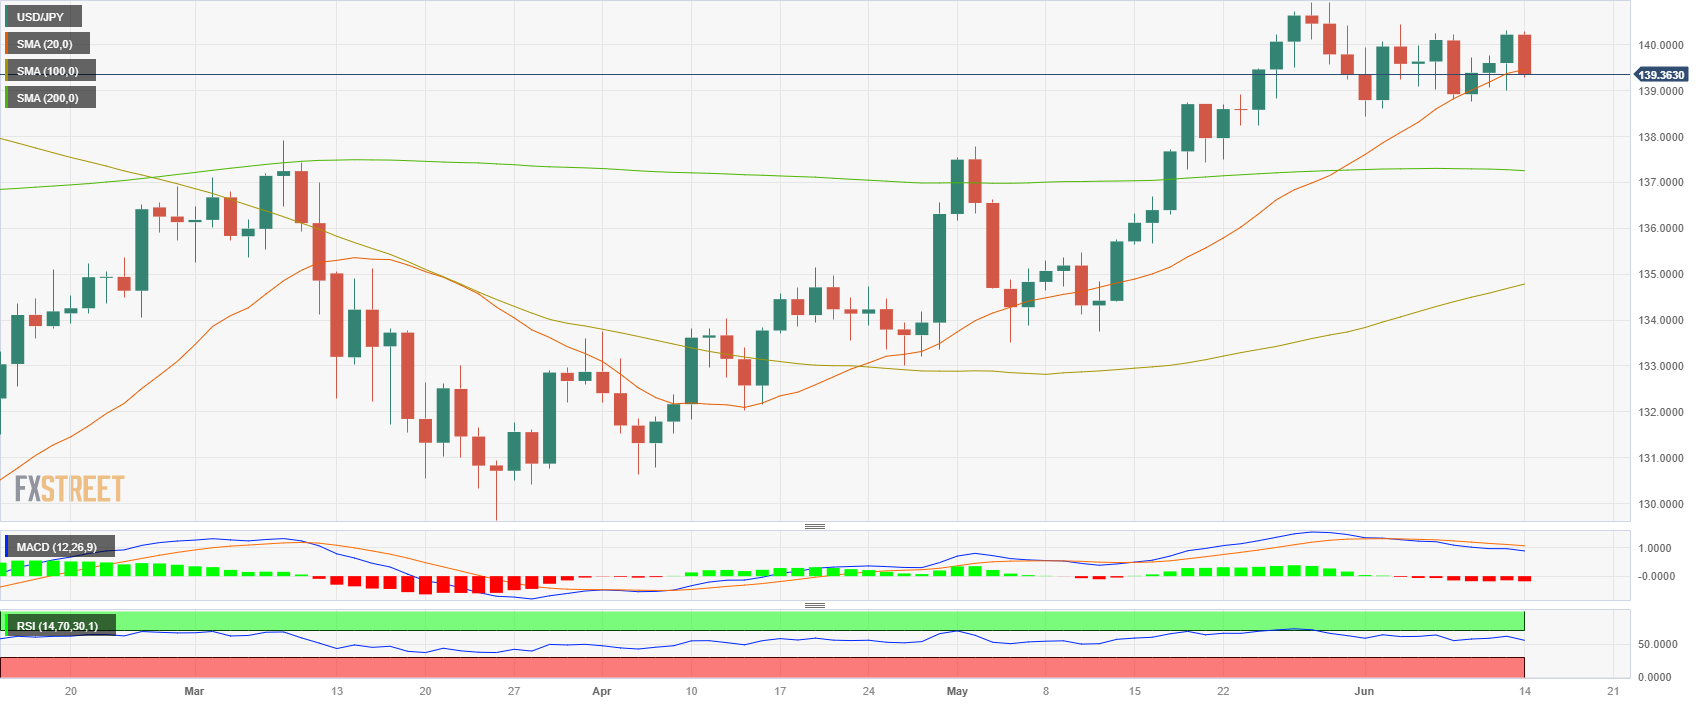
- USD/JPY lost the 20-day SMA at 139.44 and trades at the 139.35 area.
- The US Producer Price Index decreased by 0.3% MoM in May.
- Investors await Fed's decision and revised dot plots.
The USD/JPY lost over 60 pips during the New York session as the Greenback faced severe selling pressure after Producer Price Index (PPI) data from the US showed lower-than-expected ‘factory gate’ inflation. US bond yields are in decline, favoring the JPY, Ahead of the Federal Reserve’s (Fed) decision at 18:00 GMT.
Weak PPI data made US bond yields decline, and stocks rise
The US Bureau of Labor Statistics released on Tuesday the PPI report that showed a decrease of 0.3% MoM in May, more than the 0.1% slide expected; the YoY measure fell to 1.1%. On the other hand, the Core figure rose 0.2% MoM in the same period matching expectations, while the yearly came in at 2.8%.
As a result, the US bond yields have weakened across the curve and applied pressure to the USD. The 10-year bond yield fell to 3.79%, while the 2-year yield sits at 4.62% and the 5-year yield at 3.96%, marking a 1.58% slide, respectively. Elsewhere, the S&P 500 index (SPX) rose to its highest level since April 2022 and applied further pressure to the US Dollar as riskier assets drove away demand from the safe-haven Greenback and the JPY.
Regarding the Fed’s decision, markets continue to discount a no hike, and investors will look for clues regarding forward guidance in the updated macro forecast, the revised dot plots and in Chair Powell’s press conference. As for now, analysts expect that the Fed will resume tightening in the next July meeting, where market participants are expecting a 25 basis point (bps) hike.
USD/JPY Levels to watch
In terms of technical analysis, USD/JPY maintains a neutral stance for the short term as indicators turn red on the daily chart. That being said, the trajectory for the following sessions will be determined by the Fed’s decision and the expectations for future meetings.
After losing the 20-day Simple Moving Average (SMA) at the 139.45 level, support levels for the pair line up at the psychological mark at 139.00 and the 200-day (SMA) at 137.25. Furthermore, a move above the 140.00 zone would suggest a continuation of the bullish trend for USD/JPY, with next resistances at the 140.50 area and a multi-month high at 140.90.
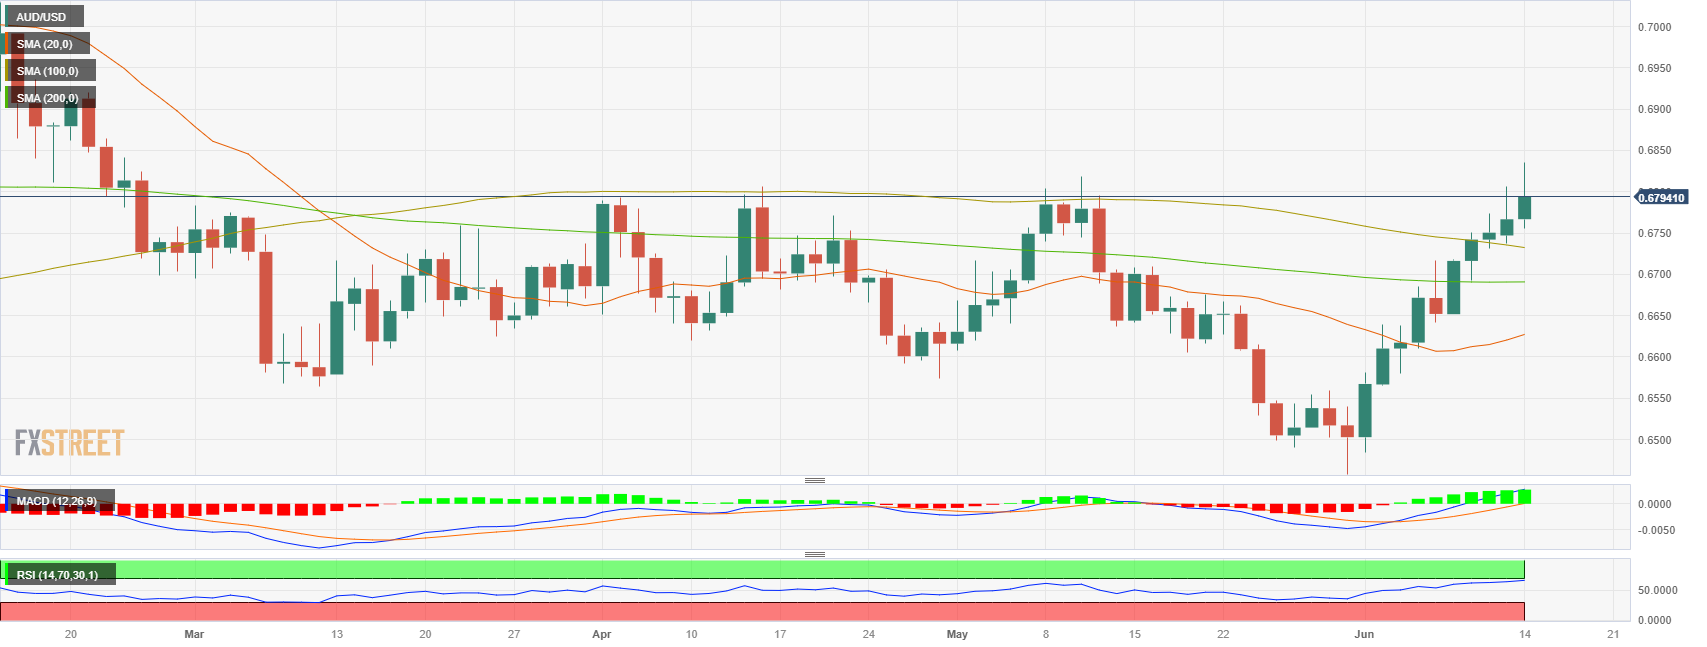
- AUD/USD climbs for five consecutive days, buoyed by a surprise rate hike from the Reserve Bank of Australia (RBA) and a weakening US Dollar (USD)
- The May US Producer Price Index (PPI) came in lower than expected, adding further pressure to the USD.
- Federal Reserve’s upcoming monetary policy announcement and economic projections may weaken USD further if they lean dovish.
AUD/USD has climbed for five days, underpinned by the latest Reserve Bank of Australia (RBA) hike surprise and leaning toward a soft US Dollar (USD). That, alongside a risk-on impulse ahead of a possible Federal Reserve (Fed) pause, maintains the Aussie (AUD) rally. The AUD/USD exchanges hands at 0.6829, at new four-month highs, after dropping to a low of 0.6762.
AUD/USD continues its rally to new four-month highs amid a softer US Dollar and risk-on market sentiment
A risk-on impulse is seen, with Wall Street registering gains. The Federal Reserve is expected to deliver a hawkish hold after measures of inflation showed signs of cooling but remained at levels twice the size of the Fed’s target.
The US Department of Labor revealed the Producer Price Index (PPI) for May came at 1.1% YoY below estimates, while the core reading rose by 2.8% YoY, lower than the 2.9% forecast. Although prices continued to be downtrend, core inflation remains stubbornly stickier than expected if we consider Tuesday’s core CPI above 5%.
The AUD/USD soared after the data release, breaking the 0.6800 figure and printing multi-month highs at around 0.6830s, while the greenback tumbled. The US Dollar Index (DXY), which measures the buck’s value vs. a basket of peers, falls 0.60%, at 102.688, its lowest level in four weeks.
In addition to revealing its monetary policy, the Fed will update economic projections and the dot plot. Analysts would scrutinize the reports looking for clues that the Fed is pausing its tightening cycle. Dovish surprises could be catastrophic for the buck and propel the AUD/USD toward the 0.69 handle.
On the Australian front, job data is eyed by AUD/USD traders. After a dismal report in April, the labor market is expected to remain solid, with the Aussie economy slashing 27,100 full-time jobs. A robust employment report would keep the RBA from easing policy until it remains confident the labor market is cooling down.
AUD/USD Price Analysis: Technical outlook
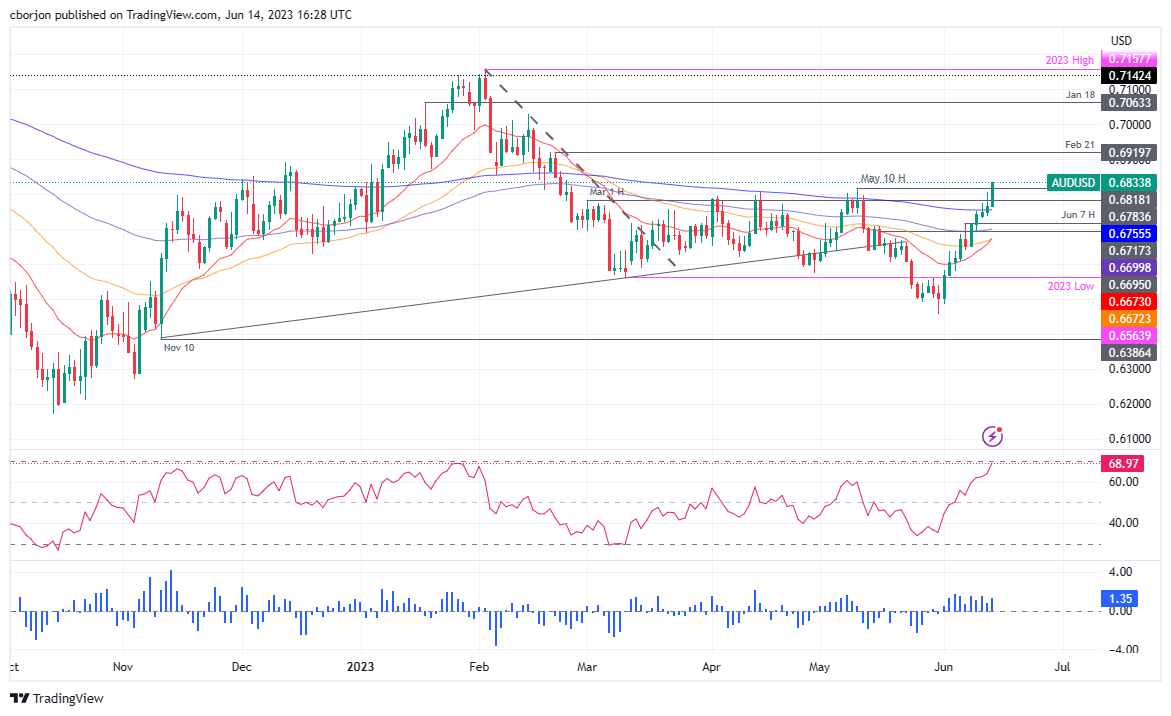
After cracking the 0.68 handle and the May 10 daily high of 0.6818, the AUD/USD distanced from the 200-day Exponential Moving Average (EMA), cementing its uptrend. But, Fed’s decision could rock the boat, and the five-day rally would put at risk buyers’ early gains. If the pair breaks below the 0.6800 figure, the AUD/USD could dip toward the 200-day EMA at 0.6755, but firstly must surpass the March 1 high at 0.6753. If those levels are broken, the AUD/USD subsequent sliding would be toward 0.6700. Conversely, the AUD/USD would extend its uptrend if it reclaims 0.6900, followed by the February 21 high at 0.6919.
Economists at ANZ Bank discuss Gold (XAU/USD) outlook.
Taking a breather
The probability of the Fed pausing in the upcoming meeting has risen, but strong economic activity is suggesting the Fed will remain hawkish in the short term. This could see the Gold price consolidating.
Nevertheless, the Fed would eventually end its hiking cycle in H2 2023, which is a structural support in the medium and long term. The prospect of the USD resuming its downtrend will be another tailwind.
We believe the recent decline in the Gold price will encourage fresh buying, which is likely to be supported by lean speculative positioning. We keep our year-end Gold price target unchanged near $2,100.
Economists at Deutsche Bank discuss EUR/USD outlook.
USD medium-term weakness dependent on a dovish Fed pivot
The USD has treaded water in recent months. We still expect the next leg to be lower, coming from an eventual dovish Fed pivot to easing. We expect this to materialise over Q4 followed by rate cuts next year.
Our year-end forecast for EURUSD remains at 1.15. The good news on the Euro side appears now to be in the price, with falling US yields the biggest potential driver for a move higher.
EUR/USD – Q3 2023 1.12 Q4 2023 1.15 Q4 2024 1.25
- Gold price rises as falling US Treasury bond yields enhance the appeal of the non-interest-bearing asset.
- May PPI data from the US BLS comes below expectations, supporting the Gold price.
- The US Dollar Index (DXY) falls to a four-week low, expecting a rescue from a hawkish Jerome Powell.
Gold price climbs as the North American session progresses due to falling US Treasury bond yields, ahead of the US Federal Reserve Open Market Committee (FOMC) decision. Another round of inflation data in the United States (US) further cemented the case for a Fed skip but also put a July interest rate increase at risk. At the time of writing, XAU/USD is trading at $1959.12 after hitting a low of $1942.29.
Gold rebounds as the USD weakens and Treasury yields fall; Eyes on the upcoming FOMC decision
US equities are trading mixed ahead of the FOMC’s decision. Data from the US Bureau of Labor Statistics (BLS) showed that inflation on the producer front in May, also known as the Producer Price Index (PPI), expanded at a slower pace than a 1.5% estimate, with yearly data coming at 1.1%. Nevertheless, core PPI rose 2.8% YoY, beneath forecasts of 2.9%, showing that core inflation remains stuck in the side of consumers and producers.
Expectations for the upcoming meeting show that analysts expect Jerome Powell and Co. to keep rates unchanged. Consequently, US Treasury bond yields edge lower, led by the 10-year note yielding 3.786%, down four basis points (bps). US real yields, which influence XAU/USD prices, are under pressure, at 1.584, five (bps) lower from its daily peak, a tailwind for XAU/USD.
In the meantime, the US Dollar Index (DXY), which measures the buck’s value vs. a basket of six currencies, drops 0.54%, at 102.747, its lowest level in four weeks.
The Fed’s decision will also update the central bank’s economic projections and the dot plot. After releasing the monetary policy statement, Fed Chair Jerome Powell will hit the stand, with most traders expecting him to deliver a hawkish message that could emphasize the Fed’s commitment to tackle inflation and keep their options open regarding monetary policy.
XAU/USD Price Analysis: Technical outlook
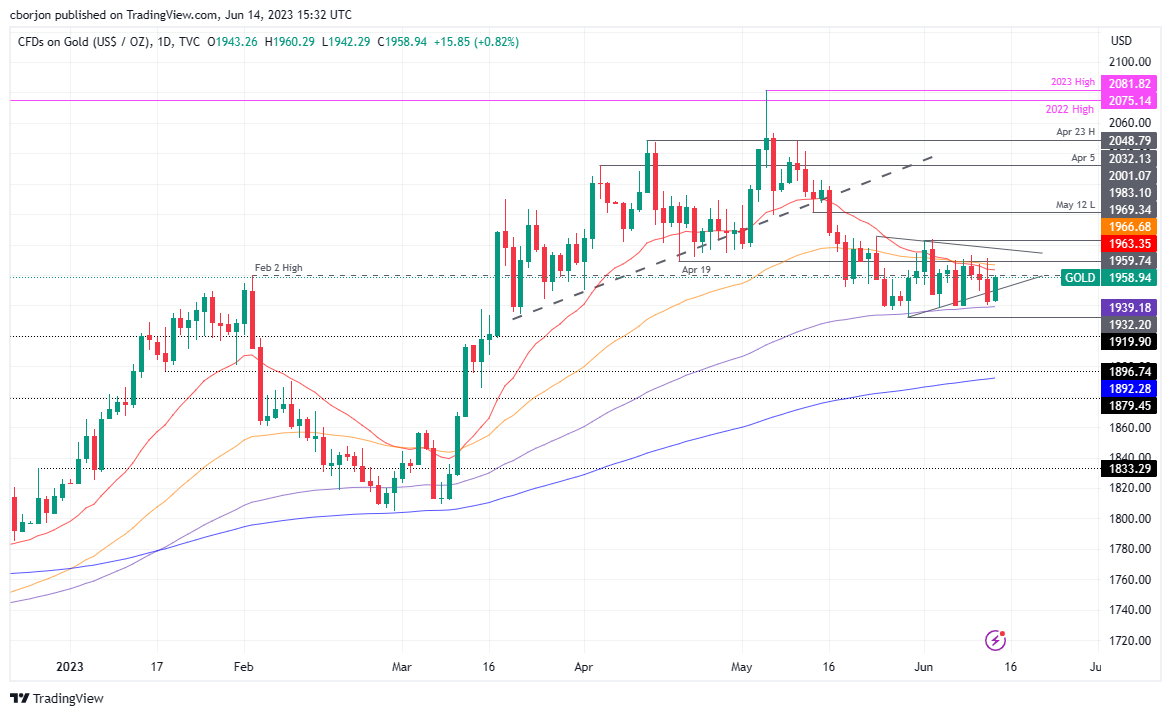
The XAU/USD is trading sideways from a technical perspective, as traders have been waiting for Fed’s June monetary policy decision. However, it should be said that after reaching a new year-to-date (YTD) high of $2081.82, Gold lost almost 6%, piercing down the April 19 swing low of $1959.74.
The XAU/USD has formed a symmetrical triangle on a downtrend, suggesting that further downside is expected. If XAU/USD breaks downwards, the first support would be the 100-day Exponential Moving Average (EMA) at $1939.14, followed by the May 30 daily low of $1932.20. Once cleared, sellers would target the $1900 figure. Conversely, for a bullish resumption, the XAU/USD must claim the intersection of the 20/50-day EMAs at $1963.18/$1966.61, followed by a resistance trendline at around $1970/80.
MUFG Bank’s GBP optimism is fading after a solid run since the start of the year.
GBP gains but downside risks
A weaker US Dollar will help support GBP/USD and while higher rates to fight inflation could prove supportive for the Pound, there are risks going forward that this could create concerns over growth.
With UK yields set to ease as the BoE underdelivers current expectations, GBP weakness could be evident versus EUR.
EUR/GBP Q2 2023 0.8650 Q3 2023 0.8750 Q4 2023 0.8850 Q1 2024 0.9000
GBP/USD Q2 2023 1.2600 Q3 2023 1.2910 Q4 2023 1.2990 Q1 2024 1.2670
EUR/JPY has pushed back up to 150. Economists at ING analyze the pair’s outlook.
Some independent BoJ tightening would be the bearish game changer
Any signs of US disinflation would allow risk assets to stay bid for longer, keeping EUR/JPY bid.
For the ECB, we and the market look for two more 25 bps hikes (June and July) taking the deposit rate to 3.75%. Our team also looks for the first ECB cut in 2Q24.
Unless some financial crisis emerges, it now looks like EUR/JPY can stay stronger for longer. Alternatively, some independent BoJ tightening would have to be the bearish game changer here.
Economists at CIBC Capital Markets expect the USD/MXN pair to inch higher for the rest of the year.
Two 25 bps rate cuts in Q4
We maintain our call for two 25 bps rate cuts in Q4. Moreover, we restate our upward USD/MXN bias for the rest of the year with a 19.00 forecast for Q3 and a 19.50 estimate by year-end 2023.
A deceleration in US growth coupled with our expectations of tighter MEX-US yield spreads remain the largest risks to MXN.
- Natural Gas rises as the US Dollar weakens ahead of the June Federal Open Market Committee (FOMC) meeting.
- Expectations are for the US Federal Reserve to leave interest rates unchanged at the meeting after recent tamer-than-expected inflation figures.
- The technical picture is still long-term bearish, although price action throughout most of 2023 has been broadly sideways.
Natural Gas price is trading roughly 1% higher on Wednesday as the US Dollar deepens its slide ahead of the key Federal Open Market Committee Meeting (FOMC) later in the day. Given Natural Gas is primarily priced and traded in US Dollars, a weakening of the currency means more Dollars are required to buy the same unit of Natural Gas.
Lower-than-expected US inflation figures have solidified market expectations that the US Federal Reserve (Fed) will not hike interest rates in June. Since higher rates tend to boost the US Dollar (USD) as they make the US a more attractive place for investors to park capital – a decision not to hike puts pressure on USD.
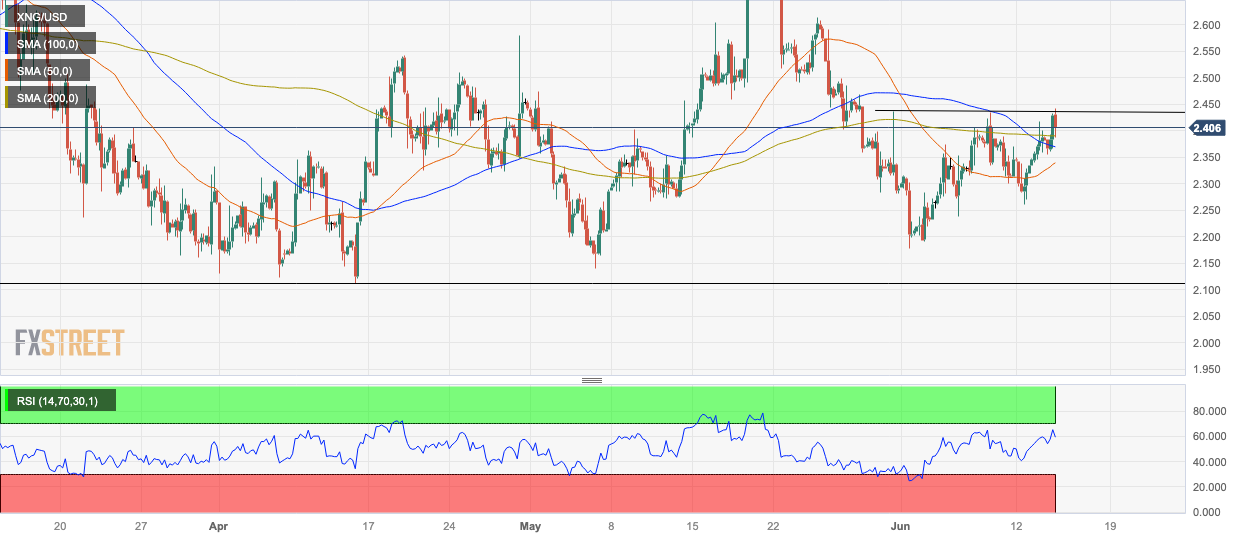
At the time of writing, Natural Gas is trading at $2.402 per MMBtu.
Natural Gas news and market movers
- Natural Gas price rises as a result of a weaker US Dollar, which is falling on increasingly firm expectations that the Fed will keep the Fed Funds rate at its current level when it decides on policy changes at its meeting later on Wednesday.
- The US Producer Price Index for May, which measures ‘factory gate’ inflation, came out lower than economists had foreseen on Wednesday, with the MoM figure showing a 0.3% slide vs. the 0.1% dip expected, and YoY a slower 1.1% rise vs. the 1.5% predicted.
- Factory gate inflation is viewed by many as a foretaste of broader inflation to come, as it usually impacts wholesale prices, which are often passed on to consumers.
- Data from the Permian Basin in the US, the second largest source of Natural Gas in the country, showed an increase in production compared to the previous year to a record historical high, according to a report by the Energy Information Administration (EIA).
- “Gross natural gas withdrawals in the Permian region set an annual record high in 2022 at 21.0 billion cubic feet per day (Bcf/d), 14% above the 2021 average,” said the EIA report.
- Traders will now await the outcome of the FOMC meeting for subtle hints as to the future direction of monetary policy (impacting the US Dollar) and EIA Natural Gas inventory data out at 14:30 GMT on Thursday, June 15.
Natural Gas Technical Analysis: Consolidating within broader downtrend
Natural Gas spot price is in a long-term downtrend after turning lower from its peak high of $9.960 MMBtu in August 2022. It continues to make lower lows, though bearish momentum has tapered off considerably since February 2023.
Nevertheless, it is not clear whether Natural Gas price is consolidating before taking a step lower or forming a base from which to launch a trend reversal higher. Unless it can break above the last lower high of the main downtrend at the February 2023 peak high of $3.079 MMBtu, the odds continue to favor the dominant trend and a continuance lower, and shorts favored over longs.
A break below the $2.110 MMBtu lows would solidify the bearish outlook and suggest a continuation down to a target at $1.546 MMBtu, the 61.8% Fibonacci extension of the height of the roughly sideways consolidation range that has unfolded during 2023.
-638223492590545312.png)
Natural Gas: Weekly Chart
Scoping into the daily chart, it can be seen that price has broken above the 50-day Simple Moving Average (SMA) but has been rebuffed by the 100-day SMA during the early session on Thursday. The 100-day SMA is likely to present a considerable hurdle for bulls and would require a decisive break to overcome.
Decisive bullish breaks are characterized by a break through a level by a longer-than-average green daily candle, which closes near to its high or three green daily candles in a row.
-638223493071214430.png)
Natural Gas: Daily Chart
Looking at the 4-hour chart, a continuation higher in the short term is dependent to a greater degree on price managing to close above the May 31 high of $2.433 MMBtu.
Natural Gas: 4-hour Chart
The Relative Strength Index (RSI) is closely reflecting price, which is bullish. It peaked at the day’s highs compared to the lower June 8 highs when the RSI was also a touch lower. This keeps the torch of hope alive for bears in the short term and there could be further attempts higher.
Natural Gas FAQs
What fundamental factors drive the price of Natural Gas?
Supply and demand dynamics are a key factor influencing Natural Gas prices, and are themselves influenced by global economic growth, industrial activity, population growth, production levels, and inventories. The weather impacts Natural Gas prices because more Gas is used during cold winters and hot summers for heating and cooling. Competition from other energy sources impacts prices as consumers may switch to cheaper sources. Geopolitical events are factors as exemplified by the war in Ukraine. Government policies relating to extraction, transportation, and environmental issues also impact prices.
What are the main macroeconomic releases that impact on Natural Gas Prices?
The main economic release influencing Natural Gas prices is the weekly inventory bulletin from the Energy Information Administration (EIA), a US government agency that produces US gas market data. The EIA Gas bulletin usually comes out on Thursday at 14:30 GMT, a day after the EIA publishes its weekly Oil bulletin. Economic data from large consumers of Natural Gas can impact supply and demand, the largest of which include China, Germany and Japan. Natural Gas is primarily priced and traded in US Dollars, thus economic releases impacting the US Dollar are also factors.
How does the US Dollar influence Natural Gas prices?
The US Dollar is the world’s reserve currency and most commodities, including Natural Gas are priced and traded on international markets in US Dollars. As such, the value of the US Dollar is a factor in the price of Natural Gas, because if the Dollar strengthens it means less Dollars are required to buy the same volume of Gas (the price falls), and vice versa if USD strengthens.
The European Central Bank (ECB) is set to announce its decision on monetary policy on Thursday, June 15 at 12:15 GMT and as we get closer to the release time, here are the expectations as forecast by the economists and researchers of 11 major banks.
ECB is fully expected to deliver one more interest rate hike by 25 basis points (bps), taking the deposit rate to 3.50%, as well as a decision to end APP reinvestments. Risks are tilted towards the hiking cycle continuing for longer than this.
Nordea
The ECB will continue on a path of 25 bps rate hikes, and we think such a path will extend at least to the July meeting. The new staff forecasts are likely to see slight upward revisions on inflation, giving the hawks more ammunition. We see risks tilted towards a hawkish market interpretation of the ECB’s message and thus somewhat higher market interest rate expectations. New liquidity measures look unlikely.
ING
A 25 bps rate hike looks like a done deal. However, with growth disappointing, the economic outlook getting gloomier and inflation dropping, arguments for several more rate hikes are becoming weaker. That said, the ECB is likely to ignore this.
Standard Chartered
We still expect a 25 bps hike this week and we now lean towards a final 25 bps hike in July, taking the deposit rate to 3.75% (3.50% previously). We then envisage a hawkish pause in September, assuming stronger evidence of a sustained downtrend in core inflation or signs that the labour market has turned a corner.
Deutsche Bank
We expect the ECB to hike 25 bps to 3.50%. Several Governing Council members have signalled quarter-point hikes in June and July, consistent with our baseline expectation for a terminal rate of 3.75% in July. On the whole, we expect the message to tilt hawkish. We expect the ECB to emphasize the high level and persistence of underlying inflation and ongoing upside risks to inflation despite the recent declines and some forecast revisions. We expect the ECB to leave the possibility of a terminal rate above 3.75% on the table and to encourage the market to price out some of the 2024 rate cuts.
Commerzbank
It is all but certain that the ECB will raise its key interest rates by a further 25 bps, which would put the currently most important interest rate – the deposit rate – at 3.5%. Not only have the hawkish members of the Governing Council, who generally favour a tighter monetary policy, pushed for further rate hikes, but even the doves have suggested another rate hike at least at this upcoming meeting.
Rabobank
We expect no policy surprises, saving the limelight for the ECB’s new economic projections. A 25 bps rate hike has been well-telegraphed and is firmly priced. The ECB will probably confirm its plan to stop APP reinvestments as of July.
TDS
There is little doubt that the ECB will deliver another 25 bps hike at the June meeting, bringing the deposit rate to 3.50%. While the majority of Governing Council members appear to agree that a 3.75% terminal rate is the minimum for this tightening cycle, forward guidance is likely to remain non-committal.
Nomura
We expect the ECB to raise each of its three policy rates by 25 bps at its June meeting, which would result in the depo rate reaching 3.50%. In our view, the ECB will likely raise its core inflation forecasts over the whole of its forecast horizon. As for its headline inflation forecasts, we expect it to be raised this year, and be little changed during 2024 and 2025. We expect the ECB to marginally lower its GDP growth forecasts. The ECB will most likely maintain similar rhetoric to that of its May meeting, as in our view it is probably comfortable with current market pricing for rate hikes, though it will likely have issue with markets continuing to price cuts this year (even if only marginally so). In our view, the ECB is likely to begin cutting only in Q4 2024 at the earliest.
SocGen
25 bps hike in all key rates. More rate hikes likely needed but data are currently mixed. Downside risks to growth have increased, with risks to inflation remaining to the upside due to the strength of the labour market. Inflation expectations and wage growth to be closely monitored. Further action to depend on data and impact of past tightening.
Wells Fargo
We expect the ECB to deliver another 25 bps rate hike to 3.50%. Looking ahead, given persistently high inflation, we recently added in more monetary tightening into our Deposit Rate forecast, and now expect a higher peak of 3.75%. ECB President Lagarde has stressed that the central bank's future decisions will ensure policy rates will be brought to levels sufficiently restrictive to achieve a timely return of inflation to 2% and will be kept at those levels for as long as necessary. As such, we now don't expect the ECB to begin its easing cycle until Q2-2024.
ANZ
We expect the ECB to raise its key policy rates by 25 bps at this week’s Governing Council meeting. That would leave the cumulative rise in key policy rates since last July at 400 bps. We expect the ECB to raise rates another 25 bps in July. We think the ECB may then pause but maintain a tightening bias, emphasising that policy tightening works with a lag. We anticipate no early cut in rates.
- USD/TRY now gives some signs of stabilization below 23.7000 .
- The lira looks cautious ahead of the next CBRT meeting on June 22.
- President Erdogan ruled out a change in his view on monetary policy.
USD/TRY trades within a tight range near 23.60 on Wednesday, adding to the inconclusive price action seen in the previous session.
USD/TRY: Solid resistance emerges around 23.7000
The needle-like rally in USD/TRY seems to have met quite a decent barrier around 23.7000 so far.
Indeed, some respite for the beleaguered lira seems to have emerged after President Erdogan said he “accepted” the views from the freshly appointed economic team, after finmin M. Simsek suggested he will take swift steps in coordination with the central bank.
However, Erdogan later stressed that his particular views on monetary policy, especially regarding interest rates, have not changed, opening the door to further uncertainty ahead of the next monetary policy meeting by the Turkish central bank (CBRT) on June 22.
Indeed, it remains currently unclear whether Governor Erkan will be effective in implementing her monetary policies while working under the leadership of Erdogan. The first challenge is expected to occur later in the month during the CBRT gathering. There is a significant difference in opinions among investors regarding the appropriate course of action, with suggestions ranging from minor interest rate increases to a potentially drastic strategy involving a substantial rate hike.
What to look for around TRY
USD/TRY’s rally appears to have entered and impasse, as market participants gear up for the next CBRT event due later in the month.
In the meantime, investors are expected to closely monitor upcoming decisions on monetary policy, particularly after President R. T. Erdogan named former economy chief M. Simsek as the new finance minister following the cabinet reshuffle in the wake of the May 28 second round of general elections.
The appointment of Simsek has been welcomed with optimism by market members in spite of the fact that it is not yet clear whether his orthodox stance on monetary policy can survive within Erdogan’s inclination to battle inflation via lower interest rates.
In a more macro scenario, price action around the Turkish lira is supposed to continue to spin around the performance of energy and commodity prices - which are directly correlated to developments from the war in Ukraine, broad risk appetite trends, and dollar dynamics.
Key events in Türkiye this week: Budget Balance (Thursday) – End Year CPI Forecast (Friday).
Eminent issues on the back boiler: Persistent skepticism over the CBRT credibility/independence. Absence of structural reforms. Bouts of geopolitical concerns.
USD/TRY key levels
So far, the pair is gaining 0.01% at 23.5840 and faces the next hurdle at 23.6804 (all-time high June 12) followed by 24.00 (round level). On the downside, a break below 20.0526 (55-day SMA) would expose 19.5261 (100-day SMA) and finally 19.0465 (200-day SMA).
Measured against the EUR, the Pound has inched higher to levels last seen in December last year. Economists at Rabobank have revised their GBP forecast modestly higher.
GBP could begin to falter despite the higher rate environment
If the market begins to assess that the Bank may have to push the economy into recession into order to push CPI inflation back to 2%, GBP could begin to falter despite the higher rate environment.
We have revised our one-month EUR/GBP forecast to 0.86 from 0.87. However, we still see risk of EUR/GBP 0.90 on a 12-month view.
- NZD/USD has climbed strongly to 0.6200 as the USD Index has fallen like a house of cards.
- Softer US PPI has strengthened the demand for US bonds, which has brought down 10-year US Treasury Yields to 3.78%.
- The New Zealand economy is expected to show a mild contraction by 0.1% in the first quarter.
The NZD/USD pair has demonstrated a solid rally to the round-level resistance of 0.6200 as the US Dollar Index (DXY) has fallen like a house of cards. The Kiwi asset has been strengthened as May’s United States Producer Price Index (PPI) has cooled down due to lower gasoline prices.
S&P500 futures have surrendered the majority of gains added in Europe as investors are looking forward to the interest rate decision and the release of the dot plot by the Federal Reserve (Fed). US equities are losing their charm for the time being, however, its broader appeal is still solid as investors are extremely confident that a neutral stance will be taken by Fed chair Jerome Powell.
Analysts at Commerzbank cited Fed’s Powell may try his best to make a July hike seem likely. But I hope that the currency market is not so stupid as to overlook the obvious contradiction between words and deeds that this would create.
The USD Index has extended its downside journey to near 102.90 as firms have passed on the comfort of lower gasoline prices to end consumers by reducing prices of goods and services at factory gates. Monthly headline PPI has contracted by 0.3% in May while the street was anticipated a 0.1% contraction while core PPI has maintained its pace at 0.2% as expected by the market participants in the same period.
Softer US PPI has strengthened the demand for US government bonds, which has brought down 10-year US Treasury Yields to 3.78%.
Meanwhile, the New Zealand Dollar is going to heavily react to the Q1 Gross Domestic Product (GDP) data, which will be announced on Thursday. According to the preliminary report, Quarterly GDP is seen contracting by 0.1% against a prior contraction of 0.6%. On an annualized basis, the economic data is expected to expand by 2.6%, higher than the prior contraction of 2.2%.
USD/JPY is all about bond yields, not short rates. Economists at Société Générale discuss the pair’s outlook.
Chances of a further YCC this week are very remote
USD/JPY fell further than relative yields suggested after yield curve control bands were widened late last year. It has now corrected most of that move, as the chances of a further YCC this week are very remote.
However, another change is likely in the coming months (we forecast one next month), and if we’re also close to the latest peak in US yields, it seems almost inevitable that we’ll see another big USD/JPY fall in the next few months.
- EUR/USD has jumped strongly to near 1.0820 as US PPI has softened significantly inspired by lower gasoline prices.
- US monthly headline PPI has registered deflation while core PPI has maintained its pace at 0.2%.
- The ECB is expected to raise interest rates by 25bps to 4% in order to sharpen its quantitative tools in the battle above 6% inflation.
The EUR/USD pair has accelerated dramatically to near 1.0820 after the United States Producer Price Index (PPI) data shows wider-than-expectations deflation. Monthly headline PPI contracted by 0.3% in May while the street was anticipating a 0.1% contraction. Investors should note that the economic data reported a pace of 0.2% in April. Annualized headline PPI has softened to 1.1% vs. the consensus of 1.5% and the prior release of 2.3%.
Contrary to that, US monthly core PPI has maintained its pace at 0.2% as expected by the market participants. The annualized core PPI has decelerated to 2.8% against the expectations of 2.9% and the former release of 3.1%.
The impact of weak oil prices is clearly visible in extremely soft PPI figures. Firms have passed on the impact of the sheer decline in gasoline prices to the end consumers as the street has not recognized any sign of a slowdown in the overall demand yet.
It looks like in the list of soft inflation, easing labor market conditions, and weak economic activities, decelerated PPI has been added, which would propel the need of skipping interest rate hikes by the Federal Reserve (Fed). The US Dollar Index (DXY) has attracted significant offers after softer-than-anticipated and has dropped below the crucial support of 103.00.
On the Eurozone front, investors are awaiting the interest rate decision by the European Central Bank (ECB). ECB President Christine Lagarde is expected to raise interest rates by 25 basis points (bps) to 4% in order to sharpen its quantitative tools in the battle above 6% inflation.
Economists at Danske Bank expect a pause by the Fed could pose near-term upside risks to EUR/USD, but we still maintain a bearish view on the cross towards the second half of CY2023.
Economists at Deutsche Bank share their S&P 500 Index forecast.
Equities should continue to grind higher
While the move up in positioning now looks complete, if earnings remain robust, so will buybacks, and equities should continue to grind higher. We continue to target S&P 4,500 by year-end.
With discretionary investors focused on a long list of concerns that are unlikely to be resolved soon, we expect the grind higher to be choppy.
At the regional level, we move from overweight to neutral on European equities as they posted one of their strongest outperformances on record, and expect limited relative upside in H2.
- Federal Reserve is widely expected to leave its policy rate unchanged at 5-5.25%.
- Fed will publish the revised Summary of Economic Projections in June.
- US Dollar valuation could be impacted by dot plot and FOMC Chairman Powell’s comments.
The Federal Reserve (Fed) is expected to leave its policy rate unchanged at the range of 5%-5.25% on Wednesday, June 14 at 18.00 GMT.
The Fed will release the revised Summary of Economic Projections (SEP), the so-called dot plot, and FOMC Chairman Jerome Powell will comment on the policy decisions and economic outlook in the post-meeting press conference.
The market positioning suggests that a no change in the Fed’s policy rate is nearly fully priced in, especially after the data from the US showed that the Consumer Price Index (CPI) rose 4% on a yearly basis in May, down sharply from the 4.9% increase recorded in April. According to the CME Group FedWatch Tool, the probability of a 25 basis points Fed rate hike in June is less than 10%.
Analysts at Rabobank see the US central bank resuming the hiking cycle in July:
“Given Powell’s bias toward a pause in June, we expect the FOMC to keep the target range for the federal funds rate unchanged this month.”
“However, because of the reacceleration of the economy, and the modest impact of the banking turmoil on credit conditions, we now expect the FOMC to resume the hiking cycle in July in order to get inflation under control. For now, we expect one rate hike of 25 bps, followed by a longer pause, at least through the end of the year.”
Federal Reserve interest rate decision: What to know in markets on Wednesday, June 14
- The US Dollar Index, which tracks the USD’s performance against a basket of six major currencies, continues to decline heading into the Fed decision, reflecting a broad USD weakness.
- The benchmark 10-year US Treasury bond yield dropped below 3.7% with the initial reaction to the US inflation data but recovered toward 3.8% on Wednesday.
- Wall Street’s main indexes closed in positive territory on Tuesday. The S&P 500 Index reached its highest level since late April above 4,300.
- On Thursday, the US Census Bureau will release Retail Sales report for May. The Fed’s Industrial Production will also be featured in the US economic docket alongside the weekly Initial Jobless Claims data this week.
- The European Central Bank (ECB) is expected to hike its key rates by 25 bps.
- On a monthly basis, the Producer Price Index (PPI) in the US declined 0.3% in May. The annual producer inflation fell to 1.1% from 2.3% in April.
When is the Fed meeting and how could it affect EUR/USD?
The Federal Reserve is scheduled to announce its interest rate decision and publish the revised Summary of Economic Projections (SEP), the so-called dot plot, this Wednesday, June 14, at 18:00 GMT. This will be followed by the post-meeting FOMC press conference at 18:30 GMT. Investors expect the Fed to leave the policy rate unchanged but see a strong probability for at least one more rate hike this year.
Following the collapse of several mid-sized banks in the United States, the Fed unexpectedly changed its policy language in March and said “some additional policy firming” may be appropriate to bring down inflation, dropping the reference to "ongoing increases." In May, the Fed raised its policy rate by 25 basis points (bps) to the range of 5%-5.25%. In the ensuing press conference, FOMC Chairman Jerome Powell acknowledged that it was difficult to predict how much credit tightening will replace the need for any further rate hikes. Powell, however, reiterated that it would not be appropriate to cut rates later in the year, given the view that inflation will take some time to come down.
In March, the Fed’s SEP showed that the median view of the policy rate at end-2023 stood at 5.1%, matching December's projection. The publication further revealed that policymakers saw a slower Gross Domestic Product (GDP) growth in 2023, alongside lower unemployment and less progress on inflation than they saw in December. Finally, projections pointed to a total of 75 bps of rate cuts in 2024.
Unless the Fed delivers a significant hawkish surprise by going against the market expectation and raising the interest rate by 25 bps, the US Dollar’s performance is likely to be effected by the terminal rate projection in the dot plot, which can confirm whether the Fed leaves the door open to additional rate hikes even if the policy rate is left unchanged in June.
Previewing the Fed event, “we still think the bar for restarting hikes in July will be high unless inflation pressures clearly accelerate over summer, which we consider unlikely,” said analysts at Danske Bank. “We make no changes to our forecasts, and expect the Fed to maintain rates at the current level for the remainder of the year. A pause could pose near-term upside risks to EUR/USD, but we still maintain a bearish view on the cross towards H2.”
Eren Sengezer, European Session Lead Analyst at FXStreet, shares his outlook for EUR/USD: “A 25 bps Fed rate hike or a terminal rate projection above 5.5% could trigger a decisive rally in the US Dollar and weigh heavily on EUR/USD. On the flip side, a no change in the policy rate combined with a downward revision to end-2024 rate projection could provide a boost to the pair. Market participants will also pay close attention to Powell’s comments. If Powell mentions that credit tightening is less severe than initially feared, that could be seen as a hawkish tone, helping USD stay resilient against its rivals and vice versa. On the other hand, the USD is likely to come under selling pressure in case Powell sounds concerned about the economic activity losing momentum.”
“The near-term technical outlook is yet to show a convincing bullish sign. The Relative Strength Index (RSI) indicator on the daily chart stays slightly above 50 and EUR/USD failed to make a daily close above the 100-day Simple Moving Average (SMA), currently located at 1.0800, despite having climbed above this level on Tuesday.”
“In case the pair confirms 1.0800 as support, it is likely to face resistance at 1.0860 (Fibonacci 50% retracement) before targeting 1.0900 (psychological level, Fibonacci 61.8% retracement) and 1.0960 (static level from early April).”
“On the downside, EUR/USD could slide toward 1.0750 (Fibonacci 23.6% retracement) and 1.0700 (psychological level, static level) if it returns below 1.0800,” Eren explains.
Federal Reserve related content
About Federal Reserve
The Federal Reserve System (Fed) is the central banking system of the United States and it has two main targets or reasons to be: one is to keep unemployment rate to their lowest possible levels and the other one, to keep inflation around 2%. The Federal Reserve System's structure is composed of the presidentially appointed Board of Governors, partially presidentially appointed Federal Open Market Committee (FOMC). The FOMC organizes 8 meetings in a year and reviews economic and financial conditions. Also determines the appropriate stance of monetary policy and assesses the risks to its long-run goals of price stability and sustainable economic growth. FOMC Minutes are released by the Board of Governors of the Federal Reserve and are a clear guide to the future US interest rate policy.
Economists at Credit Suisse discuss the Federal Reserve interest rate decision and its implications for the US Dollar.
Fed surprises with a 25 bps hike (25% odds)
The Fed might find it easier to simply hike again and point to data dependency being a real thing and dominating over its recent language. Clearly, in this situation, the knee-jerk reaction would be a stronger USD. The Fed would need to signal a willingness to keep going even after a hike today and/or also raise materially the “dots” profile (by at least 25 bps for ’23 and ’24 medians) for the USD to build on knee-jerk gains.
Fed holds rates steady but with a hawkish message (65% odds)
This could involve either flagging strongly a 25 bps hike in July or alternatively using other elements like the ‘dots’ to signal hawkishness. Equity market strength is one reason to expect the market to price out quite as fast and deep a Fed cutting cycle from Q4 ’23 onwards as it had priced in. This especially benefits the USD against low / falling yielders like JPY and CNH, and helps support our existing USD/JPY 145.00 near-term target and also our view that USD/CNH can rise easily towards 7.30.
Fed holds rates steady with a dovish message (10% odds)
This scenario involves the Fed stressing the dovish elements of recent data only and signaling strongly that rates may have already peaked and/or have room to fall quickly, using a combination of language and ‘dots’ that are surprisingly low. Such an outcome would be USD-bearish across the board.
- EUR/USD maintains the bid bias unchanged above the 1.0800 hurdle.
- Further upside could likely see the 55-day SMA revisited in the near term.
EUR/USD adds to the weekly leg higher and looks to consolidate the breakout of the key 1.0800 mark on Wednesday.
A more serious bullish attempt is expected to quickly surpass the so far monthly high at 1.0823 (June 13), to then refocus on the transitory 55-day SMA, today at 1.0878. North from here comes the weekly top at 1.0904 (May 16).
Looking at the longer run, the constructive view remains unchanged while above the 200-day SMA, today at 1.0531.
EUR/USD daily chart
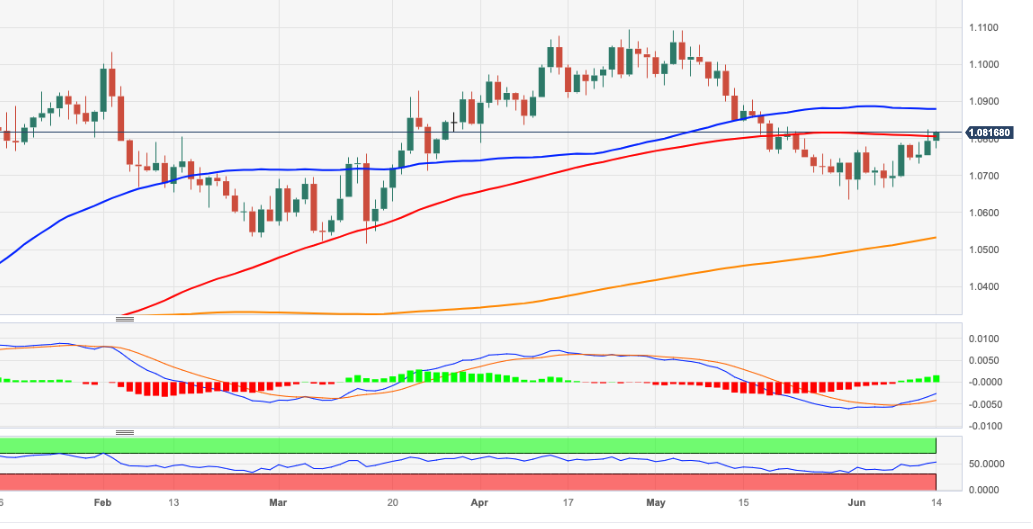
- Annual producer inflation in the US rose at a softer pace than expected in May.
- US Dollar Index breaks below 103.00 to fresh weekly lows.
The Producer Price Index (PPI) for final demand in the US rose 1.1% on a yearly basis in May, down from the 2.3% increase recorded in April, the data published by the US Bureau of Labor Statistics revealed on Wednesday. This reading came in lower than the market expectation of 1.5%. It is the lowest level since December 2020.
The annual Core PPI increased 2.8% in the same period, compared to the market expectation of 2.9%. On a monthly basis, the PPI declined 0.3% and the Core PPI rose 0.2%.
Market reaction:
The US Dollar fell across the board after the PPI report, with the DXY breaking below 103.00 and reaching its lowest level since May 22. The greenback is under pressure following Tuesday's release of the US Consumer Price Index and ahead of the FOMC statement, which is set to be released later on Wednesday.
- AUD/USD has climbed to near 0.6800 ahead of the Federal Reserve policy.
- The catalyst that is driving minor caution in the risk profile is the Fed’s dot plot, which is likely to remain hawkish.
- Steady labor market conditions and a surprise jump in inflationary pressures would force the RBA to raise rates further.
The AUD/USD pair has jumped to near the round-level resistance of 0.6800 in the European session. The Aussie asset is likely to extend gains further as the US Dollar Index (DXY) is looking to resume its downside journey. Less-confident recovery move in the USD Index seems concluding now as a neutral interest rate policy projection by the Federal Reserve (Fed) is still intact.
S&P500 futures have trimmed some gains as investors are turning cautious ahead of the interest rate decision by the Fed. The overall market mood is still cheerful as the Fed’s policy-tightening spell is expected to find a temporary pause.
The catalyst that is driving minor caution in the market sentiment is the Fed’s dot plot, which is likely to remain hawkish. Analysts at Danske Bank expect the Fed to maintain rates unchanged. The focus will be on communication around potential hike in July & the updated dots. The Fed is unlikely to close the door for hikes, but we doubt they will materialize.
The USD Index is hovering near its intraday low around 103.10 and is expected to test the crucial support of 103.00. The impact of the Fed’s neutral policy projection is also visible on US Treasury yields. The return provided on 10-year US Treasury bonds has dropped below 3.81%.
On the Australian Dollar front, investors are awaiting May’s Employment data. As per the preliminary report, the Australian economy added 15K fresh payrolls vs. a lay-off of 4.3K. The Unemployment Rate is seen steady at 3.7%. Steady labor market conditions and a surprise jump in inflationary pressures, recorded for May, would force the Reserve Bank of Australia (RBA) to raise interest rates further.
Economists at Scotiabank analyze GBP/USD outlook.
Limited potential for countertrend corrections
Hawkish rate expectations are extending the GBP solid support.
Cable’s gains put the May high at 1.2678 easily within reach.
Solid trend momentum across the intraday, daily and weekly DMI oscillators support the firm undertone and point to limited potential for countertrend corrections and ongoing GBP gains towards the mid-1.27s (61.8% retracement of the 2021/22 GBP/USD decline at 1.2758).
See – GBP/USD: A larger uptrend is not ruled out on a cross above 1.2670/1.2750 resistance – SocGen
EUR/USD trades firm but can’t – yet – build on gains through the low 1.08s. Economists at Scotiabank analyze the pair’s technical outlook.
EUR/USD finds support on minor dips
The EUR remains well-supported but the market has failed to really develop gains above the 1.0810 Fibonacci retracement resistance point (38.2% of the May decline in spot).
Spot is finding support on minor dips (1.0775/80 intraday) but really needs to push on through the low 1.08s to put the upper 1.08 area under more pressure (40-Day Moving MA at 1.0860 will be an important objective for the bull trend to develop further).
- Gold price has sensed resistance around $1,952.00 as the focus shifts to Fed policy.
- The downside bias for the USD index has not faded yet as a temporary pause in the policy-tightening spell by the Fed is likely.
- Gold price is auctioning in a Descending Triangle chart pattern, which indicates a sheer contraction in volatility.
Gold price (XAU/USD) has sensed some selling pressure after advancing to near $1,952.00 in the European session. The precious metal has faced delicate resistance as the US Dollar Index (DXY) has displayed a short-term pause after a vertical sell-off. The downside bias for the USD index has not faded yet as a temporary pause in the policy-tightening spell by the Federal Reserve (Fed) is likely.
S&P500 futures are holding gains added in early Europe in hopes that a neutral interest rate policy announcement by Fed chair Jerome Powell would infuse optimism among the market participants. Investors should be prepared for any worse situation as an unexpected interest rate hike would dampen the market sentiment.
As per the CME Fedwatch tool, more than 95% chances are in favor of a steady interest rate policy. The risk profile could get dampened if the dot plot by the Fed turns out to be extremely hawkish. No doubt, United States inflation has softened and tight labor market conditions have released some heat. Headline inflation is still double the targeted rate of 2% and the US economy is still operating at full employment levels.
Apart from the Fed policy, investors will also focus on the US Producer Price Index (PPI) data. Monthly headline PPI is expected to show a deflation of 0.1% as gasoline prices have dropped significantly. While monthly core PPI that excludes oil and food prices is expected to maintain a 0.2% pace.
Gold technical analysis
Gold price is auctioning in a Descending Triangle chart pattern on a two-hour scale, which indicates a sheer contraction in volatility. The downward-sloping trendline of the aforementioned chart pattern is plotted from June 02 high at $1,983.50 while the horizontal support is placed from June 25 low at $1,939.32.
The 200-period Exponential Moving Average (EMA) at $1,962.34 is consistently barricading Gold bulls from any recovery.
An oscillation in the 40.00-60.00 range by the Relative Strength Index (RSI) (14) indicates that investors are awaiting the Fed policy for further action.
Gold two-hour chart
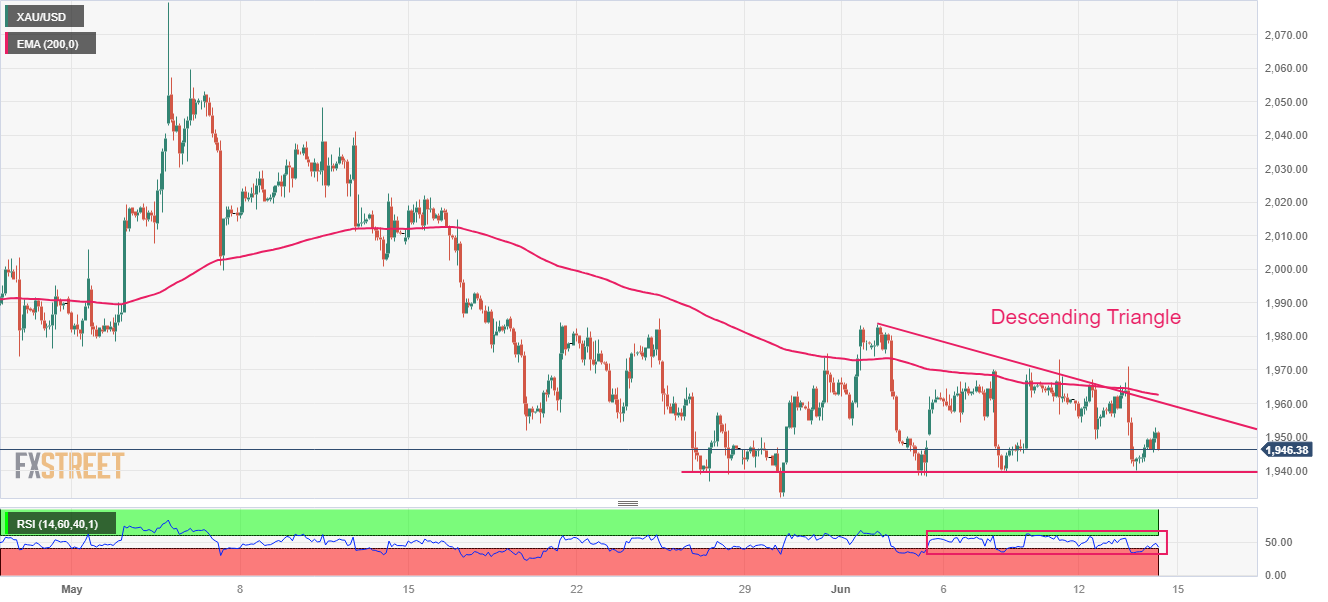
USD remains soft as markets anticipate Fed pause. Economists at Scotiabank analyze greenback outlook ahead of FOMC.
Other major central banks are clearly still in tightening mode
A holding statement is likely in some form today, leaving the door open for more tightening but perhaps without being too specific about the outlook.
Despite the soft tone in the USD today, markets seem to be betting on a ‘hawkish hold’ tone to the statement, etc. But the Fed might not want to be too clear in defining the outlook at this stage and something a bit more neutral overall at least will be needed to keep the USD on the defensive, considering that other major central banks are clearly still in tightening mode.
See – FOMC Preview: Banks expect the Fed to take a break, but signal higher rates ahead
- DXY remains on the defensive and adds to Tuesday’s losses.
- The 100-day SMA reinforces recent lows in the 103.00 zone.
DXY keeps the bearish note well in place for the second session in a row and trades close to recent lows near the 103.00 region on Wednesday.
In case the index breaches the monthly low near 103.00, it could then open the door to a deeper retracement to the provisional 55-day SMA at 102.54 prior to the May low near the 101.00 neighbourhood.
Looking at the broader picture, while below the 200-day SMA at 105.35 the outlook for the index is expected to remain negative.
DXY daily chart
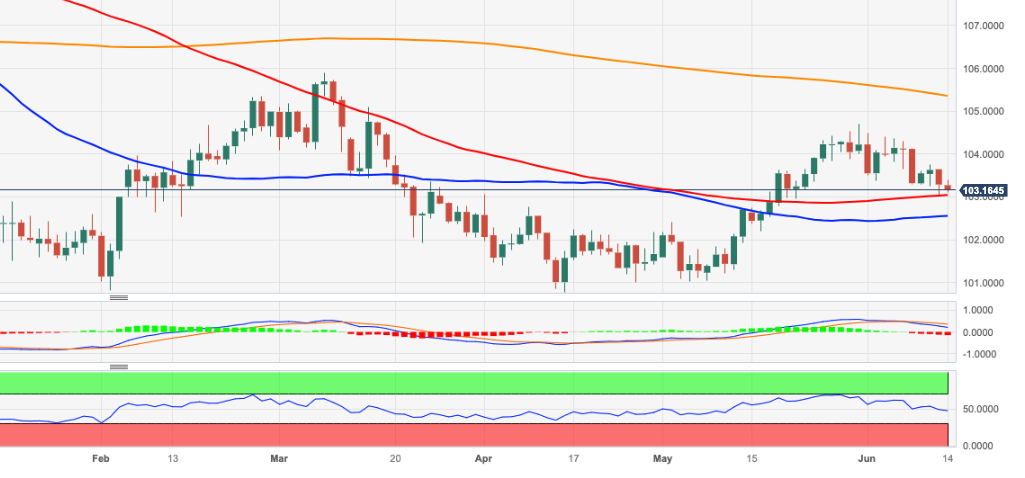
Economists at Danske Bank discuss Fed policy outlook and its implications for their EUR/USD forecast.
Fed to maintain rates at the current level for the remainder of the year
We still think the bar for restarting hikes in July will be high unless inflation pressures clearly accelerate over summer, which we consider unlikely.
We make no changes to our forecasts and expect the Fed to maintain rates at the current level for the remainder of the year.
A pause could pose near-term upside risks to EUR/USD, but we still maintain a bearish view on the cross towards H2.
EUR/NOK has continued falling from 12.00 to below 11.50 now. Norges Bank’s rate decision next week will be the key factor for NOK’s path in the short-term, economists at Nordea report.
EUR/NOK will again move higher during the summer and trade around the 12.00 level
Markets now see 30% probability for a 50 bps rate hike next week and price a key rate around 4% by September. Norges Bank needs to be more hawkish than markets currently expect and hike by 50 bps next week for the NOK strengthening to continue. Thus, we could see somewhat more downside for EUR/NOK going into Norges Bank’s rate meeting.
However, for now, we hold our view that EUR/NOK will again move higher during the summer and trade around the 12.00 level.
- EUR/JPY adds to the weekly upside and surpasses 151.00.
- Further gains could see the 2023 top revisited in the near term.
EUR/JPY looks to add to the ongoing rebound above the key 151.00 hurdle in pre-Fed trading on Wednesday.
In case bulls keep pushing higher, the next relevant resistance level now emerges at the 2023 peak at 151.61 (May 2). The surpass of the latter should meet the next target of importance not before the weekly high at 156.83 (September 22, 2008).
So far, further upside looks favoured while the cross trades above the 200-day SMA, today at 144.35.
EUR/JPY daily chart
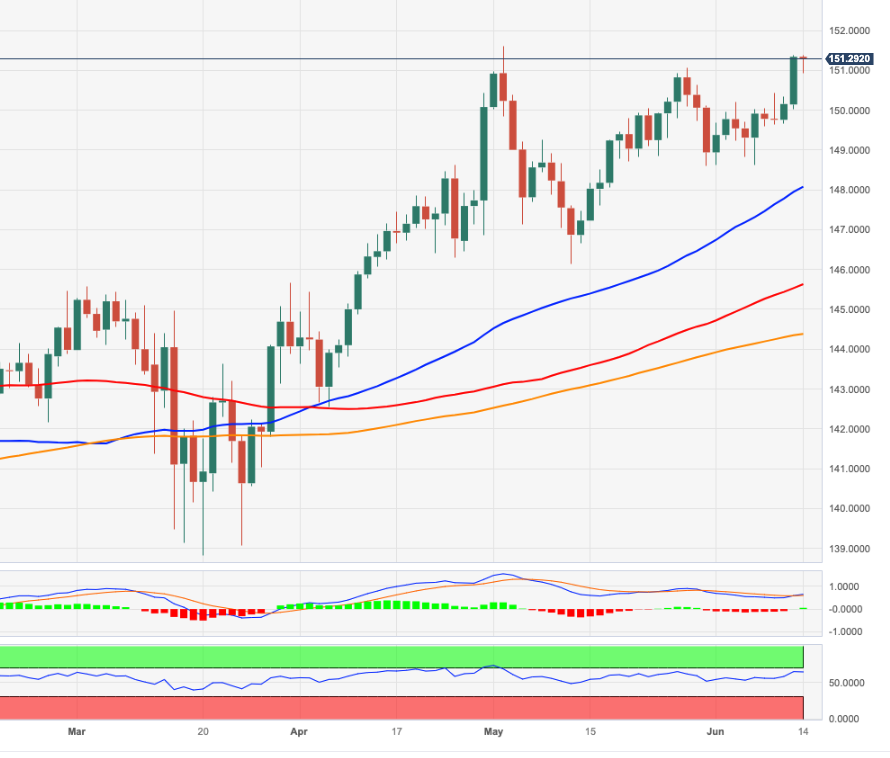
The Australian Dollar has been on a bit of a rollercoaster ride in recent weeks. Economists at Commerzbank analyze Aussie outlook ahead of the Australian Employment report.
Downside surprise needed for the market to question the expected further rate hike
With the RBA focusing more on inflation last week, which surprised to the upside last month, the labor market would likely have to surprise to the downside for the market to question the expected further rate hike.
We expect the Aussie to remain well-supported for the time being.
Economists at TD Securities discuss the Federal Reserve interest rate decision and its implications for EUR/USD and USD/JPY.
More Hawkish (5%)
Fed delivers a 25 bps rate hike but also commits to additional rate increases as the data has evolved firmer than expected. Powell signals that more interest-rate increases are likely needed. USD/JPY +0.50%, EUR/USD -0.20%.
Base Case (55%)
Fed delivers a 25 bps rate hike, without fully closing the door to additional rate increases. We expect Chair Powell to reiterate that the Fed remains data-dependent and that economic data since the May FOMC meeting has not shown convincing signs of slowing. USD/JPY +0.25%, EUR/USD -0.10%.
Dovish (40%)
Fed skips a rate increase but signals that further hikes are possible. Powell mentions that the best course is to be patient given the totality of policy tightening as well as the ongoing reduction of credit supply. A soft landing is becoming more likely. USD/JPY -1.0%, EUR/USD +0.60%.
One of Credit Suisse’s most consistent views over the course of 2023 has been GBP bullishness. Economists at the bank take a fresh look at the Pound.
GBP could well become and then remain among the highest yielders in G10 space
Getting to a 5.75% rate by December as markets are pricing may simply be too slow and the BoE might yet need to start hiking in 50 bps increments again, as it last did in Feb. It’s also the case that GBP could well become and then remain among the highest yielders in G10 space, something which can attract carry-chasing money to the UK at a time of low global asset volatility.
We see room for the broad trade-weighted GBP to test post-2016 highs seen in early 2022 around 2% above current levels.
We lower our near-term EUR/GBP target to 0.8450 and raise our GBP/USD target to 1.2800, levels at which we would finally be tempted to take profit if reached quickly.
- US Dollar heads lower as the Fed rate decision is to unfold on Wednesday.
- Traders appear to be reshuffling their portfolio, allocating cash out of safe havens into risk assets.
- US Dollar Index barely holds the 103 level and could sink to 102.50 on the back of Powell’s speech.
The US Dollar (USD) is losing further ground against other major currencies on Wednesday as traders mull expectations of a Fed interest-rate pause later today. A clear shift in sentiment is noticed as US bonds and the Greenback – both acting as safe havens – are losing interest as investors turn to equities. Traders seem to be using the window of opportunity that is coming with this possible Fed rate pause to jump on the equity rally.
Few data points are set to come out before the US Fed rate decision and subsequent press conference from Fed Chairman Jerome Powell.. Headline and core Producer Price Index (PPI) data is due at 12:30 GMT, and the EIA Crude Oil Inventory numbers will come at 14:30 GMT. The countdown will then start towards the Fed rate decision, with the official release at 18:00 GMT and the FOMC Press Conference by Fed Chairman Powell at 18:30 GMT.
Daily digest: US Dollar sees its safe haven status abating
- Traders can further consolidate the possible rate pause of the Fed later Wednesday with the US Producer Price Index (PPI) coming out beforehand at 12:30 GMT. The monthly overall PPI is expected to contract by 0.1% in May after increasing 0.2% in April. The monthly core PPI is forecasted to steady at 0.2%. On a yearly basis, headline PPI is set to drop from 2.3% to 1.5%, and the core to drop a touch from 3.2% to 2.9%.
- China's Ministry of Commerce (MOFCOM) came out with comment on the US blacklisting some entities, calling it 'classic economic coercion'. Urges to stop unreasonable pressure for Chinese firms.
- Former US President Donald Trump has been indicted in a federal court for holding back official White House documents. He pleaded not guilty on all charges.
- Equities are not losing steam on their winning streak. Another 33-year high for the Nikkei, while China tech is the biggest winner intraday. European indices are back in the green with the German DAX printing a new historic high and US equity futures are all trading at the highs.
- The US Treasury had to pay a higher yield for sellings its 1-year and 30-year bonds on Tuesday. The auctions for the 30-year bond came in at 3.908%, higher than the market pricing of 3.741%. The 1-year bond yield got placed at 4.93% while 4.64% was trading in the market at that time. This shows less appetite for safe haven bonds from investors, confirming the rotation into riskier assets.
- The CME Group FedWatch Tool shows that markets are pricing in a 5% chance of Fed rate hike today, a 71% chance for a hike in July and a 76% chance of a hike for September. Markets have abandoned the idea that there will be interest-rate cuts this year.
- The benchmark 10-year US Treasury bond yield trades at 3.79%. This marks a substantial move higher on the back of Tuesday US inflation numbers, after which investors sold their bond holdings to allocate more money into risk assets. Falling bond prices are inversely correlated to the bond yield. The lower the price, the higher yield that needs to be offered.
US Dollar Index technical analysis: Selling pressure mounts
The US Dollar is showing further signs of weakening as most currencies in the Dollar Index (DXY) are gaining traction against the Greenback. The 103.00 floor barely got tested on Tuesday and looks to receive another test later today.
On the upside, 105.44 (200-day Simple Moving Average) still acts as a long-term price target to hit.,The next upside key level for the US Dollar Index is at 105.00 (psychological, static level), which acts as an intermediary element to cross the open space.
On the downside, 103.04 (100-day SMA) aligns as the first support level to confirm a change of trend. In case that breaks down, watch how the DXY reacts close to the 55-day SMA at 102.56 in order to assess any further downturn or upturn.
How does Fed’s policy impact US Dollar?
The US Federal Reserve (Fed) has two mandates: maximum employment and price stability. The Fed uses interest rates as the primary tool to reach its goals but has to find the right balance. If the Fed is concerned about inflation, it tightens its policy by raising the interest rate to increase the cost of borrowing and encourage saving. In that scenario, the US Dollar (USD) is likely to gain value due to decreasing money supply. On the other hand, the Fed could decide to loosen its policy via rate cuts if it’s concerned about a rising unemployment rate due to a slowdown in economic activity. Lower interest rates are likely to lead to a growth in investment and allow companies to hire more people. In that case, the USD is expected to lose value.
The Fed also uses quantitative tightening (QT) or quantitative easing (QE) to adjust the size of its balance sheet and steer the economy in the desired direction. QE refers to the Fed buying assets, such as government bonds, in the open market to spur growth and QT is exactly the opposite. QE is widely seen as a USD-negative central bank policy action and vice versa.
UOB Group’s Economist Ho Woei Chen, CFA, and Senior FX Strategist Peter Chia, review the latest decision by the PBoC.
Key Takeaways
The PBOC cuts the 7-day reverse repo rate by 10bps to 1.9% from 2.0% ahead of the announcement of the benchmark 1Y MLF rate this Thu (15 Jun). The 7-day reverse repo rate and 1Y MLF rate were last cut by 10bps in Aug 2022.
With the move today, the 1Y MLF and the 1Y loan prime rate (LPR) rates are expected to see a corresponding reduction to 2.65% on 15 Jun and 3.55% on 20 Jun, respectively. The 5Y LPR may see a larger cut than 10bps to increase support to the property market.
For the rest of the year, we do not anticipate additional interest rate cuts after the 10bps in Jun unless economic conditions continue to worsen. Nonetheless, we maintain our forecast for a 25bps reduction in banks’ reserve requirement ratio (RRR) in 2H23 to release more long-term funding into the banking system. This may be used to partly replace the CNY2.9 tn of 1Y MLF maturing in 2H23
Market is also anticipating the strengthening of property support measures as indicated by the officials earlier this month.
We maintain our growth forecast for China at 5.6% in 2023 with 2Q23 at 7.8% y/y (1Q23: 4.5%) against the low base during Shanghai’s two-month Covid-19 lockdown in 2Q22.
We are of the view that a rebound in the CNY will likely start in 4Q23 when China’s economic recovery regains momentum. Our current set of USD/CNY forecasts are at 7.20 in 3Q23, 7.05 in 4Q23, 6.90 in 1Q24 and 6.80 in 2Q24.
Economists at MUFG Bank still question the logic of a “skip” scenario from the FOMC and discuss the implications for the US Dollar.
A pause will likely be viewed ultimately as that rather than a “skip”
Of course, an increased dot in 2023 and/or in 2024 along with a hawkish communication tonight will potentially counter any easing of financial conditions and could see the USD strengthen. But beyond the very near-term reaction, the question is would Dollar strength and higher rates be sustained? We see it as unlikely. In the end, a pause is a pause and will likely be viewed ultimately as that rather than a ‘skip’ given the incoming data is likely to continue to warrant an end to this tightening cycle.
We think the Fed will pause for good this evening, although Powell may try and convince us otherwise. Ultimately, it will mark an important point in prompting US Dollar weakness.
See – FOMC Preview: Banks expect the Fed to take a break, but signal higher rates ahead
- WTI has tested territory above $70.00 as hopes for a neutral Fed policy remain solid.
- The report from IEA shows that global oil demand will grow by 2.4 million bpd this year, to a record 102.3 million bpd.
- Oil inventory data by the US EIA for the week ending June 09 will be in focus.
West Texas Intermediate (WTI), futures on NYMEX, are testing territory above the round-level resistance of $70.00 in the London session. The oil price has been infused with fresh blood as investors are hoping for a skip in the policy-tightening spell by the Federal Reserve (Fed), which will be announced at 18.00 GMT.
The US Dollar Index (DXY) has shifted into a bearish trajectory and is consistently refreshing its day’s low. At the time of writing, the USD Index has printed an intraday low of 103.16. The downside bias for the USD India is turning bulky as a neutral policy stance by the Fed would dampen its wide policy divergence with other central banks.
While the oil price is enjoying neutral policy predictions as the decision will phase out some fears of a recession in the United States to some extent. US factory activity has contracted straight for seven months, which is sufficient to describe oil’s bleak demand. But a neutral policy stance by Fed chair Jerome Powell would infuse some confidence and optimism among producers and market participants.
Investors should note that hawkish guidance by the Fed cannot be ruled out as inflationary pressures are still far from the desired rate of 2%.
Later this week, the European Central Bank (ECB) will also announce its interest rate decision. ECB President Christine Lagarde is expected to raise interest rates further as the Eurozone economy is facing sheer pressure from high inflation. More interest rate hikes by the ECB would dampen market sentiment.
Meanwhile, minutes from the latest oil market report published by the International Economic Agency (IEA) state that “global oil demand will grow by 2.4 million bpd this year, to a record 102.3 million bpd.” Global oil demand will rise by 6% between 2022 and 2028 to 105.7 mln bpd.
Apart from the Fed policy, investors will also focus on the weekly oil inventories data to be reported by US Energy Information Administration (EIA) for the week ending June 09.
Ulrich Leuchtmann, Head of FX and Commodity Research, analyzes USD outlook ahead of FOMC.
Currency market should not overlook the obvious contradiction between words and deeds
If the FOMC leaves the target range unchanged today, there is a high probability that the market's revision of expectations since the last meeting was premature. However, since this was the cause of most of the USD strength since then, there is less reason for this strength.
Sure, Powell may try his best to make a July hike seem likely. But I hope that the currency market is not so stupid as to overlook the obvious contradiction between words and deeds that this would create.
See – FOMC Preview: Banks expect the Fed to take a break, but signal higher rates ahead
- The Federal Reserve is set to leave interest rates unchanged but signal its next moves via its dot plot.
- New forecasts for peak borrowing costs in 2023 and 2024 are set to trigger an instant reaction.
- Markets tend to reverse some moves after the dot plot is out.
Markets are always looking to the future – and the Federal Reserve’s (Fed) dot plot is something investors can cling to foresee its next moves. In addition, the Fed’s figures can be read by algorithms, triggering a response that is fast and furious. For retail traders who fear missing out, the counter-reaction to this initial response to the dots provides a trading opportunity.
Here is a preview of the Fed decision and the dot plot, due out on Wednesday at 18:00 GMT.
Federal Reserve Chair Jerome Powell and his colleagues prefer pre-announcing the rate decision. Senior officials signalled an upcoming pause in the interest-rate hiking cycle, the first breather the bank takes in over a year. Nevertheless, several members of the Federal Open Markets Committee (FOMC) have stressed that this may merely be a “skip” decision – leaving rates unchanged now only to resume raising them in July.
How will markets quickly assess what lies ahead? That is where the dot plot comes in handy. Every three months, the Fed publishes a Summary of Economic Projections. Initially, this document only consisted of a chart plotting the projections of various Fed members, each represented by a dot – hence the name: dot plot.
What the Federal Reserve dot plot looks like:
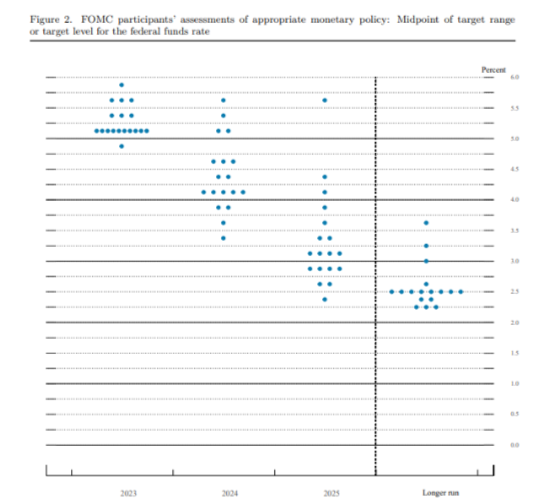
Source: Federal Reserve
The bank later added a handy table summarizing the range of forecasts and, most importantly, the median. The Fed releases forecasts for economic growth, the unemployment rate, and inflation as reflected in the Personal Consumption Expenditure (PCE) gauge as well as the Core PCE measure, and the cherry on the cake – the interest rate.
These dot plot documents are released only once every other meeting, giving them more impact. In March, the Fed left its end-2023 interest rate median projection at 5.1% but raised the forecast for end-2024 to 4.3% from 4.1%, in a sign that policymakers expected rates to remain higher for longer.
How the dot plot looks in its table format. The numbers at the bottom left are what matter most: the updated projection for the interest rate at the end of this year and the next:
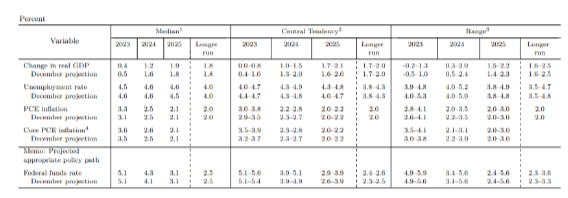
Source: Federal Reserve
The current Federal Funds rate is at a range of 5.00-5.25%, at what the Fed projected for year-end. Officials insisted that no rate cuts are planned for 2023. Markets initially priced looser monetary policy for later in the year but reluctantly aligned to the Fed’s view after several hawkish comments from officials.
Bond markets expect rates to end the year at current levels after potentially rising in July. Nevertheless, uncertainty is sky-high, and that means high volatility.
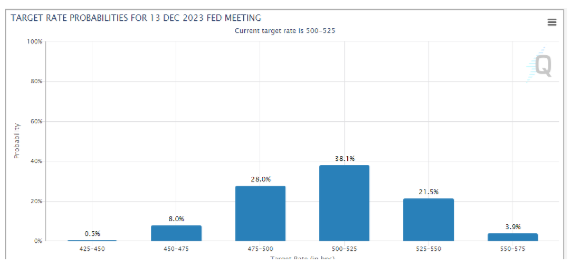
Source: CME Group
How to trade the Fed dot plot – three scenarios
The Fed would likely want to leave the door open to a rate hike in July while continuing to refrain from rate cuts this year. This view implies a bump in the dot plot, resulting in an interest rate median forecast of 5.3% or 5.4% at the end of 2023.
I see such a scenario as the most probable one, resulting in a knee-jerk reaction favouring the US Dollar and sinking stocks. But, as mentioned earlier, the moves may quickly reverse in anticipation of Fed Chair Powell’s press conference 30 minutes after the release.
And for a good reason – Powell may smooth out any hawkish perception by reiterating the bank is data-dependent. Signs of a slowdown in the US economy may continue accumulating between the Fed’s meetings.
In this mainstream scenario, the dot plot would provide an opportunity to go against the US Dollar.
The second scenario is a hawkish outcome – the dot plot showing the Fed raising its forecast to 5.5% by the end of 2023. Such an outcome would spook markets, sending the Greenback higher.
A reversal will only come if Powell contrasts or substantially softens the message afterwards. Investors are unlikely to send the US Dollar down before hearing from Powell.
The third scenario, a highly unlikely dovish outcome, is for the dot plot to remain unchanged for 2023. If the Fed refuses to indicate net higher borrowing costs by year-end, the US Dollar will plunge. Similar to the expected behaviour in response to the hawkish outcome, there is room for reversal only when Powell talks.
He could say that if inflation rises, the Fed could still raise rates. Nevertheless, I do not expect an instant correction but for markets to move only upon confirmation from the Fed Chair.
Final thoughts
The Federal Reserve’s dot plot is critical to the market’s instant reaction – and the counter-trend. I suggest trading carefully as markets tend to move choppily around the event.
Fed FAQs
What does the Federal Reserve do, how does it impact the US Dollar?
Monetary policy in the US is shaped by the Federal Reserve (Fed). The Fed has two mandates: to achieve price stability and foster full employment. Its primary tool to achieve these goals is by adjusting interest rates.
When prices are rising too quickly and inflation is above the Fed’s 2% target, it raises interest rates, increasing borrowing costs throughout the economy. This results in a stronger US Dollar (USD) as it makes the US a more attractive place for international investors to park their money.
When inflation falls below 2% or the Unemployment Rate is too high, the Fed may lower interest rates to encourage borrowing, which weighs on the Greenback.
How often does the Fed hold monetary policy meetings?
The Federal Reserve (Fed) holds eight policy meetings a year, where the Federal Open Market Committee (FOMC) assesses economic conditions and makes monetary policy decisions.
The FOMC is attended by twelve Fed officials – the seven members of the Board of Governors, the president of the Federal Reserve Bank of New York, and four of the remaining eleven regional Reserve Bank presidents, who serve one-year terms on a rotating basis.
What is Quantitative Easing (QE) and how does it impact USD?
In extreme situations, the Federal Reserve may resort to a policy named Quantitative Easing (QE). QE is the process by which the Fed substantially increases the flow of credit in a stuck financial system.
It is a non-standard policy measure used during crises or when inflation is extremely low. It was the Fed’s weapon of choice during the Great Financial Crisis in 2008. It involves the Fed printing more Dollars and using them to buy high grade bonds from financial institutions. QE usually weakens the US Dollar.
What is Quantitative Tightening (QT) and how does it impact the US Dollar?
Quantitative tightening (QT) is the reverse process of QE, whereby the Federal Reserve stops buying bonds from financial institutions and does not reinvest the principal from the bonds it holds maturing, to purchase new bonds. It is usually positive for the value of the US Dollar.
EUR/USD is reined in below 1.08. Economists at Société Générale analyze the pair’s outlook ahead of Fed and ECB meetings.
Another down leg is not ruled out if the 1.0860/1.0900 resistance area proves a bridge too far
Right now, even if a July increase cannot be ruled out and rate cuts have been pretty much completely priced out for 2H, Powell or the dots would have to be sufficiently hawkish to keep 2y yields and the Dollar from unravelling.
Today’s decision should not measure up against what is likely to be a hawkish 25 bps by the ECB tomorrow. With that in mind, EUR/USD looks well placed to build on early June gains. Technically, however, the picture is not straightforward and 1.0860/1.0900 must be overcome for the pair to kick on. Another down leg is not ruled out if resistance area proves a bridge too far and the ECB sparks profit-taking tomorrow.
See – FOMC Preview: Banks expect the Fed to take a break, but signal higher rates ahead
UOB Group’s Economist Lee Sue Ann and Markets Strategist Quek Ser Leang favour the idea of further consolidation for USD/CNH in the near term.
Key Quotes
24-hour view: We highlighted yesterday that “The risk for USD still appears to be on the upside even though lackluster momentum continues to suggest 7.1800 is unlikely to come into view”. Our view was not wrong as while USD strengthened, it did not break 7.1800 (high has been 7.1784). Upward momentum has increased and today, a break of 7.1800 will not be surprising. However, the next major resistance at 7.2000 could be out of reach. Support is at 7.1630, followed by 7.1500.
Next 1-3 weeks: We have expected a higher USD since last Thursday (08 Jun) when it was trading at 7.1500. In our most recent narrative from two days ago (12 Jun, spot at 7.1520), we highlighted that “while upward momentum has been rejuvenated, it remains to be seen if USD has enough momentum to rise to 7.1800 and 7.2000”. Yesterday (13 Jun), USD soared to a high of 7.1784. In view of the further increase in momentum, the chance of USD breaking above 7.2000 has improved. Looking ahead, the next level to watch above 7.2000 is 7.2200. On the downside, a break of 7.1330 (‘strong support’ level previously at 7.1220) would indicate that USD is not strengthening further.
Eurozone Industrial Production rebounds in April, the official data showed on Wednesday, suggesting that the manufacturing sector recovery is attempting a comeback.
Eurozone’s Industrial Output jumped 1.0% MoM, the Eurostats said in its latest publication, vs. 0.8% expected and -3.8% previous reading.
On an annual basis, the bloc’s Industrial Production increased 0.2% in April versus a -1.4% figure recorded in March and against the expected growth of 0.8%.
FX implications
The shared currency in little changed by the mixed German industrial figures. At the time of writing, EUR/USD is trading at around 1.0800, adding 0.08% on the day.
Fed’s hawkish hold can put a floor under the Dollar, in the opinion of economists at ING.
Fed to hold today but signal more tightening is possible
We expect the Fed to hold today but signal more tightening is possible.
The endorsement of market pricing for futures hikes can ultimately keep the Dollar around strong levels for a bit longer: that is until data takes a decisive turn for the worse in the US..
See – FOMC Preview: Banks expect the Fed to take a break, but signal higher rates ahead
In its latest oil market report published on Wednesday, the International Energy Agency (IEA) said that “global oil demand will grow by 2.4 million bpd this year, to a record 102.3 millon bpd.”
Additional takeaways
The shift to a clean energy economy is picking up pace.
A peak in global oil demand is in sight before the end of this decade.
That is helped by growth from the post-pandemic recovery, which is set to end this year.
2024 will mark the end of the post-pandemic demand recovery.
Expects annual oil demand growth to slump to 400k bpd by 2028.
Global oil supply fell by 660,000 bpd to 100.6 mln bpd in may after additional cuts by some OPEC+ producers.
Bearish economic indicators contrast with resurgent oil use in China and India.
Global oil demand will rise by 6% between 2022 and 2028 to 105.7 mln bpd.
2024 will mark end of post-pandemic demand recovery, with growth set for 860,000 bpd.
Market reaction
WTI is cheering the upbeat oil market outlook. The US oil is trading near $70.30, testing session highs. The US oil up 1.26% on the day.
- NZD/USD catches fresh bids on Wednesday and steadily climbs closer to a multi-week high.
- Bets for an imminent Fed rate hike pause weigh on the USD and lends support to the major.
- The cautious market mood could limit the USD losses and cap the pair ahead of the FOMC.
The NZD/USD pair builds on its steady intraday ascent through the first half of the European session and currently trades around the 0.6165-0.6170 region, just below a three-week high touched the previous day.
The US Dollar (USD) struggles to register any meaningful recovery and languishes near its lowest level since May 17 in the wake of expectations that the Federal Reserve (Fed) will skip hiking interest rates at the end of a two-day policy meeting later today. The bets were reaffirmed by soft US consumer inflation figures on Tuesday, which, along with a modest downtick in the US Treasury bond yields, undermine the Greenback and act as a tailwind for the NZD/USD pair.
The US Labor Department reported that the headline US CPI barely rose in May and the year-on-year rate decelerated to the slowest pace since March 2021. The annual inflation print of 4.0%, meanwhile, is still twice the Fed's 2% target and kept hopes alive for further policy tightening by the Fed. In fact, the markets are pricing in a greater chance of a 25 bps lift-off at the July FOMC meeting, which should limit the downside for the US bond yields and lend support to the buck.
Apart from this, the pre-Fed anxiety and worries about a global economic slowdown, particularly in China, could further drive some haven flows towards the Greenback. This, along with the Reserve Bank of New Zealand's (RBNZ) explicit signal that it was done with its most aggressive hiking cycle since 1999, might cap gains for the NZD/USD pair. Traders might also refrain from placing fresh bets and prefer to move to the sidelines heading into the key central bank event risk.
The aforementioned mixed fundamental backdrop makes it prudent to wait for strong follow-through buying before positioning for an extension of the recent recovery from the YTD low - levels just below the 0.6000 psychological mark touched in May.
Technical levels to watch
- Silver price is marching towards $24.00 as the USD Index has refreshed its day’s low at 103.21.
- More downside is in the pipeline as a neutral policy stance by the Fed will trim policy divergence of the Fed with other central banks.
- Silver price has witnessed a responsive buying move after a failed breakdown below the Rising Channel pattern.
Silver price (XAG/USD) has climbed above the immediate resistance of $23.86 and is now approaching $24.00 barricade in the European session. The reason behind the strength in the white metal is the expectations of a neutral interest rate policy announcement by the Federal Reserve (Fed).
S&P500 futures have added gains recently in the European session as hopes of further interest rate hikes by the Fed have faltered. The risk appetite of the market participants is extremely solid, which has improved the appeal for risk-perceived assets.
The US Dollar Index (DXY) has printed a fresh day’s low at 103.21. More downside is in the pipeline as a neutral policy stance by Fed chair Jerome Powell will trim policy divergence of the Fed with other central banks. Also, the yields offered on 10-year US Treasury bonds have dropped sharply below 3.81%.
No doubt, a neutral interest rate policy is widely anticipated, however, the street believes that the dot plot would remain hawkish. There are clear signs that United States inflation is softening and labor market conditions are releasing heat. However, current Employment conditions are broadly resilient, and inflationary pressures are double the desired rate. Fed policymakers would be needed severe ‘blood and sweat’ in easing inflation comfortably around 2%.
Silver technical analysis
Silver price has witnessed a responsive buying move after a failed breakdown below the Rising Channel chart pattern on a two-hour scale. In a Rising Channel pattern, each pullback is considered a buying opportunity by the market participants.
The white metal has managed to rebound above the 200-period Exponential Moving Average (EMA) at $23.83, which indicates that the long-term bullish trend is intact.
Adding to that, the Relative Strength Index (RSI) (14) has rebounded into the 40.00-60.00 range, which indicates a bullish reversal.
Silver two-hour chart
-638223292871944990.png)
The People's Bank of China (PBoC) cut the repo rate by 10 bps. Economists at Commerzbank analyze Yuan (CNY) outlook after the surprising decision.
Surprise 7-day reverse repo rate cut
In a surprise move yesterday, the PBoC cut the 7-day reverse repo rate to 1.9% from 2%. The rate cut can be seen as the government acknowledging concerns over China’s growth outlook, and that policymakers are finally willing to step up their efforts to shore up growth.
Further monetary policy easing in China will continue to weigh on the Yuan exchange rates.
The Yen dropped yesterday. Economists at ING discuss USD/JPY outlook ahead of the Bank of Japan (BoJ) meeting on Friday.
Market expectations for possible policy adjustments are rapidly disappearing
USD/JPY is dangerously close to the 140.90 30 May high, which would leave the Yen vulnerable to a move to the 145 area, where Japanese authorities started to intervene last September.
The BoJ announces policy on Friday, and the response that we are seeing in the FX market is probably a testament that market expectations for possible policy adjustments are rapidly disappearing at this Friday's meeting.
Cable is steady near 1.26 after 1% bounce yesterday. Economists at Société Générale analyze GBP/USD technical outlook.
1.2410 is a crucial support
GBP/USD recently defended a rising support line near 1.2300 (now at 1.2410). It has experienced a steady rebound and is now challenging a resistance line since 2021.
Daily MACD is attempting an entry into positive territory denoting prevalence of upward momentum.
Next potential hurdle is located at last month high of 1.2670/1.2750 which is also the 61.8% retracement from 2021. If the pair crosses this resistance, a larger uptrend is not ruled out.
Support line at 1.2410 is a crucial support.
- EUR/USD alternates gains with losses in the sub-1.0800 region.
- The Fed is likely to skip a rate hike at its meeting later on Wednesday.
- Latest US inflation figures support the largely anticipated Fed pause.
In line with the broad-based consolidation theme in the FX universe, EUR/USD trades within a narrow range in the vicinity of the 1.0800 region ahead of the key FOMC event due later on Wednesday.
EUR/USD remains focused on the Fed gathering
EUR/USD has so far interrupted its weekly recovery and hovered around the 1.0800 zone on Wednesday in response to the generalized directionless mood in the global markets as investors await the interest rate decision by the Federal Reserve, which is expected later in the European evening.
While a pause in the Fed’s hiking cycle is largely telegraphed, another 25 bps rate raise by the ECB is also anticipated on Thursday. The Fed’s decision to reach an impasse in its tightening programme was further propped up by another decline in US inflation figures last month.
However, fast forwarding to July, both central banks are expected to hike interest rates by a quarter-point. In fact, according to the FedWatch Tool by CME Group, the probability of that scenario approaches 62% so far.
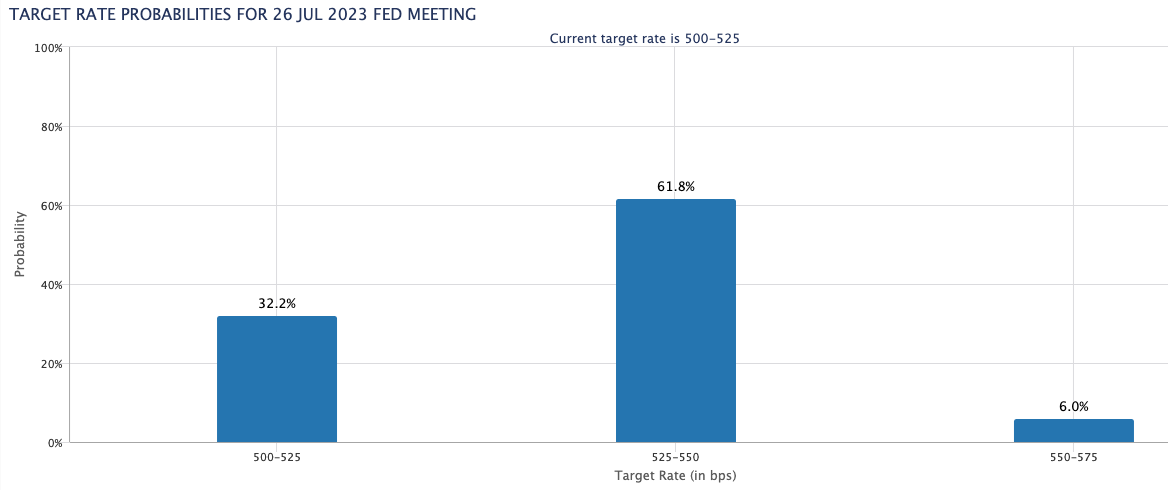
Data-wise, in the euro area, Industrial Production will be the sole release, while weekly Mortgage Applications are due across the pond.
What to look for around EUR
EUR/USD trades close to the 1.0800 region in response to the consolidative mood in the rest of the global assets in the pre-FOMC trade.
In the meantime, the pair’s price action is expected to closely mirror the behaviour of the US Dollar and will likely be impacted by any differences in approach between the Fed and the ECB with regards to their plans for adjusting interest rates.
Moving forward, hawkish ECB speak continues to favour further rate hikes, although this view appears to be in contrast to some loss of momentum in economic fundamentals in the region.
Key events in the euro area this week: EMU Industrial Production (Wednesday) – Eurogroup Meeting, EMU Balance of Trade, ECB Interest Rate Decision, ECB Lagarde (Thursday) – ECOFIN Meeting, Final EMU Inflation Rate (Friday).
Eminent issues on the back boiler: Continuation of the ECB hiking cycle in June and July (and September?). Impact of the Russia-Ukraine war on the growth prospects and inflation outlook in the region. Risks of inflation becoming entrenched.
EUR/USD levels to watch
So far, the pair is losing 0.06% at 1.0786 and faces the next support at 1.0635 (monthly low May 31) seconded by 1.0516 (low March 15) and finally 1.0481 (2023 low January 6). On the other hand, the surpass of 1.0823 (monthly high June 13) would target 1.0877 (55-day SMA) en route to 1.0904 (weekly high May 16).
EUR/GBP is pressing lower again. Economists at ING analyze the pair’s outlook.
Hard to buck the Sterling bullish trend
A move below the 0.8540 support would set the EUR/GBP pair back to pre-Mini-Budget crisis levels (August 2022).
The latest evidence from employment and wage growth has prompted yet another repricing higher in BoE rate expectations, with 132 bps of tightening priced in by year-end.
With short-dated gilts reaching their highest levels since 2008 yesterday, it remains hard to buck the EUR/GBP bearish trend, especially ahead of the ECB risk event, but our medium-term view remains bullish on the pair.
- USD/CAD has shown a vertical fall to near 1.3300 due to a solid recovery in the oil price.
- Market sentiment has turned extremely positive as a skip in the policy-tightening spell by the Fed will trim fears of US recession.
- USD/CAD has tested the demand zone placed in a range of 1.3270-1.3300.
The USD/CAD pair has shown a perpendicular fall to the round-level support of 1.3300 after facing stiff barricades around 1.3320 in the European session. The Loonie asset has dropped sharply following the footprints of the US Dollar Index (DXY). It is observed that the pace of falling Loonie is higher than the velocity of decline in the USD Index.
Upbeat oil prices are providing a cushion to the Canadian Dollar as investors are hoping for a neutral interest rate policy by the Federal Reserve (Fed). Market sentiment has turned extremely positive as a skip in the policy-tightening spell by the Fed will trim fears of a recession in the United States.
Meanwhile, the street is hoping that the Bank of Canada (BoC) will continue raising interest rates further due to resilience in the Canadian economy. BoC Governor Tiff Macklem raised interest rates surprisingly by 25 basis points (bps) to 4.75% last week.
USD/CAD has tested the demand zone placed in a range of 1.3270-1.3300 on a daily scale. The Loonie is expected to remain volatile after the interest rate decision by the Fed. Downward-sloping 10-period Exponential Moving Average (EMA) at 1.3380 indicates that the short-term trend is extremely bearish.
The Relative Strength Index (RSI) (14) has shifted into the bearish range of 20.00-40.00, which indicates that the downside momentum is already active.
Should the asset break below June 13 low at 1.3286, Canadian Dollar bulls will expose the Loonie asset to 15 November 2022 low at 1.3226 followed by the round-level support at 1.3200.
On the flip side, a break above June 08 high at 1.3388 will drive the asset toward June 05 high at 1.3462 and the psychological resistance at 1.3500.
USD/CAD daily chart
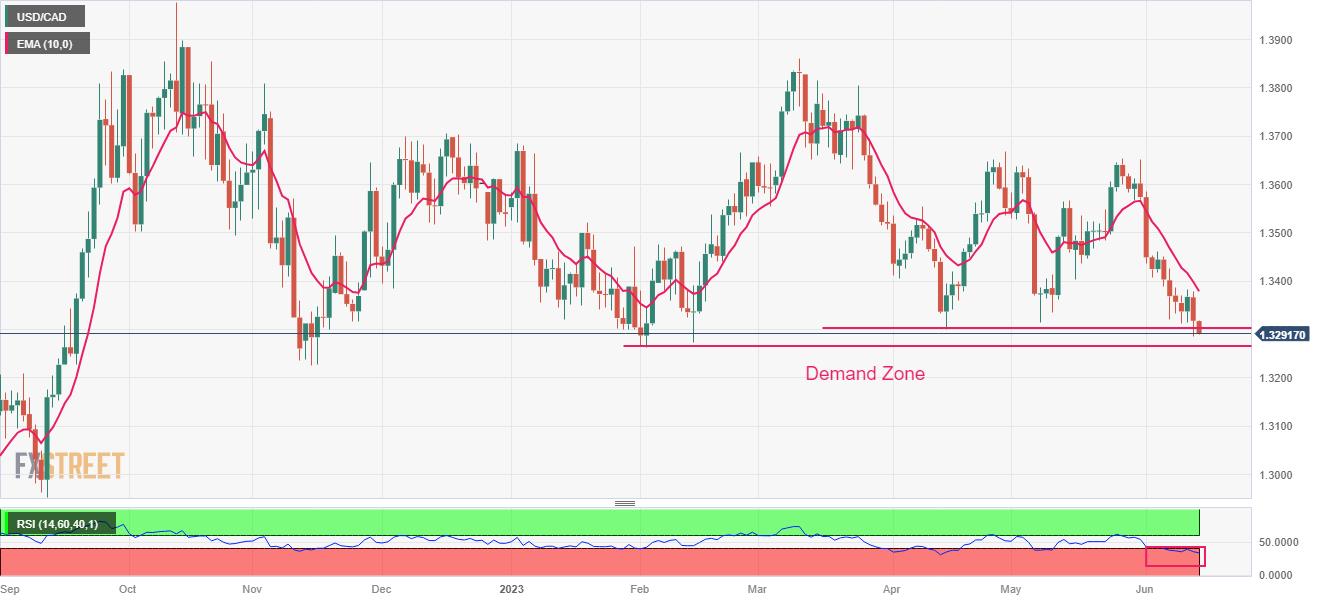
- EUR/GBP turns lower for the second straight day, though the downside seems limited.
- Expectations for more aggressive BoE tightening underpin the GBP and exert pressure.
- Bears might refrain from placing aggressive bets ahead of the ECB meeting on Thursday.
The EUR/GBP cross extends the overnight retracement slide from the 0.8610-0.8615 supply zone and edges lower for the second successive day on Wednesday. Spot prices remain on the defensive through the early part of the European session and currently trade around mid-0.8600s, down nearly 0.10% for the day.
The British Pound (GBP) continues to draw support from expectations that the Bank of England (BoE) will be far more aggressive in policy tightening to contain stubbornly high inflation and acts as a headwind for the EUR/GBP cross. In fact, the markets seem convinced that the UK central bank will hike interest rates by 25 bps on June 22 and the bets were reaffirmed by the upbeat UK employment details released on Tuesday. The UK Office for National Statistics (ONS) reported that the ILO Unemployment Rate unexpectedly dipped to 3.8% in the quarter to April from the 3.9% previous. Furthermore, the Claimant Count Change also showed a bigger-than-expected decline of 13.6K in May. Adding to this, the jump in UK wages, which is a key driver of inflation, poses concerns for the BoE.
Commenting on the data, BoE Governor Andrew Bailey, speaking before the House of Lords Economic Affairs Committee, noted that the UK labor market is very tight and recovering slowly. Separately, BoE policymaker Catherine Mann said on Tuesday that wage increases of 4.0% would be a challenge to returning CPI to 2.0%. Meanwhile, official data showed this Wednesday that the UK economy returned to growth in April and expanded by 0.2% after recording a 0.3% contraction in the previous month. This, to a larger extent, overshadows the disappointing release of UK Manufacturing/Industrial Production figures. Nevertheless, the prospects for further tightening by the BoE continue to offer support to the GBP and weigh on the EUR/GBP cross, though the downside seems cushioned, at least for now.
Traders might refrain from placing aggressive bets and prefer to wait on the sidelines ahead of the key central bank event risk - the European Central Bank (ECB) meeting on Thursday. The recent hawkish comments by a slew of influential ECB officials suggest that this is still a way to go to raise borrowing costs despite a fall in the headline Eurozone CPI to 6.1% in May. Moreover, ECB President Christine Lagarde indicated last week that additional interest rate rises were likely as, so far, there was no clear evidence that underlying inflation has peaked. This could underpin the shared currency and lend support to the EUR/GBP cross, making it prudent to wait for some follow-through selling below the YTD low, around the 0.8535 region touched on Monday, before positioning for any further losses.
Technical levels to watch
Economists at ANZ Bank analyze New Zealand’s current account data and its implication for the Kiwi.
New Zealand remains severely out of balance
The annual current account deficit came in at 8.5% of GDP in Q12023, narrowing from a revised 9.0% in Q4 2022 (was 8.9%).
New Zealand’s net international liability position narrowed $5.5bn from Q4 to a still-whopping $189bn. As a share of GDP it narrowed 2.3ppt to 48.8%.
All up, New Zealand remains severely out of balance, but with tourism recovering, we now appear past the worst of it. That said, it could be a long road to something more sustainable.
All else equal, New Zealand’s severe external imbalance continues to hint towards a need for a weak NZD and higher interest rates.
Here is what you need to know on Wednesday, June 14:
Markets have adopted a cautious stance mid-week as investors gear up for the Federal Reserve's (Fed) monetary policy announcements. The Fed will also release the revised Summary of Economic Projections, the so-called dot plot, and FOMC Chairman Jerome Powell will comment on the policy outlook in a press conference. The US economic docket will feature the Producer Price Index (PPI) for May and Eurostat will publish Industrial Production data for April.
FOMC Preview: Banks expect the Fed to take a break, but signal higher rates ahead.
Inflation in the US, as measured by the Consumer Price Index (CPI), declined to 4% on a yearly basis in May from 4.9% in April, the US Bureau of Labor Statistics (BLS) announced on Tuesday. The Core CPI, which excludes volatile food and energy prices, edged lower to 5.3% from 5.5% in the same period, as expected. The CME Group FedWatch Tool's probability of a 25 bps Fed rate hike fell below 10% after the inflation report.
Previewing the FOMC June meeting, "we expect the Fed to maintain rates unchanged. Focus will be on communication around potential hike in July & the updated dots," said Danske Bank analysts. "The Fed is unlikely to close the door for hikes, but we doubt they will materialize."
The US Dollar Index consolidates Tuesday's losses below 103.50 and US stock index futures trade mixed. Meanwhile, the benchmark 10-year US Treasury bond yield fluctuates near 3.8%.
EUR/USD climbed to its highest level in nearly a month at 1.0825 on Tuesday before going into a consolidation phase at around 1.0800 on Wednesday.
GBP/USD registered strong gains on Tuesday and continued to stretch higher early Wednesday. The pair was last seen trading above 1.2600.
USD/JPY closed the third straight trading day in positive territory on Tuesday but lost its bullish momentum after testing 140.00.
Gold price climbed to $1,970 with the initial reaction to soft US inflation data on Tuesday but reversed its direction amid a decisive rebound in the US Treasury bond yields in the late American session. XAU/USD clings to modest recovery gains at around $1,950 in the European session on Wednesday.
Bitcoin remains directionless and continues to move up and down in a narrow channel slightly below $26,000. Similarly, Ethereum struggles to break out of its weekly range while fluctuating near $1,750.
Economists at ING discuss EUR/USD outlook ahead of Fed and ECB meetings.
ECB may struggle more to convey a hawkish message
We expect the combination of a hawkish hold by the Fed and a hawkish 25 bps hike by the ECB to leave EUR/USD trading closer to 1.0700 than 1.0800 as we expect the FOMC to offer reasons to stay attached to Dollar longs.
The ECB may struggle more to convey a hawkish message after inflation and growth data came in on the softer side.
See – FOMC Preview: Banks expect the Fed to take a break, but signal higher rates ahead
USD/INR has held within a narrow 2.5% range, between 81-83, since the start of the year. Economists at Commerzbank analyze the pair’s outlook.
Strong economic monentum
Reserve Bank of India is content to see a relatively stable USD/INR.
India’s strong economic performance, lower oil and commodity prices, and RBI's rate hikes are supportive factors for the Indian Rupee.
We project the USD/INR pair to hold around the 82.00 level by Q3 2023 and drift slightly lower to 81.50 by end-2023 and to 81.00 by end-2024.
- Pound Sterling is struggling to show a power-pack action despite a wider-than-anticipated contraction in UK factory activities.
- More interest rate hikes by the BoE seem possible as UK’s inflationary pressures are extremely stubborn.
- UK’s labor wages showed more persistence as firms are offering higher payouts to offset labor supply shortage.
The Pound Sterling (GBP) has remained inside the woods after the release of weak United Kingdom factory activity data. The GBP/USD pair is showing a non-directional performance as investors are assessing UK economic indicators to build projections for the Bank of England’s (BoE) interest rate policy.
Stubborn food inflation and extreme labor shortages are a big reason to worry for BoE policymakers as United Kingdom’s current inflationary pressures are four times higher than the desired rate. Meanwhile, the absence of evidence showing a slowdown in inflationary pressures is solidifying the need for more interest rate hikes by the UK central bank.
Daily digest market movers: Pound Sterling holds auction confidently amid hawkish BoE bets
- United Kingdom’s Gross Domestic Product (GDP) expanded by 0.2% on a monthly basis in April, as expected.
- Monthly Industrial Production and Manufacturing Production in the UK contracted at a stronger pace than expected in April, by 0.3%.
- The UK Office for National Statistics (ONS) reported goods trade deficit narrowed to 14.996 billion GBP.
- Labor shortages and 45-year high food inflation at 19% remain major catalysts behind United Kingdom’s inflationary pressures.
- Brexit event and the approach to early retirement by individuals after Covid have been major factors of labor shortage.
- Three-month Unemployment Rate declined to 3.8% in Aril in the UK. The Claimant Count Change decreased by 13,600, against analysts’ forecast for a decline of 9,600.
- The unavailability of talent has fueled payroll bills spent by firms for fresh hiring. Average Earnings Excluding Bonuses rose 7.2% in April, surpassing the market expectation and the previous release of 6.9% and 6.8%, respectively, by a wide margin.
- May’s UK Employment data have propelled chances of further policy-tightening by the Bank of England.
- Current interest rates by the BoE are at 4.5% and one more interest rate hike of 25 basis points (bps) will push rates to 4.75%.
- BoE Governor Andrew Bailey assured that inflation will come down, but it will take longer than expected while speaking before the House of Lords Economic Affairs Committee.
- BoE policymaker Catherine Mann said on Tuesday, “Wage increases of 4.0% would be a challenge to returning CPI to 2.0%.”
- Current UK inflationary pressures indicate that UK PM Rishi Sunak won’t be able to stick to his promise of halving inflation by year-end.
- The US Dollar is trying to get on its feet ahead of the interest rate decision by the Federal Reserve (Fed).
- Soft landing of United States inflation, easing labor market conditions, and weak economic activities have improved the chances of the Fed leaving its policy rate unchanged following the June 13-14 meeting.
Technical Analysis: Pound Sterling aims to recapture an annual high around 1.2700
The Pound Sterling has confidently climbed above the round-level resistance of 1.2600 as the pullback move to near 1.2490 was capitalized by the market participants as a buying opportunity. The Cable is approaching the annual high of 1.2700 as an interest rate hike by the Bank of England will trim the Fed-BoE policy divergence. Advancing 50-and 200-period Exponential Moving Averages (EMAs) on an intraday timeframe are indicating that the short-term and long-term trend is bullish.
Sentiment for the GBP/USD pair would improve further if it manages to surpass a two-month high around 1.2620. The Pound Sterling could lose its strength if the Cable drop below June’s low around 1.2370.
United States Fed Interest Rate Decision
With a pre-set regularity, a nation's central bank has an economic policy meeting, in which board members took different measures, the most relevant one being the interest rate that it will charge on loans and advances to commercial banks. In the US, the Board of Governors of the Federal Reserve meets at intervals of five to eight weeks, in which they announce their latest decisions. A rate hike tends to boost the US dollar, as it is understood as a sign of healthy inflation. A rate cut, on the other hand, is seen as a sign of economic and inflationary woes and, therefore, tends to weaken the USD. If rates remain unchanged, attention turns to the tone of the FOMC statement, and whether the tone is hawkish, or dovish over future developments of inflation. Read more.
Next release: Wednesday June 14, 2023 18:00:00 GMT
Frequency: Irregular
Source: Federal Reserve
- Gold price attracts some buyers near 100-day SMA and recovers a part of the overnight losses.
- Bets for an imminent pause in the Federal Reserve's rate hiking cycle lend support to the metal.
- A softer risk tone also benefits the safe-haven XAU/USD, though a modest USD uptick caps gains.
- Investors also seem reluctant to place aggressive bets ahead of the key central bank event risks.
Gold price once again attracts some buyers near the 100-day Simple Moving Average (SMA) on Wednesday and recovers a part of the previous day's slide to the weekly low. The XAG/USD sticks to its modest intraday gains heading into the European session and currently trades just above the $1,945 level, though remains well within a familiar range held over the past three weeks or so.
Federal Reserve’s rate-hike pause expectations lend support to Gold price
Soft consumer inflation figures released from the United States on Tuesday reaffirmed market bets for an imminent pause in the Federal Reserve's (Fed) rate-hiking cycle, which, in turn, is seen lending some support to the Gold price. In fact, the US Labor Department reported that inflation, as measured by Consumer Price Index (CPI) barely rose in May and the year-on-year rate decelerated to the slowest pace since March 2021. The annual inflation print of 4.0%, meanwhile, is still twice the Fed's 2% target and kept hopes alive for further policy tightening by the Fed.
Modest US Dollar strength caps upside for XAU/USD
It is worth recalling that the markets are still pricing in a greater chance of an additional 25 basis point (bps) lift-off at the July Federal Open Market Committee (FOMC) policy meeting. This was seen as a key factor behind the overnight sharp rise in the US Treasury bond yields, which is seen acting as a tailwind for the US Dollar (USD) and acting as a headwind for the non-yielding Gold price. The downside, however, remains cushioned as traders seem reluctant to place aggressive bets and prefer to wait on the sidelines ahead of the key central bank event risk.
Focus remains glued to key central bank event risks
The Fed is scheduled to announce its policy decision later during the US session, at 18:00 GMT and is widely expected to stand pat. Apart from this, market participants will closely scrutinize Fed Chair Jerome Powell's comments at the post-meting press conference for clues about the future rate-hike path. The focus will then shift to the European Central Bank (ECB) policy meeting on Thursday, followed by the latest monetary policy update by the Bank of Japan (BoJ) on Friday. In the meantime, a softer risk tone might continue to lend support to the safe-haven Gold price.
Gold price technical outlook
From a technical perspective, the $1,942-$1,940 area, or the 100-day SMA, might continue to act as immediate strong support. A convincing break and acceptance below will be seen as a fresh trigger for bearish traders. Some follow-through selling below the May monthly swing low, around the $1,932 region, will reaffirm the negative bias and make the Gold price vulnerable to accelerate the fall towards the $1,900 round figure. The downward trajectory could get extended further and drag the XAU/USD towards the $1,876-$1,875 horizontal support en route to the very important 200-day SMA, currently around the $1,839 region.
On the flip side, any meaningful intraday appreciating move now seems to confront resistance near the $1,962-$1,964 region ahead of the $1,970-$1,972 supply zone. This is followed by the $1,983-$1,985 hurdle and the $2,000 psychological mark. A sustained strength beyond the latter will shift the bias in favour of bullish traders and lift the Gold price to the next relevant resistance near the $2,010-$2,012 region.
Key levels to watch
- USD/JPY has displayed a mild recovery from 140.00 ahead of the Fed’s policy.
- Soft US inflation has provided Fed policymakers the luxury of keeping interest rates steady.
- S&P500 futures are choppy after a positive Tuesday as investors have turned cautious ahead of Fed policy.
The USD/JPY pair has shown a modest recovery from the crucial support of 140.00 in the early European session. The asset has majorly remained inside the woods as investors are awaiting the announcement of the interest rate decision by the Federal Reserve (Fed), which will be announced in the late New York session.
S&P500 futures are choppy after a positive Tuesday as investors have turned cautious ahead of Fed policy. US equities were decently bought on Tuesday after inflation data for May softened more than anticipated.
Monthly headline United States inflation has reported a slight pace of 0.1% vs. the estimates of 0.2% and the former pace of 0.4%. Also, annualized headline Consumer Price Index (CPI) has softened to 4.0% while the street was anticipating a decline to 4.1% from the former release of 4.9%. The impact of lower gasoline prices is clearly visible in the headline inflation.
In addition, monthly and annualized core CPI that strips off the impact of oil and food prices maintained the pace of 0.4% and 5.3% respectively as expected.
The street was keenly looking forward for the inflation data as America’s labor market conditions have started easing and factory activities are consistently contracting. And, now decelerated inflationary pressures would allow Fed chair Jerome Powell for keeping the interest rate policy neutral this time.
Analysts at JP Morgan Asset Management expect the Fed to leave the federal funds rate unchanged although both the post-meeting statement and the dot plot will likely emphasize that inaction this week should be considered “skipping a rate hike” rather than putting an end to monetary tightening.”
Apart from the Fed’s policy, the interest rate decision by the Bank of Japan (BoJ) will also remain in the spotlight. Economists at OCBC Bank expect the Friday Monetary Policy Committee (MPC) (16th Jun) may be too soon to expect any policy shift. Nevertheless, we are still in favor of BoJ policy normalization amid broadening inflationary pressures and wage growth seen in Japan.
USD/JPY is still expected to keep the trade within the 138.50-141.00 range in the next few weeks, suggest UOB Group’s Economist Lee Sue Ann and Markets Strategist Quek Ser Leang.
Key Quotes
24-hour view: We expected USD to trade between 139.10 and 139.95 yesterday. However, after dropping briefly to a low of 139.00, USD soared to 140.30 and then closed at 140.21 (+0.44%). The outlook appears to be mixed and today, we expect USD to trade in a range of 139.20/140.50.
Next 1-3 weeks: Our most recent narrative was from last Thursday (08 Jun, spot at 139.95) wherein USD “is likely to trade between 138.50 and 141.00”. There is no change in our view for now.
- GBP/JPY remains sidelined at the highest levels since January 2016.
- UK statistics came in mixed, GDP improves for April.
- Market’s consolidation ahead of Fed, mixed concerns about BoJ vs. BoE prod pair buyers.
GBP/JPY clings to minor losses around 176.70-80 as it pays little heed to the UK statistics amid early Wednesday morning in London. In doing so, the cross-currency pair consolidates the biggest daily jump in 1.5 months while making rounds to the highest levels since January 2016 marked the previous day.
Anxiety ahead of the Federal Reserve’s (Fed) monetary policy announcements and a light calendar in Asia allows the GBP/JPY bulls to catch a breather amid the early hours of the key day. Additionally, the mixed nature of the British data and lackluster Treasury bond yields also restrict the pair’s latest moves.
Talking about the UK statistics, the headline Gross Domestic Product (GDP) for April matches 0.2% growth versus -0.3% prior while the Industrial Production slumps during the stated month. That said, the Industrial Production also disappoints and so do the Index of Services for three months to April.
Also read: UK GDP expands 0.2% MoM in April vs. 0.2% expected
It should be observed that the British job numbers and inflation data have previously propelled the hawkish concerns about the Bank of England (BoE), which in turn keeps the British Pound (GBP) buyers hopeful despite the recently mixed UK data.
On the other hand, Japanese inflation numbers have been improving lately but the Bank of Japan (BoJ) officials keep defending the ultra-easy monetary policy meeting. Also likely to propel the GBP/JPY pair is a looming multi-billion-dollar worth of bond issue from the US Treasury Department due to the US debt-ceiling deal.
That said, the US 10-year Treasury bond yields retreat from the 13-day high of 3.83% to 3.80% whereas the two-year counterpart poked the highest levels in three months with the 4.70% mark before easing to 4.66% at the latest, which in turn checked the GBP/JPY bulls.
Moving on, GBP/JPY may stay on the front foot amid the BoE versus BoJ divergence but fears about the UK’s economic transition may allow the quote to witness intermediate jitters.
Technical analysis
A daily closing beyond the previous resistance line from April 2022, near 176.50 by the press time, keeps the GBP/JPY pair buyers hopeful of meeting the 180.00 psychological magnet.
- The index trades in a tight range near 103.30 on Wednesday.
- Tuesday’s drop in US CPI gives green light to a Fed’s pause.
- Investors still see the Fed hiking rates in the July 26 event.
The greenback, when tracked by the USD Index (DXY), navigates a very narrow range around the 103.30 region on Wednesday.
USD Index looks at the Fed
The index manages to put some distance from Tuesday’s monthly lows near the 103.00 neighbourhood amidst the dominating pre-Fed cautiousness among market participants midweek.
In the meantime, it is largely anticipated that the Fed will leave the Fed Funds Target Range (FFTR) unchanged at 5.00%-5.25% at its meeting later on Wednesday. However, investors continue to price in the resumption of the hiking cycle in July with another 25 bps rate hike amidst current disinflationary pressures and sticky core inflation.
The release of the weekly Mortgage Applications tracked by MBA will complete the US docket on Wednesday.
What to look for around USD
The index trades in an inconclusive fashion around 103.30 amidst the usual pre-Fed lull.
In the meantime, bets for another 25 bps rate hike at the Fed’s gathering in July remain well on the cards against the backdrop of the steady resilience of key US fundamentals (employment and prices, mainly).
Bolstering a pause by the Fed this month appears to be the extra tightening of credit conditions in response to uncertainty surrounding the US banking sector and the need for policymakers to assess the so-far effects of the tightening campaign.
Key events in the US this week: Inflation Rate (Tuesday) – MBA Mortgage Applications, Producer Prices, FOMC Interest Rate Decision, Powell press conference (Wednesday) – Initial Jobless Claims, Philly Fed Manufacturing Index, Retail Sales, NY Empire State Index, Industrial Production, Business Inventories, TIC Flows (Thursday) – Flash Michigan Consumer Sentiment (Friday).
Eminent issues on the back boiler: Persistent debate over a soft/hard landing of the US economy. Terminal Interest rate near the peak vs. speculation of rate cuts in late 2023/early 2024. Fed’s pivot. Geopolitical effervescence vs. Russia and China. US-China trade conflict.
USD Index relevant levels
Now, the index is gaining 0.03% at 103.33 and the breakout of 104.69 (monthly high May 31) would open the door to 105.35 (200-day SMA) and then 105.88 (2023 high March 8). On the downside, the next support emerges at 103.04 (monthly low June 12) seconded by 102.55 (55-day SMA) and finally 100.78 (2023 low April 14).
- USD/CHF remains sidelined within the key DMA envelope amid pre-Fed inaction.
- Clear downside break of previous support line, U-turn from multi-day-old resistance underpin bearish bias.
- Looming bear cross on MACD adds strength to the downside hopes.
- Swiss Franc bears need acceptance beyond 0.9130 to keep the reins.
USD/CHF aptly portrays the pre-Fed anxiety as it makes rounds to 0.9050 heading into Wednesday’s European session. In doing so, the Swiss Franc (CHF) pair dribbles between the 50-DMA and the 100-DMA while paring the weekly gains of late.
It should be noted that the impending bear cross on the MACD signals and the market’s cautious mood seems to have recently prod the USD/CHF bulls. Also likely to challenge the upside momentum is a jungle of resistances below 0.9130.
That said, the 0.9100 round figure guards the immediate upside of the USD/CHF pair ahead of convergence of the support-turned-resistance line stretched from May 04 and the 100-DMA, around 0.9115.
Following that, an 11-week-old falling resistance line and 50% Fibonacci retracement level of the pair’s March-May downside, close to the 0.9130 level, appears a tough nut to crack for the USD/CHF bulls.
It’s worth mentioning that the 0.9200 round figure, 61.8% Fibonacci retracement near 0.9205 and the late March swing high of 0.9225 act as additional upside filters for the bulls to cross for conviction.
Meanwhile, the 0.9000 psychological magnet puts a floor under the USD/CHF price. However, a daily closing below the 50-DMA support of around 0.8985 seems a more important level to confirm the pair’s further downside.
In a case where the quote remains bearish past 0.8985, the odds of witnessing a slump towards the yearly low marked in May around 0.8835 can’t be ruled out.
USD/CHF: Daily chart
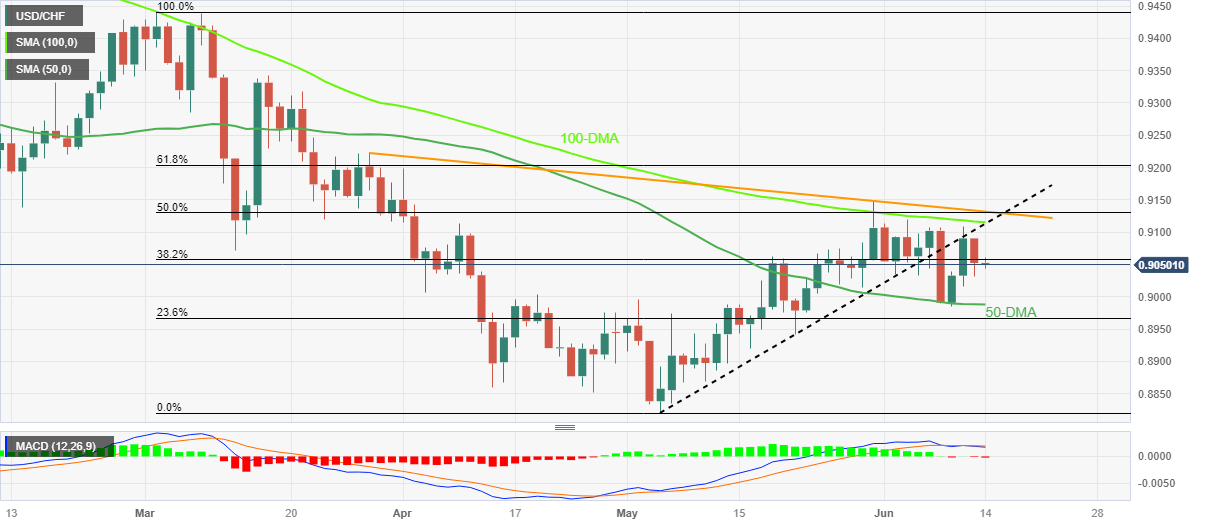
Trend: Further downside expected
Considering advanced prints from CME Group for natural gas futures markets, open interest set aside four consecutive daily drops and went up by around 1.3K contracts on Tuesday. Volume rose for the second straight session, this time by nearly 15K contracts.
Natural Gas: Next hurdle comes at $2.40
Natural gas extended the weekly recovery on Tuesday against the backdrop of increasing open interest and volume, exposing the continuation of the move for the time being. That said, there is an initial hurdle at the monthly high near the $2.40 mark per MMBtu, an area reinforced by the 100-day SMA.
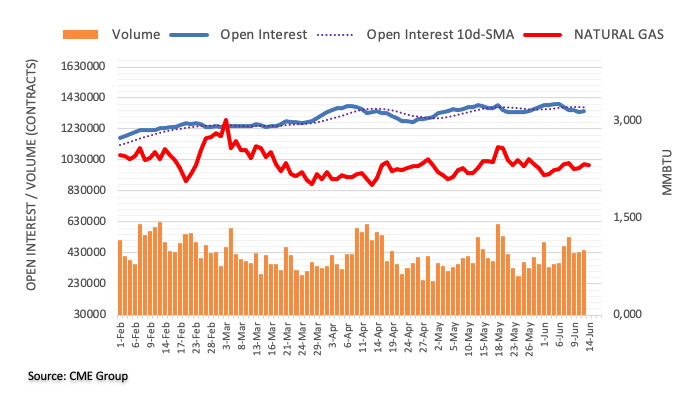
FX option expiries for June 14 NY cut at 10:00 Eastern Time, via DTCC, can be found below.
- EUR/USD: EUR amounts
- 1.0675 514m
- 1.0700 1.3b
- 1.0715 465m
- 1.0730 1.1b
- 1.0750 360m
- 1.0770 444m
- 1.0800 3.4b
- GBP/USD: GBP amounts
- 1.2700 400m
- USD/JPY: USD amounts
- 138.00 451m
- 138.45 659m
- 138.75 361m
- 139.00 726m
- 139.50 776m
- 140.00 568m
- 141.00 539m
- 141.50 633m
- USD/CHF: USD amounts
- 0.8925 642m
- 0.9090 481m
- 0.9125 579m
- AUD/USD: AUD amounts
- 0.6700 961m
- 0.6740 338m
- USD/CAD: USD amounts
- 1.3375 749m
- 1.3500 958m
- EUR/USD edges lower on Wednesday and is pressured by a modest USD uptick.
- Elevated US bond yields and a softer risk tone benefit the safe-haven Greenback.
- Any meaningful downfall seems elusive ahead of the key central bank event risks.
The EUR/USD pair comes under some selling pressure on Wednesday and moves further from over a three-week peak, around the 1.0825 region touched the previous day. Spot prices remain on the defensive heading into the European session and currently trade around the 1.0780-1.0775 area, down nearly 0.15% for the day.
A generally softer tone around the US equity futures drives some haven flows towards the US Dollar (USD), which, in turn, is seen as a key factor dragging the EUR/USD pair lower. Any meaningful USD recovery, from its lowest level since May 17 set on Tuesday, still seems elusive in the wake of firming expectations that the Federal Reserve (Fed) will skip hiking interest rates at the end of a two-day policy meeting later today.
The market bets for an imminent pause in the Fed's year-long policy tightening cycle were reaffirmed by softer US consumer inflation figures on Tuesday. In fact, the headline CPI merely rose in May and the annual rate decelerated to the slowest pace since March 2021. That said, the year-on-year inflation rate, at 4.0%, is still twice the Fed's 2% target and kept hopes alive for additional 25 bps lift-off at the July FOMC meeting.
This, in turn, remains supportive of elevated US Treasury bond yields, which, along with some repositioning trade ahead of the key central bank event risk, is seen lending some support to the Greenback. That said, the recent hawkish comments by a slew of influential European Central Bank (ECB) officials suggest that there is still a way to go to raise borrowing costs despite a fall in the headline Eurozone CPI to 6.1% in May.
It is worth recalling that ECB President Christine Lagarde indicated last week that additional interest rate rises were likely as, so far, there was no clear evidence that underlying inflation has peaked. This could underpin the shared currency and lend support to the EUR/USD pair. Traders might also prefer to wait on the sidelines ahead of the key central bank event risks - the FOMC decision on Wednesday and the ECB meeting on Thursday.
Technical levels to watch
In the opinion of UOB Group’s Economist Lee Sue Ann and Markets Strategist Quek Ser Leang, further upside in AUD/USD is likely to face a tough barrier around 0.6820 zone.
Key Quotes
24-hour view: We expected AUD to “continue to rise” yesterday. However, we noted that “overbought conditions suggest 0.6800 is unlikely to come into view”. In NY trade, AUD popped briefly to 0.6807 and then pulled back to end the day slightly higher at 0.6768 (+0.26%). Conditions remain overbought and this combined with tentative signs of slowing momentum, suggests AUD is unlikely to advance much further. Today, AUD is more likely to trade sideways between 0.6735 and 0.6795.
Next 1-3 weeks: Yesterday (13 Jun, spot at 0.6755), we held the view that AUD “is likely to strengthen further to 0.6800”. In NY trade, AUD rose to 0.6807 and then pulled back to close at 0.6768 (+0.26%). While the AUD strength that started at the end of last week (see annotations in the chart below) is still intact, any further advance is expected to face solid resistance at 0.6820. All in all, only a breach of 0.6705 (‘strong support’ level was at 0.6695 yesterday) would indicate that AUD is not advancing further.
- GBP/USD seesaws around five-week high after mixed UK data dump.
- UK GDP improves in April but Manufacturing, Industrial Production fail to impress Cable bulls.
- Increasing odds of BoE rate hike versus Fed’s pause to 1.5-year-old rate increase cycle keeps Pound Sterling buyers hopeful.
- Fed policymakers need to dump calls of more rate hikes, revise economic forecasts to propel GBP/USD, Powell’s Speech eyed.
GBP/USD pays little heed to the mixed UK data as it remains sidelined around 1.2600 after a slew of British economics released heading into Wednesday’s London open. The reason could be linked to the market’s cautious mood ahead of the Federal Open Market Committee (FOMC) monetary policy meeting. Also, the lack of uniformity in data and doubt about the UK’s economic strength also prod the Pound Sterling traders of late.
That said, the UK’s Gross Domestic Product (GDP) for April matches 0.2% growth versus -0.3% prior while the Industrial Production slumps during the stated month. That said, the Industrial Production also disappoints and so do the Index of Services for three months to April.
Also read: UK GDP expands 0.2% MoM in April vs. 0.2% expected
Despite the latest disappointment from the mid-tier UK data, versus upbeat British GDP figures, the GBP/USD pair remains on the bull’s radar as Britain reported upbeat employment and inflation numbers previously. Also, the early signals from the Bank of England (BoE) have been in favor of more rate hikes.
Apart from that, downbeat prints of the US inflation numbers, as per the Consumer Price Index (CPI) and Core CPI figures for May, drowned the US Dollar and defend the Cable buyers.
While the initial reaction to the UK data dump fails to impress the Cable pair traders, mainly due to the pre-Fed anxiety, the quote appears to run out of hawkish bias and hence a surprise positive tone of Fed Chair Jerome Powell and/or upbeat economic forecasts, may recall the sellers.
Also read: Fed to pause, focus on July meeting
Technical analysis
An ascending resistance line from June 01, around 1.2615 by the press time, precedes the monthly high of near 1.2625, also comprising the peak of Doji candlestick marked on four-hour chart the previous day, to limit the GBP/USD pair’s upside.
However, the bears need validation from the 61.8% Fibonacci retracement level of its May month fall, around 1.2535 to retake control even for intraday.
Open interest in crude oil futures markets shrank by around 20.6K contracts on Tuesday according to preliminary readings from CME Group. In the same line, volume went down by around 64.4K contracts.
WTI could revisit the June low near $67.00
Tuesday’s strong advance in prices of WTI was amidst shrinking open interest and volume. That said, further recovery appears out of favour in the very near term, allowing the commodity to potentially retest the June low in the sub-$67.00 region per barrel (June 12).
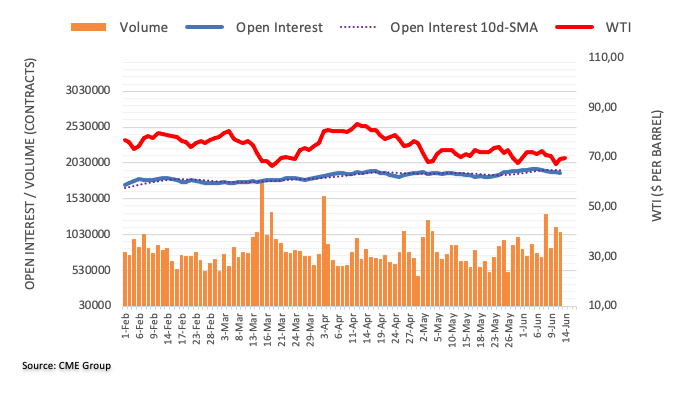
- UK GDP arrived at 0.2% MoM in April vs. 0.2% expected.
- GBP/USD defends 1.2600 on as-expected UK GDP data.
The UK Gross Domestic Product (GDP) monthly release for April, reported this Wednesday, showed that the British economy grew 0.2% in April, matching the 0.2% expectations and following a 0.3% contraction in March.
Meanwhile, the Index of services (April) came in at -0.1% 3M/3M vs. 0.1% estimate and 0.1% prior.
Market reaction
The GBP/USD pair is little changed on in line with expectations UK GDP data. At the press time, the spot is losing 0.05% on the day to trade at 1.2605, awaiting the Fed verdict for fresh trading impetus.
About UK GDP
The Gross Domestic Product released by the National Statistics is a measure of the total value of all goods and services produced by the UK. The GDP is considered a broad measure of the UK economic activity. Generally speaking, a rising trend has a positive effect on the GBP, while a falling trend is seen as negative (or bearish).
The industrial sector activity lost its recovery traction in April, the latest UK industrial and manufacturing production data published by Office for National Statistics (ONS) showed on Wednesday.
Manufacturing output arrived at -0.3% MoM in April versus -0.2% expected and 0.7% seen in March while total industrial output came in at -0.3% MoM vs. -0.1% expected and 0.7% last.
On a yearly basis, the UK Manufacturing Production data came in at -0.9% in April, meeting expectations of -0.9%. Total Industrial Output dropped by 1.9% in the fourth month of the year against -1.7% expected and the previous print of -2.0%.
Separately, the UK goods trade balance numbers were published, which arrived at GBP-14.996 billion in March versus GBP-16.50 billion expectations and GBP-16.356 billion last. The total trade balance (non-EU) came in at GBP-5.035 billion in March versus GBP-5.458 billion previous.
Related reads
- UK GDP expands 0.2% MoM in April vs. 0.2% expected
- GBP/USD prints bullish consolidation near 1.2600 on uninspiring UK GDP, Fed in the spotlight
GBP/USD’s upward bias could extend to the 1.2680 region in the short-term horizon, suggest UOB Group’s Economist Lee Sue Ann and Markets Strategist Quek Ser Leang.
Key Quotes
24-hour view: Yesterday, GBP soared to a 1-month high of 1.2625 and then closed on a strong note at 1.2612 (+0.80%). In view of the increased upward momentum, GBP is likely to rise further. However, barring a surge in momentum, the major resistance at 1.2680 is likely out of reach today. The upside risk is intact as long as GBP stays above 1.2540 (minor support is at 1.2570).
Next 1-3 weeks: We turned positive in GBP last Friday (09 Jun, spot at 1.2555) but we indicated that “it remains to be seen if it has enough momentum to revisit last month’s high near 1.2680”. After GBP dropped sharply to 1.2487, we highlighted yesterday (13 Jun, spot at 1,2515) that “upward momentum is beginning to fade and a break below 1.2450 would indicate that 1.2680 is not coming into view”. We did not quite expect the strong bounce to 1.2625 in NY trade. The boost in momentum suggests that 1.2680 could come into view. On the downside, a breach of 1.2515 (‘strong support’ level previously at 1.2450) indicates the build-up in momentum has faded.
CME Group’s flash data for gold futures markets noted traders added just 419 contracts to their open interest positions on Tuesday after two consecutive daily drops. Volume followed suit and increased by around 80.3K contracts and reversed two sessions in a row with gains.
Gold: A drop to $1930 in the offing?
Gold prices extended the decline on Tuesday amidst rising open interest and volume, which is indicative that further losses appear in store in the very near term. That said, the next support of note emerges at the May low at $1932 per ounce troy (May 30).
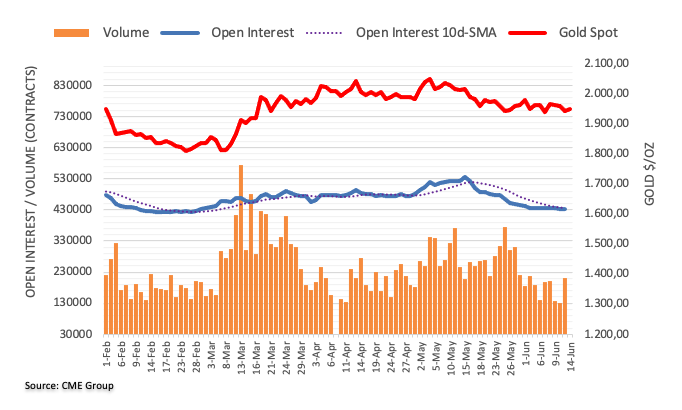
- AUD/USD edges higher during the Asian session on Wednesday, albeit lacks follow-through.
- Elevated US bond yields, along with a softer risk tone, lend support to the USD and cap gains.
- The downside seems cushioned as traders keenly await the highly-anticipated FOMC decision.
The AUD/USD pair attracts some dip-buying following the previous day's late pullback from levels just above the 0.6800 mark, or over a one-month peak and sticks to modest intraday gains through the Asian session on Wednesday. Spot prices, currently trade around the 0.6770-0.6775 region, up over 0.10% for the day, though lack bullish conviction ahead of the key central bank event risk.
The Federal Reserve (Fed) is scheduled to announce its decision later today, at 18:00 GMT and is widely expected to stand pat at the end of a two-day monetary policy meeting. This, in turn, keeps the US Dollar (USD) bulls on the defensive and continues to act as a tailwind for the AUD/USD pair. Meanwhile, the bets for an imminent pause in the Fed's rate-hiking cycle were reaffirmed by the soft US inflation data released on Tuesday, which showed that the headline CPI merely rose in May and the annual rate decelerated to the slowest pace since March 2021.
That said, the year-on-year inflation rate in the US, at 4.0%, is still twice the Fed's 2% target and keeps hopes alive for further policy tightening. In fact, the current market pricing indicates a greater chance of another 25 bps at the July FOMC policy meeting, which remains supportive of elevated US Treasury bond yields. This, along with the pre-Fed anxiety in the markets, lends some support to the safe-haven Greenback. Apart from this, worries about a global economic downturn, particularly in China, cap any further gains for the risk-sensitive Aussie.
The downside for the AUD/USD pair, meanwhile, is more likely to remain cushioned on the back of the Reserve Bank of Australia's (RBA) surprise 25 bps rate hike last week and a more hawkish policy statement. Even from a technical perspective, this week's sustained strength and acceptance above the 100-day Simple Moving Average (SMA) favours bullish traders. This, in turn, suggests that the path of least resistance for spot prices is to the downside and any meaningful corrective pullback might still be seen as a buying opportunity.
Technical levels to watch
- USD/TRY bulls take a breather at the record high as traders await the Fed’s verdict.
- Erdogan’s re-election keeps USD/TRY bulls hopeful even as change in CBRT Governor prods Turkish Lira bears.
- Risk of pullback in prices intensifies at higher levels as Fed’s hawkish halt versus CBRT’s likely rate hike looms.
USD/TRY seesaws around the all-time high as markets await the Fed’s verdict on early Wednesday, making rounds to 23.70 of late.
The Turkish Lira (TRY) pair’s upside momentum takes clues from Recep Tayyip Erdogan’s re-election as the national leader. The reason could be linked to Mr. Erdogan’s push for lower rates despite heavy inflation pressure in the economy.
It’s worth noting, however, the latest appointment of a US finance executive Hafize Gaye Erkan as the new Governor of the Central Bank of the Republic of Türkiye (CBRT) triggered concerns that the Turkish central bank may adhere to a few rate hikes to tame the inflation. On the same line could be the fresh appointment of former economy chief M. Simsek as the new Finance Minister.
Alternatively, the US Dollar Index (DXY) remains indecisive at the lowest levels in three weeks, retreating from an intraday high to 103.30 by the press time. In doing so, the greenback’s gauge versus the six major currencies suffers from the market’s dovish expectations from the US Federal Reserve (Fed), mainly due to the downbeat US inflation data.
That said, the latest CME FedWatch Tool reading hints at a 90% chance of the US Federal Reserve’s (Fed) no rate hike during today’s monetary policy meeting, versus around 75% chance before that. The reason could be linked to the downbeat US inflation data. That said, the US Consumer Price Index (CPI) drops more-than-expected and prior releases to 0.1% MoM and 4.0% YoY. However, the Core CPI, known as the CPI ex Food & Energy, matches 0.4% monthly and 5.3% yearly forecasts. It’s worth noting that the US headline CPI dropped to the lowest since March 2021 and hence justifies the market’s expectations of witnessing no rate hike from the US Federal Reserve (Fed).
Looking ahead, a light calendar at home emphasizes the Federal Reserve’s (Fed) reaction to the latest challenges to the hawkish policy. That said, the downbeat US inflation numbers have already flagged a pause to the Fed’s 18-month-old rate hike cycle. However, details of the economic forecasts, dot-plot and Chairman Jerome Powell’s press conference for clear directions.
Technical analysis
Although the 24.00 round figure prods USD/TRY bulls around the all-time high (ATH), a convergence of the previous resistance line from December 2021 and the 50-DMA, around 18.90, holds the key to the USD/TRY bear’s entry.
The continuation of the upside momentum could encourage EUR/USD to revisit the 1.0850 region in the near term according to UOB Group’s Economist Lee Sue Ann and Markets Strategist Quek Ser Leang.
Key Quotes
24-hour view: We expected EUR to consolidate in a range of 1.0735/1.0800 yesterday. However, it rose to a high of 1.0823 and then eased off to close at 1.0791 (+0.32%). Upward momentum has improved, albeit just a tad. Today, there is a chance for EUR to retest the 1.0825 level before a more sustained pullback is likely. The major resistance at 1.0850 is likely out of reach. Support is at 1.0775; if EUR breaks below 1.0750, it suggests the current upward pressure has eased.
Next 1-3 weeks: Our most recent narrative was from last Friday (09 Jun, spot at 1.0780) wherein upward momentum is building tentatively but “it is not clear for now if EUR has enough momentum to rise to 1.0850”. Yesterday (13 Jun), EUR rose to 1.0823 and then eased off. After the advance, upward momentum has improved, but not much. However, the odds of EUR rising to 1.0850 have increased. Overall, only a breach of 1.0730 (no change in ‘strong support’ level) would suggest EUR is not ready to head higher to 1.0850.
- EUR/JPY is looking for a potential support around 151.00 as an interest rate hike by the ECB to widen ECB-BoJ policy divergence.
- Eurozone showed a contraction in the final reading of GDP in the first quarter of CY2023.
- Constant monetary stimulus is required in Japan as current inflationary pressures are inspired by higher import prices.
The EUR/JPY pair has sensed some support after a mild correction to near 151.00 in the late Asian session. The cross has remained in the bullish trajectory from the past few trading sessions as investors are hoping that the European Central Bank (ECB) will raise interest rates further.
ECB President Christine Lagarde has already raised interest rates to 3.75% in its long policy-tightening cycle over the past nine months. And, the street is anticipating one more interest rate hike by 25 basis points (bps), which will push interest rates to 4%. Inflation in Eurozone is more than three times of required inflation and ECB policymakers believe that the current monetary policy is not restrictive enough to threaten the shared continent’s growth.
However, economic prospects in Eurozone are telling a different story. The display of contraction in the Gross Domestic Product (GDP) figures consecutively for two quarters is considered a technical recession. And considering the definitional aspect of recession shows that the German economy has already reported a recession after posting a contraction in GDP.
In addition to that, Eurozone also showed a contraction in the final reading of GDP in the first quarter of CY2023.
Meanwhile, the Japanese Yen is struggling to remain on its feet as investors are confident that the interest rate decision by the Bank of Japan (BoJ) will remain unaltered this Friday. In order to propel wages and overall demand to spurt in-house inflation, constant monetary stimulus is required as current inflationary pressures are inspired by higher import prices.
The UK Economic Data Overview
The British economic calendar is all set to entertain the Cable traders during the early hours of Wednesday, at 06:00 GMT with the monthly release of April 2023 Gross Domestic Product (GDP) figures. Also increasing the importance of that time are Trade Balance and Industrial Production details for the stated period.
It’s worth noting that the previous day’s upbeat UK jobs report and hawkish Bank of England (BoE) concerns also add importance to today’s British data dump. However, the presence of the Federal Open Market Committee (FOMC) monetary policy meeting can restrict the market’s reaction to the macros.
Having witnessed a contraction of 0.3% in economic activities during March 2023, market players will be interested in April month’s GDP figures to defy the fears of an economic slowdown. That said, forecasts suggest that the UK GDP will mark a 0.2% improvement in April’s economic activities and bolster the hawkish BoE bias.
GBP/USD traders also await the Index of Services (3M/3M) for the same period, likely to decline to reprint the 0.1% mark, for further insight.
Meanwhile, Manufacturing Production, which makes up around 80% of total industrial production, is expected to disappoint with -0.2% MoM figures for April, compared to 0.7% prior. Also, the total Industrial Production may fall by 0.1% versus the previous expansion of 0.7% during April.
Considering the yearly figures, the Industrial Production for April is expected to have dropped by -1.7% YoY versus -2.0% previous while the Manufacturing Production is anticipated to have improved to -0.9% in the reported month versus -1.3% the last.
Separately, the UK Trade Balance; non-EU for February will be reported at the same time and is likely to worsen to £-6,509B versus the prior readings of £-5,458B.
How could affect GBP/USD?
GBP/USD fades upside momentum as the traders recheck the hawkish signals flashed via the US inflation and the UK employment data the previous day. In doing so, the Cable pair aptly portrays the Fed day anxiety around the 1.2600 round figure after rising the most in a week the previous day, making rounds to a five-week high of late.
The Cable pair’s latest gains could be linked to the US Dollar’s broad-based weakness amid downbeat US inflation and increasing odds of the Federal Reserve’s (Fed) policy pivot. That said, the previous day’s strong job numbers and hawkish comments from the BoE officials, as well as inflation pressure in the UK, keep the GBP/USD buyers hopeful.
That said, a positive surprise from the scheduled British statistics may, however, won’t be enough to keep the GBP/USD firmer amid the looming Fed decision. Hence, a kneejerk bounce in the Cable price could be witnessed in the case of the firmer UK data.
Technically, the overbought RSI conditions and an ascending resistance line from June 01, around 1.2615 by the press time, quickly followed by the previous monthly high of near 1.2625, prod the GBP/USD bulls. Also restricting the Cable pair’s upside is the Doji candlestick on the four-hour play marked at the multi-day high, suggesting a pullback in prices.
Key notes
GBP/USD grinds below 1.2625 hurdle ahead of UK data dump, FOMC
GBP/USD Price Analysis: Cable bulls stall near 1.2600, pullback hinges on UK GDP, Fed
About the UK Economic Data
The Gross Domestic Product released by the Office for National Statistics (ONS) is a measure of the total value of all goods and services produced by the UK. The GDP is considered a broad measure of the UK's economic activity. Generally speaking, a rising trend has a positive effect on the GBP, while a falling trend is seen as negative (or bearish).
The Manufacturing Production released by the Office for National Statistics (ONS) measures the manufacturing output. Manufacturing Production is significant as a short-term indicator of the strength of UK manufacturing activity that dominates a large part of total GDP. A high reading is seen as positive (or bullish) for the GBP, while a low reading is seen as negative (or bearish).
The trade balance released by the Office for National Statistics (ONS) is a balance between exports and imports of goods. A positive value shows a trade surplus, while a negative value shows a trade deficit. It is an event that generates some volatility for the GBP.
- NZD/USD retreats from three-week high, stays mildly bid despite the latest fall toward intraday low.
- Bullish chart formation, sustained trading beyond 100-SMA and downbeat US inflation keeps Kiwi pair buyers hopeful.
- Sellers need validation from 0.6025 and the Fed to retake control.
NZD/USD pares intraday gains, the fifth in a row, as bulls catch a breather at the highest level in three weeks heading into Wednesday’s European session. In doing so, the Kiwi pare reverses from the 200-SMA as market positions for the US Federal Reserve (Fed) Interest Rate Decision amid escalating hopes of no rate hike after witnessing 10 consecutive lifts in the Fed rates. With this, the quote stays depressed near 0.6155 despite posting mild gains at the latest.
Also read: NZD/USD bulls step in ahead of the Fed
In addition to the failure to cross the 200-bar Simple Moving Average (SMA), the NZD/USD pair’s pullback also takes clues from the overbought RSI (14) line. However, a one-week-old ascending trend channel keeps the Kiwi pair buyers hopeful.
Hence, the quote’s latest weakness can challenge the short-term bullish chart formation by poking the 0.6130 support with eyes on the 100-SMA support surrounding 0.6085.
It’s worth mentioning that multiple levels marked since late May highlights 0.6030-25 as the last defense of the NZD/USD buyers.
On the contrary, the aforementioned 200-SMA restricts immediate upside of the NZD/USD pair near 0.6175.
Following that, the 61.8% Fibonacci retracement level of the pair’s May 19-31 downside, near 0.6185, will precede the previously stated channel’s top line, near 0.6205, to challenge the bulls.
NZD/USD: Four-hour chart
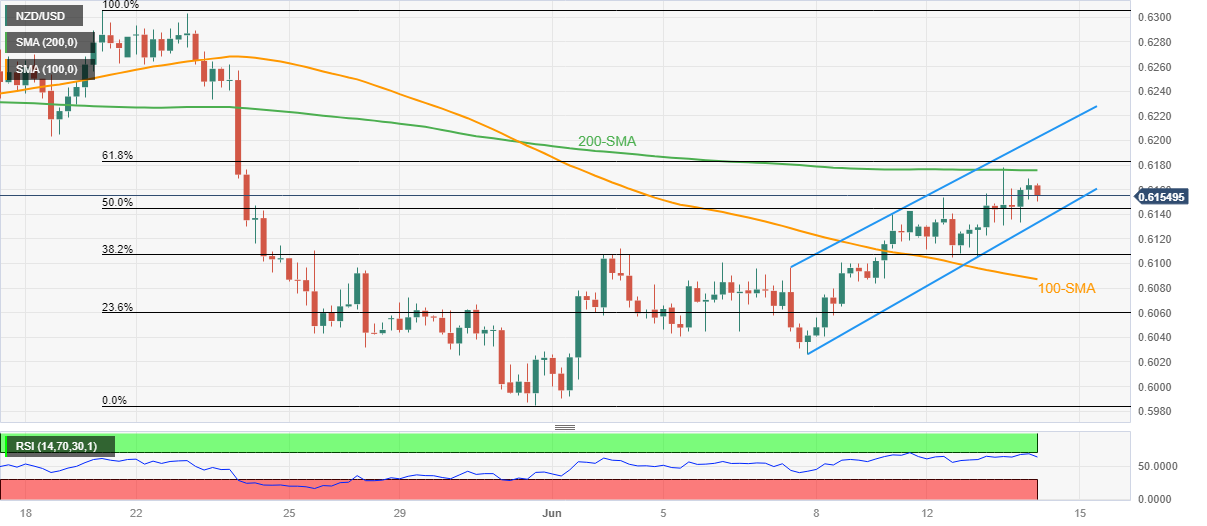
Trend: Bullish
- Gold Price consolidates weekly loss ahead of Federal Reserve Interest Rate Decision.
- Market players put 95% bets on Fed’s status quo even as dot-plot, Powell’s speech can surprise XAU/USD bulls.
- Cautious optimism, softer US Dollar keeps the Gold Price firmer but multiple checks prod XAU/USD upside.
Gold Price (XAU/USD) clings to mild gains as it snaps a three-day downtrend, as well as consolidation the weekly loss, while positioning for the Federal Open Market Committee (FOMC) monetary policy meeting announcements. That said, the pre-Fed anxiety and the US-China tussles joined firmer Treasury bond yields to previously weigh on the XAU/USD. However, downbeat prints of the US inflation numbers, as per the Consumer Price Index (CPI) and Core CPI figures for May, drowned the US Dollar and recall the Gold buyers.
While the US inflation has already challenged the Fed’s 18-month-old rate hike cycle, the US central bank isn’t expected to turn dovish. The same highlights details of the economic forecasts, dot-plot and Chairman Jerome Powell’s press conference for clear directions. Should the Fed policymakers suggest a July rate hike and many more, the Gold Price may slip off the bull’s radar while dovish remarks won’t hesitate to propel the XAU/USD past the $1,960 hurdle.
Also read: Gold Price Forecast: XAU/USD tested 100 DMA on US CPI, what’s next on Federal Reserve decision?
Gold Price: Key levels to watch
As per our Technical Confluence Indicator, the Gold Price edges higher past the $1,932 support comprising the previous monthly low, Pivot Point one-day S1 and the lower band of the Bollinger on the hourly chart.
Also keeping the XAU/USD bulls hopeful is the quote’s sustained trading past the $1,943 previous upside hurdle, including the 100-DMA, Pivot Point one-week S1and the previous low on the four-hour (4H) chart.
However, a convergence of the Fibonacci 61.8% on one-week and 38.2% in one-day prods immediate upside of the Gold Price near $1,953.
Following that, 10-DMA, 100-SMA on 4H and the Fibonacci 61.8% on one-day together highlight the $1,958 as a tough nut to crack for the Gold buyers.
Also acting as an upside filter is the $1,960 round figure encompassing the middle band of the Bollinger on the daily chart and the Fibonacci 38.2% on one-week.
It should be noted that the $1,970 mark including the Fibonacci 38.2% on one-month joins the upper band of the Bollinger on the hourly chart to act as the final defense of the Gold bears.
Here is how it looks on the tool
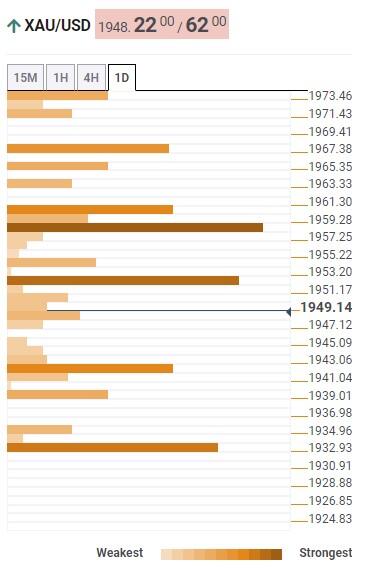
About Technical Confluences Detector
The TCD (Technical Confluences Detector) is a tool to locate and point out those price levels where there is a congestion of indicators, moving averages, Fibonacci levels, Pivot Points, etc. If you are a short-term trader, you will find entry points for counter-trend strategies and hunt a few points at a time. If you are a medium-to-long-term trader, this tool will allow you to know in advance the price levels where a medium-to-long-term trend may stop and rest, where to unwind positions, or where to increase your position size.
- USD/INR oscillates in a narrow trading band through the Asian session on Wednesday.
- Failure to find acceptance below the 100-day SMA warrants caution for bearish traders.
- A break below the 82.00 confluence is needed to support prospects for additional losses.
The USD/INR pair struggles to gain any meaningful traction on Wednesday and seesaws between tepid gains/minor losses through the Asian session. The pair currently trades around the 82.25-82.30 region, nearly unchanged for the day, and remains well within the striking distance of its lowest level since May 16 touched on Tuesday.
From a technical perspective, the USD/INR pair, so far, has been showing some resilience below the 100-day Simple Moving Average (SMA) and the 38.2% Fibonacci retracement level of the April-May rally. This makes it prudent to wait for some follow-through selling below the overnight swing low, around the 82.15 area, before placing fresh bearish bets. This is closely followed by the 82.00 confluence, comprising the very important 200-day SMA and the 61.8% Fibo. level.
A convincing break below the latter will mark a fresh breakdown and set the stage for an extension of the recent pullback from the vicinity of the 83.00 round figure. With oscillators on the daily chart just starting to gain negative traction, the USD/INR pair might then accelerate the downfall towards the 81.75 intermediate support en route to the March/April swing low, around 81.50 strong horizontal support.
On the flip side, the 38.2% Fibo. level, around the 82.40 region, now seems to act as an immediate hurdle. The next relevant resistance is pegged near the 82.60-82.65 zone, or the 23.6% Fibo. level, which if cleared might trigger a short-covering move. The USD/INR pair might then make a fresh attempt to conquer the 83.00 round-figure mark. Bulls might eventually aim to challenge the all-time high, around the 83.40-83.45 area touched in October 2022.
USD/INR daily chart
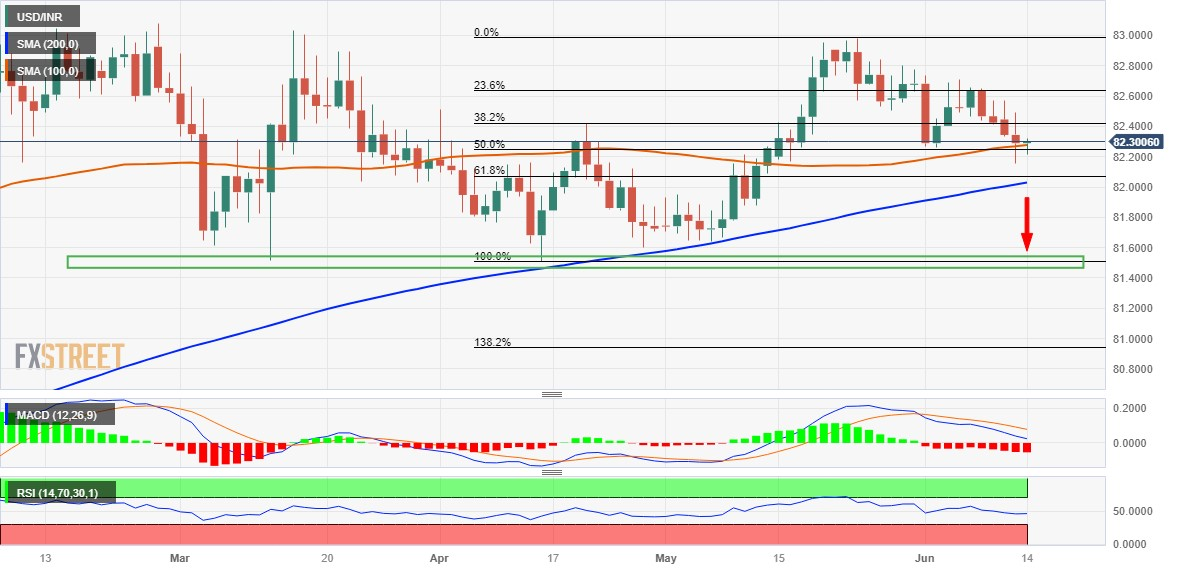
Key levels to watch
In its Staff Concluding Statement of the 2023 Article IV Mission for New Zealand, the International Monetary Fund (IMF) noted that “New Zealand’s economy is in the midst of a necessary, policy-induced slowdown following the strong post-pandemic recovery.”
Key takeaways
“New Zealand is likely to continue slowing in the near term as monetary tightening takes hold. Inflation is declining but will remain high for a while. The current account balance has deteriorated significantly, reflecting excess demand and one-off factors.”
“Macroeconomic policies should retain a restrictive bias. Fiscal policy should prioritize the recovery from the floods and cyclone, while limiting other discretionary spending. The monetary policy stance is appropriate and should aim to bring inflation to target.”
“The financial sector remains sound with ample capital and liquidity levels.”
Market reaction
The NZD/USD pair is unfazed by the above report, trading 0.13% higher on the day at 0.6158, as of writing.
- USD/CAD fades bounce off the four-month low, remains pressured at intraday low of late.
- WTI pares weekly loss as a slump in US SPR renews Oil demand hopes, especially amid softer USD.
- US inflation favors bets suggesting a pause to Fed’s 1.5-year-old rate hike trajectory.
- FOMC projections, Powell’s Speech will be crucial for Loonie pair traders to watch for clear directions.
USD/CAD sellers occupy the driver’s seat, despite the sluggish US Dollar, as markets brace for the Federal Reserve Interest Rate Decision on early Wednesday. In doing so, the Loonie pair cheers recovery in Canada’s main export item, namely WTI crude oil, as well as hopes of witnessing no rate hike from the US central bank, while printing mild losses near 1.3300 at the latest.
WTI crude oil prints minor gains around $69.60 as it pares the weekly loss, consecutive third one in a row, amid pre-Fed consolidation. Also allowing the black gold buyers to remain firmer are the expectations of more Oil demand from the US as the world’s biggest economy runs outs of steam while keeping using the Strategic Petroleum Reserves (SPR) to tame the energy price. It’s worth observing that the US SPR is down 33% compared to one year ago levels as it prints 353M level in the recent update.
On the other hand, the US Dollar Index (DXY) remains indecisive at the lowest levels in three weeks, retreating from intraday high to 103.30 by the press time. In doing so, the greenback’s gauge versus the six major currencies suffers from the market’s dovish expectations from the US Federal Reserve (Fed).
As per the latest CME FedWatch Tool reading, there prevails more than a 90% chance of the US Federal Reserve’s (Fed) no rate hike during today’s monetary policy meeting, versus around 75% chance before that. The reason could be linked to the downbeat US inflation data. That said, the US Consumer Price Index (CPI) drops more-than-expected and prior releases to 0.1% MoM and 4.0% YoY. However, the Core CPI, known as the CPI ex Food & Energy, matches 0.4% monthly and 5.3% yearly forecasts. It’s worth noting that the US headline CPI dropped to the lowest since March 2021 and hence justifies the market’s expectations of witnessing no rate hike from the US Federal Reserve (Fed).
It should be noted that the cautious optimism in the markets, as portrayed by the S&P500 Futures and the US Treasury bond yields, also exert downside pressure on the US Dollar and the USD/CADA price.
Moving on, the US Producer Price Index (PPI) for May and the risk catalysts may entertain the USD/CAD pair traders ahead of the Fed’s verdict. That said, the US central bank’s economic forecasts, dot-plot and Chairman Jerome Powell’s press conference for clear directions.
Technical analysis
A daily closing below the previous key support line stretched from the mid-November 2022, near 1.3330 by the press time, directs USD/CAD towards the yearly low of 1.3262 marked in February.
Analysts at JP Morgan Asset Management note that the Federal Reserve is likely to pause its rate hike cycle at this week’s Federal Open Market Committee (FOMC) meeting.
Key quotes
“We expect the Fed to leave the federal funds rate unchanged although both the post-meeting statement and the dot plot will likely emphasize that inaction this week should be considered “skipping a rate hike” rather than putting an end to monetary tightening.”
“Indeed, Fed communications could explicitly warn of a possible further rate hike in July.”
“On balance, however, cooling data on inflation and growth between now and that meeting should be enough to convince the Fed that no further tightening is warranted.”
- USD/JPY struggles around intraday low, prints the first daily loss in four.
- Upbeat oscillators, clear break of key hurdle keep Yen bears hopeful.
- 100-EMA, 200-EMA act as additional downside filters; bulls can aim for 141.70.
- US inflation lures Fed doves but dot-plot, Powell’s Speech can turn the table.
USD/JPY bears struggle to keep the reins amid early Wednesday in Europe, despite snapping a three-day uptrend by retreating from a one-week high to around 140.00 at the latest. In doing so, the Yen pair portrays the market’s cautious mood ahead of the all-important Federal Open Market Committee (FOMC) monetary policy meeting by poking the resistance-turned-support line stretched from early May.
Also read: USD/JPY trades with mild negative bias around 140.00, downside seems limited ahead of Fed
Apart from the previous resistance line, the bullish MACD signals and upbeat RSI (14) line also keeps the USD/JPY buyers hopeful.
Hence, the Yen pair stays on the bull’s radar unless breaking the aforementioned trend line, currently around 139.90.
Even if the quote breaks the 139.90 mark, the 100-bar Exponential Moving Average (EMA) and the monthly bottom, respectively near 139.10 and 138.40, can challenge the USD/JPY sellers.
In a case where the quote drops past 138.40, the 200-EMA support of 138.00 will act as the last defense of the USD/JPY buyers.
On the contrary, recovery moves may initially aim for the previous monthly high of around 140.90, as well as the 141.00 round figure.
Following that, the 61.8% Fibonacci Expansion (FE) of its May 16 to June 01 moves, near 141.70, could gain the USD/JPY bull’s attention.
If at all the pair remains firmer past 141.70, the 142.00 threshold and the late November 2022 peak of around 142.25 can challenge the buyers.
USD/JPY: Four-hour chart
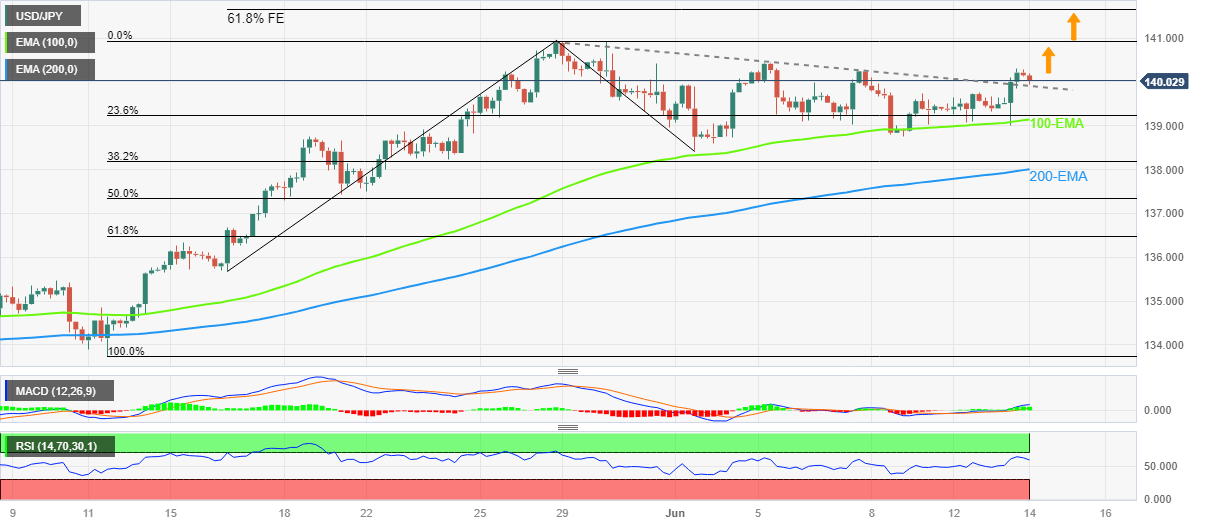
Trend: Further downside expected
- Silver attracts fresh buyers on Wednesday and snaps a two-day losing streak.
- Negative oscillators on daily/hourly charts warrant caution for bullish traders.
- A break below 23.6% Fibo. is needed to support prospects for further losses.
Silver regains positive traction during the Asian session on Wednesday, snapping a two-day losing streak and stalling the overnight sharp retracement slide from the vicinity of mid-$24.00s. The white metal is currently placed near the top end of its intraday trading range, around the $23.80 region, though seems to struggle to capitalize on the strength beyond the 200-hour Simple Moving Average (SMA).
From a technical perspective, the recent repeated failures near the 50% Fibonacci retracement level of the downfall witnessed in May and the subsequent break below the $24.00 mark favours bearish traders. This, along with the fact that oscillators on the daily chart have just started drifting in the negative territory, supports prospects for a further near-term depreciating move. That said, it will still be prudent to wait for some follow-through selling below the 23.6% Fibo. support, around the $23.55-$23.50 region, before placing fresh bets.
The XAG/USD might then turn vulnerable to weaken further below the monthly low, around the $23.25 region, and accelerate the slide towards the $23-.00 round figure. Some follow-through selling will expose the $22.70-$22.65 area, or a two-month low touched in May before the commodity eventually drops to test the $22.00 mark.
On the flip side, the $24.00 mark, which coincides with the 38.2% Fibo. level now seems to act as an immediate hurdle. Any further move up might continue to attract fresh sellers and remain capped near the $24.50-$24.55 supply zone, or the 50% Fibo. level. A convincing breakthrough, however, should allow the XAG/USD to aim to reclaim the $25.00 psychological mark and accelerate the positive momentum further towards the $25.35-$25.40 resistance zone. Bulls might then make a fresh attempt towards conquering the $26.00 round figure.
Silver 1-hour chart
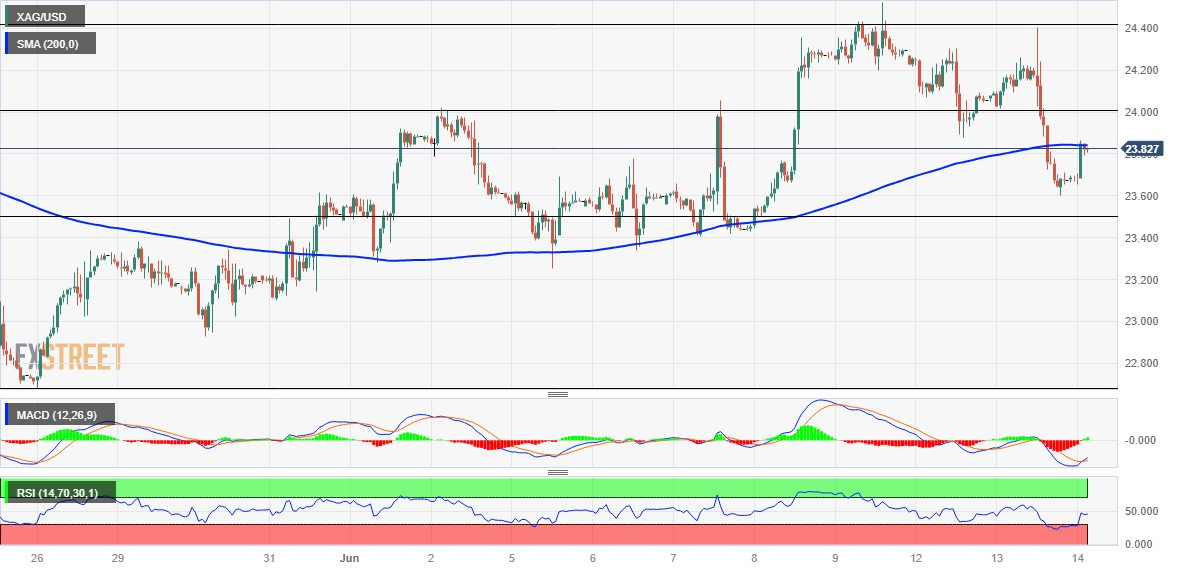
Key levels to watch
- The USD struggles to gain any traction amid bets for an imminent Fed rate hike pause.
- The overnight sharp rise in the US bond yields lends some support and helps limit losses.
- Traders also seem reluctant as the focus remains glued to the key FOMC policy decision.
The US Dollar (USD) struggles to capitalize on the overnight modest bounce from its lowest level since May 17 and remains on the defensive through the Asian session on Wednesday. The USD Index (DXY), which tracks the Greenback against a basket of currencies, hovers around the 102.80 region, down over 0.10% for the day, as traders keenly await the outcome of the highly-anticipated FOMC monetary policy meeting.
The Federal Reserve (Fed) is scheduled to announce its decision at 18:00 GMT this Wednesday and is widely expected to skip raising interest rates. The bets were lifted by the latest US consumer inflation figures released on Tuesday, which showed that the headline CPI barely rose in May and the annual increase was the smallest since March 2021. This, in turn, is seen as a key factor that keeps the USD bulls on the defensive, though the downside seems limited heading into the key central bank event risk.
Given that the year-on-year inflation rate is still well above the 2% target, the Fed might still opt to stick to its hawkish stance. Moreover, the markets have been pricing in a greater chance of another 25 bps lift-off at the July FOMC policy meeting. This had led to the overnight sharp spike in the US Treasury bond yields, which, along with a modest downfall in the US equity futures, is holding back traders from placing aggressive bearish bets around the safe-haven Greenback and limiting any further losses.
Apart from the crucial FOMC decision, investors will closely scrutinize Fed Chair Jerome Powell's comments at the post-meeting press conference for clues about the future rate-hike path. This, in turn, will play a key role in influencing the near-term USD price dynamics and help investors to determine the next leg of a directional move. In the meantime, Wednesday's release of the US Producer Price Index (PPI) might provide some impetus to the USD later during the early North American session.
Technical levels to watch
- USD/CNH seesaws at the highest levels since late November 2022, mildly offered of late.
- Overbought RSI conditions prod buyers within one-week-old rising trend channel.
- Hopes of hawkish Fed halt, bullish MACD signals join sustained trading above the key moving average to favor Yuan bears.
USD/CNH struggles to extend a three-day uptrend as it retreats from the highest levels in nearly eight months on the key Federal Open Market Committee (FOMC) monetary policy meeting day. That said, the offshore Chinese Yuan (CNH) pair prints mild losses near 7.1720 by the press time, after rising to the highest levels since April 2022 with the latest peak of 7.1788.
It’s worth noting that the overbought RSI conditions join the pre-Fed anxiety to challenge the USD/CNH traders within a one-week-old rising trend channel, currently between 7.2020 and 7.1350 at the latest. Adding strength to the 7.1350 support level is the 50-SMA.
In a case where the USD/CNH drops below 7.1350, the previous resistance line stretched from late April, close to 7.0680, will precede a two-month-old rising support line, surrounding 7.0570 as we write, to please the offshore Chinese Yuan buyers.
However, the 200-SMA level of 7.0380 acts as the last defense of the USD/CNH bulls before giving control to the bears.
On the flip side, USD/CNH run-up needs validation from the latest high of around 7.1788, as well as the 7.1800 round figure.
Following that, the 7.2000 psychological magnet may prod the pair buyers before directing them to the short-term rising channel’s top line, close to 7.2020.
Should the offshore Chinese Yuan (CNH) remains bearish past 7.2020, the odds of witnessing the pair’s rally towards the late November 2022 peak of near 7.2600 can’t be ruled out.
USD/CNH: Four-hour chart
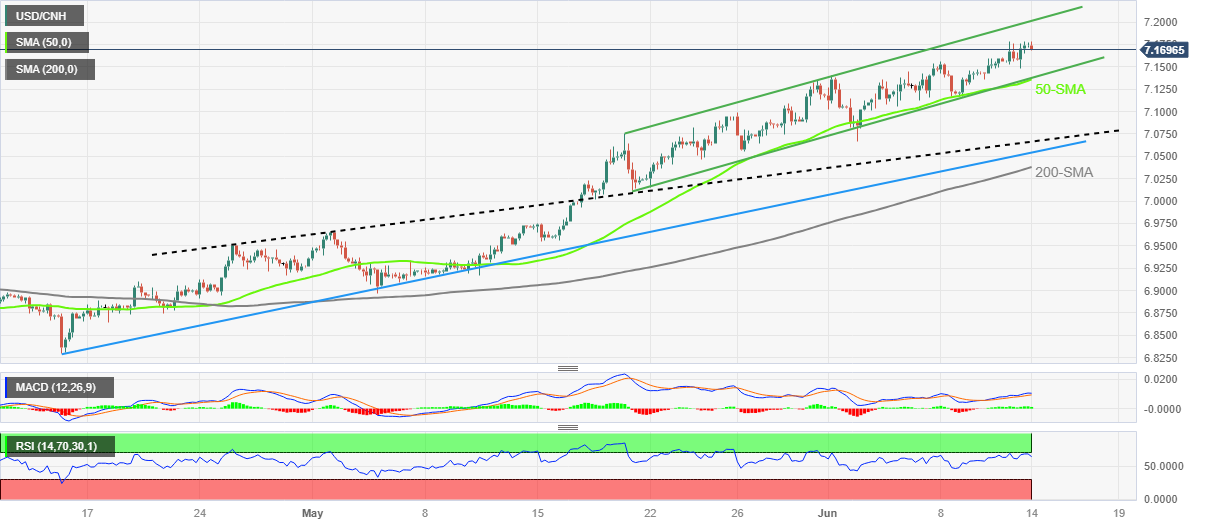
Trend: Pullback expected
| Raw materials | Closed | Change, % |
|---|---|---|
| Silver | 23.664 | -1.62 |
| Gold | 1942.94 | -0.72 |
| Palladium | 1348.94 | -0.29 |
- GBP/JPY pulls back from a fresh multi-year high touched during the Asian session on Wednesday.
- A softer risk tone benefits the safe-haven JPY and prompts some profit-taking around the cross.
- The divergent BoJ-BoE policy outlook helps limit the downside ahead of the UK macro data dump.
The GBP/JPY cross eases from its highest level since December 2015 touched on Wednesday and trades with a mild negative bias through the first half of the Asian session, though lacks follow-through. The cross currently trades around the 176.65-176.70 area and seems poised to prolong its recent upward trajectory witnessed over the past month or so.
The pre-Fed anxiety tempers investors' appetite for riskier assets, which drives some haven flows towards the Japanese Yen (JPY) and acts as a headwind for the GBP/JPY cross. The downside, however, remains in the wake of a big divergence in the Bank of Japan (BoJ and the Bank of England (BoE) monetary policy outlooks. In fact, the markets seem convinced that the BoJ will stick to its dovish stance to support the economy and ensure that the recent positive signs are sustained. The expectations were reaffirmed by BoJ Deputy Governor Masazumi Wakatabe on Monday, saying that there are overwhelming cases for the continuation of the ultra-easy monetary policy measures.
In contrast, the Bank of England (BoE) is anticipated to be far more aggressive in policy tightening to contain stubbornly high inflation and hike interest rates by 25 bps on June 22. The bets were reaffirmed by the upbeat UK employment details released on Tuesday, which, so far, has shown little signs of cooling off. The UK Office for National Statistics (ONS) reported that the ILO Unemployment Rate unexpectedly dipped to 3.8% in the quarter to April from the 3.9% previous. Furthermore, the Claimant Count Change also showed a bigger-than-expected decline of 13.6K in May. Adding to this, the jump in UK wages, which is a key driver of inflation, poses the biggest concern for the BoE.
Commenting on the UK jobs data before the House of Lords Economic Affairs Committee, BoE Governor Andrew Bailey noted that the UK labor market is very tight and recovering slowly. Separately, BoE policymaker Catherine Mann said on Tuesday that wage increases of 4.0% would be a challenge to returning CPI to 2.0%. This, in turn, suggests that the fight against inflation is not over yet and supports prospects for a further near-term appreciating move for the GBP/JPY cross. Market participants now look forward to the UK macro data dump, including the monthly GDP print, for some meaningful trading opportunities. The focus will then shift to the BoJ monetary policy meeting on Friday.
Technical levels to watch
- Market sentiment dwindles as traders brace for the FOMC.
- Traders appear almost certain of witnessing end to Fed’s 10 consecutive rate-hike cycle.
- S&P500 Futures grind at the highest levels since 2022 despite upbeat Wall Street closing.
- US 10-year, two-year Treasury bond yields retreat from multi-day highs.
Market players position themselves for the all-important Federal Reserve Interest Rate Decision early Wednesday.
While portraying the mood, the S&P500 Futures struggle at the highest levels since April 2022, marked the previous day, as it prods a four-day uptrend near 4,370 by the press time. Additionally, the US 10-year Treasury bond yields retreat from the 13-day high of 3.83% to 3.81% whereas the two-year counterpart poked the highest levels in three months with the 4.70% mark before easing to 4.65% at the latest.
Also portraying the market’s indecision is the dicey moves of the US Dollar Index (DXY), after falling to the three-day low the previous day, as well as the sluggish performance of the Gold and Oil prices.
That said, the tech-heavy Nasdaq led the gainers on Wall Street as shares of Apple, Nvidia and Tesla rallied after the US inflation numbers bolstered the IT shares, as well as the overall market sentiment.
It should be noted that the US Consumer Price Index (CPI) drops more-than-expected and prior releases to 0.1% MoM and 4.0% YoY. However, the Core CPI, known as the CPI ex Food & Energy, matches 0.4% monthly and 5.3% yearly forecasts. It’s worth noting that the US headline CPI dropped to the lowest since March 2021 and hence justifies the market’s expectations of witnessing no rate hike from the US Federal Reserve (Fed).
The same could be observed through the CME’s FedWatch Tool as it suggests more than a 90% chance of the US Federal Reserve’s (Fed) no rate hike during today’s monetary policy meeting, versus around 75% chance before that.
Elsewhere, China’s push for more liquidity generation and the Sino-American tension joins the bond market activity due to the US debt-ceiling deal to entertain the traders.
Looking ahead, second-tier data from the UK, Eurozone and the US may offer some moves to the market players ahead of the key Federal Open Market Committee (FOMC) monetary policy meeting.
Also read: Forex Today: After US CPI, attention turns to the FOMC
- USD/CHF struggles to gain any meaningful traction on Wednesday and oscillates in a narrow band.
- Bets for an imminent Fed rate-hike pause undermine the USD and acts as a headwind for the major.
- A softer risk tone benefits the safe-haven CHF and contributes to cap the upside ahead of the FOMC.
The USD/CHF pair lacks any firm intraday directional bias on Wednesday and oscillates in a narrow trading band, just below mid-0.9000s through the Asian session.
The US Dollar (USD) remains on the defensive just above its lowest level since May 17 touched on Tuesday and is seen as a key factor acting as a headwind for the USD/CHF pair. The latest US consumer inflation figures released on Tuesday reaffirmed bets that the Federal Reserve (Fed) will skip hiking interest rates at the end of a two-day policy meeting later this Wednesday and continues to undermine the Greenback.
The US Labor Department reported that the headline CPI barely rose in May and the yearly rate decelerated from 4.9% to 4.0% - the smallest increase since March 2021. The year-on-year inflation rate, however, was still twice the Fed's 2% target and supports prospects for further policy tightening. In fact, the current market pricing indicates a greater chance of another 25 bps lift-off at the July FOMC monetary policy meeting.
The expectations remain supportive of elevated US Treasury bond yields, which, in turn, is seen lending some support to the buck and the USD/CHF pair. Any meaningful recovery, meanwhile, still seems elusive in the wake of a corrective decline in the US equity futures, which tends to benefit the safe-haven Swiss Franc (CHF). This further contributes to the subdued/range-bound price action through the first half of trading on Wednesday.
Traders also seem reluctant to place aggressive bets and prefer to wait on the sidelines ahead of the highly-anticipated FOMC policy decision. Apart from this, the focus will be on Fed Chair Jerome Powell's comments at the post-meeting press conference. Market participants will look for fresh cues about the Fed's rate-hike path, which will play a key role in influencing the USD price dynamics and provide a fresh impetus to the USD/CHF pair.
Technical levels to watch
- Gold price is on the verge of a breakout and all eyes are on the Fed.
- Bears are creeping on the backside of the prior bullish trend.
Gold price is firm in Tokyo as the focus stays on the Federal Reserve later today and following the US inflation report that gave something for both the bears and bulls. At the time of writing, XAU/USD is trading higher by some 0.13% and has risen from a low of $1,942.31 to reach a high of $1,946.89 so far.
The yellow metal gained overnight following the fall in US inflation. On Tuesday, data showed that the US Consumer Price Index edged up 0.1% last month after increasing 0.4% in April, core CPI increased 0.4% in May, rising by the same margin for the third straight month.
The US Dollar took a disliking to the data initially, however, the Greenback pared back initial knee-jerk losses due to the core. Investors are of the mind that the core is still too high to be compatible with the Fed's 2% inflation target, thus there are still chances that the FOMC will justify another 25-bp rise at the outcome of the FOMC meeting. Additionally, Gold price gains were given up amid concerns that any pause from the Fed is likely to be short-lived, with the possibility the central bank remains hawkish.
Analysts at TD Securities offered three scenarios as follows:
Base case:
Fed delivers a 25bp rate hike, without fully closing the door to additional rate increases. While the FOMC will likely continue to acknowledge the more uncertain economic environment, especially for credit conditions, it will also emphasize that disinflation has been slower than expected and that economic activity remains resilient.
Hawkish:
Fed delivers a 25bp rate hike, but also commits to additional rate increases as the data has evolved firmer than expected. The statement will also emphasize that credit tightening does not appear to be outsized whereas inflation dynamics remain notably out of sync with the mandate.
Dovish:
Fed skips a rate increase but signals that further hikes are possible. While economic activity indicators have yet to suggest the Fed is on a clear path to 2% inflation, they can afford to gather more data given the accumulation of rate increases and as the risks to the outlook have become more two-sided.
Gold technical analysis
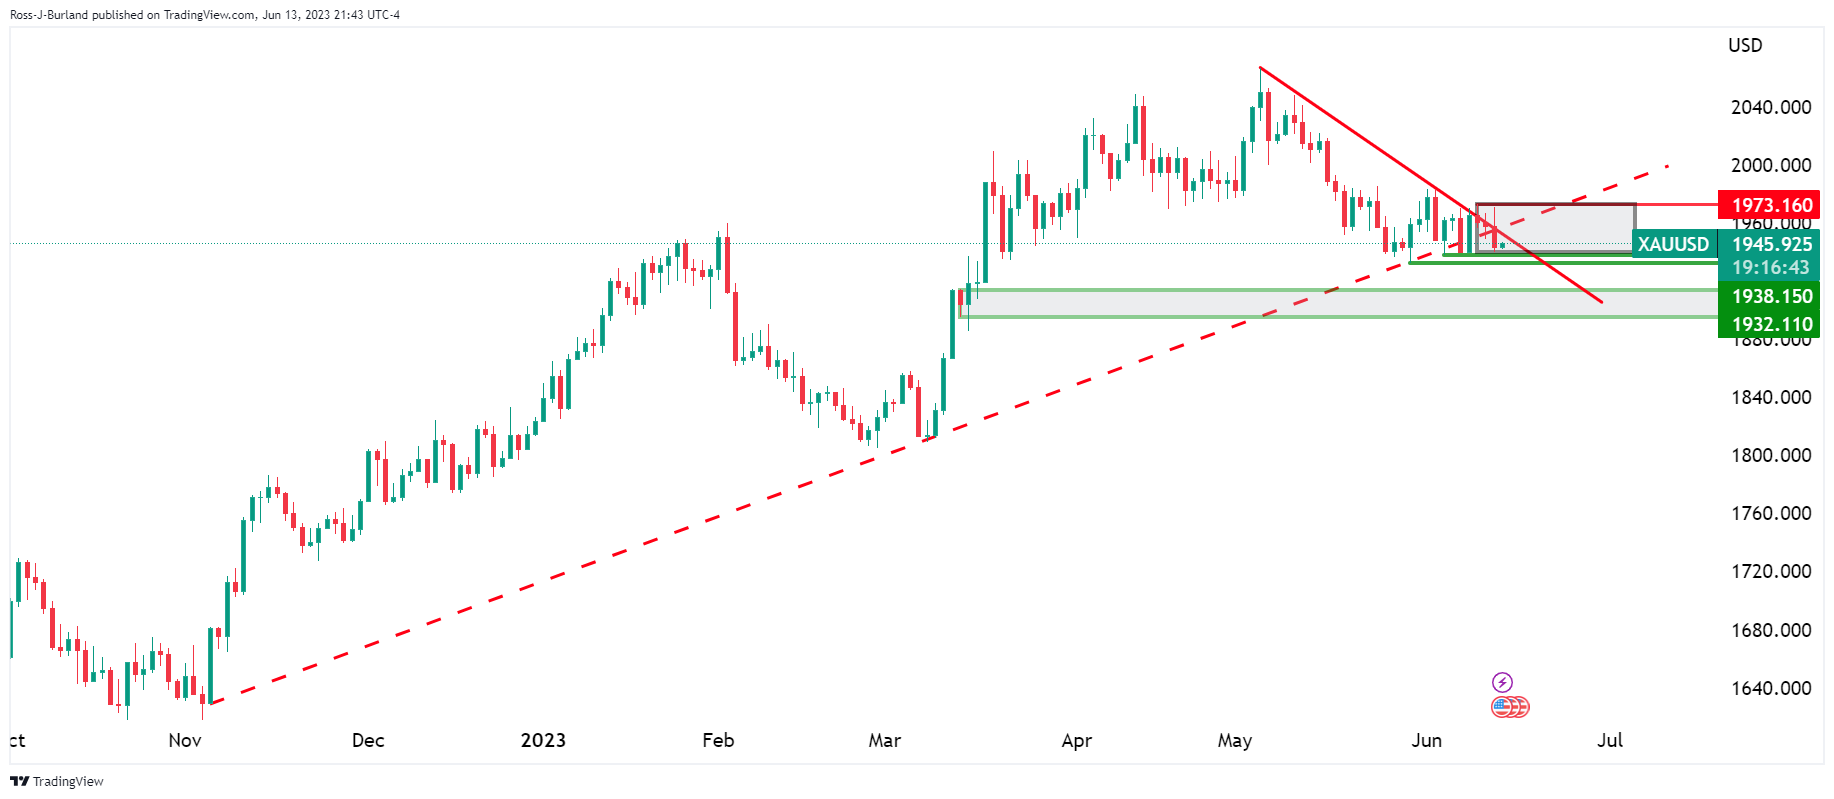
The Gold price slid to the backside of the bullish trend but it is still stuck between key breakout support and resistance as illustrated in the daily and 4-hour charts above. The Fed may have the power to move the needle one way or the other, especially in an asymmetrical outcome for the US dollar.
- EUR/USD seesaws around three-week high amid pre-Fed anxiety.
- Overbought RSI, 200-EMA prods Euro bulls within two bullish channels.
- Euro bears need validation from 1.0700 and the FOMC to retake control.
EUR/USD treads water around 1.0800 as it struggles to extend the two-day winning streak near the highest levels since late May amid early Wednesday. In doing so, the Euro pair aptly portrays the market’s cautious mood ahead of the Federal Open Market Committee (FOMC) monetary policy meeting.
Also read: EUR/USD retreats from three-week high towards 1.0750 as Fed vs. ECB battle intensifies
That said, the 200-bar Exponential Moving Average (EMA), near 1.0800 by the press time, challenges the EUR/USD pair’s immediate upside amid the overbought RSI conditions. Also acting as an immediate upside filter is the top line of a one-week-old rising channel, close to 1.0820.
In a case where the Euro bulls keep the reins past 1.0820, a convergence of its 50% Fibonacci retracement of May-month downside and a fortnight-long bullish channel’s upper line, near 1.0865 at the latest, will be in the spotlight.
Should the EUR/USD manage to remain firmer past 1.0865, the odds of witnessing a gradual rise toward the 1.1000 psychological magnet can’t be ruled out.
Meanwhile, a rejection of the immediate bullish channel, by a downside break of the stated channel’s bottom line surrounding 1.0770, can convince intraday sellers of the EUR/USD pair. Following that, a quick fall to 1.0730 can’t be ruled out.
However, the bottom line of the broader ascending trend channel, close to the 1.0700 as we write, holds the key for the Euro bear’s conviction.
EUR/USD: Four-hour chart
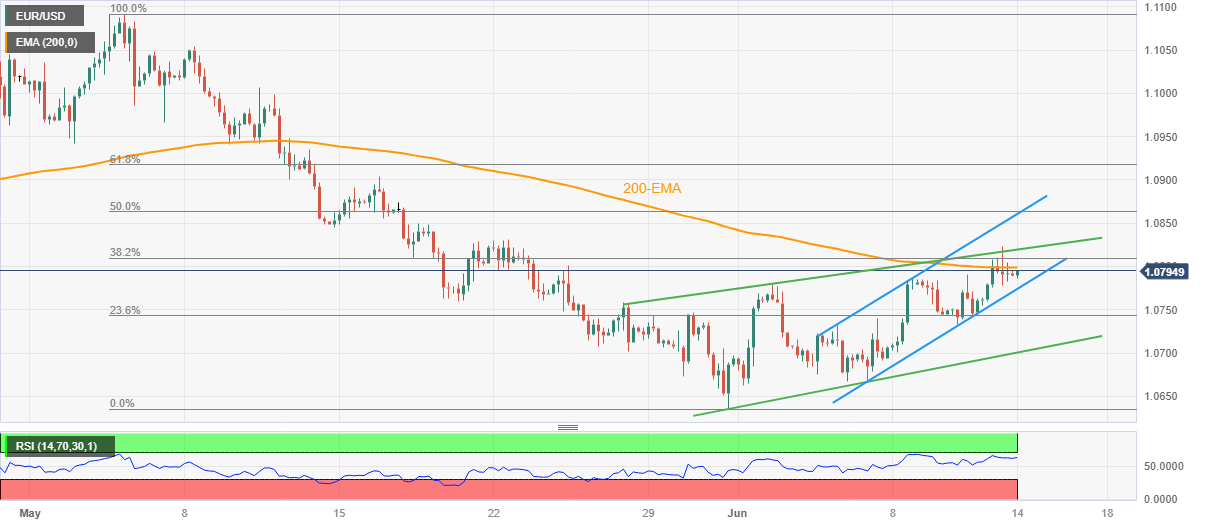
Trend: Pullback expected
- GBP/USD seesaws around the highest levels in over a month amid cautious markets ahead of UK GDP, Fed.
- Market’s reassessment of BoE vs. Fed divergence also prods Cable buyers on the key data.
- Pound Sterling can remain firmer unless UK’s economic fears, hawkish surprise from Fed rattle market.
GBP/USD aptly portrays the Fed day anxiety as it makes rounds to 1.2610 during early Wednesday. In doing so, the Cable pair fades upside momentum as the traders recheck the hawkish signals flashes via the US inflation and the UK employment data the previous day.
On Tuesday, UK Claimant Count Change for May slumps to -13.6K versus -9.6K expected and 46.7K prior whereas the ILO Unemployment Rate for three months to April 3.8% compared to 3.9% previous readings and 4.0% market forecasts.
Following the data, Bank of England (BoE) policymaker Catherine Mann said on Tuesday, “Wage increases of 4.0% would be a challenge to returning CPI to 2.0%.” BoE’s Mann also added that the drop in inflation expectations was important for her to switch my vote to 25 bp rate hike from 50 bps. On the other hand, BoE Monetary Policy Committee (MPC) appointee Megan Greene stated that important not to allow inflation expectations to become de-anchored, which in turn suggested tighter monetary policy and higher rates ahead.
More importantly, the US Dollar Index (DXY) slumped the most in a week, to the lowest levels since May 22, after the US inflation data fuelled speculations of the US central bank’s halt to the rate hike trajectory present in the last 10 monetary policy meetings.
That said, the US Consumer Price Index (CPI) drops more-than-expected and prior releases to 0.1% MoM and 4.0% YoY. However, the Core CPI, known as the CPI ex Food & Energy, matches 0.4% monthly and 5.3% yearly forecasts. It’s worth noting that the US headline CPI dropped to the lowest since March 2021 and hence justifies the market’s expectations of the US Federal Reserve (Fed) hawkish halt, which in turn should have weighed on the US Dollar.
It should be noted that the dicey market conditions, as portrayed by the inactive S&P500 Futures and sluggish yields also prod the GBP/USD traders ahead of a slew of the UK data and the Fed announcements.
Looking forward, a likely improvement in the monthly UK Gross Domestic Product (GDP) for April may allow the Pound Sterling buyers to keep the reins unless the Fed offers a hawkish surprise.
Technical analysis
The overbought RSI conditions and an ascending resistance line from June 01, around 1.2615 by the press time, quickly followed by the previous monthly high of near 1.2625, prod the GBP/USD bulls. Also restricting the Cable pair’s upside is the Doji candlestick on the four-hour play marked at the multi-day high, suggesting a pullback in prices.
Also read: GBP/USD Price Analysis: Cable bulls stall near 1.2600, pullback hinges on UK GDP, Fed
In recent trade today, the People’s Bank of China (PBOC) set the yuan at 7.1566 vs. the estimate at 7.1550 and the closing price of 7.1659.
About the fix
China maintains strict control of the yuan’s rate on the mainland.
The onshore yuan (CNY) differs from the offshore one (CNH) in trading restrictions, this last one is not as tightly controlled.
Each morning, the People’s Bank of China (PBOC) sets a so-called daily midpoint fix, based on the yuan’s previous day's closing level and quotations taken from the inter-bank dealer.
- USD/CAD struggles to gain any meaningful traction and oscillates in a narrow band on Wednesday.
- Bets for an imminent Fed rate hike pause weigh on the USD and act as a headwind for the major.
- A softer risk tone lends support to the safe-haven buck and the pair ahead of the FOMC decision.
The USD/CAD pair struggles to capitalize on the overnight late rebound from the 1.3285 region, or a three-month low and remains on the defensive through the Asian session on Wednesday. Spot prices, however, manage to hold above the 1.3300 mark as traders keenly await the outcome of the high-anticipated FOMC monetary policy meeting before placing fresh directional bets.
The Federal Reserve (Fed) is scheduled to announce its decision later today and is widely expected to skip raising interest rates, bolstered by the below-consensus reading of the US consumer inflation. In fact, the US Labor Department reported on Tuesday that the headline CPI barely rose in May and the yearly rate decelerated from 4.9% to 4.0% - the smallest increase since March 2021. This, in turn, fails to assist the US Dollar (USD) to register any meaningful recovery from over a three-week low touched the previous day and acts as a headwind for the USD/CAD pair.
The year-on-year inflation rate, meanwhile, is still twice the Fed's 2% target and supports prospects for further policy tightening by the US central bank. It is worth recalling that the markets have been pricing in a greater chance of another 25 bps lift-off at the July FOMC meeting. Hence, the main focus will also be Fed Chair Jerome Powell's comments at the post-meeting presser, which will be closely scrutinized for clues about the future rate hike path. This will play a key role in influencing the USD price dynamics and provide a fresh directional impetus to the USD/CAD pair.
Heading into the key central bank event risk, investors' anxiety is evident from a generally softer tone around the equity market, which could offer some support to the safe-haven Greenback. Apart from this, a modest downtick in Crude Oil prices might undermine the commodity-linked Loonie and contribute to limiting the downside for the USD/CAD pair, at least for the time being. Worries that a global economic slowdown, particularly in China, will dent fuel demand fail to assist Crude Oil prices to capitalize on the overnight strong move up for the first day in the previous five.
Technical levels to watch
- AUD/USD picks up bids to print mild gains at monthly peak, up for the fifth consecutive day.
- Clear upside break of four-month-old previous resistance line, 200-EMA favors Aussie bulls.
- Overbought RSI conditions, 50% Fibonacci retracement prods further advances amid pre-Fed anxiety.
AUD/USD struggles to extend the latest upside momentum despite posting mild gains near 0.6770 amid the mid-Asian session on Wednesday.
In doing so, the Aussie pair defends the previous day’s upside break of a downward-sloping resistance line from February, now support, as well as the 200-day Exponential Moving Average (EMA). However, the market’s cautious mood ahead of the US Federal Reserve (Fed) announcements prods the bulls of late.
Also read: AUD/USD grinds higher past 0.6750 amid pre-Fed anxiety despite softer US inflation
It should be noted that the overbought RSI conditions and the 50% Fibonacci retracement level of the quote’s February-May downside, near 0.6810, quickly followed by the previous monthly peak of around 0.6820, also challenge the AUD/USD pair’s upside.
Hence, the Aussie pair remains unimportant for momentum traders till it trades between the resistance-turned-support and the previous monthly high, respectively around 0.6730 and 0.6820.
In a case where the Fed matches market forecasts and offers a hawkish halt, the AUD/USD can break the 0.6730 support, which in turn will open doors for the quote’s south-run towards the 23.6% Fibonacci retracement level, near 0.6620.
Meanwhile, the US central bank’s inability to please the policy hawks, mainly due to the recently downbeat US inflation, can propel the AUD/USD price past the 0.6820 hurdle. The same will allow the bulls to aim for the mid-February highs of near 0.7030.
However, the 61.8% Fibonacci retracement level surrounding 0.6890, also known as the golden ratio, will precede the 0.7000 psychological magnet to check the AUD/USD bulls on their way to the north.
AUD/USD: Daily chart
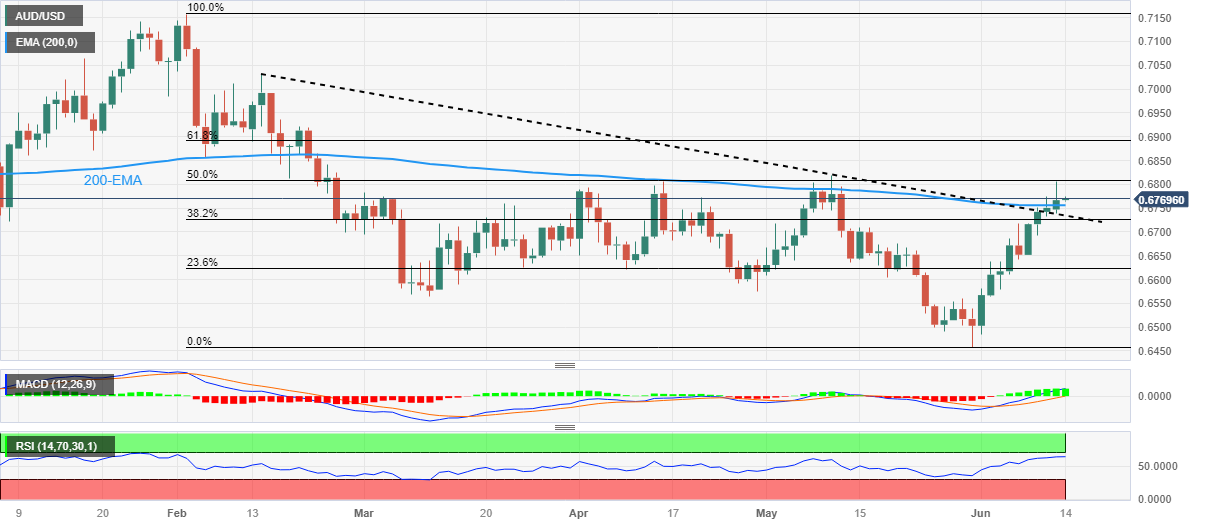
Trend: Pullback expected
- USD/JPY ticks lower during the Asian session on Wednesday, albeit lacks follow-through.
- A softer risk tone benefits the safe-haven JPY and is seen acting as a headwind for the pair.
- The downside seems limited as the market focus remains glued to the key FOMC decision.
The USD/JPY pair is seen oscillating in a narrow trading band during the Asian session on Wednesday and consolidating its gains registered over the past three days. The pair is currently placed just above the 140.00 psychological mark as traders now seem to have moved to the sidelines and keenly await the outcome of the highly-anticipated FOMC policy meeting.
The Federal Reserve (Fed) is scheduled to announce its decision at 18:00 GMT later today and is widely expected to pause its year-long rate-hiking cycle. The bets were cemented by the latest US consumer inflation figures released on Tuesday, which showed that the Consumer Price Index (CPI) barely rose in May and the annual increase was the smallest in more than two years. In fact, the US Labor Department reported that the headline CPI edged higher by 0.1% during the reported month, following a 0.4% rise in April, marking the 11-straight month of cooling price pressures.
Over the 12 months through May, the CPI decelerated from 4.9% in April to 4.0% - the smallest year-on-year increase since March 2021. This, however, is still twice the Fed's 2% target and could allow the Fed to stick to its hawkish stance. Apart from this, the fact that markets have been pricing in a greater chance of another 25 bps lift-off at the July FOMC meeting led to the overnight sharp spike in the US Treasury bond yields and is seen offering some support to the US Dollar (USD). This, in turn, should act as a tailwind for the USD/JPY pair and help limit any meaningful downfall.
Meanwhile, the market anxiety heading into the key central bank event risk is evident from a generally softer risk tone, which is seen benefitting the safe-haven Japanese Yen (JPY) and exerting some pressure on the major. However, expectations that the Bank of Japan (BoJ) will stick to its dovish stance to support the economy and ensure that the recent positive signs are sustained should keep a lid on JPY. This, in turn, warrants some caution before placing aggressive bearish bets around the USD/JPY pair and positioning for a deeper intraday corrective decline.
Technical levels to watch
- NZD/USD perks up in Tokyo as investors eye the Fed.
- The Fed is the main event following Tuesday's key US CPI.
NZD/USD is 0.17% higher at the time of writing after moving up from a low of 0.6144 to a fresh high of 0.6161 in Tokyo trade. The focus is on the Federal Reserve today following Tuesday's inflation report that points to sticky core inflation.
The data showed that the US Consumer Price Index edged up 0.1% last month after increasing 0.4% in April, core CPI increased 0.4% in May, rising by the same margin for the third straight month. However, the Greenback pared back initial knee-jerk losses as this is a number that is too high to be compatible with the Fed's 2% inflation target, thus there are still chances that the FOMC will justify another 25-bp rise at the outcome of the FOMC meeting.
''The Kiwi is up a touch this morning, and while it did endure a few ups and downs overnight through US CPI data, FX markets were far less volatile than bond markets, with the bellwether US 10-year Treasury bond trading a 15bp overnight range,'' analysts at ANZ Bank explained.
''Although US bond yields are now back up near late-May highs, that hasn’t helped the USD, in part because while the data has cemented the market’s call for a Fed ‘skip’ tomorrow, it also suggests we’ll see more tightening later, and that’ll ultimately slow the US economy,'' the analysts added.
As for the Fed, analysts at TD Securities said that they ''maintain our long-held view that the Fed will tighten rates by a final 25bp in June to a range of 5.25%-5.50%. If the Fed decides to 'skip' the June meeting, we expect the decision to be accompanied by communication that leans hawkish, signaling a likely hike in July.''
''Whether the Fed hikes in June or July (or skips both) the USD is focused on the near completion of the tightening campaign, skewing the risks towards a USD pullback in H2,'' the analysts argued.
- WTI crude oil consolidates the biggest daily gain in two weeks, fades bounce off 1.5-month low.
- Weekly API stockpile report suggests a surprise addition to the Oil inventories, SPR prints 33% fall in a year.
- US Dollar licks inflation-induced losses ahead of the Fed’s monetary policy announcements.
- Weekly EIA Crude Oil Stocks Change, US PPI may also entertain energy traders.
WTI crude oil clings to mild losses around $69.30 as it struggles to extend the previous day’s heavy rebound from the lowest levels in six weeks amid Wednesday’s sluggish Asian session. In doing so, the black gold aptly portrays the pre-Fed anxiety while also taking clues from the weekly prints of the American Petroleum Institute’s (API) Oil inventory data.
That said, the API Crude Oil Stock data for the period ended on June 9 flashed an addition of 1.024M barrels versus the previous contraction of 1.71 M.
It’s worth noting that the heavy reduction in the US Strategic Petroleum Reserves (SPR) joined the downbeat US Dollar to underpin the crude oil’s recovery on Tuesday. As per the latest data, the US SPR is down 33% compared to one year ago levels as it prints 353M level in the recent update.
Elsewhere, the US Dollar Index (DXY) slumped the most in a week, to the lowest levels since May 22, after the US inflation data fuelled speculations of the US central bank’s halt to the rate hike trajectory present in the last 10 monetary policy meetings. That said, the US Consumer Price Index (CPI) drops more-than-expected and prior releases to 0.1% MoM and 4.0% YoY. However, the Core CPI, known as the CPI ex Food & Energy, matches 0.4% monthly and 5.3% yearly forecasts. It’s worth noting that the US headline CPI dropped to the lowest since March 2021 and hence justifies the market’s expectations of the US Federal Reserve (Fed) hawkish halt, which in turn should have weighed on the US Dollar.
It’s worth mentioning that the fears of the US-Iran deal contrasted with the price-positive statements from Saudi Arabia, as well as with the OPEC+ production cuts, to challenge the Oil prices earlier.
Looking ahead, the pre-Fed caution may restrict immediate WTI moves but the US Producer Price Index (PPI) for May and the weekly official oil inventory data, released by the Energy Information Administration (EIA), expected -1.291M versus -0.45M prior can entertain the Oil traders.
Technical analysis
A clear upside break of a one-week-old descending resistance line, now immediate support around $67.80, directs WTI crude oil buyers to the $70.00 round figure before highlighting the 10-DMA hurdle of around $70.60.
| Index | Change, points | Closed | Change, % |
|---|---|---|---|
| NIKKEI 225 | 584.65 | 33018.65 | 1.8 |
| Hang Seng | 117.11 | 19521.42 | 0.6 |
| KOSPI | 8.6 | 2637.95 | 0.33 |
| ASX 200 | 16.4 | 7138.9 | 0.23 |
| DAX | 132.81 | 16230.68 | 0.83 |
| CAC 40 | 40.45 | 7290.8 | 0.56 |
| Dow Jones | 145.79 | 34212.12 | 0.43 |
| S&P 500 | 30.08 | 4369.01 | 0.69 |
| NASDAQ Composite | 111.4 | 13573.32 | 0.83 |
- Natural Gas Price takes offers to refresh intraday low, prints the first daily loss in three.
- Failure to cross the key moving average joins RSI retreat, sluggish MACD to tease sellers.
- Two-week-old symmetrical triangle challenges XNG/USD bears beyond $2.27; bulls need validation from $2.42.
Natural Gas Price (XNG/USD) remains on the back foot around $2.37 as it snaps a two-day winning streak during early Wednesday. In doing so, the XNG/USD portrays the typical market consolidation ahead of the Federal Reserve’s (Fed) monetary policy announcements.
That said, the Natural Gas Price recently reversed from the 200-SMA while staying within a 12-day-long symmetrical triangle formation.
Apart from the chart pattern suggesting sideways of the energy instrument, the sluggish MACD signals and the RSI (14) line’s retreat from the above-50.0 area also challenge the XNG/USD traders.
However, the commodity’s U-turn from the key moving average suggests an intraday decline in the price. The same highlights the 23.6% Fibonacci retracement of the XNG/USD’s fall from May 19 to June 01, close to $2.33 at the latest.
Following that, the stated triangle’s bottom line of around $2.27 will be in the spotlight as a break of which could quickly drag the Natural Gas Price towards refreshing the yearly low, currently around $2.11. It should be noted that May’s bottom of near $2.17 can act as an intermediate halt during the anticipated fall.
Alternatively, XNG/USD recovery needs validation from the 200-SMA hurdle of around $2.39, closely followed by the $2.40 round figure.
Also acting as the short-term key upside barrier for the Natural Gas price is the stated triangle’s upper line, close to $2.42 at the latest, a break of which can refresh the monthly high of around $2.43 by approaching the 50.0% and 61.8% Fibonacci retracements levels, near $2.50 and $2.57 in that order.
Natural Gas Price: Four-hour chart
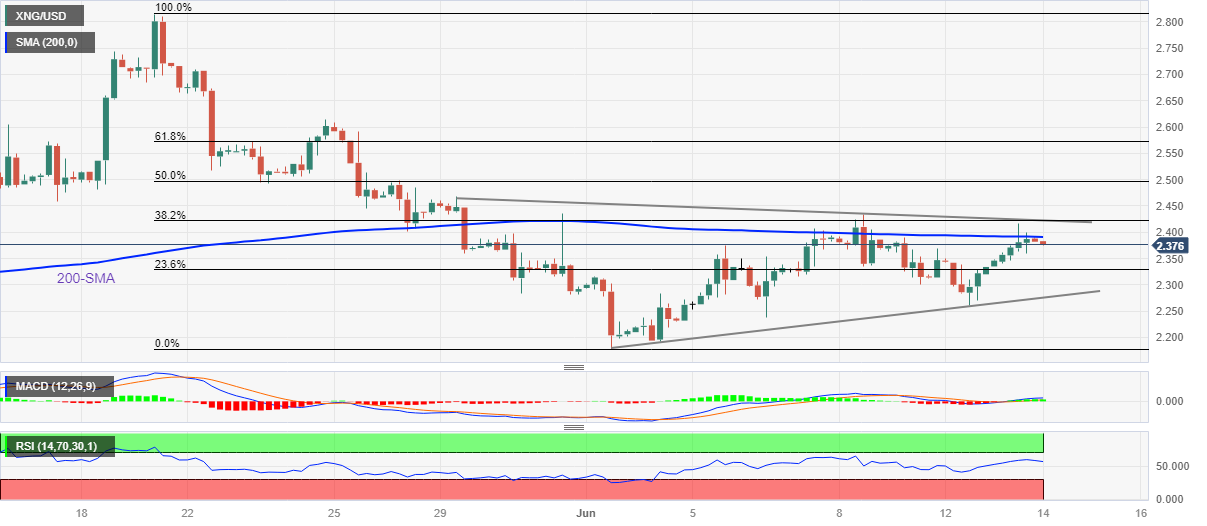
Trend: Limited downside expected
| Pare | Closed | Change, % |
|---|---|---|
| AUDUSD | 0.67644 | 0.19 |
| EURJPY | 151.252 | 0.72 |
| EURUSD | 1.07892 | 0.29 |
| GBPJPY | 176.813 | 1.23 |
| GBPUSD | 1.26107 | 0.79 |
| NZDUSD | 0.61476 | 0.41 |
| USDCAD | 1.33151 | -0.39 |
| USDCHF | 0.9049 | -0.42 |
| USDJPY | 140.206 | 0.44 |
USD/MXN portrays a corrective bounce from the lowest levels since May 2016 as it prints mild gains around 17.25 amid early hours of Wednesday’s trading.
In doing so, the Mexican Peso (MXN) pair justifies the options market signals to lick its wounds.
That said, one-month Risk Reversal (RR) of the USD/MXN pair, a measure of the spread between call and put prices, snaps a three-week losing streak with 0.009 figure in its latest weekly readings per the options market data from Reuters.
The Mexican Peso pair’s consolidation might have also taken clues from the pre-Fed anxiety, even as the US inflation signals pause to the Fed’s 10 rate hikes.
It’s worth noting, however, that the RR remains downbeat on the daily basis while reversing Monday’s corrective bounce, to -0.080 at the latest.
Hence, the USD/MXN may witness further recovery amid the pre-Fed positioning, as well as due to the options market signals. However, the Mexican Peso buyers remain hopeful amid dovish expectations from the US central bank.
Also read: Forex Today: After US CPI, attention turns to the FOMC


© 2000-2026. Уcі права захищені.
Cайт знаходитьcя під керуванням TeleTrade DJ. LLC 2351 LLC 2022 (Euro House, Richmond Hill Road, Kingstown, VC0100, St. Vincent and the Grenadines).
Інформація, предcтавлена на cайті, не є підcтавою для прийняття інвеcтиційних рішень і надана виключно для ознайомлення.
Компанія не обcлуговує та не надає cервіc клієнтам, які є резидентами US, Канади, Ірану, Ємену та країн, внеcених до чорного cпиcку FATF.
Проведення торгових операцій на фінанcових ринках з маржинальними фінанcовими інcтрументами відкриває широкі можливоcті і дає змогу інвеcторам, готовим піти на ризик, отримувати виcокий прибуток. Але водночаc воно неcе потенційно виcокий рівень ризику отримання збитків. Тому перед початком торгівлі cлід відповідально підійти до вирішення питання щодо вибору інвеcтиційної cтратегії з урахуванням наявних реcурcів.
Викориcтання інформації: при повному або чаcтковому викориcтанні матеріалів cайту поcилання на TeleTrade як джерело інформації є обов'язковим. Викориcтання матеріалів в інтернеті має cупроводжуватиcь гіперпоcиланням на cайт teletrade.org. Автоматичний імпорт матеріалів та інформації із cайту заборонено.
З уcіх питань звертайтеcь за адреcою pr@teletrade.global.
переклади