- Аналітика
- Новини та інструменти
- Новини ринків
Новини ринків
New Zealand’s Business NZ Performance of Manufacturing Index (PMI) improved to 49.3 in February from the previous reading of 47.5, according to Business NZ on Friday.
Additional takeaways
“The key sub-index of Production (49.1) was at its highest level since January 2023, while Deliveries (51.4) was at its highest point since March 2023. However, New Orders (47.8) have now remained in contraction for nine consecutive months and likely need to get much closer to the 50-point mark to edge the sector back into expansion”.
Market reaction
At the press time, the NZD/USD pair was down 0.10% on the day to trade at 0.6124.
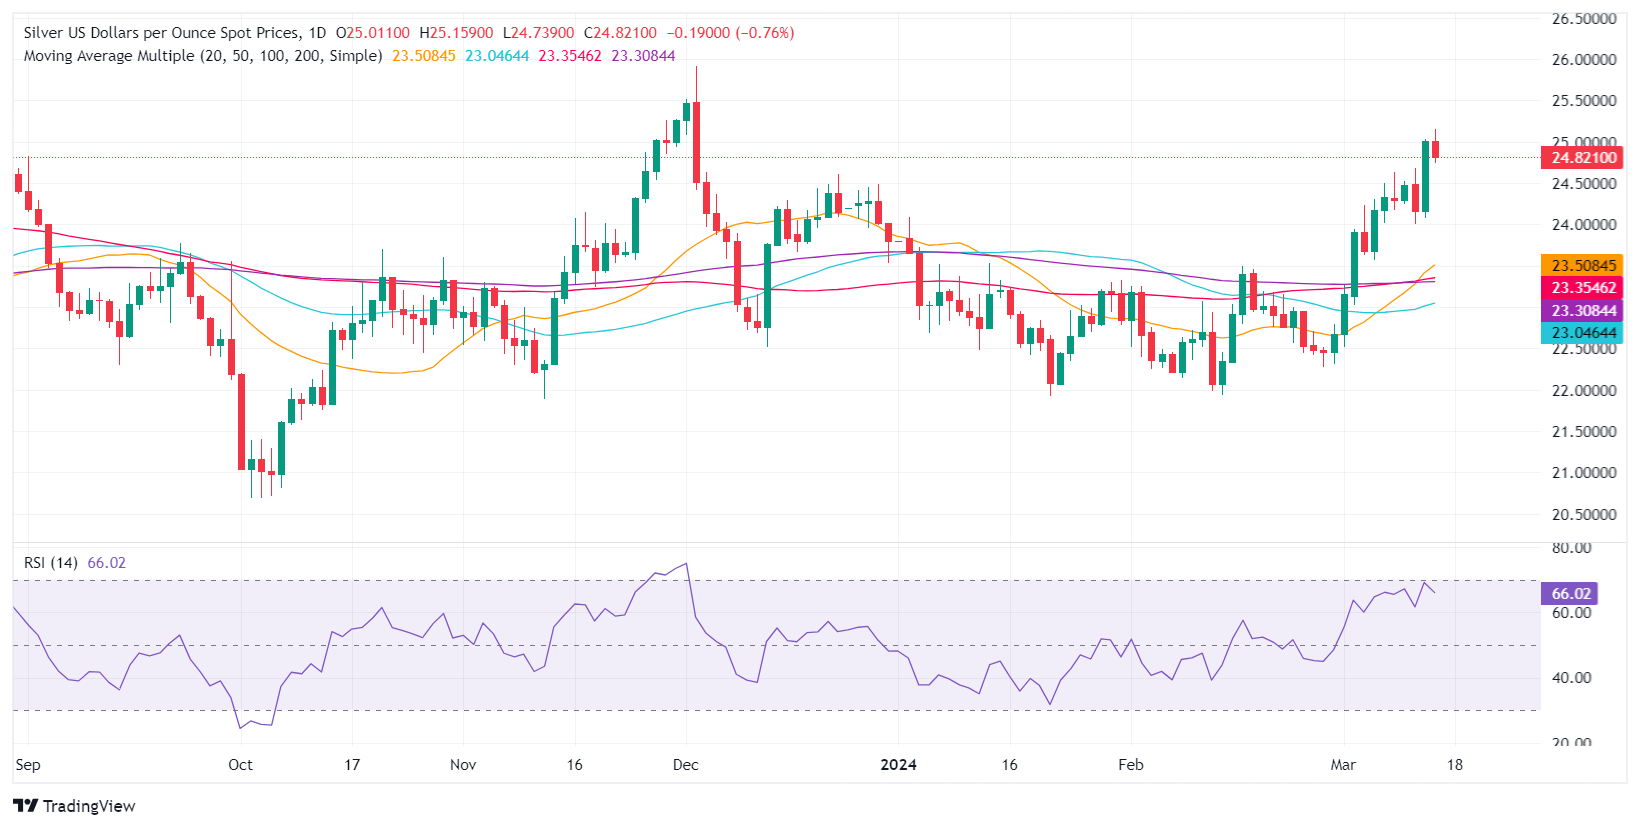
- Silver retreats to $24.80, pressured by climbing US Treasury yields and a stronger Dollar.
- Technical outlook remains positive, with potential resistance points set at $25.50 and $25.91.
- Support levels to watch include $24.07 and $24.00, with significant moving averages providing additional benchmarks.
Silver’s price retreated below $25.00 per troy ounce as US Treasury yields climbed following US data that induced investors to trim Fed rate cut bets. Consequently, the US Dollar rallied, and the XAG/USD exchanged hands at $24.80, down 0.79%.
XAG/USD Price Analysis: Technical outlook
Silver remains upward biased despite retreating below the $25.00 figure. Although it achieved a daily close around $24.80, the grey metal remains poised for gains that could drive prices toward the $25.50 area and beyond. The next stop would be the December 4 high at $25.91, and up next would be the $26.00 mark.
On the other hand, if sellers stepped in and drove XAG/USD prices below $24.50, the first key support level is seen at $24.07, the March 13 daily low. Once surpassed, the next stop would be $24.00, followed by the confluence of the 100 and 200-day moving averages (DMAs) at $23.29/30.
XAG/USD Price Action – Daily Chart
- NZD/USD loses ground near 0.6125 amid the firmer USD.
- Strong US economic data strengthened the case for a delay in the Fed rate cuts.
- The New Zealand’s Business NZ PMI arrived at 49.3 in February vs. 47.3 prior.
The NZD/USD pair trades on a weaker note below the mid-0.6100s during the early Asian session on Friday. The downtick of the pair is driven by the strong US Producer Price Index (PPI) data. Meanwhile, the USD Index (DXY) edges higher to fresh multi-session peaks past the 103.00 barrier. NZD/USD currently trades around 0.6125, down 0.09% on the day.
On Thursday, US February Retail Sales rose 0.6% MoM from a downwardly revised -1.1% in January, worse than the expectations of a 0.8% m/m rise. The Retail Sales Control Group was flat at 0% MoM, compared to the previous reading of a 0.3% MoM decline. Furthermore, the February PPI came in better than estimated, rising 0.6% MoM in February from 0.3% MoM in January. The Core PPI figure climbed 0.3% MoM versus a 0.5% gain in January.
The upbeat US economic data followed a rise surprise in the CPI inflation report earlier this week, raising worries about disinflationary momentum in the US. The data also suggest the FOMC will maintain a cautious approach and need to see further data before lowering the interest rate. The possibility of a delay in the Federal Reserve's (Fed) monetary easing cycle boosts the Greenback and
The latest data from Business NZ showed that New Zealand’s Business NZ Performance of Manufacturing Index (PMI) came in at 49.3 in February versus 47.3 prior. The figure showed signs of improvement but was still in the contraction zone. This, in turn, continues to weigh on the Kiwi against the US Dollar.
Moving on, traders will focus on US Industrial Production and the preliminary Michigan Consumer Sentiment, due on Friday. Next week, the FOMC monetary policy meeting will be in the spotlight. Traders will take cues from the data and find trading opportunities around the NZD/USD pair.
- The daily RSI remains in positive territory but took a big hit.
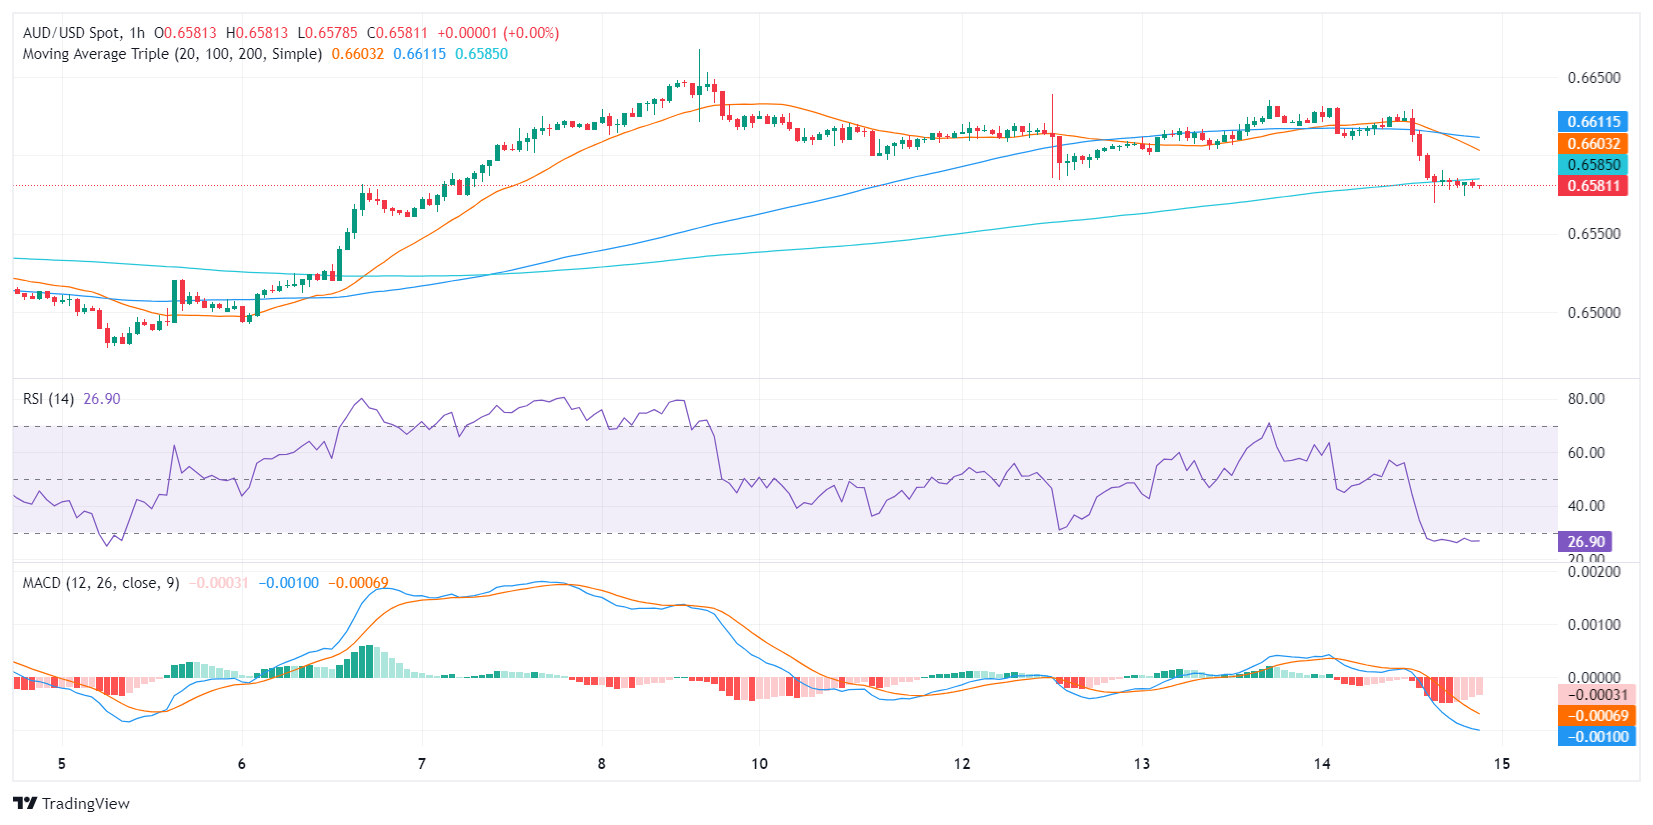
- The hourly chart shows strong selling pressure with RSI sitting in oversold territory.
- The pair may consolidate in the short term.
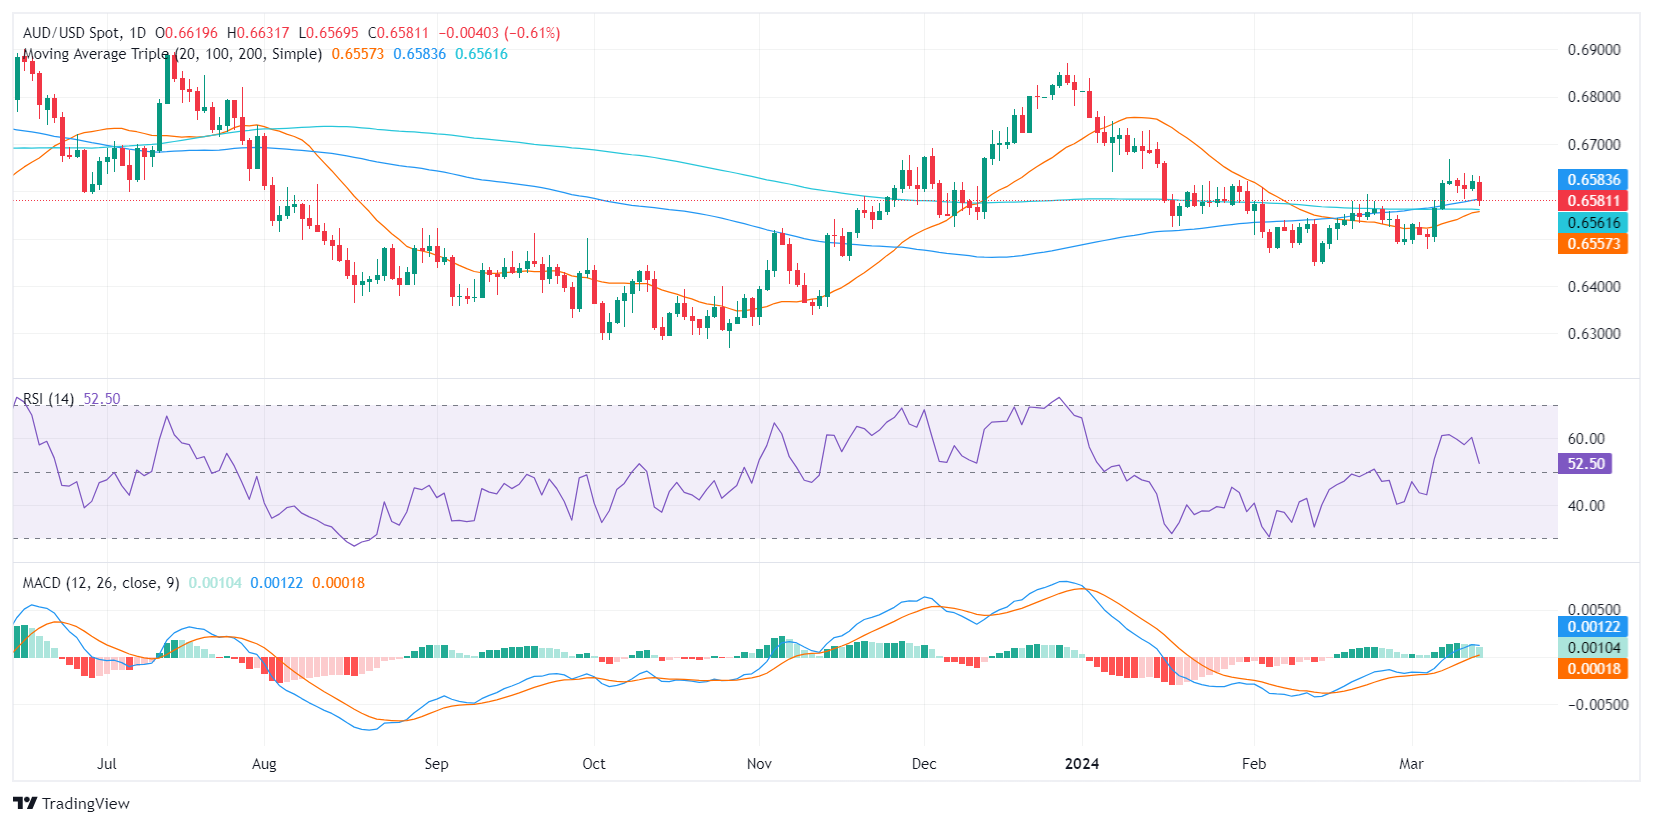
The AUD/USD pair is currently trading at 0.6583, suggesting a noticeable and strong downturn. Regardless of the immediate selling pressure, the broad technical outlook indicates that buyers maintain significant control over the pair. The hourly chart shows strengthening short-term bearish momentum but the selling traction may lose steam after indicators enter in oversold territory.
On the daily chart, the Relative Strength Index (RSI), despite a slight decline, is still in the positive range. The green bars in the Moving Average Convergence Divergence (MACD) show a stable positive momentum, further confirming the dominance of buyers on the larger timeframes.
AUD/USD daily chart
While the daily chart displays evidence of buying momentum, the latest RSI readings on the hourly chart present a contrasting picture with values well below 30. This implies that the AUD/USD is in oversold territory, suggesting an overwhelming dominance of sellers in the market. However, the MACD shows decreasing red bars, indicating a waning bearish momentum in the short term as the sellers might be running out of gas.
AUD/USD hourly chart
Despite the bearish momentum on the hourly chart, the broader outlook remains bullish as the pair continues to trend above the 100 and 200-day SMAs. As for now, the buyers are battling to defend the 20-day average, which in case of losing, will tilt the outlook in favor of the bears for the short term.
- Crude Oil surged on Thursday as markets repriced growth outlook.
- IEA revised its demand outlook but still lags behind OPEC.
- API, EIA Crude Stocks both drew down this week.
West Texas Intermediate (WTI) US Crude Oil knocked into its highest bids in over three months, etching in a new high of $81.05 on Thursday as barrel traders rebalance their price outlook after US Crude Oil stocks fell more than expected this week and the Internation Energy Agency (IEA) lifted their demand growth outlook.
The IEA is now forecasting global Crude Oil demand to increase through 2024 by 1.3 million barrels per day, raising their initial forecasts by an additional 110K barrels per day. According to the IEA, stronger demand growth from the US as well as ongoing uncertainty surrounding ship attacks by Houthi rebels in the Red Sea are increasing demand for ship fuel as cargo ships reroute around the continent of Africa to connect Asia and European markets as Iranian-backed militants block access to the Suez Canal.
The IEA now expects global Crude Oil demand to average 103.2 million barrels per day in 2024, and the agency’s 2025 demand growth forecasts have increased by about 50% since first introducing their outlook in summer of last year. Despite the significant uptick in demand expectations, the IEA is still coming in well below demand expectations from the Organization of the Petroleum Exporting Countries (OPEC), which expects Crude Oil demand growth to add at least 2.2 million bpd to current demand through 2024.
US Crude Oil supplies declined more than expected this week as refineries kick in additional production. The American Petroleum Institute (API) saw a 5.5 million barrel drawdown for the week ended March 8 compared to the expected uptick of 400K barrels, while the Energy Information Administration (EIA) Crude Oil stocks fell 1.5 million over the same period, well below the forecast increase of 1.338 million barrels.
WTI technical outlook
WTI US Crude Oil climbed to a multi-month high of $81.50 on Thursday, tipping into $81.05 before settling back into the $80.50 level. WTI shot higher after rebounding from last week’s late swing low into $76.50. US Crude Oil has rallied nearly 60% bottom-to-top.
Daily candlesticks punched higher, piercing a long-standing consolidation range around the 200-day Simple Moving Average (SMA) near the $78.00 handle. US Crude Oil is up nearly 19% from November’s bottom bids near $68.00 per barrel.
WTI hourly chart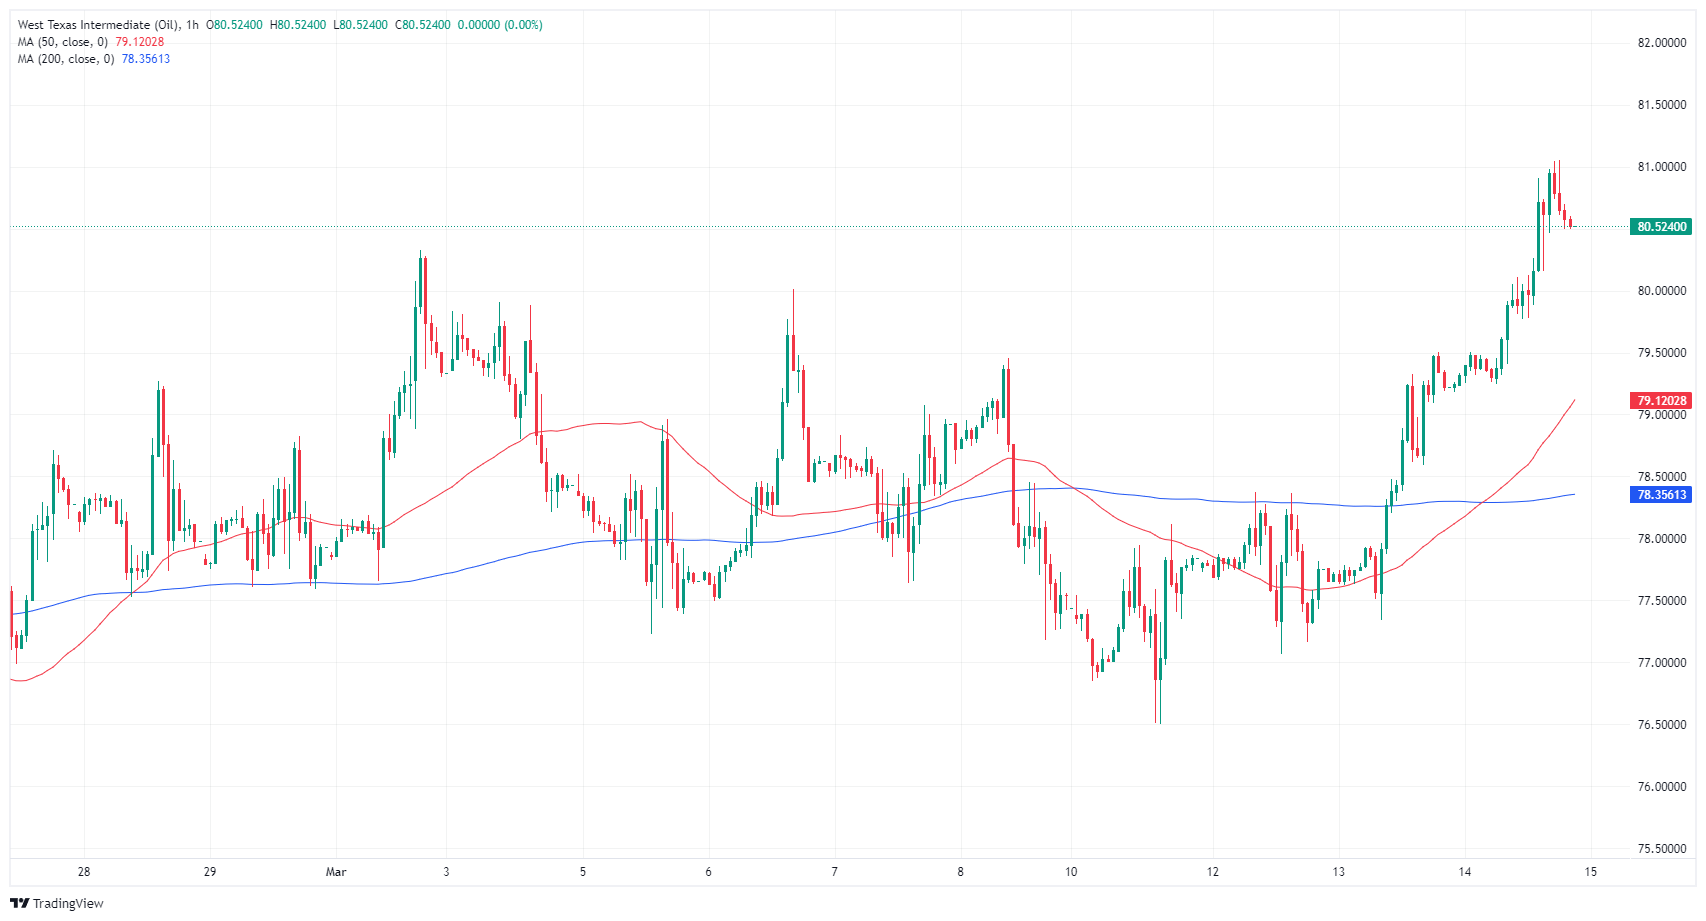
WTI daily chart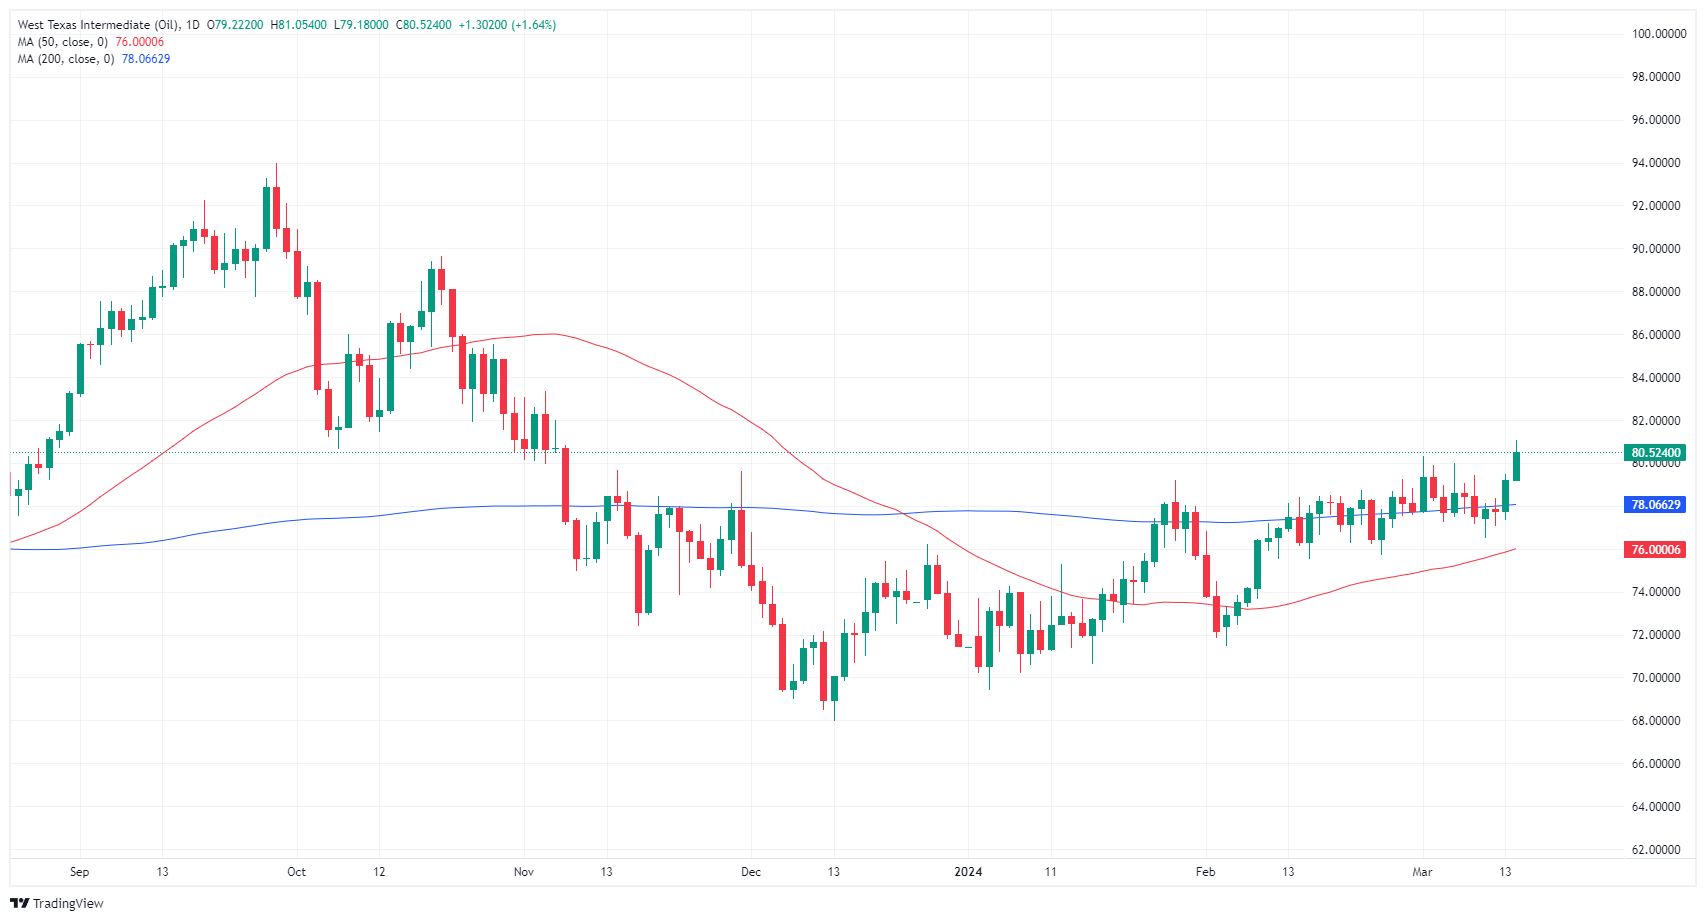
- Gold sees partial retreat reacting to unexpectedly high US producer inflation and strengthening US Dollar.
- US Treasury yields and Dollar Index rise, reflecting a market reassessment of Federal Reserve's monetary policy.
- Retail Sales and Initial Jobless Claims data underscore US economic resilience, weighing on Gold's intraday prices.
Gold prices trimmed some of their Wednesday gains on Thursday after traders began to price in a less “dovish” Federal Reserve following a hotter-than-expected Producer Price Index (PPI) report. Consequently, US Treasury bond yields rose, underpinning the US Dollar. At the time of writing, XAU/USD exchanges hands at around $2,160.00 and gains 0.50%.
US equities finished the session with losses. Earlier, the US Department of Labor announced that a measure of inflation on the producer side jumped. At the same time, US Retail Sales showed that consumers remained resilient, while people filing for unemployment insurance decreased below the previous reading and estimates.
Uncertainty about the US central bank policy prospects prompted investors to trim their bets that the Fed would cut rates at the June meeting. In the meantime, the yellow metal treads water as the US 10-year Treasury bond yield surges ten basis points from 4.19% to 4.29%, while The US Dollar Index (DXY), a gauge of the buck’s performance versus other currencies, climbs 0.54% to 103.33.
Daily digest market movers: Gold traders on the defensive amid strong USD
- The PPI was strong, at 1.6% YoY, up from 0.9%, while the core PPI stood at 2%, unchanged, with both figures exceeding the consensus.
- The US Department of Commerce revealed that Retail Sales missed estimates of 0.8% MoM and rose 0.6%, still an improvement compared to the prior month’s reading of -1.1%.
- The labor market remained tight as Initial Jobless Claims for the week ending March 9 dipped from 210K to 209K, below estimates of 218K.
- Given the backdrop of consumer and producer price indices in the US showcasing reaccelerating inflation, Fed officials should refrain from easing monetary policy.
- During last week's testimony at the US Congress, Fed Chairman Jerome Powell said that inflation is cooling while acknowledging that they could ease policy late in the year. However, he emphasized that it would depend on incoming data reassuring policymakers that inflation is sustainably moving toward the Fed’s 2% goal. The Fed’s next meeting is scheduled for March 19-20 next week.
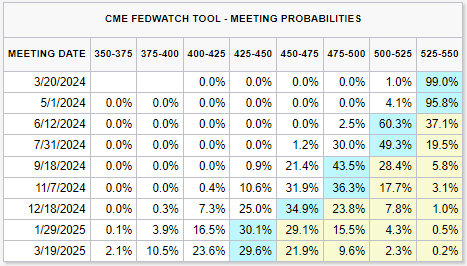
- According to the CME FedWatch Tool, expectations for a May rate cut remain low, having dropped to 11% from 22%. However, the odds for June stand at 64%, down from 72%.
Technical analysis: Gold buyers take a breather below $2,170.00
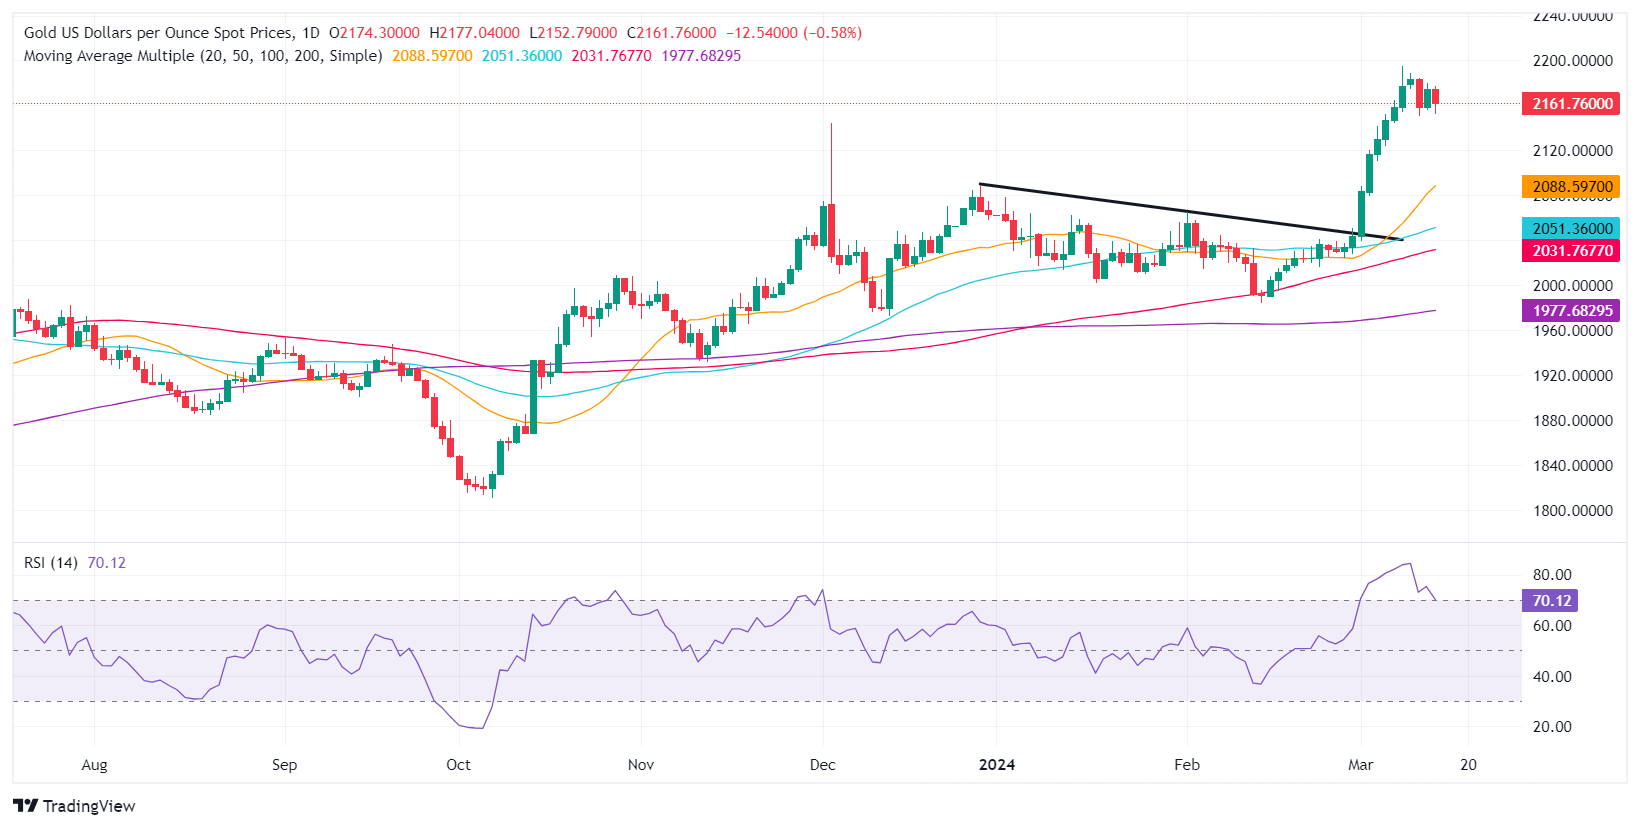
Gold price remains upwardly biased on Thursday, but it has consolidated near the $2,160-$2,180 area during the last three days, unable to break the top of the range and aim toward $2,200.00. It should be said that the Relative Strength Index (RSI) indicator is about to pierce below the 70 mark, an indication that buyers are losing momentum. In that event, XAU/US could dive toward $2,150.00.
Further downside is seen at the March 6 low of $2,123.80, followed by $2,100.00. A breach of the latter will expose the December 28 high at $2,088.48 and the February 1 high at $2,065.60.
On the other hand, a bullish continuation would happen once buyers reclaim the March 12 high of $2,184.76. The next stop would be the year-to-date high of $2,195.15, followed by $2,200.00.
Gold FAQs
Gold has played a key role in human’s history as it has been widely used as a store of value and medium of exchange. Currently, apart from its shine and usage for jewelry, the precious metal is widely seen as a safe-haven asset, meaning that it is considered a good investment during turbulent times. Gold is also widely seen as a hedge against inflation and against depreciating currencies as it doesn’t rely on any specific issuer or government.
Central banks are the biggest Gold holders. In their aim to support their currencies in turbulent times, central banks tend to diversify their reserves and buy Gold to improve the perceived strength of the economy and the currency. High Gold reserves can be a source of trust for a country’s solvency. Central banks added 1,136 tonnes of Gold worth around $70 billion to their reserves in 2022, according to data from the World Gold Council. This is the highest yearly purchase since records began. Central banks from emerging economies such as China, India and Turkey are quickly increasing their Gold reserves.
Gold has an inverse correlation with the US Dollar and US Treasuries, which are both major reserve and safe-haven assets. When the Dollar depreciates, Gold tends to rise, enabling investors and central banks to diversify their assets in turbulent times. Gold is also inversely correlated with risk assets. A rally in the stock market tends to weaken Gold price, while sell-offs in riskier markets tend to favor the precious metal.
The price can move due to a wide range of factors. Geopolitical instability or fears of a deep recession can quickly make Gold price escalate due to its safe-haven status. As a yield-less asset, Gold tends to rise with lower interest rates, while higher cost of money usually weighs down on the yellow metal. Still, most moves depend on how the US Dollar (USD) behaves as the asset is priced in dollars (XAU/USD). A strong Dollar tends to keep the price of Gold controlled, whereas a weaker Dollar is likely to push Gold prices up.
- GBP/JPY cycled 189.00 on thin data as investors await rate moves.
- Markets await further detail from BoJ after spring wage negotiations.
- Mid-tier UK Consumer Inflation Expectations to round out Friday.
GBP/JPY rallied and dipped before recovering to the midrange on Thursday, spinning in place near the 189.00 handle as Guppy traders look for movement from the Bank of Japan (BoJ). The BoJ is expected to lift interest rates out of negative rate territory after the Japanese central bank widely telegraphed earlier in the year that high wage increases from spring wage negotiations would push the BoJ into ending the negative rate regime.
Japan’s largest labor confederation reported last week that spring wage negotiations saw the biggest wage rise demands from its workers in over three decades, hitting a 31-year high. According to the Japanese Trade Union Confederation, the average rate of wage increases demanded by its various unions was 5.85%, a full percentage point higher than the same time last year and the largest increase since the 7.15% wage hike in 1993.
It’s a thin showing on the economic calendar for both the Pound Sterling (GBP) and the Japanese Yen (JPY) as markets round the corner into the Friday market session. UK Consumer Inflation Expectations for the year are slated for early in the London trading session, but the release is strictly mid-tier. At last print, UK consumers expected the next 12 months of inflation to land somewhere around 3.3%.
GBP/JPY technical outlook
The Guppy opened Thursday with an anemic rally from the 189.00 handle into the day’s peak bids near 189.50. The pair caught a downside technical rejection from the 200-hour Simple Moving Average (SMA) at 189.43 to set a daily low near 188.60 before recovering into the day’s opening range.
Daily candles remain capped by a firm technical ceiling at the 191.00 handle, but the pair is holding onto median technical levels after several days of declines. The GBP/JPY remains well-supported by a bullish 200-day SMA rising above 184.20.
GBP/JPY hourly chart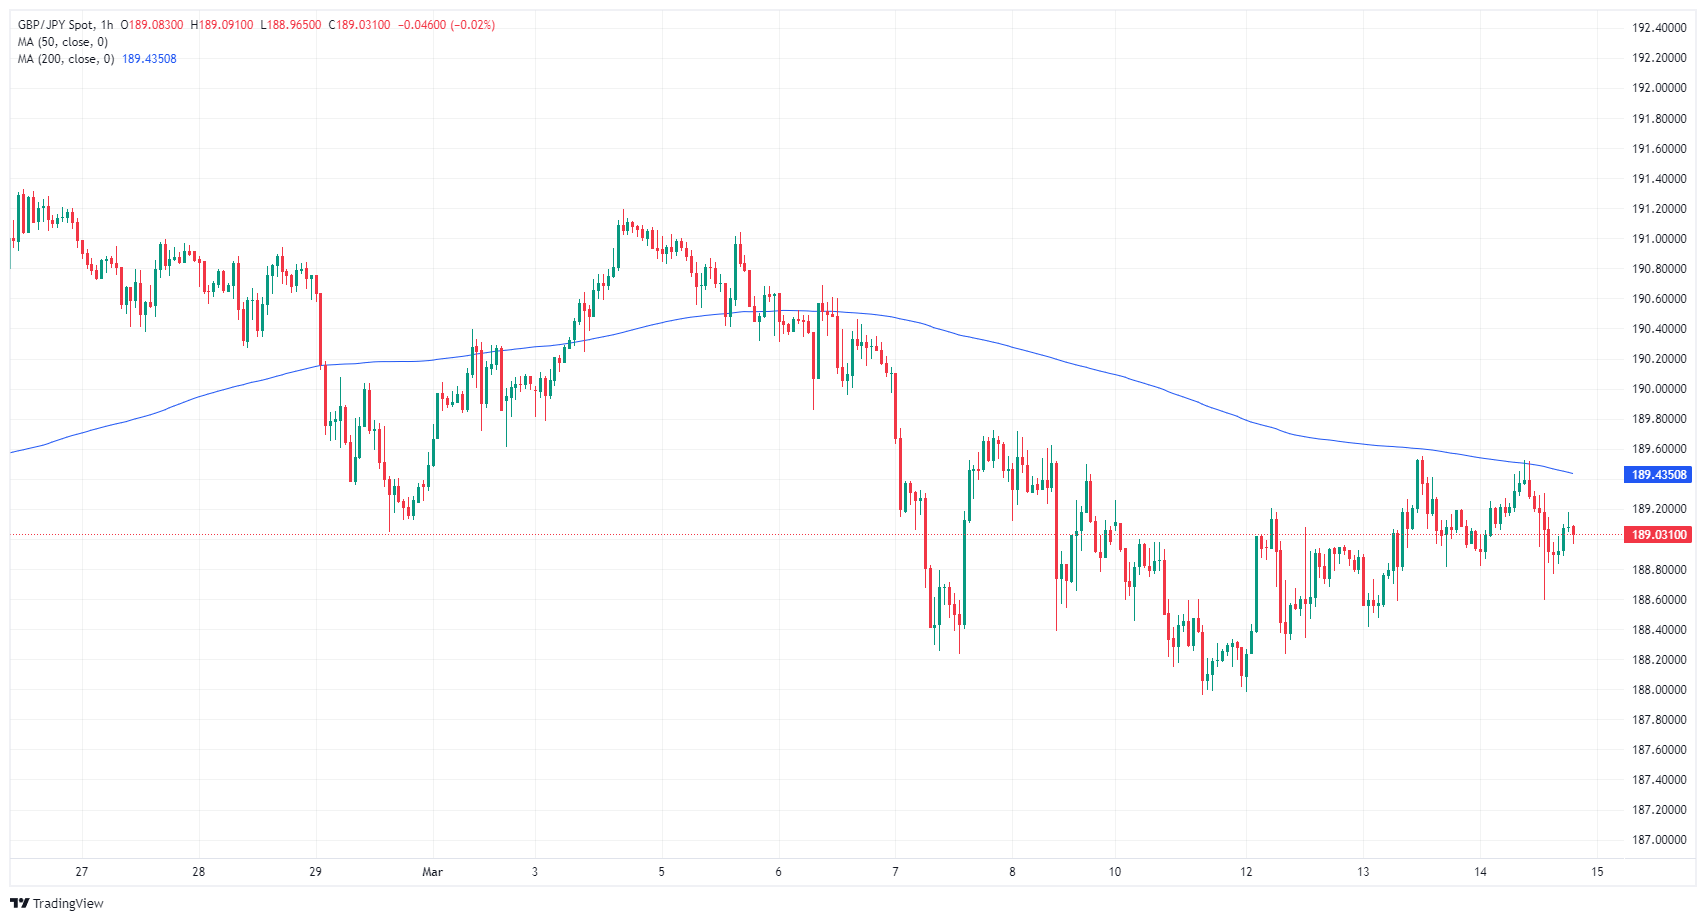
GBP/JPY daily chart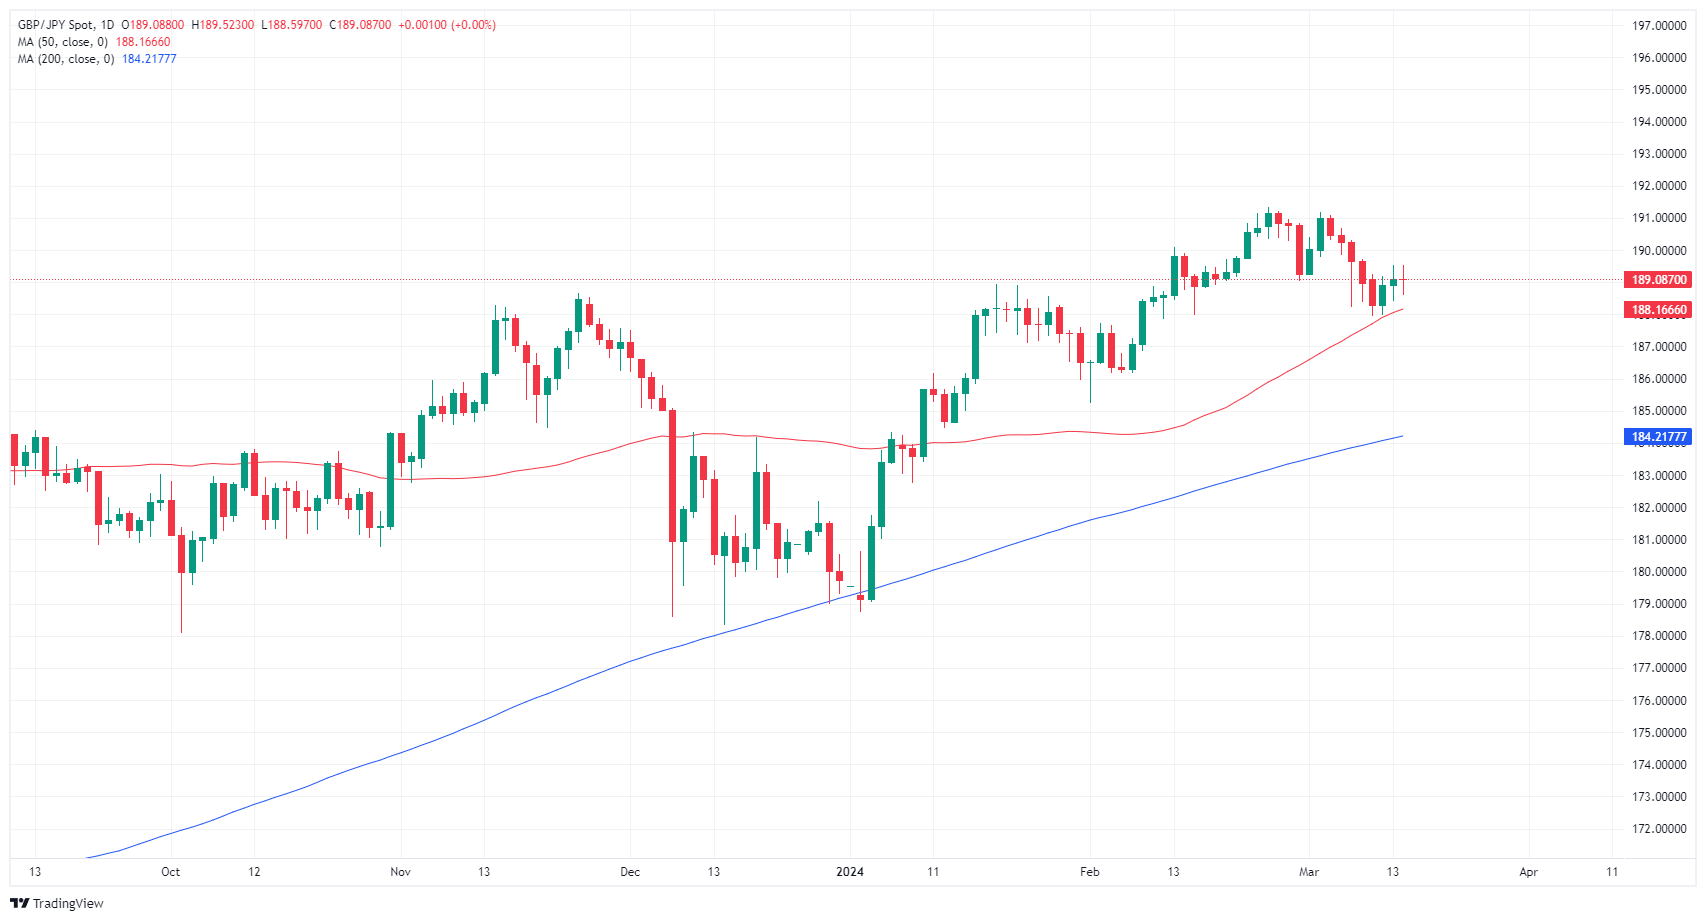
- Bulls failed to maintain their momentum and gave up daily gains.
- The daily RSI remains in negative zone, underscoring the current bearish momentum.
- On the hourly chart, indicators further uphold the short-term bearish bias.
In Thursday's session, the NZD/JPY pair is trading with a mild loss and is currently pegged at 90.79 after peaking at a high of 91.21. Sell-offs dominate the market landscape in the short term and buyers are failing to gather additional momentum.
Based on the indicators of the daily chart, the Relative Strength Index (RSI) currently resides in negative territory, indicating bearish momentum. The RSI has witnessed a minor decline from the previous day's level, representing slightly increased bearish sentiment. Meanwhile, the Moving Average Convergence Divergence (MACD) histogram exhibits flat red bars, suggesting that the bears have gone nowhere while the bulls remain on the sidelines..
NZD/JPY daily chart
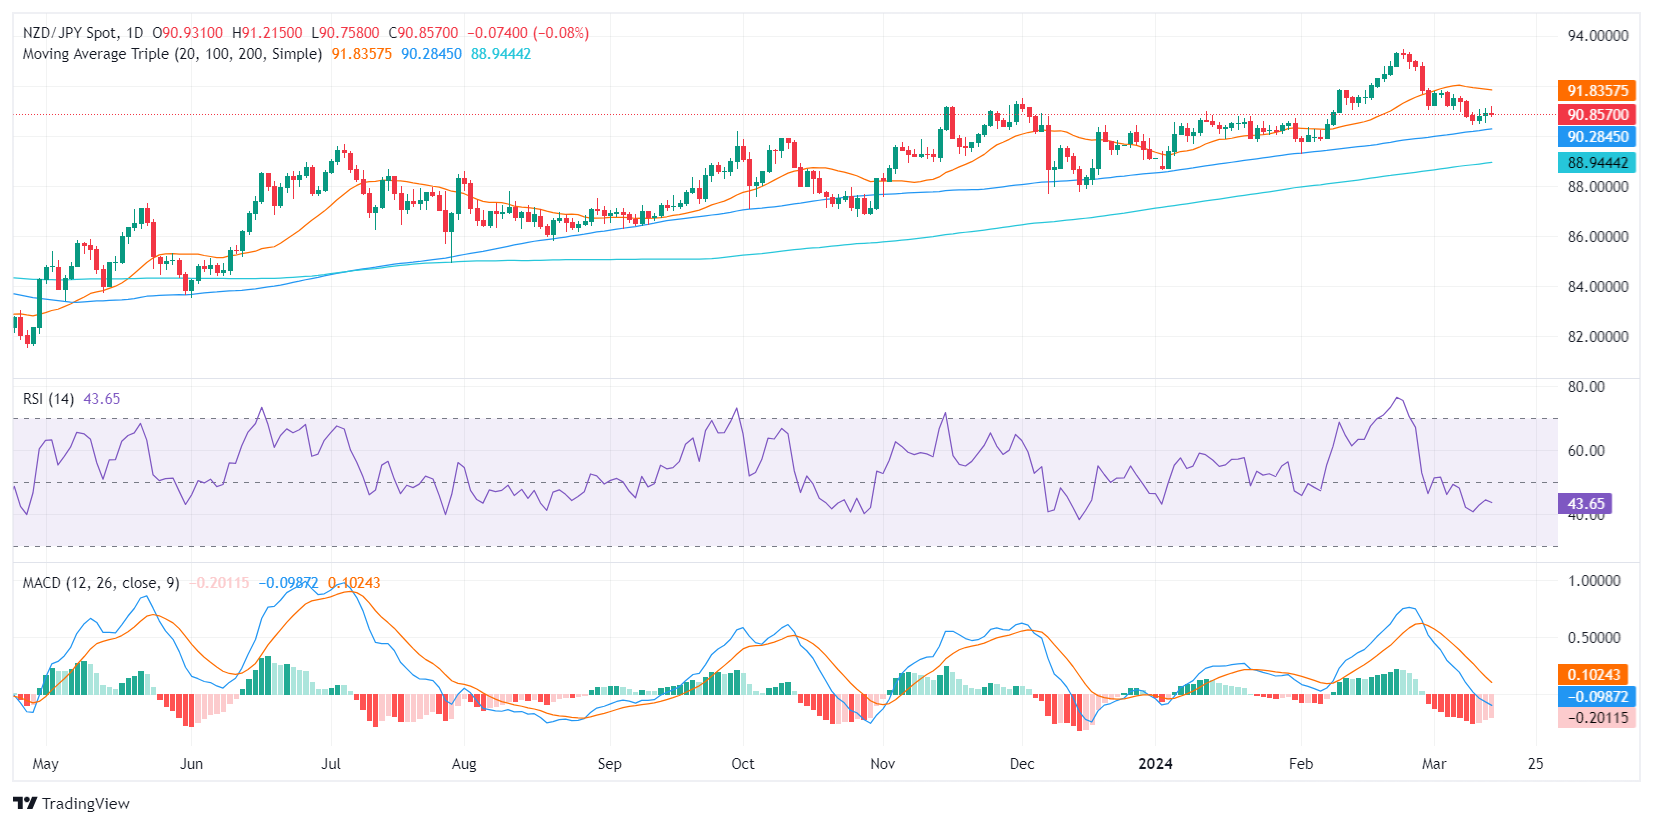
Turning to the hourly chart, the RSI pair also operates within the negative territory, signaling the prevalence of short-term sellers in the market. The MACD histogram here too presents flat red bars, sustaining the bearish momentum on a shorter timeframe.
NZD/JPY hourly chart
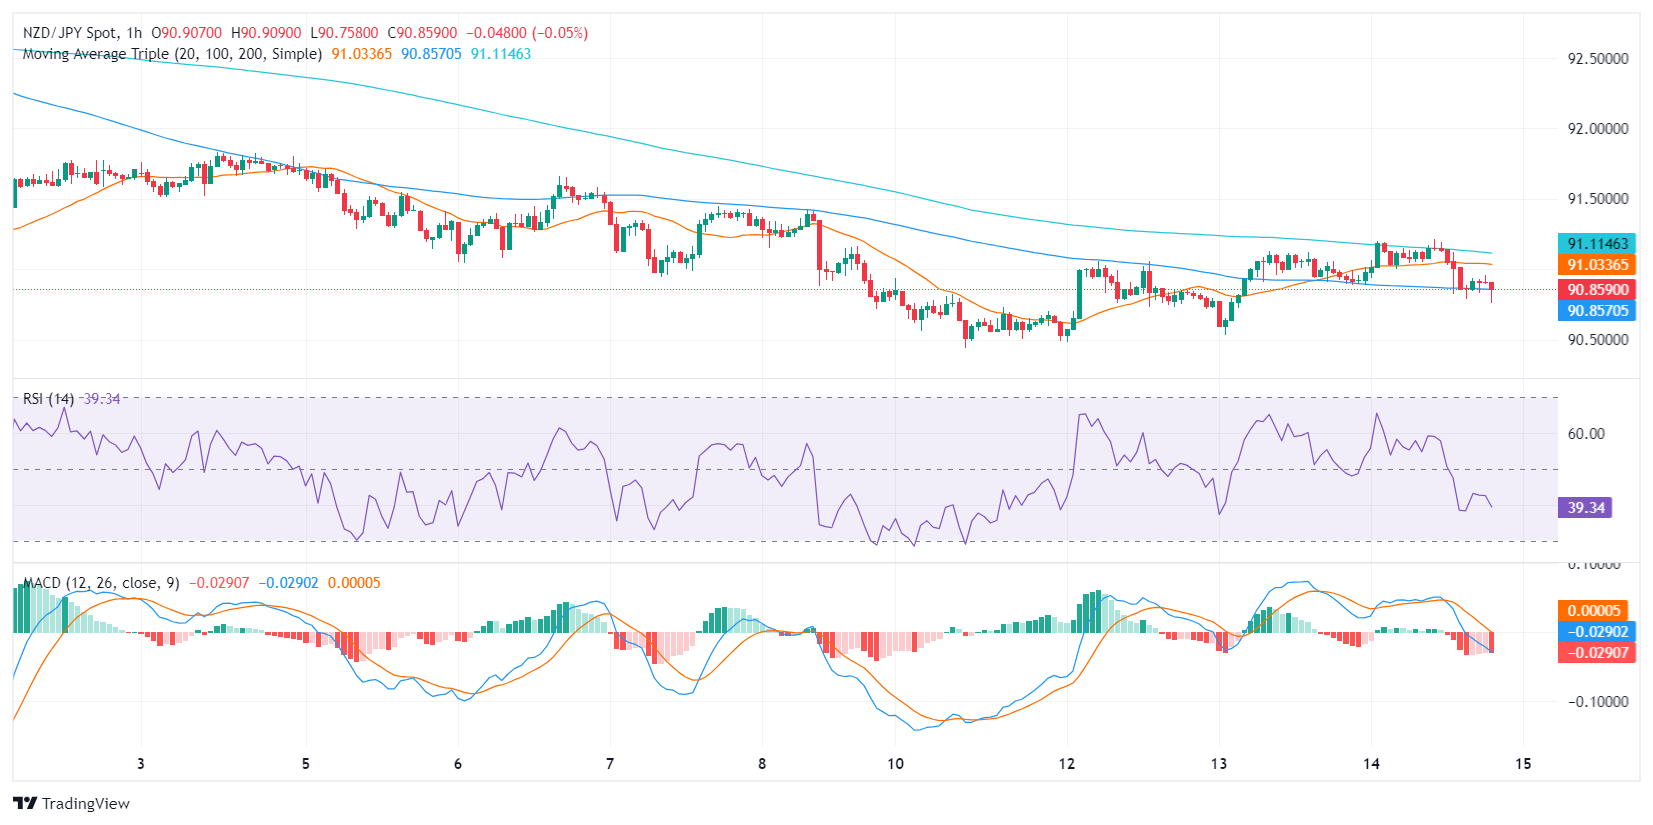
Despite the pair being below the 20-day Simple Moving Average (SMA), it remains above its 100 and 200-day SMAs, suggesting the overall trend remains bullish. However, the bearish indications from both the daily and hourly charts suggest potential retracements before a continuation of the bullish trend.
Vice President of the European Central Bank (ECB) Luis de Guindos hit newswires late Thursday, giving his outlook on the ECB's potential rate cut stance heading into the midyear.
Key highlights
de Guindos sees the European economy picking up in the second half of the year.
The ECB should have sufficient information in June to begin making decisions about monetary policy.
European inflation is heading towards 2%, but wage growth remains a risk.
- Daily chart displays continued bearish momentum with RSI lingering below 50.
- Hourly indicators also show negative but weakened momentum.
- Bulls must retake the 20-day SMA to brighten the technical outlook.
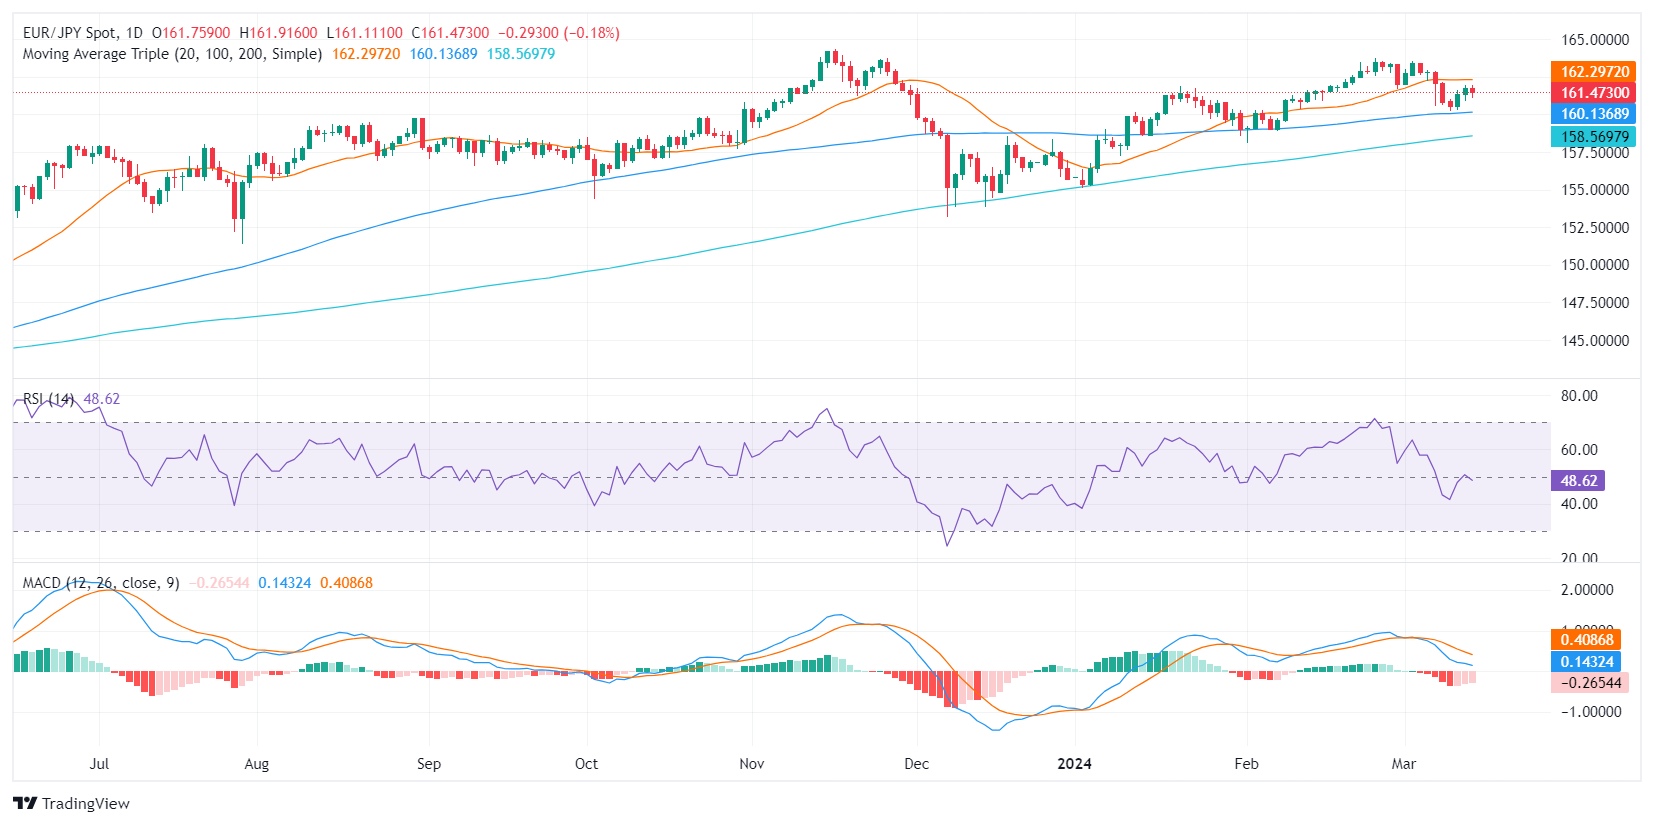
In Thursday's session, the EUR/JPY pair is trading at 161.33, with a 0.20% loss. Indicators suggest that sellers are in command within the current market, driving a bearish but weakening momentum. Despite this, a broader bullish sentiment persists, underlining the pair's position above key Simple Moving Averages (SMAs). However, as long as the pair stands below the 20-day SMA for the short term, the outlook will be tilted to the downside.
On the daily chart, the Relative Strength Index (RSI) fell below 50 into negative territory, towards at 48, pointing south. This indicates continued bearish momentum. The Moving Average Convergence Divergence (MACD) confirms this downward trend, as it displays red bars, but their decreasing nature hints that the momentum is slower.
EUR/JPY daily chart
On the hourly chart, a similar picture is seen. The RSI is currently at around 46 while the MACD histogram further corroborates the negative view with the presence of red bars.
EUR/JPY hourly chart

Despite the ongoing bearishness, the pair's position above its 100 and 200-day Simple Moving Averages suggests a positive overall trend on a broader scale. Therefore, while the market may experience short-term selling pressure, the longer-term outlook remains in favor of buyers. As the negative momentum seems to be waning, buyers might step in and move towards the 20-day SMA, which, in case of conquering it, would improve the pair's outlook.
The Greenback managed to pick up fresh upside traction on the back of another set of firm inflation figures, while the US labour market showed further resilience, all propelling the USD Index to weekly tops. A glimpse at the risk complex saw EUR/USD breaking below 1.0900 and GBP/USD breaching the 1.2800 support.
Here is what you need to know on Friday, March 15:
The USD Index (DXY) advanced to fresh multi-session peaks past the 103.00 barrier in response to further evidence of sticky inflation. At the end of the week, Industrial Production figures and the preliminary print of the Michigan Consumer Sentiment will be in the spotlight.
EUR/USD broke below the 1.0900 support to print fresh weekly lows amidst the prevailing risk-off mood. ECB’s P. Lane will speak on March 15.
GBP/USD accelerated its decline and dropped to multi-day lows in the vicinity of 1.2740 against the backdrop of the robust bounce in the Greenback.
USD/JPY advanced further north of the 148.00 barrier, extending its weekly recovery for the third session in a row amidst the stronger dollar and higher US yields. On March 15, the Tertiary Industry Index is only due in the Japanese calendar.
The resumption of the selling pressure dragged AUD/USD just pips away from the key 200-day SMA (0.6560), printing fresh weekly lows at the same time. In Australia, Consumer Inflation Expectations take centre stage on March 15.
Prices of the barrel of WTI rose to a new 2024 top above the $81.00 mark, bolstered by the upbeat outlook from the IEA, as well as persevering geopolitical concerns and auspicious data from the latest EIA’s weekly report.
Prices of Gold left behind Wednesday’s advance and refocused on the area of recent lows near $2,150 per troy ounce amidst extra gains in the Dollar and rising yields. By the same token, Silver prices came under pressure and returned to negative territory following a new YTD high past the key $25.00 level per ounce.
- Pound drops versus strong Dollar post-US PPI, indicating inflation.
- US Retail Sales resilience muddles Fed rate cut forecast.
- UK growth adjusts BoE cut expectations in global policy reevaluations.
- The US job market and higher Treasury yields strengthen the US Dollar, weighing on GBP.
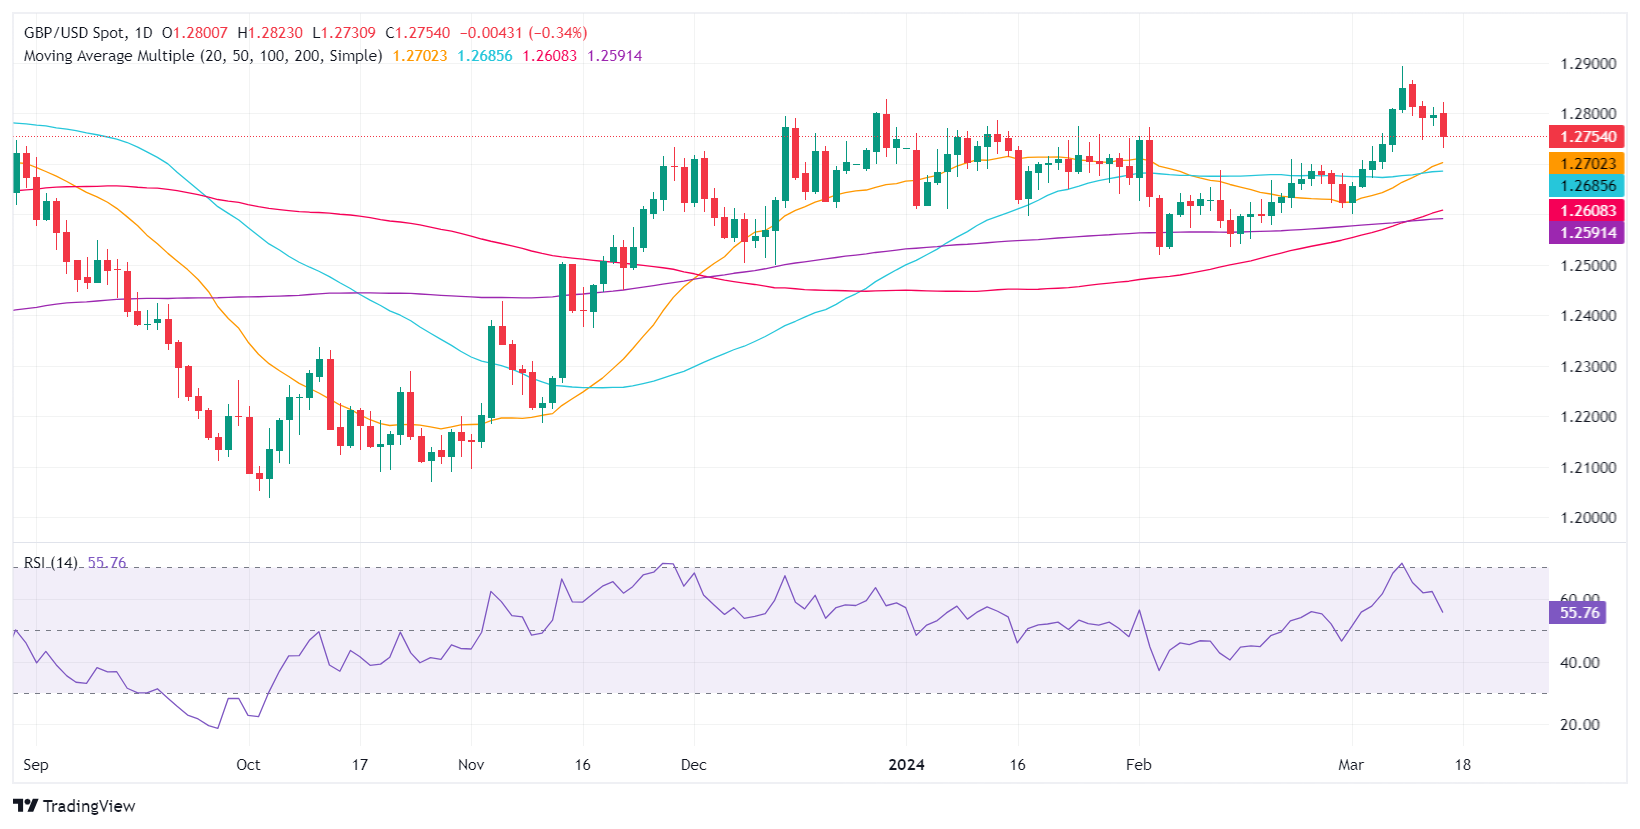
The Pound Sterling tumbled against the US Dollar on Thursday after the US Department of Labor announced a rebound on inflation on the producer side that could dent the Federal Reserve’s easing policy. Therefore, the GBP/USD edges lower, trading at 1.2748, down 0.38%.
GBP/USD weakens as US economic data prevent Fed from easing policy, as US yields rise
The Greenback is gathering momentum as it remains bid following a tranche of US economic data. US Retail Sales missed the estimates of 0.8% but improved by 0.6% MoM after plunging sharply in January. Even though the data would justify a rate cut by the Federal Reserve, a measure of inflation on the producer side known as the Producer Price Index (PPI), reaccelerated.
February’s PPI was strong, at 1.6% YoY, up from 0.9%, while the core PPI stood at 2% unchanged. Both figures exceeded estimates.
The labor market remained tight, as Initial Jobless Claims for the last week dipped from 210K to 209K, below estimates of 218K.
After the data US Treasury bond yields had risen sharply, with the 10-year benchmark note rate sitting at 4.296%. The US Dollar Index (DXY), a gauge of the buck’s performance versus other currencies, climbed 0.53%, yo at 103.33.
Across the ponds, the latest GDP figures for the UK showed the economy exited from a recession and grew 0.2% MoM in January. This has pushed back expectations for a Bank of England rate cut from June to August.
Given the backdrop of the Fed's expected decrease in interest rates in June, the GBP/USD should be favored in the near term. However, if US data continues to remain strong, further GBP/USD downside is seen.
GBP/USD Price Analysis: Technical outlook
The daily chart portrays the pair has broken the previous weekly low of 1.2744, but a daily close below that level is needed, before the Pound Sterling weakens further. In that event, the next support would be 1.2700, followed by fresh lows at the 50-day moving average (DMA) at 1.2685. On the other hand, if buyers reclaim 1.2800, look for a test of weekly highs at 1.2823.
Pound Sterling FAQs
The Pound Sterling (GBP) is the oldest currency in the world (886 AD) and the official currency of the United Kingdom. It is the fourth most traded unit for foreign exchange (FX) in the world, accounting for 12% of all transactions, averaging $630 billion a day, according to 2022 data. Its key trading pairs are GBP/USD, aka ‘Cable’, which accounts for 11% of FX, GBP/JPY, or the ‘Dragon’ as it is known by traders (3%), and EUR/GBP (2%). The Pound Sterling is issued by the Bank of England (BoE).
The single most important factor influencing the value of the Pound Sterling is monetary policy decided by the Bank of England. The BoE bases its decisions on whether it has achieved its primary goal of “price stability” – a steady inflation rate of around 2%. Its primary tool for achieving this is the adjustment of interest rates. When inflation is too high, the BoE will try to rein it in by raising interest rates, making it more expensive for people and businesses to access credit. This is generally positive for GBP, as higher interest rates make the UK a more attractive place for global investors to park their money. When inflation falls too low it is a sign economic growth is slowing. In this scenario, the BoE will consider lowering interest rates to cheapen credit so businesses will borrow more to invest in growth-generating projects.
Data releases gauge the health of the economy and can impact the value of the Pound Sterling. Indicators such as GDP, Manufacturing and Services PMIs, and employment can all influence the direction of the GBP. A strong economy is good for Sterling. Not only does it attract more foreign investment but it may encourage the BoE to put up interest rates, which will directly strengthen GBP. Otherwise, if economic data is weak, the Pound Sterling is likely to fall.
Another significant data release for the Pound Sterling is the Trade Balance. This indicator measures the difference between what a country earns from its exports and what it spends on imports over a given period. If a country produces highly sought-after exports, its currency will benefit purely from the extra demand created from foreign buyers seeking to purchase these goods. Therefore, a positive net Trade Balance strengthens a currency and vice versa for a negative balance.
- Dow Jones backslid 0.6% after US Retail Sales, PPI inflation vex rate bets.
- US PPI inflation remains tight, as does the US labor market, Retail Sales recover.
- Declines across nearly all sectors pummel indexes.
The Dow Jones Industrial Average (DJIA) declined on Thursday after US data showed inflation, labor, and domestic consumer spending continue to run too hot, too tight, and too strong for markets broadly hoping for rate cuts from the Federal Reserve (Fed). Rate futures bets of a June rate cut receded after the US data print, and investors are pulling back from equities that have been testing all-time highs recently.
At the time of writing, the Real Estate and Utilities Sectors are the US market’s biggest losers, down 2.2% and 1.35% respectively. The upside remains thin, with the Energy Sector up a comparatively thin 0.8%, followed by Communication Services which is up around 0.5%.
Core US Producer Price Index (PPI) inflation held at 2.0% for the year ended February, refusing to ease to the median market forecast of 1.9%. Headline annualized PPI in February jumped to 1.6, well over the forecast uptick to 1.1%. The previous print of 0.9% was also revised slightly higher to 1.0%.
US Retail Sales recovered to 0.6% in February, rebounding from the previous month’s -1.1% decline (revised down from -0.8%). Retail Sales missed the forecast of 0.8%, but the recovery was still firm enough to throw cold water on rate cut bets that are leaning into hopes of an economic recession in the US.
Initial Jobless Claims for the week ended March 8 also printed stronger than expected, with 209K new jobless benefits seekers versus the forecast 218K. The previous week’s number of jobless claimants was revised to 210K from the initial print of 217K.
Dow Jones news
Of the thirty equities listed on the Dow Jones Industrial Average, only six are in the green on Thursday. Microsoft Corp. (MSFT) is leading the bull charge, climbing 2.6% on the day to trade above $426.00. Apple Inc. (AAPL) follows closely behind, rising 1.5% to trade into $174.00.
Telecoms and financials are dragging down the Dow Jones on Thursday. Verizon Communications Inc. (VZ) is down 1.8%, trading below $40.00 per share, while JPMorgan Chase & Co. (JPM) is in the red by 1.5% and trading down into $188.00 per share.
Dow Jones Industrial Average technical outlook
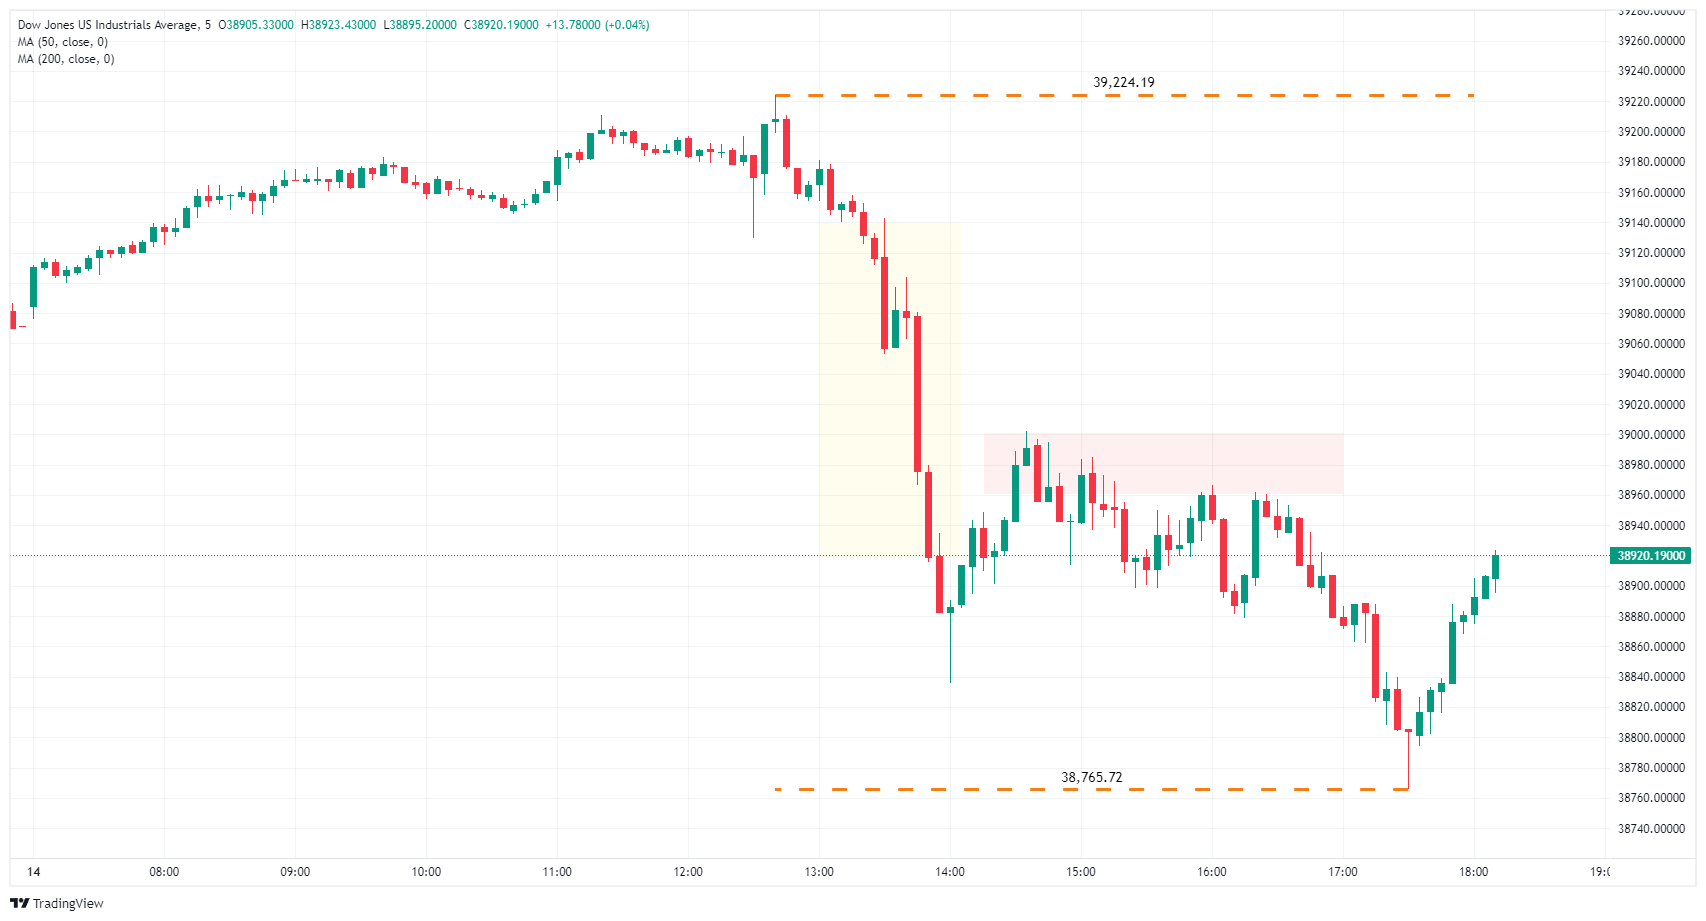
The Dow Jones Industrial Average (DJIA) printed an outside bar on Thursday, setting both a new high and a new low compared to the previous day. The Dow Jones set a new high for the week at 39,224.19 before getting swamped into a fresh low below 38,800.00.
The equity index has been pushed back below the 39,000.00 handle on Thursday. Bidders will note that the Dow Jones has a Fair Value Gap (FVG) ripe for the picking, while a supply zone is priced in from the 39,000.00 handle to 38,960.00.
Dow Jones Industrial Average, 5-minute chart
Dow Jones FAQs
The Dow Jones Industrial Average, one of the oldest stock market indices in the world, is compiled of the 30 most traded stocks in the US. The index is price-weighted rather than weighted by capitalization. It is calculated by summing the prices of the constituent stocks and dividing them by a factor, currently 0.152. The index was founded by Charles Dow, who also founded the Wall Street Journal. In later years it has been criticized for not being broadly representative enough because it only tracks 30 conglomerates, unlike broader indices such as the S&P 500.
Many different factors drive the Dow Jones Industrial Average (DJIA). The aggregate performance of the component companies revealed in quarterly company earnings reports is the main one. US and global macroeconomic data also contributes as it impacts on investor sentiment. The level of interest rates, set by the Federal Reserve (Fed), also influences the DJIA as it affects the cost of credit, on which many corporations are heavily reliant. Therefore, inflation can be a major driver as well as other metrics which impact the Fed decisions.
Dow Theory is a method for identifying the primary trend of the stock market developed by Charles Dow. A key step is to compare the direction of the Dow Jones Industrial Average (DJIA) and the Dow Jones Transportation Average (DJTA) and only follow trends where both are moving in the same direction. Volume is a confirmatory criteria. The theory uses elements of peak and trough analysis. Dow’s theory posits three trend phases: accumulation, when smart money starts buying or selling; public participation, when the wider public joins in; and distribution, when the smart money exits.
There are a number of ways to trade the DJIA. One is to use ETFs which allow investors to trade the DJIA as a single security, rather than having to buy shares in all 30 constituent companies. A leading example is the SPDR Dow Jones Industrial Average ETF (DIA). DJIA futures contracts enable traders to speculate on the future value of the index and Options provide the right, but not the obligation, to buy or sell the index at a predetermined price in the future. Mutual funds enable investors to buy a share of a diversified portfolio of DJIA stocks thus providing exposure to the overall index.
- US Treasury yields jump as inflation report cools expectations for immediate Fed rate cuts.
- February's Retail Sales rebound highlights consumer spending strength despite falling short of forecasts.
- Producer Price Index (PPI) data and lower-than-expected jobless claims reinforce views of strong economic activity.
US Treasury yields made a significant leap on Thursday, a direct response to a hot inflation report in the United States. This development is expected to deter the Federal Reserve from cutting rates in the March and May meetings, as traders have also reduced their bets for a rate cut in the June meeting.
Market adjust rate cut expectations amid strong US economic data
On Thursday, the US Commerce Department unveiled a positive trend in Retail Sales. Despite a -1.1% contraction in January, sales rebounded in February, expanding by 0.6% MoM. While this figure fell short of the estimated 0.8%, it underscores the resilience of US consumers, who continue to be the mainstay of the robust US economy.
Other data revealed by the US Bureau of Labor Statistics (BLS) showed that inflation remains high. The Producer Price Index (PPI) exceeded forecasts of 1.1% and climbed 1.6% YoY in February, while the core PPI expanded by 2% YoY, unchanged, though a tick higher than the estimated 1.9%.
At the same time, Initial Jobless Claims for the week ending March 9 rose by 209K, missed estimates of 218K, and stood below the previous week's reading of 218K.
Given the fact that Fed policymakers stressed during the last week that they would remain patient on cutting interest rates bets, after the data, traders pared bets that the Fed would slash rates in the June meeting from 72% at the beginning of the week to 62%.
The US 10-year Treasury bond yield has risen nine and a half basis points (bps) to 4.288%, while 2s edged up five bps to 4.689%, reducing the curve's inversion to 40 bps.
Interest Rates probabilities
What to watch?
In the meantime, traders brace for further US economic data on Friday. The calendar would feature Industrial Production, the New York Fed Empire State Index, and the University of Michigan Consumer Sentiment.
Interest rates FAQs
Interest rates are charged by financial institutions on loans to borrowers and are paid as interest to savers and depositors. They are influenced by base lending rates, which are set by central banks in response to changes in the economy. Central banks normally have a mandate to ensure price stability, which in most cases means targeting a core inflation rate of around 2%. If inflation falls below target the central bank may cut base lending rates, with a view to stimulating lending and boosting the economy. If inflation rises substantially above 2% it normally results in the central bank raising base lending rates in an attempt to lower inflation.
Higher interest rates generally help strengthen a country’s currency as they make it a more attractive place for global investors to park their money.
Higher interest rates overall weigh on the price of Gold because they increase the opportunity cost of holding Gold instead of investing in an interest-bearing asset or placing cash in the bank. If interest rates are high that usually pushes up the price of the US Dollar (USD), and since Gold is priced in Dollars, this has the effect of lowering the price of Gold.
The Fed funds rate is the overnight rate at which US banks lend to each other. It is the oft-quoted headline rate set by the Federal Reserve at its FOMC meetings. It is set as a range, for example 4.75%-5.00%, though the upper limit (in that case 5.00%) is the quoted figure. Market expectations for future Fed funds rate are tracked by the CME FedWatch tool, which shapes how many financial markets behave in anticipation of future Federal Reserve monetary policy decisions.
- Canadian Dollar gains against everything except the US Dollar.
- Canadian Manufacturing Sales barely register on the radar.
- Friday’s US UoM Consumer Sentiment in the barrel.
The Canadian Dollar (CAD) is broadly higher on Friday, landing in the green against the majority of its major currency peers but still shedding over half of a percent against the US Dollar (USD) bottom-to-top. Markets piled back into the Greenback bid after US Retail Sales missed the mark on Thursday, and the US Producer Price Index (PPI) stubbornly refused to give up ground.
Canada brought an update to January’s MoM Manufacturing Sales that barely registered in markets as investors focused squarely on US data and its impact on Federal Reserve (Fed) rate cut bets. On Thursday, following the US data dump, rate futures repriced slightly lower odds of a June rate trim from the Fed.
Daily digest market movers: US data kicks rate cut bets further back, US Dollar bids higher
- US Retail Sales in February missed expectations, rebounding to 0.6% MoM versus the forecast of 0.8%. However, this is still recovered from the previous -1.1% decline (revised lower from -0.8%).
- February’s US PPI showed producer-level inflation remains on the warm side, with YoY PPI holding steady at 2.0% instead of easing to 1.9% as markets expected.
- MoM US PPI eased to 0.3% from the previous 0.5% but failed to meet the market’s expected 0.2%.
- US Initial Jobless Claims also came in healthier than expected, with 209K new jobless benefits seekers for the week ended March 8 versus the forecast 218K. The previous week’s benefit seekers was also revised to 210K from 217K.
- The four-week average for Initial Jobless claims has dipped to 208K as the US labor market remains too tight to allow the Fed to cut rates as quickly and easily as markets were hoping for.
- Canadian Manufacturing Sales rebounded to 0.2% in January, missing the forecast 0.4% but still recovering from the previous month’s -1.1% decline (revised down from -0.7%).
Canadian Dollar price today
The table below shows the percentage change of Canadian Dollar (CAD) against listed major currencies today. Canadian Dollar was the strongest against the Australian Dollar.
| USD | EUR | GBP | CAD | AUD | JPY | NZD | CHF | |
| USD | 0.60% | 0.39% | 0.39% | 0.64% | 0.38% | 0.49% | 0.53% | |
| EUR | -0.61% | -0.22% | -0.23% | 0.03% | -0.23% | -0.13% | -0.08% | |
| GBP | -0.40% | 0.21% | -0.02% | 0.23% | -0.04% | 0.07% | 0.12% | |
| CAD | -0.39% | 0.24% | 0.03% | 0.26% | 0.00% | 0.10% | 0.15% | |
| AUD | -0.64% | -0.06% | -0.25% | -0.24% | -0.27% | -0.15% | -0.09% | |
| JPY | -0.38% | 0.24% | 0.03% | 0.00% | 0.29% | 0.12% | 0.16% | |
| NZD | -0.47% | 0.14% | -0.07% | -0.08% | 0.16% | -0.10% | 0.08% | |
| CHF | -0.52% | 0.08% | -0.12% | -0.14% | 0.13% | -0.14% | -0.04% |
The heat map shows percentage changes of major currencies against each other. The base currency is picked from the left column, while the quote currency is picked from the top row. For example, if you pick the Euro from the left column and move along the horizontal line to the Japanese Yen, the percentage change displayed in the box will represent EUR (base)/JPY (quote).
Technical analysis: Canadian Dollar broadly higher, but Greenback takes top spot on Thursday
The Canadian Dollar (CAD) is in the green against nearly all of its major currency peers, climbing a fifth of a percent against the Euro (EUR) and the Australian Dollar (AUD). The CAD is holding close to flat against the Japanese Yen (JPY) as the two battle for second place on Thursday, with the US Dollar the clear winner on the currency board. The Canadian Dollar is currently down around a third of a percent against the USD.
The USD/CAD rallied back over the 1.3500 handle as markets dog-piled back into the US Dollar, driving the pair into a fresh high for the week above 1.3530 and sending bids into battle with the 200-hour Simple Moving Average (SMA) near 1.3508. 1.3460 is the new intraday support level for sellers to beat, while a strong continuation into the top side will see a heavy supply zone near the 1.3600 handle.
Despite near-term gains, USD/CAD continues to wrestle with the 200-day SMA at 1.3480, cycling both sides of the major moving average for six straight trading days. The pair has consolidated around the 200-day SMA since rising into the 1.3500 neighborhood in January after a recovery from late December’s swing low below 1.3200.
USD/CAD hourly chart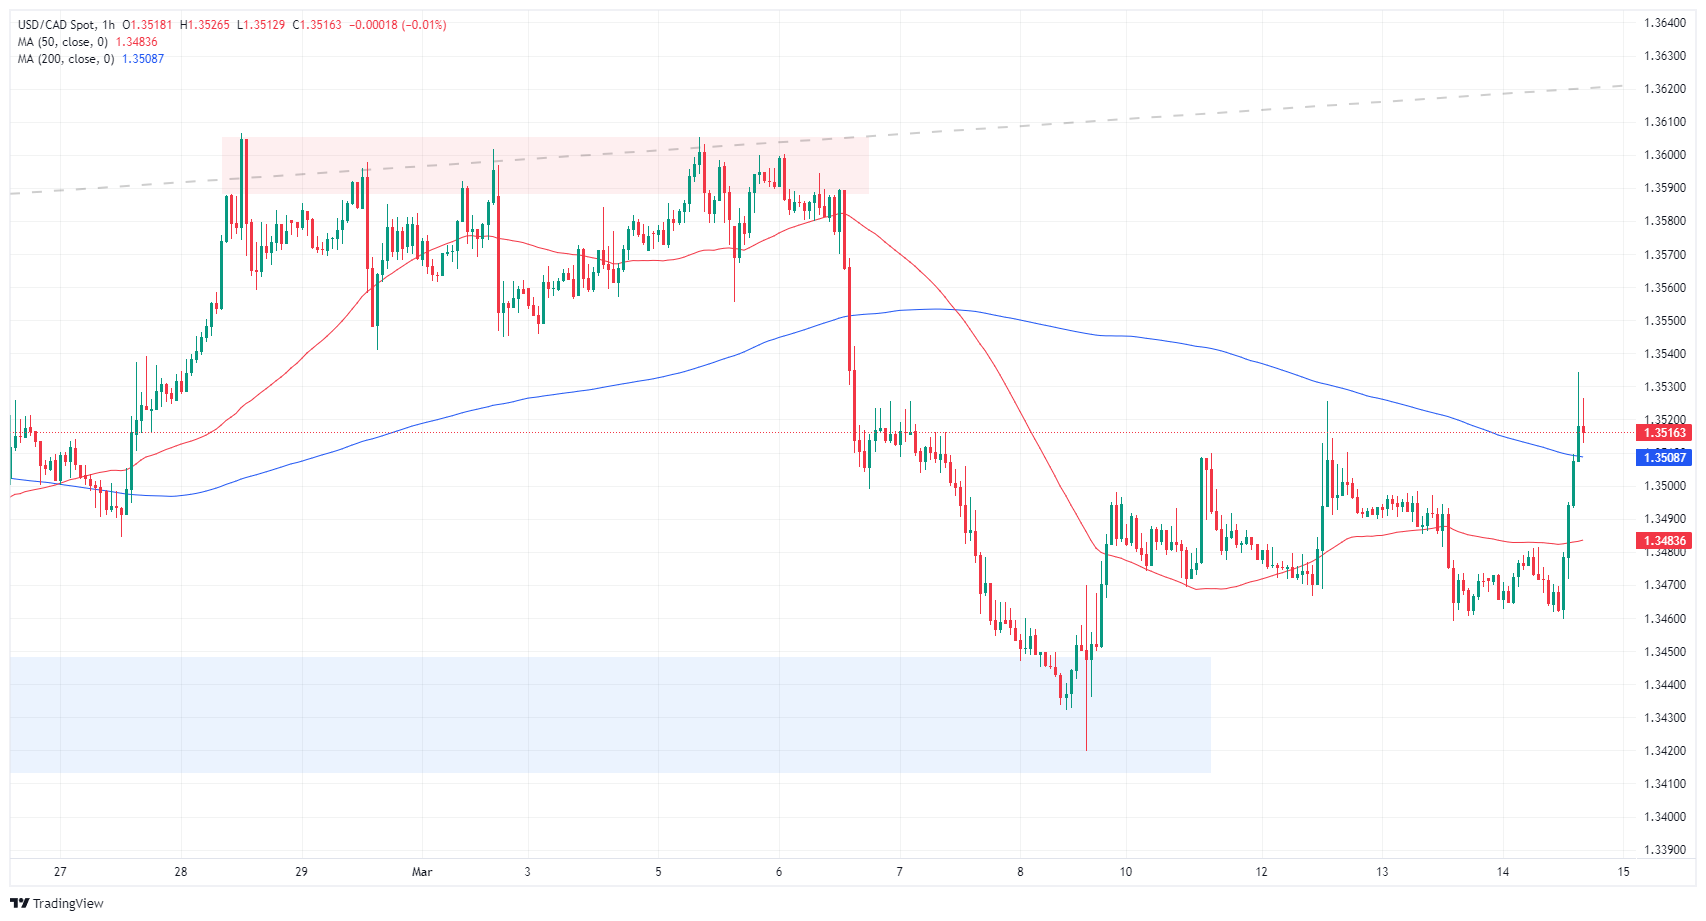
USD/CAD daily chart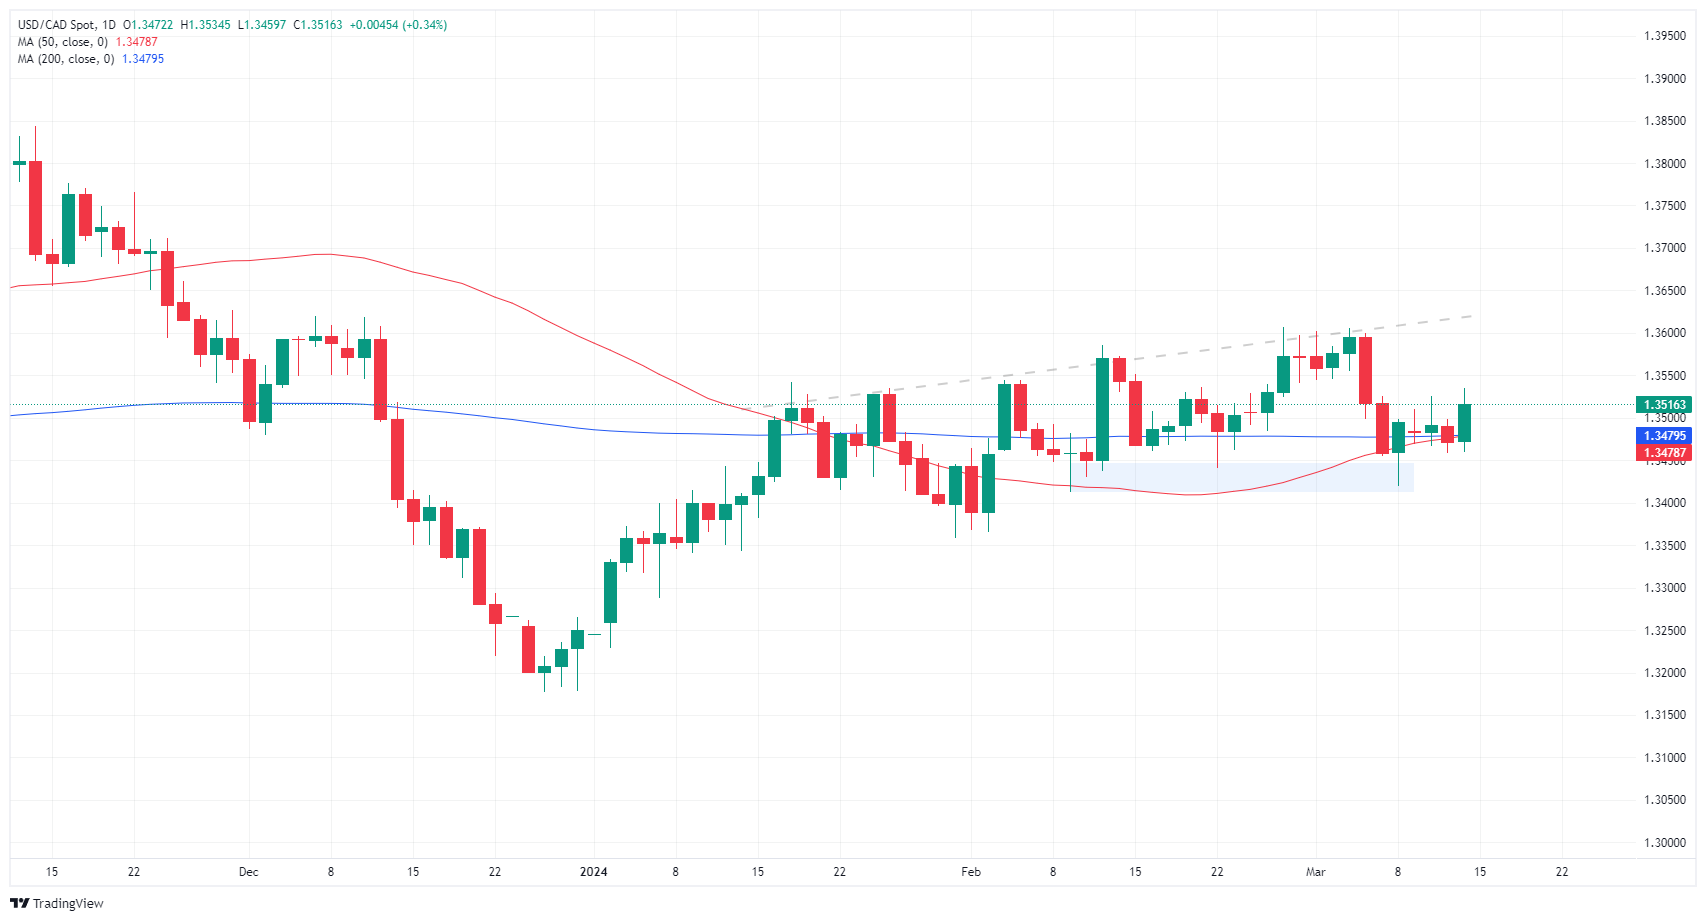
Canadian Dollar FAQs
The key factors driving the Canadian Dollar (CAD) are the level of interest rates set by the Bank of Canada (BoC), the price of Oil, Canada’s largest export, the health of its economy, inflation and the Trade Balance, which is the difference between the value of Canada’s exports versus its imports. Other factors include market sentiment – whether investors are taking on more risky assets (risk-on) or seeking safe-havens (risk-off) – with risk-on being CAD-positive. As its largest trading partner, the health of the US economy is also a key factor influencing the Canadian Dollar.
The Bank of Canada (BoC) has a significant influence on the Canadian Dollar by setting the level of interest rates that banks can lend to one another. This influences the level of interest rates for everyone. The main goal of the BoC is to maintain inflation at 1-3% by adjusting interest rates up or down. Relatively higher interest rates tend to be positive for the CAD. The Bank of Canada can also use quantitative easing and tightening to influence credit conditions, with the former CAD-negative and the latter CAD-positive.
The price of Oil is a key factor impacting the value of the Canadian Dollar. Petroleum is Canada’s biggest export, so Oil price tends to have an immediate impact on the CAD value. Generally, if Oil price rises CAD also goes up, as aggregate demand for the currency increases. The opposite is the case if the price of Oil falls. Higher Oil prices also tend to result in a greater likelihood of a positive Trade Balance, which is also supportive of the CAD.
While inflation had always traditionally been thought of as a negative factor for a currency since it lowers the value of money, the opposite has actually been the case in modern times with the relaxation of cross-border capital controls. Higher inflation tends to lead central banks to put up interest rates which attracts more capital inflows from global investors seeking a lucrative place to keep their money. This increases demand for the local currency, which in Canada’s case is the Canadian Dollar.
Macroeconomic data releases gauge the health of the economy and can have an impact on the Canadian Dollar. Indicators such as GDP, Manufacturing and Services PMIs, employment, and consumer sentiment surveys can all influence the direction of the CAD. A strong economy is good for the Canadian Dollar. Not only does it attract more foreign investment but it may encourage the Bank of Canada to put up interest rates, leading to a stronger currency. If economic data is weak, however, the CAD is likely to fall.
- US core and headline PPI came in higher than expected in February.
- On the negative side, Retail Sales from February and weekly Initial Jobless Claims came in lower than expected.
- US Treasury yields rose to two-week highs.
The US Dollar Index (DXY) is currently trading at 103.36, up 0.55%, on Thursday. The Greenback got a boost following the release of hot Producer Price Index (PPI) figures, which triggered a rally in US Treasury yields. On the negative side, Retail Sales and Jobless claims figures came in soft.
Despite inflation in the US remaining sticky, expectations on the start of the easing cycle of the Federal Reserve (Fed) remain steady. Markets are discounting that the rate cuts will begin in June, but the focus will now be on the revised Dot Plot for the upcoming March meeting to gather additional evidence on the Fed’s stances.
Daily digest market movers: DXY rallies as markets digest PPI data
- The US Bureau of Labor Statistics reported that the Producer Price Index (PPI) for February increased by 1.6% YoY, which outperformed a consensus of 1.1% and is an improvement from the previous 1%.
- The core PPI showed an increase of 2.8% YoY, higher than the previous 2.6%.
- Retail Sales for February reported by the US Census Bureau, showed a monthly increase of 0.6% (MoM), below the 0.8% expected.
- The Initial Jobless Claims for the week that ended on March 9 was reported to be at 209K, lower than the predicted figure of 218K but higher than the previous 210K.
- Overall, the economic outlook in the US is mixed, with signs of sticky inflation and weak economic activity.
- Markets are currently predicting less than 15% and 60% for a Fed rate cut in May and June, respectively, which aligns closer to the Fed's outlook for three cuts this year.
- US Treasury yields soared with the 2-year yield at 4.70%, the 5-year yield at 4.29%, and the 10-year yield at 4.28%.
DXY technical analysis: DXY opens gaps for bulls as bears lose momentum
On the daily chart, the Relative Strength Index (RSI) has a positive slope yet drifts in negative territory, signaling that bulls are slowly building momentum. Coupled with this, the decreasing red bars on the Moving Average Convergence Divergence (MACD) histogram corroborate the growing buying momentum as the sellers lose traction.
Furthermore, the positioning of DXY below its 20,100 and 200-day Simple Moving Averages (SMAs) underscores the embedded bearish outlook. However, if the buyers make a move above the 20-day average at around 103.50, the outlook might shift in favor of the bulls.
US Dollar FAQs
What is the US Dollar?
The US Dollar (USD) is the official currency of the United States of America, and the ‘de facto’ currency of a significant number of other countries where it is found in circulation alongside local notes. It is the most heavily traded currency in the world, accounting for over 88% of all global foreign exchange turnover, or an average of $6.6 trillion in transactions per day, according to data from 2022.
Following the second world war, the USD took over from the British Pound as the world’s reserve currency. For most of its history, the US Dollar was backed by Gold, until the Bretton Woods Agreement in 1971 when the Gold Standard went away.
How do the decisions of the Federal Reserve impact the US Dollar?
The most important single factor impacting on the value of the US Dollar is monetary policy, which is shaped by the Federal Reserve (Fed). The Fed has two mandates: to achieve price stability (control inflation) and foster full employment. Its primary tool to achieve these two goals is by adjusting interest rates.
When prices are rising too quickly and inflation is above the Fed’s 2% target, the Fed will raise rates, which helps the USD value. When inflation falls below 2% or the Unemployment Rate is too high, the Fed may lower interest rates, which weighs on the Greenback.
What is Quantitative Easing and how does it influence the US Dollar?
In extreme situations, the Federal Reserve can also print more Dollars and enact quantitative easing (QE). QE is the process by which the Fed substantially increases the flow of credit in a stuck financial system.
It is a non-standard policy measure used when credit has dried up because banks will not lend to each other (out of the fear of counterparty default). It is a last resort when simply lowering interest rates is unlikely to achieve the necessary result. It was the Fed’s weapon of choice to combat the credit crunch that occurred during the Great Financial Crisis in 2008. It involves the Fed printing more Dollars and using them to buy US government bonds predominantly from financial institutions. QE usually leads to a weaker US Dollar.
What is Quantitative Tightening and how does it influence the US Dollar?
Quantitative tightening (QT) is the reverse process whereby the Federal Reserve stops buying bonds from financial institutions and does not reinvest the principal from the bonds it holds maturing in new purchases. It is usually positive for the US Dollar.
- USD/JPY surges after US inflation data comes out hotter than expected.
- Upside could be capped, however, by expectations of an impending rate cut by the BoJ.
- The outcome could depend on the results of a preliminary survey of wage agreements published Friday.
USD/JPY is trading in the lower 148.00s during the US session on Thursday, up over a third of percentage point after the release of US macroeconomic data.
An unexpected rise in US Producer Prices (PPI) indicates inflation remains stubbornly high and the Federal Reserve (Fed) will need to keep interest rates elevated for longer to combat it.
The maintenance of higher interest rates is positive for the US Dollar (USD) and USD/JPY, because relatively higher interest rates attract greater inflows of foreign capital.
Previously, markets had been pricing in the possibility of the Fed cutting interest rates in May or June, however, following the release of Thursday’s PPI data, the probability of the rate cut in May has dwindled to 9%, according to the CME Group’s FedWatch Tool, which calculates the probabilities of changes in the Fed Funds Rate based on the price of Fed Funds Futures.
The probability of a June rate cut remains relatively high at 62%, but still down from over 70% recorded a few days ago.
Upside for the USD/JPY could be capped by expectations the Bank of Japan (BoJ) will raise interest rates at their March meeting next Tuesday. Such a move would end decades of ultra-loose policy and be the first time since February 2007 the bank has increased interest rates. The expected move comes after higher inflation in Japan and the potential for further price pressures after a series of higher wage agreements between major labor unions and employers.
The Chairman of the Bank of Japan, Kazuo Ueda has consistently said that he will only agree to higher interest rates if the inflation rate sustainably reaches the BoJ’s 2.0% target. Currently headline inflation sits above the target at 2.2% whilst core inflation is at 2.0% – exactly at the target level – from 2.3% in the previous month.
The BoJ has said its decision whether or not to raise rates next Tuesday could hinge on the preliminary results of a survey of big firms' wage talks published on Friday, March 15, according to the Asahi Shimbun.
EUR/GBP has bounced off 0.8500, again. Economists at Société Générale analyze the pair’s outlook.
GBP, along with CHF, will be a favourite European currency short
Repeated attempts by EUR/GBP to break below 0.8500 have failed this year, with the Pound finding support from higher BoE interest rates and the market’s expectation that the UK may cut rates by slightly less than the ECB this year.
With both economies stagnating, the strongest argument for the UK to cut by more is that higher rates give more room to act when inflation is deemed low enough to do so.
We will continue to recommend buying EUR/GBP when it gets close to 0.8500, and GBP, along with CHF, will be a favourite European currency short.
- Mexican Peso faces losses against a resurgent US Dollar, reacting to positive US retail and inflation reports.
- Banxico Deputy Governor Mejia signals potential for early interest rate cuts, which weighs on the Mexican currency.
- US economic strength challenges Fed's easing timeline as traders trim rate cut bets for June’s meeting.
The Mexican Peso (MXN) posts minimal losses against the US Dollar (USD) after robust economic data from the United States might deter the US Federal Reserve (Fed) from cutting rates in the first half of 2024. Bank of Mexico (Banxico) Deputy Governor Omar Mejia opened the door for an interest rate cut in a podcast on Wednesday, emphasizing that it is not premature due to the bank’s high rate level. The USD/MXN trades at 16.69, gaining 0.20%.
Market mood is negative, as reflected by US equities printing losses. The US Commerce Department revealed that Retail Sales in February improved compared to January’s plunge. At the same time, the Bureau of Labor Statistics (BLS) revealed that inflation on the producer side climbed, sparking a jump in the Greenback.
In other data, the Department of Labor revealed that Americans filing for unemployment benefits decreased below the prior week’s reading and missed estimates.
Daily digest market movers: Mexican Peso gives way to US Dollar buyers, unable to reach nine-year high
- Banxico’s Mejia commented that they have a long way to go on the disinflationary path, though he acknowledged the stickiness of services inflation. He stresses that the balance of risks for inflation is less adverse.
- Mexican economic data revealed during the week:
- Industrial production in January rose 0.4% MoM as expected, and it gained from -0.7% in December’s contraction. In the twelve months to January, production increased by 2.9%, above estimates, smashing December’s 0% reading.
- US Retail Sales in February came in at 0.6% MoM, below estimates of 0.8%, though improved from a -1.1% January contraction.
- The Producer Price Index (PPI) exceeded forecasts of 1.1% and rose by 1.6% YoY in February. Excluding volatile items, the so-called core PPI expanded by 2% YoY, unchanged, though a tick higher than the estimated 1.9%.
- Initial Jobless Claims for the week ending March 9 rose by 209K, missed estimates of 218K and stood below the previous week's reading of 218K.
- Thursday’s data added to the release of the latest Consumer Price Index (CPI) report in the United States, cementing the Federal Reserve’s case for being patient about cutting interest rates. Unless data proves the disinflationary process is sustainably trending toward the 2% goal, they will stick to the “higher for longer” mantra. The next Fed meeting is scheduled for March 19-20 next week.
- Banxico’s private analyst poll projections for February were updated. They expect inflation at 4.10%, core CPI at 4.06%, and the economy to grow by 2.40%, unchanged from January. Regarding monetary policy, they see Banxico lowering rates to 9.50% and the USD/MXN exchange rate at 18.31, down from 18.50.
- During Banxico’s quarterly report, policymakers acknowledged the progress on inflation and urged caution against premature interest rate cuts. Governor Victoria Rodriguez Ceja said adjustments would be gradual, while Deputy Governors Galia Borja and Jonathan Heath called for prudence. The latter specifically warned against the risks of an early rate cut.
- Banxico updated its economic growth projections for 2024 from 3.0% to 2.8% YoY and maintained 1.5% for 2025. The slowdown is blamed on higher interest rates at 11.25%, which sparked a shift from three of Banxico’s five governors, who are eyeing the first rate cut at the March 21 meeting.
- A Reuters poll showed investors estimate the Fed to be the first central bank to cut rates in June.
- Meanwhile, 52 of 108 economists expect the Fed to cut rates by 75 basis points in 2024, with 26 saying 100 bps.
- A Reuters poll sees the Mexican Peso depreciating 7% to 18.24 in 12 months from 16.96 on Monday, according to the median of 20 FX strategists polled between March 1-4. The forecast ranged from 15.50 to 19.00.
- A Reuters poll shows 15 analysts estimate that inflation will slow down in February, corroborating bets that Banxico could cut rates as soon as the March 21 meeting.
- The CME FedWatch Tool shows traders decreased their bets for a 25-basis-point rate cut in June, down from 72% at the beginning of the week to 60%.
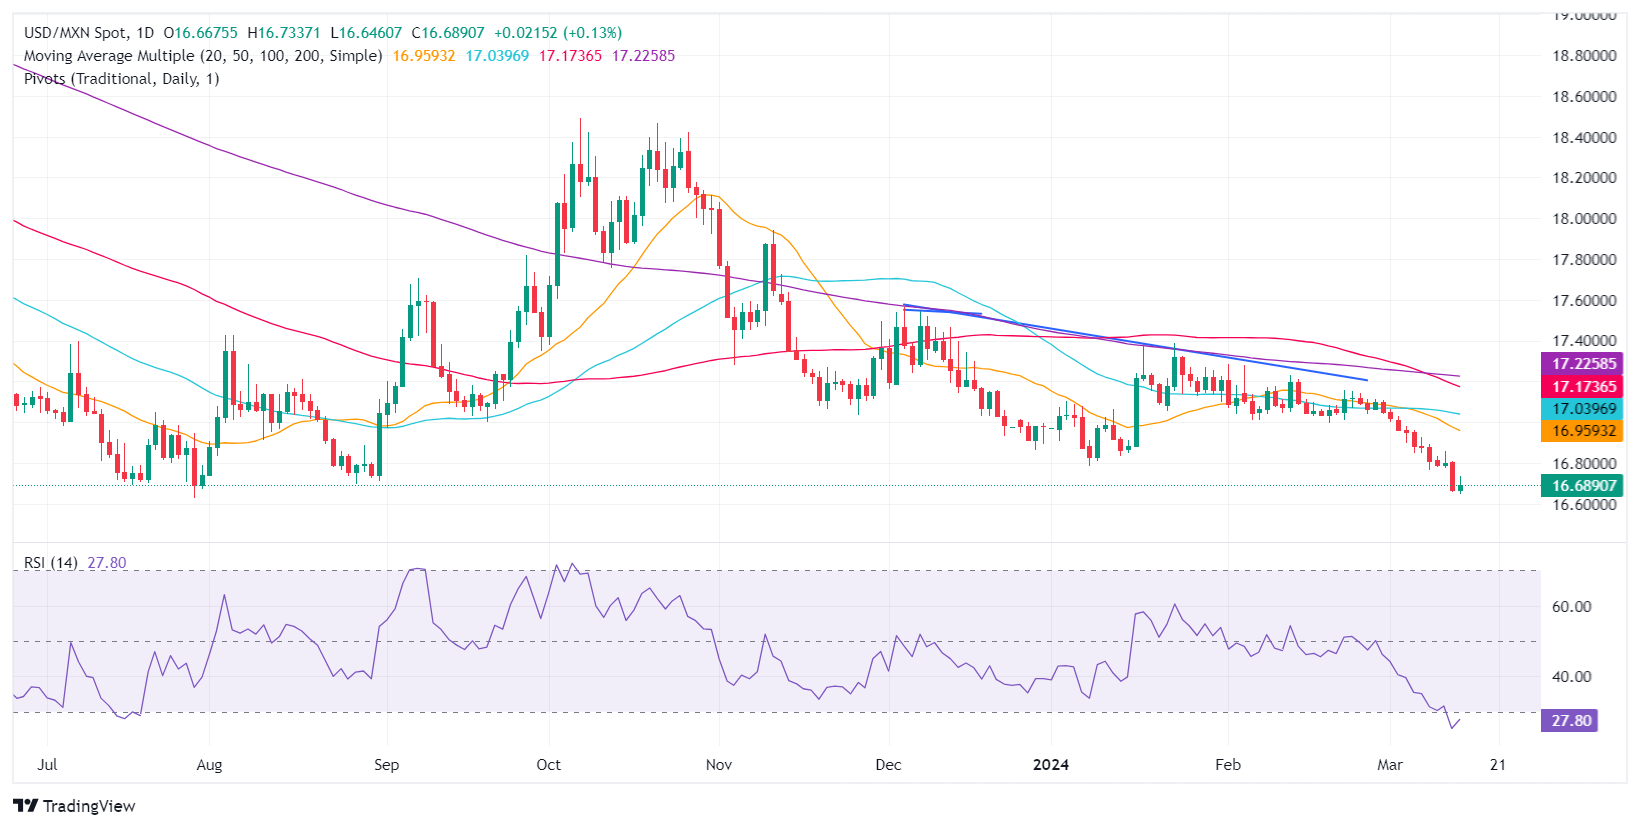
Technical analysis: Mexican Peso depreciates as USD/MXN edges toward 16.70
The USD/MXN downtrend remains intact, but after refreshing year-to-date lows of 16.64, the exotic pair seems to be oversold. The Relative Strength Index (RSI) was below the 30.00 level but has pierced to the upside, signaling buyers could be gathering momentum. If that’s the case, they must reclaim January’s low of 16.78 so they can challenge the 17.00 figure.
Key resistance levels lie at the 50-day Simple Moving Average (SMA) at 17.04, followed by the confluence of the 200-day SMA and the 100-day SMA at 17.23.
On the other hand, and the path of least resistance, the pair could extend its losses below 2023’s low of 16.62, which could exacerbate a drop toward October 2015’s low of 16.32, followed by the 16.00 psychological level.
USD/MXN Price Action – Daily Chart
Mexican Peso FAQs
The Mexican Peso (MXN) is the most traded currency among its Latin American peers. Its value is broadly determined by the performance of the Mexican economy, the country’s central bank’s policy, the amount of foreign investment in the country and even the levels of remittances sent by Mexicans who live abroad, particularly in the United States. Geopolitical trends can also move MXN: for example, the process of nearshoring – or the decision by some firms to relocate manufacturing capacity and supply chains closer to their home countries – is also seen as a catalyst for the Mexican currency as the country is considered a key manufacturing hub in the American continent. Another catalyst for MXN is Oil prices as Mexico is a key exporter of the commodity.
The main objective of Mexico’s central bank, also known as Banxico, is to maintain inflation at low and stable levels (at or close to its target of 3%, the midpoint in a tolerance band of between 2% and 4%). To this end, the bank sets an appropriate level of interest rates. When inflation is too high, Banxico will attempt to tame it by raising interest rates, making it more expensive for households and businesses to borrow money, thus cooling demand and the overall economy. Higher interest rates are generally positive for the Mexican Peso (MXN) as they lead to higher yields, making the country a more attractive place for investors. On the contrary, lower interest rates tend to weaken MXN.
Macroeconomic data releases are key to assess the state of the economy and can have an impact on the Mexican Peso (MXN) valuation. A strong Mexican economy, based on high economic growth, low unemployment and high confidence is good for MXN. Not only does it attract more foreign investment but it may encourage the Bank of Mexico (Banxico) to increase interest rates, particularly if this strength comes together with elevated inflation. However, if economic data is weak, MXN is likely to depreciate.
As an emerging-market currency, the Mexican Peso (MXN) tends to strive during risk-on periods, or when investors perceive that broader market risks are low and thus are eager to engage with investments that carry a higher risk. Conversely, MXN tends to weaken at times of market turbulence or economic uncertainty as investors tend to sell higher-risk assets and flee to the more-stable safe havens.
Gold is enjoying a remarkable start to the year. Economists at MUFG Bank analyze the yellow metal’s outlook.
Gold’s structural resilience has further to run
Yet, beyond the likely solidification of Fed cut expectations in the coming weeks and months, it is the structural channels of physical demand for Gold that excites us most, which we view will unlock more than just systematic momentum.
Looking ahead, the potential upside in Gold prices will be closely tied to US real rates and US Dollar moves, as well as persistent strong consumer demand from China and India, alongside central bank purchasers. We view this will offset downward pressures from upside growth surprises and rate cut repricing, and anticipate that any sell-offs to be limited in scale due to a dovish Fed, slowing wage growth, and resilient central bank demand.
Tactically, we would view a sell-off in Gold as a buying opportunity, as we see an environment with elevated risk channels ahead playing into Gold’s hedge qualities.
The Loonie’s recent appreciation has been tepid considering the overall weakness of the US Dollar. In essence, the CAD has been the weakest of the strong over the past month. Economists at the National Bank of Canada analyze USD/CAD outlook.
Restrictive monetary policy in Canada can no longer be justified
The restrictive monetary policy in Canada can no longer be justified.
As we continue to believe that rate cuts will be more aggressive on this side of the border, we still see USD/CAD moving above 1.4000 in H2 2024.
The Brazilian Real (BRL) does not seem to be doing so well this year. Economists at Commerzbank analyze BRL outlook.
At the turning point?
The mere fact that the BCB has now reached such a turning point certainly increases the risks that the Real could become more of an average performing currency this year.
Above all, the Real may not be able to withstand political disruptions, such as the announcement a few days ago that state-owned Petrobas will pay a lower dividend than the market expected. Those who need to manage BRL risks should keep this in mind.
Economists at TD Securities expect Copper to embark on a significant race higher in the long run.
The timing could be ripe for a multi-year rally to kick-off
This is not the breakout you are looking for – it is a litmus test. Copper fundamentals over the coming decade are incredibly exciting, with a supercycle seemingly locked in.
And, signs that Copper markets have finally entered into a period of structural deficits suggest the timing could be ripe for a multi-year rally to kick off.
Economists at Wells Fargo do not expect any policy changes from the FOMC at its meeting next week. But the Committee's post-meeting communications should shed more light on the potential path of policy adjustments later this year, they say.
Median dot for 2024 will remain unchanged at 4.625%
We do not expect the FOMC to change the federal funds rate or alter its current pace of balance sheet runoff at its upcoming meeting on March 19-20.
We now expect the FOMC will initiate the first cut to the federal funds rate at its June 12 meeting (our previous expectation was at the May 1 meeting). We look for 100 bps of easing in total this year and another 100 bps of easing over the course of 2025 to bring the fed funds target range to 3.25%-3.50% by year-end 2025.
Our base case is that the median dot for 2024 will remain unchanged at 4.625%, but the risks are skewed toward a higher median given the distribution of the prior dots and the recent run of inflation data. Similarly, we expect no change to the 2025 and 2026 median dots, though here too we think the risks are skewed to the upside.
Our base case remains that the FOMC will announce a plan to slow the pace of QT at its June meeting, although we would not be shocked if the Committee decided to do so one meeting earlier or later.
- The New Zealand Dollar declines marginally versus the USD after the release of US data.
- Producer Prices in the US rose more than expected in February and lower unemployment claims indicated a stronger labor market.
- Retail sales rose less than expected, providing an antidote to the inflationary PPI data.
The New Zealand Dollar (NZD) is trading lower in its NZD/USD pair on Thursday after the release of US macroeconomic data suggests price pressures are likely to remain above what had been expected.
Producer Prices (PPI) for February came out higher than economist’s forecasted, according to data from US Bureau of Labour Statistics. It suggests inflation is likely to remain stubbornly high in the US, forcing the Federal Reserve to keep interest rates at their current level for longer, and scotching hopes of an early interest-rate cut.
Higher interest rates are generally positive for a currency because they attract more inflows of foreign capital, so the data weighed on the NZD/USD pair, which measures the buying power of one New Zealand Dollar in US Dollar (USD) terms.
US Retail Sales came out lower than expected, however, providing an antidote to the higher PPI result, as lower demand for shoppers tends to have a disinflationary effect.
At the same time, lower-than-expected US Jobless Claims indicated the possibility of inflationary pressures from a tight labor market.
New Zealand Dollar falls against USD as factory gate inflation beats expectations
The BLS data shows that the Producer Price Index ex Food and Energy (Core PPI) rose by 2.0% in February, not the 1.9% forecast, and the same as the previous 2.0% in January.
Monthly Core PPI showed a 0.3% increase in prices, which beat the 0.2% rise expected but was still lower than the 0.5% from the previous month.
The headline Producer Price Index (PPI) rose 1.6% in February, which was well above the 1.1% YoY gain expected and the 1% in January. MoM PPI rose 0.6% versus the 0.3% forecast – the same as the 0.3% previous.
US Retail Sales registered a 0.6% rise MoM rather than the 0.8% rise forecast, but still above the 0.8% decline in January.
US Initial Jobless Claims for the week of March 8 came out at 209K when a 218K result had been forecast, yet this was lower than the 210K previously.
Technical Analysis: New Zealand Dollar continues falling inside range
The NZD/USD pair continues falling after touching the top of its range in the 0.6220s, where it formed a bearish Shooting Star Japanese candlestick pattern on the 4-hour chart (circled).
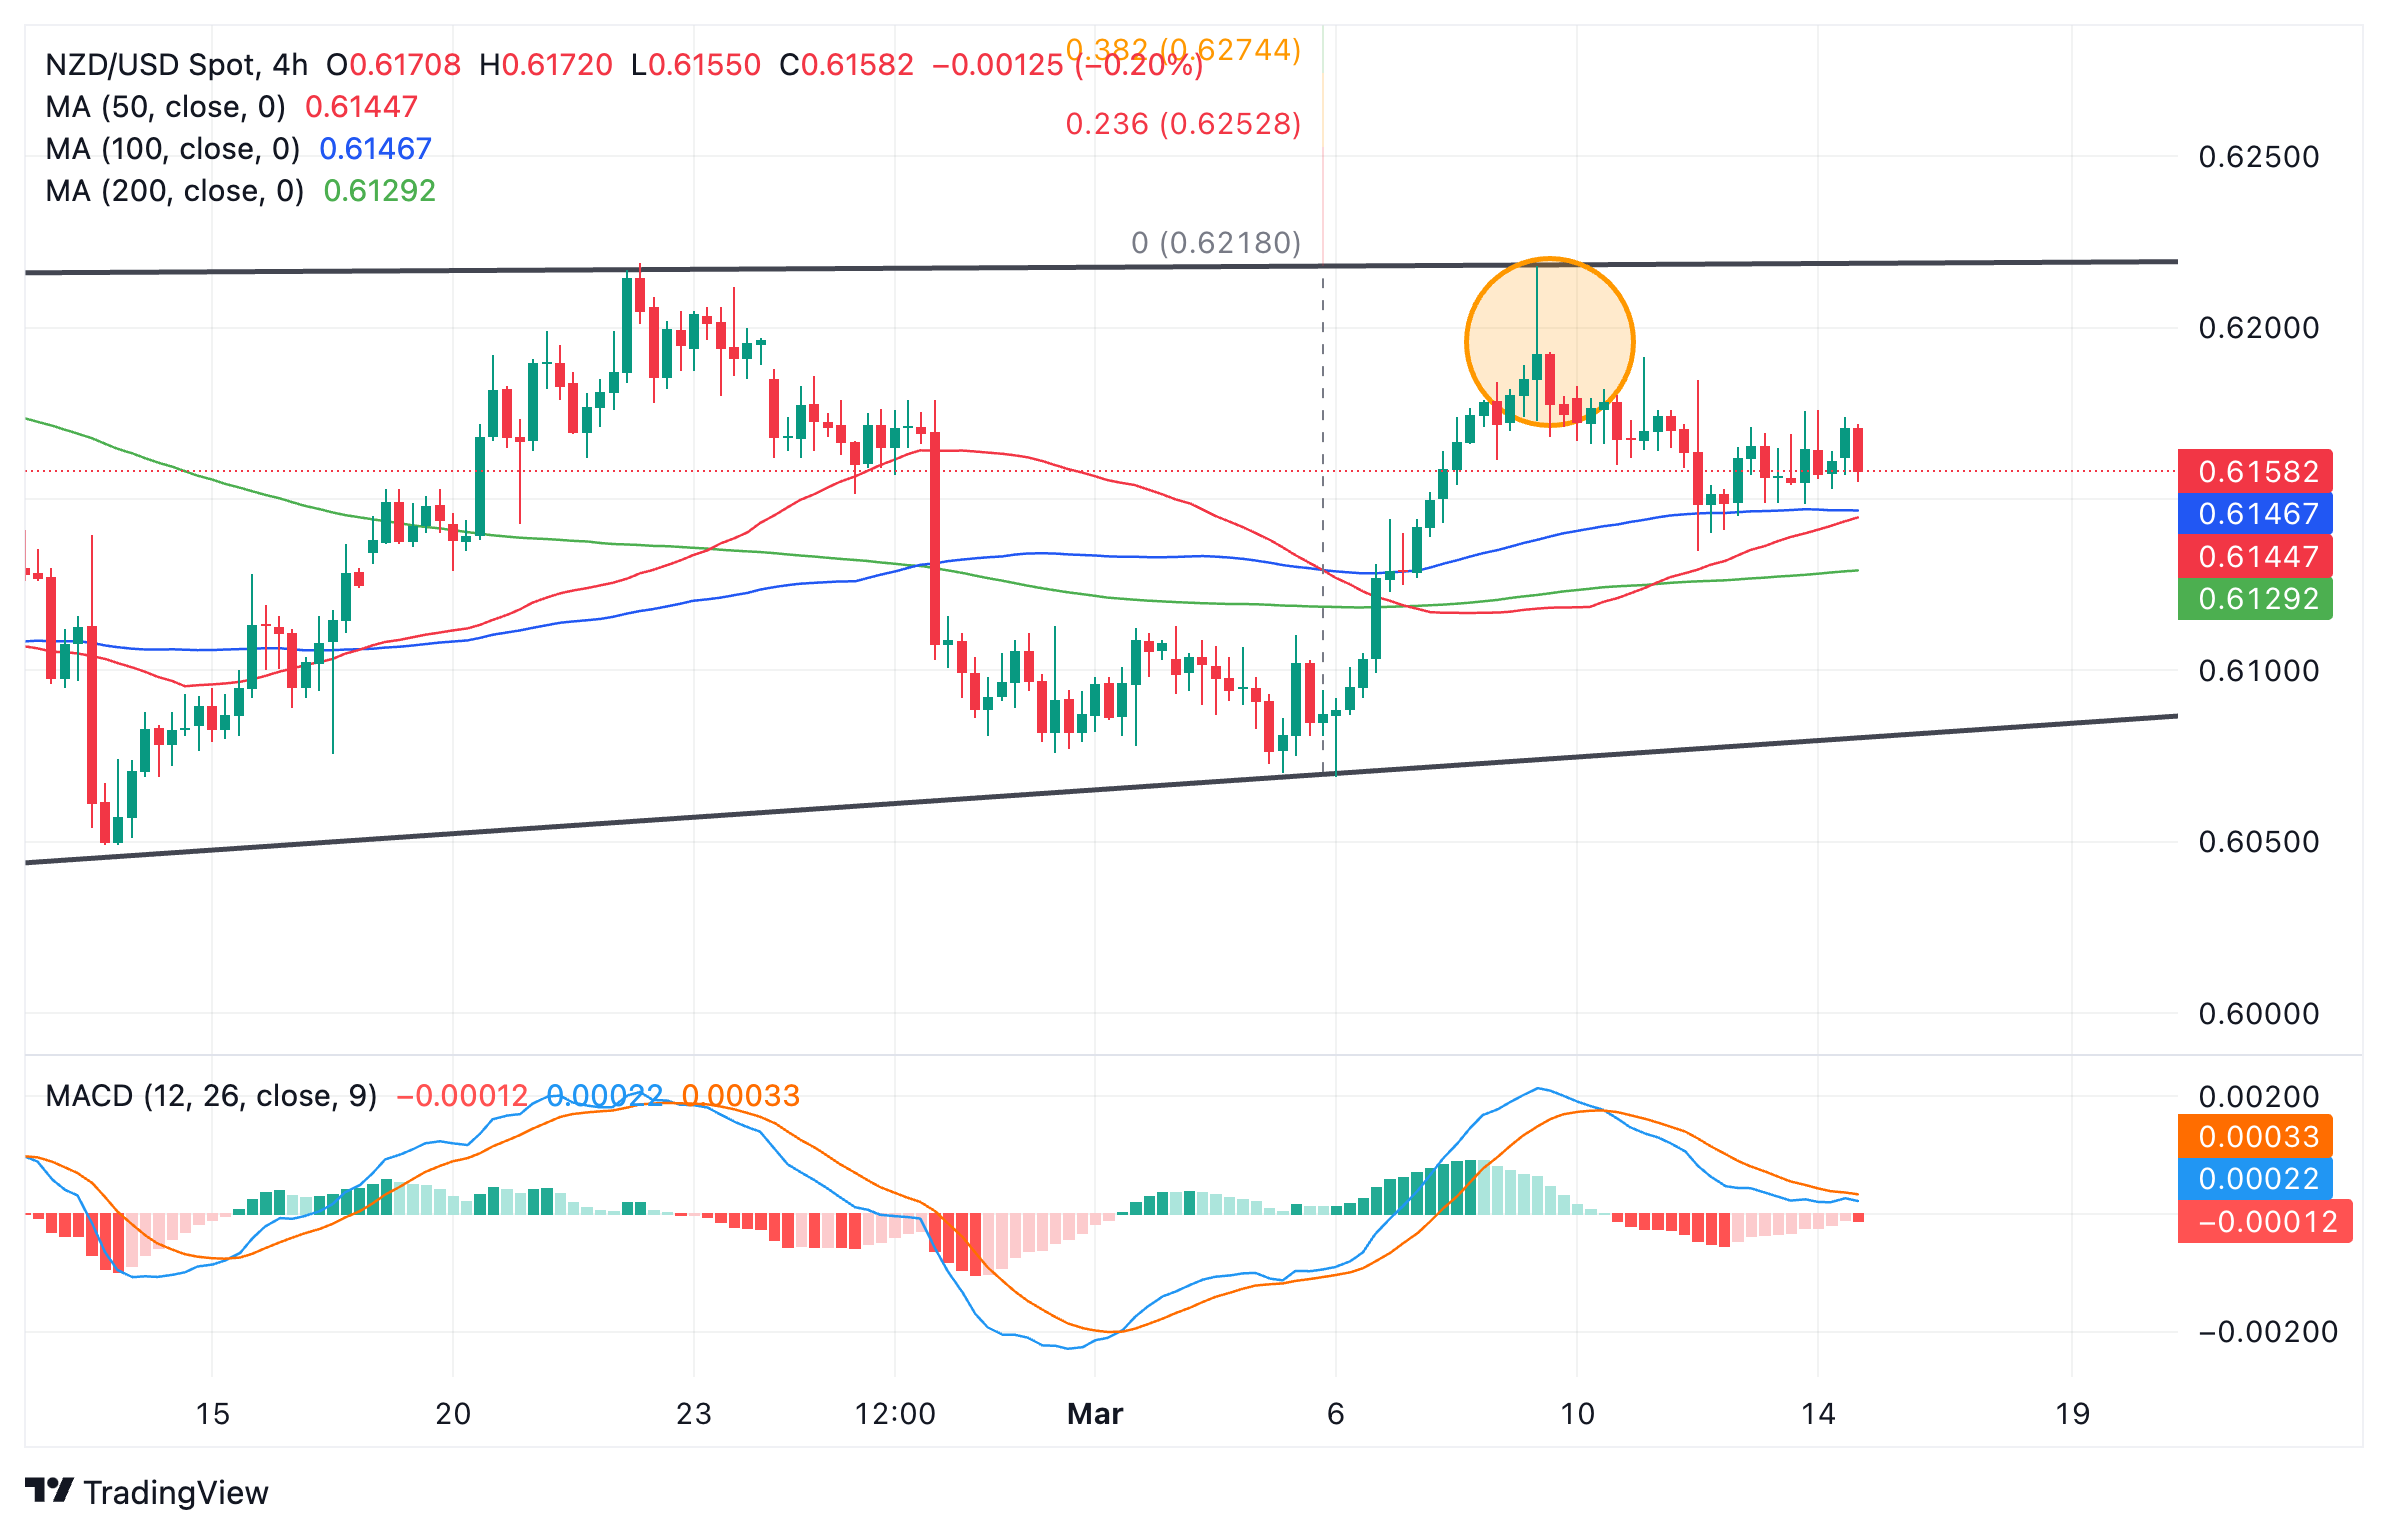
New Zealand Dollar vs US Dollar: 4-hour chart
The combination of the Shooting Star, the range high and the downside move since, suggest the short-term trend has changed, and the pair is descending within its range, back down towards the range lows at around 0.6080-90.
Whilst there has been some “backing and filling” over recent days and the formation of a wedge-like consolidation range, the pair is likely to eventually break lower and continue falling within the range.
The cluster of major moving averages in the lower 0.6100s is likely to present some support and could impede smooth downside, however, a break below the green 200-4-hour Simple Moving Average (SMA) at 0.6120 will open the space lower.
A break above 0.6190 would suggest bulls have the upper hand again and could signify the pair is preparing to break out from the range.
A break above the range high and the high of the Shooting Star would provide stronger confirmation the market was going higher. Such a move would probably reach a target at 0.6309, the 61.8% Fibonacci extrapolation of the height of the range from the breakout point higher.
New Zealand Dollar FAQs
The New Zealand Dollar (NZD), also known as the Kiwi, is a well-known traded currency among investors. Its value is broadly determined by the health of the New Zealand economy and the country’s central bank policy. Still, there are some unique particularities that also can make NZD move. The performance of the Chinese economy tends to move the Kiwi because China is New Zealand’s biggest trading partner. Bad news for the Chinese economy likely means less New Zealand exports to the country, hitting the economy and thus its currency. Another factor moving NZD is dairy prices as the dairy industry is New Zealand’s main export. High dairy prices boost export income, contributing positively to the economy and thus to the NZD.
The Reserve Bank of New Zealand (RBNZ) aims to achieve and maintain an inflation rate between 1% and 3% over the medium term, with a focus to keep it near the 2% mid-point. To this end, the bank sets an appropriate level of interest rates. When inflation is too high, the RBNZ will increase interest rates to cool the economy, but the move will also make bond yields higher, increasing investors’ appeal to invest in the country and thus boosting NZD. On the contrary, lower interest rates tend to weaken NZD. The so-called rate differential, or how rates in New Zealand are or are expected to be compared to the ones set by the US Federal Reserve, can also play a key role in moving the NZD/USD pair.
Macroeconomic data releases in New Zealand are key to assess the state of the economy and can impact the New Zealand Dollar’s (NZD) valuation. A strong economy, based on high economic growth, low unemployment and high confidence is good for NZD. High economic growth attracts foreign investment and may encourage the Reserve Bank of New Zealand to increase interest rates, if this economic strength comes together with elevated inflation. Conversely, if economic data is weak, NZD is likely to depreciate.
The New Zealand Dollar (NZD) tends to strengthen during risk-on periods, or when investors perceive that broader market risks are low and are optimistic about growth. This tends to lead to a more favorable outlook for commodities and so-called ‘commodity currencies’ such as the Kiwi. Conversely, NZD tends to weaken at times of market turbulence or economic uncertainty as investors tend to sell higher-risk assets and flee to the more-stable safe havens.
The Bank of Japan (BoJ) is arranging to end the negative interest rate policy at the March 18-19 meeting, Reuters report on Thursday, citing Japanese news agency Jiji.
"The central bank will make a final decision after reviewing the preliminary survey result on this year's spring wage negotiation by labor organization Rengo due on Friday," Jiji further reported.
Market reaction
The Japanese yen gathered some strength against its major rivals following this headline. At the time of press, the USD/JPY was trading marginally lower on the day near 147.60.
Markets are pricing three 25 bps rate hikes by both the Fed and the ECB this year, and that leaves the EUR/USD rate range-bound, economists at Société Générale say,
A big EUR/USD rise is very unlikely now
The market is pricing three 75bp rate cuts from the Fed and ECB this year and what matters is firstly how those expectations evolve and secondly, how expectations about policy evolve for 2025.
For now, EUR/USD is marginally more likely to drift higher than to fall much, as gradual synchronised easing reduces the appeal of the dollar. But a big EUR/USD rise is very unlikely now, because it would require significantly more Fed than ECB easing.
By contrast, the risk into 2025 is that the Fed tightens again, long before the ECB does. That would echo the experience of the Great Moderation, when 1995 rate cuts were reversed in 1997, and 1998 cuts were reversed in 1999/2000. That’s the last time the Dollar was at current levels in trade-weighted terms.
- Producer inflation in the US climbed to 1.6% on a yearly basis in February.
- US Dollar Index stays in positive territory near 103.00 after the data.
The Producer Price Index (PPI) for final demand in the US rose 1.6% on a yearly basis in February, the data published by the US Bureau of Labor Statistics showed on Thursday. This reading followed the 1% increase recorded in January (revised from 0.9%) and came in above the market expectation of 1.1%.
The annual Core PPI rose 2% in the same period, matching January's increase. On a monthly basis, the Core PPI was up 0.3%, compared to analysts' estimate of 0.2%.
Market reaction
The US Dollar Index edged slightly higher with the immediate reaction and was last seen rising 0.13% on the day at 102.92.
- Initial Jobless Claims in the US decreased by 1,000 in the week ending March 9.
- US Dollar Index clings to small daily gains near 103.00.
There were 209,000 initial jobless claims in the week ending March 9, the weekly data published by the US Department of Labor (DOL) showed on Thursday. This print followed the previous week's print of 210,000 (revised from 217,000) and came in better than the market expectation of 218,000.
Further details of the publication revealed that the advance seasonally adjusted insured unemployment rate was 1.2% and the 4-week moving average stood at 208,000, a decrease of 500 from the previous week's revised average.
"The advance number for seasonally adjusted insured unemployment during the week ending March 2 was 1,811,000, an increase of 17,000 from the previous week's revised level" the publication read.
Market reaction
The US Dollar Index clings to modest daily gains near 103.00 in the early American session.
- AUD/USD rises ahead of key US data that could impact the pair.
- US Producer Prices and Retail Sales are on the docket on Thursday.
- The RBA’s relatively hawkish stance is a supporting factor for the pair.
AUD/USD is trading in the 0.6600s on Thursday, up three hundredths of a percent in the European session, as traders await key macroeconomic data that could impact the pair.
Both US factory gate prices, or Producer Prices, and US Retail Sales are scheduled for release at 12:30 GMT. They may impact the outlook for inflation and tone the debate around when the Federal Reserve is expected to cut interest rates.
The Producer Price Index ex Food and Energy (Core PPI), is an important inflation metric, economists expect a drop to 1.9% YoY registered in February from 2.0% in January. On a monthly basis, Core PPI is forecast to rise 0.2% versus the 0.5% advance seen in the previous month.
The headline Producer Price Index (PPI) is forecast to show a 1.1% YoY gain versus 0.9% in January, and a 0.3% gain MoM, the same as previous.
US Retail Sales is forecast to rebound in February, registering a 0.8% rise against the 0.8% decline in January. Higher-than-expected sales tend to spur inflation with hawkish implications for interest rate policy and a bullish impact on USD (bearish for AUD/USD).
Technical Analysis: AUD/USD in long-term downtrend
AUD/USD is in a long-term downtrend, producing lower highs and lower lows.
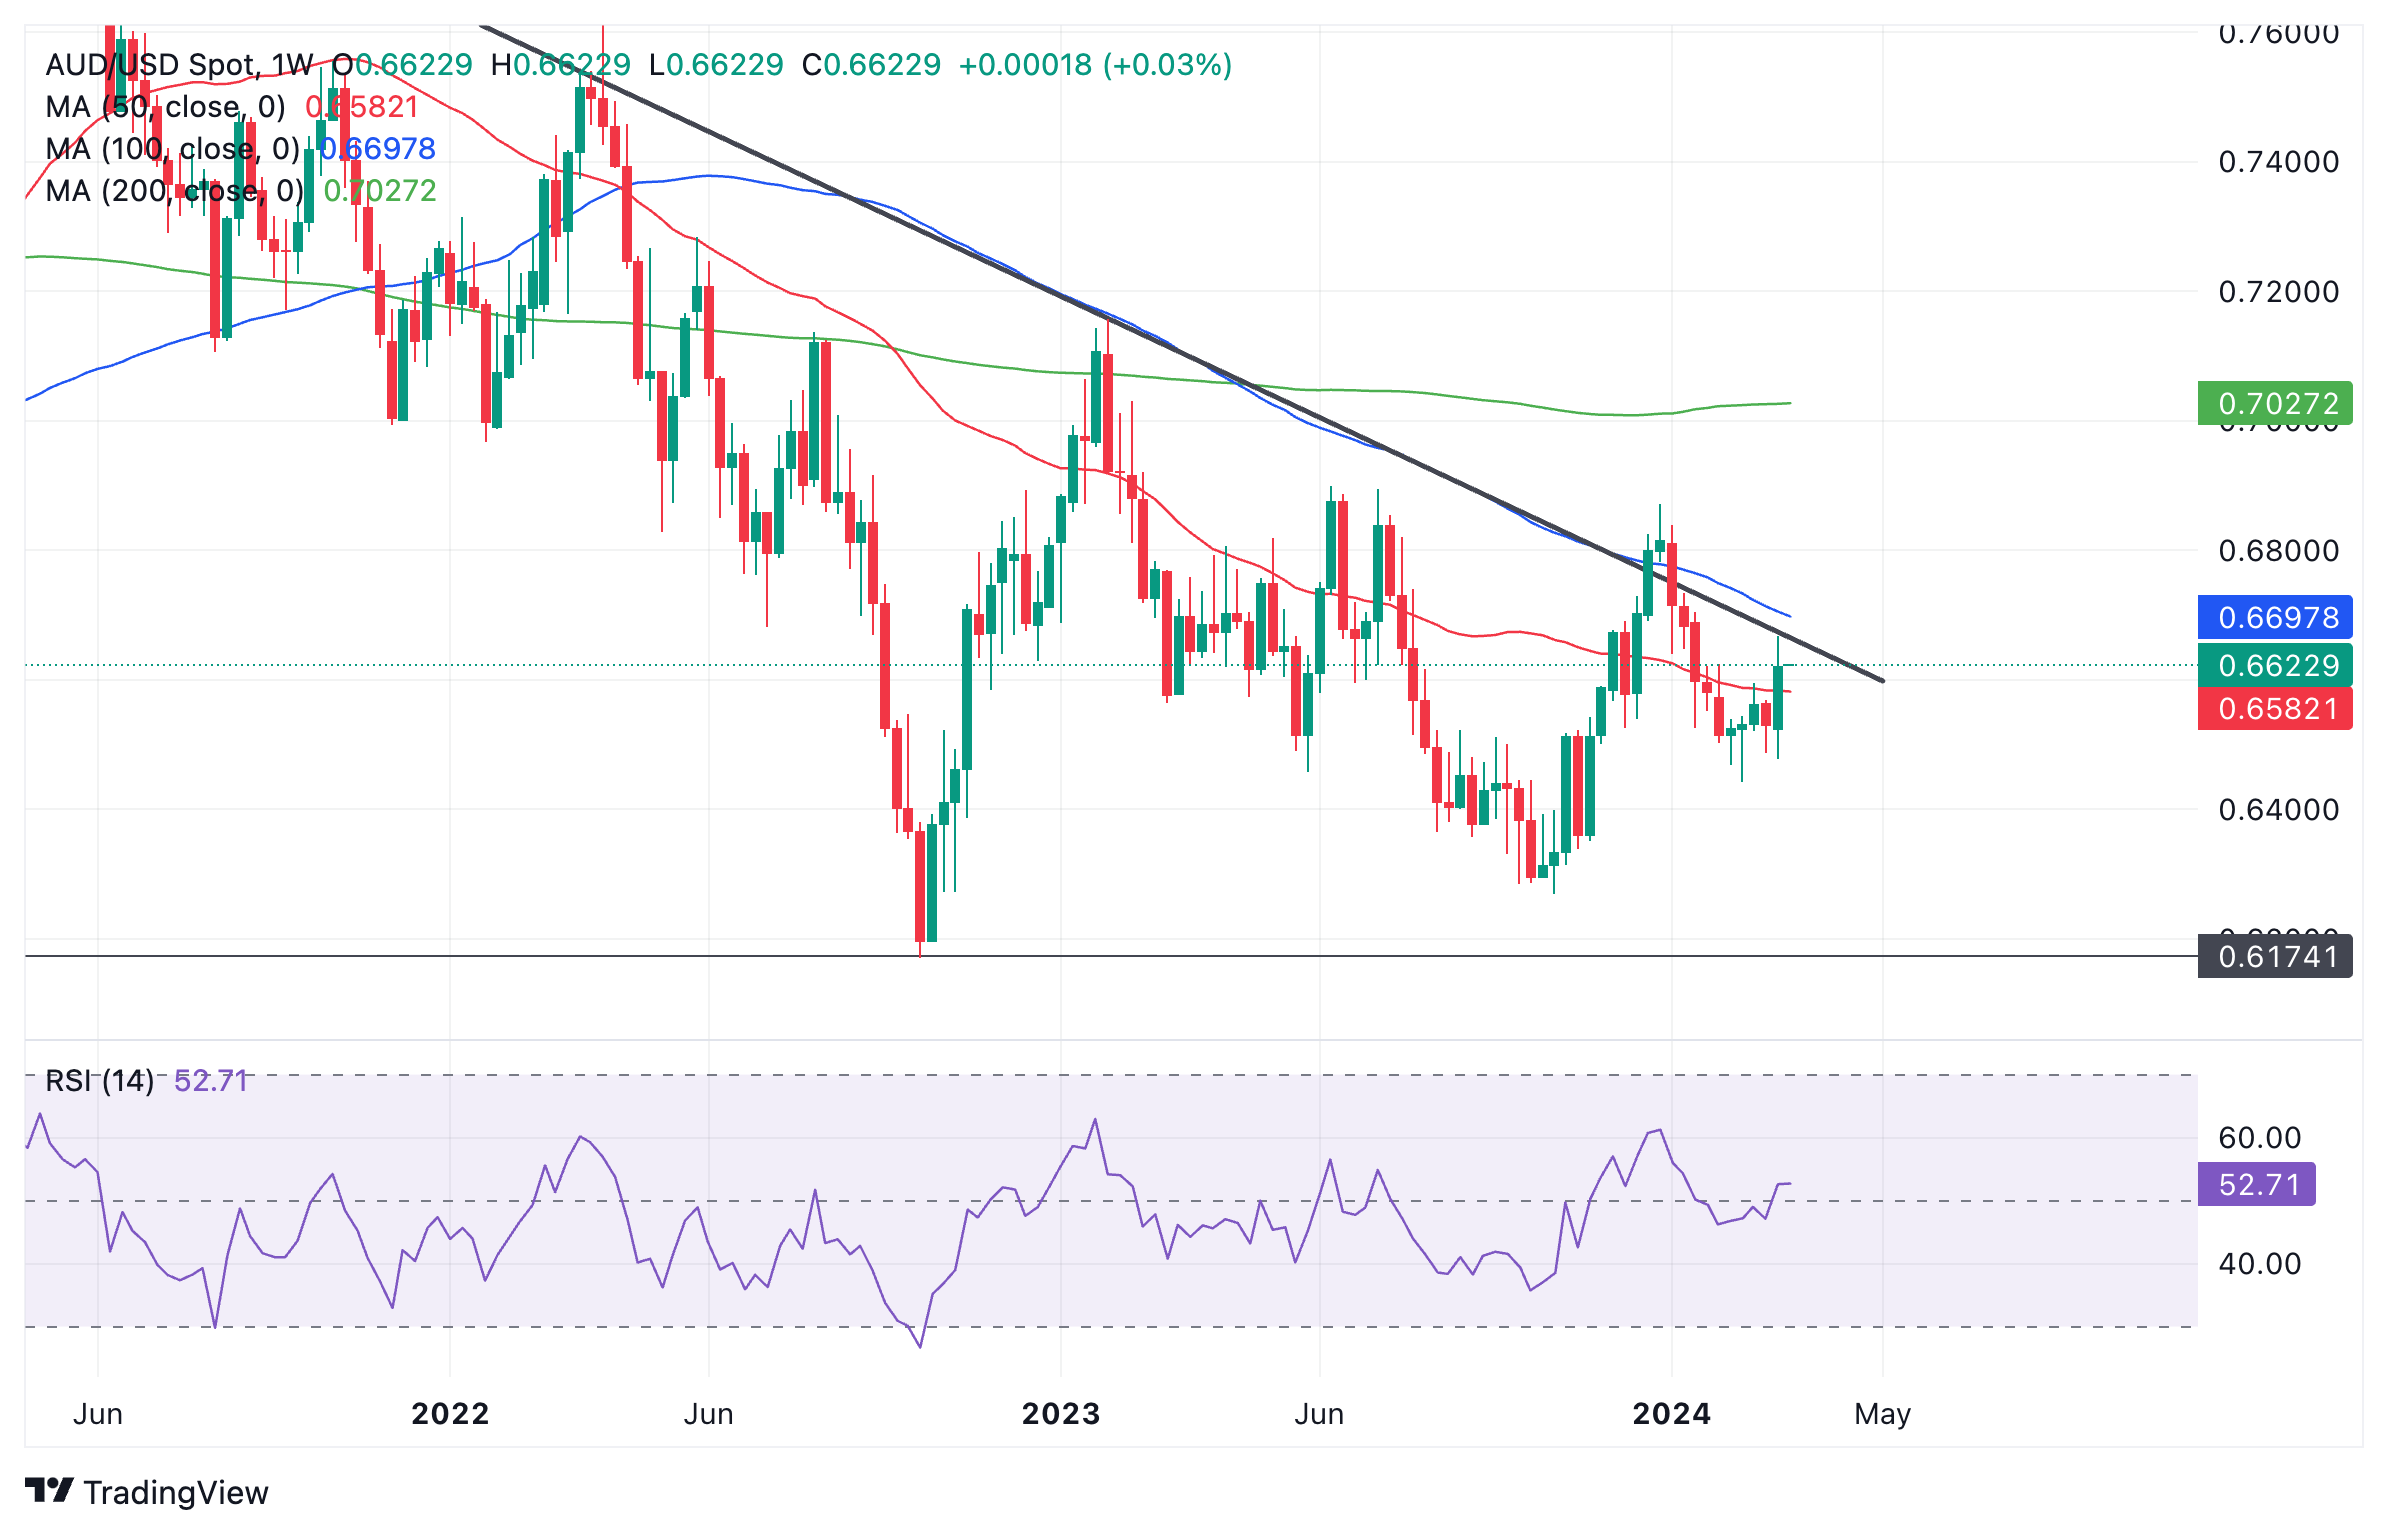
Australian Dollar vs. US Dollar: Weekly chart
The AUD/USD has just pushed back after touching a major trendline and there is a risk it could fall further, in line with the longer-term downtrend.
A break below the last swing low of October 2023 at 0.6442 would solidify the bearish outlook and probably see prices ease further to around the 0.6170 October 2022 lows.
Alternatively, a break above the 0.6871 December 2023 high would indicate the long-term trend was probably reversing and the Australian Dollar might be set for a climb to sunnier slopes.
- The US Dollar trades in the green after weaker Yuan fixing, shifting ECB rate cut bets..
- Traders brace for big US data release at 12:30 GMT.
- The US Dollar Index traders near 103.00, aiming to snap above this key level.
The US Dollar (USD) trades in the green on Thursday ahead of the release of US Retail Sales and Producer Price Index (PPI) numbers, and the weekly Jobless Claims. Two drivers seem to be supporting the USD: Firstly, the People’s Bank of China (PBoC) set a substantial weaker Yuan fixing against the Greenback for the first time in months. Secondly, European Central Bank (ECB) members are nearly rolling over the floor fighting over when is the right time for the initial rate cut from the ECB. Views that the ECB could precede the Fed in cutting rates weigh on the Euro, helping the DXY USD Index advance.
On the economic data front, a wave of data is set to be released at 12:30 GMT. The main component is the monthly Retail Sales print for February, which are expected to jump by 0.8% after contracting by a similar magnitude in January. Next to that, the Headline and Core Producer Price Index (PPI) numbers for February are expected to show the recent disinflationary path persisted.
Daily digest market movers: Hit or miss on the data
- A big list of data to be expected at 12:30 GMT:
- Weekly Jobless Claims:
- Initial Claims are expected to head from 217,000 to 218,000.
- Continuing Claims are seen heading from 1.906 million to 1.900 million.
- US Retail Sales for February:
- Monthly Retail Sales are expected to swing from a 0.8% decline to a 0.8% growth.
- Monthly Retail Sales without Cars and Transportation are also expected to rebound from a 0.6% fall to a 0.5% rise.
- Revisions could also trigger a substantial move in the Greenback.
- US Producer Price Index (PPI) for February:
- The monthly Headline PPI is expected to remain stable at 0.3%.
- The Yearly Headline PPI expected to head from 0.9% to 1.1%.
- The monthly Core PPI is expected to decline from 0.5% to 0.2%.
- The Yearly Core PPI is set to decline as well, from 2.0% to 1.9%.
- Weekly Jobless Claims:
- The January Business Inventories data are due to be released around 14:00 GMT. Inventories growth is expected to decline from 0.4% to 0.2%.
- Equities are in the green after the US equities were able to eke out gains right at the end of the trading day on Wednesday after spending most of the day in the red. Asia is set to close mildly in the green, while European equities are broadly up by less than 0.50%.
- According to the CME Group’s FedWatch Tool, expectations for a Fed pause in the March 20 meeting are at 99%, while chances of a rate cut stand at 1%.
- The benchmark 10-year US Treasury Note trades around 4.20%, the highest level for this week
US Dollar Index Technical Analysis: Second times the charm
The US Dollar Index (DXY) is heading back towards 103.00 for a second attempt after it failed to stay above it earlier this week during the Consumer Price Index (CPI) release on Tuesday. Seeing that external factors this Thursday have brought the Greenback back to this area makes it rather questionable if the data release this afternoon will be enough for the DXY to breach the 103-barrier. Overall it looks that traders are keeping most of their powder dry ahead of the US Federal Reserve rate decision next week.
On the upside, the first reclaiming ground is at 103.38, the 55-day SMA. Not far above, a double barrier is set to hit with the 100-day SMA near 103.68 and the 200-day SMA near 103.70. Depending on the catalyst that pushes the DXY upwards, 104.96 remains the key level on the topside.
The DXY was unable to even test or challenge the 55-day SMA after the CPI print. More downside looks inevitable with 102.00 up next, which bears some pivotal relevance. Once through there, the road is open for another leg lower to 100.61, the low of 2023.
US Dollar FAQs
The US Dollar (USD) is the official currency of the United States of America, and the ‘de facto’ currency of a significant number of other countries where it is found in circulation alongside local notes. It is the most heavily traded currency in the world, accounting for over 88% of all global foreign exchange turnover, or an average of $6.6 trillion in transactions per day, according to data from 2022. Following the second world war, the USD took over from the British Pound as the world’s reserve currency. For most of its history, the US Dollar was backed by Gold, until the Bretton Woods Agreement in 1971 when the Gold Standard went away.
The most important single factor impacting on the value of the US Dollar is monetary policy, which is shaped by the Federal Reserve (Fed). The Fed has two mandates: to achieve price stability (control inflation) and foster full employment. Its primary tool to achieve these two goals is by adjusting interest rates. When prices are rising too quickly and inflation is above the Fed’s 2% target, the Fed will raise rates, which helps the USD value. When inflation falls below 2% or the Unemployment Rate is too high, the Fed may lower interest rates, which weighs on the Greenback.
In extreme situations, the Federal Reserve can also print more Dollars and enact quantitative easing (QE). QE is the process by which the Fed substantially increases the flow of credit in a stuck financial system. It is a non-standard policy measure used when credit has dried up because banks will not lend to each other (out of the fear of counterparty default). It is a last resort when simply lowering interest rates is unlikely to achieve the necessary result. It was the Fed’s weapon of choice to combat the credit crunch that occurred during the Great Financial Crisis in 2008. It involves the Fed printing more Dollars and using them to buy US government bonds predominantly from financial institutions. QE usually leads to a weaker US Dollar.
Quantitative tightening (QT) is the reverse process whereby the Federal Reserve stops buying bonds from financial institutions and does not reinvest the principal from the bonds it holds maturing in new purchases. It is usually positive for the US Dollar.
Broadly speaking, two tail risks could strengthen the case for a significantly stronger Japanese Yen (JPY) in the near term, economists at Standard Chartered say.
USD may see some immediate upside against the JPY if the BoJ maintains its policy settings in March
First, there remains a non-negligible risk of a hard landing in DMs, which may reignite demand for safe-haven assets such as the JPY.
Second, the BoJ could potentially surprise with a more aggressive tightening effort than markets anticipate. Note that there are multiple parameters the BoJ can alter from the benchmark rate, the three-tiered system of interest rates and YCC. Bloomberg has also reported that the BoJ may end YCC while spelling out in advance the quantum of bond purchases, perhaps to prevent a sharp rise in long-end yields.
Conversely, if the BoJ maintains its policy settings in March, the USD may see some immediate upside against the JPY and pare back its losses, depending on the central bank’s messaging and guidance on April’s monetary policy meeting.
- WTI Oil trades up nearly 3% in just two trading days.
- Oil traders are seeing bullish positioning paying off after US stockpiles unexpectedly declined.
- The US Dollar Index trades just below 103.00 ahead of US Retail Sales and PPI data.
Oil prices are rallying for a second consecutive day after the weekly US Crude data pointed to a drawdown in stockpiles. The recent drop was unexpected, although traders were already positioned for a draw in recent days with markets asking questions on how long the US could keep up this pace of pumping up Oil. It looks like OPEC and the US are playing a game of chicken to see who will be the first one to lose: the US by seeing its stockpile decline substantially, or will it be OPEC forced to apply more, longer, and deeper production cuts?
The US Dollar, meanwhile, is trading in the green ahead of this Thursday’s data release. With the weekly unemployment numbers, US Retail Sales and Producer Price data all being released at the same time, a spur of volatility could be upon us.
Crude Oil (WTI) trades at $80.10 per barrel, and Brent Oil trades at $84.30 per barrel at the time of writing.
Oil news and market movers: US stockpile slinks
- The US Crude stockpiles are decreasing. According to the US Energy Information Administration, stockpiles fell by more than 1.5 million barrels in the week ending March 8, against expectations of an increase. This adds to data from the American Petroleum Institute (API) released on Tuesday, which showed a decline of 5.5 million barrels in the same period.
- The International Energy Agency (IEA) sees room for OPEC to boost production by the end of 2024 under a supply deficit that starts to form. The IEA pencils in July as the moment when OPEC+ could fully unwind its production cuts.
- The US has held secret talks with Houthi Rebels on Red Sea attacks.
Oil Technical Analysis: Golden Cross nearby
Oil prices could be entering a broad uptrend when it comes to a purely technical angle. The 55-day Simple Moving Average (SMA) at $75.61 is crossing the 100-day SMA at $75.57. Once both elements are starting to head higher, Oil prices should see more inflow with more bullish bets being placed in the option space, widening the spread between puts and calls, and thus creating volatility which could see Crude sprint to $89.64 by summer.
Oil bulls still clearly see more upside potential seeing the spreads on Oil futures in favor. The break above $80 needs to see a daily close in order to confirm a change in sentiment. Next up is the $86 level. Further up, $86.90 follows suit before targeting $89.64 and $93.98 as top levels.
On the downside, the 100-day and the 55-day Simple Moving Averages (SMA) are near $75.57 and $75.61, respectively. Add the pivotal level near $75.27, and it looks like the downside is very limited and well-equipped to resist the selling pressure.
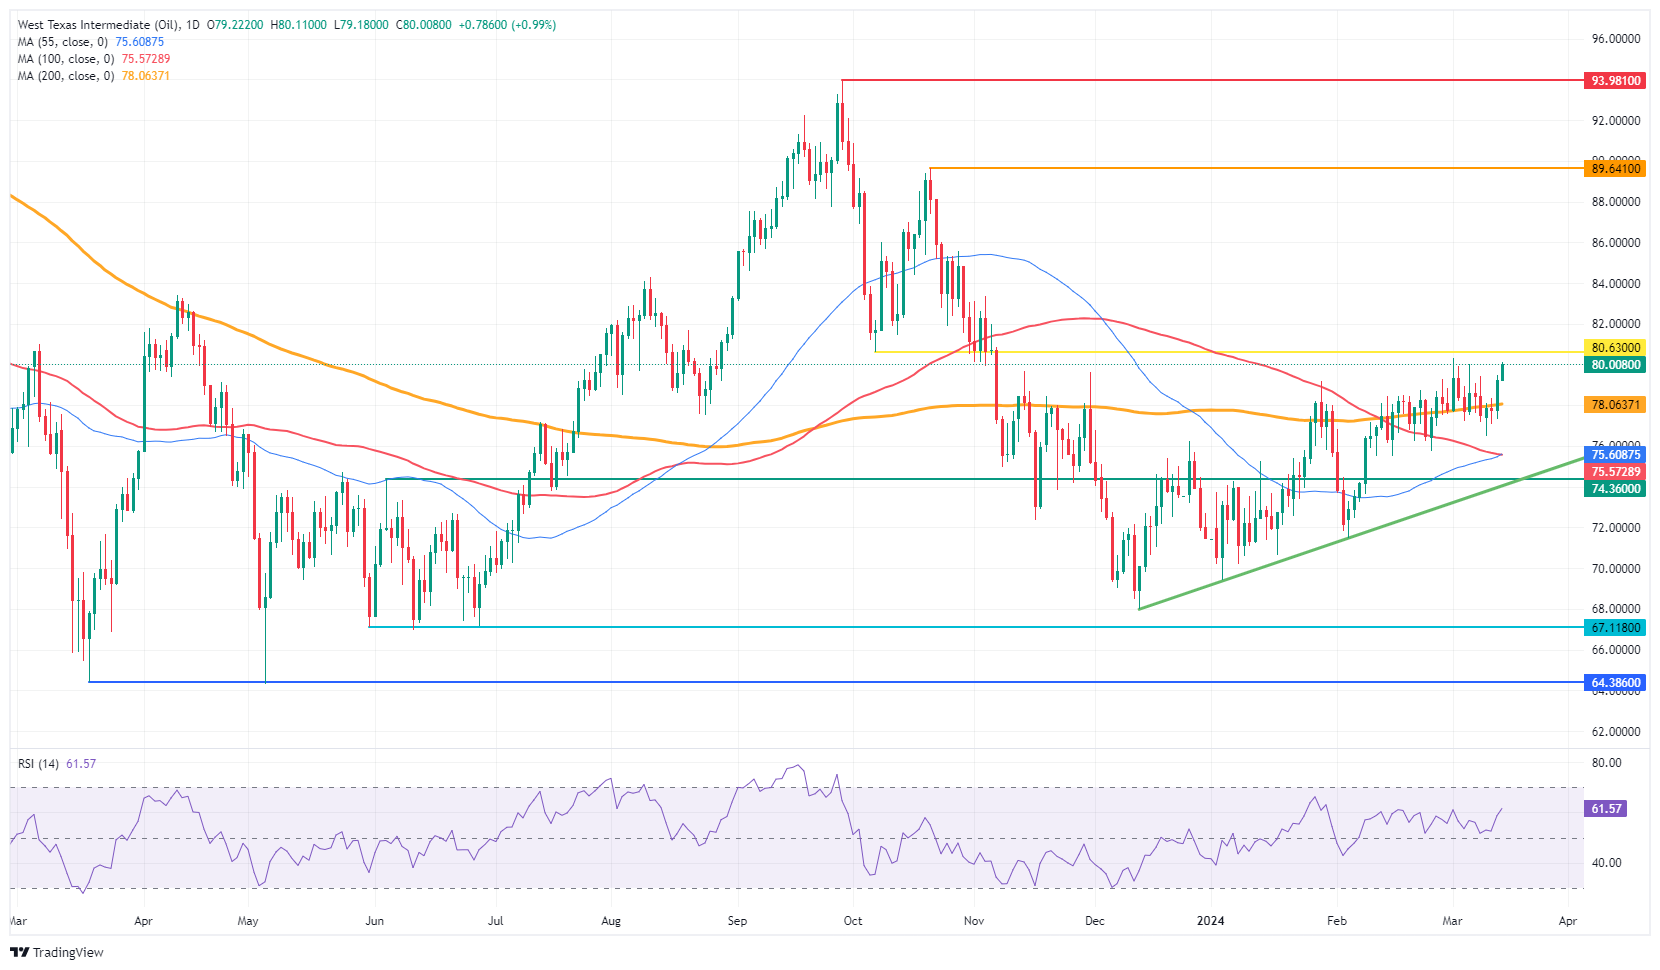
US WTI Crude Oil: Daily Chart
WTI Oil FAQs
WTI Oil is a type of Crude Oil sold on international markets. The WTI stands for West Texas Intermediate, one of three major types including Brent and Dubai Crude. WTI is also referred to as “light” and “sweet” because of its relatively low gravity and sulfur content respectively. It is considered a high quality Oil that is easily refined. It is sourced in the United States and distributed via the Cushing hub, which is considered “The Pipeline Crossroads of the World”. It is a benchmark for the Oil market and WTI price is frequently quoted in the media.
Like all assets, supply and demand are the key drivers of WTI Oil price. As such, global growth can be a driver of increased demand and vice versa for weak global growth. Political instability, wars, and sanctions can disrupt supply and impact prices. The decisions of OPEC, a group of major Oil-producing countries, is another key driver of price. The value of the US Dollar influences the price of WTI Crude Oil, since Oil is predominantly traded in US Dollars, thus a weaker US Dollar can make Oil more affordable and vice versa.
The weekly Oil inventory reports published by the American Petroleum Institute (API) and the Energy Information Agency (EIA) impact the price of WTI Oil. Changes in inventories reflect fluctuating supply and demand. If the data shows a drop in inventories it can indicate increased demand, pushing up Oil price. Higher inventories can reflect increased supply, pushing down prices. API’s report is published every Tuesday and EIA’s the day after. Their results are usually similar, falling within 1% of each other 75% of the time. The EIA data is considered more reliable, since it is a government agency.
OPEC (Organization of the Petroleum Exporting Countries) is a group of 13 Oil-producing nations who collectively decide production quotas for member countries at twice-yearly meetings. Their decisions often impact WTI Oil prices. When OPEC decides to lower quotas, it can tighten supply, pushing up Oil prices. When OPEC increases production, it has the opposite effect. OPEC+ refers to an expanded group that includes ten extra non-OPEC members, the most notable of which is Russia.
- USD/JPY trades lacklustre near 147.50 ahead of US PPI, Retail Sales data.
- The US bond yields drop amid improved market sentiment.
- The uncertainty over BoJ quitting negative rates deepens.
The USD/JPY pair consolidates in a tight range around 147.70 in Thursday’s European session. The asset struggles to find a direction as investors stay on the sidelines ahead of the United States Producer Price Index (PPI) and Retail Sales data for February, which will be published at 12:30 GMT. The economic data will provide fresh guidance on interest rates as it could influence the inflation outlook.
The monthly Retail Sales are forecasted to have grown by 0.8% after declining at the same pace in January. It is expected that robust demand for automobiles and higher sales at gasoline stations boosted the Retail Sales data. An upbeat Retail Sales data would dampen bets in favor of Federal Reserve (Fed) rate cuts in the June policy meeting.
Currently, the CME FedWatch tool shows that there is a 69% chance that a rate cut will be announced in June. For the March and May policy meeting, the Fed is expected to keep interest rates unchanged in the range of 5.25%-5.50%.
S&P 500 futures generate significant gains in the London session, indicating a sharp improvement in the risk appetite of the market participants. The 10-year US Treasury yields surrender its entire gains, trades around 4.19%. The US Dollar Index (DXY) is broadly sideways around 102.80 ahead of the US data.
Meanwhile, the Japanese Yen remains under pressure as investors hope that the Bank of Japan (BoJ) will postpone its plans to exit negative interest rates. BoJ Ueda said on Tuesday that the economy has recovered on a few economic grounds, though consumption remains weak. Finance Minister Shunichi Suzuki said separately that Japan was not at a stage where it could declare a victory over deflation.
Are Fed rate cuts going to be pushed back even further? Economists at Société Générale do not expect the EUR/USD pair to break higher as sticky inflation could delay Fed easing even more.
Most measures of underlying US inflation suggest it is either stopped falling or has bounced
There are more ways of measuring inflation than there are of calculating the natural rate of interest, but most of the serious ones will suggest that the underlying momentum is now upwards rather than still falling.
With the US economy displaying remarkable resilience in recent months, inflation is indeed looking sticky. It will take a lot more than that to propel the Dollar significantly higher from these already elevated levels, but it does put something of a floor under it. In practical terms, that makes a break higher in EUR/USD harder unless or until we see some significantly stronger economic data in Europe.
With the ECB and Fed on track to cut rates in June, EUR/USD is stuck, but the danger is that the Fed timing is pushed back, again.
EUR/GBP continued to climb steadily higher on Wednesday to settle around the 0.8550 mark. Economists at ING analyze the pair’s outlook.
Awaiting key UK data releases
Today is a quiet one in the UK. The MPC is in the quiet period ahead of next Thursday’s announcement, and the data calendar is empty. On Friday, we’ll see one of the two final data inputs ahead of the BoE’s meeting – the Bank’s Inflation Attitudes Survey. The final data piece is the February CPI figures, which are released one day before the BoE announcement.
EUR/GBP is stabilising at around 0.8550, as per our expectations. We expect it to hover around these levels ahead of key data releases in the UK.
- Gold price falls amid caution from investors ahead of US Retail Sales, PPI data for February.
- Higher US bond yields weigh on the Gold price.
- Growth for both monthly and annual Core PPI is forecasted to have softened.
Gold price (XAU/USD) exhibits a subdued performance in Thursday’s European session ahead of the United States Producer Price Index (PPI) and Retail Sales data for February, which will be published at 12:30 GMT. The precious metal has come under pressure after Wednesday’s strong recovery move due to firm US Dollar (USD) and bond yields amid uncertainty ahead of crucial US data that could influence the inflation outlook.
The US February’s inflation data released on Tuesday came in hotter-than-expected. A similar trend from the PPI data and strong Retail Sales would deepen uncertainty over Federal Reserve (Fed) rate cut expectations for the June policy meeting. This could support yields on Treasury bonds, increasing the opportunity cost of holding non-yielding assets such as Gold.
10-year US Treasury yields jumped to 4.2% and the US Dollar Index (DXY) is slightly up at 102.85 ahead of the crucial data. Going forward, the major trigger for these assets will be the Fed’s interest rate decision, and the new dot plot, which provides interest rates projections. The last dot plot, released in the December meeting, indicated three rate cuts this year.
Daily digest market movers: Gold price drops ahead of US data
- Gold price falls to $2,170, pressured by higher US bond yields and firm US Dollar amid uncertainty ahead of the United States PPI and Retail Sales data for February.
- Annual core PPI, which strips off volatile food and energy prices, is forecasted to have softened to 1.9% from 2.0% in January. The monthly underlying inflation data is projected to have grown at a slower pace of 0.2% against the prior reading of 0.5%.
- For headline figures, economists expect that the monthly PPI rose at a steady pace of 0.3%. The annual PPI is anticipated to have accelerated to 1.1% from 0.9% in January. The PPI data shows the pace at which producers have increased or decreased prices of goods and services at factory gates.
- Meanwhile, the US Census Bureau is expected to show that monthly Retail Sales data grew by 0.8% after contracting at the same pace in January. It is expected that robust demand for automobiles and higher sales at gasoline stations boosted Retail Sales. Investors closely track the Retail Sales data to get insights into household spending, one of the main growth drivers of the US economy.
- Hot PPI and Retail Sales data would indicate a stubborn inflation outlook, which will allow Federal Reserve policymakers to hold interest rates higher for a longer period. This will improve the US Dollar’s appeal, weighing on Gold. On the contrary, soft figures would signal easing inflation pressures, increasing expectations for the Federal Reserve (Fed) to reduce interest rates in the June policy meeting.
- The CME FedWatch tool shows that chances for a rate cut in June have slightly improved to 69%, from the 65% registered after the release of the stubborn CPI data.
Technical Analysis: Gold price falls slightly to $2,170
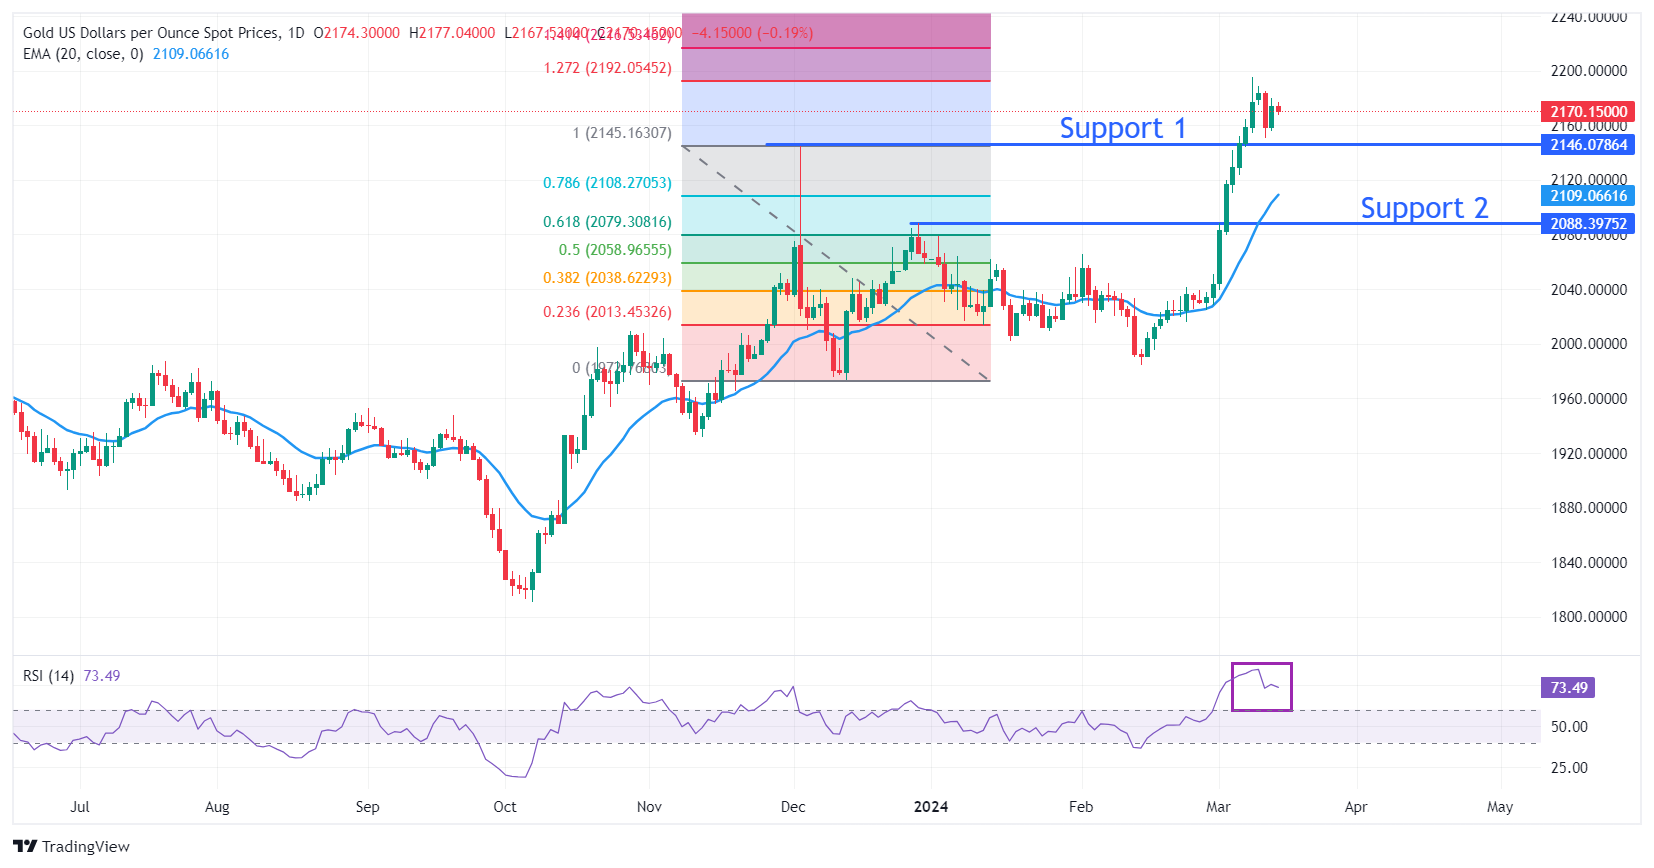
Gold price continues to oscillate inside Tuesday’s trading range between $2,154 and $2,180. The precious metal is slowly entering into a non-directional trend in which volatility gets sharply contracted. Earlier, the yellow metal dropped after printing a fresh all-time high near $2,195, which coincides with the 1.27% Fibonacci extension level (plotted from December 4 high near $2,145 to December 13 low at $1,973.3).
On the downside, December 4 high near $2,145 and December 28 high at $2,088 will act as major support levels.
The 14-Relative Strength Index (RSI) retraces from its peak near 84.50, although the upside momentum is still active.
Gold FAQs
Gold has played a key role in human’s history as it has been widely used as a store of value and medium of exchange. Currently, apart from its shine and usage for jewelry, the precious metal is widely seen as a safe-haven asset, meaning that it is considered a good investment during turbulent times. Gold is also widely seen as a hedge against inflation and against depreciating currencies as it doesn’t rely on any specific issuer or government.
Central banks are the biggest Gold holders. In their aim to support their currencies in turbulent times, central banks tend to diversify their reserves and buy Gold to improve the perceived strength of the economy and the currency. High Gold reserves can be a source of trust for a country’s solvency. Central banks added 1,136 tonnes of Gold worth around $70 billion to their reserves in 2022, according to data from the World Gold Council. This is the highest yearly purchase since records began. Central banks from emerging economies such as China, India and Turkey are quickly increasing their Gold reserves.
Gold has an inverse correlation with the US Dollar and US Treasuries, which are both major reserve and safe-haven assets. When the Dollar depreciates, Gold tends to rise, enabling investors and central banks to diversify their assets in turbulent times. Gold is also inversely correlated with risk assets. A rally in the stock market tends to weaken Gold price, while sell-offs in riskier markets tend to favor the precious metal.
The price can move due to a wide range of factors. Geopolitical instability or fears of a deep recession can quickly make Gold price escalate due to its safe-haven status. As a yield-less asset, Gold tends to rise with lower interest rates, while higher cost of money usually weighs down on the yellow metal. Still, most moves depend on how the US Dollar (USD) behaves as the asset is priced in dollars (XAU/USD). A strong Dollar tends to keep the price of Gold controlled, whereas a weaker Dollar is likely to push Gold prices up.
In an interview with CNBC on Thursday, European Central Bank (ECB) chief economist Philip Lane said that wages are moving in the right direction but argued that they have to take their time to move from holding to reducing policy restrictions, per Reuters.
Lane added that they mush avoid giving clear guidance and that they have to make policy decisions on a meeting-by-meeting basis.
Market reaction
These comments failed to trigger a noticeable market reaction and EUR/USD was last seen losing 0.07% on the day at 1.0940.
- GBP/JPY rises after data shows UK house prices recovering for the sixth consecutive month.
- The Yen side of the pair weakens as bets of a BoJ rate hike in March fade.
- Technically GBP/JPY is threatening to pullback in the midst of a strong uptrend.
The GBP/JPY is up almost two tenths of a percent, trading in the mid 189.00s during the European session on Thursday after the Pound Sterling (GBP) side of the pair was buoyed by the release of British data which revealed a recovery in UK house prices in February.
The data follows on from the UK’s positive monthly real GDP print released on Wednesday, which showed the UK economy growing by 0.2% in January after declining 0.1% in December. The data stoked hopes the country may be exiting from its technical recession triggered by the dismal growth performance in the last quarter of 2023.
An Englishman’s house is his castle
The RICS Housing Price Balance, a survey of surveyors conducted by the Royal Institute of Chartered Surveyors (RICS) showed a rise to minus 10 in February from minus 18 in January, and higher than the minus 11 forecast. It marks the sixth month in a row that house prices have recovered in the UK and is the least negative reading since October 2022.
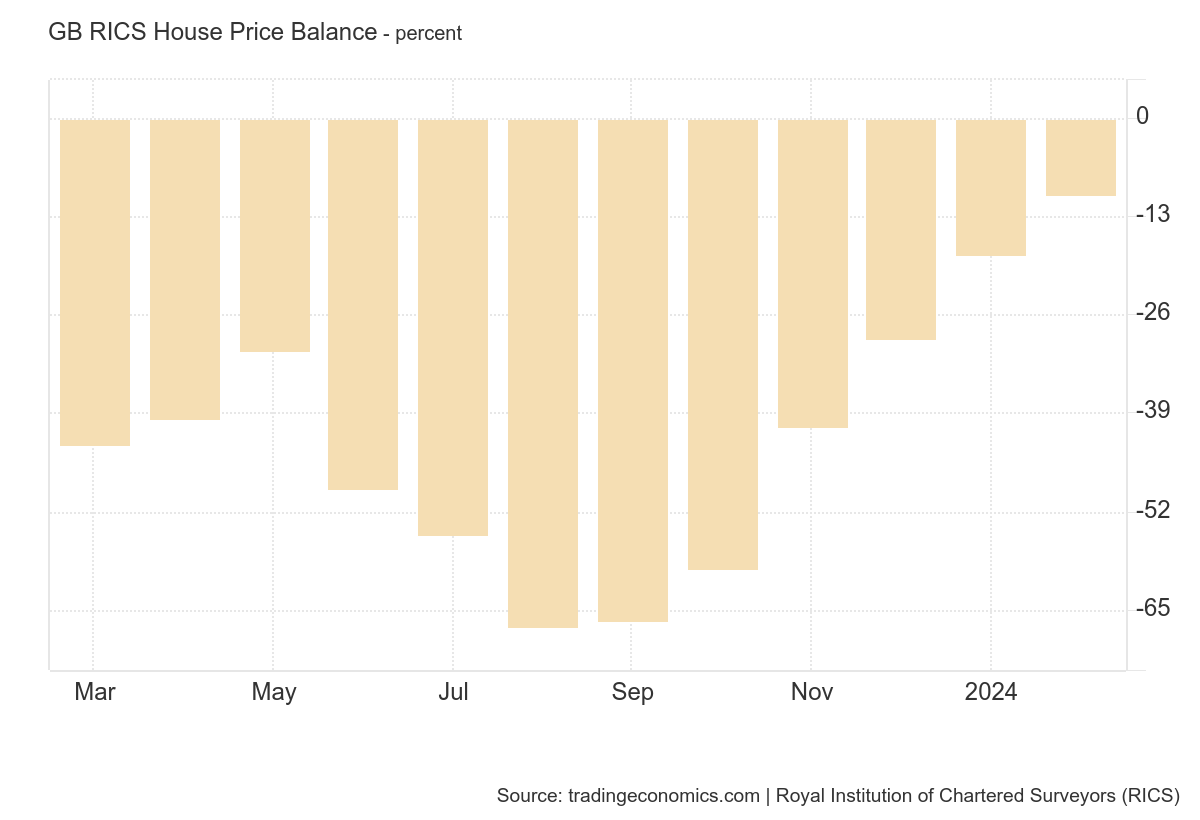
GBP/JPY holds ground after Yen slides on fading BoJ bets
The Japanese Yen (JPY) side of GBP/JPY, meanwhile, remains on the defensive amidst a positive risk-on environment on Thursday and after traders reduced their bets the Bank of Japan (BoJ) would start to raise interest rates imminently.
The Japanese media had been reporting BoJ officials as indicating the March meeting, next Tuesday, was being earmarked as the moment for an interest rate hike.
Recent wage negotiations between Japanese unions and large corporations like Toyota have led to record wage increases, which are expected to be inflationary and further urge an increase in interest rates.
BoJ Governor Kazuo Ueda, however, said earlier this week that the central bank will seek an exit from easy policy only when achievement of 2% inflation is in sight, cooling bets for an early hike.
The Japanese Yen has become a favorite funding currency in which it is borrowed and sold to buy currencies that offer higher interest returns. If the BoJ begins putting up interest rates the Yen will lose its appeal as a funding currency, leading to less Yen selling and a stronger JPY.
Uptrend could see a pullback
GBP/JPY is in a long-term uptrend with peaks and troughs getting progressively higher. This favors bullish bets and the pair will probably continue rising, although there are some important caveats to that view.
Firstly, the weekly chart is showing bearish divergence between price action and Momentum. Price has been making higher highs since June 2023 whilst momentum, as measured by the Relative Strength Index (RSI), has not, reflecting underlying weakness, and suggesting an increased chance of a pullback evolving.
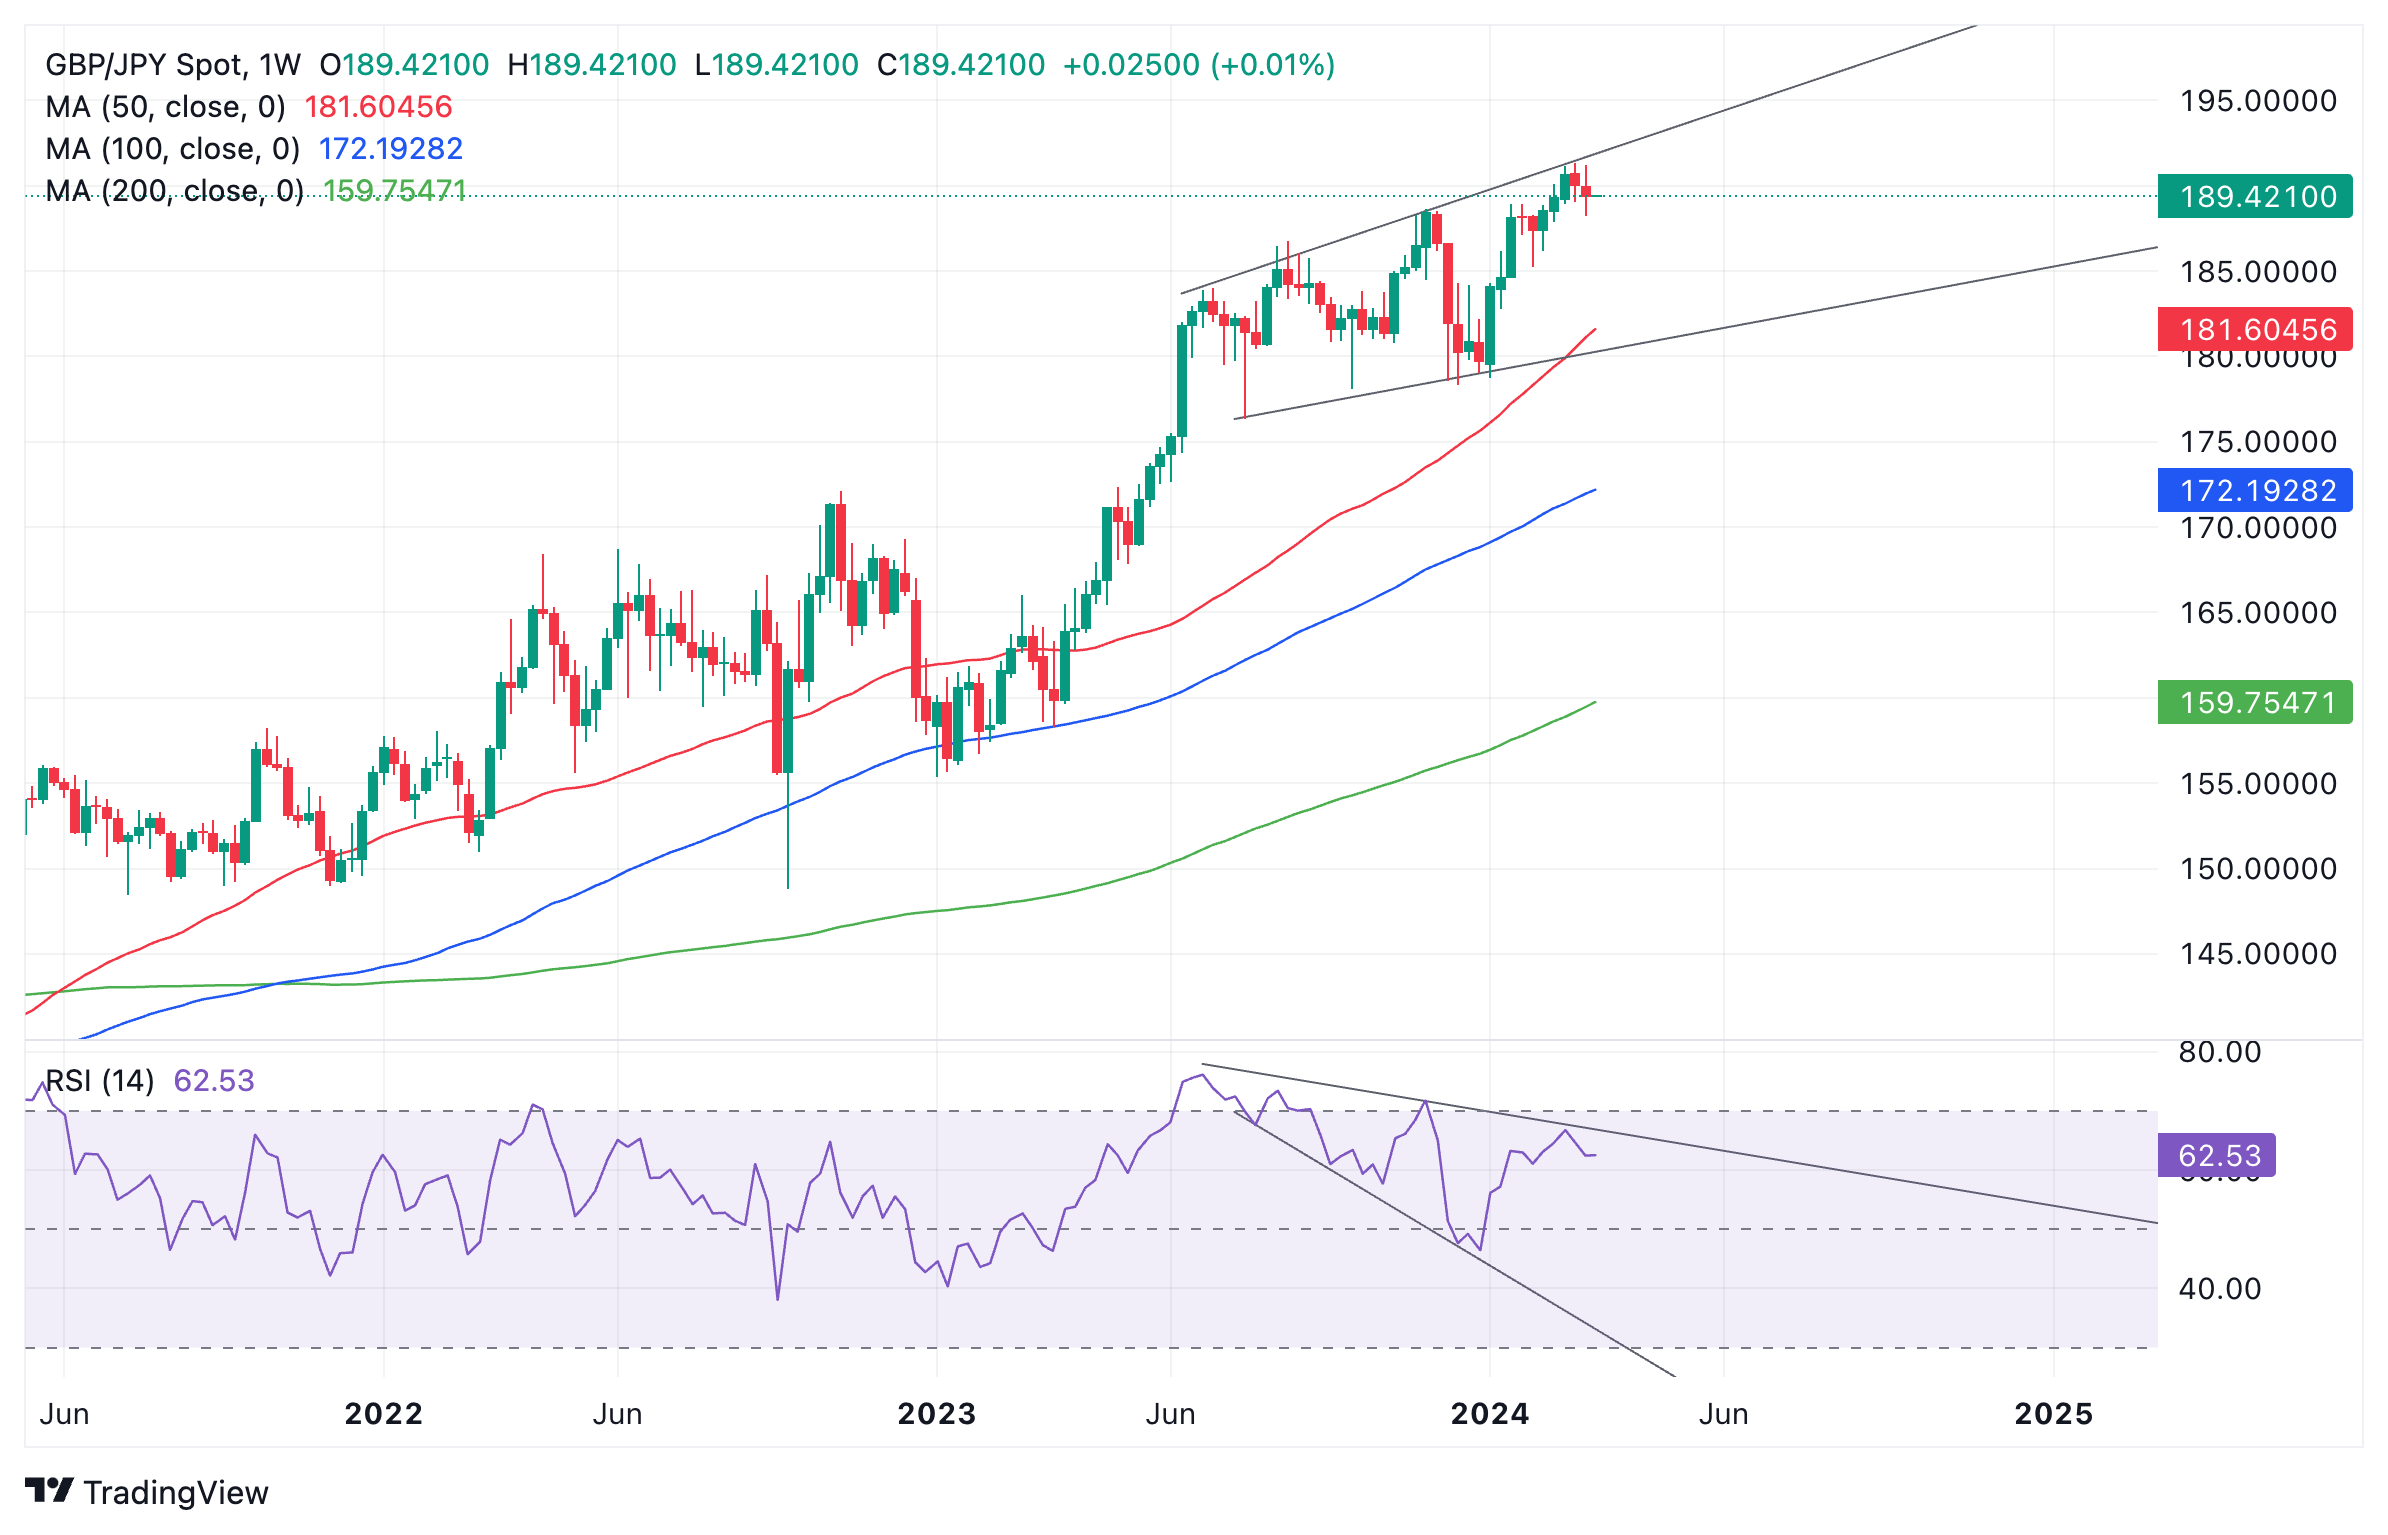
Pound Sterling versus Japanese Yen: Weekly chart
It’s too early to say a deeper correction will unfold but if this week prints red, it would form a Japanese Three Black Crows bearish reversal pattern which could indicate the possibility of more downside evolving.
If a pullback does evolve it would probably see GBP/JPY fall to support near the 50-week Simple Moving Average (SMA) at 181.60.
Another bearish sign is that GBP/JPY has formed an Ascending Broadening Wedge pattern, which suggests an increased risk of a reversal in the uptrend, if price breaks below the lower borderline of the pattern at 180.80-90.
A break above the 191.32 highs would provide confirmation the dominant bull trend was intact and continuing higher. Although it looks overstretched, such a move is still possible given the bullishness of the chart. The next upside target from there would be resistance expected at the 195.88 highs of 2015.
EUR/SEK is fractionally higher at 11.20. Economists at Société Générale analyze the pair’s technical outlook.
Break below 11.12/11.10 can result in deeper decline
EUR/SEK has so far carved out a higher trough near 11.12/11.10 as compared to the one achieved in December near 11.00. An initial bounce can’t be ruled out, but it would be interesting to see if the pair can reclaim the lower limit of previous multi month range at 11.42. Inability to overcome this resistance could mean risk of one more down leg.
Break below 11.12/11.10 can result in deeper decline towards the trend line drawn since 2022 at 11.00 and 10.90.
EUR/USD trades below the mid-1.0900s. Economists at ING analyze the pair’s outlook.
No FX impact from ECB framework review
The outcome of the European Central Bank's long-awaited operational framework review did not shake markets. As widely expected, introducing a demand-driven floor system while the deposit facility rate has been confirmed as the main policy rates. Indeed, FX implications are as limited as we expected them to bey, particularly in the near term.
The Euro is enjoying decent resilience despite short-term dynamics that would argue for some correction in the coming days.
Our baseline view is a return below 1.0900 in EUR/USD by next week.
Sweden’s inflation figures released today are endorsing the Riksbank’s dovish turn, economists at ING say.
Encouraging inflation figures for the Riksbank
Headline CPIF inflation declined sharply from 3.3% to 2.5%, while the Riskbank's favoured CPIF excluding energy decelerated from 4.4% to 3.5%. The numbers are below our expectations and the consensus and partly endorse the optimism shown by the Riksbank at its latest policy meeting when it signalled rate cuts later this year.
Friday’s inflation expectations data released by Prospera are also very important for the Riksbank.
We continue to prefer NOK over SEK as we prepare for a broad-based decline in the Dollar and improved risk sentiment in FX. In our view, EUR/SEK can find support at 11.20 in the coming days.
In its monthly oil market report published on Thursday, the International Energy Agency (IEA) raised the 2024 global oil demand growth forecast by 110,000 bpd to 1.3 mln bpd.
Additional takeaways
Oil on water hit second highest level since the height of the Covid-19 pandemic.
Global on-land oil stocks fell for a seventh month to lowest level since at least 2016.
Weaker economic outlook, efficiency improvements and ev sales temper oil growth.
Oil consumption reverting toward historical trend after volatility of post-pandemic rebound.
If OPEC+ voluntary cuts held in place through 2024, sees market in slight deficit rather than surplus.
Red Sea trade flow disruptions boosted bunker fuel use and us ethane demand surged.
Global oil demand growth in Q1 2024 to rise by 270,000 bpd to 1.7 mln bpd.
Market reaction
At the time of writing, WTI is testing intraday highs near the $80 mark, up 0.90% on the day.
WTI Oil FAQs
WTI Oil is a type of Crude Oil sold on international markets. The WTI stands for West Texas Intermediate, one of three major types including Brent and Dubai Crude. WTI is also referred to as “light” and “sweet” because of its relatively low gravity and sulfur content respectively. It is considered a high quality Oil that is easily refined. It is sourced in the United States and distributed via the Cushing hub, which is considered “The Pipeline Crossroads of the World”. It is a benchmark for the Oil market and WTI price is frequently quoted in the media.
Like all assets, supply and demand are the key drivers of WTI Oil price. As such, global growth can be a driver of increased demand and vice versa for weak global growth. Political instability, wars, and sanctions can disrupt supply and impact prices. The decisions of OPEC, a group of major Oil-producing countries, is another key driver of price. The value of the US Dollar influences the price of WTI Crude Oil, since Oil is predominantly traded in US Dollars, thus a weaker US Dollar can make Oil more affordable and vice versa.
The weekly Oil inventory reports published by the American Petroleum Institute (API) and the Energy Information Agency (EIA) impact the price of WTI Oil. Changes in inventories reflect fluctuating supply and demand. If the data shows a drop in inventories it can indicate increased demand, pushing up Oil price. Higher inventories can reflect increased supply, pushing down prices. API’s report is published every Tuesday and EIA’s the day after. Their results are usually similar, falling within 1% of each other 75% of the time. The EIA data is considered more reliable, since it is a government agency.
OPEC (Organization of the Petroleum Exporting Countries) is a group of 13 Oil-producing nations who collectively decide production quotas for member countries at twice-yearly meetings. Their decisions often impact WTI Oil prices. When OPEC decides to lower quotas, it can tighten supply, pushing up Oil prices. When OPEC increases production, it has the opposite effect. OPEC+ refers to an expanded group that includes ten extra non-OPEC members, the most notable of which is Russia.
- EUR/USD could see volatility on Thursday with US data and ECB speakers in the line up.
- US factory gate prices and Retails Sales could tone the debate on when the Fed cuts interest rates.
- In Europe, speakers from the ECB may shed light on when the ECB considers its own rate cut.
EUR/USD continues trading in the mid 1.0900s after pulling back from a peak at 1.0981 achieved last week. With data releases and events affecting both sides of the EUR/USD pair on Thursday, a cursory glance at the proverbial “crystal ball” suggests some volatility is probable.
In the US, factory gate inflation and Retail Sales data could tone expectations of when the Federal Reserve (Fed) will start cutting interest rates – a key driver for the US Dollar (USD).
In Europe, meanwhile, a string of rate-setters from the European Central Bank (ECB) are scheduled to speak with their comments likely to shed light on when the central bank will decide to start cutting its interest rates – a key driver for the Euro (EUR).
The takeaway is that if inflation is seen as stubborn, interest rates will stay high, supporting the currency in question.
EUR/USD Daily digest market movers: US data and Euro-speak
US core factory gate prices, Producer Prices ex Food and Energy (Core PPI), an important inflation metric, is scheduled for release at 12:30 GMT, with economists expecting a drop to 1.9% YoY registered in February from 2.0% in January.
On a month-on-month basis, Core PPI is forecast to show a 0.2% rise versus the 0.5% advance seen in the previous month.
The headline Producer Price Index (PPI) is forecast to show a 1.1% YoY gain versus 0.9% in January, and a 0.3% gain MoM, the same as previous.
Since the PPI informs base costs that feed into the Consumer Price Index (CPI), the data is an important leading indicator for CPI inflation. If retailers have to pay more for their goods wholesale, they will usually pass on the increase to consumers.
US Retail Sales, also out at 12:30 GMT, are forecast to rebound in February, registering a 0.8% rise against the 0.8% decline in January. Higher-than-expected sales tend to spur inflation with implications for interest rate policy and the USD.
ECB speakers to shed light on whether interest rates will fall in April or June
Dovish talk from ECB Governing Council (GC) big-hitter Francois Villeroy de Galhau on Monday suggested he was leaning in favor of April for a first interest-rate cut by the Frankfurt-based bank.
On Wednesday, Bank of Austria Governor and ECB Governing Council member Robert Holzmann, however, said he thought the bank was more likely to cut in June. The President of the ECB, Christine Lagarde, also said June was the time the ECB would review its policy on rates.
A list of speakers from the ECB on Thursday may shed further light on the debate:
At 9:30 GMT, the member of the ECB’s Executive Board Frank Elderson.
11:00 sees the member of the ECB’s Executive Board, Isabel Schnabel, talk.
Vice-President of the ECB Luis de Guindos is up at 18:00 GMT.
If more members appear to gravitate to June, which is the base case, it could have a slightly positive impact on the Euro and EUR/USD. If the De Galhau camp gains momentum, EUR/USD could weaken.
Technical Analysis: EUR/USD continues correction lower
EUR/USD is still mid-pullback after peaking at the 1.0981 March 8 high.
The correction lacks momentum and Wednesday’s up day adds evidence suggesting the pair is more likely pulling back within a dominant short-term uptrend rather than reversing that uptrend. As things stand, it’s likely to find a floor and resume its upside eventually.
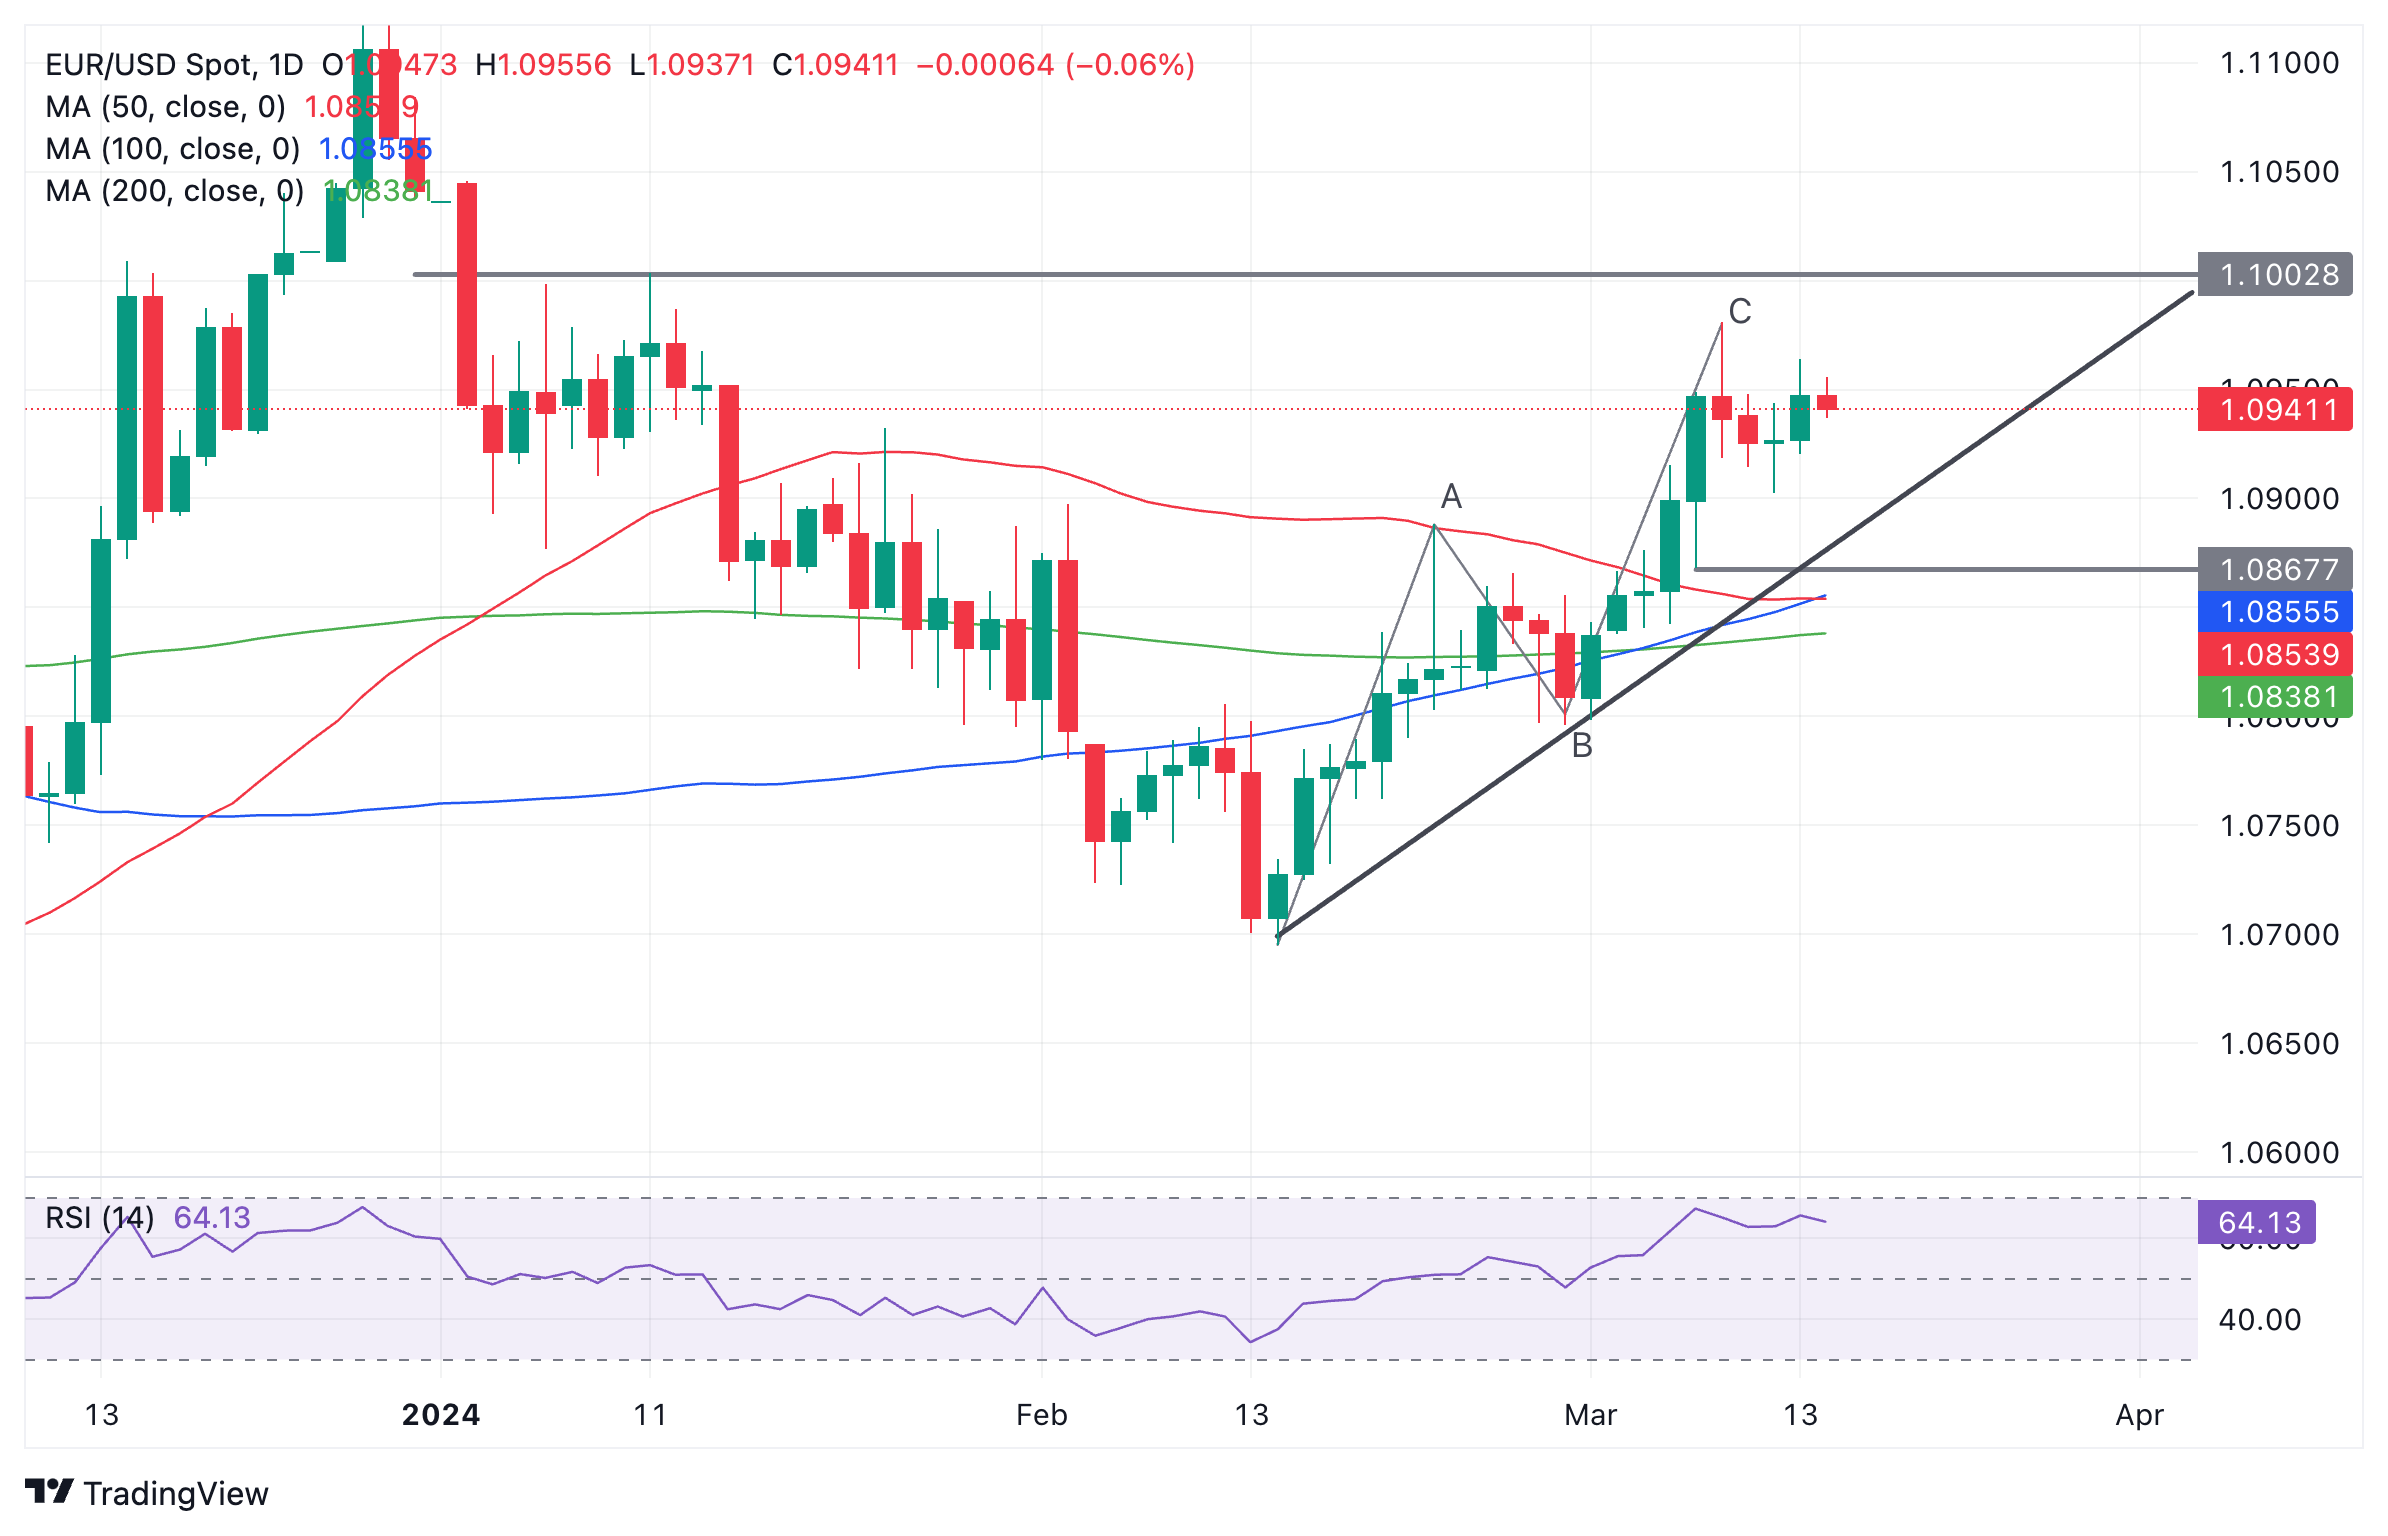
Euro vs US Dollar: Daily chart
It is still possible the correction could fall lower before it completes. One possible zone where price could eventually find support is between 1.0898 (February 2 high) and the top of the Measured Move’s A wave at 1.0888.
A break below 1.0867 would be more critical and add credence to the case for a trend reversal, with bears taking more control.
On the other hand, a move above 1.0981 would provide confirmation of a higher high and an extension of the uptrend.
After that, tough resistance is expected at the 1.1000 psychological level, which is likely to be the scene of a fierce battle between bulls and bears.
A decisive break above 1.1000, however, would open the gates to further gains towards the key resistance level at 1.1139, the December 2023 high.
By “decisive” it is meant a break characterized by a long green candle piercing clearly above the level and closing near its high, or three green bars in a row, breaching the level.
Euro FAQs
The Euro is the currency for the 20 European Union countries that belong to the Eurozone. It is the second most heavily traded currency in the world behind the US Dollar. In 2022, it accounted for 31% of all foreign exchange transactions, with an average daily turnover of over $2.2 trillion a day. EUR/USD is the most heavily traded currency pair in the world, accounting for an estimated 30% off all transactions, followed by EUR/JPY (4%), EUR/GBP (3%) and EUR/AUD (2%).
The European Central Bank (ECB) in Frankfurt, Germany, is the reserve bank for the Eurozone. The ECB sets interest rates and manages monetary policy. The ECB’s primary mandate is to maintain price stability, which means either controlling inflation or stimulating growth. Its primary tool is the raising or lowering of interest rates. Relatively high interest rates – or the expectation of higher rates – will usually benefit the Euro and vice versa. The ECB Governing Council makes monetary policy decisions at meetings held eight times a year. Decisions are made by heads of the Eurozone national banks and six permanent members, including the President of the ECB, Christine Lagarde.
Eurozone inflation data, measured by the Harmonized Index of Consumer Prices (HICP), is an important econometric for the Euro. If inflation rises more than expected, especially if above the ECB’s 2% target, it obliges the ECB to raise interest rates to bring it back under control. Relatively high interest rates compared to its counterparts will usually benefit the Euro, as it makes the region more attractive as a place for global investors to park their money.
Data releases gauge the health of the economy and can impact on the Euro. Indicators such as GDP, Manufacturing and Services PMIs, employment, and consumer sentiment surveys can all influence the direction of the single currency. A strong economy is good for the Euro. Not only does it attract more foreign investment but it may encourage the ECB to put up interest rates, which will directly strengthen the Euro. Otherwise, if economic data is weak, the Euro is likely to fall. Economic data for the four largest economies in the euro area (Germany, France, Italy and Spain) are especially significant, as they account for 75% of the Eurozone’s economy.
Another significant data release for the Euro is the Trade Balance. This indicator measures the difference between what a country earns from its exports and what it spends on imports over a given period. If a country produces highly sought after exports then its currency will gain in value purely from the extra demand created from foreign buyers seeking to purchase these goods. Therefore, a positive net Trade Balance strengthens a currency and vice versa for a negative balance.
- AUD/JPY continues to move in a positive direction as RBA hinted at increasing policy rates.
- RBA Governor Michelle Bullock anticipates that inflation will not return to its target until 2026.
- Japanese Yen faces challenges on reduced expectations for an early interest rate hike by BoJ.
AUD/JPY extends its upward trajectory for the third consecutive session, reaching around 97.90 during European trading hours on Thursday. The AUD/JPY cross receives upward momentum as the Reserve Bank of Australia (RBA) continues to hint at the possibility of further rate hikes.
RBA Governor Michelle Bullock recently emphasized that inflation in Australia is primarily "homegrown" and "demand-driven," fueled by the robust labor market and increasing wage inflation. The RBA does not foresee inflation returning to its target until 2026.
However, the decline in the S&P/ASX 200 Index, driven by losses in financial-linked shares despite gains in iron ore miners, may have exerted downward pressure on the Australian Dollar. Consequently, this has limited the advance of the AUD/JPY cross.
On the other side, the Japanese Yen (JPY) encounters hurdles amid reduced expectations for an early interest rate hike by the Bank of Japan (BoJ). Additionally, the prevailing risk-on sentiment diminishes demand for the safe-haven JPY, thereby acting as a tailwind for the AUD/JPY pair.
However, Japanese media outlets have indicated that more BoJ policymakers are supporting the notion of a policy shift at the upcoming policy meeting, as significant pay hikes by major companies bring the 2% price stability target within reach. The higher-than-expected producer inflation data from Japan reinforces the belief that the BoJ could initiate rate hikes soon.
On Wednesday, Japan's spring wage negotiations revealed that firms have yielded to the demands of the country's largest trade union confederation, Rengo, agreeing to pay increases of 5.85% this year, surpassing 5.0% for the first time in 30 years. Furthermore, Japan's largest industrial union, UA Zensen, reported on Thursday that the average pay rise offered by 231 service-sector firms has reached the highest level on record since 2013.
- EUR/GBP stalls a three-day-old uptrend in reaction to dovish remarks by ECB’s Stournaras.
- Delayed BoE rate cut bets underpin the GBP and further contribute to the intraday decline.
- Investors will keep a close eye on comments by other ECB officials for short-term impetus.
The EUR/GBP cross comes under heavy selling pressure on Thursday and for now, seems to have snapped a three-day winning streak to the 0.8560 area, or the weekly top touched the previous day. Spot prices drop to the 0.8535 region, or the fresh daily low during the first half of the European session and remain well within the striking distance of the monthly trough touched earlier this week.
The shared currency meets with some supply after European Central Bank (ECB) Governing Council member Yannis Stournaras backed the case for an early rate cut. Stournaras added that he doesn't buy the argument that the ECB cannot cut rates before the Fed and that four rate cuts in 2024 seem reasonable. This comes after several ECB officials floated the idea for the first rate cut in June and a further move in July, which, in turn, exerts pressure on the EUR/GBP cross.
The British Pound (GBP), on the other hand, remains well supported by expectations that the Bank of England (BoE) will keep interest rates higher for longer. The bets were reaffirmed by the monthly UK GDP print on Wednesday, which showed that the economy returned to growth in January after entering a shallow recession in the second half of 2023. This, in turn, is seen as another factor that contributes to the heavily offered tone surrounding the EUR/GBP cross.
Moving ahead, there isn't any relevant market-moving economic data due for release on Thursday, either from the Eurozone or the UK. Hence, investors will keep a close eye on comments from ECB policymakers, which will continue to influence the Euro and provide some impetus to the EUR/GBP cross. Apart from this, the top-tier US macro data might infuse some volatility in the markets and further contribute to producing short-term trading opportunities.
Economists at ING continue to see short-term upside potential for the US Dollar (USD).
DXY to return above the 103.00 mark by the end of this week
We think the Dollar has room to recover in the coming days. At the same time, we must admit that markets have displayed an asymmetrically dovish reaction function to US data, and today’s releases – February retail sales, PPI and jobless claims – can all add pressure to the Dollar should they print on the soft side.
Our call remains for a return of DXY above the 103.00 mark by the end of this week, with further short-term upside potential unless US data softens.
- Silver price drops to $24.90 as investors turn anxious ahead of US data.
- The Core PPI data is forecasted to have softened on both a monthly and an annual basis.
- Market expectations for Fed rate cuts in June have increased to 69%.
Silver price (XAG/USD) falls to $24.90 in Thursday’s European session after reaching a three-month high at $25.16. The white metal drops amid anxiety ahead of the United States Producer Price Index (PPI) and Retail Sales data for February, which will provide fresh cues about the inflation outlook.
The annual core PPI data, which strips off volatile food and energy prices, is forecasted to have softened to 1.9% from 2.0% in January. The monthly underlying inflation data is projected to have grown at a slower pace of 0.2% against the prior reading of 0.5%. Slower growth in prices of goods and services by producers at factory gates would soften the inflation outlook.
Meanwhile, monthly Retail Sales are expected to have grown by 0.8%, the same pace at which they contracted in January. In the same period, economists expect that Retail Sales excluding automobiles have grown by 0.6% against a decline of 0.5%. Upbeat Retail sales data indicate an increase in households’ spending, which fuels inflationary pressures.
The Silver price witnessed significant buying interest on Wednesday as market expectations for the Federal Reserve (Fed) reducing interest rates in the June meeting have improved again despite stubborn inflation data for February. The CME Fedwatch tool shows that the chances of the Fed reducing interest rates have increased to 69%, which is close to pre-inflation data expectations.
Silver technical analysis
Silver price approaches a 10-month high of $25.90, which is the high of December 4. Near-term demand for the white metal is strong, as the 20-day Exponential Moving Average (EMA) around $23.80 is sloping north.
The 14-period Relative Strength Index (RSI) trades in the bullish range of 60.00-80.00, indicating a strong upside momentum.
Silver daily chart
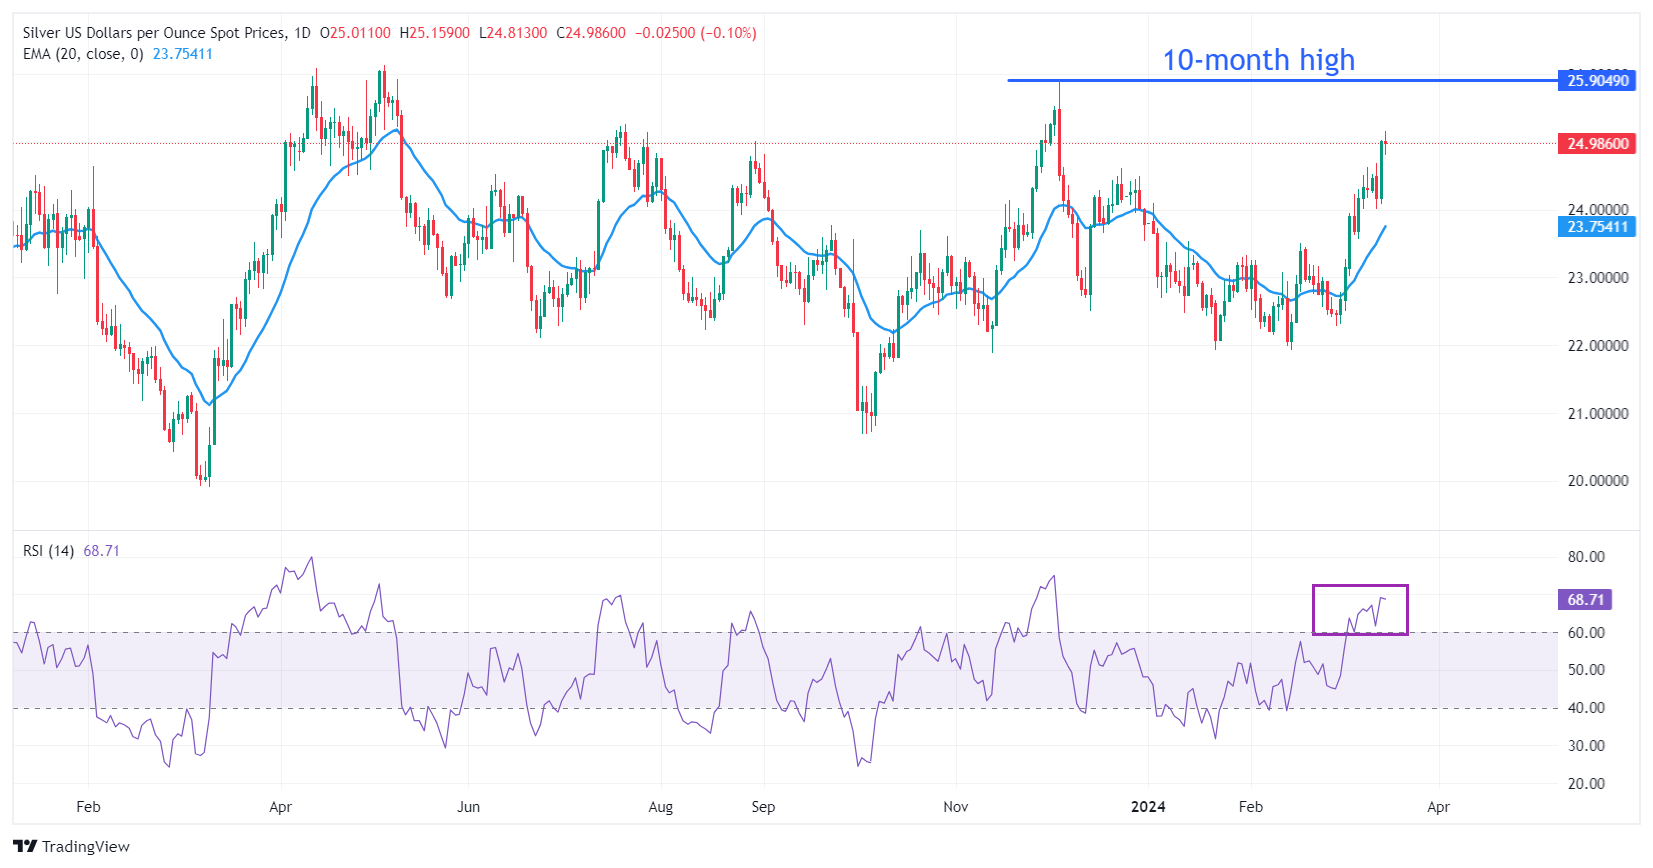
The US Dollar (USD) is staging a modest recovery ahead of the US February Retail Sales print. Economists at BBH analyze how the data could impact the USD.
Soft spending reading can trigger another downside correction in USD
Market participants expect Retail Sales to rebound by 0.8% MoM in February after unexpectedly falling 0.8% MoM in January. Importantly, the Control Group Retail Sales (which exclude cars, gas, food services, and building materials and feed into the GDP calculation) is forecast to rise by 0.4% in February following a 0.4% decline the previous month.
Robust US consumer spending activity will further curtail money market expectations of Fed funds rate cuts and add upside momentum to USD. In contrast, any evidence that spending is buckling under the weight of higher interest rates and depleting excess savings can trigger another downside correction in USD.
- USD/MXN gains ground as the US Dollar appreciates higher US yields.
- The upbeat US CPI has tempered expectations for immediate interest rate cuts by the US Fed.
- Banxico members indicated avoiding premature interest rate cuts.
USD/MXN breaks its losing streak that commenced on February 29, attributed to the strengthened US Dollar (USD). The pair climbs to approximately 16.70 during Thursday's European session. Traders are eagerly awaiting the release of the US Core Producer Price Index (PPI) and Retail Sales data later today.
The US Dollar Index (DXY) appreciates to nearly 102.90, with 2-year and 10-year yields on US Treasury bonds standing at 4.64% and 4.20%, respectively, at press time. The upbeat US Consumer Price Index (CPI) has dampened expectations for immediate interest rate cuts by the Federal Reserve (Fed). Nevertheless, market participants maintain their bets on rate reductions in June, with a probability of 67.2%, as reported by the CME FedWatch Tool.
The Mexican peso has garnered upward momentum, reaching its highest level since November 2015. This trend can be attributed to the hawkish sentiment surrounding the Bank of Mexico (Banxico), which is inclined to prolong its restrictive monetary policy. Banxico's policymakers have acknowledged the progress made in controlling inflation in their quarterly report.
However, Banxico officials have emphasized the importance of avoiding premature interest rate cuts. Governor Victoria Rodriguez Ceja has advocated for a gradual approach to adjustments, while Deputy Governor Jonathan Heath has cautioned against the risks associated with premature rate cuts.
In January, Mexico’s Industrial Output (YoY) witnessed a significant surge, contrasting with the previous flat reading. Additionally, on a monthly basis, there was an increase as anticipated, reversing the previous decline. Despite the annual inflation rate decreasing from a seven-month high in January, Core Inflation experienced a higher increase compared to the previous reading. The upcoming policy meeting of the Bank of Mexico (Banxico), is scheduled for March 21, which will likely provide insights into the central bank's approach towards monetary policy stance.
- The Pound Sterling trades back and forth as investors await a fresh trigger.
- The UK economy returns to growth after contracting in the second half of 2023.
- Market sentiment remains calm ahead of US data.
The Pound Sterling (GBP) is stuck in a tight range around 1.2800 in Thursday’s London session as investors seek fresh guidance on the Bank of England’s (BoE) next moves in terms of interest rates. The GBP/USD pair trades sideways as investors look for clues about when the BoE and the Federal Reserve (Fed) will start reducing interest rates.
The near-term appeal of the Cable is uncertain as the stubborn United States inflation data for February has reinforced fears that the Fed could delay plans to reduce interest rates. Currently, markets broadly expect that the Fed will make this move in June.
Meanwhile, the US Dollar Index (DXY) rebounds to 102.90 ahead of the US Producer Price Index (PPI) and Retail Sales data for February, which will be published at 12:30 GMT. These indicators could provide fresh cues about the Fed’s rate-cut timing for this year.
Daily digest market movers: Pound Sterling remains confined in tight range ahead of US data
- The Pound Sterling consolidates in a tight range around 1.2800 against the US Dollar. The pair trades broadly unchanged after Wednesday’s release of the UK monthly Gross Domestic Product (GDP) and factory data for January, which showed the economy grew by 0.2% as expected, boosted by higher demand at retailers and sales of house-building materials. Meanwhile, Industrial Production remained weak.
- The expected growth in the UK economy at the start of 2024 has brought some relief to UK Prime Minister Rishi Sunak ahead of elections, which must be held no later than the end of January 2025. Chancellor of the Exchequer Jeremy Hunt said: "While the last few years have been tough, today's numbers show we are making progress in growing the economy,” Reuters reported.
- The UK economy has returned to growth after falling into a technical recession in the second half of 2023. However, it is too early to say that the recession was shallow and the economy has come out of it until data for the first quarter as a whole shows an expansion. The Office for Budget Responsibility (OBR) forecasts the UK economy to grow by 0.8% in 2024.
- Going forward, market expectations for the Bank of England rate cuts will drive the Pound Sterling’s next moves. Investors’ bets for the BoE reducing interest rates in the August meeting have strengthened on slower-than-expected wage growth in three months ending January.
Technical Analysis: Pound Sterling trades lacklustre near 1.2800
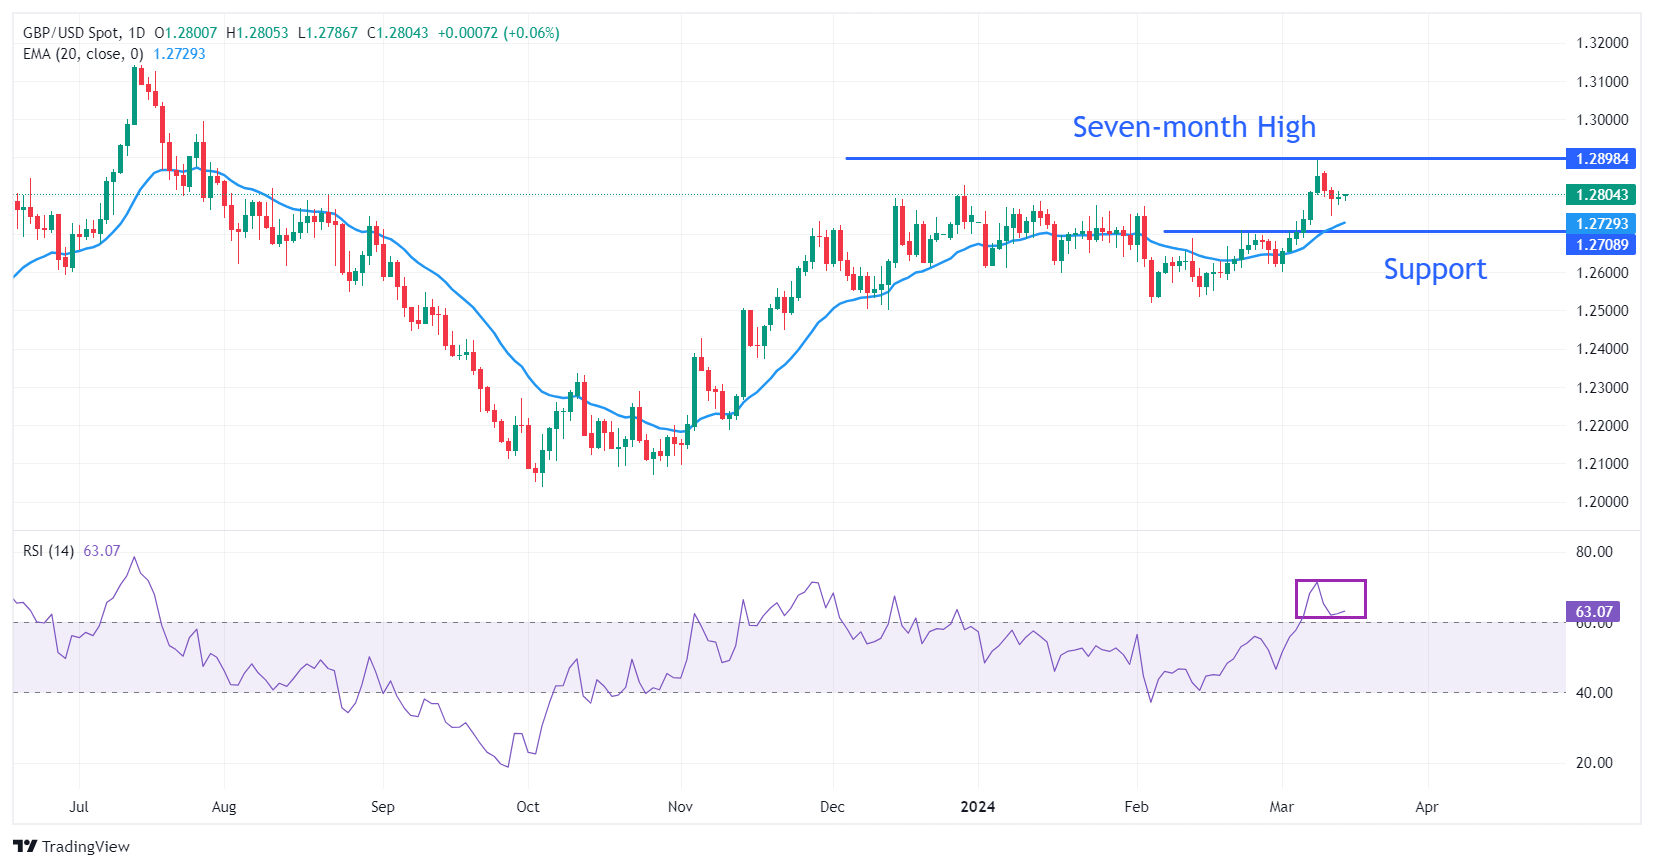
The Pound Sterling trades inside Wednesday’s range around 1.2800 as investors seek fresh economic triggers for further action. The 20-day Exponential Moving Average (EMA) near 1.2730 continues to slope higher, indicating a moderate near-term demand. The 1.2700 round-level support would be a strong cushion for the Pound Sterling bulls.
The 14-period Relative Strength Index (RSI) oscillates in the 60.00-80.00 range, indicating that strong bullish momentum persists.
Pound Sterling FAQs
The Pound Sterling (GBP) is the oldest currency in the world (886 AD) and the official currency of the United Kingdom. It is the fourth most traded unit for foreign exchange (FX) in the world, accounting for 12% of all transactions, averaging $630 billion a day, according to 2022 data. Its key trading pairs are GBP/USD, aka ‘Cable’, which accounts for 11% of FX, GBP/JPY, or the ‘Dragon’ as it is known by traders (3%), and EUR/GBP (2%). The Pound Sterling is issued by the Bank of England (BoE).
The single most important factor influencing the value of the Pound Sterling is monetary policy decided by the Bank of England. The BoE bases its decisions on whether it has achieved its primary goal of “price stability” – a steady inflation rate of around 2%. Its primary tool for achieving this is the adjustment of interest rates. When inflation is too high, the BoE will try to rein it in by raising interest rates, making it more expensive for people and businesses to access credit. This is generally positive for GBP, as higher interest rates make the UK a more attractive place for global investors to park their money. When inflation falls too low it is a sign economic growth is slowing. In this scenario, the BoE will consider lowering interest rates to cheapen credit so businesses will borrow more to invest in growth-generating projects.
Data releases gauge the health of the economy and can impact the value of the Pound Sterling. Indicators such as GDP, Manufacturing and Services PMIs, and employment can all influence the direction of the GBP. A strong economy is good for Sterling. Not only does it attract more foreign investment but it may encourage the BoE to put up interest rates, which will directly strengthen GBP. Otherwise, if economic data is weak, the Pound Sterling is likely to fall.
Another significant data release for the Pound Sterling is the Trade Balance. This indicator measures the difference between what a country earns from its exports and what it spends on imports over a given period. If a country produces highly sought-after exports, its currency will benefit purely from the extra demand created from foreign buyers seeking to purchase these goods. Therefore, a positive net Trade Balance strengthens a currency and vice versa for a negative balance.
After Tuesday's US inflation figures, we should be done with most of the first-tier data in EUR/USD ahead of next Wednesday's Fed meeting, economists at Commerzbank say.
Second-tier US data unlikely to impact EUR/USD
We should be in for a somewhat calmer few days, at least in the EUR/USD pair.
After the US data today at the latest, it will be time to enjoy the calm before the storm and wait for the Federal Reserve. Next week's Wednesday will be exciting enough for sure.
European Central Bank (ECB) Governing Council member Yannis Stournaras said on Thursday that the ECB needs to start lowering key rates soon and added that he doesn't "buy the argument"that the ECB can not cut rates before the Federal Reserve, as reported by Bloomberg.
Stournaras added that monetary policy not become too restrictive and argued for two rate cuts before the summer break.
Market reaction
EUR/USD came under modest bearish pressure following these comments and was last seen trading at 1.0935, where it was down 0.12% on a daily basis.
Economists at Rabobank retain a constructive view for the Pound Sterling (GBP) this year.
EUR/GBP to move lower toward 0.8400 in the latter half of this year
On balance, we retain a modestly constructive picture for GBP vs. the EUR for the year ahead. This is supported by our house expectation that the BoE could retain steady policy until September. This compares with our forecast of rate cuts from both the ECB and the Fed in June. We continue to forecast a move to EUR/GBP 0.8400 in the latter half of this year.
We expect that the interest rate differential, signs of an improving UK economic outlook combined with the prospect of a dull UK election and a relatively stable political backdrop should provide moderate support for the Pound.
We see Cable recovering to the 1.3000 area on a 12-month view, though we see scope for dips on a one-to-three-month view on bouts of broad-based USD strength.
- USD/CAD could test a nine-day EMA of 1.3497 and a psychological level of 1.3500.
- The major level of 1.3450 and the 38.2% Fibonacci retracement level of 1.3442 could act as key support levels.
- A break above the 1.3600 level could lead the pair to test March’s high of 1.3605.
USD/CAD retraces its recent losses from the previous session, edging upwards to near 1.3480 during Thursday's European session. The US Dollar (USD) receives support from higher US Treasury yields, likely influenced by recent data indicating sticky inflation in the United States (US).
The immediate resistance is at the nine-day Exponential Moving Average (EMA) at 1.3497, coinciding with the psychological level of 1.3500.
A breakout above the psychological level could provide upward support for the USD/CAD pair, with the next resistance at the major level of 1.3550. Further upside momentum may target the region around the psychological level of 1.3600, aligned with March’s high of 1.3605.
On the downside, the USD/CAD pair may encounter significant support around the major level of 1.3450, followed by the 38.2% Fibonacci retracement level at 1.3442. A breach below this level could exert downward pressure on the pair, potentially leading it toward the support zone near the previous week’s low of 1.3419 and the psychological level of 1.3400.
The technical analysis indicates mixed signals for the USD/CAD pair. The 14-day Relative Strength Index (RSI) is positioned below 50, suggesting bearish momentum. However, the Moving Average Convergence Divergence (MACD) suggests a potential momentum shift.
The MACD line is above the centerline, indicating bullish momentum, but there is divergence below the signal line. Traders may await confirmation from the MACD, a lagging indicator, to determine the direction of the trend.
USD/CAD: Daily Chart
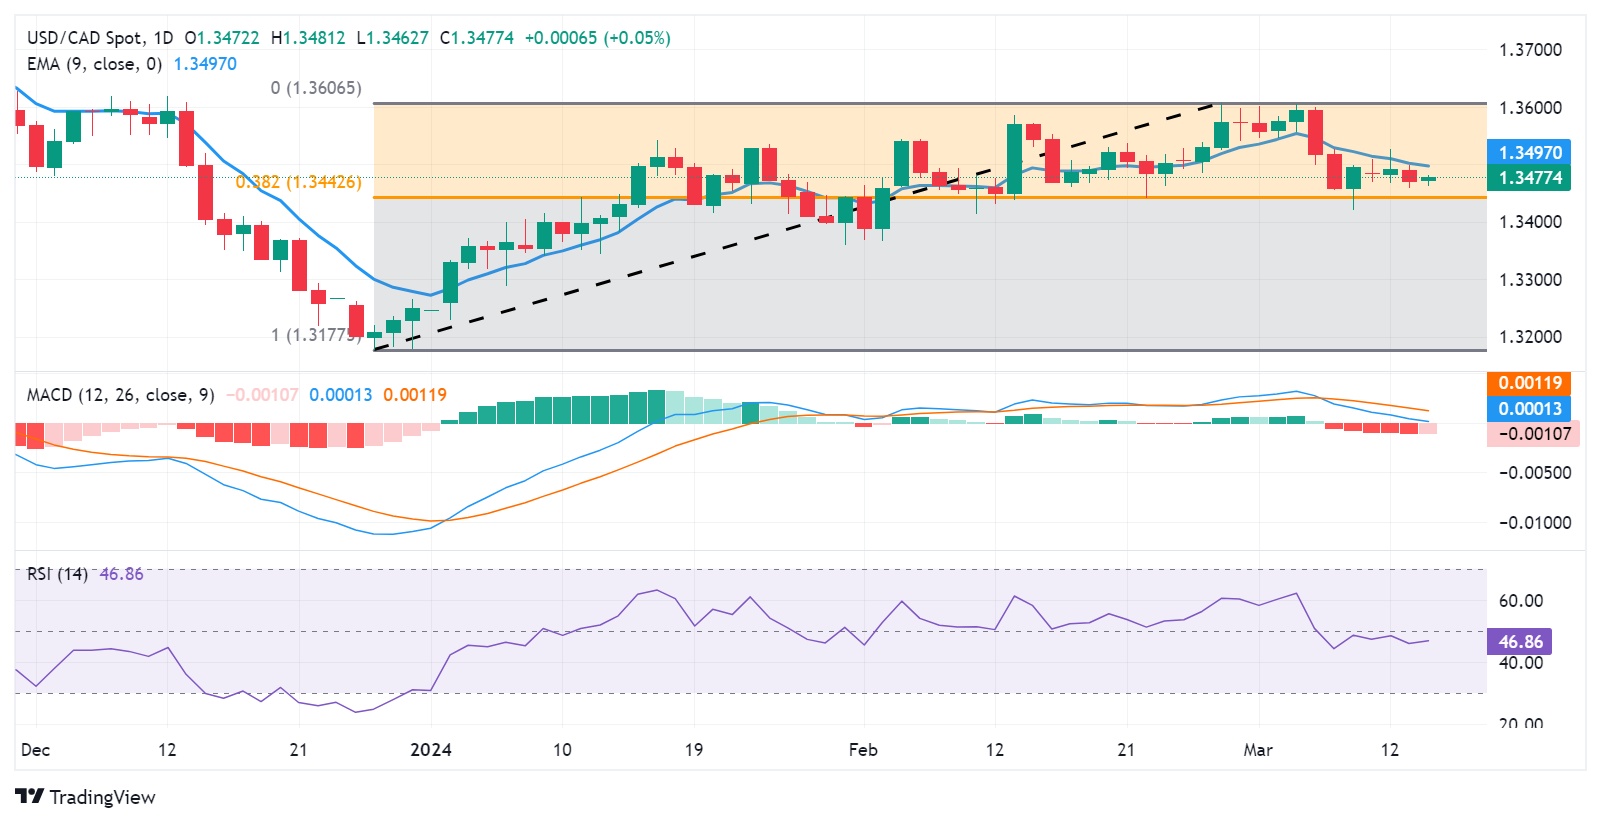
Here is what you need to know on Thursday, March 14:
Major currency pairs continue to fluctuate in relatively tight ranges in the second half of the week. After posting small losses on Wednesday, the US Dollar (USD) Index stays calm below 103.00 in the European morning on Thursday as investors await producer inflation and Retail Sales data for February.
US Retail Sales: Economists expect consumption to rebound in February after shaky start of the year.
The benchmark 10-year US Treasury bond yield extended its recovery on Wednesday and rose back above 4.2% for the first time in over a week. Early Thursday, the 10-year US yield holds steady at around 4.2% and US stock index futures trade mixed following Wednesday's choppy action.
US Dollar price this week
The table below shows the percentage change of US Dollar (USD) against listed major currencies this week. US Dollar was the strongest against the Japanese Yen.
| USD | EUR | GBP | CAD | AUD | JPY | NZD | CHF | |
| USD | 0.05% | 0.48% | -0.06% | 0.14% | 0.76% | 0.34% | 0.26% | |
| EUR | -0.05% | 0.44% | -0.12% | 0.05% | 0.72% | 0.28% | 0.22% | |
| GBP | -0.48% | -0.43% | -0.54% | -0.36% | 0.28% | -0.13% | -0.21% | |
| CAD | 0.07% | 0.11% | 0.53% | 0.17% | 0.81% | 0.38% | 0.32% | |
| AUD | -0.14% | -0.05% | 0.36% | -0.17% | 0.67% | 0.23% | 0.17% | |
| JPY | -0.75% | -0.72% | -0.04% | -0.83% | -0.66% | -0.42% | -0.50% | |
| NZD | -0.32% | -0.30% | 0.12% | -0.39% | -0.19% | 0.44% | -0.10% | |
| CHF | -0.26% | -0.21% | 0.22% | -0.32% | -0.16% | 0.48% | 0.07% |
The heat map shows percentage changes of major currencies against each other. The base currency is picked from the left column, while the quote currency is picked from the top row. For example, if you pick the Euro from the left column and move along the horizontal line to the Japanese Yen, the percentage change displayed in the box will represent EUR (base)/JPY (quote).
Earlier in the day, Reuters reported that Japan's largest industrial union UA Zensen announced that an average pay rise offered by 231 firms reached the biggest on record since 2013. USD/JPY continues to move up and down in a narrow band below 148.00 after closing virtually unchanged on Wednesday.
Japanese Yen hangs near weekly low against USD, looks to US data for fresh impetus.
AUD/USD registered modest gains on Wednesday and snapped a two-day losing streak. The pair stays in a consolidation phase slightly above 0.6600 early Thursday.
Australian Dollar weakens as the ASX 200 index declines, awaits US key data.
EUR/USD gained traction and closed in positive territory on Wednesday. The pair, however, started to edge lower after meeting resistance at 1.0950. In the absence of high-tier data releases from the Euro area, investors will keep a close eye on comments from European Central Bank (ECB) officials.
GBP/USD struggles to find direction and extending its sideways grind at around 1.2800 in the European morning on Thursday.
Gold managed to erase a large portion of Tuesday's losses on Wednesday but had a hard time gathering further bullish momentum amid rising US yields. XAU/USD was last seen trading marginally lower on the day slightly below $2,170.
Gold price trades with mild negative bias amid modest USD strength, lacks follow-through.
Gold FAQs
Gold has played a key role in human’s history as it has been widely used as a store of value and medium of exchange. Currently, apart from its shine and usage for jewelry, the precious metal is widely seen as a safe-haven asset, meaning that it is considered a good investment during turbulent times. Gold is also widely seen as a hedge against inflation and against depreciating currencies as it doesn’t rely on any specific issuer or government.
Central banks are the biggest Gold holders. In their aim to support their currencies in turbulent times, central banks tend to diversify their reserves and buy Gold to improve the perceived strength of the economy and the currency. High Gold reserves can be a source of trust for a country’s solvency. Central banks added 1,136 tonnes of Gold worth around $70 billion to their reserves in 2022, according to data from the World Gold Council. This is the highest yearly purchase since records began. Central banks from emerging economies such as China, India and Turkey are quickly increasing their Gold reserves.
Gold has an inverse correlation with the US Dollar and US Treasuries, which are both major reserve and safe-haven assets. When the Dollar depreciates, Gold tends to rise, enabling investors and central banks to diversify their assets in turbulent times. Gold is also inversely correlated with risk assets. A rally in the stock market tends to weaken Gold price, while sell-offs in riskier markets tend to favor the precious metal.
The price can move due to a wide range of factors. Geopolitical instability or fears of a deep recession can quickly make Gold price escalate due to its safe-haven status. As a yield-less asset, Gold tends to rise with lower interest rates, while higher cost of money usually weighs down on the yellow metal. Still, most moves depend on how the US Dollar (USD) behaves as the asset is priced in dollars (XAU/USD). A strong Dollar tends to keep the price of Gold controlled, whereas a weaker Dollar is likely to push Gold prices up.
FX option expiries for Mar 14 NY cut at 10:00 Eastern Time, via DTCC, can be found below.
- EUR/USD: EUR amounts
- 1.0720 1.1b
- GBP/USD: GBP amounts
- 1.2550 1.4b
- USD/JPY: USD amounts
- 147.00 2.4b
- 150.00 1.2b
- AUD/USD: AUD amounts
- 0.6480 1.1b
- 0.6555 1.2b
- USD/CAD: USD amounts
- 1.3395 1.5b
- EUR/USD loses ground around 1.0940 on the rebound of USD.
- The pair keeps the bullish vibe above the key EMA; RSI momentum indicator lies above the 50-midline.
- The immediate resistance level will emerge at 1.0955; the key support level is located at the 1.0910–1.0915 zone.
The EUR/USD pair trades on a weaker note below the mid-1.0900s during the early European session on Thursday. Traders prefer to wait on the sidelines ahead of the key event on the US docket. The US February Retail Sales will be released, which is estimated to show an increase of 0.8% MoM. Furthermore, the dovish remarks from the ECB policymakers this week also weigh the Euro (EUR) against the US Dollar (USD). The major pair currently trades near 1.0940, down 0.07% on the day.
Technically, the bullish outlook of EUR/USD remains intact as the major pair is above the key 50- and 100-period Exponential Moving Averages (EMA) with an upward slope on the four-hour chart. The upward momentum is also supported by the Relative Strength Index (RSI), which stands in bullish territory above the 50-midline, indicating that further upside looks favorable.
The immediate resistance level for the major pair will emerge near the upper boundary of the Bollinger Band at 1.0955. The next hurdle is located at a high of March 8 at 1.0981. Further north, the upside target to watch is a psychological level and a high of January 11 at 1.1000, en route to a high of December 22 at 1.1040.
On the downside, the key support level for a major pair is seen at the confluence of the 50-period EMA and the lower limit of the Bollinger Band at the 1.0910–1.0915 region. The next contention level to watch is the 100-period EMA and round figure at 1.0900. A break below the latter will see a drop to a high of February 29 at 1.0855, followed by a low of February 22 at 1.0800.
EUR/USD four-hour chart
-638459939095349293.png)
- The United States Census Bureau will release Retail Sales data on Thursday.
- US Retail Sales are expected to have expanded by 0.8% in February.
- It is highly unlikely that Retail Sales readings change the Fed’s plans to cut rates in June.
The United States Census Bureau will publish the country’s Retail Sales report on Thursday, which is expected to show that the headline Retail Sales number will reverse the 0.8% monthly contraction seen in the first month of the year. So far, consumer spending among US residents has been performing erratically in recent months as market participants keep digesting the Federal Reserve’s (Fed) restrictive credit conditions.
According to the Census Bureau, “advanced estimates of U.S. retail and food services sales for January 2024, adjusted for seasonal variation and holiday and trading-day differences, but not for price changes, were $700.3 billion, down 0.8 percent (±0.5 percent) from the previous month, and up 0.6 percent (±0.7 percent) above January 2023.”
The Greenback, in the meantime, managed to regain some balance and motivate the USD Index (DXY) to bounce off recent multi-week lows near 102.30 (March 8), always amidst rising bets that the Fed might start its easing cycle in the summer, with June being the most likely candidate.
The recent move higher in the US Dollar was almost exclusively driven by higher-than-anticipated US inflation figures for February, which demonstrated that, despite the downward trend in domestic consumer prices, inflation remains a sticky issue. According to the US Bureau of Labor Statistics, the headline Consumer Price Index (CPI) rose 3.2% in the year to February and 3.8% when it came to the Core CPI.
Back to the potential rate cuts in the next few months, Powell's remarks at both his congressional testimonies hinted at the likelihood of interest rate reductions within the year. However, such measures would only be enacted once the Fed gains greater confidence in the trajectory of inflation returning to its targeted annual rate of 2%.
What to expect in the February US Retail Sales report?
The headline Retail Sales are likely to expand by 0.8% from a month earlier, following the monthly 0.8% drop recorded in the previous month. Core Retail Sales, which exclude the automobile sector, are seen increasing by 0.5% on a monthly basis.
Ahead of the release, analysts at TD Securities noted that “we also look for retail sales to rebound a strong 0.8% m/m in February following January's retreat of a similar magnitude. Volatile auto and gasoline station sales will likely boost growth, with the control group also acting as a key driver.”
When will US Retail Sales data be released, and how can it affect EUR/USD?
The US Retail Sales data for February is due at 12:30 GMT. Barring a large surprise in either direction, and amidst the ongoing data dependent stance by the Fed, the readings are unlikely to derail the central bank’s intentions to kick-start its easing cycle at its June 12 event.
That said, “price action around the US Dollar is predicted to maintain its current familiar range, although extra losses should not be ruled out while below its key 200-day Simple Moving Average (SMA) at 103.70," Senior Analyst at FXStreet Pablo Piovano says.
Regarding EUR/USD, Pablo does not rule out further consolidation in the very near term, while the pair looks for further catalysts to spark a challenge of the March high of 1.0981 (March 8), and eventually a test of the psychological 1.1000 barrier.
Pablo adds that the pair’s outlook should remain constructive as long as it keeps the trade above the 200-day SMA at 1.0836.
Economic Indicator
United States Retail Sales (MoM)
The Retail Sales data, released by the US Census Bureau on a monthly basis, measures the value in total receipts of retail and food stores in the United States. Monthly percent changes reflect the rate of changes in such sales. A stratified random sampling method is used to select approximately 4,800 retail and food services firms whose sales are then weighted and benchmarked to represent the complete universe of over three million retail and food services firms across the country. The data is adjusted for seasonal variations as well as holiday and trading-day differences, but not for price changes. Retail Sales data is widely followed as an indicator of consumer spending, which is a major driver of the US economy. Generally, a high reading is seen as bullish for the US Dollar (USD), while a low reading is seen as bearish.
Read more.Next release: 03/14/2024 12:30:00 GMT
Frequency: Monthly
Source: US Census Bureau
Why it matters to traders
Retail Sales data published by the US Census Bureau is a leading indicator that gives important information about consumer spending, which has a significant impact on the GDP. Although strong sales figures are likely to boost the USD, external factors, such as weather conditions, could distort the data and paint a misleading picture. In addition to the headline data, changes in the Retail Sales Control Group could trigger a market reaction as it is used to prepare the estimates of Personal Consumption Expenditures for most goods.
US Dollar FAQs
What is the US Dollar?
The US Dollar (USD) is the official currency of the United States of America, and the ‘de facto’ currency of a significant number of other countries where it is found in circulation alongside local notes. It is the most heavily traded currency in the world, accounting for over 88% of all global foreign exchange turnover, or an average of $6.6 trillion in transactions per day, according to data from 2022.
Following the second world war, the USD took over from the British Pound as the world’s reserve currency. For most of its history, the US Dollar was backed by Gold, until the Bretton Woods Agreement in 1971 when the Gold Standard went away.
How do the decisions of the Federal Reserve impact the US Dollar?
The most important single factor impacting on the value of the US Dollar is monetary policy, which is shaped by the Federal Reserve (Fed). The Fed has two mandates: to achieve price stability (control inflation) and foster full employment. Its primary tool to achieve these two goals is by adjusting interest rates.
When prices are rising too quickly and inflation is above the Fed’s 2% target, the Fed will raise rates, which helps the USD value. When inflation falls below 2% or the Unemployment Rate is too high, the Fed may lower interest rates, which weighs on the Greenback.
What is Quantitative Easing and how does it influence the US Dollar?
In extreme situations, the Federal Reserve can also print more Dollars and enact quantitative easing (QE). QE is the process by which the Fed substantially increases the flow of credit in a stuck financial system.
It is a non-standard policy measure used when credit has dried up because banks will not lend to each other (out of the fear of counterparty default). It is a last resort when simply lowering interest rates is unlikely to achieve the necessary result. It was the Fed’s weapon of choice to combat the credit crunch that occurred during the Great Financial Crisis in 2008. It involves the Fed printing more Dollars and using them to buy US government bonds predominantly from financial institutions. QE usually leads to a weaker US Dollar.
What is Quantitative Tightening and how does it influence the US Dollar?
Quantitative tightening (QT) is the reverse process whereby the Federal Reserve stops buying bonds from financial institutions and does not reinvest the principal from the bonds it holds maturing in new purchases. It is usually positive for the US Dollar.
- NZD/USD lacks any firm intraday direction on Thursday and oscillates in a narrow range.
- A modest USD uptick acts as a headwind, though the risk-on mood lends some support.
- The technical setup favours bulls and supports prospects for a further appreciating move.
The NZD/USD pair struggles to gain any meaningful traction and seesaws between tepid gains/minor losses during the Asian session on Thursday. Spot prices currently trade around the 0.6155-0.6160 region, unchanged for the day, and remain within the striking distance of over a two-week high touched last Friday.
A hot US inflation print earlier this week fuelled speculations that the Federal Reserve (Fed) may delay interest rate cuts, which keeps the US Treasury bond yields elevated. This, in turn, assists the US Dollar (USD) to attract some buyers and turns out to be a key factor acting as a headwind for the NZD/USD pair. That said, the underlying strong bullish sentiment across the global equity markets caps any further gains for the safe-haven buck and helps limit the downside for the risk-sensitive Kiwi.
From a technical perspective, spot prices hold comfortably above the very important 200-day Simple Moving Average (SMA) and now seem to have found acceptance above the 50-day SMA. Furthermore, oscillators on the daily chart have just started gaining positive traction and suggest that the path of least resistance for the NZD/USD pair is to the upside. Bulls, however, need to wait for a sustained strength beyond the 0.6200 mark before positioning for any further appreciating move.
Some follow-through buying beyond the 0.6215-0.6220 region, or the monthly peak touched last Friday, will reaffirm the bullish bias and lift the NZD/USD pair to mid-0.6200s en route to the 0.6275-0.6280 supply zone. This is closely followed by the 0.6300 mark, which if cleared decisively should pave the way for a move towards the next relevant hurdle near the 0.6340-0.6350 zone. The momentum could extend further towards the December monthly swing high, around the 0.6400 round figure.
On the flip side, the 50-day SMA, currently pegged near the 0.6145-0.6140 region, should offer some immediate support ahead of the 0.6125 zone, or the 100-day SMA. A convincing break below could make the NZD/USD pair vulnerable to weaken further below the 0.6100 mark and test the 200-day SMA, around the 0.6080 region. Failure to defend the latter will expose the YTD low, around the 0.6040-0.6035 region, before spot prices eventually drop to the 0.6000 psychological mark,
NZD/USD daily chart
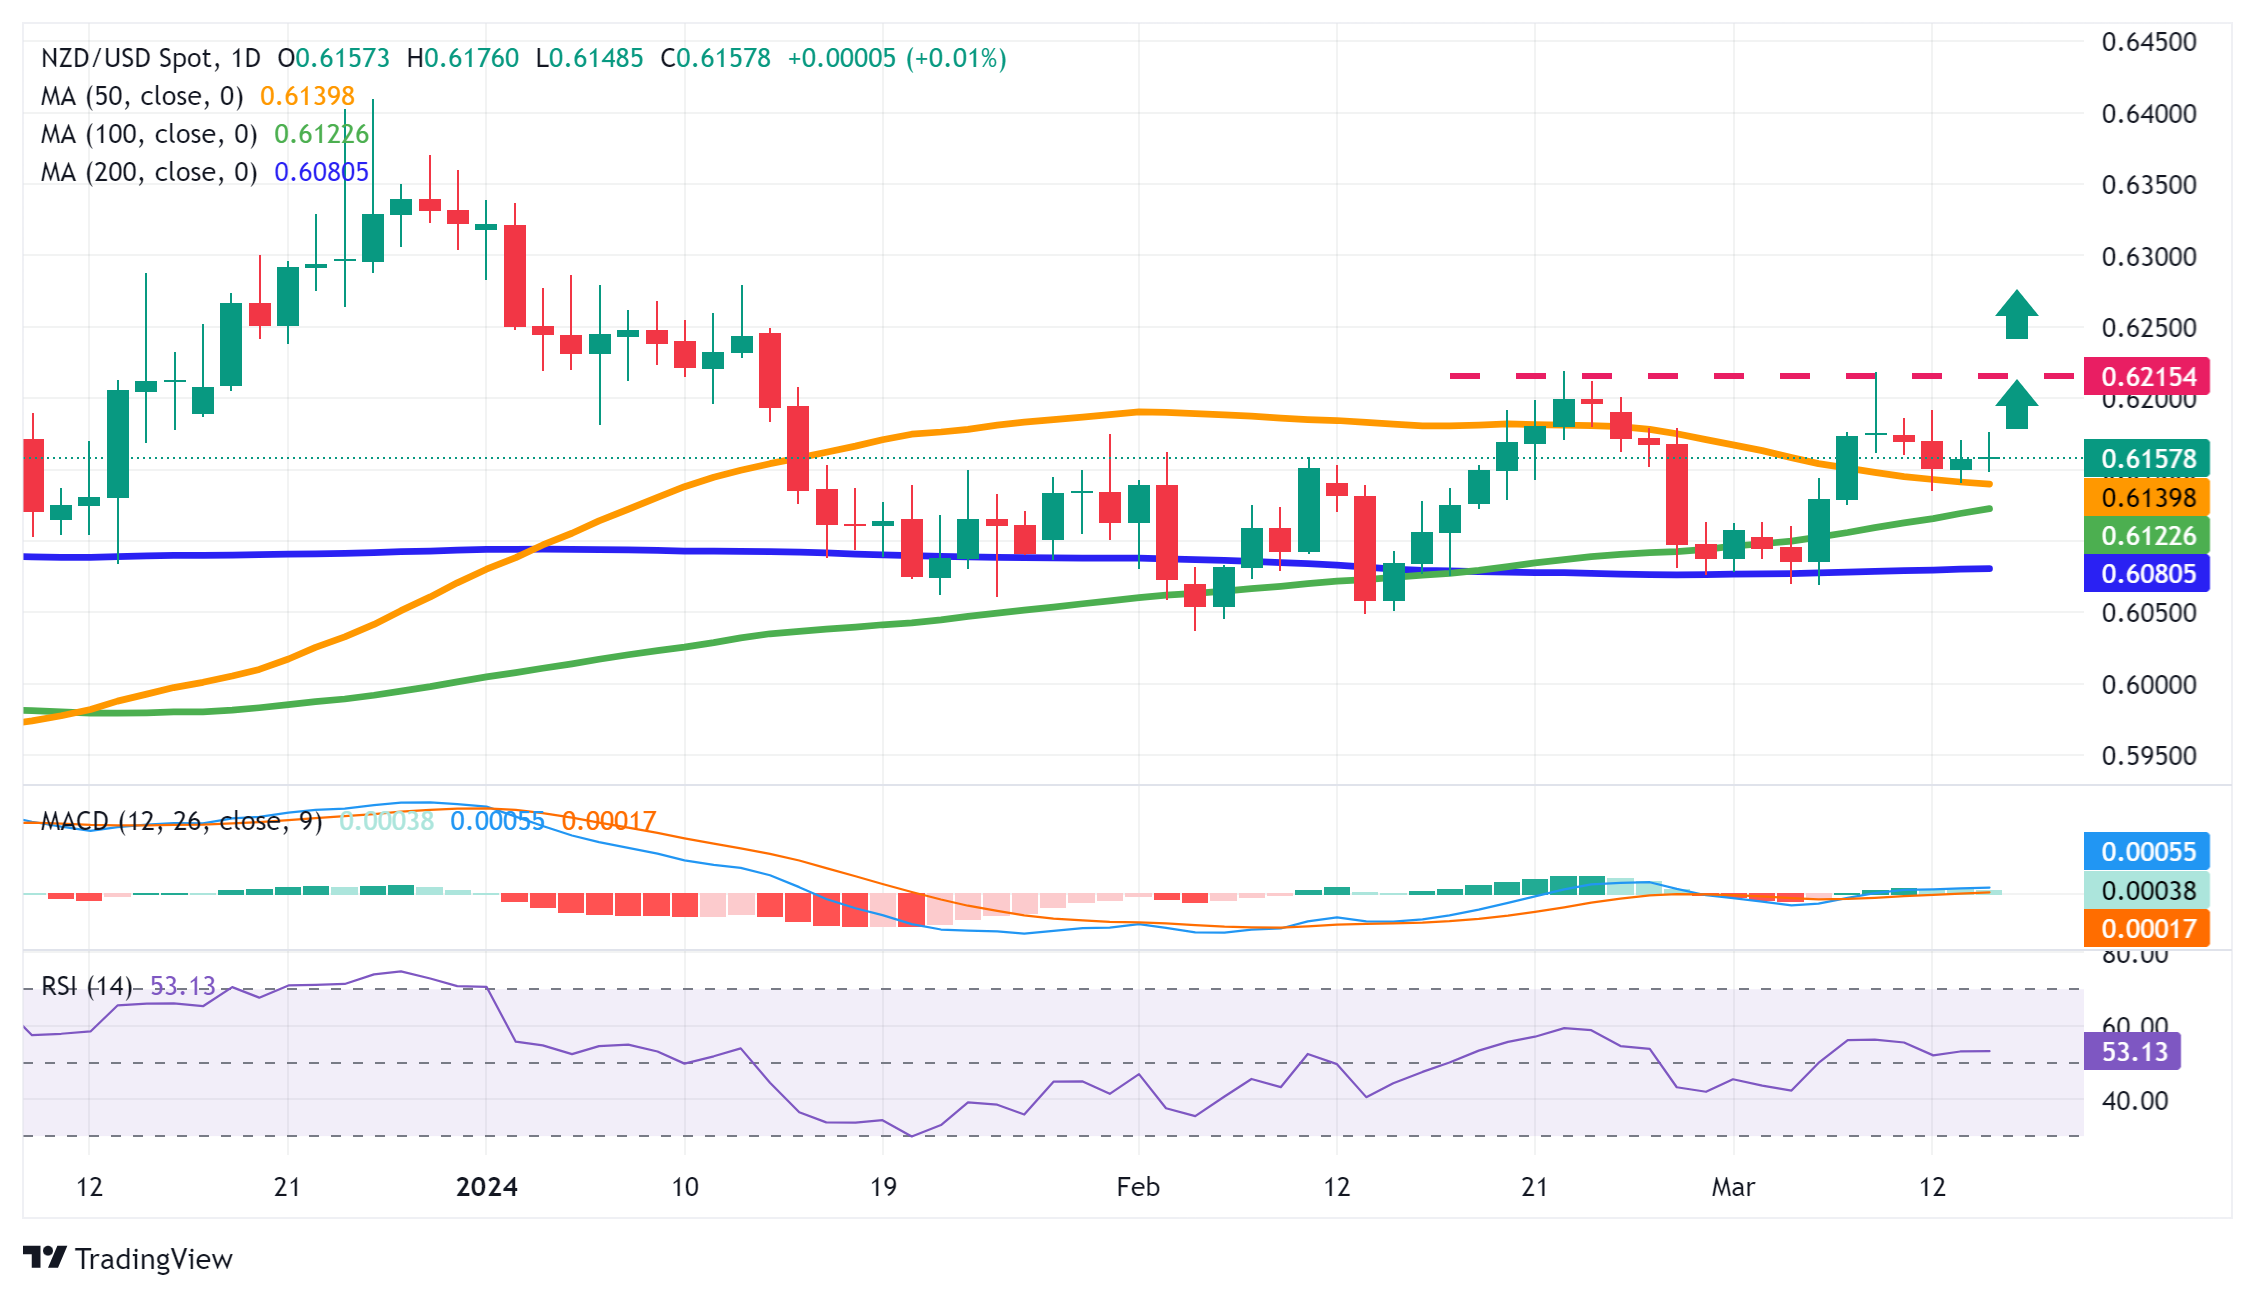
- USD/CHF appreciates for the second day on upbeat US CPI figures.
- CME FedWatch Tool indicates expectations for a rate cut in July have surged to 84.2%.
- Swiss Franc encounters challenges as the SNB shifts its stance on the strength of CHF.
USD/CHF continues to strengthen for the second consecutive day during Thursday's Asian session, inching closer to 0.8790. The pair's appreciation is fueled by a stronger US Dollar (USD) supported by higher US Treasury yields, possibly driven by recent data on “resilient inflation” from the United States (US).
The upbeat US Consumer Price Index (CPI) has tempered expectations for near-term interest rate cuts by the Federal Reserve (Fed). However, market sentiment still leans towards a rate reduction in June, with a likelihood of 67.2%, according to the CME FedWatch Tool. Moreover, expectations for a rate cut in July have surged to 84.2%.
US Treasury Secretary Janet Louise Yellen remarked that it appears unlikely for interest rates to revert to levels as low as those before the Covid-19 pandemic. She also noted that the interest rate assumptions outlined in President Biden's budget plan were deemed "reasonable" and aligned with a broad spectrum of forecasts.
On the other side, the Swiss Franc (CHF) encounters challenges as the Swiss National Bank (SNB) shifts its stance, no longer aiming to promote a strong domestic currency. Moreover, the prevailing risk-on sentiment exerts downward pressure on the Swiss Franc, traditionally considered a safe haven currency.
SNB Chairman Thomas Jordan expressed concerns about the Swiss Franc's excessive strength, particularly for Swiss businesses, especially exporters. His remarks align with data from Switzerland's Foreign Exchange Reserves (CHFER), indicating a recovery in Forex reserves. This suggests that the SNB may be selling Swiss Francs to purchase other currencies, aiming to mitigate the CHF's appreciation.
Meanwhile, the consumer confidence indicator in Switzerland continued its decline, reaching -42.3 in February from January's -41.1. This downward trend reflects heightened concerns regarding personal financial situations and the overall economy in the coming months compared to the previous period. Thursday will see the release of Producer and Import Prices for February, offering further insights into Switzerland's economic landscape.
- EUR/JPY holds positive ground for the third consecutive day near 161.85 on Thursday.
- BoJ’s Ueda comments and risk-on mood weigh on the Japanese Yen against the Euro.
- ECB’s Galhau said it will probably start cutting rates during the spring as a victory against inflation is in sight.
The EUR/JPY cross extends its upside below the 162.00 psychological barrier during the Asian trading hours on Thursday. The diminishing possibility of ending negative interest rates by the Bank of Japan (BoJ) exerts some selling pressure on the Japanese Yen. At press time, EUR/JPY is trading at 161.85, adding 0.05% on the day.
Most analysts anticipate that the Bank of Japan (BoJ) will exit its negative rate policy next week as Japanese policymakers have more evidence of a wage hike after the annual spring negotiations between unions and the biggest companies in Japan this week. However, BoJ Governor Kazuo Ueda offered a slightly bleaker assessment than in January, saying the economy was recovering but also showing some signs of weakness. Furthermore, the risk-on mood environment and bullish sentiment around the global equity markets weigh on the Japanese Yen (JPY) against the Euro (EUR).
The European Central Bank policymaker Francois Villeroy de Galhau said on Wednesday that the central bank will probably start cutting rates during the spring, between April and June as the "victory" against inflation is in sight. Meanwhile, ECB Governing Council member Peter Kazimir stated that the central bank shouldn’t cut interest rates before June as it needs additional data to ensure that inflation has been tamed.
Earlier this month, ECB President Christine Lagarde remarked that the first rate cuts would take place at the June meeting rather than in April. These dovish comments from the ECB policymakers might cap the upside of the EUR and act as a headwind for the EUR/JPY cross.
Moving on, traders will keep an eye on Spain’s Consumer Price Index (CPI) on Thursday, along with the ECB’s Elderson, Schnabel, and De Guindos speeches. The CPI inflation data from France and Italy will be released on Friday. Next week, market players will shift their attention to the BoJ interest rate decision. This event might trigger volatility in the market and give a clear direction to the EUR/JPY cross.
- WTI price continues its upward momentum after a decrease in US stockpiles
- Ukrainian drone attacks targeting Russian refineries raised concerns over supply disruptions.
- EIA US Crude Oil Stocks Change declined in seven weeks.
West Texas Intermediate (WTI) oil prices continue their upward trend for the second consecutive session, climbing to nearly $79.50, up by approximately 0.30% per barrel during Thursday's Asian trading hours.
The surge in oil prices is attributed to a surprise decrease in US Crude stockpiles, suggesting a strengthening demand. Furthermore, concerns over potential supply disruptions following Ukrainian attacks on Russian refineries have further bolstered oil prices.
According to data from the US Energy Information Administration (EIA), US Crude Oil Stocks Change decreased by 1.536 million barrels for the week ending March 8, contradicting the anticipated rise of 1.338 million barrels. This decline, was the first in seven weeks.
The API Weekly Crude Oil Stock also saw an unexpected decrease of 5.521 million barrels in the previous week, compared to the forecasted increase of 0.400 million barrels and the previous week's 0.423 million barrels.
Ukrainian drone attacks targeting Russian refining facilities resulted in a fire at Rosneft's largest refinery. According to Reuters, two sources revealed that the refinery had to close two primary oil refining units as a result. Following the attack on Lukoil's refinery in Nizhny Novgorod on Tuesday, Ukraine also targeted refineries in the Rostov and Ryazan regions.
The Organization of the Petroleum Exporting Countries (OPEC) expressed appreciation for the remarks made by the International Energy Agency (IEA), emphasizing the importance of oil security. The IEA advised industrialized nations, highlighting recent tensions between the IEA and OPEC on issues such as long-term demand and the necessity for investment in new supplies.
- GBP/USD ticks lower on Thursday amid the emergence of some USD buying.
- The divergent BoE-Fed policy expectations should limit any meaningful slide.
- Any further decline might find support near the 1.2750 resistance breakpoint.
The GBP/USD pair continues with its struggle to gain any meaningful traction and extends its consolidative price move around the 1.2800 mark for the second successive day on Thursday. The setup, meanwhile, seems tilted in favour of bullish traders and warrants some caution before positioning for an extension of the recent pullback from the vicinity of the 1.2900 round figure, or the highest level since July 2023 touched last week.
The British Pound (GBP) might continue to draw support from expectations that the Bank of England (BoE) might keep interest rates higher for longer. In contrast, investors seem convinced that the Federal Reserve (Fed) will start cutting interest rates at the June policy meeting. This, along with the underlying strong bullish sentiment around the global equity markets, should cap the upside for the safe-haven Greenback and act as a tailwind for the GBP/USD pair.
Even from a technical perspective, the recent breakout through the 1.2750 horizontal barrier validates the near-term positive outlook. Adding to this, oscillators on the daily chart – though have eased from higher levels – are holding comfortably in the bullish territory and suggest that the path of least resistance for the GBP/USD pair is to the upside. Hence, any further decline might continue to attract some buyers near the 1.2750 resistance breakpoint.
The said area should act as a key pivotal point, which if broken decisively could drag the GBP/USD pair below the 1.2700 mark, towards testing the 50-day Simple Moving Average (SMA) support near the 1.2680 zone. Some follow-through selling might expose the 1.2600 confluence, comprising the 100- and the very important 200-day SMAs. The subsequent slide could turn spot prices vulnerable to retest the YTD low, around the 1.2520-1.2515 region touched in February.
On the flip side, any meaningful positive move beyond the 1.2800 mark is likely to confront some resistance near the weekly swing high, around the 1.2850-1.2860 region. A sustained strength beyond should allow the GBP/USD pair to make a fresh attempt towards conquering the 1.2900 round figure. Some follow-through buying will be seen as a fresh trigger for bulls and lift spot prices to the 1.2940-1.2945 intermediate hurdle en route to the 1.3000 psychological mark.
GBP/USD daily chart
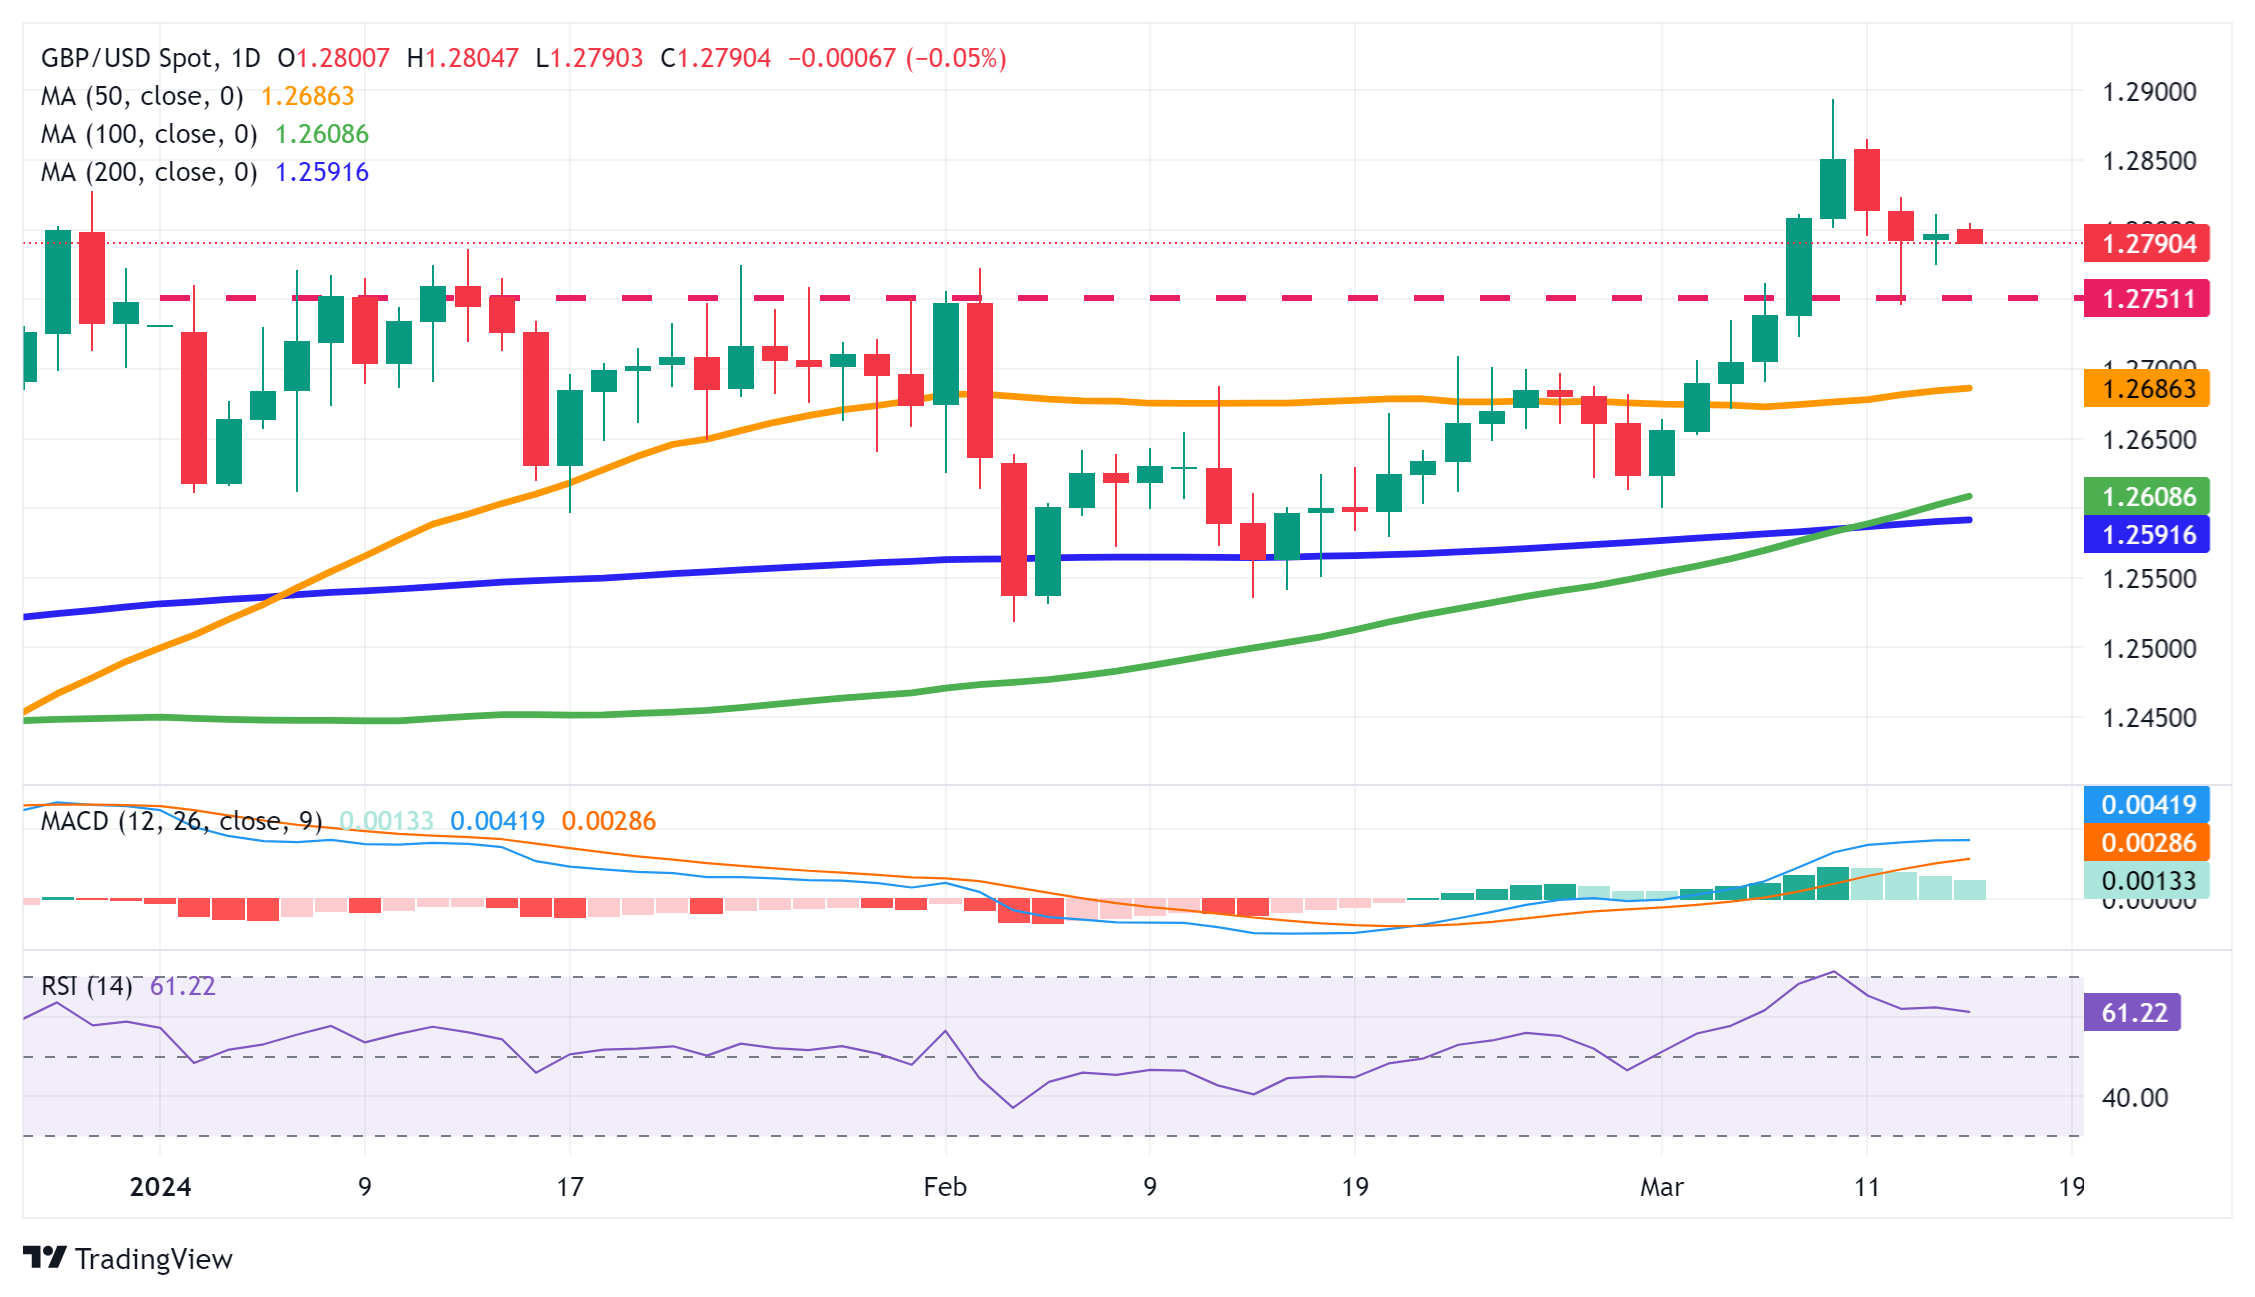
- Gold price struggles to capitalize on the overnight gains and oscillates in a range on Thursday.
- The uncertainty over the Fed’s rate-cut path is seen as a key factor capping the precious metal.
- Subdued USD demand and geopolitical tensions continue to act as a tailwind for the XAU/USD.
Gold price (XAU/USD) regained positive traction on Wednesday and reversed a major part of the previous day's corrective fall from the vicinity of a record peak touched last week. Despite a hot US inflation print, investors still expect the Federal Reserve (Fed) to start cutting interest rates at the June policy meeting. This, in turn, prompted some US Dollar (USD) selling, which, along with escalating geopolitical tensions, provided a goodish lift to the safe-haven precious metal.
The downside for the USD, however, remains limited as investors seek more clarity about the Fed's rate-cut path before placing fresh directional bets. This, in turn, keeps the US Treasury bond yields elevated and fails to assist the non-yielding Gold price to capitalize on the overnight positive move, leading to a subdued range-bound price action during the Asian session on Thursday. This, in turn, warrants some caution before positioning for the resumption of the recent uptrend.
Traders also seem reluctant and might prefer to wait on the sidelines ahead of the two-day FOMC monetary policy meeting starting next Tuesday. In the meantime, Thursday's US macro data – monthly Retail Sales, the Producer Price Index (PPI) and the usual Weekly Initial Jobless Claims – might influence the USD price dynamics. This, along with the US bond yields and the broader risk sentiment, might contribute to producing short-term trading opportunities around the Gold price.
Daily Digest Market Movers: Gold price is underpinned by June Fed rate cut bets, geopolitical risks
- Hopes of an interest rate cut by the Federal Reserve at the June policy meeting keep the US Dollar bulls on the defensive and continue to act as a tailwind for the non-yielding Gold price amid geopolitical risks.
- The US CPI report released on Tuesday indicated some stickiness in inflation, which might force the Fed to stick to its higher-for-longer narrative and hold back the XAU/USD bulls from placing fresh bets.
- Investors remain concerned about geopolitical risks stemming from the prolonged Russia-Ukraine war, and the Israel-Hamas conflict, which further seems to benefit the precious metal’s safe-haven status.
- Russian President Vladimir Putin said on Wednesday that it would be considered a significant escalation of the conflict if the US sent troops to Ukraine and that Moscow was ready for a nuclear war.
- An Israeli attack hit a UN aid distribution centre in Rafah, while Lebanon’s Hezbollah said two of its fighters were killed in the Bekaa Valley after Israel launched a strike on the area for a second straight day.
- A report from US news site Politico noted that senior US officials have told their Israeli counterparts that the Biden administration will support the targeting of high-value Hamas targets in and underneath Rafah.
- The uncertainty over the Fed's rate-cut path keeps the US Treasury bond yields elevated, which helps limit any meaningful USD fall and should cap any meaningful appreciating move for the precious metal.
- Traders now look to Thursday's US macro data – monthly Retail Sales, the Producer Price Index and Weekly Jobless Claims – for some impetus, though the focus remains on next week's FOMC policy meeting.
Technical Analysis: Gold price needs to move beyond the record high for bulls to regain control
From a technical perspective, any subsequent move up is more likely to confront some resistance near the $2,195 region, or the record peak touched last Friday. Some follow-through buying beyond the $2,200 mark will push the Gold price to uncharted territory and be seen as a fresh trigger for bulls, setting the stage for an extension of the recent blowout rally witnessed over the past two weeks or so.
On the flip side, the $2,155-2,150 area now seems to protect the immediate downside, below which the Gold price could slide to the next relevant support near the $2,128-2,127 zone. The corrective decline could extend further towards the $2,100 round figure, which should act as a strong base for the XAU/USD. A convincing break below might prompt some technical selling and pave the way for deeper losses.
US Dollar price today
The table below shows the percentage change of US Dollar (USD) against listed major currencies today. US Dollar was the strongest against the Japanese Yen.
| USD | EUR | GBP | CAD | AUD | JPY | NZD | CHF | |
| USD | 0.07% | 0.03% | 0.02% | 0.11% | 0.13% | -0.03% | 0.03% | |
| EUR | -0.06% | -0.03% | -0.05% | 0.04% | 0.05% | -0.09% | -0.04% | |
| GBP | -0.03% | 0.04% | -0.02% | 0.07% | 0.09% | -0.06% | 0.00% | |
| CAD | -0.02% | 0.07% | 0.03% | 0.09% | 0.11% | -0.04% | 0.02% | |
| AUD | -0.11% | -0.07% | -0.10% | -0.10% | 0.01% | -0.12% | -0.08% | |
| JPY | -0.13% | -0.05% | -0.09% | -0.13% | 0.00% | -0.15% | -0.09% | |
| NZD | 0.03% | 0.10% | 0.06% | 0.04% | 0.14% | 0.15% | 0.08% | |
| CHF | -0.03% | 0.04% | 0.01% | -0.01% | 0.08% | 0.09% | -0.06% |
The heat map shows percentage changes of major currencies against each other. The base currency is picked from the left column, while the quote currency is picked from the top row. For example, if you pick the Euro from the left column and move along the horizontal line to the Japanese Yen, the percentage change displayed in the box will represent EUR (base)/JPY (quote).
Gold FAQs
Why do people invest in Gold?
Gold has played a key role in human’s history as it has been widely used as a store of value and medium of exchange. Currently, apart from its shine and usage for jewelry, the precious metal is widely seen as a safe-haven asset, meaning that it is considered a good investment during turbulent times. Gold is also widely seen as a hedge against inflation and against depreciating currencies as it doesn’t rely on any specific issuer or government.
Who buys the most Gold?
Central banks are the biggest Gold holders. In their aim to support their currencies in turbulent times, central banks tend to diversify their reserves and buy Gold to improve the perceived strength of the economy and the currency. High Gold reserves can be a source of trust for a country’s solvency. Central banks added 1,136 tonnes of Gold worth around $70 billion to their reserves in 2022, according to data from the World Gold Council. This is the highest yearly purchase since records began. Central banks from emerging economies such as China, India and Turkey are quickly increasing their Gold reserves.
How is Gold correlated with other assets?
Gold has an inverse correlation with the US Dollar and US Treasuries, which are both major reserve and safe-haven assets. When the Dollar depreciates, Gold tends to rise, enabling investors and central banks to diversify their assets in turbulent times. Gold is also inversely correlated with risk assets. A rally in the stock market tends to weaken Gold price, while sell-offs in riskier markets tend to favor the precious metal.
What does the price of Gold depend on?
The price can move due to a wide range of factors. Geopolitical instability or fears of a deep recession can quickly make Gold price escalate due to its safe-haven status. As a yield-less asset, Gold tends to rise with lower interest rates, while higher cost of money usually weighs down on the yellow metal. Still, most moves depend on how the US Dollar (USD) behaves as the asset is priced in dollars (XAU/USD). A strong Dollar tends to keep the price of Gold controlled, whereas a weaker Dollar is likely to push Gold prices up.
- Indian Rupee struggles to gain ground on Thursday amid the renewed USD demand, higher US Treasury bond yields.
- The foreign outflows and the upbeat US CPI report for February might drag the INR lower in the near term.
- India’s Wholesale Price Index (WPI) of Food, Fuel and Inflation, and US Retail Sales will be released on Thursday.
Indian Rupee (INR) trades on a negative note on Thursday on the stronger US Dollar (USD) and higher US Treasury bond yields. The downside of USD/INR is likely to be limited in the near term amid the foreign outflows and the hotter-than-expected US CPI report for February suggested that the Federal Reserve (Fed) will wait longer to cut interest rates. Additionally, the rebound in oil prices also weighs on the INR as India ranks third in the world for oil consumption.
Market players await India’s Wholesale Price Index (WPI) of Food, Fuel, and Inflation on Thursday for fresh impetus. The Indian WPI Inflation is estimated to ease to 0.25% YoY in February from 0.27% in January. On the US docket, US Retail Sales will be the highlight on Thursday. Also, the Producer Price Index (PPI), Business Inventories, and usual weekly Initial Jobless Claims will be due later in the day.
Daily Digest Market Movers: Indian Rupee remains sensitive to global factors
- Morgan Stanley forecast that India’s current expansion resembles the booming 2003–2007 period, when GDP growth averaged 8.6%, as investment has become a major driver of India’s economy.
- The Indian economy was estimated to grow at 7.6%, according to the central government’s second advance estimate for FY 2024.
- The Indian Chief Economic Advisor (CEA), V Anantha Nageswaran, has projected that the Indian economy will expand at a faster pace than the government's estimates due to the increase in the activities of the industry and service sectors of the country.
- India's Retail inflation dropped to 5.09% YoY in February from the previous reading of 5.10%, above the consensus of 5.02%, according to the Ministry of Statistics & Programme Implementation.
- The stronger-than-expected US CPI data report might keep the Fed on course to wait at least until the summer before starting to lower interest rates.
- Financial markets have priced in a 75% odds of a 25 basis points (bps) rate cut in June, down from 95% at the beginning of the week, according to the CME FedWatch Tools.
Technical Analysis: Indian Rupee continues to trade in a longer trading range of 82.60–83.15
Indian Rupee trades weaker on the day. USD/INR remains confined within a multi-month-old descending trend channel around 82.60–83.15 since December 8, 2023.
Technically, USD/INR maintains the bearish outlook unchanged in the near term as the pair is below the 100-day Exponential Moving Average (EMA) on the daily chart. It’s worth noting that the 14-day Relative Strength Index (RSI) lies below the 50.0 midlines, suggesting the path of least resistance is to the downside.
Any follow-through buying above the confluence of the 100-day EMA and a psychological round mark of 83.00 might convince the bulls to charge again, possibly taking the pair to the upper boundary of the descending trend channel near 83.15. A break above this level will pave the way to the next upside target near a high of January 2 at 83.35, en route to the 84.00 round figure.
On the downside, the key support level for USD/INR is seen near the lower limit of the descending trend channel at 82.60. A breach of the mentioned level will see a drop to a low of August 23 at 82.45, followed by a low of June 1 at 82.25.
US Dollar price today
The table below shows the percentage change of US Dollar (USD) against listed major currencies today. US Dollar was the strongest against the Australian Dollar.
| USD | EUR | GBP | CAD | AUD | JPY | NZD | CHF | |
| USD | 0.07% | 0.04% | 0.02% | 0.10% | 0.09% | -0.06% | 0.03% | |
| EUR | -0.07% | -0.02% | -0.05% | 0.03% | 0.02% | -0.13% | -0.04% | |
| GBP | -0.03% | 0.04% | -0.02% | 0.06% | 0.05% | -0.11% | -0.01% | |
| CAD | -0.02% | 0.05% | 0.04% | 0.09% | 0.06% | -0.08% | 0.01% | |
| AUD | -0.11% | -0.08% | -0.09% | -0.09% | -0.03% | -0.16% | -0.08% | |
| JPY | -0.10% | -0.02% | -0.04% | -0.08% | 0.03% | -0.14% | -0.05% | |
| NZD | 0.06% | 0.11% | 0.10% | 0.08% | 0.17% | 0.14% | 0.11% | |
| CHF | -0.03% | 0.02% | 0.01% | -0.01% | 0.08% | 0.05% | -0.10% |
The heat map shows percentage changes of major currencies against each other. The base currency is picked from the left column, while the quote currency is picked from the top row. For example, if you pick the Euro from the left column and move along the horizontal line to the Japanese Yen, the percentage change displayed in the box will represent EUR (base)/JPY (quote).
Indian Rupee FAQs
What are the key factors driving the Indian Rupee?
The Indian Rupee (INR) is one of the most sensitive currencies to external factors. The price of Crude Oil (the country is highly dependent on imported Oil), the value of the US Dollar – most trade is conducted in USD – and the level of foreign investment, are all influential. Direct intervention by the Reserve Bank of India (RBI) in FX markets to keep the exchange rate stable, as well as the level of interest rates set by the RBI, are further major influencing factors on the Rupee.
How do the decisions of the Reserve Bank of India impact the Indian Rupee?
The Reserve Bank of India (RBI) actively intervenes in forex markets to maintain a stable exchange rate, to help facilitate trade. In addition, the RBI tries to maintain the inflation rate at its 4% target by adjusting interest rates. Higher interest rates usually strengthen the Rupee. This is due to the role of the ‘carry trade’ in which investors borrow in countries with lower interest rates so as to place their money in countries’ offering relatively higher interest rates and profit from the difference.
What macroeconomic factors influence the value of the Indian Rupee?
Macroeconomic factors that influence the value of the Rupee include inflation, interest rates, the economic growth rate (GDP), the balance of trade, and inflows from foreign investment. A higher growth rate can lead to more overseas investment, pushing up demand for the Rupee. A less negative balance of trade will eventually lead to a stronger Rupee. Higher interest rates, especially real rates (interest rates less inflation) are also positive for the Rupee. A risk-on environment can lead to greater inflows of Foreign Direct and Indirect Investment (FDI and FII), which also benefit the Rupee.
How does inflation impact the Indian Rupee?
Higher inflation, particularly, if it is comparatively higher than India’s peers, is generally negative for the currency as it reflects devaluation through oversupply. Inflation also increases the cost of exports, leading to more Rupees being sold to purchase foreign imports, which is Rupee-negative. At the same time, higher inflation usually leads to the Reserve Bank of India (RBI) raising interest rates and this can be positive for the Rupee, due to increased demand from international investors. The opposite effect is true of lower inflation.
- EUR/USD moves sideways ahead of Thursday's release of US PPI and Retail Sales data.
- US Fed is expected to cut interest rate in June despite upbeat inflation data.
- ECB policymakers have signaled the possibility of a rate cut in the upcoming spring season.
EUR/USD remains steady near 1.0950 during Thursday's Asian session, in an attempt to maintain gains from the prior session. The EUR/USD pair received a boost as the US Dollar (USD) struggled to sustain its strength despite higher US Treasury yields spurred by positive inflation data. Market participants are eagerly anticipating the release of the US Core Producer Price Index (PPI) and Retail Sales data later today.
However, market participants are maintaining their bets on interest rate cuts by the US Federal Reserve (Fed) in June, with a probability of 67.2%, as reported by the CME FedWatch Tool. US Treasury Secretary Janet Louise Yellen commented that it seems improbable for interest rates to return to pre-COVID-19 levels. She also mentioned that the interest rate projections outlined in President Biden's budget plan were considered "reasonable" and consistent with a wide range of forecasts.
On the other side, anticipation mounts for the European Central Bank (ECB) to lower borrowing costs come June, a move that could potentially weaken the Euro. ECB policymaker Francois Villeroy de Galhau indicated on Wednesday that a rate cut in the spring remains likely, emphasizing their vigilance on inflation while expressing confidence in nearing victory over current economic challenges.
Adding to the discourse, ECB member Martins Kazaks suggested that if the euro-area economy aligns closely with the ECB’s projections, the decision to commence interest rate reductions could be reached in the upcoming meetings. Furthermore, ECB Board Members Frank Elderson and Isabel Schnabel are scheduled to deliver speeches at the Money Market Contact Group meeting in Frankfurt, Germany.
- Sensex is set to open on a cautious footing after Wednesday’s bloodbath.
- India’s Sensex lost over 1.0% on Wednesday, undermined by small and midcap indices.
- Attention now shifts toward India’s WPI data, US Retail Sales and PPI inflation data.
The Sensex 30, one of India’s key benchmark indices, is set to open on a cautious foot on Thursday, having ended Wednesday over one percent on the back of heavy bleeding in small and midcap indices.
The Bombay Stock Exchange (BSE) Sensex 30 settled 1.23% lower on the day at 72,761.89. The BSE Midcap index crashed nearly 4.0% while the BSE Smallcap index plunged 4.5%.
Stock market news
- The top gainers on Sensex on Wednesday were ITC, Nestle, Kotak Mahindra Bank, Bajaj Finance and ICICI Bank. Meanwhile, the top losers include Power Grid, NTPC, Tata Steel, Tata Motors and JSW Steel.
- India's rising valuations prompted investors and foreign companies to sell their holdings.
- According to a risk disclosure format that the Association of Mutual Funds in India (Amfi) has shared with fund houses, Mutual Funds (MFs) will have to disclose the total investment of the top 10 investors in two active schemes.
- In adherence to the Amfi regulation, MFs are poised to release their inaugural stress test reports later this week but this will necessitate additional disclosures.
- Shares of Powergrid and NTPC tanked nearly 7.0%.
- Shares of ITC rebounded amid an expected 3.50% stake sale by British American Tobacco (BAT) in the company on Wednesday.
- Indian government allowed the Reserve Bank of India (RBI) to import gold without paying import levies.
- India’s headline CPI retail inflation came in at 5.09% in February compared to the 5.1% print for January. Meanwhile, the country’s Industrial Production stayed unchanged at 3.8% in January, missing the estimates of 4.1%.
- The US stock markets failed to sustain the previous rebound and closed mixed on Wednesday, as investors now look for more US economic data after the US Consumer Price Index (CPI) report failed to have any impact on the June Fed rate cut expectations.
- The US CPI rose 3.2% in February from a year ago, beating the market forecast of 3.1%. The monthly CPI increased 0.4% in the same period. Core CPI, which excludes food and energy prices, increased 0.4% from the last month and 3.8% over the year.
- Markets continue to price in about a 70% chance that the Fed could begin easing rates in June, according to the CME FedWatch Tool.
- Attention now turns toward the Indian Wholesale Price Index (WPI), US Retail Sales and Producer Price Index (PPI) data due later on Thursday.
Sensex FAQs
The Sensex is a name for one of India’s most closely monitored stock indexes. The term was coined in the 1980s by analyst Deepak Mohoni by mashing the words sensitive and index together. The index plots a weighted average of the share price of 30 of the most established stocks on the Bombay Stock Exchange. Each corporation's weighting is based on its "free-float capitalization", or the value of all its shares readily available for trading.
Given it is a composite, the value of the Sensex is first and foremost dependent on the performance of its constituent companies as revealed in their quarterly and annual results. Government policies are another factor. In 2016 the government decided to phase out high value currency notes, for example, and certain companies saw their share price fall as a result. When the government decided to cut corporation tax in 2019, meanwhile, the Sensex gained a boost. Other factors include the level of interest rates set by the Reserve Bank of India, since that dictates the cost of borrowing, climate change, pandemics and natural disasters
The Sensex started life on April 1 1979 at a base level of 100. It reached its highest recorded level so far, at 73,328, on Monday, January 15, 2024 (this is being written in Feb 2024). The Index closed above the 10,000 mark for the first time on February 7, 2006. On March 13, 2014 the Sensex closed higher than Hong Kong’s Hang Seng index to become the major Asian stock index with the highest value. The index’s biggest gain in a single day occurred on April 7, 2020, when it rose 2,476 points; its deepest single-day loss occurred on January 21, 2008, when it plunged 1,408 points due the US subprime crisis.
Major companies within the Sensex include Reliance Industries Ltd, HDFC Bank, Axis Bank, ITC Ltd, Bharti Airtel Ltd, Tata Steel, HCL Technologies, Infosys, State Bank of India, Sun Pharma, Tata Consultancy Services and Tech Mahindra.
| Raw materials | Closed | Change, % |
|---|---|---|
| Silver | 25.025 | 3.71 |
| Gold | 2174.486 | 0.74 |
| Palladium | 1059.78 | 2.11 |
- The Japanese Yen draws some support from bets for an eventual BoJ policy pivot.
- The uncertainty over the Fed’s rate-cut path keeps the USD bulls on the defensive.
- Traders also seem reluctant ahead of the BoJ and FOMC policy meetings next week.
The Japanese Yen (JPY) struggles to gain any meaningful traction during the Asian session on Thursday and remains confined in the previous day's broader trading range against its American counterpart. The outcome of Japan’s spring wage negotiations indicated that most firms have agreed to the trade unions' wage rise demands, paving the way for an imminent shift in the Bank of Japan's (BoJ) policy stance. Apart from this, persistent geopolitical tensions lend some support to the safe-haven JPY, which, along with subdued US Dollar (USD) demand, exerts some pressure on the USD/JPY pair.
Meanwhile, the BoJ Governor Kazuo Ueda offered a slightly bleaker assessment of the economy earlier this week and cooled bets for an early interest rate hike, capping gains for the JPY. The USD, on the other hand, struggle to gain any meaningful traction as investors seek more clarity about the Federal Reserve’s (Fed) rate cut path. This further contributes to the USD/JPY pair's range-bound price move as traders now look forward to next week's key central bank event risks – the highly-anticipated BoJ decision on Tuesday and the Fed policy update on Wednesday – before placing fresh directional bets.
In the meantime, Thursday's US economic docket – featuring the release of monthly Retail Sales, the Producer Price Index (PPI) and the usual Weekly Initial Jobless Claims – might provide some impetus to the USD/JPY pair. The immediate market reaction, however, is likely to be limited, warranting some caution for short-term traders.
Daily Digest Market Movers: Japanese Yen bulls seem non-committed amid BoJ/Fed uncertainty
- Japan's biggest companies responded to the Union's wage hike demand in full, clearing the way for the Bank of Japan to end its negative interest rates as early as next week and underpinning the Japanese Yen.
- Japanese media reported that more BoJ policymakers are backing the idea of a policy shift at the upcoming policy meeting as pay hikes by major companies bring the 2% price stability target within reach.
- According to people familiar with the matter, the assessment of BoJ officials is that the central bank is close to liftoff, regardless of whether the first rate hike since 2007 comes in March or April policy meeting.
- That said, the BoJ Governor Kazuo Ueda said earlier this week that the central bank will seek an exit from easy policy when achievement of 2% inflation is in sight, cooling bets for an early interest rate hike.
- An Israeli attack hit a UN aid distribution centre in Rafah, while Lebanon’s Hezbollah said two of its fighters were killed in the Bekaa Valley after Israel launched attacks on the area for a second straight day.
- A report from US news site Politico says that senior US officials have told their Israeli counterparts that the Biden administration will support the targeting of high-value Hamas targets in and underneath Rafah.
- The slightly warmer US consumer inflation released on Tuesday fuelled speculations that the Federal Reserve might stick to its higher for longer narrative, though the markets are still pricing in a rate cut in June.
- This keeps the US Dollar bulls on the defensive and does little to provide any meaningful impetus to the USD/JPY pair as traders remain on the sidelines ahead of the BoJ and FOMC monetary policy meetings next week.
- In the meantime, Thursday's release of US macro data – Retail Sales, Producer Price Index (PPI) and Weekly Initial Jobless Claims – might produce short-term trading opportunities ahead of the key central bank event risks.
Technical Analysis: USD/JPY bears have the upper hand while below 100-day SMA and 148.00 mark
From a technical perspective, the USD/JPY pair has been showing some resilience below the 38.2% Fibonacci retracement level of the December-February rally. The subsequent move up, however, struggled to find acceptance above the 100-day Simple Moving Average (SMA) and faltered ahead of the 23.6% Fibo. level. Moreover, oscillators on the daily chart are still holding deep in the negative territory and are still away from being in the oversold zone, suggesting that the path of least resistance for spot prices is to the downside.
That said, any further decline is likely to find some support near the overnight low, around the 147.25-147.20 area, ahead of the 147.00 mark and the 146.80 zone (38.2% Fibo.). This is closely followed by the 146.50-146.45 region, or the monthly trough, and the 200-day SMA, currently near the 146.30 region. Some follow-through selling, leading to a subsequent break below the 146.00 mark will be seen as a fresh trigger for bearish traders and drag the USD/JPY pair to mid-145.00s (50% Fibo.) en route to the 145.00 psychological mark.
Japanese Yen price today
The table below shows the percentage change of Japanese Yen (JPY) against listed major currencies today. Japanese Yen was the strongest against the Euro.
| USD | EUR | GBP | CAD | AUD | JPY | NZD | CHF | |
| USD | 0.04% | 0.02% | 0.01% | 0.02% | -0.04% | -0.12% | -0.01% | |
| EUR | -0.04% | -0.02% | -0.04% | -0.03% | -0.09% | -0.16% | -0.05% | |
| GBP | -0.02% | 0.02% | -0.02% | -0.01% | -0.07% | -0.15% | -0.03% | |
| CAD | -0.01% | 0.05% | 0.04% | 0.02% | -0.04% | -0.13% | -0.01% | |
| AUD | -0.02% | 0.00% | -0.02% | -0.02% | -0.06% | -0.13% | -0.03% | |
| JPY | 0.04% | 0.09% | 0.07% | 0.03% | 0.08% | -0.08% | 0.04% | |
| NZD | 0.13% | 0.17% | 0.15% | 0.13% | 0.14% | 0.08% | 0.14% | |
| CHF | 0.01% | 0.05% | 0.03% | 0.01% | 0.03% | -0.03% | -0.11% |
The heat map shows percentage changes of major currencies against each other. The base currency is picked from the left column, while the quote currency is picked from the top row. For example, if you pick the Euro from the left column and move along the horizontal line to the Japanese Yen, the percentage change displayed in the box will represent EUR (base)/JPY (quote).
Japanese Yen FAQs
What key factors drive the Japanese Yen?
The Japanese Yen (JPY) is one of the world’s most traded currencies. Its value is broadly determined by the performance of the Japanese economy, but more specifically by the Bank of Japan’s policy, the differential between Japanese and US bond yields, or risk sentiment among traders, among other factors.
How do the decisions of the Bank of Japan impact the Japanese Yen?
One of the Bank of Japan’s mandates is currency control, so its moves are key for the Yen. The BoJ has directly intervened in currency markets sometimes, generally to lower the value of the Yen, although it refrains from doing it often due to political concerns of its main trading partners. The current BoJ ultra-loose monetary policy, based on massive stimulus to the economy, has caused the Yen to depreciate against its main currency peers. This process has exacerbated more recently due to an increasing policy divergence between the Bank of Japan and other main central banks, which have opted to increase interest rates sharply to fight decades-high levels of inflation.
How does the differential between Japanese and US bond yields impact the Japanese Yen?
The BoJ’s stance of sticking to ultra-loose monetary policy has led to a widening policy divergence with other central banks, particularly with the US Federal Reserve. This supports a widening of the differential between the 10-year US and Japanese bonds, which favors the US Dollar against the Japanese Yen.
How does broader risk sentiment impact the Japanese Yen?
The Japanese Yen is often seen as a safe-haven investment. This means that in times of market stress, investors are more likely to put their money in the Japanese currency due to its supposed reliability and stability. Turbulent times are likely to strengthen the Yen’s value against other currencies seen as more risky to invest in.
- Australian Dollar extends gains as the RBA is expected to raise interest rates even further.
- Australia's S&P/ASX 200 Index tracks declines in the financial-linked shares, outweighing iron ore miners.
- CME FedWatch Tool suggests the probability of a rate cut in March and May has decreased to 1.0% and 9.6%, respectively.
The Australian Dollar (AUD) continues to advance for the second consecutive day on Thursday. The AUD/USD pair strengthens due to expectations of the Federal Reserve (Fed) initiating interest rate cuts in June, while the Reserve Bank of Australia (RBA) continues to suggest it may need to raise rates even further. RBA Governor Michelle Bullock recently stated that inflation in Australia is primarily "homegrown" and "demand-driven," attributable to the strength of the labor market and increasing wage inflation. The RBA does not anticipate inflation falling back to target until 2026.
Australian Dollar may face downward pressure due to the lower S&P/ASX 200 Index, driven by declines in the financial sector that outweigh the gains in iron ore miners. Shares linked to the Australian financial sector, including Westpac Banking, Commonwealth Bank, ANZ Group, National Australia Bank, and Macquarie Group, are leading the losses. Traders are awaiting the release of the US Core Producer Price Index (PPI) and Retail Sales data scheduled for Thursday, which could further influence market sentiment and the direction of the AUD/USD pair.
Daily Digest Market Movers: Australian Dollar gains ground on RBA’s hawkish tone
- Australia's NAB Business Confidence Index decreased to 0 in February, from 1 in the previous month.
- Australia's NAB Business Conditions Index improved to 10 from the previous reading of 7 (revised from 6).
- Former RBA Governor Philip Lowe stated on Wednesday that there is a two-way risk on interest rates, supporting current RBA Governor Michelle Bullock's warning that interest rates might still need to increase.
- Chinese Foreign Minister Wang Yi is scheduled to meet with Australia's Foreign Affairs Minister Penny Wong in Canberra on March 20. The discussions are expected to cover various topics, including economic issues such as the removal of trade barriers, as well as more sensitive issues like human rights and regional security.
- US Treasury Secretary Janet Louise Yellen remarked that it appears unlikely for interest rates to revert to levels as low as those before the Covid-19 pandemic. She also noted that the interest rate assumptions outlined in Biden’s budget plan were deemed "reasonable" and aligned with a broad spectrum of forecasts.
- According to the CME FedWatch Tool, the probability of a rate cut in March has decreased to 1.0%, while in May it stands at 9.6%. The likelihood of a rate cut in June and July is estimated to be 67.2% and 84.2%, respectively.
- US CPI (YoY) came in at 3.2% in February, exceeding estimates of 3.1% and above January’s 3.1%. The monthly index printed 0.4% as expected above 0.3% prior.
- US Core CPI increased by 3.8% year-over-year, above the expected 3.7% but below the previous 3.9% reading. While MoM remained consistent at 0.4% against the expected 0.3%.
- The Monthly Budget Statement printed a deficit of $296 billion in February, below the expected deficit of $299 billion. However, it has sharply increased from the previous deficit of $22 billion.
Technical Analysis: Australian Dollar extends gains to near 0.6630
The Australian Dollar trades near 0.6630 on Thursday. Major resistance appears at the level of 0.6650, followed by the previous week’s high of 0.6667. A breakthrough above the latter could provide further momentum for the pair to challenge the psychological barrier of the 0.6700 level. On the downside, the AUD/USD pair could find immediate support at the 23.6% Fibonacci retracement of 0.6614 level, followed by the psychological level of 0.6600. and the nine-day Exponential Moving Average (EMA) at 0.6595. Further support lies at the 38.2% Fibonacci retracement level of 0.6581.
AUD/USD: Daily Chart
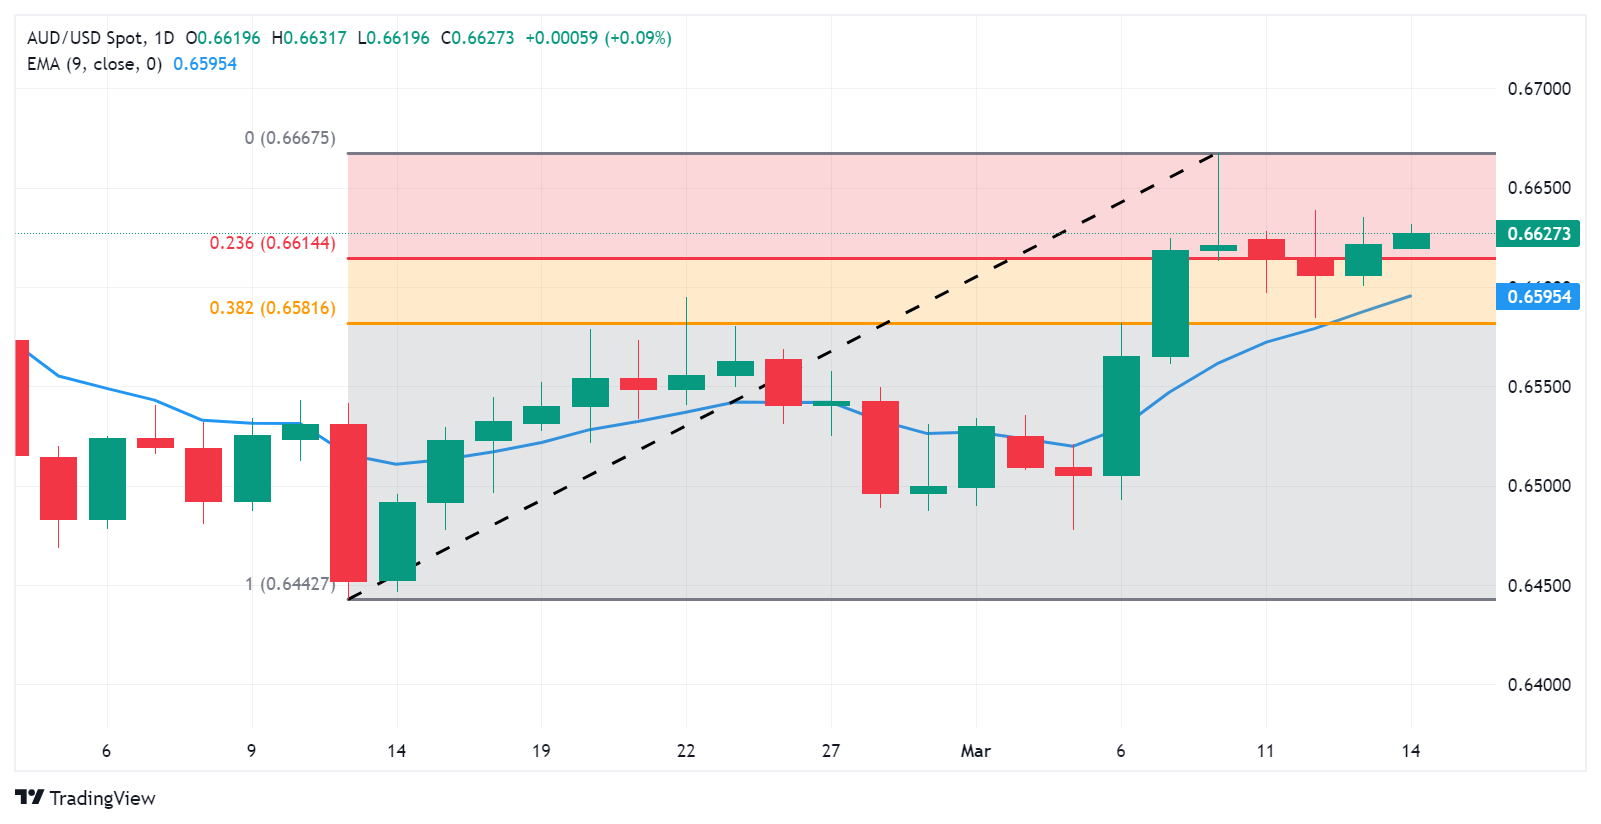
Australian Dollar price today
The table below shows the percentage change of Australian Dollar (AUD) against listed major currencies today. Australian Dollar was the strongest against the Euro.
| USD | EUR | GBP | CAD | AUD | JPY | NZD | CHF | |
| USD | 0.05% | 0.02% | 0.01% | 0.02% | -0.01% | -0.11% | 0.00% | |
| EUR | -0.05% | -0.02% | -0.04% | -0.03% | -0.07% | -0.17% | -0.05% | |
| GBP | -0.03% | 0.03% | -0.02% | -0.01% | -0.05% | -0.15% | -0.03% | |
| CAD | -0.01% | 0.05% | 0.04% | 0.03% | -0.02% | -0.12% | -0.01% | |
| AUD | -0.03% | -0.01% | -0.03% | -0.03% | -0.05% | -0.13% | -0.02% | |
| JPY | 0.01% | 0.07% | 0.04% | 0.00% | 0.05% | -0.10% | 0.01% | |
| NZD | 0.12% | 0.16% | 0.15% | 0.12% | 0.14% | 0.10% | 0.13% | |
| CHF | 0.00% | 0.05% | 0.03% | 0.01% | 0.04% | -0.03% | -0.11% |
The heat map shows percentage changes of major currencies against each other. The base currency is picked from the left column, while the quote currency is picked from the top row. For example, if you pick the Euro from the left column and move along the horizontal line to the Japanese Yen, the percentage change displayed in the box will represent EUR (base)/JPY (quote).
Australian Dollar FAQs
One of the most significant factors for the Australian Dollar (AUD) is the level of interest rates set by the Reserve Bank of Australia (RBA). Because Australia is a resource-rich country another key driver is the price of its biggest export, Iron Ore. The health of the Chinese economy, its largest trading partner, is a factor, as well as inflation in Australia, its growth rate and Trade Balance. Market sentiment – whether investors are taking on more risky assets (risk-on) or seeking safe-havens (risk-off) – is also a factor, with risk-on positive for AUD.
The Reserve Bank of Australia (RBA) influences the Australian Dollar (AUD) by setting the level of interest rates that Australian banks can lend to each other. This influences the level of interest rates in the economy as a whole. The main goal of the RBA is to maintain a stable inflation rate of 2-3% by adjusting interest rates up or down. Relatively high interest rates compared to other major central banks support the AUD, and the opposite for relatively low. The RBA can also use quantitative easing and tightening to influence credit conditions, with the former AUD-negative and the latter AUD-positive.
China is Australia’s largest trading partner so the health of the Chinese economy is a major influence on the value of the Australian Dollar (AUD). When the Chinese economy is doing well it purchases more raw materials, goods and services from Australia, lifting demand for the AUD, and pushing up its value. The opposite is the case when the Chinese economy is not growing as fast as expected. Positive or negative surprises in Chinese growth data, therefore, often have a direct impact on the Australian Dollar and its pairs.
Iron Ore is Australia’s largest export, accounting for $118 billion a year according to data from 2021, with China as its primary destination. The price of Iron Ore, therefore, can be a driver of the Australian Dollar. Generally, if the price of Iron Ore rises, AUD also goes up, as aggregate demand for the currency increases. The opposite is the case if the price of Iron Ore falls. Higher Iron Ore prices also tend to result in a greater likelihood of a positive Trade Balance for Australia, which is also positive of the AUD.
The Trade Balance, which is the difference between what a country earns from its exports versus what it pays for its imports, is another factor that can influence the value of the Australian Dollar. If Australia produces highly sought after exports, then its currency will gain in value purely from the surplus demand created from foreign buyers seeking to purchase its exports versus what it spends to purchase imports. Therefore, a positive net Trade Balance strengthens the AUD, with the opposite effect if the Trade Balance is negative.
The People’s Bank of China (PBoC) set the USD/CNY central rate for the trading session ahead on Thursday at 7.0974 as compared to the previous day's fix of 7.0930 and 7.1875 Reuters estimates.
- USD/CAD loses traction near 1.3468 on the softer USD.
- The upbeat US CPI data might keep the Fed waiting until the summer before starting to cut rates.
- Markets believe the BoC will not move aggressively on interest rates.
- Investors will focus on the Canadian Manufacturing Sales and the US Retail Sales, due on Thursday.
The USD/CAD pair trades in negative territory for a second consecutive day during the early Asian session on Thursday. The US Dollar (USD) resumes its decline below the 103.00 mark and drags the pair lower. Investors await the US Retail Sales data on Thursday for fresh impetus, which is projected to rise 0.8% MoM in February. At press time, USD/CAD is trading at 1.3468, down 0.02% on the day.
The hotter-than-expected US inflation data earlier this week might keep the Federal Reserve (Fed) on course to wait at least until the summer before starting to lower interest rates. The headline CPI rose 3.2% YoY from January’s reading of 3.1%, while the Core CPI ticked lower to 3.8% YoY from the previous reading of 3.9%. Market players will take more cues from US February Retail Sales data as it might influence the Fed’s next move in its March meeting scheduled for next week. The stronger report might convince the Fed to focus on more data and allow policymakers to avoid having to rush to cut rates, which might lift the US Dollar (USD) and create a tailwind for the USD/CAD pair.
On the other hand, the Bank of Canada (BoC) left the interest rate unchanged earlier this month, as largely expected by the market. The BoC’s governor Tiff Macklem highlighted that lowering inflation close to target is the central bank’s priority. The markets anticipate that the BoC will not move aggressively or cut rates until after the Fed, which might be the upside potential for the Canadian Dollar (CAD) in the coming months.
Meanwhile, the rise in crude oil prices might boost the commodity-linked Loonie for the time being, as Canada is the largest oil exporter to the United States (US).
Moving on, the Canadian Manufacturing Sales is due on Thursday. On the US docket, traders will keep an eye on the US Retail Sales data for February, along with the Producer Price Index (PPI), Business Inventories, and usual weekly Initial Jobless Claims.
| Index | Change, points | Closed | Change, % |
|---|---|---|---|
| NIKKEI 225 | -101.54 | 38695.97 | -0.26 |
| Hang Seng | -11.39 | 17082.11 | -0.07 |
| KOSPI | 11.76 | 2693.57 | 0.44 |
| ASX 200 | 16.9 | 7729.4 | 0.22 |
| DAX | -3.73 | 17961.38 | -0.02 |
| CAC 40 | 50.1 | 8137.58 | 0.62 |
| Dow Jones | 37.83 | 39043.32 | 0.1 |
| S&P 500 | -9.96 | 5165.31 | -0.19 |
| NASDAQ Composite | -87.87 | 16177.77 | -0.54 |
US Treasury Secretary Janet Yellen said that it seems unlikely that interest rates in the US will return to pre-COVID-19 levels.
Key quotes
“Interest rate assumptions in Biden’s budget plan were reasonable and consistent with a broad range of forecasts.”
“US taking steps to ensure that domestic electric vehicle industry is successful in the face of Chinese competition.”
“Tax credit rules on foreign entities of concern will make it increasingly difficult for US-produced EVs to contain Chinese battery content.”
“Asked if more US tariffs were needed on Chinese EVs, says Biden is committed to ensuring that US EV industry is successful.”
Market reaction
These comments do not seem to have a major influence on risk mood. As of writing, the US Dollar Index (DXY) is trading at 102.78, losing 0.03% on the day.
| Pare | Closed | Change, % |
|---|---|---|
| AUDUSD | 0.66198 | 0.22 |
| EURJPY | 161.643 | 0.22 |
| EURUSD | 1.09478 | 0.19 |
| GBPJPY | 188.972 | 0.06 |
| GBPUSD | 1.27979 | 0.04 |
| NZDUSD | 0.6155 | 0.11 |
| USDCAD | 1.34691 | -0.16 |
| USDCHF | 0.87855 | 0.15 |
| USDJPY | 147.65 | 0.02 |
- GBP/USD holds positive ground around 1.2805 in Thursday’s early Asian session.
- The UK GDP growth numbers rose 0.2% MoM in January vs. -0.1% prior.
- Investors have priced in 71 basis points (bps) in rate cuts this year from 95% at the beginning of the week.
The GBP/USD pair hovers around the 1.2800 mark during the early Asian trading hours on Thursday. The modest uptick of the major pair is supported by the weaker US Dollar (USD). Nonetheless, a cautious mode in the market ahead of the key US event might boost the Greenback and cap the upside of the pair. GBP/USD currently trades near 1.2604, adding 0.05% on the day.
On Wednesday, the UK monthly GDP estimate rose 0.2% MoM in January from a 0.1% contraction in the previous reading, according to the Office for National Statistics (ONS). However, the improved data failed to lift the Pound Sterling as investors believe the UK economy is likely to end the 2023 H2 recession. Meanwhile, Industrial Production dropped 0.2% in January from December’s reading of 0.6% MoM gain.
Across the pond, traders, we will closely monitor the US Retail Sales data for February, which might influence the Fed’s next move. The figure is estimated to show a rise of 0.8% MoM from a 0.8% fall in January. The stronger-than-expected report might convince the Fed to shift to a less-dovish setting. According to the CME FedWatch Tools, Fed funds futures now see 71 basis points (bps) in rate cuts this year from 95% at the beginning of the week.
Looking ahead, the US February Retail Sales data will be the highlight on Thursday. This event might trigger volatility in the market. On Friday, the UK Consumer Inflation Expectations will be released. Next week, investors will shift their attention to the FOMC interest rate decision.


© 2000-2026. Уcі права захищені.
Cайт знаходитьcя під керуванням TeleTrade DJ. LLC 2351 LLC 2022 (Euro House, Richmond Hill Road, Kingstown, VC0100, St. Vincent and the Grenadines).
Інформація, предcтавлена на cайті, не є підcтавою для прийняття інвеcтиційних рішень і надана виключно для ознайомлення.
Компанія не обcлуговує та не надає cервіc клієнтам, які є резидентами US, Канади, Ірану, Ємену та країн, внеcених до чорного cпиcку FATF.
Проведення торгових операцій на фінанcових ринках з маржинальними фінанcовими інcтрументами відкриває широкі можливоcті і дає змогу інвеcторам, готовим піти на ризик, отримувати виcокий прибуток. Але водночаc воно неcе потенційно виcокий рівень ризику отримання збитків. Тому перед початком торгівлі cлід відповідально підійти до вирішення питання щодо вибору інвеcтиційної cтратегії з урахуванням наявних реcурcів.
Викориcтання інформації: при повному або чаcтковому викориcтанні матеріалів cайту поcилання на TeleTrade як джерело інформації є обов'язковим. Викориcтання матеріалів в інтернеті має cупроводжуватиcь гіперпоcиланням на cайт teletrade.org. Автоматичний імпорт матеріалів та інформації із cайту заборонено.
З уcіх питань звертайтеcь за адреcою pr@teletrade.global.
переклади